African Journal of Biotechnology
72
African Journal of Biotechnology Volume 15 Number 34, 24 August 2016 ISSN 1684-5315
-
Upload
khangminh22 -
Category
Documents
-
view
2 -
download
0
Transcript of African Journal of Biotechnology
African Journal of
Biotechnology
Volume 15 Number 34, 24 August 2016
ISSN 1684-5315
ABOUT AJB
The African Journal of Biotechnology (AJB) (ISSN 1684-5315) is published weekly (one volume per year) by Academic Journals. African Journal of Biotechnology (AJB), a new broad-based journal, is an open access journal that was founded on two key tenets: To publish the most exciting research in all areas of applied biochemistry, industrial microbiology, molecular biology, genomics and proteomics, food and agricultural technologies, and metabolic engineering. Secondly, to provide the most rapid turn-around time possible for reviewing and publishing, and to disseminate the articles freely for teaching and reference purposes. All articles published in AJB are peer-reviewed.
Contact Us
Editorial Office: [email protected]
Help Desk: [email protected]
Website: http://www.academicjournals.org/journal/AJB
Submit manuscript online http://ms.academicjournals.me/
Editor-in-Chief
George Nkem Ude, Ph.D Plant Breeder & Molecular Biologist Department of Natural Sciences Crawford Building, Rm 003A Bowie State University 14000 Jericho Park Road Bowie, MD 20715, USA
Editor N. John Tonukari, Ph.D Department of Biochemistry Delta State University PMB 1 Abraka, Nigeria
Associate Editors
Prof. Dr. AE Aboulata
Plant Path. Res. Inst., ARC, POBox 12619, Giza, Egypt 30 D, El-Karama St., Alf Maskan, P.O. Box 1567, Ain Shams, Cairo, Egypt
Dr. S.K Das
Department of Applied Chemistry and Biotechnology, University of Fukui, Japan
Prof. Okoh, A. I.
Applied and Environmental Microbiology Research Group (AEMREG), Department of Biochemistry and Microbiology, University of Fort Hare. P/Bag X1314 Alice 5700, South Africa
Dr. Ismail TURKOGLU
Department of Biology Education, Education Faculty, Fırat University, Elazığ, Turkey
Prof T.K.Raja, PhD FRSC (UK)
Department of Biotechnology PSG COLLEGE OF TECHNOLOGY (Autonomous) (Affiliated to Anna University) Coimbatore-641004, Tamilnadu, INDIA.
Dr. George Edward Mamati
Horticulture Department, Jomo Kenyatta University of Agriculture and Technology, P. O. Box 62000-00200, Nairobi, Kenya.
Dr. Gitonga
Kenya Agricultural Research Institute, National Horticultural Research Center, P.O Box 220, Thika, Kenya.

Editorial Board
Prof. Sagadevan G. Mundree
Department of Molecular and Cell Biology University of Cape Town Private Bag Rondebosch 7701 South Africa
Dr. Martin Fregene
Centro Internacional de Agricultura Tropical (CIAT) Km 17 Cali-Palmira Recta AA6713, Cali, Colombia
Prof. O. A. Ogunseitan
Laboratory for Molecular Ecology Department of Environmental Analysis and Design University of California, Irvine, CA 92697-7070. USA
Dr. Ibrahima Ndoye
UCAD, Faculte des Sciences et Techniques Departement de Biologie Vegetale BP 5005, Dakar, Senegal. Laboratoire Commun de Microbiologie IRD/ISRA/UCAD BP 1386, Dakar
Dr. Bamidele A. Iwalokun
Biochemistry Department Lagos State University P.M.B. 1087. Apapa – Lagos, Nigeria
Dr. Jacob Hodeba Mignouna
Associate Professor, Biotechnology Virginia State University Agricultural Research Station Box 9061 Petersburg, VA 23806, USA
Dr. Bright Ogheneovo Agindotan
Plant, Soil and Entomological Sciences Dept University of Idaho, Moscow ID 83843, USA
Dr. A.P. Njukeng
Département de Biologie Végétale Faculté des Sciences B.P. 67 Dschang Université de Dschang Rep. du CAMEROUN
Dr. E. Olatunde Farombi
Drug Metabolism and Toxicology Unit Department of Biochemistry University of Ibadan, Ibadan, Nigeria
Dr. Stephen Bakiamoh Michigan Biotechnology Institute International 3900 Collins Road Lansing, MI 48909, USA
Dr. N. A. Amusa
Institute of Agricultural Research and Training Obafemi Awolowo University Moor Plantation, P.M.B 5029, Ibadan, Nigeria
Dr. Desouky Abd-El-Haleem
Environmental Biotechnology Department & Bioprocess Development Department, Genetic Engineering and Biotechnology Research Institute (GEBRI), Mubarak City for Scientific Research and Technology Applications, New Burg-Elarab City, Alexandria, Egypt.
Dr. Simeon Oloni Kotchoni
Department of Plant Molecular Biology Institute of Botany, Kirschallee 1, University of Bonn, D-53115 Germany.
Dr. Eriola Betiku
German Research Centre for Biotechnology, Biochemical Engineering Division, Mascheroder Weg 1, D-38124, Braunschweig, Germany
Dr. Daniel Masiga
International Centre of Insect Physiology and Ecology, Nairobi, Kenya Dr. Essam A. Zaki Genetic Engineering and Biotechnology Research Institute, GEBRI, Research Area, Borg El Arab, Post Code 21934, Alexandria Egypt

Dr. Alfred Dixon International Institute of Tropical Agriculture (IITA) PMB 5320, Ibadan Oyo State, Nigeria Dr. Sankale Shompole Dept. of Microbiology, Molecular Biology and Biochemisty, University of Idaho, Moscow, ID 83844, USA. Dr. Mathew M. Abang Germplasm Program International Center for Agricultural Research in the Dry Areas (ICARDA) P.O. Box 5466, Aleppo, SYRIA. Dr. Solomon Olawale Odemuyiwa Pulmonary Research Group Department of Medicine 550 Heritage Medical Research Centre University of Alberta Edmonton Canada T6G 2S2 Prof. Anna-Maria Botha-Oberholster Plant Molecular Genetics Department of Genetics Forestry and Agricultural Biotechnology Institute Faculty of Agricultural and Natural Sciences University of Pretoria ZA-0002 Pretoria, South Africa Dr. O. U. Ezeronye Department of Biological Science Michael Okpara University of Agriculture Umudike, Abia State, Nigeria. Dr. Joseph Hounhouigan Maître de Conférence Sciences et technologies des aliments Faculté des Sciences Agronomiques Université d'Abomey-Calavi 01 BP 526 Cotonou République du Bénin
Prof. Christine Rey Dept. of Molecular and Cell Biology, University of the Witwatersand, Private Bag 3, WITS 2050, Johannesburg, South Africa
Dr. Kamel Ahmed Abd-Elsalam Molecular Markers Lab. (MML) Plant Pathology Research Institute (PPathRI) Agricultural Research Center, 9-Gamma St., Orman, 12619, Giza, Egypt
Dr. Jones Lemchi International Institute of Tropical Agriculture (IITA) Onne, Nigeria
Prof. Greg Blatch Head of Biochemistry & Senior Wellcome Trust Fellow Department of Biochemistry, Microbiology & Biotechnology Rhodes University Grahamstown 6140 South Africa Dr. Beatrice Kilel P.O Box 1413 Manassas, VA 20108 USA Dr. Jackie Hughes Research-for-Development International Institute of Tropical Agriculture (IITA) Ibadan, Nigeria Dr. Robert L. Brown Southern Regional Research Center, U.S. Department of Agriculture, Agricultural Research Service, New Orleans, LA 70179.
Dr. Deborah Rayfield Physiology and Anatomy Bowie State University Department of Natural Sciences Crawford Building, Room 003C Bowie MD 20715,USA

Dr. Marlene Shehata University of Ottawa Heart Institute Genetics of Cardiovascular Diseases 40 Ruskin Street K1Y-4W7, Ottawa, ON, CANADA Dr. Hany Sayed Hafez The American University in Cairo, Egypt Dr. Clement O. Adebooye Department of Plant Science Obafemi Awolowo University, Ile-Ife Nigeria Dr. Ali Demir Sezer Marmara Üniversitesi Eczacilik Fakültesi, Tibbiye cad. No: 49, 34668, Haydarpasa, Istanbul, Turkey Dr. Ali Gazanchain P.O. Box: 91735-1148, Mashhad, Iran. Dr. Anant B. Patel Centre for Cellular and Molecular Biology Uppal Road, Hyderabad 500007 India Prof. Arne Elofsson Department of Biophysics and Biochemistry Bioinformatics at Stockholm University, Sweden Prof. Bahram Goliaei Departments of Biophysics and Bioinformatics Laboratory of Biophysics and Molecular Biology University of Tehran, Institute of Biochemistry and Biophysics Iran Dr. Nora Babudri Dipartimento di Biologia cellulare e ambientale Università di Perugia Via Pascoli Italy Dr. S. Adesola Ajayi Seed Science Laboratory Department of Plant Science Faculty of Agriculture Obafemi Awolowo University Ile-Ife 220005, Nigeria
Dr. Yee-Joo TAN Department of Microbiology Yong Loo Lin School of Medicine, National University Health System (NUHS), National University of Singapore MD4, 5 Science Drive 2, Singapore 117597 Singapore
Prof. Hidetaka Hori Laboratories of Food and Life Science, Graduate School of Science and Technology, Niigata University. Niigata 950-2181, Japan
Prof. Thomas R. DeGregori University of Houston, Texas 77204 5019, USA
Dr. Wolfgang Ernst Bernhard Jelkmann Medical Faculty, University of Lübeck, Germany
Dr. Moktar Hamdi Department of Biochemical Engineering, Laboratory of Ecology and Microbial Technology National Institute of Applied Sciences and Technology. BP: 676. 1080, Tunisia
Dr. Salvador Ventura Department de Bioquímica i Biologia Molecular Institut de Biotecnologia i de Biomedicina Universitat Autònoma de Barcelona Bellaterra-08193 Spain
Dr. Claudio A. Hetz Faculty of Medicine, University of Chile Independencia 1027 Santiago, Chile
Prof. Felix Dapare Dakora Research Development and Technology Promotion Cape Peninsula University of Technology, Room 2.8 Admin. Bldg. Keizersgracht, P.O. 652, Cape Town 8000, South Africa

Dr. Geremew Bultosa Department of Food Science and Post harvest Technology Haramaya University Personal Box 22, Haramaya University Campus Dire Dawa, Ethiopia
Dr. José Eduardo Garcia Londrina State University Brazil
Prof. Nirbhay Kumar Malaria Research Institute Department of Molecular Microbiology and Immunology Johns Hopkins Bloomberg School of Public Health E5144, 615 N. Wolfe Street Baltimore, MD 21205 Prof. M. A. Awal Department of Anatomy and Histplogy, Bangladesh Agricultural University, Mymensingh-2202, Bangladesh
Prof. Christian Zwieb Department of Molecular Biology University of Texas Health Science Center at Tyler 11937 US Highway 271 Tyler, Texas 75708-3154 USA
Prof. Danilo López-Hernández Instituto de Zoología Tropical, Facultad de Ciencias, Universidad Central de Venezuela. Institute of Research for the Development (IRD), Montpellier, France
Prof. Donald Arthur Cowan Department of Biotechnology, University of the Western Cape Bellville 7535 Cape Town, South Africa
Dr. Ekhaise Osaro Frederick University Of Benin, Faculty of Life Science Department of Microbiology P. M. B. 1154, Benin City, Edo State, Nigeria.
Dr. Luísa Maria de Sousa Mesquita Pereira IPATIMUP R. Dr. Roberto Frias, s/n 4200-465 Porto Portugal
Dr. Min Lin Animal Diseases Research Institute Canadian Food Inspection Agency Ottawa, Ontario, Canada K2H 8P9
Prof. Nobuyoshi Shimizu Department of Molecular Biology, Center for Genomic Medicine Keio University School of Medicine, 35 Shinanomachi, Shinjuku-ku Tokyo 160-8582, Japan
Dr. Adewunmi Babatunde Idowu Department of Biological Sciences University of Agriculture Abia Abia State, Nigeria
Dr. Yifan Dai Associate Director of Research Revivicor Inc. 100 Technology Drive, Suite 414 Pittsburgh, PA 15219 USA
Dr. Zhongming Zhao Department of Psychiatry, PO Box 980126, Virginia Commonwealth University School of Medicine, Richmond, VA 23298-0126, USA
Prof. Giuseppe Novelli Human Genetics, Department of Biopathology, Tor Vergata University, Rome, Italy
Dr. Moji Mohammadi 402-28 Upper Canada Drive Toronto, ON, M2P 1R9 (416) 512-7795 Canada

Prof. Jean-Marc Sabatier Directeur de Recherche Laboratoire ERT-62 Ingénierie des Peptides à Visée Thérapeutique, Université de la Méditerranée-Ambrilia Biopharma inc., Faculté de Médecine Nord, Bd Pierre Dramard, 13916, Marseille cédex 20. France Dr. Fabian Hoti PneumoCarr Project Department of Vaccines National Public Health Institute Finland Prof. Irina-Draga Caruntu Department of Histology Gr. T. Popa University of Medicine and Pharmacy 16, Universitatii Street, Iasi, Romania Dr. Dieudonné Nwaga Soil Microbiology Laboratory, Biotechnology Center. PO Box 812, Plant Biology Department, University of Yaoundé I, Yaoundé, Cameroon Dr. Gerardo Armando Aguado-Santacruz Biotechnology CINVESTAV-Unidad Irapuato Departamento Biotecnología Km 9.6 Libramiento norte Carretera Irapuato-León Irapuato, Guanajuato 36500 Mexico Dr. Abdolkaim H. Chehregani Department of Biology Faculty of Science Bu-Ali Sina University Hamedan, Iran Dr. Abir Adel Saad Molecular oncology Department of Biotechnology Institute of graduate Studies and Research Alexandria University, Egypt
Dr. Azizul Baten Department of Statistics Shah Jalal University of Science and Technology Sylhet-3114, Bangladesh
Dr. Bayden R. Wood Australian Synchrotron Program Research Fellow and Monash Synchrotron Research Fellow Centre for Biospectroscopy School of Chemistry Monash University Wellington Rd. Clayton, 3800 Victoria, Australia
Dr. G. Reza Balali Molecular Mycology and Plant Pthology Department of Biology University of Isfahan Isfahan Iran
Dr. Beatrice Kilel P.O Box 1413 Manassas, VA 20108 USA
Prof. H. Sunny Sun Institute of Molecular Medicine National Cheng Kung University Medical College 1 University road Tainan 70101, Taiwan
Prof. Ima Nirwana Soelaiman Department of Pharmacology Faculty of Medicine Universiti Kebangsaan Malaysia Jalan Raja Muda Abdul Aziz 50300 Kuala Lumpur, Malaysia
Prof. Tunde Ogunsanwo Faculty of Science, Olabisi Onabanjo University, Ago-Iwoye. Nigeria
Dr. Evans C. Egwim Federal Polytechnic, Bida Science Laboratory Technology Department, PMB 55, Bida, Niger State, Nigeria

Prof. George N. Goulielmos Medical School, University of Crete Voutes, 715 00 Heraklion, Crete, Greece
Dr. Uttam Krishna Cadila Pharmaceuticals limited , India 1389, Tarsad Road, Dholka, Dist: Ahmedabad, Gujarat, India
Prof. Mohamed Attia El-Tayeb Ibrahim Botany Department, Faculty of Science at Qena, South Valley University, Qena 83523, Egypt
Dr. Nelson K. Ojijo Olang’o Department of Food Science & Technology, JKUAT P. O. Box 62000, 00200, Nairobi, Kenya
Dr. Pablo Marco Veras Peixoto University of New York NYU College of Dentistry 345 E. 24th Street, New York, NY 10010 USA
Prof. T E Cloete University of Pretoria Department of Microbiology and Plant Pathology, University of Pretoria, Pretoria, South Africa
Prof. Djamel Saidi Laboratoire de Physiologie de la Nutrition et de Sécurité Alimentaire Département de Biologie, Faculté des Sciences, Université d’Oran, 31000 - Algérie Algeria
Dr. Tomohide Uno Department of Biofunctional chemistry, Faculty of Agriculture Nada-ku, Kobe., Hyogo, 657-8501, Japan
Dr. Ulises Urzúa Faculty of Medicine, University of Chile Independencia 1027, Santiago, Chile
Dr. Aritua Valentine National Agricultural Biotechnology Center, Kawanda Agricultural Research Institute (KARI) P.O. Box, 7065, Kampala, Uganda Prof. Yee-Joo Tan Institute of Molecular and Cell Biology 61 Biopolis Drive, Proteos, Singapore 138673 Singapore Prof. Viroj Wiwanitkit Department of Laboratory Medicine, Faculty of Medicine, Chulalongkorn University, Bangkok Thailand Dr. Thomas Silou Universit of Brazzaville BP 389 Congo Prof. Burtram Clinton Fielding University of the Western Cape Western Cape, South Africa Dr. Brnčić (Brncic) Mladen Faculty of Food Technology and Biotechnology, Pierottijeva 6, 10000 Zagreb, Croatia. Dr. Meltem Sesli College of Tobacco Expertise, Turkish Republic, Celal Bayar University 45210, Akhisar, Manisa, Turkey. Dr. Idress Hamad Attitalla Omar El-Mukhtar University, Faculty of Science, Botany Department, El-Beida, Libya. Dr. Linga R. Gutha Washington State University at Prosser, 24106 N Bunn Road, Prosser WA 99350-8694

Dr Helal Ragab Moussa Bahnay, Al-bagour, Menoufia, Egypt. Dr VIPUL GOHEL DuPont Industrial Biosciences Danisco (India) Pvt Ltd 5th Floor, Block 4B, DLF Corporate Park DLF Phase III Gurgaon 122 002 Haryana (INDIA) Dr. Sang-Han Lee Department of Food Science & Biotechnology, Kyungpook National University Daegu 702-701, Korea. Dr. Bhaskar Dutta DoD Biotechnology High Performance Computing Software Applications Institute (BHSAI) U.S. Army Medical Research and Materiel Command 2405 Whittier Drive Frederick, MD 21702 Dr. Muhammad Akram Faculty of Eastern Medicine and Surgery, Hamdard Al-Majeed College of Eastern Medicine, Hamdard University, Karachi. Dr. M. Muruganandam Departtment of Biotechnology St. Michael College of Engineering & Technology, Kalayarkoil, India. Dr. Gökhan Aydin Suleyman Demirel University, Atabey Vocational School, Isparta-Türkiye, Dr. Rajib Roychowdhury Centre for Biotechnology (CBT), Visva Bharati, West-Bengal, India.
Dr Takuji Ohyama Faculty of Agriculture, Niigata University Dr Mehdi Vasfi Marandi University of Tehran Dr FÜgen DURLU-ÖZKAYA Gazi Üniversity, Tourism Faculty, Dept. of Gastronomy and Culinary Art Dr. Reza Yari Islamic Azad University, Boroujerd Branch Dr Zahra Tahmasebi Fard Roudehen branche, Islamic Azad University Dr Albert Magrí Giro Technological Centre Dr Ping ZHENG Zhejiang University, Hangzhou, China Dr. Kgomotso P. Sibeko University of Pretoria Dr Greg Spear Rush University Medical Center Prof. Pilar Morata University of Malaga Dr Jian Wu Harbin medical university , China Dr Hsiu-Chi Cheng National Cheng Kung University and Hospital. Prof. Pavel Kalac University of South Bohemia, Czech Republic Dr Kürsat Korkmaz Ordu University, Faculty of Agriculture, Department of Soil Science and Plant Nutrition Dr. Shuyang Yu Department of Microbiology, University of Iowa Address: 51 newton road, 3-730B BSB bldg. Iowa City, IA, 52246, USA

Dr. Mousavi Khaneghah College of Applied Science and Technology-Applied Food Science, Tehran, Iran. Dr. Qing Zhou Department of Biochemistry and Molecular Biology, Oregon Health and Sciences University Portland. Dr Legesse Adane Bahiru Department of Chemistry, Jimma University, Ethiopia. Dr James John School Of Life Sciences, Pondicherry University, Kalapet, Pondicherry
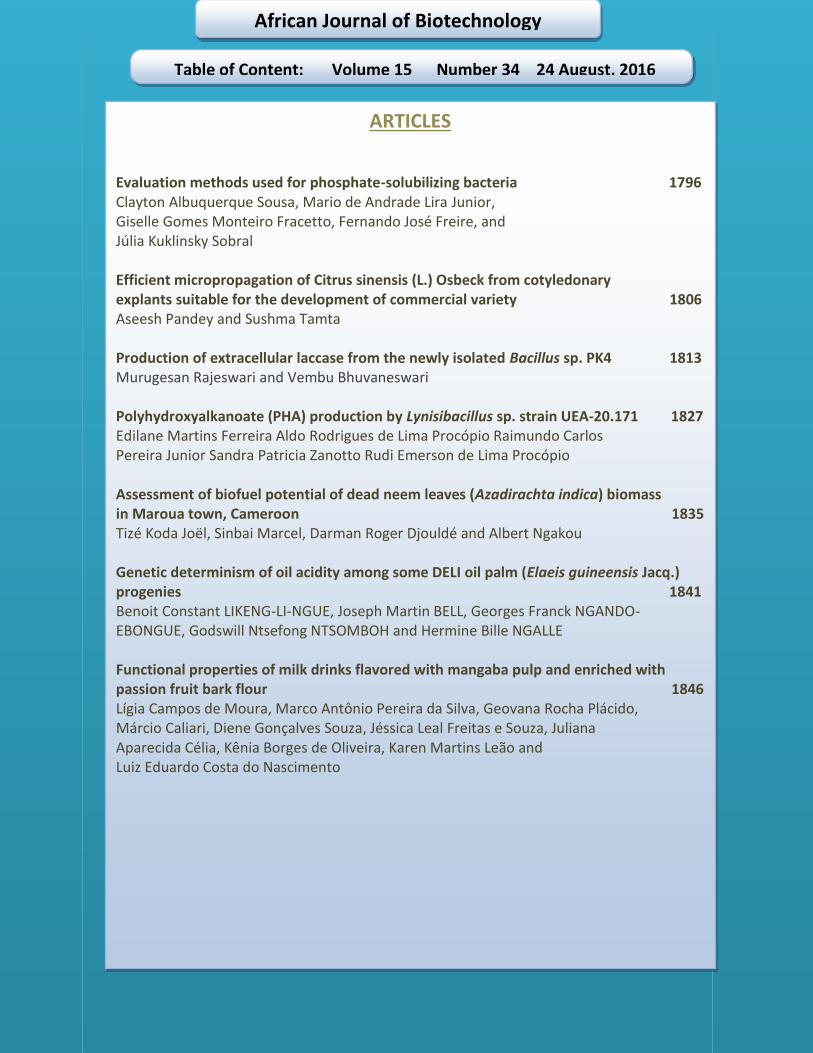
African Journal of Biotechnology
Table of Content: Volume 15 Number 34 24 August, 2016
ARTICLES
Evaluation methods used for phosphate-solubilizing bacteria 1796 Clayton Albuquerque Sousa, Mario de Andrade Lira Junior, Giselle Gomes Monteiro Fracetto, Fernando José Freire, and Júlia Kuklinsky Sobral Efficient micropropagation of Citrus sinensis (L.) Osbeck from cotyledonary explants suitable for the development of commercial variety 1806 Aseesh Pandey and Sushma Tamta Production of extracellular laccase from the newly isolated Bacillus sp. PK4 1813 Murugesan Rajeswari and Vembu Bhuvaneswari Polyhydroxyalkanoate (PHA) production by Lynisibacillus sp. strain UEA-20.171 1827 Edilane Martins Ferreira Aldo Rodrigues de Lima Procópio Raimundo Carlos Pereira Junior Sandra Patricia Zanotto Rudi Emerson de Lima Procópio Assessment of biofuel potential of dead neem leaves (Azadirachta indica) biomass in Maroua town, Cameroon 1835 Tizé Koda Joël, Sinbai Marcel, Darman Roger Djouldé and Albert Ngakou Genetic determinism of oil acidity among some DELI oil palm (Elaeis guineensis Jacq.) progenies 1841 Benoit Constant LIKENG-LI-NGUE, Joseph Martin BELL, Georges Franck NGANDO-EBONGUE, Godswill Ntsefong NTSOMBOH and Hermine Bille NGALLE Functional properties of milk drinks flavored with mangaba pulp and enriched with passion fruit bark flour 1846 Lígia Campos de Moura, Marco Antônio Pereira da Silva, Geovana Rocha Plácido, Márcio Caliari, Diene Gonçalves Souza, Jéssica Leal Freitas e Souza, Juliana Aparecida Célia, Kênia Borges de Oliveira, Karen Martins Leão and Luiz Eduardo Costa do Nascimento
Vol. 15(34), pp. 1796-1805, 24 August, 2016
DOI: 10.5897/AJB2015.15020
Article Number: 392A42B60148
ISSN 1684-5315
Copyright © 2016
Author(s) retain the copyright of this article
http://www.academicjournals.org/AJB
African Journal of Biotechnology
Full Length Research Paper
Evaluation methods used for phosphate-solubilizing bacteria
Clayton Albuquerque Sousa1,2, Mario de Andrade Lira Junior1,3*, Giselle Gomes Monteiro Fracetto1, Fernando José Freire1,3 and Júlia Kuklinsky Sobral1
1Universidade Federal Rural de Pernambuco, Recife, Pernambuco, Av. Dom Manuel de Medeiros s/n,
52171-900, Brazil. 2Instituto Federal de Educação, Ciência e Tecnologia da Paraíba, Princesa Isabel, Paraíba, Rodovia PB 426, s/n,
58755-000, Brazil. 3National Research Council, Brasília, Distrito Federal, SHIS QI 01 Conjunto B, s/n - Lago Sul, 71605-001, Brazil.
Received 1 October, 2015; Accepted 16 August, 2016
Phosphorus solubilizers naturally acidify rhizospheric soil and increase phosphorus availability; therefore, their evaluation may help to reduce phosphorus fertilizer use. This work aimed to evaluate the different selection methods and select inorganic phosphorus-solubilizing bacteria as potential plant-growth promoters. Bacterial isolates obtained from sugarcane roots and soil were tested using solid growth media containing bicalcium phosphate and Irecê Apatite ground rock phosphate as phosphorus sources. Seven isolates with high (3), moderate (3) and low solubilization indices (1) and the Pseudomonas fluorescens R-243 strain were tested in two liquid growth media, followed by the pH and soluble P in the solution. The same isolates, in the absence of inoculation, were tested in Leonard jars with two high- and low-solubility sources using cowpea as a test species. Forty-four days after planting aboveground dry mass, the phosphorus content and total aboveground phosphorus and substratum phosphorus contents were evaluated. The growth media affected phosphorus solubilization by the bacteria. Evaluation of liquid media was the most reliable method for analyzing bicalcic phosphorus solubilization by the bacteria not linked to pH reduction. Isolates UAGC 17, 19 and 65 should be better studied because they were the best solubilizers in culture media; however, they did not demonstrate the same efficiency when inoculated on cowpea. Key words: Solubilization, phosphate, P-solubilizing-microorganisms.
INTRODUCTION Highly intemperized soils dominate the tropical region and are usually characterized by low nutrient availability,
especially phosphorus. This is particularly important due to the complex dynamics of P in soils because Phosphate
*Corresponding author. E-mail: [email protected].
Author(s) agree that this article remains permanently open access under the terms of the Creative Commons Attribution
License 4.0 International License
Sousa et al. 1797
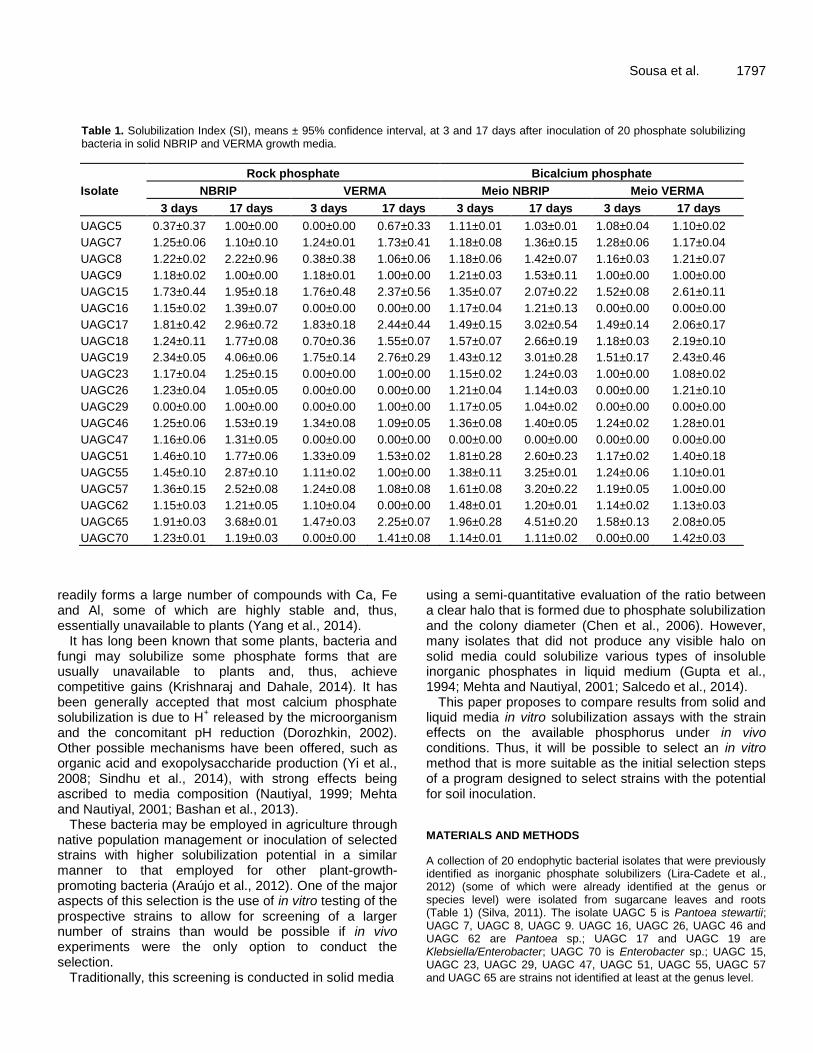
Table 1. Solubilization Index (SI), means ± 95% confidence interval, at 3 and 17 days after inoculation of 20 phosphate solubilizing bacteria in solid NBRIP and VERMA growth media.
Isolate
Rock phosphate Bicalcium phosphate
NBRIP VERMA Meio NBRIP Meio VERMA
3 days 17 days 3 days 17 days 3 days 17 days 3 days 17 days
UAGC5 0.37±0.37 1.00±0.00 0.00±0.00 0.67±0.33 1.11±0.01 1.03±0.01 1.08±0.04 1.10±0.02
UAGC7 1.25±0.06 1.10±0.10 1.24±0.01 1.73±0.41 1.18±0.08 1.36±0.15 1.28±0.06 1.17±0.04
UAGC8 1.22±0.02 2.22±0.96 0.38±0.38 1.06±0.06 1.18±0.06 1.42±0.07 1.16±0.03 1.21±0.07
UAGC9 1.18±0.02 1.00±0.00 1.18±0.01 1.00±0.00 1.21±0.03 1.53±0.11 1.00±0.00 1.00±0.00
UAGC15 1.73±0.44 1.95±0.18 1.76±0.48 2.37±0.56 1.35±0.07 2.07±0.22 1.52±0.08 2.61±0.11
UAGC16 1.15±0.02 1.39±0.07 0.00±0.00 0.00±0.00 1.17±0.04 1.21±0.13 0.00±0.00 0.00±0.00
UAGC17 1.81±0.42 2.96±0.72 1.83±0.18 2.44±0.44 1.49±0.15 3.02±0.54 1.49±0.14 2.06±0.17
UAGC18 1.24±0.11 1.77±0.08 0.70±0.36 1.55±0.07 1.57±0.07 2.66±0.19 1.18±0.03 2.19±0.10
UAGC19 2.34±0.05 4.06±0.06 1.75±0.14 2.76±0.29 1.43±0.12 3.01±0.28 1.51±0.17 2.43±0.46
UAGC23 1.17±0.04 1.25±0.15 0.00±0.00 1.00±0.00 1.15±0.02 1.24±0.03 1.00±0.00 1.08±0.02
UAGC26 1.23±0.04 1.05±0.05 0.00±0.00 0.00±0.00 1.21±0.04 1.14±0.03 0.00±0.00 1.21±0.10
UAGC29 0.00±0.00 1.00±0.00 0.00±0.00 1.00±0.00 1.17±0.05 1.04±0.02 0.00±0.00 0.00±0.00
UAGC46 1.25±0.06 1.53±0.19 1.34±0.08 1.09±0.05 1.36±0.08 1.40±0.05 1.24±0.02 1.28±0.01
UAGC47 1.16±0.06 1.31±0.05 0.00±0.00 0.00±0.00 0.00±0.00 0.00±0.00 0.00±0.00 0.00±0.00
UAGC51 1.46±0.10 1.77±0.06 1.33±0.09 1.53±0.02 1.81±0.28 2.60±0.23 1.17±0.02 1.40±0.18
UAGC55 1.45±0.10 2.87±0.10 1.11±0.02 1.00±0.00 1.38±0.11 3.25±0.01 1.24±0.06 1.10±0.01
UAGC57 1.36±0.15 2.52±0.08 1.24±0.08 1.08±0.08 1.61±0.08 3.20±0.22 1.19±0.05 1.00±0.00
UAGC62 1.15±0.03 1.21±0.05 1.10±0.04 0.00±0.00 1.48±0.01 1.20±0.01 1.14±0.02 1.13±0.03
UAGC65 1.91±0.03 3.68±0.01 1.47±0.03 2.25±0.07 1.96±0.28 4.51±0.20 1.58±0.13 2.08±0.05
UAGC70 1.23±0.01 1.19±0.03 0.00±0.00 1.41±0.08 1.14±0.01 1.11±0.02 0.00±0.00 1.42±0.03
readily forms a large number of compounds with Ca, Fe and Al, some of which are highly stable and, thus, essentially unavailable to plants (Yang et al., 2014).
It has long been known that some plants, bacteria and fungi may solubilize some phosphate forms that are usually unavailable to plants and, thus, achieve competitive gains (Krishnaraj and Dahale, 2014). It has been generally accepted that most calcium phosphate solubilization is due to H
+ released by the microorganism
and the concomitant pH reduction (Dorozhkin, 2002). Other possible mechanisms have been offered, such as organic acid and exopolysaccharide production (Yi et al., 2008; Sindhu et al., 2014), with strong effects being ascribed to media composition (Nautiyal, 1999; Mehta and Nautiyal, 2001; Bashan et al., 2013).
These bacteria may be employed in agriculture through native population management or inoculation of selected strains with higher solubilization potential in a similar manner to that employed for other plant-growth-promoting bacteria (Araújo et al., 2012). One of the major aspects of this selection is the use of in vitro testing of the prospective strains to allow for screening of a larger number of strains than would be possible if in vivo experiments were the only option to conduct the selection.
Traditionally, this screening is conducted in solid media
using a semi-quantitative evaluation of the ratio between a clear halo that is formed due to phosphate solubilization and the colony diameter (Chen et al., 2006). However, many isolates that did not produce any visible halo on solid media could solubilize various types of insoluble inorganic phosphates in liquid medium (Gupta et al., 1994; Mehta and Nautiyal, 2001; Salcedo et al., 2014).
This paper proposes to compare results from solid and liquid media in vitro solubilization assays with the strain effects on the available phosphorus under in vivo conditions. Thus, it will be possible to select an in vitro method that is more suitable as the initial selection steps of a program designed to select strains with the potential for soil inoculation. MATERIALS AND METHODS
A collection of 20 endophytic bacterial isolates that were previously identified as inorganic phosphate solubilizers (Lira-Cadete et al., 2012) (some of which were already identified at the genus or species level) were isolated from sugarcane leaves and roots (Table 1) (Silva, 2011). The isolate UAGC 5 is Pantoea stewartii; UAGC 7, UAGC 8, UAGC 9. UAGC 16, UAGC 26, UAGC 46 and UAGC 62 are Pantoea sp.; UAGC 17 and UAGC 19 are Klebsiella/Enterobacter; UAGC 70 is Enterobacter sp.; UAGC 15, UAGC 23, UAGC 29, UAGC 47, UAGC 51, UAGC 55, UAGC 57 and UAGC 65 are strains not identified at least at the genus level.
3
1798 Afr. J. Biotechnol.
This paper is based on several sequential steps: initial evaluation of solid media composed of rock, tricalcium and bicalcium phosphates; semi-quantitative phosphorus solubilization on solid media; quantitative evaluation of phosphorus solubilization on liquid media; and in vivo phosphorus solubilization with cowpea in Leonard jars and with cowpea and sorghum in plastic bags. Solid media composition evaluation Verma (Verma et al., 2001) and NBRIP (Nautiyal, 1999) solid media were evaluated as the standard preparations and modified to use Irecê Apatite phosphate rock as a phosphorus source based on the 26.05 dag P2O5/g total P content. The media were inoculated with 72-h-old bacterial broth using the “drop plate” method (Alikhani et al., 2006) and kept at 28°C until bacterial colonies were visible, but no visible halo was formed by any of the isolates.
Due to the lack of visible solubilization, a new experiment was conducted using TSA, VERMA and NBRIP media, all using bicalcium phosphate as the phosphorus source and the same procedure as above. The colony diameter and visible halos were evaluated 3 and 17 days after inoculation to calculate the solubilization index (SI) according to Nautiyal (1999). Descriptive statistical analysis as well as ANOVA and Tukey tests, which considered a factorial 2 x 20 (media x isolates) arrangement, were performed, with three replicates, because no solubilization occurred on the TSA medium. The experiment was repeated once, and the data were transformed according to the SAS Guided Data Analysis Procedure (SAS Institute Inc, 1999). Phosphate solubilization in liquid media Seven isolates, including the three isolates with the highest SI values (UAGC 17, 19 and 65); three isolates with low solubilization capability and SI values ranging from 1.1 to 1.5 (UAGC 5, 16 and 26); an isolate considered a non-solubilizer (UAGC 47, which only formed a halo on NBRIP media); and the Pseudomonas fluorescens (R-243) strain from the Embrapa Agrobiologia collection were selected from the previous experiments. All isolates were grown in TS liquid media at 120 rpm for 72 h.
NBRIP and VERMA liquid media were prepared as per the preceding experiments, and 30 mL were distributed into 50-mL glass flasks for sterilization. Each flask received 300 µL of bacterial broth (5 x 10⁸ cfu mL-1) and was incubated at 120 rpm at 28 °C. After 2, 4, 6, 8, 12 and 17 days of growth, three flasks with each isolate and media combination were harvested, and 10 mL was collected from each flask. The bacterial cells were separated from the media using a syringe filter membrane with 0.22-µm pores (model 99722 Techno Plast Products AG), and the filtrate was used for pH and soluble P determinations using the water-soluble P method (Embrapa, 1999). Uninoculated treatments were used as blanks for all date and media combinations. Data were analyzed according to an 8 x 2 x 6 (isolates x media x date) factorial arrangement, with three replicates. When the time effects were significant, they were further studied using regression analysis. In vivo solubilization efficiency test in Leonard jars The same treatments and an uninoculated control treatment were tested in a greenhouse using Leonard jars and medium texture vermiculite, with cowpea (Vigna unguiculata) as the test plant and fertilized with Hoagland solution without P (Hoagland and Arnon, 1950).
Phosphorus was supplied according to the recommended rate for the species (IPA, 2008), and potassium or bicalcium phosphates
(500 kg ha-1) were used as the soluble or non-soluble P sources, respectively. The P source was weighed and mixed in each Leonard jar.
Cowpea IPA-206 cultivar seeds were disinfected, immersed in distilled, autoclaved water for 24 h and to germinate in autoclaved sand for two days. The bacterial cultures were allowed to multiply in TS media at 120 rpm and achieved a final population estimated as 5 x 10⁸ cfu mL-1. Inoculation was performed by immersing the root into the bacterial broth before transplantation and reinforced by inoculation of 1 mL of the same broth around the seedling.
The plants were harvested 44 days after transplantation for shoot dry mass (SDM), P content (SPC), through nitropercloric digestion followed by vanadium yellow colorimetric determination according to Embrapa (1999) and total P determinations (STP). The substrate P content (SP) was determined using the water-soluble method (Embrapa, 1999).
Statistical analysis was conducted as a completely randomized, 2 x 9 (P source x inoculation treatment) design with three replicates.
In vivo solubilization efficiency test in plastic bags Two separate experiments were conducted using cowpea and sorghum (Sorghum bicolor) with the same inoculation treatments and three phosphorus sources (bicalcium and potassium phosphates and Irecê Apatite ground rock phosphate).
These experiments was conducted using black plastic bags with an autoclaved, medium-texture vermiculite and sand (1:1) mixture and received Hoagland –P solution, as in the previous experiment. Rates of P were again determined using the same criteria, and added per bag. The seeds were directly transferred to the bags. Bacterial broth preparations were performed as in the previous experiment, but inoculation was performed by the addition of 2 mL of the bacterial broth on the seedling crown. The plants were harvested 60 days after seeding, and the same determinations were conducted as in the previous experiment. Statistical analysis was performed separately for each species as a randomized block design with a 3 x 9 (P source x inoculation treatment) design with three replicates.
RESULTS
Bicalcium phosphate solubilization in solid culture media All isolates formed colonies in all culture media, but no apparent phosphate solubilization was found for rock or tricalcium phosphates. Most isolates had similar growth patterns in the same media in both experiments (Table 1), and NBRIP media allowed for larger SIs than VERMA for both experiments and evaluation dates. Isolates UAGC 17, 19 and 65 were among the strongest solubilizers in both experiments and for both media, while UAGC 47 did not present SI, except for NBRIP media in the first experiment. UAGC 5, 16 and 26 demonstrated low solubilization potential, leading to the formation of three solubilization potential groups for the liquid media experiments.
Liquid media phosphate solubilization
Isolates UAGC 17 and 19 achieved higher solubilization
Sousa et al. 1799
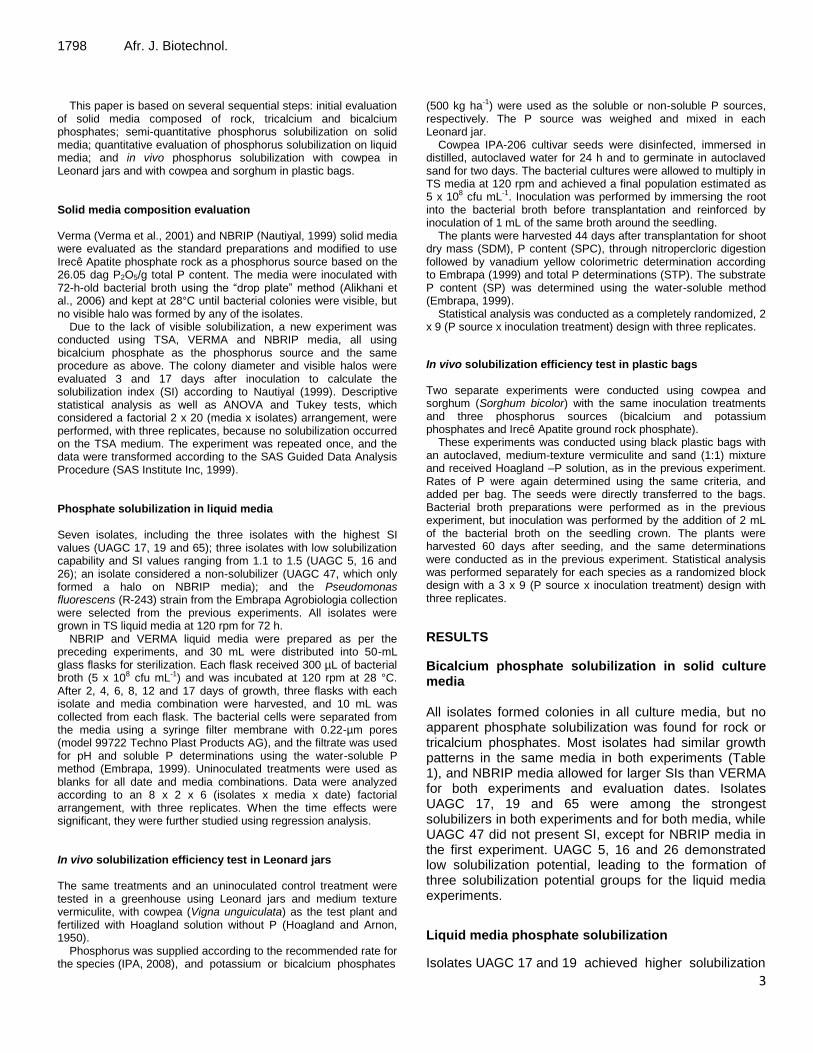
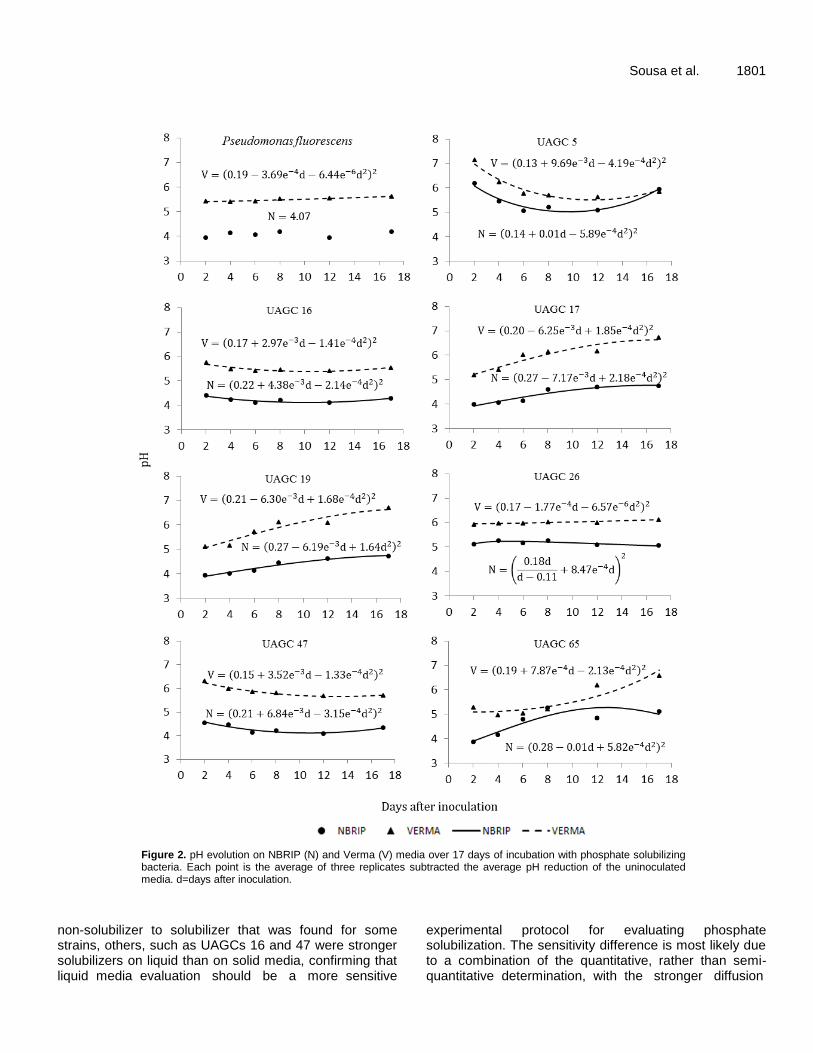
Figure 1. Soluble P contents on NBRIP and VERMA liquid media after inoculation with eight phosphate solubilizing bacteria. Each point is the average of three replicates subtracted the average soluble P content of the uninoculated media. d=days after inoculation.
on NBRIP than the standard strain, and both of these and UAGC 26 showed constant solubilization over time, with measurable P levels on the second day and stable P
levels up to the 17th day after inoculation (Figure 1). This
confirmed their higher-than-average solubilization on solid media. In VERMA media, UAGC 19 maintained
5
1800 Afr. J. Biotechnol. stable P levels, while UAGC 17 showed declining soluble P levels over time.
While isolate UAGC 19 had constantly higher soluble P levels, isolates UAGC 16, 17 and 65 were stronger solubilizers than the recommended strain, but with different solubilization patterns; the highest soluble P levels were achieved at 13, 4 and 8 days after inoculation, respectively.
The remaining isolates solubilized lower amounts of P than the control strain, and showed different curves. While isolates UAGC 5 and 47 were initially poor solubilizers in VERMA media, they increased their solubilization over time and surpassed some isolates with stronger initial solubilization by the end of the experiment. VERMA media only allowed higher soluble P levels for UAGC 5 at the latter half of the experiment, which agreed with the solid media results.
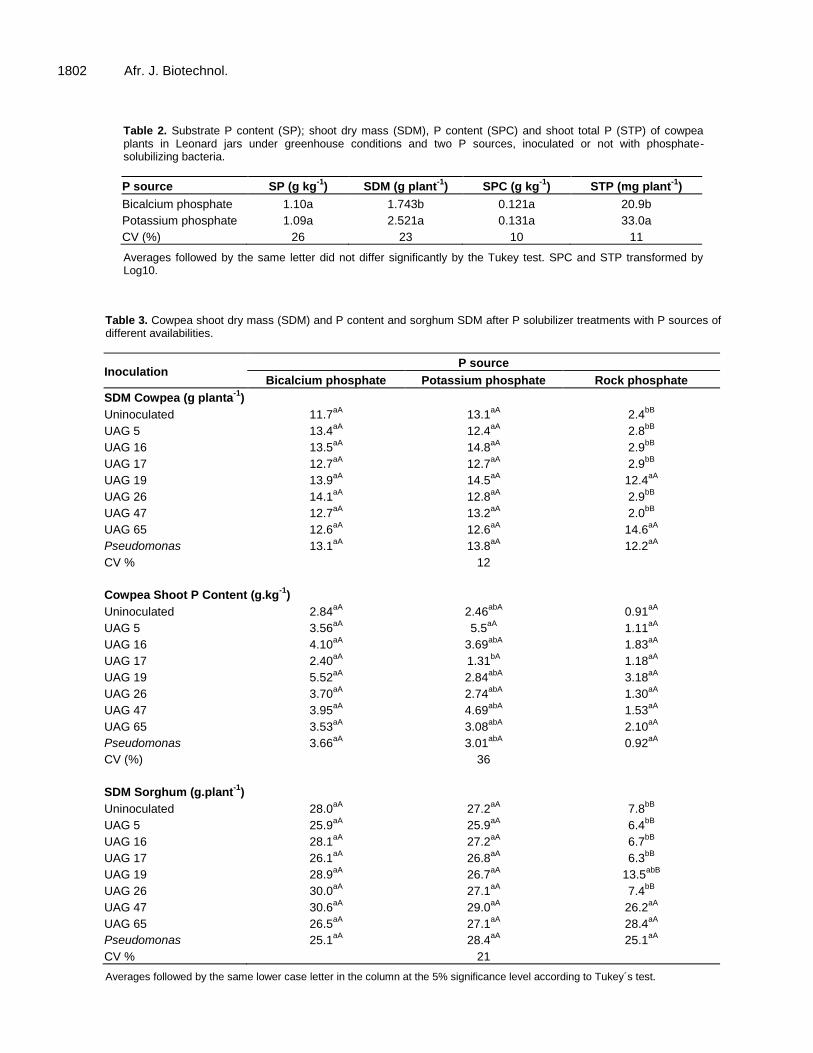
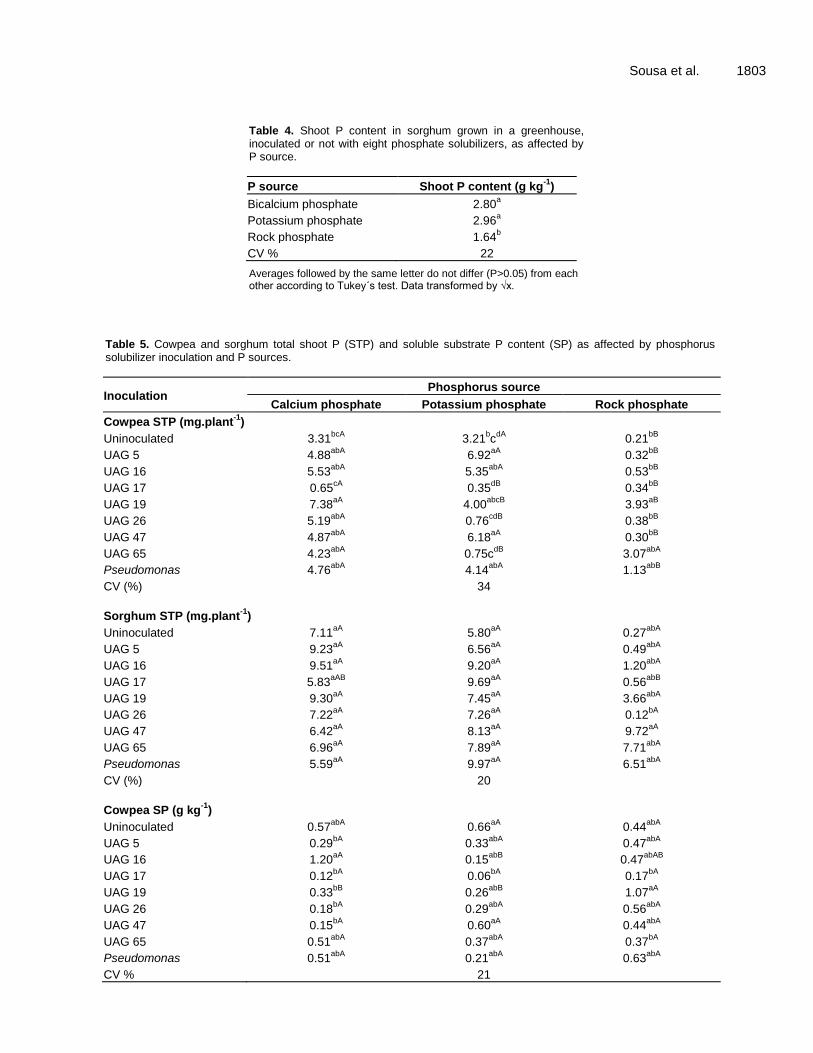
Inoculation strongly reduced the pH two days after inoculation, and each isolate had similar patterns, although different intensities, for both culture media (Figure 2). Isolates UAGC 17, 19 and 65 and the control strain were the strongest acidifiers two days after inoculation, and the pH continued to fall later in the experiment for both media. These findings were in partial agreement with the soluble P levels, which indicated that the acidification of the initial media might be the initial step in P solubilization, and this possibility was strengthened by the coincidence of the lowest pH levels and highest soluble P levels at 11 days after inoculation found for isolates UAGC 16 and 47. In vivo solubilization efficiency test in Leonard jars No inoculation effects were observed in the Leonard jars with cowpea because P sources only significantly affected the SDM and STP (P≤0.05), and no significant (P>0.05) effects were found for SP or SPC (Table 2). The highest SDM and STP were observed for potassium phosphate, most likely due to its higher solubility. In vivo solubilization efficiency test in plastic bags The shoot dry mass for cowpea and sorghum was only affected by inoculation when the P source was rock phosphate. This indicates that even the relatively low solubility of bicalcium phosphate supplied enough P to these species (Table 3).
Isolates UAG 19 and 65 and the Pseudomonas reference strain were the highest SDM performers for cowpea, but those UAG isolates and UAG 47 did not differ (P>0.05) from the reference strain for sorghum (Table 4). This difference in the response to UAG 47 may be due to some effect of the plant species on solubilization or different P requirements for both species. Importantly, the SDM of plants receiving these strains
and rock phosphate did not significantly differ (P>0.05) from those with higher solubility P sources.
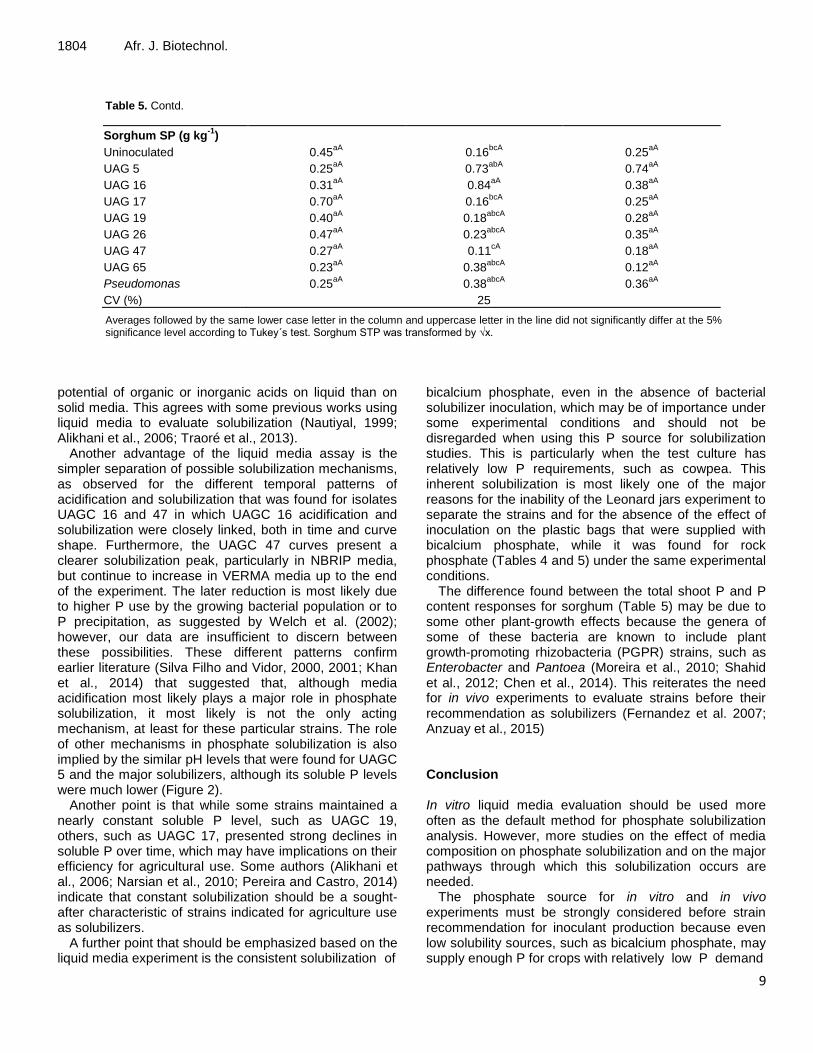
As for SDM media, the isolates did not significantly (P>0.05) change the cowpea SPC, except for those receiving rock phosphate, and, again, the highest results were found for strains UAG 19 (although not different from the remaining strains), 47 and 65 and the control strain (Table 3). On the other hand, no significant effects of inoculation on sorghum SPC (Table 4), in which only the P source was significant, were observed, and, again, rock phosphate presented the lowest results (Table 4).
While most isolates enhanced cowpea SP over the corresponding non-inoculated treatments, only UAG 19 showed significant effects (P≤0.05) for all P sources. When supplied with bicalcium phosphate, none of the UAG isolates, except for UAG 17, showed significant differences (P>0.05) from the standard Pseudomonas strain (Table 5). Sorghum STP was significantly affected (P<0.05) by inoculation only when rock phosphate was used as a source, and UAG 47 presented the highest results.
Substrate-soluble P contents did not demonstrate a clear pattern for inoculation or P source, except for the generally lower values for rock phosphate (Table 5). DISCUSSION Nautiyal (1999) ascribed the higher solubilization found for solid and liquid NBRIP media, which was also found in this study, as most likely due to the use of MgCl2 and MgSO4 as Mg sources and/or (NH4)2SO4 as the nitrogen source. These effects may also correspond to the strong effects found for different nitrogen sources when the solubilization potentials of defined media were compared, perhaps due to their effect on organic acid production (Dave and Patel, 2003; Sharan et al., 2008; Pallavi and Gupta 2013) or the liberation of H
+ when NH4
+ is
absorbed by the bacteria (Ahuja et al., 2007). Either of these mechanisms could explain the stronger acidification that was found for NBRIP than for VERMA liquid media (Figure 2), in which the pH difference between the media fell from approximately 0.2 to more than 1 for some of the bacterial strains. However, our data do not indicate which of these is most likely the main factor. Media composition was consistently found to only affect strains on the lower range of the solubilization potential. The differences found for a few isolates between the experiments in the same media are most likely due to the semi-quantitative nature of the method, in which the indication of solubilization depends on the formation of a visible halo that is larger than the bacterial colony, even though it is possible to differentiate a clear zone directly below the bacterial colony through the underside of the Petri dish. These strains were not considered solubilizers using this test, although they presented some solubilization in the liquid media experiments. In addition to the change from
Sousa et al. 1801
Figure 2. pH evolution on NBRIP (N) and Verma (V) media over 17 days of incubation with phosphate solubilizing bacteria. Each point is the average of three replicates subtracted the average pH reduction of the uninoculated media. d=days after inoculation.
non-solubilizer to solubilizer that was found for some strains, others, such as UAGCs 16 and 47 were stronger solubilizers on liquid than on solid media, confirming that liquid media evaluation should be a more sensitive
experimental protocol for evaluating phosphate solubilization. The sensitivity difference is most likely due to a combination of the quantitative, rather than semi-quantitative determination, with the stronger diffusion
1802 Afr. J. Biotechnol.
Table 2. Substrate P content (SP); shoot dry mass (SDM), P content (SPC) and shoot total P (STP) of cowpea plants in Leonard jars under greenhouse conditions and two P sources, inoculated or not with phosphate-solubilizing bacteria.
P source SP (g kg-1
) SDM (g plant-1
) SPC (g kg-1
) STP (mg plant-1
)
Bicalcium phosphate 1.10a 1.743b 0.121a 20.9b
Potassium phosphate 1.09a 2.521a 0.131a 33.0a
CV (%) 26 23 10 11
Averages followed by the same letter did not differ significantly by the Tukey test. SPC and STP transformed by Log10.
Table 3. Cowpea shoot dry mass (SDM) and P content and sorghum SDM after P solubilizer treatments with P sources of different availabilities.
Inoculation P source
Bicalcium phosphate Potassium phosphate Rock phosphate
SDM Cowpea (g planta-1
)
Uninoculated 11.7aA
13.1aA
2.4bB
UAG 5 13.4aA
12.4aA
2.8bB
UAG 16 13.5aA
14.8aA
2.9bB
UAG 17 12.7aA
12.7aA
2.9bB
UAG 19 13.9aA
14.5aA
12.4aA
UAG 26 14.1aA
12.8aA
2.9bB
UAG 47 12.7aA
13.2aA
2.0bB
UAG 65 12.6aA
12.6aA
14.6aA
Pseudomonas 13.1aA
13.8aA
12.2aA
CV % 12
Cowpea Shoot P Content (g.kg-1
)
Uninoculated 2.84aA
2.46abA
0.91aA
UAG 5 3.56aA
5.5aA
1.11aA
UAG 16 4.10aA
3.69abA
1.83aA
UAG 17 2.40aA
1.31bA
1.18aA
UAG 19 5.52aA
2.84abA
3.18aA
UAG 26 3.70aA
2.74abA
1.30aA
UAG 47 3.95aA
4.69abA
1.53aA
UAG 65 3.53aA
3.08abA
2.10aA
Pseudomonas 3.66aA
3.01abA
0.92aA
CV (%) 36
SDM Sorghum (g.plant-1
)
Uninoculated 28.0aA
27.2aA
7.8bB
UAG 5 25.9aA
25.9aA
6.4bB
UAG 16 28.1aA
27.2aA
6.7bB
UAG 17 26.1aA
26.8aA
6.3bB
UAG 19 28.9aA
26.7aA
13.5abB
UAG 26 30.0aA
27.1aA
7.4bB
UAG 47 30.6aA
29.0aA
26.2aA
UAG 65 26.5aA
27.1aA
28.4aA
Pseudomonas 25.1aA
28.4aA
25.1aA
CV % 21
Averages followed by the same lower case letter in the column at the 5% significance level according to Tukey´s test.
Sousa et al. 1803
Table 4. Shoot P content in sorghum grown in a greenhouse, inoculated or not with eight phosphate solubilizers, as affected by P source.
P source Shoot P content (g kg-1
)
Bicalcium phosphate 2.80a
Potassium phosphate 2.96a
Rock phosphate 1.64b
CV % 22
Averages followed by the same letter do not differ (P>0.05) from each other according to Tukey´s test. Data transformed by √x.
Table 5. Cowpea and sorghum total shoot P (STP) and soluble substrate P content (SP) as affected by phosphorus solubilizer inoculation and P sources.
Inoculation Phosphorus source
Calcium phosphate Potassium phosphate Rock phosphate
Cowpea STP (mg.plant-1
)
Uninoculated 3.31bcA
3.21bc
dA 0.21
bB
UAG 5 4.88abA
6.92aA
0.32bB
UAG 16 5.53abA
5.35abA
0.53bB
UAG 17 0.65cA
0.35dB
0.34bB
UAG 19 7.38aA
4.00abcB
3.93aB
UAG 26 5.19abA
0.76cdB
0.38bB
UAG 47 4.87abA
6.18aA
0.30bB
UAG 65 4.23abA
0.75cdB
3.07abA
Pseudomonas 4.76abA
4.14abA
1.13abB
CV (%) 34
Sorghum STP (mg.plant-1
)
Uninoculated 7.11aA
5.80aA
0.27abA
UAG 5 9.23aA
6.56aA
0.49abA
UAG 16 9.51aA
9.20aA
1.20abA
UAG 17 5.83aAB
9.69aA
0.56abB
UAG 19 9.30aA
7.45aA
3.66abA
UAG 26 7.22aA
7.26aA
0.12bA
UAG 47 6.42aA
8.13aA
9.72aA
UAG 65 6.96aA
7.89aA
7.71abA
Pseudomonas 5.59aA
9.97aA
6.51abA
CV (%) 20
Cowpea SP (g kg-1
)
Uninoculated 0.57abA
0.66aA
0.44abA
UAG 5 0.29bA
0.33abA
0.47abA
UAG 16 1.20aA
0.15abB
0.47abAB
UAG 17 0.12bA
0.06bA
0.17bA
UAG 19 0.33bB
0.26abB
1.07aA
UAG 26 0.18bA
0.29abA
0.56abA
UAG 47 0.15bA
0.60aA
0.44abA
UAG 65 0.51abA
0.37abA
0.37bA
Pseudomonas 0.51abA
0.21abA
0.63abA
CV % 21
9
1804 Afr. J. Biotechnol.
Table 5. Contd.
Sorghum SP (g kg-1
)
Uninoculated 0.45aA
0.16bcA
0.25aA
UAG 5 0.25aA
0.73abA
0.74aA
UAG 16 0.31aA
0.84aA
0.38aA
UAG 17 0.70aA
0.16bcA
0.25aA
UAG 19 0.40aA
0.18abcA
0.28aA
UAG 26 0.47aA
0.23abcA
0.35aA
UAG 47 0.27aA
0.11cA
0.18aA
UAG 65 0.23aA
0.38abcA
0.12aA
Pseudomonas 0.25aA
0.38abcA
0.36aA
CV (%) 25
Averages followed by the same lower case letter in the column and uppercase letter in the line did not significantly differ at the 5% significance level according to Tukey´s test. Sorghum STP was transformed by √x.
potential of organic or inorganic acids on liquid than on solid media. This agrees with some previous works using liquid media to evaluate solubilization (Nautiyal, 1999; Alikhani et al., 2006; Traoré et al., 2013).
Another advantage of the liquid media assay is the simpler separation of possible solubilization mechanisms, as observed for the different temporal patterns of acidification and solubilization that was found for isolates UAGC 16 and 47 in which UAGC 16 acidification and solubilization were closely linked, both in time and curve shape. Furthermore, the UAGC 47 curves present a clearer solubilization peak, particularly in NBRIP media, but continue to increase in VERMA media up to the end of the experiment. The later reduction is most likely due to higher P use by the growing bacterial population or to P precipitation, as suggested by Welch et al. (2002); however, our data are insufficient to discern between these possibilities. These different patterns confirm earlier literature (Silva Filho and Vidor, 2000, 2001; Khan et al., 2014) that suggested that, although media acidification most likely plays a major role in phosphate solubilization, it most likely is not the only acting mechanism, at least for these particular strains. The role of other mechanisms in phosphate solubilization is also implied by the similar pH levels that were found for UAGC 5 and the major solubilizers, although its soluble P levels were much lower (Figure 2).
Another point is that while some strains maintained a nearly constant soluble P level, such as UAGC 19, others, such as UAGC 17, presented strong declines in soluble P over time, which may have implications on their efficiency for agricultural use. Some authors (Alikhani et al., 2006; Narsian et al., 2010; Pereira and Castro, 2014) indicate that constant solubilization should be a sought-after characteristic of strains indicated for agriculture use as solubilizers.
A further point that should be emphasized based on the liquid media experiment is the consistent solubilization of
bicalcium phosphate, even in the absence of bacterial solubilizer inoculation, which may be of importance under some experimental conditions and should not be disregarded when using this P source for solubilization studies. This is particularly when the test culture has relatively low P requirements, such as cowpea. This inherent solubilization is most likely one of the major reasons for the inability of the Leonard jars experiment to separate the strains and for the absence of the effect of inoculation on the plastic bags that were supplied with bicalcium phosphate, while it was found for rock phosphate (Tables 4 and 5) under the same experimental conditions.
The difference found between the total shoot P and P content responses for sorghum (Table 5) may be due to some other plant-growth effects because the genera of some of these bacteria are known to include plant growth-promoting rhizobacteria (PGPR) strains, such as Enterobacter and Pantoea (Moreira et al., 2010; Shahid et al., 2012; Chen et al., 2014). This reiterates the need for in vivo experiments to evaluate strains before their recommendation as solubilizers (Fernandez et al. 2007; Anzuay et al., 2015) Conclusion In vitro liquid media evaluation should be used more often as the default method for phosphate solubilization analysis. However, more studies on the effect of media composition on phosphate solubilization and on the major pathways through which this solubilization occurs are needed.
The phosphate source for in vitro and in vivo experiments must be strongly considered before strain recommendation for inoculant production because even low solubility sources, such as bicalcium phosphate, may supply enough P for crops with relatively low P demand
10
to not be affected by strains that substantially increase P solubility in culture media.
Conflict of Interests The authors have not declared any conflict of interests. ACKNOWLEDGMENTS To the Conselho Nacional de Desenvolvimento Científico e Tecnológico (CNPq, Brasília, Brazil) for fellowships to the second and third authors and for the research grant that made this study possible. To the Coordenação de Formação de Pessoal de Nível Superior (CAPES, Brasília, Brazil) and Fundação de Amparo à Ciência e Tecnologia de Pernambuco (FACEPE, Pernambuco, Brazil) for the fellowship to the first author during different periods of his masters. REFERENCES Ahuja A, Ghosh SB, D'Souza SF (2007). Isolation of a starch utilizing,
phosphate solubilizing fungus on buffered medium and its characterization. Bioresour. Technol. 98:3408-3411.
Alikhani HA, Saleh-Rastin N, Antoun H (2006). Phosphate solubilization activity of rhizobia native to Iranian soils. Plant Soil 287:35-41.
Anzuay MS, Ludueña LM, Angelini JG, Fabra A, Taurian T (2015). Beneficial effects of native phosphate solubilizing bacteria on peanut (Arachis hypogaea L) growth and phosphorus acquisition. Symbiosis 66:89-97.
Araújo ASF, Leite LFC, Iwata BF, Lira Junior MA, Xavier GR, Figueiredo MBV (2012). Microbiological process in agroforestry systems. A review. Agron. Sustain. Dev. 32:215-216.
Bashan Y, Kamnev AA, de-Bashan LE (2013). Tricalcium phosphate is inappropriate as a universal selection factor for isolating and testing phosphate-solubilizing bacteria that enhance plant growth: a proposal for an alternative procedure. Biol. Fertil. Soils 49:465-479.
Chen YP, Rekha PD, Arun AB, Shen FT, Lai WA, Young CC (2006). Phosphate solubilizing bacteria from subtropical soil and their tricalcium phosphate solubilizing abilities. Appl. Soil Ecol. 34:33-41.
Chen Y, Fan JB, Du L, Xu H, Zhang QH, He YQ (2014). The application of phosphate solubilizing endophyte Pantoea dispersa triggers the microbial community in red acidic soil. Appl. Soil Ecol. 84:235-244.
Dave A, Patel HH (2003). Impact of different carbon and nitrogen sources on phosphate solubilization by Pseudomonas fluorescens. Indian J. Microbiol. 43:33-36.
Dorozhkin S (2002). A review on the dissolution models of calcium apatites. Prog. Cryst. Growth Charact. Mater. 44:45-61.
Embrapa (1999) Manual de análises químicas de solos. EMBRAPA, Brasília.
Fernandez LA, Zalba P, Gomez MA, Sagardoy MA (2007). Phosphate-solubilization activity of bacterial strains in soil and their effect on soybean growth under greenhouse conditions. Biol. Fertil. Soils 43:805-809.
Gupta R, Singal R, Shankar A, Kuhad RC, Saxena RK (1994). A modified plate assay for screening phosphate solubilizing microorganisms. J. Gen. Appl. Microbiol. 40:255-260.
Hoagland DR, Arnon DI (1950). The water-culture method for growing plants without soil. CaliforniaAgriculturalExperimentStation, Berkeley.
IPA – Instituto de Pesquisa de Pernambuco (2008). Recomendação de adubação para o estado de Pernambuco. Recife, P 122.
Khan MS, Zaidi A, Ahmad E (2014). Mechanism of phosphate solubilization and physiological functions of phosphate-solubilizing
Sousa et al. 1805
microorganisms, in Phosphate Solubilizing Microorganisms, eds Khan M. S., Zaidi A., Mussarrat J., editors. (Springer International Publishing;), pp. 34-35.
Krishnaraj PU, Dahale S (2014). Mineral phosphate solubilization: concepts and prospects in sustainable agriculture. Proc. Indian Natn. Sci. Acad. 80:389-405.
Lira-Cadete L, Farias ARB, Ramos APS, Costa DP, Freire FJ, Kuklinsky-Sobral J (2012). Variabilidade genética de bactérias diazotróficas associadas a plantas de cana-de-açúcar capazes de solubilizar fosfato inorgânico. Biosci. J. 28:122-129.
Mehta S, Nautiyal CS (2001). An efficient method for qualitative screening of phosphate-solubilizing bacteria. Curr. Microbiol. 43:51-56.
Moreira FMS, Silva K, Nobrega RSA, Carvalho F (2010). Bactérias diazotróficas associativas: diversidade, ecologia e potencial de aplicações. Comunicata Scientiae 2:74-99.
Narsian V, Samaha AASM, Patel HH (2010). Rock phosphate solubilization by specific yeast. Indian J. Microbiol. 50:57-62.
Nautiyal CS (1999). An efficient microbiological growth medium for screening phosphate solubilizing microorganisms. FEMS Microbiol. Lett. 170:265-270.
Pallavi KP, Gupta PC (2013). Effect of different carbon and nitrogen sources on solubilization of insoluble inorganic phosphate by psychrotolerant bacterial strains. Bioscan 8:1299-1302
Pereira SIA, Castro PML (2014). Phosphate-solubilizing rhizobacteria enhance Zea mays growth in agricultural P-deficient soils. Ecol. Eng. 73:526-535.
Salcedo LDP, Prieto C, Correa MC (2014). Screening phosphate solubilizing actinobacteria isolated from the rhizosphere of wild plants from the Eastern Cordillera of the Colombian Andes. Afr. J. Microbiol. Res. 8:734-742.
SAS Institute Inc (1999). The SAS System for Windows. 8.00 edn. SAS Institute Inc, Cary.
Shahid M, Hameed S, Imran A, Ali S, Van Elsas JD (2012). Root colonization and growth promotion of sunflower (Helianthus annuus L.) by phosphate solubilizing Enterobacter sp. Fs-11. World J. Microb. Biotechnol. 24:2749-2758.
Sharan A, Shikha, Darmwal NS (2008). Efficient phosphorus solubilization by mutant strain of Xanthomonas campestris using different carbon, nitrogen and phosphorus sources. World J. Microb. Biotechnol. 24:3087-3090.
Silva Filho GN, Vidor C (2000). Solubilização de fosfatos por microrganismos na presença de fontes de carbono. Rev. Bras. Cienc. Solo 24:311-319.
Silva Filho GN, Vidor C (2001). Atividade de microrganismos solubilizadores de fosfatos na presença de nitrogênio, ferro, cálcio e potássio. Pesq. Agropec. Bras. 36:1495-1508.
Silva MO (2011). Bactérias associadas à cana de açúcar: isolamento e potencial promoção de crescimento vegetal. Recife, Brasil, 57 p. (Thesis. Universidade Federal Rural de Pernambuco)
Traoré L, Nakatsu CH, DeLeon A, Stott DE (2013). Characterization of six phosphate-dissolving bacteria isolated from rhizospheric soils in Mali. Afr. J. Mocrobiol. Res. 7:3641-3650.
Verma SC, Ladha JK, Tripathi AK (2001). Evaluation of plant growth promoting and colonization ability of endophytic diazotrophs from deep water rice. J. Biotechnol. 91:127-141.
Sindhu SS, Phour M, Choudhary SR, Chaudhary D (2014). Phosphorus cycling: prospects of using rhizosphere microorganisms for improving phosphorus nutrition of plants. Geomicrobiology and Biogeochemistry 39: 199-237.
Welch SA, Taunton AE, Banfield JF (2002). Effect of microorganisms and microbial metabolites on apatite dissolution. Geomicrobiol. J. 19:343-367.
Yang X, Thornton PE, Ricciuto DM, Post WM (2014). The role of phosphorus dynamics in tropical forests – a modeling study using CLM-CNP. Biogeosci. 11:1667-1681.
Yi Y, Huang W, Ge Y (2008). Exopolysaccharide: a novel important factor in the microbial dissolution of tricalcium phosphate. World J. Microb. Biotechnol. 24:1059-1065.
Vol. 15(34), pp. 1806-1812, 24 August, 2016
DOI: 10.5897/AJB2015.14986
Article Number: A3339FB60150
ISSN 1684-5315
Copyright © 2016
Author(s) retain the copyright of this article
http://www.academicjournals.org/AJB
African Journal of Biotechnology
Full Length Research Paper
Efficient micropropagation of Citrus sinensis (L.) Osbeck from cotyledonary explants suitable for the
development of commercial variety
Aseesh Pandey1* and Sushma Tamta2
1G.B. Pant Institute of Himalayan Environment and Development, Kosi-Katarmal, Almora, Uttarakhand, India.
2Plant Tissue Culture Laboratory, Department of Botany, D.S.B. Campus, Kumaun University, Nainital, 263002,
Uttarakhand, India.
Received 18 September, 2015; Accepted 30 October, 2015
In vitro regeneration of sweet orange (Citrus sinensis (L.) Osbeck Family: Rutaceae) has been performed via direct and indirect organogenesis. For indirect organogenesis, callus was induced and proliferated from leaf explants derived from in vitro grown seedlings on Murashige and Skoog (MS) media containing 2,4-dichlorophenoxyacetic acid (2,4-D) alone or in combination with benzyl adenine (BA) and α-naphthalene acetic acid (NAA). For direct organogenesis, explants were placed on MS media containing BA alone or in combination of NAA and gibberellic acid (GA3). Well-developed microshoots were treated with different concentrations of NAA for rhizogenesis (a two-step procedure). Different responses to these treatments were recorded depending upon the procedure used. It appears that 4.53 μM 2,4-D in combination with 5.37 μM NAA induced 93.33% callus and proliferate 86.67% of callus into 6.93 shoots per explant. Exogenous addition of 4.44 μM BA in combination with 1.54 μM GA3 enhanced shoot multiplication rate significantly (17.73±1.69 shoots/explant) in comparison to control (0.00±0.00 shoots/explant). Microshoots were rooted best (75.00±14.43%) under the treatment 100μM NAA for 48 hrs. and rooted plantlets were transferred to soil, following acclimatization were taken to maturity in the polyhouse. Key words: Malta, Himalaya, benzyl adenine (BA), callus.
INTRODUCTION Citrus fruits are one of the most important commercial fruit crops of the world, cultivated in more than 100 countries (Barlass and Skene, 1999). Citrus (> 108 million
tons), ranks second among the most produced fruit crops of the world after banana (FAO, 2006). According to UN 2007 data, India is the largest producer of lemons
*Corresponding author. E-mail: [email protected]. Tel: +91 9458940052.
Author(s) agree that this article remains permanently open access under the terms of the Creative Commons Attribution
License 4.0 International License
and limes in the world and ranks sixth in the production of Citrus fruits.
Citrus sinensis is a member of family Rutaceae and commonly known as navel orange, sweet orange and „Malta‟ in Uttarakhand, India (Christman, 2003). C. sinensis is a small evergreen tree having 7.5 m height and sometimes reached up to 15 m. Many biologically active, non-nutrient compounds found in Citrus fruits such as antioxidants (Tripoli et al., 2007), soluble and insoluble dietary fibres (Ejaz et al., 2006) known to be helpful in reducing the risk for cancers (Elangovan et al., 1994); many chronic diseases like arthritis; obesity (Walton et al., 1945) and coronary heart disease (Crowell, 1999). A single orange is said to have about 170 phytonutrients and over 60 flavonoids with anti-tumor, anti-inflammatory, blood clot inhibiting and antioxidant properties (Etebu and Nwauzoma, 2014). Due to high „vitamin C‟ content and antioxidant potential of C. sinensis, it is consumed worldwide, therefore, considered as one of the major commercial fruit crops of the world (Kiong et al., 2008).
However, the cultivation of C. sinensis is difficult due to slow growth, short storage life (Mukhtar et al., 2005) and susceptibility to a large number of disease viz. Pierce‟s disease (Redak et al., 2004); Citrus chlorosis (Rossetti et al., 1977); Citrus greening (Bove, 2006); Citrus canker (Rossetti, 1977); Ring spot (Fawcett, 1933); Sweet orange scab (Kunta et al., 2013); Citrus black spot (Kotze, 1981); Powdery mildew (Sastra-Hidayat, 1992). Further, Citrus stands among difficult to root crops (Usman et al., 2005) and their seeds have a very short life because they are injured by drying during storage and thus, lose their viability (Johnston, 1968; Ali and Mirza, 2006).
Citrus species are propagated by both sexual and asexual methods; rootstocks are generally propagated sexually through seeds, while most of the commercial varieties are propagated by asexual means (Chaudhary, 1994). Micro propagation is an important asexual method that can be used for the production of disease-free rootstock plants in limited space and time under controlled conditions throughout the year (Usman et al., 2005; Hikada and Omura, 1989; Roistacher et al., 1976).
Techniques like in vitro culture made it easy to improve Citrus against different abiotic stresses, low yield and conserve important Citrus genotypes through exploiting somaclonal variations, transformation of high yielding cultivars (Deng et al., 2000, Koltunow et al., 2002). Regeneration of different species of Citrus has already been investigated, C. paradisi (Macf) (Costa et al., 2002); C. reticulata (Te-Chato and Nudoung, 1998), C. sinensis, Pena et al., 1995). Although small work has been done in C. sinensis but no work has been reported for Indian cultivars.
The study aimed to develop an in vitro regeneration system which can be used for effective propagation of selected rootstocks and regeneration of ideal genetically modified grafts which can be used to develop commercial
Pandey and Tamta 1807 variety.
MATERIALS AND METHODS
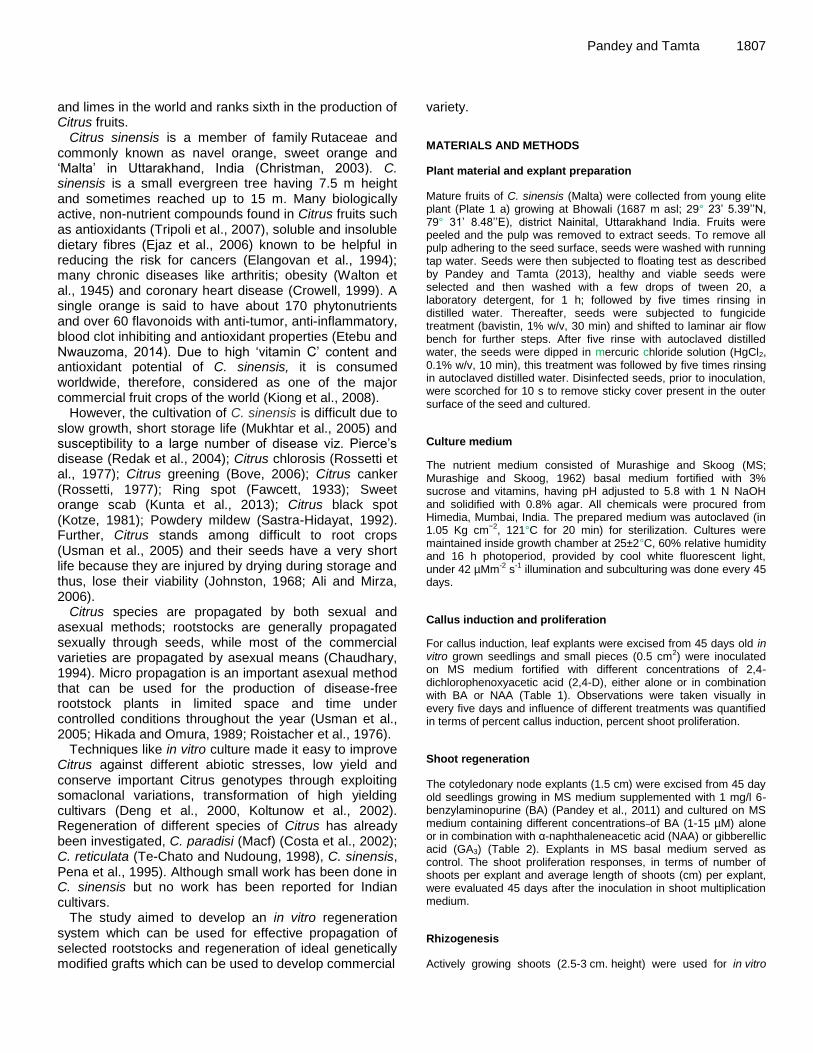
Plant material and explant preparation
Mature fruits of C. sinensis (Malta) were collected from young elite plant (Plate 1 a) growing at Bhowali (1687 m asl; 29° 23‟ 5.39‟‟N, 79° 31‟ 8.48‟‟E), district Nainital, Uttarakhand India. Fruits were peeled and the pulp was removed to extract seeds. To remove all pulp adhering to the seed surface, seeds were washed with running tap water. Seeds were then subjected to floating test as described by Pandey and Tamta (2013), healthy and viable seeds were selected and then washed with a few drops of tween 20, a laboratory detergent, for 1 h; followed by five times rinsing in distilled water. Thereafter, seeds were subjected to fungicide treatment (bavistin, 1% w/v, 30 min) and shifted to laminar air flow bench for further steps. After five rinse with autoclaved distilled water, the seeds were dipped in mercuric chloride solution (HgCl2, 0.1% w/v, 10 min), this treatment was followed by five times rinsing in autoclaved distilled water. Disinfected seeds, prior to inoculation, were scorched for 10 s to remove sticky cover present in the outer surface of the seed and cultured.
Culture medium
The nutrient medium consisted of Murashige and Skoog (MS; Murashige and Skoog, 1962) basal medium fortified with 3% sucrose and vitamins, having pH adjusted to 5.8 with 1 N NaOH and solidified with 0.8% agar. All chemicals were procured from Himedia, Mumbai, India. The prepared medium was autoclaved (in 1.05 Kg cm−2, 121°C for 20 min) for sterilization. Cultures were maintained inside growth chamber at 25±2°C, 60% relative humidity and 16 h photoperiod, provided by cool white fluorescent light, under 42 µMm-2 s-1 illumination and subculturing was done every 45 days.
Callus induction and proliferation
For callus induction, leaf explants were excised from 45 days old in vitro grown seedlings and small pieces (0.5 cm2) were inoculated on MS medium fortified with different concentrations of 2,4-dichlorophenoxyacetic acid (2,4-D), either alone or in combination with BA or NAA (Table 1). Observations were taken visually in every five days and influence of different treatments was quantified in terms of percent callus induction, percent shoot proliferation.
Shoot regeneration
The cotyledonary node explants (1.5 cm) were excised from 45 day old seedlings growing in MS medium supplemented with 1 mg/l 6-benzylaminopurine (BA) (Pandey et al., 2011) and cultured on MS medium containing different concentrations of BA (1-15 µM) alone or in combination with α-naphthaleneacetic acid (NAA) or gibberellic acid (GA3) (Table 2). Explants in MS basal medium served as control. The shoot proliferation responses, in terms of number of shoots per explant and average length of shoots (cm) per explant, were evaluated 45 days after the inoculation in shoot multiplication medium.
Rhizogenesis
Actively growing shoots (2.5-3 cm. height) were used for in vitro
1808 Afr. J. Biotechnol.
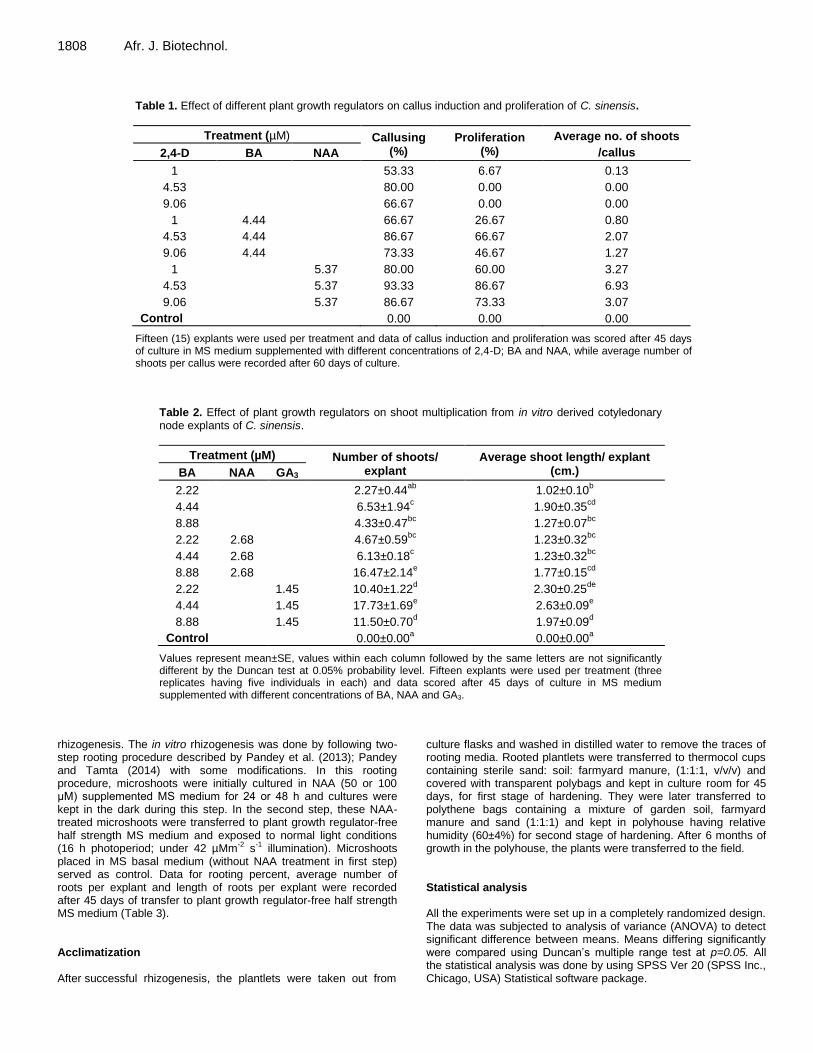
Table 1. Effect of different plant growth regulators on callus induction and proliferation of C. sinensis.
Treatment (µM) Callusing (%)
Proliferation (%)
Average no. of shoots
/callus 2,4-D BA NAA
1 53.33 6.67 0.13
4.53 80.00 0.00 0.00
9.06 66.67 0.00 0.00
1 4.44 66.67 26.67 0.80
4.53 4.44 86.67 66.67 2.07
9.06 4.44 73.33 46.67 1.27
1 5.37 80.00 60.00 3.27
4.53 5.37 93.33 86.67 6.93
9.06 5.37 86.67 73.33 3.07
Control 0.00 0.00 0.00
Fifteen (15) explants were used per treatment and data of callus induction and proliferation was scored after 45 days of culture in MS medium supplemented with different concentrations of 2,4-D; BA and NAA, while average number of shoots per callus were recorded after 60 days of culture.
Table 2. Effect of plant growth regulators on shoot multiplication from in vitro derived cotyledonary node explants of C. sinensis.
Treatment (µM) Number of shoots/ explant
Average shoot length/ explant (cm.) BA NAA GA3
2.22 2.27±0.44ab
1.02±0.10b
4.44 6.53±1.94c 1.90±0.35
cd
8.88 4.33±0.47bc
1.27±0.07bc
2.22 2.68 4.67±0.59bc
1.23±0.32bc
4.44 2.68 6.13±0.18c 1.23±0.32
bc
8.88 2.68 16.47±2.14e 1.77±0.15
cd
2.22 1.45 10.40±1.22d 2.30±0.25
de
4.44 1.45 17.73±1.69e 2.63±0.09
e
8.88 1.45 11.50±0.70d 1.97±0.09
d
Control 0.00±0.00a 0.00±0.00
a
Values represent mean±SE, values within each column followed by the same letters are not significantly different by the Duncan test at 0.05% probability level. Fifteen explants were used per treatment (three replicates having five individuals in each) and data scored after 45 days of culture in MS medium supplemented with different concentrations of BA, NAA and GA3.
rhizogenesis. The in vitro rhizogenesis was done by following two-step rooting procedure described by Pandey et al. (2013); Pandey and Tamta (2014) with some modifications. In this rooting procedure, microshoots were initially cultured in NAA (50 or 100 μM) supplemented MS medium for 24 or 48 h and cultures were kept in the dark during this step. In the second step, these NAA-treated microshoots were transferred to plant growth regulator-free half strength MS medium and exposed to normal light conditions (16 h photoperiod; under 42 µMm-2 s-1 illumination). Microshoots placed in MS basal medium (without NAA treatment in first step) served as control. Data for rooting percent, average number of roots per explant and length of roots per explant were recorded after 45 days of transfer to plant growth regulator-free half strength MS medium (Table 3). Acclimatization After successful rhizogenesis, the plantlets were taken out from
culture flasks and washed in distilled water to remove the traces of rooting media. Rooted plantlets were transferred to thermocol cups containing sterile sand: soil: farmyard manure, (1:1:1, v/v/v) and covered with transparent polybags and kept in culture room for 45 days, for first stage of hardening. They were later transferred to polythene bags containing a mixture of garden soil, farmyard manure and sand (1:1:1) and kept in polyhouse having relative humidity (60±4%) for second stage of hardening. After 6 months of growth in the polyhouse, the plants were transferred to the field. Statistical analysis All the experiments were set up in a completely randomized design. The data was subjected to analysis of variance (ANOVA) to detect significant difference between means. Means differing significantly were compared using Duncan‟s multiple range test at p=0.05. All the statistical analysis was done by using SPSS Ver 20 (SPSS Inc., Chicago, USA) Statistical software package.
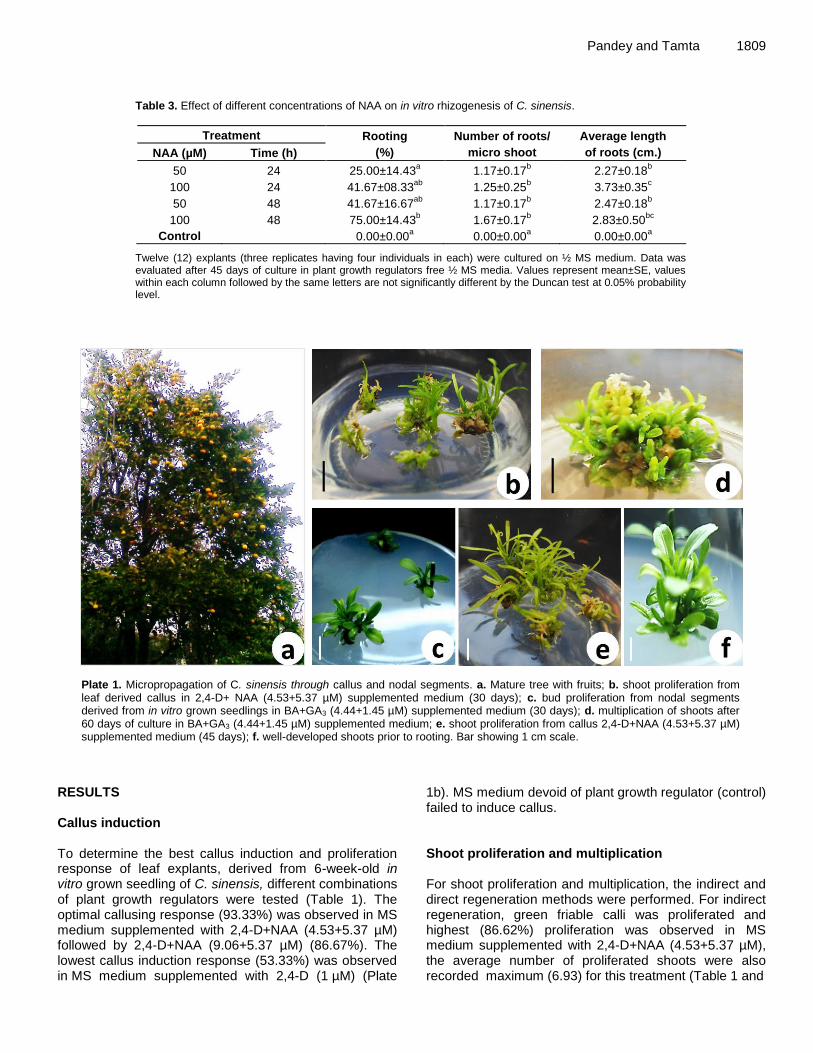
Pandey and Tamta 1809
Table 3. Effect of different concentrations of NAA on in vitro rhizogenesis of C. sinensis.
Treatment Rooting
(%)
Number of roots/
micro shoot
Average length
of roots (cm.) NAA (µM) Time (h)
50 24 25.00±14.43a 1.17±0.17
b 2.27±0.18
b
100 24 41.67±08.33ab
1.25±0.25b 3.73±0.35
c
50 48 41.67±16.67ab
1.17±0.17b 2.47±0.18
b
100 48 75.00±14.43b 1.67±0.17
b 2.83±0.50
bc
Control 0.00±0.00a 0.00±0.00
a 0.00±0.00
a
Twelve (12) explants (three replicates having four individuals in each) were cultured on ½ MS medium. Data was evaluated after 45 days of culture in plant growth regulators free ½ MS media. Values represent mean±SE, values within each column followed by the same letters are not significantly different by the Duncan test at 0.05% probability level.
Plate 1. Micropropagation of C. sinensis through callus and nodal segments. a. Mature tree with fruits; b. shoot proliferation from leaf derived callus in 2,4-D+ NAA (4.53+5.37 µM) supplemented medium (30 days); c. bud proliferation from nodal segments derived from in vitro grown seedlings in BA+GA3 (4.44+1.45 µM) supplemented medium (30 days); d. multiplication of shoots after 60 days of culture in BA+GA3 (4.44+1.45 µM) supplemented medium; e. shoot proliferation from callus 2,4-D+NAA (4.53+5.37 µM) supplemented medium (45 days); f. well-developed shoots prior to rooting. Bar showing 1 cm scale.
RESULTS Callus induction To determine the best callus induction and proliferation response of leaf explants, derived from 6-week-old in vitro grown seedling of C. sinensis, different combinations of plant growth regulators were tested (Table 1). The optimal callusing response (93.33%) was observed in MS medium supplemented with 2,4-D+NAA (4.53+5.37 µM) followed by 2,4-D+NAA (9.06+5.37 µM) (86.67%). The lowest callus induction response (53.33%) was observed in MS medium supplemented with 2,4-D (1 µM) (Plate
1b). MS medium devoid of plant growth regulator (control) failed to induce callus. Shoot proliferation and multiplication For shoot proliferation and multiplication, the indirect and direct regeneration methods were performed. For indirect regeneration, green friable calli was proliferated and highest (86.62%) proliferation was observed in MS medium supplemented with 2,4-D+NAA (4.53+5.37 µM), the average number of proliferated shoots were also recorded maximum (6.93) for this treatment (Table 1 and
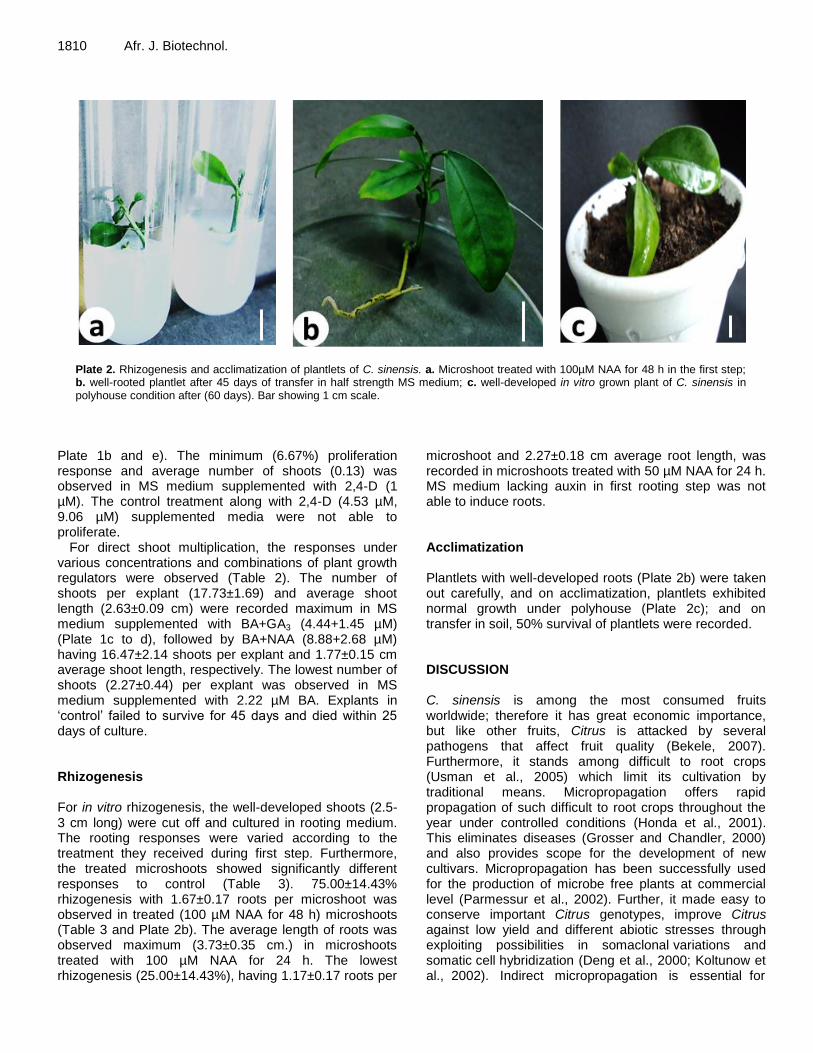
1810 Afr. J. Biotechnol.
Plate 2. Rhizogenesis and acclimatization of plantlets of C. sinensis. a. Microshoot treated with 100µM NAA for 48 h in the first step; b. well-rooted plantlet after 45 days of transfer in half strength MS medium; c. well-developed in vitro grown plant of C. sinensis in polyhouse condition after (60 days). Bar showing 1 cm scale.
Plate 1b and e). The minimum (6.67%) proliferation response and average number of shoots (0.13) was observed in MS medium supplemented with 2,4-D (1 µM). The control treatment along with 2,4-D (4.53 µM, 9.06 µM) supplemented media were not able to proliferate.
For direct shoot multiplication, the responses under various concentrations and combinations of plant growth regulators were observed (Table 2). The number of shoots per explant (17.73±1.69) and average shoot length (2.63±0.09 cm) were recorded maximum in MS medium supplemented with BA+GA3 (4.44+1.45 µM) (Plate 1c to d), followed by BA+NAA (8.88+2.68 µM) having 16.47±2.14 shoots per explant and 1.77±0.15 cm average shoot length, respectively. The lowest number of shoots (2.27±0.44) per explant was observed in MS medium supplemented with 2.22 µM BA. Explants in „control‟ failed to survive for 45 days and died within 25 days of culture. Rhizogenesis For in vitro rhizogenesis, the well-developed shoots (2.5-3 cm long) were cut off and cultured in rooting medium. The rooting responses were varied according to the treatment they received during first step. Furthermore, the treated microshoots showed significantly different responses to control (Table 3). 75.00±14.43% rhizogenesis with 1.67±0.17 roots per microshoot was observed in treated (100 µM NAA for 48 h) microshoots (Table 3 and Plate 2b). The average length of roots was observed maximum (3.73±0.35 cm.) in microshoots treated with 100 µM NAA for 24 h. The lowest rhizogenesis (25.00±14.43%), having 1.17±0.17 roots per
microshoot and 2.27±0.18 cm average root length, was recorded in microshoots treated with 50 µM NAA for 24 h. MS medium lacking auxin in first rooting step was not able to induce roots. Acclimatization Plantlets with well-developed roots (Plate 2b) were taken out carefully, and on acclimatization, plantlets exhibited normal growth under polyhouse (Plate 2c); and on transfer in soil, 50% survival of plantlets were recorded. DISCUSSION C. sinensis is among the most consumed fruits worldwide; therefore it has great economic importance, but like other fruits, Citrus is attacked by several pathogens that affect fruit quality (Bekele, 2007). Furthermore, it stands among difficult to root crops (Usman et al., 2005) which limit its cultivation by traditional means. Micropropagation offers rapid propagation of such difficult to root crops throughout the year under controlled conditions (Honda et al., 2001). This eliminates diseases (Grosser and Chandler, 2000) and also provides scope for the development of new cultivars. Micropropagation has been successfully used for the production of microbe free plants at commercial level (Parmessur et al., 2002). Further, it made easy to conserve important Citrus genotypes, improve Citrus against low yield and different abiotic stresses through exploiting possibilities in somaclonal variations and somatic cell hybridization (Deng et al., 2000; Koltunow et al., 2002). Indirect micropropagation is essential for
Agrobacterium-mediated genetic transformation (Khawale and Singh, 2005).Through transformation, disease free plants of high yielding cultivars can be produced e.g. nematode resistance Citrus rootstock etc.
MS medium was used as a nutrient source during the study, as it was found effective in seed germination of C. sinensis and also, successfully used for various citrus species e.g. C. sinensis; Carrizo citrange (Pandey et al., 2011; Germana et al., 2011). Response of explants to plant growth regulators was vigorous. The best callus induction (93.33%) and proliferation responses (86.67%) were observed in MS medium containing 2,4-D and NAA. Similarly, callus development in C. sinensis on MS medium supplemented with 2,4-D+NAA was reported by Das et al. (2000) which supports the present study, while in C. reticulata (83.0%), somatic embryogenesis was observed on MS medium supplemented with NAA + Kinetin (10+1 mgL
-1) from callus (Gill et al., 1995).
In Citrus species, BA is reported as the best cytokinin for inducing organogenesis (Carimi and Pasquale, 2003; Germana et al., 2011), 22 μM BA in Citrus reshni (Moore, 1986); 2 mgl
-1 BA in C. limon; C. paradisi (Kotsias and
Roussos, 2001, Costa et al., 2004), etc. Kobayashi et al. (2003) was able to produce 3.1 shoots per explant with a response of 54% in C. sinensis on BA+GA3 (1.8+0.7 μM) supplemented MS medium. In present study, comparatively better shoot multiplication (17.73±1.69 shoots/explant) responses were observed in MS medium supplemented with BA+GA3 (4.44+1.45 μM). It may be due to the increased concentrations of growth regulators and explant source. Therefore, present study reveals that the application of BA is effective in shoot multiplication but, BA in combination with GA3 appeared more potent in shoot multiplication.
Many different Citrus species were subjected to rhizogenesis under different auxins (NAA or IBA) supplemented mediums (Carimi and Pasquale, 2003) and NAA was found to be the best rooting auxin for Citrus species (Kaneyoshi et al., 1994; Paudyal and Haq, 2000). Further, the highest (87%) rooting percentage in C. reticulata was also obtained on NAA (2 mgl
-1)
supplemented media (Mukhtar et al., 2005). However, rooting response of C. sinensis was not satisfactory under continuous exposure of NAA and only 3.2%, rooting was observed after three months of transfer of shoots to rooting medium (Pena et al., 1995). Therefore, well-established two-step rooting procedure was adopted for in vitro rhizogenesis. Two-step rooting procedure was found to be the best for several species viz. Berberis chitria (Pandey et al., 2013), Quercus serrata (Pandey and Tamta, 2014), Quercus leucotrichophora (Pandey and Tamta, 2012) etc. In present study, moderate rooting (25 to 75%) responses were observed with 1.17 to 1.67 average number of roots-per-microshoot. The low rooting efficiency has also been reported as major problem for in vitro production of Citrus plants (Usman et al., 2005; Duran-Vila et al., 1989). The low survival of C. sinensis
Pandey and Tamta 1811 plantlets may be due to less root length, that is, 2.27±0.18 to3.73±0.35 cm. Conclusion The present study was done to develop an efficient micropropagation procedure for Malta (Citrus sinensis) through direct and indirect organogenesis. The direct organogenesis was achieved best in MS medium fortified with BA and GA3 which may be useful for mass multiplication of selected elite cultivar. Similarly the best responses for indirect organogenesis were recorded in explants cultured in MS medium supplemented with 2,4-D and NAA, which might be useful in genetic transformation system and suitable for regeneration of new „Malta Varity‟ in future. The NAA containing MS medium was able to induce 75.00±14.43% rhizogenesis in in vitro derived microshoots, but the further trials are required to achieve 100% rooting and better survival of these in vitro raised plants in field conditions. Conflict of interests The authors have not declared any conflict of interest. ACKNOWLEDGEMENTS Authors are thankful to Head, Department of Botany, D.S.B. Campus, Kumaun University, Nainital for providing necessary facilities for the present work. Dr. Dinesh Giri and Deepti Negi are also thanked for their help during initial stage of the study.
Abbreviations
MS, Murashige and Skoog media; 2,4-D, 2,4-dichlorophenoxyacetic acid; BA, benzyl adenine; NAA, α-naphthalene acetic acid. REFERENCES Ali S, Mirza B (2006). Micropropagation of rough lemon (Citrus jambhiri
Lush.): Effect of explant type and hormone concentration Acta Bot. Croat. 65 (2):137–146.
Barlass M, Skene KGM (1999). Citrus. In: Bajaj YPS (ed) Biotechnology in agriculture and forestry. Springer, Berlin, pp. 207-219.
Bekele S (2007). Identification of citrus (Citrus sinensis) postharvest pathogens from ethiopia and their control. Ph.D. Thesis. University of Pretoria.
Bove JM (2006). Huanglongbing: a destructive, newly-emerging, century-old disease of Citrus. J. Plant Pathol. 88:7–37.
Carimi F, De Pasquale F (2003). Micropropagation of citrus. In SM Jain, K Ishii, eds, Micropropagation of Woody Trees and Fruits, Kluwer, Netherlands, pp. 589-619.
Chaudhary MI (1994). Fruit Crops. In: Malik M.N. (ed.), Horticulture, 422. National Book Foundation, Islamabad.
1812 Afr. J. Biotechnol. Costa MGC, Adves VS, Lani ERG, Carvalho CR, Otoni WC (2004).
Morphogenic gradients of adventitious bud and shoot regeneration in epicotyl explants of Citrus. Sci. Hortic. 100:63-74.
Costa MGC, Otoni WC, Moor GA (2002). An elevation of factors affecting the efficieny of Agrobacterium-mediated transformation of Citrus paradisi (Macf.) and production of transgenic plants containing carotenoid biosynthetic genes, Plant Cell Rep. 21:365-373.
Crowell PL (1999). Prevention and therapy of cancer by dietary monoterpenes. J. Nutr. 129(3):775S-778S.
Das A, Paul AK, Chaudhuri S (2000). Micropropagation of sweet orange (Citrus sinensis Osbeck) for the development of nucellar seedlings. Indian J. Exp. Biol. 38:269-272.
Deng XX, Yu GH, Guo WW (2000). Somatic hybridization between diploids and allotetraploid somatic hybrids in Citrus. 9
th ISC Congress
Sun City Resort, South Africa. 54:115-121 Duran-Vila N, Ortega V, Navarro L (1989). Morphogenesis and tissue
culture of three citrus species. Plant Cell Tissue Organ Cult. 16:123-133.
Ejaz S, Ejaz A, Matsuda K, Chae WL (2006). Limonoids as cancer chemopreventive agents. J. Sci. Food Agric. 86:339-345.
Elangovan V, Sekar N, Govindasamy S (1994). Chemopreventive potential of dietary bioflavonoids against 20-methylcholanthreneinduced tumorigenesis. Cancer Lett. 87:107-113.
Fawcett HS (1933). New symptoms of psoriasis, indicating a virus disease of Citrus. Phytopathology 23:930.
Food and Agriculture Organization of the United Nations (2006). (FAO Statistics), http://faostat.fao.org/default.aspx
Germana MA, Micheli M, Chiancone B, Macaluso L, Standardi A (2011). Organogenesis and encapsulation of in vitro-derived propagules of Carrizo citrange [Citrus sinensis (L.) Osb. x Poncirius trifoliate (L.) Raf]. Plant Cell Tissue Organ Cult. 106:299-307
Gill MIS, Singh Z, Dhillon BS, Gosal SS, Singh Z (1994). Somatic embryogenesis and plantlet regeneration on calluses derived from seedling explants of kinnow mandarin (Citrus nobilis Lour × Citrus deliciosa Tenora). J. Hortic. Sci. 69:231-236.
Grosser JW, Chandler JL (2000). Somatic hybridization of high yield, cold-hardy and disease resistant parents for Citrus rootstock improvement. J. Hortic. Sci. Biotechnol. 75:641-644.
Honda H, Liu CZ, Kobayashi T (2001). Large-scale plant micropropagation. Adv. Biochem. Eng. Biotechnol 72:158-182.
Johnston JC (1968). Growing seedlings from seed. In: Opitz, K.W., Plate, R.G., Frolich, E.F. (eds.), Propagation of Citrus, Division of Agricultural Sciences University of California pp. 1-6.
Kaneyoshi J, Kobayashi S, Nakamura Y, Shigemoto N, Doi Y (1994). A simple and efficient gene transfer system to trifoliate orange (Ponicirus trifoliata Raf.). Plant Cell Rep. 13:541-545.
Khawale RN, Singh SK (2005). In vitro adventitive embryony in Citrus : A technique for Citrus germplasm exchange. Curr. Sci. 88(8):1309-1311.
Kiong ALP, Wan LS, Hussein S, Ibrahim R (2008). Induction of somatic embryos from explants different of Citrus sinensis. J. Sci. 3:18-32.
Koltunow AM (2002). Regeneration of West Indian Limes (Citrus aurantifolia) Containing genes for decreased seed set. Acta Hortic. 535:151-157.
Kotsias D, Roussos PA (2001). An investigation on the effect of different plant growth regulating compounds in in vitro shoot tip and node culture of lemon seedling. Sci. Hortic. 89:115-128.
Kotze JM (1981). Epidemiology and control of Citrus black spot in South Africa. Plant Dis. 65:945-950.
Kunta M, Palm M, Rascoe J, Desa PB, Timmer LW, Da Graça JV, Mangan RL, Malik NSA, Salas B, Satpute A, Sétamou M, Skaria M (2013). „Sweet Orange Scab with a new scab disease “syndrome” of Citrus in the U.S.A. associated with Elsinoë australis. Trop. Plant Pathol. 38:203-212.
Mukhtar R, Khan MM, Fatima B, Abbas M, Shahid A (2005). In vitro
regeneration and somatic embryogenesis in (Citrus aurantifolia and Citrus sinensis). Int. J. Agric. Biol. 7(2):414-416.
Murashige T, Skoog F (1962). A revised medium for rapid growth and bioassays with tobacco tissue culture. Plant Cell Physiol. 15:473-497.
Pandey A, Tamta S (2013). Effect of pre-sowing treatments on seed germination in Quercus serrata Thunb. and Quercus semecarpifolia Sm. Int. J. Biodivers. Conserv. 5:791-795.
Pandey A, Tamta S (2014). In vitro propagation of the important tasar oak (Quercus serrata Thunb.) by casein hydrolysate promoted high frequency shoot proliferation. J. Sustain. For. 33:590-603.
Pandey A, Brijwal L, Tamta S (2013) In vitro propagation and phytochemical assessment of Berberis chitria: An important medicinal shrub of Kumaun Himalaya, India. J. Med. Plant Res. 7:930-937.
Pandey A, Negi D, Giri D, Tamta S (2011). In vitro seed germination study in Citrus sinensis. Oaks 7: 52-55.
Parmessur YS, Alijanabi S, Saumatally S, Dookun-samutually A (2002). Sugarcane yellow virus and sugarcane yellow phytoplasma: elimination by tissue culture. Plant Pathol. 51:561-569.
Paudyal KP, Haq N (2000). In vitro propagation of pummelo (Citrus grandis L. Osbeck), In Vitro Cell. Dev. Biol. Plant 36: 511-516.
Pena L, Cervera M, Juarez J, Navarro A, Pina JA, Duran-vila N, Navarro L (1995). Agrobacterium-mediated transformation of sweet orange and regeneration M Barlass M; KGM Skene. Citrus. In: Bajaj YPS (ed) Biotechnology in agriculture and forestry.
Rossetti V (1977). Citrus canker in Latin America: a review. Proc. Int. Soc. Citricult. 3:918-924.
Sastra-hidayat AR (1992). Preliminary epidemiological study of powdery mildew (Oidium tingitaninum) on Citrus sinensis. Indonesian Center for Agricultural Library and Technology Dissemination, Pusat Perpustakaan dan Penyebaran Teknologi Pertanian (Indonesia) ICALTD Asian Citrus rehabilitation conference. Malang (Indonesia).
Te-Chato S, Nudoung S (1998). Tissue culture of Citrus reticulata Blanco CV. Shogun. and gene transformation by Agrobacteria. Proc. Abstracts IMT-GT UNITE Conf, Songkxhla.
Tripoli ELA, Guardia M, Giammanco S, Di Majo D, Giammanco M (2007). Citrus flavonoids: Molecular structure, biological activity and nutritional properties: A review. Food Chem. 104:466-479.
Usman M, Muhammad S, Fatima B (2005). In vitro multiple shoot induction from nodal explants of Citrus cultivars. J. Cent. Eur. Agric. 6:435-442.
Walton BS, Bartholomew ET, Ramsey RC (1945). Analysis of the organic acids of orange juice. Plant Physiol. 20(1):3-18.
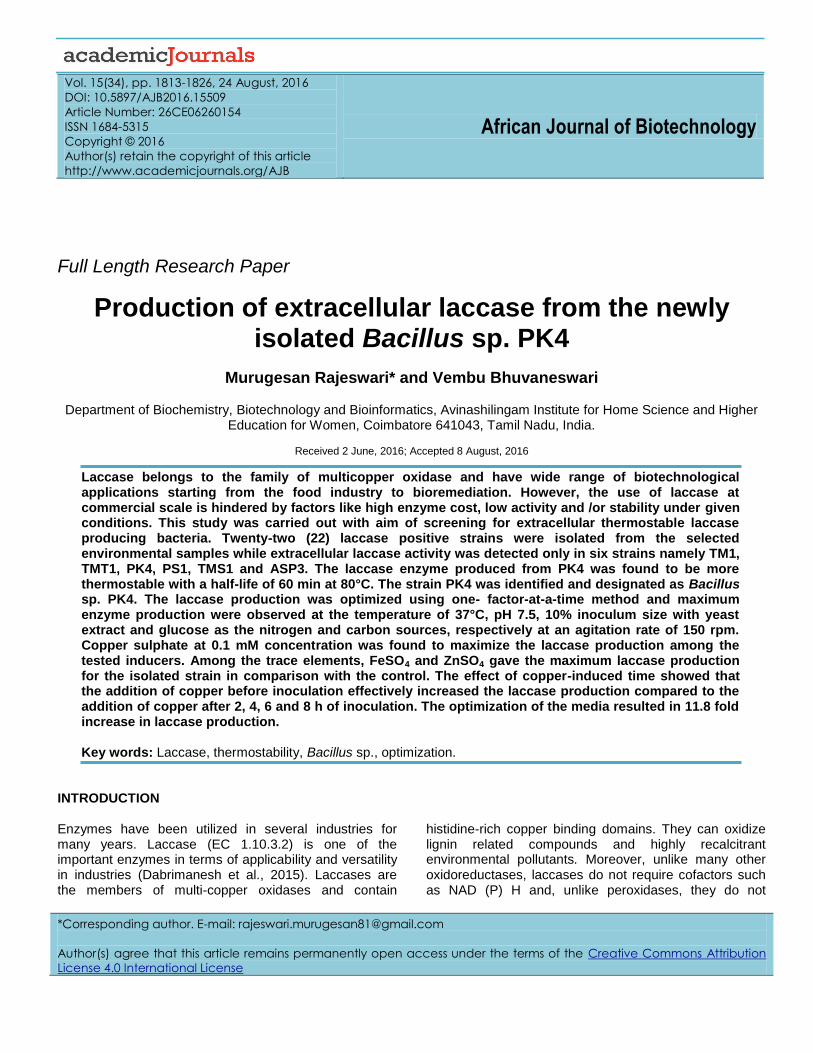
Vol. 15(34), pp. 1813-1826, 24 August, 2016
DOI: 10.5897/AJB2016.15509
Article Number: 26CE06260154
ISSN 1684-5315
Copyright © 2016
Author(s) retain the copyright of this article
http://www.academicjournals.org/AJB
African Journal of Biotechnology
Full Length Research Paper
Production of extracellular laccase from the newly isolated Bacillus sp. PK4
Murugesan Rajeswari* and Vembu Bhuvaneswari
Department of Biochemistry, Biotechnology and Bioinformatics, Avinashilingam Institute for Home Science and Higher Education for Women, Coimbatore 641043, Tamil Nadu, India.
Received 2 June, 2016; Accepted 8 August, 2016
Laccase belongs to the family of multicopper oxidase and have wide range of biotechnological applications starting from the food industry to bioremediation. However, the use of laccase at commercial scale is hindered by factors like high enzyme cost, low activity and /or stability under given conditions. This study was carried out with aim of screening for extracellular thermostable laccase producing bacteria. Twenty-two (22) laccase positive strains were isolated from the selected environmental samples while extracellular laccase activity was detected only in six strains namely TM1, TMT1, PK4, PS1, TMS1 and ASP3. The laccase enzyme produced from PK4 was found to be more thermostable with a half-life of 60 min at 80°C. The strain PK4 was identified and designated as Bacillus sp. PK4. The laccase production was optimized using one- factor-at-a-time method and maximum enzyme production were observed at the temperature of 37°C, pH 7.5, 10% inoculum size with yeast extract and glucose as the nitrogen and carbon sources, respectively at an agitation rate of 150 rpm. Copper sulphate at 0.1 mM concentration was found to maximize the laccase production among the tested inducers. Among the trace elements, FeSO4 and ZnSO4 gave the maximum laccase production for the isolated strain in comparison with the control. The effect of copper-induced time showed that the addition of copper before inoculation effectively increased the laccase production compared to the addition of copper after 2, 4, 6 and 8 h of inoculation. The optimization of the media resulted in 11.8 fold increase in laccase production. Key words: Laccase, thermostability, Bacillus sp., optimization.
INTRODUCTION Enzymes have been utilized in several industries for many years. Laccase (EC 1.10.3.2) is one of the important enzymes in terms of applicability and versatility in industries (Dabrimanesh et al., 2015). Laccases are the members of multi-copper oxidases and contain
histidine-rich copper binding domains. They can oxidize lignin related compounds and highly recalcitrant environmental pollutants. Moreover, unlike many other oxidoreductases, laccases do not require cofactors such as NAD (P) H and, unlike peroxidases, they do not
*Corresponding author. E-mail: [email protected]
Author(s) agree that this article remains permanently open access under the terms of the Creative Commons Attribution
License 4.0 International License
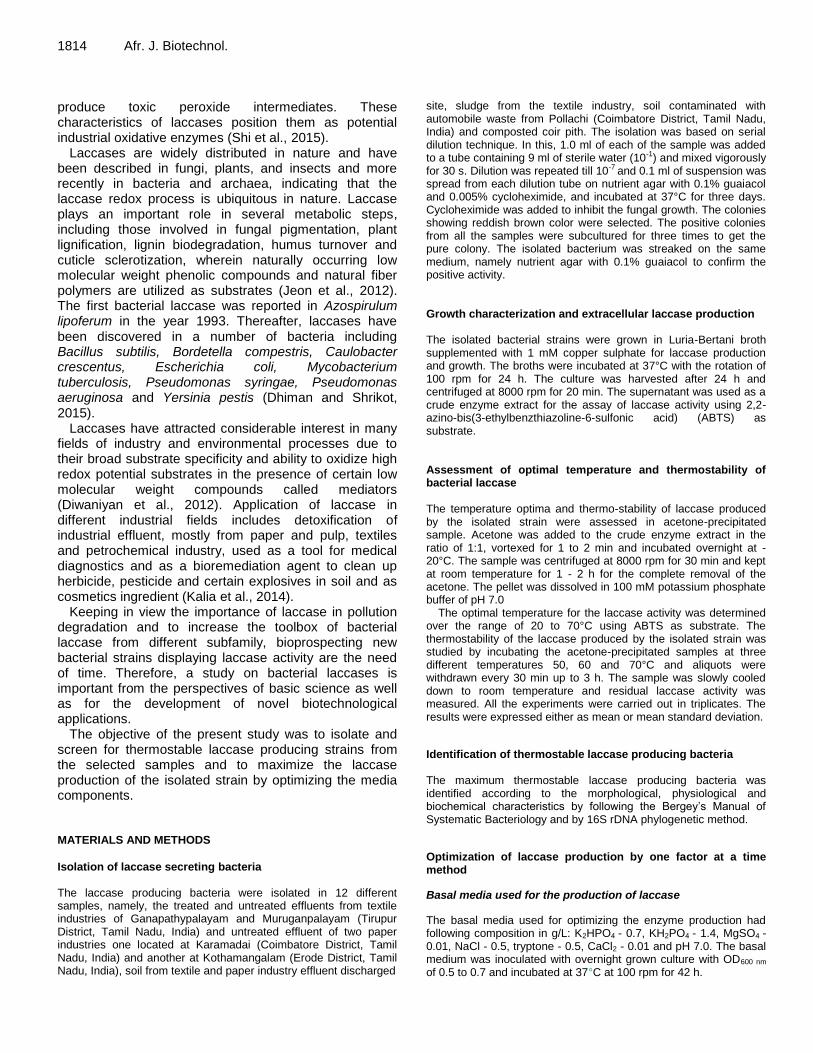
1814 Afr. J. Biotechnol. produce toxic peroxide intermediates. These characteristics of laccases position them as potential industrial oxidative enzymes (Shi et al., 2015).
Laccases are widely distributed in nature and have been described in fungi, plants, and insects and more recently in bacteria and archaea, indicating that the laccase redox process is ubiquitous in nature. Laccase plays an important role in several metabolic steps, including those involved in fungal pigmentation, plant lignification, lignin biodegradation, humus turnover and cuticle sclerotization, wherein naturally occurring low molecular weight phenolic compounds and natural fiber polymers are utilized as substrates (Jeon et al., 2012). The first bacterial laccase was reported in Azospirulum lipoferum in the year 1993. Thereafter, laccases have been discovered in a number of bacteria including Bacillus subtilis, Bordetella compestris, Caulobacter crescentus, Escherichia coli, Mycobacterium tuberculosis, Pseudomonas syringae, Pseudomonas aeruginosa and Yersinia pestis (Dhiman and Shrikot, 2015).
Laccases have attracted considerable interest in many fields of industry and environmental processes due to their broad substrate specificity and ability to oxidize high redox potential substrates in the presence of certain low molecular weight compounds called mediators (Diwaniyan et al., 2012). Application of laccase in different industrial fields includes detoxification of industrial effluent, mostly from paper and pulp, textiles and petrochemical industry, used as a tool for medical diagnostics and as a bioremediation agent to clean up herbicide, pesticide and certain explosives in soil and as cosmetics ingredient (Kalia et al., 2014).
Keeping in view the importance of laccase in pollution degradation and to increase the toolbox of bacterial laccase from different subfamily, bioprospecting new bacterial strains displaying laccase activity are the need of time. Therefore, a study on bacterial laccases is important from the perspectives of basic science as well as for the development of novel biotechnological applications.
The objective of the present study was to isolate and screen for thermostable laccase producing strains from the selected samples and to maximize the laccase production of the isolated strain by optimizing the media components. MATERIALS AND METHODS
Isolation of laccase secreting bacteria The laccase producing bacteria were isolated in 12 different samples, namely, the treated and untreated effluents from textile industries of Ganapathypalayam and Muruganpalayam (Tirupur District, Tamil Nadu, India) and untreated effluent of two paper industries one located at Karamadai (Coimbatore District, Tamil Nadu, India) and another at Kothamangalam (Erode District, Tamil Nadu, India), soil from textile and paper industry effluent discharged
site, sludge from the textile industry, soil contaminated with automobile waste from Pollachi (Coimbatore District, Tamil Nadu, India) and composted coir pith. The isolation was based on serial dilution technique. In this, 1.0 ml of each of the sample was added to a tube containing 9 ml of sterile water (10-1) and mixed vigorously for 30 s. Dilution was repeated till 10-7 and 0.1 ml of suspension was spread from each dilution tube on nutrient agar with 0.1% guaiacol and 0.005% cycloheximide, and incubated at 37°C for three days. Cycloheximide was added to inhibit the fungal growth. The colonies showing reddish brown color were selected. The positive colonies from all the samples were subcultured for three times to get the pure colony. The isolated bacterium was streaked on the same medium, namely nutrient agar with 0.1% guaiacol to confirm the positive activity. Growth characterization and extracellular laccase production The isolated bacterial strains were grown in Luria-Bertani broth supplemented with 1 mM copper sulphate for laccase production and growth. The broths were incubated at 37°C with the rotation of 100 rpm for 24 h. The culture was harvested after 24 h and centrifuged at 8000 rpm for 20 min. The supernatant was used as a crude enzyme extract for the assay of laccase activity using 2,2-azino-bis(3-ethylbenzthiazoline-6-sulfonic acid) (ABTS) as substrate. Assessment of optimal temperature and thermostability of bacterial laccase The temperature optima and thermo-stability of laccase produced by the isolated strain were assessed in acetone-precipitated sample. Acetone was added to the crude enzyme extract in the ratio of 1:1, vortexed for 1 to 2 min and incubated overnight at -20°C. The sample was centrifuged at 8000 rpm for 30 min and kept at room temperature for 1 - 2 h for the complete removal of the acetone. The pellet was dissolved in 100 mM potassium phosphate buffer of pH 7.0
The optimal temperature for the laccase activity was determined over the range of 20 to 70°C using ABTS as substrate. The thermostability of the laccase produced by the isolated strain was studied by incubating the acetone-precipitated samples at three different temperatures 50, 60 and 70°C and aliquots were withdrawn every 30 min up to 3 h. The sample was slowly cooled down to room temperature and residual laccase activity was measured. All the experiments were carried out in triplicates. The results were expressed either as mean or mean standard deviation.
Identification of thermostable laccase producing bacteria The maximum thermostable laccase producing bacteria was identified according to the morphological, physiological and biochemical characteristics by following the Bergey’s Manual of Systematic Bacteriology and by 16S rDNA phylogenetic method.
Optimization of laccase production by one factor at a time method
Basal media used for the production of laccase
The basal media used for optimizing the enzyme production had following composition in g/L: K2HPO4 - 0.7, KH2PO4 - 1.4, MgSO4 - 0.01, NaCl - 0.5, tryptone - 0.5, CaCl2 - 0.01 and pH 7.0. The basal medium was inoculated with overnight grown culture with OD600 nm of 0.5 to 0.7 and incubated at 37°C at 100 rpm for 42 h.
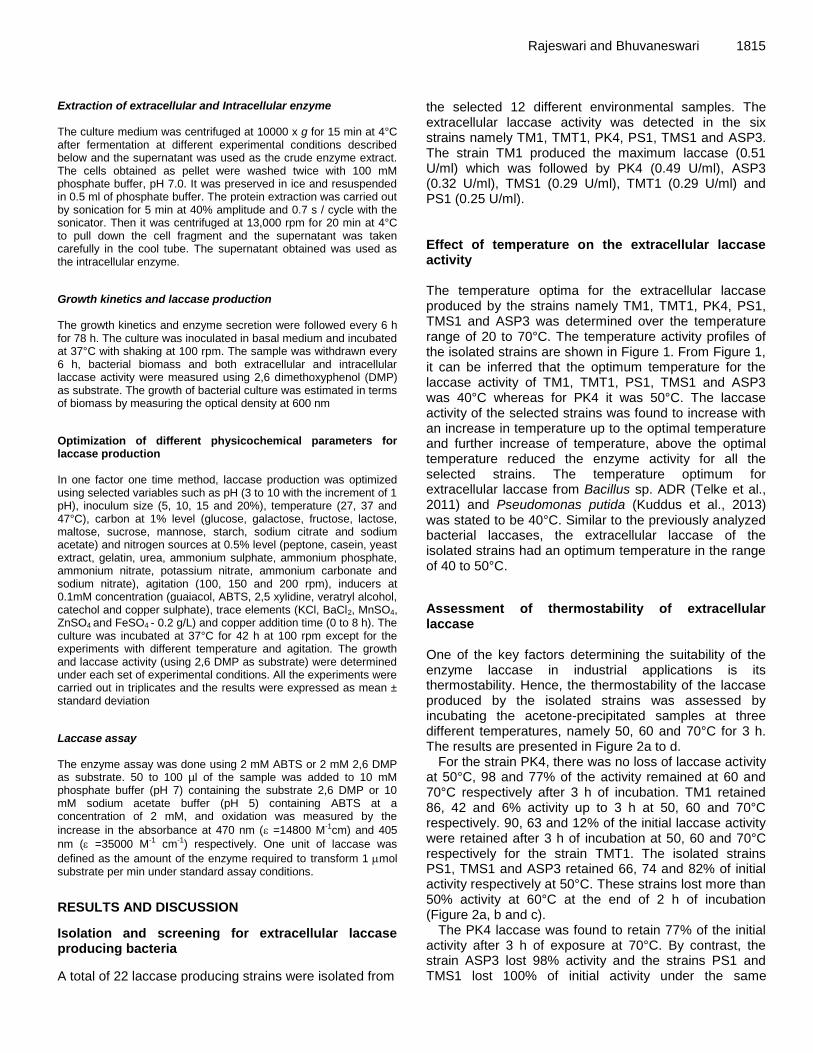
Extraction of extracellular and Intracellular enzyme The culture medium was centrifuged at 10000 x g for 15 min at 4°C after fermentation at different experimental conditions described below and the supernatant was used as the crude enzyme extract. The cells obtained as pellet were washed twice with 100 mM phosphate buffer, pH 7.0. It was preserved in ice and resuspended in 0.5 ml of phosphate buffer. The protein extraction was carried out by sonication for 5 min at 40% amplitude and 0.7 s / cycle with the sonicator. Then it was centrifuged at 13,000 rpm for 20 min at 4°C to pull down the cell fragment and the supernatant was taken carefully in the cool tube. The supernatant obtained was used as the intracellular enzyme.
Growth kinetics and laccase production The growth kinetics and enzyme secretion were followed every 6 h for 78 h. The culture was inoculated in basal medium and incubated at 37°C with shaking at 100 rpm. The sample was withdrawn every 6 h, bacterial biomass and both extracellular and intracellular laccase activity were measured using 2,6 dimethoxyphenol (DMP) as substrate. The growth of bacterial culture was estimated in terms of biomass by measuring the optical density at 600 nm
Optimization of different physicochemical parameters for laccase production In one factor one time method, laccase production was optimized using selected variables such as pH (3 to 10 with the increment of 1 pH), inoculum size (5, 10, 15 and 20%), temperature (27, 37 and 47°C), carbon at 1% level (glucose, galactose, fructose, lactose, maltose, sucrose, mannose, starch, sodium citrate and sodium acetate) and nitrogen sources at 0.5% level (peptone, casein, yeast extract, gelatin, urea, ammonium sulphate, ammonium phosphate, ammonium nitrate, potassium nitrate, ammonium carbonate and sodium nitrate), agitation (100, 150 and 200 rpm), inducers at 0.1mM concentration (guaiacol, ABTS, 2,5 xylidine, veratryl alcohol, catechol and copper sulphate), trace elements (KCl, BaCl2, MnSO4, ZnSO4 and FeSO4 - 0.2 g/L) and copper addition time (0 to 8 h). The culture was incubated at 37°C for 42 h at 100 rpm except for the experiments with different temperature and agitation. The growth and laccase activity (using 2,6 DMP as substrate) were determined under each set of experimental conditions. All the experiments were carried out in triplicates and the results were expressed as mean ± standard deviation
Laccase assay The enzyme assay was done using 2 mM ABTS or 2 mM 2,6 DMP as substrate. 50 to 100 µl of the sample was added to 10 mM phosphate buffer (pH 7) containing the substrate 2,6 DMP or 10 mM sodium acetate buffer (pH 5) containing ABTS at a concentration of 2 mM, and oxidation was measured by the
increase in the absorbance at 470 nm ( =14800 M-1cm) and 405
nm ( =35000 M-1 cm-1) respectively. One unit of laccase was
defined as the amount of the enzyme required to transform 1 mol substrate per min under standard assay conditions.
RESULTS AND DISCUSSION
Isolation and screening for extracellular laccase producing bacteria
A total of 22 laccase producing strains were isolated from
Rajeswari and Bhuvaneswari 1815 the selected 12 different environmental samples. The extracellular laccase activity was detected in the six strains namely TM1, TMT1, PK4, PS1, TMS1 and ASP3. The strain TM1 produced the maximum laccase (0.51 U/ml) which was followed by PK4 (0.49 U/ml), ASP3 (0.32 U/ml), TMS1 (0.29 U/ml), TMT1 (0.29 U/ml) and PS1 (0.25 U/ml). Effect of temperature on the extracellular laccase activity The temperature optima for the extracellular laccase produced by the strains namely TM1, TMT1, PK4, PS1, TMS1 and ASP3 was determined over the temperature range of 20 to 70°C. The temperature activity profiles of the isolated strains are shown in Figure 1. From Figure 1, it can be inferred that the optimum temperature for the laccase activity of TM1, TMT1, PS1, TMS1 and ASP3 was 40°C whereas for PK4 it was 50°C. The laccase activity of the selected strains was found to increase with an increase in temperature up to the optimal temperature and further increase of temperature, above the optimal temperature reduced the enzyme activity for all the selected strains. The temperature optimum for extracellular laccase from Bacillus sp. ADR (Telke et al., 2011) and Pseudomonas putida (Kuddus et al., 2013) was stated to be 40°C. Similar to the previously analyzed bacterial laccases, the extracellular laccase of the isolated strains had an optimum temperature in the range of 40 to 50°C.
Assessment of thermostability of extracellular laccase One of the key factors determining the suitability of the enzyme laccase in industrial applications is its thermostability. Hence, the thermostability of the laccase produced by the isolated strains was assessed by incubating the acetone-precipitated samples at three different temperatures, namely 50, 60 and 70°C for 3 h. The results are presented in Figure 2a to d.
For the strain PK4, there was no loss of laccase activity at 50°C, 98 and 77% of the activity remained at 60 and 70°C respectively after 3 h of incubation. TM1 retained 86, 42 and 6% activity up to 3 h at 50, 60 and 70°C respectively. 90, 63 and 12% of the initial laccase activity were retained after 3 h of incubation at 50, 60 and 70°C respectively for the strain TMT1. The isolated strains PS1, TMS1 and ASP3 retained 66, 74 and 82% of initial activity respectively at 50°C. These strains lost more than 50% activity at 60°C at the end of 2 h of incubation (Figure 2a, b and c).
The PK4 laccase was found to retain 77% of the initial activity after 3 h of exposure at 70°C. By contrast, the strain ASP3 lost 98% activity and the strains PS1 and TMS1 lost 100% of initial activity under the same
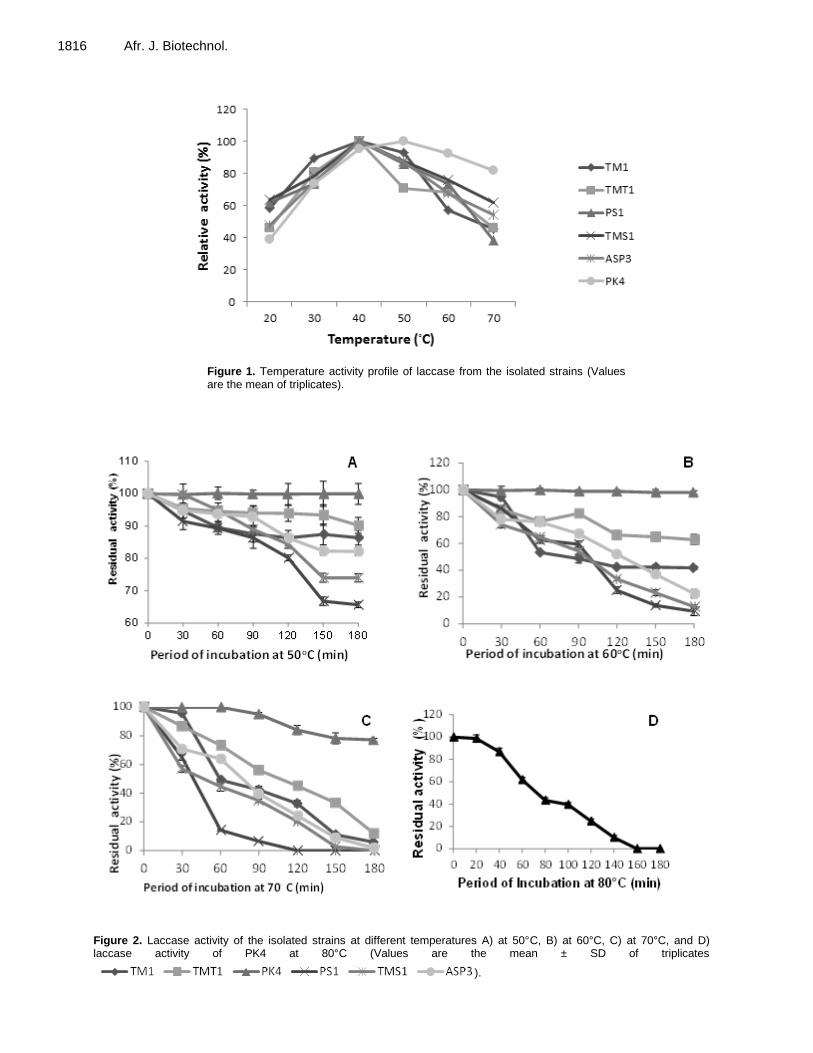
1816 Afr. J. Biotechnol.
Figure 1. Temperature activity profile of laccase from the isolated strains (Values are the mean of triplicates).
Figure 2. Laccase activity of the isolated strains at different temperatures A) at 50°C, B) at 60°C, C) at 70°C, and D) laccase activity of PK4 at 80°C (Values are the mean ± SD of triplicates
).
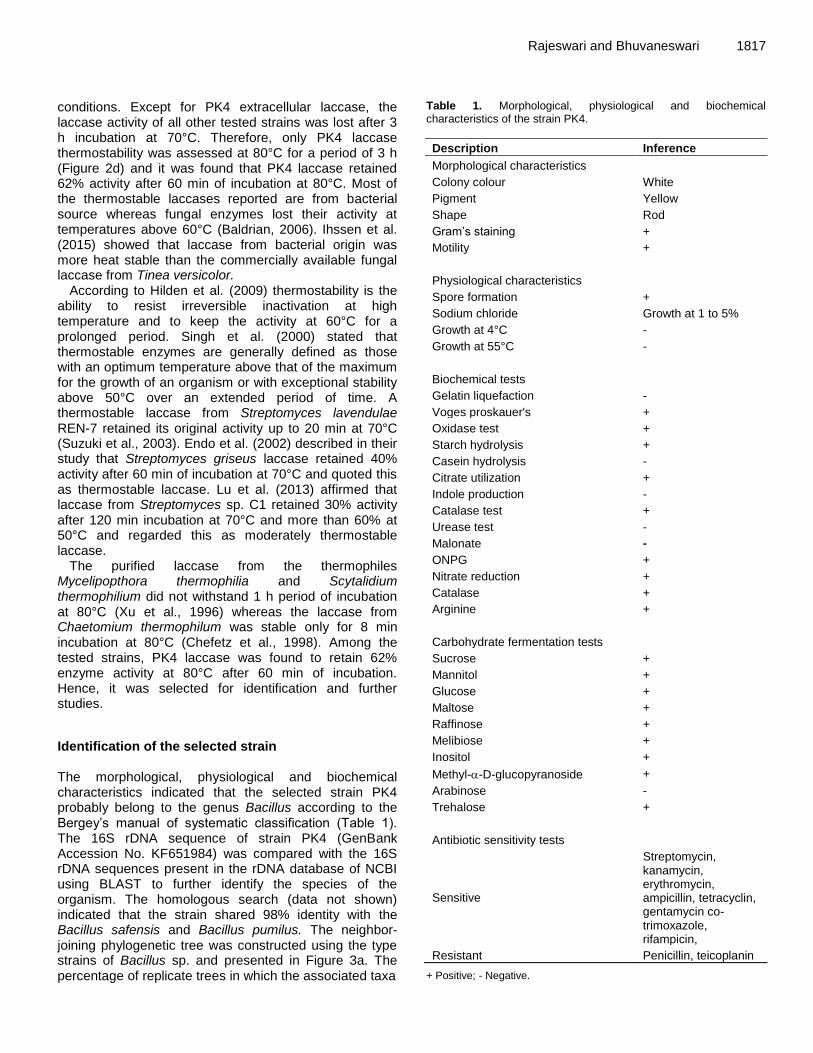
conditions. Except for PK4 extracellular laccase, the laccase activity of all other tested strains was lost after 3 h incubation at 70°C. Therefore, only PK4 laccase thermostability was assessed at 80°C for a period of 3 h (Figure 2d) and it was found that PK4 laccase retained 62% activity after 60 min of incubation at 80°C. Most of the thermostable laccases reported are from bacterial source whereas fungal enzymes lost their activity at temperatures above 60°C (Baldrian, 2006). Ihssen et al. (2015) showed that laccase from bacterial origin was more heat stable than the commercially available fungal laccase from Tinea versicolor.
According to Hilden et al. (2009) thermostability is the ability to resist irreversible inactivation at high temperature and to keep the activity at 60°C for a prolonged period. Singh et al. (2000) stated that thermostable enzymes are generally defined as those with an optimum temperature above that of the maximum for the growth of an organism or with exceptional stability above 50°C over an extended period of time. A thermostable laccase from Streptomyces lavendulae REN-7 retained its original activity up to 20 min at 70°C (Suzuki et al., 2003). Endo et al. (2002) described in their study that Streptomyces griseus laccase retained 40% activity after 60 min of incubation at 70°C and quoted this as thermostable laccase. Lu et al. (2013) affirmed that laccase from Streptomyces sp. C1 retained 30% activity after 120 min incubation at 70°C and more than 60% at 50°C and regarded this as moderately thermostable laccase.
The purified laccase from the thermophiles Mycelipopthora thermophilia and Scytalidium thermophilium did not withstand 1 h period of incubation at 80°C (Xu et al., 1996) whereas the laccase from Chaetomium thermophilum was stable only for 8 min incubation at 80°C (Chefetz et al., 1998). Among the tested strains, PK4 laccase was found to retain 62% enzyme activity at 80°C after 60 min of incubation. Hence, it was selected for identification and further studies.
Identification of the selected strain The morphological, physiological and biochemical characteristics indicated that the selected strain PK4 probably belong to the genus Bacillus according to the Bergey’s manual of systematic classification (Table 1). The 16S rDNA sequence of strain PK4 (GenBank Accession No. KF651984) was compared with the 16S rDNA sequences present in the rDNA database of NCBI using BLAST to further identify the species of the organism. The homologous search (data not shown) indicated that the strain shared 98% identity with the Bacillus safensis and Bacillus pumilus. The neighbor-joining phylogenetic tree was constructed using the type strains of Bacillus sp. and presented in Figure 3a. The percentage of replicate trees in which the associated taxa
Rajeswari and Bhuvaneswari 1817 Table 1. Morphological, physiological and biochemical characteristics of the strain PK4.
Description Inference
Morphological characteristics
Colony colour White
Pigment Yellow
Shape Rod
Gram’s staining +
Motility +
Physiological characteristics
Spore formation +
Sodium chloride Growth at 1 to 5%
Growth at 4°C
-
Growth at 55°C -
Biochemical tests
Gelatin liquefaction -
Voges proskauer's +
Oxidase test +
Starch hydrolysis +
Casein hydrolysis -
Citrate utilization +
Indole production -
Catalase test +
Urease test -
Malonate -
ONPG +
Nitrate reduction +
Catalase +
Arginine +
Carbohydrate fermentation tests
Sucrose +
Mannitol +
Glucose +
Maltose +
Raffinose +
Melibiose +
Inositol +
Methyl--D-glucopyranoside +
Arabinose -
Trehalose +
Antibiotic sensitivity tests
Sensitive
Streptomycin, kanamycin, erythromycin, ampicillin, tetracyclin, gentamycin co-trimoxazole, rifampicin,
Resistant Penicillin, teicoplanin
+ Positive; - Negative.
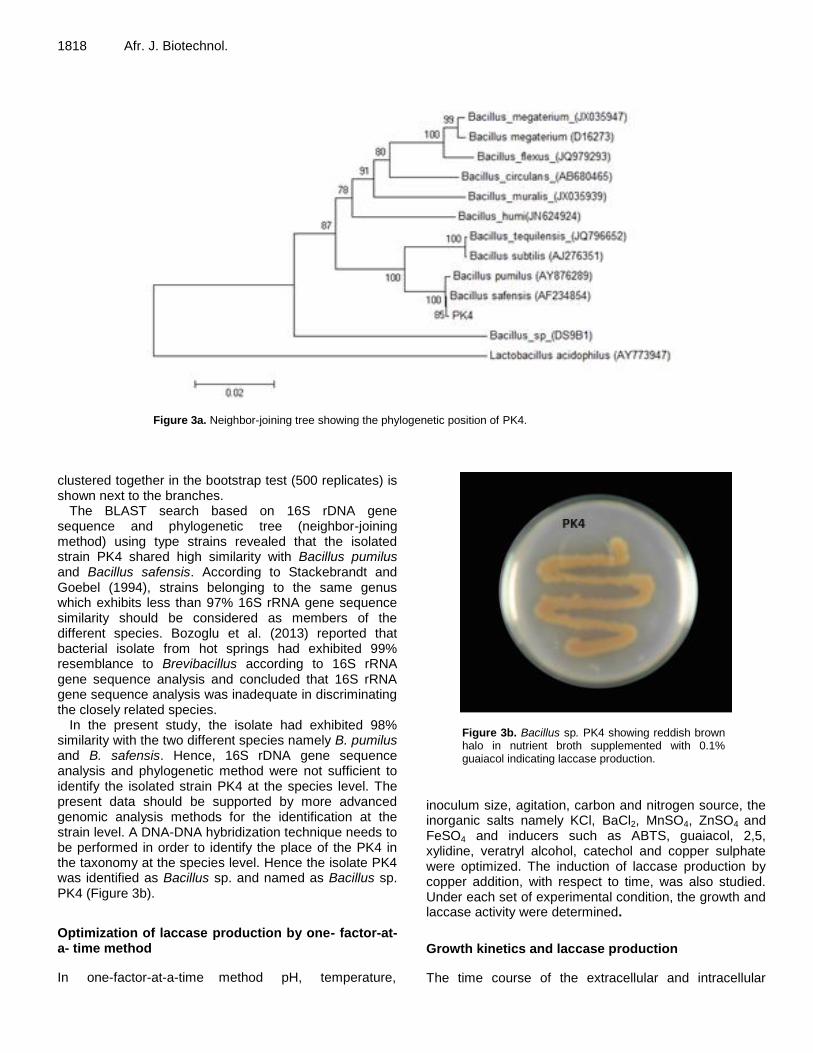
1818 Afr. J. Biotechnol.
Figure 3a. Neighbor-joining tree showing the phylogenetic position of PK4.
clustered together in the bootstrap test (500 replicates) is shown next to the branches.
The BLAST search based on 16S rDNA gene sequence and phylogenetic tree (neighbor-joining method) using type strains revealed that the isolated strain PK4 shared high similarity with Bacillus pumilus and Bacillus safensis. According to Stackebrandt and Goebel (1994), strains belonging to the same genus which exhibits less than 97% 16S rRNA gene sequence similarity should be considered as members of the different species. Bozoglu et al. (2013) reported that bacterial isolate from hot springs had exhibited 99% resemblance to Brevibacillus according to 16S rRNA gene sequence analysis and concluded that 16S rRNA gene sequence analysis was inadequate in discriminating the closely related species.
In the present study, the isolate had exhibited 98% similarity with the two different species namely B. pumilus and B. safensis. Hence, 16S rDNA gene sequence analysis and phylogenetic method were not sufficient to identify the isolated strain PK4 at the species level. The present data should be supported by more advanced genomic analysis methods for the identification at the strain level. A DNA-DNA hybridization technique needs to be performed in order to identify the place of the PK4 in the taxonomy at the species level. Hence the isolate PK4 was identified as Bacillus sp. and named as Bacillus sp. PK4 (Figure 3b).
Optimization of laccase production by one- factor-at-a- time method
In one-factor-at-a-time method pH, temperature,
Figure 3b. Bacillus sp. PK4 showing reddish brown halo in nutrient broth supplemented with 0.1% guaiacol indicating laccase production.
inoculum size, agitation, carbon and nitrogen source, the inorganic salts namely KCl, BaCl2, MnSO4, ZnSO4 and FeSO4 and inducers such as ABTS, guaiacol, 2,5, xylidine, veratryl alcohol, catechol and copper sulphate were optimized. The induction of laccase production by copper addition, with respect to time, was also studied. Under each set of experimental condition, the growth and laccase activity were determined.
Growth kinetics and laccase production
The time course of the extracellular and intracellular
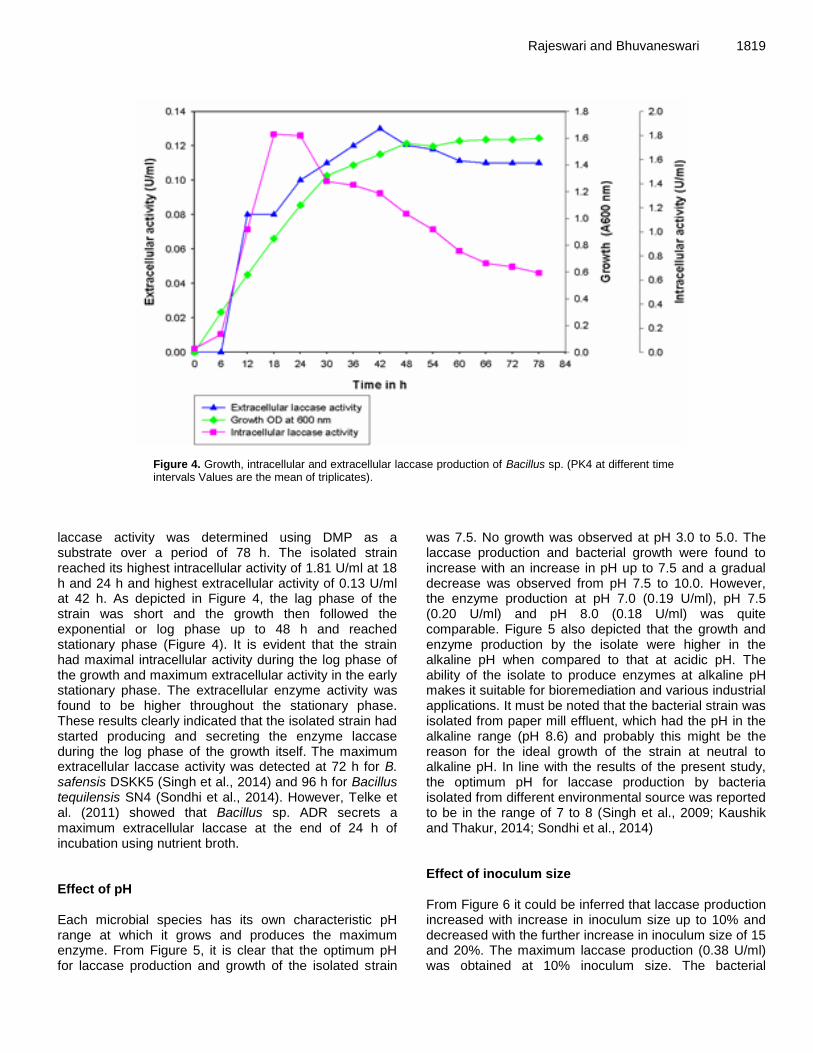
Rajeswari and Bhuvaneswari 1819
Figure 4. Growth, intracellular and extracellular laccase production of Bacillus sp. (PK4 at different time intervals Values are the mean of triplicates).
laccase activity was determined using DMP as a substrate over a period of 78 h. The isolated strain reached its highest intracellular activity of 1.81 U/ml at 18 h and 24 h and highest extracellular activity of 0.13 U/ml at 42 h. As depicted in Figure 4, the lag phase of the strain was short and the growth then followed the exponential or log phase up to 48 h and reached stationary phase (Figure 4). It is evident that the strain had maximal intracellular activity during the log phase of the growth and maximum extracellular activity in the early stationary phase. The extracellular enzyme activity was found to be higher throughout the stationary phase. These results clearly indicated that the isolated strain had started producing and secreting the enzyme laccase during the log phase of the growth itself.
The maximum
extracellular laccase activity was detected at 72 h for B. safensis DSKK5 (Singh et al., 2014) and 96 h for Bacillus tequilensis SN4 (Sondhi et al., 2014). However, Telke et al. (2011) showed that Bacillus sp. ADR secrets a maximum extracellular laccase at the end of 24 h of incubation using nutrient broth. Effect of pH Each microbial species has its own characteristic pH range at which it grows and produces the maximum enzyme. From Figure 5, it is clear that the optimum pH for laccase production and growth of the isolated strain
was 7.5. No growth was observed at pH 3.0 to 5.0. The laccase production and bacterial growth were found to increase with an increase in pH up to 7.5 and a gradual decrease was observed from pH 7.5 to 10.0. However, the enzyme production at pH 7.0 (0.19 U/ml), pH 7.5 (0.20 U/ml) and pH 8.0 (0.18 U/ml) was quite comparable. Figure 5 also depicted that the growth and enzyme production by the isolate were higher in the alkaline pH when compared to that at acidic pH. The ability of the isolate to produce enzymes at alkaline pH makes it suitable for bioremediation and various industrial applications. It must be noted that the bacterial strain was isolated from paper mill effluent, which had the pH in the alkaline range (pH 8.6) and probably this might be the reason for the ideal growth of the strain at neutral to alkaline pH. In line with the results of the present study, the optimum pH for laccase production by bacteria isolated from different environmental source was reported to be in the range of 7 to 8 (Singh et al., 2009; Kaushik and Thakur, 2014; Sondhi et al., 2014) Effect of inoculum size From Figure 6 it could be inferred that laccase production increased with increase in inoculum size up to 10% and decreased with the further increase in inoculum size of 15 and 20%. The maximum laccase production (0.38 U/ml) was obtained at 10% inoculum size. The bacterial
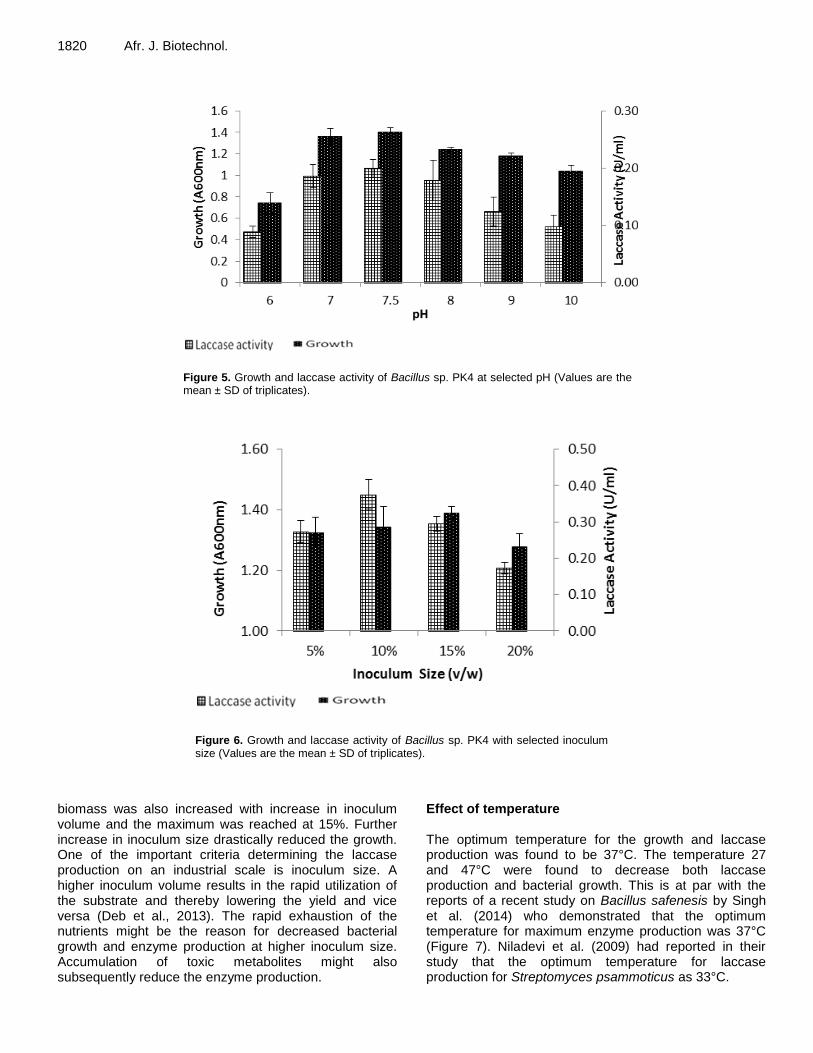
1820 Afr. J. Biotechnol.
Figure 5. Growth and laccase activity of Bacillus sp. PK4 at selected pH (Values are the mean ± SD of triplicates).
Figure 6. Growth and laccase activity of Bacillus sp. PK4 with selected inoculum size (Values are the mean ± SD of triplicates).
biomass was also increased with increase in inoculum volume and the maximum was reached at 15%. Further increase in inoculum size drastically reduced the growth. One of the important criteria determining the laccase production on an industrial scale is inoculum size. A higher inoculum volume results in the rapid utilization of the substrate and thereby lowering the yield and vice versa (Deb et al., 2013). The rapid exhaustion of the nutrients might be the reason for decreased bacterial growth and enzyme production at higher inoculum size. Accumulation of toxic metabolites might also subsequently reduce the enzyme production.
Effect of temperature The optimum temperature for the growth and laccase production was found to be 37°C. The temperature 27 and 47°C were found to decrease both laccase production and bacterial growth. This is at par with the reports of a recent study on Bacillus safenesis by Singh et al. (2014) who demonstrated that the optimum temperature for maximum enzyme production was 37°C (Figure 7). Niladevi et al. (2009) had reported in their study that the optimum temperature for laccase production for Streptomyces psammoticus as 33°C.
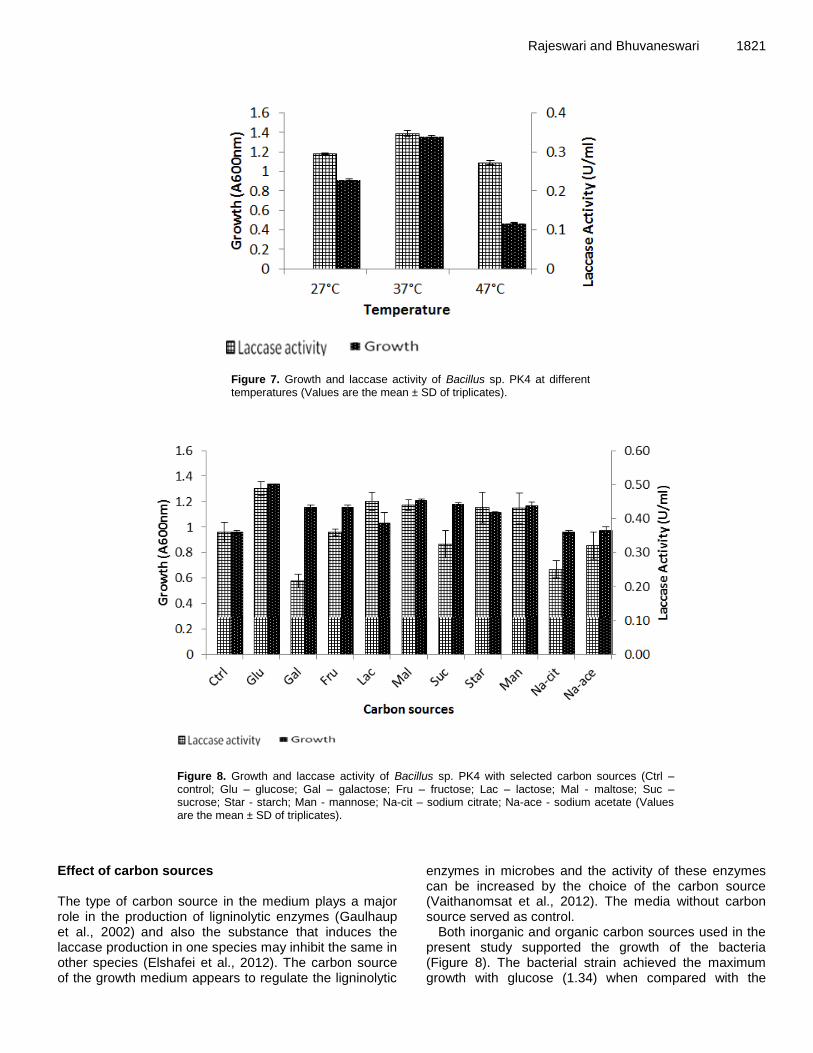
Rajeswari and Bhuvaneswari 1821
Figure 7. Growth and laccase activity of Bacillus sp. PK4 at different temperatures (Values are the mean ± SD of triplicates).
Figure 8. Growth and laccase activity of Bacillus sp. PK4 with selected carbon sources (Ctrl – control; Glu – glucose; Gal – galactose; Fru – fructose; Lac – lactose; Mal - maltose; Suc – sucrose; Star - starch; Man - mannose; Na-cit – sodium citrate; Na-ace - sodium acetate (Values are the mean ± SD of triplicates).
Effect of carbon sources The type of carbon source in the medium plays a major role in the production of ligninolytic enzymes (Gaulhaup et al., 2002)
and also the substance that induces the
laccase production in one species may inhibit the same in other species (Elshafei et al., 2012). The carbon source of the growth medium appears to regulate the ligninolytic
enzymes in microbes and the activity of these enzymes can be increased by the choice of the carbon source (Vaithanomsat et al., 2012). The media without carbon source served as control.
Both inorganic and organic carbon sources used in the present study supported the growth of the bacteria (Figure 8). The bacterial strain achieved the maximum growth with glucose (1.34) when compared with the
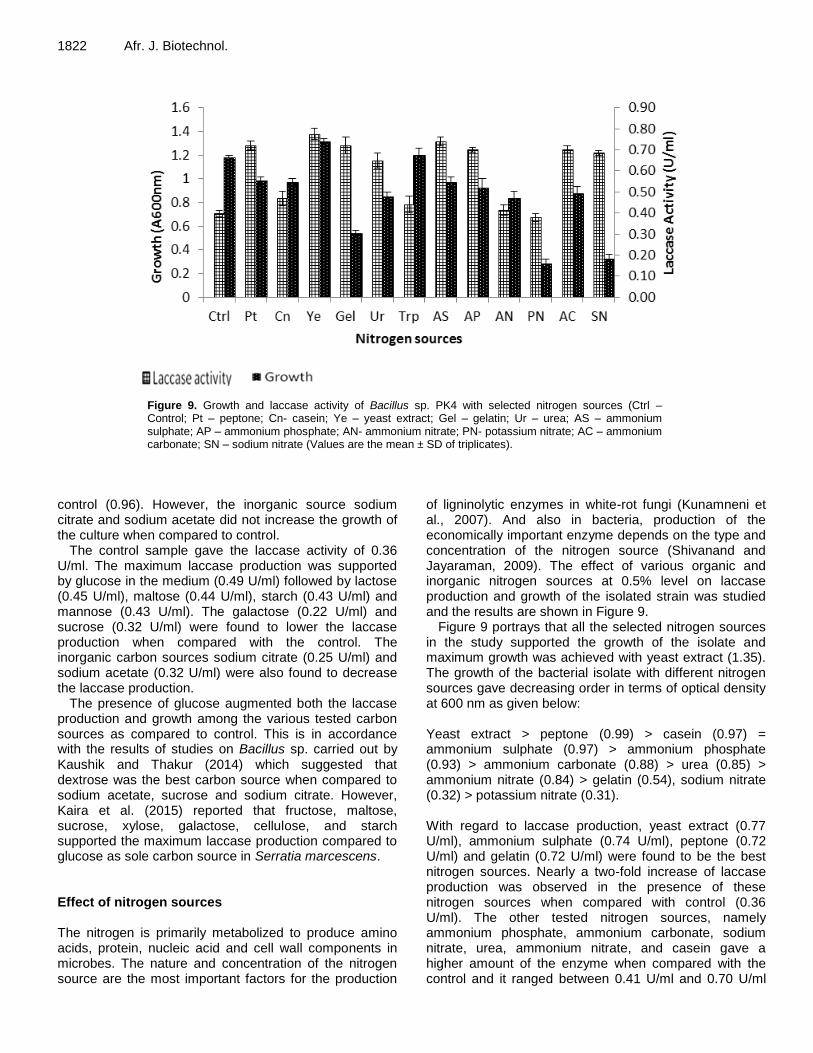
1822 Afr. J. Biotechnol.
Figure 9. Growth and laccase activity of Bacillus sp. PK4 with selected nitrogen sources (Ctrl – Control; Pt – peptone; Cn- casein; Ye – yeast extract; Gel – gelatin; Ur – urea; AS – ammonium sulphate; AP – ammonium phosphate; AN- ammonium nitrate; PN- potassium nitrate; AC – ammonium carbonate; SN – sodium nitrate (Values are the mean ± SD of triplicates).
control (0.96). However, the inorganic source sodium citrate and sodium acetate did not increase the growth of the culture when compared to control.
The control sample gave the laccase activity of 0.36 U/ml. The maximum laccase production was supported by glucose in the medium (0.49 U/ml) followed by lactose (0.45 U/ml), maltose (0.44 U/ml), starch (0.43 U/ml) and mannose (0.43 U/ml). The galactose (0.22 U/ml) and sucrose (0.32 U/ml) were found to lower the laccase production when compared with the control. The inorganic carbon sources sodium citrate (0.25 U/ml) and sodium acetate (0.32 U/ml) were also found to decrease the laccase production.
The presence of glucose augmented both the laccase production and growth among the various tested carbon sources as compared to control. This is in accordance with the results of studies on Bacillus sp. carried out by Kaushik and Thakur (2014) which suggested that dextrose was the best carbon source when compared to sodium acetate, sucrose and sodium citrate. However, Kaira et al. (2015) reported that fructose, maltose, sucrose, xylose, galactose, cellulose, and starch supported the maximum laccase production compared to glucose as sole carbon source in Serratia marcescens. Effect of nitrogen sources The nitrogen is primarily metabolized to produce amino acids, protein, nucleic acid and cell wall components in microbes. The nature and concentration of the nitrogen source are the most important factors for the production
of ligninolytic enzymes in white-rot fungi (Kunamneni et al., 2007). And also in bacteria, production of the economically important enzyme depends on the type and concentration of the nitrogen source (Shivanand and Jayaraman, 2009). The effect of various organic and inorganic nitrogen sources at 0.5% level on laccase production and growth of the isolated strain was studied and the results are shown in Figure 9.
Figure 9 portrays that all the selected nitrogen sources in the study supported the growth of the isolate and maximum growth was achieved with yeast extract (1.35). The growth of the bacterial isolate with different nitrogen sources gave decreasing order in terms of optical density at 600 nm as given below: Yeast extract > peptone (0.99) > casein (0.97) = ammonium sulphate (0.97) > ammonium phosphate (0.93) > ammonium carbonate (0.88) > urea (0.85) > ammonium nitrate (0.84) > gelatin (0.54), sodium nitrate (0.32) > potassium nitrate (0.31). With regard to laccase production, yeast extract (0.77 U/ml), ammonium sulphate (0.74 U/ml), peptone (0.72 U/ml) and gelatin (0.72 U/ml) were found to be the best nitrogen sources. Nearly a two-fold increase of laccase production was observed in the presence of these nitrogen sources when compared with control (0.36 U/ml). The other tested nitrogen sources, namely ammonium phosphate, ammonium carbonate, sodium nitrate, urea, ammonium nitrate, and casein gave a higher amount of the enzyme when compared with the control and it ranged between 0.41 U/ml and 0.70 U/ml
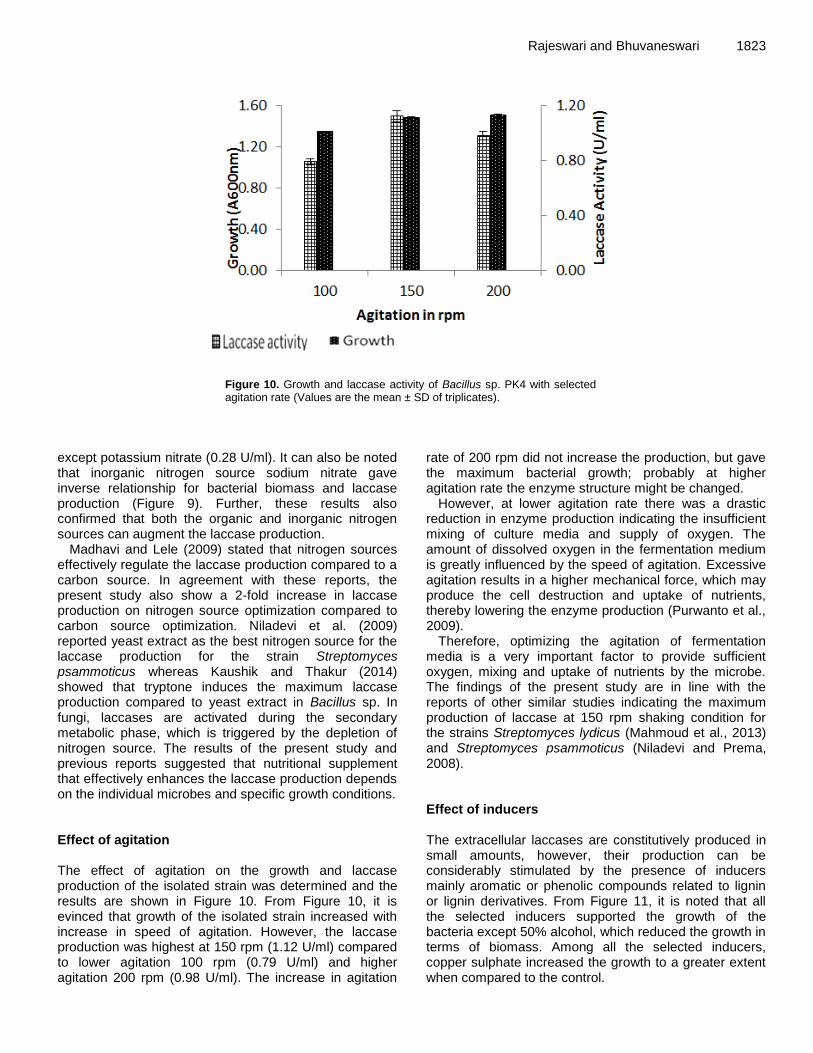
Rajeswari and Bhuvaneswari 1823
Figure 10. Growth and laccase activity of Bacillus sp. PK4 with selected agitation rate (Values are the mean ± SD of triplicates).
except potassium nitrate (0.28 U/ml). It can also be noted that inorganic nitrogen source sodium nitrate gave inverse relationship for bacterial biomass and laccase production (Figure 9). Further, these results also confirmed that both the organic and inorganic nitrogen sources can augment the laccase production.
Madhavi and Lele (2009) stated that nitrogen sources effectively regulate the laccase production compared to a carbon source. In agreement with these reports, the present study also show a 2-fold increase in laccase production on nitrogen source optimization compared to carbon source optimization. Niladevi et al. (2009) reported yeast extract as the best nitrogen source for the laccase production for the strain Streptomyces psammoticus whereas Kaushik and Thakur (2014) showed that tryptone induces the maximum laccase production compared to yeast extract in Bacillus sp. In fungi, laccases are activated during the secondary metabolic phase, which is triggered by the depletion of nitrogen source. The results of the present study and previous reports suggested that nutritional supplement that effectively enhances the laccase production depends on the individual microbes and specific growth conditions. Effect of agitation The effect of agitation on the growth and laccase production of the isolated strain was determined and the results are shown in Figure 10. From Figure 10, it is evinced that growth of the isolated strain increased with increase in speed of agitation. However, the laccase production was highest at 150 rpm (1.12 U/ml) compared to lower agitation 100 rpm (0.79 U/ml) and higher agitation 200 rpm (0.98 U/ml). The increase in agitation
rate of 200 rpm did not increase the production, but gave the maximum bacterial growth; probably at higher agitation rate the enzyme structure might be changed.
However, at lower agitation rate there was a drastic reduction in enzyme production indicating the insufficient mixing of culture media and supply of oxygen. The amount of dissolved oxygen in the fermentation medium is greatly influenced by the speed of agitation. Excessive agitation results in a higher mechanical force, which may produce the cell destruction and uptake of nutrients, thereby lowering the enzyme production (Purwanto et al., 2009).
Therefore, optimizing the agitation of fermentation media is a very important factor to provide sufficient oxygen, mixing and uptake of nutrients by the microbe. The findings of the present study are in line with the reports of other similar studies indicating the maximum production of laccase at 150 rpm shaking condition for the strains Streptomyces lydicus (Mahmoud et al., 2013) and Streptomyces psammoticus (Niladevi and Prema, 2008). Effect of inducers The extracellular laccases are constitutively produced in small amounts, however, their production can be considerably stimulated by the presence of inducers mainly aromatic or phenolic compounds related to lignin or lignin derivatives. From Figure 11, it is noted that all the selected inducers supported the growth of the bacteria except 50% alcohol, which reduced the growth in terms of biomass. Among all the selected inducers, copper sulphate increased the growth to a greater extent when compared to the control.
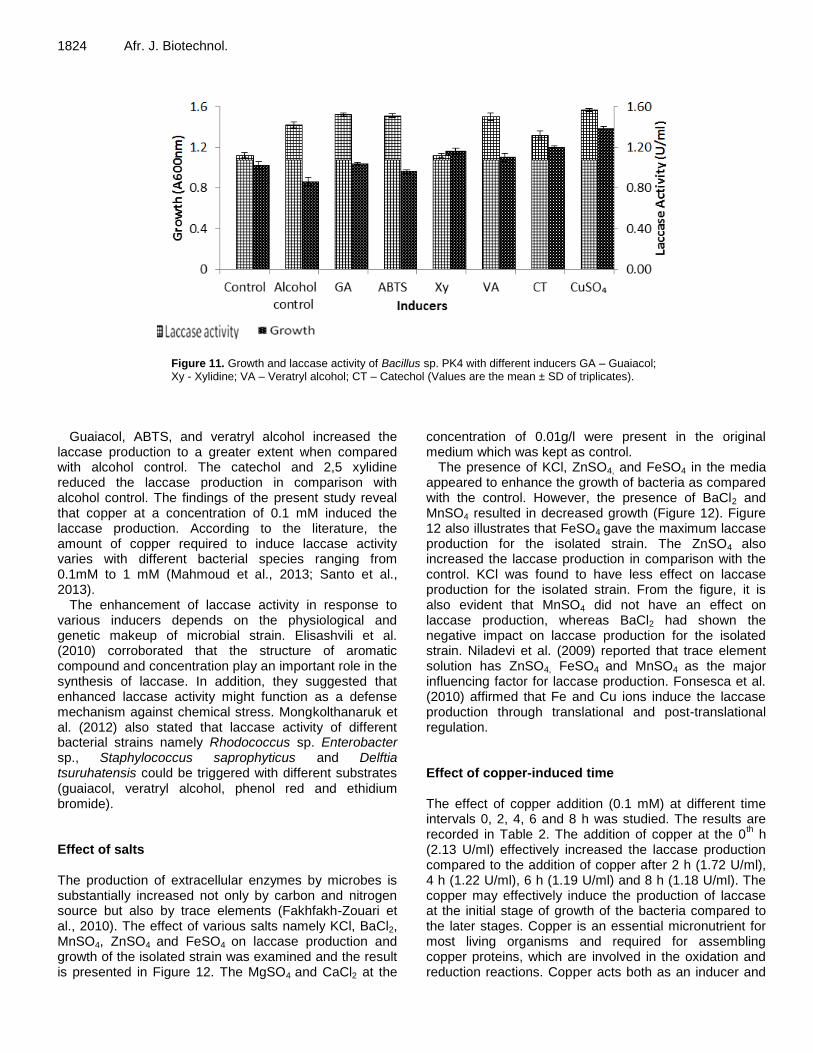
1824 Afr. J. Biotechnol.
Figure 11. Growth and laccase activity of Bacillus sp. PK4 with different inducers GA – Guaiacol; Xy - Xylidine; VA – Veratryl alcohol; CT – Catechol (Values are the mean ± SD of triplicates).
Guaiacol, ABTS, and veratryl alcohol increased the laccase production to a greater extent when compared with alcohol control. The catechol and 2,5 xylidine reduced the laccase production in comparison with alcohol control. The findings of the present study reveal that copper at a concentration of 0.1 mM induced the laccase production. According to the literature, the amount of copper required to induce laccase activity varies with different bacterial species ranging from 0.1mM to 1 mM (Mahmoud et al., 2013; Santo et al., 2013).
The enhancement of laccase activity in response to various inducers depends on the physiological and genetic makeup of microbial strain. Elisashvili et al. (2010) corroborated that the structure of aromatic compound and concentration play an important role in the synthesis of laccase. In addition, they suggested that enhanced laccase activity might function as a defense mechanism against chemical stress. Mongkolthanaruk et al. (2012) also stated that laccase activity of different bacterial strains namely Rhodococcus sp. Enterobacter sp., Staphylococcus saprophyticus and Delftia tsuruhatensis could be triggered with different substrates (guaiacol, veratryl alcohol, phenol red and ethidium bromide). Effect of salts The production of extracellular enzymes by microbes is substantially increased not only by carbon and nitrogen source but also by trace elements (Fakhfakh-Zouari et al., 2010). The effect of various salts namely KCl, BaCl2, MnSO4, ZnSO4 and FeSO4 on laccase production and growth of the isolated strain was examined and the result is presented in Figure 12. The MgSO4 and CaCl2 at the
concentration of 0.01g/l were present in the original medium which was kept as control.
The presence of KCl, ZnSO4, and FeSO4 in the media appeared to enhance the growth of bacteria as compared with the control. However, the presence of BaCl2 and MnSO4 resulted in decreased growth (Figure 12). Figure 12 also illustrates that FeSO4 gave the maximum laccase production for the isolated strain. The ZnSO4 also increased the laccase production in comparison with the control. KCl was found to have less effect on laccase production for the isolated strain. From the figure, it is also evident that MnSO4 did not have an effect on laccase production, whereas BaCl2 had shown the negative impact on laccase production for the isolated strain. Niladevi et al. (2009) reported that trace element solution has ZnSO4, FeSO4 and MnSO4 as the major influencing factor for laccase production. Fonsesca et al. (2010) affirmed that Fe and Cu ions induce the laccase production through translational and post-translational regulation. Effect of copper-induced time The effect of copper addition (0.1 mM) at different time intervals 0, 2, 4, 6 and 8 h was studied. The results are recorded in Table 2. The addition of copper at the 0
th h
(2.13 U/ml) effectively increased the laccase production compared to the addition of copper after 2 h (1.72 U/ml), 4 h (1.22 U/ml), 6 h (1.19 U/ml) and 8 h (1.18 U/ml). The copper may effectively induce the production of laccase at the initial stage of growth of the bacteria compared to the later stages. Copper is an essential micronutrient for most living organisms and required for assembling copper proteins, which are involved in the oxidation and reduction reactions. Copper acts both as an inducer and
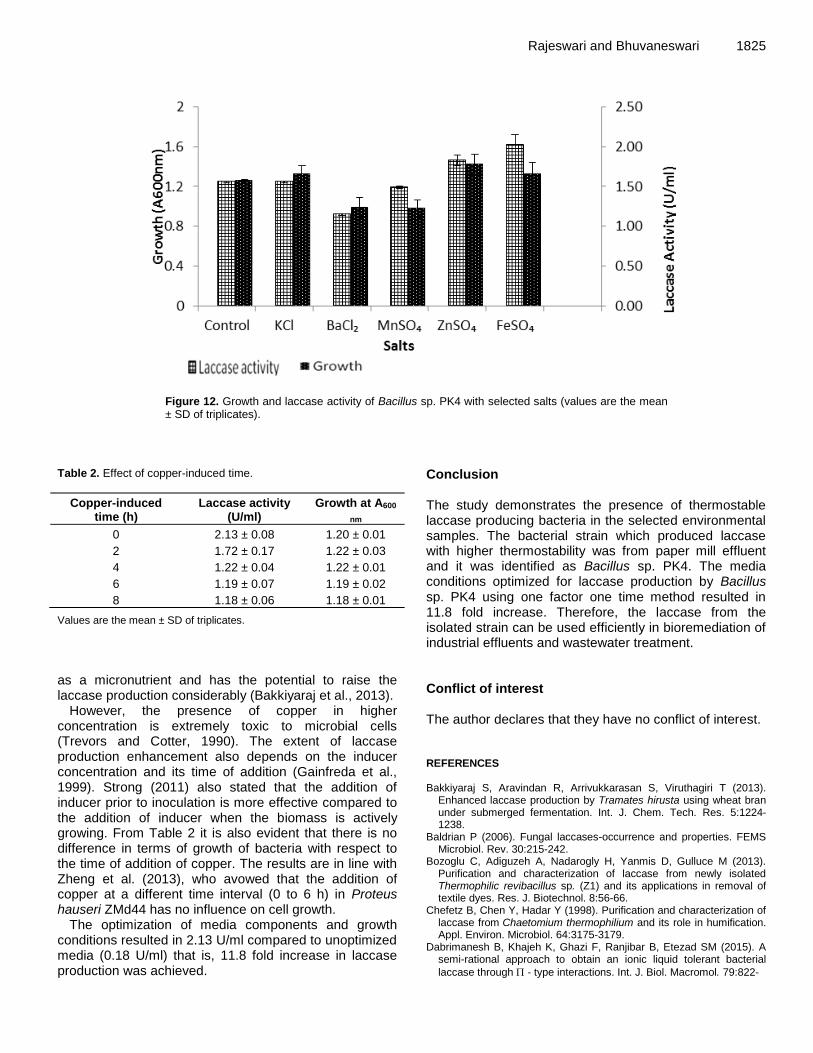
Rajeswari and Bhuvaneswari 1825
Figure 12. Growth and laccase activity of Bacillus sp. PK4 with selected salts (values are the mean ± SD of triplicates).
Table 2. Effect of copper-induced time.
Copper-induced time (h)
Laccase activity (U/ml)
Growth at A600
nm
0 2.13 ± 0.08 1.20 ± 0.01
2 1.72 ± 0.17 1.22 ± 0.03
4 1.22 ± 0.04 1.22 ± 0.01
6 1.19 ± 0.07 1.19 ± 0.02
8 1.18 ± 0.06 1.18 ± 0.01
Values are the mean ± SD of triplicates.
as a micronutrient and has the potential to raise the laccase production considerably (Bakkiyaraj et al., 2013).
However, the presence of copper in higher concentration is extremely toxic to microbial cells (Trevors and Cotter, 1990). The extent of laccase production enhancement also depends on the inducer concentration and its time of addition (Gainfreda et al., 1999). Strong (2011) also stated that the addition of inducer prior to inoculation is more effective compared to the addition of inducer when the biomass is actively growing. From Table 2 it is also evident that there is no difference in terms of growth of bacteria with respect to the time of addition of copper. The results are in line with Zheng et al. (2013), who avowed that the addition of copper at a different time interval (0 to 6 h) in Proteus hauseri ZMd44 has no influence on cell growth.
The optimization of media components and growth conditions resulted in 2.13 U/ml compared to unoptimized media (0.18 U/ml) that is, 11.8 fold increase in laccase production was achieved.
Conclusion The study demonstrates the presence of thermostable laccase producing bacteria in the selected environmental samples. The bacterial strain which produced laccase with higher thermostability was from paper mill effluent and it was identified as Bacillus sp. PK4. The media conditions optimized for laccase production by Bacillus sp. PK4 using one factor one time method resulted in 11.8 fold increase. Therefore, the laccase from the isolated strain can be used efficiently in bioremediation of industrial effluents and wastewater treatment. Conflict of interest The author declares that they have no conflict of interest. REFERENCES Bakkiyaraj S, Aravindan R, Arrivukkarasan S, Viruthagiri T (2013).
Enhanced laccase production by Tramates hirusta using wheat bran under submerged fermentation. Int. J. Chem. Tech. Res. 5:1224-1238.
Baldrian P (2006). Fungal laccases-occurrence and properties. FEMS Microbiol. Rev. 30:215-242.
Bozoglu C, Adiguzeh A, Nadarogly H, Yanmis D, Gulluce M (2013). Purification and characterization of laccase from newly isolated Thermophilic revibacillus sp. (Z1) and its applications in removal of textile dyes. Res. J. Biotechnol. 8:56-66.
Chefetz B, Chen Y, Hadar Y (1998). Purification and characterization of laccase from Chaetomium thermophilium and its role in humification. Appl. Environ. Microbiol. 64:3175-3179.
Dabrimanesh B, Khajeh K, Ghazi F, Ranjibar B, Etezad SM (2015). A semi-rational approach to obtain an ionic liquid tolerant bacterial
laccase through - type interactions. Int. J. Biol. Macromol. 79:822-
1826 Afr. J. Biotechnol.
829. Deb P, Talukdar A, Mohsina K, Sarker PK, Sayem SA (2013).
Production and partial characterization of extracellular amylase enzyme from Bacillus amyloliquaefaciens P-001. SpringerPlus. 2(1):1.
Dhiman K, Shirkot P (2015). Bioprospecting and molecular characterization of laccase producing bacteria from paper mills of Himachal Pradesh. Proc. Natl. Acad. Sci. India Sect B Biol. Sci. 85(4):1095-103.
Diwaniyan S, Sharma KK, Kuhad RC (2012). Laccase from alkalitolerant basidiomycetes Crinipellis sp. RCK-1; production optimization by response surface methodology. J. Basic Microbiol. 52:397-407.
Elisashvili V, Kachlishvili, E, Khardziani T, Agasthos SN (2010). Effect of aromatic compounds on the production of lacase and manganese peroxidase by white-rot basidiomycetes. J. Ind. Microbiol. Biotechnol. 37:1091-1096.
Elshafei AM, Hassan MM, Haroun BM, Elsayed MA, Othman AM (2012). Optimization of laccase production from Penicillium martensii NRC345. Adv. Life Sci. 2:31-37.
Endo K, Hosono K, Beppu T, Ueda K (2002). A novel extracytoplasmic phenol oxidase of Streptomyces: its possible involvement in the onset of morphogenesis. Micobiology 148:1767-1776.
Fakhfakh-Zouari N, Haddar A, Hmidet N, Frikha F, Nasri M (2010). Application of statistical experimental design for optimization of keratinases production by Bacillus pumilus A1 grown on chicken feather and some properties. Process Biochem. 45:617-626.
Fonsesca MI, Shimizu E, Zapata PD, Villalba LL (2010). Copper inducing effect on laccase production of white rot fungi native form Misiones (Argentina). Enzyme Microb. Technol. 46:534-539.
Gainfreda L, Xu F, Bollag JM (1999). Laccases: a useful group of oxidoreductive enzymes. Bioremediat. J. 3:11-26.
Gaulhaup C, Goller S, Peterbauer CK, Strauss J, Haltrich D (2002). Characterisation of the major laccase isoenzyme from Tramates pubens and regulation of its synthesis by metal ions. Microbiology 149:2159-2169.
Hilden K, Hakala TK, Lundell T (2009). Thermotolerent and thermostable laccase. Biotechnol. Lett. 31:1117-1128.
Ihssen J, Reiss R, Luchsinger R, Meyer LT, Richter M (2015). Biochemical properties and yields of diverse bacterial laccase-like multicopper oxidases expressed in Escherichia coli. Sci. Rep. 5:10465.
Jeon JR, Baldrian P, Murugesan K, Chang YS (2012). Laccase-catalysed oxidations of naturally occurring phenols: from in vivo biosynthetic pathways to green synthetic applications. Microb. Biotechnol. 5:318-332.
Kaira GS, Dhakar K, Pandey A (2015). A psychrotolerant strain of Serratia marcescens (MTCC 4822) produces laccase at wide temperature and pH range. AMB Express 5(1):1.
Kalia S, Thakur K, Kumar A, Celli A (2014). Laccase-assisted surface functionalization of lignocellulosics. J. Mol. Catal. B Enzym. 102:48-58.
Kaushik G, Thakur IS (2014). Production of laccase and optimization of its production by Bacillus sp. using distillery spent wash as inducer. Bioremediat. J. 18:28-37.
Kuddus M, Joseph B, Ramteke PW (2013). Production of laccase from newly isolated Pseudomonas putida and its application in bioremediation of synthetic dyes and industrial effluents. Biocatal. Agric. Biotechnol. 2:333-338.
Kunamneni A, Ballesteros A, Plou FJ, Alcalde M (2007). Fungal laccase a-varsatile enzyme for biotechnological application. In: Mendez-Vilas, A. (Eds). Commun. Curr. Res. Educ. Topics Trends Appl. Microbiol. 1:233-245.
Lu L, Zeng G, Fan C, Ren X, Wang C, Zhao Q, Zhang J, Chen M, Chen M, Jiang M (2013). Characterization of a laccase-like multicopper oxidase from newly isolated Streptomyces sp. C1 in agricultural waste compost and enzymatic decolorization of azo dyes. Biochem. Eng. J. 72:70-76.
Madhavi V, Lele SS (2009). Laccase: Properties and Applications. BioResources 4:1694-1717.
Mahmoud MG, Rifaat HM, EI-Sayed OH, EI-Beih FM, Selim MS (2013).
Effect of inducers and process parameters on laccase production by locally isolated marine Streptomyces lydicus from Red Sea, Egypt. Int. J. Chem. Tech. Res. 5:15-23.
Mongkolthanaruk W, Tongbopit S, Bhoonobtong A (2012). Independent behavior of bacterial laccases to inducers and metal ions during production and activity. Afr. J. Biotechnol. 11:9391-9398.
Niladevi KN, Prema P (2008). Effect of inducers and process parameters on laccase production by Streptomyces psammoticus and its application in dye decolourization. Bioresour. Technol. 99:4583-4589.
Niladevi KN, Sukumaran RK, Jacob N, Anisha GS, Prema P (2009). Optimization of laccase production from a novel strain Streptomyces psammoticus using response surface methodology. Microbiol. Res. 164:105-113.
Purwanto LA, Ibrahim D, Sudrajat H (2009). Effect of agitation speed on morphological changes in Aspergillus niger hyphae during production of tannase. World J. Chem. 4:34-38.
Santo M, Weitsman R, Sivan A (2013). The role of the copper-binding enzyme-laccase – in the biodegradation of polyethylene by the actinomycete Rhodococcus ruber. Int. Biodeterior. Biodegrad. 84:204-210.
Shi X, Liu Q, Ma J, Liao H, Xiong X, Zheng K, Wang T, Liu X, Xu T, Yuan S, Zhang X, Zhu Y (2015). An acid-stable bacterial laccase identified from the endophyte Pantoea ananatis Sd-1 genome exhibiting lignin degradation and dye decolorization abilities. Biotechnol. Lett. 37(11):2279-2288.
Shivanand P, Jayaraman G (2009). Production of extracellular protease from halotolerant bacterium, Bacillus aquimaris strain VITP4 isolated form Kumta coast. Process Biochem. 44:1088-1094.
Singh D, Sharma KK, Jacob S, Gakhar SK (2014). Molecular Docking of laccase protein from Bacillus Safensis DSKK5 isolated from earthworm gut: a novel method to study dye decolorization potential. Water Air Soil Pollut. 225(11):1-2.
Singh G, Ahuja N, Sharma P, Capalash N (2009). Response surface methodology for the optimized production of an alkalophilic laccase
from -proteobacterium JB. BioResources 4(2):544-553. Singh S, Pillay B, Prior BA (2000). Thermal stability of β-xylanases
produced by different Thermomyces lanuginosus strains. Enzyme Microb. Technol. 26:502-508.
Sondhi S, Sharma P, George N, Chauhan PS, Puri N, Gupta N (2014). An extracellular thermo-alkai-stable laccase from Bacillus tequilensis SN4, with a potential to biobleach softwood pulp. 3 Biotech 5(2):175-185.
Stackebrandt E, Goebel BM (1994). Taxonomic note: a place for DNA-DNA reassociation and 16S rRNA sequence analysis in the present species definition in bacteriology. Int. J. Syst. Bacteriol. 44:846-849.
Strong PJ (2011). Improved laccase production by Tramates pubescens MB89 in distillery wastewaters. Enzyme Res. 8p.
Suzuki T, Endo K, Ito M, Tsujibo H, Miyamoto K, Inamori Y (2003). A thermostable laccase from Streptomyces lavendulae REN-7: purification, characterization, nucleotide sequence and expression. Biosci. Biotechnol. Biochem. 67:2167-2175.
Telke AA, Ghodake GS, Kalyani DC, Dhanve RS, Govindwar SP (2011). Biochemical characteristics of a textile dye degrading extracellular laccase from a Bacillus sp. ADR. Bioresour. Technol. 102:1752-1756.
Trevors JT, Cotter CM (1990). Copper toxicity and uptake in microorganism. J. Ind. Microbiol. 6:77-84.
Vaithanomsat P, Chedchant J, Kreetachat T, Kosugi A, Apiwatanapiwat W, Thanapase W, Chuntranuluck S, Mori Y (2012). Improvement of lignin-degrading enzymes production from white-rot fungus (Lentinus strigosus) and its application in synthetic dye removal. Afr. J. Microbiol. Res. 6:137-148.
Xu F, Shin W, Brown S, Wahleithner JA, Sundaram UM, Solomon EI (1996). A study of series of recombinant fungal laccases and bilirubin oxidase that exhibit significant differences in redox potential, substrate specificity and stability. BBA - Protein Struct. Mol. Enzymol. 1292:303-311.
Zheng X, Ng IS, Ye C, Chen BY, Lu Y (2013). Copper ion stimulated Mco-A laccase production and enzyme characterization in Proteus hauseri ZMd44. J. Biosci. Bioeng. 115:388-393.
Vol. 15(34), pp. 1827-1834, 24 August, 2016
DOI: 10.5897/AJB2016.15329
Article Number: 1966EEB60162
ISSN 1684-5315
Copyright © 2016
Author(s) retain the copyright of this article
http://www.academicjournals.org/AJB
African Journal of Biotechnology
Full Length Research Paper
Polyhydroxyalkanoate (PHA) production by Lynisibacillus sp. strain UEA-20.171
Edilane Martins Ferreira1 Aldo Rodrigues de Lima Procópio2 Raimundo Carlos Pereira Junior13 Sandra Patricia Zanotto1 Rudi Emerson de Lima Procópio3*
1Programa de Pós-Graduação em Biotecnologia e Recursos Naturais da Amazônia -Univ. do Estado do
Amazonas, Brasil. 2Instituto de Ciências Biológicas, FAMETRO, Brasil.
3Centro de Biotecnologia da Amazônia – CBA, Manaus Amazonas, Brasil.
Received 9 March, 2016; Accepted 12 August, 2016
PHA is a biodegradable and biocompatible natural thermoplastic produced from renewable bioresources and is hence attracting attention as a plastic material for use in the environment and medical fields. In the present study, the Lynisibacillus sp. strain UEA-20.171 was selected for production of polyhydroxyalkanoate (PHA) in bioreactor. The accumulation of polymer in the bacterium occurs when there is an imbalance in the concentration of nitrogen in relation to carbon (glucose). After the period of adaptation in mineral medium from 12 to 24 h, the cell division occurred from 12 to 24 h, and the formation of biopolymers from 36 to 48 h. It was observed that the polymer produced by the isolated UEA-20.171, was P(3HB). Key words: Polyhydroxyalkanoates, polyhydroxybutyrate, bioplastics, Lysinibacillus.
INTRODUCTION Polyhydroxyalkanoates (PHAs) are a class of biopolymers that are an alternative to petrochemical polymers in some applications (Lee et al, 2012; Poblete-Castro et al, 2012; Kawashima et al, 2012). They are polyesters synthesized by microorganisms and are completely biodegradable. The diversity of the PHA, allows a wide range of properties and can exhibit features that range from thermoplastics, elastomers and have potentiality for use in many applications (Khanna and Srivastava, 2005; Silva et al., 2007). In addition, the
PHAs are obtained from renewable sources, in general, from agriculture (Thomson et al., 2013).
Due to its biocompatibility, the PHAs currently have the largest market in the medical field, a market which is willing to pay a higher price due to the excellent application characteristics (Chen et al, 2011; Shrivastav et al., 2013). In addition to biocompatibility, the PHAs have a biodegradability which allows reabsorption of the body by the material allowing applications such as sutures, implants and controlled release of drugs (Gumel
*Corresponding author. E-mail: [email protected].
Author(s) agree that this article remains permanently open access under the terms of the Creative Commons Attribution
License 4.0 International License
1828 Afr. J. Biotechnol. et al., 2012; Shrivastav et al., 2013).
PHA accumulation is stimulated under unbalanced growth conditions such as nitrogen- or phosphorus-source deficiency; most bacteria are able to accumulate PHA at around 30 to 50 wt% of dry cell (Tsuge et al., 2015). Members of the genus Bacillus, as well as several other microorganisms that produce PHA also produce copolymers containing 3HB and 3HV units when grown on different substrates such as glucose, among others (Gomes, 2013; Tsuge et al., 2015).
In general, the greatest obstacle to the use of PHA is still the cost of production (Gamal et al., 2013; Brito et al., 201; Falcone et al., 2007). Therefore, the aim of this study was to search for new microorganisms with biopolymer production potential of commercial importance in the industry.
MATERIALS AND METHODS Microorganism The microorganism used in this study (UEA-20.171) was isolated from the Madeira River, affluent of the Amazon River – Brazil. The tests were conducted in the laboratory of the Amazonas State University, Brazil. This bacterium was isolated and purified on nutrient agar (NA- Himedia), composed of 5 g/L peptone; 1 g/L meat extract; 5 g/L sodium chloride; 2 g/L yeast extract; agar 15 g/L and incubated at 28°C for 24 h. Means for producing polyhydroxyalkanoate For production of biopolymer bacteria were grown on mineral medium (MM) consisting of 40 g/L glucose; 1.5 g/L of KH2PO4; 3.50 g/L Na2HPO4; 0.2 g/L MgSO4.7H2O; 0.01 g/L CaCl2.2H2O; 0.06 g/L ferric ammonium citrate; 0.05 g/L (NH4)2SO4 and 1 mL of trace elements solution prepared according to the method described by Ramsay et al. (1990) and pH 7.2. For solid medium, the composition was identical to the liquid media, plus 15 g /L of agar and subsequently autoclaved for 20 min at 121°C and 1 atm. After growth in mineral medium the bacteria were stained with safranin solution and observed under an optical microscope. Growth in bioreactor The UEA-171 strain was grown in 1 L liquid nutrient medium under agitation (150 rpm) at 30°C for 24 h; after growing, the bacteria were centrifuged at 4000 g for 20 min at 4°C. The cell mass was transferred to the bioreactor (Bioflo 110) containing 3 L of mineral medium (Figure 1), being agitated at 50 rpm at 30°C and 3 m
3 of air
per hour. Every 12 h, samples were collected for reading the spectrophotometer at 600 nm (FEMTO 600 plus) and for viable cell count (colony forming unit-CFU / ml) on nutrient agar. Extraction and purification of biopolymers About 20 mg of lyophilized bacterial mass were used for the extraction of the biopolymer, and 2 mL of chloroform were added. The tubes were closed tightly, and the samples agitated and heated for 3 h at 100°C. Then the samples were filtered through a cellulose
filter with pore 0.4 µm (Millipore) to remove cell debris. The biopolymers were agitating them vigorously for 30 s and precipitated in methanol-chloroform 5:1 v/v, and then dried at 30°C and separated (Jamil et al., 2007). Polymer analysis: Gas chromatography The sample biopolymers were dissolved in 2 ml of acidified methanol (3% (v/v) H2SO4), and 1 mL of chloroform. The samples were maintained at 100°C for 60 min. After cooling to room temperature, 1 mL of sterile Mili Q water was added to the whole sample, and then stirred for 10 min for phase formation (Braunegg et al., 1978).
After separation, the supernatant (upper) was discarded and the organic phase (bottom) was used for analysis. A volume of 1 ml of this organic phase was analyzed after fractionation of the sample ("split" 1:20) by gas chromatography coupled to mass spectrophotometer, Model QP2010, Shimadzu, with helium carrier gas purity and 5.0. Identification of isolate The identification of isolated strain was performed according to Bergey’s Manual of Determinative Bacteriology (Brown and Howard 1939). Genomic DNA was extracted by a bead beating lysis method with 10% sodium dodecyl sulfate and phenol-chloroform. The 16S rRNA gene was amplified by PCR using the universal primers 27F (5'-GAGAGTTTGATCCTGGCT CAG-3') and 1401R (5'-CGGTGTGTACAAGGCCCGGGAACG-3') according to Procópio et al. (2012). The PCR conditions were: 95°C for 5 min followed by 30 cycles of 94°C for 1 min, 55°C for 1 min, and 72°C for 1 min 30 s, and a final step at 72°C for 10 min. Subsequently, the DNA amplification product was purified (GFX PCR kit, Amersham Pharmacia Biotech) and sequenced. The partial 16S rDNA sequence obtained was submitted to GenBank for BLAST searching, and phylogenetic analyses were conducted using MEGA5 (Tamura et al., 2011).
RESULTS Biopolymers accumulation The assimilated carbon sources are biochemically transformed into hydroxyalkanoates units, polymerized and stored in the form of inclusions insoluble in water in the cell cytoplasm (Brito et al., 2011), as illustrated in Figure 2, to the Isolated UEA-20.171 of Lysinibacillus sp. where isolates were grown on mineral medium containing glucose, after 10 days of incubation and stained with Safranin which the biopolymers can be viewed under an optical microscope in clearer structures Identification and phylogeny The molecular identification technique using amplification of the 16S ribosomal gene allowed the identification of isolated UEA-20.171, compared with sequences in the public database Genbank using the BLASTn program
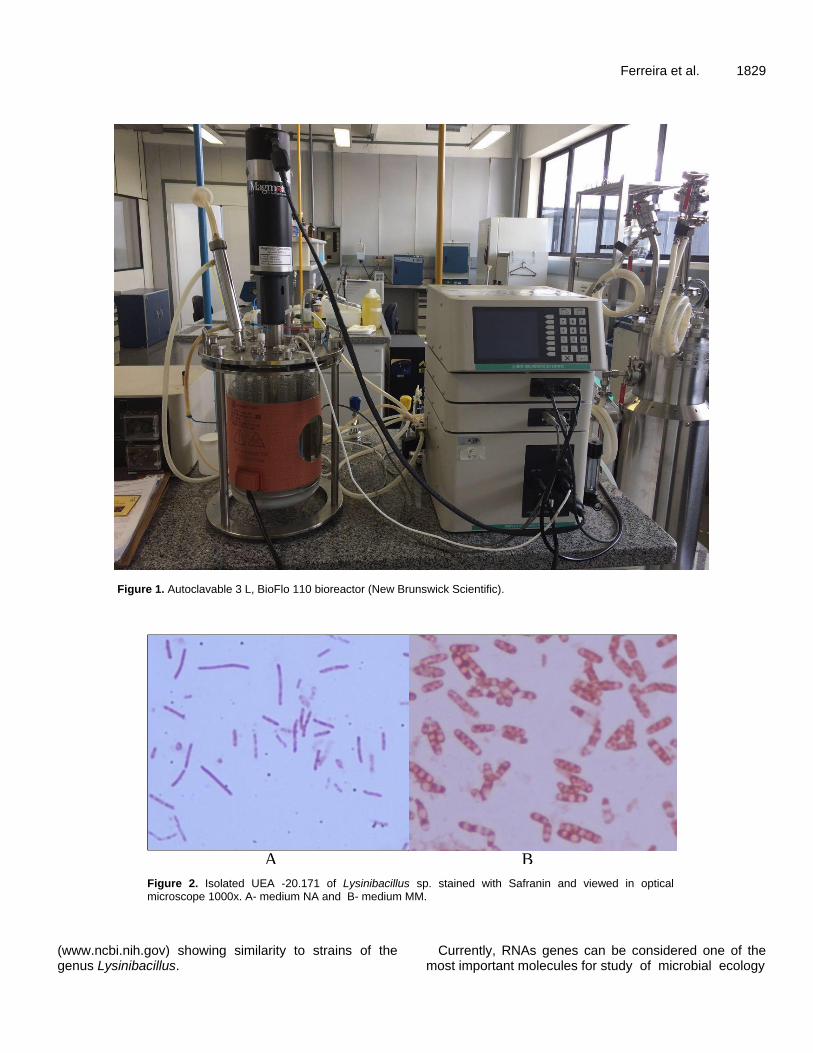
Ferreira et al. 1829
Figure 1. Autoclavable 3 L, BioFlo 110 bioreactor (New Brunswick Scientific).
A B
Figure 2. Isolated UEA -20.171 of Lysinibacillus sp. stained with Safranin and viewed in optical microscope 1000x. A- medium NA and B- medium MM.
(www.ncbi.nih.gov) showing similarity to strains of the genus Lysinibacillus.
Currently, RNAs genes can be considered one of the most important molecules for study of microbial ecology
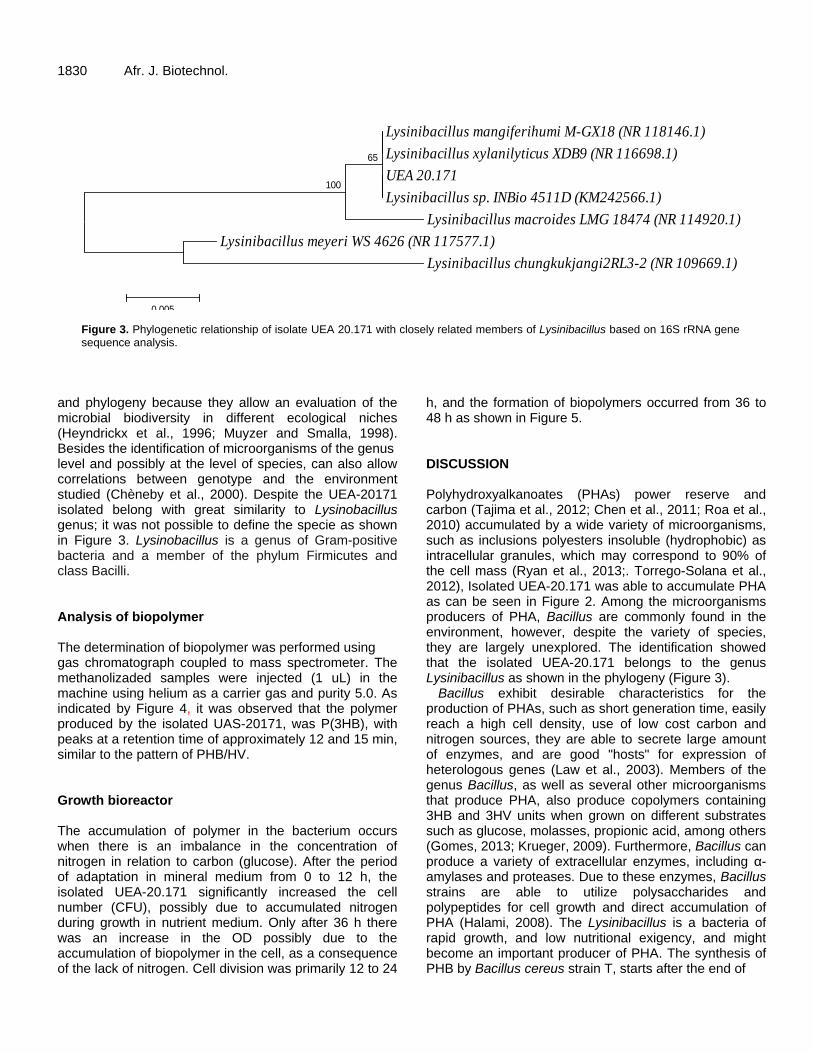
1830 Afr. J. Biotechnol.
Lysinibacillus mangiferihumi M-GX18 (NR 118146.1)
Lysinibacillus xylanilyticus XDB9 (NR 116698.1)
UEA 20.171
Lysinibacillus sp. INBio 4511D (KM242566.1)
Lysinibacillus macroides LMG 18474 (NR 114920.1)
Lysinibacillus meyeri WS 4626 (NR 117577.1)
Lysinibacillus chungkukjangi2RL3-2 (NR 109669.1)
100
65
0.005
Figure 3. Phylogenetic relationship of isolate UEA 20.171 with closely related members of Lysinibacillus based on 16S rRNA gene sequence analysis.
and phylogeny because they allow an evaluation of the microbial biodiversity in different ecological niches (Heyndrickx et al., 1996; Muyzer and Smalla, 1998). Besides the identification of microorganisms of the genus level and possibly at the level of species, can also allow correlations between genotype and the environment studied (Chèneby et al., 2000). Despite the UEA-20171 isolated belong with great similarity to Lysinobacillus genus; it was not possible to define the specie as shown in Figure 3. Lysinobacillus is a genus of Gram-positive bacteria and a member of the phylum Firmicutes and class Bacilli. Analysis of biopolymer The determination of biopolymer was performed using gas chromatograph coupled to mass spectrometer. The methanolizaded samples were injected (1 uL) in the machine using helium as a carrier gas and purity 5.0. As indicated by Figure 4, it was observed that the polymer produced by the isolated UAS-20171, was P(3HB), with peaks at a retention time of approximately 12 and 15 min, similar to the pattern of PHB/HV. Growth bioreactor The accumulation of polymer in the bacterium occurs when there is an imbalance in the concentration of nitrogen in relation to carbon (glucose). After the period of adaptation in mineral medium from 0 to 12 h, the isolated UEA-20.171 significantly increased the cell number (CFU), possibly due to accumulated nitrogen during growth in nutrient medium. Only after 36 h there was an increase in the OD possibly due to the accumulation of biopolymer in the cell, as a consequence of the lack of nitrogen. Cell division was primarily 12 to 24
h, and the formation of biopolymers occurred from 36 to 48 h as shown in Figure 5. DISCUSSION Polyhydroxyalkanoates (PHAs) power reserve and carbon (Tajima et al., 2012; Chen et al., 2011; Roa et al., 2010) accumulated by a wide variety of microorganisms, such as inclusions polyesters insoluble (hydrophobic) as intracellular granules, which may correspond to 90% of the cell mass (Ryan et al., 2013;. Torrego-Solana et al., 2012), Isolated UEA-20.171 was able to accumulate PHA as can be seen in Figure 2. Among the microorganisms producers of PHA, Bacillus are commonly found in the environment, however, despite the variety of species, they are largely unexplored. The identification showed that the isolated UEA-20.171 belongs to the genus Lysinibacillus as shown in the phylogeny (Figure 3).
Bacillus exhibit desirable characteristics for the production of PHAs, such as short generation time, easily reach a high cell density, use of low cost carbon and nitrogen sources, they are able to secrete large amount of enzymes, and are good "hosts" for expression of heterologous genes (Law et al., 2003). Members of the genus Bacillus, as well as several other microorganisms that produce PHA, also produce copolymers containing 3HB and 3HV units when grown on different substrates such as glucose, molasses, propionic acid, among others (Gomes, 2013; Krueger, 2009). Furthermore, Bacillus can produce a variety of extracellular enzymes, including α-amylases and proteases. Due to these enzymes, Bacillus strains are able to utilize polysaccharides and polypeptides for cell growth and direct accumulation of PHA (Halami, 2008). The Lysinibacillus is a bacteria of rapid growth, and low nutritional exigency, and might become an important producer of PHA. The synthesis of PHB by Bacillus cereus strain T, starts after the end of
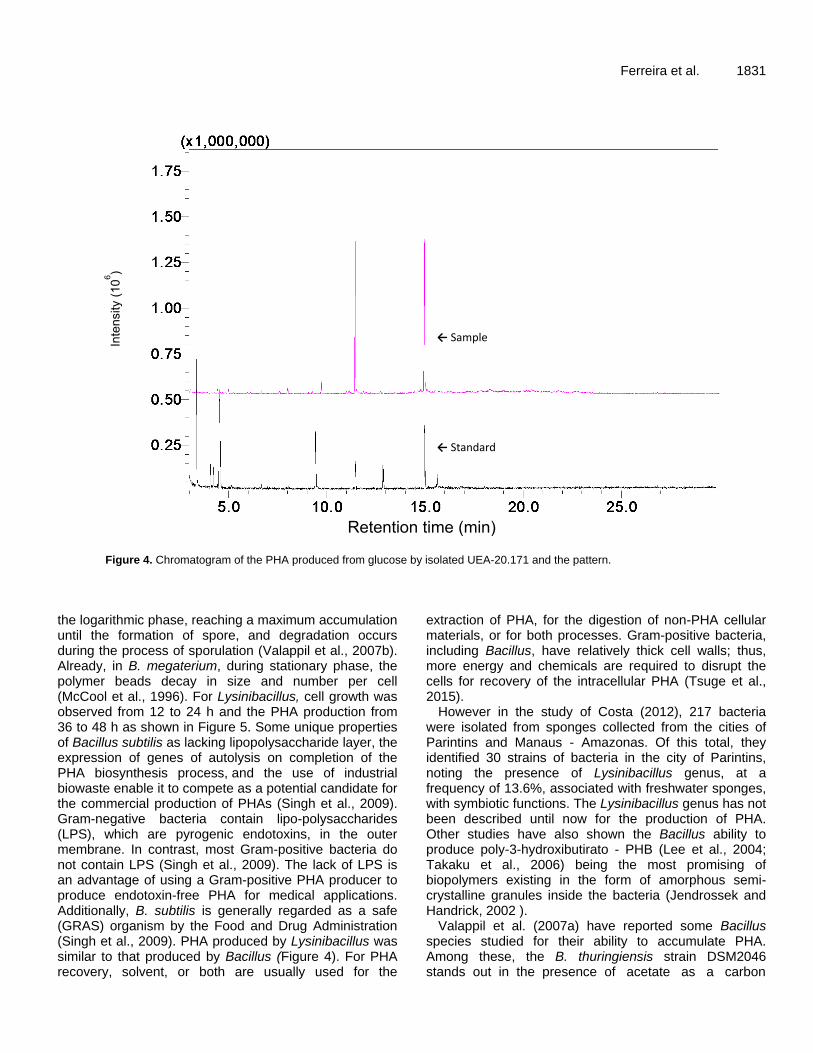
Ferreira et al. 1831
Figure 4. Chromatogram of the PHA produced from glucose by isolated UEA-20.171 and the pattern.
etention time (min
ntensity (
Figure 4. Chromatogram of the PHA produced from glucose by isolated UEA-20.171 and the pattern. the logarithmic phase, reaching a maximum accumulation until the formation of spore, and degradation occurs during the process of sporulation (Valappil et al., 2007b). Already, in B. megaterium, during stationary phase, the polymer beads decay in size and number per cell (McCool et al., 1996). For Lysinibacillus, cell growth was observed from 12 to 24 h and the PHA production from 36 to 48 h as shown in Figure 5. Some unique properties of Bacillus subtilis as lacking lipopolysaccharide layer, the expression of genes of autolysis on completion of the PHA biosynthesis process, and the use of industrial biowaste enable it to compete as a potential candidate for the commercial production of PHAs (Singh et al., 2009). Gram-negative bacteria contain lipo-polysaccharides (LPS), which are pyrogenic endotoxins, in the outer membrane. In contrast, most Gram-positive bacteria do not contain LPS (Singh et al., 2009). The lack of LPS is an advantage of using a Gram-positive PHA producer to produce endotoxin-free PHA for medical applications. Additionally, B. subtilis is generally regarded as a safe (GRAS) organism by the Food and Drug Administration (Singh et al., 2009). PHA produced by Lysinibacillus was similar to that produced by Bacillus (Figure 4). For PHA recovery, solvent, or both are usually used for the
extraction of PHA, for the digestion of non-PHA cellular materials, or for both processes. Gram-positive bacteria, including Bacillus, have relatively thick cell walls; thus, more energy and chemicals are required to disrupt the cells for recovery of the intracellular PHA (Tsuge et al., 2015).
However in the study of Costa (2012), 217 bacteria were isolated from sponges collected from the cities of Parintins and Manaus - Amazonas. Of this total, they identified 30 strains of bacteria in the city of Parintins, noting the presence of Lysinibacillus genus, at a frequency of 13.6%, associated with freshwater sponges, with symbiotic functions. The Lysinibacillus genus has not been described until now for the production of PHA. Other studies have also shown the Bacillus ability to produce poly-3-hydroxibutirato - PHB (Lee et al., 2004; Takaku et al., 2006) being the most promising of biopolymers existing in the form of amorphous semi-crystalline granules inside the bacteria (Jendrossek and Handrick, 2002 ).
Valappil et al. (2007a) have reported some Bacillus species studied for their ability to accumulate PHA. Among these, the B. thuringiensis strain DSM2046 stands out in the presence of acetate as a carbon
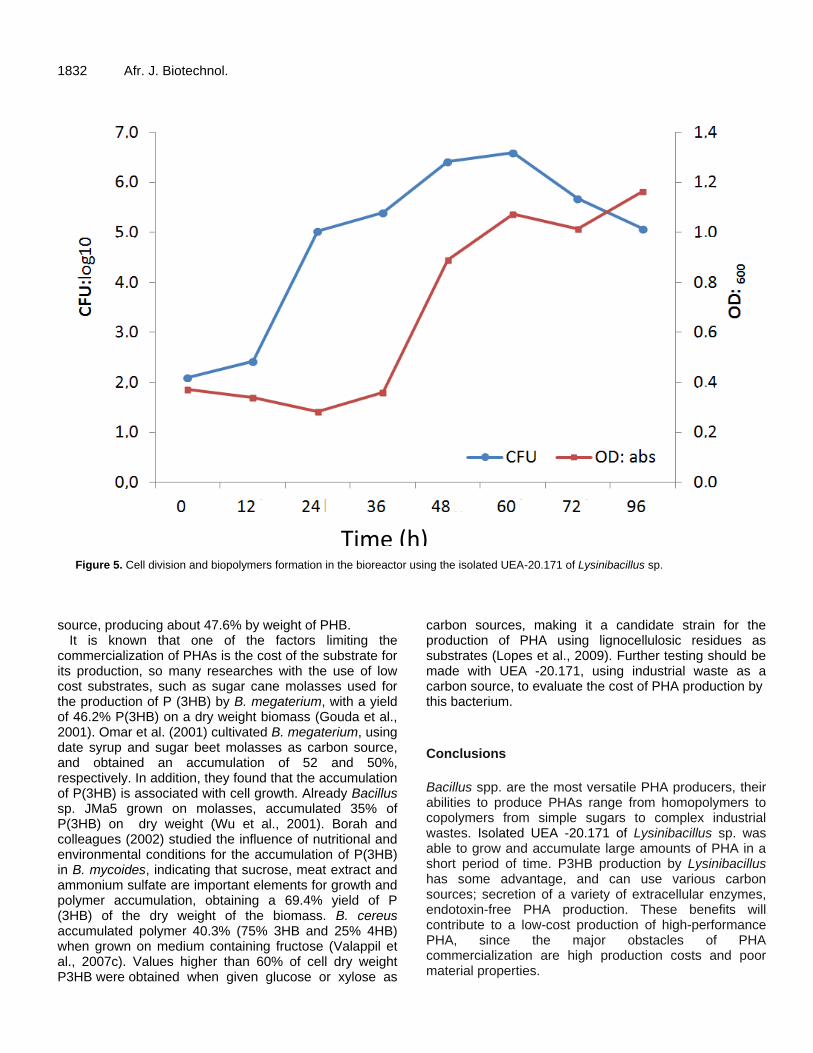
1832 Afr. J. Biotechnol.
Time (h)
Figure 5. Cell division and biopolymers formation in the bioreactor using the isolated UEA-20.171 of Lysinibacillus sp.
source, producing about 47.6% by weight of PHB.
It is known that one of the factors limiting the commercialization of PHAs is the cost of the substrate for its production, so many researches with the use of low cost substrates, such as sugar cane molasses used for the production of P (3HB) by B. megaterium, with a yield of 46.2% P(3HB) on a dry weight biomass (Gouda et al., 2001). Omar et al. (2001) cultivated B. megaterium, using date syrup and sugar beet molasses as carbon source, and obtained an accumulation of 52 and 50%, respectively. In addition, they found that the accumulation of P(3HB) is associated with cell growth. Already Bacillus sp. JMa5 grown on molasses, accumulated 35% of P(3HB) on dry weight (Wu et al., 2001). Borah and colleagues (2002) studied the influence of nutritional and environmental conditions for the accumulation of P(3HB) in B. mycoides, indicating that sucrose, meat extract and ammonium sulfate are important elements for growth and polymer accumulation, obtaining a 69.4% yield of P (3HB) of the dry weight of the biomass. B. cereus accumulated polymer 40.3% (75% 3HB and 25% 4HB) when grown on medium containing fructose (Valappil et al., 2007c). Values higher than 60% of cell dry weight P3HB were obtained when given glucose or xylose as
carbon sources, making it a candidate strain for the production of PHA using lignocellulosic residues as substrates (Lopes et al., 2009). Further testing should be made with UEA -20.171, using industrial waste as a carbon source, to evaluate the cost of PHA production by this bacterium.
Conclusions
Bacillus spp. are the most versatile PHA producers, their abilities to produce PHAs range from homopolymers to copolymers from simple sugars to complex industrial wastes. Isolated UEA -20.171 of Lysinibacillus sp. was able to grow and accumulate large amounts of PHA in a short period of time. P3HB production by Lysinibacillus has some advantage, and can use various carbon sources; secretion of a variety of extracellular enzymes, endotoxin-free PHA production. These benefits will contribute to a low-cost production of high-performance PHA, since the major obstacles of PHA commercialization are high production costs and poor material properties.
Conflict of interests The authors have not declared any conflicts of interests. ACKNOWLEDGEMENTS The authors are thankful to CNPQ (National Counsel of Technological and Scientific Development) for their financial support. REFERENCES Borah B, Thakur PS, Nigam JN (2002). The influence of nutritional and
environmental conditions on the accumulation of poly-betahydroxybutyrate in Bacillus mycoides RLJ B-017. J. Appl. Microbiol 92:776-783.
Braunegg G, Sonnleitner B, Lafferty RM (1978). A rapid gas chromatographic method for the determination of poly-?-hydroxybutyric acid in microbial biomass. Appl. Microbiol. Biotechnol. 6:29-37.
Brito GF, Agrawal P, Araújo EM, Mélo TJA (2011). Biopolímeros, polímeros biodegradáveis e polímeros verdes. Electron. Mater. Process. 6:127-139.
Brown JH (1939). Bergey's Manual of Determinative Bacteriology. Am. J. Public. Health Nations Health 29(4):404-405.
Chen GQ, Cai L, Tan D, Aibaidula G, Dong XR, Chen JC, Tian WD (2011). Comparative genomics study of polyhydroxyalkanoates (PHA) and ectoine relevant genes from Halomonas sp. TD01 revealed extensive horizontal gene transfer events and co-evolutionary relationships. Microb. Cell. Fact. 10:1-15.
Chèneby D, Philippot L, Hartmann A Hènault C, Germon JC (2000). 16S rDNA analysis for characterization of denitrifying bacteria isolated from three agricultural soils. FEMS Microbiol. Ecol. 34:121-128.
Costa GCM (2012). Microbiota bacteriana associada às esponjas de água doce da amazônia Dissertação (Mestrado em Biotecnologia) - Pós-Graduação em Biotecnologia e Recursos Naturais da Universidade do Estado do Amazonas, UEA, Manaus.
Falcone DMB, Agnelli JAM, Faria LIL (2007). Panorama setorial e perspectivas na área de polímeros biodegradáveis. Polímeros: Sci. Tecnol. 17:5-9.
Gamal RF, Abdelhady HM, Khodair TA, El-Tayeb TS, Hassan EA, Aboutaleb KA (2013). Semi-scale production of PHAs from waste frying oil by Pseudomonas fluorescens S48. Braz. J. Microbiol. 44:539-549.
Gomes MJP (2013). Tópicos em bacteriologia veterinária: gênero Bacillus spp. Rio Grande do Sul: FAVET-UFRGS, 2013.
Gouda MK, Swellam AE, Omar SH (2001). Production of PHB by a Bacillus megaterium strain using sugarcane molasses and corn steep liquor as sole carbon and nitrogen sources. Microbiol Res. 156:201-207.
Gumel AM, Annuar MS, Heidelberg T (2012). Biosynthesis and characterization of polyhydroxyalkanoates copolymers produced by Pseudomonas putida Bet001 isolated from palm oil mill effluent. PLoS One 7:1-8
Halami PM (2008). Production of polyhydroxyalkanoate from starch by the native isolate Bacillus cereus CFR06. World J. Microbiol. Biotechnol. 24:805-812.
Heyndrickx M, Vauterin L, Vandamme P, Kersters K, De Vos P (1996). Applicability of combined amplified ribosomal DNA restriction analysis (ARDRA) patterns in bacterial phylogeny and taxonomy. J. Microbiol. Methods. 26:247-259.
Jamil N, Ahmed N, Edwards DH (2007). Characterization of biopolymer produced by Pseudomonas sp.CMG607w of marine origin. J. Gen. Appl. Microbiol. 53:105-109.
Ferreira et al. 1833 Jendrossek D, Handrick R (2002). Microbial degradation of
polyhydroxyalkanoates. Annu. Rev. Microbiol. 56:403-432. Kawashima Y, Cheng W, Mifune J, Orita I, Nakamura S, Fukui T (2012).
Characterization and functional analyses of R-specific enoyl coenzyme A hydratases in polyhydroxyalkanoate-producing Ralstonia eutropha. Appl. Environ. Microbiol. 78:493-502.
Khanna S, Srivastava AK (2005). Recent advances in microbial polyhydroxyalkanoates. Process. Biochem. 40:607-619.
Krueger CL (2009). Seleção de linhagens de Bacillus produtoras de polihidroxialcanoatos a partir de resíduo do processamento de mandioca. 2009. Dissertação (Mestrado em Engenharia de Alimentos) - Universidade Federal de Santa Catarina. Florianópolis.
Law KH, Cheng YC, Leung YC, Lo WH, Chua H, Yu HF (2003). Construction of recombinant Bacillus subtilis strais for polyhydroxyalkanoates synthesis. Biochem. Eng. J. 16:203-208.
Lee JH, Ashby RD, Needleman DS, Lee K-T, Solaiman DKY (2012). Cloning, sequencing, and characterization of lipase genes from a polyhydroxyalkanoate (PHA)-synthesizing Pseudomonas resinovorans. Appl. Microbiol. Biotechnol. 96:993-1005.
Lee T, Lin J, Wang S, Shaw G (2004). PhaQ, a new class of poly-hydroxybutyrate (phb)-responsive repressor, regulates phaq and phap (phasin) expression in Bacillus megaterium through Interaction with PHB. J. Bacteriol. 186:3015-3021.
Lopes MSG, Rocha RCS, Zanotto SP, Gomez JGC (2009). Screning of bacteria to produce polyhydroxyalkanoates from xylose. World J. Microbiol. Biotechnol. 25:1751-1756.
McCool GJ, Fernandez T, Li N, Cannon MC (1996). Polyhydroxyalkanoate inclusion-body growth and proliferation in Bacillus megaterium. FEMS Microbiol. Lett. 138:41-48.
Muyzer G, Smalla K (1998). Application of denaturing gradient gel electrophoresis (DGGE) and temperature gradient gel electrophoresis (TGGE) in microbial ecology. Antonie van Leeuwenhoek. 73:127-141.
Omar S, Rayes A, Eqaab A, Vob I (2001). Steinbüchel A Optimization of cell growth and poly(3-hydroxybutyrate) accumulation on date syrup by a Bacillus megaterium strain. Biotechnol. Lett. 23:1119-1123.
Poblete-Castro I, Escapa IF, Jäger C, Puchalka J, Lam CMC, Schomburg D, Prieto MA, Santos VAPM (2012). The metabolic response of P. putida KT2442 producing high levels of polyhydroxyalkanoate under single- and multiple-nutrient-limited growth: highlights from a multi-level omics approach. Microb. Cell. Fact. 11:4-21.
Procópio ARL, Procópio REL, Pizzirani-Kleiner AA, Melo IS (2012). Diversity of propanil-degrading bacteria isolated from rice rhizosphere and their potential for plant growth promotion. Genet. Mol. Res. 3:2021-2034.
Roa JPB, Mano V, Faustino PB, Felix EB, Silva MESR, Filho JDS (2010). Synthesis and characterization of the copolymer poly(3-poly(3-hydroxybutyrate)-co-ε-caprolactone) from poly(3-hydroxybutyrate) and poly(ε-caprolactone) de poli(3-hidroxibutirato) e poli(ε-caprolactona). Polímeros. 20:221-226.
Ryan WJ, O'leary ND, O'mahony M, Dobson AD (2013). GacS-dependent regulation of polyhydroxyalkanoate synthesis in Pseudomonas putida CA-3. Appl. Environ. Microbiol. 79:1795-1802.
Shrivastav A, Kim HY, Kim YR (2013). Advances in the Applications of Polyhydroxyalkanoate Nanoparticles for Novel Drug Delivery System. Biomed. Res. Int. Pp.1-12.
Silva LF, Gomez JGC, Rocha RCS, Taciro MK, Pradella JGC (2007). Produção biotecnológica de poli-hidroxialcanoatos para a geração de polímeros biodegradáveis no Brasil. Quim. Nova. 30:1732-1743.
Singh M, Patel SKS, Kalia VC (2009). Bacillus subtilis as potential producer for olyhydroxyalkanoates. Microb. Cell. Fact. 8:1-11.
Stewart I, Schluter PJ, Shaw GR (2006). Cyanobacterial lipopolysaccharides and human health – a review. Environ. Health. 5:5-7.
Tajima K, Han X, Satoh Y , Ishii A, Araki Y, Munekata M, Taguchi S (2012). In vitro synthesis of polyhydroxyalkanoate (PHA) incorporating lactate (LA) with a block sequence by using a newly engineered thermostable PHA synthase from Pseudomonas sp. SG4502 with acquired LA-polymerizing activity. Appl. Microbiol.
1834 Afr. J. Biotechnol.
Biotechnol. 94:365-376. Takaku H, Kimoto A, Kodaira S, Nashimoto M, Takagi M (2006).
Isolation ofa Gram-positive poly(3-hydroxybutyrate) (PHB)-degrading bacterium from compost, and cloning and characterization of a gene encoding PHB depolymerase of Bacillus megaterium N-18-25-9. FEMS Microbiol. Lett. 264:152-159.
Tamura K, Peterson D, Peterson N, Stecher G, Nei M, Kumar S (2011). MEGA5: Molecular Evolutionary Genetics Analysis using Maximum Likelihood, Evolutionary Distance, and Maximum Parsimony Methods. Mol. Biol. Evol. 28:2731-2739.
Thomson NM, Saika A, Ushimaru K, Sangiambut S, Tsuge T, Summers DK, Sivaniah E (2013). Efficient production of active polyhydroxyalkanoate synthase in E. coli by co-expression of molecular chaperones. Appl. Environ. Microbiol. 79:1948-1955.
Torrego-Solana N, Martin-Arjol I, Bassas-Galia M, Diaz P, Manresa (2012). A Hydroxy-fatty acid production in a Pseudomonas aeruginosa 42A2 PHA synthase mutant generated by directed mutagenesis. Appl. Microbiol. Biotechnol. 93:2551-2561.
Tsuge T, Hyakutake M, Mizuno K (2015). Class IV polyhydroxyalkanoate (PHA) synthases and PHA-producing Bacillus. Appl. Microbiol. Biotechnol. 99:6231-6240.
Valappil SP, Boccaccini AR, Bucke C, Roy I. (2007a).
Polyhydroxyalkanoates in Gram-positive bacteria: insights from the genera Bacillus and Streptomyces. Antonie van Leeuwenhoek. 91:1-17.
Valappil SP, Misra SK, Boccaccini AR, Keshavarz T, Bucke C, Roy I (2007b). Large-scale production and efficient recovery of PHB with desirable material properties, from the newly characterized Bacillus cereus SPV. J. Biotechnol. 132:251-258.
Valappil SP, Peiris D, Langley GJ, Herniman JM, Boccaccini AR, Bucke C, Roya I (2007c). Polyhydroxyalkanoate (PHA) biosynthesis from structurally unrelated carbon sources by a newly characterized Bacillus spp. J. Biotechnol. 127:475-487.
Wu Q, Huang H, Hu GH, Chen J, Ho KP, Chen GQ (2001). Production of poly-3-hydroxybutyrate by Bacillus sp. JMa5 cultivated in molasses media. Antonie van Leeuwenhoek. 80:111-118.
Vol. 15(34), pp. 1835-1840, 24 August, 2016
DOI: 10.5897/AJB2016.15394
Article Number: E82BEDF60168
ISSN 1684-5315
Copyright © 2016
Author(s) retain the copyright of this article
http://www.academicjournals.org/AJB
African Journal of Biotechnology
Full Length Research Paper
Assessment of biofuel potential of dead neem leaves (Azadirachta indica) biomass in Maroua town,
Cameroon
Tizé Koda Joël1*, Sinbai Marcel1, Darman Roger Djouldé2 and Albert Ngakou3
1Department of Renewable Energy, Higher Institute of the Sahel, University of Maroua, Cameroon.
2Department of Agriculture, Animal Husbandry and By-Products, Higher Institute of the Sahel, University of Maroua,
Cameroon. 3Department of Biology Sciences, University of Ngaoundéré, Cameroon.
Received 11 April, 2016; Accepted 8 August, 2016
Dead leaves of neem trees in the Sahelian urban zone are among the wastes that are underutilized, since it is either buried or burnt, and thus, contribute to increased environmental pollution. Unfortunately, the lack of information on the biomass and energy potentials of these wastes empedes any initiative for its industrial biomethanization. This study was investigated with the aim of evaluating the biofuel potentials of dead neem leaves in Maroua town. The number of neem trees, as well as biomass produced by their dead leaves in the town was estimated. Different possible forms of energy which could be generated from biomass were determined. Results revealed the presence of 45500 neem trees in the whole town. In addition, averagely 1.2 kg of dead neem leaves was daily produced per tree. All the neem trees were able to generate 53.7 tons biomass/day, which can supply 756.538 m
3 of biogas
in 7 months of defoliation. This biogas volume was assimilated to 5.674 MWh/day of electrical energy, sufficient enough to support the need of 7565 householders. The biogas produced could be used as cooking energy source, or substitute the firewood demand of 3926 householders for 7 months, leading to the preservation of 567.45 ha land /year from destruction as the result of uncontrolled firewood collection in the sahelian zone. Key words: Biomethanization, biogas, biofuel, dead neem leaves, energy, Maroua town.
INTRODUCTION In response to environmental and energy problems around the world, the use of renewable energies appears as the best solution to these crisis (De Jong et al., 2016). Indeed, fossil fuels have been recognized as the main
sources of greenhouse gas effect emitted into the atmosphere and destabilizing the climate (Mudhoo, 2012). Several countries recognizing this situation have gradually implemented policies to use renewable energy
*Corresponding author. E-mail: [email protected].
Author(s) agree that this article remains permanently open access under the terms of the Creative Commons Attribution
License 4.0 International License
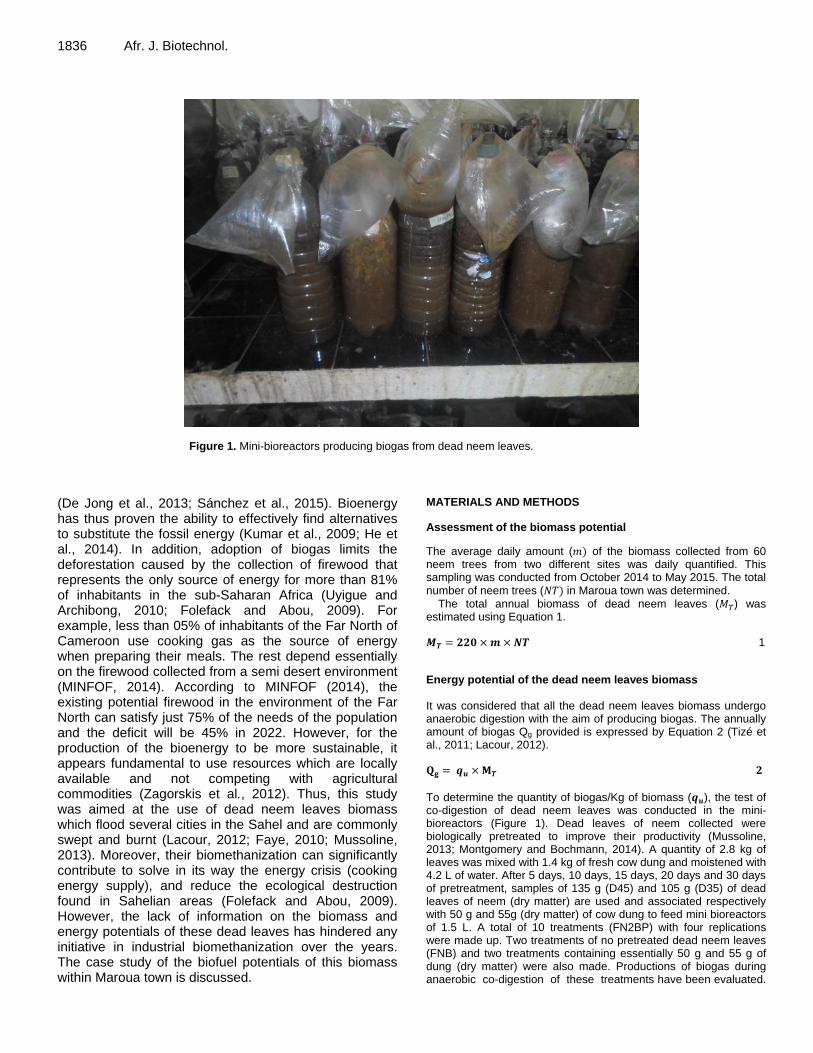
1836 Afr. J. Biotechnol.
Figure 1. Mini-bioreactors producing biogas from dead neem leaves.
(De Jong et al., 2013; Sánchez et al., 2015). Bioenergy has thus proven the ability to effectively find alternatives to substitute the fossil energy (Kumar et al., 2009; He et al., 2014). In addition, adoption of biogas limits the deforestation caused by the collection of firewood that represents the only source of energy for more than 81% of inhabitants in the sub-Saharan Africa (Uyigue and Archibong, 2010; Folefack and Abou, 2009). For example, less than 05% of inhabitants of the Far North of Cameroon use cooking gas as the source of energy when preparing their meals. The rest depend essentially on the firewood collected from a semi desert environment (MINFOF, 2014). According to MINFOF (2014), the existing potential firewood in the environment of the Far North can satisfy just 75% of the needs of the population and the deficit will be 45% in 2022. However, for the production of the bioenergy to be more sustainable, it appears fundamental to use resources which are locally available and not competing with agricultural commodities (Zagorskis et al., 2012). Thus, this study was aimed at the use of dead neem leaves biomass which flood several cities in the Sahel and are commonly swept and burnt (Lacour, 2012; Faye, 2010; Mussoline, 2013). Moreover, their biomethanization can significantly contribute to solve in its way the energy crisis (cooking energy supply), and reduce the ecological destruction found in Sahelian areas (Folefack and Abou, 2009). However, the lack of information on the biomass and energy potentials of these dead leaves has hindered any initiative in industrial biomethanization over the years. The case study of the biofuel potentials of this biomass within Maroua town is discussed.
MATERIALS AND METHODS
Assessment of the biomass potential
The average daily amount ( of the biomass collected from 60 neem trees from two different sites was daily quantified. This sampling was conducted from October 2014 to May 2015. The total number of neem trees ( in Maroua town was determined.
The total annual biomass of dead neem leaves ( ) was estimated using Equation 1.
1
Energy potential of the dead neem leaves biomass It was considered that all the dead neem leaves biomass undergo anaerobic digestion with the aim of producing biogas. The annually amount of biogas Qg provided is expressed by Equation 2 (Tizé et al., 2011; Lacour, 2012).
To determine the quantity of biogas/Kg of biomass ( ), the test of co-digestion of dead neem leaves was conducted in the mini-bioreactors (Figure 1). Dead leaves of neem collected were biologically pretreated to improve their productivity (Mussoline, 2013; Montgomery and Bochmann, 2014). A quantity of 2.8 kg of leaves was mixed with 1.4 kg of fresh cow dung and moistened with 4.2 L of water. After 5 days, 10 days, 15 days, 20 days and 30 days of pretreatment, samples of 135 g (D45) and 105 g (D35) of dead leaves of neem (dry matter) are used and associated respectively with 50 g and 55g (dry matter) of cow dung to feed mini bioreactors of 1.5 L. A total of 10 treatments (FN2BP) with four replications were made up. Two treatments of no pretreated dead neem leaves (FNB) and two treatments containing essentially 50 g and 55 g of dung (dry matter) were also made. Productions of biogas during anaerobic co-digestion of these treatments have been evaluated.
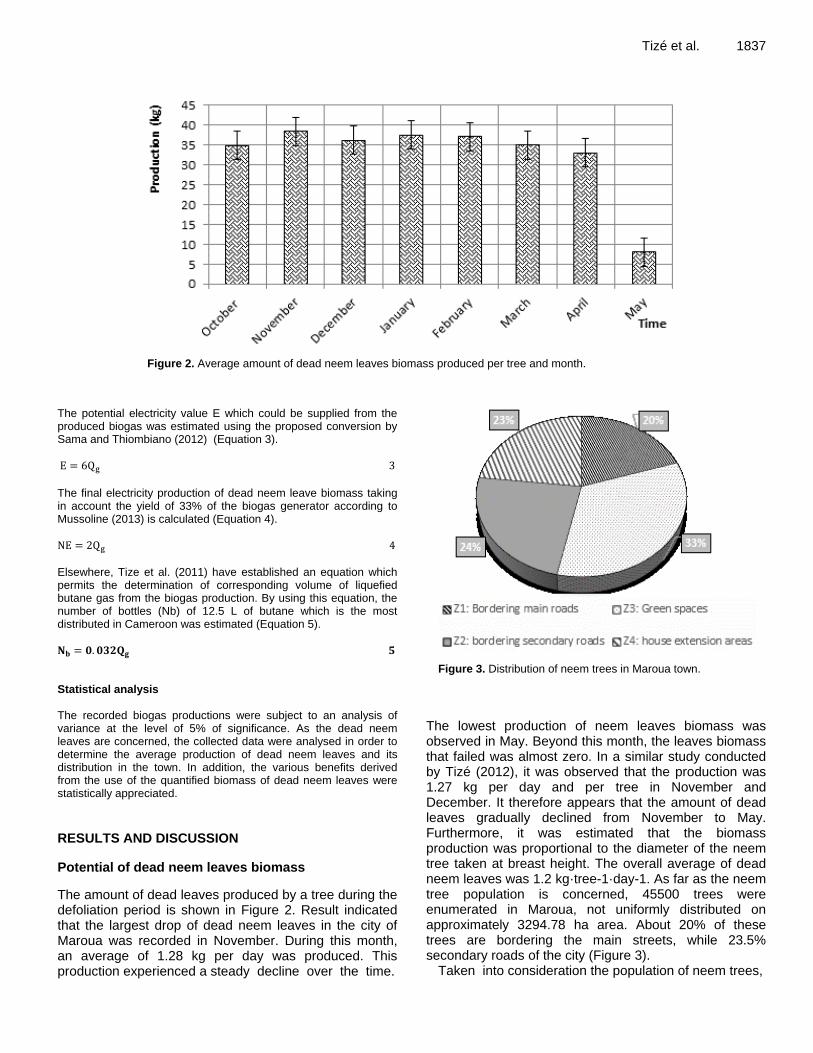
Tizé et al. 1837
Figure 2. Average amount of dead neem leaves biomass produced per tree and month.
The potential electricity value E which could be supplied from the produced biogas was estimated using the proposed conversion by Sama and Thiombiano (2012) (Equation 3).
The final electricity production of dead neem leave biomass taking in account the yield of 33% of the biogas generator according to Mussoline (2013) is calculated (Equation 4).
Elsewhere, Tize et al. (2011) have established an equation which permits the determination of corresponding volume of liquefied butane gas from the biogas production. By using this equation, the number of bottles (Nb) of 12.5 L of butane which is the most distributed in Cameroon was estimated (Equation 5).
Statistical analysis The recorded biogas productions were subject to an analysis of variance at the level of 5% of significance. As the dead neem leaves are concerned, the collected data were analysed in order to determine the average production of dead neem leaves and its distribution in the town. In addition, the various benefits derived from the use of the quantified biomass of dead neem leaves were statistically appreciated. RESULTS AND DISCUSSION
Potential of dead neem leaves biomass
The amount of dead leaves produced by a tree during the defoliation period is shown in Figure 2. Result indicated that the largest drop of dead neem leaves in the city of Maroua was recorded in November. During this month, an average of 1.28 kg per day was produced. This production experienced a steady decline over the time.
Figure 3. Distribution of neem trees in Maroua town.
The lowest production of neem leaves biomass was observed in May. Beyond this month, the leaves biomass that failed was almost zero. In a similar study conducted by Tizé (2012), it was observed that the production was 1.27 kg per day and per tree in November and December. It therefore appears that the amount of dead leaves gradually declined from November to May. Furthermore, it was estimated that the biomass production was proportional to the diameter of the neem tree taken at breast height. The overall average of dead neem leaves was 1.2 kg·tree-1·day-1. As far as the neem tree population is concerned, 45500 trees were enumerated in Maroua, not uniformly distributed on approximately 3294.78 ha area. About 20% of these trees are bordering the main streets, while 23.5% secondary roads of the city (Figure 3).
Taken into consideration the population of neem trees,
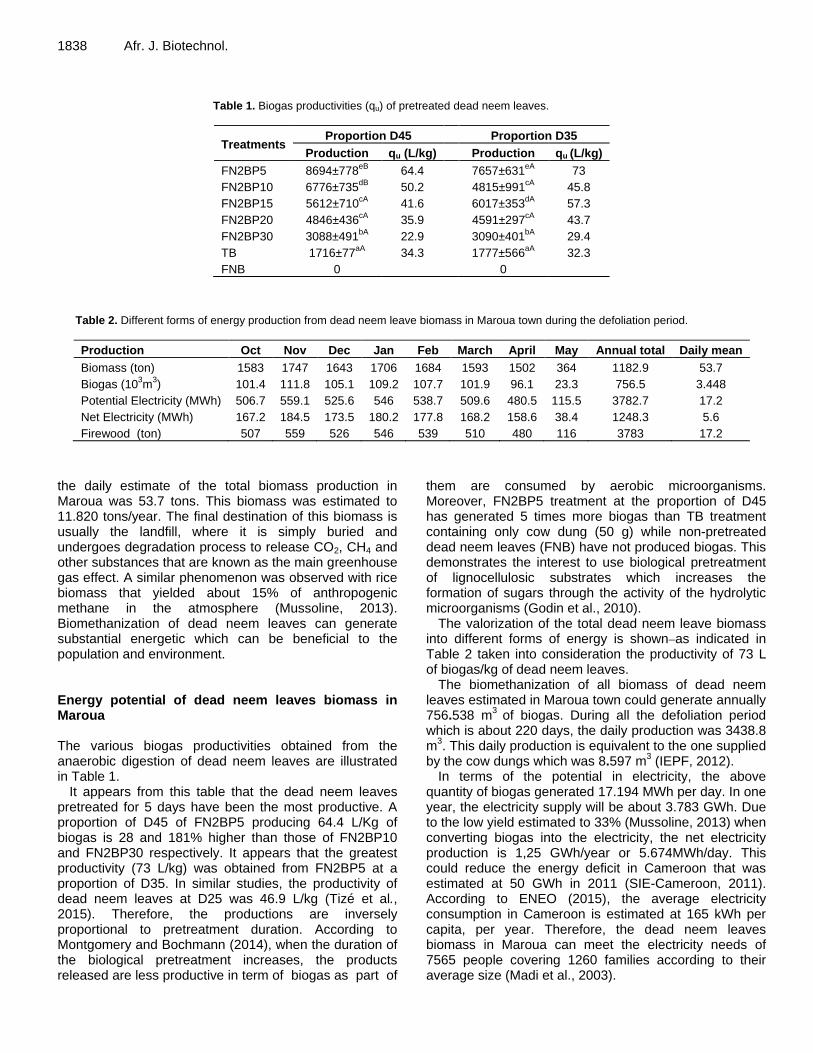
1838 Afr. J. Biotechnol.
Table 1. Biogas productivities (qu) of pretreated dead neem leaves.
Treatments Proportion D45 Proportion D35
Production qu (L/kg) Production qu (L/kg)
FN2BP5 8694±778eB
64.4 7657±631eA
73
FN2BP10 6776±735dB
50.2 4815±991cA
45.8
FN2BP15 5612±710cA
41.6 6017±353dA
57.3
FN2BP20 4846±436cA
35.9 4591±297cA
43.7
FN2BP30 3088±491bA
22.9 3090±401bA
29.4
TB 1716±77aA
34.3 1777±566aA
32.3
FNB 0 0
Table 2. Different forms of energy production from dead neem leave biomass in Maroua town during the defoliation period.
Production Oct Nov Dec Jan Feb March April May Annual total Daily mean
Biomass (ton) 1583 1747 1643 1706 1684 1593 1502 364 1182.9 53.7
Biogas (103m
3) 101.4 111.8 105.1 109.2 107.7 101.9 96.1 23.3 756.5 3.448
Potential Electricity (MWh) 506.7 559.1 525.6 546 538.7 509.6 480.5 115.5 3782.7 17.2
Net Electricity (MWh) 167.2 184.5 173.5 180.2 177.8 168.2 158.6 38.4 1248.3 5.6
Firewood (ton) 507 559 526 546 539 510 480 116 3783 17.2
the daily estimate of the total biomass production in Maroua was 53.7 tons. This biomass was estimated to 11.820 tons/year. The final destination of this biomass is usually the landfill, where it is simply buried and undergoes degradation process to release CO2, CH4 and other substances that are known as the main greenhouse gas effect. A similar phenomenon was observed with rice biomass that yielded about 15% of anthropogenic methane in the atmosphere (Mussoline, 2013). Biomethanization of dead neem leaves can generate substantial energetic which can be beneficial to the population and environment. Energy potential of dead neem leaves biomass in Maroua The various biogas productivities obtained from the anaerobic digestion of dead neem leaves are illustrated in Table 1.
It appears from this table that the dead neem leaves pretreated for 5 days have been the most productive. A proportion of D45 of FN2BP5 producing 64.4 L/Kg of biogas is 28 and 181% higher than those of FN2BP10 and FN2BP30 respectively. It appears that the greatest productivity (73 L/kg) was obtained from FN2BP5 at a proportion of D35. In similar studies, the productivity of dead neem leaves at D25 was 46.9 L/kg (Tizé et al., 2015). Therefore, the productions are inversely proportional to pretreatment duration. According to Montgomery and Bochmann (2014), when the duration of the biological pretreatment increases, the products released are less productive in term of biogas as part of
them are consumed by aerobic microorganisms. Moreover, FN2BP5 treatment at the proportion of D45 has generated 5 times more biogas than TB treatment containing only cow dung (50 g) while non-pretreated dead neem leaves (FNB) have not produced biogas. This demonstrates the interest to use biological pretreatment of lignocellulosic substrates which increases the formation of sugars through the activity of the hydrolytic microorganisms (Godin et al., 2010).
The valorization of the total dead neem leave biomass into different forms of energy is shown as indicated in Table 2 taken into consideration the productivity of 73 L of biogas/kg of dead neem leaves.
The biomethanization of all biomass of dead neem leaves estimated in Maroua town could generate annually 756.538 m
3 of biogas. During all the defoliation period
which is about 220 days, the daily production was 3438.8 m
3. This daily production is equivalent to the one supplied
by the cow dungs which was 8.597 m3 (IEPF, 2012).
In terms of the potential in electricity, the above quantity of biogas generated 17.194 MWh per day. In one year, the electricity supply will be about 3.783 GWh. Due to the low yield estimated to 33% (Mussoline, 2013) when converting biogas into the electricity, the net electricity production is 1,25 GWh/year or 5.674MWh/day. This could reduce the energy deficit in Cameroon that was estimated at 50 GWh in 2011 (SIE-Cameroon, 2011). According to ENEO (2015), the average electricity consumption in Cameroon is estimated at 165 kWh per capita, per year. Therefore, the dead neem leaves biomass in Maroua can meet the electricity needs of 7565 people covering 1260 families according to their average size (Madi et al., 2003).
Tizé et al. 1839
Table 3. Surface area (ha) preserved from the destruction caused by firewood collection when valorizing dead neem leaves.
Surface areas preserved Oct Nov Dec Jan Feb March April May Annual total Daily mean
Yearly 76.0 83.9 78.8 81.9 80.8 76.4 72.1 17.5 567.4 2.6
in 10 years 760.0 838.7 788.4 819.0 808.1 764.4 720.7 174.7 5674.0 2.6
In terms of firewood, the daily production of biogas could substitute 17.2 tons, which corresponds to 3,783 tons of firewood per year. Knowing that the annual consumption of 266.4 kg/person in the city (MINFOF, 2014), 23558 people or 3926 households who were supposed to use firewood could be supplied in seven months. The valorisation of the dead neem leaves into biogas could therefore contribute to 7.15% reduction of fire wood consumption estimated at 52.884 tons/year in 2007 in Maroua town (Folefack and Abou, 2009). When converting the biogas produced into domestic gas (butane) available in 12.5 L bottles in Maroua, it corresponded to 24.209 bottles. At a price of 6500 FCFA a bottle authorized on the market, this stock could generate an income of 157.359 millions CFA. Ecological interest According to Ntsama et al. (2007), the consumption of a ton of wood is equivalent to the destruction of 0.15 ha of the forest in the Sahel region. Therefore, the surface area which could be preserved through the year and in 10 years is illustrated in Table 3.
From Table 3, the valorisation of the biogas as cooking energy from dead neem biomass quantified in Maroua town could allow the preservation of 567.45 ha/year of the forest, usually destroyed by the population when fetching firewood. This surface is daily estimated at 2.6 ha and in 10 years, will be 5674 ha. This contributes to the reduction of the surface destroyed from the use of firewood estimated at 194,490 ha in 2008, against 875.57 ha in 1990 in Cameroon (SIE-Cameroun, 2011). Just from the ecological role played by the biomethanization of dead neem leaves which are accessible, it could be more efficient than many strategies (planting trees) taken by governments in order to fight against deforestation in northern Cameroon (SIE-Cameroun, 2011). The interest of effluents of digestion that can serve as biological amendment in agriculture is not negligible. This new fertilizer could contribute to the setting-up of organic farming in the city from which healthy and biological food could quantitatively and qualitatively be available.
Conclusion
In Maroua town, dead neem leaves biomass produced daily about 53.7 tons. This biomass can yield 3438.8 m
3
of biogas energy daily which is equivalent to 3.783
tons/year in term of firewood. This mass of wood can feed in term of energy 23558 people for seven months. Therefore, this is assimilated to an annual wood preservation of 567.45 ha from the destruction as the result of firewood collection. The valuation of this gas into electricity could effectively generate 1.25 GWh/year. This could meet the demand for electricity of 7565 people. It therefore appears that the recovery of dead neem leaves could provide solutions to energy problems in Maroua city and in the Sahel region where neem trees are the main planted trees. For further studies, it is suggested the optimization of the management of dead neem leaves through physical, chemical and biological pretreatments. Conflict of interests The authors have not declared any conflict of interest. REFERENCES De Jong P, Kiperstok A, Sánchez AS, Dargaville R, Torres EA (2016).
Integrating large scale wind power into the electricity grid in the Northeast of Brazil. Energy 100:401-415.
De Jong P, Sánchez AS, Esquerre K, Kalid RA, Torres EA (2013). Solar and wind energy production in relation to the electricity load curve and hydroelectricity in the northeast region of Brazil. Renew. Sustain. Energy Rev. 23:526-535.
ENEO-Energy of Cameroon (2015). Cameroon facing the challenge of access to electricity. Communication of the General Manager of ENEO Cameroon S.A. to the 4th sitting of the University of GICAM, 11p. Available at: http://legicam.cm/gic/uploads/2015/06/DG-Eneo-universite-GICAM-26-juin-2015.pdf.
Faye M (2010). New fractionation process of the Senegalese neem seed (Azadirachta indica a.jussi): production of a biopesticide oil and oilcake. PhD dissertation, University of Toulouse, 267 p.
Folefack DP, Abou SD (2009). Commercialization of firewood in the Sahel region of Cameroon. Secheresse 3:312-318.
Godin B, Ghysel F, Agneessens R, Schmit T, Gofflot S, Lamaudière S, Sinnaeve G, Goffart JP, Gerin P, Stilmant D, Delcarte J (2010). Determination of cellulose, hemicelluloses, lignin and ashes in diverse lignocellulosic crops used for the bioethanol production of the second generation. Biotechnol. Agron. Soc. Environ. 14(S2):549-560.
Kumar P, Barrett DM, Delwiche MJ, Stroeve P (2009). Methods for Pretreatment of Lignocellulosic Biomass for Efficient Hydrolysis and Biofuel Production. Ind. Eng. Chem. Res. 48 (8):3713-3729.
Lacour J (2012). Valorization of agricultural and other organic wastes through anaerobic digestion in Haiti. PhD dissertation, National Institute of Applied Sciences of Lyon, 217 p.
Madi A, Huub P, Babani S (2003). Urban demand for wood energy and the need for rational management of natural resources: the case of Maroua in the Far North Cameroon. Conference Proceedings, 27-31 May 2002 Garoua,10 p.
MINFOF (2014). Modernization strategies of wood chain energy value in the Far North region of Cameroon. Ministry of Forestry and Wildlife, Yaoundé, Cameroon. 118 p.
1840 Afr. J. Biotechnol. Montgomery LF, Bochmann G (2014). Pretreatment of feedstock for
enhanced biogas production. International Energy Agency Bioenergy 24 p.
Mudhoo A (2012). Biogas Production. Scrivener, Canada. 313p. Mussoline W (2013). Enhancing the methane production from untreated
rice straw using an anaerobic co-digestion approach with piggery wastewater and pulp and paper mill sludge to optimize energy conversion in farm-scale biogas plants. PhD dissertation, University of Paris-East. 143 p.
Ntsama AJ, Tchindjang M, Bene Bene CL (2008). Environmental Assessment of the firewood problem in Garoua town, northern Cameroon. 47p).
Sama H, Thiombiano ST (2012). Biogas for domestic purposes. PRISME renewables sheet 6, Institute for Energy and Environment of the Francophonie. 8 p.
Sánchez AS, Torres EA, Kalid RA (2015). Renewable energy generation for the rural electrification of isolated communities in the Amazon Region. Renew. Sustain. Energy Rev. 49:278-290.
SIE-Cameroon-System of Energy Information in Cameroon (2011). Information Processing for Energy Policies for Ecodevelopment (TIPEE). HELIO International and Institute for Energy and Environment of the Francophonie (IEPF). 93 p.
Tizé KJ (2012). Valorization of neem leaves (Azadirachta indica)
through the production of biogas. Master dissertation, University of Maroua. 60 p.
Tizé KJ, Aboubakar, Tangka J (2011). The Impact of Local Materials on the Construction Cost of Cylindrical Floating Biogas Digester. Progress Renew. Energy 1:15-31.
Tizé KJ, Djoulde DR, Ngakou A (2015). Influence of mechanical and biological pretreatment of dead neem leaves (Azadirachta indica) on the production of biogas. Int. J. Innov. Sci. Res. 16(2):505-513.
Uyigue E, Archibong EO (2010). Scaling-up renewable energy technologies in Africa. J. Eng. Technol. Res. 2(8):130-138.
Zagorskis A, Baltrėnas P, Misevičius A (2012). Experimental biogas research by anaerobic digestion of waste of animal origin and biodegradable garden waste. Afr. J. Biotechnol. 11(100):16586-16593.
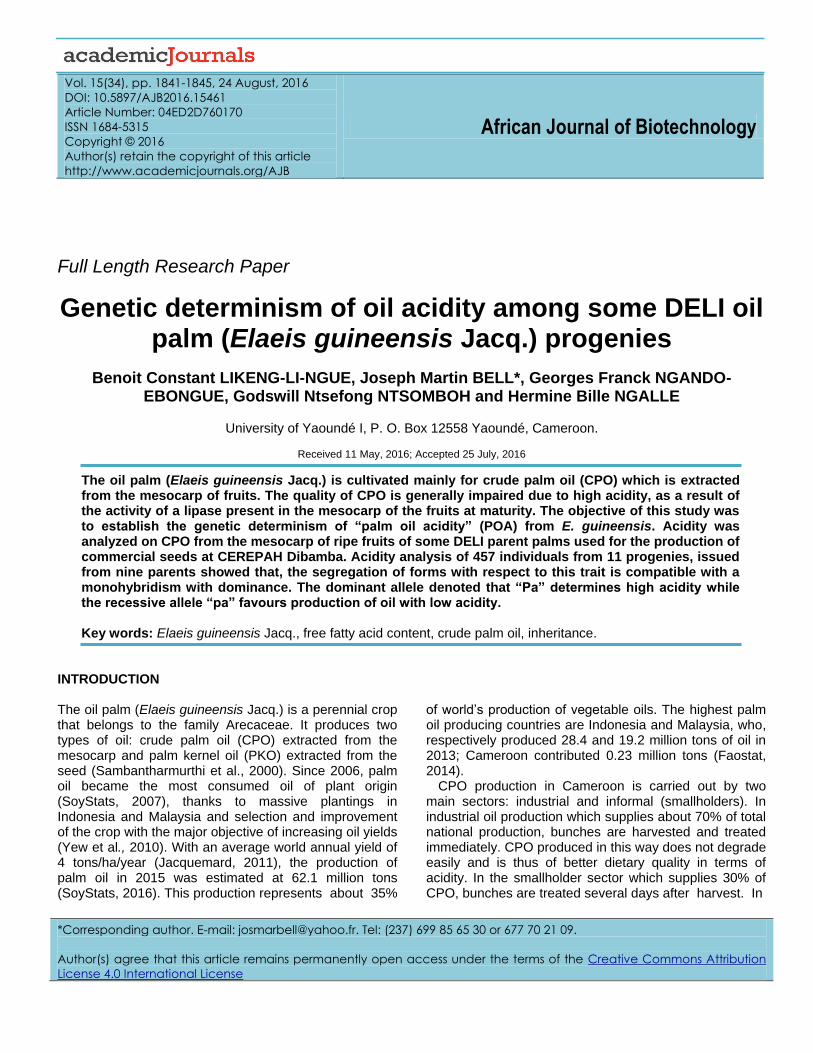
Vol. 15(34), pp. 1841-1845, 24 August, 2016
DOI: 10.5897/AJB2016.15461
Article Number: 04ED2D760170
ISSN 1684-5315
Copyright © 2016
Author(s) retain the copyright of this article
http://www.academicjournals.org/AJB
African Journal of Biotechnology
Full Length Research Paper
Genetic determinism of oil acidity among some DELI oil palm (Elaeis guineensis Jacq.) progenies
Benoit Constant LIKENG-LI-NGUE, Joseph Martin BELL*, Georges Franck NGANDO-EBONGUE, Godswill Ntsefong NTSOMBOH and Hermine Bille NGALLE
University of Yaoundé I, P. O. Box 12558 Yaoundé, Cameroon.
Received 11 May, 2016; Accepted 25 July, 2016
The oil palm (Elaeis guineensis Jacq.) is cultivated mainly for crude palm oil (CPO) which is extracted from the mesocarp of fruits. The quality of CPO is generally impaired due to high acidity, as a result of the activity of a lipase present in the mesocarp of the fruits at maturity. The objective of this study was to establish the genetic determinism of “palm oil acidity” (POA) from E. guineensis. Acidity was analyzed on CPO from the mesocarp of ripe fruits of some DELI parent palms used for the production of commercial seeds at CEREPAH Dibamba. Acidity analysis of 457 individuals from 11 progenies, issued from nine parents showed that, the segregation of forms with respect to this trait is compatible with a monohybridism with dominance. The dominant allele denoted that “Pa” determines high acidity while the recessive allele “pa” favours production of oil with low acidity. Key words: Elaeis guineensis Jacq., free fatty acid content, crude palm oil, inheritance.
INTRODUCTION The oil palm (Elaeis guineensis Jacq.) is a perennial crop that belongs to the family Arecaceae. It produces two types of oil: crude palm oil (CPO) extracted from the mesocarp and palm kernel oil (PKO) extracted from the seed (Sambantharmurthi et al., 2000). Since 2006, palm oil became the most consumed oil of plant origin (SoyStats, 2007), thanks to massive plantings in Indonesia and Malaysia and selection and improvement of the crop with the major objective of increasing oil yields (Yew et al., 2010). With an average world annual yield of 4 tons/ha/year (Jacquemard, 2011), the production of palm oil in 2015 was estimated at 62.1 million tons (SoyStats, 2016). This production represents about 35%
of world’s production of vegetable oils. The highest palm oil producing countries are Indonesia and Malaysia, who, respectively produced 28.4 and 19.2 million tons of oil in 2013; Cameroon contributed 0.23 million tons (Faostat, 2014).
CPO production in Cameroon is carried out by two main sectors: industrial and informal (smallholders). In industrial oil production which supplies about 70% of total national production, bunches are harvested and treated immediately. CPO produced in this way does not degrade easily and is thus of better dietary quality in terms of acidity. In the smallholder sector which supplies 30% of CPO, bunches are treated several days after harvest. In
*Corresponding author. E-mail: [email protected]. Tel: (237) 699 85 65 30 or 677 70 21 09.
Author(s) agree that this article remains permanently open access under the terms of the Creative Commons Attribution
License 4.0 International License
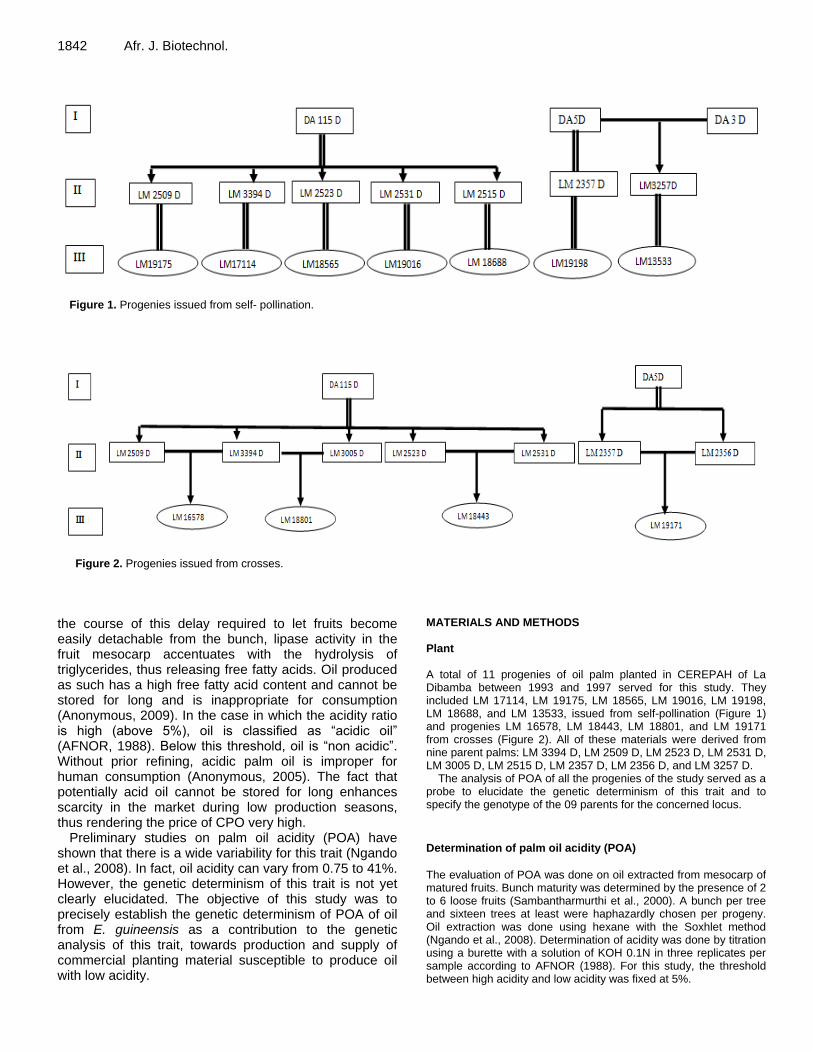
1842 Afr. J. Biotechnol.
Figure 1. Progenies issued from self- pollination.
Figure 2. Progenies issued from crosses.
the course of this delay required to let fruits become easily detachable from the bunch, lipase activity in the fruit mesocarp accentuates with the hydrolysis of triglycerides, thus releasing free fatty acids. Oil produced as such has a high free fatty acid content and cannot be stored for long and is inappropriate for consumption (Anonymous, 2009). In the case in which the acidity ratio is high (above 5%), oil is classified as “acidic oil” (AFNOR, 1988). Below this threshold, oil is “non acidic”. Without prior refining, acidic palm oil is improper for human consumption (Anonymous, 2005). The fact that potentially acid oil cannot be stored for long enhances scarcity in the market during low production seasons, thus rendering the price of CPO very high.
Preliminary studies on palm oil acidity (POA) have shown that there is a wide variability for this trait (Ngando et al., 2008). In fact, oil acidity can vary from 0.75 to 41%. However, the genetic determinism of this trait is not yet clearly elucidated. The objective of this study was to precisely establish the genetic determinism of POA of oil from E. guineensis as a contribution to the genetic analysis of this trait, towards production and supply of commercial planting material susceptible to produce oil with low acidity.
MATERIALS AND METHODS Plant A total of 11 progenies of oil palm planted in CEREPAH of La Dibamba between 1993 and 1997 served for this study. They included LM 17114, LM 19175, LM 18565, LM 19016, LM 19198, LM 18688, and LM 13533, issued from self-pollination (Figure 1) and progenies LM 16578, LM 18443, LM 18801, and LM 19171 from crosses (Figure 2). All of these materials were derived from nine parent palms: LM 3394 D, LM 2509 D, LM 2523 D, LM 2531 D, LM 3005 D, LM 2515 D, LM 2357 D, LM 2356 D, and LM 3257 D.
The analysis of POA of all the progenies of the study served as a probe to elucidate the genetic determinism of this trait and to specify the genotype of the 09 parents for the concerned locus.
Determination of palm oil acidity (POA)
The evaluation of POA was done on oil extracted from mesocarp of matured fruits. Bunch maturity was determined by the presence of 2 to 6 loose fruits (Sambantharmurthi et al., 2000). A bunch per tree and sixteen trees at least were haphazardly chosen per progeny. Oil extraction was done using hexane with the Soxhlet method (Ngando et al., 2008). Determination of acidity was done by titration using a burette with a solution of KOH 0.1N in three replicates per sample according to AFNOR (1988). For this study, the threshold between high acidity and low acidity was fixed at 5%.
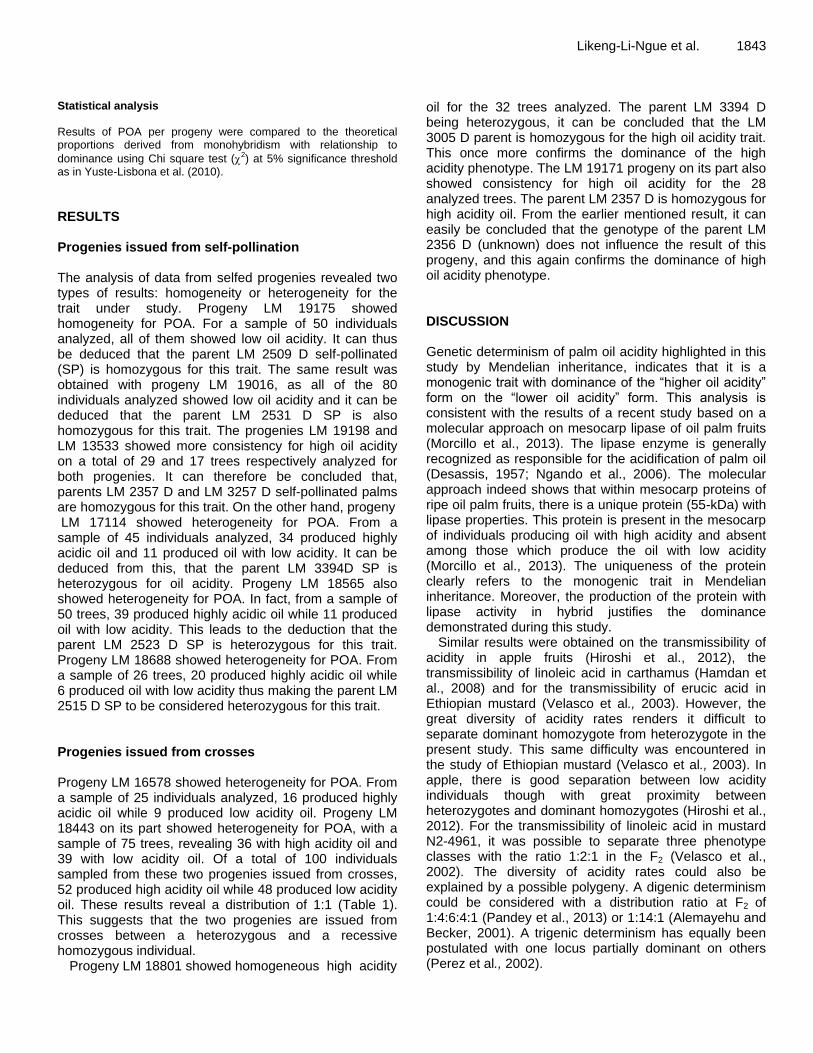
Statistical analysis Results of POA per progeny were compared to the theoretical proportions derived from monohybridism with relationship to
dominance using Chi square test (2) at 5% significance threshold
as in Yuste-Lisbona et al. (2010).
RESULTS Progenies issued from self-pollination The analysis of data from selfed progenies revealed two types of results: homogeneity or heterogeneity for the trait under study. Progeny LM 19175 showed homogeneity for POA. For a sample of 50 individuals analyzed, all of them showed low oil acidity. It can thus be deduced that the parent LM 2509 D self-pollinated (SP) is homozygous for this trait. The same result was obtained with progeny LM 19016, as all of the 80 individuals analyzed showed low oil acidity and it can be deduced that the parent LM 2531 D SP is also homozygous for this trait. The progenies LM 19198 and LM 13533 showed more consistency for high oil acidity on a total of 29 and 17 trees respectively analyzed for both progenies. It can therefore be concluded that, parents LM 2357 D and LM 3257 D self-pollinated palms are homozygous for this trait. On the other hand, progeny LM 17114 showed heterogeneity for POA. From a sample of 45 individuals analyzed, 34 produced highly acidic oil and 11 produced oil with low acidity. It can be deduced from this, that the parent LM 3394D SP is heterozygous for oil acidity. Progeny LM 18565 also showed heterogeneity for POA. In fact, from a sample of 50 trees, 39 produced highly acidic oil while 11 produced oil with low acidity. This leads to the deduction that the parent LM 2523 D SP is heterozygous for this trait. Progeny LM 18688 showed heterogeneity for POA. From a sample of 26 trees, 20 produced highly acidic oil while 6 produced oil with low acidity thus making the parent LM 2515 D SP to be considered heterozygous for this trait. Progenies issued from crosses Progeny LM 16578 showed heterogeneity for POA. From a sample of 25 individuals analyzed, 16 produced highly acidic oil while 9 produced low acidity oil. Progeny LM 18443 on its part showed heterogeneity for POA, with a sample of 75 trees, revealing 36 with high acidity oil and 39 with low acidity oil. Of a total of 100 individuals sampled from these two progenies issued from crosses, 52 produced high acidity oil while 48 produced low acidity oil. These results reveal a distribution of 1:1 (Table 1). This suggests that the two progenies are issued from crosses between a heterozygous and a recessive homozygous individual.
Progeny LM 18801 showed homogeneous high acidity
Likeng-Li-Ngue et al. 1843 oil for the 32 trees analyzed. The parent LM 3394 D being heterozygous, it can be concluded that the LM 3005 D parent is homozygous for the high oil acidity trait. This once more confirms the dominance of the high acidity phenotype. The LM 19171 progeny on its part also showed consistency for high oil acidity for the 28 analyzed trees. The parent LM 2357 D is homozygous for high acidity oil. From the earlier mentioned result, it can easily be concluded that the genotype of the parent LM 2356 D (unknown) does not influence the result of this progeny, and this again confirms the dominance of high oil acidity phenotype. DISCUSSION Genetic determinism of palm oil acidity highlighted in this study by Mendelian inheritance, indicates that it is a monogenic trait with dominance of the “higher oil acidity” form on the “lower oil acidity” form. This analysis is consistent with the results of a recent study based on a molecular approach on mesocarp lipase of oil palm fruits (Morcillo et al., 2013). The lipase enzyme is generally recognized as responsible for the acidification of palm oil (Desassis, 1957; Ngando et al., 2006). The molecular approach indeed shows that within mesocarp proteins of ripe oil palm fruits, there is a unique protein (55-kDa) with lipase properties. This protein is present in the mesocarp of individuals producing oil with high acidity and absent among those which produce the oil with low acidity (Morcillo et al., 2013). The uniqueness of the protein clearly refers to the monogenic trait in Mendelian inheritance. Moreover, the production of the protein with lipase activity in hybrid justifies the dominance demonstrated during this study.
Similar results were obtained on the transmissibility of acidity in apple fruits (Hiroshi et al., 2012), the transmissibility of linoleic acid in carthamus (Hamdan et al., 2008) and for the transmissibility of erucic acid in Ethiopian mustard (Velasco et al., 2003). However, the great diversity of acidity rates renders it difficult to separate dominant homozygote from heterozygote in the present study. This same difficulty was encountered in the study of Ethiopian mustard (Velasco et al., 2003). In apple, there is good separation between low acidity individuals though with great proximity between heterozygotes and dominant homozygotes (Hiroshi et al., 2012). For the transmissibility of linoleic acid in mustard N2-4961, it was possible to separate three phenotype classes with the ratio 1:2:1 in the F2 (Velasco et al., 2002). The diversity of acidity rates could also be explained by a possible polygeny. A digenic determinism could be considered with a distribution ratio at F2 of 1:4:6:4:1 (Pandey et al., 2013) or 1:14:1 (Alemayehu and Becker, 2001). A trigenic determinism has equally been postulated with one locus partially dominant on others (Perez et al., 2002).
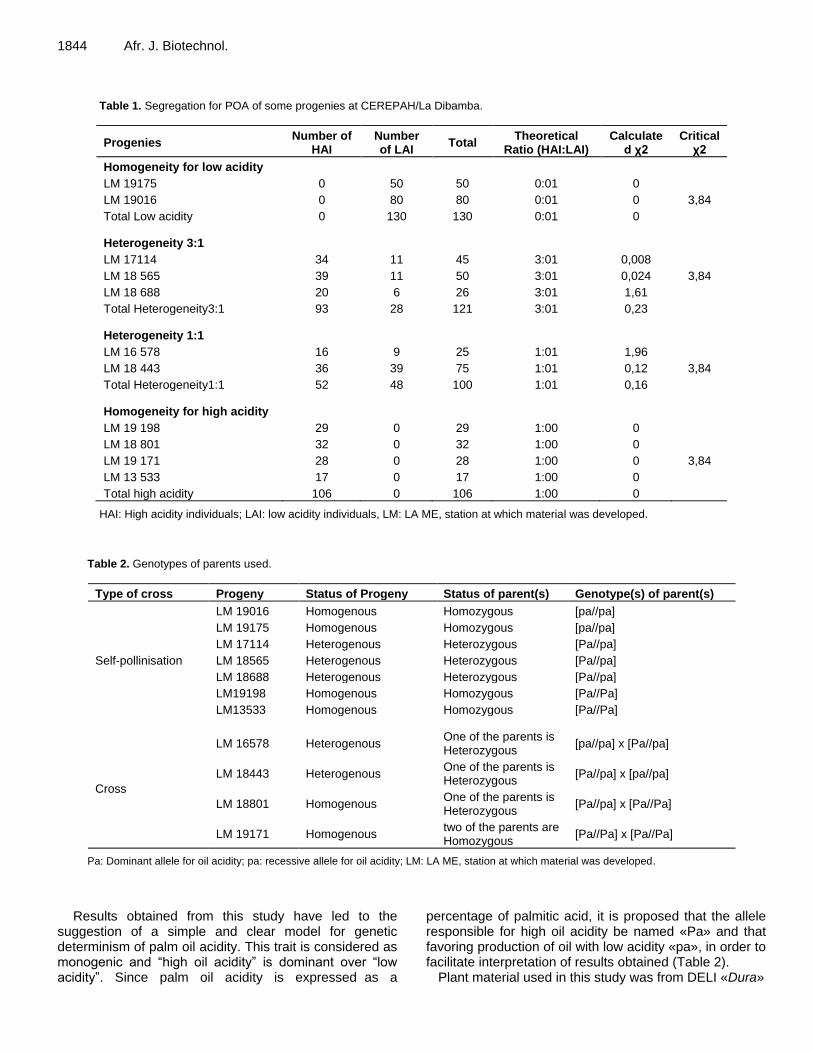
1844 Afr. J. Biotechnol.
Table 1. Segregation for POA of some progenies at CEREPAH/La Dibamba.
Progenies Number of
HAI Number of LAI
Total Theoretical
Ratio (HAI:LAI) Calculate
d χ2 Critical
χ2
Homogeneity for low acidity
LM 19175 0 50 50 0:01 0
LM 19016 0 80 80 0:01 0 3,84
Total Low acidity 0 130 130 0:01 0
Heterogeneity 3:1
LM 17114 34 11 45 3:01 0,008
LM 18 565 39 11 50 3:01 0,024 3,84
LM 18 688 20 6 26 3:01 1,61
Total Heterogeneity3:1 93 28 121 3:01 0,23
Heterogeneity 1:1
LM 16 578 16 9 25 1:01 1,96
LM 18 443 36 39 75 1:01 0,12 3,84
Total Heterogeneity1:1 52 48 100 1:01 0,16
Homogeneity for high acidity
LM 19 198 29 0 29 1:00 0
LM 18 801 32 0 32 1:00 0
LM 19 171 28 0 28 1:00 0 3,84
LM 13 533 17 0 17 1:00 0
Total high acidity 106 0 106 1:00 0
HAI: High acidity individuals; LAI: low acidity individuals, LM: LA ME, station at which material was developed.
Table 2. Genotypes of parents used.
Type of cross Progeny Status of Progeny Status of parent(s) Genotype(s) of parent(s)
Self-pollinisation
LM 19016 Homogenous Homozygous [pa//pa]
LM 19175 Homogenous Homozygous [pa//pa]
LM 17114 Heterogenous Heterozygous [Pa//pa]
LM 18565 Heterogenous Heterozygous [Pa//pa]
LM 18688 Heterogenous Heterozygous [Pa//pa]
LM19198 Homogenous Homozygous [Pa//Pa]
LM13533 Homogenous Homozygous [Pa//Pa]
Cross
LM 16578 Heterogenous One of the parents is Heterozygous
[pa//pa] x [Pa//pa]
LM 18443 Heterogenous One of the parents is Heterozygous
[Pa//pa] x [pa//pa]
LM 18801 Homogenous One of the parents is Heterozygous
[Pa//pa] x [Pa//Pa]
LM 19171 Homogenous two of the parents are Homozygous
[Pa//Pa] x [Pa//Pa]
Pa: Dominant allele for oil acidity; pa: recessive allele for oil acidity; LM: LA ME, station at which material was developed.
Results obtained from this study have led to the suggestion of a simple and clear model for genetic determinism of palm oil acidity. This trait is considered as monogenic and “high oil acidity” is dominant over “low acidity”. Since palm oil acidity is expressed as a
percentage of palmitic acid, it is proposed that the allele responsible for high oil acidity be named «Pa» and that favoring production of oil with low acidity «pa», in order to facilitate interpretation of results obtained (Table 2).
Plant material used in this study was from DELI «Dura»
families. Given that cultivated oil palm varieties are obtained from crosses between DELI «Dura» female individuals and LA ME «Pisifera» males, it is necessary to further search for and identify recessive homozygous individuals for low acidity in the LA ME population. Thence, it will be possible and easy to produce hybrids with low acidity from homozygous parents. Conclusion Definitely, in all of the results obtained, offspring are homogeneous with high acidity phenotype if at least one parent bears this trait. It is homogeneous with low acidity if both parents have a genotype producing low acidic oil. Heterogeneous offspring are obtained if and only if both parents are heterozygous. In addition, results obtained from self-pollination progenies were consistent with those from intercrossing.
These results could lead to the conclusion that: the rate of oil acidity in palm oil is controlled by a major locus which within the analyzed population presents two alleles. This study opens up the possibility for breeders to select “low acidity” genitors from which improved oil palm seeds can be produced and supplied especially to smallholders for the production of better quality palm oil in terms of acidity. Conflict of Interests The authors have not declared any conflict of interests. REFERENCES AFNOR (1988). Recueil des normes françaises sur les corps gras,
graines oléagineuses, produits dérivés, 4ème
édition. Association Française de Normalisation, Paris.
Alemayehu N, Becker HC (2001). Variation and inheritance of erucic acid content in Brassica carinata germplasm collections from Ethiopia. Plant Breed. 120:331-335.
Anonymous (2005). Norme alimentaire pour huile et graisse. Commission du codex alimentaire /FAO/OMS; CODEX-STAN 210. 16 p.
Anonymous (2009). Etude sur la filière porteuse d’emploi «palmier à huile». MINEFOP, Yaoundé. 96 p.
Desassis A (1957). Palm oil acidification. Oléagineux 12:525-534 Faosat (2014). http://faostat3.fao.org/download/Q/QC/F (accessed on
20/01/2015). Hamdan YAS, Perez-VB, Fernandez-Martinez JM, Velasco L (2008).
Inheritance of very high linoleic acid content and its relationship with nuclear male sterility in safflower. Plant Breed. 127:507-509.
Likeng-Li-Ngue et al. 1845 Hiroshi I, Shigeki M, Nobuhiro K, Naozumi M, Sae T, Kazuyuki A
(2012). Mode of inheritance in fruit acidity in apple analyses with a mixed model of a major gene and polygenes using large complex pedigree. Plant Breed. 131:322-328.
Jacquemard JC (2011). Le palmier à huile. Editions Quæ-CTA-Presses Agronomiques de Gembloux, Versailles-Wageningen-Gembloux, 240 p.
Morcillo F, Cros D, Billote N, Ngando EGF, Domonhéro H, Pizot M, Cuéllar T, Espéout S, Dhouib R, Bourgis F, Claverol S, Tranbarger TJ, Nouy B, Arondel V (2013). Improving palm oil quality through identification and mapping of the lipase causing oil deterioration. Nat. Commun. 4:2160.
Ngando EGF, Dhouib R,Carriere F, Amvan Zollo PH (2006). Assaying lipase activity from oil palm fruit (Elaeis guineensis Jacq.) mesocarp. Plant Physiol. Biochem. 44:611-617.
Ngando EGF, Koona P, Nouy B, Zok S, CarrièreF, AmvanZollo PH, Arondel V (2008). Identification of oil palm breeding lines producing oils with low acidity. Eur. J. Lipid Sci. Technol. 110:505-509.
Pandey S, Kabdal M, Tripathi MK (2013). Study of Inheritance of Erucic acid in Indian Mustard (Brassica juncea L. Czern & Coss). Octa J. Biosci. 1(1):77-84.
Perez-VB, Garces R, Fernandez-Martinez JM (2002). Inheritance of high palmitic acid content in the sunflower mutant CAS-12 and its relationship with high oleic content. Plant Breed. 121:49-56.
Sambantharmurthi R, Sundram K, Yew AT (2000). Chemistry and biochemistry of palm oil. Prog. Lipid Res. 39:507-558.
SoyStats (2016). World Vegetable Oil Consumption 2015. http://www.soystats.com/wp-content/uploads/SoyStats_2016.pdf (accessed on 5/07/2016).
SoyStats (2007). World Vegetable Oil Consumption 2006. http://www.soystats.com/2007/default.htm. (accessed on 13/01/2010).
Velasco L, Fernandez-Martınez JM, De Haro A (2002). Inheritance of reduced linolenic acid content in the Ethiopian mustard mutant N2-4961. Plant Breed. 121:263-265.
Velasco L, Fernandez-Martınez JM, De Haro A (2003). Inheritance of Increased Oleic Acid Concentration in High-Erucic Acid in Ethiopian Mustard. Crop Sci.43:106-109.
Yew AT, Kum W, Chak KL, Kum SL (2010). Imaging technique for quantification of oil palm fruit ripeness and oil content. Eur. J. Lipid Sci. Technol. 112:838-843.
Yuste-Lisbona FJ, Lopez-Sese AI, Gomez-Guillamo NML (2010). Inheritance of resistance to races 1, 2 and 5 of powdery mildew in the melon TGR-1551. Plant Breed. 129:72-75.
Vol. 15(34), pp. 1846-1854, 24 August, 2016
DOI: 10.5897/AJB2016.15438
Article Number: 918A6BB60173
ISSN 1684-5315
Copyright © 2016
Author(s) retain the copyright of this article
http://www.academicjournals.org/AJB
African Journal of Biotechnology
Full Length Research Paper
Functional properties of milk drinks flavored with mangaba pulp and enriched with passion fruit
bark flour
Lígia Campos de Moura1, Marco Antônio Pereira da Silva1*, Geovana Rocha Plácido1, Márcio Caliari2, Diene Gonçalves Souza1, Jéssica Leal Freitas e Souza1, Juliana Aparecida Célia1, Kênia Borges de Oliveira1, Karen Martins Leão1 and Luiz Eduardo Costa do Nascimento1
1Instituto Federal Goiano Campus Rio Verde – Brazil.
2Universidade Federal de Goias – Brazil.
Received 28 April, 2016; Accepted 25 July, 2016
Dairy foods including dairy based drinks play an important role in human nutrition. The flour of the passion fruit peel has high potential for use in the enrichment dairy drinks improving the nutritional and technological qualities besides an alternative to reduce waste by-products in the food industry. Thus, this study aimed to evaluate the physical and chemical parameters, texture, color, chemical composition, scanning electron microscopy (SEM), phenolic compounds, antioxidant, viability of lactic bacteria and sensory profile of milk drinks added mangaba pulp and passion fruit peel flour of the (FPFP). Four milk drinks formulations were processed with concentrations of 5; 10; 15 and 20% mangaba pulp and 1% of passion fruit peel flour. The dairy beverages showed results physical and chemical, microbiological and sensory consistent with those described in the literature and as expected, with a high sensory acceptability of milk drinks with increased by 10% mangaba pulp. Key words: Color, fermented milk, scanning electron microscopy (SEM), viability.
INTRODUCTION The Brazilian cerrado has a large variety of exotic fruit species with potential interest to food industries and source of income for local people (Souza et al., 2012). Mangaba (Hancornia speciosa Gomes) is one of a fruit plant native to Brazil belonging to the Apocinaceas family, and found in various regions of the country, from the Northeastern coast to the cerrado region of Mid-Western, Northern and Southeastern Brazil (Vieira-Neto,
1994). In recent years, there has been an increased
consumption of fruit-based drinks associated with a reduction in the consumption of fresh fruits (Zulueta et al., 2007). The development of new products such as milk drink is among the various forms of use of milk whey from the dairy industry (Oliveira, 2006) by including fruit pulp and waste. In this context, the functional properties of
*Corresponding author. E-mail: [email protected].
Author(s) agree that this article remains permanently open access under the terms of the Creative Commons Attribution
License 4.0 International License
passion fruit bark have been studied in recent years, especially those related to the content of fiber, calcium and sodium, with values higher than those of fruit pulp; the iron content also stands out, allowing the use of passion fruit bark as a source of fiber and minerals (Cordova et al., 2005).
The development of milk drinks flavored with mangaba and enriched with passion fruit bark flour can be an alternative to add functional value to products and become more attractive to consumers. Thus, this study aimed to evaluate the physicochemical profile, texture, color, scanning electron microscopy, total phenolic content, antioxidant activity, viability of lactic acid bacteria and sensory profile of milk drinks flavored with mangaba and enriched with passion fruit bark flour. MATERIALS AND METHODS Frozen mangaba pulp (Hancornia speciosa Gomes) was purchased and packed in polyethylenetube directly from Jatobá Farm, municipality of Caçu, GO, Brazil.with the following geographical coordinates 18° 33'S and 51° 08'W.
A total of 7.2 L of milk were collected obtained from the Dairy Cattle Sector of the Instituto Federal Goiano, Rio Verde Campus, and transported to the Laboratory of Animal Products for the processing of fermented milk drinks. A total of 4.8 L of Mozzarella cheese whey was collected from dairy industry in Rio Verde, GO, Brazil. The whey were then packed in aseptic packages and transported to the laboratory of Animal Products for the processing of 12 L of milk drinks. Passion fruit bark flour For drying of passion fruit bark, 1 kg of previously ground bark was used. Drying was carried out by positioning the tray with dimensions of 800 mm x 600 mm at the central region of the drying oven with air circulating and renewal model MA 035 Marconi® at temperature of 60°C and air flow of 7.728 kg / m
2.s. After drying, passion fruit
bark flour was obtained by three millings in Diogomaq® multipurpose grinder and conditioned at room temperature in low density polyethylene bags for later use. Processing of milk drinks Milk drinks were processed in the ratio of 60% milk + 40% whey (3 L for each treatment), with the addition of 10% sucrose. Subsequently, the mixture was submitted to heat treatment at 90°C / 3 min of pasteurization. After pasteurization, temperature was adjusted to 42°C of glass-house with the addition of starter culture composed of Lactobacillus acidophilus LA-5®, Bifidobactrium lactis Bb-12® and Streptococcus thermophilus were added in the amount of 400 mg for each repetition. The milk were subjected to fermentation at temperature of 42°C (BOD Quimis® model Q-315) to pH 4.5. After milk drink coagulation, BOD temperature was reduced to 20°C to break the clot under aseptic conditions with a glass rod in circular movement for one minute. Then, 1% passion fruit bark flour and various proportion of mangaba pulp: 1 –Milk drinkadded of 5% mangaba pulp; Treatment 2 - Milk drink added of 10% mangaba pulp; Treatment 3 - Milk drink added of 15% mangaba pulp and Treatment 4 - Milk drink added of 20% mangaba pulp. Milkdrinks were stored in sealed glass bottles under refrigeration at 5°C until time of analyses.
de Moura et al. 1847 Physicochemical assessment, color and texture profile Milk, milk whey and milk drinks were analyzed for pH and titratable acidity. pH was measured using digital bench potentiometer - model LUCA® - 210P and titratable acidity was determined according to Brasil (2006).
The moisture content of the milk drinks was determined at 105°C for a period of 24 h using an oven with forced air circulation as proposed by AOAC (1995). The total ash contents were determined at 550°C for about 10 h by the total carbonization of the organic matter in a muffle furnace (Bravac, M2) as described by AOAC (1995). For the crude protein analysis, total nitrogen was determined by micro-Kjeldahl method for milk drink treatments according to official method No. 960.52 of AOAC International (1995). Total nitrogen was converted into crude protein using factor 6.38 as a. The equipment used was digester block (Tecnal, TE-0070) and nitrogen distiller (Tecnal, TE-0363). Fat was assessed using the Gerber method.
Evaluations of the antioxidant activity of milk drinks were determined according to methodology described by Rufino et al. (2007). The total phenolic content present in the ethanolic extract of mangaba fruit was determined by spectrophotometry in the visible region using the Folin-Ciocalteu method (Sousa et al., 2007).
Instrumental color parameters (L *, a * and b *) of milk drink and passion fruit bark flour samples were analyzed in HunterLab colorimeter model Color Flex EZ at the Laboratory of Postharvest of Plant Products, Federal Institute of Goiás, Rio Verde Campus, GO, Brazil.The L * values (lightness or brightness) ranged from black (0) to white (100), and chroma values a * ranged from green (-60) to red (+60) and chroma b * values ranged from blue to yellow, that is, from -60 to +60, were used to determine the Hue color index (hue angle) for milk drink, these parameters were used in calculations to determine the Hue color index (hue angle), which defines color intensity. Hardness, peak stress, adhesive strength, adhesiveness and resilience were determined in Brookield® texturometer model CT3, load cell of 25 kg at the Laboratory of Postharvest of Plant Products upon compression test at 30%, trigger of 5 g, speed of 1 mm / s and probe tip TA4 / 100. All analyses were performed each seven days of storage for one month in triplicate for each treatment with three replicates. Scanning electron microscopy (SEM) SEM of fruit pulp and milk drinks added of mangaba and enriched with passion fruit bark flour was held at the Multi-User Laboratory of High Resolution Microscopy, Federal University of Goiás with microscope Jeol®, JSM-6610, equipped with EDS, Thermo Scientific NSS Spectral Imaging. Samples were previously lyophilized (Enterprise II / Terroni®), defatted by extraction in Soxhlet method No. 1.122 (IUPAC, 1979) and covered with ultrathin gold layer (electrically conductive material), allowing the SEM operating principle by emission of electron bundles through a tungsten filament. Count of viable lactic acid bacteria and coliforms Analyses of total coliforms, Escherichia coli (Brasil, 2003) and estimation of viable lactic acid bacteria (Silva et al., 1997) were performed at the Laboratory of Food Microbiology (IF Goiano) at storage times of 1, 8, 15, 22 and 29 days. About 25 g of fermented fermented milk were weighed and added to 225 ml of sterile peptone water and after homogenization, the solution was diluted to concentrations of 10
-1, 10
-2, 10
-3, 10
-4, 10
-5 and 10
-6.
The enrichment step for total coliform count with differential for E. coli used 1 ml aliquots of concentrations of 10
-1, 10
-2 and 10
-3,
which were transferred into test tubes containing 10 ml of Lauryl
1848 Afr. J. Biotechnol. sulfate broth (LST) and incubated at 35°C for 24 h. Then, the presence of coliforms was confirmed using Brilliant Green Bile Broth (BG) incubated at 35°C for 24 h and in E. coli broth (EC) incubated for 24 h in water bath at 45°C.
The count of lactic acid bacteria was carried out using MRS culture medium. About 25 g of milk drink was added to 225 mL of 0.1% peptone water. After homogenization, the samples were serially diluted (10
-1 to 10
-7) and 0.1 mL of the liquates from
appropriate dilution were inoculated into pre-dried MRS Agar sterilized petri dish in duplicate. After then the inoculated plates were addition of the culture medium (with over layer) and solidification, dishes were incubated at 35°C for three days. After this period, count of dishes of the same dilution that contained between 25 and 250 colonies was performed with the aid of colony counter. Sensory analysis To perform the sensory analysis, the “Development of fermented milk drinks flavored with cerrado fruits and enriched with passion fruit bark flour” project was submitted to the Ethics Committee on Research Involving Human of the Instituto Federal Goiano and was approved under protocol No. 020/2013.
Sensory analysis was performed by 50 untrained panelists; the model used for the analysis was the acceptance test for comparison of milk drinks enriched with passion fruit bark flour and different mangaba pulp concentrations. The sensory evaluation was based on scores given by judges through a 9-point hedonic scale, where value one represents" disliked extremely" and nine "liked extremely", in which flavor, color, aroma, acidity, viscosity and appearance of milk drinks were judged. Along with overall appearance of the product, purchase intent for each sample was also analyzed. Sensory analysis was performed in individual booths at the Laboratory of Sensory Analysis, Instituto Federal Goiano, Rio Verde Campus, GO, Brazil. The four samples were coded with three-digit numbers and delivered under white light in 50 ml white cups to each of the panelists.
Statistical analysis The sensory analysis of milk drinks flavored with mangaba and enriched with passion fruit bark flour, proximate composition, color and texture parameters were evaluated in a fully randomized design using analysis of variance and the Tukey test at 5% probability and the Statistical SISVAR® software, according to Ferreira (2010). RESULTS AND DISCUSSION Table 1 shows the mean values and standard deviation of the physicochemical analysis of milk and whey used in the processing of fermented milk drinks. The fat and protein content of the milk in percentage in the present study were 4.6 and 3.08 respectively. The milk product used in this study was showed a titrable acidity of 0.15 g/100 mL and pH value of 6.72.
The physicochemical composition values of milk are compatible with limits established by Brazilian milk quality legislation (Brasil, 2011), with fat and protein values above 3.0 and 2.9%, respectively, freezing point below of -0.535° H and acidity ranging from 0.14 g of lactic acid / 100 ml to 0.18 g of lactic acid / 100 ml.
Table 1. pH, fat, protein, titratable acidity of milk drinks flavored with mangaba and enriched with passion fruit bark flour expressed in Mean ± standard deviation.
Parameter Milk Milk Whey
Fat (%) 4.60 ±0.00 0.40 ±0.07
Protein (%) 3.08 ±0.01 2.66 ±0.04
Acidity (g of lactic acid/100 mL) 0.15 ±0.01 0.11 ±0.00
pH 6.72 ±0.01 6.44 ±0.01
Different results were observed by Santos (2011), who evaluated milk quality. The authors found compliance with legislation regarding fat content; however, protein values, freezing point and titratable acidity of pasteurized milk were in disagreement with current legislation. The average pH value of milk in this study is in agreement with the pH results recorded for (6.32 to 6.75) by Raimondo et al. (2009).
The physicochemical parameter recorded for milk whey (fat, 0.4%; protein, 2.66%; acidity, 0.11 g of lactic acid/100 mL and pH, 6.44) in the present study (Table 1) is comparable with physicochemical characteristics studied for milk whey by Teixeira and Fonseca (2008). The average pH value of milk in this study corroborates results by Raimondo et al. (2009) with variations from 6.32 to 6.75.
Comparing the physicochemical characteristics of whey used for obtaining milk drinks with the study by Teixeira and Fonseca (2008), it was possible to verify fat results of 0.77 and 0.68% protein of 0.84 and 0.80%, freezing point of -0.565 and -0.555° H and H°, titratable acidity of 13.17° D and 12.49° D and pH 6.19 and 6.3, for mozzarella and fresh cheeses, respectively. Thus, the results of this study indicated skimming of milk whey and excessive loss of casein from cheese mass to whey. Freezing point, titratable acidity and pH were similar to values presented by Teixeira and Fonseca (2008), and in this study, acidity was slightly lower and pH was higher.
The addition of mangaba pulp increased acidity and reduced the pH of milk drinks (Table 2). A similar situation was reported by Kempka et al. (2008) and Kruger et al. (2008) with increased acidity and decreased pH during storage of milk drinks, which was associated to the action of L. acidophilus, known for its great capacity to produce acid during fermentation.
Table 2 shows increasing the mangaba pulp concentration in the formulation of milk drinks with passion fruit bark flour can be related to the study by Matta et al. (2012), who found that the medium would be enhanced with higher concentration of oatmeal for multiplication and production of lactic acid by lactic acid bacteria. The titratable acidity values of the milk drink formulations were compatible with the range from 0.6 g of lactic acid / 100 g to 2.0 g lactic acid / 100 g reported by Brasil (2007). Moisture and total solids contents were significantly different (p> 0.05) only in milk drink with 20%
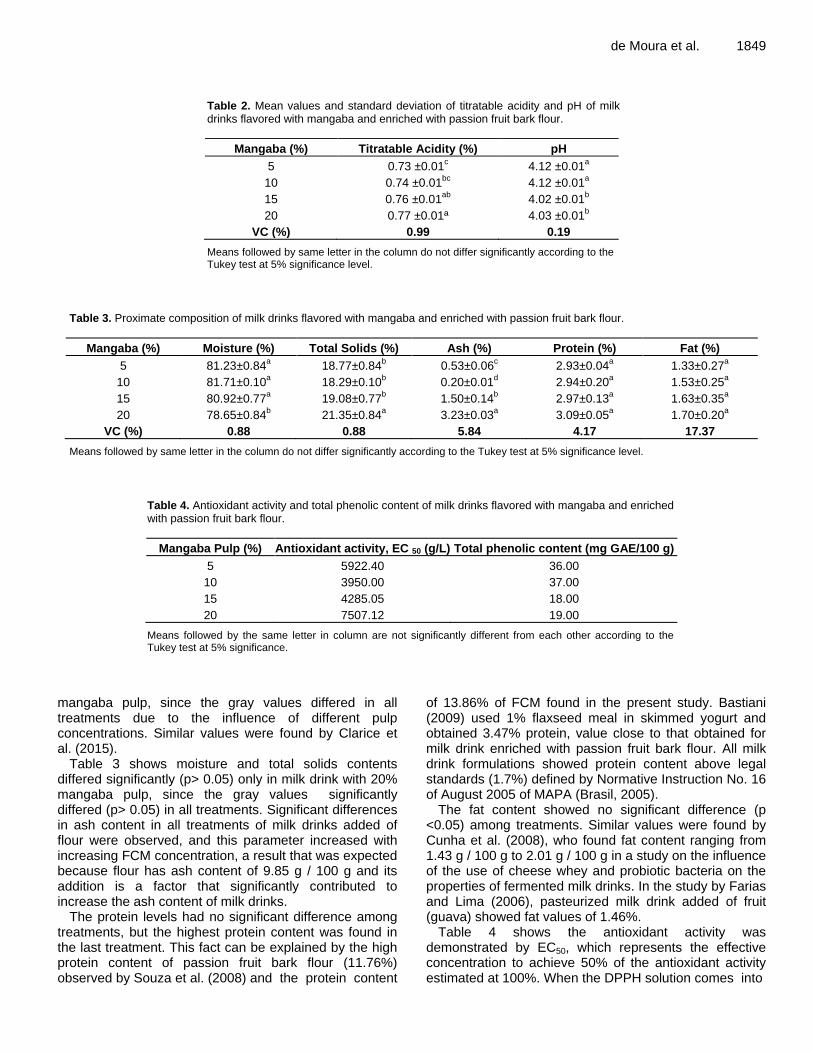
de Moura et al. 1849
Table 2. Mean values and standard deviation of titratable acidity and pH of milk drinks flavored with mangaba and enriched with passion fruit bark flour.
Mangaba (%) Titratable Acidity (%) pH
5 0.73 ±0.01c 4.12 ±0.01
a
10 0.74 ±0.01bc
4.12 ±0.01a
15 0.76 ±0.01ab
4.02 ±0.01b
20 0.77 ±0.01ª 4.03 ±0.01b
VC (%) 0.99 0.19
Means followed by same letter in the column do not differ significantly according to the Tukey test at 5% significance level.
Table 3. Proximate composition of milk drinks flavored with mangaba and enriched with passion fruit bark flour.
Mangaba (%) Moisture (%) Total Solids (%) Ash (%) Protein (%) Fat (%)
5 81.23±0.84a 18.77±0.84
b 0.53±0.06
c 2.93±0.04
a 1.33±0.27
a
10 81.71±0.10a 18.29±0.10
b 0.20±0.01
d 2.94±0.20
a 1.53±0.25
a
15 80.92±0.77a 19.08±0.77
b 1.50±0.14
b 2.97±0.13
a 1.63±0.35
a
20 78.65±0.84b 21.35±0.84
a 3.23±0.03
a 3.09±0.05
a 1.70±0.20
a
VC (%) 0.88 0.88 5.84 4.17 17.37
Means followed by same letter in the column do not differ significantly according to the Tukey test at 5% significance level.
Table 4. Antioxidant activity and total phenolic content of milk drinks flavored with mangaba and enriched with passion fruit bark flour.
Mangaba Pulp (%) Antioxidant activity, EC 50 (g/L) Total phenolic content (mg GAE/100 g)
5 5922.40 36.00
10 3950.00 37.00
15 4285.05 18.00
20 7507.12 19.00
Means followed by the same letter in column are not significantly different from each other according to the Tukey test at 5% significance.
mangaba pulp, since the gray values differed in all treatments due to the influence of different pulp concentrations. Similar values were found by Clarice et al. (2015).
Table 3 shows moisture and total solids contents differed significantly (p> 0.05) only in milk drink with 20% mangaba pulp, since the gray values significantly differed (p> 0.05) in all treatments. Significant differences in ash content in all treatments of milk drinks added of flour were observed, and this parameter increased with increasing FCM concentration, a result that was expected because flour has ash content of 9.85 g / 100 g and its addition is a factor that significantly contributed to increase the ash content of milk drinks.
The protein levels had no significant difference among treatments, but the highest protein content was found in the last treatment. This fact can be explained by the high protein content of passion fruit bark flour (11.76%) observed by Souza et al. (2008) and the protein content
of 13.86% of FCM found in the present study. Bastiani (2009) used 1% flaxseed meal in skimmed yogurt and obtained 3.47% protein, value close to that obtained for milk drink enriched with passion fruit bark flour. All milk drink formulations showed protein content above legal standards (1.7%) defined by Normative Instruction No. 16 of August 2005 of MAPA (Brasil, 2005).
The fat content showed no significant difference (p <0.05) among treatments. Similar values were found by Cunha et al. (2008), who found fat content ranging from 1.43 g / 100 g to 2.01 g / 100 g in a study on the influence of the use of cheese whey and probiotic bacteria on the properties of fermented milk drinks. In the study by Farias and Lima (2006), pasteurized milk drink added of fruit (guava) showed fat values of 1.46%.
Table 4 shows the antioxidant activity was demonstrated by EC50, which represents the effective concentration to achieve 50% of the antioxidant activity estimated at 100%. When the DPPH solution comes into
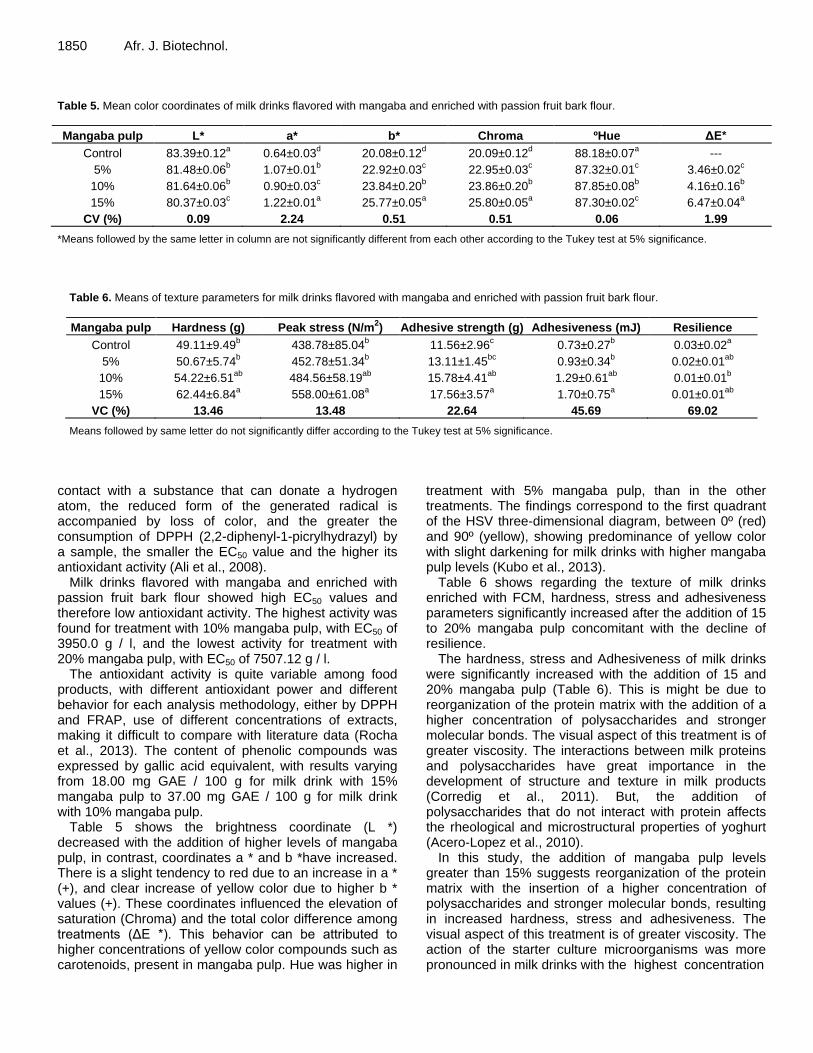
1850 Afr. J. Biotechnol. Table 5. Mean color coordinates of milk drinks flavored with mangaba and enriched with passion fruit bark flour.
Mangaba pulp L* a* b* Chroma ºHue ΔE*
Control 83.39±0.12a 0.64±0.03
d 20.08±0.12
d 20.09±0.12
d 88.18±0.07
a ---
5% 81.48±0.06b 1.07±0.01
b 22.92±0.03
c 22.95±0.03
c 87.32±0.01
c 3.46±0.02
c
10% 81.64±0.06b 0.90±0.03
c 23.84±0.20
b 23.86±0.20
b 87.85±0.08
b 4.16±0.16
b
15% 80.37±0.03c 1.22±0.01
a 25.77±0.05
a 25.80±0.05
a 87.30±0.02
c 6.47±0.04
a
CV (%) 0.09 2.24 0.51 0.51 0.06 1.99
*Means followed by the same letter in column are not significantly different from each other according to the Tukey test at 5% significance.
Table 6. Means of texture parameters for milk drinks flavored with mangaba and enriched with passion fruit bark flour.
Mangaba pulp Hardness (g) Peak stress (N/m2) Adhesive strength (g) Adhesiveness (mJ) Resilience
Control 49.11±9.49b 438.78±85.04
b 11.56±2.96
c 0.73±0.27
b 0.03±0.02
a
5% 50.67±5.74b 452.78±51.34
b 13.11±1.45
bc 0.93±0.34
b 0.02±0.01
ab
10% 54.22±6.51ab
484.56±58.19ab
15.78±4.41ab
1.29±0.61ab
0.01±0.01b
15% 62.44±6.84a 558.00±61.08
a 17.56±3.57
a 1.70±0.75
a 0.01±0.01
ab
VC (%) 13.46 13.48 22.64 45.69 69.02
Means followed by same letter do not significantly differ according to the Tukey test at 5% significance.
contact with a substance that can donate a hydrogen atom, the reduced form of the generated radical is accompanied by loss of color, and the greater the consumption of DPPH (2,2-diphenyl-1-picrylhydrazyl) by a sample, the smaller the EC50 value and the higher its antioxidant activity (Ali et al., 2008).
Milk drinks flavored with mangaba and enriched with passion fruit bark flour showed high EC50 values and therefore low antioxidant activity. The highest activity was found for treatment with 10% mangaba pulp, with EC50 of 3950.0 g / l, and the lowest activity for treatment with 20% mangaba pulp, with EC50 of 7507.12 g / l.
The antioxidant activity is quite variable among food products, with different antioxidant power and different behavior for each analysis methodology, either by DPPH and FRAP, use of different concentrations of extracts, making it difficult to compare with literature data (Rocha et al., 2013). The content of phenolic compounds was expressed by gallic acid equivalent, with results varying from 18.00 mg GAE / 100 g for milk drink with 15% mangaba pulp to 37.00 mg GAE / 100 g for milk drink with 10% mangaba pulp.
Table 5 shows the brightness coordinate (L *) decreased with the addition of higher levels of mangaba pulp, in contrast, coordinates a * and b *have increased. There is a slight tendency to red due to an increase in a * (+), and clear increase of yellow color due to higher b * values (+). These coordinates influenced the elevation of saturation (Chroma) and the total color difference among treatments (ΔE *). This behavior can be attributed to higher concentrations of yellow color compounds such as carotenoids, present in mangaba pulp. Hue was higher in
treatment with 5% mangaba pulp, than in the other treatments. The findings correspond to the first quadrant of the HSV three-dimensional diagram, between 0º (red) and 90º (yellow), showing predominance of yellow color with slight darkening for milk drinks with higher mangaba pulp levels (Kubo et al., 2013).
Table 6 shows regarding the texture of milk drinks enriched with FCM, hardness, stress and adhesiveness parameters significantly increased after the addition of 15 to 20% mangaba pulp concomitant with the decline of resilience.
The hardness, stress and Adhesiveness of milk drinks were significantly increased with the addition of 15 and 20% mangaba pulp (Table 6). This is might be due to reorganization of the protein matrix with the addition of a higher concentration of polysaccharides and stronger molecular bonds. The visual aspect of this treatment is of greater viscosity. The interactions between milk proteins and polysaccharides have great importance in the development of structure and texture in milk products (Corredig et al., 2011). But, the addition of polysaccharides that do not interact with protein affects the rheological and microstructural properties of yoghurt (Acero-Lopez et al., 2010).
In this study, the addition of mangaba pulp levels greater than 15% suggests reorganization of the protein matrix with the insertion of a higher concentration of polysaccharides and stronger molecular bonds, resulting in increased hardness, stress and adhesiveness. The visual aspect of this treatment is of greater viscosity. The action of the starter culture microorganisms was more pronounced in milk drinks with the highest concentration
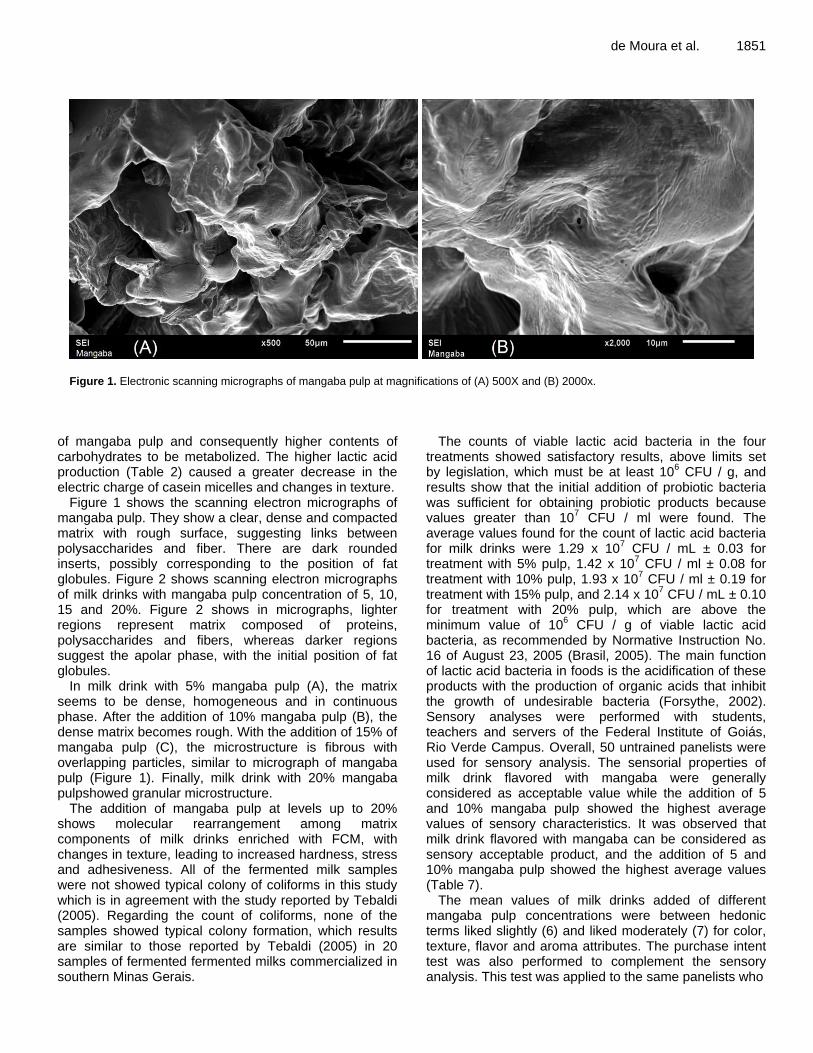
de Moura et al. 1851
FIGURE 1 - Electronic scanning micrographs of mangaba pulp at magnifications of (A)
500X and (B) 2000x.
Figure 1. Electronic scanning micrographs of mangaba pulp at magnifications of (A) 500X and (B) 2000x.
of mangaba pulp and consequently higher contents of carbohydrates to be metabolized. The higher lactic acid production (Table 2) caused a greater decrease in the electric charge of casein micelles and changes in texture.
Figure 1 shows the scanning electron micrographs of mangaba pulp. They show a clear, dense and compacted matrix with rough surface, suggesting links between polysaccharides and fiber. There are dark rounded inserts, possibly corresponding to the position of fat globules. Figure 2 shows scanning electron micrographs of milk drinks with mangaba pulp concentration of 5, 10, 15 and 20%. Figure 2 shows in micrographs, lighter regions represent matrix composed of proteins, polysaccharides and fibers, whereas darker regions suggest the apolar phase, with the initial position of fat globules.
In milk drink with 5% mangaba pulp (A), the matrix seems to be dense, homogeneous and in continuous phase. After the addition of 10% mangaba pulp (B), the dense matrix becomes rough. With the addition of 15% of mangaba pulp (C), the microstructure is fibrous with overlapping particles, similar to micrograph of mangaba pulp (Figure 1). Finally, milk drink with 20% mangaba pulpshowed granular microstructure.
The addition of mangaba pulp at levels up to 20% shows molecular rearrangement among matrix components of milk drinks enriched with FCM, with changes in texture, leading to increased hardness, stress and adhesiveness. All of the fermented milk samples were not showed typical colony of coliforms in this study which is in agreement with the study reported by Tebaldi (2005). Regarding the count of coliforms, none of the samples showed typical colony formation, which results are similar to those reported by Tebaldi (2005) in 20 samples of fermented fermented milks commercialized in southern Minas Gerais.
The counts of viable lactic acid bacteria in the four treatments showed satisfactory results, above limits set by legislation, which must be at least 10
6 CFU / g, and
results show that the initial addition of probiotic bacteria was sufficient for obtaining probiotic products because values greater than 10
7 CFU / ml were found. The
average values found for the count of lactic acid bacteria for milk drinks were 1.29 x 10
7 CFU / mL ± 0.03 for
treatment with 5% pulp, 1.42 x 10⁷ CFU / ml ± 0.08 for
treatment with 10% pulp, 1.93 x 10⁷ CFU / ml ± 0.19 for
treatment with 15% pulp, and 2.14 x 10⁷ CFU / mL ± 0.10
for treatment with 20% pulp, which are above the minimum value of 10
6 CFU / g of viable lactic acid
bacteria, as recommended by Normative Instruction No. 16 of August 23, 2005 (Brasil, 2005). The main function of lactic acid bacteria in foods is the acidification of these products with the production of organic acids that inhibit the growth of undesirable bacteria (Forsythe, 2002). Sensory analyses were performed with students, teachers and servers of the Federal Institute of Goiás, Rio Verde Campus. Overall, 50 untrained panelists were used for sensory analysis. The sensorial properties of milk drink flavored with mangaba were generally considered as acceptable value while the addition of 5 and 10% mangaba pulp showed the highest average values of sensory characteristics. It was observed that milk drink flavored with mangaba can be considered as sensory acceptable product, and the addition of 5 and 10% mangaba pulp showed the highest average values (Table 7).
The mean values of milk drinks added of different mangaba pulp concentrations were between hedonic terms liked slightly (6) and liked moderately (7) for color, texture, flavor and aroma attributes. The purchase intent test was also performed to complement the sensory analysis. This test was applied to the same panelists who
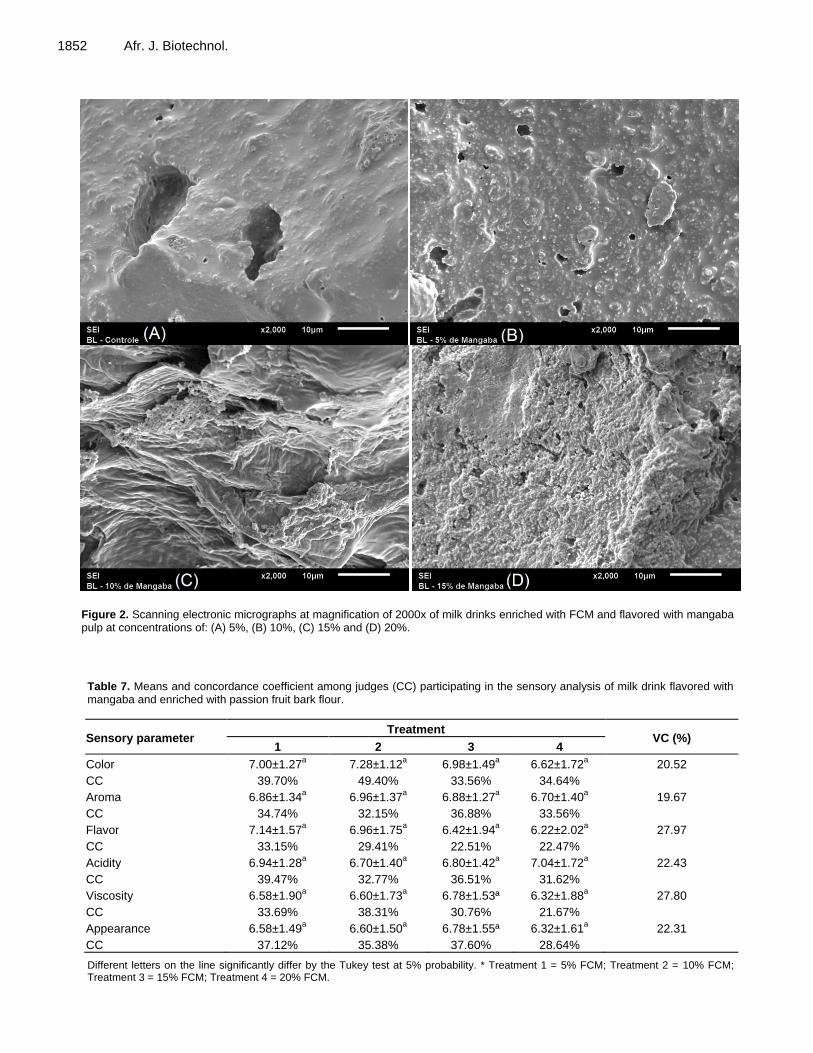
1852 Afr. J. Biotechnol.
FIGURE 2 - Scanning electronic micrographs at magnification of 2000x of milk drinks
enriched with FCM and flavored with mangaba pulp at concentrations of: (A) 5%, (B)
10%, (C) 15% and (D) 20%.
Figure 2. Scanning electronic micrographs at magnification of 2000x of milk drinks enriched with FCM and flavored with mangaba pulp at concentrations of: (A) 5%, (B) 10%, (C) 15% and (D) 20%.
Table 7. Means and concordance coefficient among judges (CC) participating in the sensory analysis of milk drink flavored with mangaba and enriched with passion fruit bark flour.
Sensory parameter Treatment
VC (%) 1 2 3 4
Color 7.00±1.27a 7.28±1.12
a 6.98±1.49
a 6.62±1.72
a 20.52
CC 39.70% 49.40% 33.56% 34.64%
Aroma 6.86±1.34a 6.96±1.37
a 6.88±1.27
a 6.70±1.40
a 19.67
CC 34.74% 32.15% 36.88% 33.56%
Flavor 7.14±1.57a 6.96±1.75
a 6.42±1.94
a 6.22±2.02
a 27.97
CC 33.15% 29.41% 22.51% 22.47%
Acidity 6.94±1.28a 6.70±1.40
a 6.80±1.42
a 7.04±1.72
a 22.43
CC 39.47% 32.77% 36.51% 31.62%
Viscosity 6.58±1.90a 6.60±1.73
a 6.78±1.53ª 6.32±1.88
a 27.80
CC 33.69% 38.31% 30.76% 21.67%
Appearance 6.58±1.49a 6.60±1.50
a 6.78±1.55ª 6.32±1.61
a 22.31
CC 37.12% 35.38% 37.60% 28.64%
Different letters on the line significantly differ by the Tukey test at 5% probability. * Treatment 1 = 5% FCM; Treatment 2 = 10% FCM; Treatment 3 = 15% FCM; Treatment 4 = 20% FCM.
performed other tests. About 18% of untrained panelists reported consuming yogurt every day, followed by 52% who consumed once a week, 8% who consumed every 15 days and 22% who consumed once a month. It was observed that most panelists consumed yogurt at least once a week. It could be observed that for the four milk drinks analyzed in this study, panelists (88%) showed that they would buy yogurt flavored with mangaba pulp. Among non-buyers, a small portion (12%) would not buy if it were available in market. According to the global acceptance, the results were not significant, but in relation to the purchase intent, panelists showed preferences.
Sensory tests are of great importance in assisting the industry in developing new products or control them in order to achieve greater acceptance by the final consumer (Nogueira, 2004). Similar to the results found in this study, other authors reported good acceptance of products added of mangaba pulp.
Rocha et al. (2008) evaluated yogurts added of mangaba sweet and obtained 6.91 on the FACT scale (I would eat it frequently). Garcia and Travassos (2012) developed goat milk fermented with umbu sweet and found similar values, where the average values of parameters evaluated ranged from 6.07 to 7.17. Milk drinks flavored with mangaba proved to be an attractive product due to their sensory characteristics, showing technological potential, especially when related to the aspect of adding value to a cerrado product. Conclusion Milk drink flavored with mangaba and enriched with passion fruit bark flour showed physicochemical, microbiological and sensory results consistent with those described in literature and as expected, had high sensory acceptance. Conflict of Interests The authors have not declared any conflict of interests. ACKNOWLEDGEMENTS The authors would like to thank the Fundação de Amparo a Pesquisa do Estado de Goiás (FAPEG), Coordenação de Aperfeiçoamento de Pessoal de Nível Superior (CNPq), Conselho Nacional de Desenvolvimento Científico e Tecnológico (CAPES) and Financiadora de Estudos e Projetos (FINEP) for funding the scientific
REFERENCES
Acero-Lopez A, Alexander M, Corredig M (2010). Diffusing wave
spectroscopy and rheological studies of rennet-induced gelation of
de Moura et al. 1853
skim milk in the presence of pectin and kappa-carrageenan. Int. Dairy J. 20(5):328-335.
Ali SS, Kasoju N, Luthra A, Singh A, Sharanabasava H, Sahu A, Bora U (2008) Indian medicinal herbs as sources of antioxidants. Food Res. Int. 41:1-15.
AOAC (1995). Association of Official Agricultural Chemists. 16 ed. Washington, DC. 2:1094.
Bastiani MID (2009). Iogurte adicionado de concentrado proteico de soro de leite e farinha de linhaça: desenvolvimento, qualidade nutricional e sensorial. [tese de doutorado]. Viçosa (MG): Universidade Federal de Viçosa.
Brasil (2003). ministério da agricultura pecuária e abastecimento. Instrução Normativa Nº. 62, DE 26 DE AGOSTO DE 2003. Oficializa os Métodos Analíticos Oficiais para Análises Microbiológicas para Controle de Produtos de Origem Animal e Água. Publicado no Diário Oficial da União de 18 set. 2003.
Brasil (2005). Ministério da Agricultura, Pecuária e Abastecimento. Gabinete do Ministro. Instrução Normativa nº16, de 23 de agosto de 2005. Aprova o Regulamento Técnico de Identidade e Qualidade de Bebida Láctea. Diário Oficial da União, Brasília, DF, 24 ago. 2005, seção 1: 7.
Brasil (2006). Ministério da Agricultura, Pecuária e Abastecimento. Secretaria de Defesa Agropecuária. Instrução Normativa n° 68, de 12 de dezembro de 2006. Oficializa os Métodos Analíticos Oficiais Físico-Químicos, para Controle de Leite e Produtos Lácteos. Diário Oficial da União, Brasília, DF. Seção 1: 8.
Brasil (2007) Ministério da Agricultura, Pecuária e Abastecimento. Regulamento Técnico de Identidade e Qualidade de Leites Fermentados. Instrução Normativa nº 46 de 23 de outubro de 2007.
Brasil (2011). Instrução Normativa n. 62, de 29 de dezembro de 2011. Diário Oficial da República Federativa do Brasil. Brasília, seção I: 8.
Cordova KRV, Gama TMMTB, Winter CMG, Neto GK, Freitas RJS (2005). Características Físico-Químicas da Casca do Maracujá Amarelo (Passiflra edulis Flavicarpa Degener) Obtida por Secagem. Boletim do Centro de Pesquisa de Processamento de Alimentos 23(2):221-230.
Corredig M, Sharafbafi N, Kristo E (2011). Polysaccharideprotein interactions in dairy matrices, control and design of structures. Food Hydrocoll. 25(8):1833-1841.
Cunha TM, Castro FP, Barreto PLM, Benedet HD, Prudêncio ES (2008). Avaliação físico-química, microbiológica e reológica de bebida láctea e leite fermentado adicionados de probióticos. Ciências Agrárias 29(1):103-116.
Farias FC, Lima LDS (2006). Elaboração de bebida pasteurizada a partir do soro do leite bovino com características funcionais e sabor fruta regional. Universidade do Estado do Pará, Paragominas, P.58.
Ferreira DF (2010). SisVar-programa estatístico. Versão 4(2):109-141. Forsythe SJ (2002). Microbiologia da segurança alimentar. Porto
Alegre: Ed. Artmed, P 423. Garcia RV, Travassos AER (2012). Leite fermentado caprino sabor
umbu: elaboração e aceitabilidade. Rev. Inst. Adolfo Lutz. 71(1):134-139.
IUPAC (1979). International Union of Pure and Applied Chemistry; Standard methods for the analysis of oils, fats and derivatives, 6th ed., Pergamon Press: Oxford.
Kempka AP, Krüger RL, Valduga E, Di Luccio M, Treichel H, Cansian R, Oliveira D, Valduga E (2008). Formulação de bebida láctea fermentada sabor pêssego utilizando substratos alternativos e cultura probiótica. Ciênc. Tecnol. Aliment. 28:170-177.
Kruger RL, kempka AP, Oliveira D, Valduga E, Cansian RL, Treichel H, Di Luccio M (2008). Desenvolvimento de um bebida láctea probiótica utilizando como substratos soro de leite e extrato hidrossolúvel de soja. Aliment. Nutr. 19:43-53.
Kubo MTK, Maus D, Xavier AAO, Mercadante AZ, Viotto WH (2013). Transference of lutein during cheese making, color stability, and sensory acceptance of prato cheese. Ciênc. Tecnol. Aliment. 33(1):81-88.
Matta CMB, Jurkiewicz CH, Kunigk L, Roson BM (2012). Influência de prebióticos e de farinha integral de aveia na sobrevivência de bactérias probióticas em bebida simbiótica à base de arroz. Alim. Nutr. 23:55-63.
Nogueira ALC (2004). Avaliação sensorial de água de coco (Cocos
1854 Afr. J. Biotechnol.
nucifera L) in natura e processada. Rev. Biol. Ciênc.Terra 4(2):1-5. Oliveira VM (2006). Formulação de bebida láctea fermentada com
diferentes concentrações de soro de queijo, enriquecida com ferro: caracterização físico-química, análises bacteriológicas e sensoriais. 2006. 78f. Dissertação (Mestrado em Medicina Veterinária) – Curso de Pós-graduação em Medicina Veterinária, Universidade Federal Fluminense, RJ.
Raimondo RFS, Brandespim FB, Prina APM, Birgel Júnior EH (2009). Avaliação do pH e da eletrocondutividade do leite e bovinos da raça Jersey durante o primeiro mês de lactação. Semina: Ciências Agrárias 30(2):447-456.
Rocha C, Cobucci RMA, Maitan VR, Silva OC (2008). Elaboração e avaliação de iogurte sabor frutos do cerrado. B.CEPPA 26:2.
Rocha MS, Figueiredo RW, Araújo MAM, Moreira-Araújo RSR (2013). Caracterização físico-química e atividade antioxidante (in vitro) de frutos do cerrado Piauiense. Rev. Bras. Frutic. 35(4):933-941.
Rufino MSM, Alves RE, Brito ES, Morais SM, Sampaio CG, Pérez-Jiménez J, Saura-Calixto F (2007). Comunicado técnico – metodologia científica: determinação da atividade antioxidante total em frutas pela captura do radical livre DPPH. Fortaleza: Embrapa, P. 4.
Santos MVA (2011). melhoria da qualidade do leite e a IN 51. Inforleite, São Paulo-SP.
Silva N, Junqueira VCA, Silveira NFA (1997). Manual de métodos de análise microbiológica de alimentos. São Paulo: Livraria Varela.
Sousa CMM, Silva HR, Vieira-JR GM, Ayres MCC, Costa CLS, Araújo DS, Cavalcante LCD, Barros EDS, Araújo PBM, Brandão MS, Chaves MH (2007). Fenóis totais e atividade antioxidante de cinco plantas medicinais. Quím. Nova 30(2):351-355.
Souza MWS, Ferreira TBO, Vieira IFR (2008). Composição centesimal e propriedades funcionais tecnológicas da farinha da casca do maracujá. Alim. Nutr.19(1):33-36.
Souza VR, Pereira PAP, Queiroz SVB, Carneiro JDS (2012).
Determination of bioactive compounds, antioxidant activity and chemical composition of Cerrado Brazilian Fruits. Food Chem. 134(1):381-386.
Tebaldi VMR (2005). Elaboração de bebida láctica de soro de ricota e estrato solúvel de soja. Dissertação (Mestrado em Microbiologia Agrícola). Universidade Federal de Lavras.
Teixeira VL, Fonseca LM (2008). Perfil físico-químico do soro de queijos mozarela e minas padrão produzidos em várias regiões do estado de Minas Gerais. Arq. Bras. Med. Vet. Zootec. 60:243-250.
Vieira-Neto RD (1994). Cultura da mangabeira. Circular Técnica, v.2. Aracaju: EMBRAPACPATC, 16 p.
Zulueta A, Esteve MJ, Frasquet I, Frígola A (2007). Vitamin C, vitamin A, phenolic compounds and total antioxidant capacity of new fruit juice and skim milk mixture beverages marketed in Spain. Food Chem. 103(4):1365-1374.

African Journal of
Biotechnology
Related Journals Published by Academic Journals
Biotechnology and Molecular Biology Reviews African Journal of Microbiology Research African Journal of Biochemistry Research African Journal of Environmental Science and Technology African Journal of Food Science African Journal of Plant Science Journal of Bioinformatics and Sequence Analysis International Journal of Biodiversity and Conservation