JOURNAL OF BIOTECHNOLOGY RESEARCH (JBR) 2012
200
Vol. 12, 2012 Journal of Biotechnology Research JBR JOURNAL OF BIOTECHNOLOGY RESEARCH (JBR) An international Journal devoted to basic and applied research of Genetic Engineering and Biotechnology Published By Arab Biotechnology Association (ABA), Federation of Arab Scientific Research Councils (FASRC) Volume 12 2012 www.arabbiotech.net
Transcript of JOURNAL OF BIOTECHNOLOGY RESEARCH (JBR) 2012
Vol. 12, 2012 Journal of Biotechnology Research JBR
JOURNAL OF BIOTECHNOLOGY RESEARCH
(JBR)
An international Journal devoted to basic and applied research of Genetic Engineering and Biotechnology
Published By
Arab Biotechnology Association (ABA),Federation of Arab Scientific Research Councils (FASRC)
Volume 12 2012
www.arabbiotech.net

Vol. 12, 2012 Journal of Biotechnology Research JBR
Journal of Biotechnology Research (JBR)
Chairman Prof. Mubarak Mohamed Ali Magzoub
Secretary General, Federation of Arab Scientific Research Council
Vice Chairman Prof. Samir Bejar
Biotechnology Center, Sfax, Tunisia
Editor-in-Chief Prof. Mahmoud M. Saker
Secretary General, Arab Association of Biotechnology, FASRC National Research Center, Egypt
Associate Editor Prof. Nabila Abdel Maksoud, Egypt
Prof. Lina Al Amir, Iraq

Vol. 12, 2012 Journal of Biotechnology Research JBR
EDITORIAL BOARD
Prof. Hamdy A. Moursy Egypt
Prof. Nasir Alkhalifah Saudi Arabia
Prof. Fawaz Al Azmaha Syria
Prof. Yasser Bakry Syria
Dr. Motasum Khlafallah Sudan
Prof. Abdel Rahman Al Ataway Bahrain
Prof. Ismaili Mohamed Morocco
Prof. Hala Ragab Egypt
Prof. Hanan Malakawi Jordan
Dr. Tarek Kapiel Egypt
Dr. Marmar El Siddig Sudan

Vol. 12, 2012 Journal of Biotechnology Research JBR
Vol. 12, 2012 Journal of Biotechnology Research JBR
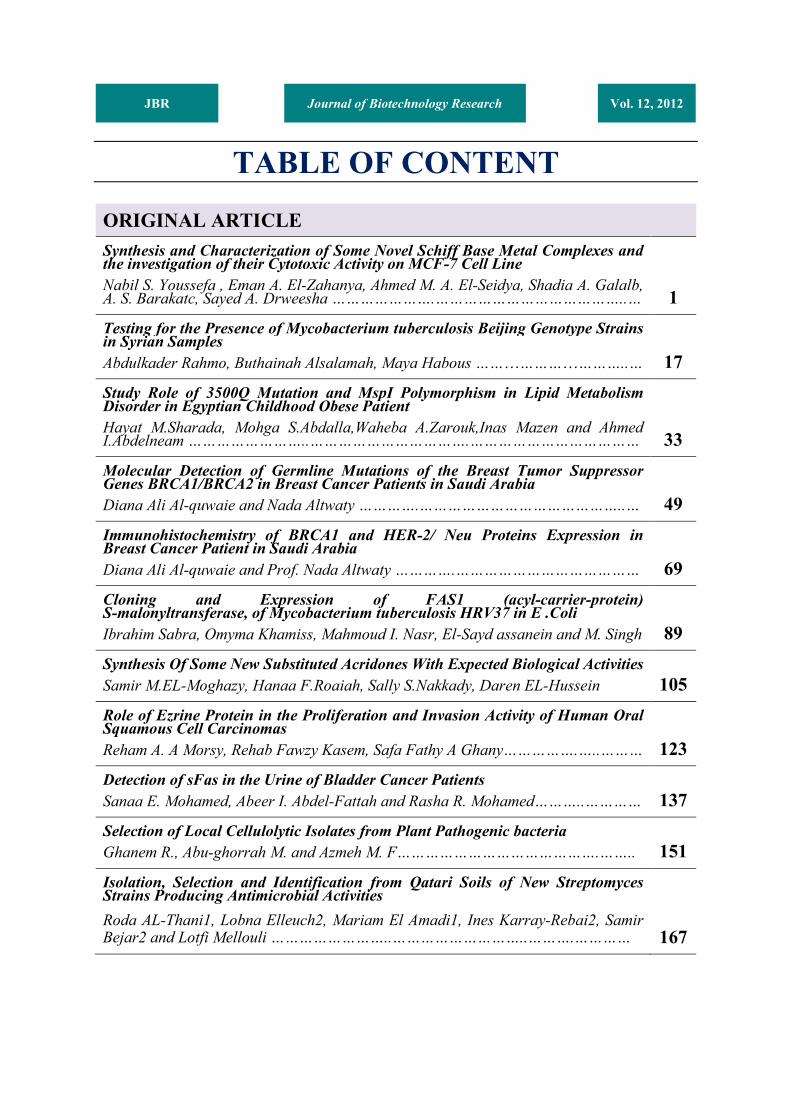
TABLE OF CONTENT
ORIGINAL ARTICLE Synthesis and Characterization of Some Novel Schiff Base Metal Complexes and the investigation of their Cytotoxic Activity on MCF-7 Cell Line Nabil S. Youssefa , Eman A. El-Zahanya, Ahmed M. A. El-Seidya, Shadia A. Galalb, A. S. Barakatc, Sayed A. Drweesha ………………….…………………………………..… 1Testing for the Presence of Mycobacterium tuberculosis Beijing Genotype Strains in Syrian Samples Abdulkader Rahmo, Buthainah Alsalamah, Maya Habous …………………………..… 17 Study Role of 3500Q Mutation and MspI Polymorphism in Lipid Metabolism Disorder in Egyptian Childhood Obese Patient Hayat M.Sharada, Mohga S.Abdalla,Waheba A.Zarouk,Inas Mazen and Ahmed I.Abdelneam ……………………..…………………………….……………………………… 33 Molecular Detection of Germline Mutations of the Breast Tumor Suppressor Genes BRCA1/BRCA2 in Breast Cancer Patients in Saudi Arabia Diana Ali Al-quwaie and Nada Altwaty ………….……………………………………..… 49 Immunohistochemistry of BRCA1 and HER-2/ Neu Proteins Expression in Breast Cancer Patient in Saudi Arabia Diana Ali Al-quwaie and Prof. Nada Altwaty ………….………………………………… 69 Cloning and Expression of FAS1 (acyl-carrier-protein) S-malonyltransferase, of Mycobacterium tuberculosis HRV37 in E .Coli Ibrahim Sabra, Omyma Khamiss, Mahmoud I. Nasr, El-Sayd assanein and M. Singh 89 Synthesis Of Some New Substituted Acridones With Expected Biological ActivitiesSamir M.EL-Moghazy, Hanaa F.Roaiah, Sally S.Nakkady, Daren EL-Hussein 105Role of Ezrine Protein in the Proliferation and Invasion Activity of Human Oral Squamous Cell Carcinomas Reham A. A Morsy, Rehab Fawzy Kasem, Safa Fathy A Ghany…………….…..……… 123Detection of sFas in the Urine of Bladder Cancer Patients Sanaa E. Mohamed, Abeer I. Abdel-Fattah and Rasha R. Mohamed………..………… 137Selection of Local Cellulolytic Isolates from Plant Pathogenic bacteria Ghanem R., Abu-ghorrah M. and Azmeh M. F…………………………………….…….. 151Isolation, Selection and Identification from Qatari Soils of New Streptomyces Strains Producing Antimicrobial Activities Roda AL-Thani1, Lobna Elleuch2, Mariam El Amadi1, Ines Karray-Rebai2, Samir Bejar2 and Lotfi Mellouli ……………………..………………………..……….………… 167

Vol. 12, 2012 Journal of Biotechnology Research JBR
Synthesis and Characterization of Some Novel Schiff Base Metal Complexes and the investigation of their Cytotoxic Activity on MCF-7 Cell Line
Nabil S. Youssefa , Eman A. El-Zahanya,*, Ahmed M. A. El-Seidya, Shadia A. Galalb,
A. S. Barakatc, Sayed A. Drweesha.
aInorganic Chemistry Department, National Research Centre, P.O. 12622 Dokki, Giza, Egypt. bDepartment of Chemistry of Natural and Microbial Products, Division of Pharmaceutical and Drug
Industries Research, National Research Centre, Cairo, Egypt. cInorganic Chemistry Department, Faculty of Science, Zagazig University, now : Tiabah University ,
Faculty of Applied Science, Al-Madinah Al-Munawarah, KSA.
*Corresponding author Tel: +202.33371433; Fax: +202.3337093.
E-mail address: [email protected], (E. A. El-Zahany).
ABSTRACT Ag(I), Cu(II), Ni(II), Ru(III), Pt(II) novel complexes of 3-((2,4-dihydroxybenzylidene)amino)-2-thioxothiazolidin-4-one, H2L1, 4-((2-(4-nitrophenyl)hydrazono)methyl)benzene-1,3-diol, H3L2, have been prepared and characterized. Mass spectra and NMR assignments for the ligands, were carried out. The proposed structures are consistent with the IR, UV–Vis, as well as conductivity and magnetic moment measurements. The ligands behaved either as neutral tridentate, monobasic tridentate or monobasic bidentate. The spectral data and magnetic measurements of the complexes indicated that, their geometries are either square planar or octahedral. The cytotoxic activity of the present organic ligands and their metal complexes against human breast cancer cell line (MCF-7) are also reported. The copper complex 3 and the silver complex 8 showed a remarkable smaller value of IC50 than that of the Tamoxifen which would provide a new potential antitumor drug that deserves more attention.
INTRODUCTION Cancer is thought to reflect a multi-step process, resulting from an accumulation of inherited and/or acquired defects in genes involved in the positive or negative regulation of cell proliferation and survival.(El-Deeb and Lee 2010) Breast cancer has been defined as an abnormal division or proliferation of epithelial cell in lactiferous duct or lobe and can be classified into ductal carcinoma and lobular carcinoma.(Lin, Su et al. 2010) Schiff base transition metal complexes have been of great interest for many years since they are becoming increasingly important as biochemical, analytical and antimicrobial reagents.(You, Shi et al. 2008) Many of metal complexes were showed anticancer and antimicrobial activities.(Bekhit, El-Sayed et al. 2004; Golcu, Tumer et al. 2005; Singh, Barwa
Vol. 12, 2012 JBR ORIGINAL ARTICLE

Abdulkader Rahmo, et. al.
et al. 2006) It was reported that, some drugs have greater activity when administered as metal complexes than that as free organic compounds. (Chakraborty and Patel 1996) So, Schiff base complexes might an untapped reservoir for drugs. Synthetic model studies involving magnetically coupled binuclear transition metal systems had attracted much interest because these studies provided deeper insights into complex biological processes. Also, homobinuclear lanthanide(III) complexes with isonicotinoyl hydrazone ligand had been prepared and characterized.(Bu, Du et al. 2000) Polyaminocarboxylate groups had been used for the design of polydentate ligands such as ethylenediamine tetraacetic acid and diethylene triamine pentaacetic acid, generally showed high affinity for metal cations.(Carraquilleo 1999) These ligands were widely used as chelating agents in fundamental research(Guo 1999) or as diagnostic tools in the pharmaceutical industry(Mortellaro 1996) and they are particularly suitable for magnetic resonance imaging (MRI).(Caravan 1999) The aim of this manuscript is the preparation, characterization and cytotoxic activity on MCF-7 cell line of Ag(I), Cu(II), Ni(II), Ru(III), Pt(II) complexes of H2L1 and H3L2. The structures of the ligands and their metal complexes were elucidated by elemental analysis, IR, 1H NMR, 13C NMR, UV-Vis, mass spectra, conductivity and magnetic susceptibility measurements at room temperature. The biological activity of the present organic ligands and their metal complexes are also reported. The remarkable smaller value of IC50 of complexes 3 and 8, than that of the Tamoxifen would provide a new potential antitumor drug that deserves more attention.
MATERIAL AND METHODS
The preparation of 2,4-Dihydroxybenzaldehyde: Followed the procedure described before in literature.(Mendelson and HAYDEN 1996) Physical Measurements:
The ligands and their metal complexes were analyzed for C, H, N and S contents at the Microanalytical Laboratory, Faculty of Science, Cairo University, Egypt. Analytical and physical data of the ligands and their metal complexes are reported in table 1. The metal ion contents of the complexes were also determined by the previously reported methods.(Welcher 1958; Holzbecher, Divis et al. 1976; Vogel 1978) IR spectra of the ligands and their metal complexes were measured using KBr discs with a Jasco FT/IR 300E Fourier transform infrared spectrophotometer covering the range 400-4000 cm-1 and in the 500-100 cm-1 region using polyethylene-sandwiched Nujol mulls on a Perkin Elmer FT-IR 1650 spectrophotometer. 1H and 13C NMR spectra were obtained on Brucker Avance 300-DRX or Avance 400-DRX spectrometers. Chemical shifts (ppm) are reported relative to TMS. The electronic spectra of the ligands and their complexes were obtained in Nujol mulls using a Shimadzu UV–240 UV-Visible recording spectrophotometer. Molar conductivities of the
Synthesis and Characterization of Some Novel Schiff Base Metal Complexes and the investigation of their Cytotoxic Activity on MCF- Cell ine
metal complexes in DMSO (10-3 M) were measured using a dip cell and a Bibbyconductimeter MC1 at room temperature. The resistance measured in ohms and the molar conductivities were calculated according to the equation: Λ = V × K × Mw/g × Ω,where Λ, molar conductivity (ohm-1 cm2 mol-1); V, volume of the complex solution (mL); K, cell constant 0.92 cm-1; Mw, molecular weight of the complex; g, weight of the complex; and Ω, resistance measured in ohms. Magnetic moments at 298 K were determined using the Gouy method with Hg[Co(SCN)4] as calibrant. Mass spectra of the solid ligands were recorded using JEUL JMS-AX-500 mass spectrometer.
Synthesis of the Schiff bases: Synthesis of H2L1 and H3L2:
The methanol solution (30 mL) of N-Aminorhodanine( 14.8 X 10⁻²gm, 1.0 mmol, in case of ligand H2L1) or 4-Nitrophenylhydrazine (15.3 mg X 10-2, 1.0 mmol, in case of ligand H3L2) was added to the methanol solution (40 mL) of 2,4-dihydroxybenzaldehyde (13.8 X 10⁻², 1.0 mmol). The mixture was stirred for 2h. The solvent was reduced to 10 mL under reduced pressure. The precipitate was filtered off, washed by ether and dried under vacuum over anhydrous CaCl2, scheme 1.
Synthesis of the metal complexes:
The metal complexes of the ligands were prepared by mixing a hot (70 oC) methanol solution of the metal salt with the required amount of ethanol solution of the ligand to form 1:1 or 1:2 M/L (metal/ligand) complexes. The reaction mixture was then refluxed for 4h. The precipitates formed were filtered off, washed with methanol, then with diethyl ether and dried under vacuum for 4 h. at 50 oC. In case of platinum(II) compounds a stock [PtCl4]2- solution was used.
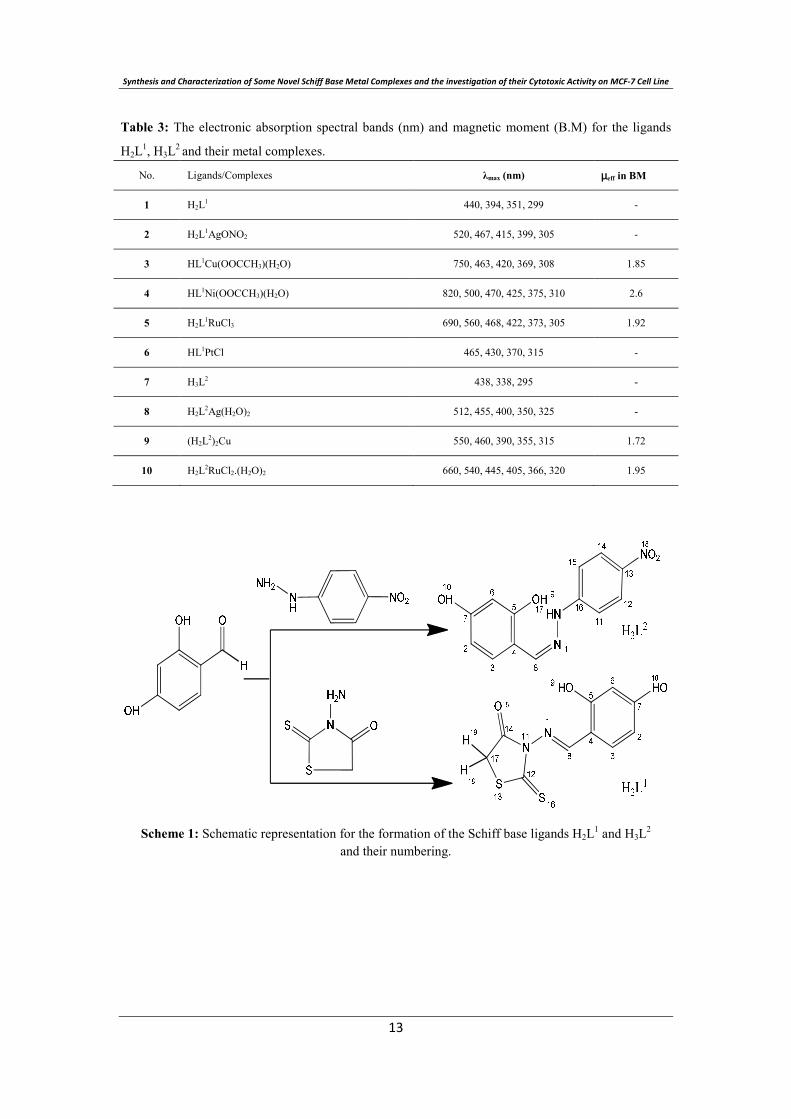
RESULTS AND DISCUSSION The elemental and physical data of the ligands H2L1 and H3L2 and their complexes (Table 1) showed that the stoichiometry of the complexes obtained is either 1:1 or 1:2 M/L (metal:ligand), Figure 2.
Mass spectra of the ligands:
The mass spectra of the Schiff bases H2L1 and H3L2 revealed the molecular ion peaks at m/e 268 and 273 which is coincident with the formulae weights 268.3 and 273.2, respectively, for these ligands and support the identity of their structures.
Abdulkader Rahmo, et. al.
Conductivity measurements:
All metal complexes are stable in air and insoluble in common organic solvents but easy
soluble in DMSO. The molar conductivities of the complexes in DMSO (10-3 M) are listed in
table 1. All complexes show a non-electrolyte nature.(Chandra and Gupta 2005; Shauib,
Elassar et al. 2006; Wang, Yang et al. 2006)
Infrared spectra: Ligands H2L1 and H3L2 showed two broad bands in the 3359-3350 and 3250-3190 cm-1 ranges, respectively, corresponding to O–H stretches.(Yue, Zhang et al. 2006) The former band was not involved in complexation since in all complexes it showed almost no shift. The disappearance of the other band in complexes 3-4, 6, 8 and 9-10 indicating the subsequent deprotonation of the phenolic proton prior to coordination.(Kannan and Ramesh 2006; Youssef, El-Zahany et al. 2009) In case of complexes 2, 5 and 10 this band was shifted to lower wave number indicating coordination to the metal. H3L2 showed a band at 3300 cm-1 corresponding to –NH stretching.(Sarkar, Sinha Ray et al. 2006) This band was found almost at its original position in case of complexes 8-10 indicating it was not involved in the complex formation. Also, the band due to the carbonyl moiety in ligand H2L1 was not involved in complex formation. In all complexes of ligand H2L1 the band corresponding to thioketone group at 1137 cm-1 was shifted to lower wave number (7-17 cm-1) along with decreasing its intensity, suggesting participation of this group in complex formation.(Singh, Barwa et al. 2006) The very sharp signal found around 1613 and 1635 cm-1 in case of ligands H2L1 and H3L2, respectively, was assigned to (CNimine). In all cases a negative shift (5-18 cm-1) of this band was observed indicating that the involvement of CNimine group in complex formation.(Bermejo, Fernandez et al. 2006; Boghaei and Gharagozlou 2006) The bands at 1261 and 1227 cm-1 for H2L1 and H3L2, respectively, are ascribed to the phenolic C–O stretching vibrations. These bands appeared as pairs on shifted upward due to O–metal coordination whereas the other retained its original position, which further supports the coordination of only of one of the two OH groups.(Keskioğlu, Gündüzalp et al. 2008) The new bands in spectra of all complexes in the 440-485, 330-375 and 508-580 cm-1 regions were assigned to υ(M–N), υ(M–S)and υ(M–O) vibrations, respectively.(Cukuravali, Yilmaz et al. 2006; Singh, Barwa et al. 2006; Patel, Gundla et al. 2008; Worayingyong, Kangvansura et al. 2008) The spectrum of nitrato complex 2 show bands in 1450 (υ1), 1030 (υ2), 1362 (υ4) and 700 (υ5) regions with υ1–υ4 separation of 88 cm−1, characteristic of monodentate nitrato group.(Nakamoto 1970; Shauib, Elassar et al. 2006). Extensive IR spectral studies reported on metal acetato complexes(Alamgir, Black et al. 2007) indicated that the acetate group may
Synthesis and Characterization of Some Novel Schiff Base Metal Complexes and the investigation of their Cytotoxic Activity on MCF- Cell ine
coordinate to the central metal in either a monodentate, bidentate or bridging manner. The νasym.(CO2) and νsym.(CO2) of the free acetate ions are found at 1560 cm-1 and 1416 cm-1, respectively. In monodentate coordination ν(C=O) is found at higher energy than νasym.(CO2) and ν(C-O) is lower than νsym.(CO2). As a result, the separation between the two v(CO) bands is much larger in monodentate complexes than the free ion.(Boghaei and Gharagozlou 2007) The opposite trend is observed in bidentateaceto coordination; the separation between ν(CO) is smaller than for the free ion. For bridging acetate with both oxygens coordinated as in copper(ll) acetate, however, the two ν(CO) bands are close to the free ion values.(Robinson and Dttley 1973; El-Shazly, Al-Hazmi et al. 2005) The acetato group in complexes 3 and 4 acted as a bidentate ligand and this is supported by the appearance of two new bands in the ranges 1529-1540 cm-1 and 1380-1390 cm-1, which may be attributed to νasym.(COO-) and νsym.(COO-), respectively.(Robinson and Dttley 1973) The separation value () between νasym.(COO-) and νsym.(COO-) in these complexes were less than 170 cm-1 (139 and 160 cm-1) suggesting the coordination of carboxylate group in a bidentate fashion.(Shauib, Elassar et al. 2006; Boghaei and Gharagozlou 2007) The broad bands in the 3460-3445 cm-1 region are due to coordinated water or water of crystallization. The bands for water of crystallization are different from those of coordinated water; the latter has bands in the 970-930 cm-1 and 660-600 cm-1 regions. The presence of water molecules within the coordination sphere in the hydrated complexes 3-4, 8 and 10 were supported by the presence of bands at 3460-3445 cm-1, 15850-15940 cm-1, 920-960 cm-1 and 625-640 cm-1 due to OH stretching, HOH deformation, H2O rocking and H2O wagging, respectively.(Teotia, Gurtu et al. 1980; El-Dissouky, Fahmy et al. 1987)
Electronic spectra magnetic moments:
The spectra of the diamagnetic Ag(I) complexes exhibit three bands in the 512-520, 455-467 cm-1 ranges may arise from charge transfer of the type ligand (π)→b1g (Ag+) and ligand (σ)→b1g (Ag+), respectively, in a typically distorted square planar environment around the metal ion.(Mostafa and Bekheit 2000; Mostafa, Ikeda et al. 2005; Bekircan and Bektas 2008) The electronic spectra of the copper complex 3 showed a band at 750 nm assignable to 2Eg→2Tg transition, which is the expected band for d9 ion in an octahedral configuration.(Sanmartin, Novio et al. 2006) while the other copper complex 9 showed a band at 550 nm assignable to 2B1g 2Eg transition of a square planar structure.(Shakir, Azim et al. 2006) The electronic spectrum of Nickel(II) complex showed bands at 820 and 500 nm that may be arising from 3A2g→3T1g(F) and 3A2g→3T1g(P) transitions, respectively in octahedral geometry.(Maurya, Sikarwar et al. 2005; Ali, Mirza et al. 2006)

Abdulkader Rahmo, et. al.
The ruthenium complexes 5 and 10 showed two bands in the ranges 690-660 and 560-540 nm. The ground state of ruthenium(III) in octahedral environment is 2T2g, arising from the t52g configuration, and the first excited doublet levels in the order of increasing energy are 2A2g and 2T1g, arising from the t42ge1g configuration. Hence, these two bands corresponding to 2T2g→2A2g and 2T2g→2T1g.(Balasubramanian, Parameswari et al. 2006; Kannan and Ramesh 2006) From the spectral data and the elemental analysis, the structure of the prepared complexes may be formulated as shown in figure 1.
NMR studies:
NMR measurements for the studied ligands were recorded in (DMSO-d6). 1H NMR (H2L1,
300 MHz, DMSO): δ = 10.70 ( s, 1H, H(9)), 10.41 ( s, 1H, H(10)), 8.72 (s, 1H,
H(8)), 7.64 (d, J = 7.5 Hz, 1H, H(3)), 7.52 (d, J = 7.5 Hz, 1H, H(6)), 6.38 ( s, 1H,
H(2)), 4.30 (s, 2H, H(18, 19)). 13C NMR (H2L1, 300 MHz, DMSO): 197.15 C(12), 170.00
C(14), 163.65 C(5, 7), 131.08 C(8), 110.62 C(4), 108.64 C(2), 102.47 C(6), 52.34 C(17). 1H NMR (H3L2, 300 MHz, DMSO): δ = 11.15 (s, 1H, H(9)), 10.26 (s, 1H, H(10)), )), 9.87 (s,
1H, H(17)), 8.24 (s, 1H, H(8)), 8.11 (psd, 2H, H(12, 14)), 7.5 (psd, 2H, H(3, 6)), 7.00 (psd,
2H, H(11, 15)), 6.36 (d , J = 7.0 Hz, 1H, H(2)). 13C NMR (H3L2, 300 MHz, DMSO):160.68
C(5), 158.42 C(7), 150.87 C(16), 142.20 C(8), 138.22 C(13), 128.95 C(3), 126.88 C(12, 14),
112.53 C(11, 15), 110.84 C(4), 108.19 C(2), 103.08 C(6).
Antitumor Activity
This study has proven the cytotoxic activity of the ligands and their corresponding metal
complexes against human breast cancer cell line (MCF-7). The complex formation (3 and 8)
has improved the anticancer activities of the ligands, which may be due to the lipophilic
character of the central metal atom explained by Tweedy`s chelation theory. (Creaven, Duff
et al. 2010; Youssef, El-Zahany et al. 2010) The decreased activity of the rest complexes as
compared to that of the ligands could be attributed to their poor solubility than their
respective free ligands.(Gottschaldt, Annett Pfeifer et al. 2006)
Some complexes showed a very interesting activity in comparison with Tamxifen; the
standard drug. H2L1Cu and H3L2Ag complexes were 1.10, and 1.26 times more cytotoxic
than Tamxifen, respectively. where the Ag(I) complexes induce apoptosis (programmed cell
death) in cancer cells which may be a direct result of their action on the cell,(McCANN,
COYLE et al. 2004) while copper complexes would cause intracellular generation of
Synthesis and Characterization of Some Novel Schiff Base Metal Complexes and the investigation of their Cytotoxic Activity on MCF- Cell ine
hydroxyl radicals from H2O2 , produced during normal cellular activities, by the reduction of
Cu(II) to Cu(I) leading to a growth inhibition in tumor cells.
CONCLUSION We report here the syntheses and characterization of the novel Schiff bases ligands, H2L1 and H3L2 and their Ag(I), Cu(II), Ni(II), Ru(III), Pt(II) metal complexes. All the data collected are in agreement with the proposed structures, figure 1. The spectral data indicated that, the ligand H2L1 behaved either as neutral or monobasic tridentate ligand while H3L2 behaved as monobasic bidentate ligand. The compounds 1-10 were tested in vitro against the MCF-7 (human breast cancer cell line) and the copper complex 3 and the silver complex 8 showed a remarkable smaller value of IC50 than that of the Tamoxifen which would provide a new potential antitumor drugs that deserves more attention.
REFERENCES Alamgir M. D., S. C. Black, Kumar N. 2007 Synthesis, Reactivity and Biological Activity
of Benzimidazoles, Top Heterocycl. Chem. 9: 87-118. Ali, M. A., Mirza A. H., Bujang F. H., Hamid M. H. S. A., Bernhardt P. V. 2006
Synthesis, characterization and X-ray crystallographic structural study of copper(II) and nickel(II) complexes of the 2-quinoline carboxaldehyde Schiff base of S-methyldithiocarbazate (Hqaldsme) Polyhedron 25: 3245-3252.
Balasubramanian K.P., Parameswari K., Chinnusamy V., Prabhakaran R., Natarajan K. 2006 Synthesis, characterization, electro chemistry, catalytic and biological activities of ruthenium(III) complexes with bidentate N, O/S donor ligands, Spectrochim. Acta Part A 65: 678-683.
Bekhit A. A., El-Sayed O. A., Al-Allaf T. A. K., Aboul-Enein H. Y., Kunhi M., Pulicat S. M., Al-Hussain K., Al-Khodairy F., Arif J. 2004 Synthesis, characterization and cytotoxicity evaluation of some new platinum(II) complexes of tetrazolo[1,5-a]quinolines, Eur. J. Med. Chem. 39 499-505.
Bekircan, O. and H. Bektas 2008 Synthesis of Schiff and Mannich Bases of Isatin Derivatives with 4-Amino-4,5-Dihydro-1H-1,2,4-Triazole-5-Ones Molecules 13: 2126-2135.
Bermejo M. R., Fernandez M. I., Gonzalez-Noya A. M., Maneiro M., Pedrido R., Rodriguez M. J., -M. G.; C. J.; B. D. 2006 Novel peroxidase mimics: µ-Aqua manganese-Schiff base dimmers, J. of Inorg. Biochem. 100: 1470–1478.
Abdulkader Rahmo, et. al.
Boghaei D. M. and M. Gharagozlou 2006 Charge transfer complexes of adenosine-5′-monophosphate and cytidine-5′-monophosphate with water-soluble cobalt(II) Schiff base complexes in aqueous solution, Spectrochim. Acta Part A 63: 139-148.
Boghaei D. M. and Gharagozlou M. 2007 Spectral characterization of novel ternary zinc(II) complexes containing 1,10-phenanthroline and Schiff bases derived from amino acids and salicylaldehyde-5-sulfonates Spectrochim. Acta A A67: 944-949.
Bu X. H., Du M., Zhang L., Song X. B., Zhang R. H. 2000 Novel homobinuclear lanthanide(III) complexes with isonicotinoyl hydrazone: synthesis and coordination chemistry, Inorg. Chim. Acta 308(1-2): 143-149.
Byrnes R. W., Antholine W. E., Petering D. H. 1992 Oxidation-reduction reactions in Ehrlich cells treated with copper-neocuproine, Free Radical Biology and Medicine 13(5): 469-478.
Caravan P., Ellison J. J., Mcmurry T. J., Lauffer R. B. 1999 Gadolinium(III) Chelates as MRI Contrast Agents: Structure, Dynamics, and Applications, Chem. Rev. 99: 2293.
Carrasquilleo J. A., White J. D., Paik C. H., Raubitschek A. N., Le, N., Rotman M., Brechbiel M., Gansow C. A., Top L. E., Peretesis P., Reynolds J. C., Nelson D. L., Waldmann T. A. 1999 Similarities and Differences in 111In- and 90Y-Labeled 1B4M-DTPA Anti Tac Monoclonal Antibody Distribution, J. Nucl. Med. 40: 268-279.
Chakraborty J. and R. N. Patel 1996 Copper, cobalt and zinc(II) complexes with monofunctional bidentate Schiff base and monodentate neutral ligands, J. Indian Chem. Soc. 73: 191-193.
Chandra S. and Gupta L. K. 2005 Spectroscopic studies on Co(II), Ni(II) and Cu(II) complexes with a new macrocyclic ligand: 2,9-dipropyl-3,10-dimethyl-1,4,8,11-tetraaza-5,7:12,14-dibenzocyclotetradeca-1,3,8,10-tetraene, Spectrochim. Acta Part A 61: 1181-1188.
Creaven B. S., Duff B., Egan D.A., Kavanagh K., Rosair G., Thangella V.R., Walsh M.2010 Anticancer and antifungal activity of copper(II) complexes of quinolin-2(1H)-one-derived Schiff bases, Inorganica Chimica Acta 363: 4048-4058.
Cukuravali A., Yilmaz I., Kirbag S. 2006 Spectroscopic characterization and biological activity of salicylaldehyde thiazolyl hydrazone ligands and their metal complexes, Trans. Met. Chem. 31: 207-213
El-Deeb I. M. and S. H. Lee. 2010 Design and synthesis of new anticancer pyrimidines with multiple-kinase inhibitory effect, Bioorg. & Med. Chem. 18: 3860-3874.
El-Dissouky A., Fahmy A., Amer A. 1987 Complexing ability of some γ-lactone derivatives. Thermal, magnetic and spectral studies on cobalt(II), nickel(II) and copper(II) complexes and their base adducts, Inorg. Chim. Acta 133: 311-316.
Synthesis and Characterization of Some Novel Schiff Base Metal Complexes and the investigation of their Cytotoxic Activity on MCF- Cell ine
El-Shazly R. M., Al-Hazmi G. A. A., Ghazy S. E., El-Shahawi M. S., El-Asmy A. A. 2005 Spectroscopic, thermal and electrochemical studies on some nickel(II) thiosemicarbazone complexes, Spectrochim. Acta A 61: 243-252.
Golcu A., Tumer M., Demirelli H., Wheatley R. A. 2005 Cd(II) and Cu(II) complexes of polydentate Schiff base ligands: synthesis, characterization, properties and biological activity, Inorg. Chim. Acta 358: 1785-1797.
Gottschaldt M., Pfeifer A., Koth D., Görls H., Dahse H. M., Möllmann U., Obata M., Yano S. 2006 Silver(I) complexes based on novel tripodal thioglycosides: synthesis, structure and antimicrobial activity, Tetrahedron 62(48): 11073-11080.
Guo Z., Sadler P. J. 1999 Metals in Medicine, Angew. Chem. Int. Ed. 38: 1512-1531. Holzbecher Z., Divis L., Kral M., Sucha L., Vracil F. 1976 Handbook of Organic Reagents in
Inorganic Analysis. Chichester, Wiley. Kannan S. and Ramesh R. 2006 Synthesis, characterization, catalytic oxidation and
biological activity of ruthenium(III) Schiff base complexes derived from 3-acetyl-6-methyl-2H-pyran-2,4(3H)-dione, Polyhedron 25: 3095-3103.
Keskioğlu E., Gündüzalp A. B., Çete S., Hamurcu F., Erk B. 2008 Cr(III), Fe(III) and Co(III) complexes of tetradentate (ONNO) Schiff base ligands: Synthesis, characterization, properties and biological activity Spectrochimica Acta Part A: Molecular and Biomolecular Spectroscopy 70(3): 634-640.
Lin Y-. L., Su Y-. T., Chen B-. H. 2010 A study on inhibition mechanism of breast cancer cells by bis-type triaziquone, Eur. J. of Pharm. 637: 1-10.
Maurya M. R., Sikarwar S., Joseph T., Palanichamy M., Halligudi S. B. 2005 Synthesis, characterization and catalytic potentials of polymer anchored copper(II), oxovanadium(IV) and dioxomolybdenum(VI) complexes of 2-(a-hydroxymethyl)benzimidazole, Reactive & Functional Polymers 63: 71-83.
McCann M., Coyle B., Mckay S., McCormack P., Kavanagh K., Devereux M., Mckee V., Kinsella P., O'Connor R., Clynes M. 2004 Synthesis and X-ray crystal structure of [Ag(phendio)2]ClO4 (phendio-1,10-phenanthroline-5,6-dione) and its effects on fungal and mammalian Cells, BioMetals 17: 635-645.
Mendelson W. L. and S. HAYDEN 1996 Preparation of 2,4-Dihyroxybenzaldehyde by the Vilsmeier-Haack Reaction, Synth. Commun. 26(3): 603-610.
Mortellaro M. A., Nocera D. G. 1996 A Supramolecular Chemosensor for Aromatic Hydrocarbons, J. Am. Chem. Soc. 118: 7414-7415. Mostafa S. I. and M. M. Bekheit 2000 Synthesis and Structure Studies of Complexes of
Some Second Row Transition Metals with 1-(Phenylacetyl and Phenoxyacetyl)-4-phenyl-3-thiosemicarbazide, Chem. Pharm. Bull. Jpn. 48 (2): 266-271.

Abdulkader Rahmo, et. al.
Mostafa S. I., Ikeda S., Ohtani B. 2005 Transition metal Schiff-base complexes chemically anchored on Y-zeolite: their preparation and catalytic epoxidation of 1-octene in the suspension and phase boundary systems, J. of Mol. Catalysis A: Chemical 225: 181-188.
Nakamoto K. 1970 Infrared Spectra of Inorganic and Coordination Compounds, 2nd ed. New York, John Wiley and Sons Inc.
Patel R. N., Gundla V. L. N., Patel D. K. 2008 Synthesis, structure and properties of some copper(II) complexes containing an ONO donor Schiff base and substituted imidazole ligands, Polyhedron 27: 1054-1060.
Robinson S. D. and M. F. Dttley, 1973 Complexes of the platinum metals. Part II. Carboxylato(triphenylphosphine) derivatives of ruthenium, osmium, rhodium, and iridium, J. Chem. Soc., Dalton Trans.: 1912-1920.
Sanmartin J., Novio F., Garcia-Deibe A. M., Fondo M., Ocampo N., Bermejo M. R. 2006 Dinuclear neutral complexes of a symmetric N2 +N2-donor diimine ligand, Polyhedron 25: 1714-1722.
Sarkar B., Sinha Ray M., Drew M. G. B., Figuerola A., Diaz C., Ghosh A. 2006 Trinuclear Cu(II) complexes containing peripheral ketonic oxygen bridges and a µ3-OH core: Steric influence on their structures and existence, Polyhedron 25: 3084-3094.
Shakir M., Azim Y., Chishti H.-T.-N., Parveen S. 2006 Synthesis, characterization of complexes of Co(II), Ni(II), Cu(II) and Zn(II) with 12-membered Schiff base tetraazamacrocyclic ligand and the study of their antimicrobial and reducing power, Spectrochim. Acta Part A 65: 490-496.
Shauib N. M., Elassar A. -Z. A., El-Dissouky A., 2006 Synthesis and spectroscopic characterization of copper(II) complexes with the polydentate chelating ligand 4,4′-[1,4-phenylenedi(nitrilo)dipente-2-one, Spectrochim. Acta Part A 63(3): 714-722.
Singh K., Barwa M. S., Tyagi P. 2006 Synthesis, characterization and biological studies of Co(II), Ni(II), Cu(II) and Zn(II) complexes with bidentate Schiff bases derived by heterocyclic ketone, Eur. J. Med. Chem. 41: 147-153.
Teotia M. P., Gurtu J. N., Rana V. B. 1980 Dimeric 5-and 6-coordinate complexes of tri and tetradentate ligands, J. inorg. nucl. Chem. 42(6): 821-831.
Vogel A. I. 1978 A Text Book of Quantitative Inorganic Analysis, 4th ed. London, Longmans.
Wang B.-d., Yang Z.-Y., Wang Q., Cai T.-k., Crewdson P. 2006 Synthesis, characterization, cytotoxic activities, and DNA-binding properties of the La(III) complex with Naringenin Schiff-base, Bioorg. & Med. Chem. 14(6): 1880-1888.

Synthesis and Characterization of Some Novel Schiff Base Metal Complexes and the investigation of their Cytotoxic Activity on MCF- Cell ine
Welcher F. J. 1958 The analytical Uses of ethylenediaminetetraaceticacid, USA, D. Van Nostrand Company, Inc.
Worayingyong A., Kangvansura P., Ausadasuk S., Praserthdam P. 2008 The effect of preparation: Pechini and Schiff base methods, on adsorbed oxygen of LaCoO3
perovskite oxidation catalysts, Colloids and Surfaces A: Physicochemical and Engineering Aspects 315(1-3): 217-225.
You Z. -L., Shi D. -H., Xu C., Zhang Q., Zhu H.-L. 2008 Schiff base transition metal complexes as novel inhibitors of xanthine oxidase, Eur. J. Med. Chem. 43: 862-871.
Youssef N. S., El-Zahany E. A., Ali M. M. 2010 Synthesis, spectral, characterization and anticancer activity of some binary and mixed ligands complexes of 4-methyl-2-pentanone thiosemicarbazone and some amino acids, Phosphorus, Sulfur, and Silicon and the Related Elements 185: 2171-2181.
Youssef N. S., El-Zahany E. A., Barsoum B. N., El-Seidy A. M. A. 2009 Synthesis and characterization of copper(II), cobalt(II), nickel(II), and iron(III) complexes with two diamine Schiff bases and catalytic reactivity of a chiral diamine cobalt(II) complex, Transition Met. Chem. 34: 905-914.
Yue H., Zhang D., Shi Z., Feng S. 2006 Synthesis and characterization of two oxovanadium (IV) Schiff base complexes derived from amino acids and pyridoxal, Solid State Sciences 8(11): 1368-1372.

Abdulkader Rahmo, et. al.
Table 1: Analytical and physical data of the ligands H2L1, H3L2 and their metal complexes.
No. Ligands/Complexes Color FW Yield
(%)
Anal./found (calc.) (%) Molar
conductance Λm
(Ω-1 cm2 mol-1)C H N S M
1H2L1
C10H8N2O3S2
yellow 268.3 74 44.6(44.8) 3.1(3.0) 10.6(10.4) 23.8(23.9) - -
2H2L1AgONO2
C10H8AgN3O6S2
yellow 438.2 81 27.3(27.4) 2.0(1.8) 9.6(9.6) 14.6(14.6) 24.5(24.6) 18
3HL1Cu(OOCCH3)(H2O)
C12H12CuN2O6S2
brown 407.9 86 35.1(35.3) 2.9(3.0) 7.1(6.9) 15.6(15.7) 15.8(15.6) 12
4HL1Ni(OOCCH3)(H2O)
C12H12N2NiO6S2
brown 403.1 83 35.8(35.8) 3.1(3.0) 7.2(7.0) 15.8(15.9) 14.5(14.6) 14
5H2L1RuCl3
C10H8Cl3N2O3RuS2
brown 475.7 79 25.3(25.3) 1.8(1.7) 6.0(5.9) 13.4(13.5) 21.1(21.2) 25
6HL1PtCl
C10H7ClN2O3PtS2
yellow 497.8 80 23.9(24.1) 1.5(1.4) 5.9(5.6) 13.0(12.9) 39.0(39.2) 14
7H3L2
C13H11N3O4
yellow
ish red 273.2 71 57.0(57.1) 4.3(4.1) 15.5(15.4) - - -
8H2L2Ag(H2O)2
C13H14AgN3O6
yellow 416.1 68 37.4(37.5) 3.6(3.4) 10.2(10.1) - 25.8(25.9) 8
9(H2L2)2Cu
C26H20CuN6O8
brown 608.0 84 51.3(51.4) 3.4(3.3) 13.9(13.8) - 10.5(10.5) 6
10 H2L2RuCl2.(H2O)2
C13H14Cl2N3O6Ru brown 480.0 76 32.3(32.5) 3.1(2.9) 9(8.8) - 20.9(21.0) 21
Table 2: IR frequencies of the bands (cm-1) of ligands H2L1, H3L2 and their metal complexes and their assignments.
No. Ligands/Complexes ν(H2O) ν(OH) ν(NH) ν(C=O) ν(C=N) ν(C=S)/
NO2ν(C-O)
νs(Coo), νas(Coo), /(∆),
ν(NO3)
1 H2L1 - 3359br, 3250sh - 1721s 1613v.s 1137 s 1261s -
2 H2L1AgONO2 - 3364br, 3236br - 1723s 1599v.s 1125 s 1277s,
1258s 1450, 1362, 1030, 700
3 HL1Cu(OOCCH3)(H2O) 3450br 3362br - 1724s 1605s 1120s 1281sh, 1264s 1540, 1380, 160
4 HL1Ni(OOCCH3)(H2O) 3445br 3355br - 1722s 1602s 1130s 1289s, 1255s 1529, 1390, 139
5 H2L1RuCl3 - 3365br, 3231br - 1721s 1600s 1121 1284m,
1262s -
6 HL1PtCl - 3362br - 1721s 1604 1127 1280m, 1666s -
7 H3L2 - 3350br, 3190br 3300s - 1635s 1340s 1227s -
8 H2L2Ag(H2O)2 3460br 3355br 3298s - 1619s 1345s 1243s, 1225s -
9 (H2L2)2Cu - 3352br 3297s - 1617s 1345s 1250s, 1230s -
10 H2L2RuCl2.(H2O)2 3450br 3360br 3299s - 1630s 1344s 1241s, 1225s -
Synthesis and Characterization of Some Novel Schiff Base Metal Complexes and the investigation of their Cytotoxic Activity on MCF- Cell ine
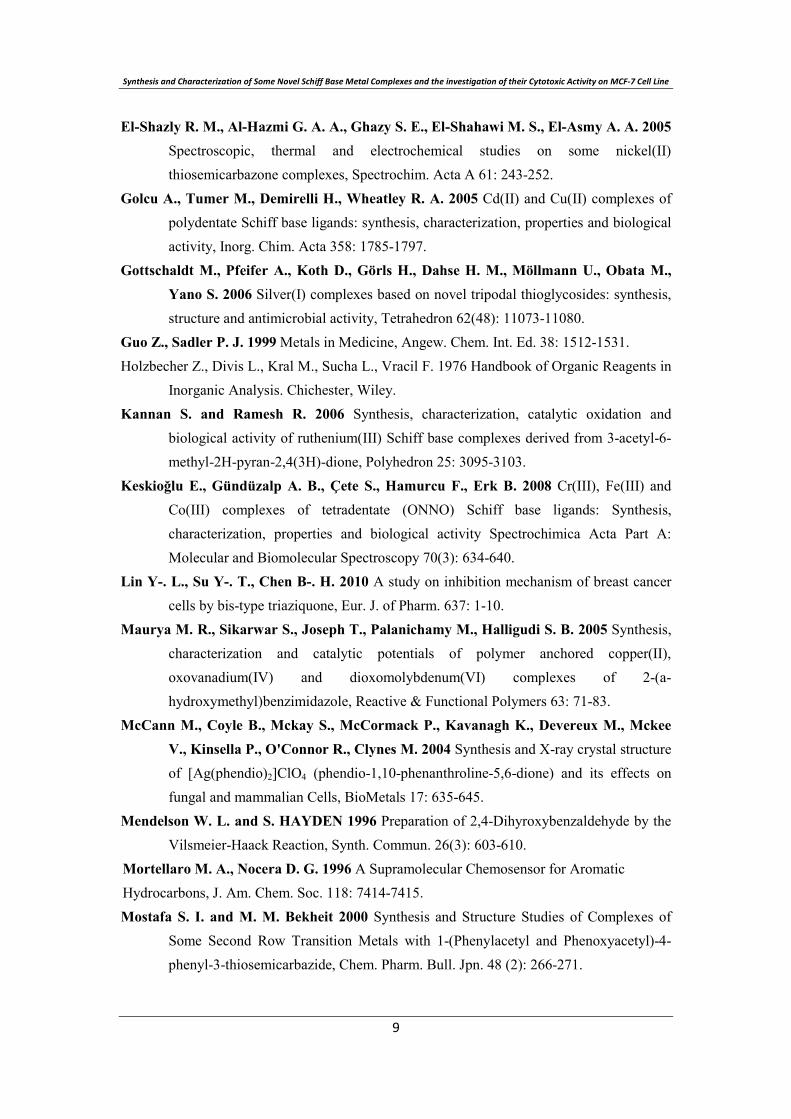
Table 3: The electronic absorption spectral bands (nm) and magnetic moment (B.M) for the ligands
H2L1, H3L2 and their metal complexes.
No. Ligands/Complexes λmax (nm) µeff in BM
1 H2L1 440, 394, 351, 299 -
2 H2L1AgONO2 520, 467, 415, 399, 305 -
3 HL1Cu(OOCCH3)(H2O) 750, 463, 420, 369, 308 1.85
4 HL1Ni(OOCCH3)(H2O) 820, 500, 470, 425, 375, 310 2.6
5 H2L1RuCl3 690, 560, 468, 422, 373, 305 1.92
6 HL1PtCl 465, 430, 370, 315 -
7 H3L2 438, 338, 295 -
8 H2L2Ag(H2O)2 512, 455, 400, 350, 325 -
9 (H2L2)2Cu 550, 460, 390, 355, 315 1.72
10 H2L2RuCl2.(H2O)2 660, 540, 445, 405, 366, 320 1.95
Scheme 1: Schematic representation for the formation of the Schiff base ligands H2L1 and H3L2
and their numbering.
Abdulkader Rahmo, et. al.
OOH
N
Ag
HONO2
NS
S
O
complex 2H2L1AgONO2
OOH
N
M
NS
S
O
H2O
OO
HL1M(OOCCH3)(H2O)complex 3: M=Cucomplex 4: M=Ni
OOH
N
Ru
NS
S
O
Cl
Cl ClH
complex 5H2L1RuCl3
OOH
N
Pt
Cl
NS
S
O
complex 6HL1PtCl
OHO
N
R
NH
Ag
H2O
H2O
complex 8H2L2Ag(H2O)2
HO O
complex 9(H2L2)2Cu
NNH
R
OHO
N
Cu
R
HN
HO O
complex 10H2L2RuCl2.(H2O)2
NNH
R
Ru
Cl
ClH2O
H2O
NO2R=
Figure 1: The proposed structures of metal complexes
Figure 2: Cytotoxic activities of ligands and their complexes against (MCF-7) human breast cancer cell line.
Synthesis and Characterization of Some Novel Schiff Base Metal Complexes and the investigation of their Cytotoxic Activity on MCF- Cell ine
a a,* aج b c a
.م .. م −
. م ب ب−
ح بم م −
.ب
QRSTUا
:ت م ت ت ت م ص
3-((2,4-dihydroxybenzylidene)amino)-2-thioxothiazolidin-4-one, H2L1,
4-((2-(4-nitrophenyl)hydrazono)methyl)benzene-1,3-diol, H3L2,
ص ب تص بس
ض س ب) -ن - ت - (
م ت ت ت س ن ت
س. ح ح
ت . م ب م ن س
ن م من)()(ح م (MCF-7) خ س
م م IC50ح بم ممنن م
.

Abdulkader Rahmo, et. al.
Testing for the Presence of Mycobacterium tuberculosis Beijing Genotype Strains in Syrian Samples
* Abdulkader Rahmo, ** Buthainah Alsalamah, *** Maya Habous
*Head of the medical biotechnology section- national commission for biotechnology-
Damascus - Syria.
** Research assistant - national commission for biotechnology-Damascus - Syria.
*** MD, reference tuberculosis laboratory – ministry of health - Damascus -Syria.
Corresponding author E.mail: [email protected]
ABSTRACT
The Beijing family of Mycobacterium tuberculosis has been reported to have exceptional capacity to spread tuberculosis and induce drug multi-resistance. We have developed a method to distinguish this family from the rest of Mycobacterium tuberculosis families through real time DNA amplification and subsequent analysis of amplicon’s melting point. We have selected two pools of multidrug resistant Mycobacterium tuberculosis samples collected at two different time periods from various regions in Syria. This preliminary screening indicated complete absence of the Beijing family in all samples. This research presents an effective differentiation of bacterial Beijing strains, with minimal effort and cost through analysis of differential amplicon melting points.
Key words: Beijing strain – Myccobacterium tuberculosis – real time PCR – DNA melting - Syria.
INTRODUCTION
Tuberculosis (TB) is one of the main infectious causes of death worldwide, with more than 9 million new cases of active disease every year and nearly 2 million deaths [WHO: 2008]. TB is an endemic disease in Syria and accounts for thousands of notified cases (new and relapse incidence rate: 21/100000 pop/year) [Ministry of health, 2010]. Mycobacterium tuberculosis (MTB) is the causative agent of most TB cases; its ability to spread and the outcome of infection depend on epidemiological, host, and bacterial factors [WHO: 2008]. Cases of drug resistant (DR) and multi-drug resistant (MDR) tuberculosis (i.e. at least resistant to Rifampicin (RIF) and Isoniazid (INH)) are increasing worldwide. In some parts of the world 10% or more of new TB cases are MDR [Wright et.al 2009]. In the Baltic region and Russia a large increase in DR-TB has occurred during the last two decades [Glynn et.al 2002]. During this period many Russians of Jewish decent have immigrated to the Middle East (Palestine).
Vol. 12, 2012 JBR ORIGINAL ARTICLE
Abdulkader Rahmo, et. al.
Strains with changed biological properties belonging to the family of strains: Beijing, have been implicated in many outbreaks of TB; suggesting more efficient transmission or enhanced ability to progress to active disease compared to other TB strains [Burman et.al 2009]. Beijing strains, in vitro and in vivo models, show more virulent phenotypes than other MTB lineages. They often associated strongly with primary drug resistance, and cause in some regions clusters ten times as big as “traditional” strains [Bjune et.al 2005]. Beijing strains appear better adapted to intracellular growth, and drug resistance. They have specific properties in terms of protein and lipid structures, which allow the immune-modulation of host response to the pathogen [Alonso et.al 2010].
Beijing strains represent about 50% of strains in East Asia and at least 13% of strains worldwide [Parwati et.al 2010]. They appear to spread further and establish themselves in new regions. In Cape Town during 2000–2003, the Beijing clade spread and became the cause of disease in children; number of cases became 33% instead of earlier values of 13% [Diarra et.al 2010]. It has been suggested that emergence of the Beijing genotype family represents an evolutionary response of M. tuberculosis to BCG vaccination or/and antibiotic treatment, resulting in a significant impact on tuberculosis control [Hanekom et.al 2007].
Active disease caused by Beijing strains was associated, in some populations, with exceptional clinical phenotypes. In a study in Russia, Beijing strains were associated with more severe radiographic manifestations of pulmonary TB. Other studies associated the Beijing family with extra-pulmonary TB, a more likely poor outcome in elderly patients, and in many areas an increased risk for relapse [Burman et.al 2009].
Recent studies have shown associations among M. tuberculosis strains, geographic regions, and human populations. These indicate that specific strains of M. tuberculosis coevolved with human subpopulations [Burman et.al 2009]. The clinical presentations of patients with tuberculosis caused by a Beijing strain were found to vary between different geographical settings [Parwati et.al 2010]. Currently, the exact origin of observed variability in clinical presentation is still unknown [Parwati et.al 2010]. The prevalence of Beijing strains has not yet been studied in Syria despite the reported presence of these strains in neighboring countries, and the influx of workers from the Far East.
The real time PCR method used by the authors is an earlier modification of the assay presented by [Hillerman et al 2006], it targets the same TB genome locies; but detection was based on SYBR Green amplicon detection, followed by profiling of amplicon's characteristic melting point. This research applies a quantitatively efficient, qualitatively unequivocal and sensitive assay for the detection of a virulent Beijing strain. Samples collected were from two different periods and from a pool of multidrug resistant Myccobacterium tuberculosis. The research has been entirely performed at the National Commission for Biotechnology in Damascus/Syria.
Testing for the Presence of Mycobacterium tuberculosis Beijing Genotype Strains in Syrian Samples
MATERIAL AND METHODS
Mycobacterium tuberculosis samples:
The first pool (22 samples) was collected between 2003 and 2005. The second pool (29 samples) was collected between 2010 and 2011 from various regions in Syria (table1). All samples represent multi-drug resistant MTBs. Drug resistance was established following the guidelines by the National committee for clinical laboratory standards [NCCLS].Beijing and non Beijing strain's control DNA were obtained from Azm center for biotechnology at the Lebanese university [Rahmo et al. 2010]. Association to the family Beijing strains has been established earlier through the standard method of spoligotyping. The research has been approved by the institutional bioethical committee.
DNA Extraction:
DNA extraction was applied with maximum precautions under biosafety class two hood [Rahmo et al. 2010]. Isolates (about 10 mg of colonies) are incubated in a water bath at 80°C for about 30 minutes to kill the bacteria, and centrifuged for 10 minutes at 8000 rpm. TE buffer containing 1% Triton X-100, 0.5% Tween 20, 10 mM Tris-HCl pH 8.0 and 1 mM EDTA was added to the pellet. The rest of the procedure was according to instructions provided by Qiagen DNA Blood Mini Kit (Qiagen Germany), with the minor modification: The period of incubation at 37°C was for 2 hours instead of 90 minutes.
Real time PCR assay:
Real time PCR experiments were run using the Stratagene Mx3005®. Primers were synthesized according to the sequence published in [Hillerman et al 2006]. Synthesis was performed by VBC Biotech (HPLC grade). PCR polymerase mix: DyNAmo® flash SYBR Green qPCR kit, was purchased from Finnzymes. Primer concentrations used were 0.5µM. Final reaction volume was 50µl, and MTB genome DNA amount added, was 5µl after 1000x dilution. The thermal profile was: 95 for 10 min, and 40-50 two steps cycle; consisting of a denaturation step: 92C for 15 s, and an annealing/extension step: 620C for one min. Measuring the derivative of fluorescence emission with respect to temperature and plotting it against temperature unveiled the presence of a peak reflecting the amplicon's melting temperature that is diagnostic of the Beijing family (Tm: 87.230C, SE: 0.01), and one that is specific for the non Beijing families of strains (Tm: 82.670C, SE: 0.11) [Rahmo et al. 2011].
Amplicon Melting point temperature:
determination of dissociation curve, and the melting point temperature (Tm) which is based on maximal fluorescence emission change at varying temperature multiplied by -1; (-dF/dT), was performed at the temperature range [60 – 94 0C], using the Fam filter (λex : 492nm, λem :516nm) suitable for the SYBR green flourophore. The applied software was: MxPro from Stratagene.
Statistical calculations:
Standard error (SE) was calculated using the excel office software from Microsoft.
Abdulkader Rahmo, et. al.
RESULTS
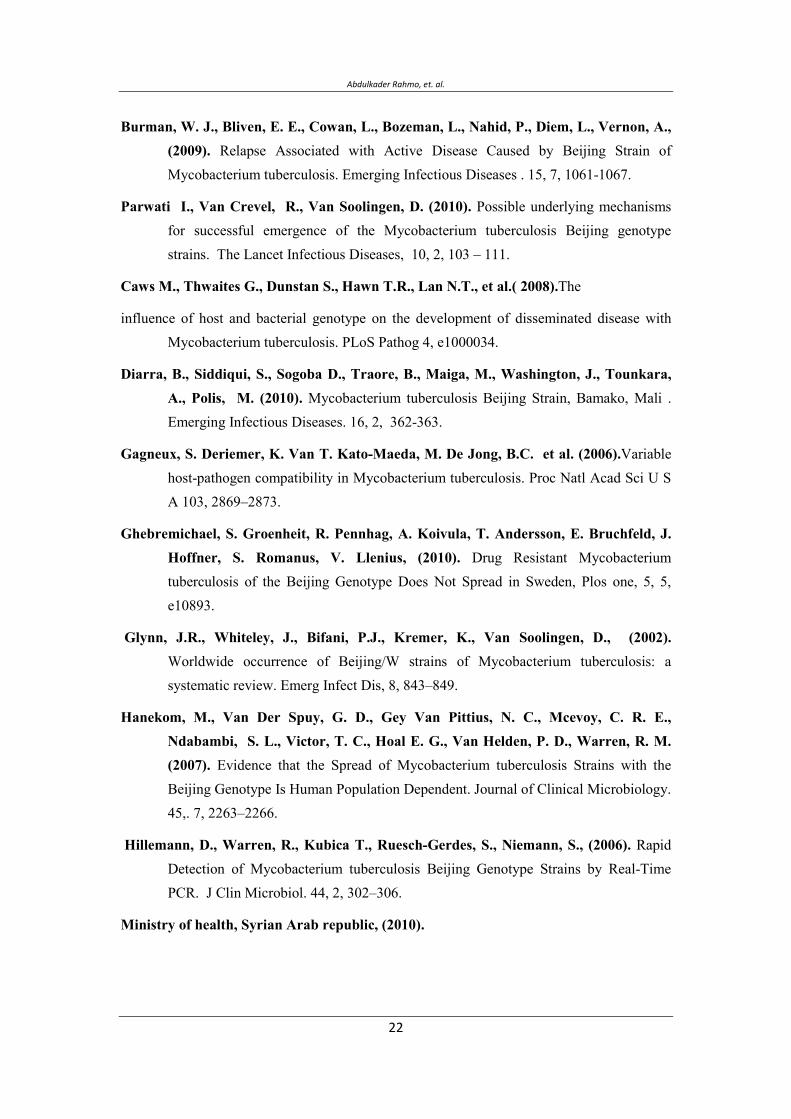
Based on the analysis of BLASTN of TB genome sequence, the expected non Beijing and Beijing family of strains amplicon length produced, should be 129 bp for the Beijing strains, and 95 bp for the non Beijing ones [Hillerman et al. 2006].
Testing non Beijing and Beijing primers on non Beijing and Beijing samples resulted in Tm
peaks and associated emissions as described in figure (1).
Testing non Beijing primers on non Beijing samples resulted in one Tm peaks (~82.67 C, SE: 0.11). Using the non Beijing primers with a Beijing sample resulted in only one Tm peak (~77C).
Testing Beijing primers on Beijing sample at 62C annealing temperature resulted in two Tm
peaks (~780C, ~87.230C). Using Beijing primers on non Beijing samples resulted, at 620Cannealing temperature, in several Tm peaks (~78 C,~860C,~900C). The Tm peak at ~87.230C(SE: 0.01) is the diagnostic peak used for the Beijing strains [Rahmo et al. 2011].
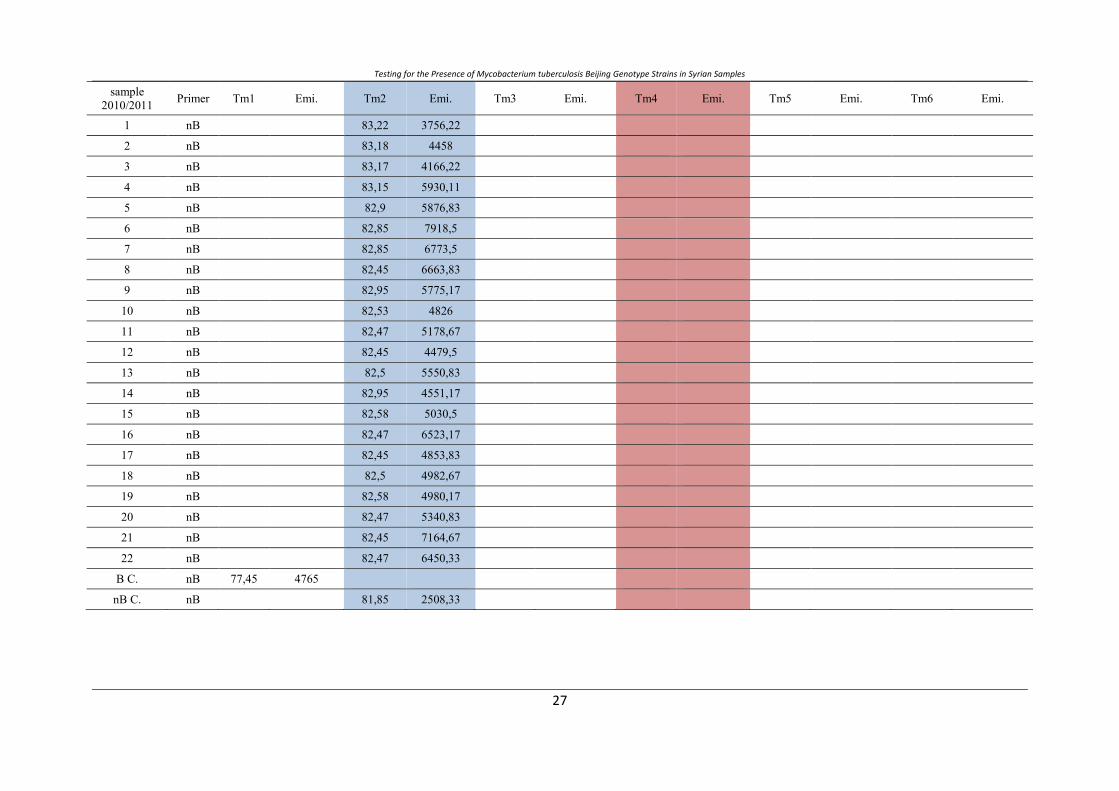
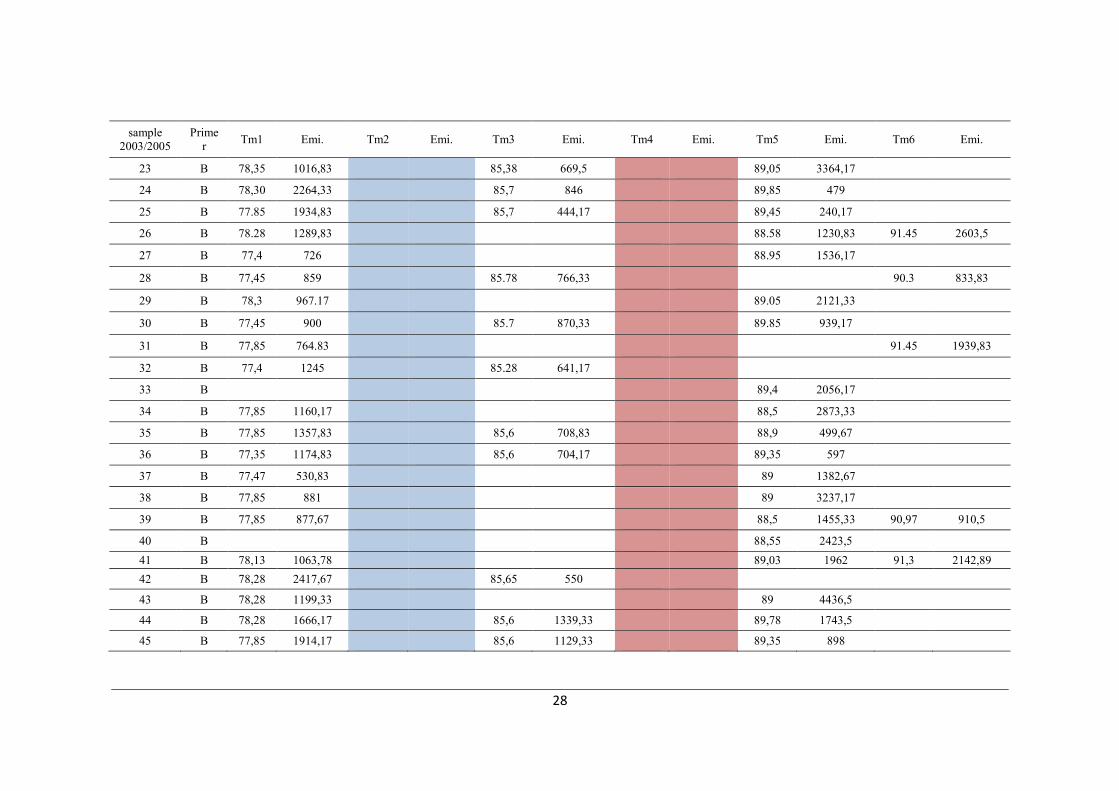
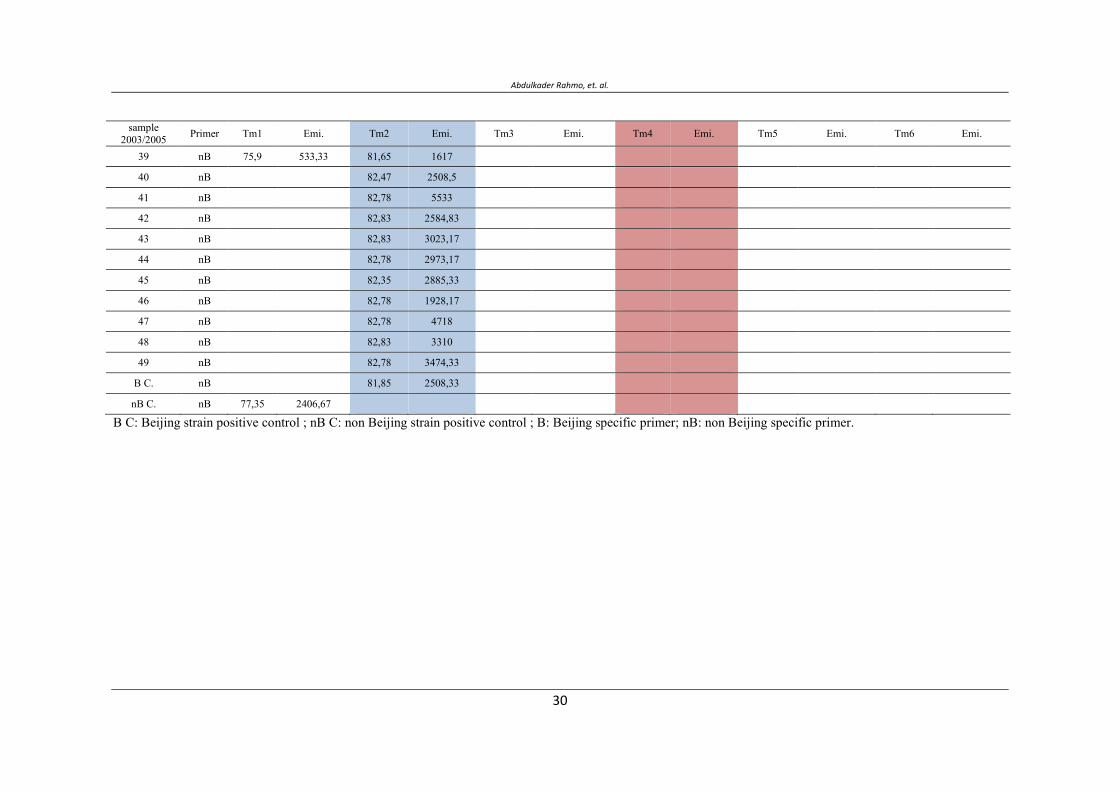
Exploring non Beijing and Beijing strains on collected samples resulted in Tm peaks and associated emission as described in table (2).
DISCUSSION
The results of the applied method were based on its clear ability to discriminate between the Beijing strain family and the rest of TB strain families. The distinction is based on the amplified region near RV 2820 uniquely present in Beijing strains; providing the specific fragment of 129 bp, and the amplified region in Rv 2819 present solely in non Beijing strains; providing the specific fragment of 95 bp. The difference in diagnostic melting temperature (Tm values) obtained for Beijing and non Beijing families (~87.230C, ~82.670C resp.) is consistent with the specific amplicon size of Beijing strains; being 36% larger than that of non Beijing strains.
Beijing family of strains have been implicated in fast transmission which emphasizes the importance of a fast, simple and economic detection method. The use of rapid diagnostics would reduce the time for implementation of appropriate treatment.
The major advantage of this method is its rapidity simplicity and sensitivity. The strains are quantifiable. The modified method presented does not require further any specific probes or modified primers. The detection is done, unlike the method by [Hillerman et.al 2006], based on just SYBR green selective binding to double stranded DNA. The use of amplicon melting analysis is an established technique in differential detection of microorganisms [Nitshe et.al 2004].

Testing for the Presence of Mycobacterium tuberculosis Beijing Genotype Strains in Syrian Samples
The observed variations in melting point of amplified DNA in the various strains tested suggest significant genetic variations among strains. This is expected since non Beijing samples represent likely a heterogeneous family of strains.
The prevalence of Beijing strains in the Middle East and its association with drug resistance has been unfortunately scarcely studied with some exceptions. In Iran reports indicate that overall prevalence of Beijing Genotype is 3.2% of which 21.7% are multidrug resistant [Parissa-Farnia et.al 2008]. An extensive study in Saudi Arabia revealed a prevalence value of 4.5% [AL Hajoj et.al 2010].
The testing of all multi-resistant samples obtained from a recent pool, and an earlier one, indicated the absence of any Beijing strain in these samples. Such absence if further confirmed through larger sampling pools is striking given the proven presence of Beijing strains in neighboring countries (Turkey, Palestine, Saudi Arabia). On the other hand it is possible that the Syrian population is less prone to infection by the Beijing family of strains [Caws et.al 2008]. This has been earlier hypothesized for other cases of limited spread of Beijing genotype [Ghebremichael et.al 2010, Gagneux et.al 2006, Hanekom et.al 2007].
CONCLUSION Using the present method allows fast assessment of epidemiological distribution and dynamics of Beijing family of strains, this may be of exceptional value in regions where their contribution to tuberculosis is still unknown. Simplifying and economizing the detection of Beijing family, provide for fast and widespread real time surveillance of their epidemiologic contribution.
REFERENCES
AL Hajoj S., Rastogi N. (2010). The emergence of Beijing genotype of Mycobacterium tuberculosis in the Kingdom of Saudi Arabia. Annals of thoracic Medicine, Vol. 5 Issue 3, 149 -152.
Alonso, M., Rodriguez, N. A., Garzelli, C., Lirola, M. M., Herranz, M., Samper, S., Serrano, M.J. R., Bouza, E., Garcia DE Viedma, D. (2010). Characterization of Mycobacterium tuberculosis Beijing isolates from the Mediterranean area. BMC Microbiology. 10: 151.
Bjune, G. (2005). Tuberculosis in the 21st century: an emerging pandemic. Norsk Epidemiologi. 15 (2): 133-139.
Abdulkader Rahmo, et. al.
Burman, W. J., Bliven, E. E., Cowan, L., Bozeman, L., Nahid, P., Diem, L., Vernon, A., (2009). Relapse Associated with Active Disease Caused by Beijing Strain of Mycobacterium tuberculosis. Emerging Infectious Diseases . 15, 7, 1061-1067.
Parwati I., Van Crevel, R., Van Soolingen, D. (2010). Possible underlying mechanisms for successful emergence of the Mycobacterium tuberculosis Beijing genotype strains. The Lancet Infectious Diseases, 10, 2, 103 – 111.
Caws M., Thwaites G., Dunstan S., Hawn T.R., Lan N.T., et al.( 2008).The
influence of host and bacterial genotype on the development of disseminated disease with Mycobacterium tuberculosis. PLoS Pathog 4, e1000034.
Diarra, B., Siddiqui, S., Sogoba D., Traore, B., Maiga, M., Washington, J., Tounkara, A., Polis, M. (2010). Mycobacterium tuberculosis Beijing Strain, Bamako, Mali . Emerging Infectious Diseases. 16, 2, 362-363.
Gagneux, S. Deriemer, K. Van T. Kato-Maeda, M. De Jong, B.C. et al. (2006).Variable host-pathogen compatibility in Mycobacterium tuberculosis. Proc Natl Acad Sci U S A 103, 2869–2873.
Ghebremichael, S. Groenheit, R. Pennhag, A. Koivula, T. Andersson, E. Bruchfeld, J. Hoffner, S. Romanus, V. Llenius, (2010). Drug Resistant Mycobacterium tuberculosis of the Beijing Genotype Does Not Spread in Sweden, Plos one, 5, 5, e10893.
Glynn, J.R., Whiteley, J., Bifani, P.J., Kremer, K., Van Soolingen, D., (2002). Worldwide occurrence of Beijing/W strains of Mycobacterium tuberculosis: a systematic review. Emerg Infect Dis, 8, 843–849.
Hanekom, M., Van Der Spuy, G. D., Gey Van Pittius, N. C., Mcevoy, C. R. E., Ndabambi, S. L., Victor, T. C., Hoal E. G., Van Helden, P. D., Warren, R. M. (2007). Evidence that the Spread of Mycobacterium tuberculosis Strains with the Beijing Genotype Is Human Population Dependent. Journal of Clinical Microbiology. 45,. 7, 2263–2266.
Hillemann, D., Warren, R., Kubica T., Ruesch-Gerdes, S., Niemann, S., (2006). Rapid Detection of Mycobacterium tuberculosis Beijing Genotype Strains by Real-Time PCR. J Clin Microbiol. 44, 2, 302–306.
Ministry of health, Syrian Arab republic, (2010).
Testing for the Presence of Mycobacterium tuberculosis Beijing Genotype Strains in Syrian Samples
NCCLS -national committee for clinical laboratory standards (2002). Antimycobacterial susceptibility testing for mycobacterium tuberculosis. Tentative standard M 24-T, NCCLS, villanova P.A.
Nitsche, A., Ellerbrok, H., Pauli, G. (2004), Detection of Orthopoxvirus DNA by Real-Time PCR and Identification of Variola Virus DNA by Melting Analysis. Journal of Clinical Microbiology, 42, 3, 1207–1213.
Parissa-Farnia, Masjedi M. R, Varahram M., Mirsaeidi M., Ahmadi M., Khazampour M., Tabarsi P., Baghei P., Marjane M., Bahadori M., Zarifi A. Z. Velayati A. A. (2008). The Recent-Transmission of Mycobacterium tuberculosis Strains among Iranian and Afghan Relapse Cases: a DNA-fingerprinting using RFLP and spoligotyping. BMC Infectious Diseases, 8:109 doi: 10.1186/1471-2334-8-109
Rahmo, A., Hamze, M. (2010). Characterization of Mycobacterium tuberculosis in Syrian patients by double-repetitive-element polymerase chain reaction. EMHJ, Vol. 16, No. 8, 820-830.
Rahmo A., Al Salame B. (2011). Testing for the presence of Mycobacterium tuberculosis Beijing genotype strains using real time PCR and amplicon melting temperature profile. Tishreen university journal for research and scientific studies accepted 27-6-2011. WHO (2008). Global tuberculosis control: surveillance, planning, financing. WHO report 2008. WHO/HTM/TB/2008.393.Geneva.
Wright, A., Zignol, M., Van Deun, A., Falzon, D., Gerdes, S.R., et al. (2009). Epidemiology of antituberculosis drug resistance 2002-07: an updated analysis of the Global Project on Anti-Tuberculosis Drug Resistance Surveillance. Lancet, 373, 1861–1873.
Abdulkader Rahmo, et. al.
The melting temperature profile for nonBeijing sample using nonBeijing specific primer.
The melting temperature profile for Beijing sample using nonBeijing specific primer.
The melting temperature profile for nonBeijing sample using Beijing specific primer.
The melting temperature profile for Beijing sample using Beijing specific primer.
: Rox : SYBR Green
Figure (1): the melting temperature profile for nonBeijing/Beijing samples using the specific
designated primers.
Testing for the Presence of Mycobacterium tuberculosis Beijing Genotype Strains in Syrian Samples
Table 1: the sex, source and resistance pattern (Rif: rifampicin; INH; Isoniazid; Strp: streptomycin; EMB;
ethambutol.) of sample pools, collected at 2010-2011 and at 2003-2005.
Sample 2010/2011 sex address Rif/ INH/Strp/
EMB Sample
2003/2005 sex address Rif/ INH/Strp/ EMB
1 male Aleppo RRRR 23 female Latakia R R R R
2 male Aleppo RRSS 24 female Aleppo R R R R
3 male 25 male DerAzour R R R R
4 female Aleppo RRRR 26 female Damascus R R R R
5 male Damascus RRRR 27 female Aleppo R R R R
6 male RifDamas RRRS 28 male Aleppo R R R R
7 male Rakka RRRS 29 female Aleppo R R R R
8 male DerAzour RRRR 30 female Aleppo R R R R
9 male DerAzour RRRS 31 female Iraq R R R R
10 male Aleppo RRSS 32 male DerAzour R R R R
11 male Hama RRRS 33 male Iraq R R R R
12 male Aleppo RRRR 34 male Damascus R R R R
13 female Aleppo RRSS 35 female Aleppo R R R R
14 male Aleppo RRRR 36 male Hasaka R R R R
15 male Aleppo RRSS 37 male DerAzour R R R R
16 male Aleppo RRRR 38 male Aleppo R R R R
17 male DerAzour RRRR 39 female Aleppo R R R R
18 male DerAzour RRRR 40 female Aleppo R R R R
19 male Aleppo RRRR 41 male RifDamas R R R R
20 male Aleppo RRRR 42 male Hama R R R R
21 male kamishly RRRR 43 female Damascus R R R R
22 male Aleppo RRRR 44 male Qunaitra R R R R
45 male kamishly R R R R
46 male Damascus R R R R
47 male Damascus R R R R
48 male Aleppo R R R R
49 male Damascus R R R R

Abdulkader Rahmo, et. al.
Table 2: The melting point analysis (Tm: melting point, Emi: emission) of amplified MTB DNA, using Beijing strain specific primers (B) and non Beijing strain specificprimers (nB).
sample2010/2011 Primer Tm1 Emi. Tm2 Emi. Tm3 Emi. Tm4 Emi Tm5 Emi. Tm6 Emi.
1 B 78,5 1445,78 89,18 3634 91,88 2039,56
2 B 77,95 1948,22 85,45 1382,11 89,72 1948,22
3 B 77,97 2277,78 85,97 1255 89,72 1069
4 B 77,97 940,33 91,3 2564,78
5 B 78,45 1494,44 91,28 4228,67
6 B 78,45 1850,33 85,85 1816,83 89,58 1465,67
7 B 78,4 833,67 88,72 5012
8 B 78,35 3984
9 B 78 2140,5 85,85 1208,5 86,67 1162 89,15 877.17
10 B 78,4 1180,33 88,75 4409,67
11 B 78,03 759 89.1 4945,5
12 B 78,35 3625
13 B 77,95 3176 85 686,5
14 B 77,58 809,17 85,85 846,17 88,78 4513,17
15 B 78,4 3059,67 85,85 586,5 89,15 679,17
16 B 78 1780,33 85,85 1305,5 90,35 1606,67
17 B 77,95 2361,17 85,4 1165,5
18 B 77,5 1875,17 85,78 1109,5
19 B 78 1484,83 88,75 3014,5
20 B 78 884 85,4 919,83 88,72 5201,5
21 B 77,95 4195 85,83 421,83
22 B 78,4 884,33 85,03 1002,83 88,72 5121,5
B C. B 77,72 1048,33 87,18 2377,67
nB C. B 77,85 1132,17 85,2 644,17 88,9 4356,5
Testing for the Presence of Mycobacterium tuberculosis Beijing Genotype Strains in Syrian Samples
sample2010/2011 Primer Tm1 Emi. Tm2 Emi. Tm3 Emi. Tm4 Emi. Tm5 Emi. Tm6 Emi.
1 nB 83,22 3756,22
2 nB 83,18 4458
3 nB 83,17 4166,22
4 nB 83,15 5930,11
5 nB 82,9 5876,83
6 nB 82,85 7918,5
7 nB 82,85 6773,5
8 nB 82,45 6663,83
9 nB 82,95 5775,17
10 nB 82,53 4826
11 nB 82,47 5178,67
12 nB 82,45 4479,5
13 nB 82,5 5550,83
14 nB 82,95 4551,17
15 nB 82,58 5030,5
16 nB 82,47 6523,17
17 nB 82,45 4853,83
18 nB 82,5 4982,67
19 nB 82,58 4980,17
20 nB 82,47 5340,83
21 nB 82,45 7164,67
22 nB 82,47 6450,33
B C. nB 77,45 4765
nB C. nB 81,85 2508,33
sample2003/2005
Primer Tm1 Emi. Tm2 Emi. Tm3 Emi. Tm4 Emi. Tm5 Emi. Tm6 Emi.
23 B 78,35 1016,83 85,38 669,5 89,05 3364,17
24 B 78,30 2264,33 85,7 846 89,85 479
25 B 77.85 1934,83 85,7 444,17 89,45 240,17
26 B 78.28 1289,83 88.58 1230,83 91.45 2603,5
27 B 77,4 726 88.95 1536,17
28 B 77,45 859 85.78 766,33 90.3 833,83
29 B 78,3 967.17 89.05 2121,33
30 B 77,45 900 85.7 870,33 89.85 939,17
31 B 77,85 764.83 91.45 1939,83
32 B 77,4 1245 85.28 641,17
33 B 89,4 2056,17
34 B 77,85 1160,17 88,5 2873,33
35 B 77,85 1357,83 85,6 708,83 88,9 499,67
36 B 77,35 1174,83 85,6 704,17 89,35 597
37 B 77,47 530,83 89 1382,67
38 B 77,85 881 89 3237,17
39 B 77,85 877,67 88,5 1455,33 90,97 910,5
40 B 88,55 2423,541 B 78,13 1063,78 89,03 1962 91,3 2142,8942 B 78,28 2417,67 85,65 550
43 B 78,28 1199,33 89 4436,5
44 B 78,28 1666,17 85,6 1339,33 89,78 1743,5
45 B 77,85 1914,17 85,6 1129,33 89,35 898

Testing for the Presence of Mycobacterium tuberculosis Beijing Genotype Strains in Syrian Samples
sample2003/2005
Primer Tm1 Emi. Tm2 Emi. Tm3 Emi. Tm4 Emi. Tm5 Emi. Tm6 Emi.
46 B 78,28 2337,17 86,1 820,33
47 B 77,85 1630,83 85,65 699,67 89,4 1112 91,4 2905,17
48 B 78,65 1675,17 85,65 1197,67 89 1690,67
49 B 78,28 2189,17 85,6 1127,5 89,4 905,83
B C. B 77,85 1132,17 85,2 644,17 88,9 4356,5
nB C. B 77,78 1768,83 86,85 1621,67
sample2003/2005 Primer Tm1 Emi. Tm2 Emi. Tm3 Emi. Tm4 Emi. Tm5 Emi. Tm6 Emi.
23 nB 82,78 2885,89
24 nB 82,75 3628,22
25 nB 82.75 5295,56
26 nB 82.25 4399,33
27 nB 82.25 3104,11
28 nB 82,58 5588,83
29 nB 76,33 1336 82,53 3482,33
30 nB 82,53 5266,33
31 nB 81,7 2868,17
32 nB 82,1 3128,67
33 nB 82,95 2779
34 nB 82,58 2832,67
35 nB 82,47 4768,17
36 nB 82,47 3174,83
37 nB 82,58 4743,67
38 nB 82,53 3549
Abdulkader Rahmo, et. al.
sample2003/2005 Primer Tm1 Emi. Tm2 Emi. Tm3 Emi. Tm4 Emi. Tm5 Emi. Tm6 Emi.
39 nB 75,9 533,33 81,65 1617
40 nB 82,47 2508,5
41 nB 82,78 5533
42 nB 82,83 2584,83
43 nB 82,83 3023,17
44 nB 82,78 2973,17
45 nB 82,35 2885,33
46 nB 82,78 1928,17
47 nB 82,78 4718
48 nB 82,83 3310
49 nB 82,78 3474,33
B C. nB 81,85 2508,33
nB C. nB 77,35 2406,67
B C: Beijing strain positive control ; nB C: non Beijing strain positive control ; B: Beijing specific primer; nB: non Beijing specific primer.
م ***, م**, *
.س-– - *
.س- – - بح **
.س-– – - ***
DEFGHا
ت ت. مم م م ن م ت ت م ت ن م
Real time PCR ج ن Melting point temperature نAmplicon .م م ج تت
. م م مض م م ت م . ج ت ض ن م ت" " ت
.ج ن ن
–ن ن–ت ن م – – :

Abdulkader Rahmo, et. al.
Synthesis and Characterization of Some Novel Schiff Base Metal Complexes and the investigation of their Cytotoxic Activity on MCF- Cell ine
Study Role of 3500Q Mutation and MspI Polymorphism in Lipid Metabolism Disorder in Egyptian Childhood Obese Patients
Hayat M.Sharada1, Mohga S.Abdalla1,Waheba A.Zarouk2,Inas Mazen3 and Ahmed
I.Abdelneam2.
1Chemistry department Faculty of science Helwan University, Egypt 2Department of Molecular Genetics and Enzymology National Research Center, Egypt. 3Department of Clinical Genetics National Research Center, Egypt.
Corresponding author E-mail: [email protected]
ABSTRACT
Obesity is associated with qualitative and quantitative abnormalities in lipid profile. Apolipoprotien B plays central role in lipid metabolism. We studied the lipid profile, Msp I polymorphism and 3500Q mutation in 30 obese patients in additional to 30 healthy volunteers. We used a (PCR-RFLP) procedure for identification of 3500Q and MspI polymorphism at the apo B gene. The technique can be performed in a single reaction, using the restriction endonuclease MspI for simultaneous detection of 3500Q mutation and MspI polymorphism and we confirmed our result by sequencing. We found that 3500q mutation play important role in changing LDL and cholesterol levels in obese patients while MspI has no significant role in changing LDL and Cholesterol levels.
Key words: ApolipoprotienB, obesity, Msp I polymorphism, LDL, HDL, 3500q mutation.
INTRODUCTION
Obesity is a medical condition in which excess body fat has accumulated to the extent that it may have an adverse effect on health, leading to reduced life expectancy and/or increased health problems (WHO, 2000; Haslam and James, 2005). Obesity increases the likelihood of various diseases, particularly heart disease, type 2 diabetes, breathing difficulties during sleep, certain types of cancer, and osteoarthritis (Haslam and James ,. 2005). Obesity is most commonly caused by a combination of excessive dietary calories, lack of physical activity, and genetic susceptibility, although a few cases are caused primarily by genes, endocrine disorders, medications or psychiatric illness. Evidence to support the view that some obese people eat little yet gain weight due to a slow metabolism is limited; on average obese people have a greater energy expenditure than their thin counterparts due to the energy required to maintain an increased body mass (Adams and Murphy, 2000; Kushner and Robert, 2007). Direct associations between obesity and several diseases, including diabetes mellitus, hypertension, dyslipidaemia and ischemic heart disease, are well recognized.
Vol. 12, 2012 JBR ORIGINAL ARTICLE
Ahmed I. Abdelneam, et. al.
Despite this, the relationship between body weight and all-cause mortality is more controversial. A very high degree of obesity (BMI 35kg/m2) seems to be linked to higher mortality rates (Drenick et al., 1980).
Obesity is associated with an unfavorable lipid profile. Lipid abnormalities related to obesity include an elevated serum concentration of cholesterol, low-density-lipoprotein (LDL) cholesterol, very low density lipoprotein (VLDL) cholesterol, triglycerides and apolipoprotein B, as well as a reduction in serum high-density-lipoprotein (HDL) cholesterol (Grundy and Barnett, 1990). In a comprehensive meta-analysis, weight loss of 1kilogram decreased serum total cholesterol by 0.05mmol/l and LDL cholesterol by 0.02mmol/l, and increased HDL cholesterol by 0.009mmol/l (Datillo and Kris-Etherton ., 1992) .
Apo B exists in human plasma as two isoforms, apo B-48 and apo B-100. Apo B-100 is the major physiological ligand for the LDL receptor. It is the largest monomeric protein sequenced so far, containing 4536 amino acid residues (Chen et al., 1986, Law et al . ,1986). Its gene has been mapped on the short arm of chromosome 2, with an approximate length of 43 kilo bases and 29 exon (Ludwig et al ., 1987). The LDL-binding domain of the molecule is proposed to be located between the residues 3129 and 3532 (Knott et a l., 1986). Apo B-100 is synthesized in the liver and is required for the assembly of (VLDL). It does not interchange between lipoprotein particles, as do the other lipoproteins, and it is found in IDL and LDL particles after the removal of the apolipoproteins A, E and C (Young, 1990).
Several restriction fragment length polymorphisms (RFLP) in the Apo B gene have been defined (Humphries & Talmud., 1995). The MspI RFLP in exon 26 is associated with an amino acid change from GAA to CAA. (Genestet al., 1990). To date, no data are available on relationship between MspI polymorphism and 3500Q mutation at Apo B and lipid levels in Egyptian population. In the present study we examined the lipid levels and its association with the MspI polymorphism and 3500Q mutation in Apo B gene and childhood obese.
MATERIAL AND METHODS
The study population consisted of 30 childhoods obese. They were 15 male and 15 female, their age ranged between 3-15 years and 30 age and sex-matched healthy volunteers served as control group. The patients were selected from clinical genetic and endocrine department at the National Research Centre.
Clinical examination:
Patients with obesity referred to the clinical genetic and endocrine department at the National Research Center were subjected to pedigree analysis, family history of obesity in the family,
Study Role of 3500Q Mutaon and MspI Polymorphism in Lipid Metabolism Disorder in Egypan Childhood Obese Paents
habit of food eating, and any history of drug intake like corticosteroid, thorough clinical examination including cardiovascular and abdominal examinations. Dysmorphic features if any with special emphasis on eye, skeletal malformations, to exclude syndromic obesity like Pradderwilli or Bardetbiedl syndromes. IQ evaluation, hearing test were also performed. Anthropometric measurements including height, weight, BMI, head circumference, waist circumference, triceps and subscapular skin folds were also conducted.
Investigations:
Estimation of cortisol level in 24 hours collection of urine, serum cortisol AM and PM and after dexamethasone suppression. Serum leptin and insulin assay to exclude monogenic obesity. Estimation of FT3, FT4, TSH, growth hormone, FSH, LH to exclude endocrinal causes.
Laboratory methods:
Estimation of lipid profile:
After overnight fast, sera were collected from all patients and controls for measurement total cholesterol, triglycerides and HDL by Olympus AU 400 using Olympus kit . LDL was calculated by Freidewald equation (Freidewald etal., 1972)
DNA isolation and amplification by PCR:
Blood samples were collected on Na2EDTA as anticoagulant .DNA was isolated by phenol / chloroform technique as described by Sambrook et al ., 1989 . a region in exon 26 of apo B gene was amplified by PCR using primers flanking the nucleotides 10.628 to 11.092.For this proposal we used the sense oligonucleotide (5"CCA ACA CTT ACT TGA ATT CCA AGA GCA CCC 3') described by Pullinger et al., 1995, that creates an Msp I endonuclease cleavage site, allowing the identification of apo B 3500Q mutation and antisense oligonucleotide (5"GGA AGC TTA GGT GTC CTT CTA AGG ATC CTG 3") described by Hansen et al,. 1991. This PCR product is large and allow identification of Msp I polymorphism and 3500Q mutation at apo B gene. Detection of 3500 Q mutation and MspI polymorphism was carried out by digestion of PCR-amplified product with MspI. Enzymatic digestion were carried out at 37C for 4 hours, in total volume 15 ul , using 5 U of restriction endonuclease . PCR and restriction product were identified on 3 and 1.5 % agarose gel electrophoresis for 3500 Q mutation and MspI polymorphis, respectively (Cavalli et al., 2001). Where homozygous for mutation and M+/M+ MspI expected bands will be 362bp and 103bp. Heterozygous for mutation and M+/M+ MspI expected bands will be 362 bp, 33,103and 29. Absence of mutation and M+/M+ MspI expected bands will be 333,103 and 29. Homozygous for mutation and M+/M- MspI expected bands will be 464,362 and 103.

Ahmed I. Abdelneam, et. al.
Heterozygous for mutation and M+/M- MspI expected bands will be 465,436,362,333,103 and 29. Absence of mutation and M+/M- MspI expected bands will be 436,333,103 and 29. . Homozygous for mutation and M-/M- MspI expected bands will be 465. heterozygous for mutation and M-/M- MspI expected bands will be 465,436 and 29bp. Absence of mutation and M-/M- MspI expected bands will be 436 and 29bp (Cavalli et al ., 2001).
DNA Sequencing:
Samples were run on 1.5% agarose gels and the bands corresponding to the predicted size were cut and purification was carried out using the gel
Extraction kit following the manufacturer protocol (QIA quick columns, Qiagen). Purified samples were subjected to cycle sequencing using Big Dye Terminator v3.1 Kit and injected to ABI 3100 Genetic Analyzer (Applied Biosystems, Germany).
Statistical analysis:
Data was presented by means ± SD and percentages .The compiled data were computerized and analyzed by SPSS PC+, version 12. The following tests of significance were used : Analysis of variance (ANOVA ) test between more than two means , t-test between means we used analyze mean difference , and chi –square between percentage to analyze percent difference. A level of significance with p ≤ 0.001 was considered highly significant and p ≤0.05 was considered insignificant.
RESULTS
Lipid profile variation
A higher total cholesterol level was observed (185.57±47.47 vs 113.60±32.73) and higher LDL (118.52±42.65 vs 52.27±30.76) in childhood obese group compared to control group (P ≤ 0.001). However there was no significance difference in HDL (P equal 0.112) and triglycerides (P equal 0.906).
- Msp I polymorphism genotype and allele frequency in childhood patients and controls
The M +/ M+ was observed to be higher in all control (63.3%) compared to the childhood obese patients (16.6%) ( P ≤ 0.001).While the genotypes M+/M- was more common in childhood obese patients (63.4%) compared to control (0% ) ( P 0.001) .While M-/M- was more common in control (36.6%) compared to childhood obese (20%) table (1) .
- Msp I allele frequency in childhood obese patients compared to control.
It was observed that allele + was more prevalent in control (46.66%) compared to childhood obese patients. However - allele was less frequent in control table (2)

Study Role of 3500Q Mutaon and MspI Polymorphism in Lipid Metabolism Disorder in Egypan Childhood Obese Paents
- 3500Q mutation genotype and allele frequency in childhood obese patients and controls
The homozygous form was not found in controls (0%) but was only found in obese (30% %) ( P ≤ 0.001). Similarly heterozygous was not found in controls (0%) and was observed in obese (53.4%)) (P ≤0.001). However normal form found more common in controls (100%) compared to obese (16.6%) ( P ≤ 0.001) table (3 ).
- 3500Q mutation allele frequency in childhood obese compared to controls.
It was observed that the + allele more common in obese (56.6%) compared to controls (0%) (P ≤ 0.001). However - allele more common in controls (100%) compared to obese patients (43.4%) (P ≤ 0.001). Table (4)
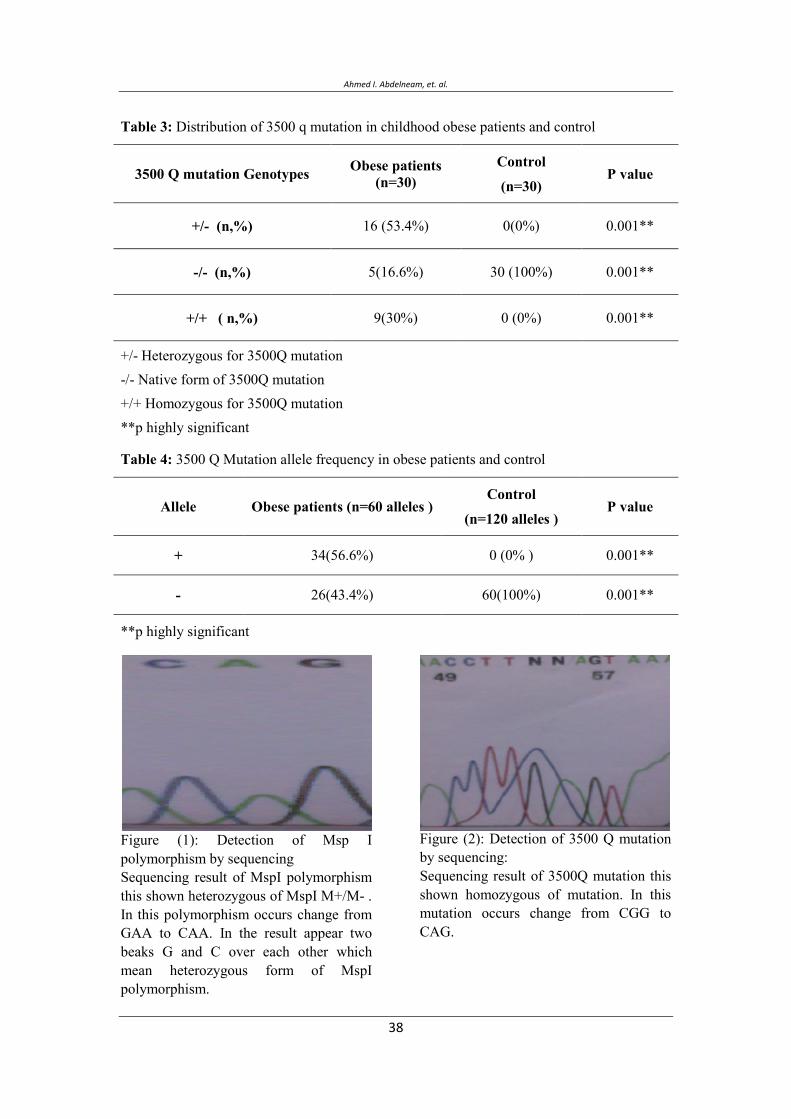
Sequencing of PCR product for Msp I polymorphism and 3500 Q mutation were shown in figure (1) and (2).
Table 1: Distribution of Msp I polymorphism in childhood obese patients and control
P value
Control (n=30)
Childhood Obese patients (n=30) Msp I Genotypes
0.001** 0(0%) 19(63.4%) +/- (n,%)
0.005* 11(36.6%) 6(20%) -/- (n,%)
0.001** 19(63.3%) 5(16.6%) +/+ ( n,%)
+/- heterozygous for MspI -/- normal form of MspI +/+ homozygous for MspI *p highly significant **p highly significant
Table 2: Msp I polymorphism allele frequency in childhood obese patients and control
P value
Control
(n=60 alleles ) Obese patients (n=60 alleles ) Allele
0.005* 38 (63.4%) 29 (48.4%) +
0.005* 22 (36.6%) 31(51.6%) -
*p highly significant
Ahmed I. Abdelneam, et. al.
Table 3: Distribution of 3500 q mutation in childhood obese patients and control
P value Control
(n=30) Obese patients
(n=30) 3500 Q mutation Genotypes
0.001** 0(0%) 16 (53.4%) +/- (n,%)
0.001** 30 (100%) 5(16.6%) -/- (n,%)
0.001** 0 (0%) 9(30%) +/+ ( n,%)
+/- Heterozygous for 3500Q mutation -/- Native form of 3500Q mutation +/+ Homozygous for 3500Q mutation **p highly significant
Table 4: 3500 Q Mutation allele frequency in obese patients and control
P value Control
(n=120 alleles ) Obese patients (n=60 alleles ) Allele
0.001** 0 (0% ) 34(56.6%) +
0.001** 60(100%) 26(43.4%) -
**p highly significant
Figure (1): Detection of Msp I polymorphism by sequencing Sequencing result of MspI polymorphism this shown heterozygous of MspI M+/M- . In this polymorphism occurs change from GAA to CAA. In the result appear two beaks G and C over each other which mean heterozygous form of MspI polymorphism.
Figure (2): Detection of 3500 Q mutation by sequencing: Sequencing result of 3500Q mutation this shown homozygous of mutation. In this mutation occurs change from CGG to CAG.

Synthesis and Characterization of Some Novel Schiff Base Metal Complexes and the investigation of their Cytotoxic Activity on MCF- Cell ine
DISCUSSION
In the present study it was observed that total cholesterol level was
(185.57±47.47vs113.60±32.73) and higher LDL (118.52±42.65 vs 52.27±30.76 ) in
childhood obese group compared to control group ( P 0.001).While there was no significance
difference in HDL( P 0.112 ) and triglycerides (P 0.906).
Simsek et al ., 2010 reported that total cholesterol, LDL-C, HDL-C, and TG in the obese
children were significantly different from values in the control subjects (all p<0.001) . In a
study of 546 obese children aged 7–12observed that Obese children are at risk of
dyslipidemia and relate also Children with the highest BMI and lowest physical fitness have
the lowest HDL-C(Korsten-Reck et al ., 2008) .High risks of hyperlipidaemia,
hypertension, insulin resistance and abnormal glucose tolerance are expected from children
who are obese(McBride., 2010).
In the Muscatine Study, 75% of school-aged children who had total cholesterol
concentrations higher than the 90th percentile at baseline had total cholesterol concentrations
of >200 mg/dl in their early twenties (Daniels et al .,2008). In the Bogalusa Heart Study,
approximately 70% of the children with elevated cholesterol levels continued to have
increased cholesterol levels in young adulthood (Webber et al ., 1991).
One of the most common single site mutations in the human apoB gene, is ApoB-100
R3500Q (apoBR3500Q) mutation, which resulted from a single nucleotide transition, CGG to
CAG, in exon 26 at position 10708 of the apoB gene and leads to amino acid substitution of
glutamine for arginine at position 3500 (Soria et al., 1989) this results in mild to severe
hypercholesterolemia and an increased risk for early onset atherosclerosis (Soria et al .,
1989). This mutation reduces the affinity to the LDL receptor by at least 95% (Maher et al .,
1993) and is the major cause of familial defective ApoB-100 (FDB).
In the present study we have identified 9 homozygous, 16 heterozygous and 5 normal for
3500 Q mutation in group of 30 obese patients. While 3500Q mutation completely absent in
control all cases were normal.
Castillo et al ., 2002 screened apolipoprotein B R3500Q gene mutation in 913 unrelated
Spanish individuals nearly 30 patients were heterozygote, moreover , All the R3500Q
mutations were found on the same allele, assigned to haplotype XbaI-/MspI+/EcoRI-
/3HVR48, they suggested that the mutant alleles are identical by descent in people from
Spain, as observed in other Caucasian populations.
The frequency of R3500Q among Caucasians has been estimated at as 1:500,
(Goldstein et al ., 2001)
Ahmed I. Abdelneam, et. al.
R3500Q was more prevalent in certain populations: 1:100 Afrikaners, 1:170 Christian
Lebanese, and 1:270 French Canadians respectively (Goldstein et al., 2001).
Fisher et al., 1999 had shown that Apo B-100 (Arg3500 Gln) in 21 individuals was (7.1%)
and , 21 carriers of apo B-100(Arg3500 Gln).this corresponds to the highest prevalence of
apo B-100 (Arg3500 Gln) reported at this date
Grombirikova et al., 2001 had found R3500Q mutation in 20 patients with isolated
hypercholesterolemia (11.8%) and in 2 patients with combined hyperlipoproteinemia (3.4%).
In the present studythat there was a significant variation in homozygous R3500Q in
childhood obese (30%) compared to controls (0%) ( P ≤ 0.001) .Also heterozygous in obese
(53.4%) was higher than control (0%) (P ≤ 0.001).
Robles-Osorio et al., 2003 reported one patient aged 44 years old with Arg3500Gln mutation
which was not found in subjects younger than 20 years old.
Several studies in Caucasian populations indicated that Mutations in the apoB gene occur at a
frequency of 1:500 (Innerarity et al ., 1990) , (Tybjxrg-Hansen et al., 1990) and (Schuster
et al ., 1990) .Moreover Miserez and Muller ., 2001 reported that The R3500Q mutation
has been detected almost exclusively in Caucasian individuals.
Humphries and Talmud ., 1995 indicated that the frequency of heterozygous in the general
Euroup and North American population was ranging between 1:500to 1:700
Miserez et al., 1994 hadreported the prevalence of carriers of this metabolic defect
corresponding to 1:209. whileMiserez and Muller ., 2001reported the prevalence of R 3500
Qmutation as1:200 in northwestern Switzerland .
Several studies indicated that R3500Q mutation is specific to western European populations
and accounts typically for 2-5% of patients with the FH phenotype (Myant, 1993; Leren et
al., 1997) and that the remaining of the ApoB mutations are very rare.
In the present study, we found that + allele is more frequent in obese patient (56.6%)
compared with control (0%) (P ≤ 0.001).
A previous study in white populations reported approximate allele frequency of The R3500Q
to be 0.1% to 0.4% , was 12% in the combined sample of 1504 Amish participants, consistent
with a founder effect (Shen et al ., 2010 ).
Bersot et al, 1993. found the rate of R3500Q mutation in California to be 0.08%
Gasparovic et al., 2007 had shown that the allele frequency of R3500Q mutation was 0.09%
in Slovak 40-year-old subjects which did not differ significantly from the published
population molecular data.
Wu et al., 2001 had reported that the mutation frequencies for Arg3500Gln, Arg4019Trp
(1/846 alleles), (2/786 alleles) .respectively
Study Role of 3500Q Mutaon and MspI Polymorphism in Lipid Metabolism Disorder in Egypan Childhood Obese Paents
Teng et al., 2000 had shown that the prevalence of allele frequency in Chinese population
was 0.3%for the R3500Q mutation, and 2.4% for R3500W mutation.
Friedlander et al ., 1993 had shown that The mutation could not be found in Israel or Japan
.in Iran Fard-Esfahani et al .,2005 reported that The prevalence of R3500Q allele in this
patient population was 0%.
Similarly (Awad and El-Tarras ., 2011 ) indicated that absence of Apo B R3500Q mutation
in Saudi Arabia confirmed that this mutation has not reached Saudi Arabia from central
Europe which is the common origin of this mutation.
Several restriction fragment length polymorphisms (RFLP) in the Apo B gene have been
defined (Humphries & Talmud 1995).The MspI RFLP in exon 26 is associated with an
amino acid change GAA to CAA. (Genestet al. ,1990).
In the present study The Msp I M +/M+ genotype was more prevalent in control (63.3%)
compared to the all obese patients (16.6%) this variation was highly significant
(P 0.001).
Similarly Hong et al .,2001 had found that MspI polymorphism M+/M+ haplotype was
more frequent among controls than in patients .
While (Hu et al ,. 2009 ) had shown that the frequencies of apoB Msp I M+/M+ genotypes
did not differ significantly between patients and healthy control .
Our result has shown that the genotypes +/- was more common in childhood obese patients
(63.4%) compared to control (0%) (P 0.001).
Wu et al., 1993 reported MspI M+/M- heterozygous genotypes in Caucasians.
While In our study there was significant difference in allele frequency between obese and
control.
Some studies have shown that no significant difference in allele frequency and genotypes
among MspI polymorphism (D e l g h a n d i et al., 1999 and Salazar et al., 2000).
Other studies indicated highly significant differences (p < 0.001) between the patients and
controls for MspI RFLP alleles of the apoB gene (Wu et al,. 1993;
CHAUFFERT et al., 1997)
CONCLUSION
3500 q mutation present more prevalent in childhood obese and play important role in change lipid LDL and cholesterol while MspI polymorphism have no role in change LDL and cholesterol.
Ahmed I. Abdelneam, et. al.
REFERENCES
Adams JP, Murphy PG .2000 ."Obesity in anaesthesia and intensive care". Br J Anaesth85 (1): 91–108.
Awad N and El-Tarras E .2011. Analysis of the APO B R3500Q Mutation and APOE Polymorphism in Taif Saudi Population using Polymerase Chain Reaction- Reveres Hybridization Technique. J MolBiomarkDiagn 2:109-113.
Bersot TP, Russell SJ, Thatcher SR, Pomernacki NK, Mahley RW, Weisgraber KH, Innerarity TL, Fox CS .1993. A unique haplotype of the apolipoprotein B-100 allele associated with familial defective apolipoprotein B-100 in a Chinese man discovered during a study of the prevalence of this disorder. J Lipid Res.34(7):1149-54.
Castillo S, Tejedor D, Mozas P, Reyes G, Civeira F, Alonso R, Ros E, Pocoví M, Mata P.2002. The apolipoprotein B R3500Q gene mutation in Spanish subjects with a clinical diagnosis of familial hypercholesterolemia. Atherosclerosis.165(1):127-35.
Cavalli SA, Hirata MH, Hirata RD .2001 .Rapid detection of 3500Q and 3531 mutations and MspI polymorphism in exon 26 at the apolipoprotein B gene.J Clin Lab Anal. 15(1):35-9.
CHAUFFERT M , LARGHERO J , NGOHOU-BOTUM K, CISSE A , CHEVENNE D andTRIVIN F .1997. DNA polymorphisms of apolipoprotein B in the population of Senegal .Annals of Human Genetics . 61:525-529 .
Chen SH, Yang CY, Chen PF, Setzer D, TanimuraM, Li WH, Gotto AM Jr& Chan L. 1986. The complete cDNA and amino acid sequence of human apolipoprotein B-100. J BiolChem 261(28): 12918-12921.
Daniels SR, Greer FR, the Committee on Nutrition .2008.Lipid screening and cardiovascular health in childhood. Pediatrics 122(1): 198-208.
DatilloAM and Kris-EthertonPM .1992. Effects of weight reduction on blood lipids and lipoproteins: a meta-analysis. Am J ClinNutr.56:320-8.
Delghandi M, Thangarajah R, Nilsen M, Grimsgaard S, Bonaa KH, Tonstad S, Jorgensen L .1999 .DNA polymorphisms of the apolipoprotein B gene (XbaI, EcoRI, and MspI RFLPs) in Norwegians at risk of atherosclerosis and healthy controls. ActaCardiol 54(4):215–225.
DrenickEJ, BaleGS, SeltzerF, JohnsonDG .1980.Excessive mortality and causes of death in morbidly obese men. JAMA 243:443-5.
Study Role of 3500Q Mutaon and MspI Polymorphism in Lipid Metabolism Disorder in Egypan Childhood Obese Paents
Fard-Esfahani P , Mohammadi-Torbati P, Khatami S, Zeinali S, Taghikhani M and Allahyari M .2005 . FAMILIAL DEFECTIVE APOLIPORROTEIN B 100: FREQUENCY OF R3500Q MUTATION OF APOLIPOROTEIN B GENE IN IRANIAN HYPERCHOLESTEROLEMIC PATIENTS. ActaMedicaIranic, 43(3): 193-196.
Fisher E, Scharnagl H, Hoffmann M, Kusterer K, Wittmann D, Wieland H, Gross W andMärz W .1999 .Mutations in the Apolipoprotein (apo) B-100 Receptor-binding region: Detection of apo B-100 (Arg3500 Trp) Associated with Two New Haplotypes and Evidence That apo B-100 (Glu3405 Gln) Diminishes Receptor-mediated Uptake of LDL .Clinical Chemistry. 45:1026-1038.
FriedewaldWT , Levy RI , and Fredrickson DS .1972 .Estimation of the concentration of low density lipoprotein cholesterol in plasma without use of preparative ultracentrifuge . Clin Chem. 18:499 – 502
Friedlander Y, Dann EJ, Leitersdorf E.1993.Absence of familialdefectiveapolipoprotein B-100 in Israelipatients with dominantlyinheritedhypercholesterolemia and in offspring with parentalhistory of myocardial infarction.Hum Genet. 91(3):299-300
Gasparovic J, Basistová Z, Fábryová L, Wsólová L, Vohnout B, Raslová K.2007. Familial defective apolipoprotein B-100 in Slovakia: are differences in prevalence of familial defective apolipoprotein B-100 explained by ethnicity? Atherosclerosis.194(2):e95-107. Epub 2006 Dec 27.
Genest JJ Jr, Ordovas JM, McNamara JR, Robbins AM,Meade T, Cohn SD, Salem DN,Wilson PW, Masharani U, Frossard PM & Schaefer EJ .1990.DNA polymorphisms of the apolipoprotein B gene in patients with premature coronary artery disease. Atherosclerosis 82(1-2):7-17.
Goldstein JL, Hobbs HH, Brown MS. Familial hypercholesterolemia. In: Scriver CR, Beaudet AL, Sly WS, Valle D, Childs B, Kinzler K, Vogelstein B, editors.2001. The Metabolic and Molecular Bases of Inherited Disease.New York: McGraw-Hill 8: 2863 – 2913.
Grombiríková H, Freiberger T, Kuhrová V, Soska V, Nedomová K.2001.Screening for mutations in apolipoprotein B genes in a group of patients with hyperlipoproteinemia. CasLekCesk.140(1):18-21.
GrundySM and BarnettJP.1990.Metabolic and health complications of obesity. Dis Mo.36:641-731.

Ahmed I. Abdelneam, et. al.
Hansen PS, Rüdiger N, Tybjaerg-Hansen A, Faergeman O, Gregersen N.1991. Detection of the apoB-3500 mutation (glutamine for arginine) by gene amplification and cleavage with MspI. J Lipid Res. 32(7):1229-33.
Haslam DW, James WP .2005."Obesity".Lancet366 (9492): 1197–209.
Hong SH, Song J, Kim JQ. 2001. The haplotype analyses using multiple markers of the apolipoprotein B gene in patients with coronary artery disease. J Korean Med Sci. 16(6):719-724.
Hu P, Qin YH, Jing CX, Lei FY, Chen P, Li MF.2008. Association of polymorphisms at restriction enzyme recognition sites of apolipoprotein B and E gene with dyslipidemia in children undergoing primary nephrotic syndrome. MolBiol Rep.36(5):1015-21.
Humphries SE, Talmud PJ.1995.Hyperlipidaemiaassociated with genetic variation in the apolipoprotein Bgene. CurrOpinLipidol.6(4):215-22.
Innerarity TL, Mahley RW, Weisgraber KH, Bersot TP, Krauss RM, Vega GL, Grundy SM, Friedl W, Davignon J, McCarthy BJ .1990. Familial defective apolipoprotein B-100: a mutation of apolipoprotein B that causes hypercholesterolemia. J Lipid Res. 31(8):1337-1349.
Knott TJ, Pease RJ, Powell LM, Wallis SC, Rall SC Jr, Innerarity TL, Blackhart B, Taylor WH, Marcel Y, Milne R, Johnson D, Fuller M, Lusis AJ, McCarthy BJ, Mahley RW, Levy-Wilson B & Scott J .1986.Complete protein sequence and identification of structural domains of human apolipoprotein B. Nature 323: 734-738.
Korsten-Reck U, Kromeyer-Hauschild K, Korsten K, Baumstark MW, Dickhuth HH, Berg A.2008. Frequency of secondarydyslipidemia in obesechildren. Vasc Health Risk Manag.4(5):1089-94.
Kushner, Robert .2007. Treatment of the Obese Patient (Contemporary Endocrinology). Totowa, NJ: Humana Press. pp. 158.ISBN 1-59745-400-1.
Law SW, Grant SM, Higuchi K, Hospattankar A, Lackner K, Lee N & Brewer HB Jr. 1986. Human liver apolipoprotein B-100 cDNA: complete nucleic acid and derived amino acid sequence. ProcNatlAcadSci USA 83(21): 8142-8146.
Leren TP, Tonstad S, Gundersen KE, Bakken KS, Rødningen OK, Sundvold H, Ose L, Berg K. 1997.Molecular genetics of familial hypercholesterolaemia in Norway. J Intern Med.241(3):185-94.

Study Role of 3500Q Mutaon and MspI Polymorphism in Lipid Metabolism Disorder in Egypan Childhood Obese Paents
Ludwig EH, Blackhart BD, Pierotti VR, Caiati L, Fortier C, Knott T, Scott J, MahleyRW, Levy-Wilson B &McCarthy BJ .1987.DNA sequence of the human apolipoprotein B gene. DNA 6(4): 363-372.
Maher VM, Gallagher JJ, Myant NB .1993.The binding of very low density lipoprotein remnants to the low density lipoprotein receptor in familial defective apolipoprotein B-100. Atherosclerosis 102(1):51–61.
McBride D.2010.Childhood obesity. Practice Nurse . 39 (11):40.
Miserez AR, Laager R, Chiodetti N, Keller U.1994. Highprevalence of familialdefectiveapolipoprotein B-100 in Switzerland. J Lipid Res.35(4):574-83.
Miserez AR, Muller PY.2000 . Familialdefectiveapolipoprotein B-100: a mutationemerged in the mesolithic ancestors of Celtic peoples?.Atherosclerosis. 148(2):433-6.
Miserez AR, Muller PY.2001. Familialdefectiveapolipoprotein B-100: a mutationemerged in the Mesolithic period. Atherosclerosis.158(1):253-4.
Myant NB.1993. Familialdefectiveapolipoprotein B-100: a review, including some comparisons with familial hypercholesterolaemia. Atherosclerosis.104(1-2):1-18.
Pullinger CR, Hennessy LK, Chatterton JE, Liu W, Love JA, Mendel CM, Frost PH, Malloy MJ, Schumaker VN, Kane JP.1995.Familial ligand-defective apolipoprotein B. Identification of a new mutation that decreases LDL receptor binding affinity. J Clin Invest. 95(3):1225-34.
Robles-Osorio L, Ordoñez ML, Aguilar-Salinas CA, Aurón-Gómez M, Tusié-Luna MT, Gómez-Pérez FJ, Rull-Rodrigo JA.2003. Familial hypercholesterolemia due to ligand-defective apolipoprotein B100: first case report in a Mexican family. Arch Med Res.34(1):70-5.
Salazar LA , Hirata MH , Giannini, SD, Forti, N, Diament, J, Lima TM., and Hirata RD .2000. Seven DNA polymorphisms at the candidate genes of atherosclerosis in Brazilian women with angiographically documented coronary artery disease. ClinChemActa300(1-2):139-149.
SambrookJ , Fritsch E F , and Maniantis T .1989.Molecular cloning .A laboratory manual 2th edition , cold spring Harbor ,Laboratory press ,New York.
Schuster H, Rauh G, Kormann B, Hepp T, Humphries S, Keller C, Wolfram G, Zöllner N.1990. Familial defective apolipoprotein B-100.Comparison with familial hypercholesterolemia in 18 cases detected in Munich.Arteriosclerosis.10(4):577-81.
Ahmed I. Abdelneam, et. al.
ShenH ,Cleen M. Damcott M,Rampersaud E, PollinT,etal .2010.Familial Defective Apolipoprotein B-100 and Increased Low-Density Lipoprotein Cholesterol and Coronary Artery Calcification in the Old Order Amish.Arch Intern Med. 170(20):1850-1855
Simsek E, Balta H, Balta Z, Dallar Y. 2010. Childhood Obesity-Related Cardiovascular Risk Factors and Carotid Intima-Media Thickness. Turk J Pediatr .52(6): 602-611.
Soria LF, Ludwig EH, Clarke HR, Vega GL, Grundy SM, et al. 1989.Association between a specific Apolipoprotein B mutation and familial defective apolipoprotein B100. ProcNatlAcadSci USA 86(2):587-591.
Teng YN, Pan JP, Chou SC, Tai DY, Lee-Chen GJ.2000.Familial defective apolipoprotein B-100: detection and haplotype analysis of the Arg(3500)-->Gln mutation in hyperlipidemic Chinese. Atherosclerosis.152(2):385-90
Tybjaerg-Hansen A, Gallagher J, Vincent J, Houlston R, Talmud P, Dunning AM, Seed M, Hamsten A, Humphries SE, Myant NB.1990.Familialdefectiveapolipoprotein B-100: detection in the United Kingdom and Scandinavia, and clinicalcharacteristics of tencases.Atherosclerosis.80(3):235-42.
Webber LS, Srinivasan SR, Wattigney WA, Berenson GS .1991.Tracking of serum and lipids and lipoproteins from childhood to adulthood .The Bogalusa Heart Study. Am J Epidemiol 133(9): 884-899.
World Health Organization,.2000 .Obesity preventing and managing the global epidemic.Report of a WHO consultation.Geneva.; WHO Tech RepSer No. 894.
Wu JH, Lee YT, Hsu HC, Hsieh LL, Wen MS, Chern MS, Wu D.2001.Further characterization of apolipoprotein B genetic variations in Taiwanese.Hum Biol.73(3):451-60.
Wu JH, Wen MS, Lo SK, Wu D.1993.DNA polymorphisms of apolipoprotein B in the population of Taiwan.J Formos Med Assoc. 92(4):330-335.
Young SG .1990. Recent progress in understanding apolipoprotein B. Circulation 82(5): 1574-1594.

Study Role of 3500Q Mutaon and MspI Polymorphism in Lipid Metabolism Disorder in Egypan Childhood Obese Paents
‚ی م‚ ‚م ش ‚ م ش
م - .
. م - ی ی
. م -
UVWXYا
ت م .ن ت م م نم تم ج م م
جی م .
جی ت نی ت ن ج ت ت من
. م

Ahmed I. Abdelneam, et. al.

Synthesis and Characterization of Some Novel Schiff Base Metal Complexes and the investigation of their Cytotoxic Activity on MCF- Cell ine
Molecular Detection of Germline Mutations of the Breast Tumor Suppressor Genes BRCA1/BRCA2 in Breast Cancer Patients in Saudi Arabia
Diana Ali Al-Quwaie and Nada Altwaty
Biology Department, Faculty of Science, King Abdulaziz University, Jeddah, Saudi Arabia.
Corresponding authorE-mail: [email protected]
ABSTRACT Breast cancer is the most frequent cancer in women worldwide. A growing interest in the use of molecular markers in order to assess prognosis of breast cancer is taking place. According to most recent studies, there is a positive relationship between increased frequency of mutations in BRACA1 and BRACA2 genes and the causes of breast cancer. The current work aims to correlate any nucleotide change observed within exons (10 & 11) in BRCA1 and BRCA2 genes (that represent most areas of mutations in the two genes) with causative etiological factors ,for a chosen group of breast cancer patients from the Western region of Saudi Arabia. The DNA was extracted from the 60 paraffin-embedded tissues and the 20 blood samples of sporadic and familial (family history) breast invasive ductal carcinoma (BIDC). Then polymerase chain reaction( PCR) and single-stranded conformation polymorphism (SSCP) ,as will as sequencing were performed for detection of mutations. The sporadic breast cancer patient's age ranged between 30-72 years. The familial breast cancer patients aged between 30-62 years. Polymerase chain reaction (PCR) was performed. Single stranded conformation polymorphisms (SSCPs) assay showed band shift for 18/60 (30%) of the sporadic tumor samples, but mutations detected by DNA sequencing in 11nucleotides only, representing 9/60 (15%). There were 4/11 (36.36 %) in BRCA1 exon 11, 4/11 (36.36) in BRCA2 exon 10 and 3/11(27.28 %) in BRCA2 exon 11. While in the 20 familial breast cancer patients, band shifts were identified in 10/20 (50%), but mutations detected in 7 nucleotide in 7/20 (35%) tumor samples, 7 mutations, 4 in BRCA1 exon 11 (57.1%), 2 in BRCA2 exon 10 (28.6 %), 1 in BRCA2 exon 11(14.3%). No mutations were detected in BRCA1 and exon 10 for the sporadic and the familial breast cancer. We conclude that , the BRCA1 or BRCA2 mutation prevalence found among women with breast cancer and positive family history was 50% (10/20). Larger studies are needed to establish the significance of BRCA mutations among Saudi women and the prevalence of specific mutations. All females from age 30 and more should watch breast cancer by doing monthly self-breast examination because the type of breast cancer discovered in the KSA is more aggressive from other countries.
Key words: Cancer breast, KSA, BRCA1/BRCA2, PCR, SSCP, Sequencing.
Vol. 12, 2012 JBR ORIGINAL ARTICLE
Diana Ali Al-Quwaie, et. al.
INTRODUCTION Breast Cancer is the most frequently diagnosed cancer in woman Worldwide. The most common cause of cancer death (World Health Organization, 2006). In Arab countries, breast cancer is the most common cancer among women with a young age of around 50 years at presentation. Locally advanced disease is very common and total mastectomy is the most commonly performed surgery (El Saghir et al., 2007). In the KSA, breast cancer constitutes 18% of all cancers in Saudi women. It constitutes more than 40% of all non-metastasis breast cancer (Ezzat et al., 1999 and Saudi Cancer Registry, 2010). About 70% of breast cancer cases are not reported until they are at a very late stage, compared with 30% or less in the U.S.A (Nasr, 2007In Saudi Arabia, the disease appears in women at younger ages and in more advanced stages than in most American cases. This makes the need for early detection and awareness essential (Austen, 2006). Cancer is growing in Saudi Arabia with 7,000 new cases being reported each year and the figure will reach 30,000 in 15 years (Ibrahim, 2007 Breast cancer and other malignancies result from stepwise genetic alterations of normal host cells and possibly from other non-genetic (or epigenetic) changes in the behavior of not only malignant cells but also host cells that interact with the tumor, such as immune, vascular and stromal cells (Lerebours and Ledereau, 2002). Carcinogenesis is a multistep process characterized by genetic alterations that influence key cellular pathways involved in growth and development. There are two main categories of genes involved in these process, tumor suppressor genes and oncogenes. Tumor suppressor genes are normal genes that slow down cell division, repair DNA mistakes, and tell cells when to die. When tumor suppressor genes don’t work properly, cells can grow out of control, which can lead to cancer. About 30 tumor suppressor genes have been identified including p53, BRCA1, BRCA2, CHK and RB (Haber JE, 2000). The BRCA1 (breast cancer 1, early onset) protein is directly involved in the repair of damaged DNA, mediating between the sensors of damage to the effectors of repair (Zhang and Powell, 2005). In the nucleus of many types of normal cells, the BRCA1 protein is thought to interact with RAD51 to mend breaks in DNA. These breaks can be caused by natural radiation or other exposures, but also occur when chromosomes exchange genetic material in preparation for cell division (Boulton SJ, 2006). Some mutations of this gene are associated with a significant increase in the risk of breast cancer, as well as other cancers (Palo A, 2008) .The BRCA1 gene is located on the long (q) arm of chromosome 17 (17q21) at band 21.Protein length (1863 amino acids) mRNA size 7.8 kb, from base pair 38,449,843 to base pair 38,530,933. Other names: Ring finger protein 53. It is composed of 22 exons and 21 introns covering approximately100 kb (Hall et al., 1990). BRCA2 (breast cancer 2, early onset) protein involved in the repair of double-strand DNA breaks, play a role in response to DNA damage, as well as in mitotic and meiotic recombination(Palo A, 2008).
Molecular Detecon of Germline Mutaons of the Breast Tumor Suppressor Genes BRCA1/BRCA2 in Breast Cancer Paents in Saudi Ara%ia
BRCA2, which has a function similar to that of BRCA1, also interacts with the RAD51 protein. Cells with mutant BRCA2 protein are like many cancer cells, genetically unstable and accumulate chromosomal rearrangements (Patel et al., 1998 and Yu et al., 2000) .
The association of RAD51–BRCA2 is required to maintain RAD51 in a form that is in a state of 'readiness'. BRCA2 localizes to damage-induced sub nuclear foci with RAD51 seems consistent with the possibility that BRCA2 plays a positive role in assembly of the recombination complex (Chen et al., 1998) . In the absence of this interaction with BRCA2, RAD51 might exist in a form that is not capable of being recruited into a functional repair complex when damage occurs (Moynahan et al., 2001). BRCA2 have a protein length (3418 amino acids). The BRCA2 gene is located on the long arm (q) of chromosome 13 at position 12.3 (13q12.3) mRNA size 10-12 kb (Bignell et al., 1997).Mutations in BRCA1 and BRCA2 genes can be changes in one or a small number of DNA base pairs. In some cases, large segments of DNA are rearranged. Those large segments, also called large rearrangements, can be a deletion or a duplication of one or several exons in the gene. Classical methods for mutations detection are unable to reveal those mutations, (Mazoyer, 2005). A mutated BRCA1 and BRCA2 genes usually makes a protein that does not function properly. The defective BRCA1 protein is unable to help fix mutations that occur in other genes. These defects accumulate and may allow cells to grow and divide uncontrollably to form a tumor (Bork et al., 1996). In addition to breast cancer, mutations in the BRCA1 gene also increase the risk of ovarian, Fallopian tube, prostate and colon cancers.Nearly 80% of mutations described in the BRCA1 gene would produce a truncated protein,
(Struewing et al., 1995 and Couch et al., 1996). Similar to BRCA1, founder mutations have been identified in the BRCA2 gene in members of defined ethnic groups. Moreover, it is estimated that mutations in BRCA1 alone account for 50% of all familial early-onset female breast cancers, while mutations in BRCA2 may be responsible for up to 35% of the remaining hereditary breast cancers (Miki et al.,1994) . Several methods have been used to screen for mutations in these genes. The BRCA1 and BRCA2 genes are the most important breast cancer susceptibility genes identified to date (Oros et al., 2004), account for majority of breast and ovarian cancer families (Narod et al., 1995). Aim of the work: The principal aim of this work was to: 1. Study the frequency of mutations in exon 10, and exon 11 of breast cancer 1 (BRCA1)
and breast cancer 2 (BRCA2) in breast cancer patients by Molecular techniques. 2. Correlate any nucleotide change observed within causative etiological factors such as
bilateral, multiple organ cancer, more than one risk factor and the early onset and possibility of recurrence.
3. Provide tool f or identifying patients with a higher risk of recurrence and subsequently develop appropriate post – operative treatment to decrease recurrence rates.
Diana Ali Al-Quwaie, et. al.
MATERIAL AND METHODS
Patients and Samples:
Paraffin-embedded tissues for breast invasive ductal carcinoma (BIDC) were obtained, after informed consent and ethical approval, from 60 sporadic breast cancer patients. Moreover, 20 blood samples from BIDC breast cancer patients with history of familial breast cancer were also collected. All patients underwent surgery at the Western region, Saudi Arabia. The study-subject sample ages ranged from 30- 72 years. Ten control tissue samples ages ranged from 30- 72 years were taken from patients with other diseases than cancer (inflammatory and benign), beside 10 blood samples from healthy volunteers as controls ages ranged from 30- 62 years.
Chemicals:
Xylene, Tris-base, ethanol absolute, liquid nitrogen (purchased locally, from Industrial Gases factory), EDTA-disodium salt, sucrose, bromophenol blue, xylene cyanol, ethidum bromide, agarose, magnesium chloride, potassium chioride, triton x-100, acrylamide, bis-acrylamide, ammonium persulphate, boric acid, formamide, glycerol, TEMED, ammonium acetate & SDS. All above chemicals were purchased from (Sigma-Aldrich Company, USA) and were molecular biology grade.
Reagents:
DNA isolation kit (QIAamp DNA Mini Kit) from (Qiagen, UK), Taq polymerase, dNTPs mix and magnesium chloride were from (Promega, USA), , DNA size marker (fragments size:50,200, 400,850 & 1500bp) and DNA ladder (fragments size:50,100,150,200, 250,300,400,500,600,700,800,900 &1000 pb) were purchased from (Fermentas Inc.,USA) and restriction enzymes HinfI, AluI and MspI were purchased from (Fermentas Inc.,USA), Kit for DNA purification from gel purchaced from (Qiagen UK), GenePrint® SilverSTR® III System were purchased from (Promega, USA).
Instruments:
PCR work carried out by using Touchgene gradient thermal cycler, (Techne-UK). Electrophoresis was carried out on a Hoefer SE 600 system (Hoefer-USA). Finally O.D of extracted DNA measured by Apel 303UV (Apel – Japan). 2100 Retrievar autoclave from (PickCell, Amsterdam-Netherlands).
Primers:
The primers were selected according to (Palmieri et al., 2002) to screen the exons 10 and 11 in BRCA1 and BRCA2 genes that represent the most expected mutations.
Molecular Detecon of Germline Mutaons of the Breast Tumor Suppressor Genes BRCA1/BRCA2 in Breast Cancer Paents in Saudi Ara%ia
METHODS:
Reagents preparation such as 1- gel electrophoresis reagents that include running buffer 50X Tris acetate EDTA (TAE), Loading buffer, ethidium bromide, agarose gel. 2- PCR master mix 5X. 3-single stranded confirmation polymorphisms reagents include acrylamide 30%, ammonium persulphate, 10X TBE-buffer, stopping solution, PAGE gel 6%. 4 - PCR products extraction from acralymide reagents, the crush and soak solution and Sodium acetate pH 5.2. DNA Extraction from Tissues, DNA extraction from blood Determination the DNA quality and PCR product. PCR amplifications, DNA obtained from both, the tumor biopsy samples as well as from all blood samples was used as templates in a PCR reaction. Primers used to amplify were chosen from exons 10 and 11 in BRCA1 and BRCA2. Single strand confirmation polymorphism (SSCP) was originally described in 1989 by (Orita, 1989On a high quality gel, single base substitutions can alter the secondary structure of the fragment in the gel, producing a visibleshift in its mobility. DNA sequencing determine the order of the bases in a DNA sample , DNA polymerase copies the single stranded DNA template by adding nucleotides to a growing chain (extension product).
Statistical analysis:
Patients were individually verified by gene mutation criteria, including exon-BRCA1/10, 11, BRCA2/10, 11, nucleotide alteration, amino acid changes, as well as BIC +ve (recorded) or BIC –ve (not recorded) status. Furthermore, the study variables were analyzed utilizing a retrospective approach (through examining patient record information) to particularly identify the impact of potential risk factors, such as age of onset of the disease, whether having a unilateral or bilateral disease, as well as multiple organ involvement, upon outcome variables (BRCA-1, 2 gene-mutation). Patient dataset was coded, entered into a Microsoft database program with adequate backup until studied. Statistical analysis was done using statistical package for social sciences (SPSS) software, version 10. Parametric techniques were utilized, whenever applicable; otherwise alternative appropriate techniques were done as required. The study's statistical testing was done at α-level 0.05, and hence results with p-value <0.05 were considered statistically significant.
Data Presentation:
Results were displayed by means of tables, graphs and photograph plates.
Breast Cancer Information Core Database:
The Breast Cancer Information Core (BIC) is an open access, on-line mutation database for
breast cancer susceptibility genes. In addition to creating a catalogue of all mutations and
polymorphisms in breast cancer susceptibility genes, a principle aim of the BIC is to facilitate
Diana Ali Al-Quwaie, et. al.
the detection and characterization of these genes by providing technical support in the form
of mutation detection protocols, primer sequences, and reagent access.
RESULTS
Overview of the 60 sporadic breast cancer patients, aged between 30-72 years with the
average age 43.6 years, showed that 6/60 patients had multiple organ cancer (representing
10%). 5/6 of patients had ovarian cancer and 1/6 with lung carcinoma [Table 1].
The highest age group of these patients was the group from 30-40 years (57%), followed by
41-50 years (10%), 51-60 years (15%), 61-70 years (15%) and the least was 71-80
years (3.3%).
In 20 familial breast cancer patients, aged between 30-62 years with the average age 42.9
years showed that 2/20 patients had ovarian cancer beside the breast cancer (representing
10%). [Table 2].
The highest age group of these patients was the group from 30-40 years (40%), followed by
age groups 41-50 years (35%), age groups 51-60 years (20%) and age groups 61-70 years
(5%), while the least was 71-80, (0%).[Table 3].
Table 1: The sex, age and clinical history of sporadic breast cancer patients.
Multiple organ cancer stage grade side Age sex Serial
IIA 2LT55F1
IIB 2RT54F2
Ovary cancer I2RT73F3
IIB 3Bi34F4
IIA 2Bi66F5
IIB 2RT38F6
IIA 2LT52F7
IIA 2LT35F8
I2RT62F9
IIB 2LT40F10
IIIB 3LT37F11
IIA 2RT30F12
I2LT61F13
IIB 3RT32F14
I2RT48F15
IIB 2RT40F16
IIIB 2RT32F17
Molecular Detecon of Germline Mutaons of the Breast Tumor Suppressor Genes BRCA1/BRCA2 in Breast Cancer Paents in Saudi Ara%ia
Multiple organ cancer stage grade side Age sex Serial
I2Bi52F18
IIIB 3RT40F19
I3RT40F20
I2Bi38F21
I2RT30F22
Ovary cancer IIA 3LT45F23
IIB 2RT37F24
I2RT44F25
Lung cancer IIB 2RT40F26
IIA 2LT35F27
IIB 2LT52F28
IIB 2Bi52F29
IIB 2RT44F30
IIA 2RT30F31
IIIB 2RT33F32
Ovary cancer IIA 2LT54F33
IIA 2RT30F34
IIB 3BI45F35
I2RT32F36
IIB 2RT65F37
IIA 2LT64F38
IIIB 3RT70F39
Ovary cancer IIIB 2RT37F40
I2LT30F41
IIA 2LT38F42
IIIB 3LT64F43
I2Bi32F44
IIA 2LT61F45
I2LT33F46
IIB 2LT36F47
I2Bi72F48
IIIB 2RT35F49
Ovary cancer IIA 3LT54F50
IIB 2LT30F51
I2RT61F52
Diana Ali Al-Quwaie, et. al.
Multiple organ cancer stage grade side Age sex Serial
I2RT34F53
IIB 3Bi50F54
IIIB 2LT35F55
I2LT54F56
I2RT39F57
IIB 2LT30F58
I2LT32F59
IIA 3RT35F60
Table 2: The sex, age and clinical history of familial Breast cancer patients.
Serial Age (years)
Sporadic breast cancer
( paents)
Familial breast cancer
( paents)
Number Percentage (%) Number Percentage (%)
- % %
- % %
- % %
- % %
- % %
Table 3: The age factor of sporadic and familial breast cancer Patients. PCR, SSCP and DNA Sequencing: DNA extracted from tissues of the 60 sporadic breast cancer patients and the white blood cells of the whole blood of the 20 familial breast cancer patients plus 10 whole blood specimens collected from normal female donors and 10 benign tissues from non malignant patients (as controls) . The extracted DNA were subjected to PCR amplification of BRCA1 and BRCA2 genes regions (Figure 2), using 36 primer pairs (12 primers pairs coding for exons 10 and 11 of BRCA1 gene and 24 primers pairs coding for exons 10 and 11 of BRCA2 gene) according to protocol described by (Pamieri at el., 2002). A negative control sample (reaction performed without DNA template) run was performed with each gel as a quality control of the process. The results showed no band in the negative lane indicating an uncontaminated PCR reaction. All amplified PCR products were verified on 1.5% PCR grade agarose gel. All the utilized specific primers give amplification products with the expected lengths or size (Figure 1).
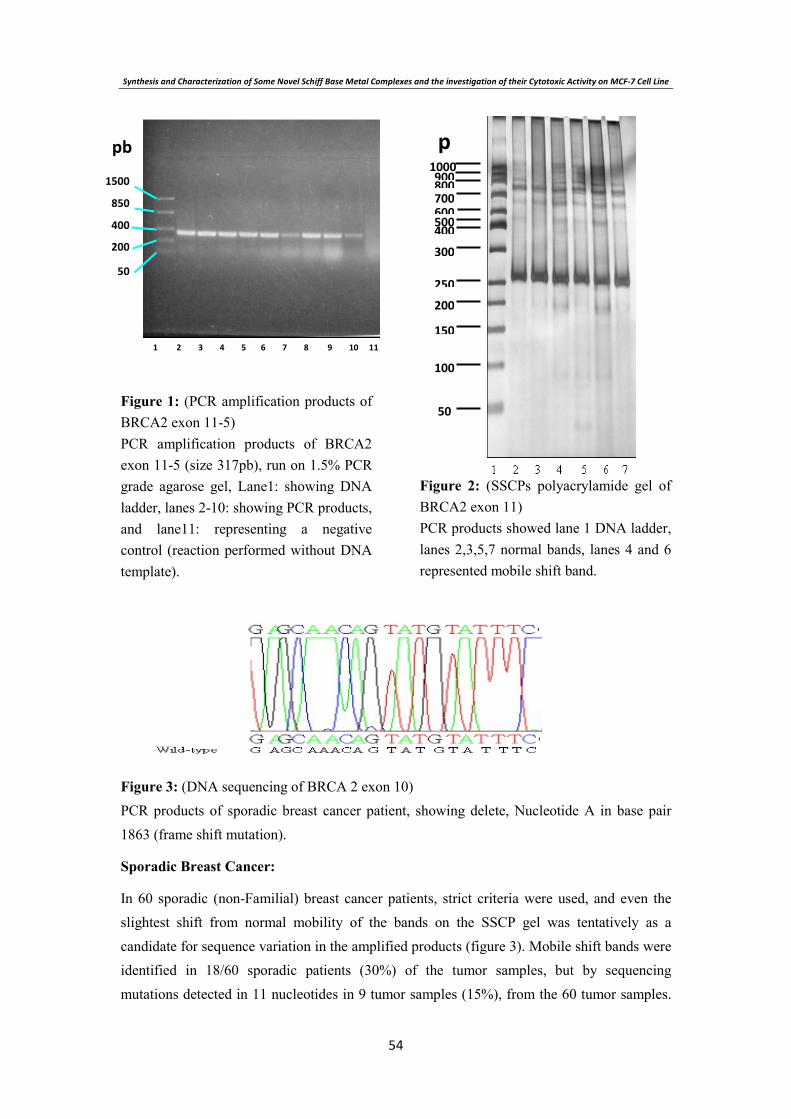
Synthesis and Characterization of Some Novel Schiff Base Metal Complexes and the investigation of their Cytotoxic Activity on MCF- Cell ine
Figure 1: (PCR amplification products of BRCA2 exon 11-5) PCR amplification products of BRCA2 exon 11-5 (size 317pb), run on 1.5% PCR grade agarose gel, Lane1: showing DNA ladder, lanes 2-10: showing PCR products, and lane11: representing a negative control (reaction performed without DNA template).
Figure 2: (SSCPs polyacrylamide gel of BRCA2 exon 11) PCR products showed lane 1 DNA ladder, lanes 2,3,5,7 normal bands, lanes 4 and 6 represented mobile shift band.
Figure 3: (DNA sequencing of BRCA 2 exon 10) PCR products of sporadic breast cancer patient, showing delete, Nucleotide A in base pair 1863 (frame shift mutation).
Sporadic Breast Cancer:
In 60 sporadic (non-Familial) breast cancer patients, strict criteria were used, and even the slightest shift from normal mobility of the bands on the SSCP gel was tentatively as a candidate for sequence variation in the amplified products (figure 3). Mobile shift bands were identified in 18/60 sporadic patients (30%) of the tumor samples, but by sequencing mutations detected in 11 nucleotides in 9 tumor samples (15%), from the 60 tumor samples.
p
pb

Diana Ali Al-Quwaie, et. al.
These results indicating that the original criteria used to select mutant samples were too strict. The 10 control tissue samples showed no mutations. The 11 mutations observed in 9 different patients meanwhile, two patients had duplicate mutations. From 11 mutations we found 4 deletions of one base pair and 1 insertion of one base pair. The other mutations, T→C (n=2), G→C (n=1), A→T (n=1), C→G (n=1) and G→A (n=1) which represent 3 transition and 3 transversions. No mutations were detected in BRCA1 exon 10. While there were 4/11 (36.36 %) in BRCA1 exon 11. 4/11 (36.36) in BRCA2 exon 10. And 3/11 (27.28 %) in BRCA2 exon 11. The different mutations are: 5/11 (45.45%) missense mutations, G → C (n=1; codon 1223), C→ G (n=1;codon 3893), T→ C (n=1; codon 3529) BRCA10 exon 11, A→T (n=1 codon 1439) BRCA2 exon 10 and T→ C (n=1codon 1906) BRCA2 exon 11, these mutations lead to change amino acid in the form of Lysine → Asparagine, Asparagine → Lysine, Methionine → Arginine, Asparagine → Lysine and Asparagine → Serine respectively. 1/11(9%) Synonymous substitution G→A (n=1; codon 1434) BRCA2 exon 10 changes the amino acid from Leucine → Leucine, and 5 frame shift mutations, one frame shift mutation in BRCA1 exon 11, two frame shift mutations in BRCA2 exon 10 and two frame shift mutations in BRCA2 exon 11 moreover, these mutations lead to changes in the amino acids [figure 4]. According to the Breast Cancer Information Core (BIC) data base, 3/11(27.28%) mutations were recorded, while 8/11 (72.72%) were not.
Figure 4: Status of BRCA1 and BRCA 2 mutations in sporadic breast cancer patients.
Num
ber

Molecular Detecon of Germline Mutaons of the Breast Tumor Suppressor Genes BRCA1/BRCA2 in Breast Cancer Paents in Saudi Ara%ia
Table 4: Mutations in sporadic Breast cancer patients
BIC data
base
Type of
mutations
Amino Acid
change
Nucleotide
alterations Exon Age Case
Ve - Missense
mutation
1223 Lys → Asn 3869 G → CBRCA 1/11 551
Ve - Missense
mutation
1231 Asn → Lys 3893 C → GBRCA 1/11 542
ve+ Missense
mutation
1137 Met → Arg 3529 T → CBRCA 1/11 373
-ve Frame shift changed 3572 del A BRCA 1/11 344
-ve
-ve
Missense
mutation
Synonymous
substitution
404 Asn → Lys
403 Leu → Leu
1439 A → T
1434 G → A
BRCA 2/10
BRCA 2/10
66 5
Ve - Frame shift changed 1863 del A BRCA 2/10 386
ve - Frame shift changed 1990 Ins C BRCA 2/10 527
-ve
+ve
Frame shift
Frame shift
Changed
changed
6043 del T
6051 del A
BRCA 2/11
BRCA 2/11
35 8
+ve Missense
mutation
560 Asn → Ser
1906 T → CBRCA 2/11
62 9
Familial Breast Cancer:
In 20 familial breast cancer patients, Frame shifts by SSCP were identified in 10/20 (50%) of
the tumor samples. but mutations detected by sequencing in 7 nucleotide in 7/20 (35%) tumor

Diana Ali Al-Quwaie, et. al.
samples. from 7 mutations, there were 2 deletions in one base pair, moreover, there were
T→C (n=2), C→G (n=1), A→C (n=1) and A→T (n=1) which represent 2 transitions and 3
transversions.
From the 7 mutations:
No mutations were detected in BRCA1 exon 10.
While 4/7 mutations in BRCA1 exon 11 (57.1%).
2/7 mutations in BRCA2 exon 10 (28.6 %).
And 1/7 mutation in BRCA2 exon 11(14.3%).
The different mutations are 5/7 (71.43%) missense mutation, T→C (n=1; codon 1137), C→G
(n=1; codon 1231), A→C (n=1; codon 1151) BRCA1 exon 11. A→T (n=1; codon 525) and
T→C (n=1; codon 479) BRCA2 exon 10. These mutations lead to change amino acid
meanwhile; these mutations lead to change amino acid in the form of Methionine →
Arginine, Asparagine → Lysine, Aspartic acid → Glycine, Threonine → Serine and Aspartic
acid → Glycine respectively.
While the 2 frame shift mutations are one frame shift mutation in BRCA1 exon 11 and one
frame shift mutation in BRCA2 exon 11 these mutations lead to changes in amino acids
(Figure 5). Regarding to BIC 3/7 (42.86 %) mutations were recorded, while 4/7 (57.14 %)
were not recorded. From the 18 mutations detected in sporadic and familial breast cancer
patients only 6 mutations (33.3%) in both groups recorded internationally in BIC data base.
The comparison between sporadic and familial breast cancer patients in the frequency of
mutations revealed large difference between two groups. This difference was very clear in
BRCA1 exon 11 and less clear in BRCA2 exon 10, 11. There were significant differences in
frequency of mutations of BRCA1/2 between sporadic and familial breast cancer patients.
Figure 5: Status of BRCA1 and BRCA2 mutations in familial breast cancer patients.
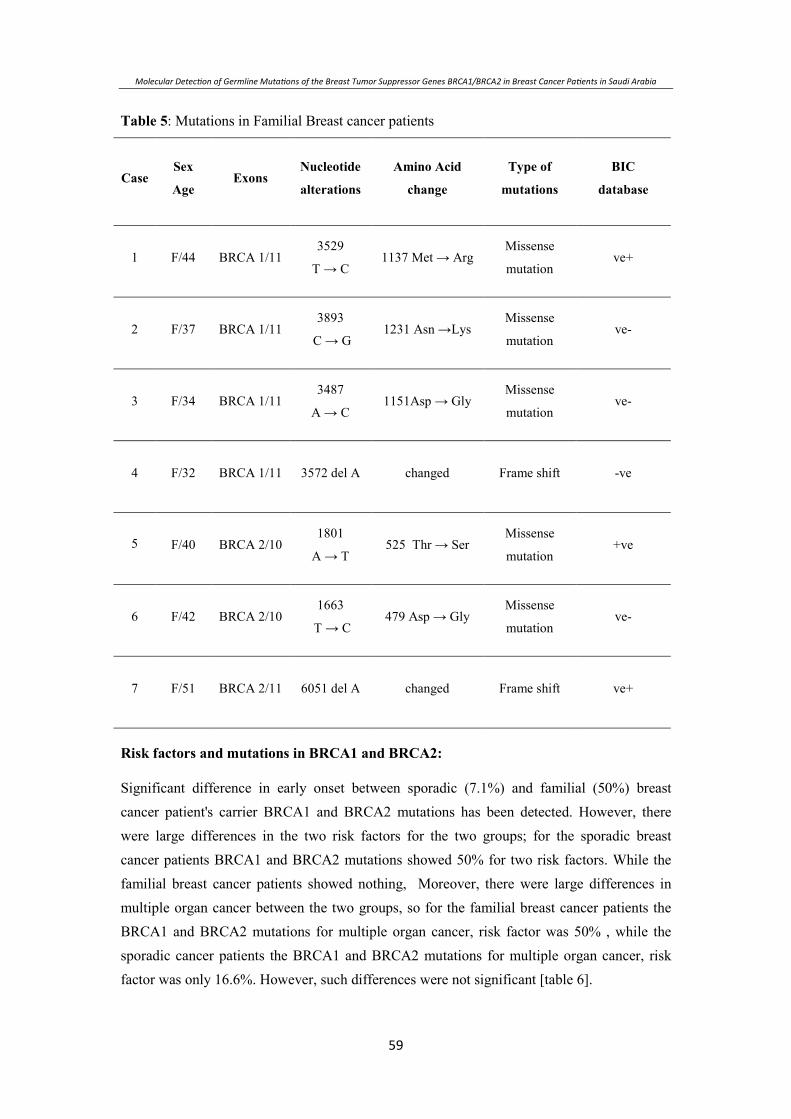
Molecular Detecon of Germline Mutaons of the Breast Tumor Suppressor Genes BRCA1/BRCA2 in Breast Cancer Paents in Saudi Ara%ia
Table 5: Mutations in Familial Breast cancer patients
BIC
database
Type of
mutations
Amino Acid
change
Nucleotide
alterations Exons
Sex
Age Case
ve+ Missense
mutation 1137 Met → Arg
3529
T → CBRCA 1/11 F/44 1
ve - Missense
mutation 1231 Asn →Lys
3893
C → GBRCA 1/11 F/37 2
ve - Missense
mutation 1151Asp → Gly
3487
A→ CBRCA 1/11 F/34 3
-ve Frame shift changed 3572 del A BRCA 1/11 F/32 4
+ve Missense
mutation 525 Thr → Ser
1801
A→ TBRCA 2/10 F/40
5
ve - Missense
mutation 479 Asp → Gly
1663
T → CBRCA 2/10 F/42 6
ve+ Frame shift changed 6051 del A BRCA 2/11 F/51 7
Risk factors and mutations in BRCA1 and BRCA2:
Significant difference in early onset between sporadic (7.1%) and familial (50%) breast cancer patient's carrier BRCA1 and BRCA2 mutations has been detected. However, there were large differences in the two risk factors for the two groups; for the sporadic breast cancer patients BRCA1 and BRCA2 mutations showed 50% for two risk factors. While the familial breast cancer patients showed nothing, Moreover, there were large differences in multiple organ cancer between the two groups, so for the familial breast cancer patients the BRCA1 and BRCA2 mutations for multiple organ cancer, risk factor was 50% , while the sporadic cancer patients the BRCA1 and BRCA2 mutations for multiple organ cancer, risk factor was only 16.6%. However, such differences were not significant [table 6].
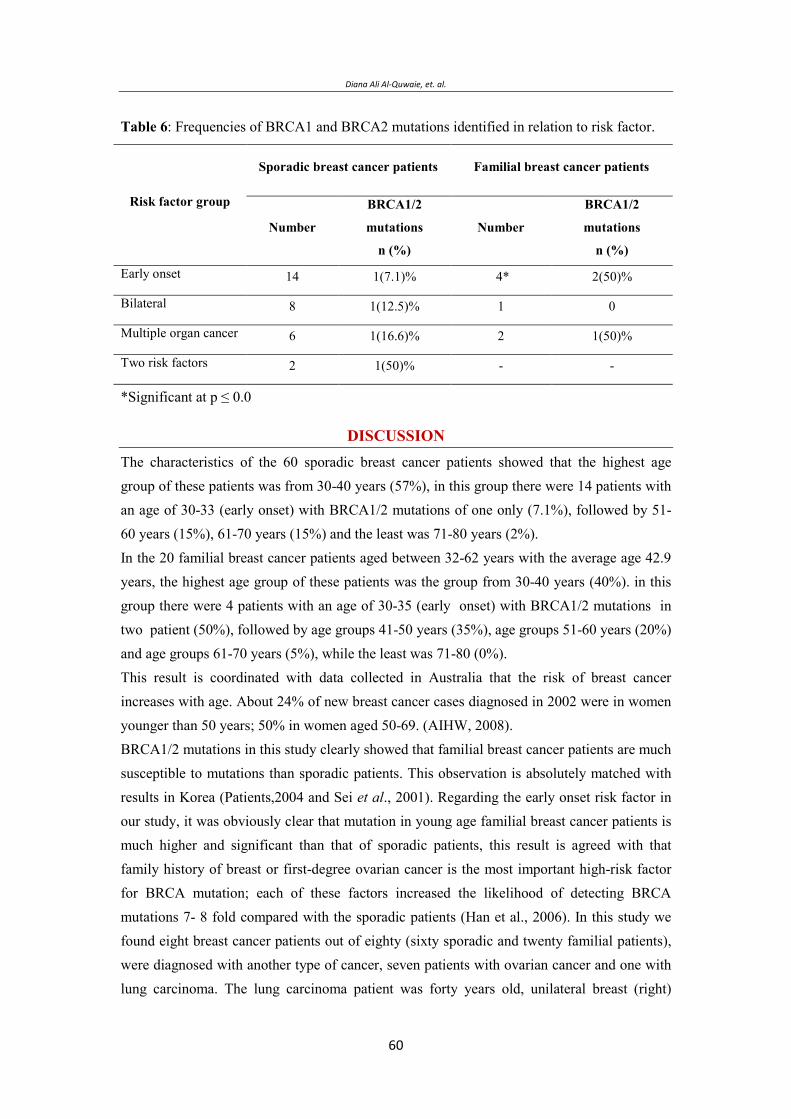
Diana Ali Al-Quwaie, et. al.
Table 6: Frequencies of BRCA1 and BRCA2 mutations identified in relation to risk factor.
Familial breast cancer patients Sporadic breast cancer patients
Risk factor group BRCA1/2
mutations
n (%)
Number
BRCA1/2
mutations
n (%)
Number
2(50)% 4* 1(7.1)% 14Early onset
011(12.5)% 8Bilateral
1(50)% 21(16.6)% 6Multiple organ cancer
--1(50)% 2Two risk factors
*Significant at p ≤ 0.0
DISCUSSION The characteristics of the 60 sporadic breast cancer patients showed that the highest age group of these patients was from 30-40 years (57%), in this group there were 14 patients with an age of 30-33 (early onset) with BRCA1/2 mutations of one only (7.1%), followed by 51-60 years (15%), 61-70 years (15%) and the least was 71-80 years (2%). In the 20 familial breast cancer patients aged between 32-62 years with the average age 42.9 years, the highest age group of these patients was the group from 30-40 years (40%). in this group there were 4 patients with an age of 30-35 (early onset) with BRCA1/2 mutations in two patient (50%), followed by age groups 41-50 years (35%), age groups 51-60 years (20%) and age groups 61-70 years (5%), while the least was 71-80 (0%). This result is coordinated with data collected in Australia that the risk of breast cancer increases with age. About 24% of new breast cancer cases diagnosed in 2002 were in women younger than 50 years; 50% in women aged 50-69. (AIHW, 2008). BRCA1/2 mutations in this study clearly showed that familial breast cancer patients are much susceptible to mutations than sporadic patients. This observation is absolutely matched with results in Korea (Patients,2004 and Sei et al., 2001). Regarding the early onset risk factor in our study, it was obviously clear that mutation in young age familial breast cancer patients is much higher and significant than that of sporadic patients, this result is agreed with that family history of breast or first-degree ovarian cancer is the most important high-risk factor for BRCA mutation; each of these factors increased the likelihood of detecting BRCA mutations 7- 8 fold compared with the sporadic patients (Han et al., 2006). In this study we found eight breast cancer patients out of eighty (sixty sporadic and twenty familial patients), were diagnosed with another type of cancer, seven patients with ovarian cancer and one with lung carcinoma. The lung carcinoma patient was forty years old, unilateral breast (right)
Molecular Detecon of Germline Mutaons of the Breast Tumor Suppressor Genes BRCA1/BRCA2 in Breast Cancer Paents in Saudi Ara%ia
cancer, grade II, stage II B, and was subjected to thoracic radiotherapy, this result is agreed with (Ford et al., 2003). The ovarian cancer patients were seven, five categorized under sporadic breast cancer, and none of them presented any BRCA1/2 exon10/11 mutation. From the two patients of the familial breast cancer patients diagnosed with ovarian cancer, one missense mutation in BRCA1 exon 11 detected in one patient (this patient died in stage I), and the other was not. This result is matched with the study of (Metcalfe et al., 2005) that reported the high incidence of ovarian cancer suggests that oophorectomy should be recommended in female BRCA1 and BRCA2 mutation carriers with a diagnosis of breast cancer, especially those with stage I disease because 25% of the deaths in women with stage one breast cancer were due to a subsequent ovarian cancer, as well as breast cancer systemic therapy did not significantly alter the risk of ovarian cancer. Number of mutations in BRCA1/2 genes depends on the size of different exons regions in other words, the more the longer the exon, the more expected mutations. In BRCA1gene exon 11 represent 61% of the total gene (De Benedetti et al., 1996), and consequently it is expected to have most of the mutations and that what we found in this study. The other exon we analyzed was BRCA1 exon 10, and we could not detect any mutation in this exon and this in part may be due to the nature of the exon small size of the BRCA1 gene, meanwhile mutations were detected in BRCA2 exon 10 which is much larger than BRCA1 exon 10. BRCA1/2 mutations lead to the production of an abnormally short version of the BRCA1/2 proteins, or prevent any protein from being made from one copy of the gene. Researchers believed that a defective or missing BRCA protein is unable to help repair damaged DNA or fix mutations that occur in other genes. As these defects accumulate, they can allow cells to grow and divide uncontrollably and form a tumor (Lee et al., 1999). In the 60 sporadic breast cancer patients frame shift were identified in 18 samples (30%), but mutations actually detected in 9 (15%) patients with 11 nucleotides mutations (two patients, everyone had duplicate mutations). In the 20 familial breast cancer patients frame shift were identified in 10 patients (50%) but mutations detected in 7 (35%) only. The difference in number between frame shift observed by SSCP assay and the mutation detected in DNA sequencing, is may be due to the sensitivity of SSCP assay that ranges from 60% to 90% in analysis of the BRCA1 fragments, as well as false positives that could be observed in some cases in this technique beside the interpretation of the results was not always unequivocal (Gross et al., 1999). Polymorphism means that the gene has several possible forms or alleles, all valid; it is heritable but is not necessarily harmful to the host. The arbitrary cut-off point between a mutation and a polymorphism is one percent (Orapan and Fucharoen, 2007), to be classed as a polymorphism, the least common allele must have a frequency of 1% or more in the population. If the frequency is lower than this, the allele is regarded as a mutation . Since we do not have enough information about BRCA1/2 genes among Saudi population, we cannot consider that this gene is polymorphic. However, our
Diana Ali Al-Quwaie, et. al.
results showed that among 80 cancer patients, mutation in BRAC gene was detected in 16 cases (20%). Three of these mutations were common and repeated twice in six patients, this will leave the number of unique mutations or alleles in this group of patients are 15 different alleles. To calculate the arbitrary cut-off point between mutation and polymorphism in this study, it was found that the highest frequency of any specific allele was 2/80 breast cancer patients analyzed (2.5%), these alleles were three in types and located in BRCA1 gene exon 11; they were detected two times in three different patients. The Saudi Cancer Registry (SCR) reported in 2004 that the incidence of all cancer types in female population was 42/1000, as for female breast cancer, the incidence was 9.5/1000 (0.95%) (Haya et al., 2004).
So, by dividing the population of breast cancer incidence (0.95%) over allele highest frequency (2.5%), the result then is 0.38% which is less than 1%. The frequency of other 12 alleles (least common allele) appeared to be 0.012%, which is much less than the frequency needed to call the presence of these alleles as polymorphism. This statistic showed that the frequency of the detected alleles in this study does not exceed which is much less than the frequency needed to call the presence of these alleles as polymorphism. Mutations in familial breast cancer patients in this study were 7/20 (35%), comparing with sporadic breast cancer patients 11/60 (18.3%), these mutations existed in 7/20 (35%) familial patients, and 9/60 (15%) sporadic patients. These observations were clearly agreed with (Han et al., 2006) that 9.9% mutation detected in Korean sporadic breast cancer patients, and that 41.6% mutation detected in Indian familial breast cancer patients (Hedau et al., 2004). The result obtained in this study for the mutation in BRCA1 exon 11, which includes about 61% of coding region of BRCA1 gene that 8 mutations detected from sporadic and familial breast cancer patients 8/80 (10%), represented 8/18 (44.4%) of the total mutations, these mutations were 6 point mutation and 2 frame shift mutation, that agreed with (De Benedetti et al., 1996), who found that most common mutations in breast and ovarian cancer susceptibility gene BRCA1 are frame shift and nonsense mutations. Mutations in BRCA1 gene is higher 4/7(57.1%) in familial breast cancer patients comparing to 4/11(36.4%) in sporadic breast cancer patients that agreed with(Hedau et al., 2004). In this study that BRCA1 exon 10 did not show any mutation in all 80 patients (sporadic and familial). In this study, the mutation in BRCA2 gene exon 10 and 11 regions showed that 10 mutations detected from sporadic and familial breast cancer patients 10/80 (12.5%), represented 10/18 (55.5%) of the total mutations, these mutations were 4 point mutation, 5 frame shift mutation and 1 synonymous substitution. The mutation in BRCA2 gene exon 10 region showed that 6 mutations detected from sporadic and familial breast cancer patients 6/80 (7.5%), represented 6/18 (33.3%) of the total mutations, these mutations were 3 point mutation, 2 frame shift mutation and 1 synonymous substitution. In exon 11 region, 4/18(22.2%) mutations detected, these mutations were 1 point mutation and 3 frame shift mutations.
Molecular Detecon of Germline Mutaons of the Breast Tumor Suppressor Genes BRCA1/BRCA2 in Breast Cancer Paents in Saudi Ara%ia
In this study the mutation in BRCA2 gene is higher 7/11(63.6%) in sporadic breast cancer
patients comparing to 3/7(42.8%) in familial breast cancer patients that agreed with (Hedau et
al., 2004). Multi mutation in BRCA2 gene were found in two breast cancer sporadic patients ,
no other multi mutation found in BRCA1 gene, a study in Taiwan found that three BRCA1
mutations (Yuan, 2009). Mutations located on the same chromosome in a familial breast
cancer patient were observed as missense mutations of C2731T (Pro871Leu), A3232G
(Glu1038Gly) and A3667G (Lys1183Arg) in the exon 11.
CONCLUSION 1- All Saudi women from age 30 should do monthly self-breast examination, but regular
mammograms and genetic testing best for susceptible females with positive family history.
2- Early diagnosis of breast cancer, using sensitive molecular techniques for BRCA genes and other related breast cancer genes will speed up disease management especially in the familial type.
3- The percentage of highest allele frequency in population, detected in this study was 0.38%, while least common alleles appeared to be 0.012% which was less any way than 1%.
4- In this study, only five mutations out of 15 (alleles) mutations were found in the BIC record, the other 10 mutations were new.
5- Mutations in BRCA1 gene exon 11 is higher in familial breast cancer patients comparing to sporadic breast cancer patients.
6- Mutation in BRCA2 gene exons10 and 11is higher in sporadic breast cancer patients comparing to familial breast cancer patients.
7- No mutations were detected in BRCA1 gene exon 10 for the two categories (the sporadic and familial breast cancer).
REFERENCES
Al- Hamdan, N.A.; Al- Zahrani, M.; Michels, H.D.; and Koriech, S. (1994). National Cancer Registry Report. Cancer incidence in Saudi Arabia. Riyadh (KSA): Ministry of Health. p12.
Austein, M. (2006). Saudi Women work to improve breast cancer awareness research. Australian Institute of Health and Welfare (AIHW). (2008). Bignell, G.; Gos, M.; Michael, R.; Stratton, A., Ashworth, R.; and Wooster., M. (1997):
The BRC repeats are conserved in mammalian BRCA2 proteins Human Molecular Genetics. 6: 53-58.
Diana Ali Al-Quwaie, et. al.
Bork, P.; Blomberg, N.; and Nilges, M. (1996): Internal repeats in the BRCA2 protein sequence. Nature Genet. 13:22-23.
Boulton, S.J. (2006): Cellular functions of the BRCA tumour-suppressor proteins. PMID 1705268, Biochemical Society Transactions. 34 (5): 633-645.
Chen, J.; Silver, D.P.; Walpita, D.; Cantor, S.B.; Gazdar, A.F.; Tomlinson, G.; Couch, F.J.; Weber, B.L.; Ashley, T.; Livingston, D.M.; and Scully, R. (1998): Stable interaction between the products of the BRCA1 and BRCA2 tumor suppressor genes in mitotic and meiotic cells. Mol Cell. 2:317–328.
Couch, F.J.; Farid, L.M.; DeShano, M.L.; Tavtigian, S.V.; Calzone, K.; Campeau, L.; Peng, Y., Bogden, B.; Chen, Q.; Neuhausen, S.; Shattuck, D.; Godwin, A.; Daly, M.; Radford D.M.; Sedlacek, S.; Rommens, J.; Simard, J.; Garber, J.; Merajver, S.; and Weber, B. (1996): BRCA2 germline mutations in male breast cancer cases and breast cancer families. Nature Genet. 13:123-125.
De Benedetti, V.M.; Radice, P.; Mondini, P.; Spatti, G.; Conti, A.; Illeni, M.T.; Caligo, M.A.; Cipollini, G.; Bevilaqua, G.; Pilotti, S.; and Pierotti, M.A. (1996): Screening for mutations in exon 11 of the BRCA1 gene in 70Italian breast and ovarian cancer patients by protein truncation test. Oncogen 19; 13(6):1353-13577.
El Saghir, N.S.; Khalil, M.K.; and Eid, T. (2007). Trends in epidemiology and management of breast cancer in developing Arab countries: a literature and registry analysis. Int. J Surg. 5: 225-233.
Ezzat, A.A.; Ibrahim, E.M.; Raja, M.A.; Al-Sobhi, S.; Rostom, A.; and Stuart, R.K. (1999): Locally advanced breast cancer in Saudi Arabia: high frequency of stage II in a young population. Med Oncol. 16: 95-103.
Ford, M.B.; Sigurdson, A.J.; Petrulis, E.S.; Chaan, S.; Kemp Bonnie, C.; Mcneese, M.; Selwyn, J.; Spitz, M.R.; Bondy, M.L. (2003): Effects of smoking and radiotherapy on lung carcinoma in breast carcinoma survivors, Cancer. 98:(7)1457-1464.
Gross, E.; Norbert A.; Goette, J.; Ulrike Schwarz-Boeger.; and Marion, K. (1999): Acomparison of BRCA1 mutation analysis by direct sequencing, SSCP and DHPLC, Hum Genet. 105:72–78.
Haber, JE (2000): Partners and pathways repairing a double-strand break. Trends Genet. 16:259–264.
Hall, J.M.; Lee, M.K.; and Newman, B. (1990): Linkage of early-onset familial breast cancer chromosome 17q21. Science. 250:1684-1689.
Han, S.H.; Lee, K.R.; Lee, D.G.; Kim, B.Y.; Lee, K.E; and Chung W.S. (2006): Mutation analysis of BRCA1 and BRCA2 from 793 Korean patients with sporadic breast cancer. Clinical Genetics. 70 (6): 496-501.
Haya, S.; Al-Eid, S.; and Omer, A. (2004): Cancer Incidence Report Saudi Arabia.
Molecular Detecon of Germline Mutaons of the Breast Tumor Suppressor Genes BRCA1/BRCA2 in Breast Cancer Paents in Saudi Ara%ia
Hedau, S.; Jain, N.; Hussain, S.A.; Mandal, A.K.; Ray, G.; Shahid, M.; Kant, R.; Gupta, V.; Shukla, N.K.; Deo, S.S.; and Das, B.C. (2004): Novel germline mutations in breast cancer susuceptibility genes BRCA1 BRCA2 and p53 gene in breast cancer patient. Pubmed. 2:177-186.
Ibrahim, E. (2007): Saudi Cancer Society, Cancer incidence on rise in Saudi Arabia. Lee, W.Y.; Jin,Y.T.; Chang, T.W.; Lin, P.W.; and SU, I.J.; (1999): Immunolocalization
of BRCA1 protein in normal breast tissue and sporadic invasive ductal carcinomas: a correlation with other biological paramet. Histopathology. 34 (2): 106-112.
Lerebours, F. and Lidereau, R. (2002): Molecular alterations in sporadic breast cancer. Crit Rev Oncol Hematol. 44: 121–141.
Mazoyer, S. (2005): Genomic rearrangements in the BRCA1 and BRCA2 genes. Hum Mutat. 25(5): 415-422.
Metcalfe, K.A.; Lynch, H.T.; Ghadirian, P.; Tung, N.; Olivotto, I.A.; Foulkes, W.D.; Warner, E.; Olopade, O.; Eisen, A.; Weber, B.; McLennan, J.; Sun, P.; and Narod, S.A. (2005): The risk of ovarian cancer after breast cancer in BRCA1 and BRCA2 carriers. Gynecol Oncol. 96 (1): 222-226.
Miki, Y.; Swensen, J.; Shattuck-Eidens, D.; Futreal, P.A.; Harshman, K.; and Tavtigian, S.; Liu, Q.; Cochran, C.; Bennett, L.M.; and Ding, W. (1994): Astrong candidate for the breast and ovarian cancer susceptibility gene BRCA1.Science. 266: 66–71.
Moynahan, A.; Pierce, M.; and Jasin,T. (2001): BRCA2 is required for Homology-Directed Repair of Chromosomal Breaks. M. Mol. Cell. 7: 263–272.
Narod, S.A.; Ford, D.; Devilee, P.; Barkardottir, R.B.; Lynch, H.T.; Smith, S.A.; PInder, B.A.; Weber, B.L.; Garber, J.E.; Birch, J.M.; Cornelis, R.S.; Kelsell, D.P.; Spurr, N.K.; Smyth, E.; Haites, N.; Sobol, H.; Bignon, Y.J.; Chang-Claude, J.E.; Ha'ann, U.; Lindblom, A.; Borg, A.; PIver, M.S.; Gallion, H.H.; Struewing, J.P.; Whittermore, A.; Tonin, P.; Goldgar, D.E.; and Easton, D.F. (1995): Breast Cancer Linkage Consortium. Am J Hum Genet. 56:254-64.
Nasr, A. D. (2007): Breast Cancer Often Untreated in Mideast. Associated Press Writer.Orapan, S. and Suthat, F. (2007): Genetic Polymorphisms and Implications for Human
Diseases. J Med Assoc Thai. 90(2): 394-398. Orita, M.; Iwahana, H.; Kanazawa, H.; Hayashi, K.; and Sekiya, T. (1989): Detection
of polymorphisms of human DNA by gel electrophoresis as single-strand conformation polymorphisms. Proc. Natl. Acad. Sci. USA. 86: 2766-2770.
Oros, K.K.; Ghadirian, P.; Greenwood, C.M.; Perret, C.; Shen, Z.; Paredes, Y.; Arcand, S.L.; Mes-Masson, A.M.; Narod, S.A.; and Foulkes, W.D. (2004): Significant proportion of breast cancer and or ovarian cancer families of French
Diana Ali Al-Quwaie, et. al.
Canadian descent harbor 1 of 5 BRCA1 and BRCA2 mutations. Intl J Cancer.112:411-419.
Pala, V. (2001): Erythrocyte membrane fatty acids and subsequent breast cancer: a prospective Italian study. Journal of the National Cancer Institute. 93:1088-95.
Palmieri, G.; Palomba, G.; Cossu, A.; Pisano, M.; Dedola, M.F.; Sarobba, M.G.; Farris, A.; Olmeo, N.; Contu, A.; Pasca, A.; Satta, M.P.; Persico, I.; Carboni, A.A.; Cossu-Rocca, P.; Contini, M.; Mangion, J.; Stratton, M.R; and Tanda, F. (2002): BRCA1 and BRCA2 germline mutations in Sardinian breast cancer families and their implications for genetic counseling. Annals of Oncology. 13:1899-1907.
Palo, Alto. (2008): Medical Foundation: Breast and Ovarian Cancer Genetic Screening. Patel, K.J.; Yu, V.P.; Lee, H.; Corcoran, A.; Thistlethwaite, F.C.; Evans, M.J.; Colledge,
W.H.; Friedman, L.S.; Ponder, B.A.; and Venkitaraman, A.R. (1998): Involvement of Brca2 in DNA repair. Mol. Cell. 1: 347-357.
Patients, J. (2004): Pathway in breast cancer development of Middle East women. Mod. Korean Med Sci. 19: 269-74.
Saudi Cancer Registry (SCR): Breast cancer in the Kingdom of Saudi Arabia: A review of all female breast cancer cases from the Saudi Cancer Registry (SCR) from 1994-2004. Cited in J Clin Oncol 28, 2010 (suppl; abstr e12042)
Sei, H.; Ahn; U.I.; Kang, H.; Beom, S.; Kwak, H.S.; Yoon, B.; Kyung Ku, H.; Jun Kang, Ji Su Kim; Byung Kyun Ko, Chang Dae Ko Kyung Sik Yoon, Dae-Yeon Cho, Jun Suk Kim, Byung Ho Son, Seralini, G., Moslemi, S. (2001): Aromatase inhibitors: past, present and future.Mol Cell Endocrinol. 178(1-2): 177-131.
Struewing, J.P.; Brody, L.C.; Erdos, M.R.; Kase, R.G.; Giambarresi, T.R.; Smith, S.A.; Collins, F.S.; and Tucker, M.A. (1995): Detection of eight BRCA1 mutations in 10 breast and ovarian cancer families. Genetic Epidemiology Branch, National Cancer Institute, National Institutes of Health Bethesda. MD 20892-7372, USA.
World Health Organization. (2006): Fact sheet No. 297: Cancer. Retrieved on 2007. Yu, V.P.; Koehler, M.; Steinlein, C.; Schmid, M.; Hanakahi, L.A.; Van Gool, A.J.;
West, S.C.; and Venkitaraman, A.R. (2000): Gross chromosomal rearrangements and genetic exchange between nonhomologous chromosomes following BRCA2 inactivation. Genes & Dev. 14: 1400-1406.
Yuan -Ping, L, Yi-Ling C, Hong-Tai C and Steven S L (2009): Nature of genetic variants in the BRCA1 and BRCA2 genes from breast cancer families in Taiwan. Life Science Journal, Vol 6, No 3, 2009.
Zhang, J.; and Powell, S.N. (2005): The role of the BRCA1 tumor suppressor in DNA Double Strand Break repair.
Molecular Detecon of Germline Mutaons of the Breast Tumor Suppressor Genes BRCA1/BRCA2 in Breast Cancer Paents in Saudi Ara%ia
BRCA1/BRCA2 .
ن ***ن ت
. ب ی- – ی- – *
** . ب ی–– - بی-
ن ن ن ن .
ن ح BRCA1 BRCA2 ت ج BRCA1 ج10ن ت
) ( BRCA2 ج1110 ت..
ت ن ن ث ث ج ئت ت -
.ن ن ح -ت
ت ث ئ ت / ح ح
%)(/ ت ن %)(%).( BRCA1 ج ن
BRCA2 ج %) .( BRCA2 ج ئ ت ث %). .(
ت ث ح ح ت ن %)(/ %).( BRCA1 ج ن %)(/
(14.3%) ج ح %).( BRCA2 ج BRCA2 .10ن ت ئ BRCA1
. ث
ن ن خ ح ت
. ح

Diana Ali Al-Quwaie, et. al.
Synthesis and Characterization of Some Novel Schiff Base Metal Complexes and the investigation of their Cytotoxic Activity on MCF- Cell ine
Immunohistochemistry of BRCA1 and HER-2/ Neu Proteins Expression in Breast Cancer Patient in Saudi Arabia
Diana Ali Al-quwaie and Nada Altwaty
Biology Department , Faculty of Science, King Abdulaziz University, Jeddah, Saudi Arabia. Corresponding author E-mail: [email protected]
ABSTRACT Breast cancer is the most common cancer in women worldwide. It is also the principle cause of death from cancer among women globally. Despite the high incidence rates, in Western countries, 89% of women diagnosed with breast cancer are still alive after their diagnosis, due to detection and treatment (Parkin et al., 2008). Breast Cancer represents the second leading cause of cancer death among women after lung cancer (Al-Mansouri and Alokail, 2006). It comprises about 17% of all female cancer in the world (McPherson et al., 1994). Early detection of a tumor is important because it increases the chances of removing the cancer before it becomes life-threatening (Breast Cancer Dictionary, 1996). Invasive ductal carcinoma is the most common and rather aggressive tumor (El Bolkeing et al., 2005). In the Kingdom of Saudi Arabia (KSA) breast cancer is the most common malignancy among women and reaching 18.8% of the total cancer cases (Al-Hamdan et al., 1994). The aim of this study was to determine the over expression of HER-2 neu and BRCA1 proteins to correlate possibility of recurrence that may provide tool for identifying patients at risk. We performed a study of 60 paraffin-embedded tissues of sporadic breast invasive ductal carcinoma (BIDC). Immunehistochemistry (IHC) analysis was performed as a confirmatory test for the over expression of HER-2 neu and BRCA1 proteins. Immunohistochemistery techniques have been widely used in diagnostic histopathology (Ross and Fletcher, 1999). The human epidermal growth factor receptor-2 gene (HER-2/neu) amplification or over-expression is an important independent prognostic indicator in breast carcinoma, identifying a subset of patients with poor prognosis. Also, patients with HER-2/neu-positive metastatic lesions appear to have more aggressive clinical course (Kim et al., 2008). It was demonstrated that, in the absence of high and sensitive technologies, IHC for HER-2/neu expression was better for follow-up in sporadic breast cancer patients. In conclusion, Immunohistochemistry of breast cancer patients for HER-2/neu expression was much better than BRCA1 expression, for patient follow-up, in the absence of high and sensitive technologies.
Key words: cancer breast, BRCA1, HER-2/neu proteins, KSA. Immunehistochemical analysis.
Vol. 12, 2012 JBR ORIGINAL ARTICLE
Diana Ali Al-quwaie, et. al.
INTRODUCTION Breast cancer continues to be a major cause of morbidity and mortality throughout the world (Parker et al., 1996). In countries with a high incidence of this disease, such as the United States, it receives great attention in both the scientific and public media. Even in countries where its incidence is lower, such as Japan, the disease remains a cause for concern and attention (Morimoto et al., 1994). While it had once been presumed that the incidence of breast cancer in Saudi Arabia was low, more recent data has indicated the contrary. Not only is breast cancer a significant disease in the Kingdom, as elsewhere in the world, but its pattern is very disturbing (Amr et al., 1995). And it is estimated that about 5-10% of breast cancer in Western countries is due to a genetic predisposition (Newman et al., 1988). In Saudi Arabia, the disease appears in women at younger ages and in more advanced stages than in most American cases. This makes the need for early detection and awareness essential (Austein, 2006). Cancer is growing in Saudi Arabia with 7,000 new cases being reported each year and the figure will reach 30,000 in 15 years (Ibrahim, 2007). Cancer develops through a multistep process in which normal, healthy cells in the body go through stages that eventually change them to abnormal cells that multiply out of control. Normal cells in the body communicate with each other and regulate each other’s proliferation (division). When cancer occurs, cells escape the normal controls on their growth and proliferation. This escape from control can happen through a variety of pathways. BIDC accounts for the majority of invasive breast cancers. With BIDC, cancer cells form in the lining of the milk duct, break free of the ductal wall and invade surrounding breast tissue. The cancer cells may remain localized, staying near the site of origin, or they can spread (metastasize) even farther throughout the body, carried by the bloodstream or lymphatic system. Part of the multistep process to cancer includes acquiring damage (mutations) to genes that normally regulate cell proliferation. A series of permanent mutations in tumor suppressor genes and proto-oncogenes are needed before cancer develops in some cases, further damage can lead to cells that can break away from the primary tumor and form cancers at other sites in the body (metastasis). Breast tissue is particularly sensitive to developing cancer for several reasons. The female hormone estrogen stimulates breast cell division. The division can increase the risk of making damage to DNA permanent. Furthermore, breast cells are not fully matured in girls and young women who have not had their first-term pregnancy. Cells that divide are at a higher risk of acquiring mutations than cells that don’t divide. Cancer is generally rare in tissues in which cells don’t divide, like nerve tissue. Alternatively, cancer is more common in tissues in which cells divide frequently such as with breast, skin, colon, and uterine tissues. Young women and girls have breast tissue that is especially sensitive to cancer causing agents (carcinogens). Unlike other tissue in the body like liver and heart that are formed at birth,
Immunohistochemistry of BRCA1 and HER2/ Neu Proteins Expression in Breast Cancer Pa&ent in Saudi Arabia
breast tissue in newborns consists only of a tiny duct. There are two main categories of genes involved in these process, tumor suppressor genes and oncogenes. Tumor suppressor genes are normal genes that slow down cell division, repair DNA mistakes, and tell cells when to die (a process known as apoptosis or programmed cell death). When tumor suppressor genes don’t work properly, cells can grow out of control, which can lead to cancer. (Haber, 2000). About 30 tumor suppressor genes have been identified, including p53, BRCA1, BRCA2, APC and RB1. Meanwhile, oncogenes are normal genes (proto-oncogenes) developed by mutations into oncogenes during the life of individual (Coussens et al., 1998). An important difference between oncogenes and tumor suppressor genes is that oncogens result from the activation (turning on) of proto-oncogenes, but tumor suppressor genes cause cancer when they are inactivated (turned off). Another major difference is that while the overwhelming majority of oncogenes develop from mutations in normal genes (proto-oncogens) during the life of the individual (acquired mutations), abnormalities of tumor suppressor genes can be inherited or acquired, so lost function effects that contribute to the malignant phenotype. Oncogenes refer to genes whose activation can contribute to the development of cancer. Activation can occur through gene amplification such that more of the protein encoded by the gene is present; hence, its function is enhanced (Downward, 2003). The human epidermal growth factor receptor 2 or Her-2/neu also called C-erbB-2 because the gene was first isolated from chicken red cell leukemia cells, and neu because a similar gene was isolated from neurobalstomas in rats, is a member of the HER tyrosine kinase receptors family (Coussens et al., 1998). The Her -2/neu gene is located on chromosome 17q and encodes a 185-kDa transmembrane tyrosine kinase growth factor receptor (Yarden and Sliwkowski, 2001). In chromosome 17, several important genes are associated with breast cancer, including oncogenic genes HER2, TOP2A and TAU, tumor suppressive genes p53, and BRCA1 (Zhang and Yu, 2011). Her-2/neu is a gene that helps control how cells grow, divide and repair themselves. Her-2/neu is one of the thousand of genes that compromise every living person’s genetic code. It provides the blueprint for manufacturing the Her-2/neu protein. This protein, which is attached to a cell membrane, begins a signaling cascade that regulates normal cell growth (Leslie et al.,2004). When a person develops cancer, the Her-2/neu gene may create additional copies of it and become “amplified”. (Olayioye, 2001). It is estimated that approximately one in four breast cancers have too man copies of the Her-2/neu gene, resulting in the over- production, or over expression, of the Her-2/neu protein receptors found on the surface of tumor cells. (Nizzoli et al., 2003). These special proteins bind with other circulating growth factors to cause uncontrolled tumor growth (Ross and Fletcher, 1999). The discovery of Her -2/neu gene amplification and over expression in primary human breast cancer and its association with more aggressive clinical behavior led to early interest in diagnostic and therapeutic applications (Slamon et al., 1987). Only a few
Diana Ali Al-quwaie, et. al.
biomarkers (such as HER-2/neu, estrogen receptor, and progesterone receptor) have utility for diagnosis and prognosis. Thus, there is a great need for new biomarkers for breast cancer. (Misek and Kim., 2011). Amplification of the HER-2/neu oncogene over-expression of its protein are detected in approximately 18% of invasive ductal carcinoma of the breast and is associated with poor prognosis (Al-Khattabi et al., 2010). The Her -2/neu gene is rarely amplified in benign breast disease, and its expression varies by histological subtype, as it is almost exclusively found in the primary breast cancers of ductal origin in contrast to those of lobular origin. The Her-2/neu gene is amplified and over expressed in 20–30% of invasive breast cancer and, interestingly, in the majority of high-grade DCIS cases (Van de Vijver et al., 1988). Antibodies to growth factor receptors were shown to inhibit growth in several preclinical models (Hudziak et al., 1989). Trastuzumab (Herceptin; Genentech, Inc.; South San Francisco, CA) is a humanized recombinant monoclonal antibody directed against the extracellular portion of the Her-2/neu protein (Carter et al., 1992). The mechanism of action of trastuzumab from animal models is presumed to be modulatory effects on cell signaling, but there is also evidence of an immunological effect ( Clynes et al.,2000). The examination of HER2 expression and copy number amplification (17q21.1) is widely utilized for predicting therapeutic response for trastuzumab (Zhang and Yu, 2011). BRCA1 (breast cancer 1, early onset) is a human gene that belongs to a class of genes known as tumor suppressors, which maintains genomic integrity to prevent uncontrolled proliferation. The multifactor BRCA1 protein product is involved in DNA damage repair, transcriptional regulation as well as other functions. Alterations in the gene have been implicated in a number of hereditary cancers, namely breast, ovarian and prostate, BRCA1 participates in maintaining genomic integrity and protects the cell against genomic instability (Focken et al., 2011). The BRCA1 gene is located on the long (q) arm of chromosome 17 (17q21) at band 21 (Hall et al.,1990).Protein length (1863 amino acids) mRNA size 7.8 kb, from base pair 38,449,843 to base pair 38,530,933. Other names: Ring finger protein 53. It is composed of 22 exons and 21 introns covering approximately100kB. The BRCA1 protein is directly involved in the repair of damaged DNA. In the nucleus of many types of normal cells, the BRCA1 protein is thought to interact with RAD51 to mend breaks in DNA, though the details and significance of this interaction is the subject of debate (Boulton, 2006). These breaks can be caused by natural radiation or other exposures, but also occur when chromosomes exchange genetic material in preparation for cell division (Zhang and Powell, 2005). BRCA1 plays a major role in the cellular response to DNA damage, mediating between the sensors of damage to the effectors of repair.
Immunohistochemistry of BRCA1 and HER2/ Neu Proteins Expression in Breast Cancer Pa&ent in Saudi Arabia
BRCA1 becomes hyperphosphorylated after exposure to the DNA-damaging agents and is rapidly (within 1 hour) relocated to sites of replication forks marked by proliferating cell nuclear antigen (Scully, et al., 1997). In addition, BRCA1 has been found in a large nuclear protein complex, named BRCA1- associated surveillance complex, which is believed to be an important sensor to monitor the genome for damage and to signal to downstream proteins (Wang, et al., 2000). The BRCA1 protein probably interacts with many other proteins, including tumor suppressors and regulators of the cell division cycle. A mutated BRCA1 gene usually makes a protein that does not function properly. (Bork et al., 1996). The defective BRCA1 protein is unable to help fix mutations that occur in other genes. These defects accumulate and may allow cells to grow and divide uncontrollably to form a tumor. Nearly 80% of mutations described in the BRCA1 gene would produce a truncated protein, (Struewing et al., 1995, and Couch et al., 1996). Although many mutations likely lead to little or no expression of the altered product primarily because of instability of the corresponding mRNA. Some researches mentioned the major predictive markers of BRCA1-associated cancers , i.e., PARP-1, EGFR, c-kit, HER-2, and steroid hormones (ER/PR) in order to reveal all therapeutic options accessible to a particular patient, so the tumor should be tested for the expression of all five major predictive markers(Domagala et al., 2011). Cancer develops through different stages. These stages may or may not eventually lead to invasive and metastasis cancer. In most cases it takes many years for cancer to develop. The severity of breast cancer usually depends upon what stage of the disease that the cancer is found. Determining what type of breast cancer is an important step in treating the disease.
Breast Cancer Screening:
Breast Self-Exam:
Breast self-examination was widely discussed in the 1990s as a useful modality for detecting breast cancer at an earlier stage (Thomas et al., 2002). All women should become familiar with both the appearance and feel of their breasts so that they notice any changes (Harris and Kinsinger, 2002).
Mammography:
There has been some debate about the benefit of mammography screening in reducing breast cancer mortality (Gotzsche and Olsen, 2000). Early detection of breast cancer through mammography greatly improves treatment options, the chances for successful treatment, and survival (Humphrey et al., 2002). On average mammography will detect about 90% of the breast cancers in women without symptoms (Kerlikowske and Barclay, 1997).
Diana Ali Al-quwaie, et. al.
Breast MRI:
Magnetic resonance imaging (MRI) has been shown to detect cancers not visible on mammograms, but has long been regarded to have disadvantages. For example, although it is 27-36% more sensitive, it is less specific than mammography (Hrung et al., 1999). MRI had more false positives (up to 5%), It is also a relatively expensive procedure one (Morrow, 2004).
Breast Ultrasound
Using an ultrasound allows a look at dense breast tissue which is not possible with digital mammography. It is a pain-free procedure.
Genetic Testing:
Women with family history of breast cancer, especially in a first–degree relative (mother, sister, or daughter), have an increased risk of developing breast cancer. Approximately 5% to 10% of breast cancer cases result from inherited mutations, in breast cancer susceptibility genes, such as BRCA1 and BRCA2, (Domchek and Antoniou, 2003).
Aim of the Work:
1. Immunohistochemical analysis of BRCA1 and HER-2/neu gene status in the 60 paraffin-embedded tissues from a chosen group of breast cancer patients from the western region of Saudi Arabia.
2. Correlate the over expression of BRCA1 and HER-2 neu protein within the chosen group of breast cancer patients and possibility of recurrence.
1. Provide tool for identifying patients with a higher risk of recurrence and subsequently develop appropriate post – operative treatment to decrease recurrence rates.
MATERIAL AND METHODS
Patients and Samples:
Paraffin-embedded tissues for breast invasive ductal carcinoma (BIDC) were obtained, after informed consent and ethical approval, from 60 sporadic breast cancer patients. All patients underwent surgery at the Western region, Saudi Arabia. The study-subject sample ages ranged from 30- 72years. Ten control tissue samples were taken from patients with other diseases than cancer (inflammatory and benign). (Table 1)
Reagents:
Monoclonal Anti-human/mouse/rat BRCA1 Antibody (Clone 265402), Catalog Number MAB2210 from (R&D system company Inc, Minneapolis, USA.), c-erbB-2/HER-2/neu Ab-17 mouse monoclonal antibody (Clone e2-4001 + 3B5), Catalog Number MS-730 from
Immunohistochemistry of BRCA1 and HER2/ Neu Proteins Expression in Breast Cancer Pa&ent in Saudi Arabia
(Thermo Fisher Scientific company,UK), histofine SAB-PO stain kit from (Nichirei,Tokyo,Japan).
Instruments:
Immunohistostaining slides were observed and snapped by Olympus BX-51 system (Olympus- Japan). Statistical Analysis: was done using statistical package for social sciences (SPSS) software, version 10.
Immunohistochemistry of BRCA1 and Her-2/neu:
The demonstration of antigens by immunohistochemistry is a two-step process involving first, the binding of a primary antibody to the antigen of interest, and second, the detection of bound antibody by a chromogen. The positive reaction was evaluated considering the location of the specific immunostaining on the tumor cells (nuclear, cytoplasmic), using a semiquantitative grade according to the intensity of immunostaining and the proportion of stained cells (Vargas-Roig 1998). Briefly, intensity scores are as follows: No staining, 0; weak staining, 1; moderate staining30%, 2; and strong staining, Proportion scores are as follows: When < 1% of the cells stained; weak staining. 1 – 10% of cells are stained; 1. 11 – 20% of cells are stained; 2. 31 – 66% of cells are stained; 3. And > 66% of cells are stained; 4. Immunohistochemical staining was performed on 5µm thick paraffin sections. Before staining slides were submitted to deparaffinize and antigen retrieval which was performed by a cycle in boiling in 0.01 M citrate buffer in a retriever autoclave.
Antigen Retrieval:
1. Dewax and rehydrate the paraffin sections as follows: A. Three times for 5 minutes in xylene B. Two times for 5 minutes in 100% ethanol C. Two times for 5 minutes in 95% ethanol D. Once for 5 minutes in 80% ethanol E. Place in distilled water until use.
2. After removal from distilled water, slides were placed into a stainless steel rack containing citrate buffer pH6.
3. The rack placed in 2100 retriever autoclave (pre programmed by manufacturer). 4. Slides were rinsed in distilled water, for 10 minutes. 5. Slides were rinsed in PBS once for five minutes, after that, kept in a humidified chamber
until staining procedure. (PickCell laboratories protocol). Then continue the staining.

Diana Ali Al-quwaie, et. al.
Immunoreactivity for HER-2/neu: Immunoreactivity for HER-2/neu was quantitatively estimated according to the extent of membranous immunostaining intensity (in multiple, representative 20x fields per case) was scored on a 5-titer scale (0, completely negative; 1+, faint membranous positivity; 2+, moderate membranous positivity; 3+, strong, circumferential membranous positivity; and 4+, extremely strong positivity. Immunoreactivity for BRCA1: Immunoreactivity for BRCA1was quantitively estimated according to Wilson, et al.,1999;negative(-) corresponded to less than 10% positive cells ,weakly positive (+) to 10-30%,moderately positive (++) to 30-50%,and strongly positive(+++)to more than 50% positive cells. Table 1: The sex, age and clinical history of sporadic breast cancer patients.
Multiple Organ
Cancer Stage Grade Side Age Sex Serial
IIA 2LT55F1
IIB 2RT54F2
I2RT73F3
IIB 3Bi34F4
IIA 2Bi66F5
IIB 2RT38F6
IIA 2LT52F7
IIA 2LT35F8
I2RT62F9
IIB 2LT40F10
IIIB 3LT37F11
IIA 2RT30F12
I2LT61F13
IIB 3RT32F14
I2RT48F15
IIB 2RT40F16
IIIB 2RT32F17
I2Bi52F18
IIIB 3RT40F19
I3RT40F20
I2Bi38F21
I2RT30F22
IIA 3LT45F23
IIB 2RT37F24
I2RT44F25
Immunohistochemistry of BRCA1 and HER2/ Neu Proteins Expression in Breast Cancer Pa&ent in Saudi Arabia
Multiple Organ
Cancer Stage Grade Side Age Sex Serial
IIB 2RT40F26
IIA 2LT35F27
IIB 2LT52F28
IIB 2Bi52F29
IIB 2RT44F30
IIA 2RT30F31
IIIB 2RT33F32
IIA 2LT54F33
IIA 2RT30F34
IIB 3BI45F35
I2RT32F36
IIB 2RT65F37
IIA 2LT64F38
IIIB 3RT70F39
IIIB 2RT37F40
I2LT30F41
IIA 2LT38F42
IIIB 3LT64F43
I2Bi32F44
IIA 2LT61F45
I2LT33F46
IIB 2LT36F47
I2Bi72F48
IIIB 2RT35F49
IIA 3LT54F50
IIB 2LT30F51
I2RT61F52
I2RT34F53
IIB 3Bi50F54
IIIB 2LT35F55
I2LT54F56
I2RT39F57
IIB 2LT30F58
I2LT32F59
IIA 3RT35F60
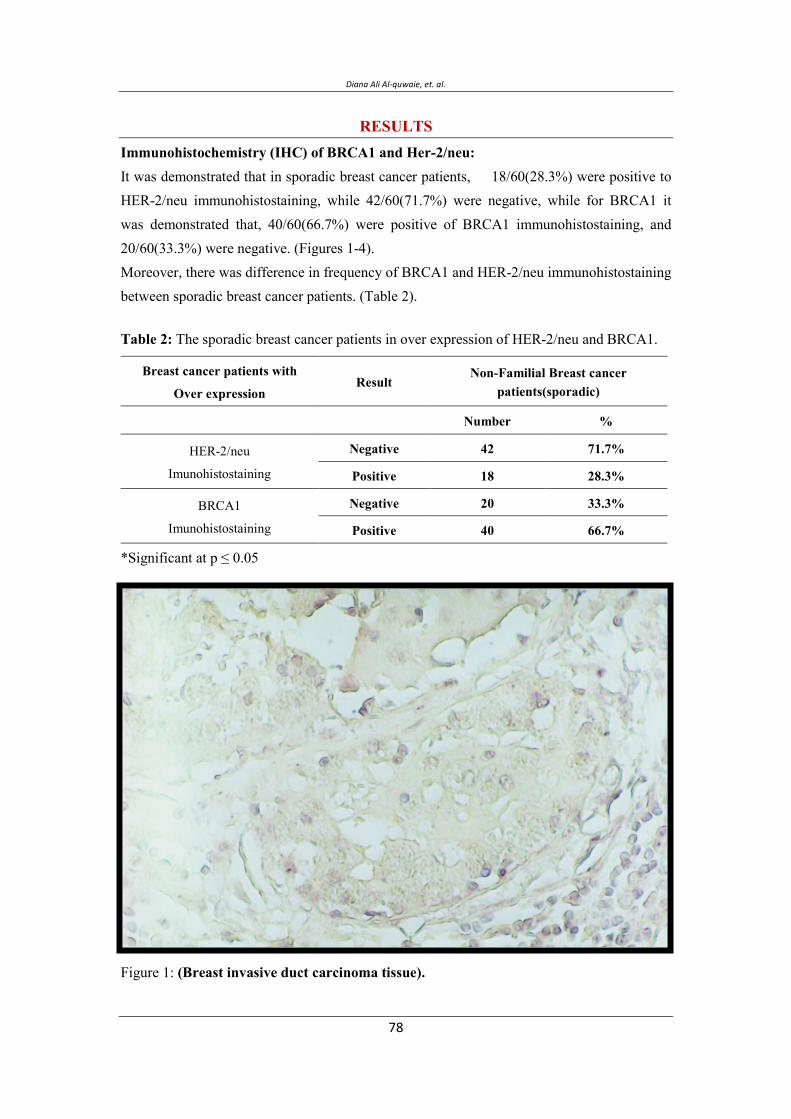
Diana Ali Al-quwaie, et. al.
RESULTS Immunohistochemistry (IHC) of BRCA1 and Her-2/neu: It was demonstrated that in sporadic breast cancer patients, 18/60(28.3%) were positive to HER-2/neu immunohistostaining, while 42/60(71.7%) were negative, while for BRCA1 it was demonstrated that, 40/60(66.7%) were positive of BRCA1 immunohistostaining, and 20/60(33.3%) were negative. (Figures 1-4). Moreover, there was difference in frequency of BRCA1 and HER-2/neu immunohistostaining between sporadic breast cancer patients. (Table 2).
Table 2: The sporadic breast cancer patients in over expression of HER-2/neu and BRCA1.
Non-Familial Breast cancer patients(sporadic)
Result Breast cancer patients with
Over expression
%Number
71.7% 42Negative HER-2/neu
Imunohistostaining 28.3% 18Positive
33.3% 20Negative BRCA1
Imunohistostaining 66.7% 40Positive
*Significant at p ≤ 0.05
Figure 1: (Breast invasive duct carcinoma tissue).
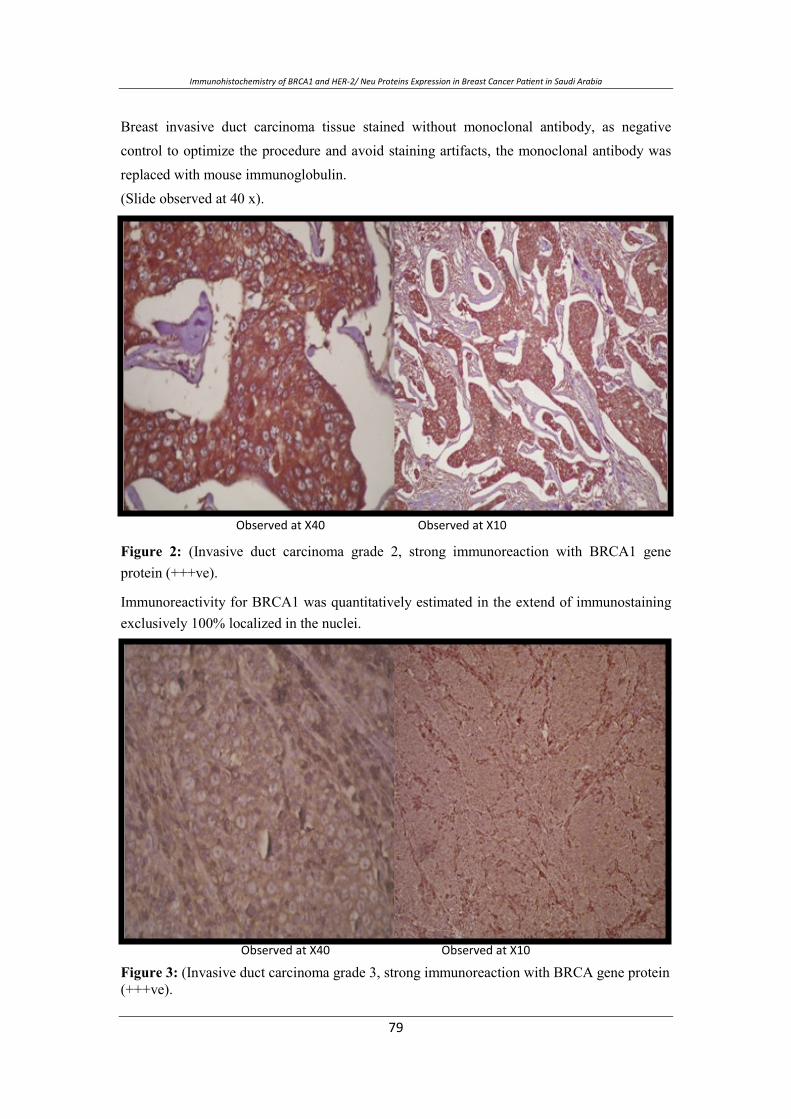
Immunohistochemistry of BRCA1 and HER2/ Neu Proteins Expression in Breast Cancer Pa&ent in Saudi Arabia
Breast invasive duct carcinoma tissue stained without monoclonal antibody, as negative control to optimize the procedure and avoid staining artifacts, the monoclonal antibody was replaced with mouse immunoglobulin. (Slide observed at 40 x).
.
Figure 2: (Invasive duct carcinoma grade 2, strong immunoreaction with BRCA1 gene protein (+++ve).
Immunoreactivity for BRCA1 was quantitatively estimated in the extend of immunostaining exclusively 100% localized in the nuclei.
Figure 3: (Invasive duct carcinoma grade 3, strong immunoreaction with BRCA gene protein (+++ve).
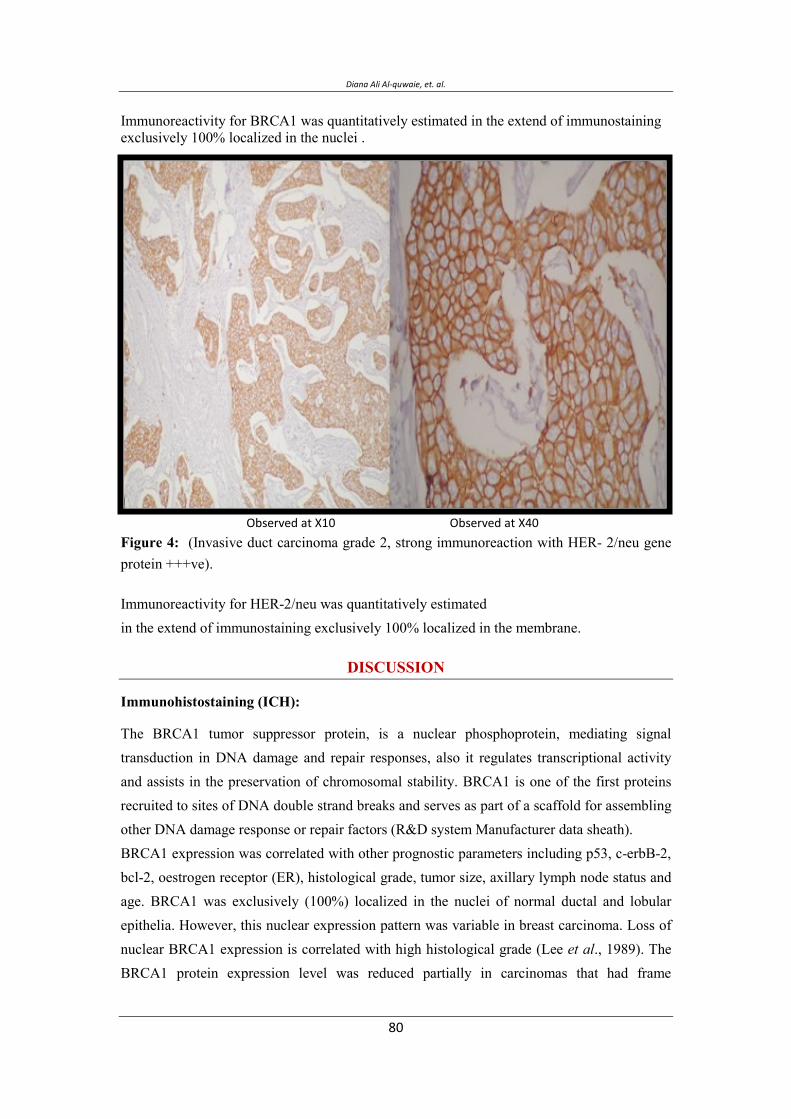
Diana Ali Al-quwaie, et. al.
Immunoreactivity for BRCA1 was quantitatively estimated in the extend of immunostaining exclusively 100% localized in the nuclei .
Figure 4: (Invasive duct carcinoma grade 2, strong immunoreaction with HER- 2/neu gene protein +++ve).
Immunoreactivity for HER-2/neu was quantitatively estimated in the extend of immunostaining exclusively 100% localized in the membrane.
DISCUSSION
Immunohistostaining (ICH):
The BRCA1 tumor suppressor protein, is a nuclear phosphoprotein, mediating signal transduction in DNA damage and repair responses, also it regulates transcriptional activity and assists in the preservation of chromosomal stability. BRCA1 is one of the first proteins recruited to sites of DNA double strand breaks and serves as part of a scaffold for assembling other DNA damage response or repair factors (R&D system Manufacturer data sheath). BRCA1 expression was correlated with other prognostic parameters including p53, c-erbB-2, bcl-2, oestrogen receptor (ER), histological grade, tumor size, axillary lymph node status and age. BRCA1 was exclusively (100%) localized in the nuclei of normal ductal and lobular epithelia. However, this nuclear expression pattern was variable in breast carcinoma. Loss of nuclear BRCA1 expression is correlated with high histological grade (Lee et al., 1989). The
BRCA1 protein expression level was reduced partially in carcinomas that had frame
Immunohistochemistry of BRCA1 and HER2/ Neu Proteins Expression in Breast Cancer Pa&ent in Saudi Arabia
mutations and in all carcinomas that had intronic or missense mutations. Although it is unknown whether intronic or missense mutations really have functional significance, but there is an association between the gene alterations and reduced expression of the gene products (Kiyotsugu et al., 1999). Complete loss of BRCA1 nuclear expression in breast cancer and its correlation with other poor prognostic markers suggest that BRCA1 expression may play an important role in the pathogenesis and prognosis of sporadic breast carcinoma (Lee et al.,1989). IHC can be a valuable preliminary test for detecting the reduction in BRCA1 protein expression if a battery of BRCA1 antibodies with different epitopes used (Fahd et al., 2005). Some researchers does not satisfy with IHC, they believed that commercially available BRCA1 antibodies had lack of specificity required to identify the BRCA1 protein and thus
are not useful for establishing differences between familial and sporadic breast tumors, or between BRCA1 associated and non-BRCA1 associated breast tumors (Pérez et al.,2001). Moreover, Further researches are needed to evaluate BRCA1 as a predictive biomarker and to target BRCA1 expression ((Weberpals et al., 2011). HER2/neu is also called c-erbB-2; it encodes a transmembrane tyrosine kinase receptor with extensive homology to the epidermal growth factor. Approximately 25% of primary breast and ovarian tumors were found to over express the protein Localized in cell membrane (Thermo Fisher Scientific, manufacturer data sheath). It has been stated that amplification of HER2/neu (ErbB2) occurs in 20-30% of early stage breast cancers and over expression of this gene in breast cancer is associated with increased disease recurrence and worse prognosis (Bange et al., 2001). the positive expression of HER-2/neu marker is associated with biologically aggressive tumors and poor prognostic profile (Al-Mumen et al., 2011). Patients with increased expression of Her-2/neu show a poorer response to chemo therapy like non-anthracycline containing cytotoxic and also toward hormonal therapies, the accurate assessment of Her-2/neu status has become essential in determining the clinical management of breast cancer patients (Priti et al., 2003). The most commonly employed methods for HER2/neu gene or its over expression are immunohistochemistry which is currently the most widely used method for assessing Her-2/neu status, and fluorescent in situ hybridization (FISH), in addition numerous PCR based methodologies have also been described. The false positivity of imunohistochemical technique represents the major criticism, in some experiences; FISH remains the most objective and powerful technique for HER-2/neu assessment on breast cancer (Nizzoli et al., 2003). One study also showed that HER2/neu amplification is higher in Saudi patients than other western populations. However, due to the

Diana Ali Al-quwaie, et. al.
inherent failures of the IHC assay, FISH should always be used when the IHC results are inconclusive (Al-Khattabi et al., 2010). Until recently, only 2 methods were validated for determining the HER2 status of breast tumors in the routine diagnostic setting: immunohistochemical analysis and fluorescence in situ hybridization (FISH) (Penault-Llorca et al., 2009). In this study immunohistostaining of the 60sporadic invasive ductul carcinoma tissue slides showed a difference in frequency of BRCA1 and HER-2/neu immunohistostaining. The results revealed that, nuclear immuno reaction for BRCA1 tissue were 40/60(66.7%) positive, and 20/60(33.3) negative, while membranous immuno reaction for HER-2/neu showed 18/60(28.3%) positive and 42/60(71.7%) were negative. As the BRCA1 expression is expressed in normal breast tissue and in sporadic invasive ductal carcinoma as well, so the high percentage of positive reaction 66.7% to BRCA1 expression does not look meaningful in disease prognoses, because only the samples of grade 2, and grade 3 well reacted high and showed high intensity, while low reaction or slightly reacted samples well look like normal breast tissue that containing BRCA1 normally, so for those of high immuno reaction we have to confirm the BRCA1 level in tissue from time to time with new biopsy to decide that patient is in good or poor prognosis. On the other hand the immunohisostaining reaction of HER-2/neu is much important in breast cancer prognosis, because the presence of even low to moderate reaction intensity indicates a bad prognosis and also confers therapeutic resistance to cancer therapies, while over expression could indicate a metastasis prognosis (Priti et al, 2003). Immunohistochemistry of breast cancer patients for HER-2/neu expression was much better than BRCA1 expression, for patient follow-up, in the absence of high and sensitive technologies. Physicians and Genetics in Saudi Arabia, working in breast cancer field should cooperate at national and international levels to enrich the information on the epidemiological and molecular etiology of the disease for fruitful results.
CONCLUSION 1. IHC of breast cancer patients for HER-2/neu expression was much better than BRCA1
expression for patient's follow-up, in the absence of high and sensitive technologies. 2. The breast cancer in Saudi Arabia tends to be advanced on presentation and affects
younger age population compared to Western countries. 3. All Saudi women from age 30 should do monthly self-breast examination, but regular
mammograms and genetic testing best for susceptible females with positive family history.
4. Early diagnosis of breast cancer will speed up disease management.

Immunohistochemistry of BRCA1 and HER2/ Neu Proteins Expression in Breast Cancer Pa&ent in Saudi Arabia
REFERENCES Al- Hamdan, N.A.; Al- Zahrani, M.; Michels, H.D.; and Koriech, S. 1994. National
Cancer Registry Report. Cancer incidence in Saudi Arabia. Riyadh (KSA): Ministry of Health. p12.
AL-Khattabi, H.; Kelany, A.; Buhmeida, A.; Maghrabi, J.; Lari, S.; Chaudhary, A.; Gari, M.; Abuzenadah, A.; and AL-Qahtani, M. 2010. Evaluation of HER-2/neu Gene Amplification by Fluorescence In Situ Hybridization and Immunohistochemistry in Saudi Female Breast Cancer. Anticancer Research October 2010 vol. 30 no. 10 4081-4088. Al-Mansouri, I.J. and Alokail, M.S. 2006. Molecular basis of breast cancer, SaudiMed.J. 27(1): 9-16.
Al-Mumen, M.; Al-Janabi, A.; Jumaa, A.; Al-Toriahi, K.; and Al- Yasseen, A. 2011. Exposure to depleted uranium does not alter the co-expression of HER-2/neu and p53 in breast cancer patients. BioMed Central Ltd,( 2011) doi: 10.1186/1756-0500-4-87.
Amr, S.S.; Sa’di ARM.; Ilahi, F.; and Sheikh, S.S. 1995. The spectrum of breast diseases in Saudi Arab females. A 26-year pathological survey at Dhahran Health Center. Ann Saudi Med. 15:125-32.
Austein, M. (2006): Saudi Women work to improve breast cancer awareness research. Bange, J.; Zwick, E.; and Ullrich A. 2001. Molecular targets for breast cancer therapy and
prevention. Nature Medicine. 7: 548 – 552. Bork, P.; Blomberg, N.; and Nilges, M. 1996. Internal repeats in the BRCA2 protein
sequence. Nature Genet. 13:22-23. Boulton, S.J. 2006. Cellular functions of the BRCA tumour-suppressor proteins. PMID
1705268, Biochemical Society Transactions. 34 (5): 633-645. Breast Cancer Dictionary. 1996. Breast Cancer. American Cancer Society Inc.Carter, P.; Presta, L.; and Gorman, C.M. 1992. Humanization of an anti-p185 HER2
antibody for human cancer therapy. Proc Natl Acad Sci. USA. 89:4285–4289. Clynes, R.A.; Towers, T.L.; and Presta, L.G. 2000. Inhibitory Fc receptors modulate in
vivo cytoxicity against tumor targets. Nat Med. 6:443–446. Coussens, L.; Yang-Feng, T.L.; Liao, Y.C.; Chen, E.; Gray, A.; McGrath, J.;
Seeburg,P.H.; Libermann, T.A.; Schlessinger, J.; and Francke, U. 1998. Tyrosine kinase receptor with extensive homology to EGF receptor shares chromosomal location with neu oncogene. Science 230: 1132–1139.
Domchek, S.M. and Antoniou, A. 2007. Cancer Risk Models: Translating Family History into Clinical Management Ann Intern Med. 147(7): 515 - 517.
Diana Ali Al-quwaie, et. al.
Domagala, P.; Huzarski, T,; Lubinski, J,; Gugala, K,; and Domagala,W. 2010. Immunophenotypic predictive profiling of BRCA1-associated breast cancer. Virchows Arch. 2011, 458(1): 55–64. doi: 10.1007/s00428-010-0988-3
Downward, J. 2003. Targeting RAS signaling pathways in cancer therapy. Nat Rev Cancer.3:11–22.
El-Bolkainy, N.; El-Bolkainy, T.; and Nouh, A. 2005. "General Pathology of Cancer", second edition. National Cancer Institute Cairo University.
Fahd, Al-Mulla.; Mahera, A.; Govindarajulu, Varadharaj; Nadeem, A.; and Jehoram T.; Anim. 2005. BRCA1 Gene Expression in Breast Cancer: A Correlative Study between Real-time RT-PCR and Immunohistochemistry Histochemistry and Cytochemistry. 53(5):621-629.
Focken,T.; Steinemann, D.; Skawran, B.; Hofmann,W.; Ahrens, P.; Arnold, N.; Kroll, P.; Kreipe, H.; Schlegelberger, B.; and Gadzicki, D. 2011. Human BRCA1-Associated Breast Cancer: No Increase in Numerical Chromosomal Instability Compared to Sporadic Tumors. .
Gotzsche, P.C. and Olsen O. 2000. Is Screening for breast cancer with mammography justifiable. Lancet. 355 (9198): 129-134.
Haber, J.E. 2000. Partners and pathways repairing a double-strand break. Trends Genet. 16:259–264.
Hall, J.M.; Lee, M.K.; and Newman, B. 1990. Linkage of early-onset familial breast cancer chromosome 17q21. Science, 250:1684-1689.
Harris, R. and Kinsinger, L.S. 2002. Routinely teaching breast cancer self-examination is dead. What does it mean. J. Natl. Cancer Inst. 94 (19):1420-1421.
Hrung, J.; Sonnand, S.; Schwartz, J.; and Langlotz, C. 1999. Accuracy of MR inaging in the work up of suspicious breast lesions: a diagnostic meta-analysis . Acad Radiol.6 (7): 387-397.
Hudziak, R.M.; Lewis, G.D.; and Winget, M. 1989. HER-2 Monoclonal antibody has antiproliferative effects in vitro and sensitizes human breast tumor cells to tumor necrosis factor. Mol Cell Biol. 9:1165–1172.
Humphrey, L.L.; Helfand, M.; Chan, B.K.; and Woolf, S.H. 2002. Breast Cancer screening a summary of the evidence for the U.S. Preventive Services Task Force. Ann Intern Med. 137(5): 347-360.
Ibrahim, E. (2007): Saudi Cancer Society, Cancer incidence on rise in Saudi Arabia. Kerlikowske, K. and Barclay, J. 1997. Outcomes of Modern Screening mammography.
J. Natl Cancer Inst Monogr. 22:105-111.
Immunohistochemistry of BRCA1 and HER2/ Neu Proteins Expression in Breast Cancer Pa&ent in Saudi Arabia
Kim, K.S.; Hyun, H.E.; Lee, S.W.; Kim, J. H.; Kim, G.; and Choe, S.Y. 2008. The effect of chromosome 17 polysomy on HER-2/neu status in breast cancer. J. Clin. Pathol.61(3): 317 - 321.
Kiyotsugu, Y.; Kazuo, H.; Takashi, I.; Hisashi, S.; Akira, Y.; Kenji, S.; Kruk, J.; and Aboul-Enein, H.Y. 2004. Psychological stress and the risk of breast cancer: a case-control study. Cancer Detection and Prevention.28:399-408.
Lee, W.H.; Bookstein, R.; and Hong, F. 1987. Human retinoblastoma susceptibility gene: Cloning identification and sequence. Science. 235:1394–1399.
Leslie, K.; Diaz, R.; Gupta, N.; Kidwai, Nour,; Sneige Elizabeth L. and Wiley, D. 2004. Detection of HER2 gene amplication in breast cancer. Journal of Histochemistry and cytochemistry. 52(4):501-507.
Misek, D.; and Kim, E. 2011. Protein Biomarkers for the Early Detection of Breast Cancer. International Journal of Proteomics.Volume 2011 (2011), Article ID 343582, 9 pages doi:10.1155/2011/343582.
Morimoto, T.; Sasa, M.; and Yamaguchi, T. 1994. High detection rate of breast cancer by ass screening using mammography in Japan. Japan Jour Cancer Res. 85:1193-1195.
Morrow, M. 2004. Magnetic resonance imaging in breast cancer: one step forward, two steps back. JAMA. 292 (22): 2779-2780.
Newman, B.; Austin, M.A.; Lee, M.; and King, M.C. 1988. (1Inheritance of human breast cancer: evidence for autosomal dominant transmission in high-risk families. Proc Natl Cancer Inst. 85:3044-3048.
Nizzoli, R.; Bozzetti, C.; and Crafa, P. 2003. Immunocytochemical evaluation of HER-2/neu on fine-needle aspirates from primary breast carcinomas. Diag Cytopathol.28:142-146.
Olayioye, M.A. 2001 Update on HER-2 as a target for cancer therapy: intracellular signaling pathways of ErbB2/HER-2 and family members. Breast Cancer Res. 3 (6): 385–389.
Parkin, M.; Pisani,P.; and Ferlay,J. (2008): Article first published online, DOI: 10.3322/canjclin.49.1.33.
Parker, S.L.; Tong, T.; Bolden, S.; and Wingo, PA. 1996. Cancer statistics, CA. AJournal for Clinicians. 46:5-27.
Penault-Llorca, F.; Bilous, M.; Dowsett, M.; Hanna, W.; Yoshiyuki Osamura, R.; Rüschoff, J.; and van de Vijver, M. 2009. Emerging Technologies for Assessing HER2 Amplification . American Journal of Clinical Pathology, 132, 539-548.
Perez-Valles A.; Martorell-Cebollada, M.; Nogueira-Vazquez, E.; García-García J.A.; and Fuster-Diana, E. 2001. The usefulness of antibodies to the BRCA1 protein in detecting the mutated BRCA1 gene. An immunohistochemical study. J Clin Pathol.54:476-480.
Diana Ali Al-quwaie, et. al.
Priti, L.; Paulo, A.; Salazar, M.; and Ladanyi, C. and Beiyun, C. 2003. Impact of Polysomy 17 on HER-2/neu Immunohistochemistry in Breast Carcinomas without HER-2/neu Gene Amplification. 5 (3):155-159.
Ross, J.S. and Fletcher, J.A. 1999. HER-2/neu gene and protein in breast cancer. Am J Clin Pathol. 112:S53-S67.
Scully, R.; Chen, J.; and Plug, A. 1997. Association of BRCA1 with Rad51 in mitotic and meiotic cells. Cell. 88:265–75.
Slamon, D.J.; Clark, G.M.; and Wong, S.G. 1987. Human breast cancer: correlation of relapse and survival with amplification of the HER-2/neu oncogene. Science.235:177–182.
Struewing, J.P.; Brody, L.C.; Erdos, M.R.; Kase, R.G.; Giambarresi, T.R.; Smith, S.A.; Collins, F.S.; and Tucker, M.A. 1995. Detection of eight BRCA1 mutations in 10 breast and ovarian cancer families. Genetic Epidemiology Branch, National Cancer Institute, National Institutes of Health Bethesda. MD 20892-7372, USA.
Thomas, D.B.; Gao, D.L.; and Ray, R.M. 2002. Randomized trail of breast self examination in Shanghai: final result. J. Natl. Cancer Inst. 94 (19): 1445-1457.
Van de Vijver, M.J.; Peterse, J.L.; and Mooi, W.J. 1988. Neu-protein overexpression in breast cancer. Association with comedo-type ductal carcinoma in situ and limited prognostic value in stage II breast cancer. N Engl J Med. 319:1239–1245.
Vargas-Roig, L.M.,; Gago, F.E.; Tello, O.; Aznar, J.C.; Ciocca, D.R. 1998. Heat shock protein expression and drug resistance in breast cancer patients treated with induction chemotherapy. Int J Cancer Pred Oncol. 79:468–475.
Wang, Y.; Cortez, D.; Yazdi, P.; Neff, N.; Elledge, SJ.; and Qin, J. 2000. BASC, a super complex of BRCA1-associated proteins involved in the recognition and repair of aberrant DNA structures. Genes Dev. 14:927–939.
Weberpals, J.; Tu, D.; Squire, J.; Amin,M.; Islam, S.; Pelletier, L.; O'Brien, A.; Hoskins, P.; and Eisenhauer, E. 2011. Breast cancer 1 (BRCA1) protein expression as a prognostic marker in sporadic epithelial ovarian carcinoma: an NCIC CTG OV.16 correlative study. Ann Oncol (2011) doi:
Yarden, Y.; and Sliwkowski, M.X. 2001. Untangling the ErbB signaling network. Nat Rev Mol Cell Biol. 2:127–137.
Zhang, J.; and Powell, S.N. 2005. The role of the BRCA1 tumor suppressor in DNA Double Strand Break repair.
Zhang, W.; and Yu, Y. 2011. The Important Molecular Markers on Chromosome 17 and Their Clinical Impact in Breast Cancer. Int. J. Mol. Sci. 2011, 12, 5672-5683; doi: 10.3390/ijms12095672.

Immunohistochemistry of BRCA1 and HER2/ Neu Proteins Expression in Breast Cancer Pa&ent in Saudi Arabia
ص ب) ( BRACA1 جHer2/neu ی ب ی.
ن ***ین ی.
. ب ی–– - بی- *
. ب ی-– ی- – **
ی م ن ن ب ی ثن م بم ج %ن ب ب ی ن م
م ن ب ی ی %- . ب ی ن ی
- ب ین م ن م بصب م ب
. ب م ی خ ص
. م صب ب
: م ص) ( ب
. ج ن Her2/neuج BRACA1ب .ی م ض ب ب ص ض ن جی
ن م م مض خ م مم ب .. ب ب صب م
ث) ( صب ب ی ج. ن ث ن ن ضب
ن م BRACA1 Her2/neuم ی ج مب م ب ب ض ن ب
.ی ی بنم جی ب می م ب
Her2/neu ی مBRACA1 ب ض ل ل ل ل ل
. ل ل ل ت ل ل ل م ل م

Diana Ali Al-quwaie, et. al.
Synthesis and Characterization of Some Novel Schiff Base Metal Complexes and the investigation of their Cytotoxic Activity on MCF- Cell ine
Cloning and Expression of FAS1 (acyl-carrier-protein) S-malonyltransferase, of Mycobacterium tuberculosis HRV37 in E .Coli Ibrahim Sabra1, Omyma Khamiss1, Mahmoud I. Nasr1, El-Sayd Hassanein2
and M. Singh2
1Animal Biotechnology Departments, Genetic Engineering and Biotechnology Research Institute
(GEBRI), Sadat City, Menofia University, Egypt.
2Genetics Departments, Faculty of Agriculture. Ain-Shams University, Egypt.
3Genome Analysis Departments, Genome Analysis, Helmholtz-Zentrum fur Infektionsforschung (HZI),
Braunschweig, Germany
Corresponding author: Dr. Omyma Khamiss, E. mail address: [email protected].
ABSTRACT Tuberculosis (TB) is a global health problem with one- third of the world’s population latently infected with Mycobacterium tuberculosis and about 8 million cases of active disease occurring each year. Due to the increasing numbers of people with M. tuberculosis in the last years, the worldwide dissemination of HIV infection, the strongest risk factor for M. tuberculosis development, and the continual migration of people from areas with a high incidence of TB to highly industrialized countries, M. tuberculosis is considered a global emergency. There is a need for a continued effort to develop rapid immunodiagnostic assays and more effective treatment for tuberculosis infection. Unlike most other bacteria, Mycobacteria make fatty acids with the multi-domain enzyme eukaryote-like fatty acid synthase I (FASI). This study aims to clone and express acyl-carrier-protein (ACP) S-malonyltransferase protein from Mycobacterium tuberculosis. ACP S-malonyltransferase DNA fragments encoding amino acids 31–382 was generated from HRV37. The amplified DNA fragment (PCR product) was digested with Nde1 and Xho1 and inserted into the expression plasmid PET 28 digested with the same restriction enzymes. The sequence of the insert was confirmed after transformation in E. coli. Expressed protein was purified, characterized by sodium dodecyl sulphate polyacrylamide gel electrophoresis (SDS-PAGE) and tested for their activity by Enzyme linked immunosorbent assay (ELISA). Our results showed that ACP was highly expressed and was found in soluble form as Recombinant Protein in Escherichia coli (E. coli.). Tthe ACP Domain from Fatty Acid Synthase gene (FAS1) composed of 1146 bp and its protein encodes a 40 kDa as expressed in E. coli. FAS1 (Acyl-carrier-protein) S-malonyltransferase could be useful for detecting human IgA and IgG antibodies against active TB. Key words: TB, Cloning, FAS1
Vol. 12, 2012 JBR ORIGINAL ARTICLE
Diana Ali Al-Quwaie, et. al.
INTRODUCTION Tuberculosis (TB) is the world's leading cause of mortality worldwide caused by Mycobacterium tuberculosis belonging to the family Mycobacteriaceae. It is an important common contagious disease with public health problem in both the developed and developing countries (Barrera, 2007). This organism is polymorphic, non-motile, non-spore forming acid-fast bacteria. It has unusually high GC content (65%) in its genomic DNA and very high lipid content in the cell wall, which accounts for more than 50% of dry weight of the cell (Bhuju, 2008). It is a slow growing, requiring approximately 20 hours to replicate. Three different schemes for de novo synthesis of fatty acids are found in nature. Eukaryotes and advanced prokaryotes generally use the type I fatty acid synthase system (FAS I), composed of complexes of large multifunctional enzymes. In contrast, Bacteria use the dissociated FAS II system that consists of a set of separate enzymes, each catalyzing one of the reactions of the fatty acid synthesis cycle (Schweizer and Hofmann, 2004). A third system exists in some parasites that use membrane-bound fatty acid elongates for the synthesis of aliphatic chains (Lee et al., 2006). Despite this considerable variation, the individual reaction steps of fatty acid biosynthesis are essentially conserved in all kingdoms of life. Four basic reactions constitute a single round of elongation. In the first step, an acceptor CoA or acyl carrier protein (ACP) associated acetyl unit is condensed with malonyl-ACP to form ketobutyryl- ACP, which is subsequently reduced by an NADPH-dependent ketoacyl-ACP reductase. The resulting hydroxyacyl-ACP is dehydrated to produce enoyl-ACP and finally reduced by an enoyl reductase (ER) to form the saturated acyl-ACP (Johansson et al., 2008). Fatty acid synthesis in bacteria is essential for cell survival; the enzymes involved in this pathway have emerged as promising targets for antimicrobial agents. The fungal metabolites cerulenin and thiolactomycin target the condensing enzymes of the bacterial FASII pathway. 5-chloro-pyrazinamide (5-CIPZA) and pyrazinamide (PZA) inhibit M. tuberculosis FASI, indicating that FASI is also a drug target (Zimhony et al; 2004). The use of PZA, a FASI inhibitor, in tuberculosis chemotherapy has greatly reduced the length of treatment necessary to cure patients. Therefore, new FASI inhibitors could be useful tools for treating tuberculosis (Campbell and Cronan, 2001; Heath et al; 2002, Wright and Reynolds, 2007). Several inhibitors targeting the ketoacyl synthase (KS) step of the FAS cycle have also been described (Banerjee et al., 1994; McMurry et al,. 1998) including cerulenin (CER) (Hata et al., 1960), thiolactomycin (TLM) (Oishi et al., 1982) and the recently discovered platensimycin (PLM) (Wang et al., 2006). The polyketide CER inhibits both FAS type I and II KS enzymes, by covalent modification of the active site cysteine and by occupying the

Molecular Detecon of Germline Mutaons of the Breast Tumor Suppressor Genes BRCA1/BRCA2 in Breast Cancer Paents in Sau$i Ara%ia
long acyl-binding pocket (D'Agnolo et al., 1973; Kauppinen et al., 1988). TLM and PLM, in contrast, have been shown to be selective toward the FAS II system, blocking the malonyl and the CoA/ACP phosphopantetheine-binding sites (Nishida et al., 1986; White et al., 2005; Wang et al 2006; Leibundgut et al., 2007). The type I FAS systems of mammals, fungi, and some bacteria comprise large, multifunctional enzymes into which ACP is integrated together with the catalytic domains (Maier et al., 2006). This leads to a drastically increased local concentration of ACP and of all catalytic domains and allows efficient catalysis by shuttling the reaction intermediates from one reaction center to the next (Jenni et al., 2006). Thus, this study aims to clone and express ACP S-malonyltransferase protein from Mycobacterium tuberculosis.
MATERIAL AND METHODS
Construction of the recombinant ACP plasmid PET28: ACP S-malonyltransferase DNA fragment encoding amino acids 31–382 was generated from HRV37 chromosomal DNA by PCR using a flanking forward primer with an extra Nde1 site P859 5-GGCTGTCATATG ACGATCCACGAGCACGAC -3 and reverse flanking primer with an extra Xho1 site P860 5-GTTAAACTCGAGTCAGGTGGCGCCGACGGTGAA-3. PCR reaction was performed in different volumes, for sequencing purpose 20 µl of PCR reaction was sufficient during gradient PCR while for cloning purpose 50-100 µl of PCR reaction was used. For all individual PCR reactions, initial optimization of PCR was performed with gradient PCR. PCR conditions were as follows: 3 min at 95ºC, then 35 cycles of: 45 sec at 95ºC, 90 sec at 65ºC, 150 sec at 74ºC,ending with a 7 min extension period at 74ºC in using Qiagen Master Mix (Qiagen, Hilden, Germany). The amplified DNA fragment (PCR product) was digested with Nde1 and Xho1 (Promega) and inserted into Nde1 and Xho1 sites of the expression plasmid PET 28 digested with the same restriction enzymes. The sequence of the insert was confirmed after transformation in E. coli top 10F combatant cells and mini-preparation of the recombinant construct DNA to be then retransformed in E .coli BL21 (DE3) for best quantitative and qualitative expression protein.
Expression and purification of recombinant protein:
Purification of the ACP S-malonyltransferase from BL21 (DE3) second combatant cells which were transformed with the expression construct. Overnight of transformed E. coli BL21 (DE3) culture was carried out at 37°C with vigorous shacking. Auto induction in E. coli BL21 (DE3) was done according to the unpublished protocol from (Lionex GmbH, Braunschweig, Germany). 5 ml of a starter culture suspension was cultivated in LB medium with Kanamycine antibiotic and spread in Q tray (Genetix) containing 200 ml APS medium with Kanamycine antibiotic to form a lawn culture. Plates were then incubated at 18°C for 3-4 days. The bacterial layer was then scrapped with cell scrapper tipped with glass rod. Cells derived from APS medium were disrupted by sonication using Branson Ultrasonic Corp. The cell lysates were clarified by centrifugation at 18.000 rpm/20 min. As for protein

Diana Ali Al-Quwaie, et. al.
purification, it was carried out by GLC technology (Gas-liquid chromatography) all procedures were carried out in cold condition (alternatively on ice). Cell pellet was re-suspended in equilibration buffer of the column used. Two types of column were tested Ni-NTA (Zhao et al., 2010) and Superdex (depending on quantity and quality of protein purified) for further purification at 5 ml /1gram wet cell pellet mass.
Protein characterization by SDS-PAGE analysis:
Protein samples were denatured by heat shocked at 100°C for 10 min before loading to the SDS-PAGE that consisted of 4% polyacrylamide (stacking gel) and 12% polyacrylamide (separating gel) with an acrylamide/bisacrylamide ratio of 29: l. and prepared as described by Lammlli (1970). After electrophoresis, the gel was transferred to polyvinylidene difluoride (PVDF) membrane and stained with 0.5% Comassie brilliant blue R-250.
ELISA with the (Acyl-carrier-protein) S-malonyltransferase:
ELISA was performed according to Talaat et al. (2010) with some modifications. A 96-well ELISA-micro-titer plate was coated with purified 1µg/ml of the antigens (ACP) overnight, and then plates were washed 3 times and blocked for 2h at 37°C. After washing 3 times again plates then incubated each well of the plates with different serum samples (diluted 1:200) for 45 min at 37°C collected from TB-patients, healthy persons and patients with other diseases. 100 µl of each sample was coated 3 times for testing anti-human IgG, IgM and IgA (100 µleach) in the next step after another washing step. These second antibodies are linked with the enzyme horseradish peroxidase (HRP), which can be detected by the substrate-chromogen solution TMB (100 µl per well), yielding a blue colour that changes to yellow upon addition of Sulfuric acid stop solution (100 µl per well). The intensity of the colour change was detectable signal which was measured at 450 nm and shows how specific the antigens react with the human antibodies in the serum samples.
RESULTS
Restriction analysis and sequencing of the insert: The coding region of (Acyl-carrier-protein) S-malonyltransferase was cloned into the plasmid PET 28, residues 31 through 382, which was demonstrated by digestion with restriction enzymes. Sequencing analysis displayed that the sequence of insert was consistent with the published (Acyl-carrier-protein) S-malonyltransferase sequence of Mycobacterium tuberculosis strain. Figures (1) demonstrated that the PCR product FAS1 gene from TB was about 1146 bp. which corresponding to (Acyl-carrier-protein) S-malonyltransferase from FAS1 gene inTB.

Molecular Detecon of Germline Mutaons of the Breast Tumor Suppressor Genes BRCA1/BRCA2 in Breast Cancer Paents in Sau$i Ara%ia
A B
Fig. (1): PCR product of (Acyl-carrier-protein) S-malonyltransferase was about 1146 bp. Migrated on 1% agarose gel elctrophorasis
Expression and identification:
The pET-28 was designed for cloning and expression of protein peptides fused with poly-His-Tag,
were expressed under the control of T7 promoter. The molecular predicted size of the expression
product was 40 kDa, into the recombinant plasmid pET-28. SDS-PAGE analysis showed that (Acyl-
carrier-protein) S-malonyltransferase was highly expressed in E. coli with the molecular size 40 kDa
after Protein purification by NiNTA column
.
Fig. (2): 12% SDS-PAGE stained by Coomassie blue of purified ACP expressed protein in E. coli was analyzed by Representative fractions containing pure band from NiNTA. (Acyl-carrier-protein) S-malonyltransferase was expressed in a soluble form and purified easily by a Ni-NTA column, the purity of (Acyl-carrier-protein) S-malonyltransferase could
BA
Diana Ali Al-Quwaie, et. al.
reach to 80%. Further purification of the (Acyl-carrier-protein) S-malonyltransferase was done through superdex column, and the purity could be up to 95% (Fig. 3). It shows that highly purified protein expression after Superdex75Hiload2660pnCA001:10_UV_250nm the size
of (Acy;-carrier-protein) S-malonyltransferase was about 40 kDa.
Fig. (3): Purification of ACP expressed protein in E.coli was analyzed by 12% SDS-PAGE, followed by Comassie blue staining. Representative fractions containing pure band from superdex.
NiNTA5ml013:10_UV3_0nm NiNTA5ml013:10_Cond NiNTA5ml013:10_Conc NiNTA5ml013:10_Fractions NiNTA5ml013:10_Inject
-1000
A B

Molecular Detecon of Germline Mutaons of the Breast Tumor Suppressor Genes BRCA1/BRCA2 in Breast Cancer Paents in Sau$i Ara%ia
Fig. (4): Chromatogram for protein purification from ACP by Ni-NTA
34.0
32.0
30.0
28.0
26.0
24.0
22.0
0.0 10.0 20.0 30.0 40.0 50.0 min
0
1000
2000
3000
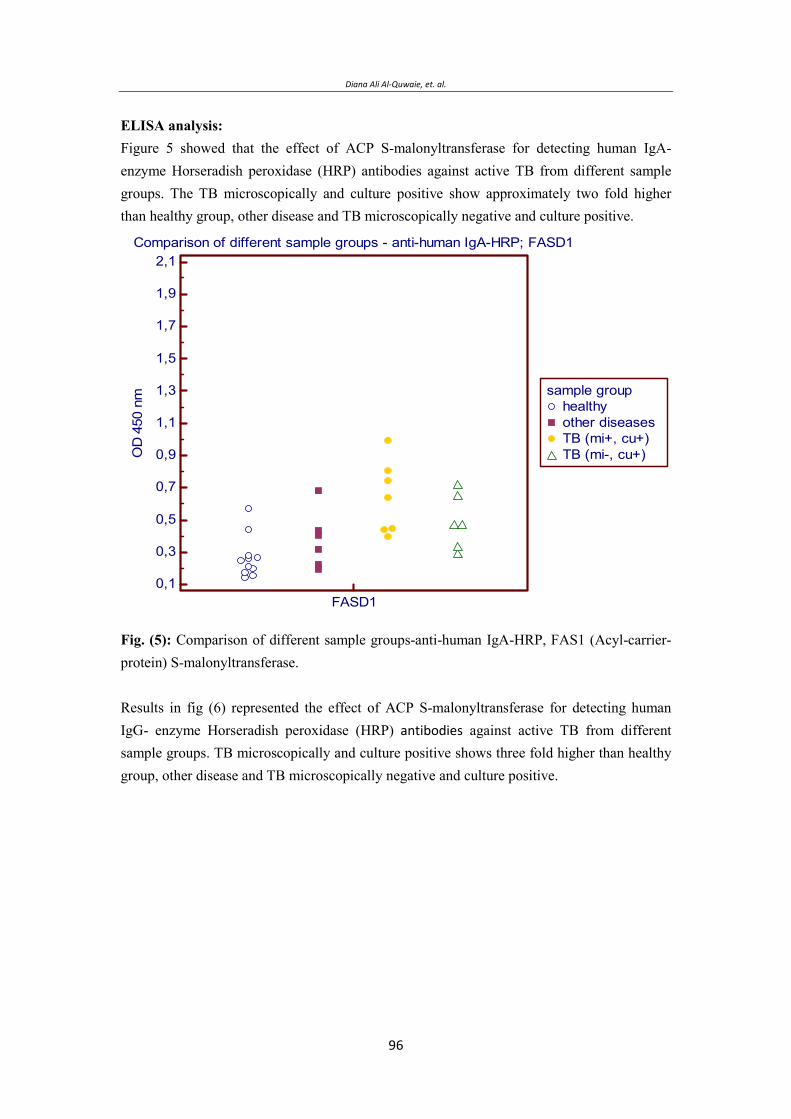
Diana Ali Al-Quwaie, et. al.
ELISA analysis: Figure 5 showed that the effect of ACP S-malonyltransferase for detecting human IgA-enzyme Horseradish peroxidase (HRP) antibodies against active TB from different sample groups. The TB microscopically and culture positive show approximately two fold higher than healthy group, other disease and TB microscopically negative and culture positive.
Comparison of different sample groups - anti-human IgA-HRP; FASD1
0,1
0,3
0,5
0,7
0,9
1,1
1,3
1,5
1,7
1,9
2,1
OD
450
nm
FASD1
sample grouphealthyother diseasesTB (mi+, cu+)TB (mi-, cu+)
Fig. (5): Comparison of different sample groups-anti-human IgA-HRP, FAS1 (Acyl-carrier-protein) S-malonyltransferase. Results in fig (6) represented the effect of ACP S-malonyltransferase for detecting human IgG- enzyme Horseradish peroxidase (HRP) !" against active TB from different sample groups. TB microscopically and culture positive shows three fold higher than healthy group, other disease and TB microscopically negative and culture positive.
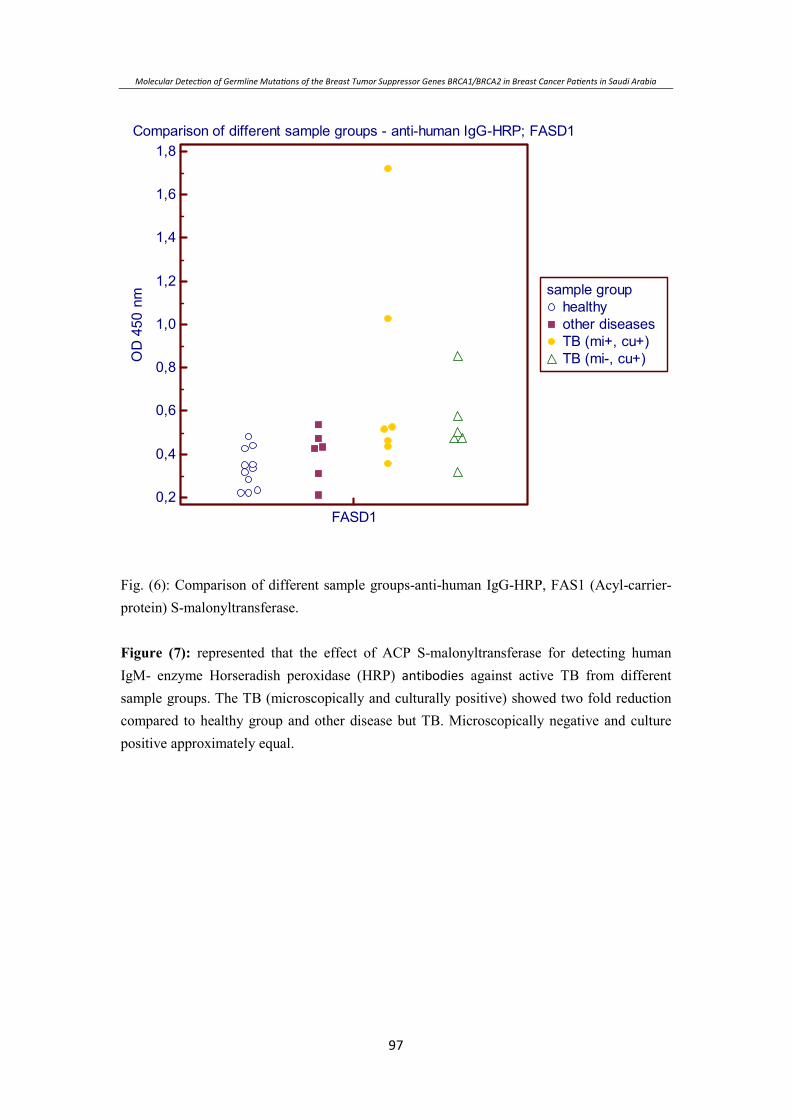
Molecular Detecon of Germline Mutaons of the Breast Tumor Suppressor Genes BRCA1/BRCA2 in Breast Cancer Paents in Sau$i Ara%ia
Comparison of different sample groups - anti-human IgG-HRP; FASD1
0,2
0,4
0,6
0,8
1,0
1,2
1,4
1,6
1,8O
D45
0nm
FASD1
sample grouphealthyother diseasesTB (mi+, cu+)TB (mi-, cu+)
Fig. (6): Comparison of different sample groups-anti-human IgG-HRP, FAS1 (Acyl-carrier-protein) S-malonyltransferase. Figure (7): represented that the effect of ACP S-malonyltransferase for detecting human IgM- enzyme Horseradish peroxidase (HRP) !" against active TB from different sample groups. The TB (microscopically and culturally positive) showed two fold reduction compared to healthy group and other disease but TB. Microscopically negative and culture positive approximately equal.
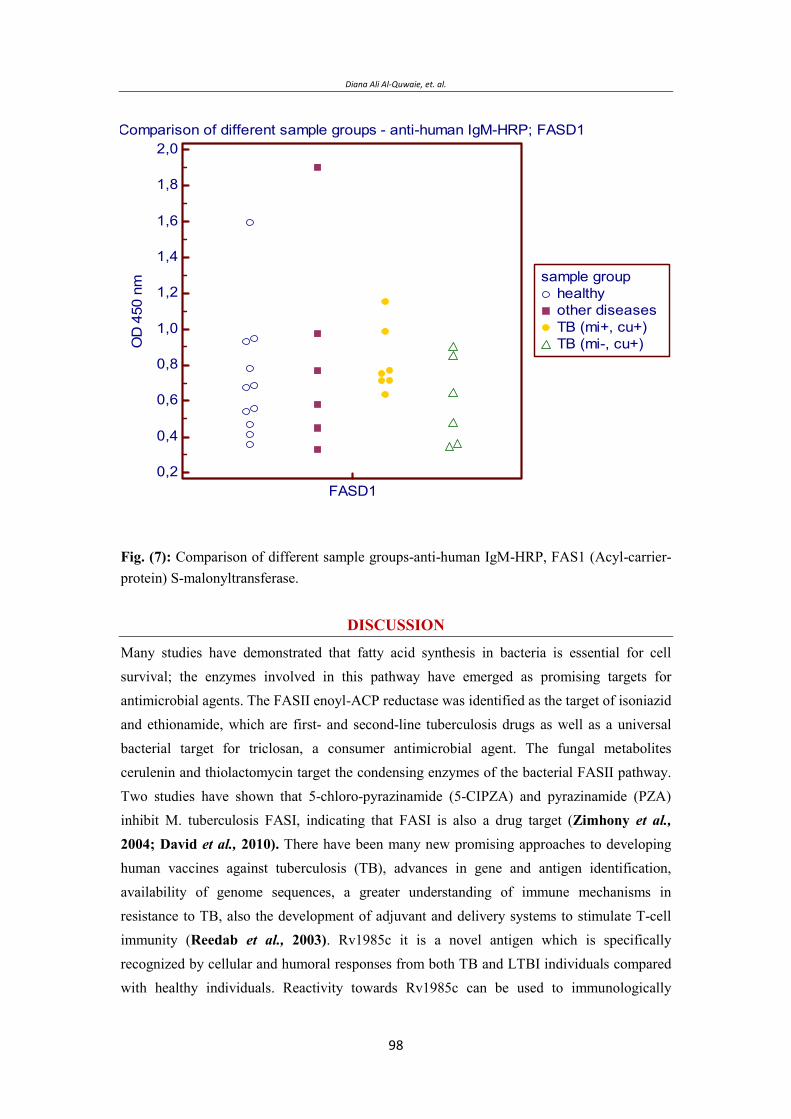
Diana Ali Al-Quwaie, et. al.
Comparison of different sample groups - anti-human IgM-HRP; FASD1
0,2
0,4
0,6
0,8
1,0
1,2
1,4
1,6
1,8
2,0O
D45
0nm
FASD1
sample grouphealthyother diseasesTB (mi+, cu+)TB (mi-, cu+)
Fig. (7): Comparison of different sample groups-anti-human IgM-HRP, FAS1 (Acyl-carrier-protein) S-malonyltransferase.
DISCUSSION
Many studies have demonstrated that fatty acid synthesis in bacteria is essential for cell survival; the enzymes involved in this pathway have emerged as promising targets for antimicrobial agents. The FASII enoyl-ACP reductase was identified as the target of isoniazid and ethionamide, which are first- and second-line tuberculosis drugs as well as a universal bacterial target for triclosan, a consumer antimicrobial agent. The fungal metabolites cerulenin and thiolactomycin target the condensing enzymes of the bacterial FASII pathway. Two studies have shown that 5-chloro-pyrazinamide (5-CIPZA) and pyrazinamide (PZA) inhibit M. tuberculosis FASI, indicating that FASI is also a drug target (Zimhony et al., 2004; David et al., 2010). There have been many new promising approaches to developing human vaccines against tuberculosis (TB), advances in gene and antigen identification, availability of genome sequences, a greater understanding of immune mechanisms in resistance to TB, also the development of adjuvant and delivery systems to stimulate T-cell immunity (Reedab et al., 2003). Rv1985c it is a novel antigen which is specifically recognized by cellular and humoral responses from both TB and LTBI individuals compared with healthy individuals. Reactivity towards Rv1985c can be used to immunologically
Molecular Detecon of Germline Mutaons of the Breast Tumor Suppressor Genes BRCA1/BRCA2 in Breast Cancer Paents in Sau$i Ara%ia
diagnose TB infection individuals along with other immunodominant antigens among BCG-vaccinated population (Chen et al., 2010). A capture enzyme-linked immunosorbent assay (ELISA) was developed for detection of lipoarabinomannan (LAM) in human sputum samples. As a capture antibody, they used a murine monoclonal antibody against LAM, with rabbit antiserum against Mycobacterium tuberculosis as a source of detector antibodies. The sensitivity of the capture ELISA was evaluated by using purified LAM and M. tuberculosis whole cells. The sensitivity of this test was to detect up to 1 ng of purified LAM/ml and 104 M. tuberculosis whole cells/ml (Lenka et al., 2000). In the present study, (Acyl-carrier-protein) S-malonyltransferase results demonstrate that it could be one of important candidate antigen for the diagnosis and vaccine development for M. tuberculosis. Fortunately, the highly expressed (Acyl-carrier-protein) S-malonyltransferase was soluble form so it could be improve to purify the expression products. As a result, the (Acyl-carrier-protein) S-malonyltransferase displays good antigen for diagnosis of M. tuberculosis infection after expression in E. Coli and it does not need further refolding process. Therefore, the constructed vectors and the optimized expression conditions in the present study are useful when (Acyl-carrier-protein) S-malonyltransferase was produced as a quantitative and qualitative diagnostic antigen. After ELISA test we can define that, FAS1 (Acyl-carrier-protein) S-malonyltransferase may be useful for detecting human IgA, IgM and IgG antibodies against active TB. OD values. The best human antibodies which was detected by (Acyl-carrier-protein) S-malonyltransferase against TB was IgG, IgA but IgM may be did not detected by (Acyl-carrier-protein) S-malonyltransferase. However, for more specific results a larger sample panel (healthy, other diseases, TB, LTBI) must be evaluated in ELISA and Rapid tests. As conclusions we can define that FAS1 (Acyl-carrier-protein) S-malonyltransferase may be useful for detecting human IgA- and IgG antibodies against active TB.
ACKNOWLEDGMENT: This work was supported by Prof. Dr. M. Singh Dept. of Genome Analysis, Helmholtz-
Zentrum fur Infektionsforschung (HZI), Braunschweig, Germany. A part of the work was
done at Lionex Diagnostics & Therapeutics GmbH, Braunschweig, Germany.
REFERENCES Barrera L.(2007). The Basics of Clinical Bacteriology. Chap.(3) p.93 in “Tuberculosis 2007
from Basic science to patient care. Juan Carlos Palomino, Leao, Viviana Ritacco. www.Tuberculosis Textbook.com.
Banerjee A., Dubnau E., Quemard A., Balasubramanian V., Um K., Wilson T., Collins D., de Lisle G. and Jacobs W. (1994) INHA, a gene encoding a target for isoniazid and ethionamide in Mycobacterium tuberculosis. Science 263:227–230.
Diana Ali Al-Quwaie, et. al.
Bhuju S. (2008). Developing of novel drug screening assays and molecular characterization of rifampicin and pyrazinamide resistance in Mycobacterium tuberculosis. Von der Fakultät für Lebenswissenschaften der Technischen Universität Carolo-Wilhelmina zu Braunschweig zur Erlangung des Grades eines Doktors der Naturwissenschaften (Dr. rer. nat.) genehmigte
Campbell J., and Cronan J. Jr. (2001) Bacterial fatty acid biosynthesis: Targets for antibacterial drug discovery. Annu Rev Microbiol 55:305–332.
Chen J., Wang S., Zhang Y., Su X., Wu Y., Shao L., Wang F., Zhang S., Weng X., Wang H., and Zhang W. (2010) Rv1985c, a promising novel antigen for diagnosis of tuberculosis infection from BCG-vaccinated controls. BMC, Infectious Diseases,10:273-280.
Chand D. and Vogel H. (2010): Current understanding of fatty acid biosynthesis and the acyl carrier protein. Biochem. J. 430: 1–19.
D'Agnolo G., Rosenfeld I.S., Awaya J., Omura S., and Vagelos P.R. (1973) Inhibition of fatty acid synthesis by the antibiotic cerulenin. Specific inactivation of beta-ketoacylacyl carrier protein synthetase. Biochim Biophys Acta 326:155–166.
Heath R.J., White S.W., and Rock C.O. (2002) Inhibitors of fatty acid synthesis as antimicrobial chemotherapeutics. Appl Microbiol Biotechnol 58:695–703.
Hata T., Matsumae A., Nomura S., Kim T., and Ryan K., (1960) Study of new antifungal antibiotic. Japan, J Bact 15:1075–1076.
Ji-Nong L., Myriam G., Francis J.C., Tirukalikundram S., Michele K.E., Wan F.H. and Ellen S.P. (2001). Pharmacological Inhibition of Fatty Acid Synthase Activity Produces Both Cytostatic and Cytotoxic Effects Modulated by p531 Cancer Research 61: p.1493–1499.
Johansson P., Wiltschi B., Kumari P., Kessler B., Clemens V., Janet V., Dieter O, and Martin G. (2008). Inhibition of the fungal fatty acid synthase type I multienzyme complex, PNAS 105:12803–12808.
Jenni S., Leibundgut M., Maier T., and Ban N. (2006) Architecture of a faungal fatty acid synthase at 5 A resolution. Science 311: 1263-1268.
Kauppinen S., Siggaard-Andersen M., and von Wettstein-Knowles P. (1988) beta-ketoacyl-ACP synthase I of Escherichia coli: Nucleotide sequence of the fabB gene and identification of the cerulenin binding residue. Carlsberg Res Commun 53:357–370.
Laemmli, U.K. (1970). Cleavage of structural proteins during the assembly of the head of bactriophage T4. Nature. 277:680-685.
Lee S.H., Stephens J.L., Paul K.S., and Englund P.T. (2006) Fatty acid synthesis by elongases in trypanosomes. Cell 126:691–699.
Molecular Detecon of Germline Mutaons of the Breast Tumor Suppressor Genes BRCA1/BRCA2 in Breast Cancer Paents in Sau$i Ara%ia
Leibundgut M., Jenni S., Frick C., and Ban N. (2007). Structural Basis for Substrate Delevary by Acyl Carrier Protein in Yeast Fatty Acid Synthase, Science 316(5822): 288-290.
Lenka M. P., Lan N.N., Ly M.H., Sjoukje K., Henk M.J. and Arend H.J.K. (2000). Development of antigen detection assay for diagnosis of Tuberculosis using Sputum Samples. J Clin Microbiol. 38(6): 2278–2283.
Maier T., Jenni S., and Ban N. (2006) Architecture of mammalian fatty acid synthase at 4.5 A resolution. Science 311(5765) 1258-1262.
McMurry L.M., Oethinger M., and Levy S.B. (1998) Triclosan targets lipid synthesis. Nature 394:531–532.
Nishida I., Kawaguchi A., and Yamada M. (1986) Effect of thiolactomycin on the individual enzymes of the fatty acid synthase system in Escherichia coli. J Biochem 99:1447–1454.
Oishi H., Noto T., Sasaki H., Suzuki K., Hayashi T., Okasaki H., Ando K., Sawada M. (1982) Thiolactomycin, a new antibiotic I Taxonomy of the producing organism, fermentation and biological properties. J Antibiot 35:391–395.
Reedab G.S., Aldersona, R.M., Dalemansc, W. , Lobetc,Y., and Skeikya W.A.Y. (2003) Prospects for a better vaccine against tuberculosis, Elsevier Science Ltd, Volume 83,Issue 1, P, 213-219.
Sanger F, Nicklen S, Coulson A, R. (1977) DNA sequencing with chain-terminating inhibitors. Biochemistry Vol. 74, No. 12, p. 5463-5467.
Schweizer E., and Hofmann J. (2004) Microbial type I fatty acid synthases (FAS): Major players in a network of cellular FAS systems. Microbiol Mol Biol Rev 68:501–517.
Talaat R.M, Radwan G.S., Mosaad A.A., Saleh S.S., Bassiouny K. (2010) Rapid immunodiagnostic assays for Mycobacterium Tuberculosis infection. Health 2(3), 171-176
Zimhony O., Vilcheze C., and Jacobs W.R. Jr. (2004). Characterization of Mycobacterium smegmatis Expressing the Mycobacterium tuberculosis Fatty Acid Synthase I (fasl) Gene, J Bact , p. 4051-4055.
Wang J., Soisson S. M., Young K., Shoop W., Kodali S., Galgoci A., Painter R., Parthasarathy G., Tang Y. S., Cummings R., Ha S., Dorso K., Motyl M., Jayasuriya H., Ondeyka J., Herath K., Zhang C., Hernandez L., Allocco J., Basilio Á.,. Tormo J. R, Genilloud O., Vicente F., Pelaez F., Colwell L., Lee S. H., Michael B., Felcetto T., Gill C., Silver L. L., Hermes J. D., Bartizal K., Barrett J., Schmatz D., Becker J. W., Cully D. and Singh S. B. (2006) Platensimycin is a selective FabF inhibitor with potent antibiotic properties. Nature 441:358–361.

Diana Ali Al-Quwaie, et. al.
White W.S., Zheng J., Zhang M.Y. and Rock O.C. (2005) The structural biology of type II fatty acid biosynthesis. Annu. Rev. Biochem. 74: 791-795.
Wright H.T., and Reynolds K.A. (2007) Antibacterial targets in fatty acid biosynthesis. Curr Opin Microbiol 10:447–453.
Zhao C., Hellman L.M., Zhan X., Bowman W.S., Whiteheart S.W., Fried M.G. (2010). "Hexahistidine-tag-specific optical probes for analyses of proteins and their interactions" Analytical biochemistry 399 (2): 237-240.
Molecular Detecon of Germline Mutaons of the Breast Tumor Suppressor Genes BRCA1/BRCA2 in Breast Cancer Paents in Sau$i Ara%ia
FAS1 ) ت (S-malonyltransferase Mycobacterium tuberculosis (HRV37 بی( )E.coli( ی
ح ب
ی ت .ی –1
2- . . .
.ن نی) ZENTRUM Infektionsforschung (HZI- ت -3
ی ح ح ح . ت ی ی ش
ی تی ت
ت ی ح .ح . ی ی ی ب ت ی ت ی . ش .
ح ح ی ح یبی)FASI(ت ت )malonyltransferase S-
ACP (ب ت. بت )ACP ( ب ب ش .E( ت بت coli (ئ . ب ACP ح )FAS1 (ت bp. ت ت .E( ب ت تت. coli (ت ب
) SDS-PAGE( ی ی ب ب (GLC) تب ت ت
بی ب ت ب )ELISA(. ب ی ی FAS1 ) ت (S-
malonyltransferase ی ی IgA تبتی ئ
)LTBI( .

Diana Ali Al-Quwaie, et. al.

Synthesis and Characterization of Some Novel Schiff Base Metal Complexes and the investigation of their Cytotoxic Activity on MCF- Cell ine
Synthesis Of Some New Substituted Acridones With Expected Biological Activities
*Samir M.EL-Moghazy, **Hanaa F.Roaiah, **Sally S.Nakkady, **Daren EL-Hussein
*Pharmacutical Chemistry Department,Faculty of Pharmacy,Cairo Universsity.
** Chemistry of Microbial and Natural Products Department,National Research Centre, Egypt.
Corresponding Author: Hanaa F.Roaiah, E- mail: [email protected]
ABSTRACT
2-Chlorobenzoic acid was condensed with anthranilic acid to give (1) followed by cyclization with sulfuric acid to form (2).Treatment of (2) with potassium hydroxide gave (3). Reaction of (3) with dimethyl sulfate yielded (4). N-substituted acridone was treated with thionyl chloride to give the intermediate chloro derivative (5) which reacted with aromatic amines to give the amino derivatives (6a- e). The chloro intermediate( 5) treated with the appropriate sulfonamides to form (E) -10-methyl-9-(4-substituted sulfamoyl-phenylimino)-9,10-dihydroacridine-4-carboxylic acid acid 7,9,11,13,15,17,19, and 21 respectively. The work was further extended to prepare the intermediate compounds (7a,9a,11a,13a,15a,17a, 19a, and 21a) by the reaction of the previous prepared compounds with thionyl chloride. The freshly prepared intermediate compounds were reacted with the proper sulfonamides to give (8a-h,10 a-h, 12a-h, 14a-h, 16a-h, 18a-h and 20a-h) respectively.
Keywords: Acridone carboxylic acid, N-substituted acridone, potassium acridone, chloro –acridone.
INTRODUCTION Considerable interest, particularly from biological and pharmacological view point is devoted to the chemistry of acridone derivatives .The acridone alkaloid acronycin(I) first isolated from Acronychia baueri (Rutaceae) was found to be active against Solid tumors. Structure-activity relationship in acronycin series clearly indicated that 1,2-double bond on the pyran ring was an essential structural requirement to observe cytotoxic activitiy (Elmori et al. 1996), it was also found that a secondary amine,hydroxyl group at C-1,C-5 and phenyl group at C-2 played an important role for antiproliferative activities of the tetracyclic acridone (Kawaii et al. 1999) .N-acridone acetic acid (cycloferon) (II), was reported to be a potent antiviral agent and interferon inducer. (Storch et al. 1986, Roemer et al. 1986, Kovalenko etal. 2000). The lithum salt of acridone acetic acid was prepared and found to be useful as immunomodulating antiviral agents; it was effective against both DNA and RNA viruses, and having a large range of pharmacological activities (anti-tumor, antiviral, antibacterial, anti-
Vol. 12, 2012 JBR ORIGINAL ARTICLE
Synthesis Of Some New Substituted Acridones With Expected Biological Activities
inflammatory, and antimalarial). (Wang et al. 2007, Noskov et al. 2004, Brana et al. 2002, Sondhi et al. 2004, Anderson et al. 2006) It has been reported that acridone ring system might constitute either part of chromophore or the whole chromophore. To confer antitumor activity, generally the chromophore should carry at least one basic side-chain. However, the addition of a second side chain was also important for biological activity, hence a series of DNA- binding potential antitumor agents (Antonini et al. 2000) e.g. comp (III). Therefore a series of acridone substituted compounds linked by a side-chain was prepared to increase cancer cell cytotoxicity .(Ramesh Kumar and Meena Kumari 2011). Accordingly, the aim of the present work is to synthesize a series of acridone derivatives with a variety of substituted functional groups with the hope of providing clinically useful drugs.
MATERIAL AND METHODS Chemistry: Experimental: All melting points were uncorrected. Elemental microanalysis was carried out at the microanalytical centre, Faculty of Science, Cairo University. IR spectra recorded on pye uricam sp-1100 spectrophotometer using KBr discs. The 1HNMR spectra were recorded on a vaian EM-390-90 MHz spectrometer using DMSO-d6 as a solvent and TMS as internal standard. Chemical shifts expressed as 6 ppm units. Mass spectra were performed on Schimadzu GCMS-QP1000 EX mass spectrometer, and Fenning an MAT, SSQ 7000 GS/ Ms at 70 ev. N-(2-Carboxyphenyl)-anthranilic acid (1):
A mixture of 27.4 g (0.2 mol) anthranilic acid, 31.3 g (0.2 mol) 2-chlorobenzoic acid, 30 g anhydrous K2CO3 and 0.1 g CuO was refluxed in 150 ml dry DMF for 1.5 hr. the reaction mixture was then cooled, diluted with water and acidified with dil. HCl to give 50.6 gm (96%) m.p 295o crystallized from ethanol and filter.
2-Chlorobenzoic acid Anthranilic acid
+COOH
Cl
COOH
NH2Cu/DMF
K2CO3
N-(2-Carboxyphenyl)-anthranilic acid
(1)
N
COOHH
COOH
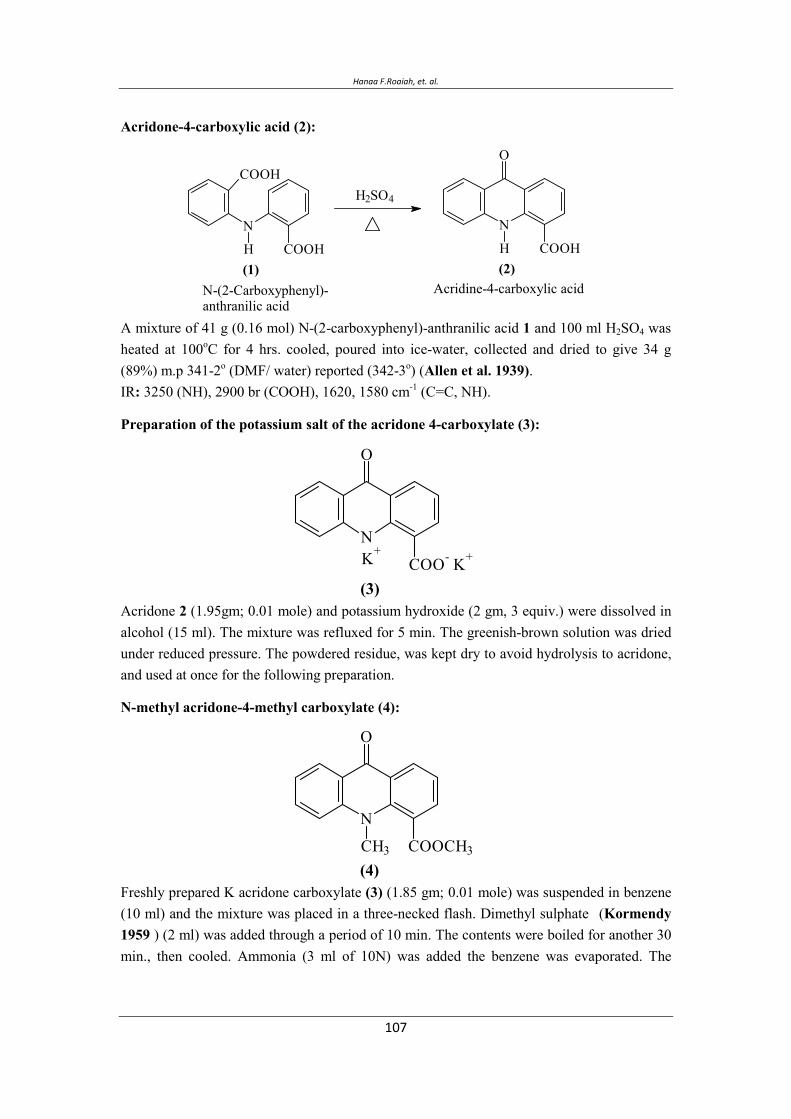
Hanaa F.Roaiah, et. al.
Acridone-4-carboxylic acid (2):
A mixture of 41 g (0.16 mol) N-(2-carboxyphenyl)-anthranilic acid 1 and 100 ml H2SO4 was heated at 100oC for 4 hrs. cooled, poured into ice-water, collected and dried to give 34 g (89%) m.p 341-2o (DMF/ water) reported (342-3o) (Allen et al. 1939).IR: 3250 (NH), 2900 br (COOH), 1620, 1580 cm-1 (C=C, NH).
Preparation of the potassium salt of the acridone 4-carboxylate (3):
Acridone 2 (1.95gm; 0.01 mole) and potassium hydroxide (2 gm, 3 equiv.) were dissolved in alcohol (15 ml). The mixture was refluxed for 5 min. The greenish-brown solution was dried under reduced pressure. The powdered residue, was kept dry to avoid hydrolysis to acridone, and used at once for the following preparation.
N-methyl acridone-4-methyl carboxylate (4):
Freshly prepared K acridone carboxylate (3) (1.85 gm; 0.01 mole) was suspended in benzene (10 ml) and the mixture was placed in a three-necked flash. Dimethyl sulphate
(Kormendy
1959 ) (2 ml) was added through a period of 10 min. The contents were boiled for another 30 min., then cooled. Ammonia (3 ml of 10N) was added the benzene was evaporated. The
Acridine-4-carboxylic acid (2)
N
COOHH
O
H2SO4
N-(2-Carboxyphenyl)-anthranilic acid
(1)
N
COOHH
COOH
N
COO- K+
O
(3)
K+
N
COOCH3CH3
O
(4)
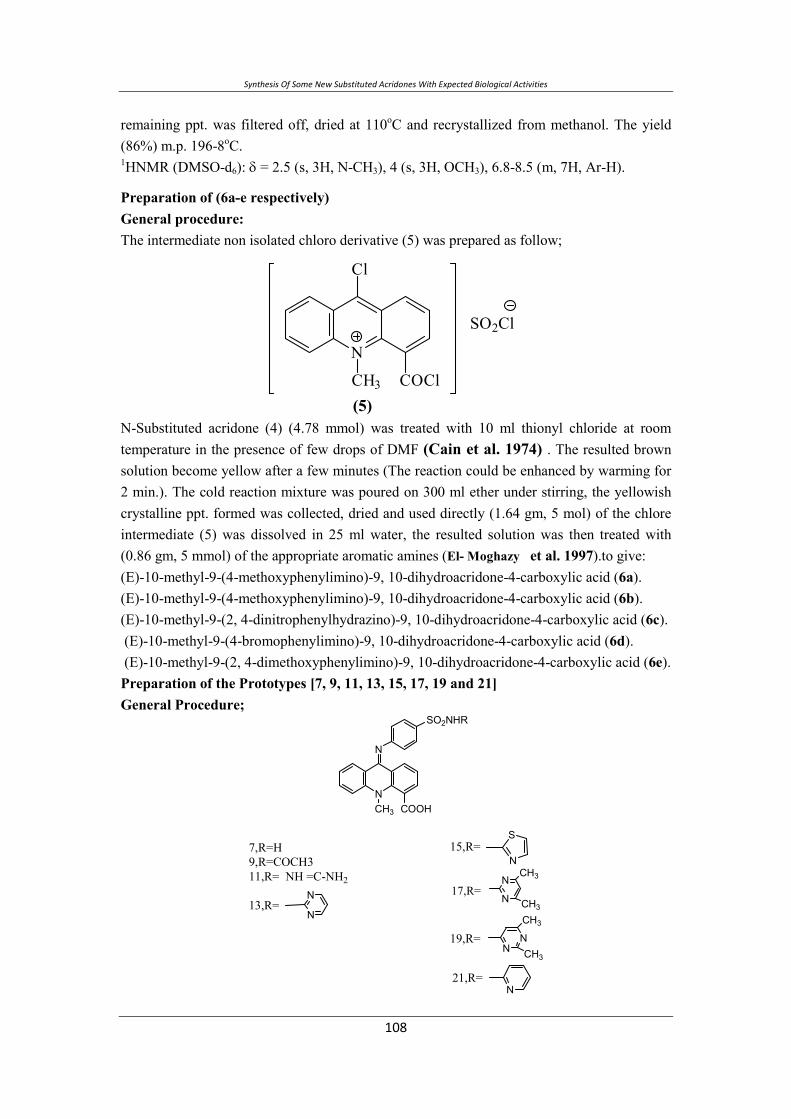
Synthesis Of Some New Substituted Acridones With Expected Biological Activities
remaining ppt. was filtered off, dried at 110oC and recrystallized from methanol. The yield (86%) m.p. 196-8oC. 1HNMR (DMSO-d6): δ = 2.5 (s, 3H, N-CH3), 4 (s, 3H, OCH3), 6.8-8.5 (m, 7H, Ar-H).
Preparation of (6a-e respectively) General procedure: The intermediate non isolated chloro derivative (5) was prepared as follow;
N-Substituted acridone (4) (4.78 mmol) was treated with 10 ml thionyl chloride at room temperature in the presence of few drops of DMF (Cain et al. 1974) . The resulted brown solution become yellow after a few minutes (The reaction could be enhanced by warming for 2 min.). The cold reaction mixture was poured on 300 ml ether under stirring, the yellowish crystalline ppt. formed was collected, dried and used directly (1.64 gm, 5 mol) of the chlore intermediate (5) was dissolved in 25 ml water, the resulted solution was then treated with (0.86 gm, 5 mmol) of the appropriate aromatic amines (El- Moghazy et al. 1997).to give: (E)-10-methyl-9-(4-methoxyphenylimino)-9, 10-dihydroacridone-4-carboxylic acid (6a). (E)-10-methyl-9-(4-methoxyphenylimino)-9, 10-dihydroacridone-4-carboxylic acid (6b). (E)-10-methyl-9-(2, 4-dinitrophenylhydrazino)-9, 10-dihydroacridone-4-carboxylic acid (6c). (E)-10-methyl-9-(4-bromophenylimino)-9, 10-dihydroacridone-4-carboxylic acid (6d). (E)-10-methyl-9-(2, 4-dimethoxyphenylimino)-9, 10-dihydroacridone-4-carboxylic acid (6e). Preparation of the Prototypes [7, 9, 11, 13, 15, 17, 19 and 21] General Procedure;
N
N
CH3
SO2NHR
COOH
7,R=H9,R=COCH311,R= NH =C-NH2
13,R=N
N
15,R=S
N
17,R=N
NCH3
CH3
NN
CH3
CH3
N
19,R=
21,R=
N
COClCH3
Cl
SO2Cl
(5)
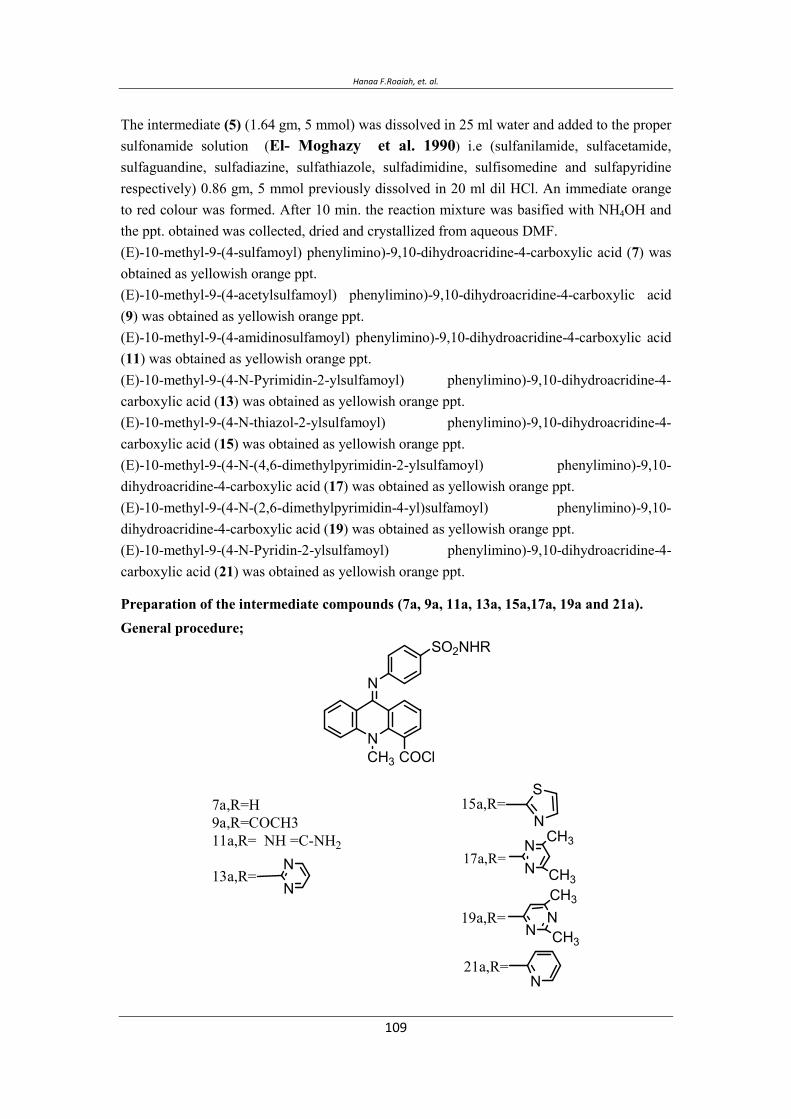
Hanaa F.Roaiah, et. al.
The intermediate (5) (1.64 gm, 5 mmol) was dissolved in 25 ml water and added to the proper sulfonamide solution (El- Moghazy et al. 1990) i.e (sulfanilamide, sulfacetamide, sulfaguandine, sulfadiazine, sulfathiazole, sulfadimidine, sulfisomedine and sulfapyridine respectively) 0.86 gm, 5 mmol previously dissolved in 20 ml dil HCl. An immediate orange to red colour was formed. After 10 min. the reaction mixture was basified with NH4OH and the ppt. obtained was collected, dried and crystallized from aqueous DMF. (E)-10-methyl-9-(4-sulfamoyl) phenylimino)-9,10-dihydroacridine-4-carboxylic acid (7) was obtained as yellowish orange ppt. (E)-10-methyl-9-(4-acetylsulfamoyl) phenylimino)-9,10-dihydroacridine-4-carboxylic acid (9) was obtained as yellowish orange ppt. (E)-10-methyl-9-(4-amidinosulfamoyl) phenylimino)-9,10-dihydroacridine-4-carboxylic acid (11) was obtained as yellowish orange ppt. (E)-10-methyl-9-(4-N-Pyrimidin-2-ylsulfamoyl) phenylimino)-9,10-dihydroacridine-4-carboxylic acid (13) was obtained as yellowish orange ppt. (E)-10-methyl-9-(4-N-thiazol-2-ylsulfamoyl) phenylimino)-9,10-dihydroacridine-4-carboxylic acid (15) was obtained as yellowish orange ppt. (E)-10-methyl-9-(4-N-(4,6-dimethylpyrimidin-2-ylsulfamoyl) phenylimino)-9,10-dihydroacridine-4-carboxylic acid (17) was obtained as yellowish orange ppt. (E)-10-methyl-9-(4-N-(2,6-dimethylpyrimidin-4-yl)sulfamoyl) phenylimino)-9,10-dihydroacridine-4-carboxylic acid (19) was obtained as yellowish orange ppt. (E)-10-methyl-9-(4-N-Pyridin-2-ylsulfamoyl) phenylimino)-9,10-dihydroacridine-4-carboxylic acid (21) was obtained as yellowish orange ppt.
Preparation of the intermediate compounds (7a, 9a, 11a, 13a, 15a,17a, 19a and 21a). General procedure;
N
N
CH3
SO2NHR
COCl
7a,R=H9a,R=COCH311a,R= NH =C-NH2
13a,R=NN
15a,R=S
N
17a,R=NN CH3
CH3
NNCH3
CH3
N
19a,R=
21a,R=

Synthesis Of Some New Substituted Acridones With Expected Biological Activities
(1.5 gm, 5 mol) of the prototype (7, 9, 11, 13, 15, 17, 19 and 21) in dry benzene was added to
10 ml of SOCl2 at room temperature. The reaction mixture was heated gently for 1 hr. till a
homogenous solution was obtained, excess SOCl2 was removed under vacuum. The yellow
residues were azeotroped with dry benzene to remove the last traces of SOCl2 and used
directly for the following step.
Preparation of compounds [(8a-h), (10a-h), (12a-h), (14a-h), (16a-h), (18a-h) and (20a-
h)].
N
N
CH3
SO2NHR
C
R=HR=COCH3R= NH =C-NH2
R=NN
R=S
N
R=NN CH3
CH3
NNCH3
CH3
N
R=
R=
ONH
SO2NHR
General procedure;
A solution of freshly prepared intermediates (7a, 9a, 11a, 13a, 15a, 17a, 19a or 21a) in dry
acetone 30 ml were added to a stirred solution of the appropriate sulfonamide i.e.
(sulfonamide, sulfacetamide, sulfaguandine, sulfadiazine, sulfathiazole, sulfadimidine,
sulfisomedine and sulfapyridine) respectively (0.7 gm, 4.2 mol) in dry acetone (10 ml) in dry
acetone (10 ml) and triethylamine (few drops). The immediately resulting orange-red solution
was stirred for 30 min., where an orange ppt. was formed. The suspension was diluted with
iced water and neutralized with dilute ammonium hydroxide for complete ppt., the products
were filtered, washed with water and dried. All the products were crystallized from
DMF/ H2O.
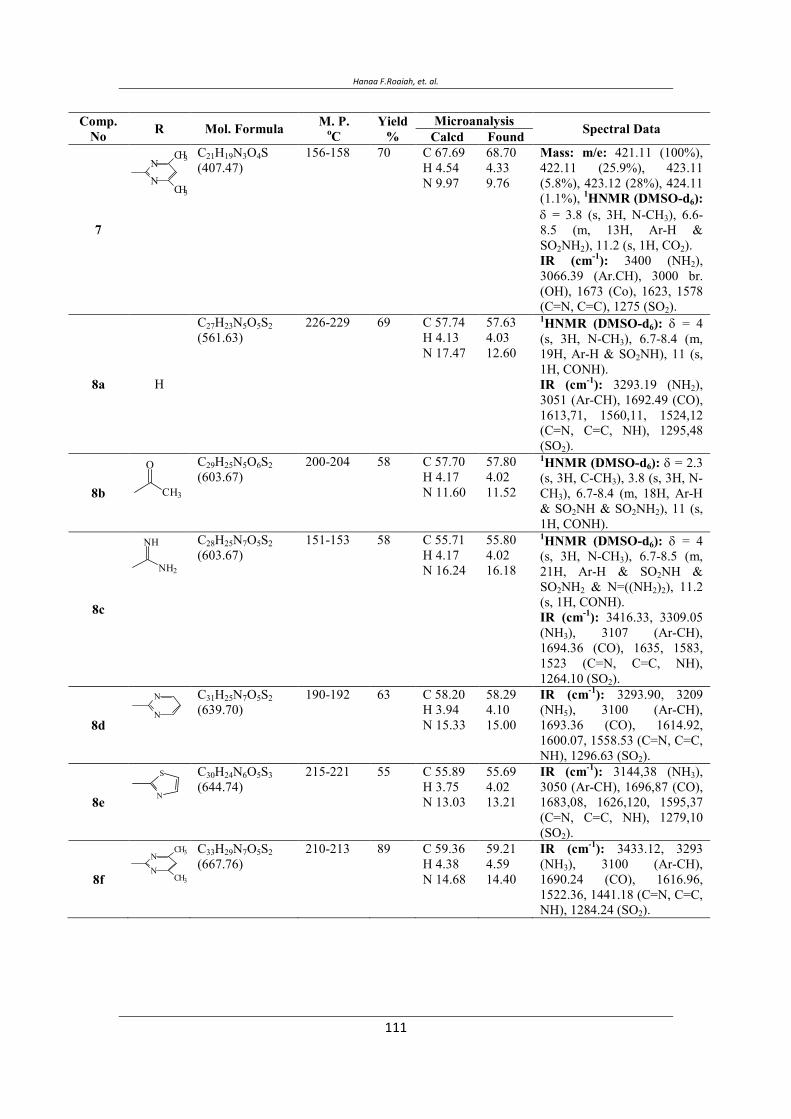
Hanaa F.Roaiah, et. al.
N
NCH3
CH3
O
CH3
NH
NH2
N
N
N
S
N
NCH3
CH3
Comp. No R Mol. Formula M. P.
oCYield
%Microanalysis Spectral Data Calcd Found
7
C21H19N3O4S(407.47)
156-158 70 C 67.69 H 4.54 N 9.97
68.70 4.33 9.76
Mass: m/e: 421.11 (100%), 422.11 (25.9%), 423.11 (5.8%), 423.12 (28%), 424.11 (1.1%), 1HNMR (DMSO-d6): δ = 3.8 (s, 3H, N-CH3), 6.6-8.5 (m, 13H, Ar-H & SO2NH2), 11.2 (s, 1H, CO2). IR (cm-1): 3400 (NH2), 3066.39 (Ar.CH), 3000 br. (OH), 1673 (Co), 1623, 1578 (C=N, C=C), 1275 (SO2).
8a H
C27H23N5O5S2(561.63)
226-229 69 C 57.74 H 4.13 N 17.47
57.63 4.03 12.60
1HNMR (DMSO-d6): δ = 4(s, 3H, N-CH3), 6.7-8.4 (m, 19H, Ar-H & SO2NH), 11 (s, 1H, CONH). IR (cm-1): 3293.19 (NH2), 3051 (Ar-CH), 1692.49 (CO), 1613,71, 1560,11, 1524,12 (C=N, C=C, NH), 1295,48 (SO2).
8b
C29H25N5O6S2(603.67)
200-204 58 C 57.70 H 4.17 N 11.60
57.80 4.02 11.52
1HNMR (DMSO-d6): δ = 2.3 (s, 3H, C-CH3), 3.8 (s, 3H, N-CH3), 6.7-8.4 (m, 18H, Ar-H & SO2NH & SO2NH2), 11 (s, 1H, CONH).
8c
C28H25N7O5S2(603.67)
151-153 58 C 55.71 H 4.17 N 16.24
55.80 4.02 16.18
1HNMR (DMSO-d6): δ = 4(s, 3H, N-CH3), 6.7-8.5 (m, 21H, Ar-H & SO2NH & SO2NH2 & N=((NH2)2), 11.2 (s, 1H, CONH). IR (cm-1): 3416.33, 3309.05 (NH3), 3107 (Ar-CH), 1694.36 (CO), 1635, 1583, 1523 (C=N, C=C, NH), 1264.10 (SO2).
8d
C31H25N7O5S2(639.70)
190-192 63 C 58.20 H 3.94 N 15.33
58.29 4.10 15.00
IR (cm-1): 3293.90, 3209 (NH5), 3100 (Ar-CH), 1693.36 (CO), 1614.92, 1600.07, 1558.53 (C=N, C=C, NH), 1296.63 (SO2).
8e
C30H24N6O5S3(644.74)
215-221 55 C 55.89 H 3.75 N 13.03
55.69 4.02 13.21
IR (cm-1): 3144,38 (NH3), 3050 (Ar-CH), 1696,87 (CO), 1683,08, 1626,120, 1595,37 (C=N, C=C, NH), 1279,10 (SO2).
8f
C33H29N7O5S2(667.76)
210-213 89 C 59.36 H 4.38 N 14.68
59.21 4.59 14.40
IR (cm-1): 3433.12, 3293 (NH3), 3100 (Ar-CH), 1690.24 (CO), 1616.96, 1522.36, 1441.18 (C=N, C=C, NH), 1284.24 (SO2).
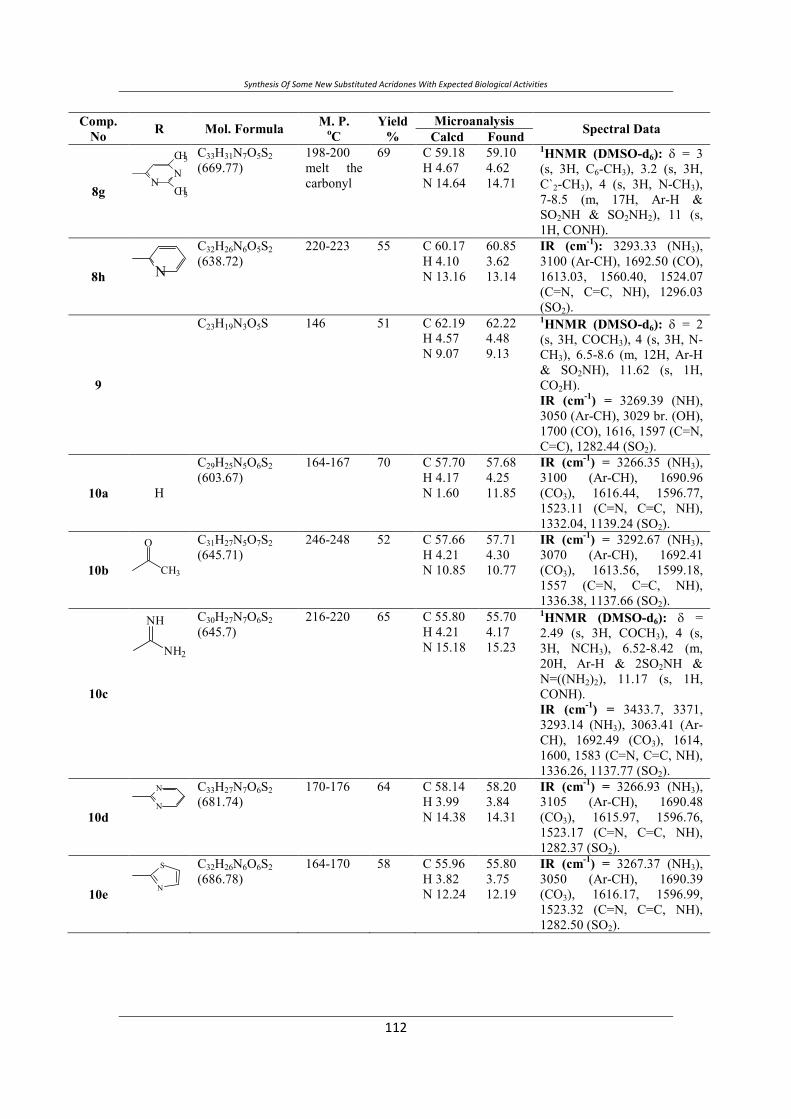
Synthesis Of Some New Substituted Acridones With Expected Biological Activities
NN
CH3
CH3
N
O
CH3
NH
NH2
N
N
N
S
Comp. No R Mol. Formula M. P.
oCYield
%Microanalysis Spectral Data Calcd Found
8g
C33H31N7O5S2(669.77)
198-200 melt the carbonyl
69 C 59.18 H 4.67 N 14.64
59.10 4.62 14.71
1HNMR (DMSO-d6): δ = 3(s, 3H, C6-CH3), 3.2 (s, 3H, C`2-CH3), 4 (s, 3H, N-CH3), 7-8.5 (m, 17H, Ar-H & SO2NH & SO2NH2), 11 (s, 1H, CONH).
8h
C32H26N6O5S2(638.72)
220-223 55 C 60.17 H 4.10 N 13.16
60.85 3.62 13.14
IR (cm-1): 3293.33 (NH3), 3100 (Ar-CH), 1692.50 (CO), 1613.03, 1560.40, 1524.07 (C=N, C=C, NH), 1296.03 (SO2).
9
C23H19N3O5S 146 51 C 62.19 H 4.57 N 9.07
62.22 4.48 9.13
1HNMR (DMSO-d6): δ = 2(s, 3H, COCH3), 4 (s, 3H, N-CH3), 6.5-8.6 (m, 12H, Ar-H & SO2NH), 11.62 (s, 1H, CO2H). IR (cm-1) = 3269.39 (NH), 3050 (Ar-CH), 3029 br. (OH), 1700 (CO), 1616, 1597 (C=N, C=C), 1282.44 (SO2).
10a H
C29H25N5O6S2(603.67)
164-167 70 C 57.70 H 4.17 N 1.60
57.68 4.25 11.85
IR (cm-1) = 3266.35 (NH3), 3100 (Ar-CH), 1690.96 (CO3), 1616.44, 1596.77, 1523.11 (C=N, C=C, NH), 1332.04, 1139.24 (SO2).
10b
C31H27N5O7S2(645.71)
246-248 52 C 57.66 H 4.21 N 10.85
57.71 4.30 10.77
IR (cm-1) = 3292.67 (NH3), 3070 (Ar-CH), 1692.41 (CO3), 1613.56, 1599.18, 1557 (C=N, C=C, NH), 1336.38, 1137.66 (SO2).
10c
C30H27N7O6S2(645.7)
216-220 65 C 55.80 H 4.21 N 15.18
55.70 4.17 15.23
1HNMR (DMSO-d6): δ =2.49 (s, 3H, COCH3), 4 (s, 3H, NCH3), 6.52-8.42 (m, 20H, Ar-H & 2SO2NH & N=((NH2)2), 11.17 (s, 1H, CONH). IR (cm-1) = 3433.7, 3371, 3293.14 (NH3), 3063.41 (Ar-CH), 1692.49 (CO3), 1614, 1600, 1583 (C=N, C=C, NH), 1336.26, 1137.77 (SO2).
10d
C33H27N7O6S2(681.74)
170-176 64 C 58.14 H 3.99 N 14.38
58.20 3.84 14.31
IR (cm-1) = 3266.93 (NH3), 3105 (Ar-CH), 1690.48 (CO3), 1615.97, 1596.76, 1523.17 (C=N, C=C, NH), 1282.37 (SO2).
10e
C32H26N6O6S2(686.78)
164-170 58 C 55.96 H 3.82 N 12.24
55.80 3.75 12.19
IR (cm-1) = 3267.37 (NH3), 3050 (Ar-CH), 1690.39 (CO3), 1616.17, 1596.99, 1523.32 (C=N, C=C, NH), 1282.50 (SO2).

Hanaa F.Roaiah, et. al.
N
NCH3
CH3
NN
CH3
CH3
Comp. No R Mol. Formula M. P.
oCYield
%Microanalysis Spectral Data Calcd Found
10f
C35H31N7O6S2(709.79)
130-134 62 C 59.22 H 4.40 N 13.81
59.18 4.32 13.75
1HNMR (DMSO-d6): δ =2.25 (s, 6H, C`4-CH3 & C6-CH3), 2.49 (s, 3H, COCH3), 4 (s, 3H, N-CH3), 6.5-8.54 (m, 18H, Ar-H & 2SO2NH), 11.58 (s, 1H, CONH). IR (cm-1) = 3267.32 (NH3), 3088 (Ar-CH), 1690.93 (CO3), 1617.16, 1593.87, 1523.50 (C=N, C=C, NH), 1282.65 (SO2).
10g
C35H31N7O6S2(709.79)
238-241 66 C 59.22 H 4.40 N 13.81
59.25 4.43 13.75
IR (cm-1) = 3292.03 (NH3), 3100 (Ar-CH), 1691.97 (CO3), 1613.68, 1558.42, 1523.73 (C=N, C=C, NH), 1336.09, 1137 (SO2).
10h N
C34H28N6O6S2(680.75)
190-194 71 C 59.99 H 4.15 N 12.35
59.83 4.09 12.45
IR (cm-1) = 3269.28 (NH3), 3051.83 (Ar-CH), 1692.38 (CO3), 1613.84, 1598.6, 1583.22 (C=N, C=C, NH), 1335.57, 1137.82 (SO2).
11
C22H19N5O4S(449.51)
177 58 C 59.60 H 4.57 N 15.11
59.52 4.60 15.04
Mass m/e: 463.13 (100%), 463.13 (27.5%) 1HNMR (DMSO-d6): δ = 3.8 (s, 3H, N-CH3), 6.5-8.4 (m, 15H, Ar-H & SO2NH & N=C (NH2)2), 11.7 (s, 1H, CO2H). IR (cm)-1 = 3433, 3370 (NH3), 3100 (Ar-CH), 3075 br. (OH), 1690 (CO), 1633, 1575, 1502 (C=N, C=C, NH), 1245 (SO2).
12a H
C28H25N7O5S2(603.67)
148 cherrg 54 C 55.71 H 4.17 N 16.24
55.66 4.03 16.12
IR (cm)-1 = 3451.87, 3369.13 (NH3), 3103.43 (Ar-CH), 1692.05 (CO), 1618.02, 1596.90, 1526.65 (C=N, C=C, NH), 1292.51 (SO2).
12b O
CH3
C30H27N7O6S2(645.15)
155-157 cherrg
75 C 55.80 H 4.4 N 15.18
55.61 4.02 15.00
IR (cm)-1 = 3424.55, 3300 (NH3), 3070 (Ar-CH), 1641.43 (CO), 1615.63, 1595.39, 1524.07 (C=N, C=C, NH), 1280.44 (SO2).
12c NH
NH2
C29H27N9O5S2(645.71)
180-184 cherrg
80 C 53.94 H 4.21 N 19.52
53.64 4.05 169.12
IR (cm)-1 = 3432.55, 3371 (NH3), 3105 (Ar-CH), 1670.62 (CO), 1575.18, 1501.53, 1436.80 (C=N, C=C, NH), 1243.20 (SO2).
12d N
N
C32H27N9O5S2(681.74)
185-188 cherrg
87 C 56.38 H 3.99 N 18.49
56.55 4.04 18.62
IR (cm)-1 = 3424.75, 3300 (NH3), 3100 (Ar-CH), 1690.90 (CO), 1545.25, 1526.14, 1440.91 (C=N, C=C, NH), 1259.43 (SO2).
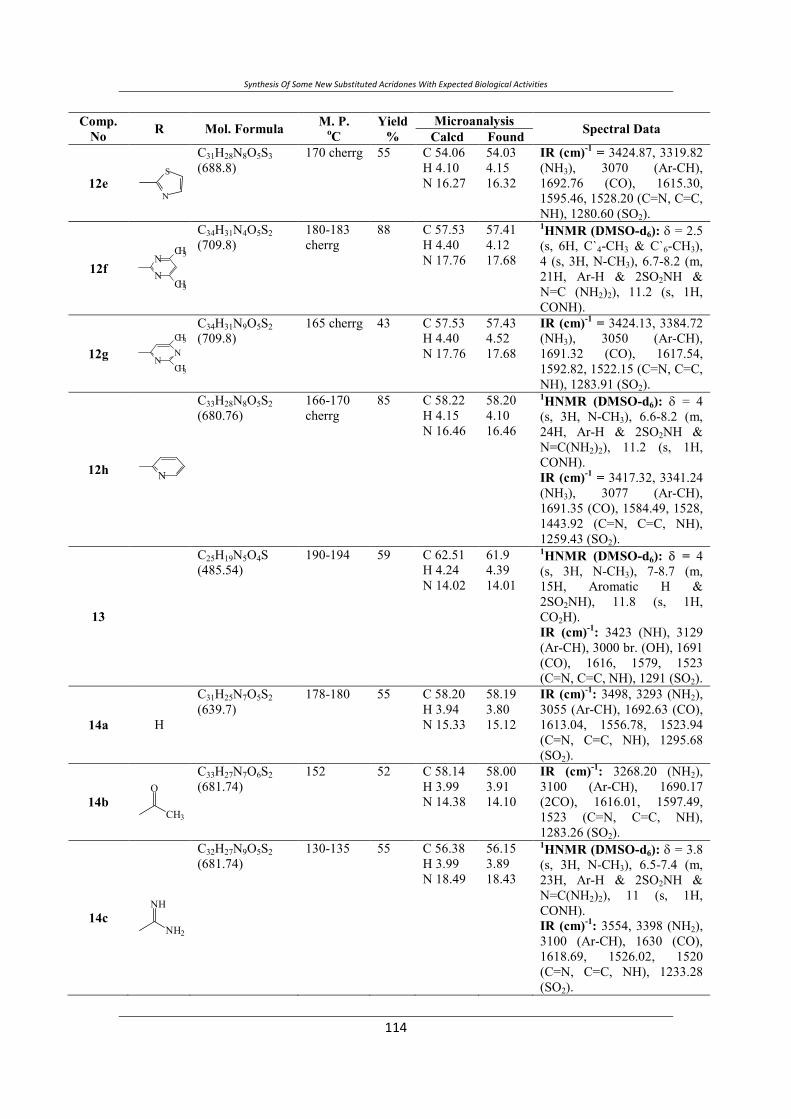
Synthesis Of Some New Substituted Acridones With Expected Biological Activities
Comp. No R Mol. Formula M. P.
oCYield
%Microanalysis Spectral Data Calcd Found
12e N
S
C31H28N8O5S3(688.8)
170 cherrg 55 C 54.06 H 4.10 N 16.27
54.03 4.15 16.32
IR (cm)-1 = 3424.87, 3319.82 (NH3), 3070 (Ar-CH), 1692.76 (CO), 1615.30, 1595.46, 1528.20 (C=N, C=C, NH), 1280.60 (SO2).
12f N
NCH3
CH3
C34H31N4O5S2(709.8)
180-183 cherrg
88 C 57.53 H 4.40 N 17.76
57.41 4.12 17.68
1HNMR (DMSO-d6): δ = 2.5 (s, 6H, C`4-CH3 & C`6-CH3), 4 (s, 3H, N-CH3), 6.7-8.2 (m, 21H, Ar-H & 2SO2NH & N=C (NH2)2), 11.2 (s, 1H, CONH).
12g NNCH3
CH3
C34H31N9O5S2(709.8)
165 cherrg 43 C 57.53 H 4.40 N 17.76
57.43 4.52 17.68
IR (cm)-1 = 3424.13, 3384.72 (NH3), 3050 (Ar-CH), 1691.32 (CO), 1617.54, 1592.82, 1522.15 (C=N, C=C, NH), 1283.91 (SO2).
12h N
C33H28N8O5S2(680.76)
166-170 cherrg
85 C 58.22 H 4.15 N 16.46
58.20 4.10 16.46
1HNMR (DMSO-d6): δ = 4(s, 3H, N-CH3), 6.6-8.2 (m, 24H, Ar-H & 2SO2NH & N=C(NH2)2), 11.2 (s, 1H, CONH). IR (cm)-1 = 3417.32, 3341.24 (NH3), 3077 (Ar-CH), 1691.35 (CO), 1584.49, 1528, 1443.92 (C=N, C=C, NH), 1259.43 (SO2).
13
C25H19N5O4S(485.54)
190-194 59 C 62.51 H 4.24 N 14.02
61.9 4.39 14.01
1HNMR (DMSO-d6): δ = 4(s, 3H, N-CH3), 7-8.7 (m, 15H, Aromatic H & 2SO2NH), 11.8 (s, 1H, CO2H). IR (cm)-1: 3423 (NH), 3129 (Ar-CH), 3000 br. (OH), 1691 (CO), 1616, 1579, 1523 (C=N, C=C, NH), 1291 (SO2).
14a H
C31H25N7O5S2(639.7)
178-180 55 C 58.20 H 3.94 N 15.33
58.19 3.80 15.12
IR (cm)-1: 3498, 3293 (NH2), 3055 (Ar-CH), 1692.63 (CO), 1613.04, 1556.78, 1523.94 (C=N, C=C, NH), 1295.68 (SO2).
14b O
CH3
C33H27N7O6S2(681.74)
152 52 C 58.14 H 3.99 N 14.38
58.00 3.91 14.10
IR (cm)-1: 3268.20 (NH2), 3100 (Ar-CH), 1690.17 (2CO), 1616.01, 1597.49, 1523 (C=N, C=C, NH), 1283.26 (SO2).
14c NH
NH2
C32H27N9O5S2(681.74)
130-135 55 C 56.38 H 3.99 N 18.49
56.15 3.89 18.43
1HNMR (DMSO-d6): δ = 3.8 (s, 3H, N-CH3), 6.5-7.4 (m, 23H, Ar-H & 2SO2NH & N=C(NH2)2), 11 (s, 1H, CONH). IR (cm)-1: 3554, 3398 (NH2), 3100 (Ar-CH), 1630 (CO), 1618.69, 1526.02, 1520 (C=N, C=C, NH), 1233.28 (SO2).
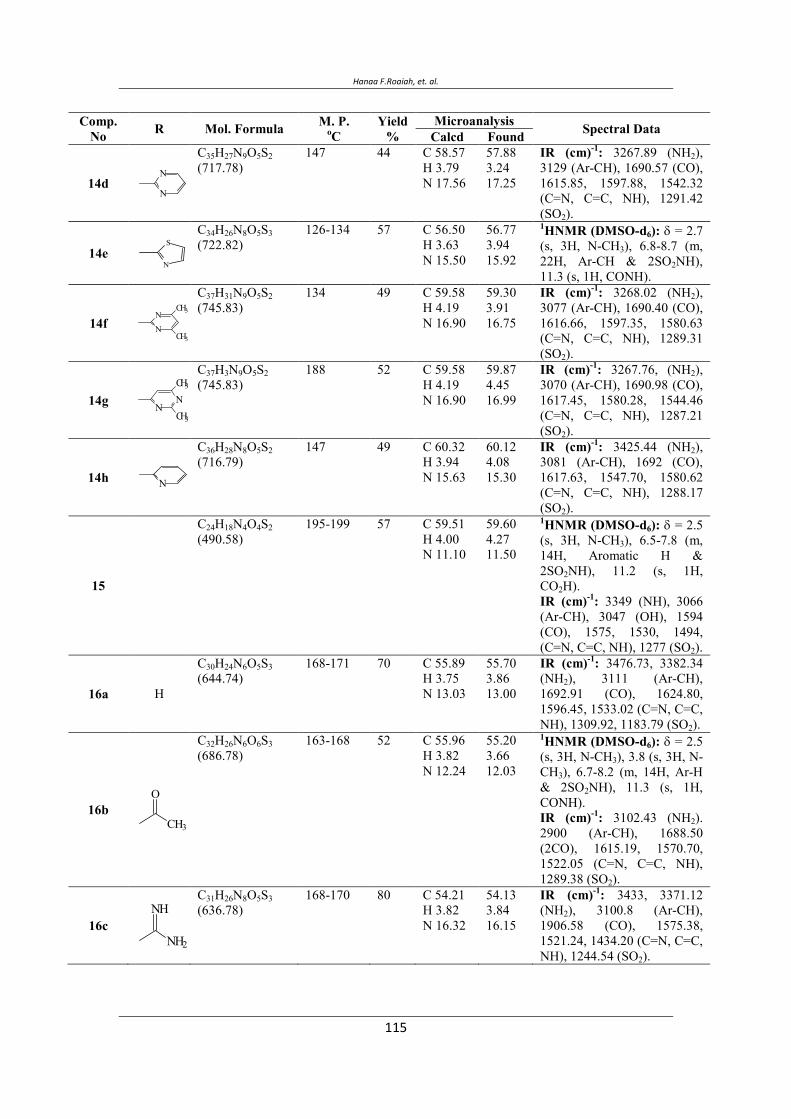
Hanaa F.Roaiah, et. al.
Comp. No R Mol. Formula M. P.
oCYield
%Microanalysis Spectral Data Calcd Found
14d N
N
C35H27N9O5S2(717.78)
147 44 C 58.57 H 3.79 N 17.56
57.88 3.24 17.25
IR (cm)-1: 3267.89 (NH2),3129 (Ar-CH), 1690.57 (CO), 1615.85, 1597.88, 1542.32 (C=N, C=C, NH), 1291.42 (SO2).
14e N
SC34H26N8O5S3(722.82)
126-134 57 C 56.50 H 3.63 N 15.50
56.77 3.94 15.92
1HNMR (DMSO-d6): δ = 2.7 (s, 3H, N-CH3), 6.8-8.7 (m, 22H, Ar-CH & 2SO2NH), 11.3 (s, 1H, CONH).
14f N
NCH3
CH3
C37H31N9O5S2(745.83)
134 49 C 59.58 H 4.19 N 16.90
59.30 3.91 16.75
IR (cm)-1: 3268.02 (NH2), 3077 (Ar-CH), 1690.40 (CO), 1616.66, 1597.35, 1580.63 (C=N, C=C, NH), 1289.31 (SO2).
14g NN
CH3
CH3
C37H3N9O5S2(745.83)
188 52 C 59.58 H 4.19 N 16.90
59.87 4.45 16.99
IR (cm)-1: 3267.76, (NH2), 3070 (Ar-CH), 1690.98 (CO), 1617.45, 1580.28, 1544.46 (C=N, C=C, NH), 1287.21 (SO2).
14h N
C36H28N8O5S2(716.79)
147 49 C 60.32 H 3.94 N 15.63
60.12 4.08 15.30
IR (cm)-1: 3425.44 (NH2), 3081 (Ar-CH), 1692 (CO), 1617.63, 1547.70, 1580.62 (C=N, C=C, NH), 1288.17 (SO2).
15
C24H18N4O4S2(490.58)
195-199 57 C 59.51 H 4.00 N 11.10
59.60 4.27 11.50
1HNMR (DMSO-d6): δ = 2.5 (s, 3H, N-CH3), 6.5-7.8 (m, 14H, Aromatic H & 2SO2NH), 11.2 (s, 1H, CO2H). IR (cm)-1: 3349 (NH), 3066 (Ar-CH), 3047 (OH), 1594 (CO), 1575, 1530, 1494, (C=N, C=C, NH), 1277 (SO2).
16a H
C30H24N6O5S3(644.74)
168-171 70 C 55.89 H 3.75 N 13.03
55.70 3.86 13.00
IR (cm)-1: 3476.73, 3382.34 (NH2), 3111 (Ar-CH), 1692.91 (CO), 1624.80, 1596.45, 1533.02 (C=N, C=C, NH), 1309.92, 1183.79 (SO2).
16b O
CH3
C32H26N6O6S3(686.78)
163-168 52 C 55.96 H 3.82 N 12.24
55.20 3.66 12.03
1HNMR (DMSO-d6): δ = 2.5 (s, 3H, N-CH3), 3.8 (s, 3H, N-CH3), 6.7-8.2 (m, 14H, Ar-H & 2SO2NH), 11.3 (s, 1H, CONH). IR (cm)-1: 3102.43 (NH2). 2900 (Ar-CH), 1688.50 (2CO), 1615.19, 1570.70, 1522.05 (C=N, C=C, NH), 1289.38 (SO2).
16c NH
NH2
C31H26N8O5S3(636.78)
168-170 80 C 54.21 H 3.82 N 16.32
54.13 3.84 16.15
IR (cm)-1: 3433, 3371.12 (NH2), 3100.8 (Ar-CH), 1906.58 (CO), 1575.38, 1521.24, 1434.20 (C=N, C=C, NH), 1244.54 (SO2).

Synthesis Of Some New Substituted Acridones With Expected Biological Activities
Comp. No R Mol. Formula M. P.
oCYield
%Microanalysis Spectral Data Calcd Found
16d N
N
C34H26N8O5S3(722.82)
219-224 66 C 56.50 H 3.63 N 15.50
56.33 3.55 15.81
IR (cm)-1: 3300 (NH2),3103.02 (Ar-CH), 1688.28 (CO), 1577.54, 1521.94, 1521.94, 1443.68 (C=N, C=C, NH), 1287.74 (SO2).
16e N
SC33H25N7O5S4(727.86)
178-183 57 C 54.45 H 3.46 N 13.47
54.70 3.55 13.60
IR (cm)-1: 3465.63 (NH2), 3067.76 (Ar-CH), 1629.51 (CO), 1593.63, 1572.52, 1533.36 (C=N, C=C, NH), 1278.80 (SO2).
16f N
NCH3
CH3
C36H30N8O5S3(750.87)
188-190 90 C 57.58 H 4.03 N 14.92
57.30 3.88 14.74
IR (cm)-1: 3366.53 (NH2), 3129 (Ar-CH), 1693.19 (CO), 1629.19, 1598.94, 1571.81, (C=N, C=C, NH), 1277.62 (SO2).
16g N
NCH3
CH3
C36H30N8O5S3(750.87)
177-183 60 C 57.58 H 4.03 N 14.92
57.41 4.01 14.86
IR (cm)-1: 3200.08 (NH5), 2800 (Ar-CH), 1687.56 (CO), 1616.34, 1522.85, 1448.28, (C=N, C=C, NH), 1290.41 (SO2).
16h N
C35H27N7O5S3(721.83)
180-184 99 C 58.24 H 3.77 N 13.58
58.60 4.00 13.28
1HNMR (DMSO-d6): δ = 2.5 (s, 3H, N-CH3), 6.5-8 (m, 23H, Aromatic H & 2SO2NH), 11 (s, 1H, CONH).
17
C27H23N5O4S(513.59)
198 54 C 63.74 H 4.78 N 13.27
63.98 4.84 13.95
1HNMR (DMSO-d6): δ = 2.3 (s, 6H, C`4-CH3 & C`6-CH3), 4 (s, 3H, N-CH3), 6.5-7.9 (m, 13H, Ar-H & 2SO2NH), 11.3 (s, 1H, CO2H). IR (cm)-1: 3441 (NH), 3105 (Ar-CH), 3075 br. (OH), 1693 (CO), 1638, 1596, 1523, (C=N, C=C, NH), 1190 (SO2).
18a H
C33H29N7O5S2(667.76)
130-135 58 C 59.36 H 4.38 N 14.68
59.90 4.19 14.60
IR (cm)-1: 3476.27, 3382.09 (NH5), 3069 (Ar-CH), 1691.08 (CO), 1626.29, 1596.22, 1524.10, (C=N, C=C, NH), 1310.52, 1150.66 (SO2).
18b O
CH3
C35H31N7O6S2(709.79)
138-140 56 C 59.22 H 4.40 N 13.81
59.40 4.33 13.78
IR (cm)-1: 3265.12 (NH5), 3050 (Ar-CH), 1692.91 (2CO), 1596.59, 1523.06, 1440.38, (C=N, C=C, NH), 1282.60 (SO2).
18c NH
NH2
C34H31N9O5S2(709.8)
110-115 48 C 57.53 H 4.40 N 17.76
57.44 4.19 17.56
IR (cm)-1: 3433.10, 3371.49 (NH5), 3083.27 (Ar-CH), 1690 (CO), 1632.47, 1609, 1523, (C=N, C=C, NH), 1245.05 (SO2).
18d N
N
C37H31N9O5S2(745.83)
139-142 62 C 59.58 H 4.19 N 16.90
59.50 4.04 16.88
IR (cm)-1: 3400 (NH5), 3063 (Ar-CH), 1691.87 (CO), 1619.34, 1596.16, 1522.87, (C=N, C=C, NH), 1281.81 (SO2).
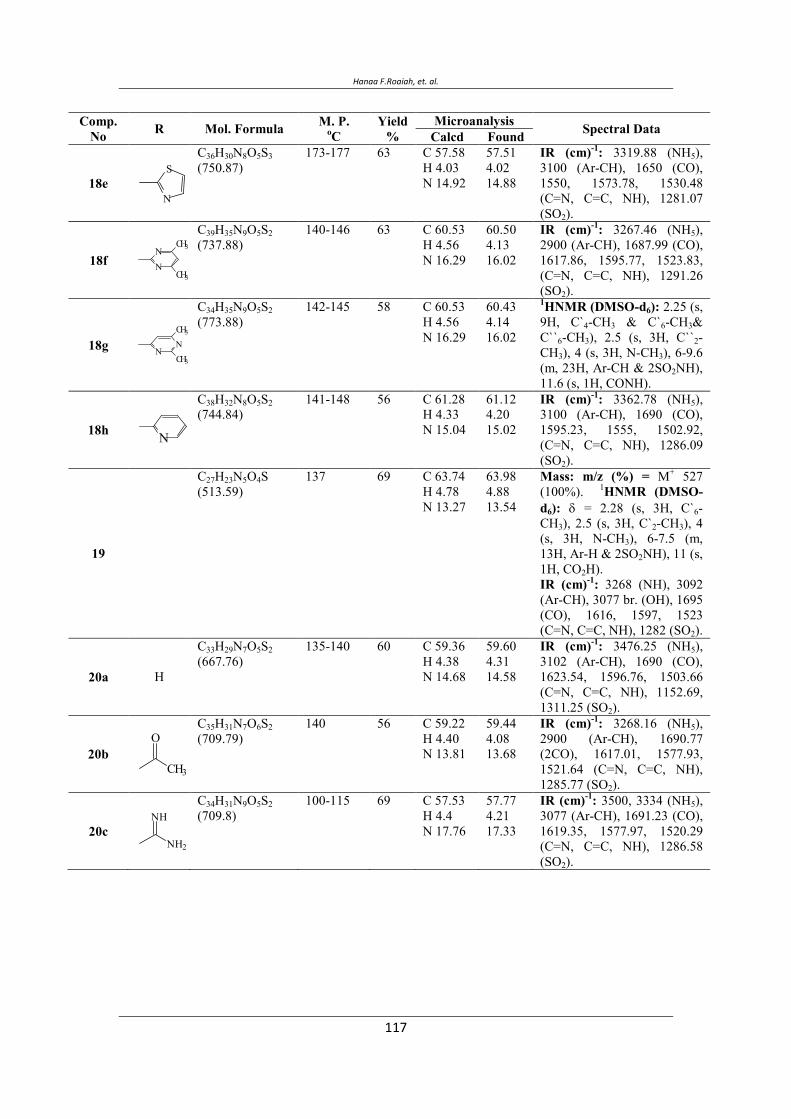
Hanaa F.Roaiah, et. al.
Comp. No R Mol. Formula M. P.
oCYield
%Microanalysis Spectral Data Calcd Found
18e N
SC36H30N8O5S3(750.87)
173-177 63 C 57.58 H 4.03 N 14.92
57.51 4.02 14.88
IR (cm)-1: 3319.88 (NH5),3100 (Ar-CH), 1650 (CO), 1550, 1573.78, 1530.48 (C=N, C=C, NH), 1281.07 (SO2).
18f NN
CH3
CH3
C39H35N9O5S2(737.88)
140-146 63 C 60.53 H 4.56 N 16.29
60.50 4.13 16.02
IR (cm)-1: 3267.46 (NH5), 2900 (Ar-CH), 1687.99 (CO), 1617.86, 1595.77, 1523.83, (C=N, C=C, NH), 1291.26 (SO2).
18g NN
CH3
CH3
C34H35N9O5S2(773.88)
142-145 58 C 60.53 H 4.56 N 16.29
60.43 4.14 16.02
1HNMR (DMSO-d6): 2.25 (s, 9H, C`4-CH3 & C`6-CH3&C``6-CH3), 2.5 (s, 3H, C``2-CH3), 4 (s, 3H, N-CH3), 6-9.6 (m, 23H, Ar-CH & 2SO2NH), 11.6 (s, 1H, CONH).
18h N
C38H32N8O5S2(744.84)
141-148 56 C 61.28 H 4.33 N 15.04
61.12 4.20 15.02
IR (cm)-1: 3362.78 (NH5), 3100 (Ar-CH), 1690 (CO), 1595.23, 1555, 1502.92, (C=N, C=C, NH), 1286.09 (SO2).
19
C27H23N5O4S(513.59)
137 69 C 63.74 H 4.78 N 13.27
63.98 4.88 13.54
Mass: m/z (%) = M+ 527 (100%). 1HNMR (DMSO-d6): δ = 2.28 (s, 3H, C`6-CH3), 2.5 (s, 3H, C`2-CH3), 4 (s, 3H, N-CH3), 6-7.5 (m, 13H, Ar-H & 2SO2NH), 11 (s, 1H, CO2H). IR (cm)-1: 3268 (NH), 3092 (Ar-CH), 3077 br. (OH), 1695 (CO), 1616, 1597, 1523 (C=N, C=C, NH), 1282 (SO2).
20a H
C33H29N7O5S2(667.76)
135-140 60 C 59.36 H 4.38 N 14.68
59.60 4.31 14.58
IR (cm)-1: 3476.25 (NH5), 3102 (Ar-CH), 1690 (CO), 1623.54, 1596.76, 1503.66 (C=N, C=C, NH), 1152.69, 1311.25 (SO2).
20b O
CH3
C35H31N7O6S2(709.79)
140 56 C 59.22 H 4.40 N 13.81
59.44 4.08 13.68
IR (cm)-1: 3268.16 (NH5), 2900 (Ar-CH), 1690.77 (2CO), 1617.01, 1577.93, 1521.64 (C=N, C=C, NH), 1285.77 (SO2).
20c NH
NH2
C34H31N9O5S2(709.8)
100-115 69 C 57.53 H 4.4 N 17.76
57.77 4.21 17.33
IR (cm)-1: 3500, 3334 (NH5), 3077 (Ar-CH), 1691.23 (CO), 1619.35, 1577.97, 1520.29 (C=N, C=C, NH), 1286.58 (SO2).
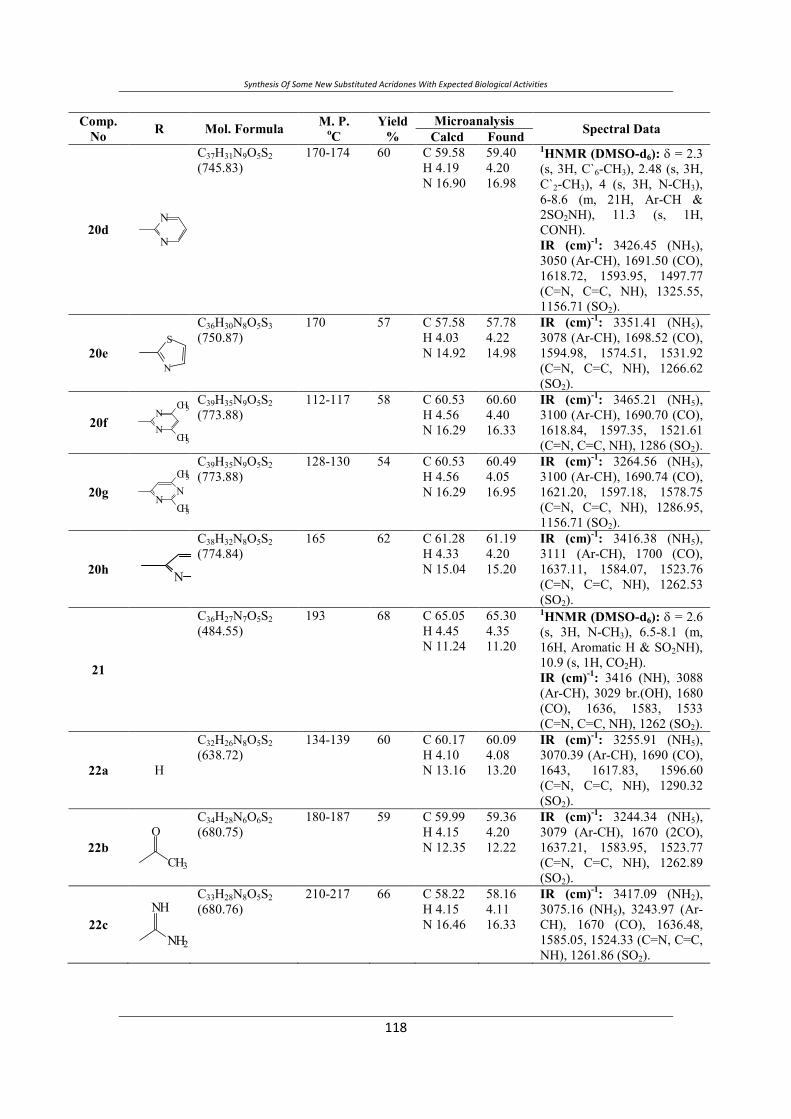
Synthesis Of Some New Substituted Acridones With Expected Biological Activities
Comp. No R Mol. Formula M. P.
oCYield
%Microanalysis Spectral Data Calcd Found
20d N
N
C37H31N9O5S2(745.83)
170-174 60 C 59.58 H 4.19 N 16.90
59.40 4.20 16.98
1HNMR (DMSO-d6): δ = 2.3 (s, 3H, C`6-CH3), 2.48 (s, 3H, C`2-CH3), 4 (s, 3H, N-CH3), 6-8.6 (m, 21H, Ar-CH & 2SO2NH), 11.3 (s, 1H, CONH). IR (cm)-1: 3426.45 (NH5), 3050 (Ar-CH), 1691.50 (CO), 1618.72, 1593.95, 1497.77 (C=N, C=C, NH), 1325.55, 1156.71 (SO2).
20e N
SC36H30N8O5S3(750.87)
170 57 C 57.58 H 4.03 N 14.92
57.78 4.22 14.98
IR (cm)-1: 3351.41 (NH5), 3078 (Ar-CH), 1698.52 (CO), 1594.98, 1574.51, 1531.92 (C=N, C=C, NH), 1266.62 (SO2).
20f NN
CH3
CH3
C39H35N9O5S2(773.88)
112-117 58 C 60.53 H 4.56 N 16.29
60.60 4.40 16.33
IR (cm)-1: 3465.21 (NH5), 3100 (Ar-CH), 1690.70 (CO), 1618.84, 1597.35, 1521.61 (C=N, C=C, NH), 1286 (SO2).
20g NNCH3
CH3
C39H35N9O5S2(773.88)
128-130 54 C 60.53 H 4.56 N 16.29
60.49 4.05 16.95
IR (cm)-1: 3264.56 (NH5), 3100 (Ar-CH), 1690.74 (CO), 1621.20, 1597.18, 1578.75 (C=N, C=C, NH), 1286.95, 1156.71 (SO2).
20h N
C38H32N8O5S2(774.84)
165 62 C 61.28 H 4.33 N 15.04
61.19 4.20 15.20
IR (cm)-1: 3416.38 (NH5), 3111 (Ar-CH), 1700 (CO), 1637.11, 1584.07, 1523.76 (C=N, C=C, NH), 1262.53 (SO2).
21
C36H27N7O5S2(484.55)
193 68 C 65.05 H 4.45 N 11.24
65.30 4.35 11.20
1HNMR (DMSO-d6): δ = 2.6 (s, 3H, N-CH3), 6.5-8.1 (m, 16H, Aromatic H & SO2NH), 10.9 (s, 1H, CO2H). IR (cm)-1: 3416 (NH), 3088 (Ar-CH), 3029 br.(OH), 1680 (CO), 1636, 1583, 1533 (C=N, C=C, NH), 1262 (SO2).
22a H
C32H26N8O5S2(638.72)
134-139 60 C 60.17 H 4.10 N 13.16
60.09 4.08 13.20
IR (cm)-1: 3255.91 (NH5), 3070.39 (Ar-CH), 1690 (CO), 1643, 1617.83, 1596.60 (C=N, C=C, NH), 1290.32 (SO2).
22b O
CH3
C34H28N6O6S2(680.75)
180-187 59 C 59.99 H 4.15 N 12.35
59.36 4.20 12.22
IR (cm)-1: 3244.34 (NH5), 3079 (Ar-CH), 1670 (2CO), 1637.21, 1583.95, 1523.77 (C=N, C=C, NH), 1262.89 (SO2).
22c NH
NH2
C33H28N8O5S2(680.76)
210-217 66 C 58.22 H 4.15 N 16.46
58.16 4.11 16.33
IR (cm)-1: 3417.09 (NH2), 3075.16 (NH5), 3243.97 (Ar-CH), 1670 (CO), 1636.48, 1585.05, 1524.33 (C=N, C=C, NH), 1261.86 (SO2).
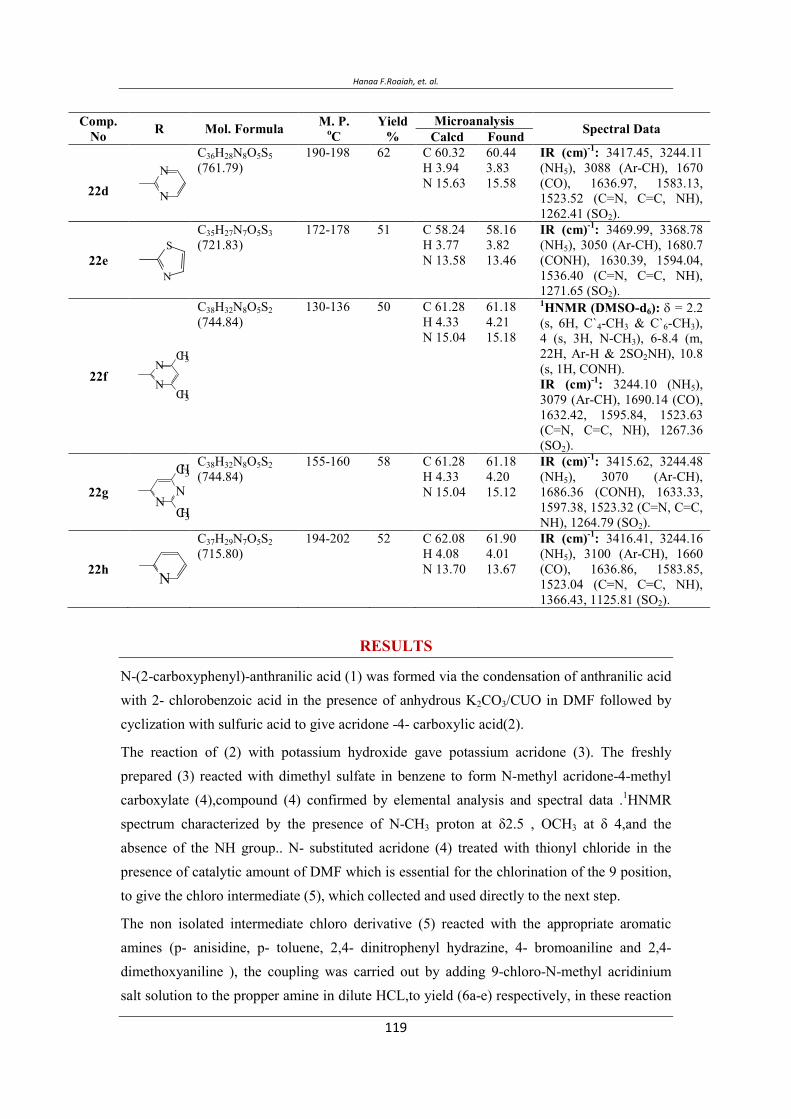
Hanaa F.Roaiah, et. al.
Comp. No R Mol. Formula M. P.
oCYield
%Microanalysis Spectral Data Calcd Found
22d N
NC36H28N8O5S5(761.79)
190-198 62 C 60.32 H 3.94 N 15.63
60.44 3.83 15.58
IR (cm)-1: 3417.45, 3244.11 (NH5), 3088 (Ar-CH), 1670 (CO), 1636.97, 1583.13, 1523.52 (C=N, C=C, NH), 1262.41 (SO2).
22e N
SC35H27N7O5S3(721.83)
172-178 51 C 58.24 H 3.77 N 13.58
58.16 3.82 13.46
IR (cm)-1: 3469.99, 3368.78 (NH5), 3050 (Ar-CH), 1680.7 (CONH), 1630.39, 1594.04, 1536.40 (C=N, C=C, NH), 1271.65 (SO2).
22f N
NCH3
CH3
C38H32N8O5S2(744.84)
130-136 50 C 61.28 H 4.33 N 15.04
61.18 4.21 15.18
1HNMR (DMSO-d6): δ = 2.2 (s, 6H, C`4-CH3 & C`6-CH3), 4 (s, 3H, N-CH3), 6-8.4 (m, 22H, Ar-H & 2SO2NH), 10.8 (s, 1H, CONH). IR (cm)-1: 3244.10 (NH5), 3079 (Ar-CH), 1690.14 (CO), 1632.42, 1595.84, 1523.63 (C=N, C=C, NH), 1267.36 (SO2).
22g N
N
CH3
CH3
C38H32N8O5S2(744.84)
155-160 58 C 61.28 H 4.33 N 15.04
61.18 4.20 15.12
IR (cm)-1: 3415.62, 3244.48 (NH5), 3070 (Ar-CH), 1686.36 (CONH), 1633.33, 1597.38, 1523.32 (C=N, C=C, NH), 1264.79 (SO2).
22h N
C37H29N7O5S2(715.80)
194-202 52 C 62.08 H 4.08 N 13.70
61.90 4.01 13.67
IR (cm)-1: 3416.41, 3244.16 (NH5), 3100 (Ar-CH), 1660 (CO), 1636.86, 1583.85, 1523.04 (C=N, C=C, NH), 1366.43, 1125.81 (SO2).
RESULTS
N-(2-carboxyphenyl)-anthranilic acid (1) was formed via the condensation of anthranilic acid with 2- chlorobenzoic acid in the presence of anhydrous K2CO3/CUO in DMF followed by cyclization with sulfuric acid to give acridone -4- carboxylic acid(2).
The reaction of (2) with potassium hydroxide gave potassium acridone (3). The freshly prepared (3) reacted with dimethyl sulfate in benzene to form N-methyl acridone-4-methyl carboxylate (4),compound (4) confirmed by elemental analysis and spectral data .1HNMR spectrum characterized by the presence of N-CH3 proton at δ2.5 , OCH3 at δ 4,and the absence of the NH group.. N- substituted acridone (4) treated with thionyl chloride in the presence of catalytic amount of DMF which is essential for the chlorination of the 9 position, to give the chloro intermediate (5), which collected and used directly to the next step.
The non isolated intermediate chloro derivative (5) reacted with the appropriate aromatic amines (p- anisidine, p- toluene, 2,4- dinitrophenyl hydrazine, 4- bromoaniline and 2,4- dimethoxyaniline ), the coupling was carried out by adding 9-chloro-N-methyl acridinium salt solution to the propper amine in dilute HCL,to yield (6a-e) respectively, in these reaction
Synthesis Of Some New Substituted Acridones With Expected Biological Activities
the amine groups reacted selectively with the acid chloride moiety. Compounds (6a-e) showed the correct analytical values, the 1HNMR spectrum revealed the appearance of a new phenyl group which was determined by integration.
When the intermediate (5) treated with the appropriate sulfonamides (sulfanilamide, sulfacetamide, sulfaguanidine, sulfadiazine, sulfathiazole, sulfadimidine, sulfasomedine,and sulfapyrazine ) using the last previous method gave the prototype characterized each by its different functional groups, which detected by both elemental analysis and spectral data. 1HNMR spectrum of compound 7 showed the presence of N-CH3 at δ 3.8 and H-CO2 at δ11.2. IR revealed absorption bands at 3000 OH, 1673 C=O and 1623 C=C cm-1. Compound 9 1HNMR showed signals at δ=2 of COCH3. IR spectrum showed absorption bands at 3029 br OH, 1700 C=O, 1616 C=N, 1597C =C cm1.
The diversity of these adducts should provide potentially different pharmacological activities.
The prototype compounds treated with thionyl chloride to give the intermediate derivatives (7a, 9a, 11a, 13a, 15a, 17a, 19a, and21a) which used directly for the following step. 1HNMR of compound 9a showed the disappearance of 1H, CO2.
The freshly prepared intermediate compounds reacted directly with the same previous sulfonamides under basic condition to form the new substituted derivatives (8a-h, 10a-h, 12a-h, 14a-h, 16a-h, 18a-h, and 20a-h) respectively. The more reactive acid chloride was first substituted selectively followed by reaction with sulfonamides.
IR spectra of these compounds revealed the presence of NH bands together with the SO2, 1HNMR spectra showed an increase in the integration of the aromatic protons.
REFERENCES
Elmori A., Mitaku S.,Michel S., Skaltsouni A.L., Tillequin F., Koch M., Pierre A., Guilbaud N., Leonce S., Berlhier L.K., Rolland Y., and Atassi G. (1996). "Synthesis , Cytotoxic and Antitumor Activity of Esters in the 1,2-dihydroxy-1,2-dihydroaconycine Series"J . Med . Chem . 39 ,4762-4766 .
Kawaii S., Tomono Y.K., Katase E., Ogawa K., Yano M., Takemura Y., Ichi M.J., Lio C., and Furukawa H. (1999). "The Antiproliferative Effect of Acridone Alkaloids on Several Cell Lines" J . Nat . Prod . 62, 587- 589 .
Storch E ., Kirchner H ., Brehm G ., Hueller K ., and Marcucci F .(1986). "Production of Interferon-β by Murine T-Cell Lines Induced by 10-carboxymethyl -9-Acridone" . J . Immunol . 23 (2), 195- 199 .
Roemer W ., Tonew E ., and Sculze W . (1986). "Cyclic AMP metabolism and Interferon Induction in mice after treatment with 10-carboxymethyl-9-Acridone". Acta Virol. 30 (5), 411 -417.
Hanaa F.Roaiah, et. al.
Kovalenko A. L., Romantsov M . G. , and Ershov F . L. (2000). "Acridoneacetic acid;Pharmacological properties and the result of clinical use" J . Immunobiol. 5, 103- 107.
Noskov F . S., Bichurina M. A., Nikitina L .E., Taros L.Yu., Tarasov V .A., Katasalukha V .v., and Polovtsev S .V. (2004). "Preparation of the lithium salt of N-acridoneacetic acid,useful as an Immunomodulating antiviral agent . Though Chem . Abst . 140 . No . 17, 27075 Ir .
Wang S .S., Lee Y .J., Hsu S .C., Chang H .O., Yin W .K ., Chang L .S., and Chou S .Y. (2007). "Synthesis and Cytotoxic properties in vitro and in vivo " Bioorganic and Medicinal Chemistry ,15 ,735- 748 .
Brana M .F., Casarrubio L., Dominguez G., Fernandez C., Perez J. M., Quiroga A .G ., Ranniniger C ,N., and Teresa B .p. (2002). "Synthesis, Cytotoxic activities and Proposed mode of binding of series of bis (9-oxo-9, 10-dihydroacridine-4-carbonyl)-amino] alkylalkylamines"; Eur. J. Med. Chem.,37, 301- 313 .
Sondhi S. M., Bhattacharjee G., Jameel R .K., Shukla R ., Raghubir R ., Lozach O ., and Meijer L . (2004). "Antiinflammatory, Analgesic and Kinase inhibition activities of some Acridine derivatives"; Central Eur. J. of Chemistry, 2 (1), 1- 15
Anderson M., Sherrill J., Madrid B .M., Liou A .P., Weisman J .L., and Guy R .K. ,(2006). "Parallel Synthesis of 9-Aminoacridines and their evaluation Aginst Chloroquine-Resistant Plasmodium flaciparum"; Bioorg. Med. Chem., 14 (2), 334- 343.
Antonini L ., Polucci P., Kelland L.R., Spinelli S., Pescalli N., and Martelli S. (2002). "N4-(ω-Aminoalkyl)-1-[(ω-aminoalkyl)amino]-4-cridinecarboxamides; Novel, Potent, Cytotoxic,and DNA - Binding Agents "; J. Med. Chem 43,4801-4805
Ramesh Kumar and Meena Kumari. (2011). "Chemistry of Acridone and its Analogues",J. Chem .Pharm .; 3(1) ;217 -230 .
Allen C.F.H.;and Mckee G.H.W. (1939). "Acridone";J.Org.Synth.;, 19, 6-9. Kormendy K., "N-Alkylated diacridylium salts" Acta Chim . Acad . Sci. Hung., (1959), 21, 83- 88.
Cain B. F., Seelye R. N., and Atwell G. J. (1974) . "Potential Antitumor Agents. 14-Acridylmethanesulfonamides" ;J. Med. Chem., , 17, 922- 930.
El- Moghazy Aly S. M., Ebeid M. Y., Aly E. I., and Abo Seri S. M. (1997). "Potential Anti-HIV Agents;Synthesis and Anti-HIV-1 Activity of some substituted 9-(4-sulfamoylphenylamino)acridin-2-yl" ; Bull. Fac. Pharm. Cairo Univ., 185- 197.
El- Moghazy Aly S. M., and Safwat H. M. (1990). "Synthesis and Antitumor Activity of Some Acridonanil Derivatives"; Egypt. J. Pharm. Scin., 31, 505- 513.

Synthesis Of Some New Substituted Acridones With Expected Biological Activities
ی ی
ی ** ی ** ی ** *
.م *
** . م
ح. یی ی
ی ی ی ی
ی ح– ح ی ی
)( ح ح ی ی)(
ی )( ی )(ی ی
)( ی ی ی
)( ).( یی
ی ح ی ی
ی ی
خ ی
.
Synthesis and Characterization of Some Novel Schiff Base Metal Complexes and the investigation of their Cytotoxic Activity on MCF- Cell ine
Role of Ezrine Protein in the Proliferation and Invasion Activity of Human Oral Squamous Cell Carcinomas Reham AA Morsy, Rehab Fawzy Kasem, Safa Fathy A Ghany
Corresponding Author:Reham AA Morsy
Basic dental science Department, Oral and Dental Medicine Division, National Research Center,
Giza, Egypt. Corresponding author E-mail: [email protected]
ABSTRACT
Oral cancer, one of the ten most common cancers in the world, remains a morbid and often fatal disease. Despite marked advances in diagnosis and management of oral squamous cell carcinoma (OSCC), the overall survival ratio has shown only a modest increase in recent years. Therefore, the development of molecular markers is needed to improve the diagnosis and assessment of tumor progression and metastasis in OSCC patients. Ezrin, a cytoskeleton linker protein, plays a functional role in modulating morphology, growth, invasion and metastasis of OSCC.
The purpose of the study is to assess the shifts in cellular distribution of ezrin in normal oral epithelium and OSCC, and study the correlation between ezrin expression in OSCC tissues and tumor differentiation.
30 Paraffin-embeded OSCC tissue samples were selected from primary OSCC (10cases were well differentiated, 10 cases were moderately differentiated and 10 cases were poorly differentiated OSCC). Another 10 paraffin embedded tissue blocks of normal oral squamous epithelium were selected as the control group (far from the tumor tissues). The immunohistochemistry was used to detect ezrin monoclonal antibody expression in paraffin embedded normal oral mucosal tissues and OSCC tissue samples.
Our data showed that ezrin expression in OSCC cases was significantly higher than in normal oral mucosal epithelium (2.4±0.516). There was a close relationship between ezrin expression and the degree of tumor differentiation where there was a statistically significant increase for ezrin positive rates in OSCC from well (3.8± 0.422) to moderate (4.6±0.516) reaching its highest value in the poorly differentiated OSCC (5±0.000). Conclusion: There was significant correlation between the expression of ezrin and OSCC development and progression which may indicate the diagnostic and prognostic significance of ezrin expression in OSCC. Modulation of the ezrin expression pattern is a potential therapeutic strategy for improving the outcome of OSCC patients.
Vol. 12, 2012 JBR ORIGINAL ARTICLE
Role of Ezrine Protein in the Proliferation and Invasion Activity of Human Oral Squamous Cell Carcinomas
Keywords: Ezrin, OSCC, immunohistochemistry, invasion, metastasis, image analysis.
INTRODUCTION Oral squamous cell carcinoma is the most common type of oral cancers which accounts for approximately 90% of oral malignancies. It constitutes a major health problem in developing countries, representing a leading cause of death. The survival index continues to be small (50%), as compared to the progress in diagnosis and treatment of other malignant tumors (Landis et al., 1999 and Smyth et al., 1999). The main characteristics of oral squamous cell carcinoma are invasive growth and the tendency to metastasize. Escape from the primary tumor is the first step of invasion and metastasis of cancer (Kobayashi etal., 2004). Ezrin, also known as cytovillin or villin-2, is a protein that in humans is encoded by the EZR gene. It is a member of the ezrin/radixin/moesin family (ERM protein family) and it is involved in the formation of cell-surface processes such as lamellipodia and filopodia and is expressed in a variety of tissues (Tsukita and Yonemura, 1999). Ezrin typically concentrates at the apical surface of polarized epithelia (Bretscher, 1999). Ezrin functions to organize specialized cell-membrane domains by linking the cell membrane to actin cytoskeleton and allows a cell to interact with its microenvironment and provides “intracellular scaffolding” that facilitates signal transduction through a number of growth factor receptors and adhesion molecules (Swanson et al, 2007 and Bretscher, 2002). It is involved in the regulation of several cytoskeletal-related functions such as cell adhesion, cell survival and cell motility (Wick et al, 2001, Yu et al, 2004, and Wei et al, 2009).Positioned at the cell membrane-cytoskeleton interface, ezrin may be a nexus in the metastatic phenotype, playing a central, necessary and early role in regulating neoplastic progression, tumor growth and the process of metastasis (Curto and McClatchey, 2004 and Park et al, 2006). In addition, over-expression of ezrin enhances the metastatic potential in various human epithelial tumors, including prostate cancer (Ekman 2004 and Valdman et al, 2005), uterine endometrioid adenocarcinoma (Ohtani et al., 2002), osteosarcoma (Ferrari et al, 2008), and uveal malignant melanoma (Makieti et al., 2001). Interestingly, ezrin upregulation has been associated with the proliferation and immortalization of fibroblasts (Kaul et al, 1996) and the acquisition of an invasive phenotype in transformed esophageal epithelial cells (Shen et al, 2003).
Reham A. A. Morsy, et. Al.
Several studies showed that expression of ezrin has been associated with tumor invasion; metastasis and less differentiation grade indicating that ezrin may play a crucial role in tumor development, progression and metastasis (Yeh et al., 2009, Park et al., 2010, Meng et al., 2010 and JianWen et al., 2009). In this study, we aimed to determine the role of ezrin in the progression of oral squamous cell carcinoma through detecting the expression of ezrin protein in different grades of oral squamous cell carcinoma and normal oral squamous epithelium.
MATERIAL AND METHODS
Tissue Specimens
A total of 30 specimens previously diagnosed as OSCC were retrieved from the archival paraffin blocks from files of Oral Pathology Department, Faculty of Oral and Dental Medicine, Cairo University and National Cancer Institute, Cairo University. Serial sections of 4 micrometer were cut from the paraffin embedded blocks. Another 10 paraffin embedded tissue blocks of normal oral squamous epithelium (N) were selected as the control group (far from the tumor tissues) regardless the histological grades of the tumors. Sections were stained with hematoxylin and eosin to reconfirm the diagnosis and graded into well (10 cases), moderately (10 cases) and poorly differentiated (10 cases) according to Pindborg et al. (1997). The selected specimens were further processed immunohistochemically.
Immunohistochemistry:
Immunohistochemical staining was performed on 4µm sections of paraffin embedded specimens and mounted on positively charged glass slides (Optiplus, Biogenex, USA). Tissue sections were deparafinized, rehydrated and treated with endogenous peroxidase in 0.3% H2O2 for 30 min to block the endogenous peroxidase activity. For antigen retrieval, the slides were placed in a container filled with target retrieval solution (code no. S3308 Dako), and heated in a microwave oven at 100oC for 15 min. The positive test slides were incubated with the primary antibody mouse monoclonal anti-ezrin antibody (clone 3C12, Thermo Scientific, Labvision, USA) in the appropriate dilution range 1:100 overnight at room temperature in a humified chamber. On the other hand, the negative control slides were not exposed to the primary antibody.
After washing with phosphate buffer solution (PBS), the slides were treated with the biotin labeled link antibody, then the streptavidin conjugated to horseradish peroxidase was used. The diaminobenzedine (DAB) chromogen was applied to visualize the antigen antibody reaction. All these reagents belong to the universal Labeled Streptavidin-Biotin 2 System, Horseradish Peroxidase (code no.K0673 DakoCytomation, Denmark).
Role of Ezrine Protein in the Proliferation and Invasion Activity of Human Oral Squamous Cell Carcinomas
All the slides were immersed in Mayer’s hematoxylin for counterstaining. Finally, the sections were covered by cover slips using aqueous mounting medium.
Immunohistochemical Evaluation:
The ordinary light microscope was used to detect and localize the ezrin immunostaining. Cells with cytoplasmic or membranous staining were considered positive (Park et al., 2010). Then, all the sections were examined by an image analyzer computer system using the software Leica Queen 500. Five random fields in each specimen were captured using a magnification (X400) to determine the area percentage and immunostaining intensity of the positive tumor cells.
The area percentage and immunostaining intensity were scored from 1 to 3 according to the difference between the largest and smallest mean value of each parameter in the studied cases. The scores of both area percentage and immunostaining intensity were then summed to obtain a single total score. The overall reaction was considered mild (Score 1 & 2), moderate (Score 3 & 4) or strong (Score 5 & 6) according to the single total score (Lim et al., 2003).
Statistical analysis:
All the obtained total scores of the examined sections were given as mean values ± standard deviation (SD) for statistical evaluation. The ANOVA test was used to compare the overall expression of ezrin among the normal epithelium nearby the tumor tissues and different grades of OSCC. Paired Student’s t-test was used to compare each two grades together.
RESULTS
Immunohistochemical findings:
All the examined 30 sections of OSCC (100%) showed positive ezrin immunoexpression, with variable degrees of positivity. Cytoplasmic and membranous immunoreaction was observed in all the tumor cells regardless to the degree of differentiation of the lesion. In well differentiated OSCC, the early invasive cases (20%) showed diffuse distribution of ezrin staining throughout the entire dysplastic epithelial cell layers (fig.1).
Both well and moderately differentiated OSCC showed moderate ezrin immunoreactivity in all cases (100%). In addition to the cytoplasmic and membranous immunoreaction of the tumor cells, positive reaction in keratin pearls and cell nests was observed as well (fig.1, 2, and 3). While 80% of poorly differentiated cases showed diffuse strong ezrin reaction throughout the lesions (fig. 4), 20% showed moderate immunreactivity.
In the connective tissue stroma, the fibroblasts, collagen fibers and most of the chronic inflammatory cells reacted negatively to ezrin. On the other hand, endothelial
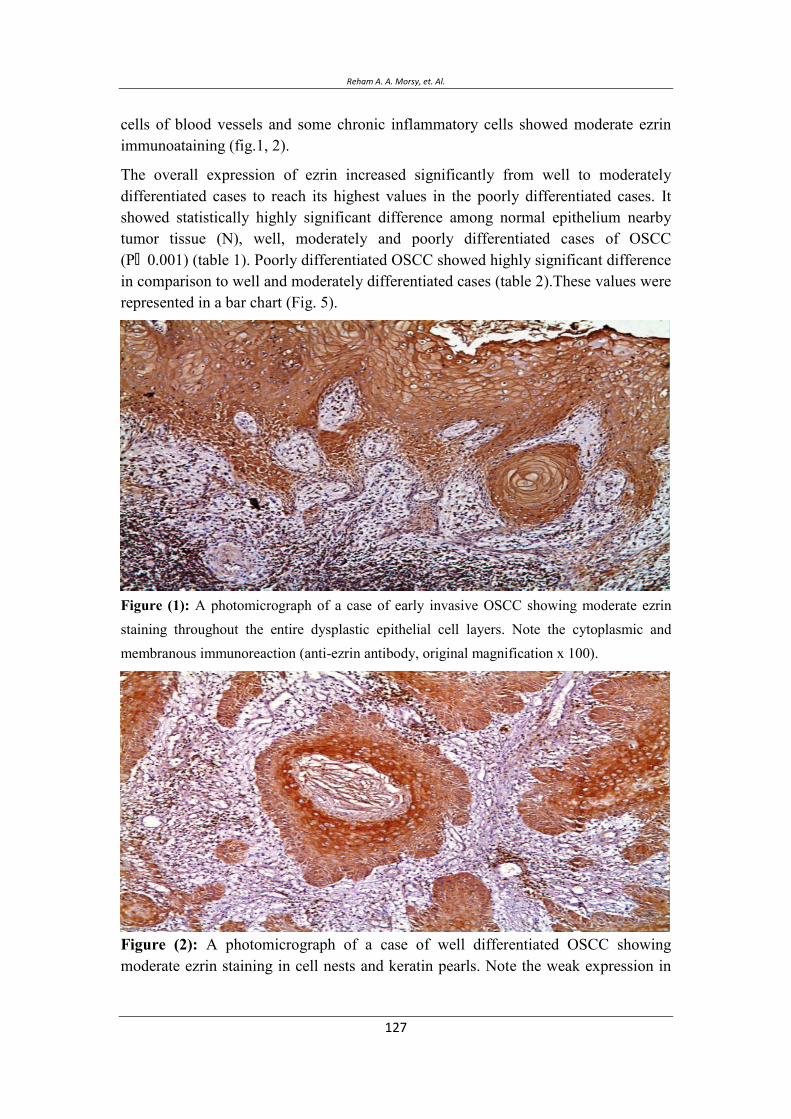
Reham A. A. Morsy, et. Al.
cells of blood vessels and some chronic inflammatory cells showed moderate ezrin immunoataining (fig.1, 2).
The overall expression of ezrin increased significantly from well to moderately differentiated cases to reach its highest values in the poorly differentiated cases. It showed statistically highly significant difference among normal epithelium nearby tumor tissue (N), well, moderately and poorly differentiated cases of OSCC (P 0.001) (table 1). Poorly differentiated OSCC showed highly significant difference in comparison to well and moderately differentiated cases (table 2).These values were represented in a bar chart (Fig. 5).
Figure (1): A photomicrograph of a case of early invasive OSCC showing moderate ezrin staining throughout the entire dysplastic epithelial cell layers. Note the cytoplasmic and membranous immunoreaction (anti-ezrin antibody, original magnification x 100).
Figure (2): A photomicrograph of a case of well differentiated OSCC showing moderate ezrin staining in cell nests and keratin pearls. Note the weak expression in
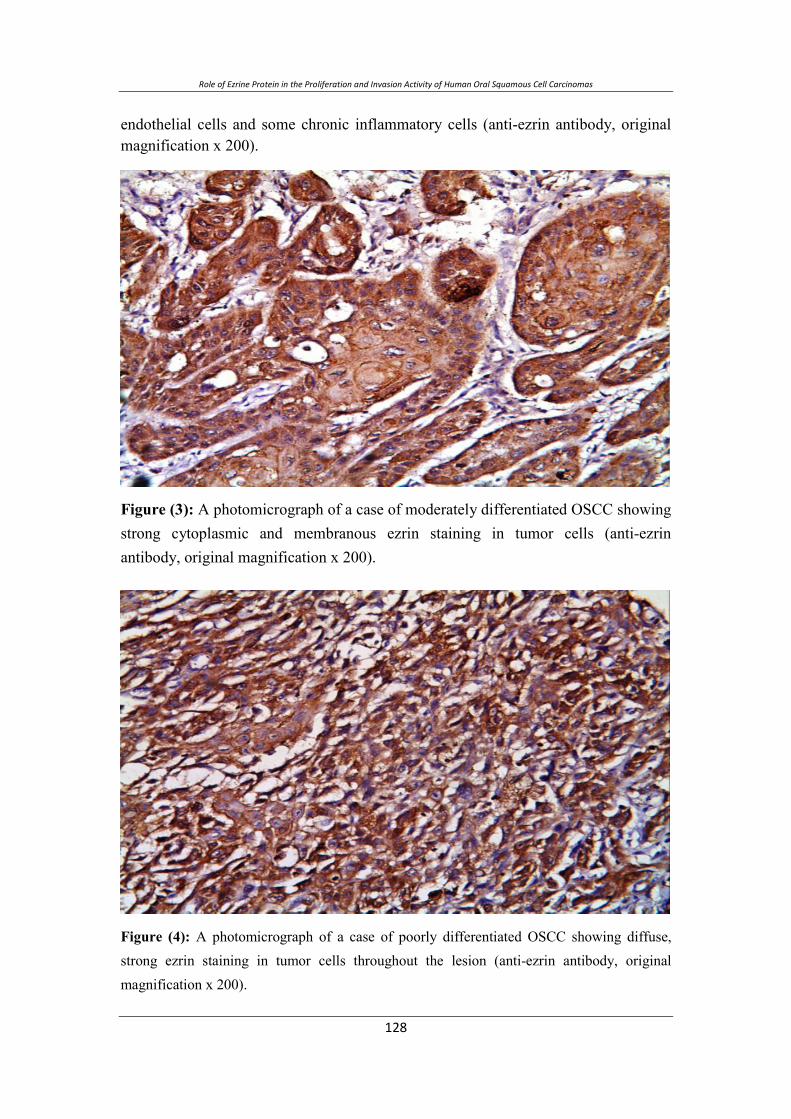
Role of Ezrine Protein in the Proliferation and Invasion Activity of Human Oral Squamous Cell Carcinomas
endothelial cells and some chronic inflammatory cells (anti-ezrin antibody, original magnification x 200).
Figure (3): A photomicrograph of a case of moderately differentiated OSCC showing strong cytoplasmic and membranous ezrin staining in tumor cells (anti-ezrin antibody, original magnification x 200).
Figure (4): A photomicrograph of a case of poorly differentiated OSCC showing diffuse, strong ezrin staining in tumor cells throughout the lesion (anti-ezrin antibody, original magnification x 200).
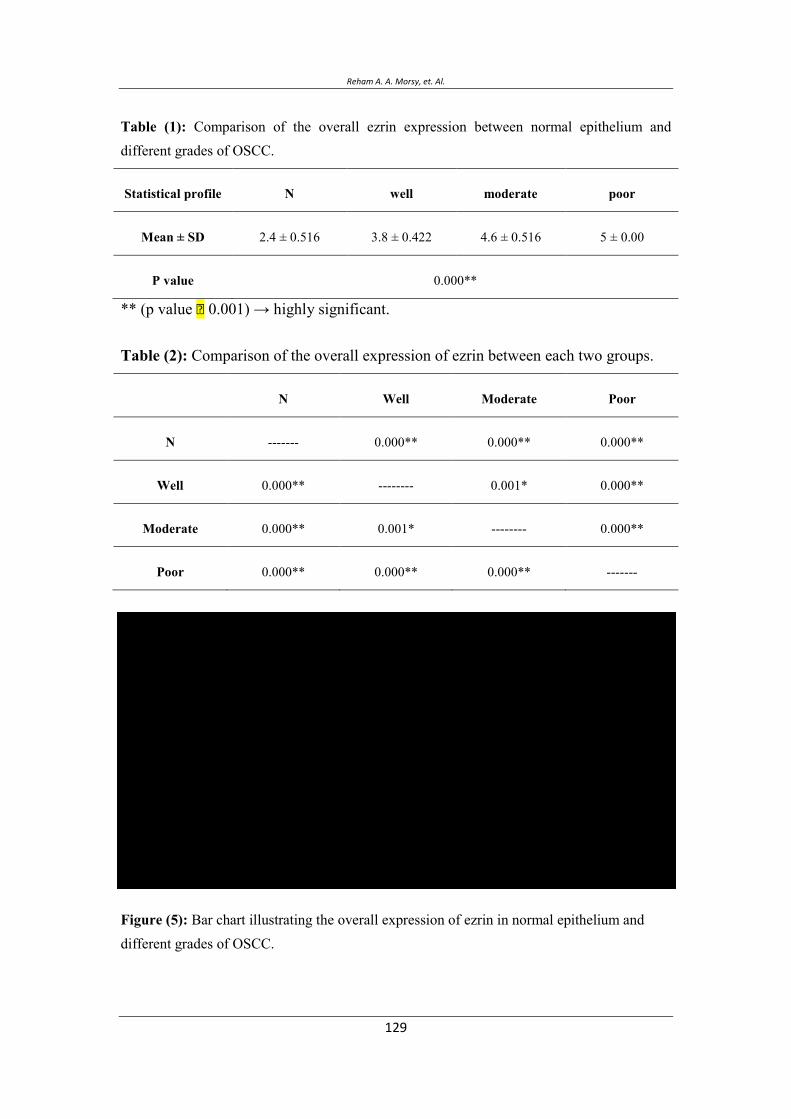
Reham A. A. Morsy, et. Al.
Table (1): Comparison of the overall ezrin expression between normal epithelium and different grades of OSCC.
Statistical profile N well moderate poor
Mean ± SD 2.4 ± 0.516 3.8 ± 0.422 4.6 ± 0.516 5 ± 0.00
P value 0.000**
** (p value 0.001)→ highly significant.
Table (2): Comparison of the overall expression of ezrin between each two groups.
N Well Moderate Poor
N ------- 0.000** 0.000** 0.000**
Well 0.000** -------- 0.001* 0.000**
Moderate 0.000** 0.001* -------- 0.000**
Poor 0.000** 0.000** 0.000** -------
Figure (5): Bar chart illustrating the overall expression of ezrin in normal epithelium and different grades of OSCC.
0
5
10
15
20
25
N well moderate poor
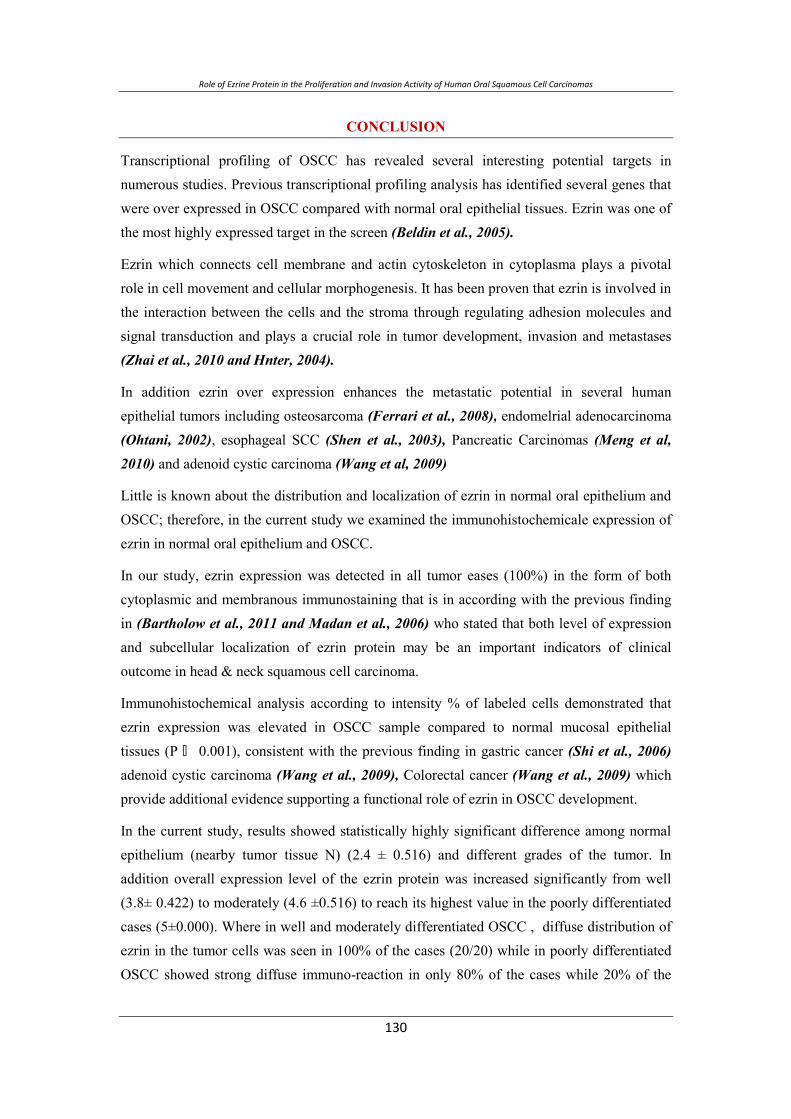
Role of Ezrine Protein in the Proliferation and Invasion Activity of Human Oral Squamous Cell Carcinomas
CONCLUSION
Transcriptional profiling of OSCC has revealed several interesting potential targets in numerous studies. Previous transcriptional profiling analysis has identified several genes that were over expressed in OSCC compared with normal oral epithelial tissues. Ezrin was one of the most highly expressed target in the screen (Beldin et al., 2005).
Ezrin which connects cell membrane and actin cytoskeleton in cytoplasma plays a pivotal role in cell movement and cellular morphogenesis. It has been proven that ezrin is involved in the interaction between the cells and the stroma through regulating adhesion molecules and signal transduction and plays a crucial role in tumor development, invasion and metastases (Zhai et al., 2010 and Hnter, 2004).
In addition ezrin over expression enhances the metastatic potential in several human epithelial tumors including osteosarcoma (Ferrari et al., 2008), endomelrial adenocarcinoma (Ohtani, 2002), esophageal SCC (Shen et al., 2003), Pancreatic Carcinomas (Meng et al, 2010) and adenoid cystic carcinoma (Wang et al, 2009)
Little is known about the distribution and localization of ezrin in normal oral epithelium and OSCC; therefore, in the current study we examined the immunohistochemicale expression of ezrin in normal oral epithelium and OSCC.
In our study, ezrin expression was detected in all tumor eases (100%) in the form of both cytoplasmic and membranous immunostaining that is in according with the previous finding in (Bartholow et al., 2011 and Madan et al., 2006) who stated that both level of expression and subcellular localization of ezrin protein may be an important indicators of clinical outcome in head & neck squamous cell carcinoma.
Immunohistochemical analysis according to intensity % of labeled cells demonstrated that ezrin expression was elevated in OSCC sample compared to normal mucosal epithelial tissues (P 0.001), consistent with the previous finding in gastric cancer (Shi et al., 2006) adenoid cystic carcinoma (Wang et al., 2009), Colorectal cancer (Wang et al., 2009) which provide additional evidence supporting a functional role of ezrin in OSCC development.
In the current study, results showed statistically highly significant difference among normal epithelium (nearby tumor tissue N) (2.4 ± 0.516) and different grades of the tumor. In addition overall expression level of the ezrin protein was increased significantly from well (3.8± 0.422) to moderately (4.6 ±0.516) to reach its highest value in the poorly differentiated cases (5±0.000). Where in well and moderately differentiated OSCC , diffuse distribution of ezrin in the tumor cells was seen in 100% of the cases (20/20) while in poorly differentiated OSCC showed strong diffuse immuno-reaction in only 80% of the cases while 20% of the

Reham A. A. Morsy, et. Al.
cases showed moderate immuno-staining. Similar finding could be detected in hepatocellular carcinoma (Yeh et al, 2009) and gastric mucosa (Madan et al., 2006) reflecting that there was a close relationship between ezrin expression and the degree of tumor differentiation.
In addition, diffuse distribution of ezrin immunoreactions was detected in tumor cells as well as keratin pearl and cell nests. Similar finding were found in the result of (David et al, 2006) where ezrin expression was detected in the marginal carcinoma cells at the nests which seem to constitute the advancing front of cancer invasion, where the ezrin protein degrade the extracellular matrix. These cells probably are involved in pathological process of tumor invasion & metastasis.
It is possible that this finding represents change in the tumor physiology between the different grades of the tumor. Moreover, ezrin may participate in the early events of OSCC development and may promote its progression to the advanced stage of the tumor.
In addition, ezrin expression was negative in both fibroblasts and collagen fibers while some
chronic inflammatory cells and endothelial cells of the blood vessels showed moderate
immuno-reaction. This finding is in accordance with the previous studies of (Birukov et al.,
2004 and Kaul et al., 1996) who explain this finding as a reflection of altered cellular
environment by ezrin expression. This study showed that, the over expression of ezrin in
OSCC tissue may be involved in tumor invasion and metastasis.
REFERENCES
Bartholow TL, Michael J Becich2, Uma R Chandran2 and Anil V Parwani3:
Immunohistochemical analysis of ezrin-radixin-moesin-binding phosphoprotein 50 in prostatic adenocarcinoma. BMC Urology 2011, 11:12doi:10.1186/1471-2490-11-12.
Beldin TJ, Singh B, Smith RV. Molecular profiling of tumor progression in head and neck cancer. Arch Otolaryngol Head Neck Surg 2005; 131:10–18.
Birukov KG, Leitinger N, Bochkov VN, Garcia JG. Signal transduction pathways activated in human pulmonary endothelial cells by OxPAPC, a bioactive component of oxidized lipoproteins. Microvasc Res 2004; 67: 18-28
Bretscher A, Edwards K, Fehon RG: ERM proteins and merlin: integrators at the cell cortex. Nat Rev Mol Cell Biol 2002, 3(8):586-599.
Bretscher A. Regulation of cortical structure by the ezrin-radixinmoesin protein family. Curr Opin Cell Biol. 1999; 11:109–116.
Role of Ezrine Protein in the Proliferation and Invasion Activity of Human Oral Squamous Cell Carcinomas
Curto M, McClatchey AI: Ezrin...a metastatic detERMinant? Cancer Cell 2004, 5(2):113-114.
David Sarrio´ 1, Socorro Marı´a Rodrı´guez-Pinilla1, Ana Dotor2, Francisco Calero3 and David Hardisson4, and Jose´ Palacios1 : Abnormal ezrin localization is associated with clinicopathological features in invasive breast carcinomas. Breast Cancer Research and Treatment (2006) 98: 71–79 _ Springer 2006, DOI 10.1007/s10549-005-9133-4.
Ekman P: Expression of ezrin in prostatic intraepithelial neoplasia. Urology 2004, 63(3):609-12.
Ferrari S, Zanella L, Alberghini M, Palmerini E, Staals E, Bacchini P. Prognostic significance of immunohistochemical expression of ezrin in non-metastatic high-grade osteosarcoma. Pediatr Blood Cancer 2008; 50: 752-756.
Hunter KW: Ezrin, a key component in tumor metastasis. Trends Mol Med 2004; 10: 201-204.
JianWen Zhai, XiaoGang Yang, FuShen Yang, JiGang Hu, WenXiaHua: Expression and clinical significance of Ezrin and Ecadherin in esophageal squamous cell carcinoma. Chinese Journal of Cancer 2009.
Kaul SC, Mitsui Y, Komatsu Y, Reddel RR, Wadhwa R. A highly expressed 81 kDa protein in immortalized mouse fibroblast: Its proliferative function and identity with ezrin. Oncogene. 1996;13:1231– 1237.
Kobayashi H,1 Junji Sagara, Hiroshi Kurita,1 Masayo Morifuji, Masamichi Ohishi,3 Kenji Kurashina,1 and Shun’ichiro Taniguchi219-Clinical Significance of Cellular Distribution of Moesin in Patients with Oral Squamous Cell Carcinoma, Vol. 10, 572–580, January 15, 2004 Clinical Cancer Research
Landis SH, Murray T, Bolden S, Wingo PA, Cancer statistics, 1999. CA Cancer J. Clin 1999;49:8-31.
Lim JJ., Kang S., Lee MR., Pai HK., Yoon HJ., Lee JI., Hong SP. And Lim CY.: Expression of vascular endothelial growth factor in salivary gland carcinomas and its relation to p53, Ki-67 and prognosis. J Oral Pathol Med 2003; 32: 552-61.
Madan R, Brandwein-Gensler M, Schlecht NF, Elias K, Gorbovitsky E, Belbin TJ, Mahmood R, Breining D, Qian H, Childs G, Locker J, Smith R, Haigentz M Jr, Gunn-Moore F, Prystowsky MB and Beldin TJ, Singh B, Smith RV:
Reham A. A. Morsy, et. Al.
Differential tissue and subcellular expressionof ERM proteins in normal and malignant tissues: cytoplasmic ezrin expression has prognostic signficance for head and neck squamous cell carcinoma. Head Neck. 2006 Nov; 28(11):1018-27.
Makitie T, Carpen O, Vaheri A, Kivela T: Ezrin as a prognostic indicator and its relationship to tumor characteristics in uveal malignant melanoma. Invest Ophthalmol Vis Sci 2001, 42(11):2442-9.
Meng Y., Lu Z., YuS., Zhang Q., Ma Y., Chen J: Ezrin promotes invasion and metastasis of pancreatic cancer cells. Journal of Translational Medicine 2010, 8:61
Ohtani K, Sakamoto H, Rutherford T, et al. Ezrin, a membranecytoskeletal linking protein, is highly expressed in atypical endometrial hyperplasia and uterine endometrioid adenocarcinoma. Cancer Lett. 2002;179:79–86.
Park HR, Jung WW, Bacchini P, Bertoni F, Kim YW, Park YK: Ezrin in osteosarcoma: comparison between conventional high-grade and central low-grade osteosarcoma. Pathol Res Pract 2006, 202(7):509-515.
Park HR, Min SK, Min K, Jun SY, Seo J, Kim KH, Choi J. Differential expression of ezrin in epithelial skin tumors: cytoplasmic ezrin immunoreactivity in squamous cell carcinoma. Int J Dermatol. 2010 Jan;49(1):48-52.
Pindborg JJ, Reichart PA, Smith CJ et al. Histological Typing of cancer and precancer of the Oral Mucosa. J Oral Path. Med 1997; 32: 513.
Shen ZY, Xu LY, Chen MH, et al. Upregulated expression of Ezrin and invasive phenotype in malignantly transformed esophageal epithelial cells. World J Gastroenterol. 2003;9:1182–1186.
Shi RL, Li JF, Qu Y, Chen XH, Gu QL, Zhu ZG, Liu BY: [Expression of Ezrin in gastric carcinoma and its significance] . Zhonghua Wei Chang Wai Ke Za Zhi. 2006 Sep; 9(5):433-5.
Smythe WR, Williams JP, Wheelock MJ, Johnson KR, Kaiser LR, Albelda SM. Cadherin and catenin expression in normal human bronchial epithelium and non-small cell lung cancer. Lung Cancer 1999; 24: 157-168.
Swanson KA, Crane DD, Caldwell HD. Chlamydia trachomatis species-specific induction of ezrin tyrosine phosphorylation functions in pathogen entry. Infect Immun 2007; 75: 5669-5677.
Role of Ezrine Protein in the Proliferation and Invasion Activity of Human Oral Squamous Cell Carcinomas
Tsukita, S., and Yonemura, S. Cortical actin organization: Lessons from ERM (ezrin/radixin/moesin) proteins. J. Biol. Chem., 274: 34507– 34510, 1999.
Valdman A, Fang X, Pang ST, Nilsson B, Ekman P, Egevad L: Ezrin expression in prostate cancer and benign prostatic tissue. Eur Urol 2005, 48(5):852-7.
Wang YY, Chen WL, Yang ZH, Huang ZQ, Li JS, Pan CB: [Effects of Ezrin gene on the proliferation and invasion activity of human salivary gland adenoid cystic carcinoma]. Zhonghua Kou Qiang Yi Xue Za Zhi. 2009 Apr; 44(4):203-7.
Wang HJ, Jin-Shui Zhu, Qiang Zhang, Qun Sun, Hua Guo: High level of ezrin expression in colorectal cancer tissues is closely related to tumor malignancy. World J Gastroenterol 2009 April 28; 15(16): 2016-2019.
Wei YC, Li CF, Yu SC, Chou FF, Fang FM, Eng HL, Uen YH, Tian YF, Wu JM, Li SH, Huang WW, Li WM, and Huang HY: Ezrin overexpression in gastrointestinal stromal tumors: an independent adverse prognosticator associated with the non-gastric location. Mod Pathol 2009, 22(10):1351-60.
Wick W, Grimmel C, Wild-Bode C, Platten M, Arpin M, Weller M: Ezrin-dependent promotion of glioma cell clonogenicity, motility, and invasion mediated by BCL-2 and transforming growth factor-beta2. J. Neurosci 2001, 21(10):3360-3368.
Yeh C., Pang S., Cen T., Wu R., Wu R and Chen M.: Expression of ezrin is associated with invasion and dedifferentiation of hepatitis B related hepatocellular carcinoma. BMC Cancer 2009, 9:233.
Yu Y, Khan J, Khanna C, Helman L, and Meltzer PS, Merlino G: Expression profiling identifies the cytoskeletal organizer ezrin and the developmental homeoprotein Six-1 as key metastatic regulators. Nat Med 2004, 10(2):175-181.
Zhai J., Yang X., Yang F., Hu J., Hua W.: Expression and clinical significance of Ezrin and Ecadherin in esophageal squamous cell carcinoma Chinese Journal of Cancer2010; Vol. 29 Issue 3317 - 320.

Reham A. A. Morsy, et. Al.
ی
*** ** ح * ی م
* - ح . م -
- م ** .م -
- م *** .م -
. م م م م ی ح م م م م
ی ی ح ی.م خ . ی
م ی م ی ی ی .م
ی م ی . ی
ح م ح ( ی م خ مخ م یح خ.)ح ی
). ی م ( ی م ئ .
ی م ح (ی م ( ی ی ). .±.)
حی ی ).±.( ی ی..±.( ح ی ). .±.( م ی (
م ی م ی
. م

Role of Ezrine Protein in the Proliferation and Invasion Activity of Human Oral Squamous Cell Carcinomas
Synthesis and Characterization of Some Novel Schiff Base Metal Complexes and the investigation of their Cytotoxic Activity on MCF- Cell ine
Detection of sFas in the Urine of Bladder Cancer Patients Sanaa E. Mohamed, Abeer I. Abdel-Fattah* and Rasha R. Mohamed**
Biochemistry department, Faculty of Mediciene, Ein Shams University,Cairo,Egypt. *Biochemistry department, Faculty of Pharmacy (girls), Al-Azhar University, Cairo,Egypt ** Biochemistry department Faculty of Pharmacy,Misr University for Science and Technology ,6-October,Egypt, Corresponding Author : Abeer I. Abd El-Fattah, [email protected]
ABSTRACT
Objective: The aim of the present study was to evaluate the usefulness of urinary sFas as a non-invasive diagnostic test for bladder cancer relative to urine cytology in different grades and stages of bladder cancer.
Patients and methods: The study included 47 patients with bladder cancer, 19 patients with benign genitourinary lesions and 19 healthy individuals. The urine supernatant was used for determination of sFas by ELISA, while urine sediment for cytology.
Results: The best cut off value for urinary sFas was determined by Receiver Characteristics operation curve (1630.46 pg/mg protein) at which sFas sensitivity is 75.5 % and specificity is 81.6 %. The combined use of urine cytology with urinary sFas increased urine cytology sensitivity from 61.22 % to 91.84 %, while decreased its specificity from 97.37% to 81.58%.
Conclusion: A direct comparison between urine cytology and urinary sFas revealed that sFas has higher sensitivity than urine cytology but lower specificity.
Keywords: Bladder cancer, Urine cytology and sFas.
INTRODUCTION Bladder cancer is a significant public health problem worldwide. It is the 4th most common cancer in men, accounting for 6.9% of all cancers, and 10th most common cancer in women, accounting for 2.6% of all cancers. Approximately 70,980 new cases were diagnosed in the United States in 2009 (Hodges et al., 2010). In Egypt, carcinoma of the bladder is the most prevalent cancer, accounting for as many as 31% of all cancer cases. Currently, it ranks first in males representing 16.2% of male cancer (Zarzour et al., 2008). Cigarette smoking is the most important risk factor, accounting for 50% of cases in men and 35% in women (Colombel et al., 2008).
Early detection of urothelial carcinoma of the urinary bladder cancer still represents a challenge to clinicians, considering that disease progression results in significant morbidity and mortality (Jemal et al., 2008). Cystoscopy is a relatively short, minimally traumatic office procedure. Nevertheless, it is still invasive and causes discomfort and distress to patients.
Vol. 12, 2012 JBR ORIGINAL ARTICLE

Detection of sFas in the Urine of Bladder Cancer Patients
Urine cytology is a secondary method of diagnosis after cystoscopy and has been used primarily for the detection of primary bladder tumors and detection of recurrent bladder tumors after transurethral resections (Hwang et al., 2011). An ideal bladder cancer monitoring test should be noninvasive, objective, easy to perform and interpret, with high sensitivity and specificity, and should provide an immediate or rapid result (Chade et al., 2009).
The low effectiveness and invasive nature of conventional methods in the diagnosis of bladder cancer have prompted the search for newer and better ways to diagnose the disease.
Apoptosis is critically important for the survival of multicellular organisms by getting rid of damaged or infected cells that may interfere with normal function (Labbe and Saleh, 2008; Vicencio et al., 2008).The Fas/FasL system is one of the major pathways in apoptosis and is important to regulate cell proliferation and tumor-cell growth. Fas is a cell-surface receptor which interacts with its natural ligand FasL , both members of the tumor necrosis factor (TNF) superfamily, to initiate the death signal cascade, which results in apoptotic cell death (Lima et al., 2008).
The Fas gene produces two protein isoforms through alternative mRNA splicing: the full-length Fas which contains a trans-membrane domain, and the soluble form of Fas (sFas), which lacks this domain. Soluble Fas acts as a decoy in the extra-cellular environment and binds FasL (Boroumand-Noughabi et al., 2010). It has been suggested that sFas modifies ligand concentration, down regulates membrane receptor number, and specifically reduces ligand-receptor numbers, and specifically inhibits ligand-receptor association in the extracellular space, thus preventing the induction of apoptosis (Sahin et al., 2007). Increased serum sFas level has been observed in patients with hepatocellular (Jodo et al., 1998), breast (Bewick et al., 2001), small cell lung cancer (Shimizu et al., 2005), esophageal (Gratas et al., 1998) and epithelial ovarian cancers (Chaudhry et al., 2008).
Serum sFas is also elevated in bladder cancer and is associated with poor prognosis and predicts early recurrences in patients with Ta bladder cancer (Lima et al., 2008). sFas is likely to be produced and released by bladder urothelial cell carcinoma cells and urinary sFas levels could be an independent predictor of the presence and invasiveness of bladder cancer (Svatek et al., 2006).
The aim of this study is to evaluate the usefulness of urinary sFas as a non-invasive diagnostic test for bladder cancer relative to urine cytology in different grades and stages of bladder cancer.
Abeer I. Abdel-Fattah, et. Al.
MATERIAL AND METHODS
Patients:
This study was conducted on 68 Egyptian patients admitted to the Urology Department, Faculty of Medicine, Ain Shams University Hospitals, Cairo, Egypt and the National Cancer Institute (NCI), Egypt. The study was approved by the Medical Ethical Committee of Ain Shams University, Faculty of Medicine.
Demographic data and medical history were obtained at the time of entry and those who receive any previous treatment were excluded from the study. Cytological test was performed on a voided urine sample collected from all patients on admission. Diagnosis of bladder cancer based on histopathological examination. Tumor staging was determined according to TNM classification (American Joint Committee on Cancer, 1997).
Grading was assessed according to criteria of International Society of Urological Pathology (ISUP) in 1998. Patients were classified into malignant and benign groups. The malignant group included 49 patients aged from 36-81 yrs, mean age was (62.31 yrs ± 10.33). 36 cases were diagnosed as transitional cell carcinoma (TCC), while 12 cases were squamous cell carcinoma (SCC) and 1 case was carcinoma in situ (CIS). Males consisted 89.8 % of malignant group and females represented 10.2 % of this group. The number of malignant patients with low grade is 39 and high grade is 10, while the number of malignant patients with respect to early stage is 28 and late stage is 21. The benign group consisted of 19 patients with benign urologic diseases, aged from 22-70 yrs with mean age (44.79 yrs ± 14.55). A group of 19 healthy volunteers, aged from 25-57 yrs with mean age (40.53 yrs ± 9.24) was also included.
Sample Collection:
Blood and voided urine samples were collected from all groups. Blood samples were centrifuged at 4000 xg for 10 min. Serum were separated and stored at -80 C until used for detecting bilharzial antibodies. Urine samples were centrifuged at 2500-4000 xg for 15-20 min and separated into urine supernatants and urine pellets. Urine supernatants were divided into two aliquots for sFas measurement by ELISA and protein measurement by Bradford. The conc of sfas determined by ELISA(pg/ml) is divided by the total protein conc determined by Bradford(mg/ml) so sfas conc will be pg /mg protein .The urinary sediment was washed with phosphate- buffered saline at PH 7. Pellets were used for cytological and microscopical examination. Detection of Schistomiasis antibodies in serum
Schistomiasis antibodies were detected in serum using indirect haemagglutination test (IHA) technique, according to (Zwingenberger et al., 1988).
Detection of sFas in the Urine of Bladder Cancer Patients
Detection of sFas in urine:
Human soluble fas (sFas) was determined using sandwich enzyme immunoassay technique according to (Bradford, 1976)
Statistical analysis:
Receiver operating characteristics (ROC) curve determined the threshold value for optimal sensitivity and specificity of sFas, which was constructed by calculating the true positive fraction (sensitivity percent) and false positive fraction (100-specificity) of marker at several cutoff points (Zweig and Campbell, 1993). Sensitivity, specificity, positive predictive value (PPV), negative predictive value (NPV) and accuracy were calculated. The chi-square test was used in studying the relation between variables and comparing the positivity rates. The level of significance was determined to be less than 0.05. All analysis was done using the Statistical Package for Social Science (SPSS Software version 15, Chicago, Illinois) on a personal computer.
RESULTS
The investigated sFas in the three studied groups The mean rank of sFas was significantly increased in malignant group compared to benign and healthy controls (p ≤ 0.01). There was a 1.39 fold increase in the mean rank of sFas in the malignant group as compared to benign group and a 2.58 fold increase as compared to normal group. Receiver operating characteristic (ROC) curve determined the threshold value for optimal sensitivity and specificity, which was constructed by calculating the true positive fraction (sensitivity percent) and false positive fraction (100-specificity) of sfas at several cutoff points. Accordingly, the best cutoff value by considering the benign and healthy normal groups as non malignant control group was 1630.46 pg/mg protein ( area under the curve : 0.781). Applying this cutoff value, the overall sensitivity of sFas was 75.5 % and specificity is 81.6 %.
Table (1) The concenteration of sFas( pg/mg) in different investigated groups
Group Median Range Mean Rank X2 P
Malignant 2257.6 160-12000 54.67
24.885 0.00 ** Benign 993.41 32.37 – 10277.5 39.26
Normal 390.63 50.87 2320 21.21
**Highly significant p value ≤ 0.01
Abeer I. Abdel-Fattah, et. Al.
Figure (1): The ROC curve analysis for sFas in malignant group versus benign and control
groups to calculate the best cutoff value. Area under the curve is 0.781; standard error is
0.054 and 95 % confidence limits are 0.675-0.887. Arrow denotes cutoff point at 1630.46
pg/mg protein, at which sFas sensitivity is 75.5 % and specificity is 81.6 %.
Table (2): The positivity of sFas in the different investigated groups according to the best
chosen cutoff value 1630.46 pg/mg proteins
Group sFas ≥ 1630.46 sFas <1630.46 Total No. (87) Statistics
Malignant 37 (75.5 % ) 12 ( 24.6 % ) 49
X2 = 30.537
P = 0.00**
Benign 6 (31.6 % ) 13 (68.4 % ) 19
Normal 1 ( 5.3 % ) 18 ( 94.7 % ) 19
**Highly significant p value ≤ 0.01
Detection of sFas in the Urine of Bladder Cancer Patients
Table (3): Correlation between sFas and clinicopathological factors in patients of bladder
cancer
Clinicopathological factor
Median Range Mean Rank
Total
No. Statistics
Sex
Male :
Female :
1865.9
583.09
32.37-12000
150.51-3847.4
47.43
27.53
72
15
Z =-2.775
P = 0.006
Smoking
Smoker:
Non smoker :
2046.7
1048.8
50.87-12000
32.37-10277.5
51.27
36.56
44
43
Z =-2.717
P = 0.007
Bilharziasis
Bilharzial :
Non bilharzial :
2116.7
5357
150.51-12000
32.37-5828.6
53.07
23.85
60
27
Z =-4.991
P = 0.00
Type
TCC :
SCC :
CIS :
2095.4
3010.8
6236.2
160.3-12000
382.8-6108.57
6236.2-6236.2
24.22
25.33
36
12
1
X2 = 0.057
P = 0.812
Grade
Low ( 1, 2 ) :
High ( 3 ) :
2006.7
3131.8
160.3-9544
238.2-12000
23.54
30.7
39
10
Z = - 1.414
P = 0.157
Stage
Superficial non muscle invasive ( 0,1 ) :
Muscle invasive (2, 3 ):
2095.6
2669
238.2-9544
160.3-12000
24.11
26.19
28
21
Z = - 0.505
P = 0.614
Cytology
+ ve :
- ve :
1970.2
2860.2
351.9-12000
160.3-8240.74
24.5
25.79
31
56
Z = -0.308
P = 0.758
* Significant p value <0.05
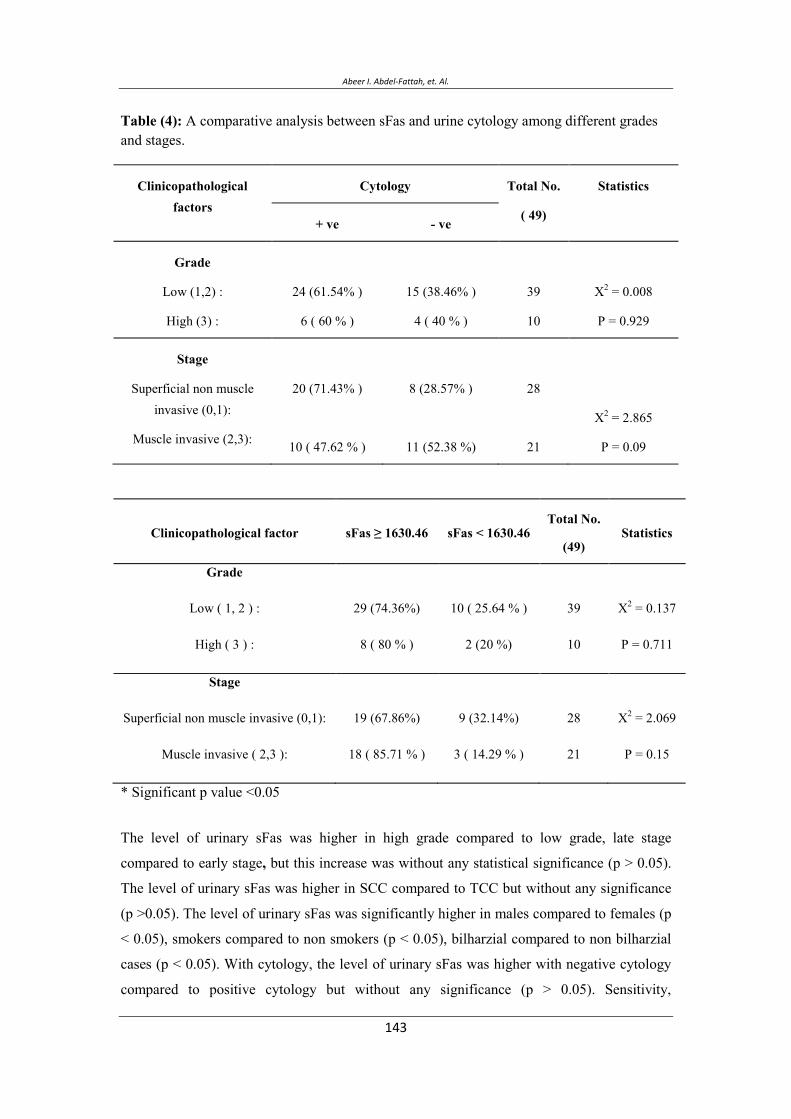
Abeer I. Abdel-Fattah, et. Al.
Table (4): A comparative analysis between sFas and urine cytology among different grades and stages.
Clinicopathological factors
Cytology Total No.
( 49)
Statistics
+ ve - ve
Grade
Low (1,2) :
High (3) :
24 (61.54% )
6 ( 60 % )
15 (38.46% )
4 ( 40 % )
39
10
X2 = 0.008
P = 0.929
Stage
Superficial non muscle invasive (0,1):
Muscle invasive (2,3):
20 (71.43% )
10 ( 47.62 % )
8 (28.57% )
11 (52.38 %)
28
21
X2 = 2.865
P = 0.09
Clinicopathological factor sFas ≥ 1630.46 sFas < 1630.46 Total No.
(49) Statistics
Grade
Low ( 1, 2 ) :
High ( 3 ) :
29 (74.36%)
8 ( 80 % )
10 ( 25.64 % )
2 (20 %)
39
10
X2 = 0.137
P = 0.711
Stage
Superficial non muscle invasive (0,1):
Muscle invasive ( 2,3 ):
19 (67.86%)
18 ( 85.71 % )
9 (32.14%)
3 ( 14.29 % )
28
21
X2 = 2.069
P = 0.15
* Significant p value <0.05
The level of urinary sFas was higher in high grade compared to low grade, late stage
compared to early stage, but this increase was without any statistical significance (p > 0.05).
The level of urinary sFas was higher in SCC compared to TCC but without any significance
(p >0.05). The level of urinary sFas was significantly higher in males compared to females (p
< 0.05), smokers compared to non smokers (p < 0.05), bilharzial compared to non bilharzial
cases (p < 0.05). With cytology, the level of urinary sFas was higher with negative cytology
compared to positive cytology but without any significance (p > 0.05). Sensitivity,

Detection of sFas in the Urine of Bladder Cancer Patients
specificity, PPV, NPV and accuracy of sFas. The sensitivity and specificity of urinary sFas
were 75.5% and 81.58% respectively. The sensitivity and specificity of urine cytology were
61.22% and 97.37% respectively. The PPV and NPV of urinary sFas were 84.09% and
72.09% respectively. The PPV and NPV of urine cytology were 96.77% and 66.07%
respectively. The overall sensitivity was increased in combination of both urinary sFas and
urine cytology from 75.5% and 61.22% respectively to 91.84 %. But; this combination didn't
increase the overall specificity.
CONCLUSION
An ideal bladder cancer monitoring test should be non invasive, objective, easy to perform
and interpret, with high sensitivity and specificity, and should provide an immediate or rapid
result (Chade et al., 2009). Cytology has low sensitivity and specificity, particularly for low-
grade tumors (Konety, 2006). In the present study the mean rank was compared between
different study groups. There was a 1.39 fold increase in the mean rank of sFas in the
malignant group as compared to benign group and a 2.58 fold increase as compared to normal
group. There is statistically significant difference between these values (p ≤ 0.01). This is in
agreement with (Shaker et al., 2009) who reported that serum sFas was found in 64.6% of
various bladder cancer lesions with a statistical significance increase compared to both
control and benign lesions. This suggests the functional role of sFas in antagonizing
apoptosis.
On correlating sFas levels with the studied clinicopathological factors in bladder cancer
group, Urinary sFas was highly expressed in bilharzial bladder cancer patients compared to
non bilharzial one (p = 0). This is in agreement with (Shaker et al., 2009), who detect serum
sFas by ELISA test in 66 % of schistosomal urothelial carcinoma, 47.6% of non schistosomal
urothelial carcinoma and 80% of SCC. Moreover, there was a significant increase of serum
sFas in schistosomal associated bladder cancer in comparison to non schistosomal one (p
0.001). This reveals that escaping apoptosis is one of the major pathogenesis of schistosomal
associated bladder cancer and suggests the usefuleness of sFas in diagnosing schistosomal
bladder cancer either TCC or SCC. However, we found that there is no correlation between
sFas levels and tumor grade or stage (p 0.05). This is inconsistent with (Shaker et al.,
2009), who reported by ELISA test , that serum sFas increased in high grade TCC to low
grade TCC (P < 0.01) and in invasive tumors compared to superficial tumors (P < 0.01) in all
65 bladder cancer patients. However, we found that there is no correlation between sFas
levels and tumor grade or stage (p 0.05). Our results are in agreement with those of
(Perabo et al., 2001) who reported that serum sFas detection by ELISA, showed that serum
Abeer I. Abdel-Fattah, et. Al.
sFas and tumor grade are not correlated in all 62 bladder cancer patients. However,
(Elbendary and Attia, 2009) reported that higher levels of urinary sFas are correlated with
higher tumor stage and grade. The positivity rate of sFas was significantly higher in
malignant group (75.5%) than benign (31.6 %) and normal control group (5.3 %) (p = 0.00).
The positivity rate of sFas was not significantly correlated to tumor grade or stage. This is in
agreement with (Mizutani et al., 2001) who reported no statistical differences with regard to
analysis of patient gender or the histologic tumor grade between patients with high and low
serum sFasL levels and (Mizutani et al., 1998) who reported no statistical differences in
patient's age and sex, as well as histological stage and grade of bladder cancer between the
patients with high and low levels of serum sFas.
In the relation between sFas and urine cytology, both were positive in 73.3 % of malignant
group cases, while 26.7% gave positive cytology but were sFas negative. Moreover 79% of
the malignant cases were negative cytology and positive sFas.
The combined use of urine cytology with our studied marker sFas increased urine cytology
sensitivity from 61.22 % to 91.84 %, while decreased its specificity from 97.37% to 81.58%.
CONCLUSION
A direct comparison between urine cytology and urinary sFas revealed that sFas has higher
sensitivity than urine cytology but lower specificity.
Using urinary sFas as a marker for detecting bladder cancer has the advantage of being a
quantitative test measured by ELISA which is of lower cost and easily performed than any
other molecular techniques. Also handling urine samples is much easier than blood samples.
ACKNOWLEDGMENT
This work was supported by the Egyptian Academy of Research and Technology, the
Technical development and Scientific Sector. The Science and Technology Center, Project21.
The authors acknowledge Dr. Kahled Kamel, Assistant Professor of Cytopathology at Early
Cancer Detection Unit, Faculty of Medicine, Ain Shams University, Cairo, Egypt for his help
in the cytological and pathological examinations of all investigated urine samples.
Detection of sFas in the Urine of Bladder Cancer Patients
REFERENCES
American Joint Committee on Cancer. (1997). Cancer Staging Manual.Philadelphia,Pa:Lippincot,Pa-Raven publishers,5th ed.,pp.,241-246.
Bewick, M., Conlon, M., Parissenti, A.M., Lee, H., Zhang, L., Glück, S., and Lafrenie, R.M. (2001). Soluble Fas (CD95) is a prognostic factor in patients with metastatic breast cancer undergoing high-dose chemotherapy and autologous stem cell transplantation. J Hematother Stem Cell Res. 10, 759-768.
Boroumand-Noughabi, S., Sima, H.R., Ghaffarzadehgan, K., Jafarzadeh, M., Raziee, H.R., Hosseinnezhad, H., Moaven, O., Rajabi-Mashhadi, M.T., Azarian, A.A.,Mashhadinejad, M., and Tavakkol-Afshari, J. (2010). Soluble Fas might serve as a diagnostic tool for gastric adenocarcinoma. BMC Cancer 10, 1471-2407.
Bradford, M.M. (1976). A rapid and sensitive method for quantitation of microgram quantities of protein utilizing the principle of protein-dye binding Anal Biochem. 72, 248.
Chade, D.C., Shariat, S.F., Godoy, G., Meryn, S., and Dalbagni, G. (2009). Critical review of biomarkers for the early detection and surveillance of bladder cancer. jmh 6, 368-382.
Chaudhry, P., Srinivasan, R., Patel, F.D., Gopalan, S., and Majumdar, S. (2008). Serum soluble Fas levels and prediction of response to platinum-based chemotherapy in epithelial ovarian cancer. Int J Cancer 122, 1716-1721.
Colombel, M., Soloway, M., Akaza, H., Böhle, A., Palou, J., Buckley, R., Lamm, D.,Brausi, M., Witjes, J.A., and Persad, R. (2008). Epidemiology,Staging, Grading, and Risk Stratification of Bladder Cancer. European urology supplements 7, 618-626.
Elbendary, M.A., and Attia, M.A. (2009). The Use of Urinary Soluble Fas for Detection of Tumor Recurrence in Patients with Superficial Bladder Cancer. Tanta Med. Sc. J 4, 22-29.
Gratas, C., Tohma, Y., Barnas, C., Taniere, P., Hainaut, P., and Ohgaki, H. (1998). Up-regulation of Fas (APO-1/CD95) ligand and down-regulation of Fas expression in human esophageal cancer. Cancer Res. 58, 2057-2062.
Hodges, K.B., Lopez-Beltran, A., Davidson, D.D., Montironi, R., and Cheng, L. (2010). Urothelial dysplasia and other flat lesions of the urinary bladder: clinicopathologic and molecular features. Human Pathology 41, 155-162.

Abeer I. Abdel-Fattah, et. Al.
Hwang, E.C., Choi, H.S., Jung, S.I., Kwon, D.D., Park, K., and Ryu, S.B. (2011). Use of the NMP22 BladderChek Test in the Diagnosis and Follow-Up of Urothelial Cancer: A Cross-sectional Study. Urology 77, 154-159.
Jemal, A., Siegel, R., Ward, E., Hao, Y., Xu, J., and Murray, T. (2008). Cancer statistics, 2008. CA: Cancer J Clin 58, 71-96.
Jodo, S., Kobayashi, S., Nakajima, Y., Matsunaga, T., Nakayama, N., Ogura, N.,Kayagaki, N., Okumura, K., and Koike, T. (1998). Elevated serum levels of soluble Fas/APO-1 (CD95) in patients with hepatocellular carcinoma. Clin Exp Immunol. 112, 166-171.
Konety, B.R. (2006). Molecular markers in bladder cancer: A critical appraisal . Urologic Oncology 24 326-337.
Labbe, K., and Saleh, M. (2008). Cell death in the host response to infection. Cell Death Differ 15, 1339-1349.
Lima, L., Morais, A., Lobo, F., Calais-da-Silva, F., Calais-da-Silva, F., and Medeiros, R. (2008). Association between FAS polymorphism and prostate cancer development. Prostate Cancer and Prostatic Diseases 11, 94-98.
Mizutani, Y., Yoshida, O., and Bonavida, B. (1998). Prognostic significance of soluble Fas in the serum of patients with bladder cancer. J Urol 160, 571-576.
Mizutani, Y., Hongo, F., Sato, N., Ogawa, O., Yoshida, O., and Miki, T. (2001). Significance of Serum Soluble Fas Ligand in Patients with Bladder Carcinoma. Cancer 92, 287-293.
Perabo, F.G.E., Mattes, R.H., Wirger, A., Steiner, G., Kamp, S., Schmidta, D., Pegelow, K., Von-Ruecker, A., and Müller, S.C. (2001). Soluble Fas and Fas-ligand in bladder cancer in vitro and in vivo. Urologic Oncology 6, 163-169.
Sahin, M., Aydıntug, O., Tunc, S.E., Tutkak, H., and Nazıroğlu, M. (2007). Serum soluble Fas levels in patients with autoimmune rheumatic diseases. Clinical Biochemistry 40, 6-10.
Shaker, O.G., Hammam, O., Salehd, A., Leithy, T.E., and Wishahi, M. (2009). Possible role of telomerase and sFas in pathogenesis of various bladder lesions associated with schistosomiasis. Clinical Biochemistry 42, 864-872.
Shimizu, M., Kondo, M., Ito, Y., Kume, H., Suzuki, R., and Yamaki, K. (2005). Soluble Fas and Fas ligand provide new information on metastasis and response to chemotherapy in SCLC patients. Cancer Detect Prev. 29, 175-180.

Detection of sFas in the Urine of Bladder Cancer Patients
Svatek, R.S., Herman, M.P., Lotan, Y., Casella, R., Hsieh, J.-T., Sagalowsky, A.I., and Shariat, S.F. (2006). Soluble Fas—A Promising Novel Urinary Marker for the Detection of Recurrent Superficial Bladder Cancer. Cancer 106, 1701-1707.
Vicencio, J.M., Galluzzi, L., Tajeddine, N., Ortiz, C., Criollo, A., Tasdemir, E., Morselli, E., Younes, A.B., Maiuri, M.C., Lavandero, S., and Kroemer, G. (2008). Senescence, apoptosis or autophagy? When a damaged cell must decide its path-a mini-review. Gerontology 54, 92-99.
Zarzour, A.H., Selim, M., Abd-Elsayed, A.A., Hameed, D.A., and AbdelAziz, M.A. (2008). Muscle invasive bladder cancer in Upper Egypt: the shift in risk factors and tumor characteristics. BMC Cancer 8:250.
Zweig, M.H., and Campbell, G. (1993). Receiver-operating characterestic (ROC) plots: a fundamental evaluation tool in clinical medicine. Clinical Chemistry 39, 561-577.
Zwingenberger ,K., Harms, G., feldmeier , H., Muller,O., Steiner,A., and Bienzle, U. (1988). Liver involvement in human schitomiasis mansoni . Regression of immunological and biochemical disease markers after specific treatment. Acta tropica 45, 263-275.
Abeer I. Abdel-Fattah, et. Al.
***ش ش ی ** *
ی ش*
ی **
*** ح
ی ح ی ح
. ی : ص ی ت ح ح .
ی ت ت ح ی ی. ی ت
. ح خص ح ی ت ح
ت ت *.
:ثث ت ش ص ث ت تت- ت . ی. ح ت ت ی-. ت ت ش-
:تح ت - .خ ث .ت -- ..ت ت -- .ی ت ی
:, ت , ص ,ح - ی
, ,.. خ ت -., ح -- ت , یی ح
., ت ی ت . خ ی :ص ی خ. . .

Detection of sFas in the Urine of Bladder Cancer Patients

Synthesis and Characterization of Some Novel Schiff Base Metal Complexes and the investigation of their Cytotoxic Activity on MCF- Cell ine
Selection of Local Cellulolytic Isolates from Plant Pathogenic Bacteria Ghanem R.,(1) Abu-ghorrah M.(2) and Azmeh M. F.(1,2)
(1) The National Commission for Biotechnology, Damascus.
(2) Department of Plant Protection, Faculty of Agriculture, Damascus University.
Corresponding author: Email: [email protected], [email protected]
ABSTRACT
Problems concerning energy and environment have been intensified in the recent decades. Global demand for energy sources is growing because of population growth and economic activity, while traditional energy sources are becoming limited. For this reason, intensive research is done for alternative renewable sources of energy, such as biomass, which is considered safer and cleaner than fossil fuels. In this perspective, the role of cellulase enzyme complex is essential, and some plant pathogenic bacteria are promising for a high level of cellulase secretion. The aim of this research is to identify potent bacterial strains for biodegradation of cellulose and hemicellulose to produce glucose and xylose.
For this purpose, 15 isolates of Erwinia sp. (from potato), 18 isolates of Xanthomonas sp. (from cotton and wheat), and 11 isolates of Bacillus sp. (from tomatoes) were purified and tested for cellulase secretion using Carboxymethyl Cellulose (1%) medium as substrate. In addition, cellulase activity has been estimated by measuring glucose produced by spectrophotometry. Significant differences in cellulase activity were found between bacterial genera tested. Strains belonging to Erwinia were the most efficient compared to isolates from other genera. Isolate A10-1 of Erwinia carotovora subsp. Carotovora showed to be the most efficient (mean of enzyme efficiency 3.86, and mean of enzyme activity 0.38 U/ml).
Keywords: Cellulase, Plant pathogenic bacteria, Erwinia.
Vol. 12, 2012 JBR ORIGINAL ARTICLE

Selection of Local Cellulolytic Isolates from Plant Pathogenic bacteria
)( )( )(
- -.Email: [email protected], [email protected]
- - - .
ح ت خ خ . ت ص
)Biomass( ح ح ح س ح
)Fossil fuel .( ت Cellulase complex ح . ت ئ ئ
.
س س س س خ Erwinia جح خ س
) ( Xanthomonas خ Bacillus Carboxymethylث خ ت س س)(خ
cellulose %ئ ج ج . سس ت . Xanthomonasث Bacillus ت Erwiniaح ت %
A10-1 ت Erwinia carotovora subsp. carotovora ح س ./ ح .س .
.Erwinia ب س: ح
م
ب تت ص ئ )1( ت ) ئ(ئ
)Bioethanol ( ئ)(س ت ح س ).2Ethanol ( خ ت ) Butanol( ت
تت ).Lignocellulosic Biomass()3( س ) ( ت ت
ت ب ح ب بس . (4) ب ئ ح س س (5)ب
).6( س :Endoglucanase ئ ب 1,4- ب
Azmeh M. F., et. Al.
Exoglucanase ب 1,4- ب Cellubiose خ-D-glucosidase 7( ب.(
Actinomycetesت ئ ح . Trichodermaح ت ب سس ب
,8(بب ب ح ت س ح ).9 :BacillusCellulomonas Clostridium Erwinia Bacteriodes
Ruminococcus Thermomonospora Streptomyces Acetovibrio Microbispora ح ب ب خ ئ
:Bacteriodes cellulosolvens Clostridium thermocellum )10.( ح ت ب ت
ت )11( ت) خص س ( ).12( ئ ت ت ب س س
Pseudomonas panici: ت solanacearum Ps. Xanthomonas campestrisX. citriX. nigromaculans X.
oryzae X.pisi X. pruniX. vesicatoriaErwinia carotovora E.chrysanthemiE. milletiaeCorynebacterium sepedonicum )13.(
.E.carotovora SR38 Eح ئ حChrysanthemi EC16 )بخ Operon PET ( Co2
/ ح ت ب / /.ب س سب
)14( Brettanomyces سب بس بت custersii )6.(خ ب Escherichia coli KO11
Endoglucanase E. chrysanthemi P86021 ح ح.Eب )CMC Substrate )15 س س ئ coli B
)Endoglucanase Z )celZ خ )out gene (E. chrysanthemi EC16 ح/ Endoglucanase
Zhou Ingram ش).16( ت %- شح )17( CelZ CelY E. chrysanthemi 3937 ت CMC ب
. Endoglucanase Z )Cel5Z (ت E. chrysanthemi PY35 ) C-terminal(ب ب %ب س بش
ب س ).18( ت .ت ت
- :
Erwinia : ب تخ Bacillus Xanthomonas )(
. ب

Selection of Local Cellulolytic Isolates from Plant Pathogenic bacteria
: س -
ئ LBس س خ ب ص ئ . س ° ح ح ح
OD600=0.1 ح ب ت ت /)CFU/ml .( ب CMC CMC س
KH2Po4.MgSo4.7H2O.NaCl . FeSo4.7H2O خ.NH4.NO3 . ) ()( ح
خ . س °ح % ب ئ ح ح س ح
NaCl )1M( . ش ح )ش . Endoglucanase س CMC ت)
ب CMC ت حئ بس)19( ت ب
.SPSSب
- Endoglucanase (CMCase):
) A10-1, 310-1, 288-1, RG3-1, O127-2(ت خ .E( ت carotovora subsp. carotovora, E. carotovora subsp. atroseptica,
E. chrysanthemi,
X. campestris pv malvasearum, Bacillus sp. ( ت ح خ . CMC خ ت
Rajoka and Malik )20(ب شDinitrosalicylic acid(DNS) CMC .سس
:ت --
. CMC ب س سئ MgSO4.7H2Oس °ح ح )Rotary
Shaker (ص ئ / ب )OD600=0.1 (g 6000 ب ). CFU/ml(/ ح تب ت
° ح Endoglucanase ئ).21(خ
-- :
.خ: ب )Rajoka and Malik )20 خ ح ( ئ . )ب CMC )(%
0.05M Citrate buffer )PH=.(ح ح ° ئ ب ح ئ DNS ش

Azmeh M. F., et. Al.
ب خ ص . Citrate buffer س ئ. ح بس س .
ت ش ح ح ح ئ خ ح ت ) ب (
)22.(
: س --
.خ: ب )Rajoka and Malik )20 خ ح ./) .. .. .( ت
. . ب خ Citrate buffer 0.05 M)PH=.( ح °ح DNS ح ئ ئ
. س خ ص س ب ت . Citrate buffer ب
).ش( ص
: س-
س ح ت )ش( سس CMCب )19(
Endoglucanase خ ).7(ب خ Erwinia Bacillus س CMC ت Xanthomonas ب
ح ت% ب س Erwinia ت .بس Bacillus ح .بس Xanthomonas ح ت ).ش( .ت خ بس
Erwinia Bacillus Soft-rot group )11( ت ب سس
ت ت س ).24 ,23( ت ت
( ت ت Xanthomonas ( EPS س
)Exopolysaccharides (ت )25.(
س ب CMC ت ت) ح ح( ت خ بخ )ش(
.بس E.c.cح ت ت ).26( E.c.a E.ch ب ب ت ب ت خ بس %

Selection of Local Cellulolytic Isolates from Plant Pathogenic bacteria
/ ( تح س . . . (. A10-1 ت E.c.c ت خ . 288-2-3 E.ch )ش( Erwiniaسس ب
)23( ت ت E.carotovora celV celS ب Endoglucanaseح ت
)27.( Walker )28( celV % )Cooper and Salmond )29 ب. ح
celV Exoglucanase .ت بE.chrysanthemi Endoglucanase celY celZ .celZ % )30(
ب ت ب E.carotovora ت ت
ت ح ب).31(ت ب سس ت ب)°( E.atrosepticaس
E.chrysanthemi E.carotovora . ت ت )32( E.atroseptica ئ ت)°(
).33(° ح ت
Bacillus خ ب)( ب ب ئ ببس % ب O127-2ح CMCت بس Bacillus ت خ O102-2-2ب ت . ).ش( .
ت Bacillus ب ش س .Bب خ ح polymyxa ت ح
ت ب س )Priest )34ت .B. ب subtilis س س)35 ,34( ب سب
بس Bacillusح س )19, 36 .(
ح ت س CMC ت Xanthomonas ت X. translucens ب ب)37( ب ب س
X. campestris pv malvacearum ب RG3-1 بس 2.55 RG1-1 ب .بسRG4 RG5
RG5-1 ش( س.( X. campestris ) خ EPSت ت )
).39 ,38(ب سس بت
Azmeh M. F., et. Al.
- :
) A10-1, 310-1, 288-1, RG3-1, O127-2( خ .E ت carotovora subsp. carotovora, E. carotovora subsp.
atroseptica,
E. chrysanthemi, X. campestris malvasearum, Bacillus sp. ت DNSس . CMC خ ت
Endoglucanase حRajoka and Malik )20( ح ت ح ./ س ت بح بس
ح ئ خ )ش%( (A10-1) . ب/ح
./ ح RG3-1 0.059 ب %
ئ س ح Endoglucanaseت ئ سE. chrysanthemi . 40( س /ح( B. pumilis
)41(/ح . .Bب licheniformis 42(/ح .ت.(خ خ ئ ب خ : س
ت حس DNS ح )43.(
خ س ب ت .Erwinia A10-1 E ب carotovora
carotovora . س س ب .
Bhat, M., Bhat, S.1997. Cellulose Degrading Enzymes and their Potential Industrial
Application. Biotech. Adv. 15:583-620.
Rakshit, S. K., Haki, G. D. 2003. Development in Industrially Important
Thermostable Enzymes. Bioresource Technology. 89:17-34.
Wilson, D. B. 2009. Cellulases and Biofuels. Current Opinion in Biotechnology.
20:295-299.
Liden, G., Olofsson, K., Bertilsson, M. 2008. SSF- an Intersting Process Option for
Ethanol Production from Lignocellulosic Feedstocks. Biotechnology for
Biofuels.1(7):14pp.
Selection of Local Cellulolytic Isolates from Plant Pathogenic bacteria
Pandey, A., Sukumaran, R. K., Singhania, R. R. 2005. Microbial Cellulases:
Production, Application and Challenges. J. Scientific and Industrial Research.
64:832-844.
Aristidou, A., Penttila, M. 2000. Metabolic Engineering Applications to Renewable
Resource Utilization. Biotech. Eng. 11:187-198.
Percival, Z. Y. H., Himmel, M. E., and Mielenz, J. R. 2006. Outlook for cellulase
improvement: screening and selection strategies. Biotechnology Advances.
(24):452-481.
Peciulyte, D. 2007. Isolation of cellulolytic Fungi from Waste Paper Gradual
Recycling Materials. EKOLOGIJA. 53(4):11-18.
Dashtban, M., Schraft, H., Qin, W. 2009. Fungal Bioconversion of Lignocellulosic
Residues; Opportunities and Perspectives. Int. J. Bid. Sci. 5(6):578-595.
Cheng, J., Sun, Y. 2002. Hydrolysis of Lignocellulosic Materials for Ethanol
Production. Bioresource Technology. 83:1-11.
Agrios, G. N. 2005. Plant Pathology. 5th E.D. Elsevier Academic Press. 922pp.
Kunkel, B. N., and Chen, Z. 2006. Virulence Strategies of Plant Pathogenic
Bacteria. The Prokaryotes. Springer New York Publisher. 2:421-440.
Masao, G., Norio, O. 1958. Cellulolytic Activity of Phytopathogenic Bacteria.
Nature. 182.p1516.
Beall, D. S., Ingram, L. O. 1993. Genetic Engineering of Soft-Rot Bacteria For
Ethanol Production from Lignocellose.JIM. 11:151-155.
Wood, B. E., Beall, D. S., Ingram, L. O. 1997. Production of Recombinant Bacterial
Endoglucanase as a Co-Product with Ethanol During Fermentation Using
Derivative of Escherichia coli KOLL. Biotechnol. Bioeng. 55(3):547-555.
Ingram, L. O., Zhou, S., Yomano, L. P., Saleh, A. Z., Davis, F. C., Aldrich, H. C.
1999. Enhancement of Expression and Apparent Secretion of Erwinia
chrysanthemi Endoglucanase (Encoded by CelZ) in Escherichia coliB. Appl.
Environ. Micro. 65(6):2439-2445.
Zhou, S. Ingram, L. O. 2000. Synergistic Hydrolysis of Carboxymethyl Cellulose
and Acid-Swollen Cellulose by Two Endoglucanases (CelZ and CelY) from
Erwinia chrysanthemi. J. Bacteriol. 182:5676-5682.

Azmeh M. F., et. Al.
Lim, W. J., Hong, S. Y., An, C. L., Cho, K. M., Choi, B. R., Kim, Y. K., An, J.
M., Kang, J. M., Lee, S. M., Cho, S. J., and Yun, H. D. 2005. Construction of
Minimum Size Cellulase (Cel5Z) from Pectobacterium chrysanthemi PY35 by
Removal of the C-terminal region. Appl Microbiol Biotechnol. (68):46-52.
Ariffin, H., Abdullah, N., Hassan, M. A., Shirai, Y., Umikalsom, M. S.
2006.Production and Characterisation of Cellulase by Bacillus Pumilus EB3. J.
Eng. Tech. 3(1):47-53.
Rajoka, M. I., Malik, K. A. 1997. Cellulase Production by Cellulomonas biazotea
Cultured in Media Containing Different Cellulosic Substrates. Bioresource
Technology. 59(1):21-27.
Bakare, M. K., Adewale, I. O., Ajayi, A., Shonokan, O. O. 2005. Purification and
Characterization of Cellulase from the Wild-Type and Two Improved Mutants
of Pseudomonas Flurescens. African Journal of Biotechnology. 4(9):898-904.
Wood, T.M. and Bhat, K.M. 1998. Method for measuring cellulase activities.
Methods in Enzymology. Cellulose and Hemicellulose, eds W.A. Wood and
J.A. Kellogg. Academic Press, New York.160:87-112.
Toth, I. K., Bell, K. S., Holeva, M. C., Birch, P. R. J. 2003. Soft Rot Erwinia: from
Genes to Genomes. Mol. P. Pathol. 4(1):17-30.
Priest, F. G., Goodfellow, M., Todd, C. 1988. A Numerical Classification of the
Genus Bacillus. J. Gen. Microbiol. 134:1847-1882.
Alfano, J. R., Collmer, A. 1996. Bacterial pathogens in plants Life up Against the
Wall. The Plant Cell. 8:1683-1698.
Nunn, D. 1999. Bacterial Type Protein Export and Pilus Biogenesis: more than Just
Homologies? Trends Cell Biology. 9:402-408.
Saarilahti, H. T., Henrissat, B., Palva, E. T. 1990. CelS: an Novel Endoglucanase
Identified from Erwinia carotovora subsp. carotovora. J. Gene. 90: 9-14.
Walker, D. S., Reeves, P. J., Salmond, G. P. C. 1994. The Major Secreted
Cellulase, CelV, of E. carotovora subsp. carotovora is an Important Soft Rot
Virulence Factor. MPMI. 7(3):425-431.
Cooper, V. J. C., Salmond, G. P. C. 1993. Molecular Analysis of the Major
Cellulase (CelV) of Erwinia carotovora: Evidence for an Evolutionary” Mix-
and-Match” of Enzyme Domains. Mol. Gen. Genet. 241:341-350.
Selection of Local Cellulolytic Isolates from Plant Pathogenic bacteria
Reverchon, S., Nasser, W., Robert, J. 1994. Pec: a Locus Controlling Pectinase,
Cellulase and Blue Pigment Production in Erwinia chrysanthemi. Mol.
Microbiol. 11(6): 1127-1139.
Salmond, G. P. C. 1994. Secretion of Extracellular Virulence Factor by Plant
Pathogenic Bacteria. Annu. Rev. Phytopathol. 32:181-200.
Peltzer, S., Sivasithamparam, K. 1985. Soft-Rot Erwinias and Stem Rot in
Potatoes. Australian Journal of Experimental Agriculture. 25:693-699.
Stommel, J. R., Goth, R. W., Haynes, K. G., Kim, S. H. 1996. Pepper (Capsicum
annum) Soft-rot Caused by Erwinia carotovora subsp. atroseptica. Plant
Disease. 80:1109-1112.
Priest, F. G., 1977. Extracellular Enzyme Synthesis in the Genus Bacillus. Bacteriol.
Rev. 41(3): 711-753.
Liao, C. H., Mcevoy, J. L., Smith, J. L. 2003. Control of Bacterial Soft Rot and
Food Borne Human Pathogens on Fresh Fruits and Vegetables. Advances in
Plant Disease Management.3pp
Ayub, M. A. Z., Heck, J. X., Hertz, P. F. 2002. Cellulase and Xylanase Production
by Isolated Amazon Bacillus Strains Using Soybean Residue Based Solid-State
Cultivation. Brazilian Journal of Microbiology. 33:213-218.
Gough, C. I., Dow, J. M., Barber, C. E., Daniels, M. J. 1988. Cloning of Two
Endoglucanase Genes of Xanthomonas campestris pv. campestris: Analysis of
the Role of the Major Endoglucanase in Pathogenicity. MPMI. 1(7):275-281.
Osbourn, A. E., Clarke, B. R., Daniels, M. J. 1990. Identification and DNA
Sequence of Pathogenecity Gene of Xanthomonas campestris pv campestris.
Mol. Plan. Micro.Int.3(5):280-285.
Poplawsky, A. R., Chun, W., Slater, H., Daniels, M. J., Dow, J. M. 1998.
Synthesis of Extracellular Polysaccharide, Extracellular Enzymes and
Xanthomonadin in Xanthomonas campestris: Evidence for the Involvement of
two Intracellular Regulatory Signals. MPMI. 11(1):68-70.
Baratti, J. C., Goachet, N. B., Gunasekaran, P., Cami, B. 1989. Trnsfer and
Expression of an Erwinia Chrysanthemi Cellulase Gene in Zymomonas Mobilis.
J. G. Micro. 135:893-902.
Azmeh M. F., et. Al.
Ariffin, H., Hassan, M. A., Mdshah, U. K., Abdullah, N., Ghazali, F. M., Shirai,
Y. 2008. Production of Bacterial Endoglucanase from Pretreated Oil Palm
Empty Fruit Banch by Bacillus Pumilus Eb3. J. of Bioscience and
Bioengineering. 106(3):231-236.
Acharya, S., Chaudhary, A. 2011. Effect of Nutritional and Environmental Factor
on Cellulase Activity by Thermophilic Bacteria Isolated from Hot Spring. J.
Scientific and Industrial Research. 70:142-148.
Gusakov, A. V., Kondratyeva, E. G., Sinitsyn, A. P. 2011. Comparison of Two Methods for Assaying Reducing Sugars in the Determination of Carbohydrase Activities. Int. J. Ana. Chem. 2011.4pp.

Selection of Local Cellulolytic Isolates from Plant Pathogenic bacteria
:م
.س ح ):(
):(
)س ت(
A10.1 AE.carotovora subsp carotovora
) (
144-2 A≈
143-2 A≈
A24 A≈
143-1 A≈
288-1 AE.chrysanthemi
) (
EchD A≈
288-2-2 A≈
288-2-1 A≈
288-2-3 A≈
310-1 AE.carotovora subsp atroseptica
a
b
.CMC س)b(ح )a(خ ):(
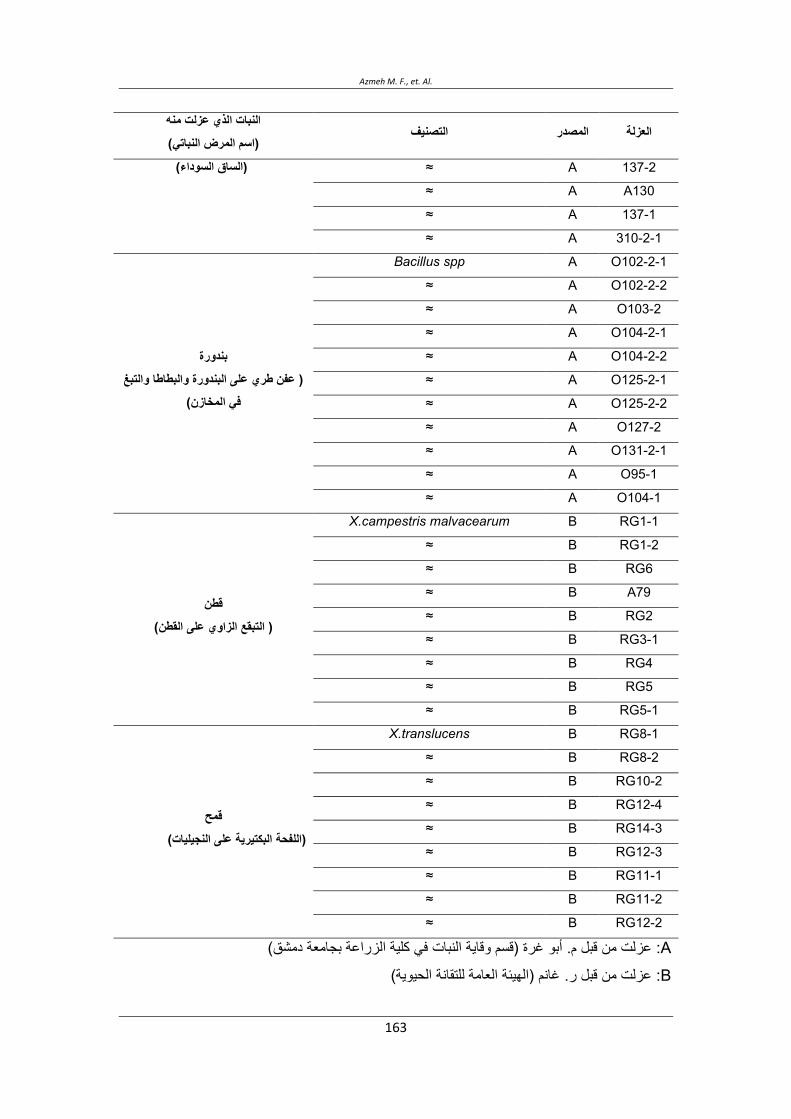
Azmeh M. F., et. Al.
)س ت(
137-2 A≈) (
A130 A≈
137-1 A≈
310-2-1 A≈
O102-2-1 ABacillus spp
) (
O102-2-2 A≈
O103-2 A≈
O104-2-1 A≈
O104-2-2 A≈
O125-2-1 A≈
O125-2-2 A≈
O127-2 A≈
O131-2-1 A≈
O95-1 A≈
O104-1 A≈
RG1-1 BX.campestris malvacearum
) (
RG1-2 B≈
RG6 B≈
A79 B≈
RG2 B≈
RG3-1 B≈
RG4 B≈
RG5 B≈
RG5-1 B≈
RG8-1 BX.translucens
) (
RG8-2 B≈
RG10-2 B≈
RG12-4 B≈
RG14-3 B≈
RG12-3 B≈
RG11-1 B≈
RG11-2 B≈
RG12-2 B≈
A: ) ب (ب .
B: .) (
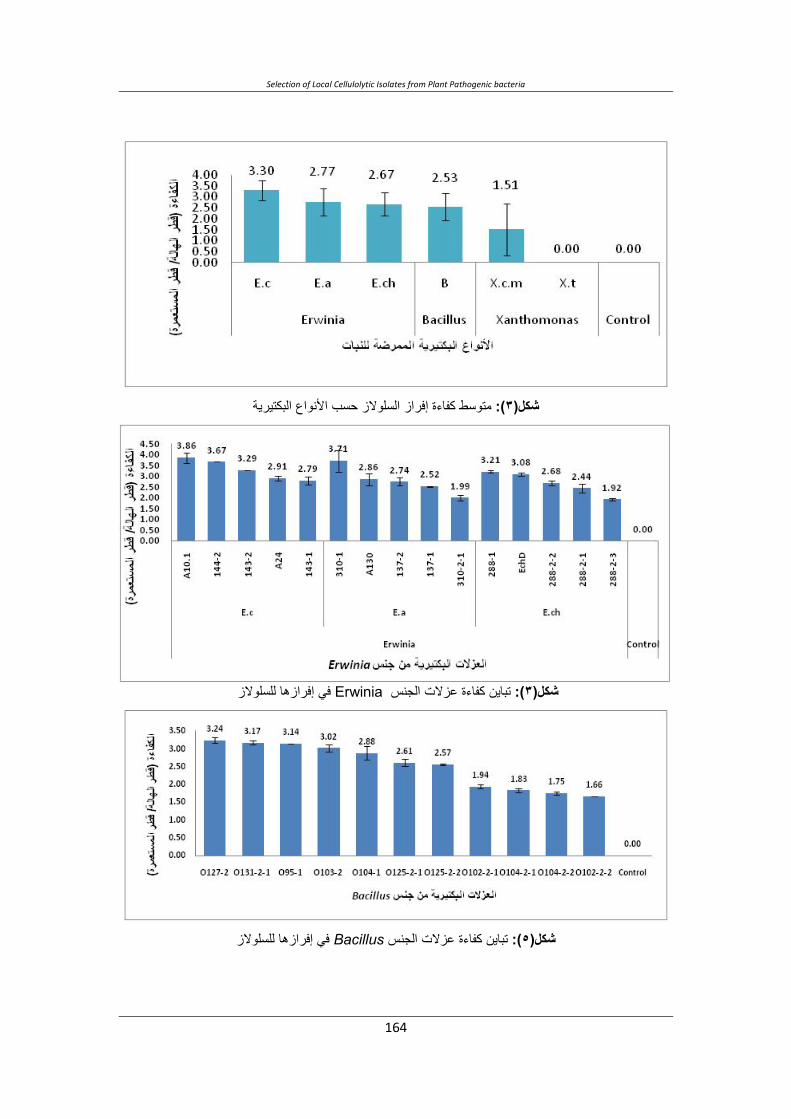
Selection of Local Cellulolytic Isolates from Plant Pathogenic bacteria
س ح ):(
Erwinia ت ):(
Bacillusت ):(

Azmeh M. F., et. Al.
.X ب ):( campestris pv malvacearum
اQWXWYP اLNONP QRSTUPآLز):(
):(

Selection of Local Cellulolytic Isolates from Plant Pathogenic bacteria
Isolation, Selection and Identification from Qatari Soils of New Streptomyces Strains Producing Antimicrobial Activities
Roda AL-Thani1, Lobna Elleuch2, Mariam El Amadi1, Ines Karray-Rebai2, Samir Bejar2 and
Lotfi Mellouli*2
1. Dept .of Biological and Environmental Sciences, Faculty of Arts and Sciences,Qatar University.
2. Laboratory of Microorganisms and Biomolecules of the Centre of Biotechnology of Sfax, Road of
Sidi Mansour Km 6, P.O. Box '1177” 3018, Sfax-Tunisia,
*Correspondence author: Prof. MELLOULI Lotfi: Laboratory of Microorganisms and
Biomolecules of the Centre of Biotechnology of Sfax, Road of Sidi Mansour Km 6, P.O. Box
'1177” 3018, Sfax - Tunisia,
Corresponding author E-mail address: [email protected]
ABSTRACT Three new actinomycete strains called QS1, QS5 and QS20 were isolated from different Qatari habitats and selected for their antimicrobial activities against Gram positive and Gram negative bacteria and fungi. Based on the results of cultural characteristics studies of these three strains, the whole nucleotide sequences of the corresponding 16S rRNA genes (strain QS1: accession n° HE584614), (strain QS5: accession n° HE584615) and (strain QS20: accession n° HE584616) and the phylogenetic analysis, we propose the assignment of our new isolates as: Streptomyces sp. QS1, Streptomyces sp. QS5 and Streptomyces sp. QS20 strains. These three studied strains exhibited ability to grow and produce active molecules in presence of the five tested carbon sources (starch, fructose, glycerol, glucose and saccharose) used as sole carbon source at 1 % (w/v) in the TSB medium. For the two strains Streptomyces sp. QS1 and Streptomyces sp. QS20, the maximum biological activity production was reached when saccharose was served as carbon source. Concerning the strain Streptomyces sp. QS5, maximum biological activity production was obtained in presence of starch as carbon source.
Keywords: Qatari soils, Actinomycetes bacteria, Identification, Antimicrobial activities
INTRODUCTION
In human medicine, the resistance of a large number of pathogenic bacteria and fungi to bioactive secondary metabolites in common use is presently an urgent focus of research and new antimicrobial molecules are necessary to combat these pathogens. In addition, in agriculture field, the application of synthetic fungicides against phytopathogens causes heavy
Vol. 12, 2012 JBR ORIGINAL ARTICLE
Samir Bejar, et. al.
toxicity to human being, domestic animals, etc. Like human pathogenic microorganisms, phytopathogens are also prone to developing drug resistances to decrease substantially the effectiveness of these pesticides. Accordingly, there is an urgent need to work towards the search of safer antimicrobial agents which are expected to be renewable, non-petrochemical, naturally and eco-friendly. Microorganisms provide a number of potentially useful active natural products, some of them are in clinical use since a long time.
Filamentous soil bacteria belonging to the genus Streptomyces are rich sources of a variety of bioactive natural products. The commercially and medically useful pharmaceuticals and agrochemical products were attributed to this kind of bacteria which produce about 75 % of the commercially and medically useful antibiotics (Miyadoh, 1993), and approximately 60 % of antibiotics developed for agricultural use were isolated from Streptomyces species (Tanaka and Mura, 1993).
In the present work, we describe the isolation and the selection of new actinomycetes bacteria, from different Qatari habitats, producing antimicrobial (antibacterial and antifungal) activities. The identification using morphological and molecular techniques and the determination of the phylogeny of the selected strains as well as the optimization of the carbon source for active molecules production are also addressed.
MATERIAL AND METHODS
Bacterial strains plasmids and primers:
Bacterial strains, plasmids and primers used in this work are listed in Table 1.
Culture conditions:
E. coli DH5 was grown on Luria-Bertani (LB) plates supplemented with ampicillin (50 g/ ml) and 5-bromo-4-chloro-3-indolyl--D-galactopyranoside (40 g/ml) when appropriate (Sambrook et al., 1989). Transformation of E. coli DH5 with pGM-T Easy derivatives was carried out according to Hanahan (1983).
For the isolation of actinomycetes strains belongs to the Streptomyces genus, soil and water samples collected from different regions of Qatar, were spreaded on solid boiled bran barley medium (Mellouli et al., 1996): After incubation at 30 °C for several days, colonies showing sporulation and filamentous aspect were picked and propagated on the same solid medium. Obtained strains were tested for their capacity to produce active secondary metabolites (antibacterial and antifungal) and enzymes (-amylases, proteases and isomerases).
For antibacterial activities determination, indicator microorganisms were grown overnight in LB medium at 30 °C for: M. luteus LB14110 and S. enterica ATCC 43972, at 37°C for:
Isolation, Selection and Identification from Qatari Soils of New Streptomyces Strains Producing Antimicrobial Activities
S.aureus 6538, L. ivanovii BUG 496 and E. coli ATCC 8739 and at 28 °C for A. tumefaciens, then diluted 1:100 in LB medium and incubated for 5 h for all used indicator bacteria, except A. tumefaciens which was incubated for 48 h, under constant agitation of 200 rpm at the appropriate temperature. For antifungal testing, Fusarium sp. was grown in Potato dextrose Agar (PDA) for 7 days at 30 °C. Spores were collected in sterile distilled water and then concentrated to produce a suspension with approximately 104 spores/ml. C. tropicalis R2 CIP203 was grown in YP10 medium (10 g/l yeast extract, 10 g/l peptone, 100 g/l glucose, 15 ml of 2 g/l adenine solution) at 30°C for 24 h in an orbital incubator with shaking at 200 rpm.
Strains QS1, QS5 and QS20 were grown in tryptic soy broth (TSB) medium for the preparation of genomic DNA (Hopwood et al., 1985). Cultural characteristics of these three strains were compared on the basis of observations made after 7, 14 and 21 days incubation on nutrient agar, Sabouraud agar and yeast malt agar media (Lechevalier et al., 1989). To investigate the influence of the carbon sources on bioactive molecules production, spores at 107 ml-1 were used to inoculate 1000 ml Erlenmeyer flasks with four indents, containing 200 ml of (TSB) supplemented at 1% (w/v) with one of the five tested carbon sources (starch, fructose, glycerol, glucose and saccharose). After incubation at 30 °C for 72 h in an orbital incubator, biological activities were assayed for each culture supernatant.
Antimicrobial assays:
To isolate new actinomycete strains producing antimicrobial activities, we have used the solid media bioassay test against the eight used indicator microorganisms (Table 1). After incubation of the isolated strains for 7 days at the appropriate growth temperature, and for antibacterial activities, plates were covered by 3 ml of top agar containing 50 l of a 5 hculture (except A. tumefaciens for 48 h). For antifungal activities determination, plates were covered by 3 ml of top agar containing 100 µl of spores suspension already prepared from the Fusarium sp. and 50 l of a 24h culture of C. tropicalis R2 CIP203. After 2h at 4°C, plates were incubated overnight at the appropriate temperature of the indicator microorganism. For the determination of the antimicrobial activities from liquid media, a paper disk was impregnated with 50 l of the corresponding sample and then laid on the surface of an agar plate containing 3 ml of top agar inseeded with the indicator microorganism (100 µl of spores suspension for the Fusarium sp.) using the same conditions as for the solid medium analysis. Plates were examined for antimicrobial activities represented by an inhibition zone of the corresponding indicator micro-organisms.
DNA isolation and manipulation:
Total DNA preparation was carried out from Streptomyces sp. QS1, QS5 and QS20 strains according to Hopwood et al., 1985. Small-scale plasmid preparations from E. coli were
Samir Bejar, et. al.
performed as described in (Sambrook et al., 1989). Digestion with restriction endonucleases, separation of DNA fragments by agarose gels electrophoresis, dephosphorilation with alkaline calf intestinal phosphate, ligation of DNA fragments and transformation were done according to Sambrook et al., 1989 for E. coli and Hopwood et al., 1985 for Streptomyces.
PCR amplification of the 16S rRNA genes of the three studied Streptomyces strains was performed using two primers (P1 and P2) as described in Table 1. Approximately 300 ng genomic template DNA was used with 150 pmol of each primer per 50 l reaction volume. To improve the denaturation of the DNA, 5 % (v/v) DMSO (final concentration) was added to the reaction mixture. Amplification was performed in automated thermocycler (Perkin Elmer) using 1U Pfu DNA polymerase (Stratagene) and the recommended buffer system according to the following amplification profile: 94 °C (3 min) followed by 45 cycles of denaturation at 94 °C (30 s), annealing at 60 °C (1 min) and extension at 72 °C (3 min). The PCR reaction mix was analysed by agarose gel electrophoresis and the expected size was purified then cloned into pGEM-T Easy vector.
Nucleotide sequences of the whole 16S rRNA genes were determined on both strands by an automated 3100 Genetic Analyser (Applied Biosystems) using specific primers (P1-P4). Homology search was performed using Blast Search algorithm. The nucleotide sequences of the whole 16S rRNA genes: 1460 bp for the Streptomyces sp. QS1 ; 1498 bp for the Streptomyces sp. QS5 and 1461 bp for the Streptomyces sp. QS20 have been assigned GenBank (EMBL) under the accession numbers : HE584614 (Streptomyces sp. QS1), HE58615 (Streptomyces sp. QS5) and HE584616 (Streptomyces sp. QS20). Multiple sequence alignment was carried out using clustal W (Thompson al., 1994) at the European Bioinformatics Institute website (http://www.ebi.ac.uk/clustalw/). Phylogenetic analyses were performed using programs from the PHYLIP package (Felsenstein, 1989) and phylogenetic tree was constructed by the neighbour joining (NJ) algorithm (Saitou and Nei, 1987) using Kimura 2-parameter distance. The robustness of the inferred tree was evaluated by bootstrap (100 replication).
RESULTS AND DISCUSSION
Screening of Streptomyces strains producing antimicrobial activities:
During our searching for new productive Streptomyces sp. of bioactive secondary metabolites, a collection of twenty eight (28) actinomycete strains were isolated from different Qatari habitats. These bacteria were tested for their capacity to produce antimicrobial activities against the following indicator microorganisms: S. aureus ATCC 6538 (Gram positive bacterium), A. tumefaciens (Gram negative bacterium) and Fusarium sp.
Isolation, Selection and Identification from Qatari Soils of New Streptomyces Strains Producing Antimicrobial Activities
Different profiles of inhibition were observed. Nine strains (QS1, QS2, QS4, QS5, QS9, QS14, QS20, QS23 and QS26) were characterized by the broad-spectrum inhibition. These nine isolates were tested for their capacity to inhibit the growth of other microorganisms. As shown in (Table 2), the largest spectrum of inhibition was obtained with QS1, QS5 and QS20 strains. The figure 1 shows the inhibitory tests in solid media, against S. aureus ATCC 6538, A. Tumefaciens and Fusarium sp., of these three selected strains. Consequently, the selected QS1, QS5 and QS20 strains were retained for elaborate studies.
Identification and phylogenetic analysis of the three strains QS1, QS5 and QS20:
According to the cultural characteristics (Error! Reference source not found.):
− QS1 strain grew moderately in Nutrient Agar medium and the colours of the vegetative and aerial mycelia were yellowish and amber respectively. The spore chains were white-amber
− QS5 strain grew well in Nutrient Agar medium and the colourous of the vegetative and aerial mycelia were yellowish and white respectively. The spore chains were abundant and white.
− QS20 strain grew moderately in Nutrient Agar medium and the colours of the vegetative and aerial mycelium were white. The spore chains were white-yellowish.
The comparison of the obtained cultural characteristics of the three studied strains with those of the known actinomycete species described in Bergey’s manual of systematic bacteriology (Lechevalier et al., 1989), suggested that these strains belong to the genus Streptomyces. Total nucleotide sequences of 1460 bp (accession n° HE584614), 1498 bp (accession n° HE584615) and 1461 bp (accession n° HE584616) of the whole 16S rRNA genes of the QS1, QS5 and QS20 strains respectively were determined in both strands. The alignment of these sequences through matching with reported 16S rRNA gene sequences in gene bank shows high similarity (97-99 %) to the Streptomyces 16S rRNA genes. The organisms most similar to the QS1, QS5 and QS20 strains were: Streptomyces glaucescens DQ442502.1 for QS1 strain, Streptomyces sp. GU045553.1 for QS5 strain and Streptomyces pseudogriseolus X80827.1 for QS20 strain (Figure 2). Based on the results of cultural characteristics studies of the three strains QS1, QS5 and QS20, the nucleotide sequences of the corresponding 16S rRNA genes and the phylogenetic analysis, we propose the assignment of our new isolates as: Streptomyces sp. QS1, Streptomyces sp. QS5 and Streptomyces sp. QS20 strains.

Samir Bejar, et. al.
Effect of carbon sources on biomolecules production by the three Streptomyces sp. QS1, QS5 and QS20:
Production of secondary metabolites by microorganisms are often connected and influenced by primary metabolism. The composition and concentrations of the constituents of the media are closely linked with the metabolic capacities of the producing organism and greatly influence the biosynthesis of the bioactive molecules (Fourati-Ben Fguira et al., 2008).
In this work and for each selected strain, five carbohydrate sources (starch, fructose, glycerol,
glucose and saccharose) were tested as sole carbon source at 1 % (w/v) in the TSB medium.
The three studied strains exhibited ability to grow and to produce active molecules in
presence of the five tested carbon sources. For the two strains Streptomyces sp. QS1 and
Streptomyces sp. QS20, the maximum biological activity production was obtained when
saccharose was served as carbon source. Concerning the strain Streptomyces sp. QS5,
maximum biological activity production was obtained in presence of starch as carbon source.
ACKNOWLEDGMENTS
This work was funded by the Tunisian Ministry of Higher Education and Scientific Research and Technology (contract program LMB-CBS, grant no. RL02CBS01) and by the Tunisia-Qatar project N° Project QU- CBS Contract N° NPRP 27-6-7-24/Subcontrat No 001.
REFERENCES
Edwards, U., Rogall, T., Bocker, H., Emde, M. and Bottger, E. (1989) Isolation and direct complete nucleotide determination of entire genes. Characterization of a gene coding for 16S ribosomal DNA. Nucl. Acids Res. 17: 7843-7853.
Felsenstein, J. (1989) PHYLIP-Phylogeny Inference Package, version 3.2, Cladistics. 5, 164-166.
Fourati-Ben Fguira, L., Karray-Rebai, I., Smaoui, S., Bejar, S. and Mellouli, L. (2008) The Antifungal Activity of the terrestrial Streptomyces US80 Strain is induced by heat killed fungi. Biotechnol. J. 3, 1058-1066.
Hanahan, D. (1983) Studies on transformation of Escherichia coli with plasmids. J. Mol. Biol. 166: 557-580.
Hopwood, D.A., Bibb, M.J., Chater, K.F., Kieser, T., Bruton, C.J., Kieser, H.M., Lydiate, D.J., Smith, C.P., Ward, J.M. and Schrempf, H. (1985)Genetic manipulation of Streptomyces, a laboratory manual, The John Innes Foundation, Norwich.

Isolation, Selection and Identification from Qatari Soils of New Streptomyces Strains Producing Antimicrobial Activities
Lechevalier, H.A., Williams, S.T., Sharpe, M.E. and Holt, J.G. (1989) Bergey’s manual of systematic bacteriology. Baltimore: Williams & Wilkins.
Mellouli, L., Ghorbel, R., Kammoun, A., Mezghani, M. and Bejar, S. (1996) Characterisation and molecular cloning of thermostable alpha-amylase from Streptomyces sp. TO1. Biotechnol. Lett. 18: 809-814.
Miyadoh, S. (1993) Research on antibiotic screening in Japan over the last decade: a producing microorganisms approach. Actinomycetologica. 9, 100-106.
Saitou, N. and Nei, M. (1987) The neighbor-joining method: a new method for reconstructing phylogenetic trees. Mol. Biol. Evol. 4, 406–425.
Sambrook, J., Fritsch, E.F. and Laniatis, T. (1989) Molecular cloning, a laboratory manual, 2nd ed., Cold Spring Harbor Laboratory Press, New York.
Tanaka, Y.T. and Mura, S.O. (1993) Agroactive compounds of microbial origin. Annu. Rev. Microbiol. 47, 57-87.
Thompson, J.D., Higgins, D.G., Gibson, T.J. (1994) CLUSTAL W: improving the sensitivity of progressive multiple sequence alignment through sequence weighting, position-specific gap penalties and weight matrix choice. Nucl. Acids Res. 22, 4673-4680.
Williams, S.T., Goodfellow, M., Alderson, G., Wllington, E.M., Sneath, P.H. and Sacki, M.J. (1983) Classification of Streptomyces and related genera. J. Gen. Microbiol. 129, 1747-1813.
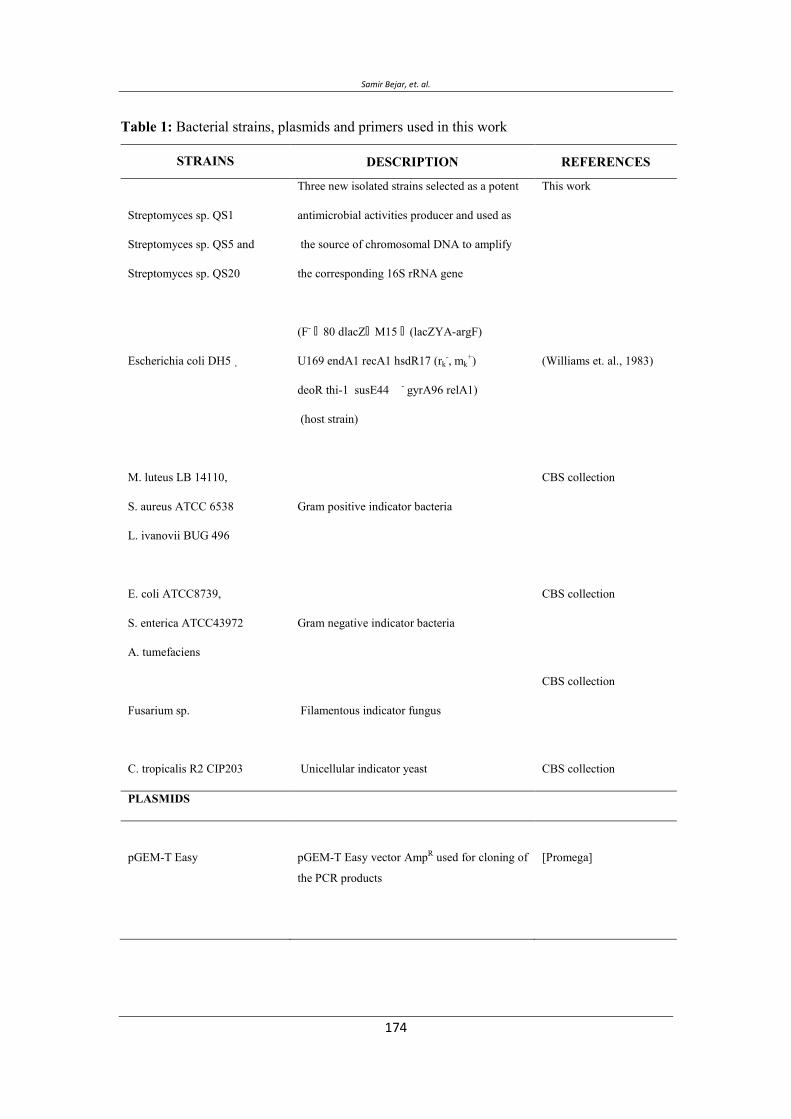
Samir Bejar, et. al.
Table 1: Bacterial strains, plasmids and primers used in this work
STRAINS DESCRIPTION REFERENCES
Streptomyces sp. QS1
Streptomyces sp. QS5 and
Streptomyces sp. QS20
Escherichia coli DH5
M. luteus LB 14110,
S. aureus ATCC 6538
L. ivanovii BUG 496
E. coli ATCC8739,
S. enterica ATCC43972
A. tumefaciens
Fusarium sp.
C. tropicalis R2 CIP203
Three new isolated strains selected as a potent
antimicrobial activities producer and used as
the source of chromosomal DNA to amplify
the corresponding 16S rRNA gene
(F- 80 dlacZ M15 (lacZYA-argF)
U169 endA1 recA1 hsdR17 (rk-, mk
+)
deoR thi-1 susE44 - gyrA96 relA1)
(host strain)
Gram positive indicator bacteria
Gram negative indicator bacteria
Filamentous indicator fungus
Unicellular indicator yeast
This work
(Williams et. al., 1983)
CBS collection
CBS collection
CBS collection
CBS collection
PLASMIDS
pGEM-T Easy
pGEM-T Easy vector AmpR used for cloning of
the PCR products
[Promega]
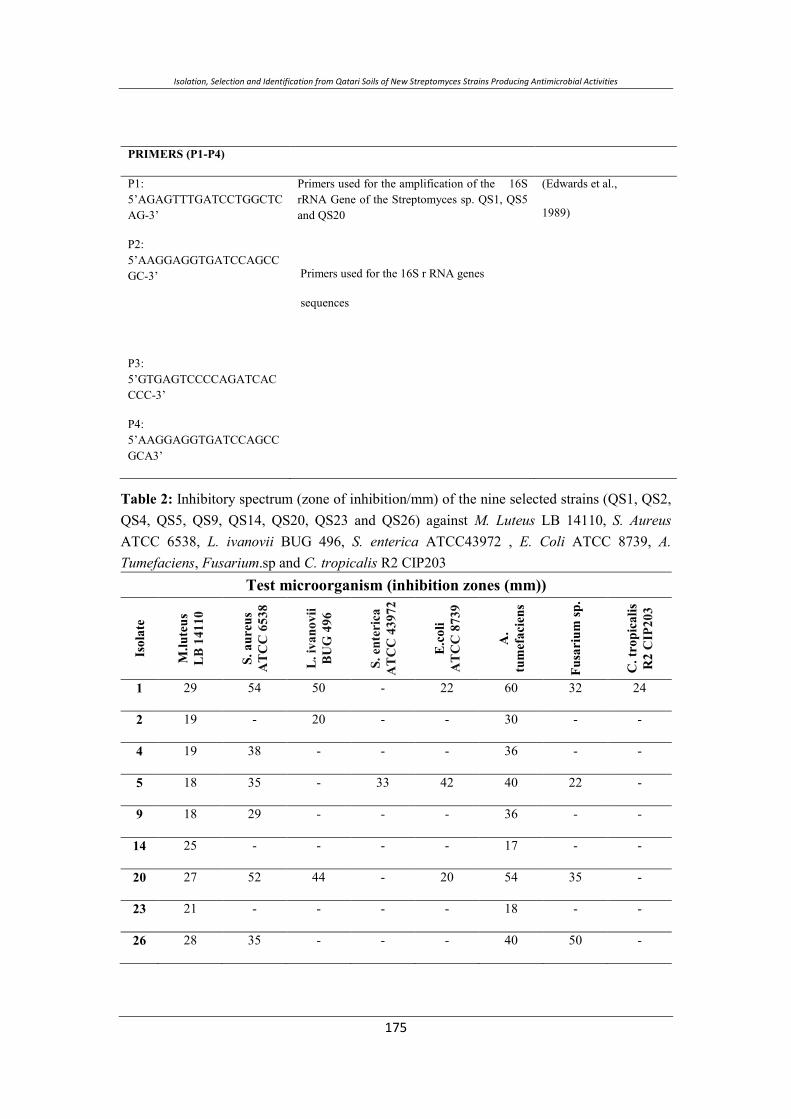
Isolation, Selection and Identification from Qatari Soils of New Streptomyces Strains Producing Antimicrobial Activities
PRIMERS (P1-P4)
P1: 5’AGAGTTTGATCCTGGCTCAG-3’
P2: 5’AAGGAGGTGATCCAGCCGC-3’
P3: 5’GTGAGTCCCCAGATCACCCC-3’
P4: 5’AAGGAGGTGATCCAGCCGCA3’
Primers used for the amplification of the 16S rRNA Gene of the Streptomyces sp. QS1, QS5 and QS20
Primers used for the 16S r RNA genes
sequences
(Edwards et al.,
1989)
Table 2: Inhibitory spectrum (zone of inhibition/mm) of the nine selected strains (QS1, QS2, QS4, QS5, QS9, QS14, QS20, QS23 and QS26) against M. Luteus LB 14110, S. Aureus ATCC 6538, L. ivanovii BUG 496, S. enterica ATCC43972 , E. Coli ATCC 8739, A. Tumefaciens, Fusarium.sp and C. tropicalis R2 CIP203
Test microorganism (inhibition zones (mm))
Isol
ate
M.lu
teus
LB14
110
S.au
reus
ATC
C65
38
L.iv
anov
iiBU
G49
6
S.en
teri
caA
TCC
4397
2
E.co
liA
TCC
8739
A.
tum
efac
iens
Fusa
rium
sp.
C.t
ropi
calis
R2
CIP
203
1 29 54 50 - 22 60 32 24
2 19 - 20 - - 30 - -
4 19 38 - - - 36 - -
5 18 35 - 33 42 40 22 -
9 18 29 - - - 36 - -
14 25 - - - - 17 - -
20 27 52 44 - 20 54 35 -
23 21 - - - - 18 - -
26 28 35 - - - 40 50 -
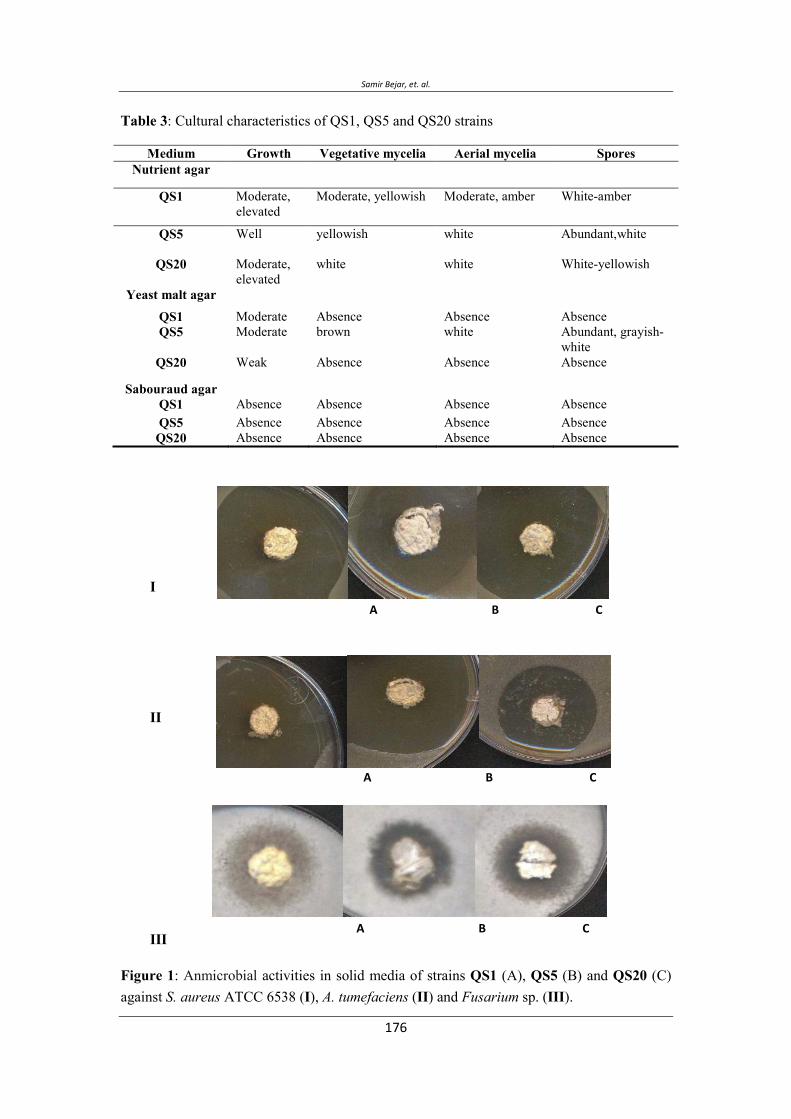
Samir Bejar, et. al.
Table 3: Cultural characteristics of QS1, QS5 and QS20 strains
Medium Growth Vegetative mycelia Aerial mycelia Spores Nutrient agar
QS1 Moderate, elevated
Moderate, yellowish
Moderate, amber White-amber
QS5 Well yellowish white Abundant,white
QS20 Moderate, elevated
white white White-yellowish
Yeast malt agar
QS1 Moderate Absence Absence Absence QS5 Moderate brown white Abundant, grayish-
white QS20 Weak Absence Absence Absence
Sabouraud agar QS1 Absence Absence Absence Absence QS5 Absence Absence Absence Absence
QS20 Absence Absence Absence Absence
I
II
III
Figure 1: Anmicrobial activities in solid media of strains QS1 (A), QS5 (B) and QS20 (C) against S. aureus ATCC 6538 (I), A. tumefaciens (II) and Fusarium sp. (III).
A B C
A B C
A B C
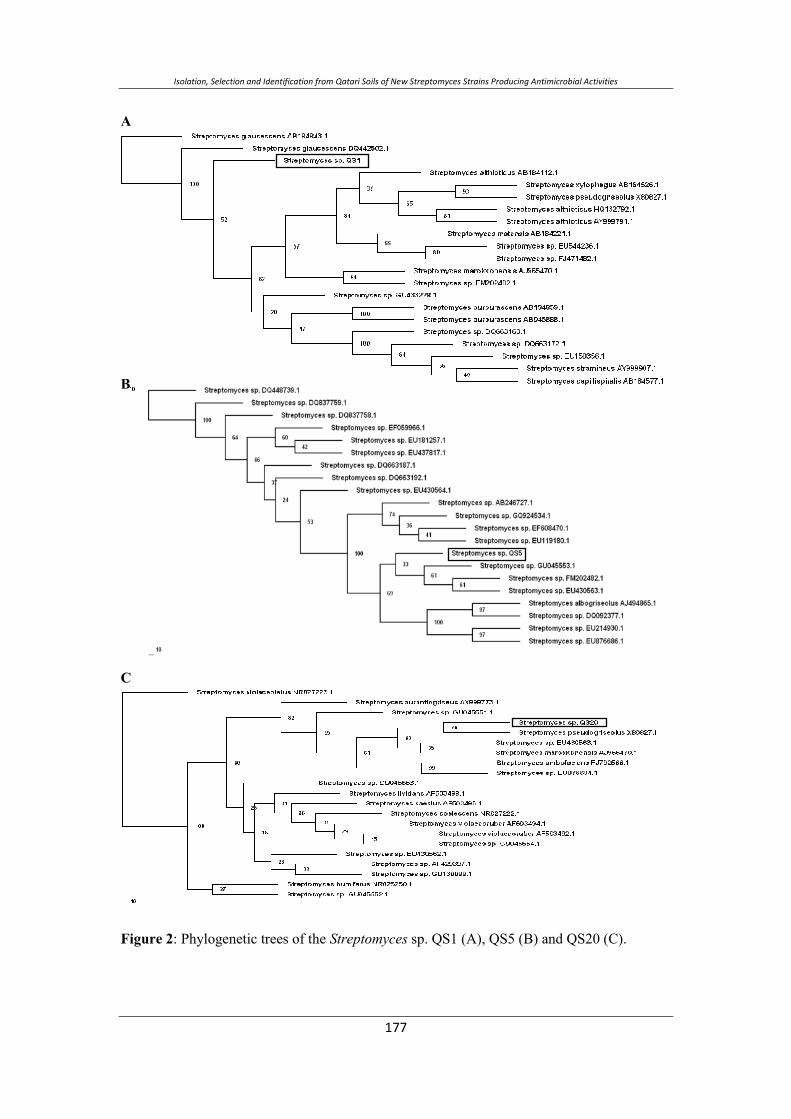
Isolation, Selection and Identification from Qatari Soils of New Streptomyces Strains Producing Antimicrobial Activities
A
B
C
Figure 2: Phylogenetic trees of the Streptomyces sp. QS1 (A), QS5 (B) and QS20 (C).
Samir Bejar, et. al.
ل ل. ل
ل لل ل ل ل ل ل ل ل
−
ب ن ی−
FGHIJا
QS5, QS1 QS20 س ی ب ن
. ب ی ن نی ی ی س یب ی
ب)RNAr 16S )QS1 س نئ س
:HE584614(,)QS5 ب :(HE584615 )QS20 ب :
HE584616 ( ی ی س ی
. QS20سب QS5 سب QS1 ص ب ن ی سب
ی ن نی ب س
ب%. ی ب ب
QS1 QS20 ب. ب ن ب
QS5 نی ب .
Vol. 12, 2012 JBR ORIGINAL ARTICLE
The Cytotoxic Effect of Essential Oils Citrus aurantium Peels on Human Colorectal Carcinoma Cell Line (Lim1863)
Fadi Odeh1*, Abdulkader Rahmo2, A. Samir Alnori1, M. Eyad Chatty3.
1: Faculty of Pharmacy, Damascus University. 2: National Commission for Biotechnology, Damascus
University. 3: Faculty of Medicine, Damascus University. *Corresponding author: E-mail: [email protected] Mobile: 00963944265320
ABSTRACT Citrus essential oils (EOs) contain different terpens that have been shown to possess antitumor effects. We determined the cytotoxic effect of essential oils of Citrus aurantium L. subsp amara peels on a colorectal cancer cell line (Lim1863). Three samples were harvested from three locations in Syria. EOs were extracted by hydrodistilation and analyzed by Gas Chromatography-mass spectrometry (GC-MS). EOs content of Limonene is 96-97.7 % while α-pinene and β-myrcene are 0.35-1% and 0.9-1.4%, respectively. Various concentrations of EOs (0.25-4٨ µl/ml) were added to cultured cells and incubated for 72 h. Cell viability was evaluated using the 3-(4, 5- dimethylthiazol-2-yl)-2, 5-diphenyl tetrazolium bromide (MTT)-based cytotoxicity assay. The obtained IC50 value range of C.aurantium EOs is 2.18-2.44 µg/ml.
Keywords: Citrus aurantium, Essential oils, cytotoxicity, Colorectal Carcinoma cell line, Lim1863
INTRODUCTION The importance of medicinal plants and EOs has been discovered as early as 5000 years ago (Umezu et al, 2002). Some of these, like Rutaceae plants, were often implicated in medical treatments because of their high content of active ingredients, especially essential oils. Citrus genus that belongs to Rutaceae is rich in EOs (Blumenthal et al, 2002). Citrus genus was used historically to prepare many remedies, foods and perfums. EOs from Citrus plants contain a high percentage of monoterpene hydrocarbons (70-95%) along with smaller amounts of sesquiterpene hydrocarbons, oxygenated derivatives and aromatic hydrocarbons (Mohamed et al, 2010; Siddique et al, 2011). Citrus oil mainly consists of Limonene, α-pinene, β-pinene, β- myrcene and linalool (Lota et al, 2001; Siddique et al, 2011) Citrus aurantium is a species of citrus genus which has been cultivated in Syria. Current chemical, medical, and pharmacological literature suggested that substances derived from C.aurantium leaf can be used as anti-cancer, antispasmodic, sedative, and tranquilliser. It confirms also that C.aurantium flower can be used as
Fadi Odeh, et. al.
antispasmodic, sedative, and tranquilliser, while peel can be used as appetizer, cholagogue, demulcent, eupeptic, cholesterol reducer, tonic and vascular stimulant (Arias et al, 2005). Several studies indicated that EOs have antitumor effects, monoterpenes have been reported to have a chemopreventive effect against rodent mammary, skin, liver, lung and forestomach cancers (Crowell et al, 1999). Despite the many publications studying the compositions of Citrus aurantium peels EOs, no report on its cytotoxic effect is yet available. In this study, the composition of Citrus aurantium peels EOs, obtained from three different locations in Syria, was determined, and their cytotoxic effect against colorectal cancer cell line (lim1863) was studied.
MATERIAL AND METHODS Plant materials: Citrus aurantium fruits of adult trees were collected from three different locations in two cities; Sample 1: was collected from Tartus-Safita. Sample 2 was collected from an agricultural region in Damascus-Adawi. Sample 3 was collected from a crowded residential area in Damascus-Tijara. Samples were collected on Jan 2011. The peels were ripped carefully using a sharp knife. EOs extraction: EOs was extracted from fresh (within one day) peels (300 g) collected by hydrodistillation for 3 h using a Clevenger-type apparatus. The oils were dried over anhydrous sodium sulfate and stored at -20 OC for subsequent analysis. EOs analysis: The oils were analyzed by GC/MS using an Agilent 7890A gas chromatograph coupled with an Agilent MS: 5975 mass detector. GC was equipped with a non-polar capillary column Agilent DB-1 (30 m×0.25 mm, film thickness 0.25 µm). Operating conditions were as follows: carrier gas, helium with a constant pressure of 9.43 psi; column temperature, 60-275OC at a rate of 3OC/min; injector temperature, 280OC; injected volume, 1 µl of the oil; and split ratio, 1:25. The MS operating parameters were as follows: ionization potential, 70 eV; ion source temperature 200OC; and resolution 1000. Identification of components present in the oil was based on computer matching with the Nist 08 library. Cell line: Human colorectal cancer cell line (Lim1863) was obtained by courtesy of Prof. Nizar Mhaidat from Jordan University of Science and Technology. They were maintained in D-MEM cell culture medium supplemented with 10% fetal calf serum and penicillin/streptomycin (100 IU/ml and 100 µg/ml). Cells were grown at 37°C in a humidified atmosphere of 5% CO2 using LabTech CO2 incubator (LCO-065 AI). The cell line was maintained and grown in D-MEM to 10 subcultures. Samples of the cell line were cryopreserved in liquid nitrogen. MTT-based cytotoxicity assay:
EOs were diluted using Ethanol to the following concentrations (0.25, 0.5, 1, 2, 4, 8, 16, 24, 32 and 48 µg/ml). Assessment of cell viability was carried out by a modified method of Mosmann (Mosmann, 1983) using 3-(4, 5- dimethylthiazol-2-yl)-2, 5-diphenyl tetrazolium bromide (MTT). Two hundred µl cell suspension (5×10⁴ cell/ml) were seeded in 96 microplates and incubated for 24 h (37°C, 5% CO2, air humidified), then 20 µl of various EOs concentrations was added. Microplates containing cells and EOs were incubated for another 72 h, under the same condition. Doxorubicin (20 µg/ml) was used as a positive control. The first row of each microplate was assumed as a negative control (containing neither EOs nor doxorubicin). To evaluate cell survival, 20 µl of MTT solution (5 mg/ml) was added to each well and incubated for 3 h. One hundred fifty µl of a medium containing MTT was replaced by DMSO and pipetted to dissolve any formazon crystals formed. Absorbance value was determined at 540 nm by an Enzyme-Linked Immunosorbent Assay (ELISA) plate reader (SCO diagnostic). Each oil concentration was repeated eight times. Standard curve of each sample (absorbance value against cell number) were also plotted. Percentage of cell survival was determined, assuming a 100% survival value for negative control. IC50 was calculated using analysis of regression. Statistical analysis: Microsoft Office Excel 2007 was used to perform statistical tests. Standard Deviation (STDEV) and Coefficient of Variation (CV) were calculated.
RESULTS
Chemical composition of the EOs
The essential oil yield was 2.5% (V/W) in sample 1, while yield was 2.1% (V/W) in samples 2 and 3. GC-MS analysis (figure 1) resulted in the following components described in table 1. Limonene is the major component and its highest percentage was in sample 3. α-pinene, β- myrcene were detected in all samples while linalol was not detected in any sample.
Cytotoxic effect of EOs
A preliminary study showed significant positive correlation between living cell count and absorbance value for MTT using 540nm wavelength for measurement (figure 2).
Lim cells showed high resistance against Doxorubicin which was used as a positive control (20 µg/ml). The cell viability was 91.6%. Ethanol used to dilute EOs showed no cytotoxicity. Our study revealed that the inhibitory concentration IC50 of sample 1 was 2.18 µg/ml, while IC50 for sample 2 and sample 3 was 2.27 µg/mland 2.44 µg/ml respectively.
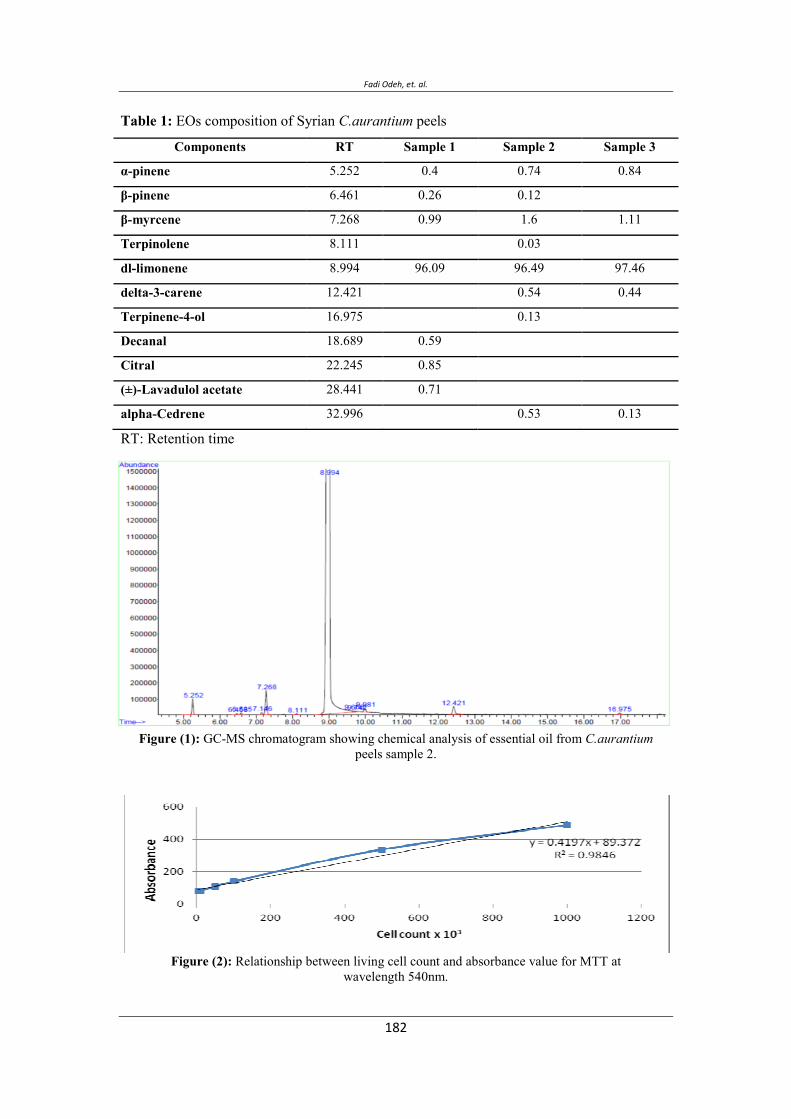
Fadi Odeh, et. al.
Table 1: EOs composition of Syrian C.aurantium peels
Components RT Sample 1 Sample 2 Sample 3
-pinene 5.252 0.4 0.74 0.84
-pinene 6.461 0.26 0.12
-myrcene 7.268 0.99 1.6 1.11
Terpinolene 8.111 0.03
dl-limonene 8.994 96.09 96.49 97.46
delta-3-carene 12.421 0.54 0.44
Terpinene-4-ol 16.975 0.13
Decanal 18.689 0.59
Citral 22.245 0.85
(±)-Lavadulol acetate 28.441 0.71
alpha-Cedrene 32.996 0.53 0.13
RT: Retention time
Figure (1): GC-MS chromatogram showing chemical analysis of essential oil from C.aurantium peels sample 2.
Figure (2): Relationship between living cell count and absorbance value for MTT at wavelength 540nm.
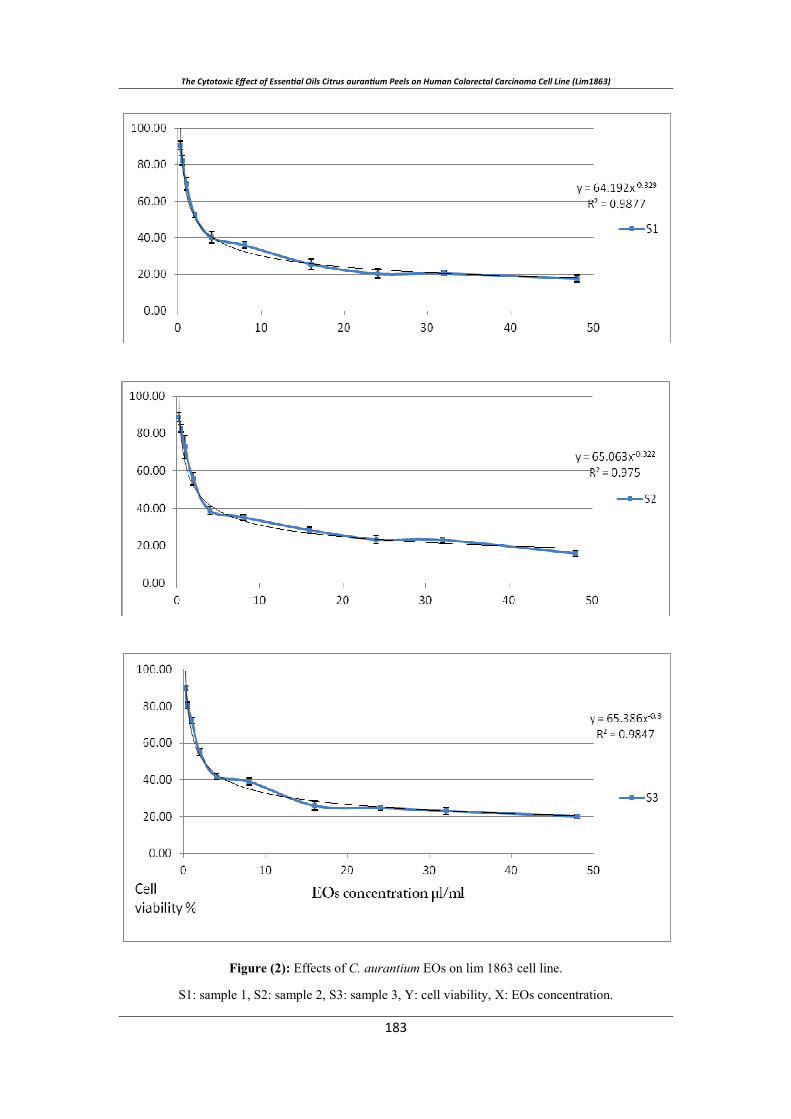
Figure (2): Effects of C. aurantium EOs on lim 1863 cell line.
S1: sample 1, S2: sample 2, S3: sample 3, Y: cell viability, X: EOs concentration.
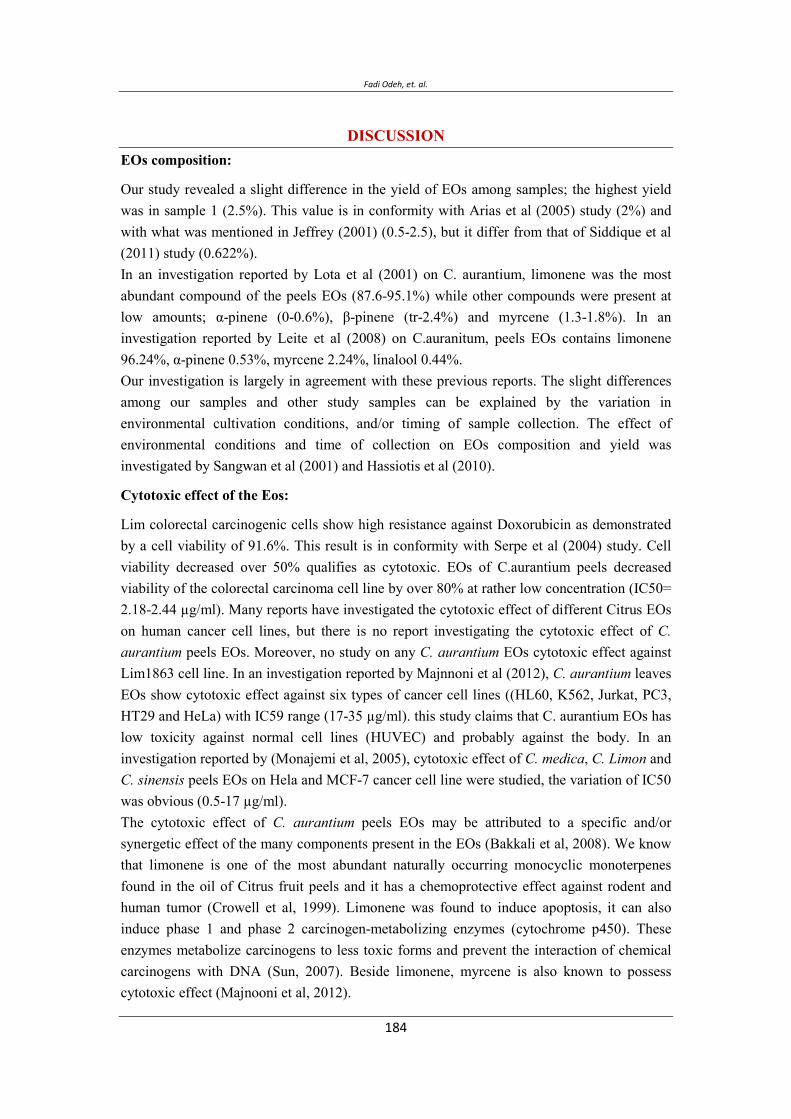
Fadi Odeh, et. al.
DISCUSSION EOs composition:
Our study revealed a slight difference in the yield of EOs among samples; the highest yield was in sample 1 (2.5%). This value is in conformity with Arias et al (2005) study (2%) and with what was mentioned in Jeffrey (2001) (0.5-2.5), but it differ from that of Siddique et al (2011) study (0.622%). In an investigation reported by Lota et al (2001) on C. aurantium, limonene was the most abundant compound of the peels EOs (87.6-95.1%) while other compounds were present at low amounts; α-pinene (0-0.6%), β-pinene (tr-2.4%) and myrcene (1.3-1.8%). In an investigation reported by Leite et al (2008) on C.auranitum, peels EOs contains limonene 96.24%, α-pinene 0.53%, myrcene 2.24%, linalool 0.44%. Our investigation is largely in agreement with these previous reports. The slight differences among our samples and other study samples can be explained by the variation in environmental cultivation conditions, and/or timing of sample collection. The effect of environmental conditions and time of collection on EOs composition and yield was investigated by Sangwan et al (2001) and Hassiotis et al (2010).
Cytotoxic effect of the Eos:
Lim colorectal carcinogenic cells show high resistance against Doxorubicin as demonstrated by a cell viability of 91.6%. This result is in conformity with Serpe et al (2004) study. Cell viability decreased over 50% qualifies as cytotoxic. EOs of C.aurantium peels decreased viability of the colorectal carcinoma cell line by over 80% at rather low concentration (IC50= 2.18-2.44 µg/ml). Many reports have investigated the cytotoxic effect of different Citrus EOs on human cancer cell lines, but there is no report investigating the cytotoxic effect of C. aurantium peels EOs. Moreover, no study on any C. aurantium EOs cytotoxic effect against Lim1863 cell line. In an investigation reported by Majnnoni et al (2012), C. aurantium leaves EOs show cytotoxic effect against six types of cancer cell lines ((HL60, K562, Jurkat, PC3, HT29 and HeLa) with IC59 range (17-35 µg/ml). this study claims that C. aurantium EOs has low toxicity against normal cell lines (HUVEC) and probably against the body. In an investigation reported by (Monajemi et al, 2005), cytotoxic effect of C. medica, C. Limon and C. sinensis peels EOs on Hela and MCF-7 cancer cell line were studied, the variation of IC50 was obvious (0.5-17 µg/ml). The cytotoxic effect of C. aurantium peels EOs may be attributed to a specific and/or synergetic effect of the many components present in the EOs (Bakkali et al, 2008). We know that limonene is one of the most abundant naturally occurring monocyclic monoterpenes found in the oil of Citrus fruit peels and it has a chemoprotective effect against rodent and human tumor (Crowell et al, 1999). Limonene was found to induce apoptosis, it can also induce phase 1 and phase 2 carcinogen-metabolizing enzymes (cytochrome p450). These enzymes metabolize carcinogens to less toxic forms and prevent the interaction of chemical carcinogens with DNA (Sun, 2007). Beside limonene, myrcene is also known to possess cytotoxic effect (Majnooni et al, 2012).

CONCLUSION This study revealed that limonene and myrcene are the main components of local C. aurantium peels EOs. It also suggests that C. aurantium EOs might be useful in testing its further potential treatments of colorectal cancer and other cancers.
ACKNOWLEDGMENT The authors are grateful to eng. Bassam Al Okla for his help in GC-MS, Maisson Elwi, Inas Nimr and Manal Saleh for their helps in culture techniques, and for the financial support provided by the National Commission for Biotechnology and the Faculty of Pharmacy- Damascus University. This work constituted part of the Mr. Odeh M.Sc. Thesis presented to the Faculty of Pharmacy, Damascus University in 2012.
REFERENCES
Arias B, Ramón-Laca L. (2005) Pharmacological properties of citrus and their ancient and medieval uses in the Mediterranean region. Journal of Ethnopharmacology. 97 : 89-95.
Bakkali F, Averbeck S, Averbeck D, Idaomar M. (2008) Biological effects of essential oils: A review. Food Chem. Toxicol. 46: 446–475.
Blumenthal M. (2002) Bitter Orange Peel and Synephrine. American Botanical Council. part 2.
Crowell PL. (1999) Prevention and therapy of cancer by dietary monoterpenes. J Nutr. 129 : 775-778.
Hassiotis C, Lazari D, Vlachonasios K. (2010) The Effects of Habitat Type and Diurnal Harvest on Essential Oil Yield and Composition of Lavandula Angustifolia Mill. Fresenius Environmental Bulletin. 19 : 1491-1498.
Jefrey B. (2001) Chemical Dictionary of Economic Plant. pp 84.
Leite M, Fassin J, Baziloni E, Almeida R, Mattei R, Leite J. (2008) Behavioral effects of essential oil of Citrus aurantium L. inhalation in rats. Braz J. Pharmacogn. 18 : 661-666.
Lota M, Serra D, Jacquemond C, Tomi F, Casanova J. (2001) Chemical variability of peel and leaf essential oils of sour orange. Flavour Fragr. J. 16 : 89-96.

Fadi Odeh, et. al.
Majnooni M, Mansouri K, Gholivand M, Mostafaie A,Motlagh H, Afnanzade N, Abolghasemi M, Piriyaei M. (2012) Chemical composition, cytotoxicity and antioxidant activities of the essential oil from the leaves of Citrus aurantium L Afr. J. Biotechnol. 11 : 498-503.
Mohamed A, Emary G, Ali H. (2010) Influence of Some Citrus Essential Oils on Cell Viability, Glutathione-S-Transferase and Lipid Peroxidation in Ehrlich Ascites Carcinoma Cells. Journal of American Science. 6 : 820-826.
Monajemi R, Oryan S, Haeri-Roohani A, Ghannadi A, Jafarian A. (2005) Cytotoxic Effects of Essential Oils of Some Iranian Citrus Peels. Iranian Journal of Pharmaceutical Research. 3: 183-187.
Mosmann T. (1983) Rapid colorimetric assay for cellular growth and survival: Application to proliferation and cytotoxicity assay. Journal of Immunological Methods. 65: 55-63.
Sangwan N, Farooqi A, Shabih F, Sangwan R. (2001) Regulation of essential oil production in plants. J Plant Growth Regul. 34 : 3–21.
Serpe L, Catalano M, Cavalli R, Ugazio E, Bosco O, Canaparo R, Muntoni E, Frairia R, Gasco M, Eandi M, Zara G. (2004) Cytotoxicity of anticancer drugs incorporated in solid lipid nanoparticles on HT-29 colorectal cancer cell line. European Journal of Pharmaceutics and Biopharmaceutics. 58 : 673–680.
Siddique S, shafique M, Parveen Z, Khan S, Khanum R. (2011) Volatile Components, Antioxidant and Antimicrobial Activity of Citrus Aurantium var Bitter Orange Peel Oil. Pharmacologyonline. 2 : 499-507.
Sun J. (2007) D-Limonene: Safety and Clinical Application, Alternative Medicine Review. 12: 259-264.
Umezu T, Ito H, Nagano K, Yamakoshi M, Oouchi H,Sakaniwa M, Morita M. (2002) Anti Conflict Effects of Rose Oil and Identification of its Active Constituents. J Life Sci. 72: 91-102.
) (1863
Fadi Odeh1*, Abdulkader Rahmo2, A. Samir Alnori1, M. Eyad Chatty3.
1: Faculty of Pharmacy, Damascus University. 2: National Commission for Biotechnology, Damascus
University. 3: Faculty of Medicine, Damascus University. *Corresponding author: E-mail: [email protected] Mobile: 00963944265320
ت ت. ت
Citrus aurantium L. subsp amara
Lim1863 . .
. ت ت
%.-ش ح ش
ت . ت%.-.%- .
). –/( Lim1863 . ض ت
. ح ت ش
MTT . IC50
. -. /.

Fadi Odeh, et. al.
Vol. 1٢, 2012 Journal of Biotechnology Research JBR
ت . تت ت
ت ح
(www.arabbiotech.net, [email protected]) ح
ج
: ت )A4( ح)( ت – ) ح( ح– ) (–– ) (–
ح – ش–ج–
ت ش
ت ت
ج ج
) Review paper( ج
ح ج (ج : ج ج ح ت )
Schrezenmeir, J. and De Vrese, M. (2001) Probiotics and symbiotic-approaching a definition. Am. J. Clin.Nutr. 73 : 3615-3645.
Kihburn, K.H. (1986) Respiratory functional impairment in metal welders:
an interpretation of current data. In Health Hazards and Biological Effects of Welding Fumes and Gases (R. M. Stem, A. Berlin, A. C. Fletcher and J. Jarvisalo, eds). pp. 363 – 78. Amsterdam: Excerpt Medica.
ت ح
ح ح

Vol. 1٢, 2012 Journal of Biotechnology Research JBR
ح ..
..
..
..
.
ح ..
..
ج..
ح ..
.
.

Vol. 1٢, 2012 Journal of Biotechnology Research JBR
.. ت
.. ت- تج
..
.. )(
. )(

Vol. 1٢, 2012 Journal of Biotechnology Research JBR
تت -
-
www.arabbiotech.net