Systems Biotechnology - doi@nrct
302
-
Upload
khangminh22 -
Category
Documents
-
view
0 -
download
0
Transcript of Systems Biotechnology - doi@nrct

PROCEEDINGS
The 23rd Annual Meeting of the Thai Society for Biotechnology
“Systems Biotechnology: Quality & Success”
February 1-2, 2012
The Imperial Queen’s Park Hotel, Bangkok THAILAND

- III -
Contents
The 23rd Annual Meeting of the Thai Society for Biotechnology “Systems Biotechnology: Quality & Success”
February 1-2, 2012
The Imperial Queen’s Park Hotel, Bangkok, THAILAND Greetings IX Organizing Committee XIV Program at a Glance XVIII Floor Plan XX Program XXIII Proceedings Plenary Session P-IV Aspects of the future of agrotechnologies 2 Rainer Jonas and Manfred Kern
Joint Symposium II SII-3 Cassava production in Vietnam: the needs for improvements 5 Le Huy Ham, Pham Thi Ly Thu SII-7 High-quality pathway of cassava starch biosynthesis in non-photosynthetic tissues 8 inferred by multiple plant templates Treenut Saithong, Orathai Rongsirikul, Saowalak Kalapanulak, Supatcharee Netrphan, Malinee Suksangpanomrung, Asawin Meechai, Supapon Cheevadhanarak SII-O-1 Analysis of gene expression during root development implies 10 the distinct gene regulation between root tissues Treenut Saithong, Samorn Saerue, Saowalak Kalapanulak, Punchapat Sojikul, Jarunya Narangajavana
Oral Presentation Oral presentation I: Agricultural Biotechnology and Agroindustry O-I-2 Bacterial community in intestine of the giant tiger shrimp Penaeus monodon 12 in rearing pond: Effects of shrimp size Mongkol Phayungsak, Sage Chaiyapechara, Pikul Jiravanichpaisal, Sirawut Klinbunga, Piamsak Menasveta O-I-3 Molecular cloning and expression analysis of the ATP/GTP binding protein gene 14 in the giant tiger shrimp Penaeus monodon Sripapan Treejatet, Kanchana Sittikhankeaw, Rachanimuk Hiransuchalert Vasin Yuvanatemiya, Sirawut Klinbunga and Padermsak Jarayabhand O-I-4 Full-length cDNA cloning and expression analysis of the selenoprotein M gene 16 during ovarian development of the giant tiger shrimp Penaeus monodon Patchari Yocawibun, Rachanimuk Hiransuchalert, Sirawut Klinbunga and Piamsak Menasveta O-I-6 Identification and expression analysis of the transforming growth factor 18 beta regulator 1 gene in domesticated giant tiger shrimp Penaeus monodon Parichat Chumtong, Sirikan Prasertlux, Sirawut Klinbunga, Piamsak Menasveta and Bavornlak Khamnamtong O-I-7 Identification of single nucleotide polymorphism in Farnesoic acid 20 O-methyltransferase (PmFAMeT) of the giant tiger shrimp Penaeus monodon Napaporn Jantee, Arun Buaklin, Sirawut Klinbunga , Bavornluk Khumnamtong and Piamsak Menasveta O-I-8 Molecular cloning and expression analysis of the asparaginyl tRNA synthertase gene 22 in the black tiger shrimp Penaeus monodon Jintana Innuphat, Kanchana Sittikhankaew, Sirawut Klinbunga, and Piamsak Menasveta

The 23rd Annual Meeting of the Thai Society for Biotechnology “Systems Biotechnology: Quality & Success”
- IV -
Oral presentation II: Microbial and Molecular Biotechnology O-II-4 Screening and characterization of antimicrobial peptide from bacteria 24 Nuttida Teerawattanakijpakorn, Watanalai Panbangred O-II-5 Antimicrobial peptides against contaminating bacteria in fuel ethanol production 27 Pennapa Manitchotpisit, Kenneth M. Bischoff, Neil P.J. Price, and Timothy D. Leathers O-II-7 Effect of substrate dilution and nutrient limitation on 29 E.coli growth using Chromocult Coliform Agar Wipavadee Sangadkit, Orana Rattanabumrung, and Aluck Thipayarat O-II-8 Visual improvement of colony detectability for high-throughput total plate count protocol 31 Orana Rattanabumrung, Wipavadee Sangadkit, Pattarin Supanivatin and Aluck Thipayarat O-II-9 Biological Activity of Trichoderma species 33 May Waine Wityi Htun , Myat Thu , Saw Sandar Maw O-II-12 New transcriptional regulator associated with adaptive stress responses in the yeast 36 Saccharomyces cerevisiae Chalinee Tangsombatvichit , Nitnipa Soontorngun and Khanok Ratanakhanokchai O-II-14 Screening and isolation of yeasts producing IAA (Indole acetic acid) 38 Nwe Nwe Soe Hlaing, Swe Zin Yu, San San Yu O-II-17 Screening of quorum quenching Streptomyces spp. for quorum-sensing control 41 of phytopathogenic bacteria Suphatra Hongvijit, Watanalai Panbangred and Surang Chankhamhaengdecha O-II-18 Biological activities of a Bacillus sphaericus binary toxin produced 46 as soluble proteins in Escherichia coli Pattarapong Inchana, Boonhiang Promdonkoy and Panadda Boonserm O-II-20 Strain Development on Nitrogen Fixing into Cellulolytic Nitrogen Fixing Bacteria 48 through Transposon Mutagenesis Honey Thet Paing Htway, Zaw Ko Latt and San San Yu Oral presentation III: Food Biotechnology and Food Safety O-III-4 Effects of osmotic stress on growth and production of pigments, monacolin K 51 and citrinin by Monascus purpureus TISTR 3541 in solid cultures Sani Jirasatid, Anan Tongta, Montira Nopharatana, Panit Kitsubun, Taweerat Vitchitsoonthonkul Oral presentation IV: Bioprocess and Industrial Biotechnology O-IV-1 Effect of crude extract to t-butanol ratio on partitioning of proteases 53 from farmed giant catfish viscera Aten Vannabun, Phanuphong Chaiwut, Saroat Rawdkuen O-IV-4 Effects of fiber length on mechanical properties 55 of oil palm empty fruit bunched fiber-reinforced biocomposites Sukanya Eiemsupackul, Bunpot Mai-Ngam, Dudsadee Uttapap, Chureerat Pudtanlek, Vilai Rungsardthong. O-IV-5 Optimization of the fructo-oligosaccharides production using 57 two-step fed-batch fermentation of Aspergillus niger TISTR 3570 Dararat Mongkolkarn, Gassinee Trakoontivakorn and Sarote Sirisansaneeyakul O-IV-7 The heterotrophic cultivation of Chlorella sp. TISTR 8990 in a 5-L fed-batch bioreactor 60 Yothaka Puchcha, Natapas Phoopat, Duenrut Chonudomkul and Sarote Sirisansaneeyakul O-IV-8 The high yield production of xylitol by repeated fed-batch fermentation 63 Siwaporn Wannawilai and Sarote Sirisansaneeyakul O-IV-9 Mathematical modeling of thermal-pH stability and activity of inulinases 65 from Aspergillus niger TISTR 3570 Molnapat Songpim, Pilanee Vaithanomsat and Sarote Sirisansaneeyakul Oral presentation V: Nano- and Analytical Biotechnology O-V-5 Synthesis of amphiphilic dextran by lipase from Candida rugosa: 68 Strategies to enhance enzyme activity in organic solvents Kulthida Kaewprapan, Emmanuelle Marie, Alain Durand and Pranee Inprakhon

The 23rd Annual Meeting of the Thai Society for Biotechnology “Systems Biotechnology: Quality & Success”
- V -
Oral presentation VI: Pharmaceutical and Medical Biotechnology O-VI-1 Nucleotide diversity of apical membrane antigen 1 (AMA-1) in patients infected 70 with Plasmodium vivax in malaria endemic areas of Thailand Wimlin Khaosanit,Chakrit Hirunpetcharat, Usa Lek-Uthai O-VI-2 Detection of Plasmodium falciparum mdr1 gene by real-time PCR 72 and loop-mediated isothermal amplification methods Siriporn Rachakhom , Kawin Leelawat, Usa Lek-uthai O-VI-4 Exploring the regulatory role for Rds2 homologue in the pathogenic yeast Candida albicans 74 Sirilak Baramee , Nitnipa Soontorngun O-VI-6 DTscreen v1: A novel drug targets identification tool for pathogenic diseases 76 through protein signature-based approach Saowalak Kalapanulak, Arporn Juntrapirom, Treenut Saithong O-VI-7 An insight into structural and functional characteristics of Plasmodium falciparum 78 falcipain3 as key drug targets against malaria Surapong Pinitglang, Krongsakda Phakthanakanok, Ratchanee Saiprajong and Khanok Ratanakhanokchai O-VI-8 Effect of Oxford selective agents on colony growth of Listeria and non-Listeria strains 80 Ruamporn Liamkaew, and Aluck Thipayarat O-VI-9 Effect of Selective enrichment substrates on colony growth kinetics of 82 Listeria innocua during selective agar cultivation Pattarin Supanivatin, Natthiga Saeteaw, Siripilin Kosonpisit, Ruamporn Liamkaew, Aluck Thipayarat O-VI-10 Study of incubation temperature and nutrients of non-selective enrichment 84 for optimizing growth of Listeria innocua in liquid cultivation Siripa Daengphuang and Aluck Thipayarat Poster Presentation Poster presentation I: Agricultural Biotechnology and Agroindustry P-I-01 The role of different viral genes on the replication of white spot syndrome virus 86 in Penaeus vannamei Pongsak Khunrae, Vanvimon Saksmerprome, Triwit Rattanarojpong P-I-02 Preparation of white spot syndrome virus VP35 protein having high folding uniformity 88 Triwit Rattanarojpong, Rukkit Suwannaboon and Pongsak Khunrae P-I-03 Expression of recombinant HtrA2 protein of Penaeus monodon in Escherichia coli 90 Triwit Rattanarojpong, Yongyuth Srisupapakdee, Pongsak Khunrae P-I-04 Functional analysis of a cassava sucrose synthase gene in transgenic potato 92 Apaporn Rattanakitti, Ratree Koohapitakthum, Rungnapa Deeto, Malinee Suksangpanomrung P-I-06 Expression of rice Os1BGlu4 -glucosidase in Escherichia coli 94 Rouyi Chen, Darawan Ruamkuson, Sumeth Imsoonthornruksa and Mariena Ketudat-Cairns P-I-09 Effects of spore inocula of ectomycorrhizal fungi Russula spp. 96 on growth stimulation of Shorea siamensis Miq. Chaowanee Aunlumpoon and Jittra Piapukiew P-I-11 Recombinant expression and biochemical characterization of 98 cassava starch debranching enzymes Supatcharee Netrphan, Chonnakarn Jirapatpongthada P-I-19 Rapid and sensitive detection of shrimp yellow head virus 100 by loop-mediated isothermal amplification Sasiwarat Khunthong, Wansadaj Jaroenram, Timothy W.Flegel, Isada Mungsantisuk, Wansika Kiatpathomchai Poster presentation II: Microbial and Molecular Biotechnology P-II-01 Bacterial isolation for industrial D-lactic acid production from natural sources 102 Budsabathip Prasirtsak, Somboon Tanasupawat, Kentaro Kodama, and Nuttha Thongchul P-II-02 Development of insulin production in Pichia pastoris GS115 107 Sasithorn Ngenprasertsiri, Ruethairat Boonsombat P-II-09 Evaluation of potential fungal strains for prebiotic oligosaccharide production 110 Premsuda Saman, Achara Chaiongkarn, Somporn Moonmangmee, Chantra Poonsiri and Suparp Artjariyasripong

The 23rd Annual Meeting of the Thai Society for Biotechnology “Systems Biotechnology: Quality & Success”
- VI -
P-II-11 Identification of non-ribosomal peptide synthetase gene expression 112 in Marianneae camptospora Sarocha Panchanawaporn, Natcha Tepragul and Chanikul Chutrakul P-II-13 Effects of long-term ultraviolet irradiation on growth rate, pigments and 118 photosynthetic efficiency of cyanobacterium, Synechocystis sp. PCC 6803 Suparaporn Khanthasuwan, Aran Incharoensakdi, Saowarath Jantaro P-II-14 Antimicrobial activity of crude extracts from fungal endophytes 120 Krit Luengchaichaweng, Siriluk Pramachote , Watanalai Panbangred , Chuenchit Boonchird and Thipa Asvarak P-II-15 Effects of culture media on production of antimicrobial compound from fungal endophyte 122 Suwaporn Thongcharoen, Thunyarat Pongtharangkul, Watanalai Panbangred, Chuenchit Boonchird, Thipa Asvarak P-II-16 Distinct expression patterns of two uvrA genes of 124 Pediococcus acidilactici BCC9545 under environmental stresses Mattika Abhisingha, Wanna Malaphan and Chetsadaporn Pitaksutheepong P-II-21 Effect of yeast extract content on bacteriocinogenic activity from Weissella confusa CP3-1 126 Apakorn Saieah, Savitri Vatanyoopaisarn and Suriya Rutatip P-II-22 Isolation of microorganisms from biodiesel and diesel oils and 128 preliminary study of their growth in fuel Tavinvong Kuhakongkeat, Savitri Vatanyoopaisarn P-II-24 Screening of xylose-utilizing oleaginous yeasts for lipid production 130 Worawat Surarit , Poranpan Thaicharoen, Sasitorn Jindamorakot , Ruthada Chanklan P-II-25 Identification of toxin genotypes from Clostridium perfringens isolates 133 in Thailand by multiplex PCR Chaowaree Adthalungrong, Chayaporn Samansoranakun, Praveenuch Ngamchom and Siraprapa Krethathorn P-II-27 Loop-mediated isothermal amplification (LAMP) for the rapid and 138 efficient detection of Salmonella in food samples Mevaree Srisawat and Watanalai Panbangred Poster presentation III: Food Biotechnology and Food Safety P-III-01 Characterization and bioactivities of collagen hydrolysates from 142 striped catfish and farmed giant catfish skins Natthawut Thitipramote, Keerati Krongsuksirichai, Phanuphong Chaiwut, Punyawatt Pintathong, Saroat Rawdkuen P-III-03 Contamination of aflatoxigenic and ochratoxigenic Aspergillus in Thai rice 144 Notai Kittikamhaeng and Cheewanun Dachoupakan P-III-04 Survival enhancement of probiotic by co-encapsulation with root crop fiber 146 Sirasa Sumongkhon and Tipparat Hongpattarakere P-III-05 Biochemical properties of muscle foods treated with different plant proteases 148 Saroat Rawdkuen P-III-06 Antimicrobial properties of gelatin based film incorporated 151 with catechin and lysozyme combination Saroat Rawdkuen, Phunsiri Suthiluk,and Damrongpol Kamhangwong P-III-07 The efficiency of sodium hypochlorite and peracetic acid on reducing of 153 Vibrio parahaemolyticus on shrimp during washing step Tanva Sompuen and Warawut Krusong P-III-10 Isolation and screening of halophilic ribonuclease-producing bacteria 155 from Thai fermented protein foods Julalak Chuprom, Nuttapong Bovornreungroj, Duangporn Kantachote, Prasert Suntinanalert, Preeyanuch Bovornreungroj P-III-11 Effect of catechin and lysozyme addition on physical and 157 mechanical properties of gelatin-based films Damrongpol Kamhangwong, Phunsiri Suthiluk and Saroat Rawdkuen P-III-12 Antimicrobial properties of synthetic and natural compounds against 159 food spoilage microorganisms Phunsiri Suthiluk, Saroat Rawdkuen and Damrongpol Kamhangwong

The 23rd Annual Meeting of the Thai Society for Biotechnology “Systems Biotechnology: Quality & Success”
- VII -
Poster presentation IV: Bioprocess and Industrial Biotechnology P-IV-01 A static bed bioreactor for immobilization of Rhizopus oryzae and 162 L(+)-lactic acid production Varunee Pimtong, Ruethairat Boonsombat, Nuttha Thongchul P-IV-02 Purification of Ca2+ -Signaling Inhibitors from Thai Medicinal Plants in Budding Yeast 169 Suphaya Sittichan, Ngampong Kongkathip, Tokichi Miyakawa and Rathada Chanklan P-IV-03 Immobilization of phenylalanine dehydrogenase on microtiter plate 172 using avidin-biotin technology Pannika Klungnuch, Kanoktip Packdibamrung and Manchumas Prousoontorn P-IV-04 Extraction optimization of phenolic and anthocyanin antioxidant 174 compounds from several pigmented rice Natthawut Thitipramote, Nisakorn Saewan, Surintip Sawangmongkhon, Suwat Vorrarathanakit P-IV-05 The bioplastic, poly(3-hydroxybutyrate) production by batch cultivation of 176 Bacillus megaterium P-12 from sugarcane liquor with different C/N ratio Wiyanan Muangkao, Nuttha Thongchul and Songsri Kulpreecha P-IV-06 Phenolic antioxidant activity from betel nut (Areca catechu L.) extracts 180 Sarita Sangthong, Punyawatt Pintathong and Phanuphong Chaiwut P-IV-07 Stabilization of bromelain extracted by polyethylene glycol-salt biphasic system 182 Sarita Sangthong, Zateebee Sompakdee, Punyawatt Pintathong, Saroat Rawdkuen and Phanuphong Chaiwut P-IV-09 Production Development of Violacein from Marine Bacteria Isolated 184 from Sponge Using Adsorbent Resins Teera Raksasuk, Chutiwan Dechasakulwattana and Preecha Phuwapraisirisan P-IV-12 Production of poly-hydroxybutyrate from molasses and 186 corn steep liquor by Alcaligenes eutrophus Suntiti Lhim and Sirilux Chaijamrus P-IV-13 Utilization of dairy by-products as media for Alcaligenes eutrophus 188 in poly-hydroxybutyrate production Darunee Sommanas and Sirilux Chaijamrus P-IV-14 Production of Acetobacter aceti Starter Powder by Low-Temperature Thermal Drying 190 Jaruwan Maneesri, Payap Masniyom, and Wipawan Wongsdaluk P-IV-16 Optimization of medium components for lactic acid production from tapioca starch 193 hydrolysate by Lactobacillus casei TISTR 453 using Response surface methodology Chayaporn Samansoranakun and Chaowaree Adthalungrong P-IV-18 Phenolic antioxidative activity of banana (Musa sapientum L.) peel extract 198 Supak Chuamsuk, Punyawatt Pintathong, Natthawut Thitipromote , Narunan Wuttisin and Phanuphong Chaiwut P-IV-19 Phenolic content and DPPH radical scavenging capacity in mung bean sprout extracts 200 Pinyada Wijitrakul, Puthinee Junhasobhaga , Punyawatt Pintathong, and Phanuphong Chaiwut P-IV-20 Production of yeast extract from Hansenula polymorpha IBGE HP-5001 using pressure reactor 202 Sarintip Sooksai, Nuttha Thongchul, Sajee Noitang, Somyos O-siripun, Parissara Chunthong, Kattaleeya Talwong, Phatthanon Prasitchoke, Veerapat Tantayakom and Amorn Petsom P-IV-25 Phenolic content and antioxidant activity from Thai flower extracts 204 : Effect of extraction conditions Nantaporn Lalitanan, Pornthip Akuniwong, Punyawatt Pintathong, Phanuphong Chaiwut, Nont Thitilertdecha P-IV-26 Hydrogen production by photosynthetic bacterium strain OS33 206 using domestic waste as carbon source Nathanan Manjeen, Saranya Phunpruch and Somchai Krairak P-IV-27 Expression, purification and partial characterization of lipase cloned 211 from Bacillus thermoamylovorans BHK52 Juthamas Suwansri, Apichat Upaichit and Aran H-Kittikun P-IV-28 Kinetic study of sophorolipid production by Pichia anomala MUE24 in a 5-L batch bioreactor 213 Tiwaporn Punrat, Suchada Chanprateep, Suthep Thaniyavarn, Sarote Sirisansaneeyakul and Jiraporn Thaniyavarn
The 23rd Annual Meeting of the Thai Society for Biotechnology “Systems Biotechnology: Quality & Success”
- VIII -
Poster presentation V: Biodiversity and Evolutionary Biotechnology P-V-01 Molecular phylogeny of ectomycorrhizal fungus Tylopilus based on nuLSU rDNA in Thailand 216 Pawara Pachit , Jittra Piapukiew and Cherdchai Phosri P-V-03 Assessment of genetic diversity and relationship among 218 Dendrobium friedericksianum Rchb.f. using AFLP markers Piyarat Chareonsap, Intira Jarupeng, Orachorn Chotiyarnwong, Prapai Mojarin, Patamaporn Tilarux, Saroch Prasertsirivatna and Pornchai Chuthamas Poster presentation VI: Pharmaceutical and Medical Biotechnology P-VI-01 Biodegradable composite films and pharmaceutical hard capsules 221 based on durian seed starch Warin Pimpa and Chakkrit Pimpa P-VI-04 Transformation of artemisinin by Aspergillus oryzae and 223 the biological activity of the transformed product Wannipa Pipatsamut, Sirirat Chancharunee, Nisa Chawapun, Uthai Wichai, Angkana Saovapakhiran P-VI-05 The possible biological marker for live attenuated dengue vaccine development 226 Sutee Yoksan, Kalyanee Jirasripongpun, Kanda Seeda, Surat Warasumpati and Nuananong Jirakanjanakit P-VI-06 Biological attributes of the live attenuated chikungunya vaccine 228 Sutee Yoksan, Surat Phunyahathaikul, Supoth Rajakam, Nuananong Jirakanjanakit P-VI-07 Development of hydrocolloid gel for wound dressing 230 Kalyanee Jirasripongpun, Monrudee Paungbupa, and Nuananong Jirakanjanakit P-VI-08 Production of monoclonal antibodies against Salmonella Typhimurium 232 Yada Chapanont, Kittinan Komolpis, Sirirat Rengpipat P-VI-09 Production of monoclonal antibodies against Vibrio parahaemolyticus 234 Krittiya Noiprapai, Nanthika Khongchareonporn, Sirirat Rengpipat P-VI-10 Bioactive compounds – target interaction networks 236 in Chinese herbs formula for type 2 diabetes Phuphiphat Jaikaew, Supa Hannongbua and Marasri Ruengjitchatchawalya P-VI-11 Evaluation of cosmetic bioactivities from Zingiberaceae rhizome extracts 238 Natthawooth Keonkaew, Pimnara Thiwongnoi, Phanuphong Chaiwut, Natthawut Thitipramote, Punyawatt Pintathong P-VI-12 Microwave-assisted extraction and optimization of antioxidant and 240 antityrosinase activities from Zingiber officinale rhizome Phanuphong Chaiwut, Natthawooth Keonkaew, Pimnara Thiwongnoi, Nont Thitilertdecha, Punyawatt Pintathong P-VI-15 A coumarin compound from Clausena harmandiana (Pierre) posseses 242 a calcium signal inhibiting activity in a mutant Saccharomyces cerevisiae Pitipreya Suauam, Boon-ek Yingyongnarongkul , Tokichi Miyakawa and Chulee Yompakdee Poster presentation VII: Biocontrol and Environmental Biotechnology P-VII-01 Antifungal activity of lactic acid bacteria against aflatoxin-producing fungi 244 Panadda Sangmanee and Tipparat Hongpattarakere P-VII-05 Insoluble Zinc Compound Solubilization by Fungi Isolated from Zinc Mining Soil 246 Thanawat Sutjaritvorakul, Sophon Roengsumran and Prakitsin Sihanonth P-VII-09 Antimicrobial activity of fungal endophytes against causal agents of cassava diseases 248 Chattri Khomkrit, Jarunya Narangajavana, Chuenchit Boonchird, Thipa Asavarak P-VII-10 Strain selection of probiotic Bacillus spp. against broiler chicken pathogen 250 Kanogporn Sriyam, Vichai Domrongpokkaphan and Thanit Pewnim P-VII-15 Isolation of bioplastics-degrading bacteria from compost soil in Thailand 252 Luksamee Sukrakanchana, Sukhumaporn Sukkhum and Peechapack Somyoonsap Index Author Index 255 Keyword Index 258 Acknowledgement 262
The 23rd Annual Meeting of the Thai Society for Biotechnology “Systems Biotechnology: Quality & Success”
- IX -
Greetings
The 23rdAnnual Meeting of the Thai Society for Biotechnology “Systems Biotechnology: Quality & Success”
February 1-2, 2012
The Imperial Queen’s Park Hotel, Bangkok, THAILAND
Invitation message from the TSB president
On behalf of the president of Thai Society for Biotechnology (TSB), I would like to invite you to join our TSB 2011 conference, to be held at the Imperial Queen's park hotel in Bangkok during 1-2 February, 2012. As you may know that TSB was established in 1991 and the TSB conference has been organized every year since 1989, this is the event that we are looking for. Particularly, this year is extremely special as it is 30th anniversary of the biotechnology department, Mahidol University, our host of the conference.
The TSB 2011 conference will have 6 keynote lectures, 8 plenary lectures, 3 special meetings, 2 given awards and 1 panel industrial discussion. Our pronounced keynote speakers are the leading success in biotechnology from China, Colombia, Japan and Thailand. Nevertheless, the updated research will be presented by our plenary lecturers from 4 countries. Please check our website for the detail. Within 2 days of the conference, you will have chance to hop in and hop out to one of many parallel sessions and get to know biotechnological people around the world. This is a great place to have a networking.
Interestingly, we are honoured to have the speakers from biotechnological industries on the topic of “Biotechnology research trends and opportunity” which will give you the opportunity to hear about the company research and job availability as well as potential research collaboration. Moreover, the post conference activity will bring you to the intensive course of Jatropha curcas (non-edible oil for biodiesel production) agronomy and entomology. It is also the touch on experience of Jatropha tree and plantation management with the experts from the centre of excellence for Jatropha.
In the heart of Bangkok at the Imperial Queen's Park Hotel, you will be in the middle of shopping malls and entertainments. The visit of most famous tourist attractions is possible within the minutes on the sky train (BTS). I am certain that not only the academic satisfaction, the enjoyable of Bangkok offering will make you unforgettable time.
I do very much hope that I will meet you at the TSB 2011 conference in October.
Yours sincerely, Associate Professor Penjit Srinophakun President Thai Society for Biotechnology (TSB)

The 23rd Annual Meeting of the Thai Society for Biotechnology “Systems Biotechnology: Quality & Success”
- X -
Welcome message from the Chairperson Organizing Committee, TSB2011 Dear Colleagues,
We would like to welcome you to the 23rd Annual Meeting of the Thai Society for Biotechnology (TSB 2011), which will be held in the exotic city of Bangkok from February 1 to 2, 2012 at the Imperial Queen's Park Hotel. This meeting is organized by the Thai Society for Biotechnology and the Department of Biotechnology, Faculty of Science, Mahidol University on the occasion of the 30th Anniversary of the Department, in collaboration with the National Center for Genetic Engineering and Biotechnology (BIOTEC) and the National Research Council of Thailand (NRCT).
The theme of the meeting this year is "Systems Biotechnology: Quality and Success". Systems biology has
become one of the most exciting new trends in bioscience research including biotechnology research. We expect the conference participants this year to number more than 400 and include experts in biotechnology and other related interdisciplinary fields.
In line with the mission and the traditions of the Annual Meeting of the Thai Society for Biotechnology, the
TSB 2011 meeting will include the following activities: keynote and invited talks, highlight Taguchi Award and Ajinomoto lectures from esteemed Thai scientists devoted to research in Biotechnology and oral and poster presentations on several topics. There will be several concurrent meetings including a joint meeting of JSPS-NRCT-NSTDA on the Next Generation Bioproduction Platform Leveraging Subtropical Microbial Resources, an International Cassava Research Symposium and a Tokyo Institute of Technology and Mahidol University Joint Symposium. The TSB2011 also welcomes those who wish to present new ideas and strategies for research and development towards industrial applications in biotechnology.
A call for participation and for submission of abstracts is now open on-line. We invite you to come and
experience this meeting with us as a speaker, poster presenter, attendee, exhibitor or sponsor and to join us in our mission to promote research in the field of Biotechnology for the ultimate benefit to society. This meeting also provides a good opportunity for students to gain experience and knowledge on current scientific advancements in the field. We wish TSB2011 to be an exciting opportunity not only to share ideas and experiences but also to establish and improve friendships among colleagues the world over.
Finally, we welcome all to join this exciting meeting and to enjoy the sights and culture of Thailand's capital city.
Yours sincerely, Associate Professor Chuenchit Boonchird Chairperson Organizing Committee, TSB 2011
The 23rd Annual Meeting of the Thai Society for Biotechnology “Systems Biotechnology: Quality & Success”
- XI -
Joint Symposium 1
JSPS Asian CORE Symposium 2011
Next-generation Bioproduction Platform Leveraging Subtropical Microbial Bioresources
For advancement of industrial biotechnology which is required urgently to solve effectively the issues of 21st century, finding of useful microorganisms and development of their ability into usable level is indispensable. Different from medical biotechnology in which more personalized or tailor-made direction for individuals is explored, industrial biotechnology is important for providing necessary commodities for society-wide level. Especially, with respect to biotechnology aiming for bioproduction, namely, i) production of low-molecular weight bioactive compounds, such as antibiotics, ii) production of highly functional enzymes required for soft biomass degradation and/or recovery of phosphate resources, and iii) development of whole-cell biocatalyst to convert petroleum-dependent processes into green-chemistry-dependent processes, whole process of the production will depend heavily on the nature of the microorganisms applied. Thus, demand for novel and useful microorganisms is large and will increase steadily.
Southeast Asian countries having subtropical climate are rich in invisible bioresources, namely unexplored microorganisms. However, since the Convention on Biological Diversity came into effect, access to or transfer of microbial bioresources has been under severe control, resulting in good protection of microbial bioresources in each country. On the contrary, this tight protection hindered the development of potential of such microbial bioresources and effective usage of microorganisms has been retarded. Because the microbial bioresources in subtropical countries are, in a sense, global assets, exploring and developing these microbial bioresources before their extinction is not only scientifically very important issue but also indispensable for the advancement of industrial biotechnology. To tackle important three issues in bioproduction, JSPS-NRCT-NSTDA project was initiated and Thai-Japanese collaborating teams have been actively pursuing these issues since 2009.
In this special occasion of joint symposium on 1st February, 2012 under the frame of TSB2011, selected researchers from both Thailand and Japan collaborating tightly in the JSPS-NRCT-NSTDA project will present their advanced approaches and results in the field of industrial biotechnology and will discuss deeply on the future direction of industrial biotechnology. We would like to express our gratitude to the kind support from National Research Council of Thailand (NRCT), National Science and Technology Development Agency (NSTDA) and The Japanese Society for the Promotion of Sciences (JSPS). Last but not least, we also would like to thank all staff and researchers from all institutes and universities in both countries for their kind contribution in this project. With their hard effort, many fruitful results are obtained which contribute significantly to the research field in biotechnology.
Yours sincerely,
Professor Takuya Nihira Director, PI JSPS Asian CORE project International Center for Biotechnology, Osaka University Professor Watanalai Panbangred Department of Biotechnology, Faculty of Science, Mahidol University
The 23rd Annual Meeting of the Thai Society for Biotechnology “Systems Biotechnology: Quality & Success”
- XII -
Joint Symposium 2
International Cassava Research Symposium 2011
Organized by RIKEN Plant Science Center, Japan
Mahidol University, Thailand
Sponsored by Strategic Funds for the Promotion of Science and Technology
(by Ministry of Education, Culture, Sports, Science and Technology, Japan)
Cassava, tapioca or manioc (Manihot esculenta Crantz), a perennial shrub, currently is one of the world food crops for more than 800 million people in tropical and sub-tropical Africa, Latin America and Asia. It is cultivated mainly by resource-limited small farmers for its starchy roots, which are used as human food either fresh when low in cyanogens or in many processed forms and products, mostly starch, flour, and for animal feed. Because of its inherent tolerance to stressful environments, where other food crops would fail, it is often considered a food security source against famine, requiring minimal care. Under optimal environmental conditions, it compares favorably in production of energy with most other major staple food crops due to its high yield potential. Cassava plays role as the major source of starch which is widely used in many food and non-food industries, thus the demand to use cassava as raw material for various industries has been promisingly increased.
It is our privilege and great pleasure to invite you to participate in the International Cassava Research Symposium 2011, which is co-organized by Mahidol University (Thailand) and RIKEN Plant Science Center (Japan) as a part of the 23rd Annual Meeting of the Thai Society for Biotechnology. We are organizing this symposium with the objectives of updating cassava research information that has been going on in Japan, Thailand, Vietnam, and other countries. The global improvement of cassava (i.e. taking advantage of the cassava genome sequencing data, integrating breeding with markers, collections of phenotypic and genotypic databases…) and facing new challenges presented by global warming such as pest and diseases, CO2, drought and heat, should be of interests to be discussed. Furthermore, the genotyping capacity, functional genomic knowledge and other large scale data can be integrated using systems biology approaches to open new avenues towards cassava improvement.
We hope that some researchers who have been working on cassava, or will decide to work on cassava, will join to this symposium. Then this will be a good opportunity for us to get to know each other and become interesting in doing cassava research collaboration to fascinating this crop that has the great merit of being the source of food and energy for our world. We would like to express our grateful to the Strategic Funds for the Promotion of Science and Technology (by Ministry of Education, Culture, Sports, Science and Technology, Japan) for kindly support to this symposium. Our cordially thanks also go to all colleagues for their significant contribution to the research field in cassava.
Yours sincerely,
Dr. Motoaki Seki Plant Genomic Network Research Team, RIKEN Plant Science Center Dr. Jarunya Narangajavana Department of Biotechnology, Faculty of Science, Mahidol University

The 23rd Annual Meeting of the Thai Society for Biotechnology “Systems Biotechnology: Quality & Success”
- XIII -
Joint Symposium 3
The Tokyo Institute of Technology and Mahidol University joint meeting
Biotechnology for Green and Life innovations
Global issues such as the depletion of resources and energy, environmental pollution and depletion of foods are becoming more and more serious problems in the world and it is necessary for all countries in the world to cooperate to resolve them. In addition to such global changes, many countries are facing an aging society with fewer children. Particularly, in the long run, limits to energy resources and increase in aging are serious and significant issues to be resolved. For this reason, researchers in the world are cooperating to make good use of various science and technology to respond to the problems of climate change, to construct a society that does not use fossil energies, and to respond to the problem of aging society. “Green innovation” and “Life innovation” achieved by biotechnology, one of the major technologies in the 21st century, are anticipated to play an important role in the resolution of these problems. Thereby, countries in Asia need to cooperate with each other and promote the research and development (R&D) to bring progress to these two big innovations.
In this special symposium on February 2nd, several researchers from Mahidol University and Tokyo Institute of Technology will introduce their advanced approaches to biotechnology R&D for life innovation and green innovation and actively discuss their developments for the near future. We would like to make this an opportunity for not only domestic collaboration but also for the Thai and Japanese participants (including presenters) to collaborate in R&D.
Yours sincerely,
Associate Professor Susumu Kajiwara Department of Life Science, Graduate School of Bioscience and Biotechnology, Tokyo Institute of Technology Associate Professor Chuenchit Boonchird Department of Biotechnology, Faculty of Science, Mahidol University
- XIV -
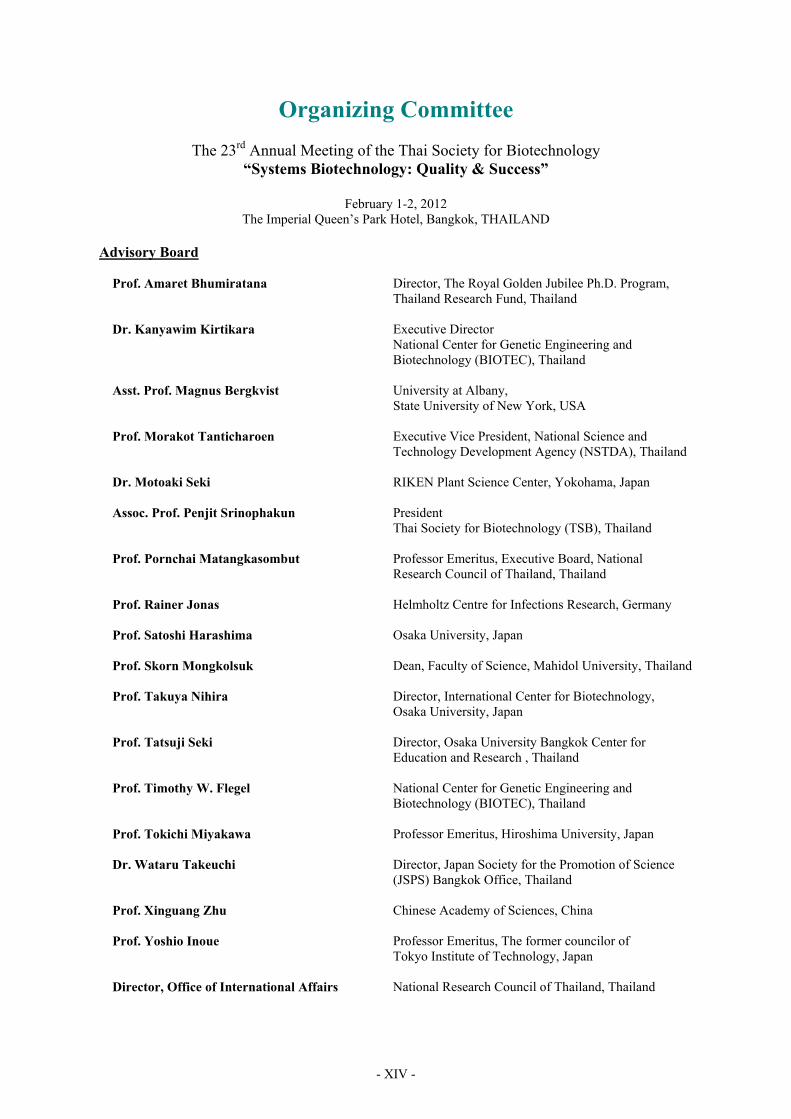
Organizing Committee
The 23rd Annual Meeting of the Thai Society for Biotechnology “Systems Biotechnology: Quality & Success”
February 1-2, 2012
The Imperial Queen’s Park Hotel, Bangkok, THAILAND Advisory Board
Prof. Amaret Bhumiratana
Director, The Royal Golden Jubilee Ph.D. Program, Thailand Research Fund, Thailand
Dr. Kanyawim Kirtikara
Executive Director National Center for Genetic Engineering and Biotechnology (BIOTEC), Thailand
Asst. Prof. Magnus Bergkvist University at Albany, State University of New York, USA
Prof. Morakot Tanticharoen
Executive Vice President, National Science and Technology Development Agency (NSTDA), Thailand
Dr. Motoaki Seki
RIKEN Plant Science Center, Yokohama, Japan
Assoc. Prof. Penjit Srinophakun
President Thai Society for Biotechnology (TSB), Thailand
Prof. Pornchai Matangkasombut
Professor Emeritus, Executive Board, National Research Council of Thailand, Thailand
Prof. Rainer Jonas
Helmholtz Centre for Infections Research, Germany
Prof. Satoshi Harashima
Osaka University, Japan
Prof. Skorn Mongkolsuk
Dean, Faculty of Science, Mahidol University, Thailand
Prof. Takuya Nihira
Director, International Center for Biotechnology, Osaka University, Japan
Prof. Tatsuji Seki
Director, Osaka University Bangkok Center for Education and Research , Thailand
Prof. Timothy W. Flegel
National Center for Genetic Engineering and Biotechnology (BIOTEC), Thailand
Prof. Tokichi Miyakawa
Professor Emeritus, Hiroshima University, Japan
Dr. Wataru Takeuchi Director, Japan Society for the Promotion of Science (JSPS) Bangkok Office, Thailand
Prof. Xinguang Zhu
Chinese Academy of Sciences, China
Prof. Yoshio Inoue Professor Emeritus, The former councilor of Tokyo Institute of Technology, Japan
Director, Office of International Affairs National Research Council of Thailand, Thailand
The 23rd Annual Meeting of the Thai Society for Biotechnology “Systems Biotechnology: Quality & Success”
- XV -
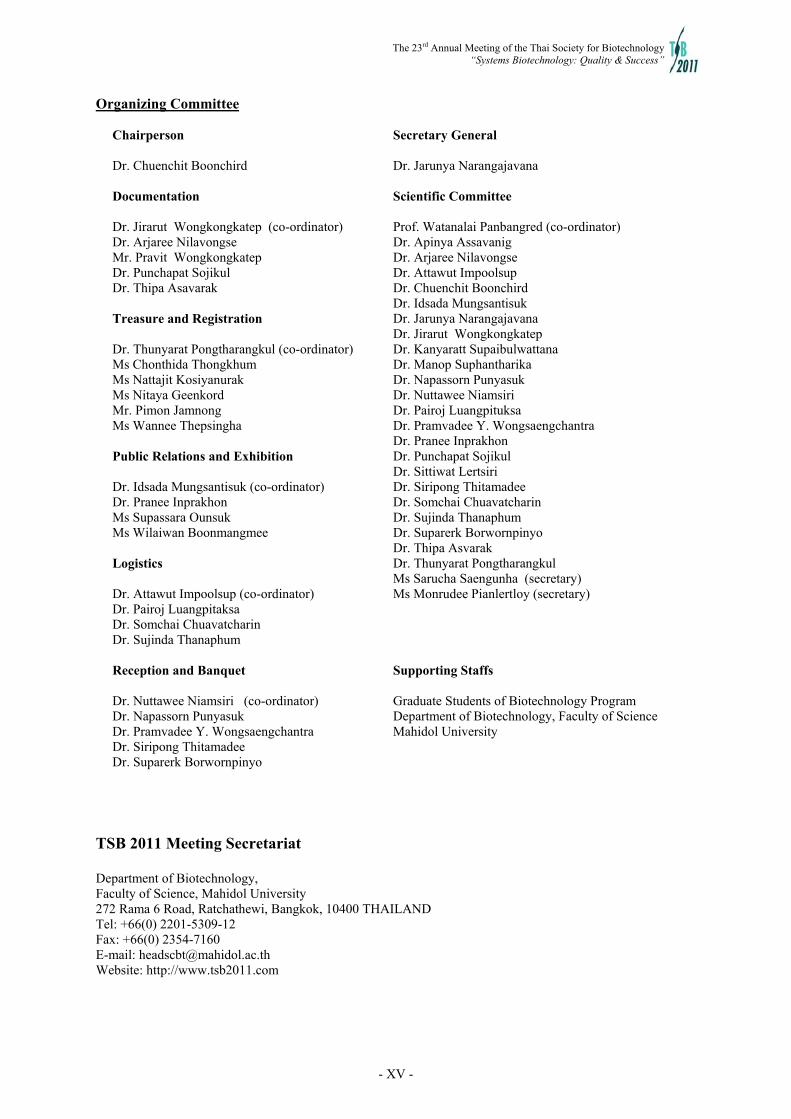
Organizing Committee
Chairperson Dr. Chuenchit Boonchird
Secretary General Dr. Jarunya Narangajavana
Documentation Dr. Jirarut Wongkongkatep (co-ordinator) Dr. Arjaree Nilavongse Mr. Pravit Wongkongkatep Dr. Punchapat Sojikul Dr. Thipa Asavarak Treasure and Registration Dr. Thunyarat Pongtharangkul (co-ordinator) Ms Chonthida Thongkhum Ms Nattajit Kosiyanurak Ms Nitaya Geenkord Mr. Pimon Jamnong Ms Wannee Thepsingha Public Relations and Exhibition Dr. Idsada Mungsantisuk (co-ordinator) Dr. Pranee Inprakhon Ms Supassara Ounsuk Ms Wilaiwan Boonmangmee Logistics Dr. Attawut Impoolsup (co-ordinator) Dr. Pairoj Luangpitaksa Dr. Somchai Chuavatcharin Dr. Sujinda Thanaphum Reception and Banquet Dr. Nuttawee Niamsiri (co-ordinator) Dr. Napassorn Punyasuk Dr. Pramvadee Y. Wongsaengchantra Dr. Siripong Thitamadee Dr. Suparerk Borwornpinyo
Scientific Committee Prof. Watanalai Panbangred (co-ordinator) Dr. Apinya Assavanig Dr. Arjaree Nilavongse Dr. Attawut Impoolsup Dr. Chuenchit Boonchird Dr. Idsada Mungsantisuk Dr. Jarunya Narangajavana Dr. Jirarut Wongkongkatep Dr. Kanyaratt Supaibulwattana Dr. Manop Suphantharika Dr. Napassorn Punyasuk Dr. Nuttawee Niamsiri Dr. Pairoj Luangpituksa Dr. Pramvadee Y. Wongsaengchantra Dr. Pranee Inprakhon Dr. Punchapat Sojikul Dr. Sittiwat Lertsiri Dr. Siripong Thitamadee Dr. Somchai Chuavatcharin Dr. Sujinda Thanaphum Dr. Suparerk Borwornpinyo Dr. Thipa Asvarak Dr. Thunyarat Pongtharangkul Ms Sarucha Saengunha (secretary) Ms Monrudee Pianlertloy (secretary) Supporting Staffs Graduate Students of Biotechnology Program Department of Biotechnology, Faculty of Science Mahidol University
TSB 2011 Meeting Secretariat Department of Biotechnology, Faculty of Science, Mahidol University 272 Rama 6 Road, Ratchathewi, Bangkok, 10400 THAILAND Tel: +66(0) 2201-5309-12 Fax: +66(0) 2354-7160 E-mail: [email protected] Website: http://www.tsb2011.com


Program
The 23rd Annual Meeting of the Thai Society for Biotechnology “Systems Biotechnology: Quality & Success”
February 1-2, 2012 The Imperial Queen’s Park Hotel, Bangkok, THAILAND

- XVIII -
Program at a Glance
The 23rd Annual Meeting of the Thai Society for Biotechnology “Systems Biotechnology: Quality & Success”
Wednesday, February 1st, 2012
Room Time
Mezzanine Queen’s Park 1
& Foyer Queen’s Park 2 Queen’s Park 3 Queen’s Park 4 Queen’s Park 5 Queen’s Park 6 Rainbow
08.00 - 9.00 Registration
09.00 - 9.30 Opening Ceremony
09.30 - 10.00
Keynote session : K-I: Prof. Satoshi Harashima “Development and applications of “Word processing technology” for
editing the yeast genome”
10.00 - 10.30
K-II: Prof. Takuya Nihira “Manipulation of secondary
metabolism for obtaining novel bioactive compounds”
10.30 - 11.00
K-III: Dr. Manabu Ishitani
“Cassava Wealth-Plus, Opportunities and Challenges”
11.00 - 11.30
Coffee Break/ Poster Display/
Exhibition Display
11.30 - 12.30
Taguchi Award Announcement and Presentation Ajinomoto Award Announcement and Presentation
12.30 - 14.00
Poster Display/
Exhibition Display
Lunch / Lunch Talk
by Ajinomoto
“The 5th Basic Taste”
14.00 - 15.30
Oral presentation III:
Food Biotechnology
and Food Safety
Joint Symposium I:
JSPS Asian CORE
Symposium 2011
Oral presentation I(A):
Agricultural Biotechnology
and Agroindustry
Oral presentation II(A):
Microbial and
Molecular Biotechnology
Joint Symposium II:
International Cassava research
Symposium 2011
15.30 - 16.30
Coffee Break/ Exhibition Display
Poster Presentation I: (Odd number)
16.30 - 18.00
Panel Discussion:
Biotechnology
Research, Trends and Opportunity
Joint Symposium I:
JSPS Asian
CORE Symposium
2011
Oral presentation I(B):
Agricultural Biotechnology
and Agroindustry
Oral presentation II(B):
Microbial and
Molecular Biotechnology
Joint Symposium II:
International
Cassava research Symposium
2011
18.00 - 19.00
Poster Display / Exhibition Display
TSB Annual meeting
19.00 - 21.00
Reception Dinner
- XIX -
Program at a Glance
The 23rd Annual Meeting of the Thai Society for Biotechnology “Systems Biotechnology: Quality & Success”
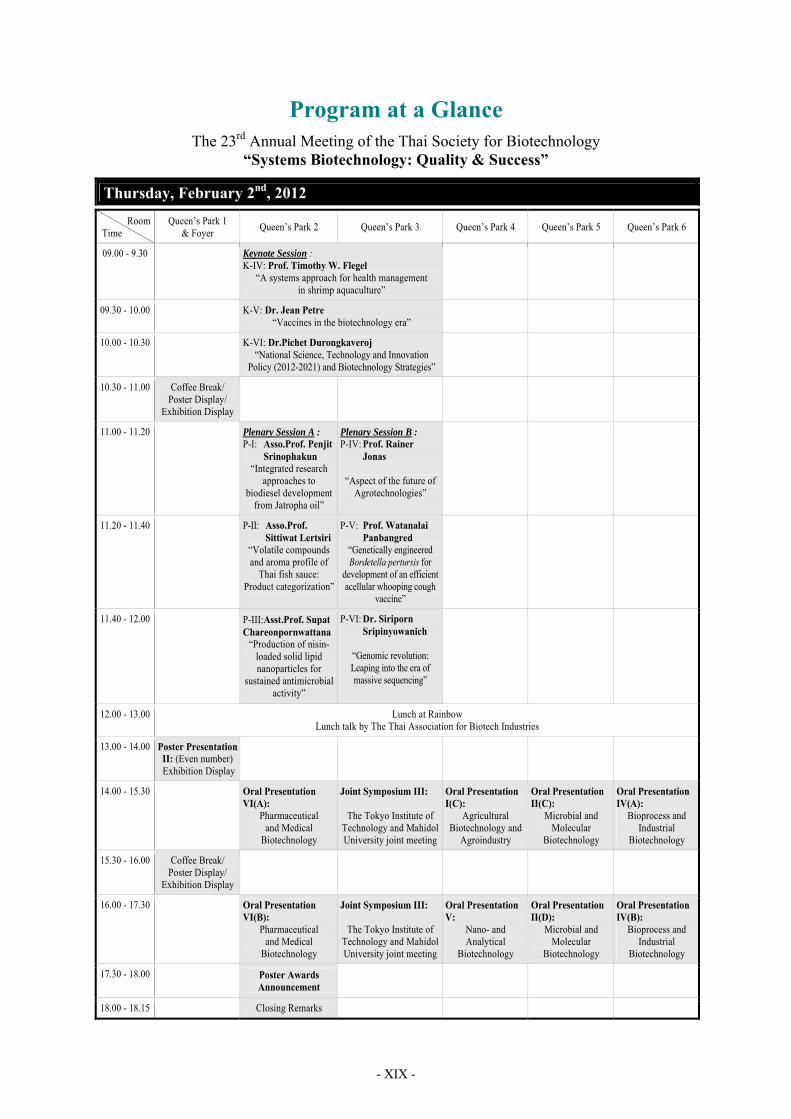
Thursday, February 2nd, 2012
Room Time
Queen’s Park 1 & Foyer
Queen’s Park 2 Queen’s Park 3 Queen’s Park 4 Queen’s Park 5 Queen’s Park 6
09.00 - 9.30
Keynote Session : K-IV: Prof. Timothy W. Flegel
“A systems approach for health management in shrimp aquaculture”
09.30 - 10.00
K-V: Dr. Jean Petre “Vaccines in the biotechnology era”
10.00 - 10.30
K-VI: Dr.Pichet Durongkaveroj “National Science, Technology and Innovation
Policy (2012-2021) and Biotechnology Strategies”
10.30 - 11.00 Coffee Break/ Poster Display/
Exhibition Display
11.00 - 11.20
Plenary Session A : P-I: Asso.Prof. Penjit Srinophakun
“Integrated research approaches to
biodiesel development from Jatropha oil”
Plenary Session B : P-IV: Prof. Rainer Jonas
“Aspect of the future of Agrotechnologies”
11.20 - 11.40
P-II: Asso.Prof. Sittiwat Lertsiri
“Volatile compounds and aroma profile of
Thai fish sauce: Product categorization”
P-V: Prof. Watanalai Panbangred
“Genetically engineered Bordetella pertursis for
development of an efficient acellular whooping cough
vaccine”
11.40 - 12.00
P-III:Asst.Prof. Supat Chareonpornwattana
“Production of nisin-loaded solid lipid nanoparticles for
sustained antimicrobial activity”
P-VI: Dr. Siriporn Sripinyowanich
“Genomic revolution: Leaping into the era of massive sequencing”
12.00 - 13.00 Lunch at Rainbow Lunch talk by The Thai Association for Biotech Industries
13.00 - 14.00 Poster Presentation II: (Even number) Exhibition Display
14.00 - 15.30
Oral Presentation VI(A):
Pharmaceutical and Medical
Biotechnology
Joint Symposium III:
The Tokyo Institute of Technology and Mahidol University joint meeting
Oral Presentation I(C):
Agricultural Biotechnology and
Agroindustry
Oral Presentation II(C):
Microbial and Molecular
Biotechnology
Oral Presentation IV(A):
Bioprocess and Industrial
Biotechnology
15.30 - 16.00 Coffee Break/ Poster Display/
Exhibition Display
16.00 - 17.30
Oral Presentation VI(B):
Pharmaceutical and Medical
Biotechnology
Joint Symposium III:
The Tokyo Institute of Technology and Mahidol University joint meeting
Oral Presentation V:
Nano- and Analytical
Biotechnology
Oral Presentation II(D):
Microbial and Molecular
Biotechnology
Oral Presentation IV(B):
Bioprocess and Industrial
Biotechnology
17.30 - 18.00
Poster Awards Announcement
18.00 - 18.15 Closing Remarks
- XX -
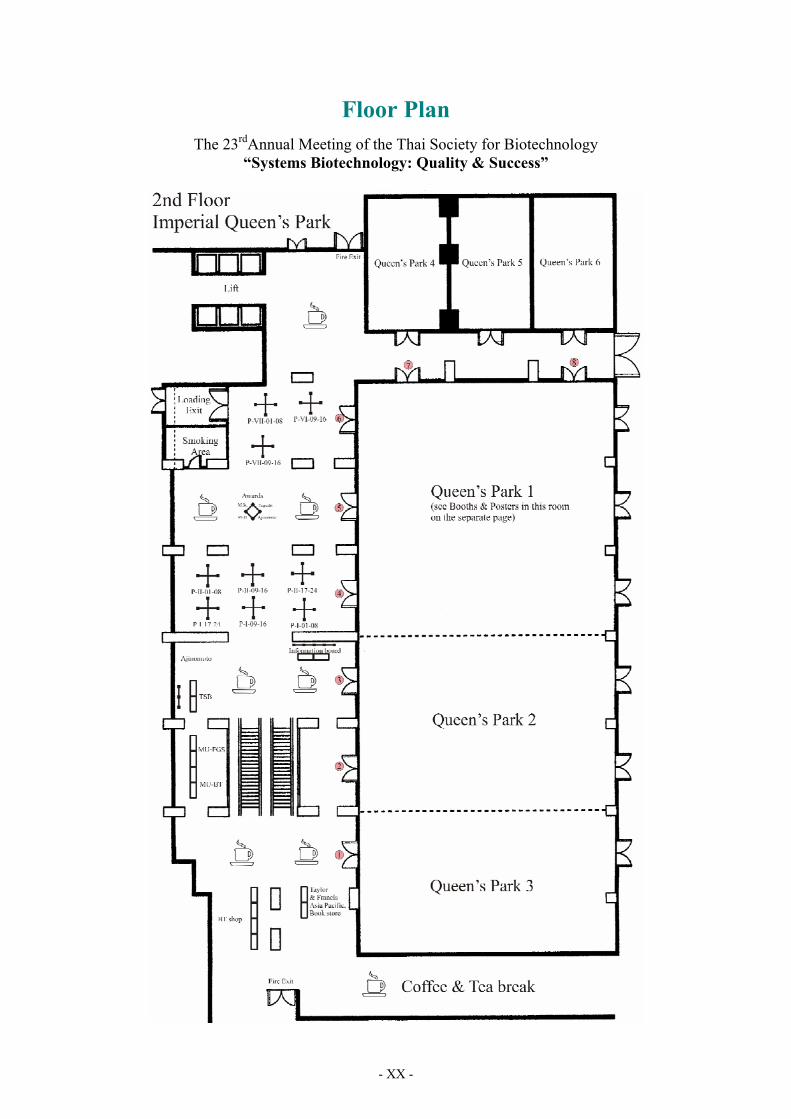
Floor Plan
The 23rdAnnual Meeting of the Thai Society for Biotechnology “Systems Biotechnology: Quality & Success”

The 23rd Annual Meeting of the Thai Society for Biotechnology “Systems Biotechnology: Quality & Success”
- XXI -
The 23rd Annual Meeting of the Thai Society for Biotechnology “Systems Biotechnology: Quality & Success”
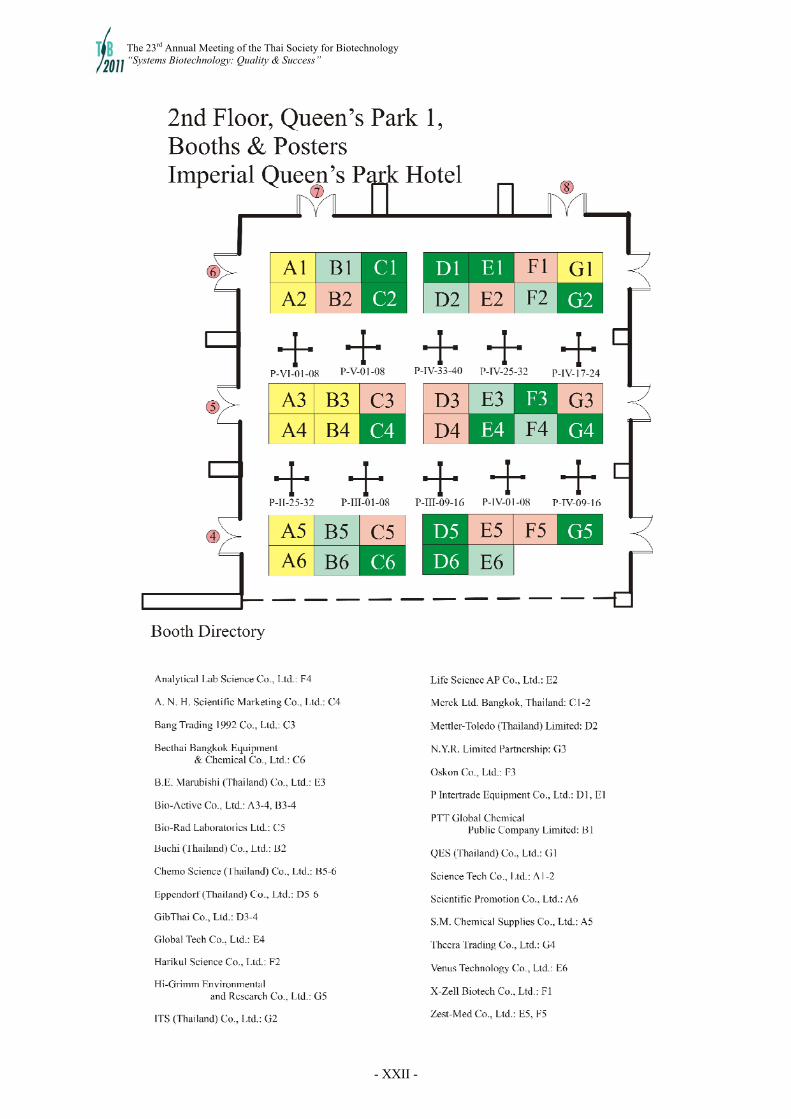
- XXII -
- XXIII -
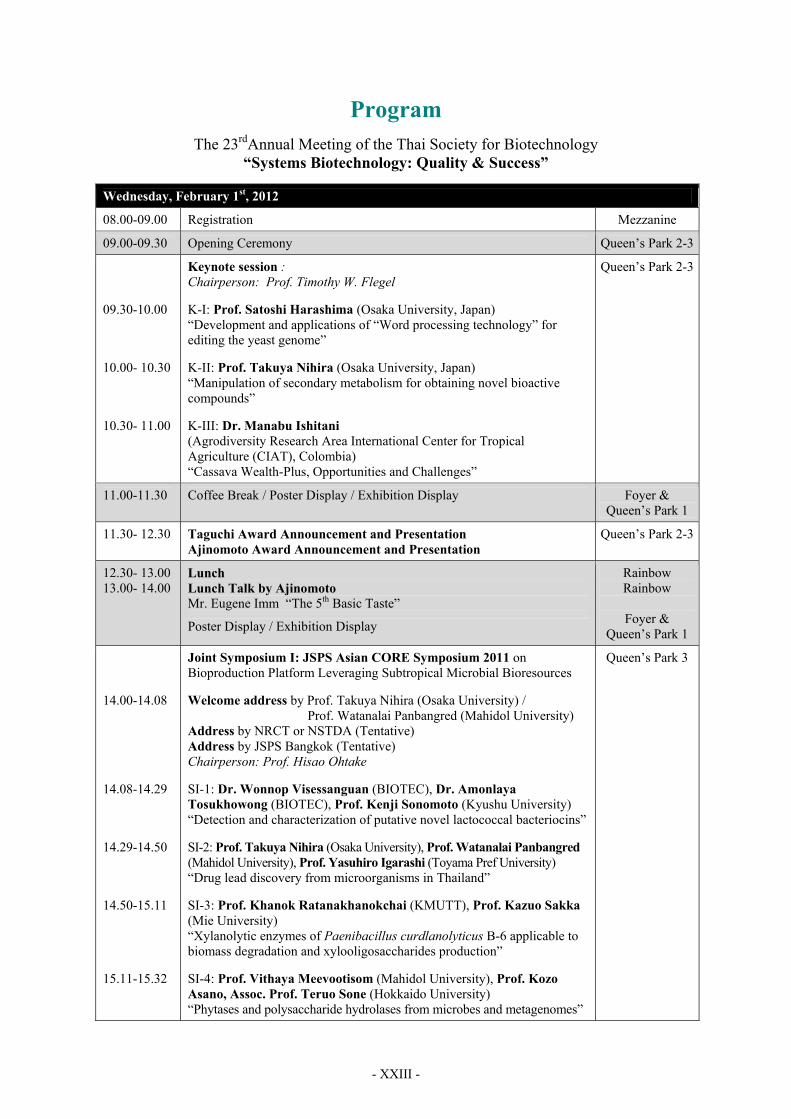
Program
The 23rdAnnual Meeting of the Thai Society for Biotechnology “Systems Biotechnology: Quality & Success”
Wednesday, February 1st, 2012
08.00-09.00 Registration Mezzanine
09.00-09.30 Opening Ceremony Queen’s Park 2-3
09.30-10.00
10.00- 10.30
10.30- 11.00
Keynote session : Chairperson: Prof. Timothy W. Flegel
K-I: Prof. Satoshi Harashima (Osaka University, Japan) “Development and applications of “Word processing technology” for editing the yeast genome” K-II: Prof. Takuya Nihira (Osaka University, Japan) “Manipulation of secondary metabolism for obtaining novel bioactive compounds” K-III: Dr. Manabu Ishitani (Agrodiversity Research Area International Center for Tropical Agriculture (CIAT), Colombia) “Cassava Wealth-Plus, Opportunities and Challenges”
Queen’s Park 2-3
11.00-11.30 Coffee Break / Poster Display / Exhibition Display Foyer & Queen’s Park 1
11.30- 12.30 Taguchi Award Announcement and Presentation Ajinomoto Award Announcement and Presentation
Queen’s Park 2-3
12.30- 13.00 13.00- 14.00
Lunch Lunch Talk by Ajinomoto Mr. Eugene Imm “The 5th Basic Taste”
Poster Display / Exhibition Display
Rainbow Rainbow
Foyer &
Queen’s Park 1
14.00-14.08
14.08-14.29
14.29-14.50
14.50-15.11
15.11-15.32
Joint Symposium I: JSPS Asian CORE Symposium 2011 on Bioproduction Platform Leveraging Subtropical Microbial Bioresources
Welcome address by Prof. Takuya Nihira (Osaka University) / Prof. Watanalai Panbangred (Mahidol University) Address by NRCT or NSTDA (Tentative) Address by JSPS Bangkok (Tentative) Chairperson: Prof. Hisao Ohtake
SI-1: Dr. Wonnop Visessanguan (BIOTEC), Dr. Amonlaya Tosukhowong (BIOTEC), Prof. Kenji Sonomoto (Kyushu University) “Detection and characterization of putative novel lactococcal bacteriocins”
SI-2: Prof. Takuya Nihira (Osaka University), Prof. Watanalai Panbangred (Mahidol University), Prof. Yasuhiro Igarashi (Toyama Pref University) “Drug lead discovery from microorganisms in Thailand”
SI-3: Prof. Khanok Ratanakhanokchai (KMUTT), Prof. Kazuo Sakka (Mie University) “Xylanolytic enzymes of Paenibacillus curdlanolyticus B-6 applicable to biomass degradation and xylooligosaccharides production”
SI-4: Prof. Vithaya Meevootisom (Mahidol University), Prof. Kozo Asano, Assoc. Prof. Teruo Sone (Hokkaido University) “Phytases and polysaccharide hydrolases from microbes and metagenomes”
Queen’s Park 3
The 23rd Annual Meeting of the Thai Society for Biotechnology “Systems Biotechnology: Quality & Success”
- XXIV -
14.00-14.10 14.10-14.30 14.30-14.50 14.50-15.10 15.10-15.30
Joint Symposium II: International Cassava Research Symposium 2011 Chairperson: Assoc.Prof. Jarunya Narangajavana Opening session: Program Officer SII-1: Mr. Adul Vinaiphat (Thai Tapioca Development Institute (TTDI)) “TTDI : Conventional breeding and Biotechnology are good complementary.” SII-2: Dr. Motoaki Seki (RIKEN Plant Science Center. Yokohama, Japan) “Establishment of cassava functional genomics platform and its application to molecular breeding” SII-3: Dr. Le Huy Ham (Institute of Agricultural Genetics, Vietnam) Cassava production in Vietnam: the needs for improvements SII-4: Dr. Tetsuya Sakurai (RIKEN Plant Science. Yokohama, Japan) “Promotion of cassava functional genomics and database development”
Queen’s Park 6
14.00-14.15 14.15-14.30 14.30-14.45 14.45-15.00
Oral presentation I(A): Agricultural Biotechnology and Agroindustry Chairperson: Assoc.Prof. Sirirat Rengpipat O-I-1 Ms. Sawarot Maibunkaew (BIOTEC, NSTDA) “ Analysis of the intestinal bacterial community in wild-caught versus domesticated black tiger shrimp (Penaeus monodon) broodstocks” O-I-2 Mr. Phayungsak Mongkol (Chulalongkorn University) “Bacterial community in intestine of the giant tiger shrimp Penaeus monodon in rearing pond: Effects of shrimp size” O-I-3 Ms. Sripapan Treejatet (Chulalongkorn University) “Molecular cloning and expression analysis of the ATP/GTP binding protein gene in the giant tiger shrimp Penaeus monodon” O-I-4 Ms. Patchari Yocawibun (Chulalongkorn University) “Full-length cDNA cloning and expression analysis of the selenoprotein M gene during ovarian development of the giant tiger shrimp Penaeus monodon”
Queen’s Park 4
14.00-14.15 14.15-14.30 14.30-14.45 14.45-15.00 15.00 -15.15
Oral presentation II(A): Microbial and Molecular Biotechnology Chairperson: Asst.Prof. Chulee Yompakdee O-II-1 Dr. Somchai Pongpattanakitshote (BIOTEC) “Molecular cloning of pectinase and amylase genes from Aspergillus aculeatus BCC17849 for textile industry application” O-II-2 Ms. Thanaporn Laothanachareon (BIOTEC) “Proteomic analysis and gene cloning of multi-polysaccharide degrading enzymes from Aspergillus aculeatus BCC17849” O-II-3 Mr. Pattanop Kanokratana (BIOTEC) “Comparative bacterial diversity analysis in industrial bagasse collecting site by pyrosequencing of tagged-16S rRNA gene amplicons” O-II-4 Ms. Nuttida Teerawattanakijpakorn (Mahidol University) “Screening and characterization of antimicrobial peptides from bacteria” O-II-5 Dr. Pennapa Manitchotpisit (Rangsit University) “Antimicrobial peptides against contaminating bacteria in fuel ethanol production”
Queen’s Park 5
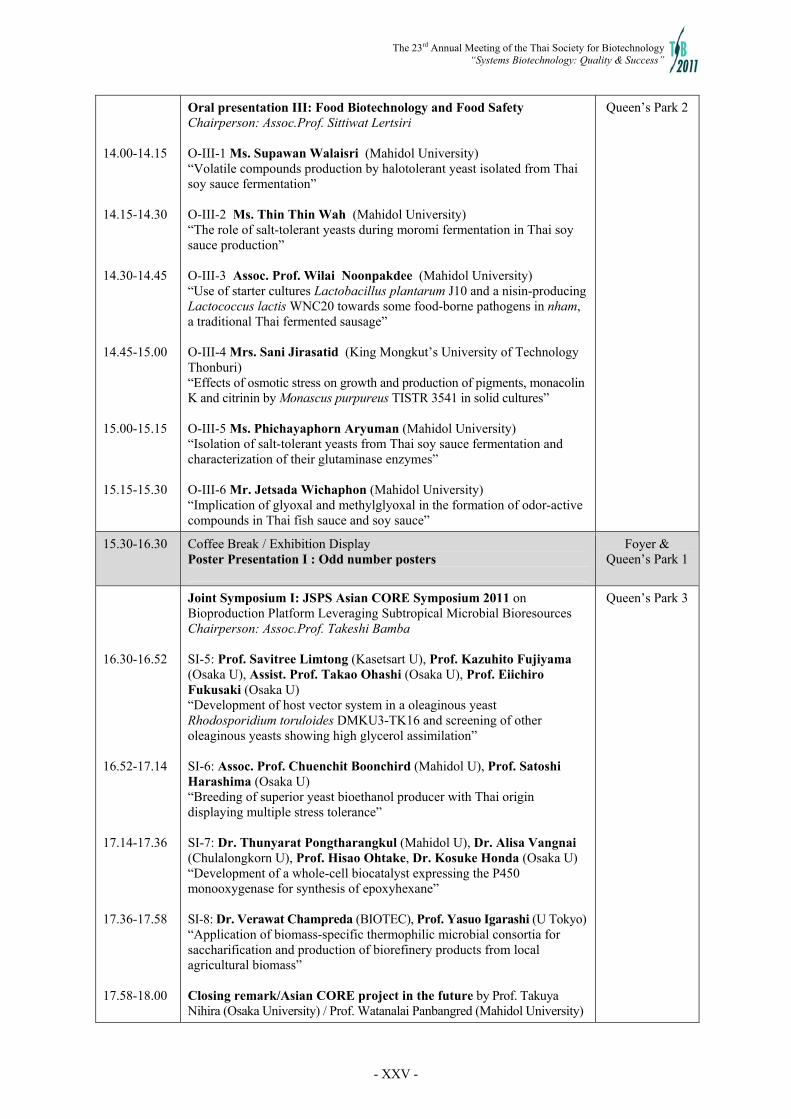
The 23rd Annual Meeting of the Thai Society for Biotechnology “Systems Biotechnology: Quality & Success”
- XXV -
14.00-14.15 14.15-14.30 14.30-14.45 14.45-15.00 15.00-15.15 15.15-15.30
Oral presentation III: Food Biotechnology and Food Safety Chairperson: Assoc.Prof. Sittiwat Lertsiri O-III-1 Ms. Supawan Walaisri (Mahidol University) “Volatile compounds production by halotolerant yeast isolated from Thai soy sauce fermentation” O-III-2 Ms. Thin Thin Wah (Mahidol University) “The role of salt-tolerant yeasts during moromi fermentation in Thai soy sauce production” O-III-3 Assoc. Prof. Wilai Noonpakdee (Mahidol University) “Use of starter cultures Lactobacillus plantarum J10 and a nisin-producing Lactococcus lactis WNC20 towards some food-borne pathogens in nham, a traditional Thai fermented sausage” O-III-4 Mrs. Sani Jirasatid (King Mongkut’s University of Technology Thonburi) “Effects of osmotic stress on growth and production of pigments, monacolin K and citrinin by Monascus purpureus TISTR 3541 in solid cultures” O-III-5 Ms. Phichayaphorn Aryuman (Mahidol University) “Isolation of salt-tolerant yeasts from Thai soy sauce fermentation and characterization of their glutaminase enzymes” O-III-6 Mr. Jetsada Wichaphon (Mahidol University) “Implication of glyoxal and methylglyoxal in the formation of odor-active compounds in Thai fish sauce and soy sauce”
Queen’s Park 2
15.30-16.30 Coffee Break / Exhibition Display Poster Presentation I : Odd number posters
Foyer & Queen’s Park 1
16.30-16.52 16.52-17.14 17.14-17.36 17.36-17.58 17.58-18.00
Joint Symposium I: JSPS Asian CORE Symposium 2011 on Bioproduction Platform Leveraging Subtropical Microbial Bioresources Chairperson: Assoc.Prof. Takeshi Bamba SI-5: Prof. Savitree Limtong (Kasetsart U), Prof. Kazuhito Fujiyama (Osaka U), Assist. Prof. Takao Ohashi (Osaka U), Prof. Eiichiro Fukusaki (Osaka U) “Development of host vector system in a oleaginous yeast Rhodosporidium toruloides DMKU3-TK16 and screening of other oleaginous yeasts showing high glycerol assimilation” SI-6: Assoc. Prof. Chuenchit Boonchird (Mahidol U), Prof. Satoshi Harashima (Osaka U) “Breeding of superior yeast bioethanol producer with Thai origin displaying multiple stress tolerance” SI-7: Dr. Thunyarat Pongtharangkul (Mahidol U), Dr. Alisa Vangnai (Chulalongkorn U), Prof. Hisao Ohtake, Dr. Kosuke Honda (Osaka U) “Development of a whole-cell biocatalyst expressing the P450 monooxygenase for synthesis of epoxyhexane” SI-8: Dr. Verawat Champreda (BIOTEC), Prof. Yasuo Igarashi (U Tokyo) “Application of biomass-specific thermophilic microbial consortia for saccharification and production of biorefinery products from local agricultural biomass” Closing remark/Asian CORE project in the future by Prof. Takuya Nihira (Osaka University) / Prof. Watanalai Panbangred (Mahidol University)
Queen’s Park 3

The 23rd Annual Meeting of the Thai Society for Biotechnology “Systems Biotechnology: Quality & Success”
- XXVI -
16.30-16.45 16.45-17.00 17.00-17.15 17.15-17.30 17.30-17.45 17.45-18.00 18.00-18.15 18.15-18.30
Joint Symposium II: International Cassava Research Symposium 2011 Chairperson: Dr. Motoaki Seki SII-5: Dr. Kanokporn Triwitayakorn (Mahidol University, Thailand) “Genome mapping for molecular breeding in cassava” SII-6: Dr. Malinee Suksangpanomrung (National Center for Genetic Engineering and Biotechnology (BIOTEC), Thailand) “Molecular studies on sucrolytic enzymes and their contribution to starch productivity in cassava storage roots” SII-7: Dr. Treenut Saithong (King Mongkut University of Technology at Thonburi (KMUTT), Thailand) “High-quality pathway of cassava starch biosynthesis in nonphotosynthetic tissues inferred by multiple plant templates” SII-8: Dr. Utsumi Yoshinori (RIKEN Plant Science.Yokohama, Japan) “Establishment of cassava microarray analysis platform and transformation system of KU50 cultivar” SII-9: Dr. Supatcharee Netrphan (National Center for Genetic Engineering and Biotechnology (BIOTEC), Thailand) “Genetic and biochemical evidence toward a better understanding of amylopectin synthesis and starch granule formation in cassava” SII-O-1: Ms. Samorn Saerue (King Mongkut’s University of Technology, Thailand) “Analysis of gene expression during root development implies the distinct gene regulation root tissues” SII-O-2: Ms. Onsaya Patanun (Mahidol University, Thailand) “Detection and identification of microRNAs and their target genes in cassava (Manihot esculenta Crantz.)” Open discussion and Closing session
Queen’s Park 6
16.30-16.45 16.45-17.00 17.00-17.15 17.15-17.30
Oral presentation I(B): Agricultural Biotechnology and Agroindustry Chairperson: Dr. Siripong Thitamadee O-I-5 Dr. Wananit Wimuttisuk (National Center for Genetic Engineering and Biotechnology) “Two halves make a whole: Characterization of arachidonate 8-lipoxygenase allene oxide synthase gene in the black tiger shrimp Penaeus monodon” O-I-6 Ms. Parichat Chumtong (Chulalongkorn University) “Identification and expression analysis of the transforming growth factor beta regulator 1 gene in domesticated giant tiger shrimp Penaeus monodon” O-I-7 Ms. Napaporn Jantee (Chulalongkorn University) “Identification of single nucleotide polymorphism in Farnesoic acid O-methyltransferase (PmFAMeT) of the giant tiger shrimp Penaeus monodon” O-I-8 Ms. Jintana Innuphat (Chulalongkorn University) “Molecular cloning and expression analysis of the asparaginyl tRNA synthertase gene in the black tiger shrimp Penaeus monodon”
Queen’s Park 4

The 23rd Annual Meeting of the Thai Society for Biotechnology “Systems Biotechnology: Quality & Success”
- XXVII -
16.30-16.45 16.45-17.00 17.00-17.15 17.15-17.30 17.30-17.45
Oral presentation II(B): Microbial and Molecular Biotechnology Chairperson: Prof. Tatsuji Seki O-II-6 Mrs. Ousana Ongcharoenwut (Mahidol University) “Isolation and screening of anti-dengue virus compounds from Actinomycetes” O-II-7 Ms. Wipavadee Sangadkit (King Mongkut's University Technology Thonburi) “Effect of substrate dilution and nutrient limitation on E. coli growth on Chromocult®Coliform Agar” O-II-8 Ms. Orana Rattanabumrung (King Mongkut's University Technology Thonburi) “Visual Improvement of colony detectability for High-throughput total plate count protocol” O-II-9 Ms. May Waine Wityi Htun (Mandalay Technological University, Myanmar) “Biological activity of Trichoderma species” O-II-10 Ms. Benjarat Bunterngsook (Kasetsart University) “Identification and characterization of bacterial expansin from Bacillus licheniformis for enhanced enzymatic hydrolysis of cellulose”
Queen’s Park 5
16:00-16:30 16.30-17.00 17.00-18.00
Panel Discussion: Biotechnology Research, Trends and Opportunity Chairperson: Asst.Prof. Sansanalak Rachdawong Registration The Trend of Biotechnology in Asia from AFOB viewpoint (Prof. Toshiomi Yoshida, Professor emeritus Osaka University Director General, Research Institute of Environment, Agriculture and Fisheries, Osaka Prefecture Government, Japan) Panel Discussion on Biotechnology Research, Trends and Opportunity Moderator: Dr. Pichet Itkor Speakers from: Monsanto Thailand Co.,Ltd. Higrimm Environmental and Research Co.,Ltd. Siam BioSceince Co., Ltd.
Queen’s Park 2
18.00-19.00 TSB Annual meeting Poster Display / Exhibition Display
Queen’s Park 2
Foyer & Queen’s Park 1
19.00-21.00 Reception Dinner Rainbow
The 23rd Annual Meeting of the Thai Society for Biotechnology “Systems Biotechnology: Quality & Success”
- XXVIII -
Thursday, February 2nd, 2012
09.00-09.30 09.30-10.00 10.00-10.30
Keynote session : Chairperson: Prof. Rainer Jonas K-IV : Prof. Timothy W. Flegel (National Center for Genetic Engineering and Biotechnology (BIOTEC), Thailand) “A systems approach for health management in shrimp aquaculture” K-V : Dr. Jean Petre (BioNet-Asia, Co. Ltd, Thailand) “Vaccines in the biotechnology era” K-VI : Dr.Pichet Durongkaveroj (National Science Technology and Innovation Policy Office, Thailand) “National Science, Technology and Innovation Policy (2012-2021) and Biotechnology Strategies"
Queen’s Park 2-3
10.30- 11.00 Coffee Break / Poster Display / Exhibition Display Foyer & Queen’s Park 1
11.00- 11.20 11.20-11.40 11.40-12.00
Plenary Session A : Chairperson: Prof. Takuya Nihira P-I: Assoc. Prof. Penjit Srinophakun (Kasetsart University, Thailand) “Integrated research approaches to biodiesel development from Jatropha oil” P-II: Assoc. Prof. Sittiwat Lertsiri (Mahidol University, Thailand) “Volatile compounds and aroma profile of Thai fish sauce: Product categorization” P-III: Asst. Prof. Supat Chareonpornwattana (Chulalongkorn University, Thailand) “Production of nisin-loaded solid lipid nanoparticles for sustained antimicrobial activity”
Queen’s Park 2
11.00- 11.20 11.20-11.40 11.40-12.00
Plenary Session B: Chairperson: Prof. Timothy Flegel P-IV: Prof. Rainer Jonas (Helmholtz Centre for Infection Research, Germany) “Aspect of the future of Agrotechnologies” P-V: Prof. Watanalai Panbangred (Mahidol University, Thailand) “Genetically engineered Bordetella pertursis for development of an efficient acellular whooping cough vaccine” P-VI: Dr. Siriporn Sripinyowanich (BGI-Thailand) “Genomic revolution: Leaping into the era of massive sequencing”
Queen’s Park 3
12.00- 13.00 13.00- 14.00
Lunch Lunch talk by The Thai Association for Biotech Industries Exhibition Display Poster Presentation II : Even number posters
Rainbow
Foyer &
Queen’s Park 1

The 23rd Annual Meeting of the Thai Society for Biotechnology “Systems Biotechnology: Quality & Success”
- XXIX -
14.00-14.15 14.15-14.30 14.30-14.45 14.45-15.00 15.00-15.15 15.15-15.30
Joint Symposium III: The Tokyo Institute of Technology and Mahidol University joint meeting Chairperson: Assoc.Prof. Chuenchit Boonchird Opening session by Prof. Susumu Kajiwara (Tokyo Institute of Technology) /Assoc.Prof. Chuenchit Boonchird (Mahidol University) SIII-1: Prof. Yasunori Tanji (Tokyo Institute of Technology) “ Application of Bacteriophage for Controlling and Detection of Pathogen” SIII-2: Dr. Nuttawee Niamsiri (Mahidol University) “Applications of biodegradable polymers from bacteria in nanotechnology and biomedicine” SIII-3: Prof. Eiry Kobatake (Tokyo Institute of Technology) “ Design of Multifunctional “Protein Materials for Tissue Engineering” SIII-4: Asst. Prof. Jirarut Wongkongkatep (Mahidol University) “Fixation of bacteria at the oil droplet surface” SIII-5: Asst. Prof. Pranee Inprakhon (Mahidol University) “How to control the lipases activity on the oil/water interface”
Queen’s Park 3
14.00-14.15 14.15-14.30 14.30-14.45 14.45-15.00 15.00-15.15
Oral presentation IV(A): Bioprocess and Industrial Biotechnology Chairperson: Assoc. Prof. Manop Suphantharika O-IV-1 Mr. Aten Vannabun (Agro-Industry Mae Fah Luang University) “Effect of crude extract to t-butanol ratio on partitioning of proteases from farmed giant catfish viscera” O-IV-2 Dr. Surisa Suwannarangsee (BIOTEC) “Optimization of lignocellulolytic enzyme systems for efficient rice straw hydrolysis by using experimental mixture design” O-IV-3 Dr. Thidarat Nimchua (BIOTEC) “Optimization of multienzyme production from Aspergillus aculeatus by solid-state fermentation for simultaneous biodesizing and bioscouring of cotton fabric” O-IV-4 Ms. Sukanya Eiemsupackul (King Mongkut’s University of Technology North Bangkok) “Effects of fiber length on mechanical properties of oil palm empty fruit bunched fiber-reinforced biocomposites” O-IV-5 Ms. Dararat Mongkolkarn (Kasetsart University) “Optimization of the fructo-oligosaccharides production using two-step fed-batch fermentation of Aspergillus niger TISTR 3570”
Queen’s Park 6
14.00-14.15 14.15-14.30
Oral presentation I(C): Agricultural Biotechnology and Agroindustry Chairperson: Dr. Sithichoke Tangphatsornruang O-I-9 Ms. Pichahpuk Uthaipaisanwong (Kasetsart University) “A draft of oil palm chloroplast genome” O-I-10 Mrs. Kanlaya Nirapathpongporn (Mahidol University) “Development of EST-SSR markers for rubber tree (Hevea brasiliensis Muell. Arg)”
Queen’s Park 4
The 23rd Annual Meeting of the Thai Society for Biotechnology “Systems Biotechnology: Quality & Success”
- XXX -
14.30-14.45 14.45-15.00
O-I-11 Ms. Manassawe Lertpanyasampatha (Mahidol University) “Expression profiling of miRNAs in rubber tree is exploited using high throughput sequencing” O-I-12 Ms. Porawee Pramoolkit (Mahidol University) “Investigation of phytohormone-responsive miRNAs and their target genes in rubber tree”
14.00-14.15 14.15-14.30 14.30-14.45 14.45-15.00 15.00-15.15
Oral presentation II(C): Microbial and Molecular Biotechnology Chairperson: Prof. Kazuhito Fujiyama O-II-11 Dr. Piyanun Harnpicharnchai (National Center for Genetic Engineering and Biotechnology) “Identification of a promoter element from thermotolerant Pichia sp.” O-II-12 Ms. Chalinee Tangsombatvichit (King Mongkut's University of Technology Thonburi) “New transcriptional regulators associated with adaptive stress responses in the yeast Saccharomyces cerevisiae “ O-II-13 Dr. Choowong Auesukaree (Mahidol University) “Role of vacuolar H+-ATPase in ethanol tolerance in Saccharomyces cerevisiae” O-II-14 Mrs. Nwe New Soe Hlaing (Mandalay Technologycal University(MTU), Myanmar) “Screening and isolation of yeasts producing IAA (Indole acetic acid)” O-II-15 Ms. Jaruta Panyakampol (King Mongkut's Uinversity of Technology Thonburi) “Global gene expression of Spirulina platensis C1 in response to heat stress”
Queen’s Park 5
14.00-14.15 14.15-14.30 14.30-14.45 14.45-15.00 15.00-15.15
Oral presentation VI(A): Pharmaceutical and Medical Biotechnology Chairperson: Prof. Rainer Jonas O-VI-1 Ms. Wimlin Khaosanit (Mahidol University) “Diversity of apical membrane antigen 1 (AMA-1) in patient infected with Plasmodium vivax in Malaria endermic areas of Thailand” O-VI-2 Ms. Siriporn Rachakhom (Mahidol University) “Detection of Plasmodium falciparum MDR1 gene by real-time PRC and loop-mediated isothermal amplification methods” O-VI-3 Ms. Varunee Musikawat (Rangsit University) “LAMP on human SRY DNA sequence emerging a simple technique for sexual investigation from minimal blood and other less tissue specimens” O-VI-4 Ms. Sirilak Baramee (King Mongkut's University of Technology Thonburi) “Exploring the regulatory role for Rds2 homologue in the pathogenic yeast Candida albicans” O-VI-5 Mr. Natthapon Laochan (Mahidol University) “Time to Plasmodium falciparum recrudescence after antimalarial treatment in pregnancy”
Queen’s Park 2
15.30-16.00 Coffee Break / Poster Display / Exhibition Display Foyer & Queen’s Park 1

The 23rd Annual Meeting of the Thai Society for Biotechnology “Systems Biotechnology: Quality & Success”
- XXXI -
16.00-16.15 16.15-16.30 16.30-16.45 16.45-17.00
Joint Symposium III: The Tokyo Institute of Technology and Mahidol University joint meeting Chairperson: Assoc.Prof. Chuenchit Boonchird SIII-6: Prof. Shinae Kizaka-Kondoh (Tokyo Institute of Technology) “In vivo Imaging and Targeting of HIF-Active Cancers by an Oxygen- Dependent Degradative Fusion Proteins” SIII-7: Assoc. Prof. Manop Suphantharika (Mahidol University) “A potential application of spent brewer's yeast beta-glucans in food and feed industries” SIII-8: Prof. Susumu Kajiwara (Tokyo Institute of Technology) “Virulent Factors of Pathogenic Fungi Causing Mycoses” SIII-9: Dr. Siripong Thitamadee (Mahidol University) “Vascular Patterning in Arabidopsis roots”
Queen’s Park 3
16.00-16.15 16.15-16.30 16.30-16.45 16.45-17.00
Oral presentation IV(B): Bioprocess and Industrial Biotechnology Chairperson: Dr. Attawut Impoolsup O-IV-6 Mr. Peerapat Potinoun (Mahidol University) “Antifungal activity of lactic acid bacteria against aflatoxin-producing fungi” O-IV-7 Ms. Yothaka Puchcha (Kasetsart University) “The heterotrophic cultivation of Chlorella sp. TISTR 8990 in a 5-L fed-batch bioreactor” O-IV-8 Ms. Siwaporn Wannawilai (Kasetsart University) “The high yield production of xylitol by repeated fed-batch fermentation” O-IV-9 Ms. Molnapat Songpim (Kasetsart University) “Mathematical modeling of thermal-pH stability and activity of inulinases from Aspergillus niger TISTR 3570”
Queen’s Park 6
16.00-16.15 16.15-16.30 16.30-16.45 16.45-17.00 17.00-17.15
Oral presentation V: Nano- and Analytical Biotechnology Chairperson: Asst.Prof. Supat Chareonpornwattana O-V-1 Prof. Alain Durand (Nancy University, France) “Enzyme-assisted elaboration of biodegradable polymeric nanoparticles with potential applications as drug delivery systems” O-V-2 Ms. Moegiratul Amaro (KMITT) “Immunoassay Based on Carbon Nanotubes/Gold Nanoparticle Nanocomposite for Salmonella typhimurium Detection” O-V-3 Ms. Ai Imas Faidoh Fatimah (KMITT) “Highly Sensitive DNA Hybridization Detection Based on Au-Capsule Electrochemical Label” O-V-4 Ms. Sasivimon Pramual (Mahidol University) “Production of poly(3-hydroxybutyrate-co-3-hydroxyvalerate) by Cupriavidus necator H16 and its application in drug delivery” O-V-5 Ms. Kulthida Kaewprapan (Mahidol University) “Synthesis of amphiphilic dextran by lipase from Candida rugosa: Strategies to enhance enzyme activity in organic solvents”
Queen’s Park 4
The 23rd Annual Meeting of the Thai Society for Biotechnology “Systems Biotechnology: Quality & Success”
- XXXII -
16.00-16.15 16.15-16.30 16.30-16.45 16.45-17.00 17.00-17.15 17.15-17.30
Oral presentation II (D): Microbial and Molecular Biotechnology Chairperson: Asst.Prof. Sansanalak Rachdawong O-II-16 Assoc. Prof. Yasuaki Kawarasaki (University of Shizuoka, Japan) “High cell-density expression system: A novel method for extracellular production of "difficult-to-express" proteins” O-II-17 Ms. Suphatra Hongvijit (Mahidol University) “Screening of quorum quenching Streptomyces spp. for quorum-sensing control of phytopathogenic bacteria” O-II-18 Mr. Pattarapong Inchana (Mahidol University) “Expression, purification and functional characterization of mosquito-larvicaidal binary toxin from Bacillus sphaericus” O-II-19 Ms. Tanyarin Ophawatanasin (Mahidol Wittayanusorn School) “Application of endophytic fungi from Para rubber tree as inhibitors against Phytoophthora botryosa, the of leaf-fall disease pathogen of rubber tree in Para Rubber” O-II-20 Ms. Honey Thet Paing Htway (Mandalay Technological University, Myanmar) “Generation of Cellulolytic Nitrogen Fixing Bacteria by Transposon Mutagenesis” O-II-21 Dr. Duriya Chantasingh (BIOTEC) “Overexpression of a catalase (CatE7) in Beauveria bassiana increases pathogencity against Spodoptera exigua larvae”
Queen’s Park 5
16.00-16.15 16.15-16.30 16.30-16.45 16.45-17.00 17.00-17.15
Oral presentation VI (B): Pharmaceutical and Medical Biotechnology Chairperson: Prof. Yashuhiro Igarashi O-VI-6 Ms. Saowalak Kalapanulak (KMITT) “DTscreen v1: A novel drug targets identification tool for pathogenic diseases through protein signature-based approach” O-VI-7 Dr. Surapong Pinitglang (University of the Thai Chamber of Commerce) “An insight into structural and functional characteristics of Plasmodium falciparum falcipain3 as key drug targets against malaria” O-VI-8 Ms. Ruamporn Liamkaew (KMITT) “Effect of Oxford selective agents on colony growth of Listeria and non-Listeria strains” O-VI-9 Ms. Pattarin Supanivatin (KMITT) “Effect of Selective enrichment substrates on colony growth kinetics of Listeria innocua during selective agar cultivation” O-VI-10 Ms. Siripa Daengphuang (KMITT) “Effect of incubation temperature and nutrient components of non-selective enrichment for optimizing growth of Listeria innocua in liquid cultivation”
Queen’s Park 2
17.30-18.00 Poster Awards Announcement Queen’s Park 2
18.00-18.15 Closing Remarks Queen’s Park 2
Proceedings
The 23rd Annual Meeting of the Thai Society for Biotechnology “Systems Biotechnology: Quality & Success”
February 1-2, 2012 The Imperial Queen’s Park Hotel, Bangkok, THAILAND

The 23rd Annual Meeting of the Thai Society for Biotechnology “Systems Biotechnology: Quality & Success”
P-IV
- 2 -
Aspects of the future of agrotechnologies Rainer Jonasa and Manfred Kernb
a Helmholtz Centre for Infection Research, Inhoffenstraße 7, 38124 Braunschweig, Germany, [email protected] b AgriExcellence GmbH, Traminerweg 8, 55296 Lörzweiler, Germany, [email protected] Abstract
The following are important factors in the future development of agrotechnologies - the development of the world population, advancements with regard to education, progress in food production systems in various regions of the world together with the critical situation of malnutrition in different countries worldwide.
It is necessary to improve the production and productivity of crops. Pre-harvest and post-harvest losses are still too high, and the use of agricultural inputs, such as fertilizers, irrigation and energy, have to be reduced as much as possible. The development and implementation of agrotechnologies has to be undertaken - especially the use of genetically modified crops – in order to feed the world in future in a more sustainable way.
Furthermore, we must substitute fossil energy in the long term. Some arable land will no doubt still be used for crops which play an important role in the bioconversion of renewable raw materials and also for new products for the market place. However there will still be some fertile arable land suitable for food production which will be used for the production of agrofuels.
Additionally, in many countries arable land is also used for the production of pet food – something really questionable if on the other side of the world there are people starving and dying from hunger.
Finally, the developed countries have to open their markets for agricultural products from developing countries and to reduce protectionism.
The Charter for Food Security from Maxwell should be a basis for a future balanced relationship between the developed and developing countries so that hunger, migration, dictatorships, terrorism, and wars are avoided. Keywords: world population, food production, malnutrition, gmo, food security charter Introduction. The future of agrotechnologies will be determined by the following aspects/facts: growth of the world population / improvement of education in developing countries / development of the nutritional situation especially in developing countries / technological development and innovations in nearly all industrial sectors / climatic changes / development of the substitution of fossil energy as an energy source, as source for products that derive from improvements in the field of renewable raw materials / improvements in global health / political situation and global development. World population. By the year 2050 world food requirements will have more than doubled as a result of population growth and changes in consumption habits. We will have to produce more food during that period than mankind has produced in total since the beginning time (1,2). The UN expects approximately 9.3 billion
people living on our planet, about 0.3 billion more than they calculated 8 years before (3-5). Malnutrition. Though the situation in many developing countries has started to improve during the past few decades, many people worldwide lack adequate nutrition. It is calculated that at least 2700kcal/day are required as the lower limit for calorie requirements otherwise one is still talking about undernourishment. Currently nearly one billion people suffer from malnutrition, and it is difficult to foresee when the FAO goal to reduce the number of people suffering from malnutrition (below 400 million) will be achieved. This will not be achieved by 2015, and even its achievement by 2050 will prove to be a difficult task (3,6,7). In absolute numbers of people suffering from malnutrition, there has been an increase in the Asian-Pacific as well as in the Sub-Saharan region for the last 15 years (7). In relative numbers this oscillated between 15 and 20% for the Asian-Pacific region as well
The 23rd Annual Meeting of the Thai Society for Biotechnology “Systems Biotechnology: Quality & Success”
P-IV
- 3 -
as for all developing countries, whereas in the Sub-Saharan region it dropped from nearly 35% at the beginning of the nineties to 27% three years ago. Since then there has been an increase to more than 30% again (7). Especially those countries with protracted crises from dictatorship, terrorism, civil wars and naturally those with ecological disasters suffered more than others (7). Substitutes for fossil energy. One of the most important energy sources, oil (and gas), will become scarce within the next 50-80 years. The actual demand for oil is increasing, especially when one considers countries as China and India. New reserves are not being discovered which would match the demand for them worldwide and this means that the price for oil (and gas) will increase. This means the oil prices will not drop anymore below 50 US$/barrel (8). Therefore, new energy sources, as well as new products which will be produced renewable raw materials will become important and this will directly influence the agrotechnology development (9). Education. Another critical point with regard to progresses in agrotechnologies is the situation of education, especially in emerging and developing countries (10). In many of these countries, there are children who do not receive any basic education, and, additionally, qualified teachers are lacking. The total number of such children is estimated to be at least 75 million. It is quite clear that only a good basic education system with further possibilities for higher education will permit escape from poverty and intolerable human suffering. For this purpose the World Bank, together with the UN/UNESCO, established the system “Education for all – a fast track initiative” (EFA-FTI) at the beginning of this century. However, the monitoring of the education situation in many countries shows that improvement is slower than expected and hoped (11,12). Technological innovations in agrotechnologies will be key factors to satisfy future food demand (5,6,13): these include improvements in crop production, the application of biotechnology, the use of irrigation systems and fertilizers. Modern plant breeding is also a necessity, including genetic engineering, in order to achieve essential productivity gains. The following are also important for the development of sustainable progress in food production in order to feed the world’s population: resistance to diseases and pests; improved tolerance of crops with regard to
abiotic stresses such as salinity and acid soils, ozone, drought, frost, and high variations in temperature; higher nutritional value of various foods; improved durability of foods during storage and transport. Nevertheless, many factors will still continue to take their toll and contribute to losses in the yields of harvest such as various contaminations found in soils, solar radiation, extreme weather conditions and natural catastrophes.
Furthermore, biotechnology specifically will play an important role in what is now called Functional Food. This means “foods that provide health benefits beyond those of basic nutrition and have measurable clinical effect” (14). Actually, functional food is already produced in industrialized countries, but it will be an important factor also in developing countries. Reasons for these changes are better living conditions, an increase in life expectancy, rising costs of health care systems, and an increasing demand for healthier food and biopharmaca (1,9,15).
A very relevant report from The Government Office for Science, London, UK (2011) titled: “Forsight. The Future of Food and Farming 2010, Challenges and Choises for Global Sustainability” promotes sustainable intensification and the use of a broad spectrum of technologies (16). This report should find use in many countries as a basis for strategic action with a view to achieving improvements with a view to global security, the fight against poverty and hunger, conservation of resources, and sustainable social development. The report should be a compulsory reading for all decision makers, scientists, for schools, and ultimately for every one of us. Conclusions. Agrotechnologies have developed very rapidly during the last decade and, therefore, provide hope for an increasing growth rate of food in the world, satisfying future demands and correspondingly safeguarding the world food supply. But these technological advances can only be effective when ecological, economic, political, social, ethical and demographic factors are taken into account. In other words, there must be a constant and constructive dialogue as well as cooperation between farmers, scientists, economists, politicians, and NGOs, and all will have to make concessions in order to achieve progress.

The 23rd Annual Meeting of the Thai Society for Biotechnology “Systems Biotechnology: Quality & Success”
P-IV
- 4 -
Furthermore, it is necessary that developed countries help to support adequate scientific and technical infrastructure growth in developing countries in order to enable them to overcome their food and health problems by means of an integrated networking of developed and developing countries (17). Finally, for its part the developed world has to open its markets for agricultural products from
developing countries and has to help to implement suitable new technologies, whereas the developing countries have to invest in innovations in agriculture, education, health care systems and land reforms. We should remember the Charter for Food Security published by Maxwell (18), and finally we should go for: “Let us do more with less, better and in time!” (19)
References (1) Kern M. 2025: Global trends to improve human health, Part 1: Basic Food, Functional Food.
AgroFOOD industry hi-tech 2006, 17(6): 39-42 (2) Kern M. Feeding the World: A wider perspective. Future, the Hoechst magazine 1998, 1/98: 24-
28 (3) Alexandratos N. World food and agriculture: Outlook of the medium and long term. PNAS USA
1999, 96: 5908-5914 (4) United Nations. World Population Prospects: The 2010 Revision. 2010,
http://esa.un.org/unpd/wpp/index.htm (5) Jonas R & Kern M. Aspects of the future development of agrotechnologies. In: Perceptions on
food and nutrition (eds. Carioca JOB, Marx F, Jonas R), Fortaleza, Brazil. Expressão Gráfica e Editora Ltda., 2006, pp. 111-131
(6) Kern M. Food, feed, fibre, fuel and industrial products of the future: Challenges and opportunities. Understanding the strategic potential of plant genetic engineering. J Agronomy & Crop Science 2002, 188(5): 291-305 Kern M. Plant biotechnology: perspectives for developing countries between 2002 and 2025. African Journal of Food, Agriculture, Nutrition and Development 2002; 2(2): 39-46
(7) FAO. 2010. The State of Food Insecurity in the World. http://www.fao.org/publications/sofi/en/, http://www.fao.org/docrep/013/i1683e/i1683e.pdf http://www.fao.org/docrep/013/i2050e/i2050e.pdf
(8) BP Statistical Review of World Energy June 2011. www.bp.com/statisticalreview (9) http://de.wikipedia.org/wiki/Biodiesel (from 15 Sept. 2011)
http://en.wikipedia.org/wiki/Biodiesel (from 15 Sept. 2011) (10) BMZ. Education in Developing Countries. 2011.
www.bmz.de/en/what_we_do/issues/Education/hintergrund/bildungsituation/index.html (11) UNESCO. 2010. Reaching the marginalized. EFA Global Monitoring Report 2010.
http://unesdoc.unesco.org/images/0018/001866/186606E.pdf (12) UNESCO. 2009. Overcoming inequality: why governance matters. EFA Global Monitoring
Report 2009. http://unesdoc.unesco.org/images/0017/001776/177683E.pdf (13) House of Lords, European Union Committee, 19th Report Session 2010-12. Innovation in EU
agriculture – Report 2011. http://www.publications.parliament.uk/pa/ld201012/ldselect/ldeucom/171/171.pdf
(14) McKenna J & Wheat D. Functional foods disease state analysis. The Bowditch Group Inc., Boston, 1999 (http://www.bowditchgroup.com )
(15) Kern M. 2025: Global trends to improve human health, Part 2: Pharma-food, pharma-farming and pharmaceuticals. AgroFOOD industry hi-tech 2007, 18(1): 18-21
(16) The Government Office for Science. 2011. Foresight. The future of food and farming 2010, Challenges and choises for global sustainability. Final Project Report. London, UK
(17) Iaccarina M. Mastering science in the South. EMBO Reports 2004; 5(5): 437-41 (18) Maxwell S. A charter for food security. Food policy 1997; 22(6): 469-73 (19) Kern M. Factor Fn: Future Farming, Food, Feed, Fitness, Fuel, Fiber, Freshwater, Fishery,
Forestry, Flora, Fauna, Fun, Freedom – Global Trends 2008/2025/2050. In: Resource Management Towards Sustainable Agriculture and Development. Behl RK, Kubat J & Kleynhans T. (Eds.), Agrobios (International), Jodhpur, India. 2010

The 23rd Annual Meeting of the Thai Society for Biotechnology “Systems Biotechnology: Quality & Success”
S-II-3
- 5 -
Cassava production in Vietnam: the needs for improvements
Le Huy Ham a, Pham Thi Ly Thu a
aInstitute of Agricultural Genetics, Vietnam Academy of Agricultural Sciences Pham Van Dong Road, Tu Liem, Hanoi, Vietnam
Abstract In Vietnam cassava (Manihot esculenta Crantz) is being converted from food crop to
industrial crop with high speed. Thank to wide adaptability cassava can be grown in all ecological regions in Vietnam, even in poor soil regions, contributing significantly to income of poor farmers. For the last decade cassava production has been changed dramatically: Area under cassava has been raised from 237,600 ha in 2000 to 560,400 ha in 2009, productivity has been doubled, from 8.36 ton/ha in 2000 to 16.9 ton/ha in 2009. Cassava is considered to be most suitable crop for biofuel production in Vietnam because of its excess production compare to other potential biofuel crop, like maize or sugarcane. To make cassava production profitable and sustainable there are high needs for varietal improvement as well cultivation technology. Modern methods of biotechnology for plant improvement, like genetic engineering, marker assisted selection should be involved in cassava breeding.
Keywords: cassava, Vietnam, biofuel crop, biotechnology
Introduction By area and production volume cassava in
Vietnam is third important food crop after rice and maize. It is grown in all provinces of all ecological regions thank to it’s wide adaptability and low input required. This is really “crop of the poor”, contributing to food and cash income of farmers. This contribution especially important in hilly, poor soil regions with ethnic minority inhabitants. Since the first years of 21st century area and productivity of cassava have been almost doubled and production raised by 4 time. Analysis of trend leading to increase of cassava production in Vietnam showed that starch for industry and biofuel need is a main reason that push cassava production ahead. But recent development is only a start, particular need in cassava as material for biofuel of the country and region will facilitate cassava research and production in the next years. Present status of cassava production in Vietnam
In 1996, total area under cassava in Vietnam was 275,600 ha, it reduced gradually to 234,000 ha in 2000. But since 2001 it started to grow and reached maximum area in 2008, when total area accounted for 560,000 ha, then reduced slightly to 494,500 ha in 2010.
For recent 15 years, there was intensive improvement of cassava productivity, through two ways: introduction of new, highly productive varieties and improvement of
cultivation technology. Benefit from growing cassava allows farmers invest back to plantation in the form of chemical fertilizers. Compare to productivity in 1996, it is more than doubled in 2010, raised from 7.5 ton/ha to 17.17 ton/ha in 2010. In average, productivity raised 15.3% per year.
Thank to increase of area and productivity, cassava production in Vietnam has been raised 4.3 times, from 2,067,000 ton in 1996 to 8,988,000 ton in 2008 and slightly reduced to 8,521,600 ton in 2010.
During the last years, a number of new varieties have been selected and introduced to production (such as varieties KM60, KM94, SM937-26, KM98-1 KM140 and KM 98-7…). Area under these new varieties accounted for 350,000 ha, equal 70% total cassava area.
In general, average cassava productivity in Vietnam still lower than other countries, like Thailand (21 ton/ha); India (30 ton/ha). Ministry of Agriculture and Rural Development has aimed to raise productivity to 20 ton/ha by the year of 2020. Productivity between regions in Vietnam still has big differences. South East region has highest productivity (25.34 ton/ha). But with the same varieties when grown in other regions, average productivity was only 15-20 ton. In lowest case (Camau) productivity was 4 ton/ha. There is a high need to have suitable varieties for each regions to maximize benefit from production. Cassava as potential material for biofuel production
The 23rd Annual Meeting of the Thai Society for Biotechnology “Systems Biotechnology: Quality & Success”
S-II-3
- 6 -
According to report of Ministry of Industry and Trading (MOIT) there are in Vietnam 4 groups potential input material for biofuel production. Among these 4 groups, at the moment first group – carbon hydrate containing material considered to be most competitive for bioethanol production. Cassava is defined as the most suitable input material for bioethanol production because of excess of production, low input, easy to grow in poor soil and less competitive with human food. The government of Vietnam has approved biofuel program to 2015 and outlook to 2025 in November 2007. As consequence of it, since 2007, establishment of biofuel factories and development of biofuel plants accelerated. It is estimated that in 2012 demand of ethanol is 300 million litters; in 2015 – 457 million litters; in 2020 – 687 million litters; in 2025- 1 billion litters. MOIT has projected demand on cassava for biofuel production according to scenarios of supplement of 5% and 10% ethanol to gasoline by the year 2015, 2020 and 2025 as 4; 5.4 and 8.1 million ton/year
However, cassava is contradictory plant, on one side there is desire to develop it, on the other side there are many fears on negative impacts of cassava (over exploitation of soil, erosion, deforestation, competition to food and other crops and pollution during processing). There were a number of discussions on how to limit negative impacts of cassava. Success of biofuel program is very much depend on resolving of these problems.. Role of biotechnology in cassava production
High demand on cassava products in the next years threads deforestation and soil degradation. There is urgent needs to raise cassava productivity to have doubled, tripled yield on the same area to avoid one of the most non-desirable impact of cassava production competition in land of food and forest crops. Biotechnology should be involved intensively in varietal improvement of cassava to raise it’s productivity. In this team cassava has some advantages compare to seed crops, as it is propagated both ways: vegetative and by seed. Desirable traits can be fixed by in vitro propagation or cutting easily. Plus to this, transgenic cassava will not be an issue for public acceptance. Improvement through genetic engineering
Cassava is drought resistant plant. For this reasons it usually grown in marginal conditions
with poor soil and lack of water. However improvement of water use efficiency still highly desirable for cassava.
Cassava starch could be modified through genetic modification to: i) High starch content; ii) easy conversion to ethanol; iii) suitable to processing into bioplastic.
A number of virus diseases should be taken under control to protect cassava. Recent development of silencing technology revealed possibility to develop virus resistant variety. This chance could be employed for cassava breeding. A number of insects threat cassava production, can reduce productivity severely.
Among diseases, Cassava witches' broom (CaWB) caused by cassava Phytoplasms presents real treat for cassava production in Vietnam at present time. In 2008-2009 it has been occurred in thousand ha in the south of Vietnam causing damages up to 10-15% productivity and 28-30% starch content. In some regions up to 60% of KM 94 effected by witches' broom. Thus, there is urgent need for improving resistance to diseases and pests.
Markers of QTL/gene(s) conferring resistance to these causing agents should be defined through molecular mapping or through genomic re-sequencing to assist breeding to derive resistant varieties within reasonable time to meet production needs. Conclusions
In the past decades cassava production in Vietnam has gone a long way from a neglected crops to a crop with significant value in both domestic market and for export. Cassava became one of very promising candidate for poverty alleviation and recently defined as most suitable candidate to provide input for biofuel industry in the country in the next decades. Cassava production in Vietnam started to go intensive way by raising productivity per land unit instead of enlargement of production area. But productivity of cassava in Vietnam is still far from expectation and from it’s potential. To raising productivity of cassava and sustain production, beside market policy, attention should be paid to problems of pests and diseases. Main tools of biotechnology like genetic transformation, micro propagation, haploid method and genomic tools should be involved intensively for breeding of resistant varieties, with high starch content and quality.
The 23rd Annual Meeting of the Thai Society for Biotechnology “Systems Biotechnology: Quality & Success”
S-II-3
- 7 -
References 1. Banitol A, Kpemoua K.E, Bissang B and
Wydra K. Assessment of cassava root and stem rots in ecozones of Togo and evaluation of pathogen virulence. Pak. J. Bot., 2010. 42(3): 2059-2068.
2. Biofuel program to 2015 and outlook to 2025. MOIT, Vietnam 2007.
3. http://cassava.vn.refer.org/spip.php?article84 4. http://longdinh.com/default.asp?act=chitiet&
ID=1437&catID=3 5. http://vukehoach.mard.gov.vn/news_pty.asp
x?id=623&nId=0 6. http://www.cassava.org 7. http://www.gso.gov.vn/default_en.aspx?tabi
d=469&idmid=3&ItemID=10112 8. http://www.isppweb.org/foodsecurity_cassa
vaghana.asp 9. http://www2.hcmuaf.edu.vn/data/hoangkim/
curent situation of cassava in Vietnam and breeding of improved cultivars
10. www.agriculture.gov.gy/Farmers%20Manual/PDF/Cassava.pdf.
The 23rd Annual Meeting of the Thai Society for Biotechnology “Systems Biotechnology: Quality & Success”
S-II-7
- 8 -
High-quality pathway of cassava starch biosynthesis in non-photosynthetic tissues inferred by multiple plant templates
Treenut Saithonga,b,d, Orathai Rongsirikula, Saowalak Kalapanulaka,b,d, Supatcharee Netrphane, Malinee Suksangpanomrunge, Asawin Meechaic,d, Supapon Cheevadhanarakb aBioinformatics and systems biology program, School of Bioresources and Technology, King Monkut’s University of Technology Thonburi, Bangkok, 49 Teintale 25, Bangkuntein-Chaitale Road, Thakam, Bangkuntein, Bangkok, 10150, Thailand. bSchool of Bioresources and Technology, King Monkut’s University of Technology Thonburi, Bangkok, 49 Teintale 25, Bangkuntein-Chaitale Road, Thakam, Bangkuntein, Bangkok, 10150, Thailand. cDepartment of Chemical Engineering, King Monkut’s University of Technology Thonburi, Bangkok, 126 Pracha-u-tid Road, Toongkhu, Bangmod, Bangkok, 10140, Thailand. dBiological modeling lab, Systems Biology and Bioinformatics research group, King Monkut’s University of Technology Thonburi, Bangkok, 49 Teintale 25, Bangkuntein-Chaitale Road, Thakam, Bangkuntein, Bangkok, 10150, Thailand. eNational Center for Genetic Engineering and Biotechnology (BIOTEC), National Science and Technology Development Agency, Thailand Science Park, 113 Pahonyothin Road, Pathumthani 12120, Thailand
Abstract Food security and green energy are becoming a popular research, because the world starts to
concern about the unbalance of the dramatically increased human population and the current capacity of the natural resources. Cassava, which is a decade ago recognised as a cheap staple crop served as food for developing countries, is at the moment known as a crop of hope in both food and energy aspects. A niche of cassava underlying its significance lies on the capability to produce and accumulate huge amount of starch in the underground roots with respect to the other crops. Despite being a high starch-content crop, the research on cassava mostly aims at the improvement of the starch yield in storage roots. One strategy is to understand the starch biosynthesis pathway, a mechanism of starch production inside plant cells. Taking the advantage of having the recently released cassava genome data, we employed an intensive alignment-based study to infer the high quality pathway of starch biosynthesis in cassava, starting from transported sucrose to starch formation. The cassava genomic data was passed through reciprocal sequence alignment process using five plant templates (i.e. rice, maize, Arabidopsis, potato castor bean). All identified cassava orthologs were given a confidence score based upon (1) the quality of sequences matching in the annotation process and (2) the consistency of the annotation results among the multiple templates. Furthermore, we performed literature validation for our established pathway by using the experimentally identified sequences from Genebank database. At the end, the informative visualisation of the reconstructed network was provided to integrate all results into a single map. In addition to the reconstructed map, we also discussed the information implied by the results, for instance the high conservation of the starch biosynthesis pathway across the plant species and the advantages of the employed method over the others. The overall results of the study, including a well-defined network, could increase the understanding in the biology of starch biosynthesis process in a cassava plant and is expected to facilitate the next step of the study in unwinding the dynamic regulation of the process.
Keywords: starch biosynthesis, cassava, metabolic pathway reconstruction Introduction and Objective
Cassava is an important crop for the world population. It is in the fourth rank after rice, maize and sugar cane in terms of the important food sources. Moreover, at the moment, the potential of cassava for being a green energy source is becoming well-established, at least in the bio-diesel production.
At the early stage, the cassava research was aimed to identify the optimal growth condition. Later, it has been found that yield of starch relies very much on the genetics (1), so that breeding technique was introduced and played an important role in finding the better cassava strains. In 2009, the release of cassava genome moved the cassava research a step forward. It accelerated the modern biological study on a process governing the starch biosynthesis.
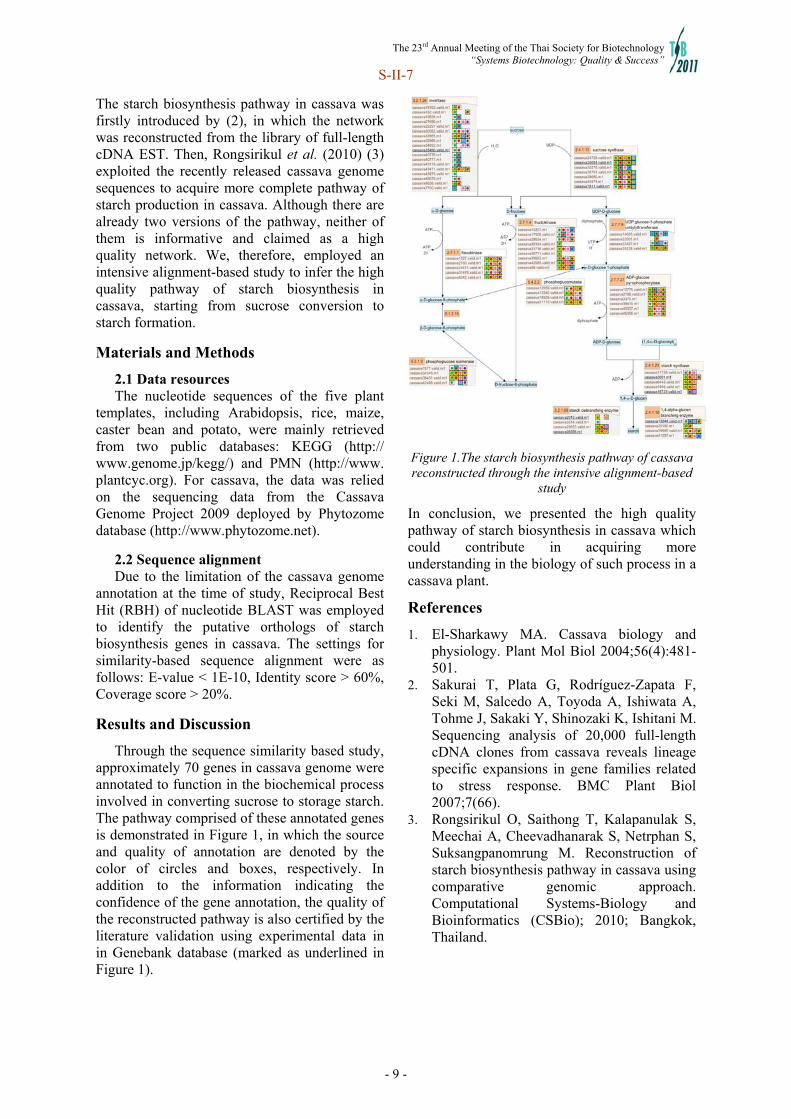
The 23rd Annual Meeting of the Thai Society for Biotechnology “Systems Biotechnology: Quality & Success”
S-II-7
- 9 -
The starch biosynthesis pathway in cassava was firstly introduced by (2), in which the network was reconstructed from the library of full-length cDNA EST. Then, Rongsirikul et al. (2010) (3) exploited the recently released cassava genome sequences to acquire more complete pathway of starch production in cassava. Although there are already two versions of the pathway, neither of them is informative and claimed as a high quality network. We, therefore, employed an intensive alignment-based study to infer the high quality pathway of starch biosynthesis in cassava, starting from sucrose conversion to starch formation.
Materials and Methods
2.1 Data resources The nucleotide sequences of the five plant
templates, including Arabidopsis, rice, maize, caster bean and potato, were mainly retrieved from two public databases: KEGG (http:// www.genome.jp/kegg/) and PMN (http://www. plantcyc.org). For cassava, the data was relied on the sequencing data from the Cassava Genome Project 2009 deployed by Phytozome database (http://www.phytozome.net).
2.2 Sequence alignment Due to the limitation of the cassava genome
annotation at the time of study, Reciprocal Best Hit (RBH) of nucleotide BLAST was employed to identify the putative orthologs of starch biosynthesis genes in cassava. The settings for similarity-based sequence alignment were as follows: E-value < 1E-10, Identity score > 60%, Coverage score > 20%.
Results and Discussion
Through the sequence similarity based study, approximately 70 genes in cassava genome were annotated to function in the biochemical process involved in converting sucrose to storage starch. The pathway comprised of these annotated genes is demonstrated in Figure 1, in which the source and quality of annotation are denoted by the color of circles and boxes, respectively. In addition to the information indicating the confidence of the gene annotation, the quality of the reconstructed pathway is also certified by the literature validation using experimental data in in Genebank database (marked as underlined in Figure 1).
Figure 1.The starch biosynthesis pathway of cassava reconstructed through the intensive alignment-based
study
In conclusion, we presented the high quality pathway of starch biosynthesis in cassava which could contribute in acquiring more understanding in the biology of such process in a cassava plant.
References
1. El-Sharkawy MA. Cassava biology and physiology. Plant Mol Biol 2004;56(4):481-501.
2. Sakurai T, Plata G, Rodríguez-Zapata F, Seki M, Salcedo A, Toyoda A, Ishiwata A, Tohme J, Sakaki Y, Shinozaki K, Ishitani M. Sequencing analysis of 20,000 full-length cDNA clones from cassava reveals lineage specific expansions in gene families related to stress response. BMC Plant Biol 2007;7(66).
3. Rongsirikul O, Saithong T, Kalapanulak S, Meechai A, Cheevadhanarak S, Netrphan S, Suksangpanomrung M. Reconstruction of starch biosynthesis pathway in cassava using comparative genomic approach. Computational Systems-Biology and Bioinformatics (CSBio); 2010; Bangkok, Thailand.

The 23rd Annual Meeting of the Thai Society for Biotechnology “Systems Biotechnology: Quality & Success”
S-II-O-1
- 10 -
Analysis of gene expression during root development implies the distinct gene regulation between root tissues
Treenut Saithonga,b, Samorn Saeruea, Saowalak Kalapanulaka,b, Punchapat Sojikulc,d, Jarunya Narangajavanac,d aBioinformatics and System Biology program, School of Bioresources and Technology, King Mongkut’s University of Technology, Bangkok, 49 Teintale 25, Bangkuntein-Chaitale Road, Thakam, Bangkuntein, Bangkok, 10150, Thailand. bBiological Modeling Lab, System biology and Bioinformatics research group, King Monkut’s University of Technology Thonburi, Bangkok, 49 Teintale 25, Bangkuntein-Chaitale Road, Thakam, Bangkuntein, Bangkok, 10150, Thailand. cCenter for Cassava Molecular Biotechnology, Faculty of Science, MahidolUniverity, Bangkok, 272 Rama 6 Road, Ratchathewi District, Bangkok, 10400, Thailand. dDepartment of Biotechnology, Faculty of science, Mahidol University, Bangkok, 272 Rama 6 Road, Ratchathewi District, Bangkok, 10400, Thailand.
Abstract Cassava is known as a starchy crop that provides carbohydrate source for human and animals.
In contrast with its importance to the world living community, the regulation in cassava root development is poorly understood. Recently, cDNA-Amplified Fragment Length Polymorphism (cDNA-AFLP) was employed to investigate gene expression during cassava root development, by which the highly expressed genes in root were identified. We here extended the cDNA-AFLP study by performing statistical analysis of the expression profiles of the 37 genes, selected from the results of cDNA-AFLP to be re-measured through real-time RT-PCR. The results showed that 14 genes can be classified as the significant genes expressed in root during developmental stages. These genes are mostly involved in cellular metabolism and biosynthesis, stress response, hypothetical protein, and cell growth and division. In addition, it was found that five of fourteen genes show high expression specifically to root cortex, while the other three of fourteen genes show parenchyma-specific. Furthermore, Pearson correlation analysis exhibited the distinct relationship between significant genes in both root tissues, suggesting the different gene regulation occurring in the different types of developmental stage of cassava root tissues. The findings are expected to help unwind the gene regulation controlling cassava root development, at least in part of genes under the scope of study. Keywords: regulation, cDNA-Amplified Fragment Length Polymorphism (cDNA-AFLP), root development, cassava, gene expression profile. Introduction and Objective
Cassava is a one of the most important starchy crops that provides carbohydrate source for human and animals. Many studies emphasize on physiology of cassava root development which is a site for starch synthesis and accumulation[2]. However, the regulation of root development is still poorly understood. Recently, cDNA-AFLP was used to study the differential expression of genes during root development in cassava under dry and wet cultured conditions [1]. The quantitative measurement of gene expression provided in the cDNA-AFLP study is extraordinarily useful for further analysis to reveal the different regulation inside plants cultivated under different water conditions. Employing these expression data of wet cultivar [1], we here performed the statistical analysis to identify the genes that are differentially expressed in roots with respect to that in leaves.
Furthermore, we showed the network schemes inferring the distinct gene regulation in cortex and parenchyma root tissues. Materials and Methods
The differentially expressed genes between roots and leaves were screened through cDNA-AFLP and subsequently remeasured by RT-PCT [1]. The expressions of 37 genes from RT-PCR measurement were used in this study. Using the criterion of one standard deviation above average expression, genes were classified into groups of highly and low expressed genes. A group of highly expressed genes in roots whose expression is low in leaves were passed to the correlation analysis. Pearson correlation (r>0.5) was performed to infer the relationship between genes leading to the proposed genetic networks of gene regulation.
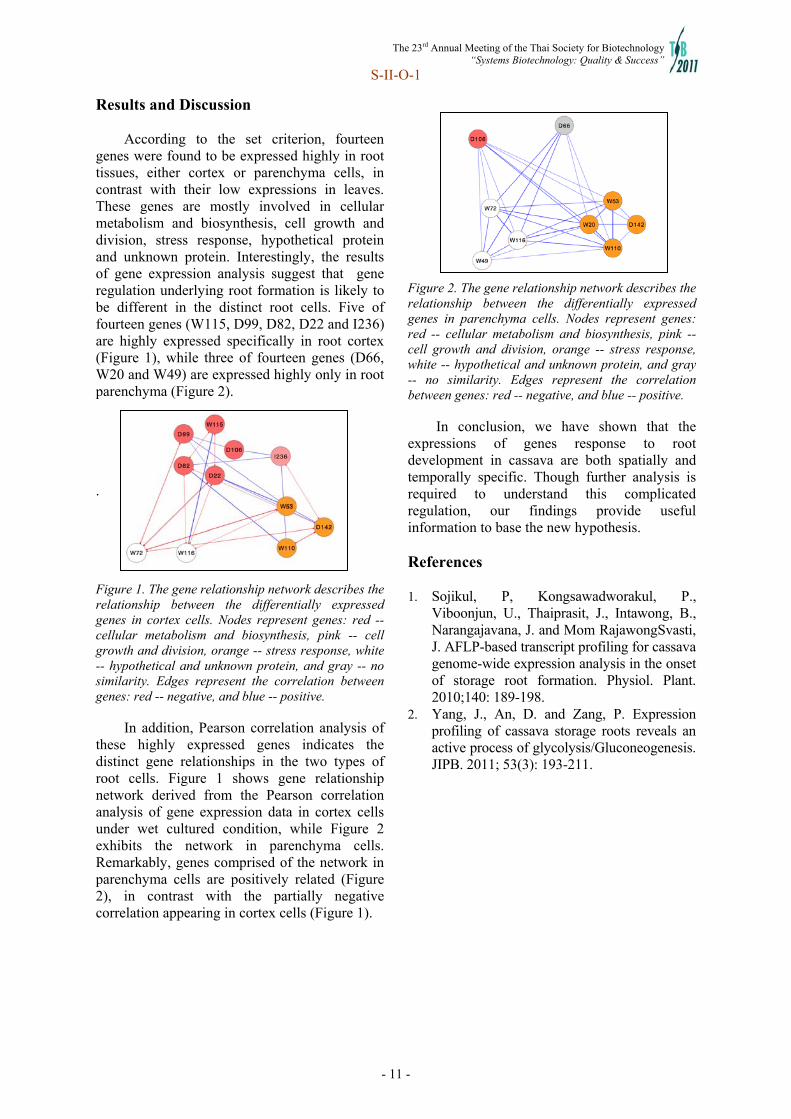
The 23rd Annual Meeting of the Thai Society for Biotechnology “Systems Biotechnology: Quality & Success”
S-II-O-1
- 11 -
Results and Discussion
According to the set criterion, fourteen genes were found to be expressed highly in root tissues, either cortex or parenchyma cells, in contrast with their low expressions in leaves. These genes are mostly involved in cellular metabolism and biosynthesis, cell growth and division, stress response, hypothetical protein and unknown protein. Interestingly, the results of gene expression analysis suggest that gene regulation underlying root formation is likely to be different in the distinct root cells. Five of fourteen genes (W115, D99, D82, D22 and I236) are highly expressed specifically in root cortex (Figure 1), while three of fourteen genes (D66, W20 and W49) are expressed highly only in root parenchyma (Figure 2).
. Figure 1. The gene relationship network describes the relationship between the differentially expressed genes in cortex cells. Nodes represent genes: red -- cellular metabolism and biosynthesis, pink -- cell growth and division, orange -- stress response, white -- hypothetical and unknown protein, and gray -- no similarity. Edges represent the correlation between genes: red -- negative, and blue -- positive.
In addition, Pearson correlation analysis of these highly expressed genes indicates the distinct gene relationships in the two types of root cells. Figure 1 shows gene relationship network derived from the Pearson correlation analysis of gene expression data in cortex cells under wet cultured condition, while Figure 2 exhibits the network in parenchyma cells. Remarkably, genes comprised of the network in parenchyma cells are positively related (Figure 2), in contrast with the partially negative correlation appearing in cortex cells (Figure 1).
Figure 2. The gene relationship network describes the relationship between the differentially expressed genes in parenchyma cells. Nodes represent genes: red -- cellular metabolism and biosynthesis, pink -- cell growth and division, orange -- stress response, white -- hypothetical and unknown protein, and gray -- no similarity. Edges represent the correlation between genes: red -- negative, and blue -- positive.
In conclusion, we have shown that the
expressions of genes response to root development in cassava are both spatially and temporally specific. Though further analysis is required to understand this complicated regulation, our findings provide useful information to base the new hypothesis. References 1. Sojikul, P, Kongsawadworakul, P.,
Viboonjun, U., Thaiprasit, J., Intawong, B., Narangajavana, J. and Mom RajawongSvasti, J. AFLP-based transcript profiling for cassava genome-wide expression analysis in the onset of storage root formation. Physiol. Plant. 2010;140: 189-198.
2. Yang, J., An, D. and Zang, P. Expression profiling of cassava storage roots reveals an active process of glycolysis/Gluconeogenesis. JIPB. 2011; 53(3): 193-211.
Figure
Figure
The 23rd Annual Meeting of the Thai Society for Biotechnology “Systems Biotechnology: Quality & Success”
O-I-2
- 12 -
Bacterial community in intestine of the giant tiger shrimp Penaeus monodon in rearing pond: Effects of shrimp size
Mongkol Phayungsaka, Sage Chaiyapecharab, Pikul Jiravanichpaisalb, Sirawut Klinbungab, c, Piamsak Menasvetac, d
a Program in Biotechnology, Faculty of Science, Chulalongkorn University, Bangkok 10330, Thailand bAquatic Molecular Genetics and Biotechnology Laboratory, Agricultural Biotechnology Research Unit, National Center for Genetic Engineering and Biotechnology (BIOTEC), National Science and Technology Development Agency (NSTDA), 113 Thailand Science Park, Phahonyothin Road, Pathumthani, 12120, Thailand cCenter of Excellence for Marine Biotechnology, Faculty of Science, Chulalongkron University,Bangkok 10330, Thailand dDepartment of Marine Science, Faculty of Science, Chulalongkron University, Bangkok 10330, Thailand
Abstract The giant tiger shrimp Penaeus monodon is an important aquaculture species for Thailand. In recent years, the industry faced with several challenges such as a lack of suitable broodstocks, environmental impact, and management of diseases. Intestinal bacteria of aquatic animals plays a crucial role in the host animals well-being such as digestion and disease resistance, However, understanding of shrimp-bacteria interaction is still limited. The goal of this study is to compare the intestinal bacterial community of the juvenile giant tiger shrimp of different sizes. The shrimp intestinal tract samples were collected and pooled according to size (large, medium and small) and age (2 and 5 month-old shrimp). The total bacterial genomic DNA was extracted and bacterial community was determined using Denatured Gradient Gel Electrophoresis (DGGE) targeting the 16S rDNA V3 region using 338f-GC - 517r primer pair. Cluster analysis, 16S rDNA sequencing and phylogenetic analysis were performed. Bacteria from 7 phylogenetic groups included α-, -, - and -Proteobacteria, Bacteroidetes, Fusobacteria, and Firmicutes were found. Vibrio spp. were the most predominant group (21 out of 55 clones) and were found in most shrimps. The results indicated that there was no significant difference of bacterial community found among the group of shrimp samples varied in size and age, but the bacterial communities varied significantly between different months of sampling. Keywords: Penaeus monodon, PCR-DGGE, intestinal microbial diversity, 16s rDNA gene
Introduction and Objective Intestinal bacteria of aquatic animals have been recognized as an important element in the host animal health, nutrition, immune responses and disease resistance (Verschuere et al. 2000). However, the interaction of these bacteria and their roles in the health of shrimp were poorly investigated. The goal of this study is to compare the intestinal bacterial community of the juvenile giant tiger shrimp of different sizes at different age (months in pond). Materials and Methods 2.1 Sampling and DNA extraction Penaeus monodon reared in an earthen pond (Chanthaburi, Thailand) were graded by weight into three sizes group (large, medium and small) at 2 and 5 months old (N=30 each). The whole intestinal tracts of each shrimp was aseptically dissected and homogenized with 2% NaCl solution. The total genomic DNA was extracted using the CTAB/ SDS/ Proteinase K -
Chloroform/ IAA protocol with some modification and stored at -20 ºC until analysis. 2.2 PCR amplification and DGGE The 16S rDNA gene for DGGE was generated using nested PCR (8fm-1492r primers and 338f-GC-517r primers). DGGE were performed using 8% polyacrylamide gel with 25-50% denaturing gradient. (0.5x TAE, 6 hours at 200 V at 60 ºC), and the gel was stained using SYBR gold (Muyzer et al. 1993). DGGE band profiles were normalized and analyzed on InfoQuest FP software using Pearson correlation and unweighted pair group method (UPGMA). 2.3 Cloning, sequencing and phylogenetic analysis A clone library of 16S rDNA PCR product from selected shrimp representing each cluster of DGGE profiles was created using the pGEM-T Easy Vector System. Clones were selected randomly and sequenced by ABI PRISM 3100 Genetic Analyzer. Phylogenetic analysis was performed using the RDP Classification

The 23rd Annual Meeting of the Thai Society for Biotechnology “Systems Biotechnology: Quality & Success”
O-I-2
- 13 -
Algorithm and constructed by the neighbor-joining method (MEGA software). Results and Discussion Table1. Average weight for different sizes (large, medium and small) of 2 and 5 month-old shrimp.
The DGGE profile from 60 shrimps formed 5 clusters with similar distribution of shrimp from each size and months represented in all clusters. Phylogenetic analysis showed that 55 sequences of 16S rDNA gene were derived from 13 genera in 4 phyla including Proteobacteria (α-, β-, δ- and γ), Bacteroidetes, Fusobacteria and Firmicutes (Table 2). Most sequences belonged to the Proteobacteria phylum, and Vibrio sp. was the most common bacteria represented in the total number of clones from the intestinal tract of juvenile giant tiger shrimp.
Table2. Sequence similarities between 16S rDNA gene sequences of clones and those of the closest relatives retrieved in the RDP Classification Algorithm.
a S_ab scores is a pairwise similarity score based on seqmatch analysis (Ribosomal Database Project) Bacterial community in three differences size shrimps were not significantly different at either 2 or 5 month-old shrimp, but the bacterial communities varied significantly between different sampling months. The predominant bacterial community of juvenile giant tiger shrimp was Proteobacteria and Vibrio sp. was the dominant species. The small difference between size groups could contribute to the similarity in the bacterial communities. Other overriding factors such as feed, shrimp health and disease status could also play a role. References 1. Muyzer G, De Waal EC, Uitterlinden AG.
Profiling of complex microbial population by denaturing gradient gel electrophoresis analysis of polymerase chain reaction-amplified genes coding for 16S rRNA. Appl Environ Microbiol.1993;59: 695-700
2. Verschuere L, Rombaut G, Sorgeloos P, Verstraete W. Probiotic bacteria as biological control agents in aquaculture. Microbiol Mol Biol Rev. 2000; 64(4): 655-671.
Small (N=10)
Medium (N=10)
Large (N=10)
2 month- old shrimp
3.3±0.2 6.0±0.3 12.7±0.5
5 month- old shrimp
6.3±0.4 11.9±0.2 20.5±0.9
Closest type strain
(no. clone) S_aba score
Phylum Proteobacteria Vibrio Xuii (12) 0.87-0.96 Vibrio rotiferianus (9) 0.93-0.98 Photobacterium damselae (8) 0.90-0.99 Ferrimonas balearica (3) 0.80-0.90 Achromobacter xylosoxidans (2) 0.90-0.97 Achromobacter insolitus (2) 0.92-0.95 Granulosicoccus antarcticus (5) 0.59-0.61 Desulfovibrio alaskensis (1) 0.80 Brevundimonas vesicularis (1) 0.97 Sphingomonas oligophenolica (1) 0.93
Phylum Fusobacteria Llyobacter tartaricus (1) 0.63
Phylum Firmicutes Fusibacter paucivorans (1) 0.62
Phylum Bacteroidetes Cytophaga fermentans (7) 0.57-0.60
Figure1. The dendrogram of DGGE profile showed bacterial community in intestine of the giant tiger shrimp Penaeus monodon in tree size groups between 2 month ( ) and 5 months ( ).
The 23rd Annual Meeting of the Thai Society for Biotechnology “Systems Biotechnology: Quality & Success”
O-I-3
- 14 -
Molecular cloning and expression analysis of the ATP/GTP binding protein gene in the giant tiger shrimp Penaeus monodon
Sripapan Treejatet a, Kanchana Sittikhankeaw b, Rachanimuk Hiransuchalert c, Vasin Yuvanatemiya c Sirawut Klinbunga b,d and Padermsak Jarayabhand e,f aProgram in Biotechnology, Faculty of Science, Chulalongkorn University, Bangkok 10330, Thailand bAquatic Molecular Genetics and Biotechnology Laboratory, Agricultural Biotechnology Research Unit, National Center for Genetic Engineering and Biotechnology (BIOTEC), National Science and Technology Development Agency (NSTDA), Thailand Science Park, 113 Paholyothin Road, Pathumthani 12120, Thailand cFaculty of Marine Technology, Burapha University, Chanthaburi Campus, 57 Moo 1, Kamong, Thamai, Chanthaburi 22170, Thailand dCenter of Excellence for Marine Biotechnology, Faculty of Science, Chulalongkorn University, Bangkok 10330, Thailand eAquatic Resources Research Institute, Chulalongkorn University, Bangkok 10330, Thailand fDepartment of Marine Science, Faculty of Science, Chulalongkorn University, Bangkok 10330, Thailand Abstract
Isolation and characterization of genes functionally involved in ovarian development is necessary for understanding molecular mechanisms of ovarian development in the giant tiger shrimp (Penaeus monodon). In this study, the full-length cDNA of P. monodon ATP/GTP binding protein was characterized by primer walking. It was 1547 bp in length containing an ORF of 1263 bp that corresponded to a polypeptide of 420 amino acids. This sequence significantly matched Pre-mRNA cleavage complex II protein (Clp1) of Harpegnathos saltator (E-value = 1e-155). The calculated isoelectric point (pI) and molecular weight (MW) of the deduced amino acid sequence of ATP/GTP binding protein of P. monodon was 5.98 and 46.52 kDa, respectively. The pre-mRNA cleavage complex II protein (Clp1) domain was found at positions 149-481 of the deduced ATP/GTP binding protein (E-value = 5.50e-157). Quantitative real-time PCR revealed that the expression level of ATP/GTP binding protein in intact broodstock of P. monodon was up-regulated in ovaries of post-spawning shrimp (P < 0.05). However, the expression of ATP/GTP binding protein was not significantly different in eyestalk-ablated broodstock. In addition, the expression levels of this gene in the same ovarian stages of both intact and eyestalk-ablated broodstock were not significantly different (P > 0.05). The information suggested that gonad inhibiting hormone (GIH) does not exhibit the downstream effects on the transcription of P. monodon ATP/GTP binding protein. Keywords: Penaeus monodon, ATP/GTP binding protein, real-time PCR Introduction and Objective
The giant tiger shrimp (Penaeus monodon) is one of the economically important cultured species. Genetic improvement to increase the productivity of P. monodon can be carried out by applications of domestication and selective breeding program. Afterwards, advance technology can be effectively applied to promote the sustainable aquaculture of P. monodon.
The development of oocytes consists of a series of complex cellular events, in which different genes express to ensure the proper development of oocytes and to store transcripts and proteins as maternal factors for early embryogenesis.
To examine the possible involvement of the ATP/GTP binding protein in ovarian development of P. monodon, its full-length cDNA and expression profiles during ovarian
development of intact and eyestalk-ablated P. monodon broodstock were examined. Materials and Methods 2.1 Isolation of the full-length cDNA of ATP/GTP binding protein
The full-length cDNA of P. monodon ATP/GTP binding protein was obtained by further sequencing of the original EST clone at the 3′ direction using a primer walking approach. 2.2. Quantitative real-time PCR
Standard curves representing 103-108 copies of P. monodon ATG/GTP binding protein (F: 5' TAGCAGTGTTCACCTGGCAT 3' and R: 5' GTAGGAAAGTCAACTCTGTGC 3' ) and the internal control, EF-1 (5´-GTCTTCCCCT TCAGGACGTC-3´ and R5: 5´-CTTTACAGAC ACGTTCTTCACGTTG-3´), were constructed.

The 23rd Annual Meeting of the Thai Society for Biotechnology “Systems Biotechnology: Quality & Success”
O-I-3
- 15 -
Quantitative real-time PCR of ATP/GTP binding protein and EF-1 of each shrimp was examined in duplicate. The relative expression level between shrimp possessing different stages of ovarian development were statistically tested (P < 0.05). Results and Discussion
ATP/GTP binding proteins are involved in the regulation of cell growth, differentiation, and vesicular transport processes. However, the functional involvement of this gene/protein in ovarian development has not been reported in P. monodon.
The full-length cDNA of P. monodon ATP/GTP binding protein was 1547 bp in length containing an ORF of 1263 bp corresponding to a polypeptide of 420 amino acids with the 5′ and 3′UTRs of 68 and 213 bp (excluding the poly A tail; Fig. 1), respectively. It significantly matched Pre-mRNA cleavage complex II protein Clp1 of Harpegnathos saltator (E-value = 1e-155). The calculated pI and MW of the deduced ATP/GTP binding protein of P. monodon was 5.98 and 46.52 kDa.. The pre-mRNA cleavage complex II protein (Clp1) domain was found at positions 149-481 of the deduced ATP/GTP binding protein (E-value = 5.50e-157).
Figure 1. Schemetic diagram illustration the full-length cDNA of P. monodon ATP/GTP.binding protein. The predicted Clp1 domain is located at positions 149-418 of the deduced protein.
ATP/GTP binding protein plays an
important role for the formation of the 3′ end of pre-mRNA for which the pre-mRNA is cleaved endonucleolytically. The upstream cleavage fragment subsequently polyadenylated and the downstream product degraded.
Quantitative real-time PCR revealed that the expression level of ATP/GTP binding protein mRNA in ovaries of both intact and eyestalk-ablated broodstock was not significantly different from that of juveniles (4-month-old shrimp) (P > 0.05).
In adults, the expression P. monodon ATP/GTP binding protein was comparable during ovarian development in both intact and
eyestalk-ablated broodstock (P > 0.05). Interestingly, this transcript was up-regulated after spawning (P > 0.05).
aab
ab abab
b
ab ab ab ab
00.05
0.10.15
0.20.25
0.30.35
0.40.45
0.5
juvenille stage I stage II stage III stage IV post spawn
Rel
ativ
e ex
pres
sion
leve
l
Intactl shrimp
Eyestalk-ablated shrimp Figure 2. Relative expression profiles of P. monodon ATP/GTP binding protein during ovarian development of intact and unilateral eyestalk ablated shrimp. (N = 6 for 4-month-old juveniles, N = 8, 6, 7, 8 and 6 for stages I-IV and post-spawning broodstock and N = 3, 8, 10 and 10 for stages I – IV of eyestalk-ablated shrimp, respectively).
The information suggested that the steady
state amounts of the P. monodon ATP/GTP binding protein mRNA may be sufficient to maintain multiple times of its translations throughout oogenesis of P. monodon. An increase of the ATP/GTP binding protein mRNA level after spawning implied that this transcript should be required for the next round of ovarian development and maturation of P. monodon. Therefore, the expression profiles of the ATP.GTP binding protein during ovarian development of this economically important species should be further carried out. References 1. Sayed, A., Shin-ichi Matsuyama, S., Inoue,
K., Alsina, J., Cai, F., Chen, J. and Inouye, M. ATPase and GTPase activities copurifying with GTP binding proteins in E. coli. J. Mol. Microbiol. Biotechnol. 2000;2(3): 261-263.
2. Sittikhankeaw, K. Isolation and charac-terization of gene involving ovarian development of the giant tiger shrimp Penaeus monodon, MS Thesis, Chulalongkorn University, 2006;159 pp.
5’UTR Clp1 3’UTR
200bp
1 149 418 421

The 23rd Annual Meeting of the Thai Society for Biotechnology “Systems Biotechnology: Quality & Success”
O-I-4
- 16 -
Full-length cDNA cloning and expression analysis of the selenoprotein M gene during ovarian development of the giant tiger shrimp
Penaeus monodon Patchari Yocawibun a,c, Rachanimuk Hiransuchalert b, Sirawut Klinbunga c,d and Piamsak Menasveta e
aProgram in Biotechnology, Faculty of Science, Chulalongkorn University, Bangkok 10330, Thailand bFaculty of Marine Technology, Burapha University, Chanthaburi Campus Chanthaburi 22170, Thailand cAquatic Molecular Genetics and Biotechnology Laboratory, Agricultural Biotechnology Research Unit, National Center for Genetic Engineering and Biotechnology (BIOTEC), National Science and Technology Development Agency (NSTDA), Thailand Science Park, 113 Paholyothin Road, Klong 1, Klong Luang, Pathumthani 12120, Thailand dCenter of Excellence for Marine Biotechnology, Faculty of Science, Chulalongkorn University, Bangkok 10330, Thailand eDepartment of Marine Science, Faculty of Science, Chulalongkorn University, Bangkok 10330, Thailand
Abstract Identification of genes involved in ovarian development is the first step towards
understanding molecular mechanisms of reproductive maturation in the giant tiger shrimp (Penaeus monodon). The full-length cDNA of P. monodon Selenoprotein M precursor (PmSelM) was identified from expressed sequence tag (EST) analysis. It was 904 bp in length containing an ORF of 396 bp encoding a polypeptide of 131 amino acids. Tissue distribution analysis indicated that PmSelM was more abundantly expressed in ovaries and hemocyte than other tissues of a female broodstock. It was not expressed in thoracic ganglion of female and testes of male broodstock. The expression level of PmSelM during ovarian development of P. monodon was examined by quantitative real-time PCR. PmSelM in premature ovaries of juveniles and previtellogenic ovaries of intact broodstock was not significantly different (P < 0.05). Its expression was up-regulated in vitellogenic (stage II) ovaries before declining to the basal level in early cortical rod (III) and mature (IV) ovaries and the highest level was observed in ovaries of post-spawning shrimp (V). The expression level of PmSelM in eyestalk-ablated broodstock was significantly greater than that in intact broodstock for all stages of ovarian development (P < 0.05). In addition, the PmSelM mRNA level in domesticated (14- and 18-month-old) broodstock was lower than that of juveniles and wild broodstock (P < 0.05). The results suggest that the expression level of PmSelM can be used as a biomarker to monitor the reduction of reproductive maturation of domesticated P. monodon females in captivity. Keywords: Penaeus monodon, selenoprotein M, gene expression, quantitative real-time PCR Introduction and Objective
The low degree of reproductive maturation of the giant tiger shrimp (Penaeus monodon) in captivity has limited the ability to genetically improve this species by domestication and selective breeding program. Understanding of the molecular mechanisms involved in ovarian and oocyte development are necessary for sustainable aquaculture of this economically important species.
To address the functional involvement of the selenoprotein M gene in ovarian development, the full-length cDNA of PmSelM was isolated. In addition, the expression profiles of this gene during ovarian development of P. momodon were also examined.
Materials and Methods
2.1 Experimental animals
Juveniles and broodstock P. monodon were live-caught. Ovaries were dissected out from each shrimp, immediately placed in liquid N2 and kept at -80 C until needed. Ovarian developmental stages of broodstock were divided according to the percentage of gonadosomatin index (%GSI)2. For tissue distribution analysis, various tissues of a female and testes of a male broodstock were collected.
2.2 RT-PCR and tissue distribution analysis
The first strand cDNA of each specimen was transcribed from DNase I-treated total RNA template using an ImProm-II™ Reverse Transcription System Kit (Promega). Expression of PmSelM in ovaries and testes of cultured juveniles and various tissue of female and testes of male broodstock was analyzed by RT-PCR (primers PmSelM-F: 5´-GACATCCCACTCTTCC

The 23rd Annual Meeting of the Thai Society for Biotechnology “Systems Biotechnology: Quality & Success”
O-I-4
- 17 -
ATAAT-3´ and PmSelM-R: 5´-TTTCATCTACA GTTCTTCCCTC-3´).
2.4 Quantitative real-time PCR Standard curves representing 103–108 copies
of PmSelM (primers PmSElM-F + PmSElM-R) and the internal control, EF-1 (F6: 5´-GTCTTCCCCTTCAGGACGTC-3´ and R5: 5´-CTTTACAGACACGTTCTTCACGTTG-3´), were constructed. Quantitative real-time PCR of PmSelM and EF-1 of each shrimp was examined in a 10 µl reaction volume contained 5 µl of 2x LightCycler 480 SYBR Green I Master (Roche), 25 ng template, 0.2 µM each gene-specific primer. The relative expression level between shrimp possessing different stages of ovarian development were statistically tested (P < 0.05).
Results and Discussion
The full-length cDNA of PmSelM was 904 bp length containing an ORF of 396 bp encoding a polypeptide of 131 amino acids with the 5´ and 3´ UTRs of 6 and 502 bp, respectively. It significantly matched SelM of Litopenaeus vanamei (E-value = 7e-74). The predicted Sep15_SelM domain was found at 31-107 (E-value=1.8e-32) of the deduced PmSelM protein.
Figure 1. Schematic diagram illustrating the full-length cDNA of PmSelM.
RT-PCR and tissue distribution analysis indicated that PmSelM was more abundantly expressed in ovaries of the female broodstock than ovaries of the female juveniles, other tissues of a female broodstock and testes of male broodstock. It was not expressed in thoracic ganglion of a female (Fig. 2).
Figure 2. RT-PCR (A) of PmSelM using the cDNA template from ovaries (lanes 1-3, A) and testes (lanes 4-6, A) of juveniles (lanes 1 and 4) and broodstock (lanes 2-3 and 5-6). EF-1 was successfully amplified from the same template. B. Tissue expression analysis in antennal gland (AN), epicuticle (EP), eyestalk (ES), gills (GL), hemocytes (HC), heart (HE), hepatopancreas (HP), intestine (IN), lymphoid organs (LO), ovaries (OV), pleopods (PL), stomach
(ST), and thoracic ganglion (TG) of a female broodstock, juvenile ovaries (JOV) and testes (TT) of male broodstock.
The result indicated that PmSelM is involved in reproductive development of P. monodon.
The expression level of PmSelM in premature ovaries of juveniles and previtellogenic (stage I) ovaries of intact broodstock of P. monodon was not significantly different (P < 0.05). Its expression was up-regulated in vitellogenic (II) ovaries before returned to the basal level in early cortical rod (III) and mature (IV) ovaries and the highest level was observed in ovaries of post-spawning shrimp (V).
The expression level of PmSelM in eyestalk-ablated broodstock was significantly greater than that in intact broodstock for all stages of ovarian development (P < 0.05). In addition, the PmSelM mRNA level in domesticated 18-month-old broodstock was significantly lower than that of 4-month-old juveniles and wild broodstock (P < 0.05, Fig. 3). Figure 3. The relative expression profiles of PmSelM in ovaries of P. monodon. For expression analysis, ovaries from different groups of shrimp (4- and 6 month-old juveniles and 14- and 18-month-old domesticated broodstock and stages I, II, III and IV of intact and unilateral eyestalk-ablated broodstock were assays. PS = post spawning broodstock.
References 1. Lu W, Li W-w, Jin X-k, He L, Wang Q.
Reproductive function of Selenoprotein M in Chinese mitten crabs (Eriocheir sinesis). Peptdes. 2011 : In press
2. Preechaphol R, Klinbunga S, Khamnamtong B, Menasveta P. Isolation and characterization of genes functionally involved in ovarian development of the giant tiger shrimp Penaeus monodon by suppression subtractive hybridization (SSH). Genet Mol Biol. 2010;33:676-685.
The 23rd Annual Meeting of the Thai Society for Biotechnology “Systems Biotechnology: Quality & Success”
O-I-6
- 18 -
Identification and expression analysis of the transforming growth factor beta regulator 1 gene in domesticated giant tiger shrimp Penaeus monodon
Parichat Chumtong a,b, Sirikan Prasertlux b, Sirawut Klinbunga b,c, Piamsak Menasveta d and Bavornlak Khamnamtong c aProgram in Biotechnology, Faculty of Science, Chulalongkorn University, Bangkok 10330, Thailand bAquatic Molecular Genetics and Biotechnology Laboratory, Agricultural Biotechnology Research Unit, National Center for Genetic Engineering and Biotechnology (BIOTEC), National Science and Technology Development Agency (NSTDA), Thailand Science Park, 113 Paholyothin Road, Klong 1, Klong Luang, Pathumthani 12120, Thailand cCenter of Excellence for Marine Biotechnology, National Center for Genetic Engineering and Biotechnology (BIOTEC), Chulalongkorn University, Bangkok 10330, Thailand dDepartment of Marine Science, Faculty of Science, Chulalongkorn University, Bangkok 10330, Thailand Abstract
Transforming growth factor beta regulator 1 (TGF1) plays an important role in growth and maintenance of chromosome stability. In this study, TGF1 in the giant tiger shrimp (Penaeus monodon) was characterized by rapid amplification of cDNA end-polymerase chain reaction (RACE-PCR). The partial cDNA sequence of PmTGF1 obtained contains an ORF of 1095 bp and the 3´ UTR of 119 bp. The deduced amino acid sequence of PmTGF1 protein contained FYRN and FYRC domains as reported in other species. Initially, the amplification of genomic DNA fragment using the designed primers generated a 923 bp fragment containing 2 introns of 455 and 241 bp. The PCR product obtained from domesticated P. monodon juveniles (3-month-old, average body weight = 13.32 ± 2.42 g, N = 53) using gene-specific primers that covered the intron 2 (353-bp product) was further analyzed by single strand conformational polymorphism (SSCP). Since a monomorphic SSCP pattern was found, polymorphism of PmTGF1 in other groups of domesticated shrimp will be further examined. In addition, quantitative real-time PCR was carried out to examine the level of PmTGF1 mRNA in hepatopancreas of 3-month-old juveniles. The expression level of PmTGF1 in female juveniles was significantly greater than that of male juveniles (P < 0.05). Disregarding sexes, the expression level of PmTGF1 in fast growing shrimp was significantly greater than that in moderate- and slow growing shrimp (P < 0.05). The information suggested that PmTGF1 seems to play functionally important roles in growth of P. monodon. Keywords: Penaeus monodon, PCR-SSCP, real-time PCR, transforming growth factor beta regulator 1 Introduction
The giant tiger shrimp (Penaeus monodon) is one of the economically important species. Despite the success of the shrimp farming industry, problems of infectious disease outbreaks and the lack of high quality broodstock result in the reduction of the aquacultural production since the last several years. The domestication and selective breeding programs of P. monodon are necessary for providing a more reliable supply of seed stock and the improvement of their production efficiency. Molecular genetic markers that allow selection of juveniles and broodstock with a high breeding value for growth rates would be useful and can be directly applied for the shrimp industry.
Materials and Methods 2.1 Experimental animals Domesticated P. monodon juveniles (3-
month-old, average body weight = 13.32 ± 2.42 g, N = 53) cultured in the same earth pond at the Broodstock Multiplication Center (BMC), Burapha University, Chanthaburi, were collected. Ten percent of shrimp exhibiting the top, the middle and the bottom according to the body weight were selected for analysis of polymorphism and expression level of the PmTGF1 gene.
2.2 Genomic DNA extraction Genomic DNA was extracted from pleopods
of each shrimp using a phenol-chloroform-proteinase K method. The concentration of extracted genomic DNA was spectrophoto-metrically estimated.

The 23rd Annual Meeting of the Thai Society for Biotechnology “Systems Biotechnology: Quality & Success”
O-I-6
- 19 -
2.3 Total RNA and first strand cDNA synthesis
Total RNA was extracted from hepatopancreas of each shrimp using TRI-Reagent (Molecular Research Center). Ten micrograms of the extracted total RNA was digested with DNase I (0.5 U/µg) at 37ºC for 30 min. One and a half microgram of the DNase I-treated total RNA was reverse-transcribed using an ImProm-II Reverse Transcription System Kit (Promega).
2.4 Characterization of PmTGF1 by RACE-PCR and PCR-SSCP analysis
An EST significantly matched transforming growth factor beta regulator 1 (TFG1) was retrieved from the shrimp database (http://monodon.biotec.or.th). RACE-PCR was carried out using a BD SMART RACE cDNA Amplification Kit (BD Biosciences). In addition, a pair of primers for amplification of the P. monodon TFG1 (PmTGF1) gene segment was amplified against genomic DNA of P. monodon. After cloning and sequencing, gene-specific primers covering the second intron of the initial gene fragment were designed. Polymorphism of the PCR product was further analyzed by SSCP analysis. The denatured PCR product was separated on 12.5% non-denaturing poly-acrylamide gel (75:1 crosslink) at 200 V at 4ºC for 17 h. SSCP bands were visualized by silver staining.
2.5 Quantitative Real-time PCR
The expression level of PmTGF1 in hepatopancreas of juvenile shrimp exhibiting fast-, moderate- and slow-growing rates (large, medium and small sizes according to the body weight) was examined by quantitative real-time PCR. The reaction was amplified in a 10 µl reaction volume containing 1x LightCycler 480 SYBR Green I Master (Roche), 500 ng of the first strand cDNA template, 0.2 µM each of gene-specific primers. Real-time PCR of each specimen was carried out in duplicate. Results and Discussion
The partial cDNA sequence containing an ORF of 1095 bp and the 3´ UTR of 119 bp was characterized by RACE-PCR. The closet similarity of PmTGF1 was TGF1 of Bombus terrestris (E-value = 1e-57). The deduced amino acid sequence of PmTGF1 protein contained FYRN (E-value = 9.48e-12) and FYRC (E-value
= 4.26e-05) domain typically found in TGF1 of previously reported species1,2.
The amplified PmTGF1 gene segment was 923 bp containing 2 introns of 455 and 241 bp. Gene-specific primers that generated the expected product of 353-bp was designed. SSCP analysis of the amplicon revealed that it was monomorphic in this sample set. Polymorphism of PmTGF1 in other groups of domesticated P. mnodon will be further examined.
Quantitative real-time PCR was carried out to determine expression levels of PmTGF1 mRNA in hepatopancreas of 3-month-old shrimp (N = 59). The expression level of PmTGF1 in female juveniles was significantly greater than that of male juveniles (P < 0.05, Fig. 1).
Figure 1. Relative expression levels of PmTGF1 in hepatopancreas of females and males of 3-month-old P. monodon juveniles.
The expression level of PmTGF1 seemed to correlate with shrimp growth rates where its expression in the fast-growing juveniles was significantly higher than that in moderate- and slow growing juveniles (P < 0.05). The information from this study suggested that PmTGF1 seems to play functionally important roles in growth of P. monodon.
Figure 2. Relative expression levels of PmTGF1 in hepatopancreas of 3-month-old P. monodon juveniles possessing different growth rates.
References 1. García-Alai, MM, Allen MD, Joerger AC,
Bycroft M. The structure of the FYR domain of transforming growth factor beta regulator 1. Prot Sci. 2010;19:1432-1438.
2. Roberts AB, Anzano MA, Wakefield LM, Roche NS, Stern DF, Sporn MB. Type ß transforming growth factor: a bifunctional regulator of cellular growth. Cell Biol. 1985;82:119-123.
The 23rd Annual Meeting of the Thai Society for Biotechnology “Systems Biotechnology: Quality & Success”
O-I-7
- 20 -
Identification of single nucleotide polymorphism in Farnesoic acid O-methyltransferase (PmFAMeT) of the giant tiger shrimp Penaeus monodon
Napaporn Jantee a , Arun Buaklin a , Sirawut Klinbunga b,c , Bavornluk Khumnamtong c and Piamsak Menasveta c,d a Program in Biotechnology, Faculty of Science, Chulalongkorn University, Bangkok 10330, Thailand bAquatic Molecular Genetics and Biotechnology Laboratory, Agricultural Biotechnology Research Unit, National Center for Genetic Engineering and Biotechnology (BIOTEC), National Science and Technology Development Agency (NSTDA), Thailand Science Park, 113 Paholyothin Road., Klong 1, Klong Luang, Pathumthani 12120, Thailand cCenter of Excellence for Marine Biotechnology, Faculty of Science, Chulalongkorn University, Bangkok 10330, Thailand
dDepartment of Marine Science, Faculty of Science, Chulalongkorn University, Bangkok 10330, Thailand
Abstract Identification of single nucleotide polymorphism (SNP) in reproduction-related genes is necessary
for development of molecular markers linked with economically important traits of the giant tiger shrimp (Penaeus monodon). Farnesoic acid O-methyltransferase (FAMeT) catalyzes the conversion of farnesoic acid to methyl farnesoate, a putative crustacean hormone believed to be involved in shrimp reproduction. In this study, SNP in FAMeT of domesticated 14-month-old P. monodon shrimp (N = 65) was identified by single strand conformational polymorphism (SSCP) analysis. Four SSCP genotypes (A, B, C and D) of PmFAMeT were found. Association between SSCP genotypes and growth and reproduction parameters was statistically tested. Significant correlation between SSCP genotypes and the body weight of domesticated P. monodon broodstock was observed (P < 0.05) where shrimp carrying the genotype B (N = 17, average body weight = 95.44 ± 10.65 ) exhibited a greater body weight than those carrying genotypes A (N = 19, average BW = 85.37 ± 12.30), C (N = 17, average BW = 82.60 ± 9.42) and D (N = 12, average BW = 84.56 ± 14.56), respectively) Although the correlation between SSCP genotypes and gonadosomatic index (GSI) was not statistically significant (P > 0.05), shrimp having the genotype B (1.04 ± 0.40) showed a trend of greater GSI values than those carrying other genotypes (0.87 ± 0.28, 0.99 ± 0.43 and 0.92 ± 0.32 for A, C and D, respectively). Results from this study indicated that PmFAMeT seems to play functional roles in growth and gonad development of P. monodon.
Keywords: SNP, FAMeT, SSCP, Penaeus monodon, molecular marker Introduction and Objectives
The giant tiger shrimp (Penaeus monodon) is one of the economically important species for aquaculture. Due to consistent exploitation of high broodstock, genetic improvement of P. monodon through selective breeding programs is needed for improvement of desired traits (e.g. fast growing, high degrees of reproductive maturation in captivity and/or disease resistance). To promote the efficiency of the genetic improvement process, molecular genetic markers should be used to assist the domestication and selection breeding of P. monodon1.
One of the efficient approaches to discover molecular markers linked with desired traits is single nucleotide polymorphism (SNP) analysis. Typically, differences in economically important traits of domesticated stocks in particular species can be used to identify the major loci contributing an interesting phenotype. Therefore, examination of SNP in growth/reproduction genes is an initial
step toward understanding molecular mechanisms of growth and/or reproductive maturation in P. monodon.
Farnesoic-O-methyltransferase (FAMeT) catalyzes the conversion of farnesoic acid (FA) to methy farnesoate (MF), which is a homolog to insect juvenile hormone (JH-III)2. MF is believed to regulate growth and reproduction in crustaceans. Recently, the full-length cDNA of P. monodon FAMeT (PmFAMeT) was successfully identified and characterized3. Expression analysis suggested its functionally important role in ovarian development of this economically important species3. In this study, polymorphism of the PmFAMeT gene segment was examined by polymerase chain reaction-single strand conformational polymorphism (PCR-SSCP). Association between SSCP genotypes of PmFAMeT and the body weight and gonadosomatic index (GSI) of 14-month-old domesticated shrimp were statistically analyzed.
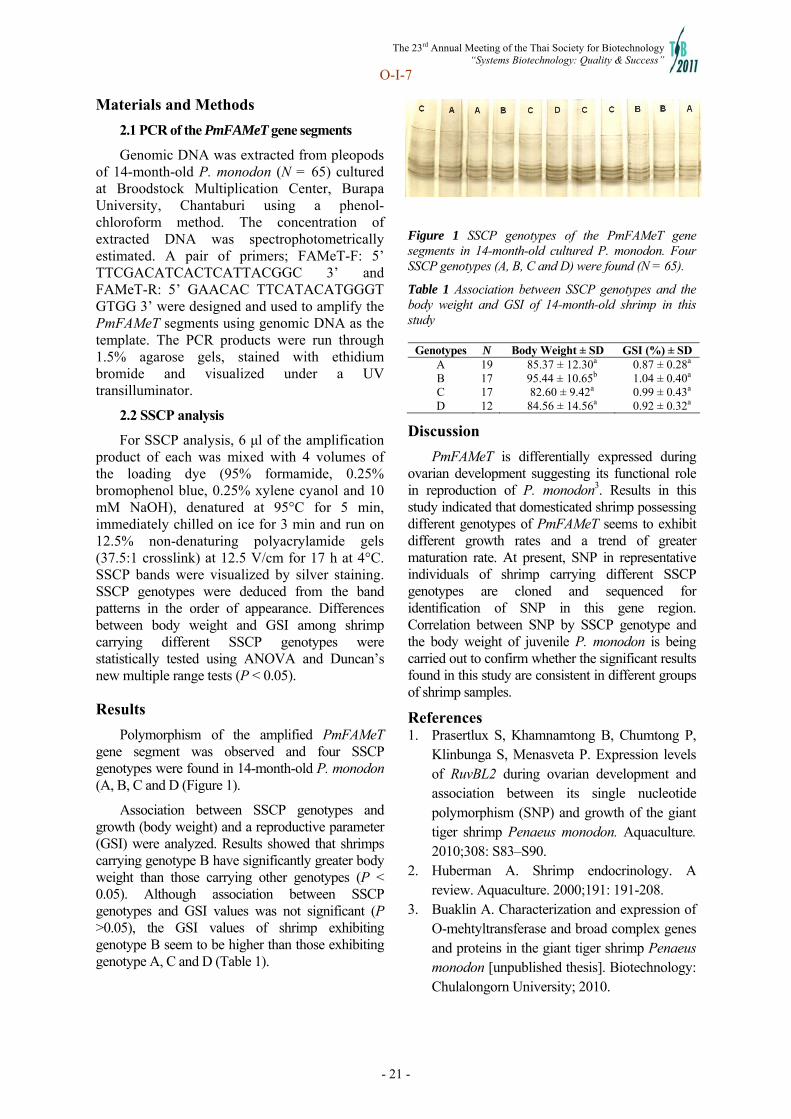
The 23rd Annual Meeting of the Thai Society for Biotechnology “Systems Biotechnology: Quality & Success”
O-I-7
- 21 -
Materials and Methods 2.1 PCR of the PmFAMeT gene segments
Genomic DNA was extracted from pleopods of 14-month-old P. monodon (N = 65) cultured at Broodstock Multiplication Center, Burapa University, Chantaburi using a phenol-chloroform method. The concentration of extracted DNA was spectrophotometrically estimated. A pair of primers; FAMeT-F: 5’ TTCGACATCACTCATTACGGC 3’ and FAMeT-R: 5’ GAACAC TTCATACATGGGT GTGG 3’ were designed and used to amplify the PmFAMeT segments using genomic DNA as the template. The PCR products were run through 1.5% agarose gels, stained with ethidium bromide and visualized under a UV transilluminator.
2.2 SSCP analysis
For SSCP analysis, 6 μl of the amplification product of each was mixed with 4 volumes of the loading dye (95% formamide, 0.25% bromophenol blue, 0.25% xylene cyanol and 10 mM NaOH), denatured at 95°C for 5 min, immediately chilled on ice for 3 min and run on 12.5% non-denaturing polyacrylamide gels (37.5:1 crosslink) at 12.5 V/cm for 17 h at 4°C. SSCP bands were visualized by silver staining. SSCP genotypes were deduced from the band patterns in the order of appearance. Differences between body weight and GSI among shrimp carrying different SSCP genotypes were statistically tested using ANOVA and Duncan’s new multiple range tests (P < 0.05).
Results
Polymorphism of the amplified PmFAMeT gene segment was observed and four SSCP genotypes were found in 14-month-old P. monodon (A, B, C and D (Figure 1).
Association between SSCP genotypes and growth (body weight) and a reproductive parameter (GSI) were analyzed. Results showed that shrimps carrying genotype B have significantly greater body weight than those carrying other genotypes (P < 0.05). Although association between SSCP genotypes and GSI values was not significant (P >0.05), the GSI values of shrimp exhibiting genotype B seem to be higher than those exhibiting genotype A, C and D (Table 1).
Figure 1 SSCP genotypes of the PmFAMeT gene segments in 14-month-old cultured P. monodon. Four SSCP genotypes (A, B, C and D) were found (N = 65).
Table 1 Association between SSCP genotypes and the body weight and GSI of 14-month-old shrimp in this study
Genotypes N Body Weight ± SD GSI (%) ± SD A 19 85.37 ± 12.30a 0.87 ± 0.28a
B 17 95.44 ± 10.65b 1.04 ± 0.40a
C 17 82.60 ± 9.42a 0.99 ± 0.43a
D 12 84.56 ± 14.56a 0.92 ± 0.32a
Discussion
PmFAMeT is differentially expressed during ovarian development suggesting its functional role in reproduction of P. monodon3. Results in this study indicated that domesticated shrimp possessing different genotypes of PmFAMeT seems to exhibit different growth rates and a trend of greater maturation rate. At present, SNP in representative individuals of shrimp carrying different SSCP genotypes are cloned and sequenced for identification of SNP in this gene region. Correlation between SNP by SSCP genotype and the body weight of juvenile P. monodon is being carried out to confirm whether the significant results found in this study are consistent in different groups of shrimp samples.
References 1. Prasertlux S, Khamnamtong B, Chumtong P,
Klinbunga S, Menasveta P. Expression levels of RuvBL2 during ovarian development and association between its single nucleotide polymorphism (SNP) and growth of the giant tiger shrimp Penaeus monodon. Aquaculture. 2010;308: S83–S90.
2. Huberman A. Shrimp endocrinology. A review. Aquaculture. 2000;191: 191-208.
3. Buaklin A. Characterization and expression of O-mehtyltransferase and broad complex genes and proteins in the giant tiger shrimp Penaeus monodon [unpublished thesis]. Biotechnology: Chulalongorn University; 2010.

The 23rd Annual Meeting of the Thai Society for Biotechnology “Systems Biotechnology: Quality & Success”
O-I-8
- 22 -
Molecular cloning and expression analysis of the asparaginyl tRNA synthetase gene in the giant tiger shrimp Penaeus monodon
Jintana Innuphat a, Kanchana Sittikhankaewb, Sirawut Klinbunga b,c, and Piamsak Menasveta c,d aProgram in Biotechnology, Faculty of Science, Chulalongkorn University, Bangkok 10330, Thailand bAquatic Molecular Genetics and Biotechnology Laboratory, Agricultural Biotechnology Research Unit, National Center for Genetic Engineering and Biotechnology (BIOTEC), National Science and Technology Development Agency (NSTDA), Thailand Science Park, 113 Paholyothin Road, Pathumthani 12120, Thailand cCenter of Excellence for Marine Biotechnology, Faculty of Science, Chulalongkorn University, Bangkok 10330, Thailand dDepartment of Marine Science, Faculty of Science, Chulalongkorn University, Bangkok 10330, Thailand Abstract
Aminoacyl-tRNA synthetases (AARSs) are essential components of protein synthesis that catalyze the attachment of amino acids to their cognate tRNAs and in some cases, perform additional roles in translational regulation, RNA splicing and tRNA proofreading. The full-length cDNA of asparaginyl-tRNA synthetase of the giant tiger shrimp, Penaeus monodon (PmAsnRS) was isolated by Rapid amplification of cDNA ends-polymerase chain reaction (RACE-PCR). It was 1855 bp in length containing an ORF of 1683 bp encoding a polypeptide of 560 amino acids. The closest sequence to PmAsnRS was asparaginyl-tRNA synthetase of Aedes aegypti (E-value = 0.0). The calculated isoelectric point (pI) and molecular weight of PmAsnRS were 6.00 and 64.06 kDa, respectively. The anti-codon binding domain (positions 139-219; E-value = 9.1e-15) and tRNA synthetase class II domain (positions 236-556; E-value = 3.7e-76) were found in the deduced PmAsnRS protein. Tissue distribution analysis indicated that PmAsnRS was abundantly expressed in ovaries and constitutively expressed in various tissues of P. monodon broodstock. Expression of PmAsnRS during ovarian development of wild P. monodon was examined by quantitative real-time PCR. The PmAsnRS mRNA was significantly increased in stage IV (mature) and V (post-spawning) ovaries of intact broodstock (P < 0.05). Eyestalk ablation resulted in a lower expression level of PmAsnRS in each stage of ovarian development compared to intact broodstock (P < 0.05). Keywords: Penaeus monodon, asparaginyl tRNA synthetase, real-time PCR, gene expression
Introduction and Objective
Reduced spawning potential and low degrees of maturation of the giant tiger shrimp (Penaeus monodon) in captivity crucially prohibit the development of effective domestication and selective breeding programs in this species.
Molecular mechanisms involving gonad development of P. monodon have long been of interest by aquaculture industries. Mechanisms controlling ovarian maturation of P. monodon at the molecular level are important and can be directly applied to the industry. In this study, the full-length cDNA of P. monodon asparaginyl-tRNA synthetase (PmAsnRS) was characterized. The expression patterns of PmAsnRS during ovarian development of intact and unilateral eyestalk-ablated P. monodon was examined. Materials and Methods 2.1 Specimens
Female broodstock were wild-caught from the Andaman Sea and acclimated under the farm conditions. Unilateral eyestalk ablation was carried out. Ovaries was dissected out from each shrimp and divided to stages I-IV according to the GSI (ovarian weight/body weight x 100) values. 2.2 RACE-PCR
5´RACE-PCR of PmAsnRS was carried out using a BD SMARTTM RACE cDNA Amplification Kit (BD Clontech). Nucleotide sequences obtained was assembled with the original EST and bioinformatically analyzed. 2.3 Tissue distribution analysis
Expression of PmAsnRS in various tissues of P. monodon were examined by RT-PCR (primers AARSs-F 5’GGACACGAACTCCA GGTAGATT-3′ and AARSs-R(5′TCATAA GGATTGAACGCAGCCG-3′). Elongation factor-1α (EF-1α, 500 bp) was included as the positive control.

The 23rd Annual Meeting of the Thai Society for Biotechnology “Systems Biotechnology: Quality & Success”
O-I-8
- 23 -
2.4 Quantitative real-time PCR
Standard curves representing 103–108 copies of PmAsnRS were constructed. Quantitative real-time PCR of PmAsnRS and EF-1 of each shrimp was examined (in duplicate). The relative expression level between shrimp possessing different stages of ovarian development were statistically tested using ANOVA followed by Duncan’s new multiple range test (P < 0.05). Results and Discussion
Knowledge of the molecular mechanisms and functional involvement of reproduction-related genes in ovarian development of P. monodon is necessary for better understanding of the reproductive maturation of P. monodon to resolve the major constraint of this economically important species in captivity.
The full-length cDNA of PmAsnRS was successfully isolated. It was 1855 bp in length containing an ORF of 1683 bp encoding a polypeptide of 560 amino acids. Its closest sequence was asparaginyl-tRNA synthetase of Aedes aegypti (E-value = 0.0). The calculated pI and MW of PmAsnRS were 6.00 and 64.06 kDa, respectively. The anti-codon binding domain (positions 139-219; E-value = 9.1e-15) and tRNA synthetase class II domain (positions 236-556; E-value = 3.7e-76) were found in the deduced PmAsnRS protein (Fig. 1).
Figure 1. Diagram illustrating the full-length cDNA of PmAsnRS. The anti-codon binding domain and tRNA synthetase class II domain were found in the decuced PmAsnRS protein.
Tissue distribution analysis indicated that PmAsnRS was abundantly expressed in ovaries and lower expression was observed in other tissues of P. monodon broodstock. This suggested that PmAsnRS plays an important role during ovarian development of P. monodon where rapid synthesis and accumulation of ovarian proteins are occurred.
Quantitative real-time PCR indicated that PmAsnRS mRNA was significantly increased in mature ovaries and after spawning in intact broodstock (P < 0.05).
Figure 2. Tissue distribution analysis of PmAsnRS in P. monodon broodstock. EF-1α was included as the control. Abbreviations; N = negative control, AG = antennal gland, EP = epicuticle, ES = eyestalk, GL = gills, HC = hemocytes, HE = heart, HP = hepatopancreas, IN = intestine, LO = lymphoid organs, OV = ovaries of broodstock, PL = pleopod, ST = stomach, TG = thoracic ganglia, OJ = juvenile ovaries and TT = testis. EF-1α was successfully amplified from the same template.
In eyestalk-ablated broodstock, a lower level
of PmAsnRS in each stage of ovarian development compared to that of intact broodstock was observed (P < 0.05). The information critically suggested that gonad inhibiting hormone (GIH) affects the expression level of PmAsnRS during ovarian development of P. monodon.
Figure 3. Relative expression levels of PmAsnRS in ovaries of 4-month-old juveniles (JN) and different stages of ovarian development (stages I-IV) of broodstock. PS, intact post-spawning broodstock. Nor = non-ablated shrimp; EA = unilateral eyestalk ablated shrimp. References 1. Grotli M, Cusack S, Leberman R. The
crystal structure of asparaginyl-tRNA synthetase from Thermus thermophilus and its complexes with ATP and asparaginyl-adenylate the mechanism of discrimination between asparagines and aspartic acid. Embo J. 1998;10: 2947-2960.
2. Khamnamtong B, Thumrungtanakit S, Klinbunga S, Aoki T, Hirono I, Menasveta P. Identification of sex-specific expression markers in the giant tiger shrimp (Penaeus monodon). J Biochem Mol Biol. 2006;39(1):37-45.
The 23rd Annual Meeting of the Thai Society for Biotechnology “Systems Biotechnology: Quality & Success”
O-II-4
- 24 -
Screening and characterization of antimicrobial peptide from bacteria Nuttida Teerawattanakijpakorna, b, Watanalai Panbangred a, b aDepartment of Biotechnology, Faculty of Science, Mahidol University, Rama VI Rd, Bangkok 10400, Thailand. bMahidol University-Osaka University Collaborative Research Center for Bioscience and Biotechnology (MU-OU:CRC), Faculty of Science, Mahidol University, Bangkok 10400, Thailand
Abstract Four out of 2096 bacterial strains which were isolated from Thai traditional fermented foods,
animal intestine and soils, produced antimicrobial peptides (AMPs) against Gram-negative bacteria. They were identified as Lactobacillus plantarum (NTB041), Escherichia coli (EcNT 37), Bacillus cereus (BcNT46) and Brevibacillus laterosporous (BbNT48) by 16S rRNA gene sequencing. B. laterosporus BbNT48 showed broad spectrum of antibacterial activities against indicator strains of both Gram positive (L.plantarum and Pediococcus pentosaceus) and Gram negative (E. coli K12 and Salmonella Typhimurium) bacteria. AMP from BbNT48 was purified by ammonium sulfate precipitation, 30 kDa and 10 kDa molecular weight cut off centrifugal device, ion exchange chromatography, and High performance liquid chromatography (HPLC). Inhibitory activity against S. Typhimurium and E. coli in Tricine SDS-PAGE gel after SDS removal was observed. A single band on SDS-PAGE was detected with a molecular mass about 5 kDa. The purified BbNT48 retained full activity after treatment at 100oC for 30 minutes. Keywords: antimicrobial peptide, bacteria, Brevibacillus spp. Introduction and Objective
Antimicrobial peptides or AMPs are small molecular weight proteins with broad antimicrobial activity against bacteria, viruses and fungi. AMPs are produced by several types of organisms including animals, plants and microorganisms. AMPs from bacteria are referred to as bacteriocins or bacteriocin-like inhibitory substances (BLIS) which are active against closely related species. AMPs are produced by many Gram-positive and Gram-negative bacteria, but there are more reports on AMPs produced by lactic acid bacteria (LAB) than those from other resources. Not only bacteriocin from Lactic acid bacteria, AMPs produced by Bacillus spp. are also interesting because different species of Bacillus produce a large number of AMPs. This study was aimed at screening bacteria which can produce broad spectrum AMPs against both of Gram-positive and Gram-negative bacteria.
Materials and Methods Bacteria were isolated from 47 Thai
traditional fermented food, 10 animal intestine and 3 soil samples. The antimicrobial activity of isolated strains was detected by inhibition of both Gram-negative and Gram positive indicator strains using overlaying technique. Indicator strains which are used for screening are Pediococcus pentosaceus and Lactobacillus plantarum (Gram-positive indicator strains), and Escherichia coli K12 and Salmonella Typhimurium (Gram-negative indicator strains).
2.1 Preparation of AMP The selected strain (1% inoculum) was
grown in 1000 ml of TSB medium at 37oC in a rotary shaker at 200 rpm for 36 hours. Cells were removed by centrifugation at 12,000 g for 10 min. The supernatant was filtered with 0.45 µM filter membrane and stored at 4° C until use. This preparation was designated as the cell free supernatant (CFS) fraction.
2.2 Preliminary study on physical and
biochemical characterization of the antimicrobial peptide
Heat stability. To analyze thermo-stability, CFS were exposed to different temperatures (50, 60, 70, 80, 90, 100 and 121oC) for 30 min, then tested for antimicrobial activity.
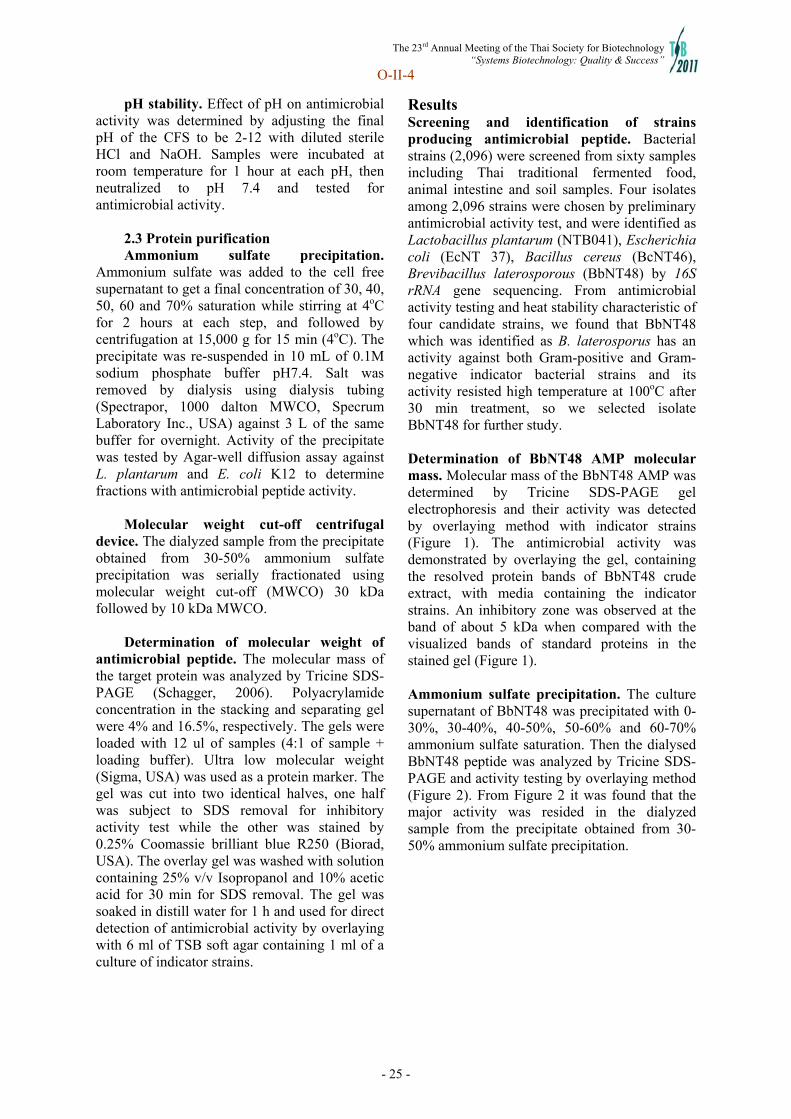
The 23rd Annual Meeting of the Thai Society for Biotechnology “Systems Biotechnology: Quality & Success”
O-II-4
- 25 -
pH stability. Effect of pH on antimicrobial activity was determined by adjusting the final pH of the CFS to be 2-12 with diluted sterile HCl and NaOH. Samples were incubated at room temperature for 1 hour at each pH, then neutralized to pH 7.4 and tested for antimicrobial activity.
2.3 Protein purification Ammonium sulfate precipitation.
Ammonium sulfate was added to the cell free supernatant to get a final concentration of 30, 40, 50, 60 and 70% saturation while stirring at 4oC for 2 hours at each step, and followed by centrifugation at 15,000 g for 15 min (4oC). The precipitate was re-suspended in 10 mL of 0.1M sodium phosphate buffer pH7.4. Salt was removed by dialysis using dialysis tubing (Spectrapor, 1000 dalton MWCO, Specrum Laboratory Inc., USA) against 3 L of the same buffer for overnight. Activity of the precipitate was tested by Agar-well diffusion assay against L. plantarum and E. coli K12 to determine fractions with antimicrobial peptide activity.
Molecular weight cut-off centrifugal
device. The dialyzed sample from the precipitate obtained from 30-50% ammonium sulfate precipitation was serially fractionated using molecular weight cut-off (MWCO) 30 kDa followed by 10 kDa MWCO.
Determination of molecular weight of
antimicrobial peptide. The molecular mass of the target protein was analyzed by Tricine SDS-PAGE (Schagger, 2006). Polyacrylamide concentration in the stacking and separating gel were 4% and 16.5%, respectively. The gels were loaded with 12 ul of samples (4:1 of sample + loading buffer). Ultra low molecular weight (Sigma, USA) was used as a protein marker. The gel was cut into two identical halves, one half was subject to SDS removal for inhibitory activity test while the other was stained by 0.25% Coomassie brilliant blue R250 (Biorad, USA). The overlay gel was washed with solution containing 25% v/v Isopropanol and 10% acetic acid for 30 min for SDS removal. The gel was soaked in distill water for 1 h and used for direct detection of antimicrobial activity by overlaying with 6 ml of TSB soft agar containing 1 ml of a culture of indicator strains.
Results Screening and identification of strains producing antimicrobial peptide. Bacterial strains (2,096) were screened from sixty samples including Thai traditional fermented food, animal intestine and soil samples. Four isolates among 2,096 strains were chosen by preliminary antimicrobial activity test, and were identified as Lactobacillus plantarum (NTB041), Escherichia coli (EcNT 37), Bacillus cereus (BcNT46), Brevibacillus laterosporous (BbNT48) by 16S rRNA gene sequencing. From antimicrobial activity testing and heat stability characteristic of four candidate strains, we found that BbNT48 which was identified as B. laterosporus has an activity against both Gram-positive and Gram-negative indicator bacterial strains and its activity resisted high temperature at 100oC after 30 min treatment, so we selected isolate BbNT48 for further study. Determination of BbNT48 AMP molecular mass. Molecular mass of the BbNT48 AMP was determined by Tricine SDS-PAGE gel electrophoresis and their activity was detected by overlaying method with indicator strains (Figure 1). The antimicrobial activity was demonstrated by overlaying the gel, containing the resolved protein bands of BbNT48 crude extract, with media containing the indicator strains. An inhibitory zone was observed at the band of about 5 kDa when compared with the visualized bands of standard proteins in the stained gel (Figure 1). Ammonium sulfate precipitation. The culture supernatant of BbNT48 was precipitated with 0-30%, 30-40%, 40-50%, 50-60% and 60-70% ammonium sulfate saturation. Then the dialysed BbNT48 peptide was analyzed by Tricine SDS-PAGE and activity testing by overlaying method (Figure 2). From Figure 2 it was found that the major activity was resided in the dialyzed sample from the precipitate obtained from 30-50% ammonium sulfate precipitation.

The 23rd Annual Meeting of the Thai Society for Biotechnology “Systems Biotechnology: Quality & Success”
O-II-4
- 26 -
(A) (B) Figure 1. (A) Coomassie blue stained gel of BbNT48 crude extract. Lane 1: molecular weight marker; lane 2: BbNT48 crude extract: (B) Inhibitory activity in gel of crude extract from BbNT48 against indicator strains; Lane 1: E. coli K12; lane 2: S. Typhimurium: lane 3: L. plantarum: Lane 4: P. pentosaceus.
(A) (B)
Figure 2. (A) Coomassie blue stained gel of the crude extract of BbNT48 precipitated with 0-30%, 30-40%, 40-50%, 50-60% and 60-70% ammonium sulfate. (B) Inhibitory activity in gel after SDS removal and overlaid with indicator strains Molecular weight cut-off centrifugal device. The dialyzed sample from the precipitate 30-50% ammonium sulfate was pooled and serially fractionated using molecular weight cut-off (MWCO) 30 kDa followed by 10 kDa MWCO. The major inhibitory activity was obtained in the filtrate passing through 30 kDa as well as filtrate passing through 10 kDa membrane, indicating the size of the peptide was smaller than 10 kDa. (data not shown). Discussion
AMPs have already been proposed as an alternative of the existing antibiotics for treatment and used as bio-preservative in food because it is inexpensive, effective and non-toxic to animals and humans (Cleveland et al., 2001). Bacillus species is a known producer of many antibiotic and antimicrobial compounds, such as sublancin 168 (Paik et al., 1998) and subtilosin
A (Shelburne et al., 2007). In summary, we have characterized an AMP produced by a B. laterosporus BbNT48 strain isolated from soil. Unlike some antimicrobial peptides from Bacillus spp. which exhibit a relatively narrow inhibitory spectrum (Abriouel et al., 2010), the antimicrobial peptide from BbNT48 presents a broad inhibitory spectrum covering Gram-positive and Gram-negative bacteria. It makes this antimicrobial peptide a potential candidate as antimicrobial agents. Nevertheless, more works are needed to be done for peptide characterization.
Acknowledgement This research was partially supported by the Center of Excellence for Agricultural Biotechnology, Science and Technology Postgraduate Education and Research Development Office, Commission on Higher Education, Ministry of Education (AG-BIO/PERDO-CHE). References 1. Abriouel, H., Franz, C.M.A.P., Omar, O.B.,
Galvez, A. (2010). Diversity and applications of Bacillus bacteriocins. FEMS Microbiol. Rev. 35, 201–232
2. Cleveland J, Montville TJ, Nes IF, Chikindas ML (2001). Bacteriocins: safe, natural antimicrobials for food preservation. Int. J. Food Microbiol. 71: 1-20.
3. Paik SH, Chakicherla A, Hansen JN (1998). Identification and characterization of the structural and transporter genes for, and the chemical and biological properties of, sublancin 168, a novel lantibiotic produced by Bacillus subtilis 168. J. Biol. Chem. 273: 23134-23142.
4. Schagger, H. (2006). Tricine–SDS-PAGE. Nature Protocols.1(1), 16-22
5. Shelburne CE, An FY, Dholpe V, Ramamoorthy A., Lopatin DE, Lantz MS (2007). The spectrum of antimicrobial activity of the bacteriocin subtilosin A. J. Antimicrob. 59: 297-300.
The 23rd Annual Meeting of the Thai Society for Biotechnology “Systems Biotechnology: Quality & Success”
O-II-5
- 27 -
Antimicrobial peptides against contaminating bacteria in fuel ethanol production
Pennapa Manitchotpisita, Kenneth M. Bischoffb, Neil P.J. Priceb, and Timothy D. Leathersb aBiochemistry Unit, Department of Medical Sciences, Faculty of Science, Rangsit University, Muangake, Lakhok, Patumthani 12000, Thailand bRenewable Product Technology Research Unit, National Center for Agricultural Utilization Research, ARS, USDA, Peoria, IL 61604, USA
Abstract
Lactic acid bacteria (LAB) are common contaminants of fuel ethanol production, and costly antibiotics such as virginiamycin and penicillin are often used in attempts to control bacterial infections. As an alternative approach, new microorganisms that inhibit LAB were isolated from various environmental sources in different parts of Thailand. Four different strains, ALT3A, ALT3B, ALT17, and MR1 were determined to have inhibitory effects on LAB growth. These strains were identified as isolates of Bacillus subtilis and B. cereus using 16S rRNA sequence analysis. Cell mass from colonies and agar samples from inhibition zones were analyzed by mass spectrometry. The chromatograms of the ALT strains showed some patterns similar to fusaricidin, a depsipeptide antibiotic, while those of MR1 appeared to show a new unknown small molecule. Protein extracts from ALT3A and MR1 were separated on SDS-PAGE which was then overlaid with LAB to produce a zymogram. Both strains produced inhibitory proteins of approximately 10 kDa, possibly representing bacteriocins. Interestingly, the antimicrobial agent from MR1 appears to be an intracellular peptide, while that from ALT3A is extracellular or membrane bound. Characterization of these small peptides and their coding genes will be very useful for further studies to develop novel inhibitors of bacterial contamination in fuel ethanol fermentation. Keywords: Lactic acid bacteria, antimicrobial peptide, antibacterial activity, bacterial contamination, ethanol production Introduction and Objective
Lactic acid bacteria (LAB), and particularly
Lactobacillus sp., are among the most common bacterial contaminants found in fuel ethanol fermentations (1), perhaps due to their fast growth rate, tolerance to alcohol and low pH, and ability to form biofilms. Contaminants can cause reduced ethanol yields and so-called “stuck” fermentations (2). Virginiamycin and penicillin are frequently used to prevent and treat contamination, but isolates with resistance to both antibiotics have been reported from dry-grind ethanol plants (3). New methods and approaches are needed to control bacterial contamination in fuel ethanol production. In this study, we screened new microbial isolates from Thailand for production of novel antimicrobial agents against LAB.
Materials and Methods
2.1 Screening and identification of LAB growth inhibited strains
Bacteria and fungi were grown on LB or PDA and the colonies were overlaid with 8 ml of molten agar containing 106 CFU/ml of either Lactobacillus fermentum 0315-1, L. brevis 0315-L1, L. mucosae 0315-2B, or L. amylovorus 0315-7B. Plates were incubated anaerobically at 37C. Inhibition was indicated by clear zones around the colonies. Isolates were identified by partial 16S rDNA sequence analysis (2). Colonial and cellular morphologies were consistent with these identifications.
2.2 MALDI-TOF MS analysis MALDI-TOF mass spectra were recorded
on a Bruker-Daltronic Omniflex instrument operating in reflectron mode using 2,5-dihydrobenzoic acid as the matrix.

The 23rd Annual Meeting of the Thai Society for Biotechnology “Systems Biotechnology: Quality & Success”
O-II-5
- 28 -
2.3 SDS-PAGE overlay Cell extracts, culture supernatants, and non-
disrupted cells were applied to 12% SDS-PAGE gels in duplicate. One gel was stained for protein and the other was washed and overlaid with 8 ml of molten MRS top agar containing 106 CFU/ml of L. fermentum strain 0315-1. This dish was incubated anaerobically overnight at 37C.
Results and Discussion
Among 22 isolates, ALT3A, ALT3B, ALT17, and MR1 were strongly inhibitory to most LAB tested (Fig. 1 and Table 1). They were identified as Bacillus spp. using 16S rRNA sequence analysis (Table 1).
Figure 1. Production of antimicrobial activity. Colonies of the indicated Bacillus strain were overlaid with agar inoculated with L. fermentum. Production of antimicrobial is indicated by a clear zone around the colony.
MALDI-TOF MS analysis indicated that secreted materials within the clear zone of the ALT strains were similar to fusaricidin, while those from MR1 represented an unknown molecule (data not shown). SDS-PAGE overlays showed inhibitory proteins of approximately 10 kD, possibly representing bacteriocins (Fig. 2). Moreover, activity tests of supernatants and methanol extracted cells indicated that the antimicrobial agents from MR1 and ALT3A are intracellular and extracellular or membrane bound peptides, respectively (data not shown). Further studies of these small peptides and their coding genes characterization may lead to the development of novel inhibitors to combat bacterial contamination in fuel ethanol fermentations.
Table 1. Strain specificity of Bacillus antibacterial peptides. Zone Diameter (mm)b
Strain IDa L. fermentum
L. mucosae
L. amylovorus
L. brevis
ALT3A B. subtilis 21 27 +/- 21 ALT3B B. subtilis 25 28 +/- 24 ALT17 B. cereus 16 17 15 18 MR1 B. cereus 17 17 14 17 aStrain identification based on sequencing of 16S ribosomal RNA. ALT3A was 99% identical with DQ057584.1; ALT3B 99% with CP002905.1; ALT17 96% with JN631037.1;MR1 99% with HQ457016.1. bDiameter of clear zone surrounding colonies overlaid with agar containing the indicated species of Lactobacillus. “+/-” indicates that Lactobacillus growth was distorted, but a zone of clearing with defined edges was not observed.
Figure 2. Analysis of antimicrobial peptide on (A) 12% SDS-PAGE and (B) L. fermentum overlaid gel. Lane 1-3 represent supernatant, cell extracts, and nondisrupted cells of MR1, respectively. Lane 4-6 represent supernatant, cell extracts, and nondisrupted cells of ALT3A, respectively. M= Precision Plus Protein All Blue Standards (Bio-Rad, Hercules, CA, USA). References 1. Skinner, K.A., Leathers, T.D. Bacterial
contaminants of fuel ethanol production. J. Ind. Microbiol. Biotechnol. 2004; 31: 401-408.
2. Bischoff K.M., Liu S., Leathers T.D., Worthington R.E., Rich J.O. Modeling bacterial contamination of fuel ethanol fermentation. Biotechnol. Bioeng. 2009; 103(1): 117-122.
3. Bischoff K.M., Skinner-Nemec K.A., Leathers T.D. Antimicrobial susceptibility of Lactobacillus species isolated from commercial ethanol plants. J. Ind. Microbiol. Biotechnol. 2007; 34: 739–744.

The 23rd Annual Meeting of the Thai Society for Biotechnology “Systems Biotechnology: Quality & Success”
O-II-7
- 29 -
Effect of substrate dilution and nutrient limitation on E.coli growth using Chromocult Coliform Agar
Wipavadee Sangadkit, Orana Rattanabumrung, and Aluck Thipayarat Department of Food Engineering, Faculty of Engineering, King Mongkut’s University of Technology Thonburi, Bangkok 10140, Thailand
Abstract This paper explored the cost reduction strategy to further dilute the CCA strength and observe
the effect of nutrient limitation on E. coli growth. Different CCA dilutions (i.e., 30, 40, 50, 60, 70, 80, 90% of CCA recipe and original CCA) were prepared to cultivate E. coli inoculum (approximately 102 CFU/ml). Colony numbers and colony color were investigated. All cultures were incubated at the same condition (35±2°C). The effect of CCA dilutions on colony count and blue pigment development were only observed when the concentration was diluted lower than 30% of the manufacturer-recommended strength. At original CCA, colony was spotted after 8 hr of incubation and the dark blue color attribute was developed after 12 hr. Not only lower CCA dilution affected the final colony count, but also retarded chromatic progression of E. coli colony on CCA. Keywords: Chromocult® Coliform Agar, E.coli, enumeration, spread plate, nutrient. Introduction and Objective
Total E. coli bacteria count is one of the key practical indicators and control limits to determine hygienic quality and food production sanitation during a production run. The detection of E. coli and total coliform (TC) in foods usually indicates poor hygienic practice in handling and production operations, inadequate storage and post-process contamination [1]. The industry commonly uses Chromocult®Coliform Agar (CCA, Merck, Germany) to perform coliforms and E. coli detection and enumeration since it helps simplify the laborious and complex protocol of MPN. However, Chromocult® Coliform Agar, most standard protocols suggest using pour plate to carry out the detection. The restriction of oxygen transfer slows down cell growth and colony expansion; thus, the protocol requires 24- to 48-h incubation at 35 ºC which is using the longer detection [2]. For routine analysis of foods, time and cost of analysis is obviously very important particularly in emergency situations to provide prompt and critical information on the possibility of pathogen contamination in raw materials and finished products. The purpose of this work was to demonstrate an alternative solution to replacement of the commercial methods and provide E. coli evaluation with the same accuracy but better throughput for less operating cost for industrial application.
Materials and Methods Cell Culture Preparation : E. coli culture were prepared in TSB and grown in shake tubes to reach 109 CFU/ml. Serial dilution was done for achieving the desired initial cell concentration at 102-105 CFU/ml. Nutrient Optimization Experiment : CCA was prepared at 10, 20, 30, 40, 50, 60, 70, 80 and 90% of the manufacturer-recommended concentration for 5 ml cultivation volume. The modified CCA was utilized to form solid agar plates using a mini Petri dish format (15x60mm Petri dishes). Inoculum at 20 L was transferred onto the pre-fabricated plates. A sterile glass bead was applied to disperse the sample until the agar surface was dried out. The growing colonies were incubated at 352 C. The color and characteristics of E. coli colonies was observed by using a reflected light microscope equipped with a 1.3 mega pixel camera.

The 23rd Annual Meeting of the Thai Society for Biotechnology “Systems Biotechnology: Quality & Success”
O-II-7
- 30 -
Time (hr)
0 10 20 30 40 50
Co
lor
chan
ge
(del
ta b
lue)
0
20
40
60
80
10% CCA recipe20% CCA recipe30% CCA recipe40% CCA recipe50% CCA recipe60% CCA recipe70% CCA recipe80% CCA recipe90% CCA recipeTypical CCA
Results and Discussion Effect of CCA concentrations on E. coli count
Dilution of CCA concentration produced a profound effects on E. coli detection. The colony count result showed significantly less colony count was obtained when the concentration of CCA went beyond 30% of the original recipe (Table 1). At lower CAA concentraions, E. coli growth was restricted as the result of the combination of limited chromogenic substrate and nutrient availabilities [3]. Also, the key substrates (salmon-GAL and X-glucuronide) for chromogenic reaction was diluted as the result of CCA serial dilution. Table 1. Colony count on culture plates using different concentrations of CCA comparing to the original conc.
CCA dilution
E. coli count (log CFU/ ml)
CCA dilution
E. coli count log CFU/ ml)
10 % 20 % 30 % 40 % 50 %
9.110.04a 9.220.04b 9.260.03c 9.290.03d 9.280.02d
60 % 70 % 80 % 90 %
Original conc.
9.300.01d 9.290.02d 9.310.01d 9.300.03d 9.300.01d
Different subscripts in the same column mean that the values are significantly different at 95% confidential level. Effect of CCA concentrations on E. coli color
In addition to the E. coli count, the captured image of E. coli colonies displayed the subtle effect of nutrient and indicator restrictions (Figure 1). Noticeably, the size and purplish E. coli colonies was gradually changed as a result of the CCA dilution. At lower dilutions, the images of the E. coli colonies were very faint affecting colony numbers and the distinction of colony itself. For colony count purposes, the CCA preparation according to manufacturer’s recommendation was able to reduce to 60-70% without compromising the colony detectivity by human vistualization. This result was implied that the key substrate components in the typical CCA media was present in excess for routine E. coli growth [4].
10% 20% 30% 40% 50%
60% 70% 80% 90% Typical conc. Figure 1. Digitized images of E. coli colony from pure culture after 12 hr of incubation at 352C.
Further image analysis revealed that with the application of digital microscope and proper magnification power one could reduce the concentration of CCA to only 40% of manufacturer’s recommendation (Figure 2). The tracking of the RGB color attributes as a function of culturing time indicated that the blue color attributes developed from beta -glucuronidase activity only differed when the CCA concentration went below 40%. The use of the developed digital microscope was able to extent the dilution further and minimize the concentration of the CCA medium. Figure 2. Profiles of color change (delta blue) of E. coli colonies as a result of varying CCA concentrations. References 1. Venkateswaran K, Murakoshi A, Satake M.
Comparision of commercially available kits with standard methods for the detection of coliforms and Escherichia coli in foods. Applied and Environment Microbiology. 1996; 62(7):2236–2243.
2. Suwansonthichai S, Rengpipat R. Enumeration of coliforms and Escherichia coli in frozen black tiger shrimp penaeus monodon by conventional and rapid methods. International Journal of Food Microbiology. 2003;81:113–121.
3. Turner K.M., Restaino L. and Frampton E.W.
4. Efficacy of Chromocult coliform agar for coliform and Escherichia coli detection in foods. Journal of Food Protection. 2000;63:539–541.
5. Bredie WLP, de Boer E, Anderson–Baird– Parker. Petrifilm E. coli and Fluorocult ECD method for enumeration of Escherichia coli in foods of animal origin. J Food Microbiol. 1992;161:197– 208.
The 23rd Annual Meeting of the Thai Society for Biotechnology “Systems Biotechnology: Quality & Success”
O-II-8
- 31 -
Visual improvement of colony detectability for high-throughput total plate count protocol
Orana Rattanabumrung, Wipavadee Sangadkit, Pattarin Supanivatin and Aluck Thipayarat Department of Food Engineering, Faculty of Engineering, King Mongkut’s University of Technology Thonburi, Bangkok, 10140, Thailand
Abstract
This paper aimed to improve the colony detection and expedite the colony count process for food industrial applications. A proposed protocol involved use of a low-cost digital microscope to transform colony image to a digital format. The background color of the TPC medium was adjusted by food-grade dyes (i.e., green, red and yellow dye pigments). Sample inoculums were introduced on the agar plates using the spread plate technique. Colony images were collected and compared with standard spread plate method. A digitized detection protocol was able to eliminate waiting period to obtain adequate colony size and accommodate human visual detection, hence, reduced the incubation time from 24 to only 8 hr. Since colony pictures were taken for colony count, this proposed protocol was able to be digitally archived for future reference. The result showed very consistent and good accuracy of colony counts in all treatments. Different dyeing treatment yielded statistically the same colony counts.
Keywords: total plate count, digital image enumeration, contrast improvement, spread plate technique
Introduction and Objective
Long incubation and complex procedure of the conventional total plate count hinders the improvement of gross productivity and products delivery of many local Thai food manufacturers. Colony count using human visualization was proven less effective and proposed to be replaced by low-cost digital image enumeration. In order to expedite microbial cell count for industrial application, a prototype of a digital microscope was constructed to monitor the growth of bacteria colonies.
In this paper, different background colors of the medium were experimented to provide the optimal contrast and facilitate colony detection in the earlier growth phase. Colony growth and numbers were observed using the prototype. Prior studies have shown in other systems that the integration of image analysis to process the colony enumeration was able to reduce the incubation time to only 8 hours [1, 2].
The objective of this work was to improve the contrast between medium and colony colors to enhance the detecting resolution of the E. coli colonies and expedite the industrial cell enumeration using a digital image analysis system.
Materials and Methods
2.1 Culture preparation and cultivation Frozen stock of E. coli was recovered in
100 ml of tryptic soy broth (TSB) for 8 h. at 37oC, 200 rpm to reach stationary growth phase. Cell pellet was re-suspended with 0.85% NaCl solution. E.coli suspension was serially dilutes to receive a desirable initial cell number at 102 cfu/ml.
500 ml of PCA mixture were mixed with 6.25 ml of different dye pigments (i.e., green, red and yellow colors). The PCA solution was autoclaved at 121oC for 15 min and formed culture plates for E.coli cultivation. The incubation was maintained at 37oC for 24 h. The size and characteristic of E. coli colonies was observed using the prototype system of image analysis.
2.2 Colony image analysis The E. coli colony image was digitized
every hour using a reflected light microscope equipped with a 1.3 megapixel camera in Fig. 1. A constructed prototype of digital image analysis system was performed to evaluate the colony count. The visual improvement of colony
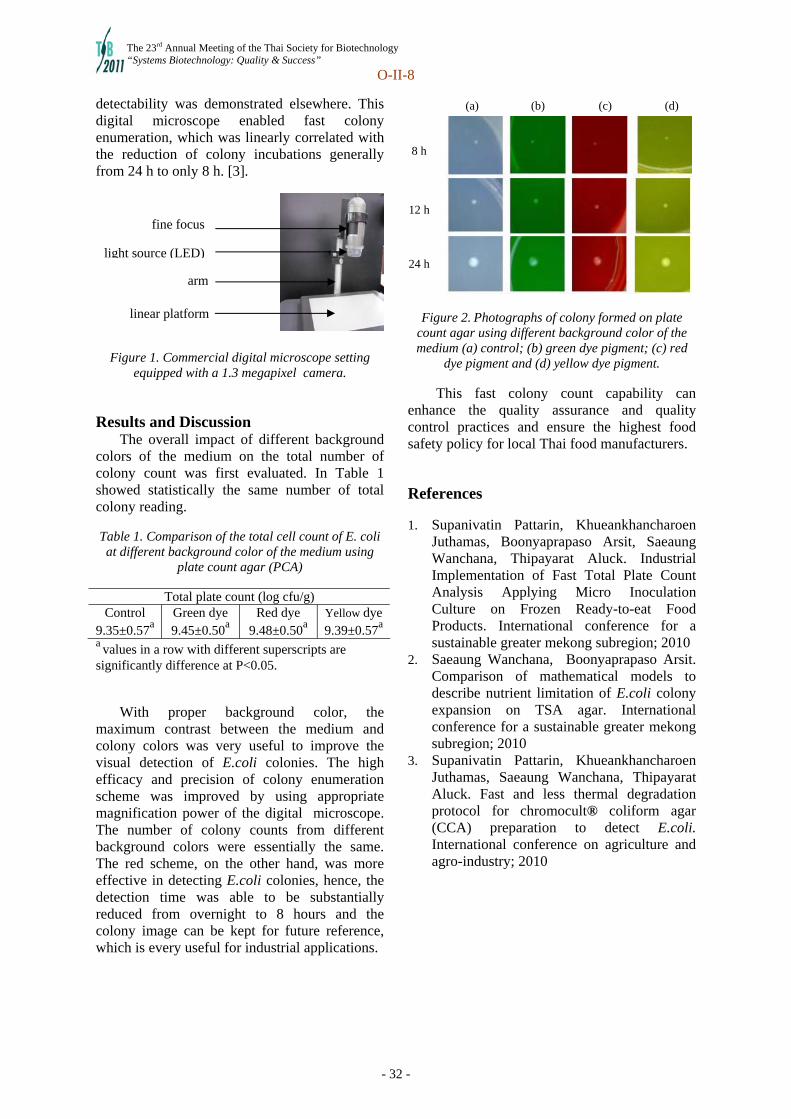
The 23rd Annual Meeting of the Thai Society for Biotechnology “Systems Biotechnology: Quality & Success”
O-II-8
- 32 -
detectability was demonstrated elsewhere. This digital microscope enabled fast colony enumeration, which was linearly correlated with the reduction of colony incubations generally from 24 h to only 8 h. [3].
Figure 1. Commercial digital microscope setting equipped with a 1.3 megapixel camera.
Results and Discussion
The overall impact of different background colors of the medium on the total number of colony count was first evaluated. In Table 1 showed statistically the same number of total colony reading. Table 1. Comparison of the total cell count of E. coli at different background color of the medium using
plate count agar (PCA)
Total plate count (log cfu/g) Control Green dye Red dye Yellow dye
9.35±0.57a 9.45±0.50a 9.48±0.50a 9.39±0.57a a values in a row with different superscripts are significantly difference at P<0.05.
With proper background color, the
maximum contrast between the medium and colony colors was very useful to improve the visual detection of E.coli colonies. The high efficacy and precision of colony enumeration scheme was improved by using appropriate magnification power of the digital microscope. The number of colony counts from different background colors were essentially the same. The red scheme, on the other hand, was more effective in detecting E.coli colonies, hence, the detection time was able to be substantially reduced from overnight to 8 hours and the colony image can be kept for future reference, which is every useful for industrial applications.
(a) (b) (c) (d)
8 h
12 h
24 h
Figure 2. Photographs of colony formed on plate count agar using different background color of the medium (a) control; (b) green dye pigment; (c) red
dye pigment and (d) yellow dye pigment.
This fast colony count capability can enhance the quality assurance and quality control practices and ensure the highest food safety policy for local Thai food manufacturers.
References 1. Supanivatin Pattarin, Khueankhancharoen
Juthamas, Boonyaprapaso Arsit, Saeaung Wanchana, Thipayarat Aluck. Industrial Implementation of Fast Total Plate Count Analysis Applying Micro Inoculation Culture on Frozen Ready-to-eat Food Products. International conference for a sustainable greater mekong subregion; 2010
2. Saeaung Wanchana, Boonyaprapaso Arsit. Comparison of mathematical models to describe nutrient limitation of E.coli colony expansion on TSA agar. International conference for a sustainable greater mekong subregion; 2010
3. Supanivatin Pattarin, Khueankhancharoen Juthamas, Saeaung Wanchana, Thipayarat Aluck. Fast and less thermal degradation protocol for chromocult® coliform agar (CCA) preparation to detect E.coli. International conference on agriculture and agro-industry; 2010
arm
linear platform
light source (LED)
fine focus
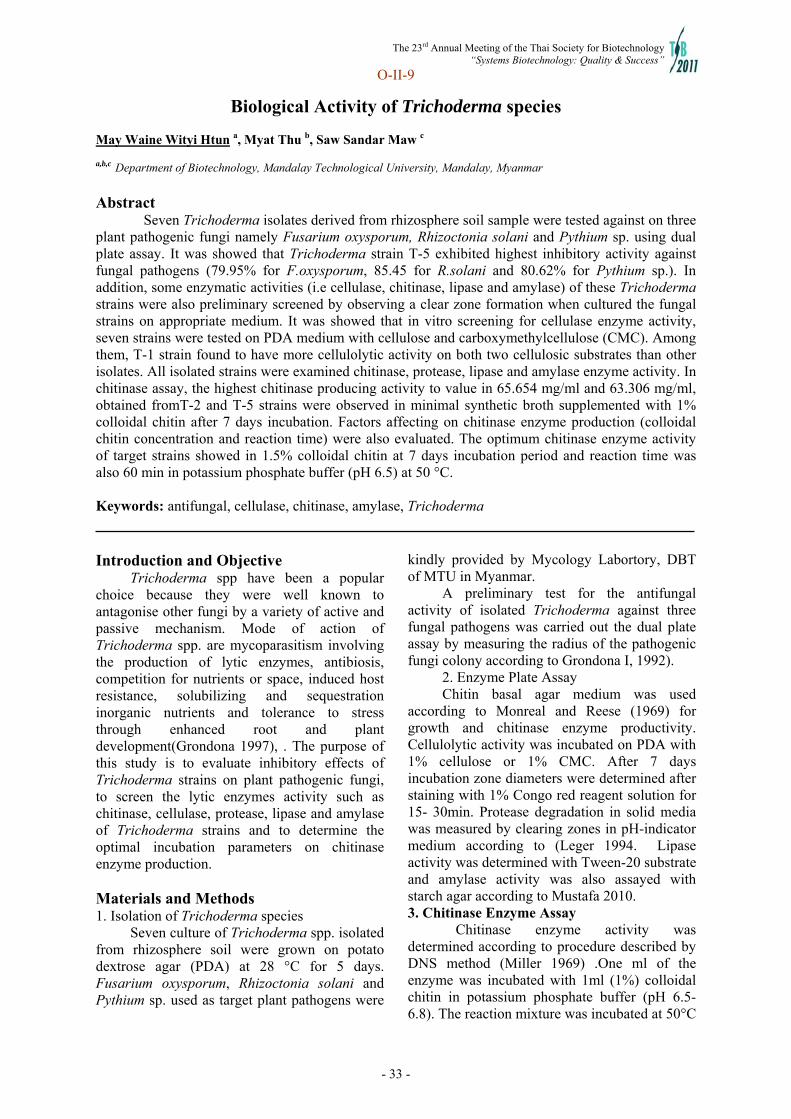
The 23rd Annual Meeting of the Thai Society for Biotechnology “Systems Biotechnology: Quality & Success”
O-II-9
- 33 -
Biological Activity of Trichoderma species May Waine Wityi Htun a, Myat Thu b, Saw Sandar Maw c
a,b,c Department of Biotechnology, Mandalay Technological University, Mandalay, Myanmar
Abstract
Seven Trichoderma isolates derived from rhizosphere soil sample were tested against on three plant pathogenic fungi namely Fusarium oxysporum, Rhizoctonia solani and Pythium sp. using dual plate assay. It was showed that Trichoderma strain T-5 exhibited highest inhibitory activity against fungal pathogens (79.95% for F.oxysporum, 85.45 for R.solani and 80.62% for Pythium sp.). In addition, some enzymatic activities (i.e cellulase, chitinase, lipase and amylase) of these Trichoderma strains were also preliminary screened by observing a clear zone formation when cultured the fungal strains on appropriate medium. It was showed that in vitro screening for cellulase enzyme activity, seven strains were tested on PDA medium with cellulose and carboxymethylcellulose (CMC). Among them, T-1 strain found to have more cellulolytic activity on both two cellulosic substrates than other isolates. All isolated strains were examined chitinase, protease, lipase and amylase enzyme activity. In chitinase assay, the highest chitinase producing activity to value in 65.654 mg/ml and 63.306 mg/ml, obtained fromT-2 and T-5 strains were observed in minimal synthetic broth supplemented with 1% colloidal chitin after 7 days incubation. Factors affecting on chitinase enzyme production (colloidal chitin concentration and reaction time) were also evaluated. The optimum chitinase enzyme activity of target strains showed in 1.5% colloidal chitin at 7 days incubation period and reaction time was also 60 min in potassium phosphate buffer (pH 6.5) at 50 °C. Keywords: antifungal, cellulase, chitinase, amylase, Trichoderma Introduction and Objective
Trichoderma spp have been a popular choice because they were well known to antagonise other fungi by a variety of active and passive mechanism. Mode of action of Trichoderma spp. are mycoparasitism involving the production of lytic enzymes, antibiosis, competition for nutrients or space, induced host resistance, solubilizing and sequestration inorganic nutrients and tolerance to stress through enhanced root and plant development(Grondona 1997), . The purpose of this study is to evaluate inhibitory effects of Trichoderma strains on plant pathogenic fungi, to screen the lytic enzymes activity such as chitinase, cellulase, protease, lipase and amylase of Trichoderma strains and to determine the optimal incubation parameters on chitinase enzyme production.
Materials and Methods 1. Isolation of Trichoderma species
Seven culture of Trichoderma spp. isolated from rhizosphere soil were grown on potato dextrose agar (PDA) at 28 °C for 5 days. Fusarium oxysporum, Rhizoctonia solani and Pythium sp. used as target plant pathogens were
kindly provided by Mycology Labortory, DBT of MTU in Myanmar.
A preliminary test for the antifungal activity of isolated Trichoderma against three fungal pathogens was carried out the dual plate assay by measuring the radius of the pathogenic fungi colony according to Grondona I, 1992).
2. Enzyme Plate Assay Chitin basal agar medium was used
according to Monreal and Reese (1969) for growth and chitinase enzyme productivity. Cellulolytic activity was incubated on PDA with 1% cellulose or 1% CMC. After 7 days incubation zone diameters were determined after staining with 1% Congo red reagent solution for 15- 30min. Protease degradation in solid media was measured by clearing zones in pH-indicator medium according to (Leger 1994. Lipase activity was determined with Tween-20 substrate and amylase activity was also assayed with starch agar according to Mustafa 2010. 3. Chitinase Enzyme Assay
Chitinase enzyme activity was determined according to procedure described by DNS method (Miller 1969) .One ml of the enzyme was incubated with 1ml (1%) colloidal chitin in potassium phosphate buffer (pH 6.5-6.8). The reaction mixture was incubated at 50°C
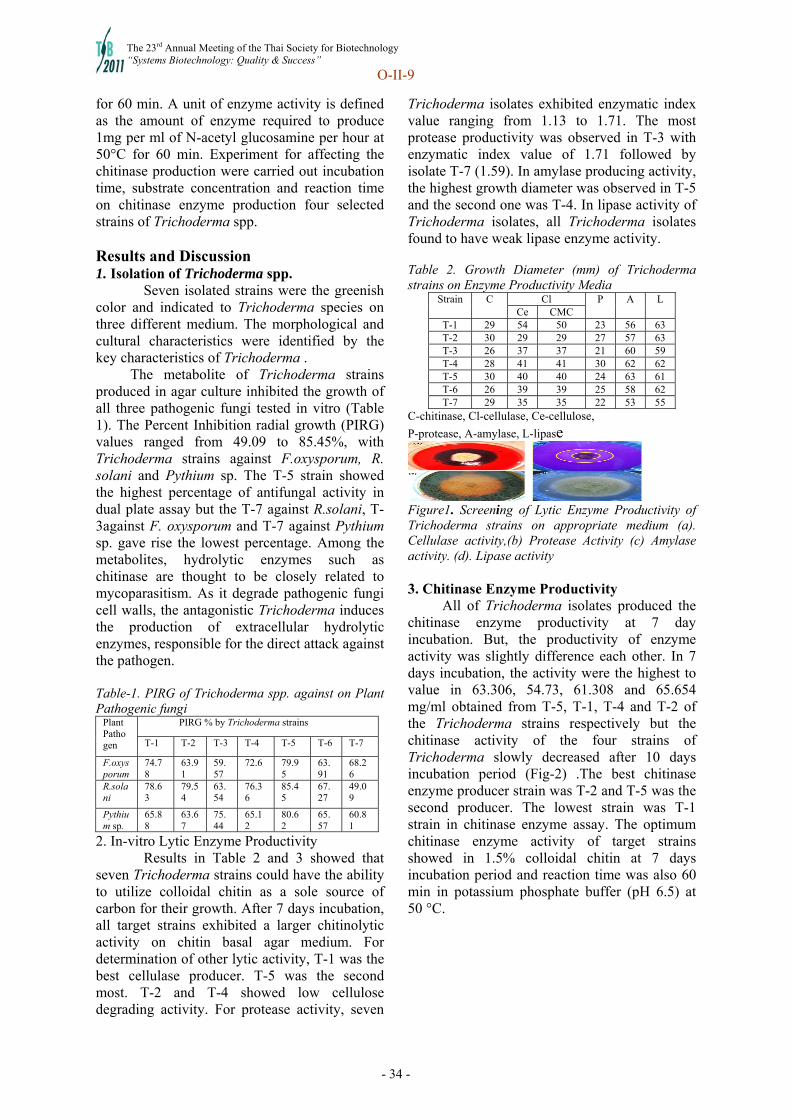
The 23rd Annual Meeting of the Thai Society for Biotechnology “Systems Biotechnology: Quality & Success”
O-II-9
- 34 -
for 60 min. A unit of enzyme activity is defined as the amount of enzyme required to produce 1mg per ml of N-acetyl glucosamine per hour at 50°C for 60 min. Experiment for affecting the chitinase production were carried out incubation time, substrate concentration and reaction time on chitinase enzyme production four selected strains of Trichoderma spp.
Results and Discussion 1. Isolation of Trichoderma spp.
Seven isolated strains were the greenish color and indicated to Trichoderma species on three different medium. The morphological and cultural characteristics were identified by the key characteristics of Trichoderma .
The metabolite of Trichoderma strains produced in agar culture inhibited the growth of all three pathogenic fungi tested in vitro (Table 1). The Percent Inhibition radial growth (PIRG) values ranged from 49.09 to 85.45%, with Trichoderma strains against F.oxysporum, R. solani and Pythium sp. The T-5 strain showed the highest percentage of antifungal activity in dual plate assay but the T-7 against R.solani, T-3against F. oxysporum and T-7 against Pythium sp. gave rise the lowest percentage. Among the metabolites, hydrolytic enzymes such as chitinase are thought to be closely related to mycoparasitism. As it degrade pathogenic fungi cell walls, the antagonistic Trichoderma induces the production of extracellular hydrolytic enzymes, responsible for the direct attack against the pathogen.
Table-1. PIRG of Trichoderma spp. against on Plant Pathogenic fungi
PIRG % by Trichoderma strains Plant Pathogen T-1 T-2 T-3 T-4 T-5 T-6 T-7
F.oxysporum
74.78
63.91
59.57
72.6 79.95
63.91
68.26
R.solani
78.63
79.54
63.54
76.36
85.45
67.27
49.09
Pythium sp.
65.88
63.67
75.44
65.12
80.62
65.57
60.81
2. In-vitro Lytic Enzyme Productivity Results in Table 2 and 3 showed that seven Trichoderma strains could have the ability to utilize colloidal chitin as a sole source of carbon for their growth. After 7 days incubation, all target strains exhibited a larger chitinolytic activity on chitin basal agar medium. For determination of other lytic activity, T-1 was the best cellulase producer. T-5 was the second most. T-2 and T-4 showed low cellulose degrading activity. For protease activity, seven
Trichoderma isolates exhibited enzymatic index value ranging from 1.13 to 1.71. The most protease productivity was observed in T-3 with enzymatic index value of 1.71 followed by isolate T-7 (1.59). In amylase producing activity, the highest growth diameter was observed in T-5 and the second one was T-4. In lipase activity of Trichoderma isolates, all Trichoderma isolates found to have weak lipase enzyme activity. Table 2. Growth Diameter (mm) of Trichoderma strains on Enzyme Productivity Media
Cl Strain C Ce CMC
P A L
T-1 29 54 50 23 56 63 T-2 30 29 29 27 57 63 T-3 26 37 37 21 60 59 T-4 28 41 41 30 62 62 T-5 30 40 40 24 63 61 T-6 26 39 39 25 58 62 T-7 29 35 35 22 53 55
C-chitinase, Cl-cellulase, Ce-cellulose,
P-protease, A-amylase, L-lipase
Figure1. Screening of Lytic Enzyme Productivity of Trichoderma strains on appropriate medium (a). Cellulase activity,(b) Protease Activity (c) Amylase activity. (d). Lipase activity 3. Chitinase Enzyme Productivity
All of Trichoderma isolates produced the chitinase enzyme productivity at 7 day incubation. But, the productivity of enzyme activity was slightly difference each other. In 7 days incubation, the activity were the highest to value in 63.306, 54.73, 61.308 and 65.654 mg/ml obtained from T-5, T-1, T-4 and T-2 of the Trichoderma strains respectively but the chitinase activity of the four strains of Trichoderma slowly decreased after 10 days incubation period (Fig-2) .The best chitinase enzyme producer strain was T-2 and T-5 was the second producer. The lowest strain was T-1 strain in chitinase enzyme assay. The optimum chitinase enzyme activity of target strains showed in 1.5% colloidal chitin at 7 days incubation period and reaction time was also 60 min in potassium phosphate buffer (pH 6.5) at 50 °C.
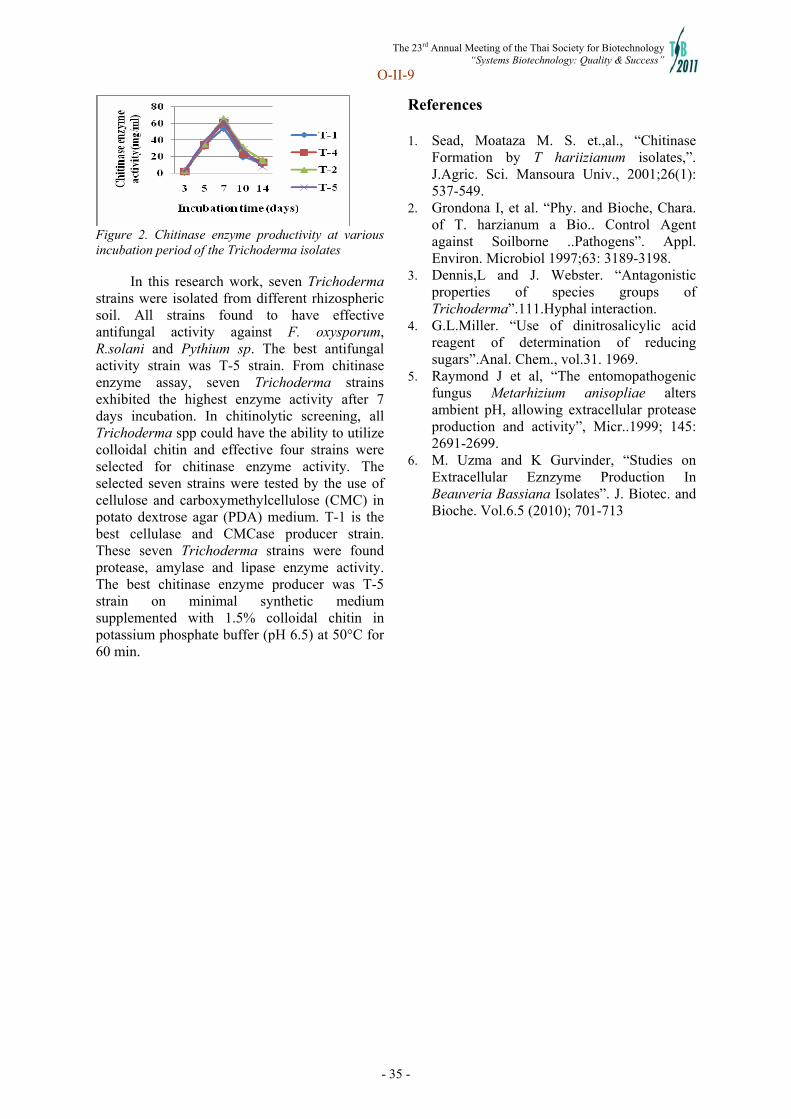
The 23rd Annual Meeting of the Thai Society for Biotechnology “Systems Biotechnology: Quality & Success”
O-II-9
- 35 -
Figure 2. Chitinase enzyme productivity at various incubation period of the Trichoderma isolates
In this research work, seven Trichoderma
strains were isolated from different rhizospheric soil. All strains found to have effective antifungal activity against F. oxysporum, R.solani and Pythium sp. The best antifungal activity strain was T-5 strain. From chitinase enzyme assay, seven Trichoderma strains exhibited the highest enzyme activity after 7 days incubation. In chitinolytic screening, all Trichoderma spp could have the ability to utilize colloidal chitin and effective four strains were selected for chitinase enzyme activity. The selected seven strains were tested by the use of cellulose and carboxymethylcellulose (CMC) in potato dextrose agar (PDA) medium. T-1 is the best cellulase and CMCase producer strain. These seven Trichoderma strains were found protease, amylase and lipase enzyme activity. The best chitinase enzyme producer was T-5 strain on minimal synthetic medium supplemented with 1.5% colloidal chitin in potassium phosphate buffer (pH 6.5) at 50°C for 60 min.
References 1. Sead, Moataza M. S. et.,al., “Chitinase
Formation by T hariizianum isolates,”. J.Agric. Sci. Mansoura Univ., 2001;26(1): 537-549.
2. Grondona I, et al. “Phy. and Bioche, Chara. of T. harzianum a Bio.. Control Agent against Soilborne ..Pathogens”. Appl. Environ. Microbiol 1997;63: 3189-3198.
3. Dennis,L and J. Webster. “Antagonistic properties of species groups of Trichoderma”.111.Hyphal interaction.
4. G.L.Miller. “Use of dinitrosalicylic acid reagent of determination of reducing sugars”.Anal. Chem., vol.31. 1969.
5. Raymond J et al, “The entomopathogenic fungus Metarhizium anisopliae alters ambient pH, allowing extracellular protease production and activity”, Micr..1999; 145: 2691-2699.
6. M. Uzma and K Gurvinder, “Studies on Extracellular Eznzyme Production In Beauveria Bassiana Isolates”. J. Biotec. and Bioche. Vol.6.5 (2010); 701-713

The 23rd Annual Meeting of the Thai Society for Biotechnology “Systems Biotechnology: Quality & Success”
O-II-12
- 36 -
New transcriptional regulator associated with adaptive stress responses in the yeast Saccharomyces cerevisiae
Chalinee Tangsombatvichita, Nitnipa Soontornguna, Khanok Ratanakhanokchaia
aBiochemical Technology, School of Bioresources and Technology, King Mongkut’s University of Technology Thonburi, 49 Soi Tienthalay 25 Bang Khuntien-Chaythalay Road, Thakham, Bang Khuntien, Bangkok 10150, Thailand
Abstract
Saccharomyces cerevisiae is important industrial yeast widely used in alcoholic fermentation and bioethanol. During the past decade, gene technology has been employed to increase its performance of industrial yeast. This study aims to better understand the genetics and biochemistry of yeast, particularly on stress adaptation. Zinc cluster transcriptional regulators are unique fungal proteins that contain a signature zinc cluster motif: CysX2CysX6CysX5-12CysX2CysX6-8Cys. They regulate genes in a wide variety of cellular processes. In this study, a number of zinc cluster proteins were selected and determined for possible functions. Growth of several yeast deletion mutants was monitored under different environmental conditions including nutrient limitation and weak acetic acid response. We performed phenotypic analysis of a strain lacking the zinc cluster protein Yor380w. Interestingly, our results indicated that the lack of YOR380W (RDR1) gene impaired growth on different carbon sources including glycerol or acetate while this strain could grow normally on glucose. Moreover, this deletion strain also showed increased sensitivity to acetic acid, a dominant by-product of alcoholic fermentation, tested at final concentration of 90, 100 and 110 mM. However, it grew normally at acidic pH of 4 when HCl was used as buffer. Thus, our analysis has assigned new phenotypes for this zinc cluster deletion strain. The knowledge gained will indicate new regulatory protein involved in nutrient limitation and weak acid stress adaptation and can be served as a guideline for quality improvement of industrial yeasts. Keywords: zinc cluster transcription factor, nutrient limitation, weak acid response, Saccharomyces cerevisiae Introduction and Objective
Yeast Saccharomyces cerevisiae has been extensively studied for ethanol production which occurs under various stressful condition such as high temperature, ethanol inhibition and osmotic pressure. The inhibitory substances released from the pretreatment of lignocellulosic biomass, especially weak organic acid by-product such as acetic acid (1, 2) Zinc cluster transcriptional regulators are unique fungal proteins that contain a signature zinc cluster motif, CysX2CysX6CysX5-12CysX2 CysX6-8Cys. They regulate genes in a wide variety of cellular processes such as in primary and secondary metabolism, gluconeogenesis and stress tolerance (4, 5). This study aims to examine a number of zinc cluster proteins of unknown function and to study the effects of their deletion on growth under different environmental stress conditions including nutrient limitation and weak acetic acid response via phenotypic analysis. For example, War1p is a novel member of zinc cluster protein that regulated weak acid stress genes in S. cerevisiae (6).
Materials and Methods 2.1 Yeast strains and media S. cerevisiae
strains used in this study are listed in Table 1. Wild-type strain used to generate the gene deletions was FY73 (MATα his3-∆200 ura3-52). Cells were routinely grown in rich media YPD containing 1% yeast extract 2% bacto-peptone 2% dextrose.
2.2 Phenotypic analysis Wild-type and zinc cluster deletion strains were grown in liquid yeast peptone dextrose (YPD) overnight. Cells were spun, resuspended in distilled water and diluted to optical density (OD600) of 0.1. Then, they were serially diluted and spotted on appropriated plates. Growth assays were monitored on different non-fermentable carbon sources, including 3% glycerol or 3% potassium acetate, at 30OC for 3-5 days. Growth on non-fermentable carbon sources was compared with growth on 3% glucose. To test for acetic acid response, wild-type and zinc cluster deletion strains were grown on YPD media containing acetic acid various concentration of 90, 100 or 110 mM.
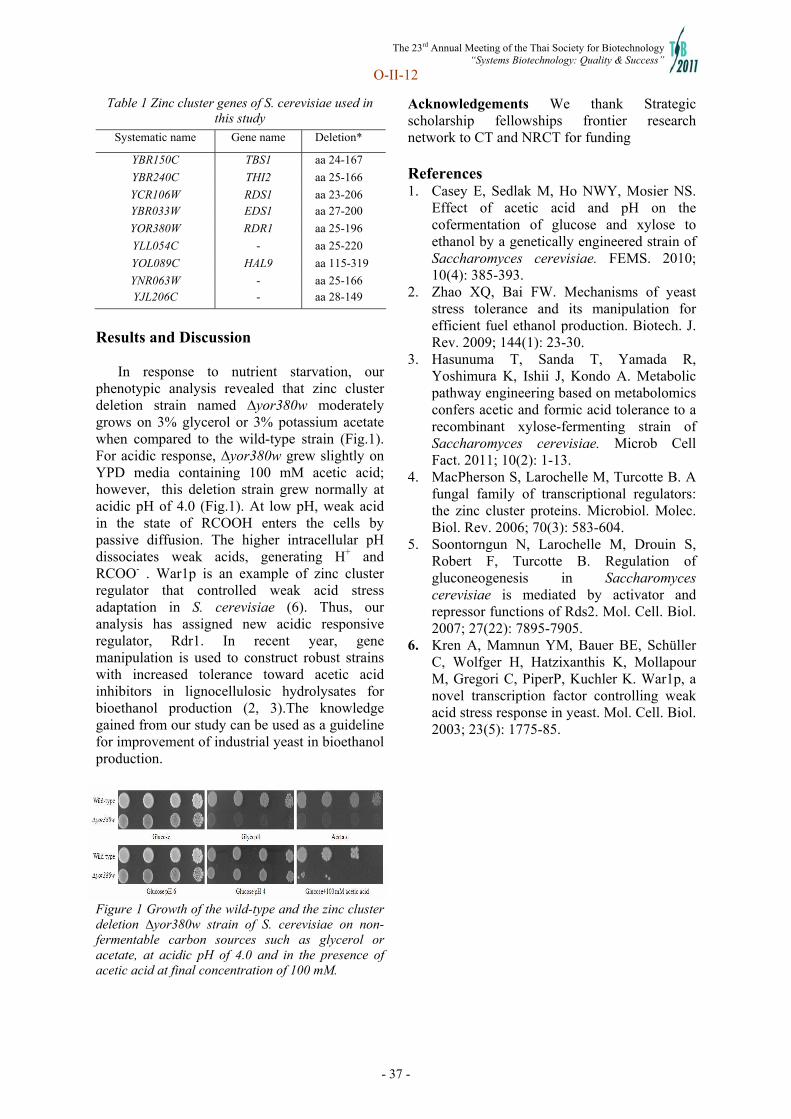
The 23rd Annual Meeting of the Thai Society for Biotechnology “Systems Biotechnology: Quality & Success”
O-II-12
- 37 -
Table 1 Zinc cluster genes of S. cerevisiae used in this study
Results and Discussion In response to nutrient starvation, our phenotypic analysis revealed that zinc cluster deletion strain named ∆yor380w moderately grows on 3% glycerol or 3% potassium acetate when compared to the wild-type strain (Fig.1). For acidic response, ∆yor380w grew slightly on YPD media containing 100 mM acetic acid; however, this deletion strain grew normally at acidic pH of 4.0 (Fig.1). At low pH, weak acid in the state of RCOOH enters the cells by passive diffusion. The higher intracellular pH dissociates weak acids, generating H+ and RCOO- . War1p is an example of zinc cluster regulator that controlled weak acid stress adaptation in S. cerevisiae (6). Thus, our analysis has assigned new acidic responsive regulator, Rdr1. In recent year, gene manipulation is used to construct robust strains with increased tolerance toward acetic acid inhibitors in lignocellulosic hydrolysates for bioethanol production (2, 3).The knowledge gained from our study can be used as a guideline for improvement of industrial yeast in bioethanol production. for quality improvement of industrial yeasts.
Figure 1 Growth of the wild-type and the zinc cluster deletion ∆yor380w strain of S. cerevisiae on non-fermentable carbon sources such as glycerol or acetate, at acidic pH of 4.0 and in the presence of acetic acid at final concentration of 100 mM.
Acknowledgements We thank Strategic scholarship fellowships frontier research network to CT and NRCT for funding References 1. Casey E, Sedlak M, Ho NWY, Mosier NS.
Effect of acetic acid and pH on the cofermentation of glucose and xylose to ethanol by a genetically engineered strain of Saccharomyces cerevisiae. FEMS. 2010; 10(4): 385-393.
2. Zhao XQ, Bai FW. Mechanisms of yeast stress tolerance and its manipulation for efficient fuel ethanol production. Biotech. J. Rev. 2009; 144(1): 23-30.
3. Hasunuma T, Sanda T, Yamada R, Yoshimura K, Ishii J, Kondo A. Metabolic pathway engineering based on metabolomics confers acetic and formic acid tolerance to a recombinant xylose-fermenting strain of Saccharomyces cerevisiae. Microb Cell Fact. 2011; 10(2): 1-13.
4. MacPherson S, Larochelle M, Turcotte B. A fungal family of transcriptional regulators: the zinc cluster proteins. Microbiol. Molec. Biol. Rev. 2006; 70(3): 583-604.
5. Soontorngun N, Larochelle M, Drouin S, Robert F, Turcotte B. Regulation of gluconeogenesis in Saccharomyces cerevisiae is mediated by activator and repressor functions of Rds2. Mol. Cell. Biol. 2007; 27(22): 7895-7905.
6. Kren A, Mamnun YM, Bauer BE, Schüller C, Wolfger H, Hatzixanthis K, Mollapour M, Gregori C, PiperP, Kuchler K. War1p, a novel transcription factor controlling weak acid stress response in yeast. Mol. Cell. Biol. 2003; 23(5): 1775-85.
Systematic name Gene name Deletion*
YBR150C TBS1 aa 24-167
YBR240C THI2 aa 25-166
YCR106W RDS1 aa 23-206 YBR033W EDS1 aa 27-200
YOR380W RDR1 aa 25-196
YLL054C - aa 25-220
YOL089C HAL9 aa 115-319
YNR063W - aa 25-166 YJL206C - aa 28-149

The 23rd Annual Meeting of the Thai Society for Biotechnology “Systems Biotechnology: Quality & Success”
O-II-14
- 38 -
Screening and isolation of yeasts producing IAA (Indole acetic acid) Nwe Nwe Soe Hlainga, Swe Zin Yub, San San Yuc
[email protected] [email protected] [email protected] a, b,c Department of Biotechnology, Mandalay Technological University, Myanmar
Abstract
In this study, twenty four yeasts were isolated from different soil samples and screened for indole acetic acid (IAA) production. Initially, all yeasts were cultivated in peptone yeast glucose (PYG) broth. The effect of L-Tryptophan (L-Trp) as a precursor was also investigated. The IAA production was then assayed colorimetrically using Salkowski’s reagent. The reaction consisted of one drop of orthophosphoric acid and mixed with 2ml of Salkowski’s reagent (50ml, 35% perchloric acid; 1ml 0.5 FeCl3). A single colony of yeast strains was inoculated on the PYG broth with tryptophan (0.5mg/ml) and without L- Trp incubated at 28±2.C for 15 days. Samples were pull out at 3 days intervals and centrifuged at 6000 rpm for 30 minutes. One millilitre of supernatant from each isolate was placed in a fresh test tube and treated with reaction mixture. The mixture in the tube was allowed to stand for 25-30 minutes. Development of pink colour indicates IAA production. The IAA concentrations were determined by measuring the absorbance at 530nm. Y10 strain was the highest IAA producer (79ppm) at 9 days incubation period in the PYG media without L- Trp. Y7, Y19 and Y21strains that were incubated in the PYG media without L- Trp also had the higher ability in the production of IAA than other yeast isolates. These potential yeast strains are of great interest due to their ability to produce IAA. Keywords: soil yeast, indole acetic acid, L-Tryptophan
Introduction and Objective
The ability to produce IAA is wide spread among soil and plant associated microorganisms. The major auxin in plant is IAA. Many plant growth promoting rizobacteria (PGBR) produce IAA. For example Pseudomonas, Bacillus, Acetobacter, Rhizobium, Burkholderia, Azotobacter, Azospirillum and some fungal genera like Verticillum, Colletotrichum, Endophylum and Ustilago. These microbes are able to produce IAA in pure culture conditions in presence or absence of precursor substrate. IAA is a common product of L- Trp metabolism by several microorganisms. The different IAA biosynthesis pathways are Indole-3-Acetamide, Indole-3-Pyruvate, Indole-3-Acetonitrile or Tryptamine pathway and Tryptophan side chain pathway. These pathways were named according to intermediate produced during IAA synthesis. Biosynthesis of IAA involves enzyme regulated mechanisms like deamination, carboxylation, oxidation and decarboxylation. IAA at low concentration induce root elongation, cell division in meristematic tissue,
cell differentiation and the formation of adventitious roots. Colorimetric method is the simplest method and has long been employed for the detection IAA produced by plant and microorganisms. In this research, yeast strains are isolated from various soil sources. The aim of this study is to screen the high efficient IAA producer yeast. Materials and Methods
2.1 Collection of Yeast Isolates and Quantitative Determination of IAA Productivity by Yeast Isolates
Twenty four soil yeast isolates were collected from Biotechnology Department, Technological University, Kyaukse. Yeast isolates were cultured on PYG agar medium (peptone 2%, yeast extract 1% and glucose 2%) to which 0.05% chloramphenicol was then added to inhibit the growth of the bacterial contaminants. After two days incubation period at 28±2˚C, the yeast colonies on PYG medium were obtained. All 24 yeast strains were screened for IAA producing activity. Concentrations were calculated from an adjusted calibration curve (IAA standard curve).
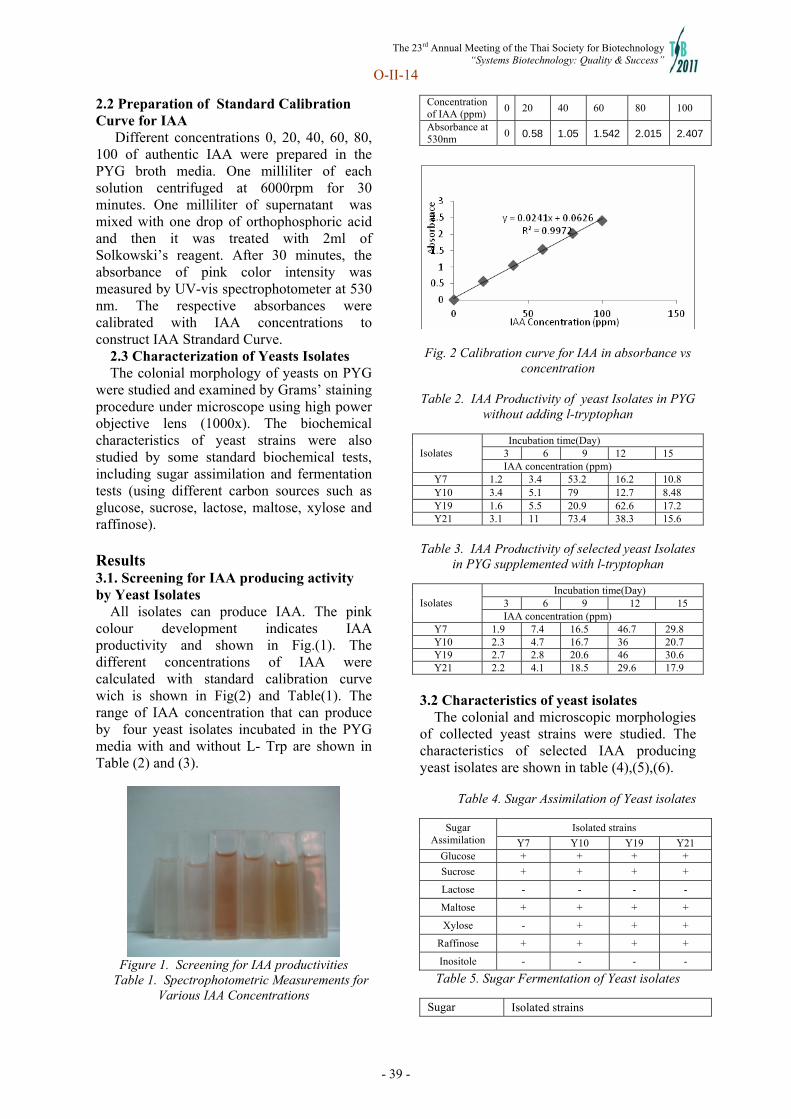
The 23rd Annual Meeting of the Thai Society for Biotechnology “Systems Biotechnology: Quality & Success”
O-II-14
- 39 -
2.2 Preparation of Standard Calibration Curve for IAA
Different concentrations 0, 20, 40, 60, 80, 100 of authentic IAA were prepared in the PYG broth media. One milliliter of each solution centrifuged at 6000rpm for 30 minutes. One milliliter of supernatant was mixed with one drop of orthophosphoric acid and then it was treated with 2ml of Solkowski’s reagent. After 30 minutes, the absorbance of pink color intensity was measured by UV-vis spectrophotometer at 530 nm. The respective absorbances were calibrated with IAA concentrations to construct IAA Strandard Curve.
2.3 Characterization of Yeasts Isolates The colonial morphology of yeasts on PYG
were studied and examined by Grams’ staining procedure under microscope using high power objective lens (1000x). The biochemical characteristics of yeast strains were also studied by some standard biochemical tests, including sugar assimilation and fermentation tests (using different carbon sources such as glucose, sucrose, lactose, maltose, xylose and raffinose). Results 3.1. Screening for IAA producing activity by Yeast Isolates
All isolates can produce IAA. The pink colour development indicates IAA productivity and shown in Fig.(1). The different concentrations of IAA were calculated with standard calibration curve wich is shown in Fig(2) and Table(1). The range of IAA concentration that can produce by four yeast isolates incubated in the PYG media with and without L- Trp are shown in Table (2) and (3).
Figure 1. Screening for IAA productivities
Table 1. Spectrophotometric Measurements for Various IAA Concentrations
Concentration of IAA (ppm)
0 20 40 60 80 100
Absorbance at 530nm
0 0.58 1.05 1.542 2.015 2.407
Fig. 2 Calibration curve for IAA in absorbance vs concentration
Table 2. IAA Productivity of yeast Isolates in PYG
without adding l-tryptophan
Incubation time(Day) 3 6 9 12 15 Isolates IAA concentration (ppm)
Y7 1.2 3.4 53.2 16.2 10.8 Y10 3.4 5.1 79 12.7 8.48 Y19 1.6 5.5 20.9 62.6 17.2 Y21 3.1 11 73.4 38.3 15.6
Table 3. IAA Productivity of selected yeast Isolates
in PYG supplemented with l-tryptophan
Incubation time(Day) 3 6 9 12 15 Isolates IAA concentration (ppm)
Y7 1.9 7.4 16.5 46.7 29.8 Y10 2.3 4.7 16.7 36 20.7 Y19 2.7 2.8 20.6 46 30.6 Y21 2.2 4.1 18.5 29.6 17.9
3.2 Characteristics of yeast isolates
The colonial and microscopic morphologies of collected yeast strains were studied. The characteristics of selected IAA producing yeast isolates are shown in table (4),(5),(6).
Table 4. Sugar Assimilation of Yeast isolates
Isolated strains Sugar Assimilation Y7 Y10 Y19 Y21
Glucose + + + +
Sucrose + + + +
Lactose - - - -
Maltose + + + +
Xylose - + + +
Raffinose + + + +
Inositole - - - -
Table 5. Sugar Fermentation of Yeast isolates
Sugar Isolated strains
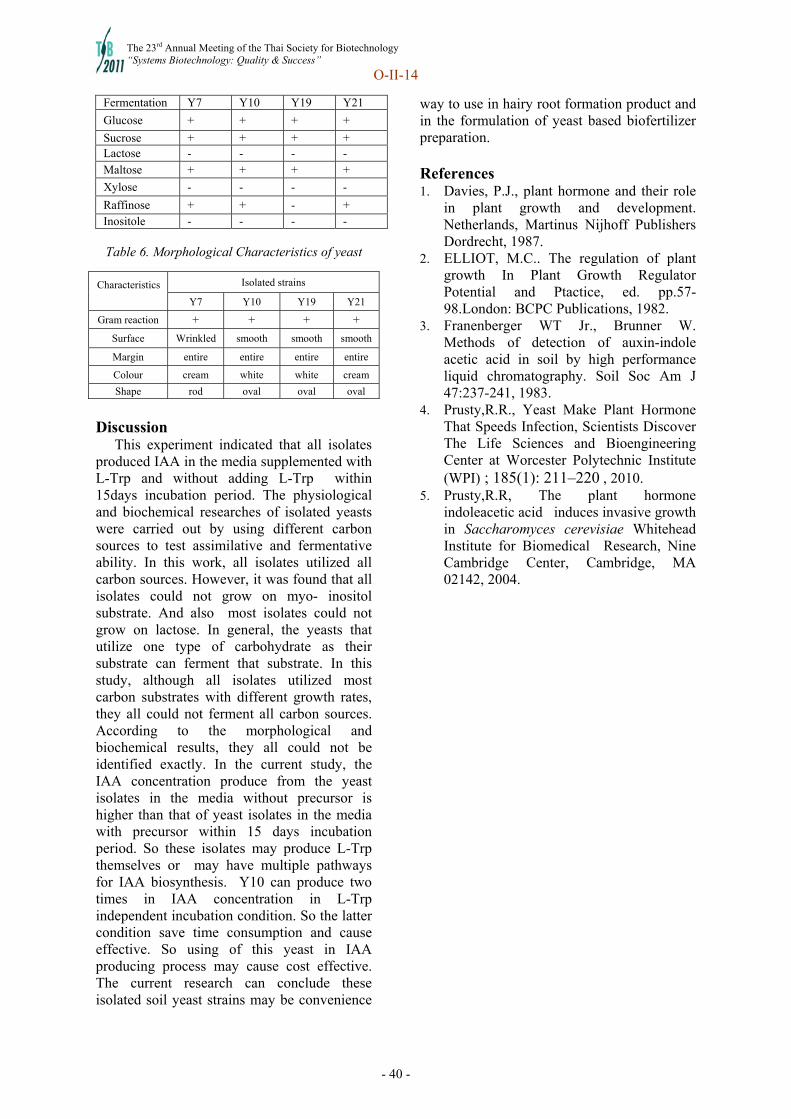
The 23rd Annual Meeting of the Thai Society for Biotechnology “Systems Biotechnology: Quality & Success”
O-II-14
- 40 -
Fermentation Y7 Y10 Y19 Y21
Glucose + + + +
Sucrose + + + + Lactose - - - - Maltose + + + +
Xylose - - - -
Raffinose + + - + Inositole - - - -
Table 6. Morphological Characteristics of yeast
Isolated strains Characteristics Y7 Y10 Y19 Y21
Gram reaction + + + +
Surface Wrinkled smooth smooth smooth
Margin entire entire entire entire
Colour cream white white cream
Shape rod oval oval oval
Discussion
This experiment indicated that all isolates produced IAA in the media supplemented with L-Trp and without adding L-Trp within 15days incubation period. The physiological and biochemical researches of isolated yeasts were carried out by using different carbon sources to test assimilative and fermentative ability. In this work, all isolates utilized all carbon sources. However, it was found that all isolates could not grow on myo- inositol substrate. And also most isolates could not grow on lactose. In general, the yeasts that utilize one type of carbohydrate as their substrate can ferment that substrate. In this study, although all isolates utilized most carbon substrates with different growth rates, they all could not ferment all carbon sources. According to the morphological and biochemical results, they all could not be identified exactly. In the current study, the IAA concentration produce from the yeast isolates in the media without precursor is higher than that of yeast isolates in the media with precursor within 15 days incubation period. So these isolates may produce L-Trp themselves or may have multiple pathways for IAA biosynthesis. Y10 can produce two times in IAA concentration in L-Trp independent incubation condition. So the latter condition save time consumption and cause effective. So using of this yeast in IAA producing process may cause cost effective. The current research can conclude these isolated soil yeast strains may be convenience
way to use in hairy root formation product and in the formulation of yeast based biofertilizer preparation. References 1. Davies, P.J., plant hormone and their role
in plant growth and development. Netherlands, Martinus Nijhoff Publishers Dordrecht, 1987.
2. ELLIOT, M.C.. The regulation of plant growth In Plant Growth Regulator Potential and Ptactice, ed. pp.57-98.London: BCPC Publications, 1982.
3. Franenberger WT Jr., Brunner W. Methods of detection of auxin-indole acetic acid in soil by high performance liquid chromatography. Soil Soc Am J 47:237-241, 1983.
4. Prusty,R.R., Yeast Make Plant Hormone That Speeds Infection, Scientists Discover The Life Sciences and Bioengineering Center at Worcester Polytechnic Institute (WPI) ; 185(1): 211–220 , 2010.
5. Prusty,R.R, The plant hormone indoleacetic acid induces invasive growth in Saccharomyces cerevisiae Whitehead Institute for Biomedical Research, Nine Cambridge Center, Cambridge, MA 02142, 2004.
The 23rd Annual Meeting of the Thai Society for Biotechnology “Systems Biotechnology: Quality & Success”
O-II-17
- 41 -
Screening of quorum quenching Streptomyces spp. for quorum-sensing control of phytopathogenic bacteria
Suphatra Hongvijit a,b,c, Watanalai Panbangred a,b and Surang Chankhamhaengdecha b,d
aDepartment of Biotechnology, Faculty of Science, Mahidol University, Rama VI Rd, Bangkok 10400, Thailand bMahidol University, Osaka University Collaborative Research for Bioscience and Biotechnology (MU-OU:CRC), Faculty of Science, Mahidol University, Rama VI Rd, Bangkok 10400, Thailand. cCenter of Excellence on Agricultural Biotechnology: (AG-BIO/PERDO-CHE), Bangkok,Thailand. dDepartment of Biology, Faculty of Science, Mahidol University, Rama VI Rd, Bangkok 10400, Thailand.
Abstract
N-Acyl homoserine lactones (AHLs) are used as quorum sensing (QS) signals to regulate diverse physiological processes and pathogenesis in several pathogens. QS in Pectobacterium carotovorum regulates the production of plant cell wall degrading enzymes and virulence factors involved in causing soft-rot symptom in plant tissue. To reduce its pathogenicity, inactivation of QS or quorum quenching by targeting at AHLs degradation may offer a promising strategy for biological control against this QS-dependent phytopathogen. In this study, AHL-degrading bacteria were selected, focusing on Streptomyces spp., due to its ability to synthesize a variety of secondary metabolites and extracellular hydrolytic enzymes. Among 397 Streptomyces isolates from soil, 130 (32.7%) were able to reduce AHL activity as detected by the biosensor strain Agrobacterium tumefaciens NTL4 (pZLR4), whereas only 8/55 (14.5%) endophytic isolates possess this activity. Only 4 soil isolates rapidly degraded synthetic AHLs C10HSL at >190 pmole/h using quantitative AHLs-degrading activity assay. The higher frequency of strains with AHLs degrading activity isolated from soil over the plant tissue indicated that Streptomyces in soil may gain more physiological advantages from QS inhibition than endophytic Streptomyces. In addition, soil-isolated Streptomyces showed a potential in soft-rot attenuation caused by P. carotovorum in vitro. Keywords: Streptomyces, quorum sensing, quorum quenching, Pectobacterium, soft-rot Introduction and Objectives Many gram negative bacteria, particular proteobacteria employ a low diffusible signal molecule to control gene expression dependent cell density. The N-acylated homoserine lactones (AHLs) comprise one such class of signal molecules (1-3). In the confined environment at low cell density, AHLs diffusible from each cell are not enough to bind with their cognate transcription factors. However at high cell density, accumulated AHLs form multimer with transcription receptors causing manipulation of gene expression. This generic phenomenon is named quorum sensing (QS) or gene regulation by cell density (4). QS system provides the organism with a wide range of physiological functions such as bioluminescence, swarming motility, plasmid transfer, and the production of antibiotics, virulence factors and extracellular hydrolytic enzymes (3). With these characteristics, QS bacteria are able to adapt themselves to changing environmental condition, survive in nature, and cause pathogenicity on plant and animals. .
As for gram-negative phytopathogen, QS plays an important role for pathogenicity on host organisms. For example, Argrobacterium tumefaciens relies on QS to regulate tra genes on the tumor inducing (Ti) plasmid as the major virulence determinant causing crown gall disease in plants (5). Pectobacterium carotovorum produces pectate lyase, pectin lyase, cellulase and protease (6) to macerate plant tissues and causes soft-rot disease on commercial crops such as carrot, potato, and onion (7). P. stewarti applies QS to produce extracellular polysaccharide correlated with Stewart’s wilt of corn (8). These paradigms indicate that QS in plant pathogen is the another tool to evade its host which on cell density of pathogen. Conventional methods to control these diseases by application of antibiotics and chemical drugs results in superbug and chemical accumulation. Therefore, QS-related pathogenicity could attenuate virulence of pathogen by means of QS inactivation or quorum quenching (QQ). Up to date there are three main approaches for QQ, disruption of

The 23rd Annual Meeting of the Thai Society for Biotechnology “Systems Biotechnology: Quality & Success”
O-II-17
- 42 -
AHLs synthesis (9-11), AHLs dissemination (12-17), and AHLs binding (10, 18-19). With these methods, pathogen is not killed resulting in decrease of drug-resistance. Several compounds inactivating QS derive from soil-isolated bacteria, including Streptomyces. This bacterium is well known for antibiotics (20) and secondary metabolites production (21) as well as some endophytic Streptomyces is used as plant-growth promoting bacterium (22). Therefore this bacterium isolated from enriched soil samples and plant samples in Thailand is valuable for screening AHLs degrading activity from several strains. These isolates may give us an opportunity to obtain Streptomyces strains with QS inactivation. Materials and Methods 2.1 Isolation of Streptomyces . Streptomyces was isolated from soil samples from Nuangbualumpoo, Bangkok, and Chantaburi provinces in Thailand, including shrimp pond soil. Soil (1.5 g) of each sample was suspended in 9 ml of 0.85% normal saline solution (NSS). The sample suspension was serially diluted and spread on Pridham’s agar (1.0% glucose, 1.0% starch, 0.2% (NH4)2SO4, 0.3% CaCO3, 0.1% K2HPO4, 0.1% NaCl, and 1.2% agar) (23) and water proline agar (1.0% proloine and 1.2% agar). Each medium was added 25 �g/ml of nalidixic acid and 50 �g/ml of cyclohexamide. Screening plates were incubated at 28C for two weeks. . As for endophytic Streptomyces, leaves, stems, and fruits from healthy plant samples were washed by running tap water and cut into small pieces. Then each piece was surface-sterilized by immersion in 10% sodium hypochlorite adding 0.1% tween 20 for 3 min, 70% ethanol for 2 min, sterile distilled water for 2 min and air-dried. Samples were placed in 1.5% water agar supplemented with 25 �g/ml of nalidixic acid and 50 �g/ml of cyclohexamide. The plates were incubated at 28C for 3-4 weeks. Colonies with Streptomyces characteristics were selected for AHLs-degrading activity. 2.2 Screening of AHLs degrading Streptomyces Each Streptomyces isolate was cultured in 5 ml of 301 production medium (2.4% starch, 0.1% glucose, 0.5% yeast extract, 0.3% meat extract, 0.4% CaCO3, and 1.2% agar) and incubated at 28C; 180 rpm for 6 days. Then the reaction mixture was mixed by 40 �l of cell-free
supernatant and 40 �l of 40 �M synthesized AHL (C10HSL). The mixture was incubated at 28C with gentle shaking for 1 h followed by heating at 95C for 5 min to stop reaction. Then ten microliters of tested reaction (≤ 200 pmole of C10HSL) was added in a well of a bioassay plate. This plate is composed of AB minimal medium (24) and 40 �g/ml of 5-bromo-4-chloro-3-indoyl-D-galactopyranoside (X-gal) overlaid with the biosensor strain A. tumefaciens NTL4 (pZLR4) (25) kindly provided by Professor Stephen K. Farrand, Department of Crop Sciences and Microbiology, University of Illinois. To determine AHLs quantity, the bioassay relies on pZLR4. This plasmid harbors traR gene and its product TraR protein when binding with AHLs is able to induce the expression of lacZ gene fused with traG gene on the same plasmid. -galactocidase from lacZ expression will digest X-gal on the plate and causes blue zone which reflects the amount of AHLs residue by comparing with blue zone of known AHLs concentration. 2.3 In vitro pathogenicity assay . To test the efficiency of soft-rot disease attenuation, potato was used as a host plant. Fresh tuber was soaked in 5% hypochlorite and washed with distilled water then sliced into a chip about 5 mm thickness. Inoculum was prepared by mixing twenty microliters of overnight culture of P. carotovorum in NB broth grown at 30C and twenty microliters of 6 days cultured of Streptomyces in 301 broth grown at 28C. This inoculum was further incubated for 4 h. Then ten microliters of inoculum was mounted on 5 mm thick potato slices. All slices were incubated in steriled boxes containing steriled wet cotton to maintain humidity. After 48 h of incubation at 30C, lesion area was observed and maceration was measured comparing to the control. Each treatment was done as triplicate. Statistical analysis was performed by one-way ANOVA in SPSS version 17.0. Reduction of soft-rot area refers to ability to control P. carotovorum infection by Streptomyces with AHLs degrading strains. Results Three hundreds and ninety-seven Streptomyces strains were isolated from soil and fifty-five strains were isolated from plants by incubation of culture supernatant from each isolate with C10HSL, 130 and 8 isolates from soil and plant, respectively, exhibited AHL
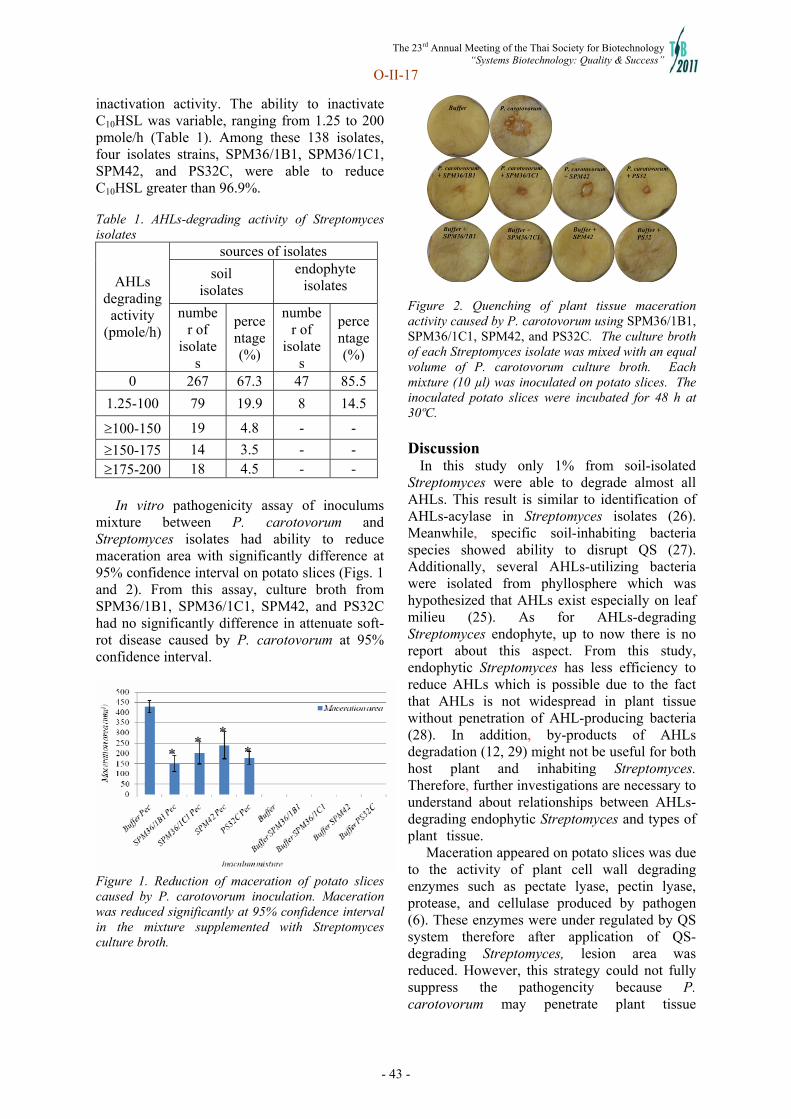
The 23rd Annual Meeting of the Thai Society for Biotechnology “Systems Biotechnology: Quality & Success”
O-II-17
- 43 -
inactivation activity. The ability to inactivate C10HSL was variable, ranging from 1.25 to 200 pmole/h (Table 1). Among these 138 isolates, four isolates strains, SPM36/1B1, SPM36/1C1, SPM42, and PS32C, were able to reduce C10HSL greater than 96.9%. Table 1. AHLs-degrading activity of Streptomyces isolates
sources of isolates
soil isolates
endophyte isolates AHLs
degrading activity
(pmole/h) numbe
r of isolate
s
percentage (%)
number of
isolates
percentage (%)
0 267 67.3 47 85.5
1.25-100 79 19.9 8 14.5
100-150 19 4.8 - -
150-175 14 3.5 - - 175-200 18 4.5 - -
In vitro pathogenicity assay of inoculums mixture between P. carotovorum and Streptomyces isolates had ability to reduce maceration area with significantly difference at 95% confidence interval on potato slices (Figs. 1 and 2). From this assay, culture broth from SPM36/1B1, SPM36/1C1, SPM42, and PS32C had no significantly difference in attenuate soft-rot disease caused by P. carotovorum at 95% confidence interval.
Figure 1. Reduction of maceration of potato slices caused by P. carotovorum inoculation. Maceration was reduced significantly at 95% confidence interval in the mixture supplemented with Streptomyces culture broth.
Figure 2. Quenching of plant tissue maceration activity caused by P. carotovorum using SPM36/1B1, SPM36/1C1, SPM42, and PS32C. The culture broth of each Streptomyces isolate was mixed with an equal volume of P. carotovorum culture broth. Each mixture (10 µl) was inoculated on potato slices. The inoculated potato slices were incubated for 48 h at 30ºC. Discussion In this study only 1% from soil-isolated Streptomyces were able to degrade almost all AHLs. This result is similar to identification of AHLs-acylase in Streptomyces isolates (26). Meanwhile, specific soil-inhabiting bacteria species showed ability to disrupt QS (27). Additionally, several AHLs-utilizing bacteria were isolated from phyllosphere which was hypothesized that AHLs exist especially on leaf milieu (25). As for AHLs-degrading Streptomyces endophyte, up to now there is no report about this aspect. From this study, endophytic Streptomyces has less efficiency to reduce AHLs which is possible due to the fact that AHLs is not widespread in plant tissue without penetration of AHL-producing bacteria (28). In addition, by-products of AHLs degradation (12, 29) might not be useful for both host plant and inhabiting Streptomyces. Therefore, further investigations are necessary to understand about relationships between AHLs-degrading endophytic Streptomyces and types of plant tissue. . Maceration appeared on potato slices was due to the activity of plant cell wall degrading enzymes such as pectate lyase, pectin lyase, protease, and cellulase produced by pathogen (6). These enzymes were under regulated by QS system therefore after application of QS-degrading Streptomyces, lesion area was reduced. However, this strategy could not fully suppress the pathogencity because P. carotovorum may penetrate plant tissue
The 23rd Annual Meeting of the Thai Society for Biotechnology “Systems Biotechnology: Quality & Success”
O-II-17
- 44 -
indirectly via the addition of Streptomyces inoculum which might have secretion system and virulence factors regarding to host-plant immune system (30). With these abilities, co-inoculation of this bacterium might have an effect on injury of host tissue which is susceptible to the respective pathogen. . Furthermore quorum quenching by secretion of AHLs degrading enzyme from Streptomyces enhance the opportunity to degrade AHLs from other competitors and inactivate virulence traits compared to non-secreted enzyme (31). This characteristic may offer bacteria nutrients and ecological niche against other bacteria in the same environment (15, 32). Screening of rhizosphere bacteria showed ability to degrade QS signal (33), which indicated that plants might be protected from QS-plant pathogens by surrounding AHLs-degrading bacteria. In this study, soil-isolated Streptomyces proves useful for decreasing AHLs and disrupting QS of P. carotovorum. This activity leads to attenuation of soft-rot disease. References 1. Fuqua C, Parsek MR, Greenberg EP.
Regulation of gene expression by cell-to-cell communication: acyl-homoserine lactone quorum sensing. Annu Rev Genet. 2001;35:439-68.
2. Miller MB, Bassler BL. Quorum sensing in bacteria. Annu Rev Microbiol. 2001;55:165-99.
3. Whitehead NA, Barnard AM, Slater H, Simpson NJ, Salmond GP. Quorum-sensing in Gram-negative bacteria. FEMS Microbiol Rev. 2001 Aug;25(4):365-404.
4. Zhang LH. Quorum quenching and proactive host defense. Trends Plant Sci. 2003 May;8(5):238-44.
5. Piper KR, Beck Von Bodman S, Hwang I, Farrand SK. Hierarchical gene regulatory systems arising from fortuitous gene associations: controlling quorum sensing by the opine regulon in Agrobacterium. Mol Microbiol. 1999 Jun;32(5):1077-89.
6. Barnard AM, Salmond GP. Quorum sensing in Erwinia species. Anal Bioanal Chem. 2007 Jan;387(2):415-23.
7. BOSGELMEZ-TINAZ G. Quorum sensing in gram-negative bacteria. Turk J Biol. [Scientific article]. 2003 15.11.2002;27:85-93.
8. Beck von Bodman S, Farrand SK. Capsular polysaccharide biosynthesis and
pathogenicity in Erwinia stewartii require induction by an N-acylhomoserine lactone autoinducer. J Bacteriol. 1995 Sep;177(17):5000-8.
9. Hanzelka BL, Greenberg EP. Quorum sensing in Vibrio fischeri: evidence that S-adenosylmethionine is the amino acid substrate for autoinducer synthesis. J Bacteriol. 1996 Sep;178(17):5291-4.
10. Hentzer M, Wu H, Andersen JB, Riedel K, Rasmussen TB, Bagge N, et al. Attenuation of Pseudomonas aeruginosa virulence by quorum sensing inhibitors. EMBO J. 2003 Aug 1;22(15):3803-15.
11. Parsek MR, Val DL, Hanzelka BL, Cronan JE, Jr., Greenberg EP. Acyl homoserine-lactone quorum-sensing signal generation. Proc Natl Acad Sci U S A. 1999 Apr 13;96(8):4360-5.
12. Dong YH, Wang LH, Xu JL, Zhang HB, Zhang XF, Zhang LH. Quenching quorum-sensing-dependent bacterial infection by an N-acyl homoserine lactonase. Nature. 2001 Jun 14;411(6839):813-7.
13. Dong YH, Xu JL, Li XZ, Zhang LH. AiiA, an enzyme that inactivates the acylhomoserine lactone quorum-sensing signal and attenuates the virulence of Erwinia carotovora. Proc Natl Acad Sci U S A. 2000 Mar 28;97(7):3526-31.
14. Dong YH, Zhang XF, Xu JL, Zhang LH. Insecticidal Bacillus thuringiensis silences Erwinia carotovora virulence by a new form of microbial antagonism, signal interference. Appl Environ Microbiol. 2004 Feb;70(2):954-60.
15. Leadbetter JR, Greenberg EP. Metabolism of acyl-homoserine lactone quorum-sensing signals by Variovorax paradoxus. J Bacteriol. 2000 Dec;182(24):6921-6.
16. Lin YH, Xu JL, Hu J, Wang LH, Ong SL, Leadbetter JR, et al. Acyl-homoserine lactone acylase from Ralstonia strain XJ12B represents a novel and potent class of quorum-quenching enzymes. Mol Microbiol. 2003 Feb;47(3):849-60.
17. March JC, Bentley WE. Quorum sensing and bacterial cross-talk in biotechnology. Curr Opin Biotechnol. 2004 Oct;15(5):495-502.
18. Givskov M, de Nys R, Manefield M, Gram L, Maximilien R, Eberl L, et al. Eukaryotic interference with homoserine lactone-mediated prokaryotic signalling. J Bacteriol. 1996 Nov;178(22):6618-22.
The 23rd Annual Meeting of the Thai Society for Biotechnology “Systems Biotechnology: Quality & Success”
O-II-17
- 45 -
19. Manefield M, de Nys R, Kumar N, Read R, Givskov M, Steinberg P, et al. Evidence that halogenated furanones from Delisea pulchra inhibit acylated homoserine lactone (AHL)-mediated gene expression by displacing the AHL signal from its receptor protein. Microbiology. 1999 Feb;145 ( Pt 2):283-91.
20. Champness W. Actinomycete development, antibiotic production and phylogeny: questions and challenges. In: Brun. Y, Shimkets. LJ, editors. Prokaryotic Development. Washington, DC: American Society for Microbiology; 2000. p. 11-31.
21. Demain AL. Pharmaceutically active secondary metabolites of microorganisms. Appl Microbiol Biotechnol. 1999 Oct;52(4):455-63.
22. Sardi P, Saracchi M, Quaroni S, Petrolini B, Borgonovi GE, Merli S. Isolation of endophytic Streptomyces strains from surface-sterilized roots. Appl Environ Microbiol. 1992 Aug;58(8):2691-3.
23. Pridham TG, Anderson P, Foley C, Lindenfelser LA, Hesseltine CW, Benedict RG. A selection of media for maintenance and taxonomic study of Streptomyces. Antibiot Annu. 1956:947-53.
24. Chilton MD, Currier TC, Farrand SK, Bendich AJ, Gordon MP, Nester EW. Agrobacterium tumefaciens DNA and PS8 bacteriophage DNA not detected in crown gall tumors. Proc Natl Acad Sci U S A. 1974 Sep;71(9):3672-6.
25. Cha C, Gao P, Chen YC, Shaw PD, Farrand SK. Production of acyl-homoserine lactone quorum-sensing signals by gram-negative plant-associated bacteria. Mol Plant Microbe Interact. 1998 Nov;11(11):1119-29.
26. Park SY, Kang HO, Jang HS, Lee JK, Koo BT, Yum DY. Identification of extracellular N-acylhomoserine lactone acylase from a Streptomyces sp. and its application to quorum quenching. Appl Environ Microbiol. 2005 May;71(5):2632-41.
27. Dong YH, Zhang LH. Quorum sensing and quorum-quenching enzymes. J Microbiol. 2005 Feb;43 Spec No:101-9.
28. Dulla GF, Lindow SE. Acyl-homoserine lactone-mediated cross talk among epiphytic bacteria modulates behavior of Pseudomonas syringae on leaves. ISME J. 2009 Jul;3(7):825-34.
29. Czajkowski R, Jafra S. Quenching of acyl-homoserine lactone-dependent quorum sensing by enzymatic disruption of signal
molecules. Acta Biochim Pol. 2009;56(1):1-16.
30. Liu H, Coulthurst SJ, Pritchard L, Hedley PE, Ravensdale M, Humphris S, et al. Quorum sensing coordinates brute force and stealth modes of infection in the plant pathogen Pectobacterium atrosepticum. PLoS Pathog. 2008 Jun;4(6):e1000093.
31. Shepherd RW, Lindow SE. Two dissimilar N-acyl-homoserine lactone acylases of Pseudomonas syringae influence colony and biofilm morphology. Appl Environ Microbiol. 2009 Jan;75(1):45-53.
32. Flagan S, Ching WK, Leadbetter JR. Arthrobacter strain VAI-A utilizes acyl-homoserine lactone inactivation products and stimulates quorum signal biodegradation by Variovorax paradoxus. Appl Environ Microbiol. 2003 Feb;69(2):909-16.
33. Morello JE, Pierson EA, Pierson LS, 3rd. Negative cross-communication among wheat rhizosphere bacteria: effect on antibiotic production by the biological control bacterium Pseudomonas aureofaciens 30-84. Appl Environ Microbiol. 2004 May;70(5):3103-9.

The 23rd Annual Meeting of the Thai Society for Biotechnology “Systems Biotechnology: Quality & Success”
O-II-18
- 46 -
Biological activities of a Bacillus sphaericus binary toxin produced as soluble proteins in Escherichia coli
Pattarapong Inchanaa, Boonhiang Promdonkoyb and Panadda Boonserma
aInstitute of Molecular Biosciences, Mahidol University, Salaya, Phutthamonthon, Nakhon Pathom 73170, Thailand bNational Center for Genetic Engineering and Biotechnology, National Science and Technology Development Agency, 113 Phahonyothin Road, Khong 1, Khlong Luang, Pathumtani 12120, Thailand Abstract Bacillus sphaericus, a Gram-positive bacterium, produces the mosquito-larvicidal protein called binary toxin (Bin) which consists of BinA and BinB. Both proteins are produced as crystalline inclusions inside the mother cell. In order to produce both proteins in a soluble form in E. coli, binA and binB genes were separately cloned in pRSETC and pET28b, respectively, to be expressed as 6xHis-BinA and 6xHis-BinB fusion proteins. Both proteins were highly produced and purified by Ni-NTA column. Mixtures of both toxins showed high larvicidal activity (LC50 = 7.72 ng/ml) when fed to Culex quinquefasciatus larvae and mortality was recorded after 48 hours. BinA and BinB could independently perturb receptor-free liposomes and the mixture of both proteins showed the highest membrane perturbation. However, after incorporation of brush border membrane fractions to produce the proteoliposomes, membrane perturbation was significantly reduced for BinB and the mixture of BinA and BinB. In contrast, membrane perturbation of BinA was comparable for both receptor-free liposomes and proteoliposomes. Our result suggests that membrane components affect BinB binding and perturbation. Keywords: binary toxin, Bacillus sphaericus, Culex quinquefasciatus Introduction
Bacillus sphaericus is a spore-forming bacterium commonly found in soil. Some strains are toxic against Culex and Anopheles mosquito larvae. Major larvicidal toxins of B. sphaericus are classified into two types, a binary (Bin) toxin and Mtx toxins. Bin toxin is produced during sporulation and is composed of two polypeptides, BinA (42 kDa) and BinB (51 kDa). Both of them are required for full activity, and maximum toxicity is achieved when both components are present in equimolar ratio.
Cloning and expression of the binary toxin in E. coli could yield high protein production, accumulating as inclusion bodies that are hardly soluble in a common buffer. Here, we demonstrated that the binary toxin can be produced as a soluble protein in E. coli. The protein shows high larvicidal activity comparable to that obtained from B. sphaericus suggesting that the soluble protein is in a native conformation.
Materials and Methods
Cloning and expression Both binA and binB genes of B. sphaericus
2297 were kindly provided by Dr. Boonhaing Promdonkoy. The binA gene was ligated into pRSETC (Invitrogen), whereas binB was ligated into pET28b (Novagen). Both genes were fused in-frame with a 6xHis tag at their N-termini. The recombinant plasmids were separately expressed in E. coli DE3 pLysS, grown in LB medium at 37 °C. The cells were induced with 0.2 mM IPTG and were grown at 18 °C for 4 hours.
Protein purification The 6xHis-tagged proteins were released
from E. coli cells by ultrasonication and separated from cell debris by centrifugation. The supernatant was loaded into a HiTrapTM Ni-chelating column. The protein was further purified by gel filtration using Superdex-200TM column. The purity of proteins was analysed on SDS-PAGE.
Mosquito- larvicidal activity assay The second-instar larvae of Culex
quinquefasciatus were used to test the toxicity following the protocol as previously described1.
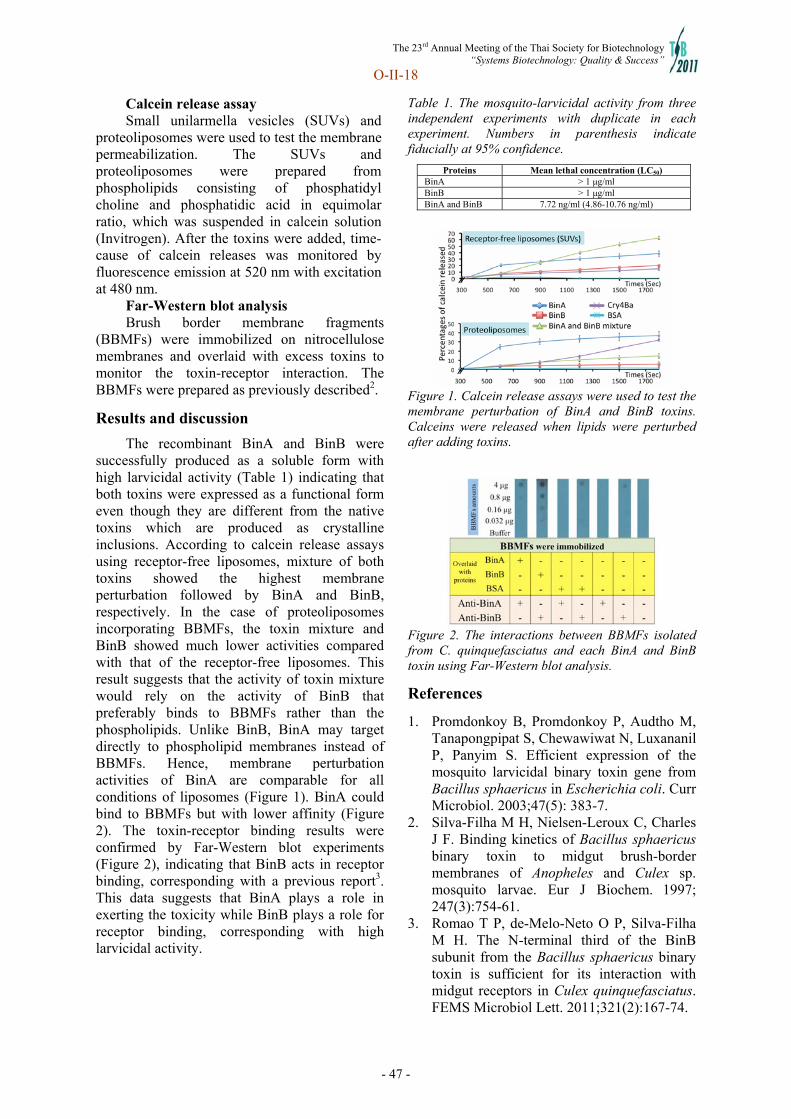
The 23rd Annual Meeting of the Thai Society for Biotechnology “Systems Biotechnology: Quality & Success”
O-II-18
- 47 -
Calcein release assay Small unilarmella vesicles (SUVs) and
proteoliposomes were used to test the membrane permeabilization. The SUVs and proteoliposomes were prepared from phospholipids consisting of phosphatidyl choline and phosphatidic acid in equimolar ratio, which was suspended in calcein solution (Invitrogen). After the toxins were added, time-cause of calcein releases was monitored by fluorescence emission at 520 nm with excitation at 480 nm.
Far-Western blot analysis Brush border membrane fragments
(BBMFs) were immobilized on nitrocellulose membranes and overlaid with excess toxins to monitor the toxin-receptor interaction. The BBMFs were prepared as previously described2.
Results and discussion
The recombinant BinA and BinB were successfully produced as a soluble form with high larvicidal activity (Table 1) indicating that both toxins were expressed as a functional form even though they are different from the native toxins which are produced as crystalline inclusions. According to calcein release assays using receptor-free liposomes, mixture of both toxins showed the highest membrane perturbation followed by BinA and BinB, respectively. In the case of proteoliposomes incorporating BBMFs, the toxin mixture and BinB showed much lower activities compared with that of the receptor-free liposomes. This result suggests that the activity of toxin mixture would rely on the activity of BinB that preferably binds to BBMFs rather than the phospholipids. Unlike BinB, BinA may target directly to phospholipid membranes instead of BBMFs. Hence, membrane perturbation activities of BinA are comparable for all conditions of liposomes (Figure 1). BinA could bind to BBMFs but with lower affinity (Figure 2). The toxin-receptor binding results were confirmed by Far-Western blot experiments (Figure 2), indicating that BinB acts in receptor binding, corresponding with a previous report3. This data suggests that BinA plays a role in exerting the toxicity while BinB plays a role for receptor binding, corresponding with high larvicidal activity.
Table 1. The mosquito-larvicidal activity from three independent experiments with duplicate in each experiment. Numbers in parenthesis indicate fiducially at 95% confidence.
Proteins Mean lethal concentration (LC50) BinA > 1 μg/ml BinB > 1 μg/ml BinA and BinB 7.72 ng/ml (4.86-10.76 ng/ml)
Figure 1. Calcein release assays were used to test the membrane perturbation of BinA and BinB toxins. Calceins were released when lipids were perturbed after adding toxins.
Figure 2. The interactions between BBMFs isolated from C. quinquefasciatus and each BinA and BinB toxin using Far-Western blot analysis.
References
1. Promdonkoy B, Promdonkoy P, Audtho M, Tanapongpipat S, Chewawiwat N, Luxananil P, Panyim S. Efficient expression of the mosquito larvicidal binary toxin gene from Bacillus sphaericus in Escherichia coli. Curr Microbiol. 2003;47(5): 383-7.
2. Silva-Filha M H, Nielsen-Leroux C, Charles J F. Binding kinetics of Bacillus sphaericus binary toxin to midgut brush-border membranes of Anopheles and Culex sp. mosquito larvae. Eur J Biochem. 1997; 247(3):754-61.
3. Romao T P, de-Melo-Neto O P, Silva-Filha M H. The N-terminal third of the BinB subunit from the Bacillus sphaericus binary toxin is sufficient for its interaction with midgut receptors in Culex quinquefasciatus. FEMS Microbiol Lett. 2011;321(2):167-74.
The 23rd Annual Meeting of the Thai Society for Biotechnology “Systems Biotechnology: Quality & Success”
O-II-20
- 48 -
Strain Development on Nitrogen Fixing into Cellulolytic Nitrogen Fixing Bacteria through Transposon Mutagenesis
Honey Thet Paing Htwaya, Zaw Ko Latt and San San Yu
Department of Biotechnology, Mandalay Technological University Mandalay, Union of Myanmar
Abstract In this experiment, eleven nitrogen fixing bacterial strains were isolated from the various rice
rhizospheric soils and determined their nitrogen fixing and cellulolytic activities. Among them, five strains which possessed high nitrogen fixing activity but low cellulolytic activity were selected and used as recipient strains which are resistant to chloramphenicol. On the other hand, E.coli S17 which carried the plasmid containing cellulase and kanamycin resistance genes via transposon mutagenesis was also used as donor strain. Two methods of conjugation experiments (filter mating and broth based assay ) were carried out to establish transconjugants which possessed dual nature of nitrogen fixing and cellulolytic activities. Five strains of transconjugants which were resistant to antibiotic markers (chloramphenicol and kanamycin) were observed and determined their nitrogen fixing and cellulolytic activities. Five number of transconjugant strains did not change in nitrogen fixing activity but higher in cellulolytic activity. The transconjugant strains of wild type (H3, H6, H7, H8, Ey) increased in cellulolytic activity from (0.008, 0.00, 0.00, 0.006 and 0.012 to 0.144, 0.240, 0.272, 0.328 and 0.058 mg/ml reducing sugar concentration, respectively). Keywords: nitrogen fixing bacteria, E.coli S17, conjugation, antibiotic marker, cellulolytic activity.
Introduction and Objective
Transposable genetic elements carrying
antibiotic-resistance genes have become well established with the repertoire of molecular geneticists as indispensable tools in bacterial genetics.[1] Transposon mutagenesis involves the use of mobile genetic elements, short pieces of DNA that replicate by inserting into other piece of DNA. They have the functions to encode the genes that may provide an advantage for the host of the transposon, for example, antibiotic resistance, ability to utilize new metabolites etc. Antibiotic sensitivity is variable among bacterial strains due to the presence of plasmids.Bacterial conjugation has been defined as the transmission of genetic material from a bacterium to another cell by cell-to-cell contact. During conjugation, DNA is transferred from the donor cell to the recipient cell through a conjugation bridge formed between them. The male cells have specialized cell-surface appendages called F-pilli that present in a plasmid called F-factor or F-plasmid. It may either remain free giving rise to F+ male cells of it may become integrated into the host chromosome producing Hfr of the male cell.[2]Microorganisms used in these studies are free living bacteria which grow well on a nitrogen free medium. They are bacteria which
reduce nitrogen to ammonia in soil which is acceptable by plants. Nitrogen fixing microorganisms are used to reduce dependence on nitrogenous chemical fertilizers.[3] The decomposition of the cellulose is inhibited by a nitrogen limitation and that this could be overcome by decomposer organisms which combined both cellulolytic and nitrogen fixing function.
The objective of the present investigation was to obtain the nitrogen fixing bacterial strains which posses the dual nature of nitrogen fixing and cellulolytic activity through the transposon mutagenesis.
Materials and Methods 2.1 Collection of Donor Strain and Isolation of the Recipient Strains The recombinant Escherichia coli (E.coli
S17) strain carrying kanmycin resistance and cellulase genes were obtained from Open Research Center, Shibaura Institute of Technology, Japan and used as conjugal transposon donor. Eleven bacterial strains were isolated from various rice rhizospheric soils sources around Patheingyi Township, MandalayDivision, Myanmar and cultured on Glucoe-Nitrogen-free minium medium by serial dilution.

The 23rd Annual Meeting of the Thai Society for Biotechnology “Systems Biotechnology: Quality & Success”
O-II-20
- 49 -
2.2 Detection of Cellulolytic and Nitrogen Fixing Activity of Bacterial Strains For the selection of the bacterial strains,
isolated strains were detected their nitrogen fixing activity by ammonium test kit and their cellulolytic activity was also detected by dinitrosalicylic colorimetric method.[4]
2.3 Minimum Inhibitory Concentration (MIC) of Selected Antibiotics Different concentration of kanamycin and
chloramphenicol were used for donor and recipient strains respectively. To obtain MIC values, various concentration was added to the LB media and then, donor and recipient strains were cultivated by streaking and incubated at 37·C for 24 hours. Then the minimum antibiotics concentrations which were least the bacterial growth were detected and chosen to be considered as MIC.[5]
2.4 Conjugation Conjugal transfer of plasmid was made by
filter mating and broth based assay. Each of the donor and recipient strains were incubated until their O.D of the cultures reached 0.8-0.9 at A600.Then centrifuged at 6000 rpm for 5min and the pellets were suspended in 100 µl of LB broth with the ratio of 1:1 and incubated 3 hours. [6]Then 25µl of the mixture was placed onto a nitrocellulose membrane laid on the top of LB plate with two antibiotics. After 24 hours incubation the filter was transferred to tube containing 10ml LB broth and the filter was suspended. The appropriate dilutions were made and 25µl of mixture was inoculated onto GNFMM agar containing two antibiotics mediated with transposon and incubated at 37·C until colonies could be observed. In the broth based assay, 0.2ml of each donor and recipient cultures (O.D 0.8-0.9) were gently mixed in a sterile cotton plugged test tube and at 37·C. The appropriate dilutions were made and 25µl of conjugated sample was streak on GNFMM plate with two antibiotics and incubated at 37·C for 24 hours.
2.5 Selection of Mutant Strains Transconjugant colonies were selected
according to their antibiotic markers and detected their cellulolytic activity by DNS method to compare with wild type strains. Moreover, various raw agricultural waste substrates (rice straw, rice husks ,sesame stalks and corn stalks) were used and detected their cellulose degrading activity.
Results and Discussion The eleven strains of nitrogen fixing
bacteria were isolated from different rice rhizospheric soil. Their nitrogen fixing activity was screened by plate screening assay and detected by ammonium test kit and the best five nitrogen fixing bacteria were selected and the reducing sugar concentration from cellulose activity was also detected by DNS method. Table 1. Detection of Excreted Ammonium Concentration and Reducing Sugar Concentration Produced From Selected Strains In GNFM broth by Ammonium Test Kit and DNS method.
Isolate code
Ammonium concentration
(ppm)
Reducing sugar concentration(mg/ml) with 0.1% cellulose
H3 >3 0.008 H6 H7
>3 >3
0.000 0.000
H8 >3 0.006 Ey >3 0.012
Then they were tested their antibiotic
sensitivity with six antibiotics (Kanamycin, Chloramphenicol, Ampicillin, Tetracycline, Gentamycin and Penicillin G) for conjugation experiments. Among them Kanamycin and Chloramphenicol were selected to be used in conjugation process and their MIC concentration was detected. According to MIC,Kanamycin (20µg/ml) and Chloramphenicol (30µg/ml) concentration were used to carry out in conjugation experiments.
The ten transconjugant strains obtained via the marker antibiotics selection and then their cellulolytic activity were detected. Among ten stains, the only five strains have more reducing sugar concentration and assuming that the cellulase gene from E.coli S17 was transferred to the recipient strains. The comparison of their reducing sugar concentration for cellulolytic activity was shown in (Figure 1).
Figure 1. Concentration of Reducing Sugars Converted from Cellulose in CNFM Broth with 0.1% Cellulose

The 23rd Annual Meeting of the Thai Society for Biotechnology “Systems Biotechnology: Quality & Success”
O-II-20
- 50 -
We also detected the reducing sugar concentration using raw agricultural substrates, H3 mutant degraded rice straw and produced more reducing sugars and H8 mutant degraded corn stalks than other substrate.
In conclusion, after conjugation experiments, the selected mutant strains not only processed the nitrogen fixing activity but also produced more reducing sugar concentration than the wild type strains in the case of cellulolytic activity.
Acknowledgment
The author would like to acknowledge the generous financial support to Union Minister U Aye Myint, Ministry of Science and Technology, Union of Myanmar and Professor Dr. Mya Mya Oo, Rector, Mandalay Technological University and all of her teachers in Department of Biotechnology for their supervision and individual advices.
References 1. Kleckner N, Roth J, Botestein D, “Genetic
engineering in vivo using translocatable drug resistance elements” Journal of Bacteriology. 116 (1977) 125-159.
2. Holmes RK, Jobling MG. Genetics: Exchange of Genetic Infromation. Baron’s Medical Microbiology. 4th ed., University of Texas Medical Branch.
3. C.M. Halbleib, P.W. Ludden, “Regulation of biological nitrogen fixation”. American Society for Nutritional Sciences, 130, 1081-1084. (2000).
4. T.K. GHOSE, “Measurement of Cellulase Activities” Biochemical Engineering Research Centre, Indian Institute of Technology, New Delhi-110016, India. Pure & Appl. Chem., Vol.59, No.2 pp.267-268,1987.
5. Winstanley T, Edwards CL, Limb D, Megson K and Spencer RJ. “Evaluation of Surfactant as an Anti-Swarming Agent in Agar Dilution Susceptibility Testing”. Journal of Antimicrobial Chemotherapy 33,353-6.
6. Hoffmann A, Thimm M, Droge E. R,Moore J.C, Munch CC, “Intergeneric Transfer of Conjugative and Mobilizable Plasmids Harbored by Escherichia coli in the Soil.” Application of Environmental Microbiology. 64: 2652-2659.
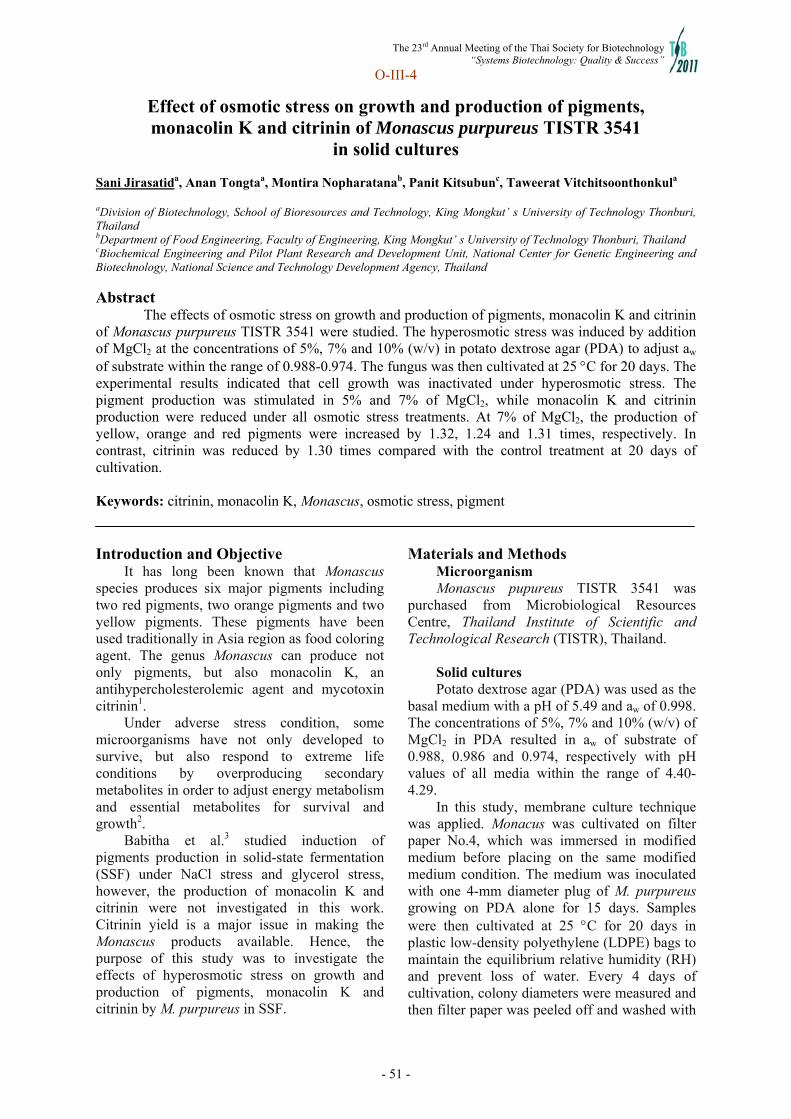
The 23rd Annual Meeting of the Thai Society for Biotechnology “Systems Biotechnology: Quality & Success”
O-III-4
- 51 -
Effect of osmotic stress on growth and production of pigments, monacolin K and citrinin of Monascus purpureus TISTR 3541
in solid cultures Sani Jirasatida, Anan Tongtaa, Montira Nopharatanab, Panit Kitsubunc, Taweerat Vitchitsoonthonkula aDivision of Biotechnology, School of Bioresources and Technology, King Mongkut’ s University of Technology Thonburi, Thailand bDepartment of Food Engineering, Faculty of Engineering, King Mongkut’ s University of Technology Thonburi, Thailand cBiochemical Engineering and Pilot Plant Research and Development Unit, National Center for Genetic Engineering and Biotechnology, National Science and Technology Development Agency, Thailand
Abstract The effects of osmotic stress on growth and production of pigments, monacolin K and citrinin of Monascus purpureus TISTR 3541 were studied. The hyperosmotic stress was induced by addition of MgCl2 at the concentrations of 5%, 7% and 10% (w/v) in potato dextrose agar (PDA) to adjust aw of substrate within the range of 0.988-0.974. The fungus was then cultivated at 25 C for 20 days. The experimental results indicated that cell growth was inactivated under hyperosmotic stress. The pigment production was stimulated in 5% and 7% of MgCl2, while monacolin K and citrinin production were reduced under all osmotic stress treatments. At 7% of MgCl2, the production of yellow, orange and red pigments were increased by 1.32, 1.24 and 1.31 times, respectively. In contrast, citrinin was reduced by 1.30 times compared with the control treatment at 20 days of cultivation. Keywords: citrinin, monacolin K, Monascus, osmotic stress, pigment Introduction and Objective
It has long been known that Monascus species produces six major pigments including two red pigments, two orange pigments and two yellow pigments. These pigments have been used traditionally in Asia region as food coloring agent. The genus Monascus can produce not only pigments, but also monacolin K, an antihypercholesterolemic agent and mycotoxin citrinin1.
Under adverse stress condition, some microorganisms have not only developed to survive, but also respond to extreme life conditions by overproducing secondary metabolites in order to adjust energy metabolism and essential metabolites for survival and growth2.
Babitha et al.3 studied induction of pigments production in solid-state fermentation (SSF) under NaCl stress and glycerol stress, however, the production of monacolin K and citrinin were not investigated in this work. Citrinin yield is a major issue in making the Monascus products available. Hence, the purpose of this study was to investigate the effects of hyperosmotic stress on growth and production of pigments, monacolin K and citrinin by M. purpureus in SSF.
Materials and Methods Microorganism Monascus pupureus TISTR 3541 was
purchased from Microbiological Resources Centre, Thailand Institute of Scientific and Technological Research (TISTR), Thailand.
Solid cultures Potato dextrose agar (PDA) was used as the
basal medium with a pH of 5.49 and aw of 0.998. The concentrations of 5%, 7% and 10% (w/v) of MgCl2 in PDA resulted in aw of substrate of 0.988, 0.986 and 0.974, respectively with pH values of all media within the range of 4.40-4.29.
In this study, membrane culture technique was applied. Monacus was cultivated on filter paper No.4, which was immersed in modified medium before placing on the same modified medium condition. The medium was inoculated with one 4-mm diameter plug of M. purpureus growing on PDA alone for 15 days. Samples were then cultivated at 25 C for 20 days in plastic low-density polyethylene (LDPE) bags to maintain the equilibrium relative humidity (RH) and prevent loss of water. Every 4 days of cultivation, colony diameters were measured and then filter paper was peeled off and washed with
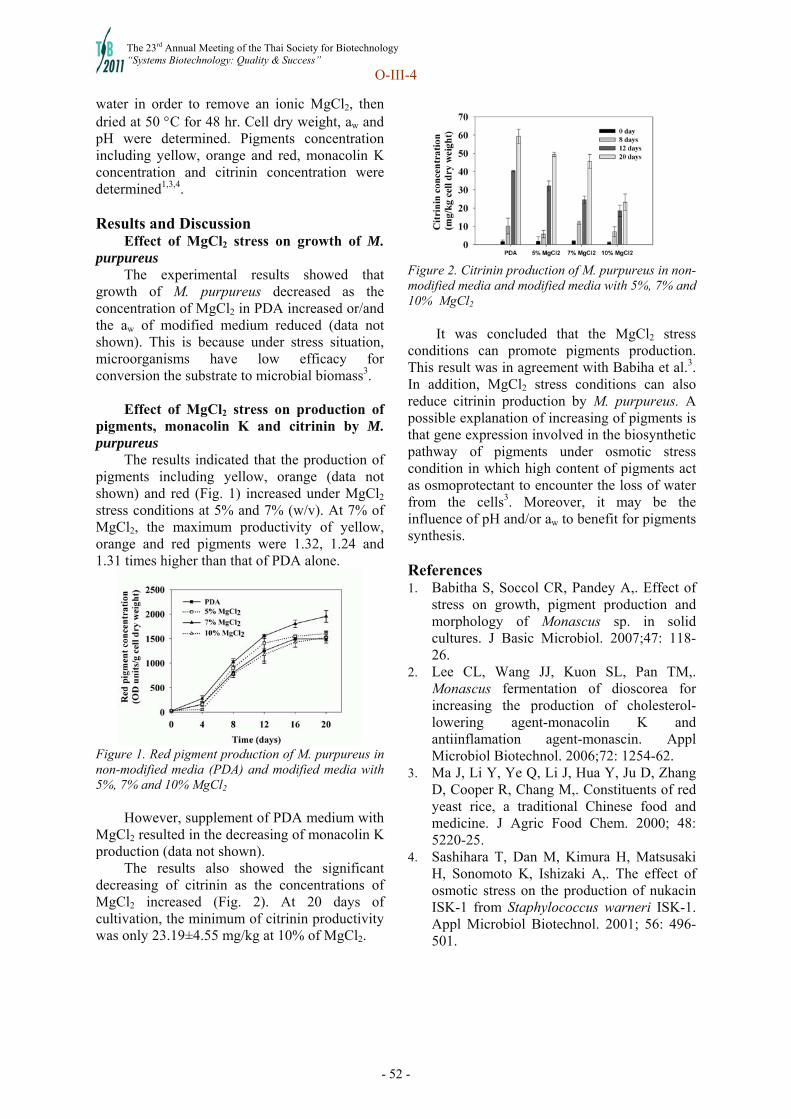
The 23rd Annual Meeting of the Thai Society for Biotechnology “Systems Biotechnology: Quality & Success”
O-III-4
- 52 -
water in order to remove an ionic MgCl2, then dried at 50 C for 48 hr. Cell dry weight, aw and pH were determined. Pigments concentration including yellow, orange and red, monacolin K concentration and citrinin concentration were determined1,3,4. Results and Discussion
Effect of MgCl2 stress on growth of M. purpureus
The experimental results showed that growth of M. purpureus decreased as the concentration of MgCl2 in PDA increased or/and the aw of modified medium reduced (data not shown). This is because under stress situation, microorganisms have low efficacy for conversion the substrate to microbial biomass3.
Effect of MgCl2 stress on production of pigments, monacolin K and citrinin by M. purpureus
The results indicated that the production of pigments including yellow, orange (data not shown) and red (Fig. 1) increased under MgCl2
stress conditions at 5% and 7% (w/v). At 7% of MgCl2, the maximum productivity of yellow, orange and red pigments were 1.32, 1.24 and 1.31 times higher than that of PDA alone.
Figure 1. Red pigment production of M. purpureus in non-modified media (PDA) and modified media with 5%, 7% and 10% MgCl2
However, supplement of PDA medium with
MgCl2 resulted in the decreasing of monacolin K production (data not shown).
The results also showed the significant decreasing of citrinin as the concentrations of MgCl2 increased (Fig. 2). At 20 days of cultivation, the minimum of citrinin productivity was only 23.19±4.55 mg/kg at 10% of MgCl2.
Figure 2. Citrinin production of M. purpureus in non-modified media and modified media with 5%, 7% and 10% MgCl2
It was concluded that the MgCl2 stress conditions can promote pigments production. This result was in agreement with Babiha et al.3. In addition, MgCl2 stress conditions can also reduce citrinin production by M. purpureus. A possible explanation of increasing of pigments is that gene expression involved in the biosynthetic pathway of pigments under osmotic stress condition in which high content of pigments act as osmoprotectant to encounter the loss of water from the cells3. Moreover, it may be the influence of pH and/or aw to benefit for pigments synthesis.
References 1. Babitha S, Soccol CR, Pandey A,. Effect of
stress on growth, pigment production and morphology of Monascus sp. in solid cultures. J Basic Microbiol. 2007;47: 118-26.
2. Lee CL, Wang JJ, Kuon SL, Pan TM,. Monascus fermentation of dioscorea for increasing the production of cholesterol-lowering agent-monacolin K and antiinflamation agent-monascin. Appl Microbiol Biotechnol. 2006;72: 1254-62.
3. Ma J, Li Y, Ye Q, Li J, Hua Y, Ju D, Zhang D, Cooper R, Chang M,. Constituents of red yeast rice, a traditional Chinese food and medicine. J Agric Food Chem. 2000; 48: 5220-25.
4. Sashihara T, Dan M, Kimura H, Matsusaki H, Sonomoto K, Ishizaki A,. The effect of osmotic stress on the production of nukacin ISK-1 from Staphylococcus warneri ISK-1. Appl Microbiol Biotechnol. 2001; 56: 496-501.

The 23rd Annual Meeting of the Thai Society for Biotechnology “Systems Biotechnology: Quality & Success”
O-IV-1
- 53 -
Effect of crude extract to t-butanol ratio on partitioning of proteases from farmed giant catfish viscera
Aten Vannabuna, Phanuphong Chaiwutb, Saroat Rawdkuen a
a Food Technology Program, School of Agro-Industry, Mae Fah Luang University, Muang, Chiang Rai 57100, Thailand b School of Cosmetic Science, Mae Fah Luang University, Muang,Chiang Rai 57100, Thailand
Abstract Three-phase partitioning (TPP) was used to partially purify proteases from the viscera of farmed giant catfish. To optimize the TPP for proteases purification, the ratio of crude enzyme extract to t-butanol (1.0:0.5, 1.0:1.0, 1.0:1.5, 1.0:2.0 v/v) were investigated, while 50% of (NH4)2SO4, K2HPO4 and 40% MgSO4 were fixed. Increasing of t-butanol to the crude extract affected to the partitioning behavior of enzymes as indicated by increasing of proteases recovery in inter-phase of the system containing K2HPO4 and MgSO4. After phase separation, most proteases partitioned into the inter-phase for the system of using (NH4)2SO4 and K2HPO4, whereas the system comprised of MgSO4 most of proteases were obtained in the bottom phase. The highest protease recovery of 101% with a purification of 1.41 fold was found in the inter-phase of the system comprising of the crude extract to t-butanol ratio of 1.0:1.5 with the presence of 50% K2HPO4. Electrophoresis patterns and zymography profiles confirmed that the protein bands with molecular weight of 84, 25, and 23 kDa were main proteases in the viscera of farmed giant catfish. The glycoprotein staining demonstrated that small molecule proteins (<18 kDa) in the viscera contained oligosaccharides. The present study shows potential efficiency of TPP technique use to primary purification process. Keywords: giant catfish, proteases, purification, three-phase partitioning, viscera Introduction and Objective
Three-phase partitioning (TPP) has been reported as an efficient alternative method for concentration and purification of various industrially important enzymes.1 The principle of this technique consists in mixing the crude protein extract with salt and t-butanol in order to obtain three phases .The upper t-butanol phase (containing non-polar compounds) is typically separated from the lower aqueous phase by an interfacial protein precipitate. Viscera have potential as a source of digestive enzymes.2 The most important proteases from viscera of fish are the aspartic protease (pepsin), and serine proteases (trypsin, and chymotrypsin). TPP was successfully used for isolation of proteases from Calotropis proceara latex3. However, no reports on protease purification from fish viscera using TPP available. Therefore, this study was conducted to optimize the purification process of the proteases from farmed giant catfish viscera by using TPP at different ratios of crude extract to t-butanol. Materials and Methods
Crude extract and TPP preparation Viscera from farmed giant catfish were
homogenized for 2 mins with extraction buffer A (10 mM Tris–HCl pH 8.0, 10 mM CaCl2) in the
ratio of 1:5 (w/v). The mixture was centrifuged at 10,000g for 10 min at 4ºC. The pellet was discarded and the supernatant was collected and used as “crude enzyme extract”. The TPP was carried out as described by Shamar and Gupta4. The effects of crude extract to t-butanol ratio (1.0:0.5, 1.0:1.0, 1.0:1.5, 1.0:2.0 (v/v) on protease partitioning were studied. The salt type and concentration was fixed at (NH4)2SO4 50%, K2HPO4 50% and MgSO4 40% (w/v) was added. Proteolytic activity and protein content determinations
Proteolytic activity was determined by using caseinolytic activity assay according to the method of Rawdkuen et al3. Bradford method5 was used determination of protein concentration. Electrophoresis
SDS-PAGE according to the method of Laemmli6 The protein band separated on SDS-PAGE was verified for proteolytic activity by using substrate (casein) gel electrophoresis according to the method of Rawdkuen et al3. Glycoprotein staining was conducted using GelCode Glycoprotein Staining Kit according to the method used in Wati et al7

The 23rd Annual Meeting of the Thai Society for Biotechnology “Systems Biotechnology: Quality & Success”
O-IV-1
- 54 -
Result and Discussion Effect of crude extract to t-butanol on protease recovery using TPP
Different ratios of crude extract to t-butanol on proteases partitioning in TPP system was determined. Increasing of t-butanol ratio resulted in increase protease recovery at the interphase (I-ph) of K2HPO4 and MgSO4 but decreased of proteases recovery in the bottom phase (B-ph). However, at ratio 1.0:0.5 gave the highest protease recovery of (NH4)2SO4 in the I-ph and MgSO4 in the B-ph. Increasing of fold was observed when ratio of t-butanol increased at the B-ph of (NH4)2SO4 and I-ph of K2HPO4. Partitioning of protease from farmed giant cat fish viscera by TPP
The partial purification of protease from farmed giant catfish viscera by TPP with different conditions was summarized in Table1. Table 1.Three-phase partitioning of proteases from viscera of farmed giant catfish.
The system 50% K2HPO4 at ration 1:1.5 gave highest protease recovery of 101% and with of purification of 1.41-fold. Most of protease partitioned into the I-ph for system of (NH4)2SO4 and K2HPO4, whereas the system of MgSO4 most proteases were obtained in the B-ph. Protein pattern, zymography and glycoprotein staining
Protein patterns are shown in Figure 2A. The major protein bands with the molecular weight (MW) of 84, 39.2 and <18 kDa were found in the crude enzyme extract.Smear protein bands with MW of 23 kDa and 25 kDa were found at the I-ph.
Figure 2B shows the activity staining. A protein band with the MW of 23, 25 and 84 kDa appeared on the protein gel provided the hydrolytic activity on substrate gel electrophoresis. The presence of this clear zone in the activity staining condition suggested that it is the protease that can hydrolyze casein in the gel.
Glycoprotein composition staining is presented in Figure 2C. The glycoprotein staining revealed that the major protein bands with MW lower than 18 kDa were contained oligosaccharide.
Figure 2 Protein patterns (A), activity staining (B) and glycoprotein staining(C) M: molecular weight marker,1,8:crude enzyme extract,2: I-ph (NH4)2SO4 1:0.5, 3: I-ph K2HPO4 1:1.5, 4: I-ph MgSO4 1:0.5, 5: B-ph (NH4)2SO4 1:0.5, 6: B-ph K2HPO4 1:1.5 t-butanol, 7: B-ph MgSO4 1:0.5
TPP technique provided high enzyme recovery with an acceptable purification fold and can be used as primary purification process. References 1. Dennison C, Lovrein R. Three phase
partitioning: concentration and purification of proteins. Protein Expres Purif. 1997:11:149-61.
2. Shahidi F, Kamil J Y V A. Enzymes from fish and aquatic invertebrates and their application in the food industry. Trend Food Sci Tech. 2001:12:435-64
3. Rawdkuen S. Chaiwut P. Pintathong P. Benjakul S. Three-phase partitioning of protease from Calotropis procera latex. Bio Eng J. 2010; 50: 145-49.
4. Sharma A. Gupta MN. Three phase partitioning as a large-scale separation method for purification of a wheat germ bifunctional protease/amylase inhibitor. Process Biochem. 2001; 37: 193-96.
5. Bradford M M. Anal Biochem. 1976:72: 248-54.
6. Laemmli U K. Cleavage of structural protein assembly of head of bacteriophage T4. Nature. 1970:227:680–85.
7. Wati, R K. Theppakorn, T. Benjakul S. Rawdkuen S. Three-phase partitioning of trypsin inhibitor from legume seeds. Process Biochem. 2009, 44, 1307-314.

The 23rd Annual Meeting of the Thai Society for Biotechnology “Systems Biotechnology: Quality & Success”
O-IV-4
- 55 -
Effects of fiber length on mechanical properties of oil palm empty fruit bunched fiber-reinforced biocomposites.
Sukanya Eiemsupackul1 , Bunpot Mai-Ngam2 , Dudsadee Uttapap3 , Chureerat Pudtanlek4 , Vilai Rungsardthong1*.
1 Department of Agro-Industrial Technology, Faculty of Applied Science, King Mongkut’s University of Technology North Bangkok, Bangkok 10800, Thailand. 2 Polymer Research Unit, Department of Plastics Technology Lab, National Metal and Materials Technology Center (MTEC), National Science and Technology Development Agency, Pathumthani 12120, Thailand. 3 Division of Biochemical Technology, School of Bioresources and Technology, King Mongkut's University of Technology Thonburi, Bangkok 10150, Thailand. 4 Department of Biotechnology, Faculty of Engineering and Industrial Technology, Silpakorn University, Nakhon Pathom 7300, Thailand. *e-mail: [email protected]
Abstract The effects of fiber length on mechanical properties and water absorption of biocomposites made from soy protein, polylactic acid (PLA) reinforced with oil palm empty fruit bunched fiber (OPF) were studied. The composites were prepared by extrusion, followed by compression molding. Three ranges of fiber length: 0.4±0.21 cm (short fiber, SF), 1.54±0.41cm (medium fiber, MF), 2.41±0.53 cm (long fiber, LF) were used with fiber loading at 5, 10, 12.5 and 15% (by weight) of the matrix. The results showed that fiber length and percentage of loading affected mechanical properties and water absorption of biocomposites. Both tensile strength and impact strength of the composites were increased when LF and MF were used, whereas flexural strength was improved with SF. The use of MF and LF at 12.5 % could improve both tensile strength and impact strength of the composite obtained at 33.51 %, 37.49%and 11.38%, 21.59% respectively. Keywords: biocomposites, soy protein, polylactic acid, empty fruit bunched fiber,
mechanical properties. Introduction:
Biopolymers can be derived from natural resources such as protein, starch, and cellulose. They have been regarded as an alternative material to petroleum based polymer as they are renewable, abundant, low cost, biodegradable and environmental friendly (1, 2). Deffated soy flour or soy protein derived from food processing by-product can be used for the production of biopolymer. They are complex macromolecules containing 20 amino acids with many sites available for interaction with plasticizer (2). Because of its low strength and high moisture absorption the performance and mechanical properties of soy protein plastic is still lower than other commercial plastic. Blending soy protein with biodegradable polymer will help improving the mechanical properties of the bioplastic obtained.
The advantages of using natural fibers instead of synthetic fibers are: low cost, low densities, biodegradable, and renewable (3). The effects of fiber length on mechanical properties of composite materials were reported (2, 5).
Many researches on the use of natural fibers such as pineapple leafs, kenaf, flax, coconut coir, bagasse reinforced biocomposites are found (1, 2, and 3). but there are very few reports on the use of oil palm fibers.
The aims of this research were to study the effects of fiber length on mechanical properties and water absorption of biocomposites made from soy protein, polylactic acid reinforced with OPF. Materials and Methods
OPF was kindly obtained from Asian Palm Oil Co., Ltd. Krabi. Polylactic acid (PLA) was supplied by Nature Work®. Isolate soy protein (ISP) and defatted soy flour (DSF) from Thai Vegetable Oil Public Co, Ltd.
2.1 Preparation of oil palm fibers: OPF were
washed by using tap water and dried in a hot air oven at 80°C for 15 hours. Then, the fibers were separated by using sieves and plastic. Three ranges of fibers length were separated as shown in Fig.1

The 23rd Annual Meeting of the Thai Society for Biotechnology “Systems Biotechnology: Quality & Success”
O-IV-4
- 56 -
Medium fiber (MF): 1.54±0.41 cm
Long fiber (LF): 2.41±0.53 cm
Fig. 1 Oil palm fiber separated into 3 ranges of length.
2.2 Extrusion of matrix and OPF-
reinforced biocomposites: DSF, ISP, PLA and OPF were all dried at 80 oC for 15 hour. After that, DSF was pre-mixed with ISP to 70 % of protein content (4). The mixture was blended with glycerol at a weight ratio of 70 (2) 30׃. and further mixed with PLA in the weight ratio of All mixture was fed into a single-screw .40׃ 60extruder with barrel temperature zones 1:2:3 at 150:160:170 °C and screw feeder speed and screw feed of 30 rpm and 100 rpm. The extruded bioplastic were cut into small pellets and re-extruded with 3 length of OPF and 4 level of fiber loading at 5, 10, 12.5 and 15%. The biocomposites were compression molded and measured following ASTM D 638, ASTM D 790, and ASTM D 256 for tensile strength (TS), impact (IS) and flexural strength (FS) respectively. Water absorption of the biocomposites was also evaluated. Results& Discussion
The mechanical properties and water absorption of OPF-reinforced biocomposites are presented in Table 1. TS of composite using SF at 5% was 10.09 MPa which was 40.19% higher than that of the matrix only. However, the increase of SF to 10 and 15% loading gave composites with lower TS. TS tended to be improved with the addition of LF and MF while IS was increased about 6.25-21.59% with the addition of LF. The results agreed with Liu, 2007(2) reported the increase of IS with longer fiber length. Improvement of FS was observed with the addition of SF. The use of LF with fiber loading at 12.5 and 15% showed high value in all mechanical properties of TS, IS and FS. The hydrophilic surface of plant fiber led to the increase of water absorption about 40-75% when compared to the matrix. The morphology of fracture surface of OPF-reinforced biocomposites is shown in Fig. 2 SEM analysis showed the phase separation of fibers and bioplastic. Fibers surface treatment in our further study will improve the compatibility of the fiber and bioplastic.
Table1. Mechanical properties and water absorption of the bioplastic reinforced with 3 length of OPF at various % loading.
Fig. 2 SEM micrographs of OPF with 400×scale bar of 50 µm (a), impact fracture surface of composites reinforced with: MF12.5% (b), SF15 % (c) and SF5% (d) with 200 × scale bar of 100 µm References 1. Liu, W., Misra, M., Askeland, P., Drzal, L. T. and
Mohanty, A. K. “Green composites from soy based plastic and pineapple leaf fiber : fabrication and properties evaluation.” Polymer. 46 (2005): 2710-2721.
2. Liu, W., Drzal, L. T., Mohanty, A. K. and Misra, M. “Influence of processing methods and fiber length on physical properties of kenaf fiber reinforced soy based biocomposites.” Composites: Part B. 38 (2007): 352-359.
3. Oksman, K., Skrifvars, M., Selin, J-F. “Natural fibres as reinforcement in polylactic acid (PLA) composites.” Composites Science and Technology. 63(2003): 1317-1324.
4. Boontima, B., Noomhorm, A., Pudtanlek, C., Uttapap, D., and Rungsardthong, V. “Effect of protein content and PLA on mechanical properties of soy protein-based bioplastic”. Proceeding of the 3rd Technology and Innovation for Sustainable Development International Conference (TISD2010), Royal Mekong Nongkhai Hotel, Nong Khai, Thailand, March 4 - 6, 2010.
5. Takagi, H. And Ichihara, Y. Effect of fiber length on mechanical properties of “Green” composites Using a Starch-Based resin and Short Bamboo fibers. JSME international Journal, Series A, Vol. 47, No. 4, 2004.
Short fiber (SF): 0.4±0.21 cm
The 23rd Annual Meeting of the Thai Society for Biotechnology “Systems Biotechnology: Quality & Success”
O-IV-5
- 57 -
Optimization of the fructo-oligosaccharides production using two-step fed-batch fermentation of Aspergillus niger TISTR3570
Dararat Mongkolkarn a, Gassinee Trakoontivakornc and Sarote Sirisansaneeyakul a,b,*
aDepartment of Biotechnology, Kasetsart University, Chatuchak, Bangkok, 10900, Thailand bCenter for Advanced Studies in Tropical Natural Resources, National Research University-Kasetsart University, Kasetsart University, Chatuchak, Bangkok, 10900, Thailand (CASTNAR, NRU-KU, Thailand) cInstitute of Food Research and Product Development, Kasetsart University, Chatuchak, Bangkok, 10900, Thailand *Corresponding author: [email protected]
Abstract Fructo-oligosaccharides (FOS) are prebiotic substances found in many vegetables and natural
foods. FOS present many unique properties, such as low caloric values, non-cariogenic and using as prebiotics to stimulate the bifidobacterial growth in the human colon. In this study, the production of FOS was carried out by applying two-step fed-batch fermentation process. In the first phase, the production β-fructofuranosidase (bFFase) by Aspergillus niger TISTR 3570 was prepared in the sucrose medium under optimal growth condition. Consecutively, in the second phase, the bFFase produced previously was activated the conversion of FOS from high sucrose concentration as substrate. Sucrose concentrations, agitation and aeration rates affecting on the FOS production were experimentally observed. The use of 100 g/L sucrose, 28°C, pH 7, 0.5 vvm and 600 rpm (CON-1) and the use of 150 g/L sucrose, 28°C, pH 7, 1 vvm and 400 rpm (CON-2) were compared in a 2-L stirred tank reactor. It was found that the production of 11,691.96 U/L bFFase and 118.62 g/L FOS were better attained with the latter one (CON-2). Also, the FOS productivity and bFFase activity were enhanced 6 and 2.5 times higher than those obtained with the former one (CON-1). In comparison, the FOS yield (YFOS/S) and volumetric productivities (QFOS/S) for CON-1 were 0.26 g/g sucrose and 0.19 g/L/h, while those for CON-2 were 0.61 g/g sucrose and 1.391 g/L/h, respectively. This was indicated that the conditions can be found optimally for the concomitant production of bFFase/FOS with high yield and productivity in a two-step fed-batch fermentation process.
Keywords: Aspergillus niger TISTR 3570, Fructo-oligosaccharides, β-fructofuranosidase, Sucrose, two-step fed-batch fermentation Introduction and Objective
Fructo-oligosaccharides (FOS) are non-digestible
carbohydrates that represent one of the major classes of bifidogenic oligosaccharides. They are compounds of a vegetable origin and are found in varying concentrations in many foods such as asparagus, onions, artichokes, garlic, wheat, bananas, tomatoes and honey. FOS are specifically defined as mixed chains of fructosyl with a glucose terminal unit; they have a maximum of 5 units and are derived from sugar through natural fermentation processes, producing 1-kestose (GF2), nystose (GF3) and 1F-fructo-furanosylnystose (GF4) in which the fructosyl units (F) are linked at the β (21) position of sucrose. Therefore, the interest for applications of FOS in food and pharmaceutical products has been increased. Then, the aim of this study was to produce FOS by two-step fed-batch fermentation process to increasing the fructo-oligosaccharides yield and productivity.
Materials and Methods
Microorganism Aspergillus niger TISTR 3570
(Sirisansaneeyakul et al., 2005), as potential β-fructofuranosidase producer was received from the Microbiological Resources Center, Thailand Institute of Scientific and Technological Research (TISTR).
FOS production In the first phase, the production β-fructo-
furanosidase (bFFase) by Aspergillus niger TISTR 3570 was prepared in the sucrose medium under optimal growth condition. Consecutively, in the second phase, the bFFase produced previously was activated the conversion of FOS from high sucrose concentration as substrate (Sangeetha et al., 2005). Sucrose concentrations, agitation and aeration rates affecting on the FOS production were experimentally

The 23rd Annual Meeting of the Thai Society for Biotechnology “Systems Biotechnology: Quality & Success”
O-IV-5
- 58 -
observed. The use of 100 g/L sucrose, 28°C, pH 7, 0.5 vvm and 600 rpm (CON-1) and the use of 150 g/L sucrose, 28°C, pH 7, 1 vvm and 400 rpm (CON-2) were compared in a 2-L stirred tank reactor.
Enzyme assay One unit of β-fructofuranosidase was
defined as 1 μmole per minute of glucose was liberated in 1 minute from the enzyme reaction at the specified condition of pH 5.0, 55°C and incubated for 60 min. The enzyme reaction was terminated by adding DNS and boiling at 100°C for 5 min, followed by immediate cooling. The glucose formed was detected as reducing sugar using 3,5-dinitrosalicylic acid (Miller, 1959).
Sugars determination Sucrose, glucose, fructose, 1-kestose nystose
and 1-fructosylnystose were determined by high performance liquid chromatography (HPLC) with a refractive index (RI) detector and an Inertsil NH2
column at 40°C using acetonitrile: double distillation water as the mobile phase and a flow rate of 1 mL/min. Detection was performed by refractive index measurement.
Results β-fructofuranosidase production
The production of bFFase for the CON-1 and CON-2 are shown in Figure 1. For both cultivations, the enzyme production was increased with time course. The maximal enzyme production of 11,691.96 U/L was attained in CON-2, which was enhanced 2.5 times higher than that obtained in CON-1 (3,385.42 U/L).
Incubation time (h)
0 6 12 18 24 30 36 42 48 54 60 66 72 78 84
bFF
ase
acti
vity
(U
/L)
0
2000
4000
6000
8000
10000
12000
CON-1 CON-2
Fig. 1 Comparison β-fructofuranosidase activity between CON-1(black circles) and CON-2 (white
circles)
Fructo-oligosaccharides production The production of FOS resulting from
CON-1 and CON-2 are shown in Figure 2. The concentration of FOS was maximized at 118.62 g/L from CON-2, which was 6 times higher than that obtained from CON-1 (16.97 g/L).
Incubation time (h)
0 6 12 18 24 30 36 42 48 54 60 66 72 78 84
FO
S C
once
ntra
tion
(g/
L)
0
20
40
60
80
100
120
140
CON-1 CON-2
Fig. 2 Comparison FOS between CON-1(black
squares) and CON-2 (white squares)
The FOS yield (YFOS/S) and volumetric productivities (QFOS/S) for CON-1 were 0.26 g/g sucrose and 0.19 g/L/h, while those for CON-2 were 0.61 g/g sucrose and 1.391 g/L/h, respectively. Discussion
In this work, the result from CON-2 was found to be optimal conditions for the production of FOS. Under the optimal conditions, the concentration, yield and volumetric productivity of FOS were improved as follows; 118.62 from 16.97 g/L, 0.61 from 0.26 g/g and 1.39 from 0.19 g/L/h, respectively, as compared with the result from CON-1. Both the yields of bFFase and FOS were satisfactory and preferable to those found in the literatures. For use of Aureobasidium sp. ATCC 20524 in a two step batch culture system, an increase of more than 0.8 times of the bFFase activity and 0.3 times of the FOS production were observed, comparing with the single batch culture mode. (Salinas and Perotti, 2009) This was indicated that the conditions can be found optimally for the concomitant production of bFFase/FOS with high yield and productivity in a two-step fed-batch fermentation process.

The 23rd Annual Meeting of the Thai Society for Biotechnology “Systems Biotechnology: Quality & Success”
O-IV-5
- 59 -
References 1. Maiorano AE, PiccoliRM, Silva ES and
Rodrigues MFA. Microbial production offructosyltransferases for synthesis of pre-biotics. Biotechnol Lett. 2008;30: 1867-1877.
2. Miller GL, Use of dinitrosalicylic acid reagent for determination of reducing sugar. Anal Chem. 1959;31: 426-428.
3. Salinas MA and Perotti NI. Production of fructosyltransferase by Aureobasidium sp. ATCC 20524 in batch and two-step batch cultures. J Ind Microb Biotechnol. 2009;36: 39-43.
4. Sangeetha PT, Ramesh MN and Prapulla SG. Maximization of fructo-oligosaccharide production by two stage continuous process and its scale up. J Food Eng. 2005;68: 57-64.
5. Sirisansaneeyakul S, Worawuthiyanan N, Vanichsriratana W, Srinophakun P and Chisti Y. Production of fructose from inulin using mixed inulinases from Aspergillus niger and Candida guiliermondii. World J Microbiol Biotechnol. 2007;23: 543-552.

The 23rd Annual Meeting of the Thai Society for Biotechnology “Systems Biotechnology: Quality & Success”
O-IV-7
- 60 -
The heterotrophic cultivation of Chlorella sp. TISTR 8990 in a 5-L fed-batch bioreactor
Yothaka Puchcha a, Natapas Phoopat c, Duenrut Chonudomkul d and Sarote Sirisansaneeyakul a,b,*
aDepartment of Biotechnology, Kasetsart University, Chatuchak, Bangkok, 10900, Thailand bInstitute of Food Research and Product Development, Kasetsart University, Chatuchak, Bangkok, 10900, Thailand cDepartment of Microbiology, Kasetsart University, Chatuchak, Bangkok, 10900, Thailand dCenter for Advanced Studies in Tropical Natural Resources, National Research University-Kasetsart University, Kasetsart University, Chatuchak, Bangkok, 10900, Thailand (CASTNAR, NRU-KU, Thailand)
*Corresponding author: [email protected]
Abstract Microalgae are recently well-known to produce oil for biodiesel. The microalga, Chlorella could be cultured under heterotrophic condition using complex organic substances. Various medium compositions and environmental factors affect controlling the algal growth and lipid accumulation, e.g. carbon/nitrogen sources and agitation. In this study, an optimization of cell concentration and lipid accumulation of Chlorella sp. TISTR 8990 was performed with the fed-batch cultivation in a 5-L bioreactor. The profile of adding glucose and potassium nitrate were investigated for maximizing algal biomass yield and productivity. The results indicated that glucose/potassium nitrate were factors available essentially as carbon/nitrogen sources for the heterotrophic cultivation of microalgae with obtainable high cell density and lipid content. As a result, the cell density of 11.65 g/L dry weight and the oil content of 9.64% w/w were attained with using the total glucose concentration of 30 g/L at 150-h culture time in a fed-batch bioreactor. Profiles of the fed-batch production of algal biomass with reasonably high oil content are further optimized to be published later. Keywords: microalgae, heterotrophic, fed-batch culture, algal oil
Introduction and objectives
Due to global warming, diminishing
petroleum reserves and environmental consequences of exhaust gases from fossil diesel, biodiesel was alternative fuel materials which have attracted wide attention.
Microalgae such as Chlorella sp. have been suggested as very good candidates for biodiesel production because of higher biomass production and faster growth compared to other energy crops. Chlorella protothecoides can be photoautotrophic or heterotrophic growth under different culture conditions. Heterotrophic growth of C. protothecoides results in high production of biomass and accumulation of high lipid content in cell (Miao and Wu, 2006). Consequently, the microalgal biomass with high lipid content becomes the new alternative oil sources. In this study, an optimization of cell concentration and lipid accumulation of Chlorella sp. TISTR 8990 was performed with the fed-batch cultivation in a 5-L bioreactor.
Materials and Methods Microalgal strain and media culture
Chlorella sp. TISTR 8990 was obtained f rom Wala i l ak Un ive r s i ty , Tha i l and (Singhasuwan et al., 2009). It was cultured in basal medium (Horikoshi et al., 1981) that contained (per liter) 2 g KNO3, 1 g KH2PO4, 1 g MgSO4·7H2O, 2 mg FeSO4·7H2O, 2.86 mg H 3 BO 3 , 1 .81 mg MnCl 2 ·4H 2 O, 0 .22 mg ZnSO4·7H2O, 0.08 mg CuSO4.5H2O and 0.021 mg Na2MoO4.
Inoculum preparation
Photoautotrophic inoculums were grown in 50 mL/200 mL microalgal culture tube, cultured under light intensity of 15 klux with the diurnal cycle of 16:8 (light:dark), continuous CO2
feeding rate of 0.67 vvm and controlled the temperature at 30oC for 7 days. To obtain heterotrophic inoculums, 10% photoautotrophic inoculums were inoculated into sterilized basal medium supplemented with 5 g/L glucose in Erlenmeyer flasks. It was incubated at 30oC, pH 6 under continuous shaking (200 rpm), and kept in dark for 5 days.

The 23rd Annual Meeting of the Thai Society for Biotechnology “Systems Biotechnology: Quality & Success”
O-IV-7
- 61 -
Heterotrophic cultivation in a 5-L fed-batch bioreactor
The 10% heterotrophic inoculums were inoculated into a 5-L bioreactor (Biostat B, B. Braun Biotech International, Germany) containing 4-L of basal medium with initial concentrated solution of glucose 5 g/L. The medium was controlled at 30oC and adjusted pH to 6. The dissolved oxygen concentration was controlled by airflow (0.5 vvm) and agitation speed (100 rpm). Concentrated glucose solution was fed into medium to keep the internal glucose concentration at 5 and 10 g/L when glucose was exhausted. Samples were taken every 6 h to measure the optical dens i ty , d ry ce l l weight , g lucose concentration, potassium nitrate concentration and lipid content. Analytical methods
Cell growth was measured by means of the absorbance of the suspension at 540 nm (Becker, 1994) and dry cell weight (Sirisansaneeyakul et al., 2011). Glucose and potassium nitrate concentrations, residual glucose and potassium nitrate in the culture broth were determined by DNS method (Miller, 1959) and brucine colorimetric method (ASTM 1976), respectively. Lipid in the microalgal biomass was extracted with the method of Işik et al. (1999). Results
As shown in Figure 1, the glucose solutions (30 g/L) were fed 3 times into culture medium at 42.30 h, 78 h and 120 h culture time when glucose concentrations were exhausted, respectively, while the potassium nitrate was depleted at the end of the second glucose feeding. The cell density increased during these cultivations and the highest algal biomass of 11.65 g/L dry weight was obtained at 150 h. However, the highest oil content of 10.04% w/w was obtained at 144 h and gradually decreased to 9.64% w/w at 150 h.
Time (h)
0 20 40 60 80 100 120 140
biom
ass,
glu
cose
and
KN
O3
conc
entr
atio
ns (
g/L
)
0
2
4
6
8
10
12
14
lipi
d co
ncen
trat
ion
(g/L
)
0
2
4
6
8
10
12
14biomass
glucose
potassium nitrate
lipid
Figure 1 Biomass and lipid concentrations of Chlorella sp. TISTR 8990 was performed with the fed-batch cultivation in a 5-L bioreactor using glucose as carbon source. Arrows indicated the points of glucose feeding. Discussion
From the result, it was found that the high cell concentration of Chlorella sp. TISTR 8990 and its productivity could be obtained from scaling up the cultivation in a 5-L fed-batch bioreactor. In contrast, lipid accumulation was not achieved during cultivation. Usually, high lipid contents are produced under stresses or nutrient limitations such as nitrogen limitation/starvation (Macduff et al., 2002). This phenomenon shows an increase of lipid accumulation but a decrease in protein synthesis, chlorophyll and cell division (Chen, 1996). Therefore, to obtain the high oil content, the condition should be improved to eliminate the effect of product inhibition or nutrient limitations.
References 1. ASTM. Annual Book of ASTM Standards,
Part 31, “Water”, Standard D 992-71, 363; 1976.
2. Becker EW. Measurement of algal growth. United Kingdom: Cambridge University Press; 1994.
3. Chen F. High cell density culture of micrialgae in heterothophic growth. Trends Biotechnol. 1996; 14: 421-426.
4. Heredia-Arroyo T, Wai W, Hu B. O i l a c c u m u l a t i o n v i a heterotrophic/mixotrophic Chlorella protothecoides. Appl. Biochem. Biotechnol. 2010; 162: 1978-1995.
The 23rd Annual Meeting of the Thai Society for Biotechnology “Systems Biotechnology: Quality & Success”
O-IV-7
- 62 -
5. Horikoshi T, Nakajima A, Sakaguchi T. Accumulation of uranium by Chlorella cells grown under autotrophic, heterotrophic and mixotrophic culture conditions. Agric. Biol. Chem. 1981; 45 (3): 781-783.
6. Isik O, Sarihana E, Kusvuran E, Gül O, Erbatur O. Comparison of the fatty acid composition of the freshwater fish larvae Tilapia zillii, the rotifer Brachionus calyciflorus, and the microalgae Scenedesmus abundans, Monoraphidium minitum and Chlorella vulgaris in the algae-rotifer-fish larvae food chains. Aquacul. 1999; 174: 299–311.
7. Macduff J.H., Humphreys M.O., Thomas H. Effects of a stay-green mutation on plant nitrogen relations in Lolium perenne during N starvation and after defoliation. Ann. Bot. 2002; 89:11-21.
8. Miao XL, Wu QY. Biodiesel production from heterotrophic microalgal oil. Bioresour. Technol. 2006; 97: 841-846.
9. Miller G.L. Use of dinitrosalicylic acid reagent for determination of sugar. Anal. Chem. 1959; 31: 426.
10. S i n g h a s u w a n S , C h o o r i t W , Phoopat N, Parakulsuksa t id P , V a n i c h s r i r a t a n a W , S i r i sansaneeyakul S . Screen ing microalgae isolated in Thailand for the production of biodiesel. The Proceedings of 47th Kasetsart University Annual Conference, Kase t sa r t Univers i ty , Bangkok, Thailand. 2009; 8: 386–391.
11. Sirisansaneeyakul S, Singhasuwan S, Choorit W, Phoopat N, Garcia JL, Chisti Y. Photoautotrophic Production of Lipids by Some Chlorella Strains. Mar. Biotechnol. 2011; 13(5): 928–941.
12. Xiong W, Li X, Xiang J, Wu Q. High-density fermentation of microalga Chlorella protothecoides in bioreactor for microbio-diesel production. Appl. Microbiol. Biotechnol. 2008; 78: 29-36.

The 23rd Annual Meeting of the Thai Society for Biotechnology “Systems Biotechnology: Quality & Success”
O-IV-8
- 63 -
The high yield production of xylitol by repeated fed-batch fermentation
Siwaporn Wannawilai a,b and Sarote Sirisansaneeyakul a,b* a Department of Biotechnology, Faculty of Agro-Industry, Kasetsart University, Bangkok 10900, Thailand b Center for Advanced Studies in Tropical Natural Resources, National Research University-Kasetsart University, Kasetsart University, Chatuchak, Bangkok 10900, Thailand (CASTNAR, NRU-KU, Thailand) *Corresponding author: [email protected]
Abstract Xylitol is a five-carbon sugar alcohol which is interesting as a sugar substitute due to its sweetening power similar to sucrose and has attractive health properties such as suitable for diabetics and does not cause tooth decay. In this study, xylitol was produced with high yields by the repeated fed-batch fermentations using high-cell density of Candida magnoliae TISTR 5663 controlled at oxygen limiting and nitrogen sources feeding conditions. The xylitol yields of 0.838, 0.938 and 0.997 g g-1 were obtained at average cell concentrations of 22, 50 and 54 g l-1, respectively, which three repeated fed-batch xylitol fermentations were controlled under the optimal initial xylose concentration of 60 g l-1 at agitation rate 300 rpm, aeration rate 1.0 vvm, temperature 30 °C and pH 7.0. For the total of 750 hours of fermentation, the average xylitol productivity was 1.79 g l-1 h-1 with the final xylitol concentration of 306-336 g l-1. Keywords: Candida magnoliae TISTR 5663, repeated fed-batch fermentation, xylitol production, oxygen limiting condition, nitrogen sources Introduction and Objective
Xylitol is considered as a sugar substitute due to its sweetening power similar to sucrose but it does not cause tooth decay and suitable for diabetics (Emodi, 1978; Carvalho et al., 2008). Currently, the production of xylitol by the biotechnological process using xylose-fermenting yeasts especially in genus Candida spp. was often investigated because of giving a high yield and productivity affecting the lower price of xylitol than the industrial xylitol production by chemical hydrogenation. At the present time, the biotechnological process of xylitol production has been divided into two phases; the biomass production phase which produces biomass under aerobic condition and xylitol production phase which converses xylose to xylitol under oxygen limiting condition. Moreover, various researches work on the optimization of these processes such as pH, the concentration of initial xylose and cells, effect of co-substrates and nitrogen sources. In this work, the effects of pH and nitrogen sources on biomass production phase using the osmotolerant yeast Candida magnoliae TISTR 5663 was investigated.
Materials and Methods
Microorganism, inoculum preparation and fermentation conditions
Candida magnoliae TISTR 5663 (Nakano et al., 2000; Tada et al., 2004) was used throughout the study. The compositions of YMP agar slant and the growth medium including the method of inoculum preparation was previously described (Wannawilai et al., 2009). Afterwards, 100 ml of C. magnoliae TISTR 5663 inoculum was transferred to a 2-l stirred-tank fermenter (Biostat B, B. Braun Biotech International, Germany) containing 900 ml of growth medium. The effect of pH on biomass production phase was investigated by comparing an initial pH at 6.8 and controlled pH at 4.0. In addition, the effect of nitrogen sources was determined by feeding 2.3 g l-1 urea and 1.0 g l-1 casamino acids to the fermenter under 30 ºC and 70-80 % air saturation of dissolved oxygen concentration. Results and Discussion
Effects of pH and the mixed nitrogen sources on biomass production due time course are shown in Figure 1 and the fermentation kinetic parameters are summarized in Table 1.
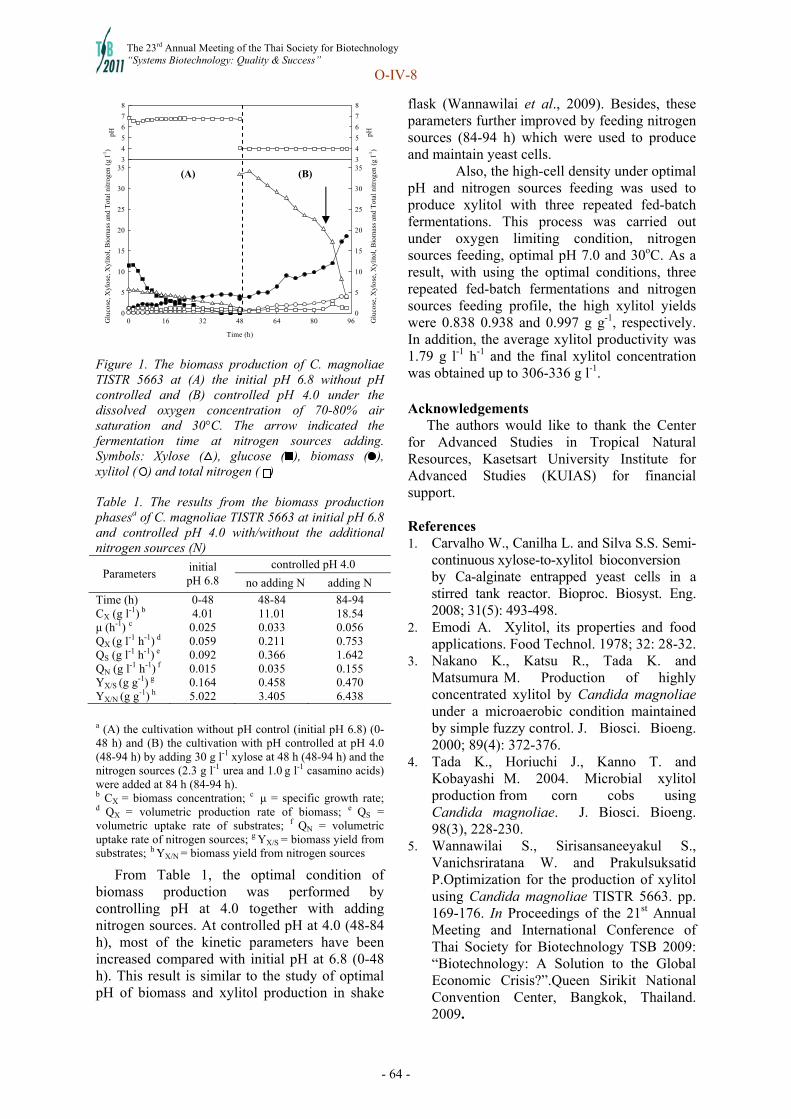
The 23rd Annual Meeting of the Thai Society for Biotechnology “Systems Biotechnology: Quality & Success”
O-IV-8
- 64 -
2D Graph 1
Time (h)
0 16 32 48 64 80 96Glu
cose
, Xyl
ose,
Xyl
itol,
Bio
mas
s an
d T
otal
nitr
ogen
(g
l-1)
0
5
10
15
20
25
30
35
Glu
cose
, Xyl
ose,
Xyl
itol,
Bio
mas
s an
d T
otal
nitr
ogen
(g
l-1)
0
5
10
15
20
25
30
35
pH
3
4
5
6
7
8
pH
3
4
5
6
7
8
Figure 1. The biomass production of C. magnoliae TISTR 5663 at (A) the initial pH 6.8 without pH controlled and (B) controlled pH 4.0 under the dissolved oxygen concentration of 70-80% air saturation and 30°C. The arrow indicated the fermentation time at nitrogen sources adding. Symbols: Xylose ( ), glucose ( ), biomass ( ), xylitol ( ) and total nitrogen ( ) Table 1. The results from the biomass production phasesa of C. magnoliae TISTR 5663 at initial pH 6.8 and controlled pH 4.0 with/without the additional nitrogen sources (N)
controlled pH 4.0 Parameters
initial pH 6.8 no adding N adding N
Time (h) 0-48 48-84 84-94 CX (g l-1) b 4.01 11.01 18.54 μ (h-1) c 0.025 0.033 0.056 QX (g l-1 h-1) d 0.059 0.211 0.753 QS (g l-1 h-1) e 0.092 0.366 1.642 QN (g l-1 h-1) f 0.015 0.035 0.155 YX/S (g g-1) g 0.164 0.458 0.470 YX/N (g g-1) h 5.022 3.405 6.438
a (A) the cultivation without pH control (initial pH 6.8) (0-48 h) and (B) the cultivation with pH controlled at pH 4.0 (48-94 h) by adding 30 g l-1 xylose at 48 h (48-94 h) and the nitrogen sources (2.3 g l-1 urea and 1.0 g l-1 casamino acids) were added at 84 h (84-94 h). b CX = biomass concentration; c μ = specific growth rate; d QX = volumetric production rate of biomass; e QS = volumetric uptake rate of substrates; f QN = volumetric uptake rate of nitrogen sources; g YX/S = biomass yield from substrates; h YX/N = biomass yield from nitrogen sources
From Table 1, the optimal condition of biomass production was performed by controlling pH at 4.0 together with adding nitrogen sources. At controlled pH at 4.0 (48-84 h), most of the kinetic parameters have been increased compared with initial pH at 6.8 (0-48 h). This result is similar to the study of optimal pH of biomass and xylitol production in shake
flask (Wannawilai et al., 2009). Besides, these parameters further improved by feeding nitrogen sources (84-94 h) which were used to produce and maintain yeast cells. Also, the high-cell density under optimal pH and nitrogen sources feeding was used to produce xylitol with three repeated fed-batch fermentations. This process was carried out under oxygen limiting condition, nitrogen sources feeding, optimal pH 7.0 and 30oC. As a result, with using the optimal conditions, three repeated fed-batch fermentations and nitrogen sources feeding profile, the high xylitol yields were 0.838 0.938 and 0.997 g g-1, respectively. In addition, the average xylitol productivity was 1.79 g l-1 h-1 and the final xylitol concentration was obtained up to 306-336 g l-1.
Acknowledgements The authors would like to thank the Center
for Advanced Studies in Tropical Natural Resources, Kasetsart University Institute for Advanced Studies (KUIAS) for financial support. References 1. Carvalho W., Canilha L. and Silva S.S. Semi-
continuous xylose-to-xylitol bioconversion by Ca-alginate entrapped yeast cells in a stirred tank reactor. Bioproc. Biosyst. Eng. 2008; 31(5): 493-498.
2. Emodi A. Xylitol, its properties and food applications. Food Technol. 1978; 32: 28-32.
3. Nakano K., Katsu R., Tada K. and Matsumura M. Production of highly concentrated xylitol by Candida magnoliae under a microaerobic condition maintained by simple fuzzy control. J. Biosci. Bioeng. 2000; 89(4): 372-376.
4. Tada K., Horiuchi J., Kanno T. and Kobayashi M. 2004. Microbial xylitol production from corn cobs using Candida magnoliae. J. Biosci. Bioeng. 98(3), 228-230.
5. Wannawilai S., Sirisansaneeyakul S., Vanichsriratana W. and Prakulsuksatid P.Optimization for the production of xylitol using Candida magnoliae TISTR 5663. pp. 169-176. In Proceedings of the 21st Annual Meeting and International Conference of Thai Society for Biotechnology TSB 2009: “Biotechnology: A Solution to the Global Economic Crisis?”.Queen Sirikit National Convention Center, Bangkok, Thailand. 2009.
(A) (B)

The 23rd Annual Meeting of the Thai Society for Biotechnology “Systems Biotechnology: Quality & Success”
O-IV-9
- 65 -
Mathematical modeling of thermal-pH stability and activity of inulinases from Aspergillus niger TISTR 3570
Molnapat Songpima, Pilanee Vaithanomsatc and Sarote Sirisansaneeyakula,b,*
aDepartment of Biotechnology, Kasetsart University,Chatuchak, Bangkok, 10900, Thailand bCenter for Advanced Studies in Tropical Natural Resources, National Research University-Kasetsart University, Kasetsart University, Chatuchak, Bangkok, 10900, Thailand (CASTNAR, NRU-KU, Thailand) cKasetsart Agricultural and Agro-Industrial Product Improvement Institute (KAPI), Kasetsart University, Chatuchak, Bangkok, 10900, Thailand *Corresponding author: [email protected] Abstract
Inulo-oligosaccharides (IOS) gain much attention as an important ingredient in food industry. IOS can be produced from inulin, consisting of a linear β-2,1-linked polyfructan chain terminated by a glucose residue. Inulinases, targeting on the β-2,1 linkage of inulin and hydrolyzing it into fructose and glucose, are classified among the hydrolases. Thus the use of inulinases has been proposed as the most promising approach to obtain IOS syrup from inulin. The thermal and pH stability of inulinases are very important for designing an enzyme reactor, as it would limit the use of the enzymes and consequently affecting the production costs of the IOS production. In this study, the mathematical modeling of the stability and activity of the enzymes was developed using thermodynamic concepts for thermal stability and polynomial model for pH stability with experimental data of inulinases from Aspergillus niger TISTR 3570. The model was designed to predict the enzyme activity with respect to temperature, pH and time course of the enzymatic process, as well as its half-life in a broad temperature and pH range. The knowledge and information provided by the model could be used to design the operational temperature and pH conditions, leading to higher enzyme activities, while preserving acceptable stability levels, representing the link between higher productivity and lower process costs. As a result, the working temperature is not necessarily the same as the maximum reaction rate temperature, but preferably a lower temperature where the enzyme is more stable. Keywords: mathematical model, inulinase, inulo-oligosaccharides, AspergillusnigerTISTR 3570 Introduction and Objective
Inulin is hydrolyzed by two types of inulinases; exo-inulinase (β-D-fructanfructanohydrolase) and endo-inulinase (2,1-β-D-fructanfructanohydrolase) which produce inulo/fructo-oligosaccharide and only fructose, respectively (Skowronek and Firedurek, 2004; Vandamme and Derycke, 1983; Santos et al., 2007). Inulinases have been proposed as the most encouraged enzyme, which could hydrolyze inulin to inulo-oligosaccharides (IOS). Considering enzyme reactor design, the temperature and pH are the most important parameters, which should be optimized due to the limitation and recycling of enzyme. The mathematic model could be designed for temperature-pH condition operation. The higher enzyme activities are received when preserve the acceptable stability levels. The simple and reliable method, which is described in this work is expressed in the effect of temperature and pH on enzyme activity and stability.
In commercial inulinases production, it usually produces from microorganisms due to the easy
cultivation and high enzyme yields (Chi et al., 2009). It has been found that there are many microorganisms can produce high inulinases activity such as Aspergillus niger. In this study, inulinases from A. niger was used as the model to improve the methology for enzyme reactor design. Materials and Methods
Enzyme production Aspergillus niger TISTR 3570 (Sirisansaneeyakul
et al., 2007) was isolated from Jerusalem artichoke tubers and identified by the Thailand Institute of Scientific and Technological Research (TISTR). Inulinases were produced by A. niger TISTR 3570 in a batch fermentation process. The activities of inulinase were measured as previous work (Sirisansaneeyakul et al., 2007). One unit of inulinase activity defines as the quantity of the enzyme that liberated 1 mol of fructose from 0.5% w/v inulin in 0.5 M McIlvaine buffer in 1 min at pH 5.0 and 40°C.
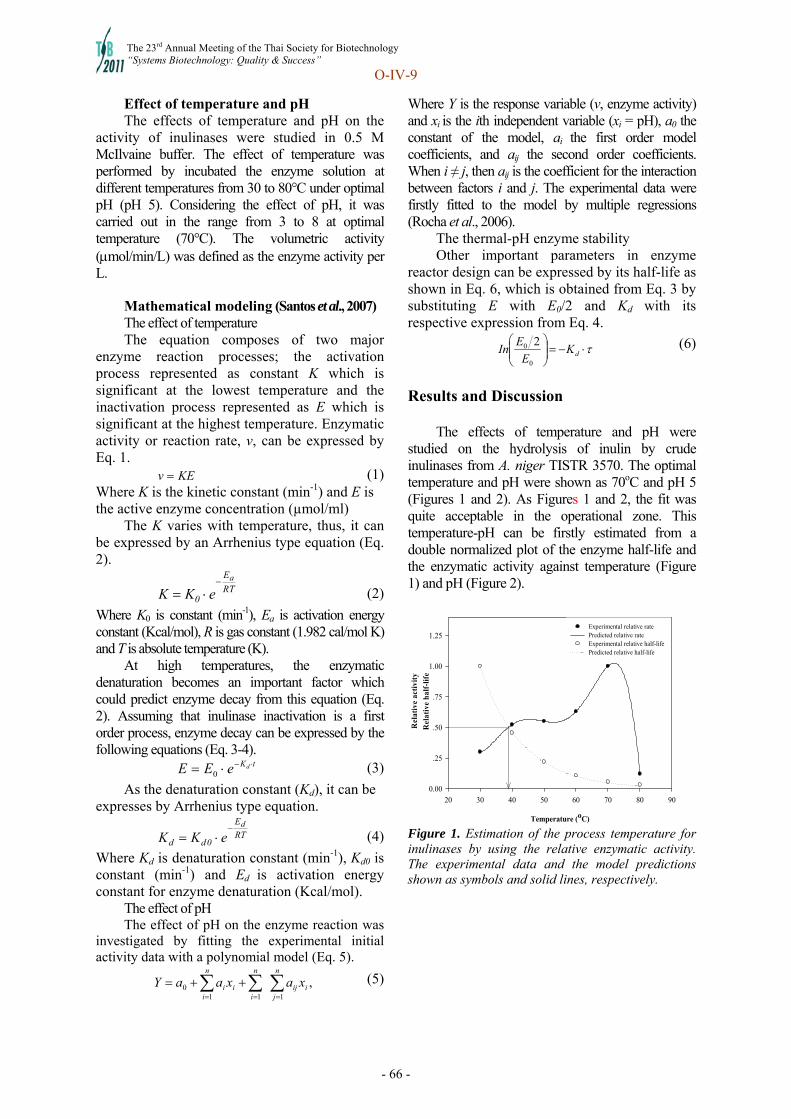
The 23rd Annual Meeting of the Thai Society for Biotechnology “Systems Biotechnology: Quality & Success”
O-IV-9
- 66 -
Effect of temperature and pH The effects of temperature and pH on the
activity of inulinases were studied in 0.5 M McIlvaine buffer. The effect of temperature was performed by incubated the enzyme solution at different temperatures from 30 to 80°C under optimal pH (pH 5). Considering the effect of pH, it was carried out in the range from 3 to 8 at optimal temperature (70°C). The volumetric activity (mol/min/L) was defined as the enzyme activity per L.
Mathematical modeling (Santos et al., 2007) The effect of temperature The equation composes of two major
enzyme reaction processes; the activation process represented as constant K which is significant at the lowest temperature and the inactivation process represented as E which is significant at the highest temperature. Enzymatic activity or reaction rate, v, can be expressed by Eq. 1.
KEv (1) Where K is the kinetic constant (min-1) and E is the active enzyme concentration (µmol/ml)
The K varies with temperature, thus, it can be expressed by an Arrhenius type equation (Eq. 2).
TR
E
0
a
eKK
(2)
Where K0 is constant (min-1), Ea is activation energy constant (Kcal/mol), R is gas constant (1.982 cal/mol K) and T is absolute temperature (K).
At high temperatures, the enzymatic denaturation becomes an important factor which could predict enzyme decay from this equation (Eq. 2). Assuming that inulinase inactivation is a first order process, enzyme decay can be expressed by the following equations (Eq. 3-4).
tKdeEE 0 (3)
As the denaturation constant (Kd), it can be expresses by Arrhenius type equation.
RT
E
0dd
d
eKK
(4)
Where Kd is denaturation constant (min-1), Kd0 is constant (min-1) and Ed is activation energy constant for enzyme denaturation (Kcal/mol).
The effect of pH The effect of pH on the enzyme reaction was
investigated by fitting the experimental initial activity data with a polynomial model (Eq. 5).
,111
0
n
jiij
n
ii
n
ii xaxaaY (5)
Where Y is the response variable (v, enzyme activity) and xi is the ith independent variable (xi = pH), a0 the constant of the model, ai the first order model coefficients, and aij the second order coefficients. When i ≠ j, then aij is the coefficient for the interaction between factors i and j. The experimental data were firstly fitted to the model by multiple regressions (Rocha et al., 2006).
The thermal-pH enzyme stability Other important parameters in enzyme
reactor design can be expressed by its half-life as shown in Eq. 6, which is obtained from Eq. 3 by substituting E with E0/2 and Kd with its respective expression from Eq. 4.
dK
E
EIn
0
0 2 (6)
Results and Discussion
The effects of temperature and pH were studied on the hydrolysis of inulin by crude inulinases from A. niger TISTR 3570. The optimal temperature and pH were shown as 70oC and pH 5 (Figures 1 and 2). As Figures 1 and 2, the fit was quite acceptable in the operational zone. This temperature-pH can be firstly estimated from a double normalized plot of the enzyme half-life and the enzymatic activity against temperature (Figure 1) and pH (Figure 2).
Temperature (oC)
20 30 40 50 60 70 80 90
Rel
ativ
e ac
tivi
ty
0.00
.25
.50
.75
1.00
1.25Experimental relative ratePredicted relative rateExperimental relative half-life Predicted relative half-life
Rel
ativ
e ha
lf-l
ife
Figure 1. Estimation of the process temperature for inulinases by using the relative enzymatic activity. The experimental data and the model predictions shown as symbols and solid lines, respectively.

The 23rd Annual Meeting of the Thai Society for Biotechnology “Systems Biotechnology: Quality & Success”
O-IV-9
- 67 -
pH
2 3 4 5 6 7 8 9
Rel
ativ
e ac
tivi
ty
0.00
.25
.50
.75
1.00
1.25Experimental relative activity Predicted relative activityExperimental relative half-life Predicted relative half-life
Rel
ativ
e h
alf-
life
Figure 2. Estimation of process pH for inulinases by using the relative enzymatic activity. The experimental data and the model predictions shown as symbols and solid lines, respectively.
The results from Figures 1 and 2 showed that the
process temperatures and pH were not necessary the optimal ones, due to the denaturation rate of the enzyme are very high at maximum enzyme activity. Therefore, the process temperature must be rather lower than that giving maximum activity in order to increase the enzyme lifetime. Moreover, it will not affect the productivity of process. This temperature and pH may be determined from the interception of the lines, as shown by the arrows in Figures 1 and 2. In this study, the operating temperature at 39oC obtaining the half-life increased from 16.42 to 146.23 min, while the relative activity decreases to 0.50. For operation pH at 5.4, the half-life increased from 43.97 to 58.74 min, as the relative activity decreases to 0.74.
From mathematical method, it is proposed to establish the most suitable operational temperature and pH for an enzyme reactor. From model predictions, it was found that the working temperature and pH are not necessary the same as the maximum reaction rate of temperature and pH. The model could be used to design the operational temperature and pH conditions, leading to higher enzyme activities, preserving acceptable stability levels, which represent the link between higher productivity and lower process costs.
References 1. Chi Z, Zhe C, Zhang T, Liu G and Lixi Y.
Inulinase-expressing microorganisms and applications of inulinases. Appl Microb Biotechnol. 2009;82: 211-220.
2. Rocha JR, Catana R, Ferreira BS, Cabral JMS and Fernandes P. Design and characterization of an enzyme system for inulin hydrolysis. Food Chem. 2006; 95: 77-82.
3. Santos AMP, Oliveira MG and MaugeriF. Modelling thermal stability and activity of free and immobilized enzyme as a novel tool for enzyme reactor design. Bioresour Technol. 2007;98: 3142-3148.
4. Skowronek M and Firedurek J. Optimization of inulinase production by Aspergillusniger using simplex and classical method. Food Technol Biotechnol. 2004;42: 141-146.
5. Singh P. and Gill P.K. Production of inulinases: recent advances. Food Technol Biotechnol.2006;44: 151-162.
6. Sirisansaneeyakul S, Worawuthiyanan N, Vanichsriratana W, Srinophakun P and Chisti Y. Production of fructose from inulin using mixed inulinases from Aspergillur niger and Candida guilliermondii. World J Microbial Biotechnol. 2007;23: 543-552.
7. Vandamme EJ and Derycke DG. Microbial inulinases: fermentation process, properties and applications. Adv Appl Microbial. 1983;29: 139-176.

The 23rd Annual Meeting of the Thai Society for Biotechnology “Systems Biotechnology: Quality & Success”
O-V-5
- 68 -
Synthesis of amphiphilic dextran by lipase from Candida rugosa: Strategies to enhance enzyme activity in organic solvents
Kulthida Kaewprapana, b, c, Emmanuelle Maried, Alain Durandc and Pranee Inprakhona, b
aDepartment of Biotechnology, Faculty of Science, Mahidol University, Rama 6 Road, Bangkok 10400, Thailand. bCenter of Excellence on Agricultural Biotechnology: (AG-BIO / PERDO-CHE), Bangkok, Thailand. cLaboratoire de Chimie-Physique Macromoléculaire, CNRS-Nancy University, ENSIC, BP 20451, 54001 Nancy cedex, France. dENS-Département Chimie, UMR 8640 CNRS-ENS-UPMC, 24 Rue Lhomond, 75005 Paris, France.
Abstract In this study, lipase AY from Candida rugosa was used for catalyzing transesterification
between dextran and vinyl decanoate in dimethyl sulfoxide (DMSO) at 50°C. The activity of this enzyme was evaluated based on the degree of substitution (DS) of decanoate to OH groups of glucose unit in the dextran backbone. To find proper conditions that lead to the enhancement of lipase’s transesterification activity, using a mixture between tert-amyl alcohol and DMSO as a reaction media was investigated. Understanding of dextran conformation in different solvents enables the possibility to design the condition for synthesis of dextran ester to compromise the stability of enzyme and solubility of substrate.
Keywords: lipase; transesterification; dextran; vinyl ester; regioselectivity Introduction and Objective
Dextran esters have been reported for their uses as materials for nanoparticle formation (1). The synthesis of dextran esters have been undertaken through esterification or transesterification in organic solvents by chemical and enzymatic processes. Several advantages of the enzymatic synthesis in organic solvents have been reported. However, the important problem for the synthesis of dextran esters in polar solvent as DMSO is the loss of enzyme activity. Several strategies for improving enzyme activity in organic solvents have been documented (2).
Our previous study reported the increase of DS for the synthesis of dextran decanoate in DMSO using pH-adjustment, co-lyophilization with 18-crown-6 and stepwise addition of lipase (3, 4). Using solvent mixture has been found to improve enzyme activity for the synthesis of sucrose ester (2).
In this work, we aimed to study the effect of solvent mixture of DMSO (common solvent for dextran) and tert-amyl alcohol (mild solvent for enzymatic synthesis) on the synthesis of dextran decanoate (Dex-VD) catalyzed by lipase.
Materials and Methods Dextran T-40 with Mw = 40,000 g/mol were
purchased from. Lipase AY, a commercial lipase from Candida rugosa was purchased from Amano Enzyme Co. A mixture used for transesterification contained 0.1 M of dextran T-40 and 0.4 M of vinyl decanoate ([OH]0 / [ester]0 = 1/4) in 5 ml of DMSO or DMSO and tert-amyl alcohol mixture. 26 mg of pretreated enzyme as described in previous study (4) was added into the reaction. The enzymatic solution was left under stirring at 50oC for 32 h. The reaction mixture was dialyzed against ethanol/water mixture for 4 days and then with distilled water for 2 days. Finally, the aqueous solution was lyophilized for 2 days. The DS of polymer samples (%) was determined by 1H NMR (300 MHz) in DMSO-d6.
Results and Discussion
It was found that dextran and vinyl decanoate can be dissolved in co-solvent constituted of DMSO and tert-amyl alcohol up to 30% (7:3 v/v). Stability of lipase in organic solvents was evaluated by determining the residual activity of lipase for hydrolysis of tributyrin (3). As shown in Figure 1, the residual
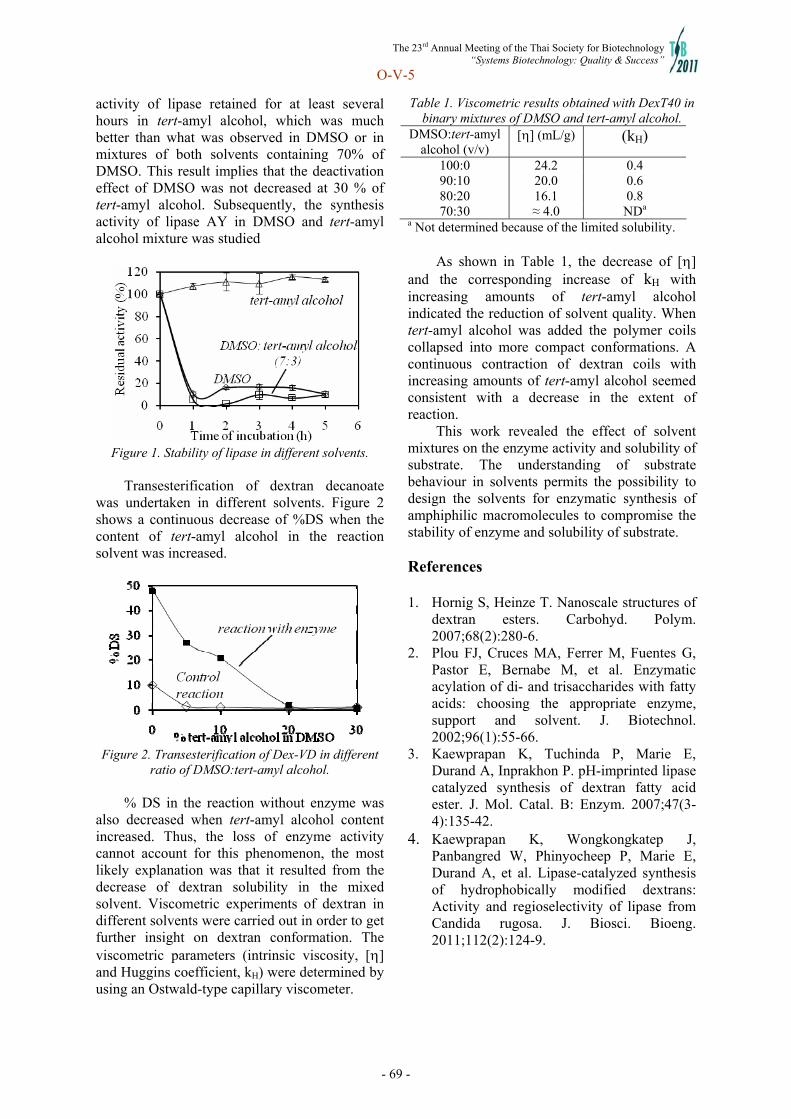
The 23rd Annual Meeting of the Thai Society for Biotechnology “Systems Biotechnology: Quality & Success”
O-V-5
- 69 -
activity of lipase retained for at least several hours in tert-amyl alcohol, which was much better than what was observed in DMSO or in mixtures of both solvents containing 70% of DMSO. This result implies that the deactivation effect of DMSO was not decreased at 30 % of tert-amyl alcohol. Subsequently, the synthesis activity of lipase AY in DMSO and tert-amyl alcohol mixture was studied
Figure 1. Stability of lipase in different solvents.
Transesterification of dextran decanoate
was undertaken in different solvents. Figure 2 shows a continuous decrease of %DS when the content of tert-amyl alcohol in the reaction solvent was increased.
Figure 2. Transesterification of Dex-VD in different
ratio of DMSO:tert-amyl alcohol.
% DS in the reaction without enzyme was also decreased when tert-amyl alcohol content increased. Thus, the loss of enzyme activity cannot account for this phenomenon, the most likely explanation was that it resulted from the decrease of dextran solubility in the mixed solvent. Viscometric experiments of dextran in different solvents were carried out in order to get further insight on dextran conformation. The viscometric parameters (intrinsic viscosity, [] and Huggins coefficient, kH) were determined by using an Ostwald-type capillary viscometer.
Table 1. Viscometric results obtained with DexT40 in binary mixtures of DMSO and tert-amyl alcohol.
DMSO:tert-amyl alcohol (v/v)
[] (mL/g) (kH)
100:0 24.2 0.4 90:10 20.0 0.6 80:20 16.1 0.8 70:30 ≈ 4.0 NDa
a Not determined because of the limited solubility. As shown in Table 1, the decrease of []
and the corresponding increase of kH with increasing amounts of tert-amyl alcohol indicated the reduction of solvent quality. When tert-amyl alcohol was added the polymer coils collapsed into more compact conformations. A continuous contraction of dextran coils with increasing amounts of tert-amyl alcohol seemed consistent with a decrease in the extent of reaction.
This work revealed the effect of solvent mixtures on the enzyme activity and solubility of substrate. The understanding of substrate behaviour in solvents permits the possibility to design the solvents for enzymatic synthesis of amphiphilic macromolecules to compromise the stability of enzyme and solubility of substrate. References 1. Hornig S, Heinze T. Nanoscale structures of
dextran esters. Carbohyd. Polym. 2007;68(2):280-6.
2. Plou FJ, Cruces MA, Ferrer M, Fuentes G, Pastor E, Bernabe M, et al. Enzymatic acylation of di- and trisaccharides with fatty acids: choosing the appropriate enzyme, support and solvent. J. Biotechnol. 2002;96(1):55-66.
3. Kaewprapan K, Tuchinda P, Marie E, Durand A, Inprakhon P. pH-imprinted lipase catalyzed synthesis of dextran fatty acid ester. J. Mol. Catal. B: Enzym. 2007;47(3-4):135-42.
4. Kaewprapan K, Wongkongkatep J, Panbangred W, Phinyocheep P, Marie E, Durand A, et al. Lipase-catalyzed synthesis of hydrophobically modified dextrans: Activity and regioselectivity of lipase from Candida rugosa. J. Biosci. Bioeng. 2011;112(2):124-9.
The 23rd Annual Meeting of the Thai Society for Biotechnology “Systems Biotechnology: Quality & Success”
O-VI-1
- 70 -
Nucleotide diversity of apical membrane antigen 1 (AMA-1) in patients infected with Plasmodium vivax in malaria endemic areas of Thailand
Wimlin Khaosanit a,b, Chakrit Hirunpetcharatc, Usa Lek-Uthai b
a Master of Science (Public Health) Program in Infectious Diseases and Epidemiology, Faculty of Graduate Studies, Mahidol University,Bangkok 10400, Thailand b Department of Parasitology and Entomology, Faculty of Public Health, Mahidol University, Rajavithi Rd, Bangkok 10400, Thailand. c Department of Microbiology, Faculty of Public Health, Mahidol University, Rajavithi Rd, Bangkok 10400, Thailand.
Abstract
Malaria remains one of the most important infectious diseases in public health of Thailand, whichs found prevalent along the international borders, especially on the Thai-Myanmar border and Thai-Cambodia border. This study aims to analyze nucleotide diversity of apical membrane antigen 1 (AMA-1) in Plasmodium vivax isolated from Tak n=10), Mae Hong Son (n=3) and Chanthaburi (n=1) provinces. The blood samples were taken by finger prick dry blood spot onto filter paper and diagnosed for P. vivax by multiplex PCR. The DNA was amplified by using 2 pairs of specific primers by nested PCR. Amplified fragments were purified and sequenced. The 878 Pvama-1 sequences of 14 samples were analyzed and aligned to identify the polymorphisms. The nucleotide diversity of Pvama-1 is 0.0153. The rates of nonsynonymous and synonymous substitutions of Pvama-1 gene were shown. From the statistic Tajima’s D test result for hypothesis of mutation is 0.0289 which is not significantly different (p >0.10), statistic Fu and Li’s F test is 0.2225 (p> 0.10) and statistic Fu and Li’s D test is 0.1946 (p>0.10). All these statistics showed positive values for the sequences of Pvama-1 gene (p>0.05). The relation of the evolution of Pvama-1 among different cases was discussed. This result suggested its possible use as a malaria preventing merozoite subunit vaccine formulation in Thailand. Keywords: Pvama-1, nucleotide diversity, Tajima’s D, Fu and Li’s D, Fu and Li’s F Introduction and Objective Malaria in Thailand, was found prevalent along the international borders, especially on the Thai-Myanmar and Thai-Cambodia borders. The design of antimalarial vaccines and the use of antimalarial drugs are hampered by extensive polymorphism in the parasite proteins, particularly those expressed on surface of the parasite, which are obvious targets for the development of highly specific vaccines. The apical membrane antigen 1 (AMA-1) is a micronemal protein of apicomplexan parasites that appears to be essential during the invasion into host cells and found in all recent studies of Plasmodium sp. Pfama-1 and Pvama-1 include three extracellular domains, designated domains I, II, and III from N-to C-terminal order (1). However, nucleotide diversity (π) analysis of AMA-1 in patients infected with P. vivax in different geographic areas presented variant forms. This variation leads to a complexity or hurdle in successful malaria vaccine design. Non-synonymous substitutions per non-
synonymous site (dN) and the synonymous substitutions per synonymous site (dS) and analyze neutrality test using Tajima’s D´(2) and Fu and Li’s D and F were estimated (3). The relation of the evolution of Pvama-1 among different cases was discussed. This result suggested its possible use as a malarial subunit vaccine formulation in Thailand for preventing merozoite development.. Materials and Methods 2.1 Blood samples and DNA extraction The blood samples taken by finger prick dry blood spot onto filter paper from symptomatic malaria Thai adult patients at malaria clinic, were collected and diagnosed for P. vivax. The extracted DNA by QIAamp DNA Mini Kit was amplified and confirmed for P. vivax by multiplex PCR.

The 23rd Annual Meeting of the Thai Society for Biotechnology “Systems Biotechnology: Quality & Success”
O-VI-1
- 71 -
2.2 Amplification and sequencing analysis Amplification of the Pvama-1gene was performed by nested PCR using the 2 pairs of specific primers. The 1st and 2nd nested PCR conditions were optimized (4). After amplification, PCR products were analysed on 1 % agarose gel and illuminated with UV light after stained with ethidium bromide. Amplified fragments were purified and sequenced.
2.3 Data analysis The Pvama-1 sequences were analysed
using Bioedit ver 7.0.5.3 (5) and analysed neutrality test using Tajima’s D´ and Fu and Li’s D and F by DnaSP ver 5.10.01 (6).
Results
The nucleotide diversity of AMA-1 in P. vivax infection isolates from Tak n=10), Mae Hong Son (n=3) and Chanthaburi (n=1) provinces were analysed. The 878 Pvama-1 sequences of 14 samples were analyzed and aligned to identify the polymorphisms. There are 39 polymorphic sites. The nucleotide diversity (π) is 0.0153. Number of non-synonymous substitutions per non-synonymous site (dN) is 0.0127 and number of synonymous substitutions per synonymous site (dS) is 0.0155. From the statistic Tajima’s D test result, hypothesis of mutation was 0.0289 which is not significantly different (p >0.10).Statistic Fu and Li’s F test and statistic Fu and Li’s D test were 0.2225 and 0.1946 (p >0.10) respectively. All these statistics showed positive values for the sequences of Pvama-1 gene (p>0.05). Discussion The nucleotide diversity of Pvama-1 in Thailand was 0.0153. In 2007, Gunasekera et al. analysed the entire coding region of 23 Pvama-1 sequences from Sri Lanka, nucleotide diversity (π) of Pvama-1 was 0.0097 (7). The overall diversity estimated for Pvama-1 in Venezuela showed high genetic polymorphism which was 0.9091 (4). These results may have significant implication for malaria vaccine development based on this antigen.
References 1. Thomas AW. Apical membrane antigen 1: a
malaria vaccine candidate in review. Trends in Parasitol 2007;24(2):74-84.
2. Tajima F. Statistical methods for testing the neutral mutation hypothesis by DNA polymorphism. Genetics. 1989;123:585-95.
3. Fu YX, Li WH. Statistical tests of neutrality of mutations. Genetics. 1993;133:693-709.
4. Ord RL, Tami A, Sutherland CJ. ama1 genes of sympatric Plasmodium vivax and P. falciparum from Venezuela differ significantly in genetic diversity and recombination frequency. PLoS One. 2008; 3(10): e3366.
5. Hall,TA. BioEdit: a user-friendly biological sequence alignment editor and analysis program for Windows 95/98/NT. Nucl. Acids. Symp. Ser. 1999;41:95-8.
6. Rozas J, Sanchez-DelBarrio JC, Meeesguer X, Rozas R. DnaSP, DNA polymorphism analyses by the coalescent and other methods. Bioinformatics 2003;19:2496-7.
7. Gunasekera AM, Wickramarachchi T, Neafsey DE et al. Genetic Diversity and Selection at the Plasmodium vivax Apical Membrane Antigen-1 (PvAMA-1) Locus in a Sri Lankan Population. Mol Biol Evol 2007;24:939-47.
The 23rd Annual Meeting of the Thai Society for Biotechnology “Systems Biotechnology: Quality & Success”
O-VI-2
- 72 -
Detection of Plasmodium falciparum mdr1 gene by real-time PCR and loop-mediated isothermal amplification methods
Siriporn Rachakhoma,b , Kawin Leelawatc, Usa Lek-uthaib
a Master of Science (Public Health) Program in Infectious Diseases and Epidemiology, Faculty of Graduate Studies, Mahidol University,Bangkok 10400, Thailand. b Department of Parasitology and Entomology, Faculty of Public Health, Mahidol University, Rajavithi Rd, Bangkok 10400, Thailand. c Department of General Surgery, Rajavithi Hospital, Bangkok, 10400, Thailand.
Abstract
Malaria remains one of the most important infectious diseases affecting public health in Thailand. Recently, drug-resistant malaria along the border area of Thailand-Myanmar in the Mae Sod district, Tak province, and the Thai-Cambodian border in Trat and Chantaburi provinces are found. Molecular markers for drug resistant malaria, such as pfmdr1 polymorphisms, could serve as useful surveillance tools. The proper technologies for the detection of these markers should be developed and used. In this study, the real-time PCR method could detect 62 cases [86.11%, (62/72)] which were positive for P. falciparum mdr1 3D7, while the LAMP method which is detected by visual judgment of the turbidity could detect 44 cases [61.11%, (44/72)]. These methods have the sensitivity and specificity of 100% and 35.71%, respectively. However, the LAMP method has the advantages of simplicity of reaction at room temperature, it does not require any advanced equipment, has a low cost, and is 2 hours faster than the real-time PCR method. The LAMP method can be an early and rapid detection method for prompt treatment.
Keywords: Plasmodium falciparum / Loop-Mediated Amplification Methods (LAMP) / multidrugs
resistance Introduction and Objective
Malaria remains one of the most important infectious diseases in public health in Thailand. In 2009, the provinces with highest malarial detections were Tak, Mae Hong Son, Ranong, Phangnga, Yala, Chumphon, Kanchanaburi, Trat, Chantaburi, and Prachuap Khiri Khan. P. falciparum can be fatal. Most malaria-endemic region feature infections involving P. falciparum and P. vivax are identified promptly and differentiated, and the drug resistances to these species are investigated. LAMP makes more economical and practical than real-time PCR, DNA amplification and 100 copies of target 18S rRNA genes P. falciparum can be detected. Results indicated that this technique shows the high sensitivity (98.5%) and specific (94.3%) (1). Failure to detect malarial infections could result in inadequate or incorrect treatment. However, the diagnosis development method should be simple, sensitive and accuracy.
Materials and Methods
The 72 volunteers with malaria aged ≥ 18 years with all sexes and occupations who were treated at malaria clinics were confirmed for their malarial infection by microscopy (Thick and thin blood films). Those patients were agreed, informed and signed in the consent form. Plasmodium falciparum from filter blood spots collected between the months of November 2007 to October 2008 were used as source for genomic DNA extraction using QIAamp® DNA MiniKits. The protocol Was performed according to manufacturer’s instruction.
2.1 Real-time PCR method Real-time PCR for Plasmodium detection
was performed according to the protocol described by Mangold et al. (2005) (2). A 20μl reaction volume was used. Real-time amplification, speciation was performed using a Chromo4® System (Bio-Rad, U.S.A.). The Tm values for the indication of P. falciparum infection were between 75.5 to 77.5°C. Primers set were designed to amplify Plasmodium specific region of the mdr1 3D7 gene.
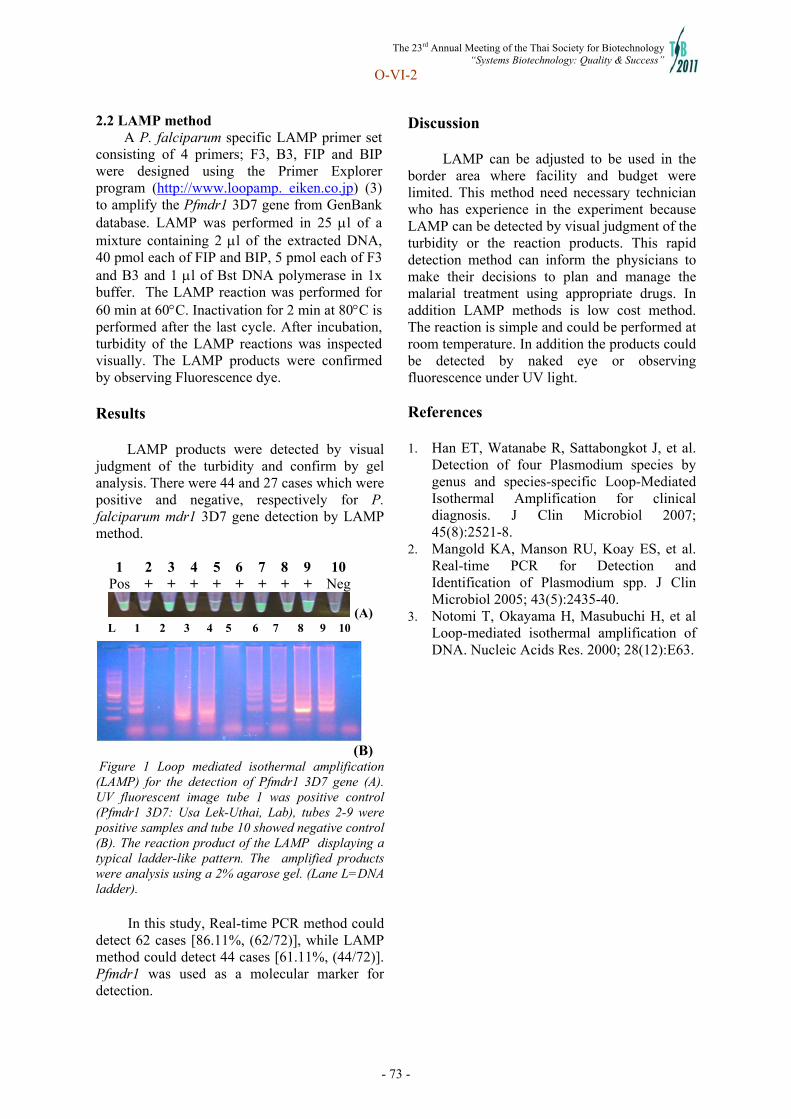
The 23rd Annual Meeting of the Thai Society for Biotechnology “Systems Biotechnology: Quality & Success”
O-VI-2
- 73 -
2.2 LAMP method
A P. falciparum specific LAMP primer set consisting of 4 primers; F3, B3, FIP and BIP were designed using the Primer Explorer program (http://www.loopamp. eiken.co.jp) (3) to amplify the Pfmdr1 3D7 gene from GenBank database. LAMP was performed in 25 l of a mixture containing 2 l of the extracted DNA, 40 pmol each of FIP and BIP, 5 pmol each of F3 and B3 and 1 l of Bst DNA polymerase in 1x buffer. The LAMP reaction was performed for 60 min at 60C. Inactivation for 2 min at 80C is performed after the last cycle. After incubation, turbidity of the LAMP reactions was inspected visually. The LAMP products were confirmed by observing Fluorescence dye. Results
LAMP products were detected by visual judgment of the turbidity and confirm by gel analysis. There were 44 and 27 cases which were positive and negative, respectively for P. falciparum mdr1 3D7 gene detection by LAMP method.
1
Pos 2 +
3 +
4 +
5 +
6+
7 +
8 +
9 +
10 Neg
(A)
(B)
Figure 1 Loop mediated isothermal amplification (LAMP) for the detection of Pfmdr1 3D7 gene (A). UV fluorescent image tube 1 was positive control (Pfmdr1 3D7: Usa Lek-Uthai, Lab), tubes 2-9 were positive samples and tube 10 showed negative control (B). The reaction product of the LAMP displaying a typical ladder-like pattern. The amplified products were analysis using a 2% agarose gel. (Lane L=DNA ladder). In this study, Real-time PCR method could detect 62 cases [86.11%, (62/72)], while LAMP method could detect 44 cases [61.11%, (44/72)]. Pfmdr1 was used as a molecular marker for detection.
Discussion
LAMP can be adjusted to be used in the border area where facility and budget were limited. This method need necessary technician who has experience in the experiment because LAMP can be detected by visual judgment of the turbidity or the reaction products. This rapid detection method can inform the physicians to make their decisions to plan and manage the malarial treatment using appropriate drugs. In addition LAMP methods is low cost method. The reaction is simple and could be performed at room temperature. In addition the products could be detected by naked eye or observing fluorescence under UV light.
References 1. Han ET, Watanabe R, Sattabongkot J, et al.
Detection of four Plasmodium species by genus and species-specific Loop-Mediated Isothermal Amplification for clinical diagnosis. J Clin Microbiol 2007; 45(8):2521-8.
2. Mangold KA, Manson RU, Koay ES, et al. Real-time PCR for Detection and Identification of Plasmodium spp. J Clin Microbiol 2005; 43(5):2435-40.
3. Notomi T, Okayama H, Masubuchi H, et al Loop-mediated isothermal amplification of DNA. Nucleic Acids Res. 2000; 28(12):E63.
L 1 2 3 4 5 6 7 8 9 10

The 23rd Annual Meeting of the Thai Society for Biotechnology “Systems Biotechnology: Quality & Success”
O-VI-4
- 74 -
Exploring the regulatory role for Rds2 homologue in the pathogenic yeast Candida albicans
Sirilak Baramee a, Nitnipa Soontorngun a aDepartment of Biochemical Technology, School of Bioresources and Technology, King Mongkut’s University of Technology Thonburi, 49 Soi Tienthalay 25, Bangkhuntien-Chaythalay Road, Thakham, Bangkhuntien, Bangkok, Thailand 10150 Abstract
Candida albicans is the most important opportunistic fungal pathogen in men. It is closely related to the model yeast, Saccharomyces cerevisiae. PCK1 is one of the key gluconeogenic genes, encoding for the metabolic enzyme phosphoenolpyruvate carboxykinase. Its expression is under glucose mediated repression and under the control of three zinc cluster transcription factors namely Cat8, Sip4 and Rds2. In this study, we compared the role of S. cerevisiae Rds2 and its homologue in C. albicans, regarding the regulation of PCK1 gene. Previous study showed that, when the carbon source was shifted from glucose to alternative carbon sources such as ethanol, the expression of S. cerevisiae PCK1 is derepressed and partially depended on Rds2. First, we performed a phenotypic analysis of the Δrds2 strain in S. cerevisiae and the Δcwt1 strain in C. albicans. The results showed that S. cerevisiae Δrds2 strain showed impaired growth in glycerol and ethanol while C. albicans Δcwt1 strain showed normal growth on these carbon sources. Then, we examined expression of PCK1gene of C. albicans in the Δcwt1 strain, compared to the wild-type strain during growth on ethanol, via qRT-PCR analysis. The results indicated that Cwt1 has minimal role in mediating the expression of PCK1 gene in C. albican and suggested unequal contribution between Rds2 and its homologue Cwt1 in alternative carbon utilization.
Keywords: Candida albicans, Saccharomyces cerevisiae, gluconeogenesis, PCK1 Introduction and Objective
Candida albicans is the most important opportunistic fungal pathogen in humans. This benign commensal organism resides in the oral cavity and gastrointestinal tracts. However, in compromised hosts, it can cause serious infections such as candidiasis (1). C. albicans is closely related to the model yeast, Saccharomyces cerevisiae. Regulator of drug sensitivity2 (Rds2) is a member of zinc cluster protein family in S. cerevisiae. Deletion of RDS2 gene results in increased sensitivity to the antifungal drug ketoconazole (2). S. cerevisiae Rds2 has a homologue in C. albicans called Cwt1 which is involved in cell wall biogenesis and integrity (3). PCK1 is one of the key gluconeogenic genes whose expression is repressed by glucose and is under a control of three zinc cluster transcription factors including Rds2 (4). Previous study showed that, during the ethanol shift, the expression of S. cerevisiae PCK1 is derepressed and partially depended on Rds2. (5) In this study, we aimed to compare the role of S. cerevisiae Rds2 and its homologue Cwt1 in C. albicans, in mediating PCK1 expression during the glucose-ethanol shift.
Materials and Methods
2.1 Strains and media. The strains used in this study were C. albicans SGY243 and cwt1. The culture medium for cell growth (YP medium) was composed of yeast extract 10 g. and peptone 20 g. per litre distilled water. Then, carbon sources (glucose, glycerol or ethanol) were added at 2% concentration.
2.2 Phenotypic analysis The yeast strains
were grown overnight in YP-glucose medium. Cells were serially diluted and spotted on YP agar medium plate, containing different carbon sources. Cells were incubated at 30oC for 3-4 days to observe the phenotypes.
2.3 Gene induction & qRT-PCR analysis The strains were grown overnight in YP-
glucose medium. Cells were then added to fresh YP-glucose till mid-log phase and then divided in half, prior to be washed and transferred to YP-ethanol medium and grown for additional of 3 hours in parallel with YP-glucose medium. Cells were then collected by centrifugation. RNA was extracted and cleaned by RNA pure kit (Invitrogen). RNA was treated by DNase (Invitrogen). cDNA was synthesized using

The 23rd Annual Meeting of the Thai Society for Biotechnology “Systems Biotechnology: Quality & Success”
O-VI-4
- 75 -
reverse transcriptase kit (Invitrogen). The transcripts of PCK1 or ACT1 genes were amplified by PCR, using MxPro QPCR machine and MxPro QPCR software for analysis. After that, the PCR products were analyzed via electrophoresis.
Results and Discussion
We performed a phenotypic analysis of the C. albicans strains, SGY243 (wild type) and Δcwt1, on YP agar medium plate, containing glucose, glycerol or ethanol as a sole carbon source. Unlike S. cerevisiae, our results showed that C. albicans Δcwt1 strain grew normally on all carbon sources tested (Fig. 1). The rationale behind the observed phenotypes could be that similar protein sequences may not translate into functional conservation. Rds2 may function as a key regulator of alternative carbon source utilization but Cwt1 has a minor role in this process. To clarify, we then measure the expression of a key gluconeogenic gene PCK1, in the absence of the Cwt1 regulator in ethanol via qRT-PCR analysis. The results were consistent with that of phenotypic analysis. It showed that the PCK1 mRNA levels of the wild type strain were similar to that of the cwt1 strain with a total average fold change of 1.4 (Fig. 2). It indicated that Cwt1 has a minimal role in mediating the expression of PCK1 in C. albicans. Altogether, the results suggested unequal function between Rds2 and its homologue Cwt1 in alternative carbon utilization.
Figure 1 Growth assay of the C. albicans Δcwt1 and the wild type SGY243 strains in glucose (Left), glycerol (Center) and ethanol (Right).
Figure 2 The mRNA levels of PCK1 gene in C. albicans in the absence of Cwt1 regulator upon the glucose-ethanol shift (experiments performed in duplicate). Acknowledgement We would like to thank Assoc.Prof. Dr. B. Turcotte for generous gift of strains and KMUTT fund for financial support. References 1. Calderone, R.A. Candida and Candidiasis.
Washington DC: American Society for Microbiology Press. 2002.
2. Akache, B., Wu, K. Q., and Turcotte, B. Phenotypic analysis of genes encoding yeast zinc cluster proteins. Nucleic Acids Res. 2001: 29: 2181–2190.
3. MacPherson, S., Larochelle, M., and Turcotte, B. A fungal family of transcriptional regulators: the zinc cluster proteins. Microbiol Mol Biol R. 2006: 70: 583–604.
4. Soontorngun, N., Larochelle, M., Drouin, S., Robert, F., and Turcotte, B. Regulation of gluconeogenesis in Saccharomyces cerevisiae is mediated by activator and repressor functions of Rds2., Mol Cell Biol. 2007: 27: 7895–7905.
5. Ausubel, F.M., Brent, B., Kingston, R.E., Moore,D.D., Seidman, J.G., Smith, J.A. and Struhl, K., Current protocols in molecular biology., John Wiley & Sons, Edison, NJ. 2000
1 2 3 4 5 6 7 8 9
3000 kb --- 1500 kb ---
500 kb ---
Lane 1 = 1 kb Laddar marker Lane 2-3 = SGY243 ACT1 gene Lane 4-5 = cwt1 ACT1 gene Lane 6-7 = SGY243 PCK1 gene Lane 8-9 = cwt1 PCK1 gene
Glycerol Ethanol Strains SGY243
Δcwt1
Glucose
The 23rd Annual Meeting of the Thai Society for Biotechnology “Systems Biotechnology: Quality & Success”
O-VI-6
- 76 -
DTscreen v1: A novel drug targets identification tool for pathogenic diseases through protein signature-based approach
Saowalak Kalapanulaka,b, Arporn Juntrapiroma, Treenut Saithonga,b
aBioinformatics and Systems Biology Program, King Mongkut’s University of Technology Thonburi (Bang Khun Thian), 49 Soi Thian Thale 25, Bang Khun Thian Chai Thale Road, Tha Kham, Bang Khun Thian, Bangkok, Thailand, 10150 bSchool of Bioresources and Technology, King Mongkut’s University of Technology Thonburi, (Bang Khun Thian), 49 Soi Thian Thale 25, Bang Khun Thian Chai Thale Road, Tha Kham, Bang Khun Thian, Bangkok, Thailand, 10150
Abstract
Developing a new drug takes a very long period of time and cost is also extremely high. Drug development process involves many stages; however, about 30%-40% of experimental drugs fail to be as drugs in the market because of choosing an inappropriate biological target at the early stage of the development pipeline. Therefore, it is a big challenge to innovate a systematic method and bioinformatics tool for accurately identifying drug targets in order to avoid any failures in the initial stage of anti-microbial drug discovery program. In this work, we implement a published method for drug targets identification in mycobacterium metabolism, proposed by Kalapanulak in 2009, to be a user friendly and standalone tool, DTscreen v1. We aim to facilitate biologists to do the automatic screening for all possible attractive drug targets in any interested pathogen genomes. The tool is developed on Visual Basic language. In the first version, Salmonella- enterica serovar Typhi CT18 (S. typhi), a causative agent of typhoid fever in human beings, is used as a case study in the DTscreen v1. For the case study, the whole genome of S. typhi was investigated and 115 genes were proposed as new drug targets based on: (1) their unique protein signatures when comparing with human host and (2) their essentiality reported from a large-scale experiment. Keywords: Drug targets, Protein signature, Bioinformatics tool Introduction and Objective
Several bioinformatics approaches have been developed for identifying drug targets against any pathogenic diseases. Behind these approaches, usual criteria for predicting drug targets are essentiality and non-homolog with human host based on sequence similarity [1,2]. Even though, non-homologous proteins are identified as drug target, they still can cause some side effects in humans because of the similarity in term of protein signatures. In 2009, a novel bioinformatics method for drug targets identification of Mycobacterium tuberculosis metabolism based on essential gene and protein signature information was proposed by Kalapanulak [3]. This approach has a high accuracy for predicting drug targets against the pathogen.
Therefore, in this work we implement a published method for drug targets identification, proposed by Kalapanulak in 2009, to be a user friendly and standalone tool, DTscreen v1. We aim to facilitate biologists to do the automatic
screening for all possible attractive drug targets in any investigated pathogen genomes before doing their wet experiments. We hope that our developed tool will decrease discovery time and cost in the drug development process. Materials and Methods
The DTscreen v1 was written in ‘Visual Basic’ language. This tool can identify the high potential drug targets based on two criteria: (1) no protein signature matching with any human protein signatures and (2) gene essentiality from large-scale wet experiments. The algorithm of DTscreen v1 is illustrated as follows.
2.1 Non-homolog finding The first module in the DTscreen, non-
homolog finding, is the main process for identifying drug targets. Comparing protein signatures corresponding to all genes of the pathogen with all human genes in the genome via InterPro accession numbers from InterPro database is the approach for receiving the preliminary proposed drug targets that are non-
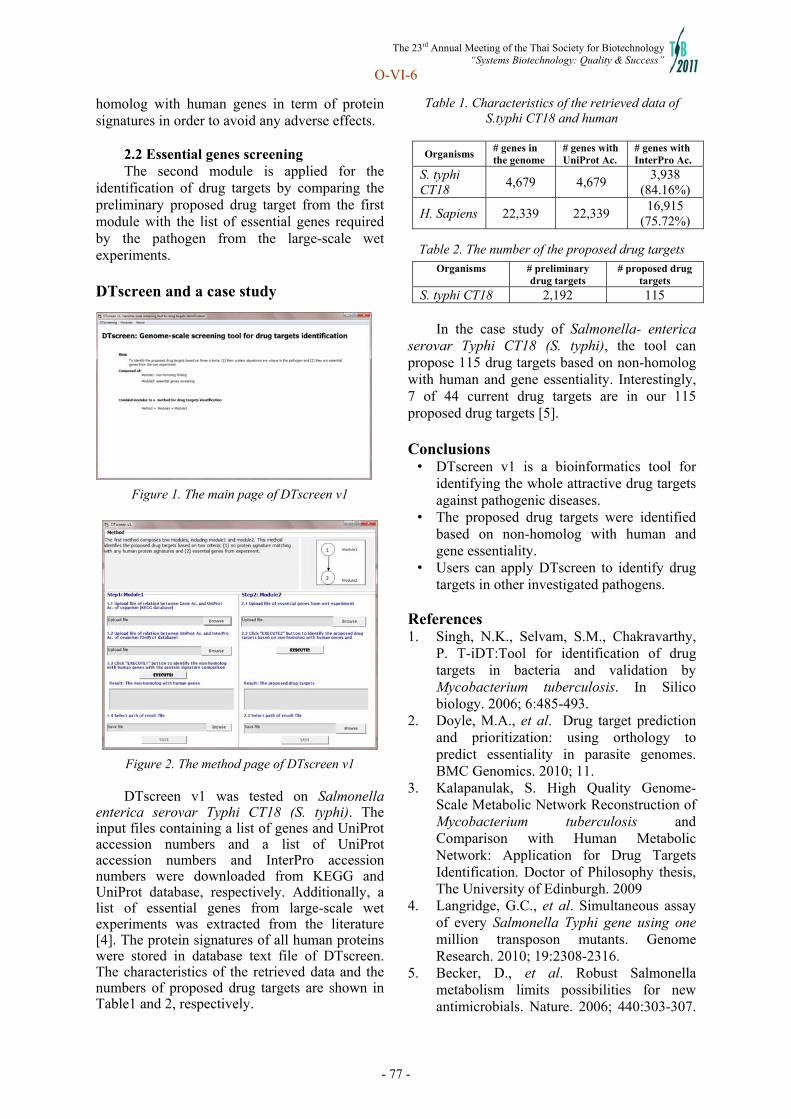
The 23rd Annual Meeting of the Thai Society for Biotechnology “Systems Biotechnology: Quality & Success”
O-VI-6
- 77 -
homolog with human genes in term of protein signatures in order to avoid any adverse effects.
2.2 Essential genes screening The second module is applied for the
identification of drug targets by comparing the preliminary proposed drug target from the first module with the list of essential genes required by the pathogen from the large-scale wet experiments. DTscreen and a case study
Figure 1. The main page of DTscreen v1
Figure 2. The method page of DTscreen v1 DTscreen v1 was tested on Salmonella
enterica serovar Typhi CT18 (S. typhi). The input files containing a list of genes and UniProt accession numbers and a list of UniProt accession numbers and InterPro accession numbers were downloaded from KEGG and UniProt database, respectively. Additionally, a list of essential genes from large-scale wet experiments was extracted from the literature [4]. The protein signatures of all human proteins were stored in database text file of DTscreen. The characteristics of the retrieved data and the numbers of proposed drug targets are shown in Table1 and 2, respectively.
Table 1. Characteristics of the retrieved data of S.typhi CT18 and human
Organisms # genes in the genome
# genes with UniProt Ac.
# genes with InterPro Ac.
S. typhi CT18
4,679 4,679 3,938
(84.16%)
H. Sapiens 22,339 22,339 16,915
(75.72%)
Table 2. The number of the proposed drug targets
In the case study of Salmonella- enterica
serovar Typhi CT18 (S. typhi), the tool can propose 115 drug targets based on non-homolog with human and gene essentiality. Interestingly, 7 of 44 current drug targets are in our 115 proposed drug targets [5]. Conclusions
• DTscreen v1 is a bioinformatics tool for identifying the whole attractive drug targets against pathogenic diseases.
• The proposed drug targets were identified based on non-homolog with human and gene essentiality.
• Users can apply DTscreen to identify drug targets in other investigated pathogens.
References 1. Singh, N.K., Selvam, S.M., Chakravarthy,
P. T-iDT:Tool for identification of drug targets in bacteria and validation by Mycobacterium tuberculosis. In Silico biology. 2006; 6:485-493.
2. Doyle, M.A., et al. Drug target prediction and prioritization: using orthology to predict essentiality in parasite genomes. BMC Genomics. 2010; 11.
3. Kalapanulak, S. High Quality Genome-Scale Metabolic Network Reconstruction of Mycobacterium tuberculosis and Comparison with Human Metabolic Network: Application for Drug Targets Identification. Doctor of Philosophy thesis, The University of Edinburgh. 2009
4. Langridge, G.C., et al. Simultaneous assay of every Salmonella Typhi gene using one million transposon mutants. Genome Research. 2010; 19:2308-2316.
5. Becker, D., et al. Robust Salmonella metabolism limits possibilities for new antimicrobials. Nature. 2006; 440:303-307.
Organisms # preliminary drug targets
# proposed drug targets
S. typhi CT18 2,192 115
The 23rd Annual Meeting of the Thai Society for Biotechnology “Systems Biotechnology: Quality & Success”
O-VI-7
- 78 -
An insight into structural and functional characteristics of Plasmodium falciparum falcipain-3 as key drug targets against malaria
Surapong Pinitglang a, Krongsakda Phakthanakanok b, Ratchanee Saiprajong a, Khanok Ratanakhanokchaic aSchool of Science and Technology, University of the Thai Chamber of Commerce, Bangkok, 10400, Thailand bSchool of Science and Technology, Muban Chombueng Rajabhat University, Ratchaburi, Thailand cSchool of Bioresources and Technology, King Mongkut’s University of Technology, Thonburi, Bangkok, Thailand.
Abstract
The aim of this research was to investigate the understanding of the insight into structural, functional characteristics and electrostatic effects of the catalytic sites of Plasmodium falciparum. Falcipain-3 as key drug targets against malaria and is a major cysteine proteinase of the human malarial parasite Plasmodium falciparum. A new biochemical targets falicain3 has been proposed and is being pursued for the structure-based drug design and development for against malaria. The virtual screenings of falcipain3 inhibitors for antimalarial agents were studied by using molecular docking. Three-dimensional structure models of interactions in a falcipain-3-ZINC code 3877, 5634 and 7499 drug like molecules adsorptive complex were studied by molecular docking using AutoDock program. The interactions between falcipain3 and all drug like molecules were predicted by flexible docking including minimization. In the active centre region of falcipain3, amino acid residues between 43-52, 90-96, 160-164, 180-183 and 212-219 were suitable for small inhibitors binding. The crystal structure of falcipain3, i.e. 3BWK, was collected from protein data bank (PDB). Three-dimensional structure of falcipain3 divided into two domain, L and R. The structure composed of five helices, six stands and six turns. The active site of falcipain-3 was located between domain L and R and its composed of amino acid about 15 residues. The catalytic dyad of the falcipain3 presented to the Cys51 and His183. The amino acids of falcipain3 involved for binding interaction located with 5 ºA of catalytic dyad such as Gln45, Tyr90, Tyr93, IIe94, Ser155, Pro181, Glu243, Ser162, His183Trp215, Lys85, Asn86, Asn87, and Gly91.
Keywords: falcipain3, Plasmodium falciparum, virtual screening Introduction and Objective
The falcipain-3 (FP3) is a newly malaria cysteine proteinase. The enzyme was an attractive target for drug design against Malaria [1]. The protease, called falcipain, degrades the denatured and native hemoglobin in vitro. The acid pH optimum, substrate specificity, and inhibitor sensitivity indicate that the enzyme belongs to a papain family of cysteine proteinase. Specific inhibitors of falcipain have been shown. These proteinases are therefore potential targets for antimalarial drug development to block hemoglobin degradation and prevent parasite development. Virtual screening is a computational technique used in drug discovery research. It involves the rapid in silico assessment of large libraries of chemical structures in order to identify structures that are most likely to be able to bind to a drug target, typically a protein receptor or enzyme. The purpose of the structure-based virtual screening requires computational fitting of compounds into
an active site of a receptor using of sophisticated algorithms, followed by scoring and ranking of these compounds to identify potential leads.
Materials and Methods Virtual screening was performed using the
subset of the ZINC database [2]. DOCK program (version 6.1) and AutoDock (version 4.0) were selected for prediction. The crystal structure of FP3, i.e. 3BWK was collected from protein data bank (PDB) [3]. The screening method was divided into three steps. The first step, virtual screenings with rigid docking and with grid energy scoring function were initially screened from 6,280,787 molecules. The second step, the top-ranked 600,000 molecules (based on energy score ranking) were continuously screened with rigid docking including energy minimization. The top-ranked 20,000 molecules were collected in the last step, and virtual screenings of these small molecules using AutoDock with flexible docking were performed

The 23rd Annual Meeting of the Thai Society for Biotechnology “Systems Biotechnology: Quality & Success”
O-VI-7
- 79 -
[4]. The top-ranked 100 molecules (based on docking energy ranking) screened from AutoDock were described into the inhibitor candidates. In virtual screening method by AutoDock, the –SH group in Cys53 of FP3 was set to center of grid box and of the docking system. The grid box was set to 80 × 80 × 80 Å and the grid spacing was set to 0.5 Å. All atom type parameters in AutoDock were used in the grid calculation. The docking was performed to simulate the interaction in the water by setting the solvent dielectric constant to 80. Results
From the results shown in Figure 1-2, the active sites of the FP3 are located in a cleft between the structurally distinct domains of the papain-like fold. The inhibitor interacts with residues in the S1, S2 and S3 subsites corresponding to the P1, P1 and P3 positions of the ligands.
Figure1. Electrostatic surface representation FP3 in complex with drug like molecule ZINC code 7499. The surface potentials of color property from blue, (positively charged) to red, (negatively charged). Discussion
The characteristics of the active site of FP3 and virtual screening with small drug like molecules against FP3 were investigated. The fully opened S subsite during simulation was proposed to be an active conformation of FP3 in the solution.
Figure. 2. The molecular docking model of interactions in a FP3-ZINC code 7499 drug like molecule adsorptive complex. Cysteine51 and proline181 form hydrogen bonds towards the drug like molecule ZINC code 7499.
The S and S′ subsite were clearly classified
based on molecular docking and virtual screening. Several amino acid residues in the S subsite represented the hydrophobic pocket. More than 60 % of the active small molecules based on virtual screening preferred S rather than S′ subsite. The S2 subsite of FP3 has a hydrophobic pocket formed mainly by side chains of FP3-drug like molecules adsorptive complex. The amino acid residues within 5 Ǻ around all small molecules were collected and analyzed. These are the important residues for binding and catalysis. From this research, it was proposed that the amino acid residues 43-52, 90-96, 180-183, 160-164 and 212-219 of FP3 were binding site regions.
References 1. Rosenthal, P.J. Proteases of malaria
parasites: new targets for chemotherapy. Emerg Infect Dis. 1998;4: 49-57.
2. Irwin, J.J., Shoichet, B.K. A free database of commercially available compounds for virtual screening. J Chem Inf Model 2005; 45 : 177-182.
3. Berman, H.M., Westbrook, J., Feng, Z., Gilliland, G., Bhat, T.N., weissing, H., Shindyalov, I., Bourne, P.E. The protein data bank. Nucleic Acids Res. 2000;28(1): 235-242.
4. Morris, G.M., Goodsell, D.S., Halliday, R.S., Huey, R., Hart, W.E., Belew, R.K., Olson, A.J. Automated docking using a lamarckian genetic algorithm and empirical binding free energy function. J Comput Chem. 1998;19(14): 1639-1662.

The 23rd Annual Meeting of the Thai Society for Biotechnology “Systems Biotechnology: Quality & Success”
O-VI-8
- 80 -
Effect of Oxford selective agents on colony growth of Listeria and non-Listeria strains
Ruamporn Liamkaew, and Aluck Thipayarat Department of Food Engineering, Faculty of Engineer, King Mongkut’s University of Technology Thonburi, Bangkok, 10140, Thailand.
Abstract The colony expansion of Listeria ivanovii, Escherichia coli and Salmonella anatum was
evaluated on OXA selective agar with various selective agent concentrations. The digital imagery of the colony expansion was processed to estimate the number of pixels of the colony-forming area by using image analysis technique. A kinetic model (i.e., logistic model) was applied to estimate growth characteristics of bacterial colony. All bacterial strains showed equivalently optimal growth characteristic when grown on the OXA without selective agents. The growth profile of Listeria colonies was improved when the concentration of OXA selective agents was minimal. Higher concentrations of the selective agent were able to effectively suppress the growth of both competing bacteria and provided better selectivity toward L. innocua. The optimal concentration of OXA selective agents was 6%. At this concentration, L. innocua was able to grow very well and distinctly showed the unique black halo while the colony growth of E. coli and S. anatum was inactivated effectively.
Keywords: colony growth, image analysis, Listeria, oxford agar, selective agents Introduction and Objective
This research gears toward studying the
colony growth of L. innocua on solid agar substrate.This bacterium was used as a model microorganism representing the pathogenic L. monocytogenes. E. coli and S. anatum were included to represent competitive bacteria commonly found in food processing and used to study the improvement of isolation step in Listeria detection process. Many foods can be contaminated by Listeria spp., including raw vegetables, raw milk, fish, poultry, process chicken and beef (1). Most universal standards and microbiological manuals refer to Oxford agar as a popular selective agar media to detect and enumerate Listeria spp. (2).
The selective agents in the Oxford medium allow simultaneous suppression of background flora (e.g. Escherichia coli and Salmonella spp.) but promote the growth of Listeria spp. However, the selective agents not only inhibit non-Listeria organisms, but are also detrimental to some degree to Listeria spp. (3). Hence, most applied inhibitors prolong growth of Listeria in agar culture and delay the detection process due to the slow colony expansion. In this research, the influence of selective agent concentrations on colony growth of Listeria and non-Listeria strains was studied in order to optimize the
Listeria detection process for food manufacturing purposes. Materials and Methods
2.1 Bacterial strains Listeria innocua, Escherichia coli and
Salmonella anatum used in this experiment were obtained from Department of Medical Science, Thailand. Frozen stocks of bacterial strains were cultured in Tryptic Soy Broth for 24 h at 37C and prepared to reach ~102 CFU/ml. Bacterial culture (20 l) were inoculated on Oxford media and incubated at 37C for 48h.
2.2 Media preparation Oxford agar (OXA) media was prepared
according to the FDA’s Bacteriological Analytical Manual (BAM) method. The concentrations of selective agents were varied at 12.5%, 6%, 3% and 1.5% of the conventional OXA media recipe. The OXA medium without selective agent (OXA+0%SA) was used as a positive control in this experiment.
2.3 Kinetics growth of bacterial colony The rate of development of microbial
growth was captured and evaluated to monitor colony expansion. The colony area was
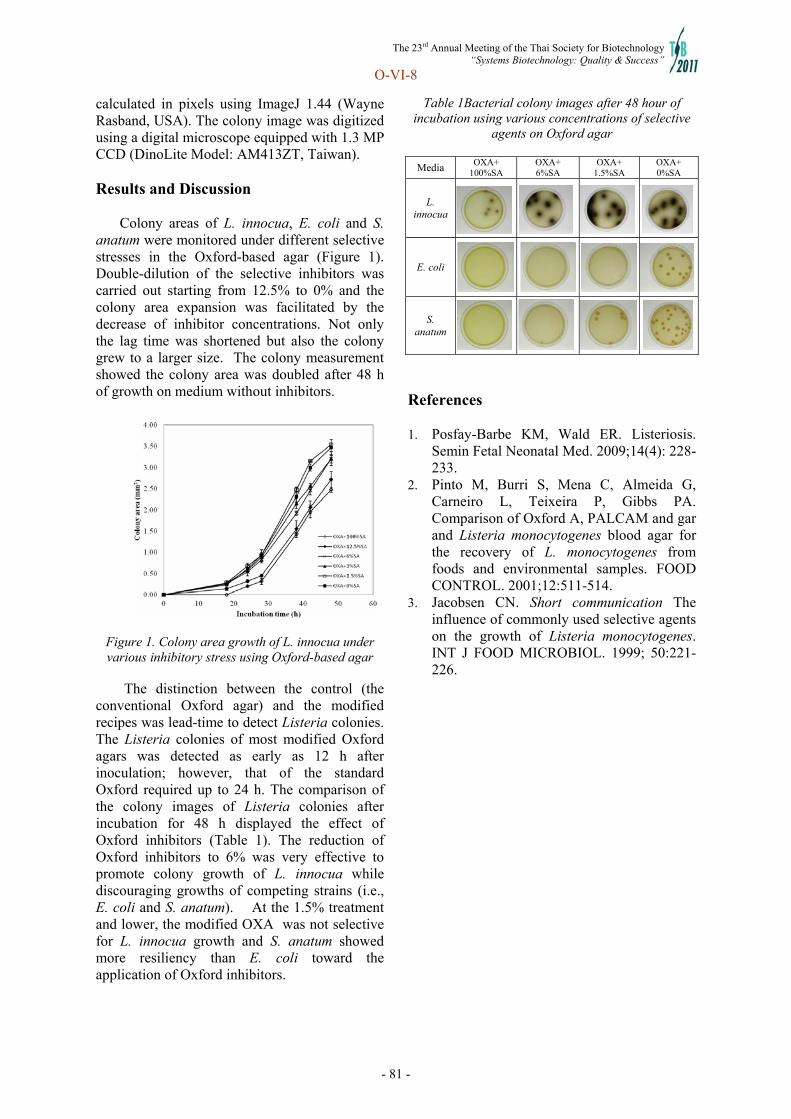
The 23rd Annual Meeting of the Thai Society for Biotechnology “Systems Biotechnology: Quality & Success”
O-VI-8
- 81 -
calculated in pixels using ImageJ 1.44 (Wayne Rasband, USA). The colony image was digitized using a digital microscope equipped with 1.3 MP CCD (DinoLite Model: AM413ZT, Taiwan).
Results and Discussion
Colony areas of L. innocua, E. coli and S.
anatum were monitored under different selective stresses in the Oxford-based agar (Figure 1). Double-dilution of the selective inhibitors was carried out starting from 12.5% to 0% and the colony area expansion was facilitated by the decrease of inhibitor concentrations. Not only the lag time was shortened but also the colony grew to a larger size. The colony measurement showed the colony area was doubled after 48 h of growth on medium without inhibitors.
Figure 1. Colony area growth of L. innocua under various inhibitory stress using Oxford-based agar
The distinction between the control (the
conventional Oxford agar) and the modified recipes was lead-time to detect Listeria colonies. The Listeria colonies of most modified Oxford agars was detected as early as 12 h after inoculation; however, that of the standard Oxford required up to 24 h. The comparison of the colony images of Listeria colonies after incubation for 48 h displayed the effect of Oxford inhibitors (Table 1). The reduction of Oxford inhibitors to 6% was very effective to promote colony growth of L. innocua while discouraging growths of competing strains (i.e., E. coli and S. anatum). At the 1.5% treatment and lower, the modified OXA was not selective for L. innocua growth and S. anatum showed more resiliency than E. coli toward the application of Oxford inhibitors.
Table 1Bacterial colony images after 48 hour of incubation using various concentrations of selective
agents on Oxford agar
Media OXA+ 100%SA
OXA+ 6%SA
OXA+ 1.5%SA
OXA+ 0%SA
L. innocua
E. coli
S. anatum
References 1. Posfay-Barbe KM, Wald ER. Listeriosis.
Semin Fetal Neonatal Med. 2009;14(4): 228-233.
2. Pinto M, Burri S, Mena C, Almeida G, Carneiro L, Teixeira P, Gibbs PA. Comparison of Oxford A, PALCAM and gar and Listeria monocytogenes blood agar for the recovery of L. monocytogenes from foods and environmental samples. FOOD CONTROL. 2001;12:511-514.
3. Jacobsen CN. Short communication The influence of commonly used selective agents on the growth of Listeria monocytogenes. INT J FOOD MICROBIOL. 1999; 50:221-226.
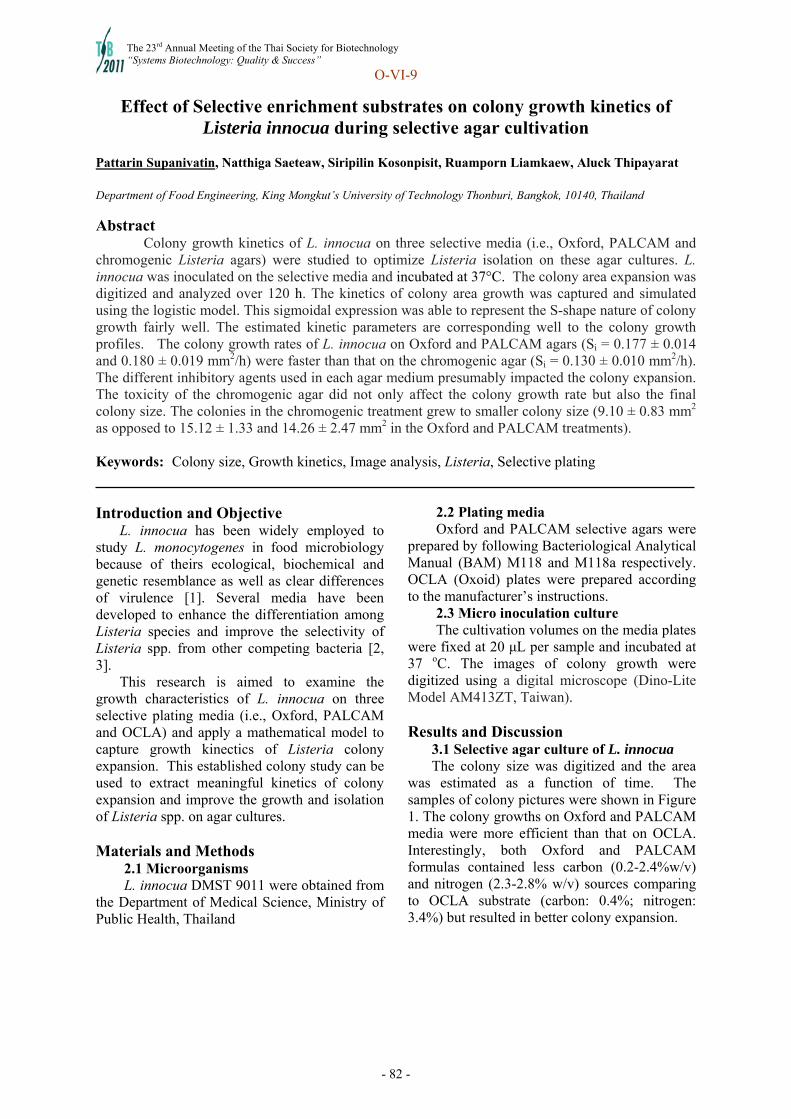
The 23rd Annual Meeting of the Thai Society for Biotechnology “Systems Biotechnology: Quality & Success”
O-VI-9
- 82 -
Effect of Selective enrichment substrates on colony growth kinetics of Listeria innocua during selective agar cultivation
Pattarin Supanivatin, Natthiga Saeteaw, Siripilin Kosonpisit, Ruamporn Liamkaew, Aluck Thipayarat Department of Food Engineering, King Mongkut’s University of Technology Thonburi, Bangkok, 10140, Thailand
Abstract Colony growth kinetics of L. innocua on three selective media (i.e., Oxford, PALCAM and chromogenic Listeria agars) were studied to optimize Listeria isolation on these agar cultures. L. innocua was inoculated on the selective media and incubated at 37°C. The colony area expansion was digitized and analyzed over 120 h. The kinetics of colony area growth was captured and simulated using the logistic model. This sigmoidal expression was able to represent the S-shape nature of colony growth fairly well. The estimated kinetic parameters are corresponding well to the colony growth profiles. The colony growth rates of L. innocua on Oxford and PALCAM agars (Si = 0.177 ± 0.014 and 0.180 ± 0.019 mm2/h) were faster than that on the chromogenic agar (Si = 0.130 ± 0.010 mm2/h). The different inhibitory agents used in each agar medium presumably impacted the colony expansion. The toxicity of the chromogenic agar did not only affect the colony growth rate but also the final colony size. The colonies in the chromogenic treatment grew to smaller colony size (9.10 ± 0.83 mm2 as opposed to 15.12 ± 1.33 and 14.26 ± 2.47 mm2 in the Oxford and PALCAM treatments).
Keywords: Colony size, Growth kinetics, Image analysis, Listeria, Selective plating Introduction and Objective
L. innocua has been widely employed to study L. monocytogenes in food microbiology because of theirs ecological, biochemical and genetic resemblance as well as clear differences of virulence [1]. Several media have been developed to enhance the differentiation among Listeria species and improve the selectivity of Listeria spp. from other competing bacteria [2, 3].
This research is aimed to examine the growth characteristics of L. innocua on three selective plating media (i.e., Oxford, PALCAM and OCLA) and apply a mathematical model to capture growth kinectics of Listeria colony expansion. This established colony study can be used to extract meaningful kinetics of colony expansion and improve the growth and isolation of Listeria spp. on agar cultures. Materials and Methods
2.1 Microorganisms L. innocua DMST 9011 were obtained from
the Department of Medical Science, Ministry of Public Health, Thailand
2.2 Plating media Oxford and PALCAM selective agars were
prepared by following Bacteriological Analytical Manual (BAM) M118 and M118a respectively. OCLA (Oxoid) plates were prepared according to the manufacturer’s instructions.
2.3 Micro inoculation culture The cultivation volumes on the media plates
were fixed at 20 μL per sample and incubated at 37 oC. The images of colony growth were digitized using a digital microscope (Dino-Lite Model AM413ZT, Taiwan).
Results and Discussion
3.1 Selective agar culture of L. innocua The colony size was digitized and the area
was estimated as a function of time. The samples of colony pictures were shown in Figure 1. The colony growths on Oxford and PALCAM media were more efficient than that on OCLA. Interestingly, both Oxford and PALCAM formulas contained less carbon (0.2-2.4%w/v) and nitrogen (2.3-2.8% w/v) sources comparing to OCLA substrate (carbon: 0.4%; nitrogen: 3.4%) but resulted in better colony expansion.
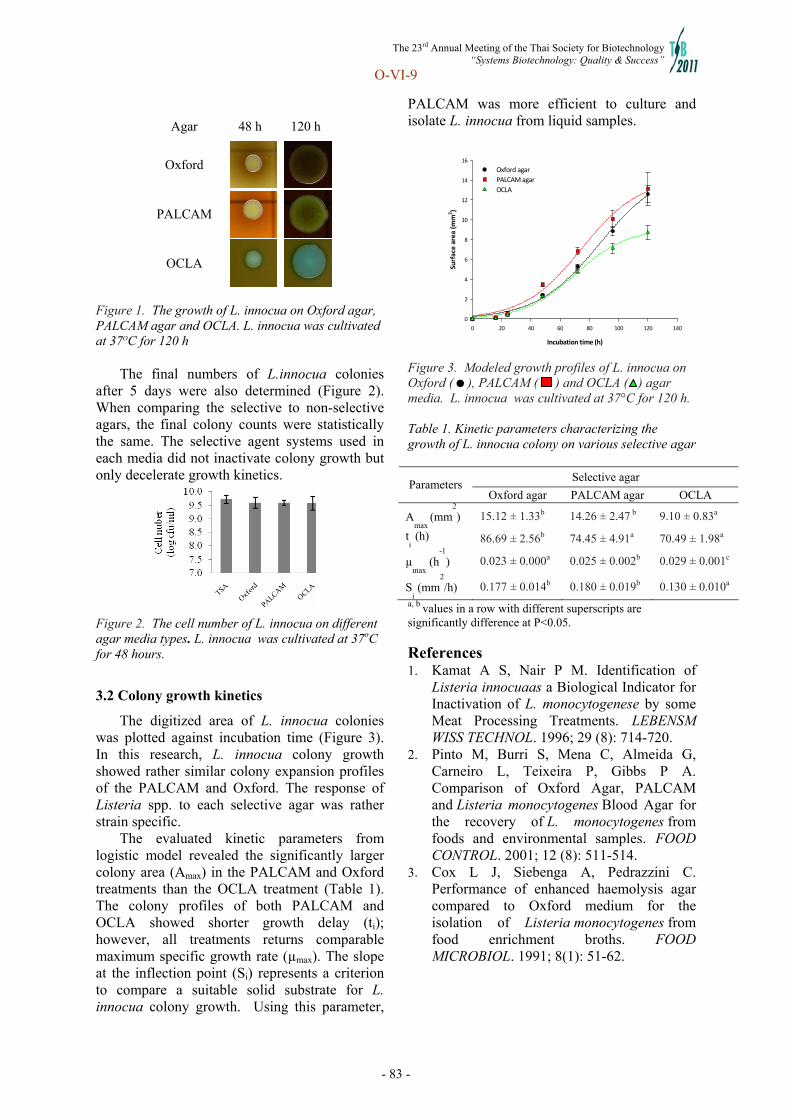
The 23rd Annual Meeting of the Thai Society for Biotechnology “Systems Biotechnology: Quality & Success”
O-VI-9
- 83 -
Incubation time (h)
0 20 40 60 80 100 120 140
Surface area (m
m2)
0
2
4
6
8
10
12
14
16
Oxford agar
PALCAM agar
OCLA
Agar 48 h 120 h
Oxford
PALCAM
OCLA
Figure 1. The growth of L. innocua on Oxford agar, PALCAM agar and OCLA. L. innocua was cultivated at 37OC for 120 h
The final numbers of L.innocua colonies
after 5 days were also determined (Figure 2). When comparing the selective to non-selective agars, the final colony counts were statistically the same. The selective agent systems used in each media did not inactivate colony growth but only decelerate growth kinetics.
Figure 2. The cell number of L. innocua on different agar media types. L. innocua was cultivated at 37oC for 48 hours.
3.2 Colony growth kinetics
The digitized area of L. innocua colonies was plotted against incubation time (Figure 3). In this research, L. innocua colony growth showed rather similar colony expansion profiles of the PALCAM and Oxford. The response of Listeria spp. to each selective agar was rather strain specific.
The evaluated kinetic parameters from logistic model revealed the significantly larger colony area (Amax) in the PALCAM and Oxford treatments than the OCLA treatment (Table 1). The colony profiles of both PALCAM and OCLA showed shorter growth delay (ti); however, all treatments returns comparable maximum specific growth rate (µmax). The slope at the inflection point (Si) represents a criterion to compare a suitable solid substrate for L. innocua colony growth. Using this parameter,
PALCAM was more efficient to culture and isolate L. innocua from liquid samples.
Figure 3. Modeled growth profiles of L. innocua on Oxford ( ), PALCAM ( ) and OCLA ( ) agar media. L. innocua was cultivated at 37°C for 120 h. Table 1. Kinetic parameters characterizing the growth of L. innocua colony on various selective agar
Selective agar Parameters
Oxford agar PALCAM agar OCLA
Amax
(mm2
) 15.12 ± 1.33b 14.26 ± 2.47 b 9.10 ± 0.83a
ti
(h) 86.69 ± 2.56b 74.45 ± 4.91a 70.49 ± 1.98a
µmax
(h-1
) 0.023 ± 0.000a 0.025 ± 0.002b 0.029 ± 0.001c
Si (mm
2
/h) 0.177 ± 0.014b 0.180 ± 0.019b 0.130 ± 0.010a a, b values in a row with different superscripts are significantly difference at P<0.05.
References 1. Kamat A S, Nair P M. Identification of
Listeria innocuaas a Biological Indicator for Inactivation of L. monocytogenese by some Meat Processing Treatments. LEBENSM WISS TECHNOL. 1996; 29 (8): 714-720.
2. Pinto M, Burri S, Mena C, Almeida G, Carneiro L, Teixeira P, Gibbs P A. Comparison of Oxford Agar, PALCAM and Listeria monocytogenes Blood Agar for the recovery of L. monocytogenes from foods and environmental samples. FOOD CONTROL. 2001; 12 (8): 511-514.
3. Cox L J, Siebenga A, Pedrazzini C. Performance of enhanced haemolysis agar compared to Oxford medium for the isolation of Listeria monocytogenes from food enrichment broths. FOOD MICROBIOL. 1991; 8(1): 51-62.
The 23rd Annual Meeting of the Thai Society for Biotechnology “Systems Biotechnology: Quality & Success”
O-VI-10
- 84 -
Study of incubation temperature and nutrients of non-selective enrichment for optimizing growth of Listeria innocua in liquid cultivation
Siripa Daengphuang and Aluck Thipayarat Department of Food Engineering, Faculty of Engineer, King Mongkut’s University of Technology Thonburi, Bangkok, 10140, Thailand.
Abstract This study explores the effects of incubation temperature and types of non-selective enrichment substrates on growth of Listeria innocua in suspended cell culture. The choice of non-selective enrichment media was derived from the primary and secondary enrichment media (Palcam Broth, Buffered Listeria Enrichment Broth, and Fraser Broth), in which selective agents were eliminated. The nutrient-rich media were compared to the conventional growth substrates (Nutrient Broth, Lactose Broth and Tryptic Soy Broth). The effect of incubation temperatures on the growth kinetics was performed at 30 ◌Cํ, 35 ◌Cํ, 37 ◌Cํ, and 40 ◌Cํ. The growth kinetics of L. innocua was captured using Sigmoidal function extracting the key kinetic parameters (maximum specific growth rate). The study revealed rather low optimal temperature (at 35oC) for growing L. innocua in all selected growth media. L. innocua showed the highest preference for growth toward Tryptic Soy Broth as quantified by higher value of the maximum specific growth rate and final cell density. Basically all media were fairly effective to sustain growth of L. innocua for non-selective enrichment process and the incubation temperature played a significant role in promoting growth. Together with proper medium, not only fast growth kinetics but also higher cell density can be achieved.
Keywords: growth kinetic, Listeria innocua, non-selective media, temperature Introduction
In most well-operated food facilities, the nature of Listeria spp. comtamination in foods tends to be very low [1]. To effectively detect low level contamination, enrichment steps are usually required to increase target organism numbers to sufficient levels and improve the likelihood of detection. In addition, there are several research groups that reported the use of modified non-selective step to produce better result than the conventional selective protocols [2,3,4]. Determining the optimal condition for selectively increasing number of Listeria monocytogenes in a wide array of food samples is critical to enhance detection resolution.
The objective of this study is to evaluate the optimum condition (non-selective enrichment media and incubation temperature) for non-selective enrichment step that allows Listeria spp. to grow best in order to improve Listeria recovering and detection.
Materials and Methods
2.1 Culture Listeria innocua (Department of Medical Science, Thailand) was grown in Tryptic Soy Broth (TSB) for 24 h at 37 ºC 200 rpm before inoculate on different non-selective enrichment broth. 2.2 Non-selective enrichment preparation
Nutrient broth (NB) (Scharlau Chemis, Spain), Lactose Broth (LB) (Hi-media, India), Tryptic Soy Broth (TSB) (Difco, France) and Buffered Listeria Enrichment Broth base (BLEB) (Oxoid, England) were prepared according to manufacturer’s instructions. Fraser Broth (FB) (Oxoid, England) and Palcam Broth (PB) (Acumedia, US) were adapted from the manufacturer’s premix but their inhibitors were removed. 2.3 Growth study Serial dilution of L. innocua was performed to dilute the initial cell density to a desired dilutions which was around 103-104 CFU/ml. Then 200 μl of the culture was transferred to 20 ml of different non-selective broths. These samples were collected at 0, 2, 4, 6, 8, 10, 12,

The 23rd Annual Meeting of the Thai Society for Biotechnology “Systems Biotechnology: Quality & Success”
O-VI-10
- 85 -
14, 16, 20 and 24 hours to enumerate the microbial count on Tryptic Soy Agar. Then the analysis of growthcharacteristic was performed by applying sigmoidal function.
Results and Discussion
In this study, L. innocua serves as a model pathogen instead of L. monocytogenes to represent growth of Listeria spp. in food production environment. The effect of incubation temperature played a crucial role to facilitate cell multiplication in the non selective step. Figure 1 shows different profiles of L. innocua numbers in TSB, which were incubated at 30, 35, 37 and 40oC. The best growth of L. innocua was obtained at 35oC. High temperatures were detrimental to L. innocua growth. When the temperature exceeded 45oC, growth was terminated (result will be shown elsewhere).
Figure 1. Effect of non-selective enrichments broths at different incubation temperature on growth of L.
innocua Sigmoidal function was applied to extract
key parameters, including maximum specific growth rate (max) and able to represent the growth of L. innocua under different substrates and incubation temperatures fairly well. Figure 2 revealed that the optimal temperature for most non selective substrates was at 35oC. The growth at 37oC was rather sub-optimal. This optimal temperature range was consistent with Faber et al. (1991), which reported that the optimum temperature for growth of Listeria spp. lied between 30 and 37oC. The effect of different types of non selective media was random. Each substrate was equivalently effective. The typical substrate such as TSB, NB, LB, and BLEB showed slight advantage over the selective media without inhibitors.
Figure 2. Maximum Specific growth rate of L.
innocua at different enrichment condition
References 1. Farber J M., Peterkin P I. Listeria
monocytogenes, a food-borne pathogen. MICROBIOL REV. 1991; 55(3): 476–511.
2. Sheridan J J., Duffy G., Mcdowell D A, Blair I S. The occurrence and initial numbers of Listeria in Irish meat and fish products and the recovery of injured cells from frozen products. INT J FOOD MICROBIOL. 1994; 22(2-3): 105-113.
3. Kosonpisit P. Optimization of Liquid Enrichment to Enhance Batch Growth Kinetics of Listeria spp. Master of Engineering. King Mongkut’s University of Technology Thonburi 2010.
4. Budu-Amoako E., Toora S., Ablett R F., Smith J. Evaluation of the Ability of Primary Selective Enrichment To Resuscitate Heat-Injured and Freeze-Injured Listeria monocytogenes Cells. APPL ENVIRON MICROBIOL. 1992; 58(9): 3177-3179.
5. Rijpens N., Herman L. Comparison of selective and nonselective primary enrichments for the detection of Listeria monocytogenes in cheese. INT J FOOD MICROBIOL. 2004; 94(1): 15– 22.
The 23rd Annual Meeting of the Thai Society for Biotechnology “Systems Biotechnology: Quality & Success”
P-I-01
- 86 -
The role of different viral genes on the replication of white spot syndrome virus in Penaeus vannamei
Pongsak Khunraea, Vanvimon Saksmerpromeb,c, Triwit Rattanarojponga aDepartment of Microbiology, Faculty of Science, King Mongkut’s University of Technology Thonburi, Pracha-Uthi Rd, Bangkok 10140, Thailand. bCentex Shrimp, Chalerm Prakiat Building, Faculty of Science, Mahidol University, Rama VI Rd, Bangkok 10400,Thailand cNational Center for Genetic Engineering and Biotechnology (BIOTEC), National Science and Technology Development Agency, Thailand Science Park, 113 Pahonyothin Rd, Pathumthani 12120, Thailand Abstract
White spot syndrome virus (WSSV) is a major agent of white spot disease in farmed shrimp all over the world. The mortality rate of this disease is 100% within 2-10 days. Here, 6 different viral genes (VP28, VP35, ICP11, DNA- pol, RR2 and IE-1) expressed in the distinct point of time after viral infection were chosen to investigate their role on the replication of WSSV infection in Penaeus vannamei. dsRNA specific for these viral genes were constructed and produced in Escherichia coli. All dsRNA could inhibit expression of their target genes in shrimps challenged with WSSV as shown by semi-quantitative PCR. Interestingly, the viral infectivity level of the shrimps treated with dsRNA specific for RR2 and VP35 was dramatically decreased when compared to that of the shrimps treated with dsRNA specific for EGFP. The data from mortality rate also suggested the same trend that the shrimps treated with dsRNA specific for RR2, DNA-pol and VP35 exhibited more resistant to viral infection than the shrimps treated with other dsRNA. Therefore, the results suggested that RR2, DNA-pol and VP35 could be promising targets for dsRNA-based therapeutics in fighting with WSSV infection in farmed shrimp. Keywords: white spot syndrome virus, dsRNA, Penaeus vannamei, semi-quantitative PCR Introduction and Objective
White spot syndrome virus (WSSV) is the major causative agent in farmed shrimp worldwide. The infected shrimp dies up to 100% within 3-10 days [1]. Several methods were developed to prevent the economic loss from this virus. Among them, RNA interference is an effective technique. However, WSSV genome composes at least 184 ORFs differentially expressed in different time after infection in shrimp and involve in each stage of viral replication. Therefore, we focused to study the role of six WSSV essential genes on the replication of virus in Penaeus vannamei by RNAi in order to find out the efficient WSSV target genes as dsRNA-based therapeutics in fighting with WSSV infection in farmed shrimps.
Materials and Methods 2.1 Shrimp and virus Shrimps (P. vannamei) of approximately
500 mg body weight was kindly provided from Charoen Pokphand Foods Public Company Limited. They were reared in 50 L tank containing sea water at 10 ppt salinity and aeration for 48 h before used. Crude WSSV stock was prepared from the gill tissues of moribund shrimp and kept at -80OC before used.
2.2 The preparation of long-hairpin dsRNA in bacteria
Long-hairpin dsRNA specific for each gene (VP28, VP35, ICP11, DNA- pol, RR2 and IE-1) were produced in RNAseIII-deficient E.coli strain HT115 (DE3) transformed with each recombinant plasmid construct containing a forward and reverse gene fragment [2].
2.3. Shrimp injection and sample analysis Shrimps were divided into 2 groups, one for
monitor viral infectivity level and dsRNA suppression efficiency, and the other for observing cumulative percent mortality. Each group was sub-divided into 9 different injections. Six-sub-groups represented injection of dsRNA specific for each gene. One-subgroup
The 23rd Annual Meeting of the Thai Society for Biotechnology “Systems Biotechnology: Quality & Success”
P-I-01
- 87 -
was dsRNA specific to EGFP injection and other two-subgroups were PBS injection (positive and negative control). 10 g of dsRNA was injected intramuscularly 24 hr (n=20) before challenging with crude WSSV at dilution 2.5X10⁻². Gill tissues were removed from each individual shrimp from each treatment at 0, 8, 24, 48 h after challenging with WSSV for detection of viral infectivity level by using IQ2000TM WSSV Detection & Prevention kit and dsRNA suppression efficiency by RT-PCR [2]. Results and Discussion When injection of dsRNA specific for each WSSV gene expressed at different time point after infection, all dsRNA specific to specific for ICP-11, VP28, VP35, DNA-pol, RR2 and IE-1 could completely suppress the expression of the target genes because no mRNA level and the reduction of mRNA of each target gene was observed in gill tissues from infected-shrimps at 8 to 48 hr of post infection detected by RT-PCR (Figure 1).
Figure 1. Suppression efficiency of each dsRNA specific for each viral gene in infected - shrimps at 8 to 48 hr of post infection. In order to investigate the infectivity level of WSSV in shrimps injected with dsRNA specific to ICP-11, VP28, VP35, DNA-pol, RR2 and IE-1. The result showed that the infectivity level of WSSV in infected-shrimps treated with dsRNA specific for RR2, and VP35 was reduced at 8 to 48 hr of post infection when compared to severe infectivity level demonstrated in the positive control (Figure 2). In addition, the infectivity level of WSSV in infected-shrimps treated with dsRNA specific for DNA-pol was only very light at 8 hr of post infection and dsRNA specific for
ICP-11, VP28, IE-1 and EGFP could not reduce the infectivity level of WSSV in infected-shrimps (data not shown). This finding was in agreement with the previous report done in P. monodon [3]. When examine the protection of dsRNA specific for specific to ICP-11, VP28, VP35, DNA-pol, RR2 and IE-1 in WSSV infected shrimps, the lowest cumulative mortality rate of infected-shrimps was observed in shrimps treated with dsRNA specific for RR2 at 7 days after post infection when compared to those of infected-shrimps injected with dsRNA specific for other genes (Data not shown). The similar reduction of cumulative mortality rate was also observed in infected-shrimps treated with dsRNA specific for DNA-pol and VP35 at the same time after post infection.
Figure 2. The infectivity level of WSSV in shrimps injected with dsRNA specific for RR2 and VP35 at 8 to 48 hr of post infection. From here, RR2, DNA-pol and VP35 could be promising targets for dsRNA-based therapeutics in fighting with WSSV infection in farmed shrimp. References 1. Lightner DV. A Handbook of shrimp
Pathology and Diagnostic Procedures for Diseases of Cultured Penaeid Shrimp. World Aquaculture Society, Baton Rouge, LA; 1996
2. Saksmerprome V, Charoonnart P, Gangnonngiw W, Withyachumnarnkul B. A novel and inexpensive application of RNAi technology to protect shrimp from viral disease. J Virol Methods. 2009; 162: 213-7.
3. Attasart P, Kaewkhaw R, Chimwai C, Kongphom U, Namramoon O, Panyim S. Inhibition of white spot syndrome virus replication in Penaeus monodon by combined silencing of viral rr2 and shrimp PmRab7. Virus Res. 2009; 145(1): 127-33.

The 23rd Annual Meeting of the Thai Society for Biotechnology “Systems Biotechnology: Quality & Success”
P-I-02
- 88 -
Preparation of white spot syndrome virus VP35 protein having high folding uniformity
Triwit Rattanarojpong, Rukkit Suwannaboon and Pongsak Khunrae Department of Microbiology, Faculty of Science, King Mongkut’ s University of Technology Thonburi, Pracha-Uthi Rd, Bangkok 10140, Thailand. Abstract
It is almost a decade since VP35 from white spot syndrome virus is identified as a nucleocapsid protein. Having no further report on VP35 characterization, little is known about the role of this protein playing in the interaction between shrimp and the virus during infection period. This is partly due to that the biochemical and structural characterization of this protein is hampered by aggregate formation when the protein is expressed in bacterial cells. In this study, the method for producing VP35 protein with high homogeneity in size and folding uniformity was presented. VP35 was fused with thioredoxin and expressed in three different bacterial strains, BL21, Origami B and Rosetta. It was found that the fusion protein expressed in Origami(DE3) cells migrated as a sharp band on both reducing and non-reducing SDS-PAGE, indicating high folding uniformity. Despite of higher protein yield, VP35 fusion protein obtained from BL21 cells became smear when migrated on non-reducing gel. No expression of VP35 fusion protein was detected in Rosetta cells. Interestingly, in comparison to the expression of VP35 without thioredoxin fusion, aggregation was greatly reduced in the expression of VP35 fusion protein observed in both BL21 and Origami B cells. Therefore, fusing VP35 with thioredoxin may be a promising method for preparing VP35 protein having suitable quality for subsequent biochemical and structural analysis.
Keywords: white spot syndrome virus, VP35 Introduction and Objective
Currently, the studying of white spot
syndrome virus (WSSV) VP35 protein has been remaining in limited knowledge. After having identified as a nucleocapsid protein (1), there is no further report on the function of VP35 ever since. Recently, results from yeast two hybrids carried out in our laboratory suggested that the VP35 protein may interact with shrimp HtrA2-like protein. In order to gain more insights into the binding of VP35 to the shrimp HtrA2, it is necessary to be able to produce recombinant VP35 protein with sufficient amount for further characterizations. In this study, the VP35 encoding gene was cloned into two different types of E.coli expression vector to produce recombinant VP35 with and without thioredoxin fused at N-terminal. The effect of theioredoxin fusion on VP35 expression in several E. coli strains was investigated.
Materials and Methods 1. Construction of expression plasmid DNA fragment encoded for VP35 (accession
No. AF394231.1) was cloned into pET28b at NcoI and SalI sites. This construct was used to expression VP35 protein having hexahistidine taq at C-terminal. In order to expression VP35 having thioredoxin fused at its N-terminal, the gene was cloned into pET15bThio, which is the modified pET15b to contain bacterial thioredoxin encoding sequence. The cloning sites for this construct were BamHI and XhoI. The fusion protein also contained hexahistidine taq at its N-terminal.
2. Expression and purification of VP35 pET28b/VP35 was transformed into
BL21cells. pET15bThio/VP35, however, was transform into three E.coli strains, BL21, Origami(DE3) and Rosetta. The transformants were cultured at 37 Cº. When the culture broth reached O.D of around 0.6, the protein expression was induced by adding IPTG to achieve the final concentration of 1 mM. The culture was then left shaken at 16 oC to allow the protein expression to take place overnight. Cells

The 23rd Annual Meeting of the Thai Society for Biotechnology “Systems Biotechnology: Quality & Success”
P-I-02
- 89 -
were harvested from 3 ml overnight culture by centrifugation and resuspended in 500 μL of lysis buffer (25mM tris-base 0.3M NaCl 15mM Imidazole 0.5% tritonx100).
Cell lysate was prepared by sonication and supernatant was collected by centrifugation. The recombinant His-taq protein was precipitated by adding Ni-NTA into the supernatant. The beads was washed with lysis buffer for 3 times and suspended in lysis buffer to make up the final volume of 50 µl. The protein was analyzed by SDS-PAGE under both reduced and non-reduced condition.
Results and Discussion The expression of VP35 in BL21 which was transformed with pET28b/VP35 was very strong as evidenced by a thick band corresponding to the molecular weight of about 35kDa. The edge of the protein band was clearly defined under reducing condition. However, the protein band became smear under non-reducing condition (Figure 1). This result suggested that, despite of the correct size, as indicated by the major protein band, the protein however consisted of several populations having different folding conformations. This is due to most of the protein molecules are misfolded. The misfolding effect can be clearly observed under the non-reducing condition.
Figure1. SDS-PAGE analysis of VP35 obtained from
BL21 under reduced and non-reduced condition To improve the folding of VP35, the protein was fused with thioredoxin and expressed in three different E. coli strains. The fusion protein showed to have molecular weight of around 45 kDa. The increased weight of the protein was due to the mass of thioredoxin incorporated into
the protein. Our results showed that Origami (DE3) may be the most suitable host cells of choice for thioredoxin-fused VP35 protein expression. The expression level in Origami (DE3) may be slightly weaker than that observed in BL21, the protein folding however was greatly improved. The fusion protein obtained from Origami (DE3) migrated on SDS-PAGE as a single band even under the non-reducing condition, indicating that most of the proteins were correctly folded. Fusion of VP35 with thioredoxin helps increase uniformity of the protein as seen in our results (Figure 2).
Figure2. SDS-PAGE analysis of thioredoxin-fused VP35 under reduced and non-reduced condition
References 1. Chen LL, Leu JH, Huang CJ, Chou CM,
Chen SM, Wang CH, et al. Identification of a nucleocapsid protein (VP35) gene of shrimp white spot syndrome virus and characterization of the motif important for targeting VP35 to the nuclei of transfected insect cells. Virology. 2002 Feb 1;293(1): 44-53.

The 23rd Annual Meeting of the Thai Society for Biotechnology “Systems Biotechnology: Quality & Success”
P-I-03
- 90 -
Expression of recombinant HtrA2 protein of Penaeus monodon in Escherichia coli
Triwit Rattanarojpong, Yongyuth Srisupapakdee, Pongsak Khunrae Department of Microbiology, Faculty of Science, King Mongkut’s University of Technology Thonburi, Pracha-Uthi Rd, Bangkok 10140, Thailand.
Abstract
HtrA2 belongs to a family of serine proteases and acts to promote apoptosis by neutralizing of inhibitor of apoptosis proteins (IAPs) in several organisms. Since the discovery of HtrA2 in Penaeus monodon, the molecular function of this protein in shrimp is still unclear. As part of the attempt to characterize the shrimp HtrA2, partial shrimp HtrA2 (pHtrA2) was cloned into two E. coli expression vectors, with and without thioredoxin, and the expressions of pHtrA2 were investigated in several E.coli host strains including BL21, Rosetta and Origami. It was found that most of pHtrA2 proteins were expressed in the form of inclusion body in BL21. However, in the same bacterial strain, the soluble form of pHtrA2 protein was successfully expressed when the protein was fused with thioredoxin. The protein could be purified by passing through Ni-NTA column and it showed to have appearance molecular weight of about 30 kDa in SDS-PAGE. This is the first time to report the expression and purification of shrimp HtrA2 protein which can be used for further characterizations.
Keywords: HtrA2, apoptosis, IAPs, Penaeus monodon, SDS-PAGE Introduction and Objective
High temperature requirement protein A2 (HtrA2) belongs to a group of protease that is classified as serine protease. This protease contains a trypsin like protease domain at N-terminus and a PDZ domain at the C terminus as well as a mitochondrial localization signal at the end of N terminus for protein targeting in mitochondria membrane. HtrA2 acts an apoptosis-promoting protein via a substitute of caspase by its interaction with IAP which leads to the activation of caspase in cells (1).
We have identified HtrA2 gene in shrimp for the first time and in this study we present the method for producing recombinant shrimp HtrA2, which can be utilized for further analysis.
Materials and Methods
2.1 Cloning and Expression of partial shrimp HtrA2 (pHtrA2) gene
The partial shrimp HtrA2 (pHtrA2) gene was cloned into BamHI and HindIII sites in pET28b (+) vector. This gene was also cloned into BamHI and XhoI sites of pET15b vector, which was modified to contain bacterial thioredoxin encoding sequence. These two constructs were expressed in three different E.coli strains, BL21, Rosetta and Origami. The recombinant pET28b (+) vector expressed pHtrA2 protein fused with His6 at the C-
terminus. The recombinant pET15b vector expressed pHtrA2 as the fusion protein that contained His6-thioredoxin at the N-terminus.
2.2 Expression and purification of HtrA2 The two recombinant vectors were
transformed to three E.coli strains. The transformants were culture in LB Broth until the O.D. of bacterial culture reached 0.6-0.8. The bacterial culture was subjected to heat shock by incubating at 42oC for 30 min before being induced with IPTG at final concentration 0.5 mM. The protein expression was allowed to take place overnight at 16 ºC. The overnight bacterial cells was harvested and centrifuged at 4500 rpm for 10 min. and resuspended in 500 μL of lysis buffer. Cell lysates was prepared by sonication and supernatant was collected by centrifugation. The recombinant pHtrA2 was purified by Ni-NTA His-Bind affinity chromatography and molecular weight of recombinant pHtrA2 was determined by SDS-PAGE 12% polyacylamide gel). The protein was subjected to Western blot analysis with a mouse anti-His antibody.
The 23rd Annual Meeting of the Thai Society for Biotechnology “Systems Biotechnology: Quality & Success”
P-I-03
- 91 -
Results and Discussion Initially, the expression of recombinant
pHtrA2 cloned in pET28b (+) vector in E. coli strain BL21 was predominantly detected in cell pellets with the molecular mass of 24 kDa but not in supernatant (Figure 1). The similar results were observed in E. coli strain Rosetta and Origami (Data not shown). This implies that the recombinant pHtrA2 could be expressed in these three E. coli strains in an insoluble form. Therefore, we alternatively cloned pHtrA2 into the modified pEt15b vector from which the recombinant pHtrA2 was expressed as His6-thioredoxin fused pHtrA2. Fusion with thioredoxin enables a fraction of recombinant pHtrA2 to translocate into periplasm where the protein can be corrected folded, hence soluble.
The result showed that the fusion protein could be detected in the supernatant of E. coli strain BL21 with the molecular mass of 30 kDa (Figure 2). The increasing in the molecular mass of recombinant pHtrA2 was resulted from additional molecular mass of thioredoxin fused at the N-terminus of recombinant pHtrA2. In addition, E.coli strain BL21 could produced higher yield of recombinant proteins than stains Rosetta and Origami (Data not shown).
To confirm that the purified fusion protein
is actually the recombinant pHtrA2, the protein was analyzed by Western blotting. The result showed that fusion protein could react with a mouse anti-His antibody and had the same molecular weight as seen in SDS-PAGE (Figure 3). Interestingly, the solubility of the protein could be improved by using heat shock. The pHtrA2 without thioredoxin could be detected in supernatant after heat shock (Figure 3) but it produced many protein bands on SDS-PAGE
(data not shown) even after purification. In conclusion, we have showed that by fusing pHtrA2 with thioredoxin and using heat shock could successfully enhanced the expression of this protein in E.coli.
References 1. Vande Walle L, Lamkanfi M, Vandenabeele
P. The mitochondrial serine protease HtrA2/Omi: an overview. Cell Death Differ. 2008 Mar;15(3):453-60.
Figure1. SDS-PAGE analysisof pHtrA2 in pET28b(+) vectorexpressed in E. coli BL21. Supernatant (Lane 1), Pellet (Lane 2)
Figure2. SDS-PAGE analysis of pHtrA2 encoded by modified pET15b vector expressed in E. coli BL21 from 4 hr (lane1) and overnight (lane 2) .
Figure3. Western blot analysis of pHtrA2 encoded by pET28b (+)(Lane 1) and modified pET15b (Lane
2). Both proteins were expressed in E. coli BL21.
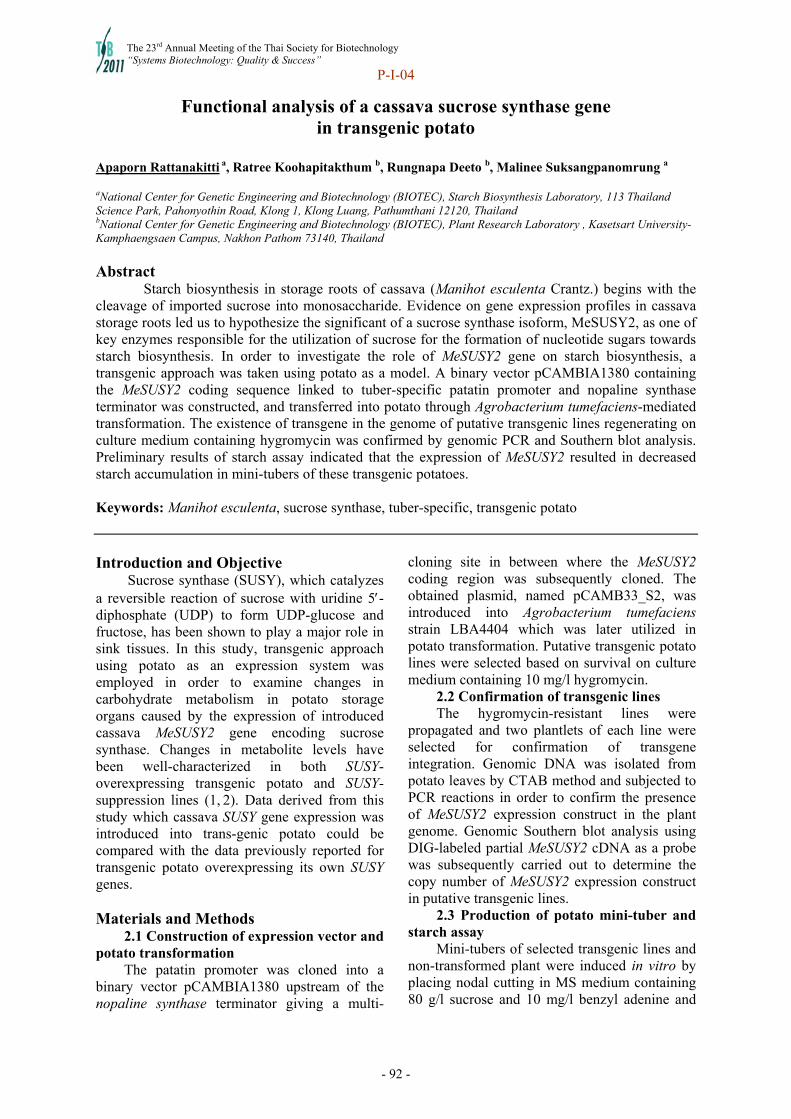
The 23rd Annual Meeting of the Thai Society for Biotechnology “Systems Biotechnology: Quality & Success”
P-I-04
- 92 -
Functional analysis of a cassava sucrose synthase gene in transgenic potato
Apaporn Rattanakitti a, Ratree Koohapitakthum b, Rungnapa Deeto b, Malinee Suksangpanomrung a aNational Center for Genetic Engineering and Biotechnology (BIOTEC), Starch Biosynthesis Laboratory, 113 Thailand Science Park, Pahonyothin Road, Klong 1, Klong Luang, Pathumthani 12120, Thailand bNational Center for Genetic Engineering and Biotechnology (BIOTEC), Plant Research Laboratory , Kasetsart University-Kamphaengsaen Campus, Nakhon Pathom 73140, Thailand
Abstract
Starch biosynthesis in storage roots of cassava (Manihot esculenta Crantz.) begins with the cleavage of imported sucrose into monosaccharide. Evidence on gene expression profiles in cassava storage roots led us to hypothesize the significant of a sucrose synthase isoform, MeSUSY2, as one of key enzymes responsible for the utilization of sucrose for the formation of nucleotide sugars towards starch biosynthesis. In order to investigate the role of MeSUSY2 gene on starch biosynthesis, a transgenic approach was taken using potato as a model. A binary vector pCAMBIA1380 containing the MeSUSY2 coding sequence linked to tuber-specific patatin promoter and nopaline synthase terminator was constructed, and transferred into potato through Agrobacterium tumefaciens-mediated transformation. The existence of transgene in the genome of putative transgenic lines regenerating on culture medium containing hygromycin was confirmed by genomic PCR and Southern blot analysis. Preliminary results of starch assay indicated that the expression of MeSUSY2 resulted in decreased starch accumulation in mini-tubers of these transgenic potatoes. Keywords: Manihot esculenta, sucrose synthase, tuber-specific, transgenic potato
Introduction and Objective
Sucrose synthase (SUSY), which catalyzes a reversible reaction of sucrose with uridine 5-diphosphate (UDP) to form UDP-glucose and fructose, has been shown to play a major role in sink tissues. In this study, transgenic approach using potato as an expression system was employed in order to examine changes in carbohydrate metabolism in potato storage organs caused by the expression of introduced cassava MeSUSY2 gene encoding sucrose synthase. Changes in metabolite levels have been well-characterized in both SUSY-overexpressing transgenic potato and SUSY-suppression lines (1, 2). Data derived from this study which cassava SUSY gene expression was introduced into trans-genic potato could be compared with the data previously reported for transgenic potato overexpressing its own SUSY genes.
Materials and Methods
2.1 Construction of expression vector and potato transformation
The patatin promoter was cloned into a binary vector pCAMBIA1380 upstream of the nopaline synthase terminator giving a multi-
cloning site in between where the MeSUSY2 coding region was subsequently cloned. The obtained plasmid, named pCAMB33_S2, was introduced into Agrobacterium tumefaciens strain LBA4404 which was later utilized in potato transformation. Putative transgenic potato lines were selected based on survival on culture medium containing 10 mg/l hygromycin.
2.2 Confirmation of transgenic lines The hygromycin-resistant lines were
propagated and two plantlets of each line were selected for confirmation of transgene integration. Genomic DNA was isolated from potato leaves by CTAB method and subjected to PCR reactions in order to confirm the presence of MeSUSY2 expression construct in the plant genome. Genomic Southern blot analysis using DIG-labeled partial MeSUSY2 cDNA as a probe was subsequently carried out to determine the copy number of MeSUSY2 expression construct in putative transgenic lines.
2.3 Production of potato mini-tuber and starch assay
Mini-tubers of selected transgenic lines and non-transformed plant were induced in vitro by placing nodal cutting in MS medium containing 80 g/l sucrose and 10 mg/l benzyl adenine and
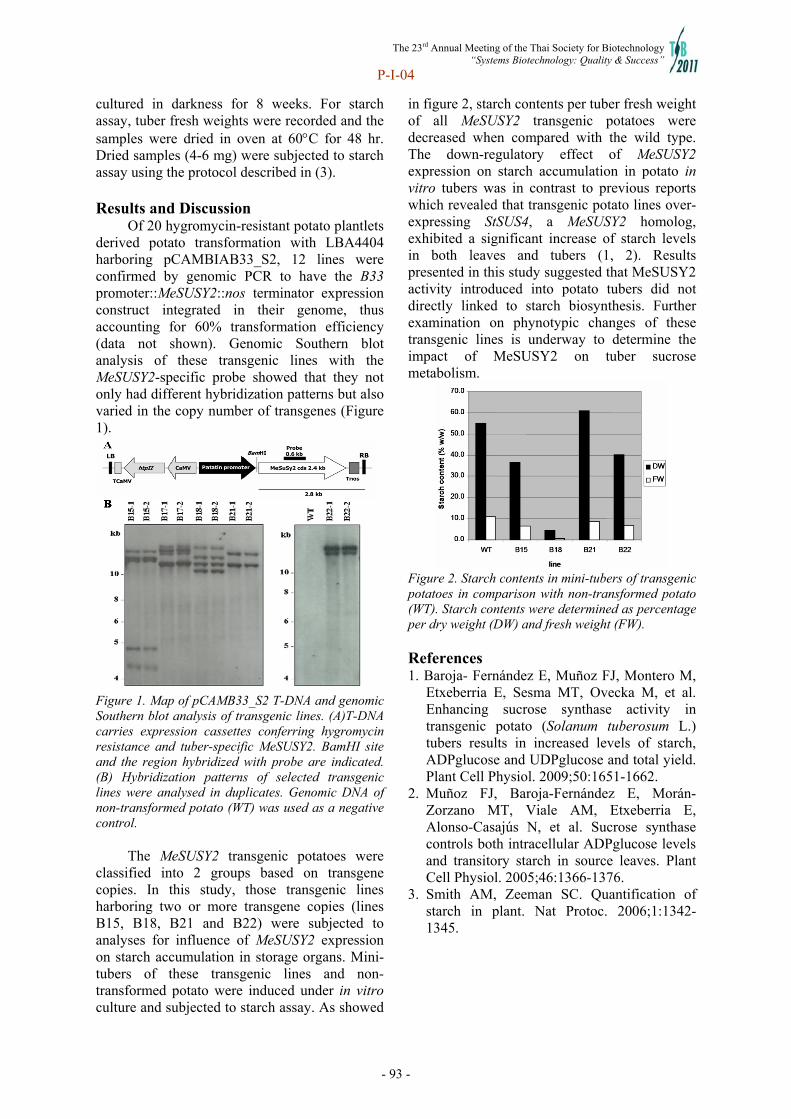
The 23rd Annual Meeting of the Thai Society for Biotechnology “Systems Biotechnology: Quality & Success”
P-I-04
- 93 -
cultured in darkness for 8 weeks. For starch assay, tuber fresh weights were recorded and the samples were dried in oven at 60C for 48 hr. Dried samples (4-6 mg) were subjected to starch assay using the protocol described in (3). Results and Discussion
Of 20 hygromycin-resistant potato plantlets derived potato transformation with LBA4404 harboring pCAMBIAB33_S2, 12 lines were confirmed by genomic PCR to have the B33 promoter::MeSUSY2::nos terminator expression construct integrated in their genome, thus accounting for 60% transformation efficiency (data not shown). Genomic Southern blot analysis of these transgenic lines with the MeSUSY2-specific probe showed that they not only had different hybridization patterns but also varied in the copy number of transgenes (Figure 1).
Figure 1. Map of pCAMB33_S2 T-DNA and genomic Southern blot analysis of transgenic lines. (A)T-DNA carries expression cassettes conferring hygromycin resistance and tuber-specific MeSUSY2. BamHI site and the region hybridized with probe are indicated. (B) Hybridization patterns of selected transgenic lines were analysed in duplicates. Genomic DNA of non-transformed potato (WT) was used as a negative control.
The MeSUSY2 transgenic potatoes were
classified into 2 groups based on transgene copies. In this study, those transgenic lines harboring two or more transgene copies (lines B15, B18, B21 and B22) were subjected to analyses for influence of MeSUSY2 expression on starch accumulation in storage organs. Mini-tubers of these transgenic lines and non-transformed potato were induced under in vitro culture and subjected to starch assay. As showed
in figure 2, starch contents per tuber fresh weight of all MeSUSY2 transgenic potatoes were decreased when compared with the wild type. The down-regulatory effect of MeSUSY2 expression on starch accumulation in potato in vitro tubers was in contrast to previous reports which revealed that transgenic potato lines over-expressing StSUS4, a MeSUSY2 homolog, exhibited a significant increase of starch levels in both leaves and tubers (1, 2). Results presented in this study suggested that MeSUSY2 activity introduced into potato tubers did not directly linked to starch biosynthesis. Further examination on phynotypic changes of these transgenic lines is underway to determine the impact of MeSUSY2 on tuber sucrose metabolism.
Figure 2. Starch contents in mini-tubers of transgenic potatoes in comparison with non-transformed potato (WT). Starch contents were determined as percentage per dry weight (DW) and fresh weight (FW). References 1. Baroja- Fernández E, Muñoz FJ, Montero M,
Etxeberria E, Sesma MT, Ovecka M, et al. Enhancing sucrose synthase activity in transgenic potato (Solanum tuberosum L.) tubers results in increased levels of starch, ADPglucose and UDPglucose and total yield. Plant Cell Physiol. 2009;50:1651-1662.
2. Muñoz FJ, Baroja-Fernández E, Morán- Zorzano MT, Viale AM, Etxeberria E, Alonso-Casajús N, et al. Sucrose synthase controls both intracellular ADPglucose levels and transitory starch in source leaves. Plant Cell Physiol. 2005;46:1366-1376.
3. Smith AM, Zeeman SC. Quantification of starch in plant. Nat Protoc. 2006;1:1342-1345.
The 23rd Annual Meeting of the Thai Society for Biotechnology “Systems Biotechnology: Quality & Success”
P-I-06
- 94 -
Expression of rice Os1BGlu4 -glucosidase in Escherichia coli
Rouyi Chen, Darawan Ruamkuson, Sumeth Imsoonthornruksa and Mariena Ketudat-Cairns* School of Biotechnology, Institute of Agricultural Technology, Suranaree University of Technology, 111 University Ave, Nakhon Ratchasima 30000 Thailand. *E-mail: [email protected]
Abstract -glucosidases have important role in many biological processes. In order to understand the
role of the rice Os1BGlu4 -glucosidase, Os1bglu4 was amplified from 7-day old rice seedling cDNAs and cloned into pET32a+ plasmid. Optimization of the recombinant Os1BGlu4 expression in Escherichia coli was performed. The host strains, induction time, induction temperature, and inducer concentration were optimized. The results indicated that for Os1BGlu4 recombinant protein expression, the BL21 (DE3) host strain gave higher soluble recombinant protein and enzymatic activity when compare to Origami B (DE3). The optimum induction time was 16 hr, the optimum temperature was 20oC and no inducer was needed to produce active recombinant Os1BGlu4. This investigation provided a simple method to produce recombinant Os1BGlu4 for further characterization of the enzyme kinetics and the functions.
Keywords: Os1bglu4, beta-Glucosidase, Rice, Recombinant protein production, pET32a+
Introduction and Objective
Glycosyl hydrolase family I (GHI) β-glucosidases have been implicated in physiolo-gically important processes in plants. In rice, 40 β-glucosidase genes1 have been found but only 34 are shown to be expressed in a range of organs and stages of development, based on the cDNA and EST sequences in public databases2. The Os1bglu4 gene product is the only rice GHI β-glucosidase predicted not to have a signal sequence. To date, the study of Os1BGlu4 protein has not been reported. To characterize the enzyme kinetics and the functions, recombinant Os1BGlu4 protein is needed. In this study, the expression of Os1BGlu4 protein in E. coli was optimized.
Materials and Methods
Optimization of Os1bglu4 expression in E. coli The Os1bglu4 gene was amplified from 7-
day-old rice seedling cDNAs then cloned into pET32a+ plasmid which contains thioredoxin (trx) fusion tag and transformed into E. coli DH5α. The recombinant plasmids were sequenced. The correct pET32Os1bglu4 was then transformed into E. coli BL21 (DE3) and Origami B (DE3). The optimization experiments were conducted by varying induction time (0, 8 16 & 24 hr), induction temperature (20 oC & 30 oC) and inducer concentration (0, 0.05 & 0.1 mM IPTG). Selected clones from each host strain were cultured at 37 oC in LB broth
containing 50 μg/ml ampicillin for BL21 (DE3) and LB broth containing 50 μg/ml ampicillin, 12.5 μg/ml tetracycline and 15 μg/ml kanamycin for Origami B (DE3) until the optical density of 600 nm reached 0.7-0.8. The inducer was added and incubated at 20 oC and 30 oC. The samples were taken every 8 hr until 24 hr. The cell pellets were centrifuged at 5,000 rpm, 4 oC for 10 min and kept at -80 oC until analyze.
SDS-PAGE analysis and activity test The cell pellets were suspended in lysis
buffer (20 mM Tris-Cl (pH 8.0), 1% Triton X-100, 1X protease inhibitors, 200 μg/ml lysozyme and 40 μg/ml DNase I) and incubated at 37 oC for 1 hr, then centrifuged at 14,000 rpm, 4 oC for 20 min. The soluble fractions were analyzed.
All samples were adjusted to 1 mg/ml (measured by Bradford method3) and subjected to 12% SDS-PAGE. Equal amount (1 mg/ml) of soluble protein was loaded in each lane. The enzymatic activity was tested following the method of Opassiri et al., 20031.

The 23rd Annual Meeting of the Thai Society for Biotechnology “Systems Biotechnology: Quality & Success”
P-I-06
- 95 -
Results and Discussions
SDS-PAGE analysis The expected recombinant Trx-Os1BGlu4
proteins of 66 kDa were found in all expression conditions (Figure 1). When the two host strains were compared, we found that the BL21 (DE3) produced more soluble Trx-Os1BGlu4 protein than Origami B (DE3). Interestingly, even when no IPTG was added for induction, both recombinant BL21 (DE3) and Origami B (DE3) cells can express the proteins. However, with 0.05 mM IPTG, the protein bands seem to be a bit more intense than 0 or 0.1 mM IPTG. At 16 hr of induction, more recombinant proteins were expressed when compare to 0 & 8 hr, which was expected. However, at 16 & 24 hr the protein level were not different when compared with naked eyes. When the induction temperatures were compared, at 20 oC, the amount of soluble recombinant protein expression was slightly higher than at 30 oC. However, the protein activity would be a better judge of the soluble active protein for further use.
Figure1. SDS-PAGE profile of Os1BGlu4
recombinant protein expression induced by 0, 0.05 & 0.1 mM IPTG for 0, 8, 16 and 24 hr in; (A) BL21 (DE3) at 20 oC, (B) Origami B (DE3) at 20 oC, (C) BL21 (DE3) at 30 oC and (D) Origami B (DE3) at 30 oC. Trx; thioredoxin.
Activity test The activity of Os1BGlu4 protein was tested
against p-nitrophenyl β-D-glucoside (pNPG)2. The BL21 (DE3) cells gave higher protein activity than the Origami B (DE3) cells. Interestingly, Os1BGlu4 from 16 hr induction showed higher activity than that of 24 hr and 20 oC culture produced Os1BGlu4 with higher activity than those of 30 oC (Table 1). These results indicated that the highest protein activity was observed after 16 hr induction with 0.05 mM IPTG at 20 oC in BL21 (DE3) cells.
Table 1. Crude recombinant Os1BGlu4 activity.
Units (nmol ρNP/min·mg protein) 0 hr 8 hr 16 hr 24 hr
Cell
[IPTG mM] 20oC 30oC 20oC 30oC 20oC 30oC 20oC 30oC
BL0 147 141 1,174 868 3,114 1,737 3,102 1,491
BL0.05 174 158 1,198 928 3,557 2,210 3,150 1,539
BL0.1 204 199 1,240 856 3,132 1,467 2,635 1,407
OriB0 113 107 590 392 1,635 1,539 1,359 1,204
OriB0.05 129 116 850 451 1,767 1,611 1,509 1,317
OriB0.1 155 126 862 437 1,425 1,287 1,234 928
This investigation provides a simple method
to produce recombinant Os1BGlu4 for further characterization of the enzyme kinetics and the functions.
References
1. Opassiri R, Ketudat Cairns JR, Akiyama T, Wara-Aswapati O, Svasti J, Esen A. (2003) Characterization of a rice β-glucosidase genes highly expressed in flower and germinating shoot. Plant Sci 165: 627-638.
2. Opassiri R, Pomthong B, Onkoksoong T, Akiyama T, Esen A, Ketudat Cairns JR. (2006) Analysis of rice glycosyl hydrolase family I and expression of Os4bglu12 β-glucosidase. BMC Plant Bio 6:33
3. Bradford M (1972) Rapid and sensitive method for the quantitation of microgram quantities of protein utilizing the principle of protein-dye binding, Anal. Biochem. 72; 248–254
B A
C D

The 23rd Annual Meeting of the Thai Society for Biotechnology “Systems Biotechnology: Quality & Success”
P-I-09
- 96 -
Effects of spore inocula of ectomycorrhizal fungi Russula spp. on growth stimulation of Shorea siamensis Miq.
Chaowanee Aunlumpoona and Jittra Piapukiewb a Program in Biotechnology, Faculty of Science, Chulalongkorn University, Phayathai Rd., Patumwan, Bangkok 10330, Thailand b Department of Botany, Faculty of Science, Chulalongkorn University, Phayathai Rd., Patumwan, Bangkok 10330, Thailand
Abstract Dipterocarp forestry needs ectomycorrhizal fungi to improve the growth of seedling in
nurseries and to enhance establishment and growth in the field. In this study, 3 species of Russula (Russula emetica (Schaeff.&Fr.) S.F.Gray, R. densifolia (Secr.) Gill and R. virescens (Fr.) were tested for their effectiveness as spore inoculum on Shorea siamensis Miq. seedlings. The percentage of ectomycorrhizal colonization on S. siamensis was more than 78 %. Colonization of S. siamensis roots by ectomycorrhizal fungi resulted in increased shoot height, stem diameter and biomass. Inoculation with these ectomycorrhizal species had no significant effect on shoot N, P and K concentration of the seedlings. The results indicate that inoculation of ectomycorrhizal fungi can promote seedling growth and that this technique will provide highly qualified production of dipterocarp seedlings for dipterocarp forestry in future.
Keywords: ectomycorrhiza, spore inoculum, Russula, dipterocarp
Introduction and Objective Shorea siamensis (Dipterocarpaceae) is one
of dominant tree species in deciduous dipterocarp forests in Thailand. It is economically important timber trees. Up to date S. siamensis has not yet been planted on a large scale. Its number has been decreasing and effective method for its regeneration has yet to be developed. The inoculation of ectomycorrhizal (ECM) fungi is one of methods to promote dipterocarp seedling growth because ECM fungi can enhance uptake of water and nutrients, protection against environmental stress factors and ECM fungi can improve plant survival and plant development [1], [2].
The aim of this study was to investigate the effect of inoculation with ECM fungi, R. emetica, R. densifolia and R. virescens on the growth of S. siamensis seedlings. . Materials and Methods
2.1 Plant material Seeds of S. siamensis were surface-
sterilized by soaking in 1% NaOCl for 7 min. After 3 rinsed in sterilized water, seeds were then placed in plastic pots contained sterilized mixture of coconut dust and sand (1:1 v/v). The
seedlings were grown in a greenhouse. Seedlings were transplanted after 2 months into pots filled with a sterilized mixture of perlite, peat moss and sand (4:2:1 v/v). Seedlings were watered with tap water 2 or 3 times a week and fertilized every 2 months.
2.2 ECM fungal inocula and inoculation The fungal spore mass was obtained from
dried mature sporocarps of the 3 Russula species. The fungal spore mass was blended in distilled water. The bulk spore suspension was diluted in water to obtain spore concentration of 105 spores per ml. The seedlings in each treatment were inoculated with spore suspension at rate of 106 spores per seedling. Control seedlings were not inoculated. 2.3 Growth measurement and harvest
The pots were arranged in a completely randomized design with three replicate pots per treatment. Shoots and roots were harvested 12 months after inoculation with ECM fungi. Shoot height, stem diameter, shoot and root dry weight and percentage of ECM colonization were measured. Content of nutrients; N, P and K in leaves from each treatment were determined. The data were subjected to one-way analysis of variance (ANOVA) and Duncan’s Multiple Range Test (DMRT).
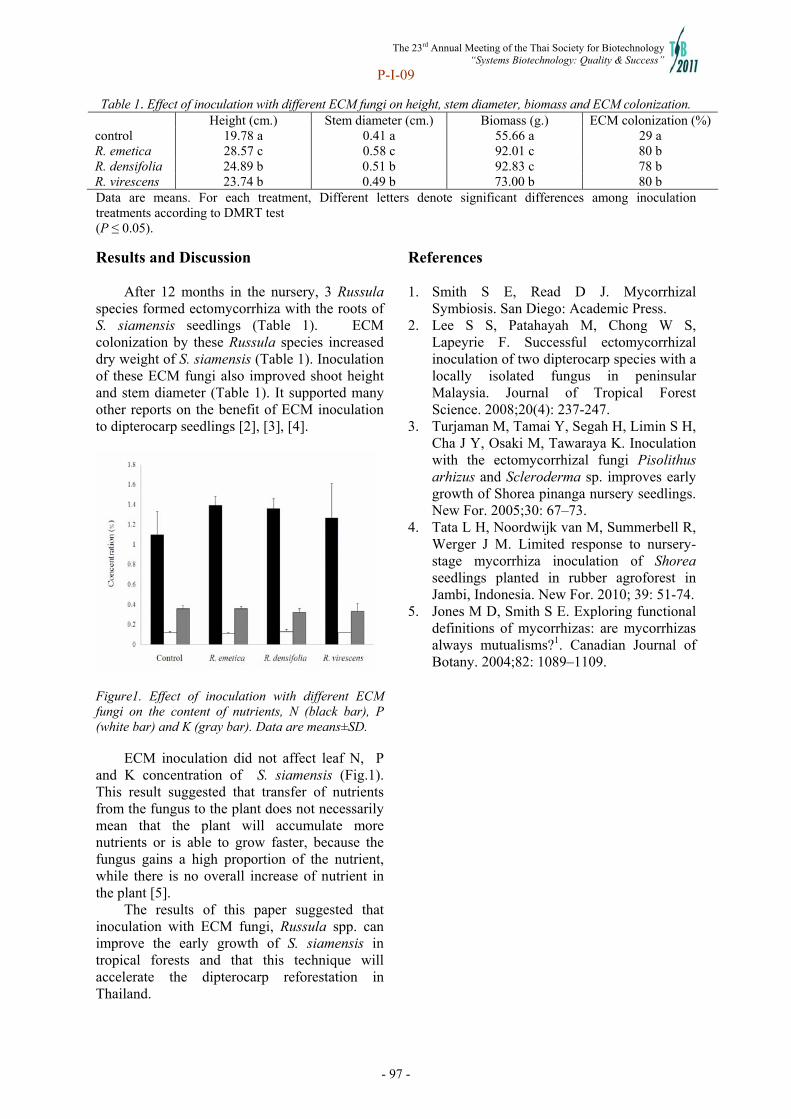
The 23rd Annual Meeting of the Thai Society for Biotechnology “Systems Biotechnology: Quality & Success”
P-I-09
- 97 -
Table 1. Effect of inoculation with different ECM fungi on height, stem diameter, biomass and ECM colonization. Height (cm.) Stem diameter (cm.) Biomass (g.) ECM colonization (%) control 19.78 a 0.41 a 55.66 a 29 a R. emetica 28.57 c 0.58 c 92.01 c 80 b R. densifolia 24.89 b 0.51 b 92.83 c 78 b R. virescens 23.74 b 0.49 b 73.00 b 80 b Data are means. For each treatment, Different letters denote significant differences among inoculation treatments according to DMRT test (P ≤ 0.05).
Results and Discussion
After 12 months in the nursery, 3 Russula species formed ectomycorrhiza with the roots of S. siamensis seedlings (Table 1). ECM colonization by these Russula species increased dry weight of S. siamensis (Table 1). Inoculation of these ECM fungi also improved shoot height and stem diameter (Table 1). It supported many other reports on the benefit of ECM inoculation to dipterocarp seedlings [2], [3], [4].
Figure1. Effect of inoculation with different ECM fungi on the content of nutrients, N (black bar), P (white bar) and K (gray bar). Data are means±SD.
ECM inoculation did not affect leaf N, P
and K concentration of S. siamensis (Fig.1). This result suggested that transfer of nutrients from the fungus to the plant does not necessarily mean that the plant will accumulate more nutrients or is able to grow faster, because the fungus gains a high proportion of the nutrient, while there is no overall increase of nutrient in the plant [5].
The results of this paper suggested that inoculation with ECM fungi, Russula spp. can improve the early growth of S. siamensis in tropical forests and that this technique will accelerate the dipterocarp reforestation in Thailand.
References 1. Smith S E, Read D J. Mycorrhizal
Symbiosis. San Diego: Academic Press. 2. Lee S S, Patahayah M, Chong W S,
Lapeyrie F. Successful ectomycorrhizal inoculation of two dipterocarp species with a locally isolated fungus in peninsular Malaysia. Journal of Tropical Forest Science. 2008;20(4): 237-247.
3. Turjaman M, Tamai Y, Segah H, Limin S H, Cha J Y, Osaki M, Tawaraya K. Inoculation with the ectomycorrhizal fungi Pisolithus arhizus and Scleroderma sp. improves early growth of Shorea pinanga nursery seedlings. New For. 2005;30: 67–73.
4. Tata L H, Noordwijk van M, Summerbell R, Werger J M. Limited response to nursery- stage mycorrhiza inoculation of Shorea seedlings planted in rubber agroforest in Jambi, Indonesia. New For. 2010; 39: 51-74.
5. Jones M D, Smith S E. Exploring functional definitions of mycorrhizas: are mycorrhizas always mutualisms?1. Canadian Journal of Botany. 2004;82: 1089–1109.
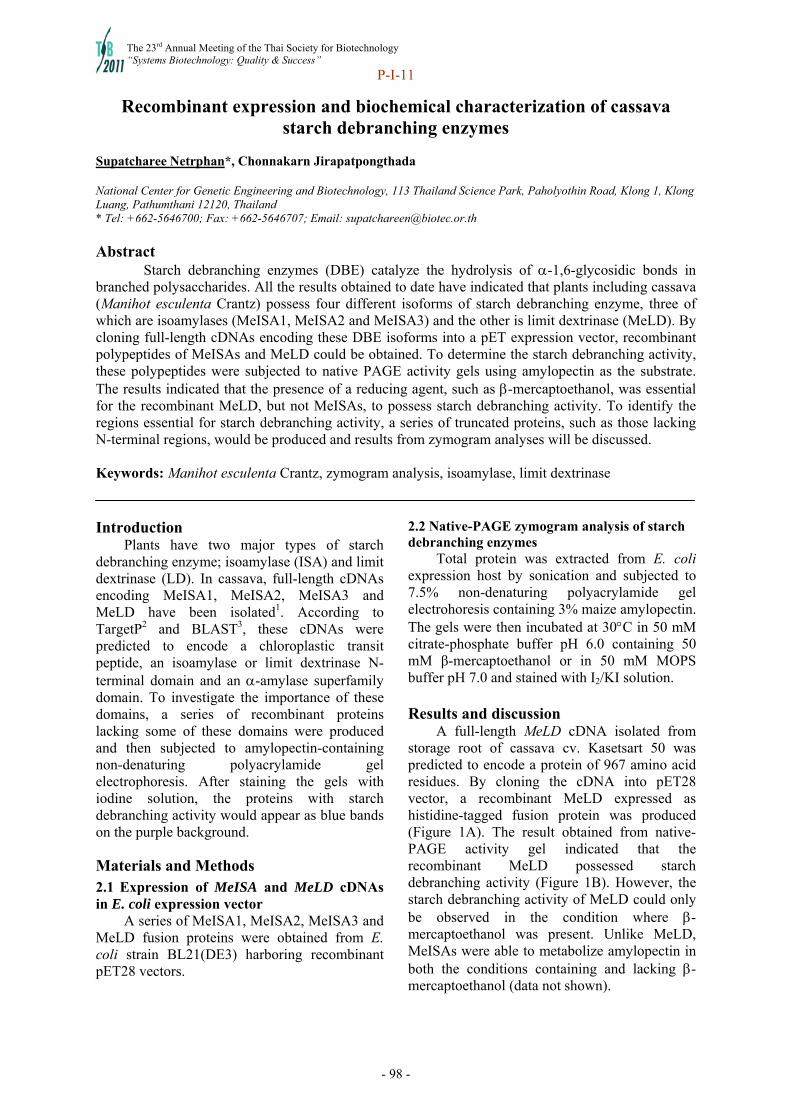
The 23rd Annual Meeting of the Thai Society for Biotechnology “Systems Biotechnology: Quality & Success”
P-I-11
- 98 -
Recombinant expression and biochemical characterization of cassava starch debranching enzymes
Supatcharee Netrphan*, Chonnakarn Jirapatpongthada National Center for Genetic Engineering and Biotechnology, 113 Thailand Science Park, Paholyothin Road, Klong 1, Klong Luang, Pathumthani 12120, Thailand * Tel: +662-5646700; Fax: +662-5646707; Email: [email protected] Abstract
Starch debranching enzymes (DBE) catalyze the hydrolysis of -1,6-glycosidic bonds in branched polysaccharides. All the results obtained to date have indicated that plants including cassava (Manihot esculenta Crantz) possess four different isoforms of starch debranching enzyme, three of which are isoamylases (MeISA1, MeISA2 and MeISA3) and the other is limit dextrinase (MeLD). By cloning full-length cDNAs encoding these DBE isoforms into a pET expression vector, recombinant polypeptides of MeISAs and MeLD could be obtained. To determine the starch debranching activity, these polypeptides were subjected to native PAGE activity gels using amylopectin as the substrate. The results indicated that the presence of a reducing agent, such as -mercaptoethanol, was essential for the recombinant MeLD, but not MeISAs, to possess starch debranching activity. To identify the regions essential for starch debranching activity, a series of truncated proteins, such as those lacking N-terminal regions, would be produced and results from zymogram analyses will be discussed. Keywords: Manihot esculenta Crantz, zymogram analysis, isoamylase, limit dextrinase Introduction Plants have two major types of starch debranching enzyme; isoamylase (ISA) and limit dextrinase (LD). In cassava, full-length cDNAs encoding MeISA1, MeISA2, MeISA3 and MeLD have been isolated1. According to TargetP2 and BLAST3, these cDNAs were predicted to encode a chloroplastic transit peptide, an isoamylase or limit dextrinase N-terminal domain and an -amylase superfamily domain. To investigate the importance of these domains, a series of recombinant proteins lacking some of these domains were produced and then subjected to amylopectin-containing non-denaturing polyacrylamide gel electrophoresis. After staining the gels with iodine solution, the proteins with starch debranching activity would appear as blue bands on the purple background.
Materials and Methods 2.1 Expression of MeISA and MeLD cDNAs in E. coli expression vector
A series of MeISA1, MeISA2, MeISA3 and MeLD fusion proteins were obtained from E. coli strain BL21(DE3) harboring recombinant pET28 vectors.
2.2 Native-PAGE zymogram analysis of starch debranching enzymes
Total protein was extracted from E. coli expression host by sonication and subjected to 7.5% non-denaturing polyacrylamide gel electrohoresis containing 3% maize amylopectin. The gels were then incubated at 30C in 50 mM citrate-phosphate buffer pH 6.0 containing 50 mM β-mercaptoethanol or in 50 mM MOPS buffer pH 7.0 and stained with I2/KI solution. Results and discussion
A full-length MeLD cDNA isolated from storage root of cassava cv. Kasetsart 50 was predicted to encode a protein of 967 amino acid residues. By cloning the cDNA into pET28 vector, a recombinant MeLD expressed as histidine-tagged fusion protein was produced (Figure 1A). The result obtained from native-PAGE activity gel indicated that the recombinant MeLD possessed starch debranching activity (Figure 1B). However, the starch debranching activity of MeLD could only be observed in the condition where -mercaptoethanol was present. Unlike MeLD, MeISAs were able to metabolize amylopectin in both the conditions containing and lacking -mercaptoethanol (data not shown).

The 23rd Annual Meeting of the Thai Society for Biotechnology “Systems Biotechnology: Quality & Success”
P-I-11
- 99 -
Since the MeLD cDNA was predicted to encode a chloroplastic transit peptide, a limit dextrinase N-terminal domain, an -amylase superfamily domain and a domain of unknown function termed DUF3372, a series of truncated polypeptiddes lacking some of these domains were produced and analyzed by native-PAGE activity gel.
Figure 1 Heterologous expression of a full-length MeLD cDNA in uninduced (-) and induced (+) cells of E. coli strain BL21(DE3) analyzed by SDS-PAGE (A) and native-PAGE activity gel (B)
According to zymogram, the recombinant MeLD lacking an N-terminal region of 72 amino acids still possessed starch debranching activity, while further deletion of its N-terminal region resulted in the disappearance of blue band on native-PAGE activity gel. To determine whether the C-terminal region of MeLD might be needed for its starch debranching activity, a truncated protein lacking 99 amino acid residues at its C-terminus was produced. Since the missing region represents the last one third of the DUF3372, all the results obtained from this study have led us to conclude that only the region that was predicted to function as the N-terminal chloroplastic transit peptide is not essential for the starch debranching activity of MeLD, while other regions including the DUF3372 were essentially needed for MeLD to be catalytically active.
Relatively similar results were observed for MeISA1 and MeISA3 indicating that complete mature polypeptides, which lack only the
chloroplastic transit peptide, were essential for the proteins to possess starch debranching activity.
Unlike other starch debranching enzymes, the deduced amino acid sequence of MeISA2 did not seem to contain a region predicted to function as a chloroplastic transit peptide. As a result, only one type of recombinant MeISA2, derived from expressing the full-length cDNA of 2.8 kb in E. coli expression host, was produced.
Similar to the previous finding from potato4, the cassava MeISA2 did not seem to possess starch debranching activity. To investigate whether MeISA2 truly lacks catalytic activity, further investigation needs to be carried out to confirm that MeISA2 also shows no activity on other branched polysaccharides such as limit dextrin, glycogen and phytoglycogen as well as amylopectin. References 1. Duerasor O, Rattanakitti A, Netrphan S.
Isolation and characterization of genes encoding three isoamylase-type starch debranching enzymes from cassava cv. Kasetsart 50 and Rayong 1. In: Proceedings of the 22nd Annual Meeting of the Thai Society for Biotechnology: International Conference on Biotechnology for Healthy Living; 2010 Oct 20-22; Trang, Thailand. p. 1025-1031.
2. Emanuelsson O, Nielsen H, Brunak S, von Heijne G. Predicting subcellular localization of proteins based on their N-terminal amino acid sequence. J. Mol. Biol. 2000;300:1005-1016.
3. Marchler-Bauer et al. CDD: a conserved domain database for the functional annotation of proteins. Nucleic Acids Res. 2011;39:D225-229.
4. Hussain et al. Three isoforms of isoamylase contribute different catalytic properties for the debranching of potato glucans. Plant Cell 2003;15:133-149.
The 23rd Annual Meeting of the Thai Society for Biotechnology “Systems Biotechnology: Quality & Success”
P-I-19
- 100 -
Rapid and sensitive detection of shrimp yellow head virus by loop-mediated isothermal amplification
Sasiwarat Khunthonga,b,c, Wansadaj Jaroenramc, Timothy W.Flegelc, Isada Mungsantisuka, Wansika Kiatpathomchaic,d, aDepartment of Biotechnology, Faculty of Science, Mahidol University, Rama VI Road, Bangkok 10400, Thailand bCenter of Excellence on Agricultural Biotechnology: (AG-BIO/PERDO-CHE), Bangkok 10900, Thailand cCENTEX Shrimp, Faculty of Science, Mahidol University, Rama VI Road, Bangkok 10400, Thailand d National Center for Genetic Engineering and Biotechnology (BIOTEC), National Science and Technology Development Agency, Thailand Science Park, 113 Pahonyothin Road, Pathumthani 12120, Thailand
Abstract Yellow head virus (YHV) called “ Hua leung” in Thai is a highly virulent pathogen of
cultivated black tiger shrimp Penaeus monodon and causes economic losses in Thailand since 1992. Screening for carrier states of YHV has been based primarily on molecular methods such as nested RT-PCR (IQ2000TM), which is required more than 4-6 hr including gel electrophoresis. Recently, reverse transcription loop-mediated isothermal amplification (RT-LAMP) assay, a novel method for nucleic acid amplification, can amplify a target DNA at constant temperature at 60–65°C using six primers that recognize eight distinct sequences of the target regions within 1 hr with high specificity, sensitivity and rapidity. This method relies on a strand displacement activity of Bst DNA polymerase. In this study, we developed an RT-LAMP method for the detection YHV. The optimized conditions were found to be 65°C and 45 min, and its sensitivity was equivalent to the nested RT-PCR method. No cross-reaction to other shrimp viruses were found, indicating the specificity of the assay.
Keywords: RT-PCR, loop-mediated isothermal amplification, Penaeus monodon, yellow head virus
1. Introduction
Yellow head virus (YHV) is major shrimp
pathogens that cause extensive mortality loses in shrimp aquaculture, accounting for about 100% of crop loss within 3-5 days post infection. (Limsuwan., 1991). To date, several methods for the detection of YHV at molecular levels have been described. Among these, loop-mediated isothermal amplification (LAMP) is a novel nucleic acid amplification method can amplifies target DNA with high specificity, efficiency, rapidity under isothermal conditions (60-65°C) using a set of six specially designed primers and Bst DNA polymerase with strand displacement activity within 1h (Notomi et al., 2000). Therefore, the purpose of this study was to develop a new detection protocol for Yellow head virus (YHV) using reverse transcription loop-mediated isothermal amplification (RT-LAMP) and compared with the nested-RT-PCR
2. Materials and Methods 2.1 Shrimp sample and RNA extraction Pleopods of shrimp (Penaeus vannamei)
infected with or without YHV were used for RNA extraction usingTRI reagent.The RNA concentration were measured by spectrophotometric analysis at 260 and 280 nm.
2.2 Optimization of YHV RT-LAMP
conditions A set of six RT-LAMP primers were
designed based on the YHV-PmA replicase polyprotein 1ab gene sequences (GenBank accession number: EU977578.1) using the Primer Explorer version3. The RT-LAMP reactions were carried out at 60, 63 and 65 °C for 1 h, followed by heat inactivation at 93 °C for 3 min to terminate the reactions. The reaction mixture contained 100 µM each of inner primers and loop primers, 2.5 µM each of outer primers ,10 mM of dNTPs mix (Promega., USA), 5 M betaine (Sigma–Aldrich, St. Louis, MO, USA), 100 mM MgSO4, 8U of Bst DNA polymerase (large fragment; New England Biolabs., USA), 1X of reaction buffer, 0.25 U of AMV Reverse transcriptase (Promega), and
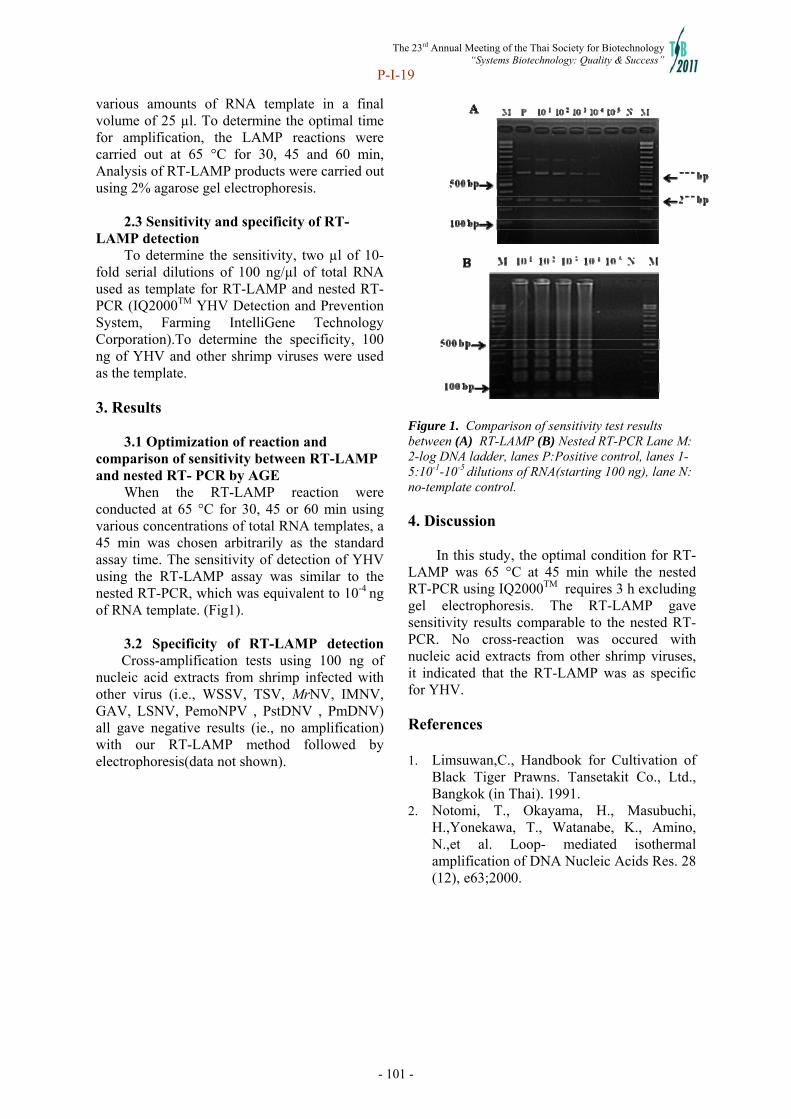
The 23rd Annual Meeting of the Thai Society for Biotechnology “Systems Biotechnology: Quality & Success”
P-I-19
- 101 -
various amounts of RNA template in a final volume of 25 µl. To determine the optimal time for amplification, the LAMP reactions were carried out at 65 °C for 30, 45 and 60 min, Analysis of RT-LAMP products were carried out using 2% agarose gel electrophoresis.
2.3 Sensitivity and specificity of RT-
LAMP detection To determine the sensitivity, two µl of 10-
fold serial dilutions of 100 ng/µl of total RNA used as template for RT-LAMP and nested RT-PCR (IQ2000TM YHV Detection and Prevention System, Farming IntelliGene Technology Corporation).To determine the specificity, 100 ng of YHV and other shrimp viruses were used as the template.
3. Results
3.1 Optimization of reaction and
comparison of sensitivity between RT-LAMP and nested RT- PCR by AGE
When the RT-LAMP reaction were conducted at 65 °C for 30, 45 or 60 min using various concentrations of total RNA templates, a 45 min was chosen arbitrarily as the standard assay time. The sensitivity of detection of YHV using the RT-LAMP assay was similar to the nested RT-PCR, which was equivalent to 10-4 ng of RNA template. (Fig1).
3.2 Specificity of RT-LAMP detection
Cross-amplification tests using 100 ng of nucleic acid extracts from shrimp infected with other virus (i.e., WSSV, TSV, MrNV, IMNV, GAV, LSNV, PemoNPV , PstDNV , PmDNV) all gave negative results (ie., no amplification) with our RT-LAMP method followed by electrophoresis(data not shown).
Figure 1. Comparison of sensitivity test results between (A) RT-LAMP (B) Nested RT-PCR Lane M: 2-log DNA ladder, lanes P:Positive control, lanes 1-5:10-1-10-5 dilutions of RNA(starting 100 ng), lane N: no-template control. 4. Discussion
In this study, the optimal condition for RT-
LAMP was 65 °C at 45 min while the nested RT-PCR using IQ2000TM requires 3 h excluding gel electrophoresis. The RT-LAMP gave sensitivity results comparable to the nested RT-PCR. No cross-reaction was occured with nucleic acid extracts from other shrimp viruses, it indicated that the RT-LAMP was as specific for YHV.
References 1. Limsuwan,C., Handbook for Cultivation of
Black Tiger Prawns. Tansetakit Co., Ltd., Bangkok (in Thai). 1991.
2. Notomi, T., Okayama, H., Masubuchi, H.,Yonekawa, T., Watanabe, K., Amino, N.,et al. Loop- mediated isothermal amplification of DNA Nucleic Acids Res. 28 (12), e63;2000.

The 23rd Annual Meeting of the Thai Society for Biotechnology “Systems Biotechnology: Quality & Success”
P-II-01
- 102 -
Bacterial isolation for industrial D-lactic acid production from natural sources
Budsabathip Prasirtsakac, Somboon Tanasupawatb, Kentaro Kodamac, and Nuttha Thongchulc
aProgram in Biotechnology, Faculty of Science, Chulalongkorn University, Bangkok, Thailand bDepartment of Biochemistry and Microbiology, Faculty of Pharmaceutical Sciences, Chulalongkorn University, Bangkok, Thailand cInstitute of Biotechnology and Genetic Engineering, Chulalongkorn University, Bangkok, Thailand
Abstract
In recent years, there has been a significant interest in polylactic acid (PLA) for substitution of petroleum- based plastics because PLA is considered renewable, compostable, and biocompatible materials. The first generation of PLA products is for disposable purpose while further development aims for semidurable and durable products such as the engineering plastic for automobiles and electronic devices. Initially, PLA was produced from polymerization of an optically pure L-lactic acid. Poly(L-lactic acid) or PLLA was fabricated into disposable products such as bags, bottles, films, and napkins. Nonetheless, heat deflection, low impact resistance, and gas barrier properties are the limitations of PLLA applications in semidurable and durable products. To further develop PLA for such the products, it is important to improve heat deflection properties of PLA. This property can be improved by preparing PLA in the stereocomplex structure. Stereocomplex PLA (Sc-PLA) is synthesized via polymerization of the optically pure L-lactic acid and the optically pure D-lactic acid. Nowadays, lactic acid fermentations commercially available are for L-lactic acid product and little is known about D-lactic acid fermentation. Therefore, many attempts have been turned into D-lactic acid producer and its fermentation process development. In this study, 133 bacterial isolates have been screened from natural habitats in Thailand and later primarily identified by the biochemical test. Among the 133 isolates, 7 isolates were found to be the potential D-lactic acid producing bacteria that provided high productivity of D-lactic acid with significantly high optical purity beyond 95% ee (enantiomer excess). Keywords: D-Lactic acid, lactic acid producing bacteria, isolation, screening, fermentation Introduction and Objective
Lactic acid (2-hydroxypropionic acid or
CH3CHOHCOOH) is an importantly versatile chemical. It has a wide range of applications including the acidulant and preservative in food, the chemical feedstock in pharmaceutical, cosmetic, and textile industries (John et al., 2009; Wee et al., 2006; Xu et al., 2008). Lactic acid can be produced via chemical synthesis or microbial fermentation. Chemical synthesis requires petroleum feedstocks and yields the racemic mixtures of lactic acid while microbial fermentation utilizes the renewable feedstocks to produce an optically pure L(+)- or D(-)- lactic acid depending on the organism used. Not only the high feedstock cost but drastic conditions (high and elevated temperature and pressure) are required during the chemical synthesis; therefore, this process is rather uneconomically and nonenvironmentally friendly (John et al.,
2009; Wee et al., 2006). In contrast, via microbial fermentation low cost substrates from agricultural products or residues are converted to lactic acid under mild conditions resulting in low energy consumption. Recently, the current demand of lactic acid is increasing due to the increasing trend of replacing petroleum based plastic by biobased plastic derived from plant materials such as polylactic acid (PLA) for sustainability PLA is made by direct polycondensation or ring opening polymerization of lactic acid. The first generation of PLA products was developed for disposable purpose including bottles, cups, film wraps, plates, straws, and candy wrappers. The second and third generation of PLA product development aims for semidurable and durable materials such as the electronic and automobile parts (Bustos et al., 2004; Okano et al., 2010). The optical purity of lactic acid is crucial in polylactic acid (PLA) production because the

The 23rd Annual Meeting of the Thai Society for Biotechnology “Systems Biotechnology: Quality & Success”
P-II-01
- 103 -
racemates (DL-lactate) give an amorphous polymer which usually causes the problem during polymer processing and fabrication while either L-lactate or D-lactate provides the crystalline structure of PLA (Zhao et al., 2010). Initially, L-lactic acid has been used in PLA synthesis due to its availability in the market. Poly(L-lactic acid) or PLLA, however, has the limited uses because of its low melting temperature and low degree of crystallization; thus, leading to difficulty in product fabrication (Xu et al., 2008; Zhao et al., 2010). To improve heat deflection properties of PLA, Karst and Yang (2006) reported that a blend of PLLA and PDLA (poly(D-lactic acid)) at 50/50 ratio exhibited the greater resistance to hydrolysis interactions than those observed in the pure PLLA or PDLA (Zhao et al., 2010). This polymer blend of PLLA and PDLA resulted in a stereocomplex (racemic crystal) of which the melting temperature is increased upto 225C (50C higher than that of the pure PLLA (177C)) (Tanaka et al., 2006; Xu et al., 2008). Due to an increasing interest in stereocomplex of PLA, the demand of D-lactic acid is increasing. However, little is known about fermentation of the optically pure D-lactic acid and the microorganisms that produce pure D-lactic acid is scarcely found in nature. Therefore, in this work D-lactic acid producing bacteria were isolated from the natural habitat in Thailand. Among the isolates obtained, the robust strains were screened for the high acid production rate with the high optical purity.
Materials and Methods 2.1 Bacterial isolation
Sample collected from nature (0.25 g) was transferred into 5 mL enrichment medium containing glucose, yeast extract, and peptone (GYP) supplemented with salt solution. After that it was incubated at 30C until the growth developed. The sample broth was then transferred onto the GYP agar plate containing CaCO3 as the acid production indicator and incubated at the same temperature until the colonies developed. The potential colonies were picked and transferred onto the freshly new GYP agar plate for further purification. The purified single colonies were kept into the freshly new GYP slant and subcultured every 2 weeks until first screening. After the first screening, the colonies that produced high lactic acid
production were stored in skim milk solution and kept at -80C.
2.2 Bacterial classification The purified bacterial isolates were
cultivated on the GYP agar plate at 30C in ambient atmosphere for 2 days. After that the anaerobic growth at 50C was observed. The colonies on the plate were tested for gram staining and the catalase activity. The catalase activity was tested by dropping 3% hydrogen peroxide solution onto the colonies and observing the oxygen bubble formation. The isolate was classified as catalase positive if the oxygen was formed. On the other hand, the isolate that did not produce oxygen was characterized as catalase negative.
2.3 1st screening of bacterial isolates Each isolate was subcultured onto the
freshly new slant and incubated at 30C for 24 h. After that 2 mL preculture liquid medium was transferred into the slant and the slant was thoroughly mixed in order to obtain the bacterial cell suspension. The bacterial suspension was then inoculated into the preculture medium (48 mL). The preculture medium contained (per liter) glucose 10 g, yeast extract 5 g, peptone 5 g, KH2PO4 250 mg, K2HPO4 250 mg, salt solution 5 mL, and CaCO3 5 g. The pH was adjusted to 6.8. For the catalase negative isolate, the culture was incubated at 30C under anaerobic condition for 24 h. Later 1 mL preculture broth was inoculated into the fermentation medium containing (per liter) glucose 100 g, yeast extract 5 g, peptone 5 g, KH2PO4 250 mg, K2HPO4 250 mg, salt solution 5 mL, and CaCO3 2.5 g. The culture was incubated at 30C for 72 h. At the end of fermentation, the culture was harvested and centrifuged to remove cell biomass. The supernatant was collected for analysis of lactic acid, acetic acid, and the remaining glucose. For the catalase positive isolate, the culture was incubated at 30C and 200 rpm for 6 h. Later 25 mL preculture broth was transferred into the glucose solution (120 g/L) containing 2.5 g CaCO3. The culture was incubated at 30C for another 48 h without shaking. At the end of fermentation, the culture was harvested and centrifuged to remove cell biomass. The supernatant was collected for analysis of lactic acid, acetic acid, and the remaining glucose.

The 23rd Annual Meeting of the Thai Society for Biotechnology “Systems Biotechnology: Quality & Success”
P-II-01
- 104 -
2.4 Analytical methods Amounts of products formed and glucose
remained during fermentation were analyzed. Product yield was determined from the ratio of product formed to glucose consumed during fermentation. Volumetric productivity was defined as the total amount of product formed per unit volume per time. High performance liquid chromatography was used to analyze the concentrations of glucose, lactic acid, and acetic acid in the fermentation broth as well as the optical purity of lactic acid produced. Fermentation samples were centrifuged, filtered through cellulose acetate membrane, and diluted with double distilled water. For analyses of glucose remained, total lactic acid (both D- and L-lactate), and acetic acid produced, 20 µL diluted particle-free samples were automatically injected (Shimadzu) into an organic acid analysis column (Biorad, Aminex HPX-87H ion exclusion organic acid column; 300mm7.8mm) maintained at 45C in a column oven (Shimadzu-CTO-6A). An eluant, 0.005 M H2SO4, was pumped through the system at the flowrate of 0.6 mL/min (Shimadzu-LC-10Avp). A refractive index detector (Shimadzu-RID-10A) was used to detect the organic compounds. The standards containing 0-2 g/L of each component were injected as the references to determine the sample concentration. The peak area was used in determining the concentration. For determining the optical purity of lactic acid produced, 5 µL diluted particle-free samples were automatically injected into a chiral column (Sumipack, Sumichiral OA5000) maintained at 40C. as The eluant 0.001 M CuSO4 were used at the flowrate of 1.0 mL/min. The UV detector was used to detect the lactate isomers at 254 nm. The standards containing 0-2 g/L of D- and L-lactate were injected as the references to determine the sample concentration.
Results and discussions Screening of D-lactic acid bacteria From the natural samples including tree
bark, root, and soil obtained from the provinces in the central and north eastern parts of Thailand, i.e., Bangkok, Nakhonpathom, Samutsakhon, Lopburi, Petchabun, and Udonthani, 133 potential bacterial isolates were obtained (Table 1). Among the 133 isolates, only 7 isolates were D-lactic acid producing bacteria that gave high optical purity of D-lactate (Table 1 and Figure 1). These 7 isolates were further characterized and the results are given in Table 2. All 7 potential isolates are gram positive and rod shape and unable to grow at the elevated temperature. Four of them possess the catalase activity while the other 3 lack this enzyme activity; thus they barely grow aerobically. According to the following previous works, most of D-lactic acid producing bacteria are in the genus of Leuconostoc, Lactobacillus, and Sporolactobacillus: Tanasupawat and coworkers, isolated Leuconostoc sp., non-spore forming and cocci shape, from fermented fish samples (Pla-ra) from Chaiyaphoom province in 1998 and Lactobacillus SR29-3, non-spore forming, microaerophile, and homofermentatively produces the optically pure D-lactic acid, from soy sauce mash in Thailand in 2002. All isolates from Brazilian meat by De Martinis and Freitas (2003) were identified as Leuconostoc sp. and Lactobacillus sp. They are gram positive, unable to produce catalase, and grow at high temperature (45C); Yanagida and coworkers (1997) isolated Sporolactobacillus inulinus, S. nakayamae subsp. nakayamae, S. terrae, S. kofuensis, and S. lactosus from soil and fermentation starters. They are unable to produce catalase, spore forming, and homofermentative. The isolates obtained in this study will be further identified, and the phylogenetic tree of those related bacterial species will be further developed.

The 23rd Annual Meeting of the Thai Society for Biotechnology “Systems Biotechnology: Quality & Success”
P-II-01
- 105 -
Table 1. Potential bacterial isolates obtained from tree and soil samples in the central and north eastern parts of Thailand
Table 2. Characteristics of D-lactic acid producing bacteria isolated from Thai natural samples
Remarks : + positive; w weakly positive; - negative
Bacterial isolates and their D-lactic acid production
All 133 isolates obtained were tested for D-lactic acid production. Among the 133 isolates, only 7 isolates produced optically pure D-lactic acid (Figure 1). It was observed that CU38-12 produced the highest D-lactic acid at 113.04 g/L from 120 g/L glucose. CU68-1, SK5-2, CU72-1, NK30-11, NK30-23, and NK26-11 produced D-lactic acid at the concentrations of 98.30, 97.24, 91.87, 78.42, 73.35, and 60.52 g/L, respectively. Among 7 isolates, SK5-2 and NK30-23 yielded the optical purity higher than 99% ee (Figure 2). D-lactic acid yields and productivities are reported in figure 3. It was found that CU38-12 not only yielded the high optical purity, it also gave both high yield and productivity. Therefore, this isolate is good for developing the technique for industrial fermentation.
Figure 1. D-lactic acid fermentation of 7 isolates obtained from Thai natural samples
Figure 2. The optical purity of D-lactic acid produced by 7 isolates
Figure 3. D-lactic acid yields and productivities from fermentation of 7 isolates
Conclusion
In this study, 133 bacterial isolates have been screened from the natural habitats in Thailand. The 7 isolates were found to be the potential D-lactic acid producing bacteria that provided a high D-lactic acid productivity with the significantly high optical purity beyond 95.0% ee. The results in this research will support the increase interest in polylactic acid (PLA), in which some properties can be improved by preparing PLA in blend of PLLA and poly-D-lactic acid (PDLA) to give a racemic crystal called a stereo-complex that has a higher melting temperature and higher resistance to hydrolysis interactions than pure PLLA.

The 23rd Annual Meeting of the Thai Society for Biotechnology “Systems Biotechnology: Quality & Success”
P-II-01
- 106 -
Acknowledgements
This work has been financially supported in part by National Research University Project of Commission on Higher Education (CHE) and the Ratchadapiseksomphot Endowment Fund (AM1026A) and the Graduate School of Chulalongkorn University. The authors also thank Program in Biotechnology, Faculty of Science, Department of Biochemistry and Microbiology, Faculty of Pharmaceutical Sciences, and the Institute of Biotechnology and Genetic Engineering at Chulalongkorn University for the collaborative research. References 1. Bustos, G., Moldes, A.B., Alonso, J.L. and
Vazquez, M. 2004. Optimization of D-lactic acid production by Lactobacillus coryniformis using response surface methodology. Food Microbiology. 21, 143-148.
2. De Martinis, E.C.P. and Freitas, F.Z. 2003. Screening of lactic acid bacteria from Brazilian meats for bacteriocin formation. Food Control. 14, 197-200.
3. John, R.P., Anisha, G.S., Nampoothiri, K.M. and Pandey, A. 2009. Direct lactic acid fermentation : Focus on simultaneous saccharification and lactic acid production. Biotechnology Advances. 27, 145-172.
4. Karst, D. and Yang, Y.Q. 2006. Molecular modeling study of the resistance of PLA to hydrolysis based on the blending of PLLA and PDLA. Polymer. 47, 4845-4850.
5. Okano, K., Zhang, Q., Yoshida, S., Tanaka, T., Ogino, C., Fukuda, H. and Kondo, A. 2010. D-lactic acid production from cellooligosaccharides and β-glucan using L-LDH gene-deficient and endoglucanase-secreting Lactobacillus plantarum. Applied Genetics and Molecular Biotechnology. 85, 643–650.
6. Tanaka, T., Hoshina, M., Tanabe, S., Sakai, K., Ohtsubo, S. and Taniguchi, M. 2006. Production of D-lactic acid from defatted rice bran by simultaneous saccharification and fermentation. Bioresource Technology. 97, 211–217.
7. Tanasupawat, S., Okada, S. and Komagata, K. 1998. Lactic acid bacteria found in fermented fish in Thailand. Journal of
General and Applied Microbiology. 44, 193-200.
8. Tanasupawat, S., Thongsanit, J., Okada, S. and Komagata, K. 2002. Lactic acid bacteria isolated from soy sauce mash in Thailand. Journal of General and Applied Microbiology. 48, 201-209.
9. Wee, Y.J., Kim, J.N. and Ryu, H.W. 2006. Biotechnological production of lactic acid and its recent applications. Food Technology and Biotechnology. 44, 163-172.
10. Xu, T.T., Bai, Z.Z., Wang, L.J. and He, B.F. 2008. Breeding of D(–)-lactic acid high producing strain by low-energy ion implantation and preliminary analysisof related metabolism. Applied
11. Biochemical and Biotechnolology.160, 314-321.
12. Yanagida, F., Suzuki, K.I., Kozaki, M. and Komagata, K. 1997. Proposal of Sporolactobacillus nakayamae subsp. nakayamae sp. nov., Sporolactobacillus nakayamae subsp. racemicus subsp. nov., Sporolactobacillus terrae sp. nov., Sporolactobacillus kofuensis sp. nov., and Sporolactobacillus lactosus sp. nov. Journal of Systematic Bacteriology. 47, 499-504.
13. Zhao, B., Wanga, L., Li, F., Hua, D., Mab, C., Maa, Y. and Xu, P. 2010. Kinetics of D-lactic acid production by Sporolactobacillus sp. strain CASD using repeated batch fermentation. Bioresource Technology. 101, 6499-6505.

The 23rd Annual Meeting of the Thai Society for Biotechnology “Systems Biotechnology: Quality & Success”
P-II-02
- 107 -
Development of insulin production in Pichia pastoris GS115
Sasithorn Ngenprasertsiria,b, Ruethairat Boonsombatb
aProgram in Biotechnology, Faculty of Science, Chulalongkorn University, Bangkok, Thailand bInstitute of Biotechnology and Genetic Engineering, Chulalongkorn University, Bangkok, Thailand
Abstract NGEN1 was obtained by transforming the plasmid pSST1 carrying regular human insulin
gene into Pichia pastoris strain GS115. Chromosomal DNA was extracted from NGEN1 and was initially screened by PCR to identify the presence of regular human insulin gene. For future work, I will study the effect of temperature and nitrogen sources to the production of regular human insulin and insulin HMR1423. Expression levels of regular human insulin and insulin analogue HMR 1423 will be determined by a modified method of SDS-PAGE. Keywords: Pichia pastoris, regular human insulin, insulin HMR1423, insulin expression
Introduction and Objective A continuous increase in worldwide
prevalence of diabetes demands effective insulin production for the treatment. The World Health Organization (WHO) estimated that there was about 177 million diabetic patients in 2000 and would be double amount by 2030. These problems have been motivated researchers to improve human insulin production, for which recombinant DNA technology is one of the most preferable choices. Furthermore, they prefer to use yeasts as hosts for insulin production because of many advantages such as rapid growth, low cost of maintenance, and very high yields of recombinant protein production (1). Moreover, yeasts are eukaryotes, so recombinant insulin produced from yeasts is similar to the one from human being (2). Currently, human insulin produced by recombinant DNA technology and used in medical treatment can be divided into 2 types: regular insulin and insulin analogues. Insulin analogues are modified from regular insulin by changing in some amino acids to provide a better glycaemic control. In the past few years, insulin analogues have been introduced for the treatment of diabetic and can be divided into 2 types based on their duration of action. One is rapid-acting insulin analogue or short-acting insulin and the other is long-acting insulin analogue (3).
Although, new insulin analogues created by amino acid changes provide a new pharmacokinetic profile, some of them induce altered metabolic and mitogenic effects such as the insulin analogue Asp(B10) causing breast cancer in rodent (4). Therefore, the safety of
insulin analogue is the first prority. Previous study has shown that the insulin analogue HMR 1423 is similar to the regular human insulin in term of mitogenic activity (5); then, the insulin analogue HMR1423 should be considered safe. In the view of production in yeast Pichia pastoris, moreover, mini-proinsulin production were affected by temperature and nitrogen sources (6). This study, therefore, aims to improve the production of regular human insulin and insulin analogue HMR1423 in P. pastoris GS115 by studying the effect of temperature and nitrogen sources. Materials and methods Strains and plasmids
P. pastoris yeast strain GS115 (his4) and the plasmid pPICZαA were purchased from Invitrogen Co., Ltd. The regular human insulin gene in plasmid pUC57 and HMR1423 gene in pJET1.2 were synthesized by Genescript and First Base Company, respectively. Escherichia coli DH5α was used to amplify these plasmids. Enzymes and reagents
Restriction endonucleases were purchased from New England Biolabs (Beverly, MA). Taq polymerase and dNTPs were obtained from Intron Biotechnology (Houston, TX). Materials for low molecular weight Tricine SDS-PAGE were obtained from Bio-Rad (Hercules, CA) and Sigma-Aldrich (St. Louis, MO). Components for microbial media were purchased from Merck (Darmstadt, Germany) and Bio Basic (Markham, ON).
The 23rd Annual Meeting of the Thai Society for Biotechnology “Systems Biotechnology: Quality & Success”
P-II-02
- 108 -
Construction of P. pastoris strains with regular human insulin and HMR 1423 genes
The synthetic gene encoding regular human insulin and insulin HMR1423 were synthesized with the structure B1-30- ArgArgPhe - A1-21 and B1-32(His[B31], His[B32]) – ArgArgPhe - A1-21(Gly[A21]), respectively. Regular human insulin and insulin HMR1423 gene were inserted into plasmid pUC57 and pJET1.2, respectively. These plasmids were cut with EcoRI and NotI, then, inserted between the same sites in pPICZαA to generate the plasmids named pSST1 and pSST2. The plasmids were transformed into E. coli DH5α and plated on low salt LB solid media with 25 µg/ml Zeocin. The plasmids pSST1and pSST2 were extracted from the transformants and cut one time at the 5' AOX1 region by SacI to linearize it. Then, the linear DNA was transformed into the yeast P. pastoris GS115 according to a manual for expression of recombinant proteins using pPICZ and pPICZα in P. pastoris version H (Invitrogen, USA). YPD plates (1% w/v yeast extract, 2% w/v peptone, and 2% w/v dextrose) with 100 µg/ml Zeocin were used to select transformants with the plasmids pSST1 (pPICZαA with regular human insulin gene) and pSST2 (pPICZαA with HMR1423 gene). The integration of regular insulin gene from pSST1 and insulin HMR1423 gene from pSST2 onto P. pastoris chromosome were screened by PCR with primer prRB27 (5'- GGATCCAAGTTTGTGAACCAAC-3') and prRB28 (3'-GAACTACTGCAACTAGAAGCT TGC-5') for regular insulin gene and prRB27 and prRB29 (3'-GAACTACTGCGGCTAGAAG CTTGC-5') for HMR1423 gene. These selected strains were named as NGEN1 and NGEN2. Expression of regular human insulin and insulin HMR 1423 in shake flask cultures
NGEN1 and NGEN2 were grown in 25 ml BMGY (1% w/v yeast extract, 2% w/v peptone, 100 mM potassium phosphate pH 6.0, 1.34% w/v yeast nitrogen base, 4x10⁻⁵ % biotin, and 1% w/v glycerol) at 30 0C in shaking incubator (250-300 rpm) until culture reaches an OD600 of 2-6 (approximately 16-18 hours). Cells were harvested by centrifugation at 1500-3000 x g for 5 minutes at room temperature, and the pellet was resuspended in MMH medium (1.34% w/v yeast nitrogen base, 4x10⁻⁵ % biotin, 0.004% histidine, and 0.5% v/v methanol) to obtain an OD600 of 1.0. For induction of the recombinant
insulin, 100% methanol was added to a final concentration of 0.5% v/v every 24 hours to maintain induction conditions for 72 hours [0, 6, 12, , 36, 48, 60, and 72]. Final samples of each culture were centrifuged at 5000 rpm for 5 minutes, and the supernatant was kept for determination of the protein expression by a modified method of SDS-PAGE according to Proteins and Proteomics a laboratory method (7). The effect of temperature and nitrogen source on insulin expression
To determine the effect of temperature on insulin production, cells were grown at 20, 25, and 30 0C for 96 hours. To induce the expression, 100% methanol will be added to final concentration of 0.5% v/v methanol every 24 hours to maintain induction conditions. To determine the effect of nitrogen source on insulin production, cells were grown in 25 ml of Basal medium (0.25 g KH2PO4, 0.08 g MgSO4 .7H2O, 0.0075 g CaCl2 .2H2O, 1.25 g glycerol, and 0.25 g ammonium sulfate) and ammonium sulfate was substituted by using other nitrogen sources (peptone plus yeast extract, ammonium nitrate, and urea). Cells will be grown at 30 0C for 96 hours and 100% methanol will be added to final concentration of 0.5% v/v methanol every 24 hours and expression levels will be determined by a modified method of SDS-PAGE according to Proteins and Proteomics a laboratory method using tricine [15% (w/v)] instead of glycine.
Results and Discussions Construction of P. pastoris strains with regular human insulin and HMR 1423 genes
The strain NGEN1 has already obtained and chromosomal DNA was extracted to determine the presence of regular human insulin gene by PCR-screening method. This strain will be subjected to the study the expression of regular human insulin and the effect of temperature and nitrogen sources on insulin expression. For the strain NGEN2 with HMR1423 gene, it is in the process of generating it.

The 23rd Annual Meeting of the Thai Society for Biotechnology “Systems Biotechnology: Quality & Success”
P-II-02
- 109 -
References 1. Markussen J. Semisynthesis of human
insulin. In: Methods in diabetes Research (Vol.I, Part A). New York: John Wiley & Sons; 1984
2. Gerngross T.U., Advances in the production of human therapeutic proteins in yeasts and filamentous fungi, Nat Biotechnol, 2004, 22, 1409-1414
3. Bolli GB, Di Marchi RD, Park GD, Pramming S, Koivisto VA. Insulin analogues and their potential in the management of diabetes mellitus. Diabetologia, 1999, 42, 1151–1167
4. Hamel FG, Siford GL, Fawcett J, Chance RE, Frank BH, Duckworth WC. Differences in the cellular processing of AspB10 human insulin compared with human insulin and LysB28ProB29 human insulin. Metabolism, 1999, 48, 611-617.
5. Hennige AM, Strack V, Metzinger E, Seipke G, Haring HU, Kellerer M. Effects of new insulin analogues HMR-1964 (insulin glulisine) and HMR-1423 on insulin receptors. Diabetologia, 2005, 48, 1891-1897.
6. Pais-Chanfrau JM, Garcia Y, Licor L, Besada V, Castellanos-Serra L, Cabello CI, Hernandez L, Mansur M, Plana L, Hidalgo A, Tambara Y, del CA-P, del TY, Valdes J, Martinez E. Improving the expression of mini-proinsulin in Pichia pastoris. Biotechnol Lett, 2004, 26, 1269-1272.
7. Simpson RJ. In: Proteins and Proteomics a Laboratory Method. New York: Cold Spring Harbor Laboratory Press; 2003
The 23rd Annual Meeting of the Thai Society for Biotechnology “Systems Biotechnology: Quality & Success”
P-II-09
- 110 -
Evaluation of potential fungal strains for prebiotic oligosaccharide production
Premsuda Saman, Achara Chaiongkarn, Somporn Moonmangmee, Chantra Poonsiri and Suparp Artjariyasripong Bioscience Department, Thailand Institute of Scientific and Technological Research 35 M3 Technopolis, Khlong 5, Khlong Luang, Pathum Thani, 12120, THAILAND Corresponding; [email protected] Abstract
This study aimed to evaluate the potential of fifteen fungal strains as an enzyme producer for production of prebiotic oligosaccharides. The fifteen fungal strains studied were Amylomyces rouxii TISTR 3182, Aspergillus foetidus TISTR 3383, Aspergillus awamori TISTR 3193, Aspergillus awamori TISTR 3379, Aspergillus usamii TISTR 3140, Aspergillus kawachi TISTR 3194, Aspergillus niger TISTR 3025, Aspergillus niger TISTR 3254, Aspergillus niger TISTR 3063, Aspergillus avenaccus TISTR 3216, Aspergillus japonicus TISTR 3269, Aspergillus oryzae TISTR 3019, Aspergillus oryzae TISTR 3102, Aspergillus oryzae TISTR 3222, and Aspergillus candidus TISTR 3268. Solid-state fermentations (SSF) of individual fungal strains using rice (Oryza sativa L.) as substrate were compared. Results showed that at the 5th day of fermentation, the highest value of α-glucosidase activity was observed in SSF of Aspergillus oryzae TISTR 3222 (0.25 U/g) followed by SSF of Aspergillus usamii TISTR 3140 (0.17 U/g), and SSF of Aspergillus awamori TISTR 3379 (0.07 U/g). After fermentation, mashing was used to further hydrolyze the remaining starch in the rice slurry. The subsequent rice syrup contained isomaltose, panose, and isomaltotriose, which were claimed as prebiotic oligosaccharides. Keywords: prebiotic, oligosaccharides, solid-state fermentation Introduction and Objective
Fungal amylolytic enzymes have an advantage in prebiotic oligosaccharide production. Isomalto-oligosaccharides, prebiotic branched-oligosaccharides, have been synthesized from starch (1, 2). The specific amylolytic enzyme, α–glucosidase, has been found to possess the activity of transglucosylation. This enzyme can catalyze both the hydrolysis of α-D-gluco-oligosaccharides and transfer of the glucosyl group to 6-OH of other glucosyl residues resulting in the synthesis of isomalto-oligosaccharides (isomaltose, panose, and isomaltotriose (3).
This study was designed to investigate the fungal strains with potential to be used as enzyme producer for isomalto-oligosaccharide production. Different fungal strains were studied individually to maximize the isomalto-oligosaccharides yield.
Materials and Methods
2.1 Preparation of spore inoculum Spore suspensions of Amylomyces rouxii
TISTR 3182, Aspergillus foetidus TISTR 3383, Aspergillus awamorii TISTR 3193, Aspergillus awamorii TISTR 3379, Aspergillus usamii TISTR 3140, Aspergillus kawachi TISTR 3194, Aspergillus niger TISTR 3025, Aspergillus niger TISTR 3254, Aspergillus niger TISTR 3063, Aspergillus avenaccus TISTR 3216, Aspergillus japonicus TISTR 3269, Aspergillus oryzae TISTR 3019, Aspergillus oryzae TISTR 3102, Aspergillus oryzae TISTR 3222, and Aspergillus candidus TISTR 3268 were used in this study. Spores were suspended using 0.85% NaCl solution. The spore concentration in an inoculum was enumerated by a haemacytometer.
2.2 Substrate preparation The 300 g of rice was weighed separately
into a 2-l Erlenmeyer flask and distilled water was added and adjusted to 70% moisture level. The contents of the flasks were mixed thoroughly and autoclaved at 121°C for 15 minutes.

The 23rd Annual Meeting of the Thai Society for Biotechnology “Systems Biotechnology: Quality & Success”
P-II-09
- 111 -
2.3 Solid-state fermentation (SSF) The sterilized solid substrate was inoculated
with 1% (w/v) of the prepared inoculum. The contents were mixed thoroughly and incubated at 30°C for 7 days.
2.4 Measurement of enzyme activity Crude enzyme from the fermented mass was
extracted. The amylolytic activities including α-amylase activity and α-glucosidase activity were measured using McCue and Shetty method (4).
Results and Discussion
SSF of 15 fungal strains using rice with 70%
initial moisture content as a raw material were studied. All SSF were inoculated with 1% (w/v) of individual fungal spore inoculum (108 spores/ml) and maintained at 30°C for 7 days. Results showed that all SSF had α-amylase activity. The highest α-glucosidase activity was observed in SSF of Aspergillus oryzae TISTR 3222 (0.25 U/g) followed by SSF of Aspergillus usamii TISTR 3140 (0.17 U/g), and SSF of Aspergillus awamorii TISTR 3379 (0.07 U/g). The other strains did not produce α-glucosidase.
There have been reported that the main amylolytic enzymes in Aspergillus spp. were α-amylase, glucoamylase, and α-glucosidase. Glucoamylase is an evidently amylolytic enzyme in Amylomyces rouxii (5). -Amylase is the key enzyme in starch degradation. -Amylase hydrolyses α-(1,4)-glucosidic linkages in amylose and amylopectin and releases malto-oligosaccharides of varying chain lengths while glucoamylase is an exo-acting starch-degrading enzyme that produces glucose from the non-reducing chain ends of the amylose and amylopectin. -Glucosidase catalyses liberation of glucose from non-reducing ends of oligosaccharides and polysaccharides. This enzyme is able to transfer sugar moieties or groups of sugar residues from one compound to another with the formation of a similar or a distinct type of linkage. Thus, an α-(1,4) link in a chain might be broken, and the separated end could be joined to the same or different chain via either and α-(1,4) or α-(1,6) link to produce molecules of maltose, isomaltose, panose, isomaltose or long chain of oligosaccharides.
From these results, SSF with Aspergillus oryzae TISTR 3222 was selected and used further in mashing. Mashing was conducted in order to digest the remaining starch in the fermented rice slurry. The rice syrup obtained
contained high levels of sugars and isomalto-oligosaccharides.
0
5
10
15
20
gluc
ose
malt
ose
isom
altos
e
malt
otrio
se
pano
se
isom
altot
riose
Con
cent
ratio
n (g
/l)
Figure 1. The concentrations of sugars and
oligosaccharides in rice syrup after mashing by A. oryzae TISTR 3222
References 1. Kuriki T, Yanase M, Takata H, Takesada Y,
Imanaka T, Okada S. A new way of producing isomalto-oligosaccharide syrup by using the transglycosylation reaction of neopullulanase. Appl Environ Microbiol.1993 April 1, 1993;59(4):953-9.
2. Pan YC, Lee WC. Production of high-purity isomalto-oligosaccharides syrup by the enzymatic conversion of transglucosidase and fermentation of yeast cells. Biotechnolgy and Bioengineering.2005;89(7):797-804.
3. Nakakuki T. Development of Functional Oligosaccharides in Japan. Trends in Glycoscience and Glycotechnology. 2003;15(28):57-64.
4. McCue P SK. Role of carbohydrate-cleaving enzymes in phenolic antioxidant mobilization from whole soybean fermented with Rhizopus oligosporus. Food Biotechnology 2003;17(1):27-37.
5. Wang HL, Swain EW, Hesseltine CW. Glucoamylase of Amylomyces rouxii. Journal of Food Science 1984;49(4):1210-1.
The 23rd Annual Meeting of the Thai Society for Biotechnology “Systems Biotechnology: Quality & Success”
P-II-11
- 112 -
Identification of non-ribosomal peptide synthetase gene expression in Marianneae camptospora
Sarocha Panchanawaporna, Natcha Tepragulb and Chanikul Chutrakula*
aNational Center for Genetic Engineering and Biotechnology, 113 Thailand Science Park, Phaholyothin Rd, Klong 1, Klong Luang, Pathumthani, 12120
bSchool of Biotechnology, Assumption University, Bangkok, 10240
Abstract
The aquatic fungus Marianneae camptospora BCC12193 was selected from BIOTEC Culture Collection (BCC), due to its proven ability to produce non-ribosomal peptides (NRPs) with unique bioactivities. To increase the production yield of NRPs by this fungus, we have optimised the culture conditions, such as nitrogen (N) and carbon (C) contents in the fermentation medium and cultivation time. The production of NRPs was examined by the analysis of crude culture extract using high performance liquid chromatography (HPLC), and confirmed by gene expression analysis using reverse transcription-PCR (RT-PCR) with primers specific to the adenylation (A) domains of NRPS genes. RT-PCR analysis showed that M. camptospora BCC12193 expressed the highest level of NRPS in medium containing 5% C and 1.4% N after being fermented for 14 days. On the contrary, the lowest levels of NRPS gene expression and metabolite production were detected, when the culture was harvested on day 5. The NRPS gene, which exhibits differential expression levels in both conditions, has been identified. Its involvement in the production of target NRPs will be confirmed by real-time PCR. Keywords: non-ribosomal peptide synthetase, expression, RT-PCR, HPLC, Marianneae camptospora Introduction and Literature review The role of microorganisms in antibiotics production and other drugs has increased tremendously in the last decades. There has been a report that 22 500 biologically active compounds have been isolated from various species of microorganisms in different habitats all around the world. Of all the compounds isolated, 45 % are produced by Actinomyces group of bacteria, 38% by fungi, and 17% by unicellular bacteria (Demain and Sanchez, 2009). Fungal secondary metabolites possess a broad range of activities, which many can be used to produce useful pharmaceutical products in the medical field. These products may include antifungal agents, antibacterial agents, antitumor agents, antiviral infections drugs, and immunosuppressant (Shwab and Keller, 2008). Penicillin and echinocandin are two common examples. Large numbers of fungal peptides are produced by NRPS multi-functional enzymes, which are encoded by NRPS gene clusters (Degenkolb and Bruckner, 2008). The enzymes work together in modules, which are semiautonomous units. The
number and order of the modules within the polypeptide chain of the peptide synthetase establish the sequence and the length of the peptide synthesised (Marahiel, Stachelhaus and Mootz, 1997). Each module comprised of several domains with defined functions to recognize, introduce, activate, modify, and bond substrates to form highly specialized polypeptide chains. Adenylation (A), Thiolation (T), and Condensation (C) are the three major domains in a module. The A domain initiates NRPs synthesis by recognising and activating a suitable amino acid substrate. The T domain or peptidyl carrier domain (PCP) role is to accept the activated amino acid from A domain via 4’-phosphopantheine (also known as 4’PP) co-factor. This activated amino acid substrate (aminoacyl adenylate) forms a thioester bond with cysteamine thiol (SH) presented on the co-factor and thus, is transferred to the next module during the elongation of the peptide chain. The condensation (C) domain aids the elongation process by playing a major role in the formation of peptide bond between amino acid units, while the thioesterase (TE) domain hydrolyses the complete peptide chain from the T domain in the termination stage to cleave or circularise the nascent molecule (Koumoutsi, 2006). Other optional domain components of NRPS include
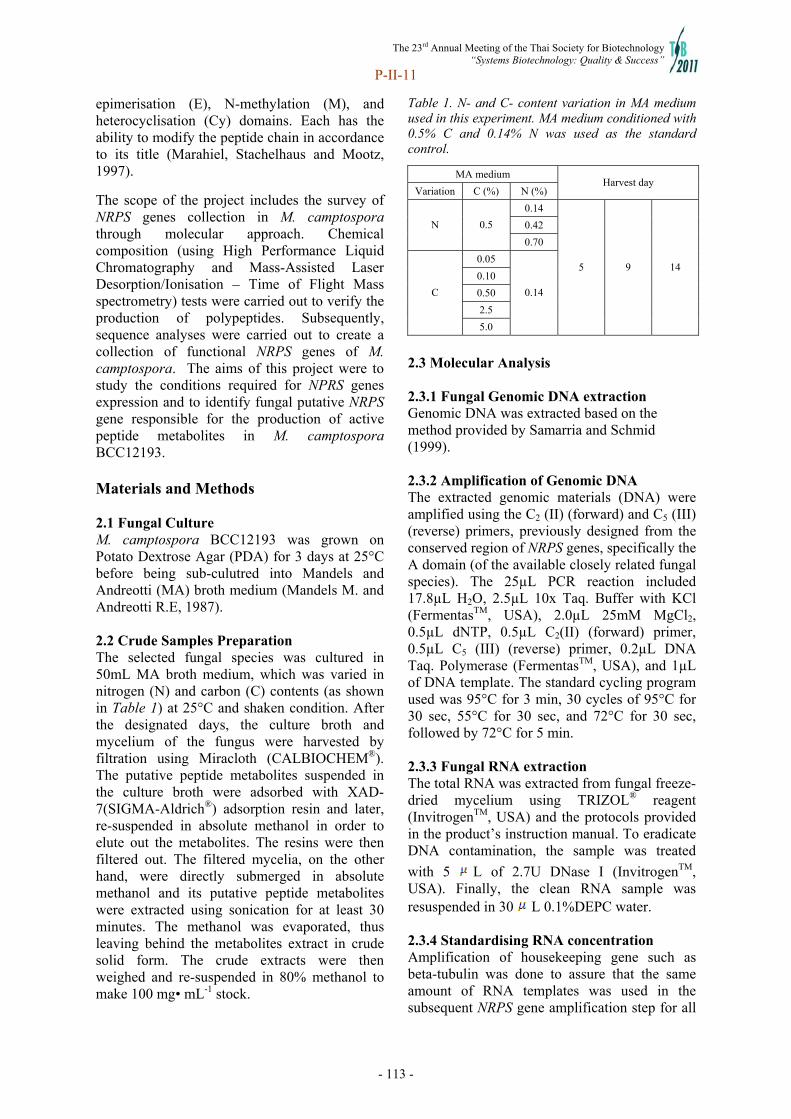
The 23rd Annual Meeting of the Thai Society for Biotechnology “Systems Biotechnology: Quality & Success”
P-II-11
- 113 -
epimerisation (E), N-methylation (M), and heterocyclisation (Cy) domains. Each has the ability to modify the peptide chain in accordance to its title (Marahiel, Stachelhaus and Mootz, 1997).
The scope of the project includes the survey of NRPS genes collection in M. camptospora through molecular approach. Chemical composition (using High Performance Liquid Chromatography and Mass-Assisted Laser Desorption/Ionisation – Time of Flight Mass spectrometry) tests were carried out to verify the production of polypeptides. Subsequently, sequence analyses were carried out to create a collection of functional NRPS genes of M. camptospora. The aims of this project were to study the conditions required for NPRS genes expression and to identify fungal putative NRPS gene responsible for the production of active peptide metabolites in M. camptospora BCC12193. Materials and Methods 2.1 Fungal Culture M. camptospora BCC12193 was grown on Potato Dextrose Agar (PDA) for 3 days at 25°C before being sub-culutred into Mandels and Andreotti (MA) broth medium (Mandels M. and Andreotti R.E, 1987). 2.2 Crude Samples Preparation The selected fungal species was cultured in 50mL MA broth medium, which was varied in nitrogen (N) and carbon (C) contents (as shown in Table 1) at 25°C and shaken condition. After the designated days, the culture broth and mycelium of the fungus were harvested by filtration using Miracloth (CALBIOCHEM®). The putative peptide metabolites suspended in the culture broth were adsorbed with XAD-7(SIGMA-Aldrich®) adsorption resin and later, re-suspended in absolute methanol in order to elute out the metabolites. The resins were then filtered out. The filtered mycelia, on the other hand, were directly submerged in absolute methanol and its putative peptide metabolites were extracted using sonication for at least 30 minutes. The methanol was evaporated, thus leaving behind the metabolites extract in crude solid form. The crude extracts were then weighed and re-suspended in 80% methanol to make 100 mg• mL-1 stock.
Table 1. N- and C- content variation in MA medium used in this experiment. MA medium conditioned with 0.5% C and 0.14% N was used as the standard control.
MA medium
Variation C (%) N (%) Harvest day
0.14
0.42 N 0.5
0.70
0.05
0.10
0.50
2.5
C
5.0
0.14
5 9 14
2.3 Molecular Analysis 2.3.1 Fungal Genomic DNA extraction Genomic DNA was extracted based on the method provided by Samarria and Schmid (1999). 2.3.2 Amplification of Genomic DNA The extracted genomic materials (DNA) were amplified using the C2 (II) (forward) and C5 (III) (reverse) primers, previously designed from the conserved region of NRPS genes, specifically the A domain (of the available closely related fungal species). The 25µL PCR reaction included 17.8µL H2O, 2.5µL 10x Taq. Buffer with KCl (FermentasTM, USA), 2.0µL 25mM MgCl2, 0.5µL dNTP, 0.5µL C2(II) (forward) primer, 0.5µL C5 (III) (reverse) primer, 0.2µL DNA Taq. Polymerase (FermentasTM, USA), and 1µL of DNA template. The standard cycling program used was 95°C for 3 min, 30 cycles of 95°C for 30 sec, 55°C for 30 sec, and 72°C for 30 sec, followed by 72°C for 5 min. 2.3.3 Fungal RNA extraction The total RNA was extracted from fungal freeze-dried mycelium using TRIZOL® reagent (InvitrogenTM, USA) and the protocols provided in the product’s instruction manual. To eradicate DNA contamination, the sample was treated
with 5 L of 2.7U DNase I (InvitrogenTM, USA). Finally, the clean RNA sample was resuspended in 30 L 0.1%DEPC water. 2.3.4 Standardising RNA concentration Amplification of housekeeping gene such as beta-tubulin was done to assure that the same amount of RNA templates was used in the subsequent NRPS gene amplification step for all

The 23rd Annual Meeting of the Thai Society for Biotechnology “Systems Biotechnology: Quality & Success”
P-II-11
- 114 -
samples. SuperScriptTM III One-step RT-PCR system kit (InvitrogenTM, USA) with beta-tubulin-2a (forward) and beta-tubulin-2b (reverse) primers were used in the cDNA synthesis and amplification (0.30kb). The amplification was performed in accordance to the protocol given by SuperScriptTM III One-step RT-PCR system kit (InvitrogenTM, USA). 2.3.5 Identification of NRPS genes from total RNA using RT-PCR Comparison of fungal NRPS gene expression level in each culture condition were carried out using SuperScriptTM III One-step RT-PCR system kit (InvitrogenTM, USA) with C2 (II) forward and C5 (III) reverse primer. 2.3.6 NRPS gene Cloning The PCR and RT-PCR products were purified with QIAEX Gel Extraction kit (Qiagen, Litunea) and sub-cloned into a suitable T/A cloning vector. The vector was cut with the restriction enzymes, Sau3AI, in order to screen for unique insert variations. 2.3.7 Gene Sequencing Sequencing was done by the Malyasia’s FIRST BASE Company. The sequences from PCR and RT-PCR products were compared to other known fungal NRPS genes through BLAST program in the United States’ National Center of Biotechnology Information (NCBI) database. 2.3.8 Real-Time PCR A primer pair, NRPS239F (forward) and NRPS239R (reverse), was designed from a selected gene sequence that was found in both least and most productive conditions. Along with the primer pair, the gene was amplified using Real-Time PCR (BIORAD CFX96TM Real-Time System) and EXPRESS One-Step SYBR® GreenERTM Kits (InvitrogenTM, USA). Reaction mix preparation and cycling condition programming were carried out according to the protocol given by the Kits. 2.4 Chemical Analysis of Non-Ribosomal Peptides (NRPs) by High Performance Liquid Chromatography (HPLC)
Detection of NRPs was done by analysing the chemical profile of the 10 mg• mL-1 fungal crude extract using HPLC (Dionex Ultimate® 3000 standard LC Systems, USA) and test instructions based on the method provided by Chutrakul et al., 2009. A C18 RP-HPLC column (Gemini-NX,
RP-C18, 100 x 4.6 mm, particle size, 110 Ǻ, Phenomenex, USA) was used to separate the metabolites based on its polarity. The injection volume was 20 l per sample. Results and Discussion 3.1 Fungal Culture The selection of M. camptospora BCC12193 for this project was based on the data obtained from two related projects, “Chemical Profile Library of non-ribosomal peptides” (Chutrakul et al., 2009) and “Building up a non-ribosomal peptide library: Improvement of peptide rapid screening method and isolation of new peptides from fungi” (Chutrakul et al., 2010-2011). These two projects have proven that certain groups of metabolites produced by M. camptosproa BCC12193 are definitely peptides belonging in the NRPs group. Previously, crude extract from M. camptosproa has shown to an anti-microbial activity against Bacillus cereus, a Gram-positive, rod-shaped, beta-hemolytic bacteria, which some strains are known to cause foodborne illness in human. The result from chemical profile analysis of the crude extract by MALDI-TOF showed at least two possible putative peptaibiotics with a series of masses at m/z 2028 and 2029. In HPLC, these peptide peaks would appear at retention time 14.333-14.593, and 14.870 minutes. This indicates that the compounds or metabolites have medium polarity. The data stated above has proven the potential of M. camptosproa to be re-selected for this project. 3.2 Expression of NRPS genes In the preliminary trials of the experiment, high concentration of RNA template (up to 1000 ng•µL-1) were used in the RT-PCR amplification. The RNA samples in all culture conditions were shown to be positive for NRPS genes expression (at 0.8 kb) (data not shown). Even though this amplification result coincided with the chemical profile produced by HPLC in which the targeted peptide peaks can be seen in all 15 cultured conditions, but the expression levels of NRPS gene in each cultured condition cannot be compared without bias. Thus, in order to make a proper comparison for the purpose of defining the best productive condition, the concentration of RNA template used in the RT-PCR reaction was controlled at 200 ng for all samples. To further ensure that the concentration of RNA templates of all culture conditions used in the

The 23rd Annual Meeting of the Thai Society for Biotechnology “Systems Biotechnology: Quality & Success”
P-II-11
- 115 -
PCR reaction were controlled at 200 ng, RT-PCR amplifications using beta-tubulin gene were performed as shown in Figure 2(a). The method uses a housekeeping gene, which is a constitutive gene commonly expressed in a relatively constant level (Biology online, 2008), as a control gene in order to standardise mRNA levels among different samples (Silver et al., 2006).
Figure 2. Genetic analysis of M. camptospora. (a) beta-tubulin gene RT-PCR amplification. 5 µL loaded. The expected size is 0.3 kb. Lanes 1-5 (5d) with % carbon: nitrogen = 0.5C:0.7N, 0.5C:0.42N, 0.5C:0.14N, 2.5C:0.14N, 5.0C:0.14N; lane 6-10 (9d) with the same % carbon: nitrogen as above; lane 11-15 (14d) with the same % carbon : nitrogen as above. (b) Investigation of NRPS gene expression by RT-PCR amplification using C2(II) and C5(III) primers. 10 µL loaded. The expected size is 0.8 kb. Lane labels are the same with (a). Comparison of NRPS gene expression level in M. camptospora BCC12193 was made from the image shown in Figure 2(b). M. camptospora BCC12193 cultured in MA medium with 5% carbon and 0.14% nitrogen has proven to be the best optimised expression condition with 14-days culture having the highest expression level (HEL)(as shown in lane 15, Figure 2(b)) and 5-days culture having the lowest expression level (LEL)(as shown in lane 5, Figure 2(b)). PCR fragments from both conditions were then extracted and cloned for DNA sequence analysis. 3.3 Sequence Analysis A total of twelve distinct NRPS sequences were found from cDNA of the LEL and HEL conditions as well as the genomic amplification of M. camptospora BCC12193, as shown in Table 2. Seven sequences were identified from the genomic DNA, two from the cDNA of LEL condition, and three from the cDNA of HEL condition. The identities of these 12 sequences range from 46% to 97%. The construction of phylogenetic tree in Figure 3 reveals the relations among these NRPS gene sequences derived from the three sources. One gene sequence in particular was found in both LEL (CL12193_20) and HEL (CH12193_07)
conditions (highlighted in Table 2). This gene was named C12193_L20H07 and became the focus of the project. Table 2. NRPS gene sequences collection of M. camtospora BCC12193.
Type Code Description Identity G12193_03 NRPS SidE 56%
G12193_103 NRPS 7 (NPS7)
gene 68%
G12193_01 NRPS SidE 68% G12193_214 NRPS, partial cds 57%
G12193_19 NRPS 7 (NPS7)
gene 69%
G12193_226 NRPS SidE 65%
Genomic DNA
G12193_17 NRPS, partial cds 47%
CL12193_17 NRPS SidE 75% cDNA (lowest expression)
CL12193_20 NRPS16 gene 46% CH12193_05 putative NRPS 63% CH12193_07 NRPS16 gene 47%
cDNA(highest expression)
CH12193_10 NRPS, partial cds 97%
Figure 3. Phylogenetic Tree of identified NRPS gene sequences of M. camtospora BCC12193. The asterisk (*) indicates C12193_L20H07 gene that was found in both expression conditions. 3.4 Chemical Analysis HPLC peaks of M. camptospora BCC12193 at retention time (RT) 14.333-14.593, and 14.870 minutes (with a deviation of ± 0.1 minutes) were identified from intra- and extracellular extracts and confirmed to be peptide originated (data not shown) when compared with the UV spectra (210 nm). The total peptide productions were measured and compared using surface area as shown by mAU•min under the targeted HPLC peaks of each culture condition. From the HPLC chromatograms, it is clear that the production of targeted NRPs was higher in the HEL condition (Figure 4(b), 149.3330 mAU•min) than the LEL condition (Figure 4(a), 86.6563 mAU•min). This pattern correlated with the expression of NRPS genes in Figure 2 and also correlated with the appearance of C12193_L20H07 gene (Figure 3) that was found in both LEL and HEL conditions. As a result, C12193_L20H07 gene was suspected to be
*
1 2 3 4 5 6 7 8 9 10 11 12 13 14 15
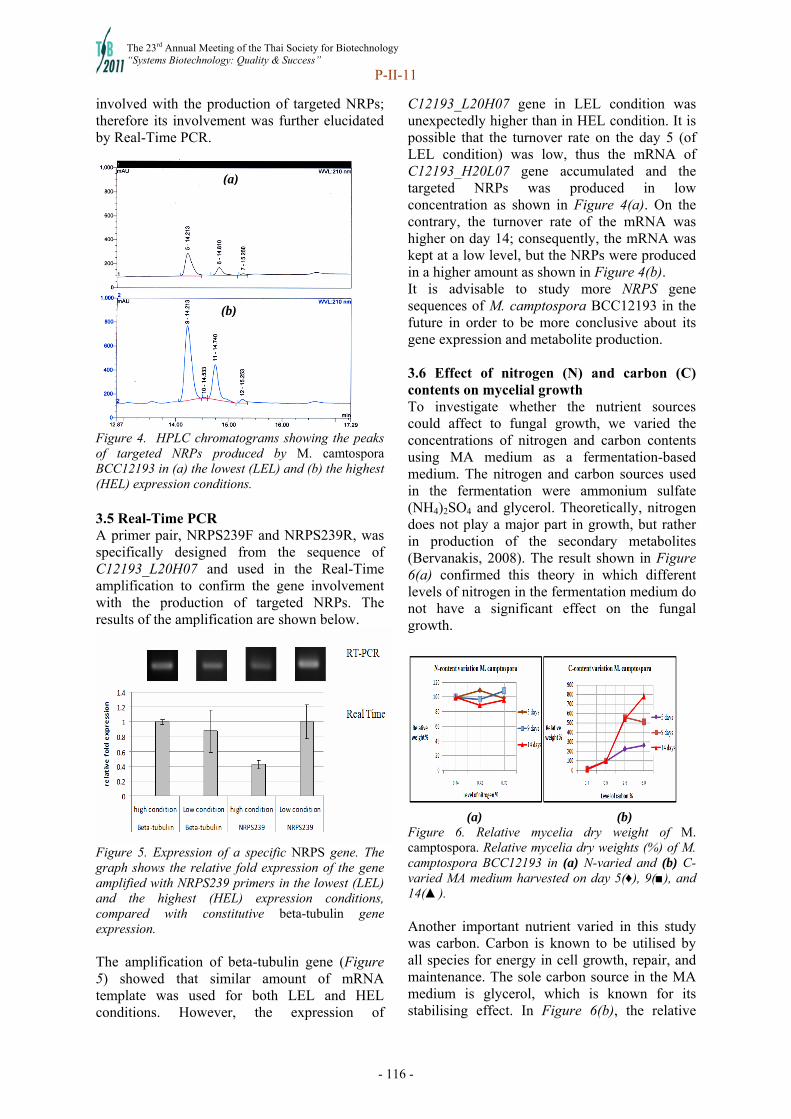
The 23rd Annual Meeting of the Thai Society for Biotechnology “Systems Biotechnology: Quality & Success”
P-II-11
- 116 -
involved with the production of targeted NRPs; therefore its involvement was further elucidated by Real-Time PCR.
Figure 4. HPLC chromatograms showing the peaks of targeted NRPs produced by M. camtospora BCC12193 in (a) the lowest (LEL) and (b) the highest (HEL) expression conditions. 3.5 Real-Time PCR A primer pair, NRPS239F and NRPS239R, was specifically designed from the sequence of C12193_L20H07 and used in the Real-Time amplification to confirm the gene involvement with the production of targeted NRPs. The results of the amplification are shown below.
Figure 5. Expression of a specific NRPS gene. The graph shows the relative fold expression of the gene amplified with NRPS239 primers in the lowest (LEL) and the highest (HEL) expression conditions, compared with constitutive beta-tubulin gene expression. The amplification of beta-tubulin gene (Figure 5) showed that similar amount of mRNA template was used for both LEL and HEL conditions. However, the expression of
C12193_L20H07 gene in LEL condition was unexpectedly higher than in HEL condition. It is possible that the turnover rate on the day 5 (of LEL condition) was low, thus the mRNA of C12193_H20L07 gene accumulated and the targeted NRPs was produced in low concentration as shown in Figure 4(a). On the contrary, the turnover rate of the mRNA was higher on day 14; consequently, the mRNA was kept at a low level, but the NRPs were produced in a higher amount as shown in Figure 4(b). It is advisable to study more NRPS gene sequences of M. camptospora BCC12193 in the future in order to be more conclusive about its gene expression and metabolite production. 3.6 Effect of nitrogen (N) and carbon (C) contents on mycelial growth To investigate whether the nutrient sources could affect to fungal growth, we varied the concentrations of nitrogen and carbon contents using MA medium as a fermentation-based medium. The nitrogen and carbon sources used in the fermentation were ammonium sulfate (NH4)2SO4 and glycerol. Theoretically, nitrogen does not play a major part in growth, but rather in production of the secondary metabolites (Bervanakis, 2008). The result shown in Figure 6(a) confirmed this theory in which different levels of nitrogen in the fermentation medium do not have a significant effect on the fungal growth.
(a) (b)
Figure 6. Relative mycelia dry weight of M. camptospora. Relative mycelia dry weights (%) of M. camptospora BCC12193 in (a) N-varied and (b) C-varied MA medium harvested on day 5(♦), 9(■), and 14(▲). Another important nutrient varied in this study was carbon. Carbon is known to be utilised by all species for energy in cell growth, repair, and maintenance. The sole carbon source in the MA medium is glycerol, which is known for its stabilising effect. In Figure 6(b), the relative
(a)
(b)

The 23rd Annual Meeting of the Thai Society for Biotechnology “Systems Biotechnology: Quality & Success”
P-II-11
- 117 -
weight of the M. camptospora’s mycelium increased in positive correlation with the increasing percentage of glycerol. It is likely that in a non-stressful environment with high carbon level such as the given fermentation condition, the fungus directed its energy and resources on producing compounds essential for its growth and maintenance, thus increasing its cell (mycelia) weight as in Figure 6(b). Conclusion In the genetic analysis of M. camptospora BCC12193, the best optimised expression condition for NRPS gene was MA medium containing 5% carbon and 0.14% nitrogen with highest mRNA yield in 14-days culture (HEL) and lowest in 5-days culture (LEL). This finding correlated with the level of NRPs production detected by the HPLC. Sequence analysis reveals twelve distinct NRPS gene sequences derived from cDNA of the LEL and HEL conditions, and from the genomic DNA of M. camptospora BCC12193. One gene sequence, C12193_L20H07, was found in both LEL and HEL conditions, and was suspected to be involved in the production of targeted NRPs, but from the result given by the Real-Time PCR, its involvement was still inconclusive. Finally, the mycelial growth of M. camptospora BCC12193 was significantly affected by the variation of glycerol (C-source) content but insignificantly affected by the variation of ammonium sulfate (N-source). References 1. Al-Samarrai T.H. and Schmid, J. “A simple
method of extraction of fungal genomic DNA.” Applied Microbiology 30 (Sep 1999): 53-56.
2. Bergmann S, Schumann J, Scherlachi K, Lange C, Brakhage A, and Hertweck C. “Genomics-driven discovery of PKS-NRPS hybrid metabolites from Aspergillus nidulans.” Nature Chemical Biology 3.4 (Apr 2007): 213-217.
3. Bervanakis G. “Detection and Expression of Biosynthetic Genes in Actinobacteria (Thesis).” Department of Medical Biotechnology (2008).
4. Biology online contributors. "Housekeeping gene." Biology online (30 Jun 2008). Biology-Online.org. Web. 17 May 2011.
5. Chutrakul C, Boonlarppradab C, Panchanawaporn S, Jaresitthikunchai J.
“Building up a non-ribosomal peptide library: Improvement of peptide rapid screening method and isolation of new peptides from fungi.” Bio-resource Technology Unit (2010-2011). National Center of Genetic Engineering and Biotechnology.
6. Chutrakul C, Boonlarppradab C, Panchanawaporn S, Jaresitthikunchai J. “Chemical Profile Library of non-ribosomal peptides.” Bio-resource Technology Unit (2009). National Center of Genetic Engineering and Biotechnology.
7. Degenkolb T. and Bruckner H. "Peptaibiomics: Towards a Myriad of Bioactive Peptides Containing Cα - Dialkylamino Acids." Chemistry and Biodiversity 5 (2008): 1817-37.
8. Demain A. L. and Sanchez S. "Microbial drug discovery: 80 years of progress." The Journal of Antibiotics 62 (2009): 5-16.
9. Dohren H.V. "A survey of nonribosomal peptide synthetase (NPRS) genes in Aspergillus nidulans." Fungal Genetics and Biology 46 (2009): 545-552.
10. Koumoutsi A. "Introduction: Functional genome analysis of the plant-growth promoting bacterium Bacillus amyloliquefaciens strain FZB42; characterizing its production and regulation of nonribosomal peptide synthetases." Dissertation (4 Dec 2006). Humboldt University’s edoc server. HTML. 25 Apr 2010.
11. Mack P.E. “Cowan 13: Pencillin.” History 122 (31 Oct 2007). Clemson. HTML. 27 Apr 1010.
12. Mandels M. and Andreotti R.E. “Problems and challenges in the cellulose to cellulase fermentation.” Proc. Biochem. 13 (1978): 6-13.
13. Marahiel M.A, Stachelhaus T, and Mootz H.D. "Modular Peptide Synthetases Involved in Nonribosomal Peptide Synthesis." Chem.Rev. 97 (10 Nov 1997): 225-230.
14. Shwab K.E. and Keller N.P. "Regulation of secondary metabolite production in filamentous ascomycetes." Mycological Research 112 (2008): 225-230.
15. Silver N, Best S, Jiang J. and Thein S.L. "Selection of housekeeping genes for gene expression studies in human reticulocytes using real-time PCR." BMC Molecular Biology 7 (2006): 33.
16. Stadler M. and Keller N.P. "Introduction: Paradigm shifts in fungal secondary metabolite research." Mycological Research 112 (2008): 127-130.
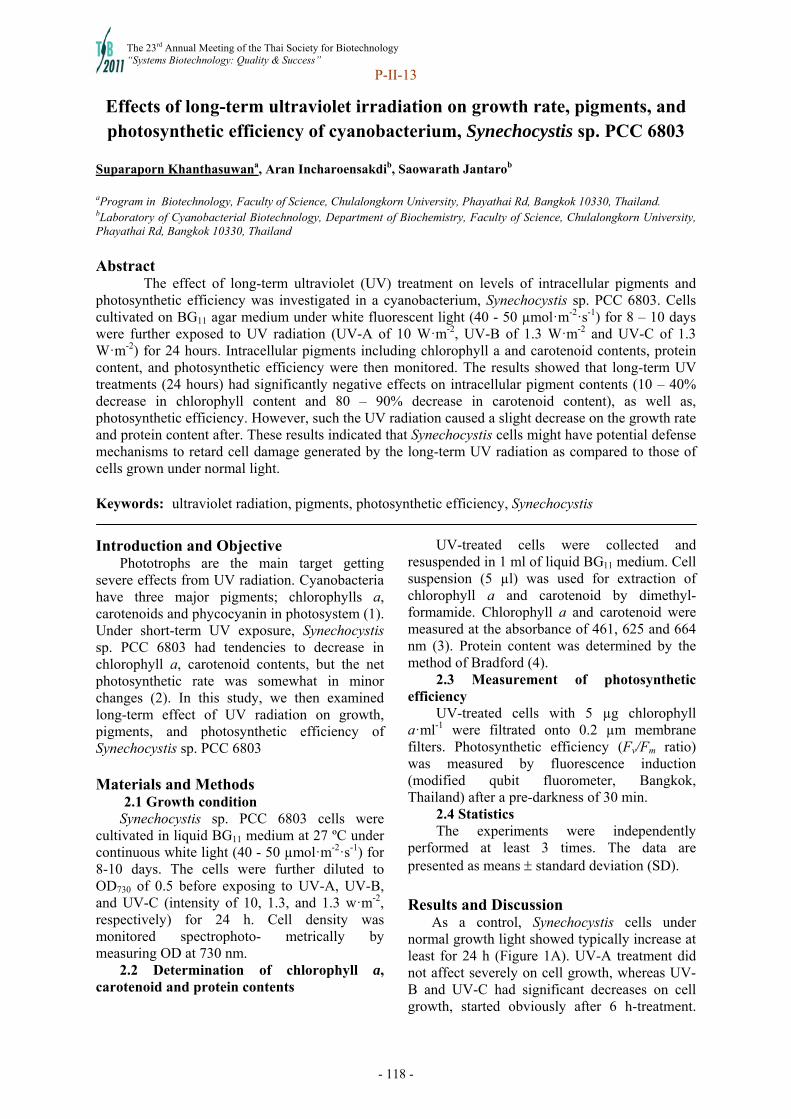
The 23rd Annual Meeting of the Thai Society for Biotechnology “Systems Biotechnology: Quality & Success”
P-II-13
- 118 -
Effects of long-term ultraviolet irradiation on growth rate, pigments, and photosynthetic efficiency of cyanobacterium, Synechocystis sp. PCC 6803
Suparaporn Khanthasuwana, Aran Incharoensakdib, Saowarath Jantarob
aProgram in Biotechnology, Faculty of Science, Chulalongkorn University, Phayathai Rd, Bangkok 10330, Thailand. bLaboratory of Cyanobacterial Biotechnology, Department of Biochemistry, Faculty of Science, Chulalongkorn University, Phayathai Rd, Bangkok 10330, Thailand Abstract
The effect of long-term ultraviolet (UV) treatment on levels of intracellular pigments and photosynthetic efficiency was investigated in a cyanobacterium, Synechocystis sp. PCC 6803. Cells cultivated on BG11 agar medium under white fluorescent light (40 - 50 µmol·m-2·s-1) for 8 – 10 days were further exposed to UV radiation (UV-A of 10 W·m-2, UV-B of 1.3 W·m-2 and UV-C of 1.3 W·m-2) for 24 hours. Intracellular pigments including chlorophyll a and carotenoid contents, protein content, and photosynthetic efficiency were then monitored. The results showed that long-term UV treatments (24 hours) had significantly negative effects on intracellular pigment contents (10 – 40% decrease in chlorophyll content and 80 – 90% decrease in carotenoid content), as well as, photosynthetic efficiency. However, such the UV radiation caused a slight decrease on the growth rate and protein content after. These results indicated that Synechocystis cells might have potential defense mechanisms to retard cell damage generated by the long-term UV radiation as compared to those of cells grown under normal light.
Keywords: ultraviolet radiation, pigments, photosynthetic efficiency, Synechocystis
Introduction and Objective
Phototrophs are the main target getting severe effects from UV radiation. Cyanobacteria have three major pigments; chlorophylls a, carotenoids and phycocyanin in photosystem (1). Under short-term UV exposure, Synechocystis sp. PCC 6803 had tendencies to decrease in chlorophyll a, carotenoid contents, but the net photosynthetic rate was somewhat in minor changes (2). In this study, we then examined long-term effect of UV radiation on growth, pigments, and photosynthetic efficiency of Synechocystis sp. PCC 6803
Materials and Methods
2.1 Growth condition Synechocystis sp. PCC 6803 cells were
cultivated in liquid BG11 medium at 27 ºC under continuous white light (40 - 50 µmol·m-2·s-1) for 8-10 days. The cells were further diluted to OD730 of 0.5 before exposing to UV-A, UV-B, and UV-C (intensity of 10, 1.3, and 1.3 w·m-2, respectively) for 24 h. Cell density was monitored spectrophoto- metrically by measuring OD at 730 nm.
2.2 Determination of chlorophyll a, carotenoid and protein contents
UV-treated cells were collected and resuspended in 1 ml of liquid BG11 medium. Cell suspension (5 µl) was used for extraction of chlorophyll a and carotenoid by dimethyl- formamide. Chlorophyll a and carotenoid were measured at the absorbance of 461, 625 and 664 nm (3). Protein content was determined by the method of Bradford (4).
2.3 Measurement of photosynthetic efficiency
UV-treated cells with 5 µg chlorophyll a·ml-1 were filtrated onto 0.2 µm membrane filters. Photosynthetic efficiency (Fv/Fm ratio) was measured by fluorescence induction (modified qubit fluorometer, Bangkok, Thailand) after a pre-darkness of 30 min.
2.4 Statistics The experiments were independently
performed at least 3 times. The data are presented as means standard deviation (SD).
Results and Discussion
As a control, Synechocystis cells under normal growth light showed typically increase at least for 24 h (Figure 1A). UV-A treatment did not affect severely on cell growth, whereas UV-B and UV-C had significant decreases on cell growth, started obviously after 6 h-treatment.
The 23rd Annual Meeting of the Thai Society for Biotechnology “Systems Biotechnology: Quality & Success”
P-II-13
- 119 -
Chlorophyll a and carotenoid contents were decreased markedly after 9 h-treatment of UV-B and UV-C, but not after 12 h-treatment of UV-A (Figure 1B and C). On the other hand, protein content of Synechocystis cells showed increasing patterns under all UV-treatments (Figure 1D). Photosynthetic efficiency of cells grown under normal white light possessed unchanged level for 24 h, whereas it was significantly decreased under all UV-treatments (Figure 1E). Moreover, the photosynthesis of Synechocystis cells were decreased exponentially during first 1 – 3 h and continually damaged in lower rate during 3 – 24 h. Altogether, Synechocystis cells seem to have potential mechanisms against long-term UV stress.
Acknowledgements
The authors would like to thank Dr. Sorawit Powtongsook (Center of excellent for marine biotechnology, NASTDA, Thailand) for providing the modified qubit fluorometer. This study was supported by Chulalongkorn University graduate scholarship to commemorate the 72nd anniversary of His Majesty King Bhumibol Adulyadej and the CHE (University staff development consortium) to A.I.
References 1. Colyer L. Christa, Kinkade S. Christopher,
Viskari J. Pertti, Landers P. James. Analysis of cyanobacterial pigments and proteins by electrophoretic and chromatographic methods. Anal Bioanal Chem. 2005; 382(3): 559 – 69.
2. Jantaro Saowarath, Pothipongsa Apiradee, Khanthasuwan Suparaporn, Incharoensakdi Aran. Short-term UV-B and UV-C radiations preferentially decrease spermidine contents and arginine decarboxylase transcript levels of Synechocystis sp. PCC 6803. Curr Microbiol. 2011; 62(2): 420 – 6.
3. Jantaro Saowarath, Ali Quaisar, Lone Samea, He Qingfang. Suppression of the lethality of high light to a quadruple HLI mutant by the inactivation of the regulatory protein PfsR in Synechocystis PCC 6803. J Biol Chem. 2006; 281(41): 30865 – 74.
4. Bradford M Marion. A rapid and sensitive method for the quantitation of microgram quantities of protein utilizing the principle of protein-dye binding. Anal Biochem. 1976; 72: 248 - 54
Figure 1. Growth (A), chlorophyll a (B),
carotenoid (C), protein contents (D) and photosynthetic efficiency (Fv/Fm ratio, E) of
Synechocystis cells grown under UV-A 10 w·m-2 (), UV-B 1.3 w·m-2() and UV-C 1.3 w·m-2() for 24 h compared to normal light 40 - 50 µmol·m-2·s-1().
The data are means SD (n = 3).
The 23rd Annual Meeting of the Thai Society for Biotechnology “Systems Biotechnology: Quality & Success”
P-II-14
- 120 -
Antimicrobial activity of crude extracts from fungal endophytes
Krit Luengchaichaweng a, Siriluk Pramachote a, Watanalai Panbangred a,b, Chuenchit Boonchird a and Thipa Asvarak a
a Department of Biotechnology, Faculty of Science, Mahidol University, 10400, Thailand b Mahidol University, Osaka University Collaborative Research Center for Bioscience and Biotechnology (MU-OU:CRC), Faculty of Science, Mahidol University, Thailand
In this study, two fungal endophytes P29-005 and P55-013, which were obtained from previous study, (isolated from Garcinia speciosa and from Lygodium sp., respectively), were selected to investigate their ability to produce antimicrobial compounds. Fungal cultures were incubated in appropriate conditions: 10 days in Potato dextrose broth (PDB) with agitation for P29-005 and 21 days in static condition in glucose peptone broth (GP) for P55-013. Their culture broths were extracted using ethyl acetate. Antifungal activity against Saccharomyces cerevisiae was observed in both crude extracts using disc diffusion and drop plate assays. However, crude extract of P55-013 was selected for further analysis due to its additional antibacterial activity against Staphylococcus aureus ATCC 25923, methicillin-resistant Staphylococcus aureus (MRSA) -1302 and MRSA-2 when assayed using disc diffusion method. Crude extract was analyzed by thin layer chromatography and biological assay to determine active fractions. Moreover, to obtain suitable culture conditions, the parameters including pH (pH at 5, 6 and 7), percentage of nitrogen source (0.5 1.0 and 1% of peptone) and magnesium sulfate (0.1 0.5 and 0.9%) were examined for maximizing antimicrobial activity. Keywords: Fungal endophytes, antibacterial activity, antifungal activity Introduction and Objective
Fungal endophytes are microorganisms that colonize plant tissue without causing disease symptoms (Wang et al., 2007). Some fungal endophytes are known to produce bioactive compounds that may be involved in host-endophyte relationships, with possible effect on host defense mechanism (Backman and Sikora, 2008). These bioactive metabolites may aid fungal endophytes for competition in nature (Mehdi et al., 2006). Secondary metabolites can be synthesized by many pathways. The intermediate metabolites from pathway metabolism serve as precursor for biosynthesis of secondary metabolites and the composition of culture medium, greatly affect the biosynthesis of the bioactive molecules (Mehdi et al., 2006).
This study aims to determine the antimicrobial activity of fungal endophytes P29-005 and P55-013, and to investigate the effect of media components on antimicrobial activity of the culture extract.
Materials and Methods
2.1 Extraction of culture broth Each fungal isolate was incubated in 300 ml
Potato dextrose broth (PDB) or Glucose peptone broth (GPB) in appropriate conditions: 10 days with agitation for P29-005 and 21 days in static condition for P55-013. Each culture broth was filtrated, centrifuged and then evaporated to 300 ml after addition of equal volume of ethanol. Extraction was performed using ethyl acetate. Sodium chloride and sodium-bisulfate were added, respectively. Finally, the extract were evaporated to final volume of three ml. Fungal crude extracts were then used in disc diffusion assay to determine antimicrobial activity.
2.2 Assay for antimicrobial activity To screen for effective antibacterial
compound in fungal extracts, disc diffusion assay was performed against two standard strains (Staphylococcus aureus ATCC 25923 and Escherichia coli) and five drug resistance strains methicillin-resistant Staphylococcus aureus -1302 (MRSA-1302), MRSA-2, Escherichia coli-7, Pseudomonas aeruginosa-6 and Acinetobactor-1275 kindly provided by Assoc. Prof. Srisurang Tantimavanich. Twenty μl of fungal crude extracts was loaded on 0.6

The 23rd Annual Meeting of the Thai Society for Biotechnology “Systems Biotechnology: Quality & Success”
P-II-14
- 121 -
mm diameter Whatman disc. Air-dried discs were then placed on bioassay plate coated with different of bacteria strains. Ethyl acetate was used as negative control.
For antifungal activities, disc diffusion assay was performed against Saccharomyces cerevisiae BY4742.
2.3 Optimization of culture condition All three parameters pH, percentage of
nitrogen source and magnesium sulfate were selected to verify the optimal condition for high antimicrobial activity. The parameters were varied at 0.5, 1.0 and 1% of peptone; 0.1, 0.5 and 0.9% of magnesium sulfate and at pH 5, 6 and 7.
The fungal endophyte was incubated in 75 ml of culture broth. Each culture broth was extracted using the extraction method as explained in 2.1.
2.4 Thin layer chromatography (TLC) Approximately 10 μl of fungal extract was
loaded on silica plate. The silica plate was then put into a chamber which has combination of solvents as mobile phase, and separation was observed under UV light at 365 nm. The combination of solvent was use 10% of methanol in dichloromethane. Results and Discussion
3.1 Antimicrobial activity of fungal extracts
Fungal endphyphytes P55-013 and P29-005 which showed antimicrobial activity in screening of fungal extracts against various microorganisms were selected for this analysis.
From disc diffusion assay with S. cerevisiae BY4742 and seven strains of bacteria for antimicrobial activity, crude extracts from P29-005 and P55-013 showed antifungal activity against S. cerevisiae BY4742, with inhibition zones of 18 mm and 23 mm, respectively. Moreover, extract from P55-013 also showed antibacterial activity against gram positive bacteria including S. aureus ATCC 25923, methicillin-resistant Staphylococcus aureus (MRSA) -1302 and MRSA-2. Extract from P55-013 was analyzed by TLC, six bands were observed. When overlaid with bacterial cells, clear zone was observed covering band with an Rf value of 0.4.
3.2 Optimization of culture condition for P55-013
The parameters in culture condition selected including pH, percentage of nitrogen source and percentage magnesium sulfate. Antibacterial activity from each condition was determined against as S. aureus as ratio of clear zone of that condition to clear zone of normal condition. At 1% peptone and o.5% magnesium sulfate, ratios of clear zone diameter were 1.11, 1.13 and 0.94 for pH 5, 6 and 7, respectively. At 1% peptone and pH 6, ratios of clear zone diameter were 1.13, 1.13 and 1.11 for 0.1%, 0.5% and 0.9% magnesium sulfate, respectively. At pH 6 and 0.5% MgSO4, ratios of clear zone diameter were 1.0, 1.13 and 1.38 for 0.5%, 1.0% and 1.5% peptone, respectively. From these results, only % nitrogen source (peptone) shows effect on antibacterial activity of crude extract at these particular conditions, further confirmation of appropriate condition is being performed. References 1. Hoffman AM, Mayer SG, Strobel GA, Hess
WM, Sovocool GW, Grange AH, Harper JK, Arif AM, Grant DM, Kelley-Swift EG. Purification, identification and activity of phomodione, a furandione from an endophytic Phoma species. Phytochemistry. 2008;69: 1049–1056
2. Saikkonen, K. Forest structure and fungal endophytes. Fungal Biology Reviews. 2007;21(2-3): 67-74.
3. Strobel, GA. Endophytes as sources of bioactive products. Microbes and Infection. 2003;5(6): 535-544.
The 23rd Annual Meeting of the Thai Society for Biotechnology “Systems Biotechnology: Quality & Success”
P-II-15
- 122 -
Effects of culture media on production of antimicrobial compound from fungal endophyte
Suwaporn Thongcharoen, Thunyarat Pongtharangkul, Watanalai Panbangred, Chuenchit Boonchird, Thipa Asvarak Department of Biotechnology, Faculty of Science, Mahidol University, Rama VI Rd, Bangkok 10400, Thailand.
Abstract The aim of this research was to optimize culture conditions of the endophytic fungus P51-026. This fungal strain, previously isolated from Balakata baccata, exhibited antimicrobial activity. Crude extracts were assayed for antibacterial activity against Escherichia coli ATCC 25922, Staphylococcus aureus ATCC 25922, Pseudomonas aeruginosa, Actinobacter sp., E. coli, methicillin resistant Staphylococcus aureus (MRSA)-1302 and MRSA-2. The Crude extract exhibited activity against gram positive bacteria including S. aureus ATCC 25923, MRSA - 1302 and MRSA- 2. To determine effects of culture medium on production of bioactive compounds, carbon sources and nitrogen sources were varied to obtain the highest antibacterial activity. Result showed glucose and peptone were the best components for gaining the highest antimicrobial activity. Fungal extract was analyzed by thin layer chromatography (TLC). Further optimization is being performed to obtain suitable condition for production of antimicrobial compounds. Keywords: endophytic fungus, bioactive compound Introduction
Bioactive compounds from nature are a
great source of interest for discovery of novel antibiotics against emerging drug-resistant pathogens. The most common antibacterial resistant microbe includes species of Staphylococcus, Mycobacterium and Streptococcus and opportunistic pathogens such as species of Candida and Cryptococcus (1). In addition to antimicrobial activity against human pathogens, several fungal metabolites were useful as pesticides and food preservatives (2).
Endophytic fungi refer to microorganisms that can colonize plant tissues without causing disease (2). Several species produce useful metabolites for their host plant. Bioactive metabolites from endophytes have been studied for activity against bacteria, fungi and other plant pathogens. For examples, extracts from endophytic fungi Aspergillus sp. and Pestalotiopsis sp. can inhibit both bacteria and fungi, including Bacillus subtilis, Escherichia coli, Staphylococcus aureus, Candida albicans and Saccharomyces cerevisiae (2). In this study, crude extract from endophytic fungal isolate P51-026 was analyzed for antimicrobial activity. Optimization of appropriate culture condition for the highest antibacterial activity was also performed.
Materials and methods
2.1 Culture condition and Extraction The fungus was grown on Malt Extract
Agar medium and incubated at 30°C for 7-10 days. Then, mycelia plugs was inoculated in 300 ml of Glucose Peptone Broth (GPB), and incubated at 30ºC for 21 days. Culture broth was filtered and evaporated to reach volume of 300 ml and extracted with ethyl acetate. Saturated sodium chloride (NaCl) and sodium sulfate (Na2SO4) were added to the extract. The extract was evaporated using a rotary evaporator to the final volume of 3 ml. 2.2 Assay for antibacterial activity
Disc diffusion method was modified from Cavalieri SJR et al (3). Twenty µl of crude extract was loaded on a 6 mm sterile disc and ethyl acetate was used as a negative control. Clear zone was observed after 16-18 hr incubation at 37°C. 2.3 Analysis of crude extract
Approximately 10-20 µl of crude extract was spot on TLC plate, then placed in chamber with organic solvent. Patterns were observed under UV light at wavelength 254 nm. Ten ml of soft agar (broth+0.8% agar) containing suspension of bacterial cells was overlaid on the TLC plate. Result was observed after 18-24 hr incubation at 37°C.

The 23rd Annual Meeting of the Thai Society for Biotechnology “Systems Biotechnology: Quality & Success”
P-II-15
- 123 -
2.4 Optimization of nutritional factor in the culture media for antimicrobial activity
Glucose, fructose and xylose were used as carbon sources and ammonium sulfate, ammonium nitrate and peptone were used as nitrogen sources during optimization. Mycelial plugs were inoculated in 75 ml of GPB with varied carbon or nitrogen source. Extract was obtained from each condition, and subjected to antimicrobial activity assay.
Results and discussion
Antibacterial activity of P51-026 extract
The crude extracts from P51-026, identified as Periconia sp., were assayed against bacterial strains. Inhibition zone on bioassay plate against S.aureus, MRSA-1302 and MRSA-2 were 1.2 cm, 1.3 cm and 1.3 cm, respectively. These inhibition zones were still observed at 1:10 and 1:50 dilutions of the crude extracts. Analysis of P51-026 extract
Bioassay using bacterial overlay showed inhibition zone covering area of bands number 4, 5, 6, 7, 8 and 9 against all gram positive bacterial strains (S.aureus, MRSA-1302 and MRSA-2) after incubation at 37°C for 24 hr. Further separation of these bands will be performed to identify active fractions. Effect of glucose and nitrogen sources on antibacterial activity
The effect of culture medium on production of antimicrobial compounds was shown in table 1. Result showed that the best carbon and nitrogen sources for the highest antimicrobial activity at this particular condition were glucose and peptone, respectively. Table 1. Effect of carbon source and nitrogen source on antibacterial activity
Diameter of inhibitory zone (cm)
Media component
S. aureus
MRSA -
1302
MRSA-
2 Glucose 1.0 1.0 1.0 Fructose 0.6 0.6 0.7 Xylose 0.8 0.8 0.8 Peptone 0.9 0.9 1.0 NH4NO3 0.7 0.7 0.7 NH4SO4 0.8 0.8 0.8
Several reports suggested that carbon and nitrogen sources play important roles in metabolic pathway and sporulation of various fungal species (4). Variation of media components, especially carbon and nitrogen sources, may effect production of fungal metabolites. For example, glucose and peptone were reported as the best components for a metabolite production in Phoma sp. (4). In this study, P51-026 also exhibited level of antibacterial activity depending on different carbon and nitrogen sources at this specific amount and condition. Further optimization of culture condition including other parameters is being performed for the highest antimicrobial activity. References 1. Gary S., Bryn D. Bioprospecting for
Microbial Endophytes and Their Natural Products. Microbiol Mol Biol Rev. 2003; 67(4): 491–502.
2. Mariana RP, Gustavo M, Ana PD. Review Article: The Use of Endophytes to Obtain Bioactive Compounds and Their Application in Biotransformation Process. 2011; doi: 10.4061/2011/576286: 11pages.
3. Cavalieri SJ,Rankin ID, Harbeck RJ, Sautter RL, McCarter YS, Sharp SE, Ortez JH, and Spiegel CA. Manual of antimicrobial susceptibility testing. American Society for Microbiology, Washinton, DC; 2005
4. Roberto P, David A, Naresh M. Medium optimization for the production of the secondary metabolite Squalestatin S1 by a Phoma sp. combining orthogonal design and Response surface methodology. 2005; 37(2005): 704-11.
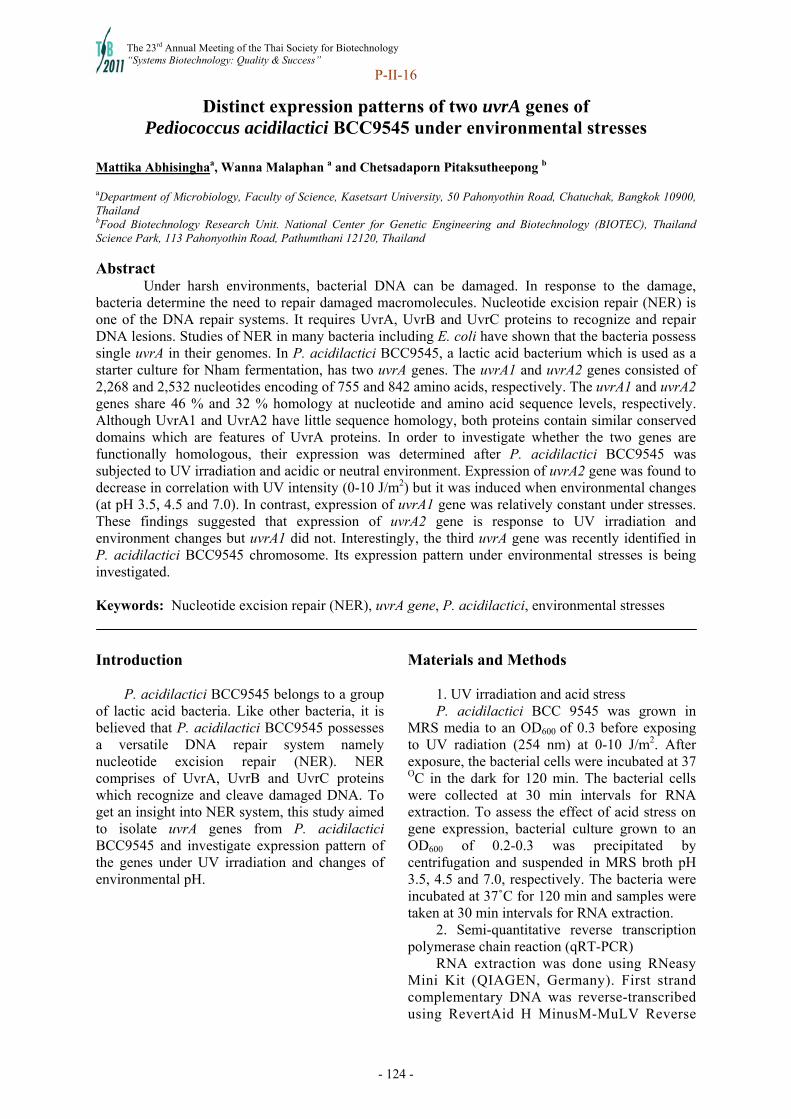
The 23rd Annual Meeting of the Thai Society for Biotechnology “Systems Biotechnology: Quality & Success”
P-II-16
- 124 -
Distinct expression patterns of two uvrA genes of Pediococcus acidilactici BCC9545 under environmental stresses
Mattika Abhisinghaa, Wanna Malaphan a and Chetsadaporn Pitaksutheepong b aDepartment of Microbiology, Faculty of Science, Kasetsart University, 50 Pahonyothin Road, Chatuchak, Bangkok 10900, Thailand bFood Biotechnology Research Unit. National Center for Genetic Engineering and Biotechnology (BIOTEC), Thailand Science Park, 113 Pahonyothin Road, Pathumthani 12120, Thailand
Abstract Under harsh environments, bacterial DNA can be damaged. In response to the damage, bacteria determine the need to repair damaged macromolecules. Nucleotide excision repair (NER) is one of the DNA repair systems. It requires UvrA, UvrB and UvrC proteins to recognize and repair DNA lesions. Studies of NER in many bacteria including E. coli have shown that the bacteria possess single uvrA in their genomes. In P. acidilactici BCC9545, a lactic acid bacterium which is used as a starter culture for Nham fermentation, has two uvrA genes. The uvrA1 and uvrA2 genes consisted of 2,268 and 2,532 nucleotides encoding of 755 and 842 amino acids, respectively. The uvrA1 and uvrA2 genes share 46 % and 32 % homology at nucleotide and amino acid sequence levels, respectively. Although UvrA1 and UvrA2 have little sequence homology, both proteins contain similar conserved domains which are features of UvrA proteins. In order to investigate whether the two genes are functionally homologous, their expression was determined after P. acidilactici BCC9545 was subjected to UV irradiation and acidic or neutral environment. Expression of uvrA2 gene was found to decrease in correlation with UV intensity (0-10 J/m2) but it was induced when environmental changes (at pH 3.5, 4.5 and 7.0). In contrast, expression of uvrA1 gene was relatively constant under stresses. These findings suggested that expression of uvrA2 gene is response to UV irradiation and environment changes but uvrA1 did not. Interestingly, the third uvrA gene was recently identified in P. acidilactici BCC9545 chromosome. Its expression pattern under environmental stresses is being investigated. Keywords: Nucleotide excision repair (NER), uvrA gene, P. acidilactici, environmental stresses Introduction
P. acidilactici BCC9545 belongs to a group
of lactic acid bacteria. Like other bacteria, it is believed that P. acidilactici BCC9545 possesses a versatile DNA repair system namely nucleotide excision repair (NER). NER comprises of UvrA, UvrB and UvrC proteins which recognize and cleave damaged DNA. To get an insight into NER system, this study aimed to isolate uvrA genes from P. acidilactici BCC9545 and investigate expression pattern of the genes under UV irradiation and changes of environmental pH.
Materials and Methods 1. UV irradiation and acid stress P. acidilactici BCC 9545 was grown in
MRS media to an OD600 of 0.3 before exposing to UV radiation (254 nm) at 0-10 J/m2. After exposure, the bacterial cells were incubated at 37 OC in the dark for 120 min. The bacterial cells were collected at 30 min intervals for RNA extraction. To assess the effect of acid stress on gene expression, bacterial culture grown to an OD600 of 0.2-0.3 was precipitated by centrifugation and suspended in MRS broth pH 3.5, 4.5 and 7.0, respectively. The bacteria were incubated at 37˚C for 120 min and samples were taken at 30 min intervals for RNA extraction.
2. Semi-quantitative reverse transcription polymerase chain reaction (qRT-PCR)
RNA extraction was done using RNeasy Mini Kit (QIAGEN, Germany). First strand complementary DNA was reverse-transcribed using RevertAid H MinusM-MuLV Reverse
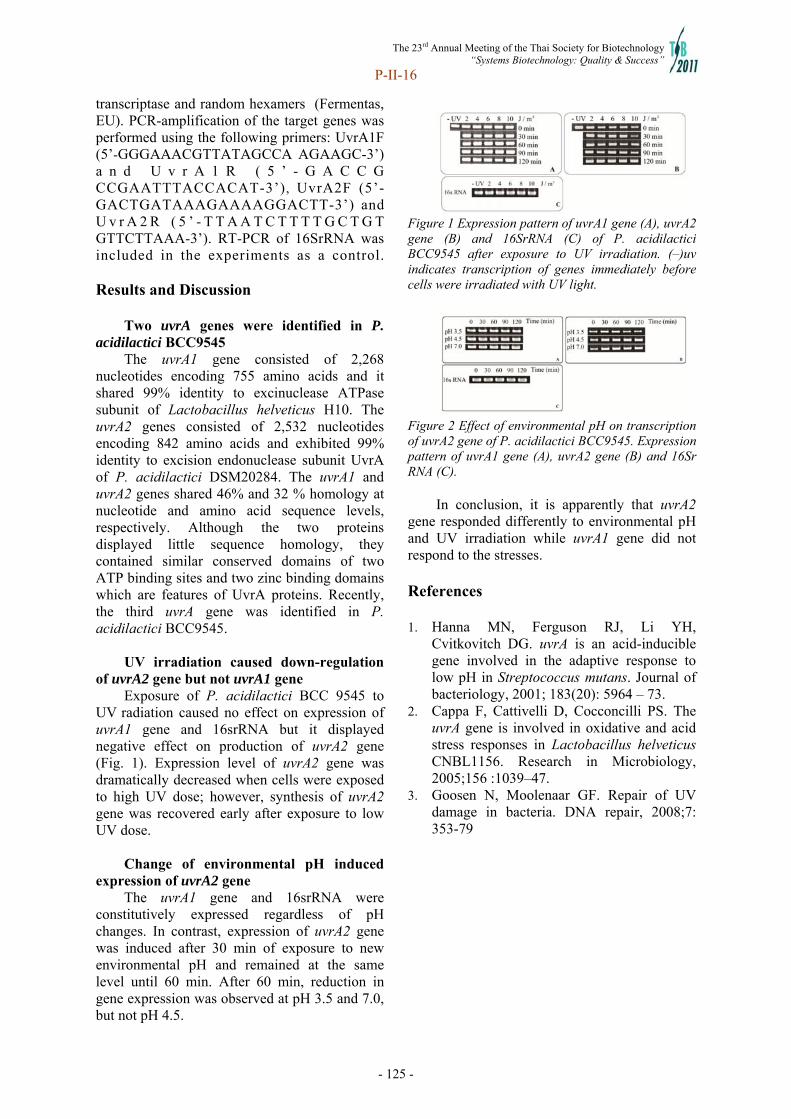
The 23rd Annual Meeting of the Thai Society for Biotechnology “Systems Biotechnology: Quality & Success”
P-II-16
- 125 -
transcriptase and random hexamers (Fermentas, EU). PCR-amplification of the target genes was performed using the following primers: UvrA1F (5’-GGGAAACGTTATAGCCA AGAAGC-3’) a n d U v r A 1 R ( 5 ’ - G A C C G CCGAATTTACCACAT-3’), UvrA2F (5’-GACTGATAAAGAAAAGGACTT-3’) and U v r A 2 R ( 5 ’ - T T A A T C T T T T G C T G T GTTCTTAAA-3’). RT-PCR of 16SrRNA was included in the experiments as a control.
Results and Discussion
Two uvrA genes were identified in P.
acidilactici BCC9545 The uvrA1 gene consisted of 2,268
nucleotides encoding 755 amino acids and it shared 99% identity to excinuclease ATPase subunit of Lactobacillus helveticus H10. The uvrA2 genes consisted of 2,532 nucleotides encoding 842 amino acids and exhibited 99% identity to excision endonuclease subunit UvrA of P. acidilactici DSM20284. The uvrA1 and uvrA2 genes shared 46% and 32 % homology at nucleotide and amino acid sequence levels, respectively. Although the two proteins displayed little sequence homology, they contained similar conserved domains of two ATP binding sites and two zinc binding domains which are features of UvrA proteins. Recently, the third uvrA gene was identified in P. acidilactici BCC9545.
UV irradiation caused down-regulation
of uvrA2 gene but not uvrA1 gene Exposure of P. acidilactici BCC 9545 to
UV radiation caused no effect on expression of uvrA1 gene and 16srRNA but it displayed negative effect on production of uvrA2 gene (Fig. 1). Expression level of uvrA2 gene was dramatically decreased when cells were exposed to high UV dose; however, synthesis of uvrA2 gene was recovered early after exposure to low UV dose.
Change of environmental pH induced
expression of uvrA2 gene The uvrA1 gene and 16srRNA were
constitutively expressed regardless of pH changes. In contrast, expression of uvrA2 gene was induced after 30 min of exposure to new environmental pH and remained at the same level until 60 min. After 60 min, reduction in gene expression was observed at pH 3.5 and 7.0, but not pH 4.5.
Figure 1 Expression pattern of uvrA1 gene (A), uvrA2 gene (B) and 16SrRNA (C) of P. acidilactici BCC9545 after exposure to UV irradiation. (–)uv indicates transcription of genes immediately before cells were irradiated with UV light.
Figure 2 Effect of environmental pH on transcription of uvrA2 gene of P. acidilactici BCC9545. Expression pattern of uvrA1 gene (A), uvrA2 gene (B) and 16Sr RNA (C).
In conclusion, it is apparently that uvrA2
gene responded differently to environmental pH and UV irradiation while uvrA1 gene did not respond to the stresses. References 1. Hanna MN, Ferguson RJ, Li YH,
Cvitkovitch DG. uvrA is an acid-inducible gene involved in the adaptive response to low pH in Streptococcus mutans. Journal of bacteriology, 2001; 183(20): 5964 – 73.
2. Cappa F, Cattivelli D, Cocconcilli PS. The uvrA gene is involved in oxidative and acid stress responses in Lactobacillus helveticus CNBL1156. Research in Microbiology, 2005;156 :1039–47.
3. Goosen N, Moolenaar GF. Repair of UV damage in bacteria. DNA repair, 2008;7: 353-79
The 23rd Annual Meeting of the Thai Society for Biotechnology “Systems Biotechnology: Quality & Success”
P-II-21
- 126 -
Effect of yeast extract content on bacteriocinogenic activity from Weissella confusa CP3-1
Apakorn Saieaha, Savitri Vatanyoopaisarna and Suriya Rutatipa aDepartment of Agro-Industrial Technology, Faculty of Applied Science, King Mongkut’s University of Technology North Bangkok, 1518 Piboonsongkram road, Bangsue 10800, Thailand
Abstract Thai fermented meat products were one of the sources that thousands of lactic acid bacterial strains have been isolated. From our previous work, Weissella confusa CP3-1 was isolated from a Thai fermented sausage. It produced bacteriocin-like activity against two foodborne pathogens i.e. Bacillus cereus and Staphylococcus aureus. The tryptic soy broth (TSB) was found to be a suitable medium to produce a bacteriocin from the CP3-1 strain. In this study the percentage of yeast extract was optimized to determine the duration of growth that provided the highest bacteriocinogenic activity. Weissella confusa CP3-1 was grown in TSB supplemented with various percentages of yeast extract from 0.5–5%. The broth samples were collected, and the filtrates were tested for inhibitory activity against B. cereus and S. aureus. The result showed that the filtrate of 2% yeast extract after 24 h of growth gave the highest inhibition against B. cereus at 1.04 ± 0.06 BU/ml. However, the filtrate with 5% yeast extract after 24h of growth displayed the highest inhibition against S. aureus at 4.46 ± 0.17 BU/ml while the filtrate with 1% yeast extract after 24h of growth showed 3.92 ± 0.19 BU/ml, the filtrates of 3 and 4% yeast extract the inhibition activity were low when tested against both B. cereus and S. aureus. (<0.5 BU/ml).
Keywords: Lactic acid bacteria, Bacteriocin, Weissella confusa, Partial purification
Introduction and Objective Bacteriocins have well recognized in their
potential use as bio-preservation to extended shelf life of foods. The protein-composing structure is readily to be inactivated by digestion with a proteolytic enzyme [4]. At the present time, nisin, which produced by Lactococcus lactis, is the only bacteriocin permitted to use for commercial preservative, although there are more bacteriocins that have been discovered over the past decade. The production of bacteriocins is influenced by media components such as nitrogen sources, growth factor, inorganic salt, and limited carbon source [6]. The optimum culture conditions are also important; for example, temperature at 37ºC and pH range 4.5-5.5 were reported to enhance the bacteriocin productivity of Pedioccocus acidilactici 13 [1]. From our previous work, Weissella confusa CP3-1 isolated from a Thai fermented sausage exhibited high bacteriocin-like activity when grown in TSB medium [5]. Therefore, in this study, the percentage of yeast extract was to be optimized to determine the duration of growth that provided the highest bacteriocinogenic activity.
Materials and Methods 2.1 Media and culture condition W. confusa CP3-1 was cultured in tryptic
soy broth (TSB) supplemented with various
percentages of yeast extract from 0.5–5%. The flasks were incubated at 37 ºC for 48 h in 5% CO2 incubator. Samples were collected at 6-h intervals up to 48 h, and then cell density and pH were measured. Staphylococcus aureus TISTR 029 and Bacillus cereus TISTR 037 were used as test organisms, which were subcultured on nutrient agar (NA) before use.
2.2 Bacteriocin assay The cultured broth samples were filtered
through a cellulose acetate membrane (pore size = 0.45 m). The filtrate was tested for bacteriocinogenic activity using the method of Hongeak et al. (2009) [5]. The bacteriocinogenic activity was calculated as bacteriocin unit, of which 1 BU is defined as a 50% inhibition of test organism as compared to the control. Results and discussion
Addition of yeast extract provided higher growth to W. confusa CP3-1 than the TSB alone. Although at the first 10 h the bacterium grew well in low percentage of yeast extract, at the 15 h the higher the percentage of yeast extract the better growth occurred (Fig. 1). This could be due to larger quantity of free amino acids and short peptides [3]. After 48 h of incubation, the initial pH of TSB (approximately 7) was slightly decreased to 6.85. The amount of yeast extract

The 23rd Annual Meeting of the Thai Society for Biotechnology “Systems Biotechnology: Quality & Success”
P-II-21
- 127 -
added also affected the dropping of pH (Fig. 2); however the final pH were still in neutral range.
Figure 1 The growth of W. confusa CP3-1 with various percentages of yeast extract at 37ºC,
anaerobic condition
Figure 2 .pH changes during growth of W. confusa
CP3-1 in TSB at different percentages of yeast extract
Bacteriocin production is growth-associated during mid-exponential phase to reach a maximum level at the end of the exponential phase or the beginning of the early-stationary phase [3]. The results of bacteriocin production in table 1 show that the highest inhibition against B. cereus at 1.04 ± 0.06 BU/ml was found in the filtrate of 2% yeast extract after 24 h, whereas the highest inhibition against S. aureus was found in the filtrate of 5% yeast extract after 24 h at 4.46± 0.17 BU/ml and followed by at 3.92± 0.19 BU/ml in 1% yeast extract after 24 h. With the filtrates of 3 and 4% yeast extract, the inhibition activities were low (<0.5 BU/ml) (data not shown). According to Li et. al. (2002), 1% yeast extract was their optimum nutrient for bacteriocin production by Lactococcus lactis [6].
Table 1.Effect of yeast extract concentration on bacteriocin activity (BU/ml) of B. cereus
Time(h) 0.5%YE 1%YE 2%YE 5%YE 6 0 0 0 0
12 0 0 0 0 18 0 0 0 0 24 0 0 1.04 0 30 36
0 0
0.78 0.40
0.57 0.58
0 0
Table 2.Effect of yeast extract concentration on bacteriocin activity (BU/ml) of S. aureus
Time(h) 0.5%YE 1%YE 2%YE 5%YE 6 0 0 0.75 0
12 0 1.01 2.96 0 18 3.56 1.81 2.07 3.26 24 2.73 3.92 1.54 4.46 30 36
3.64 3.53
2.15 1.68
0.55 1.73
3.57 3.44
Although high amount of yeast extract (5%) provided the highest bacteriocin activity, the high content of organic nitrogen source in such medium may cause difficulty in bacteriocin purification. Lowering the amount of organic nitrogen source is advantageous for bacteriocin purification as well as for minimizing the production cost. Partial separation of the crude filtrate by Millipore Pellicore XL Filter membrane showed that B. cereus was inhibited by the filtrate of >10 kDa, whereas S. aureus was inhibited by the filtrate of <5 kDa. In further study, cell free supernatant will be purified, and the exact molecular mass and amino acid sequences of this bacteriocin will be determined.
References 1. Altuntas G. E., Cosansu S. and Ayhan K. Some
growth parameters and antimicrobial activity of a bacteriocin-producing strain Pediococcus acidilactici 13. International Journal of Food Microbiology. 2010;141: 28-31.
2. Anthony T., Rajesh T., Kayalvizhi N. and Gunasekaran P. Influence of medium components and fermentation conditions on the production of bacteriocin(s) by Bacillus licheniformis AnBa9. Bioresource Technology. 2009;100: 872-877.
3. Cheigh I. C., Choi J. H., Park H., Kim B. S., Kook C. M., Kim S. T., Hwang K. J. and Pyun R. Y. Influence of growth conditions on the production of a nisin-like bacteriocin by Lactococcus lactis subsp. Lactis A164 isolated from kimchi. Journal of Biotechnology. 2002;95: 225-235.
4. Deegan L. H., Cotter P. D., Hill C. and Ross P. Bacteriocin: biological tools for bio-preservation and shelf-life extension. International Dairy Journal. 2006; 16: 1058-1071.
5. Hongeak S., Vatanyoopaisarn, S., Phalakornkule, C. Cell growth and bacteriocinogenic activity of Pediococcus acidilactici CP 7-3 and Weissella confusa CP3-1 under different culture media. The Proceeding of 47th Kasetsart University Annual Conference on Agricultural Science Leading Thailand: Food and Alternative Energy for Sustainable Balance. Vol. 8 Subject: Agro-Industry. 2009; pp. 620 – 629. (in Thai)
6. Li C., Bai J., Cai Z. and Ouyang F. Optimization of a cultural medium for bacteriocin production by Lactococcus lactis using response surface methodology. Journal of Biotechnology. 2002;93: 27-34.
The 23rd Annual Meeting of the Thai Society for Biotechnology “Systems Biotechnology: Quality & Success”
P-II-22
- 128 -
Isolation of microorganisms from biodiesel and diesel oils and preliminary study of their growth in fuel
Tavinvong Kuhakongkeat1 , Savitri Vatanyoopaisarn2
1Department of Agro-Industrial Technology, Faculty of Applied Science, King Mongkut’s University of Technology North Bangkok (KMUTNB), 1518 Pibulsongkram Road, Bangsue, Bangkok 10800, Thailand
Abstract
Isolation of microorganisms in biodiesel and diesel oils was carried out from 11 petrol stations in Bangkok. The collected fuels were filtered through cellulose acetate membranes (pore diameter = 0.45 µm). The membranes were then placed on nutrient agar and acidified yeast-malt agar in order to isolate bacteria and fungi, respectively. Thirty isolates of bacteria and 39 isolates of molds were found from biodiesel oil samples, whereas 8 isolates of bacteria and 7 isolates of molds were detected from diesel fuels. All isolates were grown in the Bushnell-Hash medium mixed with filtered-sterile biodiesel oil (1:2) for 28 days. The results showed that most bacterial isolates were less likely to grow in such conditions. Whilst all fungal isolates exhibited observable films of mycelia between the oil-liquid interface, the mycelia of some isolates also appeared in the oil layer. The measurement of cell mass showed that isolated-mold Mp3-3 gave the highest weight of 0.4703g, followed by Mp3-2 and Mb3-3, which had cell weight, of 0.4342 g and 0.3405 g, respectively. Morphological characters under microscope displayed that most molds were acoenocytic fungi and produced conidia as asexual spore. Further study will focus firstly on biofilm formation on the fuel filter since it might directly affect the vehicle and its part replacement and secondly on the diversity of microorganisms that are distributed in the petrol station in Bangkok.
Keywords: biodiesel oil, diesel oil, microorganism in fuel Introduction and Objective
Biodiesel oil is a renewable energy and
expected to replace petroleum oil in the future. In Thailand biodiesel oil is the mixture of petroleum and used vegetable oil / palm oil. There have been few report on contamination of microorganisms in diesel oil (Bento & gaylarde, 2001) and hydrocarbon fuels (Gaylarde et al., 1999). As the temperature and environment that can support the growth of microorganisms are different between tropical and temperate countries, therefore the objective of this work was to investigate the diversity of microorganisms contaminated in the biodiesel and diesel oils in Thailand and to find the growth and effects of those microorganisms in biodiesel oil.
Materials and Methods 2.1 Isolation of microorganisms
contaminated in biodiesel and diesel oils Biodiesel oil (B5) and diesel oil were
collected from 11 petrol stations around suburb of Bangkok and Nonthaburee provinces. Bacteria and fungi were isolated according to the method of Bento & Gaylarde (2001).
2.2 Study of microbial growth in biodiesel oil
Each pure isolate was placed in a screw-cap bottle filled with 300 ml of the liquid/ oil system of Bushnell-Hass broth (Difco) and filtered sterilized biodeisel oil (1:2 ratio). All screw cap bottles was incubated at 35C for 4 weeks. To quantitatively compare the growth,dry weights of each fungal isolate were measured, while a plate count technique on plate count agar was performed for each bacterial isolate . (The method was modified from Bento, 2001.)

The 23rd Annual Meeting of the Thai Society for Biotechnology “Systems Biotechnology: Quality & Success”
P-II-22
- 129 -
Results .
Table 1.Number of microorganisms isolated from biodiesel and diesel oils
Biodiesel oil
samples Bacteria Mold Total 1 B1 3 4 7 2 B2 5 2 7 3 B3 0 6 6 4 S1 4 4 8 5 S2 4 2 6 6 S3 3 2 5 7 P1 0 5 5 8 P2 3 6 9 9 P3 3 4 7 10 N1 2 1 3 11 E1 3 3 6 total 30 39 69
Diesel oil samples Bacteria Mold total
1 S1 2 1 3 2 E1 3 3 6 3 P2 3 3 6 total 8 7 15
(B=Bangjak station, S=Shell station , P=PTT station , N=Pitronas station , E=Esso station)
Thirty isolates of bacteria and 39 isolates of mold
were found from 11 biodiesel samples. In addition 8 bacterial isolates and 7 fungal isolates were detected in 3 diesel samples (Table 1). However colony morphologies of mold isolated from the same petrol station between biodiesel and diesel were different.
Table2. Cell dry weights of 39 filamentous fungi isolates grown in liquid / oil system for28 days
(a) (b)
(c) (d) Figure (a) Growth of mold in oil/ aqueous system (b) Sample of the mycelia that grew in oil layer (c) Microscopic image of isolate P3-3 (d) Colony appearance of isolate P3-3 on yeast-malt agar
All isolates were tested for their ability to grow
in biodiesel oil. While bacterial isolates seemed to grow poorly or no growth, mold isolates were readily to grow, and the isolates P3 showed the highest biomass in 28 days (Table 2).
Discussion Bacteria and molds were found in all biodiesel
and diesel samples. Microscopic observation of fungal mycelia and spores revealed that most fungi had septate hyphae and most of asexual spores were similar to the spores of the genus Aspergillus. Only 3 isolates were coenocytic fungi similar to Mucor spp. These fungi are also inhabitants in soil, which possibly be related to where the fuel has been stored in underground tanks. Gaylarde et. al. (1999) reviewed that 17 genus of bacteria and 31 genus of filamentous fungi can be isolated from stored hydrocarbon fuels, and the Aspergillus and Mucor were among those reported. In this work, all fungal isolates could grow in biodiesel oil/ broth interface. Furthermore some mycelia proliferated into the oil phase. Thus these molds might become potential biodeterioration of the fuels during storage in the oil reservoir as well as in the vehicle engine later on.
References 1. Bento, F.M. and Gaylarde, C.C. Biodeterioration of
stored diesel oil: studies in Brazil. International Biodeterioration & Biodegradation. 2001,47:107-112.
2. Gaylarde, C.C., Bento, F. M. and Kelley, J. Microbial contamination of stored hydrocarbon fuels and its controls. Revista de Microbiologia 1999, 30: 1-10.
3. Klofutar, B. and Golob, J. Microorganisms in diesel and in biodiesel fuels. Acta Chim. Slov., 2007, 54:744-748.
Isolate No.
Dry weight
(g) Isolates
No.
Dry weight
(g) Isolates
No.
Dry weight
(g)
1. B1-1 0.2317 14. S1-2 0.2021 27. P1-4 0.0949
2. B1-2 0.226 15. S1-3 0.1879 28. P1-5 0.1832
3. B1-3 0.2207 16. S1-4 0.1756 29. P2-1 0.2422
4. B1-4 0.3272 17. S2-1 0.0531 30. P2-2 0.217
5. B2-1 0.2339 18. S2-2 0.133 31. P2-3 0.3195
6. B2-2 0.3082 19. S3-1 0.1121 32. P2-4 0.3066
7. B3-1 0.2641 20. S3-2 0.1121 33. P2-5 0.2946
8. B3-2 0.2764 21. E1-1 0.1757 34. P2-6 0.2798
9. B3-3 0.3405 22. E1-2 0.1034 35. P3-1 0.167
10. B3-4 0.2727 23. E1-3 0.198 36. P3-2 0.4342
11. B3-5 0.2565 24. P1-1 0.1983 37. P3-3 0.4703
12. B3-6 0.2818 25. P1-2 0.043 38. P3-4 0.3169
13. S1-1 0.2791 26. P1-3 0.1029 39. N1-1 0.3361

The 23rd Annual Meeting of the Thai Society for Biotechnology “Systems Biotechnology: Quality & Success”
P-II-24
- 130 -
Screening of xylose-utilizing oleaginous yeasts for lipid production Worawat Surarit a, b, Poranpan Thaicharoen a, Sasitorn Jindamorakot c, Ruthada Chanklan a aDepartment of Biotechnology, Faculty of Science and Technology, Thammasat University, Pahonyothin Rd, Pathumthani 12120, Thailand. bDepartment of Biochemistry and Biomolecule, Faculty of Medicine, Thammasat University, Pahonyothin Rd, Pathumthani 12120, Thailand. cNational Center for Genetic Engineering and Biotechnology (BIOTEC), National Science and Technology Development Agency, Thailand Science Park, 113 Pahonyothin Road, Pathumthani 12120, Thailand
Abstract Xylose-utilizing yeasts were isolated from the samples collected from the Nature Education Center for Mangrove Conservation and Ecotourism in Chonburi by enrichment technique on YMxylose broth. The oleaginous yeasts were screened by cultivation of the isolated yeast strains on 150 ml of a modified minimal medium depleted nitrogen and contained 4.0 and 7.0% (w/v) xylose as a sole source of carbon, 0.1% yeast extract, 0.1% (NH4)2SO4, 0.05% MgSO4.7H2O, 0.1% KH2PO4, pH 5.0 in 500 ml Erlenmeyer flask, with 1.0 optical density at 600 nm for initial cell concentration on 200 rpm rotary shaker at room temperature for 72 h. Yeast isolate BF0206 was identified based on analysis of D1/D2 domain of 26S rDNA as a known species in ascomycetous yeast, Aureobasidium pullulan, which had been reported as oleaginous yeast. It accumulated the highest amount of total lipids in its cells at 32.11 and 40.41% DCM, when cultivated in the lipid production medium containing 4 and 7% xylose, respectively. Fatty acid methyl esters (FAMEs) analysis by gas chromatography revealed that oleic acid, palmitic acid, and linolenic acid are major constituents of the fatty acids in its cells. Therefore, the oleaginous yeast could be a potential source for alternative oil feed stock for biodiesel production.
Keywords: oleaginous yeast, xylose-utilizing, Aureobasidium pullulan, biodiesel Introduction
Biodiesel is a useful alternative energy resource and may be used as a substitute for petroleum-based diesel. It is generated by transesterification reaction of triacylglycerol with methanol. Microorganisms that can accumulate lipids at more than 20% of their biomass are defined as oleaginous species (Ratledge, 2001). Some yeast strains, such as Rhodotorula sp. and Rhodosporidium sp. can accumulate intracellular lipids as high as 70 % of their biomass dry weight. The majority of those lipids are triacylglycerol (TAG) containing long-chain fatty acids that are comparable to conventional vegetable oils. Basic physiology of lipid accumulation in oleaginous yeast shows that nitrogen-limiting conditions and the salt concentration strongly could influence on the fatty acid compositions (Rose and Harrison, 1971). D-xylose is one of the main derivatives in lignocellulose hydrolysates that distributes
widely in agricultural waste. If biodiesel could be produced from D-xylose, both environment and economy would be benefited. This study was isolation of xylose-utilizing oleaginous yeasts from the natural samples collected from mangrove forest at the Nature Education Center for Mangrove Conservation and Ecotourism in Chonburi. This study could lay the foundation for the industrial application of biodiesel.
Materials and Methods 1. Isolation of xylose-utilizing yeasts
Xylose-utilizing yeasts were isolated from samples collected from the Nature Education Center for Mangrove Conservation and Ecotourism in Chonburi by enrichment technique on 7 ml YMxylose broth, which contained 1% xylose, 0.3 % yeast extract, 0.3 % malt extract, 0.5 % peptone, 2 % NaCl, 0.2 % propionic acid sodium salt, and 0.2 % chloramphenical, under ambient temperature for 24-48 h. Single colony of isolated yeast stains were re-streaked 2-3 times on YMxylose agar plate until the pure culture was obtained. 2. Screening of oleaginous yeasts

The 23rd Annual Meeting of the Thai Society for Biotechnology “Systems Biotechnology: Quality & Success”
P-II-24
- 131 -
The xylose-utilizing yeasts were screened for lipid accumulation by cultivated on a nitrogen-limited medium by the following procedures. Seed cultures were prepared in YPD broth for 24 h and then transferred into a 250-ml Erlenmeyer flask containing 50 ml minimal medium including 2.0 % glucose, 0.1 % yeast extract, 0.1 % (NH4)2SO4, 0.05 % MgSO4.7H2O, 0.1 % KH2PO4, pH 5.0. The culture was incubated on 200 rpm rotary shaker at room temperature for 24 h. Cells were collected and inoculated into a lipid production medium, which was the minimal medium depleted nitrogen and contained 4.0 and 7.0 % (w/v) xylose as a source of carbon to obtain an initial cell concentration at 1.0 optical density at 600 nm. After incubated on 200 rpm rotary shaker at room temperature for 48 and 72 h. cells were collected by centrifugation, and growth was measured by dry mass.
3. Lipid extraction and analysis
Lipid was extracted and direct trans-methylation according to Lepage and Roy (1984). Fatty acid methyl esters (FAMEs) were analyzed by gas chromatography (AutoSystem XL Gas Chromatograph 610N2032002, Perkin Elmer, U.S.A.) with a VertibondTM Wax capillary column (30 m×0.25 mm×0.25 µm). The carrier gas flow rate was 20 ml/min. Oven temperature was held at 205°C. The injector and flame ionization detector (FID) temperatures were 250 and 260 C, respectively. Quantitative analysis was done using heneicosanoic acid (C21:0) as an internal standard.
4. Identification of xylose-utilizing yeasts
The sequence of the D1/D2 domain of the large subunit (26S) ribosomal DNA gene was determined from polymerase chain reaction (PCR) products of genomic DNA. Sequences of degenerate primers for 26S rDNA amplification were based on the sequences reported by Kurtzman and Robnett, 1998 (forward primer, F6: 5’-GCA TAT CAA TAA GCG GAG GAA AAG-3’ and reverse primer, LR3: 5’GGT CCG TGT TTC AAG ACG-3’). PCR amplification of 26S rDNA was carried out for 30 cycles, each of which consisted of template denaturation (1 min at 94 C), primer annealing (1.30 min at 52 C), and polymerization (2.30 min at 72 C). The sequences were compared in pairwise using a BLASTN homology search program (Altschul et al., 1997) and were aligned with the sequences
of related species retrieved from GenBank using the multiple alignment program CLUSTAL_X version 2.0 (Larkin et al., 2007).
Results 1. Isolation and screening of xylose-utilizing yeasts
Xylose-utilizing oleaginous yeasts were obtained by cultivation of 84 isolated yeast strains on modified minimal medium depleted nitrogen and contained 4.0 % (w/v) xylose as source of carbon and incubated on 200 rpm rotary shaker at room temperature for 48 h. BF0206 contained the highest amount of total lipids in its cells, 32.11 % DCM when cultivated in 4 % xylose for 48h. However, other yeast isolates could not produced and accumulated lipids in cells (data not shown). It might be due to inappropriate C/N ratio. Increasing of xylose concentration lead to the increasing of C/N ratio that induced high lipid accumulation of BF0206 cultivated for 72 h (40.41 % DCM). 2. Identification of xylose-utilizing yeast
By using the D1/D2 domain of 26S rDNA analysis, BF0206 was identified as known species in ascomycetous yeast, Aureobasidium pullulan. Besides, BF0904, BF0109, BF0903, and BF0227 were identified as Pichia sp., A. pullulans, Rhodosporidium toruloides, and Candida tropicalis, respectively. Thus, A. pullulan, R. toruloides, and C. tropicalis had been reported as oleaginous yeasts (Ratledge and Tan, 1990).

The 23rd Annual Meeting of the Thai Society for Biotechnology “Systems Biotechnology: Quality & Success”
P-II-24
- 132 -
Table 1. Fatty acid compositions of represent isolated yeast strains cultivated on nitrogen-depleted medium composed of 7.0% xylose for 48h.
* = BF0206 cultivated on nitrogen-depleted medium composed of 7.0% xylose for 72h.
Discussion
Xylose-utilizing yeasts were isolated from
the samples collected from the Nature Education Center for Mangrove Conservation and Ecotourism in Chonburi. Yeast isolate BF0206 contained the highest amount of total lipids in its cells (32.11 and 40.41 % DCM, when cultivated in nitrogen depleted medium containing 4 and 7 % xylose, respectively), but other isolates produced and accumulated lipid less than 20 % by dry weight. It might be due to an altered source of carbon and inappropriate time for lipid accumulation. Gas chromatography analysis revealed that oleic acid, palmitic acid, and linolenic acid are major constituents of fatty acids, which is similar to those found in vegetable oils. By using the D1/D2 domain of 26S rDNA analysis, BF0206 was identified as Aureobasidium pullulan, which had been reported as oleaginous yeast. Microbial lipids from BF0206 might have a potential to be an alternative oil feed stock for biodiesel production.
Acknowledgments
This work was supported by National Center for Genetic Engineering and Biotechnology (BIOTEC) and Thammasart University. Thank to the Nature Education Center for Mangrove Conservation and Ecotourism in Chonburi for samples collection.
References 1. Altschul SF, Madden TL, Schäffer JZ,
Zhang J, Zhang Z, Miller W, Lipman DJ. Gapped BLAST and PSIBLAST: a new generation of protein database search programs. Nucleic Acids Res. 1997(25):3389-3402.
2. Kurtzman CP, Robnett CJ. Identification and phylogeny of ascomycetous yeasts from analysis of nuclear large subunit (26S) ribosomal DNA partial sequences. Antonie van Leeuwenhoek. 1998(73):331–371.
3. Larkin MA, Blackshield G, Brown NP, Chenna R, McGettigan PA, McWilliam H, Valentin F, Wallace IM, Wilm A, Lopez R, Thompson JD, Gibson TJ, Higgins DG. Clustal W and Clustal X version 2.0. Bioinformatics. 2007(23):2947-2948.
4. Lepage G, Roy CC. Improve recovery of fatty acid though direct transesterification without prior extraction of purification. Note on Methodology. 1984(25):1391-1396.
5. Ratledge C, Tan KH. Oils and fats: production, degradation and utilization by yeasts. In Yeast Biotechnology and Biocatalysis ed. Verachtert H. and de Mot R. Marcel Dekker, New York. 1990:223–254.
6. Ratledge C. Regulation of lipid accumulation in oleaginous microorganism. Biochem Soc Trans. 2001(30):1047-1050.
7. Rose AH, Harrison JS. The yeast : Physiology and biochemistry of yeast. Academic Press. London. 1971(2):571.
Relative amount of total fatty acids (%, w/w)
Isolate
Bio
mas
s (g
/L)
Lip
id c
onte
nt (
%)
C16
:0
C16
:1
C18
:0
C18
:1
C18
:2
BF0206 3.85 26.53 38.24 3.26 2.21 42.41 13.87
BF0904 2.08 18.68 15.82 1.24 3.77 66.32 12.84
BF0109 2.17 10.55 29.36 2.80 2.73 37.02 28.09
BF0903 3.32 7.44 14.58 1.19 4.20 67.65 12.38
BF0227 2.64 7.05 11.43 10.04 6.85 44.51 27.17
BF0206* 4.60 40.41 39.84 3.67 1.91 41.30 13.28
The 23rd Annual Meeting of the Thai Society for Biotechnology “Systems Biotechnology: Quality & Success”
P-II-25
- 133 -
Identification of toxin genotypes from Clostridium perfringens isolates in Thailand by multiplex PCR
Chaowaree Adthalungrong,* Chayaporn Samansoranakun, Praveenuch Ngamchom and Siraprapa Krethathorn Department of Microbiology, Faculty of Science, Silpakorn University, Nakhon Pathom 73000, Thailand
Abstract A multiplex PCR protocol for detection of genotype coding for toxins of Clostridium
perfringens, an important pathogenic bacterium, was developed. Published sequences of multiplex PCR primers for C. perfringens toxins genes (cpa, cpb, cpb2, cpe, etx, and iap) were used. The multiplex PCR conditions were optimized and tested with 5 reference strains of C. perfringens. The optimal condition obtained was applied to 182 suspected isolates which were collected from different sources in Nakhon Pathom and Petchaburi provinces, Thailand. From the results, 73 isolates were confirmed as C. perfringens. Among 73 C. perfringens isolates, 47, 24, and 2 isolates were classified into type A, C, and E, respectively. Most of C. perfringens type A were isolated from foods and sewages whereas most of type C isolates were collected from piglet clinical specimens. The 2 type E isolates were from rabbit clinical specimens. The developed protocol can be applied as a tool for simultaneous confirmation and typing of C. perfringens. In addition, it is relatively simple since DNA purification is not necessary. Keywords: Clostridium perfringens, Multiplex PCR, toxin genotyping
Introduction
Clostridium perfringens is a Gram-
positive pathogenic bacterium which is ubiquitous in soil, sewage, water, food, and intestinal tracts of humans and animals. It is an anaerobic and sporulating bacterium which is responsible for gas gangrene, food poisoning, and other diseases. C. perfringens is classified into 5 types (A through E) according to its ability to produce four major toxins (α, β, ε, and ι). Each type causes different particular diseases. Type A and C cause human gastroenteritis and necrotizing enteritis, respectively. Other types are pathogenic in veterinary medicine (Singleton and Sainsbury, 1988). Apart from the four major toxins, enterotoxin and β2-toxin are important as well since they are associated with intestinal disorders in humans and/or animals (Herholz et al., 1999). Therefore, toxin typing of C. perfringens is crucial and the information gained may lead to an establishment of more efficient strategies for the control and prevention of diseases caused by C. perfringens.
Many methodologies for C. perfringens toxin typing have been established. These include the classical mouse neutralization test
(Sterne and Batty, 1975), enzyme-linked immunosorbent assays (Nagahama et al., 1991), microarray hybridization (Al-Khaldi et al., 2004), and PCR assays. However, the first three methods have several drawbacks comparing to PCR method. The toxin-antiserum neutralization test is time consuming, expensive, and unprecise. ELISA method is easier and more reliable, yet its efficacy is limited at some points (Baums et al., 2004). The microarray-based method is a new technology and tends to be a powerful tool. However, its complexity is a hurdle. Nowadays, many protocols of PCR and multiplex PCR for C. perfringens toxin genotyping have been reported (Baums et al., 2004; Kalender et al., 2005; Meer and Songer, 1997; Yoo et al., 1997). Unfortunately, complicated DNA extraction and preparation procedures have involved in most of those protocols resulting in the limited feasibility of routine running. To minimize such limitation, Baums et al. (2004) developed a single reaction multiplex PCR protocol in which DNA purification was not required. However, detergent treatment was still needed in DNA extraction step. Beside, the cost of each test remained high since the protocol required 50 μl of reaction volume. In the present study, we
The 23rd Annual Meeting of the Thai Society for Biotechnology “Systems Biotechnology: Quality & Success”
P-II-25
- 134 -
aimed to optimize a multiplex PCR conditions which allowed simpler and more economic assay but the results were still reliable for the detection of C. perfringens toxin genes. Published sequences of PCR primers for C. perfringens toxin genes (cpa, cpb, cpb2, cpe, etx, and iap) were used (Baums et al., 2004). The developed method was also applied to suspected isolates obtained from foods, animal clinical specimens and environments in Nakhon Pathom and Petchaburi provinces, Thailand. Since we did not find information of C. perfringens toxin genotyping in Thailand in any previous researches, the current work should be valuable for Thai public health standpoint. Materials and Methods Bacterial cultures and preservation. Reference strains: Lyophilized cultures of C. perfringens NCTC 8533, NCTC 3180, NCTC 8503, and NCTC 8084 were purchased from National Collection of Type Culture, Central Public Health Laboratory, UK. C. perfringens ATCC 13124 and other Clostridium species: C. bifermentans DMST 24380, C. sporogenes ATCC 19404, C. butyricum LGM 1217, and C. difficile ATCC 43255 were obtained from Department of Medical Science, Ministry of Public Health, Thailand. The cultures were re-suspended in reinforced clostridial medium (RCM; Merck, Darmstadt, Germany) and incubated overnight at 35C, anaerobically. Then, cultures were transferred onto blood agar (BA; Britania S.A., Buenos Aires, Argentina) containing 5% sheep blood and 24 h anaerobic incubation at 35C was allowed. To ensure the purity and identity of cultures, Gram staining and biochemical testing (nitrate reduction, motility, lactose fermentation, and gelatin liquefaction) were carried out following a standard method (Rhodehamel and Harmon, 2001). Subsequently, cultures were maintained at -80 C in brain heart infusion broth (BHI; Britania S.A., Buenos Aires, Argentina) containing 15% glycerol. Isolation of C. perfringens. Suspected colonies of C. perfringens were isolated from foods (ground chicken and ground pork), sewage effluents, clinical specimens of animals with intestinal disorders (rabbit, cattle,
sheep, and piglet). Samples were collected and stored in ice boxes during transportation and isolation procedures were performed immediately at the laboratory. All isolates were obtained by an established Fung’s double tube (FDT) system (Fung and Lee, 1980). The system contained 23 ml of sterile tempered (48ºC) Shahidi-Ferguson-Perfringens agar (SFP; Becton-Dickinson, Sparks, MD) supplemented with 3 mg Polymyxin B sulfate and 12 mg Kanamycin per litre. More details of FDT system were described in Fung et al. (2007). Sewage effluents were filtered through cellulose acetate membrane filters with 0.45 um pore size (Sartorius Stedim Biotech S.A., Aubagne Cedex, France). Then, membranes were aseptically inserted into the FDT system. Food samples and animal clinical specimens were diluted to 10-1 in 0.1% peptone water and 0.2 M phosphate buffer pH 7.0, respectively. The diluted samples were stomached for 2 min at high speed in a stomacher (Seward Stomacher 400, Seward Ltd., Norfolk, United Kingdom). Then, 1 ml of each sample was inoculated into the FDT system and incubated in a standard incubator until typical black colonies of sulfite reducing bacteria were observed. Incubation temperature was set up at 35C for cultures from foods and clinical specimens while isolates from sewage effluents were incubated at 44C. After small black colonies were observed, the cultures were streaked and re-streaked on BA until pure cultures were obtained. Subsequently, Gram staining was performed and pure Gram-positive bacilli were preserved as described earlier. PCR sample preparation. Preserved cultures from BHI broth with 15% glycerol were streaked on BA containing 5% sheep blood and incubated at 35C in anaerobic jars (Merck, Darmstadt, Germany). After 12-16 h of incubation, cultures were ready to use. Colonies surrounded by a double haemolytic zone were chosen for PCR. To prepare heat-lysed samples, 4-5 colonies on BA were suspended in 0.5 ml DNase free water in a microcentrifuge tube. The temperature was held at 100C for 15 min in a water bath to release genetic materials from disrupted cells. Then, centrifugation was applied at 14,000 x g for 1 min at room temperature to get rid of cell debris while the clear liquid was collected and

The 23rd Annual Meeting of the Thai Society for Biotechnology “Systems Biotechnology: Quality & Success”
P-II-25
- 135 -
used as PCR samples. The samples were stored at -20 C until used. PCR primers and components. Published sequences of multiplex PCR primers for C. perfringens toxins genes (cpa, cpb, cpb2, cpe, etx, and iap) were used (Baums et al., 2004). All PCR primers were synthesized by Bio Basic (Thailand). PCR reagents were obtained from Vivantis Technologies (Shah Alam, Selangor, Malaysia). Procedures of multiplex PCR assay. To conduct a multiplex PCR, 18 l of PCR mix was placed in a PCR tube and 12 l of sample was added to make a final volume of 30 l reaction. All PCR mixes were then placed onto a thermocycler (Eppendorf AG, Hamburg, Germany). Concentrations of each primer pair and PCR component were optimized. The PCR cycles were set up at 94°C for 2 min hot start, 35 cycles of 0.5 min at 94°C (denaturation), 0.5 min at 55°C (annealing), 1.5 min at 72°C (extension), and 7 min at 72°C for extra extension. After being amplified, 12 l of PCR products were subjected to an electrophoresis with 1.5% agarose gel prior to staining with ethidium bromide. Eventually, the results were observed by gel documentation (Amersham Pharmacia Biotech Inc., Uppsala, Sweden). Expected PCR product sizes are 900 bp (cpa), 611 bp (cpb), 506 bp (cpe), 396 bp (etx), 293 bp (iap), and 200 bp (cpb2). Results and Discussion
Concentrations of PCR components were optimized until bands of all toxin genes were clearly observed. Final concentrations of PCR primers that showed the best result were: 0.4 μM CPA5L, 0.4 μM CPA5R, 0.035 μM CPBL, 0.035 μM CPBR, 0.017 μM CPEL, 0.017 μM CPER, 0.012 μM CPETXL, 0.012 μM CPETXR, 0.083 μM CPIL, 0.083 μM CPIR, 0.117 μM CPB2L, 0.117 μM CPB2R. Optimal final concentrations of components in PCR reagent were: 10 mM Tris-HCl (pH 8.3), 50 mM KCl, 4 mM MgCl2, 0.4 mM each of the four dNTPs, and 1.5U Taq polymerase. Total reaction volume was 30 µl. PCR cycles were allowed as mentioned in materials and method. With these conditions, multiplex PCR
products from 5 reference strains of C. perfringens were satisfactorily shown (Figure 1).
From our study, freshly prepared PCR mixes yielded better results than frozen one. Many researchers allowed their multiplex PCR reactions to take place with 50 μl reaction volume. However, the 30 μl reaction volume was selected in the present work since it provided vivid bands of PCR products. Bigger volumes had been tried (40, 50 μl) but did not show different results (data not shown). Thus, the smallest volume was chosen for economy purpose.
When optimal multiplex PCR protocol was achieved, it was applied to 182 isolated anaerobic sulfite reducing bacteria (presumptive C. perfringens): 103 from foods (ground pork and ground chicken), 30 from sewage effluents and the rest 49 isolates were from clinical specimens of sheep, rabbit, cattle, and piglet (Table 1). To confirm the presence of C. perfringens, PCR method was applied since the cpa gene of C. perfringens is conserved only in C. perfringens but not in other organisms (Baums et al., 2004). Ruengwilysup et al. (2009) reported high efficiency and reliability of FDT method and PCR technique for the detection and confirmation of C. perfringens.
From the results, only 73 out of 182 isolates tested showed cpa band and were identified as C. perfringens. Among 73 C. perfringens isolates, 47, 24, and 2 isolates were classified into type A, C, and E, respectively. The criterion for C. perfringens genotyping was based on the detection of the major toxin genes: cpa, cpb, etx, and iap which encoded to α, β, ε, and ι-toxin, respectively. The toxin genotyping of C. perfringens was as followed: type A (cpa), type B (cpa, cpb, and etx), type C (cpa and cpb), type D (cpa and etx), type E (cpa and iap) (Petit et al., 1999). Most of C. perfringens type A were isolated from foods and sewages whereas most of type C isolates were collected from piglet clinical specimens. In addition, we detected a few C. perfringens type C from sewages. This might indicate a contamination of feces to environment. The 2 type E isolates were from rabbit clinical specimens. However, type B and D were not detected. From our results, we did not see any isolates that contained cpe and cpb2.
The 23rd Annual Meeting of the Thai Society for Biotechnology “Systems Biotechnology: Quality & Success”
P-II-25
- 136 -
Figure 1. Multiplex PCR toxin genotyping of C. perfringens reference strains. Lane 1, 100 bp ladder; Lane 2-6, C. perfringens reference strains ATCC 13124 (type A), NCTC 8533 (type B), NCTC 3180 (type C), NCTC 8503 (type D), and NCTC 8084 (type E), respectively; Lane 7-10, C. bifermentans DMST 24380, C. sporogenes ATCC 19404, C. butyricum LGM 1217, and C. difficile ATCC 43255, respectively (negative control); Lane 11, DNase free water. Table 1. Multiplex PCR toxin genotyping of C. perfringens isolates collected from foods, sewage effluents, and animal clinical specimens
Toxin genotype of C. perfringens
Sources
Numbers of anaerobic sulfite
reducing bacterial isolates
Numbers of isolates confirmed
as C. perfringens*
Type Numbers of
isolates
Foods 103 43 A 43
Sewages 30 6 A C
2 4
Sheep 9 1 A 1
Rabbit 9 2 E 2
Cattle 6 1 A 1
Piglet 25 20 C 20
Total 182 73 - 73
*Confirmed by the presence of cpa gene in multiplex PCR assay.
1 2 3 4 5 6 7 8 9 10 11 12 13 14 15
900 bp
500 bp
The 23rd Annual Meeting of the Thai Society for Biotechnology “Systems Biotechnology: Quality & Success”
P-II-25
- 137 -
In conclusion, the developed multiplex PCR method is very interesting since the confirmation and genotyping of C. perfringens can be achieved simultaneously. With the developed protocol, DNA purification or even detergent treatment was totally unnecessary. The current research provided information of C. perfringens contamination and toxin genotyping of this pathogen in various sources from the 2 provinces of Thailand. Acknowledgements
This research was financially supported
by Faculty of Science, Silpakorn University. References 1. Al-Khaldi, S.F., Myers, K.M., Rasooly,
A., and Chizhikov, V. Genotyping of Clostridium perfringens toxins using multiple oligonucleotide microarray hybridization. Mol. Cell. Probes. 2004; 18(6): 359-367.
2. Baums, C.G., Schotte, U., Amtsberg, G., and Goethe, R. Diagnostic multiplex PCR for toxin genotyping of Clostridium perfringens isolates. Vet. Microbiol. 2004; 100: 11-16.
3. Fung, D.Y.C. and Lee, C.M. Double tube anaerobic bacterial cultivation system. Food Sci. (Republic of China). 1980; 7: 209-213.
4. Fung, D.Y.C., Fujioka, R., Vijayavel, K., Sato, D. and Bishop, D. Evaluation of Fung Double Tube test for Clostridium perfringens and Easyphage test for F-specific RNA coliphages as rapid screening tests for fecal contamination in recreational waters of Hawaii. J. Rapid Methods and Automat. in Microbiol. 2007; 15: 217-229.
5. Herholz, C., Miserez, R., Nicolet, J., Frey, J., Popoff, M., Gibert, M., Gerber, H. and Straub, R. Prevalence of β2 – toxigenic Clostridium perfringens in horses with intestinal disorders. J. Clin. Microbiol. 1999; 37: 358-361.
6. Kalender, H. and Ertas, H.B. Isolation of Clostridium perfringens from chickens and detection of the alpha toxin gene by polymerase chain reaction (PCR). Turk J. Vet. Anim. Sci. 2005; 29: 847-851.
7. Meer, R.R. and Songer, J.G. Multiplex polymerase chain reaction assay for genotyping Clostridium perfringens. Am. J. Vet. Res. 1997; 58(7): 702-705.
8. Nagahama, M., Kobayashi, K., Ochi, S., Sakurai, J. Enzyme-linked immunosorbent assay for rapid detection of toxins from Clostridium perfringens. FEMS Microbiol. Lett. 1991; 68: 41-44.
9. Petit, L., Gibert, M. and Popoff, M.R. Clostridium perfringens: toxinotype and genotype. Trends Microbiol. 1999; 7(3): 104-110.
10. Rhodehamel, E.J. and Harmon, S.M. 2001. Bacteriological analytical manual online: Clostridium perfringens. Available at: http://www.fda.gov/Food/ScienceResearch/LaboratoryMethods/BacteriologicalAnalyticalManualBAM/ucm070878.htm Accessed 10 August 2011.
11. Ruengwilysup, C., Detvisitsakun, C., Aumyat, N. and Fung, D.Y.C. Application of a colony PCR technique with Fung’s double tube method for rapid detection and confirmation of Clostridium perfringens. J. Rapid Methods and Automat. in Microbiol. 2009; 17(3): 280-290.
12. Singleton, P. and Sainsbury, D. Dictionary of Microbiology and Molecular Biology. 2nd ed. Singapore: John Wiley & Son; 1988.
13. Sterne, M. and Batty, I. Pathogenic Clostridia. London: Butterworths; 1975.
14. Yoo, H.S., Lee, S.U., Park, K.Y., and Park, Y.H. Molecular typing and epidemiological survey of prevalence of Clostridium perfringens types by multiplex PCR. J. Clin. Microbiol. 1997; 35: 228-232.

The 23rd Annual Meeting of the Thai Society for Biotechnology “Systems Biotechnology: Quality & Success”
P-II-27
- 138 -
Loop-mediated isothermal amplification (LAMP) for the rapid and efficient detection of Salmonella in food samples
Mevaree Srisawat a,b and Watanalai Panbangred a,b
aDepartment of Biotechnology, Faculty of Science, Mahidol University, Rama VI Rd, Bangkok 10400, Thailand bMahidol University- Osaka University Collaborative Research Center for Bioscience and Biotechnology (MU-OU: CRC), Faculty of Science, Mahidol University, Rama VI Rd, Bangkok 10400, Thailand
Abstract The specific and sensitive loop-mediated isothermal amplification (LAMP) method for rapid
detection of Salmonella in food samples was developed and evaluated. A set of specific LAMP primers was designed for recognizing six distinct regions on a specific gene of Salmonella spp. The primers correctly detected all 97 strains of Salmonella but did not amplify other 30 non-Salmonella strains. The target DNA could be amplified under isothermal condition at 65 ºC within 20 min in a water bath and turbidity of reaction mixture could be visualized by the naked eye. The sensitivity and specificity for Salmonella detection between LAMP and multiplex PCR were compared. The detection limit of this LAMP assay was 100 fg DNA/tube while that of multiplex PCR was 10 pg/tube. Both LAMP and multiplex PCR assays were specific for Salmonella detection. Ninety food samples including minced pork, chicken and vegetable were investigated for the presence of Salmonella. The LAMP technique was shown to be 100% specificity when compared with the reference culture method in which 67 samples were positive by both methods. The total required time for the LAMP assay method (including 5 hrs of pre-enrichment step) was about 7 hrs while the reference culture method (including a 24 hrs pre-enrichment step) was 5 to 7 days. The results suggest that this method has a great potential as a rapid method for detection of Salmonella in food samples for food safety validation.
Keywords: Loop-mediated isothermal amplification, multiplex PCR, Salmonella 1. Introduction and Objective
Salmonella is a leading cause of food poisoning in humans and is also a major and important foodborne pathogen (1-2). The genus Salmonella is a member of the Enterobacteriaceae family and divided into two species, S.enterica and S.bongori. More than 2500 serovars of Salmonella were reported. Salmonella is usually transmitted to human by eating contaminated food which is often of animal origin such as eggs, beef, poultry, milk including water and vegetables (3). The food and Drug Administration (FDA) of various countries including Thailand do not allow the presence of Salmonella in foods (4-5).
The conventional microbiological method for the detection of Salmonella in food samples require multiple subculture steps followed by biochemical and serological confirmation tests which are labor intensive and too time-consuming as it takes 2-3 days for initial results, and up to 7 days for confirmation.
In recent year, PCR–based methods have successfully used to detect a number of foodborne bacterial pathogens (6). Loop-mediated isothermal amplification (LAMP) is a recently developed method based on nucleic acid amplification. The LAMP reaction requires Bst DNA polymerase with strand displacement activity and a set of four designed primers. The assay uses a single temperature step at 60-65 °C for about 60 min, resulting in large amounts of amplification products with many types of structures. LAMP is more specific, rapid and simple to perform than PCR. Furthermore, gel electrophoresis is not essentially required because the LAMP method synthesizes large amounts of DNA and generates by products which can be easily detected by turbidity or fluorescence (7-9).
The aim of this study is to develop LAMP assay for the detection of Salmonella in food samples. In combination with enrichment of Salmonella and DNA sample preparation, this method was shown highly accurate for various food matrices. This modified LAMP assay has

The 23rd Annual Meeting of the Thai Society for Biotechnology “Systems Biotechnology: Quality & Success”
P-II-27
- 139 -
the potential to become a rapid method for detection of Salmonella and could be used as a method of choices in diagnostic food laboratories. 2. Materials and Methods 2.1 Bacterial strains and culture conditions
A total of 134 bacterial strains including 104 strains of 84 serovars of Salmonella and 30 non-Salmonella strains were used in LAMP assay. All various bacterial strains were obtained from culture collection at Mahidol University-Osaka University Collaborative Research Center for Bioscience and Biotechnology (MU-OU: CRC), Thailand. Salmonella enterica subspecies enterica serovar Typhimurium ATCC 23566 was used as the positive control and primary reference strain. All of bacterial strains were stored in 15% (w/v) glycerol at 80ºC. Salmonella spp. was cultured on Xylose lysine deoxycholate agar medium (XLD), Vibrio spp. was cultured on tryptic soy agar medium (TSA) containing 3% NaCl and other bacterial strains were cultured on Luria-Bertani agar plate incubated at 37 ºC overnight.
2.2 DNA template preparation and primer
design
Salmonella DNA template was prepared from 1 ml of overnight culture in Lactose broth at 37 °C with shaking. Cells were washed twice with TE buffer (10 mMTris, 0.1 mM EDTA (pH 8.0)) (10,000 rpm, 5 min) and were resuspened in 100 µl of TE buffer, lysed by boiling at 100 °C for 10 min, cooled on ice and centrifuged at 10,000 rpm for 2 min. A 5 µl of the supernatant was used as DNA template in LAMP and multiplex PCR reactions. For non-Salmonella strains, DNA was prepared as described above, following growth in the appropriate media at the appropriate culture temperature.
The LAMP method requires a set of four specially designed primers (F3, B3, the forward inner primer (FIP), and backward inner primer (BIP)) that recognize a total of six distinct sequences (F1, F2, F3, B1, B2, and B3) in the Salmonella target DNA (Fig. 1).
Figure 1. Loop-mediated isothermal amplification (LAMP) primer design. 2.3 Multiplex PCR, LAMP assay and analysis of
products
The LAMP reaction was performed in a 25 µl volume containing the following solutions (final concentration), 1.6 µM each of FIP and BIP, 0.2 µM each of F3 and B3, 0.8 µM each of LF and LB, 1.6 mM each of deoxynucleosidetriphosphate, 1 M betaine, 6 mM MgSO4, 1 X thermopol buffer, 1µl (8U) of the Bst DNA polymerase large fragment (New England Biolabs, M0275S, Berverly, USA), and 5 µl of target genomic DNA. The mixture was incubated at 65 ̊C using a water bath and the reaction was terminated at 80 ̊C for 5 min. The products were analyzed by agarose gel electrophoresis. The minimal time as well as the minimal amount of DNA template required for LAMP reaction were also determined. Multiplex PCR was performed using PDU6, PDU7, SalF and SalR primers. The amplified products were analyzed by 1.5% agarose gel.
2.4 Detection of Salmonella in natural
contaminated food by LAMP
Detection of Salmonella in various kinds of food possibly contaminated with Salmonella was investigated. Food samples were purchased randomly in a local supermarket in Bangkok. All samples were transported to the laboratory in an ice box and were examined within 2 hrs after each purchase.

The 23rd Annual Meeting of the Thai Society for Biotechnology “Systems Biotechnology: Quality & Success”
P-II-27
- 140 -
A total of 90 food samples were minced pork meat, chicken meat and fresh vegetables. Briefly, 25 g of sample was incubated in 225 ml of lactose broth for 5 and 16 hrs at 37 ̊C. A 1.5 ml of sample suspension was removed, stand for 5 min and 1 ml of upper part was taken out, centrifuged for 5 min at 8,000 rpm and the pellet was resuspended in 100 µl TE buffer. Cells in the suspension were lysed by boiling at 100 ̊C for 10 min, cooled on ice and centrifuged at 10,000 rpm for 2 min. A 5 µl of supernatant was removed and subjected to LAMP analysis. The reference culture method was done as described online US. FDA/BAM (8thedition)(2010). 3. Results and Discussion 3.1 Optimal condition for the LAMP reaction
LAMP assay was performed using S.Typhimurium 23566 as a source of standard DNA template to determine the optimal temperature and time of the reaction. LAMP assay was performed under isothermal condition between 60-70 ºC. From the results, no significant difference was observed between 60-66 ºC but the LAMP products amplified at 63- 66 ºC showed slightly clearer product when compared to the others (Fig. 2A). Therefore, 65 ºC was used as an optimal temperature which is in accordance with the original work published by Notomiet al, 2000(7). The clearly bands of LAMP product were detected as early as 20 min at 65ºC (Fig. 2B), however, the optimal reaction time was set as 30 min to ensure positive detection with a low amount of DNA template. Therefore, the optimized condition for LAMP was performed at 65 ºC for 30 min. 3.2 Naturally contaminated food
A total of 90 food samples were analyzed by both reference culture method according to BAM and the LAMP method using 30 samples of minced pork meat, 30 samples of chicken meat and 30 samples of vegetable. The results, shown in Table 1, indicated that, the 67 samples were positive, 23 samples were negative by both methods. The pre-enrichment time for 5 hrs and 16 hrs gave the same results. The overall relative diagnostic specificity and accuracy were 100%. No false-negative or false-positive samples were obtained by the LAMP assay.
Figure 2 Determination of the optimal temperature and time for LAMP (A) Optimal temperature. Lane M: 100 bp DNA ladder marker; Lanes1-11: LAMP assay was carried out at 60, 61, 62, 63, 64, 65, 66, 67, 68, 69 and 70ºC, respectively; Lane 12: negative control. (B) Optimal time. Lane M: 100 bp DNA ladder marker; Lanes1-11: LAMP assay was carried out at 10, 15, 20, 25, 30, 35, 40, 45, 50, 55 and 60 min, respectively; Lane 12: negative control. Table1. Results of the LAMP assay compared with the reference culture method (BAM) for detection of Salmonella in various food samples.
Method BAM/LAMP
LAMP method Type of samples (n) No. of
positive No. of negative
False(neg) False(pos)
Minced pork meat (30)
28/28 2/2 0 0
Chicken meat (30)
25/25 5/5 0 0
Vegetable (30)
14/14 16/16 0 0
(B)
(A)
The 23rd Annual Meeting of the Thai Society for Biotechnology “Systems Biotechnology: Quality & Success”
P-II-27
- 141 -
In conclusion, the LAMP protocol in this study represents an inexpensive, specific, sensitive and rapid method for detection of Salmonella in food sample. The LAMP assay consists of pre-enrichment step of the food sample in lactose broth for 5 hrs followed by a DNA extraction step and finally analyzed by the LAMP assay for the presence of Salmonella DNA. The protocol of food preparation for LAMP assay including a 5 hrs of pre-enrichment step, followed by DNA extraction were applied with 90 food samples consisting of the minced pork meat, chicken meat and vegetable were analyze for the presence of Salmonella. The diagnostic accuracy obtained was 100% when compared with the reference culture method. The overall analysis time for the LAMP assay method was approximately 8 hrs. This is in contrast to 5 to 7 days of analysis time required for the reference culture method. LAMP technique does not require strict reaction condition and does not require complicated technical operation or any special equipment. Only a simple water bath or heat box is necessary for conducting LAMP assay.
References 1. Food Net. Preliminary Food Net data on the
incidence of infection with pathogens transmitted commonly through food – 10 states, 2009. MMWR Morb Mortal Wkly Rep. 2010 Apr 16;59 (14):418-22.
2. [CDC] Center for Disease Control and Prevention. Salmonella Surveillance: Annual Summary, 2006. Atlanta, Ga U.S. Department of Health and Human Services, CDC; 2006.
3. Tindall BJ, Grimont PA, Garrity GM, Euzeby JP. Nomenclature and taxonomy of the genus Salmonella. Int J Syst Evol Microbiol. 2005Jan; 55(Pt1):521-4.
4. [ICMSF] International Commission on Microbiological Specification for Foods. Microorganisms in Foods 7, Microbiological Testing in Food Safety Management. New York, NY: Kluwer Academic Plenum Publisher; 2002.
5. [ICMSF] International Commission on Microbiological Specification for Foods. Microorganism in Foods. Vol2 Sampling for Microbiological Analysis: Principles and Specific Applications. Toronto, Canada: University of Toronto Press; 1986.
6. Velusamy V, Arshak K, Korostynska O, Oliwa K, Adley C. An overview of foodborne pathogen detection: in the perspective of biosensors. Biotechnol Adv. 2010 Mar-Apr; 28(2):232-54.
7. Notomi T, Okayama H, Masubuchi H, Yonekawa T, Watanabe K, Amino N, et al. Loop-mediated isothermal amplification of DNA. Nucleic Acids Res. 2000 Jun 15;28(12):E63.
8. Techathuvanan C, Draughon FA, D'Souza DH. Loop-mediated isothermal amplification (LAMP) for the rapid and sensitive detection of Salmonella Typhimurium from pork. J Food Sci. 2010 Apr;75(3):M165-72.
9. Li X, Zhang S, Zhang H, Zhang L, Tao H, Yu J, et al. A loop-mediated isothermal amplification method targets the phoP gene for the detection of Salmonella in food samples. Int J Food Microbiol. 2009 Aug 15;133(3):252-8.
The 23rd Annual Meeting of the Thai Society for Biotechnology “Systems Biotechnology: Quality & Success”
P-III-01
- 142 -
Characterization and bioactivities of collagen hydrolysates from striped catfish and farmed giant catfish skins
Natthawut Thitipramotea,b, Keerati Krongsuksirichaib, Phanuphong Chaiwuta,b, Punyawatt Pintathonga,b, Saroat Rawdkuenc
a Excellent Center of Cosmetic and Wellness, Mae Fah Luang University, Muang, Chiang Rai 57100, Thailand. b School of Cosmetic Science, Mae Fah Luang University, Muang, Chiang Rai 57100, Thailand. c Food Technology Program, School of Agro-Industry, Mae Fah Luang University, Muang, Chiang Rai 57100, Thailand.
Abstract Collagen was extracted from skins of striped catfish (SC: Pangasianodon hypophathalmus) and farmed giant catfish (GC: Pangasianodon gigas) using acid-solubilization process at 4 C for 48 hours. The yields of collagen from SC and GC skins were 27.3% and 5.96% (wet weight basis), respectively. Protein pattern of these collagens showed the three major bands (β, α1, α2 components) as the type I collagen. SC and GC collagens were hydrolyzed by four proteases (bromelain, papain, trypsin, and protease from Calotropic procera latex) with ratio collagen: enzymes 1:1000 g/units at 37 C for 0.5, 1, 2, and 3 hours. The SC and GC collagen hydrolysates (CH) obtained showed the absence of the three major protein bands of collagen in SDS-PAGE. DPPH radical-scavenging activity of SC and GC collagen hydrolysates was significantly different among the hydrolysis condition (p<0.05). It was significant highest on Calotropic procera latex-treated CH at 1 hour for GC collagen (7.46 mg TEAC g/dry weight) and at 2 hours for SC collagen (2.44 mg TEAC g/dry weight). The results suggest that the SC and GC fish skins could be used as an alternative source for collagen extraction and the bioactive peptides can be obtained from these catfish collagens hydrolyzed with the proteolytic enzymes.
Keywords: Acid-soluble collagen, DPPH, Giant catfish, Protein hydrolysates, Striped catfish Introduction and Objective
Collagen is widely and diversely used as natural material in food, medicine and cosmetic industries. Its functional and nutritional properties (e.g. antioxidant activity) can be improved and upgraded by enzymatic hydrolysis (e.g. protease, bromelain, papain, trypsin) with optimizing condition1. Collagen and collagen hydrolysate (CH) are mainly obtained from cattle and swine, however; it has limited by the spread of the animal disease to human. Thus, the finding of new materials for collagen extraction has been investigated, especially from wastes of fishery industries. The collagen extraction from the skin, fin and bone of marine fish has been broadly studied2,3, but not in case of the freshwater fish. In Thailand, the freshwater fish that are widely commercially cultured have little been studied for collagen extraction, especially in thick skin species. The striped catfish (SC) and the farmed giant catfish (GC) have become importantly economic fish mostly cultured in Chiang Rai province, Thailand. The objectives of this study were to investigate the characteristics of the collagen from SC and GC skins, to optimize the condition for collagen
hydrolysates production using various enzymes and to investigate their bioactivity characteristics.
Materials and Methods SC and GC skins were removed manually,
cleaned and cut into small pieces (0.5x0.5cm) as well as stored at -20 C until used. Commercial collagen from bovine achilles tendon was used as the standard collagen.
1. Collagen extraction The SC and GC collagens were extracted
following the method of Kittiphattanabawon et al3 with a slight modification. The non-collagenous proteins were removed by 0.1 N NaOH (sample: alkaline; 1:10 w/v). Collagen was extracted with 0.5 M acetic acid (1:20 w/v) at 4 C for 48 hours. Collagen yield (recovery) was determined in wet basis.
2. SDS-PAGE Protein patterns of fish skin, collagen, and
collagen hydrolysate (CH) were performed by the method of Laemmli4 with 4% stacking and 7.5% running gels.
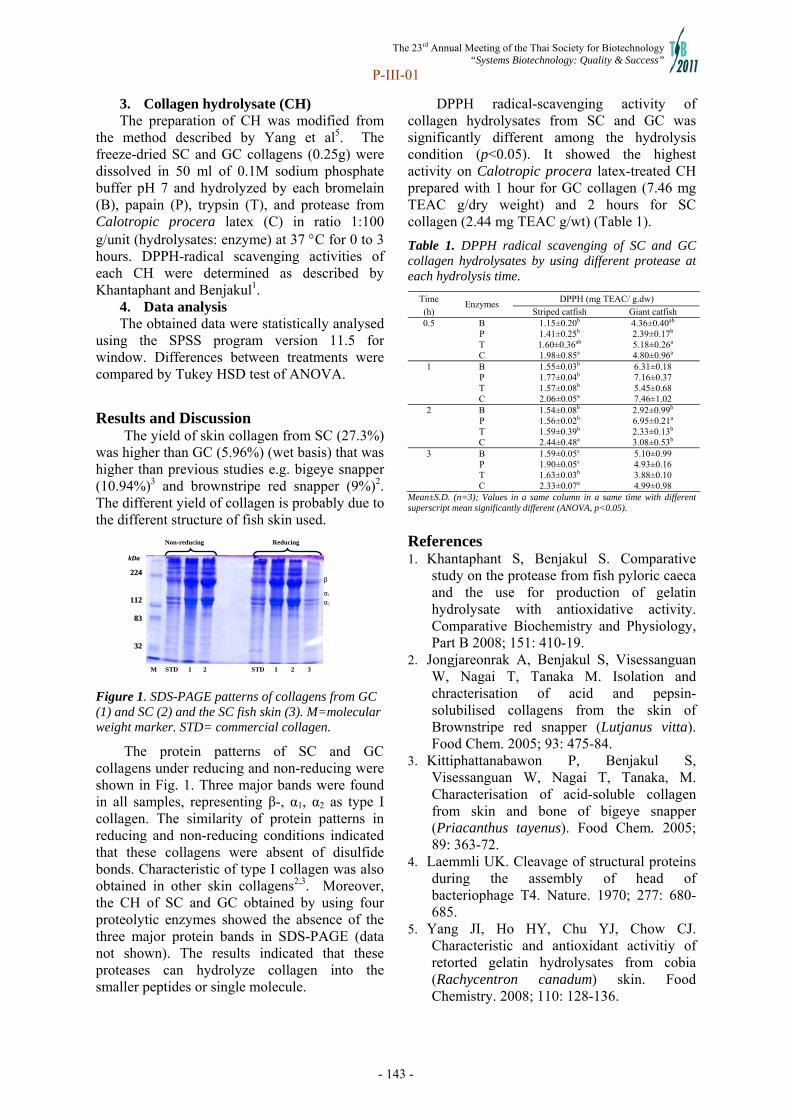
The 23rd Annual Meeting of the Thai Society for Biotechnology “Systems Biotechnology: Quality & Success”
P-III-01
- 143 -
3. Collagen hydrolysate (CH) The preparation of CH was modified from
the method described by Yang et al5. The freeze-dried SC and GC collagens (0.25g) were dissolved in 50 ml of 0.1M sodium phosphate buffer pH 7 and hydrolyzed by each bromelain (B), papain (P), trypsin (T), and protease from Calotropic procera latex (C) in ratio 1:100 g/unit (hydrolysates: enzyme) at 37 C for 0 to 3 hours. DPPH-radical scavenging activities of each CH were determined as described by Khantaphant and Benjakul1.
4. Data analysis The obtained data were statistically analysed
using the SPSS program version 11.5 for window. Differences between treatments were compared by Tukey HSD test of ANOVA.
Results and Discussion
The yield of skin collagen from SC (27.3%) was higher than GC (5.96%) (wet basis) that was higher than previous studies e.g. bigeye snapper (10.94%)3 and brownstripe red snapper (9%)2. The different yield of collagen is probably due to the different structure of fish skin used.
Figure 1. SDS-PAGE patterns of collagens from GC (1) and SC (2) and the SC fish skin (3). M=molecular weight marker. STD= commercial collagen.
The protein patterns of SC and GC collagens under reducing and non-reducing were shown in Fig. 1. Three major bands were found in all samples, representing β-, α1, α2 as type I collagen. The similarity of protein patterns in reducing and non-reducing conditions indicated that these collagens were absent of disulfide bonds. Characteristic of type I collagen was also obtained in other skin collagens2,3. Moreover, the CH of SC and GC obtained by using four proteolytic enzymes showed the absence of the three major protein bands in SDS-PAGE (data not shown). The results indicated that these proteases can hydrolyze collagen into the smaller peptides or single molecule.
DPPH radical-scavenging activity of collagen hydrolysates from SC and GC was significantly different among the hydrolysis condition (p<0.05). It showed the highest activity on Calotropic procera latex-treated CH prepared with 1 hour for GC collagen (7.46 mg TEAC g/dry weight) and 2 hours for SC collagen (2.44 mg TEAC g/wt) (Table 1).
Table 1. DPPH radical scavenging of SC and GC collagen hydrolysates by using different protease at each hydrolysis time.
Time DPPH (mg TEAC/ g.dw) (h)
Enzymes Striped catfish Giant catfish
0.5 B 1.15±0.20b 4.36±0.40ab
P 1.41±0.25b 2.39±0.17b
T 1.60±0.36ab 5.18±0.26a
C 1.98±0.85a 4.80±0.96a
1 B 1.55±0.03b 6.31±0.18 P 1.77±0.04b 7.16±0.37 T 1.57±0.08b 5.45±0.68 C 2.06±0.05a 7.46±1.02
2 B 1.54±0.08b 2.92±0.99b
P 1.56±0.02b 6.95±0.21a T 1.59±0.39b 2.33±0.13b
C 2.44±0.48a 3.08±0.53b
3 B 1.59±0.05c 5.10±0.99 P 1.90±0.05c 4.93±0.16 T 1.63±0.03b 3.88±0.10 C 2.33±0.07a 4.99±0.98
Mean±S.D. (n=3); Values in a same column in a same time with different superscript mean significantly different (ANOVA, p<0.05).
References 1. Khantaphant S, Benjakul S. Comparative
study on the protease from fish pyloric caeca and the use for production of gelatin hydrolysate with antioxidative activity. Comparative Biochemistry and Physiology, Part B 2008; 151: 410-19.
2. Jongjareonrak A, Benjakul S, Visessanguan W, Nagai T, Tanaka M. Isolation and chracterisation of acid and pepsin-solubilised collagens from the skin of Brownstripe red snapper (Lutjanus vitta). Food Chem. 2005; 93: 475-84.
3. Kittiphattanabawon P, Benjakul S, Visessanguan W, Nagai T, Tanaka, M. Characterisation of acid-soluble collagen from skin and bone of bigeye snapper (Priacanthus tayenus). Food Chem. 2005; 89: 363-72.
4. Laemmli UK. Cleavage of structural proteins during the assembly of head of bacteriophage T4. Nature. 1970; 277: 680-685.
5. Yang JI, Ho HY, Chu YJ, Chow CJ. Characteristic and antioxidant activitiy of retorted gelatin hydrolysates from cobia (Rachycentron canadum) skin. Food Chemistry. 2008; 110: 128-136.
kkDDaa
222244
111122
8833
3322
M STD 1 2 STD 1 2 3
Non-reducing Reducing
β
α1 α2
The 23rd Annual Meeting of the Thai Society for Biotechnology “Systems Biotechnology: Quality & Success”
P-III-03
- 144 -
Contamination of aflatoxigenic and ochratoxigenic Aspergillus in Thai rice Notai Kittikamhaenga and Cheewanun Dachoupakana Department of Microbiology, Faculty of Science, Chulalongkorn University, Thailand
Abstract
Three types of rice samples were collected from the central of Thailand in 2010 in three different harvest seasons to examine the contamination of Aspergillus species producing aflatoxin B1 (AFB1) and ochratoxin A (OTA). Two hundred seventy-two isolates of Aspergillus were obtained with 197 isolates of yellow-green Aspergillus and 75 isolates of black Aspergillus. The high occurrence of Aspergillus was found in dried paddy rice samples of all harvest seasons. The isolates of yellow-green Aspergillus were most abundant in dried paddy rice samples in October. Black aspergilli were most frequently isolated from dried paddy rice samples in February. For mycotoxin productions, 13% of the yellow-green Aspergillus isolates produced AFB1 (5.00-18,991.17 ng/g of culture) and 29% of the black Aspergillus isolates produced OTA (0.20-205.52 ng/g of culture). The highest incidence of mycotoxigenic Aspergillus was found in dried paddy rice samples. The maximum level of AFB1 production was produced by yellow-green Aspergillus isolated from dried paddy rice samples in July. Black Aspergillus isolated from dried paddy rice samples in February showed the maximum amount of OTA. Keywords: aflatoxin B1, ochratoxin A, Aspergillus, rice Introduction and Objective
Aflatoxin B1 (AFB1) and ochratoxin A (OTA) are mycotoxins, which have detrimental effects on humans and animals. Aspergillus flavus, A. parasiticus and A. nomius (Aspergillus section Flavi or yellow-green aspergilli) are mainly AFB1 producers contaminating in various agricultural products4. Whereas, members of Aspergillus section Nigri (black apergilli) especially A. carbonarius and A. niger are mainly responsible for OTA accumulation in a wide range of food commodities1.
Rice is one of the most importance economical agricultural products of Thailand. One of the most serious problems to confront the quality of rice is the presence of mycotoxins6. When rice is exposed to appropriate condition for Aspergillus contamination, AFB1 and OTA could be formed8. The objective of this study was to examine the contamination of Aspergillus species producing Aflatoxin B1 (AFB1) and ochratoxin A (OTA) in Thai rice.
Materials and Methods 2.1 Samples collections Ninety rice samples including paddy rice
from field, dried paddy rice from rice mill and polished rice stored in rice mill, were collected from the central of Thailand in 2010 in 3 harvest seasons (February, July and October).
2.2 Isolation of Aspergillus spp. Fifty rice seeds were randomly selected and
put onto the surface of Dichloran 18% glycerol agar (10 seeds/plate). The plates were incubated at 25 oC for 7 days and then Aspergillus colonies were isolated and identified by morphological criteria7. Yellow-green Aspergillus and black Aspergillus were selected for AFB1 and OTA productions respectively.
2.3 AFB1 and OTA production, extraction and quantification.
Inoculation was prepared by growing the strains on Potato Dextrose Agar (PDA) at 25 C for 7 days. Conidia suspension was prepared in physiological water, adjusted to 106 conidia/ml and dropped (5 l) in the centre of PDA plate. The plates were incubated at 25 C. After 7 days, 3 agar plugs were removed from middle area of the colony. For AFB1 extraction, the plugs were extracted with 2.5 ml of methanol5 and OTA extraction was carried out in 2.5 ml of methanol/formic acid (25:1 v/v). The extracts were quantified by HPLC2,3.
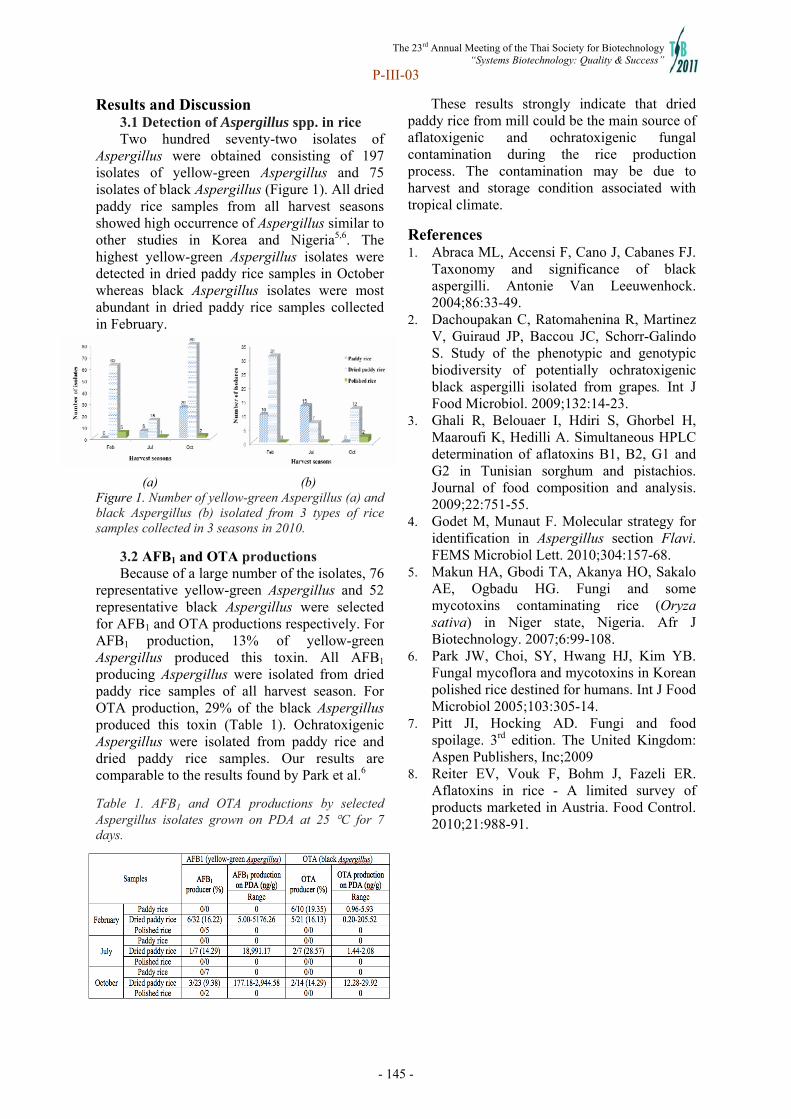
The 23rd Annual Meeting of the Thai Society for Biotechnology “Systems Biotechnology: Quality & Success”
P-III-03
- 145 -
Results and Discussion 3.1 Detection of Aspergillus spp. in rice Two hundred seventy-two isolates of
Aspergillus were obtained consisting of 197 isolates of yellow-green Aspergillus and 75 isolates of black Aspergillus (Figure 1). All dried paddy rice samples from all harvest seasons showed high occurrence of Aspergillus similar to other studies in Korea and Nigeria5,6. The highest yellow-green Aspergillus isolates were detected in dried paddy rice samples in October whereas black Aspergillus isolates were most abundant in dried paddy rice samples collected in February.
(a) (b) Figure 1. Number of yellow-green Aspergillus (a) and black Aspergillus (b) isolated from 3 types of rice samples collected in 3 seasons in 2010.
3.2 AFB1 and OTA productions Because of a large number of the isolates, 76
representative yellow-green Aspergillus and 52 representative black Aspergillus were selected for AFB1 and OTA productions respectively. For AFB1 production, 13% of yellow-green Aspergillus produced this toxin. All AFB1 producing Aspergillus were isolated from dried paddy rice samples of all harvest season. For OTA production, 29% of the black Aspergillus produced this toxin (Table 1). Ochratoxigenic Aspergillus were isolated from paddy rice and dried paddy rice samples. Our results are comparable to the results found by Park et al.6
Table 1. AFB1 and OTA productions by selected Aspergillus isolates grown on PDA at 25 C for 7 days.
These results strongly indicate that dried paddy rice from mill could be the main source of aflatoxigenic and ochratoxigenic fungal contamination during the rice production process. The contamination may be due to harvest and storage condition associated with tropical climate.
References 1. Abraca ML, Accensi F, Cano J, Cabanes FJ.
Taxonomy and significance of black aspergilli. Antonie Van Leeuwenhock. 2004;86:33-49.
2. Dachoupakan C, Ratomahenina R, Martinez V, Guiraud JP, Baccou JC, Schorr-Galindo S. Study of the phenotypic and genotypic biodiversity of potentially ochratoxigenic black aspergilli isolated from grapes. Int J Food Microbiol. 2009;132:14-23.
3. Ghali R, Belouaer I, Hdiri S, Ghorbel H, Maaroufi K, Hedilli A. Simultaneous HPLC determination of aflatoxins B1, B2, G1 and G2 in Tunisian sorghum and pistachios. Journal of food composition and analysis. 2009;22:751-55.
4. Godet M, Munaut F. Molecular strategy for identification in Aspergillus section Flavi. FEMS Microbiol Lett. 2010;304:157-68.
5. Makun HA, Gbodi TA, Akanya HO, Sakalo AE, Ogbadu HG. Fungi and some mycotoxins contaminating rice (Oryza sativa) in Niger state, Nigeria. Afr J Biotechnology. 2007;6:99-108.
6. Park JW, Choi, SY, Hwang HJ, Kim YB. Fungal mycoflora and mycotoxins in Korean polished rice destined for humans. Int J Food Microbiol 2005;103:305-14.
7. Pitt JI, Hocking AD. Fungi and food spoilage. 3rd edition. The United Kingdom: Aspen Publishers, Inc;2009
8. Reiter EV, Vouk F, Bohm J, Fazeli ER. Aflatoxins in rice - A limited survey of products marketed in Austria. Food Control. 2010;21:988-91.
The 23rd Annual Meeting of the Thai Society for Biotechnology “Systems Biotechnology: Quality & Success”
P-III-04
- 146 -
Survival enhancement of probiotic by co-encapsulation with root crop fiber Sirasa Sumongkhon and Tipparat Hongpattarakere Department of Industrial Biotechnology, Faculty of Agro-Industry, Prince of Songkhla University, Hat-Yai, Songkhla, 90112, Thailand. Abstract
Survival of probiotic bacteria, including Lactobacillus plantarum A124, L. plantarum TISTR 875 and L. acidophilus TISTR 1034 encapsulated in calcium alginate beads were tested under highly acidic conditions of simulated gastric juice at pH 2.0 for 3 h. Encapsulated L. plantarum A124 showed the highest survival of 103.88 %, whereas encapsulated L. plantarum TISTR 875 and L. acidophilus TISTR 1034 exhibited only 99.01% and 95.38% of survival respectively. Microencapsulation enhanced acidic survival of all probiotic strains comparing to free cells. Survival of L. plantarum A124 co-encapsulated with three different root crop crude fibers were evaluated under simulated gastric condition. L. plantarum A124 co-encapsulated with 2% beetroot crude fiber showed the highest survival of 86.55% (p>0.05) after acidic exposure at pH 2.0 for 3 h, while the control groups including free and microencapsulated cells exhibited 37.21% and 81.82% of survival respectively. Addition of 2% beetroot crude fiber significantly enhanced survival of L. plantarum A124 from 81.82 to 86.55%. Keywords: Microencapsulation; Probiotics; Prebiotics; Lactobacillus plantarum Introduction and Objective
Probiotics have been defined as “live microbial feed supplement that have beneficial effects on the host by improving its intestinal microbial balance”1. Among the available techniques for encapsulation of living cells, entrapment in calcium alginate bead has been frequently used2. The aim of this study was to select a complementary prebiotic for the selected probiotic strain and to investigate its effect in protecting the encapsulated bacteria under in vitro acidic and bile salt conditions The term co-encapsulation in this article refers to encapsulation of both probiotic bacteria and prebiotics together. Materials and Methods
2.1 Microorganisms, growth conditions and preparation of cell suspensions
L. plantarum TISTR 875 and L. acidophilus TISTR 1034 were obtained from the Microbiological Resources Centre (MIRCEN), Thailand. L. plantarum A124 was isolated from infant feces. All bacteria were cultivated in De Man Rogosa (MRS) broth and incubated at 37 C for 24 h. The cells were harvested by centrifugation at 8500 rpm for 20 min at 4 C, then washed twice with normal saline. The final cell
concentration was adjusted to 109-1010 CFU/ml, and then subjected to microencapsulation as described subsequently.
2.2. Microencapsulation of probiotic
organism using the emulsion technique The emulsion method of microencap-
sulation was used to encapsulate probiotics according to Capela et al.3 .
2.3 Effect of encapsulation on survival of
probiotics under acidic condition Ten ml aliquots of encapsulated and free
bacteria were added to PBS. pH was adjusted to 2.0 with 1 M HCl. Samples of individual treatments were then incubated at 37 °C for 3 h. Survival of free and encapsulated bacteria was determined using pour plate technique on MRS agar incubated at 37 °C for 48 h. 2.4 Effect of root crop crude fiber on the survival of encapsulated probiotics under acidic condition Various prebiotics including fructooligo-saccharides (FOS), crude fiber from potato, sweet potato and beet root were co-encapsulated with probiotic cells according to Capela et al.3 .

The 23rd Annual Meeting of the Thai Society for Biotechnology “Systems Biotechnology: Quality & Success”
P-III-04
- 147 -
Results and Discussion The encapsulated L. plantarum A124 showed the highest survival of 103.88% (p>0.05) from exposure to acidic condition at pH 2.0 for 3 h, whereas the encapsulated L. plantarum TISTR 875 and L. acidophilus-TISTR 1034 exhibited only 99.01% and 95.38% of survival, respectively (Fig. 1).
Figure 1. Survival of encapsulated probiotics under simulated gastric juice (pH 2.0 for 3 h at 37 C)
Fig. 2 shows the enhancement of probiotic survival when root crop crude fibers were added as co-encapsulant. L. plantarum A124 co-encapsulated with 2% beet root crude fiber showed the highest survival of 86.55% (p>0.05) after acidic exposure at pH 2.0 for 3 h, while the control groups including free and microencapsulated cells exhibited 37.21 and 81.82% of survival respectively.
Figure 2. Effect of various root crop crude fibers as co-encapsulant on viability of L. plantarum A124 under simulated gastric juice (pH 2.0 for 3 h at 37C) Addition of 2% (w/v) beet root crude fiber significantly enhanced survival of the co-encapsulated L. plantarum A124 from 81.82 to
86.55% (Fig. 3). While co-encapsulated probiotic with 0, 1, and 3% (w/v) beet root crude fiber exhibited 81.22, 82.30 and 84.70% survival, respectively. Co-encapsulated probiotic with 3% (w/v) beet root crude fiber did not significantly improve the survival of L. plantarum A124 compared with 2% (w/v). Chandramouli et al.4 reported that 1.5% (w/v) Hi-maize did not significantly improve the survival of encapsulated L. acidophilus CSCC 2400 at pH 2.0 after 3 h of incubation compared with 1.0% (w/v). This could be due to the disruption of the alginate gel matrix with excess Hi-maize
Figure 3. Effect of different beet root crude fiber concentration on the survival of L. plantarum A124 under simulated gastric juice (pH 2.0 for 3 h at 37C) References: 1. Fuller R, Probiotic food current use and
future developments. IFI NR. 1993;3:23-6. 2. Sheu T Y, Marshall R T. Microencapsula-
tion of Lactobacilli in calcium alginate gels. J. Food Sci. 1993;54(3): 557-61.
3. Capela P, Hay T K C, Shah N P. Effect of cryoprotectants, prebiotics and microencap-sulation on survival of probiotic organisms in yoghurt and freeze-dried yoghurt. Food Res. Int. 2006;39: 203-11.
4. Chandramoulia V, Kailasapathya K, Peirisb P, Jones M. An improved method of microencapsulation and its evaluation to protect Lactobacillus spp. in simulated gastric conditions. J. Microbiol. Methods. 2004;56: 27-35.
a bc d
e
f
e
c d b a c
e
d c a b c
The 23rd Annual Meeting of the Thai Society for Biotechnology “Systems Biotechnology: Quality & Success”
P-III-05
- 148 -
Biochemical properties of muscle foods treated with different plant proteases
Saroat Rawdkuen
Food Technology Program, School of Agro-Industry, Mae Fah Luang University, Muang, Chiang Rai 57100, Thailand. Abstract
This study was conducted to compare the efficiency of different plant proteases on tenderization of muscle foods in term of biochemical changes. The meat samples from chicken, fish, pork and beef were treated with 4 types of proteolytic enzymes, i.e. Calotropis procera latex proteases, papaya latex enzymes, commercial papain and bromelain at the concentrations of 2000-6000 activity units. Trichloro acetic acid (TCA) soluble peptides, pH, collagen content and solubility, muscle microstructure, and protein pattern by SDS-PAGE were determined. Chunks from different muscles were soaked with distilled water as the control and then incubated at 4C for 24 h before subjecting to various physico-chemical determinations. An increase in TCA-soluble peptides, collagen solubility, and myofibrillar protein degradation were observed in all enzyme-treated samples comparing to control. Electrophoretic pattern of muscle proteins also revealed extensive proteolysis and reduction in number of protein bands in all treated samples. At the micro-structural level, tissue fibers were broken, cell membranes were more strongly degraded, the connections between the sarcolemma and the myofibrils were loosen when each enzyme was added. Comparing to all proteolytic enzymes used, papaya latex protease showed the highest hydrolysis activity to all muscle types followed by Calotropis procera latex proteases, commercial papain and bromelain. The results show that these proteolytic enzymes could be used as an effective meat tenderizer.
Keywords: proteases, muscle foods, collagen, meat tenderization, biochemical properties Introduction and Objective
Toughness is one of the most common quality characteristics of meat. Toughness is due to a range of factors including the amount of intramuscular connective tissue, and the length of the sarcomere. A number of attempts have been made to tenderize and improve the qualities of such meat. The studies were mainly able to reduce the amounts of detectable connective tissues by the use of enzymes, phosphates, salts, and calcium chloride. Treatment by proteolytic enzymes derived from plants is a popular method for meat tenderization. Proteolytic enzymes such as papain, bromelain and ficin have been widely used as meat tenderizers in most parts of the world1. Plant proteases are superior to bacterial derived enzymes mainly because of safety problems or other disadvantageous effects. The objective of this study was to investigate the effects of the different plant proteases on the biochemical changes of the muscle food samples.
Materials and Methods
Sample preparation Meat samples (chicken, fish, pork and beef)
were purchased from ‘Makro’ supermarket, Chiang Rai, Thailand. The samples were mixed with Calotropis procera latex, papaya latex, papain and bromelain at the levels of 2000-6000 activity units and then incubated at 4C for 24 h before subjected to analysis. The sample without enzymes addition was used as the control.
Determinations Trichloro acetic acid (TCA) soluble peptide content was measured by the method used in Benjakul et al2. Collagen content and solubility were determined as described in Wattanachant et al3. pH of treated meat sample was also determined using pH-meter. Protein pattern by SDS-PAGE was carried out according to the method in Laemmli et al4. Muscle microstructure was determined using scanning electron microscopy at magnification of 250x and an acceleration voltage of 10 kV.
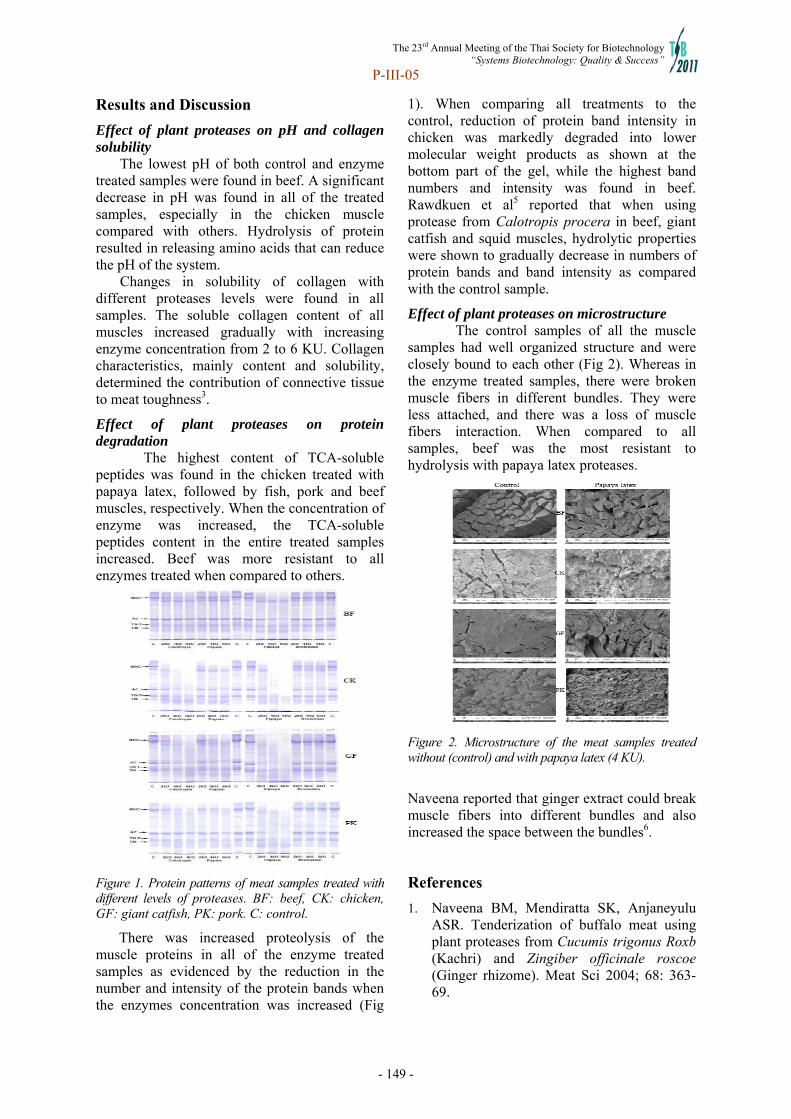
The 23rd Annual Meeting of the Thai Society for Biotechnology “Systems Biotechnology: Quality & Success”
P-III-05
- 149 -
Results and Discussion
Effect of plant proteases on pH and collagen solubility
The lowest pH of both control and enzyme treated samples were found in beef. A significant decrease in pH was found in all of the treated samples, especially in the chicken muscle compared with others. Hydrolysis of protein resulted in releasing amino acids that can reduce the pH of the system. Changes in solubility of collagen with different proteases levels were found in all samples. The soluble collagen content of all muscles increased gradually with increasing enzyme concentration from 2 to 6 KU. Collagen characteristics, mainly content and solubility, determined the contribution of connective tissue to meat toughness3.
Effect of plant proteases on protein degradation
The highest content of TCA-soluble peptides was found in the chicken treated with papaya latex, followed by fish, pork and beef muscles, respectively. When the concentration of enzyme was increased, the TCA-soluble peptides content in the entire treated samples increased. Beef was more resistant to all enzymes treated when compared to others.
Figure 1. Protein patterns of meat samples treated with different levels of proteases. BF: beef, CK: chicken, GF: giant catfish, PK: pork. C: control.
There was increased proteolysis of the muscle proteins in all of the enzyme treated samples as evidenced by the reduction in the number and intensity of the protein bands when the enzymes concentration was increased (Fig
1). When comparing all treatments to the control, reduction of protein band intensity in chicken was markedly degraded into lower molecular weight products as shown at the bottom part of the gel, while the highest band numbers and intensity was found in beef. Rawdkuen et al5 reported that when using protease from Calotropis procera in beef, giant catfish and squid muscles, hydrolytic properties were shown to gradually decrease in numbers of protein bands and band intensity as compared with the control sample.
Effect of plant proteases on microstructure The control samples of all the muscle
samples had well organized structure and were closely bound to each other (Fig 2). Whereas in the enzyme treated samples, there were broken muscle fibers in different bundles. They were less attached, and there was a loss of muscle fibers interaction. When compared to all samples, beef was the most resistant to hydrolysis with papaya latex proteases.
Figure 2. Microstructure of the meat samples treated without (control) and with papaya latex (4 KU).
Naveena reported that ginger extract could break muscle fibers into different bundles and also increased the space between the bundles6.
References
1. Naveena BM, Mendiratta SK, Anjaneyulu ASR. Tenderization of buffalo meat using plant proteases from Cucumis trigonus Roxb (Kachri) and Zingiber officinale roscoe (Ginger rhizome). Meat Sci 2004; 68: 363-69.
The 23rd Annual Meeting of the Thai Society for Biotechnology “Systems Biotechnology: Quality & Success”
P-III-05
- 150 -
2. Laemmli UK, Beguin F, Gujer-Kellenberger G. A factor preventing the major head protein of bacteriophage T4 from random aggregation. J Mol Bio 1970; 47: 69-74.
3. Benjakul S, Visessanguan W, Riebroy S, Ishizaki S, Tanaka M. Gel-forming properties of surimi produced from bigeye snapper, Priacanthus tayenus and P. macracanthus, stored in ice. J. Sci Food Agric 2002; 82:1442-51.
4. Wattanachant S, Benjakul S, Ledward DA. Composition, color, and texture of Thai indigenous and broiler chicken muscles. Poultry Sci 2004; 83: 123–28.
5. Rawdkuen S, Pintathong P, Chaiwut P, Benjakul S, The partitioning of protease from Calotropis procera latex by aqueous two-phase systems and its hydrolytic pattern on muscle proteins. Food Bioprod Proc 2010; 50: 145-49.
6. Naveena BM. The tenderization of buffalo meat using ginger extract. J Muscle Food. 2004; 15: 235-44.

The 23rd Annual Meeting of the Thai Society for Biotechnology “Systems Biotechnology: Quality & Success”
P-III-06
- 151 -
Antimicrobial properties of gelatin based film incorporated with catechin and lysozyme combination
Saroat Rawdkuena, Phunsiri Suthiluka, and Damrongpol Kamhangwongb
aFood Technology Program, School of Agro-Industry, Mae Fah Luang University, Muang, Chiang Rai 57100, Thailand. bTechnology Management of Agricultural Produces and Packaging Program, School of Agro-Industry, Mae Fah Luang University, Muang, Chiang Rai 57100, Thailand.
Abstract Antimicrobial activity against Escherichia coli, Staphylococcus aureus, Listeria innocua and
Saccharomyces cerevisiae of gelatin based films (3% gelatin and 25% glycerol) prepared with four different concentrations (i.e. 0, 125, 250, and 500 mg/g) of the combination of catechin and lysozyme (ratio 1:1) were investigated by agar diffusion assay. The films were also characterized with measurements of light transmission, transparency, and film solubility. Inhibitory activity of gelatin film against all microorganisms was concentration dependent. The highest inhibitor zone was found when the concentration of the combination of catechin and lysozyme was increased to the highest concentration. S. aureus was the most susceptible to inhibit by antimicrobial gelatin based film comparing to those of E. coli, S. cerevisiae, L. innocua, in succession. The light transmission (wavelength 200-800 nm) of the film decreased with increasing of the combination antimicrobial agents, but film transparency was not significantly affected (p>0.05). Solubility of the gelatin based film incorporated with the combined antimicrobial was not affected, especially at high level of addition (p>0.05). In conclusion, gelatin based film incorporated with the combination of catechin and lysozyme was more effective to inhibit S. aureus than E. coli, S. cerevisiae and L. innocua. Antimicrobial activity of combined catechin and lysozyme is concentration dependent; however 125 mg/g concentration could inhibit the growth of some microorganism. Keywords: antimicrobial, catechin, edible film, gelatin, lysozyme Introduction and Objective Recently, increasing attention has been paid to develop materials with film-forming capacity and having antimicrobial properties which help improve food safety and shelf life. Antimicrobial packaging is one of the most promising active packaging systems that have been found highly effective in killing, inhibiting or retarding the growth of food spoilage and pathogenic microorganisms1. Several active compounds have been proposed for antimicrobial activity in food packaging, including organic acids, enzymes, fungicides and natural active agents such as nisin, catechin and lysozyme. These compounds carry mostly antimicrobial and some antioxidant properties which are effective in reducing the levels of food borne pathogens or retarding the chemical reaction in foods. The purpose of this study was to determine the inhibitory effects of gelatin based films incorporated with the combination of catechin and lysozyme against selected food pathogens.
Materials and Methods
Film preparation Gelatin film-forming solution (FFS: protein
conc. 3% and glycerol 25% of protein) was prepared. Different concentrations (0, 125, 250, and 500 mg/g) of the combination of catechin and lysozyme were added. De-aerated FFS was cast onto a rimmed silicone resin plate and dried at 25±0.5C and 50±5% RH for 24 h. Dried films obtained were manually peeled off and used for properties testing.
Determinations The light barrier properties of the films were measured according to Gómez-Guillén et al2. Films were exposed to light at wavelengths ranging from 800 to 200 nm, and absorbance was measured and expressed as percentage transmittance. The transparency value of the films was calculated at 600 nm according to the method of Han and Floros3. The film solubility was determined according to the method of Gennadios et al4. The films were tested for their inhibition against the target microorganisms using an agar disc diffusion method according to
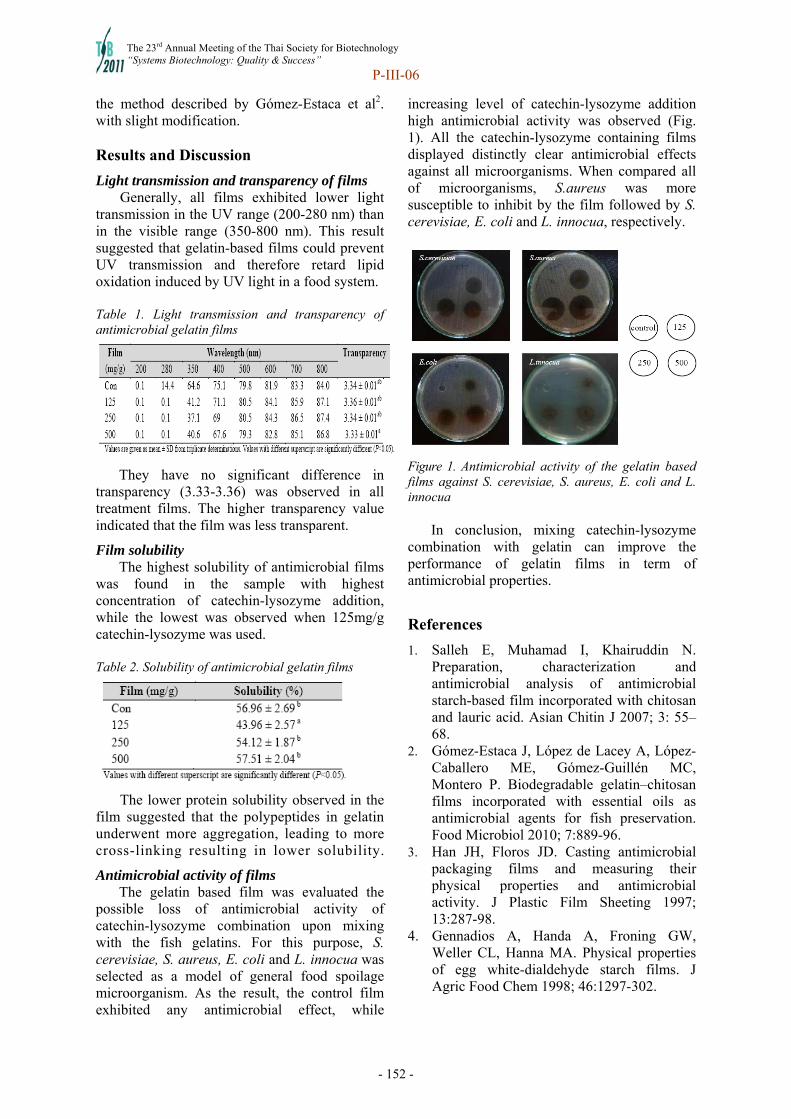
The 23rd Annual Meeting of the Thai Society for Biotechnology “Systems Biotechnology: Quality & Success”
P-III-06
- 152 -
the method described by Gómez-Estaca et al2. with slight modification. Results and Discussion
Light transmission and transparency of films Generally, all films exhibited lower light
transmission in the UV range (200-280 nm) than in the visible range (350-800 nm). This result suggested that gelatin-based films could prevent UV transmission and therefore retard lipid oxidation induced by UV light in a food system. Table 1. Light transmission and transparency of antimicrobial gelatin films
They have no significant difference in transparency (3.33-3.36) was observed in all treatment films. The higher transparency value indicated that the film was less transparent.
Film solubility The highest solubility of antimicrobial films
was found in the sample with highest concentration of catechin-lysozyme addition, while the lowest was observed when 125mg/g catechin-lysozyme was used.
Table 2. Solubility of antimicrobial gelatin films
The lower protein solubility observed in the film suggested that the polypeptides in gelatin underwent more aggregation, leading to more cross-linking resulting in lower solubility.
Antimicrobial activity of films The gelatin based film was evaluated the
possible loss of antimicrobial activity of catechin-lysozyme combination upon mixing with the fish gelatins. For this purpose, S. cerevisiae, S. aureus, E. coli and L. innocua was selected as a model of general food spoilage microorganism. As the result, the control film exhibited any antimicrobial effect, while
increasing level of catechin-lysozyme addition high antimicrobial activity was observed (Fig. 1). All the catechin-lysozyme containing films displayed distinctly clear antimicrobial effects against all microorganisms. When compared all of microorganisms, S.aureus was more susceptible to inhibit by the film followed by S. cerevisiae, E. coli and L. innocua, respectively.
Figure 1. Antimicrobial activity of the gelatin based films against S. cerevisiae, S. aureus, E. coli and L. innocua
In conclusion, mixing catechin-lysozyme combination with gelatin can improve the performance of gelatin films in term of antimicrobial properties.
References
1. Salleh E, Muhamad I, Khairuddin N. Preparation, characterization and antimicrobial analysis of antimicrobial starch-based film incorporated with chitosan and lauric acid. Asian Chitin J 2007; 3: 55–68.
2. Gómez-Estaca J, López de Lacey A, López-Caballero ME, Gómez-Guillén MC, Montero P. Biodegradable gelatin–chitosan films incorporated with essential oils as antimicrobial agents for fish preservation. Food Microbiol 2010; 7:889-96.
3. Han JH, Floros JD. Casting antimicrobial packaging films and measuring their physical properties and antimicrobial activity. J Plastic Film Sheeting 1997; 13:287-98.
4. Gennadios A, Handa A, Froning GW, Weller CL, Hanna MA. Physical properties of egg white-dialdehyde starch films. J Agric Food Chem 1998; 46:1297-302.
The 23rd Annual Meeting of the Thai Society for Biotechnology “Systems Biotechnology: Quality & Success”
P-III-07
- 153 -
The efficiency of sodium hypochlorite and peracetic acid on reducing of Vibrio parahaemolyticus on shrimp during washing step
Tanva Sompuen and Warawut Krusong Faculty of Agro-Industry, King Mongkut’s Institute of Technology Ladkrabang, Bangkok 10520, Thailand. Abstract
Vibrio parahaemolyticus(VP) is one of the most prevalent bacterial pathogens causing food-borne disease worldwide. It is main problem to Thai’s export of frozen shrimp products. The concentration of sodium hypochlorite (NaOCl) and peracetic acid (PAA) and appropriate contact time on reduction of VP were preliminarily investigated. VP was initially controlled to 5.7 log CFU/ml during in vitro study. At 50 ppm NaOCl or 10 ppm PAA with 1 min of contact time, no survival of VP was found. But some injured cells were recovered after cultivating in Trypticase Soy Broth (TSB) supplemented with 2% NaCl for 24 h. When prolonging contact time to 5 min was further investigated, no survival of VP was found only in case of PAA. Hence, the PAA was finally assigned for reduction of VP during washing step of fresh shrimps inoculated with 4.0 log CFU/g of VP. The results revealed that 20 ppm of PAA with 5 min contact time reduced VP to 1.33 log CFU/g.
Keywords: Shrimp, Vibrio parahaemolyticus, Sodium hypochlorite, Peracetic acid, Washing step
Introduction and Objective
In frozen shrimp manufacturing, the contamination of pathogens which are found in frozen shrimp is the main problem1. Recently, the sanitizing agents are used for washing the shrimp such as sodium hypochloride because it is not expensive but chlorine may react with organic compound. This reaction is formed by trihalomethane which causes of carcinogen. So, this alternative sanitizing agents is used for comparison such as peracetic acid because peroxide is organic compound, water soluble and stable. The degradation of peroxide is non toxicant. This work is to determine the potential of PAA and NaOCl during a washing process, in order to determine the optimal condition of sanitizing agents for reducing VP in vitro and survival of VP on shrimp surface after a washing process. Thus, this objective is useful for quality and safety of shrimp product which increases security for consumer and relies in security of Shrimp Thai Industry for competition in the world market. Materials and Methods
NaOCl (Movic Inc., Thailand) at 0, 10, 30, 50 and 100 ppm in 1% (w/v) sodium chloride (NaCl) steriled at 121C 15 min and PAA (Chem Serve Inc., Thailand) at 0, 5, 10, 20 and 30 ppm in 1%(w/v) NaCl steriled at 121C 15 min were prepared.
Cultivation and harvesting of cells: VP was isolated from Shrimp’s pond. Cells of VP were grown at 35-37C for 24 h in 200 ml of TSB + 2%NaCl, harvested, and used as inoculum. The 10 ml portion of culture was transferred to 90 ml of TSB + 2%NaCl, grown at 35-37°C for 2 h, and then, transferred 30 ml to 270 ml Alkaline peptone water. The approx. 5.7 log CFU/ml was prepared. Efficacy of NaOCl and PAA solution on reducing of VP in vitro: Each concentration of NaOCl or PAA was applied into culture of VP 5.7 log CFU/ml and mixed by vortex mixer. The amount of VP was enumerated during sampling period.
Efficacy of PAA solution on reducing of VP on Shrimp: the shrimps (PND tail off vannamei white shrimp) and frozen shrimps by Individual Quick Freezing were packed in PE bag (20-25 pcs/bag). Shrimp samples were washed twice with 50 ppm NaOCl and, then, washed with sterile water three times for reducing survival of VP. After washing process, shrimps were treated with VP for 5 min and dried in laminar flow cabinet for 5 min. Prior to microbial enumeration, shrimps were washed by PAA at 0, 5, 10 and 20 ppm for 1, 5 and 10 min.
Microbial enumeration: each shrimp samples after washing step were enumerated on TCBS agar at 35-37C for 24 h by spread plate technique. The number of survival of VP was studied by transferring 1 ml of VP in 9 ml TSB broth and incubating at 35-37C for 24 h.
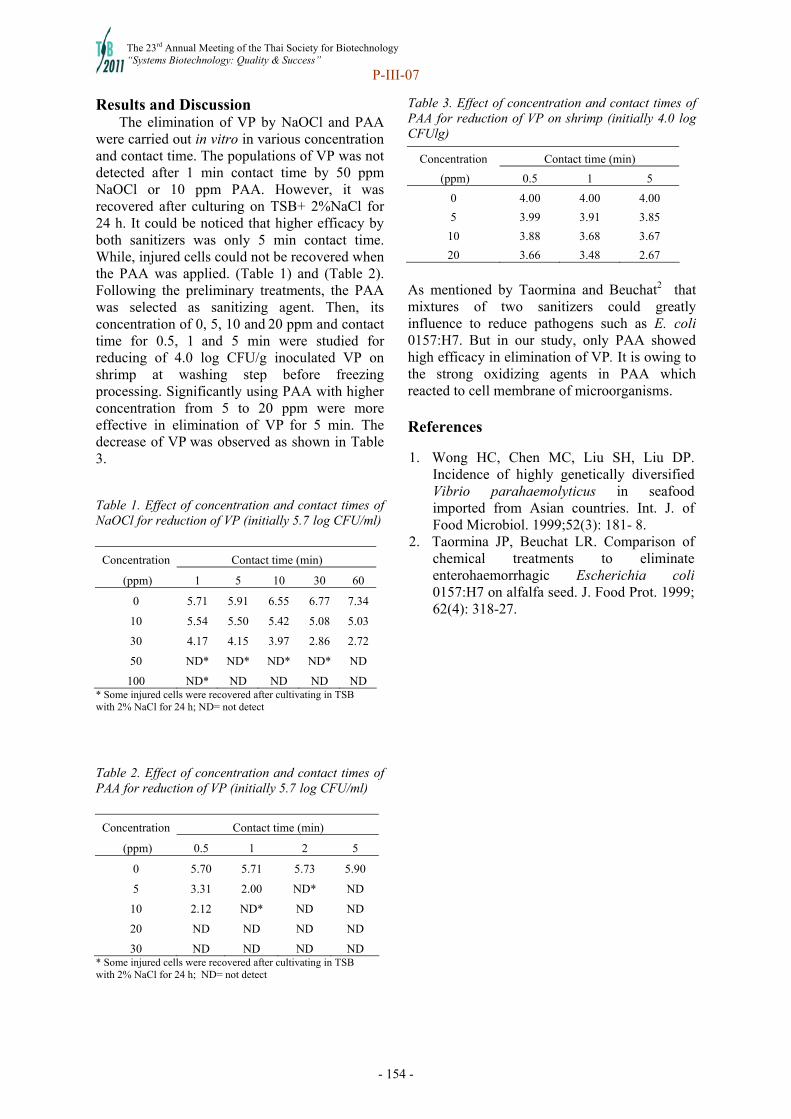
The 23rd Annual Meeting of the Thai Society for Biotechnology “Systems Biotechnology: Quality & Success”
P-III-07
- 154 -
Results and Discussion The elimination of VP by NaOCl and PAA
were carried out in vitro in various concentration and contact time. The populations of VP was not detected after 1 min contact time by 50 ppm NaOCl or 10 ppm PAA. However, it was recovered after culturing on TSB+ 2%NaCl for 24 h. It could be noticed that higher efficacy by both sanitizers was only 5 min contact time. While, injured cells could not be recovered when the PAA was applied. (Table 1) and (Table 2). Following the preliminary treatments, the PAA was selected as sanitizing agent. Then, its concentration of 0, 5, 10 and 20 ppm and contact time for 0.5, 1 and 5 min were studied for reducing of 4.0 log CFU/g inoculated VP on shrimp at washing step before freezing processing. Significantly using PAA with higher concentration from 5 to 20 ppm were more effective in elimination of VP for 5 min. The decrease of VP was observed as shown in Table 3. Table 1. Effect of concentration and contact times of NaOCl for reduction of VP (initially 5.7 log CFU/ml)
Concentration Contact time (min)
(ppm) 1 5 10 30 60
0 5.71 5.91 6.55 6.77 7.34
10 5.54 5.50 5.42 5.08 5.03
30 4.17 4.15 3.97 2.86 2.72
50 ND* ND* ND* ND* ND
100 ND* ND ND ND ND * Some injured cells were recovered after cultivating in TSB with 2% NaCl for 24 h; ND= not detect Table 2. Effect of concentration and contact times of PAA for reduction of VP (initially 5.7 log CFU/ml)
Concentration Contact time (min)
(ppm) 0.5 1 2 5
0 5.70 5.71 5.73 5.90
5 3.31 2.00 ND* ND
10 2.12 ND* ND ND
20 ND ND ND ND
30 ND ND ND ND * Some injured cells were recovered after cultivating in TSB with 2% NaCl for 24 h; ND= not detect
Table 3. Effect of concentration and contact times of PAA for reduction of VP on shrimp (initially 4.0 log CFUlg)
Concentration Contact time (min)
(ppm) 0.5 1 5
0 4.00 4.00 4.00
5 3.99 3.91 3.85
10 3.88 3.68 3.67
20 3.66 3.48 2.67
As mentioned by Taormina and Beuchat2 that mixtures of two sanitizers could greatly influence to reduce pathogens such as E. coli 0157:H7. But in our study, only PAA showed high efficacy in elimination of VP. It is owing to the strong oxidizing agents in PAA which reacted to cell membrane of microorganisms. References
1. Wong HC, Chen MC, Liu SH, Liu DP. Incidence of highly genetically diversified Vibrio parahaemolyticus in seafood imported from Asian countries. Int. J. of Food Microbiol. 1999;52(3): 181- 8.
2. Taormina JP, Beuchat LR. Comparison of chemical treatments to eliminate enterohaemorrhagic Escherichia coli 0157:H7 on alfalfa seed. J. Food Prot. 1999; 62(4): 318-27.
The 23rd Annual Meeting of the Thai Society for Biotechnology “Systems Biotechnology: Quality & Success”
P-III-10
- 155 -
Isolation and screening of halophilic ribonuclease-producing bacteria from Thai fermented protein foods
Julalak Chuprom1, Nuttapong Bovornreungroj2, Duangporn Kantachote1, Prasert Suntinanalert1, Preeyanuch Bovornreungroj1
1Department of Microbiology, Faculty of Science, Prince of Songkla University, Thailand 2 Department of Technology and Industry, Faculty of Science and Technology, Prince of Songkla University, Thailand
Abstract
The objective of this study was to isolate the halophilic ribonuclease-producing bacteria (HRNB) from various Thai fermented protein foods. A total of 201 HRNB isolates were isolated from 45 Thai fermented protein food samples including Budu, fish sauce, shrimp paste, soy sauce and Tai Pla. Effect of NaCl at various concentrations on bacterial growth and halophilic ribonuclease production (HRNP) of selected strains were also investigated. Among all, 3 isolates (1.49%) showed the highest HRNP ability on DNase agar containing 20% (w/v) NaCl, whereas 12 (5.97%) and 9 (4.48%) isolates exhibited high HRNP on DNase agar containing 20 and 25% (w/v) NaCl, respectively. Therefore, these potential halophilic ribonuclease bacteria may be selected and applied later on in Thai fish sauce production in order to enhance flavor and aroma. Keywords: halophilic nuclease, halophilic bacteria, Thai fermented protein foods Introduction and Objective
Halophilic bacteria are a group of bacteria that require certain amount of NaCl for maintaining their growth as well as enzymatic activities. (Kanlayakrit et al., 2001). They have been extensively used in the production of a wide variety of food products, such as fish sauce (Kuninaka and Bovornreungroj, 2005; Udomsil et al., 2010) and Indonesian soy sauce (Margesin and Schinner, 2001). However, some halophilic bacterial enzymes are of potential interest such as nuclease. In general, nucleases comprise of deoxyribonucleases (DNase) and ribonucleases (RNase). These enzymes are known to hydrolyze 5’-nucleotides (e.g. 5’-AMP, -GMP, -CMP and-UMP) from RNA. 5’-Nucleotides, especially 5’-IMP and 5’-GMP, enhance the flavor properties in food due to the synergistic effect with monosodium glutamate (MSG) (Kuninaka et al., 1961). Ikeda (2000) and Boonpan (2002) reported that halophilic ribonuclease from halotolerant Psuedomonas sp. cleave the RNA and DNA into nucleotides and thus can be used as a flavor-enhancer in fish sauce production.
Therefore, the aim of this study was to isolate and characterize various halophilic ribonuclease-producing bacteria from a variety of Thai fermented foods in order to evaluate the feasibility for applying those enzymes in Thai fish sauce fermentation.
Materials and Methods 2.1 Culture medium Sehgal and Gibbons Complex (SGC) broth
(Sehgal and Gibbons, 1960), supplemented with 10, 15, 20 and 25% (w/v) NaCl was used for isolation of halophilic ribonuclease-producing bacteria.
Bacto DNase test agar-methyl green containing 0, 5, 10, 15, 20 and 25% (w/v) NaCl was used for screening ribonuclease activity.
2.2 Isolation of halophilic ribonuclease-producing bacteria
Forty nine samples of various Thai fermented foods were obtained from factory and local markets in Thailand. Approximately 1 ml or 1 g of each sample was added into Seghal and Gibbons Complex (SGC) medium containing 10, 15, 20 and 25% (w/v) NaCl and incubated on a rotary shaker at 37°C, 200 rpm for 7 to 10 days. The suspension was streaked onto SGC agar containing 10, 15, 20 and 25% and incubated at 37๐C for 7 to 10 days. After purification, pure culture was examined for nuclease activity test on plate agar.
2.3 Nuclease activity test on plate agar The strains were tested for nuclease activity
by spotting onto Bacto DNase test agar-methyl green containing 0, 5, 10, 15, 20 and 25% (w/v) NaCl and then incubated at 37°C for 7 days. A positive reaction for the DNase test indicated the disappearance of methyl green around the colony.

The 23rd Annual Meeting of the Thai Society for Biotechnology “Systems Biotechnology: Quality & Success”
P-III-10
- 156 -
Table 1. Source and distribution of halophilic bacteria isolated from fermented products on SGC medium at different NaCl concentrations incubated at 37ºC for 7 to 10 days.
No. of isolated on SGC medium at various NaCl concentrations (%) Name of the fermented
products No. of
samples No. of detected
samples 10 15 20 25
Total (isolates)
Budu (BU) 7 7 9 8 3 1 21
Fish sauce (FS) 1 1 1 0 0 0 1
Shrimp paste (SP) 31 31 51 50 29 39 169
Soy sauce (SS) 2 0 0 0 0 0 0
Tai Pla (TP) 8 6 6 4 0 0 10
Total 49 45 67 62 32 40 201
Table 2. Screening of halophilic ribonuclease producing isolates cultured on DNase medium at various NaCl concentrations incubated at 37oC for 7 days.
No. of isolates (percent) of ribonuclease producing bacteria at difference NaCl concentrations (%) Range of ratio between
clear zone/colony size
Level of ribonuclease activity
0 5 10 15 20 25
ND Not detected 117(58.21) 63(31.34) 24(11.94) 61(30.35) 102(50.75) 140(69.65)
0-2.50 Fair 19(9.45) 63(31.34) 82(40.80) 69(34.33) 54(26.87) 27(13.43)
2.51-5.00 Good 60(29.85) 66(32.84) 84(41.79) 54(26.87) 30(14.93) 25(12.44)
5.01-7.50 Very good 5(2.49) 9(4.48) 9(4.48) 17(8.46) 12(5.97) 9(4.48)
7.51-10.00 Excellent 0(0) 0(0) 2(1.00) 0(0) 3(1.49) 0(0)
*Number in the bracket represents the total percentage of bacteria isolated at each concentration
In particular, the size of the colony together with the width of the clear zone was considered to be directly related with the amount of extracellular deoxyribonuclease produced by each isolate. The enzyme production and growth ratio was defined as the diameter of clear zone (mm) to the diameter of the colony size (mm).
Results and discussion
Among 49 samples of fermented products obtained from factory and local markets in Thailand, halophilic ribonuclease-producing bacteria were detected in 45 samples. A total of 201 halophilic ribonuclease-producing bacteria were isolated from 45 samples on SGC medium at various NaCl concentrations (%) (Table 1). From the results, shrimp paste showed the highest halophilic ribonuclease-producing bacteria isolates (169 isolates from 31 samples), followed by Budu (21 isolates from 7 samples). In case of fish sauce sample, only 1 isolate was detected, whereas, 10 isolates from 8 Tai Pla samples were identified. However, no isolates was found in samples from soy sauce. In addition, using 10% and 20% (w/v) NaCl, only two isolates (1.00%) and three isolates (1.49%), showed the highest ribonuclease activity respectively. At the level of 25% (w/v) NaCl, 9 isolates (4.48%) displayed very good halophilic ribonuclease production on
DNase agar. Therefore, the halophilic ribonuclease bacteria having high nuclease activity at either 20% or 25% NaCl may be considered potentially useful and could be further applied in Thai fish sauce for the improvement of flavor and aroma.
Acknowledgement
We would like to thank the National Research University Project of Thailand’s Office of the Higher Education Commission code no.SCI540557M for Financial Support and Graduate School.
References
1. Kanlayakrit W, Bovornreungroj P. Isolation of extremely halophilic bacteria producing halophilic protease from fish sauce sample. Kasetsart J. Nat. Sci. 2005;39(1):88-97.
2. Kanlayakrit W, Ikeda T, Tojai S., Rodprapakorn M, Sirisansaneeyakul S. Isolation and Characterization of Extracellular Halophilic Ribonuclease from Halotolerant Pseudomonas species. Kasetsart J. Nat. Sci. 2001;35:179-187.
3. Udomsil N, Rodtong S, Tanasupawat S, Yongsawatdigul J. Proteinase-producing halophilic lactic acid bacteria isolated from fish sauce fermentation and their ability to produce volatile compound. Int. Food Microbiol. 2010; 141:186–194.
The 23rd Annual Meeting of the Thai Society for Biotechnology “Systems Biotechnology: Quality & Success”
P-III-11
- 157 -
Effect of catechin and lysozyme addition on physical and mechanical properties of gelatin-based films
Damrongpol Kamhangwonga, Phunsiri Suthilukb, and Saroat Rawdkuenb
aTechnology Management of Agricultural Produces and Packaging Program, School of Agro-Industry, Mae Fah Luang University, Muang, Chiang Rai 57100, Thailand. bFood Technology Program, School of Agro-Industry, Mae Fah Luang University, Muang, Chiang Rai 57100, Thailand
Abstract Gelatin-based films are thin, flexible, and transparent biodegradable materials. There are
manyapplications of this type of film in food engineering, packaging, drug recover, and others. The addition of some other active compounds can alter physical properties of the film, such as increasing flexibility, moisture sensitivity, as well as other functional properties. In this study, the effects of combining catechin and lysozyme (CLC) into the 2-dimensional films made from fish gelatin were investigated. The effects of CLC at various concentrations of (i.e. 0, 0.125, 0.250, and 0.500% CLC) on the mechanical properties of the modified gelatin films including tensile strength (TS) and elongation at break (EAB), water vapor permeability (WVP) and color of films were also evaluated. CLC at the level of 0.500% addition showed the greatest EAB at 143.17%, and the lowest WVP at 6.50 X 10⁻⁸ g·mm·h-1·cm-2·Pa-1, whereas the control provided high TS at 33.49 MPa. The highest WVP at 12.60 X 10⁻⁸ g·mm·h-1·cm-2·Pa-1 was found in the control film. For color appearance, the fish gelatin film with no CLC became more transparent with high brightness (L*) but low yellowness (b*). However, the brightness and yellowness of the film decreased with an increasing of CLC concentrations. Nevertheless, our findings suggest that using CLC incorporated into the fish gelatin film can improve some mechanical properties of the films (i.e. elongation and barrier properties), thus allowing the modified films become more applicable in the area of high-stretching applications. Keywords: gelatin film, biodegradable packaging, catechin, lysozyme Introduction and Objective
Gelatin is a heterogeneous protein containing 20 different amino acids in their polypeptide chains. The physical and structural properties of gelatin are mainly influenced by many factors such as the molecular weight distribution (MWD), amino acid composition, plasticizer and additive used that plays an important role in the mechanical, optical and barrier properties of the resulting films.
Additive is a factor affecting the properties of gelatin films. Many researchers have reported that various bioactive additives, as enzymes, antimicrobial agents and antioxidant agents might be entrapped in porous solid matrices in the gelatin and can be immobilized by covalent binding to a solid support. These resulted in the changes in the gelatin films’ properties. Thus, the objectives of this present study was to investigate the effects of adding various combinations of catechin and lysozyme on the properties of fish gelatin-based film.
Materials and Methods 2.1 Film preparation
The studied levels of CLM (catechin and lysozyme combination with ratio 1:1) in film forming solution (FFS) were 0, 0.125 %, 0.250 0.500 % (w/v) of the FFS. Fish Gelatin and CLM were dissolved at 60C for 30 min to obtain the FFS with 3% (w/v) protein concentration, and then mixed with glycerol (25% w/w of the protein). FFS was cast onto a rimmed silicone resin plate, dried at room temperature 12 h and dried in a ventilated oven at 25 0.5C and 50% 5%RH for 24 h. respectively. All experimental treatments were compared to 3% (w/v) gelatin film with glycerol (25% w/v of the protein) as a control. 2.2 Mechanical properties
Tensile strength (TS) and elongation at break (EAB) were determined as previously described by Bower et al. (2006) using the Universal Testing Machine. 2.3 Film thickness
The thickness of film was measured using a digital micrometer. Ten random locations around
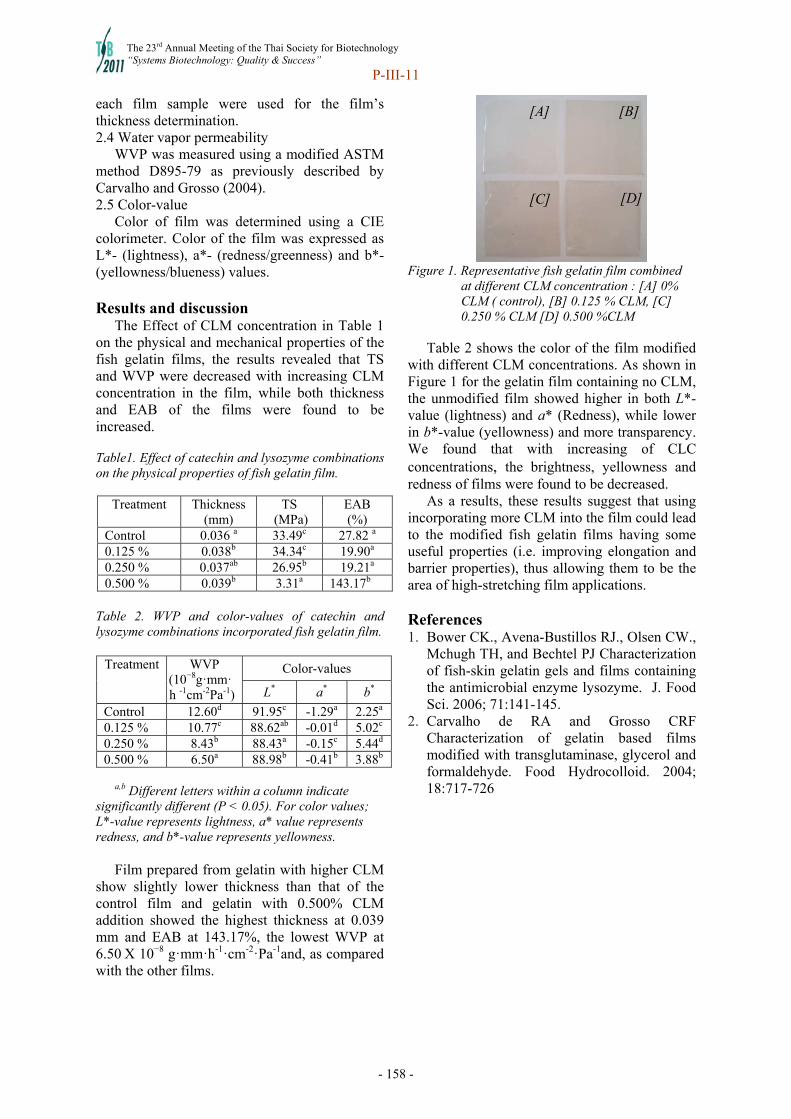
The 23rd Annual Meeting of the Thai Society for Biotechnology “Systems Biotechnology: Quality & Success”
P-III-11
- 158 -
each film sample were used for the film’s thickness determination. 2.4 Water vapor permeability
WVP was measured using a modified ASTM method D895-79 as previously described by Carvalho and Grosso (2004). 2.5 Color-value
Color of film was determined using a CIE colorimeter. Color of the film was expressed as L*- (lightness), a*- (redness/greenness) and b*- (yellowness/blueness) values. Results and discussion
The Effect of CLM concentration in Table 1 on the physical and mechanical properties of the fish gelatin films, the results revealed that TS and WVP were decreased with increasing CLM concentration in the film, while both thickness and EAB of the films were found to be increased. Table1. Effect of catechin and lysozyme combinations on the physical properties of fish gelatin film.
Table 2. WVP and color-values of catechin and lysozyme combinations incorporated fish gelatin film.
Color-values Treatment
WVP (10−8g·mm· h -1cm-2Pa-1) L* a* b*
Control 12.60d 91.95c -1.29a 2.25a 0.125 % 10.77c 88.62ab -0.01d 5.02c 0.250 % 8.43b 88.43a -0.15c 5.44d 0.500 % 6.50a 88.98b -0.41b 3.88b
a,b Different letters within a column indicate significantly different (P < 0.05). For color values; L*-value represents lightness, a* value represents redness, and b*-value represents yellowness.
Film prepared from gelatin with higher CLM
show slightly lower thickness than that of the control film and gelatin with 0.500% CLM addition showed the highest thickness at 0.039 mm and EAB at 143.17%, the lowest WVP at 6.50 X 10⁻⁸ g·mm·h-1·cm-2·Pa-1and, as compared with the other films.
Figure 1. Representative fish gelatin film combined at different CLM concentration : [A] 0% CLM ( control), [B] 0.125 % CLM, [C] 0.250 % CLM [D] 0.500 %CLM
Table 2 shows the color of the film modified
with different CLM concentrations. As shown in Figure 1 for the gelatin film containing no CLM, the unmodified film showed higher in both L*-value (lightness) and a* (Redness), while lower in b*-value (yellowness) and more transparency. We found that with increasing of CLC concentrations, the brightness, yellowness and redness of films were found to be decreased.
As a results, these results suggest that using incorporating more CLM into the film could lead to the modified fish gelatin films having some useful properties (i.e. improving elongation and barrier properties), thus allowing them to be the area of high-stretching film applications.
References 1. Bower CK., Avena-Bustillos RJ., Olsen CW.,
Mchugh TH, and Bechtel PJ Characterization of fish-skin gelatin gels and films containing the antimicrobial enzyme lysozyme. J. Food Sci. 2006; 71:141-145.
2. Carvalho de RA and Grosso CRF Characterization of gelatin based films modified with transglutaminase, glycerol and formaldehyde. Food Hydrocolloid. 2004; 18:717-726
Treatment Thickness (mm)
TS (MPa)
EAB (%)
Control 0.036 a 33.49c 27.82 a 0.125 % 0.038b 34.34c 19.90a 0.250 % 0.037ab 26.95b 19.21a 0.500 % 0.039b 3.31a 143.17b
[A] [B]
[C] [D]
The 23rd Annual Meeting of the Thai Society for Biotechnology “Systems Biotechnology: Quality & Success”
P-III-12
- 159 -
Antimicrobial properties of synthetic and natural compounds against food spoilage microorganisms
Phunsiri Suthiluka, Saroat Rawdkuena, and Damrongpol Kamhangwongb
aFood Technology Program, School of Agro-Industry, Mae Fah Luang University, Muang, Chiang Rai 57100, Thailand. bTechnology Management of Agricultural Produces and Packaging Program, School of Agro-Industry, Mae Fah Luang University, Muang, Chiang Rai 57100, Thailand.
Abstract
Antimicrobial activities of six compounds (i.e. acetic acid, catechin, chitosan, gallic acid, lysozyme and nisin) at the concentration of 500 µg/ml each against the growth of Escherichia coli, Staphylococcus aureus, Listeria innocua and Saccharomyces cerevisiae were determined by measuring inhibition zones using agar disc diffusion method. Inhibition zones were significantly different (P<0.05) depending on types of compound and types of microorganism. Among six different compounds, our results showed that catechin had the highest antimicrobial activity against E. coli and S. aureus with a mean inhibition zone of 6.94 and 10.38 mm, respectively. Lysozyme also showed the most effective against L. innocua and S. cerevisiae with 8.31 and 7.25 mm of inhibition zone, respectively. In addition, antimicrobial parameters in terms of minimum inhibitory (MIC) and minimum bactericidal concentration (MBC) were also determined. The MIC values of catechin for E. coli and S. aureus were found to be at similar range (640 µg/ml), while the MBC values were at 640 and 1,280 µg/ml, respectively. The MIC and MBC values of lysozyme for L. innocua were found to be at 160 µg/ml and 640 µg/ml, respectively. However, comparing these two, lysozyme appear to be more effective killing S. cerevisiae than bacteria, since both of its MIC and MBC were found to be at much lower value and at the same range (2.5 µg/ml). This study thus revealed the potential application of some of natural occurring compounds such as catechin and lysozyme for their usage in making antimicrobial edible films for food packaging.
Keywords: antimicrobial activity, catechin, lysozyme, agar disc diffusion Introduction and Objective
The spoilage of foods each year all over the world incurs great economic losses. On the contrary, safe, stable and high quality food products have been increasingly required. In addition, consumers have had a great desire for high quality foods that are more natural, minimally processed and preservative free or naturally derived, while remaining food safety with an extended shelf life. Thus, food scientists and the food industries have combined their efforts to develop or looking for new technologies that can be used to maintain the safety as well as improve the quality of food products1. Various antimicrobial or antioxidant based products and processes have been developed to solve this problem. Several categories of antimicrobials have been tested including: organic acids, fungicides, bacteriocins, proteins, enzymes, inorganic gases, silver substitute zeolite, and others2. They can control microbial contaminations by either reducing the microbial growth rate, or extending
the lag-phase of the target microorganisms3. The purpose of this study therefore was to determine the inhibitory effects of selected natural and synthetic antimicrobial agents against four important species of food spoilage microorganisms. Materials and Methods
Samples preparation Six compounds of synthetic and natural
antimicrobial agents (acetic acid, catechin, chitosan, gallic acid, lysozyme and nisin) with the concentration of 500 µg/ml were used to test their antimicrobial activities. Four common microbial strains causing food spoilage were selected, which are Gram-positive species; S. aureus, L. innocua and Gram-negative species; E. coli and spoilage yeast; S. cerevisiae. All of these microorganisms were activated before plating on plate count agars. A stock suspension of 107-108 CFU/ml was prepared for each each microbial culture
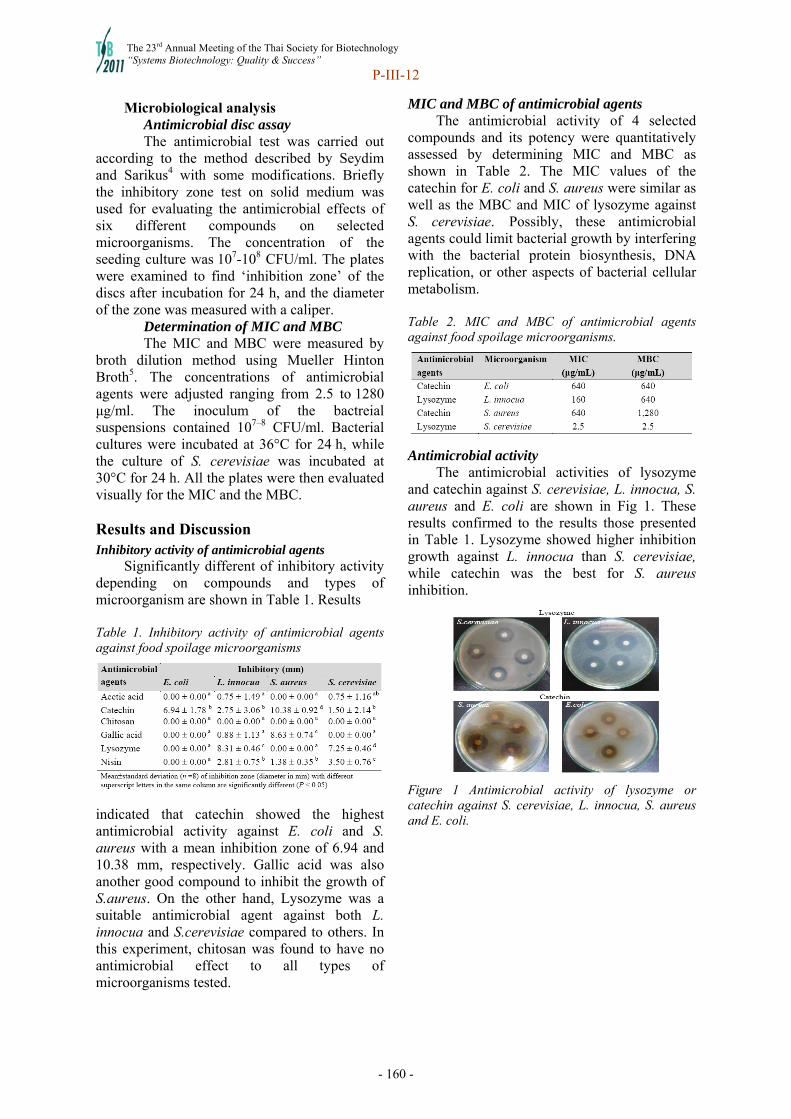
The 23rd Annual Meeting of the Thai Society for Biotechnology “Systems Biotechnology: Quality & Success”
P-III-12
- 160 -
Microbiological analysis Antimicrobial disc assay
The antimicrobial test was carried out according to the method described by Seydim and Sarikus4 with some modifications. Briefly the inhibitory zone test on solid medium was used for evaluating the antimicrobial effects of six different compounds on selected microorganisms. The concentration of the seeding culture was 107-108 CFU/ml. The plates were examined to find ‘inhibition zone’ of the discs after incubation for 24 h, and the diameter of the zone was measured with a caliper.
Determination of MIC and MBC The MIC and MBC were measured by
broth dilution method using Mueller Hinton Broth5. The concentrations of antimicrobial agents were adjusted ranging from 2.5 to 1280 μg/ml. The inoculum of the bactreial suspensions contained 107–8 CFU/ml. Bacterial cultures were incubated at 36°C for 24 h, while the culture of S. cerevisiae was incubated at 30°C for 24 h. All the plates were then evaluated visually for the MIC and the MBC.
Results and Discussion Inhibitory activity of antimicrobial agents
Significantly different of inhibitory activity depending on compounds and types of microorganism are shown in Table 1. Results
Table 1. Inhibitory activity of antimicrobial agents against food spoilage microorganisms
indicated that catechin showed the highest antimicrobial activity against E. coli and S. aureus with a mean inhibition zone of 6.94 and 10.38 mm, respectively. Gallic acid was also another good compound to inhibit the growth of S.aureus. On the other hand, Lysozyme was a suitable antimicrobial agent against both L. innocua and S.cerevisiae compared to others. In this experiment, chitosan was found to have no antimicrobial effect to all types of microorganisms tested.
MIC and MBC of antimicrobial agents The antimicrobial activity of 4 selected
compounds and its potency were quantitatively assessed by determining MIC and MBC as shown in Table 2. The MIC values of the catechin for E. coli and S. aureus were similar as well as the MBC and MIC of lysozyme against S. cerevisiae. Possibly, these antimicrobial agents could limit bacterial growth by interfering with the bacterial protein biosynthesis, DNA replication, or other aspects of bacterial cellular metabolism.
Table 2. MIC and MBC of antimicrobial agents against food spoilage microorganisms.
Antimicrobial activity The antimicrobial activities of lysozyme
and catechin against S. cerevisiae, L. innocua, S. aureus and E. coli are shown in Fig 1. These results confirmed to the results those presented in Table 1. Lysozyme showed higher inhibition growth against L. innocua than S. cerevisiae, while catechin was the best for S. aureus inhibition.
Figure 1 Antimicrobial activity of lysozyme or catechin against S. cerevisiae, L. innocua, S. aureus and E. coli.

The 23rd Annual Meeting of the Thai Society for Biotechnology “Systems Biotechnology: Quality & Success”
P-III-12
- 161 -
References
1. Artes F, Gomez P, Artes-Hernandez F. Physical, physiological and microbial deterioration of minimally fresh processed fruits and vegetables. Food Sci Technol Int 2007; 13: 177–88.
2. Suppakul P, Miltz J, Sonneveld K, Bigger SW. Active packaging technologies with an emphasis on antimicrobial packaging and its applications. J Food Sci 2003; 68:408–20.
3. Quintavalla S, Vicini L. Antimicrobial food packaging in meat industry. Meat Sci 2002; 62: 373-80.
4. Seydim AC, Sarikus G. Antimicrobial activity of whey protein based edible films incorporated with oregano, rosemary and garlic essential oils. Food Res Int 2006; 39: 639–44.
5. Ogata M, Hoshi M, Urano S, Endo T. Antioxidant activity of eugenol and related monomeric and dimeric compounds. Chem Pharmaceu Bull 2000; 48: 1467–469.
The 23rd Annual Meeting of the Thai Society for Biotechnology “Systems Biotechnology: Quality & Success”
P-IV-01
- 162 -
A static bed bioreactor for immobilization of Rhizopus oryzae and L(+)-lactic acid production
Varunee Pimtonga,b, Ruethairat Boonsombatb, Nuttha Thongchulb
aProgram in Biotechnology, Faculty of Science, Chulalongkorn University, Bangkok, Thailand bInstitute of Biotechnology and Genetic Engineering, Chulalongkorn University, Bangkok, Thailand
Abstract
L(+)-lactic acid has been widely used in food and pharmaceutical industries. Currently, pure isomer of lactic acid is in high demand for the production of polylactic acid (PLA), a biodegradable polymer which will sustainably solve the environmental problems related to non-degradable plastic wastes. Rhizopus oryzae is known to be outstanding in producing optically pure L(+)-lactic acid. Nonetheless, Rhizopus morphology has the profound effect on rheology of fermentation broth which eventually influences the performance of the bioreactor. To achieve high lactic acid production rate, controlling morphology of R. oryzae in an appropriate manner is required in a specific bioreactor. A static-bed bioreactor was proven to be a good design for controlling morphology and improving L(+)-lactic acid fermentation. A high lactic acid yield of 65.51% (w/w) and productivity of 2.25 g/L·h with the final concentration of 35.88 g/L from 70 g/L glucose was achieved when operating the bioreactor at 700 rpm and 0.5 vvm air. In addition, high cell density achieved in the static bed bioreactor exhibited glucose tolerant ability; thus, fermentation could be performed at high initial glucose concentration which eventually led to high L(+)-lactic acid production rate. Keywords: static bed bioreactor, L(+)-lactic acid, morphology, Rhizopus oryzae, initial glucose Introduction and Objective
L(+)-Lactic acid is an important biological product due to its wide applications in food processing, chemical and pharmaceutical industries. Currently, there has been an increased interest in lactic acid production because it is the starting material of polylactic acid (PLA), a compostable thermoplastic. It is expected that in the near future PLA will replace the commodity polymers such as polyethylene, polypropylene, and polystyrene in packaging and other applications due to its biodegradability (Bai et al., 2008). Lactic acid has long been produced for food and beverages via bacterial fermentation because of the high production rate. Nonetheless, PLA production via polymerization requires the specifically high optical purity of lactic acid which has not been taken into account in food and beverage products. Many attempts have been made for screening the organisms that produce the optically pure lactic acid. Recently, Rhizopus oryzae has become attractive because it is one of the organisms that are capable of producing the optically pure L(+)-lactic acid. More advantages of using R. oryzae in lactic acid fermentation include growth on simple media such as starchy materials from
agricultural residues, low nutrient requirements, and easy product recovery (Thongchul, 2005; Yin et al., 1997; Zhang et al., 2007).
R. oryzae is obligated aerobe; therefore, lactic acid fermentation by this fungus requires vigorous mixing. Usually, fungal fermentation suffers from low production rate which is caused by oxygen transfer limitation. In R. oryzae culture, ethanol is the major byproduct that appears when oxygen supply is insufficient (Wee et al., 2006). In addition, diverse fungal morphology from dispersed mycelia to compact pellets found in submerged culture leads to the difficulties in controlling the bioreactor. For example, dispersed mycelia increase the broth viscosity. Unwanted growth is also found at the sampling lines, sensors, and impellers. This eventually lowers gas-liquid oxygen transfer rate and decreases production efficiency and bioreactor performance. On the other hand, the culture containing the pellets usually experiences the problem in oxygen diffusion when the pellets become larger and denser. This problem becomes more profound during long term operation.
Several techniques have been attempted to control R. oryzae morphology and improve lactic acid fermentation. When culturing R.
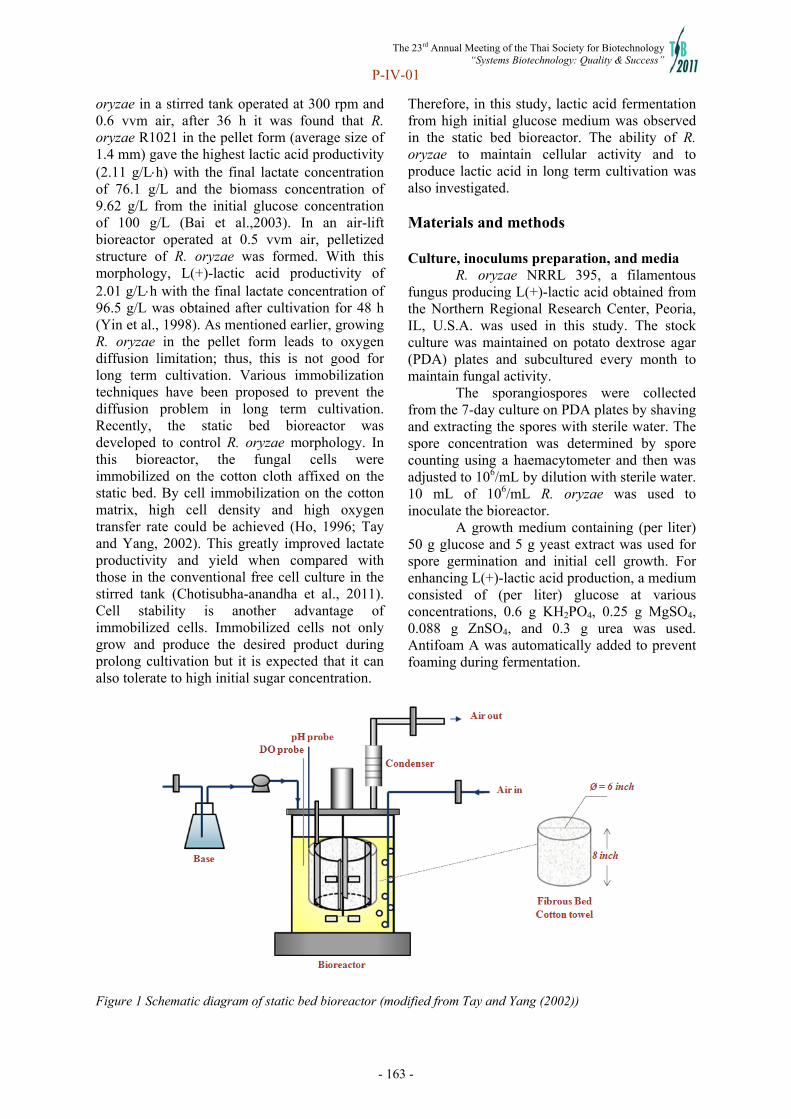
The 23rd Annual Meeting of the Thai Society for Biotechnology “Systems Biotechnology: Quality & Success”
P-IV-01
- 163 -
oryzae in a stirred tank operated at 300 rpm and 0.6 vvm air, after 36 h it was found that R. oryzae R1021 in the pellet form (average size of 1.4 mm) gave the highest lactic acid productivity (2.11 g/Lh) with the final lactate concentration of 76.1 g/L and the biomass concentration of 9.62 g/L from the initial glucose concentration of 100 g/L (Bai et al.,2003). In an air-lift bioreactor operated at 0.5 vvm air, pelletized structure of R. oryzae was formed. With this morphology, L(+)-lactic acid productivity of 2.01 g/Lh with the final lactate concentration of 96.5 g/L was obtained after cultivation for 48 h (Yin et al., 1998). As mentioned earlier, growing R. oryzae in the pellet form leads to oxygen diffusion limitation; thus, this is not good for long term cultivation. Various immobilization techniques have been proposed to prevent the diffusion problem in long term cultivation. Recently, the static bed bioreactor was developed to control R. oryzae morphology. In this bioreactor, the fungal cells were immobilized on the cotton cloth affixed on the static bed. By cell immobilization on the cotton matrix, high cell density and high oxygen transfer rate could be achieved (Ho, 1996; Tay and Yang, 2002). This greatly improved lactate productivity and yield when compared with those in the conventional free cell culture in the stirred tank (Chotisubha-anandha et al., 2011). Cell stability is another advantage of immobilized cells. Immobilized cells not only grow and produce the desired product during prolong cultivation but it is expected that it can also tolerate to high initial sugar concentration.
Therefore, in this study, lactic acid fermentation from high initial glucose medium was observed in the static bed bioreactor. The ability of R. oryzae to maintain cellular activity and to produce lactic acid in long term cultivation was also investigated.
Materials and methods Culture, inoculums preparation, and media
R. oryzae NRRL 395, a filamentous fungus producing L(+)-lactic acid obtained from the Northern Regional Research Center, Peoria, IL, U.S.A. was used in this study. The stock culture was maintained on potato dextrose agar (PDA) plates and subcultured every month to maintain fungal activity.
The sporangiospores were collected from the 7-day culture on PDA plates by shaving and extracting the spores with sterile water. The spore concentration was determined by spore counting using a haemacytometer and then was adjusted to 106/mL by dilution with sterile water. 10 mL of 106/mL R. oryzae was used to inoculate the bioreactor.
A growth medium containing (per liter) 50 g glucose and 5 g yeast extract was used for spore germination and initial cell growth. For enhancing L(+)-lactic acid production, a medium consisted of (per liter) glucose at various concentrations, 0.6 g KH2PO4, 0.25 g MgSO4, 0.088 g ZnSO4, and 0.3 g urea was used. Antifoam A was automatically added to prevent foaming during fermentation.
Figure 1 Schematic diagram of static bed bioreactor (modified from Tay and Yang (2002))
The 23rd Annual Meeting of the Thai Society for Biotechnology “Systems Biotechnology: Quality & Success”
P-IV-01
- 164 -
L(+)-lactic acid fermentation Free cell fermentation was carried out in the stirred tank bioreactor (Biostat B plus, Sartorius, Germany) while immobilized cell fermentation was performed in the static bed bioreactor modified from a 5-liter stirred tank (Biostat B plus, Sartorius, Germany). The baffle matrix affixed to the cover plate of the bioreactor was mounted with a 100% cotton towel sheet.
The bioreactor containing 4 L of the growth medium was autoclaved at 121C for 45 minutes. After cooling, the dissolved oxygen (DO) probe was calibrated with nitrogen and air. The bioreactor was controlled at 30 C, 700 rpm, and 0.5 vvm air. 10 mL spore suspension (106/mL) was inoculated into the bioreactor. The growth phase took approximately 48 h for spore germination and initial cell growth. After that, the growth medium was discharged and the bioreactor was filled up with 3 L of the sterile fresh production medium. During the production phase, the pH was automatically controlled at 6.0 by 10 M NaOH. The batch finished when glucose was depleted or lactic acid concentration stopped increasing.
The ability of immobilized R. oryzae in the static bed bioreactor to maintain cellular activity and produce lactic acid was observed and compared with those of free cells during fermentation with high initial glucose concentration. In addition, the stability in long term cultivation was observed for the purpose of continuous culture.
Determination of volumetric oxygen transfer coefficient
Before the end of fermentation, the oxygen uptake rate, OUR and the dynamics of oxygen transfer in the bioreactor were studied using the dynamic method of gassing out described in Thongchul and Yang (2003). When aeration is stopped, there is no oxygen transfer ( 0OTR ) and OUR (mM/min) can be determined from the slope of the plot of dissolved oxygen concentration ( LC ) versus time (t) during the period without aeration. Both volumetric oxygen transfer coefficient ( aK L ) and oxygen
solubility ( *C ) can be then estimated from the
plot of
OUR
dt
dCL versus LC during the
period with aeration, with aK L equal to the
negative slope and *C equal to the Y-intercept
divided by aK L . Analytical methods Amounts of cell growth and products formed during fermentation were analyzed. Product yield was determined from the ratio of product formed to glucose consumed during fermentation. Volumetric productivity was defined as the total amount of product formed per unit volume per time.
Cell biomass of R. oryzae was measured at the end of fermentation. Biomass was harvested from the bioreactor and washed with water to remove the residues. Washed biomass was dried at 80C until constant weight was obtained (Chotisubha-anandha et al., 2011).
High performance liquid chromatography was used to analyze glucose, lactic acid, fumaric acid, and ethanol in the fermentation broth. Fermentation samples were centrifuged, filtered through cellulose acetate membrane, and diluted with double distilled water. 20 µL diluted particle-free samples were manually injected into an organic acid analysis column (Biorad, Aminex HPX-87H ion exclusion organic acid column; 300mm7.8mm) maintained at 45C in a column oven (Shimadzu-CTO-6A). 0.005 M H2SO4, as an eluant, was pumped through the system at the flowrate of 0.6 mL/min (Shimadzu-LC-8A). A refractive index detector (Shimadzu-RID-6A) was used to detect the organic compounds. A standard containing 2 g/L of each component was injected as a reference to determine the sample concentration. The peak area was used in determining the concentration.
Cell morphology was investigated under a scanning electron microscope (SEM). Small pieces of samples (0.3 cm × 0.3 cm) were cut from the different parts of the harvested cells at the end of fermentation. The samples were fixed by immersing into 2.5% glutaraldehyde in 0.1 M phosphate buffer solution (pH 7.2) overnight at 4C. Later they were rinsed twice in phosphate buffer solution and once in distilled water. The samples were progressively dehydrated in various concentrations of ethanol (from 30% to 95%) for 10 min at each concentration. Finally the samples were immerged into 100% ethanol for 10 min 3 times. Before examination, the samples were subjected to critical point drying (Critical point dryer, Balzers model CPD 020) and coated with gold (Sputter coater, Balzers
The 23rd Annual Meeting of the Thai Society for Biotechnology “Systems Biotechnology: Quality & Success”
P-IV-01
- 165 -
model SCD 040) in the presence of the medium containing argon gas. After coating, the samples were examined using JEOL (model JSM-5410LV) scanning electron microscope.
Results and Discussions R. oryzae morphology and L(+)-lactic production in free cell culture
L(+)-lactic acid production with free cells was observed in the stirred tank bioreactor operated at 30C, pH 6.0, 700 rpm, and 0.5 vvm air using glucose as a sole carbon source. Figure 2 shows the morphology of free cells of R. oryzae grown in the stirred tank bioreactor (Figure 2A). Three distinctive morphologies were found including 1) a hard biofilm attached on the bioreactor wall (Figure 2B), 2) pellets suspended in the culture broth (Figure 2C), and 3) the clumps attached on baffles, sensors, and stirrer shaft (Figure 2D). The maximum L(+)-lactic acid concentration at the end of the production phase was found to be 30.7 g/L with the productivity of 1.16 g/L·h. Whereas the maximum ethanol concentration was 6.68 g/L with the productivity of 0.29 g/L·h. The dry biomass concentration at the end of fermentation was 7.16 g/L. It was obvious that uncontrolled fungal growth in the stirred tank bioreactor caused an increase in broth viscosity and a formation of the large air bubbles. As a result, gas-liquid oxygen transfer was hindered. This eventually led to less lactic acid but more ethanol produced during fermentation (Skory et al., 1998; Tay and Yang, 2002). Controlling R. oryzae morphology in the static bed bioreactor
L(+)-lactic acid was produced by immobilized R. oryzae in the static bed bioreactor operated at the same conditions as those cultivated in the stirred tank bioreactor. Unlike those found in the stirred tank bioreactor, after 12 h inoculation R. oryzae spores germinated and fully immobilized on the cotton matrix provided in the static bed bioreactor (Figure 3). This resulted in cell free broth that eventually yielded better gas-liquid oxygen transfer when compared with free cell culture (data not shown). The maximum L(+)-lactic acid concentration from immobilized cells was 35.9 g/L with the productivity of 2.25 g/L·h. It was evident that lactate productivity from immobilized cell culture was about 2 times
higher than that obtained from free cell culture. Besides, as a result of better oxygen transfer, lower ethanol production was observed in immobilized cells compared with that in free cells. In the static bed bioreactor, only 3.72 g/L ethanol was produced. In addition, immobilized cell culture gave higher density as observed from more biomass was harvested from the static bed bioreactor compared to that obtained from the stirred tank bioreactor. Table 1 summarizes the fermentation kinetics of R. oryzae free cells grown in the stirred tank and the immobilized cells cultivated in the static bed bioreactor. From the results obtained, it was clear that the static bed bioreactor is suitable for R. oryzae growth and L(+)-lactic acid production. Effects of aeration and agitation Previous study indicated that oxygen is crucial in L(+)-lactic acid fermentation by R. oryzae (Chotisubha-anandha et al., 2011; Skory et al., 1998). Maintaining high dissolved oxygen concentration can be achieved in many ways, but the simplest alternative is to provide sufficient agitation and aeration. In this study, to further improve L(+)-lactic acid production in the static bed bioreactor, various agitation and aeration rates were tested (Table 2). It was evident that L(+)-lactic acid productivity increased with the increase in agitation and aeration rates. The highest lactate productivity was achieved at 700 rpm and 0.5 vvm air. However, the final concentration and lactate yield were not different when changing the agitation or aeration. In contrary, increasing agitation and aeration rates lowered ethanol production (Table 2) while cell biomass production was not significantly affected by agitation and aeration. Higher lactate but lower ethanol production could be explained by an increasing KLa value when operating the static bed bioreactor at higher agitation and/or aeration rates (Table 2).
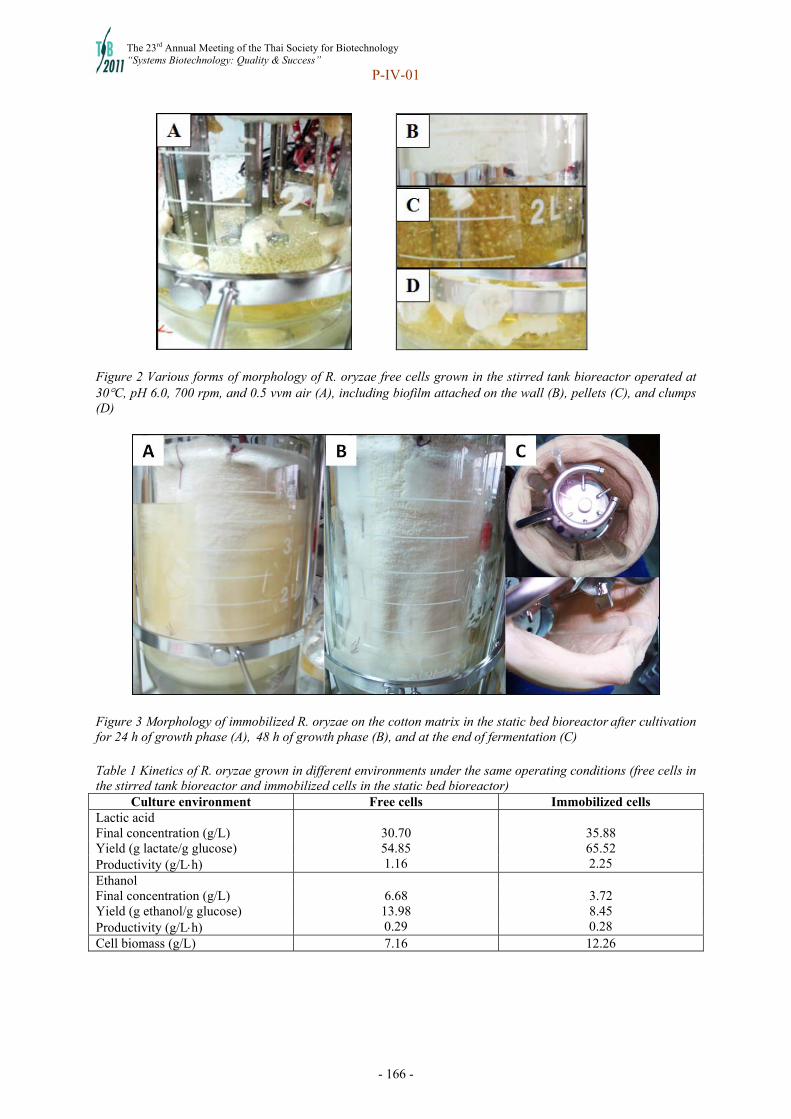
The 23rd Annual Meeting of the Thai Society for Biotechnology “Systems Biotechnology: Quality & Success”
P-IV-01
- 166 -
Figure 2 Various forms of morphology of R. oryzae free cells grown in the stirred tank bioreactor operated at 30C, pH 6.0, 700 rpm, and 0.5 vvm air (A), including biofilm attached on the wall (B), pellets (C), and clumps (D)
Figure 3 Morphology of immobilized R. oryzae on the cotton matrix in the static bed bioreactor after cultivation for 24 h of growth phase (A), 48 h of growth phase (B), and at the end of fermentation (C) Table 1 Kinetics of R. oryzae grown in different environments under the same operating conditions (free cells in the stirred tank bioreactor and immobilized cells in the static bed bioreactor)
Culture environment Free cells Immobilized cells Lactic acid Final concentration (g/L) 30.70 35.88 Yield (g lactate/g glucose) 54.85 65.52 Productivity (g/Lh) 1.16 2.25 Ethanol Final concentration (g/L) 6.68 3.72 Yield (g ethanol/g glucose) 13.98 8.45 Productivity (g/Lh) 0.29 0.28 Cell biomass (g/L) 7.16 12.26

The 23rd Annual Meeting of the Thai Society for Biotechnology “Systems Biotechnology: Quality & Success”
P-IV-01
- 167 -
Table 2 Effects of agitation and aeration on the kinetics during the production phase of immobilized R. oryzae cultivated in the static bed bioreactor Aeration (vvm) 0.5 1.0 Agitation (rpm) 300 500 700 300 500 700 Lactic acid Final concentration (g/L) 38.34 40.78 35.88 32.28 39.77 40.66 Yield (g lactate/g glucose) 67.40 62.75 65.52 58.14 62.29 60.25 Productivity (g/Lh) 1.02 1.03 2.25 1.12 1.35 1.55 Ethanol Final concentration (g/L) 6.45 3.48 3.72 1.13 3.16 0 Yield (g ethanol/g glucose) 19.52 11.65 8.45 16.09 8.50 0 Productivity (g/Lh) 0.28 0.35 0.28 0.41 0.17 0 Cell biomass (g/L) 10.59 10.99 12.26 10.59 9.94 11.88 KLa (s-1) 0.022 0.036 0.088 0.021 0.033 0.043 Table 3 Effects of initial glucose concentration on kinetics of immobilized R. oryzae grown in the static bed bioreactor during the production phase at 30C, pH 6.0, 700 rpm, and 0.5 vvm Initial glucose concentration (g/L) 70 100 150 200 Glucose Glucose consumed (g/L) Remaining glucose in broth (g/L)
65.52
0
89.33
0
151.60
0
153.35 35.13
Lactic acid Final concentration (g/L) Yield (g lactate/g glucose) Productivity (g/Lh)
35.88 65.52 2.25
48.86 75.00 2.04
75.27 58.05 1.67
80.76 62.07 1.74
Ethanol Final concentration (g/L) Yield (g ethanol/g glucose) Productivity (g/Lh)
3.72 8.45 0.28
6.30
12.79 0.49
11.04 8.72 0.23
12.37 9.06 0.23
Cell biomass (g/L) 12.26 16.06 12.61 27.02 KLa (s-1) 0.088 0.091 0.041 0.069 Increasing initial glucose concentration for enhancing L(+)-lactic acid production
To further increase the final concentration of L(+)-lactic acid, high initial glucose concentration was fed into the static bed bioreactor during the production phase. It was found that immobilized R. oryzae was capable of utilizing high glucose concentration for L(+)-lactic acid production (Table 3). All glucose fed was consumed in all conditions tested except at the concentration of 200 g/L. Increasing initial glucose concentration from 70 g/L to 150 g/L increased final concentration of L(+)-lactic acid. However, further increasing of initial glucose concentration to 200 g/L did not help improving L(+)-lactic acid production. In addition, more ethanol was produced when higher initial glucose concentration was present during the production phase. From the result in Table 3, the initial glucose concentration of 150 g/L was the suitable concentration in the production medium.
Conclusion
The results in this study clearly demonstrated that immobilized R. oryzae in the static bed bioreactor provided the superior ability on L(+)-lactic acid production when compared with the free cells grown in the stirred tank bioreactor. With better oxygen transfer in the static bed bioreactor, more L(+)-lactic acid but less ethanol were produced in the static bed bioreactor. The efficiency of the static bed bioreactor was found to be affected by agitation, aeration, and initial glucose concentration. Acknowledgments
This work has been financially supported by National Research University Project of Commission on Higher Education (CHE) and the Ratchadapiseksomphot Endowment Fund (AM1026A). Partial support from the Graduate School of Chulalongkorn University is also acknowledged. The authors appreciated US Department of Agriculture for providing the fungal strain used in this study.
The 23rd Annual Meeting of the Thai Society for Biotechnology “Systems Biotechnology: Quality & Success”
P-IV-01
- 168 -
References 1. Bai, D.M., Jia, M.Z., Zhao, X.M., Ban, R.,
Shen, F., Li, X.G. and Xu, S.M. L(+)-lactic acid production by pellet-form Rhizopus oryzae R1021 in a stirred tank fermentor. Chemical Engineering Science, 2003, 58, 758-791.
2. Bai, D.M., Li, S-Z., Liu, Z.L.L. and Cui, Z-F. Enhanced L-(+)-lactic acid production by an adapted strain of Rhizopus oryzae using corncob hydrolysate. Applied Biochemistry and Biotechnology, 2008, 144, 79-85.
3. Chotisubha-anandha, N., Thitiprasert, S., Tolieng, V. and Thongchul, N. Improved oxygen transfer and increased L-lactic acid production by morphology control of Rhizopus oryzae in a static bed bioreactor. Bioprocess and Biosystems Engineering, 2011, 34, 163-172.
4. Ho, W. Kinetics of L(+)-lactic acid production from glucose, xylose, and starch by free cells and immobilized cells of Rhizopus oryzae. MS Thesis, The Ohio State University, Columbus Ohio. 1996.
5. Skory, C.D., Freer, S.N. and Bothast, R.J. Production of L-lactic acid by Rhizopus oryzae under oxygen limiting conditions. Biotechnology Letters, 1998, 20, 191-194.
6. Sun, Y., Li, Y.-L. and Bai, S. Modeling of L(+)-lactic acid production immobilized R. oryzae in an airlift bioreactor. Biochemical Engineering Journal, 1999, 3, 87-90.
7. Tay, A. and Yang, S.T. Production of L(+)-lactic acid from glucose and starch by immobilized cells of Rhizopus oryzae in a rotating fibrous bed bioreactor. Biotechnology and Bioengineering, 2002, 80, 1-12.
8. Thongchul, N. and Yang, S.T., Controlling filamentous fungal morphology by immobilization on a rotation fibrous matrix to enhance oxygen transfer and L(+)-lactic acid production by Rhizopus oryzae. In Fermentation Biotechnology, ed. B.C. Saha. Oxford University Press, MA, 2003, 36-51.
9. Thongchul, N. Lactic acid production by immobilized Rhizopus oryzae in a rotating fibrous bed bioreactor. PhD thesis. The Ohio State University. Columbus, Ohio. 2005.
10. Wee, Y.J., Kim, J.N. and Ryu, H.W.
Biotechnological production of lactic acid and its recent applications. Biotechnological Production of Lactic Acid, Food Technology and Biotechnology, 2006, 44, 163–172.
11. Yin, P., Nishina, N., Kosakai, Y., Yahiro, K., Park, Y. and Okabe, M. Enhanced production of L(+)-lactic acid from corn starch in a culture of Rhizopus oryzae using an air-lift bioreactor. Journal of Fermentation and Bioengineering, 1997, 84, 249-253.
12. Yin, P., Yahiro, K., Ishigaki, T., Park, Y. and Okabe, M. L(+)-lactic acid production by repeated batch culture of Rhizopus oryzae in air-lift bioreactor. Journal of Fermentation and Bioengineering, 1998, 96, 96-100.
13. Zhang, Z. Y., Jin, B. and Kelly, J.M. Production of lactic acid from renewable materials by Rhizopus fungi, Biochemical Engineering Journal, 2007, 25, 251-263.
The 23rd Annual Meeting of the Thai Society for Biotechnology “Systems Biotechnology: Quality & Success”
P-IV-02
- 169 -
Purification of Ca2+-Signaling Inhibitors from Thai Medicinal Plants in Budding Yeast
Suphaya Sittichan a, Ngampong Kongkathip b, Tokichi Miyakawa c and Rathada Chanklan a aDepartment of Biotechnology, Faculty of Science and Technology, Thammasat University, Pahonyothin Rd, Pathumthani 12120, Thailand bDepartment of Chemistry, Faculty of Science, Kasetsart University, Ngam Wong Wan Rd, Bangkok 10900, Thailand. cDepartment of Molecular Biotechnology, Graduate School of Advanced Sciences of Matter, Hiroshima University, Higashihiroshima 739-8530, Japan
Abstract In eukaryotic organisms, calcium ion (Ca2+) is a universal second messenger that plays key
regulatory roles in diverse biological processes. In the yeast Saccharomyces cerevisiae, zds1Δ cells, hyperactivation of the Ca2+-triggered signaling pathways caused characteristic physiological consequences such as polarized bud growth and growth inhibition in the G2 phase. Nine of Thai medicinal plants were collected from Pathumthani province and their crude powders were prepared. The capacities of those powders to attenuate the Ca2+-signaling activity were then evaluated by the high throughput drug screening method named ‘positive screening’. It was found that PAC crude ethanol extract, medicinal plant in Euphorbiaceae, possessed high biological activities. The bioactive compound of crude sample was extracted by successively macerated in n-hexane, chloroform, ethyl acetate and ethanol, sequentially. Among the fraction of PAC macerated extracts, ethanolic crude extract revealed the strongest biological activity. The positive fraction was partial purified using a chromatographic technique on silica gel. Further chromatographic purification providing A-11 active fraction of which the structure elucidation is in progress. Keywords: Ca2+ signaling, G2 cell-cycle, Saccharomyces cerevisiae Introduction and Objective
Calcium ion (Ca2+) is a ubiquitous
intracellular signal responsible for controlling numerous cellular processes in eukaryotic organisms including cell proliferation, fertilization, muscle contraction, development, memory, motility, transcription, exocytosis and apoptosis.
Among various eukaryotes, the yeast Saccharomyces cerevisiae is a microorganism, the cellular function of which is most extensively studied at the molecular level and the Ca2+ signal is involved in control of G2/M phase cell-cycle progression in S. cerevisiae.2) When zds1Δ cells are grown in the medium containing high concentrations of CaCl2 (70-200 mM), Ca2+ signal is hyper-activated due to the elevation of the cellular Ca2+ level, this lead to severe growth retardation and blocked cell growth.2) Growth inhibition is accompanied by characteristic physiological alterations, such as G2 cell-cycle arrest and polarized bud growth.2) Thus, the assay is likely to detect inhibitors of the calcium dependent pathway targets. Small-
molecule inhibitors of Ca2+ signal in of great medical importance such as the immuno suppressive compounds tacrolimus (FK506) and cyclosporine A (CsA) that are significance and specific inhibitors of the calcineurin phospha- tase.4) Moreover, these are widely used as potent immunosuppressants and various cell-cycle inhibitors have potential as anti-cancer agents.5)
Based on this mechanism, a high throughput drug screening method named ‘positive screening’ was used in this study for searching plant extracts as inhibitors of the Ca2+-signaling pathways. Materials and Methods
2.1 Microorganism, media and growth conditions
The yeast S. cerevisiae used in this study was YNS17 (MATa zds1:: TRP1 erg3:: HIS3 pdr1::hisG URA3 hisG pdr3::hisG). The strain was derivatives of strain W303. YPD used in this study was as described previously. 2,3)
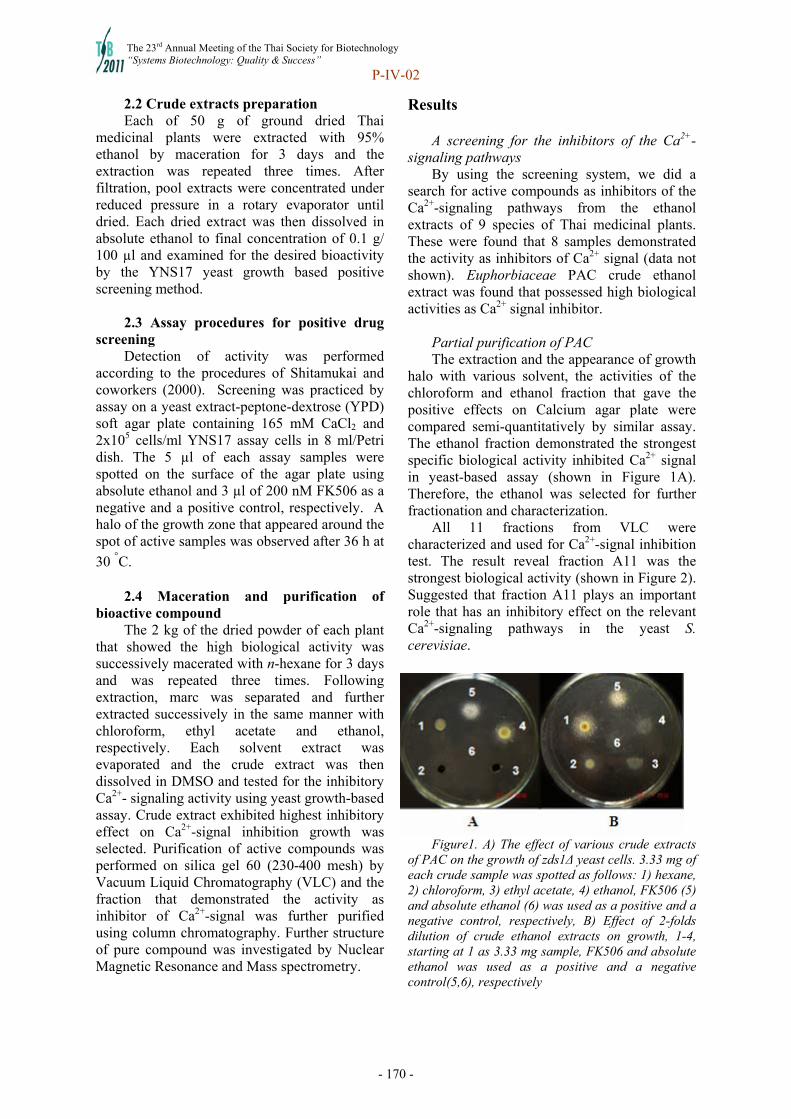
The 23rd Annual Meeting of the Thai Society for Biotechnology “Systems Biotechnology: Quality & Success”
P-IV-02
- 170 -
2.2 Crude extracts preparation Each of 50 g of ground dried Thai
medicinal plants were extracted with 95% ethanol by maceration for 3 days and the extraction was repeated three times. After filtration, pool extracts were concentrated under reduced pressure in a rotary evaporator until dried. Each dried extract was then dissolved in absolute ethanol to final concentration of 0.1 g/ 100 µl and examined for the desired bioactivity by the YNS17 yeast growth based positive screening method.
2.3 Assay procedures for positive drug
screening Detection of activity was performed
according to the procedures of Shitamukai and coworkers (2000). Screening was practiced by assay on a yeast extract-peptone-dextrose (YPD) soft agar plate containing 165 mM CaCl2 and 2x10⁵ cells/ml YNS17 assay cells in 8 ml/Petri dish. The 5 µl of each assay samples were spotted on the surface of the agar plate using absolute ethanol and 3 µl of 200 nM FK506 as a negative and a positive control, respectively. A halo of the growth zone that appeared around the spot of active samples was observed after 36 h at
30 ◦C. 2.4 Maceration and purification of
bioactive compound The 2 kg of the dried powder of each plant
that showed the high biological activity was successively macerated with n-hexane for 3 days and was repeated three times. Following extraction, marc was separated and further extracted successively in the same manner with chloroform, ethyl acetate and ethanol, respectively. Each solvent extract was evaporated and the crude extract was then dissolved in DMSO and tested for the inhibitory Ca2+- signaling activity using yeast growth-based assay. Crude extract exhibited highest inhibitory effect on Ca2+-signal inhibition growth was selected. Purification of active compounds was performed on silica gel 60 (230-400 mesh) by Vacuum Liquid Chromatography (VLC) and the fraction that demonstrated the activity as inhibitor of Ca2+-signal was further purified using column chromatography. Further structure of pure compound was investigated by Nuclear Magnetic Resonance and Mass spectrometry.
Results
A screening for the inhibitors of the Ca2+-signaling pathways
By using the screening system, we did a search for active compounds as inhibitors of the Ca2+-signaling pathways from the ethanol extracts of 9 species of Thai medicinal plants. These were found that 8 samples demonstrated the activity as inhibitors of Ca2+ signal (data not shown). Euphorbiaceae PAC crude ethanol extract was found that possessed high biological activities as Ca2+ signal inhibitor.
Partial purification of PAC The extraction and the appearance of growth
halo with various solvent, the activities of the chloroform and ethanol fraction that gave the positive effects on Calcium agar plate were compared semi-quantitatively by similar assay. The ethanol fraction demonstrated the strongest specific biological activity inhibited Ca2+ signal in yeast-based assay (shown in Figure 1A). Therefore, the ethanol was selected for further fractionation and characterization.
All 11 fractions from VLC were characterized and used for Ca2+-signal inhibition test. The result reveal fraction A11 was the strongest biological activity (shown in Figure 2). Suggested that fraction A11 plays an important role that has an inhibitory effect on the relevant Ca2+-signaling pathways in the yeast S. cerevisiae.
Figure1. A) The effect of various crude extracts of PAC on the growth of zds1Δ yeast cells. 3.33 mg of each crude sample was spotted as follows: 1) hexane, 2) chloroform, 3) ethyl acetate, 4) ethanol, FK506 (5) and absolute ethanol (6) was used as a positive and a negative control, respectively, B) Effect of 2-folds dilution of crude ethanol extracts on growth, 1-4, starting at 1 as 3.33 mg sample, FK506 and absolute ethanol was used as a positive and a negative control(5,6), respectively
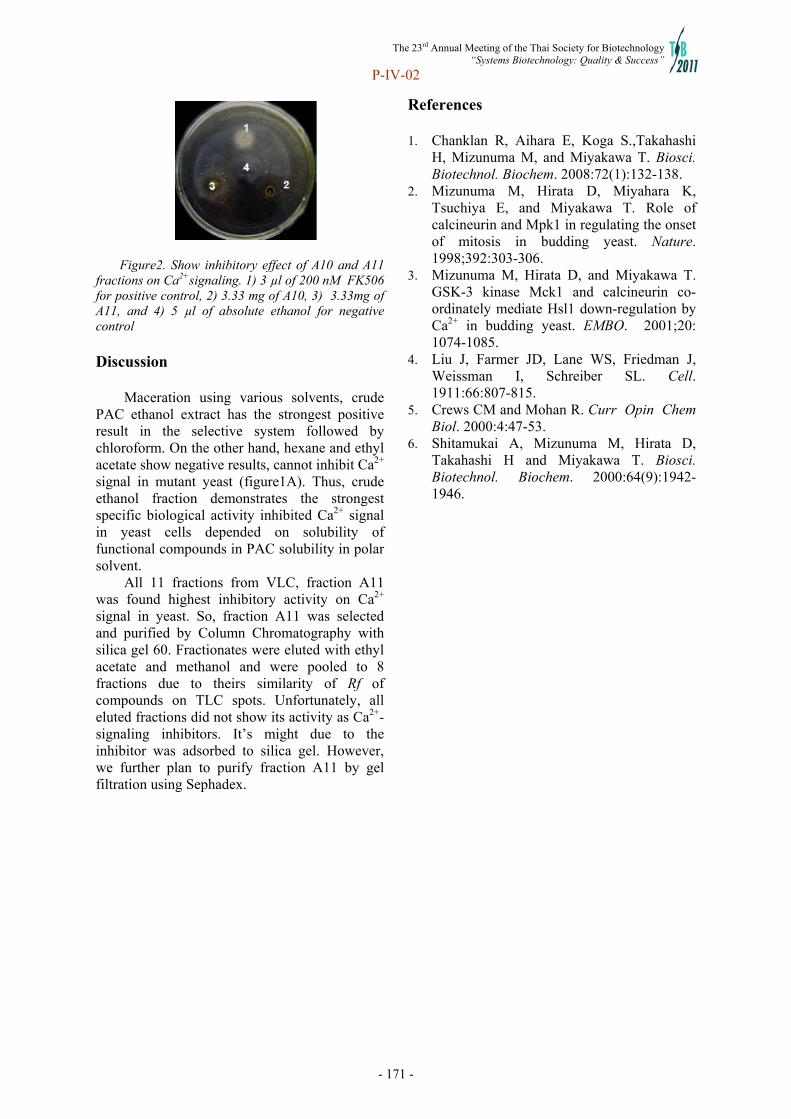
The 23rd Annual Meeting of the Thai Society for Biotechnology “Systems Biotechnology: Quality & Success”
P-IV-02
- 171 -
Figure2. Show inhibitory effect of A10 and A11 fractions on Ca2+signaling. 1) 3 µl of 200 nM FK506 for positive control, 2) 3.33 mg of A10, 3) 3.33mg of A11, and 4) 5 µl of absolute ethanol for negative control Discussion
Maceration using various solvents, crude PAC ethanol extract has the strongest positive result in the selective system followed by chloroform. On the other hand, hexane and ethyl acetate show negative results, cannot inhibit Ca2+ signal in mutant yeast (figure1A). Thus, crude ethanol fraction demonstrates the strongest specific biological activity inhibited Ca2+ signal in yeast cells depended on solubility of functional compounds in PAC solubility in polar solvent.
All 11 fractions from VLC, fraction A11 was found highest inhibitory activity on Ca2+ signal in yeast. So, fraction A11 was selected and purified by Column Chromatography with silica gel 60. Fractionates were eluted with ethyl acetate and methanol and were pooled to 8 fractions due to theirs similarity of Rf of compounds on TLC spots. Unfortunately, all eluted fractions did not show its activity as Ca2+-signaling inhibitors. It’s might due to the inhibitor was adsorbed to silica gel. However, we further plan to purify fraction A11 by gel filtration using Sephadex.
References 1. Chanklan R, Aihara E, Koga S.,Takahashi
H, Mizunuma M, and Miyakawa T. Biosci. Biotechnol. Biochem. 2008:72(1):132-138.
2. Mizunuma M, Hirata D, Miyahara K, Tsuchiya E, and Miyakawa T. Role of calcineurin and Mpk1 in regulating the onset of mitosis in budding yeast. Nature. 1998;392:303-306.
3. Mizunuma M, Hirata D, and Miyakawa T. GSK-3 kinase Mck1 and calcineurin co-ordinately mediate Hsl1 down-regulation by Ca2+ in budding yeast. EMBO. 2001;20: 1074-1085.
4. Liu J, Farmer JD, Lane WS, Friedman J, Weissman I, Schreiber SL. Cell. 1911:66:807-815.
5. Crews CM and Mohan R. Curr Opin Chem Biol. 2000:4:47-53.
6. Shitamukai A, Mizunuma M, Hirata D, Takahashi H and Miyakawa T. Biosci. Biotechnol. Biochem. 2000:64(9):1942-1946.

The 23rd Annual Meeting of the Thai Society for Biotechnology “Systems Biotechnology: Quality & Success”
P-IV-03
- 172 -
Immobilization of phenylalanine dehydrogenase on microtiter plate using avidin-biotin technology
Pannika Klungnucha, Kanoktip Packdibamrungb and Manchumas Prousoontornb
aProgram in Biotechnology, Faculty of Science, Chulalongkorn University, Bangkok 10330, Thailand. bDepartment of Biochemistry, Faculty of Science, Chulalongkorn University, Bangkok, 10330, Thailand.
Abstract
Enzymatic method using immobilized phenylalanine dehydrogenase (PheDH) was developed to determine phenylalanine concentration, based on the PheDH reaction coupled with an intermediate electron acceptor system. In this work PheDH was immobilized on the surface of 96-well microtiter plate using avidin-biotin technology. PheDH from recombinant Escherichia coli BL21(DE3) was conjugated with succinimidyl-6-(biotinamido)hexanoate (NHS-LC-Biotin), prior to the immobilization onto the microtiter plate surface via avidin and biotin system. Avidin and biotinylted PheDH were alternately and repeatedly immobilized on the microtiter plate. The optimum condition for enzyme immobilization was to use 0.5 mg/mL of NHS-biotin, 0.25 mg/mL of avidin and 100 µg of biotinylated enzyme per well. The wells having 12 layers of B-PheDH gave higher activity than those with one layer and enzyme activity increased with increasing layer of B-PheDH. Keywords: L-phenylalnine, phenylalanine dehydrogenase, immobilized enzyme, avidin, biotin Introduction and Objective
The determination of phenylalanine concentration has been used to diagnose phenylketonuria, the genetic disorder which requires screening of newborns. Early method for diagnosis is bacteriological inhibition assay (BIA) or Guthrie test. Although this method has been widely used, it lacks sensitivity. The HPLC, spectrophotometric and fluorometric techniques are highly sensitive but time-consuming and require expensive equipment. Enzymatic method using phenylalanine dehydrogenase (PheDH) was then developed to determine phenylalanine concentration. In 1992, Dooley K.C. reported the use of PheDH for the determination of phenylalanine in dry-blood spot.1 Although the method is simple, sensitive and requires short analysis time, the enzyme cannot be reused. In this work, PheDH was then immobilized onto the microtiter well plate via biotin and avidin system for reusability and analysis of large number of samples.
Materials and Methods
2.1 Preparation and immobilization of PheDH
PheDH was prepared from recombinant Escherichia coli BL21(DE3). The enzyme was purified by ammonium sulfate precipitation and DEAE-Toyopearl column chromatography. The resulted PheDH was then conjugated with
succinimidyl-6-(biotinamido)hexanoate (NHS-LC-biotin) according to Pierce's manual. Biotinylated PheDH (B-PheDH) was used for the following immobilization procedure according to Ukeda's method2 with a slight modification as shown in Fig. 1. Fig. 1. Stepwise deposition of avidin and B- PheDH
onto amino microtiter plate surface.
2.2 Activity assay of free PheDH The activity of PheDH was determined by monitoring NADH formation using L-phenylalanine and NAD+ at pH 11.0, 30°C.
2.3 Activity assay of immobilized PheDH The activity of PheDH was determined by monitoring formazan formation using
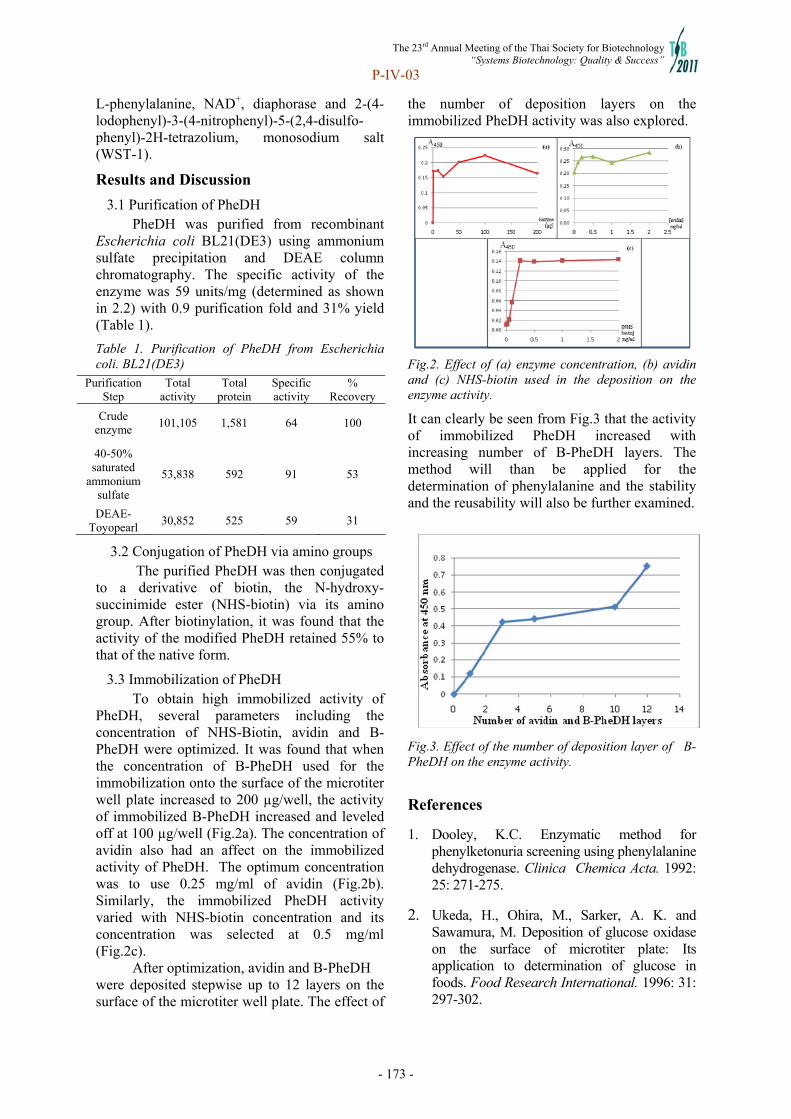
The 23rd Annual Meeting of the Thai Society for Biotechnology “Systems Biotechnology: Quality & Success”
P-IV-03
- 173 -
L-phenylalanine, NAD+, diaphorase and 2-(4-lodophenyl)-3-(4-nitrophenyl)-5-(2,4-disulfo-phenyl)-2H-tetrazolium, monosodium salt (WST-1).
Results and Discussion
3.1 Purification of PheDH PheDH was purified from recombinant Escherichia coli BL21(DE3) using ammonium sulfate precipitation and DEAE column chromatography. The specific activity of the enzyme was 59 units/mg (determined as shown in 2.2) with 0.9 purification fold and 31% yield (Table 1).
Table 1. Purification of PheDH from Escherichia coli. BL21(DE3)
3.2 Conjugation of PheDH via amino groups The purified PheDH was then conjugated to a derivative of biotin, the N-hydroxy-succinimide ester (NHS-biotin) via its amino group. After biotinylation, it was found that the activity of the modified PheDH retained 55% to that of the native form.
3.3 Immobilization of PheDH To obtain high immobilized activity of PheDH, several parameters including the concentration of NHS-Biotin, avidin and B-PheDH were optimized. It was found that when the concentration of B-PheDH used for the immobilization onto the surface of the microtiter well plate increased to 200 µg/well, the activity of immobilized B-PheDH increased and leveled off at 100 µg/well (Fig.2a). The concentration of avidin also had an affect on the immobilized activity of PheDH. The optimum concentration was to use 0.25 mg/ml of avidin (Fig.2b). Similarly, the immobilized PheDH activity varied with NHS-biotin concentration and its concentration was selected at 0.5 mg/ml (Fig.2c). After optimization, avidin and B-PheDH were deposited stepwise up to 12 layers on the surface of the microtiter well plate. The effect of
the number of deposition layers on the immobilized PheDH activity was also explored.
Fig.2. Effect of (a) enzyme concentration, (b) avidin and (c) NHS-biotin used in the deposition on the enzyme activity.
It can clearly be seen from Fig.3 that the activity of immobilized PheDH increased with increasing number of B-PheDH layers. The method will than be applied for the determination of phenylalanine and the stability and the reusability will also be further examined.
Fig.3. Effect of the number of deposition layer of B-PheDH on the enzyme activity.
References
1. Dooley, K.C. Enzymatic method for phenylketonuria screening using phenylalanine dehydrogenase. Clinica Chemica Acta. 1992: 25: 271-275.
2. Ukeda, H., Ohira, M., Sarker, A. K. and Sawamura, M. Deposition of glucose oxidase on the surface of microtiter plate: Its application to determination of glucose in foods. Food Research International. 1996: 31: 297-302.
Purification Step
Total activity
Total protein
Specific activity
% Recovery
Crude enzyme
101,105 1,581 64 100
40-50% saturated
ammonium sulfate
53,838 592 91 53
DEAE-Toyopearl
30,852 525 59 31

The 23rd Annual Meeting of the Thai Society for Biotechnology “Systems Biotechnology: Quality & Success”
P-IV-04
- 174 -
Extraction optimization of phenolic and anthocyanin antioxidant compounds from several pigmented rice
Natthawut Thitipramotea,b, Nisakorn Saewana,b, Surintip Sawangmongkhonb, Suwat Vorrarathanakitb a Excellent Center of Cosmetic and Wellness, Mae Fah Luang University, Muang, Chiang Rai 57100, Thailand. b School of Cosmetic Science, Mae Fah Luang University, Muang, Chiang Rai 57100, Thailand. Abstract This study investigated the extraction optimization of phenolic and anthocyanin antioxidant compounds from two pigmented rice [black sticky rice (BS) and Homnin rice (HN)] by using various solvents (propylene glycol and ethanol) with different extraction time (4, 8 and 12 h) at 25 oC and 50
oC with/without sonication. 2,2-Diphenyl-1-picryhydrazyl (DPPH)-radical scavenging activity of each extraction condition of BS and HN rice was also determined. The results showed that the optimal extraction condition for the phenolic and anthocyanin antioxidant compounds of BS and HN rice was propylene glycol extraction at 50 oC for 12 h with sonication. However, the total phenolic compounds of BS rice extract (9.77±0.06 g/l) obtained at the optimum extraction conditions were higher than those of HN rice extract (5.49±0.01 g/l). Harmoniously, the anthocyanin content was higher in BS rice extract (1,037±0.47 mg/l) than HN rice extract (288.56±3.78 mg/l). DPPH-radical scavenging activity of both rice extracts was highest during the optimal extraction condition that was 85.18±0.12% for BS rice and 60.85±1.45% for HN rice. The results suggested that the black sticky rice and the Homnin rice could be used as a source for phenolic and anthocyanin antioxidant compounds. These findings may be useful for further investigation to optimize the extraction conditions for antioxidant or functional ingredients in cosmetics, dietary supplements and food.
Keywords: anthocyanin, black sticky rice, DPPH, Homnin rice, pigmented rice Introduction and Objective
Rice is the seed of the monocot plant Oryza sativa, of the grass family (Gramineae). Rice production and export are significant to Thailand. More than 5,000 rice varieties are known within the country1. Pigmented rice (or colored rice) which is distinguished by the rice grain having red brown or dark purple color in its covering layers1,2, have little been interesting from consumer. However, it comprises gamma-oryzanol, tocopherols, tocotrienols, and flavonoids as major active component for antioxidant1. Moreover, the main substance of phenolic compounds in pigment rice has been reported as anthocyanins1. Health benefits of these pigmented rice extracts have also been reported such as relate to aldose reductase inhibitory activity and diabetic prevention1.
Recently, antioxidants are widely used in food, pharmaceutical and cosmetic industries. Synthetic antioxidants, such as butylated hydroxyanisole (BHA) and butylated hydroxytoluene (BHT), are commonly used but these synthetic substances effect to human as toxic and carcinogen. Thus, safety concerns over synthetic antioxidants have led to an increasing interest in identifying naturally occurring antioxidants from natural sources and the
compounds in rice are potential source to replace synthetic antioxidants2. Therefore, the objective of this study was to investigate the optimizing conditions for extract antioxidants from two local pigmented rice; black sticky rice (BS) and homnin rice (HN), that are cultivated in northern Thailand.
Materials and Methods
1. Plant material Pigmented rice (BS and HN) were collected
from Mae-Chan, Chiang Rai, northern Thailand in January 2009.
2. Extraction Pigmented rice (50 g) was extracted with
ethanol or propylene glycol (PG) (80 ml) for 4, 8, 12 hours at 25 °C and 50 °C with/without sonicate. Samples were filtered and adjusted volume to 80 ml with extracted solvent. The extracts were stored at 4 °C until used.
3. Total phenolic contents (TPC) TPC of the extracts were determined by the
method of Rezaeizadeh et al. (2011)3 with some modifications. Gallic acid was used as a standard for gallic acid equivalents (GAE).
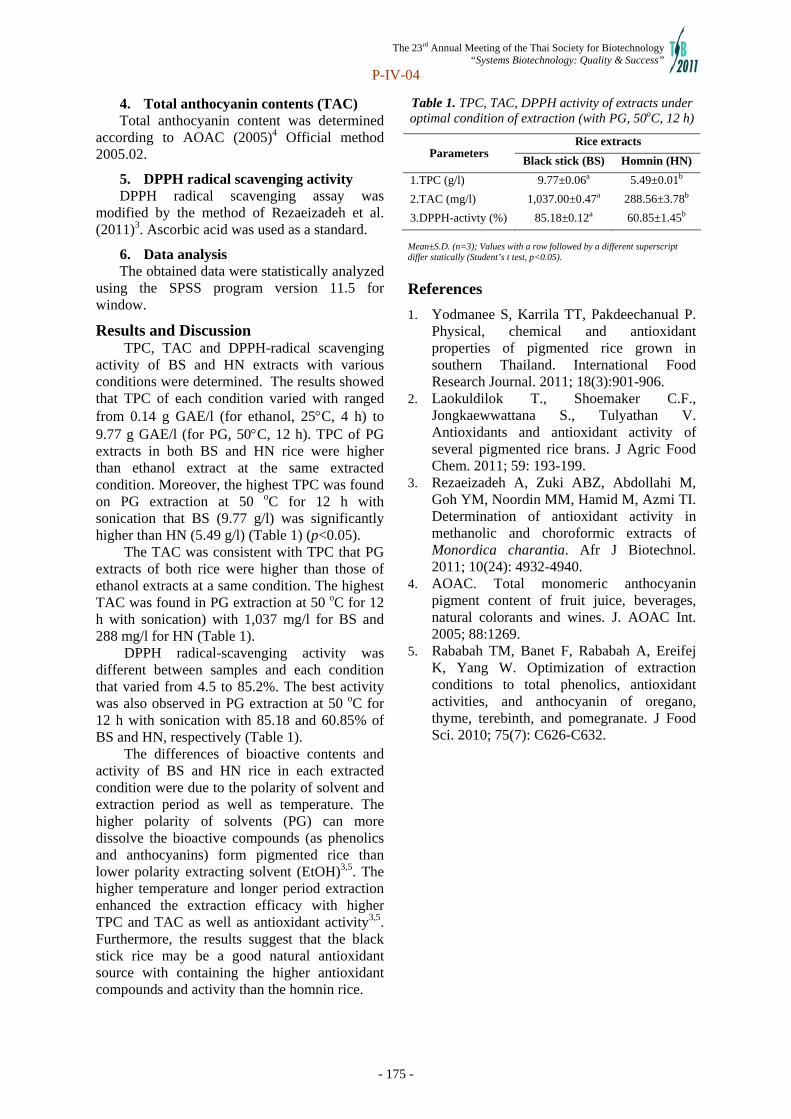
The 23rd Annual Meeting of the Thai Society for Biotechnology “Systems Biotechnology: Quality & Success”
P-IV-04
- 175 -
4. Total anthocyanin contents (TAC) Total anthocyanin content was determined
according to AOAC (2005)4 Official method 2005.02.
5. DPPH radical scavenging activity DPPH radical scavenging assay was
modified by the method of Rezaeizadeh et al. (2011)3. Ascorbic acid was used as a standard.
6. Data analysis The obtained data were statistically analyzed
using the SPSS program version 11.5 for window.
Results and Discussion TPC, TAC and DPPH-radical scavenging
activity of BS and HN extracts with various conditions were determined. The results showed that TPC of each condition varied with ranged from 0.14 g GAE/l (for ethanol, 25C, 4 h) to 9.77 g GAE/l (for PG, 50C, 12 h). TPC of PG extracts in both BS and HN rice were higher than ethanol extract at the same extracted condition. Moreover, the highest TPC was found on PG extraction at 50 oC for 12 h with sonication that BS (9.77 g/l) was significantly higher than HN (5.49 g/l) (Table 1) (p<0.05).
The TAC was consistent with TPC that PG extracts of both rice were higher than those of ethanol extracts at a same condition. The highest TAC was found in PG extraction at 50 oC for 12 h with sonication) with 1,037 mg/l for BS and 288 mg/l for HN (Table 1).
DPPH radical-scavenging activity was different between samples and each condition that varied from 4.5 to 85.2%. The best activity was also observed in PG extraction at 50 oC for 12 h with sonication with 85.18 and 60.85% of BS and HN, respectively (Table 1).
The differences of bioactive contents and activity of BS and HN rice in each extracted condition were due to the polarity of solvent and extraction period as well as temperature. The higher polarity of solvents (PG) can more dissolve the bioactive compounds (as phenolics and anthocyanins) form pigmented rice than lower polarity extracting solvent (EtOH)3,5. The higher temperature and longer period extraction enhanced the extraction efficacy with higher TPC and TAC as well as antioxidant activity3,5. Furthermore, the results suggest that the black stick rice may be a good natural antioxidant source with containing the higher antioxidant compounds and activity than the homnin rice.
Table 1. TPC, TAC, DPPH activity of extracts under optimal condition of extraction (with PG, 50oC, 12 h)
Rice extracts Parameters
Black stick (BS) Homnin (HN)
1.TPC (g/l) 9.77±0.06a 5.49±0.01b
2.TAC (mg/l) 1,037.00±0.47a 288.56±3.78b
3.DPPH-activty (%) 85.18±0.12a 60.85±1.45b
Mean±S.D. (n=3); Values with a row followed by a different superscript differ statically (Student’s t test, p<0.05).
References
1. Yodmanee S, Karrila TT, Pakdeechanual P. Physical, chemical and antioxidant properties of pigmented rice grown in southern Thailand. International Food Research Journal. 2011; 18(3):901-906.
2. Laokuldilok T., Shoemaker C.F., Jongkaewwattana S., Tulyathan V. Antioxidants and antioxidant activity of several pigmented rice brans. J Agric Food Chem. 2011; 59: 193-199.
3. Rezaeizadeh A, Zuki ABZ, Abdollahi M, Goh YM, Noordin MM, Hamid M, Azmi TI. Determination of antioxidant activity in methanolic and choroformic extracts of Monordica charantia. Afr J Biotechnol. 2011; 10(24): 4932-4940.
4. AOAC. Total monomeric anthocyanin pigment content of fruit juice, beverages, natural colorants and wines. J. AOAC Int. 2005; 88:1269.
5. Rababah TM, Banet F, Rababah A, Ereifej K, Yang W. Optimization of extraction conditions to total phenolics, antioxidant activities, and anthocyanin of oregano, thyme, terebinth, and pomegranate. J Food Sci. 2010; 75(7): C626-C632.

The 23rd Annual Meeting of the Thai Society for Biotechnology “Systems Biotechnology: Quality & Success”
P-IV-05
- 176 -
The bioplastic, poly(3-hydroxybutyrate) production by batch cultivation of Bacillus megaterium P-12 from sugarcane liquor with different C/N ratio
Wiyanan Muangkao a, Nuttha Thongchul b and Songsri Kulpreecha a
aDepartment of Microbiology, Faculty of Science, Chulalongkorn University, Phayathai Rd, Bangkok 10330, Thailand. bInstitute of Biotechnology and Genetic Engineering, Chulalongkorn University, Phayathai Rd, Bangkok 10330, Thailand.
Abstract Poly(3-hydroxybutyrate) or P(3HB) is one of the promising bioplastics which currently attract
many interests. Nonetheless, P(3HB) application is limited due to high production cost when compared with the petroleum based plastic. Low P(3HB) production cost can be accomplished when using low cost feedstocks and robust microorganism in fermentation. In our research group, Bacillus megaterium P-12 was isolated and identified. Compared with other P(3HB) producing strains, B. megaterium P-12 provided a significantly high P(3HB) production rate. To further reduce the production cost, searching for the locally available carbon and nitrogen substrates is important. In this work, the inexpensive sugarcane liquor and urea were used as the carbon and nitrogen sources, respectively. B. megaterium P-12 was cultivated in a 5-L stirred fermentor under controlled temperature, pH, agitation and aeration rates. The effects of initial total sugar concentration and the inoculum size in the preculture step on cell growth and P(3HB) production were investigated. With the initial total sugar concentration of 30 g/L and 10% (v/v) inoculum size, the maximum cell density of 14.79 g/L and P(3HB) concentration of 3.45 g/L corresponded to 23.32% P(3HB) content were achieved within 6 h cultivation. Moreover, the optimal C/N ratio was determined. It was found that at the C/N ratio of 10, the maximum cell density of 19.07 g/L with 4.97 g P(3HB)/L (equivalent to 26.08% P(3HB) content) were obtained at 9 h cultivation. The results obtained in this study suggested that the C/N ratio and nitrogen content controlled both cell growth and P(3HB) production. Keywords: Bacillus megaterium P-12, P(3HB), Sugarcane liquor, batch cultivation Introduction and Objective
Poly(3-hydroxybutyrate) or [P(3HB)] which
is biodegradable thermoplastic polyester with the similar properties of synthetic plastics from petroleum based plastics that synthesized and accumulated intracellular in form of granules by many microorganisms under stress conditions such as excess carbon, nitrogen phosphorus magnesium or oxygen limitation.(Steinbüchel and Füchtenbusch, 1998). P(3HB) is a special type of biomaterial that have biocompatible properties and used for medical pharmaceutical agricultural and packaging materials applications (Braunegg et al., 1998).
P(3HB) is the most studies for PHB production by Bacillus megaterium (Kulpreecha et al., 2009) B. cereus (Suriyamongkol et al., 2007) Ralstonia eutropha (Haas et al., 2008) and used various inexpensive carbon source to reduce the production cost such as sugarcane molasses (Albuquerque et al., 2007; Kulpreecha et al., 2009) whey (Koller et al., 2008) industrial activated sludge (Bengtsson and Werker, 2008) and sugarcane liquor (Jiang et al.,2008).
Sugarcane liquor is a renewable source and less expensive substrate for P(3HB) production that contains high sugar content in forms of sucrose and small amount of glucose, fructose and other sugar.
Bacillus megaterium P-12 is one of the potential strain could produce P(3HB) and fast growing. This strain able to utilize sugarcane liquor as carbon source for high cell growth and P(3HB) production.
The objective of this study to investigate the effect of initial total sugar, inoculum size and C/N ration on cell growth and P(3HB) production by batch cultivation of B. megaterium P-12 from sugarcane liquor.
Materials and Methods Microorganism
Bacillus megaterium P-12, which was isolated from soil in Petchburi, Thailand and identified by our laboratory. The stock culture was kept on NA slant at 4ºC and transferred to other new slants every 2 weeks.

The 23rd Annual Meeting of the Thai Society for Biotechnology “Systems Biotechnology: Quality & Success”
P-IV-05
- 177 -
Media and inoculums preparation Basal culture medium (BCM) was composed of 10 g/l yeast extract, 10 g/l bacto tryptose, 5 g/l beef extract, 5 g/l NaCl and 10 g/l sucrose and adjusted initial pH to 7.0. For inoculum preparation, B. megaterium P-12 grown on NA slant for 24 h then suspended in 0.85%(w/v) sodium chloride with the optical density (600 nm) was adjusted to 0.4. 2% of cell suspension was inoculated in 250 ml Erlenmeyer flask containing 50 ml of BCM, incubated on a rotary shaker at 200 rpm, 37 ºC for 6 h. For P(3HB) production medium in g/l: 1 g urea, 2 g KH2PO4, 0.6 g Na2HPO4, 0.2 g MgSO4.7H2O, 0.75 g citric acid, 0.1 g yeast extract and 1 ml of trace element (in g/l; 20 g CaCl2, 1.3 g ZnSO4.7H2O, 0.2 g FeSO4.7H2O, 0.6 g (NH4)6.Mo7O24.4H2O, 0.6 g H3BO3, 0.08 g MnCl2.4H2O, 0.5 g CoCl2.6H2O, 0.05 g CuSO4.5H2O, 0.02 g NiCl2.6H2O) was used. Sugarcane liquor and urea were used as carbon and nitrogen sources. Sugarcane liquor was separately autoclaved and added according to the production medium containing other components. The final pH of medium was adjusted to 7.0. P(3HB) production in batch cultivation
1.1 Effect of initial total sugar in sugarcane liquor and inoculums size on cell growth and P(3HB) production
Batch cultivations were carried out in 5-L fermenter vessel (MDL, Marubishi Bioengi-neering Co. Ltd., Tokyo, Japan) which contained 3 l of culture medium supplemented with various initial total sugar (10,20,30,50 and 70 g/l) in sugarcane liquor then inoculated with different inoculums size (5, 10 and 15 % of working volume). Temperature was controlled at 37°C. pH was maintained at 7.0 using 4N NaOH and 4N HCl. Agitation speed and aeration rate were set at 600 rpm and 1.0 vvm.The cultures were cultivated for 24 h. Samples were taken every 3 h and analyzed for dry cell weight, total sugar, urea concentration P(3HB) concentration and P(3HB) content
1.2 Effect of C/N ratio on cell growth
and P(3HB) production Effect of C/N ratio were performed the
optimal condition from 1.1 with diferrent C/N ratio (mol carbon / mol nitrogen) 5:1, 10:1 and 15:1 then cultivate under the same conditions. Samples were analyzes as describe above.
Analytical methods
Dry cell weight The cell pellet obtained after centrifugation (10,000 rpm at 4°C for 10 min) was dried at 80°C until the constant cell weight was obtained.
Sugar concentration Total Sugar concentration in the supernatant was determined by the method of Bernfeld (Bernfeld, 1995). For determination of sugarcane liquor concentration, the sample was first hydrolyzed by invertase (45 U/ml at 55°C for 20 min) prior to determine the total sugar concentration.
Nitrogen was determined by Kjeldahl method (A.O.A.C., 1975) and converted to urea concentration. P(3HB) content was determined by the method described by Comeau et al. (1988) using a gas chromatograph (Varian, CP-3800GC) equipped witha Carbowax PEG capillary column and flame ionization detector (FID)
P(3HB) content Two ml each of chloroform and acidified methanol (3% (v/v) H2SO4) were added into 20 mg of dried cell and then heated at 80°C for 3.5 h. After cooling to room temperature, 2 ml of distilled water was added. Followed by vigorous shaking and centrifugation (3000 rpm for 10 min), chloroform portion containing P(3HB) methyl ester was transferred to a vial for Gas Chromatography (GC) analysis. P(3HB) was determined by the method described by Comeau et al.(Comeau et al.,1988) Benzoic acid was used as the internal standard. Results and Discussion
1. Effect of initial total sugar in
sugarcane liquor and inoculums size on cell growth and P(3HB) production
Figure 1 showed the initial total sugar concentration of 30 g/L and 10% (v/v) inoculum size effected cell growth and P(3HB) synthesis. The results show that the high specific growth rate 0.43 h-1, maximum cell density of 14.79 g/L and P(3HB) concentration of 3.45 g/L corresponded to 23.32% P(3HB) content were achieved within 6 h cultivation. Cell growth at initial total sugar 50 and 70 g/l were higher than 30 g/l but show the large amount of residue total sugar and at 70 g/l increasing the log time (Table 1). This results suggested that this strain can use high total sugar but not effective.
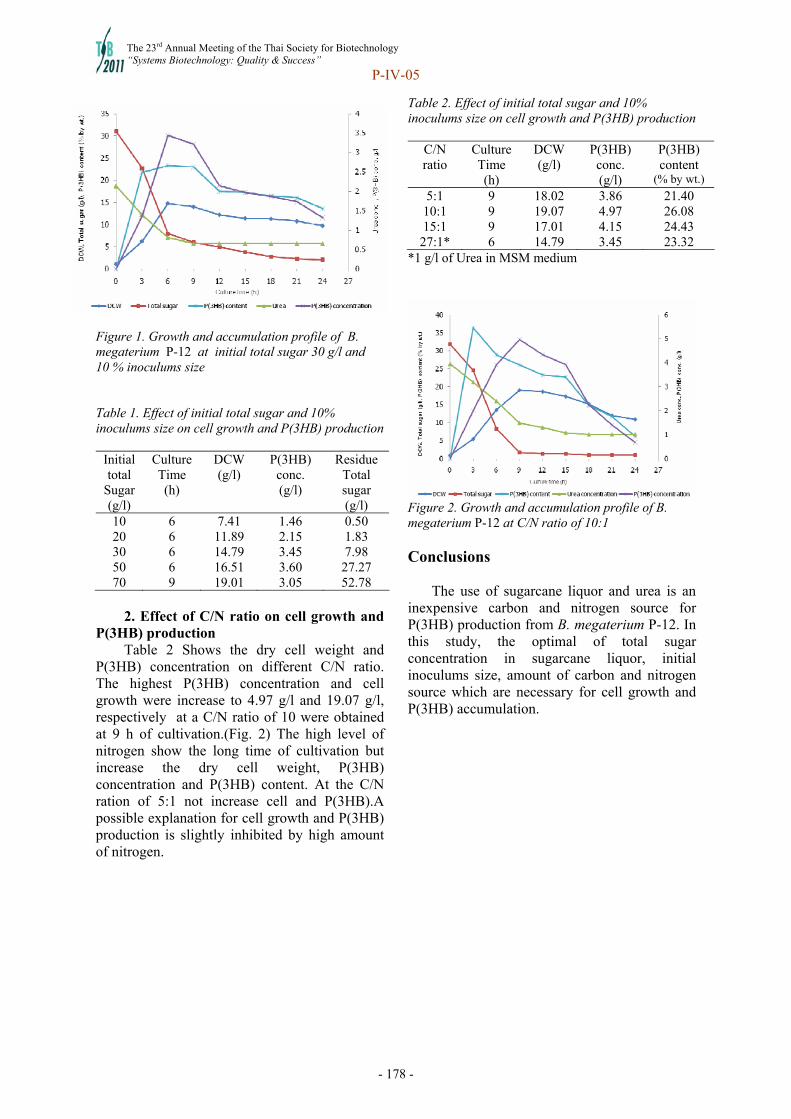
The 23rd Annual Meeting of the Thai Society for Biotechnology “Systems Biotechnology: Quality & Success”
P-IV-05
- 178 -
Figure 1. Growth and accumulation profile of B. megaterium P-12 at initial total sugar 30 g/l and 10 % inoculums size
Table 1. Effect of initial total sugar and 10% inoculums size on cell growth and P(3HB) production
Initial total
Sugar (g/l)
Culture Time (h)
DCW (g/l)
P(3HB) conc. (g/l)
Residue Total sugar (g/l)
10 6 7.41 1.46 0.50 20 6 11.89 2.15 1.83 30 6 14.79 3.45 7.98 50 6 16.51 3.60 27.27 70 9 19.01 3.05 52.78
2. Effect of C/N ratio on cell growth and
P(3HB) production Table 2 Shows the dry cell weight and
P(3HB) concentration on different C/N ratio. The highest P(3HB) concentration and cell growth were increase to 4.97 g/l and 19.07 g/l, respectively at a C/N ratio of 10 were obtained at 9 h of cultivation.(Fig. 2) The high level of nitrogen show the long time of cultivation but increase the dry cell weight, P(3HB) concentration and P(3HB) content. At the C/N ration of 5:1 not increase cell and P(3HB).A possible explanation for cell growth and P(3HB) production is slightly inhibited by high amount of nitrogen.
Table 2. Effect of initial total sugar and 10% inoculums size on cell growth and P(3HB) production
C/N ratio
Culture Time (h)
DCW (g/l)
P(3HB) conc. (g/l)
P(3HB) content
(% by wt.)
5:1 9 18.02 3.86 21.40 10:1 9 19.07 4.97 26.08 15:1 9 17.01 4.15 24.43
27:1* 6 14.79 3.45 23.32 *1 g/l of Urea in MSM medium
Figure 2. Growth and accumulation profile of B. megaterium P-12 at C/N ratio of 10:1 Conclusions
The use of sugarcane liquor and urea is an
inexpensive carbon and nitrogen source for P(3HB) production from B. megaterium P-12. In this study, the optimal of total sugar concentration in sugarcane liquor, initial inoculums size, amount of carbon and nitrogen source which are necessary for cell growth and P(3HB) accumulation.

The 23rd Annual Meeting of the Thai Society for Biotechnology “Systems Biotechnology: Quality & Success”
P-IV-05
- 179 -
References 1. Albuquerque M.G.E, Eiroa M, Torres C,
Nunes B.R, Reis M.A.M. Strategies for the development of a side stream process for polyhydroxyalkanoate (PHA) production from sugar cane molasses. J Biotechnol. 2007;130:411-21.
2. A.O.A.C. Official Methods of analysis. The Association of Official Analytical Chemists, 12th ed., Horwits, Washington, USA.1975; pp. 1015.
3. Bernfeld, P. Amylase, alpha and beta. Methods in Enzymology. 1995;1: 149.
4. Braunegg G, Lefebvre G, Genser K.F. Polyhydroxyalkanoates, biopolyesters from renewable resources: physiology and engineering aspects. J Biotechnol. 1998;65: 127-61.
5. Comeau Y, Hall K.J, Oldham, W.K. Determination of poly-3- hydroxybutyrate and poly-3-hydroxyvalerate in activated sludge by gas-liquid chromatography. Appl Environ Microb. 1988;54: 2325-27.
6. Haas R, Jin B, Zepf F.T. Production of poly(3-hydroxybutyrate) from waste potato starch. Biosci Biotechnol Bioch. 2008;72(1): 253-56.
7. Jiang Y,Song X, Gong L, Li P, Dai C,Shao. High poly(β-hydroxybutyrate) production by Pseudomonas fluorescens A2a5 from inexpensive substrates. Enzyme Microb Tech. 2008;42: 167-72.
8. Kulpreecha S, Boonruangthavorn A, Meksiriporn B, and Thongchul N. Inexpensive fed-batch cultivation for high poly(3-hydroxybutyrate) production by new isolate of Bacillus megaterium. J Biosci Bioeng. 2009;107(3):240-45.
9. Koller M, Bona R, Chiellini E, Fernandes E.G, Horvat P, Kutschera C, Hesse P, Braunegg G. Polyhydroxyalkanoate production from whey by Pseudomonas hydrogenovora. Bioresource technol. 2008;99(11):4854-63.
10. Luengo J.M, Garcia B, Sandoval A, Naharro G, Olivera E.R, Bioplastics from microorganisms. Curr Opin Microbiol. 2003;6:251-60.
11. Steinbüchel A, Füchtenbusch B. Bacterial And Other biological systems for polyester production. Trends Biotechnol. 1998;16:419-27
12. Suriyamongkol P, Weselake R, Narine S, Moloney, M, Shah S. Biotechnological
approaches for the production of polyhydroxyalkanoates in microorganisms and plants. Biotechnol Adv. 2007;25:148-75.

The 23rd Annual Meeting of the Thai Society for Biotechnology “Systems Biotechnology: Quality & Success”
P-IV-06
- 180 -
Phenolic antioxidant activity from betel nut (Areca catechu L.) extracts Sarita Sangthong a, Punyawatt Pintathong a,b and Phanuphong Chaiwut a,b
aSchool of Cosmetic Science, Mae Fah Luang University, Chiang Rai, 57100, Thailand bExcellent Center of Cosmetic and Wellness, School of Cosmetic Science, Mae Fah Luang University, Chiang Rai, 57100, Thailand
Abstract This study was purposed to evaluate the phenolic antioxidant activity of two different stages,
raw and ripe, of betel nut (Areca catechu L.) seed and pericarp. The betel nut extracts were obtained by using 50% ethanol as a solvent with 125 rpm shaking speed. Extractable phenolic content (EPC) was analyzed by Folin-Ciocalteu method. Antioxidant activities were determined by DPPH, ABTS radical scavenging and FRAP assays. Amongst the extracts, the raw seed possessed significantly the highest EPC of 169.44 mg gallic equivalent (GAE)/g sample followed by the extract of ripe seed, ripe pericarp and raw pericarp with the EPC values of 109.568, 12.201, and 9.043 mg GAE/g sample, respectively. In accordance with the EPC value, the raw betel nut seed extract exhibited the highest antioxidant activity of 16.235, 42.376 and 1.134 mM Trolox equivalent antioxidant capacity (TEAC)/g sample when determined by DPPH, ABTS and FRAP assays, respectively. Correlation coefficients between EPC and the three antioxidant capacity assays was found to be closely related (R
2 >0.9) demonstrating that phenolics are the major antioxidants of all betel extracts. Keywords: Antioxidant, betel nut, pericarp, phenolic, seed Introduction and Objective
Phenolic compounds are a group of aromatic secondary plant metabolites widely spread throughout the plant kingdom, and they have been reported to possess multiple biological effects such as antioxidant capacity and antimicrobial activity (1). There is a great interest in dietary supplement and cosmetic industry because they improve the quality and the nutritional value of plant extract. Areca catechu L. is commonly known as betel nut widely distributed in south-east Asia. The major constituents of the nut are carbohydrates, fats, proteins, mineral matter, crude fiber, polyphenols, and alkaloids. Polyphenols which are the main constituent in betel nut including simple phenolics, catechin, caffeic acid, ferulic acid, non-tannin flavans, hydrolysable and condensed tannins, alkaloids and flavonoids (2). However, variation polyphenols quantities in different ripening stage and different part of betel nut were not documented.
The aim of this study is to compare the phenolic antioxidant in different stages of ripening; raw and ripe and in different parts; seed and pericarp of betel nut. Correlation of EPC with antioxidant activities by means of DPPH, ABTS, and FRAP assays.
Materials and Methods Plant material
Betel nuts (Areca catechu L.) in 2 stages of ripening; raw 3-6 and ripe 7-9 months old were obtained from Nakorn Sri Thammarat province, Thailand. Then washed through tap water and air dried. The whole fruit was manually separated into 2 parts; pericarp and seed. Then dried in 50°C hot air oven, ground into powder and sieved through of 500 µm nylon mesh. Four samples obtained; raw seed (RS), ripe seed (RrS), raw pericarp (RP), and ripe pericarp (RrP). 2.1 Preparation of betel nut extract
Four betel nut samples were extracted by vertical shaker at room temperature with shaking speed of 125 rpm. The extraction solvent used to extract the phenolics compounds was 50%EtOH, at the ratio of sample: solvent 1:10(w/v). After 6 h. of extraction, the extracts were filtered using vacuum suction through filter paper Whatman No.1. Then the filtrates were collected for further determinations. 2.2 Determination of extractable phenolic contents
The EPC was determined using Folin-Cioculteu method (3).
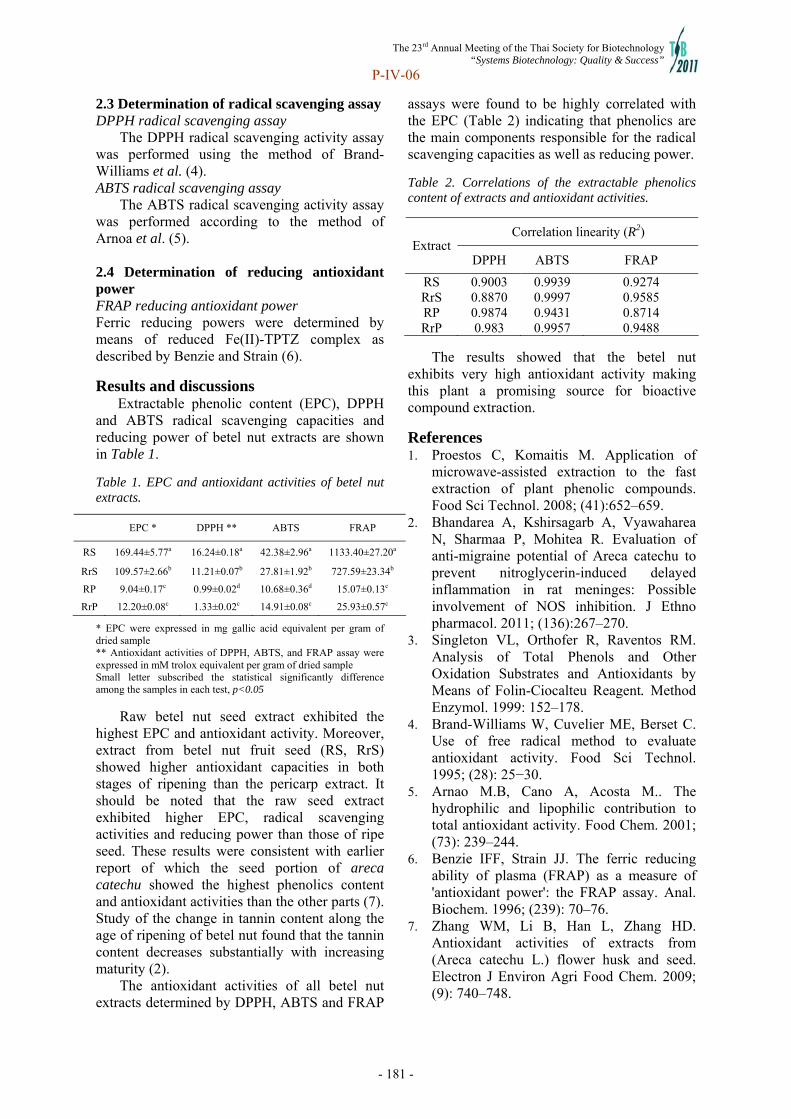
The 23rd Annual Meeting of the Thai Society for Biotechnology “Systems Biotechnology: Quality & Success”
P-IV-06
- 181 -
2.3 Determination of radical scavenging assay DPPH radical scavenging assay
The DPPH radical scavenging activity assay was performed using the method of Brand-Williams et al. (4). ABTS radical scavenging assay
The ABTS radical scavenging activity assay was performed according to the method of Arnoa et al. (5). 2.4 Determination of reducing antioxidant power FRAP reducing antioxidant power Ferric reducing powers were determined by means of reduced Fe(II)-TPTZ complex as described by Benzie and Strain (6).
Results and discussions Extractable phenolic content (EPC), DPPH and ABTS radical scavenging capacities and reducing power of betel nut extracts are shown in Table 1.
Table 1. EPC and antioxidant activities of betel nut extracts.
EPC * DPPH ** ABTS FRAP
RS 169.44±5.77a 16.24±0.18a 42.38±2.96a 1133.40±27.20a
RrS 109.57±2.66b 11.21±0.07b 27.81±1.92b 727.59±23.34b
RP 9.04±0.17c 0.99±0.02d 10.68±0.36d 15.07±0.13c
RrP 12.20±0.08c 1.33±0.02c 14.91±0.08c 25.93±0.57c
* EPC were expressed in mg gallic acid equivalent per gram of dried sample ** Antioxidant activities of DPPH, ABTS, and FRAP assay were expressed in mM trolox equivalent per gram of dried sample Small letter subscribed the statistical significantly difference among the samples in each test, p<0.05
Raw betel nut seed extract exhibited the highest EPC and antioxidant activity. Moreover, extract from betel nut fruit seed (RS, RrS) showed higher antioxidant capacities in both stages of ripening than the pericarp extract. It should be noted that the raw seed extract exhibited higher EPC, radical scavenging activities and reducing power than those of ripe seed. These results were consistent with earlier report of which the seed portion of areca catechu showed the highest phenolics content and antioxidant activities than the other parts (7). Study of the change in tannin content along the age of ripening of betel nut found that the tannin content decreases substantially with increasing maturity (2).
The antioxidant activities of all betel nut extracts determined by DPPH, ABTS and FRAP
assays were found to be highly correlated with the EPC (Table 2) indicating that phenolics are the main components responsible for the radical scavenging capacities as well as reducing power.
Table 2. Correlations of the extractable phenolics content of extracts and antioxidant activities.
Correlation linearity (R2) Extract
DPPH ABTS FRAP
RS 0.9003 0.9939 0.9274 RrS 0.8870 0.9997 0.9585 RP 0.9874 0.9431 0.8714 RrP 0.983 0.9957 0.9488
The results showed that the betel nut exhibits very high antioxidant activity making this plant a promising source for bioactive compound extraction.
References 1. Proestos C, Komaitis M. Application of
microwave-assisted extraction to the fast extraction of plant phenolic compounds. Food Sci Technol. 2008; (41):652–659.
2. Bhandarea A, Kshirsagarb A, Vyawaharea N, Sharmaa P, Mohitea R. Evaluation of anti-migraine potential of Areca catechu to prevent nitroglycerin-induced delayed inflammation in rat meninges: Possible involvement of NOS inhibition. J Ethno pharmacol. 2011; (136):267–270.
3. Singleton VL, Orthofer R, Raventos RM. Analysis of Total Phenols and Other Oxidation Substrates and Antioxidants by Means of Folin-Ciocalteu Reagent. Method Enzymol. 1999: 152–178.
4. Brand-Williams W, Cuvelier ME, Berset C. Use of free radical method to evaluate antioxidant activity. Food Sci Technol. 1995; (28): 25−30.
5. Arnao M.B, Cano A, Acosta M.. The hydrophilic and lipophilic contribution to total antioxidant activity. Food Chem. 2001; (73): 239–244.
6. Benzie IFF, Strain JJ. The ferric reducing ability of plasma (FRAP) as a measure of 'antioxidant power': the FRAP assay. Anal. Biochem. 1996; (239): 70–76.
7. Zhang WM, Li B, Han L, Zhang HD. Antioxidant activities of extracts from (Areca catechu L.) flower husk and seed. Electron J Environ Agri Food Chem. 2009; (9): 740–748.

The 23rd Annual Meeting of the Thai Society for Biotechnology “Systems Biotechnology: Quality & Success”
P-IV-07
- 182 -
Stabilization of bromelain extract by polyethylene glycol-salt biphasic system
Sarita Sangthong a, Zateebee Sompakdee a, Punyawatt Pintathong a,b, Saroat Rawdkuen c and Phanuphong Chaiwut a,b aSchool of Cosmetic Science, Mae Fah Luang University, Chiang Rai, 57100, Thailand bExcellent Center for Cosmetic and Wellness, School of Cosmetic Science, Mae Fah Luang University, Chiang Rai, 57100, Thailand cFood Technology Program, School of Agro-Industry, Mae Fah Luang University, Muang, Chiang Rai 57100, Thailand
Abstract This study was purposed to evaluate stability of free-bromelain and polyethylene glycol (PEG)-bromelain from the pineapple waste for its application in food and cosmetic industries. Bromelain form Phulae pineapple peels was extracted by using aqueous biphasic system comprising of 18% (w/w) PEG 6000 and 17% (w/w) MgSO4. The bromelain predominantly partitioned to the PEG top phase with proteolytic yield of 88.19%. Dialysis was performed to remove the PEG obtaining the free-bromelain. Proteolytic activities of free-bromelain and PEG-bromelain after lyophilization were compared. Residual activities of 53.44 and 85.68% of those before drying were found in the free- and PEG-bromelain, respectively. Stability of the enzyme was investigated by keeping the lyophilized sample at -20, -4, room temperature and 50°C. The PEG-bromelain showed higher thermal stability than free-bromelain during 3 month storage at all temperature studied by preserving more than 90% residual activity. In contrast, the activity of the free-bromelain was decreased to around 50% after 3 months. The results showed the PEG 6000 greatly stabilizing bromelain activity even at 50oC. This study would be useful for industrial application of bromelain and Value-added agricultural waste. Keywords: bromelain, biphasic system, polyethylene glycol, proteolytic activity, stabilization Introduction and Objective
Bromelain, a proteolytic enzyme, is found in pineapple (Ananas comosus L.) (1) and has been used widely in medical, pharmaceuticals, food and cosmetic industries (2). When consuming and industrial processing of pineapple, wastes such as cores, peels, leave and crown are produced. The peels are accounted to be the largest portion of these wastes. There have been reported that pineapple peels were potential source for bromelain extraction, apart from the flesh and stem (1-3). Bromelain has been used widely in medical, pharmaceuticals, food and cosmetic industries (2). Those applications, however, are limited due its low stability. The aim of this research is, therefore, to extract and stabilize bromelain from pineapple peels by polyethylene glycol (PEG). Proteolytic activity of enzyme sample before and after drying, and during 3 months storage under various temperatures were investigated.
Materials and Methods 2.1 Preparation of bromelain crude extract
The fresh pineapple peels of Phulae cultivar were obtained from Chiang Rai province, Thailand. The extraction was performed by blending pineapple peels with phosphate buffer pH 7.0 containing 15 mM cysteine and 4 mM EDTA in a ratio of pineapple peels to buffer solution of 1:1 (w/v) for 5 min. The mixture was filtered through cheesecloth and centrifuged at 10,000 rpm, 4°C for 10 min. The supernatant was filtered through a filter paper. The bromelain was, then, partially purified from the crude extract using aqueous two-phase system (ATPS) technique composing of 18% (w/w) PEG 6000 and 17% (w/w) MgSO4 (1). Then, the mixture was centrifuged at 7000 rpm, 4°C for 20 min for separation into 2 phases.
The PEG–rich phase was divided into 2 parts. The first part was dialyzed through dialysis bag with MWCO 10 kDa at 4°C overnight for removing the PEG 6000 and MgSO4 out This fraction was named “free-bromelain”, while the other upper PEG–rich phase, was called “PEG-bromelain”. Then, both

The 23rd Annual Meeting of the Thai Society for Biotechnology “Systems Biotechnology: Quality & Success”
P-IV-07
- 183 -
bromelain extracts were freeze dried using a lyophilizer. 2.2 Determination of bromelain activity.
The protease activity of bromelain was determined according to Murachi (4) using tyrosine as a standard. One unit of protease activity is defined as the amount of enzyme releasing product equivalent to 1 µmole of tyrosine min−1 mL−1 under the assay condition.
The proteolytic activity were determined weekly for 12 weeks. The results were presented as percentage of residual activity against time of storage.
Results and discussions
Partitioning of bromelain by ATPS is shown in Table 1. The enzyme predominantly partitioned to the PEG top phase (Tp) by the considered factors as total activity, purification factor and proteolytic yield compared to bottom phase (Bp).
Table 1 Partitioning of bromelain from Phulae pineapple peels by ATPS.
Phase
Total activity (U)
Purification Factor (fold)
Proteolytic Yield (%)
Crude 3,063 ± 24 1.00 100% Tp 2,701 ± 9 1.57 ± 2.01 88.19%
Bp 456 ± 7 0.32 ±0.72 14.89%
Proteolytic activities of free-bromelain and PEG-bromelain after lyophilization were compared. Table 2 illustrated that after drying, caseinolytic activity of PEG- and free-bromelain were 2,314 and 1,192 U/g, accounting for 85.68% and 53.44% proteolytic yield, respectively. It is clearly observed that presence PEG help to retain the bromelain stability.
Table 2 Protease activity and yield of PEG- and free-bromelain after freeze drying.
Before After Enzyme
Proteolytic
activity (U/g)
Proteolytic activity (U/g))
Recovery Yield
(%w/v)
Proteolytic Yield (%)
PEG- Bromelain
2,701± 9 2,314±16 29.43 85.68%
Free- Bromelain
2,232±41 1,192±11 4.80 53.44%
Stability of free- and PEG-bromelain powders during storage at various temperatures is depicted in Figure 1. PEG-bromelain showed higher residual activity (more than 90%) during
3 months storage than those of free-bromelain at all temperatures. There has been reported that the PEG is one of the well-known polymers for bioconjugation (5).
0
20
40
60
80
100
120
0 2 4 6 8 10 12Time (weeks)
Res
idua
l act
ivit
y (%
)
Figure 1. Residual activity of PEG-bromelain
(opaque symbol) and free-bromelain (clear symbol) when storing at -20°C (♦,◊),4°C (■,□), room
temperature (▲,∆) and 50°C (●,○).
It can be concluded that the PEG was efficiently extract the bromelain from pineapple peel in conjunction with the improvement the stability of bromelain during 3 months storage. This research might be useful for application of bromelain in many industries.
References: 1. Babu BR, Rastogi, N.K, Raghavarao K. S. M. S.
Liquid-liquid extraction of bromelain and polyphenol oxidase using aqueous two phase system. Chem. Eng. Proc. 2008; 47:83-89.
2. Ketnawa, S, Rawdkuen, S., Chaiwut, P. Two phase partitioning and collagen hydrolysis of bromelain from pineapple peel Nanglae cultivar. Biochem. Eng. J. 2010; 52: 205-211.
3. Ketnawa, S., Chaiwut, P., Rawdkuen, S. Extraction of bromelain from pineapple peels. Food Sci. Technol. Inter. 2011; 17: 395-402.
4. Murachi, T. Bromelain enzymes. In: Method Enzymology. New York: Academic Press; 1976: 475-485.
5. Inada, Y., Yoshimoto, T., Matsushima, A., Saito, Y. Engineering physicochemical and biological of proteins by chemical modification. Trends Biotechnol. 1986, 4: 68-73.
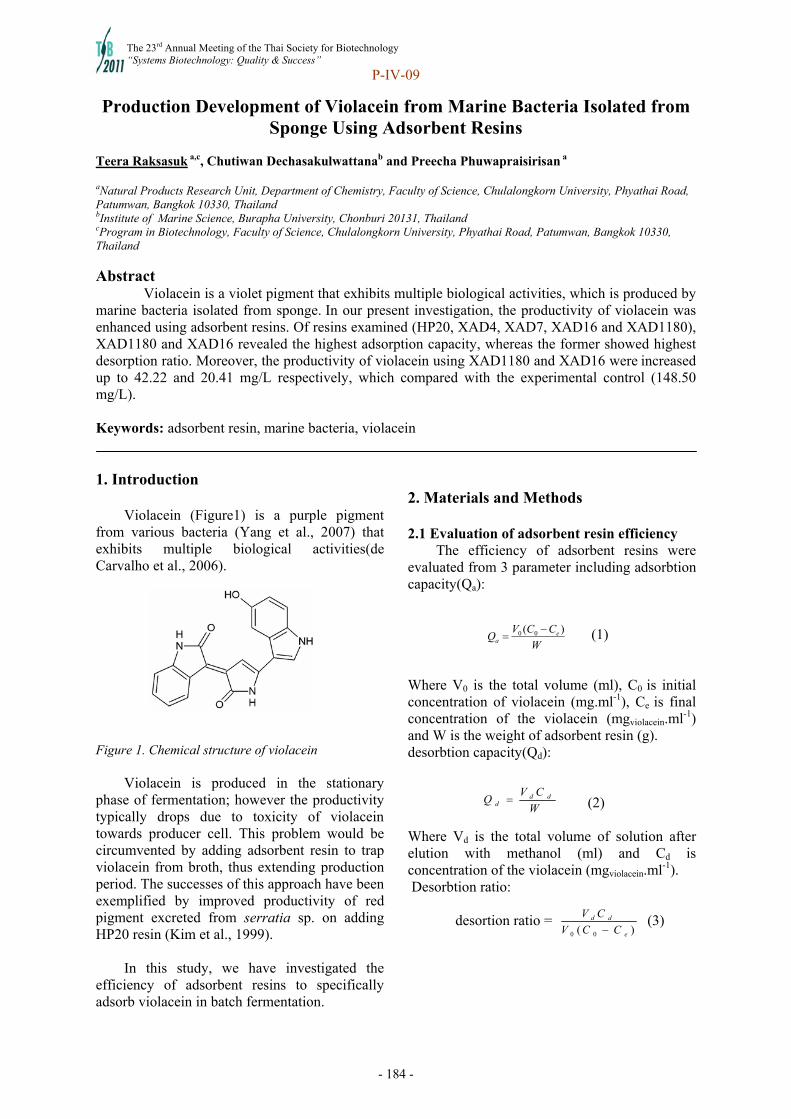
The 23rd Annual Meeting of the Thai Society for Biotechnology “Systems Biotechnology: Quality & Success”
P-IV-09
- 184 -
Production Development of Violacein from Marine Bacteria Isolated from Sponge Using Adsorbent Resins
Teera Raksasuk a,c, Chutiwan Dechasakulwattanab and Preecha Phuwapraisirisan a aNatural Products Research Unit, Department of Chemistry, Faculty of Science, Chulalongkorn University, Phyathai Road, Patumwan, Bangkok 10330, Thailand bInstitute of Marine Science, Burapha University, Chonburi 20131, Thailand cProgram in Biotechnology, Faculty of Science, Chulalongkorn University, Phyathai Road, Patumwan, Bangkok 10330, Thailand
Abstract Violacein is a violet pigment that exhibits multiple biological activities, which is produced by
marine bacteria isolated from sponge. In our present investigation, the productivity of violacein was enhanced using adsorbent resins. Of resins examined (HP20, XAD4, XAD7, XAD16 and XAD1180), XAD1180 and XAD16 revealed the highest adsorption capacity, whereas the former showed highest desorption ratio. Moreover, the productivity of violacein using XAD1180 and XAD16 were increased up to 42.22 and 20.41 mg/L respectively, which compared with the experimental control (148.50 mg/L). Keywords: adsorbent resin, marine bacteria, violacein 1. Introduction
Violacein (Figure1) is a purple pigment
from various bacteria (Yang et al., 2007) that exhibits multiple biological activities(de Carvalho et al., 2006).
Figure 1. Chemical structure of violacein
Violacein is produced in the stationary
phase of fermentation; however the productivity typically drops due to toxicity of violacein towards producer cell. This problem would be circumvented by adding adsorbent resin to trap violacein from broth, thus extending production period. The successes of this approach have been exemplified by improved productivity of red pigment excreted from serratia sp. on adding HP20 resin (Kim et al., 1999).
In this study, we have investigated the efficiency of adsorbent resins to specifically adsorb violacein in batch fermentation.
2. Materials and Methods 2.1 Evaluation of adsorbent resin efficiency
The efficiency of adsorbent resins were evaluated from 3 parameter including adsorbtion capacity(Qa): (1) Where V0 is the total volume (ml), C0 is initial concentration of violacein (mg.ml-1), Ce is final concentration of the violacein (mgviolacein.ml-1) and W is the weight of adsorbent resin (g). desorbtion capacity(Qd): (2) Where Vd is the total volume of solution after elution with methanol (ml) and Cd is concentration of the violacein (mgviolacein.ml-1). Desorbtion ratio: desortion ratio = (3)
W
CCVQ e
a
)( 00
W
CVQ dd
d
)( 00 e
dd
CCV
CV

The 23rd Annual Meeting of the Thai Society for Biotechnology “Systems Biotechnology: Quality & Success”
P-IV-09
- 185 -
2.2 Fermentation with adsorbent resins All of fermentations were studied in
Erlenmeyer flasks with various types of adsorbent resins (XAD4, XAD7, XAD16, XAD1180 and HP20). They were carried out in a 2L Erlenmeyer flask with 1L working volumn and fermentation at 28 0C for 48 h with an inoculum size of 10% (v/v) on an orbital shaker at 100 rpm. After 48 h, adsorbent resins were dispersed and fermentation was carried out until 72 h. Adsorbent resins were separated using plankton net (100 µm), and the obtained aliquot was centrifuged (8500 rpm) for 15 min and filtered by filter paper (45 µm), yielding bacterium cell and medium. 2.3 Analyses and measurement
The concentration of violacein was determined by UV-VIS spectrometer at 570 nm 3. Results and discussion 3.1 Adsorbent resins efficiency for violacein
Five adsorbent resins (XAD4, XAD7, XAD16, XAD1180 and HP20) were tested for violacein absorption (table 1). As the results from the experiment, XAD7 the showed highest adsorption and desorption capacities. However, XAD1180 demonstrated highest desorption ratio that led to highest violacein recovery.
Table 1 Adsorption capacity, desorption capacity and desorption ratio of violacein on various resins
Adsorbent
resin
Qa
Qd Desorption
ratio
XAD4 4.15 0.29 6.99
XAD7 5.14 0.67 13.04
XAD16 4.60 0.33 7.17
XAD1180 3.74 0.63 16.84
HP20 4.55 0.37 8.13
3.2 Production of violacein with various adsorbent resins
The relationship between resin type and violacein production were shown in table 2. In the result, the cell density and violacein productivity increased when using XAD1180 and XAD16 in batch fermentation in which the productivity of violacein using XAD1180 and
XAD16 were increased up to 42.22 (29%) and 20.41 (14%) mg/L, respectively. From this research, it was proved that XAD1180 was the most efficient resin in improving production of violacein.
Table 2 Violacein production in the batch fermentation with various adsorbent resins
Adsorbent
resin
Cell density (O.D. 660
nm)
Total amount of violacein produced
(mg/l)
Control 0.420 148.50
XAD4 0.453 129.99
XAD7 0.330 117.34
XAD16 0.575 168.91
XAD1180 0.618 190.72
HP20 0.441 148.71
References
1. Yang LH, Xiong H, Lee QO, Qi SH, Sumantha PY. Effect of agitation on violacein production in Pseudoalteromonas luteoviolacea isolated from a marine sponge. LETT APPL MICROBIOL. 2007; 44: 625-630.
2. Kim CH, Kim SW, Hong SI. An integrated fermentation-separation process for the production of red pigment by Serratia sp. KH-95. PROCESS BIOCHEM. 1999; 35: 485-490.
3. de Carvalho DD, Duran N, Costa FTM, Haum M. Cytotoxic activity of violacein in human colon cancer cells. TOXICOL IN VITRO. 2006; 20:1514-1521.

The 23rd Annual Meeting of the Thai Society for Biotechnology “Systems Biotechnology: Quality & Success”
P-IV-12
- 186 -
Production of poly-hydroxybutyrate from molasses and corn steep liquor by Alcaligenes eutrophus
Suntiti Lhim a and Sirilux Chaijamrus a
aDepartment of Biology, Faculty of Science, Naresuan University, Mueang, Phitsanulok 65000, Thailand Abstract
Poly-hydroxybutyrate (PHB) is a biodegradable thermoplastic. Molasses and corn steep liquor (CSL) were used as a C-source and N-source of bacterial cultivation, respectively. The maximum PHB concentration was 0.8 g/l after 35 h of incubation at 4 %w/v molasses and 4 %w/v CSL. Accumulation of PHB of A. eutrophus was found in the intracellular granules by TEM. Cell disruption was performed using a homoginizer and PHB was dissolved with chloroform. The PHB was analyzed by 1H-NMR and 13C-NMR to confirm the chemical structure. The molecular weight of PHB (580 kDa) was determined by gel permeation chromatography (GPC). In addition, the thermal property of PHB was determined by differential scanning calorimetry (DSC) technique. The results showed on the melting temperature (Tm) at 167 °C, crystallinity (XC) of 57 % and glass transition (Tg) at -1.83 °C. Thus, molasses and CSL could be used as economic raw materials.
Keywords: poly-hydroxybutyrate, Alcaligenes eutrophus, molasses, corn steep liquor
1. Introduction
A. eutrophus is a gram-negative rod bacterium. Metabolism is strictly respiratory, although be capable of anaerobic respiration using nitrate or nitrite as terminal electron acceptors [1]. PHB biosynthesis in microbial cells (Figure 1) was limited under environmental stress such as nutrient (nitrogen, phosphorus) and oxygen [2, 3]. The microorganism and the strategy of production were affected on duration of fermentation, growth rate, carbon source concentration, etc.
Figure 1. PHB biosynthesis [4, 5] This work aims to investigate the effect of molasses and CSL ratios in media on the growth of Alcaligenes eutrophus and PHB accumulation. The productivity of PHB was estimated to accumulate PHB on the growth rate. The chemical structure and the thermal property of obtained PHB were characterized.
2. Materials and Methods
2.1 Bacterial stain and culture medium
Bacterial stain was carried out using A. eutrophus from DSMZ, Germany. A lyophilized culture was reactivated at 30 °C for 24 h in a growth medium (DSMZ catalogue, 1993). In this study, molasses and CSL were used, instead of fructose and ammonium chloride in DSMZ medium.
2.2 Incubation and cell collection
Batch cultivation was conducted in 150 ml of the medium volume, in 250 ml flask with 3 bottom baffles and incubated at 30 °C for 50 h on a rotary shaker at 130 rpm. Bacterial cells were collected by centrifugation at 10,000 rpm, 10 °C for 10 min (Sorvall, Germany) and the pellets were freeze-dried.
2.3 Isolation of PHB
Homoginization was used to extract intracellular PHB with chloroform. Soluble PHB was precipitated into ethanol and then air-dried.
2.4 Chemical analysis
Intracellular PHB granule was demonstrated by TEM. The chemical structure and molecular weight of PHB were analyzed by NMR and GPC, respectively. Thermal properties

The 23rd Annual Meeting of the Thai Society for Biotechnology “Systems Biotechnology: Quality & Success”
P-IV-12
- 187 -
of PHB were determined by differential scanning calorimetry (DSC).
3. Results and discussion
PHB production was carried out in batch
fermentation by A. eutrophus using molasses and CSL as a C-source and N-source, respectively. After 35 h incubation, the cells growth attained the stationary phase (max. 2.3 g/l dry-cell weight, DCW), while maximum of PHB concentration was obtained to be 0.8 g/l at the ratio of 4% (w/v) molasses and 4% (w/v) CSL (Figure 2).
Figure 2. Batch cultivation of A. eutrophus The accumulation of intracellular PHB of A. eutrophus in the form of granules was demonstrated by TEM observation (Figure 3). The structure of repeat units, [-O-CH-(CH3)-CH2-(C=O)-]n was confirmed by 1H-NMR in the PHB sample. The chemical shift signals of 13C NMR spectrum obtained in the present work was in agreement with those published earlier by Fabian et al. (2007) [6]. The molecular weight of PHB sample, important properties for industrial application was determined to be 580 kDa with low polydispersity. In addition, the thermal properties of PHB sample were similar to that of polypropylene since it showed the melting temperature (Tm) at 167 °C. Highly crystalline polymers are usually stiff and brittle resulting in very poor mechanical properties with low extension with break. However, crystallinity (XC) of PHB sample was obtained 57 % and glass transition (Tg) of -1.83 °C.
(A) (B) Figure 3. Accumulation of PHB granules of A.
eutrophus after 35 h of incubation
(A) Longitudinal section by TEM (59K X) (B) Cross section by TEM (97K X) Acknowledgments
This research was financially supported by National Research Council of Thailand (NRCT) and Naresuan University. References 1. Klem, J. Thomas. Alcaligenes. Department
of Food Science, California, USA. 1999. 2. Steinbüchel, A. and Füchtenbusch, B.
Bacterial and other biological systems for polyester production. Trends Biotechnol. 1998; 16: 419-427.
3. Thakor, S.N., Patel, A.M., Trivedi, B.U. and Patel, C.K. Production of poly(β-hydroxybutyrate) by Comamonas testosteroni during growth on naphthalene. World Journal of Microbiology & Biotechnology. 2003; 19, 185-189.
4. Rehm, A.H. Bernd. Polyester synthases: natural catalysts for plastics. Biochem J. 2003; 376: 15-33.
5. Stubbe, J., Tian, J., He, A., Sinsky, A.J., Lawrence, A.G. and Liu, P. Nontemplate-dependent polymerization processes: polyhydroxyalkanoate synthases as a paradigm. Annu. Rev. Biochem. 2005; 74: 433-480.
6. Fabian, C.D., Marcos, L.D., Leda, R.C. and Denise, M.G.F. Characterization of poly(3-hydroxybutyrate) produced by Cupriaviduc necator in solid-state fermentation. Bioresource Technology. 2007; 98:633-638.
0
0,5
1
1,5
2
2,5
3
3,5
0 6 12,5 18 24 30 36 42 48 54 60 66 72 78
Time(h)
DC
W(g
/L)
0
5
10
15
20
25
30
35
PH
B(%
)
DCW(g/L)PHB(%)

The 23rd Annual Meeting of the Thai Society for Biotechnology “Systems Biotechnology: Quality & Success”
P-IV-13
- 188 -
Utilization of dairy by-products as media for Alcaligenes eutrophus in poly-hydroxybutyrate production
Darunee Sommanas a and Sirilux Chaijamrus a
aDepartment of Biology, Faculty of Science, Naresuan University, Mueang, Phitsanulok 65000, Thailand.
Abstract
Poly-hydroxybutyrate (PHB) is a biodegradable plastic producing from dairy by-products by Alcaligenes eutrophus. Dairy by-products were pretreated by fermentation with Pseudomonas talwanensis and Acinetobacter soli at 30 °C for 40 h followed by adjusting the pH of fermented hydrolysate to 9.0 with 10 N NaOH to hydrolyze the residual proteins at 60 °C for 3 h. This milk hydrolysate (70 %w/v) was used as a culture media for A. eutrophus to obtain PHB productivity of 23 mg/l h-1 after 35 h of incubation at 30 °C, 130 rpm. Isolation of PHB from cell debris, using homogenization and centrifugation was coupled with chloroform extraction. The molecular structure of PHB was analyzed by 1H-NMR and 13C-NMR. The molecular weight of PHB (280 kDa) was determined by permeation chromatography (GPC). In addition, the thermal property of PHB was investigated by differential scanning calorimetry (DSC) technique. The data showed the melting temperature (Tm) of 164 °C, Crystallinity (Xc) of 56 % and glass transition temperature (Tg) of 0.87 °C. This results suggest that dairy by-products could be used as an alternative raw material for PHB production. Keywords: poly-hydroxybutyrate, Alcaligenes eutrophus, dairy by-products 1. Introduction
Poly-hydroxybutyrate (PHB) is a
biodegradable polymer which can be used as a thermoplastic [1,2]. Microorganisms accumulate PHB intracellularly as a storage granule to provide a reserved of carbon and energy. Acaligenes eutrophus is a strict aerobe to generate ATP from the tricarboxylic acid (TCA) cycle under heterotrophic conditions to synthesize PHB product (Figure 1).
Figure 1. Metabolic pathway of PHB of A.
eutrophus on lactate substrate [3]
This work aims to hydrolyze a dairy by-product by co-microorganisms couple with base catalyzed hydrolysis. Influence of milk hydrolysate concentration on growth of A. eutrophus and PHB accumulation were determined. PHB was extracted from cell debris to analyze chemical structure and thermal property.
2. Materials and Methods
2.1 Bacterial stain and culture medium
Bacterial stain was carried out using Alcaligenes eutrophus from DSMZ, Germany. A lyophilized culture was reactivated at 30 °C for 24 h in a growth medium (DSMZ catalogue, 1993). Dairy by-product from Sukhothai was enzymatically hydrolyzed using co-microorganisms of Pseudomonas talwanensis and Acinetobacter soli on static culture at 30 °C for 20-168h. The obtained fermented hydrolysate was further basic hydrolyzed by adjusting the pH to 9.0 with 10 N NaOH and conducting the reaction at 60 °C for 3 h. This milk hydrolysate was diluted (5-100 %w/v) prior to be used as culture broths mixed with trace and mineral of DSMZ medium.
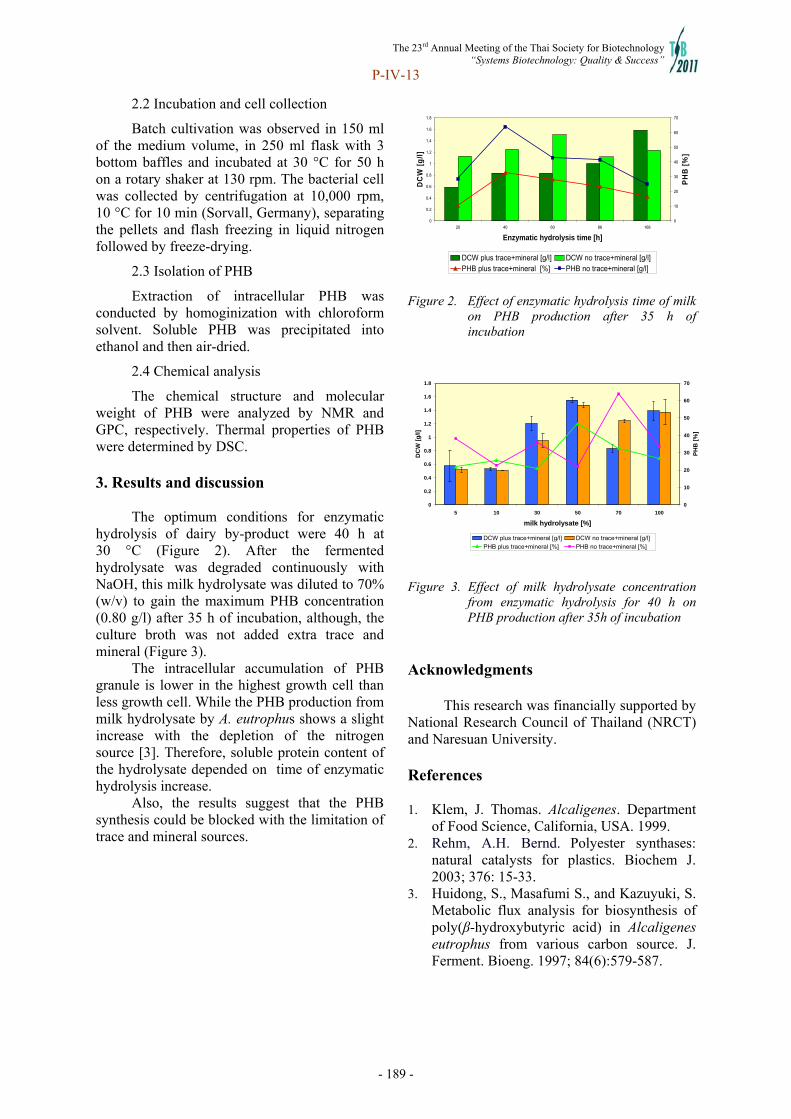
The 23rd Annual Meeting of the Thai Society for Biotechnology “Systems Biotechnology: Quality & Success”
P-IV-13
- 189 -
2.2 Incubation and cell collection
Batch cultivation was observed in 150 ml of the medium volume, in 250 ml flask with 3 bottom baffles and incubated at 30 °C for 50 h on a rotary shaker at 130 rpm. The bacterial cell was collected by centrifugation at 10,000 rpm, 10 °C for 10 min (Sorvall, Germany), separating the pellets and flash freezing in liquid nitrogen followed by freeze-drying.
2.3 Isolation of PHB
Extraction of intracellular PHB was conducted by homoginization with chloroform solvent. Soluble PHB was precipitated into ethanol and then air-dried.
2.4 Chemical analysis
The chemical structure and molecular weight of PHB were analyzed by NMR and GPC, respectively. Thermal properties of PHB were determined by DSC.
3. Results and discussion
The optimum conditions for enzymatic hydrolysis of dairy by-product were 40 h at 30 °C (Figure 2). After the fermented hydrolysate was degraded continuously with NaOH, this milk hydrolysate was diluted to 70% (w/v) to gain the maximum PHB concentration (0.80 g/l) after 35 h of incubation, although, the culture broth was not added extra trace and mineral (Figure 3). The intracellular accumulation of PHB granule is lower in the highest growth cell than less growth cell. While the PHB production from milk hydrolysate by A. eutrophus shows a slight increase with the depletion of the nitrogen source [3]. Therefore, soluble protein content of the hydrolysate depended on time of enzymatic hydrolysis increase. Also, the results suggest that the PHB synthesis could be blocked with the limitation of trace and mineral sources.
0
0.2
0.4
0.6
0.8
1
1.2
1.4
1.6
1.8
20 40 60 86 168
Enzymatic hydrolysis time [h]
DC
W [
g/l
]
0
10
20
30
40
50
60
70
PH
B [
%]
DCW plus trace+mineral [g/l] DCW no trace+mineral [g/l]PHB plus trace+mineral [%] PHB no trace+mineral [g/l]
Figure 2. Effect of enzymatic hydrolysis time of milk
on PHB production after 35 h of incubation
0
0.2
0.4
0.6
0.8
1
1.2
1.4
1.6
1.8
5 10 30 50 70 100
milk hydrolysate [%]
DC
W [
g/l
]
0
10
20
30
40
50
60
70
PH
B [
%]
DCW plus trace+mineral [g/l] DCW no trace+mineral [g/l]
PHB plus trace+mineral [%] PHB no trace+mineral [%]
Figure 3. Effect of milk hydrolysate concentration
from enzymatic hydrolysis for 40 h on PHB production after 35h of incubation
Acknowledgments
This research was financially supported by National Research Council of Thailand (NRCT) and Naresuan University. References 1. Klem, J. Thomas. Alcaligenes. Department
of Food Science, California, USA. 1999. 2. Rehm, A.H. Bernd. Polyester synthases:
natural catalysts for plastics. Biochem J. 2003; 376: 15-33.
3. Huidong, S., Masafumi S., and Kazuyuki, S. Metabolic flux analysis for biosynthesis of poly(β-hydroxybutyric acid) in Alcaligenes eutrophus from various carbon source. J. Ferment. Bioeng. 1997; 84(6):579-587.
The 23rd Annual Meeting of the Thai Society for Biotechnology “Systems Biotechnology: Quality & Success”
P-IV-14
- 190 -
Production of Acetobacter aceti Starter Powder by Low-Temperature Thermal Drying
Jaruwan Maneesria, Payap Masniyomb, and Wipawan Wongsdaluka aDepartment of Food Science and Nutrition, Faculty of Science and Technology, Prince of Songkla University, Pattani 94000, Thailand. bDepartment of Technology and Industries, Faculty of Science and Technology, Prince of Songkla University, Pattani 94000, Thailand.
Abstract Development of Acetobacter aceti TISTR102 starter powder by low-temperature thermal drying is investigated for vinegar production. The powder was prepared by mixing 4 ml of cell coated by 20% mannitol (w/v) with 10 g of rice bran as carrier and dried at 35oC for 12 h. The starter powder showed better residual viability (1.53x10¹⁴ CFU/g) when compared with freeze-dried cells (2.73x10⁹ CFU/g). Ability of starter power in vinegar production from palm sap was acceptable as acetic acid content of about 3.99 g/100ml was obtained within 4 days of fermentation. The starter powder was stored at 4oC or room temperature for 1 month, in an aluminum foil bag or a linear low-density polyethylene (LLDPE) bag, with or without vacuum. The cell viability and fermentability remained unchange after storage for 1 week but decreased afterwards. It was found that the starter powder stored in aluminum foil bag, under vacuum for 1 month at 4oC gave higher viability than that stored at the room temperature. Keywords: Acetobacter aceti, vinegar, starter powder, low-temperature thermal drying, storage Introduction and Objective
Vinegar is produced in both the household
level to industrial scale. Production at household level in traditional, it takes quite a long time to produce. The vinegar production by natural starter culture it is impossible to control the quality of vinegar. A pure culture has been popular in the industry but it is not suitable for production in the household because people lack the tools and knowledge to use a pure culture. The use of pure culture, it is easy to use and the quality of vinegar is stable. Nowadays, many methods for the production of starter powder such as freeze drying and spray drying (Ndoye et al., 2007) because it preserves the culture of the time and the ability to recover the fine. On the other hand, the starter culture resulted in decreased cell viability and starter culture efficiencies, due to the cell membranes of microorganisms have been damaged during the drying process and from the high-temperature drying. Drying by heating is not suitable for production of starter culture. However, at present the application of low-temperature thermal drying to produce the starter powder. This method is cheaper than freezing and spray drying. Also, the low-temperature thermal drying can reduce the loss of the cell viability.
This method, it is one option in the application process for the production of starter powder.
Thus, this study aims to develop a culture of vinegar powder production process by low-temperature thermal drying for use in quality control of vinegar production.
Materials and Methods 2.1 Cell cultivation
The Acetobacter aceti TISTR102 was provided by Microbiological Resources Centre, T h a i l a n d I n s t i t u t e o f S c i e n t i f i c a n d Technological Research. A. aceti TISTR102 was maintained on a GYE agar slant at 4°C and subculture at about 1 month interval (GYE agar contained glucose 100 g/l, yeast extract 10 g/l and agar 20 g/l). One loop of cells from the slant was inoculated into 150 ml GYE broth, incubated for 24 hrs at 30°C on a rotary shaker with agitation of 100 rpm and then employed as the preculture. Then, they were inoculated with 5% w/w the preculture into a 600 ml flask containing 400 ml of aseptic the palm sap was used as the raw material, incubated for 4 days at 30°C on a rotary shaker with agitation of 180 rpm. Cells were then harvested by centrifugation for 10 min at 9600g at 4°C, washed with a phosphate buffer followed by centrifugation.
The 23rd Annual Meeting of the Thai Society for Biotechnology “Systems Biotechnology: Quality & Success”
P-IV-14
- 191 -
2.2 The production of starter powder by low-temperature thermal drying.
The cell paste was resuspended into 20% w/w mannitol as protective agent and hold 1 hr at room temperature. Mixed 4 ml the suspension with 10 g of rice bran as carrier and drying at 35°C for 12 h. 2.3 The production of starter powder by freeze drying
The cell paste was resuspended into 20% w/w mannitol as protective agent and frozen overnight at -60°C before freeze-drying for 24 hrs. 2.4 Analytical procedure
To compare low-temperature thermally-dried A. aceti TISTR102 with wet cell and freeze-dried cell and with those low-themperature thermally-dried cells stored for 1 week and 1 month. The viable cells were enumerated by with using spread plate technique on GYE agar. The starter powders (1g) were rehydration in peptone water by mixing thoroughly with a vortex mixer for 10 min and spreaded onto the surface of GYE agar. The acetic acid content was determined by titration with 0.1N NaOH using phenolphthalein as indicator (AOAC., 2000). The starter powders (1g) were rehydration in peptone water by mixing thoroughly with a vortex mixer for 10 min and added 5% w/w the suspension into a 250 ml flask containing 150 ml of the palm sap wine (6% ethanol), incubated for 2-4 days at 30°C on a rotary shaker with agitation of 100 rpm.
Results and Discussion 3.1 Effect of the drying process
Low-temperature thermal drying and freeze drying were used to investigate the effect of dehydration on cell viability and stability. The use of 20% w/w mannitol as protective agent, added to the fresh paste before drying. The results are presented in table 1.
Table 1. Comparison of efficiency by wet, low-temperature thermally-dried and freeze-dried cells of A. aceti TISTR102.
Acetic acid (g/100 ml)
Sample Cell
viability (CFU/g)
2 days 4 days
Wet cells 2.44x10¹⁴ 0.45 4.40
Low-temperature thermally-dried cells
1.53x10¹⁴
0.45
3.99
Freeze-dried cells 2.73x10⁹ 0.23 2.79
Low-temperature thermally-dried cells
showed the cell viability 1.53x10¹⁴ CFU/g and the water activity (aw) 0.408. While, freeze-dried cells showed the cell viability 2.73x10⁹ CFU/g and aw 0.413. Both low-temperature thermally-dried cells and freeze-dried cells had the water activity is lower than 0.6, the amount of bacteria, yeast and mold can not grow (Zapsalis and Beck, 1985).
The result showed low-temperature thermally-dried and wet cells exhibited similar the cell viability and acetic acid content. While, freeze-dried cells is efficiency lower may be caused the cell viability in freeze-dried cells below due to dehydration, the cell viability were decreased to occur during the drying or freezing. when the ice crystals and the concentration of salt increased both inside and outside the cell can cause dehydration which the cell walls were destroyed. 3.2 Stability of low-temperature thermally-dried cells
Ten gram of starter powder A. aceti TISTR 102 was placed in a plastic bag or aluminum foil laminate pouch sealing by either vacuum or atmospheric condition (Fig. 1 and 2) and then stored at room temperature (30 ± 1°C) or 4°C for 1 month. The result showed that duration of storage a month to keep the culture of starter powder at room temperature conditions contained the cell viability at a room temperature below 4°C during storage. While packaged in aluminum foil laminate pouch and vacuum sealed plastic bag and store at 4 °C. The starter powder has the highest amount of the cell viability for 1 week of conservation. Vinegar fermentation for 4 days showed that starter

The 23rd Annual Meeting of the Thai Society for Biotechnology “Systems Biotechnology: Quality & Success”
P-IV-14
- 192 -
powder is stored at 4°C with acetic acid production was higher than storage at room temperature. In addition, the starter powder in a aluminium foil laminate pouch and sealed in a vacuum has the highest amount of the cell viability and acetic acid production.
Stability of starter powder stored at room temperature decreased quickly in 1 month of conservation, while stability of starter powder stored at 4°C decreased slightly. Storage temperature affect the survival of the samples. In addition, they were maintained in an oxygen atmosphere. Survival rates are low because the oxygen can penetrate into cells that react with cell dry during storage. Which is oxygen free radicals can accumulate, but can not be metabolizing light or be removed from the cells. The reaction is irreversible damage to cells .
Figure 1. Starter powder of A. aceti TISTR 102 in a plastic bag, sealing the two conditions: vacuum (A) and atmosphere (B).
Figure 2. Starter powder of A. aceti TISTR 102 in a aluminum foil laminate pouch, sealing the two conditions: vacuum (A) and atmosphere (B).
Acknowledgements The authors are grateful to Faculty of Science and Technology, Prince of Songkla University for financial support of this work. References
1. AOAC. Official Method of Analysis. 16th
ed. Verginia: The Associate Analysis Chemists; 2000.
2. Ndoye, B., Weekers, F., Diawara, B., Guiro, T.A. and Thonart, P. Survival and preservation after freeze-drying process of thermoresistant acetic acid bacteria isolated from tropical products of Subsaharan Africa. Food Engineering. 2007;79, 1374-82.
3. Zapsalis, C. and Beck, R.A. Food chemistry and nutritional biochemistry. John Wiley&Sons, USA; 1985.
.
(A) (B)
(A) (B)
The 23rd Annual Meeting of the Thai Society for Biotechnology “Systems Biotechnology: Quality & Success”
P-IV-16
- 193 -
Optimization of medium components for lactic acid production from tapioca starch hydrolysate by Lactobacillus casei TISTR 453 using
Response surface methodology Chayaporn Samansoranakun and Chaowaree Adthalungrong Department of Microbiology, Faculty of Science, Silpakorn University, Nakhon Pathom 73000, Thailand Abstract
Response surface methodology (RSM) was used to determine optimum values of winery yeast disposal, peptone, meat extract and dipotassium hydrogen phosphate to achieve a maximum lactic acid concentration. Tapioca starch hydrolysate was applied as a carbon source for the production of lactic acid by Lactobacillus casei TISTR 453. According to Box-Behnken design, 27 experiments were generated with 3 levels of each medium component. A submerged fermentation in 250 ml Erlenmeyer flasks was carried out for 48 h under 200 rpm at 34 ̊C with an initial level of reducing sugar at 130 g/l. From the results, the highest experimental lactic acid concentration at 126.4 g/l and the highest productivity at 2.63 g/l/h were obtained when winery yeast disposal and peptone were supplied at 10 g/l with the addition of meat extract at 12 g/l while dipotassium hydrogen phosphate was omitted. Under the optimal levels of medium components, the model generated from RSM estimated a maximum lactic acid concentration around 121 g/l, which was close to the experimental value observed. Keywords: lactic acid, Lactobacillus casei, Response surface methodology, Box-Behnken design, tapioca starch hydrolysate Introduction and Objective
Lactic acid is an organic acid used in food,
pharmaceutical, leather, textile, laundry, tanning and cosmetic industries. In addition, it can be polymerized to biodegradable polylactic acid (PLA) (1, 2). About 90% of lactic acid are produced by fermentation either by lactic acid bacteria or mold and another 10% is produced by chemical synthesis by the hydrolysis of lactonitrile (3). Microbial fermentation results in stereospecific L(+), D(-) lactic acid from using specific microbial strain whereas racemic DL lactic is obtained from chemical synthesis (2). Another significant advantage of lactic acid fermentation over chemical synthesis is that cheap and renewable resources such as starch, whey, cane sugar, molasses and other carbohydrates from agricultural wastes can be used as fermentation substrate.
Tapioca starch is an interesting resource for lactic acid bio-production because after being hydrolyzed, it contains high concentrations of glucose which is feasible for an efficient lactic acid production (4).
Lactic acid bacteria have specific growth factor requirement. Among many nitrogen sources, yeast extract is reported as a good choice for lactic acid production since it contains high content of nitrogen compounds as well as other growth factors. However, the cost of yeast extract is high. Hence, it is important to find an alternative nitrogen source which is more cost-effective (5, 6). In the present study, winery yeast disposal (a by-product from winery industry) was selected to replace yeast extract. It consisted of essential nutrients that the starter culture required for lactic acid production.
Traditional method of medium optimization has been carried out in many researches by monitoring the influence of one factor at a time on an experimental response. The disadvantage of said method is that it does not include the interactive effects among the variables studied. Moreover, it needs a number of experiments to be run, leading to an increase of time, chemicals and manpower (7). Response surface methodology (RSM) is served as a tool to evaluate the importance of factors and to study the interactions between variables. Besides, optimum conditions of variables can be estimated by RSM (8).

The 23rd Annual Meeting of the Thai Society for Biotechnology “Systems Biotechnology: Quality & Success”
P-IV-16
- 194 -
The aim of the present study was to optimize medium components for lactic acid production by Lactobacillus casei TISTR 453 using RSM when tapioca starch hydrolysate and winery yeast disposal were supplied as a carbon and nitrogen source, respectively.
Materials and Methods
2.1 Materials All chemicals used in this research were
analytical grade. Meat extract was purchased from HiMedia Laboratories, India. Peptone was obtained from BIOMARK LABORATORIES, India. Dipotassium hydrogen phosphate was provided by UNIVAR, Ajax Finecem, Australia. Winery yeast disposal was purchased from Siam Winery CO., Ltd.
2.2 Microorganism L. casei TISTR 453, a homo-fermentative
lactic acid bacterium, was obtained from the Bangkok MIRCEN, Thailand. The strain was stored in deMan, Rogosa and Sharpe (MRS) broth (Lab M Ltd., United Kingdom) with 15% glycerol at -80C and a short-term preserved culture was stored in MRS agar slant. The culture was kept refrigerated with monthly subculturing.
2.3 Enzymes for starch hydrolysis Hydrolysis of tapioca starch was carried out
using commercially available thermostable α-amylase (EC 3.2.1.1), Liquozyme® SC DS (Novozymes A/S, Denmark) produced by Bacillus licheniformis with a declared activity of 240-KNU-S/g and gluco-amylase (EC 3.2.1.3), Spirizyme®Fuel (Novozymes A/S, Denmark) with a declared activity of 750 AGU/g.
2.4 Enzymatic hydrolysis of tapioca starch Tapioca starch was purchased from local
stores in Nakhon Pathom, Thailand. The 3L Erlenmeyer flask containing 560 g dry tapioca starch and 1200 ml of distilled water was used. Liquefaction was initiated by addition of α-amylase, the level used was 0.23 g enzyme/kg starch (70 ̊C, pH 5.5 for 90 min). Then, saccharification was achieved by gluco-amylase, the level used was 1.0 g enzyme/kg starch (55 ̊C,
pH 5.5 for 48 h.). When the process finished, the enzymes were inactivated by heating starch hydrolysate at 100 ̊C for 5 min. Starch residues were eliminated by centrifugation at 5,000 x g, 4 ̊C for 15 min and the clear tapioca starch hydrolysate was stored at 4 ̊C until use.
2.5 Cultivation The inoculums was prepared by inoculating
one loopfull of L. casei TISTR 453 from MRS slant into 200 ml of sterile MRS broth, in 250 ml Erlenmeyer flask and incubated at 37 ̊C for 24 h. Then, cells were harvested in a sterile centrifuge tube by centrifugation at 6,000 rpm for 15 min at 4 ̊C for seed culture. The pellet obtained was re-suspended in 550 ml sterile 0.1% peptone to adjust an optical density (660 nm) to 1.0. Then, 20 ml of cell suspension was transferred to 250 ml Erlenmeyer flasks containing 180 ml of fermentation medium which consisted of basal medium components and 4 variables studied. These included different concentrations of winery yeast disposal, peptone, meat extract and dipotassium hydrogen phosphate. Basal medium components included 130 g/l reducing sugar from tapioca starch hydrolysate, 60 g/l CaCO3, 1 ml/l tween 80, 2 g/l triammonium citrate, 5 g/l sodium acetate, 0.2 g/l magnesium sulfate monohydrate, 0.05 g/l manganese sulphate monohydrate. The fermentation of lactic acid was carried out at 34 ̊C, 200 rpm for 48 h.
2.6 Sample analysis After 48 h of fermentation, 20 ml of
samples were collected and measured for pH by pH meter (Metrohm Siam, Thailand). Subsequently, the pH level of fermentation medium was adjusted to 1.8-2.0 by 4M HCl. At this stage, lactic acid was released from calcium lactate salt. Then, the volume of each sample was adjusted to 40 ml by distilled water and samples were centrifuged at 6,000 rpm for 15 min. Finally, the clear supernatant was subjected to lactic acid estimation by colorimetric method (9) and concentration of reducing sugar was determined following the DNS method (10).

The 23rd Annual Meeting of the Thai Society for Biotechnology “Systems Biotechnology: Quality & Success”
P-IV-16
- 195 -
2.7 Optimization by RSM Box-Behnken design (BBD) (11, 12) for 4
independent variables including winery yeast disposal, peptone, meat extract and dipotassium hydrogen phosphate were studied. Each variable was studied at three levels (coded as -1, 0 and 1) (7) which corresponded to the lower, middle and higher values, respectively (Table 1).
Table 1 Experimental range and levels of independent variables used in Box-Behnken design
Range and levels Independent variables -1 0 1
winery yeast disposal (g/l)
X1 5.0 10.0 15.0
Peptone (g/l) X2 5.0 10.0 15.0 meat extract (g/l) X3 4.0 8.0 12.0 K2HPO4 (g/l) X4 0 0.2 0.4
The number of experiments (runs)
according to N = 2k(k-1) + Cp , where k is the number of variable and Cp is the number of the central points; a total of 27 runs were used for the study (13). (Table 2)
The data on lactic acid production obtained from RSM were subjected to the analysis of variance (ANOVA). The results of RSM were used to fit a second-order polynomial [Eq.(1)].
Y = b0 + Σ bixi + Σ biixi
2 + Σ bijxixj (1)
Where Y is lactic acid production, b0 is the offset term, bi is the linear effect, bii is the squared effect, bij is the interaction effect and xi is the independent variable. Results and discussion
There were a total of 27 runs of variables in
coded units displayed in Table 2. Multiple regression analysis was used to
analyze the data and thus a second-order polynomial equation was derived [Eq.(2)], This contained linear terms, quadratic terms and factorial interactions.
Table 2 Experimental design and results of Box-Behnken design
Lactic acid (g/l) Run X1 X2 X3 X4 Experimental Predicted 1 -1 -1 0 0 68.75 69.73 2 1 -1 0 0 78.70 80.04 3 -1 1 0 0 98.63 96.17 4 1 1 0 0 111.20 109.10 5 0 0 -1 -1 56.05 62.72 6 0 0 1 -1 126.43 120.18 7 0 0 -1 1 59.12 64.25 8 0 0 1 1 112.87 105.07 9 -1 0 -1 0 68.47 60.53
10 1 0 -1 0 73.03 70.36 11 -1 0 1 0 109.07 107.89 12 1 0 1 0 117.21 121.30 13 0 -1 0 -1 80.25 78.02 14 0 1 0 -1 108.26 102.36 15 0 -1 0 1 65.76 67.81 16 0 1 0 1 100.60 98.98 17 -1 0 0 -1 82.40 89.07 18 1 0 0 -1 102.77 103.81 19 -1 0 0 1 81.46 85.40 20 1 0 0 1 95.60 93.90 21 0 -1 -1 0 45.38 41.23 22 0 1 -1 0 74.21 77.17 23 0 -1 1 0 96.54 98.56 24 0 1 1 0 109.00 118.13 25 0 0 0 0 89.91 90.29 26 0 0 0 0 92.42 90.29 27 0 0 0 0 88.54 90.29
Y = 90.2900 +5.8108x1 +13.8767x2 +24.5717x3
–3.3958x4 +2.3596x12 –3.8917x2
2 -2.6792x32
+0.3946x42 +0.655x1x2 +0.895x1x3 -1.5575x1x4
-4.0925x2x3 +1.7075x2x4 -4.1575x3x4 (2)
Where Y is the predicted lactic acid production and x1, x2, x3, x4 are the coded values for winery yeast disposal, peptone, meat extract and dipotassium hydrogen phosphate, respectively.
The adequacy of the model was checked using analysis of variance (ANOVA), as shown in Table 3. The F-value (the ratio of mean square regression to mean square residual) was high (F = 17.81) and the probability value was very low (P = 0.000), suggesting that the variable studied were significant on lactic acid production by L. casei TISTR 453.
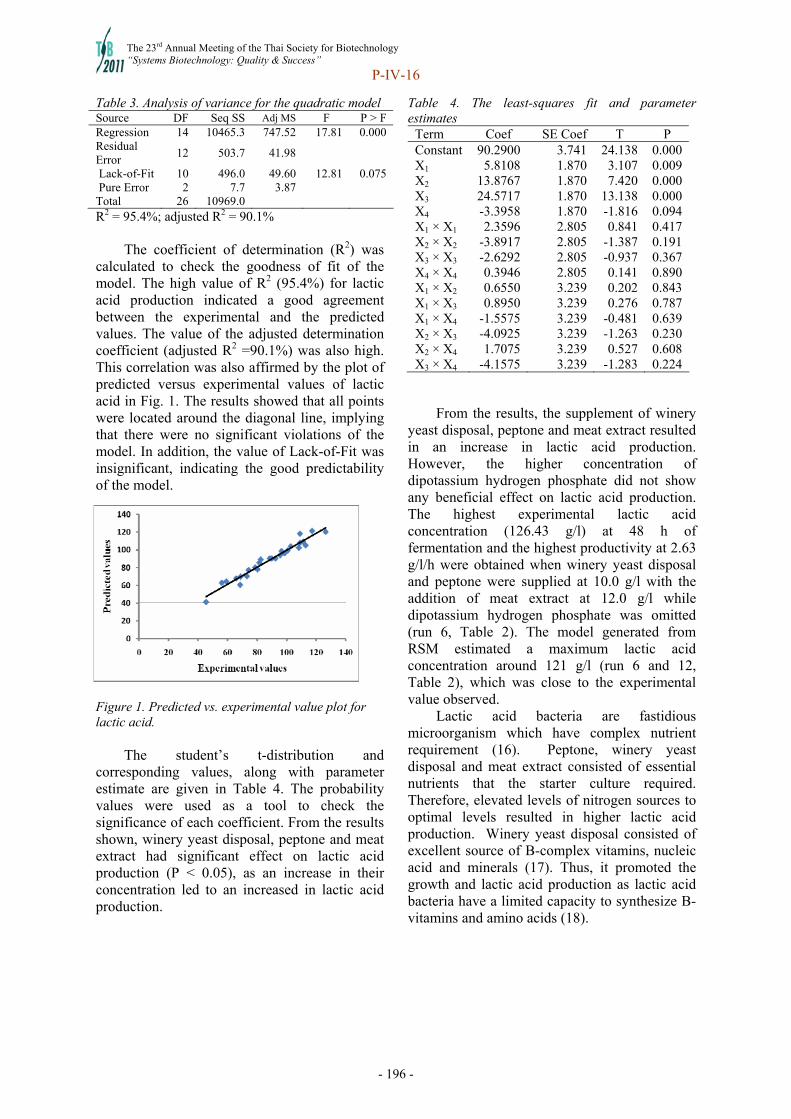
The 23rd Annual Meeting of the Thai Society for Biotechnology “Systems Biotechnology: Quality & Success”
P-IV-16
- 196 -
Table 3. Analysis of variance for the quadratic model Source DF Seq SS Adj MS F P > F Regression 14 10465.3 747.52 17.81 0.000 Residual Error
12 503.7 41.98
Lack-of-Fit 10 496.0 49.60 12.81 0.075 Pure Error 2 7.7 3.87 Total 26 10969.0 R2 = 95.4%; adjusted R2 = 90.1%
The coefficient of determination (R2) was calculated to check the goodness of fit of the model. The high value of R2 (95.4%) for lactic acid production indicated a good agreement between the experimental and the predicted values. The value of the adjusted determination coefficient (adjusted R2 =90.1%) was also high. This correlation was also affirmed by the plot of predicted versus experimental values of lactic acid in Fig. 1. The results showed that all points were located around the diagonal line, implying that there were no significant violations of the model. In addition, the value of Lack-of-Fit was insignificant, indicating the good predictability of the model.
Figure 1. Predicted vs. experimental value plot for lactic acid.
The student’s t-distribution and corresponding values, along with parameter estimate are given in Table 4. The probability values were used as a tool to check the significance of each coefficient. From the results shown, winery yeast disposal, peptone and meat extract had significant effect on lactic acid production (P < 0.05), as an increase in their concentration led to an increased in lactic acid production.
Table 4. The least-squares fit and parameter estimates
Term Coef SE Coef T P Constant 90.2900 3.741 24.138 0.000 X1 5.8108 1.870 3.107 0.009 X2 13.8767 1.870 7.420 0.000 X3 24.5717 1.870 13.138 0.000 X4 -3.3958 1.870 -1.816 0.094 X1 × X1 2.3596 2.805 0.841 0.417 X2 × X2 -3.8917 2.805 -1.387 0.191 X3 × X3 -2.6292 2.805 -0.937 0.367 X4 × X4 0.3946 2.805 0.141 0.890 X1 × X2 0.6550 3.239 0.202 0.843 X1 × X3 0.8950 3.239 0.276 0.787 X1 × X4 -1.5575 3.239 -0.481 0.639 X2 × X3 -4.0925 3.239 -1.263 0.230 X2 × X4 1.7075 3.239 0.527 0.608 X3 × X4 -4.1575 3.239 -1.283 0.224
From the results, the supplement of winery
yeast disposal, peptone and meat extract resulted in an increase in lactic acid production. However, the higher concentration of dipotassium hydrogen phosphate did not show any beneficial effect on lactic acid production. The highest experimental lactic acid concentration (126.43 g/l) at 48 h of fermentation and the highest productivity at 2.63 g/l/h were obtained when winery yeast disposal and peptone were supplied at 10.0 g/l with the addition of meat extract at 12.0 g/l while dipotassium hydrogen phosphate was omitted (run 6, Table 2). The model generated from RSM estimated a maximum lactic acid concentration around 121 g/l (run 6 and 12, Table 2), which was close to the experimental value observed.
Lactic acid bacteria are fastidious microorganism which have complex nutrient requirement (16). Peptone, winery yeast disposal and meat extract consisted of essential nutrients that the starter culture required. Therefore, elevated levels of nitrogen sources to optimal levels resulted in higher lactic acid production. Winery yeast disposal consisted of excellent source of B-complex vitamins, nucleic acid and minerals (17). Thus, it promoted the growth and lactic acid production as lactic acid bacteria have a limited capacity to synthesize B-vitamins and amino acids (18).
The 23rd Annual Meeting of the Thai Society for Biotechnology “Systems Biotechnology: Quality & Success”
P-IV-16
- 197 -
Acknowledgements We thank the Department of Microbiology, Faculty of Science, Silpakorn University for chemicals and facilities. We also would like to thank Siam Winery Co., Ltd., and The East Asiatic (Thailand) Public Company Limited for providing the yeast disposal and enzymes for starch hydrolysis, respectively.
References
1. Di Lorenzo M L. Crystallization behavior of
poly (L-lactic acid). Eur. Polym. J. 2005: 569-75.
2. Datta R, Tsai S P, Bonsignor P, Moon S, Frank J. Technological and economical potential of polylactic acid and lactic acid derivatives. FEMS Microbiol Rev. 1995; 16: 221-31.
3. Kadam S R, Patil S S, Bastawde K B, Khire J M, Gokhale D V. Strain improvement of Lactobacillus delbrueckii NCIM 2365 for lactic acid production. Proc. Biochem. 2006; 41: 120-26.
4. Adthalungrong C, Temviriyanukul S. Optimization of lactic acid production from tapioca starch hydrolysate by Lactobacillus casei TISTR 453. KKU Research Journal. 2010; 15(5): 436-45.
5. Nancib N, Nancib A, Boudjelal A, Benslimane C, Blanchard F, Boudrant J. the effect of supplementation by different nitrogen sources on the production of lactic acid from date juice by lactobacillus casei subsp. rhamnosus. Bioresour. Technol. 2001; 78: 149-53.
6. Kwon S, Lee P C, Lee E G, Keun C Y, Chang N. Production of lactic acid by Lactobacillus rhamnosus with vitamin-supplemented soybean hydrolysate. Enzyme Microb. Technol. 2000; 26: 209-15.
7. Bezerra M A, Santelli R E, Oliveira E P, Villar L S, Escaleira L A. Response surface methodology (RSM) as a tool for optimization in analytical chemistry. Talanta. 2008; 76: 965-77.
8. Gheshlaghi R, Scharer J M, Moo-Young M, Douglas P L. Medium optimization for hen egg white lysozyme production by recombinant Aspergillus niger using statistical methods. Biotechnol Bioeng. 2005; 90(6): 754-60.
9. Barker S B, Summerson W. The colorimetric determination of lactic acid in biological
material. J. of Biol. Chem. 1941; 138: 535-54.
10. Miller G L. Use of Dinitrosalicylic acid reagent for determination of reducing sugar. Anal. Chem. 1959; 31(3): 426-428.
11. Box G.E.P., Behnken D.W. Some new three level designs for the study of quantitative variables. Technometrics. 1960; 2: 455-75.
12. Box G.E.P., Draper N.R., Response Surface, Mixtures, and Ridge Analysis. 2nd ed. New York: John Wiley & Sons; 2007
13. Ferreira S L C, Bruns R E, Ferreira H S, Matos G D, David J M, Brandao G C, da Silva E G P, Portugal L A, dos Reis P S, Souza A S, dos Santos W N L. Box-Behnken design: An alternative for the optimization of analytical methods. Analytica Chimica Acta. 2007; 597: 179-86.
14. Yu L, Lei T, Ren X, Pei X, Feng Y. Response surface optimization of L-(+)-lactic acid production using corn steep liquor as an alternative nitrogen source by Lactobacillus rhamnosus CGMCC 1466. Biochem. Eng. J. 2003; 16: 229-35.
15. Reddy L V A, Wee Y-J, Yun J-S, Ryu H-W. Optimization of alkaline protease production by batch culture of Bacillus sp. RKY3 through Plackett-Burman and response surface methodology approaches. Bioresour. Technol. 2008; 99: 2242-49.
16. Fitzpatrick J J, O’Keeffe U. Influence of whey protein hydrolyzate addition to whey permeate batch fermentations for producing lactic acid. Process Biochem. 2001; 37: 183-186.
17. Ferreira I M P V O, Pinho O, Vieira E, Tavarela J G. Brewer’s Saccharomyces yeast biomass: characteristics and potential applications. Trends in Food science & technology. 2010; 21: 77-84.
18. Hofvendahl K, Hahn-Hagerdal B. Factors affecting the fermentative lactic acid production from renewable resources. Enzyme Microb. Technol. 2000; 26; 87-107.
The 23rd Annual Meeting of the Thai Society for Biotechnology “Systems Biotechnology: Quality & Success”
P-IV-18
- 198 -
Phenolic antioxidative activity of banana (Musa sapientum L.) peel extract Supak Chuamsuk a, Punyawatt Pintathong a,b, Natthawut Thitipromote a,b, Narunan Wuttisina and Phanuphong Chaiwut a,b
aSchool of Cosmetic Science, Mae Fah Luang University, Chiang Rai, 57100, Thailand bExcellent Center for Cosmetic and Wellness, School of Cosmetic Science, Mae Fah Luang University, Chiang Rai, 57100, Thailand
Abstract Phenolic content and antioxidant activity of extract from banana (Musa sapientum L.) peel were evaluated. The banana peel extract was obtained by microwave-assisted extraction. Influences of extraction factors including microwave power and duration were investigated. Folin-Ciocalteu method was used to assess the phenolic content. Radical scavenging assay (using DPPH and ABTS) and ferric reducing antioxidant power (FRAP) assays were used to evaluate the antioxidant capacity. Duration of 30 min resulted in higher phenolic content of 10.77 mg-gallic acid equilvalent (GAE)/g-sample and greater antioxidant activities of 8.21, 13.80 and 8.42 mg-Trolox equivalent antioxidant capacity (TEAC)/g-sample for DPPH, ABTS and FRAP assays, respectively. Lower phenolic antioxidant activity was observed for the extraction duration of 15 and 45 min. Study on effect of microwave power revealed that lower power resulted in higher extraction efficiency. An extraction using 360 Watt exhibited highest phenolic content (11.64 mg-GAE)/g-sample) and antioxidant activities of 8.64, 14.28 and 8.64 mg-TEAC/g-sample for DPPH, ABTS and FRAP assays, respectively. Our result indicated banana peel as a potential source of phenolic antioxidant, offering a possibility to obtain value-added products from banana waste.
Keywords: Antioxidant, banana peel, microwave-assisted extraction, phenolic Introduction and Objective
A vast number of plants have been explored to be a new source of bioactive compounds. Natural antioxidative compounds are generally considered as safe and scientifically proven for protection against various diseases (1). Therefore, the antioxidants from various plants have attracted the attention of many industries, especially in food, cosmetic and pharmaceutic. Recently, a lot of agricultural wastes have been investigated as they are potential sources for antioxidant extraction. Banana (Musa sapientum L.) is one of the most popular fruits in Thailand and applied in many recipes of Thai cuisine. Consumption of banana fruit produces a lot of banana peel wastes. There has been reported that banana peel showed stronger antioxidant activity than the pulp extract (2). Gallocatechin, anthocyanin, cyanidin and other phenolic compounds have been found in banana peels (3). However, previous reports have extracted the antioxidant from banana peels by using simple solvent extraction. Therefore, the aim of this study is to use the microwave in antioxidant
extraction from banana peel wastes. Extraction duration and microwave power affecting on extraction efficiency were also investigated.
Materials and Methods
Banana peels were collected from banana deep fire shop in Muang, Chiang Rai province, Thailand. The samples were dried by using hot air oven at 55°C for 16 h and then powdered by a hammer mill prior to further study. Phenolic antioxidant in banana peels was extracted by 50% ethanol using microwave-assisted extraction with ratio of sample to solvent fixed at 1:5 w/v. The extraction procedure was operated by varying microwave power at 360, 630 and 900 W and duration of 15, 30 and 45 min. The mixtures were filtered through filter paper to collect the extract for further analysis.
Extractable phenolic content (EPC), radical scavenging activity of the banana peel extract were evaluated by using the Folin-Ciocalteu method, DPPH and ABTS radical scavenging activity and FRAP assays, respectively (4).
The 23rd Annual Meeting of the Thai Society for Biotechnology “Systems Biotechnology: Quality & Success”
P-IV-18
- 199 -
Table 1. Extractable phenolic content and antioxidant capacity of banana peel extract.
Antioxidant capacity (mg TEAC/g)* Extraction condition
Power (Watt) Duration (min)
EPC (mg GAE/g)*
DPPH ABTS FRAP 360 30 11.64 ± 0.46b 8.64 ± 0.65a 14.28 ± 0.56b 8.64 ± 0.09b
630 30 10.77 ± 0.22a 8.21 ± 0.24a 13.80 ± 0.81a 8.42 ± 0.18b
900 30 10.37 ± 0.31a 8.38 ± 0.64a 13.74 ± 0.11a 7.97 ± 0.14a
630 15 8.61 ± 0.53a 7.01 ± 0.78a 12.08 ± 0.01a 7.21 ± 0.05ab
630 630
30 45
10.77 ± 0.22b
8.56 ± 0.36a 8.21 ± 0.24b 7.95 ± 0.02b
13.80 ± 0.81b
12.02 ± 0.23a 8.42 ± 0.18b
6.92 ± 0.10a
*Values are means ± S.D. (n=5). Superscripts of lower case in each extraction condition indicate significantly different (P<0.05). GAE: gallic acid equivalent, TEAC: trolox equivalent antioxidant capacity.
Results and Discussion
The EPC of banana peel extract ranged from 8.56-10.77 mg GAE/g sample. The highest value was obtained from the extraction condition of 360 W for 30 min. This condition also provided the highest radical scavenging capacity and reducing power of 8.64, 14.28 and 8.64 TEAC/g sample for DPPH, ABTS and FRAPS assays, respectively (P<0.05). Homogenization of dry banana peel with 50% ethanol for 120 min showed radical scavenging capacities of 11 and 32 mg TEAC/ g sample when determined with DPPH and ABTS assays, respectively (3).
Study on the effect of microwave power on phenolic antioxidant extraction from banana peel showed that the power of 360 W gave the highest EPC, radical scavenging capacity and reducing power, while higher power including 630 and 900 W exhibited significantly lower efficiency (Table 1). This result was agreed with previous report that increasing of microwave power decreased the phenolic extraction ability (5).
Effect of duration on extraction of phenolic compounds from banana peel also showed in Table 1. It was observed that when a microwave power was constant at 630 W, 30 min of extraction duration offered higher amount of EPC and antioxidant capacity. Significant lower efficacy was found in lower and higher duration (15 and 45 min, respectively). There has been documented that extraction with microwave less than 30 min possibly resulted in lower releasing of phenolic compound due to a few slight ruptures on the surface of the sample (6) and also extraction time higher than 30 min might cause degradation of major phenolic antioxidant content in the sample.
This study has demonstrated that banana peel could be a substantial source for phenolic antioxidant extraction. It is also showed that
microwave-assisted extraction possibly is a powerful method for natural active compound extraction. References 1. Sulaiman, S., Yusoff, N.A.M., Eldeen, I.M.,
Seow, E.M., Sajak, A.A.B., Ooi, S.K.L. Correlation between total phenolic and mineral contents with antioxidant activity of eight Malaysian bananas (Musa sp.). J. Food Composit. Anal. 2011; 24: 1-10.
2. Someya, S., Yoshiki, Y., Okubo, K. Antioxidant compounds from bananas (Musa Cavendish). Food Chem. 2002; 79: 351-354.
3. Gonzalez-Montelongo, R., Lobo, M.G., Gonzalez, M. Antioxidant activity in banana peel extracts: Testing extraction conditions and related bioactive compounds. Food Chem. 2010; 119: 1030-1039.
4. Pintathong, P., Chaiwut, P., Thitipromote, N., Rawdkuen, S. Comparison of differenct methods for bioactive compounds from Bombox ceiba L. flowers. Proceeding in: The 22nd Annual Meeting of the Thai Society for Biotechnology, 2010:184-191.
5. Hayat, K., Zhang, X., Farooq, U., Abbas, S., Xia, S., Jia, C., Zhong, F., Zhang, J. Effect of microwave treatment on phenolic content and antioxidant activity ofcitrus mandarin pomace. Food Chem. 2010; 123: 423-429.
6. Mandal, V., Mohan, Y., Hemalatha, S. Microwave assisted extraction –an innovative and promising extraction tool for medicinal plant research. Pharmacog. Rev. 2007; 1: 7-18.

The 23rd Annual Meeting of the Thai Society for Biotechnology “Systems Biotechnology: Quality & Success”
P-IV-19
- 200 -
Phenolic content and DPPH radical scavenging capacity in mung bean sprout extracts
Pinyada Wijitrakul a, Puthinee Junhasobhaga a, Punyawatt Pintathong a,b, and Phanuphong Chaiwut a,b
aSchool of Cosmetic Science, Mae Fah Luang University, Chiang Rai, 57100, Thailand bExcellent Center of Cosmetic and Wellness, School of Cosmetic Science, Mae Fah Luang University, Chiang Rai, 57100, Thailand Abstract This study was purposed to evaluate the phenolic content and antioxidant activity in different growing stages and different part of mung bean sprout. The mung bean seed was germinated for 12, 24 and 48 h and separated seed coat from sprout kernel. The extract was obtained by using various ethanol concentrations with constant shaking speed. Phenolic content and antioxidant activity of the mung bean sprout extract was determined by using Folin-Ciocalteu method and 2,2-diphenyl-1-picrylhydrazyl (DPPH) radical scavenging assay, respectively. The ethanol concentration of 50% (v/v) provided the highest extractable phenolic content from the seed coat, whereas the ethanol amount was not significantly affected on that from the sprout kernel. The 50% (v/v) ethanol extract also gave the highest DPPH radical scavenging activity in the seed coat of mung bean sprout with displaying the values of 44.60, 46.50 and 50.54 mg Trolox equivalent antioxidant capacity (TEAC)/g sample for 12, 24 and 48 h of germinated sprouts, respectively. However, the 75% (v/v) ethanol provided the highest antioxidant capacity in the sprout kernel extract possessing the value in the ranges of 1.11, 1.59 and 1.42 mg TEAC/g sample for 12, 24 and 48 h germination, respectively. The result clearly showed that the seed coat exhibited higher phenolic antioxidant than the kernel of mung bean sprout. Keywords: Antioxidant, extract, mung bean, phenolic, sprout Introduction and Objective Seed sprouts have long been used as functional food due to basic nutrients and phytochemical containing. Recently, germinated legumes are gaining interest because they are excellent sources of bioactive compounds (1). Mung bean sprout is widely consumed in Thailand. However, there has been very little information in bioactivity from mung bean sprout. Therefore, study on extraction and evaluation of the activity of phenolic compound in the mung bean sprout is attractive and might be useful for application especially in food, pharmaceutical and cosmetic. This research is, thus, aimed to extract phenolic compounds from various germination times of mung bean sprout and evaluate their antioxidant activities. Materials and Methods Sample preparation Dry mung bean (Vigna radiate L.) was soaked in water for 12 h. They were then germinated in a cover chamber containing moist cotton with saturated water vapor for 12, 24 and
48 h. The germinated mung beans were separated as sprout kernel and sprout seed coat. All samples were freeze dried and ground to be a powder and then stored at -20°C until used. Extraction of antioxidant from mung bean sprouts Ethanol (50% v/v) was used as an extract solvent. The mung bean sprout powder was soaked in the solvent at the ratios of sample to solvent as 1:3, 1:6 and 1:9 (w/v). The soaking was performed at room temperature (25°C) for 6 hours with continuous shaking at 150 rpm. The mixture was then filtered through Whatman No. 1 filter paper. The collected filtrated was named as mung bean sprout extract. Determination of phenolic content and antioxidant activity
Extractable phenolic content (EPC) and DPPH radical scavenging activity of the mung bean extract were avaluated as described by Kahkonen et al. (2) and Blois (3), respectively. Gallic acid and trolox were used as standard phenolic and antioxidant, respectively.

The 23rd Annual Meeting of the Thai Society for Biotechnology “Systems Biotechnology: Quality & Success”
P-IV-19
- 201 -
0
1
2
3
4
5
6
25% 50% 75%
EtO H concentration (%)
EP
C (
mg
GA
E /
g s
ampl
e)
12h
24h
48h
0
1
2
3
4
5
6
25% 50% 75%
EtO H concentration (%)
EP
C (
mg
GA
E)/
g sa
mpl
e) 12h
24h
48h
0
10
20
30
40
50
60
25% 50% 75%EtO H concentration (%)
DP
PH
radi
cal s
cave
ngi
ng a
ctiv
ity
(mg
TE
AC
/g s
am
ple)
12h
24h
48h
0
1
2
3
4
5
6
25% 50% 75%EtO H concentration (%)
DP
PH
ra
dic
al
sca
ven
gin
g a
ctiv
ity
(mg
TE
AC
/g s
am
ple
)
12h
24h
48h
0
10
20
30
40
50
60
Kernel and root Seed coat Whole sprout
Part of mung bean sprout
DP
PH
rad
ical
sca
veng
ing
act
ivit
y
(mg
TE
AC
/g s
amp
le)
12h24h48h
Results and discussion Extractable phenolic content of mung bean extract Extraction with 50% ethanol provided the highest EPC (5.52-5.95 mg GAE/ g sample) from the sprout seed coat as results shown in Figure 1A. Increase ethanol to 75% tended to decrease the EPC from the sprout seed coat. This result was contrary with previous report of Cho et. al. (4) which found that increase ethanol from 60-95% led to the accumulation of the flavonoid and isoflavone from soy bean. In contrast, the amount of ethanol was not influential to the extraction of EPC from the sprout kernel (Figure 1B). The EPC ranged of 0.50-1.26 mg GAE/g were obtained whatever the ethanol concentration used.
Figure 1. Phenolic content (EPC) of mung bean sprout seed coat (A) and kernel (B) extract.
DPPH radical scavenging capacity of mung bean extract The 50% (v/v) ethanol extract also gave the highest DPPH radical scavenging activity in the seed coat of mung bean sprout with displaying the values of 44.60, 46.50 and 50.54 mg TEAC/g sample for 12, 24 and 48 h sprout germination, respectively. However, the 75% (v/v) ethanol provided the highest antioxidant capacity in the sprout kernel extract possessing the value in the ranges of 1.11, 1.59 and 1.42 mg TEAC/g sample for 12, 24 and 48 h germination, respectively (Figure 2).
Figure 2. DPPH radical inhibition of mung bean sprout seed coat (A) and kernel (B) extract.
Seed coat extract of mung bean sprout exhibited the highest antioxidant capacity when comparing to those of kernel and whole sprout (Figure 3). This might be explained by high phenolic content in the seed coat of sprout. It can be concluded that mung bean sprout showed substantial phenolic antioxidant content. This may help to value-add the mung bean sprout and provide the new source for antioxidant extraction.
Figure 3. DPPH radical inhibition of extract from various part of mung bean sprout.
References 1. Lin, P.Y and Lai, H.M. Bioactive compounds in
legumes and their germinated products. J. Agric. Food Chem. 2006: 54: 2807-3814.
2. Kahkonen, M.P., Hopia, A.I. Antioxidant activity of plant extracts containing phenolic compounds. J. Agric Food Chem. 1999; 47(10): 3954-62.
3. Blois, M.S. Antioxidant determinations by use of a stable free radical. Nature. 1958; 181: 1199-200.
4. Cho, S.Y., Lee, Y.N., Park, H.J. Optimization of ethanol extraction and further purification of isoflavones from soybean sprout cotyledon. Food Chem. 2009: 117: 312-317.
B
A
B
A

The 23rd Annual Meeting of the Thai Society for Biotechnology “Systems Biotechnology: Quality & Success”
P-IV-20
- 202 -
Production of yeast extract from Hansenula polymorpha IBGE HP-5001 using pressure reactor
Sarintip Sooksaia, Nuttha Thongchula, Sajee Noitanga, Somyos O-siripuna, Parissara Chunthonga, Kattaleeya Talwonga, Phatthanon Prasitchokeb, Veerapat Tantayakomb and Amorn Petsoma aInstitute of Biotechnology and Genetic Engineering, Chulalongkorn University, Institute building 3, 5th Floor, Phayatai, Phatumwan, Bangkok 10330, Thailand bPTT Chemical Public Company Limited, 123 Suntowers Building B, 31st-35thFloors, Vibhavadi Rangsit Road, Chomphon, Chatuchak, Bangkok 10900, ThailandPostal address(es) are typed with an italic type 9-point Times New Roman, and aligned left.
Abstract
Hansenula polymorpha IBGE HP-5001 was obtained by treatingH. polymorpha NRRL Y-2214 with ethylmethane sulfonate. Comparing with the parental strain, H. polymorpha IBGE HP-5001 grew better in medium containing yeast extract and crude glycerol. In addition, this mutant yeast lacked surface adhesion property; thus, no wall growth was observed during cultivation in the shake flask. In yeast extract preparation, dried cell of H. polymorpha IBGE HP-5001 cultivated in the mineral salts medium containing glycerol as a sole carbon source was used as raw materials. Pressure reactor was used in the preparation under different pH (4.0, 5.0, and 6.0) and temperature (121, 150, 170, and 190C). The results demonstrated that there was no significant effect of pH on extraction yields and total soluble protein recovery. On the other hand, there was an increase in total soluble protein recovery and protein concentration in liquid extract with increasing hydrolysis temperature. The product of subcritical water hydrolysis was tested as a nutrient source for yeast growth with 1% glycerol as C-source. The results showed that the OD660 of the suspension of yeast cells grown in the product resulted from subcritical water hydrolysis at 121OC was significantly higher than that grown in commercial yeast extract, possibly because of the yeast extract (YE121) from H. polymorpha IBGE HP-5001 was richer in vitamin composition.
Keywords: Hansenula polymorpha, pressure reactor, subcritical water hydrolysis, yeast extract Introduction and Objective
Glycerol is the major by-product from
biodiesel manufacture. Nowadays, glycerol has decreased in price, as a result of a dramatic increase in biodiesel production. Using the biotechnology technique to convert glycerol to the value-added product has been brought into attraction. H. polymorpha is well known to be able to consume glycerol as both carbon and energy sources and achieve in high cell density. In this study, subcritical water hydrolysis was used to extract the soluble protein in H. polymorpha IBGE HP-5001and the effects of temperature, pH and protein recovery were obtained.
Materials and Methods
H. polymorpha IBGE HP-5001, a mutant of H. polymorpha NRRL Y-2214, which grew better than the parental strain in medium containing crude glycerol from biodiesel as sole carbon source was used in this study. Dried cell of H. polymorpha IBGE HP-5001 cultivated in the mineral salts medium (Hellmuth et al, 2001) which culture in 5 – 90 L stirred tank bioreactor was used as raw materials (Petsom et al, 2010). 2.1 Subcritical water hydrolysis
Dried cell of H. polymorpha IBGE HP-5001 was suspended in deionized water to about 10 % (w/v) and adjusted pH as desired. Then, 150 ml of this yeast suspension was put into a pressure reactor (Figure 1). The reactor was then heated with electric heater to the desired temperature (121 – 190OC) for 20 min. The
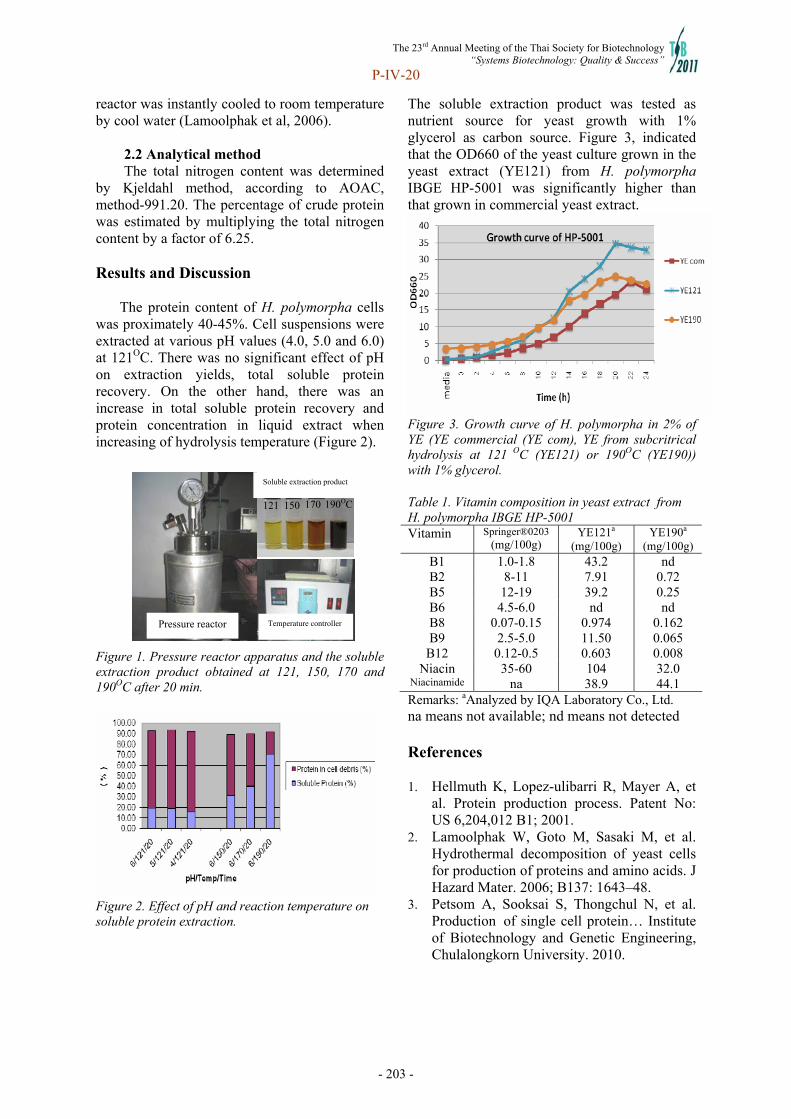
The 23rd Annual Meeting of the Thai Society for Biotechnology “Systems Biotechnology: Quality & Success”
P-IV-20
- 203 -
reactor was instantly cooled to room temperature by cool water (Lamoolphak et al, 2006).
2.2 Analytical method The total nitrogen content was determined
by Kjeldahl method, according to AOAC, method-991.20. The percentage of crude protein was estimated by multiplying the total nitrogen content by a factor of 6.25.
Results and Discussion
The protein content of H. polymorpha cells
was proximately 40-45%. Cell suspensions were extracted at various pH values (4.0, 5.0 and 6.0) at 121OC. There was no significant effect of pH on extraction yields, total soluble protein recovery. On the other hand, there was an increase in total soluble protein recovery and protein concentration in liquid extract when increasing of hydrolysis temperature (Figure 2).
Figure 1. Pressure reactor apparatus and the soluble extraction product obtained at 121, 150, 170 and 190OC after 20 min.
Figure 2. Effect of pH and reaction temperature on soluble protein extraction.
The soluble extraction product was tested as nutrient source for yeast growth with 1% glycerol as carbon source. Figure 3, indicated that the OD660 of the yeast culture grown in the yeast extract (YE121) from H. polymorpha IBGE HP-5001 was significantly higher than that grown in commercial yeast extract.
Figure 3. Growth curve of H. polymorpha in 2% of YE (YE commercial (YE com), YE from subcritrical hydrolysis at 121 OC (YE121) or 190OC (YE190)) with 1% glycerol. Table 1. Vitamin composition in yeast extract from H. polymorpha IBGE HP-5001 Vitamin Springer®0203
(mg/100g) YE121a
(mg/100g) YE190a
(mg/100g) B1 1.0-1.8 43.2 nd B2 8-11 7.91 0.72 B5 12-19 39.2 0.25 B6 4.5-6.0 nd nd B8 0.07-0.15 0.974 0.162 B9 2.5-5.0 11.50 0.065
B12 0.12-0.5 0.603 0.008 Niacin 35-60 104 32.0
Niacinamide na 38.9 44.1 Remarks: aAnalyzed by IQA Laboratory Co., Ltd. na means not available; nd means not detected References 1. Hellmuth K, Lopez-ulibarri R, Mayer A, et
al. Protein production process. Patent No: US 6,204,012 B1; 2001.
2. Lamoolphak W, Goto M, Sasaki M, et al. Hydrothermal decomposition of yeast cells for production of proteins and amino acids. J Hazard Mater. 2006; B137: 1643–48.
3. Petsom A, Sooksai S, Thongchul N, et al. Production of single cell protein… Institute of Biotechnology and Genetic Engineering, Chulalongkorn University. 2010.
121 150 170 190OC
Temperature controller Pressure reactor
Soluble extraction product

The 23rd Annual Meeting of the Thai Society for Biotechnology “Systems Biotechnology: Quality & Success”
P-IV-25
- 204 -
Phenolic content and antioxidant activity from Thai flower extracts : Effect of extraction conditions
Nantaporn Lalitanan a, Pornthip Akuniwonga, Punyawatt Pintathonga,b, Phanuphong Chaiwuta,b, Nont Thitilertdechaa aSchool of Cosmetic Science, Mae Fah Luang University, Chiang Rai 57100, Thailand. bExcellent Center of Cosmetic and Wellness, Mae Fah Luang University, Chiang Rai 57100, Thailand.
Abstract Reactive oxygen species (ROS) are harmful to biological molecules and play a causative role in
disease initiation. Recently, there is an increasing interest in searching antioxidants from natural sources. Following that trend, the present research aims to evaluate phenolic contents and antioxidant properties of five Thai flowers (Bougainvillea hybrida (BH), Cassia occidentalis L. (CO), Ixora coccinea (IC), Millingtonia hortensis L.f. (MH) and Pyrostegia venusta (PV)). The extraction method for the air-dried whole flowers was optimized by varying the time of extraction and the weight ratio of sample/solvent. The antioxidant activities assessed by DPPH radical scavenging and FRAP assays as well as the phenolic contents determined by Folin-Ciocalteu method was used to evaluate the effect of extraction conditions. Depending of the extraction conditions, the phenolic contents were varied from 0.091-3.010 mg gallic acid equivalent /g, while the DPPH radical scavenging activities and FRAP values were ranging from 0.323-7.416 mg TEAC/ g and, from 1.14 -15.77 mg TEAC/g, respectively. The optimal extraction times were 4 hours for MH and PV and 8 hours for BH, CO and IC. The best weight ratio of sample/solvent was 1:15 (w/v). Amongst the flower extracts, the BH and IC extracts possessed stronger antioxidant properties (P < 0.05) compared to the others. They are, thus, considered as potential alternative sources for antioxidants in further cosmetic, food and pharmaceutical applications. Keywords: antioxidant, phenolic compounds, extraction, flowers Introduction and Objective
Antioxidants have been well known to be potentially used for pharmaceutical, cosmetic, and food applications. Many literature data reported plants are potential sources of natural antioxidants, especially phenolic compounds; flavonoids, proanthocyanidins, phenolic acids, tannins. Flowers are an alternative source which is becoming interesting due to their amount of antioxidants and phenolic compounds. Searching new sources of phenolic antioxidants derived from flowers is potential because of safety, high availability, low cost and high efficiency.
In this study, Five Thai flowers (Cassia occidentalis L. (CO), Millingtonia hortensis L.f. (MH), Bougainvillea hybrid (BH), Pyrostegia venusta (PV) and Ixora coccinea (IC)) were evaluated for phenolic contents and antioxidant properties. The optimization for phenolic compounds and antioxidants were also investigated.
Materials and Methods The collected flowers were dried in hot air
oven at 55°C and then powdered prior to be studied. The experiment was carried out according to 35 factorial experiment with three replications. The first factor was sample/solvent ratio (1:5, 1:10 and 1:15 w/v) and the second factor was varied for extraction time (0, 2, 4, 8, 12 h). The extraction was performed by shaking method using 95% ethanol as extracting solvent. The extracts were filtered for further analyzed.
The phenolic content assay was carried out by using Folin-Ciocalteu method (Singleton et al., 1999). For antioxidant activities, DPPH radical scavenging and ferric reducing antioxidant power (FRAP) assays were used to investigate. DPPH radical scavenging assay was performed according to the method described by Milardovic et al. (2006) while FRAP assay was carried out using the method of Benize and Strain (1999).
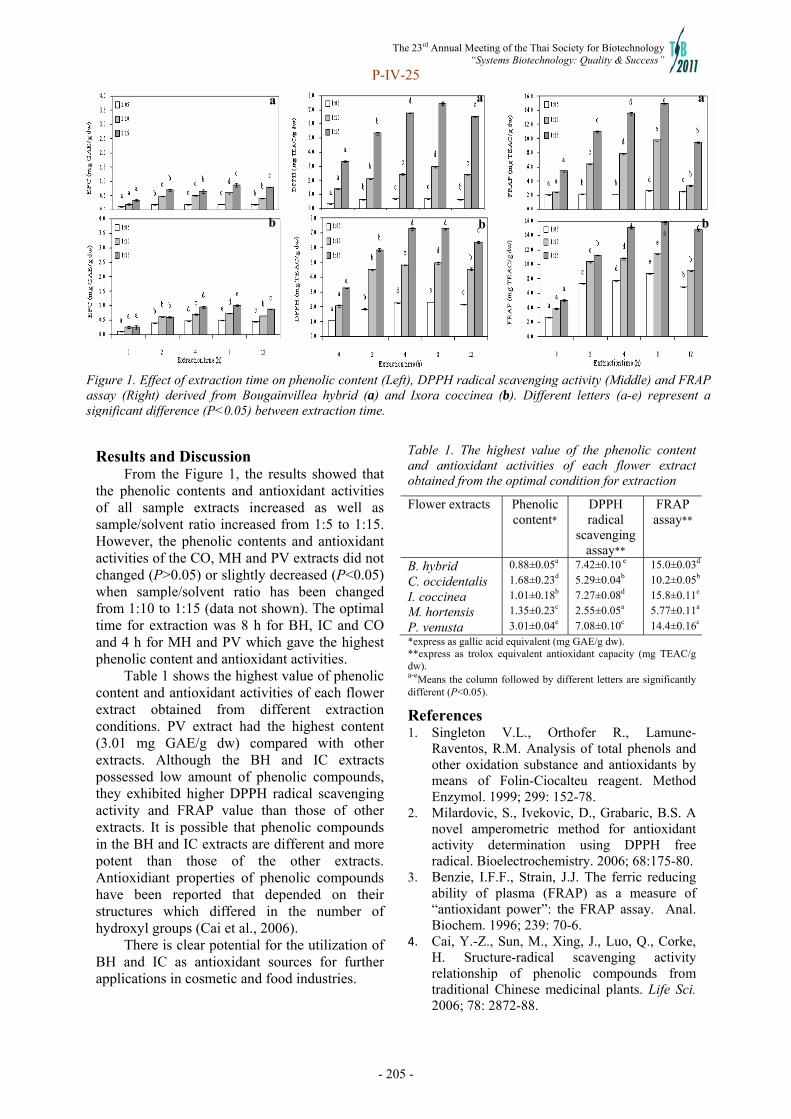
The 23rd Annual Meeting of the Thai Society for Biotechnology “Systems Biotechnology: Quality & Success”
P-IV-25
- 205 -
a a a
b b b
Figure 1. Effect of extraction time on phenolic content (Left), DPPH radical scavenging activity (Middle) and FRAP assay (Right) derived from Bougainvillea hybrid (a) and Ixora coccinea (b). Different letters (a-e) represent a significant difference (P<0.05) between extraction time.
Results and Discussion
From the Figure 1, the results showed that the phenolic contents and antioxidant activities of all sample extracts increased as well as sample/solvent ratio increased from 1:5 to 1:15. However, the phenolic contents and antioxidant activities of the CO, MH and PV extracts did not changed (P>0.05) or slightly decreased (P<0.05) when sample/solvent ratio has been changed from 1:10 to 1:15 (data not shown). The optimal time for extraction was 8 h for BH, IC and CO and 4 h for MH and PV which gave the highest phenolic content and antioxidant activities.
Table 1 shows the highest value of phenolic content and antioxidant activities of each flower extract obtained from different extraction conditions. PV extract had the highest content (3.01 mg GAE/g dw) compared with other extracts. Although the BH and IC extracts possessed low amount of phenolic compounds, they exhibited higher DPPH radical scavenging activity and FRAP value than those of other extracts. It is possible that phenolic compounds in the BH and IC extracts are different and more potent than those of the other extracts. Antioxidiant properties of phenolic compounds have been reported that depended on their structures which differed in the number of hydroxyl groups (Cai et al., 2006).
There is clear potential for the utilization of BH and IC as antioxidant sources for further applications in cosmetic and food industries.
Table 1. The highest value of the phenolic content and antioxidant activities of each flower extract obtained from the optimal condition for extraction
Flower extracts Phenolic content*
DPPH radical
scavenging assay**
FRAP assay**
B. hybrid 0.88±0.05a 7.42±0.10 e 15.0±0.03d
C. occidentalis 1.68±0.23d 5.29±0.04b 10.2±0.05b
I. coccinea 1.01±0.18b 7.27±0.08d 15.8±0.11e
M. hortensis 1.35±0.23c 2.55±0.05a 5.77±0.11a
P. venusta 3.01±0.04e 7.08±0.10c 14.4±0.16c
*express as gallic acid equivalent (mg GAE/g dw). **express as trolox equivalent antioxidant capacity (mg TEAC/g dw). a-eMeans the column followed by different letters are significantly different (P<0.05).
References 1. Singleton V.L., Orthofer R., Lamune-
Raventos, R.M. Analysis of total phenols and other oxidation substance and antioxidants by means of Folin-Ciocalteu reagent. Method Enzymol. 1999; 299: 152-78.
2. Milardovic, S., Ivekovic, D., Grabaric, B.S. A novel amperometric method for antioxidant activity determination using DPPH free radical. Bioelectrochemistry. 2006; 68:175-80.
3. Benzie, I.F.F., Strain, J.J. The ferric reducing ability of plasma (FRAP) as a measure of “antioxidant power”: the FRAP assay. Anal. Biochem. 1996; 239: 70-6.
4. Cai, Y.-Z., Sun, M., Xing, J., Luo, Q., Corke, H. Sructure-radical scavenging activity relationship of phenolic compounds from traditional Chinese medicinal plants. Life Sci. 2006; 78: 2872-88.

The 23rd Annual Meeting of the Thai Society for Biotechnology “Systems Biotechnology: Quality & Success”
P-IV-26
- 206 -
Hydrogen production by photosynthetic bacterium strain OS33 using domestic waste as a carbon source
Nathanan Manjeena, Saranya Phunpruch and Somchai Krairaka Department of Biology, Faculty of Science, King Mongkut’s Institute of Technology Ladkrabang, Bangkok 10520, Thailand
Abstract Domestic waste, in Thailand, normally contains rice and carbohydrate residues which can be
utilized as a carbon source for biohydrogen production by photosynthetic bacteria. This process not only reduces the pollution but also generates sustainable energy. Hydrogen production by purple non-sulfur photosynthetic bacterium stain OS33 was studied by using 3 types of artificial domestic waste (15% of rice in distilled water, tap water and starch medium). The artificial domestic waste was inoculated with OS33 (at 10% v/v) and incubated at 40oC with 1500 lux of light intensity for 1 month. Fermented samples were collected at 3 and 5 days. pH of all samples dropped to 3.5-5, because various organic acids were produced. These organic acids could be served as proton donors for biohydrogen production by photosynthetic bacteria. More biohydrogen and growth were observed at the early stage (the first 3 days) due to higher culture pH (pH 5). OS33 was identified using 16S rDNA as Rhodopseudomonas sp. Keywords: biohydrogen , photosynthetic bacteria , domestic waste 1. Introduction Natural resources in the world have been used increasingly by the rate of increase of population and economic growth. It is uncertain whether these resources will be exhausted in the near future. Especially energy and the use of depleted fossil fuel such as natural gas, coal, oil, etc. Current economic growth is rapidly increasing cause energy utilizing increment. The burning up of this energy would affect the environment directly such as green house effect and global warming. For this reason, all researchers have tried to study the development of renewable energy in various forms of renewable energy with unlimited usage such as solar energy, hydroelectricity, wind energy, wave power, geothermal energy, bioenergy, and tidal power. This sustainable energy shows the advantage for indefinite usage (1). Hydrogen is recognized as a promising future for fuel. It is a clean and renewable energy carrier. Hydrogen could be produced by thermal chemical process, electrochemical process and biological process (2). Biohydrogen production shows the environment friendly. Many reports were studied on dark fermentation (anaerobic bacteria), autotrophic and photo-fermentation (algae, cyanobacteria and photosynthetic bacteria) (3). The hydorgen production from photosynthetic bacteria indicates the maximum theoretical yield but low
productivity due to the specific growth rate. The cost of hydrogen production could be minimized by using sunlight and domestic waste as substrate. Therefore, the photosynthetic bacteria present the remarkable choice. Previous report, the OS33 was selected and optimized for growth and hydrogen production in starch medium (4). Therefore, this research would be focused on the hydrogen production by using artificial domestic waste as a substrate.
2. Materials and Methods 2.1 Microorganism Photosynthetic bacteria isolate OS33 was isolated from sewage. Growth and hydrogen production was examined in starch medium (4). 2.2 Medium compositions One liter of the starch medium was composed of 10 g cassava starch, 10 g Na-glutamate, 10 g Na2HPO4, 1 g yeast extract and 1 L distilled water. In case of wastewater experimentation, the starch medium without c-course was used as a basal solution. 2.3 Artificial Domestic waste Artificial Domestic waste was prepared by adding 15 g of rice in 100 ml of distilled water (DW), tap water (TW) and starch medium (without c-source) (MAM), respectively. These three types of non-sterilized medium were

The 23rd Annual Meeting of the Thai Society for Biotechnology “Systems Biotechnology: Quality & Success”
P-IV-26
- 207 -
incubated at 40°C for 3 and 5 days, respectively, thus allowing the fermentation of normal flora. 2.4 Culture condition The inoculum of OS33 was cultured in starch medium at 40°C under 1500 lux for 7 days. Then 10% of inoculums were added. Hydrogen production in 3 types of artificial domestic wastewater was cultivated at 40°C under 1500 lux for 20 days. The sample was taken every 4 days to analyze cell growth, total soluble sugar concentration, pH and volume of H2 production. 2.5 Analysis The cell number of normal flora was determined by measuring optical density at 660 nm. The photosynthetic bacteria OS33 was determined in term of bacteriochlorophyll content by harvesting the culture at 7000 rev/min for 20 min and then extracted with acetone/methanol (7:2v/v) for 2.5 hr, finally measured at 770 nm [5].The total soluble sugar was estimated following the phenol-sulfuric method [6].The amount of hydrogen production was followed by water replacement. 2.6 Identification of hydrogen producing
isolate. Organisms were gram stained and examined under a light microscope. Microbial strains producing high hydrogen yields were further identified by 16S rDNA sequence analysis. Total genomic DNA of the organisms was isolated by DNA purification kit (Epicentre, USA). A 1,500 bp segment of the 16S rDNA gene was amplified by PCR with a pair of primers designed from conserved sequences of γ-proteobacteria. One (FDNA, 5’-AGAGTTTGATCCTGGCTCAG-3’) targeted the beginning and another (RDNA, 5’- GGTTACCTTGTTACGACTT -3’) targeted the end of the 16S rDNA gene [4]. PCR of genomic DNA from isolated strains was carried out in a DNA thermal cycler (Perkin Elmer 480, USA). Reaction mixtures of 100 μl contained 100 ng of genomic DNA, 2.5 units of Taq DNA polymerase (Promega, USA), 20 pmole of each deoxynucleoside triphosphate (Promega, USA), 1.5 μM MgCl2 (Promega, USA), and 25 pmole of each primer. The PCR protocol consisted of a denaturing step of 95oC for 5 mins, followed by 30 cycles of denaturation for 30 secs at 95oC, primer annealing for 30 secs at 55oC and a minute primer extension at 72oC. A final
extension at 72oC for 10 mins was then performed. PCR products were purified by using the QIAquick PCR purification kit (Qiagen, Germany) and cloned into plasmids using the PCR cloning kit (pDrive) (Qiagen, Germany). The recombinant plasmid was sequenced in both strands with the Big-DyeTM Terminator Cycle Sequencing Ready Reaction kit (Perkin Elmer, USA) by using the ABI PRISMR 3700 DNA analyzer. Sequences were compared to those in GeneBank by using the BLAST function [5] of the National Center for Biotechnology Information Server, National Institutes of Health, USA.
3. Results 3.1 Hydrogen production from starch
medium with rice as a carbon source The hydrogen production by OS33 was studied on starch medium containing cassava starch or rice at various concentrations. Figure 1 shows the amount of hydrogen production after 30 days of cultivation. Using cassava starch as C-source, it was found that the C/N ratio higher than 15:1 exhibited the high medium viscosity resulting in low cell growth and hydrogen production. Rice, in contrary, did not affect medium viscosity. The C/N ratio (using rice as C-source) of 10:1, 15:1 and 20:1 yielded higher cell growth and hydrogen with the C/N ratio at 15:1 giving the highest amount of hydrogen produced. 3.2 Hydrogen production from 3-day
fermented artificial domestic waste The artificial domestic waste was prepared by adding 15 g of steamed rice in 100 ml of distilled water (DW), tap water (TW) and starch medium (without C-source) (MAM) and then left at 40oC for 3 day . It was found that, the normal flora grew (OD660nm at 0.58, 0.6 and 0.63) and pH was dropped (4.9, 4.8 and 5.6), respectively. The pH of these artificial domestic waste was decreased due to organic acids produced by normal flora. The experiment for hydrogen production was started by adding 10% of OS33 inoculums and then cultured at 40oC under 1500 lux for 20 days. The growth of mixed culture between normal flora and OS33 are shown in Figure 2. Figure 2a shows the growth of normal flora which was stable for 4 days after OS33 had been inoculated. Then the growth of normal flora rapidly increased in DW, while gradually increased in MAM. However, the growth in TW
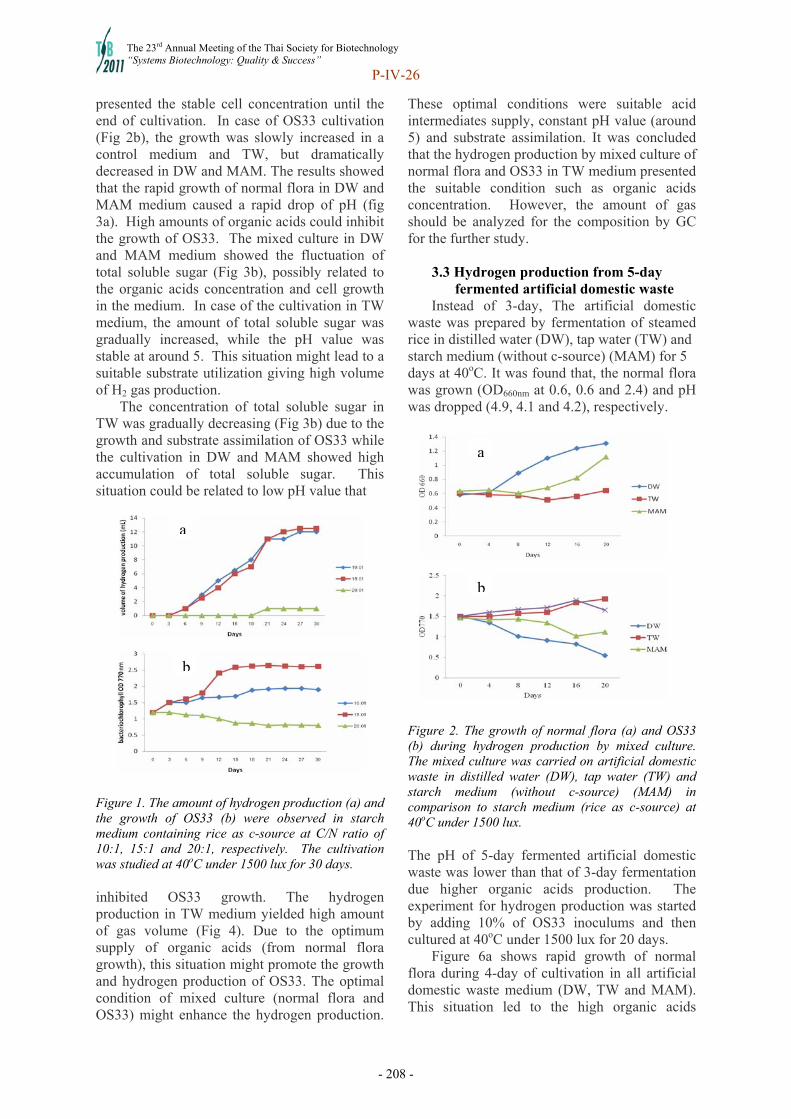
The 23rd Annual Meeting of the Thai Society for Biotechnology “Systems Biotechnology: Quality & Success”
P-IV-26
- 208 -
presented the stable cell concentration until the end of cultivation. In case of OS33 cultivation (Fig 2b), the growth was slowly increased in a control medium and TW, but dramatically decreased in DW and MAM. The results showed that the rapid growth of normal flora in DW and MAM medium caused a rapid drop of pH (fig 3a). High amounts of organic acids could inhibit the growth of OS33. The mixed culture in DW and MAM medium showed the fluctuation of total soluble sugar (Fig 3b), possibly related to the organic acids concentration and cell growth in the medium. In case of the cultivation in TW medium, the amount of total soluble sugar was gradually increased, while the pH value was stable at around 5. This situation might lead to a suitable substrate utilization giving high volume of H2 gas production. The concentration of total soluble sugar in TW was gradually decreasing (Fig 3b) due to the growth and substrate assimilation of OS33 while the cultivation in DW and MAM showed high accumulation of total soluble sugar. This situation could be related to low pH value that
Figure 1. The amount of hydrogen production (a) and the growth of OS33 (b) were observed in starch medium containing rice as c-source at C/N ratio of 10:1, 15:1 and 20:1, respectively. The cultivation was studied at 40oC under 1500 lux for 30 days. inhibited OS33 growth. The hydrogen production in TW medium yielded high amount of gas volume (Fig 4). Due to the optimum supply of organic acids (from normal flora growth), this situation might promote the growth and hydrogen production of OS33. The optimal condition of mixed culture (normal flora and OS33) might enhance the hydrogen production.
These optimal conditions were suitable acid intermediates supply, constant pH value (around 5) and substrate assimilation. It was concluded that the hydrogen production by mixed culture of normal flora and OS33 in TW medium presented the suitable condition such as organic acids concentration. However, the amount of gas should be analyzed for the composition by GC for the further study. 3.3 Hydrogen production from 5-day
fermented artificial domestic waste Instead of 3-day, The artificial domestic waste was prepared by fermentation of steamed rice in distilled water (DW), tap water (TW) and starch medium (without c-source) (MAM) for 5 days at 40oC. It was found that, the normal flora was grown (OD660nm at 0.6, 0.6 and 2.4) and pH was dropped (4.9, 4.1 and 4.2), respectively.
Figure 2. The growth of normal flora (a) and OS33 (b) during hydrogen production by mixed culture. The mixed culture was carried on artificial domestic waste in distilled water (DW), tap water (TW) and starch medium (without c-source) (MAM) in comparison to starch medium (rice as c-source) at 40oC under 1500 lux. The pH of 5-day fermented artificial domestic waste was lower than that of 3-day fermentation due higher organic acids production. The experiment for hydrogen production was started by adding 10% of OS33 inoculums and then cultured at 40oC under 1500 lux for 20 days. Figure 6a shows rapid growth of normal flora during 4-day of cultivation in all artificial domestic waste medium (DW, TW and MAM). This situation led to the high organic acids
a
b
a
b

The 23rd Annual Meeting of the Thai Society for Biotechnology “Systems Biotechnology: Quality & Success”
P-IV-26
- 209 -
production that inhibited the growth of OS33 (Fig 6b).
Figure 3. The pH value (a) and the concentration of total soluble sugar (b) during hydrogen production by mixed culture of normal flora and OS33. The cultivation was carried on artificial domestic waste in distilled water (DW), tap water (TW) and starch medium (without c-source) (MAM) in comparison to starch medium (rice as c-source) at 40oC under 1500 lux.
Figure 4. The amount of gas volume during hydrogen production by mixed culture of normal flora and OS33. The cultivation was carried on artificial domestic waste in distilled water (DW), tap water (TW) and starch medium (without c-source) (MAM) in comparison to starch medium (rice as c-source) at 40oC under 1500 lux. The pH value of three artificial domestic waste medium was about 4 (Fig 7a). Low concentration of total soluble sugar was observed in all three medium (Fig 7b).
Figure 5. The growth of normal flora (a) and OS33 (b) during hydrogen production by mixed culture. The mixed culture was carried on artificial domestic waste in distilled water (DW), tap water (TW) and starch medium (without c-source) (MAM) in comparison to starch medium (rice as c-source) at 40oC under 1500 lux.
Figure 6. The pH value (a) and the concentration of total soluble sugar (b) during hydrogen production by mixed culture of normal flora and OS33. The cultivation was carried on artificial domestic waste in distilled water (DW), tap water (TW) and starch medium (without c-source) (MAM) in comparison to starch medium (rice as c-source) at 40oC under 1500 lux.
Figure 7. The amount of gas volume during hydrogen production by mixed culture of normal flora and OS33. The cultivation was carried on artificial domestic waste in distilled water (DW), tap water (TW) and starch medium (without c-source) (MAM) in comparison to starch medium (rice as c-source) at 40oC under 1500 lux.
a
a
b
a
b
b

The 23rd Annual Meeting of the Thai Society for Biotechnology “Systems Biotechnology: Quality & Success”
P-IV-26
- 210 -
The high concentration of organic acids and low pH value of culture (around 3.8) might relate to the low substrate utilization in this mixed culture. Moreover, the amount of gas volume was lower in mixed cultivation of all three artificial domestic waste (fig 8). It was concluded that low pH and high amount of organic acids exerted a strong effect on hydrogen production.
3.4 Identification of hydrogen producing
microbial strains. Using 16S rDNA sequence analysis, OS33 isolate was identified as a member of the genus Rhodopseudomonas sp. The OS33 isolate showed 100% homology with Rhodopseudomonas palustris and 98% homology with Rhodopseudomonas oryzae, therefore this isolate was designated as Rhodopseudomonas sp. OS33. OS33, isolated from the sewage in Chonburi, Thailand, not only showed high hydrogen production but also possessed the glucose and starch utilizing capability that could be useful for hydrogen production from domestic wastewater, composed mainly of carbohydrate. The mixed culture among hydrogen producing anaerobic bacteria and photosynthetic bacteria (Rhodopseudomonas sp. OS33) would be examined in the future study. Conclusion The selected isolate OS33 was identified as Rhodopseudomonas sp. having an ability to utilize glucose and starch utilization as well as to produce hydrogen. The pH and concentration of organic acids significantly affected hydrogen production by mixed culture of normal flora and Rhodopseudomonas sp. OS33. Using a 3-day fermented artificial domestic waste as substrate, its low organic acids concentration with pH around 5 was found to be suitable for hydrogen production by mixed culture. The 5-day fermented artificial domestic waste, with its high organic acids content with pH value of 4 inhibited the growth of Rhodopseudomonas sp. OS33. Therefore, growth of normal flora should be constrained so that the organic acids production would meet the demand of Rhodopseudomonas sp. OS33 for hydrogen production. Moreover, pH of 5 and low acids concentration promoted the substrate utilizing performance and cell growth. The future study of hydrogen production includes optimization of suitable cell growth, inoculation time and inoculums size.
Acknowledgement This study is supported by Energy Policy and Planning Office, Ministry of Energy, Thailand References [1] Nandi R. and Sengupta S. Microbial
production of hydrogen: 1998. 24 (1): 61–84.
[2] Melis A, Melnicki MR. Integrated biological hydrogen production. Int 5 Hydrogen Energy 2006; 31:1563-73
[3] Das D. and Veziroglu TN. Hydrogen production by biological processes: a survey of literature. Int. J. Hydrogen Energy. 2001. 26: 29–37.
[4] Manjeen N. and Krairak S. Hydrogen production by photosynthetic bacteria strains S12 and OS33 with cassava starch as a carbon source. Poster of Buu 6th-7th July 2011.
[5] Cohen-Bazire G, W.R. Sistrom, and R.Y. Stanier. Kinetic studies of pigment synthesis by non-sulfur purple bacteria.J.Cell.Comp.Physiol. 1957; 49:25-68.
[6] Dubois, M., Gilles, K.A., Hamilton, J.K., Rebers, P.A. and Smith, Colorimetric method in behalf of full of determination of sugars and related substances. Anal. Chem. 1956; 28:350-356.
The 23rd Annual Meeting of the Thai Society for Biotechnology “Systems Biotechnology: Quality & Success”
P-IV-27
- 211 -
Expression, purification and partial characterization of lipase cloned from Bacillus thermoamylovorans BHK52
Juthamas Suwansri, Apichat Upaichit and Aran H-Kittikun
aDepartment of Industrial Biotechnology, Faculty of Agro-Industry, Prince of Songkla University, Hat-Yai, 90112, Thailand
Abstract Lipases are the most important lipolytic enzymes used as industrial biocatalysts for a variety of biotechnological applications. In this study, lipase gene (lip52) was cloned from genomic DNA of Bacillus thermoamylovorans BHK52. The lip52 gene (pColdILip52) was expressed in Escherichia coli BL21. The optimal lipase production was accomplished when E. coli BL21 cells were induced (0.1 mM IPTG) during the mid-log phase (OD660 0.5) of cells cultivation at 15C for 24 h with shaking (200 rpm). A one step purification of recombinant lipase was achieved using Ni-NTA resin. The purified lipase had an optimum pH of 9.0 and showed maximal activity at 60C. It was highly stable within a pH range of 5.0-11.0 and a temperature range of 30-80C. The effect of metal ions on the enzyme activity was that there are no metal ions that can activate the activity of lipase. In addition, the lipase was activated when incubated in the presence of H2O2, whereas PMSF, EDTA and SDS did not affect the activity of the purified lipase. Keywords: Bacillus thermoamylovorans, lipase, thermotolerant Introduction and Objective
Lipases occur widely in micro-organisms,
plants, and animals. However, microbial lipases have gained special industrial attention due to their stability, selectivity, and broad substrate specificity (Dutra et al., 2008). In this study, the lipase gene (lip52) cloned from Bacillus thermoamylovorans BHK52 (Uschara, 2008) was expressed in various Escherichia coli host strains. The enzyme was purified and partially characterized for further application. Materials and Methods 2.1 Strains and media Escherichia coli strains (BL21, JM109, HB101, SURE) were used as hosts for improving the expression level of lip52 gene. All strains were routinely cultivated in Luria-Bertani (LB) medium at 37 °C overnight. When necessary, ampicillin (100 µg/ml) was added to media. 2.2 Enzyme assay Lipolytic activity was determined spectrophometrically using p-nitrophenyl caprylate as a substrate which modified from Ertugrul et al., 2007. 2.3 Expression and purification of Lip52 Escherichia coli host strains harboring pColdLip52 were cultivated at 37 °C with
shaking (200 rpm). To inactivate other proteins, the culture broth was refrigerated at 15 °C for 30 min. The induction of lipase expression was performed by adding IPTG and continued cell cultivation with shaking (200 rpm) at 15 °C for 24 h. After cell sonication, all of cell-free supernatants containing lipase were purified by Hi-Trap affinity column containing nickel-nitrilo-triacetic acid as described by manufacture (Qiagen, UK). 2.4 Characterization of Lip52 Lipase activity and stability were determined at different pH and temperatures. The effects of metal ions as well as reagents on enzyme activity were also investigated. Results and Discussion 3.1 Expression and purification of Lip52 The production of Lip52 protein was inefficient under the conditions used in previous studies (Uschara, 2008). Experiments to optimize expression conditions for lipase Lip52 production were performed. The parameters that were examined included the use of different Escherichia coli host strains, concentrations of IPTG, time points of induction and induction periods. E. coli host strains harboring pColdLip52 were induced with 1 mM IPTG during mid-log phase (OD660 0.5). By using the

The 23rd Annual Meeting of the Thai Society for Biotechnology “Systems Biotechnology: Quality & Success”
P-IV-27
- 212 -
levels of enzyme activity and total cell protein concentration, both E. coli BL21 (1.17 U/ml; 1.39 mg/ml) and E. coli SURE (1.00 U/ml; 1.31 mg/ml) showed their efficacy to be applied as host strains compared with the others including E. coli JM109 (0.86 U/ml; 0.82 mg/ml) and E. coli HB101 (0.68 U/ml; 0.60 mg/ml). However, only E. coli BL21 was selected for further studies because it grew faster than E. coli SURE. High level expression of Lip52 protein could be achieved as analyzed by SDS-PAGE (data not shown). Further investigation revealed that the optimal enzyme production (1.11 U/ml; 1.04 mg/ml) was accomplished when E. coli BL21 cells were induced with 0.1 mM IPTG during mid-log phase for 24 h. The one-step purification of Lip52 protein using Ni-NTA affinity chromatography was applied. The purified lipase has a purification fold of 11.07 with a protein yield of 78.29% and a specific activity of 4.02 U/mg (data not shown). 3.2 Characterization of Lip52 The optimum activity of the purified lipase was at pH 9.0 (Fig 1). The result obtained were similar to that of Bacillus licheniformis B42 (Bayoumi et al., 2007) with was active at pH 9.0-10.0. The stability of the purified lipase was observed within a pH range of 8.0-10.0 (Fig 2). The purified lipase exhibited the highest activity at 60C and was stable at a wide range of temperature ranging from 30C to 80C (Fig 3). Fe2+ ions did not affect on the lipase activity. In contrast, this lipase was sensitive to Zn2+, Cu2+ and Ag+. The purified lipase was activated when incubated in the presence of H2O2, whereas PMSF, SDS and EDTA did not affect the activity of the purified lipase.
Figure 1. Effect of pH on lipase activity. 50 mM sodium acetate (pH 3.0-6.0) (); 50 mM phosphate (pH 6.0-8.0) (); 50 mM Tris-HCl (pH 7.0-9.0) (); and 50 mM glycine-NaOH (pH 8.0-11.0) ().
Figure 2. Effect of pH on lipase stablility. 250 mM sodium acetate (pH 3.0-6.0) (); 250 mM phosphate (pH 6.0-8.0) (); 250 mM Tris-HCl (pH 7.0-9.0) (); and 250 mM glycine-NaOH (pH 8.0-11.0) ().
Figure 3 Effects of temperatures on lipase activity () and stability (). References 1. Bayonmi RA, El-Louboudey SS, Sidkey
NM. and Abd-El-Rahman MA. Production, purification and characterization of thermoalkalophilic lipase for application in bio-detergent industry. J. Appl. Sci. Res. 2007; 3: 1752-1765.
2. Dutra JCV, Terzi SC, Bevilaqua J.V, Damaso MCT, Couri S. and Langone MAP. Lipase production in solid-state fermentation monitoring biomass growth of Aspergillus niger using digital image processing. Appl. Biochem. Biotechnol. 2008; 147: 63-75.
3. Ertgrul S, Donmez G. and Takac S. Isolation of lipase producing Bacillus sp. From olive mill wastewater and improving its enzyme activity. J. Hazard. Materials. 2007; 149: 720-724.
4. Uschara, T. Identification, gene cloning and characterization of an extremely thermoactive and thermotolerant from Bacillus thermoamylovorans BHK52. M.Sc. Biotechnology. 2008. Prince of Songkla University, Hat-Yai, Thailand.
The 23rd Annual Meeting of the Thai Society for Biotechnology “Systems Biotechnology: Quality & Success”
P-IV-28
- 213 -
Kinetic study of sophorolipid production by Pichia anomala MUE24 in a 5-L batch bioreactor
Jiraporn Thaniyavarna, Tiwaporn Punrat a, Suchada Chanprateep a, Suthep Thaniyavarna and Sarote Sirisansaneeyakulb,c aDepartment of Microbiology, Faculty of Science, Chulalongkorn University, Phya-Thai Rd, Bangkok 10330, Thailand. bDepartment of Biotechnology, Faculty of Agro-Industry, Kasetsart University, Bangkok 10900, Thailand cCenter for Advanced Studies in Tropical Natural Resources, National Research University-Kasetsart University, Kasetsart University, Chatuchak, Bangkok 10900, Thailand (CASTNAR, NRU-KU, Thailand)
Abstract Sophorolipid, a type of glycolipid biosurfactant, produced by Pichia anomala MUE24 was studied in the modified medium containing (%, w/v); KH2PO4 0.02, MgSO47H2O 0.02, yeast extract 0.64, NaNO3 0.11, adjusted with an initial pH 4.5. The mixed carbon sources (S) were soybean oil, 13.34 and glucose, 6.66% (w/v). The shaken flask cultivation was performed with using an inoculum size of 8% (v/v), controlled at 30C and 200 rpm. After 7 days of cultivation, the biosurfactant was able to reduce the surface tension of culture broth to 36 mNewton/m. The final concentrations of cells (X) and biosurfactant (P) were 16.4 and 0.55 g/l, respectively, resulting in the biosurfactant yield (YP/S) and productivity (QP) of 0.0038 g-P/g-S and 0.003 g-P/l/h, respectively. To improve the yield and productivity, the batch cultivations in a 5-l bioreactor were performed at 30C, 2-vvm aeration rate and 400-rpm agitation rate. As a result, both cell (X) and biosurfactant (P) concentrations found to be increased to 75.46 and 1.95 g/l, respectively, in which the yield (YP/S) of 0.0135 g-P/g-S, and the productivity (QP) of 0.0116 g-P/l/h were obtained. The specific productivity of biosurfactant in shake flask culture and batch bioreactor was 0.199 and 0.154(mg-P/g-X/h), respectively.
Keywords: sophorolipids, Pichia anomala, soybean oil, batch bioreactor, kinetics Introduction and Objective
Surfactants can be used in a broad range of
industrial applications, particularly the textile, food industries, cosmetics, health care and agriculture, etc. However, the large majority of the currently used surfactants are synthesized by petroleum-based. These compounds are often toxic to the environment and may lead to significant ecological problems. Therefore, another class of surfactant is interested, biosurfactant, produced by microorganisms, especially bacteria and yeasts. Most of biosurfactants are complex molecules, comprising different structures including glycolipids, lipopeptides, polysaccharide protein complex, fatty acids and phospholipids (Van Bogaert et al., 2007). Glycolipid surfactants are composed of a carbohydrate head and a lipid tail. They are a class of nonionic surfactants that has significantly increased its market share during the last 10 years. However, biosurfactant have not been yet employed extensively in industry because of their high production costs. The development of improved technologies for
reduced the production costs are necessary such as studied an optimal medium composition, methods to produce biosurfactant in high concentration and the production methods in bioreactor. Pichia anomala MUE24 is the mutant strain of PY1 which can produce biosurfactant as indicated by LCMS spectrum correspond to sophorolipid compound containing fatty acid of [C22]Lactone and [C22:1]Lactone (Thaniyavarn et al., 2008). This strain is able to produce biosurfactant when grown in a modified medium containing both water-soluble and water-insoluble carbon sources: glucose and soy bean oil, respectively. This study aims to develop the optimal conditions leading to the maximal of biosurfactant production by P. anomala MUE24 in a 5-l batch bioreactor.

The 23rd Annual Meeting of the Thai Society for Biotechnology “Systems Biotechnology: Quality & Success”
P-IV-28
- 214 -
Materials and Methods Microorganism The strain used in this study was Pichia
anomala MUE24, mutant strain of PY1 isolated from Thai fermented food in central part of Thailand. Yeast strain was maintained on yeast extract-malt extract (YM) agar slant at 4 ºC and subcultured every month.
Fermentation conditions Cultures were grown on a modified medium
containing: KH2PO4 0.02%, MgSO4·7H2O 0.02%, NaNO3 0.11%, yeast extract 0.64%, glucose 6.66% and soy bean oil 13.34%. The initial pH of the medium was adjusted to 4.5 and sterilized by autoclaving at 121ºC for 20 min. The overnight inoculum of P. anomala MUE24 was added to the fermentation medium at an 8% concentration (v/v). Batch fermentations were performed in a 5-l laboratory scale bioreactor (Winpact FS-01) with a working volume of 2.5 l for 168 h. The operation conditions were as follows: initial pH 4.5, temperature 30oC, agitation rate 400 rpm and aeration rate 2 vvm. Samples were withdrawn for analyzing the growth of culture and biosurfactant production during the fermentation.
Analytical methods Culture samples were centrifuged at 8,000
rpm for 20 min for cell removal and the cell free broth was obtained to measure biosurfactant activity. Surface tensions were determined with a Krüss Tensiometer (model K6, Hamburg, Germany) using du Nouy ring method at room temperature and oil displacement area as described by Morikawa et al. (1993). Growth was measured in terms of dry cell mass.Reducing sugar was determined by the use of dinitrosalicylic acid reagent. The soybean oil concentrations in the samples were determined via partition-gravimetric method using dichloromethane as solvent (APHA et al., 1992).
Isolation of biosurfactant Sample of fermentation broth was centrifuged
to remove the microbial cells. The obtained supernatant was extracted with hexane to remove fatty acids. The crude extract was obtained by extracted with an equal volume of ethyl acetate.
Results and Discussion
The profiles of surface tension, oil displacement area and yeast biomass growth in shake flasks are illustrated in Fig 1. The profiles of surface tension, oil displacement area, yeast biomass growth, and utilization of glucose and soybean oil in the 5-l batch bioreactor with control pH are illustrated in Fig 2. It can be seen from Fig 1 that lag phase was not observed and an exponential phase was as long as 72 h. Nevertheless, the amount of SLs produced was less. Once yeast entered stationary phase SL yield found increase with time as judged by its oil displacement area. Thus, SL production in this case is non-growth associated. In batch reactor, the diauxic growth was observed due to the presence of glucose and soybean oil in medium, correspond to the oil dispersion area at 48-72 h and 84-168 h, respectively (Fig 2).
Figure 1. Profile of biosurfactant production and yeast biomass growth in batch shake flasks
Figure 2. Profile of SL production, yeast biomass growth, utilization of glucose and soybean oil in a 5-l
bioreactor operated with pH control
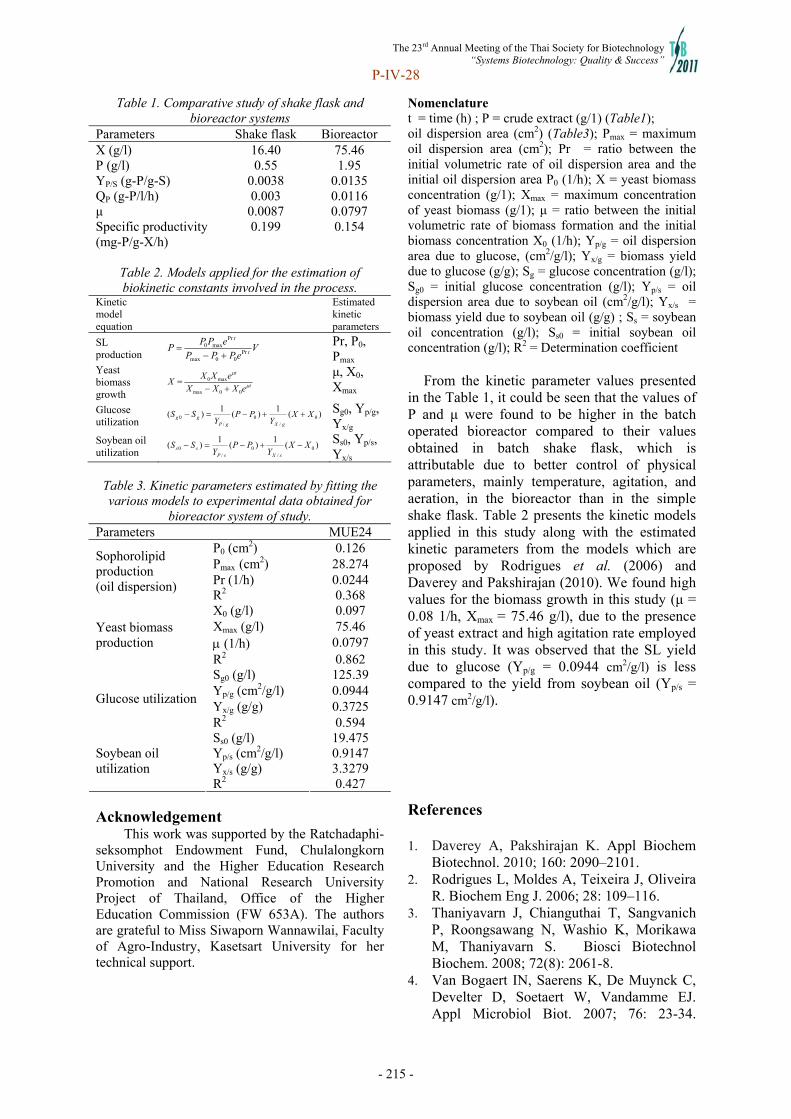
The 23rd Annual Meeting of the Thai Society for Biotechnology “Systems Biotechnology: Quality & Success”
P-IV-28
- 215 -
Table 1. Comparative study of shake flask and bioreactor systems
Parameters Shake flask Bioreactor X (g/l) 16.40 75.46 P (g/l) 0.55 1.95 YP/S (g-P/g-S) 0.0038 0.0135 QP (g-P/l/h) 0.003 0.0116 μ 0.0087 0.0797 Specific productivity (mg-P/g-X/h)
0.199 0.154
Table 2. Models applied for the estimation of biokinetic constants involved in the process.
Kinetic model equation
Estimated kinetic parameters
SL production V
ePPP
ePPP t
t
Pr00max
Prmax0
Pr, P0, Pmax
Yeast biomass growth
t
t
eXXX
eXXX
00max
max0
μ, X0, Xmax
Glucose utilization
)(1
)(1
)( 0/
0/
0 XXY
PPY
SSgXgP
gg Sg0, Yp/g,
Yx/g Soybean oil utilization
)(1
)(1
)( 0/
0/
0 XXY
PPY
SSsXsP
ss Ss0, Yp/s,
Yx/s
Table 3. Kinetic parameters estimated by fitting the various models to experimental data obtained for
bioreactor system of study. Parameters MUE24
P0 (cm2) 0.126 Pmax (cm2) 28.274
Sophorolipid production (oil dispersion) Pr (1/h)
R2 0.0244 0.368
X0 (g/l) 0.097 Xmax (g/l) 75.46 (1/h) 0.0797
Yeast biomass production
R2 0.862 Sg0 (g/l) 125.39 Yp/g (cm2/g/l) 0.0944 Yx/g (g/g) 0.3725
Glucose utilization
R2 0.594 Ss0 (g/l) 19.475 Yp/s (cm2/g/l) 0.9147 Yx/s (g/g) 3.3279
Soybean oil utilization
R2 0.427 Acknowledgement
This work was supported by the Ratchadaphi-seksomphot Endowment Fund, Chulalongkorn University and the Higher Education Research Promotion and National Research University Project of Thailand, Office of the Higher Education Commission (FW 653A). The authors are grateful to Miss Siwaporn Wannawilai, Faculty of Agro-Industry, Kasetsart University for her technical support.
Nomenclature t = time (h) ; P = crude extract (g/1) (Table1); oil dispersion area (cm2) (Table3); Pmax = maximum oil dispersion area (cm2); Pr = ratio between the initial volumetric rate of oil dispersion area and the initial oil dispersion area P0 (1/h); X = yeast biomass concentration (g/1); Xmax = maximum concentration of yeast biomass (g/1); μ = ratio between the initial volumetric rate of biomass formation and the initial biomass concentration X0 (1/h); Yp/g = oil dispersion area due to glucose, (cm2/g/l); Yx/g = biomass yield due to glucose (g/g); Sg = glucose concentration (g/l); Sg0 = initial glucose concentration (g/l); Yp/s = oil dispersion area due to soybean oil (cm2/g/l); Yx/s = biomass yield due to soybean oil (g/g) ; Ss = soybean oil concentration (g/l); Ss0 = initial soybean oil concentration (g/l); R2 = Determination coefficient
From the kinetic parameter values presented
in the Table 1, it could be seen that the values of P and μ were found to be higher in the batch operated bioreactor compared to their values obtained in batch shake flask, which is attributable due to better control of physical parameters, mainly temperature, agitation, and aeration, in the bioreactor than in the simple shake flask. Table 2 presents the kinetic models applied in this study along with the estimated kinetic parameters from the models which are proposed by Rodrigues et al. (2006) and Daverey and Pakshirajan (2010). We found high values for the biomass growth in this study (μ = 0.08 1/h, Xmax = 75.46 g/l), due to the presence of yeast extract and high agitation rate employed in this study. It was observed that the SL yield due to glucose (Yp/g = 0.0944 cm2/g/l) is less compared to the yield from soybean oil (Yp/s = 0.9147 cm2/g/l). References 1. Daverey A, Pakshirajan K. Appl Biochem
Biotechnol. 2010; 160: 2090–2101. 2. Rodrigues L, Moldes A, Teixeira J, Oliveira
R. Biochem Eng J. 2006; 28: 109–116. 3. Thaniyavarn J, Chianguthai T, Sangvanich
P, Roongsawang N, Washio K, Morikawa M, Thaniyavarn S. Biosci Biotechnol Biochem. 2008; 72(8): 2061-8.
4. Van Bogaert IN, Saerens K, De Muynck C, Develter D, Soetaert W, Vandamme EJ. Appl Microbiol Biot. 2007; 76: 23-34.
The 23rd Annual Meeting of the Thai Society for Biotechnology “Systems Biotechnology: Quality & Success”
P-V-01
- 216 -
Molecular phylogeny of ectomycorrhizal fungus Tylopilus based on nuLSU rDNA in Thailand
Pawara Pachit a, Jittra Piapukiew a and Cherdchai Phosrib aDepartment of Botany, Faculty of Science, Chulalongkorn University, Phayathai Rd., Patumwan, Bangkok 10330, Thailand bBiology Programme, Faculty of Science & Technology, Pibulsongkram Rajabhat University, Phitsanulok 65000, Thailand
Abstract Tylopilus is a genus of bolete fungi in Boletaceae. Tylopilus species are ectomycorrhizal fungi
associated with many plant species and widely distributed across subtropical and tropical regions. Tylopilus co-distributes with plant families Dipterocarpaceae, Myrtaceae, Fagaceae and Pinaceae throughout Thailand. Little knowledge of the systematics of this genus based on molecular phylogeny has been obtained. In this study, phylogenetic relationships among Tylopilus species were studied based on large subunit ribosomal DNA (nuLSU rDNA). Sequences of thirteen Tylopilus local samples were compared with some Tylopilus species available in GenBank database. Phylogenetic analysis suggested that at least seven Tylopilus species exist in Thailand. Only one Tylopilus species corresponded to Tylopilus ballouii which was a species complex. The remaining species did not match any previously reported species in GenBank. Therefore, morphological data of these Thai Tylopilus species are needed for further study. Keywords: Tylopilus, ectomycorrhiza, phylogenetic relationship, nuLSU rDNA Introduction and Objective
Tylopilus is a large genus of ectomycorrhizal fungi in family Boletaceae which has at least 75 species[1],[2]. The geographical ranges of these fungi include temperate zone but mainly distributed in tropical[2],[3]. In Thailand, Tylopilus species distribute with their host plants families, Dipterocarpaceae, Myrtaceae, Fagaceae and Pinaceae in every parts. Although the diversity of Tylopilus is abundant, the knowledge of the systematics of this genus based on molecular phylogeny has never been well investigated. In this study, phylogenetic relationships among Tylopilus spp. were studied based on nuclear large subunit ribosomal DNA (nuLSU rDNA). Materials and Methods
2.1 Taxon sampling Thirteen specimens in genus Tylopilus were
collected during July to August 2010. The study sites were Dipterocarp forests, Coniferous forests and Eucalyptus plantations in Chiangmai, Phitsanulok, Kanchanaburi and Chaiyaphum Provinces.
2.2 DNA extraction and sequencing DNA was extracted from dried specimens
by CTAB method[4]. A pair of primers used for the amplification of nuclear large subunit (nuLSU) rDNA were LR0R and LR7[5]. All PCR products were sequenced and blasted in GenBank database.
2.3 Phylogenetic analyses Thirteen sequences of Thai Tylopilus, 23
sequences of Tylopilus spp. from GenBank database and 2 outgroups were aligned and the dataset were analyzed with Maximum likelihood by using Mega5[6]. Results and Discussion
The molecular phylogenetic tree of
Tylopilus (Fig.1) indicated that seven Tylopilus species were found in this study. One species might be Tylopilus ballouii (Tylopilus sp.4) which was a species complex. The remaining species did not match any previously reported species in GenBank.
Tylopilus spp. could be separated into 6 clades. Clade I which bootstrap support (BS) was 60% contained a species of Thai Tylopilus. All species in this clade associated with Pinaceae
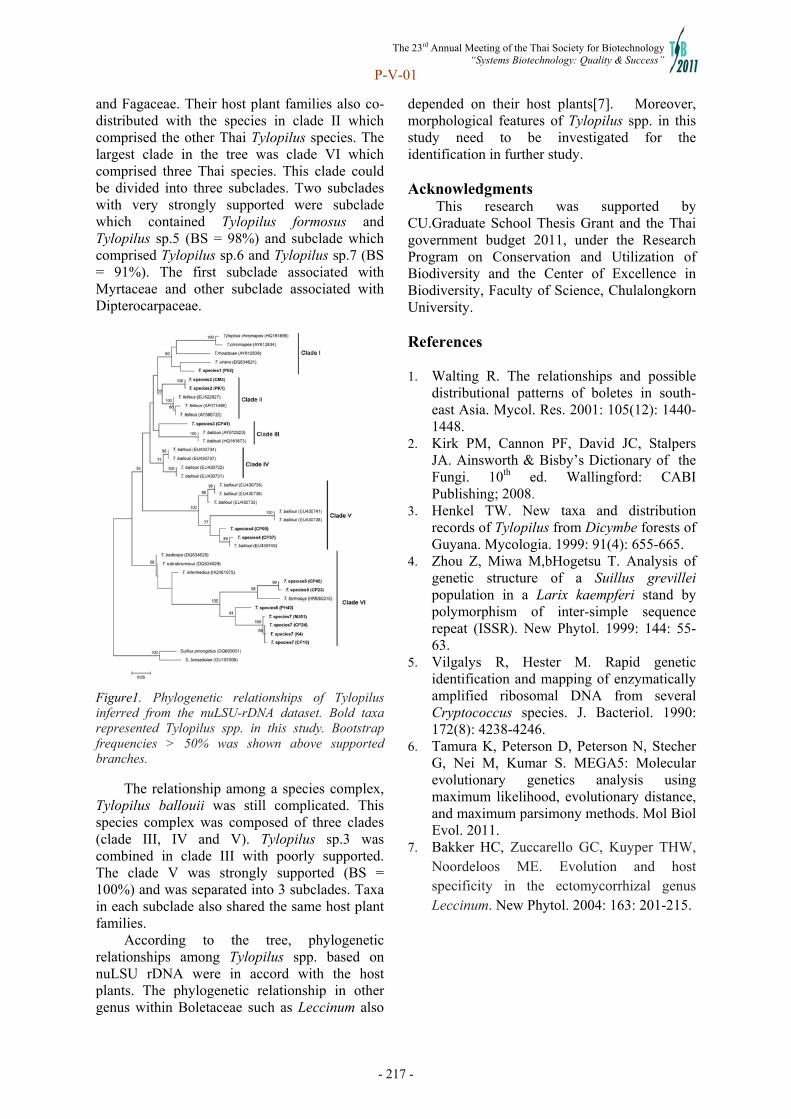
The 23rd Annual Meeting of the Thai Society for Biotechnology “Systems Biotechnology: Quality & Success”
P-V-01
- 217 -
and Fagaceae. Their host plant families also co-distributed with the species in clade II which comprised the other Thai Tylopilus species. The largest clade in the tree was clade VI which comprised three Thai species. This clade could be divided into three subclades. Two subclades with very strongly supported were subclade which contained Tylopilus formosus and Tylopilus sp.5 (BS = 98%) and subclade which comprised Tylopilus sp.6 and Tylopilus sp.7 (BS = 91%). The first subclade associated with Myrtaceae and other subclade associated with Dipterocarpaceae.
Figure1. Phylogenetic relationships of Tylopilus inferred from the nuLSU-rDNA dataset. Bold taxa represented Tylopilus spp. in this study. Bootstrap frequencies > 50% was shown above supported branches.
The relationship among a species complex, Tylopilus ballouii was still complicated. This species complex was composed of three clades (clade III, IV and V). Tylopilus sp.3 was combined in clade III with poorly supported. The clade V was strongly supported (BS = 100%) and was separated into 3 subclades. Taxa in each subclade also shared the same host plant families.
According to the tree, phylogenetic relationships among Tylopilus spp. based on nuLSU rDNA were in accord with the host plants. The phylogenetic relationship in other genus within Boletaceae such as Leccinum also
depended on their host plants[7]. Moreover, morphological features of Tylopilus spp. in this study need to be investigated for the identification in further study. Acknowledgments This research was supported by CU.Graduate School Thesis Grant and the Thai government budget 2011, under the Research Program on Conservation and Utilization of Biodiversity and the Center of Excellence in Biodiversity, Faculty of Science, Chulalongkorn University. References 1. Walting R. The relationships and possible
distributional patterns of boletes in south-east Asia. Mycol. Res. 2001: 105(12): 1440-1448.
2. Kirk PM, Cannon PF, David JC, Stalpers JA. Ainsworth & Bisby’s Dictionary of the Fungi. 10th ed. Wallingford: CABI Publishing; 2008.
3. Henkel TW. New taxa and distribution records of Tylopilus from Dicymbe forests of Guyana. Mycologia. 1999: 91(4): 655-665.
4. Zhou Z, Miwa M,bHogetsu T. Analysis of genetic structure of a Suillus grevillei population in a Larix kaempferi stand by polymorphism of inter-simple sequence repeat (ISSR). New Phytol. 1999: 144: 55-63.
5. Vilgalys R, Hester M. Rapid genetic identification and mapping of enzymatically amplified ribosomal DNA from several Cryptococcus species. J. Bacteriol. 1990: 172(8): 4238-4246.
6. Tamura K, Peterson D, Peterson N, Stecher G, Nei M, Kumar S. MEGA5: Molecular evolutionary genetics analysis using maximum likelihood, evolutionary distance, and maximum parsimony methods. Mol Biol Evol. 2011.
7. Bakker HC, Zuccarello GC, Kuyper THW, Noordeloos ME. Evolution and host specificity in the ectomycorrhizal genus Leccinum. New Phytol. 2004: 163: 201-215.

The 23rd Annual Meeting of the Thai Society for Biotechnology “Systems Biotechnology: Quality & Success”
P-V-03
- 218 -
Assessment of genetic diversity and relationship among Dendrobium friedericksianum Rchb.f. samples using AFLP markers
Piyarat Chareonsapa, Intira Jarupenga, Orachorn Chotiyarnwonga, Prapai Mojarina, Patamaporn Tilaruxb, Saroch Prasertsirivatnab and Pornchai Chuthamasa a Plant Genetic Conservation Project as The Royal Initiation of Her Royal Highness Princess Maha Chakri Sirindhorn (RSPG), Chitralada Palace, Dusit, Bangkok 10303, Thailand. b Faculty of Agro Industrial Technology, Rajamangala University Tawan-ok, Chantaburi Campus, Chantaburi 22000, Thailand.
Abstract Leaungchanthaboon (Dendrobium friedericksianum Rchb.f.) is the name of native orchid found
in the Eastern of Thailand especially Chanthaburi Province. Genetic diversity and relationships among thirty-three collective Leaungchanthaboon was investigated using AFLP (Amplified Fragment Length Polymorphism) markers. Ten AFLP primers gave 213 amplified reproducible polymorphic fragment products, and cluster analysis was then conducted using UPGMA method by Jaccard similarity coefficients. The results demonstrated that these collections were clearly separated into nine groups at similarity level of 0.568. The highly significant cophenetic correlation of r = 0.84 indicated that these samples were well grouped. The results obtained from this study can be used to explain the relationship between Leaungchanthaboon germplasm as well as to select for parents in a breeding program, to avoid inbreeding depression. This finding can be added up to the scarcely available information on Leaungchanthaboon genetic resource. Keywords: Dendrobium friedericksianum Rchb.f., AFLP, genetic diversity Introduction and Objective
“Leaungchanthaboon” (Dendrobium friedericksianum Rchb.f.) is native orchid found in the Eastern of Thailand especially Chanthaburi Province. It is in the family Orchidaceae, genus Dendrobium (Boonkead et.al., 1982). Leaung chanthaboon is one of the most beautiful and expensive orchids. Recently, there has been high domestic and international demanded for this orchid. Therefore, this wild orchid was stolen from their origin in the forest for sale in the black market. This is the reason why this species has been on the verge of extinction in Chantaburi Province’s forest. Now, the tissue culture technique has been used to propagate most orchids, because it is able to increase the number of orchids in the short time (Prasertsirivatna and Koolpluksee, 2011).
However, the tissue culture technique might generate genetic variation as a result of induced mutation within Leaung chanthaboon orchid culture. Therefore, DNA fingerprint technique can be used to identify a variety and its genetic purity. It is technically possible to develop a protocol for evaluating genetic diversity and relationship among the Leaung chanthaboon
orchid to provide an efficient management for a large number of germplasm.
The amplified fragment length polymorphism (AFLP) technique is being widely used for genetic diversity studies because it reveals significant polymorphisms and is a reliable and robust molecular marker assay (Vos et al., 1995).
The objective of this study was to assess genetic diversity of 33 samples of Leaung chanthaboon using AFLP markers Materials and Methods
Plant material Thirtythree leaf-samples of Leaung
chanthaboon from Faculty of Agro Industrial Technology, Rajamangala University Tawan-ok, Chantaburi Campus were used.
Genomic DNA extraction and AFLPs procedure
Total DNA was extracted from young leaves of 33 samples using the DNeasy Plant Kit (Qiagen, Hilden, Germany) according to the instructions of the manufacturer. After that DNA quantification was performed using a Hoefer DyNA Quant 200 (Pharmacia Biotech, Piscataway, NJ, USA)
The 23rd Annual Meeting of the Thai Society for Biotechnology “Systems Biotechnology: Quality & Success”
P-V-03
- 219 -
The AFLP procedure was carried out as reported by Vos et al. (1995) with a slight modification. Approximately 100 ng/µl of DNA was digested by two restriction enzymes, i.e. EcoRI and Tru9I in 10x buffer A (Promega) and incubated for 1 h at 37°C. The restricted DNA fragment was ligated to EcoRI-adapter and MseI-adapter for at least 3 h at 37 °C to generate DNA template for amplification. Five microliters of the 1:10 diluted generated DNA template was first pre-amplified (Px2 Thermal Cycler; Thermo Electron Corporation, USA) using EcoRI+A and MseI+C primers. Then the pre-amplified DNA was diluted to 1:9 with sterilized distilled water and 3 µl of the product was then used for selective amplification in a reaction tube containing 20 µl of selective amplification mixtures. AFLP adapters and ten primers pairs (E+ACG/M+CTG, E+AGC/M+CGT, E+AGC/M+CTG, E+AGA/M+CGA, E+AGA/M+CTG, E+AGA/M+CGT, E+ACT/M+CTG, E+ACT/M+CAG, E+AAG/M+CTG and E+AGG/M+CTG) were used for the selective amplification. The final PCR products were run on a 4.5% denaturing polyacrylamide gel electrophoresis in 1x TBE buffer in a Sequi-Gen GT Sequencing Cell (Bio-Rad, USA). DNA fragments on gels were visualized using silver nitrate staining protocol (Bassam et al., 1991). The gel was rinsed with distilled water and air-dried on mirror plates.
Data analysis For the genetic similarity analysis, AFLP
fragments were visually scored as present (1) or absent (0) to create a binary data set. The data was entered into a binary data matrix as discrete variables. Jaccard’s coefficient of similarity (Sneath and Sokal, 1973) was calculated for all pair-wise comparisons among the Leaung chanthaboon as follows: Jaccard = NAB/ (NAB+NA+NB), where NAB is the number of fragments shared by two cultivars (A and B), NA represents amplified fragments in cultivar A and NB represents fragments in cultivar B. A dendrogram was constructed using NTSYS version 2.1 (Exeter Software, Setauket, NY, USA) (Rohlf, 2000) based on the Unweighted Pair Group Method of the Arithmetic Average (UPGMA).
Results and Discussion
The number of AFLP fragments generated per primer set ranged from 13 to 39 with fragment sizes varying from 100 to 500 bp, suggesting that each primer generated an average of 30.1 fragments and 21.3 of them were polymorphic. A total of 301 AFLP fragments was detected, of which 213 were polymorphic (70.76%) (Table 1). Table 1 AFLP primer combinations, total number of
bands generated by each primer set, number of polymorphic bands detected, and percentage of
polymorphic bands used in 33 samples of Leaung chanthaboon
Primer Total no. of bands
no. of polymorphic
bands
% poly morphic bands
E+ACG/M+CTG 15 10 66.67 E+AGC/M+CGT 13 8 61.54 E+AGC/M+CTG 29 19 65.52 E+AGA/M+CGA 39 31 79.49 E+AGA/M+CTG 32 23 71.88 E+AGA/M+CGT 25 20 80.00 E+ACT/M+CTG 38 24 63.16 E+ACT/M+CAG 37 28 75.68 E+AAG/M+CTG 34 23 67.65 E+AGG/M+CTG 39 27 69.23
Total 301 213 70.76
Average 30.1 21.3 70.76
A cluster analysis with UPGMA indicated ranges of Jaccard’s similarity between 0.36 to 0.88. At the Jaccard’s similarity of 0.568, thirty-three collective Leaung hanthaboon samples could be divided into 9 groups (Figure 2). The highly significant cophenetic correlation of r = 0.837 indicated that these samples were high goodness of fit.
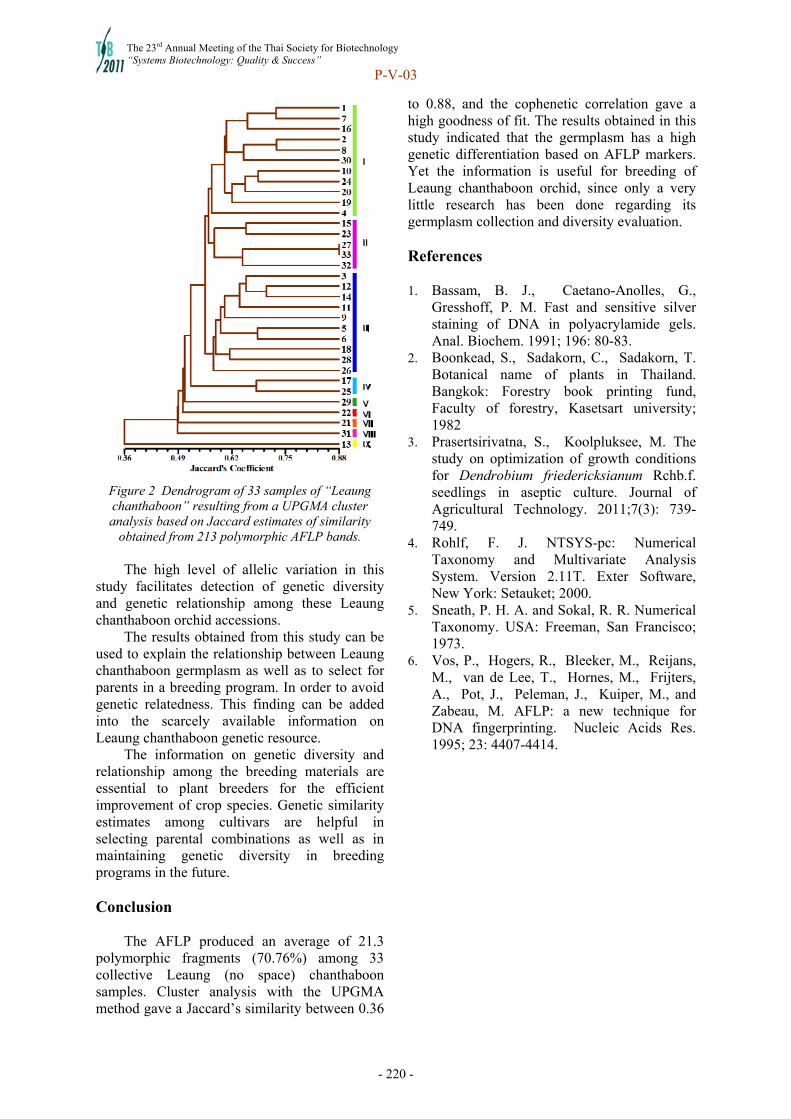
The 23rd Annual Meeting of the Thai Society for Biotechnology “Systems Biotechnology: Quality & Success”
P-V-03
- 220 -
Figure 2 Dendrogram of 33 samples of “Leaung chanthaboon” resulting from a UPGMA cluster analysis based on Jaccard estimates of similarity
obtained from 213 polymorphic AFLP bands.
The high level of allelic variation in this study facilitates detection of genetic diversity and genetic relationship among these Leaung chanthaboon orchid accessions.
The results obtained from this study can be used to explain the relationship between Leaung chanthaboon germplasm as well as to select for parents in a breeding program. In order to avoid genetic relatedness. This finding can be added into the scarcely available information on Leaung chanthaboon genetic resource.
The information on genetic diversity and relationship among the breeding materials are essential to plant breeders for the efficient improvement of crop species. Genetic similarity estimates among cultivars are helpful in selecting parental combinations as well as in maintaining genetic diversity in breeding programs in the future. Conclusion
The AFLP produced an average of 21.3 polymorphic fragments (70.76%) among 33 collective Leaung (no space) chanthaboon samples. Cluster analysis with the UPGMA method gave a Jaccard’s similarity between 0.36
to 0.88, and the cophenetic correlation gave a high goodness of fit. The results obtained in this study indicated that the germplasm has a high genetic differentiation based on AFLP markers. Yet the information is useful for breeding of Leaung chanthaboon orchid, since only a very little research has been done regarding its germplasm collection and diversity evaluation. References 1. Bassam, B. J., Caetano-Anolles, G.,
Gresshoff, P. M. Fast and sensitive silver staining of DNA in polyacrylamide gels. Anal. Biochem. 1991; 196: 80-83.
2. Boonkead, S., Sadakorn, C., Sadakorn, T. Botanical name of plants in Thailand. Bangkok: Forestry book printing fund, Faculty of forestry, Kasetsart university; 1982
3. Prasertsirivatna, S., Koolpluksee, M. The study on optimization of growth conditions for Dendrobium friedericksianum Rchb.f. seedlings in aseptic culture. Journal of Agricultural Technology. 2011;7(3): 739-749.
4. Rohlf, F. J. NTSYS-pc: Numerical Taxonomy and Multivariate Analysis System. Version 2.11T. Exter Software, New York: Setauket; 2000.
5. Sneath, P. H. A. and Sokal, R. R. Numerical Taxonomy. USA: Freeman, San Francisco; 1973.
6. Vos, P., Hogers, R., Bleeker, M., Reijans, M., van de Lee, T., Hornes, M., Frijters, A., Pot, J., Peleman, J., Kuiper, M., and Zabeau, M. AFLP: a new technique for DNA fingerprinting. Nucleic Acids Res. 1995; 23: 4407-4414.

The 23rd Annual Meeting of the Thai Society for Biotechnology “Systems Biotechnology: Quality & Success”
P-VI-01
- 221 -
Biodegradable composite films and pharmaceutical hard capsules based on durian seed starch
Warin Pimpa*and Chakkrit Pimpa
*Department of Agro-Industry, Faculty of Agriculture Natural Resource and Environment, Naresuan University, Phitsanulok, 65000, Thailand.
Abstract
Starch is a natural polymer which possesses many unique properties and some shortcoming simultaneously. Many efforts have been exerted to develop starch-based polymers for conserving the petrochemical resources, reducing environmental impact and searching more applications. In this study, the durian seed starch was extracted and used as a base raw material for production of biodegradable films. To improve the properties of starch, blending with various biopolymers, including carboxymethylcellulose (CMC), gelatin, caragenan and pectin, have been investigated. The physical and mechanical properties of the films were compared with the PVC synthetic polymer film. The water barrier property of the durian seed starch-CMC composite films (18.115 x 10⁻¹⁰ g/m2.h.Pa) was higher than the PVC film (0.765 x 10⁻¹⁰ g/m2.h.Pa). In the cases of tensile strength and elongation properties, the composite films had lower values (0.3890 KgF/mm2 and 41.94%, respectively) than the PVC film (2.1848 KgF/mm2 and 242.16%). The durian seed starch-CMC composite films were also used to develop hard capsules for utilization in the pharmaceutical industry as a substitute for gelatin or animal based products. Evidently, the composite durian seed starch-based biodegradable polymers are attractive to be medical polymer materials for the production of hard capsules. Keywords: composite films, hard capsules, durian seed starch Introduction
Starch films and coatings have been used for various food and pharmaceutical applications. Films prepared from starches are isotropic, odorless, tasteless, colorless, non-toxic and biodegradable. Starch is the major chemical component of durian seed flour, comprising around 56% of the dry weight [1]. The objectives of this study were (1) to develop films based on durian seed starch (DSS) and (2) to find out whether DSS is suitable base raw material for pharmaceutical hard capsule production.
Materials and Methods
Film preparation The DSS film solution was prepared by
mixing 5% (w/v) of DSS, 30% (w/w DSS) of glycerol and 10% (w/w DSS) of citric acid. Film preparation procedure was followed by Pimpa and Pimpa [1]. In order to improve the mechanical and water barrier properties of the DSS film, each of CMC, gelatin, caragenan and pectin at the concentration of 5% (w/w DSS) was blended with DSS film solution.
Film characterization The gravimetric modified cup method based on ASTM E96-80 was used to determine water vapor permeability (WVP) and calculated as described by McHugh et al.[2]. The tensile strength (TS) and elongation at break (%E) based on ASTM D882-95 were performed using an Instron Universal Testing Machine (Model 4414, Canton. Mass.,USA). Initial gap separation and cross-headed speed were set to 50 mm and 0.5 mm/s. SEM was used to characterize the microstructure of films by using Leo 1455 Vp scanning electron microscope.
Capsule dipping using DSS film solution The conventional dip-coating method was used for hard capsule development according to Bae et al. [3]. The loss on drying and dissolution properties were also tested.
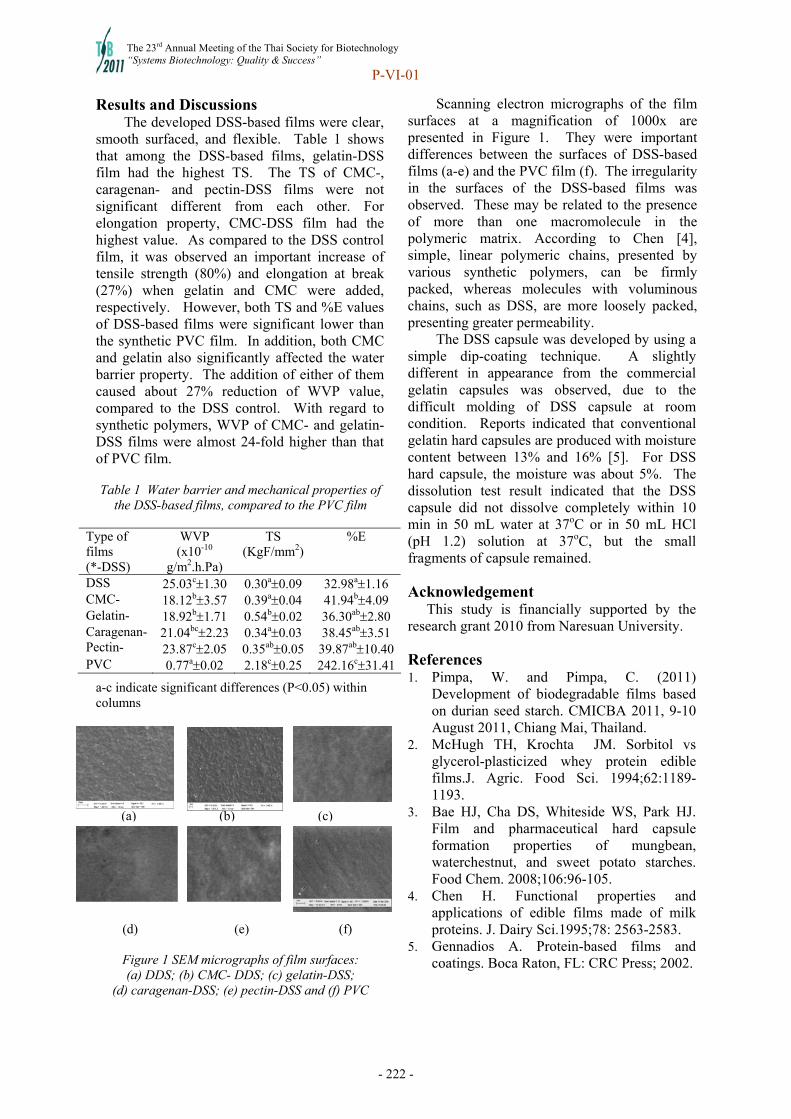
The 23rd Annual Meeting of the Thai Society for Biotechnology “Systems Biotechnology: Quality & Success”
P-VI-01
- 222 -
Results and Discussions The developed DSS-based films were clear,
smooth surfaced, and flexible. Table 1 shows that among the DSS-based films, gelatin-DSS film had the highest TS. The TS of CMC-, caragenan- and pectin-DSS films were not significant different from each other. For elongation property, CMC-DSS film had the highest value. As compared to the DSS control film, it was observed an important increase of tensile strength (80%) and elongation at break (27%) when gelatin and CMC were added, respectively. However, both TS and %E values of DSS-based films were significant lower than the synthetic PVC film. In addition, both CMC and gelatin also significantly affected the water barrier property. The addition of either of them caused about 27% reduction of WVP value, compared to the DSS control. With regard to synthetic polymers, WVP of CMC- and gelatin-DSS films were almost 24-fold higher than that of PVC film.
Table 1 Water barrier and mechanical properties of
the DSS-based films, compared to the PVC film
Type of films (*-DSS)
WVP (x10-10
g/m2.h.Pa)
TS (KgF/mm2)
%E
DSS 25.03c1.30 0.30a0.09 32.98a1.16 CMC- 18.12b3.57 0.39a0.04 41.94b4.09 Gelatin- 18.92b1.71 0.54b0.02 36.30ab2.80 Caragenan- Pectin-
21.04bc2.23 23.87c2.05
0.34a0.03 0.35ab0.05
38.45ab3.51 39.87ab10.40
PVC 0.77a0.02 2.18c0.25 242.16c31.41
a-c indicate significant differences (P<0.05) within columns
(a) (b) (c)
(d) (e) (f)
Figure 1 SEM micrographs of film surfaces: (a) DDS; (b) CMC- DDS; (c) gelatin-DSS;
(d) caragenan-DSS; (e) pectin-DSS and (f) PVC
Scanning electron micrographs of the film surfaces at a magnification of 1000x are presented in Figure 1. They were important differences between the surfaces of DSS-based films (a-e) and the PVC film (f). The irregularity in the surfaces of the DSS-based films was observed. These may be related to the presence of more than one macromolecule in the polymeric matrix. According to Chen [4], simple, linear polymeric chains, presented by various synthetic polymers, can be firmly packed, whereas molecules with voluminous chains, such as DSS, are more loosely packed, presenting greater permeability.
The DSS capsule was developed by using a simple dip-coating technique. A slightly different in appearance from the commercial gelatin capsules was observed, due to the difficult molding of DSS capsule at room condition. Reports indicated that conventional gelatin hard capsules are produced with moisture content between 13% and 16% [5]. For DSS hard capsule, the moisture was about 5%. The dissolution test result indicated that the DSS capsule did not dissolve completely within 10 min in 50 mL water at 37oC or in 50 mL HCl (pH 1.2) solution at 37oC, but the small fragments of capsule remained.
Acknowledgement This study is financially supported by the research grant 2010 from Naresuan University.
References 1. Pimpa, W. and Pimpa, C. (2011)
Development of biodegradable films based on durian seed starch. CMICBA 2011, 9-10 August 2011, Chiang Mai, Thailand.
2. McHugh TH, Krochta JM. Sorbitol vs glycerol-plasticized whey protein edible films.J. Agric. Food Sci. 1994;62:1189-1193.
3. Bae HJ, Cha DS, Whiteside WS, Park HJ. Film and pharmaceutical hard capsule formation properties of mungbean, waterchestnut, and sweet potato starches. Food Chem. 2008;106:96-105.
4. Chen H. Functional properties and applications of edible films made of milk proteins. J. Dairy Sci.1995;78: 2563-2583.
5. Gennadios A. Protein-based films and coatings. Boca Raton, FL: CRC Press; 2002.
The 23rd Annual Meeting of the Thai Society for Biotechnology “Systems Biotechnology: Quality & Success”
P-VI-04
- 223 -
Transformation of artemisinin by Aspergillus oryzae and the biological activity of the transformed product
Wannipa Pipatsamuta,b, Sirirat Chancharuneeb,c, Nisa Chawapund, Uthai Wichaie, Angkana Saovapakhiranb
a Division of Biochemistry and Biochemical Technology, Department of Biotechnology, Graduate School, Chiang Mai University, Chiang Mai, 50200, Thailand b Bio-organic synthesis and Molecular Biochemistry,Department of Chemistry, Faculty of Science, Chiang Mai University, Chiang Mai, 50200, Thailand c Department of Chemistry and Center for Innovation in Chemistry, Faculty of Science, Chiang Mai University, Chiang Mai, 50200, Thailand d Department of Radiology, Faculty of Medicine, Chiang Mai University, Chiang Mai, 50200, Thailand eDepartment of Chemistry and Centre of Excellence for Innovation in Chemistry, Faculty of Science, Naresuan University, Phitsanulok, 65000 Thailand
Abstract Artemisinin is a promising antimalarial agent for the treatment of multidrug-resistant strains of Plasmodium falciparum. Transformation of artemisinin was carried out by Aspergillus oryzae (Ozykat-1). The transformed product was isolated from the culture broth and identified as deoxyartemisinin. The biological activity of deoxyartemisinin was investigated for in vitro cytotoxicity and antimicrobial activities. Deoxyartemisinin was approximately 20-fold less cytotoxic than artemisinin toward L929 normal mouse fibroblast cell line (ATCC CCL-1). However, deoxyartemisinin was slightly more cytotoxic to A549 human lung adenocarcinoma cell line (ATCC CCL-185) than the parent endoperoxide. The 50% inhibition of cell growth (IC50) values for A549 cells of deoxyartemisinin and artemisinin were 0.568 and 0.676 mg/ml, respectively. According to antimicrobial assay, it is clear that the transformed product derived from A. oryzae (Ozykat-1) did not provide more desirable antimicrobial activities against selected indicator microorganisms, Staphylococcus aureus TISTR 1466, Salmonella typhimurium TISTR 292, Escherichia coli TISTR 780, Candida albicans BCC 5390 and Aspergillus niger TISTR 3254, than artemisinin. Keywords: Aspergillus oryzae, transformation, artemisinin, deoxyartemisinin, cytotoxicity Introduction Artemisinin is a sesquiterpene lactone which was isolated from Artemisia annua. Artemisinin and its endoperoxides derivatives are found to possess antimalarial activities against multidrug-resistance Plasmodiun falciparum (1). Furthermore, artemisinin and its derivatives are also found to possess cytotoxic activity against human breast, leukemia, colon and mouse neuroblastoma cancer cell lines (2). However, they provided limited biological activity due to their toxicity and low solubility in water (1).
Recently, the use of microbial transformation has received much attention in drug discovery areas to produce new or novel bioactive substances and improve bioactive substances more active or less toxic (3, 4).
The aim of this work is to study the biotransformation products of artemisinin using A. oryzae (Ozykat-1). The structure elucidation
of transformed product was carried out using various spectroscopic techniques. The in vitro cytotoxicity and antimicrobial activities of purified transformed product was studied in order to evaluate the effect of structural modification on biological activities. Materials and Methods Microorganisms: A. oryzae (Ozykat-1), A. niger TISTR 3254 and C. albicans BCC 5390 were maintained on PDA slant. S. aureus TISTR 1466 and S. typhimurium TISTR 292 were maintained on a slant of NA. E. coli TISTR 780 was maintained on a slant of LB. Cell culture: The normal mouse fibroblast L929 (ATCC CCL-1) and human lung adenocarcinoma A549 (ATCC CCL-185) cell lines were cultured at 37°C in an atmosphere of 5% CO2 in RPMI 1640 containing 10% (v/v) fetal bovine serum and penicillin (100 IU/ml) and streptomycin (100 mg/ml).
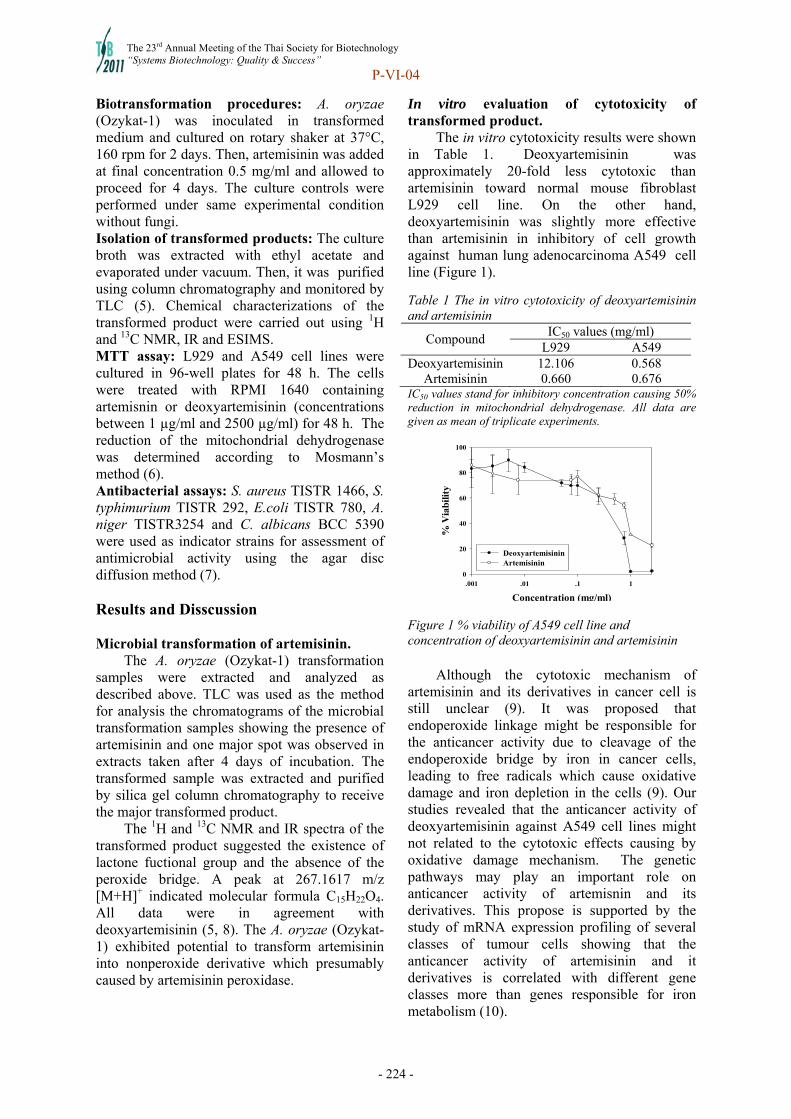
The 23rd Annual Meeting of the Thai Society for Biotechnology “Systems Biotechnology: Quality & Success”
P-VI-04
- 224 -
Biotransformation procedures: A. oryzae (Ozykat-1) was inoculated in transformed medium and cultured on rotary shaker at 37°C, 160 rpm for 2 days. Then, artemisinin was added at final concentration 0.5 mg/ml and allowed to proceed for 4 days. The culture controls were performed under same experimental condition without fungi. Isolation of transformed products: The culture broth was extracted with ethyl acetate and evaporated under vacuum. Then, it was purified using column chromatography and monitored by TLC (5). Chemical characterizations of the transformed product were carried out using 1H and 13C NMR, IR and ESIMS. MTT assay: L929 and A549 cell lines were cultured in 96-well plates for 48 h. The cells were treated with RPMI 1640 containing artemisnin or deoxyartemisinin (concentrations between 1 µg/ml and 2500 µg/ml) for 48 h. The reduction of the mitochondrial dehydrogenase was determined according to Mosmann’s method (6). Antibacterial assays: S. aureus TISTR 1466, S. typhimurium TISTR 292, E.coli TISTR 780, A. niger TISTR3254 and C. albicans BCC 5390 were used as indicator strains for assessment of antimicrobial activity using the agar disc diffusion method (7). Results and Disscussion Microbial transformation of artemisinin.
The A. oryzae (Ozykat-1) transformation samples were extracted and analyzed as described above. TLC was used as the method for analysis the chromatograms of the microbial transformation samples showing the presence of artemisinin and one major spot was observed in extracts taken after 4 days of incubation. The transformed sample was extracted and purified by silica gel column chromatography to receive the major transformed product.
The 1H and 13C NMR and IR spectra of the transformed product suggested the existence of lactone fuctional group and the absence of the peroxide bridge. A peak at 267.1617 m/z [M+H]+ indicated molecular formula C15H22O4. All data were in agreement with deoxyartemisinin (5, 8). The A. oryzae (Ozykat-1) exhibited potential to transform artemisinin into nonperoxide derivative which presumably caused by artemisinin peroxidase.
In vitro evaluation of cytotoxicity of transformed product.
The in vitro cytotoxicity results were shown in Table 1. Deoxyartemisinin was approximately 20-fold less cytotoxic than artemisinin toward normal mouse fibroblast L929 cell line. On the other hand, deoxyartemisinin was slightly more effective than artemisinin in inhibitory of cell growth against human lung adenocarcinoma A549 cell line (Figure 1).
Table 1 The in vitro cytotoxicity of deoxyartemisinin and artemisinin
IC50 values (mg/ml) Compound
L929 A549 Deoxyartemisinin 12.106 0.568
Artemisinin 0.660 0.676 IC50 values stand for inhibitory concentration causing 50% reduction in mitochondrial dehydrogenase. All data are given as mean of triplicate experiments.
Concentration (mg/ml)
.001 .01 .1 1
% V
iabi
lity
0
20
40
60
80
100
DeoxyartemisininArtemisinin
Figure 1 % viability of A549 cell line and concentration of deoxyartemisinin and artemisinin
Although the cytotoxic mechanism of artemisinin and its derivatives in cancer cell is still unclear (9). It was proposed that endoperoxide linkage might be responsible for the anticancer activity due to cleavage of the endoperoxide bridge by iron in cancer cells, leading to free radicals which cause oxidative damage and iron depletion in the cells (9). Our studies revealed that the anticancer activity of deoxyartemisinin against A549 cell lines might not related to the cytotoxic effects causing by oxidative damage mechanism. The genetic pathways may play an important role on anticancer activity of artemisnin and its derivatives. This propose is supported by the study of mRNA expression profiling of several classes of tumour cells showing that the anticancer activity of artemisinin and it derivatives is correlated with different gene classes more than genes responsible for iron metabolism (10).
The 23rd Annual Meeting of the Thai Society for Biotechnology “Systems Biotechnology: Quality & Success”
P-VI-04
- 225 -
Study on the antibacterial properties of transformed product.
According to antibacterial assay, it was found that deoxyartemisinin did not show any antibacterial activity against S. aureus TISTR 1466, S. typhimurium TISTR 292, E.coli TISTR 780, A. niger TISTR3254 and C. albicans BCC 5390. This result was different from the previous report which deoxyatemisinin has been found to exhibit antibacterial activity against Staph. aureus, Staph. epidermidis and Strept. mutan at MIC of 1 mg/ml (5). The difference in antibacterial activity could be explained by variations in species or subspecies of microorganisms (11)
In summary, we have demonstrated that A. oryzae (Ozykat-1) can transform artemisinin to deoxyartemisinin which showed slightly higher cytotoxic activity against A549 cell lines and did not show any antimicrobial activity against S. aureus TISTR 1466, S. typhimurium TISTR 292, E.coli TISTR 780, A. niger TISTR3254 and C. albicans BCC 5390.
References 1. Meshnick SR. Artemisinin: mechanisms of
action, resistance and toxicity. Int J Parasitol. 2002;32(13):1655-60.
2. Nakase I, Lai H, Singh NP, Sasaki T. Anticancer properties of artemisinin derivatives and their targeted delivery by transferrin conjugation. Int J Pharm. 2008;354(1-2):28-33.
3. Yang G, Zhang Z, Bai H, Gong J, Wang Y, Li B, et al. Biotransformation of β-amyrin acetate by Rhodobacter sphaeroides. J Biosci Bioengi. 2008;105(5):558-61.
4. Venisetty RK, Ciddi V. Application of microbial biotransformation for the new drug discovery using natural drugs as substrates. Curr Pharm Biotechnol. 2003 Jun;4(3):153-67.
5. Srivastava S, Luqman S, Fatima A, Darokar MP, Negi AS, Kumar JK, et al. Biotransformation of artemisinin mediated through fungal strains for obtaining derivatives with novel activities. Sci Pharm. 2009;77(1):87-95.
6. Mosmann T. Rapid colorimetric assay for cellular growth and survival: application to proliferation and cytotoxicity assays. J Immunol Methods. 1983 Dec 16;65(1-2):55-63.
7. Bizani D, Brandelli A. Characterization of a bacteriocin produced by a newly isolated Bacillus sp. Strain 8 A. J App Microbiol. 2002;93(3):512-9.
8. Lee IS, ElSohly HN, Croom EM, Hufford CD. Microbial metabolism studies of the antimalarial sesquiterpene artemisinin. J Nat Prod. 1989;52(2):337-41.
9. O'Neill PM, Barton VE, Ward SA. The molecular mechanism of action of artemisinin--the debate continues. Molecules. 2010 Mar;15(3):1705-21.
10. Efferth T, Olbrich A, Bauer R. mRNA expression profiles for the response of human tumor cell lines to the antimalarial drugs artesunate, arteether, and artemether. Biochem Pharmacol. 2002;64(4):617-23.
11. Swenson JM, Wallace RJ, Jr., Silcox VA, Thornsberry C. Antimicrobial susceptibility of five subgroups of Mycobacterium fortuitum and Mycobacterium chelonae. Antimicrob Agents Chemother. 1985 Dec;28(6):807-11.
The 23rd Annual Meeting of the Thai Society for Biotechnology “Systems Biotechnology: Quality & Success”
P-VI-05
- 226 -
The possible biological marker for live attenuated dengue vaccine development
Sutee Yoksana, Kalyanee Jirasripongpunb, Kanda Seedab, Surat Warasumpatia and Nuananong Jirakanjanakita
aCenter for Vaccine Development, Institute of Molecular Biosciences, Mahidol University, Salaya, Puttamonthon, Nakhonpathom, 73170, Thailand bDepartment of Biotechnology, Faculty of Engineering and Industrial Technology, Silpakorn University, Nakhonnpathom 73000, Thailand
Abstract Live attenuated dengue vaccine has been developed by serial passage of the wild type viruses in certified primary cell systems; i.e. primary dog kidney cells. Although, various biological markers have been assessed such as plaque size morphology, temperature sensitivity, suckling mouse neurovirulence and kinetics of replication in mosquitoes, attenuation of live vaccine remained uncertain. The relationship of oxidative stress level in dengue fever (DF) and dengue hemorrhagic fever (DHF) patients implied the connection with disease severity and probably virulence of the virus. Thus, the parental strain (DEN-1 16007), vaccine (DEN-1 PDK13), the over attenuate strain (DEN-1 PDK40) as well as the newly isolate virus (DEN-1 234) from DHF patient were tested for their capability to induce oxidative stress in ex-vivo system using Vero cell culture. Viability of the infected cells was diminished with the increasing number of infected virus (multiplicity of infection; MOI) and incubation times after infection. Interestingly, cell mortality rates were well correlated with viral attenuation i.e., DEN-1 234, DEN-1 16007, DEN-1 PDK13 and DEN-1 PDK40, consecutively. Lipid peroxidation, a marker of oxidative stress as measured by thiobarbituric acid reactive substances assay was higher for DEN-1 16007 and DEN-1 234 than DEN-1 PDK13 and DEN-1 PDK40. However, conclusive correlation with viral attenuation under the tested condition could not be made due to high variation in MDA level among each experiment. This could possibly result from the instability of MDA. Other oxidative stress markers such as reactive oxygen species or antioxidant enzyme; catalase, superoxide dismutase and protein carbonyls are being evaluated. Keywords: live attenuated dengue vaccine, biological marker, oxidative stress Introduction and Objective
Development of live attenuated dengue
(DEN) vaccine remains indecisive due to unavailable of a conclusive marker(s) of attenuation. Additionally, immunization of live vaccine was fear for affecting individuals to the severe form of DEN infection. The lack of a suitable animal model with the same pathological facets of human also made it difficult to extrapolate the balance between level of viral attenuation and immunogenicity. Induction of oxidative stress by DEN virus infection has been demonstrated and appeared to be a good predictor for DHF/DSS. This observation could possibly imply some relationship with disease severity and/or virulence of the virus. Thus, we attempted to verify the correlation between level of virus attenuation and oxidative stress in infected cells basing on DEN-1 PDK13 vaccine.
Materials and Methods Vero cells were infected with DEN-1
vaccine (DEN-1 PDK13), its parental strain (DEN-1 16007), the over attenuated strain (DEN-1 PDK 40) and the newly isolates (DEN-1 234) from DHF patient at varying number of virus (multiplicity of infection; MOI).
1. Induction of cell death Vero cells, cultured in 96-well plate, were
infected with each strain of DEN viruses at the MOI of 0.01, 0.1 and 1. After incubation for 5, 6, 7, 9 days, cell viability was determined by MTT assay.
2. Induction of oxidative stress Vero cells were infected with each strain of
DEN viruses at 0.1 MOI and incubated for 4 days. Chemical oxidative stressor, t-BHP was used as positive control. Lipid peroxidation was performed using thiobarbituric acid reactive substances (TBARS) protocol. The absorbance at 532 nm was determined for malondialdehyde
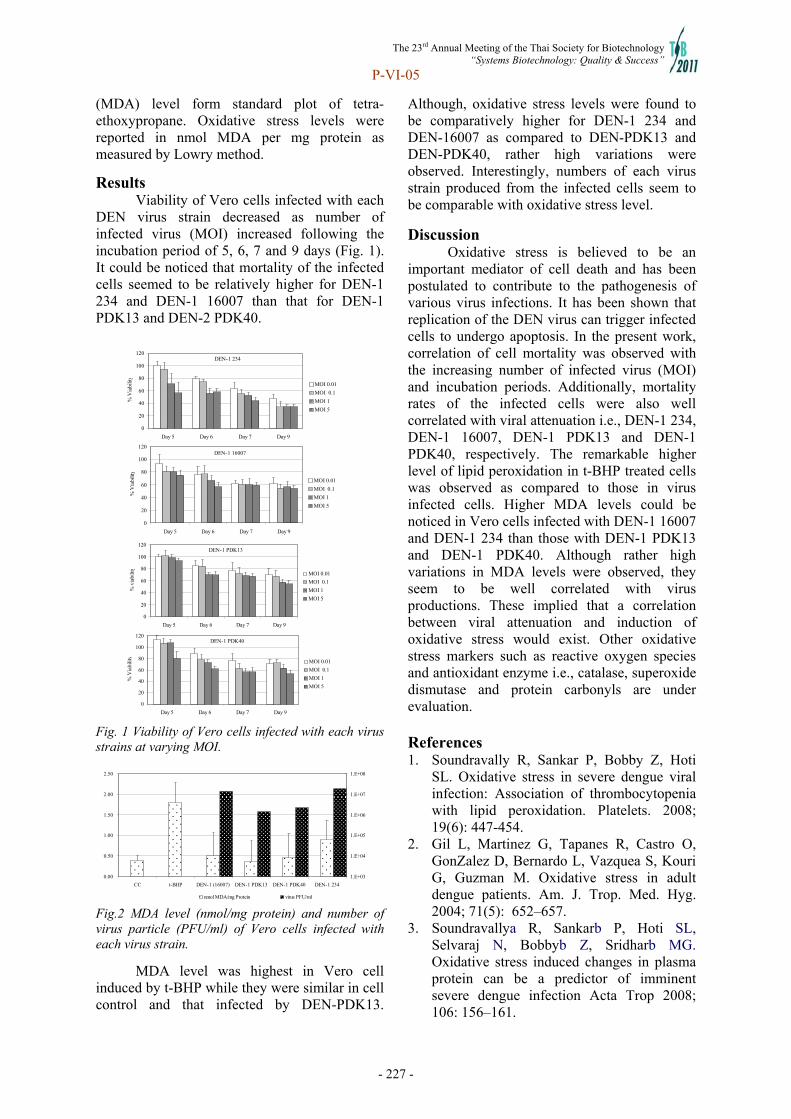
The 23rd Annual Meeting of the Thai Society for Biotechnology “Systems Biotechnology: Quality & Success”
P-VI-05
- 227 -
(MDA) level form standard plot of tetra-ethoxypropane. Oxidative stress levels were reported in nmol MDA per mg protein as measured by Lowry method.
Results Viability of Vero cells infected with each
DEN virus strain decreased as number of infected virus (MOI) increased following the incubation period of 5, 6, 7 and 9 days (Fig. 1). It could be noticed that mortality of the infected cells seemed to be relatively higher for DEN-1 234 and DEN-1 16007 than that for DEN-1 PDK13 and DEN-2 PDK40.
Fig. 1 Viability of Vero cells infected with each virus strains at varying MOI. Fig.2 MDA level (nmol/mg protein) and number of virus particle (PFU/ml) of Vero cells infected with each virus strain.
MDA level was highest in Vero cell induced by t-BHP while they were similar in cell control and that infected by DEN-PDK13.
Although, oxidative stress levels were found to be comparatively higher for DEN-1 234 and DEN-16007 as compared to DEN-PDK13 and DEN-PDK40, rather high variations were observed. Interestingly, numbers of each virus strain produced from the infected cells seem to be comparable with oxidative stress level.
Discussion Oxidative stress is believed to be an
important mediator of cell death and has been postulated to contribute to the pathogenesis of various virus infections. It has been shown that replication of the DEN virus can trigger infected cells to undergo apoptosis. In the present work, correlation of cell mortality was observed with the increasing number of infected virus (MOI) and incubation periods. Additionally, mortality rates of the infected cells were also well correlated with viral attenuation i.e., DEN-1 234, DEN-1 16007, DEN-1 PDK13 and DEN-1 PDK40, respectively. The remarkable higher level of lipid peroxidation in t-BHP treated cells was observed as compared to those in virus infected cells. Higher MDA levels could be noticed in Vero cells infected with DEN-1 16007 and DEN-1 234 than those with DEN-1 PDK13 and DEN-1 PDK40. Although rather high variations in MDA levels were observed, they seem to be well correlated with virus productions. These implied that a correlation between viral attenuation and induction of oxidative stress would exist. Other oxidative stress markers such as reactive oxygen species and antioxidant enzyme i.e., catalase, superoxide dismutase and protein carbonyls are under evaluation. References 1. Soundravally R, Sankar P, Bobby Z, Hoti
SL. Oxidative stress in severe dengue viral infection: Association of thrombocytopenia with lipid peroxidation. Platelets. 2008; 19(6): 447-454.
2. Gil L, Martinez G, Tapanes R, Castro O, GonZalez D, Bernardo L, Vazquea S, Kouri G, Guzman M. Oxidative stress in adult dengue patients. Am. J. Trop. Med. Hyg. 2004; 71(5): 652–657.
3. Soundravallya R, Sankarb P, Hoti SL, Selvaraj N, Bobbyb Z, Sridharb MG. Oxidative stress induced changes in plasma protein can be a predictor of imminent severe dengue infection Acta Trop 2008; 106: 156–161.
DEN-1 16007
0
20
40
60
80
100
120
Day 5 Day 6 Day 7 Day 9
% V
iabi
lity
MOI 0.01
MOI 0.1
MOI 1
MOI 5
DEN-1 PDK13
0
20
40
60
80
100
120
Day 5 Day 6 Day 7 Day 9
% v
iabi
lity
MOI 0.01
MOI 0.1
MOI 1
MOI 5
DEN-1 PDK40
0
20
40
60
80
100
120
Day 5 Day 6 Day 7 Day 9
% V
iabi
lity
MOI 0.01
MOI 0.1
MOI 1
MOI 5
DEN-1 234
0
20
40
60
80
100
120
Day 5 Day 6 Day 7 Day 9
% V
iabi
lity
MOI 0.01
MOI 0.1
MOI 1
MOI 5
0.00
0.50
1.00
1.50
2.00
2.50
CC t-BHP DEN-1 (16007) DEN-1 PDK13 DEN-1 PDK40 DEN-1 234
1.E+03
1.E+04
1.E+05
1.E+06
1.E+07
1.E+08
nmol MDA/mg Protein virus PFU/ml

The 23rd Annual Meeting of the Thai Society for Biotechnology “Systems Biotechnology: Quality & Success”
P-VI-06
- 228 -
Biological attributes of the live attenuated chikungunya vaccine
Sutee Yoksan, Surat Phunyahathaikul, Supoth Rajakam, Nuananong Jirakanjanakit Center for Vaccine Development, Institute of Molecular Biosciences, Mahidol University, Salaya, Puttamonthon, Nakhonpathom, 73170, Thailand
Abstract
In the absence of specific drug for chikungunya (CHIK) virus infection or suitable vector control measures, illnesses caused by CHIKV remain a high risk public health problem. CHIK Vaccine might be the best solution for this disease. The attenuated live CHIKV vaccine has been developed at the Center for Vaccine Development of Mahidol University using empirically serial passage of the virus in certified MRC-5 cell culture. A wild type CHIKV of East/Central African strain isolated from patient in Pattani Province in 2008 was selected as a starting material. After 35 consecutive passages, progeny viruses were subjected to plaque purification by plaque picking technology. Several clones with pin point plaque were amplified in certified Vero cells for another 3-5 passages to verify for its homogeneity and plaque size stability. Tissue culture passaged virus strains were then subjected to biological marker studies. Two biological attributes were initially tested to characterize all clones obtained. They were plaque size morphology in Vero cells and neurovirulence in 1-2 day old mice. Preliminary results of the 3 selected clones revealed no or low neurovirulence in suckling mice. Additionally, high neutralizing antibody titers were presented during 2-4 weeks after immunization in adult mice. These virus strains, under selective pressure in MRC-5 cell culture, revealed potential vaccine candidates. A full description of biological markers of a live attenuated CHIKV will be further investigated. Keywords: chikungunya, vaccine, suckling mice, neurovirulence Introduction and Objective
Chikungunya virus (CHIKV) is a mosquito-borne alpha virus which represents a recent threat to people in various countries. In 2008, there was a large epidemic of CHIK disease in the South of Thailand and thousands of cases were reported. At present, many cases were found in almost all part of the country. Predominant clinical manifestations of the disease were high fever with severe arthralgia or arthritis. Infection in pregnant women may also result in neonatal death. Vaccine development might be one of the best solution to this problem besides the vector control measure. This prompted the Center for Vaccine Development of Mahidol University to put an effort on development of live attenuated CHIKV vaccine using empirically serial passage the virus in certified MRC-5 cell culture. A wild type CHIKV of East/Central African strain isolated from patient in Pattani Province in 2008 was selected as a starting material.
Materials and Methods A wild type CHIKV of East/Central
African strain isolated from patient in Pattani Province in 2008 was used. The virus was inoculated in Toxorhynchites splendens mosquitoes, amplified in Vero cell culture and kept as stock seed viruses.
Vero cells and MRC-5 cells were cultured using Minimum essential medium supplemented with 10% fetal calf serum. They were sub-cultured after reach confluency by 4-5 days.
1. Viral attenuation The CHIKV was serially passaged in
certified MRC-5 cell cultures. After 35 passages, their progenies were subjected to plaque purification by plaque picking in certified Vero cells. The viruses with pin point plaque (< 1 mm) were selected. Then, the purified clones were amplified in Vero cell cultures for 3 consecutive passages before subjected to biological markers test to verify for the attenuated clones.

The 23rd Annual Meeting of the Thai Society for Biotechnology “Systems Biotechnology: Quality & Success”
P-VI-06
- 229 -
2. Biological marker studies Plaque size morphology study was
performed using monolayer cultures of Vero cells. After infection, agarose overlayer medium was added and the infected cells were incubated at 37°C, 5% CO2. Plaque sizes were determined after incubation for 5 days.
Suckling mouse neurovirulence was carried out using 1 to 2 days old Swiss Albino suckling mice. They were inoculated with 0.03 ml of virus suspension containing 100 PFU of the selected clones. The parent virus was also tested in the same manner for comparison. The clinical signs of illness and death were observed during 21 days.
Results
After passaging in MRC-5 cells, various plaque sizes population of the parent virus exhibited only large (4-6 mm) and small to pin point plaque (<1 mm to 1 mm) as shown in figure 1. By plaque purification, 15 clones of pin point plaque size could be selected. These purified clones produced stable and homogeneous plaque size morphology after amplification in Vero cell cultures.
Figure 1 Plaque size morphology of CHIKV after
passaging in MRC-5 cells Suckling mouse neurovirulence of at least
3 clones with pin point plaque size (<1 mm) showed no or low neurovirulence in suckling mice during 21 days. Preliminary study on immunogenicity demonstrated that high neutralizing antibody titers of 10 to >1000 PRNT50 were presented after immunization in adult mice for 4 weeks.
Discussion Considering the active occurrence of
CHIKV in Thailand, the need for an effective CHIK vaccine is obvious. Development of candidate vaccine at Mahidol University was performed using certified MRC-5 cell culture. The criteria employed in selecting the vaccine candidate viruses was initially performed based on plaque size morphology and suckling mouse neurovirulence. At least 3 purified clones with pin point plaque were achieved. Evaluation in weaning mice showed no neurotoxicity after 21 days. Immunogenicity was obtained from the preliminary test in adult mice. It is expected that a live attenuated CHIKV could be identified after further investigation. Acknowledgement: Gratefully thank to Ms. Sompit Seesai and other officers at Center for Disease Control, Ministry of Public Health, Pattani Province for sample collection. Many thank also to Mr. Nathanoph Thongchai, Ms. Duangnapa Wanlayaporn, Miss Jintana Wattnapalasiri, and officers at the Center for Vaccine Development for all their help to facilitate this research work.
References: 1. Levitt NH, Ramsburg H.H., Hasty, S.E.,
Repik, P.M., Cole Jr.F.E., and Lupton, H.W. 1986. Development of an attenuated strain of chikungunya virus for use in vaccine production. Vaccine 1986; 4: 157–162.
2. Wang E, Volkovac E, Adamsa AP, Forrester N, Xiaoa SY, Frolov I. Weavera SC. Chimeric alphavirus vaccine candidates for Chikungunya. Vaccine 2008; 26: 5030–5039.

The 23rd Annual Meeting of the Thai Society for Biotechnology “Systems Biotechnology: Quality & Success”
P-VI-07
- 230 -
Development of hydrocolloid gel for wound dressing Kalyanee Jirasripongpuna, Monrudee Paungbupaa, and Nuananong Jirakanjanakitb
aDepartment of Biotechnology, Faculty of Engineering and Industrial Technology, Silpakorn University, Nakhonnpathom, 73000, Thailand bCenter for Vaccine Development, Institute of Molecular Biosciences, Mahidol University, Salaya, Puttamonthon, Nakhonpathom, 73170, Thailand Abstract Hydrocolloid gel was prepared from pectin (0.7%), carboxy-methylcellulose (4%) and propylene glycol (20%) as plain and with silver nitrated addition at 1% and 5%. The silver content in gel was 15-70 mg/100cm2 and was in the range of commercial wound dressing. The silver ion in 5% silver nitrate gel was reduced to silver nanoparticle as observed by the maximum absorbance at 418 nm. Plain and silver added gels could uptake water similarly at about 45% (w/w). Silver nanoparticle in 5% silver nitrate containing gel was slowly released and achieved its maximum content within 12 min. Study on biological activity of the gel found that plain gel has no antimicrobial activity. However, gel with silver nitrate addition at 1% and 5% similarly inhibited both gram positive and negative bacteria found on skin. These included Staphylococcus aureus (S. aureus) S.epidermidis (antibiotic resistant strain), Enterococcus sp., Pseudomonas aeruginosa (P. aeruginosa) and Escherichia coli (E.coli). Plain gel was found cytotoxic to Vero cell. This was due to the high content over IC50 of carboxymetheycellulose and propylene glycol. Furthermore, silver contents at 5% and 1% in gels were also too high and caused cytotoxic to Vero cell. Therefore, gel components should be modified and the silver content should be reduced to develop a safe wound dressing. Keywords: Hydrocolloid gel, pectin, carboxy-methylcellulose, propylene glycol, wound dressing Introduction and objective
Skin, an effective biological barrier, could be highly susceptible to microbial attack if breached by trauma. Wound dressings, a simply cover with antibiotics, would reduce microbial attack and infection. Furthermore, wound dressing providing moisture management has been claimed to increase healing rate. It absorbs exudates, maintains hydration and gives moisture which could enhance autolytic debridement of necrotic and sloughing tissues. Thus, we aimed to develop pectin hydrocolloid gel supplemented with silver nitrate and tested for its potential for wound dressing.
Materials and methods Preparation of the composite dressing
Gel was prepared from pectin (0.7%), CMC (4%) and propylene glycol (20%). All components were heated to dissolve in water at 60°C, sterilized at 121°C and poured on Petri-dish. Silver nitrate at 1% or 5% was added to gel solution before casting. Physical properties study
Gel formation was observed and its elasticity was compared while cutting and
removing gel sheets. Water uptake rate was calculated from 1 cm2 gel dropping with 10 µl of water till gel loss of its shape. Silver nanoparticle and silver release were analyzed from gel immersing in 4 ml water by spectrophotometer at 418 nm. Biolocical properties study
Antimicrobial test was performed based on diffusion agar assay against Staphylococcus aureus (S. aureus) S. epidermidis (antibiotic resistant strain), Enterococcus sp., Pseudomonas aeruginosa (P. aeruginosa) and Escherichia coli (E.coli). The samples at 50 µl were added including positive control of Ciprofloxacin (1 µg/ml) and silver nitrate solution (1 and 5% (w/v)), and the inhibition zones were measured after 24 h.
Cytotoxicity assay was performed using Vero cells seeded in 96 well-plates. Various concentrations of gels were added and MTT assay was carried out after incubation for 24 h. A half maximal inhibitory concentration (IC50) of each sample was calculated.
Results Physical properties of gels: Formation of
gel with and without silver addition was found to
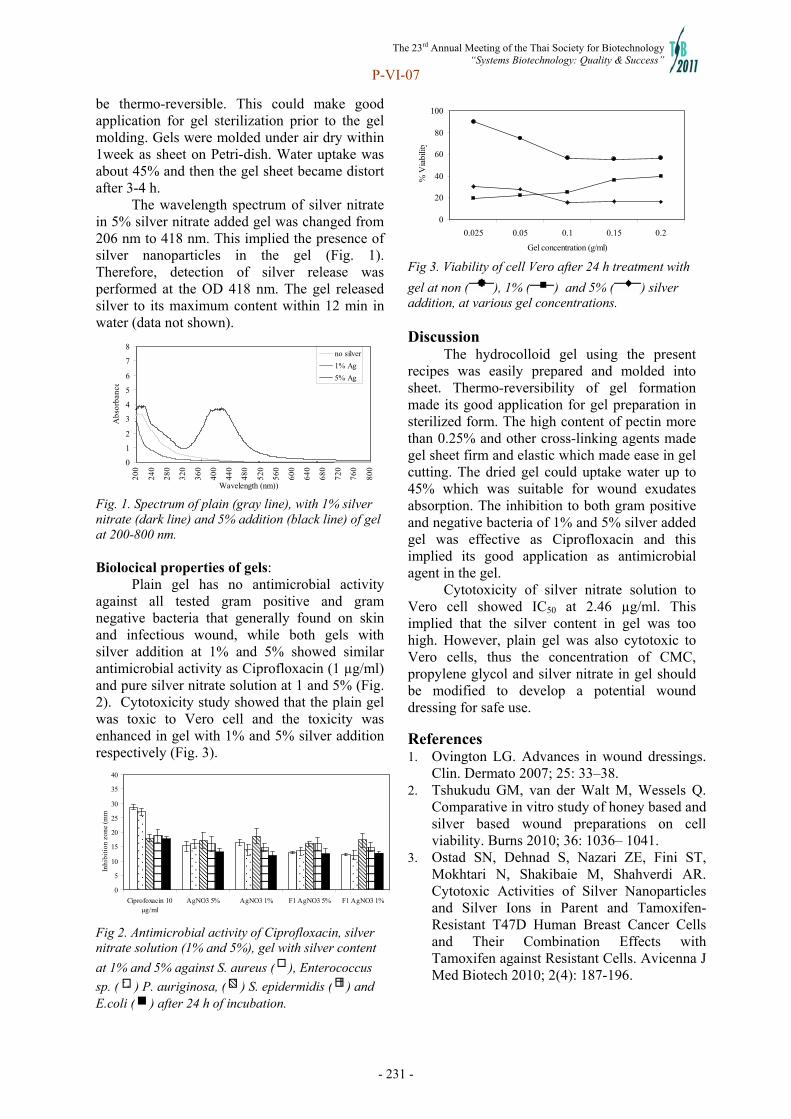
The 23rd Annual Meeting of the Thai Society for Biotechnology “Systems Biotechnology: Quality & Success”
P-VI-07
- 231 -
be thermo-reversible. This could make good application for gel sterilization prior to the gel molding. Gels were molded under air dry within 1week as sheet on Petri-dish. Water uptake was about 45% and then the gel sheet became distort after 3-4 h.
The wavelength spectrum of silver nitrate in 5% silver nitrate added gel was changed from 206 nm to 418 nm. This implied the presence of silver nanoparticles in the gel (Fig. 1). Therefore, detection of silver release was performed at the OD 418 nm. The gel released silver to its maximum content within 12 min in water (data not shown).
0
1
2
3
4
5
6
7
8
200
240
280
320
360
400
440
480
520
560
600
640
680
720
760
800
Wavelength (nm))
Abs
orba
nce
no silver
1% Ag
5% Ag
Fig. 1. Spectrum of plain (gray line), with 1% silver nitrate (dark line) and 5% addition (black line) of gel at 200-800 nm. Biolocical properties of gels:
Plain gel has no antimicrobial activity against all tested gram positive and gram negative bacteria that generally found on skin and infectious wound, while both gels with silver addition at 1% and 5% showed similar antimicrobial activity as Ciprofloxacin (1 µg/ml) and pure silver nitrate solution at 1 and 5% (Fig. 2). Cytotoxicity study showed that the plain gel was toxic to Vero cell and the toxicity was enhanced in gel with 1% and 5% silver addition respectively (Fig. 3).
0
5
10
15
20
25
30
35
40
Ciprofoxacin 10µg/ml
AgNO3 5% AgNO3 1% F1 AgNO3 5% F1 AgNO3 1%
Inhi
biti
on z
one
(mm
Fig 2. Antimicrobial activity of Ciprofloxacin, silver nitrate solution (1% and 5%), gel with silver content
at 1% and 5% against S. aureus ( ), Enterococcus
sp. ( ) P. auriginosa, ( ) S. epidermidis ( ) and E.coli ( ) after 24 h of incubation.
0
20
40
60
80
100
0.025 0.05 0.1 0.15 0.2
Gel concentration (g/ml)
% V
iabi
lity
Fig 3. Viability of cell Vero after 24 h treatment with
gel at non ( ), 1% ( ) and 5% ( ) silver addition, at various gel concentrations.
Discussion
The hydrocolloid gel using the present recipes was easily prepared and molded into sheet. Thermo-reversibility of gel formation made its good application for gel preparation in sterilized form. The high content of pectin more than 0.25% and other cross-linking agents made gel sheet firm and elastic which made ease in gel cutting. The dried gel could uptake water up to 45% which was suitable for wound exudates absorption. The inhibition to both gram positive and negative bacteria of 1% and 5% silver added gel was effective as Ciprofloxacin and this implied its good application as antimicrobial agent in the gel.
Cytotoxicity of silver nitrate solution to Vero cell showed IC50 at 2.46 µg/ml. This implied that the silver content in gel was too high. However, plain gel was also cytotoxic to Vero cells, thus the concentration of CMC, propylene glycol and silver nitrate in gel should be modified to develop a potential wound dressing for safe use.
References 1. Ovington LG. Advances in wound dressings.
Clin. Dermato 2007; 25: 33–38. 2. Tshukudu GM, van der Walt M, Wessels Q.
Comparative in vitro study of honey based and silver based wound preparations on cell viability. Burns 2010; 36: 1036– 1041.
3. Ostad SN, Dehnad S, Nazari ZE, Fini ST, Mokhtari N, Shakibaie M, Shahverdi AR. Cytotoxic Activities of Silver Nanoparticles and Silver Ions in Parent and Tamoxifen-Resistant T47D Human Breast Cancer Cells and Their Combination Effects with Tamoxifen against Resistant Cells. Avicenna J Med Biotech 2010; 2(4): 187-196.
The 23rd Annual Meeting of the Thai Society for Biotechnology “Systems Biotechnology: Quality & Success”
P-VI-08
- 232 -
Production of monoclonal antibodies against Salmonella Typhimurium Yada Chapanont a, Kittinan Komolpis b, Sirirat Rengpipat a aDepartment of Microbiology, Faculty of Science, Chulalongkorn University, Bangkok 10330, Thailand. bThe Institute of Biotechnology and Genetic Engineering, Chulalongkorn University Institute Building 3, Phayathai Road, Pathumwan, Bangkok 10330, Thailand
Abstract Salmonella enterica subsp. enterica serovar Typhimurium is a pathogen for human and animal,
commonly causing foodborne diseases such as gastroenteritis and enteric fever. This study aims to develop monoclonal antibodies specific to S. Typhimurium that can identify and differentiate S. Typhimurium accurately from other groups of Salmonella and other bacteria. Monoclonal antibodies were obtained after immunization of BALB/c with whole cells of heat-killed S. Typhimurium. Only three monoclonal antibodies were selected and isotyped as IgG1, IgG2b and IgM by Sigma’s Mouse Monoclonal Antibody Isotyping Kit (Sigma-Aldrich, USA). All monoclonal antibodies were determined by dot blotting with various heat-killed bacteria. Our results indicated that three monoclonal antibodies could be divided into 2 groups;(group I and group II), based on their specificity. Group I could detect S. Typhimurium and S. Enteritidis 1773-72 ; whereas, group II could detect only Salmonella spp. and S. Typhimurium except S. Typhimurium DMST 34045. The sensitivity of monoclonal antibodies was determined using heat-killed S. Typhimurium as antigen by Dot Blotting. The detection limit was in the range of ~103 - 104 CFU /µl/spot.
Keywords: monoclonal antibodies, Salmonella Typhimurium, dot blotting Introduction and Objective Salmonella Typhimurium, a member of the Family Enterobacteriaceae, is a pathogen for human and animal, which commonly causes foodborne diseases such as gastroenteritis[1]. S. Typhimurium is among the most extensive serovar in Europe and America and growing importantly in Southeast Asia, Africa and the Western Pacific[2]. Several reports have demonstrated the presence of Salmonella spp. in Thai chicken meats, chicken egg, and pork, obtained from local markets[3]. Determination for S. Typhimurium in meat products are required in order to ensure wholesomeness of foods. Immunoassay method is easy to use, gives specific for target host and can reduce detection time to 2-3 days[4]. Therefore, this study aims to develop monoclonal antibodies specific to S. Typhimurium that can identify and differentiate S. Typhimurium accurately from other Salmonella and other bacteria. Materials and Methods 2.1 Bacteria and antigen preparation Salmonella Typhimurium ATCC 13311 and other bacteria were cultured in tryptic soy broth (TSB) with agitation at 30 oC for 24 h. All bacteria were harvested, centrifuged and
resuspended in phosphate buffer saline (PBS), adjusted OD660 ~1 and heat killed at 60 °C for 60 min. 2.2 Production of monoclonal antibody BALB/c mice of 8 weeks old were immunized by intraperitoneal injection and heat killed of S. Typhimurium ATCC 13311 in Freund’s complete adjuvant and boostered with antigen in Freund’s incomplete adjuvant. Mice antisera were collected and tested against S. Typhimurium ATCC 13311 by Dot blotting. The spleen cells of immunized mice were fused with P3X myeloma cells with 50% polyethylene glycol. Hybridomas against S. Typhimurium ATCC 13311 were screened. 2.3 Dot blotting
S. Typhimurium ATCC 13311and other bacteria were used for screening. Heat-killed bacteria samples (1 μl spot -1) were spotted to nitrocellulose membrane, dried at 37 oC for 30 min and blocked in 5% skim milk in PBS for 30 min. The membrane was placed in hybridoma supernatant for 2 h, and washed. After that the membranes were incubated in horseradish peroxidase-conjugates goat anti mouse IgG (GAM-HRP) diluted 1:3000 in PBS for 2 h. After washing, the membrane was treated with

The 23rd Annual Meeting of the Thai Society for Biotechnology “Systems Biotechnology: Quality & Success”
P-VI-08
- 233 -
3,3' Diaminobenzidine (DAB) substrate solution for 5 min, and the color reaction was stopped by washing membrane in distilled water.
2.4 Sensitivity test
Five-fold serial dilutions of heat-killed S. Typhimurium ATCC 13311 were diluted in PBS. One microlitre of each dilution was spotted onto a nitrocellulose membrane and detected by using various MAbs. 2.5 Isotype determination Isotype of mouse immunoglobulins from hybridomas were determined for class and subclass based on sandwich ELISA using Sigma’s Mouse Monoclonal Antibody Isotyping Kit (Sigma-Aldrich, USA). Results and discussion Three MAbs against S. Typhimurium ATCC 13311 were determined by dot blotting with various heat-killed bacterial strains. These 3 MAbs can be divided into 2 groups according to their antigen specificities (Figure 1).
Figure 1. Specificity of MAbs assayed by dot blotting. Heat-killed bacteria (~109 CFU ml-1) were spotted onto nitrocellulose membrane 1 µl spot-1 and treated with MAbs. Bacterium was spotted onto each block of the membrane as follows: Row 1: (A) S. Typhimurium ATCC 13311; (B) S. Typhimurium DT 104; (C) S. Typhimurium ATCC 14028; (D) S. Typhimurium (Copenhagen); (E) S. Typhimurium DMST 34036 Row 2: (A) S. Typhimurium DMST 34037; (B) S. Typhimurium DMST 34038; (C) S. Typhimurium DMST 34039; (D) S. Typhimurium DMST 34040; (E) S. Typhimurium DMST 34041 Row 3: (A) S. Typhimurium DMST 34042; (B) S. Typhimurium DMST 34043; (C) S. Typhimurium DMST 34044; (D) S. Typhimurium DMST 34045; (E) S. Typhimurium DMST 34046 Row 4: (A) S. Typhi; (B) S. Paratyphi; (C) S. Enteritidis; (D) S. Enteritidis1773-72; (E) S. Enteritidis 13076 Row 5: (A) Acinetobacter baumanii; (B) Citrobacter freundii; (C) Escherichia coli; (D) Enterobacter cloacae; (E) Enterococcus faecalis Row 6: (A) Edwardsiella tarda; (B) Klebsiella pneuminoae; (C) Proteus mirabilis; (D) Providencia rettgeri; (E)
Pseudomonas aeruginosa Row 7: (A) Serratia marcescens; (B) Shigella flexneri; (C) Yersinia enterocolitica; (D) Y. frederiksenii; (E) Y. kristensenii The specificity of MAbs in each group was as follows: The specificity of MAbs were as follows: group I consisted of ST16 and ST41 reacted with some strain of S. Typhimurium and showed cross-reactivity to S. Enteritidis 1773-72. And group II consisted of ST1. This MAb reacted with Salmonella spp. except S. Typhimurium DMST 34045. The sensitivity of the MAbs for S. Typhimurium detection by dot blotting ranges from 2.0x10⁶ to 5.2x10⁷ CFU/ml (Figure 2). And three MAbs were classified as IgG1(ST16), IgG2b(ST41) and IgM(ST1).
Figure 2. Sensitivity test of MAbs for S. Typhimurium ATCC 13311. Five-fold serial dilution were spotted onto nitrocellulose membrane as 1 µl spot-1 and treated with MAbs: ST1(1), ST16 (2) and ST 41 (3). References 1. Bangtrakulnonth A, Pornreongwong S,
Pulsrikarn C, Sawanpanyalert P, Hendriksen RS, Lo Fo Wong DM, Aarestrup FM. Salmonella serovars from humans and other sources in Thailand, 1993-2002. Emerging Infectious Diseases. 2004;10: 131-136.
2. Herikstad H, Motarjemi Y, Tauxe RV. Salmonella surveillance: a global survey of public health serotyping. Epidemiology and Infection. 2002:129: 1-8.
3. Padungtod P, Kaneene JB. Salmonella in food animals and humans in northern Thailand. International Journal of Food Microbiology. 2006:108: 346-354.
4. Varadaraj MC. Methods for detection and enumeration of foodborne bacterial pathogens: A critical evaluation. Journal of Food Science and Technology. 1993:30: 1-13.

The 23rd Annual Meeting of the Thai Society for Biotechnology “Systems Biotechnology: Quality & Success”
P-VI-09
- 234 -
Production of monoclonal antibodies against Vibrio parahaemolyticus Krittiya Noiprapai a, Nanthika Khongchareonporna, Sirirat Rengpipat a aDepartment of Microbiology, Faculty of Science, Chulalongkorn University, Bangkok 10330, Thailand. aThe Institute of Biotechnology and Genetic Engineering, Chulalongkorn University Institute Building 3, Phayathai Road, Patumwan, Bangkok 10330, Thailand aDepartment of Microbiology, Faculty of Science, Chulalongkorn University, Bangkok 10330, Thailand.
Abstract Vibrio parahaemolyticus is a Gram-negative bacteria found in marine environments
worldwide causing foodborne diseases. A total of three hybridoma cells that produced monoclonal antibodies (MAbs) against Vibrio parahaemolyticus were prepared in this study. Heat-killed V. parahaemolyticus ATCC 27914 were used as antigen to immunize BALB/c mice and three MAbs were obtained. Two groups of MAbs were classified based on their specificity. The first group was composed of two MAbs (VP279, VP292) which could react with V. parahaemolyticus and Vibrio spp.. MAbs (VP290) in the second group could react with V. parahaemolyticus and Vibrio spp. except V. vulnificus, V. mimicus and V. cholera. However, all three MAbs did not show cross-reactivity to other bacteria of Family Enterobacterace. VP279 and VP290 were IgG2a; whereas, the isotype of VP292 was IgM. All MAbs can be used to identify Vibrio spp. by Dot blotting with the sensitivity range of 104-105 CFU/µl/spot.
Keywords: Vibrio parahaemolyticus, monoclonal antibody, dot blotting Introduction and Objective
Vibrio parahaemolyticus, Gram-negative short rod, is a naturally occurring marine bacteria that can cause severe foodborne diseases. Therefore, in order to ensure safety from contaminated marine foods, it is necessary to develop an immunoassay by producing monoclonal antibodies for detection V. parahaemolyticus which gives more sensitive, and specific with rapid results.
Materials and Methods 2.1 Bacterial culture and antigen preparation
V. parahaemolyticus ATCC 27914 and other bacteria (Fig 1) used in this study were cultured at 37˚C for 24h with shaking in typtic soy broth (TSB) supplemented with 2%NaCl (w/v) for the growth of Vibrio species. Bacteria were harvested by centrifugation (4˚C, 20min, 3000 × g) and washed twice with 0.15M phosphate-buffered saline (PBS) pH 7.2, resuspended in PBS For antigen preparation, the suspension was heat-killed at 60˚C for 60 min, and adjusted to the OD ~1.0 at 660 nm. Aliquots were stored at 4˚C used for immunization 2.2 Immunization of Mice
Two BALB/c female mice, 6-8 week old (National Laboratory Animal Centre, Mahidol University, Thailand) were immunized by
intraperitoneally injections with 50µl of heat-killed suspension (109CFU ml-1) mixed with 50µl of Freund’s complete adjuvant (Sigma) at 1:1(v/v). After three booster doses of heat-killed suspension (50µl) in Freund’s incomplete adjuvant at 2 week intervals. One week after the fourth injection, mouse antiserum were collected and then determined antiserum titer by dot blotting. The best performing mouse was final boostered with heat-killed suspension in PBS 3 days before hybridoma production. 2.3 Production of hybridoma
The immunized mice were sacrificed and their spleens were removed. The splenocytes were fused with myeloma cells method developed by Köhler & Milstein (1976) with modification described by Mosmann et al (1979). P3X myeloma cell line was used as the fusion partner. The fused cells were seeded in 96-well culture plates. 2.4 Screening of Hybridoma
Culture supernatants from hybridoma cells were tested by Dot blotting. 2.5 Characterization of monoclonal antibodies (MAbs)

The 23rd Annual Meeting of the Thai Society for Biotechnology “Systems Biotechnology: Quality & Success”
P-VI-09
- 235 -
1 2 3 4 5 6
Determination of cross reactivity Individual MAb was tested its reactivity
with V. parahaemolyticus ATCC 27914 and other bacteria (Fig 1) Isotyping of monoclonal antibodies
The Class and subclass of immunoglobulins secreted by hybridoma cell lines were determined by sandwich ELISA using Sigma’s Mouse Monoclonal Antibody Isotyping Kit (Sigma-Aldrich, USA). Determination of cross reactivity
The MAbs were produced in this study. Individual MAb was tested for its reactivity with V. parahaemolyticus ATCC 27914 and other bacteria (Fig1) Sensitivity of monoclonal antibodies by dot blotting
Serial dilution of V. parahaemolyticus ATCC27914 (begin with 109 CFU ml-1) in PBS was performed and 1µl of each dilution was spotted onto a nitrocellulose membrane, then fixed for 30 min and processing for dot blotting
Results and Discussion Production of monoclonal antibodies
After the fusion was found positive by dot blotting, approximately 90 % well yielded hybriomas. Only three hybridoma clones were selected and recloned, which can be divided into 2 groups according to their specificites (Fig 1) Determination of cross reactivity A B C D E F
VP279 VP290 VP292 Figure1 Cross-Reactivity of MAbs assayed by dot blotting Row 1 (A) V. parahaemolyticus (B) V.parahaemolyticus, (C) V. parahaemolyticus (D) V.parahaemolyticus DMST5665, (E) V. vulnificus,(F) V. vulnificus Row 2 (A) V. vulnificus, (B) V. vulnificus, (C) V. vulnificus, (D) V. harveyi (E) V. mimicus DMST15142, (F) V. mimicus Row 3 (A) V. mimicus, (B) V. anguillarum (C) V. fluvialis, (D) V. fluvialis, (E) V. cholera (F) V.fumissi Row 4 (A) V. alginolyticu, (B) A. baumanii, (C) C. freundii, (D) E. coli, (E) E. cloacae (F) E. faecalis ATCC 7080 Row 5 (A) E. tarda (B) K. pneumonia
(C) L. monocytogenus DMST 17303 (D) P. mirabilis, (E) P. retgeri, (F) P. aeruginosa Row 6 (A) Serratia (B)S.flexneri, (C) Y. enterocolitica (D) Y. kristensenii, (E) Y. frederiksenii, (F) V. parahaemolyticus ATCC 27914
All 3 MAbs (VP279, VP290 and VP292)
were tested for cross-reactivity by dot blotting with V.parahaemolyticusATCC27914, Vibrio spp. and other bacteria (Fig 1). Three MAbs did not show cross reaction with other bacteria of Family Entrobacteraceae which can be divided into group1 and group 2. MAbs in group 1 consisted of two MAbs (VP279, VP292) reacted with V. parahaemolyticus ATCC27914 and Vibrio spp. MAbs in group 2 consisted of one MAbs (VP292) which reacted with V. parahaemolyticus ATCC 27914 and Vibrio spp. except V. vulnificus, V. mimicus and V. cholera. Class and subclass of MAbs obtained were IgG2a (VP279, VP290) and IgM(VP292).
Sensitivity of MAbs by dot blotting
1×10⁸CFU/ml
1×10⁷CFU/ml
1×10⁶CFU/ml
1×10⁶CFU/ml
1×10⁶CFU/ml
1×10⁵CFU/ml VP279 VP290 VP292
Figure 2 Sensitivity of MAbs by dot blotting
All 3 MAbs can be used to identify Vibrio spp. by Dot blotting with the sensitivity range of 104-105 CFU/µl/spot. References 1. Köhler G., Milstein C. Derivative of specific
antibody producing tissue culture and tumor cell fusion.European. Journal of Immunology. 1976:511–519.
2. Mosmann T.R., Bauman R, Williamson A.R.. Mutations affecting immunoglobulin light chain secretion by myeloma cells 1. Functional analysis by cell fusion. European Journal of Immunology. 1979:9:511-516.
3. Yeung PS, Boor KJ. Epidemiology pathogenesis and prevention of foodborne Vibrio parahaemolyticus infections. Foodborne Pathogens and Disease. 2004:1 (2): 74-88.

The 23rd Annual Meeting of the Thai Society for Biotechnology “Systems Biotechnology: Quality & Success”
P-VI-10
- 236 -
Bioactive compounds – target interaction networks in Chinese herbs formula for type 2 diabetes
Phuphiphat Jaikaewa, Supa Hannongbuab and Marasri Ruengjitchatchawalyaa aBioinformatics and Systems Biology Program, King Mongkut’s University of Technology Thonburi (KMUTT), 126, Pracha-utid, Bangmod, Toongkru, Bangkok, 10140, Thailand. bDepartment of Chemistry, Faculty of Science, Kasetsart University, 50, Phahon-yothin, Bangkok 10900, Thailand.
Abstract Function association between bioactive compounds in Chinese herbs recipe and target
proteins involving in type 2 diabetes (T2D) has been studied using bioinformatic tools. The protein data extracted from entire database and text mining using Cytoscape tools were rendered to generate an extensive network of drug-target interaction of the T2D. The obtained results showed 479 known drugs for T2D and 127 targeting proteins. In particular, due to their similarity pairs, the bioactive compounds-known drugs and newly found targeting proteins were mapped into drug-target interaction networks of the Chinese herbs recipe. The mapping networks demonstrated that 55 bioactive compounds interact with 52 known targeting proteins and 5 newly found proteins. In addition, the predicted numbers of bioactive compounds were different among the interaction network derived from each Chinese herbs recipes, we found that beta-sitosterol was found in 6 networks whereas benzoic acid, formononetin, and higenamine were found in 5 networks. Besides, hesperetin was found to be used as a scaffold for other 17 bioactive compounds. Keywords: drug-target interaction, type 2 diabetes (T2D), bioactive compound, Chinese herbs recipe, network-based method Introduction and Objective
The Chinese herbs have efficient medicine and quite safety to treat complex chronic disease such as T2D. The network based method can provide insights into biological complex mechanisms and can represent multi-drug targeting design. Thus far, most of information about the interaction between bioactive compounds in Chinese herbs and protein targets has been still unclear. As a result, this study aims to construct and evaluate new drug-target interaction networks of T2D and used these mapping networks to predict bioactive compounds present in different Chinese herb recipes.
Materials and Methods
We used three datasets consisting of; first, chemical structures of bioactive compounds from KEGG database and from DrugBank database. Second, protein-protein interaction data from T2D database,text mining technique and drug-target interaction from Drugbank database. Third, proteomic data collected from Uniport database. We used Cytoscape tool for visualize network and analyse them by Cytoscape plugin.
2.1 Network reconstruction Datasets were used for each network
reconstruction by Cytoscape tool. The protein-protein interaction from T2D database (PPIDB) and text mining technique (PPITM) were used for protein ID linkage with other protein ID to build network so-called “PPIDB network” and “PPITM network”. The drug-target interaction from DrugBank database was used to build “DTI network” by linking drug ID with target protein ID together. These networks were visualized and assigned by Cytoscape program.
2.2 Network integration The PPIDB network, PPITM network, and
DTI network were integrated by using Cytoscape “merging network” plug-in. Total data in the global network was specifically extracted to drug-target interaction network of T2D. This network was analyzed and included node degree centrality (DC), betweeness centrality (BC), closeness centrality (CC), eccentricity centrality (EC), strees centrality (SC), centroid centrality (TC), and radiality centrality (RC) to refer the relationship of nodes in the network with T2D.
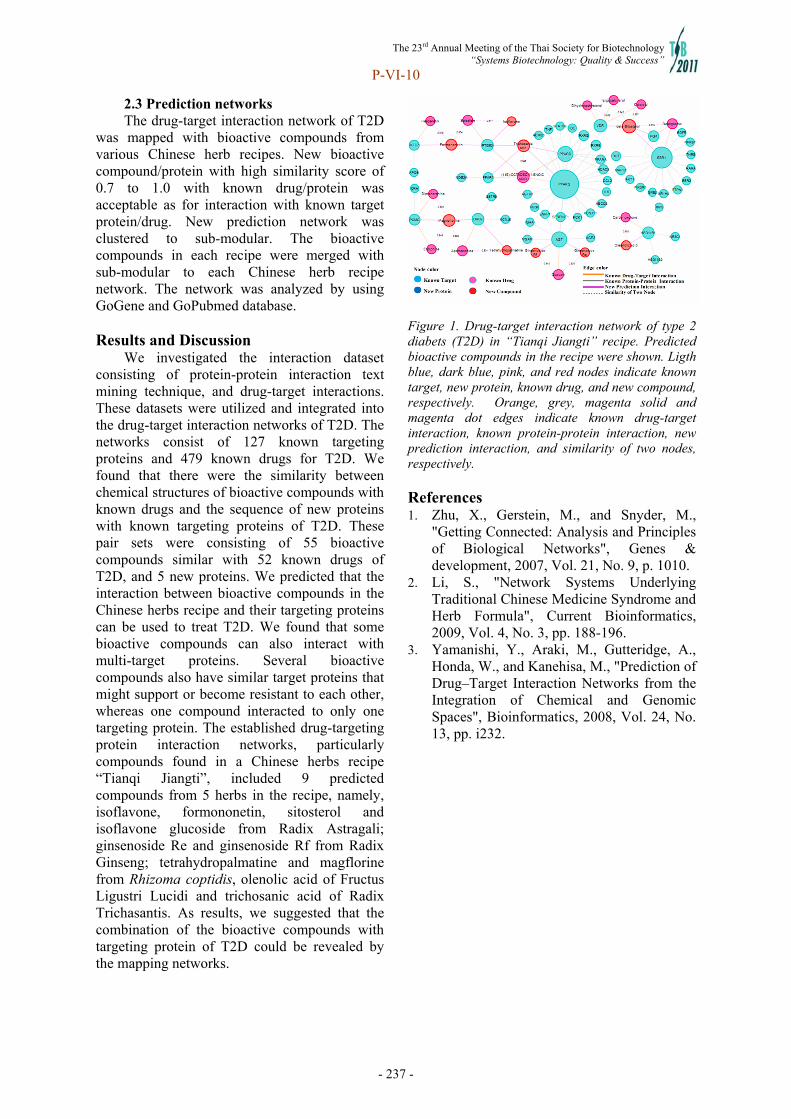
The 23rd Annual Meeting of the Thai Society for Biotechnology “Systems Biotechnology: Quality & Success”
P-VI-10
- 237 -
2.3 Prediction networks The drug-target interaction network of T2D
was mapped with bioactive compounds from various Chinese herb recipes. New bioactive compound/protein with high similarity score of 0.7 to 1.0 with known drug/protein was acceptable as for interaction with known target protein/drug. New prediction network was clustered to sub-modular. The bioactive compounds in each recipe were merged with sub-modular to each Chinese herb recipe network. The network was analyzed by using GoGene and GoPubmed database. Results and Discussion
We investigated the interaction dataset consisting of protein-protein interaction text mining technique, and drug-target interactions. These datasets were utilized and integrated into the drug-target interaction networks of T2D. The networks consist of 127 known targeting proteins and 479 known drugs for T2D. We found that there were the similarity between chemical structures of bioactive compounds with known drugs and the sequence of new proteins with known targeting proteins of T2D. These pair sets were consisting of 55 bioactive compounds similar with 52 known drugs of T2D, and 5 new proteins. We predicted that the interaction between bioactive compounds in the Chinese herbs recipe and their targeting proteins can be used to treat T2D. We found that some bioactive compounds can also interact with multi-target proteins. Several bioactive compounds also have similar target proteins that might support or become resistant to each other, whereas one compound interacted to only one targeting protein. The established drug-targeting protein interaction networks, particularly compounds found in a Chinese herbs recipe “Tianqi Jiangti”, included 9 predicted compounds from 5 herbs in the recipe, namely, isoflavone, formononetin, sitosterol and isoflavone glucoside from Radix Astragali; ginsenoside Re and ginsenoside Rf from Radix Ginseng; tetrahydropalmatine and magflorine from Rhizoma coptidis, olenolic acid of Fructus Ligustri Lucidi and trichosanic acid of Radix Trichasantis. As results, we suggested that the combination of the bioactive compounds with targeting protein of T2D could be revealed by the mapping networks.
Figure 1. Drug-target interaction network of type 2 diabets (T2D) in “Tianqi Jiangti” recipe. Predicted bioactive compounds in the recipe were shown. Ligth blue, dark blue, pink, and red nodes indicate known target, new protein, known drug, and new compound, respectively. Orange, grey, magenta solid and magenta dot edges indicate known drug-target interaction, known protein-protein interaction, new prediction interaction, and similarity of two nodes, respectively. References 1. Zhu, X., Gerstein, M., and Snyder, M.,
"Getting Connected: Analysis and Principles of Biological Networks", Genes & development, 2007, Vol. 21, No. 9, p. 1010.
2. Li, S., "Network Systems Underlying Traditional Chinese Medicine Syndrome and Herb Formula", Current Bioinformatics, 2009, Vol. 4, No. 3, pp. 188-196.
3. Yamanishi, Y., Araki, M., Gutteridge, A., Honda, W., and Kanehisa, M., "Prediction of Drug–Target Interaction Networks from the Integration of Chemical and Genomic Spaces", Bioinformatics, 2008, Vol. 24, No. 13, pp. i232.
The 23rd Annual Meeting of the Thai Society for Biotechnology “Systems Biotechnology: Quality & Success”
P-VI-11
- 238 -
Evaluation of cosmetic bioactivities from Zingiberaceae rhizome extracts
Natthawooth Keonkaewa, Pimnara Thiwongnoia, Phanuphong Chaiwuta,b, Natthawut Thitipramotea,b, Punyawatt Pintathonga,b a School of Cosmetic Science, Mae Fah Luang University, Chiang Rai 5710, Thailand b Excellent Center of Cosmetic and Wellness, Mae Fah Luang University, Chiang Rai 57100, Thailand
Abstract Nowadays, there is an increasing interest in finding anti-wrinkle and whitening agents from
natural sources. The present study aims to evaluate extractable phenolic content (EPC), antioxidant and antityrosinase activities of five Zingiberaceae rhizome plants; Alpinia galangal (AG), Boesenbergia rotunda (BR), Curcuma longa (CL), Zingiber cassumunar (ZC) and Zingiber officinale (ZO). The ethanolic extracts (95% ethanol) from different rhizomes were obtained using microwave-assisted method (630 W, 30 min). The results revealed that all extracts provided both antioxidant and antityrosinase activities. The ZO extract contained the highest extractable phenolic compounds (EPC) (12.90 mg gallic acid equivalent (GAE)/g). The ZO extract also reflected the highest antioxidant activities (P0.05) assessed by DPPH radical scavenging activity, ABTS radical scavenging activity and ferric reducing antioxidant power (FRAP) with the values of 6.53, 46.62 and 21.71 mg TEAC/g, respectively. The tyrosinase inhibitory activity of the ZO extract (43.31 mg kojic acid equivalent (KAE)/g) was greater than the CL and BR extracts (35.83 and 20.14 mg KAE/g, respectively) (P0.05). Moreover, antioxidant and antityrosinase activities were highly correlated with phenolic content. This study recommends that five Zingiberaceae rhizomes, especially Zingiber officinale, could be used as a natural source to be claimed as anti-wrinkle and whitening agents for application in cosmetic products.
Keywords: antioxidant, antityrosinase, phenolic compound, rhizome, Zingiberaceae Introduction and Objective
Nowadays, the development of cosmetic products such as whitening and anti-aging have focused on the plant extracts that provides the natural active ingredients. Finding new plant sources is useful in order to decrease the import of active ingredients used as antioxidants and also promote the application of Thai traditional plants.
Zingiberaceae family has been reported that possess high amount of phenolic compounds and exhibit high antioxidant properties (Vankar et al., 2006) and also exhibit tyrosinase activity. In the present work, we screened five species of Zingiberaceae plants for biological activity using different methods including extractable phenolic content (EPC), 2,2-diphenyl-1-picrylhydrazyl (DPPH) free radical scavenging assay, 2,2-azinobis-(3-ethyl-benzothiazoline-6-sulfonic acid) (ABTS) free radical scavenging assay, ferric reducing antioxidant power (FRAP) assay and tyrosinase inhibition activity.
Materials and Methods
Five rhizomes collected from Chiang Rai province, Thailand were dried by using hot air oven at 55°C for and then powdered prior to be studied. Dried–powdered rhizomes (5 g) were extracted with 95% ethanol (30 mL) as extracting solvent. The extraction procedure was operated by using microwave at 630 W for 15 min. The extracts were filtered prior to be further analyzed.
The extracts were evaluated for extractable phenolic content (EPC) by using the Folin-Ciocalteu method (Kahkonen et al., 1999). For antioxidant activities, DPPH radical scavenging activity, ABTS radical scavenging activity and ferric reducing antioxidant power (FRAP) assays were used to evaluate according to the method described by Blois (1958), Arnao et al. (2001) and Chu et al. (2000), respectively. The tyrosinase inhibition activity of the extracts was investigated by the procedure described by Momtaz et al. (2008).

The 23rd Annual Meeting of the Thai Society for Biotechnology “Systems Biotechnology: Quality & Success”
P-VI-11
- 239 -
Table 1. Extractable phenolic content, antioxidant and tyrosinase inhibitory activities of Zingiberaceae rhizomes.
Antioxidant capacity (mg TEAC/g)* Plant samples Extractable
phenolic content
(mg GAE/g )* DPPH ABTS FRAP
Tyrosinase inhibition activity
(mg KAE/g)* Zingiber officinale 12.9 ± 0.57a 6.53 ± 0.36a 46.6 ± 2.45a 21.7 ± 1.35a 43.3 ± 2.83a Alpinia galangal 5.20 ± 0.08d 2.25 ± 0.04c 23.5 ± 0.21e 5.08 ± 0.11d 17. 6 ± 0.78d Curcuma longa 8.92 ± 0.08c 5.56 ± 1.10a 41.4 ± 0.74b 12.7 ± 2.21b 35.8 ± 1.29b Zingiber cassumunar 10.1 ± 0.09b 3.36 ± 0.09b 30.2 ± 0.36c 13.8 ± 0.14b 15.4 ± 3.62d Boesenbergia rotunda 4.55 ± 1.09d 1.40 ± 0.08d 26.6 ± 0.31d 3.63 ± 0.35e 20.1 ± 1.37c *Values are means ± S.D. (n=5). a-eMeans the column followed by different letters are significantly different (P<0.05).
Results and Discussion
Five Zingiberaceae rhizomes (AG, BR, CL, ZC and ZO) have been evaluated for their extractable phenolic contents, antioxidant activities based on DPPH radical scavenging, ABTS radical scavenging and FRAP assays and tyrosinase inhibition activity.
From the Table 1, the extractable phenolic contents of the Zingiberaceae rhizome extracts varied between 4.55 to 12.9 mg GAE/g. The DPPH radical scavenging activity, ABTS radical scavenging activity and FRAP values of all extracts were ranging from 1.40 to 6.53 mg TEAC/g, 23.5-46.6 mg TEAC/g and from 3.63-21.7 mg TEAC/g, respectively. It was found that the ZO extract not only contained the highest amount of extractable phenolic compounds (P<0.05) but also possessed strong antioxidant properties compared with the others in all determined assays. The rhizome of ZO was also reported in the previous studies that possess strong radical scavenging property (Stoilova et al., 2007). For the tyrosinase inhibition assay, the extracts exhibited the activity in the range of 15.4 and 43.3 mg KAE/g while the rhizome extract of ZO possessed the strongest tyrosinase inhibition activity (P<0.05). There was a correlation between the extractable phenolic content and tyrosinase inhibition activity.
The plants in Zingiberaceae family have been reported that possess high amount of phenolic compounds and exhibit moderate to good antioxidant properties (Vankar et al., 2006). These Zingiber species are believed that produce and transport antioxidant compounds to accumulate in rhizomes as its more potent antioxidant activity than the other parts (Habsah et al., 2000). There are many literatures that report the correlation between antioxidant properties and phenolic compounds.
This study has demonstrated that Zingiberaceae rhizomes, especially Zingiber officinale, possessed high phenolic contents, antioxidant and antityrosinase properties. Thus, they can be considered as a natural source of anti-wrinkle and whitening agents for cosmetic applications. References 1. Kahkonen, M.P., Hopia, A.I. Antioxidant activity
of plant extracts containing phenolic compounds. J. Agric Food Chem. 1999; 47(10): 3954-62.
2. Blois, M.S. Antioxidant determinations by use of a stable free radical. Nature. 1958; 181: 1199-200.
3. Arnao, M.B. Cano, A., Acosta, M. The hydrophilic and lipophilic contribution to total antioxidant activity. J. Agric Food Chem. 2001; 73: 239-44.
4. Chu, Y.H., Chang, C.L. Hsu, H.F. Flavonoid content of several vegetables and their antioxidant activity. J. Sci. Food Agric. 2000; 80(5): 561-66.
5. Momtaz, S., Mapunya, B.M., Houghton, P.J., Edgerly, C., Hussein, A., Naidoo, S., Lall, N. Tyrosinase inhibition by extracts and constituents of Sideroxylon inerme L. stem bark, used in South Africa for skin lightening. J. Ethnopharmacol. 2008; 119: 507- 17.
6. Vankar, P.S., Tiwari, V., Singh, L.W., Swapana, N. Antioxidant properties of some exclusive species of Zingiberaceae family of Manipur. Electron. J. Environ. Agric. Food Chem. 2006; 5(2): 1318-22.
7. Habsah, M., Amran, M., Mackeen, M.M., Lajis, N.H., Kikuzaki, H., Nakatani, N. Screening of Zingiberaceae extracts for antimicrobial and antioxidant activities. J. Ethnopharmacol. 2000; 72: 403-10.
8. Stoilova, I., Krastanov, A., Stoyanova, A., Denev, P., Gargova, S. Antioxidant activity of a ginger extract (Zingiber offcinale). Food Chem. 2007; 102: 764-70.

The 23rd Annual Meeting of the Thai Society for Biotechnology “Systems Biotechnology: Quality & Success”
P-VI-12
- 240 -
Microwave-assisted extraction and optimization of antioxidant and antityrosinase activities from Zingiber officinale rhizome
Phanuphong Chaiwuta,b, Natthawooth Keonkaewa, Pimnara Thiwongnoia, Nont Thitilertdechaa, Punyawatt Pintathonga,b a School of Cosmetic Science, Mae Fah Luang University, Muang, Chiang Rai 5710, Thailand. b Excellent Center of Cosmetic and Wellness, Mae Fah Luang University, Muang, Chiang Rai 57100, Thailand.
Abstract Several extraction methods have been applied for bioactive compounds extraction in which to achieve for the highest efficiency. The aim of this study was to optimize condition for microwave-assisted extraction of antioxidant and antityrosinase compounds from rhizome of Zingiber officinale using response surface methodology (RSM). Three independent variables of ethanol concentration (X1), extraction power (X2) and extraction time (X3) were investigated their effects on DPPH radical scavenging and tyrosinase inhibitory activities in order to get the highest efficiency. The statistical analysis illustrated that ethanol concentration and extraction power significantly had greatly potential effects on these two activities of antioxidant and antityrosinase (P0.05), while interaction effects were not observed. The optimum extraction conditions analyzed from 3D response surface plots of the mathematic model were as follows: 75% v/v of ethanol concentration, 900 Watt of extraction power and 33.71 min of extraction time. Under this condition, the values of DPPH radical scavenging and tyrosinase inhibitory activities were predicted to be at 23.22 mg TEAC/g dry sample and 46.32 mg KAE/g dry sample, respectively, which were closely matched with the experimental values. The mathematical model for the optimization condition would be extremely helpful in the extraction process of the active substances containing antioxidant and antityrosinase activities from Zingiber officinale rhizome. Keywords: antioxidant, antityrosinase, response surface methodology (RSM), Zingiberaceae officinale Introduction and Objective
Many different extraction methods such as maceration, percolation, conventional shaking, soxhlet, sonication and supercritical fluid extraction have been used to extract bioactive compounds. Microwave assisted-methods are also recently introduced to increase for yield and efficiency with less time-consuming. All of these extraction techniques are needed for appropriate extraction conditions such as type and concentration of solvent, extraction time, shaking speed, temperature. RSM can be employed to determine the optimized extraction condition. The rhizome of Zingiber officinale has been reported about its bioactivities (Maizura et al., 2011) Therefore, in this study, microwave-assisted method was used for antioxidant and antityrosinase compounds extraction from Zingiber officinale rhizome, and the extraction condition was also optimized using RSM.
Materials and Methods
The Zingiber officinale were collected from Chiang Rai province, Thailand and then prepared into dry powder which was used to extract antioxidant and antityrosinase compounds using microwave assisted-method. The RSM was carried out for optimization of extraction condition. The experiment was designed based on a Box-Behnken design with the independent variables of ethanol concentration (X1), extraction power (X2) and extraction time (X3). The response surface analysis was determined by Design Expert Software (Trial Version 7.1.6, Stat-Ease Inc., Minneapolis, MN). Antioxidant activity was determined by DPPH radical scavenging activity (Maisutthisakul and Gordon, 2009), and antityrosinase activities was determined as described by Momtaz et al., 2009 with a slight modification.
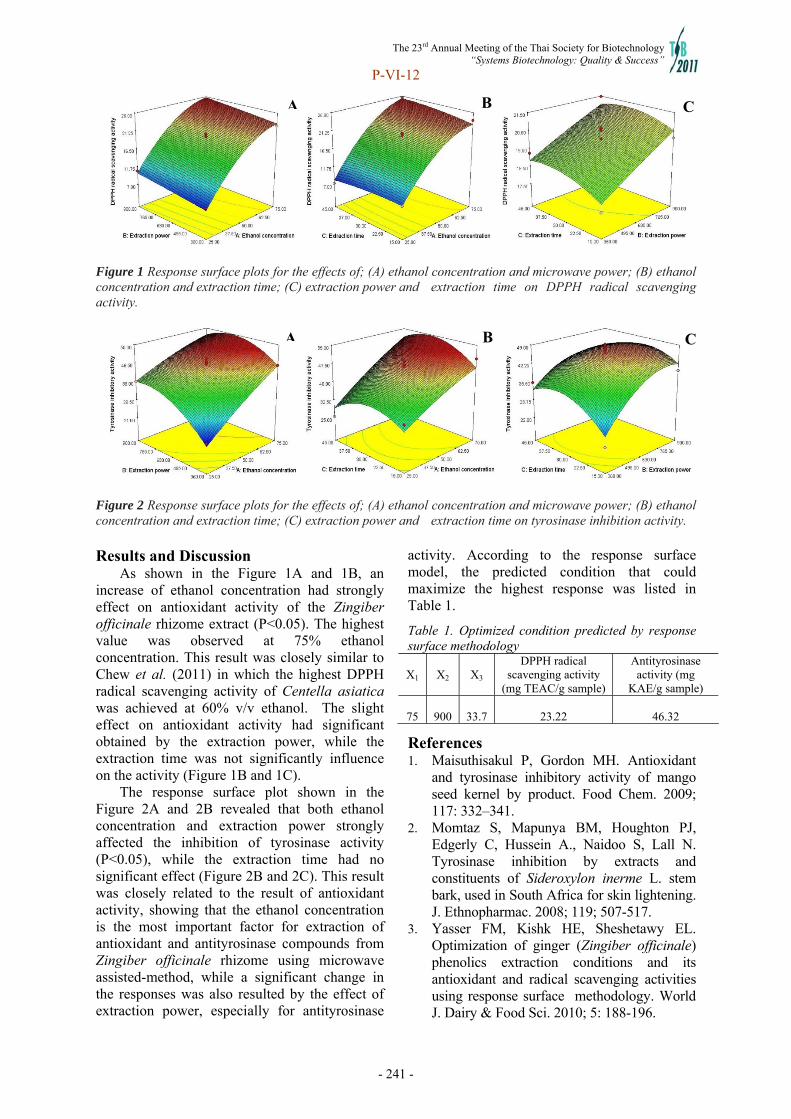
The 23rd Annual Meeting of the Thai Society for Biotechnology “Systems Biotechnology: Quality & Success”
P-VI-12
- 241 -
Figure 1 Response surface plots for the effects of; (A) ethanol concentration and microwave power; (B) ethanol concentration and extraction time; (C) extraction power and extraction time on DPPH radical scavenging activity.
Figure 2 Response surface plots for the effects of; (A) ethanol concentration and microwave power; (B) ethanol concentration and extraction time; (C) extraction power and extraction time on tyrosinase inhibition activity. Results and Discussion
As shown in the Figure 1A and 1B, an increase of ethanol concentration had strongly effect on antioxidant activity of the Zingiber officinale rhizome extract (P<0.05). The highest value was observed at 75% ethanol concentration. This result was closely similar to Chew et al. (2011) in which the highest DPPH radical scavenging activity of Centella asiatica was achieved at 60% v/v ethanol. The slight effect on antioxidant activity had significant obtained by the extraction power, while the extraction time was not significantly influence on the activity (Figure 1B and 1C).
The response surface plot shown in the Figure 2A and 2B revealed that both ethanol concentration and extraction power strongly affected the inhibition of tyrosinase activity (P<0.05), while the extraction time had no significant effect (Figure 2B and 2C). This result was closely related to the result of antioxidant activity, showing that the ethanol concentration is the most important factor for extraction of antioxidant and antityrosinase compounds from Zingiber officinale rhizome using microwave assisted-method, while a significant change in the responses was also resulted by the effect of extraction power, especially for antityrosinase
activity. According to the response surface model, the predicted condition that could maximize the highest response was listed in Table 1.
Table 1. Optimized condition predicted by response surface methodology
X1 X2 X3 DPPH radical
scavenging activity (mg TEAC/g sample)
Antityrosinase activity (mg
KAE/g sample)
75
900
33.7
23.22
46.32
References 1. Maisuthisakul P, Gordon MH. Antioxidant
and tyrosinase inhibitory activity of mango seed kernel by product. Food Chem. 2009; 117: 332–341.
2. Momtaz S, Mapunya BM, Houghton PJ, Edgerly C, Hussein A., Naidoo S, Lall N. Tyrosinase inhibition by extracts and constituents of Sideroxylon inerme L. stem bark, used in South Africa for skin lightening. J. Ethnopharmac. 2008; 119; 507-517.
3. Yasser FM, Kishk HE, Sheshetawy EL. Optimization of ginger (Zingiber officinale) phenolics extraction conditions and its antioxidant and radical scavenging activities using response surface methodology. World J. Dairy & Food Sci. 2010; 5: 188-196.
A C
B
B
A C

The 23rd Annual Meeting of the Thai Society for Biotechnology “Systems Biotechnology: Quality & Success”
P-VI-15
- 242 -
A coumarin compound from Clausena harmandiana (Pierre) posseses a calcium signal inhibiting activity in a mutant Saccharomyces cerevisiae
Pitipreya Suauama, Boon-ek Yingyongnarongkul b, Tokichi Miyakawac and Chulee Yompakdeea
aDepartment of Microbiology, Faculty of Science, Chulalongkorn University, Phayathai rd., Pathumwan, Bangkok 10330, Thailand bDepartment of Chemistry, Faculty of Science, Ramkhamhaeng University, Ramkhamhaeng road, Hua Mark, Bangkapi, Bangkok 10240, Thailand cDepartment of Molecular Biotechnology, Graduate School of Advanced Sciences of Matter, Hiroshima University, Higashihiroshima, 739-8530, Japan
Abstract
Calcium signal transduction pathways play important roles in the regulation of many biological processes in eukaryotes ranging from yeast to human. The small-molecule inhibitors of the pathways in humans are of great medical importance e.g. FK-506 and cyclosporine A. A high throughput drug screening assay for the inhibitors was developed based on the ability of inhibitor that could recover the severe growth defect of a zds1null mutant Saccharomyces cerevisiae suffering from the hyperactivation of Ca2+-signals. With the aim on searching for a calcium signal inhibitor from Thai medicinal plant extracts, we found a strong positive effect from a crude ethanolic leaf extract of Clausena harmandiana (Pierre) from the screens using the Δzds1-proliferation assay. The yeast based assay was used for activity guided fractionation and purification of the crude extract until a coumarin compound was obtained. The pure compound could restore the severe growth defect, the abnormal budding morphology as well as the unequal nuclear division of Δzds1cells resulting from the Ca2+-hyperactivation. The results suggested that such coumarin compound posseses an inhibitory effect to the Ca2+-signals in yeast. Keywords: Clausena harmandiana (Pierre), coumarin, calcium signal inhibitor, Saccharomyces cerevisiae Introduction and Objective
Calcium-signaling pathways are transduction pathways that play roles in the regulation of diverse cellular biological processes such as cell proliferation, T-cell activation and secretion in higher eukaryotes. In S. cerevisiae, the Ca2+ signals are implicated in the regulation of the G2/M cell cycle progression. The zds1 null mutant showed severe growth defect when it was cultivated in high-calcium condition. A Δzds1-proliferation screening procedure was developed (1). This based on the ability of an inhibitor that could antagonize the high Ca2+-signals leading to recovery of cell growth under Ca2+-hyperactivation.
C. harmandiana (Pierre), a Thai medicinal herb was used for food from young leaves and for treatment of headache and fever. Previously, a crude extract of this plant showing a strong growth promoting effect in the yeast based assay was obtained. This study aimed at finding the bioactive compound in C. harmandiana (Pierre) that can inhibit the calcium signals in yeast.
Materials and Methods 1. Plant materials
The fresh leaves of C. harmandiana (Pierre) were harvested from Khoa Hin Sorn Royal Development Study Center, Chachoengsao province in March, 2010.
2. Extraction and fractionation The dried powdered leaves (1.37 kg) were
extracted with n-Hexane. The Hexane extract (39.26 g) was fractional extracted to four fractions: fraction A, B, C and D, respectively. The zds1 yeast-based assay (2) was used to guide fractionation and purification until a coumarin compound, Compound I, was obtained (1.50 g). 3. Yeast strains and the yeast-based screening assay
The zds1 strain, YNS17 (MATa zds1::TRP1 erg3::HIS3 pdr1::hisG URA3 hisG pdr3::hisG) was used as an indicator cell for the assay which was performed according to Wangkangwan et. al. 2009 (2).

The 23rd Annual Meeting of the Thai Society for Biotechnology “Systems Biotechnology: Quality & Success”
P-VI-15
- 243 -
Cel
ls d
ensi
ty (
x107
cell
s/m
l)
Time (h)
Results and Discussion Compound I exhibited dose-dependent effect on growth defect restoration in Ca2+-hyperactivated ∆zds1 cells
Activity guided fractionation and purification of the crude ethanolic extract showed a coumarin compound, Compound I. Compound I (250 M) showed no cytotoxic effect to the yeast cells. The Δzds1 cells treated with either Compound I (250 M) or FK506 (250 nM) prior to cultivation in high calcium containing medium showed growth restoration. However, the lower dose of Compound I (125 M) could restore the growth defect in lesser extent(Fig. 1.)
Figure 1. Dose dependent effect of Compound I on growth of zds1 in high-calcium medium. Symbols are as follow: YPD medium, YPD+250M Compound I, YPD+250nM FK506+100mM CaCl2, YPD+250M Compound I+100mM CaCl2, YPD+125M Compound I+100mM CaCl2 and YPD+100 mM CaCl2 Compound I could restore the abnormal budding morphology and unequal nuclear division of Ca2+-hyperactivated zds1 cells.
The hyperactivation of Ca2+ signals induces abnormal bud emergence (3). Hoechst 33342 nuclear staining revealed that DMSO treated Ca2+-hyperactivated cells displayed an abnormal morphology, with elongated buds (Fig. 3A, left), and unequal nuclear budding (Fig. 3A, right). In contrast, the cells treated with 250 M Compound I prior to exposure to 100 mM CaCl2 showed a normal nuclear morphology (Fig. 3B, left) with an equal distribution of nuclei in the mother and daughter cells (Fig. 3B, right).
Figure 3. Effect of Compound I on cell morphology and nuclear division of zds1cells cultivated in high Ca2+-containing medium. DMSO solvent treated cells (A) or 250 M compound I treated cells (B) grown in 100 mM CaCl2 containting medium. Cell morphology was examined at 6 hours later. Left: the cells under light microscope, Right: Hoechst 33342 stained cells under fluorescence microscope.
Our data suggested that Compound I from C. harmendiana (Pierre) is a rather strong Ca2+-signal inhibitor in the yeast S. cerevisiae. Further studies emphasized on finding the molecular target of Compound I in the yeast is under investigation. References 1. Shitamukai A, Mizunuma M, Hirata D,
Takahashi H, Miyakawa T. A positive screening for drugs that specifically inhibit the Ca2+-signaling activity on the basis of the growth promoting effect on a yeast mutant with a peculiar phenotype. Bioscience, Biotechnology, and Biochemistry 2000;64(9):1942-6.
2. Wangkangwan W, Boonkerd S, Chavasiri W, Sukapirom K, Pattabapanyasat K, Kongkathip N, et al. Pinostrobin from Boesenbergia pandurata Is an Inhibitor of Ca2+-Signal-Mediated Cell-Cycle Regulation in the Yeast Saccharomyces cerevisiae. Bioscience, Biotechnology and Biochemistry 2009;73(7): 1679-82.
3. Mizunuma M,Hirata D, Miyahara K, Tsuchiya E, Miyakawa T. Role of calcineurin and Mpk1 in regulating the onset of mitosis in budding yeast. Nature 1998;392(6673):303-6.
Elongated bud
Unequal nuclear division
The 23rd Annual Meeting of the Thai Society for Biotechnology “Systems Biotechnology: Quality & Success”
P-VII-01
- 244 -
Antifungal activity of lactic acid bacteria against aflatoxin-producing fungi Panadda Sangmaneea and Tipparat Hongpattarakerea
aDepartment of Industrial Biotechnology, Faculty of Agro–Industry, Prince of Songkla University, Hat Yai, Songkhla 90112, Thailand.
Abstract Antifungal activity of 150 lactic acid bacteria (LAB) strains against Aspergillus sp. and
Penicillium sp. were primarily screened by agar spot assay. Ten strains showed strong antifungal activity with inhibition zone (annular radius) ≥4.5 mm. Strain K35 displayed the highest antifungal activity against the aflatoxin producing strains of Aspergillus flavus and Aspergillus parasiticus by broth microdilution assay. Strain K35 was identified as Lactobacillus plantarum K35 based on its nucleotide sequence of 16S rDNA, which showed 100% homology (779/779bp) to Lactobacillus plantarum strain ZJ316. The freeze-dried supernatant of L. plantarum K35 exhibited antifungal activity against A. flavus and A. parasiticus at the MIC values of 11 mg/ml and 22 mg/ml, respectively. When neutralization (pH 7.0) and catalase-treatment to exclude the effects of acid and hydrogen peroxide were performed, the inhibitory activity decreased with MIC values of 88 mg/ml and 176 mg/ml, respectively. Antifungal substance of L. plantarum K35 was heat-stable after heat treatment at 121oC for 15 min. The antifungal activity remained the same after the treatment of proteolytic enzyme. Keywords: antifungal activity, lactic acid bacteria, L. plantarum, A. flavus, A. parasiticus Introduction Aflatoxins are secondary metabolites produced by certain strains of the fungi Aspergillus flavus, Aspergillus parasiticus. They are both acutely and chronically toxic to animals (Angsubhakorn, 1989).
Lactic acid bacteria (LAB) have a long history of use as biopreservatives for foods. Recent research has revealed that LAB can produce antifungal substances, such as phenyllactic acid, p-hydroxyphenyllactic acid, cyclic dipeptides, and short-chain fatty acids (Ström et al., 2002; Magnusson et al., 2003) The aim of this study was to investigate the inhibition of aflatoxitgenic fungi by LAB. Materials and Methods 2.1 Determination of antifungal activity
LAB strains isolated from prawns and fermented rice products were screened for antifungal activity using agar spot assay according to Hassan and Bullerman (2008). 2.2 Determination of Minimum Inhibitory Concentration (MIC) and Minimum Fungicidal Concentration (MFC)
The MIC values were determined using broth microdilution assay. Test solutions (clear supernatants mixed with PDB at various dilutions) were dispensed into each well of 96-
microplate inoculated with spore suspension (final concentration of 105 spores/ml) and incubated at 30-35°C for 2 days. Fungal viability in the well which showed no growth was determined by streak on PDA and incubated at 30-35°C for 48h. The highest dilution of clear supernatant required to completely destroy the test fungi (no growth on the agar plate) was defined as the MFC. Antifungal activity, was expressed as arbitrary units (AU/ml) (Schnürer and Magnusson, 2005). 2.3 Molecular identification of LAB Strains were identified by 16S rDNA gene sequence analysis. Gene sequences were examined for similarity with deposited sequences using the BLAST program. 2.4 Characterization of the antifungal compounds. LAB was grown in MRS broth. Cells were removed by centrifugation. The clear supernatants were concentrated by lyophilized. 1. To test pH influence; pH 4, 5, 6 and 7 2. Heat sensitivity; 63°C, 100°C and 121°C 3. Sensitivity to enzymes; catalase, proteinase-K and trypsin. Residual activity of supernatants was determined by broth microdilution method.
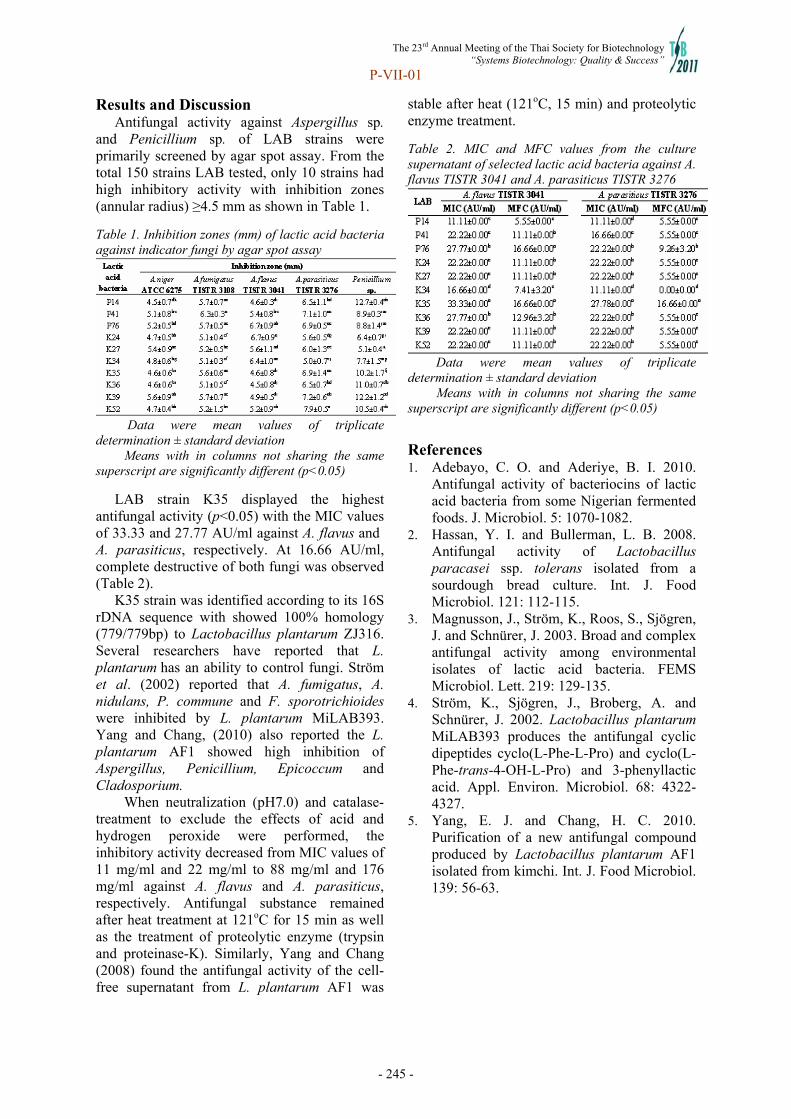
The 23rd Annual Meeting of the Thai Society for Biotechnology “Systems Biotechnology: Quality & Success”
P-VII-01
- 245 -
Results and Discussion Antifungal activity against Aspergillus sp.
and Penicillium sp. of LAB strains were primarily screened by agar spot assay. From the total 150 strains LAB tested, only 10 strains had high inhibitory activity with inhibition zones (annular radius) ≥4.5 mm as shown in Table 1.
Table 1. Inhibition zones (mm) of lactic acid bacteria against indicator fungi by agar spot assay
Data were mean values of triplicate
determination ± standard deviation Means with in columns not sharing the same
superscript are significantly different (p<0.05)
LAB strain K35 displayed the highest antifungal activity (p<0.05) with the MIC values of 33.33 and 27.77 AU/ml against A. flavus and A. parasiticus, respectively. At 16.66 AU/ml, complete destructive of both fungi was observed (Table 2).
K35 strain was identified according to its 16S rDNA sequence with showed 100% homology (779/779bp) to Lactobacillus plantarum ZJ316. Several researchers have reported that L. plantarum has an ability to control fungi. Ström et al. (2002) reported that A. fumigatus, A. nidulans, P. commune and F. sporotrichioides were inhibited by L. plantarum MiLAB393. Yang and Chang, (2010) also reported the L. plantarum AF1 showed high inhibition of Aspergillus, Penicillium, Epicoccum and Cladosporium.
When neutralization (pH7.0) and catalase-treatment to exclude the effects of acid and hydrogen peroxide were performed, the inhibitory activity decreased from MIC values of 11 mg/ml and 22 mg/ml to 88 mg/ml and 176 mg/ml against A. flavus and A. parasiticus, respectively. Antifungal substance remained after heat treatment at 121oC for 15 min as well as the treatment of proteolytic enzyme (trypsin and proteinase-K). Similarly, Yang and Chang (2008) found the antifungal activity of the cell-free supernatant from L. plantarum AF1 was
stable after heat (121oC, 15 min) and proteolytic enzyme treatment.
Table 2. MIC and MFC values from the culture supernatant of selected lactic acid bacteria against A. flavus TISTR 3041 and A. parasiticus TISTR 3276
Data were mean values of triplicate
determination ± standard deviation Means with in columns not sharing the same
superscript are significantly different (p<0.05)
References 1. Adebayo, C. O. and Aderiye, B. I. 2010.
Antifungal activity of bacteriocins of lactic acid bacteria from some Nigerian fermented foods. J. Microbiol. 5: 1070-1082.
2. Hassan, Y. I. and Bullerman, L. B. 2008. Antifungal activity of Lactobacillus paracasei ssp. tolerans isolated from a sourdough bread culture. Int. J. Food Microbiol. 121: 112-115.
3. Magnusson, J., Ström, K., Roos, S., Sjögren, J. and Schnürer, J. 2003. Broad and complex antifungal activity among environmental isolates of lactic acid bacteria. FEMS Microbiol. Lett. 219: 129-135.
4. Ström, K., Sjögren, J., Broberg, A. and Schnürer, J. 2002. Lactobacillus plantarum MiLAB393 produces the antifungal cyclic dipeptides cyclo(L-Phe-L-Pro) and cyclo(L-Phe-trans-4-OH-L-Pro) and 3-phenyllactic acid. Appl. Environ. Microbiol. 68: 4322-4327.
5. Yang, E. J. and Chang, H. C. 2010. Purification of a new antifungal compound produced by Lactobacillus plantarum AF1 isolated from kimchi. Int. J. Food Microbiol. 139: 56-63.
The 23rd Annual Meeting of the Thai Society for Biotechnology “Systems Biotechnology: Quality & Success”
P-VII-05
- 246 -
Insoluble Zinc Compounds Solubilization by Fungi Isolated from Zinc Mining Soil
Thanawat Sutjaritvorakul a, Sophon Roengsumranb and Prakitsin Sihanonthc a Program of Biotechnology, Faculty of Science, Chulalongkorn University, Phayathai Rd, Bangkok 10330, Thailand b Department of Chemistry, Faculty of Science, Chulalongkorn University, Phayathai Rd, Bangkok 10330, Thailand c Department of Microbiology, Faculty of Science, Chulalongkorn University, Phayathai Rd, Bangkok 10330, Thailand
Abstract Industry, agriculture, sewage treatment, and mining operations are the cause of heavy metal
contaminated sites. The effect of heavy metal contamination directly affects on human health. The objective of this research was to examine soil fungi solubilizing insoluble zinc compounds such as ZnO, Zn3(PO)4, Zn(CO)3, and ZnS. Soil fungi were isolated from zinc mine at Tak Province, Thailand. Soil suspensions were plated on PDA medium, which was supplemented with 0.5% (w/v) of insoluble zinc compounds. Fungi, showing clear zone around the colonies, were selected for further studies. Only four fungi from twenty-three isolates were able to solubilize ZnO, Zn3(PO)4, and Zn(CO)3 with the highest activity in solubilizing insoluble zinc compounds more than 40 mm in diameters. The four fungi were then indentified as Phomopsis sp., A. nomius, A. niger, and A. oryzae. Zinc oxide was the common compound to be solubilized by the tested fungi; 86.95%, 52.17%, and 60.87% of the tested fungi were able to solubilize ZnO, Zn3(PO)4, and Zn(CO)3, respectively. However, none of the isolated fungi were able to solubilize zinc sulfide (ZnS). Acidification seems to be the main mechanism of mineral dissolution for most soil fungi studied; ergo, it would be suggested that these fungal strains have the potential application in bioremediation of heavy metals contaminated soils. Keywords: solubilization, insoluble zinc compound, soil fungi. Introduction and Objective
Heavy metals contaminated soil in mining
industry and smelter sludge regions site may have extremely high level of toxic metal accumulation. Inorganic zinc compounds are commonly found in mine spoils as insoluble form. Soil fungi have important influence on biogeochemical cycle and are involved in solubilization of insoluble metal compounds1. These fungi can be used in the clean up of heavy metal from the contaminated site. The objective of this research was to study the ability of fungi to solubilize insoluble zinc compounds. Materials and Methods
Isolation of soil fungi Soil sample was collected from zinc mining
site at Tak Province, Thailand. All samples were stored in sterile polythene bags. The soil dilution plate method was used for fungi isolation2. The isolated fungi were maintained on Potato Dextrose Agar (PDA) at 25 ºC.
Preparation of heavy metal and culture condition
The commercial preparation of ZnO, Zn3(PO)4 , ZnCO3 and ZnS was supplemented to PDA for the final concentration of various inorganic zinc compounds at 0.5% (w/v). Seven mm diameter of mycelium were cut from the edge of fungal colony and inoculated to PDA amended plates. These were incubated at 25 ºC for 7 days2, 3.
Determination of solubilization ability
and pH measurement The magnitude of solubilizing ability was
assessed by the diameter of solubilization clear zones in agar medium3, 4. The degree of any solubilization clear zones and pH measurements were measured every day till the end of incubation period (7 days). The selected fungi were identified according to their macro- and microscopic structures.

The 23rd Annual Meeting of the Thai Society for Biotechnology “Systems Biotechnology: Quality & Success”
P-VII-05
- 247 -
Results and Discussion
Twenty-three fungal isolates were tested for solubilization activities of insoluble zinc compounds (Table 1). ZnO was the common compound to be solubilized by tested fungi (86.95%) follow by Zn3(PO)4 (52.17%) and ZnCO3 (60.87%).
Table 1. Halo clear zone diameters produce by fungi
Insoluble zinc compounds 0.5%(v/w) Strain
ZnO Zn3(PO)4 ZnCO3 ZnS HM1 +++ +++ +++ - HM2 + - - - HM3 +++ +++ +++ - HM4 +++ +++ +++ - HM5 +++ ++ ++ - HM6 +++ - ++ - BT1 - - - - BT2 +++ ++ ++ - BT3 +++ ++ +++ - BT4 - - - - SS1 +++ +++ +++ - SS2 +++ ++ ++ - SS3 +++ - ++ - SS4 ++ - - - MS1 + - - - MS2 +++ ++ ++ - MS3 +++ - ++ - MS4 ++ - - - MS5 + - - - MS6 +++ ++ +++ - MS7 +++ ++ ++ - MS8 - - - - MS9 +++ - ++ -
Where (-) = no clear zone, (+) 7-20 mm, (++) 20-40 mm, (+++) > 40 mm.
However, none of isolated fungi were able to solubilize ZnS. Phomopsis sp. (HM1), A. nomius (HM3), A. niger (HM4), and A. oryzae (SS1) showed the highest activity in solubilizing insoluble zinc compounds. Clear zone diameter and final pH of selected fungi were shown in table 2. The relationship between solubilization and acidification results was expressed in correlation coefficient (R2). The acidification has strong effect on solubilization. Fungal organic acid secretion during growth decreases the pH of the system and increases heavy metal solubility5.
Table 2. Clear zone, final pH in growth medium and correlation coefficient of selected fungi Zinc compounds
Isolate Clear zone diameter (mm)
Final pH R2
ZnO HM1 64.16±3.32 5.07±0.03 0.94 HM3 63.33±2.56 5.04±0.05 0.91 HM4 70.50±1.80 4.51±0.01 0.92 SS1 60.50±2.50 5.78±0.00 0.84 Zn3(PO)4 HM1 56.83±1.25 3.79±0.01 0.81 HM3 60.00±1.50 3.62±0.00 0.91 HM4 55.00±3.50 3.75±0.00 0.94 SS1 44.83±2.75 4.25±0.00 0.95 ZnCO3 HM1 50.50±2.17 5.05±0.01 0.91 HM3 59.00±1.80 4.19±0.01 0.96 HM4 55.33±1.04 4.62±0.02 0.98 SS1 41.83±1.25 5.73±0.01 0.97
A. niger exhibited the highest solubilization
clear zone diameters; fungi in these taxonomical groups such as Aspergillus sp., Penicillium sp. are common in contaminated soil. They can also produce an amount of organic acid6, which was directly involved in the metal solubilization. References 1. Gadd G.M. Interactions of fungi with toxic
metals. New Phytol. 1993; 124: 25-60. 2. Sayer, J.A., Raggett, S.L. and Gadd, G.M.
Solubilization of insoluble metal compounds by soil fungi: development of a screening method for solubilizing ability and metal tolerance. Mycol Res. 1995; 99(8): 987-993
3. Fomina, M.A., Alexander, I.J., Colpaert, J.V. and Gadd, G.M. Solubilization of toxic metal minerals and metal tolerance of mycorrhizal fungi. Soil Biol Biochem. 2003; 37: 851-866.
4. Martino, E., Perotto, S., Parsons, R. and Gadd, G.M. Solubilization of insoluble inorganic zinc compounds by ericoid mycorrhizal fungi derived from heavy metal polluted sites. Soil Biol Biochem. 2003; 35: 133-141.
5. Bosecker, K. Bioleaching: metal solubilization by microorganisms. FEMS Micro Rev. 1997; 20: 591-604
6. Levinskaitė, L., Smirnov, A., Lukšienė, B., Druteikienė, R., Remeikis, V. and Baltrūnas, D. Pu (IV) and Fe (III) accumulation ability of heavy metal-tolerant soil fungi. Nukleonika. 2009; 54: 285−290.

The 23rd Annual Meeting of the Thai Society for Biotechnology “Systems Biotechnology: Quality & Success”
P-VII-09
- 248 -
Antimicrobial activity of fungal endophytes against causal agents of cassava diseases
Chattri Khomkrit a, Jarunya Narangajavanaa, Chuenchit Boonchirda, Thipa Asavaraka
aDepartment of Biotechnology, Faculty of Science, Mahidol University, Rama VI Rd, Bangkok 10400, Thailand Abstract
Cassava is an important crop grown worldwide for food and industries. Plant diseases result in decreased yield and quality of products. Instead of harmful chemical treatment, a friendly alternative method to treat crop diseases becomes necessary. This study aims to identify fungal endophytes from cassava as potential biocontrol agents against cassava diseases. Fungal endophytes were isolated from cassava cultivar Rayong-11 stem. Four fungal isolates were obtained. Based on sequence of internal transcribed spacer region of rDNA, these four fungal isolates showed highest similarity to Colletotrichum sp., Fusarium sp., Phomopsis sp. and Diaporthe sp. Co-culture assay showed that two of the four isolates, R11-01 and R11-04., possessed an antifungal activity against mycelial growth of two strains of Colletotrichum gloeosporioides, causal agents of anthracnose disease in guava and cassava. R11-01 also showed inhibitory activity against Xanthomonas sp., bacteria causing bacterial blight disease in cassava. Currently, culture filtrates of the antagonists are being examined for their effects on each pathogen.
Keywords: endophyte, Colletotrichum gloeosporioides, antimicrobial activity
Introduction and Objectives
Colletotrichum gloeosporioides is known as pathogenic fungus causing anthracnose disease in many crops such as avocado, almond, guava, and cassava (1). The fungus produces one-celled, ovoid to oblong, or dumbbell shaped conidia, approximately 10-15 μm in length and 5-7 μm in width. Anthracnose is one of the major important economic diseases of cassava. Disease dispersion occurs easily and rapidly under wet and warm conditions by spreading of fungus spores (2). Anthracnose disease in cassava is found to be a multiple infection with bacterial blight disease caused by bacteria Xanthomonas campestris (3). This study aims to evaluate antagonistic activity of endophytic fungi isolated from cassava plant against Colletotrichum gloeosporioides, causal agent of anthracnose disease in cassava and guava, and against Xanthomonas sp., causal agent of bacterial blight disease in cassava. Materials and Methods 2.1 Pathogen
Colletotrichum gloeosporioides (C-1060), causal agent of anthracnose disease in guava, was kindly provided by Prof.Wattanalai Panbangred, Department of biotechnology, Faculty of science, Mahidol University.
Colletotrichum gloeospoioides (C-DOA), the fungus causing anthracnose in cassava, and Xanthomonas sp., bacteria causing bacterial blight disease in cassava, were kindly provided by Dr. Rungsri Charaensathapon, Field Crops Research Institute, Department of Agriculture. 2.2 Fungal endophyte isolation
Stem of cassava cultivar Rayong-11 was cut and surface sterilized by soaking in 70% alcohol and 10% bleach. After being washed with sterile distilled water, stem was cut into small pieces and put on water agar. Fungal isolates were obtained by hyphal tip collection. 2.3 Molecular identification of fungal isolates
Genomic DNAs of the fungi were obtained by using Qaigen DNeasy Plant mini Kit. Polymerase chain reaction (PCR) was performed by using ITS1 and ITS4 universal primers (white et al, 1990). PCR fragments were submitted to sequencing (Macrogen, Korea). Sequences were blast with GenBank database. 2.4 In vitro antagonistic assay
Antimicrobial activity of the fungal isolates was evaluated when fungal endophytes were cultured on PDA for 14 days. Agar blocks of C. gloeospoioides C-1060 and C-DOA were pre-cultured on the center of PDA plates for three days before endophyte agar blocks were

The 23rd Annual Meeting of the Thai Society for Biotechnology “Systems Biotechnology: Quality & Success”
P-VII-09
- 249 -
inoculated at 1 cm away from the edge of C. gloeospoioides colony. Plates were incubated at 30°C. Alteration of C. gloeosporioides growth was recorded. For antibacterial activity test, ten colonies of Xanthomonas sp. were grown in LB broth for 5 hours. Bacterial culture was spread over LB agar plates, and then endophyte agar blocks were placed on the agar surface. Bioassay plates were incubated at 37°C, and then diameter of clear zone was recorded. Results and Discussion Molecular identification of fungal endophytes
Four different fungal isolates were obtained from cassava Rayong-11 stem. Based on sequence of internal transcribed spacer region of rDNA, R11-01 showed highest similarity to Fusarium sp. TA26-30 (JF819150.1) and Fusarium sp. P6-16 (GU723434.1) with 100% identity. R11-02 showed highest similarity to Phomopsis sp. 40GP/S (GQ352478.1) with 99% identity. R11-03 showed highest similarity to Diaporthe sp. SAB-2009a strain Q1983 (FJ799938.1) with 97% identity. R11-04 showed highest similarity to Colletotrichum lini (JF923836.1) with 94% identity. Assay of antimicrobial activity against phytopathogens
Among the four fungal endophytes tested for antifungal activity against two strains of Colletotrichum gloeosporioides, C-1060 and C-DOA, R11-01 and R11-04 showed inhibitory activity against both pathogens in which R11-01 exhibited the greatest distance from pathogen colonies (Table1). Table1. Distance from pathogen colony
Distance from pathogen colony (mm.) Isolate C-1060 C-DOA
R11-01 R11-02 R11-03 R11-04
+++ - - +
+++ - -
++ +: x ≤ 1 mm, ++: 1 mm< x ≤2 mm, +++: x > 2 mm x = diameter of clear zone
For antibacterial activity assay, only R11-01
showed inhibitory effect against Xanthomonas sp. in which it produced clear zone of 10 mm diameter.
Two endophytes (Fusarium sp. R11-01 and Colletotrichum sp. R11-04) showed
antimicrobial activity against selected phytopathogens. Many Fusarium species have been reported to produce bioactive secondary metabolites including antimicrobial compounds. For example, extracellular metabolites of Fusarium sp. were active against gram-positive bacteria, gram-negative bacteria and fungi (4). In addition, fusapyron and deoxyfusapyrone from Fusarium semitectum also inhibited growth of C. gloeosporioides (5). Most Colletotrichum sp. was reported to be host-specific phytopathogen. However, some endophyte strains were found to produce bioactive metabolites (6).
Currently, R11-01 and R11-04 are being analyzed for the effects of their metabolites against phytopathogens.
References 1. Freeman S, Katan T, Shabi E.
Characterization of Colletotrichum species responsible for anthracnose disease of various fruits. Plant Dis 1998; 82:596-605.
2. Fokunang CN, Dixon AGO, Ikotun T, Tembe EA, Akem CN, Asiedu R. Anthracnose: an economic disease of cassava in Africa. Pakistan J Biol Sci 2001; 4:920-925.
3. Fokunang CN, Dixon AGO, Ikotun T. Synergistic relationship of bacterial blight and anthracnose disease pathogen in cassava multiple infection. J Biol Sci 2003; 3:596-606.
4. Devaraju R, Satish S. Endophytic mycoflora of Mirabilis jalapa L. and studies on antimicrobial of its endophytie Fusarium sp. Asian J Exp Biol Sci 2011; 2:75-79.
5. Altomare C, Perrone G, Zonno MC, Evidente A, Pengue R, Fanti F, et al. Biological characterization of fusapyrone and deoxyfusapyrone, two bioactive secondary metabolites of Fusarium semitectum. J Nat Pro 2000; 63:1131-1135.
6. Lu H, Zou WX, Meng JC, Hu J, Tan RX. New bioactive matabolites produced by Colletotrichum sp., an endophytic fungus in Artemisia annua. Plant Sci 2000; 151:63-67

The 23rd Annual Meeting of the Thai Society for Biotechnology “Systems Biotechnology: Quality & Success”
P-VII-10
- 250 -
Strain selection of probiotic Bacillus spp. against broiler chicken pathogen
Kanogporn Sriyama, Vichai Domrongpokkaphana and Thanit Pewnimb
aDepartment of Agro-Industrial Technology, Faculty of Applied Science, King Mongkut’s University of Technology, North Bangkok (KMUTNB), 1518 Pibulsongkram Road, Bangsue, Bangkok 10800, Thailand bDepartment of Chemistry, Faculty of Science, Silpakorn University, Sanamchandra Palace Campus, Nakorn Pathom 73000, Thailand
Abstract Eighty-five isolates of Bacillus spp. from the intestine of healthy broiler chickens were screened for their antimicrobial activity against broiler chicken pathogen and for producing the digestive enzyme. Escherichia coli and Staphylococcus aureus are known to be the causative bacteria of the avian cellulitis in broiler chickens. In agar-well diffusion assay, twenty-seven and eight strains were found to inhibit S. aureus and E. coli, respectively. In addition, eight strains were active against both pathogenic strains. Bacillus spp. B04 showed strong antibacterial activity toward E. coli and S. aureus with the average diameter of inhibition zones of 1.51 ± 0.09 cm and 1.16 ± 0.11 cm, respectively. In addition, these strains produced the digestive enzymes, e.g. protease, amylase, cellulase and lipase on the different media such as skim milk agar, starch agar, carboxymethyl cellulose agar and tributyrin agar, respectively. Bacillus spp. B04 was identified as Bacillus subtilis TISTR 2057 by Thailand Institute of Scientific and Technological Research (TISTR). This strain was tested for pH resistance in an intestinal tract of broiler chicken. The cell viability of B. subtilis TISTR 2057-that was slightly decreased with a decreased pH from 6.5 to 2.0 was 1.735x10⁸ to 1.655x10⁷, cfu/ml. B. subtilis TISTR 2057 showed potential to be antimicrobial against broiler-chicken pathogen and to produce digestive enzyme for growth promotion. This strain might be useful as a biological control agent in the culture of broiler chicken. Keywords: probiotic, Bacillus spp., avian cellulitis, Escherichia coli , Staphylococcus aureus Introduction and Objective An avian cellulitis is an infectious disease of broilers caused by E. coli and S. aureus (Derakhshanfar, 2002). It is the major causes of economic losses in the poultry industry. Bacillus spp. has been used as probiotic bacteria in animal because it can produce some beneficial substances such as antimicrobial reagent and digestive enzyme (Domrongpokkaphan, 2006). The object of this study was to screen and to select Bacillus spp. against both E. coli and S. aureus that produced some digestive enzyme. Their abilities to survive in pH of intestinal tract on broiler chicken were investigated. Materials and Methods
2.1 Screening and selection of Bacillus spp. Forty broiler chicken intestine samples were
collected from fresh market. The intestinal Bacillus spp. was collected by scraping and washing with 0.85% NaCl. Suspension was heated in water bath at 80oC for 20 min and then spread on nutrient agar and incubated at 37oC for 24 hr.
2.2 Agar well diffusion assay Antimicrobial activity of Bacillus spp. was
tested as followed. The E. coli and S. aureus cultures were adjusted into a final concentration of 106 cfu/ ml in nutrient agar and then were poured into plates. After solidity, wells (8 mm-diameter) were punched out using sterile cork borer.
The 50 µl of Bacillus spp. supernatant was added into each well and incubated at 37oC. After 24 h, the diameter of inhibition zones was measured. For enzyme activity test, Bacillus spp. supernatant was tested for producing protease, amylase, cellulase and lipase on skim milk agar, starch agar, carboxymethylcellulose agar and tributyrin agar, respectively.
2.3 Effect of pH The Bacillus spp. cultures (5 ml) were
centrifuged. Supernatant was removed. The 0.85% NaCl (5 ml) adjusted pH at 6.5, 6, 5, 4, 3 and 2, were added and kept for 1 hr. The viable cells were counted using standard plate count method.
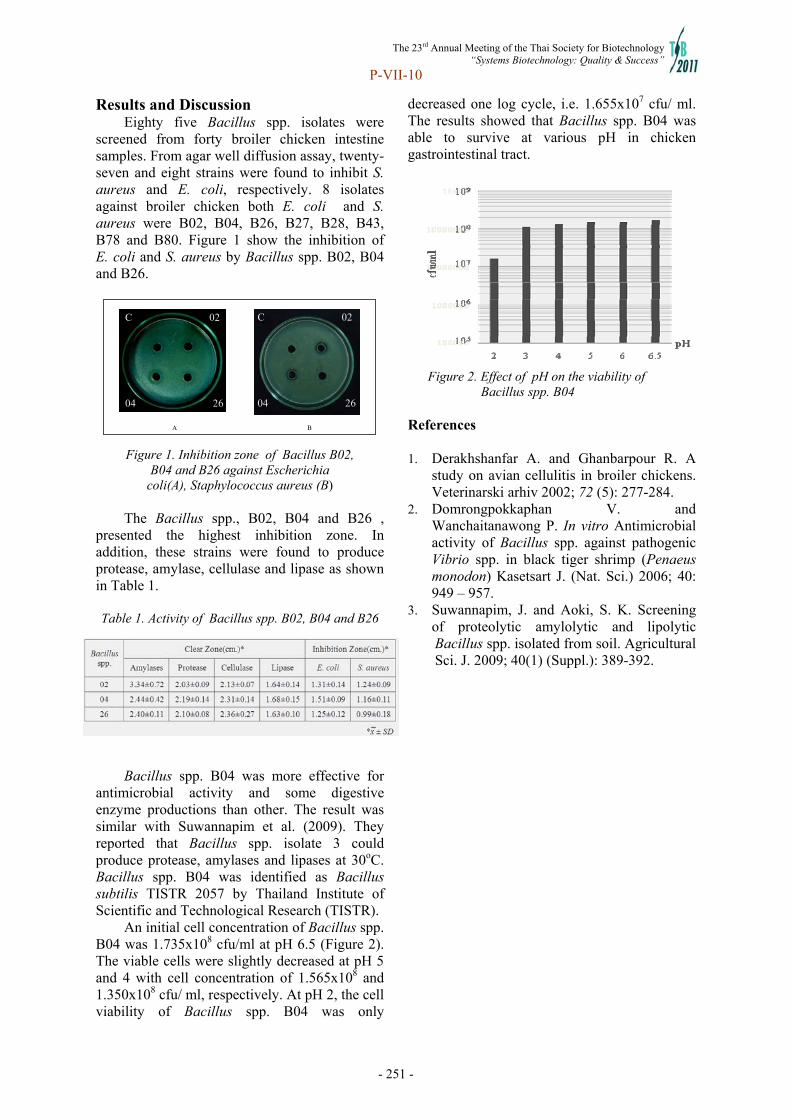
The 23rd Annual Meeting of the Thai Society for Biotechnology “Systems Biotechnology: Quality & Success”
P-VII-10
- 251 -
Results and Discussion Eighty five Bacillus spp. isolates were
screened from forty broiler chicken intestine samples. From agar well diffusion assay, twenty-seven and eight strains were found to inhibit S. aureus and E. coli, respectively. 8 isolates against broiler chicken both E. coli and S. aureus were B02, B04, B26, B27, B28, B43, B78 and B80. Figure 1 show the inhibition of E. coli and S. aureus by Bacillus spp. B02, B04 and B26.
Figure 1. Inhibition zone of Bacillus B02, B04 and B26 against Escherichia
coli(A), Staphylococcus aureus (B) The Bacillus spp., B02, B04 and B26 ,
presented the highest inhibition zone. In addition, these strains were found to produce protease, amylase, cellulase and lipase as shown in Table 1.
Table 1. Activity of Bacillus spp. B02, B04 and B26
Bacillus spp. B04 was more effective for
antimicrobial activity and some digestive enzyme productions than other. The result was similar with Suwannapim et al. (2009). They reported that Bacillus spp. isolate 3 could produce protease, amylases and lipases at 30oC. Bacillus spp. B04 was identified as Bacillus subtilis TISTR 2057 by Thailand Institute of Scientific and Technological Research (TISTR).
An initial cell concentration of Bacillus spp. B04 was 1.735x10⁸ cfu/ml at pH 6.5 (Figure 2). The viable cells were slightly decreased at pH 5 and 4 with cell concentration of 1.565x10⁸ and 1.350x10⁸ cfu/ ml, respectively. At pH 2, the cell viability of Bacillus spp. B04 was only
decreased one log cycle, i.e. 1.655x10⁷ cfu/ ml. The results showed that Bacillus spp. B04 was able to survive at various pH in chicken gastrointestinal tract.
Figure 2. Effect of pH on the viability of Bacillus spp. B04 References 1. Derakhshanfar A. and Ghanbarpour R. A
study on avian cellulitis in broiler chickens. Veterinarski arhiv 2002; 72 (5): 277-284.
2. Domrongpokkaphan V. and Wanchaitanawong P. In vitro Antimicrobial activity of Bacillus spp. against pathogenic Vibrio spp. in black tiger shrimp (Penaeus monodon) Kasetsart J. (Nat. Sci.) 2006; 40: 949 – 957.
3. Suwannapim, J. and Aoki, S. K. Screening of proteolytic amylolytic and lipolytic Bacillus spp. isolated from soil. Agricultural Sci. J. 2009; 40(1) (Suppl.): 389-392.
C 02 04 26
A B
C 02 04 26
The 23rd Annual Meeting of the Thai Society for Biotechnology “Systems Biotechnology: Quality & Success”
P-VII-15
- 252 -
Isolation of bioplastics-degrading bacteria from compost soil in Thailand Luksamee Sukrakanchana, Sukhumaporn Sukkhum, and Peechapack Somyoonsap Department of Biology, Faculty of Science, Srinakharinwirot University, Sukhumvit 23 Rd, Bangkok 10110, Thailand. *Corresponding author: [email protected]
Abstract Eight strains of bioplastics-degrading microorganisms were isolated by screening for their ability to degrade and form clear zones on bioplastics-emulsified mineral agar plates using polylactic acid (PLA), polycaprolactone (PCL), poly-(butylene succinate) (PBS) and polybutylene succinate-co-adipate (PBSA) as substrates. Analysis of the bioplastics-degrading enzyme in culture broth showed high specific activity of PLA, PCL, PBS and PBSA degradation in strain APL3 (3.010.1U/mg), APL8 (3.160.19 U/mg), APL3 (2.150.1 U/mg) and APL6 (3.180.08 U/mg), respectively. The clear zone formation on biodegradable plastics agar plate showed a correlation with biodegradable plastic-degrading activity in culture broth. Phenotypic characterization and phylogenetic tree of 16S rDNA sequence classified them as a member of the genus Streptomyces and Saccharothrix.
Keywords: bioplastic, biodegradable plastic, plastic-degrading enzyme, biodegradation Introduction and Objective Nowadays, the synthetic plastics are produced worldwide and increased the environmental pollution. A variety of biodegradable polyesters (bioplastics) have been developed to make useful product in many country. Some types of bioplastics, polylactic acid (PLA), polycaprolactone (PCL), poly-(butylene succinate) (PBS) and polybutylene succinate-co-adipate (PBSA) are the most promising materials of the commercially available synthetic polyesters and the microorganisms can attack by polyester-degrading enzymes secretion. These microbial metabolic end products were water, carbon dioxide and methane (in case of anaerobic degradation). Some information on microorganisms that degrade polymer has been reported, but bioplastics degradation has not been extensively studied in Thailand. Thus, in this study, we tried to isolate bacteria from compost soil in Thailand and screen the bioplastics-degrading using the clear zone methods. Identification and phenotypic characterization of microorganisms can analyze by 16S rDNA gene.
Materials and Methods Polymer studied PLA, PCL, PBS and PBSA were obtained from Sigma-Aldrich. Growth media Ten soil samples were collected from different location in Bangkok and Nan, Thailand. Polymer emulsion was prepared as follows: 1 g polymer was dissolved in 20 ml methylene chloride and emulsified with ultrasonicator into one liter of basal medium composed of 200 mg yeast extract, 1 g (NH4)2SO4, 200 mg MgSO4.7H2O, 100 mg NaCl, 20 mg CaCl2.2H2O, 10 mg FeSO4.7H2O, 0.5 mg Na2MoO4.2H2O, 0.5 mg Na2WO4.2H2O, 0.5 mg MnSO4, 1.6 g K2HPO4 and 200 mg KH2PO4. The methylene chloride was removed by incubation at 50C for 30 min. Agar (20 g) was added to the emulsified medium for polymer agar plate. The colonies forming clear zones were selected as polymer-degrading strains. Identification of polymer-degrading strains The isolated strains that formed clear zones on emulsified-polymer agar plates were studied for phylogenetic relationship based on 16S rDNA sequencing. Polymer-degrading enzyme assay Polymer-degrading strains were cultivated in emulsified-polymer medium at 37C for one week with rotary shaking at 190 rpm. Polymer-degrading enzyme activity was assayed at 37C for 30 min based on the decrease of turbidity by a modified method of Nakamura et al. (1). A
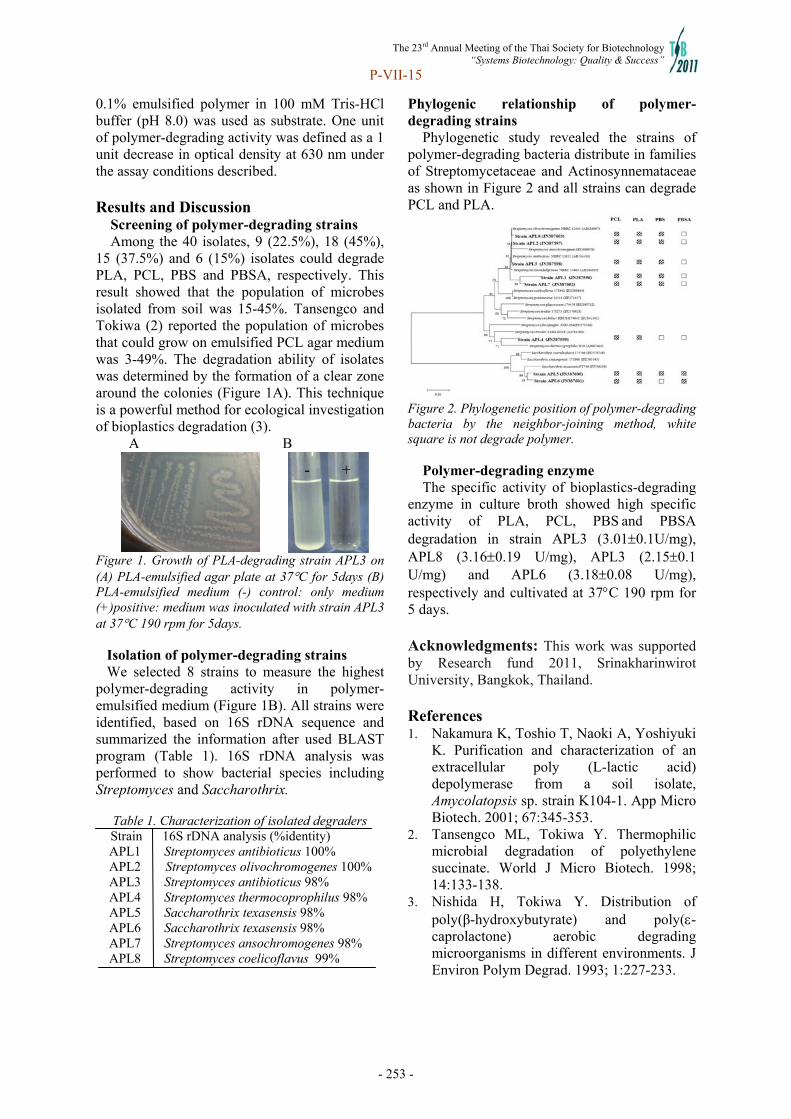
The 23rd Annual Meeting of the Thai Society for Biotechnology “Systems Biotechnology: Quality & Success”
P-VII-15
- 253 -
0.1% emulsified polymer in 100 mM Tris-HCl buffer (pH 8.0) was used as substrate. One unit of polymer-degrading activity was defined as a 1 unit decrease in optical density at 630 nm under the assay conditions described. Results and Discussion Screening of polymer-degrading strains Among the 40 isolates, 9 (22.5%), 18 (45%), 15 (37.5%) and 6 (15%) isolates could degrade PLA, PCL, PBS and PBSA, respectively. This result showed that the population of microbes isolated from soil was 15-45%. Tansengco and Tokiwa (2) reported the population of microbes that could grow on emulsified PCL agar medium was 3-49%. The degradation ability of isolates was determined by the formation of a clear zone around the colonies (Figure 1A). This technique is a powerful method for ecological investigation of bioplastics degradation (3). A B
Figure 1. Growth of PLA-degrading strain APL3 on (A) PLA-emulsified agar plate at 37C for 5days (B) PLA-emulsified medium (-) control: only medium (+)positive: medium was inoculated with strain APL3 at 37C 190 rpm for 5days. Isolation of polymer-degrading strains We selected 8 strains to measure the highest polymer-degrading activity in polymer-emulsified medium (Figure 1B). All strains were identified, based on 16S rDNA sequence and summarized the information after used BLAST program (Table 1). 16S rDNA analysis was performed to show bacterial species including Streptomyces and Saccharothrix.
Table 1. Characterization of isolated degraders
Strain 16S rDNA analysis (%identity) APL1 Streptomyces antibioticus 100% APL2 Streptomyces olivochromogenes 100% APL3 Streptomyces antibioticus 98% APL4 Streptomyces thermocoprophilus 98% APL5 Saccharothrix texasensis 98% APL6 Saccharothrix texasensis 98% APL7 Streptomyces ansochromogenes 98% APL8 Streptomyces coelicoflavus 99%
Phylogenic relationship of polymer- degrading strains Phylogenetic study revealed the strains of polymer-degrading bacteria distribute in families of Streptomycetaceae and Actinosynnemataceae as shown in Figure 2 and all strains can degrade PCL and PLA.
Figure 2. Phylogenetic position of polymer-degrading bacteria by the neighbor-joining method, white square is not degrade polymer. Polymer-degrading enzyme The specific activity of bioplastics-degrading enzyme in culture broth showed high specific activity of PLA, PCL, PBS and PBSA degradation in strain APL3 (3.010.1U/mg), APL8 (3.160.19 U/mg), APL3 (2.150.1 U/mg) and APL6 (3.180.08 U/mg), respectively and cultivated at 37C 190 rpm for 5 days. Acknowledgments: This work was supported by Research fund 2011, Srinakharinwirot University, Bangkok, Thailand. References 1. Nakamura K, Toshio T, Naoki A, Yoshiyuki
K. Purification and characterization of an extracellular poly (L-lactic acid) depolymerase from a soil isolate, Amycolatopsis sp. strain K104-1. App Micro Biotech. 2001; 67:345-353.
2. Tansengco ML, Tokiwa Y. Thermophilic microbial degradation of polyethylene succinate. World J Micro Biotech. 1998; 14:133-138.
3. Nishida H, Tokiwa Y. Distribution of poly(β-hydroxybutyrate) and poly(-caprolactone) aerobic degrading microorganisms in different environments. J Environ Polym Degrad. 1993; 1:227-233.
- +

Index

The 23rd Annual Meeting of the Thai Society for Biotechnology “Systems Biotechnology: Quality & Success”
- 255 -
Author Index
A
Abhisingha M 124 Adthalungrong C 133, 193 Akuniwong P 204 Artjariyasripong S 110 Asavarak T 120, 122, 248 Aunlumpoon C 96
B
Baramee S 74 Bischoff KM 27 Boonchird C 120, 122, 248 Boonserm P 46 Boonsombat R 107, 162 Bovornreungroj N 155 Bovornreungroj P 155 Buaklin A 20
C
Chaijamrus S 186, 188 Chaiongkarn A 110 Chaiwut P 53, 142, 180, 182, 198 200, 204, 238, 240 Chaiyapechara S 12 Chancharunee S 223 Chankhamhaengdecha S 41 Chanklan R 130, 169 Chanprateep S 213 Chapanont Y 232 Chareonsap P 218 Chawapun N 223 Cheevadhanarak S 8 Chen R 94 Chonudomkul D 60 Chotiyarnwong O 218 Chuamsuk S 198 Chumtong P 18 Chunthong P 202 Chuprom J 155 Chuthamas P 218 Chutrakul C 112
D
Dachoupakan C 144 Daengphuang S 84 Dechasakulwattana C 184 Deeto R 92 Domrongpokkaphan V 250 Durand A 68
E
Eiemsupackul S 55
F
Flegel TW 100
H
Ham LH 5 Hannongbua S 236 Hiransuchalert R 14, 16 Hirunpetcharat C 70 H-Kittikun A 211 Hlain NNS 38 Hongpattarakere T 146, 244 Hongvijit S 41 Htun WW 33 Htway HTP 48
I
Imsoonthornruksa S 94 Inchana P 46 Incharoensakdi A 118 Innuphat J 22 Inprakhon P 68
J
Jaikaew P 236 Jantaro S 118 Jantee N 20 Jarayabhand P 14 Jaroenram W 100 Jarupeng I 218 Jindamorakot S 130 Jirakanjanakit N 226, 228, 230 Jirapatpongthada C 98 Jirasatid S 51 Jirasripongpun K 226, 230 Jiravanichpaisal P 12 Jonas R 2 Junhasobhaga P 200 Juntrapirom A 76
K
Kaewprapan K 68 Kalapanulak S 8, 10, 76 Kamhangwong D 151, 157, 159 Kantachote D 155 Keonkaew N 238, 240 Kern M 2 Ketudat-Cairns M 94 Khamnamtong B 18 Khanthasuwan S 118 Khaosanit W 70 Khomkrit C 248 Khongchareonporn N 234
The 23rd Annual Meeting of the Thai Society for Biotechnology “Systems Biotechnology: Quality & Success”
- 256 -
Khumnamtong B 20 Khunrae P 86, 88, 90 Khunthong S 100 Kiatpathomchai W 100 Kitsubun P 51 Kittikamhaeng N 144 Klinbunga S 12, 14, 16, 18, 20, 22 Klungnuch P 172 Kodama K 102 Komolpis K 232 Kongkathip N 169 Koohapitakthum R 92 Kosonpisit S 82 Krairak S 206 Krethathorn S 133 Krongsuksirichai K 142 Krusong W 153 Kuhakongkeat T 128 Kulpreecha S 176
L
Lalitanan N 204 Latt ZK 48 Leathers TD 27 Leelawat K 72 Lek-uthai U 70, 72 Lhim S 186 Liamkaew R 80, 82 Luengchaichaweng K 120
M
Mai-Ngam B 55 Malaphan W 124 Maneesri J 190 Manitchotpisit P 27 Manjeen N 206 Marie E 68 Masniyom P 190 Maw SS 33 Meechai A 8 Menasveta P 12, 16, 18, 20, 22 Miyakawa T 169, 242 Mojarin P 218 Moonmangmee S 110 Muangkao W 176 Mungsantisuk I 100
N
Narangajavana J 10, 248 Netrphan S 8, 98 Ngamchom P 133 Ngenprasertsiri S 107 Noiprapai K 234 Noitang S 202 Nopharatana M 51
O
O-siripun S 202
P
Pachit P 216 Packdibamrung K 172 Panbangred W 24, 41, 120, 122, 138 Panchanawaporn S 112 Paungbupa M 230 Petsom A 202 Pewnim T 250 Phakthanakanok K 78 Phayungsak M 12 Phoopat N 60 Phosri C 216 Phunpruch S 206 Phunyahathaikul S 228 Phuwapraisirisan P 184 Piapukiew J 96, 216 Pimpa C 221 Pimpa W 221 Pimtong V 162 Pinitglang S 78 Pintathong P 142, 180, 182, 198 200, 204, 238, 240 Pipatsamut W 223 Pitaksutheepong C 124 Pongtharangkul T 122 Poonsiri C 110 Pramachote S 120 Prasertlux S 18 Prasertsirivatna S 218 Prasirtsak B 102 Prasitchoke P 202 Price NPJ 27 Promdonkoy B 46 Prousoontorn M 172 Puchcha Y 60 Pudtanlek C 55 Punrat T 213
R
Rachakhom S 72 Rajakam S 228 Raksasuk T 184 Ratanakhanokchai K 36, 78 Rattanabumrung O 29, 31 Rattanakitti A 92 Rattanarojpong T 86, 88, 90 Rawdkuen S 53, 142, 148, 151, 157, 159, 182 Rengpipat S 232, 234 Roengsumran S 246 Rongsirikul O 8 Ruamkuson D 94 Ruengjitchatchawalya M 236 Rungsardthong V 55 Rutatip S 126
The 23rd Annual Meeting of the Thai Society for Biotechnology “Systems Biotechnology: Quality & Success”
- 257 -
S
Saerue S 10 Saeteaw N 82 Saewan N 174 Saieah A 126 Saiprajong R 78 Saithong T 8, 10, 76 Saksmerprome V 86 Saman P 110 Samansoranakun C 133, 193 Sangadkit W 29, 31 Sangmanee P 244 Sangthong S 180, 182 Saovapakhiran A 223 Sawangmongkhon S 174 Seeda K 226 Sihanonth P 246 Sirisansaneeyakul S 60, 63, 65, 213 Sittichan S 169 Sittikhankaew K 22 Sittikhankeaw K 14 Sojikul P 10 Sommanas D 188 Sompakdee Z 182 Sompuen T 153 Somyoonsap P 252 Songpim M 65 Sooksai S 202 Soontorngun N 36, 74 Srisawat M 138 Srisupapakdee Y 90 Sriyam K 250 Suauam P 242 Sukkhum S 252 Sukrakanchana L 252 Suksangpanomrung M 8, 92 Sumongkhon S 146 Suntinanalert P 155 Supanivatin P 31, 82 Surarit W 130 Suthiluk P 151, 157, 159 Sutjaritvorakul T 246 Suwannaboon R 88 Suwansri J 211
T
Talwong K 202 Tanasupawat S 102
Tangsombatvichit C 36 Tantayakom V 202 Teerawattanakijpakorn N 24 Tepragul N 112 Thaicharoen P 130 Thaniyavarn J 213 Thaniyavarn S 213 Thipayarat A 29, 31, 80, 82, 84 Thitilertdecha N 204, 240 Thitipramote N 142, 174, 238 Thitipromote N 198 Thiwongnoi P 238, 240 Thongcharoen S 122 Thongchul N 102, 162, 176, 202 Thu M 33 Thu PTL 5 Tilarux P 218 Tongta A 51 Treejatet S 14
U
Upaichit A 211 Uttapap D 55
V
Vaithanomsat P 65 Vannabun A 53 Vatanyoopaisarn S 126, 128 Vitchitsoonthonkul T 51 Vorrarathanaki S 174
W
Wannawilai S 63 Warasumpati S 226 Wichai U 223 Wijitrakul P 200 Wongsdaluk W 190 Wuttisin N 198
Y
Yingyongnarongkul B 242 Yocawibun P 16 Yoksan S 226, 228 Yompakdee C 242 Yu SS 38, 48 Yu SZ 38 Yuvanatemiya V 14
The 23rd Annual Meeting of the Thai Society for Biotechnology “Systems Biotechnology: Quality & Success”
- 258 -
Keywords Index
1
16s rDNA gene 12
A
Acetobacter aceti 190 acid-soluble collagen 142 adsorbent resin 184 aflatoxin B1 144 AFLP 218 agar disc diffusion 159 Alcaligenes eutrophus 186, 188 algal oil 60 amylase 33 anthocyanin 174 antibacterial activity 27, 120 antibiotic marker 48 antifungal 33 antifungal activity 120, 244 antimicrobial 151 antimicrobial activity 159, 248 antimicrobial peptide 24, 27 antioxidant 180, 198, 200, 204, 238, 240 antityrosinase 238, 240 apoptosis 90 artemisinin 223 asparaginyl tRNA synthetase 22 Aspergillus 144 Aspergillus flavus 244 Aspergillus oryzae 223 Aspergillus parasiticus 244 AspergillusnigerTISTR 3570 65 ATP/GTP binding protein 14 avian cellulitis 250 avidin 172
B
Bacillus megaterium P-12 176 Bacillus sphaericus 46 Bacillus spp. 250 Bacillus thermoamylovorans 211 bacteria 24 bacterial contamination 27 bacteriocin 126 banana peel 198 batch bioreactor 213 batch cultivation 176 beta-Glucosidase 94 betel nut 180 binary toxin 46 bioactive compound 122, 236 biochemical properties 148 biocomposites 55 biodegradable packaging 157 biodegradable plastic 252
biodegradation 252 biodiesel oil 128 biofuel crop 5 biohydrogen 206 bioinformatics tool 76 biological marker 226 bioplastic 252 biotechnology 5 biotin 172 biphasic system 182 black sticky rice 174 Box-Behnken design 193 Brevibacillus spp. 24 bromelain 182
C
Ca2+ signaling 169 calcium signal inhibitor 242 Candida albicans 74 Candida magnoliae TISTR 5663 63 carboxy-methylcellulose 230 cassava 5, 8, 10 catechin 151, 157, 159 cDNA-Amplified Fragment 10 Length Polymorphism (cDNA-AFLP) cellulase 33 cellulolytic activity 48 chikungunya 228 Chinese herbs recipe 236 chitinase 33 Chromocult® Coliform Agar 29 citrinin 51 Clausena harmandiana (Pierre) 242 Clostridium perfringens 133 collagen 148 Colletotrichum gloeosporioides 248 colony growth 80 colony size 82 composite films 221 conjugation 48 contrast improvement 31 corn steep liquor 186 coumarin 242 Culex quinquefasciatus 46 cytotoxicity 223
D
dairy by-products 188 Dendrobium friedericksianum Rchb.f. 218 deoxyartemisinin 223 dextran 68 diesel oil 128 digital image 31 dipterocarp 96 D-Lactic acid 102

The 23rd Annual Meeting of the Thai Society for Biotechnology “Systems Biotechnology: Quality & Success”
- 259 -
domestic waste 206 dot blotting 232, 234 DPPH 142, 174 drug targets 76 drug-target interaction 236 dsRNA 86 durian seed starch 221
E
E.coli 29 E.coli S17 48 ectomycorrhiza 96, 216 edible film 151 empty fruit bunched fiber 55 endophyte 248 endophytic fungus 122 enumeration 29, 31 environmental stresses 124 Escherichia coli 250 ethanol production 27 expression 112 extract 200 extraction 204
F
falcipain3 78 FAMeT 20 fed-batch culture 60 fermentation 102 flowers 204 food production 2 food security charter 2 Fu and Li’s D 70 Fu and Li’s F 70 fungal endophytes 120
G
G2 cell-cycle 169 gelatin 151 gelatin film 157 gene expression 16, 22 gene expression profile 10 genetic diversity 218 giant catfish 53, 142 gluconeogenesis 74 gmo 2 growth kinetic 84 growth kinetics 82
H
halophilic bacteria 155 halophilic nuclease 155 Hansenula polymorpha 202 hard capsules 221 heterotrophic 60 Homnin rice 174
HPLC 112 HtrA2 90 hydrocolloid gel 230
I
IAPs 90 image analysis 80, 82 immobilized enzyme 172 indole acetic acid 38 initial glucose 162 insoluble zinc compound 246 insulin expression 107 insulin HMR1423 107 intestinal microbial diversity 12 inulinase 65 inulo-oligosaccharides 65 isoamylase 98 isolation 102
K
kinetics 213
L
L(+)-lactic acid 162 lactic acid 193 lactic acid bacteria 27, 126, 244 lactic acid producing bacteria 102 Lactobacillus casei 193 Lactobacillus plantarum 146, 244 limit dextrinase 98 lipase 68, 211 Listeria 80, 82 Listeria innocua 84 live attenuated dengue vaccine 226 loop-Mediated Amplification Methods (LAMP) 72 loop-mediated isothermal amplification 100, 138 low-temperature thermal drying 190 L-phenylalnine 172 L-Tryptophan 38 lysozyme 151, 157, 159
M
malnutrition 2 Manihot esculenta 92 Manihot esculenta Crantz 98 Marianneae camptospora 112 marine bacteria 184 mathematical model 65 meat tenderization 148 mechanical properties 55 metabolic pathway reconstruction 8 microalgae 60 microencapsulation 146 microorganism in fuel 128 microwave-assisted extraction 198 molasses 186
The 23rd Annual Meeting of the Thai Society for Biotechnology “Systems Biotechnology: Quality & Success”
- 260 -
molecular marker 20 monacolin K 51 Monascus 51 monoclonal antibodies 232 monoclonal antibody 234 morphology 162 multidrugs resistance 72 multiplex PCR 133, 138 mung bean 200 muscle foods 148
N
network-based method 236 neurovirulence 228 nitrogen fixing bacteria 48 nitrogen sources 63 non-ribosomal peptide synthetase 112 non-selective media 84 nucleotide diversity 70 nucleotide excision repair (NER) 124 nuLSU rDNA 216 nutrient limitation 36 nutrient. 29
O
ochratoxin A 144 oligosaccharides 110 Os1bglu4 94 osmotic stress 51 oxford agar 80 oxidative stress 226 oxygen limiting condition 63
P
P(3HB) 176 P. acidilactici 124 partial purification 126 PCK1 74 PCR-DGGE 12 PCR-SSCP 18 pectin 230 Pectobacterium 41 Penaeus monodon 12, 14, 16, 18, 20, 22, 90, 100 Penaeus vannamei 86 peracetic acid 153 pericarp 180 pET32a+ 94 phenolic 180, 198, 200 phenolic compound 238 phenolic compounds 204 phenylalanine dehydrogenase 172 photosynthetic bacteria 206 photosynthetic efficiency 118 phylogenetic relationship 216 Pichia anomala 213 Pichia pastoris 107 pigment 51
pigmented rice 174 pigments 118 Plasmodium falciparum 72, 78 plastic-degrading enzyme 252 polyethylene glycol 182 poly-hydroxybutyrate 186, 188 polylactic acid 55 prebiotic 110 prebiotics 146 pressure reactor 202 probiotic 250 probiotics 146 propylene glycol 230 proteases 53, 148 protein hydrolysates 142 protein signature 76 proteolytic activity 182 purification 53 Pvama-1 70
Q
quantitative real-time PCR 16 quorum quenching 41 quorum sensing 41
R
real-time PCR 14, 18, 22 recombinant protein production 94 regioselectivity 68 regular human insulin 107 regulation 10 repeated fed-batch fermentation 63 response surface methodology (RSM) 193, 240 rhizome 238 Rhizopus oryzae 162 rice 94, 144 root development 10 RT-PCR 100, 112 Russula 96
S
Saccharomyces cerevisiae 36, 74, 169, 242 Salmonella 138 Salmonella Typhimurium 232 screening 102 SDS-PAGE 90 seed 180 selective agents 80 selective plating 82 selenoprotein M 16 semi-quantitative PCR 86 shrimp 153 SNP 20 Sodium hypochlorite 153 soft-rot 41 soil fungi 246 soil yeast 38
The 23rd Annual Meeting of the Thai Society for Biotechnology “Systems Biotechnology: Quality & Success”
- 261 -
solid-state fermentation 110 solubilization 246 sophorolipids 213 soy protein 55 soybean oil 213 spore inoculum 96 spread plate 29 spread plate technique 31 sprout 200 SSCP 20 stabilization 182 Staphylococcus aureus 250 starch biosynthesis 8 starter powder 190 static bed bioreactor 162 storage 190 Streptomyces 41 striped catfish 142 subcritical water hydrolysis 202 suckling mice 228 sucrose synthase 92 sugarcane liquor 176 Synechocystis 118
T
Tajima’s D 70 tapioca starch hydrolysate 193 temperature 84 Thai fermented protein foods 155 thermotolerant 211 three-phase partitioning, viscera 53 total plate count 31 toxin genotyping 133 transesterification 68 transformation 223 transforming growth factor beta regulator 1 18 transgenic potato 92 Trichoderma 33 tuber-specific 92 Tylopilus 216 type 2 diabetes (T2D) 236
U
ultraviolet radiation 118 uvrA gene 124
V
vaccine 228 Vibrio parahaemolyticus 153, 234 Vietnam 5 vinegar 190 vinyl ester 68 violacein 184 virtual screening 78 VP35 88
W
washing step 153 weak acid response 36 Weissella confusa 126 white spot syndrome virus 86, 88 world population 2 wound dressing 230
X
xylitol production 63
Y
yeast extract 202 yellow head virus 100
Z
zinc cluster transcription factor 36 Zingiberaceae 238 Zingiberaceae officinale 240 zymogram analysis 98
The 23rd Annual Meeting of the Thai Society for Biotechnology “Systems Biotechnology: Quality & Success”
- 262 -
Acknowledgement
The Organizing Committee gratefully thanks to the generous contributions from the following:
Ajinomoto (Thailand) Co., Ltd. Analytical Lab Science Co., Ltd. A.N.H. Scientific Marketing Co., Ltd. Bang Trading 1992 Co.,Ltd. Bara Scientific Co., Ltd. Becthai Bangkok Equipment & Chemical Co., Ltd. Better Science Instrument Co., Ltd. B.E. Marubishi (Thailand) Co., Ltd. Bio-Active Co., Ltd. BioNet-Asia Co., Ltd. Bio-Rad Laboratories Ltd. Buchi (Thailand) Co., Ltd. Chemo Science (Thailand) Co., Ltd. COM-LINK Co., Ltd. Eppendorf (Thailand) Co., Ltd. GibThai Co., Ltd. Global Tech Co., Ltd. Harikul Science Co., Ltd. Hi-Grimm Environmental and Research Co., Ltd. ITS (Thailand) Co.,Ltd. Life Science AP Co., Ltd. Merck Ltd. Bangkok, Thailand Mettler-Toledo (Thailand) Limited Nano Bio Group Co., Ltd. N.Y.R.Limited Partnership Oskon Co.,Ltd. P Intertrade Equipment Co., Ltd. PTT Global Chemical Public Company Limited QES (Thailand) Co., Ltd. Taylor & Francis Asia Pacific Theera Trading Co., Ltd. United Analyst and Engineering Consultant Co., Ltd. Science Tech Co., Ltd. Scientific Promotion Co., Ltd. Siam Bioscience Co., Ltd. S.M.Chemical Supplies Co., Ltd. Venus Technology Co., Ltd. X-Zell Biotech Co., Ltd. Zest-Med Co., Ltd.


บริษัท เบทเทอร์ ซายน ์อินสทรูเมนท์ จาํกัด โทรศัพท์ 086 8214 990
ตัวแทนจําหน่ายเคร่ืองมือวิทยาศาสตร์ เช่น Surface tension, Contact angel,
Electronic nose, Colony pickler, Zeta meter


. . . . . . . . . .
. . . . . . . . . .
COM-LINK Co., Ltd. 888 I-Tower Building, 31th Floor Vibhavadi Rangsit Road, Chatuchak Bangkok 10900 Thailand Tel: (66)2554-9974-6 Fax: (66)2554-9979