การผลิตไบโอดีเซลจากสารป้อนปาล์มน...
117
การผลิตไบโอดีเซลจากสารป้ อนปาล์มน ้ ามันด้วยกรรมวิธีไฮโดรโพรเซสซิ่งบนตัวเร ่งปฏิกิริยา นิกเกิลโมลิบดินัมและโคบอลต์โมลิบดินัมบนอะลูมินา นางสาวนริศรา รอดบุญ วิทยานิพนธ์นี ้เป็นส่วนหนึ ่งของการศึกษาตามหลักสูตรปริญญาวิศวกรรมศาสตรมหาบัณฑิต สาขาวิชาวิศวกรรมเคมี ภาควิชาวิศวกรรมเคมี คณะวิศวกรรมศาสตร์ จุฬาลงกรณ์มหาวิทยาลัย ปีการศึกษา 2555 ลิขสิทธิ ์ของจุฬาลงกรณ์มหาวิทยาลัย บทคัดย่อและแฟ้มข้อมูลฉบับเต็มของวิทยานิพนธ์ตั้งแต่ปีการศึกษา 2554 ที่ให้บริการในคลังปัญญาจุฬาฯ (CUIR) เป็นแฟ้มข้อมูลของนิสิตเจ้าของวิทยานิพนธ์ที่ส่งผ่านทางบัณฑิตวิทยาลัย The abstract and full text of theses from the academic year 2011 in Chulalongkorn University Intellectual Repository(CUIR) are the thesis authors' files submitted through the Graduate School.
-
Upload
khangminh22 -
Category
Documents
-
view
0 -
download
0
Transcript of การผลิตไบโอดีเซลจากสารป้อนปาล์มน...

การผลิตไบโอดีเซลจากสารป้อนปาลม์น ้ามนัดว้ยกรรมวธีิไฮโดรโพรเซสซ่ิงบนตวัเร่งปฏิกิริยา
นิกเกิลโมลิบดินมัและโคบอลตโ์มลิบดินมับนอะลูมินา
นางสาวนริศรา รอดบุญ
วทิยานิพนธ์น้ีเป็นส่วนหน่ึงของการศึกษาตามหลกัสูตรปริญญาวศิวกรรมศาสตรมหาบณัฑิต
สาขาวชิาวศิวกรรมเคมี ภาควชิาวศิวกรรมเคมี
คณะวศิวกรรมศาสตร์ จุฬาลงกรณ์มหาวทิยาลยั
ปีการศึกษา 2555
ลิขสิทธ์ิของจุฬาลงกรณ์มหาวทิยาลยั
บทคัดย่อและแฟ้มข้อมูลฉบับเต็มของวิทยานิพนธ์ตั้งแต่ปีการศึกษา 2554 ที่ให้บริการในคลังปัญญาจุฬาฯ (CUIR) เป็นแฟ้มข้อมูลของนิสิตเจ้าของวิทยานิพนธ์ที่ส่งผ่านทางบัณฑิตวิทยาลัย
The abstract and full text of theses from the academic year 2011 in Chulalongkorn University Intellectual Repository(CUIR) are the thesis authors' files submitted through the Graduate School.

Biodiesel production from different palm-oil feedstocks with hydroprocessing process
over Ni-Mo/Al2O3 and Co-Mo/Al2O3 catalysts
Miss Narisara Rodboon
A Thesis Submitted in Partial Fulfillment of the Requirements
for the Degree of Master of Engineering Program in Chemical Engineering
Department of Chemical Engineering
Faculty of Engineering
Chulalongkorn University
Academic Year 2012
Copyright of Chulalongkorn University
Thesis Title BIODIESEL PRODUCTION FROM DIFFERENT
PALM-OIL FEEDSTOCKS WITH
HYDROPROCESSING PROCESS OVER Ni-
Mo/Al2O3 AND Co-Mo/Al2O3 CATALYSTS
By Miss Narisara Rodboon
Field of Study Chemical Engineering
Thesis Advisor Professor Suttichai Assabumrungrat, Ph.D.
Thesis Co-advisor Assistant Professor Worapon Kiatkittipong, D.Eng.
Accepted by the Faculty of Engineering, Chulalongkorn University
Partial Fulfillment of the Requirements for the Master‟s Degree
.....…………………………….………….Dean of the Faculty of Engineering
(Associate Professor Boonsom Lerdhirunwong, Dr.Ing.)
THESIS COMMITTEE
……………………………………………Chairman
(Assistant Professor Suphot Phatanasri, D.Eng.)
……………………………………………Thesis Advisor
(Professor Suttichai Assabumrungrat, Ph.D.)
…………………………………………...Thesis Co-advisor
(Assistant Professor Worapon Kiatkittipong, D.Eng.)
…………………………………………...Examiner
(Associate Professor Artiwan Shotipruk, Ph.D.)
…………………………………………...External Examiner
(Associate Professor Navadol Laosiripojan, Ph.D.)

iv
นริศรา รอดบุญ : การผลิตไบโอดีเซลจากสารป้อนปาลม์น ้ามนัดว้ยกรรมวธีิไฮโดรโพรเซสซ่ิงบนตวัเร่งปฏิกิริยา นิกเกิลโมลิบดินมัและโคบอลตโ์มลิบดินมับนอะลูมินา (BIODIESEL PRODUCTION FROM DIFFERENT PALM-OIL FEEDSTOCKS
WITH HYDROPROCESSING PROCESS OVER Ni-Mo/Al2O3 AND Co-Mo/Al2O3
CATALYSTS) อ. ท่ีปรึกษาวทิยานิพนธ์หลกั : ศ.ดร.สุทธิชยั อสัสะบ ารุง รัตน์, อ.ท่ีปรึกษาวทิยานิพนธ์ร่วม: ผศ.ดร.วรพล เกียรติกิตติพงษ,์ 101 หนา้. ในงานวจิยัน้ีใชส้ารป้อนจ าพวกน ้ามนัปาลม์ ไดแ้ก่ น ้ามนัปาลม์ท่ีผา่นการกระบวนการ
ก าจดัยางเหนียว , น ้ามนัปาลม์ท่ี ผา่นการท าใหบ้ริสุทธ์ิจ าพวก ไขปาลม์ในการผลิตไบโอดีเซล การทดลองท าในเตาปฏิกรณ์แบบกะขนาดเล็ก ภายใตส้ภาวะความดนัท่ี 50 บาร์ โดยใช้ตวัเร่งปฏิกิริยานิกเกิลโมลิบดินมัและโคบอลตโ์มลิบดินมับนตวัรองรับอะลูมินา จากการทดลองพบวา่เม่ืออุณหภูมิในการท าปฏิกิริยาต ่า (นอ้ยวา่ 360 องศาเซลเซียส ) ตวัเร่งปฏิกิริยา โคบอลตโ์มลิบดินมั มีความสามารถในการท าปฏิกิริยาดีกวา่ ตวัเร่งปฏิกิริยานิกเกิลโมลิบดินั มและเม่ืออุณหภูมิสูงข้ึนความสามารถในการท าปฏิกิริยาของตวัเร่งทั้งสองมีค่าใกลเ้คียงกนั ผลไดดี้เซลของตวัเร่งปฏิกิริยานิกเกิลโมลิบดินั มมีค่า สูงกว่าผลไดดี้เซล ของตวัเร่งปฏิกิริยา โคบอลตโ์มลิบดินมั เน่ืองจาก ตวัเร่งปฏิกิริยานิกเกิลโมลิบดินั มมีความสามารถในการเลือกเกิด สารผลิตผลในช่วงท่ีเป็นดีเซลได้ ดีกวา่ ภายใตส้ภาวะการท าปฏิกิริยาท่ีก าหนด ปริมาณของไตรกลีเซอไรดแ์ละกรดไขมนัท่ีถูกใชใ้นการท าปฏิกิริยาเรียงตามล าดั บจากมากท่ีสุดไปนอ้ยท่ีสุดไดด้งัน้ี ไขมนัปาลม์ชนิดแขง็ , ไขมนัปาลม์ชนิดอ่อนและน ้ามนัปาลม์ท่ีผา่นกระบวนการก าจดัยางเหนียว ปริมาณของไตรกลีเซอไรดแ์ละกรดไขมนัท่ีใชใ้นการท าปฏิกิริยาจะมีค่าสูงข้ึนเม่ือ ค่าความอ่ิมตวัของสารป้อน มีค่ามาก จากผลการทดลองพบวา่ท่ีอุณหภูมิ 360 องศาเซลเซียส เวลาในการท าปฏิกิริยา 4 ชัว่โมงโดยใช้ตวัเร่งปฏิกิริยาซลัไฟต์ของนิกเกิลโมลิบดินมัไขมนัปาลม์ชนิดแขง็ใหค้่าผลไดข้องดีเซลสูงท่ีสุดคือ 71 เปอร์เซ็นต.์
ภาควชิา............................................. ลายมือช่ือนิสิต.................................................................. สาขาวชิา........................................... ลายมือช่ือ อ.ท่ีปรึกษาวทิยานิพนธ์หลกั............................. ปีการศึกษา........................................ ลายมือช่ือ อ.ท่ีปรึกษาวทิยานิพนธ์ร่วม..............................
วศิวกรรมเคมี
วศิวกรรมเคมี 2555
v
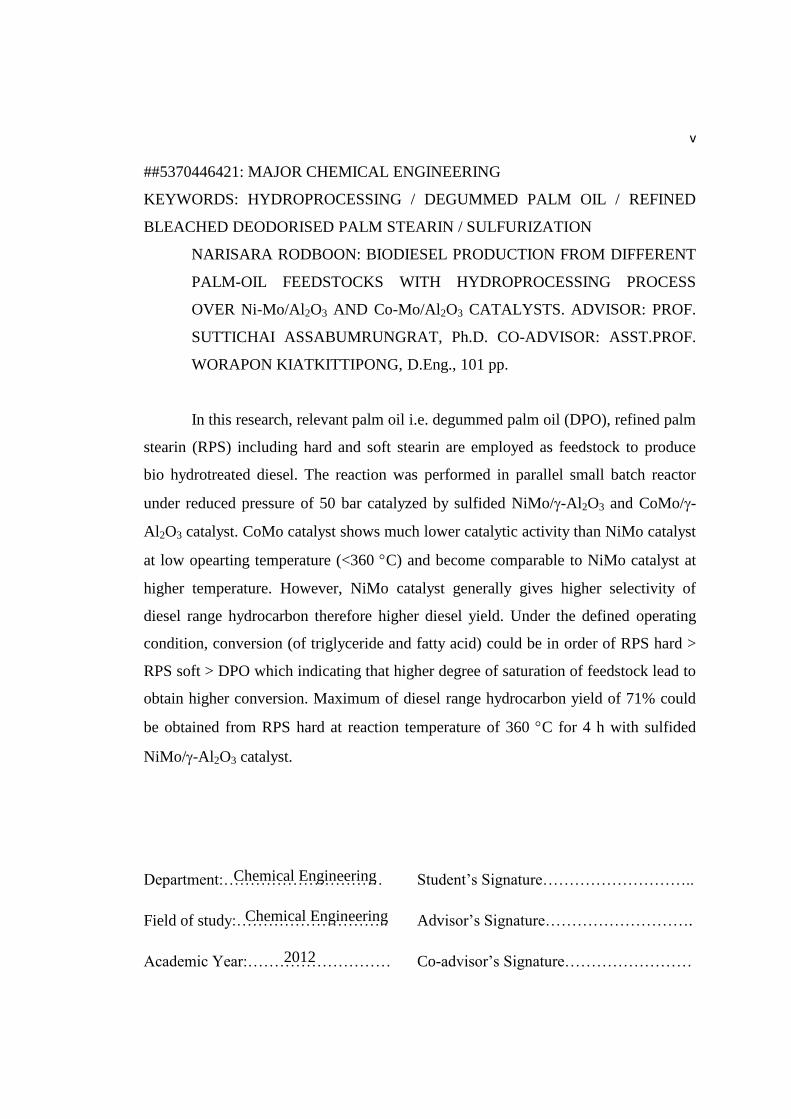
##5370446421: MAJOR CHEMICAL ENGINEERING
KEYWORDS: HYDROPROCESSING / DEGUMMED PALM OIL / REFINED
BLEACHED DEODORISED PALM STEARIN / SULFURIZATION
NARISARA RODBOON: BIODIESEL PRODUCTION FROM DIFFERENT
PALM-OIL FEEDSTOCKS WITH HYDROPROCESSING PROCESS
OVER Ni-Mo/Al2O3 AND Co-Mo/Al2O3 CATALYSTS. ADVISOR: PROF.
SUTTICHAI ASSABUMRUNGRAT, Ph.D. CO-ADVISOR: ASST.PROF.
WORAPON KIATKITTIPONG, D.Eng., 101 pp.
In this research, relevant palm oil i.e. degummed palm oil (DPO), refined palm
stearin (RPS) including hard and soft stearin are employed as feedstock to produce
bio hydrotreated diesel. The reaction was performed in parallel small batch reactor
under reduced pressure of 50 bar catalyzed by sulfided NiMo/-Al2O3 and CoMo/-
Al2O3 catalyst. CoMo catalyst shows much lower catalytic activity than NiMo catalyst
at low opearting temperature (<360 C) and become comparable to NiMo catalyst at
higher temperature. However, NiMo catalyst generally gives higher selectivity of
diesel range hydrocarbon therefore higher diesel yield. Under the defined operating
condition, conversion (of triglyceride and fatty acid) could be in order of RPS hard >
RPS soft > DPO which indicating that higher degree of saturation of feedstock lead to
obtain higher conversion. Maximum of diesel range hydrocarbon yield of 71% could
be obtained from RPS hard at reaction temperature of 360 C for 4 h with sulfided
NiMo/-Al2O3 catalyst.
Department:………………………… Student‟s Signature………………………..
Field of study:……………………….. Advisor‟s Signature……………………….
Academic Year:……………………… Co-advisor‟s Signature……………………
Chemical Engineering
Chemical Engineering
2012

vi
ACKNOWLEDGEMENTS
This thesis is made under the sincere guidance of Professor Sutichai
Assabumrungrat whose most kindness and gave the life attitude in non-thesis area. An
author would like to express her special thanks of gratitude to her co-advisor,
Assistant Professor Worapon Kiatkittipong, who gave the golden opportunity to do
this project on the topic of production of biodiesel, which also helped a lot of
conceptualize the thesis. Without his guidance of co-advisor there wouldn‟t be able to
make it completed in time. Special thanks extended to Assistant Professor Suphot
Phatanasri as a chairman, Associate Professor Artiwan Shotipruk, and Associate
Professor Navadol Laosiripojan, as the members of thesis committee for precious
time, their valuable suggestions and comments.
Secondly the author would also like to thank to the Oleen Company limited
and Patum Oil Company who provided raw materials for the thesis. With deep sense
of gratitude to her family especially her parents whom pay attention to take care of
health along time during the thesis. The most success of graduation is devoted to
them.
Moreover, the author wishes to thank the members of the Center of Excellence
on Catalysis and Catalytic Reaction Engineering, Chulalongkorn University and the
member also the staff of Chemical Engineering Laboratory for their friendship and
assistance.
Finally, the big thanks for the Thailand Research Fund (TRF), as well as the
Graduate School of Chulalongkorn University for their financial supports.
CONTENTS
Page
ABSTRACT (THAI) ...................................................................................... iv
ABSTRACT (ENGLISH) ............................................................................... v
ACKNOWLEDGEMENTS ............................................................................ vi
CONTENTS ................................................................................................... vii
LIST OF TABLES .......................................................................................... xii
LIST OF FIGURES ........................................................................................ xiv
CHAPTER
I INTRODUCTION ................................................................... 1
1.1 Rationale ............................................................................ 1
1.2 Objective ............................................................................ 3
1.3 Scope of work .................................................................... 3
II THEORY ................................................................................. 4
2.1 Mechanism of hydroprocessing ......................................... 4
2.1.1 Hydrodeoxygenation (hydrogenation/dehydration) .. 5
2.1.2 Hydrodecarboxylation ............................................... 7
2.1.3 Hydrodecarbonylation ............................................... 7
2.1.4 Isomerization and cracking ........................................ 8
2.1.5 Water gas shift and methanization............................. 8
2.1.6 Hydrodesulfurization ................................................. 8

viii
Page
CHAPTER
2.2 Raw material ...................................................................... 10
2.2.1 Degummed palm oil (DPO) ....................................... 11
2.2.2 Refined Bleached Deodorised Palm Stearin .............. 11
2.3 Standard of biodiesel ......................................................... 13
2.4 Simulated distillation ......................................................... 17
2.4.1 Measurement of boiling point distribution using the
total area method .......................................................
18
2.5 Catalysts ............................................................................ 23
2.5.1 Nickel......................................................................... 24
2.5.2 Cobalt......................................................................... 25
2.5.3 Molybdenum .............................................................. 26
2.5.4 Aluminium oxide ....................................................... 27
2.6 Presufurization method ..................................................... 28
III LITERATURE REVIEW ........................................................ 29
3.1 Raw material ..................................................................... 29
3.2 Reaction condition of hydroprocessing process ................ 30
3.3 Thermodynamic balance ................................................... 31
3.4 Effect of operating condition ............................................. 32
3.5 Catalyst selection ............................................................... 39
3.6 Properties of production .................................................... 41

ix
Page
CHAPTER
IV Experiment .............................................................................. 43
4.1 Materials and Chemicals ................................................... 43
4.2 Catalyst Preparation .......................................................... 43
4.2.1 Preparation of bimetallic oxide supported on Al2O3 . 43
4.2.2 Presulfidation process ................................................ 44
4.3 Catalyst Characterization .................................................. 46
4.3.1 Inductively coupled plasma-optical emission
spectrometer ............................................................
45
4.3.2 Nitrogen physisorption .............................................. 45
4.3.3 Scanning Electron Microscope .................................. 45
4.3.4 X-ray diffraction ........................................................ 46
4.3.5 Temperature-programmed reduction ......................... 46
4.3.6 NH3 Temperature programmed desorption ............... 46
4.4 Raw material characterization ........................................... 47
4.4.1 Individual fatty acid content (GC/MS/MS) ............... 47
4.4.2 Fourier transforms infrared Spectroscopic method ... 47
4.5 Experimental Setup ........................................................... 47
4.6 Experimental Procedure .................................................... 48
4.6.1 Preparation of Feed Stock.......................................... 48
4.6.2 Reaction Performance Testing................................... 48
4.7 Product Characterization ................................................... 49

x
Page
CHAPTER
V RESULTS AND DISCUSSIONS ........................................... 52
5.1 Characterization of Catalysts ............................................ 52
5.1.1 Inductively coupled plasma-optical emission
spectrometer ............................................................
52
5.1.2 Nitrogen physisorption .............................................. 53
5.1.3 Scanning Electron Microscope .................................. 54
5.1.4 X-ray diffraction ........................................................ 55
5.1.5 Temperature-programmed reduction ......................... 57
5.1.6 NH3 Temperature programmed desorption ............... 59
5.2 Raw material characterization ........................................... 60
5.2.1 Individual fatty acid content (GC/MS/MS) ............... 60
5.2.2 Fourier transforms infrared Spectroscopic method ... 61
5.3 Hydroprocessing of Different palm oil feed stock ............ 62
5.3.1 Influence of process conditions ................................. 62
5.3.2 Influence of feed composition ................................... 66
5.3.3 Influence of catalyst................................................... 70
5.3.4 FTIR spectra of product ............................................. 73
VI CONCLUSIONS AND RECOMMENDATIONS .................. 75
6.1 Conclusions ....................................................................... 75
6.2 Recommendations ............................................................. 76

xi
Page
CHAPTER
REFERENCES ............................................................................................... 77
APPENDICES ................................................................................................ 87
APPENDIX A CALCULATION FOR CATALYST
PREPARTION .................................................................................
88
APPENDIX B PROGRAM SIMULATED DISTILLATION OF
GAS CHROMATOGRAPHY WITH FLAME
IONIZATION DETECTOR......................................
91
APPENDIX C DATA OF CALCULATION OF TOTAL ACID
SITE ..........................................................................
99
VITA ............................................................................................................... 101

xii
LIST OF TABLE
TABLE Page
1.1 Physical properties of biodiesel ..................................................... 1
2.1 Glyceride Composition of CPO, RPS Palm oil, RPS Palm olein
and RPS Palm stearin ....................................................................
13
2.2 Standard test physicochemical properties of the organic liquid
products ..................................................................................................
14
2.3 The physiochemical properties standard of the organic liquid
products from hydroprocessing .........................................................
15
2.4 Cetane number of normal and iso-paraffins .................................... 16
2.5 Component of n-C5 to n-C44 alkanes in calibration mixture .........
21
2.6 Distillation data in specified temperature range ............................ 23
2.7 Physical properties of nickel.......................................................... 24
2.8 Physical properties of cobalt.......................................................... 25
2.9 Physical properties of molybdenum .............................................. 26
4.1 Operating condition for hydroprocessing ...................................... 48
4.2 Operating condition for gas chromatograph equipped with flame
ionization detector ...........................................................................
50
5.1 The composition of catalysts as determined by ICP-OES ..................... 52
5.2 Typical properties of the catalysts ................................................. 53
5.3 Total acid sites of oxide catalysts .................................................. 59
5.4 The weight percentages of fatty acid composition in DPO, RPS
Hard and RPS Soft .........................................................................
60
xiii
TABLE Page
5.5 The properties of DPO, refined bleached deodorisied palm soft
and hard stearin (From OLEEN Company Limited) .....................
61
5.6 The optimum value of various feeds and catalysts ........................ 69
B.1 Conditions use in gas chromatography with flame ionization
detector ..........................................................................................
92
B.2 Results from chromatogram of calibration mixture reference....... 94
B.3 Distillation GC calibration initial setting ...................................... 95
C.1 Area of NH3 TPD curve for calculation of total acid site ..................... 99

xiv
LIST OF FIGURES
FIGURE Page
2.1 Reaction pathway for conversion of triglycerides to alkanes ........ 5
2.2 Reaction pathway of carboxylic acid to enol form ........................ 5
2.3 Reaction pathway of enol from to alkane ......................................... 6
2.4 Mechanism of the hydrodeoxygenation reaction pathway for the
removal of 0xygen from triglyceride .............................................
6
2.5 Mechanism of the hydrodecarboxylation reaction pathway for the
removal of oxygen form triglyceride .............................................
7
2.6 Mechanism of the hydrodecarbonylation reaction pathway for the
removal of oxygen form triglyceride .............................................
8
2.7 A simplified diagram for the cycle ................................................ 9
2.8 Palm oil refining processes ............................................................ 12
2.9 Calibration curve ........................................................................... 19
2.10 Graph of n-C5 to n-C44 alkanes at various times in calibration
mixture ...........................................................................................
19
2.11 Calculating the elution amou ......................................................... 22
2.12 Distillation characteristics curve ................................................... 22
2.13 Thermal transformations of different types of starting material.... 27
3.1 Schematic representation of the different reaction pathways for
the removal of triglyceride oxygen by hydrodeoxygenation (--)
and decarboxylation (--) ..........................................................................
30
4.1 Flow diagrams of synthesis metal sulfided catalysts ..................... 44
4.2 Illustrated of Shaking Batch Reactor ............................................. 47
5.1 N2 adsorption-desorption isotherm ................................................ 53

xv
FIGURE Page
5.2 SEM-EDX images of NiMo/Al2O3 oxide and sulfided catalyata .... 54
5.3 SEM-EDX images of CoMo/Al2O3oxide and sulfided catalysts ..... 55
5.4 XRD patterns of Al2O3 support, NiMo/Al2O3 and CoMo/Al2O3
catalysts ..............................................................................................
56
5.5 XRD patterns of NiMo/Al2O3 and CoMo/Al2O3 oxide and sulfided
catalysts ..............................................................................................
56
5.6 TPR profiles of the NiMo/Al2O3 oxide catalyst ............................... 57
5.7 TPR profiles of the CoMo/Al2O3 oxide catalyst............................... 58
5.8 NH3 profiles of reduced catalysts NiMo/Al2O3 and CoMo/Al2O3 ... 59
5.9 FTIR spectra of DPO, RPS Soft and RPS Hard ............................... 61
5.10 Temperature effect on diesel yield and gasoline yield(as vol% of
total liquid product). All experiment were perform at P=50 bar,
NiMo/Al2O3 sulfided catalyst and time of reaction 4 hr.................
63
5.11 Temperature effect on diesel yield and gasoline yield (as vol% of
total liquid product). All experiment were perform at P=50 bar,
CoMo/Al2O3 sulfided catalyst and time of reaction 4 hr ................
64
5.12 Time effect on diesel conversion and diesel selectivity. All
experiment were perform at P=50 bar, NiMo/Al2O3 sulfided
catalyst and reaction temperature at 390ᵒC ......................................
65
5.13 Time effect on diesel conversion and diesel selectivity. All
experiment were perform at P=50 bar, CoMo/Al2O3 sulfided
catalyst and reaction temperature at 390ᵒC ......................................
65
5.14 Fatty acid compositions of various feeds ........................................ 66
5.15 The conversion, diesel selectivity, gasoline selectivity and diesel
yield of various feed stocks ...............................................................
67

xvi
FIGURE Page
5.16 The conversion, diesel yield and gasoline yield of various feed
stocks of CoMo sulfided catalysts. (Figure 5.15A. 360ᵒC 50 bar 4
hours and Figure 5.15B 390ᵒC 50bar 4hour) ...................................
68
5.17 A Ratios of C15/C16 and B. Ratio of C17/C18 to study of catalyst
effect (360 ᵒC 50 bar 4h) ...................................................................
71
5.18 A Ratios of C15/C16 and B Ratios of C17/C18 for effect of
temperature to CoMo catalyst (50 bar with 4h) ..............................
72
5.19 FTIR spectra of product of RPS soft stearin of 2 hours and NiMo
sulfided catalyst .................................................................................
73
5.20 FTIR spectra of product of RPS soft stearin 360ᵒC 50bar on
CoMo sulfided catalyst ..................................................................
74
B.1 Chromatogram of calibration mixture reference ............................. 93
B.2 Chromatogram of data analysis ........................................................ 93
B.3 Calculated distillation data ............................................................... 96
B.4 Distillation curve ............................................................................... 97
B.5 Distillation data in specified temperature range ............................ 97
B.6 ASTM D-86 ....................................................................................... 98
C.1 Calibration curve of ammonia ....................................................... 100

CHAPTER I
INTRODUCTION
1.1. Rationale
Rapid industrialization and development has continued to heighten the
demand for petroleum oil. Consequently, concerns regarding the increase in
petroleum prices, energy security, global warming and environmental problem has
been raised(Ong et al., 2011). Moreover, many critics have pointed out that fossil
fuels are not considered sustainable in terms of economic feasibility, ecology and
environment (Kamm et al., 2006). For these reasons, renewable energy resources are
urgently explored to substitute the fossil fuels (Dennis Y.C. Leung et al., 2010). One
of the alternative fuel options with the highest potential is the biofuel, especially the
biodiesel (Fernando et al., 2006). Biodiesel is an alternative fuel for diesel engines
produced by the chemical reaction of vegetable oil or animal fat. The physical
properties of biodiesel are a clear yellow liquid with similar viscosity to petroleum
diesel as shown in Table 1. Biodiesel is non-flammable, non-explosive with a flash
point of 423 K compared to 337 K for petroleum diesel (Fernando et al., 2006)
Table 1.1 Physical properties of biodiesel (Demirbas et al., 2009).
Common name Biodiesel
Common chemical name Fatty acid (m)ethyl ester
Chemical formula range C14-C24 methyl esters or C15-25H28-48O2
Kinematic viscosity range (mm2/s, at
313K)
3.3-5.2
Density range (kg/m3, at 288K) 860-894
Boling-point range (K) >457
Flash-point range (K) 420-450
Distillation range (K) 470-600
Vapor pressure (mm Hg, at 295K) <5
Solubility in water Insoluble in water
Physical appearance Light to dark yellow, clear liquid
Odor Light musty/soapy odor
Biodegradability More biodegradable than petroleum
diesel
Reactivity Stable, but avoid strong oxidizing agents

2
The conventional method for producing biodiesel is trans-esterification of oil
and fat. Trans-esterification of triglyceride with methanol or ethanol produced fatty
acid methyl or ethyl ester (FAME, FAEE) which is called first generation biodiesel.
However, fatty acid methyl ester from trans-esterification, the first generation of
biodiesel, have several limitations e.g. low oxidation resistance, low compatibility
with diesel engine and a glut of glycerol by-product (Alexander Guzman., 2010,
Kiatkittipong et al., 2010).
Nowadays, the advanced biodiesel research is focused on hydrotreated
vegetable oil which is called second generation biodiesel. The hydrotreated biodiesel
(HBD) becomes more attractive for utilization as renewable energy for diesel engine.
For this method, the transformation of triglyceride present in vegetable oils or animal
fats are converted to hydrocarbons, mainly to n-alkanes at the temperatures above
300–360 ˚C and pressure at least 3 MPa leaving propane, CO2 and water as side-
products (da Rocha Filho et al., 1993). The main advantages of the hydrotreated
biodiesel are the higher heating content than from FAME, high cetane number and
low capital costs and operating costs (Mikkonen., 2008).
Palm oil is the highest potential feedstock for biodiesel production in
Thailand; however, as the food vs. fuel debate, many researchers are turning their
focus to utilizing inedible or waste oil. In order to render the oils to an edible form,
the impurities (non-glycerides) were removed. The highest impurities are gums
(phospholipids, phosphotides). Firstly, an impurity called gum in crude palm oil
(CPO) was removed by precipitation process. At this state, we will get degummed
palm oil (DPO). The DPO is then bleached to remove any undesirable impurities such
as pigments and trace metals giving a bleached palm oil (BPO). Next, the BPO is
deodorized to eliminate free fatty acid content. This step results in refined, bleached,
deodorized palm oil (RPSPO) and palm fatty acid distillate (PFAD) as a byproduct.
Finally, The RPSPO is fractionated to yield refined palm olein and refined palm
stearin. In this study, DPO, and RPS palm stearin are used as raw materials to produce
biodiesel.
NiMo/Al2O3 and CoMo/Al2O3 were recently employed as catalyst for HBD
production. The catalysts are normally activated by sulfur compound to sulphidation
catalyst form. It is worthy to note that NiMo/Al2O3 and CoMo/Al2O3 were previously
employed as hydrodesulfurization (HDS) catalyst successfully. However, some
researchers found that bimetallic carbides catalyst showed higher activites in
hydrodenitrogenation (HDN) and HDS reactions than that of commercial Ni-
Mo/Al2O3 and Co-Mo/Al2O3 catalysts (Schwartz et al., 2000; Izhar et al., 2006;
Sundaramurthy et al., 2007; Diaz et al., 2003; Ramanathan and Oyama 1995).

3
This present work is investigated in hydroprocessing of DPO and RPS palm
stearin catalyzed by Ni-Mo/Al2O3, Co-Mo/Al2O3 presulfided catalysts in-house
prepared catalysts. Two main products are liquid products and gas products. The main
liquid products are hydrocarbons which identified as C12- C18 alkanes. The calculated
of the yield of diesel (range 250 – 380 ˚C) is following by ASTM-2887-D86
procedure. The influence of operating parameters i.e. H2 pressure, operating
temperature and reaction time on the diesel range yield and product composition are
also discussed.
1.2 Objective
To find the appropriate catalyst and operating condition for the production of
biodiesel via hydroprocessing of different palm-oil feedstocks.
1.3 Scope of work
1. Prepared bimetallic Ni-Mo/Al2O3, Co-Mo/Al2O3 sulfided catalysts with
characterization including Brunauer-Emmett-Teller (BET) surface area analysis,
Coupled plasma-optical emission spectrometer (ICP-OES), Scanning Electron
Microscope (SEM), X-ray diffraction (XRD), temperature-programmed reduction of
hydrogen (H2-TPR) and NH3 Temperature programmed desorption (NH3 –TPD).
2. Perform the experiment of hydroprocessing of, DPO, refined bleached
deodorised palm soft stearin and refined bleached deodosized palm hard stearin in a
shaking batch reactor under various operating temperature and reaction time by using
Ni-Mo/Al2O3, Co-Mo/Al2O3 sulfided catalysts.
3. The product composition was analyzed by using gas chromatography with
flame ionization detector (FID) and yield of diesel range is calculated form simulated
distillation following by ASTM-2887D-68 and Fourier transforms infrared
Spectroscopic method (FT-IR).

CHAPTER II
THEORY
This chapter describes the background information of hydroprocessing of
vegetable oil, the mechanism of reaction, raw-material for biodiesel production,
properties of diesel, and simulated distillation method.
2.1 Mechanism of hydroprocessing
Hydrotreating and hydrocracking are occurred in hydroprocessing which
hydrotreating is heteroatom removal such as sulfur and nitrogen while hydrocracking,
is saturation and breakage of C–C bonds in order to produce high quality gasoline and
diesel molecules (Scherzer and Gruia., 1996). Hydrotreating has been used to produce
straight chain alkanes ranging from n-C15 – n-C18 from other vegetable oil and fat.
Owing to a removal of oxygen from triglyceride molecule, there are two possible
deoxygenation approaches: (i) hydrodeoxygenation and (ii) decarboxylation. For the
first approach, oxygen is removed in the form of water while for another one it is
removed as CO2 (Donnis., 2009). The hydrocracking reactions produced not only
normal alkanes but also cycloalkanes, aromatics and carboxylic acids where the
decarboxylation and decarbonylation are take place (da Roch Filho et al., 1993).
Accordingly several reactions have an important role in the hydroproceesing such as
hydrodenitrogenation (HDN), hydrodesulfurization (HDS), hydrodeoxygenation
(HDO), hydrogenation (HYD) and hydrodemetallization (HDM). The various feed,
operating condition and type of catalyst have an effect on these reactions (Furimsky.,
2003).
A reaction pathway for conversion of triglycerides into alkanes is shown in
Figure 2.1. For the first step, double bonds of triglycerides are at first saturated. The
hydrogenated triglycerides are broken down into various intermediates by
hydroprocessing. The next step has mainly three pathways for hydroprocessing of
triglycerides including hydrodeoxygenation (hydrogenation/ dehydration),
decarboxylation and decarbonylation. This process also has another reactions such as
water gas shift and methanization as well as isomerization and cracking that can be
described as follows (Huber et al., 2007; Mikulec et al., 2010).

5
Figure 2.1. Reaction pathway for conversion of triglycerides to alkanes.
2.1.1 Hydrodeoxygenation (hydrogenation/dehydration)
Hydrodeoxygenation (HDO) is a hydrogenolysis process that removes
oxygenated compounds from the organic molecule in reaction with hydrogen forming
water using commercial hydrotreating catalysts. There is commonly used Ni-Mo or
Co-Mo on γ-Al2O3, zeolites (ZSM-5), Pd or Pt on carbon as well as alumina. Ni-Mo
sites for hydrogenation reactions and acid catalytic sites for dehydration reactions.
The summarized reactions are shown in Figure 2.2.
Figure 2.2 Reaction pathway of carboxylic acid to enol form.
The carboxylic acids as a reactant which is hydrogenated can be converted
into aldehyde and water. The aldehyde compound is enolized because α-hydrogen can
be isomerized to the enol from, which is the reactive intermediate. On the contrary,
compounds lacking α-hydrogen cannot be isomerized to the enol form (Donnis et al.,
2009).

6
In Figure 2.3 shown the enol form could either be hydrogenated over the
catalyst at the highly reactive oxygen, at the C=C double forming alcohol or forming 1-
alkene and water. The alcohol which is dehydrated can be converted into alkane and
water. The alkene which is hydrogenated at C=C double can be converted to alkane
(Donnis et al., 2009).
Figure 2.3 Reaction pathway of enol form to alkane.
If non double bond triglycerides are converted by the hydrodeoxygenation
route. The products for this mechanism are water, propane and three normal alkanes
of the full length of fatty acid chains in Figure 2.4. By this reaction, one mole of
triglyceride reacts with 12 moles of hydrogen. The products are forms one mole of
propane, six moles of water, and three moles of normal alkanes of the full length of
fatty acid (Donnis et al., 2009; Mikulec et al., 2010).
Figure 2.4 Mechanism of the hydrodeoxygenation reaction pathway for the removal
of oxygen form triglyceride.

7
2.1.2 Hydrodecarboxylation
Hydrodecarboxylation (HDC) consists of decarboxylation (CO2
elimination) of compounds containing carboxylic functional group and hydrogenation
of the unsaturated intermediates of CO2 elimination. The primary product of this
reaction is CO2 and it may undergo further reactions, particularly hydrogenation,
which is undesired since it causes significant increase in hydrogen consumption.
Therefore, there are many attempts to achieve selective decarboxylation without CO2
hydrogenation. In this path way, it is required less hydrogen consumption. Due to the
saturated triglycerides are converted by the decarboxylation route, the carbon dioxide,
propane and three normal alkanes with carbon numbers one less than fatty acid chains
are produced as show in Figure 2.5. The products are forms one mole of propane,
three moles of carbon dioxide and three moles of a normal alkanes one carbon atom
shorter than the full length of fatty acid (Donnis et al., 2009; Mikulec et al., 2010).
Figure 2.5 Mechanism of the hydrodecarboxylation reaction pathway for the removal
of oxygen form triglyceride.
2.1.3 Hydrodecarbonylation
The decarbonylation is chemical reaction which the carboxylic group
is reacted with hydrogen for removal one or more carbonyl groups from a molecule to
produce a methyl group, carbon monoxide and water. In case of the saturated
triglycerides are converted by the decarbonylation route. The products for this
mechanism are carbon monoxide, water, propane and three normal alkanes with
carbon numbers one less than fatty acid chains in Figure 2.6. As a result of this, one
mole of triglyceride reacts with 6 moles of hydrogen. The products are forms one
mole of propane, three moles of carbon monoxide, three moles of water and three
moles of a normal alkanes one carbon atom shorter than the full length of fatty acid
(Donnis et al., 2009; Mikulec et al., 2010).

8
Figure 2.6 Mechanism of the hydrodecarbonylation reaction pathway for the removal
of oxygen form triglyceride.
2.1.4 Isomerization and cracking
The isomerization and cracking reaction produce isomerized and
lighter alkanes which the normal alkanes from triglyceride can undergo. High cetane
number is required for a good diesel production which desired to minimize the
isomerization and cracking reactions (Huber et al., 2007).
2.1.5 Water gas shift and methanization
OHCOHCO 222 (2.1)
OHCHH3CO 242 (2.2)
The water gas shift and methanization produce carbon monoxide and carbon
dioxide. The water gas shift is a chemical reaction in which carbon dioxide reacts
with hydrogen to form carbon monoxide and water vapor as shown in Eq. 2.1. To
converted carbon monoxide from water gas reaction reacting with hydrogen into
methane and water vapor is the methanization as shown in Eq. 2.2. The influences of
both reactions are the hydrogen consumption and product yields (Mikulec et al.,
2010).
2.1.6 Hydrodesulfurization
Hydrodesulfurization (HDS) is a catalytic chemical process which
removes sulfur (S) from natural gas and from refined petroleum products such as

9
gasoline or petrol, jet fuel, kerosene, diesel fuel, and fuel oils (Gary et al., 1984). The
purpose of removing the sulfur is to reduce the sulfur dioxide (SO2) emissions that
result from using those fuels in automotive vehicles, aircraft, railroad locomotives,
ships, gas or oil burning power plants, residential and industrial furnaces, and other
forms of fuel combustion.
There is a wide range of organic sulfur compounds, including thiols,
thiphenes, organic sulfides and disulfides contain in the refinery HDS feedstocks.
These organic compounds are produced by degradation of sulfur containing biological
components, present during the natural formation of fossil fuel, petroleum crude oil.
In order to prevent poisoning of the noble metal catalysts in the subsequent catalytic
reforming of the naphthas, it is necessary to remove the total sulfur down to the parts
per million ranges or lower.
The general HDS catalysts are based on molybdenum disulfide (MoS2)
with smaller amounts of other metals (Topsøe H et al., 1996). At the edges of the
MoS2 crystallites, the molybdenum center can stabilize a coordinatively unsaturated
site, also known as an anion vacancy. Substrates, such as thiophene, bine to this site
and undergo a series a reactions that result in both C-S scission and C=C
hydrogenation. Therefore, the hydrogen serves multiple roles to generate of anion
vacancy by removal of sulfide, hydrogenation and hydrogenolysis as show in the
figure 2.7
(http://en.wikipedia.org/wiki).
Figure 2.7. A simplified diagram for the cycle.

10
There are two parallel pathways for the hydrodesulurization reaction.
These are hydrogenation and hydrogenolysis which the hydrogenolysis occurs first
and the product moieties are hydrogenated the unsaturated heterocycle to a saturated
species.
Two reactions occurred in hydrodesulfurization process are:
(I) Hydrogenation of unsaturated compounds which occurs during
hydrodesulfurization, and the reaction rates are significant compared
with hydrodesulfurization;
S
2H catalyst
S
(II) Hydrogenolysis that is results in cleavage of a C-S bond;
SHRHHSHR 22
The hydrodesulfurization reactions are practically irreversible at
temperatures and pressures ordinary applied, roughly 300 to 450˚C and up to 200 atm.
The reactions are exothermic with heats of reaction of the order of 10 to 20 kcal/mol
of hydrogen consumed. Coking of catalysts not occur only poisons a catalyst surfaces
but also contribute to blocking of the catalyst pores and fixed-bed interstices (Gates et
al., 1979).
2.2 Raw material
The most suitable raw material for producing high quality engine fuels is
triacylglycerols (TAG) present in vegetable oils or animal fats which give their high
molecular weight and low volatility of the use in diesel engines without construction
changes of the engines (Mikulec et al., 2010). The sustainable biomass resource as a
renewable feedstock being used for production of biofuels is the vegetable oils (Huber
et al,. 2007). The source for biodiesel production is usually chosen according to the
availability in each country. Malaysia, Indonesia and Thailand also have surplus palm
oil and coconut oil which is utilized for the synthesis of biodiesel. However, some
Asian countries are not self-sufficient in edible oil and exploring non-edible oil like
Jatropha and waste cooking as biodiesel raw materials. For palm oil in Thailand or
known as refined palm olein which is achieved from the refinery of crude palm oil,
mostly used as bio resource for biodiesel production. Typically, crude palm oil always
contains high amount of fatty acids (FFAs) and presence of the soap formation during
the transesterification reaction but it could be suitable for hydrotreating reaction.
Moreover, the most of FFAs in crude palm oil is removed via the refinement of crude
11
palm oil (CPO) to purified palm oil (PPO) as called palm fatty acid distilled or PFAD
with high contain of FFA is also used as an economically promising feedstock for
biodiesel production (Shotipruk et al., 2009). There is a degummed palm oil (DPO)
which is resulting from removed gums from crude palm oil also used as a feedstock
for biodiesel production.
2.2.1 Degummed palm oil (DPO)
DPO is a byproduct from the refining process of palm oil to palm
olein. From the refining process, palm oils were removed gum by precipitant step that
give degummed palm oil as a byproduct as shown in Figure .
2.2.2 Refined Bleached Deodorised Palm Stearin (RBD palm stearin)
RBD Palm Stearin ia solid fraction obtained by the fraction of palm oil
after crystallization at controlled temperature from the refining process of crude palm
oil. The refining process consists of 3 major steps:
1. Degumming: To condition gums (phosphatides) and oxidative trace metals
(such as copper and iron) with food grade phosphoric acid, citric acid, EDTA
etc, for later removal with the spent earth after the bleaching stage.
2. Bleaching: To remove pigments, oxidation products, residual trace metals and
phosphatides and soaps.
3. Steam refining/deodorization: To remove fatty acids, pigments (e.g.
caoptenoids)
Fully-refined palm oil (RPO) is an off-white solid in cold climates, a
yellowish semi-solid at room temperature, and a yellowish liquid when heated to
about 45ᵒC. The RPO may be fractionated into its liquid component, which is called
palm olein, and its solid component, which is called palm stearin.
Palm olein is popular used for frying applications and often blended
with other oils such as Canola to improve their stability and shelf life and to minimize
smoke formation during high-temperature frying applications.

12
Figure 2.8 Palm oil refining processes (Haslenda et al., 2011).
Palm stearin is utilized for high temperature industrial frying
applications such as in the production of instant noodles. Palm stearin is free of trans-
fatty acids, and is used as a replacement for hydrogenated oil such as soyabean and
Canola and also be utilized in non-edible applications as in the manufacture of soaps
and candles. It contains mainly of triglyceride with minimal of fatty acids causing by
pass through the refining process. Y.B. Che Man and co-workers are investigated in
the composition and thermal profile of crude palm oil and its products which found
the triglycerides composition of RPS palm oil were quite similar to triglycerides
composition of crude palm oil (CPO). The results showed that CPO, refined palm
stearin, refined palm olein and superolein consist mainly of monosaturated and
disaturated triglycerides while refined palm stearin consists of mainly of disaturated
and trisaturated triglycerides as shown in table 2.1.
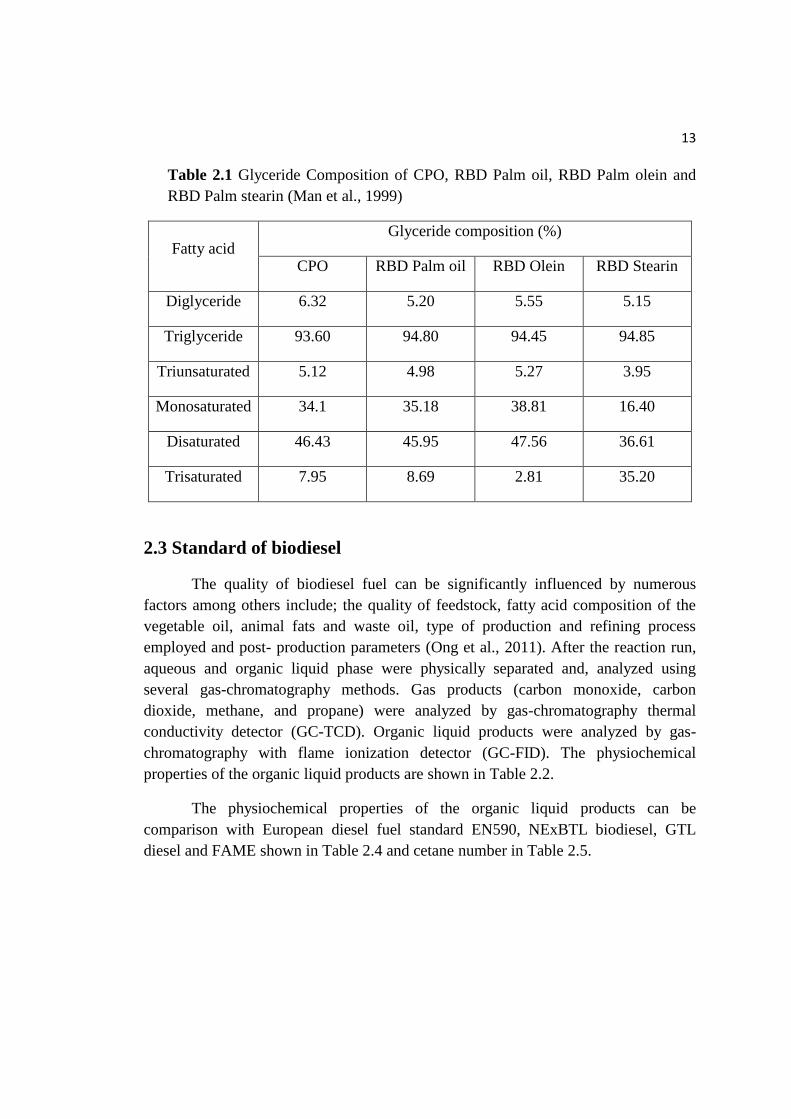
13
Table 2.1 Glyceride Composition of CPO, RBD Palm oil, RBD Palm olein and
RBD Palm stearin (Man et al., 1999)
Fatty acid Glyceride composition (%)
CPO RBD Palm oil RBD Olein RBD Stearin
Diglyceride 6.32 5.20 5.55 5.15
Triglyceride 93.60 94.80 94.45 94.85
Triunsaturated 5.12 4.98 5.27 3.95
Monosaturated 34.1 35.18 38.81 16.40
Disaturated 46.43 45.95 47.56 36.61
Trisaturated 7.95 8.69 2.81 35.20
2.3 Standard of biodiesel
The quality of biodiesel fuel can be significantly influenced by numerous
factors among others include; the quality of feedstock, fatty acid composition of the
vegetable oil, animal fats and waste oil, type of production and refining process
employed and post- production parameters (Ong et al., 2011). After the reaction run,
aqueous and organic liquid phase were physically separated and, analyzed using
several gas-chromatography methods. Gas products (carbon monoxide, carbon
dioxide, methane, and propane) were analyzed by gas-chromatography thermal
conductivity detector (GC-TCD). Organic liquid products were analyzed by gas-
chromatography with flame ionization detector (GC-FID). The physiochemical
properties of the organic liquid products are shown in Table 2.2.
The physiochemical properties of the organic liquid products can be
comparison with European diesel fuel standard EN590, NExBTL biodiesel, GTL
diesel and FAME shown in Table 2.4 and cetane number in Table 2.5.

14
Table 2.2 Standard test physiochemical properties of the organic liquid products
(Walendziewski et al., 2009; Guzman et al., 2010)
Properties Solution Method
European diesel
fuel standard
(EN)
ASTM
Total acid number
(TAN)
titration of the
sample with KOH
solution PN 85/C-
04066
ASTM D-664
ASTMD974
Carbon and hydrogen ASTM D-5291
Cetane index ASTM D-4737
Thermal stability ASTM D-6468
Thermal stability ASTM D-6468
Simulated distillation ASTM D-7213
ASTM-2887-
D86
Contents o f ester bonds,
aromatic compounds and
carboxylic groups in
hydrorefined products
FTIR method
Density (15°C) aerometer EN ISO 3675,
EN ISO 12185
ASTM D-4052
Kinematical viscosity
(40 °C)
Ubbelohde
viscosimeter
EN ISO 3104 ASTM D-445
Fractional composition EN ISO 3405
Flash point Pensky-Martens-
closed cup
EN ISO2719 ASTM D-93
Cloud point ASTM D-2500
Pour point ASTM D-97
Corrosion ASTM D-130
Color ASTM D-1500
Cold filter plugging point
(CFPP)
EN 116
Bromine number PN-68/C-04520 ASTM D-1159

15
Table 2.3 The physiochemical properties standard of the organic liquid products from
hydroprocessing (Technical Research centre of Finland 2005)
Fuel properties NExBTL
biodiesel
GTL diesel FAME EN590/2005
density @ 15°C
(kg/m3)
775-785 770-785 ≈ 885 ≈ 835
viscosity @ 40°C
(mm2/s)
2.9-3.5 3.2-4.5 ≈ 4.5 ≈ 3.5
Cetane index 84-99 73-81 ≈ 51 ≈ 53
Distillation
10 vol% (°C)
260-270 ≈ 260 ≈ 340 ≈ 200
Distillation
90 vol% (°C)
295-300 325-330 ≈ 355 ≈ 350
Cloud point (°C) -5…-30 0…-25 ≈ -5 ≈ -5
Lower heating
value (MJ/kg)
≈ 44 ≈ 43 ≈ 38 ≈ 43
Lower heating
value (MJ/litres)
≈ 34 ≈ 34 ≈ 34 ≈ 36
Polyaromatics
(wt%)
0 0 0 ≈ 4
Oxygen (wt%) 0 0 ≈ 11 0
Sulfur (mg/kg) ≈ 0 < 10 < 10 < 10

16
Table 2.4 Cetane number of normal and iso-paraffins. (Santana et al., 2006)
N-PARAFFINS CN ISO-PARAFFINS CN
n-Butane 22 2-Methylpentane 33
n-Pentane 30 3-Methylpentane 30
n-Hexane 45 2,3-Dimethylpentane 22
n-Heptane 54 2,4-Dimethylpentane 29
n-Octane 64 2,2,4-Trimethylpentane 14
n-Nonane 72 2,2,5-Trimethylhexane 24
n-Decane 77 2,2-Dimethyloctane 59
n-Undecane 81 2,2,4,6,6-Pentamethylheptane 9
n-Dodecane 87 3-Ethyldecane 47
n-Tridecane 90 4,5-Diehtyloctane 20
n-Tetradecane 95 4-Propyldecane 39
n-Pentadecane 96 2,5-Dimethylundecane 58
n-Hexadecane 100 5-Butylnonane 53
n-Heptadecane 105 2,7-Dimethyl-4,5-diethyloctane 39
n-Octadecane 106 5-Butyldodecane 45
n-Nonadecane 110 7,8-Dimethyltetradecane 40
n-Eicosane 110 7-Butyltridecane 70
7,8-Diethyltetradecane 67
8-Propylpentadecane 48
9-Methylheptadecane 66
5,6-Dibutyldecane 30
9,10-Dimethyloctadecane 60
7-Hexylpentadecane 83
2,9-Dimethyl-5,6-
diisopentyldecane
48
10,13-Dimethyldocosane 56
9-Heptylheptadecane 88
9,10-Dipropyloctadecane 47

17
2.4 Simulated distillation
Simulated distillation (SimDist) is a gas chromatography (GC) method used to
characterize petroleum fractions and products that separates the individual
hydrocarbon components in the order of their boiling points, and is used to simulate
the time-consuming laboratory-scale physical distillation procedure known as true
boiling point (TBP) distillation. The determination of the boiling range distribution of
petroleum fractions by conventional GC is rapid analytical tool, which is widely used
to replace conventional distillation methods for control of refining operations and
specification testing. The separation is accomplished with a non-polar
chromatography column using a gas chromatograph equipped with an oven and
injector that can be temperature programmed. A flame ionization detector (FID) is
used for detection and measurement of the hydrocarbon analysts. The result of
SimDist is reported as a correlation between the boiling points and the percentages of
the sample eluted from the column. The chromatographic elution times of the
hydrocarbons are calibrated to the atmospheric equivalent boiling point (AEBP) of the
paraffins reference material. The SimDist method ASTM (American Society for
Testing and Materials) D2887 covers the boiling range 55–538°C (100–1000°F)
which covers the n-alkanes (n-paraffins) of chain length about C5–C44. The high-
temperature simulated distillation (HTSD) method covers the boiling range 36–750°C
(97–1382 °F) which covers the n-alkane range of about C5–C120. A key difference
between ASTM D2887 and HTSD is the ability of the latter technique to handle
residue-containing samples (i.e. material boiling > 538°C, 1000°F). SimDist and
laboratory-scale physical distillation procedures are routinely used for determining
boiling ranges of petroleum crude oils and refined products, which include crude oil
bottoms and residue processing characterization. The boiling points with yield profile
data of these materials are used in operational decisions made by refinery engineers to
improve product yields and product quality. Data from SimDists are valuable for
computer modeling of refining processes for improvements in design and process
optimization. Precise yield correlations between HTSD and crude assay distillation
(methods ASTM D2892 and D5236) have allowed HTSD to be successfully used in
place of physical distillation procedures. This has given the refiner the ability to
rapidly evaluate crude oils for selection of those with economic advantages and more
favorable refining margins. SimDist methods are becoming more widely used in
environmental applications. HTSD is useful for characterizing hydrocarbons which
can be present as soil and water contaminants; for example, to map and follow
hydrocarbon removal processes.
SimDist became an ASTM standard method in 1973, with the designation
D2887, „„Boiling Range Distribution of Petroleum Fractions by GC‟‟. The current

18
edition is designated D2887-97. This method covers the determination of the boiling
range distribution of petroleum products and fractions having a final boiling point
(FBP) of 538°C (1000°F) or lower at atmospheric pressure. HTSD is a relatively
recent method which extends ASTM D2887 determination of the boiling range
distribution of hydrocarbons to a FBP of about 750°C (1382°F). Technological
advances in capillary GC columns and stationary phases together with either
programmed temperature vaporization (PTV) or on-column injection techniques,
provide adequate separation from C5 to C120 normal paraffins and allows the
characterization of petroleum products from about 36–750°C (97–1382°F). Under the
special conditions of HTSD, elution of materials from the GC column occurs at up to
260–316°C (500–600°F) below their AEBP. For instance, the elution of C110 (AEBP
of 735°C or 1355°F) occurs at a column temperature of about 427°C (800°F). Also
under these conditions, little or no evidence of cracking is normally seen in HTSD
(Villalanti et al., 2000).
2.4.1 Measurement of boiling point distribution using the total
area method
The analysis using a gas chromatograph with a non-polar liquid phase
column is applied for a linear temperature programming method. The hydrocarbons
will be eluted in the order of boiling point. Since the elution time is more or less
directly proportional to the boiling point, a calibration curve of the retention time and
boiling point can be created, as shown in Figure 2.9. Otherwise, the retention time can
be converted into the boiling point. Therefore, by working out the relationship
between the retention time and the boiling point before through the analysis of a
hydrocarbon mixture with a known boiling point (with the gas chromatograph
analysis conditions kept constant), it becomes possible to convert the retention time of
an unknown sample into the boiling point. Furthermore, the total area of the gas
chromatogram obtained is divided into fixed time intervals, and the smaller areas
comprised by each time period are calculated. Since the time interval can be
converted into the boiling point interval, this in effect calculates the gas
chromatogram area for the fraction of a particular boiling point
(http://www.shimadzu.com).

19
Figure 2.9 Calibration curve (http://www.shimadzu.com)
In this study, used calibration mixture 1%wt/wt -An accurately
weighed mixture of approximately equal mass quantities of n-hydrocarbons dissolved
in carbon disulfide (CS2) The mixture shall cover the boiling range from n-C5 to n-
C44, but does not need to include every carbon number shown in Table 2.5 and Figure
2.10.
Figure 2.10 Graph of n-C5 to n-C44 alkanes at various times in calibration mixture
(http://www.Restek.com).

20
In addition, by obtaining the cumulative area through the addition of all the
small areas from the start point onwards, and expressing it as a ratio of the area of the
entire gas chromatogram, the elution amount up to that time will have been
calculated. In Figure 2.11 for example, the cumulative area up to „n‟ consists of „S1‟,
„S2‟, „Sn-1‟, „Sn‟. By figuring out the ratio with respect to the total area „St‟, the
elution amount at „tn‟ is obtained. The data in Figure 2.12 is an example of the elution
amount (corresponds to the amount of distillate). This method is applied to samples
where all the components of the sample are eluted from the column during high
temperature analysis using GC, such as the oil fractions of gasoline, kerosene, and
light oil (http://www.shimadzu.com).
Figure 2.11 Calculating the elution amount. (http://www.shimadzu.com)
Figure 2.12 Distillation characteristics curve. (http://www.shimadzu.com)

21
Table 2.5 Component of n-C5 to n-C44 alkanes in calibration mixture.
(http://www.Restek.com)
Elution
order
Compound CAS# Percent
Purity
Concentration
(weight/weight%)
1 n-Pentane (C5) 109-66-0 99% 0.9995 wt./wt.%
2 n-Hexane (C6) 110-54-3 99% 0.9995 wt./wt.%
3 n-Heptane (C7) 142-82-5 99% 0.9995 wt./wt.%
4 n-Octane (C8) 111-65-9 99% 0.9995 wt./wt.%
5 n-Nonane (C9) 111-84-2 99% 0.9995 wt./wt.%
6 n-Decane (C10) 124-18-5 99% 0.9995 wt./wt.%
7 n-Undecane (C11) 1120-21-4 99% 0.9995 wt./wt.%
8 n-Dodecane (C12) 112-40-3 99% 0.9995 wt./wt.%
9 n-Tetradecane (C14) 629-59-4 99% 0.9995 wt./wt.%
10 n-Pentadecane (C15) 629-62-9 99% 0.9995 wt./wt.%
11 n-Hexadecane (C16) 544-76-3 99% 0.9995 wt./wt.%
12 n-Heptadecane (C17) 629-78-7 99% 0.9995 wt./wt.%
13 n-Octadecane (C18) 593-45-3 99% 0.9995 wt./wt.%
14 n-Eicosane (C20) 112-95-8 99% 0.9995 wt./wt.%
15 n-Tetracosane (C24) 646-31-1 99% 0.9995 wt./wt.%
16 n-Octacosane (C28) 630-02-4 99% 0.9995 wt./wt.%
17 n-Dotriacontane (C32) 544-85-4 98% 0.9991 wt./wt.%
18 n-Hexatriacontane
(C36)
630-06-8 99% 0.9995 wt./wt.%
19 n-Tetracontane (C40) 4181-95-7 97% 0.9986 wt./wt.%
20 n-Tetratetracontane
(C44)
7098-22-8 99% 0.9995 wt./wt.%
Solvent Carbon Disulfide 75-15-0 99%
22
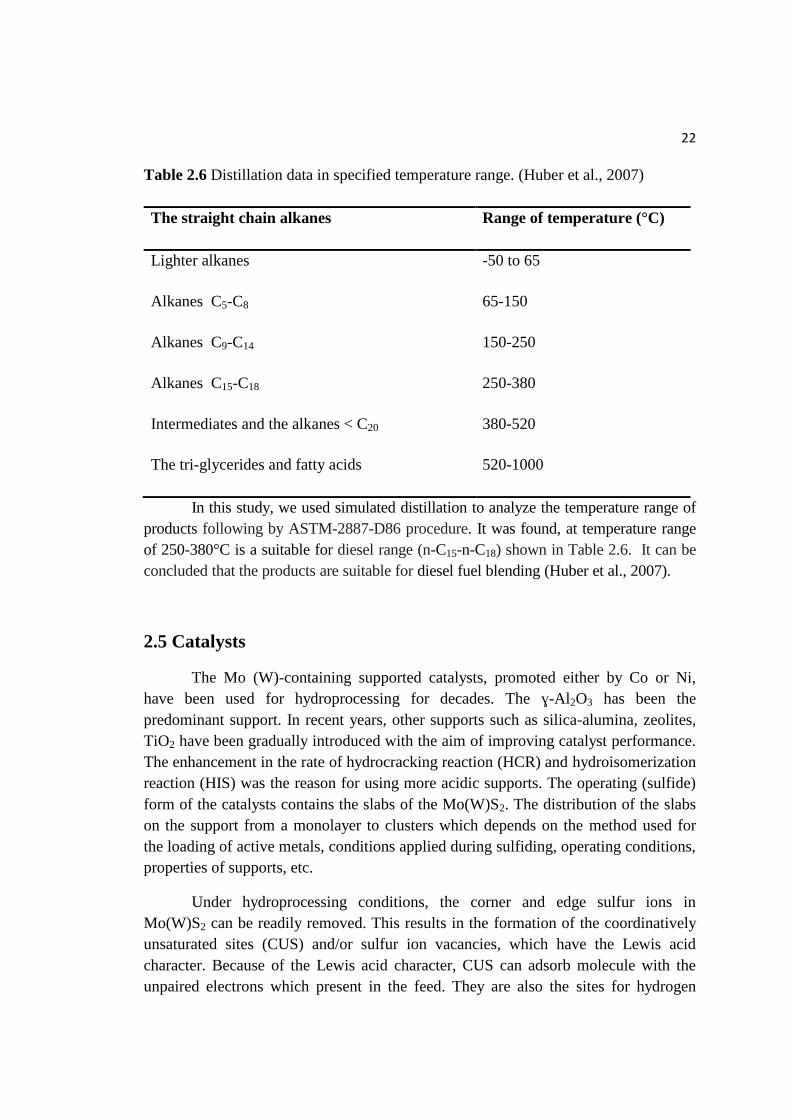
Table 2.6 Distillation data in specified temperature range. (Huber et al., 2007)
The straight chain alkanes Range of temperature (°C)
Lighter alkanes -50 to 65
Alkanes C5-C8 65-150
Alkanes C9-C14 150-250
Alkanes C15-C18 250-380
Intermediates and the alkanes < C20 380-520
The tri-glycerides and fatty acids 520-1000
In this study, we used simulated distillation to analyze the temperature range of
products following by ASTM-2887-D86 procedure. It was found, at temperature range
of 250-380°C is a suitable for diesel range (n-C15-n-C18) shown in Table 2.6. It can be
concluded that the products are suitable for diesel fuel blending (Huber et al., 2007).
2.5 Catalysts
The Mo (W)-containing supported catalysts, promoted either by Co or Ni,
have been used for hydroprocessing for decades. The ɣ-Al2O3 has been the
predominant support. In recent years, other supports such as silica-alumina, zeolites,
TiO2 have been gradually introduced with the aim of improving catalyst performance.
The enhancement in the rate of hydrocracking reaction (HCR) and hydroisomerization
reaction (HIS) was the reason for using more acidic supports. The operating (sulfide)
form of the catalysts contains the slabs of the Mo(W)S2. The distribution of the slabs
on the support from a monolayer to clusters which depends on the method used for
the loading of active metals, conditions applied during sulfiding, operating conditions,
properties of supports, etc.
Under hydroprocessing conditions, the corner and edge sulfur ions in
Mo(W)S2 can be readily removed. This results in the formation of the coordinatively
unsaturated sites (CUS) and/or sulfur ion vacancies, which have the Lewis acid
character. Because of the Lewis acid character, CUS can adsorb molecule with the
unpaired electrons which present in the feed. They are also the sites for hydrogen

23
activation. In this case, H2 may be homolytically and heterolytically split to yield the
Mo-H and S-H moieties, respectively.
Catalytic functionality of a catalyst could not be established without its ability
to activate hydrogen. The active hydrogen id subsequently transferred to the reactant
molecules adsorbed on or near CUS. Part of the active hydrogen can be spilt over on
the support and to a certain extent protect slabs of the active phase from deactivation
by coke deposits. The promoters, such as Co and Ni decorate Mo(W)S2 crystals at the
edges and corners sites of the crystals. In the presence of promoters, CUS are
considerably more active than those on the metal sulfide alone. Consequently, the rate
of hydrogen activation is enhanced. The H2S/H2 ratio is the critical parameter for
maintaining the optimal number of CUS. It has been confirmed that above 673 K, the
–SH moieties on the catalyst surface possess the Bronsted acid character. The
presence of the Bronsted acid sites is desirable for achieving a high rate of
hydrodenitrogenation (HDN). In addition, the formation of coke and metal
(predominantly V and Ni) deposits on CUS will diminish the availability of active site
(Marafi et al., 2010).
2.5.1 Nickel
Table 2.7 Physical properties of nickel (http://en.wikipedia.org/wiki)
Property Value
atomic number 28
atomic weight 58.69
melting point, oC 1453
latent heat of fusion, Hfus kJ/mola 7.48
boiling point, oC 2732
latent heat of vaporization at bp, Hvap kJ/mola 377.5
specific heat, kJ/(mol.K)a 25
oC 26.07
coefficient of thermal expansion, µm·m−1
·K−1 o
C-1
13.4
thermal conductivity at 27 oC, W/(m.K) 90.9
Curie temperature, oC355 355
Young‟s modulus, Gpac 200

24
Nickel is a chemical element with the atomic number 28. It is a silvery-
white lustrous metal with a slight golden tinge. It uses in certain alloys that will retain
a high silvery polish. The metal is chiefly valuable in the modern world for the alloys
it forms; about 60% of the world production is used in nickel-steels (particularly
stainless steel). The most of the remainder of the world nickel use with chemical uses
for nickel compounds. As a compound, nickel has a number of niche chemical
manufacturing uses, such as a catalyst for hydrogenation. The physical properties of
the nickel are shown in Table 2.7 (http://en.wikipedia.org/wiki).
2.5.2 Cobalt
Cobalt is a chemical element with atomic number 27. It is found
naturally only in chemically combined form. The free element, produced by reductive
smelting, is hard, lustrous, silver-gray metal. Nowadays, some cobalt is produced
specifically from various metallic-lustered ores, but the main source of the element is
as a byproduct of copper and nickel mining. Cobalt occurs naturally as only one stable
isotope, cobalt-59. Pure cobalt is not found in nature, but compounds of cobalt are
common. It is a weakly reducing metal that is protected from oxidation by a
passivating oxide film and attacked by halogens and sulfur. Physical properties of
cobalt are shown in Table 2.8.

25
Table 2.8 Physical properties of cobalt (Othmer 1991)
Property Value
Atomic number 27 Atomic weight 58.93 Heat of transformation, J/g
a 251 Melting point,
oC 1493
Latent heat of fusion, Hfus J/ga 395
Boiling point, oC 3100
Latent heat of vaporization at bp, Hvap kJ/ga 6276
Specific heat, J/(g.oC)
a
15-100oC 0.442
molten metal 0.560
Coefficient of thermalexpansion, oC
-1
cph at room temperature 12.5
fcc at 417oC 14.2
Thermal conductivity at 25 oC, W/(m
.K) 69.16
Curie temperature, oC 1121
Young‟s modulus, Gpac 211

26
2.5.3 Molybdenum
Molybdenum is a group 6 chemical element with atomic number 42. It
readily forms hard, stable carbides, and for this reason it is often used in high-strength
steel alloys. Molybdenum does not occur as a free metal on earth, but rather in various
oxidation states in minerals. Industrially, molybdenum compounds are used in high-
pressure and high-temperature applications, as pigments and catalysts
(http://en.wikipedia.org/wiki). Table 2.9 is shown the physical properties of
molybdenum.
Table 2.9 Physical properties of molybdenum (http://en.wikipedia.org/wiki)
Property Value
atomic number 42
atomic weight 95.96
melting point, oC 2610
latent heat of fusion, Hfus kJ/mol 37.48
boiling point, oC 4825
latent heat of vaporization at bp, Hvap kJ/mol 598
specific heat, J/(molK) 25oC 24.06
coefficient of thermal expansion, oC
-1 4.8 µm·m
−1·K
−1
thermal conductivity at 27 oC, W/(mK) 138
Young‟s modulus, GPa 329

27
2.5.4 Aluminium oxide
Aluminium oxide is an amphoteric oxide with the chemical formula
Al2O3. It is commonly referred to as alumina (α-alumina), or corundum in its
crystalline form, as well as many other names, reflecting its widespread occurrence in
nature and industry. Alumina can exist in many metastable phase before transforming
to the stable form of alumina in which the stable form of alumina was well known as
α-alumina or corundum from. There are six principle phase namely by the Greek
letters, composed that chi (), kappa (), eta (), theta (), delta (), and gamma ().
Each of their phases, has a unique crystal structure and properties. The several phases
depend on many factors such as calcination temperature, heating environment, as
called heat treatment condition. Additionally, Aluminum hydroxide minerals are the
main component of bauxite, the principal ore of aluminium. A mixture of the minerals
comprise bauxite ore, including gibbsite (Al(OH)3), boehmite (ɣ-AlO(OH)), and
diaspora (α-AlO(OH)), along with impurities of iron oxides and hydroxides, quartz
and clay minerals which effect to the nature of the product as illustrated in Figure
2.13. It shows thermal transformation scheme of different types of starting material
that among of various crystalline phases of alumina, ɣ-Al2O3 is probably the most
important inorganic oxide refractory of widespread technological importance in the
field of catalysis, also used as catalyst support. In addition, ɣ-Al2O3 is an
exceptionally good choice for catalytic applications because of a defect spinel crystal
lattice that imparts to it a structure that is both open and capable of high surface area
(Yang et al., 2007, http://en.wikipedia.org/wiki).
Figure 2.13 Thermal transformations of different types of starting material (Santos
et al., 2000).

28
2.6 Presufurization method
The hydrotreating catalysts are commonly sulfided CoMo/Al2O3 and
NiMo/Al2O3. The promoter may be added to lower the acidity of the catalyst and
improve Mo dispersion and sulfidability. Mo and Ni are regarded as the active species
in hydrotreating catalysts. The form of active metal species in the sulfurized catalysts
is rather complicated, and the precise structure of sulfided catalyst is still under
debate. Nominally, MoS2, Ni3S2, and mixed sulfides (Co-Mo-s, etc) are some of
examples. Presulfurization is an essential process for activation of hydrotreating
catalyst in the oxidic form. There are many procedures for presulfiding catalyst. The
conventional process is insitu presulfurization (IPRES), which used to sulfurize the
pre-loaded catalyst in the reactor by introducing a sulfurizing agent. Moreover, ex situ
presulfurization (EPRES) is the process in which the catalyst is sulfuruzed or partially
sulfurized before loading the catalyst into the reactor. Comparing two of these
procedures, ex situ presulfurization takes much shorter of treating time, hence
significantly increases production efficiency. The key point with the ex situ
presulfurization (EPRES) process of hydrotreating catalysts is to take advantage of
using combined sulfur-containing agents as the sulfur source and the reducing the loss
of sulfur from the EPRES catalysts. The impregnation method was mainly used for
introducing sulfurizing agent and different kinds of solvents are essential to dissolve
the sulfurizing agent.
The more accomplish of different ex situ presufurization were investigated
since 1980s‟. Staring with EURECAT first adopted organic polysulfide as sulfurizing
agent to achieve presulfurization in two steps (Berrebi et al., 1991). Later on
EURECAT also used (NH4)2S as sulfur-containing additives and elemental S or H2S
as the sufurizing agents (Berrebi et al., 1992, Dufresne et al., 1995, Dufressne et al.,
2002). CRITEIRON used element S as the sulfurizing agent and high boiling point oil
or liquid hydrocarbon as the solvent (Seamans et al., 1990).

CHAPTER III
LITERATURE REVIEW
This chapter consists of the research reviews of the biodiesel production via
hydroprocessing reaction. In this reviews, there are many useful knowledge such as
raw material, operating condition, and catalyst selection, analysis of product,
advantages and drawback of their strategies.
3.1 Raw material
The sustainable biomass resource as a renewable feedstock being used for
production of biofuels is the vegetable oils (Huber et al,. 2007). Because of the food
and fuel debate, there are many attempts has been made to produce biodiesel from
non-edible plant oils such as mahua (Ghadge and Raheman, 2005), tobacco
(Veljkovic et al., 2006), rubber seed oil (Ramadhas et al., 2005), Jatropha curcas (Ong
et al., 2011), waste oils such as waste cooking oils (Leung and Guo, 2006), waste
tallow (Bhattie etal., 2008) and animal fats (Canakci and van Gerpen, 2001) as cheap
feedstocks for biodiesel production. Malaysia, as one of the biggest palm oil
producers and exporters in the world, is producing large amounts of low-grade oil
from palm oil industries such as degummed palm oil (DPO), palm fatty acid distillate
(PFAD) and sludge palm oil (SPO). The DPO is a byproduct of degumming step with
mainly composes of gums and free fatty acid (http://www.andrew.cmu.edu).
Similarly with degummed palm oils, PFAD recovered from deodorization process
which rich in free fatty acid content. It is commonly used as raw materials in
producing medium-grade cleaners, animal feeds, plastics and other intermediate
products for the oleochemical industries (Haslenda, Jamaludin, 2011). There are many
studies that demonstrated the potential use of the local palm fatty acid distillate
(PFAD) as alternative feedstock for fatty acid methyl ester (FAMEs) production such
that the study of the possibility to replace the conventional acid-catalyzed
esterification process (with H2SO4) with non-catalytic process in supercritical
methanol by esterification of palm fatty acid distillate (Shotipruk et al., 2009).
Another research PFAD, a byproduct from the production of consumable palm oil,
with a free fatty acid content of 93 wt% was used as a feedstock for biodiesel

30
production with mild operating conditions and continuous overflow production
(Chongkhong et al., 2009).
3.2 Reaction condition of hydroprocessing process
Hydroprocessing of triglycerides includes the following major reactions:
hydrogenation of unsaturated bonds in alkyl chains of carboxylic acid and
hydrodeoxygenation of fatty acids (Kikhtyanin et al., 2010). The hydrogenation
reaction is quite similar to those of hydrodesulfurization (HDS), which is convert
sulfur-containing molecules into H2S. Therefore, the hydrogenation of oils and fats
can take place desulfurization unit. Donnis et al., 2009 studied mechanism of overall
reaction for the hydrogenation between triglycerides and hydrogen. This study
describes the three carboxylic acids are stepwise liberated and hydrogenated into
straight chain alkanes of the same length or one carbon atom shorter. Then the
backbone of the triglycerides is converted into propane, water, carbon monoxide,
carbon dioxide and methane. These products will be considerable due to appropriated
conditions and suitable catalyst. The proposed reaction mechanism, which can be
explained the path way of these products, involve at least three reaction pathways as
hydrodeoxygenation, decarboxylation and decarbonylation.
One mechanism is hydrodeoxygenation (HDO) reaction (see the unbroken red
lines in Figure 3.1), which occurs via the absorbed enol intermediate. The products for
this mechanism are water, propane and three normal alkanes of the full length of fatty
acid chains. The others mechanism, which are called decarboxylation and
decarbonylation (see the broken blue lines in Figure 3.1). The triglycerides are broken
down the products, which are propane, carbon monoxide and/or carbon dioxide and
three normal alkanes with carbon numbers one less than fatty acid chains (Filho et al.,
1993).

31
Figure 3.1 Schematic representation of the different reaction pathways for the
removal of triglyceride oxygen by hydrodeoxygenation (--) and decarboxylation (--)
3.3 Thermodynamic balance
Smejkal et al., 2009 studied the thermodynamic model derived for the total
hydrogenation and its predictions were compared with the experimental of rape-seed
oil transformation into hydrocarbons. Tristearate was chosen as a model compound to
represent vegetable oils in the calculations. As the thermodynamic data for tristearate
were not available in literature, their values were estimated by using the Joback‟s
contribution method. Based on the comparison to a relevant known system (butyl
stearate) it was concluded that the chosen method is suitable for the assessment of
thermodynamic data of triglycerides. The Joback‟s contribution method has been
demonstrated to estimate accurately the thermodynamic data of tristearate (ΔHf˚ = -
2176.9 kJ/mol and ΔGf˚ = -504.5 kJ/mol) from Aspen plus. A thermodynamic model
for the total hydrogenation of tristearate was derived for temperatures between 250-
450 C and hydrogen pressures ranging from 7 to 70 bar. The reaction was assumed to
enable isothermal reaction conditions. Phase equilibrium liquid-gas was considered in the
model too (Peng–Robinson and Ideal EOS = Equation of State).The basic reaction
mechanism of the proposed catalytic transformation is summarised and consists of two
main reactions: hydrodeoxygenation and hydrodecarboxylation, completed by water-gas-
shift reaction and CO formation. The thermodynamic balance of the system was used to
predict the composition of the liquid phase, namely to predict the distribution of C17and
C18 hydrocarbons. The predictions suggest that C18 hydrocarbons are the main reaction

32
products and that their concentration is affected by temperature and particularly by
pressure. Moreover, the model predictions were found to be in good agreement with
experimental data. The estimations suggested that the reaction were limited by hydrogen
and triglyceride diffusivity through the liquid film on catalyst particles
The study of hydroprocessing of crude palm oil (CPO) using conventional
hydrotreating with NiMo/γAl2O3 catalyst where they obtained products was
characteristic by GC-MS. It was found when pressure is decreased (15 bar), product
yields from n-C16 to n-C18 increased due to increasing number of products and
cannot specified exactly products like octadecenes, octadecanol, n-hexadecanoic acid,
actadecanal and hexa-actadecyl hexadecanoate (Guzman et al., 2010). On the other
hand, pressure is increased (90 bar), decreasing number of products can be indentified
because intermediates were not found and fatty acids is reduced as well.
Subsequently, test pressure effect and hydrogen consumption via simulated in Aspen
plus. It was found that. The hydrodeoxygenation reaction is better than
decarboxylation and decarbonylation when pressure increased (10-100 bar) and
increasing hydrogen consumption. Moreover, time analysis was obtained by
simulated distillation curves, the best diesel yields (95.3 %vol) was observed at 4
hours.
3.4 Effect of operating condition
The hydroprocessing studies related to the renewable fuel production involve
complete conversion of the vegetable oils to alkanes. The composition of
hydroprocessed vegetable oil depends on reaction conditions and the catalyst used. A
key parameter for reaction activity and properties of product are temperatures,
hydrogen pressure, time of stream and feedstock. Hydroprocessing of vegetable oils is
usually carried out in the temperature range of 300–400˚C and under the hydrogen
pressure of 6–20 MPa.

33
A study of noble metal cstslyst was investigated by Murzin et al. on liquid-
phase deoxygenation reaction over a Pd/C catalyst under constant pressure and
temperature, 15-27 bar and 300-360 ˚C, respectively. Deoxygenation of unsaturated
renewable, such as oleic acid, methyl oleate and linoleic acid, with high selectivity to
saturated diesel fuel range hydrocarbons, was successfully accomplished over Pd/C.
Under hydrogen rich atmosphere the hydrogenation was enhanced and the
deoxygenation reaction became predominant. Sebos et al. hydroprocessed
desulphurized (S < 50 ppm) mineral diesel containing 10 wt.% of cotton-seed oil.
Hydroprocessing was carried out over a commercial CoMo/Al2O3 and under common
hydrotreating conditions (305–355˚C, 3 MPa). The feed was artificially sulphurized
by adding DMDS. The obtained product containing renewable diesel had a benefit of
+3 cetane units compared to the pure mineral diesel used as a matrix. The cloud point
of the product was the same as cloud point of the summer-type diesel matrix (0˚C).
According to a commercial catalyst for hydrotreating process, bimetallic
catalyst was studied by Huber et al. on the hydroprocessing of sunflower oil and
heavy vacuum oil–sunflower oil mixtures (5–50 wt.% of sunflower oil) over a wide
range of reaction temperatures (300–450˚C). Their experiments were carried out over
a NiMo/Al2O3 and under the pressure of 5 MPa. The total conversion of sunflower oil
into hydrocarbons was observed at a reaction temperature of 350˚C and above, at
which no acidity was detected. For the wide range of reaction temperatures general
trends of increasing n-alkane isomerization and cracking at higher reaction
temperatures were well illustrated as was the increasing
decarbonylation/decarboxylation selectivity. It was found, that desulfurization of
petroleum-derived feed component is significantly slower than hydrocarbon formation
from vegetable oil. However, mixing the sunflower oil with petroleum-derived feed
did not decrease the rate of desulfurization. Co-processing vegetable oil with
conventional petroleum fractions on an industrial scale has been reported by
Petrobras. The process is known under the name H-Bio.
Donnis et al., 2009 were conducted the hydroprocessing by feed 0, 15 and 25
vol% rapeseed oil in light gas oil (LGO) with reaction temperature 350ºC and under

34
hydrogen pressure of 45 bar. A commercial TK-565 (Ni-Mo based) catalyst was used.
The products obtain 100% conversion from rapeseed oil and the same final boiling
point (FBP) of all three products were analyzed by the simulated distillation curves,
which is also the FBP of the LGO feed. The HDO route and the decarboxylation route
can be calculated from the yields of CO, CO2, and CH4. The triglycerides reacted via
the decarboxylation rate about 66-74%. Increased rapeseed oil mixed in LGO;
properties of the diesel product were a low density and a high cetane index. The
cloud point is important because the car manufactures observed filter plugging from
the tank to the engine when operated at low temperatures. Therefore, the production
of rapeseed oil will be improved product properties as concern cloud and pour point.
Walendziewski et al., 2009 studied hydroprocessing of 10 and 20 wt.% of rape
oil and 90 and 80 wt.% of LGO fraction mixtures in continuous reactor with the same
parameter sets, temperature 320, 350 and 380ºC as well as under hydrogen pressure 3
and 5 MPa. A commercial NiMo/Al2O3 catalyst was used. As the result of process the
temperature range 350-380ºC and hydrogen pressure 5 MPa are good efficiency. In
comparision to the product yields for hydrotreating of vegetable oil (sunflower oil)
used simulated distillation to analyze with the same as catalyst, temperature and
pressure. It was obtained the maximum theoretical products carbon yields and carbon
yields of C15-C18 are 95% and 75%, respectively. The yields of gaseous (propane,
carbon monoxide and carbon dioxide), isomerized and cracked products are minimum
at the same temperature (Huber et al., 2007).
The obtained liquid product was approximately 95 wt% yields of all products
and 5 wt% of gaseous light hydrocarbons. Hydrogenation of unsaturated
hydrocarbons and hydrogenolysis reactions of ester and carboxyl acid bonds results in
fatty acid chains were converted to saturated linear hydrocarbon (paraffins), which are
higher melting temperatures. It leads to undesirable increasing in boiling point, cloud
point and CFPP. Bromine number decreased but acid number increased because ester
bonds in fatty acids was hydrogenolized giving carboxylic group, which is loss
because of hydrogenation of the carbonyl group (Filho et al., 1993). Then partial
hydrocracking of paraffins hydrocarbons were transformed to light hydrocarbons

35
whose flash point, density and kinematics viscosity are lower. There are improvement
by the separation and removal of low boiling hydrocarbons from the product
distillation. More research which conducts Ni-Mo catalyst for hydroprocessing of
rapeseed oil as a source of hydrocarbon-based biodiesel (Šimácˇek et al., 2010). The
Rapeseed oil was hydroprocessed in a laboratory flow reactor under four
combinations of reaction conditions at temperatures 310 and 360˚C and under
hydrogen pressure of 7 and 15 MPa. Reaction products contained mostly n-
heptadecane and n-octadecane accompanied by low concentrations of other n-alkanes
and i-alkanes. Reaction product obtained at 360˚C and 7 MPa was blended into
mineral diesel fuel in several concentration levels ranging from 5 to 30 wt.%. It was
found, that most of the standard parameters were similar to or better than those of
pure mineral diesel. On the other hand, low-temperature properties were worse, even
after addition of high concentrations of flow improvers.
Under high hydrogen pressure and relative high temperature vegetable oils can
be converted into paraffins (from n-C15 up to n-C18) having water, propane and COx
gases as by-products. Intermediates as monoglycerides, diglycerides, ketenes,
aldehydes, acrolein and carboxylic acids have been proposed these are formed in the
initial step and subsequently hydrogenated or broken down via decarboxylation,
decarbonylation or hydrodeoxygenation (Chang and Wan. 1947, Stumborg et al.,
1996 and Hodge. 2008). In addition, cyclization and aromatization reactions can take
place especially when fatty acids that compose the triglycerides in the vegetable oil
are polyunsaturated as linoleic and linolenic acids (Filho et al., 1993). The
hydroprocessing of rapeseed oil at various temperatures (260–340˚C) under a pressure
of 7 MPa in a laboratory flow reactor over three Ni–Mo/alumina hydrorefining
catalysts were dealing by Kubicka et al. The main components of OLP were identified
as C17 and C18 n-alkanes and i -alkanes. At a low reaction temperature, OLP
contained also free fatty acids and triglycerides. At reaction temperatures higher than
310˚C, OLP contained only hydrocarbons of the same nature as hydrocarbons present
in diesel fuel. The content of reactants and intermediates decreased with increasing
reaction temperature. At temperatures higher than about 310˚C, the mentioned
36
reactants and intermediates were not detected in the reaction mixture. However the
absence of triglycerides and free fatty acids was observed already at lower reaction
temperatures (290–300˚C). Conclude that the reaction temperature has a relatively
strong influence on the ratio of n-alkanes with even and odd carbon atom number
which is increasing reaction temperature the content of n-heptadecane were increases
at the expense of n-octadecane. It is apparent that with increasing reaction
temperature decarboxylation comes into play more prominently. For more
investigated the hydroprocessing of palm oil using conventional hydroteating catalyst
(NiMo/ɣAl2O3), Guzman et al are observed at 40–90 bar hydrogen pressure crude
palm oil (CPO) can be deeply converted into paraffins in the diesel range. However, at
lower pressures hydrodeoxygenation cannot be fully reached and the appearance of
intermediates as C16–C18 alcohols, C16–C18 acids and esters were preliminary
identified in the reaction product. Times of stream (TOS) experiments have shown
that conventional hydrotreating catalyst suffers of slight deactivation as the reaction
proceeds. As more work with another triglycerides such as sunflower oil Hancsók et
al. are carried the process of hydrotreating of sunflower oil on CoMo/Al2O3 catalyst
which found (380˚C, 40–60 bar, 500–600 Nm3/m
3 H2/sunflower oil ratio, 1.0 h
-1),
where the conversion of triglycerides was 100% and the yield of the target fraction
(high paraffin containing (>99%) gas oil boiling range product) was relatively high
(73.7–73.9%). The deoxygenation of triglycerides the reduction as well as the
decarboxylation/decarbonylation reactions took place.
The several degummed edible/non-edible oil are also studies for production of
biodiesel fuel. Degumming is an economical chemical process that is done by
concentrated phosphoric acid. This process is applied to the non-edible oils to remove
the impurities for the improvement of viscosity, cetane number and better combustion
in the diesel engine up to certain blend of diesel and non-edible vegetable oils. Gomes
et al. demonstrated that the degummed soybean oil can be used to obtain biodiesel by
transesterification with ethanol and basic catalyst (NaOH 1%, w/w). Due to the free
fatty acids of degummed soybean oil used in the experiments (0.87%), it was

37
found that a temperature lower than 40 ˚C and an oil: alcohol molar ratio
higher than 1:7 give the maximum ester yield.
Palm fatty acid distillate has been explored as a feedstock for biodiesel
production only via transesterification techniques. Shotipruk et al. demonstrated the
potential use of local palm fatty acid distillate (PFAD) as alternative feed-stock for
fatty acid methyl esters (FAMEs) production and the possibility to replace the
conventional acid-catalyzed esterification process (with H2SO4), which was
industrially proven to suffer by several corrosion and environmental problems, with
non-catalytic process in supercritical methanol. The esterification of PFAD in
supercritical methanol gave FAMEs production yield of 95% at 300˚C with the PFAD
to methanol molar ratio of 1:6 and the reaction time of 30 min. Compared with the
conventional acid catalyzed esterification of PFAD, only 75% FAMEs yield was
obtained in 5 h. Laosiripojana et al. was studied the esterification of palm fatty acid
distillate (PFAD), a byproduct from palm oil industry, in the presence of three
modified zirconia-based catalysts. It was found that, among all synthesized catalysts,
the reaction in the presence of SO4– ZrO2 and WO3–ZrO2 (with 1.8 %SO4 calcined at
500 °C and/or 20 %WO3 calcined at 800 °C) enhances relatively high fatty acid
methyl ester (FAME) yield (84.9 –93.7%). Production of fatty acid methyl ester
(FAME) from palm fatty acid distillate (PFAD) having high free fatty acids (FFA)
was investigated by Chongkhong et al. The optimum condition for the continuous
esterification process (CSTR) was molar ratio of methanol to PFAD at 8:1 with 1.834
wt% of H 2 SO4 at 70˚C under its own pressure with a retention time of 60 min. The
amount of FFA was reduced from 93 wt% to less than 2 wt% at the end of the
esterification process. The final FAME product met with the Thai biodiesel quality
standard, and ASTM D6751-02.
The product yields for hydrotreating of vegetable oil were analyzed by using
the simulated distillation. The products at temperature less than 350ºC was observed
which contained small amounts of reaction intermediate and reactant. It was obtained
that temperature at 350ºC is suitable due to no oxygenated compounds and achieved
100% conversion (Simacek et al., 2010), the maximum theoretical products carbon

38
yields and carbon yields of C15-C18 are 95% and 75%, respectively. The yields of
gaseous (propane, carbon monoxide and carbon dioxide), isomerized and cracked
products are minimum (Huber et al., 2007). It was observed by GC-MS when pressure
is decreased to15 bar, product yields from n-C16 to n-C18 was increased due to
increasing number of products and cannot specified exactly products like octadecenes,
octadecanol, n-hexadecanoic acid, actadecanal and hexa-actadecyl hexadecanoate so
there are several intermediates of this reactions. On the other hand, when pressure is
increased (90 bar), decreasing number of products can be identified because
intermediates were not found and fatty acids is reduced as well. Subsequently,
pressure effect and hydrogen consumption were tested via simulated in Aspen plus. It
was found that the hydrodeoxygenation reaction is better than decarboxylation and
decarbonylation when pressure increased and increasing hydrogen consumption.
Moreover, time analysis was obtained by simulated distillation curves, the best diesel
yields (95.3 %vol) was observed at 4 hours (Guzman et al., 2010).
Influence of temperature to the conversion and pathway of process was show
on the study effect of temperature at 350, 370 and 390ºC, the conversion and product
yields are estimated from the simulated distillation data of the total liquid product at
the each temperature by Bezergianni and Kalogianni. The produced liquid biofuels
(gasoline and diesel) increase. This is expected as hydrocracking activity rises with
increasing temperature. Furthermore gasoline yield increases monotonically with
temperature, while diesel yield is smaller at the middle temperature (370ºC). The
minimum diesel yield observed at 370ºC is attributed to the fact that increasing
temperature. The cracking reactions favored by increasing temperature. These
hydrocracking reactions convert heavier molecules including some diesel molecules
into lighter gasoline molecules (Bezergianni et al., 2010). Bezergianni et al., 2010 was
observed that as the temperature increases the amount of paraffins decrease, while the
amount of iso-paraffins increases. The decrease of n-paraffins vs. the increase of iso-
paraffins indicate that isomerization reactions are favored by hydrotreating
temperature, which is expected as higher temperatures because hydrocracking type of
reactions (which include isomerization and cracking).

39
A small percentage of DMDS (di-methyl-di-sulfide) and TBA (tetra-butyl-
amine) is added in the feedstock. Heteroatom removal (mainly sulfur, nitrogen and
oxygen) is expressed as the percentage of the sulfur (27,200 wppm), nitrogen (219.8
wppm) and oxygen (3.9 wt%) contained in the feed which has been removed during
hydrotreatment reactions at operating temperature 330, 350, 370, 385 and 398ºC. As the
result, Sulfur and nitrogen is most effectively removed by over 99.4% for all cases.
Furthermore, the most difficult element to remove is oxygen. In low temperatures the
oxygen removal is low (78.3%). However, by increasing the temperature, the oxygen
removal gradually reaches over 99%. It is evident that higher temperatures favor all
heteroatom removal from the final products (Bezergianni and Kalogianni 2009;
Bezergianni et al., 2010).
3.5 Catalyst selection
The beginning of thermo catalytic processing of vegetable oil dates back to
twenties of 20th
century. The first catalysts used for cracking in gas phase were MgO,
Al2 O3, CaO and Cu. Chlorides of Zn, Cu and Ba were used for cracking in liquid
phase. The pro-cesses were carried out at temperatures 400–450˚C Bezergianni and
Kalogianni, 2009; Kubicˇka et al., 2009; Šimácˇek et al., 2009 were investigated the
applicability of a transition metal/metals containing heteroatom (sulphur and nitrogen)
removal catalyst which is from the petroleum industry or expediently modified for the
oxygen removing reaction (HDO, hydrodeoxygenation, reduction). Another research
group (Simakova et al., 2009) were investigated the decarboxylation or
decarbonylation reaction route on supported noble metal catalysts (Pd or Pt/activated
carbon). Generally the bimetallic aluminium oxide supported catalysts in sulphided
form (usually NiMo/Al2O3 and less CoMo/Al2O3) were investigated for the HDO
reaction (Craig and Sorevan, 1991; Donnis et al., 2009; Gusmao et al., 1989; Krár
et al., 2010; Liu et al., 2009 ).

40
Hydroprocessing of vegetable oils is usually carried out in the temperature
range of 300–400˚C and under the hydrogen pressure of 6–20 MPa. Traditional
hydrogenation catalysts of the type Ni/Al2O3, Ni–Mo/Al2O3, Co–Mo/Al2O3 or
Ni/SiO2 are used. Laurent and Delmon have studied the catalytic performance of
CoMo sulfide catalysts of various supports for the hydrodeoxygenation of oxygen-
containing molecules. Murzin et al. using a variety of model compounds resembling
vegetable oils investigated the performance of a number of catalysts for the
production of renewable diesel. According to their results, Pd supported on active
carbon catalysts displayed superior deoxygenation properties, yielding diesel-like
hydrocarbons. Krause and co-workers studied HDO of sulfided CoMo/Al2O3 and
NiMo/Al2O3 on heptanoic acid, heptanol and heptanoate methyl and ethyl esters.
Sulfidation by addition of H2S instead of CS2 shifted the selectivity from C7 to C6
hydrocarbons. It was found that NiMo, but not CoMo was very sensitive to the
sulfidation conditions and that the unsulfided catalysts were neither very active nor
selective to C6 and C7 alkane formation. Kubicˇka and co-workers evaluated the
conversion of rapeseed oil over sulfided catalysts in a number of studies. When the
activity and selectivity of sulfided NiMo/Al2O3 catalyst was compared to that of
unsulfided Ni/Al2O3 at 270–350˚C, the sulfided catalyst was found to be much more
active. However, the unsulfided catalysts primary yielded odd number hydrocarbons
(decarboxylation/ decarbonylation) while the sulfided yielded primarily even num-
bered (complete reduction). The activity of sulfided NiMo/Al2O3 surpassed that of
Mo/Al2O3 and Ni/Al2O3 separately in liquid phase HDO below 300˚C in H2
atmosphere (Kubicˇka et al., 2010). Rapeseed oil HDO over commercial sulfided
NiMo/Al2O3 at 70 bar H2 achieved full conversion above 300˚C, while higher
temperatures yielded higher selectivity towards odd-number hydrocarbons (Šimácˇek
et al., 2009). Supporting sulfided CoMo on mesoporous Al2O3 rather than MCM-41
resulted in higher yields of alkanes, but incorporating Al into the framework of
MCM-41 did improve yields due to support acidity (Kubicˇka and Šimácˇ ek, 2009,
Kubicˇka et al., 2010).

41
Resasco et al. concluded that HDO of methyl octanoate and methyl stearate
over Pt/Al2O3 at 330˚C proceeds in inert atmosphere, but addition of H2 suppresses
formation of higher self-condensates of both compounds. Decarbonylation was found
always to be the primary reaction route. The deoxygenation of methyl octanoate over
H-ZSM-5 at 500˚C resulted in lighter hydrocarbon gases and aromatization, the latter
of which proceeded through self-condensation products (tetradecane, 8-
pentadecanone, octyloctanoate) (Danuthai et al., 2009).
3.6 Properties of production
From the refinery point of view, all hydrocarbons present in hydroprocessed
vegetable oil belong to middle distillates and are thus suitable for production of diesel
fuel. Hydroprocessed vegetable oil can be called hydrocarbon-based or oxygen-free
bio-diesel. Oxygen-free biodiesel eliminates some drawbacks of the traditional
FAME-type biodiesel relating mostly to fuel stability. Car manufacturers would
probably also prefer hydrocarbon-based biodiesel to FAME as it offers full
compatibility with current diesel fuel for which the diesel engine systems are
optimized (Šimácˇek et al., 2010). Thanks to its high content of n -alkanes, oxygen-
free biodiesel has an excellent cetane number ranging from 55 to 90 (Stumborg et al.,
1996) depending on degree of branching. The worsened low-temperature properties
seem to be the only disadvantage in comparison with FAME-type biodiesel. Low-
temperature properties can be improved either by choice of proper catalyst and
reaction conditions or by isomerisation (Hodge, 2006 and Hancsók et al., 2007)
following the hydroprocessing. The production of biodiesel takes place in two stages.
Product of vegetable oil hydroprocessing (stage 1) proceeds to an isomerisation unit
(stage 2) where its low-temperature properties are improved. The final product called
NExBTL is used as renewable component for production of diesel fuel. Neste Oil
guarantees that its Neste Green diesel, which suits all diesel engines, contains at least
10% of NExBTL.

42
The analyses of products were analyzed by gas chromatography. The reaction
products mostly are aqueous phase which separated in to liquid phase and gaseous
phase. Gaseous products and all organic liquid products were analyzed by gas-
chromatographic methods. Physiochemical properties of the organic liquid products
and mixed fuels were determined using standard test procedures designated for diesel
fuel or petroleum products. As a result of Šimácˇ ek et al. experiment,
hydroprocessing of rapeseed oil yielded water, gaseous hydrocarbons and organic
liquid product (OLP). The conversion of rape-seed oil was >99% at 310˚C and
complete conversion was achieved at 360˚C. The yields of the main products were as
follows: OLP–83 wt.%, water – 11 wt.% and gaseous hydrocarbons 6 wt.%. Beside
hydrogen, the reaction gas contained mainly propane (0.8–2.5 vol.%) and small
amounts of carbon dioxide (0.05–0.3 vol.%), carbon monoxide (up to 0.5 vol.%) and
methane.

CHAPTER IV
EXPERIMENTAL
This chapter presents the overview of the hydroprocessing of different palm
oil for biodiesel production. First part of this chapter about materials and chemicals
are provided for the experiments, catalyst preparation, and products analysis. The
procedure of the catalyst preparation by the incipient wetness co-impregnation
method was then described. Next part was explained the catalyst characterization.
The experimental set up and the procedure were described. Finally, feedstock and
Product Characterization were also including in this chapter.
4.1 Materials and Chemicals
The different palm oil was obtained from Oleen Company limited as the
feedstock for the reaction. Ni(NO3)26H2O (Aldrich, 99.9%), Co(NO3)26H2O
(Aldrich, 99.9%) and (NH4)6Mo7O244H2O (March, 99.9%) were used as precursors.
The Alumina (γ-Al2O3) from Aldrich was supports in this work. The 2-propanol
(Sigma-Aldrich, 99.9%) was used as a solvent for dilute liquid product. Hydrogen
(Linde Gases, 99.999%) was used as reactant in the reaction. Helium ultra high purity
(Linde Gases, 99.999%) was used as purge gas. Hydrogen (Linde Gases, 99.999%),
Nitrogen (Linde Gases, 99.999%) and H2S/H2 (Linde Geses , 10vol% of H2S) were
used to presulphidation process.
44
4.2 Catalyst Preparation
4.2.1 Preparation of bimetallic oxide supported on γ-Al2O3
The catalysts were prepared by impregnating commercial γ-Al2O3 with
heated deionized water solution of ammonium heptamolybdate ((NH4)6Mo7O244H2O,
March) and nickel nitrate hexahydrate (Ni(NO3)26H2O, Aldrich) or cobalt nitrate
hexahydrate (Co(NO3)26H2O, Aldrich) followed by the atomic ratio [x/(x+Mo)] =
0.3 (x = Co, Ni). The solution was dropped to γ-Al2O3 support with a surface area of
141.8 m2/g (Kubicka and Kaluza, 2010). The method of incipient wetness co-
impregnation was divided in to three steps with three times drying and calcinations.
Each of three steps was impregnated by 40%, 35% and 25% of the total amount of
precursor. After the dropping of the first step precursor, the sample were dried at
120ᵒC for 12 hours and calcined at 500
ᵒC for 5 hours (ramp rate 3
ᵒC/min). And the
calcined sample was re-impregnated with the next step of aqueous precursor then does
it again with the same procedure till finish the third step. Both of NiMo/Al2O3 and
CoMo/Al2O3 oxide catalysts were activated into sulfides form.
4.2.2 Presulfidation process
The sulfidation catalysts were prepared with 5vol. % H2S/H2 mixture
at 400ᵒC under atmospheric pressure. The sulfidation reactions were conducted under
atmospheric pressure in fixed bed reactor (Pyrex glass). The 0.1 grams of oxide
catalyst was placed in to a fixed bed reactor with a temperature controller. First the
sample was heated to 400ᵒC at heating rate of 10
ᵒC /min under N2 gas flow. The gas
flow was switched to 5vol. % H2S/H2 mixture when the temperature rose to 400ᵒC
(Dumeignil, 2003). The presulfidation was continued for 4 hours with 50ml/min of
5vol. % H2S/H2. The catalyst sample was cool down to room temperature with N2
flow (Viljava, 2000). The Figure 4.1 was showed a flow diagram of sulfided catalyst.

4CH
2H
1
2 3 4 5
/HeO 1% 2
12
3
4
5
22S/HH 5%
12
3
4
5
He
Vent
6
7
88
8 8
10
6
66
6
7
9
1. Pressure Regulator 2. On-Off Value 3. Gas Filter 4. Mass Flow Meter 5. Check Valve
6. 3-way 7. 3-way Valve 8. Sampling point 9. Furnace 10. Bubble Flow Mete
Figure 4.1 Flow diagrams of synthesis metal sulfided catalysts.

46
4.3 Catalyst Characterization
4.3.1 Inductively coupled plasma-optical emission spectrometer (ICP-
OES)
The percentage of metal loading of catalyst was analyzed by
inductively coupled plasma-optical emission spectrometer (ICP-OES). The amount of
metal on the surface of catalyst was measured with an inductively coupled plasma
atomic emission spectrometer (ICP-AES) Perkin Elmer model PLASMA-1000. The
0.03 g of an exactly amount of catalyst was dissolved in 10 ml of hydrofluoric acid
49%, hydrochloric acid and nitric acid with ratio 3:1:1 respectively. The mixture were
stirred until all solid become a solution then make volume up to 100 ml using de-
ionized water by the 100ml volumetric flask. The concentration of the sample after
volume adjustment is about 5-20 ppm (mg/l).
4.3.2 Nitrogen physisorption (BET surface area)
The BET apparatus for the multiple point method from Micromeritics
ASAP 2020 was used for analysis surface area of catalysts. The mixture gases of
helium and nitrogen will flow through the system at the nitrogen relative in the range
of 0.05 < P/P0 < 0.35. The catalyst sample (cat. 0.1 g) will be placed in the sample
cell to degassed, which will be then heated up to 150C and will hold at this
temperature for 3 h. After the catalyst sample was cooled down to room temperature,
nitrogen uptakes will be measure. Adsorption measurements were carried out using
liquid nitrogen at 77K (-196ᵒC). The specific surface area was calculated on the basis
of the BET isotherm. Volume distributions and pore size were performed by BJH
(Barrett-Joyner-Halenda) desorption branch analysis.
4.3.3 Scanning Electron Microscope (SEM)
A Hitachi S-3400N Scanning Electron Microscope (SEM) was used to
observe the surface morphology of the sample with an acceleration voltage of 15 kV.

47
4.3.4 X-ray diffraction (XRD)
The X-ray diffraction characterization was carried out on a D8
Advance of Bruker AXS, equipped with a long fine focus ceramic Cu Kα X-ray
source. The pattern was recorded in the range of 20ᵒ < 2Ɵ <80
ᵒ with incremental steps
of 0.04ᵒ, and scan speed of 0.5 s/step.
4.3.5 Temperature-programmed reduction (TPR)
Temperature-programmed reduction (TPR) analyses of the oxide
catalysts were performed on Micrometritics Chemisorb 2750. The catalyst sample
(0.1 g) to be tested was pretreated in N2 stream at 150C for 1 h and then cooled to
room temperature. Then the N2 flow was switched to a 10% H2/Ar flow (15ml/min),
and catalyst sample was heated to 800C at a rate of 10C/min. The hydrogen
consumption of the catalyst reducing was detected by a thermal conductivity detector
(TCD).
4.3.6 NH3 Temperature programmed desorption (NH3 –TPD)
The study of NH3-TPD was performed in a Micrometric ChemiSorb
2750 automated system attached with ChemiSoft TPX software. The amount of NH3
adsorbed on the surface was determined by thermal conductivity detector. The 0.05 g
of catalyst sample was placed in quartz tube in temperature controlled furnace. Then
helium gas with flow rate of 15 ml/min was fed through sample and heating
temperature up from room temperature to 500ᵒC with heating rate of 10
ᵒC/min after
that held for 2 hour to remove moisture. The catalyst sample was cooled down to
room temperature and flowed 15%vol of NH3 in helium gas through a sample at flow
rate of 15 ml/min then held for 15 minutes. Subsequently, helium gas was fed through
the sample for 3 hours. Finally, the catalyst sample was heated from room
temperature to 500ᵒC (10
ᵒC/min). The signal was recorded every one second and
stored on a microcomputer. The acid property of catalysts was determined by this
method.
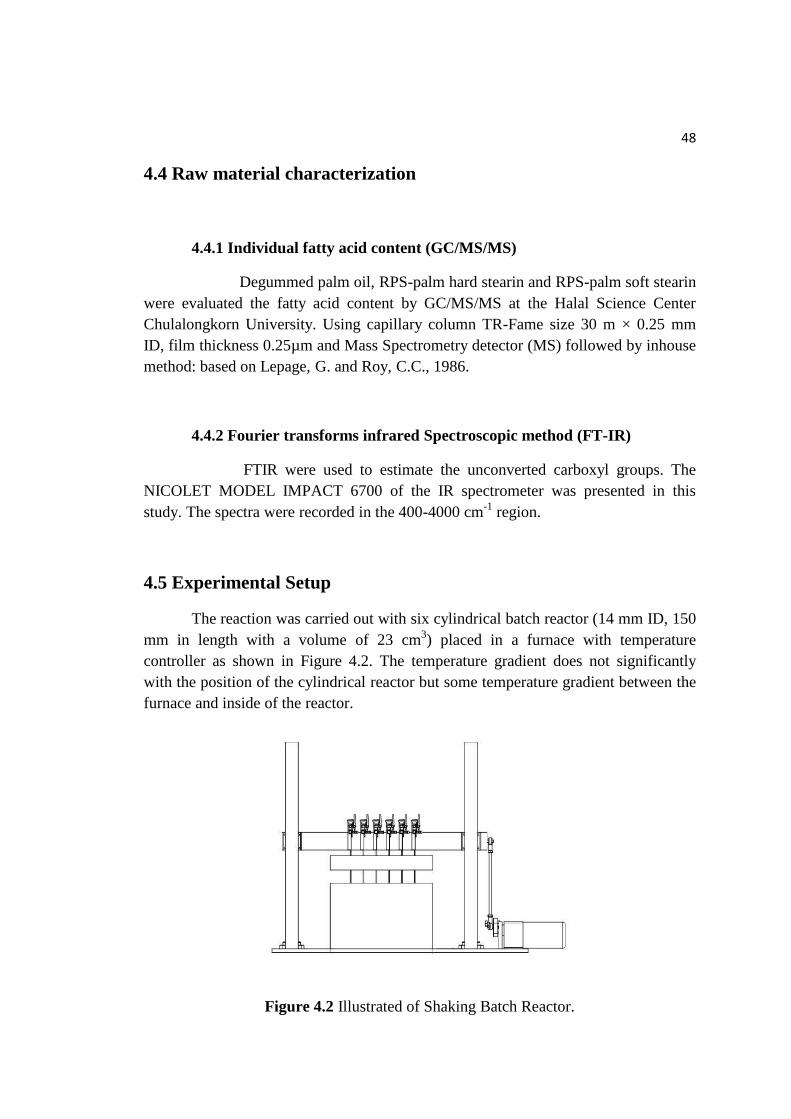
48
4.4 Raw material characterization
4.4.1 Individual fatty acid content (GC/MS/MS)
Degummed palm oil, RPS-palm hard stearin and RPS-palm soft stearin
were evaluated the fatty acid content by GC/MS/MS at the Halal Science Center
Chulalongkorn University. Using capillary column TR-Fame size 30 m × 0.25 mm
ID, film thickness 0.25µm and Mass Spectrometry detector (MS) followed by inhouse
method: based on Lepage, G. and Roy, C.C., 1986.
4.4.2 Fourier transforms infrared Spectroscopic method (FT-IR)
FTIR were used to estimate the unconverted carboxyl groups. The
NICOLET MODEL IMPACT 6700 of the IR spectrometer was presented in this
study. The spectra were recorded in the 400-4000 cm-1
region.
4.5 Experimental Setup
The reaction was carried out with six cylindrical batch reactor (14 mm ID, 150
mm in length with a volume of 23 cm3) placed in a furnace with temperature
controller as shown in Figure 4.2. The temperature gradient does not significantly
with the position of the cylindrical reactor but some temperature gradient between the
furnace and inside of the reactor.
Figure 4.2 Illustrated of Shaking Batch Reactor.

49
4.6 Experimental Procedure
4.6.1 Preparation of Feed Stock
Degummed palm oil and two kinds of RPS palm stearin were used as a
feed for the biodiesel production. Degummed palm oil (DPO) was kindly provided by
Patum Oil, Thailand. The DPO was past the process of degumming of the crude palm
oil to remove proteins, pigments and other unwanted substances but still contains
mainly free fatty acid (FFA) as palmitic (5% max). The DPO has red-yellow liquid at
room temperature that can be use for the reaction without any treatment. RPS palm oil
has light-yellow liquid and semi-solid at room temperature which is formed during
fractionation of palm oil after crystallization process at a specific temperature. Before
the reaction, the RPS palm oil was melted to clear-yellow liquid on slightly heating
(40-45ᵒ C).
4.6.2 Reaction Performance Testing
Several feed stock and catalysts were measured and fill in six tubular
reactors with the condition for hydroprocessing experiments as follow in Table 4.1.
To perform the reaction, the reactor was purged with Helium gas for 3
times to get rid of air in the reactor then compressed hydrogen pressure of 50 bars into
the reactor. After that, the reactor was put into the furnace by shacking 30 rpm. The
reactor was put out of the furnace at the interval time and dipped into the water
immediately for stop the reaction after that taken the reaction products.
Table 4.1 Operating condition for hydroprocessing
Variable Condition
Amount of Feed stock 2 ml
Temperature 330, 360, 390 and 415C
Hydrogen pressure 50 bar
Reaction time 0, 0.5, 1.5 and 3.5 h
Catalyst type Ni-Mo/Al2O3 and Co-Mo/Al2O3 sulfided
Amount of catalyst 0.02 g

50
4.7 Product Characterization
The hydroprocessed products were contained two phase that gaseous phase
and liquid phase. The composition of the total organic products, obtained from the
catalytic conversion of the triglycerides were determined.
The liquid product was centrifuged to separate the liquid phase and solid phase
(catalyst) then analyzed using gas-chromatography method.
Organic liquid products were analyzed by gas-chromatography equipped with
flame ionization detector (GC-14B, Shimadzu). In addition, the distillation
temperature was determined by simulated distillation according to the ASTM-2887-
D86 procedure. Table 4.2 is shown the operating condition for gas chromatograph
equipped with flame ionization detector and operating condition temperature program.
Product yields of desired product (middle distillate yield) were used to
describe the effectiveness of hydrotreating reaction. The conversion and selectivity
was determined by similated distillation data as follows:
Conversion % =Feed360+ − Product360+
Feed360+× 100
Where: Feed360+ is the weight percent of the feed which have a boiling point higher
than 360ᵒC. Product360+ is the weight percent of the product which have a boiling
point higher than 360ᵒC.
As middle distillate (Diesel) is the desired product, the measure of Diesel
selectivity is based on the boiling point range and defined by the following equation:
Diesel selectivity % = Product180−360 − Feed180−360
Feed360+ − Product360+ × 100
Where: Feed180-360 and Product180-360 are the weight percentage of feed and product
respectively, which have a boiling point between 180-360ᵒC (Diesel range)
(Bezergianni et al., 2010)

51
Table 4.2 Operating condition for gas chromatograph equipped with flame ionization
detector.
Gas Chromagraph SHIMADZU GC-14B
Detector FID
Column Capillary DB-2887
(Agilent J&W GC Columns)
- Column material Silica
- Length 10 m
- Outer diameter 0.53 mm
- Film thickness 3 µm
Spilt flow rate
Purge flow rate
Carrier gas
Carrier gas flow
30 ml/min
4 ml/min
He (99.999%)
70 kPa
Hydrogen gas flow 60 kPa

52
Table 4.2 Operating condition for gas chromatograph equipped with flame ionization
detector (cont.)
Gas Chromagraph SHIMADZU GC-14B
Air gas flow 50 kPa
Primary gas flow 500 kPa
Make up flow 60 kPa
Temperature limits (oC) -60 - 350
Injector temperature (oC) 250
Column oven temperature program
- initial column temperature (oC) 40
- ramp rate (oC/min) 10
- final column temperature (oC) 330
Detector temperature (oC) 340
Analyzed liquids Hydrocarbon normal C5-C44 alkanes

CHAPTER V
RESULTS AND DISCUSSION
This chapter presents the results with a discussion about the characteristics and
catalytic properties in the hydrotreating activity for biodiesel production. The
selectivity and conversion of diesel like hydrocarbon under condition (330- 415ᵒC, H2
pressure = 50 bar, time = 0.5, 1, 2 and 4 h) are also discuss in this chapter.
5.1 Characterization of Catalysts
5.1.1 Inductively coupled plasma-optical emission spectrometer (ICP-
OES)
The compositions of metal in catalysts were confirmed by inductively
coupled plasma optical emission spectroscopy (ICP-OES). The catalysts were loaded
of 2.5 wt% of Ni, 2.5 wt% of Co and 10 wt% of Mo. Table 5.1 was showed the
compositions of catalysts.
Table 5.1 The compositions of catalysts as determined by ICP-OES
Sample Ni content (%wt.) Co content (%wt.) Mo content (%wt)
Calculated Measured Calculated Measured Calculated Measured
NiMo/Al2O3 2.5 2.4 - - 10 9.25
CoMo/Al2O3 - - 2.5 2.55 10 9.39

54
5.1.2 Nitrogen physisorption (BET surface area)
Table 5.2 Typical properties of the catalysts.
Samples Surface area
(m2/g)
Pore volume
(cm3/g)
Pore size
(nm)
Al2O3 141.88 0.23 3.91
NiMo/Al2O3 100.19 0.16 4.54
CoMo/Al2O3 100.84 0.18 4.52
Figure 5.1 N2 adsorption-desorption isotherm of Al2O3, NiMo/Al2O3 and
CoMo/Al2O3.
The isotherms of nitrogen adsorption-desorption is shown in Figure 5.1. All
catalysts and support exhibit a type IV N2 adsorption isotherm, which is typical for
mesoporous materials (S. Rana et al., 2004). The diminished shape of hysteresis loop
of NiMo/Al2O3 and CoMo/Al2O3 are shown in the fiuure 5.1 indicating that structure
of material is change a bit after Mo and Ni loading. The decrease in the height of
hysteresis loops indicates the loss of pore volume, due to the filling of pores by Ni
and Mo species. BET surface areas, pore volume and pore size are shown in Table
0
20
40
60
80
100
120
140
0 0.2 0.4 0.6 0.8 1
Qu
anti
ty A
dso
rbe
d (
cm³/
g ST
P)
Relative Pressure (P/Po)
Adsorption of Al2O3
Desorption of Al2O3
Adsorption of NiMo/Al2O3
Desorption of NiMo/Al2O3
Adsorption of CoMo/Al2O3
Desorption of CoMo/Al2O3

55
5.2. which indicates the decrease in the surface area and pore volume upon loading of
nickel and molybdenum oxide. This could be explained by substantial blocking of
pore opening by large MoO3 crystallites (Badoga et al., 2012).
5.1.3 Scanning Electron Microscope (SEM)
Figure 5.2 SEM-EDX images of NiMo/Al2O3 catalysts in an oxide (upper) and
sulfided (lower) form.
Figure 5.2 is shown the SEM-EDX images of NiMo/-Al2O3.
The upper block of Mo and Ni are indicated as an oxide catalyst which representing
Mo and Ni are well distributed on the alumina surface. The three lower block shows
the mapping of Mo, Ni and S on NiMo/-Al2O3 sulfided catalyst. As seen, the location
S atom is matched very well with Mo atom which could imply that Mo atoms are
adjacent with S atoms. The possible species of Mo-S species will be discussed laterin
the XRD section.
Figure 5.3 is shown the SEM-EDX images of CoMo/-Al2O3.
Similarly, good dispersion of metal could be observed. Sulfided CoMo/-Al2O3 show
a presence of Mo accompany with S atoms.

56
Figure 5.3 SEM-EDX Images of CoMo/Al2O3 oxide and sulfided catalysts.
5.1.4 X-ray diffraction (XRD)
The XRD patterns of alumina support and oxide catalysts were shown in
Figure.5.4. The diffraction patterns show broad peaks at 37.5, 46.2 and 67ᵒ, which can
be attributed to γ-alumina phase (Lai and Pang, 2013). For NiMo/Al2O3 catalyst was
showed four prominent reflections at 2θ = 23.5, 37.7, 46.2 and 67ᵒ, typically at 37.7,
46.2 and 67ᵒ are assigned to γ-alumina phase and 23.5 is a characteristic of MoO3. The
peak at 13.1, 23.3, 25.5, 27.9 and 33.7ᵒ correspond to crystalline orthorhombic α-
MoO3 (Zhou and Chen et al, 2012). However, no peaks corresponding to nickel and
cobalt species, which could be due to the high dispersion of these species. The
disappearance of nickel and cobalt observed with low loadings of Ni and Co species
(Zhou and Chen, 2012)

57
Figure 5.4 XRD patterns of Al2O3 support, NiMo/Al2O3 and CoMo/Al2O3 catalysts.
Figure 5.5 XRD patterns of NiMo/Al2O3 and CoMo/Al2O3 oxide and sulfided
catalysts.

58
For more clear difference between two forms of catalysts can be found
by comparing the XRD patterns of both NiMo/Al2O3 and CoMo/Al2O3. As shown in
the figure 5.5, two peaks at 33ᵒ and 59
ᵒ were observed for NiMo/Al2O3 sulfided
catalyst such as MoS2, and NiMo2S4 (Monteiro-Gezork et al., 2007). Puello-polo and
co-worker reported Mo4+
species could be the active center for converted to MoS2.
The peak of Ni was not exhibit significant as its low loading. For CoMo/Al2O3
sulfided catalyst, only peaks of MoS2 at 33ᵒ were observed but not show for peak at
59ᵒ indicating that the MoS2 phases are highly dispersed over the support and their
particle sizes are below the detection limit of XRD technique or the amorphous form
of MoS2 (Sundaramurthy et al., 2008).
5.1.5 Temperature-programmed reduction (TPR)
Time (min)
0 20 40 60 80 100 120 140 160
H2 c
onsum
ption
(a.u
.)
Tem
pe
ratu
re (C
)
0
200
400
600
800
Figure 5.6 TPR profiles of the NiMo/Al2O3 oxide catalyst

59
Temperature-programmed reduction of hydrogen (H2-TPR)
was performed in order to determine the reducibility of oxide catalysts. Figure 5.6 and
Figure 5.7 are shown the H2-TPR profile of NiMo/Al2O3 and CoMo/Al2O3 oxide
catalysts. There are two main reduction peaks where the first is located at around
420ᵒC, related to the reduction of Mo
6+ species in polymolybdate structures to Mo
4+
species (Badoga et al., 2012) and the second peak located at around 800ᵒC, which can
be attributed to the reduction of the Mo+4
to Mo0 (Kaluza and Gulkova et al., 2007).
The shoulder observed at about 520ᵒC could be assigned to the reduction of Ni
2+ to
Ni0 species on the alumina surface.
Time (min)
0 20 40 60 80 100 120 140 160
H2 C
on
su
mp
tio
n (
a.u
.)
Te
mp
era
ture
(oC
)
0
200
400
600
800
Figure 5.7 TPR profiles of the CoMo/Al2O3 oxide catalyst
The TPR patterns and trend in the reducibility of CoMo/Al2O3 oxide
catalyst are presented in figure 5.7. CoMo/Al2O3 shows two principal reduction peaks
where the first is attributed to the partial reduction of Mo6+
to Mo4+
at 420ᵒC while the
subsequent peaks are the stepwise reduction of the bulk MoO3 (Leyva and S. Rana et
al., 2008).

60
5.1.6 NH3 Temperature programmed desorption (NH3 –TPD)
To investigate the acidity of the catalysts, the NH3-TPD measurement
of the catalysts was carried out. Two spectra in Figure 5.8 show a broad peak in the
temperature range 110-500
ᵒC, which indicates the combination of weak-intermediate-
strong acid centers (Zhu et al., 2010). The strength of the acid sites can be determined
by the temperature at which the adsorbed NH3 desorbs. As seen, it is most likely that
no significant different in the strength of acidity between both catalysts. Total acidity
shown in Table 5.3 was determined from the amount of ammonia desorbed from the
entire temperature region. The result shows NiMo/Al2O3 contains higher acidity than
CoMo/Al2O3 catalyst.
Temperature (C)
0 100 200 300 400 500
TC
D s
igna
l (a
.u.)
NiMo/Al2O3
CoMo/Al2O3
Figure 5.8 NH3 profiles of reduced catalysts NiMo/Al2O3 and CoMo/Al2O3.
Table 5.3 Total acid sites of oxide catalysts.
Catalyst Total acid site (mmol NH3/g)
NiMo/Al2O3 1.415
CoMo/Al2O3 1.253

61
5.2 Raw material characterization
5.2.1 Individual fatty acid content (GC/MS)
The weight percentages of fatty acid composition in triglyceride were
characterized by the Research and Service Laboratory of Halal Science Center
Chulalongkorn University which shown in Table 5.4. From the GC-MS analysis, it
was observed that DPO, RPS hard and RPS soft contain mainly palmitic acid and
oleic acid. Palmitic acid content (saturated fatty acid) could be ordered as RPS hard >
RPS soft > DPO while oleic and linoleic content (unsaturated ones) could be inversely
ordered as DPO > RPS soft > RPS hard. The degree of unsaturation could be
expressed by iodine value as shown in Table 5.5 could be ordered as DPO > RPS soft
> RPS hard, which are corresponding well with the fatty acid composition in Table
5.4. As shown in Tale 5.5, DPO contain the highest free fatty acid content while RPS
soft and hard are similar and much lower than that of DPO.
Table 5.4 The weight percentages of fatty acid composition in DPO, RPS Hard and
RPS Soft.
FATTY ACID DPO (wt.%) RPS Hard (wt%) RPS Soft (wt.%)
C 12:0 (Lauric) 0.8 0.08 0.11
C 14:0 (Myristic) 1.2 0.69 0.71
C 16:0 (Palmitic) 45.4 61.40 54.86
C 16:1 (Palmitoleic) 0.1 - -
C 18:0 (Stearic) 3.8 5 4.26
C 18:1 (Oleic) 39.0 27.07 32.47
C 18:2 (Linoleic) 9.1 5.52 7.26
C18:3 (Linolenic) 0.2 - -
C 20:0
(Arachidonic) 0.3 0.25 0.33
C 20:1 (Eicosenoic) 0.1 - -

62
Table 5.5 The properties of DPO, refined bleached deodorisied palm soft and hard
stearin (From OLEEN Company Limited).
Parameter DPO RPS Soft RDB Hard
Free Fatty Acid (%) 5% Max. 0.06 0.06
Iodine Value (Wijs method) 51.1 43.94 31.24
5.2.2 Fourier transforms infrared Spectroscopic method (FT-IR)
The FTIR spectra used to determine the glycerides molecules present
in the feed. The intensity of the stretching peak at 1742.8, 1742.5 and 1738.3 cm-1
of
DPO, RPS Soft and RPS Hard respectively are corresponding to the carboxyl group
(C-C=O) in FTIR. The CH stretching peaks in the region of 2750-3150 cm-1
was
taken as the reference for monitoring the decreasing of carboxyl peak because this
peak remains nearly unaffected by the reaction and carboxyl peak decrease as the
reaction proceeds (Jitendra K.Satyarthi and Darbha Srinivas, 2011).
Wavenumbers (cm-1
)
1000200030004000
Ab
sorb
an
ce
DPO
RBD Soft
RBD Hard
1742.8 cm-1
1742.5 cm-1
1738.3 cm-1
2929.5 cm-1
2919.7 cm-1
2917.1 cm-1
Figure 5.9 FTIR spectra of DPO, RPS Soft and RPS Hard.

63
5.3 Hydroprocessing of different palm oil feed stock
5.3.1 Influence of process conditions
Several sequential and concurrent reactions occur during the
hydroprocessing of triglyceride feeds. These reactions pathways are consist of parallel
and/or consecutive reaction steps, including saturation, cracking, decarboxylation,
decarbonylation, and/or hydrodeoxygenation (Veriansyah et al., 2012). There are
many of researcher aim to study on the process condition of hydroprocessing such as
operating temperature, pressure, and reaction time.
The diesel yield and gasoline yield as a function of reaction
temperature are shown in Figure 5.10. When the temperature was increased from
330ᵒC to 360
ᵒC, the diesel yields of RPS soft and hard palm stearin increased from
47.4% to 65.9% and 49% to 70.8% respectively. As the temperature continued to
increase above 360ᵒC, the diesel yield began to decrease. According to Figure 5.10,
there is little effect the diesel yield of DPO when temperature rises from 330ᵒC to
360ᵒC, in which the yield only changes from 56.9% to 61.3%. The maximum diesel
yield of degummed palm oil (DPO) is 65.1% at reaction temperature 390ᵒC; whereas,
the maximum diesel yield for both types of refined bleaching deodorised palm stearin
are 65.9% and 70.8% respectively at reaction temperature of 360ᵒC. Comparing
between two different catalysts, at low temperature NiMo sulfided catalyst show
much higher activity than CoMo sulfided catalyst but CoMo sulfided catalyst become
comparable at high temperature.
Figure 5.10 shows that at temperature below 360ᵒC, the gasoline yield
of the several feedstocks show a similar trend. The gasoline yield of the several
feedstocks increases as the temperature increase. The result show the same as Huber
et al studied of reaction temperature general trends of increasing n-alkane
isomerization and cracking at higher reaction temperature cause high gasoline yield of
product.
Figure 5.11 shows the temperature effect for CoMo sulfided catalyst.
At 390ᵒC of reaction temperature, degummed palm oil and refined bleaching
deodorised soft and hard palm stearin shown the maximum of diesel yield at 62%,
63.3% and 51.2% respectively. Gasoline yield of several feed were observed the
maximum at the same temperature (415ᵒC) which yield of gasoline are 27.6% of RPS
Soft, 23.7% of RPS Hard and 19.9% of DPO.

64
Figure 5.10 Temperature effect on diesel yield and gasoline yield (as vol% of total
liquid product). All experiment were perform at P=50 bar, NiMo/Al2O3 sulfided
catalyst and time of reaction 4 hr.
Figure 5.11 Temperature effect on diesel yield and gasoline yield (as vol% of total
liquid product). All experiment were perform at P=50 bar, CoMo/Al2O3 sulfided
catalyst and time of reaction 4 hr.
0
10
20
30
40
50
60
70
80
90
100
330 360 390 420
Die
sel Y
ield
an
d G
aso
line
Yiel
d (
%)
Temperature (ᵒC)
Diesel yield of DPO Diesel yield of RBD Soft
Diesel yield of RBD Hard GSL yield of DPO
0
10
20
30
40
50
60
70
80
90
100
330 360 390 420
Die
sel Y
ield
an
d G
aso
line
Yiel
d (
%)
Temperature (ᵒC)
Diesel yield of DPO Diesel yield of RBD Soft Diesel yield of RBD Hard
GSL yield of DPO GSL yield of RBD Soft GSL yield of RBD Hard

65
Diesel conversion of DPO tends to increase with increasing reaction
time at reaction temperature of 390ᵒC of NiMo sulfided and CoMo sulfided as shown
in figure 5.12 and Figure 5.13. For NiMo sulfided catalyst, the maximum conversion
are 65.8% at 2 h of DPO, 76.76% at 4 h of RPS soft palm stearin and 75.81% at 4 h of
RPS hard palm stearin. For CoMo sulfided catalyst, the maximum conversion at 4 h is
72.8% of DPO, 69.2% of RPS soft palm stearin and 75.2% of RPS hard palm stearin.
The increasing of reaction time leads to increase in conversion of triglycerides and
fatty acids to C12-C18 alkanes. Moreover, a long period of reaction time may cause to
increase of light hydrocarbons (less than C12 alkanes from cracking of C12-C18
alkanes) which decrease of diesel selectivity. As shown in Figure 5.13 the decreasing
trend of diesel selectivity over a long period time of reaction implies that the cracking
reaction can cause light hydrocarbon.
Figure 5.12 Time effect on diesel conversion and diesel selectivity. All experiment
were perform at P=50 bar, NiMo/Al2O3 sulfided catalyst and reaction temperature at
390ᵒC.
0
10
20
30
40
50
60
70
80
90
100
0 1 2 3 4
Die
sel Y
ield
an
d G
aso
line
Yiel
d (
%)
Time (h)Conversion of DPO Conversion of RBD Soft
Conversion of RBD Hard Diesel Selectivity of DPO
Diesel selectivity of RBD Soft Diesel selectivity of RBD Hard

66
Figure 5.13 Time effect on diesel conversion and diesel selectivity. All experiment
were perform at P=50 bar, CoMo/Al2O3 sulfided catalyst and reaction temperature at
390ᵒC.
5.3.2 Influence of feed composition.
The main compositions of all feed are mostly palmitic acids (C16:0)
and Oleic acids (C18:1) as shown in figure 5.14. The studies of hydroprocessing have
shown the product alkanes contain equivalent or one less carbon than the parent fatty
acids. The renewable diesel product composition of vegetable oil hydroprocessing
reaction can thereby be roughly estimated based on the fatty acids composition of the
feed. However, depending on the chain length and degree of saturation of the
vegetable oil, some differences have been observed in the product yields (Filho et al.,
1992). Y.B. Che Man and co-worker were determined that RPS palm stearin has
similar triglycerides composition of crude palm oil as further explaining on the
chapter 2. RPS palm stearin has small amount of free fatty acid contain than
degummed palm oil via the neutralization step in the refining process (Haslenda,
2011).
0
10
20
30
40
50
60
70
80
90
100
0 1 2 3 4
Die
sel Y
ield
an
d G
aso
line
Yiel
d (
%)
Time (h)
Conversion of DPO Conversion of RBD Soft
Conversion of RBD Hard Diesel Selectivity of DPO
Diesel selectivity of RBD Soft Diesel selectivity of RBD Hard

67
Figure 5.14 Fatty acid compositions of various feeds.
Figure 5.15A showing at reaction temperature of 360ᵒC, the DPO has
lower conversion and diesel yield than RPS soft and hard stearin. While the reaction
temperature at 390ᵒC and reaction time 4 hour in figure 5.15B, the diesel yield and
conversion of DPO are higher and become comparable to the RPS soft and hard
stearin. At the reaction temperature of 390ᵒC with 2 hour of reaction time has the
maximum conversion and diesel yield of DPO as show in figure 5.15C which explain
that the DPO use high reaction temperature for converting the reactant because of
many of impurity than those of RPS stearin. The gasoline yield is increase when the
reaction temperature increased as shown in the figure 5.15A, B and C.
For CoMo sulfided catalyst in figure 5.16A, the conversion of DPO is
nearly the same as the conversion of RPS hard stearin at the reaction temperature of
360ᵒC with 4 hour of reaction time. At 390
ᵒC of reaction temperature, DPO show
higher conversion than those of RPS stearin which this condition (390ᵒC, 50bar and 4
hour) of all feedstocks has the maximum diesel yield. In case of gasoline range (C5-
C11), the increasing of reaction temperature effected to increase of the gasoline yield.
45.4
61.4
54.86
3.8 5 4.26
39
27.07
32.47
9.15.52 7.26
0
10
20
30
40
50
60
70
DPO RBD Hard RBD Soft
Fatt
y ac
id c
om
po
siti
on
(w
t.%
)
palmitic acid (C16:0) Stearic acid (C18:0)
Oleic acid (C18:1) Linolenic acid (C18:2)

68
Figure 5.15 The conversion, diesel yield and gasoline yield of various feed stocks of
NiMo sulfided catalysts. (Figure 5.15A. 360ᵒC 50 bar 4 hours, Figure 5.15B 390
ᵒC
50bar 4hour and Figure 5.15C 390ᵒC 50bar 2hour)
61.3 65.9 70.8
2.2
6.1 2.6
0.0
10.0
20.0
30.0
40.0
50.0
60.0
70.0
80.0
90.0
100.0
DPO RBD Soft RBD Hard
Co
nve
rsio
n a
nd
Yie
ld (
%) A Gasoline yield Diesel yield
65.1 65.0 65.6
7.1 11.7 8.6
0.0
10.0
20.0
30.0
40.0
50.0
60.0
70.0
80.0
90.0
100.0
DPO RBD Soft RBD Hard
Co
nve
rsio
n a
nd
yie
ld (
%) B Gasoline yield Diesel yield
65.8 62.2 61.2
8.76.8 7.8
0.0
10.0
20.0
30.0
40.0
50.0
60.0
70.0
80.0
90.0
100.0
DPO RBD Soft RBD Hard
Co
nve
rsio
n a
nd
Yie
ld (
%)
C Gasoline yield Diesel yield

69
Figure 5.16 The conversion, diesel yield and gasoline yield of various feed stocks of
CoMo sulfided catalysts. (Figure 5.15A. 360ᵒC 50 bar 4 hours and Figure 5.15B 390
ᵒC
50bar 4hour)
56.4 51.260.5
7.85.3
3.6
0.0
10.0
20.0
30.0
40.0
50.0
60.0
70.0
80.0
90.0
100.0
DPO RBD Soft RBD Hard
Co
nve
rsio
n a
nd
Yie
ld (
%) A Gasoline yield Diesel yield
6254.7 60.5
10.814.5 8.2
0
10
20
30
40
50
60
70
80
90
100
DPO RBD Soft RBD Hard
Co
nve
rsio
n a
nd
Yie
ld (
%)
B Gasoline yield Diesel yield

70
Table 5.6 The optimum value of various feeds and catalysts.
NiMo/Al2O3 sulfided CoMo/Al2O3 sulfided
DPO RPS Soft RPS Hard DPO RPS Soft RPS Hard
Temperature(ᵒC) 390 360 360 390 390 390
Time (h) 2 4 4 4 4 2
Conversion (%) 74.5 69 73.4 72.8 69.2 66.4
Diesel selectivity (%) 88.4 91.1 96.5 85.3 79.1 87.7
Diesel yield (%) 65.8 65.9 70.8 62 54.7 63.3
GSL selectivity (%) 11.6 8.9 3.5 14.9 20.9 12.3
GSL yield (%) 8.7 6.1 2.6 10.8 14.5 8.2
As concluded in the above table, the optimum of process condition at
the highest desirable product (diesel yield), the value were shown in table 5.6. For
NiMo sulfided catalyst, the optimum of reaction temperature at 390ᵒC with 2 h of
DPO and reaction temperature 360ᵒC with 2 h of RPS palm soft and hard stearin is
65.8%, 65.9% and 70.8% respectively. For used of CoMo sulfided catalysts at 390ᵒC
of reaction temperature of RPS palm hard stearin with 2 h, DPO and RPS palm soft
stearin with 4 h was observed to reach the optimum of desired product. RPS hard has
always the highest of diesel selectivity and diesel yield indicating that higher degree
of saturation high diesel selectivity of the liquid product.
5.3.3 Influence of catalyst
As a carbon number of the fatty acids of the triglycerides was mainly
16 and 18 in the applied feedstocks (and it is know that the several feedstocks do not
contain C15 and C17 fatty acids) that is why we present only the results which were
obtained from the investigation of the deoxygenation ratio by reduction and
decarboxylation/decarbonylation (so C15/C16 and C17/C18 paraffin ratio)

71
The hydrotreated of NiMo sulfided catalyst were show the activity for
hydrodeoxygenation route that resulted alkane product had the same carbon as the
parent fatty acids or triglycerides (Donnis et al., 2009). The Cn-1/Cn for NiMo sulfided
catalyst is less than 1 but in the batch reactor with limited mole of hydrogen in the
reactor can lead to another route such as decarboxylation and decarbonylation
reaction. The show of drop in hydrogen pressure was observed by Veriansyah and co-
worker explained the double bonds that were present in the triglycerides and fatty
acids were saturated with hydrogen at this step. Figure 5.17A indicated the ratio of
C15/C16 which explaining that NiMo sulfided catalyst has the activity for
deoxygenation reaction than for decarboxylation and decarbonylation as followed by
the lower C15/C16 ratio in NiMo sulfided catalyst than CoMo sulfided catalyst. In
figure 5.16A and figure 5.16B, DPO is shown Cn-1/Cn less than 1 which is
hydrodeoxygenation pathway occurs via hydrotreating of DPO on NiMo sulfided
catalyst (Veriansyah et al., 2012). Pathways of decarboxylation and decarbonylation
may show when Cn-1/Cn more than 1 as indicated for RPS soft and RPS hard stearin
which Cn-1/Cn of RPS Soft is more than the Cn-1/Cn of RPS hard for all catalysts. From
the resulting, RPS Soft can occur the decarboxylation and decarbonylation pathways
because use more hydrogen to hydrogenate the unsaturated molecule in their
component bring to insufficient of hydrogen for hydrodeoxygenation pathway. The
saturation of feed can lead to high Cn-1/Cn as in RPS soft than RPS hard since RPS
hard was more saturated components than RPS soft.
The effect of CoMo sulfided catalyst was shown in figure 5.17B. RPS
soft shows high Cn-1/Cn ratio is due to high odd carbon number of alkanes products
from decarboxylation and decarbonylation as CoMo sulfided catalyst favor or causing
from cracking of even carbon number of alkane products as favor cracking activity of
CoMo sulfided catalyst. For ratio more than 1 of DPO and RPS hard are due to
selective occur decarboxylation and decarbonylation pathways of CoMo sulfided
catalyst and/or less surplus of hydrogen in the reactor after hydrogenated unsaturated
molecules
G.M. da Rocha Filho et al observed that the decarboxylation process
can either thermal or catalytic, where as the deoxygenation is only a catalytic process.
Figure 5.18A and figure 5.18B are confirming that increase the reaction temperature
increase of Cn-1/Cn ratio for CoMo sulfided catalyst. There is not clearly trend to
explanation for NiMo sulfided catalyst which could be an influence of catalytic
process.

72
.
Figure 5.17A Ratios of C15/C16 and B. Ratio of C17/C18 to study of catalyst effect
(360 ᵒC 50 bar 4h).
0.71
1.161.011.02
3.92
1.14
0
1
2
3
4
DPO RBD Soft RBD Hard
C1
5/C
16
Rat
io
NiMoS
CoMoS
A
0.80 0.901.040.99
2.28
1.35
0
1
2
3
4
DPO RBD Soft RBD Hard
C1
7/C
18
Rat
io
NiMoS
CoMoSB

73
Figure 5.18A Ratios of C15/C16 and B Ratios of C17/C18 for effect of temperature to
CoMo catalyst (50 bar with 4h).
0
1
2
3
4
330 360 390 415
C1
5/C
16
rat
io
Temperature (ᵒC)
CoMoS DPO
RBD Soft
RBD hard
0
1
2
3
4
330 360 390 415
C1
7/C
18
rat
io
Temperature (ᵒC)
CoMoSDPO
RBD Soft
RBD hard

74
5.3.4 FTIR spectra of product
FTIR was used to estimate the unconverted carboxyl groups, which are
present in tri-, di-, and monoglycerides of feed. By increasing temperature of the
reaction, the intensity of the stretching peak (at about 1740 cm-1
) corresponding to the
carboxyl group continues to decrease as shown in figure 5.19. Observing that intensity
of the stretching peak of acid groups (at about 1708 cm-1
) occur at 330ᵒC was
disappeared at high temperature range because it converted faster than triglyceride
molecules. Following by Veriansyah et al investigation, first drop of hydrogen due to
saturated double bond in the fatty acids and triglycerides after that hydrogenated
triglyceride degraded into various intermediates was followed by the conversion of
the intermediates into deoxygenated products. Figure 5.20 shows clearer the
converted step of triglyceride and fatty acid as the effect of reaction time. Starting
with the RPS soft has the intensity at 1742.5 cm-1
corresponding to triglycerides, at
0.5 hours of reaction time appeared the intensity of acid group at 1707.2 cm-1
, which
explained by the degraded of triglyceride molecule. After passed through first hour of
the reaction, the intensity of acid was disappeared specifying at that time fatty acid
completely converted.
Figure 5.19 FTIR spectra of product of RPS soft stearin of 2 hours and NiMo sulfided
catalyst.

75
Figure 5.20 FTIR spectra of product of RPS soft stearin 360ᵒC 50bar on CoMo
sulfided catalyst.

CHAPTER VI
CONCLUSIONS AND RECOMMENDATIONS
6.1 Conclusions
Production of biodiesel can help in tackling the increasing greenhouse gas
emissions from transportation and diminish the depletion of fossil fuel.
Hydroprocessing of RPS palm stearin is an effective and promising process for the
production of biodiesel. The hydroprocessing is occurs via the several pathways. The
first step is the saturation of double bonds in the triglycerides molecule then saturated
triglycerides molecule is hydrogenated and cracked to C15 or C17 compound
depending on the chain length of the triglyceride molecule. The step of hydrogenated
is provided into three reaction pathways: deoxygenation, decarboxylation and
decarbonylation.
The optimum process condition for biodiesel production via hydroprocessing
of degummed palm oil with reaction temperature of 390C, hydrogen pressure of 50
bar, reaction time of 2 h and NiMo sulfided catalyst was observed to maximize the
diesel yield. Refined bleached deodorized palm soft and hard stearin shows the same
condition in maximum diesel yield of 360C, hydrogen pressure of 50 bar, reaction
time 4 h and NiMo sulfided catalyst. The process condition suggests that CoMo
sulfided catalyst at maximum diesel yield is reaction temperature of 390C, hydrogen
pressure of 50 bar and reaction time of 4 h for DPO, RPS soft and RPS hard. The
highest gasoline yield is found at maximum temperature (415C) for all kind of
feedstocks.
In conclusion, this work indicates the effect of temperature, time of reaction,
different feed composition and catalyst for hydroprocessing of DPO, RPS soft and
RPS hard. The effect of temperature for the conversion is shown that increasing
temperature of reaction increase the conversion, which the highest conversion of
DPO, RPS soft and RPS hard are 63.6%, 69% and 73.4% respectively. At low
temperature NiMo sulfided catalyst show much higher activity than CoMo sulfided
catalyst but CoMo sulfided catalyst become comparable at high temperature. The
77
study of reaction time observed that long period of reaction time lead to the decreases
in diesel yield, which the highest diesel selectivity for DPO, RPS soft and RPS hard
are at 2 h of the reaction time. Highest trend of diesel selectivity is found in the
hydroprocessing of RPS hard. NiMo sulfided catalyst promotes the
hydrodeoxygenation reaction while CoMo sulfided catalyst promotes higher
decarboxylation and decarbonylation. Since hydrodeoxygenation is the catalytic
process while hydrodecarboxylation and hydrodecarbonylation are thermal and
catalytic process (Filho et al, 1992)
6.2 Recommendations
1. Develop the reactor or add more design to perform the study of
pressure effect.
2. Modify the reactor to become a semi batch, in order to increase
more hydrogen to last through the length of the reaction, for more
study of deoxygenation reaction.
3. Study with gas products to minimized the effect of side reaction.
4. Use FTIR to indicate the amount of converted triglycerides.

REFERENCES
A.P.E. York, J.B. Claridge, V.C. Williams, A.J. Brungs, J. Sloan, A. Hanif, H. Al-
Megren, M.L.H. Green., Synthesis of high surface area transition metal
carbide catalysts. Surface Science and Catalysis 130 (2000): 989-994.
A.J. Brungs., A.P.E. York, M.L.H. Green, Catal. Lett. 57 (1999): 65.
Alexander Guzman, Juan E. Torres, Laura P. Prada, Manuel L. Nunez.,
Hydroprocessing of crude palm oil at pilot plant scale. Catalysis Today 156
(2010): 38–43.
Arno de Klerk., Hydroprocessing peculiarities of Fischer–Tropsch syncrude. Catalysis
Today 130 (2008): 439–445.
Artiwan Shotipruk, Mitsuru Sasaki, Motonobu Goto, Duangkamol Yujaroen.,
Esterification of palm fatty acid distillate (PFAD) in supercritical methanol:
Effect of hydrolysis on reaction reactivity. Fuel 88 (2009): 2011–2016
Badoga Sandeep, K. Chandra Mouli, Kapil K.Soni, A.K. Dalai, J. Adjaye., Beneficial
influence of EDTA on the structure and catalytic properties of sulfided
NiMo/SBA-15 catalysts for hydrotreating of light gas oil. Applied
CatalysisB: Environmental 125 (2012): 67-84
B.C. Gates, J.R. Katzer, and G.C.A. Chuit., Chemistry of catalytic Processes. New
York: McGraw-Hill, 1979.
B. Diaz, S. J. Sawhill, D. H. Bale, R. Main, D. C. Phillips, S. Korlann, R. Self and M.
E. Bussell., Hydrodesulfurization over supported monometallic, bimetallic and
promoted carbide and nitride catalysts. Catalysis Today 86 (2003): 191–209.
B. Donnis, R.G. Egeberg, P. Blom, and K.G. Knudsen., Hydroprocessing of Bio-Oils
and Oxygenates to Hydrocarbons Understanding the Reaction Routes, Top
Catalyst (2009) 52:229–240.
Berrebi G., Process for presulfurizing with phosphorous and/or halogen additive. US
Patent 4 (1991).
Berrebi G., Process of presulfuration of hydrocarbon processing catalyst and catalyst
produced by the process. US Patent 5 (1992)

79
Bezergianni Stella, Aggeliki Kalogianni., Hydrocracking of used cooking oil for
biofuels production. Bioresource Technology 100 (2009): 3927-3932.
Bezergianni Stella, Aggeliki Kalogianni, Athanasios Dimitriadis., Catalyst evaluation
for waste cooking oil hydroprocessing. Fuel 93(2012): 638-641.
Bhatti, H.N., Hanif, M.A., Qasim, M., Rehman, A.U., Biodiesel from waste tallow.
Fuel 87(2008): 2961–2966.
C. Chang, S. Wan., China‟s motor fuel from tung oil, Industrial and Engineering
Chemistry 39 (1947): 1543–1548.
Canakci, M., van Gerpen, J., 2001. Biodiesel production from oils and fats with high
free fatty acids. Trans. ASAE 44 (6)(2001): 1429–1436.
Centeno A, Laurent E, Delmon B., Influence of the support of CoMo sulfide catalysts
and of the addition of potassium and platinum on the catalytic performances for
the hydrodeoxygenation of carbonyl, carboxylic and guaiacol-type molecules.
Catalyst 154(1995): 288–98.
Craig, K.W., Sorevan, W.D., Production of hydrocarbons with a relatively high cetane
rating. US 4(1991): 992,605.
C.W. Colling, and L.T. Thompson., The structure and function of supported
molybdenum nitride hydrodenitrogenation catalysts. Journal of Catalysis. 146
(1994) 193-203.
D.C. Villalanti, J.C. Raia, and J.B. Maynard., High-temperature Simulated Distillation
Applications in Petroleum Characterization. Encyclopedia Analytical Chemistry
R.A. Meyers (Ed.) pp. 6726-6741@John Wiley&Sons Ltd, Chicherter, 2000.
Danuthai T, Jongpatiwut S, Rirksomboon T, Osuwan S, Resasco DE. Conversion of
methylesters to hydrocarbons over an H-ZSM5 zeolite catalyst. Appl Catal A
361 (2009): 99–105.
Demirbas A., Progress and recent trends in biodiesel fuels. Energy Convers Manage
50 (2009):14–34.
Dennis Y.C. Leung, Xuan Wu, M.K.H. Leung., A review on biodiesel production
using catalyzed transesterification. Applied Energy 87 (2010): 1083–1095.
D.J. Sajkowski, and S.T. Oyama., Catalytic hydrotreating by molybdenum carbide
and nitride: unsupported Mo2N and Mo2C/Al2O3. Applied Catalysis A: 134
(1996): 399-349.

80
Dufresne P., B. Legall, G. Berrebi., Process for the presulphurization of hydrocarbon
treatment catalysts. US Patent 5 (1995)
Dufresne P., F. Labruyere, Ex-siyu presulfuration in the presence of hydrocarbon
molecule. US Patent 6 (2002).
Dumeignil Franck, Hiroshi Amano, Danhong Wang, Eika W. Qian, Atsushi Ishihara,
Toshiaki Kabe., Study of the sulfidation process of CrO3–Al2O3
hydrodesulfurization catalysts by a 35
S-labeled H2S pulse tracer method.,
Applied Catalysis A: General 249 (2003): 255–263.
D.Yu. Murzin, M. Sna˚re, I. Kubicˇkova´, P.Ma¨ki-Arvela, D. Chichova, K. Era¨nen.,
Catalytic deoxygenation of unsaturated renewable feedstocks for production of
diesel fuel hydrocarbons. Fuel 87 (2008): 933–945.
Do PT, Chiappero M, Lobban LL, Resasco DE. Catalytic deoxygenation of methyl-
octanoate and methyl-stearate on Pt/Al2O3. Catal Lett 130 (2009): 9–18.
E. Laurent, B. Delmon., Deactivation of a Sulfided NiMo/γ-Al2O3 during the
Hydrodeoxygenation of Bio-Oils: Influence of a High Water Pressure. Applied
Catalyst A: General 109 (1994): 97–115.
Fernando S, Hall C, Jha S., NOx reduction from biodiesel fuels. Energy Fuels 20
(2006): 376–382.
Ferrari M, Maggi R, Delmon B, Grange P., Influence of the hydrogen sulfide partial
pressure and of a nitrogen compound on the hydrodeoxygenation activity of a
CoMo/carbon catalyst. Catalyst 198(2001): 47–55.
Ferrari M, Bosmans S, Maggi R, Delmon B, Grange P., CoMo/Carbon
hydrodeoxygenation catalysts: influence of the hydrogen sulfide partial pressure
and of the sulfidation temperature. Catalyst Today 65 (2001): 257–64.
Filho G.N. da Rocha, D. Brodzki, G. Djega-Mariadassou., Formation of alkanes,
alkylcycloalkanes and alkylbenzenes during the catalytic hydrocracking of
vegetable oils. (1992).
Franco A, Diaz AR., The future challenges for „„clean coal technologies‟‟: joining
efficiency increase and pollutant emission control. Energy 34 (2009):348–354.
Ghadge, S.V., Raheman, H., Biodiesel production from mahua (Madhuca indica) oil
having high free fatty acids. Biomass Bioenergy 28(2005): 601–605.

81
Gusmao, J., Brodzki, D., Djéga-Mariadassou, G., Frety, R., Utilization of vegetable
oils as an alternative source for diesel-type fuel: hydrocracking on reduced
Ni/SiO2 and sulphided Ni-Mo/c -Al2O3. Catalysis Today 5(1989): 533–544.
G.N. da Rocha Filho D.N, Bentes M.H.S, Brodzki D, Djega-Mariadassou G, Catalytic
conversion of Hevea brasiliensis and Virola sebifera oils to hydrocarbon fuels.
Journal of the American Oil Chemists‟ Society 69-(3) (1992): 266–271.
G.N. da Roch Filho G.N, Brodzki D, Djéga-Mariadassou G., Formation of alkanes,
alkylcycloalkanes and alkylbenzenes during the catalytic hydrocracking of
vegetable oils. Fuel 72 (4) (1993), 543–549.
H.C. Ong, T.M.I. Mahlia, H.H. Masjuki and R.S. Norhasyima., Comparison of palm
oil, Jatropha curcas and Calophyllum inophyllum for biodiesel: A review.
Renewable and Sustainable Energy Reviews 15 (2011): 3501– 3515.
Haslenda H., Industry to Industry By-products Exchange Network towards zero waste
in palm oil refining process. (2011).
H. Haslenda, M.Z. Jamaludin., iIndustry to Industry By-products Exchange Network
towards zero waste in palm oil refining processes. Resources, Conservation
and Recycling 55 (2011): 713–718
H.O. Pierson., Handbook of Refractory Carbides and Nitrides. Noyes Publ.,
Westwood, NJ, USA 1996.
Hancsók J, Krár M, Magyar S, Boda L, Holló A, Kalló D. Investigation of the
production of high cetane number bio gas oil from pre-hydrogenated vegetable
oils over Pt/HZSM-22/Al2O3. Micropor Mesopor Mater 101 (2007): 148–52.
Hodge C. California Energy Commission, workshop on bioenergy, 9 March 2006.
Huber G.W, O‟Connor P, Corma A., Processing biomass in conventional oil
refineries: production of high quality diesel by hydrotreating vegetable oils in
heavy vacuum oil mixtures. Applied Catalysis A: General 329 (2007): 120–129.
Immer Jeremy G., M. Jason Kelly, H. Henry Lamb., Catalytic reaction pathways in
liquid-phase deoxygenation of C18 free fatty acids. Applied Catalysis A:
General 375 (2010): 134–139.
J. Walendziewski, M. Stolarski, R. Luzny, and B. Klimek., Hydroprocesssing of light
gas oil- rape oil mixtures. Fuel Processing Technology 90 (2009): 686–691.

82
Jacques Monnier, Hardi Sulimma, Ajay Dalai, Gianni Caravaggio.,
Hydrodeoxygenation of oleic acid and canola oil over alumina-supported metal
nitrides. Applied Catalysis A: General 382 (2010): 176–180.
Jeno Hancsók, Márton Krár, Sándor Kovács, Dénes Kalló., Fuel purpose
hydrotreating of sunflower oil on CoMo/Al2O3 catalyst. Bioresource
Technology101(2010): 9287–9293.
Jitendra K., Satyarthi and Darbha Srinivas., Fourier Transform Infrared Spectroscopic
Method for Monitoring Hydroprocessing of Vegetable Oils to Produce
Hydrocarbon-Based Biofuel. Energy & Fuels article.
Jozef Mikulec ,Ja´ n Cvengrosˇ, Lˇ udmila Jorı´ kova´, Marek Banicˇ, Andrea
Kleinova., Second generation diesel fuel from renewable sources. Journal of
Cleaner Production 18 (2010): 917–926.
K. Othmer., Encyclopedia of chemical technology. Vol 6. 4th ed. New York: A Wiley
Interscience Publication, John Wiley&Son, 1991.
Kamm B, Gruber P.R, Kamm M., Biorefinery Industrial Processes and Products.
Status and Future Direction, vols. 1 and 2.Wiley-Verlay Gmbtt and Co KGaA,
Weinheim (2006).
Kaluza L., D. Gulkova ´,Z.Vı ´t, M. Zdraz ˇil., Effect of support type on the
magnitude of synergism and promotion in CoMo sulphide
hydrodesulphurisation catalyst. Applied Catalysis A General 324 (2007): 30-35.
Kobayashi K, Yamaguchi E., Artificial petroleum from fish oils. Journal Chemical
Industries Japan 24 (1921): 1399–420.
Kojima R, Aika KI., Molybdenum nitride and carbide catalysts for ammonia
synthesis. Applied Catalyst A: General 219 (2001):141–147.
Krár, M., Thernesz, A., Tóth, Cs., Kasza, T., Hancsók, J., Investigation of catalytic
conversion of vegetable oil/gas oil mixtures. In: Halász, I. (Ed.), Silica and
Silicates in Modern Catalysis. Trans world Research Network, Kerala, India,
(2010): 435–455.
Kubicˇka D, Šimácˇek P, Kolena J, Lederer J, Šebor G. Catalytic transformations of
vegetable oils into hydrocarbons. In: ICP2007 proceedings–43rd
international
petroleum conference, Bratislava, Slovakia; 2007. p. 1–7.
Kubicˇka D, Kaluzˇa L. Deoxygenation of vegetable oils over sulfided Ni, Mo and
NiMo catalysts. Appl Catal A 372 (2010): 199–208.

83
Kubicˇka D, Bejblová M, Vlk J. Conversion of vegetable oils into hydrocarbons over
CoMo/MCM-41 catalysts. Top Catal 53 (2010): 168–78.
Kumar R, Rana B.S, Tiwari R, Verma D, Kumar R, Joshi R.K, Garg M.O, Sinha
A.K., Hydroprocessing of jatropha oil and its mixtures with gas oil. Green
Chem 12 (2010): 2232–2239.
Lai Weikun, Liqing Pang, Jinbao Zheng, Juanjuan Li, ZhongfangWu, Xiaodong Yi,
Weiping Fang, Lishan Jia., Efficient one pot synthesis of mesoporous NiMo–
Al2O3 catalysts for dibenzothiophene hydrodesulfurization. Fuel Processing
Technology 110 (2013): 8-16.
Leung, D.Y.C., Guo, Y., Transesterification of neat and used frying oil: optimization
for biodiesel production. Fuel process. Technol. 87(2006): 883–890.
Leyva Carolina, Mohan S. Rana, Jorge Ancheyta., Surface characterization of Al2O3–
SiO2 supported NiMo catalysts: An effect of support composition. Catalysis
Today 130 (2008): 345–353.
Li S, Lee JS, Hyeon T, Suslick KS., Catalytic hydrodenitrogenation of indole over
molybdenum nitride and carbides with different structures. Applied Catalyst A:
General 184 (1999):1–9.
Liu, Y., Sotelo-Boyás, R., Murata, K., Minowa, T., Sakanishi, K., 2009.
Hydrotreatment of jatropha oil to produce green diesel over trifunctional Ni–
Mo/SiO2–Al2O3 catalyst. Chemistry Letters 38(2009): 552–553.
M. Stumborg, A. Wong, E. Hogan., Hydroprocessed vegetable oils for diesel fuel
improvement, Bioresource Technology 56 (1996): 13–18.
Mailhe MA. Sur la décomposition catalytique de l„huile de requin. Bull Soc Chim
France 31 (1922): 249–52.
Man Y.B. Che, T. Haryati, H.M. Ghazali, B.A. Asbi., Composition and Thermal
Profile of Crude Palm Oil and Its Products. JAOCS 76 (1999): 237-242.
Maria Carolina Sérgi Gomes, Pedro Augusto Arroyo, Nehemias Curvelo Pereira.,
Biodiesel production from degummed soybean oil and glycerol removal using
ceramic membrane. Journal of Membrane Science 378 (2011): 453– 461.
Meena Marafi, Antony Stanislaus, Edward Furimsky., Handbook of Spent
Hydroprocessing Catalysts, 2010: Pages 17-49
N. Laosiripojana, P. Mongkolbovornkij, V. Champreda, W. Sutthisripok.,
Esterification of industrial-grade palm fatty acid distillate over modified ZrO2

84
(with WO3 – ,SO4 – and TiO2 – ): Effects of co-solvent adding and water
removal. Fuel Processing Technology 91 (2010): 1510 –1516
Oleg V. Kikhtyanin, Anton E. Rubanov, Artem B. Ayupov, Gennadii V. Echevsky.,
Hydroconversion of sunflower oil on Pd/SAPO-31 catalyst. Fuel 89 (2010):
3085–3092.
Patil PD, Deng S., Optimization of biodiesel production from edible and non-edible
vegetable oils. Fuel 88 (2009): 1302–1306.
Pavel Šimácˇek, David Kubicˇka, Gustav Šebora, Milan Pospíšil., Fuel properties of
hydroprocessed rapeseed oil. Fuel 89 (2010): 611–615.
Petrobras.[online].2009:http://www2.petrobras.com.br/ingles/ads/ads_Tecnologia.htm
l [2 January 2011]
Priecel Peter, David Kubicka, Libor Capek, Zdenek Bastl, Petr Rysánek., The role of
Ni species in the deoxygenation of rapeseed oil over NiMo-alumina catalysts.
Applied Catalysis A: General 397 (2011): 127–137.
Q. Smejkal, L. Smejkalova, and D. Kubicka., Thermodynamic balance in reaction
system of total vegetable oil hydrogenation. Chemical Engineering Journal
146 (2009): 155–160.
Rana Mohan S., J. Ancheyta, P. Rayo, S.K. Maity., Effect of alumina preparation on
hydrodemetallization and hydrodesulfurization of Maya crude. Catalysis Today
98 (2004): 151–160.
R.C. Santana, P.T. Do, M. Santikunaporn, W.E. Alvarez, J.D. Taylor, E.L. Sughrue,
and D.E. Resasco., Evaluation of different reaction strategies for the
improvement of cetane number in diesel fuels. Fuel 85 (2006): 643-656.
Ramadhas, A.S., Jayaraj, S., Muraleedharan, C., Biodiesel production from high FFA
rubber seed oil. Fuel 84(2005): 335–340.
Seamans J.D., J.G. Gasser., Method of presulfiding a hydrotreating catalyst. US
Patent 4 (1990).
S. Bezergianni, and A. Kalogianni., Hydroprocessing of used cooking oil for biofuels
production. Bioresource Technology 100 (2009): 3927-3932.
S.Bezergianni, A. Dimitriadis, A. Kalogianni, and P.A. Pilavachi., Hydrotreating of
waste cooking oil for biodiesel production Part I: Effect of temperature on

85
product yields and heteroatom removal. Bioresource Technology 101 (2010):
6651–6656.
S.Bezergianni, A. Dimitriadis, T. Sfetsas, and A. Kalogianni., Hydrotreating of waste
cooking oil for biodiesel production Part II: Effect of temperature on
hydrocarbon composition. Bioresource Technology 101 (2010): 7658–7660.
S. Chongkhong, C. Tongurai, P. Chetpattananondh, C. Bunyakan., Biodiesel
production by esterification of palm fatty acid distillate. Biomass and Bioenergy
31 (2007): 563 – 568.
S. Chongkhong, C. Tongurai, P. Chetpattananondh., Continuous esterification for
biodiesel production from palm fatty acid distillate using economical process.
Renewable Energy 34 (2009): 1059–1063
S.P. Santos, S.H. Santos, and S.P. Toledo., Standard transition aluminas. Electron
microscopy studies. Materials Research 3, 4 (2000): 104-114.
S. Ramanathan, and S.T. Oyama., J. Phys. Chem. 99 (1995): 16365.
S.T. Oyama, G. Ertl, H. Knozinger, J. Wcitkamp., Handbook of Heterogeneous
Catalysis, vol. 1, VCH, Verlagsgesellschaft mbH, Weinheim< Germany, 1997,
p. 39.
S. Izhar, H. Kanesugi, H. Tominaga, and M. Nagai., Cobalt molybdenum carbides:
Surface properties and reactivity for methane decomposition. Applied Catalysis
A: General 317 (2007): 82–90.
S. Mikkonen., Second-generation renewable diesel offers advantages. Hydrocarbon
Processing February (2008): 63–66.
Scherzer, J., Gruia, A.J., Hydrocracking Science and Technology. Marcel Dekker
Inc., New York. (1996)
Sebos I, Matsoukas A, Apostolopoulos V, Papayannakos N., Catalytic
hydroprocessing of cottonseed oil in petroleum diesel mixtures for production
of renewable diesel. Fuel 2009(88):145–9.
Senol O, Viljava T, Krause A. Hydrodeoxygenation of aliphatic esters on sulphided
NiMo/ ɣ-AlO and CoMo/ ɣ-AlO catalyst: the effect of water. Catalyst Today
106 (2005): 186–9.

86
Senol OI, Ryymin EM, Viljava T-R, Krause AOI. Reactions of methyl heptanoate
hydrodeoxygenation on sulphided catalysts. Journal Molecular Catalyst A 268
(2007): 1–8.
Šimácek P, Kubicka D, Šebor G, Pospíšil M. Hydroprocessed rapeseed oil as a source
of hydrocarbon-based biodiesel. Fuel 88 (2009): 456–60.
Šimácek Pavel, David Kubicka, Gustav Šebor, Milan Pospíšil., Hydroprocessed
rapeseed oil as a source of hydrocarbon-based biodiesel. Fuel 88 (2009): 456–
460.
Šimácek Pavel, David Kubicka., Hydrocracking of petroleum vacuum distillate
containing rapeseed oil: Evaluation of diesel fuel. Fuel 89 (2010): 1508–1513.
Šimácek Pavel, David Kubicka, Gustav Šebor, Milan Pospíšil., Fuel properties of
hydroprocessed rapeseed oil. Fuel 89 (2010): 611–615.
Šimácek Pavel, David Kubicka, Iva Kubicková, František Homola, Milan Pospíšil,
Josef Chudoba., Premium quality renewable diesel fuel by hydroprocessing of
sunflower oil. Fuel 90 (2011): 2473–2479.
Singh SP, Singh D., Biodiesel production through the use of different sources and
characterization of oils and their esters as the substitute of diesel: a review.
Renewable & Sustainable Energy Reviews 14(1) (2010): 200–216.
Sundaramurthy V., A.K. Dalai, J. Adjaye., Comparison of P-containing ɣ-Al2O3
supported Ni-Mo bimetallic carbide, nitride and sulfide catalysts for HDN and
HDS of gas oils derived from Athabasca bitumen. Applied Catalysis A: General
311 (2006): 155–163.
Takuya Ito, Yusuke Sakurai, Yusuke Kakuta, Motoyuki Sugano, Katsumi Hirano.,
Biodiesel production from waste animal fats using pyrolysis method. Fuel
Processing Technology 94 (2012): 47 – 52.
Tominaga H, Nagai M. Theoretical study of methane reforming on molybdenum
carbide. Applied Catalyst A: General 328 (2007): 35–42.
Topsøe H, Clausen B. S, Massoth F. E, Hydrotreating Catalysis. Science and
Technology. Springer-Verlag: Berlin, 1996.
V.Schwartz, S. T. Oyama, and J. G. Chen., Supported Bimetallic Nb-Mo Carbide:
Synthesis, Characterization, and Reactivity. J. Phys. Chem. B (2000): 104 8800-8006

87
V.Sundaramurthy, A.K.Dalai, and J.Adjaye., Effect of phosphorus addition on the
hydrotreating activity of NiMo/Al2O3 carbide catalyst. Catalysis Today 125
(2007): 239-247.
Veriansyah Bambang, Jae Young Han, Seok Ki Kim, Seung-Ah Hong, Young Jun
Kim, Jong Sung Limb, Young-Wong Shu, Seong-Geun Oh, Jaehoon Kim.,
Production of renewable diesel by hydroprocessing of soybean oil: Effect of
catalysts. Fuel 94 (2012): 578–585.
Veljkovic, V.B., Lakicevic, S.H., Stamenkovic, O.S., Todorovic, Z.B., Lazic, M.L.,
Biodiesel production from tobacco ( Nicotiana tabacum L.) seed oil with a high
content of free fatty acids. Fuel 85(2006): 2671–2675.
Viljava T.-R., R.S. Komulainen, A.O.I. Krause., Effect of H2S on the stability of
CoMo/Al2O3 catalysts during hydrodeoxygenation. Catalysis Today 60 (2000):
83–92.
W. Kiatkittipong, S. Suwanmanee, N. Laosiripojana, P.Praserthdam and S.
Assabumrungrat., Cleaner gasoline production by using glycerol as fuel
extender. Fuel Processing Technology 91 (2010): 456–460.
X. Yang, and NJ. Edison., Stabilized flash calcined gibbsite as a catalyst support.
United States: Patent Application Publication, 2007.
Yao Z, Shi C., Development of a catalytic cycle in molybdenum carbide catalyzed
NO/CO reaction. Catalyst Lett 130 (2009): 239–45.
Zhou Zheng, Zhou, Sheng-Li Chen, Derun Hua, Ai-Cheng Chen, Zhi-Gang Wang,
Jun-Hui Zhang, Jinsen Gao., Structure and activity of NiMo/alumina
hydrodesulfurization model catalyst with ordered opal-like pores. Catalysis
Communications 19 (2012): 5–9.
Zhu Xinli, Lance L. Lobban, Richard G. Mallinson, Daniel E. Resasco., Tailoring the
mesopore structure of HZSM-5 to control product distribution n the conversion
of propanal. Journal of Catalysis 271 (2010): 88–98.

APPENDICES

89
APPENDIX A
CALCULATION FOR CATALYST PREPARTION
Preparation of 2.5Ni10Mo/ γ-Al2O3 is shown as follows:
Calculation for the preparation of Nickel and Molybdenum loading catalyst for
2.5Ni10Mo
Example calculation for the preparation of 2.5Ni10Mo/ γ-Al2O3
Based on 100 g of catalyst used, the composition of the catalyst will be as follows:
Nickel = 2.5 g
Molybdenum = 10 g
Al2O3 = 100 – (2.5+10) = 87.5 g
For 2 g of Al2O3
Weight of catalyst = 2 × (100/87.5) =
2.2857 g
Nickel required = 2.2857 × (2.5/100) = 0.0571 g
Nickel 0.0571 g was prepared from Ni(NO3)2∙6H2O and molecular weight of
Ni is 58.6934 g/mol which molecular weight of Ni(NO3)2∙6H2O is 290.79.

90
Ni(NO3)2∙6H2O required = MW of Ni (NO 3)2∙6H2O ×Nickel required
MW of Nickel
= (290.79/58.6934) × 0.0571 =0.2829g
For 10Mo from 2 g of Al2O3
Molybdenum required = 2.2857 × (10/100) = 0.2285g
Molybdenum 0.2285 g was prepared from (NH4)6Mo7O24∙4H2O molecular
weight is 1,234.58 g/mol and molecular weight of Mo is 95.94 g/mol
NH4)6Mo7O24∙4H2O required= MW of NH 4 6Mo 7O24.4H2O) ×Molybdenum required
MW of Molybdenum
= (1,234.58 × 0.2285)/(95.94× 7)
= 00.4200 g
Preparation of 2.5Co10Mo/γ-Al2O3 is shown as follows:
Calculation for the preparation of Cobalt and Molybdenum loading catalyst for
2.5Co10Mo
Example calculation for the preparation of 2.5Co10Mo/γ-Al2O3
Based on 100 g of catalyst used, the composition of the catalyst will be as follows:
Cobalt = 2.5 g
Molybdenum = 10 g
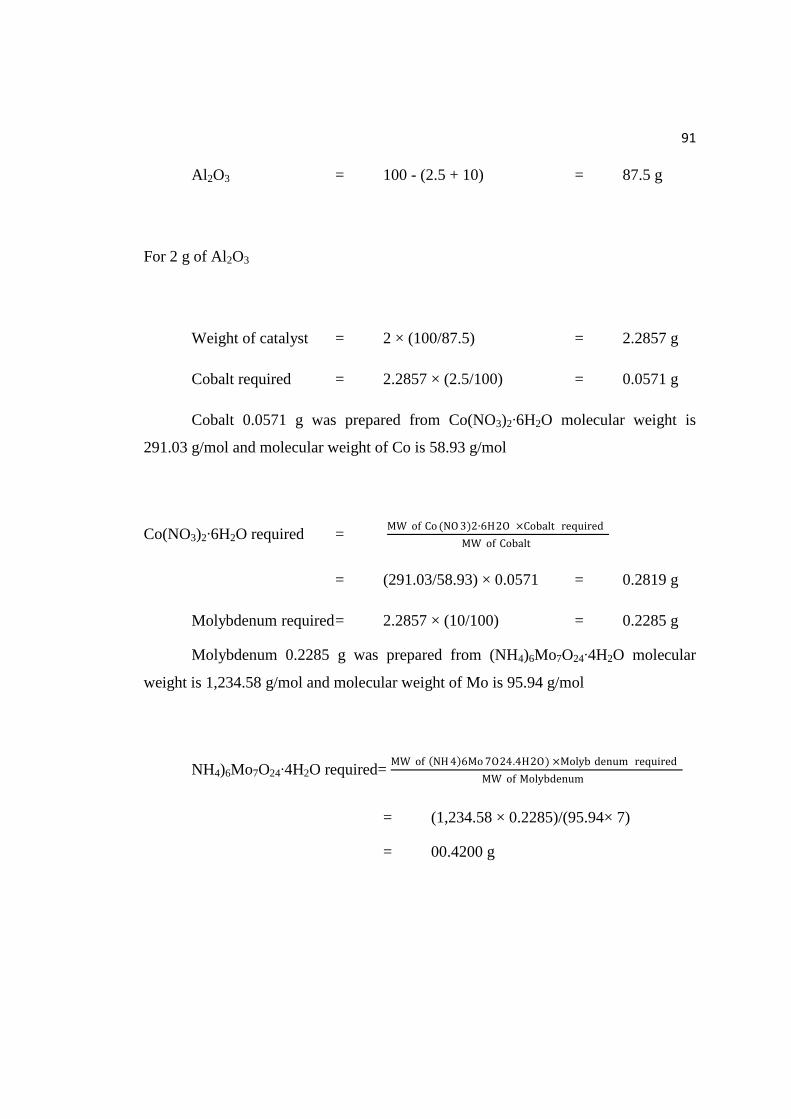
91
Al2O3 = 100 - (2.5 + 10) = 87.5 g
For 2 g of Al2O3
Weight of catalyst = 2 × (100/87.5) = 2.2857 g
Cobalt required = 2.2857 × (2.5/100) = 0.0571 g
Cobalt 0.0571 g was prepared from Co(NO3)2∙6H2O molecular weight is
291.03 g/mol and molecular weight of Co is 58.93 g/mol
Co(NO3)2∙6H2O required = MW of Co (NO 3)2∙6H2O ×Cobalt required
MW of Cobalt
= (291.03/58.93) × 0.0571 = 0.2819 g
Molybdenum required = 2.2857 × (10/100) = 0.2285 g
Molybdenum 0.2285 g was prepared from (NH4)6Mo7O24∙4H2O molecular
weight is 1,234.58 g/mol and molecular weight of Mo is 95.94 g/mol
NH4)6Mo7O24∙4H2O required= MW of NH 4 6Mo 7O24.4H2O) ×Molyb denum required
MW of Molybdenum
= (1,234.58 × 0.2285)/(95.94× 7)
= 00.4200 g
92
APPENDIX B
PROGRAM SIMULATED DISTILLATION OF GAS
CHROMATOGRAPHY WITH FLAME IONIZATION
DETECTOR
This appendix showed the program Simulated distillation (SimDist) for
calculation of composition of hydrocarbon components in hydroprocessing reaction.
A flame ionization detector (FID) is used for detection and measurement
of the hydrocarbon analytes. The result of SimDist analysis provides a quantitative
percent mass yield as a function of boiling point of the hydrocarbon components of the
sample. The chromatographic elution times of the hydrocarbons are calibrated to the
atmospheric equivalent boiling point (AEBP) of the paraffins reference material. The
SimDist method ASTM (American Society for Testing and Materials) D2887 covers the
boiling range 55–538°C (100–1000°F) which covers the n-alkanes (n-paraffins) of chain
length about C5–C44.
In this study, we used simulated distillation to analyze the temperature
range of products following by ASTM-2887-D86 procedure. It was found, at
temperature range of 250-380°C is a suitable for diesel range (n-C15-n-C18). Table B.1 –
Table B.3 and Figure B.1 – Figure B.2 are shown conditions use in gas
chromatography with flame ionization detector, chromatogram of calibration mixture
reference and data analysis.

93
Table B.1 Conditions use in gas chromatography with flame ionization detector.
Parameters Condition
Width 5 sec
Slope 2,000 uV/min
Drift 0 uV/min
T.DBL 1,000 min
Min.Area/Hight 10,000 counts
Quantitation
Quantitative Method Corrected Area Normalization
External Standard
Calculated by Area
# of Calib. Levels 1
Curve Fit Type Liner
Unit %(w/w)
X Axis of Calib. Curve Conc.
Identification
Window 5 %
Default Band Time 0.01 min
Identification Method Absolute Rt
Peack Select Closest Peak
Grouping Not Used
Correction of RT No Change

94
Figure B.1 Chromatogram of calibration mixture reference.
Figure B.2 Chromatogram of data analysis.

95
Table B.2 Results from chromatogram of calibration mixture reference.
Peak Component Rt
(min)
Area Conc. Conc.
(100%)
Units
1 C5H12 0.163 316798.1 0.9995 5.00033 %(w/w)
2 C6H14 0.3 345611.2 0.9995 5.00033 %(w/w)
3 C7H16 0.61 330865.1 0.9995 5.00033 %(w/w)
4 C8H18 1.22 63212.1 0.9995 5.00033 %(w/w)
5 C9H20 2.23 300457.4 0.9995 5.00033 %(w/w)
6 C10H22 3.55 291602.6 0.9995 5.00033 %(w/w)
7 C11H24 5.01 273183.5 0.9995 5.00033 %(w/w)
8 C12H26 6.5 262581.8 0.9995 5.00033 %(w/w)
9 C14H30 9.32 239842.9 0.9995 5.00033 %(w/w)
10 C15H32 10.62 233431.4 0.9995 5.00033 %(w/w)
11 C16H34 11.85 225150.5 0.9995 5.00033 %(w/w)
12 C17H36 13.02 216383.8 0.9995 5.00033 %(w/w)
13 C18H38 14.13 205113.8 0.9995 5.00033 %(w/w)
14 C20H42 16.19 187065.4 0.9995 5.00033 %(w/w)
15 C24H50 19.76 160614.5 0.9995 5.00033 %(w/w)
16 C28H58 22.83 160561.9 0.9995 5.00033 %(w/w)
17 C32H66 25.45 157273.7 0.9991 4.99832 %(w/w)
18 C36H74 27.76 153387.5 0.9995 5.00033 %(w/w)
19 C40H82 29.94 158740 0.9986 4.99582 %(w/w)
20 C44H90 33.52 146186.8 0.9995 5.00033 %(w/w)

96
Data analysis can be converted from GC postrun to program GC distillation
data calibration by batch table for calculated distillation data, distillation curve,
distillation data in specified temperature range and ASTM D-86. Result analysis form
program simulated distillation is shown in Figure D.3 – Figure D.6 respectively.
Table B.3 Distillation GC calibration initial setting.
ID Component Rt (min) Boiling point (˚C)
1 C5H12 0.163 36
2 C6H14 0.3 69
3 C7H16 0.61 98
4 C8H18 1.22 126
5 C9H20 2.23 151
6 C10H22 3.55 174
7 C11H24 5.01 196
8 C12H26 6.5 216
9 C14H30 9.32 254
10 C15H32 10.62 271
11 C16H34 11.85 287
12 C17H36 13.02 302
13 C18H38 14.13 316
14 C20H42 16.19 344
15 C24H50 19.76 391
16 C28H58 22.83 431
17 C32H66 25.45 466
18 C36H74 27.76 496
19 C40H82 29.94 522
20 C44H90 33.52 545
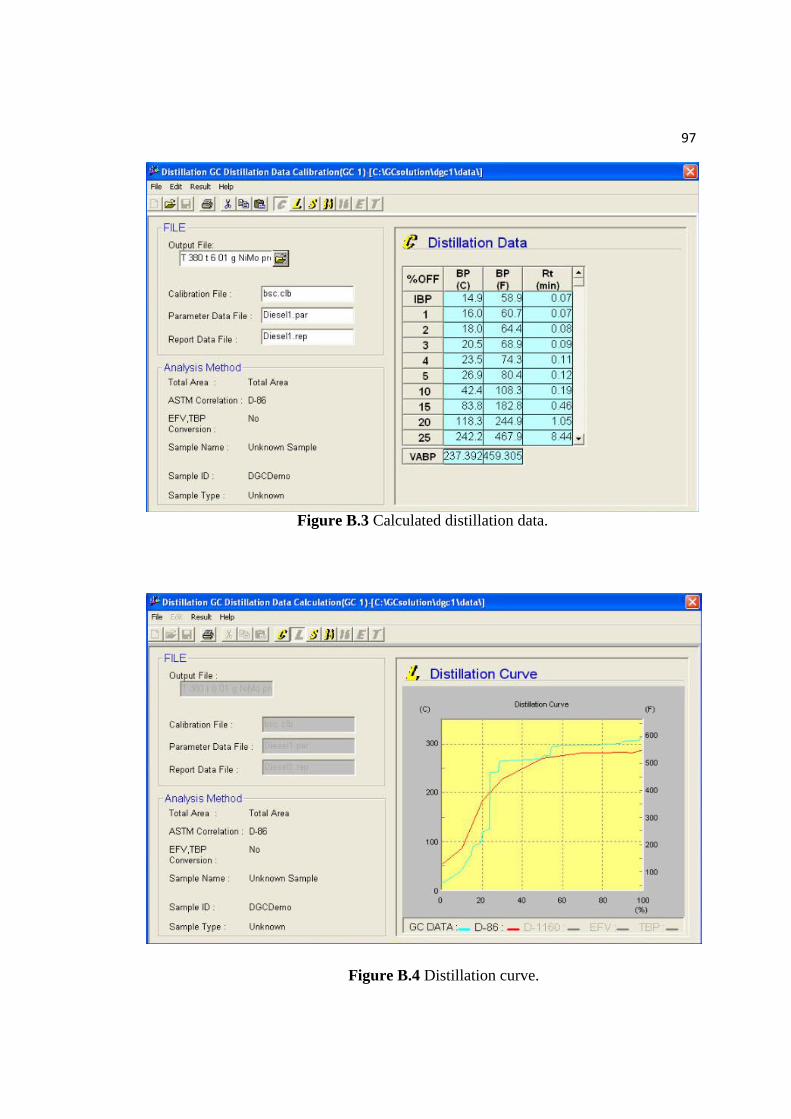
97
Figure B.3 Calculated distillation data.
Figure B.4 Distillation curve.

98
Figure B.5 Distillation data in specified temperature range.
Figure B.6 ASTM D-86.

99
APPENDIX C
DATA OF CALCULATION OF TOTAL ACID SITE
Table C.1 Area of NH3 TPD curve for calculation of total acid site
Sample Temperature (ᵒC) area Total area
NiMo/Al2O3 238.7 0.33607 0.33607
CoMo/Al2O3 181.3 0.0093
0.11865 209.4 0.10935
Calculation of total acid sites
For example, NiMo/Al2O3 sample, total acid site is calculated from the
following step
1. Calculation of total peak area to peak volume
From Figure C.1 below, the volume of NH3 calculates from equation y = 35.847x
The volume of NH3 = 35.847 x area
(Total acid strength = 35.847 x 0.33607
= 12.047 ml
2. Calculation for adsorbed volume of 15%NH3
Adsorbed volume of 15% NH3 = 0.15x total peak volume
= 0.15 x 12.047ml
= 1.807ml

100
Figure C.1 The calibration curve of ammonia.
3. The acid sites are calculated from the following equation
The acid sites =Adsorbed volume ml × 101.325 Pa
3.314 × 10⁻³ Pa ∙ mlK ∙ μmol
× 298K × weight of catalyst(g)
For NiMo/Al2O3 sample, 0.0522 g of this sample was measured,
therefore
The acid sites =1.807ml × 101.325 Pa
3.314 × 10⁻³ Pa ∙ mlK ∙ μmol
× 298K × 0.0522 g
= 1.415 mmol/g

101
VITA
Miss. Narisara Rodboon was born on 7th
November 1987, in Bangkok
Thailland. She studies high school from Navamintrachinuthid Suankularb Wittayalai
Samutprakarn. Her graduated Bachelor degree of Chemical Engineering from King
Mongkut University of Technology Thonburi, Thailand in April 2010. She has
studying for her Master degree of Engineering from the department of Chemical
Engineering, Chulalongkorn University.
List of Plublication:
Narisara Rodboon, Worapon Kiatkittipong, and Suttichai Assabumrungrat,
“THE HYDROPROCESSING OF WASTE COOKING PALM OIL FOR DIESEL
LIKE HYDROCARBONS PRODUCTION OVER NiMo/Al2O3 CARBIDE
CATALYST”, Proceedings of Pure and Applied Chemistry International Conference
2012, Chiang Mai, Thailand, Jan.10-12,2012.