DOI: 10.18554 / reas.v9i1.3730 - FI-Admin
13
ORIGINAL ARTICLE DOI: 10.18554 / reas.v9i1.3730 DOI: 10.18554/reas.v9i1.3730 Rev Enferm Health Care [Online]. Jan/Jul 2020; 9(1):14-26 ISSN 2317-1154 GENDER DIFFERENCES IN DIABETES: A STARTING POINT TO OPTIMIZE QUALITY OF LIFE DIFERENÇAS DE GÊNERO NA DIABETES: UM PONTO DE PARTIDA PARA OTIMIZAR A QUALIDADE DE VIDA DIFERENCIAS DE GÉNERO EN LA DIABETES: UN PUNTO DE PARTIDA PARA OPTIMIZAR LA CALIDAD DE VIDA Fernanda Monteiro Coelho 1 , Erika Masanet 2 ABSTRACT Objective: to evaluate gender differences in quality of life and anthropometric indicators among people with type 2 diabetes in comparison with people without diabetes. Method: Quan- titative and cross-sectional study with 117 patients type 2 diabetes and 81control aged 40 or over. Univariate analysis was used for sociodemographic variables and T-Student test was also used to compare the means in quality of life and anthropometric indicators. Results: women’s quality of life was worse to a greater extent when compared to men in the presence of diabetes, especially in the mental component. Women presented higher values for anthropometric varia- bles, what may be a factor that help to explain the lower quality of life. Conclusion: women have the worst results in the variables studied, what suggest the relevance to adopt a gender- oriented strategies in the assistance of people with diabetes making possible a better control of the disease. Descriptors: Diabetes type 2; Gender and health; Quality of life. RESUMO Objetivo: analisar as diferenças de gênero na qualidade de vida e nos indicadores antropométricos de pessoas com e sem diabetes tipo 2. Método: Estudo quantitativo de caráter transversal realizado com 117 indivíduos diagnosticados com diabetes tipo 2 e 81 controles ≥ a 40 anos de idade. Utilizou-se análise univariada para as variáveis sociodemográficas e teste t de Student para comparação das médias na qualidade de vida e nos indicadores antropométricos. Resultados: a qualidade de vida das mulheres piora em maior medida comparada à dos homens na presença da doença, sobre tudo do ponto de vista mental. Mulheres apresentam valores mais elevados para as variáveis antropométricas comparadas aos homens, o que possivelmente contribui para a menor qualidade de vida. Conclusão: mulheres apresentam piores resultados nas variáveis estudadas, sendo necessário adotar estratégias orientadas pelo gênero para uma melhor assistência às pessoas com diabetes, o que contribui para o melhor controle da doença. Descritores Diabetes tipo 2; Gênero e saúde; Qualidade de vida. ____________________ 1 PhD in Life Sciences / Nutrition - clinical specialty, Faculty of Medical Sciences, Universidade Nova de Lisboa (Portugal). 2 PhD in Sociology from the University of Alicante (Spain). Lecturer in the Department of Sociology and Social Anthropology at Universitat de València (Spain).
-
Upload
khangminh22 -
Category
Documents
-
view
0 -
download
0
Transcript of DOI: 10.18554 / reas.v9i1.3730 - FI-Admin
ORIGINAL ARTICLE
DOI: 10.18554 / reas.v9i1.3730 DOI: 10.18554/reas.v9i1.3730
Rev Enferm Health Care [Online]. Jan/Jul 2020; 9(1):14-26 ISSN 2317-1154
GENDER DIFFERENCES IN DIABETES: A STARTING POINT TO OPTIMIZE
QUALITY OF LIFE
DIFERENÇAS DE GÊNERO NA DIABETES: UM PONTO DE PARTIDA PARA
OTIMIZAR A QUALIDADE DE VIDA
DIFERENCIAS DE GÉNERO EN LA DIABETES: UN PUNTO DE PARTIDA PARA
OPTIMIZAR LA CALIDAD DE VIDA
Fernanda Monteiro Coelho1, Erika Masanet2
ABSTRACT
Objective: to evaluate gender differences in quality of life and anthropometric indicators
among people with type 2 diabetes in comparison with people without diabetes. Method: Quan-
titative and cross-sectional study with 117 patients type 2 diabetes and 81control aged 40 or
over. Univariate analysis was used for sociodemographic variables and T-Student test was also
used to compare the means in quality of life and anthropometric indicators. Results: women’s
quality of life was worse to a greater extent when compared to men in the presence of diabetes,
especially in the mental component. Women presented higher values for anthropometric varia-
bles, what may be a factor that help to explain the lower quality of life. Conclusion: women
have the worst results in the variables studied, what suggest the relevance to adopt a gender-
oriented strategies in the assistance of people with diabetes making possible a better control of
the disease.
Descriptors: Diabetes type 2; Gender and health; Quality of life.
RESUMO
Objetivo: analisar as diferenças de gênero na qualidade de vida e nos indicadores
antropométricos de pessoas com e sem diabetes tipo 2. Método: Estudo quantitativo de caráter
transversal realizado com 117 indivíduos diagnosticados com diabetes tipo 2 e 81 controles ≥
a 40 anos de idade. Utilizou-se análise univariada para as variáveis sociodemográficas e teste t
de Student para comparação das médias na qualidade de vida e nos indicadores
antropométricos. Resultados: a qualidade de vida das mulheres piora em maior medida
comparada à dos homens na presença da doença, sobre tudo do ponto de vista mental. Mulheres
apresentam valores mais elevados para as variáveis antropométricas comparadas aos homens,
o que possivelmente contribui para a menor qualidade de vida. Conclusão: mulheres
apresentam piores resultados nas variáveis estudadas, sendo necessário adotar estratégias
orientadas pelo gênero para uma melhor assistência às pessoas com diabetes, o que contribui
para o melhor controle da doença.
Descritores Diabetes tipo 2; Gênero e saúde; Qualidade de vida.
____________________ 1 PhD in Life Sciences / Nutrition - clinical specialty, Faculty of Medical Sciences, Universidade Nova de Lisboa
(Portugal). 2PhD in Sociology from the University of Alicante (Spain). Lecturer in the Department of Sociology and Social
Anthropology at Universitat de València (Spain).

15
Rev Enferm Health Care [Online]. Jan / Jul 2020; 9 (1): 14-26 ISSN 2317-1154
RESUMEN
objective: analyze gender differences in quality of life and anthropometric indicators between
people with type 2 diabetes. Method: Cross-sectional quantitative study with 117 individuals
diagnosed with type 2 diabetes and 81 controls ≥ 40 years. Univariate analysis was performed
for sociodemographic variables and Student's t test to compare the means of quality of life and
anthropometric indicators. Results: the quality of life of women is much greater compared to
men in the presence of diabetes, especially in the mental component. Women presented higher
values in anthropometric variables, which helps to explain the lower quality of life. Conclusion:
women present better results in the studied variables,
Descriptors: Type 2 diabetes; Gender and health; Quality of life.
INTRODUCTION
Diabetes is a chronic disease that is
advancing rapidly worldwide, where devel-
oping countries are particularly affected. It
is believed that 8.8% of the world's adults
aged between 20 and 79 years live with di-
abetes, with 79% of these residing in low
and middle income countries, such as Bra-
zil.1
In general, about 90% of cases diag-
nosed with diabetes aretype 2, which is con-
stantly associated with aging and changes in
lifestyles. The latter contributing to over-
weight and obesity in the population, fac-
tors that are strongly associated with the de-
velopment of type 2 diabetes mellitus
(DM2) .2
Currently, there are major difficul-
ties in controlling diabetes in America La-
tina and more specifically in Brazil, which
leads to the development of comorbidities
associated with pathology both in the me-
dium and long term.3 Such comorbidities
negatively affect the functionality and qual-
ity of life of individuals, in addition to gen-
erating high costs for public health. 4
Difficulty in containment recog-
nizedtion of the advances of diabetes in
Brazil, the federal government initiated, in
2002, the so-called Reorganization Plan for
Attention to Arterial Hypertension and Dia-
betes Mellitus, which aims to prevent and
control the advances of hypertension and
diabetes in Brazil. The main strategy of the
program to contain the complications of di-
abetes and hypertension at the secondary
level, has been the implementation of spe-
cialized care centers, the Hiperdia Centers.5
These must be prepared to offer multidisci-
plinary care, in order to delay the advances
of diabetes and favor the quality of life of
individuals assisted by the program.
In general, studies indicate that peo-
ple with DM have worse perception of qual-
ity of life in relation to the general popula-
tion.6 Specifically, individuals with DM
have decreased physical performance, with
16
Rev Enferm Health Care [Online]. Jan / Jul 2020; 9 (1): 14-26 ISSN 2317-1154
increased dependence on performing activ-
ities of daily living and reduced perfor-
mance in psychosocial aspects, such as de-
creased cognitive ability and presence of
symptoms depressive.7
The literature also shows that diabe-
tes affects men and women8 differently,
both in prevalence and incidence9, in com-
plications and control10, and in mortality11.
Women have a worse quality of life com-
pared to men in the presence of diabe-
tes.6,12 The social factors associated with
gender discrimination would explain, in
part, the worst health outcomes seen in
women. Knowing the gender differences in
quality of life, in people with and without
DM2, in the most diverse Brazilian con-
texts, can contribute to optimize the assis-
tance of the person diagnosed with the pa-
thology and, consequently, improve the
control of the disease in the country.
Based on the men above, the objec-
tive of this study was to evaluate the quality
of life and the variables Body Mass Index
(BMI), Abdominal Perimeter (BP) and so-
ciodemographic characteristics of men and
women with and without DM2 living in the
city of Viçosa - Minas Gerais and assisted
by the Hiperdia Program.
METHODS
Cross-sectional quantitative study
conducted through individual interviews
with people diagnosed with DM2 and indi-
viduals without DM2, aged 40 years or
over, living in the city of Viçosa-Minas Ge-
rais. For the study group (people with
DM2), users of the Centro Hiperdia de Mi-
nas Gerais (CHVM) were interviewed, se-
lected by means of simple random sampling
from the patient register provided by the
health center. Inclusion criteria were: indi-
viduals who were being followed for at least
three months by the CHVM and who did
not have a state of severe or chronic severe
disease and neither active ulcer and / or am-
putation. In addition to the study group, data
were collected from a control group
(individuals not diagnosed with DM2 and
without acute or chronic pathologies in
target organs of diabetes). For the selection
of this group, the study cases themselves
indicated individuals residing in a
neighborhood equivalent and who did not
have a family connection, of these, those
who formed the sample were randomly
selected.
Individuals who did not obtain a
score greater than or equal to 15 points in
the Mini Mental State Exam (MMSE) in-
strument were excluded from the study,
considering the low level of education of
the participants. The final sample consisted
of 117 individuals with DM2 and 81 con-

17
Rev Enferm Health Care [Online]. Jan / Jul 2020; 9 (1): 14-26 ISSN 2317-1154
trols (CTL), accounting for a total of 198 re-
spondents. Of the total, 125 were women
(63%) and 73 men (37%). Data collection
took place between September 2013 and
January 2014. Before we started the work,
all individuals were informed about the
study and signed the Free and Informed
Consent Form.
For the sociodemographic charac-
terization of the sample, the following vari-
ables were used: age, education, residence,
marital status and occupation. For anthro-
pometric assessment, individuals were
asked to check weight and height to obtain
the body mass index (BMI) and abdominal
perimeter (BP), these data being recorded in
the surveys of each of the participants. For
data collection regarding weight, height and
BP we used a Micheletti® digital scale
model / code 1227, with attached stadiome-
ter and a non-extensible measuring tape
with marking in centimeters and millime-
ters. WHO criteria were used to classify in-
dividuals according to BMI, considering
excess weight values greater than 25 and
less than 30 (Kg / m²) and obesity, values
greater than or equal to 30 (Kg / m²) .
In assessing health-related quality of
life, we used the Medical Outcomes Study
SF-36 version 2 (SF-36 v2®) translated and
validated for Brazil. It is a generic instru-
ment (not specific to any age group, disease
or treatment) and easy to apply and under-
stand. The SF-36 is a multidimensional
questionnaire consisting of two compo-
nents, physical (FC) and mental (CM),
which comprises eight health scales totaling
thirty-six questions. Within the FC are the
scales: physical function, physical perfor-
mance, pain and general health. The CM co-
vers the scales vitality, social function,
mental performance and mental health. The
instrument assesses the individual's last
four weeks, both in negative (disease) and
positive (well-being) aspects.
Data were analyzed using the IBM
SPSS Statistics Version 21 program. A uni-
variate descriptive analysis was performed
for sociodemographic variables, repre-
sented by distribution of relative frequen-
cies for categorical variables, and measures
of central tendency (means and standard de-
viation) for variables continuous. For the
analysis of the components and scales of the
SF-36 and anthropometric indicators (BMI
and BP) the means and standard deviation
were calculated. To compare the means be-
tween the groups (CTL and DM2) in
women and men, Student's t test was used,
considering the significance level p <0.05.
The verification of the homoscedasticity of
the variances and the normal distribution of
the variables Quality of life, BMI and BP
were performed respectively by Bartlett's
tests and normal distribution. In the absence
of homoscedasticity and normal distribu-
tion, the data were transformed using loga-
rithms. In addition to comparing the means
18
Rev Enferm Health Care [Online]. Jan / Jul 2020; 9 (1): 14-26 ISSN 2317-1154
using the Student's t test, the differences be-
tween the means of the CTL and DM2
groups in women and men were calculated.
The analysis data for the SF-36,
BMI and BP variables were presented in
separate tables for women (table 2) and men
(table 3). This perspective of analysis dis-
aggregated by sex (Women DM2 vs.
Women CTL; Men DM2 vs. Men CTL)
shows the difference between the averages
of the groups CTL and DM2 in each sex.
This allowed to verify greater or lesser dif-
ferences in the averages of the studied vari-
ables, contributing to a better assessment of
the impact of the disease according to sex.
The study presented here was ap-
proved by the Ethics Committee of the Fac-
ulty of Medical Sciences of the Univer-
sidade Nova de Lisboa (Portugal), by the
Coordination for the Improvement of
Higher Education Personnel (CAPES) and
by the CHVM.
RESULTS
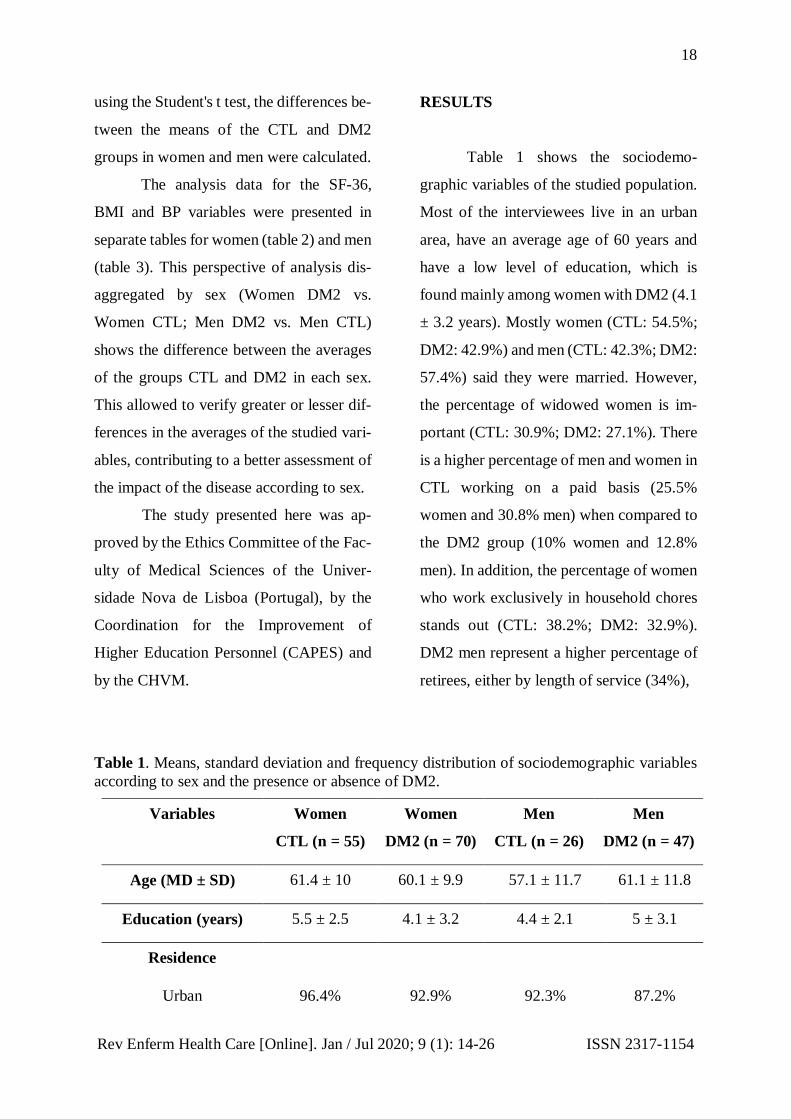
Table 1 shows the sociodemo-
graphic variables of the studied population.
Most of the interviewees live in an urban
area, have an average age of 60 years and
have a low level of education, which is
found mainly among women with DM2 (4.1
± 3.2 years). Mostly women (CTL: 54.5%;
DM2: 42.9%) and men (CTL: 42.3%; DM2:
57.4%) said they were married. However,
the percentage of widowed women is im-
portant (CTL: 30.9%; DM2: 27.1%). There
is a higher percentage of men and women in
CTL working on a paid basis (25.5%
women and 30.8% men) when compared to
the DM2 group (10% women and 12.8%
men). In addition, the percentage of women
who work exclusively in household chores
stands out (CTL: 38.2%; DM2: 32.9%).
DM2 men represent a higher percentage of
retirees, either by length of service (34%),
Table 1. Means, standard deviation and frequency distribution of sociodemographic variables
according to sex and the presence or absence of DM2.
Variables Women
CTL (n = 55)
Women
DM2 (n = 70)
Men
CTL (n = 26)
Men
DM2 (n = 47)
Age (MD ± SD) 61.4 ± 10 60.1 ± 9.9 57.1 ± 11.7 61.1 ± 11.8
Education (years) 5.5 ± 2.5 4.1 ± 3.2 4.4 ± 2.1 5 ± 3.1
Residence
Urban 96.4% 92.9% 92.3% 87.2%

19
Rev Enferm Health Care [Online]. Jan / Jul 2020; 9 (1): 14-26 ISSN 2317-1154
Rural 3.6% 7.1% 7.7% 12.8%
Marital Status
Never been married 10.9% 11.4% 19.2% 14.9%
Married 54.5% 42.9% 42.3% 57.4%
separated or divorced 1.8% 4.3% 30.7% 12.7%
Widower 30.9% 27.1% 7.7% 4.3%
live together 1.8% 4.3% - 10.7%
Occupation
Paid work 25.5% 10% 30.8% 12.8%
Self-employed 5.5% 8.6% 11.5% 17%
Housewife 38.2% 32.9% 3.8% -
Retired 25.5% 25.7% 26.9% 34%
Retired due to disabi-
lity
- 7.1% 3.8% 25.5%
Unemployed 5.4% 15.7% 23% 10.7%
Table 2 shows the statistics univariable var-
iables and t-test for SF-36 components and
scales and anthropometric indicators (BMI
and BP) of women CTL and DM2. The re-
sults show statistically significant differ-
ences for the physical and mental compo-
nents of quality of life between the CTL vs.
DM2 in women (FC: p <0.05; CM: p
<0.05). Higher means were found in the
CTL group (FC: 53.4 ± 6.2; CM: 52 ± 11.8)
compared to the DM2 group (FC: 42.3 ±
10.1; CM: 46.9 ± 12.4), suggesting lower
quality of life in the latter. Considering the
eight scales of the quality of life compo-
nents, it is possible to verify statistically
significant differences for all CTL vs. DM2
in women (p <0.05). However, greater dif-
ferences are observed in the physical func-
tion (26.8) and physical performance (27.7)
20
Rev Enferm Health Care [Online]. Jan / Jul 2020; 9 (1): 14-26 ISSN 2317-1154
scales in the physical component, and in the
vitality scale (22,
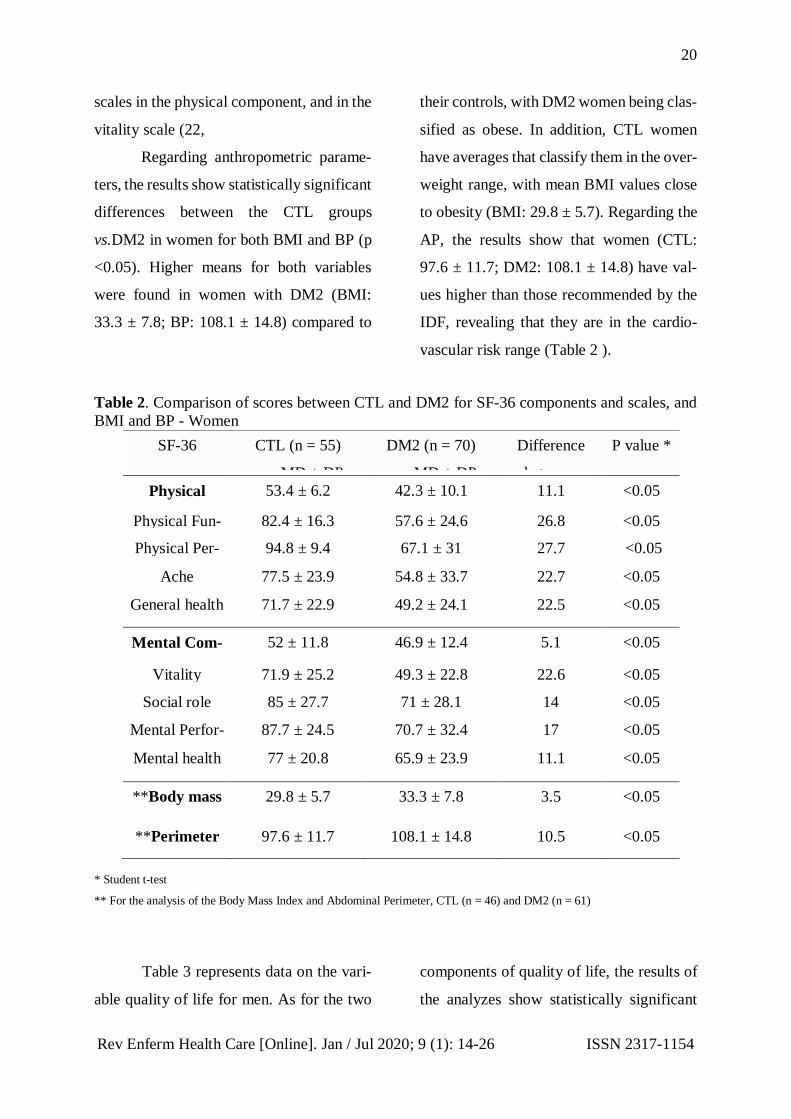
Regarding anthropometric parame-
ters, the results show statistically significant
differences between the CTL groups
vs.DM2 in women for both BMI and BP (p
<0.05). Higher means for both variables
were found in women with DM2 (BMI:
33.3 ± 7.8; BP: 108.1 ± 14.8) compared to
their controls, with DM2 women being clas-
sified as obese. In addition, CTL women
have averages that classify them in the over-
weight range, with mean BMI values close
to obesity (BMI: 29.8 ± 5.7). Regarding the
AP, the results show that women (CTL:
97.6 ± 11.7; DM2: 108.1 ± 14.8) have val-
ues higher than those recommended by the
IDF, revealing that they are in the cardio-
vascular risk range (Table 2 ).
Table 2. Comparison of scores between CTL and DM2 for SF-36 components and scales, and
BMI and BP - Women
SF-36 CTL (n = 55)
MD ± DP
DM2 (n = 70)
MD ± DP
Difference
between
means (MD)
P value *
Physical
Component
53.4 ± 6.2 42.3 ± 10.1 11.1 <0.05
Physical Fun-
ction
82.4 ± 16.3 57.6 ± 24.6 26.8 <0.05
Physical Per-
formance
94.8 ± 9.4 67.1 ± 31 27.7 <0.05
Ache 77.5 ± 23.9 54.8 ± 33.7 22.7 <0.05
General health 71.7 ± 22.9 49.2 ± 24.1 22.5 <0.05
Mental Com-
ponent
52 ± 11.8 46.9 ± 12.4 5.1 <0.05
Vitality 71.9 ± 25.2 49.3 ± 22.8 22.6 <0.05
Social role 85 ± 27.7 71 ± 28.1 14 <0.05
Mental Perfor-
mance
87.7 ± 24.5 70.7 ± 32.4 17 <0.05
Mental health 77 ± 20.8 65.9 ± 23.9 11.1 <0.05
**Body mass
index
29.8 ± 5.7 33.3 ± 7.8 3.5 <0.05
**Perimeter
Abdominal
97.6 ± 11.7 108.1 ± 14.8 10.5 <0.05
* Student t-test
** For the analysis of the Body Mass Index and Abdominal Perimeter, CTL (n = 46) and DM2 (n = 61)
Table 3 represents data on the vari-
able quality of life for men. As for the two
components of quality of life, the results of
the analyzes show statistically significant

21
Rev Enferm Health Care [Online]. Jan / Jul 2020; 9 (1): 14-26 ISSN 2317-1154
differences only for the FC (p <0.05), with
higher means verified in the CTL group
(52.6 ± 7.4) when compared to the group
DM2 (46 ± 8.5). For the mental component,
there was no statistically significant differ-
ence between the two groups (p> 0.05). Re-
garding the scales of the quality of life com-
ponents of men, there are statistically sig-
nificant differences between the CTL and
DM2 groups for the four SC scales and only
for the social function scale of the mental
component. When observing the differ-
ences in the means, it can be said that these
are higher for the scales of body pain (20),
general health (16.4) and social function
(14) (table 3).
As for the pairanthropometric meas-
urements of men, the data also show statis-
tically significant differences in the means
of BMI and BP between the CTL and DM2
groups (p <0.05), with the means of men be-
ing DM2 (BMI: 28.8 ± 6.4; PA : 100.4 ±
15.9) higher when compared to CTL (BMI:
25.3 ± 2.8; PA: 89.3 ± 7.4), classifying
DM2 men in the overweight range. Also,
the mean BMI values in CTL men show the
presence of overweight, while the mean BP
for DM2 men is higher than that recom-
mended by the IDF (Table 3).
Table 3. Comparison of scores between CTL and DM2 for SF-36 components and scales, and
BMI and BP - Men
SF-36 CTL (n = 26)
MD ± DP
DM2 (n = 47)
MD ± DP
Difference
between
means
(MD)
P value *
Physical
Component
52.6 ± 7.4 46 ± 8.5 6.6 <0.05
Physical Fun-
ction
83.6 ± 17.5 70.5 ± 25.6 13.1 <0.05
Physical Per-
formance
89.1 ± 19.9 82 ± 22.1 7.1 <0.05
Ache 78.1 ± 27.1 58.1 ± 27.5 20 <0.05
General health 76.5 ± 20.4 60.1 ± 23.9 16.4 <0.05

22
Rev Enferm Health Care [Online]. Jan / Jul 2020; 9 (1): 14-26 ISSN 2317-1154
Mental Com-
ponent
55.5 ± 9.2 54 ± 9.5 1.5 > 0.05
Vitality 74.7 ± 20.4 65 ± 25.1 9.7 > 0.05
Social role 92.3 ± 17.3 78.3 ± 27.8 14 <0.05
Mental Perfor-
mance
87.5 ± 24 87.4 ± 20.7 0.1 > 0.05
Mental health 85.3 ± 15.2 79.1 ± 19.8 6.2 > 0.05
**Body mass
index
25.3 ± 2.8 28.8 ± 6.4 3.5 <0.05
**Perimeter
Abdominal
89.3 ± 7.4 100.4 ± 15.9 11.1 <0.05
* Student t-test
** For the analysis of the Body Mass Index and Abdominal Perimeter, CTL (n = 22) and DM2 (n = 43)
DISCUSSION
The results of the present study
show that, in relation to quality of life, DM2
men have a lower average score only for the
physical component when compared to
CTL men, while the mental component
seems to be less affected by the disease. Un-
like women, who had decreased quality of
life for both components of the SF-36. More
specifically, the differences in the means
between CTL and DM2 in the two compo-
nents of quality of life and in their scales
(tables 2 and 3, columns “Differences be-
tween means”) are greater among women
(CF: 11.1; CM: 5 , 1) compared to men (FC:
6.6; CM: 1.5), especially in CM. However,
in the Social Function scale of this compo-
nent, there is the same difference between
both sexes (14 points of difference). With
regard to the vitality scale, women showed
the greatest differences in means between
CTL vs. DM2 (22.6 points),
This indicates that, in general, in the
presence As a result of the disease, the qual-
ity of life of women worsens to a greater ex-
tent compared to that of men, especially
from a mental point of view, a result that is
also confirmed by other studies.6,12 Specifi-
cally, a study states that men are less likely
to report symptoms of depression or anxi-
ety, when compared to women13, which can
contribute to the better quality of life seen
in males. The performance of traditionally

23
Rev Enferm Health Care [Online]. Jan / Jul 2020; 9 (1): 14-26 ISSN 2317-1154
female roles, and their influence on social
pressures, chronic stress, overload with
household responsibilities and low levels of
satisfaction, is related to gender differences
in health.14,15 Therefore, female vulnerabil-
ity, caused mainly by the situation of gender
discrimination in society15, explain the
worst results in the mental component of
quality of life among women with DM2 in
our sample. The worst state of mental health
of women highlights the need for more
comprehensive psychological assistance in
the CHVM, making it essential to provide
training on gender issues and their specific
problems to health professionals. Thus, an
improvement in women's mental health
would contribute to the optimization of the
disease's self-control with positive effects
on quality of life.
With regard to anthropomic indica-
tors the data show higher values in women
when compared to men, both in the CTL
group and in DM2, suggesting that women,
in general, are more prone to obesity.16,17
However, when comparing the difference
between the CTL means vs. DM2 in men
and women for anthropometric variables
(tables 2 and 3, columns “Differences be-
tween means”), very similar differences are
observed in women and men (3.5 points dif-
ference in BMI in women and men, and
about 11 points in the PA in both women
and men). Thus, in the presence of the dis-
ease, the results for anthropometric varia-
bles increase similarly in both women and
men, which indicates that diabetes affects
both sexes with regard to obesity. However,
in addition to the aging process and changes
in the lifestyles of individuals, obesity in
women is also associated with social factors
related to discrimination in society and their
influence on socioeconomic conditions.18
Therefore, it becomes relevant to consider
the greater predisposition for obesity in
women, where socioeconomic and gender
factors are interrelated, in the implementa-
tion of specific interventions to control
DM2 in the CHVM. On the other hand,
some studies show that, in the general pop-
ulation, there is a relationship between in-
creased BMI and negative well-being, and
this relationship would be even more appar-
ent in women.19 Therefore, considering that
BMI and BP are related to the quality of and
that the women in the study have obesity
and the highest results for BP,
Finally, it is worth mentioning the
low level of education in the sample, espe-
cially among women. In general, low edu-
cation hinders access to information, in ad-
dition to leading to reduced chances of com-
pression of therapeutic guidelines, which,
consequently, leads to greater difficulties
for self-management of diabetes.20 In this
sense, it is important that health profession-
als do CHVM adapt therapeutic strategies

24
Rev Enferm Health Care [Online]. Jan / Jul 2020; 9 (1): 14-26 ISSN 2317-1154
to the profile of users, considering the soci-
oeconomic conditions and the level of edu-
cation of the people assisted by the Center,
with special attention to women, since they
had lower levels of education.
CONCLUSION
The findings of the study show un-
favorable results in the quality of life of
women compared to men in the presence of
DM2, especially from the mental point of
view, and also the higher prevalence of obe-
sity among women in general. Taking these
results into account, it is convenient to plan
the strategies of assistance to people with
DM2 assisted by the CHVM guided by gen-
der. This would make it possible to opti-
mize the self-management of diabetes with
positive effects on the quality of life of in-
dividuals with DM2.
Finally, the study has two main lim-
itations. First, it is a cross-sectional study,
which may partially explain the unfavorable
results for quality of life in people with
DM2. Second, it would be necessary to
broaden and deepen the analysis of gender
by considering other social variables, in ad-
dition to the educational level. Furthermore,
considering the socio-cultural diversity of
Brazil, further studies are necessary, in or-
der to adapt the assistance to people with
DM2 to the different life contexts in the
country.
REFERENCES
1. International Diabetes Federation. IDF
diabetes atlas [Internet]. 8th
ed.Brussels: IDF; 2017 [cited on 18
Dec 2018]. 147p. Available at:
https://www.idf.org/e-
library/epidemiology-
research/diabetes-atlas/134-idf-
diabetes-atlas-8th-edition.html
2. Leitner DR, Frühbeck G, Yumuk V,
Schindler K, Micic D, Woodward E, et
al. Obesity and type 2 diabetes: two
diseases with a need for combined
treatment strategies - EASO can lead
the way. Obes Facts. [Internet]. 2017
[cited on 29 Jul 2019]; 10 (5): 483-92.
doi: 10.1159 / 000480525
3. Top scorer MMVSA, Franco SC,
Schulz VC, Coelho CC. Who are and
how are patients treated for diabetes
mellitus treated at SUS ?. Health
Debate [Internet]. 2014 [cited on Feb 2,
2019]; 101 (38): 210-24. doi:
/10.5935/0103-1104.20140019
4. Borges BB, Lacerda JT. Actions aimed
at controlling diabetes mellitus in
primary care: proposal for an
evaluation model. Health Debate
[Internet]. 2018 [cited on Feb 2, 2019];
116 (42): 162-78. doi: /10.1590/0103-
1104201811613
5. Junior ACA. Consolidating the care
network for chronic conditions:
experience of the Hiperdia network of
Minas Gerais. Brasília, DF: Pan
American Health Organization; 2011.
22p.
6. Werfalli M, Kassanjee R, Kalula S,
Kowal P, Phaswana-Mafuya N, Levitt
NS. Diabetes in South African older
adults: prevalence and impact on
quality of life and functional disability
- as assessed using SAGE Wave 1 data.
Glob Health Action [Internet]. 2018

25
Rev Enferm Health Care [Online]. Jan / Jul 2020; 9 (1): 14-26 ISSN 2317-1154
[cited on 29 Jul 2019]; 11 (1):
1449924. doi: 10.1080 /
16549716.2018.1449924
7. Al Senany S, Al Saif A. Assessment of
physical health status and quality of
life among Saudi older adults. J Phys
Ther Sci. [Internet]. 2015 [cited on 7
Mar 2019]; 27 (6): 1691-95. It hurts:
10.1589 / jpts.27.1691
8. Kautzky-Willer A, Harreiter J, Pacini
G. Sex and gender differences in risk,
pathophysiology and complications of
type 2 diabetes mellitus. Endocr Rev.
[Internet]. 2016 [cited on 29 Jul 2019];
37 (3): 278–316. doi: 10.1210 /
er.2015-1137
9. Vitoi NC, Fogal AS, Nascimento CM,
Franceschini SCC, Ribeiro AQ.
Prevalence and factors associated with
diabetes in the elderly in the
municipality of Viçosa, Minas Gerais.
Rev Bras Epidemiol. [Internet]. 2015
[cited on 7 Mar 2019]; 18 (4): 953-65.
doi: /10.1590/1980-
5497201500040022
10. Lira Neto JCG, Xavier MA, Borges
JWP, Araújo MFM, Damasceno MMC,
Freitas RWJF. Prevalence of metabolic
syndrome in people with type 2
diabetes mellitus. Rev Bras Enferm.
[Internet]. 2017 [cited on 7 Mar 2019];
70 (2): 265-70. It hurts:/10.1590/0034-
7167-2016-0145
11. I think JM, Périco E. Mortality due to
Diabetes mellitus in a health macro-
region of Minas Gerais. Rev Enferm
Attention Health [Internet]. 2016 [cited
on 10 Mar 2019]; 5 (2): 34-44.
It hurts:/10.18554/reas.v5i2.1536
12. Hajian-Tilaki K, Heidari B, Hajian-
Tilaki A. Are gender differences in
health-related quality of life
attributable to sociodemographic
characteristics and chronic disease
conditions in elderly people? Int J Prev
Med. [Internet]. 2017 [cited on 29 Jul
2019]; 8:95. doi: 10.4103 /
ijpvm.IJPVM_197_16
13. Salk RH, Hyde JS, Abramson LY.
Gender differences in depression in
representative national samples: meta-
analyzes of diagnoses and symptoms.
Psychol Bull. [Internet]. 2017 [cited on
29 Jul 2019]; 143 (8): 783-822.
14. Mayor E. Gender roles and traits in
stress and health. Front Psychol.
[Internet]. 2015 [cited on 29 Jul 2019];
6: 779. doi: 10.3389 /
fpsyg.2015.00779
15. Nava S, Carreno I, Rempel C,
Schwingel G, Pissia LF, Belé P.
Epidemiological profile of
hypertension and diabetes in women.
Rev Enferm Attention Health
[Internet]. 2015 [cited on 17 Mar
2019]; 4 (1): 42-54. Available at:
http://seer.uftm.edu.br/revistaeletronica
/index.php/enfer/article/view/1262
16. Silveira E, Vieira LL, Souza JD. High
prevalence of abdominal obesity in the
elderly and association with diabetes,
hypertension and respiratory diseases.
Ciên Saúde Colet. [Internet]. 2018
[cited on 10 Mar 2019]; 23 (3): 903-12.
doi: /10.1590/1413-
81232018233.01612016
17. Malta DC, Silva AG, Tonaco LAB,
Made MIF, Velasquez-Melendez G.
Temporal trend of the prevalence of
morbid obesity in the Brazilian adult
population between the years 2006 and
2017. Cad Saúde Pública [Internet].
2019 [cited on 24 Oct 2019]; 35 (9):
e00223518. doi: /10.1590/0102-
311X00223518
18. Palomino PA, Grande ML, Linares M.
Health and its social determinants.
Inequalities and exclusion in the
society of the 21st century. Rev Int
Sociol. [Internet]. 2014 [cited on 28
Mar 2019]; 72 (1): 45-70. doi:
/10.3989/ris.2013.02.16
19. Apple R, Samuels LR, Fonnesbeck C,
Schlundt D, Mulvaney S, Hargreaves
M, et al. Body mass index and health-
related quality of life. Obes Sci Pract
[Internet]. 2018 [cited on Oct 22]; 4
(5): 417-26. It hurts:10.1002 / osp4.292
20. Couselo-Fernández I, Rumbo-Prieto
JM. Diabetic risk and self-care deficit

26
Rev Enferm Health Care [Online]. Jan / Jul 2020; 9 (1): 14-26 ISSN 2317-1154
in patients with Type 2 Diabetes
Mellitus. Enferm Univ. [Internet]. 2018
[cited on October 22]; 15 (1): 17-29.
doi: 10.22201 /
eneo.23958421e.2018.1.62902
RECEIVED: 16/05/2019
APPROVED: 10/12/2019
PUBLISHED: 07/2020