Admin - EPRA Journals
461
-
Upload
khangminh22 -
Category
Documents
-
view
14 -
download
0
Transcript of Admin - EPRA Journals
1. Dr.Yi-Lin Yu, Ph. D Associate Professor, Department of Advertising & Public Relations, Fu Jen Catholic University, Taipei, Taiwan.2. Dr.G. Badri Narayanan, PhD, Research Economist, Center for Global Trade Analysis, Purdue University, West Lafayette, Indiana, USA.3. Dr. Gajendra Naidu.J., M.Com, LL.M., M.B.A., PhD. MHRM Professor & Head, Faculty of Finance, Botho University, Gaborone Campus, Botho Education Park, Kgale, Gaborone, Botswana.4. Dr. Ahmed Sebihi Associate Professor Islamic Culture and Social Sciences (ICSS), Department of General Education (DGE), Gulf Medical University (GMU), UAE.5. Dr. Pradeep Kumar Choudhury, Assistant Professor, Institute for Studies in Industrial Development, An ICSSR Research Institute, New Delhi- 110070.India.6. Dr. Sumita Bharat Goyal Assistant Professor, Department of Commerce, Central University of Rajasthan, Bandar Sindri, Dist-Ajmer, Rajasthan, India7. Dr. C. Muniyandi, M.Sc., M. Phil., Ph. D, Assistant Professor, Department of Econometrics, School of Economics, Madurai Kamaraj University, Madurai-625021, Tamil Nadu, India.8. Dr. B. Ravi Kumar, Assistant Professor Department of GBEH, Sree Vidyanikethan Engineering College, A.Rangampet, Tirupati, Andhra Pradesh, India9. Dr. Gyanendra Awasthi, M.Sc., Ph.D., NET Associate Professor & HOD Department of Biochemistry, Dolphin (PG) Institute of Biomedical & Natural Sciences, Dehradun, Uttarakhand, India.10. Dr. D.K. Awasthi, M.SC., Ph.D. Associate Professor Department of Chemistry, Sri J.N.P.G. College, Charbagh, Lucknow,
Chief EditorDr. A. Singaraj, M.A., M.Phil., Ph.D.
Managing EditorMrs.M.Josephin Immaculate Ruba
Editorial Advisors
EPRA International Journal of
Multidisciplinary Research
SJIF Impact Factor :8.047ISI I.F. Value : 1.188
DOI : 10.36713/epra2013
ISSN (Online) : 2455 - 3662
Monthly Peer Reviewed & IndexedInternational Online Journal
Indexed By:
Published By :EPRA Publishing
CC License
Volume: 7 Issue: 9 September 2021

Volume: 7 | Issue: 9 | September 2021 || SJIF Impact Factor 2021: 8.047 ISSN (Online): 2455-3662
EPRA International Journal of Multidisciplinary Research
(IJMR) Peer Reviewed Journal|| Journal DOI URL: https://doi.org/10.36713/epra2013
CONTENTS
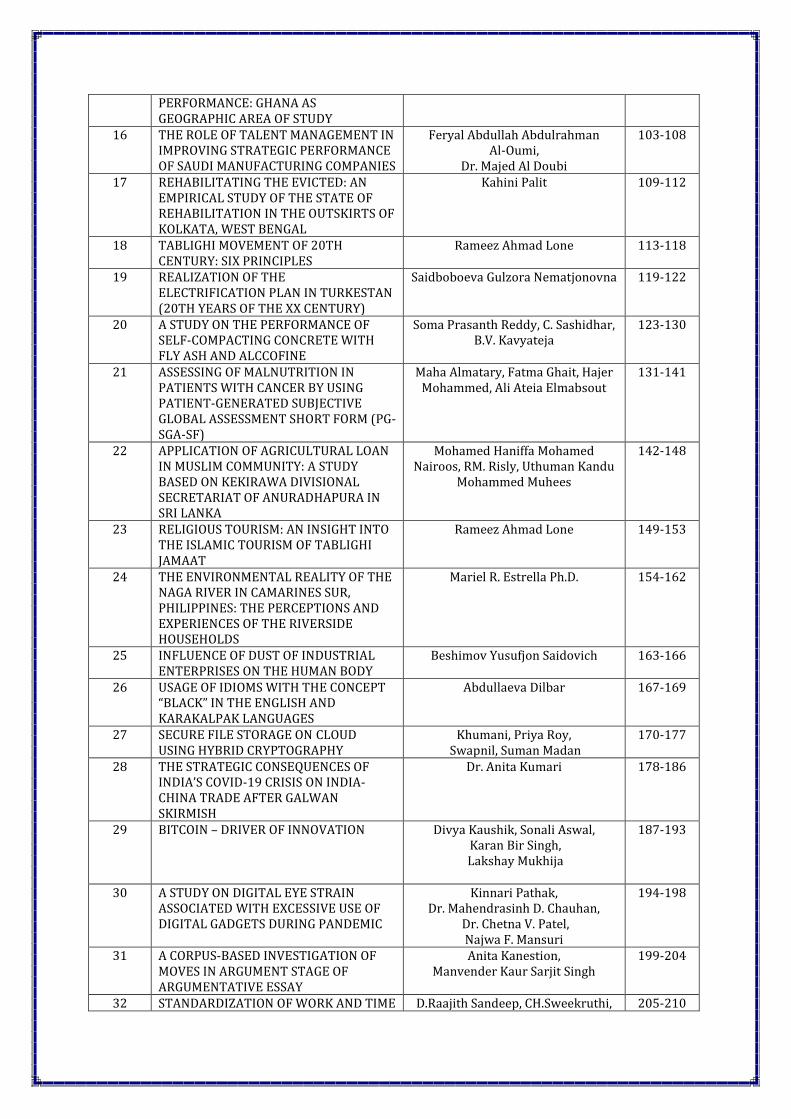
S.NO TITLE AUTHOR/S PAGES 1 SUSTAINABLE TOURISM AFTER COVID-
19 PANDEMIC: INDIAN CONTEXT Somenath Nandan 1-3
2 ANALYSIS REPORT ON GREEN CLOUD COMPUTING: A REPORT
Inder Singh Bisht, Suraj Shaji, Yogesh,
Divya Kaushik, Dr. Deepti Sharma
4-10
3 IMPACTS OF YOGIC PROGRAMME ON BLOOD PRESSURE AND RESPIRATORY RATE AMONG FOOTBALLERS
D. Chochalingam 11-14 11-14
4 A SEARCH ON INTEGER SOLUTIONS TO NON-HOMOGENEOUS TERNARY CUBIC EQUATION 9(x2-y2)+x+y=4y3
Dr.N.Thiruniraiselvi, Dr.M.A.Gopalan 15-18
5 ANALYSIS OF ATMOSPHERIC PRESSURE AND TEMPERATURE EFFECTS ON COSMIC RAY MEASUREMENTS
R.Soundar 19-29
6 LEO LAGNA CONTRIBUTION IN SIVACHARYA’S HOROSCOPE
P Valsala, Sri Prathyangira Swamy 30-33
7 VIRGO LAGNA IN SIVACHARYA’S HOROSCOPE
P. Valsala, Sri Prathyangira Swamy 34-37
8 BADMINTON PLAYER’S FITNESS OUTPUT IN RESPONSE TO KETTLEBELL TRAINING
J. Vijay, Dr. V. Vallimurugan 38-41
9 THE EFFECT OF INADEQUATE ACCESS TO POTABLE WATER ON THE HEALTH OF THE PEOPLE IN THE WA MUNICIPALITY OF GHANA
Ebenezer Nkrumah, Yaw Frimpong, Adubofour Isaac
42-53
10 A REVIEW ON GAS CONSUMPTION AND GAS PREDICTION IN ETHEREUM SMART CONTRACTS
Kuldeep Nageshawar, Rupali chourey, Dr. Ritu Shrivastava
54-58
11 VARIATIONS IN SEX RATIO OF INDIA: OBSERVATIONS FROM 2011 CENSUS
Dr.T.Chandrasekarayya, Prof. I. V. Lalitha Kumari
59-65
12 A STUDY TO OBSERVE EFFICACY OF POSTERIOR SUB TENON INJECTION OF TRIAMCINOLONE ACETONIDE (TA) IN DIABETIC MACULOPATHY AND CYSTOID MACULA EDEMA
Hardip Mahida, Dr. Mahendrasinh D. Chauhan,
Dr. Chetna Patel
66-69
13 ACCEPTABILITY OF SHASP: SELF-HELP APP IN STATISTICS AND PROBABILITY
John Nimrod M. Ladiana, Benjamin O. Arjona, EdD
70-82
14 JURIDICAL ANALYSIS OF HANDLING VITAL OBJECTS IN THE PERSPECTIVE OF ENSURING PUBLIC SAFETY AND ORDER: A STUDY ON VITAL OBJECTS IN WATER CATCHMENT AREAS AND RESERVOIRS LOCATED IN THE BATAM CONCESSION AGENCY
Genduk Afreni, Laily Washliati, Idham
83-90
15 IMPACT OF SOCIAL MEDIA USAGE AND ACTIVE COLLABORATIVE LEARNING ON STUDENT ENGAGEMENT, SATISFACTION, AND LEARNING
Clarissa Oteng – Darko, Fan Ming Yue, Otu Larbi-Siaw
91-102
PERFORMANCE: GHANA AS GEOGRAPHIC AREA OF STUDY
16 THE ROLE OF TALENT MANAGEMENT IN IMPROVING STRATEGIC PERFORMANCE OF SAUDI MANUFACTURING COMPANIES
Feryal Abdullah Abdulrahman Al-Oumi,
Dr. Majed Al Doubi
103-108
17 REHABILITATING THE EVICTED: AN EMPIRICAL STUDY OF THE STATE OF REHABILITATION IN THE OUTSKIRTS OF KOLKATA, WEST BENGAL
Kahini Palit 109-112
18 TABLIGHI MOVEMENT OF 20TH CENTURY: SIX PRINCIPLES
Rameez Ahmad Lone 113-118
19 REALIZATION OF THE ELECTRIFICATION PLAN IN TURKESTAN (20TH YEARS OF THE XX CENTURY)
Saidboboeva Gulzora Nematjonovna 119-122
20 A STUDY ON THE PERFORMANCE OF SELF-COMPACTING CONCRETE WITH FLY ASH AND ALCCOFINE
Soma Prasanth Reddy, C. Sashidhar, B.V. Kavyateja
123-130
21 ASSESSING OF MALNUTRITION IN PATIENTS WITH CANCER BY USING PATIENT-GENERATED SUBJECTIVE GLOBAL ASSESSMENT SHORT FORM (PG-SGA-SF)
Maha Almatary, Fatma Ghait, Hajer Mohammed, Ali Ateia Elmabsout
131-141
22 APPLICATION OF AGRICULTURAL LOAN IN MUSLIM COMMUNITY: A STUDY BASED ON KEKIRAWA DIVISIONAL SECRETARIAT OF ANURADHAPURA IN SRI LANKA
Mohamed Haniffa Mohamed Nairoos, RM. Risly, Uthuman Kandu
Mohammed Muhees
142-148
23 RELIGIOUS TOURISM: AN INSIGHT INTO THE ISLAMIC TOURISM OF TABLIGHI JAMAAT
Rameez Ahmad Lone 149-153
24 THE ENVIRONMENTAL REALITY OF THE NAGA RIVER IN CAMARINES SUR, PHILIPPINES: THE PERCEPTIONS AND EXPERIENCES OF THE RIVERSIDE HOUSEHOLDS
Mariel R. Estrella Ph.D. 154-162
25 INFLUENCE OF DUST OF INDUSTRIAL ENTERPRISES ON THE HUMAN BODY
Beshimov Yusufjon Saidovich 163-166
26 USAGE OF IDIOMS WITH THE CONCEPT “BLACK” IN THE ENGLISH AND KARAKALPAK LANGUAGES
Abdullaeva Dilbar 167-169
27 SECURE FILE STORAGE ON CLOUD USING HYBRID CRYPTOGRAPHY
Khumani, Priya Roy, Swapnil, Suman Madan
170-177
28 THE STRATEGIC CONSEQUENCES OF INDIA’S COVID-19 CRISIS ON INDIA-CHINA TRADE AFTER GALWAN SKIRMISH
Dr. Anita Kumari 178-186
29 BITCOIN – DRIVER OF INNOVATION
Divya Kaushik, Sonali Aswal, Karan Bir Singh, Lakshay Mukhija
187-193
30 A STUDY ON DIGITAL EYE STRAIN ASSOCIATED WITH EXCESSIVE USE OF DIGITAL GADGETS DURING PANDEMIC
Kinnari Pathak, Dr. Mahendrasinh D. Chauhan,
Dr. Chetna V. Patel, Najwa F. Mansuri
194-198
31 A CORPUS-BASED INVESTIGATION OF MOVES IN ARGUMENT STAGE OF ARGUMENTATIVE ESSAY
Anita Kanestion, Manvender Kaur Sarjit Singh
199-204
32 STANDARDIZATION OF WORK AND TIME D.Raajith Sandeep, CH.Sweekruthi, 205-210

USING SEGMENTAL WORKMEN FOR ENGINEERING APPLICATIONS
K.Pavan Kalyan Yadav, A. Suresh
33 WINTER SEASON TEMPERATURE TRENDS IN THE 20TH CENTURY OVER THE RAJOURI DISTRICT, INDIA
Rakesh Sharma 211-214
34 EDUCATION AND UPBRINGING IN THE STATE OF AMUR TEMUR
Oybek Kamilovich Komilov, Khabibullo Kuchkarov
215-217
35 AN ANALYSIS OF THE ‘DOWRY PROHIBITION ACT 1961’ CONCEPT & EVOLUTION
Vanshika Shukla 218-227
36 EXPLORING THE IMPACT OF ECONOMIC GROWTH AND INFLATION RATE ON UNEMPLOYMENT IN INDIA
Sunita Kumari 228-232
37 MGA PILING BARYABOL NA NAKAKAIMLUWENSYA SA PAG-UUGALI NG MGA MAG-AARAL NG GRADE12 SENIOR HIGH NG LAGUNA STATE POLYTECHNIC UNIVERSITY
Sierra Marie S. Aycardo, Phd. 233-240
38 HISTORY OF SCIENCE OF KARAKALPAKSTAN OF THE ХХ CENTURY
Temirkhanov Baxtiyar 241-244
39 REDRESS CYBER SECURITY THREATS Mr. Vikas P. Raut 245-247 40 ISSUES OF STUDYING THE BASIC UNITS
OF THE LANGUAGE STRUCTURE OF THE MODERN UZBEK LANGUAGE
Keldiyorova Gulchekhra Saydievna 248-252
41 NEW GENERALIZED CIESARO SPACE WITH SOME TOPOLOGICAL PROPERTIES
Rayees Ahmad 253-262
42 INTERMOLECULAR INTERACTIONS STUDIES IN BINARY MIXTURES OF CURCUMIN PARTICLES WITH PRIMARY ALCOHOLS
R.Soundar 263-265
43 PROBLEMS OF TEACHING RUSSIAN LANGUAGE IN PHARMACEUTICAL UNIVERSITIES
Shukurjanova Samiahon Alimovna, Matyusupova Shakarzhon
Bekmamatovna
266-270
44 HOW LIS PROFESSIONALS ARE PREVENTING OF COVID -19 IN CENTRAL UNIVERSITY LIBRARIES IN UTTAR PRADESH STATE, INDIA: AN ANALYTICAL STUDY
Prem Prakash Kushawaha, Prof. M. P. Singh
271-276
45 WOMEN’S ROLE IN INDIAN ADMINISTRATION
Dr.Vinay P.Raut 277-278
46 THE NEW WAVE OF AUTHORITARIANISM POPULISM: THE CRISIS OF LIBERAL DEMOCRACY IN CONTEMPORARY INDIA
Zulafqar Ahmed 279-286
47 IMPACT OF INDIAN PEOPLE ON ADIVASI PEOPLE OF VIDARBHA REGION OF MAHARASHTRA (INDIA)
Dr. Deoman Shrikrushna Umbarkar 287-293
48 STUDENTS’ ATTITUDES TOWARDS RESEARCH OF COLLEGE OF TEACHER EDUCATION: INPUT TO ACTION PLAN
Dennis N. Daran, Phd, Aileen M. Daran, EdD
294-301
49 EMBROIDERY ART OF UZBEKISTAN Gulirano Ravshan qizi Orifjonova 302-307 50 ANALYSIS OF ATTITUDE TOWARDS
YOGA AMONG COLLEGE STUDENTS USING CLUSTERING TECHNIQUES
Dr. Birbal Saha, Dr. Subir Sen,
Anasuya Adhikari
308-314
51 LEVEL OF EMOTIONAL INTELLIGENCE AND THE ASSOCIATIONS OF THESE LEVELS TO THEIR SOCIO-
Mrs. Maya Murali, Dr. Well Haorei
315-320
DEMOGRAPHIC: A STUDY ON EMPLOYEES OF PRIMARY COOPERATIVE CREDIT SOCIETIES IN IDUKKI DISTRICT
52 EFFECT OF BEHAVIOURAL REHEARSAL TECHNIQUE ON LOW SELF-CONCEPT OF SECONDARY SCHOOL STUDENTS IN ORLU LOCAL GOVERNMENT AREA
Ada Anyamene, Nnanemere Gideon O
321-327
53 WATER QUALITY ASSESSMENT OF UPPER LAKE BHOPAL WITH REFERENCE TO CONSERVATION AND MANAGEMENT
Shabnum Farooq, Pragya Shrivastava, Majid Hassan Bhat
328-332
54 LEVEL OF EMOTIONAL INTELLIGENCE AND ITS IMPACT ON ACCEPTANCE TO TECHNOLOGY IMPLEMENTATION: A STUDY ON EMPLOYEES OF PRIMARY COOPERATIVE CREDIT SOCIETIES IN IDUKKI DISTRICT
Mrs. Maya Murali, Dr. Well Haorei
333-337
55 TECHNOLOGY IMPLEMENTATION ACCEPTANCE LEVEL AND THE ASSOCIATIONS OF THESE LEVELS TO THEIR SOCIO-DEMOGRAPHIC: A STUDY ON EMPLOYEES OF PRIMARY COOPERATIVE CREDIT SOCIETIES IN IDUKKI DISTRICT
Mrs. Maya Murali, Dr. Well Haorei
338-343
56 CONDITION OF WOMEN DURING ‘COVID-19’: HEALTH, VIOLENCE AND ECONOMY
Vanshika Shukla 344-348
57 HISTORY OF TELUK ANSON TOWN IN THE STATE OF PERAK, MALAYSIA, 1882 - 1957
Dr.Khairi Ariffin,PhD, Dr.Ganesan Shanmugavelu,PhD,
Dr.Mohd.Hairy Ibrahim,PhD, Dr.Ishak Saat,PhD,
Mohd.Kamal Kamaruddin, Dr.Sahul Hamid Mohamad
Maidin,PhD Dr.Mohamed Jefferi Haji Mat
Lazim,PhD
349-353
58 OPTOMETRIST, A PRIMARY EYE CARE PROVIDER: AN UNDERUTILIZED AND UNTAPPED HUMAN RESOURCE IN INDIA
Salal Khan, Kamal Pant, Rajat Bansal
354-361
59 THE DEVELOPED AND THE DEVELOPING WORLD IN THE BIODIVERSITY REGIME
Fahima Khanum 362-366
60 INCIDENCE OF ARTICLE 151: ITS PROPENSITY RATE IN TIMES OF PANDEMIC
Odessa G. Lacanilao 367-370
61 A STUDY WITH SPECIAL REFERENCE ON SELECT COMMODITIES DURING PRE AND POST PANDEMIC ESTIMATION OF COMMODITY TREND THROUGH HORDRIC PRESCOTT FILTER
Dr. P. Chellasamy, Deepakarunya.C
371-379
62 THE ROLE OF INTESTINAL MICROFLORA IN THE PATHOGENESIS OF PARKINSON’S
DISEASE
Yakutkhon Nabievna Madjidova, Nargiza Asrorovna Mansurova
380-383
63 FEATURES OF PSYCHOMOTOR DEVELOPMENT IN CHILDREN WITH
SOMATIC BURDEN
Umida Tadjimuratovna Babadjanova,
Yakutkhon Nabievna Madjidova
383-385
64 REINFORCED CONCRETE POST WITHOUT FORMWORK FOR POWER
LINE POLES WITH A VOLTAGE OF 0.4 - 10 kV
Zulaykho Shamansurova, Pulat Mirzaev,
386-391
65 CONVULSIVE SYNDROME OF Y.N, Madjidova, 392-397
POSTPONED ENCEPHALITIS K.M. Dalimova 66 THE EFFECTIVENESS OF THERAPY FOR
HEREDITARY MOTOR NEURONAL NEUROPATHY IN CHILDREN: CLINICAL
AND BIOCHEMICAL PARAMETERS
S.U. Berdibaeva, Y.N. Madjidova,
398-406
67 CLINICAL AND NEUROLOGICAL MANIFESTATIONS IN CHILDREN WITH POST-TRAUMATIC ENCEPHALOPATHY
Y.N. Madjidova, D.Sh. Nasirova
407-410
68 PATHOGENETIC FEATURES OF IMMUNO-BIOCHEMICAL SHIFTS IN CHILDREN
WITH IDIOPATHIC EPILEPSY
Yakutkhon Nabievna Madjidova, Muazzamkhon Ilkhomidinovna
Abdullaeva
411-416
69 LOGICAL ANALYSIS OF ABDULKHALIQ GIJDUVANI’S WORK “MAQOMOTI YUSUF
HAMADONI”
N.U. Nurmatova
417-420
70 Creative and pedagogical activity of Patkhulla Hayitov
Erkin Nurmanov,
421-429
71 INFLUENCE OF LOCAL NON-CONVENTIONAL FERTILIZERS ON SOIL
WATER PERMEABILITY
Aksungul Uzakbaevna Ismailova, Islam Maxsetovich Tolybekov,
Uzakbergen Kurbashev
430-432
72 EVALUATION OF THE EFFECTIVENES OF ALCEBA IN CHILDREN WITH CERERAL
PALSY ON THE BASIS OF POTENTIAL INDICATORS OF COGNITIV IMPAIRMENT
Y.N. Madjidova, D.M. Mukhammadjonova,
G.S. Isakova,
433-436
73 SUPERMOLECULAR STRUCTURE OF COTTON CELLULOSE TREATED WITH
LIQUID AMMONIA AND INCLUDED WITH ALCOHOLS
F.E. Ochilov
437-439
74 SELECTION OF THE DIAMETER OF THE GRANULATOR MATRIX DEPENDING ON
THE AGE AND WEIGHT OF THE FISH AND ITS ANALYSIS
K D Astanakulov, F J Isakova,
F K Kurbonov
440-443
75 ECOLOGICAL MONITORING OF GROUND BEETLES (COLEOPTERA, CARABIDAE)
OF THE LOWER AMUDARYA STATE BIOSPHERE RESERVE
Reymov K. D., Eshmuratov A. Ya., Embergenov M. A., Seytmuratov A.
K.
444-447
76 GRAMMATIC AND SEMANTIC PROPERTIES OF CONVERSIVE PAIRS OF EMOTIVE VERBS IN MODERN RUSSIAN LANGUAGE
Olga Alekseevna Kukatova 448-453
ISSN (Online): 2455-3662
EPRA International Journal of Multidisciplinary Research (IJMR) - Peer Reviewed Journal Volume: 7| Issue: 9| September 2021|| Journal DOI: 10.36713/epra2013 || SJIF Impact Factor 2021: 8.047 || ISI Value: 1.188
2021 EPRA IJMR | www.eprajournals.com | Journal DOI URL: https://doi.org/10.36713/epra2013 1
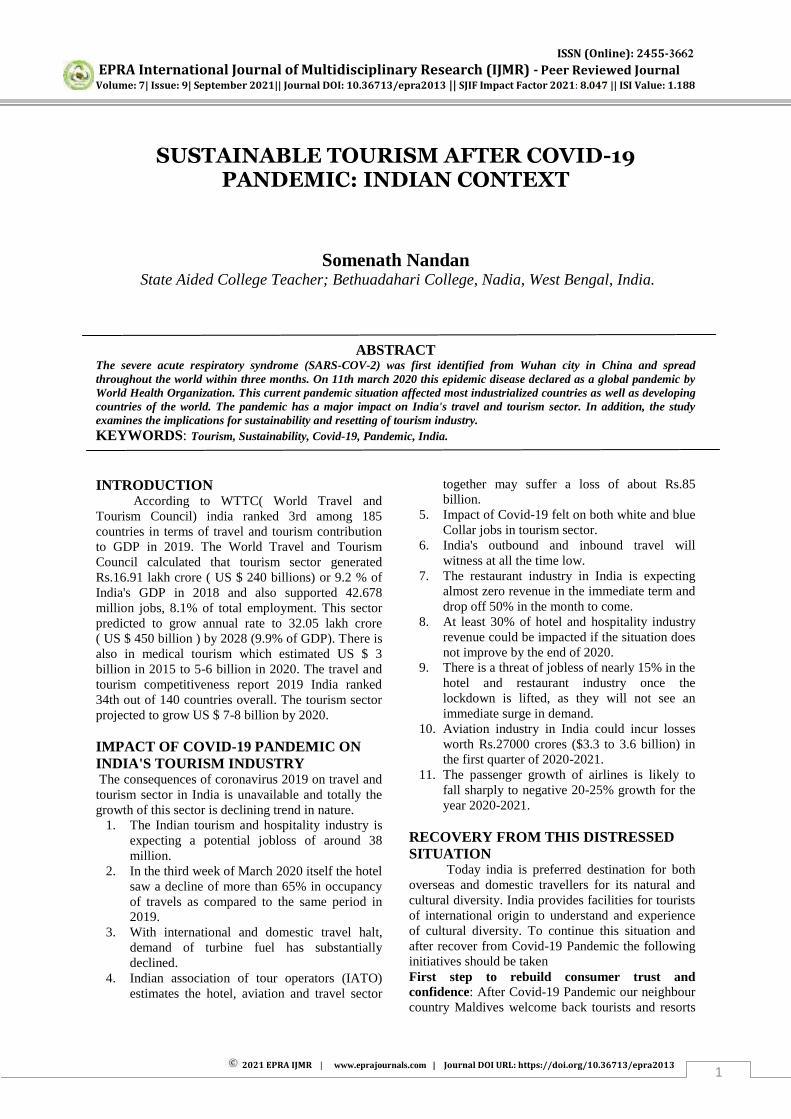
SUSTAINABLE TOURISM AFTER COVID-19 PANDEMIC: INDIAN CONTEXT
Somenath Nandan
State Aided College Teacher; Bethuadahari College, Nadia, West Bengal, India.
ABSTRACT
The severe acute respiratory syndrome (SARS-COV-2) was first identified from Wuhan city in China and spread throughout the world within three months. On 11th march 2020 this epidemic disease declared as a global pandemic by World Health Organization. This current pandemic situation affected most industrialized countries as well as developing countries of the world. The pandemic has a major impact on India's travel and tourism sector. In addition, the study examines the implications for sustainability and resetting of tourism industry. KEYWORDS: Tourism, Sustainability, Covid-19, Pandemic, India.
INTRODUCTION
According to WTTC( World Travel and Tourism Council) india ranked 3rd among 185 countries in terms of travel and tourism contribution to GDP in 2019. The World Travel and Tourism Council calculated that tourism sector generated Rs.16.91 lakh crore ( US $ 240 billions) or 9.2 % of India's GDP in 2018 and also supported 42.678 million jobs, 8.1% of total employment. This sector predicted to grow annual rate to 32.05 lakh crore ( US $ 450 billion ) by 2028 (9.9% of GDP). There is also in medical tourism which estimated US $ 3 billion in 2015 to 5-6 billion in 2020. The travel and tourism competitiveness report 2019 India ranked 34th out of 140 countries overall. The tourism sector projected to grow US $ 7-8 billion by 2020. IMPACT OF COVID-19 PANDEMIC ON INDIA'S TOURISM INDUSTRY The consequences of coronavirus 2019 on travel and tourism sector in India is unavailable and totally the growth of this sector is declining trend in nature.
1. The Indian tourism and hospitality industry is expecting a potential jobloss of around 38 million.
2. In the third week of March 2020 itself the hotel saw a decline of more than 65% in occupancy of travels as compared to the same period in 2019.
3. With international and domestic travel halt, demand of turbine fuel has substantially declined.
4. Indian association of tour operators (IATO) estimates the hotel, aviation and travel sector
together may suffer a loss of about Rs.85 billion.
5. Impact of Covid-19 felt on both white and blue Collar jobs in tourism sector.
6. India's outbound and inbound travel will witness at all the time low.
7. The restaurant industry in India is expecting almost zero revenue in the immediate term and drop off 50% in the month to come.
8. At least 30% of hotel and hospitality industry revenue could be impacted if the situation does not improve by the end of 2020.
9. There is a threat of jobless of nearly 15% in the hotel and restaurant industry once the lockdown is lifted, as they will not see an immediate surge in demand.
10. Aviation industry in India could incur losses worth Rs.27000 crores ($3.3 to 3.6 billion) in the first quarter of 2020-2021.
11. The passenger growth of airlines is likely to fall sharply to negative 20-25% growth for the year 2020-2021.
RECOVERY FROM THIS DISTRESSED SITUATION
Today india is preferred destination for both overseas and domestic travellers for its natural and cultural diversity. India provides facilities for tourists of international origin to understand and experience of cultural diversity. To continue this situation and after recover from Covid-19 Pandemic the following initiatives should be taken First step to rebuild consumer trust and confidence: After Covid-19 Pandemic our neighbour country Maldives welcome back tourists and resorts
ISSN (Online): 2455-3662
EPRA International Journal of Multidisciplinary Research (IJMR) - Peer Reviewed Journal Volume: 7| Issue: 9| September 2021|| Journal DOI: 10.36713/epra2013 || SJIF Impact Factor 2021: 8.047 || ISI Value: 1.188
2021 EPRA IJMR | www.eprajournals.com | Journal DOI URL: https://doi.org/10.36713/epra2013 2
open from 15 th July 2020. Tourists can be ensure strict safety and hygiene standards to ensure safe reopening of the country to tourists from around the world when traveling instructions begins to ease. WTTC also launched 'safe travel stamp' which has been design to allow potential travellers to recognise and establishment around the world which adopt standardize health and hygiene protocols. India should be go ahead with Maldives and WTTC measures to maintain sustainable tourism after covid-19 pandemic. Regional co-operation towards restoration: As a part of pandemic response to the Covid-19 crisis, The World economic forum regularly convinced a multistakeholder community of prominent holders, policymakers, regional expert group which meets virtually from July to design the impact of Covid-19 Pandemic on travel and tourism and need to adopt recovery efforts.
The countries with large domestic market in the way of recovery journey. As India at an advantage since they will be able to create more favourable fiscal conditions for stimulating growth in the sector actively promoting local and regional level.
Most recently India and Maldives announced that they will be established a ' travel bubble' to strengthen connectivity and tourism ties. Such agreement are likely to come up with other countries in the Asian region as terms and conditions establishing safe travel zones are negotiated. Niche tourism push: Travel and tourism competitiveness report published in 2019 attributes natural and cultural diversity along with price competitiveness for the emergence of South Asia's attractive natural tourists destination. For example India could explore an adventure tourism circuit with Nepal, Bhutan and Srilanka, where travellers get the experience the enthusing Himalayan landscapes, followed down a trip to South to explore of Srilanka's best surfing spot. Similarly spiritual tourism circuit could offer the tourists discover faith of historical manuments that bind the region together. An opportunity that can be explored to bring back international travellers to India is the niche segment of medical wellness and Ayurveda tourism. In the pre covid-19 era, the medical tourism space would have touched $9 billion. Adequate support from the government will be needed to further facilitate medical travel and safety protocols accross each stage of patient care continuum. Long term measures: investment in the physical as well as technological infrastructure will be reqire to enhance the competitiveness of the sector of the region to generate more income and employment
opportunity in the tourism industry. The sector must be innovative measure to bounce back and build future resilience as composite lockdown get significant degradation. Co-ordination with tourism facility: Close co-ordination among sector such as aviation, railways, Hostaliy and insurance will be needed to adopt for the rebuild of favourable tourism after this pandemic situation. Some Key Suggestions: According to the FICCI report 2020 the following initiatives can be implemented
1. Direct support to taxi driver, waiver of taxes. 2. Offer hotel infrastructure status in order to
give them access to greater sum of funds for increase infrastructure loan rates as foreign trade borrowings. It will also allow them to borrow from India financing company limited (IFCL).
3. Stimulas plan to include business salary help. 4. Clear aviation cash assistance ( airlines,
ground handling and airports). 5. Exception from parking and landing fees 6. Quick, interest free or low interest loans to
reconstruction companies in the form of terms loans and working capital loans.
7. Create separate tourism fund with ministry of tourism, with it access for the industry as collateral free, a 10 years loan, interest free in the first two years and minimum interest rate for the remaining eight years, to help company stabilize in the time of crisis.
8. Aviation assist initiatives, travel agencies, tour operators, hotels, theme parks, the area of transport.
9. Encourage business travel, increases the no of trains, developed digital content, investment in emerging technologies and developed local skills.
CONCLUSION
Tourism is a major part of many national economies and the broader economy is affected by the immediate and enormous shock to the tourism sector resulting from the pandemic of coronavirus 2019. The no of tourists decreased as travel restrictions and bans imposed by Indian government. Many countries are now entering a new phase in fighting the virus and trying to reopen the tourism industry simultaneously. Recovery is currently expected to begin later with the previous measures as well as travel restrictions and containment measures also be included. The recovery of demand site will also take some time, given in the combined affects of the economic and health crisis and the gradual easing
ISSN (Online): 2455-3662
EPRA International Journal of Multidisciplinary Research (IJMR) - Peer Reviewed Journal Volume: 7| Issue: 9| September 2021|| Journal DOI: 10.36713/epra2013 || SJIF Impact Factor 2021: 8.047 || ISI Value: 1.188
2021 EPRA IJMR | www.eprajournals.com | Journal DOI URL: https://doi.org/10.36713/epra2013 3
of travel restrictions although the longer pandemic affects of the economic and health crisis the more profound the consumer trust and travel behaviours will be affected. Finally, we are confident that together we can overcome this situation. The recovery might be slow, but we are sure, once we manage to control this virus infection, the tourism industry will be the first one to see major growth. After a very long time of no international travel, people would be looking forward to explore once again. REFERENCES
1. COVID-19 Government Public Health Mitigation Measures. (2020). Retrieved 1st january 2020, from https://www.iata.org/en/programs/safety/health/diseases/government-measures-related-to-coronavirus/
2. Ganguly A. (2020) coronavirus: Travel industry seeks government support to tide over impact of Covid-19 outbreak. Retrieved 5th January 2020, from https://www.financialexpress.com/lifestyle/traveltourism/coronavirus-travel-industry-seeks-government-support-to-tide-over-impact-of-covid-19outbreak/1888137/
3. Creating a better post Covid-19 world. (2020) retrieved 1 st January 2020, from https://medium.com/%40alanalew/creating-a-better-post-covid-19-world-36b2b3e8a7ae
4. Covid-19 impact on Indian hotel sector, a report by HVS (2020) retrieved 1 st January 2020 from http://bwhotelier.businessworld.in/article/COVID-19-Impact-on-the-Indian-Hotels-Sector-AReport-by-HVS/10-04-2020-188770/
5. Hall, C., Scott, D., & Grossling, S. (2020). Pandemics, transformations and tourism; be careful what you wish for. Tourism Geographies, 1-22. doi: 10.1080/14616688. 2020. 1759131.
6. Impact of Covid-19 on independent/ budget hotel industry in India. (2020) Retrieved 1st january 2020 from http://bwhotelier.businessworld.in/article/Impact-of-Covid-19-on-Independent-Budget-HotelIndustry-in-India/25-04-2020-190282/
7. Covid-19 impact on Indian airline industry. Curley Tales (2020). Retrieved 1st january 2020 from https://curlytales.com/the-future-of-the-airline-industry-post-lockdown/
8. Immediate steps required to minimize Covid-19 impact and revive the sector FICCI- grant Thornton travel and tourism report, June 10, 2020. Retrieved 1st january 2020 from http://www.ficci.in/pressrelease-page.asp?nid=3736
9. Dash, J. (2020). Covid-19 impact: Tourism industry to incur Rs 1.25 trn revenue loss in 2020. Retrieved 1st january 2020, from https://www.business-standard.com/article/economy-policy/covid-
19impact-tourism-industry-to-incur-rs-1-25-trn-revenue-loss-in-2020-120042801287_1.html
10. Tourism Policy Responses to the coronavirus (COVID-19). (2020). Retrieved 1st january 2020, from https://www.oecd.org/coronavirus/policy-responses/tourism-policy-responses-to-the-coronaviruscovid-19-6466aa20/

ISSN (Online): 2455-3662
EPRA International Journal of Multidisciplinary Research (IJMR) - Peer Reviewed Journal Volume: 7| Issue: 9| September 2021|| Journal DOI: 10.36713/epra2013 || SJIF Impact Factor 2021: 8.047 || ISI Value: 1.188
2021 EPRA IJMR | www.eprajournals.com | Journal DOI URL: https://doi.org/10.36713/epra2013 4
ANALYSIS REPORT ON GREEN CLOUD COMPUTING: A REPORT
Inder Singh Bisht1, Suraj Shaji2, Yogesh3, Divya Kaushik4, Dr. Deepti Sharma5
1Jagan Institute of Management Studies, Rohini, New Delhi, India 2Jagan Institute of Management Studies, Rohini, New Delhi, India 3Jagan Institute of Management Studies, Rohini, New Delhi, India 4Jagan Institute of Management Studies, Rohini, New Delhi, India
5Associate Professor, Rohini, New Delhi, India
ABSTRACT Cloud Computing is getting popular day by day as it reduces the cost of business, provides improved services and security. In simple terms, Cloud computing is the delivery of services via the internet, including servers, storage, databases, and much more. It gives the user power to access anything and anywhere through the internet and you typically have to pay only for the cloud services you use. Green Computing is a recent trend towards operating computer systems to be energy efficient and to reduce carbon footprints and E-waste. Cloud computing is reshaping modern networking with a capacity of environmental protection prospects as well. In This paper will talk about the attainments of green cloud computing and green data centers and why we need them. Then, recent studies with some existing work are briefed and environmental issues are explicitly addressed. KEYWORDS: Green cloud, cloud computing, data center, carbon footprint
1. INTRODUCTION Since its arrival, cloud computing has gained a
lot of popularity. Green cloud computing is a created term that means making the practices and approaches of the use of technological developments like computing and other IT resources sustainable for latent environment benefits.
The rapidly growing number of industries and companies all around the world makes a substantial impact on the environment. Green cloud computing answers these forthcoming environmental issues by providing options that will lower emitted carbon footprints around the world.
Unsustainability has been gaining significance amongst software program and hardware developers
and users in the final two many years, due to the fast boom in power consumption.
More and more businesses are leaning at the cloud services as such many technological programs and practices that can reduce environmental influences are being evolved every day. Green computing makes it viable to keep and enhance enterprise operations and techniques at the same time as looking after the surroundings.
The growth of green cloud computing is closely associated with the evolution of green data centers because the info centers are the core of cloud computing. According to Koomey, the energy consumptions by data centers in 2010 represented 1.3% of the total consumption. A report published by GeSI, which was taken into account “one of the foremost
ISSN (Online): 2455-3662
EPRA International Journal of Multidisciplinary Research (IJMR) - Peer Reviewed Journal Volume: 7| Issue: 9| September 2021|| Journal DOI: 10.36713/epra2013 || SJIF Impact Factor 2021: 8.047 || ISI Value: 1.188
2021 EPRA IJMR | www.eprajournals.com | Journal DOI URL: https://doi.org/10.36713/epra2013 5
comprehensive and well-recognized snapshots of the Internet‟s energy demand at the worldwide level”,
estimates a rise in the share of total carbon dioxide (CO2) emissions from ICTs from 1.3% of the global emissions in 2002 to 2.3% in the year 2020
The aids of green cloud computing are focused specifically on energy-saving and carbon footprint reduction. From the strength-efficiency perspective,
there are two methods for cloud companies to achieve green cloud computing: enhancing the power efficiency
of the cloud and using clean power. In these facilities, the whole infrastructure is
designed to achieve maximum strength efficiency with
minimal environmental impact. This includes lightning, electrical, mechanical, construction, and laptop structures. They use low-emission cloth for buildings, use alternative energy assets, and eat minimal electricity resources for operations and upkeep for all devices. Green cloud computing would be a great deal less difficult to put in force if all statistics facilities could have these traits.
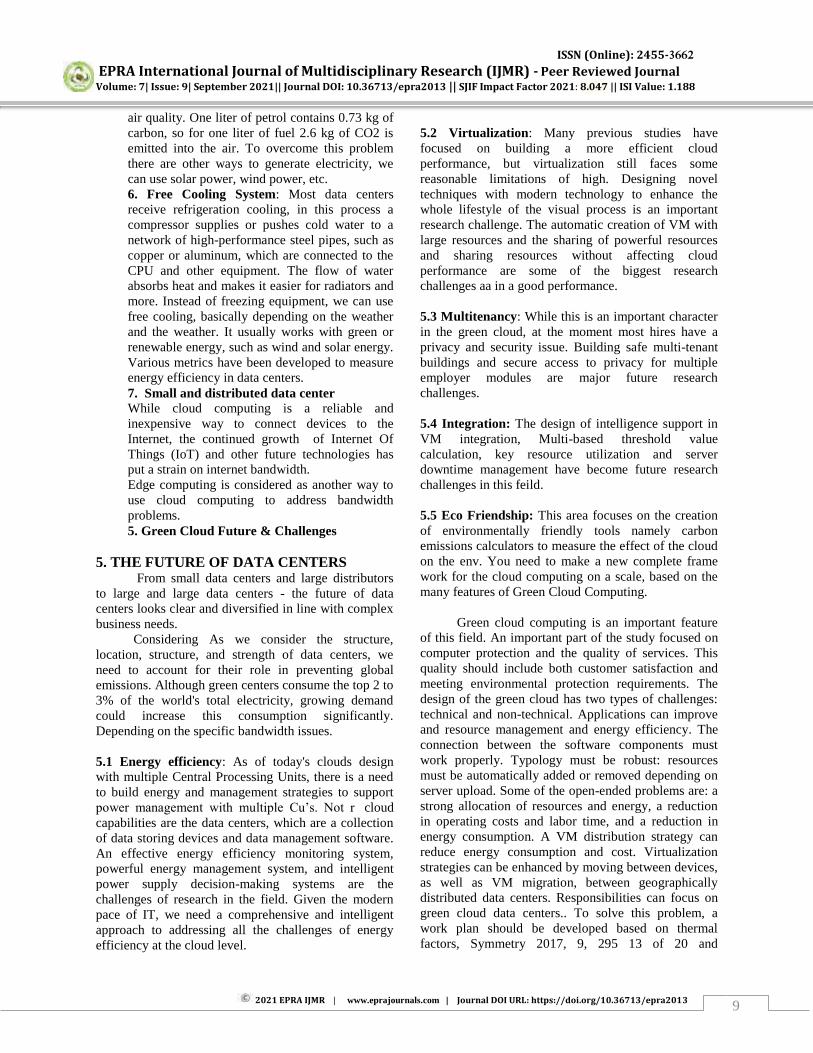
2. LITERATURE SURVEY: GREEN CLOUD COMPUTING Thermal gases, or GHGs, are composite gases or longwave rays in the atmosphere. The main GHGs, also called thermal gases, are CO2, methane, nitrous oxide, hence gaseous gases. Cloud infrastructure is becoming a major environmental issue in terms of energy efficiency and carbon emissions. the following are the four key factors that have enabled Cloud Computing to measure power consumption and ICT deployment. in this way, organizations can reduce carbon emissions by at least 30-40%. Hosman and Baikie et al,[10] gave a new challenge in the field of cloud computing, data centers consume a lot of energy and energy is not available every time, so the author is discussing solar use.
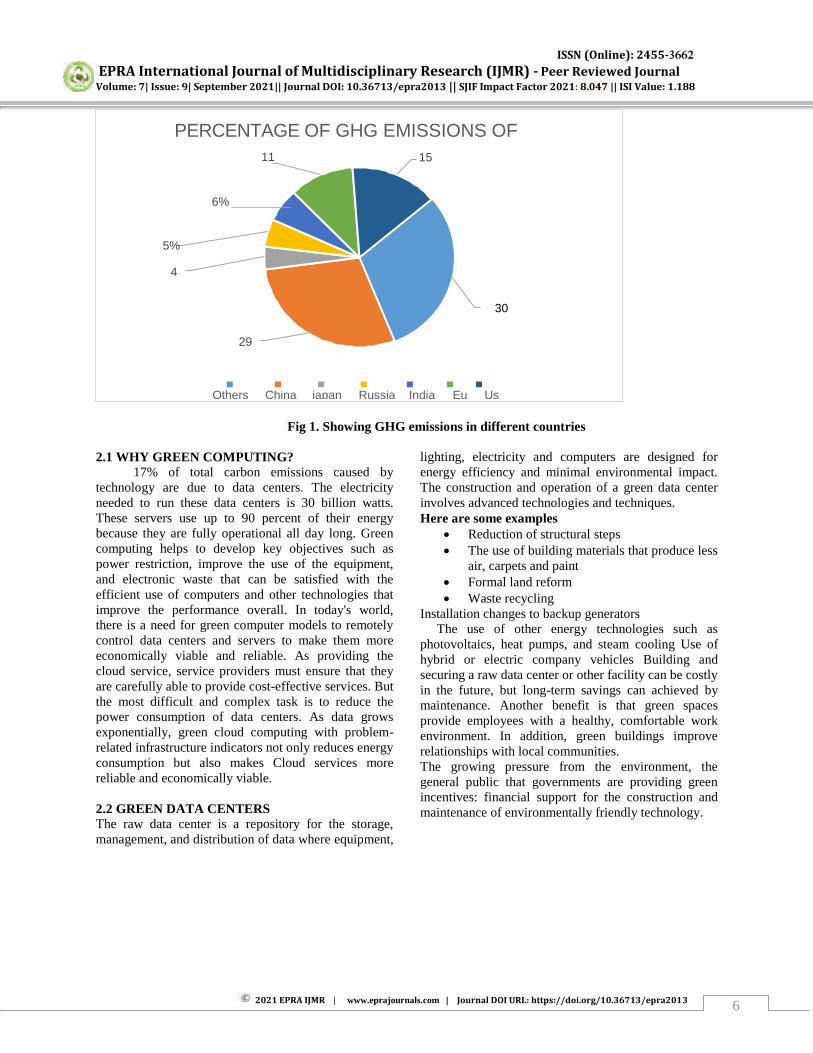
Pat Boher e-el[8] researched power management strategies while operating online servers at their low level of usage, with no impact on their performance. They are focusing on the logs of the system because they are the sources of the most input, soliciting power consumption rates on an online server at various levels of usage. The author provides an effective model of CPU and other resources used for energy values, which helps predict long-term energy needs Bhanu Priya et al., [12] gave computing metrics to make the cloud green in terms of energy efficiency, different energy methods have been talked about in this paper to reduce the power consumption and CO2 emission to make the cloud greener. The use of cloud computing has attracted the attention of many entrepreneurs, the only concern with cloud computing is the uncontrolled rise of cloud data centers. Improper use of cloud resources opens the way to inefficiency and environmental hazards. To understand the seriousness of this issue, several researchers have contributed to the promotion of the use of the green cloud in various ways. Green Cloud Computing is the process of developing methods and techniques to enhance the professionalism of soft materials to reduce energy consumption and the natural effect of their use. The power utility of the data center provides features such as web-based testing, live machine movement, and advanced machine configuration improvements. CML is responsible for selecting the right resources for all available resources and GML selects the best for it. As a result of this excellent resource selection, the average response time for services is reduced with reduced energy consumption costs. When handling 500 service requests, the proposed operation uses 4298 W and the comparison methods use a lot of power. Here is a chart representing carbon emissions in several countries:
ISSN (Online): 2455-3662
EPRA International Journal of Multidisciplinary Research (IJMR) - Peer Reviewed Journal Volume: 7| Issue: 9| September 2021|| Journal DOI: 10.36713/epra2013 || SJIF Impact Factor 2021: 8.047 || ISI Value: 1.188
2021 EPRA IJMR | www.eprajournals.com | Journal DOI URL: https://doi.org/10.36713/epra2013 6
Fig 1. Showing GHG emissions in different countries
2.1 WHY GREEN COMPUTING? 17% of total carbon emissions caused by
technology are due to data centers. The electricity needed to run these data centers is 30 billion watts. These servers use up to 90 percent of their energy because they are fully operational all day long. Green computing helps to develop key objectives such as power restriction, improve the use of the equipment, and electronic waste that can be satisfied with the efficient use of computers and other technologies that improve the performance overall. In today's world, there is a need for green computer models to remotely control data centers and servers to make them more economically viable and reliable. As providing the cloud service, service providers must ensure that they are carefully able to provide cost-effective services. But the most difficult and complex task is to reduce the power consumption of data centers. As data grows exponentially, green cloud computing with problem-related infrastructure indicators not only reduces energy consumption but also makes Cloud services more reliable and economically viable. 2.2 GREEN DATA CENTERS The raw data center is a repository for the storage, management, and distribution of data where equipment,
lighting, electricity and computers are designed for energy efficiency and minimal environmental impact. The construction and operation of a green data center involves advanced technologies and techniques. Here are some examples
Reduction of structural steps The use of building materials that produce less
air, carpets and paint Formal land reform Waste recycling
Installation changes to backup generators The use of other energy technologies such as photovoltaics, heat pumps, and steam cooling Use of hybrid or electric company vehicles Building and securing a raw data center or other facility can be costly in the future, but long-term savings can achieved by maintenance. Another benefit is that green spaces provide employees with a healthy, comfortable work environment. In addition, green buildings improve relationships with local communities. The growing pressure from the environment, the general public that governments are providing green incentives: financial support for the construction and maintenance of environmentally friendly technology.
PERCENTAGE OF GHG EMISSIONS OF REGION WISE 11
% 15%
6%
5%
4%
30%
29%
Others China japan Russia India Eu Us
ISSN (Online): 2455-3662
EPRA International Journal of Multidisciplinary Research (IJMR) - Peer Reviewed Journal Volume: 7| Issue: 9| September 2021|| Journal DOI: 10.36713/epra2013 || SJIF Impact Factor 2021: 8.047 || ISI Value: 1.188
2021 EPRA IJMR | www.eprajournals.com | Journal DOI URL: https://doi.org/10.36713/epra2013 7
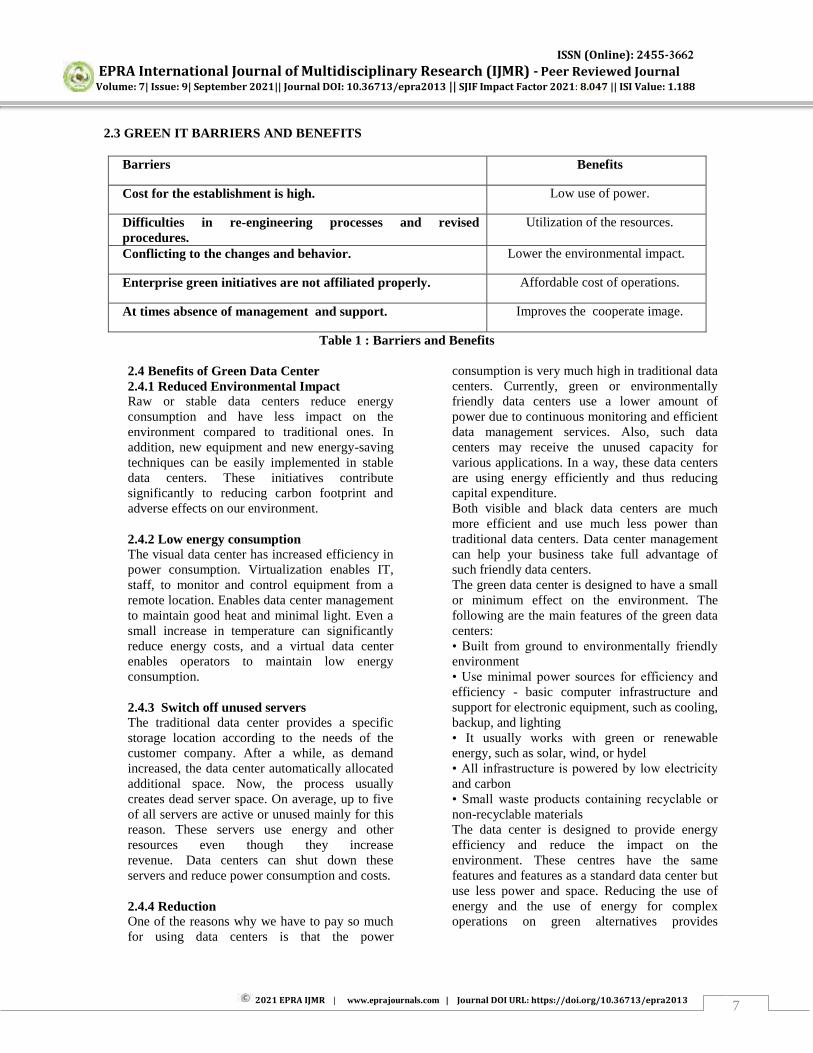
2.3 GREEN IT BARRIERS AND BENEFITS
Barriers Benefits
Cost for the establishment is high. Low use of power.
Difficulties in re-engineering processes and revised procedures.
Utilization of the resources.
Conflicting to the changes and behavior. Lower the environmental impact.
Enterprise green initiatives are not affiliated properly. Affordable cost of operations.
At times absence of management and support. Improves the cooperate image.
Table 1 : Barriers and Benefits 2.4 Benefits of Green Data Center 2.4.1 Reduced Environmental Impact Raw or stable data centers reduce energy consumption and have less impact on the environment compared to traditional ones. In addition, new equipment and new energy-saving techniques can be easily implemented in stable data centers. These initiatives contribute significantly to reducing carbon footprint and adverse effects on our environment. 2.4.2 Low energy consumption The visual data center has increased efficiency in power consumption. Virtualization enables IT, staff, to monitor and control equipment from a remote location. Enables data center management to maintain good heat and minimal light. Even a small increase in temperature can significantly reduce energy costs, and a virtual data center enables operators to maintain low energy consumption. 2.4.3 Switch off unused servers The traditional data center provides a specific storage location according to the needs of the customer company. After a while, as demand increased, the data center automatically allocated additional space. Now, the process usually creates dead server space. On average, up to five of all servers are active or unused mainly for this reason. These servers use energy and other resources even though they increase revenue. Data centers can shut down these servers and reduce power consumption and costs. 2.4.4 Reduction One of the reasons why we have to pay so much for using data centers is that the power
consumption is very much high in traditional data centers. Currently, green or environmentally friendly data centers use a lower amount of power due to continuous monitoring and efficient data management services. Also, such data centers may receive the unused capacity for various applications. In a way, these data centers are using energy efficiently and thus reducing capital expenditure. Both visible and black data centers are much more efficient and use much less power than traditional data centers. Data center management can help your business take full advantage of such friendly data centers. The green data center is designed to have a small or minimum effect on the environment. The following are the main features of the green data centers: • Built from ground to environmentally friendly
environment • Use minimal power sources for efficiency and
efficiency - basic computer infrastructure and support for electronic equipment, such as cooling, backup, and lighting • It usually works with green or renewable energy, such as solar, wind, or hydel • All infrastructure is powered by low electricity
and carbon • Small waste products containing recyclable or
non-recyclable materials The data center is designed to provide energy efficiency and reduce the impact on the environment. These centres have the same features and features as a standard data center but use less power and space. Reducing the use of energy and the use of energy for complex operations on green alternatives provides
ISSN (Online): 2455-3662
EPRA International Journal of Multidisciplinary Research (IJMR) - Peer Reviewed Journal Volume: 7| Issue: 9| September 2021|| Journal DOI: 10.36713/epra2013 || SJIF Impact Factor 2021: 8.047 || ISI Value: 1.188
2021 EPRA IJMR | www.eprajournals.com | Journal DOI URL: https://doi.org/10.36713/epra2013 8
economic and environmental benefits to organizations.
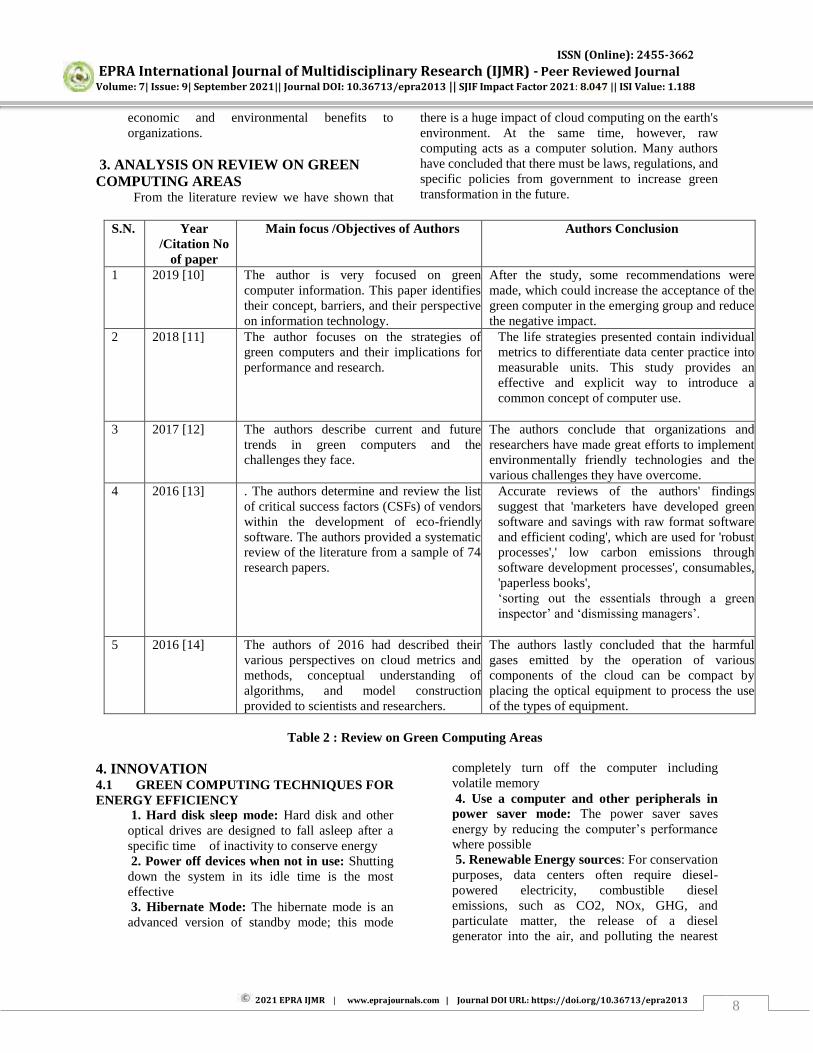
3. ANALYSIS ON REVIEW ON GREEN COMPUTING AREAS
From the literature review we have shown that
there is a huge impact of cloud computing on the earth's environment. At the same time, however, raw computing acts as a computer solution. Many authors have concluded that there must be laws, regulations, and specific policies from government to increase green transformation in the future.
S.N. Year
/Citation No of paper
Main focus /Objectives of Authors Authors Conclusion
1 2019 [10] The author is very focused on green computer information. This paper identifies their concept, barriers, and their perspective on information technology.
After the study, some recommendations were made, which could increase the acceptance of the green computer in the emerging group and reduce the negative impact.
2 2018 [11] The author focuses on the strategies of green computers and their implications for performance and research.
The life strategies presented contain individual metrics to differentiate data center practice into measurable units. This study provides an effective and explicit way to introduce a common concept of computer use.
3 2017 [12] The authors describe current and future
trends in green computers and the challenges they face.
The authors conclude that organizations and researchers have made great efforts to implement environmentally friendly technologies and the various challenges they have overcome.
4 2016 [13] . The authors determine and review the list of critical success factors (CSFs) of vendors within the development of eco-friendly software. The authors provided a systematic review of the literature from a sample of 74 research papers.
Accurate reviews of the authors' findings suggest that 'marketers have developed green software and savings with raw format software and efficient coding', which are used for 'robust processes',' low carbon emissions through software development processes', consumables, 'paperless books', „sorting out the essentials through a green
inspector‟ and „dismissing managers‟.
5 2016 [14] The authors of 2016 had described their various perspectives on cloud metrics and methods, conceptual understanding of algorithms, and model construction provided to scientists and researchers.
The authors lastly concluded that the harmful gases emitted by the operation of various components of the cloud can be compact by placing the optical equipment to process the use of the types of equipment.
Table 2 : Review on Green Computing Areas 4. INNOVATION 4.1 GREEN COMPUTING TECHNIQUES FOR ENERGY EFFICIENCY
1. Hard disk sleep mode: Hard disk and other optical drives are designed to fall asleep after a specific time of inactivity to conserve energy 2. Power off devices when not in use: Shutting down the system in its idle time is the most effective 3. Hibernate Mode: The hibernate mode is an advanced version of standby mode; this mode
completely turn off the computer including volatile memory 4. Use a computer and other peripherals in power saver mode: The power saver saves energy by reducing the computer‟s performance
where possible 5. Renewable Energy sources: For conservation purposes, data centers often require diesel-powered electricity, combustible diesel emissions, such as CO2, NOx, GHG, and particulate matter, the release of a diesel generator into the air, and polluting the nearest
ISSN (Online): 2455-3662
EPRA International Journal of Multidisciplinary Research (IJMR) - Peer Reviewed Journal Volume: 7| Issue: 9| September 2021|| Journal DOI: 10.36713/epra2013 || SJIF Impact Factor 2021: 8.047 || ISI Value: 1.188
2021 EPRA IJMR | www.eprajournals.com | Journal DOI URL: https://doi.org/10.36713/epra2013 9
air quality. One liter of petrol contains 0.73 kg of carbon, so for one liter of fuel 2.6 kg of CO2 is emitted into the air. To overcome this problem there are other ways to generate electricity, we can use solar power, wind power, etc. 6. Free Cooling System: Most data centers receive refrigeration cooling, in this process a compressor supplies or pushes cold water to a network of high-performance steel pipes, such as copper or aluminum, which are connected to the CPU and other equipment. The flow of water absorbs heat and makes it easier for radiators and more. Instead of freezing equipment, we can use free cooling, basically depending on the weather and the weather. It usually works with green or renewable energy, such as wind and solar energy. Various metrics have been developed to measure energy efficiency in data centers. 7. Small and distributed data center While cloud computing is a reliable and inexpensive way to connect devices to the Internet, the continued growth of Internet Of Things (IoT) and other future technologies has put a strain on internet bandwidth. Edge computing is considered as another way to use cloud computing to address bandwidth problems. 5. Green Cloud Future & Challenges
5. THE FUTURE OF DATA CENTERS From small data centers and large distributors
to large and large data centers - the future of data centers looks clear and diversified in line with complex business needs.
Considering As we consider the structure, location, structure, and strength of data centers, we need to account for their role in preventing global emissions. Although green centers consume the top 2 to 3% of the world's total electricity, growing demand could increase this consumption significantly. Depending on the specific bandwidth issues. 5.1 Energy efficiency: As of today's clouds design with multiple Central Processing Units, there is a need to build energy and management strategies to support power management with multiple Cu‟s. Not r cloud capabilities are the data centers, which are a collection of data storing devices and data management software. An effective energy efficiency monitoring system, powerful energy management system, and intelligent power supply decision-making systems are the challenges of research in the field. Given the modern pace of IT, we need a comprehensive and intelligent approach to addressing all the challenges of energy efficiency at the cloud level.
5.2 Virtualization: Many previous studies have focused on building a more efficient cloud performance, but virtualization still faces some reasonable limitations of high. Designing novel techniques with modern technology to enhance the whole lifestyle of the visual process is an important research challenge. The automatic creation of VM with large resources and the sharing of powerful resources and sharing resources without affecting cloud performance are some of the biggest research challenges aa in a good performance. 5.3 Multitenancy: While this is an important character in the green cloud, at the moment most hires have a privacy and security issue. Building safe multi-tenant buildings and secure access to privacy for multiple employer modules are major future research challenges. 5.4 Integration: The design of intelligence support in VM integration, Multi-based threshold value calculation, key resource utilization and server downtime management have become future research challenges in this feild. 5.5 Eco Friendship: This area focuses on the creation of environmentally friendly tools namely carbon emissions calculators to measure the effect of the cloud on the env. You need to make a new complete frame work for the cloud computing on a scale, based on the many features of Green Cloud Computing. Green cloud computing is an important feature of this field. An important part of the study focused on computer protection and the quality of services. This quality should include both customer satisfaction and meeting environmental protection requirements. The design of the green cloud has two types of challenges: technical and non-technical. Applications can improve and resource management and energy efficiency. The connection between the software components must work properly. Typology must be robust: resources must be automatically added or removed depending on server upload. Some of the open-ended problems are: a strong allocation of resources and energy, a reduction in operating costs and labor time, and a reduction in energy consumption. A VM distribution strategy can reduce energy consumption and cost. Virtualization strategies can be enhanced by moving between devices, as well as VM migration, between geographically distributed data centers. Responsibilities can focus on green cloud data centers.. To solve this problem, a work plan should be developed based on thermal factors, Symmetry 2017, 9, 295 13 of 20 and
ISSN (Online): 2455-3662
EPRA International Journal of Multidisciplinary Research (IJMR) - Peer Reviewed Journal Volume: 7| Issue: 9| September 2021|| Journal DOI: 10.36713/epra2013 || SJIF Impact Factor 2021: 8.047 || ISI Value: 1.188
2021 EPRA IJMR | www.eprajournals.com | Journal DOI URL: https://doi.org/10.36713/epra2013 10
temperature recovery should be improved. The construction of data centers in areas with free cooling facilities is a non-technical solution to this problem. CONCLUSION
Green cloud computing is an emerging technology and research topic in this technology world of technology lovers. Nowadays, IT companies are advancing when it comes to cloud computing due to increased data storage and computer needs leading to the growth of cloud infrastructure in an environmentally friendly and economical way. Cloud computing is designed and developed in a very advanced way to make servers and data centers more powerful. This paper reviews a brief discussion of the computer cloud, its barriers, and the benefits of the world. Following, annual updates in the green fields of cloud IT where the ideas and conclusions are the same the writers exclaim. This paper concludes that efficiency and power management are considered to be key objectives and specific policies that government should focus on environmental change in the near forthcoming.
This paper discusses the contribution of cloud computing to environmental protection according to the studies in this article conducted to date. The most important features are:
1. The biggest benefits advertised are those that focus on energy efficiency. To comply with environmental protection regulations, cloud service companies must at least reduce energy consumption from non-renewable sources and replace renewable energy. Studies conducted so far have shown that the index of energy consumption is still very high, surpassing the energy available from non-renewable sources.
2. Increased energy consumption from renewable sources will lead to a reduction in CO2 emissions, but given that the initial indicator is not as high as expected, pollution reduction is unlikely to meet the expectations of the organizations.
3. Reducing e-waste is another controversial alternative that leads to higher expectations. The practice of cloud computing could affect the reduction in the amount of equipment required by organizations and the speed of retrieval REFERENCES
1) Peter Mell and Tim Grance (2011). “The NIST Definition of Cloud Computing” Version 15, 10-7-09, National Institute of Standards and Technology, Information Technology Laboratory.
2) Heininger, R.(2012). IT Service Management in a Cloud Environment: A Literature Review. In Proceedings of the 9th Workshop on Information Systems and Services Sciences, München, Germany.
3) https://www.forbes.com/sites/louiscolumbus/2018/09/23/roundup-of-cloud-computing-forecasts-and-market-estimates-2018/#727f7b5b507b
4) Hilty, M.L., Arnfalk, P, Erdmann L, Goodman J, Lehmann M & Wager A.P.(2006). The a relevance of this information and communication technologies for environmental sustainability—A prospective simulation study.
5) Pat Bohrer, Elmootazbellah N. Elnozahy, Tom Keller, Michael Kistler, Charles Lefurgy, Chandler McDowell, & Ram Rajamony et al.(2002). The case for power
6) S. K. Garg and R. Buyya, “Green Cloud computing and Environmental Sustainability”, Edited by S. Murugesan and G. R. Gangadharan, Wiley-IEEE Press Ebook (2012), Edition 1, no. 3, pp. 76-87.
7) L. Hosman and B. Baikie, (Eds.), “Solar-Powered Cloud Computing datacenters”, vol. 2 no. 15, (2013).,
8) B. Priya, E. S. Pilli and R. C. Joshi, (Eds.), “A Survey on Energy and Power Consumption Models for Greener Cloud”, Proceeding of the IEEE 3 International Advance Computing Conference (IACC), (2013), February 22-23; Ghaziabad.
9) https://www.techopedia.com/definition/14753/green-computing
10) https://www.colocationamerica.com/blog/data-center-environmental- impacts
11) https://www.ucsusa.org/resources/each-countrys-share-co2-emissions
12) Prof. Pallavi Wankhede, Mr. Nayan Agrawal, Ms. Jasneet Kaur Sain, Review on Green Cloud Computing: A Step Towards Saving Global Environment
13) J. M. T. I. Jayalath Faculty of Graduate Studies and Research, Sri Lanka Institute of Information Technology, Sri Lanka; E. J. A. P. C. Chathumali; K. R.M. Kothalawala; N. Kuruwitaarachchi
14) S. Greenberg, E. Mills, B. Tschudi, P. Rumsey and B. Myatt, (Eds.), “Best Practices for Data Centres: Results from Benchmarking 22 Data Centres”, Proceedings of the ACEEE Summer Study on Energy Efficiency in Buildings, (2006) April, pp. 3-76, -3-87
ISSN (Online): 2455-3662
EPRA International Journal of Multidisciplinary Research (IJMR) - Peer Reviewed Journal Volume: 7| Issue: 9| September 2021|| Journal DOI: 10.36713/epra2013 || SJIF Impact Factor 2021: 8.047 || ISI Value: 1.188
2021 EPRA IJMR | www.eprajournals.com | Journal DOI URL: https://doi.org/10.36713/epra2013 11
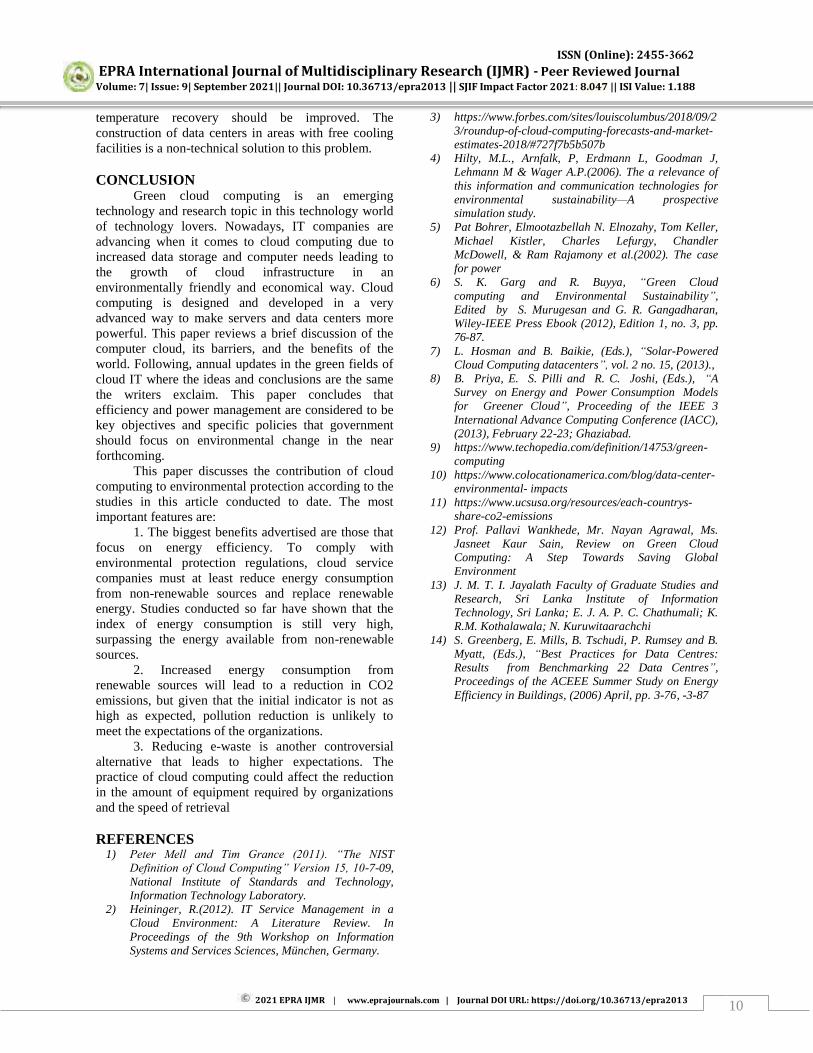
IMPACTS OF YOGIC PROGRAMME ON BLOOD PRESSURE AND RESPIRATORY RATE AMONG
FOOTBALLERS
D. Chochalingam
Teaching Fellow in Physical Education, University College of Engineering, Ramanathapuram, Tamilnadu, India
ABSTRACT This investigation evaluated the impacts of yogic programme on Blood Pressure and respiratory rate. The current investigation was conducted at the Footballers, University College of Engineering, Ramanathapuram. The age of the subjects were ranged between 18 to 23 years. Tools and Technique Selected Physiological variables i.e. Blood Pressure and respiratory rate were used and measured in this study to know the impact of yoga training on its. Measurements for the variables were taken at the pre test and at the end of the treatment period, after eight weeks post test the data were collected for all the variables from treatment group, for three days. During this period the subject were not allowed to participate in any training. The information was analyzed using paired‘t’ test to compare the before and after yogic
training programme values of treatment group. P value of less than 0.05 was accepted as indicating significant difference between the compared values. The results of this investigation indicate that 6 weeks of yoga practice can significantly improve blood pressure and respiratory rate in collegiate footballers. KEYWORDS: Yogic Programme, Blood Pressure, Respiratory Rate, Football Players.
1. INTRODUCTION Regular yoga practice reduces illness and
daily stress in the body. As a result, your body becomes healthier and more energetic. Physical exercise and yoga improve blood flow in the body and lower blood pressure. When small problems in life increase the tension and make you a patient of BP. This is not known. But in yoga there is a solution to this problem of yours. If you take the path of yoga to control increased blood pressure, then you feel healthier for longer. The lungs can be kept healthy. By doing this yoga practice, the respiratory system is strengthened and the lungs also function actively. This reduces the risk of any type of disease associated with the respiratory system by several times.
2. METHODOLOGY The current investigation was conducted at the
Footballers, University College of Engineering, Ramanathapuram. The age of the subjects were ranged between 18 to 23 years. Tools and Technique Selected Physiological variables i.e. Blood Pressure and respiratory rate were used and measured in this study to know the effect of yoga training on it. Measurements for the variables were taken at the pre test and at the end of the treatment period, after six weeks post test the data were collected for all the variables from treatment group, for three days. During this period the subject were not allowed to participate in any training.
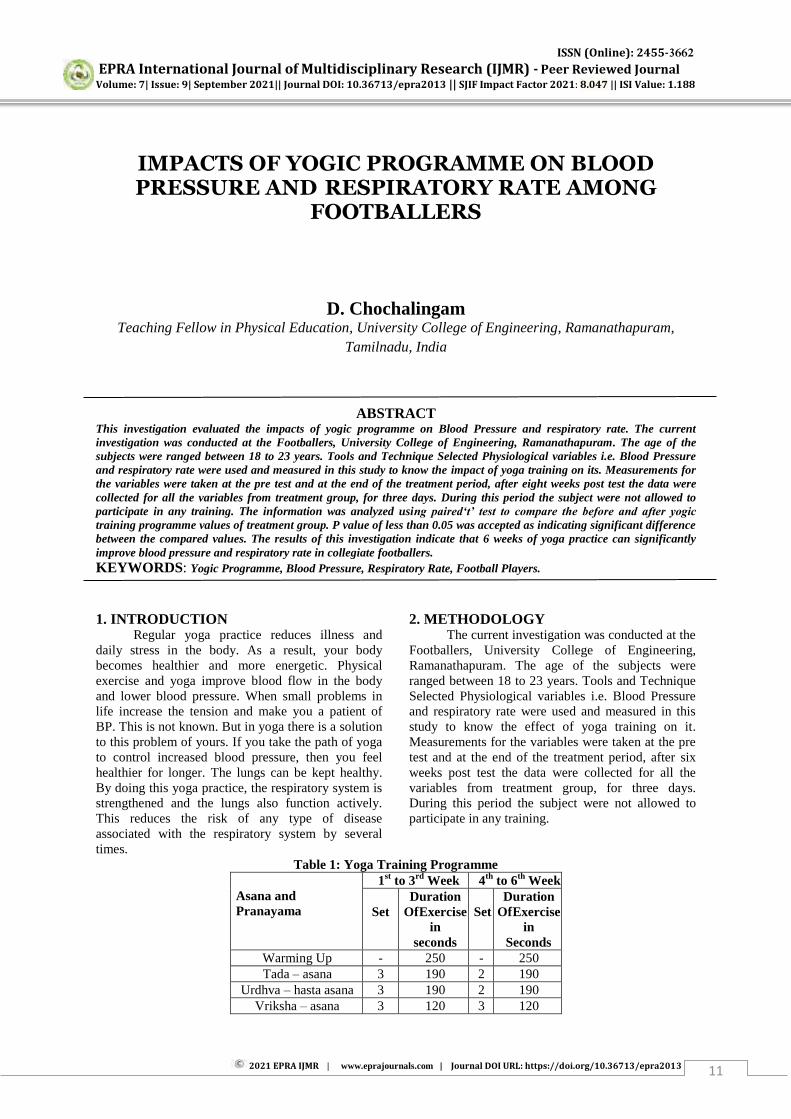
Table 1: Yoga Training Programme Asana and Pranayama
1st to 3rd Week 4th to 6th Week
Set Duration
Of Exercise in
seconds
Set
Duration Of Exercise
in Seconds
Warming Up - 250 - 250 Tada – asana 3 190 2 190
Urdhva – hasta asana 3 190 2 190 Vriksha – asana 3 120 3 120
ISSN (Online): 2455-3662
EPRA International Journal of Multidisciplinary Research (IJMR) - Peer Reviewed Journal Volume: 7| Issue: 9| September 2021|| Journal DOI: 10.36713/epra2013 || SJIF Impact Factor 2021: 8.047 || ISI Value: 1.188
2021 EPRA IJMR | www.eprajournals.com | Journal DOI URL: https://doi.org/10.36713/epra2013 12
Vajra asana 3 120 3 120 Paschima – uttana –
asana 4 120 2 120
Padma – asana 4 160 2 160 Sarvanga – asana 3 120 2 120
Hala – asana 3 120 1 120 Karna – pida – asana 3 120 2 120
Bhujanga – asana 3 120 2 120 Dhanur asana 3 120 2 120 Shawa – asana 1 180 1 180
Kapalbhati 2 240 2 240 Anulom vilom
pranayam 2 240 2 240
Nadi shodhana 2 240 2 240 Ujjayi-pranayama 2 240 2 240
Simhasana-pranayama 2 240 2 240 Shawa – asana 1 180 1 180
3. SELECTION OF VARIABLES AND TESTS The subjects were tested on the following variables.
Table 2 Name of
Variables Test Unit
Blood Pressure Sphygmomanometer Milliliter of Mercury Respiratory rate Manual method Numbers of breathing
cycle in one minute 4. STATISTICAL ANALYSIS
The information was analyzed using paired‘t’ test to compare the before and after yogic training
programme values of treatment group. P value of less than 0.05 was accepted as indicating significant difference between the compared values.
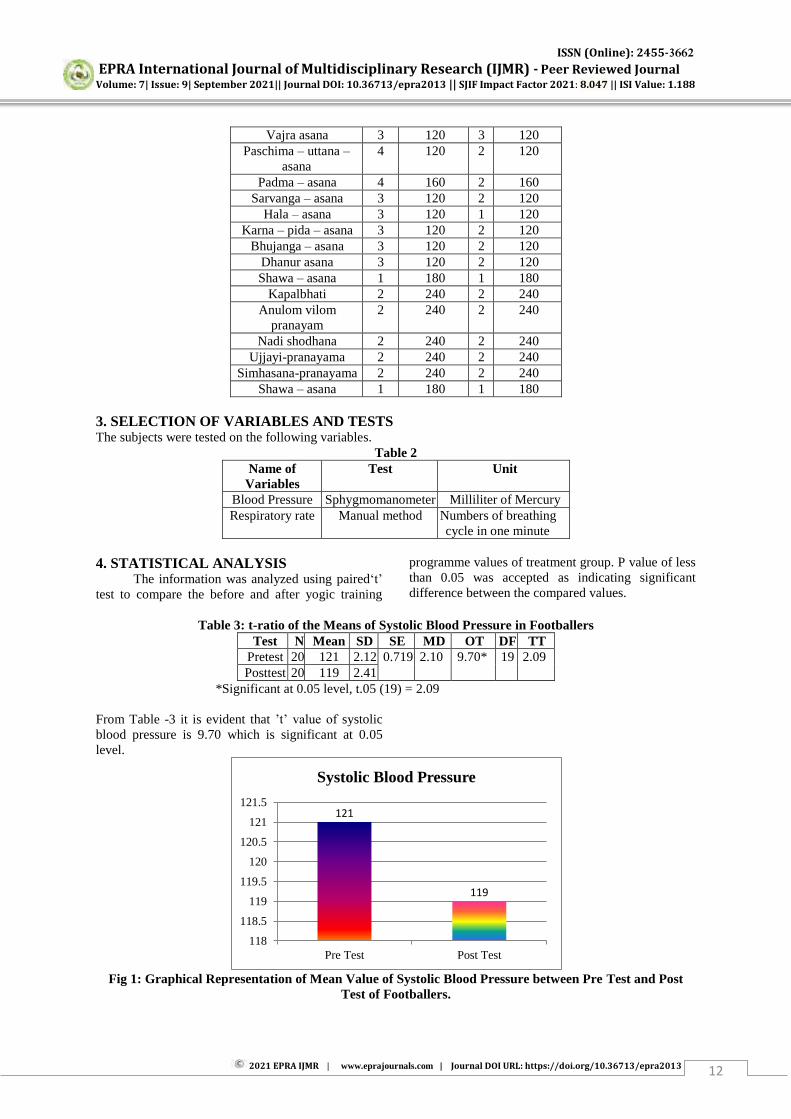
Table 3: t-ratio of the Means of Systolic Blood Pressure in Footballers
Test N Mean SD SE MD OT DF TT Pretest 20 121 2.12 0.719 2.10 9.70* 19 2.09 Posttest 20 119 2.41
*Significant at 0.05 level, t.05 (19) = 2.09 From Table -3 it is evident that ’t’ value of systolic blood pressure is 9.70 which is significant at 0.05 level.
Fig 1: Graphical Representation of Mean Value of Systolic Blood Pressure between Pre Test and Post
Test of Footballers.
121
119
118
118.5
119
119.5
120
120.5
121
121.5
Pre Test Post Test
Systolic Blood Pressure
ISSN (Online): 2455-3662
EPRA International Journal of Multidisciplinary Research (IJMR) - Peer Reviewed Journal Volume: 7| Issue: 9| September 2021|| Journal DOI: 10.36713/epra2013 || SJIF Impact Factor 2021: 8.047 || ISI Value: 1.188
2021 EPRA IJMR | www.eprajournals.com | Journal DOI URL: https://doi.org/10.36713/epra2013 13
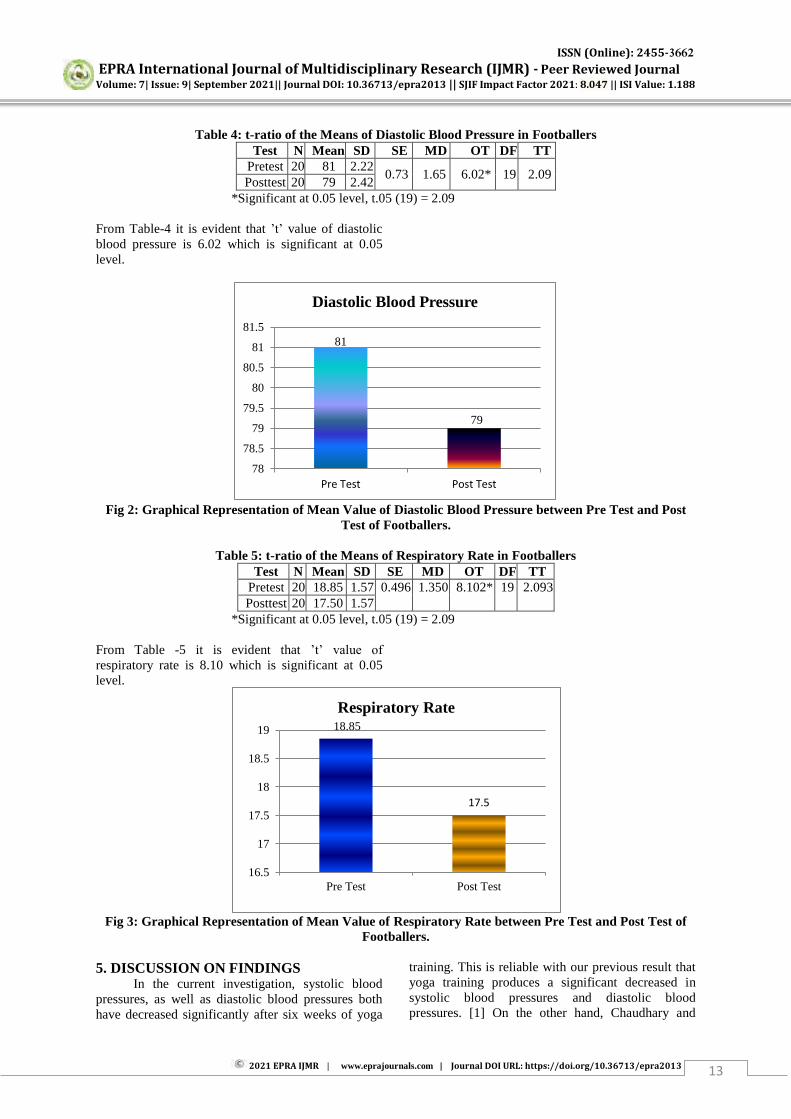
Table 4: t-ratio of the Means of Diastolic Blood Pressure in Footballers Test N Mean SD SE MD OT DF TT
Pretest 20 81 2.22 0.73 1.65 6.02* 19 2.09
Posttest 20 79 2.42 *Significant at 0.05 level, t.05 (19) = 2.09 From Table-4 it is evident that ’t’ value of diastolic blood pressure is 6.02 which is significant at 0.05 level.
Fig 2: Graphical Representation of Mean Value of Diastolic Blood Pressure between Pre Test and Post
Test of Footballers.
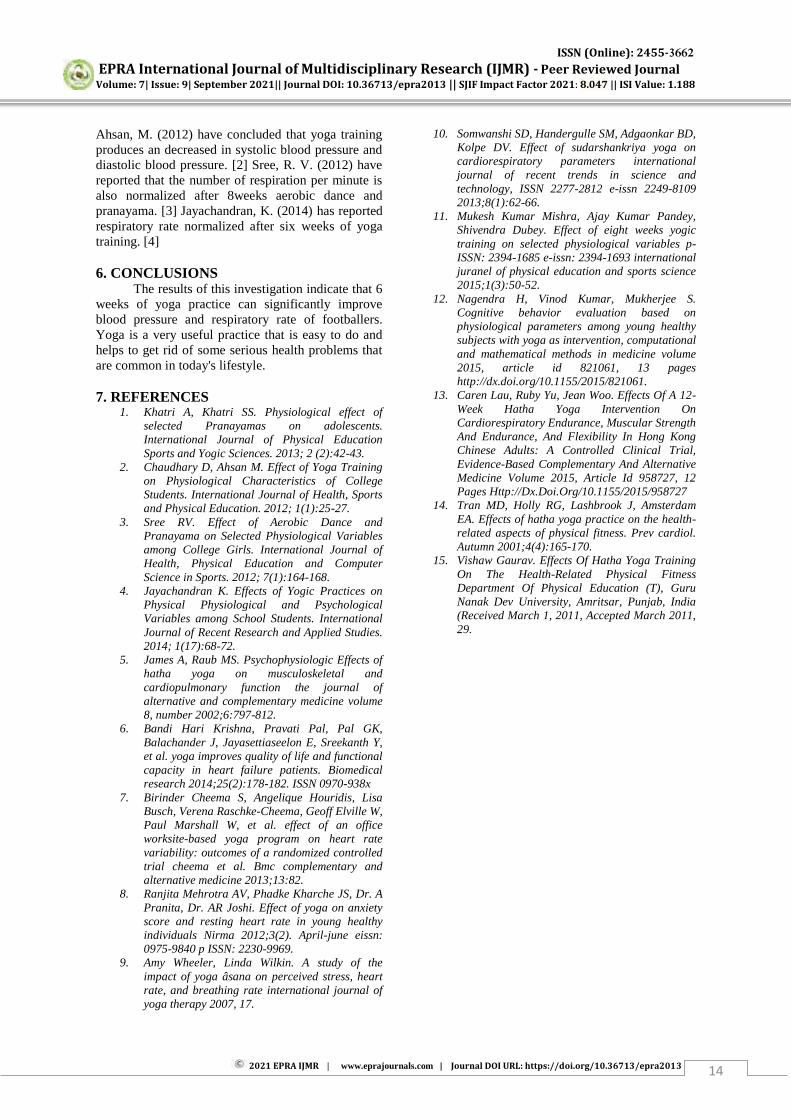
Table 5: t-ratio of the Means of Respiratory Rate in Footballers Test N Mean SD SE MD OT DF TT
Pretest 20 18.85 1.57 0.496 1.350 8.102* 19 2.093 Posttest 20 17.50 1.57
*Significant at 0.05 level, t.05 (19) = 2.09 From Table -5 it is evident that ’t’ value of
respiratory rate is 8.10 which is significant at 0.05 level.
Fig 3: Graphical Representation of Mean Value of Respiratory Rate between Pre Test and Post Test of
Footballers. 5. DISCUSSION ON FINDINGS
In the current investigation, systolic blood pressures, as well as diastolic blood pressures both have decreased significantly after six weeks of yoga
training. This is reliable with our previous result that yoga training produces a significant decreased in systolic blood pressures and diastolic blood pressures. [1] On the other hand, Chaudhary and
81
79
78
78.5
79
79.5
80
80.5
81
81.5
Pre Test Post Test
Diastolic Blood Pressure
18.85
17.5
16.5
17
17.5
18
18.5
19
Pre Test Post Test
Respiratory Rate
ISSN (Online): 2455-3662
EPRA International Journal of Multidisciplinary Research (IJMR) - Peer Reviewed Journal Volume: 7| Issue: 9| September 2021|| Journal DOI: 10.36713/epra2013 || SJIF Impact Factor 2021: 8.047 || ISI Value: 1.188
2021 EPRA IJMR | www.eprajournals.com | Journal DOI URL: https://doi.org/10.36713/epra2013 14
Ahsan, M. (2012) have concluded that yoga training produces an decreased in systolic blood pressure and diastolic blood pressure. [2] Sree, R. V. (2012) have reported that the number of respiration per minute is also normalized after 8weeks aerobic dance and pranayama. [3] Jayachandran, K. (2014) has reported respiratory rate normalized after six weeks of yoga training. [4] 6. CONCLUSIONS
The results of this investigation indicate that 6 weeks of yoga practice can significantly improve blood pressure and respiratory rate of footballers. Yoga is a very useful practice that is easy to do and helps to get rid of some serious health problems that are common in today's lifestyle. 7. REFERENCES
1. Khatri A, Khatri SS. Physiological effect of selected Pranayamas on adolescents. International Journal of Physical Education Sports and Yogic Sciences. 2013; 2 (2):42-43.
2. Chaudhary D, Ahsan M. Effect of Yoga Training on Physiological Characteristics of College Students. International Journal of Health, Sports and Physical Education. 2012; 1(1):25-27.
3. Sree RV. Effect of Aerobic Dance and Pranayama on Selected Physiological Variables among College Girls. International Journal of Health, Physical Education and Computer Science in Sports. 2012; 7(1):164-168.
4. Jayachandran K. Effects of Yogic Practices on Physical Physiological and Psychological Variables among School Students. International Journal of Recent Research and Applied Studies. 2014; 1(17):68-72.
5. James A, Raub MS. Psychophysiologic Effects of hatha yoga on musculoskeletal and cardiopulmonary function the journal of alternative and complementary medicine volume 8, number 2002;6:797-812.
6. Bandi Hari Krishna, Pravati Pal, Pal GK, Balachander J, Jayasettiaseelon E, Sreekanth Y, et al. yoga improves quality of life and functional capacity in heart failure patients. Biomedical research 2014;25(2):178-182. ISSN 0970-938x
7. Birinder Cheema S, Angelique Houridis, Lisa Busch, Verena Raschke-Cheema, Geoff Elville W, Paul Marshall W, et al. effect of an office worksite-based yoga program on heart rate variability: outcomes of a randomized controlled trial cheema et al. Bmc complementary and alternative medicine 2013;13:82.
8. Ranjita Mehrotra AV, Phadke Kharche JS, Dr. A Pranita, Dr. AR Joshi. Effect of yoga on anxiety score and resting heart rate in young healthy individuals Nirma 2012;3(2). April-june eissn: 0975-9840 p ISSN: 2230-9969.
9. Amy Wheeler, Linda Wilkin. A study of the impact of yoga âsana on perceived stress, heart rate, and breathing rate international journal of yoga therapy 2007, 17.
10. Somwanshi SD, Handergulle SM, Adgaonkar BD, Kolpe DV. Effect of sudarshankriya yoga on cardiorespiratory parameters international journal of recent trends in science and technology, ISSN 2277-2812 e-issn 2249-8109 2013;8(1):62-66.
11. Mukesh Kumar Mishra, Ajay Kumar Pandey, Shivendra Dubey. Effect of eight weeks yogic training on selected physiological variables p-ISSN: 2394-1685 e-issn: 2394-1693 international juranel of physical education and sports science 2015;1(3):50-52.
12. Nagendra H, Vinod Kumar, Mukherjee S. Cognitive behavior evaluation based on physiological parameters among young healthy subjects with yoga as intervention, computational and mathematical methods in medicine volume 2015, article id 821061, 13 pages http://dx.doi.org/10.1155/2015/821061.
13. Caren Lau, Ruby Yu, Jean Woo. Effects Of A 12-Week Hatha Yoga Intervention On Cardiorespiratory Endurance, Muscular Strength And Endurance, And Flexibility In Hong Kong Chinese Adults: A Controlled Clinical Trial, Evidence-Based Complementary And Alternative Medicine Volume 2015, Article Id 958727, 12 Pages Http://Dx.Doi.Org/10.1155/2015/958727
14. Tran MD, Holly RG, Lashbrook J, Amsterdam EA. Effects of hatha yoga practice on the health-related aspects of physical fitness. Prev cardiol. Autumn 2001;4(4):165-170.
15. Vishaw Gaurav. Effects Of Hatha Yoga Training On The Health-Related Physical Fitness Department Of Physical Education (T), Guru Nanak Dev University, Amritsar, Punjab, India (Received March 1, 2011, Accepted March 2011, 29.
ISSN (Online): 2455-3662
EPRA International Journal of Multidisciplinary Research (IJMR) - Peer Reviewed Journal Volume: 7| Issue: 9| September 2021|| Journal DOI: 10.36713/epra2013 || SJIF Impact Factor 2021: 8.047 || ISI Value: 1.188
2021 EPRA IJMR | www.eprajournals.com | Journal DOI URL: https://doi.org/10.36713/epra2013 15
A SEARCH ON INTEGER SOLUTIONS TO
NON-HOMOGENEOUS TERNARY CUBIC EQUATION 322 4)(9 zyxyx
Dr.N.Thiruniraiselvi1, Dr.M.A.Gopalan2 1Assistant Professor, Department of Mathematics, Nehru Memorial College, Affiliated to Bharathidasan University, Trichy-621 007, Tamil Nadu, India.
2Professor, Department of Mathematics, Shrimati Indira Gandhi College,
Affiliated to Bharathidasan University, Trichy-620 002, Tamil Nadu, India.
ABSTRACT This paper concerns with the problem of obtaining non-zero distinct integer solutions to non-homogeneous ternary cubic
Diophantine equation 322 4)(9 zyxyx . A few relations between the solutions are presented.
KEY WORDS: ternary cubic, non-homogeneous cubic, integer solutions
NOTATION
2
)2()1(1,
mnnt nm
INTRODUCTION The cubic Diophantine equations are rich in variety and offer an unlimited field for
research [1,2]. In particular, refer [3-16] for a few problems on cubic equation with 3 unknowns. This paper concerns with an interesting non-homogeneous cubic Diophantine equation with three
unknowns given by 322 4)(9 zyxyx for determining its infinitely many non-zero
distinct integral solutions. A few relations between the solutions are presented.
METHOD OF ANALYSIS Consider the non-homogeneous cubic Diophantine equation
322 4)(9 zyxyx (1) Different ways of solving (1) are presented below:
WAY: 1 The substitution of the linear transformations
uzvkuyvkux ,, (2) in (1) leads to

ISSN (Online): 2455-3662
EPRA International Journal of Multidisciplinary Research (IJMR) - Peer Reviewed Journal Volume: 7| Issue: 9| September 2021|| Journal DOI: 10.36713/epra2013 || SJIF Impact Factor 2021: 8.047 || ISI Value: 1.188
2021 EPRA IJMR | www.eprajournals.com | Journal DOI URL: https://doi.org/10.36713/epra2013 16
1182 vu (3) whose smallest positive integer solution is
20,19 00 vu
Assume that hvvuhu 0101 , (4)
be the second solution to(3).Substituting (4) in (3) and simplifying , note that 182 0 uh
In view of (4), one obtains 182,18 00101 vuvuu
Repeating the above process again and again, the general solution ),( nn vu
to (3) is given by 2
000 182,18 nvnuvnuu nn
In view of (2), the corresponding integer solutions to (1) are given by
nuz
nknvunky
nknvunkx
n
n
n
18
),(18)2(
),(18)2(
0
00
00
Properties:
(i) 4076 nyx nn is a perfect square
(ii) )40(mod072 ,3 nnn tyx
(iii) )111(mod7172 ,74 nnn tyx
(iii) )4(mod078272 ,3 nnnn ztyx
WAY: 2
Considering
uzvkuyvkux ,, 22 (5) in (1) ,it reduces to the Pellian equation
118 22 vu
whose general solution ),( nn vu is given by
,...2,1,0,182
,2
ng
vf
u nn
nn
where
,)18417()18417(
,)18417()18417(11
11
nnn
nnn
g
f
In view of (5), the corresponding integer solutions to (1) are given by

ISSN (Online): 2455-3662
EPRA International Journal of Multidisciplinary Research (IJMR) - Peer Reviewed Journal Volume: 7| Issue: 9| September 2021|| Journal DOI: 10.36713/epra2013 || SJIF Impact Factor 2021: 8.047 || ISI Value: 1.188
2021 EPRA IJMR | www.eprajournals.com | Journal DOI URL: https://doi.org/10.36713/epra2013 17
nn
nnn
nnn
fz
gfk
y
gfk
x
2
172
1
2
12
1
2
2
2
Properties:
1. 1)(92 nnn yxz
2. kyxkyx nnnn 2)(36)( 1212
3. 222 4)(36)( kkyxyx nnnn
4. Each of the following expressions is a perfect square:
)2(,4)(36 1212 kyxkyx nnnn
))(3( 23232
nnnn yxyxk is a cubical integer )2)2(4( 12123434
3 kkyxyxk nnnn is a bi-quadratic integer
Way :3
Introduction of the transformations
uzvkuyvkux ,, 2222 in (1) leads to
118 2 vu Thus, the corresponding integer solutions to (1) are obtained as
118
,)118(
,)118(
2
222
222
kz
kkky
kkkx
Properties: (i) 1)(9 yxz (ii) Each of the following expressions is a nasty number:
)24(3,)1(3,)(3 kkzyxkzyx CONCLUSION In this paper, we have presented different sets of non-zero distinct integer solutions to the ternary cubic equation 322 4)(9 zyxyx . As the cubic Diophantine equations are rich in variety, one may search for the other choices of equations along with their solutions and relations among the solutions.

ISSN (Online): 2455-3662
EPRA International Journal of Multidisciplinary Research (IJMR) - Peer Reviewed Journal Volume: 7| Issue: 9| September 2021|| Journal DOI: 10.36713/epra2013 || SJIF Impact Factor 2021: 8.047 || ISI Value: 1.188
2021 EPRA IJMR | www.eprajournals.com | Journal DOI URL: https://doi.org/10.36713/epra2013 18
REFERENCES 1. L.E. Dickson, History of Theory of Numbers, Vol.2, Chelsea Publishing company, NewYork, 1952. 2. L.J. Mordell, Diophantine equations, Academic press, New York, 1969.
3. M.A. Gopalan, G. Sangeetha, “On the ternary cubic Diophantine equation 322 zDxy ” , Archimedes J.Math
1(1), 2011, 7-14. 4. M.A. Gopalan, B. Sivakami, “Integral solutions of the ternary cubic equation
3222 w51ky6xy4x4 ”,Impact J.Sci.Tech, Vol.6, No.1, 2012, 15-22.
5. M.A. Gopalan, B. Sivakami, “On the ternary cubic Diophantine equation zxyxz2 2 ” , Bessel J.Math 2(3),
2012, 171-177. 6. S. Vidyalakshmi, T.R. Usharani, M.A. Gopalan, “Integral solutions of non-homogeneous ternary cubic equation
322 zbabyax ”, Diophantus J.Math 2(1), 2013, 31-38.
7. M.A. Gopalan, K. Geetha, “On the ternary cubic Diophantine equation 322 zxyyx ”, Bessel J.Math.,
3(2), 2013,119-123.
8. M.A. Gopalan, S. Vidhyalakshmi, A.Kavitha “Observations on the ternary cubic equation 322 z12xyyx
”, Antartica J.Math 10(5), 2013, 453-460. 9. M.A. Gopalan, S. Vidhyalakshmi, K. Lakshmi, “Lattice points on the non-homogeneous cubic equation
0zyxzyx 333 ”, Impact J.Sci.Tech, Vol.7, No.1, 2013, 21-25.
10. M.A. Gopalan, S. Vidhyalakshmi, K. Lakshmi “Lattice points on the non-homogeneous cubic equation
0zyxzyx 333 ”, Impact J.Sci.Tech, Vol.7, No1, 2013, 51-55,
11. M.A. Gopalan, S. Vidhyalakshmi, S. Mallika, “On the ternary non-homogenous cubic equation
3233 z2k32yx3yx ”, Impact J.Sci.Tech, Vol.7, No.1, 2013, 41-45.
12. S. Vidhyalakshmi, M.A. Gopalan, S. Aarthy Thangam, “On the ternary cubic Diophantine equation
322 z146)y2y(5)xx(4 ” International Journal of Innovative Research and Review (JIRR), Vol
2(3)., pp 34-39, July-Sep 2014
13. M.A. Gopalan, N. Thiruniraiselvi and V. Kiruthika, “On the ternary cubic diophantine equation322 z3y4x7
”, IJRSR, Vol.6, Issue-9, Sep-2015, 6197-6199. 14. M.A. Gopalan, S. Vidhyalakshmi, J. Shanthi, J. Maheswari, “On ternary cubic diophantine equation
322 z121yxxy5yx3 ”, International Journal of Applied Research, 1(8), 2015, 209-212.
15. R. Anbuselvi, K. Kannaki, “On ternary cubic diophantine equation 322 z151yxxy5yx3 ”,
IJSR, Vol.5, Issue-9, Sep 2016, 369-375. 16. G. Janaki, C. Saranya, “Integral solutions of the ternary cubic equation
322 z9721yx2xy4yx3 ”, IRJET, Vol.04, Issue 3, March 2017, 665-669.
ISSN (Online): 2455-3662
EPRA International Journal of Multidisciplinary Research (IJMR) - Peer Reviewed Journal Volume: 7| Issue: 9| September 2021|| Journal DOI: 10.36713/epra2013 || SJIF Impact Factor 2021: 8.047 || ISI Value: 1.188
2021 EPRA IJMR | www.eprajournals.com | Journal DOI URL: https://doi.org/10.36713/epra2013 19
ANALYSIS OF ATMOSPHERIC PRESSURE AND TEMPERATURE EFFECTS ON COSMIC RAY
MEASUREMENTS
R.Soundar Asst.Prof of Physics, GFGC KGF.
ABSTRACT
The analysis of atmospheric pressure and temperature effects on the records of the cosmic ray detector CARPET. This detector has monitored secondary cosmic ray intensity since 2006 at Complejo Astronomico El Leoncito (San Juan, Argentina, 31S, 69W, 2550m over sea level) where the geomagnetic rigidity cutoff, Rc, is ~9.8 GV. From the correlation between atmospheric pressure deviations and relative cosmic ray variations, we obtain a barometric coefficient of –0.44_0.01 %/hPa. Once the data are corrected for atmospheric pressure, they are used to analyze temperature effects using four methods. Three methods are based on the surface temperature and the temperature at the altitude of maximum production of secondary cosmic rays. The fourth method, the integral method, takes into account the temperature height profile between 14 and 111 km above Complejo Astronomico El Leoncito. The results obtained from these four methods are compared on different time scales from seasonal time variations to scales related to the solar activity cycle.
INTRODUCTION Investigations of the physical nature of the
cosmic ray variations in different time scales are an important subject in cosmic ray physics and astrophysics. More specifically, the modulation of cosmic rays is an important tool to describe disturbed conditions in the heliosphere. Longer time scales are related to the solar activity cycle, while faster variations of the order of minutes to hours and days, can be associated with solar transient events, geomagnetic disturbances, and Earth’s atmospheric phenomena. When analyzing variations in cosmic ray intensity using ground-based detectors, atmospheric effects on the flux of secondary particles cannot be ignored. The pressure and temperature effects produce significant background variations. Thus, it is important to remove these effects from ground-based data, before studying its relation with any extraterrestrial phenomena. The pressure effect on secondary cosmic ray variations has been known for a long time. Myssowsky and Tuwim [1926] and Steinke [1929] are among the first who have studied the relation between cosmic ray time variations and atmospheric pressure changes.
THE BAROMETRIC EFFECT The barometric effect is experimentally determined by equation is (ΔI/I) p =β. Δp (1) where (ΔI/I)P is the normalized deviation of the cosmic ray intensity related with the pressure effect, ΔP is the atmospheric pressure deviation and β is the barometric coefficient, which depends on many factors, such as the nature of the secondary component and the altitude where the observation is performed [Dorman, 2004]. Atmospheric temperature change is an additional cause for the seasonal/ annual variations of cosmic ray intensities detected by ground-based instruments. The seasonal modulation has its maximum and minimum in winter and summer, respectively. Generally, the temperature effect is described in two different ways, called negative and positive temperature effects. The negative effect corresponds to the decrease of muon intensity at ground level, since more muons decay during the heating and the expansion of the atmosphere from winter to summer due to the increase of their propagation path . The positive effect is related to the temperature influence on muon production from the decay of charged pions
ISSN (Online): 2455-3662
EPRA International Journal of Multidisciplinary Research (IJMR) - Peer Reviewed Journal Volume: 7| Issue: 9| September 2021|| Journal DOI: 10.36713/epra2013 || SJIF Impact Factor 2021: 8.047 || ISI Value: 1.188
2021 EPRA IJMR | www.eprajournals.com | Journal DOI URL: https://doi.org/10.36713/epra2013 20
Figure 1. The CARPET Cosmic Ray Detector. In general, experimental studies of the temperature effect on secondary cosmic ray intensity consider one or more terms on the right-hand side of the following equation (ΔI/I)T =KG ΔT (hG ) +CHΔT(hM) +KM ΔT(hM) 2 where (ΔI/I)T is the normalized deviation of the cosmic ray intensity related with the temperature effect, ΔT(hG) is the ground temperature deviation, ΔH(hM) and ΔT(hM) are respectively the height deviation and the temperature deviation at the altitude of maximum production of secondary particles. Wang and Lee [1967] is an example of a study that uses the two last terms of the equation (1). Duperier [1949], Trefall [1957], Hayakawa et al. [1955], French and Chasson [1959] and Mathews [1959] are examples of studies that use the second and/or the third term of the equation (2). Studies using the first term were more common before 1950, e.g., Hess [1940]. [6] There is also an approach to describe the temperature effect, which is called the integral method [Maeda and Wada, 1954; Dorman, 1972; Sagisaka, 1986]. Differently from the methods shown above, the integral method takes into account the temperature along the whole vertical atmospheric path rather than at a single altitude range. Thus, the temperature effect is given by the following relation: (ΔI/I)P = ∫
(x) ΔT(X) dx 3
where (ΔI/I)T is the normalized deviation of the cosmic ray intensity related with the temperature effect at the atmospheric pressure p, ΔT(x) is the temperature deviation for this atmospheric pressure x, a(x) is the
temperature coefficient at this same atmospheric pressure. In this paper, we compare cosmic ray time variations observed by CARPET detector with atmospheric pressure and temperature changes. First we calculate the barometric coefficient and we obtain the pressure corrected CARPET cosmic ray data. Then, in order to analyze and correct for the temperature effect, we propose and compare four different methods:
1. Considering the ground temperature variations, i.e., the first term in equation (2); 2. Considering the temperature variations at the altitude of maximum secondary cosmic ray production, i.e., the third term in equation (2); 3. Considering both the first and the third terms in equation (2); and 4. Considering an approximation of the integral method. For the last method, differently to what has been done before, we have used experimental data to calculate both a(x) and ΔT(x). We mention that this method assumes that each atmospheric layer behaves independently from one of the others in response to temperature variations. This may not be totally correct, and therefore indicates the limitations of our integral method. INSTRUMENTATION
This study is based on the cosmic ray intensity data provided by the CARPET detector shown in Figure 1, and temperature records measured at ground level and between 14 and
111 km of altitude. The CARPET detector was installed in April 2006 at CASLEO. The CARPET
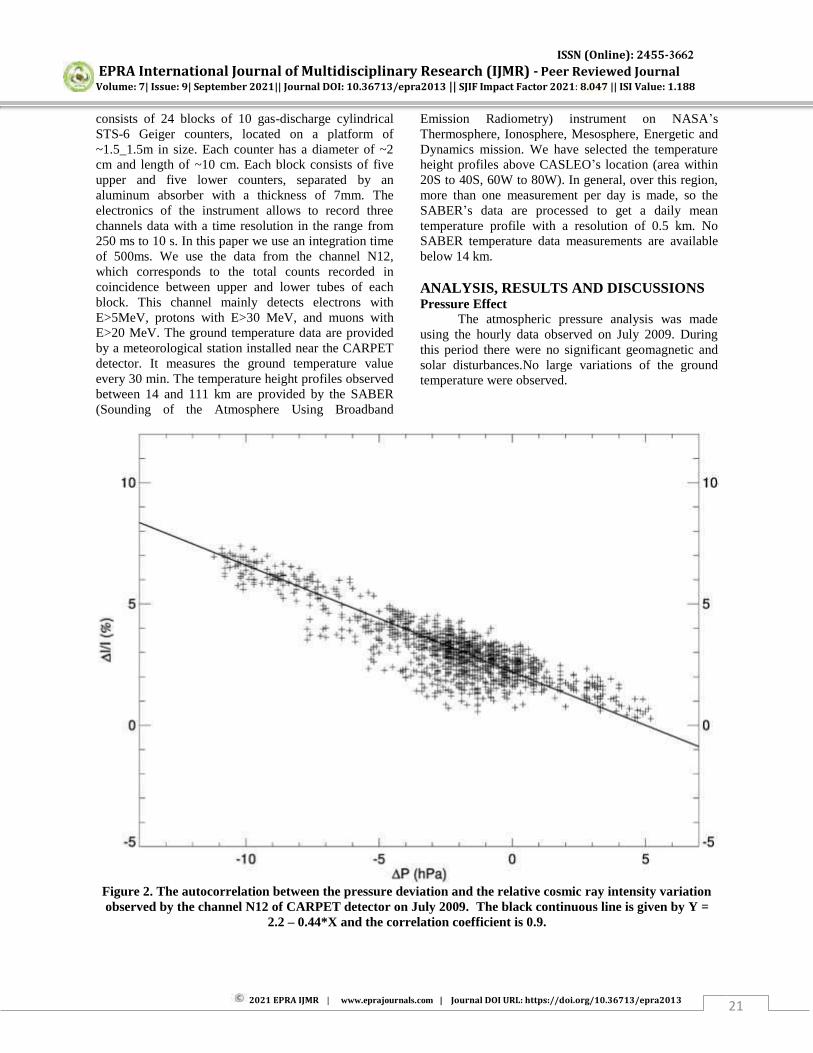
ISSN (Online): 2455-3662
EPRA International Journal of Multidisciplinary Research (IJMR) - Peer Reviewed Journal Volume: 7| Issue: 9| September 2021|| Journal DOI: 10.36713/epra2013 || SJIF Impact Factor 2021: 8.047 || ISI Value: 1.188
2021 EPRA IJMR | www.eprajournals.com | Journal DOI URL: https://doi.org/10.36713/epra2013 21
consists of 24 blocks of 10 gas-discharge cylindrical STS-6 Geiger counters, located on a platform of ~1.5_1.5m in size. Each counter has a diameter of ~2 cm and length of ~10 cm. Each block consists of five upper and five lower counters, separated by an aluminum absorber with a thickness of 7mm. The electronics of the instrument allows to record three channels data with a time resolution in the range from 250 ms to 10 s. In this paper we use an integration time of 500ms. We use the data from the channel N12, which corresponds to the total counts recorded in coincidence between upper and lower tubes of each block. This channel mainly detects electrons with E>5MeV, protons with E>30 MeV, and muons with E>20 MeV. The ground temperature data are provided by a meteorological station installed near the CARPET detector. It measures the ground temperature value every 30 min. The temperature height profiles observed between 14 and 111 km are provided by the SABER (Sounding of the Atmosphere Using Broadband
Emission Radiometry) instrument on NASA’s Thermosphere, Ionosphere, Mesosphere, Energetic and Dynamics mission. We have selected the temperature height profiles above CASLEO’s location (area within 20S to 40S, 60W to 80W). In general, over this region, more than one measurement per day is made, so the SABER’s data are processed to get a daily mean temperature profile with a resolution of 0.5 km. No SABER temperature data measurements are available below 14 km. ANALYSIS, RESULTS AND DISCUSSIONS Pressure Effect
The atmospheric pressure analysis was made using the hourly data observed on July 2009. During this period there were no significant geomagnetic and solar disturbances.No large variations of the ground temperature were observed.
Figure 2. The autocorrelation between the pressure deviation and the relative cosmic ray intensity variation observed by the channel N12 of CARPET detector on July 2009. The black continuous line is given by Y =
2.2 – 0.44*X and the correlation coefficient is 0.9.

ISSN (Online): 2455-3662
EPRA International Journal of Multidisciplinary Research (IJMR) - Peer Reviewed Journal Volume: 7| Issue: 9| September 2021|| Journal DOI: 10.36713/epra2013 || SJIF Impact Factor 2021: 8.047 || ISI Value: 1.188
2021 EPRA IJMR | www.eprajournals.com | Journal DOI URL: https://doi.org/10.36713/epra2013 22
Finally, during this period we have also verified
that there was no atmospheric electric field variations or rain occurrence. We have analyzed the atmospheric pressure deviation (ΔP) and the corresponding relative deviation of the cosmic ray intensity (ΔI/I) observed by the channel N12. Figure 2 shows the correlation found between ΔI/I and ΔP. Using a least-squares fitting method, we found the barometric coefficient b ~ –0.44 to 0.01 %/hPa and a correlation coefficient ~0.9. Figure 3 shows an example of the pressure correction by comparing uncorrected (top panel), and corrected (bottom panel) cosmic ray records, with pressure time variations (middle panel). An increase of the uncorrected cosmic ray intensity occurred between 20 and 24 March 2010, which was clearly related with a decrease of the atmospheric pressure during the same period. This variation practically disappears in the pressure corrected data. It is believed that the small amplitude of the diurnal variation that occurs in this period is associated with interplanetary phenomena.
Temperature Effect
The database used for the temperature analysis is composed by the cosmic ray intensities corrected for pressure effects, (ΔI/I)PC , and temperature height profiles measured between April 2006 and August 2010. The temperature data were processed to get ΔT(h), which corresponds to the temperature deviation at a given altitude h. In the first method, as illustrated in Figure 4A, a clear anti correlation can be observed between (ΔI/I) PC and ΔT (hG), where hG = 2550m is the altitude of CASLEO. The ground temperature coefficient (KG) obtained from the anti correlation shown in Figure 4B, is: –0.40 to 0.02 %/C and the correlation coefficient is 0.81. Figure 5A illustrates the second method and compares (ΔI/I)PC with the temperature deviations at the altitude of the maximum production of secondary cosmic rays ΔT
Figure 3. (top) The uncorrected cosmic ray data, (middle) the atmospheric pressure, and (bottom) the
pressure corrected cosmic ray data observed between 1 March 2010 and 1 April 2010. All data are presented in hourly mean values
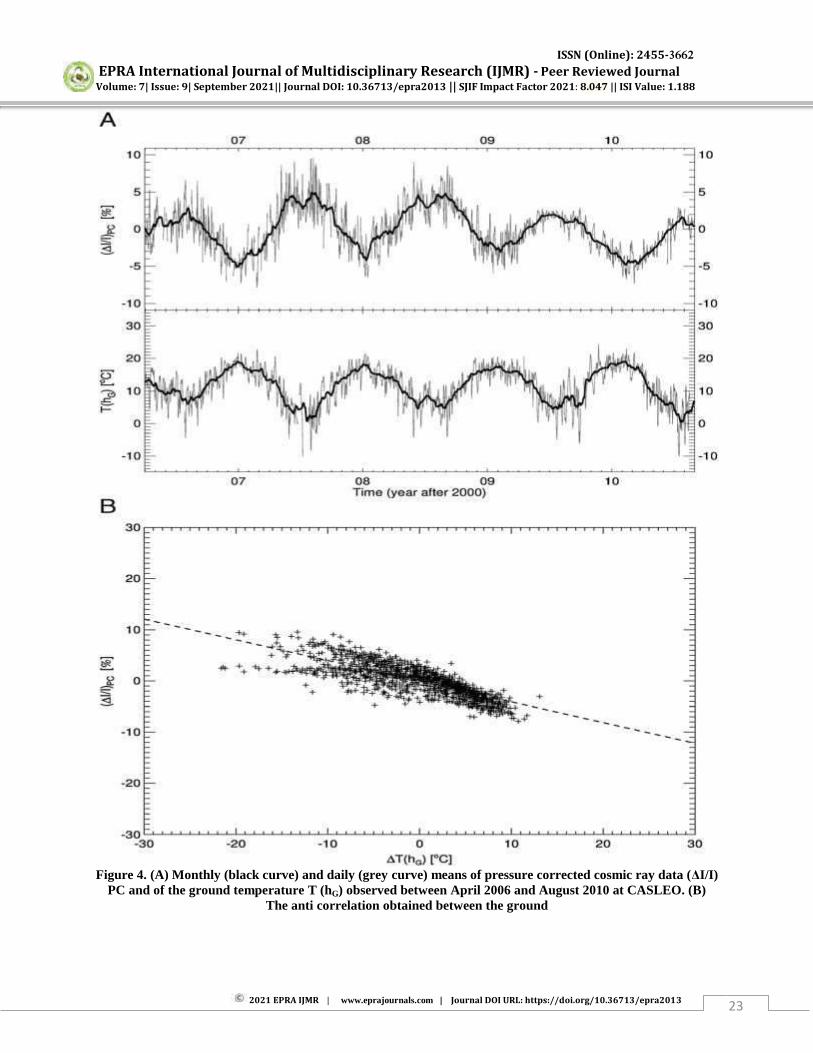
ISSN (Online): 2455-3662
EPRA International Journal of Multidisciplinary Research (IJMR) - Peer Reviewed Journal Volume: 7| Issue: 9| September 2021|| Journal DOI: 10.36713/epra2013 || SJIF Impact Factor 2021: 8.047 || ISI Value: 1.188
2021 EPRA IJMR | www.eprajournals.com | Journal DOI URL: https://doi.org/10.36713/epra2013 23
Figure 4. (A) Monthly (black curve) and daily (grey curve) means of pressure corrected cosmic ray data (ΔI/I)
PC and of the ground temperature T (hG) observed between April 2006 and August 2010 at CASLEO. (B) The anti correlation obtained between the ground
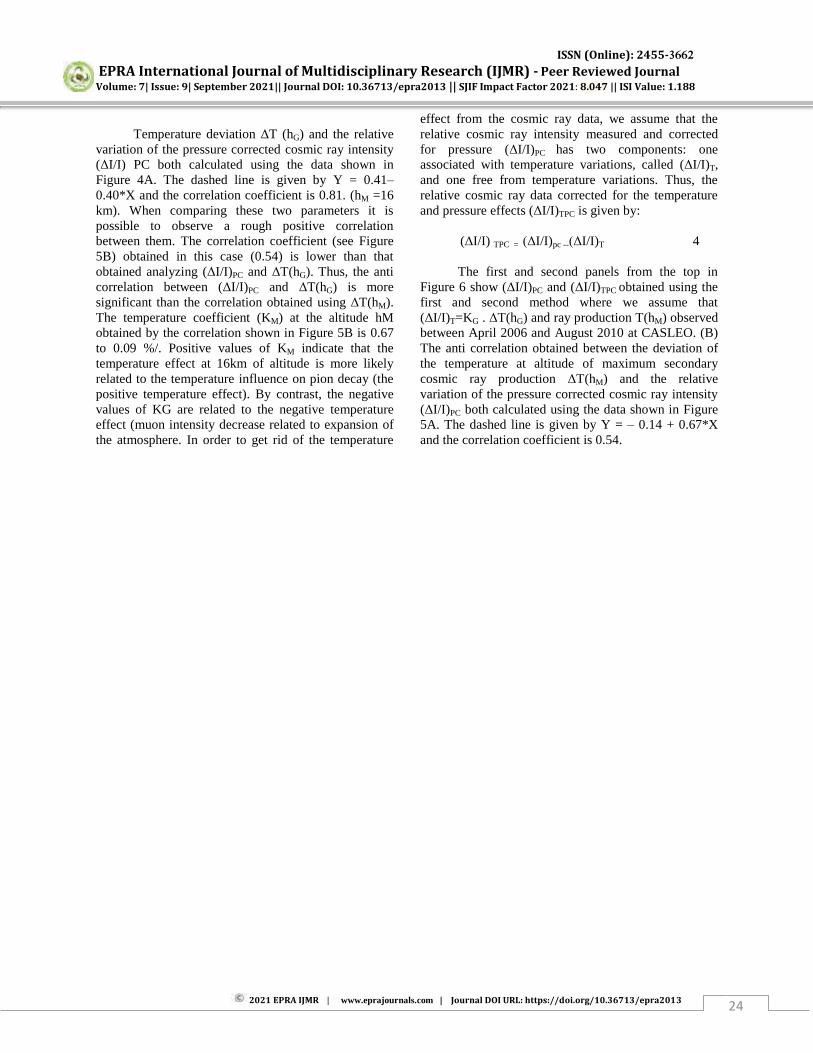
ISSN (Online): 2455-3662
EPRA International Journal of Multidisciplinary Research (IJMR) - Peer Reviewed Journal Volume: 7| Issue: 9| September 2021|| Journal DOI: 10.36713/epra2013 || SJIF Impact Factor 2021: 8.047 || ISI Value: 1.188
2021 EPRA IJMR | www.eprajournals.com | Journal DOI URL: https://doi.org/10.36713/epra2013 24
Temperature deviation ΔT (hG) and the relative
variation of the pressure corrected cosmic ray intensity (ΔI/I) PC both calculated using the data shown in Figure 4A. The dashed line is given by Y = 0.41– 0.40*X and the correlation coefficient is 0.81. (hM =16 km). When comparing these two parameters it is possible to observe a rough positive correlation between them. The correlation coefficient (see Figure 5B) obtained in this case (0.54) is lower than that obtained analyzing (ΔI/I)PC and ΔT(hG). Thus, the anti correlation between (ΔI/I)PC and ΔT(hG) is more significant than the correlation obtained using ΔT(hM). The temperature coefficient (KM) at the altitude hM obtained by the correlation shown in Figure 5B is 0.67 to 0.09 %/. Positive values of KM indicate that the temperature effect at 16km of altitude is more likely related to the temperature influence on pion decay (the positive temperature effect). By contrast, the negative values of KG are related to the negative temperature effect (muon intensity decrease related to expansion of the atmosphere. In order to get rid of the temperature
effect from the cosmic ray data, we assume that the relative cosmic ray intensity measured and corrected for pressure (ΔI/I)PC has two components: one associated with temperature variations, called (ΔI/I)T, and one free from temperature variations. Thus, the relative cosmic ray data corrected for the temperature and pressure effects (ΔI/I)TPC is given by:
(ΔI/I) TPC = (ΔI/I)pc --(ΔI/I)T 4
The first and second panels from the top in Figure 6 show (ΔI/I)PC and (ΔI/I)TPC obtained using the first and second method where we assume that (ΔI/I)T=KG . ΔT(hG) and ray production T(hM) observed between April 2006 and August 2010 at CASLEO. (B) The anti correlation obtained between the deviation of the temperature at altitude of maximum secondary cosmic ray production ΔT(hM) and the relative variation of the pressure corrected cosmic ray intensity (ΔI/I)PC both calculated using the data shown in Figure 5A. The dashed line is given by Y = – 0.14 + 0.67*X and the correlation coefficient is 0.54.
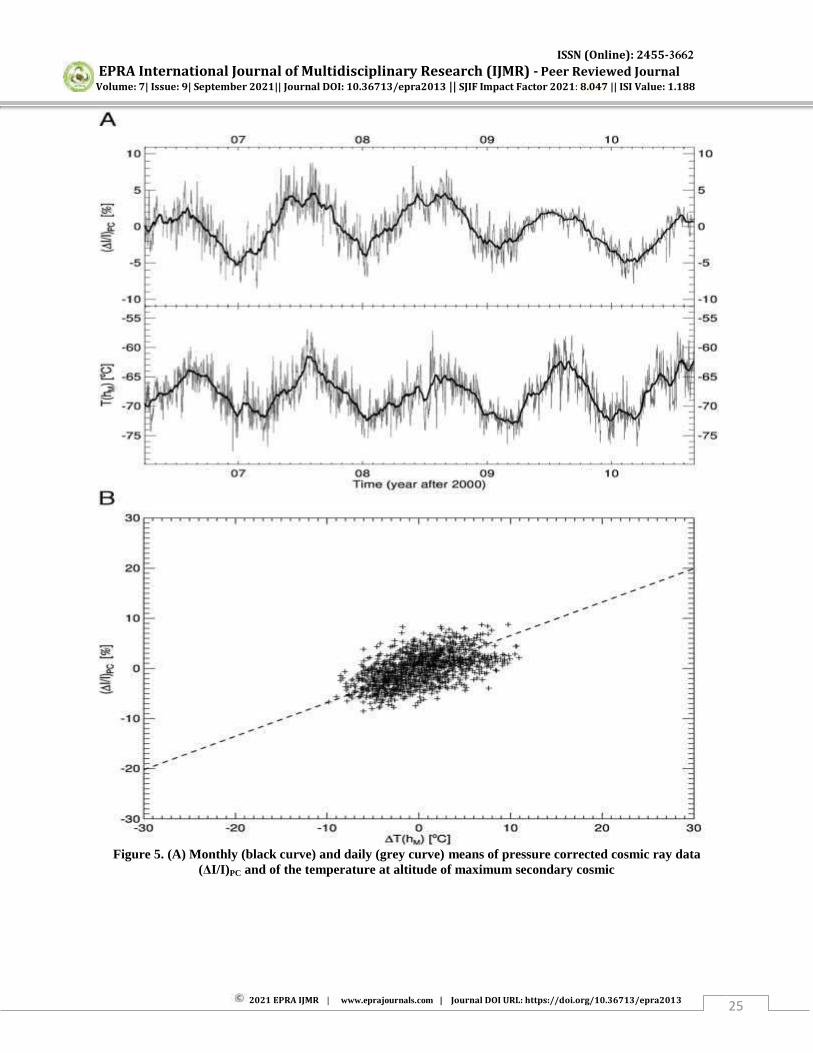
ISSN (Online): 2455-3662
EPRA International Journal of Multidisciplinary Research (IJMR) - Peer Reviewed Journal Volume: 7| Issue: 9| September 2021|| Journal DOI: 10.36713/epra2013 || SJIF Impact Factor 2021: 8.047 || ISI Value: 1.188
2021 EPRA IJMR | www.eprajournals.com | Journal DOI URL: https://doi.org/10.36713/epra2013 25
Figure 5. (A) Monthly (black curve) and daily (grey curve) means of pressure corrected cosmic ray data
(ΔI/I)PC and of the temperature at altitude of maximum secondary cosmic
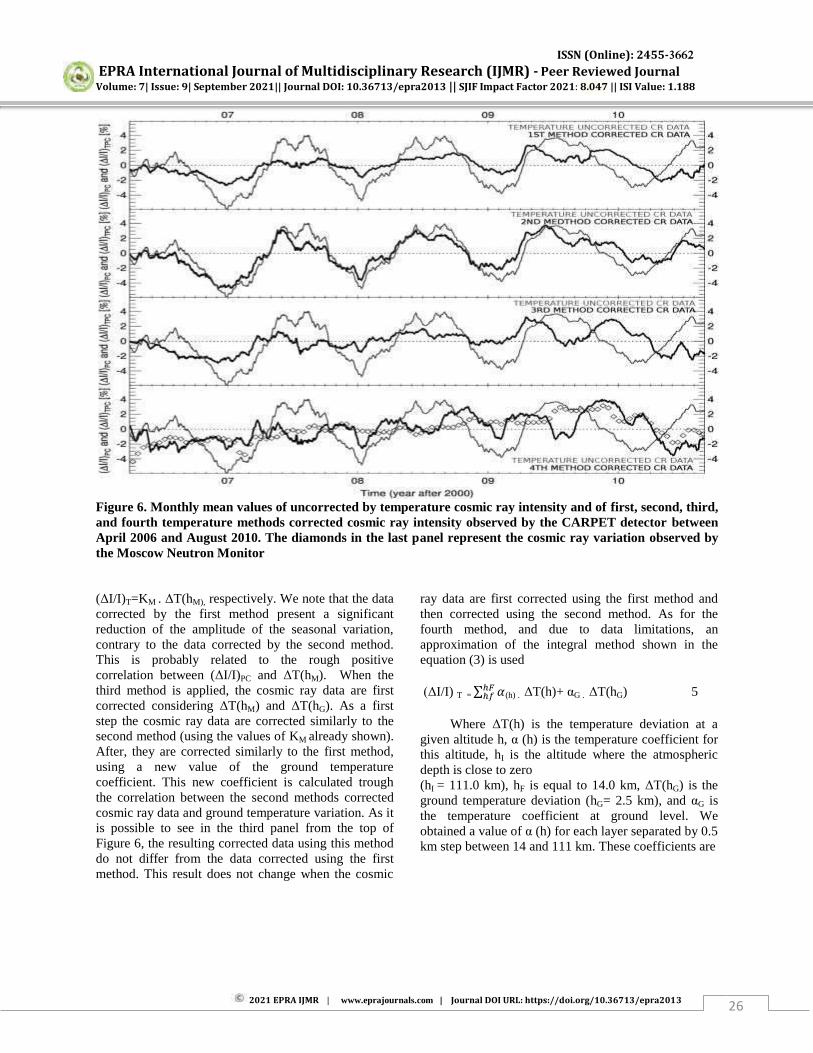
ISSN (Online): 2455-3662
EPRA International Journal of Multidisciplinary Research (IJMR) - Peer Reviewed Journal Volume: 7| Issue: 9| September 2021|| Journal DOI: 10.36713/epra2013 || SJIF Impact Factor 2021: 8.047 || ISI Value: 1.188
2021 EPRA IJMR | www.eprajournals.com | Journal DOI URL: https://doi.org/10.36713/epra2013 26
Figure 6. Monthly mean values of uncorrected by temperature cosmic ray intensity and of first, second, third, and fourth temperature methods corrected cosmic ray intensity observed by the CARPET detector between April 2006 and August 2010. The diamonds in the last panel represent the cosmic ray variation observed by the Moscow Neutron Monitor (ΔI/I)T=KM . ΔT(hM), respectively. We note that the data corrected by the first method present a significant reduction of the amplitude of the seasonal variation, contrary to the data corrected by the second method. This is probably related to the rough positive correlation between (ΔI/I)PC and ΔT(hM). When the third method is applied, the cosmic ray data are first corrected considering ΔT(hM) and ΔT(hG). As a first step the cosmic ray data are corrected similarly to the second method (using the values of KM already shown). After, they are corrected similarly to the first method, using a new value of the ground temperature coefficient. This new coefficient is calculated trough the correlation between the second methods corrected cosmic ray data and ground temperature variation. As it is possible to see in the third panel from the top of Figure 6, the resulting corrected data using this method do not differ from the data corrected using the first method. This result does not change when the cosmic
ray data are first corrected using the first method and then corrected using the second method. As for the fourth method, and due to data limitations, an approximation of the integral method shown in the equation (3) is used (ΔI/I) T = ∑
(h) . ΔT(h)+ αG . ΔT(hG) 5 Where ΔT(h) is the temperature deviation at a given altitude h, α (h) is the temperature coefficient for this altitude, hI is the altitude where the atmospheric depth is close to zero (hI = 111.0 km), hF is equal to 14.0 km, ΔT(hG) is the ground temperature deviation (hG= 2.5 km), and αG is the temperature coefficient at ground level. We obtained a value of α (h) for each layer separated by 0.5 km step between 14 and 111 km. These coefficients are

ISSN (Online): 2455-3662
EPRA International Journal of Multidisciplinary Research (IJMR) - Peer Reviewed Journal Volume: 7| Issue: 9| September 2021|| Journal DOI: 10.36713/epra2013 || SJIF Impact Factor 2021: 8.047 || ISI Value: 1.188
2021 EPRA IJMR | www.eprajournals.com | Journal DOI URL: https://doi.org/10.36713/epra2013 27
Figure 7. The continuous curve with crosses represents α (h) values obtained. The black dashed curve represents the smoothing of these values and the continuous grey curve represents the typical temperature
altitude profile observed by the SABER instrument.
Figure 8. The Moscow and Rome Neutron Monitors measurements (diamonds and plus symbols respectively).The CARPET temperature uncorrected cosmic ray data (dashed black curve) and the corrected data using: first method (grey curve with squares), second method (grey curve with triangles), and third method (grey curve with asterisks) observed between 2006 and 2010. The black curve with crosses shows the fourth method corrected cosmic ray data and the grey histograms and black dotted curve shows the monthly mean and 13 months smoothed Brussels Sunspot Number. The bar in the left upper corner indicates the upper limit of the RMS estimated on daily mean data. Calculated as follows:
ISSN (Online): 2455-3662
EPRA International Journal of Multidisciplinary Research (IJMR) - Peer Reviewed Journal Volume: 7| Issue: 9| September 2021|| Journal DOI: 10.36713/epra2013 || SJIF Impact Factor 2021: 8.047 || ISI Value: 1.188
2021 EPRA IJMR | www.eprajournals.com | Journal DOI URL: https://doi.org/10.36713/epra2013 28
α (111 km) is first computed by comparing (ΔI/I)PC and ΔT(111 km) measured between April 2006 and August 2010, and used to correct our cosmic ray data. These corrected data are then used to estimate a (110.5 km). This procedure is repeated in an iterative way to get α (14.0 km). Finally, αG is calculated comparing the final corrected cosmic ray data and ΔT(hG). The results are shown in Figure 7 where we compare α (h) and temperature as a function of height. Note that near the altitude hM the values of α (h) are positive, in agreement with the analysis made using the second method. Moreover, on the ground altitude α (hG) =–
0.09_0.02 %/C is negative, which is in agreement with the analysis made using the first method. However, the values of α (hM) and α (hG) are smaller than the values of KM and KG. [21] In order to verify our correction of cosmic ray flux for temperature variations, we have applied the same method to the period between July 2009 and December 2010 during which atmospheric pressure remains almost constant at CASLEO (P mean = 744 to 3 hPa). As a result we have found the same correction coefficients to within 9%, confirming the relevance of the method. Finally, a preliminary comparison between the temperature coefficients obtained in this paper and the ones obtained considering the atmospheric layers not independent suggests that they are in good agreement [Yanke et al., 2011]. The comparison of the results obtained by the different methods and with the uncorrected data is shown in Figure 6. On longer time scales related to the solar activity cycle, we note also significant differences between the uncorrected and the corrected data. This is illustrated in Figure 8, where cosmic ray data are compared with the S.I.D.C. Brussels International Sunspot Number. Between November 2007 and April 2010, the uncorrected data present a very flat intensity maximum, while the corrected data tend to present a more defined peak. The data corrected using the integral method present the best defined peak, which occurs close to the period when the sunspot number presents its lower values. This peak-shaped cosmic ray maximum during the last solar minimum is expected due to the well known 22 year cosmic ray cycle [Webber and Lockwood, 1988]. We also note a decrease of the cosmic ray intensity after April 2010 associated with an increasing solar activity during the same period. CONCLUSIONS
In this work we have analyzed and corrected the cosmic ray data from CARPET detector for atmospheric pressure effect. We also use four different methods to describe and correct for the temperature effect. We analyzed the cosmic ray and atmospheric pressure data measured on July 2009, when significant
variations of the atmospheric pressure were observed without significant influences from solar and geophysical phenomena. From this analysis, we obtain a barometric coefficient equal to –0.44 to 0.01 %/hPa. In the analysis of the temperature effect, we found an anti correlation between the relative variations of the cosmic ray intensity and the surface temperatures. Moreover, a correlation was found between relative variations of the cosmic ray data and the temperature at the altitude of maximum production of secondary particles. The cosmic ray data corrected by the first method presented a large reduction of the seasonal variation, while the data corrected by the temperature at the altitude hM presented a small reduction. The results obtained using the third method do not differ from those obtained using the first method. Data corrected using the fourth method removed most of the seasonal variations. Moreover, the cosmic ray intensities corrected by the fourth method have shown peak-shaped maximum values in August to September 2009 well associated with the 23rd solar activity minimum. Thus, the fourth correction method, or integral method, is believed to be the most suitable among the others due to the best removal temperature effects superimposed on the seasonal variation and the good anti correlation with the solar activity cycle between 2006 and 2012. REFERENCES
1. Adamson, P., et al. (2010), Observation of muon intensity variations by season with the MINOS far detector. Phys. Rev., D(81), 012001, doi:10.1103/PhysRevD.81.012001.
2. Ambrosio, M., et al. (1997), Seasonal variations in the underground muon intensity as seen by MACRO, Astroparticle Phys., 7(1–2), 109–124, doi:10.1016/S0927-6505(97)00011-X.
3. Berkova, M. D., A. V. Belov, E. A. Eroshenko, D. Smirnov, and V. G. Yanke (2008), Temperature effect of muon component and practical questions of its account, in Proc. 21st European Cosmic Ray Symposium, edited by P. Kiraly et al., pp. 123–126, Institute of Experimental Physics, Slovak Academy of Sciences, Kosice, Slovakia.
4. Berkova, M. D., A. V. Belov, E. A. Eroshenko, and V. G. Yanke (2011), Temperature effect of the muon component and practical questions for considering it in real time, Bull. Russ. Acad. Sci. Phys., 75(6), 820–824, doi:10.3103/S1062873811060086.
5. Blackett, P. M. S. (1938) On the instability of the barytron and the temperature effect of cosmic rays, Phys. Rev., 54(11), 973–974, doi:10.1103/PhysRev.54.973.
6. De Mendonça, R. R. S., J.-P. Raulin, F. C. P. Bertoni, E. Echer, V. S. Makhmutov, and G. Fernandez (2011), Long-term and transient time variation of cosmic ray fluxes detected in Argentina by CARPET cosmic ray detector, J. Atmos. Sol.-
ISSN (Online): 2455-3662
EPRA International Journal of Multidisciplinary Research (IJMR) - Peer Reviewed Journal Volume: 7| Issue: 9| September 2021|| Journal DOI: 10.36713/epra2013 || SJIF Impact Factor 2021: 8.047 || ISI Value: 1.188
2021 EPRA IJMR | www.eprajournals.com | Journal DOI URL: https://doi.org/10.36713/epra2013 29
Terr. Phys., 73, 1410–1416, doi:10.1016/j.jastp.2010.09.034.
7. Dorman, L. I. (1972), The Meteorological Effects of Cosmic Rays, Nauka Press, Moscow, Russia.
1. 8 .Dorman, L. I. (2004), Cosmic Rays in the Earth’s Atmosphere and Underground, Kluwer, Dordrecht, Netherlands.
8. Duperier, A. (1949), The meson intensity at the surface of the earth and the temperature at the production level, Proc. Phys. Soc. A, 62(11), 684–696, doi:10.1088/0370-1298/62/11/302.
9. French, W. R., and R. L. Chasson (1959), Atmospheric effects on the hard component of cosmic radiation near sea level, J. Atmos. Terr. Phys., 14(1–2), 1–18, doi:10.1016/0021-9169(59)90051-0.
10. Hayakawa, S., K. Ito, and Y. Terashima (1955), Positive temperature effect of cosmic rays, Prog. Theor. Phys., 14(6), 497–510, doi:10.1143/ PTP.14.497.
11. Hess, V. F. (1940), On the seasonal and the atmospheric temperature effect in cosmic radiation, Phys. Rev., 57(9), 781–785, doi:10.1103/PhysRev.57.781.
12. Maeda, K., and M. Wada (1954), Atmospheric temperature effect upon cosmic ray intensity at sea level, J. Sci. Res. Ins. (Tokyo), 48, 71–79.
13. Mathews, P. M. (1959), Atmospheric effects on cosmic ray intensity at sea level, Can. J. Phys., 37(2), 85–101, doi:10.1139/p59-015.
14. Myssowsky, L., and L. Tuwim (1926), Unregelmassige Intensitätsschwankungen der Hohenstrahlung in geringer Seehohe, Zeitschrift fur Physik A Hadrons and Nuclei, 39(2–3), 146–150, doi:10.1007/BF01394307.
15. Sagisaka, S. (1986), Atmospheric effects on cosmic-ray muon intensities at deep underground depths, Il Nuovo Cimento C, 9(4), doi:10.1007/ BF02558081.
16. Steinke, E. (1929),Wasserversenkmessungen der durchdringenden Hessschen Strahlung, Zeitschrift fur Physik A Hadrons and Nuclei, 58(3–4), 183–193, doi:10.1007/BF01339040.
17. Trefall, H. (1957), On the positive temperature effect in the cosmic radiation and the p - m decay, Physica, 23(1-5), 65–72, doi:10.1016/S0031-8914 (57)90472-X.
18. Yanke, V. G., A. Asipenka, M. Berkova, R. R. S. de Mendonca, J.-P. Raulin, F. C. P. Bertoni, E. Echer, G. Fernández, andV.Makhmutov (2011), Temperature effect of general component seen by cosmic ray detectors, in Proceedings of 32nd International Cosmic Ray Conference, 11, 377–380.
19. Yanchukovsky, V. L., G. Ya. Filimonov, and R. Z. Hisamov (2007), Atmospheric variations in muon intensity for different zenith angles, Bull. Russ. Acad. Sci. Phys., 71(7), 1038–1040, doi:10.3103/S106287380707043X
20. Wang, C. P., and A. H. Lee (1967), Cosmic-ray muons and atmospheric coefficients near to
geomagnetic equator, J. Geophys. Res., 72(23), 6107–6109, doi:10.1029/JZ072i023p06107.
21. Webber, W. R., and J. A. Lockwood (1988), Characteristics of the 22-year modulation of cosmic rays as seen by neutron monitors, J. Geophys. Res., 93(A8), 8735–8740, doi:10.1029/JA093iA08p08735.
ISSN (Online): 2455-3662
EPRA International Journal of Multidisciplinary Research (IJMR) - Peer Reviewed Journal Volume: 7| Issue: 9| September 2021|| Journal DOI: 10.36713/epra2013 || SJIF Impact Factor 2021: 8.047 || ISI Value: 1.188
2021 EPRA IJMR | www.eprajournals.com | Journal DOI URL: https://doi.org/10.36713/epra2013 30
LEO LAGNA CONTRIBUTION IN SIVACHARYA’S HOROSCOPE
P Valsala1, Sri Prathyangira Swamy2
1Research Scholar, Dept. of Astrology, Vels Int. of Science, Technology & Advanced Studies, Chennai, India
2Director & HoD, Dept. of Astrology, Vels Int. of Science, Technology & Advanced Studies, Chennai,
India
ABSTRACT Astrology and spirituality are closely related. There is no doubt that astrology helps us a great deal in protecting ourselves from the evils that befall us and in bringing us to the Lord. Lagna, Zodiac, Star, Yoga are predicted when one is born with the movements of the planets. Indian astrology is calculated based on the rotation of the moon. Indian astrology predicts 27 star clusters in our sky with the Moon passing by. The profession he does is predicted by putting the 10th house in one's favor. Predicting the 2nd house of Tanasthana, the 11th sin of profit and the strength of the 10th, 2nd, 11th sinners, it is said that the fortune-telling business is progressing and getting rich. KEYWORDS - Sivacharya, Ragu, Ketu
I. INTRODUCTION Everyone who is born a human being is in a
situation where he or she has to earn a living by pursuing a career to meet their needs. They are making various efforts on a daily basis to make themselves better and more knowledgeable in the industry. He thinks that he can achieve a good position in the society in which he lives by developing his economic status, influence and respect.The horoscope's horoscopes determine the career of the target and the tenth lord of the profession. The purpose of this study is to show that the Sivacharyas should work in harmony with the target sin, the tenth sin and the ninth sin in order to carry out their work.
Gurus, also known as Sivacharyas, do a wonderful job of cultivating godliness in the minds of the priests by reciting the Vedic mantras they have learned to others. This is their deity.His advice and counsel can make a positive difference in the minds of the devotees who come to tell God their grievances and help them to forget their sorrows and worries and bring peace of mind and happiness. II. SIVACHARYAS - STUDY HYPOTHESIS
The aim of the study is to establish and confirm the guesswork rules for Sivacharyas work, and to confirm that the influence of the Sun, Guru and Ketu on the horoscopes of the Sivacharyas, who
are the ninth and tenth sins, and the planets for Sivacharyas to serve as Sivacharyas. This study is based on these.
The Planets Sun, Guru and Ketu in the horoscopes determine the position to perform the divine mission of Sivacharya. Although there are various works in the field of charities, the work of the Sivacharyas working in the temples is to be examined in this study.
The Sun gives the leadership position of Sivacharyar to do charity to the Lord and as the Guru is the intellectual, it gives yoga, knowledge and wisdom for the work of Sivacharya.
Scriptural education for Sivacharya's work imparts the knowledge of education, the virtue of Sivacharya's work after education, and the Guru's wisdom for Sivacharya's work. Similarly, the ninth sin of Bhakti, Dharma, also contributes to the practice of Sivacharya.
II. ASPECTS IN SIVACHARYA HOROSCOPES
1. Position of Sun, Jupiter and Ketu planets in Sivacharya horoscopes. 2. Sun, Jupiter, Ketu contact in 1st, 9th, 10th houses. 3. Correlation between Sun, Guru, Ketu. 4. Rules for setting up Sivacharyar mission.
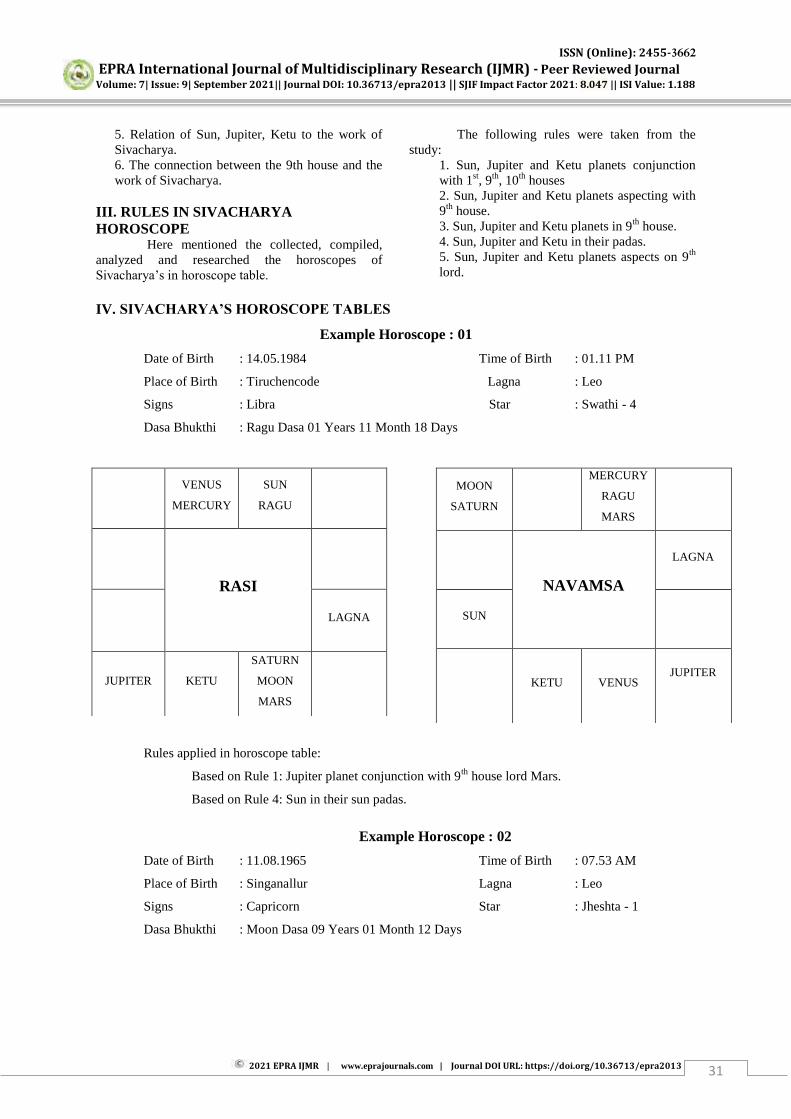
ISSN (Online): 2455-3662
EPRA International Journal of Multidisciplinary Research (IJMR) - Peer Reviewed Journal Volume: 7| Issue: 9| September 2021|| Journal DOI: 10.36713/epra2013 || SJIF Impact Factor 2021: 8.047 || ISI Value: 1.188
2021 EPRA IJMR | www.eprajournals.com | Journal DOI URL: https://doi.org/10.36713/epra2013 31
5. Relation of Sun, Jupiter, Ketu to the work of Sivacharya. 6. The connection between the 9th house and the work of Sivacharya.
III. RULES IN SIVACHARYA HOROSCOPE
Here mentioned the collected, compiled, analyzed and researched the horoscopes of Sivacharya‟s in horoscope table.
The following rules were taken from the study:
1. Sun, Jupiter and Ketu planets conjunction with 1st, 9th, 10th houses 2. Sun, Jupiter and Ketu planets aspecting with 9th house. 3. Sun, Jupiter and Ketu planets in 9th house. 4. Sun, Jupiter and Ketu in their padas. 5. Sun, Jupiter and Ketu planets aspects on 9th lord.
IV. SIVACHARYA’S HOROSCOPE TABLES
Example Horoscope : 01
Date of Birth : 14.05.1984 Time of Birth : 01.11 PM
Place of Birth : Tiruchencode Lagna : Leo
Signs : Libra Star : Swathi - 4
Dasa Bhukthi : Ragu Dasa 01 Years 11 Month 18 Days
Rules applied in horoscope table:
Based on Rule 1: Jupiter planet conjunction with 9th house lord Mars.
Based on Rule 4: Sun in their sun padas.
Example Horoscope : 02
Date of Birth : 11.08.1965 Time of Birth : 07.53 AM
Place of Birth : Singanallur Lagna : Leo
Signs : Capricorn Star : Jheshta - 1
Dasa Bhukthi : Moon Dasa 09 Years 01 Month 12 Days
MOON
SATURN
MERCURY
RAGU
MARS
NAVAMSA
LAGNA
SUN
KETU
VENUS JUPITER
VENUS
MERCURY
SUN
RAGU
RASI
LAGNA
JUPITER KETU
SATURN
MOON
MARS
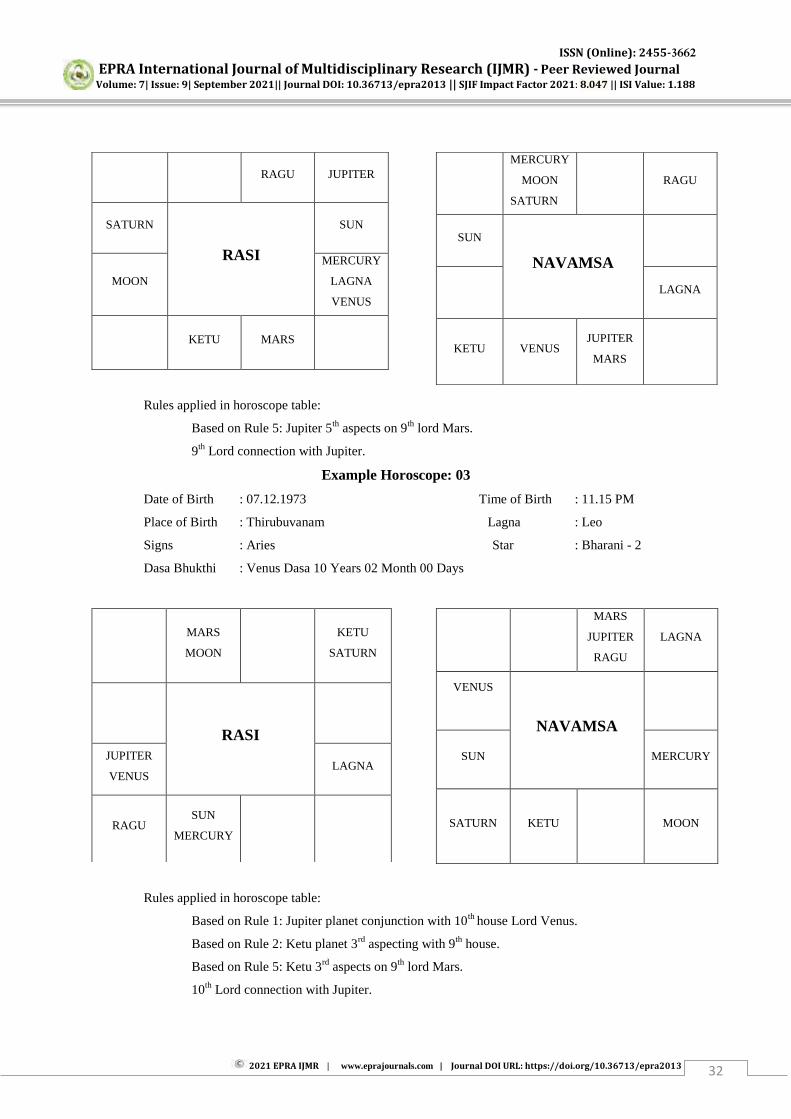
ISSN (Online): 2455-3662
EPRA International Journal of Multidisciplinary Research (IJMR) - Peer Reviewed Journal Volume: 7| Issue: 9| September 2021|| Journal DOI: 10.36713/epra2013 || SJIF Impact Factor 2021: 8.047 || ISI Value: 1.188
2021 EPRA IJMR | www.eprajournals.com | Journal DOI URL: https://doi.org/10.36713/epra2013 32
Rules applied in horoscope table:
Based on Rule 5: Jupiter 5th aspects on 9th lord Mars.
9th Lord connection with Jupiter.
Example Horoscope: 03
Date of Birth : 07.12.1973 Time of Birth : 11.15 PM
Place of Birth : Thirubuvanam Lagna : Leo
Signs : Aries Star : Bharani - 2
Dasa Bhukthi : Venus Dasa 10 Years 02 Month 00 Days
Rules applied in horoscope table:
Based on Rule 1: Jupiter planet conjunction with 10th house Lord Venus.
Based on Rule 2: Ketu planet 3rd aspecting with 9th house.
Based on Rule 5: Ketu 3rd aspects on 9th lord Mars.
10th Lord connection with Jupiter.
MERCURY
MOON
SATURN
RAGU
SUN
NAVAMSA
LAGNA
KETU VENUS JUPITER
MARS
RAGU JUPITER
SATURN
RASI
SUN
MOON
MERCURY
LAGNA
VENUS
KETU MARS
MARS
JUPITER
RAGU
LAGNA
VENUS
NAVAMSA
SUN MERCURY
SATURN KETU MOON
MARS
MOON
KETU
SATURN
RASI
JUPITER
VENUS LAGNA
RAGU SUN
MERCURY
ISSN (Online): 2455-3662
EPRA International Journal of Multidisciplinary Research (IJMR) - Peer Reviewed Journal Volume: 7| Issue: 9| September 2021|| Journal DOI: 10.36713/epra2013 || SJIF Impact Factor 2021: 8.047 || ISI Value: 1.188
2021 EPRA IJMR | www.eprajournals.com | Journal DOI URL: https://doi.org/10.36713/epra2013 33
V. CONCLUSION The study, entitled „The Impact of the Sun,
Jupiter and Ketu Planets in the “Leo Lagna Contribution In Sivacharya‟s Horoscope”, was done
to know more about the Sivacharya‟s who contribute
to the development of spirituality and devotion in the society and to help in further research. REFERENCES
1. Gopikrishnan k, Parivaartha Rathnagaram, Kumaran Publications, Chennai, 2005.
2. Sathasivam S M, Uththirakalaamirtham, Indhu Publications, Chennai, 2003.
3. Boopathi Rajan, Navagraha Jothida Paripalanam, Abirami Publications, Chennai, 1982.
4. Hariharan k, Grahangal yethai kurikattukirathu, Krishnamoorthy Publications, Chennai. 1997.
5. Iyer P S, Jothida Ariviyal, Kerala Jothisha Publications, Madurai, 1993.

ISSN (Online): 2455-3662
EPRA International Journal of Multidisciplinary Research (IJMR) - Peer Reviewed Journal Volume: 7| Issue: 9| September 2021|| Journal DOI: 10.36713/epra2013 || SJIF Impact Factor 2021: 8.047 || ISI Value: 1.188
2021 EPRA IJMR | www.eprajournals.com | Journal DOI URL: https://doi.org/10.36713/epra2013 34
VIRGO LAGNA IN SIVACHARYA’S HOROSCOPE
P. Valsala1, Sri Prathyangira Swamy2
1Research Scholar, Dept. of Astrology, Vels Int. of Science, Technology & Advanced Studies, Chennai, India
2Director & HOD, Dept. of Astrology, Vels Int. of Science, Technology & Advanced Studies, Chennai,
India
ABSTRACT Astrology is the science of predicting one's life. Mathematics is the basis of this. Each of the 9 planets in the zodiac gives birth to certain forces that are responsible for their motions and for the causality and sinfulness of the respective planets to the life of the creatures according to their power. Pros mathematics is the study of all these and every aspect of mathematics. Man is said to be controlled by his inheritance and growing circumstances. But astrology is said to be controlled by the planetary positions at the time of his birth. These planets are the basic forces of our life. These are all associated with the star, the zodiac, and houses. A person's career is determined by the 10th house in his favor. The 2nd house owner called Dhanasthanam and the 11th house owner called Ilapastanam, despite their strength, make progress in their business and become rich. KEYWORDS - Sivacharya, Ragu, Ketu I. INTRODUCTION
The Sivacharya profession is much loved by the Adi Saiva devotees. A great work that can give peace of mind and happiness. Gurus, also known as Sivacharya‟s, do a wonderful job of cultivating
godliness in the minds of others by reciting the Vedic mantras they have learned. It is also their divine profession. Sivacharya advice and counsel can bring about positive changes in the minds of the devotees who come to tell their grievances to God and help them to forget their sorrows and worries and bring peace of mind and happiness.
Gurus, also known as Sivacharyas, do a wonderful job of cultivating godliness in the minds of the priests by reciting the Vedic mantras they have learned to others. This is their deity. His advice and counsel can make a positive difference in the minds of the devotees who come to tell God their grievances and help them to forget their sorrows and worries and bring peace of mind and happiness.
II. SIVACHARYAS - STUDY HYPOTHESIS
Priests, priestesses, Bhattacharyas, and so-called Sivacharyas are those who use what they have learned to apply to others. His words of comfort made a positive difference in the minds of the people who came to express their concerns to God and helped to make them better human beings. Those who act as a bridge between God and man. Those
who take away people's worries by saying words of comfort to them. Through it they are refreshed and helped to gain the inspiration and mental courage to do their daily tasks.
In the early days, the Gurukul education system functioned to learn the Vedic mantras and their methods. The students who wanted to study went in search of the location of the Guru who had chosen the Guru for them and stayed there, doing chores for the Guru and the Guru's ten and learning the Guru's oral education, the Vedic mantras and the process of temple restoration. They stayed in the gurukul till the end of their education. III. IMPACT OF SUN, JUPITER AND KETU A. Sun Planet
Chief Ministers, Honesty, Honor, Fame, Status in Society, City, generosity, lighting, kindness, self-respect, Specialization, Political Science, Social Science, General Life, Sanskrit, Desert, Lord Shiva, Lord Shiva Temples, Male, fire, red, majesty, royal power, victory, fame, Father, eldest son, father-in-law, politician, politicians, Supervisors, Manager, Medical Chairman, Multipurpose Government Hospital, General Secretariat, Cardiovascular Drugs, Overconfidence, government duty, hero, East, government position, kindness, stubbornness, President, Prime Minister, to rise, Governor,
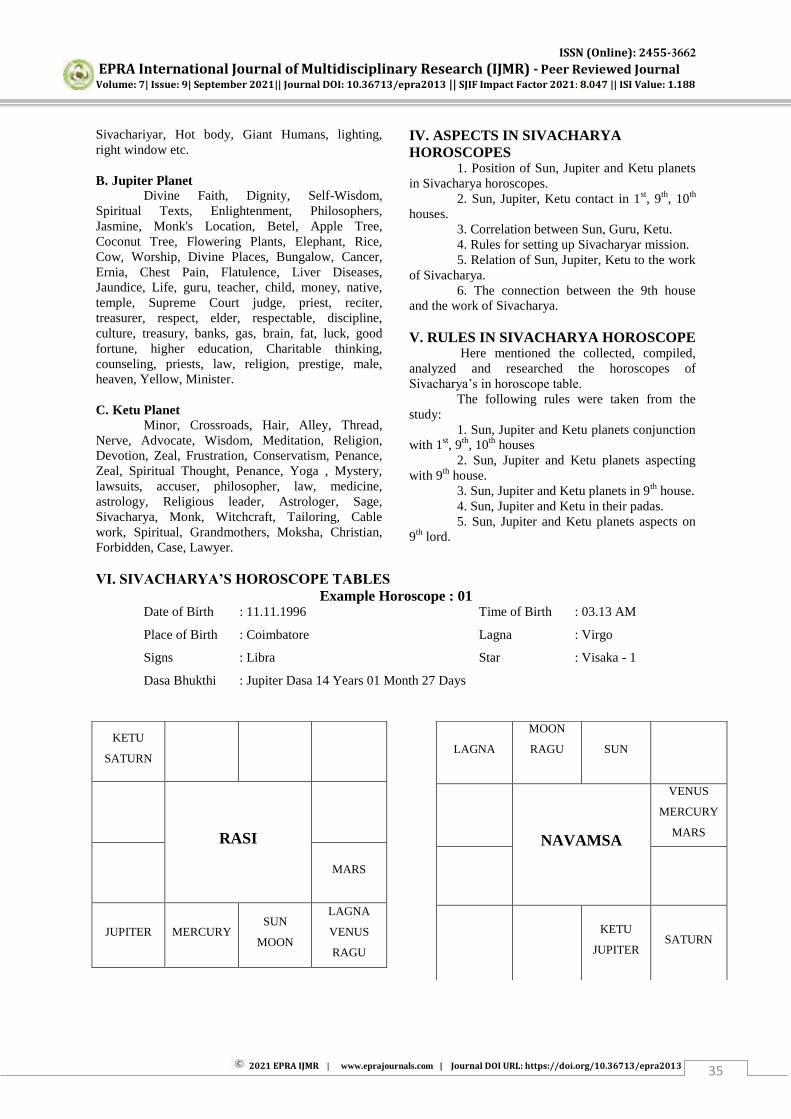
ISSN (Online): 2455-3662
EPRA International Journal of Multidisciplinary Research (IJMR) - Peer Reviewed Journal Volume: 7| Issue: 9| September 2021|| Journal DOI: 10.36713/epra2013 || SJIF Impact Factor 2021: 8.047 || ISI Value: 1.188
2021 EPRA IJMR | www.eprajournals.com | Journal DOI URL: https://doi.org/10.36713/epra2013 35
Sivachariyar, Hot body, Giant Humans, lighting, right window etc.
B. Jupiter Planet Divine Faith, Dignity, Self-Wisdom, Spiritual Texts, Enlightenment, Philosophers, Jasmine, Monk's Location, Betel, Apple Tree, Coconut Tree, Flowering Plants, Elephant, Rice, Cow, Worship, Divine Places, Bungalow, Cancer, Ernia, Chest Pain, Flatulence, Liver Diseases, Jaundice, Life, guru, teacher, child, money, native, temple, Supreme Court judge, priest, reciter, treasurer, respect, elder, respectable, discipline, culture, treasury, banks, gas, brain, fat, luck, good fortune, higher education, Charitable thinking, counseling, priests, law, religion, prestige, male, heaven, Yellow, Minister. C. Ketu Planet Minor, Crossroads, Hair, Alley, Thread, Nerve, Advocate, Wisdom, Meditation, Religion, Devotion, Zeal, Frustration, Conservatism, Penance, Zeal, Spiritual Thought, Penance, Yoga , Mystery, lawsuits, accuser, philosopher, law, medicine, astrology, Religious leader, Astrologer, Sage, Sivacharya, Monk, Witchcraft, Tailoring, Cable work, Spiritual, Grandmothers, Moksha, Christian, Forbidden, Case, Lawyer.
IV. ASPECTS IN SIVACHARYA HOROSCOPES
1. Position of Sun, Jupiter and Ketu planets in Sivacharya horoscopes.
2. Sun, Jupiter, Ketu contact in 1st, 9th, 10th houses.
3. Correlation between Sun, Guru, Ketu. 4. Rules for setting up Sivacharyar mission. 5. Relation of Sun, Jupiter, Ketu to the work
of Sivacharya. 6. The connection between the 9th house
and the work of Sivacharya. V. RULES IN SIVACHARYA HOROSCOPE
Here mentioned the collected, compiled, analyzed and researched the horoscopes of Sivacharya‟s in horoscope table.
The following rules were taken from the study:
1. Sun, Jupiter and Ketu planets conjunction with 1st, 9th, 10th houses
2. Sun, Jupiter and Ketu planets aspecting with 9th house.
3. Sun, Jupiter and Ketu planets in 9th house. 4. Sun, Jupiter and Ketu in their padas. 5. Sun, Jupiter and Ketu planets aspects on
9th lord.
VI. SIVACHARYA’S HOROSCOPE TABLES Example Horoscope : 01
Date of Birth : 11.11.1996 Time of Birth : 03.13 AM
Place of Birth : Coimbatore Lagna : Virgo
Signs : Libra Star : Visaka - 1
Dasa Bhukthi : Jupiter Dasa 14 Years 01 Month 27 Days
LAGNA
MOON
RAGU
SUN
NAVAMSA
VENUS
MERCURY
MARS
KETU
JUPITER SATURN
KETU
SATURN
RASI
MARS
JUPITER MERCURY SUN
MOON
LAGNA
VENUS
RAGU
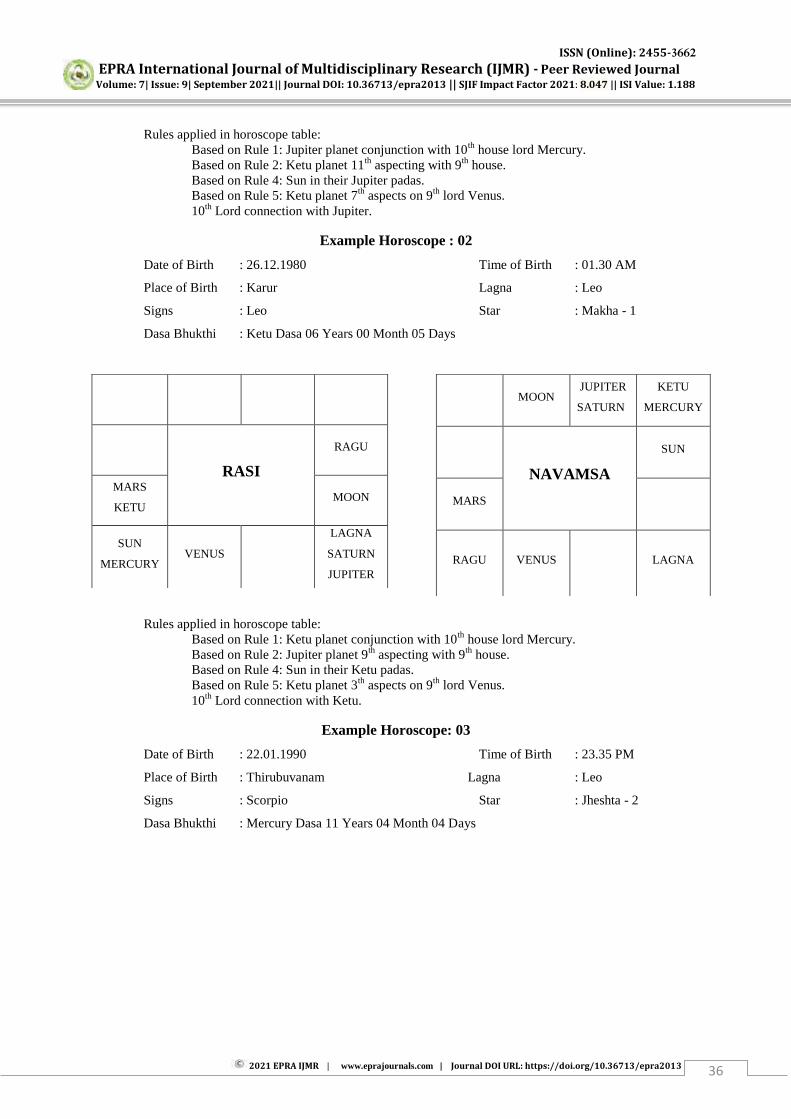
ISSN (Online): 2455-3662
EPRA International Journal of Multidisciplinary Research (IJMR) - Peer Reviewed Journal Volume: 7| Issue: 9| September 2021|| Journal DOI: 10.36713/epra2013 || SJIF Impact Factor 2021: 8.047 || ISI Value: 1.188
2021 EPRA IJMR | www.eprajournals.com | Journal DOI URL: https://doi.org/10.36713/epra2013 36
Rules applied in horoscope table: Based on Rule 1: Jupiter planet conjunction with 10th house lord Mercury.
Based on Rule 2: Ketu planet 11th aspecting with 9th house. Based on Rule 4: Sun in their Jupiter padas.
Based on Rule 5: Ketu planet 7th aspects on 9th lord Venus. 10th Lord connection with Jupiter.
Example Horoscope : 02
Date of Birth : 26.12.1980 Time of Birth : 01.30 AM
Place of Birth : Karur Lagna : Leo
Signs : Leo Star : Makha - 1
Dasa Bhukthi : Ketu Dasa 06 Years 00 Month 05 Days
Rules applied in horoscope table: Based on Rule 1: Ketu planet conjunction with 10th house lord Mercury. Based on Rule 2: Jupiter planet 9th aspecting with 9th house.
Based on Rule 4: Sun in their Ketu padas. Based on Rule 5: Ketu planet 3th aspects on 9th lord Venus. 10th Lord connection with Ketu.
Example Horoscope: 03
Date of Birth : 22.01.1990 Time of Birth : 23.35 PM
Place of Birth : Thirubuvanam Lagna : Leo
Signs : Scorpio Star : Jheshta - 2
Dasa Bhukthi : Mercury Dasa 11 Years 04 Month 04 Days
MOON JUPITER
SATURN
KETU
MERCURY
NAVAMSA
SUN
MARS
RAGU VENUS LAGNA
RASI
RAGU
MARS
KETU MOON
SUN
MERCURY VENUS
LAGNA
SATURN
JUPITER
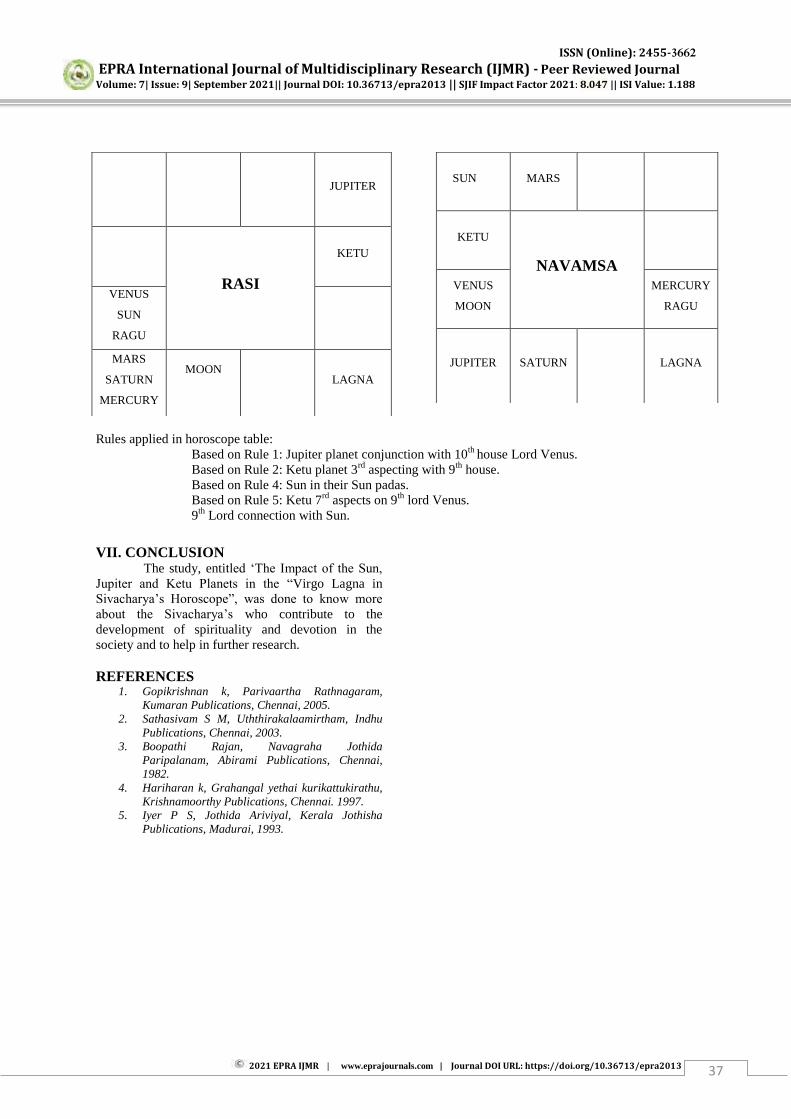
ISSN (Online): 2455-3662
EPRA International Journal of Multidisciplinary Research (IJMR) - Peer Reviewed Journal Volume: 7| Issue: 9| September 2021|| Journal DOI: 10.36713/epra2013 || SJIF Impact Factor 2021: 8.047 || ISI Value: 1.188
2021 EPRA IJMR | www.eprajournals.com | Journal DOI URL: https://doi.org/10.36713/epra2013 37
Rules applied in horoscope table: Based on Rule 1: Jupiter planet conjunction with 10th house Lord Venus.
Based on Rule 2: Ketu planet 3rd aspecting with 9th house. Based on Rule 4: Sun in their Sun padas. Based on Rule 5: Ketu 7rd aspects on 9th lord Venus. 9th Lord connection with Sun.
VII. CONCLUSION The study, entitled „The Impact of the Sun,
Jupiter and Ketu Planets in the “Virgo Lagna in Sivacharya‟s Horoscope”, was done to know more
about the Sivacharya‟s who contribute to the development of spirituality and devotion in the society and to help in further research. REFERENCES
1. Gopikrishnan k, Parivaartha Rathnagaram, Kumaran Publications, Chennai, 2005.
2. Sathasivam S M, Uththirakalaamirtham, Indhu Publications, Chennai, 2003.
3. Boopathi Rajan, Navagraha Jothida Paripalanam, Abirami Publications, Chennai, 1982.
4. Hariharan k, Grahangal yethai kurikattukirathu, Krishnamoorthy Publications, Chennai. 1997.
5. Iyer P S, Jothida Ariviyal, Kerala Jothisha Publications, Madurai, 1993.
SUN MARS
KETU
NAVAMSA
VENUS
MOON
MERCURY
RAGU
JUPITER SATURN LAGNA
JUPITER
RASI
KETU
VENUS
SUN
RAGU
MARS
SATURN
MERCURY
MOON
LAGNA
ISSN (Online): 2455-3662
EPRA International Journal of Multidisciplinary Research (IJMR) - Peer Reviewed Journal Volume: 7| Issue: 9| September 2021|| Journal DOI: 10.36713/epra2013 || SJIF Impact Factor 2021: 8.047 || ISI Value: 1.188
2021 EPRA IJMR | www.eprajournals.com | Journal DOI URL: https://doi.org/10.36713/epra2013 38
BADMINTON PLAYER’S FITNESS OUTPUT IN
RESPONSE TO KETTLEBELL TRAINING
J. Vijay1, Dr. V. Vallimurugan2* 1 PhD, Research Scholar (Part Time), Department of Physical Education, Bharathiar University,
Coimbatore, Tamilnadu, India
2*Assistant Professor, Department of Physical Education, Bharathiar University, Coimbatore,
Tamilnadu, India.
ABSTRACT The underlying principle of this study was to discover the badminton player’s fitness output in response to kettlebell
training. To accomplish this purpose of the study thirty college level women badminton players from PSNA College of Engineering and Technology, Dindigul district, Tamilnadu, India were randomly selected as subjects. Their age ranged in between 18 and 23 years. The subjects were separated into two groups namely kettlebell group and control group. The kettlebell group was subjected to kettlebell training (for weekly three days monday, wednesday, friday) at evening session for eight weeks. Leg strength and muscular strength was selected as dependent variable. After the compilation of proper data, it was statistically analyzed by using paired‘t’ test. The level of significance was set at 0.05. The result of the present study showed that the kettlebell training has significant enhancement on leg strength and muscular strength of badminton players. KEYWORDS: Kettlebell Training, Physical Fitness Components, Badminton Players.
1. INTRODUCTION kettlebell is a cast-iron or cast steel weight
(resembling a cannonball with a handle) used to perform all types of exercises, including but not limited to ballistic exercises that combine cardiovascular, strength and flexibility training. They are also the primary equipment used in the weight lifting sport of kettlebell lifting. It's well-known that compound, whole body movements typical of kettlebell exercises are superior to machines that isolate muscles for improving muscle tone, body composition, and strength. Further, kettlebells strengthen the tendons and ligaments, making the joints tougher and less-susceptible to injury. Strengthens every muscle from head-to-toe. Kettlebell training consists of whole-body movement exercises. It's well-known that compound, whole body movements typical of kettlebell exercises are superior to machines that isolate muscles for improving muscle tone, body composition, and strength. kettlebell training should be implemented in the condition program of all sports, not just strength sports. The increase in leg strength, muscular strength and muscular endurance will advantages of every sport. As badminton game involves more of muscular contraction. Which build the components for the game, as a research scholar
special planned kettlebell training programme for the college level women badminton players. 2. METHODOLOGY
The underlying principle of this study was to discover the badminton player’s fitness output in
response to kettlebell training. To accomplish this purpose of the study thirty college level women badminton players from PSNA College of Engineering and Technology, Dindigul district, Tamilnadu, India were randomly selected as subjects. Their age ranged in between 18 and 23 years. The subjects were separated into two groups namely kettlebell group and control group. The kettlebell group was subjected to kettlebell training (for weekly three days monday, wednesday, friday) at evening session for eight weeks. Leg strength and muscular strength was selected as dependent variable. After the compilation of proper data, it was statistically analyzed by using paired‘t’ test. The level of
significance was set at 0.05. 3. TRAINING PROTOCOL
For kettle group underwent their training programme as three days per week for six weeks. Training was given in the evening session. The training session includes warming up and cool down. All day the workout lasted for 50 to 60 minutes
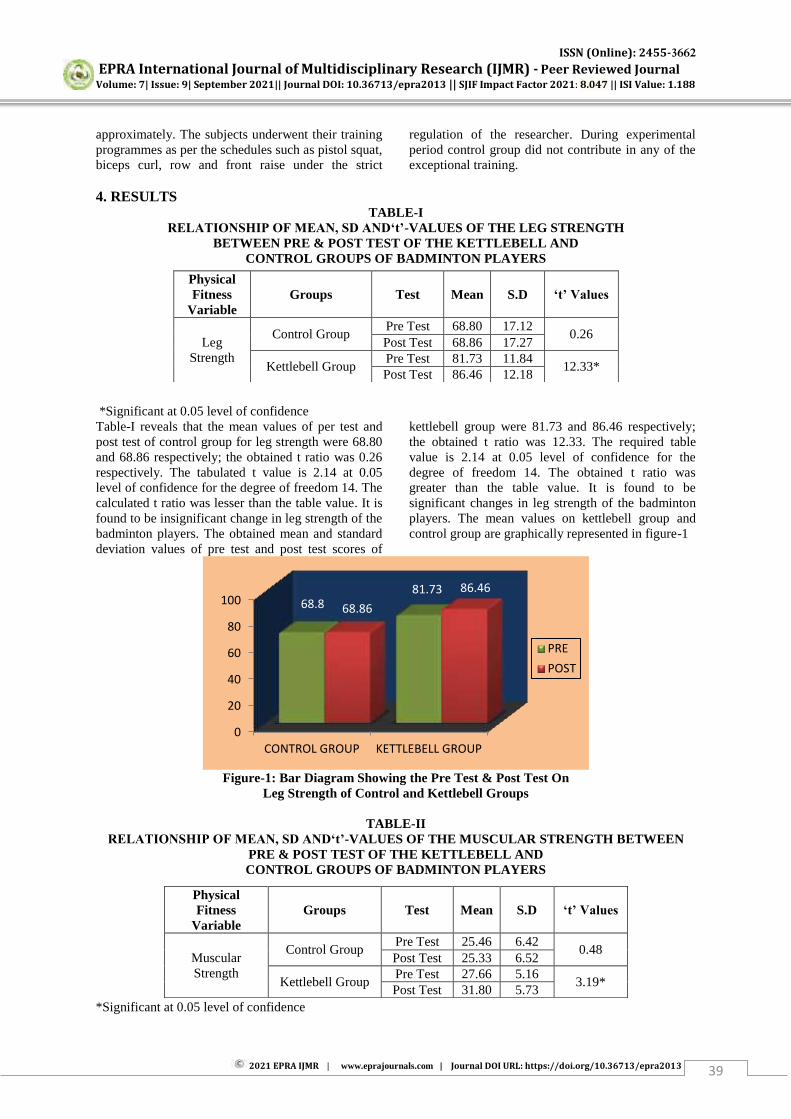
ISSN (Online): 2455-3662
EPRA International Journal of Multidisciplinary Research (IJMR) - Peer Reviewed Journal Volume: 7| Issue: 9| September 2021|| Journal DOI: 10.36713/epra2013 || SJIF Impact Factor 2021: 8.047 || ISI Value: 1.188
2021 EPRA IJMR | www.eprajournals.com | Journal DOI URL: https://doi.org/10.36713/epra2013 39
approximately. The subjects underwent their training programmes as per the schedules such as pistol squat, biceps curl, row and front raise under the strict
regulation of the researcher. During experimental period control group did not contribute in any of the exceptional training.
4. RESULTS
TABLE-I RELATIONSHIP OF MEAN, SD AND‘t’-VALUES OF THE LEG STRENGTH
BETWEEN PRE & POST TEST OF THE KETTLEBELL AND CONTROL GROUPS OF BADMINTON PLAYERS
*Significant at 0.05 level of confidence Table-I reveals that the mean values of per test and post test of control group for leg strength were 68.80 and 68.86 respectively; the obtained t ratio was 0.26 respectively. The tabulated t value is 2.14 at 0.05 level of confidence for the degree of freedom 14. The calculated t ratio was lesser than the table value. It is found to be insignificant change in leg strength of the badminton players. The obtained mean and standard deviation values of pre test and post test scores of
kettlebell group were 81.73 and 86.46 respectively; the obtained t ratio was 12.33. The required table value is 2.14 at 0.05 level of confidence for the degree of freedom 14. The obtained t ratio was greater than the table value. It is found to be significant changes in leg strength of the badminton players. The mean values on kettlebell group and control group are graphically represented in figure-1
Figure-1: Bar Diagram Showing the Pre Test & Post Test On
Leg Strength of Control and Kettlebell Groups
TABLE-II RELATIONSHIP OF MEAN, SD AND‘t’-VALUES OF THE MUSCULAR STRENGTH BETWEEN
PRE & POST TEST OF THE KETTLEBELL AND CONTROL GROUPS OF BADMINTON PLAYERS
*Significant at 0.05 level of confidence
0
20
40
60
80
100
CONTROL GROUP KETTLEBELL GROUP
68.8 81.73
68.86
86.46
PRE
POST
Physical Fitness
Variable Groups Test Mean S.D ‘t’ Values
Leg Strength
Control Group Pre Test 68.80 17.12
0.26 Post Test 68.86 17.27
Kettlebell Group Pre Test 81.73 11.84
12.33* Post Test 86.46 12.18
Physical Fitness
Variable Groups Test Mean S.D ‘t’ Values
Muscular Strength
Control Group Pre Test 25.46 6.42
0.48 Post Test 25.33 6.52
Kettlebell Group Pre Test 27.66 5.16
3.19* Post Test 31.80 5.73

ISSN (Online): 2455-3662
EPRA International Journal of Multidisciplinary Research (IJMR) - Peer Reviewed Journal Volume: 7| Issue: 9| September 2021|| Journal DOI: 10.36713/epra2013 || SJIF Impact Factor 2021: 8.047 || ISI Value: 1.188
2021 EPRA IJMR | www.eprajournals.com | Journal DOI URL: https://doi.org/10.36713/epra2013 40
Table-II reveals that the mean values of per test and post test of control group for muscular strength were 25.46 and 25.33 respectively; the obtained t ratio was 0.48 respectively. The tabulated t value is 2.14 at 0.05 level of confidence for the degree of freedom 14. The calculated t ratio was lesser than the table value. It is found to be insignificant change in muscular strength of the badminton players. The obtained mean and standard deviation values of pre
test and post test scores of kettlebell group were 27.66 and 31.80 respectively; the obtained t ratio was 3.19. The required table value is 2.14 at 0.05 level of confidence for the degree of freedom 14. The obtained t ratio was greater than the table value. It is found to be significant changes in muscular strength of the badminton players. The mean values on kettlebell group and control group are graphically represented in figure-2
Figure-2: Bar Diagram Showing the Pre Test & Post Test On Muscular
Strength of Control and Kettlebell Groups 5. DISCUSSION ON FINDINGS
The kettlebell training is a incredible training which has been found to be beneficial of the badminton players. To study the kettlebell training on leg strength and muscular strength of college level women badminton players, it was tested under to difference between kettlebell group and control group. The kettlebell training includes on selected physical fitness components. The kettlebell exercises are namely pistol squat, biceps curl, row and front raise. It also improves the leg strength, muscular strength, muscle size and other than some physical fitness components are namely speed, agility, and power. The obtained result proved positively the kettlebell group significantly improved. The result of the present study showed that the kettlebell training has significant improvement on leg strength and muscular strength of badminton players. The results of the study are in line with the studies of Ooraniyan et al (2018), Manocchia, P et al., (2015) & Joe girard et al., (2014) The result of the study showed that the control group was not significantly improved kettlebell training on leg strength and muscular strength of college level women badminton players. 6. CONCLUSIONS Based on the findings and within the limitation of the study it is noticed that practice of kettlebell training helped to improve leg strength and muscular strength of college level women badminton players. It was also seen that there is progressive improvement in the
selected criterion variables of kettlebell group of badminton players after eight weeks of kettlebell training programme. Further, it also helps to improve leg strength and muscular strength.
1. It was concluded that individualized impacts of kettlebell group showed a statistically significant positive sign over the course of the treatment period on leg strength and muscular strength of college level women badminton players.
2. It was concluded that individualized impacts of control group showed a statistically insignificant positive sign over the course of the period on leg strength and muscular strength of college level women badminton players.
3. The results of comparative effects lead to conclude that kettlebell group had better significant improvement on leg strength and muscular strength of college level women badminton players as compared to their performance with control group.
7. REFERENCES 1. K.Ooraniyan , S.Senthil Kumaran (2018) Impacts
Of Kettlebell Training On Selected Physical Fitness Components Among Handball Players, International Journal of Current Trends in Science and Technology, Vol. 8, Issue. 05, Page no: MS 20427-20430
2. Falatic et al., (2015) Effects of Kettlebell Training on Aerobic Capacity. The Journal of
0
10
20
30
40
CONTROL GROUP KETTLEBELL GROUP
25.46 27.66 25.33
31.8
PRE
POST

ISSN (Online): 2455-3662
EPRA International Journal of Multidisciplinary Research (IJMR) - Peer Reviewed Journal Volume: 7| Issue: 9| September 2021|| Journal DOI: 10.36713/epra2013 || SJIF Impact Factor 2021: 8.047 || ISI Value: 1.188
2021 EPRA IJMR | www.eprajournals.com | Journal DOI URL: https://doi.org/10.36713/epra2013 41
Strength & Conditioning Research, Volume 29 - Issue 7 - p 1943–1947.
3. Manocchia, P et al., (2015) Transference of Kettlebell Training to Strength, Power, and Endurance. Journal of Strength and Conditioning Research, 27, 2, 477-484.
4. Joe girard et al., (2014) the Effects of Kettlebell traIning on Strength, Power and Endurance. Journal of Physical Therapy, Volume 20 - Issue 1.
5. Matthew R. Maulit et al., (2017) Effects of Kettlebell Swing vs. Explosive Deadlift Training on Strength and Power. International Journal of Kinesiology & Sports Science, Vol. 5 No.1
6. Jay K et al., (2010) Kettlebell Training for Musculoskeletal and Cardiovascular Health: A Randomized Controlled Trial. Scand J Work Environ Health. Epub
7.
ISSN (Online): 2455-3662
EPRA International Journal of Multidisciplinary Research (IJMR) - Peer Reviewed Journal Volume: 7| Issue: 9| September 2021|| Journal DOI: 10.36713/epra2013 || SJIF Impact Factor 2021: 8.047 || ISI Value: 1.188
2021 EPRA IJMR | www.eprajournals.com | Journal DOI URL: https://doi.org/10.36713/epra2013 42
THE EFFECT OF INADEQUATE ACCESS TO POTABLE
WATER ON THE HEALTH OF THE PEOPLE IN THE WA MUNICIPALITY OF GHANA
Ebenezer Nkrumah1*, Yaw Frimpong1, Adubofour Isaac2
1 School of Management, Jiangsu University, Zhenjiang, P.R. China 2 School of Finance and Economics, Jiangsu University, Zhenjiang, P.R. China
*Correspondence: Ebenezer Nkrumah
Article DOI: https://doi.org/10.36713/epra8370
DOI No: 10.36713/epra8370
ABSTRACT Accessibility to safe drinking water is regarded as a fundamental human right since it is essential to preserving healthy livelihoods and the basic human dignity of all human beings. The study examined the effect of inadequate potable water supply on the health of the people in the Wa Municipality of Ghana. Findings of the study revealed that water related diseases are very common in the municipality due to the inadequate supply of potable water. About 55% of respondents, mentioned schistosomiasis as the top disease burden in the area. Again, the analysis of data on water provision and accessibility in the study suggested that most of the residents of the Municipality precisely 69.2% covered distances more than the standard distance of 1km stipulated by World Health Organization in search for potable water. The impacts of the time spent and distance traveled to acquire water in the Municipality were largely experienced by children and women, owing to the fact that in Ghana, water collection is considered to be the primary duty of children and women. Based on the findings the study recommends that more boreholes should be provided in the Wa Municipality to enable the residents have easy access to potable water supply. KEYWORDS: Ghana, Wa Municipality, Potable water accessibility.
1. INTRODUCTION A reasonable access to an acceptable amount of water from an upgraded source, such as a public standpipe, household connection, borehole, protected well, spring rainwater collection or protected well, (UNICEF/ WHO, 2017). According to WHO/UNICEF (2015), reasonable access is defined as "the availability of at least 20 liters per person per day from sources within one kilometer of the habitation. “The further definition of reasonable access where quality of water is given importance is a good measure since once a source of water has been provided quality is given more attention than quantity Chaplin, S. E. (1999). Water that can be given to the user and is safe for drinking, personal hygiene, food preparation, and washing is known as safe drinking (potable) water. At the point of supply to the users, the water should be able to meet the requisite (biological, chemical, and physical) quality criteria. As a result, safe drinking water is a relative phrase that is determined by a country's quality standards
and guidelines; the requirements set for various quality metrics varies. The WHO standard differs from that of the United States, Canada, China, Japan, Ghana, the European Commission, South Africa, and the rest of the world. The term "safe" refers to a person's ability to withstand certain substances. Some Nations' clean drinking water may not be safe in Asian countries. Several African nations have already evolved resilience to water-borne illnesses. Access to adequate potable water is considered to be very critical prerequisite for improving health, however, most countries are faced with the plight of fetching water from various water sources which could be contaminated. Potable water scarcity has become a severe issue in the world, from a local to a global level, and has attracted a lot of attention (Volker, 2007). Despite the fact that water covers three-quarters of the planet, it is nevertheless considered a limited resource in this world because only 1% of useable clean water is available for human consumption on a
ISSN (Online): 2455-3662
EPRA International Journal of Multidisciplinary Research (IJMR) - Peer Reviewed Journal Volume: 7| Issue: 9| September 2021|| Journal DOI: 10.36713/epra2013 || SJIF Impact Factor 2021: 8.047 || ISI Value: 1.188
2021 EPRA IJMR | www.eprajournals.com | Journal DOI URL: https://doi.org/10.36713/epra2013 43
daily basis. According to the report by WHO and UNICEF through their Joint Monitoring Programme (JMP) for water supply and sanitation, about 2.3 billion people lack access to an improved drinking water. The report indicates that global access to safe drinking water over the past two decades has not been, this implies that the success of MDGs is even doubtful since most developing countries, particularly the poor still find it difficult to access safe drinking water. Access to potable drinking water is a serious issue in most Ghanaian communities of which Upper West is no exception. Quality health is a powerful tool for development and one of the strongest instruments for reducing poverty, gender inequality, mortality rate, promoting peace and stability in a country (Shedrack & Nayebare, 2014). Quality health is a critical tool for breaking the cycle of poverty and yet most of the communities in Ghana lack access to potable water. Inadequate potable drinking water has serious effects on people health in Ghana. According to Ghana Government (2003) about 26% of Ghana’s rural population does not have access to improved water; women and children usually bear primary responsibility for water collection. Available information shows that communities with adequate potable water supply are always healthy and strong and can get ample time for other development projects. In most studies, the problem of improved water and sanitation facilities is related to the rapid speed of urbanization and population increase (WHO & UNICEF, 2006; Helena L. 2009; UN-Habitat, 2006). Urbanization and population rise are escalating the strains on trends and future in many countries of the globe, culminating in more residents living without access to safe drinking water (Hubbard et. al, 2011). Ghana has been urbanized, according to the Ghana Statistical Service (2010), signaling a need for municipal authorities to take proactive or suitable actions to address the accompanying repercussions, specifically water and sanitation difficulties. This paper therefore seeks to investigate the effect of inadequate access to potable water on the residents in the Wa Municipality in Ghana.
2. REVIEW OF LITERATURE The World Water Development Report (WWDR) of the United Nations (UN) for 2021 has offered an update on current trends in clean water availability as well as future expectations. Water security, defined as a population's ability to ensure long-term access to enough quantities of water of acceptable quality, is already in jeopardy for many, and the issue is only going to get worse in the next decades. In today's world of 7.7 billion people, clean water scarcity is a big issue. By 2050, the world population will have risen by 22 to 34 percent to 9.4 to 10.2 billion people, putting a pressure on the water infrastructure. Uneven
population increase in different locations, which is unconnected to local resources, will exacerbate the burden. The majority of this population expansion will occur in poor nations, first in Africa and subsequently in Asia, where clean water scarcity is already a serious concern, according to the World Health Organization and UNICEF (2006). The United Nations World Water Development Report, Leaving No One Behind, was released on March 19, 2019, during the 40th session of the United Nations Human Rights Council (UNHRC) and in conjunction with World Water Day. It demonstrates how improvements in water resource management and access to water supply and sanitation services are critical to addressing various social and economic inequities, as well as achieving sustainable development goals (Bahri, 2012). International human rights law requires states to aim toward universal access to water and sanitation for all, without discrimination, with the most vulnerable people receiving priority. Water and sanitation services must be available, physically accessible, equitably inexpensive, safe, and culturally acceptable in order to fulfill human rights to water and sanitation (Jérémie, 2006; Helena, 2009). According to WHO and UNICEF (2015), 26.3 percent of the world's population did not have access to a better water source on their premises and had to go outside to obtain water. Given the Sustainable Development Goals (SDGs) goal of universal and equitable access (i.e., 100 percent) to water by 2030, it is critical to assess the influence of collection difficulty, whether in terms of time or distance, on this target. The globe is facing an invisible water quality crisis that is robbing badly polluted places of one-third of their potential economic growth and endangering human and environmental well-being. Lack of access to water inhibits economic growth by one-third (Loc, 2012). It demands that these threats, which affect both rich and developing countries, be addressed immediately at the global, national, and local levels. Healthy water is a critical component of economic development. In many countries, declining water quality is stifling economic progress, affecting health, lowering food supply, and intensifying poverty. Report of the United Nations Millennium Summit (2000). According to WHO/UNICEF (2017), over half of the global population or 4.2 billion people lack access to satisfactory water supply. World Health Organization (WHO) and UNICEF provide the United Nations systems monitoring of progress on Millennium Development Goal’s target 10. They
jointly define safe drinking water from four different perspectives. To begin, they describe drinking water as water used in the home for cooking, drinking, and personal hygiene. The second definition emphasis the distance of the source of the water which should not
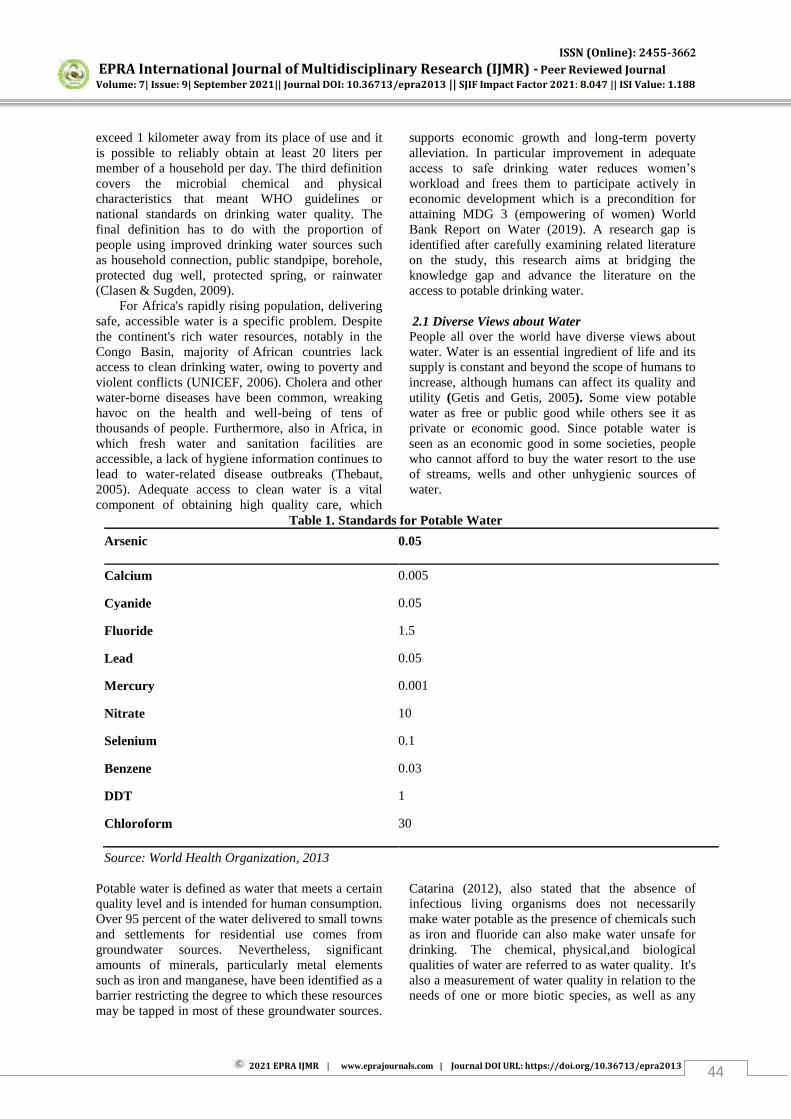
ISSN (Online): 2455-3662
EPRA International Journal of Multidisciplinary Research (IJMR) - Peer Reviewed Journal Volume: 7| Issue: 9| September 2021|| Journal DOI: 10.36713/epra2013 || SJIF Impact Factor 2021: 8.047 || ISI Value: 1.188
2021 EPRA IJMR | www.eprajournals.com | Journal DOI URL: https://doi.org/10.36713/epra2013 44
exceed 1 kilometer away from its place of use and it is possible to reliably obtain at least 20 liters per member of a household per day. The third definition covers the microbial chemical and physical characteristics that meant WHO guidelines or national standards on drinking water quality. The final definition has to do with the proportion of people using improved drinking water sources such as household connection, public standpipe, borehole, protected dug well, protected spring, or rainwater (Clasen & Sugden, 2009). For Africa's rapidly rising population, delivering safe, accessible water is a specific problem. Despite the continent's rich water resources, notably in the Congo Basin, majority of African countries lack access to clean drinking water, owing to poverty and violent conflicts (UNICEF, 2006). Cholera and other water-borne diseases have been common, wreaking havoc on the health and well-being of tens of thousands of people. Furthermore, also in Africa, in which fresh water and sanitation facilities are accessible, a lack of hygiene information continues to lead to water-related disease outbreaks (Thebaut, 2005). Adequate access to clean water is a vital component of obtaining high quality care, which
supports economic growth and long-term poverty alleviation. In particular improvement in adequate access to safe drinking water reduces women’s
workload and frees them to participate actively in economic development which is a precondition for attaining MDG 3 (empowering of women) World Bank Report on Water (2019). A research gap is identified after carefully examining related literature on the study, this research aims at bridging the knowledge gap and advance the literature on the access to potable drinking water. 2.1 Diverse Views about Water People all over the world have diverse views about water. Water is an essential ingredient of life and its supply is constant and beyond the scope of humans to increase, although humans can affect its quality and utility (Getis and Getis, 2005). Some view potable water as free or public good while others see it as private or economic good. Since potable water is seen as an economic good in some societies, people who cannot afford to buy the water resort to the use of streams, wells and other unhygienic sources of water.
Table 1. Standards for Potable Water
Arsenic 0.05
Calcium 0.005
Cyanide 0.05
Fluoride 1.5
Lead 0.05
Mercury 0.001
Nitrate 10
Selenium 0.1
Benzene 0.03
DDT 1
Chloroform 30
Source: World Health Organization, 2013 Potable water is defined as water that meets a certain quality level and is intended for human consumption. Over 95 percent of the water delivered to small towns and settlements for residential use comes from groundwater sources. Nevertheless, significant amounts of minerals, particularly metal elements such as iron and manganese, have been identified as a barrier restricting the degree to which these resources may be tapped in most of these groundwater sources.
Catarina (2012), also stated that the absence of infectious living organisms does not necessarily make water potable as the presence of chemicals such as iron and fluoride can also make water unsafe for drinking. The chemical, physical,and biological qualities of water are referred to as water quality. It's also a measurement of water quality in relation to the needs of one or more biotic species, as well as any
ISSN (Online): 2455-3662
EPRA International Journal of Multidisciplinary Research (IJMR) - Peer Reviewed Journal Volume: 7| Issue: 9| September 2021|| Journal DOI: 10.36713/epra2013 || SJIF Impact Factor 2021: 8.047 || ISI Value: 1.188
2021 EPRA IJMR | www.eprajournals.com | Journal DOI URL: https://doi.org/10.36713/epra2013 45
human purpose or need (Kpieta and Laari, 2014; Shedrack & Nayebare, 2014). 2.2. Potable Water Accessibility Because access to safe drinking water is regulated by distinct countries, definitions vary significantly. Apart from country-specific definitions, access to safe water can also be "determined by the number of individuals who have a decent method of obtaining a sufficient amount of clean water, expressed as a share of the total population." It means that household members do not have to spend a lot of time each day gathering water in rural areas.” In this research, physical, technical and economic access to potable water will be considered. Ghana statistical service (2005) had it that, the Upper West Region had 63.9% of the populace who have access to potable water. This is made up of 15.1% pipe borne water and 47.8% of boreholes. The remaining depends on wells, streams and other water sources. It has been estimated by the International Water and Sanitation Decade that, about 63% of Ghana’s
population had access to potable water supply. Out of this 93% were urban dwellers and 50% rural inhabitants. However, various types of access will influence allocation, design, the use and consequently the impact and distribution of benefits of a new water supply system. 2.2.1. Physical Accessibility Physical access to potable water comes into existence as a result of the fact of difference in spatial distribution and spatial differentiation in settlement. Geographic factors therefore are the main phenomena underlying physical access. Clasen and Cairncross (2004) has indicated that “great differences may be
found in water collection distance and time needed to cover this distance”. 2.2.2. Technical Accessibility It deals with the technological aspect of the potable water supply system. When the technology does not yield its expected results in terms of efficiency, acceptability of the technology and its availability to the beneficiaries, it influences accessibility (Bahri, 2012; Ghana Water Company Limited, 2009). 2.2.3. Economic Accessibility The issue of economic access to social services such as water has to do with income levels and the cost of water (Chaplin, 1999). These expenses are incurred as a result of individuals and families wasting significant energy and time, particularly as a result of treatment costs and lost productivity in man hours due to water and sanitation-related diseases. These squandered resources should be put to better use in areas like childcare, farming, and education.
Accelerated water and sanitation provision to enhance access to these facilities will thereby improve Ghanaians' health, increase productivity, and reduce poverty (Ghana Statistical Service, 2005). According to Clasen and Cairncross (2004), the fact that a water system is established in a community does not necessarily guarantee access to potable water by all members of the community. In 2010, about 84% of the global population which constituted 6.74 billion people had access to pipe water supply through house connection or to an improved water source through other means than house, including stand pipes, protected springs and wells. However, (UN 2021), further stated that about 14% (884 million) people did not have access to an improved water source and had to use unprotected wells and springs, canals, lakes or rivers for their water need. In most rural and many urban areas of developing countries, basic infrastructure development requires that obtaining drinking water is typically time consuming and complicated. All available sources, such as wells, lakes, streams, and even canals, will almost certainly be used. The poor are usually denied access to essential utilities like as piped water, sewage, and power, and are at risk of disasters such as fire outbreak, flooding, and infectious diseases. Residents in squatter colonies typically purchase water from peddlers or obtain it from a public drain pipe or well. The constant lifting and transporting of endless containers of water is exhausting and often harmful to one's health, whereas the product delivered, from whatever source is most handy, and may be of questionable value (Chaplin, 1999). In Ghana for instance, there is currently a vast backlog in the provision of potable water in small towns and rural areas. The lack of access to potable water and poor sanitation contributes to 70% of the diseases in Ghana (Cooperative Housing Foundation International, 2010). In Ghana, approximately 40% of homes have access to piped water. Around 41% of people use well water, while 16% rely on natural sources for their drinking water. Water tanker services, water vendors, sachet/bottled water, and other sources are available to the remaining 4% of households. In metropolitan regions, approximately 73 percent of homes have access to piped water, however the source is usually from outside the home. In metropolitan areas, a large percentage of families (16%) have accessibility to well water, while 11 % have lots of natural and other sources (Clasen and Cairncross, 2004). Also in relation to Northern Ghana, Bacho (2001) stated that the scanty and seasonal nature of rainfall has a significant implication for all year round water accessibility for both economic and household consumption.
ISSN (Online): 2455-3662
EPRA International Journal of Multidisciplinary Research (IJMR) - Peer Reviewed Journal Volume: 7| Issue: 9| September 2021|| Journal DOI: 10.36713/epra2013 || SJIF Impact Factor 2021: 8.047 || ISI Value: 1.188
2021 EPRA IJMR | www.eprajournals.com | Journal DOI URL: https://doi.org/10.36713/epra2013 46
2.3. Water and its Health implication Because the development and management of water resources has important health implications, access to safe drinking water and basic sanitation can have a significant positive impact on human health. Water investment is a cost-effective and efficient strategy to tackle water-borne diseases. Due to financial limits and a scarcity of educated health workers in most developing nations, health needs must be prioritized by the international health community (Clasen, 2006). In Ghana, it is believed that lack of clean water and sanitation is responsible for 70% of all infections. Because the majority of Ghanaians do not have access to piped water, this is the case. Only 41% of Ghanaians have access to a piped water supply. Because of a lack of drinkable water and sanitation services, the majority of people in rural and urban regions are vulnerable to disease. For example, over 34% of rural residents rely on untreated water from streams, rivers, and other natural sources for drinking water. In Ghana, poor water and sanitation conditions have resulted in a high incidence of sanitation and water-related diseases. Malaria, for example, was predicted to account for 44 percent of all outpatient visits to Ghanaian health institutions in 2002. Malaria infections, on the other hand, are spread by mosquitoes, which are aided by poor sanitation and drainage. On the other hand, skin diseases, diarrheal diseases, acute eye infections, cholera and dysentery, trachoma, typhoid and infectious hepatitis, and scabies are projected to account for 12% of all visits to health institutions (Ghana Water Company Limited, 2009). Two international groups focusing on water and poverty, Water Aid and Tearfund18, for example, feel that global efforts to eliminate poverty would fail if poor sanitation is not addressed promptly. It's no surprise, then, that access to safe drinking water and improved sanitation systems has been identified as one of the Millennium Development Goals' most important objectives by both international and local organizations such as the New Partnership for African Development (NEPAD), The Ghana Poverty Reduction Strategy and the World Health Organization have both mandated that all member countries take steps to ensure long-term access to safe and adequate clean water supply and sanitation, particularly for the poor. The Millennium Development Goals also recommend that the proportion of the population without access to potable water be cut in half by 2015. (Population and Housing Census, 2010). Accumulated evidence from various researchers on water and sanitation reveals that there is a strong correlation between access to potable water and health. No wonder the WHO estimated that 10% of global disease burden could be prevented with safe drinking water.
STUDY MUNICIPALITY
Wa Municipality is one of the eleven Districts/Municipalities that make up the Upper West Region of Ghana. It was elevated from Wa District in 2004 with Legislative Instrument (LI) 1800, as part of the centralization process that began in 1988. The Assembly performs deliberative, legislative, and executive powers in the Municipality under section 10 of the Local Government Act 1993 (Act 426). Wa Municipality is bordered on the north by Nadowli District, on the east by Wa East District, and on the south by Wa District. It is located between the latitudes of 1o40'N and 2o45'N, and the longitudes of 9o32'W and 10o20'W. Wa Municipality's capital is Wa, which also acts as the Upper West Region's regional capital. It covers around 579.86 square kilometers, or about 6.4 percent of the Region's land area. The Assembly is entrusted with enabling the implementation of national policies as the highest administrative and political body in the country. METHODOLOGY
The data collection and analysis methodology used is a blend of qualitative and quantitative methodologies. Creswell's point of view (2009). Combining quantitative and qualitative data analysis approaches goes a long way toward balancing the strengths and weaknesses of the two, as well as enhancing validity and reliability. Based on the home population, the study used simple random sampling to select 520 respondents from the Municipality. Based on the 2010 Ghanaian Population and Housing Census numbers, the residential areas polled during the study were divided into five zones: Busa, Kpong, Wa, Charia, and Kperisi, with households picked systematically with probability proportional to the household population of each zoned region. Purposive sampling was used once again to obtain information from major organizations such as the Ghana Water Company and some Municipal Assembly Departments deemed pertinent to the study's goal. The researchers employed structured questionnaires and interviews to interview family heads or representatives, as well as to obtain information from major institutions involved in the Municipality's water delivery services. Secondary data was gathered from the field, publications, papers, and major entities within the Municipality that were deemed significant for the study's goal. The status of water supply services in the Municipality, issues related with the provision and supply of potable water, and the effects of limited access to potable water supply in the Municipality are among the data acquired. The distance and time it takes to get to water; the average time spent waiting at water sources; and a slew of other factors. The quantitative data was organized using the Statistical Package for
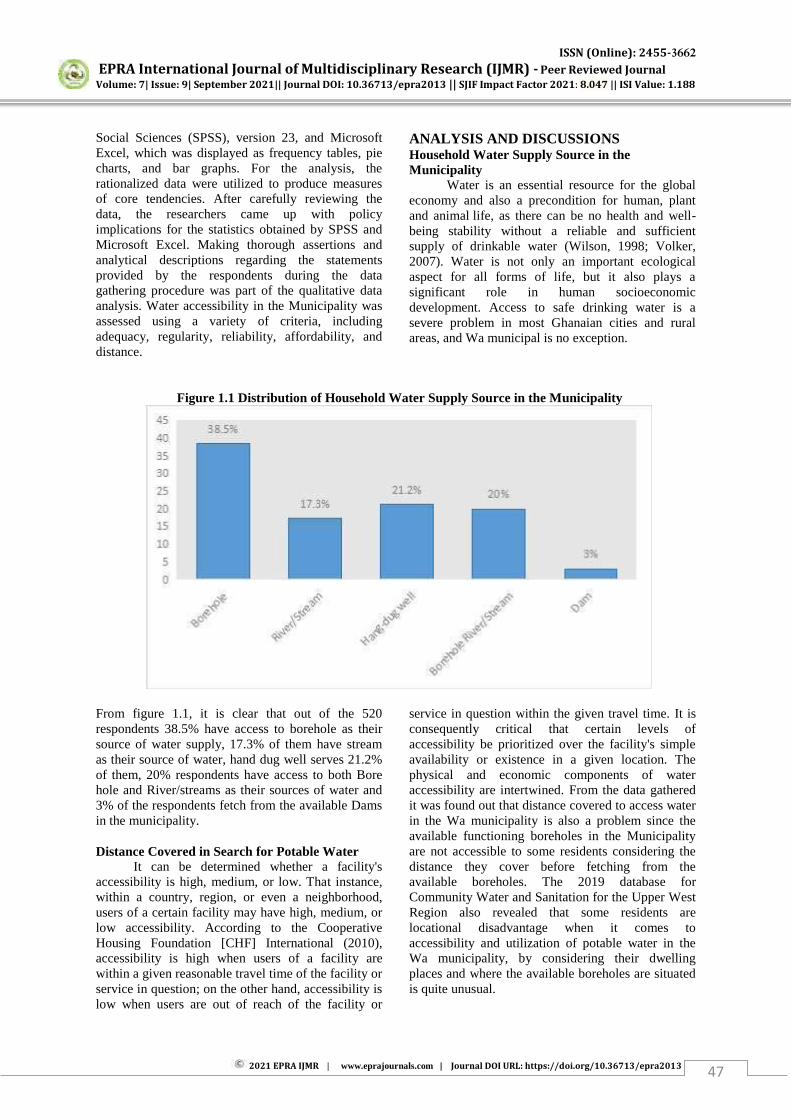
ISSN (Online): 2455-3662
EPRA International Journal of Multidisciplinary Research (IJMR) - Peer Reviewed Journal Volume: 7| Issue: 9| September 2021|| Journal DOI: 10.36713/epra2013 || SJIF Impact Factor 2021: 8.047 || ISI Value: 1.188
2021 EPRA IJMR | www.eprajournals.com | Journal DOI URL: https://doi.org/10.36713/epra2013 47
Social Sciences (SPSS), version 23, and Microsoft Excel, which was displayed as frequency tables, pie charts, and bar graphs. For the analysis, the rationalized data were utilized to produce measures of core tendencies. After carefully reviewing the data, the researchers came up with policy implications for the statistics obtained by SPSS and Microsoft Excel. Making thorough assertions and analytical descriptions regarding the statements provided by the respondents during the data gathering procedure was part of the qualitative data analysis. Water accessibility in the Municipality was assessed using a variety of criteria, including adequacy, regularity, reliability, affordability, and distance.
ANALYSIS AND DISCUSSIONS Household Water Supply Source in the Municipality
Water is an essential resource for the global economy and also a precondition for human, plant and animal life, as there can be no health and well-being stability without a reliable and sufficient supply of drinkable water (Wilson, 1998; Volker, 2007). Water is not only an important ecological aspect for all forms of life, but it also plays a significant role in human socioeconomic development. Access to safe drinking water is a severe problem in most Ghanaian cities and rural areas, and Wa municipal is no exception.
Figure 1.1 Distribution of Household Water Supply Source in the Municipality
From figure 1.1, it is clear that out of the 520 respondents 38.5% have access to borehole as their source of water supply, 17.3% of them have stream as their source of water, hand dug well serves 21.2% of them, 20% respondents have access to both Bore hole and River/streams as their sources of water and 3% of the respondents fetch from the available Dams in the municipality.
Distance Covered in Search for Potable Water
It can be determined whether a facility's accessibility is high, medium, or low. That instance, within a country, region, or even a neighborhood, users of a certain facility may have high, medium, or low accessibility. According to the Cooperative Housing Foundation [CHF] International (2010), accessibility is high when users of a facility are within a given reasonable travel time of the facility or service in question; on the other hand, accessibility is low when users are out of reach of the facility or
service in question within the given travel time. It is consequently critical that certain levels of accessibility be prioritized over the facility's simple availability or existence in a given location. The physical and economic components of water accessibility are intertwined. From the data gathered it was found out that distance covered to access water in the Wa municipality is also a problem since the available functioning boreholes in the Municipality are not accessible to some residents considering the distance they cover before fetching from the available boreholes. The 2019 database for Community Water and Sanitation for the Upper West Region also revealed that some residents are locational disadvantage when it comes to accessibility and utilization of potable water in the Wa municipality, by considering their dwelling places and where the available boreholes are situated is quite unusual.
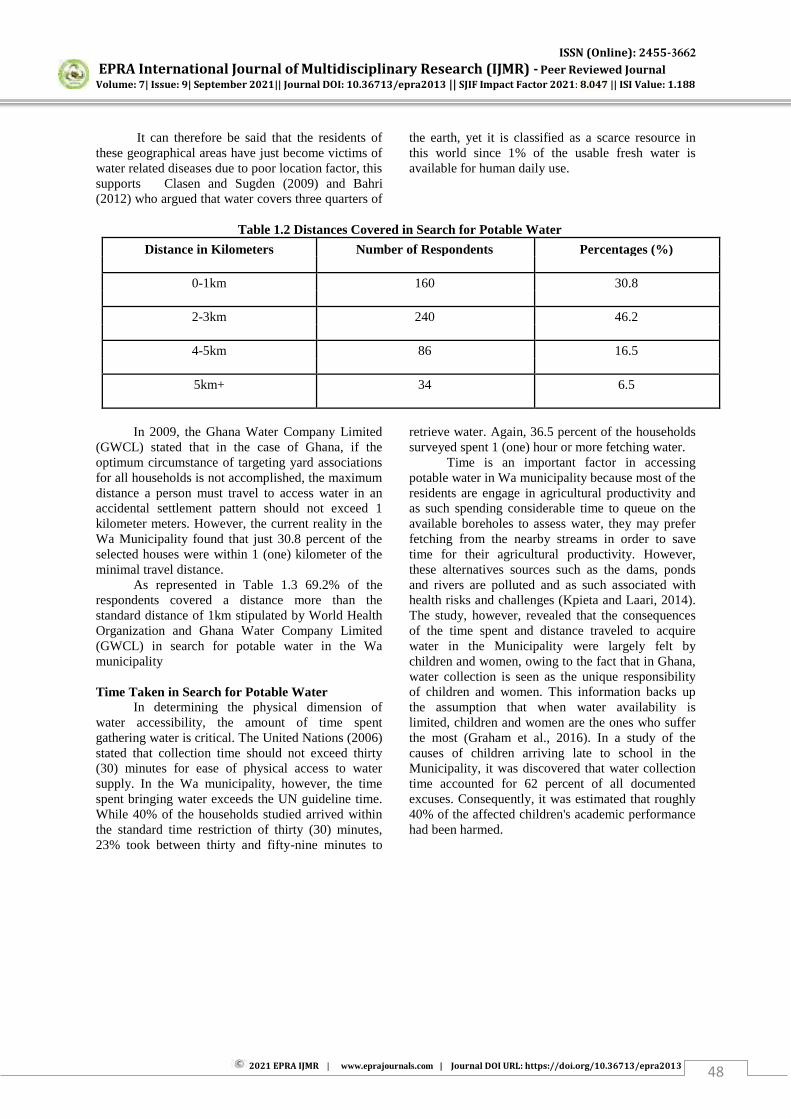
ISSN (Online): 2455-3662
EPRA International Journal of Multidisciplinary Research (IJMR) - Peer Reviewed Journal Volume: 7| Issue: 9| September 2021|| Journal DOI: 10.36713/epra2013 || SJIF Impact Factor 2021: 8.047 || ISI Value: 1.188
2021 EPRA IJMR | www.eprajournals.com | Journal DOI URL: https://doi.org/10.36713/epra2013 48
It can therefore be said that the residents of these geographical areas have just become victims of water related diseases due to poor location factor, this supports Clasen and Sugden (2009) and Bahri (2012) who argued that water covers three quarters of
the earth, yet it is classified as a scarce resource in this world since 1% of the usable fresh water is available for human daily use.
Table 1.2 Distances Covered in Search for Potable Water
Distance in Kilometers Number of Respondents Percentages (%)
0-1km 160 30.8
2-3km 240 46.2
4-5km 86 16.5
5km+ 34 6.5
In 2009, the Ghana Water Company Limited
(GWCL) stated that in the case of Ghana, if the optimum circumstance of targeting yard associations for all households is not accomplished, the maximum distance a person must travel to access water in an accidental settlement pattern should not exceed 1 kilometer meters. However, the current reality in the Wa Municipality found that just 30.8 percent of the selected houses were within 1 (one) kilometer of the minimal travel distance.
As represented in Table 1.3 69.2% of the respondents covered a distance more than the standard distance of 1km stipulated by World Health Organization and Ghana Water Company Limited (GWCL) in search for potable water in the Wa municipality
Time Taken in Search for Potable Water
In determining the physical dimension of water accessibility, the amount of time spent gathering water is critical. The United Nations (2006) stated that collection time should not exceed thirty (30) minutes for ease of physical access to water supply. In the Wa municipality, however, the time spent bringing water exceeds the UN guideline time. While 40% of the households studied arrived within the standard time restriction of thirty (30) minutes, 23% took between thirty and fifty-nine minutes to
retrieve water. Again, 36.5 percent of the households surveyed spent 1 (one) hour or more fetching water.
Time is an important factor in accessing potable water in Wa municipality because most of the residents are engage in agricultural productivity and as such spending considerable time to queue on the available boreholes to assess water, they may prefer fetching from the nearby streams in order to save time for their agricultural productivity. However, these alternatives sources such as the dams, ponds and rivers are polluted and as such associated with health risks and challenges (Kpieta and Laari, 2014). The study, however, revealed that the consequences of the time spent and distance traveled to acquire water in the Municipality were largely felt by children and women, owing to the fact that in Ghana, water collection is seen as the unique responsibility of children and women. This information backs up the assumption that when water availability is limited, children and women are the ones who suffer the most (Graham et al., 2016). In a study of the causes of children arriving late to school in the Municipality, it was discovered that water collection time accounted for 62 percent of all documented excuses. Consequently, it was estimated that roughly 40% of the affected children's academic performance had been harmed.
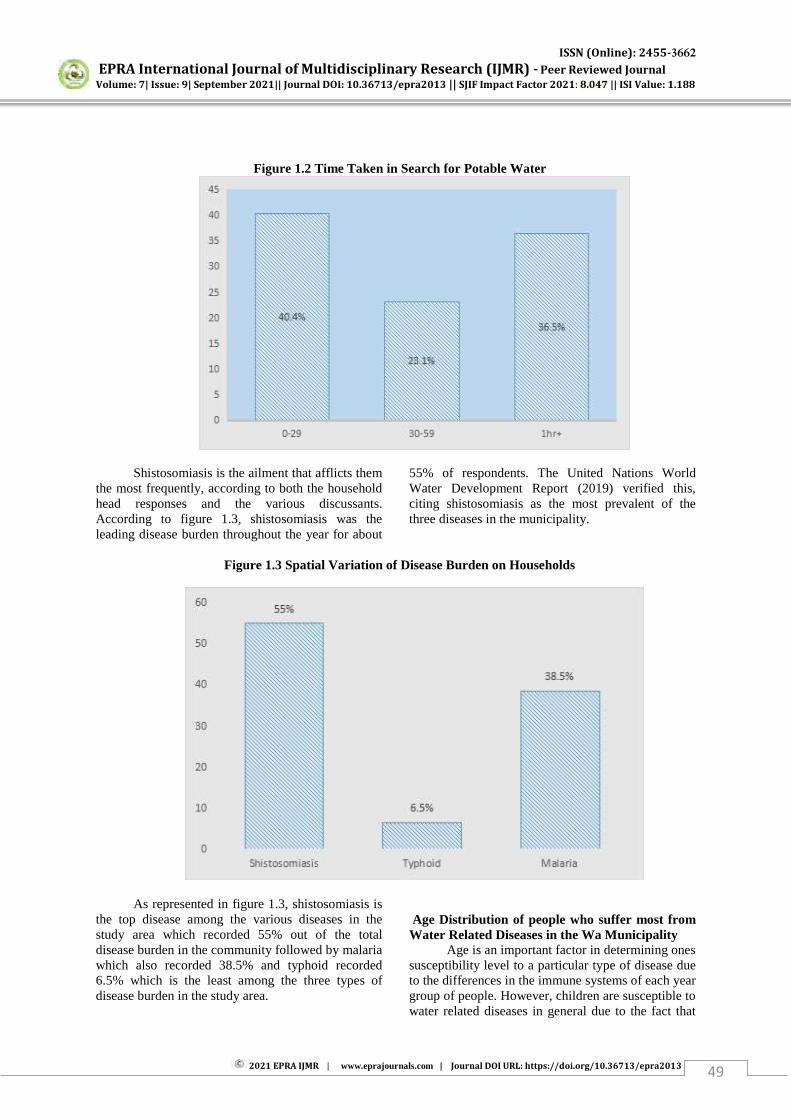
ISSN (Online): 2455-3662
EPRA International Journal of Multidisciplinary Research (IJMR) - Peer Reviewed Journal Volume: 7| Issue: 9| September 2021|| Journal DOI: 10.36713/epra2013 || SJIF Impact Factor 2021: 8.047 || ISI Value: 1.188
2021 EPRA IJMR | www.eprajournals.com | Journal DOI URL: https://doi.org/10.36713/epra2013 49
Figure 1.2 Time Taken in Search for Potable Water
Shistosomiasis is the ailment that afflicts them the most frequently, according to both the household head responses and the various discussants. According to figure 1.3, shistosomiasis was the leading disease burden throughout the year for about
55% of respondents. The United Nations World Water Development Report (2019) verified this, citing shistosomiasis as the most prevalent of the three diseases in the municipality.
Figure 1.3 Spatial Variation of Disease Burden on Households
As represented in figure 1.3, shistosomiasis is the top disease among the various diseases in the study area which recorded 55% out of the total disease burden in the community followed by malaria which also recorded 38.5% and typhoid recorded 6.5% which is the least among the three types of disease burden in the study area.
Age Distribution of people who suffer most from Water Related Diseases in the Wa Municipality
Age is an important factor in determining ones susceptibility level to a particular type of disease due to the differences in the immune systems of each year group of people. However, children are susceptible to water related diseases in general due to the fact that
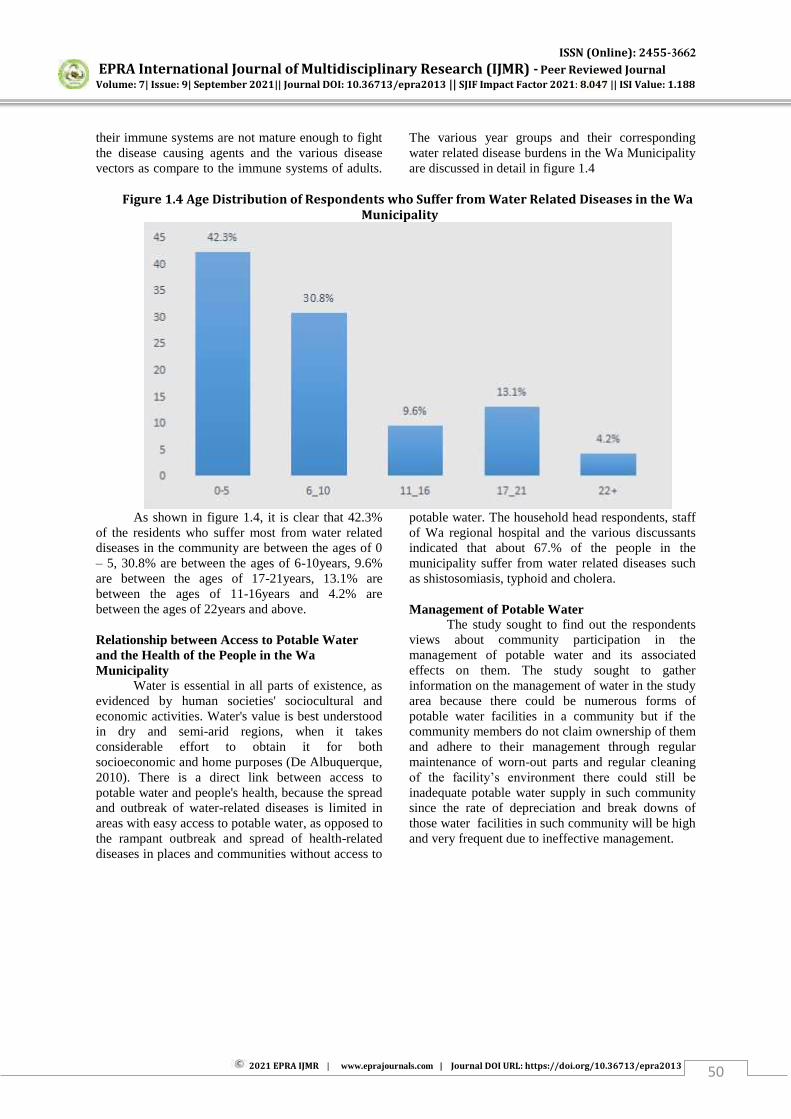
ISSN (Online): 2455-3662
EPRA International Journal of Multidisciplinary Research (IJMR) - Peer Reviewed Journal Volume: 7| Issue: 9| September 2021|| Journal DOI: 10.36713/epra2013 || SJIF Impact Factor 2021: 8.047 || ISI Value: 1.188
2021 EPRA IJMR | www.eprajournals.com | Journal DOI URL: https://doi.org/10.36713/epra2013 50
their immune systems are not mature enough to fight the disease causing agents and the various disease vectors as compare to the immune systems of adults.
The various year groups and their corresponding water related disease burdens in the Wa Municipality are discussed in detail in figure 1.4
Figure 1.4 Age Distribution of Respondents who Suffer from Water Related Diseases in the Wa
Municipality
As shown in figure 1.4, it is clear that 42.3%
of the residents who suffer most from water related diseases in the community are between the ages of 0 – 5, 30.8% are between the ages of 6-10years, 9.6% are between the ages of 17-21years, 13.1% are between the ages of 11-16years and 4.2% are between the ages of 22years and above. Relationship between Access to Potable Water and the Health of the People in the Wa Municipality
Water is essential in all parts of existence, as evidenced by human societies' sociocultural and economic activities. Water's value is best understood in dry and semi-arid regions, when it takes considerable effort to obtain it for both socioeconomic and home purposes (De Albuquerque, 2010). There is a direct link between access to potable water and people's health, because the spread and outbreak of water-related diseases is limited in areas with easy access to potable water, as opposed to the rampant outbreak and spread of health-related diseases in places and communities without access to
potable water. The household head respondents, staff of Wa regional hospital and the various discussants indicated that about 67.% of the people in the municipality suffer from water related diseases such as shistosomiasis, typhoid and cholera. Management of Potable Water
The study sought to find out the respondents views about community participation in the management of potable water and its associated effects on them. The study sought to gather information on the management of water in the study area because there could be numerous forms of potable water facilities in a community but if the community members do not claim ownership of them and adhere to their management through regular maintenance of worn-out parts and regular cleaning of the facility’s environment there could still be
inadequate potable water supply in such community since the rate of depreciation and break downs of those water facilities in such community will be high and very frequent due to ineffective management.
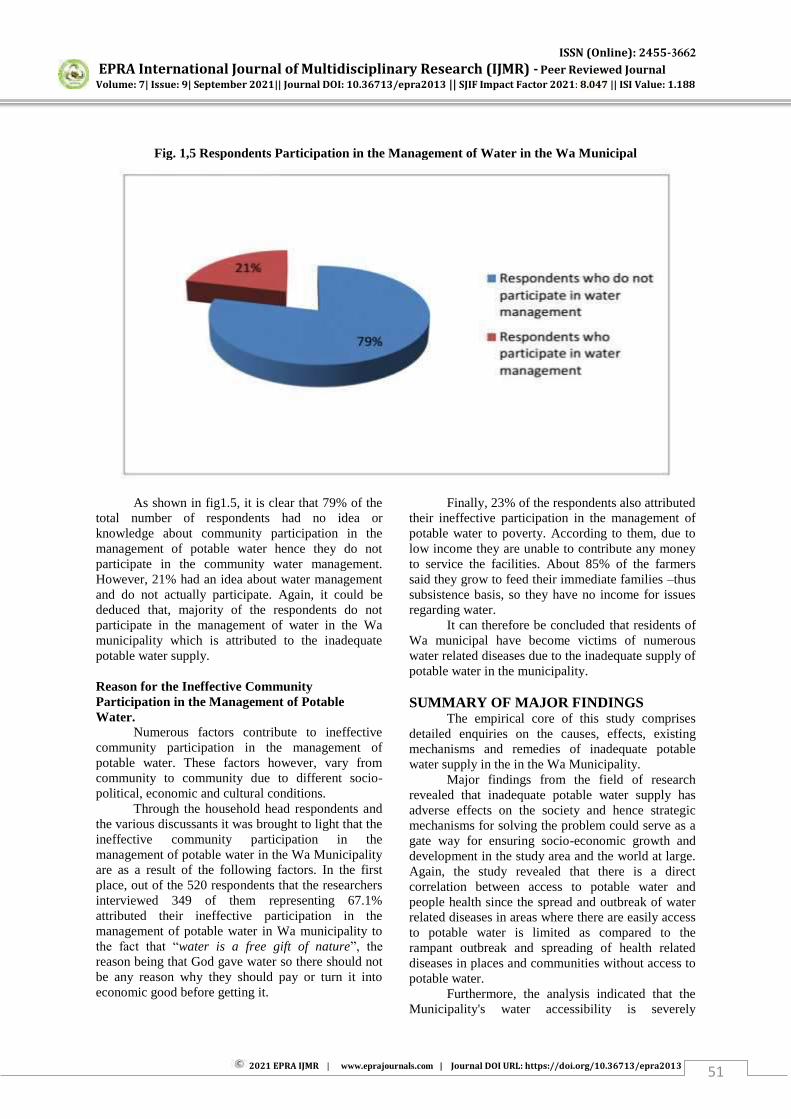
ISSN (Online): 2455-3662
EPRA International Journal of Multidisciplinary Research (IJMR) - Peer Reviewed Journal Volume: 7| Issue: 9| September 2021|| Journal DOI: 10.36713/epra2013 || SJIF Impact Factor 2021: 8.047 || ISI Value: 1.188
2021 EPRA IJMR | www.eprajournals.com | Journal DOI URL: https://doi.org/10.36713/epra2013 51
Fig. 1,5 Respondents Participation in the Management of Water in the Wa Municipal
As shown in fig1.5, it is clear that 79% of the total number of respondents had no idea or knowledge about community participation in the management of potable water hence they do not participate in the community water management. However, 21% had an idea about water management and do not actually participate. Again, it could be deduced that, majority of the respondents do not participate in the management of water in the Wa municipality which is attributed to the inadequate potable water supply. Reason for the Ineffective Community Participation in the Management of Potable Water.
Numerous factors contribute to ineffective community participation in the management of potable water. These factors however, vary from community to community due to different socio-political, economic and cultural conditions.
Through the household head respondents and the various discussants it was brought to light that the ineffective community participation in the management of potable water in the Wa Municipality are as a result of the following factors. In the first place, out of the 520 respondents that the researchers interviewed 349 of them representing 67.1% attributed their ineffective participation in the management of potable water in Wa municipality to the fact that “water is a free gift of nature”, the
reason being that God gave water so there should not be any reason why they should pay or turn it into economic good before getting it.
Finally, 23% of the respondents also attributed their ineffective participation in the management of potable water to poverty. According to them, due to low income they are unable to contribute any money to service the facilities. About 85% of the farmers said they grow to feed their immediate families –thus subsistence basis, so they have no income for issues regarding water.
It can therefore be concluded that residents of Wa municipal have become victims of numerous water related diseases due to the inadequate supply of potable water in the municipality.
SUMMARY OF MAJOR FINDINGS
The empirical core of this study comprises detailed enquiries on the causes, effects, existing mechanisms and remedies of inadequate potable water supply in the in the Wa Municipality.
Major findings from the field of research revealed that inadequate potable water supply has adverse effects on the society and hence strategic mechanisms for solving the problem could serve as a gate way for ensuring socio-economic growth and development in the study area and the world at large. Again, the study revealed that there is a direct correlation between access to potable water and people health since the spread and outbreak of water related diseases in areas where there are easily access to potable water is limited as compared to the rampant outbreak and spreading of health related diseases in places and communities without access to potable water.
Furthermore, the analysis indicated that the Municipality's water accessibility is severely
ISSN (Online): 2455-3662
EPRA International Journal of Multidisciplinary Research (IJMR) - Peer Reviewed Journal Volume: 7| Issue: 9| September 2021|| Journal DOI: 10.36713/epra2013 || SJIF Impact Factor 2021: 8.047 || ISI Value: 1.188
2021 EPRA IJMR | www.eprajournals.com | Journal DOI URL: https://doi.org/10.36713/epra2013 52
hampered on both an economic and physical level. The main institution, Ghana Water Company Limited, which is responsible for providing potable water to Municipal residents, does not have the production capacity to meet the average daily water demand or requirement of 50 to 100 litres per household per day, resulting in only half of the daily water needs being met. It is impossible to overestimate the importance of mankind having access to adequate quantities and quality of drinking water. However, the investigation indicated that in the Municipality, obtaining adequate quantities and quality of water is quite difficult. While the average household daily water requirements of 50 to 100 litres set by the United Nations Children's Fund (2001) and the United Nations in 2006 were not reached, water contamination was a major concern, as was the high cost of water. The study found that all of the tested homes in the Municipality spent between 7% and 10% of their monthly incomes for water, greatly exceeding the United Nations' 2006 recommendation of 3% of household income for water, with low-income households being the hardest hit. This condition not only goes against globally acknowledged indicators, but it also makes it difficult to satisfy other similarly basic human needs. Apart from the Ghana Water Company Limited's incapacity to supply suitable water volumes in the Municipality, the Assembly had also failed to determine the market paid on water by non-governmental commercial water vendors, or make any endeavor to enhance water supply in the Municipality. CONCLUSION
Because of the increased public health risk linked with the usage of dirty water sources such as streams, dams, and rivers by inhabitants of Wa city in Ghana's Upper West Region, inadequate access to potable water is becoming an issue that requires immediate action from all stakeholders. Water stress in the region exacerbates the situation during the region's seven-month dry season, which runs from October to May each year. People consume severely contaminated water from dams, rivers, and streams due to a lack of potable water for domestic use, putting their health at danger. In the municipality, these polluted rivers are also the only source of water for vegetable production and animal watering. Households residing near these sources of water are at a higher risk of contracting infectious and parasitic disorders. The results of this survey show that citing dams and streams in water-stressed communities like Wa and its surrounding communities in the Upper West Region without sufficient boreholes for households' safe drinking water needs is a recipe for increasing the burden of water-related disease on the people.
The following recommendations were given in light of the study's findings. To begin, substantial attention should be paid to increasing the capacity of water provisioning organizations to fulfill demand. Due to the fact that the Ghana Water Company Limited is unable to meet water demand or requirement in the Municipality as revealed by the study, the Municipal Assembly should try to compliment water production capacity in the Municipality, and the activities of private water operators should be controlled to reduce the high price for water in the municipality, in order to avoid exploitation, and also to protect the concern of consumers. This could be achieved through dialogue with the private water suppliers in the municipality.
Moreover, Community Water and Sanitation Agency (CWSA) in collaboration with Ghana Water Works (GWW) should conduct in-service training and seminars for the residents of the Municipality about the needs, importance and roles of community participation in water management system.
REFERENCES
1. Bacho Z.L.F (2001a). From a gift of Nature to an Economic Good. Changing the Perceptions and Management of Drinking Water. Spring Research Series, Published by Spring Centre, University of Dortmund. House. Pall Mall. London.
2. Bahri, A. (2012). Integrated Urban Water Management. Stocskholm: Global Water partnership.
3. Chaplin, S. E. (1999). Cities, sewers and poverty: India’s politics of sanitation. Environment and
Urbanization, 11(1), 145–158. http://dx.doi.org/10.1177/095624789901100123
4. Clasen, F. T., & Cairncross, S. (2004). Household Water Management:. s.l.:Trop. Med. Int.
5. Clasen, T. (2006). Interventions To Improve Water Quality for Preventing Diarrhoea. Cochrane Database Syst. Rev. s.l.:s.n.
6. Clasen, T., & Sugden, S. (2009). Water and sanitation. In R. Detels, R. Beaglehole, M. A. Lansang, & M. Gulliford (Eds.), Oxford textbook of public health, Volume 1: the scope of public health (pp. 159-176). Oxford: Oxford University Press.
7. Cooperative Housing Foundation International. (2010). Sekondi-Takoradi Poverty Map. A Guide to Urban Poverty Reduction in Sekondi-Takoradi. Sekondi-Takoradi: CHF International.
8. De Albuquerque, C. (2010). Report of the Independent Expect on the Issue of Human Rights Obligations Related
9. Catarina de A. (2012). On the Right Track - Good Practices in realizing the rights to water and sanitation, UNESCO WWAP
10. Community water and Sanitation database (DiMES 2011) Upper West Region
11. Creswell, J. W. (2009). Research design; Qualitative, quantitative, and mixed methods approaches (3rd ed.). sage publication, Inc.
ISSN (Online): 2455-3662
EPRA International Journal of Multidisciplinary Research (IJMR) - Peer Reviewed Journal Volume: 7| Issue: 9| September 2021|| Journal DOI: 10.36713/epra2013 || SJIF Impact Factor 2021: 8.047 || ISI Value: 1.188
2021 EPRA IJMR | www.eprajournals.com | Journal DOI URL: https://doi.org/10.36713/epra2013 53
12. Graham J., Hirai M. & Kim S.-S. 2016 An analysis of water collection labor among women and children in 24 sub-Sarahan African countries . PLoS One 11 (6), e0155981 Google Scholar Crossref PubMed
13. Getis and Getis, (2005). The Analysis of Spatial Association by Use of Distance Statistics.
14. Ghana Government, (2003). Ghana poverty Reduction Strategy .AN agenda for growth and development. Accra, Ghana: National Development Planning Commission.
15. Ghana Statistical Service (2010). Population and Housing Census Report.
16. Ghana Statistical Service Report - Wa, Upper West Region (2005).
17. Ghana Water Company Limited. (2009). Ghana Water and Sanitation Sector. Performance Report, Accra: Ministry of Water Resources, Works and Housing
18. Helena L. (2009). Children's Book Review of a Fish out of Water, by Helen Palmer illustrated by P. D. Eastman, 1961, Random House
19. Hubbard B, Sarisky J, Gelting R, Baffigo V, Seminario R, etal. A community demand driven approach toward sustainable water and sanitation infrastructure development. Int J Hyg Environmental Health, (2011).
20. Jérémie T. (2006) Costing MDG Target 10 on Water Supply and Sanitation: Comparative Analysis, Obstacles and Recommendations. World Water Council
21. Kpieta B. A and Laari B. P (2014). Small-Scale Dams Water Quality and the Possible Health Risk to Users of the Water in the Upper West Region of Ghana
22. Loïc F. (2012). Achieving the MDGs for Water and Sanitation in Africa, Cotonou Snyder (2006-2011). Report on water project.
23. 2010 Population and Housing Census District Analytical Report Wa Municipality, (2010).
24. Shedrack R. Nayebare. (2014). A review of Potable water accessibility and Sustainability issues in developing countries.
25. Thebaut J. Produced and directed by J. Thebaut. Redondo Beach, CA: The Chronicles Group; 2005. Running dry.
26. UNICEF & WHO (2015), Progress on Sanitation and Drinking Water 2015 Update and MDG Assessment
27. UNICEF & WHO (2017), Progress on Drinking Water, Sanitation and Hygiene and SDG Baselines.
28. (WHO & UNICEF, 2006 ;) Global Issues In Water, Sanitation, And Health
29. JMP (Joint Monitoring Programme for Water Supply and Sanitation). Progress on drinking water and sanitation: special focus on sanitation. New York and Geneva (2006).
30. United Nation Human Settlement programme (UN-HABITAT) Water and Sanitation in the World’s Cities, Local Action for Global Goals,
Earthscan Publication LTD, London. Sterling, VA. (2006).
31. UN (United Nations). World water development report, determining the true value of the ‘blue
gold’ we need to protect. New York: UNESCO
and Earthscan; 2021. 32. The United Nations World Water Development
Report, Leaving no one behind, New York: UNESCO and Earthscan; (2019).
33. United Nation Millennium Summit (2000) Report on MDG II.
34. United Nations Children’s Fund (UNICEF).
(2001). Safe Drinking Water, New York, NY. 35. Volker H. (2007). Children and the Right to
Water. Switzerland. 36. Wilson, F.J. (1998). Making Waste Work; A
Strategy for Sustainable Development. Int’l
Journal of Environmental Science & Management. Vol. 6(8). 114 -118.
37. World Bank Report on Water (2019). Worsening Water Quality Reducing Economic Growth by a Third in Some Countries.
38. World Health Organisation & UNICEF. (2006). Meeting the MDG Drinking Water and Sanitation Target: The Urban and Rural Challenge of the Decade. Geneva: WHO Press.
39. World Health Organisation. (2004). Meeting the MDG Drinking Water and A Mid-Term Assessment of Progress; Geneva:
ISSN (Online): 2455-3662
EPRA International Journal of Multidisciplinary Research (IJMR) - Peer Reviewed Journal Volume: 7| Issue: 9| September 2021|| Journal DOI: 10.36713/epra2013 || SJIF Impact Factor 2021: 8.047 || ISI Value: 1.188
2021 EPRA IJMR | www.eprajournals.com | Journal DOI URL: https://doi.org/10.36713/epra2013 54
A REVIEW ON GAS CONSUMPTION AND GAS
PREDICTION IN ETHEREUM SMART CONTRACTS
Kuldeep Nageshawar1, Rupali chourey2, Dr. Ritu Shrivastava3
1Research Scholar, Department of Computer Science and Engineering, Sagar Institute of Research & Technology, Bhopal, India
2Asst. Professor, Department of Computer Science and Engineering,
Sagar Institute of Research & Technology, Bhopal, India
3Dean & HOD, Department of Computer Science and Engineering, Sagar Institute of Research & Technology, Bhopal, India
Article DOI: https://doi.org/10.36713/epra8349 DOI No: 10.36713/epra8349
ABSTRACT
This paper is a review of some real-time issues associated with the development of Ethereum smart contracts like out of gas exception and gas inefficient code patterns and focuses on the methods and solutions presented in recent years. With the help of this paper, we are trying to summarize the methods which can be used in future researches for gas prediction with the help of old transaction data and machine learning algorithms and have a look at old researches which are trying to predict with the help of regression algorithms and their efficiency. KEYWORDS: Blockchain, Etherium, Gas Consumption, Gas Prediction, Transaction
I. INTRODUCTION Ethereum is a blockchain-based software platform that is primarily used to support the world’s second-largest cryptocurrency by market capitalization after Bitcoin. Value exchange is the main use case of the Ethereum blockchain today, often via the blockchain’s native
token, ether. Ethereum uses smart contracts to leverage the benefits of blockchain. Unlike other blockchains, Ethereum is programmable using a Turing complete language[1], i.e., developers can code smart contracts that control digital value, run exactly as programmed, and are immutable. Every single operation in smart contracts requires some amount of gas to execute in an Ethereum virtual machine.
II. BACKGROUND Blockchain Blockchain is a tamper evident and tamper resistance digital ledger implemented in a distributed fashion and usually without a central authority. It enables a community of users to record transactions in a shared ledger within that community.
In 2008, the Blockchain idea was combined with several other technologies and computing concepts to create modern cryptocurrencies: electronic cash protected through cryptographic mechanisms instead of a central repository or authority. It allowed users to securely transfer crypto-currencies, known as “Bitcoins” without a centralized regulator. Besides,
Ethereum, NXT, and Hyperledger Fabric were also proposed as blockchain-based systems used for the cryptocurrency [2].In Bitcoin the transfer of digital money takes place in a distributed system. Bitcoin users can digitally sign and transfer their rights to that information to another user and the Bit-coin blockchain records this transfer publicly, allowing all participants of the network to independently verify the validity of the transactions. Trust in the Bitcoin network is maintained by the 4 essential properties.
● Ledger – the technology uses an append-only ledger to provide full transactional history. Unlike traditional databases, transactions and values in a blockchain are not overridden.
● Secure – blockchains are cryptographically secure, ensuring that the data contained within
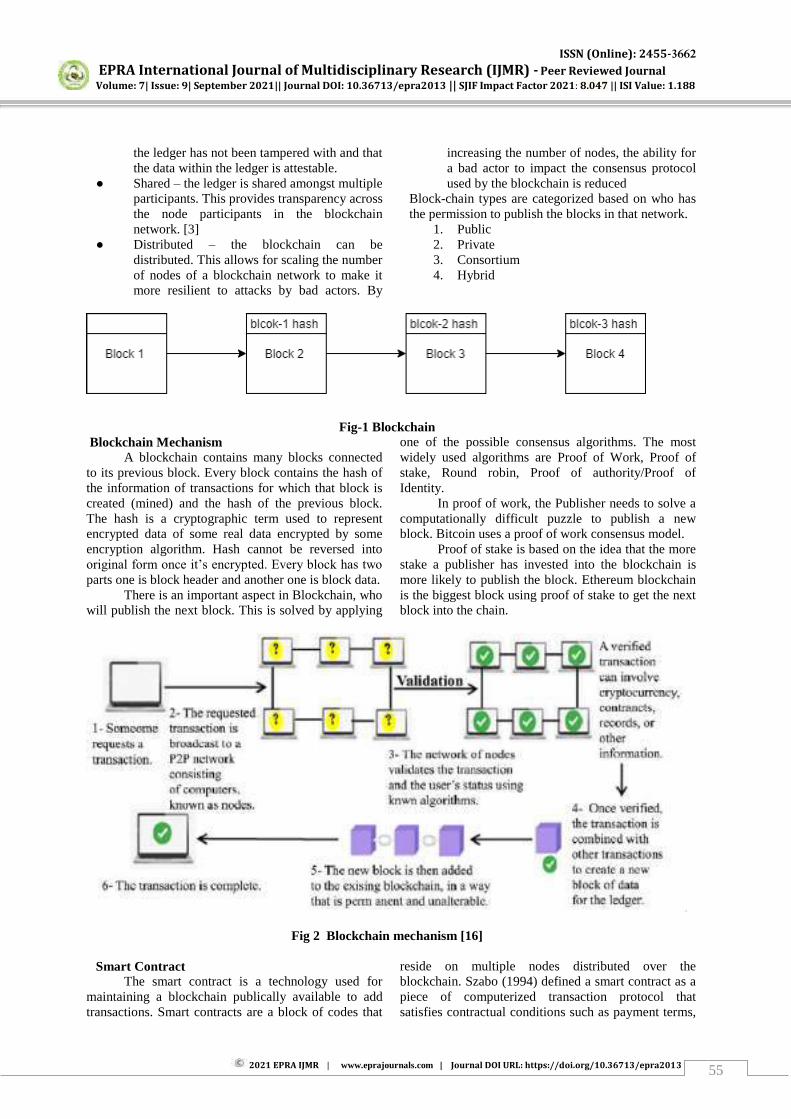
ISSN (Online): 2455-3662
EPRA International Journal of Multidisciplinary Research (IJMR) - Peer Reviewed Journal Volume: 7| Issue: 9| September 2021|| Journal DOI: 10.36713/epra2013 || SJIF Impact Factor 2021: 8.047 || ISI Value: 1.188
2021 EPRA IJMR | www.eprajournals.com | Journal DOI URL: https://doi.org/10.36713/epra2013 55
the ledger has not been tampered with and that the data within the ledger is attestable.
● Shared – the ledger is shared amongst multiple participants. This provides transparency across the node participants in the blockchain network. [3]
● Distributed – the blockchain can be distributed. This allows for scaling the number of nodes of a blockchain network to make it more resilient to attacks by bad actors. By
increasing the number of nodes, the ability for a bad actor to impact the consensus protocol used by the blockchain is reduced
Block-chain types are categorized based on who has the permission to publish the blocks in that network.
1. Public 2. Private 3. Consortium 4. Hybrid
Fig-1 Blockchain
Blockchain Mechanism A blockchain contains many blocks connected
to its previous block. Every block contains the hash of the information of transactions for which that block is created (mined) and the hash of the previous block. The hash is a cryptographic term used to represent encrypted data of some real data encrypted by some encryption algorithm. Hash cannot be reversed into original form once it’s encrypted. Every block has two
parts one is block header and another one is block data. There is an important aspect in Blockchain, who
will publish the next block. This is solved by applying
one of the possible consensus algorithms. The most widely used algorithms are Proof of Work, Proof of stake, Round robin, Proof of authority/Proof of Identity.
In proof of work, the Publisher needs to solve a computationally difficult puzzle to publish a new block. Bitcoin uses a proof of work consensus model.
Proof of stake is based on the idea that the more stake a publisher has invested into the blockchain is more likely to publish the block. Ethereum blockchain is the biggest block using proof of stake to get the next block into the chain.
Fig 2 Blockchain mechanism [16] Smart Contract
The smart contract is a technology used for maintaining a blockchain publically available to add transactions. Smart contracts are a block of codes that
reside on multiple nodes distributed over the blockchain. Szabo (1994) defined a smart contract as a piece of computerized transaction protocol that satisfies contractual conditions such as payment terms,
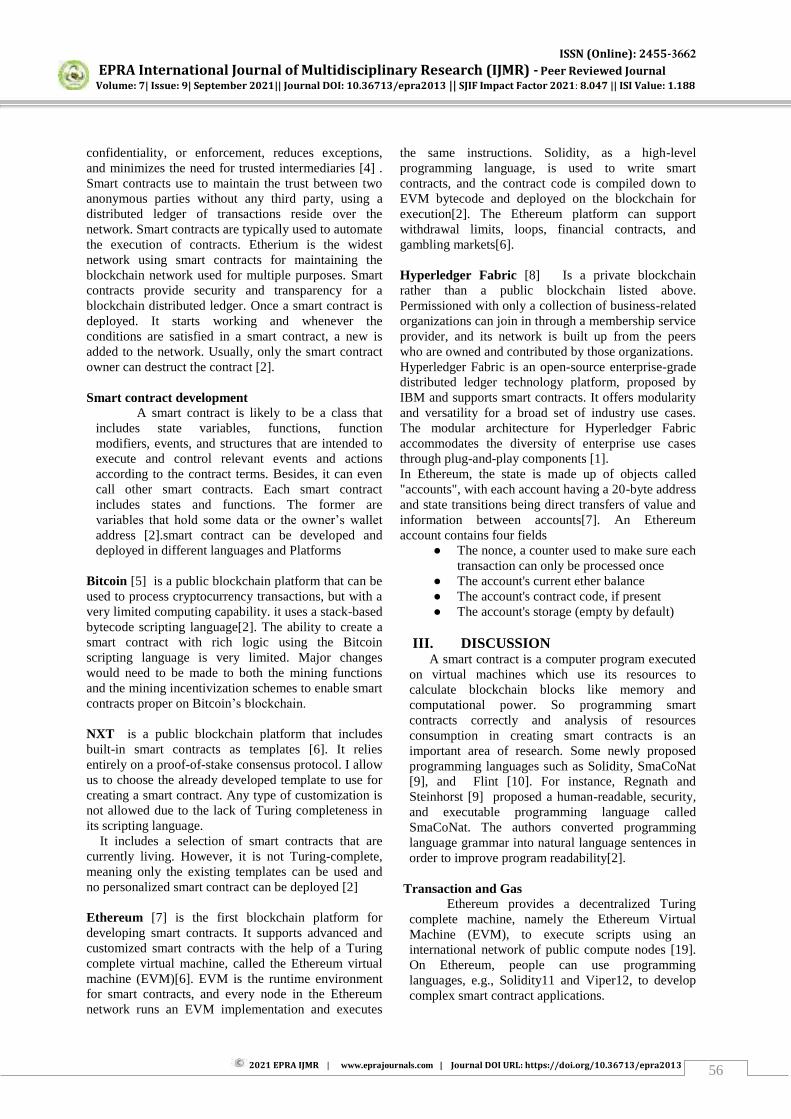
ISSN (Online): 2455-3662
EPRA International Journal of Multidisciplinary Research (IJMR) - Peer Reviewed Journal Volume: 7| Issue: 9| September 2021|| Journal DOI: 10.36713/epra2013 || SJIF Impact Factor 2021: 8.047 || ISI Value: 1.188
2021 EPRA IJMR | www.eprajournals.com | Journal DOI URL: https://doi.org/10.36713/epra2013 56
confidentiality, or enforcement, reduces exceptions, and minimizes the need for trusted intermediaries [4] . Smart contracts use to maintain the trust between two anonymous parties without any third party, using a distributed ledger of transactions reside over the network. Smart contracts are typically used to automate the execution of contracts. Etherium is the widest network using smart contracts for maintaining the blockchain network used for multiple purposes. Smart contracts provide security and transparency for a blockchain distributed ledger. Once a smart contract is deployed. It starts working and whenever the conditions are satisfied in a smart contract, a new is added to the network. Usually, only the smart contract owner can destruct the contract [2]. Smart contract development
A smart contract is likely to be a class that includes state variables, functions, function modifiers, events, and structures that are intended to execute and control relevant events and actions according to the contract terms. Besides, it can even call other smart contracts. Each smart contract includes states and functions. The former are variables that hold some data or the owner’s wallet
address [2].smart contract can be developed and deployed in different languages and Platforms
Bitcoin [5] is a public blockchain platform that can be used to process cryptocurrency transactions, but with a very limited computing capability. it uses a stack-based bytecode scripting language[2]. The ability to create a smart contract with rich logic using the Bitcoin scripting language is very limited. Major changes would need to be made to both the mining functions and the mining incentivization schemes to enable smart contracts proper on Bitcoin’s blockchain. NXT is a public blockchain platform that includes built-in smart contracts as templates [6]. It relies entirely on a proof-of-stake consensus protocol. I allow us to choose the already developed template to use for creating a smart contract. Any type of customization is not allowed due to the lack of Turing completeness in its scripting language. It includes a selection of smart contracts that are currently living. However, it is not Turing-complete, meaning only the existing templates can be used and no personalized smart contract can be deployed [2] Ethereum [7] is the first blockchain platform for developing smart contracts. It supports advanced and customized smart contracts with the help of a Turing complete virtual machine, called the Ethereum virtual machine (EVM)[6]. EVM is the runtime environment for smart contracts, and every node in the Ethereum network runs an EVM implementation and executes
the same instructions. Solidity, as a high-level programming language, is used to write smart contracts, and the contract code is compiled down to EVM bytecode and deployed on the blockchain for execution[2]. The Ethereum platform can support withdrawal limits, loops, financial contracts, and gambling markets[6]. Hyperledger Fabric [8] Is a private blockchain rather than a public blockchain listed above. Permissioned with only a collection of business-related organizations can join in through a membership service provider, and its network is built up from the peers who are owned and contributed by those organizations. Hyperledger Fabric is an open-source enterprise-grade distributed ledger technology platform, proposed by IBM and supports smart contracts. It offers modularity and versatility for a broad set of industry use cases. The modular architecture for Hyperledger Fabric accommodates the diversity of enterprise use cases through plug-and-play components [1]. In Ethereum, the state is made up of objects called "accounts", with each account having a 20-byte address and state transitions being direct transfers of value and information between accounts[7]. An Ethereum account contains four fields
● The nonce, a counter used to make sure each transaction can only be processed once
● The account's current ether balance ● The account's contract code, if present ● The account's storage (empty by default)
III. DISCUSSION A smart contract is a computer program executed on virtual machines which use its resources to calculate blockchain blocks like memory and computational power. So programming smart contracts correctly and analysis of resources consumption in creating smart contracts is an important area of research. Some newly proposed programming languages such as Solidity, SmaCoNat [9], and Flint [10]. For instance, Regnath and Steinhorst [9] proposed a human-readable, security, and executable programming language called SmaCoNat. The authors converted programming language grammar into natural language sentences in order to improve program readability[2].
Transaction and Gas
Ethereum provides a decentralized Turing complete machine, namely the Ethereum Virtual Machine (EVM), to execute scripts using an international network of public compute nodes [19]. On Ethereum, people can use programming languages, e.g., Solidity11 and Viper12, to develop complex smart contract applications.
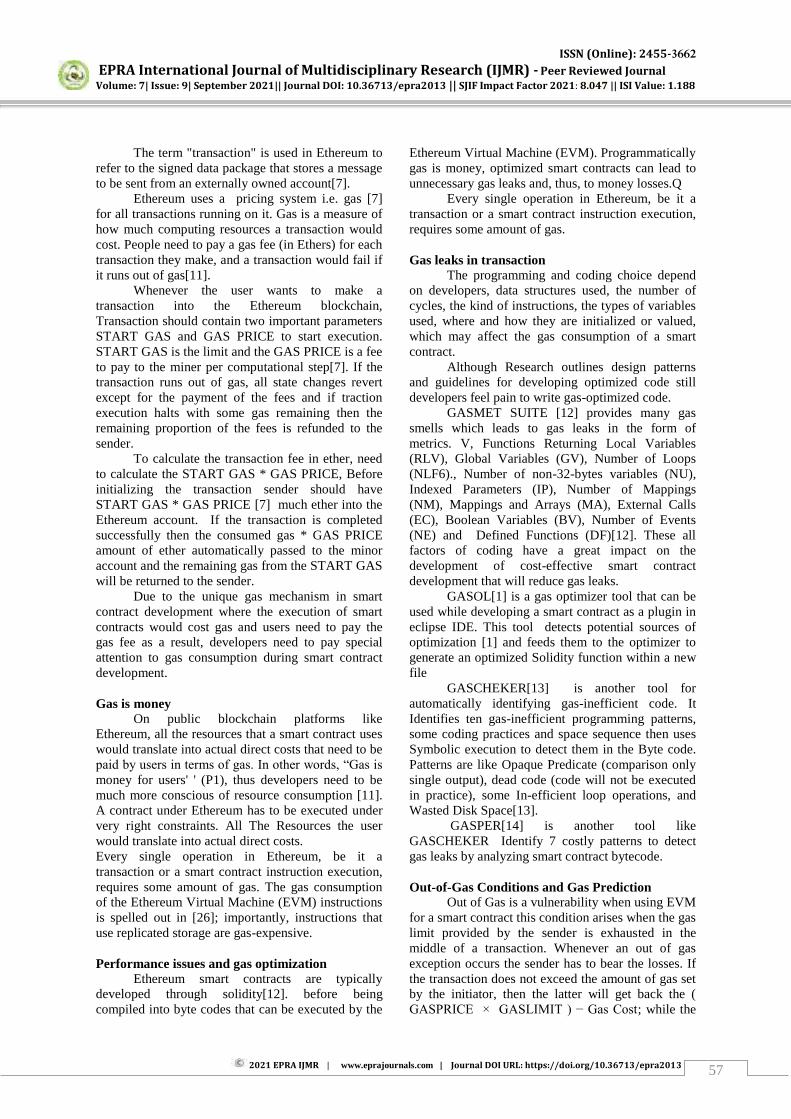
ISSN (Online): 2455-3662
EPRA International Journal of Multidisciplinary Research (IJMR) - Peer Reviewed Journal Volume: 7| Issue: 9| September 2021|| Journal DOI: 10.36713/epra2013 || SJIF Impact Factor 2021: 8.047 || ISI Value: 1.188
2021 EPRA IJMR | www.eprajournals.com | Journal DOI URL: https://doi.org/10.36713/epra2013 57
The term "transaction" is used in Ethereum to refer to the signed data package that stores a message to be sent from an externally owned account[7].
Ethereum uses a pricing system i.e. gas [7] for all transactions running on it. Gas is a measure of how much computing resources a transaction would cost. People need to pay a gas fee (in Ethers) for each transaction they make, and a transaction would fail if it runs out of gas[11].
Whenever the user wants to make a transaction into the Ethereum blockchain, Transaction should contain two important parameters START GAS and GAS PRICE to start execution. START GAS is the limit and the GAS PRICE is a fee to pay to the miner per computational step[7]. If the transaction runs out of gas, all state changes revert except for the payment of the fees and if traction execution halts with some gas remaining then the remaining proportion of the fees is refunded to the sender.
To calculate the transaction fee in ether, need to calculate the START GAS * GAS PRICE, Before initializing the transaction sender should have START GAS * GAS PRICE [7] much ether into the Ethereum account. If the transaction is completed successfully then the consumed gas * GAS PRICE amount of ether automatically passed to the minor account and the remaining gas from the START GAS will be returned to the sender.
Due to the unique gas mechanism in smart contract development where the execution of smart contracts would cost gas and users need to pay the gas fee as a result, developers need to pay special attention to gas consumption during smart contract development.
Gas is money
On public blockchain platforms like Ethereum, all the resources that a smart contract uses would translate into actual direct costs that need to be paid by users in terms of gas. In other words, “Gas is
money for users' ' (P1), thus developers need to be much more conscious of resource consumption [11]. A contract under Ethereum has to be executed under very right constraints. All The Resources the user would translate into actual direct costs. Every single operation in Ethereum, be it a transaction or a smart contract instruction execution, requires some amount of gas. The gas consumption of the Ethereum Virtual Machine (EVM) instructions is spelled out in [26]; importantly, instructions that use replicated storage are gas-expensive.
Performance issues and gas optimization
Ethereum smart contracts are typically developed through solidity[12]. before being compiled into byte codes that can be executed by the
Ethereum Virtual Machine (EVM). Programmatically gas is money, optimized smart contracts can lead to unnecessary gas leaks and, thus, to money losses.Q
Every single operation in Ethereum, be it a transaction or a smart contract instruction execution, requires some amount of gas.
Gas leaks in transaction
The programming and coding choice depend on developers, data structures used, the number of cycles, the kind of instructions, the types of variables used, where and how they are initialized or valued, which may affect the gas consumption of a smart contract.
Although Research outlines design patterns and guidelines for developing optimized code still developers feel pain to write gas-optimized code.
GASMET SUITE [12] provides many gas smells which leads to gas leaks in the form of metrics. V, Functions Returning Local Variables (RLV), Global Variables (GV), Number of Loops (NLF6)., Number of non-32-bytes variables (NU), Indexed Parameters (IP), Number of Mappings (NM), Mappings and Arrays (MA), External Calls (EC), Boolean Variables (BV), Number of Events (NE) and Defined Functions (DF)[12]. These all factors of coding have a great impact on the development of cost-effective smart contract development that will reduce gas leaks.
GASOL[1] is a gas optimizer tool that can be used while developing a smart contract as a plugin in eclipse IDE. This tool detects potential sources of optimization [1] and feeds them to the optimizer to generate an optimized Solidity function within a new file
GASCHEKER[13] is another tool for automatically identifying gas-inefficient code. It Identifies ten gas-inefficient programming patterns, some coding practices and space sequence then uses Symbolic execution to detect them in the Byte code. Patterns are like Opaque Predicate (comparison only single output), dead code (code will not be executed in practice), some In-efficient loop operations, and Wasted Disk Space[13].
GASPER[14] is another tool like GASCHEKER Identify 7 costly patterns to detect gas leaks by analyzing smart contract bytecode.
Out-of-Gas Conditions and Gas Prediction
Out of Gas is a vulnerability when using EVM for a smart contract this condition arises when the gas limit provided by the sender is exhausted in the middle of a transaction. Whenever an out of gas exception occurs the sender has to bear the losses. If the transaction does not exceed the amount of gas set by the initiator, then the latter will get back the ( GASPRICE × GASLIMIT ) − Gas Cost; while the
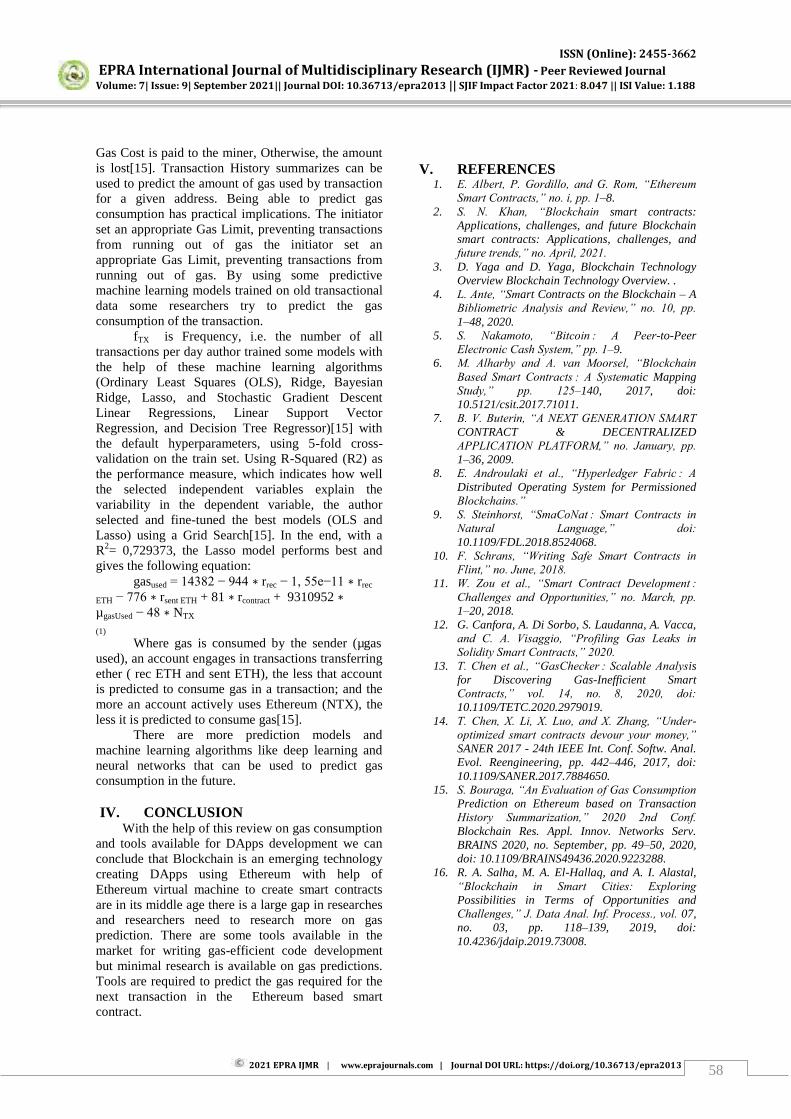
ISSN (Online): 2455-3662
EPRA International Journal of Multidisciplinary Research (IJMR) - Peer Reviewed Journal Volume: 7| Issue: 9| September 2021|| Journal DOI: 10.36713/epra2013 || SJIF Impact Factor 2021: 8.047 || ISI Value: 1.188
2021 EPRA IJMR | www.eprajournals.com | Journal DOI URL: https://doi.org/10.36713/epra2013 58
Gas Cost is paid to the miner, Otherwise, the amount is lost[15]. Transaction History summarizes can be used to predict the amount of gas used by transaction for a given address. Being able to predict gas consumption has practical implications. The initiator set an appropriate Gas Limit, preventing transactions from running out of gas the initiator set an appropriate Gas Limit, preventing transactions from running out of gas. By using some predictive machine learning models trained on old transactional data some researchers try to predict the gas consumption of the transaction.
fTX is Frequency, i.e. the number of all transactions per day author trained some models with the help of these machine learning algorithms (Ordinary Least Squares (OLS), Ridge, Bayesian Ridge, Lasso, and Stochastic Gradient Descent Linear Regressions, Linear Support Vector Regression, and Decision Tree Regressor)[15] with the default hyperparameters, using 5-fold cross-validation on the train set. Using R-Squared (R2) as the performance measure, which indicates how well the selected independent variables explain the variability in the dependent variable, the author selected and fine-tuned the best models (OLS and Lasso) using a Grid Search[15]. In the end, with a R2= 0,729373, the Lasso model performs best and gives the following equation:
gasused = 14382 − 944 ∗ rrec − 1, 55e−11 ∗ rrec
ETH − 776 ∗ rsent ETH + 81 ∗ rcontract + 9310952 ∗ µgasUsed − 48 ∗ NTX
(1)
Where gas is consumed by the sender (µgas used), an account engages in transactions transferring ether ( rec ETH and sent ETH), the less that account is predicted to consume gas in a transaction; and the more an account actively uses Ethereum (NTX), the less it is predicted to consume gas[15].
There are more prediction models and machine learning algorithms like deep learning and neural networks that can be used to predict gas consumption in the future.
IV. CONCLUSION
With the help of this review on gas consumption and tools available for DApps development we can conclude that Blockchain is an emerging technology creating DApps using Ethereum with help of Ethereum virtual machine to create smart contracts are in its middle age there is a large gap in researches and researchers need to research more on gas prediction. There are some tools available in the market for writing gas-efficient code development but minimal research is available on gas predictions. Tools are required to predict the gas required for the next transaction in the Ethereum based smart contract.
V. REFERENCES
1. E. Albert, P. Gordillo, and G. Rom, “Ethereum
Smart Contracts,” no. i, pp. 1–8. 2. S. N. Khan, “Blockchain smart contracts:
Applications, challenges, and future Blockchain smart contracts: Applications, challenges, and future trends,” no. April, 2021.
3. D. Yaga and D. Yaga, Blockchain Technology Overview Blockchain Technology Overview. .
4. L. Ante, “Smart Contracts on the Blockchain – A Bibliometric Analysis and Review,” no. 10, pp.
1–48, 2020. 5. S. Nakamoto, “Bitcoin : A Peer-to-Peer
Electronic Cash System,” pp. 1–9. 6. M. Alharby and A. van Moorsel, “Blockchain
Based Smart Contracts : A Systematic Mapping Study,” pp. 125–140, 2017, doi: 10.5121/csit.2017.71011.
7. B. V. Buterin, “A NEXT GENERATION SMART
CONTRACT & DECENTRALIZED APPLICATION PLATFORM,” no. January, pp.
1–36, 2009. 8. E. Androulaki et al., “Hyperledger Fabric : A
Distributed Operating System for Permissioned Blockchains.”
9. S. Steinhorst, “SmaCoNat : Smart Contracts in
Natural Language,” doi:
10.1109/FDL.2018.8524068. 10. F. Schrans, “Writing Safe Smart Contracts in
Flint,” no. June, 2018. 11. W. Zou et al., “Smart Contract Development :
Challenges and Opportunities,” no. March, pp.
1–20, 2018. 12. G. Canfora, A. Di Sorbo, S. Laudanna, A. Vacca,
and C. A. Visaggio, “Profiling Gas Leaks in
Solidity Smart Contracts,” 2020. 13. T. Chen et al., “GasChecker : Scalable Analysis
for Discovering Gas-Inefficient Smart Contracts,” vol. 14, no. 8, 2020, doi:
10.1109/TETC.2020.2979019. 14. T. Chen, X. Li, X. Luo, and X. Zhang, “Under-
optimized smart contracts devour your money,”
SANER 2017 - 24th IEEE Int. Conf. Softw. Anal. Evol. Reengineering, pp. 442–446, 2017, doi: 10.1109/SANER.2017.7884650.
15. S. Bouraga, “An Evaluation of Gas Consumption
Prediction on Ethereum based on Transaction History Summarization,” 2020 2nd Conf.
Blockchain Res. Appl. Innov. Networks Serv. BRAINS 2020, no. September, pp. 49–50, 2020, doi: 10.1109/BRAINS49436.2020.9223288.
16. R. A. Salha, M. A. El-Hallaq, and A. I. Alastal, “Blockchain in Smart Cities: Exploring
Possibilities in Terms of Opportunities and Challenges,” J. Data Anal. Inf. Process., vol. 07, no. 03, pp. 118–139, 2019, doi: 10.4236/jdaip.2019.73008.

ISSN (Online): 2455-3662
EPRA International Journal of Multidisciplinary Research (IJMR) - Peer Reviewed Journal Volume: 7| Issue: 9| September 2021|| Journal DOI: 10.36713/epra2013 || SJIF Impact Factor 2021: 8.047 || ISI Value: 1.188
2021 EPRA IJMR | www.eprajournals.com | Journal DOI URL: https://doi.org/10.36713/epra2013 59
VARIATIONS IN SEX RATIO OF INDIA:
OBSERVATIONS FROM 2011 CENSUS
Dr.T.Chandrasekarayya1, Prof. I. V. Lalitha Kumari2
1Associate Professor, Dept. of Population Studies, S.V.University, Tirupati-517502.
2Dept. of Social Work, Sri Padmavati Mahila Visvavidyalayam,Tirupai-517502
ABSTRACT Sex composition of the human population is one of the basic demographic characteristics of any society. Changes in the sex composition largely reflect the underlying socio-economic and cultural patterns of society in different ways. It is primarily determined by past fertility, mortality and migration rates. Moreover, it plays crucial role in deciding the future vital events such as births, deaths, migration, marriage, population growth and workforce etc. Hence, it received major attention by planners, policy-makers, social activities and others. The paper is aimed at examining the variations in sex ratios of India based on secondary collected from census of India, 2011 and civil registration system. Differences in sex ratios are observed by residence, age-group, religion and sex ratio at birth in India and bigger states. KEYWORDS: Sex Ratio, Residence, Age-group, Religion, Sex ratio at birth and Mortality rate
INTRODUCTION Sex ratio is a valuable source for finding the population of women in India and what is the ratio of women to that of men in India. Analysis of population composition from perspective is very central in under sting nitty-gritty of social structure of a society and also very crucial for framing policy intervention. It is an important and useful indicator to assess relative excess of deficit of men or women in a given population at that point of time. Two major factors play a crucial role in shaping the population composition, one attributes to biological or natural causes (fertility/mortality) and the other one attributes to human behaviour (migration). An attempt is made in this paper to understand the variation in sex ration of India and bigger states by residence, by age-group, by religion and sex ratio at birth. In India, Sex ratio is defined as the number of females per 1000 males in the population, whereas in almost all the United Nation publication/ international publications, it is expressed as males to per 100 females. During the post-Independence period from 1951 to 2011, sex ratio in rural India has decreased from 965 to 946 and increased from 860 to 929 in urban India, but lower than rural areas. At all India level, the sex ratio has decreased from 946 in 1951 to 943 in 2011 and it varied among bigger states.
Sex ratio variations can be due to difference in mortality rate, migration, sex ratio at birth and at times the undercounting of women at the time of population enumeration. It is commonly understood that males and females in the population balance each other in number. According to United Nation estimates; the world had 986 females against 1000 males in 2000. Except Indonesia and Japan, all other Asian countries have low sex ratios. However, most of the developed European countries have high sex ratio. Interestingly the sheer weight of the population of the four Asian countries, particularly China (944) and India (933) with low sex ratio contributes to the preponderance of males over females in world. In the Population Census of 2011, the sex ratio shows an upward trend from the census 2001 data. Census 2001 revealed that there were 933 females to that of 1000 males. Since decades India has seen a decrease in the sex ratio 2011, but since the last two of the decades there has been in slight increase in the sex ratio. Since last five decades, the sex ratio has been moving around 930 of females to that of 1000 of males.
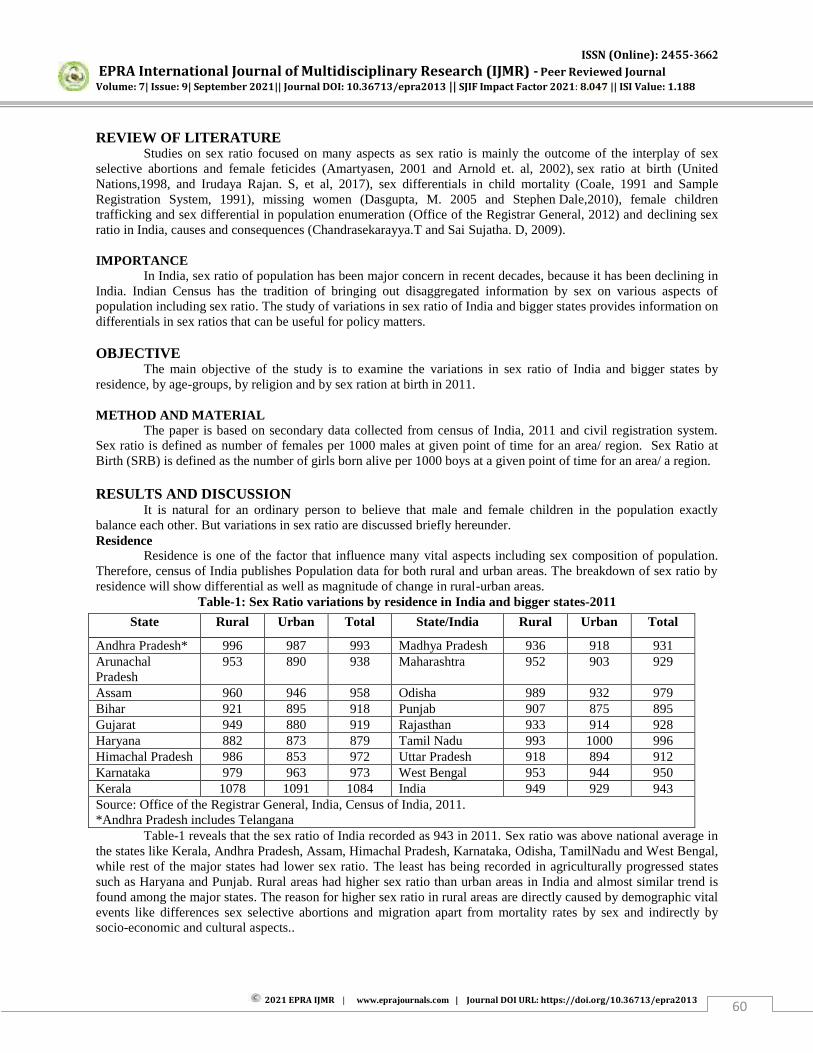
ISSN (Online): 2455-3662
EPRA International Journal of Multidisciplinary Research (IJMR) - Peer Reviewed Journal Volume: 7| Issue: 9| September 2021|| Journal DOI: 10.36713/epra2013 || SJIF Impact Factor 2021: 8.047 || ISI Value: 1.188
2021 EPRA IJMR | www.eprajournals.com | Journal DOI URL: https://doi.org/10.36713/epra2013 60
REVIEW OF LITERATURE Studies on sex ratio focused on many aspects as sex ratio is mainly the outcome of the interplay of sex
selective abortions and female feticides (Amartyasen, 2001 and Arnold et. al, 2002), sex ratio at birth (United Nations,1998, and Irudaya Rajan. S, et al, 2017), sex differentials in child mortality (Coale, 1991 and Sample Registration System, 1991), missing women (Dasgupta, M. 2005 and Stephen Dale,2010), female children trafficking and sex differential in population enumeration (Office of the Registrar General, 2012) and declining sex ratio in India, causes and consequences (Chandrasekarayya.T and Sai Sujatha. D, 2009). IMPORTANCE
In India, sex ratio of population has been major concern in recent decades, because it has been declining in India. Indian Census has the tradition of bringing out disaggregated information by sex on various aspects of population including sex ratio. The study of variations in sex ratio of India and bigger states provides information on differentials in sex ratios that can be useful for policy matters. OBJECTIVE The main objective of the study is to examine the variations in sex ratio of India and bigger states by residence, by age-groups, by religion and by sex ration at birth in 2011. METHOD AND MATERIAL
The paper is based on secondary data collected from census of India, 2011 and civil registration system. Sex ratio is defined as number of females per 1000 males at given point of time for an area/ region. Sex Ratio at Birth (SRB) is defined as the number of girls born alive per 1000 boys at a given point of time for an area/ a region. RESULTS AND DISCUSSION
It is natural for an ordinary person to believe that male and female children in the population exactly balance each other. But variations in sex ratio are discussed briefly hereunder. Residence
Residence is one of the factor that influence many vital aspects including sex composition of population. Therefore, census of India publishes Population data for both rural and urban areas. The breakdown of sex ratio by residence will show differential as well as magnitude of change in rural-urban areas.
Table-1: Sex Ratio variations by residence in India and bigger states-2011
Table-1 reveals that the sex ratio of India recorded as 943 in 2011. Sex ratio was above national average in the states like Kerala, Andhra Pradesh, Assam, Himachal Pradesh, Karnataka, Odisha, TamilNadu and West Bengal, while rest of the major states had lower sex ratio. The least has being recorded in agriculturally progressed states such as Haryana and Punjab. Rural areas had higher sex ratio than urban areas in India and almost similar trend is found among the major states. The reason for higher sex ratio in rural areas are directly caused by demographic vital events like differences sex selective abortions and migration apart from mortality rates by sex and indirectly by socio-economic and cultural aspects..
State Rural Urban Total State/India Rural Urban Total
Andhra Pradesh* 996 987 993 Madhya Pradesh 936 918 931 Arunachal Pradesh
953 890 938 Maharashtra 952 903 929
Assam 960 946 958 Odisha 989 932 979 Bihar 921 895 918 Punjab 907 875 895 Gujarat 949 880 919 Rajasthan 933 914 928 Haryana 882 873 879 Tamil Nadu 993 1000 996 Himachal Pradesh 986 853 972 Uttar Pradesh 918 894 912 Karnataka 979 963 973 West Bengal 953 944 950 Kerala 1078 1091 1084 India 949 929 943 Source: Office of the Registrar General, India, Census of India, 2011. *Andhra Pradesh includes Telangana

ISSN (Online): 2455-3662
EPRA International Journal of Multidisciplinary Research (IJMR) - Peer Reviewed Journal Volume: 7| Issue: 9| September 2021|| Journal DOI: 10.36713/epra2013 || SJIF Impact Factor 2021: 8.047 || ISI Value: 1.188
2021 EPRA IJMR | www.eprajournals.com | Journal DOI URL: https://doi.org/10.36713/epra2013 61
Age groups Age is one of the demographic factors that determine several vital events such as births, deaths, migration, marriage, sex ratio and workforce of a nation. Indian census divides the population into border age groups and provides information on some socio-economic and demographic events. Like the sex composition of the total population, the sex composition by age groups is vital for studying the demographic trends of young population, its future patterns and particularly, the status of the girl child.
Table-2: Sex ratio variations by age-groups in India and bigger states-2011 State/India Early Childhood
(0-6) Childhood
(0-19) Economically Active (15-59)
Old Age (60+)
Andhra Pradesh* 939 940 995 1119 Arunachal Pradesh 972 978 918 917 Assam 962 951 956 971 Bihar 935 897 921 877 Gujarat 890 876 914 1132 Haryana 834 817 888 1015 Himachal Pradesh 909 900 988 1062 Karnataka 948 938 966 1108 Kerala 964 963 1106 1226 Madhya Pradesh 918 912 918 1063 Maharashtra 894 887 918 1114 Odisha 941 966 986 998 Punjab 846 811 914 985 Rajasthan 888 888 930 1102 Tamil Nadu 943 941 1008 1051 Uttar Pradesh 902 891 922 921 West Bengal 956 949 940 1010 India 918 908 944 1033 Source: Office of the Registrar General, India, Census of India, 2011. *Andhra Pradesh includes Telangana
Table-2 shows that higher sex ratios were recorded in old age (60+ years) and economically active (15-59 years), whereas lower sex ratios were observed in child hood (0-19 years) and early childhood (0-6 years)ages. Similar observations were noticed among bigger states of India. The reason for lower sex ration in child ages is being higher female children mortality rate due to neglect of girl children in providing food, nutrition, schooling, health and other aspects as compared to male children. Child Sex Ratio
In any country, child sex ratio (0-6 years) of human population is one of the key determinants of future demographic aspects. In recent decades, decline in child sex ratio in many Indian states as well as all districts raises the questions on the status of girl children. Moreover, the child sex ratio has been significantly varied in rural as well as urban areas and also in different caste groups. It could lead to many severe socio-economic, culture and demographic implications in the future. Therefore, the child sex ratio of Indian population has always been topic of interest in the demographers, social scientists, women’s organisations, researchers, and various planners as well as policy-makers. At the Census 2011, sex ratio of the population in the age group 0-6 years has been registered as 918, in India, declining from 927 in 2001, 945 in 1991 and 962 in 1981. The decreasing sex ratio in this age group has a cascading effect on population over a period of time leading to diminishing sex ratio in the country. One thing is clear-the imbalance that has set in at this early age group is difficult to be removed and would remain to haunt the population for a long time to come.
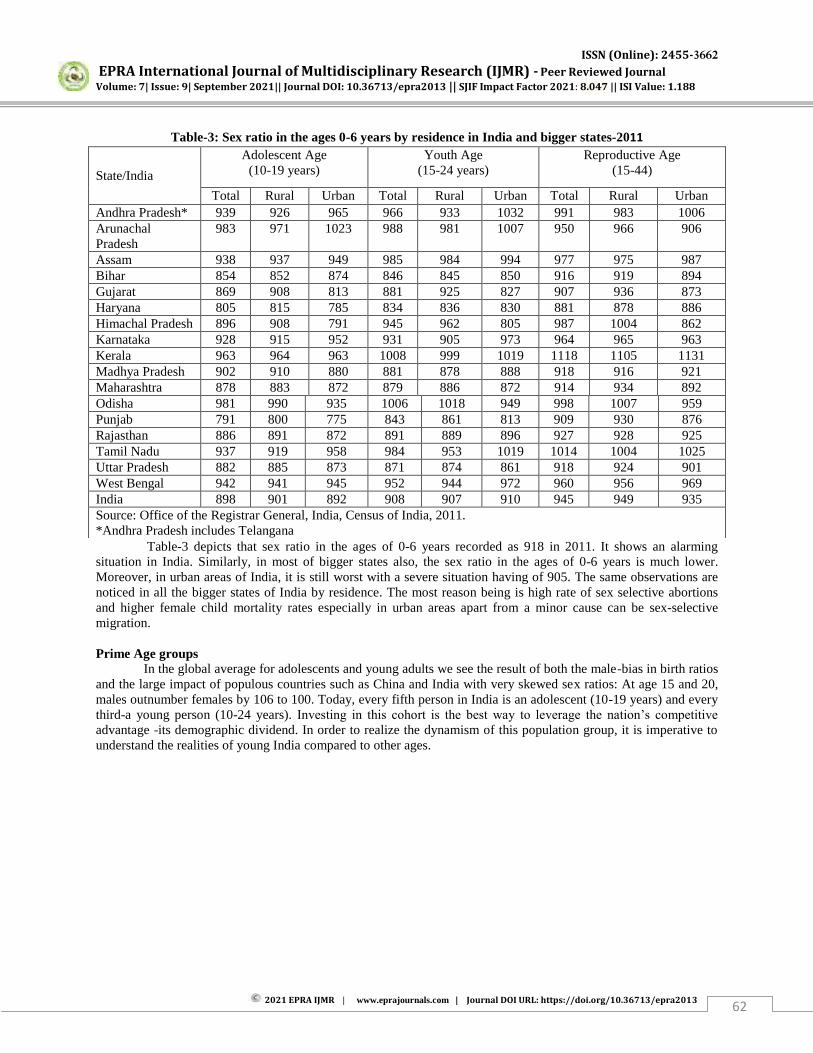
ISSN (Online): 2455-3662
EPRA International Journal of Multidisciplinary Research (IJMR) - Peer Reviewed Journal Volume: 7| Issue: 9| September 2021|| Journal DOI: 10.36713/epra2013 || SJIF Impact Factor 2021: 8.047 || ISI Value: 1.188
2021 EPRA IJMR | www.eprajournals.com | Journal DOI URL: https://doi.org/10.36713/epra2013 62
Table-3: Sex ratio in the ages 0-6 years by residence in India and bigger states-2011
Table-3 depicts that sex ratio in the ages of 0-6 years recorded as 918 in 2011. It shows an alarming situation in India. Similarly, in most of bigger states also, the sex ratio in the ages of 0-6 years is much lower. Moreover, in urban areas of India, it is still worst with a severe situation having of 905. The same observations are noticed in all the bigger states of India by residence. The most reason being is high rate of sex selective abortions and higher female child mortality rates especially in urban areas apart from a minor cause can be sex-selective migration. Prime Age groups
In the global average for adolescents and young adults we see the result of both the male-bias in birth ratios and the large impact of populous countries such as China and India with very skewed sex ratios: At age 15 and 20, males outnumber females by 106 to 100. Today, every fifth person in India is an adolescent (10-19 years) and every third-a young person (10-24 years). Investing in this cohort is the best way to leverage the nation’s competitive advantage -its demographic dividend. In order to realize the dynamism of this population group, it is imperative to understand the realities of young India compared to other ages.
State/India
Adolescent Age (10-19 years)
Youth Age (15-24 years)
Reproductive Age (15-44)
Total Rural Urban Total Rural Urban Total Rural Urban Andhra Pradesh* 939 926 965 966 933 1032 991 983 1006 Arunachal Pradesh
983 971 1023 988 981 1007 950 966 906
Assam 938 937 949 985 984 994 977 975 987 Bihar 854 852 874 846 845 850 916 919 894 Gujarat 869 908 813 881 925 827 907 936 873 Haryana 805 815 785 834 836 830 881 878 886 Himachal Pradesh 896 908 791 945 962 805 987 1004 862 Karnataka 928 915 952 931 905 973 964 965 963 Kerala 963 964 963 1008 999 1019 1118 1105 1131 Madhya Pradesh 902 910 880 881 878 888 918 916 921 Maharashtra 878 883 872 879 886 872 914 934 892 Odisha 981 990 935 1006 1018 949 998 1007 959 Punjab 791 800 775 843 861 813 909 930 876 Rajasthan 886 891 872 891 889 896 927 928 925 Tamil Nadu 937 919 958 984 953 1019 1014 1004 1025 Uttar Pradesh 882 885 873 871 874 861 918 924 901 West Bengal 942 941 945 952 944 972 960 956 969 India 898 901 892 908 907 910 945 949 935 Source: Office of the Registrar General, India, Census of India, 2011. *Andhra Pradesh includes Telangana
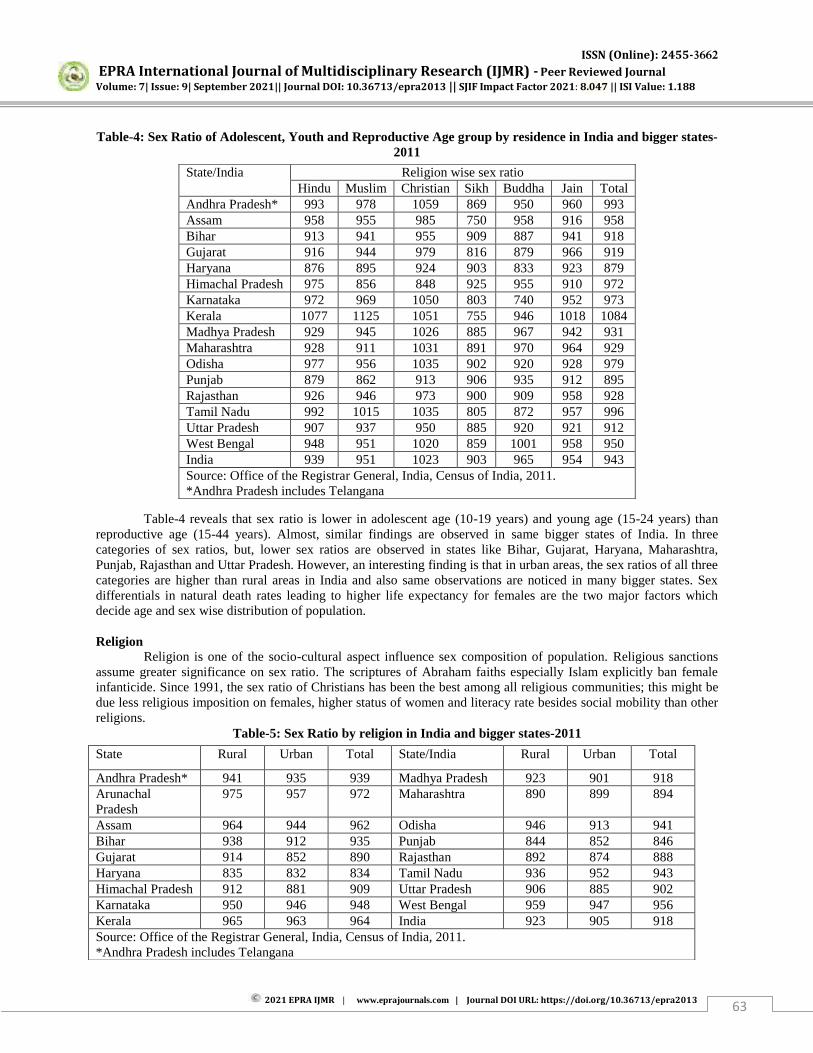
ISSN (Online): 2455-3662
EPRA International Journal of Multidisciplinary Research (IJMR) - Peer Reviewed Journal Volume: 7| Issue: 9| September 2021|| Journal DOI: 10.36713/epra2013 || SJIF Impact Factor 2021: 8.047 || ISI Value: 1.188
2021 EPRA IJMR | www.eprajournals.com | Journal DOI URL: https://doi.org/10.36713/epra2013 63
Table-4: Sex Ratio of Adolescent, Youth and Reproductive Age group by residence in India and bigger states-2011
Table-4 reveals that sex ratio is lower in adolescent age (10-19 years) and young age (15-24 years) than reproductive age (15-44 years). Almost, similar findings are observed in same bigger states of India. In three categories of sex ratios, but, lower sex ratios are observed in states like Bihar, Gujarat, Haryana, Maharashtra, Punjab, Rajasthan and Uttar Pradesh. However, an interesting finding is that in urban areas, the sex ratios of all three categories are higher than rural areas in India and also same observations are noticed in many bigger states. Sex differentials in natural death rates leading to higher life expectancy for females are the two major factors which decide age and sex wise distribution of population. Religion
Religion is one of the socio-cultural aspect influence sex composition of population. Religious sanctions assume greater significance on sex ratio. The scriptures of Abraham faiths especially Islam explicitly ban female infanticide. Since 1991, the sex ratio of Christians has been the best among all religious communities; this might be due less religious imposition on females, higher status of women and literacy rate besides social mobility than other religions.
Table-5: Sex Ratio by religion in India and bigger states-2011
State/India Religion wise sex ratio Hindu Muslim Christian Sikh Buddha Jain Total
Andhra Pradesh* 993 978 1059 869 950 960 993 Assam 958 955 985 750 958 916 958 Bihar 913 941 955 909 887 941 918 Gujarat 916 944 979 816 879 966 919 Haryana 876 895 924 903 833 923 879 Himachal Pradesh 975 856 848 925 955 910 972 Karnataka 972 969 1050 803 740 952 973 Kerala 1077 1125 1051 755 946 1018 1084 Madhya Pradesh 929 945 1026 885 967 942 931 Maharashtra 928 911 1031 891 970 964 929 Odisha 977 956 1035 902 920 928 979 Punjab 879 862 913 906 935 912 895 Rajasthan 926 946 973 900 909 958 928 Tamil Nadu 992 1015 1035 805 872 957 996 Uttar Pradesh 907 937 950 885 920 921 912 West Bengal 948 951 1020 859 1001 958 950 India 939 951 1023 903 965 954 943 Source: Office of the Registrar General, India, Census of India, 2011. *Andhra Pradesh includes Telangana
State Rural Urban Total State/India Rural Urban Total
Andhra Pradesh* 941 935 939 Madhya Pradesh 923 901 918 Arunachal Pradesh
975 957 972 Maharashtra 890 899 894
Assam 964 944 962 Odisha 946 913 941 Bihar 938 912 935 Punjab 844 852 846 Gujarat 914 852 890 Rajasthan 892 874 888 Haryana 835 832 834 Tamil Nadu 936 952 943 Himachal Pradesh 912 881 909 Uttar Pradesh 906 885 902 Karnataka 950 946 948 West Bengal 959 947 956 Kerala 965 963 964 India 923 905 918 Source: Office of the Registrar General, India, Census of India, 2011. *Andhra Pradesh includes Telangana
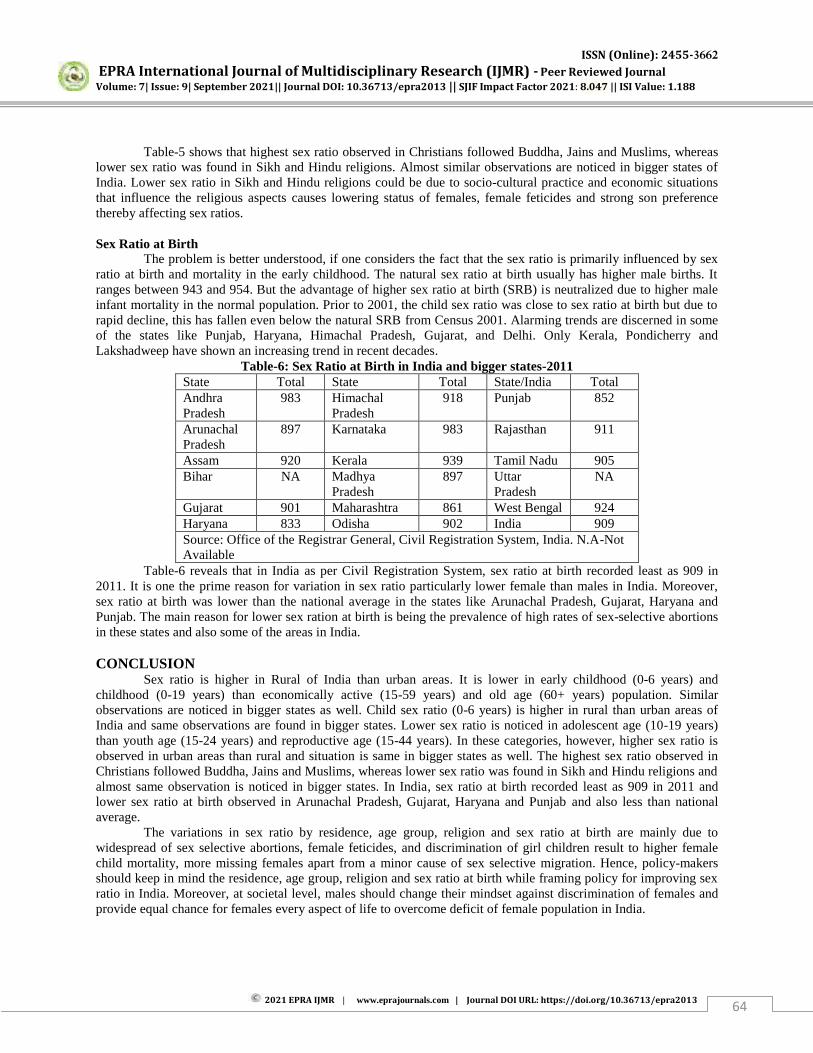
ISSN (Online): 2455-3662
EPRA International Journal of Multidisciplinary Research (IJMR) - Peer Reviewed Journal Volume: 7| Issue: 9| September 2021|| Journal DOI: 10.36713/epra2013 || SJIF Impact Factor 2021: 8.047 || ISI Value: 1.188
2021 EPRA IJMR | www.eprajournals.com | Journal DOI URL: https://doi.org/10.36713/epra2013 64
Table-5 shows that highest sex ratio observed in Christians followed Buddha, Jains and Muslims, whereas
lower sex ratio was found in Sikh and Hindu religions. Almost similar observations are noticed in bigger states of India. Lower sex ratio in Sikh and Hindu religions could be due to socio-cultural practice and economic situations that influence the religious aspects causes lowering status of females, female feticides and strong son preference thereby affecting sex ratios. Sex Ratio at Birth
The problem is better understood, if one considers the fact that the sex ratio is primarily influenced by sex ratio at birth and mortality in the early childhood. The natural sex ratio at birth usually has higher male births. It ranges between 943 and 954. But the advantage of higher sex ratio at birth (SRB) is neutralized due to higher male infant mortality in the normal population. Prior to 2001, the child sex ratio was close to sex ratio at birth but due to rapid decline, this has fallen even below the natural SRB from Census 2001. Alarming trends are discerned in some of the states like Punjab, Haryana, Himachal Pradesh, Gujarat, and Delhi. Only Kerala, Pondicherry and Lakshadweep have shown an increasing trend in recent decades.
Table-6: Sex Ratio at Birth in India and bigger states-2011 State Total State Total State/India Total Andhra Pradesh
983 Himachal Pradesh
918 Punjab 852
Arunachal Pradesh
897 Karnataka 983 Rajasthan 911
Assam 920 Kerala 939 Tamil Nadu 905 Bihar NA Madhya
Pradesh 897 Uttar
Pradesh NA
Gujarat 901 Maharashtra 861 West Bengal 924 Haryana 833 Odisha 902 India 909 Source: Office of the Registrar General, Civil Registration System, India. N.A-Not Available
Table-6 reveals that in India as per Civil Registration System, sex ratio at birth recorded least as 909 in 2011. It is one the prime reason for variation in sex ratio particularly lower female than males in India. Moreover, sex ratio at birth was lower than the national average in the states like Arunachal Pradesh, Gujarat, Haryana and Punjab. The main reason for lower sex ration at birth is being the prevalence of high rates of sex-selective abortions in these states and also some of the areas in India. CONCLUSION
Sex ratio is higher in Rural of India than urban areas. It is lower in early childhood (0-6 years) and childhood (0-19 years) than economically active (15-59 years) and old age (60+ years) population. Similar observations are noticed in bigger states as well. Child sex ratio (0-6 years) is higher in rural than urban areas of India and same observations are found in bigger states. Lower sex ratio is noticed in adolescent age (10-19 years) than youth age (15-24 years) and reproductive age (15-44 years). In these categories, however, higher sex ratio is observed in urban areas than rural and situation is same in bigger states as well. The highest sex ratio observed in Christians followed Buddha, Jains and Muslims, whereas lower sex ratio was found in Sikh and Hindu religions and almost same observation is noticed in bigger states. In India, sex ratio at birth recorded least as 909 in 2011 and lower sex ratio at birth observed in Arunachal Pradesh, Gujarat, Haryana and Punjab and also less than national average.
The variations in sex ratio by residence, age group, religion and sex ratio at birth are mainly due to widespread of sex selective abortions, female feticides, and discrimination of girl children result to higher female child mortality, more missing females apart from a minor cause of sex selective migration. Hence, policy-makers should keep in mind the residence, age group, religion and sex ratio at birth while framing policy for improving sex ratio in India. Moreover, at societal level, males should change their mindset against discrimination of females and provide equal chance for females every aspect of life to overcome deficit of female population in India.
ISSN (Online): 2455-3662
EPRA International Journal of Multidisciplinary Research (IJMR) - Peer Reviewed Journal Volume: 7| Issue: 9| September 2021|| Journal DOI: 10.36713/epra2013 || SJIF Impact Factor 2021: 8.047 || ISI Value: 1.188
2021 EPRA IJMR | www.eprajournals.com | Journal DOI URL: https://doi.org/10.36713/epra2013 65
REFERENCES 1. Amartya, Sen, 1990: “More than 100 Million Women are Missing,” New York Review of Books, 20, December, 61-66. 2. Arnold Fred, Sunita Kishor and T. K. Roy, 2002: “Sex Selective Abortions in India,” Population and Development
Review, 28 (4): 759-785. 3. Chandrasekarayya.T and Sai Sujatha. D, 2009: Declining Sex Ratio in India: Causes and Consequences, Artha Journal
of Social Science, Vol. 8, No.1, PP.75-81. 4. Coale, Ansley J, 1991: “Excess Female Mortality and the Balance of the Sexes in the Population”: An estimate of the
number of Missing Females‟, PDR, 17 (3), 517-523. 5. Dasgupta, M. 2005: “Explaining Asia‟s Missing Women: A New Look at the Data”, Population and Development
Review, 31 (3): 529-535. 6. Irudaya Rajan. S, et al, 2017: Update on Trends in Sex Ratio at Birth in India, Economic and Political Weekly,
Vol.LLI, No.14 o 11, pp14–16, March, 18, 2017. 7. Office of the Registrar General,2012: Census of India- 2011, Government of India, viewed on 4 April 2011,
http://censusindia.gov.in 8. Sample Registration System- Fertility and Mortality Indicators 1991; Registrar General of India, New Delhi. 1993;
PP.34. 9. Stephen Dale, 2010: India's missing daughters, Nov.04,https://www.idrc.ca/en/article. 10. United Nations Secretariat, „1998: “Levels and Trends of Sex differentials in Infant, Child and Under Five Mortality”,
into Young to Die: Genes or Gender? New York: U.N. Population Division, Dept. of Economics and Social Welfares, United Nations.
ISSN (Online): 2455-3662
EPRA International Journal of Multidisciplinary Research (IJMR) - Peer Reviewed Journal Volume: 7| Issue: 9| September 2021|| Journal DOI: 10.36713/epra2013 || SJIF Impact Factor 2021: 8.047 || ISI Value: 1.188
2021 EPRA IJMR | www.eprajournals.com | Journal DOI URL: https://doi.org/10.36713/epra2013 66
A STUDY TO OBSERVE EFFICACY OF POSTERIOR SUB TENON INJECTION OF TRIAMCINOLONE ACETONIDE
(TA) IN DIABETIC MACULOPATHY AND CYSTOID MACULA EDEMA
Hardip Mahida1, Dr. Mahendrasinh D. Chauhan2, Dr. Chetna Patel3
1Tutor, Shree Bharatimaiya College of Optometry & Physiotherapy, Surat
2Principal, Shree Bharatimaiya College of Optometry & Physiotherapy, Surat
3Associate professor, Shree Bharatimaiya College of Optometry & Physiotherapy, Surat
ABSTRACT To compare pre and post macula thickness after single posterior sub-Tenon’s triamcinolone acetonide on progression of
macular edema in diabetic patients and cystoids macula edema. The objectives were to compare the change in the central macular thickness (CMT) between macular edema in diabetic patients and cystoids macula edema. This was prospective study based on investigation; was performed on 44 eyes of treated between 2016 to 2017 for macular edema in diabetic patients and cystoids macula edema. In 44 eyes injected with 20 mg of TA, the mean central macular thickness was 530 +/- 103.73 µ SD before treatment. There was significant difference between before and after treatment the two groups (P=6.2, ANOVAs Single Factor). Follow up 15 days After Giving injection, it was 427.34 +/- 115.19 µ in injected eyes (Anova, single factor test) and after 30 days, the respective values were 339.79 +/- 126 µ (ANOVA Single Factor Test). I.e. statistically significant when difference between two follow up after giving treatment. KEY WORDS: Triamcinolone Acetonide, clinical significant macula edema., Cystoid macular edema, clinical significant macular edema INTRODUCTION
Diabetes is the name used to describe a metabolic condition of having higher than normal blood sugar levels. There are different reasons why people get high blood glucose levels and so a number of different types of diabetes exist. Majority of diabetic patients have retinopathy of varying severity, approximately 25% of the diabetic patients have sight-threatening levels of retinopathy with legal blindness (best corrected visual acuity of 20/200 or worse) being 25 times more common in the diabetic when compared to the non-diabetic population The common causes of visual impairment in diabetic retinopathy include macular edema and complications due to proliferative retinopathy1. Macular edema can be treated with macular photocoagulation, sub-Tenon’s triamcinolone
acetonide steroids or anti-vascular endothelial growth factor (VEGF) agents2. MATERIAL & METHODOLOGY
It was an observation based prospective study done at Surat retina Foundation hospital; Surat with purposive sample of 44 eyes of patients who fulfilled the inclusion criteria to evaluate pre and post macula thickness after single posterior sub-Tenon’s
triamcinolone acetonide on progression of macular edema in diabetic patients and cystoids macula edema. In present study Preoperative Assessment includes were Patient’s Demographic data, detailed history, Study participants had a detailed eye examination including, visual Acuity by Snellen’s chart, slit lamp examination and fundoscopy (78D, indirect ophthalmoscope). Patient’s macular thickness
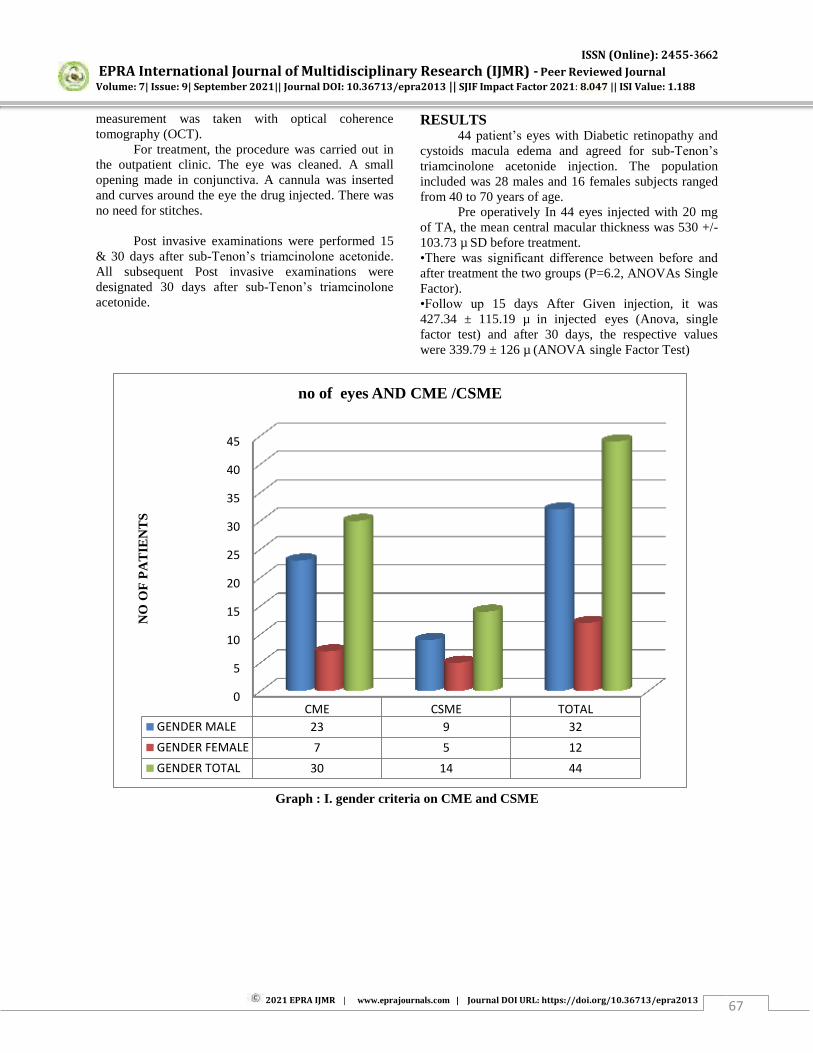
ISSN (Online): 2455-3662
EPRA International Journal of Multidisciplinary Research (IJMR) - Peer Reviewed Journal Volume: 7| Issue: 9| September 2021|| Journal DOI: 10.36713/epra2013 || SJIF Impact Factor 2021: 8.047 || ISI Value: 1.188
2021 EPRA IJMR | www.eprajournals.com | Journal DOI URL: https://doi.org/10.36713/epra2013 67
measurement was taken with optical coherence tomography (OCT).
For treatment, the procedure was carried out in the outpatient clinic. The eye was cleaned. A small opening made in conjunctiva. A cannula was inserted and curves around the eye the drug injected. There was no need for stitches.
Post invasive examinations were performed 15
& 30 days after sub-Tenon’s triamcinolone acetonide. All subsequent Post invasive examinations were designated 30 days after sub-Tenon’s triamcinolone
acetonide.
RESULTS 44 patient’s eyes with Diabetic retinopathy and
cystoids macula edema and agreed for sub-Tenon’s
triamcinolone acetonide injection. The population included was 28 males and 16 females subjects ranged from 40 to 70 years of age.
Pre operatively In 44 eyes injected with 20 mg of TA, the mean central macular thickness was 530 +/- 103.73 µ SD before treatment. •There was significant difference between before and
after treatment the two groups (P=6.2, ANOVAs Single Factor). •Follow up 15 days After Given injection, it was 427.34 ± 115.19 µ in injected eyes (Anova, single factor test) and after 30 days, the respective values were 339.79 ± 126 µ (ANOVA single Factor Test)
Graph : I. gender criteria on CME and CSME
0
5
10
15
20
25
30
35
40
45
CME CSME TOTAL
GENDER MALE 23 9 32
GENDER FEMALE 7 5 12
GENDER TOTAL 30 14 44
NO
OF
PA
TIE
NT
S
no of eyes AND CME /CSME

ISSN (Online): 2455-3662
EPRA International Journal of Multidisciplinary Research (IJMR) - Peer Reviewed Journal Volume: 7| Issue: 9| September 2021|| Journal DOI: 10.36713/epra2013 || SJIF Impact Factor 2021: 8.047 || ISI Value: 1.188
2021 EPRA IJMR | www.eprajournals.com | Journal DOI URL: https://doi.org/10.36713/epra2013 68
Graph: A : A-(BEFORE TREATMENT) B-[ 1st FOLLOW UP (15 DAYS)] follow-up treatment comparion
after sub-Tenon’s triamcinolone acetonide injection
Graph: B: (-[1st FOLLOW UP (15 DAYS)], - [2st FOLLOW UP (30DAYS)] follow-up treatment comparison
after sub-Tenon’s triamcinolone acetonide injection
0
200
400
600
800
1000
1200
1400
1600
1 3 5 7 9 11 13 15 17 19 21 23 25 27 29 31 33 35 37 39 41 43
mac
ula
thic
knes
s(µ)
no of patients
Chart Title
B
A
ISSN (Online): 2455-3662
EPRA International Journal of Multidisciplinary Research (IJMR) - Peer Reviewed Journal Volume: 7| Issue: 9| September 2021|| Journal DOI: 10.36713/epra2013 || SJIF Impact Factor 2021: 8.047 || ISI Value: 1.188
2021 EPRA IJMR | www.eprajournals.com | Journal DOI URL: https://doi.org/10.36713/epra2013 69
In 44 eyes injected with 20 mg of TA, the mean
central macular thickness was 530 ± 103.73 µ SD before treatment. There was significant difference between before and after treatment the two groups (P=6.2, ANOVAs Singal Factor). Follow up 15 days After Given injection, it was 427.34 ± 115.19 µ in injected eyes (Anova, single factor test) and after 30 days, the respective values were 339.79 ± 126 µ (ANOVA Singal Factor Test)3.
Toda J1, Fukushima H14, Kato S the mean central macular thickness +/- SD was 624.8 +/- 173.7 micron before treatment. In the fellow eyes, it was 452.8 +/- 235.2 micron. There was no significant difference between the two groups (P=0.10, unpaired t-test). One month after injection, it was 434.0 +/- 120.7 micron in injected eyes (P=0.017, paired t-test) and 462.2 +/- 232.7 micron in fellow eyes (P=0.70, paired t-test), and after 3 months, the respective values were 423.1 +/- 186.3 micron (P=0.052, paired t-test) and 478.3 +/- 269.1 micron (P=0.65, paired t-test).reduces macular thickening due to DME, at least in the short term.
YilmazT1, WeaverCD, GallagherMJ, Cordero-ComaM, CervantesCastaneda RA, Klisovic D, Lavaque AJ, Larson RJIn5 the 4 randomized clinical trials comparing IVTA injection with placebo or no treatment, IVTA injection demonstrated greater improvement in VA at 3 months, but the benefit was no longer significant at 6 months. Those who received IVTA injection had significantly higher IOP at 3 months and at 6 months. In the 2 randomized clinical trials comparing IVTA injection with STTA injection, IVTA injection demonstrated greater improvement in VA at 3months, but not at 6months. Intravitreal triamcinolone acetonide injection demonstrated no difference in IOP at 3 months or at 6 months.
CONCLUSION Injection of 20 mg of TA into the posterior sub-Tenon capsule effectively reduces macular thickening due to DME and CME, at least in the short term. REFERENCES
1. Kahn HA, Hiller R. Blindness caused by diabetic retinopathy. Am J Ophthalmol 1974; 78:58-67? [PUBMED]
2. Martidis A, Duker JS, Greenberg PB, Rogers AH, Puliafito CA, Reichel E, et al. Intra-vitreal triamcinolone for refractory diabetic macular edema. Ophthalmology 2002; 109:920-7.
3. BIOSTATISTIC book for statistic anova single factor (page nu: 227).
4. Toda J1, Fukushima H, Kato S.
5. YilmazT1, WeaverCD, GallagherMJ, Cordero-ComaM, CervantesCastaneda RA, Klisovic D, Lavaque AJ, Larson RJ.
ISSN (Online): 2455-3662
EPRA International Journal of Multidisciplinary Research (IJMR) - Peer Reviewed Journal Volume: 7| Issue: 9| September 2021|| Journal DOI: 10.36713/epra2013 || SJIF Impact Factor 2021: 8.047 || ISI Value: 1.188
2021 EPRA IJMR | www.eprajournals.com | Journal DOI URL: https://doi.org/10.36713/epra2013 70
ACCEPTABILITY OF SHASP: SELF-HELP APP IN STATISTICS AND PROBABILITY
John Nimrod M. Ladiana.1, Benjamin O. Arjona, EdD.2 1 Teacher, Barangay Longos Senior High School, Kalayaan, Laguna, Philippines
2Professor, College of Teacher Education, Laguna State Polytechnic University – Main
Campus, Santa Cruz, Laguna, Philippines
ABSTRACT The main objective of this study was to develop a multi-device compatible, offline interactive digital Self-Learning Module called SHASP: Self-Help App in Statistics and Probability, which was designed to help the Grade 11 students to become independent learners. Specifically, it sought to answer the following questions: 1. What is the level of acceptability of SHASP: Self- Help App in Statistics and Probability in terms of the following pedagogical components namely learning content, assessment exercises, consistency, adaptability and appropriateness?; 2. What is the level of acceptability of SHASP: Self- Help App in Statistics and Probability in terms of the following technical components namely technical quality, ease of use and aesthetic value?
The respondents of the study consisted of 30 select Mathematics teachers (15 from Lumban District and 15 from Kalayaan District) who evaluated the developed SHASP: Self-Help App in Statistics and Probability.
The researcher gathered data and information on the lessons for the third quarter period in the said subject, giving close consideration on the DepEd-released self-learning modules, books, journals, video tutorials and other related articles and other forms of literature that can serve as supporting documents, give credibility to the boundaries of the lessons and immediate need for a workable solution. Regarding SHASP: Self-Help App on Statistics and Probability, the researcher focused on the usage of computer-based instructional materials providing a detailed step-by-step word problem solving as well as practice problems for assessment and enrichment. These are the results of this study. SHASP: Self-Help App in Statistics and Probability was given a remark of highly acceptable in all of its pedagogical components. The weighted mean are as follows: Learning Content (M = 4.55); Assessment Exercises (M= 4.58); Consistency (M= 4.49); Adaptability (M=4.56); Appropriateness (M= 4.48). It was also was given a remark of highly acceptable in all of its technical components. The weighted mean are as follows: Technical Quality(M = 4.50); Ease of Use (M= 4.51); Aesthetic Value (M= 4.61). Based on the data gathered and its findings, the researcher conclude that SHASP: Self-Help App In Statistics And Probability may be used as a learning material during the learners’ independent study. The researcher arrived at this conclusion as the teacher-evaluators agreed that there is sufficient learning content covered, adequate assessment exercises for mastery of each lesson, the lessons are consistent and related with each other, they are appropriate for the current grade level, may be used as an alternative learning material because it is adaptive, free from errors, easy to use and contains a visual design which helps maintain the learners interest.
INTRODUCTION Over a period of only few months, drastic
changes have already been made in the Philippine education system. These changes were brought about by the global pandemic COVID-19. The main dilemma for the continuity of learning are the risks caused by this contagious disease. Because of this, people are instructed to stay at home and observe health protocols as per advised by the Inter-Agency Task Force.
To pursue learning continuity amidst the pandemic, the DepEd Order No. 18, s. 2020 was
released, whereas different distance learning modalities will be utilized. Thus, the production of Alternative Delivery Modules (ADMs) or Self-Learning Modules (SLMs) is initiated. Under the said Deped order, ADMs or SLMs are defined as self-contained, self-instructional, self-paced and interactive learning resources for public schools intended for learning a specific topic or lesson where the learner interacts actively with the instructional material rather than reading the material passively. The main strategy for this learning continuity plan is the independent study. By utilizing this strategy, the teacher’s external control is reduced and the students
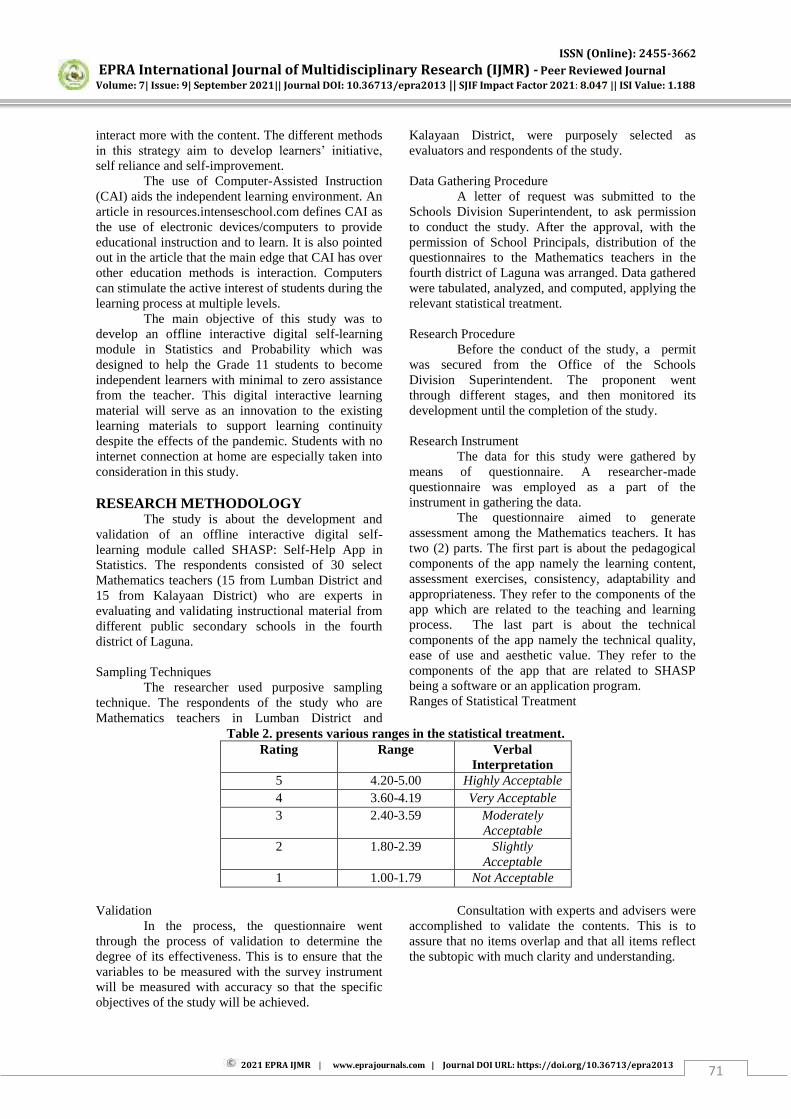
ISSN (Online): 2455-3662
EPRA International Journal of Multidisciplinary Research (IJMR) - Peer Reviewed Journal Volume: 7| Issue: 9| September 2021|| Journal DOI: 10.36713/epra2013 || SJIF Impact Factor 2021: 8.047 || ISI Value: 1.188
2021 EPRA IJMR | www.eprajournals.com | Journal DOI URL: https://doi.org/10.36713/epra2013 71
interact more with the content. The different methods in this strategy aim to develop learners’ initiative,
self reliance and self-improvement. The use of Computer-Assisted Instruction
(CAI) aids the independent learning environment. An article in resources.intenseschool.com defines CAI as the use of electronic devices/computers to provide educational instruction and to learn. It is also pointed out in the article that the main edge that CAI has over other education methods is interaction. Computers can stimulate the active interest of students during the learning process at multiple levels.
The main objective of this study was to develop an offline interactive digital self-learning module in Statistics and Probability which was designed to help the Grade 11 students to become independent learners with minimal to zero assistance from the teacher. This digital interactive learning material will serve as an innovation to the existing learning materials to support learning continuity despite the effects of the pandemic. Students with no internet connection at home are especially taken into consideration in this study. RESEARCH METHODOLOGY
The study is about the development and validation of an offline interactive digital self-learning module called SHASP: Self-Help App in Statistics. The respondents consisted of 30 select Mathematics teachers (15 from Lumban District and 15 from Kalayaan District) who are experts in evaluating and validating instructional material from different public secondary schools in the fourth district of Laguna. Sampling Techniques
The researcher used purposive sampling technique. The respondents of the study who are Mathematics teachers in Lumban District and
Kalayaan District, were purposely selected as evaluators and respondents of the study. Data Gathering Procedure A letter of request was submitted to the Schools Division Superintendent, to ask permission to conduct the study. After the approval, with the permission of School Principals, distribution of the questionnaires to the Mathematics teachers in the fourth district of Laguna was arranged. Data gathered were tabulated, analyzed, and computed, applying the relevant statistical treatment. Research Procedure Before the conduct of the study, a permit was secured from the Office of the Schools Division Superintendent. The proponent went through different stages, and then monitored its development until the completion of the study. Research Instrument The data for this study were gathered by means of questionnaire. A researcher-made questionnaire was employed as a part of the instrument in gathering the data.
The questionnaire aimed to generate assessment among the Mathematics teachers. It has two (2) parts. The first part is about the pedagogical components of the app namely the learning content, assessment exercises, consistency, adaptability and appropriateness. They refer to the components of the app which are related to the teaching and learning process. The last part is about the technical components of the app namely the technical quality, ease of use and aesthetic value. They refer to the components of the app that are related to SHASP being a software or an application program. Ranges of Statistical Treatment
Table 2. presents various ranges in the statistical treatment. Rating Range Verbal
Interpretation 5 4.20-5.00 Highly Acceptable 4 3.60-4.19 Very Acceptable 3 2.40-3.59 Moderately
Acceptable 2 1.80-2.39 Slightly
Acceptable 1 1.00-1.79 Not Acceptable
Validation In the process, the questionnaire went through the process of validation to determine the degree of its effectiveness. This is to ensure that the variables to be measured with the survey instrument will be measured with accuracy so that the specific objectives of the study will be achieved.
Consultation with experts and advisers were accomplished to validate the contents. This is to assure that no items overlap and that all items reflect the subtopic with much clarity and understanding.
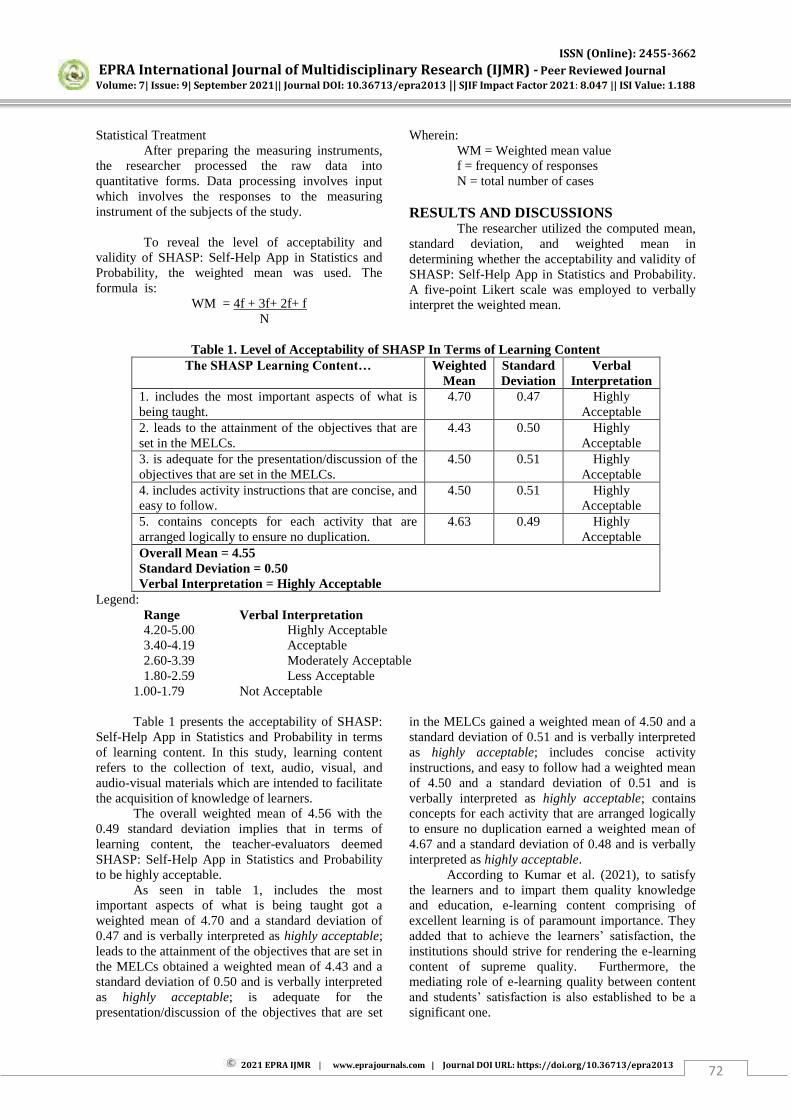
ISSN (Online): 2455-3662
EPRA International Journal of Multidisciplinary Research (IJMR) - Peer Reviewed Journal Volume: 7| Issue: 9| September 2021|| Journal DOI: 10.36713/epra2013 || SJIF Impact Factor 2021: 8.047 || ISI Value: 1.188
2021 EPRA IJMR | www.eprajournals.com | Journal DOI URL: https://doi.org/10.36713/epra2013 72
Statistical Treatment After preparing the measuring instruments,
the researcher processed the raw data into quantitative forms. Data processing involves input which involves the responses to the measuring instrument of the subjects of the study.
To reveal the level of acceptability and
validity of SHASP: Self-Help App in Statistics and Probability, the weighted mean was used. The formula is:
WM = 4f + 3f+ 2f+ f N
Wherein: WM = Weighted mean value
f = frequency of responses N = total number of cases RESULTS AND DISCUSSIONS
The researcher utilized the computed mean, standard deviation, and weighted mean in determining whether the acceptability and validity of SHASP: Self-Help App in Statistics and Probability. A five-point Likert scale was employed to verbally interpret the weighted mean.
Table 1. Level of Acceptability of SHASP In Terms of Learning Content
The SHASP Learning Content… Weighted Mean
Standard Deviation
Verbal Interpretation
1. includes the most important aspects of what is being taught.
4.70 0.47 Highly Acceptable
2. leads to the attainment of the objectives that are set in the MELCs.
4.43 0.50 Highly Acceptable
3. is adequate for the presentation/discussion of the objectives that are set in the MELCs.
4.50 0.51 Highly Acceptable
4. includes activity instructions that are concise, and easy to follow.
4.50 0.51 Highly Acceptable
5. contains concepts for each activity that are arranged logically to ensure no duplication.
4.63 0.49 Highly Acceptable
Overall Mean = 4.55 Standard Deviation = 0.50 Verbal Interpretation = Highly Acceptable
Legend: Range Verbal Interpretation 4.20-5.00 Highly Acceptable 3.40-4.19 Acceptable 2.60-3.39 Moderately Acceptable 1.80-2.59 Less Acceptable
1.00-1.79 Not Acceptable
Table 1 presents the acceptability of SHASP: Self-Help App in Statistics and Probability in terms of learning content. In this study, learning content refers to the collection of text, audio, visual, and audio-visual materials which are intended to facilitate the acquisition of knowledge of learners.
The overall weighted mean of 4.56 with the 0.49 standard deviation implies that in terms of learning content, the teacher-evaluators deemed SHASP: Self-Help App in Statistics and Probability to be highly acceptable.
As seen in table 1, includes the most important aspects of what is being taught got a weighted mean of 4.70 and a standard deviation of 0.47 and is verbally interpreted as highly acceptable; leads to the attainment of the objectives that are set in the MELCs obtained a weighted mean of 4.43 and a standard deviation of 0.50 and is verbally interpreted as highly acceptable; is adequate for the presentation/discussion of the objectives that are set
in the MELCs gained a weighted mean of 4.50 and a standard deviation of 0.51 and is verbally interpreted as highly acceptable; includes concise activity instructions, and easy to follow had a weighted mean of 4.50 and a standard deviation of 0.51 and is verbally interpreted as highly acceptable; contains concepts for each activity that are arranged logically to ensure no duplication earned a weighted mean of 4.67 and a standard deviation of 0.48 and is verbally interpreted as highly acceptable.
According to Kumar et al. (2021), to satisfy the learners and to impart them quality knowledge and education, e-learning content comprising of excellent learning is of paramount importance. They added that to achieve the learners’ satisfaction, the
institutions should strive for rendering the e-learning content of supreme quality. Furthermore, the mediating role of e-learning quality between content and students’ satisfaction is also established to be a
significant one.
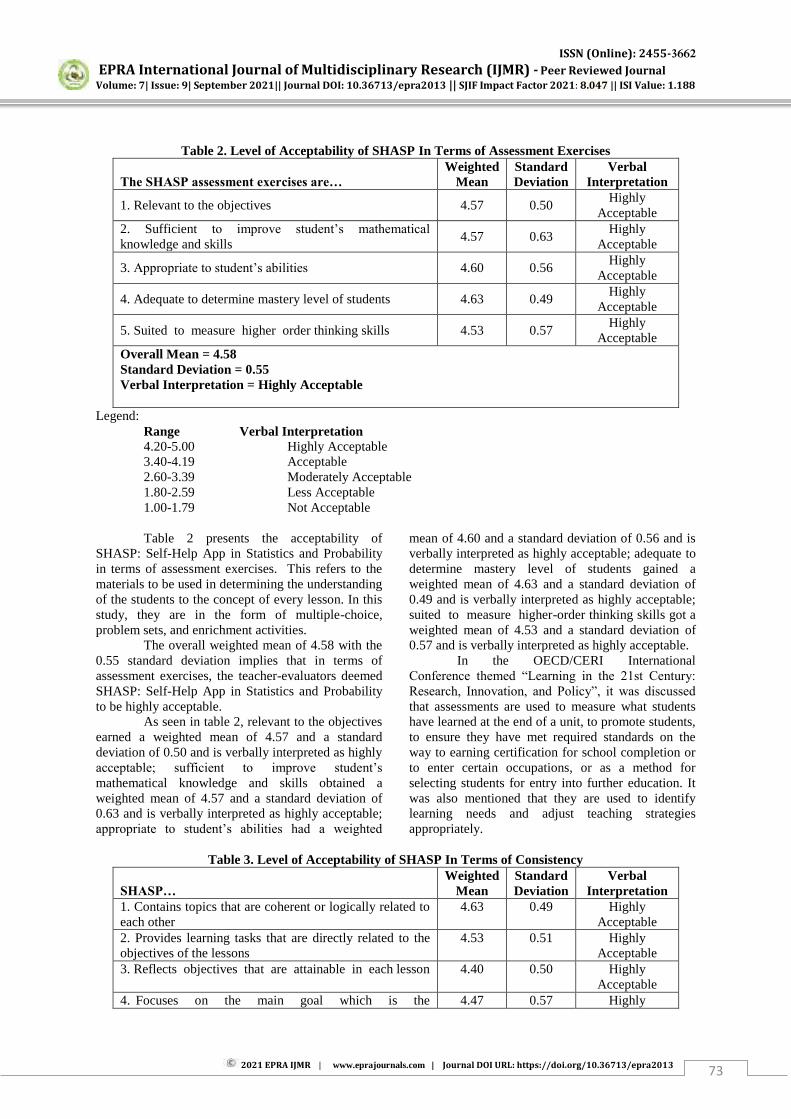
ISSN (Online): 2455-3662
EPRA International Journal of Multidisciplinary Research (IJMR) - Peer Reviewed Journal Volume: 7| Issue: 9| September 2021|| Journal DOI: 10.36713/epra2013 || SJIF Impact Factor 2021: 8.047 || ISI Value: 1.188
2021 EPRA IJMR | www.eprajournals.com | Journal DOI URL: https://doi.org/10.36713/epra2013 73
Table 2. Level of Acceptability of SHASP In Terms of Assessment Exercises
The SHASP assessment exercises are… Weighted
Mean Standard Deviation
Verbal Interpretation
1. Relevant to the objectives 4.57 0.50 Highly
Acceptable 2. Sufficient to improve student’s mathematical
knowledge and skills 4.57 0.63
Highly Acceptable
3. Appropriate to student’s abilities 4.60 0.56 Highly
Acceptable
4. Adequate to determine mastery level of students 4.63 0.49 Highly
Acceptable
5. Suited to measure higher order thinking skills 4.53 0.57 Highly
Acceptable Overall Mean = 4.58 Standard Deviation = 0.55 Verbal Interpretation = Highly Acceptable
Legend: Range Verbal Interpretation 4.20-5.00 Highly Acceptable 3.40-4.19 Acceptable 2.60-3.39 Moderately Acceptable 1.80-2.59 Less Acceptable 1.00-1.79 Not Acceptable Table 2 presents the acceptability of
SHASP: Self-Help App in Statistics and Probability in terms of assessment exercises. This refers to the materials to be used in determining the understanding of the students to the concept of every lesson. In this study, they are in the form of multiple-choice, problem sets, and enrichment activities.
The overall weighted mean of 4.58 with the 0.55 standard deviation implies that in terms of assessment exercises, the teacher-evaluators deemed SHASP: Self-Help App in Statistics and Probability to be highly acceptable.
As seen in table 2, relevant to the objectives earned a weighted mean of 4.57 and a standard deviation of 0.50 and is verbally interpreted as highly acceptable; sufficient to improve student’s
mathematical knowledge and skills obtained a weighted mean of 4.57 and a standard deviation of 0.63 and is verbally interpreted as highly acceptable; appropriate to student’s abilities had a weighted
mean of 4.60 and a standard deviation of 0.56 and is verbally interpreted as highly acceptable; adequate to determine mastery level of students gained a weighted mean of 4.63 and a standard deviation of 0.49 and is verbally interpreted as highly acceptable; suited to measure higher-order thinking skills got a weighted mean of 4.53 and a standard deviation of 0.57 and is verbally interpreted as highly acceptable.
In the OECD/CERI International Conference themed “Learning in the 21st Century:
Research, Innovation, and Policy”, it was discussed
that assessments are used to measure what students have learned at the end of a unit, to promote students, to ensure they have met required standards on the way to earning certification for school completion or to enter certain occupations, or as a method for selecting students for entry into further education. It was also mentioned that they are used to identify learning needs and adjust teaching strategies appropriately.
Table 3. Level of Acceptability of SHASP In Terms of Consistency
SHASP… Weighted
Mean Standard Deviation
Verbal Interpretation
1. Contains topics that are coherent or logically related to each other
4.63 0.49 Highly Acceptable
2. Provides learning tasks that are directly related to the objectives of the lessons
4.53 0.51 Highly Acceptable
3. Reflects objectives that are attainable in each lesson 4.40 0.50 Highly Acceptable
4. Focuses on the main goal which is the 4.47 0.57 Highly
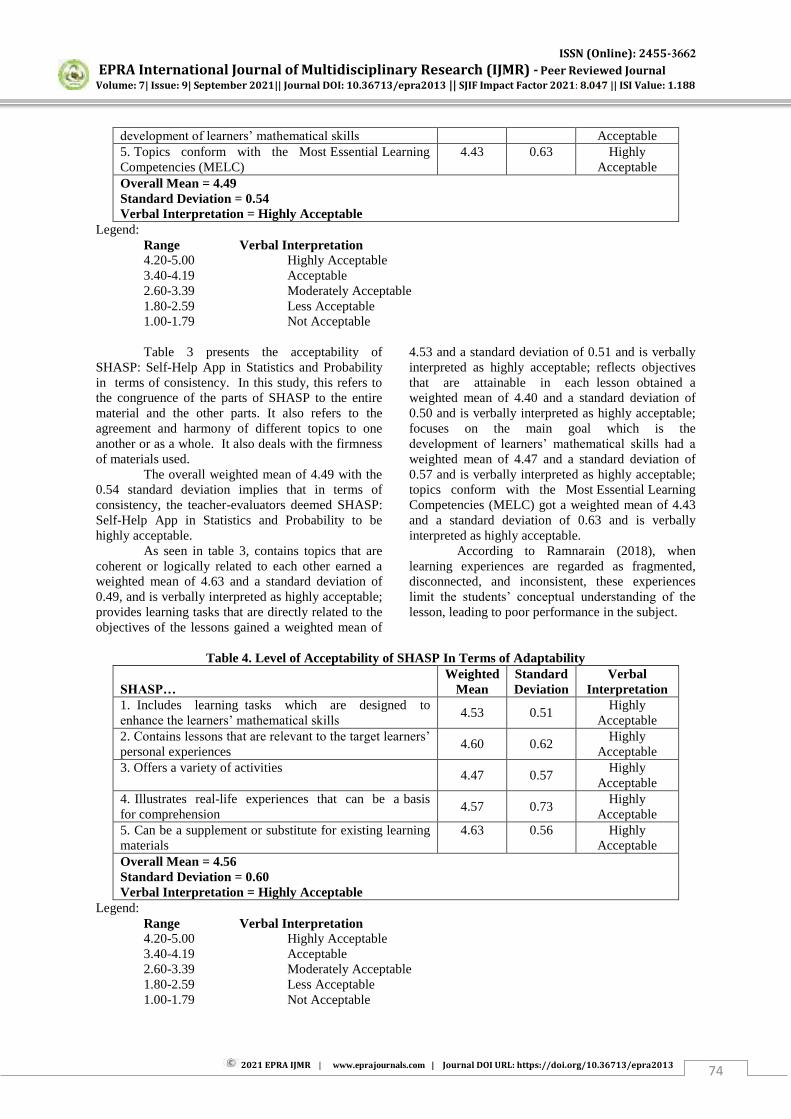
ISSN (Online): 2455-3662
EPRA International Journal of Multidisciplinary Research (IJMR) - Peer Reviewed Journal Volume: 7| Issue: 9| September 2021|| Journal DOI: 10.36713/epra2013 || SJIF Impact Factor 2021: 8.047 || ISI Value: 1.188
2021 EPRA IJMR | www.eprajournals.com | Journal DOI URL: https://doi.org/10.36713/epra2013 74
development of learners’ mathematical skills Acceptable 5. Topics conform with the Most Essential Learning Competencies (MELC)
4.43 0.63 Highly Acceptable
Overall Mean = 4.49 Standard Deviation = 0.54 Verbal Interpretation = Highly Acceptable
Legend: Range Verbal Interpretation 4.20-5.00 Highly Acceptable 3.40-4.19 Acceptable 2.60-3.39 Moderately Acceptable 1.80-2.59 Less Acceptable 1.00-1.79 Not Acceptable Table 3 presents the acceptability of
SHASP: Self-Help App in Statistics and Probability in terms of consistency. In this study, this refers to the congruence of the parts of SHASP to the entire material and the other parts. It also refers to the agreement and harmony of different topics to one another or as a whole. It also deals with the firmness of materials used.
The overall weighted mean of 4.49 with the 0.54 standard deviation implies that in terms of consistency, the teacher-evaluators deemed SHASP: Self-Help App in Statistics and Probability to be highly acceptable.
As seen in table 3, contains topics that are coherent or logically related to each other earned a weighted mean of 4.63 and a standard deviation of 0.49, and is verbally interpreted as highly acceptable; provides learning tasks that are directly related to the objectives of the lessons gained a weighted mean of
4.53 and a standard deviation of 0.51 and is verbally interpreted as highly acceptable; reflects objectives that are attainable in each lesson obtained a weighted mean of 4.40 and a standard deviation of 0.50 and is verbally interpreted as highly acceptable; focuses on the main goal which is the development of learners’ mathematical skills had a
weighted mean of 4.47 and a standard deviation of 0.57 and is verbally interpreted as highly acceptable; topics conform with the Most Essential Learning Competencies (MELC) got a weighted mean of 4.43 and a standard deviation of 0.63 and is verbally interpreted as highly acceptable.
According to Ramnarain (2018), when learning experiences are regarded as fragmented, disconnected, and inconsistent, these experiences limit the students’ conceptual understanding of the
lesson, leading to poor performance in the subject.
Table 4. Level of Acceptability of SHASP In Terms of Adaptability
SHASP… Weighted
Mean Standard Deviation
Verbal Interpretation
1. Includes learning tasks which are designed to enhance the learners’ mathematical skills
4.53 0.51 Highly
Acceptable 2. Contains lessons that are relevant to the target learners’
personal experiences 4.60 0.62
Highly Acceptable
3. Offers a variety of activities 4.47 0.57
Highly Acceptable
4. Illustrates real-life experiences that can be a basis for comprehension
4.57 0.73 Highly
Acceptable 5. Can be a supplement or substitute for existing learning materials
4.63 0.56 Highly Acceptable
Overall Mean = 4.56 Standard Deviation = 0.60 Verbal Interpretation = Highly Acceptable
Legend: Range Verbal Interpretation 4.20-5.00 Highly Acceptable 3.40-4.19 Acceptable 2.60-3.39 Moderately Acceptable 1.80-2.59 Less Acceptable 1.00-1.79 Not Acceptable

ISSN (Online): 2455-3662
EPRA International Journal of Multidisciplinary Research (IJMR) - Peer Reviewed Journal Volume: 7| Issue: 9| September 2021|| Journal DOI: 10.36713/epra2013 || SJIF Impact Factor 2021: 8.047 || ISI Value: 1.188
2021 EPRA IJMR | www.eprajournals.com | Journal DOI URL: https://doi.org/10.36713/epra2013 75
Table 4 presents the acceptability of
SHASP: Self-Help App in Statistics and Probability in terms of adaptability. In this study, adaptability refers to the capability of SHASP to be utilized in the educational scenario where the students are in the independent home study arrangement due to the pandemic.
The overall weighted mean of 4.53 with the 0.62 standard deviations implies that in terms of adaptability, the teacher-evaluators deemed SHASP: Self-Help App in Statistics and Probability to be highly acceptable.
As seen in table 4, includes learning tasks that are designed to enhance the learners’
mathematical skills got a weighted mean of 4.53 and a standard deviation of 0.51 and is verbally interpreted as highly acceptable; contains lessons that are relevant to the target learners’ personal
experiences had a weighted mean of 4.60 and a
standard deviation of 0.62 and is verbally interpreted as highly acceptable; offers a variety of activities earned a weighted mean of 4.47 and a standard deviation of 0.57 and is verbally interpreted as highly acceptable; illustrated real-life experiences that can be a basis for comprehension obtained a weighted mean of 4.57 and a standard deviation of 0.73 and is verbally interpreted as highly acceptable; can be a supplement or substitute for existing learning materials gained a weighted mean of 4.50 and a standard deviation of 0.68 and is verbally interpreted as highly acceptable.
According to Almanar (2020), to be considered adaptable in distance learning amidst the pandemic, the learning material must be designed to be flexible and be able to provide convenience in learning to produce students who are autonomous learners.
Table 5. Level of Acceptability of SHASP In Terms of Appropriateness
SHASP… Weighted
Mean Standard Deviation
Verbal Interpretation
1. Provides activities that are suited to the objectives of each lesson
4.60 0.50 Highly Acceptable
2. Presents lessons which are based on real-life contexts
4.47 0.51 Highly Acceptable
3. Includes exercises that assess objectively the level of knowledge of the target learners
4.50 0.51 Highly Acceptable
4. Contains topics that are suitable, interesting, current and up-to-date
4.43 0.50 Highly Acceptable
5. Takes in consideration the varying attitudes and capabilities of the learners
4.40 0.50 Highly Acceptable
Overall Mean = 4.48 Standard Deviation = 0.50 Verbal Interpretation = Highly Acceptable
Legend: Range Verbal Interpretation 4.20-5.00 Highly Acceptable 3.40-4.19 Acceptable 2.60-3.39 Moderately Acceptable 1.80-2.59 Less Acceptable 1.00-1.79 Not Acceptable
Table 5 presents the acceptability of
SHASP: Self-Help App in Statistics and Probability in terms of appropriateness. This study refers to the compatibility of SHASP with the current curriculum. It also refers to its applicability to the alternative distance learning modality.
The overall weighted mean of 4.48 with the 0.50 standard deviation implies that in terms of appropriateness, the teacher-evaluators deemed SHASP: Self-Help App in Statistics and Probability to be highly acceptable.
As seen in Table 5, provides activities that are suited to the objectives of each lesson
obtained a weighted mean of 4.60 and a standard deviation of 0.50 and is verbally interpreted as highly acceptable; presents lessons which are based on real-life contexts had a weighted mean of 4.47 and a standard deviation of 0.51 and is verbally interpreted as highly acceptable; includes exercises that assess objectively the level of knowledge of the target learners gained a weighted mean of 4.50 and a standard deviation of 0.51 and is verbally interpreted as highly acceptable; contains topics that are suitable, interesting, current and up-to-date earned a weighted mean of 4.43 and a standard deviation of 0.50 and is verbally interpreted as highly acceptable;
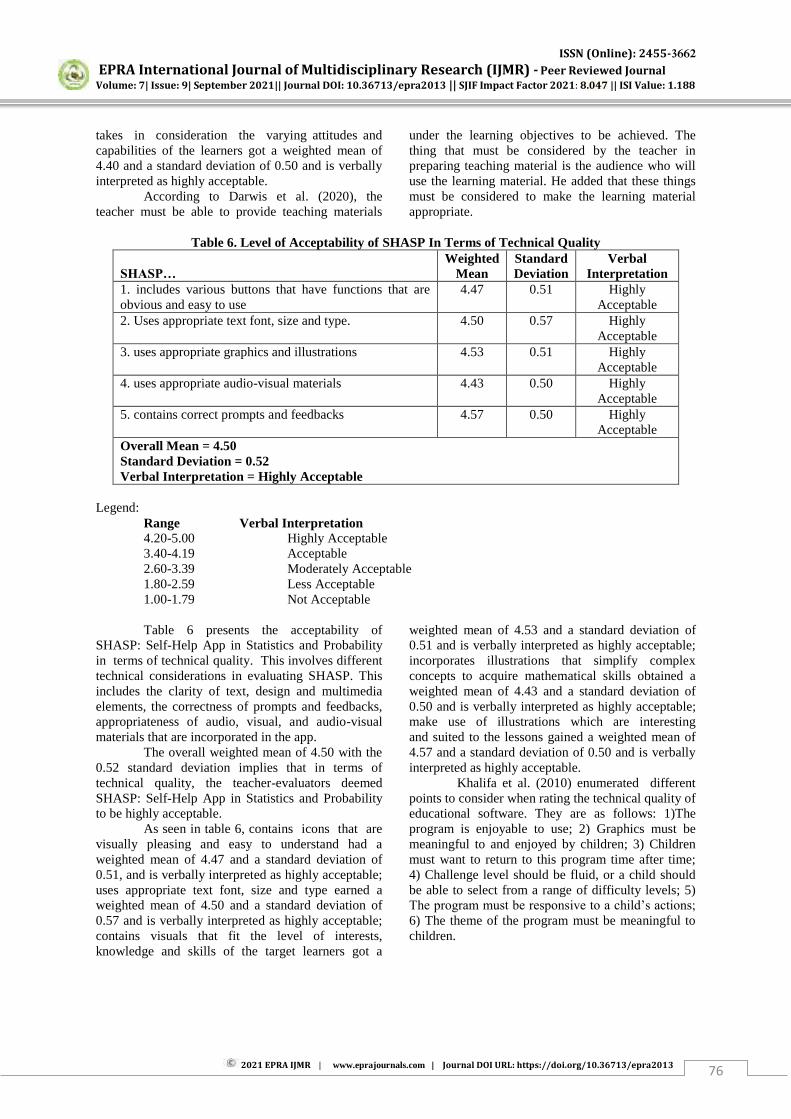
ISSN (Online): 2455-3662
EPRA International Journal of Multidisciplinary Research (IJMR) - Peer Reviewed Journal Volume: 7| Issue: 9| September 2021|| Journal DOI: 10.36713/epra2013 || SJIF Impact Factor 2021: 8.047 || ISI Value: 1.188
2021 EPRA IJMR | www.eprajournals.com | Journal DOI URL: https://doi.org/10.36713/epra2013 76
takes in consideration the varying attitudes and capabilities of the learners got a weighted mean of 4.40 and a standard deviation of 0.50 and is verbally interpreted as highly acceptable. According to Darwis et al. (2020), the teacher must be able to provide teaching materials
under the learning objectives to be achieved. The thing that must be considered by the teacher in preparing teaching material is the audience who will use the learning material. He added that these things must be considered to make the learning material appropriate.
Table 6. Level of Acceptability of SHASP In Terms of Technical Quality
SHASP… Weighted
Mean Standard Deviation
Verbal Interpretation
1. includes various buttons that have functions that are obvious and easy to use
4.47 0.51 Highly Acceptable
2. Uses appropriate text font, size and type. 4.50 0.57 Highly Acceptable
3. uses appropriate graphics and illustrations 4.53 0.51 Highly Acceptable
4. uses appropriate audio-visual materials 4.43 0.50 Highly Acceptable
5. contains correct prompts and feedbacks 4.57 0.50 Highly Acceptable
Overall Mean = 4.50 Standard Deviation = 0.52 Verbal Interpretation = Highly Acceptable
Legend:
Range Verbal Interpretation 4.20-5.00 Highly Acceptable 3.40-4.19 Acceptable 2.60-3.39 Moderately Acceptable 1.80-2.59 Less Acceptable 1.00-1.79 Not Acceptable
Table 6 presents the acceptability of
SHASP: Self-Help App in Statistics and Probability in terms of technical quality. This involves different technical considerations in evaluating SHASP. This includes the clarity of text, design and multimedia elements, the correctness of prompts and feedbacks, appropriateness of audio, visual, and audio-visual materials that are incorporated in the app.
The overall weighted mean of 4.50 with the 0.52 standard deviation implies that in terms of technical quality, the teacher-evaluators deemed SHASP: Self-Help App in Statistics and Probability to be highly acceptable.
As seen in table 6, contains icons that are visually pleasing and easy to understand had a weighted mean of 4.47 and a standard deviation of 0.51, and is verbally interpreted as highly acceptable; uses appropriate text font, size and type earned a weighted mean of 4.50 and a standard deviation of 0.57 and is verbally interpreted as highly acceptable; contains visuals that fit the level of interests, knowledge and skills of the target learners got a
weighted mean of 4.53 and a standard deviation of 0.51 and is verbally interpreted as highly acceptable; incorporates illustrations that simplify complex concepts to acquire mathematical skills obtained a weighted mean of 4.43 and a standard deviation of 0.50 and is verbally interpreted as highly acceptable; make use of illustrations which are interesting and suited to the lessons gained a weighted mean of 4.57 and a standard deviation of 0.50 and is verbally interpreted as highly acceptable.
Khalifa et al. (2010) enumerated different points to consider when rating the technical quality of educational software. They are as follows: 1)The program is enjoyable to use; 2) Graphics must be meaningful to and enjoyed by children; 3) Children must want to return to this program time after time; 4) Challenge level should be fluid, or a child should be able to select from a range of difficulty levels; 5) The program must be responsive to a child’s actions;
6) The theme of the program must be meaningful to children.
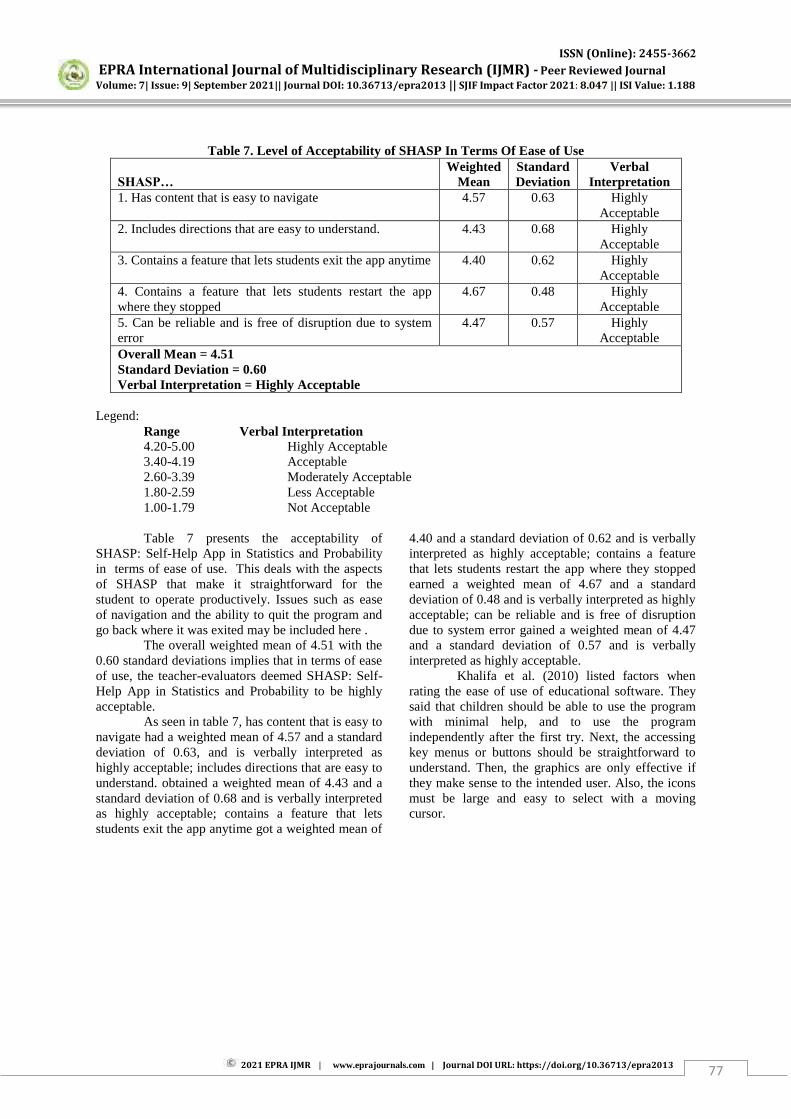
ISSN (Online): 2455-3662
EPRA International Journal of Multidisciplinary Research (IJMR) - Peer Reviewed Journal Volume: 7| Issue: 9| September 2021|| Journal DOI: 10.36713/epra2013 || SJIF Impact Factor 2021: 8.047 || ISI Value: 1.188
2021 EPRA IJMR | www.eprajournals.com | Journal DOI URL: https://doi.org/10.36713/epra2013 77
Table 7. Level of Acceptability of SHASP In Terms Of Ease of Use
SHASP… Weighted
Mean Standard Deviation
Verbal Interpretation
1. Has content that is easy to navigate 4.57 0.63 Highly Acceptable
2. Includes directions that are easy to understand. 4.43 0.68 Highly Acceptable
3. Contains a feature that lets students exit the app anytime 4.40 0.62 Highly Acceptable
4. Contains a feature that lets students restart the app where they stopped
4.67 0.48 Highly Acceptable
5. Can be reliable and is free of disruption due to system error
4.47 0.57 Highly Acceptable
Overall Mean = 4.51 Standard Deviation = 0.60 Verbal Interpretation = Highly Acceptable
Legend:
Range Verbal Interpretation 4.20-5.00 Highly Acceptable 3.40-4.19 Acceptable 2.60-3.39 Moderately Acceptable 1.80-2.59 Less Acceptable 1.00-1.79 Not Acceptable
Table 7 presents the acceptability of
SHASP: Self-Help App in Statistics and Probability in terms of ease of use. This deals with the aspects of SHASP that make it straightforward for the student to operate productively. Issues such as ease of navigation and the ability to quit the program and go back where it was exited may be included here .
The overall weighted mean of 4.51 with the 0.60 standard deviations implies that in terms of ease of use, the teacher-evaluators deemed SHASP: Self-Help App in Statistics and Probability to be highly acceptable.
As seen in table 7, has content that is easy to navigate had a weighted mean of 4.57 and a standard deviation of 0.63, and is verbally interpreted as highly acceptable; includes directions that are easy to understand. obtained a weighted mean of 4.43 and a standard deviation of 0.68 and is verbally interpreted as highly acceptable; contains a feature that lets students exit the app anytime got a weighted mean of
4.40 and a standard deviation of 0.62 and is verbally interpreted as highly acceptable; contains a feature that lets students restart the app where they stopped earned a weighted mean of 4.67 and a standard deviation of 0.48 and is verbally interpreted as highly acceptable; can be reliable and is free of disruption due to system error gained a weighted mean of 4.47 and a standard deviation of 0.57 and is verbally interpreted as highly acceptable.
Khalifa et al. (2010) listed factors when rating the ease of use of educational software. They said that children should be able to use the program with minimal help, and to use the program independently after the first try. Next, the accessing key menus or buttons should be straightforward to understand. Then, the graphics are only effective if they make sense to the intended user. Also, the icons must be large and easy to select with a moving cursor.
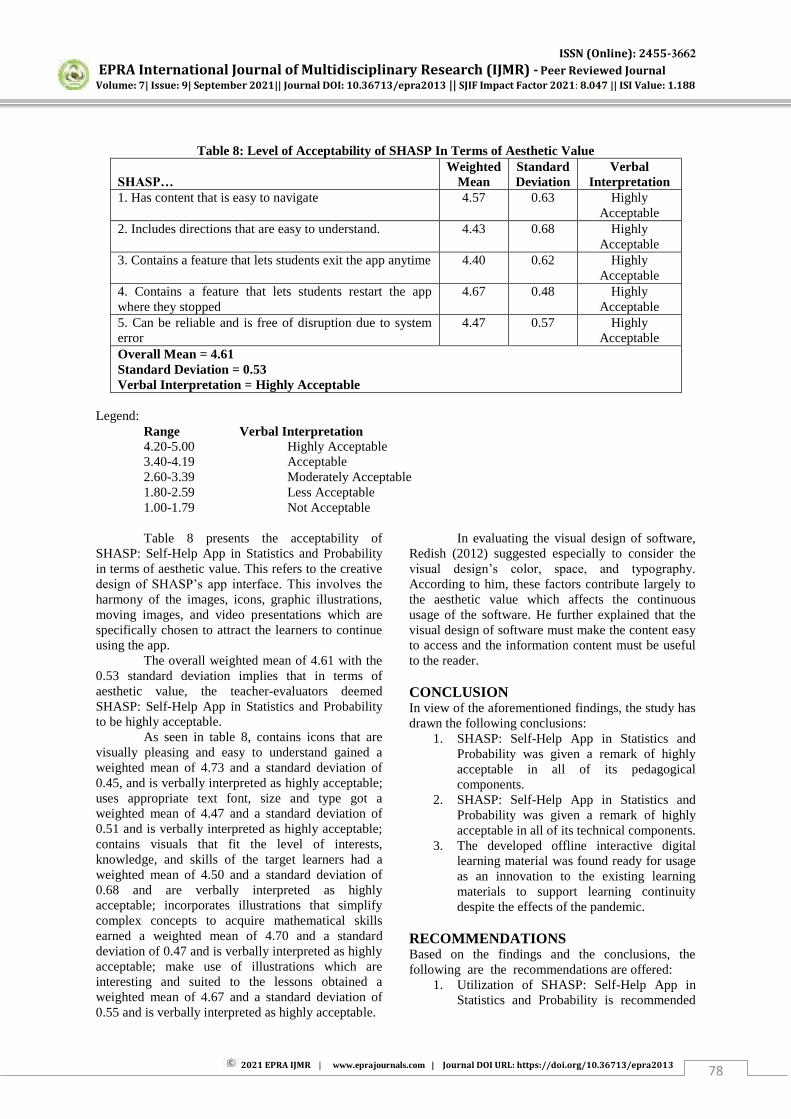
ISSN (Online): 2455-3662
EPRA International Journal of Multidisciplinary Research (IJMR) - Peer Reviewed Journal Volume: 7| Issue: 9| September 2021|| Journal DOI: 10.36713/epra2013 || SJIF Impact Factor 2021: 8.047 || ISI Value: 1.188
2021 EPRA IJMR | www.eprajournals.com | Journal DOI URL: https://doi.org/10.36713/epra2013 78
Table 8: Level of Acceptability of SHASP In Terms of Aesthetic Value
SHASP… Weighted
Mean Standard Deviation
Verbal Interpretation
1. Has content that is easy to navigate 4.57 0.63 Highly Acceptable
2. Includes directions that are easy to understand. 4.43 0.68 Highly Acceptable
3. Contains a feature that lets students exit the app anytime 4.40 0.62 Highly Acceptable
4. Contains a feature that lets students restart the app where they stopped
4.67 0.48 Highly Acceptable
5. Can be reliable and is free of disruption due to system error
4.47 0.57 Highly Acceptable
Overall Mean = 4.61 Standard Deviation = 0.53 Verbal Interpretation = Highly Acceptable
Legend:
Range Verbal Interpretation 4.20-5.00 Highly Acceptable 3.40-4.19 Acceptable 2.60-3.39 Moderately Acceptable 1.80-2.59 Less Acceptable 1.00-1.79 Not Acceptable
Table 8 presents the acceptability of
SHASP: Self-Help App in Statistics and Probability in terms of aesthetic value. This refers to the creative design of SHASP’s app interface. This involves the
harmony of the images, icons, graphic illustrations, moving images, and video presentations which are specifically chosen to attract the learners to continue using the app.
The overall weighted mean of 4.61 with the 0.53 standard deviation implies that in terms of aesthetic value, the teacher-evaluators deemed SHASP: Self-Help App in Statistics and Probability to be highly acceptable.
As seen in table 8, contains icons that are visually pleasing and easy to understand gained a weighted mean of 4.73 and a standard deviation of 0.45, and is verbally interpreted as highly acceptable; uses appropriate text font, size and type got a weighted mean of 4.47 and a standard deviation of 0.51 and is verbally interpreted as highly acceptable; contains visuals that fit the level of interests, knowledge, and skills of the target learners had a weighted mean of 4.50 and a standard deviation of 0.68 and are verbally interpreted as highly acceptable; incorporates illustrations that simplify complex concepts to acquire mathematical skills earned a weighted mean of 4.70 and a standard deviation of 0.47 and is verbally interpreted as highly acceptable; make use of illustrations which are interesting and suited to the lessons obtained a weighted mean of 4.67 and a standard deviation of 0.55 and is verbally interpreted as highly acceptable.
In evaluating the visual design of software, Redish (2012) suggested especially to consider the visual design’s color, space, and typography.
According to him, these factors contribute largely to the aesthetic value which affects the continuous usage of the software. He further explained that the visual design of software must make the content easy to access and the information content must be useful to the reader. CONCLUSION In view of the aforementioned findings, the study has drawn the following conclusions:
1. SHASP: Self-Help App in Statistics and Probability was given a remark of highly acceptable in all of its pedagogical components.
2. SHASP: Self-Help App in Statistics and Probability was given a remark of highly acceptable in all of its technical components.
3. The developed offline interactive digital learning material was found ready for usage as an innovation to the existing learning materials to support learning continuity despite the effects of the pandemic.
RECOMMENDATIONS Based on the findings and the conclusions, the following are the recommendations are offered:
1. Utilization of SHASP: Self-Help App in Statistics and Probability is recommended
ISSN (Online): 2455-3662
EPRA International Journal of Multidisciplinary Research (IJMR) - Peer Reviewed Journal Volume: 7| Issue: 9| September 2021|| Journal DOI: 10.36713/epra2013 || SJIF Impact Factor 2021: 8.047 || ISI Value: 1.188
2021 EPRA IJMR | www.eprajournals.com | Journal DOI URL: https://doi.org/10.36713/epra2013 79
for use of Grade 11 students in their independent study.
2. School administrators are encouraged to provide the teachers the means to create interactive digital learning materials.
3. It is suggested for teachers to equip themselves with the appropriate ICT skills by attending related pieces of training to produce interactive digital learning materials.
4. It is recommended for researchers to continue this study by testing its effectiveness to actual Grade 11 students of Statistics and Probability.
5. Similar studies about the use of interactive digital learning materials as intervention are therefore recommended not only in the field of Statistics and Probability but also in the other subjects.
REFERENCES
1. Abirin S. G., & Obra Jr., M.R., Ed.D. (2018). Development and Use of Social Media-Based Mathematics Instructional Module for Grade 7 Students of Geras Integrated School. New Media and Mass Communication, 72(31).
2. Almanar, M. (2020). The Shifting Of Face To Face Learning To Distance Learning During The Pandemic Covid-19. Muhammadiyah University.
3. Anwar, M. S., Choirudin, Ningsih, E.F., Dewi, T., & Maseleno, A. (2019). Developing an Interactive Mathematics Multimedia Learning Based on Ispring Presenter in Increasing Students’ Interest in Learning Mathematics.
Institute of Information and Computing in Energy, University Tenaga Nasional, Malaysia.
4. Ariani, N., & Haryanto, D. (2010). Multimedia Learning In Schools. Jakarta: Prestasi Pustaka
5. Arimi, K., & Mubarak A.A., (2014). Distance Learning. In ERPA International Congress on Education, ERPA Congress 2014, 6-87 152:82-88
6. Asyhar, R. (2012). Creatively Develop Learning Media. Jakarta.
7. Bekele, A. (2019). Investigating The Influence Of pre-Calculus Mathematics Refreshment Module To First Year Engineering Students In An Ethiopian University. Globish (An English-Indonesian journal for English, Education and Culture), 9(2). Retrieved from http://dx.doi.org/10.31000/globish.v7i276
8. Bilbao, P. B. (2015). Curriculum development for teachers. Quezon City, Philippines: Lorimar Publishing, Inc.
9. Bonk, Curt & Lee, Mimi & Kou, Xiaojing & Xu, Shuya & Sheu, Feng-Ru. (2015). Understanding the Self-Directed Online Learning Preferences, Goals, Achievements, and Challenges of MIT OpenCourseWare Subscribers. Educational Technology & Society. 18. 349-365.
10. Bozkurt, A., Akgun-Ozbek, E., Yilmazel, S., Erdogdu, E., Ucar, H., Guler, E., Sezgin, S.,
Karadeniz, A., Sen-Ersoy, N., Goksel-Canbek, N., Dincer, G. D., Ari, S., & Aydin, C. H. (2015). Trends in Distance Education Research: A Content Analysis of Journals 2009-2013. The International Review of Research in Open and Distributed Learning, 16(1). Retrieved from https://doi.org/10.19173/irrodl.v16i1.1953
11. Busstra, C., Feskens, E. J. M., Hartog, R. J. M., Van’t Veer, P., and Kok, F.J. . (2011). Interactive
digital learning material on collating evidence from human nutrition research. e-SPEN, Eur. e-J. Clin. Nutr. Metab., 3, 52-61.
12. Calderon, Jose F. Gonzales, Expectacion F. (2010). Methods of Research and Thesis Writing. Madaluyong Philippines: National Bookstore.
13. Churiyah M., Sholikhan, Filianti, & Dewi A.S. (2020). Indonesia Education Readiness Conducting Distance Learning in Covid-19 Pandemic Situation 2020. Retrieved from http://dx.doi.org/10.18415/ijmmu.v7i6.1833 2020
14. Chuttur, M.Y. (2009). Overview of the Technology Acceptance Model: Origins, Developments and Future Directions, Indiana University, USA, Sprouts: Working Papers on Information Systems
15. Dane, F. C. (2005). Research Methods. Fourth Edition, USA: Brooks/Cole Publishing Company
16. Daniels J.S. (2002): “Foreword” in Information
and Communication Technology in Education–A Curriculum for Schools and Programme for Teacher Development. Paris: UNESCO.
17. Danu D.K. (2012). Development of Sets Visioned Redox Reaction Teaching Materials, Constructivistic Orientation. Semarang: Universitas Negeri Semarang.
18. Daryanto, D. (2013). Media Learning. Yogyakarta: Gava Media.
19. Davis, F. D. (1989), "Perceived Usefulness, Perceived Ease Of Use, And User Acceptance Of Information Technology", MIS Quarterly, 13 (3): 319–340, doi:10.2307/249008, JSTOR 249008
20. DepEd Order No. 18, s. 2020. Policy Guidelines for the Provision of Learning Resources in the Implementation of the Basic Education Continuity Plan. Retrieved from https://www.deped.gov.ph/2020/07/20/july-20-2020-do-018-s-2020-policy-guidelines-for-the-provision-of-learning-resources-in-the-implementation-of-the-basic-education-continuity-plan/
21. Depdiknas. (2010). Teaching Material Development Guide. Jakarta: Ministry of National Education.
22. Diah Mulhayatiah D., Purwanti, P., Setya W., Suhendi, H.Y., Kariadinata R., & Sri Hartini. (2018). The Impact of Digital Learning Module in Improving Students' Problem-Solving Skills. Jurnal Ilmiah Pendidikan Fisika. https://doi.org/10.24042/jipfalbiruni.v8i1.3150.
23. Diederen, J., Gruppen, H., Hartog, R., Moerland, G., and Voragen, A. G. J. (2010). Design of Activating Digital Learning Material for Food Chemistry Education. Chemistry Education Practicum, 4, 353–371.
ISSN (Online): 2455-3662
EPRA International Journal of Multidisciplinary Research (IJMR) - Peer Reviewed Journal Volume: 7| Issue: 9| September 2021|| Journal DOI: 10.36713/epra2013 || SJIF Impact Factor 2021: 8.047 || ISI Value: 1.188
2021 EPRA IJMR | www.eprajournals.com | Journal DOI URL: https://doi.org/10.36713/epra2013 80
24. Evaluation Of Blended Learning Approach In Computer Engineering Education. (2013). Procedia - Social And Behavioral Sciences, 141 ( 2014 ) 807 – 812.
25. Fausih, & Tandionomanu, M. (2015). Development Electronic Module as A Media for Subjects Productive Installing LAN for Participants Class XI Department of Computer Network Engineering at SMK Negeri 1 Labang Bangkalan Madura.
26. Griffiths, B. (2016). A Faculty’s Approach to
Distance Learning Standardization. Teaching and Learning in Nursing, 11(4), 157–162. Retrieved from https://doi.org/10.1016/j.teln.2016.04.004
27. Gunawardhana, D. (2020). Review of E-Learning as a Platform for Distance Learning in Sri Lanka. In: Education Quarterly Reviews 3(2), 141-145
28. Hamidi, S. (2012). Designing Teaching and Learning Activities so Entertaining, The Edudtaintment Method Makes Students Creative and Comfortable in Class. Yogyakarta: Divapress.
29. Hsieh, W.M. & Tsai, C.C. (2017). Taiwanese High School Teachers’ Conceptions of Mobile
Learning. Computers & Education, 115, 82–95. Retrieved from https://doi.org/10.1016/j.compedu.2017.07.013
30. Introduction to Computer Assisted Learning (CAL). (2016). Retrieved from Resources.intenseschool.com: https://resources.intenseschool.com/introduction-to-computer-assisted-learning-cal/
31. Irfan, A., & Puput W.R. (2014). Development of Learning Modules in Electromagnetic Field I Courses in the Department of Electrical Engineering, Surabaya State University. Journal of Electrical Engineering Education, 3(3).
32. Isnaeni, I. , & Agustina, Y. (2018). An Increase In Learning Outcome Students Is Through The Development Of Archive E-Module Based On The Flipbook With Discovery Learning Model. Admathedust, 6(11).
33. iSpring Presenter Reviews & Product Details. (2020). Retrieved from www.g2.com: https://www.g2.com/products/ispring-presenter/reviews
34. Jaenudin A., Baedhowi, & Murwaningsih, T. (2017). The Effectiveness of The E-Module of Economics Learning on Problem Based Learning Used To Improve Students Learning Outcomes. Advances in Social Science, Education and Humanities Research (ASSEHR), 158 (1). International Conference on Teacher Training and Education 2017 (ICTTE 2017).
35. Jonassen, D. H. (2014). Handbook of Research on Educational Communications and Technology, 2nd ed. Erlbaum, Mahwah, NJ.
36. Kalyuga, S., & Liu, T. C. (2015). Guest editorial: Managing cognitive load in technology-based learning environments. Educational Technology & Society.
37. Kebritchi, M., Lipschuetz, A. & Santiague, L. (2017). Issues and Challenges for Teaching
Successful Online Courses in Higher Education: A Literature Review. Journal of Educational Technology Systems. 46(1): 4–29. DOI: 10.1177/0047239516661713
38. Kumar, P., Saxena, C. & Baber, H. Learner-content interaction in e-learning- the moderating role of perceived harm of COVID-19 in assessing the satisfaction of learners. (2021). Smart Learn. Environ. 8, 5 . https://doi.org/10.1186/s40561-021-00149-8
39. Lee, L.-T., & Hung, J. C. (2015). Effects of blended e-learning: A case-study in highereducation tax learning setting. Human-centric Computing and Information Sciences.
40. Li, C. , Lalani, F. (2020). The COVID-19 pandemic has changed education forever. This is how. Retrieved from Weforum.org: https://www.weforum.org/agenda/2020/04/coronavirus-education-global-covid19-online-digital-learning/
41. Markova, T., Glazkova, I. & Zaborova, E. (2017). Quality Issues of Online Distance Learning. 7th International Conference on Intercultural Education “Education, Health and
ICT for a Transcultural World”, EDUHEM
2016, 15-17 June 2016, Almeria, Spain. Procedia - Social and Behavioral Sciences 237(): 685 – 691.
42. Martin, F., Hoskins, O. J., Brooks, R., & Bennett, T. (2013). Development of an Interactive Multimedia Instructional Module. The Journal of Applied Instructional Design, 3(3).
43. Mayer, R. E. (2009). Multimedia learning (2nd ed). New York:Cambridge University Press.
44. Mathew, I., R. & Ebelelloanya, J. (2016). Open And Distance Learning: Benefits And Challenges Of Technology Usage For Online Teaching And Learning In Africa. Conference Proceedings & Working Papers. Pan-Commonwealth Forum 8 (PCF8). Retrieved from http://hdl.handle.net/11599/2543.
45. Meli, K., Zacharos, K., & Koliopoulos, D. (2016). The Integration of Mathematics in Physics Problem Solving : A Case Study of Greek Upper Secondary School Students. Canadian Journal of Science, Mathematics and Technology Education.
46. Mulenga, E. M. (2020). Is COVID-19 the Gateway for Digital Learning in Mathematics Education?ContemporaryEducationalTechnology.
47. Munir. (2013). Multimedia: Concepts and Applications in Education. Bandung: Alfabeta.
48. Musingafi M.C.C., M. B. (2015). Challenges for Open and Distance learning (ODL) Students: Experiences from Students of the Zimbabwe Open University. Journal of Education and Practice, 6(8).
49. Neumann, D. L. , Neumann, M. M., & Hood, M. (2011). Evaluating Computer-Based Simulations, Multimedia And Animations That Help Integrate Blended Learning With Lectures In First Year Statistics. Griffith University.
50. Ningrum, M., Dewi, N., & Parmin, P. (2018). Guided Inquiry-based Pop-up Module
ISSN (Online): 2455-3662
EPRA International Journal of Multidisciplinary Research (IJMR) - Peer Reviewed Journal Volume: 7| Issue: 9| September 2021|| Journal DOI: 10.36713/epra2013 || SJIF Impact Factor 2021: 8.047 || ISI Value: 1.188
2021 EPRA IJMR | www.eprajournals.com | Journal DOI URL: https://doi.org/10.36713/epra2013 81
DevelopmentOn The Theme Of The Solar System For Class VII Of Junior High School. Jurnal Inovasi Pendidikan IPA, 4(1), 1-10.
51. Nithyanantham, V. (2019). Integration of ICT for Transforming Education among the Non-Science Stream Pedagogical Learners. Universal Journal of Educational Research.
52. Norhapizah Mohd Burhan, Ab Halim Tamuri, Norazah Mohd Nordin, Khairul Husna Hj Abd Kadir. (2015). Acceptance towards Digital Learning Module based Blended Learning Strategy in Higher Learning Institutions: A case study from Malaysia. Australian Journal of Basic and Applied Sciences.
53. Noroozi, O., Busstra, M. C., Mulder, M., Biemans, H. J. A., Tobi, H., Geelen, M. M. E. E., … Chizari, M. (2012). Online discussion
compensates for suboptimal timing of supportive information presentation in a digitally supported learning environment. Educational Technology Research and Development.
54. Nurlaini. (2017). Development of WxMaxima Software Assisted Calculus II Module in the Mathematics Education Studies Program. Universitas Syiah Kuala Thesis.
55. Parreno E.B. & Jimenez R.O. (2006). Basic Statistics A Work Text , Manila: C & E Publishing Inc.
56. Pombo, L. M. (2015). An evaluation model for quality assurance of blended learning:Exploring the lecturers’ perspectives. Springer Science and
Business Media. 57. Prasmala E.R., & Tanggu E.D. (2020). Needs
Analysis of Digestive System Module Development with Make a Match Learning Model Based on Digital Daily Assessment. PEDAGOGIA: Jurnal Pendidikan. https://doi.org/10.21070/pedagogia.v9i1.266.
58. Pratita, D., & Djahir, D. (2020). Analysis of Students Needs for Teaching Materials as A Reference for Developing E-Module of Digital Learning Courses. Advances in Social Science, Education and Humanities Research 513 (4). Sriwijaya University Learning and Education International Conference (SULE-IC 2020)
59. Pupitasari, D. E., Amin, M., & Lukiati, B. (2016). Development of Textbooks in Cell Biology Based In Silico. Journal of Education: Theory, Research, and Development, 1(9), 1836–1847.
60. Purnawati, R. (2017). Development Of Interactive Learning Module In Computer Accounting Subject To Improve Student Motivation Of Class Xi Ak 1 In Smk Negeri 1 Yogyakarta. Jurnal Pendidikan Bisnis dan Manajemen, 4(3).
61. Puspandari, N., Widayati. (2019). Development Of Mathematics Module In Trigonometry Material Based On Discovery Learning For Grade 10th. Mathematics Education Study Program. Ahmad Dahlan University.
62. Ramnarain U. (2018). Coherence in the Teaching of South African Chemistry Lessons. In: Yeo J., Teo T., Tang KS. (eds) Science Education Research and Practice in Asia-Pacific and
Beyond.Springer,Singapore.https://doi.org/10.1007/978-981-10-5149-4_12
63. Rufii, R. (2015). Developing Module On Constructivist Learning Strategies To Promote Students’ Independence And Performance.
International Journal of Education, 7(1), 18–28. 64. Sari F.K., Farida & Syazali, M. (2016).
Pengembangan Media Pembelajaran (Modul) Berbantuan GeoGebra pokok bahasan Turunan Al-JabarJurnal Pendidikan Matematika 7 .
65. Sevilla, Consuelo G. et. al (2001). Research Methods, Quezon City: Rex Printing Co.
66. Schnotz, W. (2012). Towards An Integrated View of Learning from Text and Visual Displays. Educational Psychology, 14, 101–120.
67. Suratno, T. (2014). The Education System in Indonesia at a Time of Significant Changes. Revue internationale d’éducation de Sèvres.
Retrievedfromhttp://journals.openedition.org/ries/3814
68. Suryani, A.I., Anwar, Hajidin & Rofiki. (2020). The Practicality Of Mathematics Learning Module On Triangles Using Geogebra. Mathematics Education.
69. Sutiah, S., Slamet, S., Shafqat, A. & Supriyono, S., (2020). Implementation of distance learning during the COVID-19 in Faculty of Education and Teacher Training. Cypriot Journal of Educational Science. 15(5), 1204 - 1214. https://doi.org/10.18844/cjes.v15i5.5151
70. Sutrisno, D. (2015). Engaging E-Lectures Blended Course With Problem Based Learning Activities At A Developing University. Ma’arif
Nahdlatul Ulama University Of Kebumen Indonesia .
71. Ulfa, A. M., Sugiyarto, K. H., & Ikhsan, J. (2017). The Effect of the Use of Android-based Application in Learning Together to Improve Students’ Academic Performance. Retrieved from
https://doi.org/10.1063/1.4983910 72. Wang, R., Mattick, K., & Dunne, E. (2010)
Medical Students’ Perceptions Of Video-Linked Lectures And Video-Streaming, ALT-J, 18:1, 19-27, DOI: 10.1080/09687761003657622
73. Wena,M., (2013). Contemporary Innovative Learning Strategies: An Operational Conceptual Review. Jakarta: Bumi Aksara
74. Wong, J., Baars, M., Davis, D., Van Der Zee, T., Houben, G.J., & Paas, F. (2019). Supporting Self-Regulated Learning in Online Learning Environments and MOOCs: A Systematic Review. International Journal of Human–
Computer Interaction, 35(4–5), 356–373. Retrievedfromhttps://doi.org/10.1080/10447318.2018.1543084
75. Wylie, R., Chi M. (2014). The self-explanation principle in multimedia learning. New York, NY, US: Cambridge University Press.
76. Yeh, Charles & Cheng, Hercy & Chen, Zhi-Hong & Liao, Chang-Yen & Chan, Tak-Wai. (2019). Enhancing achievement and interest in mathematics learning through Math-Island. Research and Practice in Technology Enhanced Learning. 14. 10.1186/s41039-019-0100-9.
ISSN (Online): 2455-3662
EPRA International Journal of Multidisciplinary Research (IJMR) - Peer Reviewed Journal Volume: 7| Issue: 9| September 2021|| Journal DOI: 10.36713/epra2013 || SJIF Impact Factor 2021: 8.047 || ISI Value: 1.188
2021 EPRA IJMR | www.eprajournals.com | Journal DOI URL: https://doi.org/10.36713/epra2013 82
77. Yigit, T., Koyun, A., Yuksel A., & Canknurlaya I. (2013). Evaluation Of Blended Learning Approach In Computer Engineering Education. Procedia - Social And Behavioral Sciences, 141 ( 2014 ) 807 – 812.
78. Yusuf, M. O. (2005). Information and communication technologies and education: Analyzing the Nigerian national policy for information technology. International Education Journal, 6(3), 316-321.
79. Yusof, Y. (2010). The Development of Instructional Module of Hybrid Approach Using Collaborative and Metacognitive (HybCoMet) Strategy as an Alternative Approach to Help Improving Generic Skills among Students in Malaysian Polytechnics. Citeweb. http://citeweb.info/20101451136
ISSN (Online): 2455-3662
EPRA International Journal of Multidisciplinary Research (IJMR) - Peer Reviewed Journal Volume: 7| Issue: 9| September 2021|| Journal DOI: 10.36713/epra2013 || SJIF Impact Factor 2021: 8.047 || ISI Value: 1.188
2021 EPRA IJMR | www.eprajournals.com | Journal DOI URL: https://doi.org/10.36713/epra2013 83
JURIDICAL ANALYSIS OF HANDLING VITAL
OBJECTS IN THE PERSPECTIVE OF ENSURING
PUBLIC SAFETY AND ORDER: A STUDY ON VITAL
OBJECTS IN WATER CATCHMENT AREAS AND
RESERVOIRS LOCATED IN THE BATAM
CONCESSION AGENCY
*1Genduk Afreni, 2Laily Washliati, 3Idham 1,2,3Faculty of Law,Universitas Batam, Indonesia
*1Corresponding author
ABSTRACT Threats and security disturbances to vital objects, either directly or indirectly, have an impact on the national economic system, and, at a particular level, have an impact on politics, the state administration system, and national security. The vital objects have a critical role in encouraging national development and may have a significant impact on the country's economic system, political and government systems, and national security. The issue addressed in this study is how to handle vital objects in order to improve the community's security and order in the catchment area and reservoirs situated within the Batam concession agency. How to implement vital object handling with the goal of enhancing public order and security. What factors become impediments? Solutions for the safe handling of vital objects with the goal of enhancing community security and order. The purpose of this research is to ascertain the legal arrangements for the handling of vital objects with the goal of ensuring security and public order in the Batam Concession Agency's catchment area and reservoirs. In addition, to decide how the legal analysis of handling vital objects will be implemented in order to ensure community security and order. Moreover, to identify elements that become impediments as well as solutions for handling vital objects with the goal of ensuring the security and order of the people living in the Batam Concession Agency's catchment and reservoir region. This study employs a descriptive methodology in order to collect primary data via field research utilizing a normative legal research approach. The results indicated that the handling of vital objects in the context of strengthening community security and order (A Research Study on Vital Objects in Catchment Areas and Reservoir Areas located in Batam Concession Agency) has been implemented largely successfully, despite the presence of numerous obstacles in the field, particularly legal obstacles that accompany the performance of the law. As a result, it is anticipated that laws governing the preservation of protected forest areas and reservoirs will be implemented effectively, including the imposition of penalties against community members who commit the crime of forest area destruction. KEYWORDS: Vital Objects, Security, Public Order, Catchment Area, Reservoirs
INTRODUCTION
Today, the issue of security and order has taken on a more strategic position. This may be observed in the increasing proportion of threats and disruptions to security and order, which come with a variety of risks and consequences. Threats and security disruptions to vital objects such as airports, ports, processing plants, storage and distribution of fuel oil, and water supply systems continue to expand in scope, posing a variety of risks and consequences. The advancement of science and technology, as well as the growing complexity of community issues (social exclusion) (Silver, 2007), have resulted in a variety of possible security breaches affecting a
variety of vital objects, resulting in financial losses, property damage, and even fatalities.
Threats and security disruptions to vital objects have a direct or indirect effect on the national economic system and, to a slightly lesser degree, on political stability, the state administration system, and national security. The vital objects have a critical role in supporting national development and may have a significant impact on the national economic system, political system, and governance, as well as national security.
Given its critical role, the vital object needs enhanced system security built on top of normal system security in order to mitigate security risks and effects from threats and disruptions. Standards for
ISSN (Online): 2455-3662
EPRA International Journal of Multidisciplinary Research (IJMR) - Peer Reviewed Journal Volume: 7| Issue: 9| September 2021|| Journal DOI: 10.36713/epra2013 || SJIF Impact Factor 2021: 8.047 || ISI Value: 1.188
2021 EPRA IJMR | www.eprajournals.com | Journal DOI URL: https://doi.org/10.36713/epra2013 84
vital object security systems may be used to evaluate the performance of vital object security systems. In addition, to establish guidelines for the protection of vital objects, the Minister of Human Resources of the Republic of Indonesia issued Decree No. 77 K/90/MEM/2019 and the Minister of Energy and Mineral Resources issued Regulation No. 48 of 2018. In the Ministerial Decree, the National Vital Objects in the Energy and Mineral Resources Sector are areas/locations, buildings/installations, and/or businesses that concern the livelihood of the people, state interests, and/or strategic sources of state revenue in the energy and mineral resources sector. According to Presidential Decree No. 63/2004, the vital objects have the following characteristics.
1) Threats and disruptions may result in disasters on humanity and development;
2) Threats and disruptions may it cause national disruptions in transportation and communications; and/or
3) Threats and disruptions may it result in a obstacle of the state government's administration.
According to the Presidential Decree, Vital Objects require that the standard configuration of security for each vital object meet the quality or capability requirements established by the Indonesian National Police and that security systems undergo periodic audits. This guideline for vital object security systems includes security patterns, standard configuration, security implementation capability standards, security audit management, and supervision and control.
To ensure that vital object managers adhere to the security system standards for vital objects, Ministries/Non-Departmental Institutions that regulate vital objects may issue a policy requiring the mandatory implementation of security system standards and conducting periodic audits of the vital object security system's performance. Some criteria/indicators may be used to evaluate the performance of the vital object security system, including the following: internal security policy, security planning, security standards and procedures, security personnel qualification, security technology, cooperation and coordination system with the police, self-security cooperation with the community and stakeholders, supervision and control.
In this case, as one of the managers of vital objects in Batam, the Batam Concession Board has the right to obtain land management rights in accordance with the provisions of Batam Concession legislation in order to conduct activities for the use and supervision of water catchment areas and reservoirs located in protected forests. A water catchment area is a watershed area that extends from the reservoir's outer border to its upstream, and
contains, among other things, natural reserves, nature conservation areas, and protected forests.
The Batam Concession Agency, as the owner and manager of the reservoirs, utilizes and supervises the catchment area, which includes monitoring and maintaining the safety of the dam and securing and maintaining the catchment area. Based on the regulations of the Head of the Batam Concession Board No. 24/2016, the regulations of the Head of the Batam Concession Board No. 19/2019, and No. 20/2019, the activity was carried out by the environmental facility business entity together with the General Manager of water resources, waste, and the environment, the Directorate of asset security with the sub-Directorate for environmental and forest security, and the sub-unit for safeguarding assets and vital objects. The situation overlaps with the supervisory authority of the Ministry of Environment and Forestry, which has given the technical supervision authority to the protected forest management unit II Batam, which is tasked with and functions in forest protection, forest security, law enforcement, advocacy, consultation, and assistance in the forestry sector.
Most dams managed by the Batam Concession Agency were constructed prior to the Minister of the Environment issuing the Borrow-to-Use Forest Area Permit, which means that there were no regulations established by the government/state regarding the borrow-to-use forest area during construction. All drinking water resources or reservoirs in Batam are situated inside protected forest areas, according to forestry statistics. It was formerly a conservation forest. However, since its usage for reservoirs or dams can not be controlled, it has been turned into a protected forest. In order to overcome security breaches involving vital objects, it is crucial to establish a coordination framework that defines the roles and responsibilities of each participant. This coordination system is required to ensure that security disruptions to vital objects may be addressed promptly and efficiently, mitigating the security impact. Given the background of thought, the study problem formulation is as follows:
1) What is the legal arrangement to handle the vital objects in the perspective of strengthening community security and order in the context of catchment areas and reservoirs located at the Batam Concession Agency?
2) What is the implementation handling for the vital objects from the perspective of strengthening community security and order in the context of catchment areas and reservoirs located at the Batam Concession Agency?
ISSN (Online): 2455-3662
EPRA International Journal of Multidisciplinary Research (IJMR) - Peer Reviewed Journal Volume: 7| Issue: 9| September 2021|| Journal DOI: 10.36713/epra2013 || SJIF Impact Factor 2021: 8.047 || ISI Value: 1.188
2021 EPRA IJMR | www.eprajournals.com | Journal DOI URL: https://doi.org/10.36713/epra2013 85
3) What are the inhibiting factors and solutions to handling the vital objects from the perspective of strengthening public order and security in the context of catchment areas and reservoirs located at the Batam Concession Agency?
Therefore, several research objectives, among others, are arranged as follows.
1) Understanding the legal arrangements for handling vital objects in the perspective of strengthening public security and order.
2) Understanding the implementation of handling vital objects in the perspective of strengthening public security and order in the context of water catchment areas and reservoirs located in the Batam Concession Agency.
3) Understanding the inhibiting factors and solutions for handling vital objects in the perspective of confirming public safety and order in the context of water catchment areas and reservoirs located in the Batam Concession Agency.
The current research will contribute to theoretical and practical benefits. Theoretically, this research will provide enrichment for the development of legal science, especially in the land sector, considering that this study provides clarity regarding the handling of vital objects. In practice, this research will provide useful information to stakeholders, in particular, the Batam Concession Board and the general public, who need legal certainty over land ownership rights. LITERATURE REVIEW
The purpose of the conceptual framework is to understand the correlation between certain concepts explored. The concept is one of the theory's concrete elements. However, further elaboration in the shape of even an operational definition is required. JURIDICAL ANALYSIS
Analysis is the process of synthesizing a huge quantity of raw data and then grouping or separating the pertinent elements and pieces in order to connect the gathered data and solve the issue. Analysis is an effort to systematically characterize patterns in data in order for the analysis findings to be examined and interpreted. While juridical refers to something that is recognized by law, is based on law, and has an effect on violations. Juridical also refers to a rule that is considered law or has its validity justified in the viewpoints of the law, whether it's through regulations, habits, ethics, or even morals that serve as the basis for its assessment.
In this research, the authors define juridical analysis as an activity that entails identifying and dissecting the components of an issue for further
examination and then relating them to the law, legal regulations, and relevant legal standards as a means of resolving the problem. The activity of juridical analysis is to explore pertinent laws and other supporting documentation in order to develop findings as remedies or answers to issues. The aim of the juridical analysis activity is to develop a mentality for law-abiding problem resolution, particularly in the area of legal politics in land registration. VITAL OBJECTS
Vital objects are areas, places, buildings, and businesses that concern the dignity of life of people, interests, and/or large sources of state income that have the potential for vulnerability and can shake economic, political, and security stability in the event of security disturbances. The authors assume that the legal arrangements for handling vital objects that are focused on are water catchment areas and reservoirs located in protected forests. The high rate of logging crimes, namely by committing theft of wood, is a threat and challenge to security and order. community, which in turn hinders development efforts to achieve community welfare. As a consequence of frequent logging and water pollution around protected forests in Batam City. SECURITY AND ORDER
Security and order in society is a dynamic condition as one of the prerequisites for the implementation of the national development process in the context of achieving national goals marked by ensuring security, order, and law enforcement, as well as the establishment of peace. The capability to foster and develop the potential and strength of society to prevent and overcome overall law violations and other situations of disturbance that may disturb the public.
According to Tata Tentram Kerta Raharja, safety has four main points, namely the feeling of being free from worries, the feeling of being free from risk, and the feeling of inner peace. Security is a condition that is free from all kinds of disturbances and obstacles. Meanwhile, the order is a condition in which the social unit that includes members of the community can play a role in accordance with existing provisions. Therefore, the notion of order is a condition in which all activities function and play a role in accordance with existing provisions. Security and public order are a situation that is needed by the community in terms of development and socializing with other communities.
According to the Law of the Republic of Indonesia, Number 2 of 2002 concerning the National Police of the Republic of Indonesia, Article 1 number 5, concerning security and public order, is one of the prerequisites for the implementation of the
ISSN (Online): 2455-3662
EPRA International Journal of Multidisciplinary Research (IJMR) - Peer Reviewed Journal Volume: 7| Issue: 9| September 2021|| Journal DOI: 10.36713/epra2013 || SJIF Impact Factor 2021: 8.047 || ISI Value: 1.188
2021 EPRA IJMR | www.eprajournals.com | Journal DOI URL: https://doi.org/10.36713/epra2013 86
national development process in the context of achieving national goals marked by guaranteed security, order, and upholding the law. The establishment of peace, which includes the ability to foster and develop the potential and strength of the community in preventing, preventing and overcoming all forms of law violations and other forms of disturbances.
The notion of security and public order, as mentioned, is a basic need of the community who want a safe, peaceful, and orderly atmosphere in the order of life. This is related to the hopes and desires of the community, who crave a feeling of being free from physical and psychological disturbances, free from fear and all kinds of threats of danger, and a feeling of inner and outer peace and serenity. These rights are natural human rights based on natural law. Because humans have rights known as living shadows from God, every individual has the right to sovereignty, the right to exist, the right to function and the right to be protected.
Water Catchment Area The catchment area is the watershed area from
the outer boundary of the reservoir to its upstream; and what is meant by "land in water catchment areas" are, among others, nature reserves, nature conservation areas, and protected forests. The Batam Concession Agency, as the holder of land management rights, carries out utilization and supervision activities for the water catchment area and reservoir located in the forest.
Protected forest A protected forest is a forest or large area of
land that contains a collection of flora and fauna species that are formed naturally or not. Forest areas designated as protected forest areas have a role as a provider of clean water reserves, flood prevention, erosion control, urban lungs, and many others. A Protected forest is also a term for a forest whose sustainability is protected in order to avoid damage caused by humans, continue to run according to its ecological function and be used for the common good. Protected forest implies an intention that protected forest can be designated in the highlands as a catchment area, along rivers, or on the edges of the coast.
The main assets of this protected forest are trees that stand as barriers to reduce mass movements such as rock, erosion, landslides, debris flows, and floods. The protective effect of this protected forest can only be ensured if the management of the silvicultural system used does not have a significant adverse impact on the surrounding environment. This paper presents an overview of the meaning, benefits, examples, legal basis, regulations, and problems of protected forests that occur in Indonesia. Often, people generally think that protected areas and protected forests are the same thing. Protected areas
and protected forests are actually two different things, but they are closely related to each other. Protected areas include forest and non-forest areas, while protected forests are protected areas located in forest areas. So simply, a protected forest is part of a protected area.
Based on Presidential Decree Number 32 of 1990 concerning Management of Protected Areas, a protected area is an area designated with the main function of protecting environmental sustainability, which includes natural resources, artificial resources, and historical and cultural values of the nation in the interest of sustainable development. Protected areas also include protected forests that have the characteristic of protecting the surrounding area and the area below it. This forest is useful for regulating water systems, preventing flooding and erosion, and maintaining soil fertility. As explained in the sub-heading above, the functions and real benefits provided by protected forests are as a distinctive area and able to provide protection to the surrounding area as a water management area, an area to prevent flooding and erosion, and a unique area for maintaining soil fertility. JURIDICAL AND NON-JURIDICAL INHIBITING FACTORS
The actions of forest management and utilization, on the one hand, will provide great benefits for mankind (community). However, if forest management and utilization is carried out in such a way as to cause damage, then it will cause harm to mankind. One of these losses occurred as a result of the absence of a legal basis on which to prevent arbitrary acts against the forest. Therefore, we need a set of laws that regulate the use and management of forests, as well as the role of the state in managing forests so that they remain sustainable. With the law that regulates and protects forests, it is expected to minimize the occurrence of forest damage, which has broad implications for the harmonious environment. The legal basis formed will be very good with the support of criminal aspects that can limit and regulate the imposition of sanctions for anyone who destroys and pollutes forests. JURIDICAL INHIBITING FACTORS.
There are three aspects of law enforcement in the forestry sector that can not be separated from each other as part of the legal system. (1) the legal substance regulated and contained in Law no. 41 of 1999 and its implementing regulations, and other laws and regulations relating to forestry law. (2) the legal structure, namely law enforcement officers, starting from investigators, public prosecutors, as well as judges (including ad hoc judges), and legal advisers. Do law enforcers work properly according to their respective duties and authorities and
ISSN (Online): 2455-3662
EPRA International Journal of Multidisciplinary Research (IJMR) - Peer Reviewed Journal Volume: 7| Issue: 9| September 2021|| Journal DOI: 10.36713/epra2013 || SJIF Impact Factor 2021: 8.047 || ISI Value: 1.188
2021 EPRA IJMR | www.eprajournals.com | Journal DOI URL: https://doi.org/10.36713/epra2013 87
coordinate well as part of the integrated criminal justice system? (3) legal culture, which is related to community participation, both individuals, social groups, social organizations, NGOs, and universities in forestry law enforcement.
In Article 47 of Law no. 41 of 1999 concerning Forestry, it is stated that forest area protection is an effort to (1) prevent and limit damage to forests, forest areas, and forest products caused by human actions, livestock, fire, natural forces, pests, and diseases; and (2) maintain and safeguard the rights of the state, communities, and individuals to forests, forest areas, forest products, investments, and instruments related to forest management.
The purpose of forest protection is to maintain the sustainability and function of the forest, and to maintain the quality, value and use of forest products. Furthermore, in Article 46 of Law Number 41 of 1999, it is stated that the purpose of forest protection is so that forest functions, which include protection functions, conservation functions, and production functions, can be achieved. Thereby, forest protection is an effort to prevent forest destruction.
There are four kinds of forest protection in Government Regulation Number 28 of 1985, namely: (1) Protection of forest areas, forest reserves, and other forests; (2) Protection of forest land; (3) Protection against forest destruction; and (4) Protection of forest products. ILLEGAL LOGGING
One form of crime in the forestry sector, as mentioned above, is timber theft, or better known as illegal logging. Some interpret illegal logging as illegal logging, which includes all activities in the forestry sector related to harvesting, managing, and trading timber that are against the law. Illegal logging is a series of activities of logging and transporting wood to the processing site to export timber that are carried out illegally because they do not have a permit from the competent authority. Such an act is contrary to the applicable law and is seen as an act that could damage the forest. Thus, it can also be stated that illegal logging includes acts of forest destruction that have an impact on the emergence of losses both from economic, ecological and socio-cultural aspects.
Illegal logging is a crime because the impacts are very broad, covering economic, socio-cultural and environmental aspects. This crime is a potential threat to social order and can lead to tensions and conflicts in various dimensions, so that forest crimes actually deviate from the norms that underlie social life and order. The impact of forest damage caused by illegal logging is not only felt by people living around the forest, but also nationally, regionally, and internationally, because forests do not only belong to
certain communities or countries, but belong to the universal community as the lungs of the world.
Creating Agricultural and Fisheries Land around the Reservoir
Batam City has six reservoirs that have a single purpose, namely as a provider of raw water. The condition of the city of Batam, which does not have springs, makes reservoirs a source of life. Around 90 percent of Batam's clean water needs depend on the availability of water in reservoirs. The reservoir is also the only source of drinking water. Not only for people's daily needs, water is also very much needed for industrial needs. The absence of water in the reservoir will affect the economy of Batam City. Industrial operations and infrastructure development processes in Batam all require water. So the reservoir has an important role in life in Batam. The function of the reservoir in Batam, which is single-purpose, is only capable of providing raw water to accommodate the falling rainfall. The reservoir in Batam can not be used for other activities because it does not have a spring and only depends on rainfall. Batam does not have a water source from the ground because the type of soil layer is impermeable or can not absorb water. Activities around the reservoir, both agriculture and fishing, will affect the capacity of the reservoir alone. Batam's special soil conditions mean reservoirs in Batam also need to be maintained to maintain the availability of reservoir water in the long term. To maintain the existence of reservoirs and the availability of water in the city of Batam, the Batam Concession Agency divides the reservoir resilience zone into three zones. The first zone is the reservoir alone, the second zone is 500 meters from the core zone, and the third zone is from the buffer to the existing space limit.
The juridical obstacles that accompany the performance of law enforcement against crimes in the forestry sector can come from factors of legal substance and from law enforcement officials. In terms of legal substance, there are several problems that interfere with the performance of law enforcement against criminal acts in the forestry sector, namely: (1) Forestry Criminal Law provisions can not touch intellectual actors; (2) Difficulty in Proving Forestry Crimes; (3) The Scope of the Formulation of Criminal Offenses and Sanctions is still narrow; (4) Ecological Compensation is not determined; (5) No Special Judicial Institution for Forestry Crimes has been established. NON- JURIDICAL INHIBITING FACTORS
Non-juridical barriers that become obstacles to the performance of law enforcement against criminal acts in the forestry sector are related to issues of legal structure and legal culture, which include: (1) Weak Coordination among Law
ISSN (Online): 2455-3662
EPRA International Journal of Multidisciplinary Research (IJMR) - Peer Reviewed Journal Volume: 7| Issue: 9| September 2021|| Journal DOI: 10.36713/epra2013 || SJIF Impact Factor 2021: 8.047 || ISI Value: 1.188
2021 EPRA IJMR | www.eprajournals.com | Journal DOI URL: https://doi.org/10.36713/epra2013 88
Enforcers; (2) Obstacles in the Confiscation Process; (3) Limited Funds in the Law Enforcement Process; (4) Lack of Law Enforcement Facilities and Infrastructure. CONCLUSION
Legal arrangements for handling the vital objects in the perspective of confirming community security and order have been carried out well, but there are still people who violate existing laws and regulations, namely committing illegal logging around reservoirs as a source of water for the people of Batam City.
The Implementation of Handling Vital Objects in the Perspective of Strengthening Community Security and Order shows that the Regional Government has carried out the handling of disturbances that often occur in Community Security and Order can be divided into three parts. First: Conventional Public Order and Security Disturbance, in the sense of being a social pathological symptom that is always attached, grows and develops in a universal society. Second, Disturbance in Security and Order of Conventional Society with a New Dimension, where the basic pattern or basic pattern is conventional deviant behavior, but in its development it has shown increasing intensity. Third, Disturbance in Security and Public Order as the impact of national development, which shows different characteristics from the two disturbances mentioned above, both in terms of motivation, fluctuations in threats, locus delictinya and in terms of victims.
Inhibiting factors/obstacles and solutions for handling vital objects from the perspective of confirming the security and order of the people in the catchment areas and reservoirs located in the Batam concession area. Juridical obstacles that accompany the performance of law enforcement against crimes in the forestry sector can come from factors of legal substance and from law enforcement officials. In terms of legal substance, there are several problems that interfere with the performance of law enforcement against criminal acts in the forestry sector, namely: First: Forestry Criminal Law Provisions can not touch intellectual actors; Second: Difficulty in Proving Forestry Crimes; Third: the Scope of the Formulation of Offenses and Criminal Sanctions is still narrow; Fourth: Ecological Compensation is not determined; Fifth: No Special Court for Forestry Crimes was formed. Non-juridical barriers that become obstacles to the performance of law enforcement against criminal acts in the forestry sector are related to issues of legal structure and legal culture, which include: First: Weak Coordination among Law Enforcers; Second: Obstacles in the Confiscation Process; Third: Limited Funds in the Law Enforcement Process; Second: Lack of Law Enforcement Facilities and Infrastructure.
Therefore, the solution that the authors offer is to increase legal awareness for law enforcers themselves and legal awareness for the community, and always keep the environment stable and produce quality water sources for human life.. SUGGESTIONS
The government, as the legislator and implementer, is expected to make laws and regulations that specifically discuss vital objects in catchment areas and reservoirs located in protected forests, not to be mixed with other obvit regulations.
The Batam Concession Agency and the police are actually expected to implement comprehensive regulations so that the implementation of protected forest areas and reservoirs can be carried out as well as possible. With the treatment of providing sanctions for people who commit criminal acts of forest destruction.
The community is expected to always protect the environment, not throw garbage, create agricultural and fishing land and livestock, and not throw hazardous waste into reservoirs. REFERENCES
1. Abdurrahman (2017). Manajemen Daerah, Penerbit Grafindo, Jakarta.
2. Anshori, A. G. (2009). Lembaga kenotariatan Indonesia: perspektif hukum dan etika. UII Press.
3. Ashshofa, B. (2017). Metode Peneltian Hukum, Penerbit PT. Rineka Cipta, Jakarta.
4. Aspan, H., Indrawan, M. I., & Wahyuni, E. S. The authority of active partners and passive partners in the company type of commanditaire vennootschap.
5. Deni, L., Rumengan, J., & Fadlan, F. (2020).Juridical analysis of the police role in the resolution of the mild theft problem through the mediation of penal: A research study in the Sagulung Police. IJARIIE 6 (4), 197-207
6. Effendie, B. (2013). Pendaftaran Tanah di Indonesia dan Peraturan-Peraturan Pelaksanaanya, Alumni, Bandung.
7. Fadlan, F. (2019). Government Policy Regarding Building Permits in Indonesia. International Journal Of Research Culture Society 3 (11), 150-154.
8. Fadlan, F. (2019). Perkembangan Kebijakan Daerah Sebagai Paradigma Dasar Untuk Penentuan Kebijakan Mengelola Potensi Keberagaman. Soumatera Law Review 2 (1), 2620-5904
9. Fadlan, F. (2020).Debtor's Guarantee in Providing the Convenience of Credit Agreement. International Journal Of Research Culture Society 6 (1), 159-162.
10. Ginting, D. (2015). Hukum Kepemilikan Hak Atas Tanah Bidang Agribisnis Hak Menguasai Negara dalam Sistem Hukum Pertanahan Indonesia, Penerbit Ghalia Indonesia, Jakarta.
ISSN (Online): 2455-3662
EPRA International Journal of Multidisciplinary Research (IJMR) - Peer Reviewed Journal Volume: 7| Issue: 9| September 2021|| Journal DOI: 10.36713/epra2013 || SJIF Impact Factor 2021: 8.047 || ISI Value: 1.188
2021 EPRA IJMR | www.eprajournals.com | Journal DOI URL: https://doi.org/10.36713/epra2013 89
11. Harsono, B. (2018). Hukum Agraria Indonesia. Himpunan Peraturan Hukum-hukum Tanah, Djambatan, Jakarta.
12. Hasbullah, F.H. (2012). Hukum Kebendaan Perdata Ind–Hil –co, Jakarta.
13. Herlin, B. (2013). Dasar Teknik Pembuatan Akta Notaris, Cetakan Ke I,: Penerbit PT. Citra Aditya Bakti-Bandung.
14. Hoesein, B. (2013). Kebijakan Publik, Penerbit. Sinar Grafika, Bandung.
15. Idham (2004). Konsolidasi tanah Perkotaan Guna Meneguhkan Kedaulatan Rakyat. Alumni Bandung.
16. Idham (2014). Konsolodasi Tanah Perkotaan dalam Prespektif Otonomi Daerah, PT. Alumni, Bandung.
17. Idham, H. (2014). Konsolidasi Tanah Perkotaan Dalam Perspektif Otonomi Daerah Guna Meneguhkan Kedaulatan Rakyat dan Negara Berkesejahteraan-Edisi Kedua. Alumni Bandung.
18. Idham, I., Juliandi, A., Fadlan, F., & I. M. (2018). Political Paradigm of Complete Systematic Land Registration Law to Actualize Economic Growth Compliance in Batam City, Indonesia. Journal of Arts & Humanities, 7(10), 13-29.
19. Idham. (2005). Konsolidasi tanah perkotaan dalam perspektif otonomi daerah. Alumni. Bandung.
20. Ikhsan, P.A., Fadlan, F., & Idham, I. (2021). Analisis Yuridis Proses Penyidikan Terhadap Tindak Pidana Penganiayaan Yang Dilakukan Oleh Anak (Studi Penelitian Di Polsek Nongsa). Zona Keadilan: Program Studi Ilmu Hukum (S1) Universitas Batam 10 (2), 1-17
21. Limbong, B. (2012). Konflik Pertanahan, Margaretha Pustaka, Jakarta.
22. Mahendra, A. O. (1996). Menguak masalah hukum, demokrasi, dan pertanahan. Pustaka Sinar Harapan.
23. Mediheryanto., J Rumengan. J., & Fadlan, F., (2020).Analysis of Juridical Legal Protection of Women Reproductive Health in Family Planning: A Research Study in Batam City. Scholars International Journal of Law, Crime and Justice 7 (7), 97-107
24. Muhammad, A.K. (2012). Hukum Sengketa Bisnis, Penerbit. Rineka Citra, Jakarta.
25. Mulyadi, D. (2015). Studi Kebijakan Publik dan Pelayanan Publik, Konsep dan Aplikasi Proses Kebijakan dan Pelayanan Publik, Penerbit Alfabeta, Bandung, 2015
26. Nasrudin, N., Washliati, L., & Fadlan, F. (2021). Analisis Yuridis Perlindungan Hukum Terhadap Hak Milik Diatas Tanah Hak Pengelolaan Lahan Untuk Mewujudkan Kepastian Hukum (Studi Penelitian Kantor Pertanahan Kota Batam). Zona Hukum: Jurnal Hukum, 14(2), 37-55.
27. Prakoso, P. (2014). Hukum, Filsafat Logika dan Argumentasi Hukum. Laks Bang Justitia. Surabaya.
28. Prastyo, A., Fadlan, F., & Fadjriani, L.(2021). Analisis Yuridis Terhadap Keberangkatan Kapal Penumpang Tanpa Adanya Surat Persetujuan
Berlayar (Studi Penelitian Kantor Kesyahbandaran Dan Otoritas Pelabuhan Khusus Batam). Zona Keadilan: Program Studi Ilmu Hukum (S1) Universitas Batam 10 (3), 1-15
29. Saliman, A. R., & SH, M. (2016). Hukum Bisnis Untuk Perusahaan Edisi V. Prenada Media.
30. Saputra, N., J Rumengan, J., Idham., & Fadlan, F. (2020).Juridical Analysis of the Code of Conduct Violations in Perspective to Determine the Establishment of the Notary Position: A Research Related to the Notary Public in Batam City International Journal Of Research Publication And Reviews 1 (3), 8-12.
31. Silver, H. (2007). Social exclusion: Comparative analysis of Europe and Middle East youth. Middle East Youth Initiative Working Paper, (1).
32. Sodiki, A. (2013). Politik Hukum Agraria, Konstitusi Press, Jakarta.
33. Stevanus, J., Rumengan, J., Idham., & Fadlan, F. (2020). Juridical analysis of the auction of fiduciary collaterals on unregistered fiduciary deed: A research study in the Kemenkumham Regional Office, Tanjung Pinang, Indonesia. IJARIIE 6 (3), 1235-1244
34. Stevanus, J., Rumengan, J., Idham., & Fadlan. (2020). Juridical analysis of the auction of fiduciary collaterals on unregistered fiduciary deed: A research study in the Kemenkumham Regional Office, Tanjung Pinang, Indonesia
35. Sunggono, B. (2017). Metode Penelitian Hukum, Penerbit. Raja Grafindo, Jakarta.
36. Sutedi, A. (2013). Peralihan Hak Atas Tanah dan Pendaftarannya, Jakarta.
37. Syahrin, A. (2013). Pengaturan Hukum dan Kebijakan Pembangunan Perumahan dan Permukaan Berkelanjutan, Pustaka Bangsa Press, Medan.
38. Syarief, E. (2014). Pensertifikatan Tanah Bekas Hak Eigendoom, PT. Gramedia, Jakarta.
39. Syawal, S., J Rumengan,J., Idham., & Fadlan, F. (2020). Juridical Analysis of the Responsibilities of Directors in the Perspective of Creating Good Corporate Governance: A Research Study in Pt Putra Raflesia, Batam- Indonesia. International Journal of Research and Review 7 (6), 430-439.
40. Winarta, F.H. (2012). Hukum Penyelesaian Sengketa Arbitrase Nasional Indonesia dan Internasional, Sinar Grafika, Jakarta.
41. Yulindo, R., Jihad, K., & Fadlan.. F. (2021). Analisis Yuridis Tindak Pidana Khusus Pencucian Uang Yang Berasal Dari Tindak Pidana Narkotika (Studi Penelitian Putusan Pengadilan). Zona Keadilan: Program Studi Ilmu Hukum (S1) Universitas Batam 10 (2), 75-93.
42. Yusril., Rumengan, J., Idham., & Fadlan, F. (2020). Juridical Analysis of the Transfer of Ownership of Objects Which are Still the Responsibility of Other Debtors for Legal Certainty; A Research Study at PT.BPR LSE Manggala. International Journal of Research and Review 7 (7), 97-107.

ISSN (Online): 2455-3662
EPRA International Journal of Multidisciplinary Research (IJMR) - Peer Reviewed Journal Volume: 7| Issue: 9| September 2021|| Journal DOI: 10.36713/epra2013 || SJIF Impact Factor 2021: 8.047 || ISI Value: 1.188
2021 EPRA IJMR | www.eprajournals.com | Journal DOI URL: https://doi.org/10.36713/epra2013 90
REGULATIONS 1. Keputusan Menteri Energi Sumber Daya
Manusia Republik Indonesia Nomor 77 K / 90 / MEM / 2019 Tentang Penetapan Objek Vital Nasional Bidang Energi Dan Sumber Daya Mineral
2. Keputusan Presiden No. 63/2004 Tentang Kawasan Objek Vital
3. Peraturan Kepala Badan Pengusahaan Batam No 24/2016
4. Peraturan Kepala Badan Pengusahaan Batam No. 19/2019
5. Peraturan Kepala Badan Pengusahaan Batam No. 20/2019
6. Peraturan Kepala Kepolisian Nomor 13 Tahun 2017 tentang Pemberian Bantuan Pengamanan pada Objek Vital Nasional dan Objek Tertentu.
7. Peraturan Kepolisian Nomor 3 Tahun 2019 tentang Perubahan atas Peraturan Kepala Kepolisian Nomor 13 Tahun 2017 tentang Pemberian Bantuan Pengamanan pada Objek Vital Nasional dan Objek Tertentu
8. Peraturan Kepolisian Nomor 7 Tahun 2019 tentang Perubahan Kedua atas Peraturan Kepala Kepolisian Nomor 13 Tahun 2017 tentang Pemberian Bantuan Pengamanan pada Objek Vital Nasional dan Objek Tertentu.
9. Peraturan Menteri Esdm Nomor 48 Tahun 2018, Tanggal 14 Nopember 2018
ISSN (Online): 2455-3662
EPRA International Journal of Multidisciplinary Research (IJMR) - Peer Reviewed Journal Volume: 7| Issue: 9| September 2021|| Journal DOI: 10.36713/epra2013 || SJIF Impact Factor 2021: 8.047 || ISI Value: 1.188
2021 EPRA IJMR | www.eprajournals.com | Journal DOI URL: https://doi.org/10.36713/epra2013 91
IMPACT OF SOCIAL MEDIA USAGE AND ACTIVE COLLABORATIVE LEARNING ON STUDENT
ENGAGEMENT, SATISFACTION, AND LEARNING PERFORMANCE: GHANA AS GEOGRAPHIC AREA OF
STUDY
Clarissa Oteng – Darko*1, Fan Ming Yue2, Otu Larbi-Siaw3 1,2,3School of Management, Jiangsu University, 301 Xuefu Road, Jingkou-Zhenjiang, Jiangsu Province,
China 212013. *Corresponding Author
Article DOI: https://doi.org/10.36713/epra8416 DOI No: 10.36713/epra8416
ABSTRACT
This research aims to explore how social media use improves higher level education in Ghana. Emphatically, it attempts to investigate the effect of social media use and active collaborative learning on student engagement, satisfaction and learning performance. A close-ended questionnaire was administered through online survey to collect data from 429 higher education students. The relationship between variables were tested using partial least square structural equation modeling (PLS-SEM). The research findings involve the significant effect of social media usage and active collaborative learning on student engagement, satisfaction, and learning performance. As per result development, student engagement positively affected satisfaction, which in turn influences learning performance. Moreover, this study concludes that effective use of social media, active collaborative and student engagement via social media enhances learning and satisfaction. The present study also offers several theoretical and practical implications for educational institutions and research directions for upcoming scholars. KEYWORDS: Social media use, active collaborative learning, student engagement, student satisfaction, student learning performance.
1. INTRODUCTION Although, several studies have been explored on
how new technologies could enable educational process (Aldahdouh et al., 2020), technologies have been promoted as assisting with teaching, facilitating research collaboration (Al-Daihani et al., 2018), and supporting students learning (Manca & Ranieri, 2017), as well as improving staff professional development (Deshpande & Shesh, 2021). Accordingly, the constant advancement in online technologies is reshaping the way the field of academia communicates, connects and collaborates with diverse partners (e.g., students, their parents, teachers, and donors). To support and promote these interactions social media has become a fall-on platform to birth and sustain this course. Social media
consists of photo, video, bookmarking and social networking sites, wikis, and discussion forums (Sikandar Ali Qalati, Dragana Ostic, et al., 2021). Since December 2019, when the epidemic-turned-pandemic (COVID-19) hit and drastically changed the lives of every single being, also forced educational institutions of all levels and scope to shift from the traditional form, that is, face-to-face education to online. Although, educational institutions operating in developing countries often do not have adequate resources and reliable, non–interruptive access to formal online learning system (Sobaih et al., 2020), social media is making it possible as it opens new and cost-efficient avenue for academics to improve education by publicizing their work, and engaging with stakeholders (Chugh et al., 2021). However, simply
ISSN (Online): 2455-3662
EPRA International Journal of Multidisciplinary Research (IJMR) - Peer Reviewed Journal Volume: 7| Issue: 9| September 2021|| Journal DOI: 10.36713/epra2013 || SJIF Impact Factor 2021: 8.047 || ISI Value: 1.188
2021 EPRA IJMR | www.eprajournals.com | Journal DOI URL: https://doi.org/10.36713/epra2013 92
using social media tools does not guarantee that students and academic staff are effectively and efficiently using it (Aldahdouh et al., 2020).
Globally, there are over 3.8 billion social media users (Chugh et al., 2021) and estimated to be more than 4.41 billion (Department, 2021) which corresponds to over half of the world population (Sikandar Ali Qalati, Esthela Galvan Vela, et al., 2021) and includes students, and academic staff at different educational levels: students of different degree level, ages and experiences actively utilizing social media tools to search session lectures, research collaboration, share information, improve their interaction with others, whereas teachers in higher education institutions are using social media applications to promote their research work, contribute to wider line of conversation and enable the public (i.e., students, government, and other scholars) as a whole to actively participate in construction of knowledge (Pausé & Russell, 2016). In addition, prior work also evidenced that social media use in higher education support the communication and interaction with students, enhance their learning experience, and supplement traditional learning (Sobaih et al., 2020). Moreover, it enables the students to develop, innovate, interact, and share content of course relatable to them in text, audio, and video form (Ansari & Khan, 2020). However, at the same time few scholars evidenced that the area of academia would rather set aside the use of social media or even when in use , exploit it the bare minimum possible, this is as a result of the conflicts between the clear cut benefits of the use of social media as against its shortcomings that these institutions may face and also cultural restrictions that poses itself as a mind distraction and other pedagogical and pragmatic reasons (Manca & Ranieri, 2016; Maryanti et al., 2021; Montazer & Al-Rikabi, 2021).
Admittedly, social media use equips educational institutes and its user’s performance, but it is clear that this may not be the case consistently and extensively, and the existing literature presents very limited insights into active collaborative learning and student’s
performance (Ansari & Khan, 2020). Besides, there is lack of studies and growing interest towards the social media usage and active collaborative learning and its impact on students engagement, satisfaction, and learning performance (Waleed Mugahed Al-Rahmi et al., 2018). Therefore, the present study aims to investigate the effects of social use on active collaborative learning. In addition, how it improves the education of higher level students and how active learning leads to student engagement, satisfaction, and learning performance.
2. LITERATURE REVIEW 2.1 Social Media use in HIGHER EDUCATION Social media adoption and its usage is become a growing body of interest, where attention is given and widely recognized by scholars and practitioners as a mechanism for driving, reshaping communication and interaction in developing countries (Ali Qalati et al., 2021; Barfi et al., 2021; Sikander Ali Qalati et al., 2021). In addition, social media usage has emerged as one of the most useful tool, if not the most useful, for improving the learning process, supporting collaboration, sharing of information and interaction between students and tutors, improving student experience, building cordial relationships among peers, and also a reliable medium that facilitates the effectiveness of distance learning (Awidi et al., 2019; Manca, 2020; Sobaih & Moustafa, 2016). Previously, studies evidenced that academic staff used social media for professional development, gaining training, participating in discussion, attend conferences, and for teaching purposes (Prestridge, 2019).Prior literature has explored the networks frequently used as social media platforms, like Facebook, Twitter, Myspace, WhatsApp, and YouTube. However, the most widely used are Facebook and WhatsApp (Manca, 2020). Apart from the above, few studies examined the social media policies in higher education context and it’s been
discovered that social media offers significant ways to promote staff and students learning process (Alharthy et al., 2020; Diamond, 2017; Harlow, 2021; Pomerantz et al., 2015). 2.2 Hypotheses development 2.2.1 Social media use and student engagement, satisfaction, and learning performance
Student engagement in the context of social media illustrate their mental and physical engagement and time spent on interaction and an enhancement of educational excellency (Sobaih & Moustafa, 2016). Student involvement when interacting with instructor and peers increased and it’s in the same direction as when sharing information and ideas (Kumar & Nanda, 2019). Students engagement in relation to the use of social media is an active state that is influenced by its usage (Waleed Mugahed Al-Rahmi et al., 2018). Many scholars and practitioners have shown interest in the investigation of social media usage in an educational setting as it is purported to improve student’s
engagement. In this context, (Alshuaibi et al., 2018) also reports significant effect of social media usage to this effect - student engagement. In addition, (Koshkin et al., 2017) argued that higher educational institutions are giving importance to integrating social media tools
ISSN (Online): 2455-3662
EPRA International Journal of Multidisciplinary Research (IJMR) - Peer Reviewed Journal Volume: 7| Issue: 9| September 2021|| Journal DOI: 10.36713/epra2013 || SJIF Impact Factor 2021: 8.047 || ISI Value: 1.188
2021 EPRA IJMR | www.eprajournals.com | Journal DOI URL: https://doi.org/10.36713/epra2013 93
into their practices to pitch student satisfaction. Through social media usage, students can satisfy both academic and social needs simultaneously (Punyanunt-Carter et al., 2017). (Jarman et al., 2021a) recently lays claims on the positive correlations between social media usage and student satisfaction among Australian students. Not limited to the aforementioned scholars that have argued that social media usage leads to improvement in learning performance, in the study, (Tur & Marín, 2015) conducted study in Spain, where it’s stated that most of the students felt that the use of social media was able to enable them to better understand course contents and make them learned and enjoy from the activities presented. Likewise, (Alshuaibi et al., 2018) study includes a sample of 227 business students concurring the significant effect of social media usage on students’ academic performance in Malaysia. Although, a number of studies have been conducted to explore the effect of social media use, there is a continuing call from above studies to empirically test the relationship and support the existing literature in the context of higher level education. Thus, it’s hypothesized that
H1–3: There is significant effect of social media use on student engagement, satisfaction, and learning performance.
2.2.2 Social media use on active collaborative learning
Collaborative learning refers to “instructional
activities in which both learners and instructors engage in a common task where both the learner and the instructor, individually depend on and are accountable to each other, and is placed on an equal footing in working together” (Gogus, 2012). (Chen, 2015) argued that social media tools are as most important as learning aims in the way that they necessitate to have entailing interacting learning, social presence, and supporting active collaborative learning. Similarly (Zhu, 2012) evidenced that social applications and networking sites improve the constructions and collaboration of knowledge. In addition, (Waleed Mugahed Al-Rahmi et al., 2018) recently identified the social media tool as one of antecedents of active collaborative learning and found that consequences of it includes student’s engagement, performance. Social
media tools are seen as a channel for collaboration, transmitting information, interaction, and knowledge sharing between participants (Waleed Mugahed Al-Rahmi & Zeki, 2017). Recently (Ansari & Khan, 2020) highlighted the importance of active collaboration in the context of developing countries and found that social media used for collaborative learning had a significant influence on interactivity with peers, teachers and online knowledge behavior. In addition,
the authors call for future studies to explore how social media use influences active collaboration learning in developing countries. Furthermore, (Sarwar et al., 2019) also researched that web-based application acts as a dynamic tool to accelerate the improvement of learning environment by promoting cooperation and communication among the students which improves their performance and learning. Thus, it’s hypothesized
that H4: There is significant effect of social media use on active collaboration learning.
2.2.3 Active collaboration learning, student’s
engagement, satisfaction, and learning performance. Active learning refers to the concept of
engaging students to perform things and realize what they are actually doing (Qureshi et al., 2021). In other word, active learning is a process where students conscientiously engage in receiving and using knowledge imparted to full capacity and to yield desired results. Active learning requires a consuming amount of student engagement in the learning process, not limited to listening to instructions, reading, but also comprises students participation in presentation, class meetings, discussion and involvement in other events pertaining to their academic course (Hamouda & Tarlochan, 2015). P (Waleed Mugahed Al-Rahmi et al., 2018; Waleed Mugahed Al-Rahmi & Zeki, 2017; Ansari & Khan, 2020; McDonough & Foote, 2015; Qureshi et al., 2021).Previous studies give information that active learning associates with student engagement, and the method of stimulation that involves student participating actively in the learning process. (W Mugahed Al-Rahmi et al., 2015; Hyun et al., 2017) proves that active learning process leads to students satisfaction. Likewise, (Waleed Mugahed Al-Rahmi et al., 2018) recently found the significant impact of active learning on students satisfaction in Malaysia. (Stowell & Nelson, 2007) argued that the impact of active learning on students’ performance can
be improved when combined with the use of new technological platforms of which social media networks are of no exemption and what this study seeks to explore. Thus, (Blasco-Arcas et al., 2013) empirically tests a conceptual model and stated that student engagement , satisfaction and performance are results of active learning. More so, (Kulikovskikh et al., 2017) studies the impact of encouraging collaborative learning in student learning performance, and observed and reported that active learning encourages students to disseminate information, and enable them to foster a more positive turnout in performance . Similarly (Chan et al., 2019) recently throws light on the significant effect of active learning
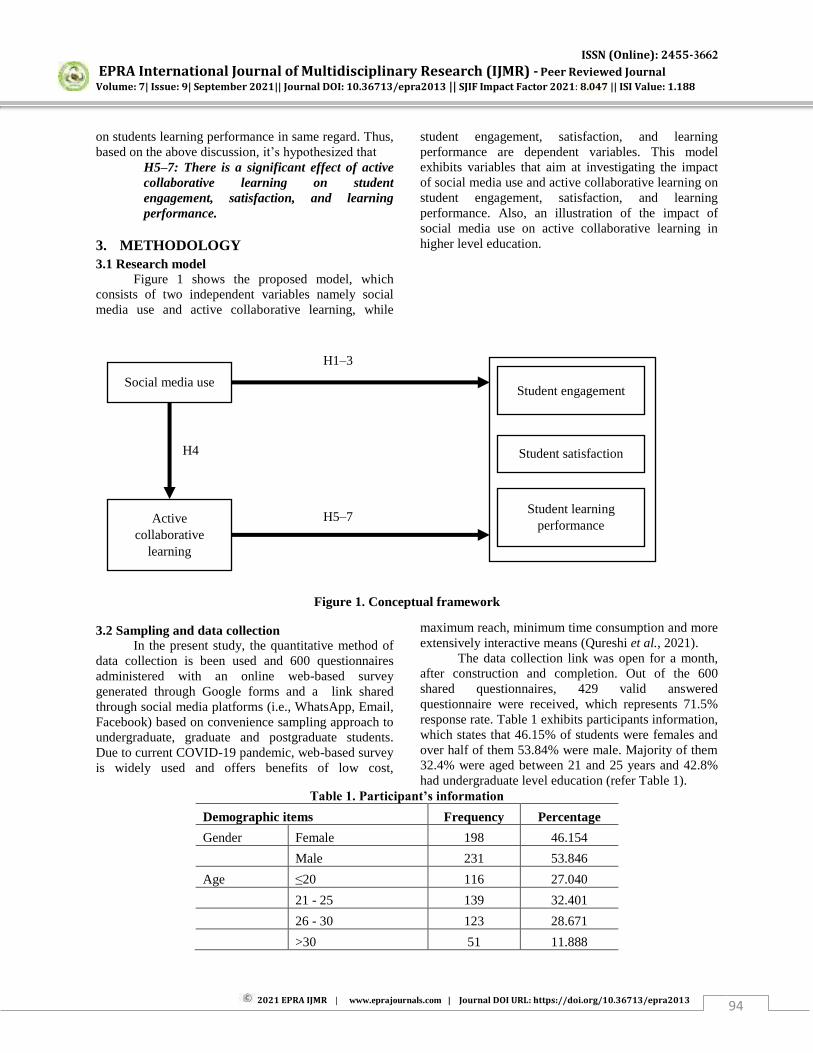
ISSN (Online): 2455-3662
EPRA International Journal of Multidisciplinary Research (IJMR) - Peer Reviewed Journal Volume: 7| Issue: 9| September 2021|| Journal DOI: 10.36713/epra2013 || SJIF Impact Factor 2021: 8.047 || ISI Value: 1.188
2021 EPRA IJMR | www.eprajournals.com | Journal DOI URL: https://doi.org/10.36713/epra2013 94
on students learning performance in same regard. Thus, based on the above discussion, it’s hypothesized that
H5–7: There is a significant effect of active collaborative learning on student engagement, satisfaction, and learning performance.
3. METHODOLOGY 3.1 Research model
Figure 1 shows the proposed model, which consists of two independent variables namely social media use and active collaborative learning, while
student engagement, satisfaction, and learning performance are dependent variables. This model exhibits variables that aim at investigating the impact of social media use and active collaborative learning on student engagement, satisfaction, and learning performance. Also, an illustration of the impact of social media use on active collaborative learning in higher level education.
Figure 1. Conceptual framework
3.2 Sampling and data collection In the present study, the quantitative method of
data collection is been used and 600 questionnaires administered with an online web-based survey generated through Google forms and a link shared through social media platforms (i.e., WhatsApp, Email, Facebook) based on convenience sampling approach to undergraduate, graduate and postgraduate students. Due to current COVID-19 pandemic, web-based survey is widely used and offers benefits of low cost,
maximum reach, minimum time consumption and more extensively interactive means (Qureshi et al., 2021).
The data collection link was open for a month, after construction and completion. Out of the 600 shared questionnaires, 429 valid answered questionnaire were received, which represents 71.5% response rate. Table 1 exhibits participants information, which states that 46.15% of students were females and over half of them 53.84% were male. Majority of them 32.4% were aged between 21 and 25 years and 42.8% had undergraduate level education (refer Table 1).
Table 1. Participant’s information
Demographic items Frequency Percentage
Gender Female 198 46.154
Male 231 53.846
Age ≤20 116 27.040
21 - 25 139 32.401
26 - 30 123 28.671
>30 51 11.888
Social media use
Active collaborative
learning
Student engagement
Student satisfaction
Student learning performance
H1–3
H5–7
H4
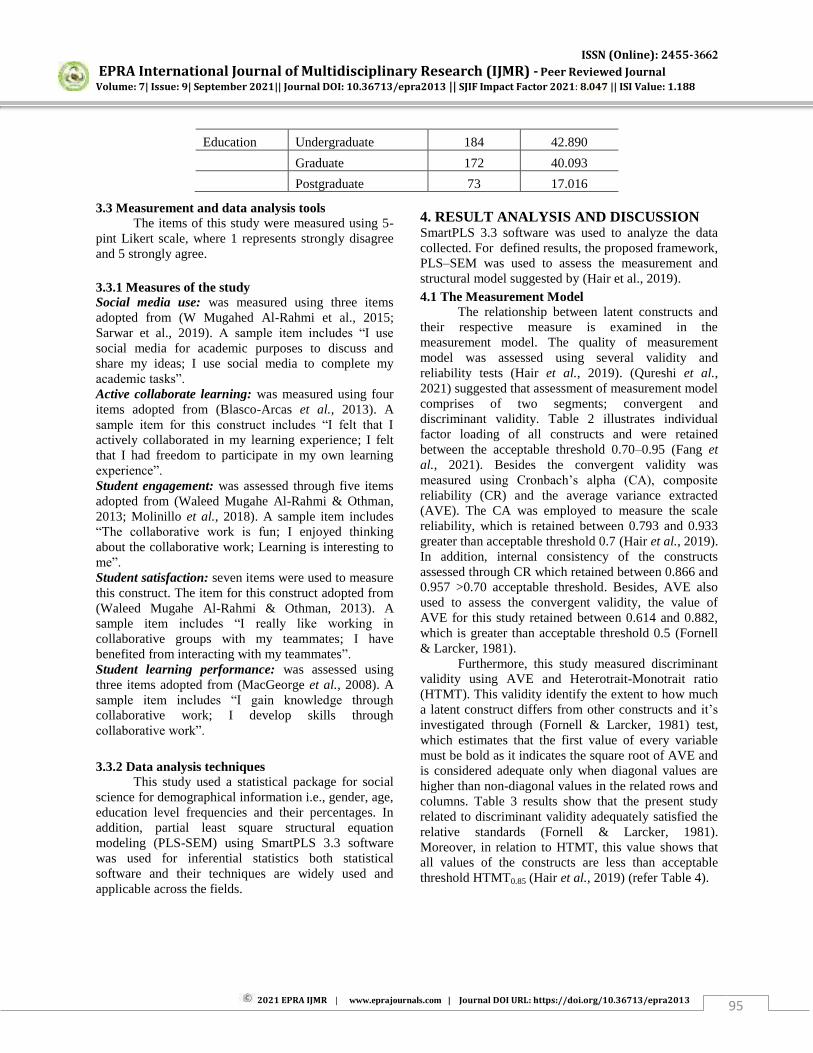
ISSN (Online): 2455-3662
EPRA International Journal of Multidisciplinary Research (IJMR) - Peer Reviewed Journal Volume: 7| Issue: 9| September 2021|| Journal DOI: 10.36713/epra2013 || SJIF Impact Factor 2021: 8.047 || ISI Value: 1.188
2021 EPRA IJMR | www.eprajournals.com | Journal DOI URL: https://doi.org/10.36713/epra2013 95
Education Undergraduate 184 42.890
Graduate 172 40.093
Postgraduate 73 17.016
3.3 Measurement and data analysis tools The items of this study were measured using 5-
pint Likert scale, where 1 represents strongly disagree and 5 strongly agree. 3.3.1 Measures of the study Social media use: was measured using three items adopted from (W Mugahed Al-Rahmi et al., 2015; Sarwar et al., 2019). A sample item includes “I use
social media for academic purposes to discuss and share my ideas; I use social media to complete my academic tasks”. Active collaborate learning: was measured using four items adopted from (Blasco-Arcas et al., 2013). A sample item for this construct includes “I felt that I
actively collaborated in my learning experience; I felt that I had freedom to participate in my own learning experience”. Student engagement: was assessed through five items adopted from (Waleed Mugahe Al-Rahmi & Othman, 2013; Molinillo et al., 2018). A sample item includes “The collaborative work is fun; I enjoyed thinking about the collaborative work; Learning is interesting to me”. Student satisfaction: seven items were used to measure this construct. The item for this construct adopted from (Waleed Mugahe Al-Rahmi & Othman, 2013). A sample item includes “I really like working in
collaborative groups with my teammates; I have benefited from interacting with my teammates”. Student learning performance: was assessed using three items adopted from (MacGeorge et al., 2008). A sample item includes “I gain knowledge through
collaborative work; I develop skills through collaborative work”. 3.3.2 Data analysis techniques
This study used a statistical package for social science for demographical information i.e., gender, age, education level frequencies and their percentages. In addition, partial least square structural equation modeling (PLS-SEM) using SmartPLS 3.3 software was used for inferential statistics both statistical software and their techniques are widely used and applicable across the fields.
4. RESULT ANALYSIS AND DISCUSSION SmartPLS 3.3 software was used to analyze the data collected. For defined results, the proposed framework, PLS–SEM was used to assess the measurement and structural model suggested by (Hair et al., 2019). 4.1 The Measurement Model
The relationship between latent constructs and their respective measure is examined in the measurement model. The quality of measurement model was assessed using several validity and reliability tests (Hair et al., 2019). (Qureshi et al., 2021) suggested that assessment of measurement model comprises of two segments; convergent and discriminant validity. Table 2 illustrates individual factor loading of all constructs and were retained between the acceptable threshold 0.70–0.95 (Fang et al., 2021). Besides the convergent validity was measured using Cronbach’s alpha (CA), composite
reliability (CR) and the average variance extracted (AVE). The CA was employed to measure the scale reliability, which is retained between 0.793 and 0.933 greater than acceptable threshold 0.7 (Hair et al., 2019). In addition, internal consistency of the constructs assessed through CR which retained between 0.866 and 0.957 >0.70 acceptable threshold. Besides, AVE also used to assess the convergent validity, the value of AVE for this study retained between 0.614 and 0.882, which is greater than acceptable threshold 0.5 (Fornell & Larcker, 1981).
Furthermore, this study measured discriminant validity using AVE and Heterotrait-Monotrait ratio (HTMT). This validity identify the extent to how much a latent construct differs from other constructs and it’s investigated through (Fornell & Larcker, 1981) test, which estimates that the first value of every variable must be bold as it indicates the square root of AVE and is considered adequate only when diagonal values are higher than non-diagonal values in the related rows and columns. Table 3 results show that the present study related to discriminant validity adequately satisfied the relative standards (Fornell & Larcker, 1981). Moreover, in relation to HTMT, this value shows that all values of the constructs are less than acceptable threshold HTMT0.85 (Hair et al., 2019) (refer Table 4).

ISSN (Online): 2455-3662
EPRA International Journal of Multidisciplinary Research (IJMR) - Peer Reviewed Journal Volume: 7| Issue: 9| September 2021|| Journal DOI: 10.36713/epra2013 || SJIF Impact Factor 2021: 8.047 || ISI Value: 1.188
2021 EPRA IJMR | www.eprajournals.com | Journal DOI URL: https://doi.org/10.36713/epra2013 96
Table 2. Assessment of Measurement Model Construct Item code Loading CA CR AVE VIF
Social media use (SMU) SMU1 0.938 0.92 0.949 0.862 3.12
SMU2 0.917
2.978
SMU3 0.929
2.991
Active collaborative learning (ACL) ACL1 0.725 0.793 0.866 0.619 1.486
ACL2 0.829
1.969
ACL3 0.83
2.05
ACL4 0.758
1.593
Student engagement (SE) SE1 0.897 0.915 0.94 0.797 2.969
SE2 0.888
2.813
SE3 0.897
2.938
SE4 0.889
2.735
Student satisfaction (SS) SS1 0.74 0.874 0.905 0.614 1.623
SS2 0.723
1.626
SS3 0.808
2.162
SS4 0.847
2.498
SS5 0.804
2.152
SS6 0.774
1.976
Student learning performance (SLP) SLP1 0.942 0.933 0.957 0.882 1.663
SLP2 0.937
3.012
SLP3 0.938
3.122
Table 3. Discriminant validity (Fornell-Larcker-criterion)
ACL SMU SE SLP SS
ACL 0.787
SMU 0.631 0.928
SE 0.604 0.575 0.893
SLP 0.625 0.614 0.558 0.939
SS 0.621 0.59 0.726 0.713 0.784
Table 4. Discriminant validity (HTMT-criterion)
ACL SMU SE SLP SS
ACL SMU 0.739
SE 0.708 0.626
SLP 0.727 0.663 0.604
SS 0.745 0.657 0.811 0.79
4.2 The Structural Model The assessment of structural model is the second
approach of PLS-SEM, it indicates the relationship between the constructs (Qureshi et al., 2021). Based on
PLS path modeling existing literature (Alshuaibi et al., 2018; Fang et al., 2021; Hair et al., 2019; Henseler et al., 2009) four measures were used in structural model testing, namely, path coefficient, coefficient of

ISSN (Online): 2455-3662
EPRA International Journal of Multidisciplinary Research (IJMR) - Peer Reviewed Journal Volume: 7| Issue: 9| September 2021|| Journal DOI: 10.36713/epra2013 || SJIF Impact Factor 2021: 8.047 || ISI Value: 1.188
2021 EPRA IJMR | www.eprajournals.com | Journal DOI URL: https://doi.org/10.36713/epra2013 97
determination (R2), effect size(f2) and predictive relevance (Q2). This study uses bootstrapping techniques with 5000 subsample to generate path coefficient and their level of significance. Table 5 shows that all of the hypotheses were supported based on the criterion (p-value<0.05, t-value>1.96). Among these hypotheses social media use has the strongest influence on active collaborative learning (Beta=0.631). Figure 2 also indicates the relationship between constructs along with path coefficient and their level of significance.
Regarding the R2 value, (Cohen, 1992) suggested that 0.19, 0.33, and 0.60 are considered weak, moderate and substantial, respectively. Table 5 results states that this study has moderate level of explaining power, as value are found between 0.399 and 0.471, which is greater than 0.33, while less than
0.60 (Cohen, 1992). R2 value 0.399 states that social media use explains 39.9% changes in active collaborative learning. Furthermore, related to effect size (Cohen, 1992) explained the f2 values of 0.35, 0.15, and 0.02 have large, medium, and weak effects respectively. Table 5 shows that f2 value for social media usage on student engagement and satisfaction is weak, while on student learning it’s medium and on active collaborative learning it’s large. Regarding the predictive relevance Q2 a cross validated redundancy measure was suggested by (Henseler et al., 2009). It is proposed that the model has a predictive relevance if Q2 value is greater than zero (refer Table 5). (Hair et al., 2019; Henseler et al., 2009) suggested standardized root mean square residual (SRMR) to test the goodness of fit. In our study SRMR is 0.046, which falls below the acceptable threshold 0.08 (Hair et al., 2019).
Table 5. Hypotheses testing, R2, f2, and Q2
Hypotheses Relationships Path coefficient
SD t-value Decision Effect
size (f2)
H1 Social media use → Student engagement 0.322 0.053 6.03* Supported 0.109
H2 Social media use → Student satisfaction 0.329 0.055 5.956* Supported 0.118
H3 Social media use → Student learning performance
0.366 0.048 7.56* Supported 0.152
H4 Social media use → Active collaborative
learning 0.631 0.036 17.418* Supported 0.663
H5 Active collaborative learning → Student engagement
0.400 0.05 8.03* Supported 0.168
H6 Active collaborative learning → Student satisfaction
0.413 0.055 7.549* Supported 0.187
H7 Active collaborative learning → Student learning performance
0.394 0.048 8.14* Supported 0.176
Note: Critical values. * t-value >1.96 (p <0.05) R2 (Student engagement) = 0.427; (Student satisfaction) = 0.451; (Student learning performance) = 0.471; and (Active collaborative learning) = 0.399 Q2 (Student engagement) = 0.318; (Student satisfaction) = 0.257; (Student learning performance) = 0.391 and (Active collaborative learning) = 0.232 Goodness of fit summary: SRMR = 0.046
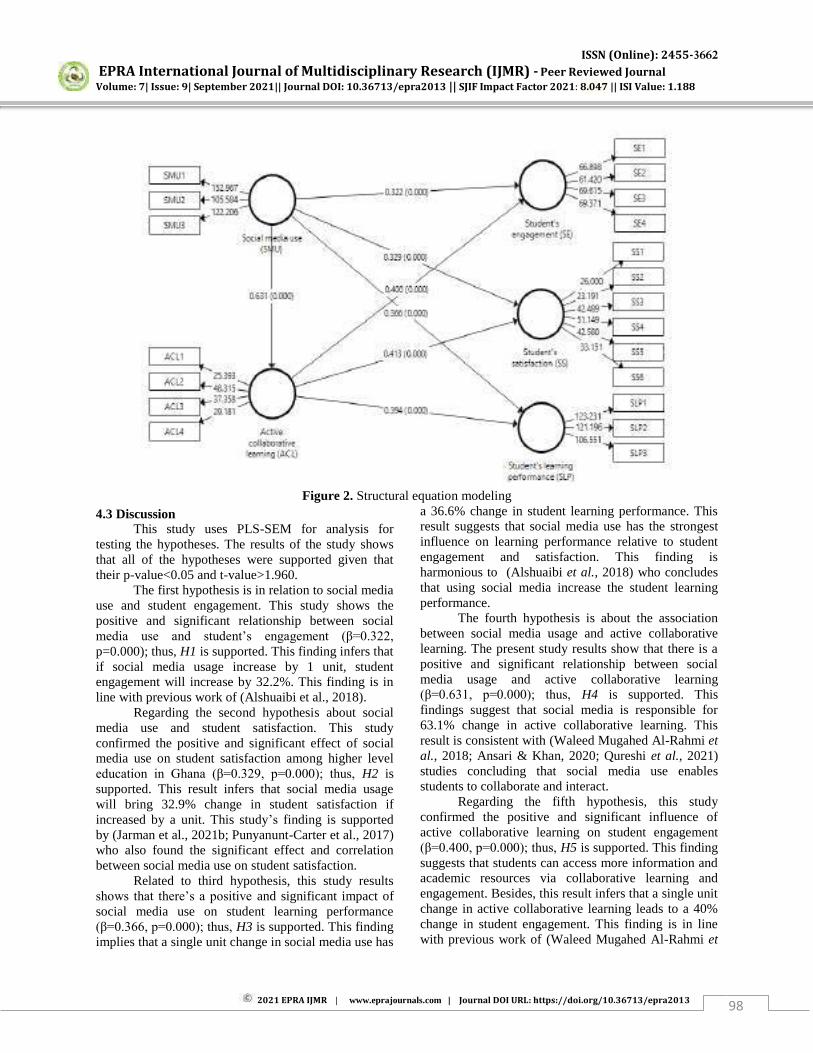
ISSN (Online): 2455-3662
EPRA International Journal of Multidisciplinary Research (IJMR) - Peer Reviewed Journal Volume: 7| Issue: 9| September 2021|| Journal DOI: 10.36713/epra2013 || SJIF Impact Factor 2021: 8.047 || ISI Value: 1.188
2021 EPRA IJMR | www.eprajournals.com | Journal DOI URL: https://doi.org/10.36713/epra2013 98
Figure 2. Structural equation modeling
4.3 Discussion This study uses PLS-SEM for analysis for
testing the hypotheses. The results of the study shows that all of the hypotheses were supported given that their p-value<0.05 and t-value>1.960.
The first hypothesis is in relation to social media use and student engagement. This study shows the positive and significant relationship between social media use and student’s engagement (β=0.322,
p=0.000); thus, H1 is supported. This finding infers that if social media usage increase by 1 unit, student engagement will increase by 32.2%. This finding is in line with previous work of (Alshuaibi et al., 2018).
Regarding the second hypothesis about social media use and student satisfaction. This study confirmed the positive and significant effect of social media use on student satisfaction among higher level education in Ghana (β=0.329, p=0.000); thus, H2 is supported. This result infers that social media usage will bring 32.9% change in student satisfaction if increased by a unit. This study’s finding is supported by (Jarman et al., 2021b; Punyanunt-Carter et al., 2017) who also found the significant effect and correlation between social media use on student satisfaction.
Related to third hypothesis, this study results shows that there’s a positive and significant impact of social media use on student learning performance (β=0.366, p=0.000); thus, H3 is supported. This finding implies that a single unit change in social media use has
a 36.6% change in student learning performance. This result suggests that social media use has the strongest influence on learning performance relative to student engagement and satisfaction. This finding is harmonious to (Alshuaibi et al., 2018) who concludes that using social media increase the student learning performance.
The fourth hypothesis is about the association between social media usage and active collaborative learning. The present study results show that there is a positive and significant relationship between social media usage and active collaborative learning (β=0.631, p=0.000); thus, H4 is supported. This findings suggest that social media is responsible for 63.1% change in active collaborative learning. This result is consistent with (Waleed Mugahed Al-Rahmi et al., 2018; Ansari & Khan, 2020; Qureshi et al., 2021) studies concluding that social media use enables students to collaborate and interact.
Regarding the fifth hypothesis, this study confirmed the positive and significant influence of active collaborative learning on student engagement (β=0.400, p=0.000); thus, H5 is supported. This finding suggests that students can access more information and academic resources via collaborative learning and engagement. Besides, this result infers that a single unit change in active collaborative learning leads to a 40% change in student engagement. This finding is in line with previous work of (Waleed Mugahed Al-Rahmi et

ISSN (Online): 2455-3662
EPRA International Journal of Multidisciplinary Research (IJMR) - Peer Reviewed Journal Volume: 7| Issue: 9| September 2021|| Journal DOI: 10.36713/epra2013 || SJIF Impact Factor 2021: 8.047 || ISI Value: 1.188
2021 EPRA IJMR | www.eprajournals.com | Journal DOI URL: https://doi.org/10.36713/epra2013 99
al., 2018; Waleed Mugahed Al-Rahmi & Zeki, 2017; Ansari & Khan, 2020; McDonough & Foote, 2015; Qureshi et al., 2021) which concludes that active collaborative learning increases student engagement.
The sixth hypothesis was constructed with regards to the relationship between active collaborative learning and student satisfaction. The result proves the positive and significant effect of active collaborative learning on student’s satisfaction (β=0.413, p=0.000); thus, H6 is supported. The finding suggest that the better the extent of collaboration, the more student satisfaction will be. In addition, this result infers that a single unit change in active collaborative learning leads to 41.3% change in student’s satisfaction. This result is
consistent with (Waleed Mugahed Al-Rahmi et al., 2018) study which also confirmed the significant effect of student’s satisfaction.
Regarding the seventh hypothesis, this study confirmed the positive and significant effect of active collaborative learning on student learning performance (β=0.394, p=0.000); thus, H7 is supported. This result state that if active collaborative learning increase by 1 unit, student learning performance will increase by 39.4%. This finding is consistent with (Chan et al., 2019; Kulikovskikh et al., 2017) which concludes that active collaborative learning improves the student’s learning performance.
5. CONCLUSION Social media usage is growing and gaining
attention across the sectors, since it has greatly changed the way of communication, collaboration and interaction with other. This study objective to investigate the how social media use improve higher education among Ghanaian high level students and the effect of social media and active collaborative learning on their engagement, satisfaction, and learning performance. To the education sector, it offers variety of benefits including access to more research opportunities for postgraduate students, improved communication and networking with students and colleagues, increased willingness to share information and publish, access to experienced researchers, facilitate and support learning and teaching, etc. Despite the benefits offered, there are several challenges of social media use in education such as lack of trust, unclear benefits to participants, security and privacy concerns, low interest and awareness, inadequate training and skills, and distorted management of time to learn and use new platforms (Chugh et al., 2021).
In order to meet the objectives of the study, the quantitative approach was adopted and data was collected through online survey. The use of PLS-SEM
in this present study shows that all of the hypotheses were supported based on criterion p-value<0.05. This study’s results provide an understanding about student’s engagement, satisfaction, and learning
performance and their relationship with social media usage and active collaboration. Of seven hypotheses, the results indicate that social media usage has the strongest influence on active collaborative learning (beta=0.631).
5.1 Implications
This study also offers certain implications for the practitioners and academic institutions. Higher level educational institutions must motivate their academic staff to employ social media and active collaborative learning practices in their teaching styles to improve student engagement, satisfaction, and learning performance when constructing academic curriculum (Waleed Mugahed Al-Rahmi et al., 2018; Ansari & Khan, 2020). In educational institutions, where collaborative learning is not as common, as a result of the COVID-19 global pandemic, yet it is one of the main concerns of teachers in developing countries to adjust and modify the traditional way of teaching and learning into an advanced updated online- based method of teaching and learning. With effect, online students can collaborate easily via social media which can affect learning performance (Qureshi et al., 2021). Furthermore, instructors must guide students to use social media for collaborative learning as it provides a more conducive e – learning environment for. Notwithstanding that, it improves the learning environment by providing student engagement, satisfaction, collaboration, interaction and by allowing group discussion about research projects at the core as well as other developmental yet educational resources. Indeed, students utilize social media tools for collaboration with colleagues, teammates, and tutors and exchange information which develop learning, 5.2 Limitation and Future Research
This study is not free from the limitations, implying that there avenues for the future studies. To start with, the study was conducted in the context of higher level education. Therefore, this study’s results cannot be generalized and implemented on in an all- level educational standard. Thus, it is suggested that future scholars may replicate this study in school level education. Also, this study was conducted in a geographic educational context of a developing country. Therefore, future studies sample should be targeted at developed countries for enriching the generalizability of outcomes. Furthermore, data was
ISSN (Online): 2455-3662
EPRA International Journal of Multidisciplinary Research (IJMR) - Peer Reviewed Journal Volume: 7| Issue: 9| September 2021|| Journal DOI: 10.36713/epra2013 || SJIF Impact Factor 2021: 8.047 || ISI Value: 1.188
2021 EPRA IJMR | www.eprajournals.com | Journal DOI URL: https://doi.org/10.36713/epra2013 100
collected from cross-sectional online survey; therefore, caution must be taken while inferring basic relationship. To address this challenge, it is suggested that future studies accumulate data through in person surveys and observations for validating proposed model. Lastly, this study shows more of the direct effect of social media and active collaborative learning on student’s engagement, satisfaction, and performance. Contrary to that, active collaborative learning can mediate the relationship between social media usage and students learning performance (Qureshi et al., 2021). Thus, it is suggested that future studies investigate the mediating role of active collaborative learning. REFERENCE
1. Al-Daihani, S. M., Al-Qallaf, J. S., & AlSaheeb, S. A. (2018). Use of social media by social science academics for scholarly communication. Global Knowledge, Memory and Communication, 67(6/7), 412-424. doi:10.1108/GKMC-11-2017-0091
2. Al-Rahmi, W. M., Alias, N., Othman, M. S., Marin, V. I., & Tur, G. (2018). A model of factors affecting learning performance through the use of social media in Malaysian higher education. Computers & Education, 121, 59-72. doi:https://doi.org/10.1016/j.compedu.2018.02.010
3. Al-Rahmi, W. M., & Othman, M. S. (2013). Evaluating student's satisfaction of using social media through collaborative learning in higher education. International Journal of advances in engineering & technology, 6(4), 1541.
4. Al-Rahmi, W. M., Othman, M. S., & Yusuf, L. M. (2015). Effect of engagement and collaborative learning on satisfaction through the use of social media on Malaysian higher education. Research Journal of Applied Sciences, Engineering and Technology, 9(12), 1132-1142.
5. Al-Rahmi, W. M., & Zeki, A. M. (2017). A model of using social media for collaborative learning to enhance learners’ performance on learning.
Journal of King Saud University - Computer and Information Sciences, 29(4), 526-535. doi:https://doi.org/10.1016/j.jksuci.2016.09.002
6. Aldahdouh, T. Z., Nokelainen, P., & Korhonen, V. (2020). Technology and Social Media Usage in Higher Education: The Influence of Individual Innovativeness. SAGE Open, 10(1), 2158244019899441. doi:10.1177/2158244019899441
7. Alharthy, F., Wang, Y., & Dudley, A. (2020). An Analysis of the Current Policies for Social Media Use in Saudi Higher Education. Paper presented at the International Conference on Human-Computer Interaction.
8. Ali Qalati, S., Li, W., Ahmed, N., Ali Mirani, M., & Khan, A. (2021). Examining the Factors Affecting SME Performance: The Mediating Role of Social Media Adoption. Sustainability, 13(1), 75. Retrieved from https://www.mdpi.com/2071-1050/13/1/75
9. Alshuaibi, M. S. I., Alshuaibi, A. S. I., Shamsudin, F. M., & Arshad, D. A. (2018). Use of social media, student engagement, and academic performance of business students in Malaysia. International Journal of Educational Management, 32(4), 625-640. doi:10.1108/IJEM-08-2016-0182
10. Ansari, J. A. N., & Khan, N. A. (2020). Exploring the role of social media in collaborative learning the new domain of learning. Smart Learning Environments, 7(1), 9. doi:10.1186/s40561-020-00118-7
11. Awidi, I. T., Paynter, M., & Vujosevic, T. (2019). Facebook group in the learning design of a higher education course: An analysis of factors influencing positive learning experience for students. Computers & Education, 129, 106-121. doi:https://doi.org/10.1016/j.compedu.2018.10.018
12. Barfi, K. A., Bervell, B., & Arkorful, V. (2021). Integration of social media for smart pedagogy: initial perceptions of senior high school students in Ghana. Education and Information Technologies, 26(3), 3033-3055. doi:10.1007/s10639-020-10405-y
13. Blasco-Arcas, L., Buil, I., Hernández-Ortega, B., & Sese, F. J. (2013). Using clickers in class. The role of interactivity, active collaborative learning and engagement in learning performance. Computers & Education, 62, 102-110. doi:https://doi.org/10.1016/j.compedu.2012.10.019
14. Chan, S. C. H., Wan, C. L. J., & Ko, S. (2019). Interactivity, active collaborative learning, and learning performance: The moderating role of perceived fun by using personal response systems. The International Journal of Management Education, 17(1), 94-102. doi:https://doi.org/10.1016/j.ijme.2018.12.004
15. Chen, Y.-c. (2015). Linking learning styles and learning on mobile Facebook. International review of research in open and distributed learning, 16(2), 94-114.
16. Chugh, R., Grose, R., & Macht, S. A. (2021). Social media usage by higher education academics: A scoping review of the literature. Education and Information Technologies, 26(1), 983-999. doi:10.1007/s10639-020-10288-z
17. Cohen, J. (1992). Statistical power analysis. Current directions in psychological science, 1(3), 98-101.
ISSN (Online): 2455-3662
EPRA International Journal of Multidisciplinary Research (IJMR) - Peer Reviewed Journal Volume: 7| Issue: 9| September 2021|| Journal DOI: 10.36713/epra2013 || SJIF Impact Factor 2021: 8.047 || ISI Value: 1.188
2021 EPRA IJMR | www.eprajournals.com | Journal DOI URL: https://doi.org/10.36713/epra2013 101
18. Department, S. R. (2021). Number of global social network users 2017-2025 Retrieved from https://www.statista.com/statistics/278414/number-of-worldwide-social-network-users/
19. Deshpande, S., & Shesh, A. (2021, 2021//). Blended Learning and Analysis of Factors Affecting the Use of ICT in Education. Paper presented at the Next Generation Information Processing System, Singapore.
20. Diamond, A. (2017). Social media policies and academic freedom: Higher education Faculty and administrator perceptions. Concordia University (Oregon),
21. Fang, G. G., Qalati, S. A., Ostic, D., Shah, S. M. M., & Mirani, M. A. (2021). Effects of entrepreneurial orientation, social media, and innovation capabilities on SME performance in emerging countries: a mediated–moderated model. Technology Analysis & Strategic Management, 1-13. doi:10.1080/09537325.2021.1957816
22. Fornell, C., & Larcker, D. F. (1981). Evaluating structural equation models with unobservable variables and measurement error. Journal of marketing research, 18(1), 39-50.
23. Gogus, A. (2012). Active Learning. In N. M. Seel (Ed.), Encyclopedia of the Sciences of Learning (pp. 77-80). Boston, MA: Springer US.
24. Hair, J. F., Risher, J. J., Sarstedt, M., & Ringle, C. M. (2019). When to use and how to report the results of PLS-SEM. European Business Review, 31(1), 2-24. doi:10.1108/EBR-11-2018-0203
25. Hamouda, A., & Tarlochan, F. (2015). Engaging engineering students in active learning and critical thinking through class debates. Procedia-Social and Behavioral Sciences, 191, 990-995.
26. Harlow, S. (2021). Protecting News Companies and Their Readers: Exploring Social Media Policies in Latin American Newsrooms. Digital Journalism, 9(2), 176-195.
27. Henseler, J., Ringle, C. M., & Sinkovics, R. R. (2009). The use of partial least squares path modeling in international marketing. In R. R. Sinkovics & P. N. Ghauri (Eds.), New Challenges to International Marketing (Vol. 20, pp. 277-319): Emerald Group Publishing Limited.
28. Hyun, J., Ediger, R., & Lee, D. (2017). Students' Satisfaction on Their Learning Process in Active Learning and Traditional Classrooms. International Journal of Teaching and Learning in Higher Education, 29(1), 108-118.
29. Jarman, H. K., Marques, M. D., McLean, S. A., Slater, A., & Paxton, S. J. (2021a). Motivations for Social Media Use: Associations with Social Media Engagement and Body Satisfaction and Well-Being
among Adolescents. Journal of Youth and Adolescence. doi:10.1007/s10964-020-01390-z
30. Jarman, H. K., Marques, M. D., McLean, S. A., Slater, A., & Paxton, S. J. (2021b). Social media, body satisfaction and well-being among adolescents: A mediation model of appearance-ideal internalization and comparison. Body Image, 36, 139-148. doi:https://doi.org/10.1016/j.bodyim.2020.11.005
31. Koshkin, A. P., Rassolov, I. M., & Novikov, A. V. (2017). Monitoring social media: Students satisfaction with university administration activities. Education and Information Technologies, 22(5), 2499-2522. doi:10.1007/s10639-016-9558-x
32. Kulikovskikh, I. M., Prokhorov, S., & Suchkova, S. (2017). Promoting collaborative learning through regulation of guessing in clickers. Computers in Human Behavior, 75, 81-91.
33. Kumar, V., & Nanda, P. (2019). Social media in higher education: A framework for continuous engagement. International Journal of Information and Communication Technology Education (IJICTE), 15(1), 97-108.
34. MacGeorge, E. L., Homan, S. R., Dunning, J. B., Elmore, D., Bodie, G. D., Evans, E., . . . Lichti, S. M. (2008). The influence of learning characteristics on evaluation of audience response technology. Journal of Computing in Higher Education, 19(2), 25-46.
35. Manca, S. (2020). Snapping, pinning, liking or texting: Investigating social media in higher education beyond Facebook. The Internet and Higher Education, 44, 100707. doi:https://doi.org/10.1016/j.iheduc.2019.100707
36. Manca, S., & Ranieri, M. (2016). Facebook and the others. Potentials and obstacles of Social Media for teaching in higher education. Computers & Education, 95, 216-230. doi:https://doi.org/10.1016/j.compedu.2016.01.012
37. Manca, S., & Ranieri, M. (2017). Implications of social network sites for teaching and learning. Where we are and where we want to go. Education and Information Technologies, 22(2), 605-622.
38. Maryanti, R., Nandiyanto, A. B. D., Hufad, A., & Sunardi, S. (2021). Science education for students with special needs in Indonesia: From definition, systematic review, education system, to curriculum. Indonesian Journal of Community and Special Needs Education, 1(1), 1-8.
39. McDonough, K., & Foote, J. A. (2015). The impact of individual and shared clicker use on students' collaborative learning. Computers & Education, 86, 236-249.
40. Molinillo, S., Aguilar-Illescas, R., Anaya-Sánchez, R., & Vallespín-Arán, M. (2018). Exploring the
ISSN (Online): 2455-3662
EPRA International Journal of Multidisciplinary Research (IJMR) - Peer Reviewed Journal Volume: 7| Issue: 9| September 2021|| Journal DOI: 10.36713/epra2013 || SJIF Impact Factor 2021: 8.047 || ISI Value: 1.188
2021 EPRA IJMR | www.eprajournals.com | Journal DOI URL: https://doi.org/10.36713/epra2013 102
impacts of interactions, social presence and emotional engagement on active collaborative learning in a social web-based environment. Computers & Education, 123, 41-52.
41. Montazer, G. A., & Al-Rikabi, Y. K. (2021, 19-20 May 2021). Identifying the Obstacles of Implementing E-Learning in Iraqi Universities. Paper presented at the 2021 7th International Conference on Web Research (ICWR).
42. Pausé, C., & Russell, D. (2016). Sociable scholarship: The use of social media in the 21st century academy.
43. Pomerantz, J., Hank, C., & Sugimoto, C. R. (2015). The state of social media policies in higher education. PLoS One, 10(5), e0127485.
44. Prestridge, S. (2019). Categorising teachers’ use of
social media for their professional learning: A self-generating professional learning paradigm. Computers & Education, 129, 143-158. doi:https://doi.org/10.1016/j.compedu.2018.11.003
45. Punyanunt-Carter, N. M., De La Cruz, J. J., & Wrench, J. S. (2017). Investigating the relationships among college students' satisfaction, addiction, needs, communication apprehension, motives, and uses & gratifications with Snapchat. Computers in Human Behavior, 75, 870-875. doi:https://doi.org/10.1016/j.chb.2017.06.034
46. Qalati, S. A., Ostic, D., Shuibin, G., & Mingyue, F. (2021). A mediated–moderated model for social media adoption and small and medium-sized enterprise performance in emerging countries. Managerial and Decision Economics, n/a(n/a). doi:https://doi.org/10.1002/mde.3422
47. Qalati, S. A., Vela, E. G., Li, W., Dakhan, S. A., Hong Thuy, T. T., & Merani, S. H. (2021). Effects of perceived service quality, website quality, and reputation on purchase intention: The mediating and moderating roles of trust and perceived risk in online shopping. Cogent Business & Management, 8(1), 1869363. doi:10.1080/23311975.2020.1869363
48. Qalati, S. A., Yuan, L. W., Khan, M. A. S., & Anwar, F. (2021). A mediated model on the adoption of social media and SMEs’ performance
in developing countries. Technology in Society, 64, 101513. doi:https://doi.org/10.1016/j.techsoc.2020.101513
49. Qureshi, M. A., Khaskheli, A., Qureshi, J. A., Raza, S. A., & Yousufi, S. Q. (2021). Factors affecting students’ learning performance through
collaborative learning and engagement. Interactive Learning Environments, 1-21. doi:10.1080/10494820.2021.1884886
50. Sarwar, B., Zulfiqar, S., Aziz, S., & Ejaz Chandia, K. (2019). Usage of social media tools for
collaborative learning: The effect on learning success with the moderating role of cyberbullying. Journal of Educational Computing Research, 57(1), 246-279.
51. Sobaih, A. E. E., Hasanein, A. M., & Abu Elnasr, A. E. (2020). Responses to COVID-19 in Higher Education: Social Media Usage for Sustaining Formal Academic Communication in Developing Countries. Sustainability, 12(16), 6520. Retrieved from https://www.mdpi.com/2071-1050/12/16/6520
52. Sobaih, A. E. E., & Moustafa, M. A. (2016). Speaking the Same Language: The Value of Social Networking Sites for Hospitality and Tourism Higher Education in Egypt. Journal of Hospitality & Tourism Education, 28(1), 21-31. doi:10.1080/10963758.2015.1127169
53. Stowell, J. R., & Nelson, J. M. (2007). Benefits of electronic audience response systems on student participation, learning, and emotion. Teaching of psychology, 34(4), 253-258.
54. Tur, G., & Marín, V. I. (2015). Exploring student teachers' attitudes and beliefs towards e-portfolios and technology in education. Exploring student teachers' attitudes and beliefs towards e-portfolios and technology in education, 57-82.
55. Zhu, C. (2012). Student satisfaction, performance, and knowledge construction in online collaborative learning. Journal of Educational Technology & Society, 15(1), 127-136.
ISSN (Online): 2455-3662
EPRA International Journal of Multidisciplinary Research (IJMR) - Peer Reviewed Journal Volume: 7| Issue: 9| September 2021|| Journal DOI: 10.36713/epra2013 || SJIF Impact Factor 2021: 8.047 || ISI Value: 1.188
2021 EPRA IJMR | www.eprajournals.com | Journal DOI URL: https://doi.org/10.36713/epra2013 103
THE ROLE OF TALENT MANAGEMENT IN
IMPROVING STRATEGIC PERFORMANCE OF SAUDI MANUFACTURING COMPANIES
Feryal Abdullah Abdulrahman Al-Oumi1, Dr. Majed Al Doubi2
1,2Faculty of Business and Management, Al Medina International University, Kuala Lumpur, Malaysia
Article DOI: https://doi.org/10.36713/epra8423
DOI No: 10.36713/epra8423
ABSTRACT
This paper aimed at investigating the impact of talent management strategies on improving the strategic performance of business organizations. To achieve the study objectives, a survey methodology was utilized using questionnaires for collecting data from seventy-six Saudi manufacturing listed companies which represents the research population. Statistical Package for Social Sciences (SPSS, V. 19) was utilized for data analysis using several statistical tests and methods including arithmetic Mean, Standard Deviation, Exploratory Factor Analysis, and Linear and step Regression.
The main findings of the study indicate that talent management strategies dimensions together have a significant impact on strategic performance. However, individually, it was found that development and motivation were the only talent strategy dimensions that have a significant impact on strategic performance. In addition, the study reveals that talent management strategies were moderately implemented in Saudi manufacturing companies with a mean of (3.57) and that their strategic performance was also moderate with a mean (3.55).
The study presented several recommendations for Saudi manufacturing companies including that importance of establishing specific section for talent management responsible for implementing talent management strategies according to scientific methodology that would enable these companies to achieve positive results in the long run. KEYWORDS: Talent management, Strategies performance, Manufacturing Companies.
INTRODUCTION Business organizations are experiencing many
challenges on the list of technological, economic, political, social and other levels that have had a significant impact on business organization strategies in order to come up with solutions that will bring about the development of organizations to meet those challenges and achieve an ongoing competitive advantage, and many of these organizations have felt the importance of focusing on the human element, which can be a key focus and support for them to help them survive, continue and excel. Business organizations need outstanding talent that leads the stage of change and development and are competitive, so talent management is one of the biggest challenges they face, and in preparation for the prospects for improved growth levels in business organizations in the wake of the global economic crisis, most of them plan
to make changes to their talent management programs. It must also make extraordinary efforts to build an effective and efficient talent strategy by relying not only on attracting and retaining talent, as it plays a major role in improving business performance and increasing productivity.
Given the role that human resources talent and management play in organizations, it is important to identify and analyses them at the organization level in the Arab countries, specifically in Saudi Arabia, and the importance of focusing on talent management to improve the strategic performance of these organizations, which this study seeks to focus on.
1. STUDY PROBLEM Improving the strategic performance of business
organizations is currently the main focus of their attention due to the increasing competition between
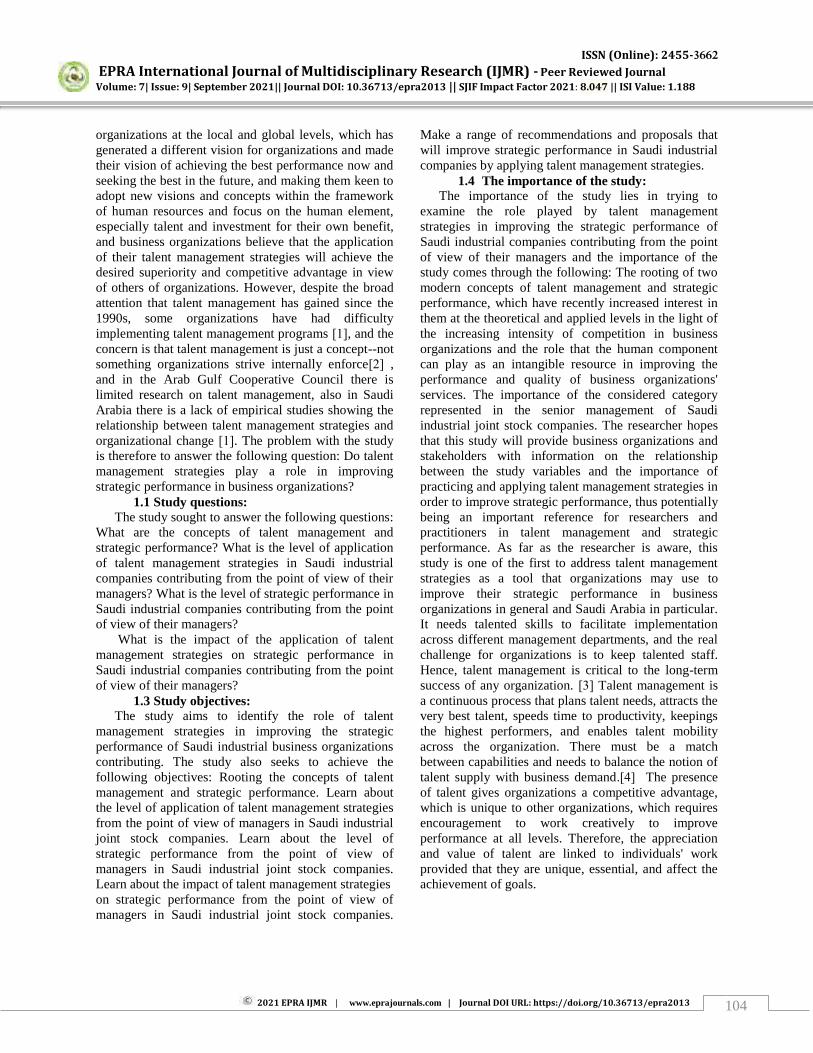
ISSN (Online): 2455-3662
EPRA International Journal of Multidisciplinary Research (IJMR) - Peer Reviewed Journal Volume: 7| Issue: 9| September 2021|| Journal DOI: 10.36713/epra2013 || SJIF Impact Factor 2021: 8.047 || ISI Value: 1.188
2021 EPRA IJMR | www.eprajournals.com | Journal DOI URL: https://doi.org/10.36713/epra2013 104
organizations at the local and global levels, which has generated a different vision for organizations and made their vision of achieving the best performance now and seeking the best in the future, and making them keen to adopt new visions and concepts within the framework of human resources and focus on the human element, especially talent and investment for their own benefit, and business organizations believe that the application of their talent management strategies will achieve the desired superiority and competitive advantage in view of others of organizations. However, despite the broad attention that talent management has gained since the 1990s, some organizations have had difficulty implementing talent management programs [1] , and the concern is that talent management is just a concept--not something organizations strive internally enforce [2] , and in the Arab Gulf Cooperative Council there is limited research on talent management, also in Saudi Arabia there is a lack of empirical studies showing the relationship between talent management strategies and organizational change [1 ] . The problem with the study is therefore to answer the following question: Do talent management strategies play a role in improving strategic performance in business organizations?
1.1 Study questions: The study sought to answer the following questions:
What are the concepts of talent management and strategic performance? What is the level of application of talent management strategies in Saudi industrial companies contributing from the point of view of their managers? What is the level of strategic performance in Saudi industrial companies contributing from the point of view of their managers?
What is the impact of the application of talent management strategies on strategic performance in Saudi industrial companies contributing from the point of view of their managers?
1.3 Study objectives: The study aims to identify the role of talent
management strategies in improving the strategic performance of Saudi industrial business organizations contributing. The study also seeks to achieve the following objectives: Rooting the concepts of talent management and strategic performance. Learn about the level of application of talent management strategies from the point of view of managers in Saudi industrial joint stock companies. Learn about the level of strategic performance from the point of view of managers in Saudi industrial joint stock companies. Learn about the impact of talent management strategies on strategic performance from the point of view of managers in Saudi industrial joint stock companies.
Make a range of recommendations and proposals that will improve strategic performance in Saudi industrial companies by applying talent management strategies.
1.4 The importance of the study: The importance of the study lies in trying to
examine the role played by talent management strategies in improving the strategic performance of Saudi industrial companies contributing from the point of view of their managers and the importance of the study comes through the following: The rooting of two modern concepts of talent management and strategic performance, which have recently increased interest in them at the theoretical and applied levels in the light of the increasing intensity of competition in business organizations and the role that the human component can play as an intangible resource in improving the performance and quality of business organizations' services. The importance of the considered category represented in the senior management of Saudi industrial joint stock companies. The researcher hopes that this study will provide business organizations and stakeholders with information on the relationship between the study variables and the importance of practicing and applying talent management strategies in order to improve strategic performance, thus potentially being an important reference for researchers and practitioners in talent management and strategic performance. As far as the researcher is aware, this study is one of the first to address talent management strategies as a tool that organizations may use to improve their strategic performance in business organizations in general and Saudi Arabia in particular. It needs talented skills to facilitate implementation across different management departments, and the real challenge for organizations is to keep talented staff. Hence, talent management is critical to the long-term success of any organization. [3] Talent management is a continuous process that plans talent needs, attracts the very best talent, speeds time to productivity, keepings the highest performers, and enables talent mobility across the organization. There must be a match between capabilities and needs to balance the notion of talent supply with business demand [4.] The presence of talent gives organizations a competitive advantage, which is unique to other organizations, which requires encouragement to work creatively to improve performance at all levels. Therefore, the appreciation and value of talent are linked to individuals' work provided that they are unique, essential, and affect the achievement of goals.
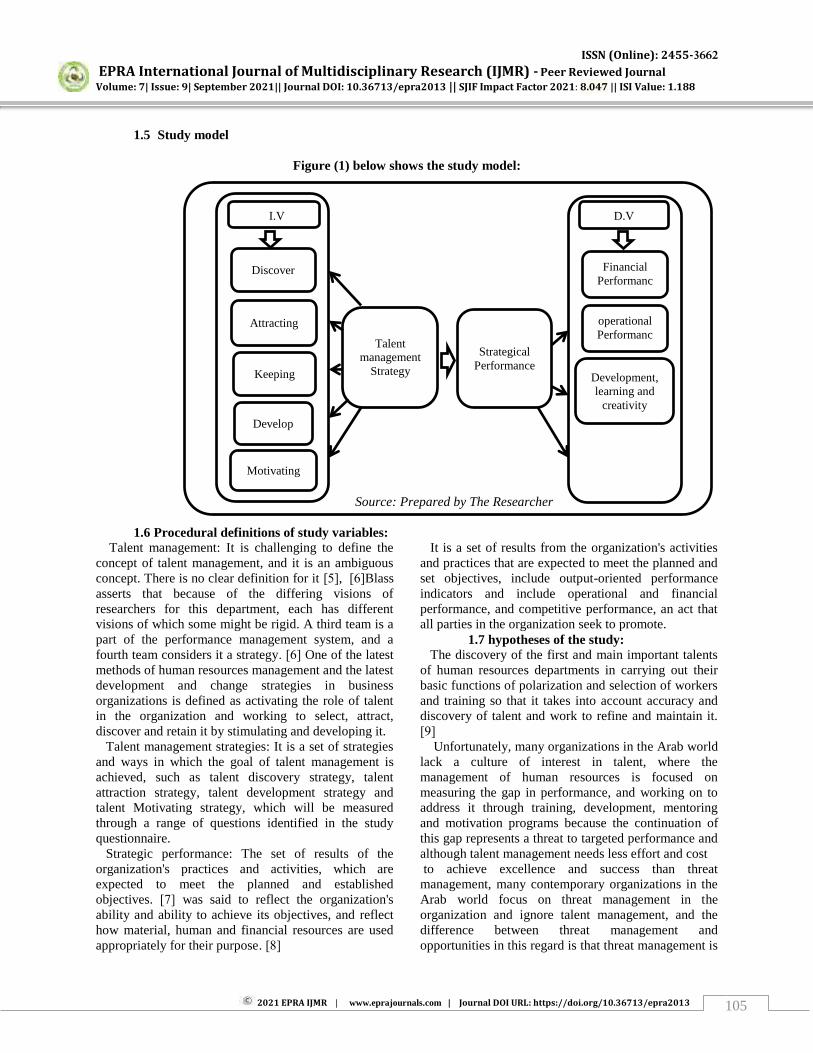
ISSN (Online): 2455-3662
EPRA International Journal of Multidisciplinary Research (IJMR) - Peer Reviewed Journal Volume: 7| Issue: 9| September 2021|| Journal DOI: 10.36713/epra2013 || SJIF Impact Factor 2021: 8.047 || ISI Value: 1.188
2021 EPRA IJMR | www.eprajournals.com | Journal DOI URL: https://doi.org/10.36713/epra2013 105
1.5 Study model
Figure (1) below shows the study model:
Source: Prepared by The Researcher
1.6 Procedural definitions of study variables: Talent management: It is challenging to define the
concept of talent management, and it is an ambiguous concept. There is no clear definition for it [5] , [6 ] Blass asserts that because of the differing visions of researchers for this department, each has different visions of which some might be rigid. A third team is a part of the performance management system, and a fourth team considers it a strategy. [6] One of the latest methods of human resources management and the latest development and change strategies in business organizations is defined as activating the role of talent in the organization and working to select, attract, discover and retain it by stimulating and developing it.
Talent management strategies: It is a set of strategies and ways in which the goal of talent management is achieved, such as talent discovery strategy, talent attraction strategy, talent development strategy and talent Motivating strategy, which will be measured through a range of questions identified in the study questionnaire.
Strategic performance: The set of results of the organization's practices and activities, which are expected to meet the planned and established objectives. [7] was said to reflect the organization's ability and ability to achieve its objectives, and reflect how material, human and financial resources are used appropriately for their purpose. [8]
It is a set of results from the organization's activities and practices that are expected to meet the planned and set objectives, include output-oriented performance indicators and include operational and financial performance, and competitive performance, an act that all parties in the organization seek to promote.
1.7 hypotheses of the study: The discovery of the first and main important talents
of human resources departments in carrying out their basic functions of polarization and selection of workers and training so that it takes into account accuracy and discovery of talent and work to refine and maintain it.
[9] Unfortunately, many organizations in the Arab world
lack a culture of interest in talent, where the management of human resources is focused on measuring the gap in performance, and working on to address it through training, development, mentoring and motivation programs because the continuation of this gap represents a threat to targeted performance and although talent management needs less effort and cost to achieve excellence and success than threat management, many contemporary organizations in the Arab world focus on threat management in the organization and ignore talent management, and the difference between threat management and opportunities in this regard is that threat management is
Talent management
Strategy
Strategical Performance
Discover
Attracting
Develop
Keeping
Motivating
Financial Performanc
e
operational Performanc
e
Development, learning and
creativity
I.V D.V

ISSN (Online): 2455-3662
EPRA International Journal of Multidisciplinary Research (IJMR) - Peer Reviewed Journal Volume: 7| Issue: 9| September 2021|| Journal DOI: 10.36713/epra2013 || SJIF Impact Factor 2021: 8.047 || ISI Value: 1.188
2021 EPRA IJMR | www.eprajournals.com | Journal DOI URL: https://doi.org/10.36713/epra2013 106
concerned with seeking to achieve an acceptable level of performance by focusing on focusing on threat management in the organization. On treatment while talent management aims to achieve excellence and creativity in managing opportunities by supporting and developing talent management. [11]
In another study, the researcher said, “There is some
lack of research into organizations' actual practices and how talent management activities are created”. [6] , [11] The theories of the study can therefore be developed by knowing the impact of talent management strategies on the strategic performance of business organizations and any dimensions or strategic performance indicators most affected by these strategies. The study therefore aimed to examine the following main hypothesis: There is no statistically significant impact at the level of significance (0.05 ≥ α) of talent management strategies (Ddiscovering, Attracting, Keeping, Developing, Motivating) in its community or individually in improving strategic performance with its indicators (financial performance index, operational performance index, development, learning and creativity index, customer index) combined from the point of view of managers in Saudi industrial joint stock companies.
Four sub-hypotheses also emerge from this hypothesis: There is no significant statistically significant impact at the level of significance (0.05 ≥ α)
of talent management strategies (Ddiscovering, Attracting, Keeping, Developing, Motivating) in the financial performance index as one of the indicators of measuring strategic performance from the point of view of managers in Saudi industrial joint stock companies. There is no significant statistically significant impact at the level of significance (0.05 ≥ α) of talent
management strategies (Ddiscovering, Attracting, Keeping, Developing, Motivating) in the operational performance index as one of the indicators of strategic performance measurement from the point of view of managers in Saudi industrial joint stock companies. There is no significant statistically significant impact at the level of significance (0.05 ≥ α) of talent
management strategies (Ddiscovering, Attracting, Keeping, Developing, Motivating) in the development, learning and creativity index as one of the indicators of measuring strategic performance from the point of view of managers in Saudi industrial joint stock companies. There is no significant statistically significant impact at the level of significance (0.05 ≥ α) of talent
management strategies (Ddiscovering, Attracting, Keeping, Developing, Motivating) in the customer index as one of the indicators of strategic performance measurement from the point of view of managers in Saudi industrial joint stock companies.
2.1 Statistical treatment To answer the study's questions and test its
hypotheses, descriptive and analytical statistics methods were used, using statistical package for social sciences, and to answer the study questions, mathematical averages and standard deviations were used for all dimensions of the independent and successive study, and a multi-step and gradual line regression analysis to ensure that the model was fit to test the two-study hypothesis and to see which independent variables had a more significant impact on the variable in this study. Therefore, the values of the calculation averages reached by the study will be treated as follows: High (3.6 and above), medium (3.59-2.79) low (2.78 and less), Accordingly, if the average value of paragraphs is greater than (3.6), the level of perceptions of the respondents is high, which means that the sample members agree to the paragraphs, but if the average value of the calculation (3.59-2.79) is average, and if the calculation average is less than (2.79) the level of perceptions is low.
3. Findings and recommendations After performing the complete statistical operations, the results were as follows: The study examined the impact of talent management strategies in strategic performance indicators in Saudi industrial companies contributing to the following are the most important findings of the study:
1. The results indicate that the overall arithmetic average of the responses of the complete talent management strategies was averaged (3.57) and this demonstrates the need for Saudi industrial companies to contribute to the strategies of talent management more care and attention in order to keep up with the progress and global competition, and the availability of these strategies according to the responses of the respondents as follows: strategies (Ddiscovering, Attracting, Keeping, Developing, Motivating) were medium. This result, based on the questionnaire paragraphs, demonstrates that the senior management of the industrial joint stock companies is well oriented towards discovering and attracting talent, indicating
2. That they understand the importance of focusing on the human element, which is a major supporter of them and helps them to survive and continue, and this is consistent with the strategic objective of these companies to achieve excellence and development so that they can excel in the local and global competitive markets.
3. The results show that the total arithmetic average level of availability of strategic performance
ISSN (Online): 2455-3662
EPRA International Journal of Multidisciplinary Research (IJMR) - Peer Reviewed Journal Volume: 7| Issue: 9| September 2021|| Journal DOI: 10.36713/epra2013 || SJIF Impact Factor 2021: 8.047 || ISI Value: 1.188
2021 EPRA IJMR | www.eprajournals.com | Journal DOI URL: https://doi.org/10.36713/epra2013 107
4. indicators in Saudi industrial joint stock companies was average at (3.55) and the operational performance index came in first place with an average calculation of (3.92), followed by the customer index and then the financial performance index and finally the learning and creativity index. The occupation of the operational performance and customer indicators advanced among the averages is evidence of the interest of Saudi industrial companies in recruiting highly skilled and distinguished human resources capable of managing operational operations efficiently and at an advanced level, which reflected on operational performance in general, and this was agreed with the study. [11 ] Where the study found a moral correlation between the elements of operations strategy and areas of strategic performance, which confirms
5. the orientation of the attention of major companies to the operational performance of its great association with strategic performance and from there. The strategic performance of business organizations can be measured.
6. The results show that there is an impact of the application of talent management strategies combined on strategic performance indicators in Saudi industrial joint stock companies, but this effect was strong for the talent Motivating index with a statistical significance of less than (05.05).
To achieve any more influential factors, the results after the gradient regression test showed that the talent development strategy was at its highest level, followed by a talent Motivating strategy of 050,000, respectively.
This is in line with what most literature has emphasized that the development of staff, especially talented people, is an important way to improve institutional performance in general and thus the strategic performance of organizations, developing talent first and motivating them to enable the Keeping of talented cadres within organizations and achieve excellence within and outside organizations, in addition to enabling organizations to implement new strategies at work that increase the efficiency of organizations' performance and development, This is consistent with a study, [12] that found that large companies implement a range of training programs within on-the-job training, that they reward their talented people with physical and moral motivation, that they consider them talented, and that there are contributing factors in staff Keeping, such as support for job development.
The impact of other strategies on strategic performance has been weakened because the talent development and motivation strategies will undoubtedly lead to the presence of other strategies because of the socio-economic conditions that lead the individual to look for business organizations that offer a greater advantage and development of their capabilities and because they drive and encourage staff in general to perform best for the organization to achieve a high and sustainable competitive advantage. CONCLUSION
In the light of the results of the study, the study proposes a number of recommendations: Business organizations need to pay more attention to providing talent management or allocating a human resources job to discover and take care of their talents. As Rostam study Many organizations face high attrition of employees; they lose their top talent because of management's negligence towards employees' talent. It is essential to keeping top talent by an effective talent management system implementing in the organization,
[4] Applying talent management according to a codified scientific method enables business organizations to achieve positive results in the long run. Try to share experiences on talent management by joining local and international associations interested in this matter.
Follow up on published scientific research on talent management and the experiences of modern organizations on their application. Hold annual conferences to keep up with the latest talent management and implement its recommendations first and foremost. Spreading talent management concepts as an important tool for improving strategic performance and focusing on the need to seek best practices by:
Enable talent to participate and make strategic decisions for the company. Enable the company's talents to choose the advantages of motivating and supporting them in multiple and specific choices at the same time in order to raise their morale and achieve psychological stability for them. Develop strategic plans to provide, maintain and invest talented talent as a competitive advantage. REFERENCES
1. Bafagih, L. (2019). Developing Talent Pipelines for Small and Medium-Sized Enterprises in Saudi Arabia. Walden University, College of Management and Technology.
2. Ekelöf, S., Holmström, C., & Lindberg, N. (2019). Talent within Strategic Human Resource Management (Dissertation). Retrieved from
ISSN (Online): 2455-3662
EPRA International Journal of Multidisciplinary Research (IJMR) - Peer Reviewed Journal Volume: 7| Issue: 9| September 2021|| Journal DOI: 10.36713/epra2013 || SJIF Impact Factor 2021: 8.047 || ISI Value: 1.188
2021 EPRA IJMR | www.eprajournals.com | Journal DOI URL: https://doi.org/10.36713/epra2013 108
http://urn.kb.se/resolve?urn=urn:nbn:se:lnu:diva-85384.
3. Sukanya, M, (2011)," Talent management strategies and challenges in the competitive era: a study of select software & BPO companies in India " Jawaharlal Nehru Technological University.
4. Rostam, F. (2019). A Review of Talent Management as a Key in any Organizations. The International Journal of Indian Psychology. 7. 78-83.
5. Adebola, Sunday (2017) Talent Management: Perspectives, Practices, and Evaluation in UK Private Sector Organizations. Doctoral thesis, University of Huddersfield. http://eprints.hud.ac.uk/id/eprint/34166.
6. Saleh, Ahmed Ali and Saad, Ali Mowat (1431), "Talent Management: Scientific and Strategic Perspective", Institute of Public Administration Management Magazine, Oman, Issue 120.
7. Gitonga, A. (2019), Influence of Human Resource Capability in Relating Talent Management Strategy and Competitive Advantage, Journal of Human Resource Management.Vol.7, No. 4, 2019, pp.120-130.doi:10.11648/j. jhrm. 20190704.16.
8. Rami Tarakji (2010) "How do the best employers in Kuwait understand and apply Talent Management?" A thesis submitted in partial fulfillment of the requirements for the degree of Masters of Business Administration (MBA) of the Maastricht School of Management (MSM), Maastricht, the Netherlands.

ISSN (Online): 2455-3662
EPRA International Journal of Multidisciplinary Research (IJMR) - Peer Reviewed Journal Volume: 7| Issue: 9| September 2021|| Journal DOI: 10.36713/epra2013 || SJIF Impact Factor 2021: 8.047 || ISI Value: 1.188
2021 EPRA IJMR | www.eprajournals.com | Journal DOI URL: https://doi.org/10.36713/epra2013 109
REHABILITATING THE EVICTED: AN EMPIRICAL STUDY OF THE STATE OF REHABILITATION IN THE
OUTSKIRTS OF KOLKATA, WEST BENGAL
Kahini Palit Assistant Professor, Department of Sociology, School of Liberal Arts and Culture Studies, Adamas
University, Kolkata 700126, West Bengal, India & PhD Research Scholar, Burdwan University
Article DOI: https://doi.org/10.36713/epra8404
DOI No: 10.36713/epra8404
ABSTRACT Incidence of Displacement has been a common issue in the journey of development, and the people who are displaced have often been offered rehabilitation in the form of low-income housing. But those rehabilitations are rarely the coveted solutions to the everyday problems of the poor, neither are they the dream housing complex the poor are made to believe. Rehabilitations are often planned arbitrarily, without proper planning and programme, and the result of the lack of sincerity of the authorities in rehabilitation of the displaced people are paid for by the poor, displaced people. The rehabilitated people, in most cases, are given small spaces to live, notwithstanding the size of the families. This leads to an overcrowded household, sometimes a family of six people are clumped together in a one room flat. The rehabilitated also face the problem of income in the new place, where the Government moved the people, but barely thought of any economic amenities in the surrounding area. The problem of clean drinking water and sanitation has also been noteworthy problems in the rehabilitated places. If displacement could not be avoided, and the question of rehabilitation follows, it is imperative for the authorities to plan fruitful rehabilitation programmes so that the people are not further impoverished, but instead, be empowered. KEYWORDS- Displacement, Eviction, Migration and Resettlement, Rehabilitation
INTRODUCTION India has geared towards development in the
post liberalization period. The state of West Bengal is no different, especially the level of infrastructural development in cities like Kolkata is exemplary. Along with the development of the city, displacement of the marginalized people has been a common occurring. According to Ranabir Samddar, ‘The dream of publishing Calcutta into the 21st century with subways, flyovers, underground markets, wide boulevards and islands of picture postcard suburban villages vanishing into the distant green, which Louis Mumford characterized as metropolis continues’ (Samadder, 2013).
Displacement is inevitable because the government needs to build roads, flyovers, metro railways, shopping complexes and so on. Often, displacement follows as a result of migration due to natural disasters, or economic crisis in the villages. They end up in the city, with dreams of a better life, and, in the absence of better options, most of the times, they are forced to live in the slums at the bottom of the high-rise buildings, or on the
pavements, or in informal settlements. So, the government, on occasion, inspired by the need for development, displaces these people. The poor who live in the city, on the road, or in the slums, are often treated as illegal encroachers- in spite of them being citizens, they are offered no rights to live in the city. The poor and the marginalized are driven out, due to lack of space and the rising cost of land and rent in the city. The city provides no space or planning for them, but due to the livelihood provided by the city and its diverse economic opportunities, the poor and the working class are often forced to live in the slums or the pavements. A 2003 UN Habitat report suggests the existence of over 5500 registered and unregistered slums in Kolkata (Bera, 2012). But the slums stand a chance to be bulldozed when they come in the way of development of the city. Chris de Wet (2001) has defined Involuntary resettlement as an instance where, for the purpose of a development intervention, people are permanently displaced, sometimes with an offer of compensation in the form of a new house, land or income. Overall, forced displacement cause a profound unravelling of the
ISSN (Online): 2455-3662
EPRA International Journal of Multidisciplinary Research (IJMR) - Peer Reviewed Journal Volume: 7| Issue: 9| September 2021|| Journal DOI: 10.36713/epra2013 || SJIF Impact Factor 2021: 8.047 || ISI Value: 1.188
2021 EPRA IJMR | www.eprajournals.com | Journal DOI URL: https://doi.org/10.36713/epra2013 110
existing patterns of social organization. In this regard, Cernea (1999) has argued that forcible displacement causes production systems to be dismantled, residential ties to be disorganized, and family and kinship groups to scatter. Thus, according to Cernea (2000), compulsory displacement due to development raise ethical questions because they reflect an inequitable distribution of development’s
benefits and losses; and the effect of displacement has often been impoverishment. A similar dismal picture of displacement is also found in West Bengal, India- where a number of displacements have taken place in the recent years.
As a token of compensation for displacement in the city of Kolkata, while displacing the vast number of people, the Government offers rehabilitation- in a distant corner or outskirt of the city, these people are offered apartments and the dream of a new life, where the roofs are made of concrete, with doors and windows and a bathroom, a much better living than the leaking plastic covering of the slum settlements. The present research studies in-depth the state of rehabilitation offered to the people, their lives after being rehabilitated. The undoubted relevance of the study is corroborated by the fact that displacements and the associated rehabilitation have increased in recent times, but although there have been few studies on the displacements of the people, very few studies have been conducted on the state of rehabilitation. Although researchers like Fernandes (2001), Roy (2000), Cernea (2000), Chris de Wet (2001) have written extensively on displacement, there is a severe lack of qualitative research on the issue of rehabilitation. This research delves into that area, and provides insight regarding the major problems associated with inadequately planned rehabilitation. METHODOLOGY
The study was conducted at a place called Nonadanga, situated at the outskirt of the city of Kolkata. It is located at quite a distance from the central part of the city. The government of West Bengal had set up low-income housing in Nonadanga for the thousands of evicted families from in and around the city of Kolkata. So, the residents of Nonadanga were an ideal study subject for a research on rehabilitation.
Nonadanga was a vast area, with thousands of apartments and relocated families. Thus, a homogeneous Purposive Sampling technique was used to choose respondents for the study. For the in-depth nature of the research, Ethnography was used as a method of study. The method involved in-depth discussions with the respondents on the issue of eviction and rehabilitation in their natural environments, and intricate problems associated with relocation, and problems of finding the means of
subsistence in the relocated place, which was absolutely essential for those marginalized people. The nature of the conversations with the respondents was kept informal to build rapport with them, and encourage the respondents to talk about the issue of their rehabilitation in an unreserved way. Detailed narratives of the respondents were also recorded. Methodological triangulation has been employed in the present study by detailed observation of respondents’ place of residence, the surroundings and
community life, in addition to collection of narratives, and recordings with informed consent. RESULTS
Thousands of lower income group families resided in the flats in Nonadanga. Since Nonadanga was a little further from the city area, there was no work nearby. Most jobs which paid a considerable amount were in the city, and the Government had not set up any income opportunities in Nonadanga itself. People had put up small shops for essentials, whose buyers were also from the same economic class.
People in Nonadanga had come from various slums and settlements in Kolkata. They lived in their earlier settlements for years, along with their neighbors, before being shifted there. In Nonadanga, they found new neighbors, and new relationships were forged. The place had its own problems which needed sorting, and people helped each other in the endeavor. Many claimed that they were close to the neighboring families, who were like relatives, and they could count on them in the event of need. Regarding the state of their life in Nonadanga, there were mixed perspectives among the residents. Many were simply happy to have a concrete roof over their heads, and had actively pursued the authorities to receive the flat. Life in an apartment was far more dignified than one in the slum with poor sanitation, security and privacy. The rehabilitation also provided them with toilets, which came attached with each apartment, unlike the common toilet in the slum.
But all was not well with the state of rehabilitation. The flats in Nonadanga were extremely small, with a very small bathroom and a kitchen. The space was gravely inadequate for even a family of three.
Most family members spent their evenings outside their homes when tutors came in the house to teach their children. Due to the extremely small space in the flats, if one studied with a tutor, there was no space left in the room. They were habituated to that routine, so that during the evenings, people came out of their houses and chitchatted under the shades of tea stalls, older women gathered in the nearby makeshift temple.
During the hot season, the insides of the small flats became too hot, so that people came out just to breathe. While assigning the flats, the Government

ISSN (Online): 2455-3662
EPRA International Journal of Multidisciplinary Research (IJMR) - Peer Reviewed Journal Volume: 7| Issue: 9| September 2021|| Journal DOI: 10.36713/epra2013 || SJIF Impact Factor 2021: 8.047 || ISI Value: 1.188
2021 EPRA IJMR | www.eprajournals.com | Journal DOI URL: https://doi.org/10.36713/epra2013 111
didn’t pay any heed to the number of family members. Most families of 6-7 members were given a single flat only. The shade was a relief from the over crowdedness of the small rooms where there was barely room for everyone to stay in.
The apartments looked gloomy, with broken windows, and tattered clothes hanging from the little verandahs. There were no flowering plants hanging from the balconies, as was a standard sight of apartments in the city. Nor were there any trees by the side of the dusty roads, and the whole place reeked of over crowdedness and lack of fresh air.
Nonadanga was also far away from the heart of the city, and after relocation many women had to quit their jobs. There were no places for the women to work nearby, and as the commute to the city was too expensive to afford, many had to become frugal housewives who had to run the family of six or more with little. The families became dependent on only the husband’s meagre income as a daily wage
laborer, a rickshaw puller, or any such low paying job. This meant compromise in essential nutrients, like vitamins and proteins, and most of the days, their food comprised of rice and pulses only.
Life in Nonadanga had given them an address and a concrete roof over their heads, but affording the lifestyle in an apartment was challenging for the families with marginal income. On the slums, they cooked in firewood, and hooked the electric lines for lights and fans in their homes. So, the expenses of electricity and cooking gas were not something they had to pay for. But in the flats, they could no longer cook with firewood, and had to buy LPG (Liquid Petroleum Gas) for cooking, which was way too expensive, and hooking electricity was out of the question. Increased expenses in the event of decreased incomes carried forward their marginal existence.
After being shifted to Nonadanga, for a very long time, there was intense water crisis. They had to carry the required water of the entire families from the roadside tap, all the way to the topmost floors. But later on, electric pumps were installed, which was supposed to solve the problem. But it was not operated as often as it was needed to meet the water requirements of all the families, and thus they often had to go without water. The space in the flats were also not enough to store water, which were already overcrowded with a greater number of family members than the small spaces could handle, with the few essential furniture like beds and wardrobes. But all families had to manually carry drinking water dispensed by the Corporation Water Tank every day to their respective flats.
In recent times a brand-new problem had come up in the lives of the people of Nonadanga. Residents of the flats were mostly lower income group, working as care givers, or laborers, or
rickshaw pullers. They could not pay for maintenance of the buildings. Due to lack of maintenance on one hand, and the poor-quality materials used by the construction company on the other, the buildings had started to show signs of decay. Often, chunks of concrete from the corners or below the windows had started to split. Sometimes they fell heavily on motorbikes or rickshaws parked on the pavement and caused severe damages. But even after everyone’s
contribution, it could not amount to the money required for repair of the buildings. People had started avoiding walking too close to the buildings, let alone cleaning the drain that flowed beside them, for fear of losing their lives under broken concrete. The residents feared that the buildings might break down someday, and a terrible accident might occur. DISCUSSION
My experience in Nonadanga was revealing. All the debates and discussions in the media about rehabilitation for evicted people vanished into nothingness after watching the deplorable conditions of the rehabilitated. Inspection of the buildings from close proximity confirmed the imminent danger. The dark patches (which looked damp too) had covered several parts of the buildings, and its original yellow color had faded into a grayish tint of yellow. Numerous parts showed cracks, or had a chunk or two missing. The buildings indeed required immediate repair, failing which could lead to a serious accident. Life on the slum was disrespectful, but they could stay alive, healthy and happy, as much as they could. But the decaying flat in Nonadanga posed a threat which was impossible to ignore.
The Government had washed their hands clean after people took possession of the flats, and they were nowhere to be found when they could not earn enough from the vicinity to sustain their lives, or when the buildings started to break away. Since a flat was not a piece of land, if a three storied apartment broke down, the people would have no space of their own left. It was a lingering fear among many who lived in Nonadanga. But again, they had no means of counteracting their predicament, as Nonadanga offered no means to emulate their marginalized status, rather in certain ways, it reinforced it. The people could not accumulate enough money to repair the buildings, and had to stand by and watch their homes break away. It was a situation of utter helplessness, the way out of which seemed unclear. Shoving the evicted people in degraded flats in a distant location from the city clearly brought out the lack of foresight of the authorities on one hand, and absence of the necessary research before such projects are embarked upon, on the other. The marginalized people, again, were the victims of such incompetence of the authorities, the price for which was high, and that they had to pay dearly.
ISSN (Online): 2455-3662
EPRA International Journal of Multidisciplinary Research (IJMR) - Peer Reviewed Journal Volume: 7| Issue: 9| September 2021|| Journal DOI: 10.36713/epra2013 || SJIF Impact Factor 2021: 8.047 || ISI Value: 1.188
2021 EPRA IJMR | www.eprajournals.com | Journal DOI URL: https://doi.org/10.36713/epra2013 112
CONCLUSION
News of eviction has been heard in the city of Kolkata in the last few decades. The Government strives to achieve a picturesque beautiful city, like the ones shown in the movies. So, the development initiatives made sure to clear out the visible sore spots as much as they could, and demolished many slums and evicted the people to make way for high rise buildings, state sponsored gardens, expensive shopping complexes, and so on. After all evictions, the electronic media and the newspapers overflow with the demands for rehabilitation, and criticisms against the Government if it is not provided. Sometimes, the families had to appeal to local political party leaders to enroll them as beneficiaries of rehabilitation. In this study, I set out to understand the experience of rehabilitation for the evicted people, who had received it from the Government. A major issue of the state of rehabilitation unravelled in the study was inadequate space provided for the families to live. It seemed that the Government was much more concerned about their humanitarian image rather than the well-being and upliftment of the rehabilitated people. Overcrowding in inadequate spaces was unhealthy and unsanitary, besides being a serious impediment to the development of children and care of the elderly. Another major problem faced by the relocated people was avenues of income. Most of the daily wage earners and women working as household help had their income in the city. And no economic development initiatives were arranged by the Government in the place of relocation. This created a serious economic crisis among the already downtrodden people with meagre incomes. Travelling long distances on a daily basis, from Nonadanga to the city was impossible for a daily wage earner who earned a maximum of 300-400 Rupees on a working day. The Municipal facilities, like clean water, and sanitation in the area was also inadequate for such a large population residing there. But the gravest problem of all was probably the building maintenance, which could not be arranged by the residents, even after accumulating the contributions from all the families. The amount proved to be vastly inadequate, owing to the economic condition of the dwellers. But the degrading condition of the buildings could be hardly ignored, but then again, they felt helpless about doing something about it. The future was quite uncertain for them in the event the buildings broke down, either due to a natural calamity or due to lack of maintenance. These findings portray lack of planning in the rehabilitation process, and ignorance about the upliftment of the poor and the homeless. The impoverishment of the rehabilitated people questions the humanitarian face of the Government and calls for more earnest endeavour of the authorities to plan
for a rehabilitation keeping in mind the dignity of the rehabilitated people. Conflict of Interest No conflict of interest was reported by the author. REFERENCES
1. Banerjee, S. (2013) ‘Redefining Development and Reclaiming Subaltern Space: Arundhati Roy and the Post-Development Critique Of Indian Modernity’ in IOSR Journal Of Humanities and Social Science (IOSR-JHSS) Vol. 8, Issue 5 (Mar. – Apr).
2. Bera, Sayantan. (2012) ‘Kolkata evicts ecological refugees’ in Down to Earth, 11 April.
3. Bhaduri, A. (2015) A Study in Development by Dispossession. Kolkata: IDSK.
4. Brewer, John, D. (2000) Ethnography. Buckingham: Open University Press.
5. Cernea, M.M. (1999) ‘Why Economic Analysis is Essential to Resettlement: A
6. Sociologists View’ in Michael M. Cernea (ed.),
The Economics of Involuntary Resettlement: Questions and Challenges, Washington, DC: The World Bank.
7. Cernea, M.M. (2000) Risks, Safeguards and Reconstruction: A Model for Population
8. Displacement and Resettlement., in Michael M. Cernea and Christopher McDowell (eds), Risks and Reconstruction: Experiences of Resettlers and Refugees, Washington, DC: The World Bank.
9. Chatterjee, P. (2011) ‘Lineages of the Political Society: Studies in Post-Colonial democracy’, Columbia University Press.
10. Downing, T.E. (2002) Avoiding New Poverty: Mining-Induced Displacement and Resettlement. International Institute for Environment and Development. England.
11. Dutta, N. (2007) ‘Bulldozing over people’ in The Times of India (New Delhi), 10 Jan.
12. Fernandes, W. (2001) ‘Development induced displacement and sustainable development’ 87-103 Social Change; March-June. Vol. 31 Nos. 1&2.
13. Hobart, M., ed. (1993) An Anthropological Critique of Development: The Growth of Ignorance. London: Routledge.
14. Ray, P (2000) ‘Development Induced Displacement in India’. SARWATCH Vol. 2 No. 1 July.
15. Roy, A. (2002) The greater common good, in The algebra of infinite justice. New Delhi Penguin Books.
16. Samadder, R. (2013) ‘Passive Revolution in West Bengal: 1977-2011’, New Delhi: Sage.
17. Wet, Chris de. (2001) ‘Economic Development and Population Displacement: Can Everybody Win?’ in Economic and Political Weekly. Vol.36, No.50 (Dec. 15-21).

ISSN (Online): 2455-3662
EPRA International Journal of Multidisciplinary Research (IJMR) - Peer Reviewed Journal Volume: 7| Issue: 9| September 2021|| Journal DOI: 10.36713/epra2013 || SJIF Impact Factor 2021: 8.047 || ISI Value: 1.188
2021 EPRA IJMR | www.eprajournals.com | Journal DOI URL: https://doi.org/10.36713/epra2013 113
TABLIGHI MOVEMENT OF 20TH CENTURY: SIX PRINCIPLES
Rameez Ahmad Lone
Senior Research Fellow and Assistant Prof. (Contr.) Department of Sociology GDC Sopore, J & K
Article DOI: https://doi.org/10.36713/epra8426
DOI No: 10.36713/epra8426
ABSTRACT Tablighi Jamaat is one of the most prominent and most widespread Islamic missionary movements of 20th century Islam. It’s
active today almost in every country wherever Muslims live. The organization is said to be having a presence in between 150 to 200 countries, with its estimated adherents numbering between twelve million to one hundred fifty million, the majority of which are living in South Asia. It primarily focuses on making Muslims better and purer Muslims. When they visit a village or any place, they invite local people to assemble in a mosque and present their message in the form of six principles. These six principles are commonly called “chai baati’’ (six talks) in Tablighi circles. These six principles are: Kalimah ‘Article of Faith’, Salah ‘Prayers’, Ilm and Zikr ‘Knowledge and Remembrance of God’, Ikraam-i-Muslim ‘Respect for Muslim’, Ikhlas-e-Niyyat, ‘Sincerity of Intention’ and Tafrigh-i-waqt ‘Sparing of time in tabligh (preaching)’. These six principles are fundamental to the teachings of ‘Tablighi Jamaat’ and represent the basic ideological structure of the Tablighi Movement. KEY WORDS: Tablighi Jamaat, Six Principles, Preaching, Muslims.
Tablighi Jamaat which literally means „preaching
group or party‟ was founded by Maulana Mohamad
Ilyas Kandhalvi in 1920‟s in Mewat-India. In its course of dawah „preaching‟ work, Maulana Ilyas required Tablighi activists to strictly follow „six principles‟ or
which in Tablighi circles are commonly referred as chai baatien ‘six talks‟. These six principles represent a sort of „ideological structure‟ of the Jamaat , which according to „Tablighi Jamaat‟ is fundamental for the renewal of faith among the Muslims at the basic level, which will help in their knowledge, cultivation of faith, moral and spiritual development (Lone, 2018; Sikand, 1986; Mumtaz, 1991). However some scholars like, Agwani, (1986: 43-45), Anawrul Haq (1973:142) and Lone (2018), that Ilyas required seven essentials for the Tablighi activists to concentrate on, while in a dawah or preaching tour. These six principles ‘chai baatie’ viz. i. Shahadah, ii. Namaaz, iii. Ilm-o zikr, iv. Ikram-i-Muslim, v. Ikhlas-i-niyat and vi. Tafrigh waqt are the fundamental one‟s and the „seventh‟ one that is, tarq-i-layani „giving meaning less persuits‟ is of general character. In all, these could be referred as „seven
essentials‟ containing six fundamentals (ibid, 2018). However, Anwarul, Haq (Haq, 1972:142-45), has referred these principles or essentials as „six positive‟
and one negative, while as Maulana Wahidudin Khan (Khan, 1986: 24) maintained, that, Maulana Ilyas‟s
plan was comprised of „six important aims‟. Mumtaz
Ahamad (Ahmad, 1991), is of the view, that Maulana Ilyas‟s plan comprised of small, mobile units of
Tablighi Jamaat activists, containing around and at least 10 to 12 members, who were required to travel to various villages for preaching and to present their dawah „preaching‟ messages according to the six demands.
These principles, which lie at the base of Tablighi dawah „preaching‟ ideology and methodology, have been discussed systematically in the following pages.
(A) PROFESSION OF FAITH/TESTIMONY (KALIMA SHAHADAH) The first one is the „Kalima’ (also called article of faith), which is as follows : „La Illha Illa‟Llahu,
Muhamamadu-r-Rasool-ull Llah‟ meaning „that
there is no deity but God- Almighty Allah, and Muhammad is the Apostle and servant of Allah‟.
Ilyas‟s message gives prime importance to the Kalima; to believe in the reality that there is no deity but God Almighty Allah, that He alone is the Creator and the Nourisher of the universe, and the

ISSN (Online): 2455-3662
EPRA International Journal of Multidisciplinary Research (IJMR) - Peer Reviewed Journal Volume: 7| Issue: 9| September 2021|| Journal DOI: 10.36713/epra2013 || SJIF Impact Factor 2021: 8.047 || ISI Value: 1.188
2021 EPRA IJMR | www.eprajournals.com | Journal DOI URL: https://doi.org/10.36713/epra2013 114
truth had been made manifest through His messenger, the Prophet Muhammad(PBUH). When one recites these words: that there is no deity but God Allah and the Prophet Muhammad is His last messenger and servant, it amounts to expressing one‟s inner feelings of conviction of the
truth, of these words. It also proclaims ones determination to follow a path based on the firm conviction that God Allah is the only real existence, the centre of all our complete trust. This proclamation is an expression of an all-pervasive feeling within one of having at last found the true way of life and also the source from which truth emanates- the only source whose guidance is worthy of trust.
Trust and conviction are, in fact, the source of all revolution, be it religious or secular. A history of revolution tells us that it was the courage of conviction-right or wrong-in certain souls, which has made history. For instance Maulana Wahidudin Khan (W. Khan, 1986: 25), gives the example of communism, though was based on partial truth, yet some political, economic or nationalistic truths or convictions, aroused and inspired people to such a degree that they concentrated all their potentialities and energies on making it known to people. One can then imagine what the strength of such a conviction would be like when based on a truth in real sense of the word. When such truths are firmly implanted in ones heart and mind, like a divine fervour, one can guess what enormous benefits can result. The true faith, over which the people have put their total trust in God Allah, has the potential to move all mankind. The kalimah is thus the essence of religion- the greatest power on the earth. The movement can be thus appropriately called a ‘Kalimah movement or „Tahreek Emaan’( ibid., 26).
The Kalima has to be memorized correctly, paying particular attention to pronunciation at least uttered correctly. The emphasis is on understanding its significance as a divine command. The article has broadly two aspects: one having the belief, that God Almighty Allah is alone deity worthy of worship; and second having a belief that the last Messenger of Allah‟s way that is, the Prophet‟s Mohammad‟s way is the right
way and final way to worship or establish connection with God-Allah. In other words ‘Kalima’ has two parts that is, belief and testimony in one Allah and; testimony and obedience to the Prophet Muhammad (PBUH). Besides the „Kalima‟ is sometimes also referred to as „faith‟ or
‘emaan’. The word ‘emaan’ in Arabic describing faith literally means „believing in the words of the
messenger with full conviction and certainty. The word of faith ‘Kalima’ thus means expressing belief in the message of Allah, conveyed through His Messenger with full conviction, confidence and certainty (Haq, 1972; Kandhalavi, 2009) (B) PRAYERS (SALAH OR NAMAAZ)
The second important part of the Maulana Ilyas‟s call is to prayer or Namaaz or Salah . Here Tablighi Jamaat activists learn about the various details and rules of Namaaz, the obligatory and other prayers, as well as rules about the ritual purity. Just as ‘Kalima’ enjoys the main position in one's thoughts and feelings, so does prayer in ones practical life. The real significance of prayer lies in men diverting all his attention to God Allah and making contact with Him through sense perceptions. Through them the worshipper bows before his Lord, placing his forehead on the ground, he testifies to his own lowliness as opposed to God-Allah‟s exalted nature. He presents himself as Allah‟s servant. He stands
before Allah, bows down to Him, and prostrates himself before Him, in a practical demonstration of submission to Allah. It is when one humbles oneself before the Lord that one is in a position to meet Him; for one discovers Allah on a level of humility, not on a level of pride or egotism. One's soul then undergoes such an experience that one can feel the blessing of God-Allah descending upon one. Such an experience, which defies description, gives a new dimension to human personality. The worshiper consciously realizes how helpless and powerless he is before God Almighty Allah. Humility and modesty alone befit a servant of God-Allah. In the process, arrogance and haughtiness, which are the source of most evils, vanish into thin air.
Prayer, as mentioned in the Quran, keeps one away from evils and shameful practices and is the only manifest difference between a Muslim and a kafir1. With every prayer, man expresses his servitude before God and promises to Him that he will try to lead his life as His devoted servant. It reminds him of the day of reckoning. If a man is true to his words, his life can be transformed by them.
Besides, in the first principle, the pledge of worship and obedience to Allah and His Prophet
1 . Kafir denotes „atheist‟ or one who does not believe in one
God or Allah and His Messenger Muhammad.
ISSN (Online): 2455-3662
EPRA International Journal of Multidisciplinary Research (IJMR) - Peer Reviewed Journal Volume: 7| Issue: 9| September 2021|| Journal DOI: 10.36713/epra2013 || SJIF Impact Factor 2021: 8.047 || ISI Value: 1.188
2021 EPRA IJMR | www.eprajournals.com | Journal DOI URL: https://doi.org/10.36713/epra2013 115
are fulfilled through prayers and prayers are the first practical step towards proof of one‟s faith.
Prayer also has two parts, external and internal. The former consists in performing the preludes to prayer such as ablutions, involving all the acts which the Prophet and his Companions performed. These are to be done exactly the same way as Prophet did them. In the internal sense, prayer is to strive for perfect submissiveness in every single act which will create in the individual the quality of abstention from vile deeds. This is the real meaning of prayers (Haq, 1972; W. Khan, 1986 ; Kandhalavi, 2009).
(C) KNOWLEDGE AND REMEMBERANCE OF GOD-ALMIGHTY ALLAH (ILM-O-DHIKR OR ZIKR)
The third essential principle is the acquiring knowledge and remembering God Allah all the time. In Tablighi parlance, this principle is referred as ‘Ilm-o-Zikr’. Every day a part of the morning and evening hours is to be spent for this purpose. There are general and special forms of remembrance. As regards the former, a Muslim is expected to recite the tasbiha2 (one hundered times) of the third kalimah and two tasbih each of the durood3 and istighafaar4. A specific time is to be fixed for these devotions. In addition, special devotions are to be offered by those who are to be disciples of the shaykh in accordance with the manner prescribed by him.
To acquire the religious knowledge certain books are to be studied, such as Faza‟il namaz, Faza‟il Quran, Faz‟il zikr, Faza‟il ramazan, Faza‟il hajj, Faza‟ilsadakaat, and Hikayat-i-sahaba. These books are in Urdu and are meant for Muslims in general. For the „ulama‟ various sections from
Sahih-al Bukhari are prescribed: ‘kitab al-iman (book of faith), kitab al-ilm(book of knowledge), al-itisam bil-kitab wa al-sunnah (adherence to Quran and the Practice of the Prophet), kitab al-jihad (book of struggle), al-amr bill-maruf wa al-nahi ‘an-al munkar, kitab al-adab, kitab al-riqaq and kitab al-fitan (Haq, 1972).
2 . Praises of God-Allah; counting of beads one hundred times; rosary. 3 . Darood, simply means paying salutation to Prophet Muhammad. 4 „Istighafaar‟ is the act of seeking forgiveness from Allah, by reciting Arabic word „Astaghfirullah’, repeatedly meaning "I seek forgiveness from Allah". Various other dua‟s are also
recited for this purpose. It is considered one of the essential parts of worship in Islam.
The details of this divine command, its correct procedures are needed to be learnt through the learned scholars of religion. Usually, three procedures are to be adopted to get this particular aspiration of „acquiring knowledge‟. These are: (a) By making urge for knowledge to other faithful Muslim brothers especially the Ulama. (b) By making self efforts to acquire it, and; (c) By prostrating before God or seeking Allah‟s
help for the achievement of this goal. Besides the Quran and Sunnah (hadith),
relevant books as described above are believed to be a great source of knowledge. The contents are to be acquired and installed in the heart to mean that the knowledge is really acquired. Mere reading, understanding or its memorizing does not carry any merit. The knowledge in true sense is one that is conveyed by the creator of the universe through His messenger for the guidance of the mankind, which is revealed in the divine books of Quran and Hadith. The knowledge has got importance and so is honoured. The ignorance has got no value and can bear no fruit. Knowledge alone is going to be useful in the grave and ignorance can never. Only those who acquired knowledge and acted upon will be able to pass through various trials and tests in the grave or on the Day of Judgment and thus will be able to shield or free themselves from the hellfire. Ignorance, or even knowledge with weak belief, or without compliance too will prove useless. The lives of the Prophet and his companions are the model for the Muslims about acquiring knowledge and acting upon (ibid). (D) RESPECTING MULIMS (IKRAAM-E-MUSLIM)
To pay due respect to the Muslims, called „Ikram-e-Muslim‟ in Tablighi terminology, forms next important principle of the Tablighi Jamaat‟s
preaching project. Maulana Ilyas emphasized that honor and deference should be shown to fellow Muslims, especially in the matter of rights. In addition to this, it is the special right of the young to be treated with affection by the elders, while elders are to be shown deference by the younger generation. At the same time Maulana Ilyas, emphasized that rights are only a means to an end, the end being the spread of Islam. In the pursuit of this goal, one should be prepared to sacrifice one‟s
own rights, for which one will be rewarded in the hereafter.
Thus, „Ikram-i-Muslim‟ also stands for respecting others rights and not insisting ours. We should invariably fulfil the obligations towards
ISSN (Online): 2455-3662
EPRA International Journal of Multidisciplinary Research (IJMR) - Peer Reviewed Journal Volume: 7| Issue: 9| September 2021|| Journal DOI: 10.36713/epra2013 || SJIF Impact Factor 2021: 8.047 || ISI Value: 1.188
2021 EPRA IJMR | www.eprajournals.com | Journal DOI URL: https://doi.org/10.36713/epra2013 116
other human beings as commanded by Allah, and as taught by Prophet Muhammad. We should do this task as a duty and should never demand our own right upon them. It should be our effort to serve others, in whatever way it is possible. Besides, it should be always our concern not to become a cause of trouble or problem for others. The poor needy, neighbour, should be taken care of. The elders, scholars, pious, should be looked with due regards. The weak, young and poor should be treated with compassion. We should overlook the weakness of others if we happen to come across. Allah will overlook our weakness on the Day of Judgment. We should understand the worth of our faithful Muslim brothers. It is reported in a Hadith, that Allah will continue to sustain the universe till that day all the faithful are dead. So Muslims are very dear to Almighty Allah. We find all the infighting, quarrels a today are because people generally enforce their rights on others and forget their duties towards them. It is the main cause of the quarrels and broken family bonds all around in the society now-days. We should volunteer ourselves for serving our brethren, the needy. The Prophet Muhammad and his companions have a set of excellent sacrifice of self interest for us to replicate. It is narrated that once the Prophet had set on a tour along with the companions. On the way they made a halt for a while for lunch. While others were busy in cooking, Prophet volunteered himself to collect the firewood. He has thus show-cased an excellent example of fraternity, service and social work. He always behaved one among the many. While in Jamaat or „Tablighi tour‟ one should put aside his individual identity, status and act as one among the participants and act for the welfare of others (ibid).
The other aspect of this fourth principle is akhlaque meaning „character building and
imbibing moral values‟ and haquq-ul-ibaad meaning „rights of the human beings‟
encompassing rights of the Muslims as well as mankind. It is through these moral values, character building and showing sympathy to Muslims and non Muslims like poor, sick, elderly and other needy Islamic teachings could be practically disseminated (Zainuddin 2020).
(E) PURITY AND SINCERITY OF INTENTION (IKHLAS-E-NIYAT) The fifth, important principle also called ‘Ikhlas-e- niyyat’- in Tablighi parlance is concerned with emendation of intention and sincerity. Every action is to be undertaken with no other end in view but
to please God Almighty Allah, and to reform oneself. Any slightest deviation from this set path is bound to generate the wrath, anger of Allah instead as it tantamount to admitting partner in that deed. According to one hadith (sayings of the Prophet Mohammad), a religious scholar, a philanthropist and a crusader will be brought before Almighty Allah on the Day of Judgment. They will be asked one by one to explain their behavior in the life. They will happily report about their performances and achievements. Allah will declare that their acts were with the intention to gain publicity and fame. It was achieved and nothing remains for them as a reward. They will be then ordered to be thrown in the fire of hell. It is also said that one of the attributes of Allah is being „Pure‟ and He accepts only such deeds which are offered purely with an intention to gain His pleasure only. Hence the Muslims or the Tablighi activists must ensure „perfect purity in intention‟ is
achieved at all costs. An impure act is dangerous and a way definite towards hell. A small act with purity in intention is great, considered acceptable and fully reward-able by Allah compared to a big one but with a slightest corruption in intention (ibid).
Thus Tablighi‟s must perform every act
with the sole purpose to please Allah and not for any selfish purpose like earning fame or name. If they do so then their acts would not only disqualify them for any reward but will also invite them punishment of Allah
(F) SPARING TIME IN THE PATH OF ALLAH OR MISSIONARY TOURS. Also called ‘Tafrigh-i- waqt’ in Tablighi terminology, means to spare time, that is, to withdraw from ones worldly engagements and to go forth in missionary groups. This sixth principle „making people come out of their homes‟ is central
to the Maulana Ilyas‟s way of working, because this gives people the opportunity to quit their worldly atmosphere and to go in search of religious one. Only in atmosphere free of worldly thoughts can be there a true receptivity to the message concerned. Ilyas is reported to have once said, „our
method of working, lays emphasis upon taking people out of their homes in groups. The main advantage of this method is to encourage people to come out of worldly and static atmosphere in order to enter a new, pure and dynamic one where there is much to foster the growth of the religious consciousness. Besides, travel and emigration involve hardship, sacrifice and self-abnegation for
ISSN (Online): 2455-3662
EPRA International Journal of Multidisciplinary Research (IJMR) - Peer Reviewed Journal Volume: 7| Issue: 9| September 2021|| Journal DOI: 10.36713/epra2013 || SJIF Impact Factor 2021: 8.047 || ISI Value: 1.188
2021 EPRA IJMR | www.eprajournals.com | Journal DOI URL: https://doi.org/10.36713/epra2013 117
the sake of God-Allah‟s cause, and thus entitle one to divine succor (Khan, 1986:29).
This principle has also been referred as „the
course of action‟ in the Tablighi literature, because this is the principle where Muslims or Tablighi activists are practically taught the above five principles. Thus this principle may be described as the essence or soul of Tablighi project. While at his own place, one should move to bring people together for Salah (congregational prayers/prayers), Zikr remembrance of Allah etc., in the local mosque. The fellow Muslim brothers should be argued to assemble in the evening and to stay back in the mosque to offer late night Salah (prayer) called ‘tahajud’. Supplication for forgiveness‟, guidance for all should be made to
Almighty with a humble and begging posture. Again by persuasion a Jamaat should be formed to move out for three days to a nearby place. Some seniors should brief the junior participants the correct procedure of spending the time while in the path of Allah. A senior, learned among the group will be selected to head them to be called „Ameer‟
of the group. The other important persons are the „Mutakalim‟ that is, a talk-giver and, a „Rahbar‟
that is, a guide- a local person of a village or an area where the Tablighi Jamaat visits. A 24 hour program is prepared everyday in the morning to practice to bringing of the „six principles‟ in the
lives of the participants. For this, the prescribed books are also read and recited while in the Jamaat. The Muslims living in the village or around the mosque are contacted and invited, with an urge to join the Jamaat and follow the same procedures for the success. This is done through the ‘ghast’ that is, Tablighi activists patrol in the locality around the mosque and went door to door or house to house while inviting people to mosque. The patrolling usually lasts for an hour, and the tablighi activists must return before 5 to 10 minutes before the salath (prayer). After Salaat, the „Mutakalim‟
delivers speech or talk in a simple manner in the light of six principles to enlighten about the need of strengthening bond of Muslims with the God-Allah. After this, a call is given by the ‘Ameer’ usually in a gathering called ‘tashkeel’5 to the local
5 . tashkeel, literally means „put in pictures, practice, action
or words‟ In tablighi parlance, it refers to a special call on the
part of head or ameer of the tabligi jamaat to the local people about joining the tablighi tour for specific periods of time, usually 3, 7,10,40 (0ne chillah), and 120 days. Those accept the call, either raise their hands, or stand up, to register their names as per their convenience. The names are written by one
people, to join the Jamaat. Upon joining by some local people, similar groups numbering from 3-11 are formed there and dispatched to other places to work on the same pattern, for a convenient period that is, 3 days, 10 days, 40 days, 4 months etc. The dos and don‟ts supposed to be observed while in the path are learnt from the seniors (Kandhalavi, 2009).
Thus, „sixth principle‟ of the movement deals with the formation of the groups, of the volunteers, willing to donate their time for preaching tours. It advocates that it is the duty of every member of the community to call others to religion, just as in the past it had been the preoccupation of those who had accepted Islam upon the hand of the Prophet (Haq, 1972: 145)
These six positive (Haq, 1972) and fundamental principles are to be observed constantly by the members of the touring group. The seventh essential principle or rule is of prohibitive nature. This principle in Tablighi parlance is called “Tarq-i-La‟ya‟ni” meaning,
„giving up useless actions or deeds‟. This principle
calls upon the Muslims or Tablighi activists to abstain from wasting time in unnecessary talks, futile actions, sinful and prohibitive deeds. Besides these six principles (including the seventh) can be condensed into three main tenets:
„The ‘Kalimah Tauhid’, Article of Faith „Salah’ prayers and „Tafrigh-i- waqt’ sparing time for preaching. The other three are, in actual fact, offshoots of the main tenets. When they are adopted wholeheartedly all other things follow in consequence (Khan, 1986). And, when one „spares
time‟, in Tabligi tours, he in the due course of time, learns by default about the other principles of the Jamaat. Besides and because, one must note that these „Tablighi‟ mobile units are not just formed to preach among people, but fundamentally to learn about Islam in the light of above mentioned six principles. So in the Tablighi Jamaat, the members both learn and practice these six principles.
CONCLUSION
The above mentioned six principles form the backbone of Tablighi Jamaat‟s dawah project encompassing its ideology and methodology. The first principle that is, Kalima profession of faith is the fundamental of all, all other principles follow logically and consistently. If one believes whole heartedly in
of the tabligji member on the dairy. The registered people are contacted and departed for tablighi tours, for various places.s
ISSN (Online): 2455-3662
EPRA International Journal of Multidisciplinary Research (IJMR) - Peer Reviewed Journal Volume: 7| Issue: 9| September 2021|| Journal DOI: 10.36713/epra2013 || SJIF Impact Factor 2021: 8.047 || ISI Value: 1.188
2021 EPRA IJMR | www.eprajournals.com | Journal DOI URL: https://doi.org/10.36713/epra2013 118
Allah the way taught by Prophet Mohammad (PBUH), it is natural he will pray regularly, remember and praise Allah always, show respect to Muslims and mankind, spare time for learning and preaching Islam for the sake of Allah alone. However, the other distinguishing characteristic of Tablighi Jamaat‟s ideology and
methodology is its fifth principle, Tafrigh-i- waqt that is, sparing time in touring and patrolling from one place to another place or from one mosque to another mosque while learning and practicing the Islam which also includes learning of rest of the principles and their injunctions. It is primarily this principle of preaching methodology „Tafrigh-i- waqt (touring, travelling and patrolling), which distinguishes Tablighi Jamaat from other Islamic revival movements. Moreover, each and every Tablighi activist is strictly advised to abide by these principles both in the Jamaat as well as in his personal life. In nut shell, Tablighi Jamaat‟s core
ideology is confined to these six principles (basic rituals) and unlike Jamaati Islami does not have any explicit and elaborate social, political and economic agenda.
REFERENCES
1. Agwani, M. . (1986). Islamic Fundamentalism in India. Chandigarh: Twenty-First Century India Society.
2. Ahmad, M. (1991). Islamic Fundamentalismin South Asia: The Jam’at-i-Islami and the Tabligi Jamaat of South
3. Asia. In M. E. Marty, R. S. Appleby, & S. Asia (Eds.), Fundamentalisms Observed. Chicago and London: Univrrsity of Chicago.
4. Alam, S. A. Z. M. (1985). The Message of Tableeg and Da’wa. Dhaka: Islamic Foundation Bangladesh.
5. Baliyavi, M. U. (n.d.). Tarikh-i-Da’wat-o-Tabligh. Dehli: Arshi Publications.
6. Baliyavi, M. U. (2013). Tarikh-i-Dawa’at-o-Tabligh. Dehli: Arshi Publications.
7. Bulandsahri, M. A. E. (1989). Six Fundamentals of Tabligh. New Dehli: Idara-i-Isha’at-i-Diniyat.
8. Falahi, U. F. (1996). Tarikh-i-Da’wat-o-Jihad Baresaghir ke Tanazur main. Dehli: Hindustan Publications.
9. Ferozepuri, M. I. (n.d.-a). Tabligh ka Muqami Kaam (2011th ed.). Dehli: Rabbani Book Depot.
10. Ferozepuri, M. I. (n.d.-b). Tablighi jama’at ki Layi
Ranvangi ke Hidayat. Dehli: Rabbani Book Depot. 11. Ferozepuri, M. I. (n.d.-c). Tablighi Tehreekh ki
Ibtida aur uski Bunyadi Usool. Dehli: Rabbani Book Depot.
12. Haq, S. A. (1972). The Faith Movement of Maulana Mohammad Ilyas. London: George Allen and Unwin.
13. Kandhalavi, M. S. (2009). The Six Numbers.
Hyderabad: Nasir Book Depot. 14. Khan, W. (1986). Tabligh Movement. New Dehli:
the Islamic Centre. 15. Lone, R. A. (2018). Tablighi Jamaat : Ideological
Structure, 8(1), 1001–1011 16. Masud, K. (2000). Travellers in Faith: Studies of
the Tablighi Jama’at as a Transnational Islamic
Movement for Faith Renewal. Brill: Leiden. 17. Sikand, Y. (2002). The Origins and Development of
the Tablighi Jama’at (1920-2000). New Dehli: Orient Longman.
18. Zainuddin, S (2020). Some Aspects of Society and Religious Movement among Muslims "The Case of Tablighi Jamaat in Orissa." Publications Division, Aligarh Muslim University.
ISSN (Online): 2455-3662
EPRA International Journal of Multidisciplinary Research (IJMR) - Peer Reviewed Journal Volume: 7| Issue: 9| September 2021|| Journal DOI: 10.36713/epra2013 || SJIF Impact Factor 2021: 8.047 || ISI Value: 1.188
2021 EPRA IJMR | www.eprajournals.com | Journal DOI URL: https://doi.org/10.36713/epra2013 119
REALIZATION OF THE ELECTRIFICATION PLAN IN TURKESTAN
(20TH YEARS OF THE XX CENTURY)
Saidboboeva Gulzora Nematjonovna PhD, Department of History source and archival studies of National University of Uzbekistan
Article DOI: https://doi.org/10.36713/epra8420 DOI No: 10.36713/epra8420
ABSTRACT The article describes the state of electrification in Turkestan during the Soviet era on the basis of statistical materials, scientific literature and archival documents (20th years of the XX century). The author also analyzes the engineers who took an active part in this process in the country and their participation in the electrification of the regions.
DISCUSSION
In realizing the GOELRO plan in Turkestan, the central offices of the Union had to do a number of things. Due to the fact that electrification in the transition period was planned to be carried out on a planned farm, it was confronted with the specifics of the districts, which consisted of "designing large district centers and developing district economic plans as part of a single national plan” 1:1].
Turkestan is divided into four economic regions – Fergana, Chirchik-Mirzachul, Zarafshan, Yettisuv. Plans have been drawn up for each of them, taking into account the development of electrification, irrigation and industrial construction.
The plan for electrification of the Turkestan economic region was approved by the GOELRO commission. G.K. Rizenkamf (chairman), V.D. Jurin (who developed the electrification plan of the Fergana valley), V.M. Buzinova (prepared written report "Electrification of Chirchik and Mirzachul districts"), A.M. Yestifeev (prepared written report "Electrification of Zarafshan region"), E.E. Skornyakov (prepared a written report "Electrification of the Yettisuv region"), prepared by V.V. Zaorskaya-Alexandrova (using the work "Economic plate of the Turkestan region") and others. As consultants, I.G. Aleksandrov, A. V. Chaplygin, G.D. Dubemr, R.A. Ferman, E.Ya. Shulgin is included.
According to the GOELRO plan, in order to electrify the national republics, in particular Turkestan, in March 1921, its own executive body
and the Committee for the Electrification of Turkestan, which had 70 million rubles at its disposal, were established 2:24].
In late 1921–early 1922, the Commission on Electrification of the Republic of Turkestan began its work in Tashkent. The commission continued the work of the Electrification Committee set up in the hydropower department of the Central Economic Council of Turkestan. According to the Regulations on the Electrification Commission of Turkestan, it is entrusted with the following tasks: a) to draw up a general plan of electrification of the Republic of Turkestan for the next 10 years; b) development of a project to increase the performance of existing electrical equipment; c) creation of cadastre of energy sources (water, coal, oil, etc.); g) promotion and dissemination of the electrification plan 3:97].
As a key part of the overall plan to electrify Turkestan, G.K. Riesenkamf's "Program for the establishment of cotton growing in Turkestan" was also adopted. The forecast of the development of economic life of the region, the network of power plants and power transmission lines in the region, the work to determine the periodic sequence of the electrification plan belong to him. The general explanatory letter is from the team of engineers consultant It was developed by R.A. Ferman and he was also commissioned to write a review of the plan 4:17].
Given the low level of energy supply in Turkestan, the developers of the GOELRO plan said: "It is absolutely inappropriate to talk about 'supplying
ISSN (Online): 2455-3662
EPRA International Journal of Multidisciplinary Research (IJMR) - Peer Reviewed Journal Volume: 7| Issue: 9| September 2021|| Journal DOI: 10.36713/epra2013 || SJIF Impact Factor 2021: 8.047 || ISI Value: 1.188
2021 EPRA IJMR | www.eprajournals.com | Journal DOI URL: https://doi.org/10.36713/epra2013 120
electricity to neighboring areas from existing power plants' because the electricity supply in Turkestan is so low and its capacity is insignificant" 5:642].
The resolution on electrification of Turkestan (April 25, 1922) focused on the electrification of cultural centers, the use of existing facilities and the restoration of old irrigation systems, the development of electrification plans and the establishment of a special energy section under the Turkestan State Planning Committee 6:542].
There are no plans to build power plants in the Yettisuv district in the first place. In the second phase, it is planned to build the Atbashi HPP with a capacity of 3,000 kW, the main canal water pumping station at Jilarik station with a capacity of 30,000 kW, and the Alamedin HPP with a capacity of several thousand kW on the Alamedin River 7:644-647].
It should be noted that the Caspian region and the northern part of the Syrdarya region are not included in the plan to electrify Turkestan. Because in these regions there were no economic factors that required the need for electrification at the state level 8:644].
After studying the rich water resources of Fergana region, the special commission considered that it was possible to build three power plants there as well 9:94]. Initially, it is planned to build a single power plant for the Fergana region near Uchkurgan on the Naryn River with a capacity of 30,000 kW, and then 80-100 thousand kW. It is possible to build a dam up to 10 meters high in the upper reaches of the river, which will create a pressure of up to 30 meters, the water flow of the river will vary from 170 m3 to 3100 m3, thus providing power to the entire Fergana Valley. reported to take about 4 years 10:644].
It is planned to build two main stations for the Chirchik-Mirzachul region: the projected Chirchik canal at the Bozsuv stream, in the north of the region initially with a capacity of about 30,000 kW, and then expanded to about 60-80 thousand kW, and in the northern Mirzachul region and in the south. Bekabad station with a capacity of 18 thousand kW for part 11:645].
There were 11 power plants with a production capacity of 38,039 rubles, 18 mechanical engines, and 989 horsepower12:217].
Mirzachul district, according to preliminary estimates, it is planned to spend 30 million for construction, 56 for agriculture, 125 for industry, 15 for cities and settlements, a total of 226 million kWh 13:226].
Electrification of the 350 km long Tashkent-Aris and Tashkent-Pskent-Dalvarzin railways doubled the volume of freight traffic in 1912 to 80 million pounds. An additional 20 million pounds of
cotton will be transported from Chirchik and Mirzachul districts, and 20 million pounds from Fergana alone. It was also possible to transport construction materials.
In particular, in Chirchik district 10000 kWh of electricity is intended for construction, 1000 for agriculture, 95670 for heavy industry, 20000 for other consumers (small industry), 66000 for cities and settlements, 26200 thousand kWh for electrification of telegraph lines 14:223].
A.M. Yestifeev's report on the electrification of the Zarafshan region states that electricity is required first for irrigation works and earthworks for irrigation canals and in artificial constructions for mechanized irrigation, and then in agriculture: the use of energy for plowing, plowing, planting, weeding, harvesting - It should be noted that the harvest and, finally, the processing of raw materials such as cotton, grain, grapes, vegetables from irrigated lands should serve industrial enterprises, it is possible to operate different plants from each of these types of raw materials 15:259].
I.G. Alexandrov, a member of the commission who is well aware of the energy potential of the Chirchik-Chatkal basin. put forward the idea of launching the production of synthetic nitrogen fertilizers using cheap hydropower to develop cotton growing in the Central Asian republics. He proposed to build an electrochemical complex and Chirchik electrochemical plant from the cascade of hydropower plants on the Chirchik River 16:17].
Thus, for the whole of Turkestan, first of all, 5 regional stations with a capacity of about 80-100 thousand kW, and secondly, 6 stations (including one station on the Sokh River in Fergana region) and 100-170 thousand kW due to the expansion of the total capacity of the first stations designed to generate electricity 17:647; 31].
In the study of the general plan for the electrification of Turkestan, it was planned to build dozens of large hydropower facilities for its time, which, according to the authors, would serve the restoration of the country, the growth of its economy and culture. Despite the urgency of the plans, the GOELRO plan, approved by the VIII All-Russian Congress of Soviets, included the construction of a hydroelectric power station in the Tashkent region in the first place. According to the initial version of the GOELRO plan, the total capacity of the hydropower plant in Turkestan was to be 12.5% of the total electricity in the planned country 18:18]. The remaining power plants, which were originally planned to be built by the GOELRO commission, were not included in the government-approved plan. This is explained by the inadequacy of the material and technical base of the country in 1920, the inability to build all the power plants specified in the GOELRO plan.
ISSN (Online): 2455-3662
EPRA International Journal of Multidisciplinary Research (IJMR) - Peer Reviewed Journal Volume: 7| Issue: 9| September 2021|| Journal DOI: 10.36713/epra2013 || SJIF Impact Factor 2021: 8.047 || ISI Value: 1.188
2021 EPRA IJMR | www.eprajournals.com | Journal DOI URL: https://doi.org/10.36713/epra2013 121
The Electrification Commission concluded that the expansion of Turkestan was facilitated by the expansion and facilitation of trade relations with neighboring regions - Siberia, Kuldja, Kashgar, Afghanistan, Iran and the south-east of Russia, as well as the construction of railways connecting them 19:23]. The GOELRO commission came to the following conclusions on the electrification of agriculture in Turkestan: 1. For the restoration and development of the country's productive forces it is necessary, first of all, to carry out a great deal of work on irrigating the lands, while artificial raising of water, i.e. mechanized irrigation, can only be solved on the basis of electrification. 2. Extensive mechanization of agricultural production on the basis of electrification is required. 3. Restoration and further development of cotton growing, which is the basis of the national economy of the country, can only be on the basis of electrification.
It is obvious that the electrification of the Turkestan region is closely connected with irrigation, without which there could be no talk of raising cotton growing. Therefore, the GOELRO plan reflects the emergence of three crucial links of the national economy - electrification, irrigation, cotton growing, which are interrelated and interdependent.
The construction of a system of large power plants across the country envisages the integrated use of its vast natural resources and labor resources. The fuel industry has considerably strengthened its influence in the new districts. Coal production increased slightly in Central Asia and Kazakhstan 20:244].
In 1923, the supply of oil and coal was regulated, and electric power plants were put into operation at the enterprises. As a result, productivity has increased significantly. In the same year, the construction of Fergana and Margilan power plants began, as well as in Bukhara, Kokand, Termez and Karshi 21:34; 94].
At the request of the Turkestan ASSR government, the chairman of the State Planning Committee (Gosplan), G.M. In 1923, Krzyzanovsky set up a special commission of well-known experts to determine the possibility of building a hydroelectric power station in Tashkent, which is part of the GOELRO plan. After a positive solution to this issue, the government of the RSFSR allocated 350 thousand rubles for the construction of the Bozsuv hydroelectric power station 22:250-251].
The GOELRO plan, which envisages a large-scale hydraulic construction program in its time, served as a basis for the comprehensive and planned use of hydropower from rivers. The project for the construction of a hydroelectric power station on the
Bozsuv River, submitted on July 31, 1923 by the power section of the Central Electrotechnical Council (CSC), recognized the expediency of supplying Tashkent with electricity noted the presence of 23:543].
The construction of the Bozsuv HPP has started the development of a school for the training of hydropower and the rich hydropower resources of the republic. The construction of the station has paved the way for large-scale development of rich hydropower in Uzbekistan 24:277]. The newspaper of “Turkestanskaya Pravda” published a report on the construction of a power plant in Bozsuv on May 23, 1923: “The work is going well. The main gateway is
ready to block the riverbed ” 25:24]. The State Planning Committee of the USSR
confirmed the economic and technical importance of the Bozsuv hydroelectric power plant and pointed out the need to increase funding for its construction. On February 20, 1924, the Labor and Defense Council accepted for information the proposal of the Turkestan government to allocate 350,000 rubles for the construction of a power plant, and 600,000 rubles from local funds 26:543].
In 1923–1924, the number of power plants in Turkestan was 31, in the Georgian ASSR 31, in the Ukrainian ASSR 91, and in the RSFSR 851, indicating that the country did not pay much attention to the electricity industry 27:588].
According to the 1924 issue of Turkestanskaya Pravda, the construction of a 2,000-kW station in the Dalvarzin Desert to electrify and irrigate the city of Merv at the expense of 400 kW of power from the Hindu Kush hydroelectric power station will produce nitrogen fertilizer. It was hoped that this would alleviate the difficulties faced by the country's cotton industry 28].
The above data show that electrification measures in the country have been carried out at the expense of increasing the production of agricultural raw materials, and insufficient attention has been paid to industry and the social sphere. The electrification of Turkestan was an integral part of the plan to electrify the entire Union. The idea of electrification is not only to make profound changes in all sectors of the economy - industry, agriculture and transport, but also to cover the entire territory of the country, all republics, regions and districts in a single centralized electrification plan, which in practice makes the country economically dependent, served to strengthen.
BIBLIOGRAPHY 1. Economic regionalization of Russia. Report of the
State Planning Committee of the III Session of the All-Russian Central Executive Committee. - Moscow:
ISSN (Online): 2455-3662
EPRA International Journal of Multidisciplinary Research (IJMR) - Peer Reviewed Journal Volume: 7| Issue: 9| September 2021|| Journal DOI: 10.36713/epra2013 || SJIF Impact Factor 2021: 8.047 || ISI Value: 1.188
2021 EPRA IJMR | www.eprajournals.com | Journal DOI URL: https://doi.org/10.36713/epra2013 122
Edition of the All-Russian Central Executive Committee, 1922.
2. National Archives of Uzbekistan, R-25-fund, 1-register, 106-case.
3. On the Commission for the Electrification of the Turkestan Republic // Izvestia. December 1, 1921 No. 271; Karimov R.Kh. Uzbekistan during the restoration of the national economy of the USSR (1921-1925) - Tashkent: "Uzbekistan", 1974.
4. Matniyazov M. Electrification and its social consequences (Based on the materials of the republics of Central Asia). - Tashkent: "Uzbekistan", 1984.
5. The plan for the electrification of the RSFSR (Report to the VIII Congress of Soviets of the State Commission for the Electrification of Russia). Second edition. - Moscow: State. publishing house of political literature, 1955.
6. Development of the electrification of the Soviet country in 1921-1925. - Moscow: State. publishing house of political literature, 1956.
7. The plan for the electrification of the RSFSR (Report to the VIII Congress of Soviets of the State Commission for the Electrification of Russia). Second edition. - Moscow: State. publishing house of political literature, 1955.
8. Plan for the electrification of the RSFSR (Report to the VIII Congress of Soviets of the State Commission for the Electrification of Russia). Second edition. - Moscow: State. publishing house of political literature, 1955.
9. National Archives of Uzbekistan, R-25-fund, 1-register, 346-case.
10. The plan for the electrification of the RSFSR (Report to the VIII Congress of Soviets of the State Commission for the Electrification of Russia). Second edition. - Moscow: State. publishing house of political literature, 1955. - P. 644.
11. The plan for the electrification of the RSFSR (Report to the VIII Congress of Soviets of the State Commission for the Electrification of Russia). Second edition. - Moscow: State. publishing house of political literature, 1955.
12. Buzinova V.M. Electrification of Chirchik and Golodnostep districts // Proceedings of the State Commission for the Electrification of Russia GOELRO. Materials on the electrification of certain areas. - Moscow: "Science", 1964.
13. Buzinova V.M. Electrification of Chirchik and Golodnostep districts // Proceedings of the State Commission for the Electrification of Russia GOELRO. Materials on the electrification of certain regions. - Moscow: "Science", 1964.
14. Buzinova V.M. Electrification of Chirchik and Golodnostep districts // Proceedings of the State Commission for the Electrification of Russia GOELRO. Materials on the electrification of certain regions. - Moscow: "Science", 1964.
15. Yestifeev A.M. Electrification of the Zeravshan region // Proceedings of the State Commission for the Electrification of Russia GOELRO. Materials on the electrification of certain regions. - Moscow: "Science", 1964. - P. 259.
16. Matniyazov M. Electrification and its social consequences (Based on the materials of the
republics of Central Asia). - Tashkent: "Uzbekistan", 1984. - P. 17.
17. Plan for the electrification of the RSFSR (Report to the VIII Congress of Soviets of the State Commission for the Electrification of Russia). Second edition. - Moscow: State. publishing house of political literature, 1955. - P. 647; Electrification of the Turkestan region. Compiled by the State Electrification Commission of Russia. – Moscow, 1920 .
18. Burdin E.A. Hydropower in the GOELRO plan (1920–1935) // Bulletin of UlSTU. - Ulyanovsk, 2010. - No. 1.
19. Electrification of the Turkestan region. Compiled by the State Electrification Commission of Russia. - Moscow, 1920.
20. Lenin's plan for socialist industrialization and its implementation / Ed. board: P.N. Pospelov (leader) and others - Moscow: Politizdat, 1969 .
21. Ziyadullaev S.K. Industry of Uzbekistan and the main economic problems of its development. - Tashkent: "Fan", 1967; R.Kh. Karimov Uzbekistan in the period of restoration of the national economy of the USSR (1921 - 1925) - Tashkent: "Uzbekistan", 1974.
22. Abdushukurov R.Kh. The October Revolution, the dawn of the Uzbek socialist nation and its rapprochement with the nations of the USSR. - Tashkent: State Publishing House of the UzSSR, 1962.
23. Development of the electrification of the Soviet country in 1921-1925. - Moscow: State. publishing house of political literature, 1956.
24. Desyatchikov B.A. Ozbekistonni elektrlashtirish. - Toshkent: Uzdavnashr, 1949; Yu.V. Steklov IN AND. Lenin and electrification. - Moscow: "Science", 1970.
25. Pulatova M. Industry of the TASSR in the years of transition to the NEP // "Social Sciences in Uzbekistan". - Tashkent, 1968. - No. 4.
26. Development of the electrification of the Soviet country 1921-1925. - Moscow: State. publishing house of political literature, 1956.
27. Industrial Russia 1923–1924 Reference book. Publishing of the newspaper "Economic Life". - Leningrad, 1924.
28. Development of power construction in Turkestan // Turkestanskaya Pravda. July 24, 1924, No. 160 (473).
ISSN (Online): 2455-3662
EPRA International Journal of Multidisciplinary Research (IJMR) - Peer Reviewed Journal Volume: 7| Issue: 9| September 2021|| Journal DOI: 10.36713/epra2013 || SJIF Impact Factor 2021: 8.047 || ISI Value: 1.188
2021 EPRA IJMR | www.eprajournals.com | Journal DOI URL: https://doi.org/10.36713/epra2013 123
A STUDY ON THE PERFORMANCE OF
SELF-COMPACTING CONCRETE WITH FLY ASH AND
ALCCOFINE
Soma Prasanth Reddy1*, C. Sashidhar2, B.V. Kavyateja3 1,2,3Department of Civil Engineering, Jawaharlal Nehru Technological University, Anantapur, India
ABSTRACT The presence of self-compacting concrete (SCC) mix offers many advantages to the structural elements that cast by this type of mix. This paper presents the results on an experimental program carried to explore the possibility of fly ash and alccofine as partial replacement of cement in self-compacting concrete. SCC mixes were designed and cement was replaced with fly ash (i.e. 30%) and alccofine (5, 10 and 15%). Tests were performed to evaluate the compressive strength, split tensile strength and modulus of rupture of SCC. Results indicated that compressive strength, split tensile strength and flexural strength of self-compacting concrete improved with incorporation of 25% of fly ash and 10% of alccofine at all the curing ages. KEYWORDS: Alccofine, Mechanical properties, Self-compacting concrete, Fly ash, Super plasticizers, Alternative materials
1. INTRODUCTION The self-compacting concrete (SCC) is
classified as a new material in which the concrete gets compacted under its self-weight without main contributions from mechanical vibrator. The self-compacting concrete is very useful to fill the spaces in case of for heavy structural elements such as beams, slabs, columns, shear walls and foundations. Many advantages for self-compact concrete make the structural engineering to adapt such as reduction in time of constructions, no noise, improving the capacity of the structural elements by filling the spacing’s and giving excellent structural behaviour.
Super plasticizer can be used in concrete mix to avoid segregations and increase the concrete workability [1,2]
Now-a-days cement is being used on large scale in the production of concrete worldwide. Due to this the global demand of cement has reached about 5 billion metric tons. Due to which the large amount of raw material is consumed for the production of cement, which causing huge amount of CO2 release into the atmosphere [3–7]. About 5% to 7% of manmade CO2 gas emission is released during the production of cement [8,9]. The lot of research is being done to find the supplementary cementitious material in order to safeguard the environment. Efforts are being made for usage of industrial by products as cementitious materials possessing pozzolanic properties [10–12]. The pozzolanic materials such as the Silica Fume (SF), Ground
Granulated Blast Furnace Slag (GGBS), Rice Husk Ash (RHA), Fly Ash (FA) etc, which are byproduct from various industries are being used as replacing material for cement [13–16]. The utilization of pozzolanic materials diminishes the cement consumption and furthermore expands the strength and durability of concrete.
The development of SCC has significantly changed the way of concreting without compaction [17]. The development of SCC has led to better quality concrete and an efficient construction process even in the congested reinforced portion of the building. Fluidity and cohesiveness of the SCC mix can be achieved by using Superplasticizer (SP) and large quantity of fine powder materials [18]. Pozzolans are an optimal alternative powder material for cement as it provides adequate strength, enhanced durability, and reduction in cost, energy consumption and less greenhouse gas emission [19]. Kannan and Ganesan [20] studied the chloride and chemical resistance of SCC containing MK and rice husk. They found that higher silica content presents in MK improves pozzolanic reaction of concrete which improves the strength and durability of concrete. Al-Akhras [21] stated the inclusion of MK in concrete improves the resistance to sulphate attack. Kavitha et al. [22] studied the microstructure of MK blended SCC. They stated that incorporation of MK reduces the permeability and ingress of chloride ions into the concrete due to the refined pore structure concrete.
ISSN (Online): 2455-3662
EPRA International Journal of Multidisciplinary Research (IJMR) - Peer Reviewed Journal Volume: 7| Issue: 9| September 2021|| Journal DOI: 10.36713/epra2013 || SJIF Impact Factor 2021: 8.047 || ISI Value: 1.188
2021 EPRA IJMR | www.eprajournals.com | Journal DOI URL: https://doi.org/10.36713/epra2013 124
Kavitha et al [23] investigated the effect of MK on the fresh, mechanical and durability properties of SCC mixes containing 0,5,10 and 15% of MK. They found that the SCC mix containing 10% MK exhibited good fresh and hardened properties. They also reported that the utilization of MK in concrete reduces energy consumption and carbon di-oxide emission.
SCC is a cement based matrix, under tensile stress or impact loading it may subject to brittle failure. But addition of fibers into the cement based SCC will reduce the brittleness of concrete and increases the tensile properties of SCC. Conventional reinforced concrete structures can significantly deteriorate with time, necessitating regular and often costly maintenance. The addition of small closely spaced and uniformly dispersed discontinuous discrete fibers to concrete would significantly improve its static and dynamic properties. Further to extend the possible fields of applications of SCC, fiber may be added to the concrete. The addition of fibers in concrete will resolve these deficiencies of concrete [24]. Aydin [25] investigated the effect of fiber inclusion on the SCC on the mechanical properties such as compressive, split and flexural strength of fiber reinforced SCC.
Rao et al. [26] studied the effect of Alkali-resistant (AR) glass fiber (0%, 0.03%, 0.06% and 0.1%) reinforcement on durability of concrete. They reported that maximum improvement in durability of concrete was achieved with different percentages of glass fibers at 0.1% for all the grades of concrete.
Mirza and Soroushian [27] studied the effect of AR glass fiber on crack and temperature resistance of light weight concrete; they found that inclusion GF reduces the crack width and negative effect caused due to temperature. They stated that GF improves the serviceability and durability characteristics of concrete.
Barluenga and Hernandez-Olivares [24] developed SCC with inclusion of AR glass fiber. They conducted compression, flexural strength tests, free shrinkage tests with and without air flow over the sample and double restrained slab cracking tests to assess the cracking control ability of AR glass fiber. They described that the inclusion of low amounts of fiber did not modify the flowability and mechanical properties of concrete. They concluded that less amount of glass fiber showed the maximum cracking control ability, but larger amounts did not increase the fiber efficiency.
Earlier practices were to partially replace the ordinary Portland cement with some suitable industrial and agro waste materials such as fly ash, rice husk ash, ground granulated blast furnace slag which are pozzolanic in nature. As their primary role, slags or Pozzolans are added to cement because they
improve properties (durability and mechanical) of concrete as well as concrete structures.
The most significant impacts of pozzolans in the microstructure of concrete or cement paste are changing the interfacial transition zone (ITZ) and reduction of pore structure by pozzolanic reaction [15]. The application of newly developed supplementary cementitious materials or pozzolans has thus become a necessity to improve the strength as well as durability properties of concrete structures, particularly under aggressive environmental conditions.
Alccofine is a new generation, ultra-fine supplementary cementitious material (SCM) having ultrafine particle size with specially controlled granulation which has shown significantly better enhancement in the strength as well as durability properties even better than with other SCM’s like
cement, fly ash, rice husk ash etc., which are generally adopted by construction industry. Alccofine has surprising effects to improve the overall performance of concrete in fresh and hardened states. Alccofine is an ultrafine slag material and glass based SCM obtained from steel or iron industries. Alccofine is one amongst the mineral admixtures of very finely solid glass spheres of non-crystalline polymorph or amorphous of silicon-dioxide. The higher specific surface area of alccofine particles has greater effect on both fresh and hardened state properties of concrete.
Most of the admixtures are pozzolanic in nature, helps in enhancing strength and durability properties of the concrete with age. Therefore, the combination of different admixtures with cement may leads to many benefits such as reduction in usage of cement, recycling the solid waste produced from industries, improvement in physical characteristics along with the enhancement of rheological, mechanical, and durability of concrete and reduced environmental impact through reduction of greenhouse gases.
The aim of present paper is to examine the strength properties of SCC incorporating alccofine and fly ash. Constant fly ash quantity (i.e. 30% by overall mass) with varying dosage of alccofine (5, 10 and 15%) is added to produce SCC. The SCC is adapted to cast beams, cylinders and cubes specimens and then tested for flexural strength, tensile strength, compressive strength respectively.
2. MATERIALS
In this study Ordinary Portland cement (OPC) 53 grade is used as a binder. The coarse aggregate and fine aggregate are used as filler materials along with superplasticizers. OPC is tested as per Indian Specifications IS 12269: 1987 [28]. The fine and coarse aggregates are tested as per Indian Specifications BIS 383–1970 [29]. The coarse

ISSN (Online): 2455-3662
EPRA International Journal of Multidisciplinary Research (IJMR) - Peer Reviewed Journal Volume: 7| Issue: 9| September 2021|| Journal DOI: 10.36713/epra2013 || SJIF Impact Factor 2021: 8.047 || ISI Value: 1.188
2021 EPRA IJMR | www.eprajournals.com | Journal DOI URL: https://doi.org/10.36713/epra2013 125
aggregates of 20 mm downgrade and fine aggregates 4.75 mm downgraded have been used. Fly ash was obtained from thermal power plant having 540–860 kg/m3 and confirming to ASTM C618. Alccofine (AL-1203) was obtained from Ambuja Cement Ltd, Goa having the specific gravity of 2.9 confirming to ASTM C989-1999 [30] was used in entire study. The
physical properties of AL-1203 are given in Tables 1. In the current research, superplasticizer i.e. Conplast SP 430 composed primarily of polycarboxylic ether conforming to ASTM C494-2017 [31] Type F is used. The properties of conplast SP 430 are shown in Table 2.
TABLE 1: physical properties of Al Characteristics Test results Specific gravity 2.9 Specific surface area [m2/kg] 1200 Bulk density [kg/m3] 680 Particle Size in Micron D10 1.5 D50 5 D90 9
Table 2: Properties of SP 430 Characteristics Test results Specific gravity Appearance Brown Liquid Chloride content Nil Air entrainment <2%
3. EXPERIMENTAL PROGRAM
In the present investigation, M25 grade normal concrete mix design was carried out according to BIS: 10262–2009 [32]. Mix proportions: 1:1.66:2.97:0.52. Self-compact ability can be largely affected by the characteristics of materials and mix proportions. In this experimental study, three types of Self-compacting concrete mixture proportions were adopted. The mortar or the paste in the self compacting concrete requires high viscosity and deformability, thereby the water-powder ratio has been adopted as 0.36 (as per EFNARC guide lines) constantly. A total of five concrete mixes were cast and tested to examine the effect of alccofine and fly ash on the SCC and mix proportion of SCC mixtures as shown in Table 3. After mixing the mixes satisfied the requirements of passing ability, filling ability and segregation resistance were poured into appropriate molds without any external vibration or compaction. The concrete specimens were removed from the mold after 24 h and cured in water until the day of testing. To determine compressive, split tensile strength and flexural strength three cubes of size 150 X 150 X 150 mm, cylinders of 300 X 150 mm and prisms of 100 X
100 X 500 mm were cast and tested for each mix. The mechanical properties namely compressive and flexural strength were performed according to IS: 516–1959 [33] and split tensile strengths was conducted according to IS: 5816–1999 [34]. The cube samples of size 150 mm were placed in between the steel plates the without packing. The load applied was increased constantly at 1.4 N/mm2 / minute till the cube failed. From the dial, the maximum load reading is noted. The cylindrical specimens of size 300 mm X 150 mm diameter were placed horizontally between the loading surface of compression testing machine and the load was applied at a nominal rate of 1.2 N/ mm2 / minute without any shock until the failure of the sample occurs. The beam samples of size 500 mm X 100 mm X 100mmwere placed in the flexural testing machine and two point loading was applied at a nominal rate of 0.7 N/mm2 /minute without any shock or vibration. The load was increased until the specimen failed and the failure load was recorded. The appearance of the fractured faces of concrete and any unusual features in the type of failure were noted.
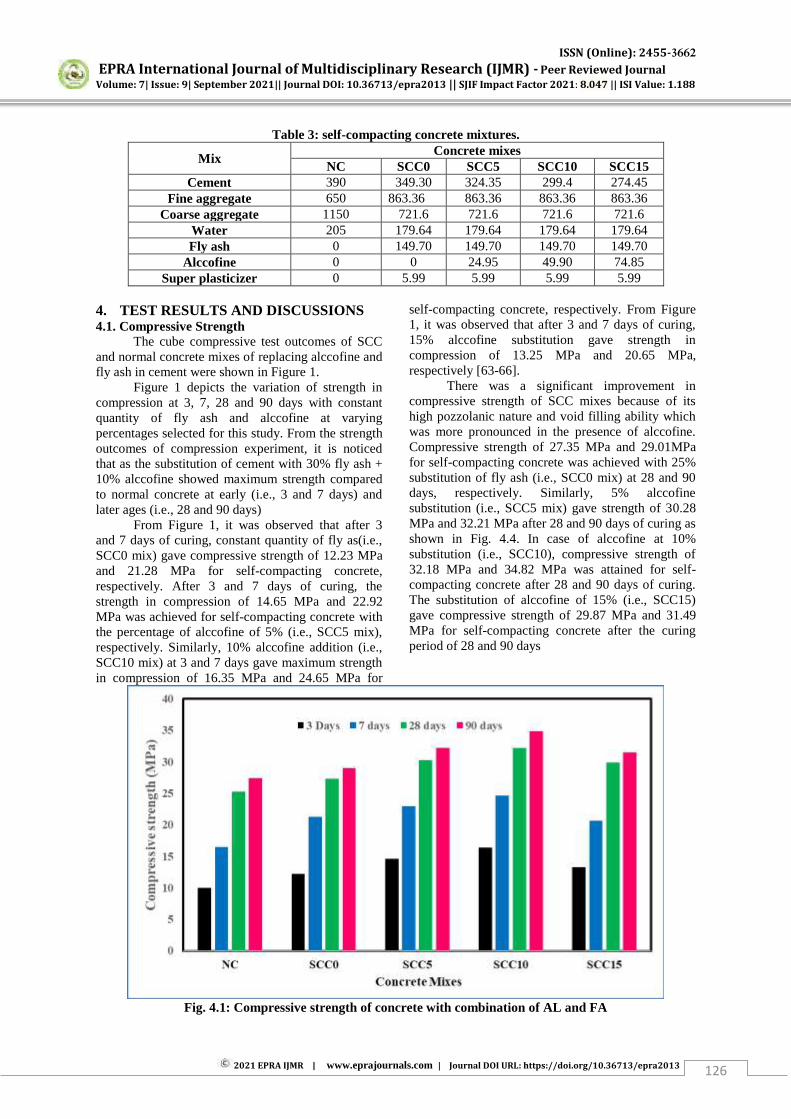
ISSN (Online): 2455-3662
EPRA International Journal of Multidisciplinary Research (IJMR) - Peer Reviewed Journal Volume: 7| Issue: 9| September 2021|| Journal DOI: 10.36713/epra2013 || SJIF Impact Factor 2021: 8.047 || ISI Value: 1.188
2021 EPRA IJMR | www.eprajournals.com | Journal DOI URL: https://doi.org/10.36713/epra2013 126
Table 3: self-compacting concrete mixtures.
Mix Concrete mixes
NC SCC0 SCC5 SCC10 SCC15 Cement 390 349.30 324.35 299.4 274.45
Fine aggregate 650 863.36 863.36 863.36 863.36 Coarse aggregate 1150 721.6 721.6 721.6 721.6
Water 205 179.64 179.64 179.64 179.64 Fly ash 0 149.70 149.70 149.70 149.70
Alccofine 0 0 24.95 49.90 74.85 Super plasticizer 0 5.99 5.99 5.99 5.99
4. TEST RESULTS AND DISCUSSIONS 4.1. Compressive Strength
The cube compressive test outcomes of SCC and normal concrete mixes of replacing alccofine and fly ash in cement were shown in Figure 1.
Figure 1 depicts the variation of strength in compression at 3, 7, 28 and 90 days with constant quantity of fly ash and alccofine at varying percentages selected for this study. From the strength outcomes of compression experiment, it is noticed that as the substitution of cement with 30% fly ash + 10% alccofine showed maximum strength compared to normal concrete at early (i.e., 3 and 7 days) and later ages (i.e., 28 and 90 days)
From Figure 1, it was observed that after 3 and 7 days of curing, constant quantity of fly as(i.e., SCC0 mix) gave compressive strength of 12.23 MPa and 21.28 MPa for self-compacting concrete, respectively. After 3 and 7 days of curing, the strength in compression of 14.65 MPa and 22.92 MPa was achieved for self-compacting concrete with the percentage of alccofine of 5% (i.e., SCC5 mix), respectively. Similarly, 10% alccofine addition (i.e., SCC10 mix) at 3 and 7 days gave maximum strength in compression of 16.35 MPa and 24.65 MPa for
self-compacting concrete, respectively. From Figure 1, it was observed that after 3 and 7 days of curing, 15% alccofine substitution gave strength in compression of 13.25 MPa and 20.65 MPa, respectively [63-66].
There was a significant improvement in compressive strength of SCC mixes because of its high pozzolanic nature and void filling ability which was more pronounced in the presence of alccofine. Compressive strength of 27.35 MPa and 29.01MPa for self-compacting concrete was achieved with 25% substitution of fly ash (i.e., SCC0 mix) at 28 and 90 days, respectively. Similarly, 5% alccofine substitution (i.e., SCC5 mix) gave strength of 30.28 MPa and 32.21 MPa after 28 and 90 days of curing as shown in Fig. 4.4. In case of alccofine at 10% substitution (i.e., SCC10), compressive strength of 32.18 MPa and 34.82 MPa was attained for self-compacting concrete after 28 and 90 days of curing. The substitution of alccofine of 15% (i.e., SCC15) gave compressive strength of 29.87 MPa and 31.49 MPa for self-compacting concrete after the curing period of 28 and 90 days
Fig. 4.1: Compressive strength of concrete with combination of AL and FA
ISSN (Online): 2455-3662
EPRA International Journal of Multidisciplinary Research (IJMR) - Peer Reviewed Journal Volume: 7| Issue: 9| September 2021|| Journal DOI: 10.36713/epra2013 || SJIF Impact Factor 2021: 8.047 || ISI Value: 1.188
2021 EPRA IJMR | www.eprajournals.com | Journal DOI URL: https://doi.org/10.36713/epra2013 127
The improvement in early age compressive
strength of self-compacting concrete mix might be due to the accelerated hydration reaction on addition of Alccofine [15]. Similar types of results were observed at the age of 28 and 90 days. For 28 days curing period the mixes with Fly Ash and Alccofine i.e., SCC0, SCC1, SCC2 and SCC3 showed an improvement in compressive strength by 7.12%, 12.11%, 17.49% and 12.96% respectively with respect to the normal concrete mix. The later age strength (90 days) showed a negligible change with respect to 28 days strength is may be due to the acceleration of heat of hydration by FA and ALC in concrete lead to dense micro structure, from the results it has been observed that maximum percentage of the hydration is completed at 28 days, the rest negligible percentage of hydration will be very very slow and keep going with the time so it had showed the negligible change of strength for 90 days curing period. From the above results, it was observed that the percentage strength gain is higher for 7 days of curing when compared with other ages of curing. Therefore it can be concluded that the rapid development of the compressive strength of self compacting concrete at early age shows that the Alccofine and fly ash not only serves as a filler to increase the density of the micro and nanostructure of concrete but also serves as an activator in the hydration process. The decrease in strength on addition of alccofine beyond 10% is attributed to the reason that alccofine is much finer than cement; it increases the water demand for workable mix that leads to decrease in pore bonding strength [36]. Thus, at this stage the combination of Fly Ash and Alccofine acts as cement replacement materials used for filling the pores but does not involve in the hydration process [15,35]. The inclusion of Fly Ash and Alccofine enhanced the compressive strength for all the employed cases, in comparison with the normal concrete mix. Fig. 6 shows the failing mode of cube samples.
4.2. Splitting Tensile Strength.
The cylindrical tensile strength test outcomes of SCC and normal concrete mixes of replacing alccofine and fly ash in cement were shown in Figure 2. The tensile strength values for normal concrete mix after 7, 28 and 90 days were 1.51 MPa, 1.75 MPa and 1.82 MPa, respectively. SCC0 mix (i.e., 30%FA+0%AL) gave a tensile strength of 1.6 MPa, 1.87 MPa and 1.91 MPa after 7, 28 and 90 days of curing, respectively. After 7, 28 and 90 days of curing, the strength in tension of 1.68 MPa, 1.94 MPa and 1.99 MPa was achieved for self-compacting concrete with the percentage of alccofine of 5% (i.e., SCC5 mix), respectively. Similarly, 10% alccofine addition (i.e., SCC10 mix) at 7, 28 and 90 days gave maximum strength in tension of 1.74 MPa, 1.98 MPa and 2.15 MPa for self-compacting concrete, respectively. The substitution of alccofine of 15% (i.e., SCC15) gave tensile strength of 1.64 MPa, 1.93 MPa and 1.97 MPa for self-compacting concrete after the curing period of 7, 28 and 90 days [73-77].
The tensile strength results were enhanced with addition of alccofine and fly ash. The silicon and aluminium oxide present in fly ash assist for improving tensile strength in concrete at early and later strengths. Calcium and silicate of alccofine in the SCC mixes tries to react and forms CSH gel relating more early and later strength. This rise in tensile strength may be attributed to the better properties of the concrete matrix and the strong inter-phase bond between the binders (i.e., between alccofine, fly ash and cement) and the aggregates used. The Interfacial Transition Zone (ITZ) plays a significant role in the development of split tensile strength. By utilizing micro particles like Alccofine and fly ash, the ITZ becomes denser resulting in improvement of split tensile strength. The optimum tensile strength found to be is 1.74 MPa, 1.98 MPa and 2.15 MPa for SCC10 mix at 7, 28 and 90 days, respectively [78-82].

ISSN (Online): 2455-3662
EPRA International Journal of Multidisciplinary Research (IJMR) - Peer Reviewed Journal Volume: 7| Issue: 9| September 2021|| Journal DOI: 10.36713/epra2013 || SJIF Impact Factor 2021: 8.047 || ISI Value: 1.188
2021 EPRA IJMR | www.eprajournals.com | Journal DOI URL: https://doi.org/10.36713/epra2013 128
Fig. 4.2: Split tensile strength of concrete with combination of AL and FA
From the results it has been observed that
maximum percentage of the hydration is completed at 28 days, the rest negligible percentage of hydration will be very slow and keep going with the time so it had showed the negligible change of strength for 90 days curing period. This increase in tensile strength may be attributed to the improved properties of the concrete matrix and the strong inter-phase bond between the binders (i.e., between cement, Fly ash and Alccofine) and the aggregates used [35]. The Interfacial Transition Zone (ITZ) plays a key role in the development of split tensile strength. By utilizing micro particles like Alccofine and fly ash, the ITZ becomes denser resulting in improvement of split tensile strength [37,38]. It was also noticed that the Split tensile strength of self compacting concrete samples was enhanced when cement content was replaced up to 10% AL and declined slightly on increasing the alccofine content. The decrease in tensile strength with greater than 10% AL replacement is attributed to the reason that the quantity of alccofine particles is higher than the of liberated lime quantity in the hydration process resulting in alccofine is much finer than cement, it increases the water demand for workable mix that leads to decrease in strength [15,35]. 4.3. Modulus of rupture
The modulus of rupture was conducted for all concrete mixes; the test was done after 7, 28 and 90 days of curing. Figure 3 shows the strength values
attained for all SCC mixes at all curing ages. The tests were conducted as per IS 516-1959.
The modulus of rupture for normal concrete mix at 7, 28 and 90 days of curing were 2.15 MPa, 3.52 MPa and 3.65 MPa, respectively. From Figure 3, it was observed that after 7, 28 and 90 days of curing, SCC0 (i.e., 30%FA+0%AL) gave a modulus of rupture values of 2.6 MPa, 3.94 MPa and 4.5 MPa, respectively. After 7, 28 and 90 days of curing, the modulus of rupture of 3.2 MPa, 4.8 MPa and 4.93 MPa was achieved in self-compacting concrete with SCC5 mix (i.e.,25%FA+5% AL), respectively. Similarly, 10% alccofine substitution (i.e., SCC10 mix) gave maximum modulus of rupture of 3.3 MPa, 5.12 MPa and 5.25 MPa in self-compacting concrete. On the other hand, 15% alccofine substitution (i.e., SCC15 mix) gave a modulus of rupture of 3.05 MPa, 4.42 MPa and 4.68 MPa in self-compacting concrete after 7, 28 and 90 days, respectively [36-38].
The presence of alccofine and fly ash has improved the modulus of rupture results. The reason for strength enhancement is due to the pozzolonic reactivity which is relatable to higher silicon amount in fly ash as it improves CSH gel in concrete and also helps in enhancing the modulus of rupture. Silicates and calcium contents of alccofine in the concrete samples reacts and form CSH gel which gives rise to increment in modulus of rupture. The optimum flexural strength found to be are 3.3 MPa, 5.12 MPa and 5.25 MPa for SCC10 mix at 7, 28 and 90 days, respectively
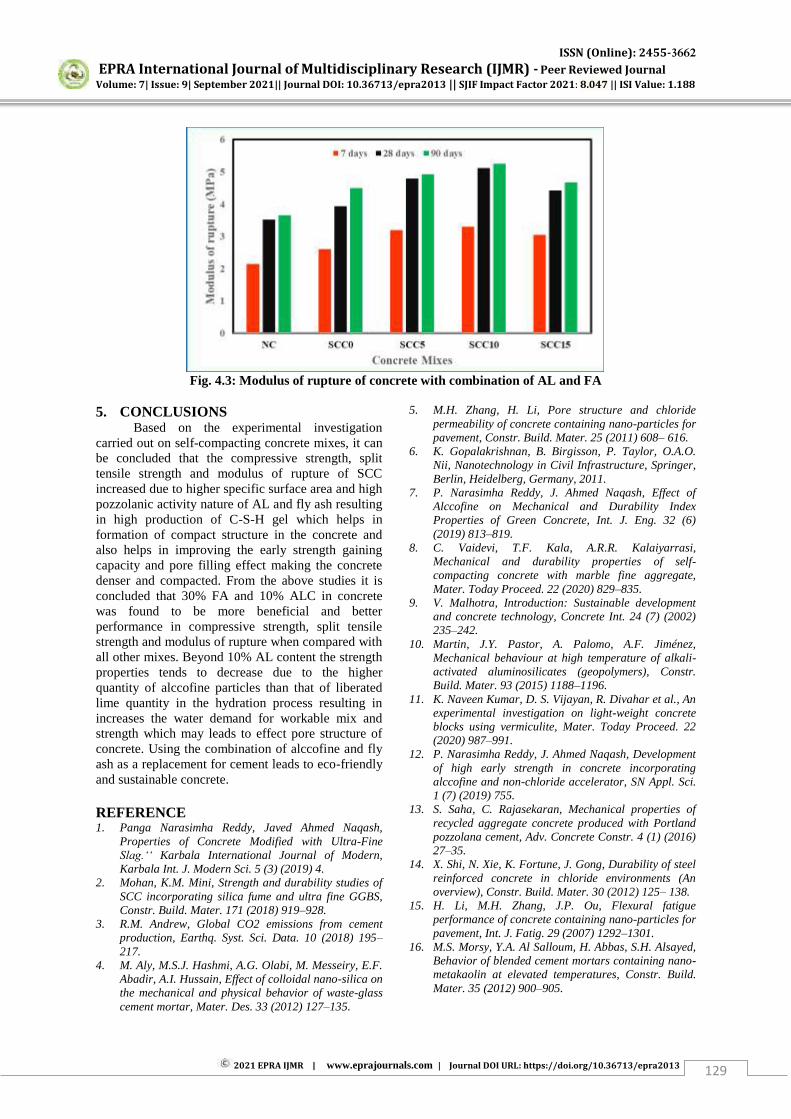
ISSN (Online): 2455-3662
EPRA International Journal of Multidisciplinary Research (IJMR) - Peer Reviewed Journal Volume: 7| Issue: 9| September 2021|| Journal DOI: 10.36713/epra2013 || SJIF Impact Factor 2021: 8.047 || ISI Value: 1.188
2021 EPRA IJMR | www.eprajournals.com | Journal DOI URL: https://doi.org/10.36713/epra2013 129
Fig. 4.3: Modulus of rupture of concrete with combination of AL and FA
5. CONCLUSIONS
Based on the experimental investigation carried out on self-compacting concrete mixes, it can be concluded that the compressive strength, split tensile strength and modulus of rupture of SCC increased due to higher specific surface area and high pozzolanic activity nature of AL and fly ash resulting in high production of C-S-H gel which helps in formation of compact structure in the concrete and also helps in improving the early strength gaining capacity and pore filling effect making the concrete denser and compacted. From the above studies it is concluded that 30% FA and 10% ALC in concrete was found to be more beneficial and better performance in compressive strength, split tensile strength and modulus of rupture when compared with all other mixes. Beyond 10% AL content the strength properties tends to decrease due to the higher quantity of alccofine particles than that of liberated lime quantity in the hydration process resulting in increases the water demand for workable mix and strength which may leads to effect pore structure of concrete. Using the combination of alccofine and fly ash as a replacement for cement leads to eco-friendly and sustainable concrete. REFERENCE 1. Panga Narasimha Reddy, Javed Ahmed Naqash,
Properties of Concrete Modified with Ultra-Fine Slag.‘‘ Karbala International Journal of Modern, Karbala Int. J. Modern Sci. 5 (3) (2019) 4.
2. Mohan, K.M. Mini, Strength and durability studies of SCC incorporating silica fume and ultra fine GGBS, Constr. Build. Mater. 171 (2018) 919–928.
3. R.M. Andrew, Global CO2 emissions from cement production, Earthq. Syst. Sci. Data. 10 (2018) 195–
217. 4. M. Aly, M.S.J. Hashmi, A.G. Olabi, M. Messeiry, E.F.
Abadir, A.I. Hussain, Effect of colloidal nano-silica on the mechanical and physical behavior of waste-glass cement mortar, Mater. Des. 33 (2012) 127–135.
5. M.H. Zhang, H. Li, Pore structure and chloride permeability of concrete containing nano-particles for pavement, Constr. Build. Mater. 25 (2011) 608– 616.
6. K. Gopalakrishnan, B. Birgisson, P. Taylor, O.A.O. Nii, Nanotechnology in Civil Infrastructure, Springer, Berlin, Heidelberg, Germany, 2011.
7. P. Narasimha Reddy, J. Ahmed Naqash, Effect of Alccofine on Mechanical and Durability Index Properties of Green Concrete, Int. J. Eng. 32 (6) (2019) 813–819.
8. C. Vaidevi, T.F. Kala, A.R.R. Kalaiyarrasi, Mechanical and durability properties of self-compacting concrete with marble fine aggregate, Mater. Today Proceed. 22 (2020) 829–835.
9. V. Malhotra, Introduction: Sustainable development and concrete technology, Concrete Int. 24 (7) (2002) 235–242.
10. Martin, J.Y. Pastor, A. Palomo, A.F. Jiménez, Mechanical behaviour at high temperature of alkali-activated aluminosilicates (geopolymers), Constr. Build. Mater. 93 (2015) 1188–1196.
11. K. Naveen Kumar, D. S. Vijayan, R. Divahar et al., An experimental investigation on light-weight concrete blocks using vermiculite, Mater. Today Proceed. 22 (2020) 987–991.
12. P. Narasimha Reddy, J. Ahmed Naqash, Development of high early strength in concrete incorporating alccofine and non-chloride accelerator, SN Appl. Sci. 1 (7) (2019) 755.
13. S. Saha, C. Rajasekaran, Mechanical properties of recycled aggregate concrete produced with Portland pozzolana cement, Adv. Concrete Constr. 4 (1) (2016) 27–35.
14. X. Shi, N. Xie, K. Fortune, J. Gong, Durability of steel reinforced concrete in chloride environments (An overview), Constr. Build. Mater. 30 (2012) 125– 138.
15. H. Li, M.H. Zhang, J.P. Ou, Flexural fatigue performance of concrete containing nano-particles for pavement, Int. J. Fatig. 29 (2007) 1292–1301.
16. M.S. Morsy, Y.A. Al Salloum, H. Abbas, S.H. Alsayed, Behavior of blended cement mortars containing nano-metakaolin at elevated temperatures, Constr. Build. Mater. 35 (2012) 900–905.
ISSN (Online): 2455-3662
EPRA International Journal of Multidisciplinary Research (IJMR) - Peer Reviewed Journal Volume: 7| Issue: 9| September 2021|| Journal DOI: 10.36713/epra2013 || SJIF Impact Factor 2021: 8.047 || ISI Value: 1.188
2021 EPRA IJMR | www.eprajournals.com | Journal DOI URL: https://doi.org/10.36713/epra2013 130
17. M.H. Beigi, J. Berenjian, O.L. Omran, A.S. Nik, I.M. Nikbin, An experimental survey on combined effects of fibers and nanosilica on the mechanical, rheological, and durability properties of self-compacting concrete, Mater. Des. 50 (2013) 1019–1029.
18. R. Madandoust, S.Y. Mousavi, Fresh and hardened properties of self-compacting concrete containing metakaolin, Constr. Build. Mater. 35 (2012) 752–760.
19. C. Franck, M. Michel, E. Gilles, B. Philippe, B. Alexandre, Metakaolin, a solution for the precast industry to limit the clinker content in concrete: mechanical aspects, Constr. Build. Mater. 24 (2010) 1109–1118.
20. V. Kannan, K. Ganesan, Chloride and chemical resistance of self-compacting concrete containing rice husk ash and metakaolin, Constr. Build. Mater. 51 (2014) 225–234.
21. N.M. Al-Akhras, Durability of metakaolin to sulfate attack, Cem. Concr. Res. 36 (2006) 1727–1734.
22. O.R. Kavitha, V.M. Shanthi, G. Prince Arulraj, V.R. Sivakumar, Microstructural studies on eco-friendly and durable self-compacting concrete blended with Metakaolin, Appl. Clay Sci. 124 (2016) 143–149.
23. O.R. Kavitha, V.M. Shanthi, G. Prince Arulraj, P. Sivakumar, Fresh micro-and macrolevel studies of metakaolin blended self-compacting concrete, Appl. Clay Sci. 114 (2015) 370–374.
24. G. Barluenga, F. Hernandez-Olivares, Cracking control of concretes modified with short AR-glass fibers at early age. Experimental results on standard concrete and SCC, Cem. Concr. Res. 37 (2007) 1624–
1638. 25. A.C. Aydin, Self compactability of high volume hybrid
fiber reinforced concrete, Constr. Build. Mater. 21 (2007) 1149–1154.
26. P.S. Rao, K.C. Mouli, T.S. Sekhar, Durability studies on glass fibre reinforced concrete, J. Civ. Eng. Sci. 1 (2012) 37–42.
27. F.A. Mirza, P. Soroushian, Effects of alkali-resistant glass fiber reinforcement on crack and temperature resistance of lightweight concrete, Cem. Concr. Compos. 24 (2002) 223–227.
28. BIS 12269 (2013), Ordinary Portland Cement 53 Grade-Specification, New Delhi, India
29. BIS 383 (2016), Specification for Coarse and Fine Aggregates from Natural Sources for Concrete, New Delhi, India.
30. ASTM C989 (1999), Standard Specification for Ground Granulated Blastfurnace Slag for Use in Concrete and Mortars,West Conshohocken, USA.
31. ASTM, C494. ‘‘Standard specification for chemical
admixtures for concrete.”, Philadelphia: American
Society for Testing and Materials (2004). 32. BIS, Indian Standard. ‘‘10262 Concrete Mix
Proportioning—Guideline.” Bureau of Indian
Standards, New Delhi, India (2009). 33. BIS 516, Methods of Tests for Strength of Concrete,
New Delhi, India, 1959 34. BIS 5816, Split Tensile Strength of Concrete – Method
of Test, New Delhi, India. 35. S. Chithra, S.R.R. Senthil Kumar, K. Chinnaraju, The
effect of Colloidal Nanosilica on workability, mechanical and durability properties of High-Performance Concrete with Copper slag as partial
fine aggregate, Constr. Build. Mater. 113 (2016) 794–
804. 36. D. S. Vijayan, Dineshkumar, S. Arvindan et al.,
Evaluation of ferrock: A greener substitute to cement, Mater. Today Proceed. 22 (2020) 781–787.
37. F. Sanchez, K. Sobolev, Nanotechnology in concrete - a review, Constr. Build. Mater. 24 (2010) 2060–2071.
38. Aly M. Said, Mohamed S. Zeidan, M.T. Bassuoni, Ying Tian, Properties of concrete incorporating nano-silica, Constr. Build. Mater. 36 (2012) 838–844.
ISSN (Online): 2455-3662
EPRA International Journal of Multidisciplinary Research (IJMR) - Peer Reviewed Journal Volume: 7| Issue: 9| September 2021|| Journal DOI: 10.36713/epra2013 || SJIF Impact Factor 2021: 8.047 || ISI Value: 1.188
2021 EPRA IJMR | www.eprajournals.com | Journal DOI URL: https://doi.org/10.36713/epra2013 131
ASSESSING OF MALNUTRITION IN PATIENTS WITH
CANCER BY USING PATIENT-GENERATED SUBJECTIVE GLOBAL ASSESSMENT SHORT FORM
(PG-SGA-SF)
Maha Almatary1, Fatma Ghait2, Hajer Mohammed3, Ali Ateia Elmabsout4 1,2,3,4Department of Nutrition, Faculty of Public Health, University of Benghazi, Benghazi, Libya.
*Address for correspondence: Dr. Ali Ateia Elmabsout, Department of Nutrition, Faculty of Public Health, University of Benghazi, Benghazi, Libya.
Article DOI: https://doi.org/10.36713/epra8405 DOI No: 10.36713/epra8405
ABSTRACT Introduction: Cancer-related malnutrition has negative consequences are taken too lightly in most oncology wards. The objective of this study is to determine the malnutrition risk (MR)/malnutrition (MN) in cancer patients using PG-SGA short form. Methods: This cross sectional study was conducted with cancer patients in oncology unit at Benghazi medical center on 229 patients in which 107 male and 122 female. The data collected through PG-SGA short form and analyzed by either frequencies or by suing Chi-square for significant differences. Results and discussion: The study enrolled 229 oncology patients. The mean age was 58.34 ± 11.60 years. One hundred and twenty tow (53.7.3%) of the patients were female. The most common three tumor types were breast tumors (27.9%) followed by colorectal cancer (14%) whereas, almost similar report for lung, liver and upper GIT (10.9%). (11.4%) and (11.8%) respectively . The mean BMI of the patients was 26.17 ± 0.3 kg/m2. According to PG-SGA short form of the patients were in moderate risk of nutritional status and overall score of PG-SGA short form was 18. 34± 0.56. Furthermore the prevalence of cancer in this study was significant high in male (P< 0.05) Conclusion: In cancer patients, the risk of malnutrition is significantly high, and this may alter the patient’s life quality and
expectancy. Therefore, the nutritional status of the patient that is diagnosed with cancer should be assessed in early stages of the disease.
KEYWORDS: malnutrition, cancer, PG-SGA Nutrition Assessments
INTRODUCTION Cancer-related malnutrition has negative impact and undertaking in most oncology wards [1]. There are many studies reported that malnutrition prevalence ranging from 25% to over 70% based on nutritional assessments. Certainly, people suffering from cancer are among the most malnourished of all patient groups [2-7]. Unfortunately, the health team particularly clinicians often miss malnutrition risk in cancer patients [8]. In addition, when malnutrition risk is recognized, it may not be adequately addressed. There is evidence from European hospitals showed that only one third of cancer patients at risk of malnutrition in fact received nutritional support [9-11]. The consequences of malnutrition will become serious if goes untreated, consequences can be serious [11].
Malnutrition led to increase the financial costs for managing cancer patients, which involvement the costs for longer hospital stays and higher rates of complications following cancer-related therapy [12]. Recent growing evidence shown that the most severe, patients who were malnourished had a 2- to 5-fold higher risk of dying compared to patients with little or no malnutrition [13]. Indeed, due to generally lack or low awareness of cancer-associated malnutrition, the strategies were overlooked by many oncologist for taking early actions to prevent and treat anorexia, cachexia, and sarcopenia [14]. Furthermore, malnutrition in patients with cancer are a result from insufficient nutritional intake that lead to a depletion of body stores of fat and lean mass, and
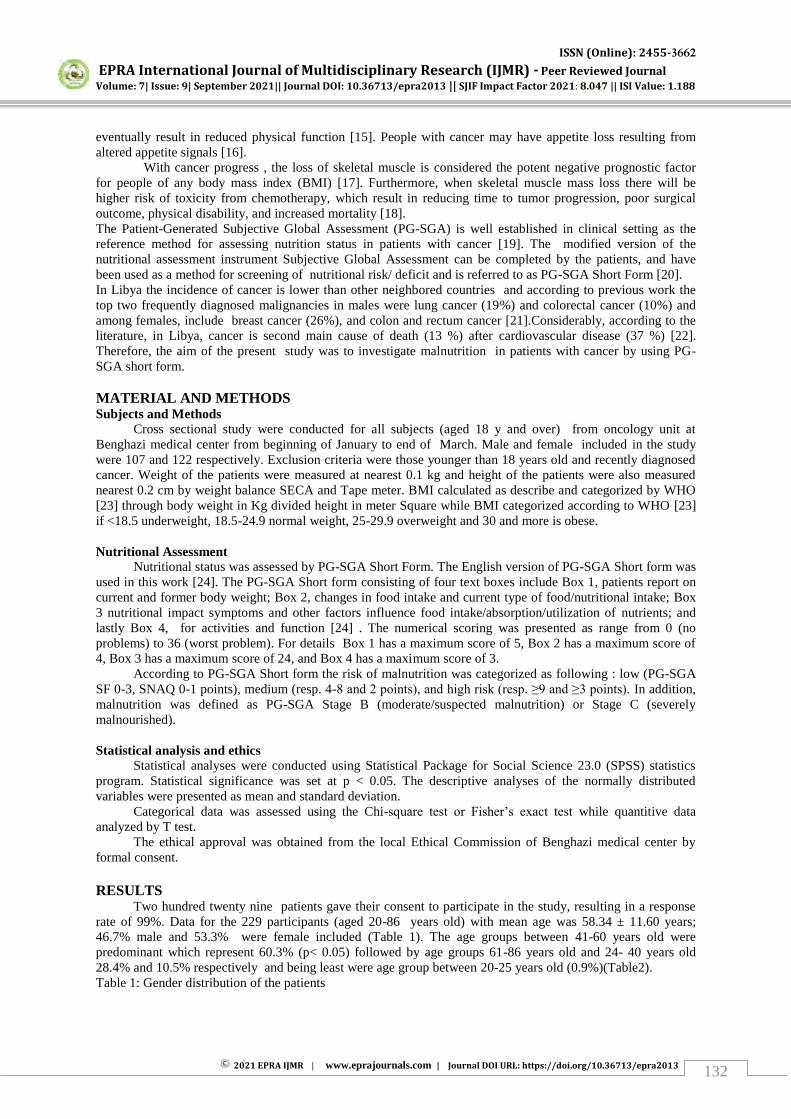
ISSN (Online): 2455-3662
EPRA International Journal of Multidisciplinary Research (IJMR) - Peer Reviewed Journal Volume: 7| Issue: 9| September 2021|| Journal DOI: 10.36713/epra2013 || SJIF Impact Factor 2021: 8.047 || ISI Value: 1.188
2021 EPRA IJMR | www.eprajournals.com | Journal DOI URL: https://doi.org/10.36713/epra2013 132
eventually result in reduced physical function [15]. People with cancer may have appetite loss resulting from altered appetite signals [16].
With cancer progress , the loss of skeletal muscle is considered the potent negative prognostic factor for people of any body mass index (BMI) [17]. Furthermore, when skeletal muscle mass loss there will be higher risk of toxicity from chemotherapy, which result in reducing time to tumor progression, poor surgical outcome, physical disability, and increased mortality [18]. The Patient-Generated Subjective Global Assessment (PG-SGA) is well established in clinical setting as the reference method for assessing nutrition status in patients with cancer [19]. The modified version of the nutritional assessment instrument Subjective Global Assessment can be completed by the patients, and have been used as a method for screening of nutritional risk/ deficit and is referred to as PG-SGA Short Form [20]. In Libya the incidence of cancer is lower than other neighbored countries and according to previous work the top two frequently diagnosed malignancies in males were lung cancer (19%) and colorectal cancer (10%) and among females, include breast cancer (26%), and colon and rectum cancer [21].Considerably, according to the literature, in Libya, cancer is second main cause of death (13 %) after cardiovascular disease (37 %) [22]. Therefore, the aim of the present study was to investigate malnutrition in patients with cancer by using PG-SGA short form. MATERIAL AND METHODS Subjects and Methods
Cross sectional study were conducted for all subjects (aged 18 y and over) from oncology unit at Benghazi medical center from beginning of January to end of March. Male and female included in the study were 107 and 122 respectively. Exclusion criteria were those younger than 18 years old and recently diagnosed cancer. Weight of the patients were measured at nearest 0.1 kg and height of the patients were also measured nearest 0.2 cm by weight balance SECA and Tape meter. BMI calculated as describe and categorized by WHO [23] through body weight in Kg divided height in meter Square while BMI categorized according to WHO [23] if <18.5 underweight, 18.5-24.9 normal weight, 25-29.9 overweight and 30 and more is obese. Nutritional Assessment
Nutritional status was assessed by PG-SGA Short Form. The English version of PG-SGA Short form was used in this work [24]. The PG-SGA Short form consisting of four text boxes include Box 1, patients report on current and former body weight; Box 2, changes in food intake and current type of food/nutritional intake; Box 3 nutritional impact symptoms and other factors influence food intake/absorption/utilization of nutrients; and lastly Box 4, for activities and function [24] . The numerical scoring was presented as range from 0 (no problems) to 36 (worst problem). For details Box 1 has a maximum score of 5, Box 2 has a maximum score of 4, Box 3 has a maximum score of 24, and Box 4 has a maximum score of 3.
According to PG-SGA Short form the risk of malnutrition was categorized as following : low (PG-SGA SF 0-3, SNAQ 0-1 points), medium (resp. 4-8 and 2 points), and high risk (resp. ≥9 and ≥3 points). In addition, malnutrition was defined as PG-SGA Stage B (moderate/suspected malnutrition) or Stage C (severely malnourished). Statistical analysis and ethics
Statistical analyses were conducted using Statistical Package for Social Science 23.0 (SPSS) statistics program. Statistical significance was set at p < 0.05. The descriptive analyses of the normally distributed variables were presented as mean and standard deviation.
Categorical data was assessed using the Chi-square test or Fisher’s exact test while quantitive data analyzed by T test.
The ethical approval was obtained from the local Ethical Commission of Benghazi medical center by formal consent. RESULTS
Two hundred twenty nine patients gave their consent to participate in the study, resulting in a response rate of 99%. Data for the 229 participants (aged 20-86 years old) with mean age was 58.34 ± 11.60 years; 46.7% male and 53.3% were female included (Table 1). The age groups between 41-60 years old were predominant which represent 60.3% (p< 0.05) followed by age groups 61-86 years old and 24- 40 years old 28.4% and 10.5% respectively and being least were age group between 20-25 years old (0.9%)(Table2). Table 1: Gender distribution of the patients
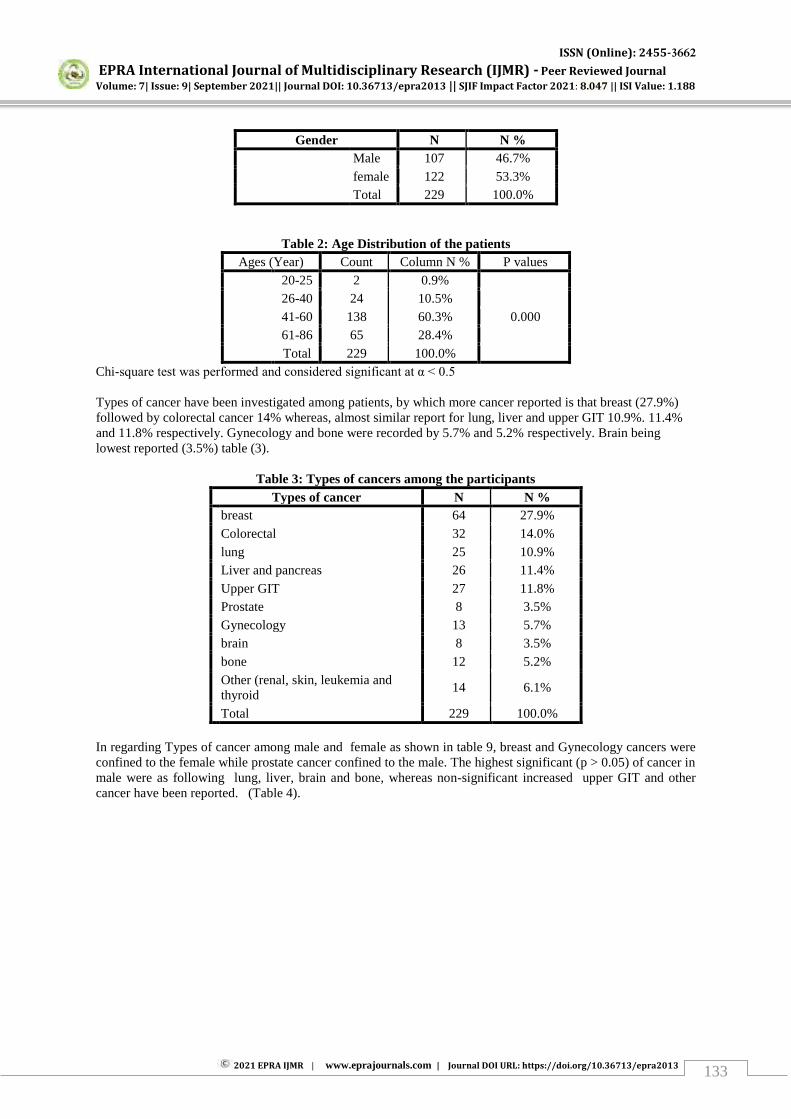
ISSN (Online): 2455-3662
EPRA International Journal of Multidisciplinary Research (IJMR) - Peer Reviewed Journal Volume: 7| Issue: 9| September 2021|| Journal DOI: 10.36713/epra2013 || SJIF Impact Factor 2021: 8.047 || ISI Value: 1.188
2021 EPRA IJMR | www.eprajournals.com | Journal DOI URL: https://doi.org/10.36713/epra2013 133
Gender N N % Male 107 46.7%
female 122 53.3% Total 229 100.0%
Table 2: Age Distribution of the patients Ages (Year) Count Column N % P values
20-25 2 0.9% 26-40 24 10.5% 41-60 138 60.3% 0.000 61-86 65 28.4% Total 229 100.0%
Chi-square test was performed and considered significant at α < 0.5 Types of cancer have been investigated among patients, by which more cancer reported is that breast (27.9%) followed by colorectal cancer 14% whereas, almost similar report for lung, liver and upper GIT 10.9%. 11.4% and 11.8% respectively. Gynecology and bone were recorded by 5.7% and 5.2% respectively. Brain being lowest reported (3.5%) table (3).
Table 3: Types of cancers among the participants Types of cancer N N %
breast 64 27.9% Colorectal 32 14.0% lung 25 10.9% Liver and pancreas 26 11.4% Upper GIT 27 11.8% Prostate 8 3.5% Gynecology 13 5.7% brain 8 3.5% bone 12 5.2% Other (renal, skin, leukemia and thyroid
14 6.1%
Total 229 100.0% In regarding Types of cancer among male and female as shown in table 9, breast and Gynecology cancers were confined to the female while prostate cancer confined to the male. The highest significant (p > 0.05) of cancer in male were as following lung, liver, brain and bone, whereas non-significant increased upper GIT and other cancer have been reported. (Table 4).
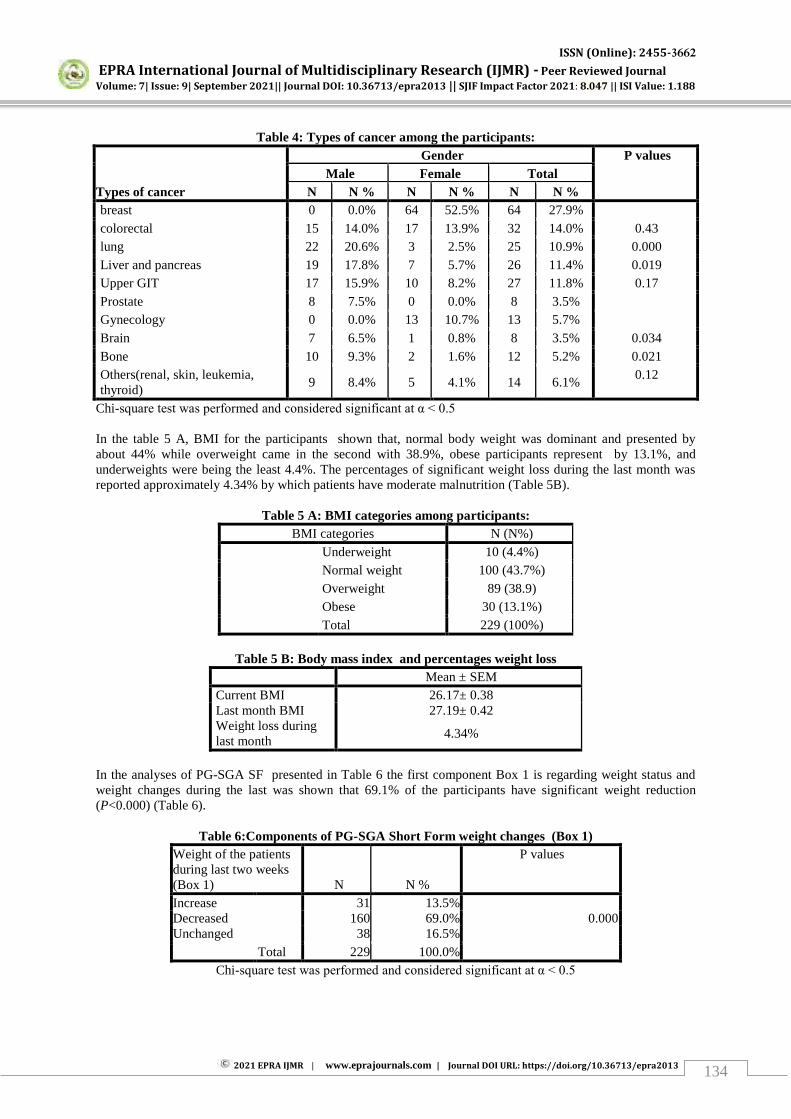
ISSN (Online): 2455-3662
EPRA International Journal of Multidisciplinary Research (IJMR) - Peer Reviewed Journal Volume: 7| Issue: 9| September 2021|| Journal DOI: 10.36713/epra2013 || SJIF Impact Factor 2021: 8.047 || ISI Value: 1.188
2021 EPRA IJMR | www.eprajournals.com | Journal DOI URL: https://doi.org/10.36713/epra2013 134
Table 4: Types of cancer among the participants:
Types of cancer
Gender P values Male Female Total
N N % N N % N N % breast 0 0.0% 64 52.5% 64 27.9% colorectal 15 14.0% 17 13.9% 32 14.0% 0.43 lung 22 20.6% 3 2.5% 25 10.9% 0.000 Liver and pancreas 19 17.8% 7 5.7% 26 11.4% 0.019 Upper GIT 17 15.9% 10 8.2% 27 11.8% 0.17 Prostate 8 7.5% 0 0.0% 8 3.5% Gynecology 0 0.0% 13 10.7% 13 5.7% Brain 7 6.5% 1 0.8% 8 3.5% 0.034 Bone 10 9.3% 2 1.6% 12 5.2% 0.021 Others(renal, skin, leukemia, thyroid)
9 8.4% 5 4.1% 14 6.1% 0.12
Chi-square test was performed and considered significant at α < 0.5 In the table 5 A, BMI for the participants shown that, normal body weight was dominant and presented by about 44% while overweight came in the second with 38.9%, obese participants represent by 13.1%, and underweights were being the least 4.4%. The percentages of significant weight loss during the last month was reported approximately 4.34% by which patients have moderate malnutrition (Table 5B).
Table 5 A: BMI categories among participants: BMI categories N (N%)
Underweight 10 (4.4%) Normal weight 100 (43.7%) Overweight 89 (38.9) Obese 30 (13.1%) Total 229 (100%)
Table 5 B: Body mass index and percentages weight loss
Mean ± SEM Current BMI 26.17± 0.38 Last month BMI 27.19± 0.42 Weight loss during last month
4.34%
In the analyses of PG-SGA SF presented in Table 6 the first component Box 1 is regarding weight status and weight changes during the last was shown that 69.1% of the participants have significant weight reduction (P<0.000) (Table 6).
Table 6:Components of PG-SGA Short Form weight changes (Box 1) Weight of the patients during last two weeks (Box 1) N N %
P values
Increase 31 13.5% Decreased 160 69.0% 0.000 Unchanged 38 16.5%
Total 229 100.0% Chi-square test was performed and considered significant at α < 0.5
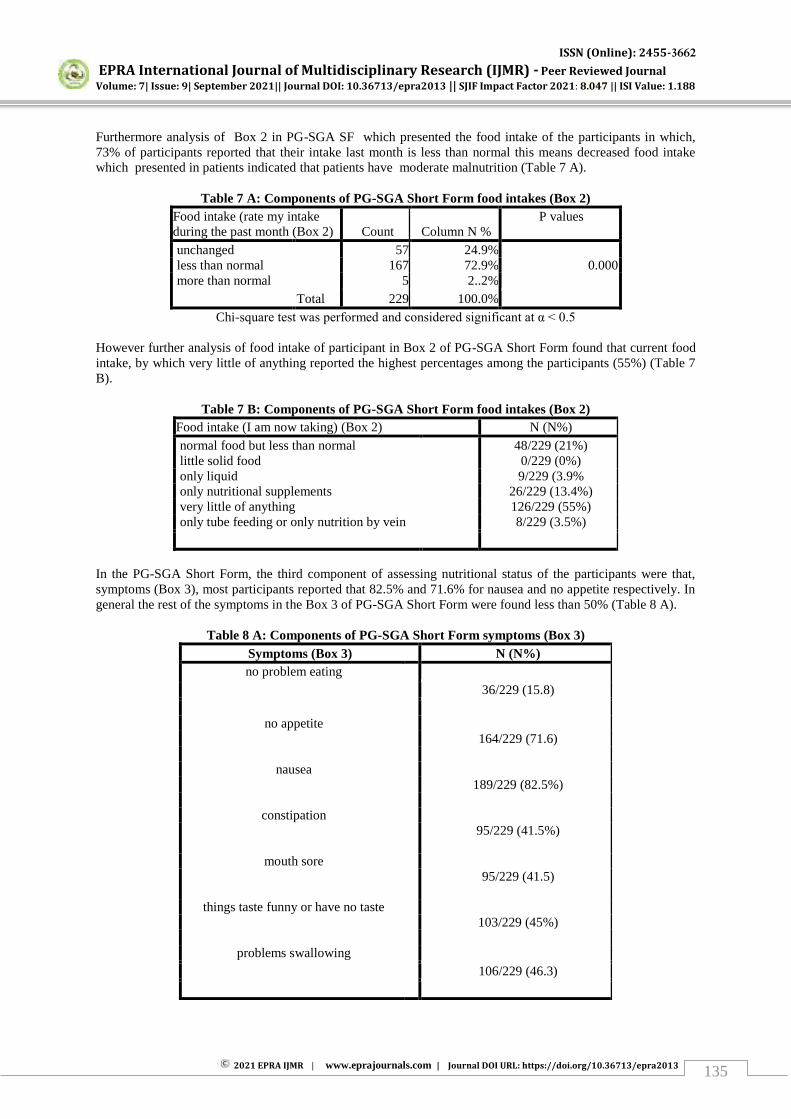
ISSN (Online): 2455-3662
EPRA International Journal of Multidisciplinary Research (IJMR) - Peer Reviewed Journal Volume: 7| Issue: 9| September 2021|| Journal DOI: 10.36713/epra2013 || SJIF Impact Factor 2021: 8.047 || ISI Value: 1.188
2021 EPRA IJMR | www.eprajournals.com | Journal DOI URL: https://doi.org/10.36713/epra2013 135
Furthermore analysis of Box 2 in PG-SGA SF which presented the food intake of the participants in which, 73% of participants reported that their intake last month is less than normal this means decreased food intake which presented in patients indicated that patients have moderate malnutrition (Table 7 A).
Table 7 A: Components of PG-SGA Short Form food intakes (Box 2) Food intake (rate my intake during the past month (Box 2) Count Column N %
P values
unchanged 57 24.9% less than normal 167 72.9% 0.000 more than normal 5 2..2%
Total 229 100.0% Chi-square test was performed and considered significant at α < 0.5
However further analysis of food intake of participant in Box 2 of PG-SGA Short Form found that current food intake, by which very little of anything reported the highest percentages among the participants (55%) (Table 7 B).
Table 7 B: Components of PG-SGA Short Form food intakes (Box 2) Food intake (I am now taking) (Box 2) N (N%) normal food but less than normal 48/229 (21%) little solid food 0/229 (0%) only liquid 9/229 (3.9% only nutritional supplements 26/229 (13.4%) very little of anything 126/229 (55%) only tube feeding or only nutrition by vein 8/229 (3.5%)
In the PG-SGA Short Form, the third component of assessing nutritional status of the participants were that, symptoms (Box 3), most participants reported that 82.5% and 71.6% for nausea and no appetite respectively. In general the rest of the symptoms in the Box 3 of PG-SGA Short Form were found less than 50% (Table 8 A).
Table 8 A: Components of PG-SGA Short Form symptoms (Box 3)
Symptoms (Box 3) N (N%) no problem eating
36/229 (15.8)
no appetite 164/229 (71.6)
nausea 189/229 (82.5%)
constipation 95/229 (41.5%)
mouth sore 95/229 (41.5)
things taste funny or have no taste 103/229 (45%)
problems swallowing 106/229 (46.3)
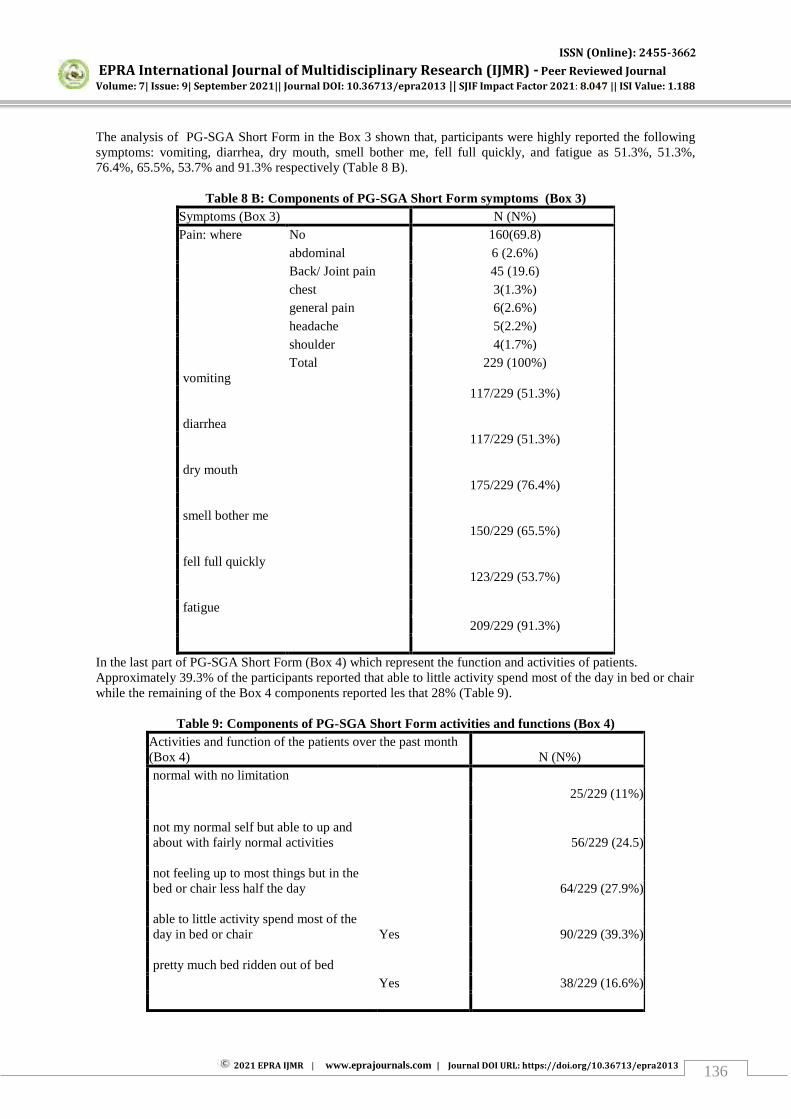
ISSN (Online): 2455-3662
EPRA International Journal of Multidisciplinary Research (IJMR) - Peer Reviewed Journal Volume: 7| Issue: 9| September 2021|| Journal DOI: 10.36713/epra2013 || SJIF Impact Factor 2021: 8.047 || ISI Value: 1.188
2021 EPRA IJMR | www.eprajournals.com | Journal DOI URL: https://doi.org/10.36713/epra2013 136
The analysis of PG-SGA Short Form in the Box 3 shown that, participants were highly reported the following symptoms: vomiting, diarrhea, dry mouth, smell bother me, fell full quickly, and fatigue as 51.3%, 51.3%, 76.4%, 65.5%, 53.7% and 91.3% respectively (Table 8 B).
Table 8 B: Components of PG-SGA Short Form symptoms (Box 3)
Symptoms (Box 3) N (N%) Pain: where No 160(69.8)
abdominal 6 (2.6%) Back/ Joint pain 45 (19.6) chest 3(1.3%) general pain 6(2.6%) headache 5(2.2%) shoulder 4(1.7%) Total 229 (100%)
vomiting 117/229 (51.3%)
diarrhea 117/229 (51.3%)
dry mouth 175/229 (76.4%)
smell bother me 150/229 (65.5%)
fell full quickly 123/229 (53.7%)
fatigue 209/229 (91.3%)
In the last part of PG-SGA Short Form (Box 4) which represent the function and activities of patients. Approximately 39.3% of the participants reported that able to little activity spend most of the day in bed or chair while the remaining of the Box 4 components reported les that 28% (Table 9).
Table 9: Components of PG-SGA Short Form activities and functions (Box 4) Activities and function of the patients over the past month (Box 4) N (N%) normal with no limitation
25/229 (11%)
not my normal self but able to up and about with fairly normal activities
56/229 (24.5)
not feeling up to most things but in the bed or chair less half the day
64/229 (27.9%)
able to little activity spend most of the day in bed or chair
Yes 90/229 (39.3%)
pretty much bed ridden out of bed Yes 38/229 (16.6%)
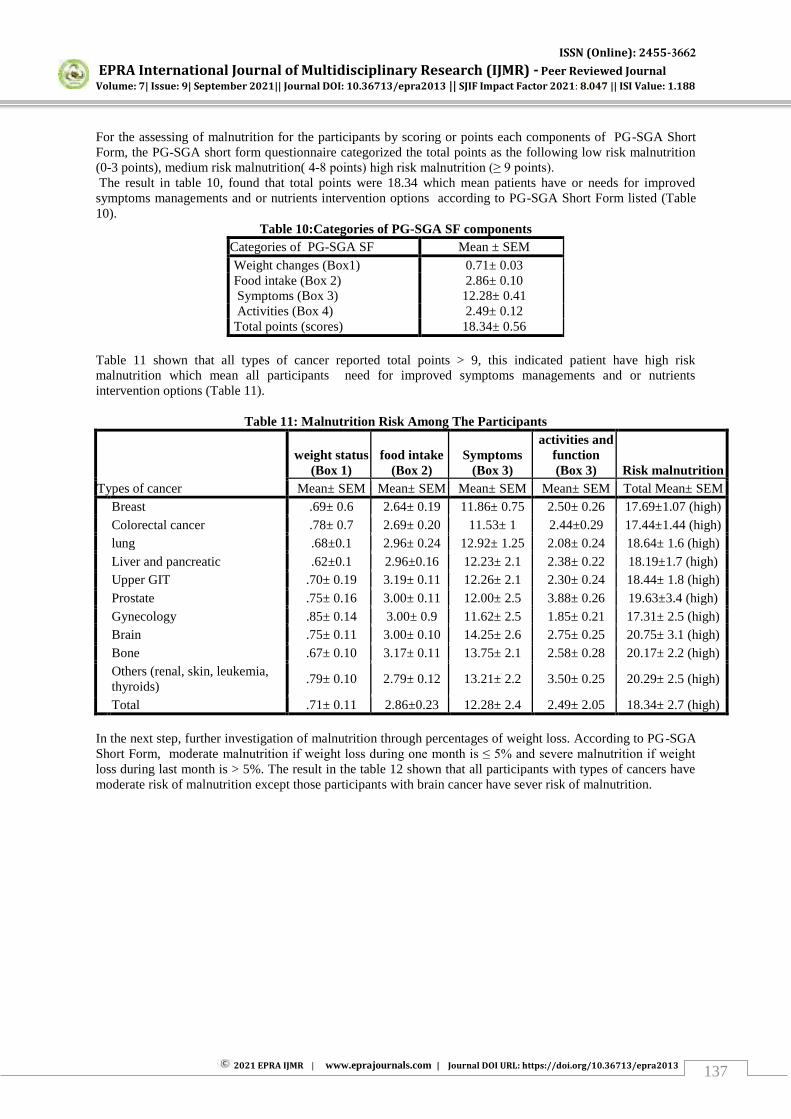
ISSN (Online): 2455-3662
EPRA International Journal of Multidisciplinary Research (IJMR) - Peer Reviewed Journal Volume: 7| Issue: 9| September 2021|| Journal DOI: 10.36713/epra2013 || SJIF Impact Factor 2021: 8.047 || ISI Value: 1.188
2021 EPRA IJMR | www.eprajournals.com | Journal DOI URL: https://doi.org/10.36713/epra2013 137
For the assessing of malnutrition for the participants by scoring or points each components of PG-SGA Short Form, the PG-SGA short form questionnaire categorized the total points as the following low risk malnutrition (0-3 points), medium risk malnutrition( 4-8 points) high risk malnutrition (≥ 9 points). The result in table 10, found that total points were 18.34 which mean patients have or needs for improved symptoms managements and or nutrients intervention options according to PG-SGA Short Form listed (Table 10).
Table 10:Categories of PG-SGA SF components Categories of PG-SGA SF Mean ± SEM Weight changes (Box1) 0.71± 0.03 Food intake (Box 2) 2.86± 0.10 Symptoms (Box 3) 12.28± 0.41 Activities (Box 4) 2.49± 0.12 Total points (scores) 18.34± 0.56
Table 11 shown that all types of cancer reported total points > 9, this indicated patient have high risk malnutrition which mean all participants need for improved symptoms managements and or nutrients intervention options (Table 11).
Table 11: Malnutrition Risk Among The Participants
Types of cancer
weight status (Box 1)
food intake (Box 2)
Symptoms (Box 3)
activities and function (Box 3) Risk malnutrition
Mean± SEM Mean± SEM Mean± SEM Mean± SEM Total Mean± SEM Breast .69± 0.6 2.64± 0.19 11.86± 0.75 2.50± 0.26 17.69±1.07 (high)
Colorectal cancer .78± 0.7 2.69± 0.20 11.53± 1 2.44±0.29 17.44±1.44 (high) lung .68±0.1 2.96± 0.24 12.92± 1.25 2.08± 0.24 18.64± 1.6 (high) Liver and pancreatic .62±0.1 2.96±0.16 12.23± 2.1 2.38± 0.22 18.19±1.7 (high) Upper GIT .70± 0.19 3.19± 0.11 12.26± 2.1 2.30± 0.24 18.44± 1.8 (high) Prostate .75± 0.16 3.00± 0.11 12.00± 2.5 3.88± 0.26 19.63±3.4 (high) Gynecology .85± 0.14 3.00± 0.9 11.62± 2.5 1.85± 0.21 17.31± 2.5 (high) Brain .75± 0.11 3.00± 0.10 14.25± 2.6 2.75± 0.25 20.75± 3.1 (high) Bone .67± 0.10 3.17± 0.11 13.75± 2.1 2.58± 0.28 20.17± 2.2 (high) Others (renal, skin, leukemia, thyroids)
.79± 0.10 2.79± 0.12 13.21± 2.2 3.50± 0.25 20.29± 2.5 (high)
Total .71± 0.11 2.86±0.23 12.28± 2.4 2.49± 2.05 18.34± 2.7 (high) In the next step, further investigation of malnutrition through percentages of weight loss. According to PG-SGA Short Form, moderate malnutrition if weight loss during one month is ≤ 5% and severe malnutrition if weight
loss during last month is > 5%. The result in the table 12 shown that all participants with types of cancers have moderate risk of malnutrition except those participants with brain cancer have sever risk of malnutrition.
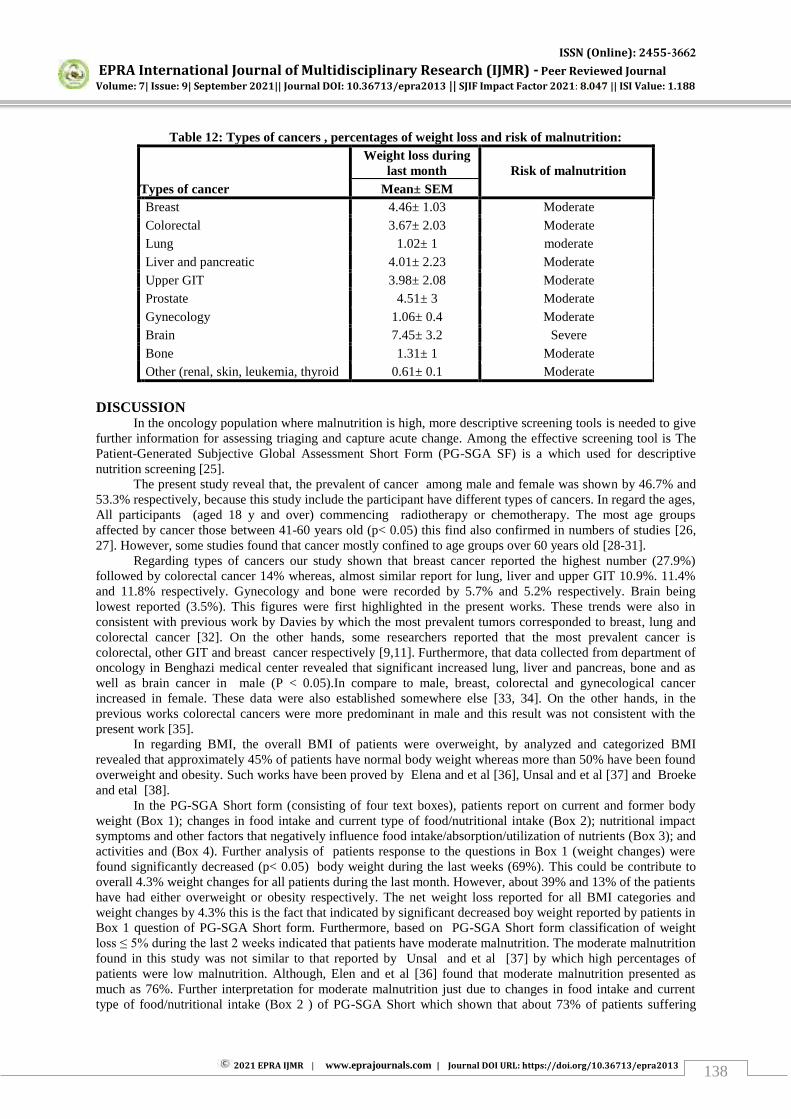
ISSN (Online): 2455-3662
EPRA International Journal of Multidisciplinary Research (IJMR) - Peer Reviewed Journal Volume: 7| Issue: 9| September 2021|| Journal DOI: 10.36713/epra2013 || SJIF Impact Factor 2021: 8.047 || ISI Value: 1.188
2021 EPRA IJMR | www.eprajournals.com | Journal DOI URL: https://doi.org/10.36713/epra2013 138
Table 12: Types of cancers , percentages of weight loss and risk of malnutrition:
Types of cancer
Weight loss during last month
Risk of malnutrition
Mean± SEM Breast 4.46± 1.03 Moderate Colorectal 3.67± 2.03 Moderate Lung 1.02± 1 moderate Liver and pancreatic 4.01± 2.23 Moderate Upper GIT 3.98± 2.08 Moderate Prostate 4.51± 3 Moderate Gynecology 1.06± 0.4 Moderate Brain 7.45± 3.2 Severe Bone 1.31± 1 Moderate Other (renal, skin, leukemia, thyroid 0.61± 0.1 Moderate
DISCUSSION In the oncology population where malnutrition is high, more descriptive screening tools is needed to give
further information for assessing triaging and capture acute change. Among the effective screening tool is The Patient-Generated Subjective Global Assessment Short Form (PG-SGA SF) is a which used for descriptive nutrition screening [25].
The present study reveal that, the prevalent of cancer among male and female was shown by 46.7% and 53.3% respectively, because this study include the participant have different types of cancers. In regard the ages, All participants (aged 18 y and over) commencing radiotherapy or chemotherapy. The most age groups affected by cancer those between 41-60 years old (p< 0.05) this find also confirmed in numbers of studies [26, 27]. However, some studies found that cancer mostly confined to age groups over 60 years old [28-31].
Regarding types of cancers our study shown that breast cancer reported the highest number (27.9%) followed by colorectal cancer 14% whereas, almost similar report for lung, liver and upper GIT 10.9%. 11.4% and 11.8% respectively. Gynecology and bone were recorded by 5.7% and 5.2% respectively. Brain being lowest reported (3.5%). This figures were first highlighted in the present works. These trends were also in consistent with previous work by Davies by which the most prevalent tumors corresponded to breast, lung and colorectal cancer [32]. On the other hands, some researchers reported that the most prevalent cancer is colorectal, other GIT and breast cancer respectively [9,11]. Furthermore, that data collected from department of oncology in Benghazi medical center revealed that significant increased lung, liver and pancreas, bone and as well as brain cancer in male (P < 0.05).In compare to male, breast, colorectal and gynecological cancer increased in female. These data were also established somewhere else [33, 34]. On the other hands, in the previous works colorectal cancers were more predominant in male and this result was not consistent with the present work [35].
In regarding BMI, the overall BMI of patients were overweight, by analyzed and categorized BMI revealed that approximately 45% of patients have normal body weight whereas more than 50% have been found overweight and obesity. Such works have been proved by Elena and et al [36], Unsal and et al [37] and Broeke and etal [38].
In the PG-SGA Short form (consisting of four text boxes), patients report on current and former body weight (Box 1); changes in food intake and current type of food/nutritional intake (Box 2); nutritional impact symptoms and other factors that negatively influence food intake/absorption/utilization of nutrients (Box 3); and activities and (Box 4). Further analysis of patients response to the questions in Box 1 (weight changes) were found significantly decreased (p< 0.05) body weight during the last weeks (69%). This could be contribute to overall 4.3% weight changes for all patients during the last month. However, about 39% and 13% of the patients have had either overweight or obesity respectively. The net weight loss reported for all BMI categories and weight changes by 4.3% this is the fact that indicated by significant decreased boy weight reported by patients in Box 1 question of PG-SGA Short form. Furthermore, based on PG-SGA Short form classification of weight loss ≤ 5% during the last 2 weeks indicated that patients have moderate malnutrition. The moderate malnutrition found in this study was not similar to that reported by Unsal and et al [37] by which high percentages of patients were low malnutrition. Although, Elen and et al [36] found that moderate malnutrition presented as much as 76%. Further interpretation for moderate malnutrition just due to changes in food intake and current type of food/nutritional intake (Box 2 ) of PG-SGA Short which shown that about 73% of patients suffering
ISSN (Online): 2455-3662
EPRA International Journal of Multidisciplinary Research (IJMR) - Peer Reviewed Journal Volume: 7| Issue: 9| September 2021|| Journal DOI: 10.36713/epra2013 || SJIF Impact Factor 2021: 8.047 || ISI Value: 1.188
2021 EPRA IJMR | www.eprajournals.com | Journal DOI URL: https://doi.org/10.36713/epra2013 139
from less food intake than normal (p< 0.05) or very little intake of anything (54%). In addition, the PG-SGA Short Form, in the third component of assessing nutritional status of the participants were that, symptoms (Box 3), most participants reported that 82.5% and 71.6% for nausea and no appetite respectively. These factors could contribute to malnutrition among the patients. Moreover, analysis of PG-SGA Short Form in the Box 3 shown that, participants were highly reported vomiting, diarrhea, dry mouth, smell bother me, fell full quickly, and fatigue as 51.3%, 51.3%, 76.4%, 65.5%, 53.7% and 91.3% respectively and those symptoms further implicated in loss of appetites and weight loss.
Further analysis of weight loss for each cancer shown that, all types of cancer with except of brain have moderate risk of malnutrition risk and for brain severe malnutrition risk. The result obtained from the present study considered highlighted finding because neither studies were consistent with the present finding. In the studies conducted by [39, 40] in patients with different types of cancers which were not similar to the our patients, the risk of malnutrition was moderately as overall risks by using Nutriscore.
While those studies used PG-SGA as a tool for assessing malnutrition pointed out the overall malnutrition as percentages [41, 42] Only very few studies were figure out malnutrition as moderately after used PG-SGA total score [24, 25].
The total scores or points obtained in this study from PG-SGA were 18which considered as high as than those previously described [43] and those patients need for improved symptoms managements and or nutrients intervention options. These result could be probably what were reported individually in PG-SGA components.
In sum, the present work highlighted some points by which all types of cancer have high risk of malnutrition which could be prone to protein energy malnutrition or cachexia. Furthermore all patients in studied samples need for improved symptoms managements and or nutrients intervention options. The prevalence of cancer was high in man. This study need to validity in large samples. Its highly recommended that nutrition screening and assessment strongly advocated in order to minimized protein energy malnutrition and/ or sarcopinia. CONCLUSION
The present work reveal that, cancer prevalent was more predominate in female, and the most age affected by cancer those age groups between 41-60 years old, some types of cancer significant increase in male include lung, liver, bone and brain. On the words female patients have found increased breast, colorectal and gynecological cancer. Overall mean BMI of patients were overweight. Body mass indices reveal that approximately 45% of patients eutrophic weight and more than 50% were overweight and obese. Overall significant weight loss during the last months were 4.34% and this indicated that patients suffering from moderate malnutrition. About 73% of patients suffering from less intake of foods. Furthermore, the overall mean of PG-SGA SF score was 18 which mean patients have high risk for malnutrition and need for improved symptoms managements and or nutrients intervention options. Conflict of Interest No conflict of interest. Acknowledgments The acknowledgement for this work forwarded to all subjects involved in the study. Sayeed MA, Hussain MZ, Rumi MAK, Khan AK. Prevalence of diabetes in a suburban population of Bangladesh. Diab Res Clin Pract. 1997; 34(1): 149-155. REFERENCES
1. Nitenberg G, Raynard B. Nutritional support of the cancer patient: issues and dilemmas. Crit Rev Oncol Hematol. 2000;34:137–168.
2. Maasberg S, Knappe-Drzikova B, Vonderbeck D, Jann H, Weylandt KH, Grieser C, Pascher A, Schefold JC, Pavel M, Wiedenmann B, Sturm A, Pape UF. Malnutrition predicts clinical outcome in patients with neuroendocrine neoplasias. Neuroendocrinology. 2014; 104 :11-25.
3. Attar A, Malka D, Sabate JM, Bonnetain F, Lecomte T, Aparicio T, Locher C, Laharie D, Ezenfis J, Taieb J. Malnutrition is high and underestimated during chemotherapy in gastrointestinal cancer: an AGEO prospective cross-sectional multicenter study. Nutr Cancer. 2012;64:535-542.
4. Hebuterne X, Lemarie E, Michallet M, de Montreuil CB, Schneider SM, Goldwasser F. Prevalence of malnutrition and current use of nutrition support in patients with cancer. JPEN J Parenter Enteral Nutr. 2014;38:196-204.
5. Pressoir M, Desne S, Berchery D, Rossignol G, Poiree B, Meslier M, Traversier S, Vittot M, Simon M, Gekiere JP, Meuric J, Serot F, Falewee MN, et al. Prevalence, risk factors and clinical implications of malnutrition in French Comprehensive Cancer Centres. Br J Cancer. 2012;102:966-971.
ISSN (Online): 2455-3662
EPRA International Journal of Multidisciplinary Research (IJMR) - Peer Reviewed Journal Volume: 7| Issue: 9| September 2021|| Journal DOI: 10.36713/epra2013 || SJIF Impact Factor 2021: 8.047 || ISI Value: 1.188
2021 EPRA IJMR | www.eprajournals.com | Journal DOI URL: https://doi.org/10.36713/epra2013 140
6. Planas M, Alvarez-Hernandez J, Leon-Sanz M, Celaya- Perez S, Araujo K, Garcia de Lorenzo A; PREDyCES® researchers. Prevalence of hospital malnutrition in cancer patients: a sub-analysis of the PREDyCES® study. Support Care Cancer. 2016;14:429-435.
7. Silva FR, de Oliveira MG, Souza AS, Figueroa JN, Santos CS. Factors associated with malnutrition in hospitalized cancer patients: a cross-sectional study. Nutr J. 2015;14:123.
8. Ryan AM, Power DG, Daly L, Cushen SJ, Ni Bhuachalla E, Prado CM. Cancer-associated malnutrition, cachexia and sarcopenia: the skeleton in the hospital closet 40 years later. Proc Nutr Soc.2016;75:1-13.
9. Gyan E, Raynard B, Durand JP, Lacau Saint Guily J, Gouy S, Movschin ML, Khemissa F, Flori N, Oziel-Taieb S, Bannier Braticevic C, Zeanandin G, Hebert C, Savinelli F, et al; NutriCancer 2012 Investigator Group. Malnutrition in patients with cancer. JPEN J Parenter Enteral Nutr. 2017;5:123-135.
10. Aaldriks AA, van der Geest LG, Giltay EJ, le Cessie S, Portielje JE, Tanis BC, Nortier JW, Maartense E. Frailty and malnutrition predictive of mortality risk in older patients with advanced colorectal cancer receiving chemotherapy. J Geriatr Oncol. 2013;4: 218-226.
11. Planas M, Alvarez-Hernandez J, Leon-Sanz M, Celaya-Perez S, Araujo K, Garciade Lorenzo A, et al. Prevalence of hospital malnutrition in cancer patients: a subanalysis of the PREDyCES study. Support Care Cancer. 2016;24: 429-35.
12. Orrevall Y, Tishelman C, Permert J, Cederholm T. Nutritional support and risk status among cancer patients in palliative home care services. Support Care Cancer2019;17:153-61.
13. Segura A, Pardo J, Jara C, Zugazabeitia L, et al. An epidemiological evaluation of the prevalence of malnutrition in Spanish patients with locally advanced or metastatic cancer. Clin Nutr. 2005;24: 801-14.
14. Arribas L, Hurtós L, Sendrós MJ, Peiró I, Salleras N, Fort E, Sanchez-Migallon JM. Nutriscore: A new nutritional screening tool for oncological outpatients. Nutrition.2017;33:297-303.
15. Fearon K, Strasser F, Anker SD, Bosaeus I, Bruera E, Fainsinger RL, Jatoi A, Loprinzi C et al. Definition and classification of cancer cachexia: an international consensus. Lancet Oncol. 2011;12:489-95.
16. Pastore CA, Orlandi SP, Gonzalez MC. The Inflammatory-Nutritional Index;assessing nutritional status and prognosis in gastrointestinal and lung cancer patients. Nutr Hosp. 2014;29:629-34.
17. Read JA, Crockett N, Volker DH, MacLennan P, Choy ST, Beale P, et al. Nutritional assessment in cancer: comparing the Mini-Nutritional Assessment (MNA) with the scored Patient-Generated Subjective Global Assessment (PGSGA). Nutr Cancer. Nutr Cancer.2005; 53: 51-56.
18. Gheorghe C, Pascu O, Iacob R, Vadan R, Iacob S, Goldis A, et al. Nutritional riskscreening and prevalence of malnutrition on admission to gastroenterology departments: a multicentric study. Chirurgia (Bucur). 2013;108:535–541
19. Arribas L, Hurtós L, Sendrós MJ, Peiró I, Salleras N, Fort E, Sanchez-Migallon JM. 20. Nutriscore: A new nutritional screening tool for oncological outpatients. Nutrition. 2017;33: 297-303. 21. Harri¨et Jager-Wittenaar, Hester F. de Bats, Bertine J. Welink-Lamberts, and et al. Self-Completion of the
Patient-Generated Subjective Global Assessment Short Form Is Feasible and Is Associated With Increased Awareness on Malnutrition Risk in Patients Within Head and Neck Cancer Nutrition in Clinical Practice. 2020;35: 353–362.
22. Trude R Balstad, Asta Bye, Cathrine RS Jenssen, Tora S Solheim, Lene Thoresen, Kari Sand. Patient interpretation of the Patient-Generated Subjective Global Assessment (PG-SGA) Short Form. Patient Preference and Adherence. 2019;13:1391–1400
23. 22.Gellrich NC, Handschel J, Holtmann H, Kruskemper G. Oral cancer malnutrition impacts weight and quality of life. Nutrients. 2015;7:2145-2160.
24. Bouchard, D.R.; Ross, R.; Janssen, I. Coffee, tea and their additives: Association with BMI and waist circumference. Obes. Facts. 2010;3:345–352.
25. Jessica Abbott, L. Teleni, D. McKavanagh, and J. Watson. Patient-Generated Subjective Global Assessment Short Form (PG-SGA SF) is a valid screening tool in chemotherapy outpatients. Supportive Care in Cancer. 2016;24:3883–3887
26. Kim YJ, Hui D, Zhang Y, Park JC, Chisholm G, Williams J, et al. Differences in performance status assessment among palliative care specialists, nurses, and medical oncologists. J Pain Symptom Manage. 2015;49:1050-1058.
27. Wie GA, Cho YA, Kim SY, Kim SM, Bae JM, Joung H, et al. Prevalence and risk factors of malnutrition among cancer patients according to tumor location and stage in the National Cancer Center in Korea. Nutr. 2015;26:263–268.
28. Marian AE. Nutritional support strategies for malnourished cancer patients. Eur J Oncol Nurs.2005;9: 74–83. 29. Korfali G, Gündoğdu H, Aydintuğ S, Bahar M, Besler T, Moral AR, et al. Nutritional risk of hospitalized patients
in Turkey. Clin Nutr.2009;28 :533-53 30. Hebuterne X, Lemarie E, Michallet M, de Montreuil CB, Schneider SM, Goldwasser F. Prevalence of malnutrition
and current use of nutrition support in patients with cancer. J Parenter Enteral Nutr. 2014;38: 196e204. 31. Melchior JC, Preaud E, Carles J, Brami M, Duru G, Fontaine E, Hebuterne X, Lukacs B, Zazzo JF, Panis Y,
Nitenberg G. Clinical and economic impact of malnutrition per se on the postoperative course of colorectal cancer patients. Clin Nutr. 2012;31:896-902.
32. Blauwhoff-Buskermolen S, Ruijgrok C, Ostelo RW, de Vet HC, Verheul HM, de van der Schueren MA, Langius JA. The assessment of anorexia in patients with cancer: cut-off values for the FAACT-A/CS and the VAS for appetite. Support Care Cancer. 2016;24: 661-666.
ISSN (Online): 2455-3662
EPRA International Journal of Multidisciplinary Research (IJMR) - Peer Reviewed Journal Volume: 7| Issue: 9| September 2021|| Journal DOI: 10.36713/epra2013 || SJIF Impact Factor 2021: 8.047 || ISI Value: 1.188
2021 EPRA IJMR | www.eprajournals.com | Journal DOI URL: https://doi.org/10.36713/epra2013 141
33. Davies M. Nutritional screening and assessment in cancer-associated malnutrition. Eur J Oncol Nurs. 2005;9:Suppl 2:S64-73
34. Farhangfar A, Makarewicz M, Ghosh S, Jha N, Scrimger R, Gramlich L, Baracos V. Nutrition impact symptoms in a population cohort of head and neck cancer patients: multivariate regression analysis of symptoms on oral intake, weight loss and survival. Oral Oncol. 2014;50:877-883.
35. Dev R, Hui D, Chisholm G, Delgado-Guay M, Dalal S, Del Fabbro E, Bruera E. Hypermetabolism and symptom burden in advanced cancer patients evaluated in a cachexia clinic. J Cachexia Sarcopenia Muscle. 2015;6: 95-98.
36. McMillan DC. The systemic inflammation-based Glasgow Prognostic Score: a decade of experience in patients with cancer. Cancer Treat Rev. 2013;39:534-40.
37. Elena A lvaro Sanz, Marga Garrido Siles, Laura Rey Fern«andez, Rosa Villatoro Rold, Antonio Rueda Dom«õnguez) , Jimena Abil « es. Nutritional risk and malnutrition rates at diagnosis of cancer in patients treated in outpatient settings. Early intervention protocol. The End-to-end Journal. 2018;5:21-30.
38. Unsal D, Bulent Mentes, , Muge Akmansu, , Aytug Uner, Mehmet Oguz, and Yucel Pak, MD. Evaluation of Nutritional Status in Cancer Patients Receiving Radiotherapy. A Prospective Study. Am J Clin Oncol. 2006;29:183–188.
39. Fruchtenicht AVG, Poziomyck AK, Kabke GB, Loss SH, Antoniazzi JL, Steemburgo T, et al. Nutritional risk assessment in critically ill cancer patients: systematic review. Rev Bras Ter Intensiva. 2015;27:274-283.
40. Lee JLC, Leong LP, Lim SL. Nutrition intervention approaches to reduce malnutrition in oncology patients: a systematic review. Support Care Cancer. 2016;24:469–80..
41. Sarikaya D, Halil M, Kuyumcu ME, Kilic MK, Yesil Y, Kara O, et al. Mini nutritional assessment test long and short form are valid screening tools in Turkish older adults. Arch Gerontol Geriatr. 2015;61:56–60.
42. Marín Caro MM, Laviano A, Pichard C. Nutritional intervention and quality of life in adult oncology patients. Clin Nutr. 2007;26:289-301.
43. Santarpia L, Contaldo F, Pasanisi F. Nutritional screening and early treatment of malnutrition in cancer patients. J Cachexia Sarcopenia Muscle. 2011;2: 27-35.
44. Leuenberger M, Kurmann S, Stanga Z. Nutritional screening tools in daily clinical practice: the focus on cancer. Support Care Cancer. 2010;18:S17–27.
ISSN (Online): 2455-3662
EPRA International Journal of Multidisciplinary Research (IJMR) - Peer Reviewed Journal Volume: 7| Issue: 9| September 2021|| Journal DOI: 10.36713/epra2013 || SJIF Impact Factor 2021: 8.047 || ISI Value: 1.188
2021 EPRA IJMR | www.eprajournals.com | Journal DOI URL: https://doi.org/10.36713/epra2013 142
APPLICATION OF AGRICULTURAL LOAN IN MUSLIM COMMUNITY: A STUDY BASED ON KEKIRAWA
DIVISIONAL SECRETARIAT OF ANURADHAPURA IN SRI LANKA
Mohamed Haniffa Mohamed Nairoos1, RM. Risly2,
Uthuman Kandu Mohammed Muhees3 1 Senior Lecturer, Department of Islamic Studies, FIA,South Eastern University of Sri Lanka
2 BA (Hons) in Islamic Banking and Finance,South Eastern University of Sri Lanka
3BA (Hons) in Islamic Thought & Civilization,South Eastern University of Sri Lanka, MA (UPDN)
Correspondent Name: MHM Nairoos
Article DOI: https://doi.org/10.36713/epra8442
DOI No: 10.36713/epra8442
ABSTRACT
Agriculture plays most important role in Sri Lankan economy like some other developing nations in South Asia such as India, Bangladesh, Pakistan, Nepal and Bhutan. In this way, the agricultural farming sector is identified as a key tool for the economic development in Sri Lanka and it helps to effectively utilize the invaluable resources of the country such as green lands and appropriate climate as it should be and to significantly boost the wealth of the country as well. Furthermore, as it helps to expand the level of GDP, the Interest rates as well as the inflation rates are mostly estimated at present depending on the level of agricultural cultivation sector in the country. It is noteworthy to point out at this occasion that as Sri Lanka is mainly an agricultural nation the most people are involving in individual and joint venture farming activities. At the same time, it is also very important to mention here that most people who involve in agricultural cultivation reach the banks and financial institution for the purpose of getting loans to meet their agricultural financial needs. In this context, this research aims to identify the loan systems which are implemented in agricultural sector among the Muslim community, especially among Muslim farmers who are living in Kekirawa divisional secretariat in Anuradhapura district. The research would be extremely significance due to there is no sufficient previous studies find concerning with agricultural loan systems among Muslim community in particular research area in Sri Lanka. This research is designed as mixed method with the inclusion of qualitative and quantitative data which collected in term of finding the correct solutions and providing appropriate recommendations. The findings of the research reveals that the farmers who live in Kekirawa divisional secretariat of Anuradhapura do not depend and connect with banks or other financial institutions to get any advances, but they use to fulfil their needs of capital for farming from money lenders, shopkeepers, friends relatives and NGOs. Therefore, the system should be introduced under the Islamic banks and financial institutions to promote the Shariah compliance products and interest free loan systems not only for Muslim farmers but also to all citizens who wish to involve in agricultural cultivations. Moreover, NGOs and shopkeepers who provide agricultural credit services should be adapted in accordance with the Islamic Shariah compliance. KEY WORDS: Agriculture, Loan Systems, Farmers, Kekirawa. Shariah Compliance, Islamic Banks
INTRODUCTION Nowadays, agriculture is the major source of household income and it plays the key role of the Gross
Domestic Product (GDP) of many countries in the world especially in agricultural nations. Many scholars sturdily consider that agriculture sector is an important factor for development of individuals, families, communities and nations. Moreover, the remarkable agricultural growth has positive advantages to the rural and the urban poor people through its effectiveness in reducing the prices of agricultural food products as well as significantly contributes the prosperous of nations. Simultaneously, the consequence of agricultural growth
ISSN (Online): 2455-3662
EPRA International Journal of Multidisciplinary Research (IJMR) - Peer Reviewed Journal Volume: 7| Issue: 9| September 2021|| Journal DOI: 10.36713/epra2013 || SJIF Impact Factor 2021: 8.047 || ISI Value: 1.188
2021 EPRA IJMR | www.eprajournals.com | Journal DOI URL: https://doi.org/10.36713/epra2013 143
enormously reflects on the industrial growth as well due to providing a lot of raw materials to the various industrial sectors. Thus, the agricultural advancement is necessary for improving the supply of raw materials for the agro based industries, especially in developing countries. The shortage of agricultural goods has its impact on industrial production and a consequent increase in the general price level. It will impede the growth of the country’s economy. The flour mills, rice sellers, oil & dhal mills, bread, meat, milk products sugar factories,
wineries, jute mills, textile mills and numerous other industries are based on agricultural products (Praburaj L. 2018).
Since Sri Lanka is mainly an agricultural nation, many crops such as tea, rice, coffee, coconut products, rubber, cinnamon, various fruits as well as vegetables are remarkably produced and some products are exported. Especially tea, rubber, coffee and cinnamon productions play the most important role of the gross export revenue of the country. Development and exports are usually observed as a device for economic growth. More exports generate more income, raise more foreign exchange and indirectly promote economic growth through competition. The agriculture sector is the basis of economy in Sri Lanka. This sector contributes 10.1% of Gross Domestic Product and 28.5% of the employment (CBSL, 2014). Agricultural export contributes 25.1% share of the total exports in Sri Lanka (CBSL, 2014). In this way, the contribution of agricultural export to the economic growth is vital importance (Vanitha Prasannath, 2015). Even if the country is mainly as an agricultural nation, the facilities provided for farmers to utilize in agricultural doings particularly for seeds, fertilizer, pesticides, plough, harvest, wages for labors as well as the better irrigation should be seriously considered. Moreover, it is very important to consider that farmers how get their finance and other facilities as a result of faceable heavy challenges and difficulties during their farming period.
In this background most farmers reach the banks, financial institutions and personal creditors for the purpose of getting loans and invest them in their farming production sectors. Nowadays lot of banks and financial institutions in Sri Lanka provide agricultural loans similar to rest of the countries in the world. It is remarkable at this juncture to identify some popular agricultural loan system in Sri Lanka for farmers such as Commercial Agri Loans for Professionals provided by Commercial Bank PLC, Surusara loan scheme of Seylan bank PLC and Agriculture loan scheme of Bank of Ceylon. However, the loan systems provided by conventional banks, financial institutions and personal creditors are based on interest based. Therefore, in many occasions particularly during the period of agricultural loss, these farmers face many challenges and stresses. These farmers are mostly effected on account of the heavy burden of interest based agricultural loans they got. If they face unexpected losses due to climate change or other factors they are seriously struggling to pay these interest based loans and sometimes they sell their paddy lands or living houses as well to repay loans. At the same time, it is also notable that nowadays there are flexible interest free loan systems offered by Islamic banks and financial institution which called Qarl Hasan.
However in Kekirawa DS division which is the research area, it could not be found any agricultural loans which are provided by Islamic banks and financial institutions for their farming customers. In this situation, lots of Muslim farmers are using some different ways in getting loans to carry on their agricultural activities. Consequently the topic, Application of agricultural loans in Muslim community: A study based on Kekirawa Divisional secretariat in Sri Lanka is taken for this study. The research area is situated in Anuradhapura District and there are more than 10 Muslim villages here which consisted more farmers. These farmers face heavy financial crisis to utilize in their farming efforts. As a result, some of these farmers get loans from conventional banks and financial institutions with interest; in the meantime, several of them use some other different ways to get loans due to unavailability of loan systems from Islamic banks and financial institutions. As a consequence, the researcher would like to find by means of this research that how the farmers among the Muslim community in Kekirawa divisional secretariat get do loans from different ways. And, how they repay their loans obtained, as well as the loan systems used are under Shariah compliance or are not. PROBLEM STATEMENT
The most people, who enthusiastically involve in agricultural endeavours in Muslim community in Kekirawa Divisional Secretariat Area, do not have enough capital to manage their expenses rising on it. As a result, these farmers are interesting to take the agricultural loans for the purpose of pesticides, plough, harvest, and wages for the labourers. They obtain these agricultural loans from several ways. Consequently, it is very important to find that those ways practiced in obtaining loans are mainly based on Shariah compliant or do not and are these farmers face any challenges and complicatedness due to the loan systems they got.
Farmers buy their necessary goods and items to utilize in cultivation from particular shops and stores situated in the city area. Subsequent to made cultivation either they got profit or loss from harvesting their repayment loan scheme must be settled with extra amount of money or without.
However, the agricultural loans which obtained by most farmers in Muslim community in Kekirawa divisional secretariat for their agricultural needs and in developing their measures of farming have to be analyzed that the contracts made by them are comply with Shariah basis and recognized to practice. Islam has

ISSN (Online): 2455-3662
EPRA International Journal of Multidisciplinary Research (IJMR) - Peer Reviewed Journal Volume: 7| Issue: 9| September 2021|| Journal DOI: 10.36713/epra2013 || SJIF Impact Factor 2021: 8.047 || ISI Value: 1.188
2021 EPRA IJMR | www.eprajournals.com | Journal DOI URL: https://doi.org/10.36713/epra2013 144
presented wonderful loan system which the needy people can be assisted by wealthy people for the sake of Almighty Allah and without any purpose of extra gaining all the way through prohibited ways. Therefore, the research problem of the study is that what are the agricultural loan systems practiced among the Muslim farmers in the research area and to examine that those are implemented under Shariah compliant or not. RESEARCH QUESTIONS Specifically, this research has been carried out to explore the answers to the following questions with the aim of solving the research problem of the study RQ1: What are the agricultural loan systems in practice among the Muslim community in Kekirawa divisional
secretariat? RQ2: How does the Muslim community get agricultural loans away from the banks and financial institutions
and how do they repay them? RQ3: Are the agricultural loan systems experienced in the Muslim community based on Shariah compliant or
not? OBJECTIVES OF THE RESEARCH Primary Objective The primary objective of the research is as follow RO1: To investigate the agricultural loan systems in practice among the Muslim community in Kekirawa divisional secretariat Secondary Objectives The secondary objectives of the research are RO2: To identify the agricultural loans obtained by Muslim farmers except the banks and regulated financial institutions and how do they repay them RO3: To find out that the agricultural loan systems experienced in the Muslim community based on Shariah
compliant or not LITERATURE REVIEW The farmers tended towards the replacement of traditional methods of farming with scientific and developed methods. For instance, use of High Yield Variety (HYV) of seeds, fertilizers, pesticides, irrigation, machinery and equipment etc. requires huge amount of capital which is beyond the capacity of most of the farmers. Due to this the farmers compulsorily depend upon borrowed funds. This causes the increasing demand for credit. So, in respect of transformation of traditional or subsistence farming into commercial farming, the importance of agricultural credit has increased comparatively (Mr. Joy Joseph P, December, 1994). The informal sector has the legitimacy and blessing of rural communities. Assuming no other lucrative alternative is available, it is more in line with the rural tradition for farmers to go to the middleman or to resort to the better-off neighbours or the money lenders in order to dispose of surplus grains (i.e., beyond needs of the household) or sell livestock in order to circumvent the need for a short-term credit. Households in the rural sector also have at their disposal endogenous and informal saving and credit associations that are capable of servicing their physical/financial requirements (Dr. Mahmoud A. Gulaid) Informal lenders can be moneylenders, traders and agro-processing firms. They adopt different monitoring mechanisms which would be expensive, or even impossible for banks. Besides, informal lenders can interlink the terms of the transactions in the credit market with those of transactions in the product markets. For instance, a trader-lender may offer lower prices on fertilizers and pesticides to farmers who borrow from him because the use of these inputs reduces the probability of default (Qi Zhou, Xiangfeng Chen and Shuting Li, 2018). Agricultural credit has played a vital role in supporting agricultural production in the state. Green Revolution characterized by a greater use of inputs like fertilizers, seeds and other inputs (Jeeban Jyoti Mohanty, October 2017) Agricultural credit has helped enhance the agricultural productivity of the farmers. With such a credit facility, farmers will have a better access to improved seeds, fertilizer, pesticides and better irrigation facility. Thus, farmer friendly agricultural credit services should be extended and deepened even in the rural areas. It will help the farmers of the rural area attain a higher level of technical efficiency and higher farm productivity. (Nepal Rastra Bank, 2014)
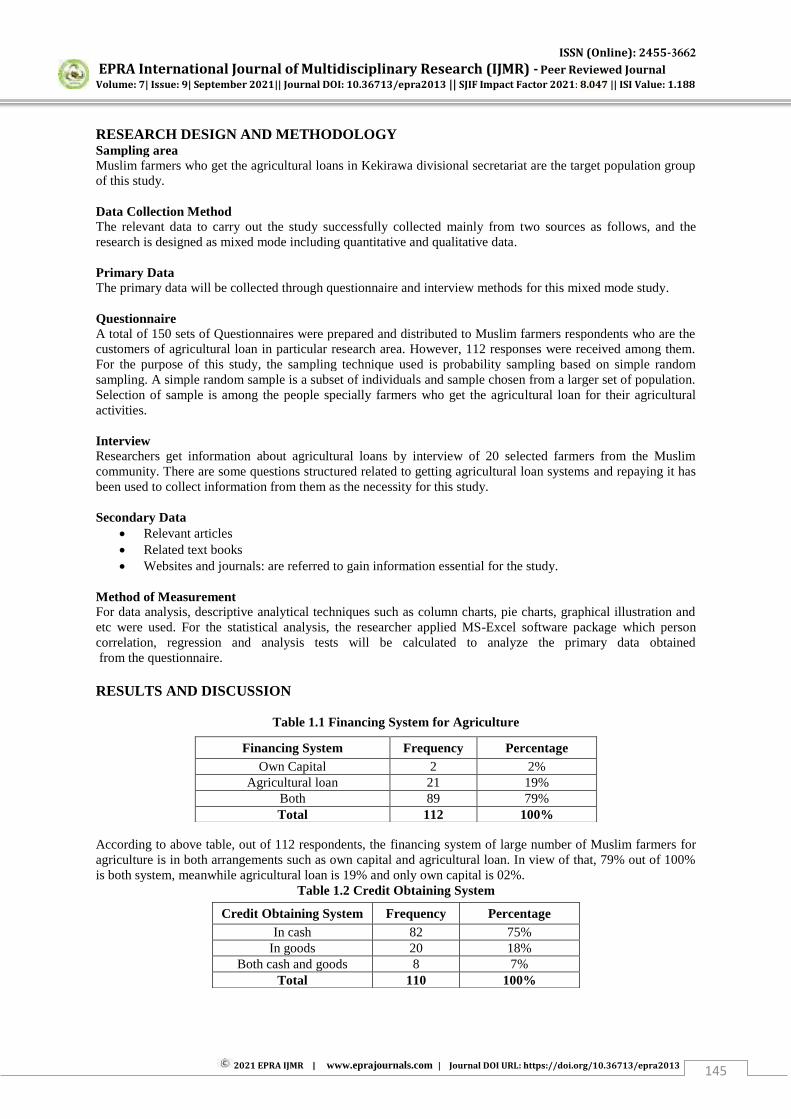
ISSN (Online): 2455-3662
EPRA International Journal of Multidisciplinary Research (IJMR) - Peer Reviewed Journal Volume: 7| Issue: 9| September 2021|| Journal DOI: 10.36713/epra2013 || SJIF Impact Factor 2021: 8.047 || ISI Value: 1.188
2021 EPRA IJMR | www.eprajournals.com | Journal DOI URL: https://doi.org/10.36713/epra2013 145
RESEARCH DESIGN AND METHODOLOGY Sampling area Muslim farmers who get the agricultural loans in Kekirawa divisional secretariat are the target population group of this study. Data Collection Method The relevant data to carry out the study successfully collected mainly from two sources as follows, and the research is designed as mixed mode including quantitative and qualitative data. Primary Data The primary data will be collected through questionnaire and interview methods for this mixed mode study. Questionnaire A total of 150 sets of Questionnaires were prepared and distributed to Muslim farmers respondents who are the customers of agricultural loan in particular research area. However, 112 responses were received among them. For the purpose of this study, the sampling technique used is probability sampling based on simple random sampling. A simple random sample is a subset of individuals and sample chosen from a larger set of population. Selection of sample is among the people specially farmers who get the agricultural loan for their agricultural activities. Interview Researchers get information about agricultural loans by interview of 20 selected farmers from the Muslim community. There are some questions structured related to getting agricultural loan systems and repaying it has been used to collect information from them as the necessity for this study. Secondary Data
Relevant articles Related text books Websites and journals: are referred to gain information essential for the study.
Method of Measurement For data analysis, descriptive analytical techniques such as column charts, pie charts, graphical illustration and etc were used. For the statistical analysis, the researcher applied MS-Excel software package which person correlation, regression and analysis tests will be calculated to analyze the primary data obtained from the questionnaire. RESULTS AND DISCUSSION
Table 1.1 Financing System for Agriculture
According to above table, out of 112 respondents, the financing system of large number of Muslim farmers for agriculture is in both arrangements such as own capital and agricultural loan. In view of that, 79% out of 100% is both system, meanwhile agricultural loan is 19% and only own capital is 02%.
Table 1.2 Credit Obtaining System
Financing System Frequency Percentage Own Capital 2 2%
Agricultural loan 21 19% Both 89 79% Total 112 100%
Credit Obtaining System Frequency Percentage In cash 82 75%
In goods 20 18% Both cash and goods 8 7%
Total 110 100%

ISSN (Online): 2455-3662
EPRA International Journal of Multidisciplinary Research (IJMR) - Peer Reviewed Journal Volume: 7| Issue: 9| September 2021|| Journal DOI: 10.36713/epra2013 || SJIF Impact Factor 2021: 8.047 || ISI Value: 1.188
2021 EPRA IJMR | www.eprajournals.com | Journal DOI URL: https://doi.org/10.36713/epra2013 146
Based on above table, large number of respondents gets the agricultural loan by cash that 75%. 18% of them get the agricultural loan by goods, and 07% of them use the both system cash and goods.
Table 1.3 Ways of Credit Accessed Ways of Credit Accessed Frequency Percentage
Friend/Relative 24 22% Money Lender 28 25%
Local Trader/Shop Keeper 24 22% Farmers Organization 2 2%
Informal savings group 4 4% Buyer/Trader(Contract farming) 1 1%
NGO 21 19% Other 6 5% Total 110 100%
Table 1.4 Loan Repaying Medium
Loan Paying Medium Frequency Percentage By Cash 65 59%
By Goods 45 41% Total 110 100%
Table 1.5 Repaying System by Cash
Repaying System by Cash Frequency Percentage Basic Loan Amount 19 29%
Extra Amount with Basic Loan 46 71% elay Charge with Basic Amount 0 0%
Total 65 100%
Table 1.6 Repaying System by Goods and Products Repaying system by goods Frequency Percentage
Agricultural product as a repayment of loan amount 20 44% Agricultural product and other some additional things as a
repayment of loan amount 25 56%
Total 45 100% In accordance with the above tables No 1.3, 1.4, 1.5 & 1.6
Money lender, by cash, basic loan amount 0 0%
Moneylender, by cash, Extra amount with loan amount 27 96% Moneylender, by good, Provide an agricultural product as a repayment of loan amount. 0 0%
Moneylender, by good, Provide an agricultural product and other some additional things as a repayment of loan. 1 4%
Local trader, by cash ,basic loan amount 6 25%
Local trader, by cash, Extra amount with loan amount 12 50% Local trader, by good, Provide an agricultural product as a repayment of loan amount. 5 21% Local trader, by good, Provide an agricultural product and other some additional things as a repayment of loan. 1 4%
Friend/ Relative, by cash, basic loan amount 12 50%
Friend/ Relative, by cash, Extra amount with loan amount 0 0%
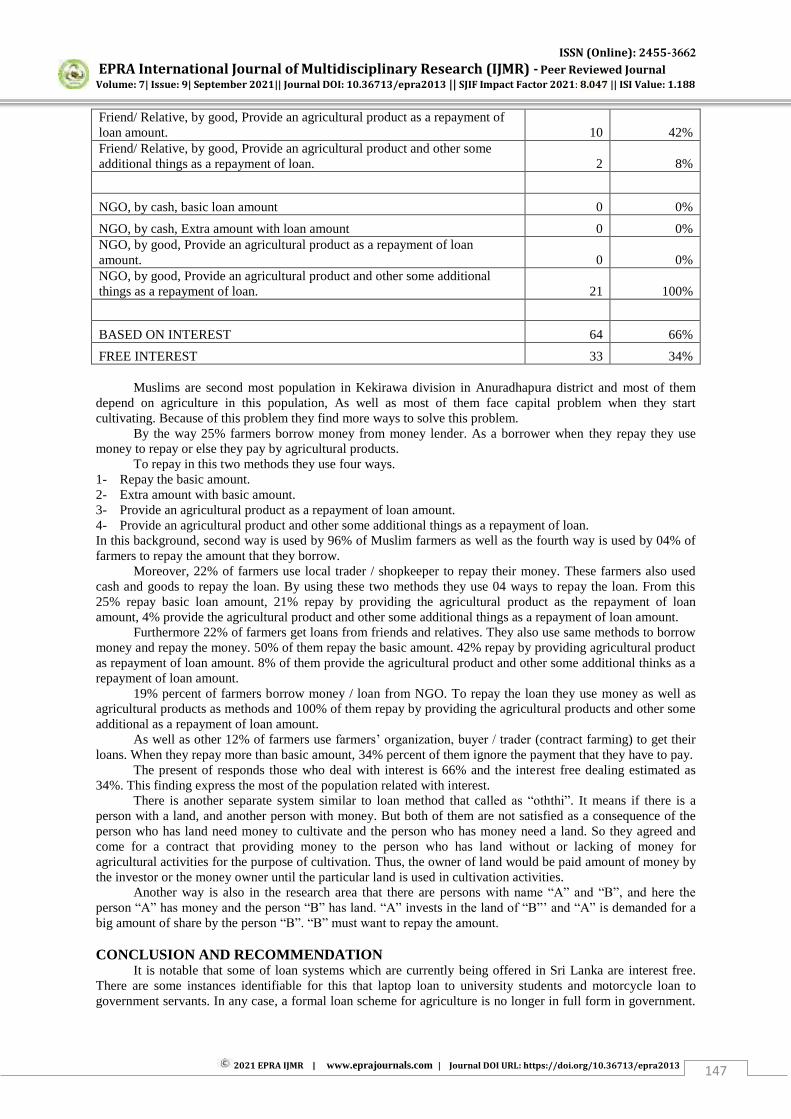
ISSN (Online): 2455-3662
EPRA International Journal of Multidisciplinary Research (IJMR) - Peer Reviewed Journal Volume: 7| Issue: 9| September 2021|| Journal DOI: 10.36713/epra2013 || SJIF Impact Factor 2021: 8.047 || ISI Value: 1.188
2021 EPRA IJMR | www.eprajournals.com | Journal DOI URL: https://doi.org/10.36713/epra2013 147
Friend/ Relative, by good, Provide an agricultural product as a repayment of loan amount. 10 42% Friend/ Relative, by good, Provide an agricultural product and other some additional things as a repayment of loan. 2 8%
NGO, by cash, basic loan amount 0 0%
NGO, by cash, Extra amount with loan amount 0 0% NGO, by good, Provide an agricultural product as a repayment of loan amount. 0 0% NGO, by good, Provide an agricultural product and other some additional things as a repayment of loan. 21 100%
BASED ON INTEREST 64 66%
FREE INTEREST 33 34%
Muslims are second most population in Kekirawa division in Anuradhapura district and most of them depend on agriculture in this population, As well as most of them face capital problem when they start cultivating. Because of this problem they find more ways to solve this problem.
By the way 25% farmers borrow money from money lender. As a borrower when they repay they use money to repay or else they pay by agricultural products.
To repay in this two methods they use four ways. 1- Repay the basic amount. 2- Extra amount with basic amount. 3- Provide an agricultural product as a repayment of loan amount. 4- Provide an agricultural product and other some additional things as a repayment of loan. In this background, second way is used by 96% of Muslim farmers as well as the fourth way is used by 04% of farmers to repay the amount that they borrow.
Moreover, 22% of farmers use local trader / shopkeeper to repay their money. These farmers also used cash and goods to repay the loan. By using these two methods they use 04 ways to repay the loan. From this 25% repay basic loan amount, 21% repay by providing the agricultural product as the repayment of loan amount, 4% provide the agricultural product and other some additional things as a repayment of loan amount.
Furthermore 22% of farmers get loans from friends and relatives. They also use same methods to borrow money and repay the money. 50% of them repay the basic amount. 42% repay by providing agricultural product as repayment of loan amount. 8% of them provide the agricultural product and other some additional thinks as a repayment of loan amount.
19% percent of farmers borrow money / loan from NGO. To repay the loan they use money as well as agricultural products as methods and 100% of them repay by providing the agricultural products and other some additional as a repayment of loan amount.
As well as other 12% of farmers use farmers’ organization, buyer / trader (contract farming) to get their loans. When they repay more than basic amount, 34% percent of them ignore the payment that they have to pay.
The present of responds those who deal with interest is 66% and the interest free dealing estimated as 34%. This finding express the most of the population related with interest.
There is another separate system similar to loan method that called as “oththi”. It means if there is a person with a land, and another person with money. But both of them are not satisfied as a consequence of the person who has land need money to cultivate and the person who has money need a land. So they agreed and come for a contract that providing money to the person who has land without or lacking of money for agricultural activities for the purpose of cultivation. Thus, the owner of land would be paid amount of money by the investor or the money owner until the particular land is used in cultivation activities.
Another way is also in the research area that there are persons with name “A” and “B”, and here the
person “A” has money and the person “B” has land. “A” invests in the land of “B”’ and “A” is demanded for a big amount of share by the person “B”. “B” must want to repay the amount. CONCLUSION AND RECOMMENDATION
It is notable that some of loan systems which are currently being offered in Sri Lanka are interest free. There are some instances identifiable for this that laptop loan to university students and motorcycle loan to government servants. In any case, a formal loan scheme for agriculture is no longer in full form in government.
ISSN (Online): 2455-3662
EPRA International Journal of Multidisciplinary Research (IJMR) - Peer Reviewed Journal Volume: 7| Issue: 9| September 2021|| Journal DOI: 10.36713/epra2013 || SJIF Impact Factor 2021: 8.047 || ISI Value: 1.188
2021 EPRA IJMR | www.eprajournals.com | Journal DOI URL: https://doi.org/10.36713/epra2013 148
The fact is that agriculture subsidies are not fully paid. Therefore, the Agricultural Departments in Sri Lanka should consider the basic livelihood of farmers and in the manner systematically introducing the agricultural loan scheme on a yearly basis to consider the economy of the country. Land and subsidies for a farmer must be properly calculated and credited in each year. By appointing a qualified officer the farming divisions in each category should repay the loan for the loss of agricultural profit and loss. This loan system should not be directly linked to the bank, but the departments have to intervene and give agricultural credit and the Department of Recycling should be forwarded.
The money lender, NGOs, local trader and shopkeeper have to deal with non-interest payments and calculate the returns in terms of profit and losses. These companies should implement the Islamic banking system in their respective companies and institutions. At the same time, the Islamic banks and Islamic Windows in Sri Lanka should implement the agrarian credit system in their banks and institutions in the country. Currently the Islamic banks and financial institutions functioning in Sri Lanka are providing their Islamic banking services in line with the wealthy and wealthy individuals in the accounting institution community.
Allah says in the Quran the wealth should not be concentrated only to the rich. He tells us that economic activities should not be cantered on the rich.
انم انتام نذ انقزب سل نهز فهه م انقز مه أ رسن عه ا أفاء للا م م ابه انس ه م سا ما آتا ه الغىاء مىكم ل كن دنة ب
شذذ انعقاب إن للا اتقا للا م عى فاوتا ما وا سل فخذي انز
“And what Allah restored to His Messenger from the people of the towns - it is for Allah and for the
Messenger and for [his] near relatives and orphans and the [stranded] traveler - so that it will not be a perpetual distribution among the rich from among you. And whatever the Messenger has given you - take; and what he has forbidden you - refrain from. And fear Allah; indeed, Allah is severe in penalty” (Surah al-hashr: 07)
So there is a huge responsibility for each Islamic bank and financial institutions. The basic purpose of each of the banks and institutions is that everyone who is in the community should take on daily Islamic banking without having to pay their daily payments. They also have the responsibility to protect all those who are in the community from interest based on the needs and objectives of the farmers and the accounting agencies should also provide agricultural credit for each Islamic banking institution in the country.
Thus, every Islamic banking and accounting firms should introduce a system of agricultural loans to the benefit of farmers and introduce agricultural loans such as introduction of households such as home loan, land loan and leasing services in the Islamic way of Mudharaba, Murabaha, Musharaka and Salam. Agricultural credit is a direct profit but not indefinitely, however indirectly for the country's economy and Islamic banks. For example we can clearly understand it through GDP.
While the above recommendations are being implemented, there is an expectation that the farmers would be able to obtain agricultural loans in the community without any interest and able to utilize these funds in smoothly developing their farming measures. REFERENCES
1. Dr. Mahmoud Gulaid, A. (1995). Financing Agriculture through Islamic Modes and Instruments: Practical Scenarios and Applicability. Jeddah: Islamic Research and Training Institute Islamic Development Bank.
2. JeebanJyotiMohanty. (2017). Agriculture Credit Market in Odisha: A Source of Sustainable Livelihood for the Farmer. International Journal of Scientific and Research Publications,7(10) 291-301.
3. Joy Joseph, P. (1994). A study Of Agricultural and Rural Development Banks in Kerala with Special Reference to Funds Management (PhD Thesis). Cochin University of Science and Technology, Cochin – 22
4. Nepal rastra bank. (2014). Agricultural credit and its impact on farm productivity:A case study of kilali district. 5. Praburaj I. (2018). Role of Agriculture in the Economic Development of a Country. International Journal of
Commerce. Vol.6 (03), 01-05. Doi:10.5281/zenodo.1323056. https://www.researchgate.net/Publications/334645070_Role_of_Agriculture_in_the_Economic_Development_of_a_Country
6. Qi Zhou, Xiangfeng Chen and Shuting Li. (2018). Innovative Financial Approach for Agricultural Sustainability: A Case Study of Alibaba. China: School of Management, Fudan University.
7. Vanitha Prasannath. (2015). Impact of Agricultural Export on Economic Growth in Sri Lanka. Proceedings of National Symposium on Agriculture. Faculty of Science, Eastern University of Sri Lanka .p. 56 – 65. http://www.researcgate.net/publication/341130610
ISSN (Online): 2455-3662
EPRA International Journal of Multidisciplinary Research (IJMR) - Peer Reviewed Journal Volume: 7| Issue: 9| September 2021|| Journal DOI: 10.36713/epra2013 || SJIF Impact Factor 2021: 8.047 || ISI Value: 1.188
2021 EPRA IJMR | www.eprajournals.com | Journal DOI URL: https://doi.org/10.36713/epra2013 149
RELIGIOUS TOURISM: AN INSIGHT INTO THE ISLAMIC TOURISM OF TABLIGHI JAMAAT
Rameez Ahmad Lone Senior Research Fellow & Assistant Professor Contr., Department of Sociology,
GDC Sopore J & K -193198
Article DOI: https://doi.org/10.36713/epra8443 DOI No: 10.36713/epra8443
ABSTRACT
Islam is not merely the set of religious rituals or beliefs but a complete way of life. There is not even a single matter, no matter how peculiar, awkward or dull it may seem, about which Islam does not deals or directs. In all behind every act, including tourism, there is sole purpose seeking the pleasure of God-Almighty Allah, by following His commandments. Islam encourages travel or tourism and hospitable behavior, and unlike west connects it with the most sublime and honorable values and morals. It is in this backdrop, the focus of the present study is ‘Tablighi Jamaat’- an Islamic revival movement, founded by Maulana Ilyas in Mewat region near Delhi-India, around 1920’s. This movement has come to establish its presence surprisingly in and over one hundred and fifty countries throughout the world with a large number of adherents in between 100 to 150 million. This is principally, because of its unique ‘travel and tourism’ approach, which it has adopted as a daw‘ah (invitation towards Islam) methodology. Consequently and interestingly, because of this fact ‘the travel and tourism
approach,’ the movement has also been named as ‘travelers in faith’. This paper is primarily based on secondary sources and the main objective of the paper is to provide an insight into the religious tourism of Tablighi Jama‘at. KEY WORDS: Islam, Religious Tourism, Tablighi Jamaat, Tourism, Travelers.
INTRODUCTION
Islam and tourism are complimentary and not contradictory. The two are mutually reinforcing. However, the goals of tourism and travel in Islam are quite contradictory, to the goals of modern tourism industry especially the western, which primarily focus on more and more profit, without caring its evil effects or dark side like sex tourism, prostitution, gambling, alcoholism and other environmental impacts. Islam encourages travel or tourism and hospitable behavior, and unlike west connects it with most sublime and honorable values and morals. The main purpose of travelling in Islam besides spreading the word of Allah (or Islam), is to attain spiritual, social and physical goals. The verses of the Quran which deal with travel and tourism are: Al-Naml (The Ant): 69; Al Nahl (The Bee): 36; Al-Imran (The Amramites): 137; Al-Ankaboot (The Spider): 20; Al-An‟am (The
Livestock): 11; Al-Room (The Romans): 42/9; Ghafer (Forgiver): 82/21; Saba‟ (Sheba): 18; Muhammad:10;
Al-Mulk (Kingship): 15; Younus ( Joseph): 109; Al-Hajj (The Pilgrimage): 46; and Faater (Initiator): 44 (Yousuf Ali, 2005; Pickthall, 1976). The main lessons are that the beauty and bounty of God-Allah‟s creation enhances in submitting oneself completely to God-Almighty Allah, by reinforcing ones belief in Allah and in His greatness. Feeling weak or grasping the smallness before the greatness of God-Allah, in His creations improves faith in God-Allah. Travel or tourism enable Muslims to serve God happily and better, because it reduces stress on the one hand, and improves one‟s health and well being on the other. It is also one of the main ways to acquire knowledge which is obligatory in Islam for every men and women and is a test of perseverance and patience ((Zamani-Farahani & Henderson, 2010). According to Quran, the holy text of Islam, Muslims should travel so that they can grasp and appreciate the beauty of Almighty Allah‟s world;
and also visit their relatives and friends. Besides they must provide hospitality to the tourists or visitors who,

ISSN (Online): 2455-3662
EPRA International Journal of Multidisciplinary Research (IJMR) - Peer Reviewed Journal Volume: 7| Issue: 9| September 2021|| Journal DOI: 10.36713/epra2013 || SJIF Impact Factor 2021: 8.047 || ISI Value: 1.188
2021 EPRA IJMR | www.eprajournals.com | Journal DOI URL: https://doi.org/10.36713/epra2013 150
under Islamic Shariah (Islamic code of conduct) enjoy certain rights. (Okhovat, 2010).In addition to the above, the „dawa‟h
1 and seeking knowledge‟2 which are
obligatory upon every Muslim, men and women, young or old is impossible and incomplete, without some travel. Thus, „Tablighi Jamaat‟- a dawah or religious revival movement among Muslims have adopted „tour and
travelling‟ as their basic method in its call towards
Islam. Maulana Mohamad Ilyas required strictly from his Tablighi activists and followers that: (i). They should „tour‟ their neighbourhoods, and thereby must invite the people of their locality towards Islam. There they must preach about the fundamental principles of religion like „Kalimah‟
3 and Prayers. For this to be practised daily a proper method should be formed under the direction of a leader. (ii). That in every month, for preaching, Mewati‟s
4 or Tablighi activists should spend three days in travelling up-to a distance of five kilometres- which was referred as „kos‟ or „panch kosa‟ in Mewati parlance. There they should persuade local people to take „similar tours‟ for
the preaching. (iii). That they should spend forty days (also called one chillah) every year in „Tablighi tour‟ for their learning
and propagation of basic teachings of Islam among their fellow Muslims, and; (iv). That they should spent, at least four months or three chillah‟s once in a life for „tablghi work‟ and
should leave their homes for the learning and study of Islam (Haq, 1972).
From above, it seems clear, that „Tablighi Jamaat‟ is nothing but a „travelling and touring group‟
which travel for the propagation or renewal of basic fundamentals of their religion- Islam, among their fellow Muslim brothers. Thus they provide a unique instance of „religious tourism‟ A brief and precise discussion of their, origin, principles and methods of working in the light of „travel and tourism approach‟ is
given in the following pages.
1 http://aboutislam.net/counseling/ask-the-scholar/dawah-principles/giving-dawah-obligatory/ 2 . http://www.quranreading.com/blog/importance-of-seeking-knowledge-in-islam/ 3 . Kalimah which means, that „there is no God, but
Allah and Prophet Muhammad is His last messenger‟. Its sometimes also called as word of „shahada‟ or
testimony. 4 .Mewatis or Meos, are the residents of the Mewat region of Haryana, among whom Maulana Ilyas started his Tablghi project in 1920‟s.
TABLIGHI JAMAAT Tablighi Jamaat is one of the most prominent
Islamic missionary movements of 20th century Islam. The organization is said to be having a presence in between 150 to 200 countries, with its estimated adherents numbering between twelve million to one hundred fifty million, the majority of which are living in South Asia. It primarily focuses on making Muslims better and purer Muslims, and are having least concern in inviting non-Muslims to Islam. They are of the view that is quite illogical and irrational to preach others towards Islam, when Muslims are themselves not truly practising their own religion. So their prime focus is on the „renewal and rejuvenation of faith among their own fellow Muslims, through tabligh and through the „novel
method‟ of „travel and tourism‟. ORIGIN
The „Tablighi Jamaat‟ was founded by Maulana
Muhammad Ilyas in 1920‟s and was formally launched
either in 1926, or 1927.This movement came as a reaction against Shuddi and Sanghathan threat- which were busy in converting nau-Muslims to Hinduism. These Hindu revival movements were at peak in early 20th century and its leaders were not only calling to „forceful conversion‟ of all Indian Muslims but were
„openly‟ branding Islam as a „bloodthirsty‟ religion. It
is said, that these Hindu revival movements were successful to a large extent in conversion of neo-Muslims back to Hindu fold. It‟s in this approximate
context, Maulana Ilyas Muhammad „travelled‟ to
Mewat and started its „dawa‟ah‟ project among the Meos of Mewat (neo-Muslims) who were still practising their Hindu accredited customs or traditions, and which were under constant threat of Hindu revival movements. In the beginning, Ilyas is said to have formed various „madrasas‟ (religious schools) for his „dawah project‟ and among the Mewati‟s, but was soon disappointed with his „madrasa experience‟ which to
him were producing mere „religious functionaries‟ and
not „religious preachers‟ as he desired. So he opted for
„travel and tour‟ method, for direct and oral preaching among the Mewati‟s and enjoined his followers to
follow the same method among the other Muslims (Sikand, 2002; Lone, 2018; Agwani, 1986 )
However, the inspiration to launch the movement and to devote his life for preaching of Islam at the grass- roots level through travel and by visiting door to door came to Ilyas during his „second
pilgrimage‟ to Hijaz-Mecca in 1926. According to one chronicler of the movement, the principles of the „tabligh‟ were conveyed to Ilyas by divine revelation in the course of his sojourn in Mecca. On his return to
ISSN (Online): 2455-3662
EPRA International Journal of Multidisciplinary Research (IJMR) - Peer Reviewed Journal Volume: 7| Issue: 9| September 2021|| Journal DOI: 10.36713/epra2013 || SJIF Impact Factor 2021: 8.047 || ISI Value: 1.188
2021 EPRA IJMR | www.eprajournals.com | Journal DOI URL: https://doi.org/10.36713/epra2013 151
India, Ilyas started the practice of undertaking „preaching tours‟ and invited others to do likewise (Agwani, 1986:41).
PRICNCIPLES In its preaching „tour and travel‟ the members of the
Tablighi Jamaat are required to follow a certain set of six ideological principles‟ while presenting the dawah message before Muslims. These „six principles‟ are
called „chaii baatien‟ (six talks) in tablighi terminology. Similarly, Rameez Ahmad, mentions, Ilyas had advised, to form a mobile units of around ten persons which are required to „travel or visit‟ to various
places and would present their message in the light of „six principles‟ principles‟ in order to improve the
knowledge and faith of the local Muslims(Lone, 2018). These principles are: 1. „Kalima‟ or Shahadah‟ (which literally means
testimony, but here refers to the verse of the Quran which says: „there is no god, but God „Allah‟ and Muhammad is His messenger‟). The
recite of the Shahadah will eventually be obliged to ascertain God‟s commandments on all matters
concerning ones daily life. 2. „Namaaz‟ or prayers. Muslims offer five times
obligatory prayers daily. Tablighi activists are required to observe strictly prayers and are advised to call the local people to practice the same. In this principle members of the tablighi are instructed and learned about its various rules and composition.
3. „Ilm and Zikr‟ (which means knowledge and remembrance of God-Allah respectively). Attaining knowledge is obligatory in Islam and „zikr‟ „remembrance of Allah‟ is the best way to cultivate the „love of God Almighty Allah‟. The
practice of zikr purifies the heart and also increases knowledge. Various types of „zikr‟ are recommended in Tablighi literature, for its activists to practice.
4. „Ikram-i-Muslim‟ (respect for faithful or Muslim). A Muslim must show respect for and courtesy to fellow Muslims. A hate, grudge or being envious to Muslims is strictly objected.
5. „Ikhlaas-i-Niyat‟ (sincerity of „intention‟). All
good works like worshipping Allah or praying must be motivated by the wish or desire to please Allah alone and not to gain any public reputation or recognition.
6. „Taffrig-i-waqt‟ (means sparing of time). According to this principle Tablighi activists in particular and all Muslims in general must spare time in preaching and inviting people towards
Islam. This principle is also called „dawat-o-tabligh‟ that is, „inviting and preaching‟.
The sixth principle is the most important principle, because when this principle is practised, all other principles follow logically. When one spent‟s
time or „travels and tours‟ with the Tablighi Jamaat to various places, he naturally learns meanings and demands of other principles in the company of tablighi activists under the daily direction of „Ameer‟ or head (Haq, 1972; Agwani, 1986; Lone, 2018; Khan, 1986).
METHOD OF WORKING
The Maulana‟s method of working for this goal „of reviving the faith and fostering the relationship with God-Allah‟ was very simple. It was to revive the activities of the mosques on the pattern of the early days of Islam. „Movement and travel‟ were greatly
emphasized, as a means to make people truly religious. People were to be withdrawn for a time from their daily chores to share in the religious environment. There they were trained to urge others to follow the same path (undertaking preaching tours). And, when they returned home they were expected to retain their impression for a long time. It was expected that the religious and spiritual lessons, they had been taught, would be pursued by them in the mosques of their neighbourhood. This mosque oriented life „travelling from mosque to mosque‟ in itself as the Maulana saw
it, would ensure success in both the worlds. Besides regarding travelling for dawah, he
explained his point of view in a letter to one of his followers: “To learn to lead a truly religious life, whatever the sphere one belonged to, one was required to spare four months out of one‟s worldly engagements. During this period of travelling one had to preach the word of the God-Allah to all those, one came in contact with, on journeys to various places in and outside the country. The prophet‟s companions had thrown
themselves into the performing of this task with total dedication. Their activities centred on mosques, where they talked of the greatness of God-Allah which strengthened them in their faith. It was in the mosques that they learnt how to purify their actions. It was there that the fact that they were accountable to God-Allah for their deeds was indelibly impressed upon them. It was in the mosques also that the missionary groups were formed. People from all the walks of life gathered to remember the God-Allah in the mosques and came in contact with one another there. Now we must set ourselves the task of preparing others to share this responsibility of indoctrinating others with religious truths alongside their secular education. After having performed the outdoor activities they should not forget the learning they have gained in the process of
ISSN (Online): 2455-3662
EPRA International Journal of Multidisciplinary Research (IJMR) - Peer Reviewed Journal Volume: 7| Issue: 9| September 2021|| Journal DOI: 10.36713/epra2013 || SJIF Impact Factor 2021: 8.047 || ISI Value: 1.188
2021 EPRA IJMR | www.eprajournals.com | Journal DOI URL: https://doi.org/10.36713/epra2013 152
teaching, and they must continue those activities in the mosques of their own areas. It‟s our bounden duty to
draw their attention towards this gigantic task. At least one person in each family should devote a part of his time to this job. Such people should work in unison. The local parties must visit different local mosques in turn to impart religious education to those assembled therein. This will create an environment for religious activities. Afterwards they should cover and travel the mosques, situated outside their own settlements. The mosques situated at a distance should be visited once a month and their stay there should be for at least three days in the month. Almighty God Allah will generously reward them for these three days, the reward equal to thirty days of work. Those who devote three days to such work every month will be reckoned by God Allah as having served for the whole year (Khan, 1986). Likewise, Mumtaz Ahmad (Ahmad, 1991) mentions, “The method devised by Maulana Mohammad Ilyas
was to arrange mobile units of at least ten persons and send them to various villages. These „Tablighi‟ units, or groups, would travel a village and request the local people to assemble in the mosque, if there was one, or at any other meeting place, and would present their message in the form of the six demands”. While in Tablighi Jamaat, the members are required and instructed to spend at least three days in a month, forty days, in a year and four months once in a life while „travelling‟ with the Jamaat. Besides, they do not just make religious trips at local, village or state levels, but also travel from country to country and continent to continent.
According to the plan and method evolved by Maulana Ilyas, a preaching team must have an Ameer (leader), Mutakalim (speaker) and a Rahbar (guide). The size of the team may vary between a maximum of ten and a minimum of three members. An average team must contain both instructors and learners. The „Ameer‟ of course, provides leadership. He, however, must consult his colleagues, look after their needs and must inculcate among them an attitude of modesty. Everyone who could speak on the matter of the tabligh must have an opportunity to do so. The „Ameer‟ might appoint a
speaker or may do the job himself. If the speaker made a mistake while talking to individuals and groups in the target area, it was then, the responsibility of the „Ameer‟ to correct him in a discreet manner. The
speaker's task is to invite the Muslims of the target area to faith and to right conduct in as persuasive as a manner as he was capable of. The main emphasis, however, was to be on instructing people on how to perform ritual prayers and read the Quran correctly. Those of the team who knew should concentrate on teaching; and those who did not, on learning. The
guide, for this part, concerned himself with practical arrangements such as travel and cooking and others chores (Agwani, 1986).
Thus Ilyas laid down various guidelines for these „travelling‟ preaching teams. Besides, he believed that the work of religion could be promoted only by participating in the preaching tours and not by donating money. He, therefore, laid it down as a rule that each member of the preaching team should pay for his own travel and board. He was of the view that travel and emigration involve hardship, sacrifice and self-abnegation for the sake of God Allah‟s cause, and thus entitle one to divine succour (ibid, 43; Zainuddin, 2020).
CONCLUSION
In Islam it is not only permissible but religious obligation to tour and travel for spreading the message of Islam. Tablighi Jamaat- an Islamic, faith renewal movement provides a unique example such religious tourism‟ in the 21
st Century. The founder of the movement namely Maulana Muhamad Ilyas made „travel and tour‟ the fundamental principle of the
Jamaat. It‟s primarily because of this principle that the „Tablighi Jamaat‟ has become one of the prominent
Islamic movements throughout the world. In this article, an attempt has been made to
explore the religious tourism of „Tablighi Jamaat‟. It
has been found that, „travel and tourism‟ is one of the
fundamental principle and method of „Tablighi Jamaat‟
in its invitation to Islam. On the basis of this principle and the „much importance‟ they attach to it, one can
plainly and precisely name them as „travelers in faith‟.
Thus in nut shell, one can conclude that Tablighi Jamaat provides a unique example of Islamic religious tourism in the 21st century. REFRENCES
1. Agwani, M. . (1986). Islamic Fundamentalism in India. Chandigarh: Twenty-First Century India Society.
2. Ahmad, M. (1991). Islamic Fundamentalismin South Asia: The Jam‟at-i-Islami and the Tabligi Jamaat of South Asia. In M. E. Marty, R. S. Appleby, & S. Asia (Eds.), Fundamentalisms Observed. Chicago and London: Univrrsity of Chicago.
3. Bulandsahri, M. A. E. (1989). Six Fundamentals of Tabligh. New Dehli: Idara-i-Isha‟at-i-Diniyat.
4. Haq, S. A. (1972). The Faith Movement of Maulana Mohammad Ilyas. London: George Allen and Unwin.
5. Kadir, H.Din. (1989). Islam and Tourism: Patterns, Issues and Options, 16(4), 542-563.
6. Khan, W. (1986). Tabligh Movement. New Dehli:

ISSN (Online): 2455-3662
EPRA International Journal of Multidisciplinary Research (IJMR) - Peer Reviewed Journal Volume: 7| Issue: 9| September 2021|| Journal DOI: 10.36713/epra2013 || SJIF Impact Factor 2021: 8.047 || ISI Value: 1.188
2021 EPRA IJMR | www.eprajournals.com | Journal DOI URL: https://doi.org/10.36713/epra2013 153
the Islamic Centre. 7. Lone, R. A. (2018). Tablighi Jamaat : Ideological
Structure, 8(1), 1001–1011. 8. Masud, K. (2000). Travellers in Faith: Studies of
the Tablighi Jama‟at as a Transnational Islamic
Movement for Faith Renewal. Brill: Leiden. 9. Nadwi, S. A. H. A. (n.d.). Ilyas aur Unki Deni
Daw‟at. Deoband: Kutub Khana 10. Okhovat, H. (2010). A Study on Religious Tourism
Industry Management, Case Study: the Islamic Republic of Iran, International Journal of Academic Research, Vol. 2. No. 5. September 2010
11. Pickthall MW. (1976). The Glorious Quran (English & Arabic). Taheike Tarsile Quran Inc. Elmhurst, New York.
12. Sikand, Y. (2002). The Origins and Development of the Tablighi Jama‟at (1920-2000). New Dehli: Orient Longman.
13. Yusuf Ali A. 2005. The Meaning of the Holy Quran. Secretariat for Asia Assembly of Ulama: Selangor.
14. Zamani-Farhani, H., & Hendeson, J.C (2010). Islamic Tourism and Managing Tourism. Development in Islamic Societies: The cases of Iran and Saudi Arabia. International Journal of Tourism Research, 12(1), 79-89.
15. Zainuddin, S. (2020). Some Aspects of Society and Religious Movement among Muslims “The Case of
Tablighi Jamaat in Orissa.” Publications Division, Aligarh Muslim University.
ISSN (Online): 2455-3662
EPRA International Journal of Multidisciplinary Research (IJMR) - Peer Reviewed Journal Volume: 7| Issue: 9| September 2021|| Journal DOI: 10.36713/epra2013 || SJIF Impact Factor 2021: 8.047 || ISI Value: 1.188
2021 EPRA IJMR | www.eprajournals.com | Journal DOI URL: https://doi.org/10.36713/epra2013 154
THE ENVIRONMENTAL REALITY OF THE NAGA RIVER
IN CAMARINES SUR, PHILIPPINES: THE
PERCEPTIONS AND EXPERIENCES OF THE
RIVERSIDE HOUSEHOLDS
Mariel R. Estrella Ph.D. School of Graduate Studies, Partido State University
Article DOI: https://doi.org/10.36713/epra8422 DOI No: 10.36713/epra8422
ABSTRACT
The present study documented the early and current state of the Naga river by categorizing it in four decades of development. The timeline helped the respondents visualize the ideal state of the river which for them is worth conserving for the future generations. The study also identified the perceptions and experiences of the riverside households on the stresses and shocks, fears and anxiety, and benefits derived. The identification of environmental stresses and shocks constructed a reality map or a perception of environmental reality based on their experiences. Focus Group Discussion was conducted with 79 respondents in 5 of the 11 riverside barangays. These represented the upstream ,midstream, and downstream barangays. Key Informant Interview was done with 19 key people of the study. Results of the FGD show that flood brought about by the typhoons and the heavy rains are their biggest shocks and stresses. As to fears and anxiety, the fear of floods had the highest and the least was the loss of a religious tradition. This concurs on the findings that floods are the primary environmental shock as perceived by the respondents. The identification of benefits determined the reasons on what holds the community to the river despite the threats. Topmost among the benefits was the river as source of livelihood and the least benefit was for recreation. KEYWORDS: Naga River, environmental reality, environmental stresses and shocks, fears and anxiety of the river, benefits of riverside households
The Naga river is located in Naga City, a city situated 377 kilometers southeast of Manila in the Philippines. Naga river traverses the city center. It stretches about 2.8 kilometers winding through 11 of the 27 barangays of the city. The Naga River is a water body that bisects the Naga City center. The river system originates from Mount Isarog in the north and drains to the Bicol River in the south.
Naga river used to be abundantly endowed with aquatic resources and people used to enjoy its bounty. The people’s attitude and behavior towards the river are
believed, however, to contribute to what the river is today. This why sharing their past experiences with the river helps to understand the present reality and to predict what might happen in the future. The environmental reality of Naga river, then, is the people’s experiences with the river as it relates to their way of life.
Perceptions of the river vary among individuals. Tarranum, F. et.al. (2018) stated that people perceive the river Yamuna in India in a non-scientific way. They perceive the river through their senses (sensorial) and according to the uses of the river (heuristic). The perception of respondents on sources of pollution in the river is shaped by personal experiences. The risk perception on the pollution in the river due to anthropogenic activities was found to be linked to their direct dependence on the river for their daily needs. The children in the study of Tunstall, S, et.al. (2007), on the other hand, recognized the aesthetic appeal of the river and the dangers of pollution. They also recognized the river as their play area giving them varied, adventurous and manipulable play opportunities. But they expressed they want the river to be cleaner, safer, more accessible, and properly managed.
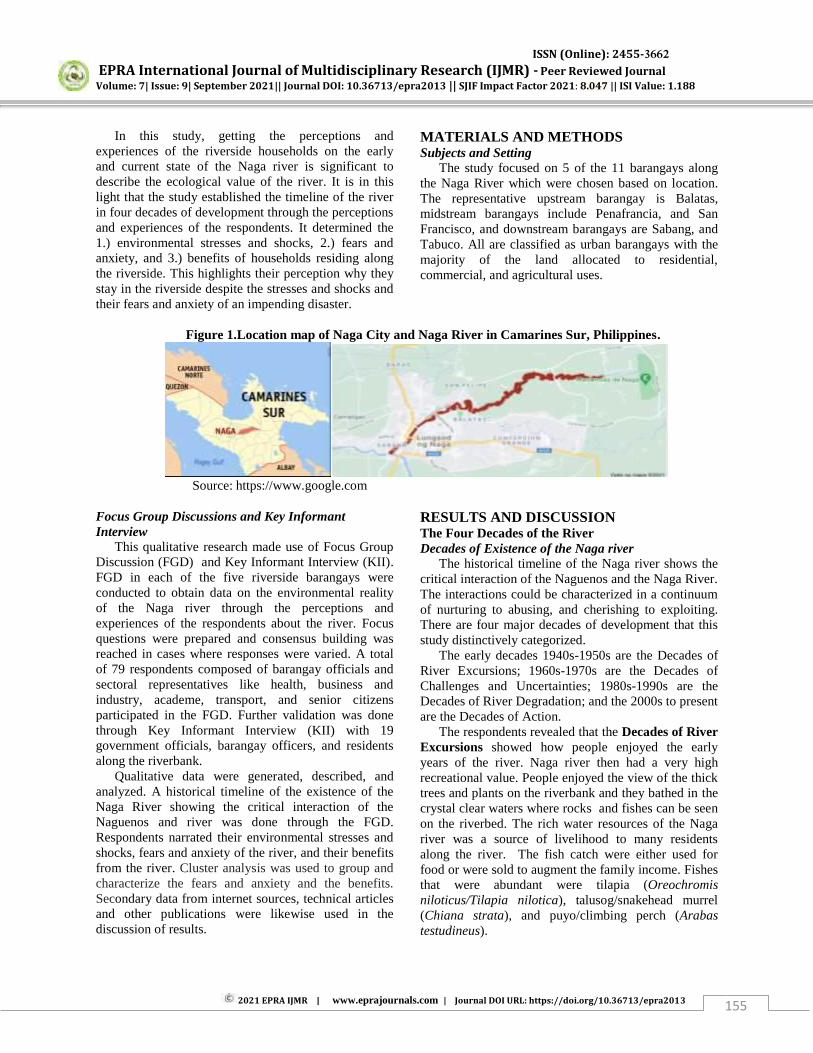
ISSN (Online): 2455-3662
EPRA International Journal of Multidisciplinary Research (IJMR) - Peer Reviewed Journal Volume: 7| Issue: 9| September 2021|| Journal DOI: 10.36713/epra2013 || SJIF Impact Factor 2021: 8.047 || ISI Value: 1.188
2021 EPRA IJMR | www.eprajournals.com | Journal DOI URL: https://doi.org/10.36713/epra2013 155
In this study, getting the perceptions and experiences of the riverside households on the early and current state of the Naga river is significant to describe the ecological value of the river. It is in this light that the study established the timeline of the river in four decades of development through the perceptions and experiences of the respondents. It determined the 1.) environmental stresses and shocks, 2.) fears and anxiety, and 3.) benefits of households residing along the riverside. This highlights their perception why they stay in the riverside despite the stresses and shocks and their fears and anxiety of an impending disaster.
MATERIALS AND METHODS Subjects and Setting
The study focused on 5 of the 11 barangays along the Naga River which were chosen based on location. The representative upstream barangay is Balatas, midstream barangays include Penafrancia, and San Francisco, and downstream barangays are Sabang, and Tabuco. All are classified as urban barangays with the majority of the land allocated to residential, commercial, and agricultural uses.
Figure 1.Location map of Naga City and Naga River in Camarines Sur, Philippines.
Source: https://www.google.com
Focus Group Discussions and Key Informant Interview
This qualitative research made use of Focus Group Discussion (FGD) and Key Informant Interview (KII). FGD in each of the five riverside barangays were conducted to obtain data on the environmental reality of the Naga river through the perceptions and experiences of the respondents about the river. Focus questions were prepared and consensus building was reached in cases where responses were varied. A total of 79 respondents composed of barangay officials and sectoral representatives like health, business and industry, academe, transport, and senior citizens participated in the FGD. Further validation was done through Key Informant Interview (KII) with 19 government officials, barangay officers, and residents along the riverbank.
Qualitative data were generated, described, and analyzed. A historical timeline of the existence of the Naga River showing the critical interaction of the Naguenos and river was done through the FGD. Respondents narrated their environmental stresses and shocks, fears and anxiety of the river, and their benefits from the river. Cluster analysis was used to group and characterize the fears and anxiety and the benefits. Secondary data from internet sources, technical articles and other publications were likewise used in the discussion of results.
RESULTS AND DISCUSSION The Four Decades of the River Decades of Existence of the Naga river
The historical timeline of the Naga river shows the critical interaction of the Naguenos and the Naga River. The interactions could be characterized in a continuum of nurturing to abusing, and cherishing to exploiting. There are four major decades of development that this study distinctively categorized.
The early decades 1940s-1950s are the Decades of River Excursions; 1960s-1970s are the Decades of Challenges and Uncertainties; 1980s-1990s are the Decades of River Degradation; and the 2000s to present are the Decades of Action.
The respondents revealed that the Decades of River Excursions showed how people enjoyed the early years of the river. Naga river then had a very high recreational value. People enjoyed the view of the thick trees and plants on the riverbank and they bathed in the crystal clear waters where rocks and fishes can be seen on the riverbed. The rich water resources of the Naga river was a source of livelihood to many residents along the river. The fish catch were either used for food or were sold to augment the family income. Fishes that were abundant were tilapia (Oreochromis niloticus/Tilapia nilotica), talusog/snakehead murrel (Chiana strata), and puyo/climbing perch (Arabas testudineus).
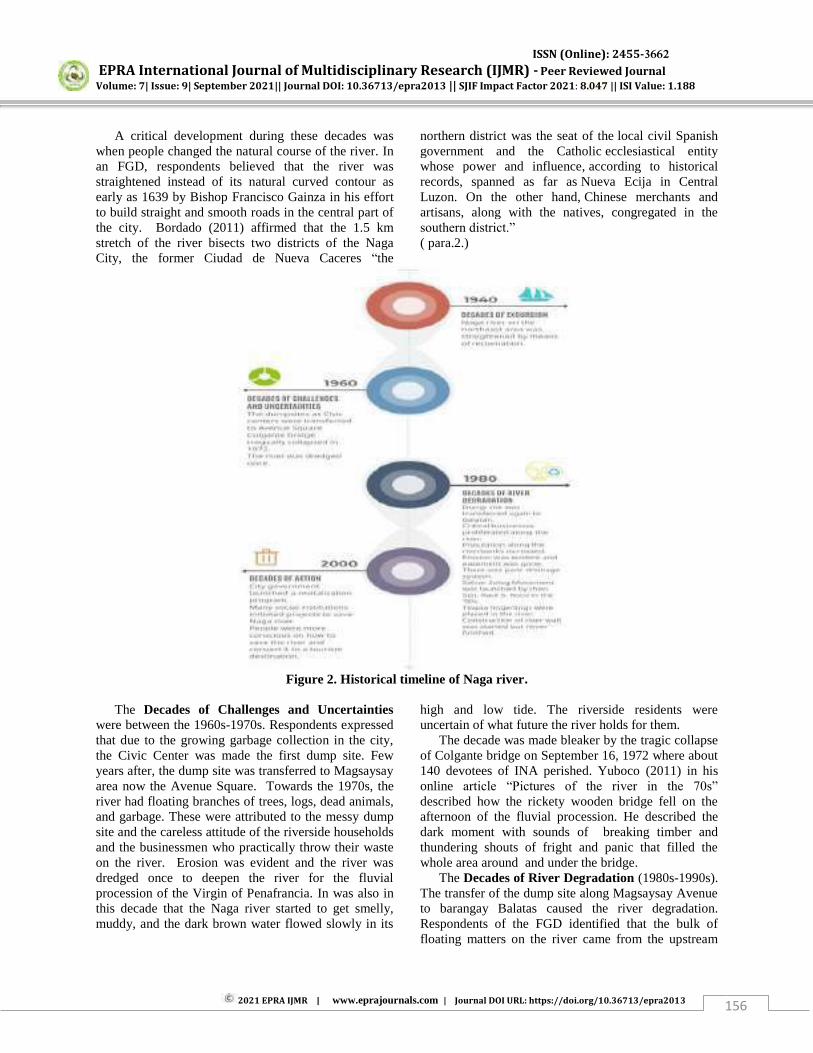
ISSN (Online): 2455-3662
EPRA International Journal of Multidisciplinary Research (IJMR) - Peer Reviewed Journal Volume: 7| Issue: 9| September 2021|| Journal DOI: 10.36713/epra2013 || SJIF Impact Factor 2021: 8.047 || ISI Value: 1.188
2021 EPRA IJMR | www.eprajournals.com | Journal DOI URL: https://doi.org/10.36713/epra2013 156
A critical development during these decades was when people changed the natural course of the river. In an FGD, respondents believed that the river was straightened instead of its natural curved contour as early as 1639 by Bishop Francisco Gainza in his effort to build straight and smooth roads in the central part of the city. Bordado (2011) affirmed that the 1.5 km stretch of the river bisects two districts of the Naga City, the former Ciudad de Nueva Caceres “the
northern district was the seat of the local civil Spanish government and the Catholic ecclesiastical entity whose power and influence, according to historical records, spanned as far as Nueva Ecija in Central Luzon. On the other hand, Chinese merchants and artisans, along with the natives, congregated in the southern district.” ( para.2.)
Figure 2. Historical timeline of Naga river.
The Decades of Challenges and Uncertainties
were between the 1960s-1970s. Respondents expressed that due to the growing garbage collection in the city, the Civic Center was made the first dump site. Few years after, the dump site was transferred to Magsaysay area now the Avenue Square. Towards the 1970s, the river had floating branches of trees, logs, dead animals, and garbage. These were attributed to the messy dump site and the careless attitude of the riverside households and the businessmen who practically throw their waste on the river. Erosion was evident and the river was dredged once to deepen the river for the fluvial procession of the Virgin of Penafrancia. In was also in this decade that the Naga river started to get smelly, muddy, and the dark brown water flowed slowly in its
high and low tide. The riverside residents were uncertain of what future the river holds for them.
The decade was made bleaker by the tragic collapse of Colgante bridge on September 16, 1972 where about 140 devotees of INA perished. Yuboco (2011) in his online article “Pictures of the river in the 70s”
described how the rickety wooden bridge fell on the afternoon of the fluvial procession. He described the dark moment with sounds of breaking timber and thundering shouts of fright and panic that filled the whole area around and under the bridge.
The Decades of River Degradation (1980s-1990s). The transfer of the dump site along Magsaysay Avenue to barangay Balatas caused the river degradation. Respondents of the FGD identified that the bulk of floating matters on the river came from the upstream
ISSN (Online): 2455-3662
EPRA International Journal of Multidisciplinary Research (IJMR) - Peer Reviewed Journal Volume: 7| Issue: 9| September 2021|| Journal DOI: 10.36713/epra2013 || SJIF Impact Factor 2021: 8.047 || ISI Value: 1.188
2021 EPRA IJMR | www.eprajournals.com | Journal DOI URL: https://doi.org/10.36713/epra2013 157
barangay Balatas which is so called the “Smokey
Mountain” of Naga City. The study further relates the river degradation to the increasing population in the city particularly along the riverbanks. As the population increased, there were more residential houses and business establishments built near the riverbank mostly with poor drainage system. In fact, the FGD respondents confirmed that most households did not construct septic tanks instead toilet and kitchen wastes flow directly to the river. The study further noted that in this decade, many business establishments were opened very near or even along the riverbank. Among the identified critically harmful establishments to the state of the river were the Alatco/Philtranco bus terminal located in barangay San Francisco, fishing business in barangay Tabuco, junk shop, calesas, lumber, eateries and piggeries in Dayangdang. Respondents in the FGD particularly expressed their concern on the flowing gasoline residue and oil spill coming from the bus terminal which they connected to the pollution and the oily and muddy taste of the fishes. In the 5 FGDs conducted, the respondents narrated the malpractice of a local sludge extractor company. There was a time in this decade that the sludge collected was drained in the Naga river. It was done once but it was the major pollutant in the river.
Easement problem was also evident because of the heavy erosion brought about by typhoons and the natural course of the river. While the respondents know that they have 3-4-meter easement from the riverbank, there was a confusion as to where it is counted because of the heavy erosion over the years.
Significant initiatives were done to address the degradation problem. Among these were the “Salvar
Salog Movement” initiated by then Senator Raul S.
Roco in 1993. To increase the fish catch, tilapia fingerlings were released in the river. To address erosion problem, river wall locally called “riprap” was likewise started although unfinished in most parts. Despite these efforts, however, the respondents specifically cited their fear on the damaged river wall along the Sto. Nino Memorial Park. For them, the cemetery residues negatively impact the quality of the Naga river. It is also in these decades that water appeared turbid, greenish and dark brown coupled with a smell of gasoline, fish, and mud. Fish catch dwindled and the fishes started to die. Those who took a bath or swam in the river got skin diseases.
With a common vision of rehabilitating the Naga River, the Decades of Action (2000s to present) show the effort of the City Government and other concerned groups to revitalize the river. The Revitalization program was launched by the City Government of Naga and researches to improve the condition of the
Naga river were conducted by mostly academe, NGOs, and other international organizations.
Among the significant initiatives of the City Government was the Reactivation of the Salvar Salog Clean Up Drive which is a regular clean-up of the Naga River that started in the early 1990s. A major effort to revitalize the river was the Feasibility Study on the Integrated Naga River Revitalization Project (INRRP) in 2012. Supported by the CDIA, it identified viable subprojects like River Walk, Flood Mitigation and Drainage, Sanitation, Solid Waste, and Isla Sison as a relocation site. Naga river was also identified as a means of transport and a tourism destination. Another was the relocation of the riverside residents particularly under the bridge of Magsaysay, Colgante, Delfin Rosales, and Tabuco. At present there are four relocation sites in Naga City namely Sitio Salunguigui in Cararayan; Zone 9 in Green Park, Pacol; San Rafael, Balatas; and Pagdaicon, Mabolo. (Naga Smiles Magazine, Vol. 1, No. 1, Sept. 2010 and HSDO)
FGD results also show that during the decades of action, the residents were more conscious on how to save the river and they are looking forward to converting the Naga river as a formal means of transport and as a Tourism destination. They noted that in mid 2000s, water became much clearer with less floating matters. The odor is more tolerable than the previous decades.
This timeline largely shows the attitude, motivation and cultural convictions of the riverbank residents where they turned the current state of the river into their future perceptions. The respondents were reconnecting with the Naga river being the immediate stewards of the environment. Perceptions and experiences of the riverside households
Perception is a personal thing, it is a person’s map
of reality. This reality map is a result of the person’s
own values, beliefs, and experiences. Through perception, a person becomes aware of his reality and gain understanding of a certain phenomenon.
Environmental stresses and shocks
The identification of environmental stresses and shocks is designed to construct a reality map or a perception of environmental reality based on the experiences of the respondents.
The FGD sessions in the five barangays indicated that the biggest environmental shock and stress is the flood caused by the regular typhoons and heavy rains. The general adverse effects on the respondents are on their lives and properties. Loss of lives was noted where 5 were drowned in Penafrancia and about 5 and
ISSN (Online): 2455-3662
EPRA International Journal of Multidisciplinary Research (IJMR) - Peer Reviewed Journal Volume: 7| Issue: 9| September 2021|| Journal DOI: 10.36713/epra2013 || SJIF Impact Factor 2021: 8.047 || ISI Value: 1.188
2021 EPRA IJMR | www.eprajournals.com | Journal DOI URL: https://doi.org/10.36713/epra2013 158
10 became sick in Tabuco and Sabang, respectively, due to the river floods.
Properties include houses, businesses, and domestic animals. The study shows that 60-75% of the businesses are affected particularly in barangay Penafrancia, and Sabang. The affected businesses were bamboocraft, piggery, lumber, junk shop, and car repair shop. Damage to property is most severe with houses made of light materials which were washed away in Sabang, Penafrancia and San Francisco. This also included the loss of domestic animals like pigs, dogs, chickens, and horses of the respondents in barangay Tabuco, and Penafrancia.
These barangays were the same areas confirmed by DDRMO as Flood Prone Barangays, from where populations at risk are not only by those who lived by the riverbanks but the whole barangay. On the other hand, DDRMO has developed infrastructural mitigation to minimize the effect of floods as well as updated Flood Hazard Maps. (SDP-DDRMO 2012). Other researches further support the findings of this study. Guarin (2008) described that the flooding that occurs in the low lying areas of Mabolo and Triangulo in Naga City as seriously jeopardizing by obstructing the residents in terms of their mobility, provision of medicines, food and relief from outside. The damage surveys and rapid assessments done by the Department of Social Work Welfare (DSWD) and the Office of the City Mayor (1998) show that the number of casualties reported were 10 persons perished by drowning, hypothermia, cardiac arrest and fetal death as a result of Typhoon Loleng. The reported damaged houses were 8,634 from which nearly 1,700 or 16 percent were reported as totally damaged. Typhoon Unding and Yoyong struck the city in 2004 and a total 1,974 houses were reported as totally damaged, 1,026 as heavily
damaged, and some 8,218 partially damaged. Displaced residents accounted to nearly 55,000 (almost 11,218) and 4 casualties (cited CDMO, 2004). Fears and Anxiety
The drawing of fears and anxiety is designed to establish perceptions of what may happen in the future as manifested by threats of which is a consequence of environmental stresses and shocks. Among the fears, the fear of floods had the highest 88% and the least 12% is the loss of a religious tradition. This data concur with the findings that floods are the primary environmental shocks as perceived by the respondents.
The data also show that fear of losing a religious tradition, although among the least feared and cause of anxiety, connotes a strong cultural attachment to the religious event. Its loss due to a dying river provides a strong bio-physical and socio-cultural connectivity among the communities.
In the FGDs, the respondents expressed high level of apprehension due to the occurrence of floods. The respondents further clustered their sub fears which are 1.) Threat to life. The respondents experienced family members or neighbors drown, got illnesses and diseases due to flood, and sometimes snakes settle in their houses when the water subsides. 2) Loss of livelihood. This results to no income to buy basic needs and minimal or no food for the family. 3)Loss of shelter. This compels them to stay in evacuation areas with poor facilities and oftentimes result to the spread of diseases, and 4) Soil erosion. This results in destruction of easement, riverbanks, riverwalls and rails. Soil erosion also cause the river to become shallow making it impossible for the annual fluvial procession to proceed during low tide.
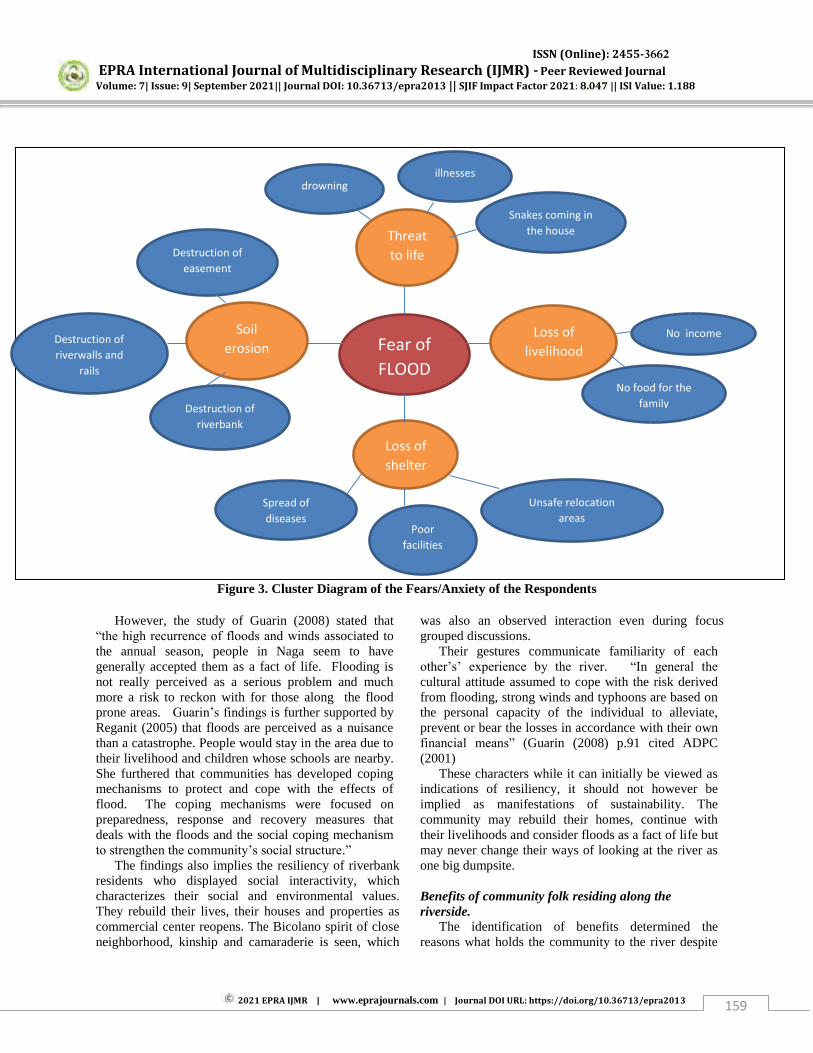
ISSN (Online): 2455-3662
EPRA International Journal of Multidisciplinary Research (IJMR) - Peer Reviewed Journal Volume: 7| Issue: 9| September 2021|| Journal DOI: 10.36713/epra2013 || SJIF Impact Factor 2021: 8.047 || ISI Value: 1.188
2021 EPRA IJMR | www.eprajournals.com | Journal DOI URL: https://doi.org/10.36713/epra2013 159
Figure 3. Cluster Diagram of the Fears/Anxiety of the Respondents However, the study of Guarin (2008) stated that
“the high recurrence of floods and winds associated to the annual season, people in Naga seem to have generally accepted them as a fact of life. Flooding is not really perceived as a serious problem and much more a risk to reckon with for those along the flood prone areas. Guarin’s findings is further supported by Reganit (2005) that floods are perceived as a nuisance than a catastrophe. People would stay in the area due to their livelihood and children whose schools are nearby. She furthered that communities has developed coping mechanisms to protect and cope with the effects of flood. The coping mechanisms were focused on preparedness, response and recovery measures that deals with the floods and the social coping mechanism to strengthen the community’s social structure.”
The findings also implies the resiliency of riverbank residents who displayed social interactivity, which characterizes their social and environmental values. They rebuild their lives, their houses and properties as commercial center reopens. The Bicolano spirit of close neighborhood, kinship and camaraderie is seen, which
was also an observed interaction even during focus grouped discussions.
Their gestures communicate familiarity of each other’s’ experience by the river. “In general the
cultural attitude assumed to cope with the risk derived from flooding, strong winds and typhoons are based on the personal capacity of the individual to alleviate, prevent or bear the losses in accordance with their own financial means” (Guarin (2008) p.91 cited ADPC (2001)
These characters while it can initially be viewed as indications of resiliency, it should not however be implied as manifestations of sustainability. The community may rebuild their homes, continue with their livelihoods and consider floods as a fact of life but may never change their ways of looking at the river as one big dumpsite. Benefits of community folk residing along the riverside.
The identification of benefits determined the reasons what holds the community to the river despite
Fear of
FLOOD
Soil
erosion
Threat
to life
Loss of
shelter
Loss of
livelihood
drowning illnesses
Snakes coming in
the house
No income
No food for the family
Unsafe relocation areas
Poor
facilities
Spread of
diseases
Destruction of
easement
Destruction of
riverwalls and
rails
Destruction of riverbank
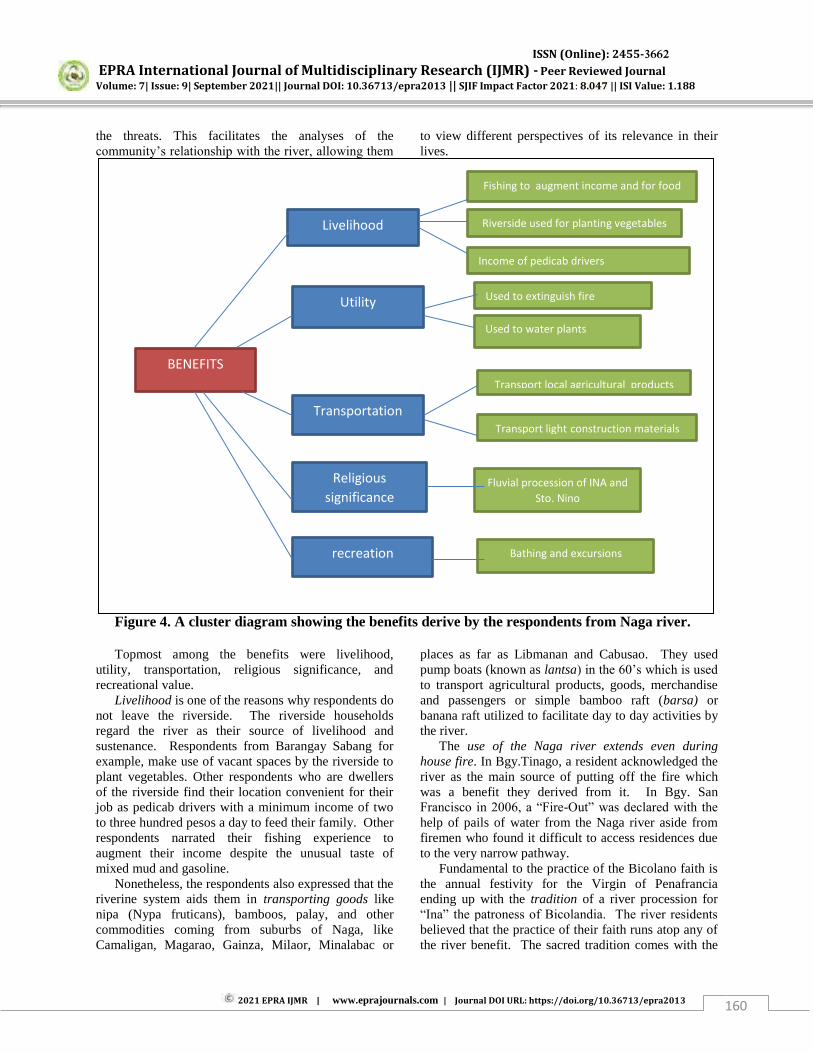
ISSN (Online): 2455-3662
EPRA International Journal of Multidisciplinary Research (IJMR) - Peer Reviewed Journal Volume: 7| Issue: 9| September 2021|| Journal DOI: 10.36713/epra2013 || SJIF Impact Factor 2021: 8.047 || ISI Value: 1.188
2021 EPRA IJMR | www.eprajournals.com | Journal DOI URL: https://doi.org/10.36713/epra2013 160
the threats. This facilitates the analyses of the community’s relationship with the river, allowing them
to view different perspectives of its relevance in their lives.
Figure 4. A cluster diagram showing the benefits derive by the respondents from Naga river. Topmost among the benefits were livelihood,
utility, transportation, religious significance, and recreational value.
Livelihood is one of the reasons why respondents do not leave the riverside. The riverside households regard the river as their source of livelihood and sustenance. Respondents from Barangay Sabang for example, make use of vacant spaces by the riverside to plant vegetables. Other respondents who are dwellers of the riverside find their location convenient for their job as pedicab drivers with a minimum income of two to three hundred pesos a day to feed their family. Other respondents narrated their fishing experience to augment their income despite the unusual taste of mixed mud and gasoline.
Nonetheless, the respondents also expressed that the riverine system aids them in transporting goods like nipa (Nypa fruticans), bamboos, palay, and other commodities coming from suburbs of Naga, like Camaligan, Magarao, Gainza, Milaor, Minalabac or
places as far as Libmanan and Cabusao. They used pump boats (known as lantsa) in the 60’s which is used
to transport agricultural products, goods, merchandise and passengers or simple bamboo raft (barsa) or banana raft utilized to facilitate day to day activities by the river.
The use of the Naga river extends even during house fire. In Bgy.Tinago, a resident acknowledged the river as the main source of putting off the fire which was a benefit they derived from it. In Bgy. San Francisco in 2006, a “Fire-Out” was declared with the
help of pails of water from the Naga river aside from firemen who found it difficult to access residences due to the very narrow pathway.
Fundamental to the practice of the Bicolano faith is the annual festivity for the Virgin of Penafrancia ending up with the tradition of a river procession for “Ina” the patroness of Bicolandia. The river residents
believed that the practice of their faith runs atop any of the river benefit. The sacred tradition comes with the
BENEFITS
Livelihood
Utility
Transportation
Religious
significance
recreation
Fluvial procession of INA and
Sto. Nino
Riverside used for planting vegetables
etablesvegetablesvegeta
Used to extinguish fire
Used to water plants
Transport local agricultural products
Transport light construction materials
Bathing and excursions
Fishing to augment income and for food
Income of pedicab drivers
ISSN (Online): 2455-3662
EPRA International Journal of Multidisciplinary Research (IJMR) - Peer Reviewed Journal Volume: 7| Issue: 9| September 2021|| Journal DOI: 10.36713/epra2013 || SJIF Impact Factor 2021: 8.047 || ISI Value: 1.188
2021 EPRA IJMR | www.eprajournals.com | Journal DOI URL: https://doi.org/10.36713/epra2013 161
conscious awareness that the river will continue to exist with it. This implies that behind the motivation of river sustainability is the perpetuation of the Bicolano’s religious culture. It is the Bicolano’s faith and tradition
that hinders the river state to rest in degradation. It can be further implied that their religious nature makes them the stewards of their river. According to the respondents of barangay Penafrancia they take care of it by watching out for the people who throw their garbage in the river. They are also concerned of erosion that can make their river shallow and be difficult for the passage of “Ina”. The ecological value of the river is emphasized through information disseminated by the local government.
FGD sessions revealed that the respondents are aware that a flowing river will stagnate when it becomes polluted and become the basin for waste disposal. As it is today, it is a big drainage system for the entire city where the sewage and effluents run through canals and ends up in the river. Hence, the presence of these river residents is a threat to the existence of the river ecosystem. Similar to the study of Tarranum, F. et.al. (2018), people perceive the river Yamuna in India in a non-scientific way. They perceive the river through their senses specifically according to the uses of the river. The respondents believed that the sources of pollution in the river are the anthropogenic activities which were found to be linked to their direct dependence on the river for their daily needs. In the present study, riverside residents of Naga City are directly dependent on the river for livelihood, domestic use, transport of goods, religious activities, and for recreation purposes.
At present, programs and projects of the city government are slowly educating the river respondents. However they are waiting for a more aggressive action to preserve the river. Their desire to cooperate in local projects, programs and campaigns must be viewed as an opportunity to address the changing environment of the Naga river. CONCLUSION
The present study documented the four decades of development of the Naga river through the experiences the respondents had with the river. The Decades of River Excursions (1940s-1950s) was when people felt the high recreational value of the Naga river. Significant in this decade was the straightening of the northeast part of the river instead of its natural curve to build straight and smooth roads in the central part of Naga City. The Decades of Challenges and Uncertainties (1960s-1970s) made the Civic Center the first dump site. Few years after, the dump site was transferred to Magsaysay area now the Avenue Square.
This was also the decade where Colgante Bridge collapsed in 1972 during the Traslacion which killed 140 devotees of INA, the Virgen de Penafrancia. The Decades of River Degradation (1980s-1990s) showed an intensified river degradation. The dump site along Magsaysay Avenue was transferred to barangay Balatas now the “Smokey Mountain” of Naga City. There was a proliferation of residential houses and business establishments which greatly contributed to the pollution. Initiatives to save the river were started primarily by the local government. The Decades of Action (2000s to present) intensified the rehabilitation efforts by the City Government and other concerned groups to revitalize the river. The Revitalization Program was launched, researches to improve the condition of the Naga river were conducted, Feasibility Study on the Integrated Naga River Revitalization Project (INRRP) in 2012 was conducted, Salvar Salog Clean Up Drive was revived, and the relocation of the riverside residents to four relocation sites was done in Naga City.
Perceptions and experiences were likewise determined in terms of shocks and stresses, fears and anxiety, and benefits they derive from the river. The biggest environmental shock and stress experienced by the riverside barangays is the flood brought about by typhoons and heavy rains. Fear of flood is also what the respondents fear most. The riverside households derive benefits from the Naga river which attach them to the river. The primary benefit is the river as a source of their livelihood. This is followed by as a means of transport, use in calamities like fire, a venue for religious activities, and for recreational purposes.
REFERENCES
1. Blog site of Ateneo de Naga, 1980. The Colgante Bridge Strategy. Sept. 16, 1972.
2. Bordado, G. H. (2011, May 30). Revitalizing the River. City Government of Naga. http://naga.gov.ph/naga-smiles-2/revitalizing-the-naga-river-2.
3. Cities Development Initiative for Asia. (2012, June 14). Executive Summary Naga Pre-Feasibility Study – River Revitalization. www.cdia.asia/2012/06/executive-summary-naga-pre-feasibility-study-river-revitalization/
4. City Government of Naga (2012). The Naga City Contingency Plan. https://carbonn.org/uploads/tx_carbonndata/Action%2016%20-%20Disaster%20Mitigations.pdf
5. DRRMO and CSWDO Naga City (2012). Risk and Hazard Survey.
6. INRRP 2012 Annex B.2 ‐ (Flood Management and Drainage).
7. Elcamel, Ernesto T. “MANAGING URBAN DISASTERS THE NAGA CITY EXPERIENCE ON
ISSN (Online): 2455-3662
EPRA International Journal of Multidisciplinary Research (IJMR) - Peer Reviewed Journal Volume: 7| Issue: 9| September 2021|| Journal DOI: 10.36713/epra2013 || SJIF Impact Factor 2021: 8.047 || ISI Value: 1.188
2021 EPRA IJMR | www.eprajournals.com | Journal DOI URL: https://doi.org/10.36713/epra2013 162
MITIGATION AND PLANNING”. Naga City Disaster Mitigation Project.Environmental Shocks: as Policy Drivers. citeseerx.ist.psu.edu/viewdoc/download?doi=10.1.1.8..
8. Executive Summary Naga Pre-feasibility Study – River Revitalization. CITIES DEVELOPMENT INITIATIVES FOR ASIA. www.cdia.asia/2012/06/executive-summary-naga-pre-feasibility-study-river-revitalization/
9. Huq, S. Environmental Shocks as Policy Drivers. http://citeseerx.ist.psu.edu/viewdoc/download?doi=10.1.1.8.7998&rep=rep1&type=pdf\
10. Naga River Revitalization Project. From Decision to Action and Results.Naga Smiles Magazine, Vol. 1, No. 1, Sept. 2010.
11. Neola, Jason B. Solid Waste Management Office steps up expanded mandate to keep Naga clean, green, and orderly. Naga SMILES Vol. 2 No. 3 p. 3. 2012.
12. Pasion, Cathy. (2007). Managing the Naga City River: Where to Go from Here.
13. Perez, J.B (Ed). (2010, September) Naga River Revitalization Project: From Decision to Action and Results. Naga Smiles Magazine, Vol. 1, No. 1.
14. Philippine Fish Species - List of Common Fish in the Philippines. (2011, May 27). http://philfoodie.blogspot.com/2011/05/philippine-fish.html.
15. Reganit, M. P. (2005). Analysis of Community’s
Coping Mechanisms in Relation to Floods: A Case Study in Naga City, Philippines.
16. The Filipino Traditional Roman Catholic. (2008). http://thefilipinotraditionalromancatholic.blogspot.com /2008/10/naga-to-be-pilgrim-city.html
17. Tarannum, Fawzia, Kansal, Arun, and Sharma, Prateek. (2018). Understanding public perception, knowledge and behaviour for water quality management of the river Yamuna in India. Official Journal of the World Water Council. April 2018. Volume 20, Issue 2 iwaponline.com
18. Tunstall, Sylvia, Tapsell, Susan & House, Margaret House (2007). Children's perceptions of river landscapes and play: what children's photographs reveal. Journal on Landscape Research. Volume 29, 2004 - Issue 2. www.tandfonline.com
19. Usamah, M. B (2005). Modeling Floods Events in the Lower Bicol Floodplain. https://webapps.itc. utwente.nl/librarywww/papers2005/msc/ereg/usamah.pdf
20. Victoria, A. (June 28,2009). Environmental Social Perception. Ezine Articles. http://ezinearticles.com/?Environmental-Social-Perception&id=2536990
21. USAID. (2006). Rapid Socio Ecological Assessment of the Okavango River Basin Communities in Kuando-Kubango Province, Angola. http://salvarsalog.blogspot.com/p/naga-river-rivatalization.html
ISSN (Online): 2455-3662
EPRA International Journal of Multidisciplinary Research (IJMR) - Peer Reviewed Journal Volume: 7| Issue: 9| September 2021|| Journal DOI: 10.36713/epra2013 || SJIF Impact Factor 2021: 8.047 || ISI Value: 1.188
2021 EPRA IJMR | www.eprajournals.com | Journal DOI URL: https://doi.org/10.36713/epra2013 163
INFLUENCE OF DUST OF INDUSTRIAL ENTERPRISES ON THE HUMAN BODY
Beshimov Yusufjon Saidovich Bukhara Engineering Technological Institute, Bukhara, Uzbekistan
ABSTRACT Air purification is one of the most important processes in production. Because human health and the prevention of occupational diseases are one of the main goals. During the processing of raw materials at industrial enterprises, toxic gases and dust are formed, which are considered dangerous to the human body. This article focuses on the centrifugal cyclone used for dust removal and the potential for dust removal is enormous. It has the principle of continuous and continuous operation depending on the concentration of dust. The article discusses a wide range of specific sources for dust formation, particle size, cleaning methods. KEY WORDS: microscopic dust, ultramicroscopic dust, dispersed system, aerosol, bronchitis, pneumoconiosis, cyclones, centrifugal motion, dusty air pressure, dust velocity.
INTRODUCTION Dust is very small particles of solid or liquid
that can circulate in the air. Clean air in production facilities is essential for the health of workers. When workers breathe in compressed air, the upper respiratory tract itches and the person involuntarily breathes shallowly, which negatively affects lung function and causes various diseases. Itching of the mucous membranes of the eyes in dusty rooms causes conjunctivitis, and at the same time dust particles are also a means of transferring tubercle bacilli and harmful bacteria. Coarser dust gets into the nose and throat. Fine dust enters the respiratory tract. When the air speed is lower than the speed of dust (size 0,1-10 mkm), dust particles slowly settle on the ground at a constant speed. The rotation speed of dust particles can be determined by the following Stokes formula:
where: Vr is the speed of dust particles, m/s;
r is the density of raw materials, kg/m3; d - particle diameter, μm.
The degree of harmful effect of dust on the human body depends on its size: - if dust particles with a size of 50 microns or more enter the upper respiratory tract, it will not cause harm; - if dust particles with a size of 10-50 microns penetrate deep into the respiratory tract, a very small amount of dust gets into the lungs: - if dust particles smaller than 10 microns enter the branches of the respiratory tract, they are dangerous to the body; - It is very dangerous
for dust particles less than 1 micron to enter the lungs. Because it causes silicosis. The harmfulness of dust depends on its size and chemical properties. Sanitary standards provide for the maximum allowable amount of dust (REC) in the air of workplaces:
1. For plant and animal dust containing 10 percent or more of free silicon oxide (II) (SiO2) -2 mg/m3;
2. For plant and animal dust containing up to 10% silicon oxide (II) (SiO2) - 4 mg/m3;
3. For plants and animals, mineral dust containing silicon oxide (II) (SiO2) in an amount of up to 2% - 6 mg/m3. For example, if at light industry enterprises the maximum allowable dust level is 4 mg/m3, air pollution at the workplace is 65-75 mg/m3 and 1,7% silicon oxide (II) (SiO2) is eighteen times higher than sanitary standards. According to the sanitary standards for the design of industrial enterprises, harmful substances are divided into five categories according to the degree of harm to the human body: MATERIALS AND METHODS
1 hazardous substances; 2 highly hazardous substances; 3 moderately hazardous substances; 4 hazardous substances; 5 Less hazardous substances (harmful gases and bacterial contaminants). In the process of processing raw materials for light industry, toxic gases are emitted along with harmful dust. Toxic gases are mainly extracted from waste water treatment plants. These gases include carbon dioxide,
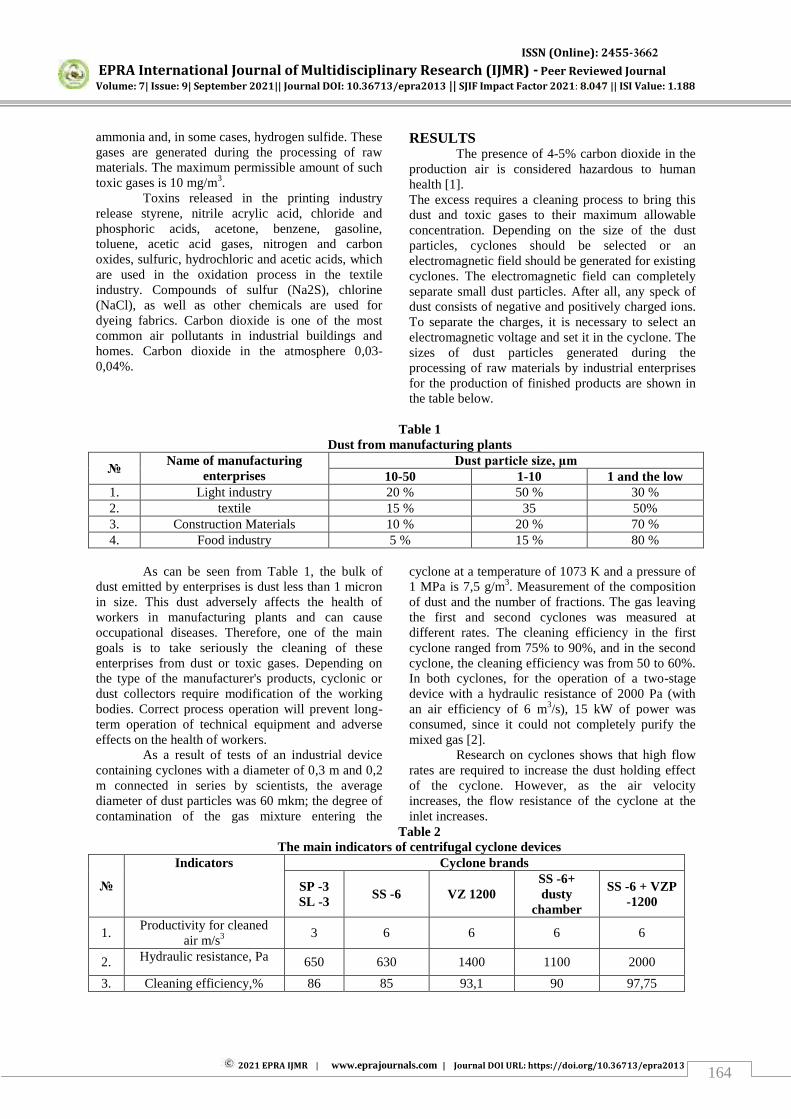
ISSN (Online): 2455-3662
EPRA International Journal of Multidisciplinary Research (IJMR) - Peer Reviewed Journal Volume: 7| Issue: 9| September 2021|| Journal DOI: 10.36713/epra2013 || SJIF Impact Factor 2021: 8.047 || ISI Value: 1.188
2021 EPRA IJMR | www.eprajournals.com | Journal DOI URL: https://doi.org/10.36713/epra2013 164
ammonia and, in some cases, hydrogen sulfide. These gases are generated during the processing of raw materials. The maximum permissible amount of such toxic gases is 10 mg/m3.
Toxins released in the printing industry release styrene, nitrile acrylic acid, chloride and phosphoric acids, acetone, benzene, gasoline, toluene, acetic acid gases, nitrogen and carbon oxides, sulfuric, hydrochloric and acetic acids, which are used in the oxidation process in the textile industry. Compounds of sulfur (Na2S), chlorine (NaCl), as well as other chemicals are used for dyeing fabrics. Carbon dioxide is one of the most common air pollutants in industrial buildings and homes. Carbon dioxide in the atmosphere 0,03-0,04%.
RESULTS The presence of 4-5% carbon dioxide in the
production air is considered hazardous to human health [1]. The excess requires a cleaning process to bring this dust and toxic gases to their maximum allowable concentration. Depending on the size of the dust particles, cyclones should be selected or an electromagnetic field should be generated for existing cyclones. The electromagnetic field can completely separate small dust particles. After all, any speck of dust consists of negative and positively charged ions. To separate the charges, it is necessary to select an electromagnetic voltage and set it in the cyclone. The sizes of dust particles generated during the processing of raw materials by industrial enterprises for the production of finished products are shown in the table below.
Table 1
Dust from manufacturing plants
№ Name of manufacturing
enterprises Dust particle size, μm
10-50 1-10 1 and the low 1. Light industry 20 % 50 % 30 % 2. textile 15 % 35 50% 3. Construction Materials 10 % 20 % 70 % 4. Food industry 5 % 15 % 80 %
As can be seen from Table 1, the bulk of
dust emitted by enterprises is dust less than 1 micron in size. This dust adversely affects the health of workers in manufacturing plants and can cause occupational diseases. Therefore, one of the main goals is to take seriously the cleaning of these enterprises from dust or toxic gases. Depending on the type of the manufacturer's products, cyclonic or dust collectors require modification of the working bodies. Correct process operation will prevent long-term operation of technical equipment and adverse effects on the health of workers.
As a result of tests of an industrial device containing cyclones with a diameter of 0,3 m and 0,2 m connected in series by scientists, the average diameter of dust particles was 60 mkm; the degree of contamination of the gas mixture entering the
cyclone at a temperature of 1073 K and a pressure of 1 MPa is 7,5 g/m3. Measurement of the composition of dust and the number of fractions. The gas leaving the first and second cyclones was measured at different rates. The cleaning efficiency in the first cyclone ranged from 75% to 90%, and in the second cyclone, the cleaning efficiency was from 50 to 60%. In both cyclones, for the operation of a two-stage device with a hydraulic resistance of 2000 Pa (with an air efficiency of 6 m3/s), 15 kW of power was consumed, since it could not completely purify the mixed gas [2].
Research on cyclones shows that high flow rates are required to increase the dust holding effect of the cyclone. However, as the air velocity increases, the flow resistance of the cyclone at the inlet increases.
Table 2 The main indicators of centrifugal cyclone devices
№
Indicators
Cyclone brands
SP -3 SL -3
SS -6 VZ 1200 SS -6+ dusty
chamber
SS -6 + VZP -1200
1. Productivity for cleaned
air m/s3 3 6 6 6 6
2. Hydraulic resistance, Pa 650 630 1400 1100 2000
3. Cleaning efficiency,% 86 85 93,1 90 97,75
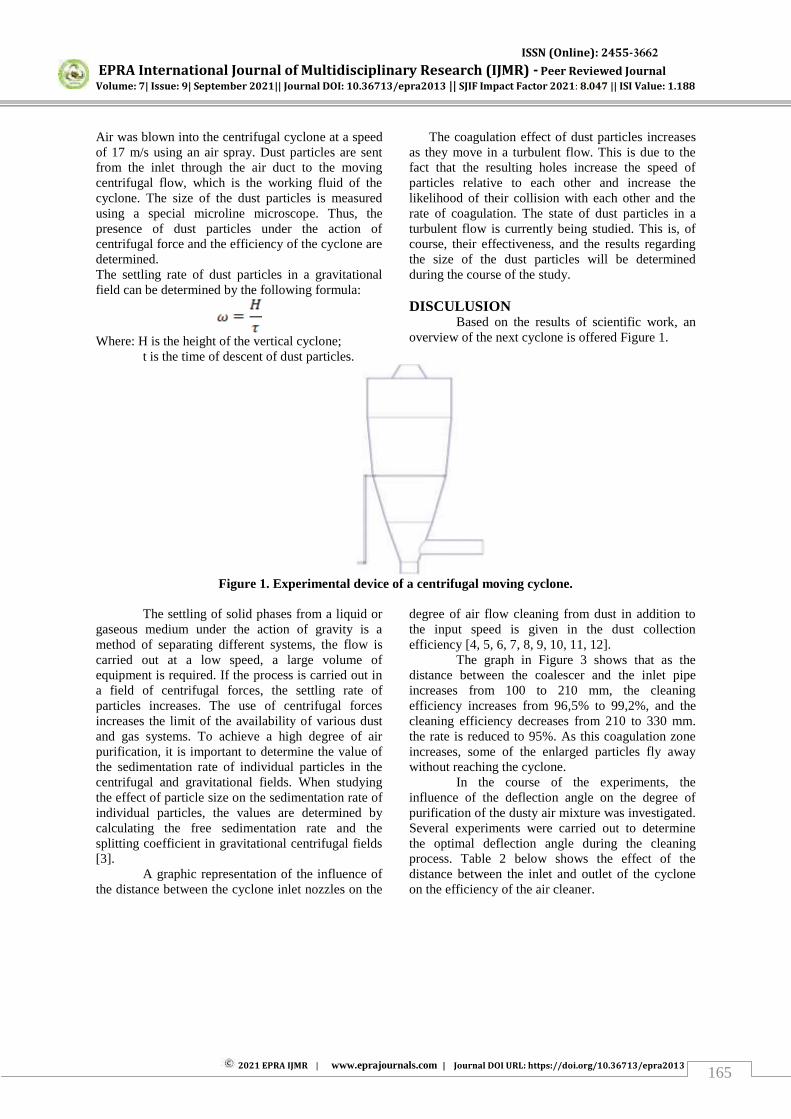
ISSN (Online): 2455-3662
EPRA International Journal of Multidisciplinary Research (IJMR) - Peer Reviewed Journal Volume: 7| Issue: 9| September 2021|| Journal DOI: 10.36713/epra2013 || SJIF Impact Factor 2021: 8.047 || ISI Value: 1.188
2021 EPRA IJMR | www.eprajournals.com | Journal DOI URL: https://doi.org/10.36713/epra2013 165
Air was blown into the centrifugal cyclone at a speed of 17 m/s using an air spray. Dust particles are sent from the inlet through the air duct to the moving centrifugal flow, which is the working fluid of the cyclone. The size of the dust particles is measured using a special microline microscope. Thus, the presence of dust particles under the action of centrifugal force and the efficiency of the cyclone are determined. The settling rate of dust particles in a gravitational field can be determined by the following formula:
Where: H is the height of the vertical cyclone;
t is the time of descent of dust particles.
The coagulation effect of dust particles increases as they move in a turbulent flow. This is due to the fact that the resulting holes increase the speed of particles relative to each other and increase the likelihood of their collision with each other and the rate of coagulation. The state of dust particles in a turbulent flow is currently being studied. This is, of course, their effectiveness, and the results regarding the size of the dust particles will be determined during the course of the study. DISCULUSION
Based on the results of scientific work, an overview of the next cyclone is offered Figure 1.
Figure 1. Experimental device of a centrifugal moving cyclone.
The settling of solid phases from a liquid or
gaseous medium under the action of gravity is a method of separating different systems, the flow is carried out at a low speed, a large volume of equipment is required. If the process is carried out in a field of centrifugal forces, the settling rate of particles increases. The use of centrifugal forces increases the limit of the availability of various dust and gas systems. To achieve a high degree of air purification, it is important to determine the value of the sedimentation rate of individual particles in the centrifugal and gravitational fields. When studying the effect of particle size on the sedimentation rate of individual particles, the values are determined by calculating the free sedimentation rate and the splitting coefficient in gravitational centrifugal fields [3].
A graphic representation of the influence of the distance between the cyclone inlet nozzles on the
degree of air flow cleaning from dust in addition to the input speed is given in the dust collection efficiency [4, 5, 6, 7, 8, 9, 10, 11, 12].
The graph in Figure 3 shows that as the distance between the coalescer and the inlet pipe increases from 100 to 210 mm, the cleaning efficiency increases from 96,5% to 99,2%, and the cleaning efficiency decreases from 210 to 330 mm. the rate is reduced to 95%. As this coagulation zone increases, some of the enlarged particles fly away without reaching the cyclone.
In the course of the experiments, the influence of the deflection angle on the degree of purification of the dusty air mixture was investigated. Several experiments were carried out to determine the optimal deflection angle during the cleaning process. Table 2 below shows the effect of the distance between the inlet and outlet of the cyclone on the efficiency of the air cleaner.
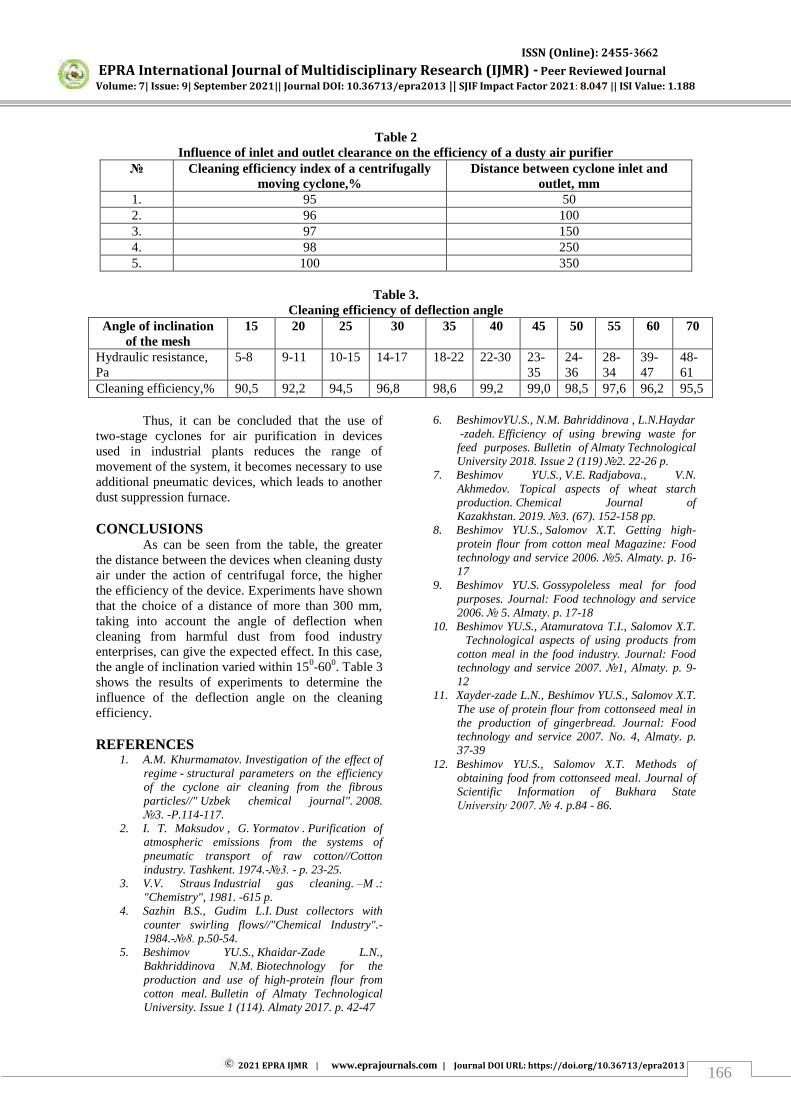
ISSN (Online): 2455-3662
EPRA International Journal of Multidisciplinary Research (IJMR) - Peer Reviewed Journal Volume: 7| Issue: 9| September 2021|| Journal DOI: 10.36713/epra2013 || SJIF Impact Factor 2021: 8.047 || ISI Value: 1.188
2021 EPRA IJMR | www.eprajournals.com | Journal DOI URL: https://doi.org/10.36713/epra2013 166
Table 2 Influence of inlet and outlet clearance on the efficiency of a dusty air purifier
№ Cleaning efficiency index of a centrifugally moving cyclone,%
Distance between cyclone inlet and outlet, mm
1. 95 50 2. 96 100 3. 97 150 4. 98 250 5. 100 350
Table 3.
Cleaning efficiency of deflection angle Angle of inclination
of the mesh 15 20 25 30 35 40 45 50 55 60 70
Hydraulic resistance, Pa
5-8 9-11 10-15 14-17 18-22 22-30 23-35
24-36
28-34
39-47
48-61
Cleaning efficiency,% 90,5 92,2 94,5 96,8 98,6 99,2 99,0 98,5 97,6 96,2 95,5
Thus, it can be concluded that the use of two-stage cyclones for air purification in devices used in industrial plants reduces the range of movement of the system, it becomes necessary to use additional pneumatic devices, which leads to another dust suppression furnace. CONCLUSIONS
As can be seen from the table, the greater the distance between the devices when cleaning dusty air under the action of centrifugal force, the higher the efficiency of the device. Experiments have shown that the choice of a distance of more than 300 mm, taking into account the angle of deflection when cleaning from harmful dust from food industry enterprises, can give the expected effect. In this case, the angle of inclination varied within 150-600. Table 3 shows the results of experiments to determine the influence of the deflection angle on the cleaning efficiency.
REFERENCES
1. A.M. Khurmamatov. Investigation of the effect of regime - structural parameters on the efficiency of the cyclone air cleaning from the fibrous particles//" Uzbek chemical journal". 2008. №3. -P.114-117.
2. I. T. Maksudov , G. Yormatov . Purification of atmospheric emissions from the systems of pneumatic transport of raw cotton//Cotton industry. Tashkent. 1974.-№3. - p. 23-25.
3. V.V. Straus Industrial gas cleaning. –M .: "Chemistry", 1981. -615 p.
4. Sazhin B.S., Gudim L.I. Dust collectors with counter swirling flows//"Chemical Industry".- 1984.-№8. p.50-54.
5. Beshimov YU.S., Khaidar-Zade L.N., Bakhriddinova N.M. Biotechnology for the production and use of high-protein flour from cotton meal. Bulletin of Almaty Technological University. Issue 1 (114). Almaty 2017. p. 42-47
6. BeshimovYU.S., N.M. Bahriddinova , L.N.Haydar -zadeh. Efficiency of using brewing waste for feed purposes. Bulletin of Almaty Technological University 2018. Issue 2 (119) №2. 22-26 p.
7. Beshimov YU.S., V.E. Radjabova., V.N. Akhmedov. Topical aspects of wheat starch production. Chemical Journal of Kazakhstan. 2019. №3. (67). 152-158 pp.
8. Beshimov YU.S., Salomov X.T. Getting high-protein flour from cotton meal Magazine: Food technology and service 2006. №5. Almaty. p. 16-17
9. Beshimov YU.S. Gossypoleless meal for food purposes. Journal: Food technology and service 2006. № 5. Almaty. p. 17-18
10. Beshimov YU.S., Atamuratova T.I., Salomov X.T. Technological aspects of using products from cotton meal in the food industry. Journal: Food technology and service 2007. №1, Almaty. p. 9-12
11. Xayder-zade L.N., Beshimov YU.S., Salomov X.T. The use of protein flour from cottonseed meal in the production of gingerbread. Journal: Food technology and service 2007. No. 4, Almaty. p. 37-39
12. Beshimov YU.S., Salomov X.T. Methods of obtaining food from cottonseed meal. Journal of Scientific Information of Bukhara State University 2007. № 4. p.84 - 86.
ISSN (Online): 2455-3662
EPRA International Journal of Multidisciplinary Research (IJMR) - Peer Reviewed Journal Volume: 7| Issue: 9| September 2021|| Journal DOI: 10.36713/epra2013 || SJIF Impact Factor 2021: 8.047 || ISI Value: 1.188
2021 EPRA IJMR | www.eprajournals.com | Journal DOI URL: https://doi.org/10.36713/epra2013 167
USAGE OF IDIOMS WITH THE CONCEPT “BLACK” IN THE ENGLISH AND KARAKALPAK LANGUAGES
Abdullaeva Dilbar
Assistant Teacher, Foreign Languages Department, Nukus State Pedagogical Institute Nukus, Karakalpakstan, Uzbekistan
Article DOI: https://doi.org/10.36713/epra8441 DOI No: 10.36713/epra8441
ABSTRACT The article deals with the importance of using idioms, peculiarities, semantic meanings, and formation of idiomatic expressions. In this article, idioms with the concept “black” in the English and Karakalpak languages have been analyzed and examples are provided. Comparative and descriptive methods analyses are used in this article. The article gives information about the problem of understanding and using idioms with foreign speakers lies in the definition of an idiom. Also, in the article, black color in the Karakalpak culture is explained and the reason of why this colour mostly associated with the negative concepts has been defined. KEY WORDS: idioms, black, English and Karakalpak language, idiomatic expressions.
INTRODUCTION The significance of theory on conceptual metaphor is extremely important while talking about idioms and their relationship with the culture. Dobrovolski and Piirainen [1] state that, each culture comprehends the same phenomenon in a different manner. They carried out an analysis of number perception in the English, Lithuanian and German languages. The same phenomenon was brought out by the means of a different number, even though the cultures are not so extremely diverse. Scholars suggest the idea that all the idioms were based on one conceptual metaphor “Happy is up”, however, number were chosen differently as different numbers have a historical significance in different cultures. For instance, number 7 is characteristic to Western cultures, whereas number nine is common to North-Europeans. Idioms as culture specific elements cause numerous problems not only in intercultural communication but also in translation. Language acquisition is usually related to the acquisition of foreign culture, as in many cases it helps to perceive the linguistic system in a better way. Moreover, each language possesses its individual peculiarities, all language have common elements. In this case, idioms as culture specific elements could be perceived in an easier way if the acquisition starts from common and comes to specific. Some linguists rely on the classification provided by Vinogradov. Indeed, his
input into the investigation of phraseology is significant and valid until nowadays. According to Gozdarev [2] the basis for Vinogradov’s
classification was the relationship between separate components of the phraseological unit with the overall meaning of an idiom, whereas such a relationship might be different. The latter observations led to the distinguishing of three major types of idioms in the following: 1) Analytical – the meaning of each component could be distinguished; 2) Synthetic – idioms possessing one synthetic meaning; a) Motivated by the direct meaning of the elements (phraseological unities); b) Not motivated by the direct meaning of the elements (phraseological fusions). LITERATURE REVIEW It might be a challenging task to define the notion of idioms. However, it is rather difficult to decide on the nature of idioms as well. As Seidl and McMordi state that a phrase has to be used for a long period of time to be called an idiom therefore possible ways for the idiom to enter the language should be discussed [7]. According to Seidl and McMordi it is important to stress the fact that idioms could be defined according to other criteria such as: 1) Idioms appear in formal as well as in the colloquial styles; 2) A whole unit possesses one meaning rather than words taken separately; 3) Parts
ISSN (Online): 2455-3662
EPRA International Journal of Multidisciplinary Research (IJMR) - Peer Reviewed Journal Volume: 7| Issue: 9| September 2021|| Journal DOI: 10.36713/epra2013 || SJIF Impact Factor 2021: 8.047 || ISI Value: 1.188
2021 EPRA IJMR | www.eprajournals.com | Journal DOI URL: https://doi.org/10.36713/epra2013 168
of idioms are not interchangeable; 4) Some idioms may be characterized as illogical and ungrammatical; 5) Long usage defines the phrase as an idiom [7]. When we refer to Jack, in many cases, it is possible to recognize the roots of idioms, in some cases, idioms originate from the historical events, in others idioms originate from unbelievable events but in most of the cases there is an explanation how one or another idiom ended up in the language use [3]. Also, Garcia stresses the fact that the major sources for the idiom formation are the following: literature, mythology, religion, folklore, and culture diversity [8]. The formation of idioms just like the formation of new words show that the language still functions. Referring to Gozdarev newly coined idioms have a special name – phraseological neologisms [2]. He notes that in most of the cases new idioms are coined by one person and are considered as phraseological units only when people start actively using it. The drawback of this phenomenon is that the authors of the idioms usually remain in the dark. Furthermore, Gozdarev notes that semantic classification depends on the level of motivation between the elements. Therefore, those three types of semantic classification are: phraseological collocations, phraseological unities and phraseological fusions [2]. However, if we consider the works of M. Qudaybergenov and Sh. Xojanov, this may not be true if we refer to the famous authors who also take part in the creation of phraseology, just like in the Karakalpak language: Berdakh, I.Uysupov, T.Qayipbergenov and J.Aymurzaev are accounted for a great source for phraseological neologisms [4]. Also, Qudaybergenov states that using idioms with contrastive meaning is one of the pecularities of Karakalpak culture. He stresses that idioms’
meanings could be compared in defining criteria of the components of antonymic idioms as idioms are distinguished with their specific components and sematic pecularities described in the respect of expression, as stable grammatical units which are learnt once and for all and used without reinvention. Semantic properties idioms can be paraphrased in one word. Taking into account the usage of idioms, they could be used in a particular lexical environment without which they cannot function as idioms. RESULTS AND DISCUSSION In the Karakalpak culture black colour is closely related to either hard life or hard work. The concept of difficult wellbeing is expressed through number of idioms and examples indicate this point of view. The example could also be ascribed to the group of bad living conditions as it expresses the idea of poor nutrition. The concept of hard work is expressed through idioms. Along with the hard life, black colour is used to express worries and sadness about danger. Black colour idioms could be used for
a character building describing negative aspects of a person. The description may start with the representation of a social class, black colour is used to describe people who belong to the lowest social strata, and physical appearance which involves such description as poorly-looking could be expressed with the help of the idiom. Personal characteristics such as being an extremely ill-natured person who is cruel to people and curse and scolds, being unfair to someone and being poor, gloomy and unsociable could be expressed with the help of the Karakalpak black colour idioms. In the following, we have analyzed some idioms using the concept “black” in the English and Karakalpak languages with some examples: 1. Black somebody’s eyes - birewdin’ ko’zin
ko’gertiw; For example: There was a man and he was bothering me and he wouldn’t stop and she glanced at Angus, and the laughter bubbled in her again, he made him go outside and blacked his eyes. (Catherine Cookson. The Round Tower). 2. Be in black - qara jamiliw, qayg’iriw; For instance: Why don’t you have a party at Christmas, lass , and come out of yourself ? As long as you still wear black you are still in the grave with him. Let the dead bury the dead, as the saying goes. (Catherine Cookson. Tilly Trotter widowed Part One). 3. A black ingratitude - duzin jep tuzlig’ina tu’piriw, jaqsiliq jaqpaw, da’m tatqan
qudiqqa tu’kiriw, jaqsiliqti bahalamaw; For instance: She answered with black ingratitude to my hospitality. 4. Black money - nizamsiz tu’rde yamasa
urliq penen, birewdi aldaw arqali tabilg’an aqsha. 5. Black sheep occurs in all families It is a small flock that has not a black sheep; For instance: There is a black sheep in every flock – Qara qoy barliq waqitta qorada boladi; Elde bir tentek ju’rmey me qoylardin’ shaytan menen
baylanisi bar. 6. Black and blue all over - ko’k qara
qoyday, birewdin’ urg’aninan yamasa bir na’rsege uring’annan denesi ko’geriw (be, beat somebody). For example: My first husband, Captain Johnson used to trash me regularly. He was a man. He was handsome, six foot three and when he was drunk there was no holding him. It would be black and blue all over for days at a time. (Somerset Maugham.The moon and Sixpence). 7. A black frost - qara suwiq, qarsiz, izg’arli
suwiq. For example: And then there was the morning of the first really hard frost, a black frost. There was a patch of ice outside the door some yards long and impulsively I slid along it , much to my
ISSN (Online): 2455-3662
EPRA International Journal of Multidisciplinary Research (IJMR) - Peer Reviewed Journal Volume: 7| Issue: 9| September 2021|| Journal DOI: 10.36713/epra2013 || SJIF Impact Factor 2021: 8.047 || ISI Value: 1.188
2021 EPRA IJMR | www.eprajournals.com | Journal DOI URL: https://doi.org/10.36713/epra2013 169
parents’ amusement. (Catherine Cookson. The Hause of Men). 8. A black hen lays a white egg - qara tawiq aq ma’yek tuwadi, qara siyirdin’ su’ti aq boladi, shirayli emes bolg’ani menen ishki qa’siyeti jaqsi. 9. In black and white - aqqa qara basqanday aniq, alaqang’a salg’anday, aydan aniq
(get, have, put something, state). For example: If he wanted money, there was no money and accounts in black and white proved it. (Edward Behr. the Last Emperor). 10. Go into black - qara jamiliw, aza tutiw. For example: You know Leonard did not with me go into black or have the house mouring. 11. Prove that black is white, make out black was white - qarani aq dew, o’tirik so’ylew; For example: These men with their words and their cleverness, they could make out black was white. Therefore, the actions of treating politely could be presented with the contribution of black color as well. In addition, black colour could also be related to the positive phenomenon as it warns against being in touch with bad people as they can spoil good people. Black colour is usually associated with the colour of a yurt. Thus, Karakalpak people used to take their house when moving from one place to another has a figurative meaning “A big united family” darkness, therefore such idioms as and help to figuratively describe the class of people. One more meaning of black colour is connected with beauty: black-eyed, black-haired. Writers to portray girl’s quality 3 or more colours: black eye, black currant eye, eye like sheep, eyes like coal, black hair like silk. For example, if the girl’s eyes were big and black, such eyes were compared with currant. CONCLUSION Thus, an idiom is a phrase or an expression that has a figurative or sometimes literal meaning. Categorized as formulaic language, an idiom’s
figurative meaning is different from the literal meaning. There are thousands of idioms occurring frequently in all languages. As idioms are used in our everyday life and people use them unconsciously they may cause a lot of misunderstandings between the speakers of different languages. As Liu notes idioms are part of culture-specific elements [6], relying on Yoko idioms constantly cause communication breakdowns [9]. The problem of understanding and using idioms with non-native speakers lies in the definition of an idiom. We have seen that black color in the Karakalpak culture is mostly associated with the negative concepts, it reflects the temper of Karakalpak culture, culture where people work hard and still live hard, with the help of black color idioms it is possible to form a personality who belongs to the lowest social class, is bad looking, possesses a number of negative personal
traits. Moreover, black colour is treated as natural colour: colour of the earth, sign of prosperity. This philosophical notion meaning constancy, statics: “naked earth”, “common people”, “matchlock gun”,
“black horse”, “maid who does spade work”. Contrary concepts of darkness and clearness are expressed via black colour idioms. However, those are not the only contradictions of the black colour idioms, as they express the concept of everything, nothing and anything. REFERENCES
1. Dobrovolskiy D., Piirainen E. 2006. Cultural Knowledge and idioms. International Journal of English Studies. 6/1. pp. 27-41.
2. Gozdarev, Yu.A. Sovremenny Russkiy yazik: Leksikologiya i Frazeologiya.
3. Moskva-Rostov na Donu: Mart. 2009. pp. 212-340.
4. Jack A. 2004. Red Herrings and White Elephants. London: HarperCollins Publishers. p. 3.
5. Berdimuratov E. Ha’zirgi qaraqalpaq leksikologiyasi. Nukus, 1994. pp. 147-149.
6. Bespontovaya N.S. Yazikovoy determinism I Russkaya Frazelogiya. Moskva. 2010.
7. Liu D. Translation and Culture: Translating Idioms between English and Chinese from Cultural Perspective. Theory and Practice in Language Studies. 11/2: 2357-2362. 2012.
8. Seidl J., McMordie W. 1983. English Idioms and How to Use Them. Moscow: Vysšaja Škola. pp. 7.
9. Garcia M.J. Idiomatic Expressions Influenced by the Greek and Roman cultures. Memorias del vi foro de estudios en lenguas internacional. 2010. pp. 410-416.
10. Yoko I. 1993. The study of idioms and its application to ESL and intercultural communication, accessed November, 15. 2014, available from: http://scholarworks.sjsu.edu/cgi/viewcontent.cgi?article=1628&context=etd_these.
ISSN (Online): 2455-3662
EPRA International Journal of Multidisciplinary Research (IJMR) - Peer Reviewed Journal Volume: 7| Issue: 9| September 2021|| Journal DOI: 10.36713/epra2013 || SJIF Impact Factor 2021: 8.047 || ISI Value: 1.188
2021 EPRA IJMR | www.eprajournals.com | Journal DOI URL: https://doi.org/10.36713/epra2013 170
SECURE FILE STORAGE ON CLOUD USING HYBRID
CRYPTOGRAPHY
Khumani1, Priya Roy2, Swapnil3, Suman Madan4
1,2,3Research Scholar, Jagan Institute of Management Studies, Sector-5, Rohini, Delhi, India.
4Associate Professor, Jagan Institute of Management Studies, Sector-5, Rohini, Delhi, India
Article DOI: https://doi.org/10.36713/epra8447 DOI No: 10.36713/epra8447
ABSTRACT In this paper our intention is to soundly preserve records into the cloud, with the aid of the usage of splitting statistics into numerous chunks and storing components of it on cloud with inside the route of a way that preserves statistics confidentiality, guarantees availability and integrity. The all at once superior use of cloud computing with inside the various corporation and IT industries offers new software program with low fee. Cloud computing is beneficial in phrases of low fee and accessibility of records. Cloud computing offers lot of blessings with low fee and of records accessibility via Internet. Ensuring the protection of cloud computing can be a outstanding take into account the cloud computing environment, as customers regularly preserve touchy records with cloud garage corporations, however the ones corporations additionally may be untrusted. So, sharing statistics in normal way at the same time as keeping statistics from an untrusted cloud stays a tough issue. Our method guarantees the protection and privateness of consumer touchy records with the aid of the usage of storing statistics at some point of unmarried cloud, with the use of AES, DES and RC2 sets. KEYWORDS— Cloud computing, Data Security, Cryptography, Storage.
I. INTRODUCTION It is originated from in advance large-scale
allotted computing era. NIST defines Cloud computing as a version for permitting convenient, on call for community get proper of access to a shared pool of configurable computing re-assets (for example: networks, garage, applications and offerings) so one may be all at once provisioned and launched with agency issuer interaction or minimum control attempt[1].
In Cloud computing, each documents and software program software are not honestly contained at the purchaser computer. File safety issues stand up due to the reality each purchaser software program and software program software are residing in issuer premises. The cloud issuer can solve this problem with the aid of the usage of encrypting the documents with the aid of the usage of the use of encryption set of recommendations [2].
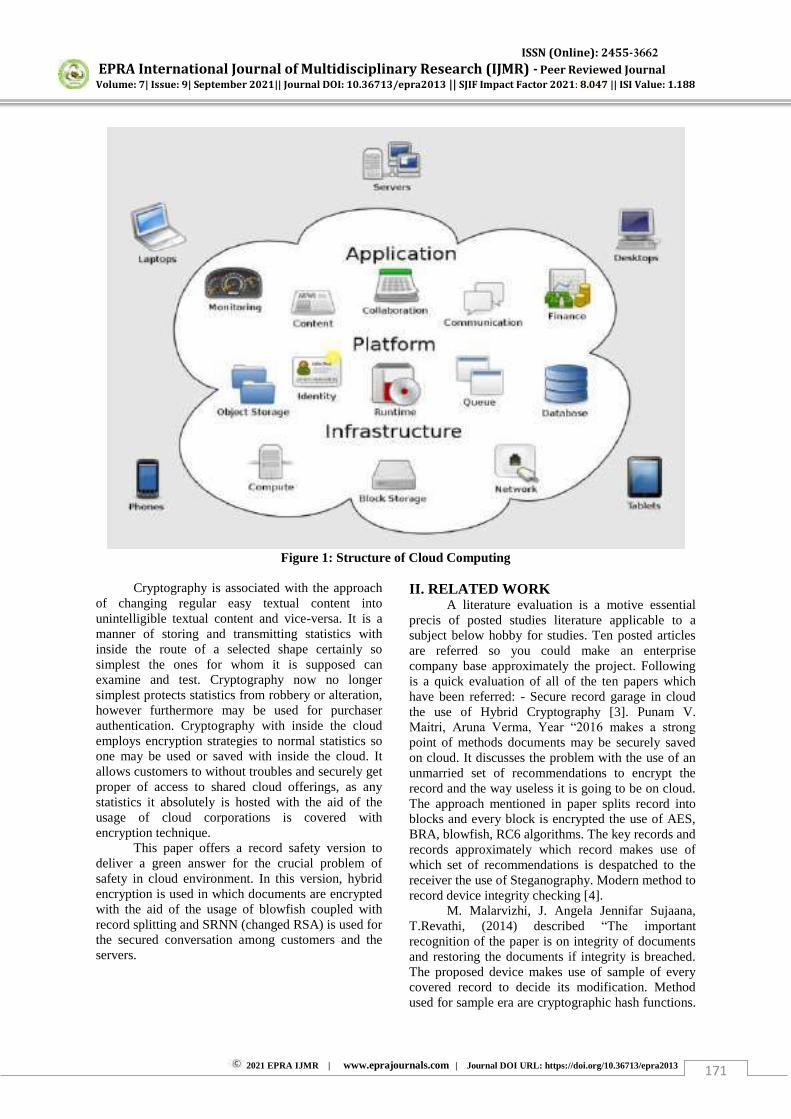
ISSN (Online): 2455-3662
EPRA International Journal of Multidisciplinary Research (IJMR) - Peer Reviewed Journal Volume: 7| Issue: 9| September 2021|| Journal DOI: 10.36713/epra2013 || SJIF Impact Factor 2021: 8.047 || ISI Value: 1.188
2021 EPRA IJMR | www.eprajournals.com | Journal DOI URL: https://doi.org/10.36713/epra2013 171
Figure 1: Structure of Cloud Computing
Cryptography is associated with the approach of changing regular easy textual content into unintelligible textual content and vice-versa. It is a manner of storing and transmitting statistics with inside the route of a selected shape certainly so simplest the ones for whom it is supposed can examine and test. Cryptography now no longer simplest protects statistics from robbery or alteration, however furthermore may be used for purchaser authentication. Cryptography with inside the cloud employs encryption strategies to normal statistics so one may be used or saved with inside the cloud. It allows customers to without troubles and securely get proper of access to shared cloud offerings, as any statistics it absolutely is hosted with the aid of the usage of cloud corporations is covered with encryption technique.
This paper offers a record safety version to deliver a green answer for the crucial problem of safety in cloud environment. In this version, hybrid encryption is used in which documents are encrypted with the aid of the usage of blowfish coupled with record splitting and SRNN (changed RSA) is used for the secured conversation among customers and the servers.
II. RELATED WORK A literature evaluation is a motive essential
precis of posted studies literature applicable to a subject below hobby for studies. Ten posted articles are referred so you could make an enterprise company base approximately the project. Following is a quick evaluation of all of the ten papers which have been referred: - Secure record garage in cloud the use of Hybrid Cryptography [3]. Punam V. Maitri, Aruna Verma, Year “2016 makes a strong
point of methods documents may be securely saved on cloud. It discusses the problem with the use of an unmarried set of recommendations to encrypt the record and the way useless it is going to be on cloud. The approach mentioned in paper splits record into blocks and every block is encrypted the use of AES, BRA, blowfish, RC6 algorithms. The key records and records approximately which record makes use of which set of recommendations is despatched to the receiver the use of Steganography. Modern method to record device integrity checking [4].
M. Malarvizhi, J. Angela Jennifar Sujaana, T.Revathi, (2014) described “The important recognition of the paper is on integrity of documents and restoring the documents if integrity is breached. The proposed device makes use of sample of every covered record to decide its modification. Method used for sample era are cryptographic hash functions.
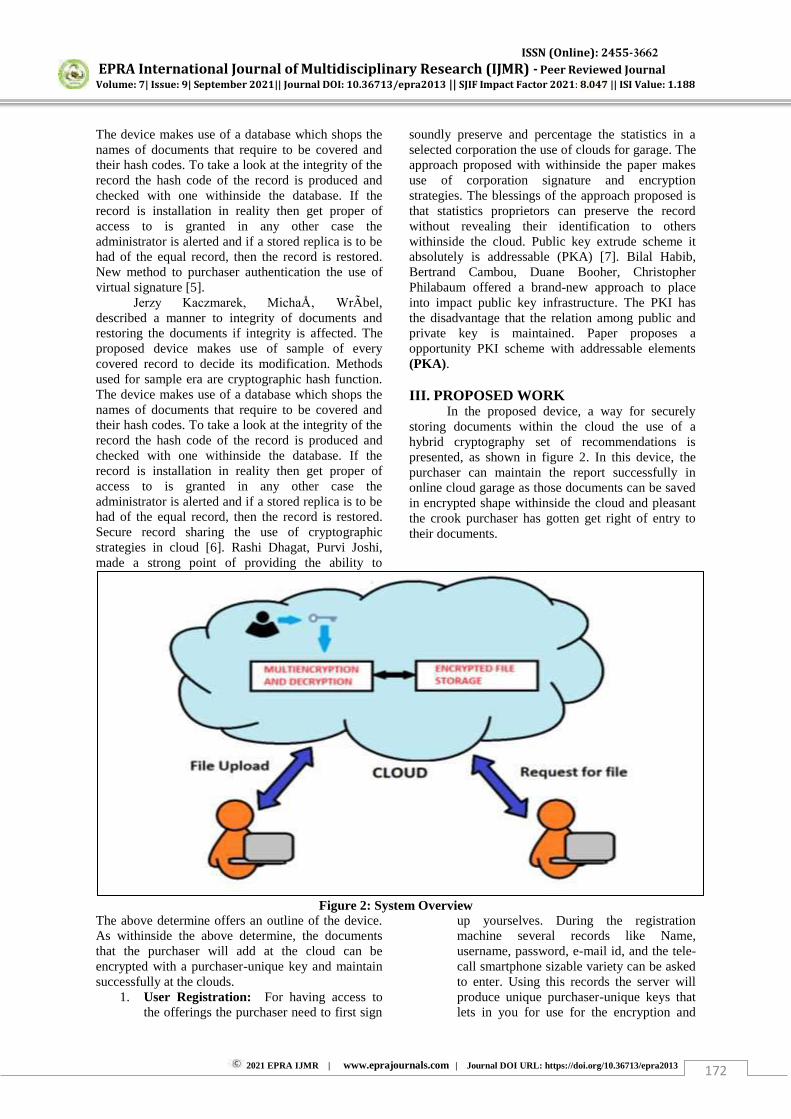
ISSN (Online): 2455-3662
EPRA International Journal of Multidisciplinary Research (IJMR) - Peer Reviewed Journal Volume: 7| Issue: 9| September 2021|| Journal DOI: 10.36713/epra2013 || SJIF Impact Factor 2021: 8.047 || ISI Value: 1.188
2021 EPRA IJMR | www.eprajournals.com | Journal DOI URL: https://doi.org/10.36713/epra2013 172
The device makes use of a database which shops the names of documents that require to be covered and their hash codes. To take a look at the integrity of the record the hash code of the record is produced and checked with one withinside the database. If the record is installation in reality then get proper of access to is granted in any other case the administrator is alerted and if a stored replica is to be had of the equal record, then the record is restored. New method to purchaser authentication the use of virtual signature [5].
Jerzy Kaczmarek, MichaÅ‚ WrÃbel, described a manner to integrity of documents and restoring the documents if integrity is affected. The proposed device makes use of sample of every covered record to decide its modification. Methods used for sample era are cryptographic hash function. The device makes use of a database which shops the names of documents that require to be covered and their hash codes. To take a look at the integrity of the record the hash code of the record is produced and checked with one withinside the database. If the record is installation in reality then get proper of access to is granted in any other case the administrator is alerted and if a stored replica is to be had of the equal record, then the record is restored. Secure record sharing the use of cryptographic strategies in cloud [6]. Rashi Dhagat, Purvi Joshi, made a strong point of providing the ability to
soundly preserve and percentage the statistics in a selected corporation the use of clouds for garage. The approach proposed with withinside the paper makes use of corporation signature and encryption strategies. The blessings of the approach proposed is that statistics proprietors can preserve the record without revealing their identification to others withinside the cloud. Public key extrude scheme it absolutely is addressable (PKA) [7]. Bilal Habib, Bertrand Cambou, Duane Booher, Christopher Philabaum offered a brand-new approach to place into impact public key infrastructure. The PKI has the disadvantage that the relation among public and private key is maintained. Paper proposes a opportunity PKI scheme with addressable elements (PKA). III. PROPOSED WORK
In the proposed device, a way for securely storing documents within the cloud the use of a hybrid cryptography set of recommendations is presented, as shown in figure 2. In this device, the purchaser can maintain the report successfully in online cloud garage as those documents can be saved in encrypted shape withinside the cloud and pleasant the crook purchaser has gotten get right of entry to their documents.
Figure 2: System Overview The above determine offers an outline of the device. As withinside the above determine, the documents that the purchaser will add at the cloud can be encrypted with a purchaser-unique key and maintain successfully at the clouds.
1. User Registration: For having access to the offerings the purchaser need to first sign
up yourselves. During the registration machine several records like Name, username, password, e-mail id, and the tele-call smartphone sizable variety can be asked to enter. Using this records the server will produce unique purchaser-unique keys that lets in you for use for the encryption and

ISSN (Online): 2455-3662
EPRA International Journal of Multidisciplinary Research (IJMR) - Peer Reviewed Journal Volume: 7| Issue: 9| September 2021|| Journal DOI: 10.36713/epra2013 || SJIF Impact Factor 2021: 8.047 || ISI Value: 1.188
2021 EPRA IJMR | www.eprajournals.com | Journal DOI URL: https://doi.org/10.36713/epra2013 173
decryption motive. But this key will now no longer be saved withinside the database as an alternative it'll in all likelihood be saved the use of the steganography set of recommendations in a photograph that lets in you for use because of the truth the purchaser’s profile photograph.
2. Uploading a File on Cloud : Steps are: • When the purchaser uploads a report at the
cloud first it'll in all likelihood be uploaded in a short folder.
• Then purchaser’s report can be cut up into N components.
• These all components of report can be
encrypted the use of cryptographic algorithms. Every element will use a selected encryption set of recommendations.
• These all components of report can be
encrypted the use of specific algorithms which might be AES, 3DES, RC6.The key to those algorithms can be retrieved from the steganographic photograph created withinside the route of the registration.
• After the cut up encryption, the report
reassembled and saved withinside the purchaser's unique folder. The genuine report is eliminated from the short folder.
• Then Combining all Encrypted Parts of
report.
3. Download a File from the Cloud : Steps are: • When the purchaser requests a report to be
downloaded first the report is cut up into N components.
• Then those components of report can be
decrypted the use of the same algorithms with which they had been encrypted. The
key to the algorithms for the decryption machine can be retrieved from the steganographic photograph created withinside the route of the registration.
• Then those components can be re-mixed to shape a totally decrypted report
IV. SECURITY The hybrid cryptosystem used to maintain security of the files has two phase: Encryption Phase and Decryption Phase. This section explains these phases:
1. Encryption Phase: At the encryption end, • On the specification of patron, the file being
encrypted may be sliced into n slices. Each of the file slices is encrypted the usage of Blowfish key provided with the resource of the use of the patron for each slice, as shown in figure 3.
• The key may be encrypted the usage of RSA
public key • After encryption, we have got were given
encrypted files slices and the corresponding encrypted keys. The process is shown in figure 4.
2. Decryption Phase: At the decryption end,
• The patron will provide n RSA non-public keys, constant with the amount of slices (n) created with inside the direction of encryption phase. Blowfish key is decrypted at the server surrender the usage of the RSA non-public key specific to the slice, as shown in figure 5.
• Using corresponding decrypted Blowfish
keys, file slices stored in server are decrypted.
• The decrypted slices may be merged to
generate specific file.
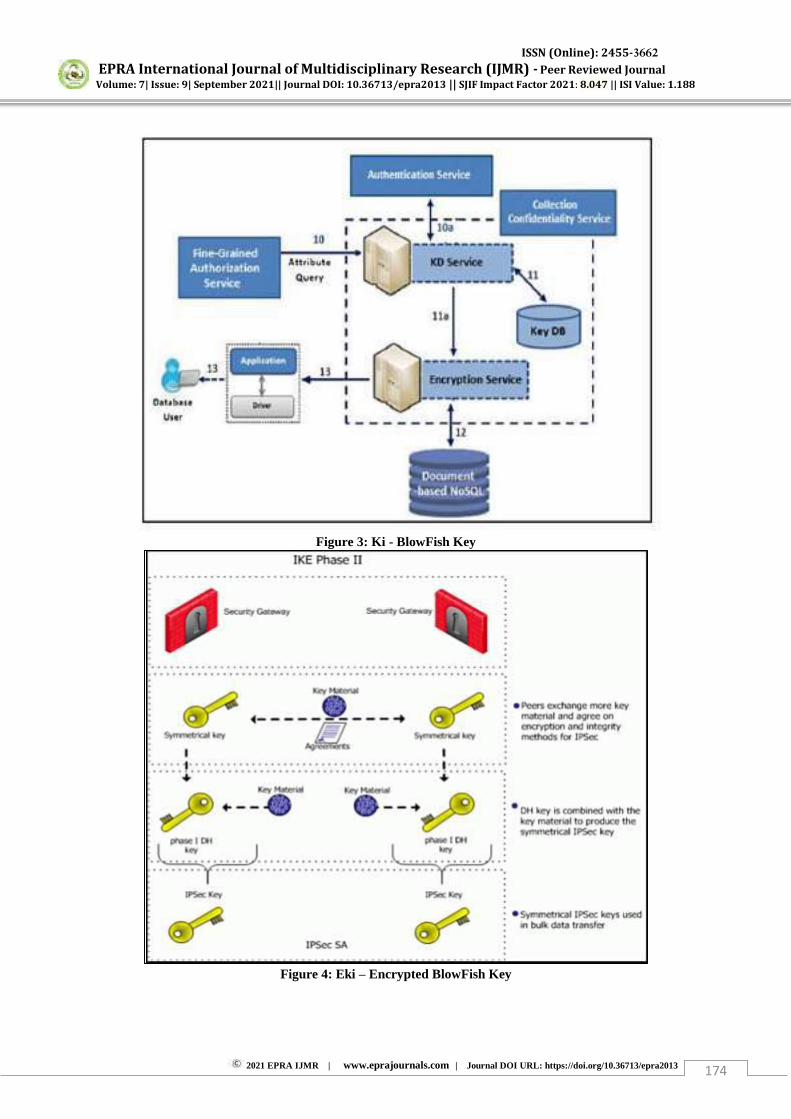
ISSN (Online): 2455-3662
EPRA International Journal of Multidisciplinary Research (IJMR) - Peer Reviewed Journal Volume: 7| Issue: 9| September 2021|| Journal DOI: 10.36713/epra2013 || SJIF Impact Factor 2021: 8.047 || ISI Value: 1.188
2021 EPRA IJMR | www.eprajournals.com | Journal DOI URL: https://doi.org/10.36713/epra2013 174
Figure 3: Ki - BlowFish Key
Figure 4: Eki – Encrypted BlowFish Key
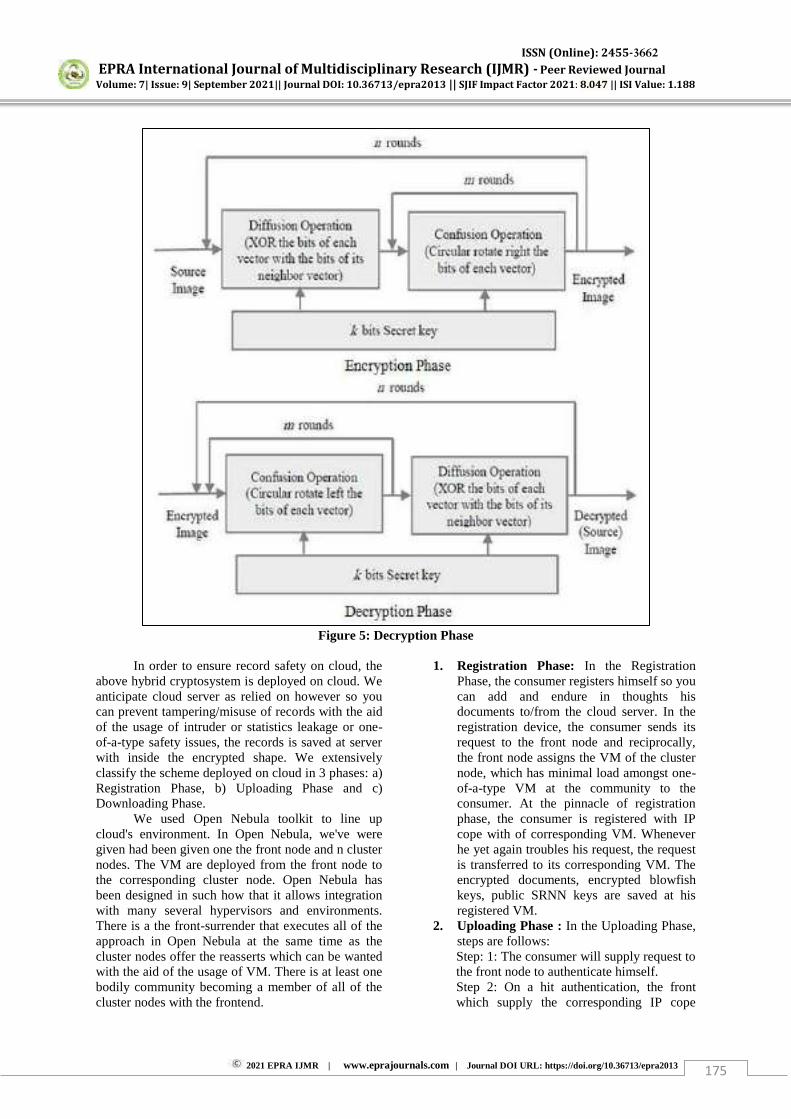
ISSN (Online): 2455-3662
EPRA International Journal of Multidisciplinary Research (IJMR) - Peer Reviewed Journal Volume: 7| Issue: 9| September 2021|| Journal DOI: 10.36713/epra2013 || SJIF Impact Factor 2021: 8.047 || ISI Value: 1.188
2021 EPRA IJMR | www.eprajournals.com | Journal DOI URL: https://doi.org/10.36713/epra2013 175
Figure 5: Decryption Phase
In order to ensure record safety on cloud, the
above hybrid cryptosystem is deployed on cloud. We anticipate cloud server as relied on however so you can prevent tampering/misuse of records with the aid of the usage of intruder or statistics leakage or one-of-a-type safety issues, the records is saved at server with inside the encrypted shape. We extensively classify the scheme deployed on cloud in 3 phases: a) Registration Phase, b) Uploading Phase and c) Downloading Phase.
We used Open Nebula toolkit to line up cloud's environment. In Open Nebula, we've were given had been given one the front node and n cluster nodes. The VM are deployed from the front node to the corresponding cluster node. Open Nebula has been designed in such how that it allows integration with many several hypervisors and environments. There is a the front-surrender that executes all of the approach in Open Nebula at the same time as the cluster nodes offer the reasserts which can be wanted with the aid of the usage of VM. There is at least one bodily community becoming a member of all of the cluster nodes with the frontend.
1. Registration Phase: In the Registration Phase, the consumer registers himself so you can add and endure in thoughts his documents to/from the cloud server. In the registration device, the consumer sends its request to the front node and reciprocally, the front node assigns the VM of the cluster node, which has minimal load amongst one-of-a-type VM at the community to the consumer. At the pinnacle of registration phase, the consumer is registered with IP cope with of corresponding VM. Whenever he yet again troubles his request, the request is transferred to its corresponding VM. The encrypted documents, encrypted blowfish keys, public SRNN keys are saved at his registered VM.
2. Uploading Phase : In the Uploading Phase, steps are follows: Step: 1: The consumer will supply request to the front node to authenticate himself. Step 2: On a hit authentication, the front which supply the corresponding IP cope
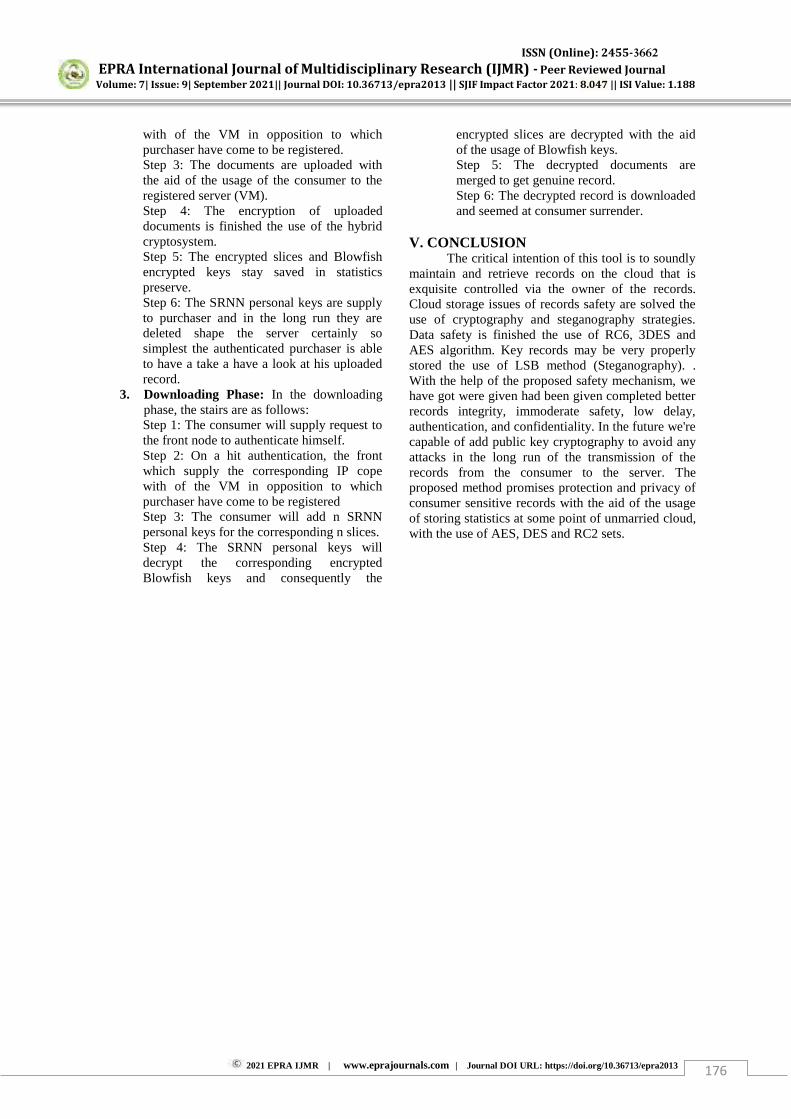
ISSN (Online): 2455-3662
EPRA International Journal of Multidisciplinary Research (IJMR) - Peer Reviewed Journal Volume: 7| Issue: 9| September 2021|| Journal DOI: 10.36713/epra2013 || SJIF Impact Factor 2021: 8.047 || ISI Value: 1.188
2021 EPRA IJMR | www.eprajournals.com | Journal DOI URL: https://doi.org/10.36713/epra2013 176
with of the VM in opposition to which purchaser have come to be registered. Step 3: The documents are uploaded with the aid of the usage of the consumer to the registered server (VM). Step 4: The encryption of uploaded documents is finished the use of the hybrid cryptosystem. Step 5: The encrypted slices and Blowfish encrypted keys stay saved in statistics preserve. Step 6: The SRNN personal keys are supply to purchaser and in the long run they are deleted shape the server certainly so simplest the authenticated purchaser is able to have a take a have a look at his uploaded record.
3. Downloading Phase: In the downloading phase, the stairs are as follows: Step 1: The consumer will supply request to the front node to authenticate himself. Step 2: On a hit authentication, the front which supply the corresponding IP cope with of the VM in opposition to which purchaser have come to be registered Step 3: The consumer will add n SRNN personal keys for the corresponding n slices. Step 4: The SRNN personal keys will decrypt the corresponding encrypted Blowfish keys and consequently the
encrypted slices are decrypted with the aid of the usage of Blowfish keys. Step 5: The decrypted documents are merged to get genuine record. Step 6: The decrypted record is downloaded and seemed at consumer surrender.
V. CONCLUSION
The critical intention of this tool is to soundly maintain and retrieve records on the cloud that is exquisite controlled via the owner of the records. Cloud storage issues of records safety are solved the use of cryptography and steganography strategies. Data safety is finished the use of RC6, 3DES and AES algorithm. Key records may be very properly stored the use of LSB method (Steganography). . With the help of the proposed safety mechanism, we have got were given had been given completed better records integrity, immoderate safety, low delay, authentication, and confidentiality. In the future we're capable of add public key cryptography to avoid any attacks in the long run of the transmission of the records from the consumer to the server. The proposed method promises protection and privacy of consumer sensitive records with the aid of the usage of storing statistics at some point of unmarried cloud, with the use of AES, DES and RC2 sets.
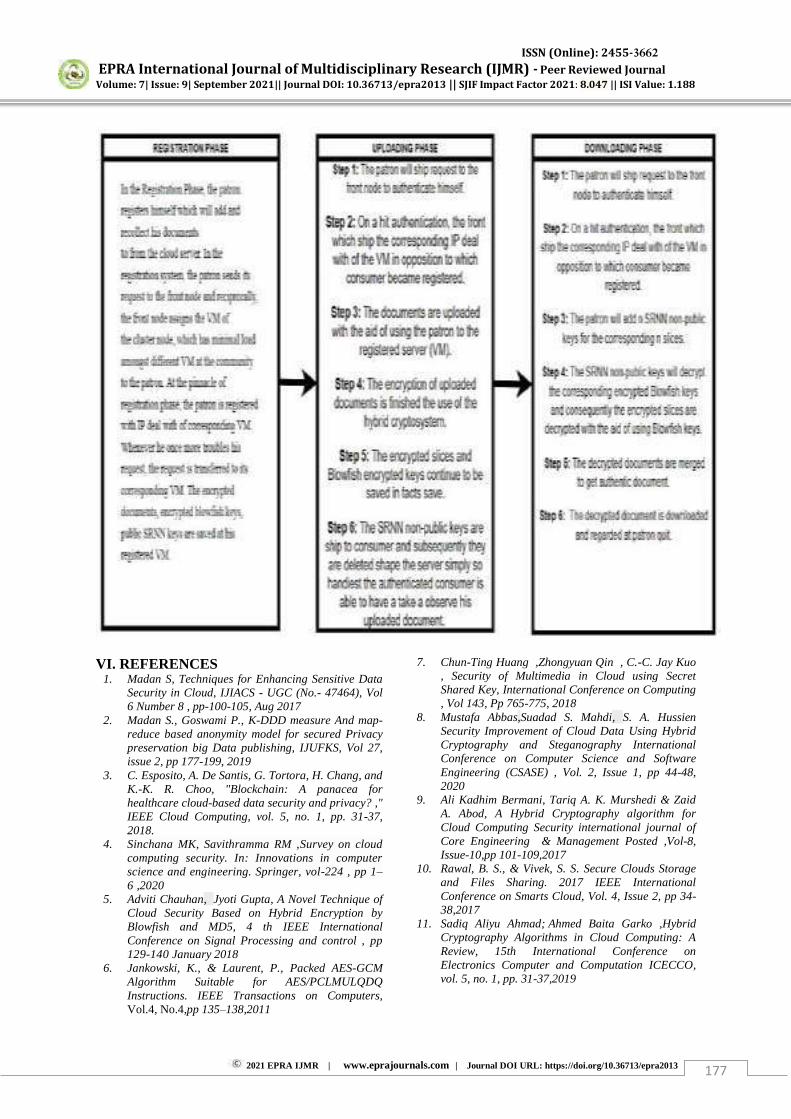
ISSN (Online): 2455-3662
EPRA International Journal of Multidisciplinary Research (IJMR) - Peer Reviewed Journal Volume: 7| Issue: 9| September 2021|| Journal DOI: 10.36713/epra2013 || SJIF Impact Factor 2021: 8.047 || ISI Value: 1.188
2021 EPRA IJMR | www.eprajournals.com | Journal DOI URL: https://doi.org/10.36713/epra2013 177
VI. REFERENCES
1. Madan S, Techniques for Enhancing Sensitive Data Security in Cloud, IJIACS - UGC (No.- 47464), Vol 6 Number 8 , pp-100-105, Aug 2017
2. Madan S., Goswami P., K-DDD measure And map-reduce based anonymity model for secured Privacy preservation big Data publishing, IJUFKS, Vol 27, issue 2, pp 177-199, 2019
3. C. Esposito, A. De Santis, G. Tortora, H. Chang, and K.-K. R. Choo, "Blockchain: A panacea for healthcare cloud-based data security and privacy? ," IEEE Cloud Computing, vol. 5, no. 1, pp. 31-37, 2018.
4. Sinchana MK, Savithramma RM ,Survey on cloud computing security. In: Innovations in computer science and engineering. Springer, vol-224 , pp 1–6 ,2020
5. Adviti Chauhan, Jyoti Gupta, A Novel Technique of Cloud Security Based on Hybrid Encryption by Blowfish and MD5, 4 th IEEE International Conference on Signal Processing and control , pp 129-140 January 2018
6. Jankowski, K., & Laurent, P., Packed AES-GCM Algorithm Suitable for AES/PCLMULQDQ Instructions. IEEE Transactions on Computers, Vol.4, No.4,pp 135–138,2011
7. Chun-Ting Huang ,Zhongyuan Qin , C.-C. Jay Kuo , Security of Multimedia in Cloud using Secret Shared Key, International Conference on Computing , Vol 143, Pp 765-775, 2018
8. Mustafa Abbas,Suadad S. Mahdi, S. A. Hussien Security Improvement of Cloud Data Using Hybrid Cryptography and Steganography International Conference on Computer Science and Software Engineering (CSASE) , Vol. 2, Issue 1, pp 44-48, 2020
9. Ali Kadhim Bermani, Tariq A. K. Murshedi & Zaid A. Abod, A Hybrid Cryptography algorithm for Cloud Computing Security international journal of Core Engineering & Management Posted ,Vol-8, Issue-10,pp 101-109,2017
10. Rawal, B. S., & Vivek, S. S. Secure Clouds Storage and Files Sharing. 2017 IEEE International Conference on Smarts Cloud, Vol. 4, Issue 2, pp 34-38,2017
11. Sadiq Aliyu Ahmad; Ahmed Baita Garko ,Hybrid Cryptography Algorithms in Cloud Computing: A Review, 15th International Conference on Electronics Computer and Computation ICECCO, vol. 5, no. 1, pp. 31-37,2019
ISSN (Online): 2455-3662
EPRA International Journal of Multidisciplinary Research (IJMR) - Peer Reviewed Journal Volume: 7| Issue: 9| September 2021|| Journal DOI: 10.36713/epra2013 || SJIF Impact Factor 2021: 8.047 || ISI Value: 1.188
2021 EPRA IJMR | www.eprajournals.com | Journal DOI URL: https://doi.org/10.36713/epra2013 178
THE STRATEGIC CONSEQUENCES OF INDIA’S COVID-19 CRISIS ON INDIA-CHINA TRADE AFTER
GALWAN SKIRMISH
Dr. Anita Kumari Assistant Professor, Department of Commerce, Dr. Harisingh Gour Vishwavidyalaya, Sagar, M.P
Article DOI: https://doi.org/10.36713/epra8462 DOI No: 10.36713/epra8462
ABSTRACT The magnitude of the second one wave of India’s coronavirus surge became an increasing number of clear to the world, U.S.
policymakers soon started to comprehend the strategic implications of India’s national trauma.U.S. President and his top
officials publicly pledged their commitments to ship medical supplies, which include oxygen, vaccine materials, and therapeutics to India, while looking for additional approaches to deal with India’s crisis.COVID-19 already inflicted a crushing blow to India’s economy closing 12 months. A countrywide lockdown instituted via prime Minister Narendra Modi at the early levels of the worldwide pandemic was meant to alleviate the stresses on Indian’s insufficient healthcare system, however it also brought a 24 percentage contraction in the economy and led millions of migrant day workers to flee India’s
towns for lack of work. thru the late fall and wintry weather, it seemed that by some means India might break out the worst of the pandemic, but that hope has now been dashed by a devastating combination of new viral strains and inadequate public health preparations. India now faces this wave of the virus exhausted and depleted.China–India relations, also referred to as Sino–Indo relations or Indian–chinese relations, refers back to the bilateral relationship between the humans's Republic of China and the Rebublic of India. despite the fact that the relationship has been cordial, there were border disputes. The current relationship started out in 1950 whilst India turned into many of the first countries to end formal ties with the Republic of China (Taiwan) and understand the human beings's Republic of China because the valid government of Mainland China. China and India are the two of the principal regional powers in Asia, and are two of the most populous countries and quickest growing primary economies in the global. boom in diplomatic and financial influence has increased the importance of their bilateral courting. KEY WORDS: India, China, Magnitude, China-India trade, trade warfare, composition of economy, INTRODUCTION
India was famed for her excellent wealth ever since the historical instances till the establishment of the British Empire. Indian trade records reflects that in spite of the frequent political upheavals during the twelfth to the sixteenth centuries, the country was still prosperous. The political and financial rules followed through the Muslim rulers propagated the growth of towns in various parts of the country. these towns grew into exchange and business centers which in flip led to the general prosperity. From the sixteenth to the 18th centuries, covering the two hundred years of Mughal rule, Indian urbanization saw in addition growth.India and China are among the oldest civilizations of the international with lengthy history of interaction and courting. They are the fastest growing economies amongst the major economies of the world. both have made fast progress after liberlisation. One of the primary occasions in worldwide trade and economics is the latest fast increase in the bilateral change. India has emerged as one of the top ten trading partners of China while China has emerged one of the pinnacle 3 trading partners of India. Due to big size of economies and composition of economies and exports as well as high boom rates and political will from each facets, the bilateral trade will develop further and would have vast effect on global alternate and economic system As border tensions between India and China flared up with the deadliest clash in more than four decades, leaving at least 20 Indian soldiers dead, there have been calls for boycotting goods imported from the
ISSN (Online): 2455-3662
EPRA International Journal of Multidisciplinary Research (IJMR) - Peer Reviewed Journal Volume: 7| Issue: 9| September 2021|| Journal DOI: 10.36713/epra2013 || SJIF Impact Factor 2021: 8.047 || ISI Value: 1.188
2021 EPRA IJMR | www.eprajournals.com | Journal DOI URL: https://doi.org/10.36713/epra2013 179
neighbouring nation. That, however, won’t be easy because the two economies are intertwined.China is Asia’s
largest economy and the world’s second-biggest with a GDP of about $13.6 trillion. India is No. 3 in Asia at $2.7 trillion. From supplying industrial components and raw materials to investments in India’s startups and technology
firms, China is India’s biggest trading partner after the U.S.The magnitude of India’s crisis turns it into a worldwide
disaster. With over 1.3 billion people, India alone counts for one-sixth of humanity. And India’s crisis will not be
contained within its borders. New viral lines out of India should worsen the health threat to all. different second-order economic effects will observe; a minimum of, India’s lost monetary productiveness will hurt worldwide trade
and investment.yet the geopolitical implications of India’s tragedy must additionally be keenly felt by using the new
Biden management. After his election, the president’s top national security officials quickly established the aim of
closer partnership with New Delhi as a cornerstone in the U.S. strategy for competition with Beijing. India’s
position was highlighted with the aid of President Biden’s choice to host a virtual “leaders’ summit” of the Quad in
March, and by U.S. Secretary of defense Lloyd Austin’s 3-day visit to India shortly thereafter.Having made a strategic bet on India as an essential Asian counterweight to China, U.S. concerns about Indian health, economic growth, and political balance are not purely altruistic or humanitarian. As some of distinguished Indian foreign policy analysts observed in the days earlier than the Biden administration announced its plans to help India, the promise of U.S. partnership might be significantly undermined from India's attitude if Washington had been to fall short in such a time of need.inside the midst of immense suffering, it is tempting to count on that India’s state of
affairs could not worsen. but, the truth is that India become already going through an entirely different, daunting danger to its country wide safety previous to this new viral wave: a year of heightened tensions and unusual levels of violence along its contested border with China. most of the causes of deteriorating family members between India and China stay unaddressed. the two sides have taken some initial steps to disengage from their border conflict inside the Himalayas in early 2021, however in latest weeks their bilateral army dialogues have stalled without progress. If Beijing were to are looking for a territorial advantage from India’s ongoing health emergency, the
compounding of multiple crises could complicate New Delhi’s decision-making and would increase the potential for policy miscalculations and otherwise avoidable armed escalation.An argue in an replace of an earlier CFR Contingency making plans Memorandum at the chance of armed war between China and India, the us has a strong interest in preventing navy escalation alongside their border. through carefully calibrated protective help to India, the united states can help it deter China with out taking steps that make battle more likely. other diplomatic and financial measures can enhance India’s defenses and resilience in the face of chinese aggression, reduce regional
tensions, and prepare U.S. policymakers in the event of another Himalayan standoff this year OBJECTIVE OF STUDY
The goal of the observe is to consciousness on the impact of COVID-19 second wave on various sectors of the economic system. The sectoral evaluation has also helped to compare the beyond consequences with the existing scenario and also analyse the state of affairs winning in the country in phrases of losses and possibility prices. The main objective of this paper is to have a look at the spillover results Indo-china trade war on the economic system amongst diverse markets and sectors mentioned as follows: Chinese Investments in India
Chinese Hooks In India’s Startups The Smartphone Dominance Chinese Smartphone applications Pharmaceutical Sector India-China Tourism
Spurred to an extent by India importing medical items from China to fight the deadly second wave of the Covid-19 pandemic, trade between the two neighbours soared by more than 70% year-on-year to over $48 billion within the first five months of 2021, China’s customs data showed.
Calling it a “impressive growth”, chinese state media interpreted the increase in bilateral trade as a sign of resilience in trade ties between the two nations despite conflict at the border and political variations.“Trade among
China and India soared 70.1% in US greenback terms in the first five months of this year to $48.16 billion, in line with chinese customs records released on Monday. specially, chinese exports to India grew 64.1% year-on-year from January to may, while imports surged 90.2%,” the tabloid global times reported.The India-China trade volume changed into better than the trade that Beijing conducted with different trading partners, the report said.The paper
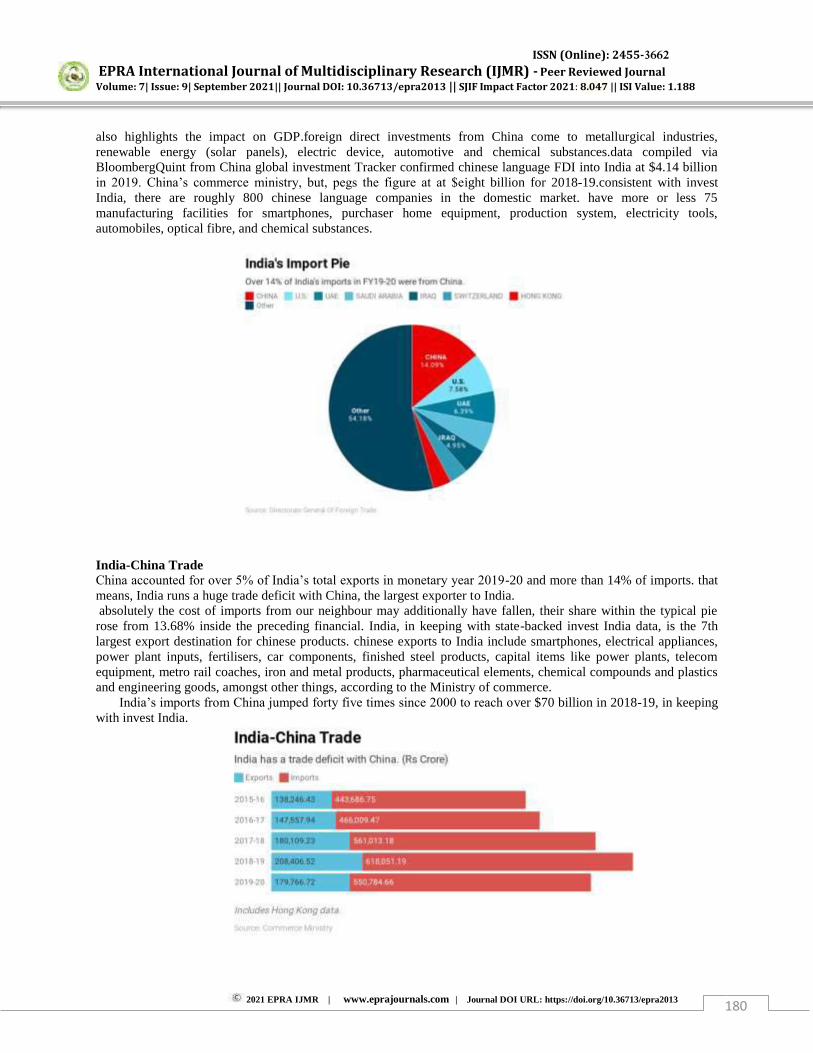
ISSN (Online): 2455-3662
EPRA International Journal of Multidisciplinary Research (IJMR) - Peer Reviewed Journal Volume: 7| Issue: 9| September 2021|| Journal DOI: 10.36713/epra2013 || SJIF Impact Factor 2021: 8.047 || ISI Value: 1.188
2021 EPRA IJMR | www.eprajournals.com | Journal DOI URL: https://doi.org/10.36713/epra2013 180
also highlights the impact on GDP.foreign direct investments from China come to metallurgical industries, renewable energy (solar panels), electric device, automotive and chemical substances.data compiled via BloombergQuint from China global investment Tracker confirmed chinese language FDI into India at $4.14 billion in 2019. China’s commerce ministry, but, pegs the figure at at $eight billion for 2018-19.consistent with invest India, there are roughly 800 chinese language companies in the domestic market. have more or less 75 manufacturing facilities for smartphones, purchaser home equipment, production system, electricity tools, automobiles, optical fibre, and chemical substances. India-China Trade China accounted for over 5% of India’s total exports in monetary year 2019-20 and more than 14% of imports. that means, India runs a huge trade deficit with China, the largest exporter to India. absolutely the cost of imports from our neighbour may additionally have fallen, their share within the typical pie rose from 13.68% inside the preceding financial. India, in keeping with state-backed invest India data, is the 7th largest export destination for chinese products. chinese exports to India include smartphones, electrical appliances, power plant inputs, fertilisers, car components, finished steel products, capital items like power plants, telecom equipment, metro rail coaches, iron and metal products, pharmaceutical elements, chemical compounds and plastics and engineering goods, amongst other things, according to the Ministry of commerce. India’s imports from China jumped forty five times since 2000 to reach over $70 billion in 2018-19, in keeping with invest India.
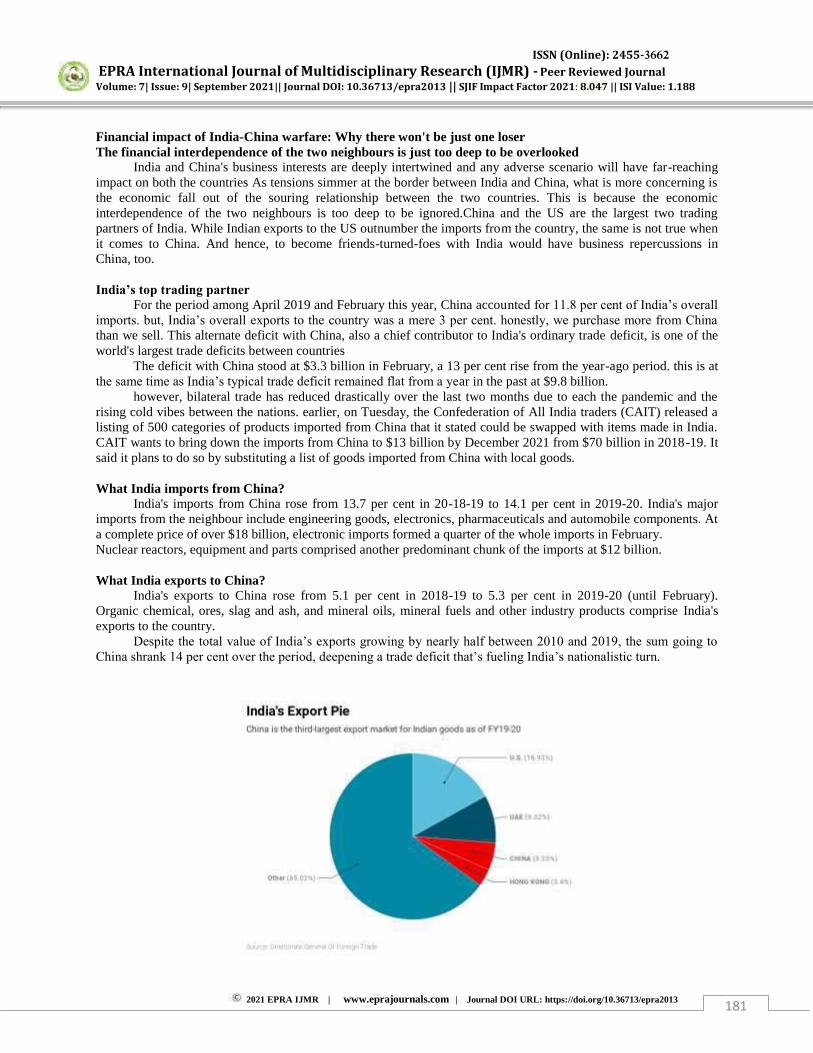
ISSN (Online): 2455-3662
EPRA International Journal of Multidisciplinary Research (IJMR) - Peer Reviewed Journal Volume: 7| Issue: 9| September 2021|| Journal DOI: 10.36713/epra2013 || SJIF Impact Factor 2021: 8.047 || ISI Value: 1.188
2021 EPRA IJMR | www.eprajournals.com | Journal DOI URL: https://doi.org/10.36713/epra2013 181
Financial impact of India-China warfare: Why there won't be just one loser The financial interdependence of the two neighbours is just too deep to be overlooked
India and China's business interests are deeply intertwined and any adverse scenario will have far-reaching impact on both the countries As tensions simmer at the border between India and China, what is more concerning is the economic fall out of the souring relationship between the two countries. This is because the economic interdependence of the two neighbours is too deep to be ignored.China and the US are the largest two trading partners of India. While Indian exports to the US outnumber the imports from the country, the same is not true when it comes to China. And hence, to become friends-turned-foes with India would have business repercussions in China, too. India’s top trading partner
For the period among April 2019 and February this year, China accounted for 11.8 per cent of India’s overall
imports. but, India’s overall exports to the country was a mere 3 per cent. honestly, we purchase more from China
than we sell. This alternate deficit with China, also a chief contributor to India's ordinary trade deficit, is one of the world's largest trade deficits between countries
The deficit with China stood at $3.3 billion in February, a 13 per cent rise from the year-ago period. this is at the same time as India’s typical trade deficit remained flat from a year in the past at $9.8 billion.
however, bilateral trade has reduced drastically over the last two months due to each the pandemic and the rising cold vibes between the nations. earlier, on Tuesday, the Confederation of All India traders (CAIT) released a listing of 500 categories of products imported from China that it stated could be swapped with items made in India. CAIT wants to bring down the imports from China to $13 billion by December 2021 from $70 billion in 2018-19. It said it plans to do so by substituting a list of goods imported from China with local goods.
What India imports from China?
India's imports from China rose from 13.7 per cent in 20-18-19 to 14.1 per cent in 2019-20. India's major imports from the neighbour include engineering goods, electronics, pharmaceuticals and automobile components. At a complete price of over $18 billion, electronic imports formed a quarter of the whole imports in February. Nuclear reactors, equipment and parts comprised another predominant chunk of the imports at $12 billion. What India exports to China?
India's exports to China rose from 5.1 per cent in 2018-19 to 5.3 per cent in 2019-20 (until February). Organic chemical, ores, slag and ash, and mineral oils, mineral fuels and other industry products comprise India's exports to the country.
Despite the total value of India’s exports growing by nearly half between 2010 and 2019, the sum going to
China shrank 14 per cent over the period, deepening a trade deficit that’s fueling India’s nationalistic turn.
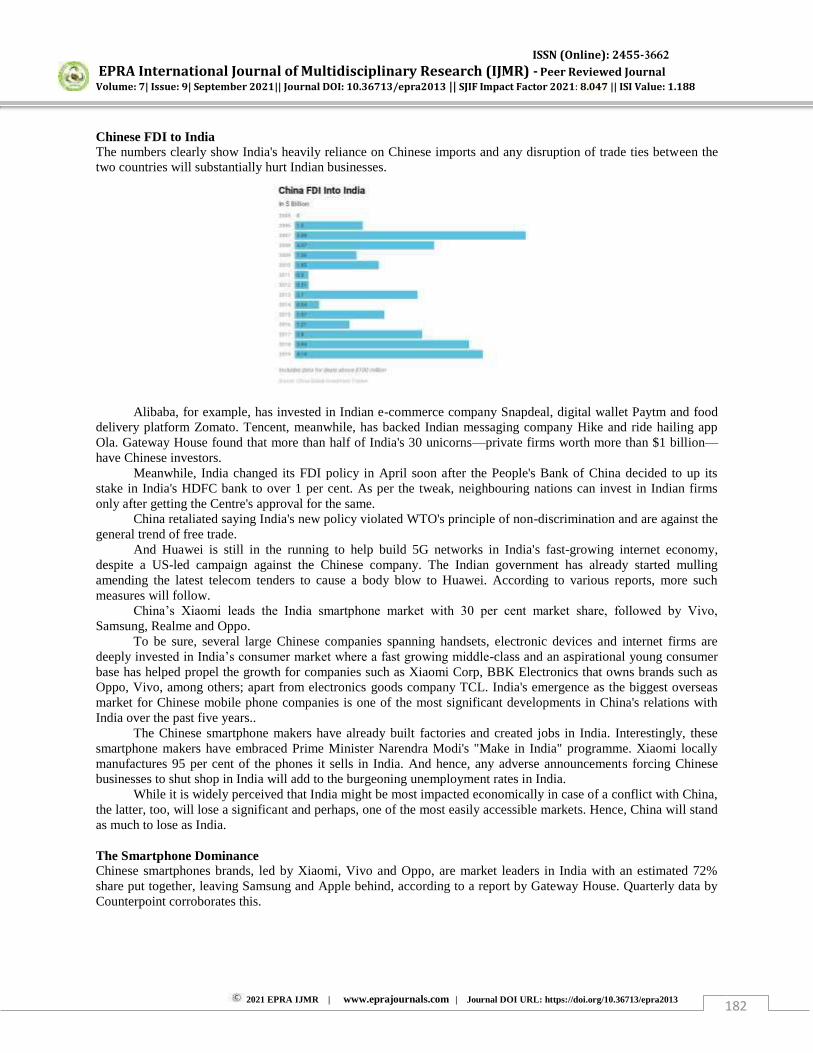
ISSN (Online): 2455-3662
EPRA International Journal of Multidisciplinary Research (IJMR) - Peer Reviewed Journal Volume: 7| Issue: 9| September 2021|| Journal DOI: 10.36713/epra2013 || SJIF Impact Factor 2021: 8.047 || ISI Value: 1.188
2021 EPRA IJMR | www.eprajournals.com | Journal DOI URL: https://doi.org/10.36713/epra2013 182
Chinese FDI to India The numbers clearly show India's heavily reliance on Chinese imports and any disruption of trade ties between the two countries will substantially hurt Indian businesses.
Alibaba, for example, has invested in Indian e-commerce company Snapdeal, digital wallet Paytm and food delivery platform Zomato. Tencent, meanwhile, has backed Indian messaging company Hike and ride hailing app Ola. Gateway House found that more than half of India's 30 unicorns—private firms worth more than $1 billion—
have Chinese investors. Meanwhile, India changed its FDI policy in April soon after the People's Bank of China decided to up its
stake in India's HDFC bank to over 1 per cent. As per the tweak, neighbouring nations can invest in Indian firms only after getting the Centre's approval for the same.
China retaliated saying India's new policy violated WTO's principle of non-discrimination and are against the general trend of free trade.
And Huawei is still in the running to help build 5G networks in India's fast-growing internet economy, despite a US-led campaign against the Chinese company. The Indian government has already started mulling amending the latest telecom tenders to cause a body blow to Huawei. According to various reports, more such measures will follow.
China’s Xiaomi leads the India smartphone market with 30 per cent market share, followed by Vivo,
Samsung, Realme and Oppo. To be sure, several large Chinese companies spanning handsets, electronic devices and internet firms are
deeply invested in India’s consumer market where a fast growing middle-class and an aspirational young consumer base has helped propel the growth for companies such as Xiaomi Corp, BBK Electronics that owns brands such as Oppo, Vivo, among others; apart from electronics goods company TCL. India's emergence as the biggest overseas market for Chinese mobile phone companies is one of the most significant developments in China's relations with India over the past five years..
The Chinese smartphone makers have already built factories and created jobs in India. Interestingly, these smartphone makers have embraced Prime Minister Narendra Modi's "Make in India" programme. Xiaomi locally manufactures 95 per cent of the phones it sells in India. And hence, any adverse announcements forcing Chinese businesses to shut shop in India will add to the burgeoning unemployment rates in India.
While it is widely perceived that India might be most impacted economically in case of a conflict with China, the latter, too, will lose a significant and perhaps, one of the most easily accessible markets. Hence, China will stand as much to lose as India. The Smartphone Dominance Chinese smartphones brands, led by Xiaomi, Vivo and Oppo, are market leaders in India with an estimated 72% share put together, leaving Samsung and Apple behind, according to a report by Gateway House. Quarterly data by Counterpoint corroborates this.
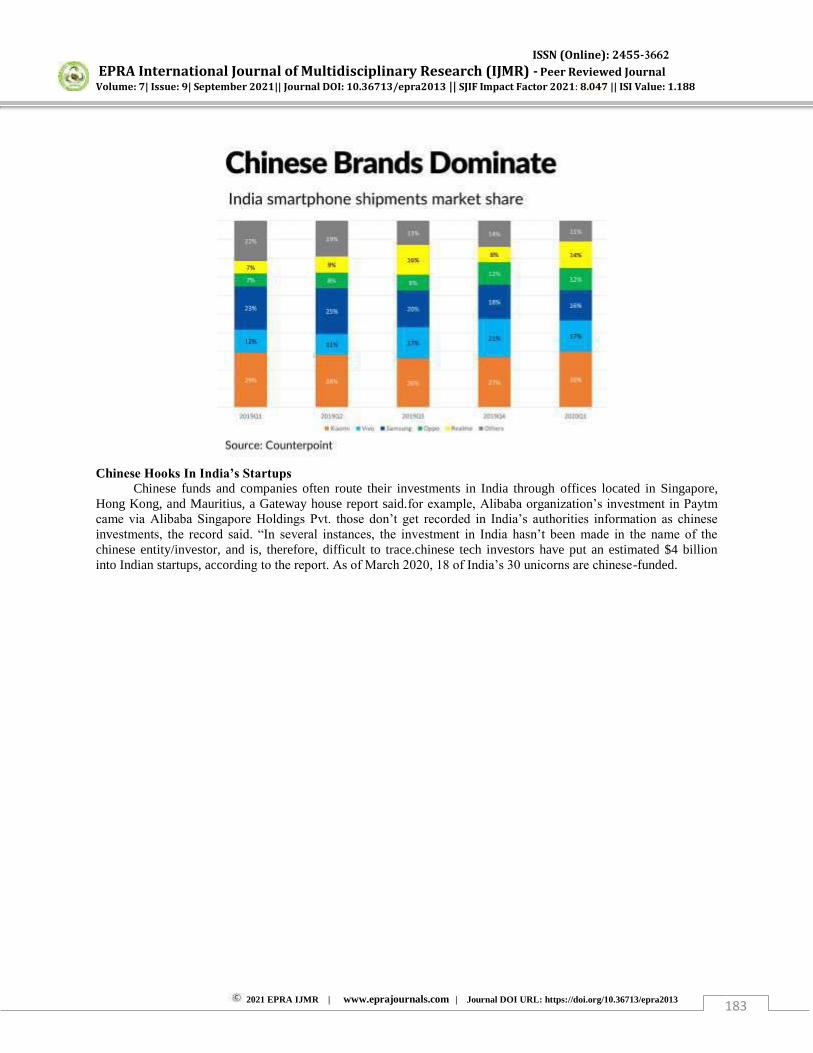
ISSN (Online): 2455-3662
EPRA International Journal of Multidisciplinary Research (IJMR) - Peer Reviewed Journal Volume: 7| Issue: 9| September 2021|| Journal DOI: 10.36713/epra2013 || SJIF Impact Factor 2021: 8.047 || ISI Value: 1.188
2021 EPRA IJMR | www.eprajournals.com | Journal DOI URL: https://doi.org/10.36713/epra2013 183
Chinese Hooks In India’s Startups
Chinese funds and companies often route their investments in India through offices located in Singapore, Hong Kong, and Mauritius, a Gateway house report said.for example, Alibaba organization’s investment in Paytm
came via Alibaba Singapore Holdings Pvt. those don’t get recorded in India’s authorities information as chinese
investments, the record said. “In several instances, the investment in India hasn’t been made in the name of the
chinese entity/investor, and is, therefore, difficult to trace.chinese tech investors have put an estimated $4 billion into Indian startups, according to the report. As of March 2020, 18 of India’s 30 unicorns are chinese-funded.
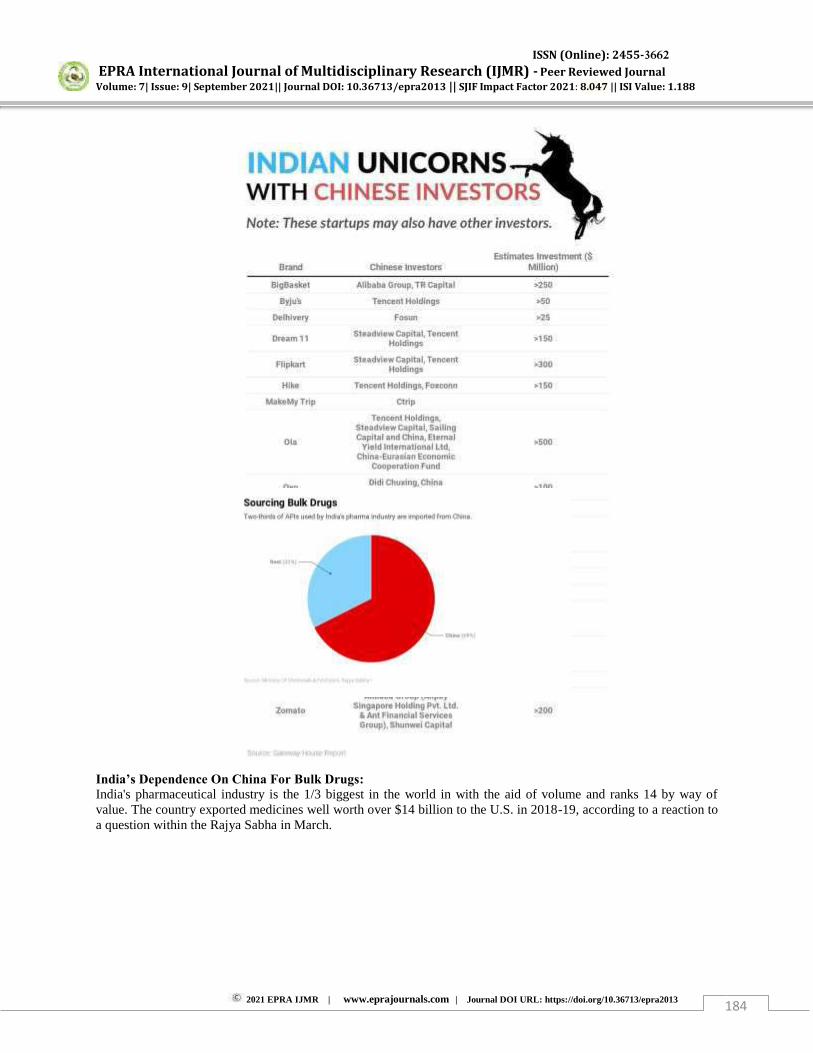
ISSN (Online): 2455-3662
EPRA International Journal of Multidisciplinary Research (IJMR) - Peer Reviewed Journal Volume: 7| Issue: 9| September 2021|| Journal DOI: 10.36713/epra2013 || SJIF Impact Factor 2021: 8.047 || ISI Value: 1.188
2021 EPRA IJMR | www.eprajournals.com | Journal DOI URL: https://doi.org/10.36713/epra2013 184
India’s Dependence On China For Bulk Drugs: India's pharmaceutical industry is the 1/3 biggest in the world in with the aid of volume and ranks 14 by way of value. The country exported medicines well worth over $14 billion to the U.S. in 2018-19, according to a reaction to a question within the Rajya Sabha in March.
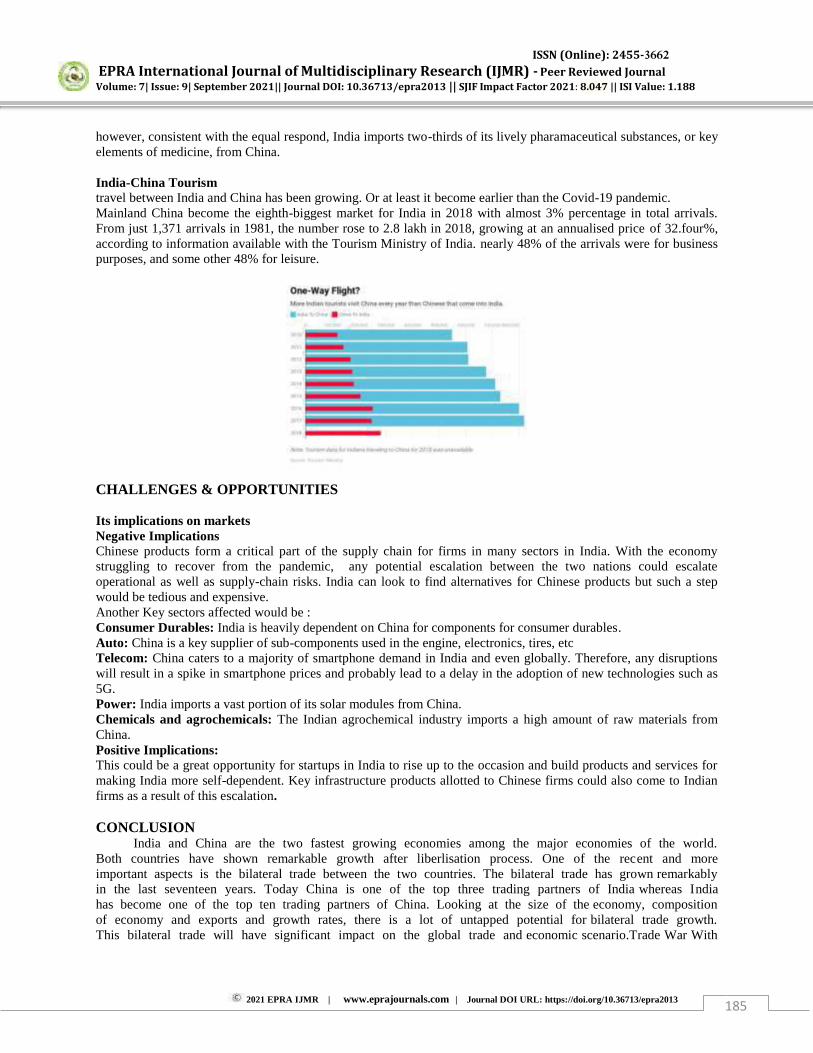
ISSN (Online): 2455-3662
EPRA International Journal of Multidisciplinary Research (IJMR) - Peer Reviewed Journal Volume: 7| Issue: 9| September 2021|| Journal DOI: 10.36713/epra2013 || SJIF Impact Factor 2021: 8.047 || ISI Value: 1.188
2021 EPRA IJMR | www.eprajournals.com | Journal DOI URL: https://doi.org/10.36713/epra2013 185
however, consistent with the equal respond, India imports two-thirds of its lively pharamaceutical substances, or key elements of medicine, from China. India-China Tourism travel between India and China has been growing. Or at least it become earlier than the Covid-19 pandemic. Mainland China become the eighth-biggest market for India in 2018 with almost 3% percentage in total arrivals. From just 1,371 arrivals in 1981, the number rose to 2.8 lakh in 2018, growing at an annualised price of 32.four%, according to information available with the Tourism Ministry of India. nearly 48% of the arrivals were for business purposes, and some other 48% for leisure. CHALLENGES & OPPORTUNITIES Its implications on markets Negative Implications Chinese products form a critical part of the supply chain for firms in many sectors in India. With the economy struggling to recover from the pandemic, any potential escalation between the two nations could escalate operational as well as supply-chain risks. India can look to find alternatives for Chinese products but such a step would be tedious and expensive. Another Key sectors affected would be : Consumer Durables: India is heavily dependent on China for components for consumer durables. Auto: China is a key supplier of sub-components used in the engine, electronics, tires, etc Telecom: China caters to a majority of smartphone demand in India and even globally. Therefore, any disruptions will result in a spike in smartphone prices and probably lead to a delay in the adoption of new technologies such as 5G. Power: India imports a vast portion of its solar modules from China. Chemicals and agrochemicals: The Indian agrochemical industry imports a high amount of raw materials from China. Positive Implications: This could be a great opportunity for startups in India to rise up to the occasion and build products and services for making India more self-dependent. Key infrastructure products allotted to Chinese firms could also come to Indian firms as a result of this escalation. CONCLUSION
India and China are the two fastest growing economies among the major economies of the world. Both countries have shown remarkable growth after liberlisation process. One of the recent and more important aspects is the bilateral trade between the two countries. The bilateral trade has grown remarkably in the last seventeen years. Today China is one of the top three trading partners of India whereas India has become one of the top ten trading partners of China. Looking at the size of the economy, composition of economy and exports and growth rates, there is a lot of untapped potential for bilateral trade growth. This bilateral trade will have significant impact on the global trade and economic scenario.Trade War With

ISSN (Online): 2455-3662
EPRA International Journal of Multidisciplinary Research (IJMR) - Peer Reviewed Journal Volume: 7| Issue: 9| September 2021|| Journal DOI: 10.36713/epra2013 || SJIF Impact Factor 2021: 8.047 || ISI Value: 1.188
2021 EPRA IJMR | www.eprajournals.com | Journal DOI URL: https://doi.org/10.36713/epra2013 186
China Not Good Idea Given India’s Manufacturing Ability.Instead of 'Boycott China', the call should be to develop
our own domestic industry and compete naturally.The clamour for boycotting Chinese products amid Indo-China tensions is unrealistic.Trade Promotion Council of India (TPCI), which is plays a key role in assisting the government in policies matter. As a trade and investment promotion.The anti-Chinese sentiments are not in the economic interest of the country if one is looking at the current reality, REFERENCES
1. https://www.bloombergquint.com/amp/economy-finance/six-things-to-know-about-india-china-economic-relations 2. https://indianexpress.com/article/opinion/columns/coronavirus-impact-on-economy-recession-job-loss-covid-19-sajjid-
z-chinoy-6416299/lite/ 3. https://www.theweek.in/news/biz-tech/2020/06/18/economic-impact-of-india-china-conflict-why-there-wont-be-just-
one-loser.amp.html 4. https://www.outlookindia.com/website/amp/india-news-trade-war-with-china-not-good-idea-given-indias-
manufacturing-ability-trade-promotion-body/354952
ISSN (Online): 2455-3662
EPRA International Journal of Multidisciplinary Research (IJMR) - Peer Reviewed Journal Volume: 7| Issue: 9| September 2021|| Journal DOI: 10.36713/epra2013 || SJIF Impact Factor 2021: 8.047 || ISI Value: 1.188
2021 EPRA IJMR | www.eprajournals.com | Journal DOI URL: https://doi.org/10.36713/epra2013 187
BITCOIN – DRIVER OF INNOVATION
Divya Kaushik1, Sonali Aswal2, Karan Bir Singh3, Lakshay Mukhija4
1Jagan Institute of Management Studies, Rohini, New Delhi, India 2Jagan Institute of Management Studies, Rohini, New Delhi, India 3Jagan Institute of Management Studies, Rohini, New Delhi ,India 4Jagan Institute of Management Studies, Rohini, New Delhi, India
ABSTRACT
Bitcoin, the first and most popular crypto currency, paves the way as a disruptive technology in the long-term and stable payment systems that have existed for decades. In addition to its security, two key infrastructures are likely to be key to success: power distribution and Global availability. Cryptocurrensets can transform digital trading markets by creating a free flowing trading system without money. Within two years of its peaceful launch in 2009, Bin Coin grew to billions of dollars in economic value without a basic analysis of the design of the system. Since then the growing book has identified hidden but important areas of the program, identified attacks, proposed other promising alternatives, and selected more difficult future challenges. In this paper, we provide a complete description of the details that make such a cryptocurrency a popular currency and offer new things that can be dismissed. KEYWORDS:Cryptocurrency, Bitcoin, Encryption , Currency , Exchange Rates, Transaction
1. INTRODUCTION Bitcoin is a digital, medium-sized, anonymous currency, which cannot be supported by any government
or other legal entity, and cannot be used to acquire gold or other commodities. It relies on interacting with peers to maintain its integrity.
Since its acquaintance with the world more than 10 years earlier, Bitcoin has had an unpopular and inexpensive trading history.
Such a major event took place in 2011. Bitcoin prices rose from $ 1 in April of that year to a peak of $ 32 in June, an increase of 3200% in three short months. That high rise was followed by a sharp decline in the crypto market and the cost of Bitcoin reached as low as possible by $ 2 in November 2011. There was a negative improvement the following year and the cost had risen from $ 4.80 in May to $ 13.20 on August 15.
2013 ends up being the perfect year for the cost of Bitcoin. The top price started the year in the exchange of $ 13.40 and went through two price increases at the same time. The main reason for this happened when the price shot up to $ 220 in early April 2013. That sharp increase was followed by a similar rapid decline in its costs and digital currency was changing hands at $ 70 in mid-April.
In any case, that was not the end of you. Another meeting (and a related accident) took place later that year. In early October, the cryptographic currency was exchanged at $ 123.20. By December, it had reached $ 1156.10. However, it fell to about $ 760 in three days after the fact. Those rapid changes marked the beginning of several years of Bitcoin costs and reached $ 315 lower in early 2015. 1.1 How Bitcoin Works
Bitcoin is a digital currency, a separate system that records transactions in a distributed ledger called a blockchain. successfully, these blocks are included in the blockchain record and miners are rewarded with a small amount of bitcoins. Some Bitcoin market participants can buy or sell tokens through cryptocurrency exchanges or see other people. The Bitcoin book is protected from fraud by the fraudulent system; Bitcoin trading also works to protect itself from potential theft, even if it is widely stolen.
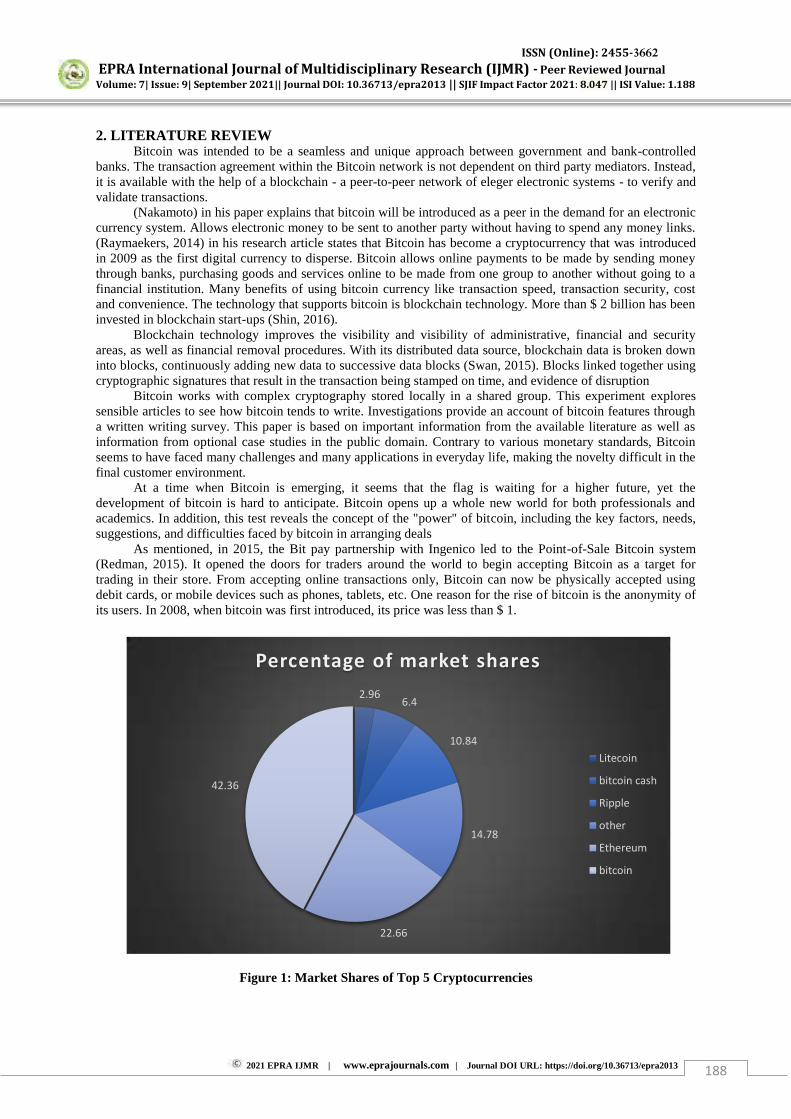
ISSN (Online): 2455-3662
EPRA International Journal of Multidisciplinary Research (IJMR) - Peer Reviewed Journal Volume: 7| Issue: 9| September 2021|| Journal DOI: 10.36713/epra2013 || SJIF Impact Factor 2021: 8.047 || ISI Value: 1.188
2021 EPRA IJMR | www.eprajournals.com | Journal DOI URL: https://doi.org/10.36713/epra2013 188
2. LITERATURE REVIEW Bitcoin was intended to be a seamless and unique approach between government and bank-controlled
banks. The transaction agreement within the Bitcoin network is not dependent on third party mediators. Instead, it is available with the help of a blockchain - a peer-to-peer network of eleger electronic systems - to verify and validate transactions.
(Nakamoto) in his paper explains that bitcoin will be introduced as a peer in the demand for an electronic currency system. Allows electronic money to be sent to another party without having to spend any money links. (Raymaekers, 2014) in his research article states that Bitcoin has become a cryptocurrency that was introduced in 2009 as the first digital currency to disperse. Bitcoin allows online payments to be made by sending money through banks, purchasing goods and services online to be made from one group to another without going to a financial institution. Many benefits of using bitcoin currency like transaction speed, transaction security, cost and convenience. The technology that supports bitcoin is blockchain technology. More than $ 2 billion has been invested in blockchain start-ups (Shin, 2016).
Blockchain technology improves the visibility and visibility of administrative, financial and security areas, as well as financial removal procedures. With its distributed data source, blockchain data is broken down into blocks, continuously adding new data to successive data blocks (Swan, 2015). Blocks linked together using cryptographic signatures that result in the transaction being stamped on time, and evidence of disruption
Bitcoin works with complex cryptography stored locally in a shared group. This experiment explores sensible articles to see how bitcoin tends to write. Investigations provide an account of bitcoin features through a written writing survey. This paper is based on important information from the available literature as well as information from optional case studies in the public domain. Contrary to various monetary standards, Bitcoin seems to have faced many challenges and many applications in everyday life, making the novelty difficult in the final customer environment.
At a time when Bitcoin is emerging, it seems that the flag is waiting for a higher future, yet the development of bitcoin is hard to anticipate. Bitcoin opens up a whole new world for both professionals and academics. In addition, this test reveals the concept of the "power" of bitcoin, including the key factors, needs, suggestions, and difficulties faced by bitcoin in arranging deals
As mentioned, in 2015, the Bit pay partnership with Ingenico led to the Point-of-Sale Bitcoin system (Redman, 2015). It opened the doors for traders around the world to begin accepting Bitcoin as a target for trading in their store. From accepting online transactions only, Bitcoin can now be physically accepted using debit cards, or mobile devices such as phones, tablets, etc. One reason for the rise of bitcoin is the anonymity of its users. In 2008, when bitcoin was first introduced, its price was less than $ 1.
Figure 1: Market Shares of Top 5 Cryptocurrencies
2.96 6.4
10.84
14.78
22.66
42.36
Percentage of market shares
Litecoin
bitcoin cash
Ripple
other
Ethereum
bitcoin

ISSN (Online): 2455-3662
EPRA International Journal of Multidisciplinary Research (IJMR) - Peer Reviewed Journal Volume: 7| Issue: 9| September 2021|| Journal DOI: 10.36713/epra2013 || SJIF Impact Factor 2021: 8.047 || ISI Value: 1.188
2021 EPRA IJMR | www.eprajournals.com | Journal DOI URL: https://doi.org/10.36713/epra2013 189
Growing slowly to the general trend, its price reached $ 1000 in February 2017 for the first time. As of
August 2017, its price has quadrupled in a short period of time which has kept the attention of the whole world. Later, in just four months, by December its price had tripled and had grown at an unusual rate by 2 translations. Many of the other digital currencies on the market follow the same trend again (coindesk.com, 2018). In the form of a bubble circle, the emergence of the cryptocurrency market has sparked various claims that it is one of the most eye-catching guns.
Many economists have agreed that economic bubbles, crashes, and problems are inevitable the effects of the capitalist system. Marx (1867) argued that imminent problems were common it is caused by the 'contradiction' within the capitalist system itself, and this the debate will turn out to be more complex and sharp as the so-called capitalist system it grows. He believed that these problems were a failure at the end of the capitalist system. No. scepticism, given the innovations and technological advances, the capitalist. The system will produce new bubbles like cryptocurrency football.
Although all transactions are recorded in the public ledger, only one public address is associated with the transfer transaction. Public address does not contain personal information, and as long as the public address is not associated with an identity, the transaction remains anonymous. This anonymity has made bitcoin the optional currency of the so-called "darknet" - websites that sell illegal items such as drugs and weapons. Since its closure, many new websites have emerged to replace them and use the bitcoin model as a means of communicating with buyers and sellers. 3. ANALYSIS
Bitcoin's current goal is to be a store of value as well as a payment system, there is nothing to say that Bitcoin could not be used in such a way in the future, though consensus would need to be reached to add these systems to Bitcoin. The main goal of the Ethereum project is to have a platform where these "smart contracts" can occur, therefore creating a whole realm of decentralized financial products without any middlemen or the fees and potential data breaches that come along with them.
Figure 2: Global crypto market size 2021
This versatility has caught the eye of governments and private corporations; indeed, some analysts believe that blockchain technology will ultimately be the most impactful aspect of the cryptocurrency craze. 3.1 Superior Competing Currency
Bitcoin is by far the largest crypto asset and holding it as a store of value has become the dominant narrative.A Store of value is an asset, commodity, or currency that maintains its worth and therefore can be exchanged in the future without deteriorating in value.
106
125
129
142
203
221
0 50 100 150 200 250
Jan-21
Feb-21
Mar-21
Apr-21
May-21
Jun-21
Global Crypto market size over Time

ISSN (Online): 2455-3662
EPRA International Journal of Multidisciplinary Research (IJMR) - Peer Reviewed Journal Volume: 7| Issue: 9| September 2021|| Journal DOI: 10.36713/epra2013 || SJIF Impact Factor 2021: 8.047 || ISI Value: 1.188
2021 EPRA IJMR | www.eprajournals.com | Journal DOI URL: https://doi.org/10.36713/epra2013 190
3.1.1 Scarcity While there are a number of factors required in a good stock market, a shortage is the most important of
all. To be a value store, the good can't be too much, easily available or easily produced in bulk otherwise it would be a small thing to increase the availability of the good. As the basic economics have taught us, when supply rises above demand, the price drops, making it a bad store of value. However, when supply is limited, any increase in demand increases the value of the good that helps maintain its value.
Gold is one of the rarest natural metals on Earth. It is difficult, expensive and very effective for digging the soil. As a result, the supply of gold does not increase easily and is not very high compared to other metals. This is the key building block for gold as a value store, because when demand rises and prices rise, it is a small effort to produce more gold which means it is difficult to fill the market with new acquisitions. This is the reason why there is a negative relationship between the value of a metal and the shortage of that metal. Compared with copper or silver, which is much easier to produce, gold had a different chance of being small and thus became a prominent type of value and money.
Therefore, Bitcoin is the only liquid liquid in the world with a fixed supply. That makes Bitcoin one of the scarce assets in the world. With constant supply, any increase in demand means that the price increases over time making it a good value chain store.
3.1.2 Durable
In order to preserve its value in the future, the asset should not be easily damaged or damaged. Food, although very important for our health, is a poor store of value because it spoils over time.
Taking into account computer standards does not change in a way that makes it difficult to use Bitcoin or reduce its performance, it will not degrade over time. It does not wear out, wear out or deteriorate due to time or use. Any bitcoin will still work in the near future as it does today.
3.1.3 Fungible
The price store needs to be exchanged in parallel. The ability to return good for another good simplifies the exchange processes, as risk means an equal amount between assets. Therefore, the disability allows for the exchange of goods in many places and markets. This is important in the value store because the asset owner knows that they can easily sell the good in the future to more buyers, the good is likely to hold its value.
One Bitcoin remains exactly the same as another Bitcoin. Because of the software, Bitcoin is not mined for any pollution. One Bitcoin will always be the same as any other Bitcoin ever made. As a result, Bitcoin is easily recognizable than gold. 3.1.4 Verifiable
The stock market is easy to identify and easy to verify. And it can be very difficult, if not impossible, to make a fake. Simple verification simplifies the exchange process thus increasing confidence in the manager that they will have no problem getting the price in the future. Knowing that the good can not be counterfeit ensures that the market will not be flooded with illegal goods and increases confidence in future transactions. 3.1.5 Storable
Because the asset store is designed to be held in the future, there should be a secure way to store the asset in order to recover it over time.
By comparison, Bitcoin is much easier to maintain and can be made for free. Bitcoin is digital so it does not need a large or secure room. Anyone can hold any amount of their own using a web-based digital, or hardware-based wallet. The wallet can also be stored on mobile phones, desktops, hard drives or kept secure by printing private keys and addresses on paper. There is a small curve to learn how to securely save bitcoin for anyone new to the space but once understood, there is no limit or cost limit to keep Bitcoin. 3.1.6 Portable
The goods store is easy to move, making it easy to get to wherever you are. This feature also helps to trade long distances.
Gold is heavy and very disruptive to deal with. In fact, this was a major setback for gold and a reason to move away from handling gold coins and using bank notes indicating a gold claim. It is expensive and slow to move which is why it is done so often. In fact, when Germany reclaimed $ 31 billion worth of gold barracks at the last stops in New York and Paris in 2017, it took more than four years and cost $ 9.1 million to ship all that metal to Frankfurt.
However, portability is not a problem with Bitcoin. It can be stored on a thumb drive or accessible anywhere in the world with internet meaning you can "take it with you" wherever you go. This is especially
ISSN (Online): 2455-3662
EPRA International Journal of Multidisciplinary Research (IJMR) - Peer Reviewed Journal Volume: 7| Issue: 9| September 2021|| Journal DOI: 10.36713/epra2013 || SJIF Impact Factor 2021: 8.047 || ISI Value: 1.188
2021 EPRA IJMR | www.eprajournals.com | Journal DOI URL: https://doi.org/10.36713/epra2013 191
important for refugees who have historically been forced to flee and who can only manage. Now they have a way to save and take whatever wealth they have. 3.2 Payment connection
The software maintains a continuous update recorder that records all Bitcoin transactions. The code sets out the Bitcoin shortage, and the mines introduce new Bitcoins from time to time. This Bitcoins payment form consists of solving the mathematical problems needed to verify a transaction. Successful solutions to those problems using mathematical calculations create a lot of money. 3.3 Market value
Today, there are billions of dollars in digital assets in the world. In 2017, consolidated digital funds had a total market value of approximately $ 100 billion. Depending on the market price, the price of digital currencies can be ten times higher than the most important companies
4. INNOVATION Digital currencies have the power to transform fiat currencies into a popular new payment method. In this
scenario, a country with a highly efficient cryptocurrency system could benefit greatly from ‘arms’ competition
and financial leadership. The integrity of the data flow in the network of cryptocurrency systems has the potential to reduce, to
some extent, the problems of corruption and underground industries that exist in all countries. Physical income grows at a faster rate than cash. This is due to the simplicity of modern payment
methods and the current state of technological advancement, which allows seamless transactions in the port and online sales.
Cryptocurrencies have the potential to serve as a tool to build new financial systems in countries with a high percentage of unregistered people and political instability due to their key benefits such as no external disruption, user anonymity, low transactions and cross-border transaction.
People will be able to participate in global commercial markets, which has led to economic growth. When citizens in a country face political, social, and / or financial turmoil, they can use cryptocurrencies in large quantities.
Blockchain technology that supports cryptocurrensets allows for a variety of technological advances, including faster and more secure payments, the best-selling transactions in the financial markets, and the validation of sensitive data.
Blockchain will disrupt all businesses, and digital money will enhance the company's new model, speed up and maximize business outcomes at unprecedented levels. This change could be the explosion or the beginning of financial restructuring. Therefore, investors are investing more in blockchain success, which is a crypto-currency collapse technology. 4.1 Fraud management
An unprecedented level of security is possible with Bitcoin. The network offers users protection from the most common types of fraud such as payments or unwanted expenses, and bitcoins are less likely to cheat. Consumers can support or crucify their wallets. Hardware bags make it very difficult to steal or lose money. Bitcoin is designed to allow its users to have complete control over their money. 4.2 Global availability
With Bitcoin, all payments in the world are usually fully integrated. Bitcoin allows any bank, business or individual to securely send and receive payments anywhere at any time, with or without a test account. Bitcoin is available in many countries that remain unavailable in most payment systems due to their limitations. Bitcoin increases global access to trade and can help international trade to flourish.
One of the most important benefits of crypto sets is their global availability. With limited government restrictions and laws, except in China where digital currency trading takes place despite restrictions, cryptocurrencies can be accessed and traded by people from all over the world using integrated investment platforms that require nothing but an online connection and a cryptocurrency fund to get started. .
In addition, customers are able to purchase products from overseas eCommerce sites at a lower cost per crypt sets, as cross-border payments benefit at lower costs with this digital asset.
This means that eCommerce sites can open their doors to represent the most targeted audience if they are to adopt crypto sets. Transactions on cryptocurrency networks are also much faster than traditional fiat currencies, and remain more secure, further helping to make products more accessible worldwide.
ISSN (Online): 2455-3662
EPRA International Journal of Multidisciplinary Research (IJMR) - Peer Reviewed Journal Volume: 7| Issue: 9| September 2021|| Journal DOI: 10.36713/epra2013 || SJIF Impact Factor 2021: 8.047 || ISI Value: 1.188
2021 EPRA IJMR | www.eprajournals.com | Journal DOI URL: https://doi.org/10.36713/epra2013 192
4.3 Cost effective With the use of encryption, secure payment is possible without any problem and is expensive. Bitcoin
transactions can be more expensive than alternatives and be completed in a short period of time. This means that Bitcoin has some potential to become a standard way to transfer any money in the future. Bitcoin can also play a role in reducing poverty in many countries by cutting transaction costs higher on workers' wages. 4.4 Reimbursement in bulk
Bitcoin can be used to run refund campaigns like Kickstarter, where people promise money for a project taken from them only if there are enough promises to achieve the goal. Such verification contracts are processed by the Bitcoin protocol, which prevents transactions from happening until all conditions are met. 4.5 Dispute Resolution
Bitcoin can be used to develop new dispute resolution services using multiple signatures. Such services may allow third parties to approve or reject the transaction in the event of a dispute between the parties without the control of their finances. As these services will be compatible with any user and merchant using Bitcoin, this can lead to free competition and high quality standards.
4.6 Accounts sign in bulk Most signatures allow transactions to be accepted by the network only if a certain number of designated
groups agree to the signing process. This may be used by the board of directors to prevent any member from using parts of his or her treasury without the consent of other members. This can also be used by banks to prevent theft by preventing overtime payment if the user does not provide additional information. 4.7 Trust and integrity
Bitcoin offers solutions to many of the trust problems that plague banks. With a clear choice of accounting, digital contracts, and consistent transactions, Bitcoin can be used as a ground for restoring trust and consistency. Fraudulent banks cannot cheat the system to make a profit by polluting other banks or the public. A future where major banks will support Bitcoin can help restore credibility and trust in financial institutions. 4.8 Strengthening and decentralization of communities
In the form of land redistribution, Bitcoin has created a unique type of payment network with a growing level of robustness and retrieval. Bitcoin can hold millions of dollars in trading without the need for military protection. Without a common point of failure as a data center, network attacks are difficult. Bitcoin can represent an exciting initiative to protect domestic and foreign financial systems. 4.9 Flexible transparency
All Bitcoin transactions are public and transparent and the identity of the people after the transaction is automatically confidential. This allows individuals and organizations to work with flexible rules to reflect this. For example, an entity may choose to disclose certain transactions and balances to certain employees as a non-profit organization is free to let the public see how much you earn through daily and monthly contributions.
5. FUTURE SCOPE The next decade could prove its significance in the evolution of Bitcoin. Changes within the external
financial system, there are a few areas in the Bitcoin's ecosystem where investors should take care. Currently, cryptocurrency stands between being a value store and a daily trading platform. Institutional
investors are eager to get into action and benefit from fluctuations in prices as even governments around the world, such as Japan, have announced that it is a fair way to pay for goods.
The introduction of Bitcoin (or, in that case, increases in its appeal as an asset class) as a payment method would not be possible without technological advances in its natural environment. To be considered a viable investment asset or payment method, Bitcoin's blockchain must be able to manage millions of transactions in a short period of time. Several technologies, such as the Lightning Network, promise scale on its performance. New cryptocurrensets have been developed as a result of the complex forks of the bitcoin blockchain, including Bitcoin Cash and Bitcoin Gold, which aim to adjust ecosystem parameters so that they can manage more transactions at a faster pace. CONCLUSION
Bitcoin is a payment system based on a redesigned architecture that provides a file for how to get more anonymous credentials, bitcoin addresses, can used to make and receive payments. The long-held view of
ISSN (Online): 2455-3662
EPRA International Journal of Multidisciplinary Research (IJMR) - Peer Reviewed Journal Volume: 7| Issue: 9| September 2021|| Journal DOI: 10.36713/epra2013 || SJIF Impact Factor 2021: 8.047 || ISI Value: 1.188
2021 EPRA IJMR | www.eprajournals.com | Journal DOI URL: https://doi.org/10.36713/epra2013 193
bitcoin is that it is the subject of much debate. Making Bitcoin requires ingenuity, patience, and most importantly, minimizing power. After all, the basic rules enshrined in the Bitcoin constitution ultimately take the technology. That’s why Silicon Valley has had a hard time understanding the value proposition of Bitcoin, not
just technology, financial instrument, or consumer request; an entire technology-backed financial system. Changing the constitution of Bitcoin requires a political process that can break its financial structures, therefore, new technologies are being used as modules. Bitcoin is a digital novel that has the potential to be a key player in micropayment markets and global markets. It is also a good alternative to gold bugs who prefer to hold funds that are fully funded by assets. In addition, because they are anonymous and in their hands, it is therefore difficult to shut them down, it can allow organizations that are hated by the government, whether they are praiseworthy or disgusting organizations - to be funded without the risk of money laundering or sanctions against donors. REFERENCES
1. Agarwal, R. and M. Kimball, (2015). “Breaking through the Zero Lower Bound.”IMF Working Paper WP/15/224.
Washington: International Monetary Fund, October. 2. Chiu, J., and T. Wong. (2014). “E-Money: Efficiency, Stability and Optimal Policy.” Bank of Canada Working
Paper No. 2014-16. 3. Robb, A. B. (2017). Block chain, forensic accounting and research. Working
paper.https://www.cmegroup.com/education/courses/introduction-to-bitcoin/introduction-to-bitcoin-reference-rate.html
4. Nakamoto, S. (n.d.). Bitcoin: A Peer-to-Peer Electronic Cash System. https://bitcoin.org/bitcoin.pdfhttps://www.researchgate.net/publication/281773799_Research_and_Challenges_on_Bitcoin_Anonymity
5. https://www.researchgate.net/publication/316656878_An_Analysis_of_Cryptocurrency_Bitcoin_and_the_Future 6. Lagos, L. and R. Wright, (2005). “A unified framework for monetary theory and policy analysis, ” Journal of
political Economy, 113.3 (2005): 463-484. 7. Moore, T. and N. Christin, (2013). “Beware the Middleman: Empirical Analysis of BitcoinExchange Risk,” in
Financial Cryptography and Data Security. 8. Rogoff, K.S., (2016). The Curse of Cash. Princeton University Press. 9. Ron, D. and A. Shamir, (2013) “Quantitative analysis of the full bitcoin transaction graph.” International
Conference on Financial Cryptography and Data Security, pp. 6-24. 10. https://medium.com/digitalassetresearch/a-look-at-innovation-in-bitcoins-technology-stack-7edf877eab14 11. Raymaekers. (2014). Cryptocurrency Bitcoin: Disruption, challenges and opportunities. Journal of Payments
Strategy & Systems, 1-40.
ISSN (Online): 2455-3662
EPRA International Journal of Multidisciplinary Research (IJMR) - Peer Reviewed Journal Volume: 7| Issue: 9| September 2021|| Journal DOI: 10.36713/epra2013 || SJIF Impact Factor 2021: 8.047 || ISI Value: 1.188
2021 EPRA IJMR | www.eprajournals.com | Journal DOI URL: https://doi.org/10.36713/epra2013 194
A STUDY ON DIGITAL EYE STRAIN ASSOCIATED WITH
EXCESSIVE USE OF DIGITAL GADGETS DURING
PANDEMIC
Kinnari Pathak1, Dr. Mahendrasinh D. Chauhan2, Dr. Chetna V. Patel3, Najwa F. Mansuri4
1Optometrist, Shree Bharatimaiya College of Optometry and Physiotherapy, Surat. 2Principal, Shree Bharatimaiya College of Optometry and Physiotherapy, Surat. 3Professor, Shree Bharatimaiya College of Optometry and Physiotherapy, Surat.
4Assistant Professor, Shree Bharatimaiya College of Optometry and Physiotherapy, Surat.
Affiliated to: Veer Narmad South Gujarat University, Surat.
ABSTRACT An observational study on changes in refractive error associated with excessive use of digital gadgets during pandemic. Home-isolation and social distancing during the COVID-19 pandemic caused increased use of digital devices, posing a greater risk of developing digital eye strain-related symptoms.Our study included 200 eyes of 100 patients and A self-reported questionnaire which was used to compare the total hours per day, either continuous or intermittent, spent on digital devices during and before lockdown and the association of these durations with digital eye strain and vision related complaints. It showed that 100 patients including both male and female, out of which 58% were males and 42% were females. Majority of gadgets user were found in age group of 11 to 20 (62%), followed by the age group of 21 to 30 (29%) and least used by the age group of 5 to 10 (9%).In this study we also observed that maximum patients used gadgets for about 6 to 8 hours a day (51%), 3 to 5 hours a day (49%), and least use of 1 to 2 hours a day. The results shows that digital gadgets user among them 80% patients having an complaint of headache, 66% patients complaint of squeezing the eyes ,77% patients having an complaint of digital eye strain. Also out of 100 patients in 26% patients don’t wearing spectacle, and 30% patients having a history of eye rubbing. Mainly In our study, we found that out of 100 patients 64% patients are myopic astigmatism, 14% are hyperopic astigmatism, 12% are astigmatism, and 10% patients are only myopic. From the our study, we concluded that the excessive use of screens in childhood and adults can have many negative effects and unregulated amounts of screen time may lead to ailments like Asthenopia and increase risk of myopi KEY WORDS: Covid 19, digital eye strain, asthenopic symptoms, digital devices, refractive error
INTRODUCTION COVID-19 is a disease caused by a new strain
of coronavirus. 'CO' stands for corona, 'VI' for virus, and 'D' for disease. Since the declaration of the lockdown due to COVID-19, the usage of digital devices has gone up across the globe, resulting in a challenge for the visual system of all ages. The sudden
increase in usage of digital devices, and the overall number of hours of screen time logged per day have been due to a shift of professional and social activities to a web-based platform after the advent of the novel coronavirus. This includes online conference calls, meetings, webinars, online classes and assignments done on digital devices, work from home, personal and
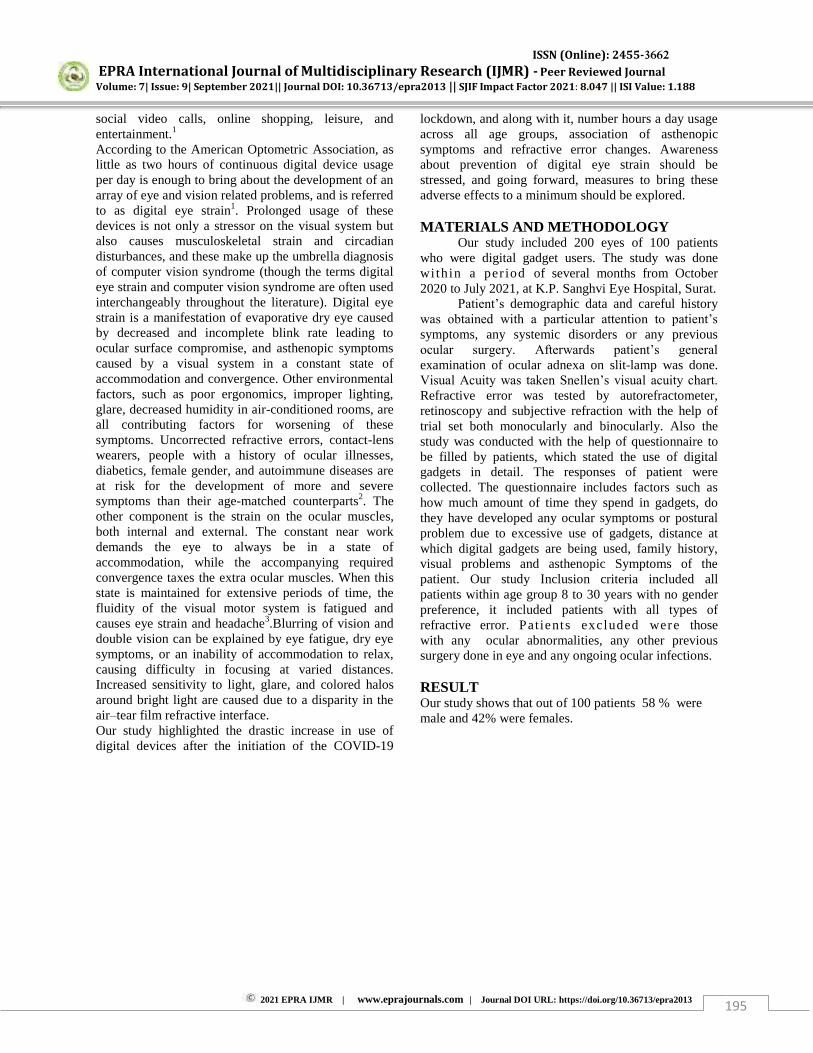
ISSN (Online): 2455-3662
EPRA International Journal of Multidisciplinary Research (IJMR) - Peer Reviewed Journal Volume: 7| Issue: 9| September 2021|| Journal DOI: 10.36713/epra2013 || SJIF Impact Factor 2021: 8.047 || ISI Value: 1.188
2021 EPRA IJMR | www.eprajournals.com | Journal DOI URL: https://doi.org/10.36713/epra2013 195
social video calls, online shopping, leisure, and entertainment.1
According to the American Optometric Association, as little as two hours of continuous digital device usage per day is enough to bring about the development of an array of eye and vision related problems, and is referred to as digital eye strain1. Prolonged usage of these devices is not only a stressor on the visual system but also causes musculoskeletal strain and circadian disturbances, and these make up the umbrella diagnosis of computer vision syndrome (though the terms digital eye strain and computer vision syndrome are often used interchangeably throughout the literature). Digital eye strain is a manifestation of evaporative dry eye caused by decreased and incomplete blink rate leading to ocular surface compromise, and asthenopic symptoms caused by a visual system in a constant state of accommodation and convergence. Other environmental factors, such as poor ergonomics, improper lighting, glare, decreased humidity in air-conditioned rooms, are all contributing factors for worsening of these symptoms. Uncorrected refractive errors, contact-lens wearers, people with a history of ocular illnesses, diabetics, female gender, and autoimmune diseases are at risk for the development of more and severe symptoms than their age-matched counterparts2. The other component is the strain on the ocular muscles, both internal and external. The constant near work demands the eye to always be in a state of accommodation, while the accompanying required convergence taxes the extra ocular muscles. When this state is maintained for extensive periods of time, the fluidity of the visual motor system is fatigued and causes eye strain and headache3.Blurring of vision and double vision can be explained by eye fatigue, dry eye symptoms, or an inability of accommodation to relax, causing difficulty in focusing at varied distances. Increased sensitivity to light, glare, and colored halos around bright light are caused due to a disparity in the air–tear film refractive interface. Our study highlighted the drastic increase in use of digital devices after the initiation of the COVID-19
lockdown, and along with it, number hours a day usage across all age groups, association of asthenopic symptoms and refractive error changes. Awareness about prevention of digital eye strain should be stressed, and going forward, measures to bring these adverse effects to a minimum should be explored. MATERIALS AND METHODOLOGY
Our study included 200 eyes of 100 patients who were digital gadget users. The study was done wi thin a per iod of several months from October 2020 to July 2021, at K.P. Sanghvi Eye Hospital, Surat.
Patient’s demographic data and careful history was obtained with a particular attention to patient’s
symptoms, any systemic disorders or any previous ocular surgery. Afterwards patient’s general
examination of ocular adnexa on slit-lamp was done. Visual Acuity was taken Snellen’s visual acuity chart.
Refractive error was tested by autorefractometer, retinoscopy and subjective refraction with the help of trial set both monocularly and binocularly. Also the study was conducted with the help of questionnaire to be filled by patients, which stated the use of digital gadgets in detail. The responses of patient were collected. The questionnaire includes factors such as how much amount of time they spend in gadgets, do they have developed any ocular symptoms or postural problem due to excessive use of gadgets, distance at which digital gadgets are being used, family history, visual problems and asthenopic Symptoms of the patient. Our study Inclusion criteria included all patients within age group 8 to 30 years with no gender preference, it included patients with all types of refractive error. Patients excluded were those with any ocular abnormalities, any other previous surgery done in eye and any ongoing ocular infections.
RESULT Our study shows that out of 100 patients 58 % were male and 42% were females.
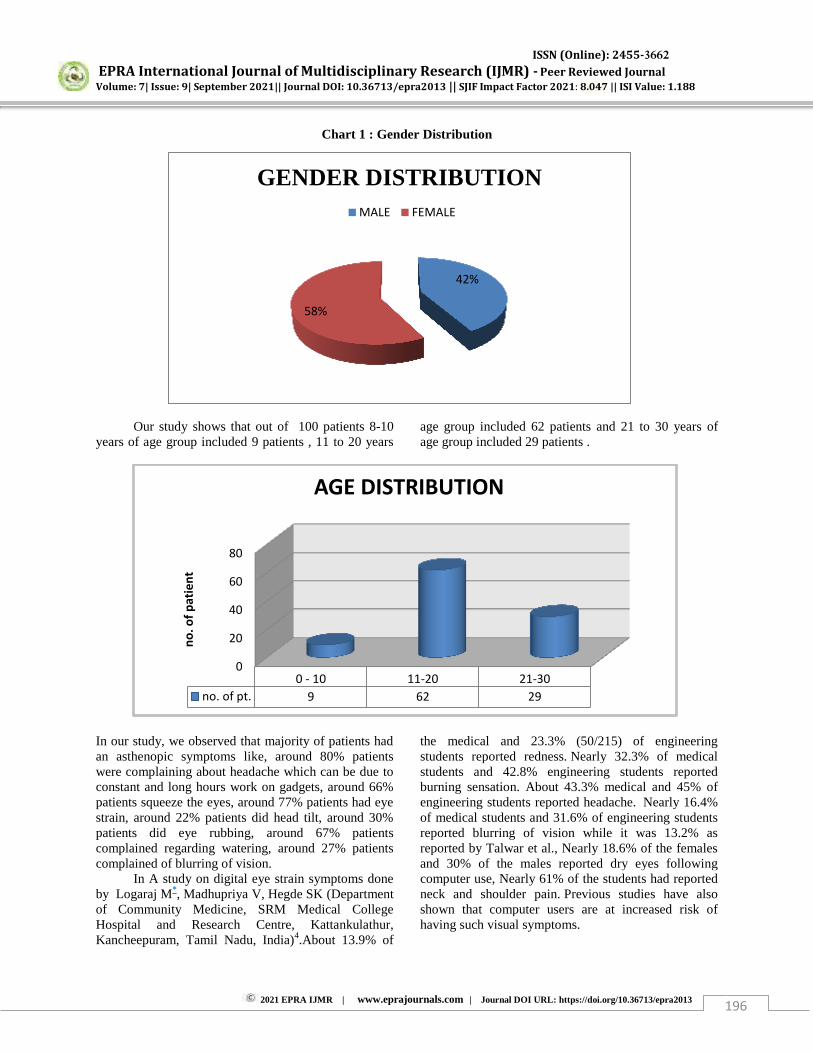
ISSN (Online): 2455-3662
EPRA International Journal of Multidisciplinary Research (IJMR) - Peer Reviewed Journal Volume: 7| Issue: 9| September 2021|| Journal DOI: 10.36713/epra2013 || SJIF Impact Factor 2021: 8.047 || ISI Value: 1.188
2021 EPRA IJMR | www.eprajournals.com | Journal DOI URL: https://doi.org/10.36713/epra2013 196
Chart 1 : Gender Distribution
Our study shows that out of 100 patients 8-10 years of age group included 9 patients , 11 to 20 years
age group included 62 patients and 21 to 30 years of age group included 29 patients .
In our study, we observed that majority of patients had an asthenopic symptoms like, around 80% patients were complaining about headache which can be due to constant and long hours work on gadgets, around 66% patients squeeze the eyes, around 77% patients had eye strain, around 22% patients did head tilt, around 30% patients did eye rubbing, around 67% patients complained regarding watering, around 27% patients complained of blurring of vision.
In A study on digital eye strain symptoms done by Logaraj M*, Madhupriya V, Hegde SK (Department of Community Medicine, SRM Medical College Hospital and Research Centre, Kattankulathur, Kancheepuram, Tamil Nadu, India)4.About 13.9% of
the medical and 23.3% (50/215) of engineering students reported redness. Nearly 32.3% of medical students and 42.8% engineering students reported burning sensation. About 43.3% medical and 45% of engineering students reported headache. Nearly 16.4% of medical students and 31.6% of engineering students reported blurring of vision while it was 13.2% as reported by Talwar et al., Nearly 18.6% of the females and 30% of the males reported dry eyes following computer use, Nearly 61% of the students had reported neck and shoulder pain. Previous studies have also shown that computer users are at increased risk of having such visual symptoms.
0
20
40
60
80
0 - 10 11-20 21-30
no. of pt. 9 62 29
no
. of
pat
ien
t
AGE DISTRIBUTION
42%
58%
GENDER DISTRIBUTION MALE FEMALE
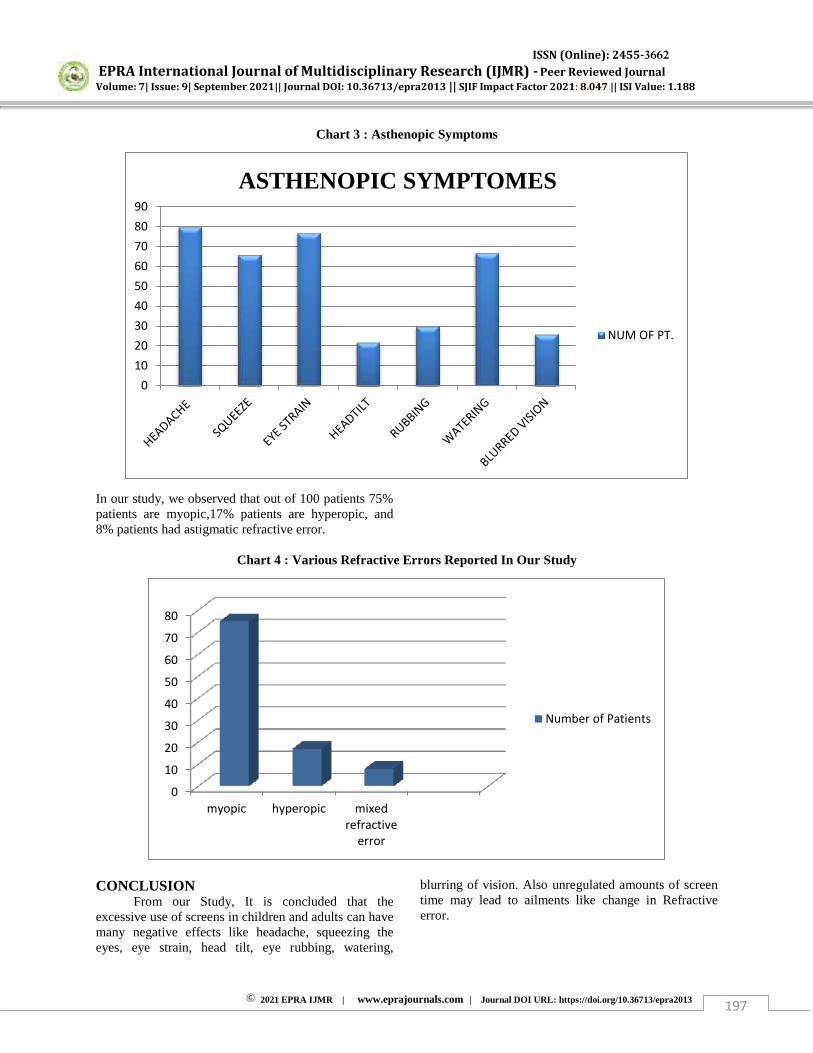
ISSN (Online): 2455-3662
EPRA International Journal of Multidisciplinary Research (IJMR) - Peer Reviewed Journal Volume: 7| Issue: 9| September 2021|| Journal DOI: 10.36713/epra2013 || SJIF Impact Factor 2021: 8.047 || ISI Value: 1.188
2021 EPRA IJMR | www.eprajournals.com | Journal DOI URL: https://doi.org/10.36713/epra2013 197
Chart 3 : Asthenopic Symptoms
In our study, we observed that out of 100 patients 75% patients are myopic,17% patients are hyperopic, and 8% patients had astigmatic refractive error.
Chart 4 : Various Refractive Errors Reported In Our Study
CONCLUSION
From our Study, It is concluded that the excessive use of screens in children and adults can have many negative effects like headache, squeezing the eyes, eye strain, head tilt, eye rubbing, watering,
blurring of vision. Also unregulated amounts of screen time may lead to ailments like change in Refractive error.
0
10
20
30
40
50
60
70
80
90
ASTHENOPIC SYMPTOMES
NUM OF PT.
0
10
20
30
40
50
60
70
80
myopic hyperopic mixedrefractive
error
Number of Patients

ISSN (Online): 2455-3662
EPRA International Journal of Multidisciplinary Research (IJMR) - Peer Reviewed Journal Volume: 7| Issue: 9| September 2021|| Journal DOI: 10.36713/epra2013 || SJIF Impact Factor 2021: 8.047 || ISI Value: 1.188
2021 EPRA IJMR | www.eprajournals.com | Journal DOI URL: https://doi.org/10.36713/epra2013 198
AREA OF FURTHER RESEARCH
Our study had a small sample size, and the investigation were performed only on healthy Indian subjects. For this reason, we were unable to assess the influence of ethnicity in our research. In addition, we do not know whether the results apply to patients with existing eye problems and diseases, as we examined only normal eyes. We hope to examine the findings for long term effects of use of digital devices in the future.
REFERENCES 1. Computer vision syndrome (CVS). American
Optometric Association [Online]. Available from: http://wwwaoaorg/x5374xmlLast cited on 2020 Aug 24
2. Loh K, Redd S. Understanding and preventing computer vision syndrome Malays Fam Physician. 2008;3:128–30
3. Bhootra AK. Basics of Computer Vision Syndrome New Delhi, India: Jaypee Brothers Medical Publishers, 2014 ISBN 978-93-5152-413-7
4. Logaraj M*, Madhupriya V, Hegde SK (Department of Community Medicine, SRM Medical College Hospital and Research Centre, Kattankulathur, Kancheepuram, Tamil Nadu, India).
ISSN (Online): 2455-3662
EPRA International Journal of Multidisciplinary Research (IJMR) - Peer Reviewed Journal Volume: 7| Issue: 9| September 2021|| Journal DOI: 10.36713/epra2013 || SJIF Impact Factor 2021: 8.047 || ISI Value: 1.188
2021 EPRA IJMR | www.eprajournals.com | Journal DOI URL: https://doi.org/10.36713/epra2013 199
A CORPUS-BASED INVESTIGATION OF MOVES IN ARGUMENT STAGE OF ARGUMENTATIVE ESSAY
Anita Kanestion1 , Manvender Kaur Sarjit Singh2
1 PhD Research Scholar, School of Language, Culture and Philosophy (SLCP), Northern University of Malaysia, Malaysia
2Associate Professor, School of Language, Culture and Philosophy (SLCP),
Northern University of Malaysia, Malaysia
Article DOI: https://doi.org/10.36713/epra8475 DOI No: 10.36713/epra8475
ABSTRACT
Genre analysis has been frequently employed in Malaysia to analyse undergraduate and postgraduate target discourse, particularly research articles and abstracts. On the other hand, just a few studies have been done on argumentative essays written by pre-university students taking the Malaysian University English Test (MUET). The goal of this study is to examine rhetorical moves of the argument stage in 60 argumentative essays. The major instrument utilised to assess the rhetorical structure in the assembled essays was a compiled representative corpus of argumentative essays, COMWArE. The identification of rhetorical moves was investigated using BCU approach, which is aided by a computer-assisted corpus analysis (CACA). In addition, two subject matter experts were interviewed in order to gain insider perspectives. The analysis reveals that the argument stage in argumentative essays consists of three moves and five steps. The findings of the study lend itself to providing a representative template of rhetorical organisation for organising argument stage in producing an argumentative essay. Pedagogically, this rhetorical structure is useful particularly to novice writers to better understand how argument stage is produced. KEYWORDS: Rhetorical Moves; Genre Analysis; Malaysian University English Test (MUET); Argumentative Essay; Computer-Assisted Corpus Analysis (CACA)
1. INTRODUCTION
Writing is regarded as one of the most difficult skills for both English as a Second Language (ESL) and English as Foreign Language (EFL) students to master (David, Thang, & Azman, 2015; Habibi & Singh, 2019; Hirvela, 2017; Kanestion, Singh, Shamsudin, 2017; Rahmanita & Cahyono, 2018). This is because non-native speakers' written talents are learnt and practised via experience, rather than being innate (Grape and Kaplan, 1999). To be able to grasp and generate a decent degree of writing proficiency, linguistic competence alone is insufficient; second language writers must additionally examine the rhetorical structure of a document. According to Bhatia (1993), rhetorical structure appears in the macro-organization of writing, which encompasses a few levels of information organisation. In summary, rhetorical structure is a formal structure of a text that is acknowledged or known by its discourse community.
Kaplan (1966) developed the notion of contrastive rhetoric, which claims that writing is a mirror of cultural thought processes, recognising that the structural rhetorical organisation of a text varies by language and culture. Contrastive rhetoricians are interested in deciphering and analysing the rhetorical structure of written discourse in both L1 and L2. Academics respond to criticism by claiming that it simply provides a better understanding of cultural differences (Matsuda, 1997; Connor & A. Mauranen, 1999). Though there are many studies on contrastive rhetoric, especially in the ESL context, Reza and Atena (2013) claimed that the need for students to learn the rhetorical structure persists, and it is noteworthy that knowing the rhetorical structure in English and other languages or cultures will likely only help learners understand the differences and similarities that exist. In Malaysia, for example, contrastive rhetoric has yet to develop a structure that can be used as a foundation in ESL writing instruction.
ISSN (Online): 2455-3662
EPRA International Journal of Multidisciplinary Research (IJMR) - Peer Reviewed Journal Volume: 7| Issue: 9| September 2021|| Journal DOI: 10.36713/epra2013 || SJIF Impact Factor 2021: 8.047 || ISI Value: 1.188
2021 EPRA IJMR | www.eprajournals.com | Journal DOI URL: https://doi.org/10.36713/epra2013 200
Since the introduction of Swales' (1990) Create A Research Space (CARS) model, there has been a growing interest in analysing various types of texts in the field of English for Specific Purposes (ESP), including academic and professional texts, namely grant proposals (Connor & Mauranen, 1999; Cotos, 2019), job advertisements (Bhatia, 1993), application letters (Henry & Roseberry, 2001), letters of appeal (Sadeghi & Samuel, 2013), EAP classroom lessons (Lee, 2016), research articles (RA) in various disciplines (Davis, 2015; Fazilatfar & Naseri, 2014; Maswana et al., 2015), three minutes thesis presentation (Hu & Liu, 2018); engineering work procedures (Singh, 2014) and sub-genres such as introductions in RAs (Maher & Milligan, 2019; Ina, Aizan, & Noor Hashima, 2015), abstracts (Nguyen, 2018; Tseng, 2011), theoretical framework sections (Tseng, 2018), and discussions (Amnuai & Wannaruk, 2012; Holmes, 1997; Moreno & Swales, 2018). As is usual in the field of genre analysis, researchers in these studies concentrated on the examination of the rhetorical structure of distinct works. As a result, such studies have aided inexperienced writers in academic and professional settings in adopting the rhetorical structure of the target genres.
As with other varieties of academic writing (theses, research papers, proposals, and problem statements), the argumentative essay is regarded a distinct genre due to the fact that it follows a widely established rhetorical framework. While Swales (1990) introduced the concept of rhetorical structure by examining the rhetorical structure of research articles' introductions, which consists of several moves and steps, in the same era, Hyland (1990) proposed an analytical model of an argumentative essay using 65 essays written by sampled non-native speakers, which consists of three stages and several moves. To the authors' knowledge, however, there have been few research utilising Hyland's analytical framework (1990) in the field of genre analysis, which could be a result of the model's development process. For instance, Liu (2015) has conducted research on the moves and quality of wrap-up sentences in essay conclusions while exploring the impact of L1 rhetorical transfer at the text level. The findings reveal that Affirmation move, which is an optional move in English essays, has been greatly employed by the students due to their inductive style of writing, a typical Chinese rhetorical mode, while Consolidation move is underused in Chinese essays. Albeit, the findings highlight L1 rhetorical transfer with some novel approaches, but no attempt is made to develop an analytical framework for argumentative essays that may be extensively used in teaching and learning in ESL/EFL classrooms. The moves are selected manually, which contradicts the current study's methodology, as the researchers employ computer-assisted corpus analysis, or CACA, (Singh,
2014), and to eliminate subjectivity in the detected moves, validation and reliability tests are conducted.
Due to its limitations, Swalesian move analysis is used to further examine and refine the rhetorical structure in argumentative writing. A move is defined as a unit that acts within a section of text and directly contributes to the text's overall purpose. When writers apply a step or a group of steps, the purposes of the moves are achieved (Bhatia, 1993). This is demonstrated in Chandrasegaran's (2008) work, which examines argument techniques, specifically stance assertion moves, stance support moves, and rhetorical use of topic knowledge, in two types of discourse: online informal forum and formal academic essay. Nonetheless, the study overlooked the holistic aspect of argumentative writing in educational settings when communicative goals must be met formally.
According to the aforementioned studies, the majority of attention has been focused on academic writing and professional settings, while argumentative writing among pre-university students continues to be a neglected topic, particularly in Malaysia. As a result, the current study conducts move analysis utilising Swales' (1990) model and Hyland's (1990) analytical framework as a guide, with the intention of employing them as a framework for developing teaching and learning materials. As with other studies that evaluate a single part of a genre, or what is referred to as a sub-genre, such as the introduction, problem statement, discussion, and conclusion, this study examines the argument stage of argumentative essays produced by sampled pre-university students.
2. RESEARCH QUESTIONS The following research questions were framed
to guide the study.
i) What are the rhetorical moves in the argument stage of the sampled argumentative essays produced by the pre-university students? ii) What are the frequencies of the rhetorical moves used in the argument stage of argumentative essays produced by the pre-university students?
3. METHODOLOGY Pre-university students from two pre-
university colleges in Perlis and Kedah participated in this study. Pre-university colleges were chosen because students would be required to sit for the Malaysian University English Test (MUET) annually. MUET is a competency test that is regularly administered throughout the country prior to entering university education. At the pre-university level, pupils are required to take the test because it is a requirement for university admission.
Prior to the actual MUET, pre-university students were assigned previous year questions and
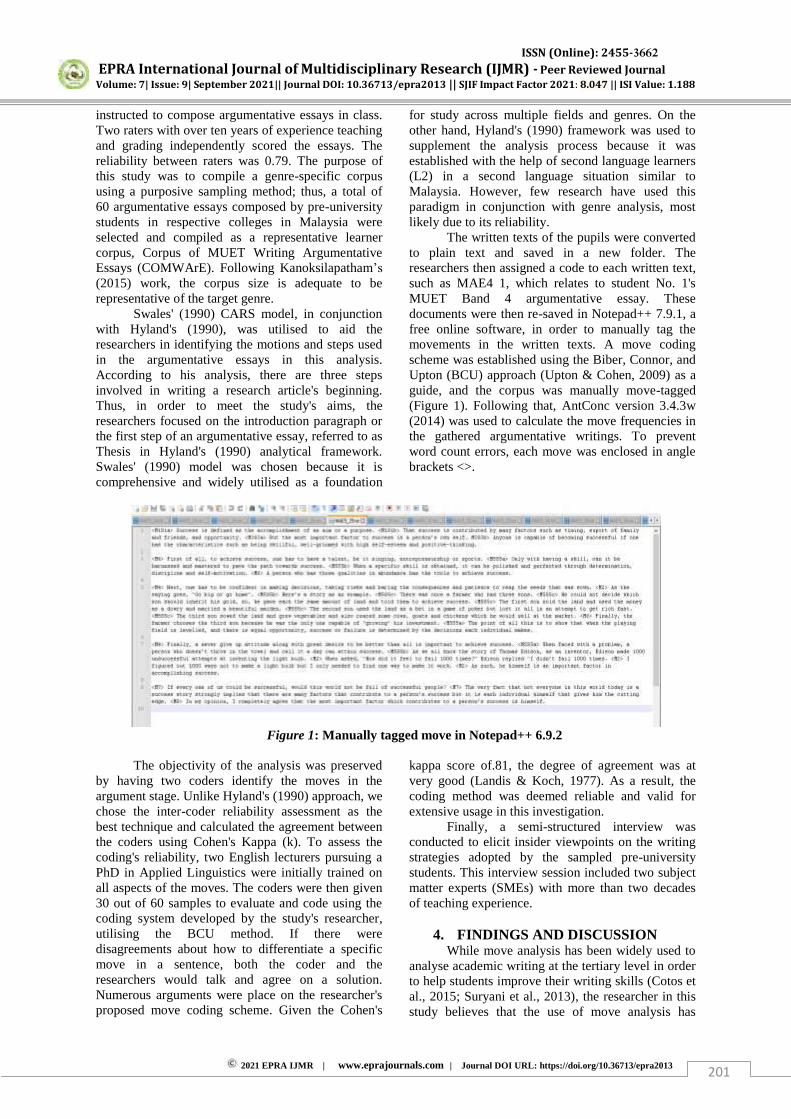
ISSN (Online): 2455-3662
EPRA International Journal of Multidisciplinary Research (IJMR) - Peer Reviewed Journal Volume: 7| Issue: 9| September 2021|| Journal DOI: 10.36713/epra2013 || SJIF Impact Factor 2021: 8.047 || ISI Value: 1.188
2021 EPRA IJMR | www.eprajournals.com | Journal DOI URL: https://doi.org/10.36713/epra2013 201
instructed to compose argumentative essays in class. Two raters with over ten years of experience teaching and grading independently scored the essays. The reliability between raters was 0.79. The purpose of this study was to compile a genre-specific corpus using a purposive sampling method; thus, a total of 60 argumentative essays composed by pre-university students in respective colleges in Malaysia were selected and compiled as a representative learner corpus, Corpus of MUET Writing Argumentative Essays (COMWArE). Following Kanoksilapatham’s (2015) work, the corpus size is adequate to be representative of the target genre.
Swales' (1990) CARS model, in conjunction with Hyland's (1990), was utilised to aid the researchers in identifying the motions and steps used in the argumentative essays in this analysis. According to his analysis, there are three steps involved in writing a research article's beginning. Thus, in order to meet the study's aims, the researchers focused on the introduction paragraph or the first step of an argumentative essay, referred to as Thesis in Hyland's (1990) analytical framework. Swales' (1990) model was chosen because it is comprehensive and widely utilised as a foundation
for study across multiple fields and genres. On the other hand, Hyland's (1990) framework was used to supplement the analysis process because it was established with the help of second language learners (L2) in a second language situation similar to Malaysia. However, few research have used this paradigm in conjunction with genre analysis, most likely due to its reliability.
The written texts of the pupils were converted to plain text and saved in a new folder. The researchers then assigned a code to each written text, such as MAE4 1, which relates to student No. 1's MUET Band 4 argumentative essay. These documents were then re-saved in Notepad++ 7.9.1, a free online software, in order to manually tag the movements in the written texts. A move coding scheme was established using the Biber, Connor, and Upton (BCU) approach (Upton & Cohen, 2009) as a guide, and the corpus was manually move-tagged (Figure 1). Following that, AntConc version 3.4.3w (2014) was used to calculate the move frequencies in the gathered argumentative writings. To prevent word count errors, each move was enclosed in angle brackets <>.
Figure 1: Manually tagged move in Notepad++ 6.9.2
The objectivity of the analysis was preserved
by having two coders identify the moves in the argument stage. Unlike Hyland's (1990) approach, we chose the inter-coder reliability assessment as the best technique and calculated the agreement between the coders using Cohen's Kappa (k). To assess the coding's reliability, two English lecturers pursuing a PhD in Applied Linguistics were initially trained on all aspects of the moves. The coders were then given 30 out of 60 samples to evaluate and code using the coding system developed by the study's researcher, utilising the BCU method. If there were disagreements about how to differentiate a specific move in a sentence, both the coder and the researchers would talk and agree on a solution. Numerous arguments were place on the researcher's proposed move coding scheme. Given the Cohen's
kappa score of.81, the degree of agreement was at very good (Landis & Koch, 1977). As a result, the coding method was deemed reliable and valid for extensive usage in this investigation.
Finally, a semi-structured interview was conducted to elicit insider viewpoints on the writing strategies adopted by the sampled pre-university students. This interview session included two subject matter experts (SMEs) with more than two decades of teaching experience.
4. FINDINGS AND DISCUSSION While move analysis has been widely used to
analyse academic writing at the tertiary level in order to help students improve their writing skills (Cotos et al., 2015; Suryani et al., 2013), the researcher in this study believes that the use of move analysis has
ISSN (Online): 2455-3662
EPRA International Journal of Multidisciplinary Research (IJMR) - Peer Reviewed Journal Volume: 7| Issue: 9| September 2021|| Journal DOI: 10.36713/epra2013 || SJIF Impact Factor 2021: 8.047 || ISI Value: 1.188
2021 EPRA IJMR | www.eprajournals.com | Journal DOI URL: https://doi.org/10.36713/epra2013 202
benefited the investigation of how pre-university students structure their written argumentative texts.
.
Research Question 1 In response to the first research question, the
following moves were identified in pre-university students' argumentative essays using BCU approach.
Table 1. Proposed moves in the argument stage of argumentative essays
Stage Move Steps Argument Move 4:
Establishing topic sentence
Move 5: Justifying the main idea
5a. Providing the reason(s) 5b. Providing specific examples,
evidences, facts or analogy 5c. Illustrating and analysing the
examples, evidences, facts or analogy 5d. Showing comparison 5e. Showing the impact
Move 6: Drawing conclusion
The argument stage is the most important component of an argumentative essay. As can be seen in Table 1, the argument stage involves three steps. Move 4: Establishing the topic sentence is the first step. The primary idea of a body paragraph is introduced by a topic sentence, which should be related to the thesis statement. Hyland (1990) drew attention to a similar strategy known as Marker and Restatement. These two actions, he claimed, essentially mark the presentation of a claim and the rebuttal of the notion. Miller & Pessoa's (2016) hyper-Theme identified a similar move in which the higher scored essays employed topic sentences when composing their essays.
The essential step in the argument stage is Move 5: Justifying the main idea. This move serves to expand and develop the preceding move's key notion. To show further, the idea is expanded in five steps, namely <M5S5a> Providing the reason(s), which focuses on answering the question "why" so that the writers can reason out; <M5S5b> Providing specific examples, evidence, or analogy to support the reason and main idea, as well as to answer the question "how"; <M5S5c> Illustrating examples, evidences, facts, or analogies is an explanation of the
examples, evidences, facts, or analogies that connects them to support the main point; making comparisons to support the main point is the aim of <M5S5d> which is Showing comparison; and <M5S5e> Showing the impact emphasises the influence of the main idea. All these steps are adapted from Hyland (1990), except for Move 5 step 5d.
Following that, Move 6 Drawing conclusion summarises and supports the key point of the body paragraph. Move 6 rounds up each paragraph with a short summary related to the idea in move 4 and this move is adapted from Tessuto's (2015) work. He highlighted a similar move under the discussion section of research articles. By using this move, the authors evaluate and provide the implications based on the study that they conducted. In a similar way, move 6, which is identified in the present study, is used to summarise the ideas by evaluating each idea and providing its implications. Research Question 2
In answering the second research question, frequency analysis was conducted using AntConc 3.4.3w (2014).
Table 2. Frequency of moves 4, 5 and 6 in COMWArE
Move M4 M5S5a M5S5b M5S5c M5S5d M5S5e M6 Total MAE4 67 122 124 30 2 9 46 287 MAE5 66 147 167 22 18 26 56 380 MAE6 65 152 155 38 15 18 60 378 Total 198 421 446 90 35 63 162 1045
As shown in Table 2, the total number of
move 4 appearing in the COMWArE corpus is 198 hits. MAE4 has the most occurrences with 67 hits. This is followed by MAE5 with a total of 66
occurrences. Meanwhile, MAE6 recorded the least as it appears 65 times. This move has appeared to be an obligatory strategy as the frequency of occurrences is 100% (Kanoksilapatham, 2005, 2015). According to
ISSN (Online): 2455-3662
EPRA International Journal of Multidisciplinary Research (IJMR) - Peer Reviewed Journal Volume: 7| Issue: 9| September 2021|| Journal DOI: 10.36713/epra2013 || SJIF Impact Factor 2021: 8.047 || ISI Value: 1.188
2021 EPRA IJMR | www.eprajournals.com | Journal DOI URL: https://doi.org/10.36713/epra2013 203
SME 1, this move is an obligatory strategy as pre-university students are taught on the importance of having topic sentences in each body paragraph. On the other hand, SME 2 said that the students will have a focus in developing the paragraphs. Without a topic sentence, the body paragraphs will be vague and has unclear direction.
The biggest number of occurrences among all the moves is move 5 step 5b, which has 446 occurrences followed by M5S5a, which has 421 occurrences. To be specific, MAE5 had the most occurrences for move 5 step 5b, with 167. MAE6 comes in second with 155 hits, while MAE4 comes in last with 124 hits. M5S5b appears to be a mandatory strategy because it appeared in 60 (100%) of the files, whereas M5S5a appears to be a conventional move because the frequency of occurrences is greater than 60%. Students must justify how the idea is relevant and important, according to SME 1. Move 5 step 5b is employed as an obligation because students must justify how the idea is relevant and important. SME 2, on the other hand, stated that students back up their arguments with examples that demonstrate how each notion is related to the debated topic.
M5S5d, on the other hand, has the fewest occurrences (35), while M5S5c and M5S5e have 90 and 63, respectively. These three steps are optional, as they were only found in about 60% of the files. When asked why move 5 step 5d is only used optionally in essays, SME 1 replied, “It depends on the essay question...they will use this method if they need to make a comparison”. SME 2 stated that it is nature of the question necessitates it.
MAE6 has the most occurrences with 60, followed by MAE5 with 56. MAE4 had the fewest occurrences, with 46 hits. This appears to be a common strategy, as the number of occurrences exceeds 60%. Both SME 1 and SME 2 claimed they taught students this method such that each body paragraph ends with a mini-conclusion before going on to the following paragraph.
5. CONCLUSION
By and large, the analyses reveal that having such rhetorical structure reflects the systematic structure of the argument stage which sequentially provides a comprehensive outline of information to the readers, who are the examiners (San & Tan, 2012). Nonetheless, based on the data in Table 2, it's worth noting that there are some variances within each band. To accomplish their communicative goals, above satisfactory writers employ the majority of the moves and steps. In order to achieve its communicative purpose, are found to use most of the moves and steps. It can be deduced that, move 4, move 5 step 5b and move 6 are obligatory.
It is obvious that pre-university students should be aware of the structure of argumentative
essays, particularly the rhetorical structure in the band 4, 5, and 6 argument stage, as the majority of them struggled to create and develop ideas in MUET (Ka-kan-dee & Kaur, 2015; Yunus & Chien, 2016). As a result, familiarity with rhetorical structure as a framework can aid students in generating effective argument stages. Similarly, because this framework is descriptive in nature, it may also be used as a scaffolding tool to assist students in developing their own piece of writing, as it provides a platform for students to identify their own shortcomings and strengths. This is consistent with the findings of Ka-kan-dee & Kaur (2015) and Kanestion et al., (2017), who assert that genre-based training enables students to develop writing abilities through exposure to the genre's fundamental linguistic items.
However, other subgenres of argumentative writing, such as introduction and conclusion, were not fully examined in this study. Future research could apply move analysis to examine the introduction and conclusion stages, and also complete an important component in BCU approach, which is the linguistic analysis. REFERENCES
1. Amnuai, W., & Wannaruk, A. (2012). Investigating move structure of English applied linguistics research article discussions published in international and Thai journals. English Language Teaching, 6(2), 1–13. https://doi.org/10.5539/elt.v6n2p1
2. Chandrasegaran, A. (2008). NNS students’
arguments in English: Observations in formal and informal contexts. Journal of Second Language Writing, 17(4), 237–254. https://doi.org/10.1016/j.jslw.2008.04.003
3. Cotos, E., Huffman, S., & Link, S. (2015). Furthering and applying move/step constructs: Technology-driven marshalling of Swalesian genre theory for EAP pedagogy. Journal of English for Academic Purposes, 19, 52–72. https://doi.org/10.1016/j.jeap.2015.05.004
4. Davis, R. H. (2015). A genre analysis of medical research articles [University of Glasgow]. http://theses.gla.ac.uk/6724/
5. Fazilatfar, A. M., & Naseri, Z. S. (2014). Rhetorical Moves in Applied Linguistics Articles and their Corresponding Iranian Writer Identity. Procedia - Social and Behavioral Sciences, 98, 489–498. https://doi.org/10.1016/j.sbspro.2014.03.444
6. Holmes, R. (1997). Genre analysis, and the social sciences: An investigation of the structure of research article discussion sections in three disciplines. English for Specific Purposes, 16(4), 321–337. https://doi.org/10.1016/S0889-4906(96)00038-5
7. Hu, G., & Liu, Y. (2018). Three minute thesis presentations as an academic genre: A cross-disciplinary study of genre moves. Journal of English for Academic Purposes, 35, 16–30. https://doi.org/10.1016/j.jeap.2018.06.004
8. Hyland, K. (1990). A Genre Description of the
ISSN (Online): 2455-3662
EPRA International Journal of Multidisciplinary Research (IJMR) - Peer Reviewed Journal Volume: 7| Issue: 9| September 2021|| Journal DOI: 10.36713/epra2013 || SJIF Impact Factor 2021: 8.047 || ISI Value: 1.188
2021 EPRA IJMR | www.eprajournals.com | Journal DOI URL: https://doi.org/10.36713/epra2013 204
Argumentative Essay. RELC Journal, 21(1), 66–
78. https://doi.org/10.1177/003368829002100105
9. Ina, S., Aizan, Y., & Noor Hashima, A. A. (2015). Introduction sections of research articles with high and low citation indices. Pertanika Journal of Social Sciences and Humanities, 23(4), 1139–
1152. 10. Ka-kan-dee, M., & Kaur, S. (2015). Teaching
Strategies Used by Thai EFL Lecturers to Teach Argumentative Writing. In Procedia - Social and Behavioral Sciences (Vol. 208, Issue Icllic 2014). Elsevier B.V. https://doi.org/10.1016/j.sbspro.2015.11.191
11. Kanestion, A., Singh, M. K. S., & Shamsudin, S. (2017). Developing A Framework For Writing Skill : A Corpus-Based Analysis Of The. Sains Humanika, 9:4-2, 39–47.
12. Kanoksilapatham, B. (2005). Rhetorical structure of biochemistry research articles. English for Specific Purposes, 24(3), 269–292. https://doi.org/10.1016/j.esp.2004.08.003
13. Kanoksilapatham, B. (2015). Distinguishing textual features characterizing structural variation in research articles across three engineering sub-discipline corpora. English for Specific Purposes, 37(1), 74–86. https://doi.org/10.1016/j.esp.2014.06.008
14. Liu, D. (2015). Moves and Wrap-Up Sentences in Chinese Students’ Essay Conclusions. SAGE Open, 5(2), 1–9. https://doi.org/10.1177/2158244015592681
15. Maher, P., & Milligan, S. (2019). Teaching master thesis writing to engineers: Insights from corpus and genre analysis of introductions. English for Specific Purposes, 55, 40–55. https://doi.org/10.1016/j.esp.2019.05.001
16. Maswana, S., Kanamaru, T., & Tajino, A. (2015). Move analysis of research articles across five engineering fields: What they share and what they do not. Ampersand, 2, 1–11. https://doi.org/10.1016/j.amper.2014.12.002
17. Posteguillo, S. (1999). The Schematic Structure of Computer Science Research Articles. English for Specific Purposes, 18(2), 139–160. https://doi.org/10.1016/S0889-4906(98)00001-5
18. Sadeghi, V., & Samuel, M. (2013). Genre analysis of the letters of appeal. Discourse Studies, 15(2), 229–245. https://doi.org/10.1177/1461445612471467
19. Singh, M. K. S (2014). A Corpus-Based Genre Analysis of the Quality, Health, Safety and Environment Work Procedures in Malaysian Petroleum Industries. Unpublished PhD Thesis: Universiti Teknologi Malaysia.
20. Suryani, I., Hashima, N., Yaacob, A., Rashid, S. A., & Desa, H. (2013). Rhetorical Structures in Academic Research Writing by Non- Native Writers. International Journal of Higher Education, 3(1), 29–38. https://doi.org/10.5430/ijhe.v3n1p29
21. Tessuto, G. (2015). Generic structure and rhetorical moves in English-language empirical law research articles: Sites of interdisciplinary and interdiscursive cross-over. English for Specific Purposes, 37(1), 13–26.
https://doi.org/10.1016/j.esp.2014.06.002 22. Tseng, F. (2011). Analyses of Move Structure and
Verb Tense of Research Article Abstracts in Applied Linguistics. International Journal of English Linguistics, 1(2), 27–39. https://doi.org/10.5539/ijel.v1n2p27
23. Tseng, M. (2018). Journal of English for Academic Purposes Creating a theoretical framework : On the move structure of theoretical
framework sections in research articles related to language and linguistics. Journal of English for Academic Purposes, 33, 82–99. https://doi.org/10.1016/j.jeap.2018.01.002
24. Upton, T. A., & Cohen, M. A. (2009). An approach to corpus-based discourse analysis: The move analysis as example. Discourse Studies, 11(5), 585–605. https://doi.org/10.1177/1461445609341006
25. San, L., & Tan, H. (2012). A Comparative Study of the Rhetorical Moves in Abstracts of Published Research Articles and Students’Term Papers in
the Field of Computer and Communication Systems Engineering. International Journal of Applied Linguistics & English Literature, 1(7), 40–50. https://doi.org/10.7575/ijalel.v.1n.7p.40
26. Yunus, M. M., & Chien, C. H. (2016). The Use of Mind Mapping Strategy in Malaysian University English Test (MUET) Writing. Creative Education, 07(04), 619–626. https://doi.org/10.4236/ce.2016.74064
ISSN (Online): 2455-3662
EPRA International Journal of Multidisciplinary Research (IJMR) - Peer Reviewed Journal Volume: 7| Issue: 9| September 2021|| Journal DOI: 10.36713/epra2013 || SJIF Impact Factor 2021: 8.047 || ISI Value: 1.188
2021 EPRA IJMR | www.eprajournals.com | Journal DOI URL: https://doi.org/10.36713/epra2013 205
STANDARDIZATION OF WORK AND TIME USING SEGMENTAL WORKMEN FOR ENGINEERING
APPLICATIONS
D.Raajith Sandeep1, CH.Sweekruthi2, K.Pavan Kalyan Yadav3, A. Suresh4
1,2,3,4Department of Mechanical Engineering, CVR College of Engineering, Hyderabad, India.
ABSTRACT The research paper presents an elusive outcome of study, analysis and summary of work measurement using time and method principles for the engineering workshop trades using the segmental workmen. Usually the workmen are three types viz skilled, semi skilled and unskilled. Out of the above three the analysis of best performance for the given task is to be identified in order to make the work more reachable and deliverable. At the outset of the paper the trades such carpentry, tin smithy, welding and fitting are used. After study and analysis of various processes that are carried out in laboratories of engineering college, the most encouraging results have been obtained. The Standardized time of different skill levels of labor for various mechanical operations are identified. KEY WORDS: standardization, workshop trades, segmental workmen, work measurement.
1. INTRODUCTION
Work measurement is very difficult owing to diversified set of reasons. Perhaps the measurement of human factors is the most difficult factors of all. The human measurement particulars with a balance between work content and labor time is beyond the scope of scientific methods due to various physiological factors such as frustrations, monotony, boredom, anxiety, willingness to work, skill, willpower, confidence, attitude and many more. A part from these there will be the influence of physical and environmental factors like temperature, dust, noise, vibrations, pressure, humidity etc. keeping all these in normal or acceptable conditions some methods have already been laid down for measurement of any type of work [1,2,3]. The work measurement is generally followed by method study by which a clearly defined and developed method is laid down. All that credit goes to the pioneering work of Fredrick Winslow Taylor for his methods of work measurement and time study. He suggests splitting the activity into elements and assigning the time to each element by repeated experimentation. Thus time study provides a reliable data for establishing consistent standard performance and elimination of the ineffective time from the production cycle time.
2. METHODOLOGY The methodology is given as follows.
Step1: Record all the necessary information about the job such as product information (name of the product, material, quantity, quality requirements), process information (location of work place, process description, tooling, jigs and fixtures, layout, speeds & feeds, settings, rate of productions), information about operator (name, competence, skill, education, experience etc), information regarding working conditions (temperature, pressure, humidity, economical factors, human factors, lighting etc [4,5].
Step2: Record the method by breaking down the operation into elements to ensure most effective method and sequence of the motions.
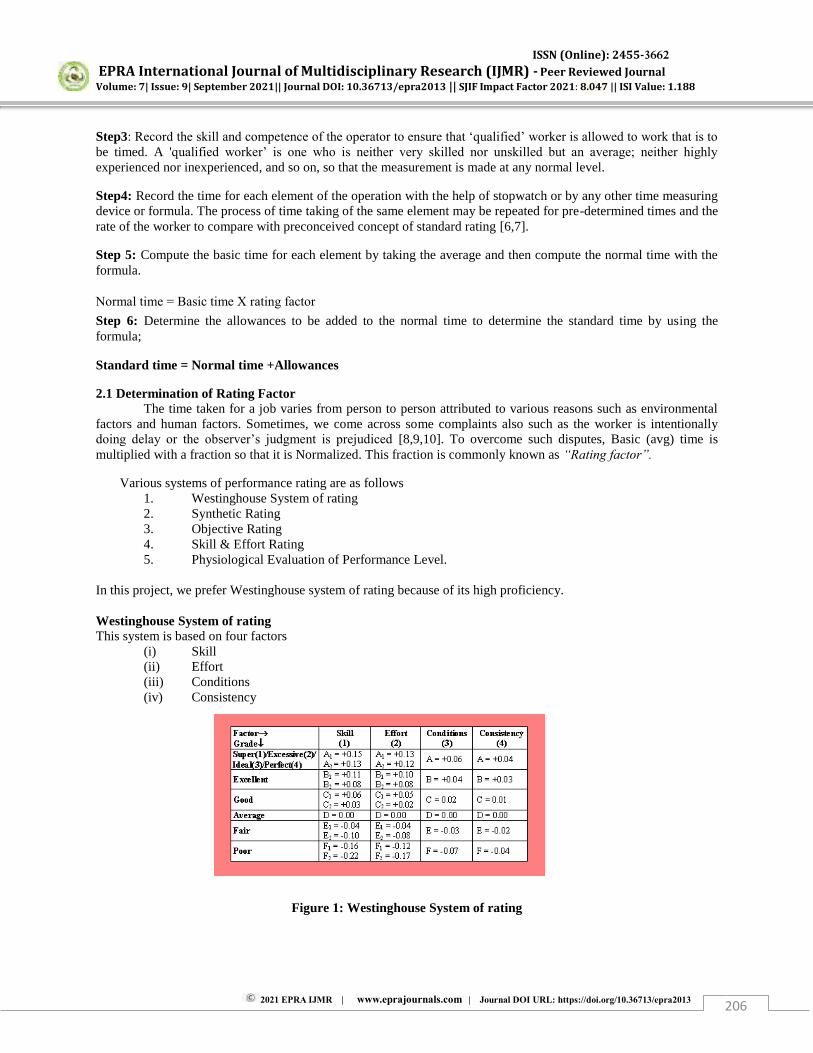
ISSN (Online): 2455-3662
EPRA International Journal of Multidisciplinary Research (IJMR) - Peer Reviewed Journal Volume: 7| Issue: 9| September 2021|| Journal DOI: 10.36713/epra2013 || SJIF Impact Factor 2021: 8.047 || ISI Value: 1.188
2021 EPRA IJMR | www.eprajournals.com | Journal DOI URL: https://doi.org/10.36713/epra2013 206
Step3: Record the skill and competence of the operator to ensure that „qualified‟ worker is allowed to work that is to
be timed. A 'qualified worker‟ is one who is neither very skilled nor unskilled but an average; neither highly
experienced nor inexperienced, and so on, so that the measurement is made at any normal level.
Step4: Record the time for each element of the operation with the help of stopwatch or by any other time measuring device or formula. The process of time taking of the same element may be repeated for pre-determined times and the rate of the worker to compare with preconceived concept of standard rating [6,7].
Step 5: Compute the basic time for each element by taking the average and then compute the normal time with the formula.
Normal time = Basic time X rating factor
Step 6: Determine the allowances to be added to the normal time to determine the standard time by using the formula;
Standard time = Normal time +Allowances
2.1 Determination of Rating Factor The time taken for a job varies from person to person attributed to various reasons such as environmental factors and human factors. Sometimes, we come across some complaints also such as the worker is intentionally doing delay or the observer‟s judgment is prejudiced [8,9,10]. To overcome such disputes, Basic (avg) time is multiplied with a fraction so that it is Normalized. This fraction is commonly known as “Rating factor”.
Various systems of performance rating are as follows 1. Westinghouse System of rating 2. Synthetic Rating 3. Objective Rating 4. Skill & Effort Rating 5. Physiological Evaluation of Performance Level.
In this project, we prefer Westinghouse system of rating because of its high proficiency. Westinghouse System of rating This system is based on four factors
(i) Skill (ii) Effort (iii) Conditions (iv) Consistency
Figure 1: Westinghouse System of rating

ISSN (Online): 2455-3662
EPRA International Journal of Multidisciplinary Research (IJMR) - Peer Reviewed Journal Volume: 7| Issue: 9| September 2021|| Journal DOI: 10.36713/epra2013 || SJIF Impact Factor 2021: 8.047 || ISI Value: 1.188
2021 EPRA IJMR | www.eprajournals.com | Journal DOI URL: https://doi.org/10.36713/epra2013 207
Summary Calculation Observed Time = Sum of Ratings i.e. rating of (Skill + Effort + Conditions + Consistency) as given in Westinghouse tables.
Rating Factor = 1 ± Westinghouse Rating
Normal Time = Observed Time X Rating Factor
Standard Time = Normal Time + Allowances Synthetic Rating
This system of rating was introduced by Morrow. The time study observer records the actual time of performance for the element as done in the previous method. Performance times for such elements have been standardized, which are known as “Predetermined Motion Time Values” or „PMTS Values‟Summarily this is
expressed as
R = P/A
Where R= Performance Rating Factor
P = Pre-determined Motion Time Standard value for the element in minutes (from tables) and
A = Average Actual Time (Observed) for the same element in minutes Similarly objective rating and skill & effort rating are considered.
Physiological Evaluation of performance level It is known fact that there is a relation between the physical work and the amount of oxygen consumed. It has also been tried out to find the changes in heartbeat for various physical works.
Observed Time Rating Factor
Work Delay
Constant Allowance
Relaxation Allowance
Observed Time
Basic Time
Normal Time*
Work Content
Standard time
Figure 2: Performance level Determination of Allowances
The determination of allowances is the most controversial part of the time study, because it varies from person to person, Situation to situation, place to place, job to job, and season to season and many more. Therefore the industrial engineer feels it most difficult job. However, certain standardized norms of allowances are in regular practice by the industrial engineers. These are narrated under five heads as follows:
1. Interference allowance 2. Relaxation allowance 3. Process allowance 4. Contingency allowance

ISSN (Online): 2455-3662
EPRA International Journal of Multidisciplinary Research (IJMR) - Peer Reviewed Journal Volume: 7| Issue: 9| September 2021|| Journal DOI: 10.36713/epra2013 || SJIF Impact Factor 2021: 8.047 || ISI Value: 1.188
2021 EPRA IJMR | www.eprajournals.com | Journal DOI URL: https://doi.org/10.36713/epra2013 208
5. Special allowance Process Allowance
When an operator is running an automatic machine, he becomes idle after loading or if the process demands some time to go for next operation such as allowing cooling after welding operation, he becomes idle. In such cases this allowance becomes prominent.
Depending on the situations, Indian industries are using the following index of process allowance. 25% of Normal Time - Heavy Work Load (>30Kg) 20% of Normal Time - Short Cycle Load (0.2 min) 15% of Normal Time - Similar type of Work Load 10% of Normal Time - Power fed Machine operation 5% of Normal Time - Operation on automatic machine
3. DATA ANALYSIS CARPENTRY Material Preparation
Skill : Good C1 = 0.06
Effort : Good C1 = 0.05
Conditions : Good C = 0.02
Consistency : Perfect A =0.04
Westing house Rating Factor: =1 + (Skill + Effort + Conditions + Consistency)
= 1 + (0.06+0.05+0.02+0.04)
= 1 + (0.17)
= 1.17
Process Allowance : 20% of Normal Time – Short Cycle Load
Machining Process
Skill : Excellent B1 =0.11
Effort : Excellent B1 =0.10
Conditions : Excellent B1 =0.04
Consistency : Perfect A =0.04
Westing house Rating Factor: =1 + (Skill + Effort + Conditions + Consistency)
= 1 + (0.11+0.10+0.04+0.04)
= 1 + (0.29)
= 1.29
Process Allowance : 20% of Normal Time – Short Cycle Load

ISSN (Online): 2455-3662
EPRA International Journal of Multidisciplinary Research (IJMR) - Peer Reviewed Journal Volume: 7| Issue: 9| September 2021|| Journal DOI: 10.36713/epra2013 || SJIF Impact Factor 2021: 8.047 || ISI Value: 1.188
2021 EPRA IJMR | www.eprajournals.com | Journal DOI URL: https://doi.org/10.36713/epra2013 209
Finishing Process
Skill : Perfect B1 =0.15
Effort : Perfect B1 =0.10
Conditions : Excellent B1 =0.04
Consistency : Perfect A =0.04
Westing house Rating Factor: = 1 + (Skill + Effort + Conditions + Consistency)
= 1 + (0.15+0.10+0.04+0.04)
= 1 + (0.36)
= 1.36
Process Allowance : 20% of Normal Time – Short Cycle Load
Inspection
Skill : Perfect B1 =0.15
Effort : Excellent B1 =0.10
Conditions : Perfect B1 =0.06
Consistency : Perfect A =0.04
Westing house Rating Factor: = 1 + (Skill + Effort + Conditions + Consistency)
= 1 + (0.06 + 0.05 + 0.02 + 0.04)
= 1 + (0.35)
= 1.35
Process Allowance : 20% of Normal Time – Short Cycle Load
Similarly for the other processes the analysis is carried out. 4. RESULTS
After study and analysis of various processes that are carried out in laboratories of engineering college, the most encouraging results have been obtained. The Standardized time of different skill levels of labor for various mechanical operations as follows:
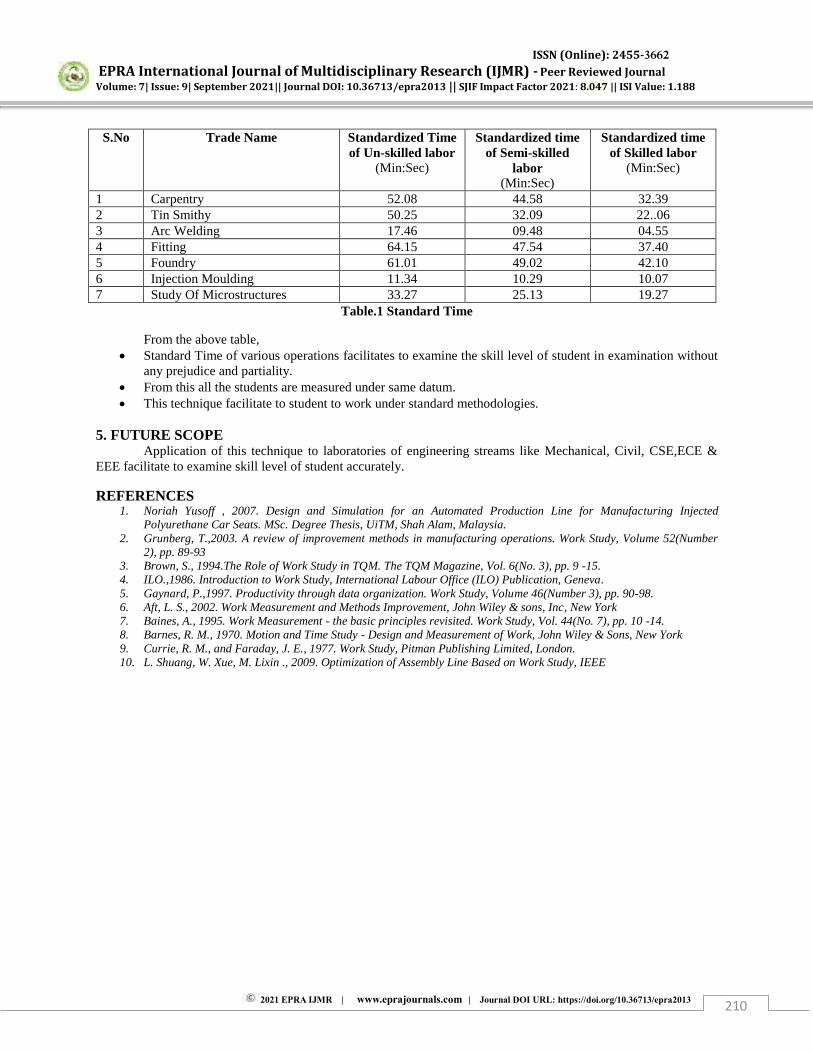
ISSN (Online): 2455-3662
EPRA International Journal of Multidisciplinary Research (IJMR) - Peer Reviewed Journal Volume: 7| Issue: 9| September 2021|| Journal DOI: 10.36713/epra2013 || SJIF Impact Factor 2021: 8.047 || ISI Value: 1.188
2021 EPRA IJMR | www.eprajournals.com | Journal DOI URL: https://doi.org/10.36713/epra2013 210
S.No Trade Name Standardized Time of Un-skilled labor
(Min:Sec)
Standardized time of Semi-skilled
labor (Min:Sec)
Standardized time of Skilled labor
(Min:Sec)
1 Carpentry 52.08 44.58 32.39 2 Tin Smithy 50.25 32.09 22..06 3 Arc Welding 17.46 09.48 04.55 4 Fitting 64.15 47.54 37.40 5 Foundry 61.01 49.02 42.10 6 Injection Moulding 11.34 10.29 10.07 7 Study Of Microstructures 33.27 25.13 19.27
Table.1 Standard Time
From the above table, Standard Time of various operations facilitates to examine the skill level of student in examination without
any prejudice and partiality. From this all the students are measured under same datum. This technique facilitate to student to work under standard methodologies.
5. FUTURE SCOPE Application of this technique to laboratories of engineering streams like Mechanical, Civil, CSE,ECE & EEE facilitate to examine skill level of student accurately.
REFERENCES 1. Noriah Yusoff , 2007. Design and Simulation for an Automated Production Line for Manufacturing Injected
Polyurethane Car Seats. MSc. Degree Thesis, UiTM, Shah Alam, Malaysia. 2. Grunberg, T.,2003. A review of improvement methods in manufacturing operations. Work Study, Volume 52(Number
2), pp. 89-93 3. Brown, S., 1994.The Role of Work Study in TQM. The TQM Magazine, Vol. 6(No. 3), pp. 9 -15. 4. ILO.,1986. Introduction to Work Study, International Labour Office (ILO) Publication, Geneva. 5. Gaynard, P.,1997. Productivity through data organization. Work Study, Volume 46(Number 3), pp. 90-98. 6. Aft, L. S., 2002. Work Measurement and Methods Improvement, John Wiley & sons, Inc, New York 7. Baines, A., 1995. Work Measurement - the basic principles revisited. Work Study, Vol. 44(No. 7), pp. 10 -14. 8. Barnes, R. M., 1970. Motion and Time Study - Design and Measurement of Work, John Wiley & Sons, New York 9. Currie, R. M., and Faraday, J. E., 1977. Work Study, Pitman Publishing Limited, London. 10. L. Shuang, W. Xue, M. Lixin ., 2009. Optimization of Assembly Line Based on Work Study, IEEE

ISSN (Online): 2455-3662
EPRA International Journal of Multidisciplinary Research (IJMR) - Peer Reviewed Journal Volume: 7| Issue: 9| September 2021|| Journal DOI: 10.36713/epra2013 || SJIF Impact Factor 2021: 8.047 || ISI Value: 1.188
2021 EPRA IJMR | www.eprajournals.com | Journal DOI URL: https://doi.org/10.36713/epra2013 211
WINTER SEASON TEMPERATURE TRENDS IN THE
20TH CENTURY OVER THE RAJOURI DISTRICT, INDIA
Rakesh Sharma Research Scholar, Department of Geography, Panjab University, Chandigarh
ABSTRACT The present paper analyse the trends of maximum and minimum temperature in the winter season over the Rajouri district of Jammu and Kashmir UT during the 20th century. Climatic data for the analysis was collected from India water portal organization website. Results stated that climate change took place in the study area during the winter season. Both maximum and mean minimum temperature has been increased, thus warming took place in the study area. KEYWORDS: Climate, Change, Maximum Temperature, Minimum Temperature, and Warming etc.
INTRODUCTION The average surface temperature of Planet
Earth has been increased by above 1°C since the beginning of the 20th century and half of the increase in temperature occurred after 1970 due to rapid industrialization (Cicerone and Nurse 2014). The concentration of greenhouse gases such as carbon dioxide, methane and nitrous oxide has been increased since the industrial revolution. For example, the CO2 concentration measured at the Mauna Loa Observatory in Hawaii has risen from 316 parts per million (ppm) in the year 1959 to more than 411 ppm in the year 2019. Similar rates of rise in CO2 concentration was recorded at numerous other stations worldwide. Since preindustrial times, the atmospheric concentration of CO2 has increased over 40 per cent, CH4 has increased more than 150 per cent and N₂ O has increased 20 per cent. Half of the rise in CO2 has taken place since 1970. Increases in gases leads to warming of Earth. Changes in climate over the surface have bad consequences and disturbed the ecosystems (Roy and Balling 2005).
Climate change led to extinction of many species of flora and fauna, population migrations, and changes in the land surface and ocean circulation (IPCC 2015). It is seen that the pace of current change in climate is faster than past events, making it tougher to adapt and adjust with this change. The present paper studied climate change over the Rajouri district of Jammu and Kashmir.
METHODOLOGY Research used secondary data, the climatic
records from 1901 to 2002 was retrieved from India Waterportal organization website. For the identification of outliers, methodology given by Zhang et al. (2005) was used. District Rajouri was taken as a study area, Rajouri shares international border with Pakistan on the West, district Punch on the North and district Reasi on the East and Jammu on the South. Maize, rice and wheat are the chief crops grown in the area, whereas maize is the staple food. Research studied the change over temperature regime in the winter season. The import terms used in the research are as below:- Meteorological seasons in India are winter season (January and February), Monsoon season (March to May) followed by Southwest Monsoon season (June to September) and Post Monsoon season which includes the months of October, November and December (IMD 2019). Maximum Temperature refers to the highest temperature attained during a day. It often occurs during the afternoon hours. Minimum Temperature refers to the lowest temperature recorded which usually occurs during the early morning hours. (IMD 2019) DATA ANALYSIS Trends in maximum temperature and minimum temperature over the study area has been analysed in this section with the help of diagrams.
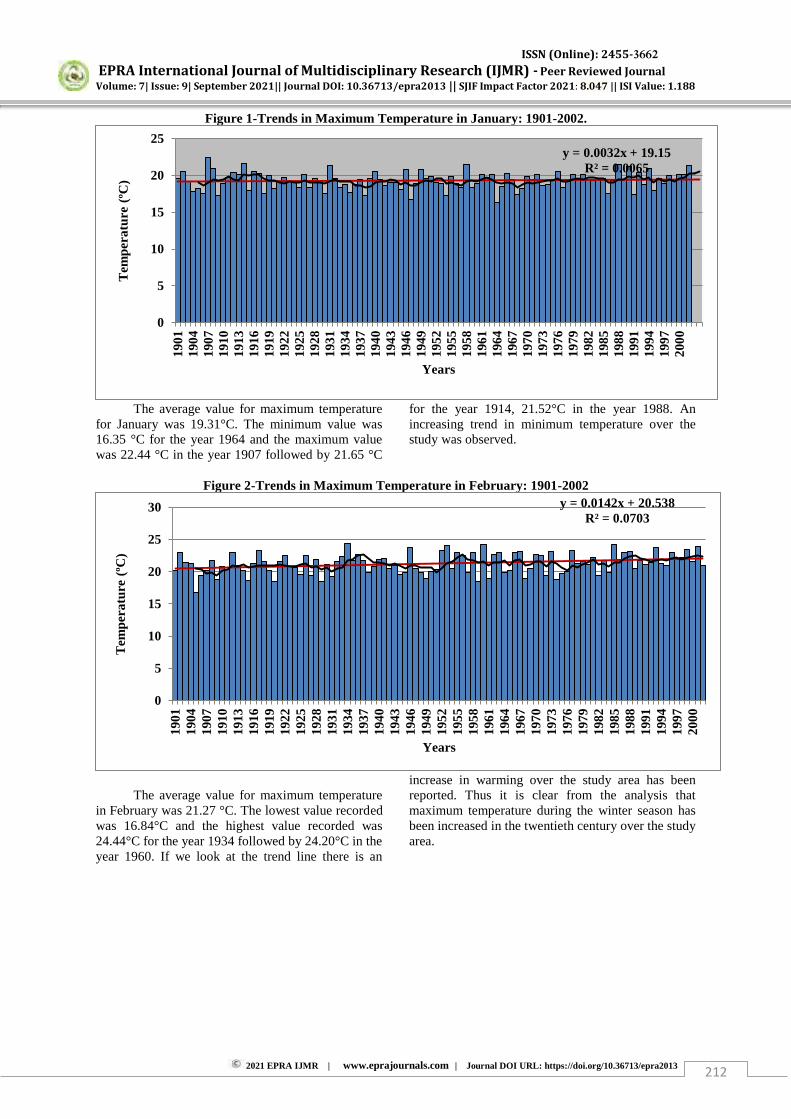
ISSN (Online): 2455-3662
EPRA International Journal of Multidisciplinary Research (IJMR) - Peer Reviewed Journal Volume: 7| Issue: 9| September 2021|| Journal DOI: 10.36713/epra2013 || SJIF Impact Factor 2021: 8.047 || ISI Value: 1.188
2021 EPRA IJMR | www.eprajournals.com | Journal DOI URL: https://doi.org/10.36713/epra2013 212
Figure 1-Trends in Maximum Temperature in January: 1901-2002.
The average value for maximum temperature
for January was 19.31°C. The minimum value was 16.35 °C for the year 1964 and the maximum value was 22.44 °C in the year 1907 followed by 21.65 °C
for the year 1914, 21.52°C in the year 1988. An increasing trend in minimum temperature over the study was observed.
Figure 2-Trends in Maximum Temperature in February: 1901-2002
The average value for maximum temperature in February was 21.27 °C. The lowest value recorded was 16.84°C and the highest value recorded was 24.44°C for the year 1934 followed by 24.20°C in the year 1960. If we look at the trend line there is an
increase in warming over the study area has been reported. Thus it is clear from the analysis that maximum temperature during the winter season has been increased in the twentieth century over the study area.
y = 0.0032x + 19.15 R² = 0.0065
0
5
10
15
20
25
1901
1904
1907
1910
1913
1916
1919
1922
1925
1928
1931
1934
1937
1940
1943
1946
1949
1952
1955
1958
1961
1964
1967
1970
1973
1976
1979
1982
1985
1988
1991
1994
1997
2000
Tem
pera
ture
(ºC
)
Years
y = 0.0142x + 20.538 R² = 0.0703
0
5
10
15
20
25
30
1901
1904
1907
1910
1913
1916
1919
1922
1925
1928
1931
1934
1937
1940
1943
1946
1949
1952
1955
1958
1961
1964
1967
1970
1973
1976
1979
1982
1985
1988
1991
1994
1997
2000
Tem
pera
ture
(ºC
)
Years
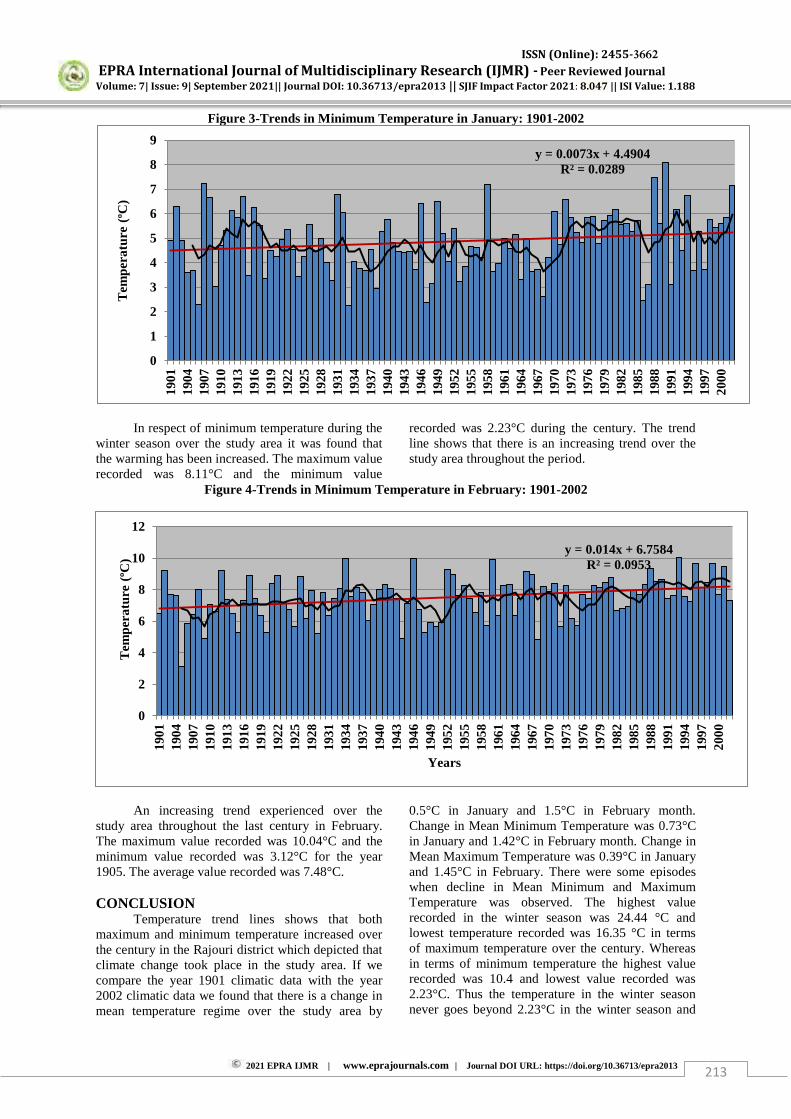
ISSN (Online): 2455-3662
EPRA International Journal of Multidisciplinary Research (IJMR) - Peer Reviewed Journal Volume: 7| Issue: 9| September 2021|| Journal DOI: 10.36713/epra2013 || SJIF Impact Factor 2021: 8.047 || ISI Value: 1.188
2021 EPRA IJMR | www.eprajournals.com | Journal DOI URL: https://doi.org/10.36713/epra2013 213
Figure 3-Trends in Minimum Temperature in January: 1901-2002
In respect of minimum temperature during the winter season over the study area it was found that the warming has been increased. The maximum value recorded was 8.11°C and the minimum value
recorded was 2.23°C during the century. The trend line shows that there is an increasing trend over the study area throughout the period.
Figure 4-Trends in Minimum Temperature in February: 1901-2002
An increasing trend experienced over the study area throughout the last century in February. The maximum value recorded was 10.04°C and the minimum value recorded was 3.12°C for the year 1905. The average value recorded was 7.48°C. CONCLUSION
Temperature trend lines shows that both maximum and minimum temperature increased over the century in the Rajouri district which depicted that climate change took place in the study area. If we compare the year 1901 climatic data with the year 2002 climatic data we found that there is a change in mean temperature regime over the study area by
0.5°C in January and 1.5°C in February month. Change in Mean Minimum Temperature was 0.73°C in January and 1.42°C in February month. Change in Mean Maximum Temperature was 0.39°C in January and 1.45°C in February. There were some episodes when decline in Mean Minimum and Maximum Temperature was observed. The highest value recorded in the winter season was 24.44 °C and lowest temperature recorded was 16.35 °C in terms of maximum temperature over the century. Whereas in terms of minimum temperature the highest value recorded was 10.4 and lowest value recorded was 2.23°C. Thus the temperature in the winter season never goes beyond 2.23°C in the winter season and
y = 0.0073x + 4.4904 R² = 0.0289
0
1
2
3
4
5
6
7
8
9
1901
1904
1907
1910
1913
1916
1919
1922
1925
1928
1931
1934
1937
1940
1943
1946
1949
1952
1955
1958
1961
1964
1967
1970
1973
1976
1979
1982
1985
1988
1991
1994
1997
2000
Tem
pera
ture
(ºC
)
y = 0.014x + 6.7584 R² = 0.0953
0
2
4
6
8
10
12
1901
1904
1907
1910
1913
1916
1919
1922
1925
1928
1931
1934
1937
1940
1943
1946
1949
1952
1955
1958
1961
1964
1967
1970
1973
1976
1979
1982
1985
1988
1991
1994
1997
2000
Tem
pera
ture
(ºC
)
Years
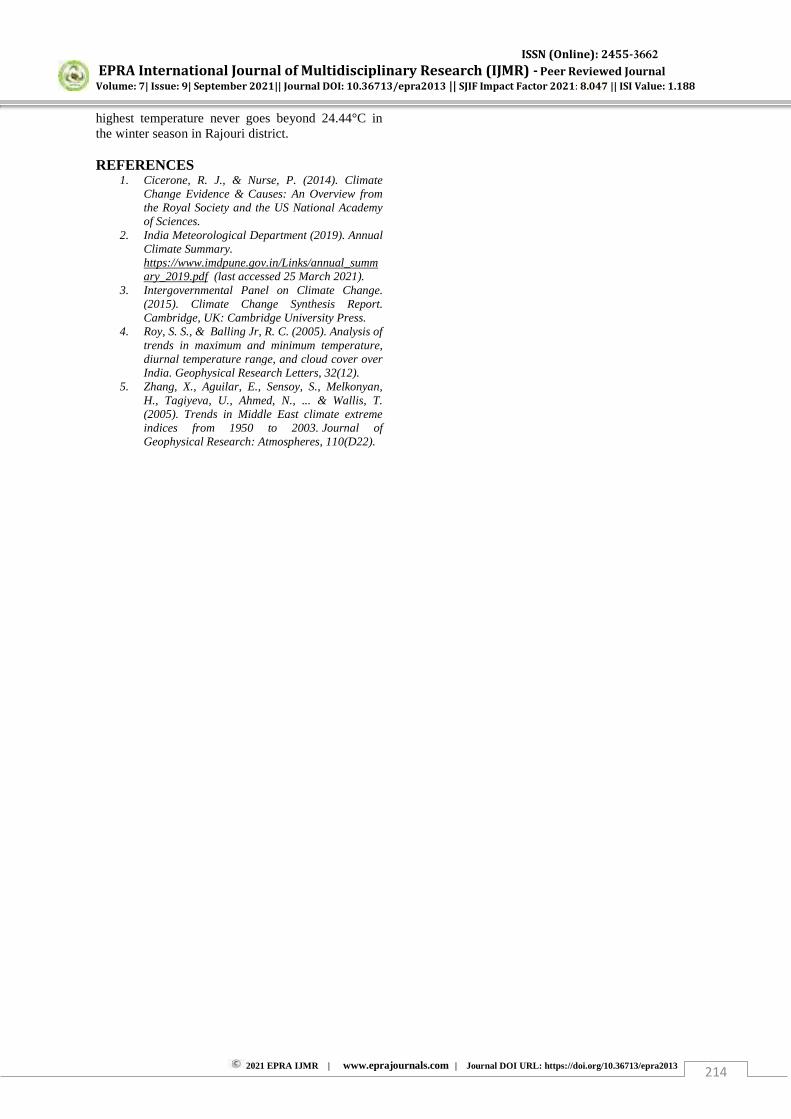
ISSN (Online): 2455-3662
EPRA International Journal of Multidisciplinary Research (IJMR) - Peer Reviewed Journal Volume: 7| Issue: 9| September 2021|| Journal DOI: 10.36713/epra2013 || SJIF Impact Factor 2021: 8.047 || ISI Value: 1.188
2021 EPRA IJMR | www.eprajournals.com | Journal DOI URL: https://doi.org/10.36713/epra2013 214
highest temperature never goes beyond 24.44°C in the winter season in Rajouri district. REFERENCES
1. Cicerone, R. J., & Nurse, P. (2014). Climate Change Evidence & Causes: An Overview from the Royal Society and the US National Academy of Sciences.
2. India Meteorological Department (2019). Annual Climate Summary. https://www.imdpune.gov.in/Links/annual_summary_2019.pdf (last accessed 25 March 2021).
3. Intergovernmental Panel on Climate Change. (2015). Climate Change Synthesis Report. Cambridge, UK: Cambridge University Press.
4. Roy, S. S., & Balling Jr, R. C. (2005). Analysis of trends in maximum and minimum temperature, diurnal temperature range, and cloud cover over India. Geophysical Research Letters, 32(12).
5. Zhang, X., Aguilar, E., Sensoy, S., Melkonyan, H., Tagiyeva, U., Ahmed, N., ... & Wallis, T. (2005). Trends in Middle East climate extreme indices from 1950 to 2003. Journal of Geophysical Research: Atmospheres, 110(D22).
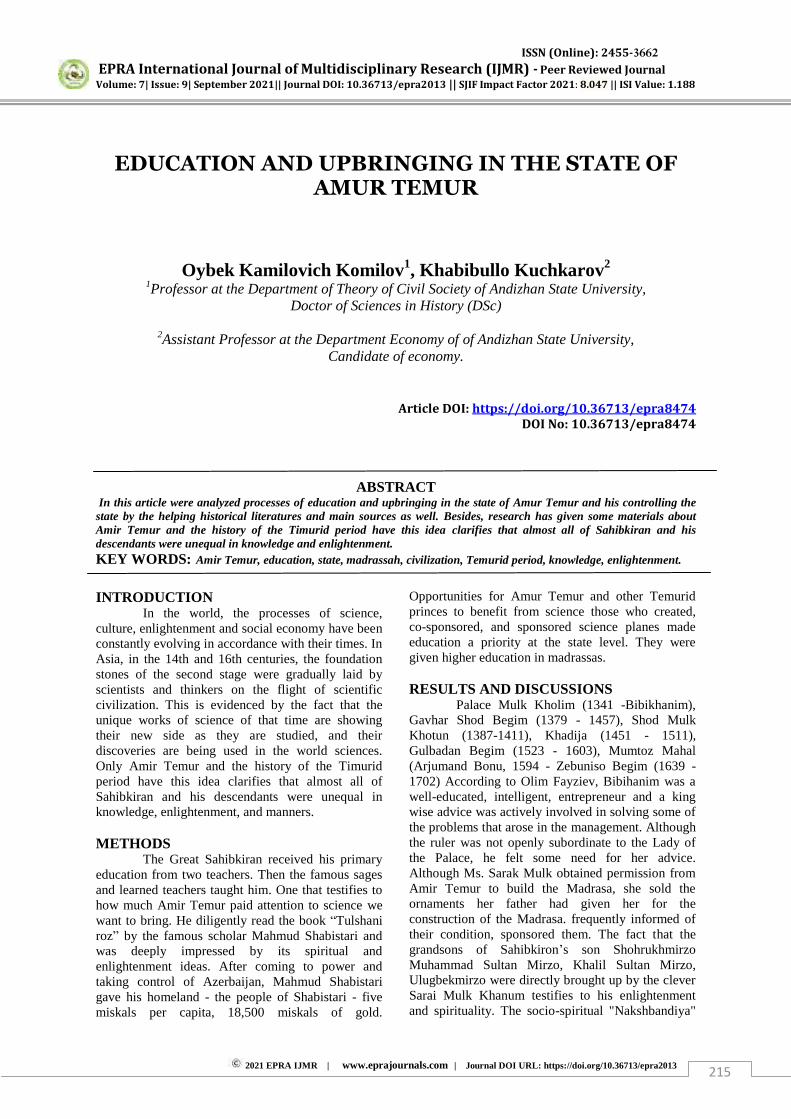
ISSN (Online): 2455-3662
EPRA International Journal of Multidisciplinary Research (IJMR) - Peer Reviewed Journal Volume: 7| Issue: 9| September 2021|| Journal DOI: 10.36713/epra2013 || SJIF Impact Factor 2021: 8.047 || ISI Value: 1.188
2021 EPRA IJMR | www.eprajournals.com | Journal DOI URL: https://doi.org/10.36713/epra2013 215
EDUCATION AND UPBRINGING IN THE STATE OF
AMUR TEMUR
Oybek Kamilovich Komilov1, Khabibullo Kuchkarov2
1Professor at the Department of Theory of Civil Society of Andizhan State University, Doctor of Sciences in History (DSc)
2Assistant Professor at the Department Economy of of Andizhan State University,
Candidate of economy.
Article DOI: https://doi.org/10.36713/epra8474 DOI No: 10.36713/epra8474
ABSTRACT
In this article were analyzed processes of education and upbringing in the state of Amur Temur and his controlling the state by the helping historical literatures and main sources as well. Besides, research has given some materials about Amir Temur and the history of the Timurid period have this idea clarifies that almost all of Sahibkiran and his descendants were unequal in knowledge and enlightenment. KEY WORDS: Amir Temur, education, state, madrassah, civilization, Temurid period, knowledge, enlightenment.
INTRODUCTION
In the world, the processes of science, culture, enlightenment and social economy have been constantly evolving in accordance with their times. In Asia, in the 14th and 16th centuries, the foundation stones of the second stage were gradually laid by scientists and thinkers on the flight of scientific civilization. This is evidenced by the fact that the unique works of science of that time are showing their new side as they are studied, and their discoveries are being used in the world sciences. Only Amir Temur and the history of the Timurid period have this idea clarifies that almost all of Sahibkiran and his descendants were unequal in knowledge, enlightenment, and manners. METHODS
The Great Sahibkiran received his primary education from two teachers. Then the famous sages and learned teachers taught him. One that testifies to how much Amir Temur paid attention to science we want to bring. He diligently read the book “Tulshani roz” by the famous scholar Mahmud Shabistari and was deeply impressed by its spiritual and enlightenment ideas. After coming to power and taking control of Azerbaijan, Mahmud Shabistari gave his homeland - the people of Shabistari - five miskals per capita, 18,500 miskals of gold.
Opportunities for Amur Temur and other Temurid princes to benefit from science those who created, co-sponsored, and sponsored science planes made education a priority at the state level. They were given higher education in madrassas. RESULTS AND DISCUSSIONS
Palace Mulk Kholim (1341 -Bibikhanim), Gavhar Shod Begim (1379 - 1457), Shod Mulk Khotun (1387-1411), Khadija (1451 - 1511), Gulbadan Begim (1523 - 1603), Mumtoz Mahal (Arjumand Bonu, 1594 - Zebuniso Begim (1639 - 1702) According to Olim Fayziev, Bibihanim was a well-educated, intelligent, entrepreneur and a king wise advice was actively involved in solving some of the problems that arose in the management. Although the ruler was not openly subordinate to the Lady of the Palace, he felt some need for her advice. Although Ms. Sarak Mulk obtained permission from Amir Temur to build the Madrasa, she sold the ornaments her father had given her for the construction of the Madrasa. frequently informed of their condition, sponsored them. The fact that the grandsons of Sahibkiron’s son Shohrukhmirzo Muhammad Sultan Mirzo, Khalil Sultan Mirzo, Ulugbekmirzo were directly brought up by the clever Sarai Mulk Khanum testifies to his enlightenment and spirituality. The socio-spiritual "Nakshbandiya"
ISSN (Online): 2455-3662
EPRA International Journal of Multidisciplinary Research (IJMR) - Peer Reviewed Journal Volume: 7| Issue: 9| September 2021|| Journal DOI: 10.36713/epra2013 || SJIF Impact Factor 2021: 8.047 || ISI Value: 1.188
2021 EPRA IJMR | www.eprajournals.com | Journal DOI URL: https://doi.org/10.36713/epra2013 216
sect is also an important factor in the rapid development of science, enlightenment and culture of Amir Temur and the Temurid state served. The state activity was carried out on the basis of this sect. Education in the rise of science and enlightenment of Amir Temur and the Temurids one of the scholars who conducted research on the education of the Timurid period, also played an important role. H.Razzokov according to the Abdurahmanovs, education in schools of this period began with the teaching of Arabic letters and the rules of writing, “Haftiyak” (one of the seven sources of the Qur’an), religious ceremonies national customs. “Top group” - in the group for 3 years learned the letters written on a special board, then “Haftiyak” was taught. In the middle group for 3 years were taught the spelling of letters, systems, mathematical concepts of Arabic numerals. In the “Four Books”, the wisdom of Sufi Alloyar was taught - in the upper group, the swimmers for 3 years, along with the acquisition of religious and secular knowledge, propagated the basics of Islam.
Also Sheikh Saadi Sherazi and those who loved to read and memorize the ghazals of Khoja Hafiz, wrote poems themselves, and engaged in scientific work. The content and quality of education in the world's scientific schools depended on the teacher’s teaching skills and level of knowledge. This reinforces our view. In the Middle Ages, there were many types of schools. Relatively older students (18 to 40 years old) who could read and recite were taught. The choirs were involved in the ceremonies, and applications were written for the needy learned the basics.
Shabistar population Family members of Imam Khatibs, poets and other educated women opened their homes and practiced atheism, giving girls religious and moral education. They found an opportunity for housework. During this period, there were also institutions that provided school care for the children of the palace population with a separate application. The children became literate when they were 5-6 years old. They were burned at the stake. Such people were called qasidahs. They were the oldest, most influential men who had worked for several years in the affairs of state and in the military (1341). In 1411, Khadija Begim was the brother and elder of Amir Temur, Said Baraka, and Ulugbek’s brother was Shah Malik [2, p.6].
In 1594 the Qasids made reports on the administration, In order to awaken the minds of our people to the example of the exemplary period, they narrated with interest the stories and narrations that they directly participated in and heard. Shah Malik Ulugbek’s work, his knowledge of Kopryaing’s methods of warfare, increased his knowledge of military affairs. He always shared with princes and nobles, taught them military skills,
swordsmanship, spear-fighting, and military training. With his advice, he conducted educational work on “Sulukul muluk” (“Guide to the horns”) in the Palace led by Sulukul muluk is in Arabic script, in Persian, consists of several books. According to him, the princes received knowledge in the following areas, but managed the affairs of state during the construction; mastering the sciences; issues of diplomacy (reception of ambassadors of foreign countries, tax collection; military affairs were taught, and knowledge and skills in conducting religious affairs were formed.
Madrassahs have served as higher education institutions in the country. Amir Temur built two madrassahs, Muhammad Sultan and Bibikhanim. Madrassahs were built and operated mainly in the cities of Samarkand, Bukhara, Herat and Merv. Ulugbek built literacy madrasahs in Bukhara in 1417, in Samarkand in 1417-1420, and in 1433 to teach swimmers [3, p.44].
According to Zayniddin Wasifi’s Bados-ul-Waho, the first madrasah built in Samarkand was taught by Mawlana Shamsuddin Muhammad Khawafi. He studied the Qur’an, Hadith, natural sciences, astronomy, geography, geodesy, and taught literacy classes in medicine, physics, history, literature, and logic.
The students were self-employed, engaged in socially useful cocktails in the landscaping around the Madrasa. Each of them is trained in areas such as career orientation; Prayers were offered five times in the madrasa.
Amir Temur and the Temurids attached great importance to the independence of the country, the peace of the people, the creative work for its prosperity. Amir Temur used to celebrate every triumphant event and joyful event with the construction of a magnificent architectural monument. For this purpose, famous craftsmen from India, Sheroz, Isfahan and Damascus have built luxurious buildings and structures in the country. During this period, ancient cities, castles and fortresses, such as Samarkand, Bukhara, Termez, Merv, Banokat (Shohrukhiya), which were destroyed by Genghis Khan’s invasion and incessant Mongol invasions, were rebuilt, that is, cities and villages were built. According to Sahibkiran’s order, defensive walls were built around Karshi in 1365, Samarkand in 1370, and Kesh in 1380 [4, p.45].
Amir Temur also carried out creative work in the conquered lands (a number of cities (Baghdad, the capital of Iraq, which was destroyed by the Mongols in 1258), Darband in the Republic of Dagestan, the city near the confluence of the Arake and Kura rivers, destroyed during the Mongol invasion in 1221 (1403) was restored. Although Amir Temur built a mosque in Tabriz, a

ISSN (Online): 2455-3662
EPRA International Journal of Multidisciplinary Research (IJMR) - Peer Reviewed Journal Volume: 7| Issue: 9| September 2021|| Journal DOI: 10.36713/epra2013 || SJIF Impact Factor 2021: 8.047 || ISI Value: 1.188
2021 EPRA IJMR | www.eprajournals.com | Journal DOI URL: https://doi.org/10.36713/epra2013 217
palace in Sheroz, a madrasa in Baghdad, and a mausoleum on the tomb of the famous Sheikh Khoja Ahmad Yassavi in Turkestan in 1389–1395, he focused on his hometown of Kesh (Shahrisabz) and the capital, Samarkand. In the state of Amir Temur, too, legal relations are based on the rules set out in the Qur'an and Hadith. Elements of his rights and laws are reflected in “Temur's Statutes”. Temur's statutes are a historical work that provides information about the military and political activities of Amir Temur as an important principle in building a just and strong state. In the last years of his life, Amir Temur wrote his memoirs and memoirs. It is known that the first scientific copy of "Temur's Statutes" was written in the old Uzbek language. The work was translated into Persian by Mir Abu Talib Husseini al-Arizi at-Turbati, a Central Asian, in 1610 on behalf of one of the Ottoman Turkish rulers, Ja'far Pasha, ruler of Yemen (1607–1612). spread under the name. We have received a copy of it in Persian and three copies of its translation from Persian into Uzbek. The most complete copy is called “Malfuzot-i Temuriy” and is kept in the library named after Saltikov-Shchedrin in St. Petersburg, Russia. This copy was published in Tashkent in 2000. The work consists of two parts, 56 verses. In the first part, the life and socio-political activities of Amir Temur from the age of seven to his death (February 18, 1342–1405), his conquest of central power in Movarounnahr, the abolition of social disintegration and the establishment of a centralized state, the neighboring country and 27 countries, including Iran , The conquest of Afghanistan, Azerbaijan, Georgia, and India, the military campaigns of the Golden Horde ruler Tokhtamish against the Turkish Sultan Boyazid I Yildirim, and his treatment of various social strata to consolidate his vast kingdom.
CONCLUSION
In short, one of the sources of our spiritual roots is the spirituality of Amir Temur Temurids. We have realized how important this spirituality is due to independence and how precious it is to our people, who are moving towards a great future. The struggle of Timur and some Temurid princes for justice and peace. At present, the direct instructions of the government on the further development of the third renaissances provide incentives for deeper knowledge and encourage people to grow up to be perfect people for the country. This will be the basis for the socio-economic and spiritual development of our country.
REFERENCES 1. Muminov A. The place and role of Amir Temur in
the history of Central Asia. -Tashkent, 1993. 2. Temur’s rules.-Tashkent, 1996. 3. Temurnoma.-Tashkent: Chulpon, 1990. 4. History of Uzbekistan. –Tashkent, Ukituvchi,
1994.

ISSN (Online): 2455-3662
EPRA International Journal of Multidisciplinary Research (IJMR) - Peer Reviewed Journal Volume: 7| Issue: 9| September 2021|| Journal DOI: 10.36713/epra2013 || SJIF Impact Factor 2021: 8.047 || ISI Value: 1.188
2021 EPRA IJMR | www.eprajournals.com | Journal DOI URL: https://doi.org/10.36713/epra2013 218
AN ANALYSIS OF THE ‘DOWRY PROHIBITION ACT 1961’ CONCEPT & EVOLUTION
Vanshika Shukla Babasaheb Bhimrao Ambedkar University, Lucknow
ABSTRACT The paper contented the various things of dowry system and essentially examined The Dowry Prohibition Act, 1961 in India. Dowry implies giving of wealth or property to the Groom or his family by the bride ‘s family at the time of their marriage. The Dowry Prohibition Act, 1961 makes the compromising of share void and unlawful. Section 498A IPC penalizes the husband and his family members in case there is an act of cruelty on the bride within seven years of marriage. Though, the section constructs the crime non bailable and non-compoundable. These laws are absolutely favorable to women’s and requires very little prior support in case there is any grievances under these provisions of law and this has given certain segment of women the freedom to misuse these segments to satisfy their mala-fide intentions. In additionally under the dowry system the ultimate goal to be achieved in one’s life, especially that of a woman and those who feel that a woman can be happy only if married. In a perfect world that the talking a marriage would finish in joy for both a man and a woman in case everything is well in that relationship. A non-dowry marriage will bring down their status among the relatives or will demonstrate that the son is worthless. INTRODUCTION
India is an immense and multi-social country. The Civilization of India is the antiquated most on the planet and with every time another social design is brought into the world since the introduction of our general public. With the second most noteworthy population in the world after China, India has progressed significantly in ideas of advancement in all circles of society. In Indian Law, The Dowry Prohibition Act, enacted on 1st May 1961, meant to save you the giving or receiving of a dowry. Under the Dowry Prohibition Act, settlement comprises of possessions, things, or cash given by one or the other party to the wedding, by utilizing the guardians of one or the other party, or by way of everybody else in connection with the marriage. The Dowry Prohibition Act applies to folks of all religions in India. The authentic text of the Dowry Prohibition Act becomes widely judged to be useless in curtailing the exercise of dowry. Moreover, precise kinds of violence in opposition to women endured to be connected to a failure to satisfy dowry needs. As a result, the regulation underwent next modification. Although, it became modified to specify as an example, that presents given to a bride or a groom on the time of a marriage are allowed in 1984. The law required, however, that a list be maintained describing each gift, its fee, the identification of the man or woman giving it,
and the individual‟s relation to both celebration to the
wedding. Though, the Dowry Prohibition Act and
subsequent sections of the Indian Penal Code had been further amended to cover female sufferers of dowry-associated violence. Some other layer of felony safety was provided in 2005 underneath the safety of girls from home Violence Act. Amendments under the Dowry Prohibition Act additionally mounted insignificant and most disciplines for giving and getting settlement and made a punishment for tumult share or retailing offers of money or belongings in reference to a marriage. The Indian Penal Code turned into additionally changed in 1983 to set up specific crimes of dowry-related cruelty, dowry demise, and abetment of suicide. Hence, those endorsements punished violence in opposition to girls with the aid of their husbands or their relatives whilst proof of dowry needs or dowry harassment may be shown. HISTORICAL BACKGROUND
Dowry is an old framework under which the guardians of the woman pay the man or bridegroom or his parent money, goods or home regarding the bridegroom‟s ability to acknowledge the woman in the marriage. The convincing organic inclination for mating among all creatures including humans creates a
ISSN (Online): 2455-3662
EPRA International Journal of Multidisciplinary Research (IJMR) - Peer Reviewed Journal Volume: 7| Issue: 9| September 2021|| Journal DOI: 10.36713/epra2013 || SJIF Impact Factor 2021: 8.047 || ISI Value: 1.188
2021 EPRA IJMR | www.eprajournals.com | Journal DOI URL: https://doi.org/10.36713/epra2013 219
magnetic pull between others.1 The requirement for delayed parental consideration in advanced animals has fashioned the concept of family. Hence, these variables have cumulatively given birth to the concept of marriage to the human race. Though, Marriage viewed a scared establishment in Indian society. The threat of dowry was obscure in earlier societies. Women delighted in thought about opportunity and regard in open life. Marriage was considered a sacrosanct association. In the Vedic culture dowry system was obscure.2
As per Hindu texts only Brahma type of marriage which was unconventional to the upper to the privileged that marriage implied the gift of a daughter with some ornaments and articles. Something else, the Dowry is the property which is obtains from the guardians of the bride by the parents of the groom under pressure, compulsion, or pressing factor.3 Although, it‟s not that property which comes from the side of the woman family out of their eagerness.
In India, it has additionally established in medieval times when a gift in real money or kind was given to a bride by her family to keep up with her autonomy after marriage.4 During the colonial period, it turned into the legal approach to get married, with the British making the practice of dowry needed. The modern dowry system has a modest start with a gift which as a manifestation of natural love and affection from the brides‟ parents and relatives. Slowly these gifts took giant shape contingent on the expectations for everyday comforts and status in the society.5 CONCEPT OF DOWRY
The Dowry alludes to the solid merchandise, money, and genuine or versatile property that the women's family provides for the man of the hour, his folks and his family members as a state of the
1 Dowry: its meaning, historical background and ill
effects (thefactfactor.com) 2 Haveripeth P.D., ―Cause and consequences of dowry
menace in India‖; RIJS Vol 2(2) 2013. (www.rierc.org) 3 Mehek Singh., ―Dowry as a factor of violence in
Marriage: A study of Women seeking help in family counselling centres in chandigarh‖; International
Journal of Advancements in Research & Technology, Vol-2 Issue-6 (2013) 4 Dowry: its meaning, historical background and ill
effects (thefactfactor.com) 5 Reshma, Ramegouda .A., ―Socio Legal Perspective
of Dowry‖: A Study; International Journal of Scientific
and Engineering Research; Vol-3, Issue-7 (2012).
marriage.6 Dowry is basically in the concept of an installment in real money or some sort of gifts given to the groom‟s family alongside the woman and
incorporates cash, adornments, electrical apparatuses, furniture, bedding, earthenware, utensils, vehicles and other family things that help the love birds set up their home.7 Dowry is alluded to as Dahez in Arabic. In the far eastern parts of India, it is called Aaunnpot.8 The Dowry Prohibition Act 1961 In India under dowry prohibition, first it was done with the enactment of Sindh Deti-Leti Act, 1939.
It prohibited the giving and taking of any valuable article or dowry beyond permissible limit prescribed by the list enumerated by the panchayats or provincial governments.9 The next step was Bihar Dowry Restraint Act, 1950 and The Andhra Pradesh Dowry Prohibition Act, 1958. Although the provincial enactments could not bring the desired results, but they stimulated the general public to raise a voice against dowry as the dowry system started strangulating the peace of society.10
Perhaps the Central government felt that The Hindu Succession Act, 1956 may be a suitable alternative to the eradication of dowry system as many provisions in the Act were made with regard to the women.11 All these enactments appeared to be really pro-women but due to the lack of effective awareness, and proper utilization, most of the Acts merely remained on papers rather than curbing the menace of dowry.12 On 24th April, 1959, The Dowry Prohibition Bill, 1959 was introduced by the government. After a discussion and introduction of several changes, it was further moved to the joint committee. Finally, the bill was taken into the consideration at a joint sitting and was passed on 1st July 1961.13 Therefore, after a long-awaited time
6 Moneycontrol.com". 8 March 2007. Archived from the original on 11 January 2012. 7 Rani Jethmalani & P.K. Dey (1995). Dowry Deaths and Access to Justice in Kali's Yug: Empowerment, Law and Dowry Deaths. pp. 36, 38. 8 Paras Diwan and Peeyushi Diwan (1997). Law Relating to Dowry, Dowry Deaths, Bride Burning, Rape, and Related Offences. Delhi: Universal Law Pub. Co. p. 10. 9 The Dowry Prohibition Act, 1961 repealed the earlier local laws e.g. The Andhra Pradesh Dowry Prohibition Act, 1958 and The Bihar Dowry Restraint Act, 1950. 10
Section 3(1), Dowry Prohibition Act 1961 11 Section 2, Dowry Prohibition Act 1961 12 Section 3(1), Dowry Prohibition Act 1961 13 Sections 5 and 6, Dowry Prohibition Act 1961
ISSN (Online): 2455-3662
EPRA International Journal of Multidisciplinary Research (IJMR) - Peer Reviewed Journal Volume: 7| Issue: 9| September 2021|| Journal DOI: 10.36713/epra2013 || SJIF Impact Factor 2021: 8.047 || ISI Value: 1.188
2021 EPRA IJMR | www.eprajournals.com | Journal DOI URL: https://doi.org/10.36713/epra2013 220
period, The Dowry Prohibition Act, 1961 was finally enacted. This Act is considered to be a remedial as well as a penal statute simultaneously. Originally, there were ten Sections in the Act and afterwards Sections 4A ban on advertisement‟s 8A burden of proof in certain cases sec.8B dowry probation officer, were further added by the Dowry Prohibition (Amendment) act, 1986.14 Need of dowry prohibition act
The dowry is a deep-rooted evil in the society. It is started as customary presents with love and affection. In olden days, it was customary to give some presents to the bride and bridegroom and his family at the time of marriage. The parents of the bride or their relations out of affection and good intention used to provide the couple something to fall back upon in case of need. The system started at a time when girls were generally not very much educated and even if they were educated, they were unwilling to take up gainful employment.15 There was also less opportunity for them either to supplement the family income or to become financially independent. There was yet another reason for such customary gifts. The daughter then was not entitled to a share in the joint family properties when she had a brother. Hence the father out of affection or other consideration used to give some cash of kind to the daughter at the time of marriage.16 The right of the father to give a small portion of even the family property as a gift to the daughter at the time of her marriage was recognized. But unfortunately, over the years new practice developed. The boy or his family members started demanding cash or kind from the brides‟ parents.17 They started demanding dowry as a matter of right. The demand more often extended even after the marriage. There were instances of harassment of the. Wife, if the demand was not complied with. In order to curb this evil practice, the Parliament enacted the Dowry Prohibition Act, 961 (Act No. 28 of 1961).18 The Act prohibited the giving or taking of dowry. But in-spite of this enactment, the pernicious practice continued in some communities. The joint Committee of Parliament appointed to examine the working of
14 Section 8A, Dowry Prohibition Act 1961 15
Agrahari, Gunjan (2011). Law Relating to Dowry Prohibition, Cruelty, and Harassment: An up-to-Date, Lucid, and Exhaustive Commentary with Case Law on the Dowry Prohibition Act, 1961. Delhi: India Law House. 16
Ibid 17
Ibid 18
Ibid
Dowry Prohibition Act remarked “the evil sought to be done away with by the Act, on the other hand, increased by leaps and bounds and has now assumed grotesque and alarming proportions.”
19 Objectives of Dowry Prohibition Act, 1961
To promote marital and family harmony. To effectively work for creating a dowry free
society. To provide a base to fight against the abuse
of dowry laws. To create awareness about the present
cruelty/dowry/harassment related laws and their damaging effects on the family.
To provide emotional, legal and social support to the innocent persons who are affected by the vindictive implication of the dowry laws. To provide legal aid to the weaker and needy section of the community.20
To safeguard children welfare and integrity of Indian families.
To safeguard interests of Elderly people and their respect in society and to discourage elder abuse through dowry related laws.
To promote deterrents against malicious complaints and arrests without investigation.
To discourage malicious prosecutions in matrimonial cases.21
Analysis of The Dowry Prohibition Act, 1961
The Section 3 of Dowry Prohibition Act, 1961 makes a provision, which is as under: “If any person,
after commencement of this Act gives or takes or abets the giving or get hold of dowry, he will be blame able with delay for term which will not be under five years and with fine which will not be under fifteen thousand rupees with the number of the worth of such dowry whichever is more; provided that the court may, force a sentence of detainment for a term of under five years. For satisfactory and extraordinary motivation to be recorded in the judgment.22 Exception to section 3
Thus, Nothing in Sub-segment 3(1) will apply to, or corresponding to (1) presents which are given at the hour of union with be lady (with no interest having
19
Ibid 20
https://en.wikipedia.org/wiki/Dowry_system_in_India 21
https://wcd.nic.in/act/dowry-prohibition-act-1961 22 https://lawlex.org/lex-pedia/critical-analysis-of-the-dowry-prohibition-act-1961/23162
ISSN (Online): 2455-3662
EPRA International Journal of Multidisciplinary Research (IJMR) - Peer Reviewed Journal Volume: 7| Issue: 9| September 2021|| Journal DOI: 10.36713/epra2013 || SJIF Impact Factor 2021: 8.047 || ISI Value: 1.188
2021 EPRA IJMR | www.eprajournals.com | Journal DOI URL: https://doi.org/10.36713/epra2013 221
been made for that benefit); Provided that such presents are entered in a list maintained in accordance with the rules made under this Act; Section 9 power to make rules the central government may make a rule for carry out the purpose of this act in particularly Such rules may provide for the person by whom list of customary present made under section 3(2)23 and the manner and form in which it is prepared and all other matters connected therewith and the better coordination of policy and action with respect to the administration of this act. In exercise of the forces gave by Sec.9 of the Dowry Prohibition Act, 1961 (28 of 1961),24 the Central Government makes the accompanying guidelines and such principles might be known as the Dowry Prohibition (Maintenance of Lists of Presents to the Bride and Bridegroom) Rules, 1985.They will come into power on the second day of October, 1985, according to section 2 of the rules.25
The list of presents which are given at the time of the marriage to the bride or bridegroom shall be maintained by the bride or bridegroom respectively.26 The rundown of presents will be recorded as a hard copy and will be ready at the hour of the marriage or straightaway after the marriage will be endorsed by both the bride and the bridegroom. Where the bride or bridegroom is unable to sign, they may affix their thumb impression in lieu signature.27 Specifics of the list (i) A short description of each present. (ii) The approximate worth of the present. (iii) The name of the individual who has given the present. Exception 2 of section 3
where such presents are made by or in interest of the bride or any individual related to the bride, such presents are of a standard sort and the worth isn't exorbitant having respect to the financial status of the individual by whom, or for whose benefit, such presents are given.28
23
dowry prohibition act 3 (indiankanoon.org) 24 http://www.cyberabadpolice.gov.in/information/PDF/acts-laws/act-dowry.pdf 25
dowry prohibition act 3 (indiankanoon.org) 26
A1860-45.pdf (legislative.gov.in) 27
https://crlreview.in/the-dowry-prohibition-act-what-you-must-know/ 28
Agrahari, Gunjan (2011). Law Relating to Dowry Prohibition, Cruelty, and Harassment: An up-to-Date, Lucid, and Exhaustive Commentary with Case Law on
Analysis of section 3 1. The dowry Prohibition Act, ponders two stages. The principal stage is taking or giving or abetting of giving or taking of dowry. It is punishable and hence, such demonstration is a void.29
The second stage is, subsequent to taking dowry and forthcoming exchange of something similar to the recipient, the individual holds it in trust to support the woman.30 Along these lines, during the subsequent stage, it is available to a woman to document a suit to recuperate the sum from the individual who held the dowry in trust. Victim is punishable under section 3 2. Since it rebuffs settlement provider i.e., for the most part guardians of casualty. Accordingly, casualty and her folks reluctant to hold up a case. Consequently, the deceitful provider ought to be excluded in any case this part will debilitate casualty to get the law rolling.31 3. Section 3 of the Act doesn't accommodate enrollment of the rundowns, nor does it set out that the gifts made to the woman couldn't be estranged during initial seven years of the marriage without her consent. 4. The Act has made obligatory for the woman of the hour and husband to keep up with the rundown of the presents given to them in the marriage. It should be independently kept up with and properly endorsed by the gatherings. However, there is no functional execution and no veritable upkeep of such records happens in real. This standard is generally disregarded in the relationships as individuals don't approach it in a serious way.32 5. Explanation 1 to Section 2 of the Dowry Prohibition Act 1961 the presents as money, trimmings, garments and different articles are not to be considered as settlement except if they are made as thought for the marriage of the said parties. This arrangement debilitates the law and invalidates the target for which it was ordered.33 In this way, it has been excluded by Dowry Prohibition (Amendment) Act 1984, it doesn't imply that wedding presents have been restricted or their giving establishes any offense under the Act. The wedding presents by guardians, family members, companions and close colleague at or about the hour of marriage can in any case be given for the sake of
the Dowry Prohibition Act, 1961. Delhi: India Law House. 29
Ibid 30
Ibid 31
https://wcd.nic.in/act/dowry-prohibition-act-1961 32
dowry prohibition act 3 (indiankanoon.org) 33
Ibid
ISSN (Online): 2455-3662
EPRA International Journal of Multidisciplinary Research (IJMR) - Peer Reviewed Journal Volume: 7| Issue: 9| September 2021|| Journal DOI: 10.36713/epra2013 || SJIF Impact Factor 2021: 8.047 || ISI Value: 1.188
2021 EPRA IJMR | www.eprajournals.com | Journal DOI URL: https://doi.org/10.36713/epra2013 222
presents of a standard sort. All things considered, these are the share in the name or under the shadow of presents which are legitimately endorsed by the section 3 of the Act.34 Section 4 penalty for demanding dowry
If any person demands requests straight forwardly from the parents or by implication or Guardian of bride or bridegroom as the case may be any dowry, he shall be punishable with detainment for a term which will not be under half year however which might stretch out to two years and with fine which might reach out to 10000 rupees given that the court may impose a sentence of imprisonment for a term less than six month for adequate and special reason to be mentioned in the judgment.35 Analysis of section 4
The object of Section 4 of the Act was to debilitate the very interest for property or important security as thought for a marriage between the gatherings. As indicated by Webster's
New World Dictionary, 1962 end. Woman of the hour implies a woman who has quite recently been married or is going to be married. If we give this strict meaning of a bride or a bridegroom used in Section 4 of the Act then property or valuable security demanded and consented to be given prior may not be “dowry”
within the meaning of the Act.36 Which is again the object section 4 of the Act therefore liberal construction has to be given to the word “dowry” to fulfill its
object? Punishment not in consonance with the object of section 4 I.e. The punishment for demanding dowry is quite inadequate.37
(i) Mere interest for "Dowry" before marriage, at the hour of marriage or any time after the marriage is an offense; Bachni Devi v. State of Haryana, AIR 2011
Outfitting of a list of ornaments and other household articles at the hour of settlement of marriage adds up to request of dowry and charged are obligated to be sentenced under section 4; Raksha Devi v. Aruna Devi, I (1991)
34
Ibid 35https://indiankanoon.org/doc/1023340/#:~:text=%E2%80%94If%20any%20person%20demands%2C%20directly,which%20may%20extend%20to%20ten 36
https://www.indiacode.nic.in/bitstream/123456789/5556/1/dowry_prohibition.pdf 37https://indiankanoon.org/doc/1023340/#:~:text=%E2%80%94If%20any%20person%20demands%2C%20directly,which%20may%20extend%20to%20ten
Section interest for "Dowry" before marriage, at the hour of marriage or any time after the marriage is an offense; Bachni Devi V. Union of India, 3 (1991)38 Section 4 A. Ban on Advertisement. If any person (a) offers, through any ad in any newspaper, periodical, magazine or through some other media, any offer in his property or of any cash or both as an offer in any business or other premium as thought for the marriage of his child or girl or some other family member; Then, he will be punishable with detainment for a term which will not be under a half year, yet which might stretch out to five years, or with fine which might reach out to fifteen thousand rupees: Provided that the Court may, force a sentence of detainment for a term of under a half year for sufficient and exceptional motivations to be recorded in the judgment, This is added by the dowry prohibition Amendment Act 1986 with upheld on 19-11-1986.39 Section 5. Arrangement for giving or taking share to be void. Any agreement for the giving or taking of dowry will be void.
The section based on maxim i.e., dolo malo non torture action which implies that No court will loan its guide to a hit man reason for action upon a corrupt or an illicit demonstration. In straightforward words we can say that if offended parties by his own action violate positive law of this country, he has no option to be assisted by court.40
Meaning of Word Agreement. Area 2(e) of Indian Contract Act characterizes
the term arrangement as under: "Each guarantee and each set of guarantees
framing the thought for one another is an Agreement." One of the basics of a substantial agreement is that the thought and the item ought to be legal.41
Section 23 of the Indian Contract Act, 1872 - What contemplations and articles are legal and what not the thought or object of an understanding is legal, except if it is illegal by law; or is of such a nature that, whenever allowed, it would overcome the arrangements of any law; or is deceitful; or includes or infers injury to the individual or property of another; or
38
https://www.indiacode.nic.in/bitstream/123456789/5556/1/dowry_prohibition.pdf 39 India Code: Drugs and Magic Remedies (Objectionable Advertisement) Act, 1954 40https://indiankanoon.org/doc/1023340/#:~:text=%E2%80%94If%20any%20person%20demands%2C%20directly,which%20may%20extend%20to%20ten 41
Advertising in Legal Profession (legalservicesindia.com)
ISSN (Online): 2455-3662
EPRA International Journal of Multidisciplinary Research (IJMR) - Peer Reviewed Journal Volume: 7| Issue: 9| September 2021|| Journal DOI: 10.36713/epra2013 || SJIF Impact Factor 2021: 8.047 || ISI Value: 1.188
2021 EPRA IJMR | www.eprajournals.com | Journal DOI URL: https://doi.org/10.36713/epra2013 223
the Court sees it as corrupt, or went against to public approach. In every one of these cases, the thought or object of an arrangement said to be unlawful. Each agreement of which the item or thought is unlawful is void. The giving or taking of dowry in any structure overcomes the arrangements of Dowry Prohibition Act. Consequently, the Act is void itself. Area 6 Dowry to be to help the spouse or her beneficiaries.42 (1) Where any dowry is gotten by any individual other than the lady that individual will move it to the woman- (a) If the dowry was gotten before marriage, inside one year after the date of Marriage; or (b) If the dowry was gotten at the hour of or after the marriage, inside one year after the date of its receipt; or (C) If the dowry was gotten when the woman was a minor, inside one year after she has accomplished the age of eighteen years; and forthcoming such exchange, will hold it in trust for the Advantage of the woman.43 (2) If such individual neglects to move than he will be culpable with detainment which might stretch out to a half year, or with fine which might reach out to 5,000 rupees, or with both; however, such discipline will not exculpate the individual from his commitment to move the property. (3) Where the woman qualified for any property under section 6 (1) dies before prior to getting it, the beneficiaries of the woman will be qualified for guarantee it from the individual holding it for now.44 Exemption of section 6 According to sec 6 (4)
Nothing contained in this part will influence the arrangements of section 3 punishment for compromising dowry or Section 4 penalty for demanding dowry.
The excellent target was to clear off the social picture of the women‟s of being an economic burden and to work on their economic condition by ensuring their material resources. In basic words we can say that Section 6 of the D.P.A. focuses on the advantage of such woman/spouse/bride of the hour whose property has been wrongfully held by her better half or some
42
Objectionable Advertisements Act, 1954 - iPleaders 43
Agrahari, Gunjan (2011). Law Relating to Dowry Prohibition, Cruelty, and Harassment: An up-to-Date, Lucid, and Exhaustive Commentary with Case Law on the Dowry Prohibition Act, 1961. Delhi: India Law House. 44 Legal-Status-1.pmd (cghealth.nic.in)
other individual and when they are not prepared to return back such property to her.45 Other provision in support of section 6
Section 406 of I.P.C. is invoked where the husband or in-laws do not transfer the property of dowry to the wife or her legal heirs in the situations mentioned under Section 6. On failure to do so a proceeding under the offence of criminal breach of trust can be initiated at either of the place where the property was received or retained or the place of occurrence of criminal breach of trust.46 The Section 6 provides that if dowry is received by any person other than the bride, such a person must transfer it to the woman within a stipulated time and on failure to do so, the person is punishable with imprisonment or fine.47 Bobbili Ramakrishna Raju Yadav vs. State of Andhra Pradesh. AIR 2020
Supreme Court on Tuesday has held that giving of dowry and the customary presents at or about the hour of wedding doesn't in any capacity raise an assumption that such a property was in this way depended and put under the territory of the parents‟ in-law of the lady or other close relations in order to draw in elements of Section 6 of the Dowry Prohibition Act. Secondly, if the woman/bride entitled to such property dies before receiving it, then the legal heirs of the woman are entitled to claim it. Thus, by virtue of this Section, dowry is to be for the benefit of the bride or her legal heirs.48 Section7. Cognizance of offenses (1) Although, anything contained in the Code of Criminal Procedure, 1973 (2 of 1974) (a) No Court substandard compared to that of a Metropolitan Magistrate or a Judicial Magistrate of the top of the line will attempt any offense under this Act; (b) No court will take awareness of an offense under this Act besides upon (I) Its own insight or a police report of the realities which establish such offense, or
45https://indiankanoon.org/doc/1023340/#:~:text=%E2%80%94If%20any%20person%20demands%2C%20directly,which%20may%20extend%20to%20ten 46
https://www.indiacode.nic.in/bitstream/123456789/5556/1/dowry_prohibition.pdf 47https://indiankanoon.org/doc/1023340/#:~:text=%E2%80%94If%20any%20person%20demands%2C%20directly,which%20may%20extend%20to%20ten 48
dowry prohibition act 3 (indiankanoon.org)
ISSN (Online): 2455-3662
EPRA International Journal of Multidisciplinary Research (IJMR) - Peer Reviewed Journal Volume: 7| Issue: 9| September 2021|| Journal DOI: 10.36713/epra2013 || SJIF Impact Factor 2021: 8.047 || ISI Value: 1.188
2021 EPRA IJMR | www.eprajournals.com | Journal DOI URL: https://doi.org/10.36713/epra2013 224
(ii) A complaint by the individual wronged by the offense or a parent or other relative of such individual, or by any perceived government assistance establishment or association; According to Explanation connected to section 7(1)(b). For the "recognized welfare institution or organization” signifies a social government assistance establishment or association perceived for this sake by the Central or State Government.49 (c) It will be legal for a Metropolitan Magistrate or a Judicial Magistrate of the top of the line to pass any sentence approved by this Act on any person indicted for an offense under this Act. (2) Chapter XXXVI of the Code of Criminal Procedure, 1973 i.e., constraint for taking insight of specific offenses will not have any significant bearing to any offense punishable under this Act. (3) Notwithstanding anything contained in any law for the time being in power an assertion made by the person oppressed by the offense will not expose such person to an indictment under this Act. Yashpal Kumar v. Bhola Nath Khanna, It isn't required that lone the casualty young woman/bride of the hour be considered as oppressed person. 'Indeed, even father of the casualty young woman, who was constrained to give dowry, can be considered as an oppressed person.50 Analysis of Section 7
Subramaniam v. State of Madras AIR1983 The effect of the non-obstante clause in Section 7 of the Act has now to be considered by Supreme Court and said that section 7 stated with non obstante clause thus provision of this section 7 would prevail over any other provision contained in criminal procedure code, 1973. Family Courts have not been empowered with Jurisdiction to try dowry cases. Offences under the Act should be tried only by the Family Courts, because family problems, being of a sensitive and delicate nature, require careful handling and a different kind of treatment.51 Locus Standing to File a Complaint under the Act. Only four categories of persons have a locus
49
Dowry Offence: Its cognizance under S. 7 of the Dowry Prohibition Act (thefactfactor.com) 50
Section 7 Dowry Prohibition Act| cognizance of offences | 7 The Dowry Prohibition Act 1961 (aaptaxlaw.com) 51
A.S. Altekar, The Position of Women in Hindu Civilization, Motilal Banarsidass, Delhi, 1999,. Act No. 28 of 1961, Ministry of Law and Justice, Government of India.
standing for moving the court to take the cognizance of offence under the Act: (i) The Court on its own knowledge. (ii) Police officials. (iii) A complaint by individual bothered by offense or a parent or other relative of such person. (iv) Or by any Recognized Welfare Institution or Organization. It can be clearly seen that the provisions of the Act itself have created certain practical challenges in the implementation of the Act. For an instance, if the parents of the aggrieved person have given dowry at the initial stage, they will hesitate to report matter to the authorities afterwards. Because they have given the dowry and therefore, they are also liable for the punishment under this Act. Another drawback is that no third person for example a neighbor or anyone else in public who is aware of a dowry transaction in any marriage cannot file the complaint. It mitigates the chances of reporting the dowry related matters.52 The State of Assam v. Sri Shyamal Sil. It is very natural that at the early stage of the marriage no bride will speak alleging against her husband to any neighbouring people. Even misbehavior and ill treatment that happens within the four walls of a house in between spouse generally remains unexposed to the neighborhood.‟ Section8. Offenses to be cognizable for specific purposes and to be billable and non-Compoundable.53 (1) The Code of Criminal Procedure, 1973 (2 of 1974) will apply to offenses under this Act as though they were cognizable offenses (a) For the motivations behind investigation of such offenses; and (b) For the motivations behind issue other than (I) Matters alluded to in area 42 of that Code; and (ii) The arrest of an individual without a warrant or without a request for a Magistrate. (2) Every offence under this Act shall be non-billable and non-compoundable. By making these non-billable, the Legislature has tried to give biting teeth to the provision to curb the evil of dowry.54 Analysis of section 8
The Act has not defined the meaning of the expression to take cognizance „nor is defined in Cr PC.
52
Ibid 53
Ibid 54
Ibid
ISSN (Online): 2455-3662
EPRA International Journal of Multidisciplinary Research (IJMR) - Peer Reviewed Journal Volume: 7| Issue: 9| September 2021|| Journal DOI: 10.36713/epra2013 || SJIF Impact Factor 2021: 8.047 || ISI Value: 1.188
2021 EPRA IJMR | www.eprajournals.com | Journal DOI URL: https://doi.org/10.36713/epra2013 225
However, the term cognizance „indicates the point
when the judicial notice of an offence is taken by the Magistrate as held in Darshan Singh v. State of Maharashtra, AIR 1971
The legality of cognizance can be determined at the point of time when the cognizance of an offence is actually taken by the court as held in M.L. Sethi v. R.P. Kapur, AIR 1967 According to section 2 (C) of Criminal Procedure Code cognizable offence means when a police officer may arrest without warrant in accordance with the first schedule or then again under some other law for the time being in power. As per area 156 (1) of CrPC any official responsible for police headquarters Mein without the request for judge examine any cognizable case. This section makes it expressly clear that a collection cognizable case can be investigated by the police officer without the order of magistrate but on the point of arrest in cognizable case reference may be made to Section 41 clause 1 of CrPC it says that any police officer May without order of magistrate and without warrant only under the circumstance mentioned under section 41 of the code But section 8 of the dowry prohibition act,1961 makes cognizable offence only for the purpose of investigation .on the point of arrest sanction of magistrate is required under the act.55
The offences under the Act are non-billable i.e., bail cannot be demanded as a matter of right and if the criteria of granting bail are fulfilled under section 437 of criminal procedure code,1973 i.e., when bail may be taken in case of non-billable offence as per satisfaction of court only then the bail can be granted. By making these non-billable, the Legislature has tried to give biting teeth to the Provision to curb the evil of dowry. The victims of dowry related matters are more interested in reaching to a compromise with husband and in-laws rather than punishing them. Therefore, the non-billable and non-compoundable nature of offences may lead to reluctance in filing the complaint as it will end the chances of compromise.
The Law Commission of India in its reports as well as the report given by the Malimath Committee also suggested making the offence compoundable. But the view point is discarded on the grounds that it will dilute the provision and hence defeat its objective. But on practical grounds, the non-compoundable nature of this offence seems to be a major obstacle in the smooth implementation of this provision. This non-compoundable nature of the offence leaves no
55
Dowry Prohibition Act, 1961 | Ministry of Women & Child Development (wcd.nic.in)
probability of compromise between the both spouses, howsoever regretful the husband might be and howsoever willing the wife might be.56 The only option left for the victim to reach to the compromise is only through the route of Section 482 of Criminal Procedure Code inherent power of the High Court to intercept abuse of the process of any Court or otherwise to secure the ends of justice. Which is again time consuming and expensive process, it is of course not a very good option. 8A. Burden of proof in certain cases. Where any individual is indicted for taking or abetting the taking of any settlement under segment 3, or the requesting of share under section 4, the weight of demonstrating that he had not submitted an offense under those areas will be on him.
Analysis of section 8A by using the word shall no room left for discretion of the court i.e. it is mandatory for Court to take the fact as proved unless the party interested in disproving gives sufficient evidence for that purpose. This section 8A shifts the burden of proof on the accused. However, the initial burden of bringing the accused within the circumference still lies on the prosecution, as essentials of term dowry „must be proved to have been fulfilled in
accordance with Section 2 of Dowry Prohibition Act. It signifies that Section 8(a) must be read with Section 2 of the Act.
Need of presumption under section 8A the offence is usually committed within the Four walls of matrimonial house of the victim. The victim is all alone among the majority of her husband and his relatives who are usually the culprits or the mute spectators of the crime. 1. It creates the difficulty for the prosecution to find the genuine witnesses of the crime. 2. Several times, the circumstantial evidence is also tampered by the accused or their family members to escape the chances of prosecution. 3. The victim is not taken to the hospital on time which not only mitigates her chances of survival but also minimize the chances of recording of her dying declaration. The effect of presentation is that it will shift the burden of proof on husband and his family to establish that's he is not committed offence under section 8A.57
56
Section 8 in the Dowry Prohibition Act, 1961 (indiankanoon.org) 57
Dowry Prohibition Act, 1961 | Ministry of Women & Child Development (wcd.nic.in)
ISSN (Online): 2455-3662
EPRA International Journal of Multidisciplinary Research (IJMR) - Peer Reviewed Journal Volume: 7| Issue: 9| September 2021|| Journal DOI: 10.36713/epra2013 || SJIF Impact Factor 2021: 8.047 || ISI Value: 1.188
2021 EPRA IJMR | www.eprajournals.com | Journal DOI URL: https://doi.org/10.36713/epra2013 226
Other provisions in support of section 8A 1. In order to curb the menace of dowry death and incidents related to dowry death section 113A of Indian evidence act ,1872 presumption as to abetment of suicide by married woman was incorporated by Criminal Law (Amendment) Act, 1983. According to Section 113A, when the question is whether the commission of suicide by a woman had been abetted by her husband or any of his relatives and it is shown that: (a) She had committed suicide within 7 years of her marriage; and (b) Her husband or such relatives had subject her to cruelty as defined under Section 498A of I.P.C., 1860 which was of such a nature as was likely to drive her to commit suicide or cause danger to her life limb or health, then the Court may presume, having regard to other circumstances, that such suicide, had been abetted by her husband or relatives of her husband. Pinakin Mahipatray Rawal v. State of Gujarat, (2013) 10 SCC 48 Supreme Court held that prerequisites as stated in Section 113-A must be established by prosecution before presumption can be invoked.58 Retrospective application of section 113B
Supreme Court in Gurbachan Singh v. Satpal Singh, AIR 1990 and reaffirmed in Arvind Kumar v. State of M.P., (2007) held that section 113A of Indian evidence act, 1872 does not create any new offence. It lays down merely matters of procedure and do not affect the substantive right. Hence this provision has retrospective application. Section 113B of Indian evidence act, 1872 i.e. presumption as to dowry death was inserted by Dowry Prohibition (Amendment) Act, 1986. Under this section, when it is shown that soon before the death, the woman had been subjected to cruelty or harassment by the accused for dowry, the court shall presume that the accused had caused the dowry death and the burden is on the accused to rebut the presumption.
Dowry death is defined under Section 304B of Indian Penal Code.59 Unnatural death occurring within seven years of marriage and preceded by cruelty or harassment in connection with dowry is covered within the ambit of this section. Initial burden is on the prosecution to prove by preponderance of probability the ingredients of Section 304B of Indian Penal Code. Prosecution is not required to prove these ingredients beyond reasonable doubt because it will defeat the purpose of Section 304-B. Once this initial burden is
58
Section 8 in the Dowry Prohibition Act, 1961 (indiankanoon.org) 59
Dowry Prohibition Act, 1961, India-legitquest
discharged by the prosecution it gets replaced by deemed presumption of guilt of the accused.
Thakkan Jha v. State of Bihar, (2004) 13 SCC 348 Supreme Court held that 'soon before' does not mean 'immediately before. It implies that there should be presence of general and live connection between savagery/badgering and the censured death. It is a relative term and depends upon facts and circumstances of the case. 8B. Dowry Prohibition Officers (1) The State Government might appoint though many Dowries Prohibition Officers as it may suspect fit and specify the regions in interpret of which they will practice their ward and powers under this Act. (2) Every Dowry Prohibition Officer will practice and play out the accompanying forces and capacities, specifically: (a) To see that the arrangements of this Act are agreed with; (b) To forestall, beyond what many would consider possible, the taking or abetting the taking of, or the requesting of, dowry; 60 (c) To gather such proof as might be important for the indictment of people submitting offenses under the Act; and (d) To perform such extra capacities as might be allocated to him by the State Government, or as might be indicated in the standards made under this Act. As indicated by Section 10 enabled state government to make rules for do the motivations behind this demonstration by notice in official gazette? Section 10(2) explicitly engaged state government to make rule for the extra capacities to be performed by Dowry post trial agent under Section 8B (2). (3) The State Government might notice in the Official Gazette; adjacent such powers of a cop as might be determined in the notice on the Dowry Prohibition Officer who will exercise such powers subject to such restrictions and conditions as might be indicated by rules made under this Act. As per Section 10(2) state government can make a standard for impediment and conditions subject to which an endowment forbiddance official might practice his capacity under section 8B (3) Each standard made by State Government under this part 10 will be laid before the state legislature. (4) The State Government may, to exhort and helping Dowry Prohibition Officers in the proficient execution of their capacities under this Act, delegate a warning board comprising of not in excess of five social
60
Dowry Prohibition Officers. | Dowry Prohibition Act, 1961 | Bare Acts | Law Library | AdvocateKhoj

ISSN (Online): 2455-3662
EPRA International Journal of Multidisciplinary Research (IJMR) - Peer Reviewed Journal Volume: 7| Issue: 9| September 2021|| Journal DOI: 10.36713/epra2013 || SJIF Impact Factor 2021: 8.047 || ISI Value: 1.188
2021 EPRA IJMR | www.eprajournals.com | Journal DOI URL: https://doi.org/10.36713/epra2013 227
government assistance laborers (out of whom somewhere around two will be women‟s) from the
space in regard of which such Dowry Prohibition Officer practices jurisdiction.61 Analysis of section 8 B
Provision is inserted with an aim to create a social instrument designed to eradicate the dowry practice from the society i.e., to employ social means to curb this evil but unfortunately the practical implementation of this Section is lingering on. The Act envisages the appointment of„
Dowry Prohibition Officers‟ as well as establishment of Advisory boards for advising and assisting these officers. But the problem is that in most of states, no separate appointments of DPOs have been done. The other state officers like sub divisional magistrates, superintendents of police, probation officers etc.62 have been given the charge of Dowry Prohibition Officers.63 The provisions for appointment of DPOs under the Act were inserted with an objective of effective implementation of this Act. If no separate and dedicated officers would be appointed, then such DPOs will probably be an eye wash and formality. Another concern is that by giving the additional charge of DPOs to the already existing officers will again result in pendency of cases and hence a delayed justice.64 CONCLUSION
And last, Dowry is a social problem, it emerged in Ancient Indian society and social awareness is the most important element to eradicate this evil practice. All things considered, the Dowry Prohibition Act ought to be made more powerful, tough and changes ought to be brought out every once in a while, as per the conditions. In keeping view with Hindu mythology, marriages are made in heaven, though mother-in-law, sister-in-law, husbands and different respected ones are being an increasing number of worried within the breaking of the marriage for the lust of dowry. The woman should be made as the owner of all the properties and gifts given to her at the time of marriage and the registration of these gifts should be made compulsory. Though, the changes should also to be made in laws which give equal rights to women in
61
dowry prohibition officer (indiankanoon.org) 62 Ibid 63 Sections 8B, 9 and 10 of the Dowry Prohibition Act,
1961 64
Section 8B in the Dowry Prohibition Act, 1961 (indiankanoon.org)
parental and matrimonial property. Women should be aware of legal remedies and their right. At the same time, they should avoid misusing the laws as one has to accept the bitter truth that the practice cannot be eradicated easily, the government, social activists, the Non-Governmental Organizations and the public themselves should come forward to create awareness through camps, cultural programmes and pamphlets among people about the evils of this practice. Since everyone knows that the legal procedure is time consuming and expensive it may be difficult for the girl's family to spend too much and wait for long to get justice. Hence, it is very important that the courts should register the cases and dispense judgment quickly. However, it is also true that justice delayed is justice denied. Legislative measures, education, socio-economic status alone cannot put an end to this evil practice which is the major cause for so many crimes against women in the society. It is the attitudinal change of the people and the end of the dominance of the patriarchal system that could help to lower the crime and gradually it may put an end to this inhuman social evil.
ISSN (Online): 2455-3662
EPRA International Journal of Multidisciplinary Research (IJMR) - Peer Reviewed Journal Volume: 7| Issue: 9| September 2021|| Journal DOI: 10.36713/epra2013 || SJIF Impact Factor 2021: 8.047 || ISI Value: 1.188
2021 EPRA IJMR | www.eprajournals.com | Journal DOI URL: https://doi.org/10.36713/epra2013 228
EXPLORING THE IMPACT OF ECONOMIC GROWTH AND INFLATION RATE ON UNEMPLOYMENT IN INDIA
Sunita Kumari
PhD Scholar, University of Jammu
Article DOI: https://doi.org/10.36713/epra8489
DOI No: 10.36713/epra8489
ABSTRACT In India, it has been observed that after the Economic Reforms of 1991, the participation of labor force has increased marginally but the rate of unemployment has remained unchanged which still remains a matter of concern. On the other hand, India has faced the issue of persistent rise in prices which is another major problem. As both these parameters are vital measures of economic growth, this paper attempts to find the correlation between both these variables in the Indian context from the year 1991 to 2019. A. W. Phillips in his theory states that inflation and unemployment have a stable and inverse relationship. The major claim of the theory is that with economic growth comes inflation, which in turn should lead to more jobs and less unemployment. On the basis of Phillips Curve this paper attempts to analyze the effect of economic growth and Inflation on unemployment in India during the time period of 1991 to 2020. The observational findings revealed a negligible association between unemployment, inflation and economic growth in India. KEY WORDS: employment, inflation, economic, growth, problem
INTRODUCTION The Indian economy is facing the issues of
persistent rise in prices and unemployment continuously for a number of years. In India, inflation, that is, the persistent rise in prices is measured on year to year basis on the basis of consumer price index and whole sale price index. The unemployment rate, on the other hand, is defined as the number of unemployed people as percentage of the total labor force. Further the Economic Growth of a country is measured in terms of growth in its Gross Domestic Product (GDP). Growth in GDP is the increase in the market value of all goods and services produced by an economy over a period of time.
The present study finds its theoretical basis in the Phillips curve, which is an economic concept developed by A.W. Phillips. The concept states that inflation and unemployment have a stable and inverse relationship. Also, the theory claims that with growth in GDP, inflation takes place which in turn leads to the creation of more jobs and less unemployment. On the basis of Philips Curve, this paper attempt to study the
relation between unemployment, inflation and economic growth in India from the year 1991 to 2020. OBJECTIVES OF THE STUDY 1. To find out the relationship between inflation rate and unemployment rate in India. 2. To find out the impact of Gross Domestic Product and Inflation rate on Unemployment rate in India. HYPOTHESES 1. There is a negative relationship between Inflation and Unemployment. 2. Increasing Gross Domestic Product and Inflation rate decreases the Unemployment. METHODOLOGY
The present study is based on secondary data. The data is collected from the official website of macrotrends and World Bank. Inflation rate is measured on the basis of consumer price Index. The Pearson’s Correlation Coefficient technique is used to
determine correlation between the variables inflation and unemployment. Stata software is used for
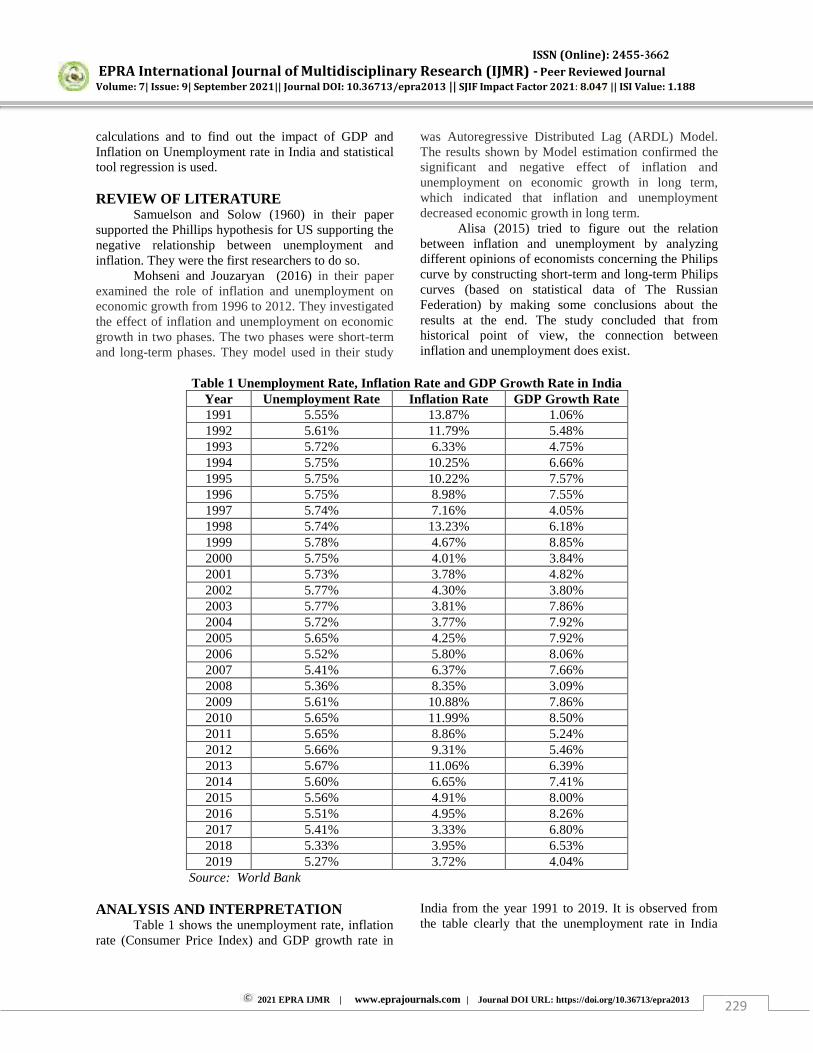
ISSN (Online): 2455-3662
EPRA International Journal of Multidisciplinary Research (IJMR) - Peer Reviewed Journal Volume: 7| Issue: 9| September 2021|| Journal DOI: 10.36713/epra2013 || SJIF Impact Factor 2021: 8.047 || ISI Value: 1.188
2021 EPRA IJMR | www.eprajournals.com | Journal DOI URL: https://doi.org/10.36713/epra2013 229
calculations and to find out the impact of GDP and Inflation on Unemployment rate in India and statistical tool regression is used. REVIEW OF LITERATURE
Samuelson and Solow (1960) in their paper supported the Phillips hypothesis for US supporting the negative relationship between unemployment and inflation. They were the first researchers to do so.
Mohseni and Jouzaryan (2016) in their paper examined the role of inflation and unemployment on economic growth from 1996 to 2012. They investigated the effect of inflation and unemployment on economic growth in two phases. The two phases were short-term and long-term phases. They model used in their study
was Autoregressive Distributed Lag (ARDL) Model. The results shown by Model estimation confirmed the significant and negative effect of inflation and unemployment on economic growth in long term, which indicated that inflation and unemployment decreased economic growth in long term.
Alisa (2015) tried to figure out the relation between inflation and unemployment by analyzing different opinions of economists concerning the Philips curve by constructing short-term and long-term Philips curves (based on statistical data of The Russian Federation) by making some conclusions about the results at the end. The study concluded that from historical point of view, the connection between inflation and unemployment does exist.
Table 1 Unemployment Rate, Inflation Rate and GDP Growth Rate in India
Year Unemployment Rate Inflation Rate GDP Growth Rate 1991 5.55% 13.87% 1.06% 1992 5.61% 11.79% 5.48% 1993 5.72% 6.33% 4.75% 1994 5.75% 10.25% 6.66% 1995 5.75% 10.22% 7.57% 1996 5.75% 8.98% 7.55% 1997 5.74% 7.16% 4.05% 1998 5.74% 13.23% 6.18% 1999 5.78% 4.67% 8.85% 2000 5.75% 4.01% 3.84% 2001 5.73% 3.78% 4.82% 2002 5.77% 4.30% 3.80% 2003 5.77% 3.81% 7.86% 2004 5.72% 3.77% 7.92% 2005 5.65% 4.25% 7.92% 2006 5.52% 5.80% 8.06% 2007 5.41% 6.37% 7.66% 2008 5.36% 8.35% 3.09% 2009 5.61% 10.88% 7.86% 2010 5.65% 11.99% 8.50% 2011 5.65% 8.86% 5.24% 2012 5.66% 9.31% 5.46% 2013 5.67% 11.06% 6.39% 2014 5.60% 6.65% 7.41% 2015 5.56% 4.91% 8.00% 2016 5.51% 4.95% 8.26% 2017 5.41% 3.33% 6.80% 2018 5.33% 3.95% 6.53% 2019 5.27% 3.72% 4.04%
Source: World Bank ANALYSIS AND INTERPRETATION
Table 1 shows the unemployment rate, inflation rate (Consumer Price Index) and GDP growth rate in
India from the year 1991 to 2019. It is observed from the table clearly that the unemployment rate in India
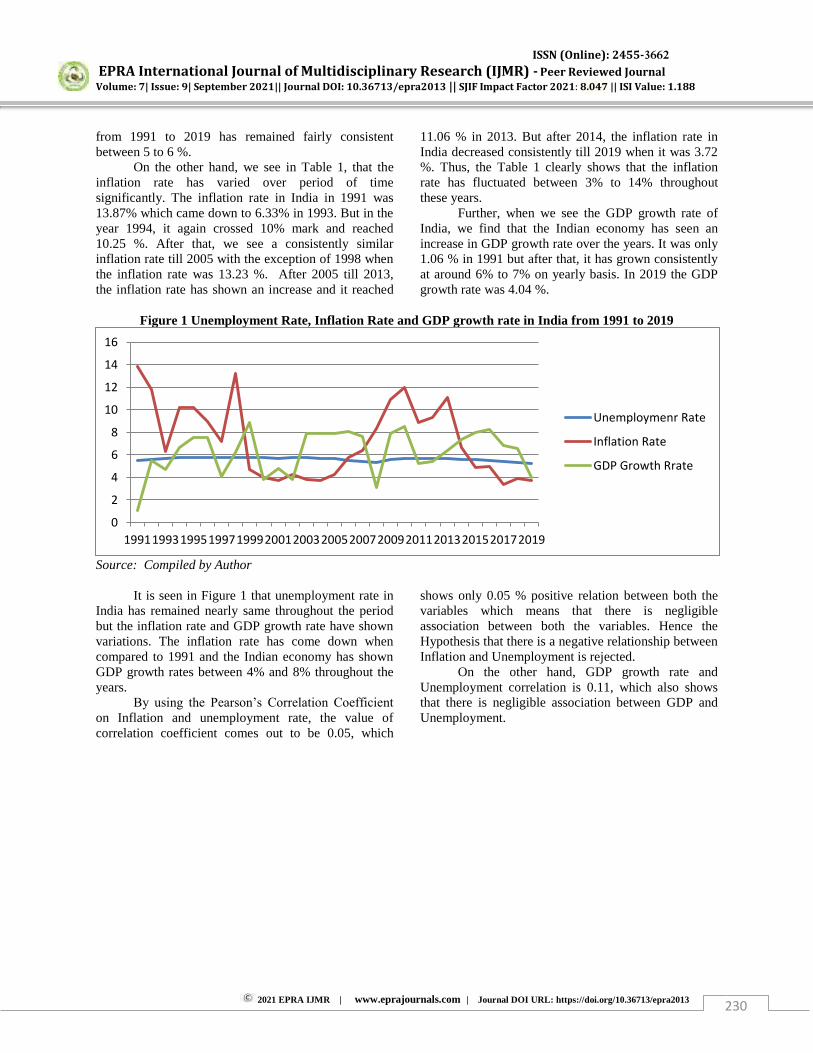
ISSN (Online): 2455-3662
EPRA International Journal of Multidisciplinary Research (IJMR) - Peer Reviewed Journal Volume: 7| Issue: 9| September 2021|| Journal DOI: 10.36713/epra2013 || SJIF Impact Factor 2021: 8.047 || ISI Value: 1.188
2021 EPRA IJMR | www.eprajournals.com | Journal DOI URL: https://doi.org/10.36713/epra2013 230
from 1991 to 2019 has remained fairly consistent between 5 to 6 %.
On the other hand, we see in Table 1, that the inflation rate has varied over period of time significantly. The inflation rate in India in 1991 was 13.87% which came down to 6.33% in 1993. But in the year 1994, it again crossed 10% mark and reached 10.25 %. After that, we see a consistently similar inflation rate till 2005 with the exception of 1998 when the inflation rate was 13.23 %. After 2005 till 2013, the inflation rate has shown an increase and it reached
11.06 % in 2013. But after 2014, the inflation rate in India decreased consistently till 2019 when it was 3.72 %. Thus, the Table 1 clearly shows that the inflation rate has fluctuated between 3% to 14% throughout these years.
Further, when we see the GDP growth rate of India, we find that the Indian economy has seen an increase in GDP growth rate over the years. It was only 1.06 % in 1991 but after that, it has grown consistently at around 6% to 7% on yearly basis. In 2019 the GDP growth rate was 4.04 %.
Figure 1 Unemployment Rate, Inflation Rate and GDP growth rate in India from 1991 to 2019
Source: Compiled by Author
It is seen in Figure 1 that unemployment rate in India has remained nearly same throughout the period but the inflation rate and GDP growth rate have shown variations. The inflation rate has come down when compared to 1991 and the Indian economy has shown GDP growth rates between 4% and 8% throughout the years.
By using the Pearson’s Correlation Coefficient
on Inflation and unemployment rate, the value of correlation coefficient comes out to be 0.05, which
shows only 0.05 % positive relation between both the variables which means that there is negligible association between both the variables. Hence the Hypothesis that there is a negative relationship between Inflation and Unemployment is rejected.
On the other hand, GDP growth rate and Unemployment correlation is 0.11, which also shows that there is negligible association between GDP and Unemployment.
0
2
4
6
8
10
12
14
16
199119931995199719992001200320052007200920112013201520172019
Unemploymenr Rate
Inflation Rate
GDP Growth Rrate
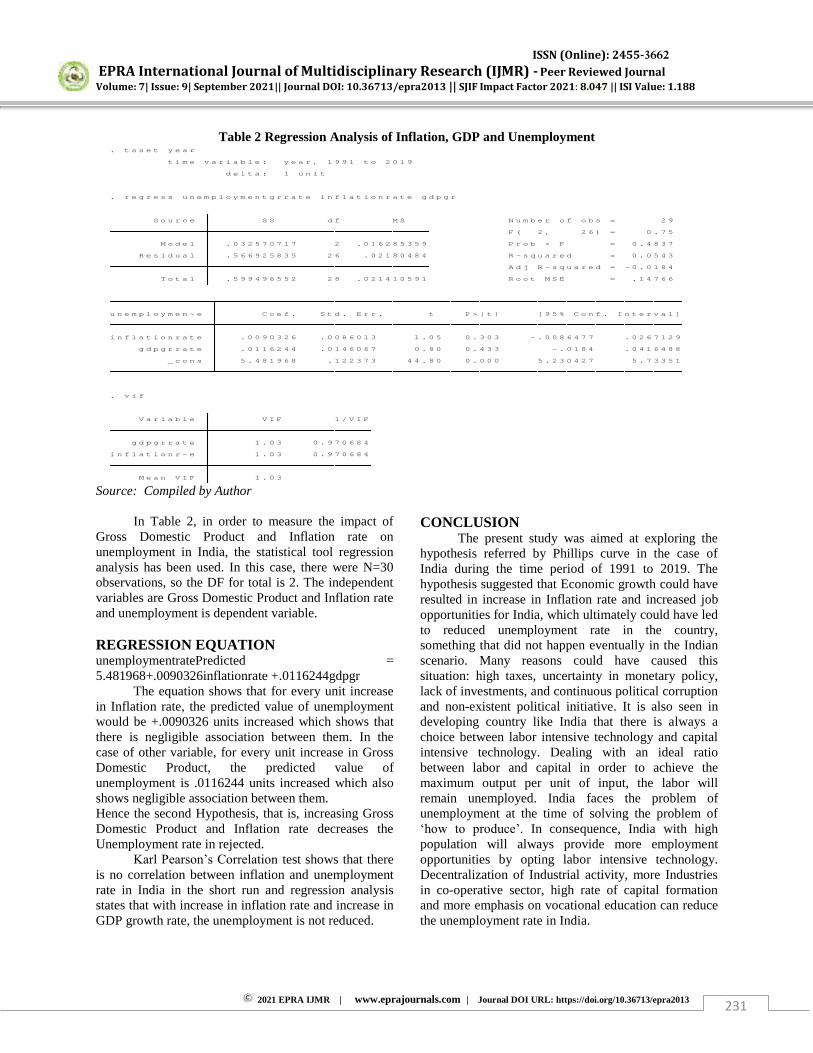
ISSN (Online): 2455-3662
EPRA International Journal of Multidisciplinary Research (IJMR) - Peer Reviewed Journal Volume: 7| Issue: 9| September 2021|| Journal DOI: 10.36713/epra2013 || SJIF Impact Factor 2021: 8.047 || ISI Value: 1.188
2021 EPRA IJMR | www.eprajournals.com | Journal DOI URL: https://doi.org/10.36713/epra2013 231
Table 2 Regression Analysis of Inflation, GDP and Unemployment
Source: Compiled by Author
In Table 2, in order to measure the impact of Gross Domestic Product and Inflation rate on unemployment in India, the statistical tool regression analysis has been used. In this case, there were N=30 observations, so the DF for total is 2. The independent variables are Gross Domestic Product and Inflation rate and unemployment is dependent variable. REGRESSION EQUATION unemploymentratePredicted = 5.481968+.0090326inflationrate +.0116244gdpgr
The equation shows that for every unit increase in Inflation rate, the predicted value of unemployment would be +.0090326 units increased which shows that there is negligible association between them. In the case of other variable, for every unit increase in Gross Domestic Product, the predicted value of unemployment is .0116244 units increased which also shows negligible association between them. Hence the second Hypothesis, that is, increasing Gross Domestic Product and Inflation rate decreases the Unemployment rate in rejected.
Karl Pearson’s Correlation test shows that there is no correlation between inflation and unemployment rate in India in the short run and regression analysis states that with increase in inflation rate and increase in GDP growth rate, the unemployment is not reduced.
CONCLUSION The present study was aimed at exploring the
hypothesis referred by Phillips curve in the case of India during the time period of 1991 to 2019. The hypothesis suggested that Economic growth could have resulted in increase in Inflation rate and increased job opportunities for India, which ultimately could have led to reduced unemployment rate in the country, something that did not happen eventually in the Indian scenario. Many reasons could have caused this situation: high taxes, uncertainty in monetary policy, lack of investments, and continuous political corruption and non-existent political initiative. It is also seen in developing country like India that there is always a choice between labor intensive technology and capital intensive technology. Dealing with an ideal ratio between labor and capital in order to achieve the maximum output per unit of input, the labor will remain unemployed. India faces the problem of unemployment at the time of solving the problem of ‘how to produce’. In consequence, India with high population will always provide more employment opportunities by opting labor intensive technology. Decentralization of Industrial activity, more Industries in co-operative sector, high rate of capital formation and more emphasis on vocational education can reduce the unemployment rate in India.
M e a n V I F 1 . 0 3
i n f l a t i o n r ~ e 1 . 0 3 0 . 9 7 0 6 8 4
g d p g r r a t e 1 . 0 3 0 . 9 7 0 6 8 4
V a r i a b l e V I F 1 / V I F
. v i f
_ c o n s 5 . 4 8 1 9 6 8 . 1 2 2 3 7 3 4 4 . 8 0 0 . 0 0 0 5 . 2 3 0 4 2 7 5 . 7 3 3 5 1
g d p g r r a t e . 0 1 1 6 2 4 4 . 0 1 4 6 0 6 7 0 . 8 0 0 . 4 3 3 - . 0 1 8 4 . 0 4 1 6 4 8 8
i n f l a t i o n r a t e . 0 0 9 0 3 2 6 . 0 0 8 6 0 1 3 1 . 0 5 0 . 3 0 3 - . 0 0 8 6 4 7 7 . 0 2 6 7 1 2 9
u n e m p l o y m e n ~ e C o e f . S t d . E r r . t P > | t | [ 9 5 % C o n f . I n t e r v a l ]
T o t a l . 5 9 9 4 9 6 5 5 2 2 8 . 0 2 1 4 1 0 5 9 1 R o o t M S E = . 1 4 7 6 6
A d j R - s q u a r e d = - 0 . 0 1 8 4
R e s i d u a l . 5 6 6 9 2 5 8 3 5 2 6 . 0 2 1 8 0 4 8 4 R - s q u a r e d = 0 . 0 5 4 3
M o d e l . 0 3 2 5 7 0 7 1 7 2 . 0 1 6 2 8 5 3 5 9 P r o b > F = 0 . 4 8 3 7
F ( 2 , 2 6 ) = 0 . 7 5
S o u r c e S S d f M S N u m b e r o f o b s = 2 9
. r e g r e s s u n e m p l o y m e n t g r r a t e i n f l a t i o n r a t e g d p g r
d e l t a : 1 u n i t
t i m e v a r i a b l e : y e a r , 1 9 9 1 t o 2 0 1 9
. t s s e t y e a r

ISSN (Online): 2455-3662
EPRA International Journal of Multidisciplinary Research (IJMR) - Peer Reviewed Journal Volume: 7| Issue: 9| September 2021|| Journal DOI: 10.36713/epra2013 || SJIF Impact Factor 2021: 8.047 || ISI Value: 1.188
2021 EPRA IJMR | www.eprajournals.com | Journal DOI URL: https://doi.org/10.36713/epra2013 232
BIBLIOGRAPHY 1. Samuelson, P.A. and Solow, R.M. (1960)
‘Analytical aspect of anti-inflation policy’,
American Economic Review, Vol. 50, No. 2, pp.177–194.
2. Alisa, M. (2015) ‘The Relationship between
Inflation and Unemployment: A Theoretical Discussion about the Philips Curve’ Journal of
International Business and Economics, December 2015, Vol. 3, No. 2, pp. 89-97
3. Mohseni, M. and Jouzaryan, F. (2016) ‘Examining
the Effects of Inflation and Unemployment on Economic Growth in Iran (1996-2012)’ Procedia Economics and Finance, Volume 36, 2016, Pages 381-389.

ISSN (Online): 2455-3662
EPRA International Journal of Multidisciplinary Research (IJMR) - Peer Reviewed Journal Volume: 7| Issue: 9| September 2021|| Journal DOI: 10.36713/epra2013 || SJIF Impact Factor 2021: 8.047 || ISI Value: 1.188
2021 EPRA IJMR | www.eprajournals.com | Journal DOI URL: https://doi.org/10.36713/epra2013 233
MGA PILING BARYABOL NA NAKAKAIMLUWENSYA SA PAG-UUGALI NG MGA MAG-AARAL NG GRADE12
SENIOR HIGH NG LAGUNA STATE POLYTECHNIC UNIVERSITY
Sierra Marie S. Aycardo, Phd.
ABSTRACT
Ang pananaliksik na ito ay naglalayong bigyang kasagutan ang mga sumusunod na katanungan:
1. Ano ang antas ng kaalaman ng mga estudyante hinggil sa impluwnsya ng Piling Varyabol sa Kaugalian ng mga mag-aaral batay sa
1.1Pasilidad 1.2Kurikulum 1.3 Guro 1.4 Panturo
2. Ano ang pananaw ng mga estudyante ukol sa kasapatan ng mga kaalamang itinuturo sa Paaralan hinggil sa impluwenya ng mga Piling varyabol sa kaugalian ng mga mag-aaral batay sa Moral at sosyal na kaugalian? 3. May makabuluhang epekto ba ng antas ng kaalaman ng mga estudyante hinggil impluwensya ng Piling Varyabol sa Kaugalian ng mga mag-aaral?
Ang mga mananaliksik ay gumamit ng diskriptibong pamamaraan upang makalap ang mga tiyak na kasagutan at mahahalagang impormasyon ng mga mag-aaral.
Ang mananaliksik ay bumuo ng talatanungan at itoy ipinamahagi sa tatlumpong (60) mag-aaral sa senior High School ng Laguna State polytechnic University.
Ang pag – aaral na ito ay isinagawa sa pamamagitan ng pagseserbey. Ang mananaliksik ay maghahanda ng isang serbey – kwestyoneyr na maglalayong makapangalap ng mga datos.
Ang weighted mean at T-test ay ginamit upang malaman ang antas upang masuri ang mga piling baryabol na nakakaimpluwensya sa pag-uugali nga ng SHS sa LSPU. Koklusyon 1. ang antas ng kaalaman ng mga estudyante hinggil sa impluwnsya ng Piling Varyabol sa Kaugalian ng mga mag-aaral batay sa Pasilidad ay sumasang-ayon samantalang ang , Kurikulum, Guro,at Panturo ay ganap na sumasang-ayon 2. Ang pananaw ng mga estudyante ukol sa kasapatan ng mga kaalamang itinuturo sa Paaralan hinggil sa impluwenya ng mga Piling varyabol sa kaugalian ng mga mag-aaral batay sa Moral at sosyal na kaugalian ay ganap na sumasang-ayon 3. May makabuluhang epekto ang antas ng kaalaman ng mga estudyante hinggil impluwensya ng Piling Varyabol sa Kaugalian ng mga mag-aaral
Batay sa mga nabanggit na kasagutan at Konklusyon nabuo ang sumusunod na rekomendasyon 1. Kinakailangan ipagpatuloy ng mga mag-aaral ang pagbabasa sa mga naisulat na komedya partikular ang
nilikha/inakda ng mga lokal na manunulat upang lumawak ang kaalamang pampanitikan 2. Lalo pang pag-ibayuhin ng mga mag-aaral ang pag-unawa sa nilalaman ng Komedya at kilalanin/tukuyin
ang mga mensaheng nakapaloob dito upang magamit sa buhay, pamumuhay at pakikipamuhay tungo sa paghubog ng kalagayang pangkatauhan.
3. Makapagtanghal ng mga Komedyang naisulat ng lokal na may akda upang ang mga ito ay mananatiling buhay
4. Sa mga susunod na mananaliksik, maari itong gamiting gabay at batayan sa pagsasagawa ng panibagong pananaliksik na katulad nito at dagdagan pa ng mga baryabols tagatugon at sanggunian upang higit na maging mabisa at makita ang tagumapay ng isinasagawang pananaliksik
Para sa pamahalaan, paigtingin pa ang kalidad ng iba’t- ibang varyabol upang hindi na ganap na makaapekto ang mga ito sa kaugalian ng mga mag-aaral.
Para sa mga administrador ng paaralan, bigyang pansin ang ang mga kakulangan o problema sa mga piling varyabol upang di na makaapekto sa kaugalian ng mga mag-aaral.
Para sa mga propesor sa Senior High School, maging aktibo o magbigay puna sa mga piling varyabol upang di na makaapekto sa kaugalian ng mga mag-aaral.

ISSN (Online): 2455-3662
EPRA International Journal of Multidisciplinary Research (IJMR) - Peer Reviewed Journal Volume: 7| Issue: 9| September 2021|| Journal DOI: 10.36713/epra2013 || SJIF Impact Factor 2021: 8.047 || ISI Value: 1.188
2021 EPRA IJMR | www.eprajournals.com | Journal DOI URL: https://doi.org/10.36713/epra2013 234
Para sa mga mag-aaaral, magsalita o magpahayag ng opinion ukol sa mga problema sa mga piling varyabol upang di na makaapekto sa kaugalian ng mga mag-aaral.
Para sa mga susunod pang mananaliksik, ipagpatuloy pa ang pag-aaral ukol sa epekto sa piling varyabol sa kaugalian ng mga mag-aaral upang makatulong pa sa pagpapalawak ng kaalaman hinggil sa pag-aaral na ito SUSING SALITA: Pag-uugali, Guro, Mag-aaral, Panturo, Moral, Sosyal
PANIMULA
Sa tahanan nagsisimula ang karunungan. Sa paaralan naman natatamo ng mga mag-aaral ang tamang proseso ng pag-aaral na huhubog sa kanya sa darating pang panahon. Dito nahuhulma ang isipan ng mga mag-aaral, nababago ang kanilang pagkilos, nadaragdagan ang kanilang karunungan at kagandahang-asal upang maging mabuti at kapaki-pakinabang na mamamayan. Maraming insidente ng mga kabataang naliligaw ng landas, nagkakaroon nang problema sa pag-iisip, at higit sa lahat, humahantong sa pagpapakamatay.Ang ilan sa mga nasabing epekto nito ay problema sa guro, sa mga gawain, sa mga kagamitan, at problema sa pasilidad.
Ang mga estudyanteng pumapasok sa paaralan ay naghahangad ng wastong pasilidad upang mas maramdaman nila na pinahahalagahan sila ng kinauukulan. Isa ito sa mga piling varyabol na nakaka-apekto sa kaugalian ng mga mag-aaral, kung kaya’t ang wastong pasilidad ay nararapat lamang sa mga masisipag na mag-aaral.
Isa pang varyabol ang mga guro. Ang mga guro ang nagsilbing pangalawang magulang ng mga mag-aaral dahil sa karunungang kanilang ibinabahagi sa mga mag-aaral. Ang pakikisama at galing ng guro sa pagtuturo ang higit na kailangan ng mga estudyante.
Ang kagamitang panturo ay kailangan din ng mga estudyante para sa kanilang matagumpay na pag-aaral. Ang kalidad at halaga nito kailangang magkaroon ang mga estudyante. Ang pananaliksik na ito ay naglalayong bigyang kasagutan ang mga sumusunod na katanungan:
2. Ano ang antas ng kaalaman ng mga estudyante hinggil sa impluwnsya ng Piling Varyabol sa Kaugalian ng mga mag-aaral batay sa
1.1Pasilidad 1.2Kurikulum 1.3 Guro 1.4 Panturo
2. Ano ang pananaw ng mga estudyante ukol sa kasapatan ng mga kaalamang itinuturo sa Paaralan hinggil sa impluwenya ng mga Piling varyabol sa kaugalian ng mga mag-aaral batay sa Moral at sosyal na kaugalian? 3. May makabuluhang epekto ba ng antas ng kaalaman ng mga estudyante hinggil impluwensya ng Piling Varyabol sa Kaugalian ng mga mag-aaral?
Ang K-12 ay isa sa matagumpay na proyekto ng pamahalaan. Binago ng programang ito ang bumago sa daloy ng edukasyon sa Pilipinas. Ang pagsasabatas ng Enhanced Basic Education Act ng 2013 ang bumago sa sistema ng edukasyon ditto sa ating bansa. Marami ang natuwa, marami ang hindi nasiyahan. Iniisip ng mga magulang ang dalawang taon pang dagdag sa pag-aaral ng kanilang anak.Pero para sa iba, mas maganda na rin ang ganitong programa para medaling makahanap ng trabaho ang mga estudyanteng magsisipagtapos.
Saklaw ng mga tagumpay sa programang ito, marami rin ang problemang kinakaharap ng mga estudyante ukol rito. Ilan na dito ang mga pagbabagong nagaganap sa kanilang pag-iisip na naaapektuhan ng pasiidad, guro, kurikulum at mga kagamitang panturo.Maraming estudyante ang nawawalan ng gana sa pag-aaral dahil sa mga suliraning ito.
Ang pasilidad ang isa sa mga piling varyabol na nakakaapekto sa kaugalian ng mga mag-aaral. Wastong palikuran na ginagamit ng mga estudyante at mga guro, sapat na bentilasyon sa bawat silid-aralan, mga kagamitang panulat tulad ng mga whiteboard marker, chalk at iba pa, mga lamesa at upuan na ginagamit, at malinis na pader ang ilan lamang sa mga katangian ng wastong pasilidad na kinakailangan ng mga estudyante upang hindi maapektuhan ang kanilang moral at sosyal na kaugalian.
Isa pa rito ang kurikulum. Sa pag-usbong ng bagong sistema ng edukasyon sa Pilipinas. Karamihan sa mga estudyante at magulang ay hindi pamilyar sa kalakarang ito. Nahihirapan rin silang mag-adjust sa bagong sistemang ito. Kakulangan sa kaalaman, kaangkupan ng mga proyekto at sabjek, mga gastusin sa mga kaukulang proyekto, at pagpapatupad ng mga seminar ukol rito ang ilan lamang sa mga ikinababahala ng mga estudyante at magulang upang hindi maapektuhan ang kanilang kaugalian.
Ang guro ang isa pa sa mga varyabol na nakakaapekto rito. Halos lahat ng mga guro ay kailangang mag-adjust sa bagong kalakarang ito. Ang tamang porte sa pagtuturo, wastong oras at kalinawan ng sabjek, pakikisama sa mga estudyante, at tamang oras sa pagpasok nila ang inaasahan ng mga mag-aaral na magiging daan upang makamit nila ang kanilang minimithi.
At ang huli ay ang kagamitang panturo. Kailangan ng mag-aaral ang tama at sapat na kagamitan upang mas magawa nila ang mga iniatas na Gawain at proyekto. Ang kasapatan at karagdagang kagamitan,
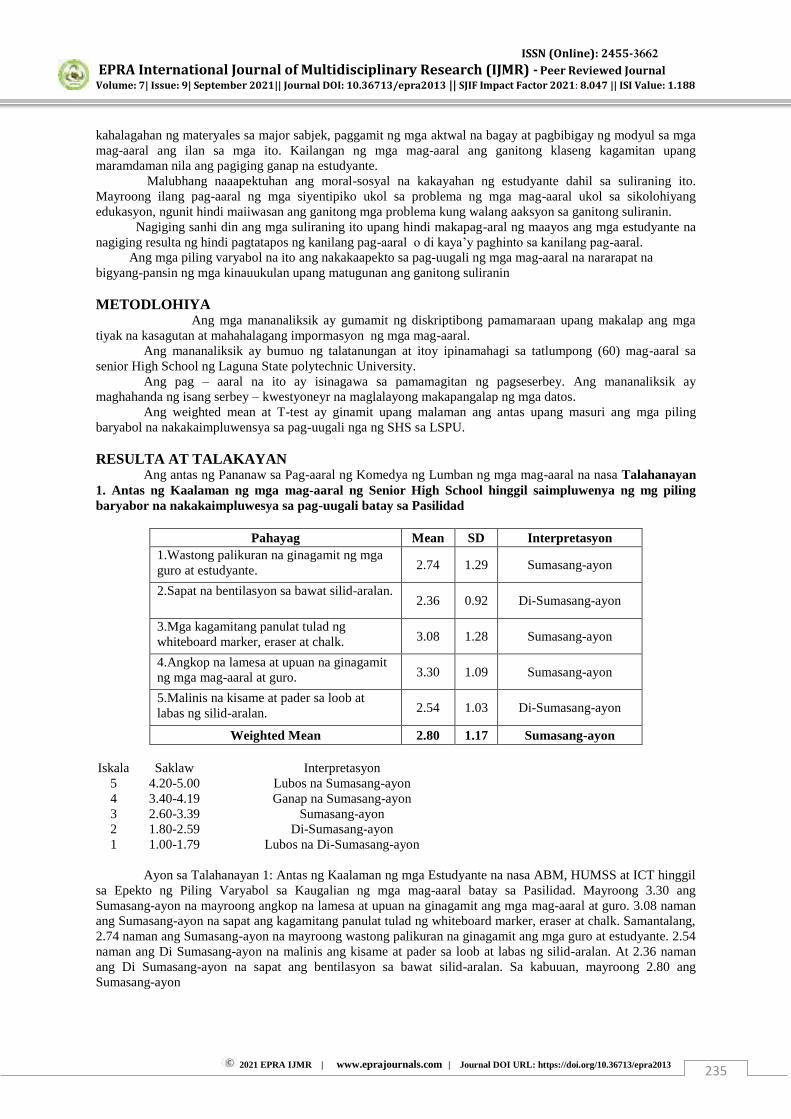
ISSN (Online): 2455-3662
EPRA International Journal of Multidisciplinary Research (IJMR) - Peer Reviewed Journal Volume: 7| Issue: 9| September 2021|| Journal DOI: 10.36713/epra2013 || SJIF Impact Factor 2021: 8.047 || ISI Value: 1.188
2021 EPRA IJMR | www.eprajournals.com | Journal DOI URL: https://doi.org/10.36713/epra2013 235
kahalagahan ng materyales sa major sabjek, paggamit ng mga aktwal na bagay at pagbibigay ng modyul sa mga mag-aaral ang ilan sa mga ito. Kailangan ng mga mag-aaral ang ganitong klaseng kagamitan upang maramdaman nila ang pagiging ganap na estudyante.
Malubhang naaapektuhan ang moral-sosyal na kakayahan ng estudyante dahil sa suliraning ito. Mayroong ilang pag-aaral ng mga siyentipiko ukol sa problema ng mga mag-aaral ukol sa sikolohiyang edukasyon, ngunit hindi maiiwasan ang ganitong mga problema kung walang aaksyon sa ganitong suliranin. Nagiging sanhi din ang mga suliraning ito upang hindi makapag-aral ng maayos ang mga estudyante na nagiging resulta ng hindi pagtatapos ng kanilang pag-aaral o di kaya’y paghinto sa kanilang pag-aaral. Ang mga piling varyabol na ito ang nakakaapekto sa pag-uugali ng mga mag-aaral na nararapat na bigyang-pansin ng mga kinauukulan upang matugunan ang ganitong suliranin METODLOHIYA
Ang mga mananaliksik ay gumamit ng diskriptibong pamamaraan upang makalap ang mga tiyak na kasagutan at mahahalagang impormasyon ng mga mag-aaral.
Ang mananaliksik ay bumuo ng talatanungan at itoy ipinamahagi sa tatlumpong (60) mag-aaral sa senior High School ng Laguna State polytechnic University.
Ang pag – aaral na ito ay isinagawa sa pamamagitan ng pagseserbey. Ang mananaliksik ay maghahanda ng isang serbey – kwestyoneyr na maglalayong makapangalap ng mga datos.
Ang weighted mean at T-test ay ginamit upang malaman ang antas upang masuri ang mga piling baryabol na nakakaimpluwensya sa pag-uugali nga ng SHS sa LSPU. RESULTA AT TALAKAYAN Ang antas ng Pananaw sa Pag-aaral ng Komedya ng Lumban ng mga mag-aaral na nasa Talahanayan 1. Antas ng Kaalaman ng mga mag-aaral ng Senior High School hinggil saimpluwenya ng mg piling baryabor na nakakaimpluwesya sa pag-uugali batay sa Pasilidad
Pahayag Mean SD Interpretasyon 1.Wastong palikuran na ginagamit ng mga guro at estudyante. 2.74 1.29 Sumasang-ayon
2.Sapat na bentilasyon sa bawat silid-aralan. 2.36 0.92 Di-Sumasang-ayon
3.Mga kagamitang panulat tulad ng whiteboard marker, eraser at chalk. 3.08 1.28 Sumasang-ayon
4.Angkop na lamesa at upuan na ginagamit ng mga mag-aaral at guro. 3.30 1.09 Sumasang-ayon
5.Malinis na kisame at pader sa loob at labas ng silid-aralan. 2.54 1.03 Di-Sumasang-ayon
Weighted Mean 2.80 1.17 Sumasang-ayon Iskala Saklaw Interpretasyon
5 4.20-5.00 Lubos na Sumasang-ayon 4 3.40-4.19 Ganap na Sumasang-ayon 3 2.60-3.39 Sumasang-ayon 2 1.80-2.59 Di-Sumasang-ayon 1 1.00-1.79 Lubos na Di-Sumasang-ayon
Ayon sa Talahanayan 1: Antas ng Kaalaman ng mga Estudyante na nasa ABM, HUMSS at ICT hinggil
sa Epekto ng Piling Varyabol sa Kaugalian ng mga mag-aaral batay sa Pasilidad. Mayroong 3.30 ang Sumasang-ayon na mayroong angkop na lamesa at upuan na ginagamit ang mga mag-aaral at guro. 3.08 naman ang Sumasang-ayon na sapat ang kagamitang panulat tulad ng whiteboard marker, eraser at chalk. Samantalang, 2.74 naman ang Sumasang-ayon na mayroong wastong palikuran na ginagamit ang mga guro at estudyante. 2.54 naman ang Di Sumasang-ayon na malinis ang kisame at pader sa loob at labas ng silid-aralan. At 2.36 naman ang Di Sumasang-ayon na sapat ang bentilasyon sa bawat silid-aralan. Sa kabuuan, mayroong 2.80 ang Sumasang-ayon
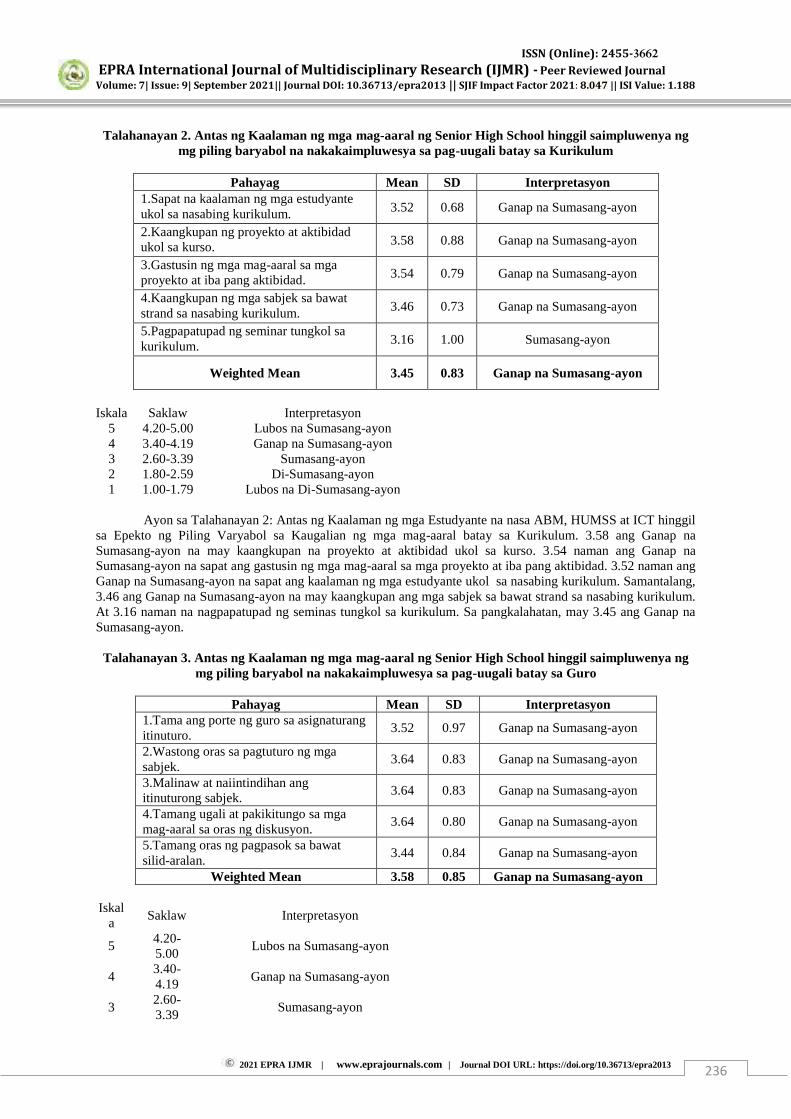
ISSN (Online): 2455-3662
EPRA International Journal of Multidisciplinary Research (IJMR) - Peer Reviewed Journal Volume: 7| Issue: 9| September 2021|| Journal DOI: 10.36713/epra2013 || SJIF Impact Factor 2021: 8.047 || ISI Value: 1.188
2021 EPRA IJMR | www.eprajournals.com | Journal DOI URL: https://doi.org/10.36713/epra2013 236
Talahanayan 2. Antas ng Kaalaman ng mga mag-aaral ng Senior High School hinggil saimpluwenya ng mg piling baryabol na nakakaimpluwesya sa pag-uugali batay sa Kurikulum
Pahayag Mean SD Interpretasyon
1.Sapat na kaalaman ng mga estudyante ukol sa nasabing kurikulum. 3.52 0.68 Ganap na Sumasang-ayon
2.Kaangkupan ng proyekto at aktibidad ukol sa kurso. 3.58 0.88 Ganap na Sumasang-ayon
3.Gastusin ng mga mag-aaral sa mga proyekto at iba pang aktibidad. 3.54 0.79 Ganap na Sumasang-ayon
4.Kaangkupan ng mga sabjek sa bawat strand sa nasabing kurikulum. 3.46 0.73 Ganap na Sumasang-ayon
5.Pagpapatupad ng seminar tungkol sa kurikulum. 3.16 1.00 Sumasang-ayon
Weighted Mean 3.45 0.83 Ganap na Sumasang-ayon
Iskala Saklaw Interpretasyon
5 4.20-5.00 Lubos na Sumasang-ayon 4 3.40-4.19 Ganap na Sumasang-ayon 3 2.60-3.39 Sumasang-ayon 2 1.80-2.59 Di-Sumasang-ayon 1 1.00-1.79 Lubos na Di-Sumasang-ayon
Ayon sa Talahanayan 2: Antas ng Kaalaman ng mga Estudyante na nasa ABM, HUMSS at ICT hinggil
sa Epekto ng Piling Varyabol sa Kaugalian ng mga mag-aaral batay sa Kurikulum. 3.58 ang Ganap na Sumasang-ayon na may kaangkupan na proyekto at aktibidad ukol sa kurso. 3.54 naman ang Ganap na Sumasang-ayon na sapat ang gastusin ng mga mag-aaral sa mga proyekto at iba pang aktibidad. 3.52 naman ang Ganap na Sumasang-ayon na sapat ang kaalaman ng mga estudyante ukol sa nasabing kurikulum. Samantalang, 3.46 ang Ganap na Sumasang-ayon na may kaangkupan ang mga sabjek sa bawat strand sa nasabing kurikulum. At 3.16 naman na nagpapatupad ng seminas tungkol sa kurikulum. Sa pangkalahatan, may 3.45 ang Ganap na Sumasang-ayon.
Talahanayan 3. Antas ng Kaalaman ng mga mag-aaral ng Senior High School hinggil saimpluwenya ng
mg piling baryabol na nakakaimpluwesya sa pag-uugali batay sa Guro
Pahayag Mean SD Interpretasyon 1.Tama ang porte ng guro sa asignaturang itinuturo.
3.52 0.97 Ganap na Sumasang-ayon
2.Wastong oras sa pagtuturo ng mga sabjek.
3.64 0.83 Ganap na Sumasang-ayon
3.Malinaw at naiintindihan ang itinuturong sabjek.
3.64 0.83 Ganap na Sumasang-ayon
4.Tamang ugali at pakikitungo sa mga mag-aaral sa oras ng diskusyon.
3.64 0.80 Ganap na Sumasang-ayon
5.Tamang oras ng pagpasok sa bawat silid-aralan.
3.44 0.84 Ganap na Sumasang-ayon
Weighted Mean 3.58 0.85 Ganap na Sumasang-ayon Iskal
a Saklaw Interpretasyon
5 4.20-5.00
Lubos na Sumasang-ayon
4 3.40-4.19
Ganap na Sumasang-ayon
3 2.60-3.39
Sumasang-ayon
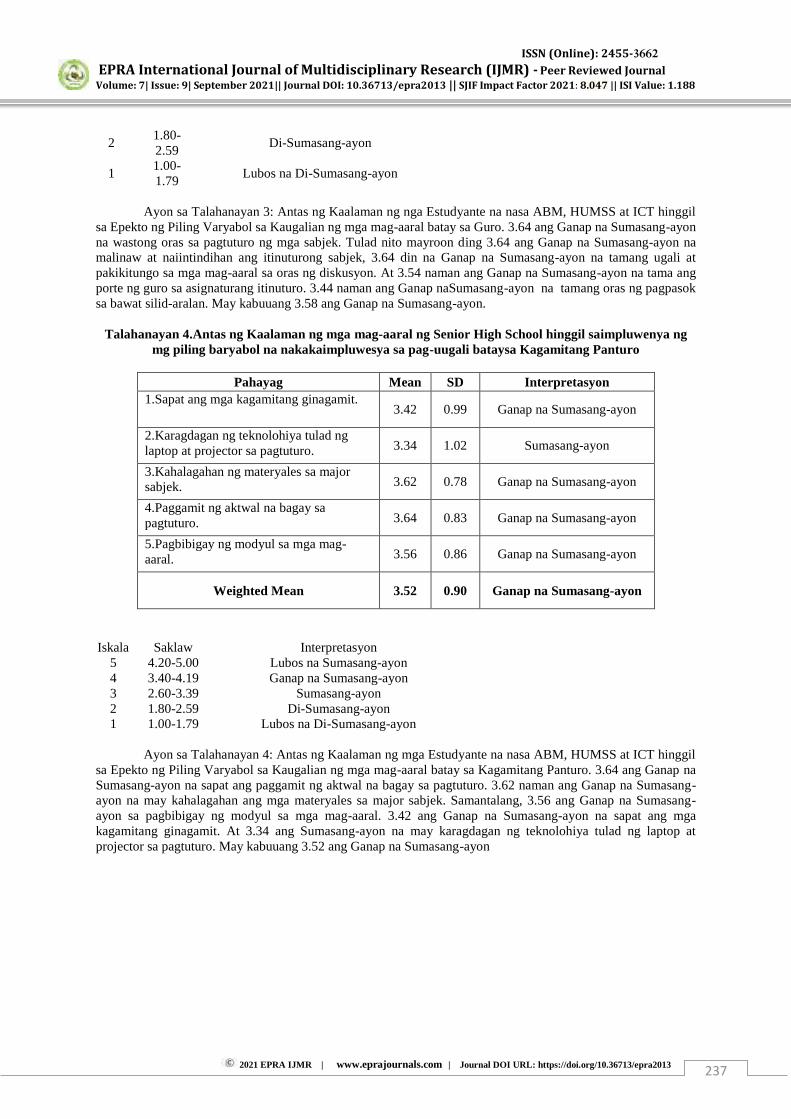
ISSN (Online): 2455-3662
EPRA International Journal of Multidisciplinary Research (IJMR) - Peer Reviewed Journal Volume: 7| Issue: 9| September 2021|| Journal DOI: 10.36713/epra2013 || SJIF Impact Factor 2021: 8.047 || ISI Value: 1.188
2021 EPRA IJMR | www.eprajournals.com | Journal DOI URL: https://doi.org/10.36713/epra2013 237
2 1.80-2.59
Di-Sumasang-ayon
1 1.00-1.79
Lubos na Di-Sumasang-ayon
Ayon sa Talahanayan 3: Antas ng Kaalaman ng nga Estudyante na nasa ABM, HUMSS at ICT hinggil sa Epekto ng Piling Varyabol sa Kaugalian ng mga mag-aaral batay sa Guro. 3.64 ang Ganap na Sumasang-ayon na wastong oras sa pagtuturo ng mga sabjek. Tulad nito mayroon ding 3.64 ang Ganap na Sumasang-ayon na malinaw at naiintindihan ang itinuturong sabjek, 3.64 din na Ganap na Sumasang-ayon na tamang ugali at pakikitungo sa mga mag-aaral sa oras ng diskusyon. At 3.54 naman ang Ganap na Sumasang-ayon na tama ang porte ng guro sa asignaturang itinuturo. 3.44 naman ang Ganap naSumasang-ayon na tamang oras ng pagpasok sa bawat silid-aralan. May kabuuang 3.58 ang Ganap na Sumasang-ayon.
Talahanayan 4.Antas ng Kaalaman ng mga mag-aaral ng Senior High School hinggil saimpluwenya ng mg piling baryabol na nakakaimpluwesya sa pag-uugali bataysa Kagamitang Panturo
Pahayag Mean SD Interpretasyon
1.Sapat ang mga kagamitang ginagamit. 3.42 0.99 Ganap na Sumasang-ayon
2.Karagdagan ng teknolohiya tulad ng laptop at projector sa pagtuturo. 3.34 1.02 Sumasang-ayon
3.Kahalagahan ng materyales sa major sabjek. 3.62 0.78 Ganap na Sumasang-ayon
4.Paggamit ng aktwal na bagay sa pagtuturo. 3.64 0.83 Ganap na Sumasang-ayon
5.Pagbibigay ng modyul sa mga mag-aaral. 3.56 0.86 Ganap na Sumasang-ayon
Weighted Mean 3.52 0.90 Ganap na Sumasang-ayon
Iskala
Saklaw
Interpretasyon
5 4.20-5.00 Lubos na Sumasang-ayon 4 3.40-4.19 Ganap na Sumasang-ayon 3 2.60-3.39 Sumasang-ayon 2 1.80-2.59 Di-Sumasang-ayon 1 1.00-1.79 Lubos na Di-Sumasang-ayon
Ayon sa Talahanayan 4: Antas ng Kaalaman ng mga Estudyante na nasa ABM, HUMSS at ICT hinggil sa Epekto ng Piling Varyabol sa Kaugalian ng mga mag-aaral batay sa Kagamitang Panturo. 3.64 ang Ganap na Sumasang-ayon na sapat ang paggamit ng aktwal na bagay sa pagtuturo. 3.62 naman ang Ganap na Sumasang-ayon na may kahalagahan ang mga materyales sa major sabjek. Samantalang, 3.56 ang Ganap na Sumasang-ayon sa pagbibigay ng modyul sa mga mag-aaral. 3.42 ang Ganap na Sumasang-ayon na sapat ang mga kagamitang ginagamit. At 3.34 ang Sumasang-ayon na may karagdagan ng teknolohiya tulad ng laptop at projector sa pagtuturo. May kabuuang 3.52 ang Ganap na Sumasang-ayon

ISSN (Online): 2455-3662
EPRA International Journal of Multidisciplinary Research (IJMR) - Peer Reviewed Journal Volume: 7| Issue: 9| September 2021|| Journal DOI: 10.36713/epra2013 || SJIF Impact Factor 2021: 8.047 || ISI Value: 1.188
2021 EPRA IJMR | www.eprajournals.com | Journal DOI URL: https://doi.org/10.36713/epra2013 238
Talahanayan 5. Pananaw ng mga mag-aaral ng Senior High School hinggil saimpluwenya ng mg piling baryabol na nakakaimpluwesya sa pag-uugali batay sa Moral na Kaugalian
Pahayag Mean SD Interpretasyon
1.Kakayahang gumawa ng mag-aaral sa lohikal sa pamamaraan sa iba’t-ibang Gawain.
3.56 0.84 Ganap na Sumasang-ayon
2. Wastong pag-uugali ng mga estudyante. sa loob at labas ng silid-aralan.
3.66 1.00 Ganap na Sumasang-ayon
3. Angkop na paggalang sa iba’t-ibang indibidwal. 3.62 0.92 Ganap na Sumasang-ayon
4. Tamang pagkilos ng mga mag-aaral sa paraang moral. 4.04 0.90 Ganap na Sumasang-ayon
5.Implementasyon ng tamang pag-uugali sa iba’t-ibang disiplina. 3.74 0.83 Ganap na Sumasang-ayon
Weighted Mean 3.72 0.91 Ganap na Sumasang-ayon Iskala Saklaw Interpretasyon
5 4.20-5.00 Lubos na Sumasang-ayon 4 3.40-4.19 Ganap na Sumasang-ayon 3 2.60-3.39 Sumasang-ayon 2 1.80-2.59 Di-Sumasang-ayon 1 1.00-1.79 Lubos na Di-Sumasang-ayon
Ayon sa Talahanayan 5: Pananaw ng mga Estudyante ukol sa Kasapatan ng mga Kaalamang itinuturo sa Paaralan hinggil sa Epekto ng mga Piling Varyabol sa Kaugalian ng mga mag-aaral batay sa Moral na Kaugalian. May 4.04 ang Ganap na Sumasang-ayon na tamang pagkilos ng mga mag-aaral sa paraang moral. 3.74 ang Ganap na Sumasang-ayon na Implementasyon ng tamang pag-uugali sa ibat-ibang disiplina. 3.66 naman ang Ganap na Sumasang-ayon na wasto ang pag-uugali ng mga estudyante sa loob at labas ng silid-aralan. 3.62 ang Ganap na Sumasang-ayon na angkop na paggalang sa ibat-ibang indibidwal. Samantalang, 3.56 ang Ganap na Sumasang-ayon na may kakayahang gumawa ang mga mag-aaral sa lohikal na pamamaraan sa ibat-ibang Gawain. At 3.72 ang kabuuang Ganap na Sumasang-ayon.
Talahanayan 6.Pananaw ng mga mag-aaral ng Senior High School hinggil saimpluwenya ng mg piling baryabol na nakakaimpluwesya sa pag-uugali batay sa Sosyal na Kaugalian
Pahayag Mean SD Interpretasyon
1. Sapat na komunikasyon ng mga estudyante sa isa’t-isa. 3.70 0.86 Ganap na Sumasang-ayon
2. Tamang pakikisalamuha sa mga ibang estudyante at mga guro. 3.78 0.97 Ganap na Sumasang-ayon
3. Pakikipag-ugnayan at pagrespeto ng mga estudyante sa iba’t-ibang indibidwal. 3.64 0.98 Ganap na Sumasang-ayon
4. Paggalang ng estudyante sa mga guro sa pamamagitan ng paggamit ng po at opo.
4.22 0.86 Lubos na Sumasang-ayon
5. Pagiging matatag ng samahan ng guro at mag-aaral,gayundin ang mga kapwa mag-aaral sa isa’t-isa.
3.96 0.78 Ganap na Sumasang-ayon
Weighted Mean 3.86 0.91 Ganap na Sumasang-ayon
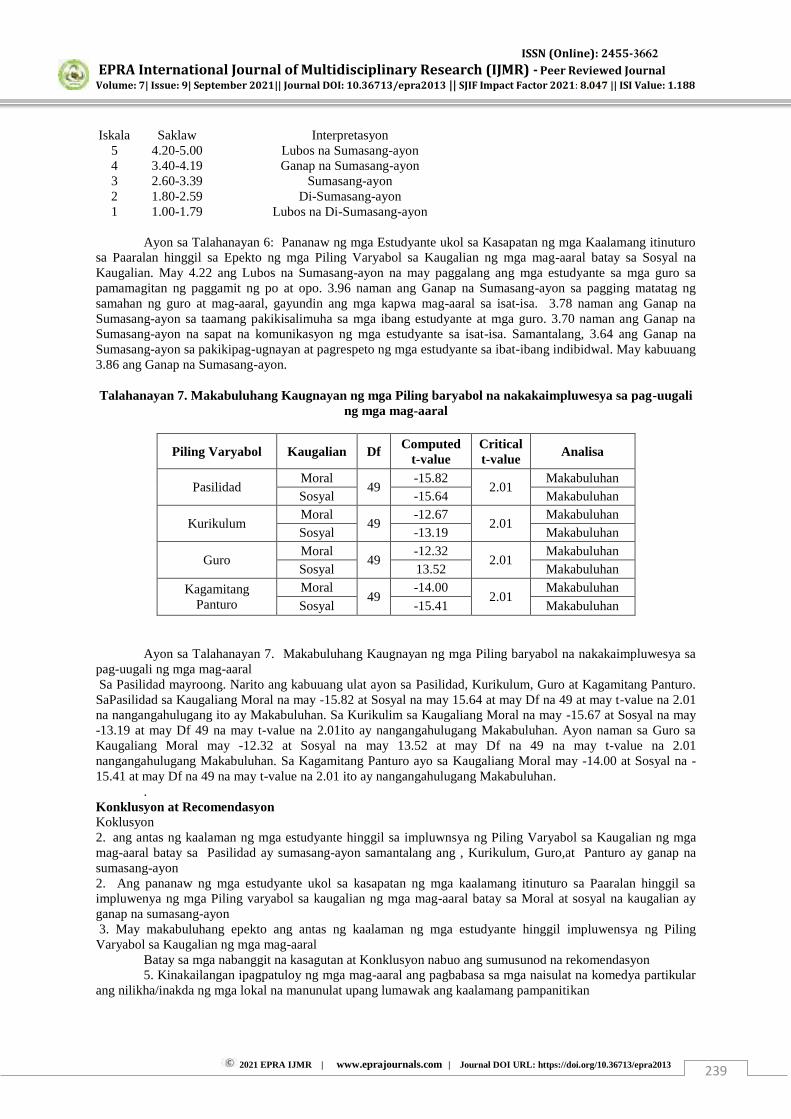
ISSN (Online): 2455-3662
EPRA International Journal of Multidisciplinary Research (IJMR) - Peer Reviewed Journal Volume: 7| Issue: 9| September 2021|| Journal DOI: 10.36713/epra2013 || SJIF Impact Factor 2021: 8.047 || ISI Value: 1.188
2021 EPRA IJMR | www.eprajournals.com | Journal DOI URL: https://doi.org/10.36713/epra2013 239
Iskala Saklaw Interpretasyon 5 4.20-5.00 Lubos na Sumasang-ayon 4 3.40-4.19 Ganap na Sumasang-ayon 3 2.60-3.39 Sumasang-ayon 2 1.80-2.59 Di-Sumasang-ayon 1 1.00-1.79 Lubos na Di-Sumasang-ayon
Ayon sa Talahanayan 6: Pananaw ng mga Estudyante ukol sa Kasapatan ng mga Kaalamang itinuturo sa Paaralan hinggil sa Epekto ng mga Piling Varyabol sa Kaugalian ng mga mag-aaral batay sa Sosyal na Kaugalian. May 4.22 ang Lubos na Sumasang-ayon na may paggalang ang mga estudyante sa mga guro sa pamamagitan ng paggamit ng po at opo. 3.96 naman ang Ganap na Sumasang-ayon sa pagging matatag ng samahan ng guro at mag-aaral, gayundin ang mga kapwa mag-aaral sa isat-isa. 3.78 naman ang Ganap na Sumasang-ayon sa taamang pakikisalimuha sa mga ibang estudyante at mga guro. 3.70 naman ang Ganap na Sumasang-ayon na sapat na komunikasyon ng mga estudyante sa isat-isa. Samantalang, 3.64 ang Ganap na Sumasang-ayon sa pakikipag-ugnayan at pagrespeto ng mga estudyante sa ibat-ibang indibidwal. May kabuuang 3.86 ang Ganap na Sumasang-ayon. Talahanayan 7. Makabuluhang Kaugnayan ng mga Piling baryabol na nakakaimpluwesya sa pag-uugali
ng mga mag-aaral
Piling Varyabol Kaugalian Df Computed
t-value Critical t-value
Analisa
Pasilidad Moral
49 -15.82
2.01 Makabuluhan
Sosyal -15.64 Makabuluhan
Kurikulum Moral
49 -12.67
2.01 Makabuluhan
Sosyal -13.19 Makabuluhan
Guro Moral
49 -12.32
2.01 Makabuluhan
Sosyal 13.52 Makabuluhan
Kagamitang Panturo
Moral 49
-14.00 2.01
Makabuluhan
Sosyal -15.41 Makabuluhan Ayon sa Talahanayan 7. Makabuluhang Kaugnayan ng mga Piling baryabol na nakakaimpluwesya sa pag-uugali ng mga mag-aaral Sa Pasilidad mayroong. Narito ang kabuuang ulat ayon sa Pasilidad, Kurikulum, Guro at Kagamitang Panturo. SaPasilidad sa Kaugaliang Moral na may -15.82 at Sosyal na may 15.64 at may Df na 49 at may t-value na 2.01 na nangangahulugang ito ay Makabuluhan. Sa Kurikulim sa Kaugaliang Moral na may -15.67 at Sosyal na may -13.19 at may Df 49 na may t-value na 2.01ito ay nangangahulugang Makabuluhan. Ayon naman sa Guro sa Kaugaliang Moral may -12.32 at Sosyal na may 13.52 at may Df na 49 na may t-value na 2.01 nangangahulugang Makabuluhan. Sa Kagamitang Panturo ayo sa Kaugaliang Moral may -14.00 at Sosyal na -15.41 at may Df na 49 na may t-value na 2.01 ito ay nangangahulugang Makabuluhan.
. Konklusyon at Recomendasyon Koklusyon 2. ang antas ng kaalaman ng mga estudyante hinggil sa impluwnsya ng Piling Varyabol sa Kaugalian ng mga mag-aaral batay sa Pasilidad ay sumasang-ayon samantalang ang , Kurikulum, Guro,at Panturo ay ganap na sumasang-ayon 2. Ang pananaw ng mga estudyante ukol sa kasapatan ng mga kaalamang itinuturo sa Paaralan hinggil sa impluwenya ng mga Piling varyabol sa kaugalian ng mga mag-aaral batay sa Moral at sosyal na kaugalian ay ganap na sumasang-ayon 3. May makabuluhang epekto ang antas ng kaalaman ng mga estudyante hinggil impluwensya ng Piling Varyabol sa Kaugalian ng mga mag-aaral
Batay sa mga nabanggit na kasagutan at Konklusyon nabuo ang sumusunod na rekomendasyon 5. Kinakailangan ipagpatuloy ng mga mag-aaral ang pagbabasa sa mga naisulat na komedya partikular
ang nilikha/inakda ng mga lokal na manunulat upang lumawak ang kaalamang pampanitikan

ISSN (Online): 2455-3662
EPRA International Journal of Multidisciplinary Research (IJMR) - Peer Reviewed Journal Volume: 7| Issue: 9| September 2021|| Journal DOI: 10.36713/epra2013 || SJIF Impact Factor 2021: 8.047 || ISI Value: 1.188
2021 EPRA IJMR | www.eprajournals.com | Journal DOI URL: https://doi.org/10.36713/epra2013 240
6. Lalo pang pag-ibayuhin ng mga mag-aaral ang pag-unawa sa nilalaman ng Komedya at kilalanin/tukuyin ang mga mensaheng nakapaloob dito upang magamit sa buhay, pamumuhay at pakikipamuhay tungo sa paghubog ng kalagayang pangkatauhan.
7. Makapagtanghal ng mga Komedyang naisulat ng lokal na may akda upang ang mga ito ay mananatiling buhay
8. Sa mga susunod na mananaliksik, maari itong gamiting gabay at batayan sa pagsasagawa ng panibagong pananaliksik na katulad nito at dagdagan pa ng mga baryabols tagatugon at sanggunian upang higit na maging mabisa at makita ang tagumapay ng isinasagawang pananaliksik
Para sa pamahalaan, paigtingin pa ang kalidad ng iba’t- ibang varyabol upang hindi na ganap na makaapekto ang mga ito sa kaugalian ng mga mag-aaral.
Para sa mga administrador ng paaralan, bigyang pansin ang ang mga kakulangan o problema sa mga piling varyabol upang di na makaapekto sa kaugalian ng mga mag-aaral.
Para sa mga propesor sa Senior High School, maging aktibo o magbigay puna sa mga piling varyabol upang di na makaapekto sa kaugalian ng mga mag-aaral.
Para sa mga mag-aaaral, magsalita o magpahayag ng opinion ukol sa mga problema sa mga piling varyabol upang di na makaapekto sa kaugalian ng mga mag-aaral.
Para sa mga susunod pang mananaliksik, ipagpatuloy pa ang pag-aaral ukol sa epekto sa piling varyabol sa kaugalian ng mga mag-aaral upang makatulong pa sa pagpapalawak ng kaalaman hinggil sa pag-aaral na ito. Sanggunian
1. Aton, A. (2007) “Pagtanaw at Pag-unawa: Pilipinas”. Diwa Learning System Inc. 2. John Kerr (2003). Multi dimensional constructs in organizational behavior research: An integrative analytical
framework. Organizational research methods, 4, 144-192 3. Cialdini T(2001). Human Understanding New Jersey: Developmental Psychology Journal 4. https://prezi.com/lpqfqpgf9to6/sa/?webgl=0 5. Lardizadal,A,http://wol.jw.org./tl/wol/d/r27/lptg/1200002643http.//www.alternatetakes.co.uk/?2016,2,222
http.//www.tlpaper.com.(2018)
ISSN (Online): 2455-3662
EPRA International Journal of Multidisciplinary Research (IJMR) - Peer Reviewed Journal Volume: 7| Issue: 9| September 2021|| Journal DOI: 10.36713/epra2013 || SJIF Impact Factor 2021: 8.047 || ISI Value: 1.188
2021 EPRA IJMR | www.eprajournals.com | Journal DOI URL: https://doi.org/10.36713/epra2013 241
HISTORY OF SCIENCE OF KARAKALPAKSTAN OF THE ХХ CENTURY
Temirkhanov Baxtiyar Karakalpak Scientific Research Institute of Humanities
Karakalpak Branch of the Academy of Sciences of the Republic of Uzbekistan
Article DOI: https://doi.org/10.36713/epra8501 DOI No: 10.36713/epra8501
ABSTRACT The article is devoted to the history of the formation and development of science in Karakalpakstan. It is stated that in 1931 the Karakalpak Integrated Research Institute was established in Turtkul. In the pre-war period, this institute was reorganized several times, as a result of which difficulties arose in coordinating scientific and research work in Karakalpakstan. In 1947, it was transferred to the Academy of Sciences of Uzbekistan. In 1959, the Karakalpak affiliate of the Academy of Sciences of the Uzbek Soviet Socialist Republic was organized on the basis of the Karakalpak Integrated Research Institute, which made it possible to coordinate and develop fundamental scientific research in the republic. The scientists focused on topical issues of the development of the economy and culture of the republic, in particular, the study of natural resources, material and spiritual culture of the Karakalpak people. The author claims that a new stage in the development of this scientific center begins in 1991, when the Karakalpak affiliate of the Academy of Sciences of the Republic of Uzbekistan receives the status of the Karakalpak branch. The author critically assesses the period of development of science in Karakalpakstan in the 1990s, while claiming that this scientific institution has risen to new stages of its development and certain achievements have been achieved. KEYWORDS. Science; history; scientific expeditions; Karakalpak Scientific Research Institute; reorganization; integrated institute; affiliate, branch; scientific research; department; prospects. INTRODUCTION
The history of the formation and state of science, its structural development is studied by a discipline called science studies. This is a field of research that studies the laws of the functioning and development of science, the structure and dynamics of scientific work, the interaction of science with state and other social institutions and spheres of the material and spiritual life of society.
The history of science or science studies is an important part of scientific and empirical research. Science itself is a set of theoretical and practical knowledge about the surrounding world, obtained by specialist scientists. It represents objective knowledge about the surrounding world, at the same time it is the process of obtaining and using this knowledge by society, the organization of scientific activities and scientific institutions.
The relevance of the topic of our research is to develop the historical foundations of the organization, planning and management of science in Karakalpakstan in the ХХ century. Scientific interest
in the topic is characterized by the objective logic of the development of science in modern Uzbekistan, due to the pace of its development in the world and the need to improve the effectiveness of scientific research. MATERIALS AND METHODS
The history of science of Karakalpakstan is an almost unexplored page in the national history; however, a lot of information about the organization of scientific activities in the territory of Karakalpakstan has been preserved in the scientific literature. As known, the first scientific expeditions were carried out in 1926-1930, when groups of students from Tashkent and Moscow repeatedly came to Karakalpakstan to study the history, language and culture of the Karakalpaks. These groups received all the support of the local authorities [1].
As K.Aymbetov recalls, in 1928 and 1930 the head of the Karakalpak expedition of the Society for the Study of Kazakhstan A.L.Melkov arrived, and also N.A.Baskakov and A.S.Morozova worked here.
ISSN (Online): 2455-3662
EPRA International Journal of Multidisciplinary Research (IJMR) - Peer Reviewed Journal Volume: 7| Issue: 9| September 2021|| Journal DOI: 10.36713/epra2013 || SJIF Impact Factor 2021: 8.047 || ISI Value: 1.188
2021 EPRA IJMR | www.eprajournals.com | Journal DOI URL: https://doi.org/10.36713/epra2013 242
In 1930 professor S.E.Malov arrived, also the famous professor A.A.Sokolov, who, after K.Nurmukhamedov's speech to the Central Executive Committee of the Russian Soviet Federative Socialist Republic, organized a scientific expedition in the Chimbay and Takhtakupyr districts in 1933 [2].
From that moment, the general composition of the science of Karakalpakstan, the means and forms of its functioning began to form. It is important to note that scientific activity had a close connection with the political, economic and socio-cultural transformations in the Karakalpak society. It is impossible not to take into account the dependence of the pace and directions of its development on other social phenomena and institutions.
The main methods of working on the topic are the problem-thematic approach, which allows us to identify a socially significant problem that was tracked in a number of publications for a certain time period. One of the most popular in the course of the study was the comparative-historical method used to compare single-topic materials and identify the dynamics of changes that occurred in the field of science and scientific activity.
During the period under study, the science of Karakalpakstan functioned under the conditions of Soviet rule and the years of national independence of the Republic of Uzbekistan. This creates conditions for the application of an interdisciplinary approach that includes the entire range of research methods of the humanities, allowing us to consider a set of interrelated and interacting objects, taking into account a wide historical context, a variety of socio-political structures and economic institutions. RESULT AND DISCUSSION
According to the resolution of the Council of People's Commissars of the Karakalpak Autonomous Soviet Socialist Republic, in August 1931, the first scientific institution in Karakalpakstan was organized - the Karakalpak Integrated Research Institute. It was located in the building of a former church in Turtkul. The first director of the Karakalpak Integrated Research Institute was appointed A.A.Gnedenko, who in 1930 was sent to the Karakalpak Autonomous Soviet Socialist Republic for a permanent job. The institute includes sections of history, soil-desert-sand, economic research, methods and planning of mass local history work, an entomology office, a hydro meteorological bureau, a chemical laboratory, as well as a scientific and terminological section of the department of public education, a local history museum, a department of the history of the regional archive, etc.
In 1932, a large-scale expedition of the Union of Soviet Socialist Republics Academy of Sciences took place on the territory of Karakalpakstan, the results of which were discussed
at the 1st conference on the study of the productive forces of the Karakalpak Autonomous Soviet Socialist Republic in March 1933 in Leningrad (now St. Petersburg).
The organization of this research expedition gave a huge impetus to the development of science in Karakalpakstan. On June 29, 1932, the Council of People's Commissars of the Karakalpak Autonomous Soviet Socialist Republic proposed to allocate funds for the organization of a chemical laboratory at the Karakalpak Scientific Research Institute [3]. At the end of the expedition, it was proposed to transfer the Karakalpak Scientific Research Institute to the Union of Soviet Socialist Republics Academy of Sciences. On August 29, 1932, the Council of People's Commissars of the Karakalpak Autonomous Soviet Socialist Republic heard a report by A.A.Gnedenko “On strengthening scientific research in the Karakalpak Autonomous Soviet Socialist Republic”. In the resolution on this issue, it was decided to “enter with a petition to the Presidium of the Union of Soviet Socialist Republics Academy of Sciences on the transfer of the Academy of Sciences of the Karakalpak Scientific Research Institute of the Karakalpak Autonomous Soviet Socialist Republic, retaining the direction and the name “Integrated Research Institute of the Union of Soviet Socialist Republics Academy of Sciences in the Karakalpak Autonomous Soviet Socialist Republic” with the following sections: a) geological; b) socio-cultural; c) economic research; d) soil-geo botanical; e) desert-sandy; f) physical-chemical laboratory” [4]. At the same time, it was decided to convene a scientific conference on the study of the productive forces of the Karakalpak Autonomous Soviet Socialist Republic with the involvement of the country's leading scientists.
In October 1933, it was proposed to organize a popular scientific journal of the Karakalpak Scientific Research Institute, at the meeting of the Council of People's Commissars of the Karakalpak Autonomous Soviet Socialist Republic on September 9, 1933, an editorial board was formed (D.Loginov, Tetyushev, K.Bazhakov, A.Kulenov, Gavrilin, Yakubov, Ismukhamedov). A month later, the composition of the board was changed and it was approved as part of Tetyushev (executive secretary), Aimbetov, Dzhaksymuratov, Isamukhamedov, Karp, Kulenov, Loginov, Sokolov, Yakubov [5].
In 1934, the situation changed and scientific activity was gradually curtailed. According to the resolution of the Council of People's Commissars of the Karakalpak Autonomous Soviet Socialist Republic, on March 15, 1936, the Karakalpak Scientific Research Institute was reorganized and a scientific group was formed under the State Planning Committee [6]. Subsequently, V.Efanov's article “We need a research institute” indicated that the
ISSN (Online): 2455-3662
EPRA International Journal of Multidisciplinary Research (IJMR) - Peer Reviewed Journal Volume: 7| Issue: 9| September 2021|| Journal DOI: 10.36713/epra2013 || SJIF Impact Factor 2021: 8.047 || ISI Value: 1.188
2021 EPRA IJMR | www.eprajournals.com | Journal DOI URL: https://doi.org/10.36713/epra2013 243
reorganization, “and in essence the liquidation of the Karakalpak Scientific Research Institute did not give positive results” [7]. The dispersal of the control levers over scientific research and search operations did not give a practical effect. The formation of a single center for the management and coordination of research activities in Karakalpakstan was urgently required.
In 1939, the Karakalpak Scientific Research Institute of Language, Literature and History was organized as one of the sectors in the system of the People's Commissariat of Education of the Karakalpak Autonomous Soviet Socialist Republic, but with the beginning of the Second World War, the institute was inactive [8]. On September 27, 1943, it was decided to form the Academy of Sciences of the Uzbek Soviet Socialist Republic on the basis of the Uzbek affiliate of the Union of Soviet Socialist Republics Academy of Sciences. According to the decree of the Presidium of the Supreme Soviet, the Council of People's Commissars of the Uzbek Soviet Socialist Republic and the Central Committee of the Communist Party (b) of the Uzbek Soviet Socialist Republic, the opening was scheduled for November 4, 1943. In March 1944, the Karakalpak Scientific Research Institute of Language, Literature and History under the Council of Ministers of the Karakalpak Autonomous Soviet Socialist Republic resumed its work [9]. Although at that time the institute did not have its own premises, equipment, or scientific personnel.
On July 26, 1947, the resolution of the Council of Ministers of the Uzbek Soviet Socialist Republic No. 1179 was adopted on the transfer of the Karakalpak Scientific Research Institute of Language, Literature and History under the Council of Ministers of the Karakalpak Autonomous Soviet Socialist Republic to the Academy of Sciences of Uzbekistan. On September 24, 1947, a positive decision was made by the Presidium of the Academy of Sciences of the Republic and this institute was transformed into an independent scientific institution – the Karakalpak Scientific Research Institute of Economics and Culture. In 1948, 4 candidates of sciences and 4 researchers with higher education worked at the Institute.
In 1959, the Karakalpak affiliate of the Academy of Sciences of the Uzbek Soviet Socialist Republic was organized on the basis of the Karakalpak Integrated Research Institute, which made it possible to coordinate fundamental scientific research in the republic. The topics of scientific works covered almost the entire range of branches of the national economy. Academic publications on the history of Karakalpakstan, the Karakalpak language and literature were published; a 20-volume book of “Karakalpak folklore” was published. The Institute of History, Language and Literature has begun to work
on the collection and introduction into scientific circulation of written monuments, which are an invaluable spiritual value of the people.
The most important scientific problem raised by scientists of the Karakalpak affiliate of the Academy of Sciences of the Uzbek Soviet Socialist Republic was the Aral ecological disaster. Back in the mid-1970s, scientists very sharply raised the question of the need to save the Aral Sea, justifying it from an economic point of view. Doctor of Biological Sciences R.Tleuov in the mid-1970s wrote that it is difficult to predict all the consequences of the drying of the Aral Sea and pointed out the possibility of reducing the humidity of the air and soil, increasing the harmful influence of winds. He then foresaw that “as a result of the drying of the Aral Sea, huge masses of salts will be carried away by the wind to the plains of Central Asia and Kazakhstan, 20 million hectares of land will be salted”. He also assumed that the impact of the drying up of the Aral Sea would be felt on all aspects of the economy of the republics of Central Asia and Kazakhstan, on the climatic and natural conditions of the Aral Sea basin. To solve the problem of the sea, he proposes to widely adopt “agro technical measures in the basins of the Amu Darya and the Syr Darya aimed at obtaining products at lower water costs, establishing a minimum flow pass necessary for the development of the economy and maintaining water losses for evaporation by lacing the delta reservoirs and collapsing the Amu Darya and the Syr Darya spills and using underground run off” [10].
The well-known scientist, Doctor of Biological Sciences S.Kabulov considered the problem much more broadly. Assessing the problem of the Aral Sea as a complex one, he advocated a comprehensive analysis of both the problem itself and the consequences arising from it. “The drying up of the Aral Sea will be accompanied by a violation of the balance in the nature of Central Asia”, he argued.
S.Kabulov makes excursions into history, justifying the need to take into account, first of all, the human factor. “The peoples who inhabited these places in ancient times, unlike the steppe Saks, were called Apasiaks, i.e. marsh or water Saks", the natural balance was established not yesterday, it has existed for thousands of years [11].
In general, in the 1970s, advanced scientific thought actively advocated the salvation of the Aral Sea, offering new forms and methods of managing water resources. The struggle for saving the Aral Sea was not only at the level of scientifically based recommendations, but also publications in the periodical press. In the second half of the 1970s, in connection with the resuscitation of the issues of the transfer of northern rivers to Central Asia and Kazakhstan, advanced scientific thought was able to
ISSN (Online): 2455-3662
EPRA International Journal of Multidisciplinary Research (IJMR) - Peer Reviewed Journal Volume: 7| Issue: 9| September 2021|| Journal DOI: 10.36713/epra2013 || SJIF Impact Factor 2021: 8.047 || ISI Value: 1.188
2021 EPRA IJMR | www.eprajournals.com | Journal DOI URL: https://doi.org/10.36713/epra2013 244
bring the complexity of the environmental situation to the public more widely.
The proclamation of the national independence of the Republic of Uzbekistan has become a new stage in the development of science in Karakalpakstan. In 1991, the Karakalpak affiliate of the Academy of Sciences of the Republic of Uzbekistan was transformed into the Karakalpak branch. Chairman of the Presidium of the Karakalpak Branch of the Academy of Sciences of Uzbekistan S.Kamalov argued that “with the acquisition of the status of sovereign states, the Academy of Sciences of the Republic of Uzbekistan has become an independent, self-governing organization operating on the basis of the laws of the Republic of Uzbekistan and its own Charter. The organization of the Karakalpak branch of the Academy of Agricultural Sciences of the Republic of Uzbekistan is gratifying" [12].
As part of the Karakalpak Branch of the Academy of Sciences of the Republic of Uzbekistan, new institutes and divisions were organized, including the Integrated Institute of Natural Sciences, the Institute of Language and Literature named after N.Davkarayev, the Institute of History, Archeology and Ethnography, a Computing Center, a Botanical Garden, and a fundamental library. In 1992, the Scientific Research Coordination Center “Aral” was transferred to the Karakalpak branch by the decree of the Cabinet of Ministers under the President of the Republic of Uzbekistan and was formed as the Department of Environmental Problems of the Aral Sea region. A Fundamental library also functioned.
In 1992, 39 topics were developed in the institutes of the branch, including 34 fundamental, 5 search, and 17 contractual projects, and in the following 1993-50 fundamental topics [13]. In the following years, the scientists of the branch conducted their research annually on a budget basis, until the transition to a competitive basis in 2002. CONCLUSION
The formation of a scientific center in Karakalpakstan in the early 1930s was a significant event in the life of the republic. All scientific research works were concentrated here, major scientists conducted their research, and a new generation of scientists from among local nationalities was formed.
In its development, the scientific center of Karakalpakstan has experienced several stages of reorganization, which were associated with socio-economic phenomena. The process of science development in Karakalpakstan experienced its greatest development in the 1970s, when topical issues of economic and cultural development of the republic were actively studied.
Independence gave a new impetus to the development of science and in the mid-1990s, the Karakalpak Branch of the Academy of Sciences of the Republic of Uzbekistan became the support base of national scientific and pedagogical personnel for universities of the Republic, as well as the Karakalpak branch of the Academy of Agricultural Sciences of the Republic of Uzbekistan, the Research Institute of Clinical and Experimental Medicine of the Academy of Sciences of the Republic of Uzbekistan, the Karakalpak branch of the Uzbek Research Institute of Pedagogical Sciences, and other scientific institutions. LITERATURE
1. Esbergenov H., Nurzhanov S. Son of the Fatherland. Nukus, 2018. P. 80.
2. Aymbetov K. Memory of the past days. Nukus, 2008. P. 169.
3. Central State Archive of the Republic of Karakalpakstan, fund 322, inventory 1, case 9, sheet 20.
4. Central State Archive of the Republic of Karakalpakstan, fund 322, inventory 1, case 5, sheet 80.
5. Central State Archive of the Republic of Karakalpakstan, fund 322, inventory 1, case 9, sheet 186.
6. Kyzyl Karakalpakstan, 1936, March 28. 7. Soviet Karakalpakia, 1937, June. 8. Central State Archive of the Republic of
Karakalpakstan, fund R-551, inventory 1, case 6234, sheet 46.
9. Central State Archive of the Republic of Karakalpakstan, fund R-551, inventory 1, case 6234, sheet 48.
10. Tleuov R. Measures aimed at preserving the Aral Sea // Bulletin of the Karakalpak affiliate of the Academy of Sciences of the Uzbek Soviet Socialist Republic, 1974, No. 2. PP. 38-46.
11. Kabulov S. Possible consequences of the drying up of the Aral Sea. // Bulletin of the Karakalpak affiliate of the Academy of Sciences of the Uzbek Soviet Socialist Republic, 1974, No. 4. PP. 35-45.
12. Kamalov S. The year of our work // Bulletin of the Karakalpak affiliate of the Academy of Sciences of the Uzbek Soviet Socialist Republic, 1993, No. 1. P. 166.
13. Annual Meeting of Scientists of Karakalpakstan // Bulletin of the Karakalpak affiliate of the Academy of Sciences of the Uzbek Soviet Socialist Republic, 1994, No. 1. P. 3.
ISSN (Online): 2455-3662
EPRA International Journal of Multidisciplinary Research (IJMR) - Peer Reviewed Journal Volume: 7| Issue: 9| September 2021|| Journal DOI: 10.36713/epra2013 || SJIF Impact Factor 2021: 8.047 || ISI Value: 1.188
2021 EPRA IJMR | www.eprajournals.com | Journal DOI URL: https://doi.org/10.36713/epra2013 245
REDRESS CYBER SECURITY THREATS
Mr. Vikas P. Raut
Head – Department of Computer Science, Vikas College of Arts, Science & Commerce, Kannamwar Nagar – 2, Vikhroli ( East ), Mumbai – 400083,Maharashtra, India.
ABSTRACT
Identifying security vulnerabilities in an organisation operating with large number of web applications is not a major hurdle because techniques such as Data Flow Analysis and Taint Analysis are proficient enough to identify billions and millions of security vulnerabilities in web application’s source code based on OWASP. Steep growth in Internet
interconnections has expressively led growth in cyber-attack incidents many with critical consequences, one of the main concerns challenging cyber security analysts is arranging and sorting the vulnerabilities, as it is not practical to timely address risk extenuation of the web applications. Cyber security teams always prefer to redress the threats preliminary on the basis of the perilous application that is managing the confidential data, a B2B website handling financial transactions would be the best example. According to Canadian statistics of 2019 about 54% of businesses suffered cyber-attacks crumbling their day to day operations, 36% of businesses suffered financial losses. Researching further I will first present overview of the most oppressed vulnerabilities followed by evaluations of extenuation techniques and finally new cyber – attack patterns in emerging technologies like smart phone technology, social media, and cloud computing featuring hypothetical observations on future research directions. KEYWORDS : Cyber Security, Cyber – Attack, Vulnerabilities, Web Applications. INTRODUCTION
We, our economy, organisations and critical infrastructures have become principally dependent on computer network, internet and information technology solutions. Cyber attacks have become more potentially and disastrous as our reliance increases on information technology. Organisations can integrate web-page utilization as a secondary source of information to classify and prioritise cyber threats vulnerabilities, by incorporating the information attained from the sources such as web applications server logs a proper technique can be combined with the existing categorization scheme to formulate to redress cyber security threats.
A Symantec cyber crime report says that about 27 people become victim of cyber attack every
second or more than one million attacks every day. Considering cyber attack to be the cheapest, convenient and less risky wherein the cyber criminals only require internet connection besides a computer and with unconstrained by geography and distance cyber crimes and criminals has kept growing since decades.
Web-pages with identified security weakness has high risk of cyber attacks as compared to low utilized web-pages. Combining the utilization of data with the existing categorized schemes, security analyst will be able to approach practically to contextually prioritize redressing activities on basis of usage statistics with the existing classifications given by OWASP Top 10.
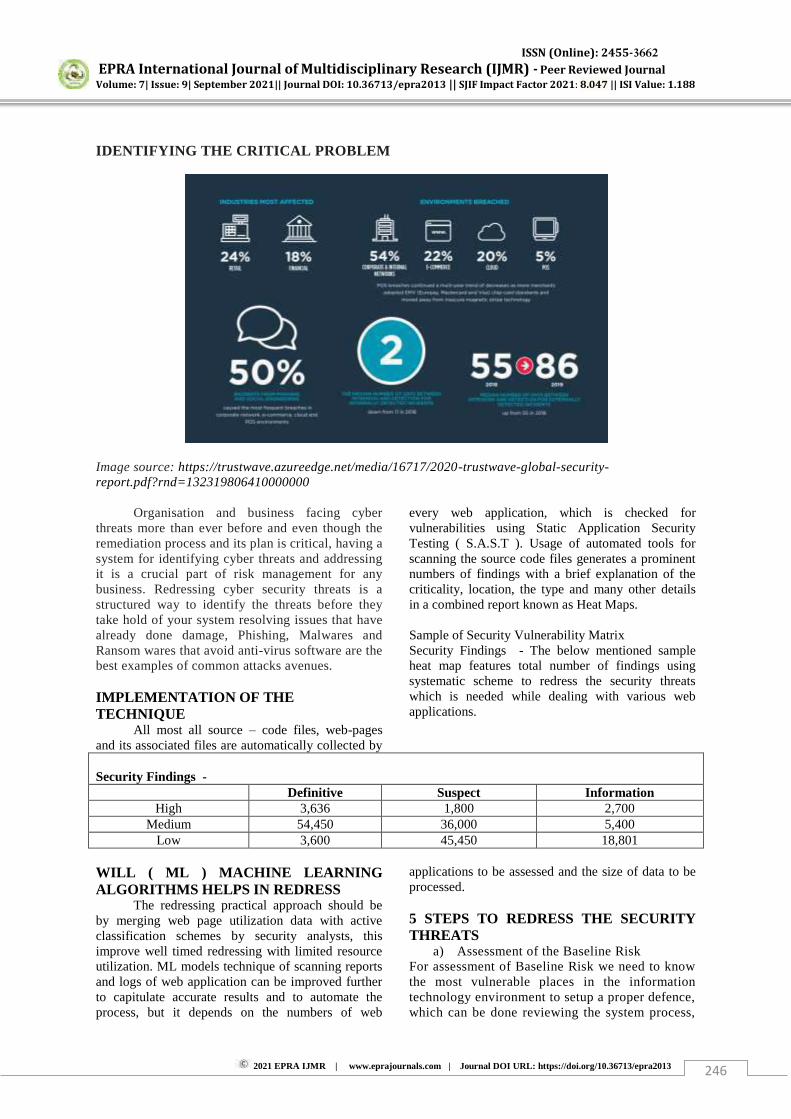
ISSN (Online): 2455-3662
EPRA International Journal of Multidisciplinary Research (IJMR) - Peer Reviewed Journal Volume: 7| Issue: 9| September 2021|| Journal DOI: 10.36713/epra2013 || SJIF Impact Factor 2021: 8.047 || ISI Value: 1.188
2021 EPRA IJMR | www.eprajournals.com | Journal DOI URL: https://doi.org/10.36713/epra2013 246
IDENTIFYING THE CRITICAL PROBLEM
Image source: https://trustwave.azureedge.net/media/16717/2020-trustwave-global-security-report.pdf?rnd=132319806410000000
Organisation and business facing cyber threats more than ever before and even though the remediation process and its plan is critical, having a system for identifying cyber threats and addressing it is a crucial part of risk management for any business. Redressing cyber security threats is a structured way to identify the threats before they take hold of your system resolving issues that have already done damage, Phishing, Malwares and Ransom wares that avoid anti-virus software are the best examples of common attacks avenues. IMPLEMENTATION OF THE TECHNIQUE
All most all source – code files, web-pages and its associated files are automatically collected by
every web application, which is checked for vulnerabilities using Static Application Security Testing ( S.A.S.T ). Usage of automated tools for scanning the source code files generates a prominent numbers of findings with a brief explanation of the criticality, location, the type and many other details in a combined report known as Heat Maps. Sample of Security Vulnerability Matrix Security Findings - The below mentioned sample heat map features total number of findings using systematic scheme to redress the security threats which is needed while dealing with various web applications.
Security Findings -
Definitive Suspect Information High 3,636 1,800 2,700
Medium 54,450 36,000 5,400 Low 3,600 45,450 18,801
WILL ( ML ) MACHINE LEARNING ALGORITHMS HELPS IN REDRESS
The redressing practical approach should be by merging web page utilization data with active classification schemes by security analysts, this improve well timed redressing with limited resource utilization. ML models technique of scanning reports and logs of web application can be improved further to capitulate accurate results and to automate the process, but it depends on the numbers of web
applications to be assessed and the size of data to be processed. 5 STEPS TO REDRESS THE SECURITY THREATS
a) Assessment of the Baseline Risk For assessment of Baseline Risk we need to know the most vulnerable places in the information technology environment to setup a proper defence, which can be done reviewing the system process,

ISSN (Online): 2455-3662
EPRA International Journal of Multidisciplinary Research (IJMR) - Peer Reviewed Journal Volume: 7| Issue: 9| September 2021|| Journal DOI: 10.36713/epra2013 || SJIF Impact Factor 2021: 8.047 || ISI Value: 1.188
2021 EPRA IJMR | www.eprajournals.com | Journal DOI URL: https://doi.org/10.36713/epra2013 247
assets and operations. We can commence with reviewing antivirus standards, wireless network configuration and patching process, scanning of devices connected to your network. Secondly reviewing the systems security design, firewall configuration and finally reviewing policies for administration of identified threats, disaster recovery options.
b) Creating a Monitoring System Monitoring System has to be created in with a methodology that it gives out alerts on the potential issues, very important for organisations with large numbers of unsecured laptops, smart phones and internet enabled devices. Making a list of your IT security ecosystem pertaining of all security vendors, platforms, programs you have been operating through which we can keep a tab on the updates of the vendors on new threats, security patches which may need to be addressed. This monitoring system has to be designed to proactively warns you at times when a cyber attack takes place.
c) Redressing Identified Vulnerable Threats Redressing the identified vulnerable threats could process by collecting your Risk Assessment data and by workflows of your Monitoring System. Proper assigning work with IT staff, vendors, and present security teams can chart known vulnerable, assign levels of risk, calculating efforts required to resolve and draft a plan to address the risk issues.
d) Training IT Staff in Redressing Threat Issues
Cyber threats begins from social engineering and phishing which means the entire responsibility goes on the IT staff for falling in the net of cyber criminals who attempt to force their way past other security measures. Hence IT staff should be trained cyber security.
e) Regular Practices Keeping all the above process in regular practice will prove to guarantee the security and one can achieve the best redressing of cyber security threats. This practice has to be an ongoing process reviewing numerous times to keep your IT environment risk free with the needed security infrastructure. CONCLUSION
This research focused on two portions of information system like understanding vulnerabilities in the present system and redressing of the cyber security threats. The paper discussed threats emerging from social media, cloud computing, smart phone technologies often taking advantage of their unique characteristics; it also discussed common set of cyber attacks found in the emerging technology as most of it technologies offer services through online and the most vulnerable attacks exploit the browser security through the hidden malware extensions. This
paper also briefed the redressing process and methods for restricting cyber security threats. ONLINE REFERENCES
1. Laura Bell, M. B.-S. (2017). Agile Application Security
2. OWASP: https://www.owasp.org/index.php/Category:OWASP_Top_Ten_Project
3. http://www.maawg.org 4. http://www.antiphishing.org 5. Australian Parliament the report of the inquiry
into Cyber Crime, http://www.aph.gov.au/house/committee/coms/cybercrime/report/full_report.pdf.
6. Internet Security Threats Report. Symantec, http://www.symantec.com/threatreport

ISSN (Online): 2455-3662
EPRA International Journal of Multidisciplinary Research (IJMR) - Peer Reviewed Journal Volume: 7| Issue: 9| September 2021|| Journal DOI: 10.36713/epra2013 || SJIF Impact Factor 2021: 8.047 || ISI Value: 1.188
2021 EPRA IJMR | www.eprajournals.com | Journal DOI URL: https://doi.org/10.36713/epra2013 248
ISSUES OF STUDYING THE BASIC UNITS OF THE
LANGUAGE STRUCTURE OF THE MODERN UZBEK LANGUAGE
Keldiyorova Gulchekhra Saydievna Associate Professor of the Department of Uzbek Linguistics, National University of Uzbekistan named
after Mirza Ulugbek, Tashkent.
SUMMARY The author of the article discusses the language units through the materials based on the classification of dialectic unity of speech and languages. As it is known, language unit is a widely used term and notion in linguistics and there are a lot of materials dedicated to concrete units of languages. KEY WORDS: language units, language construction, language, speech, main unit, dialectic unity, linguistics.
ВОПРОСЫ ИЗУЧЕНИЯ ОСНОВНЫХ ЕДИНИЦ ЯЗЫКОВОЙ
СТРУКТУРЫ СОВРЕМЕННОГО УЗБЕКСКОГО ЯЗЫКА
Келдиёрова Гулчехра Сайдиевна Доцент кафедры Узбекского языкознания
Национального университета Узбекистана имени Мирза Улугбека.Ташкент.
Аннотация
В статье обсуждаются материалы, основанные на рассмотрение и классификацию
языковых единиц, различия между языком и речью. Как известно, понятие языковая единица
считается самой распространенной в лингвистике и существует немалое количество
материалов дающие информацию о конкретных единицах, которые считаются
строительным материалом языка. Ключевые слова: языковые единицы, строение языка, язык, речь, диалектическое
единство, лингвистика.
Узбекский язык по своему словарному
запасу считается одно из богатейших тюркских
языков. Но до сегоднещнего дня его языковые
единицы были мало изучены. Нам хорошо известно, что языковое
единство - один из наиболее широко
используемых терминов и понятий в лингвистике.
Хотя об этой концепции написано не так много,
были опубликованы тома книг, диссертаций и
множество статей о каждой из единиц,
подпадающих под эту концепцию. Среди них
много источников, которые предоставляют
информацию о конкретных единицах,
составляющих базовые единицы языковой
конструкции. В этом отношении особенно
значительную работу проделали С. Усманов
(2010), Ш. Рахматуллаев (2002), Х. Неьматов
(1995) и М. Халбеков (2008). Однако из наблюдений ясно, что,
несмотря на большой объем исследований,
точное количество базовых языковых единиц в
узбекской лингвистике еще не достаточно
изучено. Это приводит к новым проблемным
ситуациям, особенно в языковом обучении, что
приводит к скорее негативным, чем позитивным
последствиям. Только тогда, когда образование
будет организовано на основе единообразия, а не
ISSN (Online): 2455-3662
EPRA International Journal of Multidisciplinary Research (IJMR) - Peer Reviewed Journal Volume: 7| Issue: 9| September 2021|| Journal DOI: 10.36713/epra2013 || SJIF Impact Factor 2021: 8.047 || ISI Value: 1.188
2021 EPRA IJMR | www.eprajournals.com | Journal DOI URL: https://doi.org/10.36713/epra2013 249
теоретического разнообразия, будет целостное,
понятное, целостное, систематическое
образование и эффективность. Поэтому
положительное решение этой проблемы очень
важно как для узбекского языкознания, так и для
литературного языкового образования. Хотелось бы отметить, что сегодня
учебная литература, даже учебники, практически
неотличима от научных исследований. Однако,
помимо сходства между ними, есть и должны
быть резкие различия. К сожалению, наши
лингвисты, являющиеся авторами учебников и
учебных пособий, не обратили внимания на эти
отличия. Многие из них нуждаются в
методической обработке. Итак, в этой связи,
прежде всего, мы должны преодолеть наши
проблемы в научной и учебной литературе.
Объект исследования требовал использования
общих и частных исследовательских методов,
таких как наблюдение, анализ, сравнение, синтез,
семантико-функциональный анализ, при
осмыслении данной проблемной ситуации и ее
характера. Наши наблюдения за научной и учебной
литературой показали, что количество единиц,
которые интерпретируются как языковые
единицы, варьируется от одного уровня к
другому, а в некоторых случаях даже более резко.
Другими словами, они колеблются от 3 до 14.
Трудно заметить то же самое в их именовании, в
том порядке, в котором они даны. Некоторые
объединили языковые и речевые единицы, не
разделяя их, выдели их все среди основных
единиц языка (конструкции), в то время как
другие отметили их по отдельности. Например,
Ш. Рахматуллаев (2006), известный
представитель ташкентской системной
лингвистики, дал 6 различных языковых единиц в
соответствии с акцентом и порядком автора, но
на практике существует 7 различных языковых
единиц: 2. Основные, первичные языковые
единицы - лексемы и морфемы. 3. Существует
буквальная иерархическая связь между лексемой
и морфемой и единицей, образованной их
объединением - лексемой. Лексема - это
первичная составная единица. 4. Следующее
иерархическое отношение возникает между
лексемой и составной частью, образованной
лексемой, и их синтаксической связью. 5. Самая
важная единица языка - диалект. 6. Фразема - языковая единица сложной природы.
Вышеупомянутое представляет собой начальное
введение в шесть языковых единиц, участвующих
в построении языка. Характер этих языковых
единиц поочередно описывается в разделах
учебника (Рахматуллаев, 2006). Теоретическая грамматика,
опубликованная коллективом авторов под
руководством профессора У.Шакировна самом
деле перечисляет 6 различных языковых единиц:
―Единица каждого уровня в языковой системе - это фонема, морфема, лексема, словоформа,
синтаксис, лингвистический (лингвистический)
текст. ед., Шакиров У, 2001). Видно, что Ш. Хотя
это не фундаментальная ошибка, мы думаем, что
было бы уместно обобщить их как языковые
единицы, а затем дифференцировать их по стилю
и порядку языковых единиц и речевых единиц.
Во-вторых, лингвистические и лингвистические
термины не являются синонимами там, где язык и
речь различны. Следовательно, возникает
внутреннее противоречие в представлении текста
как лингвистической (лингвистической) фонемы,
морфемы, лексемы, словоформы, синтаксиса.
Лингвистический термин означает
«лингвистический» или «лингвистический» и
имеет терминологическое значение. Однако
термин «лингвистический» относится к языковым
единицам, которые хранятся в нашей
лингвистической памяти и используются для
различения готовых языковых единиц,
основанных на них, речи, полученной в
результате их использования, и речевых единиц,
составляющих ее. стал. Теперь термин
«лингвистический» используется для описания
языковых единиц, то есть языковых единиц,
которые не даются при прямом наблюдении, в
форме мысленной печати, акустического образа
или нейрона, хранящихся в нашей
лингвистической памяти, воображении.
Следовательно, при научной интерпретации,
особенно когда лингвистический и речевой статус
языка различается, необходимо использовать
каждый из лингвистических, лингвистических и
речевых терминов в их месте и значении. В
противном случае очевидно, что возникнет
путаница в понимании классификации и
интерпретации. Когда единицы сознания и язык
противоречат друг другу, термин
«лингвистический» может использоваться
взаимозаменяемо с термином «лингвистический»
в лингвистическом смысле, но это не
оправдывает себя в разных местах языка и речи,
поскольку подрывает научную точность. и
согласованность. В этой связи поговорим о
классификации Ш. Рахмутуллаева. Потому что
его классификация и интерпретация не лишены
противоречивой двусмысленности. Верно, что
основы различения и интерпретации языка и речи
как двух состояний существования языка более
видны в исследованиях Ш. Рахматуллаева. Даже
Бухарская школа лингвистики, выступавшая с
многочисленными речами об этом различии, была
вынуждена заменить различие языка и речи
различением языка и речи после интерпретаций
Ш. Рахматуллаева. В этом плане трактовка Ш.

ISSN (Online): 2455-3662
EPRA International Journal of Multidisciplinary Research (IJMR) - Peer Reviewed Journal Volume: 7| Issue: 9| September 2021|| Journal DOI: 10.36713/epra2013 || SJIF Impact Factor 2021: 8.047 || ISI Value: 1.188
2021 EPRA IJMR | www.eprajournals.com | Journal DOI URL: https://doi.org/10.36713/epra2013 250
Рахматуллаева, по сути, полностью оправдала
себя. Однако Ш. Рахматуллаев также употребляет
термин «звуки языка» в системе базовых единиц
языковой конструкции, что само по себе
приводит к противоречию звуков языка и звуков
речи. В этом случае следует признать, что
существует еще третье частное состояние языка,
которое отличается от состояния языка и речи, и
это необходимо доказать. С нашей точки зрения, языку присущи
два различных состояния существования, и
наименование одного из них языком, а другое - речью служит для их различения. Спонтанные
языковые единицы называются
лингвистическими, а связанные с речью языковые
единицы - разговорной. Думать, что существуют
языковые звуки, значит признать, что язык
отличается от языка и речи, или что существует
другое отдельное языковое состояние, которое
воплощает их обоих. Это еще больше усложняет
проблему, которую уже гораздо труднее понять и
понять. Потому что теперь необходимо
определить три различных состояния каждого
типа языковой единицы, будь то звук, слово или
дополнение, чтобы определить их три разных
состояния, определить их границы и назвать
каждое из них отдельно. Этого требуют научная
точность и последовательность. Насколько
сложна эта работа, видно из проблем,
возникающих только в отношении лексем и слов.
Этот вопрос все еще открыт. Теперь представьте,
что в этом случае вы различаете три разных
состояния каждой языковой единицы. Ты можешь
представить ?! На самом деле, по нашему
мнению, это происходит из-за смешения или
смешения единиц сознания, мышления, языка.
Чтобы этого не делать, целесообразно во всех
отношениях идентифицировать и различать два
реальных состояния существования языка и их
единиц, а также назвать, обозначить, а затем
описать и классифицировать каждое в
соответствии с его формой, значением, функцией,
и используйте. Многие лингвисты, которые
думают об этом, в том числе Ш. Рахматуллаев,
пытались сделать то же самое в отношении
других единиц, кроме звуков языка. Однако
намерение хорошее, но ... как говорится, все
зависит от того, насколько четким и
последовательным, успешным, объективным и
последовательным будет это действие. К
сожалению, в этой связи, в частности, при
классификации и описании языковых
конструктивных единиц, Ш. Это проявляется не
только в некоторых аспектах его интерпретации
звуков языка, упомянутых выше, но также в
идентификации и обозначении других единиц. В
частности, исследователь выдвигает основные
единицы языковой конструкции, а также
языковые звуки, лексемы, морфемы, фразы, а
также единицы, которые следует обозначать как
лексемы, союзы, речевые формы. На наш взгляд,
не существует отдельной языко-речевой единицы,
отличной от предложения, составного слова,
которую следует называть составной, а составной
- синтаксической единицей. Существуют правила
составления предложений, но термины составной
и разговорный не означают названия такого
правила в одном и том же месте. Они даются как
название языковой единицы того или иного типа.
Из них также неизвестно, являются ли эти типы
единиц лингвистическими или вербальными
единицами. Однако существует особый суффикс,
используемый для различения языковых и
речевых единиц, и сам ученый использует
термины лексема, морфема и фразема, которые
являются языковыми единицами и прикреплены к
ним. Однако исследователь не использует этот
инструмент в максимально возможной степени,
по какой-то причине отказывается от этого
широко принятого и принятого метода и идет
совершенно новым путем, используя термины
лексема, соединение, идиома, требующие
глубокого научного понимания. объяснение. Эти
термины могли быть поняты исследователю даже
тогда, когда они использовались и описаны в
научно-исследовательской монографии, но они
приводятся в учебнике для высшего образования.
Такие нововведения в учебниках ставят
пользователей в затруднительное положение,
расстраивая их. Для профессионалов высшего
образования также очевидно, что учебники,
руководства и исследования - это две разные
вещи. К сожалению, однако, исчезновение этого
различия между ними, особенно для высшего
филологического образования, усложняет
преподавание лингвистики, особенно
современного узбекского литературного языка, и
приводит к резкому снижению эффективности.
Ведь не только студенту, но и преподавателю
вуза сложно усвоить эти новые термины и
понятия. Можно ли добиться эффективности с
плохо усвоенной теорией ?! Конечно, мы не
хотим уничтожить учебник Ш. Рахматуллаева.
Наши взгляды связаны с общей классификацией и
описанием языковых единиц, наиболее широко
признанного современного узбекского
литературного языка, его развития, обогащения,
«Система лексем», «Система морфем», «Система
составных слов», «Система фраз. Разделы, «Алфавит. Правильное написание. Правильное
произношение» примечательны своим четким и
последовательным, систематическим плавлением,
а их введение в учебный процесс, несомненно,
повысит качество и эффективность обучения
языку. Только учителя должны учитывать
ISSN (Online): 2455-3662
EPRA International Journal of Multidisciplinary Research (IJMR) - Peer Reviewed Journal Volume: 7| Issue: 9| September 2021|| Journal DOI: 10.36713/epra2013 || SJIF Impact Factor 2021: 8.047 || ISI Value: 1.188
2021 EPRA IJMR | www.eprajournals.com | Journal DOI URL: https://doi.org/10.36713/epra2013 251
вышеупомянутые особенности исследователя при
различении языковых и речевых единиц, лучше
всего игнорировать концепции, еще не
проверенные на практике, игнорировать новые
перспективы и обращаться к четким и
последовательным интерпретациям знакомых
единиц. Поэтому мы не будем слишком подробно
останавливаться на анализе этих терминов. Другие различия в классификации и
интерпретации языковых единиц можно
наблюдать в учебниках, используемых в
узбекской лингвистике и языковом образовании, особенно в высшем филологическом
образовании, что указывает на то, что граница
между лингвистикой и языковым образованием
практически исчезла. Возьмем, к примеру, учебники,
созданные для высшей школы представителями
Бухарской лингвистической школы, которые
первоначально назывались формально-функциональными, имманентными, а затем
содержательными, а теперь называются
содержательными. В частности, в учебнике проф.
Х. Нематова и проф. Р. Расулова языковые и
речевые единицы даны отдельно, 3 различных
языковых единицы (фонема, морфема, паттерн
(конструкция, устройство, модель)); Различают 7
типов речевых единиц (звук (буква) - слог - словосочетание - речь - составное предложение - текст), всего 10 языковых единиц (Нематов,
Расулов, 1993). Однако представители этой
школы М.Абузалова и С.Назарова (2008)
различают язык и речь и говорят, что существует
4 типа языка и 5 типов речевых единиц:
«Существуют специфические единицы языка и
речи: Лингвистические единицы - фонема,
морфема, лексема, паттерн; Речевые единицы - звук, суффикс, слово, (искусственное слово,
составное слово…) словосочетание, речь
»(Абузалова, Назарова, 2008). Справедливости
ради стоит отметить, что, в отличие от Ш.
Рахматуллаева и А. Нурмонова, представители
школы используют практически все языковые
единицы - термины с суффиксами. Однако при
записи единиц речи они предпочитают
использовать термины, которые использовались
до сих пор. Мы тоже это одобряем. Однако
следует отметить, что количество базовых единиц
языковой конструкции не ограничивается
лингвистическими и речевыми единицами. Если
бы это было так, наша речь не была бы такой
привлекательной, трогательной, образной,
многозначительной и выразительной. Однако
узбекский язык не отстает от речей, созданных на
языках мира, называемых мана. Это означает, что
единицы современного узбекского литературного
языка еще не нашли своей полной классификации
и интерпретации. К сожалению, последующие
исследования также не смогли отразить систему
языковых единиц в соответствии с объективной
реальностью. Напротив, было показано, что их
количество ограничено до минимума. Такая
относительно новая информация принадлежит
исследователю М. Хайруллаеву, который
подчеркивает, что существует 3 различных
языковых единицы, согласно которым существует
не более трех языковых уровней: ―...
определение языковых уровней должно
согласовываться с его единицами. Таким образом,
в языке не должно быть больше уровней, чем
фонематических, морфемных и словесных.
Уровень словообразования не может иметь
особого статуса, ибо искусственное слово не
требует никакого единства, кроме слова.
(Хайруллаев, 2010). На наш взгляд, взгляды профессора
С.Усманова, который первым в узбекском
языкознании попытался научно обосновать, что
язык и речь, их единицы взаимосвязаны, но
разные явления, единицы, и которому удалось
проделать эту сложную работу на одном языке.
фундаментальной основы, заслуживают
внимания. Примечательно, что в то время, то есть
в 60-е годы, он проделал самую важную работу,
на которой многие в 90-е годы сосредоточились:
научное и практическое различение языка (речи)
и речи, определение единиц для каждой из них,
перечисление их одной по одному и записывая их
с некоторыми комментариями, достигнутыми Для
сравнения, наблюдения С.Усманова кажутся
более близкими к объективной реальности - к
современному узбекскому литературному языку,
к его основоположникам, чем к большинству
современных интерпретаций. Он отмечает, что
―... включает в себя элемент языка и феномен
языка: 1. Сумма отдельных производных слов, т.
е. общий словарный запас . 2. Морфемы (т. е. Основы и отдельные
аффиксы). 3. Устойчивые словосочетания, сложные
термины, фразеологические выражения. 4. Система фонем языка. 5. Существующие грамматические
правила. 6. Перманентная (устойчивая)
синонимия, омонимия и полисемия. К речевым
явлениям и элементам речи можно отнести: 1. Модальные и словесные формы слова. 2. Свободные выражения. 3. Составные (т.е. «составные») глаголы,
комплексные числа. 4. Разрыв.
ISSN (Online): 2455-3662
EPRA International Journal of Multidisciplinary Research (IJMR) - Peer Reviewed Journal Volume: 7| Issue: 9| September 2021|| Journal DOI: 10.36713/epra2013 || SJIF Impact Factor 2021: 8.047 || ISI Value: 1.188
2021 EPRA IJMR | www.eprajournals.com | Journal DOI URL: https://doi.org/10.36713/epra2013 252
5. Специфические звуки речи, т.е.
варианты фонем. 6. Новообразованные слова (неологизмы)
. Конечно, с тех пор прошло шестьдесят
лет, некоторые термины и определения были
уточнены, но ясно, что С.Усманов далеко впереди
нас в определении языковых и речевых единиц.
Доказательством этого является то, что
единичное вновь созданное слово
интерпретируется как единица речи. Такие случаи
не могут остаться незамеченными только самыми
талантливыми лингвистами. В 90-е годы это
наблюдалось только у Х. Нематова (1995). Но
даже тогда он отмечал их не в прямой
классификации, а в ответ на критические мнения,
когда он отстаивал свои взгляды. Очевидно, что с 1960-х годов в узбекской
лингвистике проводились особые наблюдения за
классификацией языковых единиц в зависимости
от языка (речи) и речевых различий и на этой
основе для их определения и количественной
оценки. Но пока удовлетворительного ответа не
найдено. Исследования продолжаются и должны
быть. Эта статья была дополнена исследованиями
в области узбекского языкознания за последние
два десятилетия с целью способствовать
положительному решению этой проблемы, хотя и
в меньшей степени. Каждый тип и каждая из этих единиц
имеют свои собственные семантико-функциональные, структурные особенности
формы, и это известно многим из
лингвистических наук. Многие из них являются
единством, предметом отдельных уровней и наук,
изучающих их. В том числе: фонема в фонологии
(фонемика), мимема, эмотема, лексограммема,
граммема, морфология слова, лексема в
лексикологии (лексемика), онома в
ономазиологии, морфема в морфемах, синтаксис,
синтаксис, предложение, фразовый синтаксис,
текст, изучается текст в текстология
(текстология). Но дело в том, что интерпретации
этих исследований, правильность их выводов,
описание в них типов, содержания, значения и
функции языковых единиц четко, обоснованно,
полностью отражены. К сожалению, большинство
проблем возникло в одном и том же процессе, и
последняя работа, включая нашу статью, не
может быть исключением. Следовательно, эти
блоки и связанные с ними вопросы представляют
собой отдельные объекты исследования,
требующие специальной исследовательской
работы. Поэтому в наших дальнейших
исследованиях уместно остановиться на этом
подробнее.
Использованная литература 1. Абузалова М., Назарова С. Основы
системной лингвистики. Бухара. 2008. -144 с. 2. Шакиров У. и др. Теоретическая
грамматика узбекского языка. Т .: Новое
поколение. 2001, - 264 с. 3. Неъматов Х., Расулов Р. Основы системной
лексикологии узбекского языка. - Т .:
Укитувчи, 1995. - 156 с. 4. Рахматуллаев Ш. Основные единицы
языковой конструкции. Т., 2002. - 168 с. 5. Рахматуллаев Ш. Современный
литературный узбекский язык. Учебник. Т.,
2006. - 244 с. 6. Усмонов С. Морфологический состав слов
узбекского языка. Т., Фан.2010. - 156 с. 7. Халбеков И.Д. Иерархическая взаимосвязь
языковых единиц. Т., Фан, 2008. - 144 с.
ISSN (Online): 2455-3662
EPRA International Journal of Multidisciplinary Research (IJMR) - Peer Reviewed Journal Volume: 7| Issue: 9| September 2021|| Journal DOI: 10.36713/epra2013 || SJIF Impact Factor 2021: 8.047 || ISI Value: 1.188
2021 EPRA IJMR | www.eprajournals.com | Journal DOI URL: https://doi.org/10.36713/epra2013 253
NEW GENERALIZED CIESARO SPACE WITH SOME
TOPOLOGICAL PROPERTIES
Rayees Ahmad
Article DOI: https://doi.org/10.36713/epra8493 DOI No: 10.36713/epra8493
ABSTRACT The sequence space introduced by M. Et and have studied its various properties. The aim of the present paper is
to introduce the new pranormed generalized difference sequence space. )(],,,[ ),](,,,[ 0rn
rn upgfupgf
and )(],,,[ rnupgf , We give some topological properties and inclusion relations on these spaces.
2010 AMS Mathematical Subject Classification: 46A45; 40C05. KEYWORDS: Paranormed sequence space; -, - and -duals.
1. INTRODUCTION
A sequence space is defined to be a linear space of real or complex sequences.
Throughout the paper N , R and C denotes the set of non-negative integers, the set of real
numbers and the set of complex numbers respectively. Let denote the space of all sequences
(real or complex). Let l and c be Banach spaces of bounded and convergent sequences
0=}{= nnxx with supremum norm ||sup= nn
xxPP . Let T denote the shift operator on , that is,
1=}{= nnxTx ,
2=2 }{= nnxxT and so on. A Banach limit L is defined on l as a non-negative
linear functional such that L is invariant .,.ei )(=)( xLSxL and )(1,1,1,...= 1,=)( eeL (see,
[12]).
Lorentz (see, [12]), called a sequence }{ nx almost convergent if all Banach limits of ,x
)(xL , are same and this unique Banach limit is called F -limit of x . In his paper, Lorentz
proved the following criterian for almost convergent sequences.
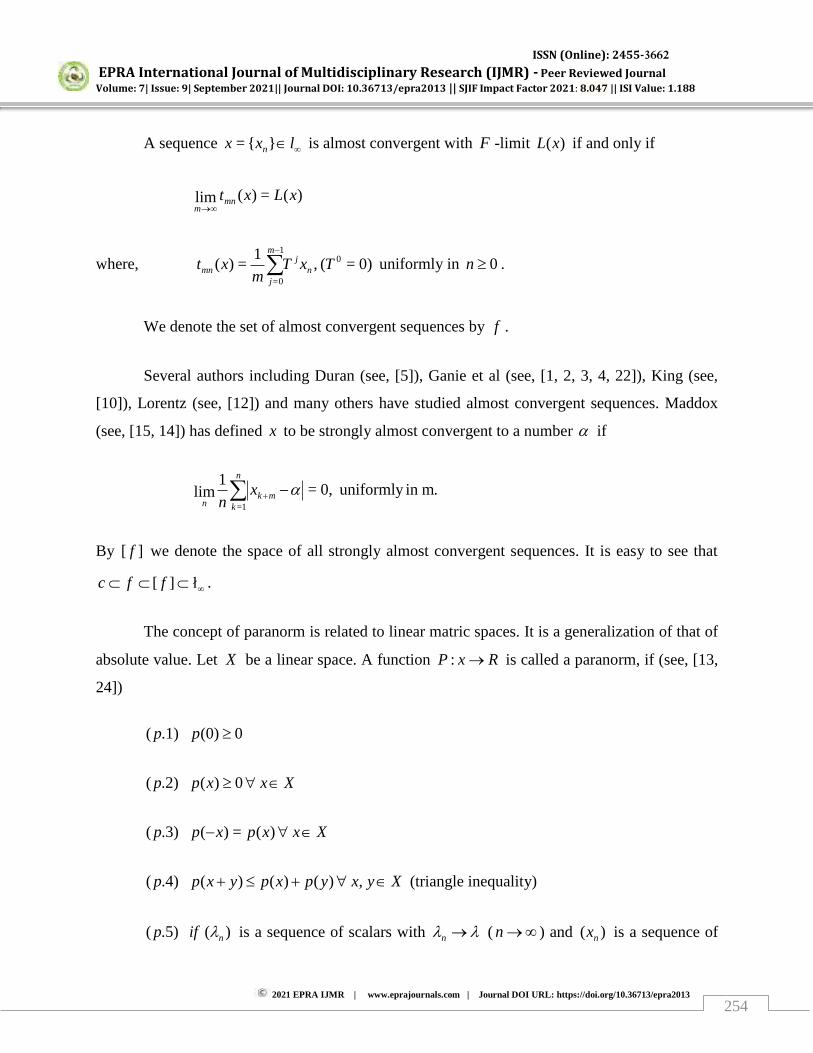
ISSN (Online): 2455-3662
EPRA International Journal of Multidisciplinary Research (IJMR) - Peer Reviewed Journal Volume: 7| Issue: 9| September 2021|| Journal DOI: 10.36713/epra2013 || SJIF Impact Factor 2021: 8.047 || ISI Value: 1.188
2021 EPRA IJMR | www.eprajournals.com | Journal DOI URL: https://doi.org/10.36713/epra2013 254
A sequence lxx n}{= is almost convergent with F -limit )(xL if and only if
)(=)(lim xLxtmnm
where, 0)=( ,1
=)( 01
0=
TxTm
xt nj
m
jmn
uniformly in 0n .
We denote the set of almost convergent sequences by f .
Several authors including Duran (see, [5]), Ganie et al (see, [1, 2, 3, 4, 22]), King (see,
[10]), Lorentz (see, [12]) and many others have studied almost convergent sequences. Maddox
(see, [15, 14]) has defined x to be strongly almost convergent to a number if
.min uniformly 0,=1
lim1=
mk
n
knx
n
By ][ f we denote the space of all strongly almost convergent sequences. It is easy to see that
ł][ ffc .
The concept of paranorm is related to linear matric spaces. It is a generalization of that of
absolute value. Let X be a linear space. A function RxP : is called a paranorm, if (see, [13,
24])
0(0) .1)( pp
Xxxpp 0)( .2)(
Xxxpxpp )(=)( .3)(
Xyxypxpyxpp , )()()( .4)( (triangle inequality)
)( .5)( nifp is a sequence of scalars with n ( n ) and )( nx is a sequence of

ISSN (Online): 2455-3662
EPRA International Journal of Multidisciplinary Research (IJMR) - Peer Reviewed Journal Volume: 7| Issue: 9| September 2021|| Journal DOI: 10.36713/epra2013 || SJIF Impact Factor 2021: 8.047 || ISI Value: 1.188
2021 EPRA IJMR | www.eprajournals.com | Journal DOI URL: https://doi.org/10.36713/epra2013 255
vectors with 0)( xxp n ( n ), then 0)( xxp nn ( n ),(continuity of
multiplication of vectors).
A paranorm p for which 0=)(xp implies 0=x is called total. It is well known that the
metric of any linear metric space is given by some total paranorm (see, [15]).
The following inequality will be used throughout this paper. Let )(= kpp be a sequence
of positive real numbers with <=sup<0 Hpp kkk and let )2 (1,max= 1HD . For
Ckk ba , . We have (see, [13, 14]) that
.}|||{||| kp
kkp
kkp
kk baDba (1)
Nanda (see, [18, 19]) defined the following:
,min uniformly 0=1
lim:=],[1=
kp
mk
n
knx
nxpf
,min uniformly 0=1
lim:=],[1=
0
kp
mk
n
knx
nxpf
.<1
sup:=],[1=,
kp
mk
n
knm
xn
xpf
The difference sequence spaces,
,:)(==)( XxxxX k
where clX ,= and 0c , were studied by Kizmaz (see, [11]).
It was further generalized by Et and Çolak (see, [8]), Ganie et al (see, [3]), Sengönül (see,
[21]) and many others.

ISSN (Online): 2455-3662
EPRA International Journal of Multidisciplinary Research (IJMR) - Peer Reviewed Journal Volume: 7| Issue: 9| September 2021|| Journal DOI: 10.36713/epra2013 || SJIF Impact Factor 2021: 8.047 || ISI Value: 1.188
2021 EPRA IJMR | www.eprajournals.com | Journal DOI URL: https://doi.org/10.36713/epra2013 256
Further, it was Tripathy et al (see, [23]) generalized the above notions and unified these
as follows:
,)(:= Zxxx kmnk
mn
where
,1)(=0=
mk
n
kmn x
r
nx
and
. =0 N kxx kkn
Recently, M. Et (see, [6]) defined the following:
,min uniformly 0,=1
lim:)(==)](,[1=
kp
mkr
n
knk
r xfn
xxpf
,min uniformly 0,=1
lim:)(==)(],[1=
0
kp
mkr
n
knk
r xfn
xxpf
.min uniformly ,<1
sup:)(==)(],[1=
kp
mkr
n
knk
r xfn
xxpf
Following Maddox (see, [16])and Ruckle (see, [20]), a modulus function g is a function from
) [0, to ) [0, such that
(i) 0=)(xg if and only if 0=x ,
(ii) 0, )()()( yxygxgyxg
(iii) g is increasing,

ISSN (Online): 2455-3662
EPRA International Journal of Multidisciplinary Research (IJMR) - Peer Reviewed Journal Volume: 7| Issue: 9| September 2021|| Journal DOI: 10.36713/epra2013 || SJIF Impact Factor 2021: 8.047 || ISI Value: 1.188
2021 EPRA IJMR | www.eprajournals.com | Journal DOI URL: https://doi.org/10.36713/epra2013 257
(iv) g if continuous from right at 0=x .
Maddox (see, [15])introduced and studied the following sets:
} 0|=|1
lim :{=1=
0 minuniformlyxn
xf mk
n
kn
} :{= 0 C linsomeforflexxf
of sequences that are strongly almost convergent to zero and strongly almost convergent.
Let )(= kpp be a sequence of positive real numbers with Mpp kk
k =sup<0 and
) (1,max= MH .
2. MAIN RESULTS
In the present paper, we define the spaces )(],,,[ ),](,,,[ 0rn
rn upgfupgf and
)(],,,[ rnupgf , where )(= kuu is such that kuk 0 , as follows:
,min uniformly 0,=1
lim:)(==)](,,,[1=
kp
mkrnk
n
knk
rn xug
nxxupgf
,min uniformly 0,=1
lim:)(==)(],,,[1=
0
kp
mkrnk
n
knk
rn xug
nxxupgf
,min uniformly ,<1
sup:=)(],,,[1=
kp
mkrnk
n
kn
rn xug
nxupgf
where )( kp is any bounded sequence of positive real numbers.
Theorem 1: Let )( kp be any bounded sequence and g be any modulus function. Then

ISSN (Online): 2455-3662
EPRA International Journal of Multidisciplinary Research (IJMR) - Peer Reviewed Journal Volume: 7| Issue: 9| September 2021|| Journal DOI: 10.36713/epra2013 || SJIF Impact Factor 2021: 8.047 || ISI Value: 1.188
2021 EPRA IJMR | www.eprajournals.com | Journal DOI URL: https://doi.org/10.36713/epra2013 258
)(],,,[ ),](,,,[ 0rn
rn upgfupgf and )(],,,[ r
nupgf are linear space over the set of complex
numbers.
Proof: We shall prove the result for )(],,,[ 0rnupgf and the others follows on similar
lines. Let )(],,,[, 0rnupgfyx . Now for C , , we can find positive numbers BA , such
that A|| and B|| . Since f is sub-additive and rn is linear
1
1=
kp
mkmkrnk
n
k
yxugn
kp
mkrnkmk
rnk
n
k
yugxugn
1=
1
kp
mkrnk
n
k
H xugn
AD
1=
1)(
01
)( 1=
kp
mkrnk
n
k
H xugn
BD
as n , uniformly in m . This proves that )(],,,[ 0rnkupgf is linear and the result follows.
W
Theorem 2: Let g be any modulus function. Then
).(],,,[)(],,,[ and )(],,,[)](,,,[ 0rn
rn
rn
rn upgfupgfupgfupgf
Proof: We shall prove the result for )(],,,[)](,,,[ rn
rn upgfupgf and the second shall be
proved on similar lines. Let )](,,,[ rnupgfx . Now, by definition of g , we have
1
=1
1=1=
kp
mkrnk
n
k
kp
mkrnk
n
k
LLxugn
xugn

ISSN (Online): 2455-3662
EPRA International Journal of Multidisciplinary Research (IJMR) - Peer Reviewed Journal Volume: 7| Issue: 9| September 2021|| Journal DOI: 10.36713/epra2013 || SJIF Impact Factor 2021: 8.047 || ISI Value: 1.188
2021 EPRA IJMR | www.eprajournals.com | Journal DOI URL: https://doi.org/10.36713/epra2013 259
. 1=1=
kpn
k
kp
mkrnk
n
k
Lgn
DLxug
n
D
Thus, for any number L , there exists a positive integer LK such that LKL || , we have
1
=1
1=1=
kp
mkrnk
n
k
kp
mkrnk
n
k
LLxugn
xugn
1.(1) 1=1=
n
k
kpL
kp
mkrnk
n
k
gKn
DLxug
n
D
Since, )](,,,[ rnupgfx , we have )(],,,[ r
nupgfx and the proof of second result follows.
W
Theorem 3: )(],,,[ 0rnpgf is a paranormed space with
.1
sup=)(
1
1=,
Hkp
mkrnk
n
knm
xugn
xh
Proof: From Theorem 2, for each )(],,,[ 0rnupgfx , )(xh exists. Also, it is trivial that
)(=)( xhxh and 0=mkrn x for 0=x . Since, 0=(0)h , we have 0=)(xh for 0=x . Since,
1M
pk for 1M , therefore, by Minkowski’s inequality and by definition of g for each n that
1
1
1=
Hkp
mkrnmk
rnk
n
k
yxugn
1
1
1=
Hkp
mkrnkmk
rnk
n
k
yugxugn

ISSN (Online): 2455-3662
EPRA International Journal of Multidisciplinary Research (IJMR) - Peer Reviewed Journal Volume: 7| Issue: 9| September 2021|| Journal DOI: 10.36713/epra2013 || SJIF Impact Factor 2021: 8.047 || ISI Value: 1.188
2021 EPRA IJMR | www.eprajournals.com | Journal DOI URL: https://doi.org/10.36713/epra2013 260
,11
1
1=
1
1=
Hkp
mkrnk
n
k
Hkp
mkrnk
n
k
yugn
xugn
which shows that )(xh is sub-additive. Further, let be any complex number. Therefore, we
have by definition of g , we have
),(1
sup=)(
1
1=,
xhSxugn
xh M
HHkp
mkrnk
n
knm
where, S is an integer such that S< . Now, let 0 for any fixed x with 0)( xh . By
definition of g for 1|<| , we have for )(> Nn that
.<1
1=
kp
mkrnk
n
k
xugn (2)
As g is continuous, we have, for Nn 1 and by choosing so small that
.<1
1=
kp
mkrnk
n
k
xugn (3)
Consequently, (2) and (3) gives that 0)( xh as 0 . W
Theorem 4: The spaces )(],,,[ ),](,,,[ 0rn
rn pgfupgf and )(],,,[ r
npgf are not solid
in general.
Proof : To show that the spaces )(],,,[ ),](,,,[ 0rn
rn pgfupgf and )(],,,[ r
npgf are
not solid in general, we consider the following example.
Let kk up =1= for all k and xxg =)( with nr =1= . Then, )(],,,[)(=)( rnk pgfkx
but )(],,,[)( rnkk pgfx when k
k 1)(= for all Nk . Hence is result follows. W

ISSN (Online): 2455-3662
EPRA International Journal of Multidisciplinary Research (IJMR) - Peer Reviewed Journal Volume: 7| Issue: 9| September 2021|| Journal DOI: 10.36713/epra2013 || SJIF Impact Factor 2021: 8.047 || ISI Value: 1.188
2021 EPRA IJMR | www.eprajournals.com | Journal DOI URL: https://doi.org/10.36713/epra2013 261
From above Theorem, we have the following corollary.
Corollary 5: The spaces )(],,[ ),](,,,[ 0rn
rn pgfupgf and )(],,,[ r
npgf are not
perfect.
Theorem 6: The spaces )(],,,[ ),](,,,[ 0rn
rn upgfupgf and )(],,,[ r
nupgf are not
symmetric in general.
Proof : To show that the spaces )(],,,[ ),](,,,[ 0rn
rn upgfupgf and )(],,,[ r
nupgf
are not perfect in general, To show this, let us consider kk up =1= for all k and xxg =)( with
1=n . Then, )(],,,[)(=)( rnk upgfkx Let the re-arrangement of )( kx be )( ky where )( ky is
defined as follows,
.0,...9,,6,,5,,6,,,,,,,=)( 14837261593421 xxxxxxxxxxxxxxyk
Then, )(],,,[)( rnk upgfy and this proves the result.
REFERENCES 1. A. H. Ganie, N. A. Sheikh, Infinite matrices and almost convergence, Filomat, 29(6)(2015), 1183-1188.. 2. A. H. Ganie and N. A. Sheikh, Infinite matrices and almost bouned sequences, Vietnam Journal of Mathematics,
42(2)(2014), 153-157.
3. A. H. Ganie and N. A. Sheikh, On some new sequence space of non-absolute type and matrix transformations, Jour.
Egyptain Math. Soc., 21( 2013), 34-40.
4. A. H. Ganie, N. A. Sheikh and T. Jalal, On some new type of invariant means with respect to modulus function, Int. J.
Mod. Math. Sc, 13(1)(2015), 210-216.
5. J. P. Duran, Infinite matrices and almost convergence, math. Zeit., 128(1972), 75-83.
6. M. Et, Strongly almost summable difference sequences of order m defined by modulus, Studia Scientiarum Math.
Hung., 40(2003), 463-476.
7. M. Et and M. Basarir, On some new generalized difference sequence spaces, Periodica Mathematica Hungarica
35(3)(1997), 169-175.
8. M. Et and R. Çolak, On some generalised difference sequence spaces, Soochow J. Math. 21(1995), 377-386.
9. P. Kampthan and M. Gupta, Sequence spaces and series, Marcel Dekkar Inc., (1981).
10. J. P. King, Almost summable sequences, Proc. Ammer. Math. Soc., 16(1966), 1219-1225.
11. H. Kizmaz, On certain sequence spaces, Canad. Math. Bull. 24(1981), 169-176.
12. G. G. Lorentz, A contribution to the theory of divergent sequences, Acta Math., 80(1948), 167-190.

ISSN (Online): 2455-3662
EPRA International Journal of Multidisciplinary Research (IJMR) - Peer Reviewed Journal Volume: 7| Issue: 9| September 2021|| Journal DOI: 10.36713/epra2013 || SJIF Impact Factor 2021: 8.047 || ISI Value: 1.188
2021 EPRA IJMR | www.eprajournals.com | Journal DOI URL: https://doi.org/10.36713/epra2013 262
13. I. J. Maddox, Elements of Functionls Analysis, Cambridge Univ. Press, (1970).
14. I. J. Maddox, On strong almost convergence, Math. Proc. Camb. Phil. Soc., 85(1979), 345-350.
15. I. J. Maddox, Spaces of strongly summable sequences, Qurt. J. Math., 18(1967), 345-355.
16. I. J. Maddox, Sequence spaces defined by a modulus, Math. Proc. Camb. Phil. Soc., 100(1986), 161-166.
17. M. Mursaleen, Generalized spaces of difference sequences, Jour. Math. Anal. App., 203(1996), 738-745.
18. S. Nanda, Strongly almost convergent sequences, Bull. Cal. Math. Soc., 76(1984), 236-240.
19. S. Nanda, Strongly summable and strongly almost convergent sequences, Acta Math. Hung., 49(1987), 71-76.
20. W. H. Ruckle, FK spaces in which the sequence coordinate verctors in bounded, Canad. J. Math., 25(1973), 973-978.
21. M. Sengönül and F. Ba s ar, Some new Cesàro sequences spaces of non-absolute type, which include the spaces oc
and c , Soochow J. Math., 1(2005), 107-119.
22. N. A. Sheikh and A. H. Ganie,On the space of -convergent sequence and almost convergence, Thai Journal of
Math., 2(11) (2013), 393-398.
23. Tripathy, B. C., Esi, A., and Tripathy, B., On a new type of generalized difference Cesaro sequence spaces,
31(3)(2005), 33-340.
24. A. Wilansky, Summability through Functional Analysis, North Holland Mathematics Studies, Oxford, (1984).
ISSN (Online): 2455-3662
EPRA International Journal of Multidisciplinary Research (IJMR) - Peer Reviewed Journal Volume: 7| Issue: 9| September 2021|| Journal DOI: 10.36713/epra2013 || SJIF Impact Factor 2021: 8.047 || ISI Value: 1.188
2021 EPRA IJMR | www.eprajournals.com | Journal DOI URL: https://doi.org/10.36713/epra2013 263
INTERMOLECULAR INTERACTIONS STUDIES IN
BINARY MIXTURES OF CURCUMIN PARTICLES
WITH PRIMARY ALCOHOLS
R.Soundar Asst.Prof of physics, GFGC KGF.
ABSTRACT Ultrasonic velocity, density, and viscosity for Curcumin with primary alcohols binary mixture viz, I-propanol is determined at 303k using Ultrasonic Interferometer. The result shows values for thermodynamic parameters such as adiabatic compressibility, intermolecular free length, free volume, acoustic impedance, and the molecular association have been calculated and tabulated. The data are used study to correlate the properties and relevant interaction parameters with the nature of intermolecular interaction between the binary mixture compounds. The results show a nonlinear variation of acoustical parameters which confirms the presence of molecular associative nature.
KEY WORDS: Intermolecular interaction, Curcumin, Ultrasonic velocity, Adiabaticcompressibility, intermolecular free length.
INTRODUCTION
Curcumin (Diferuloymethane) is a natural yellow dye derived from the rhizome of Curcuma Longa Linn. Curcumin is a poly phenol di-ketone from extracted from turmeric [1]. It is yellow in color and is responsible for most of the therapeutic effects of turmeric used widely as a food coloring [2]. It has been known as an Ayurvedic medicine for centuries on the Indian subcontinents a pharmacological safety drug because of its antioxidant and anti-inflammatory effect; it has wide application in medical fields. Alcohols are industrially and scientifically important organic compounds and its property is largely depending on hydroxyl groups. Interaction between two or more molecules is called intermolecular interaction. Intermolecular interactions is particular important in terms of how molecules interact. Inter molecular forces are responsible intermolecular interaction [3].
To understand the intermolecular interaction, it is necessary to determine the various ultrasonic parameters, which are related to molecular associations.
I MATERIALS AND METHODS Analytical research grade of Primary Alcohol
werepurchased from SD fine chemicals Ltd, India and purified by the standard method [4,5,6]. Curcumin isolated from local turmeric rhizome.
The turmeric rhizomes are powered by sieved through a mesh of 0.5mm thickness mesh to obtain uniform size of sample. It is mixed with acetone to get mixture of oil and a resin. It mixed with solvent and kept overnight to get a yellow precipitate of curcumin. The precipitate is washed and purify for several times with solvent. Various concentrations of the binary liquid mixtures were prepared in terms of mole fractions varied from 0.1 to 0.7.
An ultrasonic interferometer supplied by m/s, Mittal Enterprises, New Delhi, having the maximum frequency 2MHz with an overall accuracy of ±2 ms-1
has been used for ultrasonic velocity measurement. The density of pure liquids and liquid
mixtures are determined using a 10 ml specific gravity bottle by relative measurement method with an accuracy of ±0.1mg. An Ostwald’s viscometer
which is 10 ml capacity is used for the viscosity measurement of pure liquids and experimental liquid mixtures, Ultrasonic velocity is calculated for using relation
U= nχ m/s 1 Adiabatic compressibility β = 1/ρU2 ms2 kg-1 2 Intermolecular free length Lf = √β kT kg m-2 s-1 3
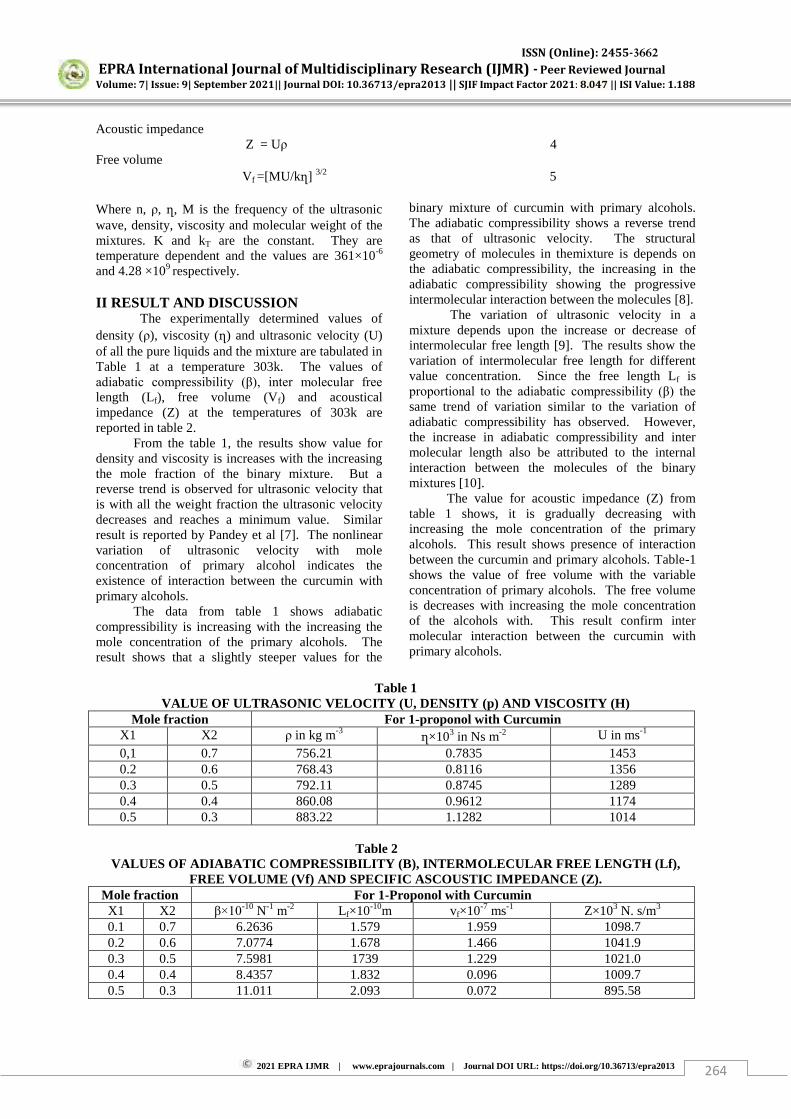
ISSN (Online): 2455-3662
EPRA International Journal of Multidisciplinary Research (IJMR) - Peer Reviewed Journal Volume: 7| Issue: 9| September 2021|| Journal DOI: 10.36713/epra2013 || SJIF Impact Factor 2021: 8.047 || ISI Value: 1.188
2021 EPRA IJMR | www.eprajournals.com | Journal DOI URL: https://doi.org/10.36713/epra2013 264
Acoustic impedance Z = Uρ 4 Free volume Vf =[MU/kղ] 3/2 5 Where n, ρ, ղ, M is the frequency of the ultrasonic wave, density, viscosity and molecular weight of the mixtures. K and kT are the constant. They are temperature dependent and the values are 361×10-6 and 4.28 ×10⁹ respectively. II RESULT AND DISCUSSION
The experimentally determined values of density (ρ), viscosity (ղ) and ultrasonic velocity (U) of all the pure liquids and the mixture are tabulated in Table 1 at a temperature 303k. The values of adiabatic compressibility (β), inter molecular free
length (Lf), free volume (Vf) and acoustical impedance (Z) at the temperatures of 303k are reported in table 2.
From the table 1, the results show value for density and viscosity is increases with the increasing the mole fraction of the binary mixture. But a reverse trend is observed for ultrasonic velocity that is with all the weight fraction the ultrasonic velocity decreases and reaches a minimum value. Similar result is reported by Pandey et al [7]. The nonlinear variation of ultrasonic velocity with mole concentration of primary alcohol indicates the existence of interaction between the curcumin with primary alcohols.
The data from table 1 shows adiabatic compressibility is increasing with the increasing the mole concentration of the primary alcohols. The result shows that a slightly steeper values for the
binary mixture of curcumin with primary alcohols. The adiabatic compressibility shows a reverse trend as that of ultrasonic velocity. The structural geometry of molecules in themixture is depends on the adiabatic compressibility, the increasing in the adiabatic compressibility showing the progressive intermolecular interaction between the molecules [8].
The variation of ultrasonic velocity in a mixture depends upon the increase or decrease of intermolecular free length [9]. The results show the variation of intermolecular free length for different value concentration. Since the free length Lf is proportional to the adiabatic compressibility (β) the
same trend of variation similar to the variation of adiabatic compressibility has observed. However, the increase in adiabatic compressibility and inter molecular length also be attributed to the internal interaction between the molecules of the binary mixtures [10].
The value for acoustic impedance (Z) from table 1 shows, it is gradually decreasing with increasing the mole concentration of the primary alcohols. This result shows presence of interaction between the curcumin and primary alcohols. Table-1 shows the value of free volume with the variable concentration of primary alcohols. The free volume is decreases with increasing the mole concentration of the alcohols with. This result confirm inter molecular interaction between the curcumin with primary alcohols.
Table 1
VALUE OF ULTRASONIC VELOCITY (U, DENSITY (p) AND VISCOSITY (H) Mole fraction For 1-proponol with Curcumin
X1 X2 ρ in kg m-3 ղ×103 in Ns m-2 U in ms-1
0,1 0.7 756.21 0.7835 1453 0.2 0.6 768.43 0.8116 1356 0.3 0.5 792.11 0.8745 1289 0.4 0.4 860.08 0.9612 1174 0.5 0.3 883.22 1.1282 1014
Table 2
VALUES OF ADIABATIC COMPRESSIBILITY (B), INTERMOLECULAR FREE LENGTH (Lf), FREE VOLUME (Vf) AND SPECIFIC ASCOUSTIC IMPEDANCE (Z).
Mole fraction For 1-Proponol with Curcumin X1 X2 β×10
-10 N-1 m-2 Lf×10-10m vf×10-7 ms-1 Z×103 N. s/m3 0.1 0.7 6.2636 1.579 1.959 1098.7 0.2 0.6 7.0774 1.678 1.466 1041.9 0.3 0.5 7.5981 1739 1.229 1021.0 0.4 0.4 8.4357 1.832 0.096 1009.7 0.5 0.3 11.011 2.093 0.072 895.58
ISSN (Online): 2455-3662
EPRA International Journal of Multidisciplinary Research (IJMR) - Peer Reviewed Journal Volume: 7| Issue: 9| September 2021|| Journal DOI: 10.36713/epra2013 || SJIF Impact Factor 2021: 8.047 || ISI Value: 1.188
2021 EPRA IJMR | www.eprajournals.com | Journal DOI URL: https://doi.org/10.36713/epra2013 265
III CONCLUSION From measured ultrasonic velocity, density
and viscosity, the related acoustical parameter for the binary mixture are calculated. It is noticed that ultrasonic velocity is decreases with increasing mole concentration and adiabatic compressibility is increases with increasing mole concentration. Inter molecular free length is increases and free volume increases with concentration. This result shows existences a molecular association and it can be conclude that there is a intermolecular interaction present in the binary mixture. REFERENCES
1. G.K.Jayapraksh, J.M.Rao, J.Agric. Food chem., 50 (13), 3668-71, 2000.
2. C.A.C. Ara’ujo and L.L.Leon, “Biological
Activities of Curcumalonga L”, MemInst Oswaldo Cruz, Rio de Janeiro 96, 723-728,2001.
3. P.E. savage “Organic chemical reactions in
supercritical water”, Chem Rev, 99, 603-622, 1999.
4. A weissberger “Technique of Organic
Chemistry”, New York, Wiley Interscience, 1970. 5. A I Vogal “Text book of practical organic
chemistry”, Longman, 1957, London. 6. S. Thirumaran and K. Job Sabu. Ind J Pure &
Appl Phys., 47,87,2009. 7. S.Thirumaran and J Earnest Jaya Kumar. Ind J
Pure & Appl Phys. 47,265,2009. 8. H.C. Pandey, R P Jain and J D Pandey,
“Temperature and pressure dependence of free
volume and intermolecular free length Acustica 34, 123, 1975.
9. V A Tabhane and B A Patki, Acoustica. 52, 44 1982.
10. Nithya, S.Nithiyanathan, S. Mullainathan, and M. Rajashekaran, “Ultrasonic investigation of
Molecular Interactions in Binary Mixtures at 303 K”, E-Journal of Chemistry, 6, pages 138-140,2009.
11. R.S Thirumaran and P.Thenmozhi, “Study of
molecular interaction in ternary liquid mixture by ultrasonic velocity measurements”, Asian
J.AppliedSci, 3(2), 153-159, 2010.

ISSN (Online): 2455-3662
EPRA International Journal of Multidisciplinary Research (IJMR) - Peer Reviewed Journal Volume: 7| Issue: 9| September 2021|| Journal DOI: 10.36713/epra2013 || SJIF Impact Factor 2021: 8.047 || ISI Value: 1.188
2021 EPRA IJMR | www.eprajournals.com | Journal DOI URL: https://doi.org/10.36713/epra2013 266
PROBLEMS OF TEACHING RUSSIAN LANGUAGE IN PHARMACEUTICAL UNIVERSITIES
Shukurjanova Samiahon Alimovna1,
Matyusupova Shakarzhon Bekmamatovna2
1,2Senior Teachers of the Department of Uzbek Language and Literature of Tashkent pharmaceutical institute.Uzbekistan.
ANNOTATION The article discusses the specifics of teaching foreign students of Russian biomedical terminology, identifies effective means of optimizing the process of teaching professional vocabulary in the classroom in the Russian language. The main tasks in the organization of work with professional texts are presented. KEY WORDS: terminology, term, term element, specialty language, eponym.
ПРОБЛЕМЫ ПРЕПОДАВАНИЯ РУССКОГО ЯЗЫКА В
ФАРМАЦЕВТИЧЕСКИХ ВУЗАХ
Шукурджанова Самиахон Алимовна,
Матюсупова Шакаржон Бекмаматовна Старшие преподаватели кафедры Узбекского
языка и литературы Ташкентского фармацевтического института.
Узбекистан.
Аннотация В статье рассмотрена специфика обучения иностранных студентов русской
медико-биологической терминологии, определены эффективные средства
оптимизации процесса обучения профессиональной лексике на занятиях по русскому
языку. Представлены основные задачи при организации работы с текстами
профессиональной направленности. Ключевые слова: терминология, термин, терминоэлемент, язык специальности,
эпоним.
ISSN (Online): 2455-3662
EPRA International Journal of Multidisciplinary Research (IJMR) - Peer Reviewed Journal Volume: 7| Issue: 9| September 2021|| Journal DOI: 10.36713/epra2013 || SJIF Impact Factor 2021: 8.047 || ISI Value: 1.188
2021 EPRA IJMR | www.eprajournals.com | Journal DOI URL: https://doi.org/10.36713/epra2013 267
Специфике обучения иностранных
студентов в вузах медицинской отрасли
посвящено немало работ, в которых ставятся и
решаются актуальные задачи достижения лучших
результатов в профессиональном речевом
развитии [4;5;6]. Обучение иностранных
студентов научному стилю речи является одним
из перспективных направлений в преподавании
русского языка как иностранного (РКИ) и
направлено на развитие профессиональной
компетентности будущих специалистов. В Национальном фармацевтическом
университете (г. Харьков, Украина) обучается
более 1000 иностранных студентов из 40 стран
мира. Дисциплина «Русский язык» на 1 - 4 курсах
является вспомогательной и рассчитана на 7
семестров. Преподаватели-русисты работают над
формированием общих коммуникативных
компетенций, которые на 1 курсе у иностранных
студентов не всегда присутствуют в должном
объѐме, что затрудняет восприятие
профессиональной речи преподавателей
специальных дисциплин (химия, биология,
анатомия и др.). При первоначальном анализе
состояния речевых навыков и умений студентов-иностранцев на 1 курсе отмечается недостаточно
свободное владение ими устной и письменной
русской речью, хотя русский язык является
языком получаемой специальности. Известно, что примерно 4000 наиболее
частотных слов покрывают 95% текстов
неспециального содержания. Однако результаты
тестирования, ежегодно проводимого в
Национальном фармацевтическом университете,
показывают, что лексический запас у
иностранных студентов после подготовительных
факультетов составляет примерно 2000 слов. По
нашим наблюдениям, меньше всего оказывается
усвоенной научная лексика. Поэтому повышение
эффективности обучения русскому языку было и
остаѐтся актуальной проблемой, которую активно
решают преподаватели кафедры гуманитарных
наук. Научно-технический прогресс в
современном обществе приводит к повышению
значения терминологии как средства получения и
организации научных знаний. Вопросы
информационного обеспечения и научно-технического обмена, которые затрагивают
полноценное функционирование языков,
особенно важны. Терминология разных наук
претерпевает процесс интернационализации и
развивается путѐм заимствования из разных
мѐртвых и живых языков. Лексическая составляющая научного стиля
речи определяется тремя основными
лексическими группами: 1) общая лексика,
составляющая основу любых текстов; 2)
общенаучная лексика; 3) термины, которые
составляют метаязык определѐнной науки. Как известно, медико-биологическая
терминология имеет свою специфику и
различную этимологию. Усвоение медико-биологической терминологии сопряжено с
большими трудностями из-за еѐ значительного
объѐма и разнообразия. Термины медицины
бывают различными по структуре: корневые,
производные, образованные путѐм
словосложения и словосочетания,
метонимического или метафорического переноса
(дельтовидная мышца, палочка Коха, солнечное
сплетение и др.). Исследование медико-фармацевтической терминологии обусловлено
потребностью еѐ презентации как строго
упорядоченной системы, соответствующей
современному уровню развития
фармацевтической науки и запросам
практической деятельности студентов
фармацевтического вуза и совершенствованием
переводческой деятельности. По происхождению медико-биологические
термины могут быть заимствованными из других
языков (абдоминальный, рецептурный, терапевт,
фармацевт) и исконно русскими (желудочек,
предсердие, детский врач). Особенностью
русской научной медико-биологической лексики
является так называемый «медицинский
билингвизм» [2]: формы терминов латинского
или греческого происхождения и эквивалентная
терминология на русской основе (апофиз - отросток, вырост, склера - белочная оболочка,
антидот - противоядие, абдоминальный - брюшной, латентный - скрытый, паротит -свинка,
систола - сокращение, венечный - коронарный).
Это является одним из затруднений в усвоении
русской научной терминологии, так как такие
синонимы иностранные студенты воспринимают
как абсолютно разные слова. Особенно это
характерно для студентов, которые не владеют
европейскими языками [10]. В то же время греко-латинские
терминоэлементы полностью освоены и служат
базой создания новых слов уже на русской почве.
Они достаточно кратки, удобны в употреблении,
преимущественно моносемичны и используются
в регулярных словообразовательных моделях. В
настоящее время они являются основными при
образовании медицинской и фармацевтической
терминологии. Исследуя словообразовательный
механизм медико-биологической терминологии,
исследователи пришли к выводу, что образования
на основе греко-латинских терминоэлементов
составляют подавляющее число (свыше 1000
наименований) [2]. Практические задания по
изучению структуры мотивированных слов
должны быть направлены на то, чтобы студент
мог не только предсказать значение слова, но и
ISSN (Online): 2455-3662
EPRA International Journal of Multidisciplinary Research (IJMR) - Peer Reviewed Journal Volume: 7| Issue: 9| September 2021|| Journal DOI: 10.36713/epra2013 || SJIF Impact Factor 2021: 8.047 || ISI Value: 1.188
2021 EPRA IJMR | www.eprajournals.com | Journal DOI URL: https://doi.org/10.36713/epra2013 268
правильно образовать необходимое
мотивированное слово для выражения
определѐнного значения. Эти задачи связаны с
двумя важными проблемами
словообразовательной семантики:
компонентными значениями мотивированного
слова, семантическими закономерностями
образования слов и их лексической реализацией. Термины принадлежат не только к
отдельным отраслям науки, но прежде всего они
являются единицами языка. Значит, им не могут
быть чужды такие лексико-семантические
процессы как синонимия, омонимия и полисемия.
Эти процессы услож- няют процесс профессиональной
коммуникации будущих медиков и фармацевтов.
Развитию асиметрии термина в немалой степени
способствуют термины-эпонимы, то есть
термины, в состав которых входят фамилии
учѐных, врачей или больных («островки
Лангерганса», «болезнь Паркинсона», «синдром
Ван Гога»). Часто эпонимы служат причиной
путаницы в медицинской терминологии.
Например, «симптомом Бехтерева» называют 8
различных симптомов [3]. И, наоборот, Базедова
болезнь в научной литературе называется ещѐ
диффузный токсический зоб или болезнь Грейвса
и т.п. Следует учитывать и тот факт, что
некоторые медицинские явления в разных
странах имеют свои эпонимы. Например,
гигантоклеточный (темпоральный) артериит во
франкоязычных странах известен как болезнь
Хортона, а в англоязычных странах под этим
названием данное заболевание практически
неизвестно. Подобные явления зачастую
препятствуют эффективной научной и
профессиональной коммуникации. Точность
терминологии - обязательное условие взаимного
общения специалистов любой области. Но ещѐ
большее значение играет точность терминологии
в обучении иностранных студентов.
Терминологическая лексика научного стиля речи
в обучении русскому языку как иностранному
служит средством для формирования предметной
(профессиональной) компетенции. Когда
студенты хорошо понимают слова, которыми
преподаватель излагает научные положения, они
хорошо усваивают материал. Если текстовый и
лексический материал занятий по русскому языку
соответствует главным темам изучаемых
дисциплин, а система упражнений организована
таким образом, что студенты всѐ время находятся
в предметной сфере своей основной
деятельности, то процесс обучения приобретает
целевую направленность и повышает мотивацию
обучения. Также студенты должны получить от
преподавателя чѐткую целевую установку на
самостоятельную работу с терминологией по
специальности, подробный инструктаж по еѐ
содержанию, приѐмам и способам
осуществления. Очень важно переориентировать
студентов от репродуктивных методов работы к
творческой деятельности. В качестве основной
формы внеаудиторной и аудиторной работы с
лексикой по специальности иностранным
студентам Национального фармацевтического
университета предлагается на занятиях по
русскому языку работать по специально
подготовленным пособиям, учебникам или
материалам [1;7;8;9 и др.]. Практическое
использование этой учебно-методической
литературы позволяет обеспечить презентацию
учебного материала на ситуативно-тематической
основе, осуществлять функциональный подход к
решению языковых задач и выработке
профессионально-ориентированных речевых
навыков, а также рассмотреть структурно-грамматические особенности образования
терминов, показать взаимодействие
интернациональных и национальных элементов
внутри номинативных единиц. Формирование терминологической
компетенции студентов в фармацевтическом вузе
является одной из важнейших задач РКИ. Для еѐ
реализации необходима система заданий и
упражнений, цель которых - всестороннее
знакомство с законами словообразования,
сочетаемости и взаимозависимости лексических
единиц, выработка навыков практического
владения терминологией. Словообразование
является своеобразным соединительным звеном
между лексическими и грамматическими
структурами в русском языке. Поэтому
целенаправленный словообразовательный анализ
позволяет студентам ощутить специфику
изучаемого языка. Интенсификация работы по обучению
терминологической лексике должна
способствовать усилению активности
иностранных студентов в изучении учебного
материала и формированию умения
самостоятельно, систематически и методически
правильно расширять полученные знания,
формированию потребности в чтении литературы
по специальности, специальных
терминологических и толковых словарей.
Студенты медицинских и фармацевтических
вузов должны не просто владеть русским языком
и приѐмами работы со специальной и справочной
литературой, а уметь правильно использовать
терминологию на занятиях по профилирующим
предметам. Безусловно, работа над терминологической
лексикой должна проводиться в тесном контакте
русистов с преподавателями специальных кафедр.
Особенно это касается вопросов отбора лексики и
организации еѐ в систему заданий. Удачным
примером такого сотрудничества является,
ISSN (Online): 2455-3662
EPRA International Journal of Multidisciplinary Research (IJMR) - Peer Reviewed Journal Volume: 7| Issue: 9| September 2021|| Journal DOI: 10.36713/epra2013 || SJIF Impact Factor 2021: 8.047 || ISI Value: 1.188
2021 EPRA IJMR | www.eprajournals.com | Journal DOI URL: https://doi.org/10.36713/epra2013 269
например, пособие по изучающему чтению на
материале текстов по неорганической химии,
созданное авторским коллективом кафедры
гуманитарных наук и кафедры неорганической
химии Национального фармацевтического
университета [1]. Обучение языку специальности студентов-
иностранцев в фармацевтическом вузе является
ключевой задачей, поскольку подъязык фармации
имеет достаточно разветвлѐнную структуру и
связан с освоением разных лексико-тематических
терминологических групп: анатомическая
терминология, химическая терминология,
фармацевтическая терминология и клиническая
терминология. Исследование словарного состава
данных групп имеет весьма актуальное значение
для методики преподавания научного стиля
русского языка иностранцам с учѐтом
специальности. Перед преподавателем-русистом
стоит чисто практическая цель - подготовить
иностранного студента к восприятию и
пониманию лекций по специальности, то есть
помочь иностранному студенту, обучающемуся
на русском языке, выработать языковую
компетенцию при использовании языка
специальности. Библиографический список
1. Аргунова Г.В. Русский язык: пособие для
иностр. студентов 1 курса (изучающее чтение
на материале текстов по неорганической
химии) / Г. В. Аргунова, Л. А. Су-бота, Е. Я.
Левитин, И. Д. Рой. Харьков: Изд-во НФаУ:
Золотые страницы, 2006. 232 с. 2. Бесекирска Л. Стилистические особенности
медицинской терминологии в
общелитературном языке // Терминоведение.
Вып. 1-3. Москва, 1997. С. 102. 3. Грошева А.А. К вопросу об асиметрии
терминологического знака в медицинской
терминологии // Известия Самарского
научного центра Российской академии наук.
Социальные, гуманитарные, медико-биологические науки. Самара: Самарский
научный центр РАН. Т.17. №2 (2). 2015. С.449-452.
4. Крысенко Т.В., Суханова Т.Е. Некоторые
особенности словообразовательной работы со
специальной лексикой на занятиях по русскому
языку как иностранному (на материале
медико-биологической терминологии) //
Русская филология. Украинский вестник.
Харьков, 2008. №2 (36). С. 73-76. 5. Митрофанова О.Д. Взаимодействие языковой и
предметной компетенции в процессе обучения
студентов-нефилологов // Современный
учебник русского языка для иностранцев:
теоретические проблемы и прикладные
аспекты: Сб. тезисов. М.: Изд-во МГУ им. М.В.
Ломоносова, 2002. С. 109-110. 6. Морковкин В.В. О лексикографическом
обеспечении профессионально
ориентированного обучения русскому языку
нерусских студентов // Теория и практика
научно-технической лексикографии: сб.
статей. М.: Рус. яз., 1988. С. 180-185. 7. Русский язык: учеб. пособие / Т.В. Крысенко,
Н.Н. Филянина, Е.А. Долгая и др. Харьков:
НФаУ: Золотые страницы, 2016. 240 с. 8. Субота Л.А. Русский язык. Учебник для
иностранных студентов высших учебных
заведений Украины. В двух частях. Часть 1. Х.:
Майдан, 2007. 408 с. 9. Субота Л.А. Русский язык. Учебник для
иностранных студентов высших учебных
заведений Украины. Часть 2. Х.: Майдан, 2009.
405 с. 10. Шарапа А.А. Особенности презентации
медицинской лексики на уроках РКИ //
Карповские научные чтения: сб. науч. ст.
Вып.8: в 2 ч. Ч. 1. Минск: «Белорусский дом печати», 2014. С. 217-220.
REFERENCES
1. Argunova G.V. Russian language: course-book for foreign students of the first year (studying reading on the material of texts on inorganic chemistry) / G.V. Argunova, L.A. Subota, E.Y. Levitin, I.D. Roy. Kharkov, 2006. 232 p.
2. Besekirska L. Stylistic features of medical terminology in general literary language // Terminology. Issue 1-3. Moscow, 1997. 102 p.
3. Grosheva A.A. To the question of asymmetry of a terminological sign in medical terminology // News of the Samara Scientific Centre of the Russian Academy of Sciences. Social, humanitarian, medical and biological sciences. Samara: Samara Scientific Centre of the Russian Academy of Sciences. Vol. 17. № 2 (2). 2015. P. 449-452.
4. Krysenko T.V., Sukhanova Т.Е. Some features of word-formative work with special vocabulary at the lessons of Russian as a foreign language (on the basis of medical and biological terminology) // Russian Philology. Ukrainian Herald. Kharkov, 2008. № 2 (36). P. 7376.
5. Mitrofanova O.D. Interaction of language and subject competence in the process of teaching non-philological students // Modern textbook of the Russian language for foreigners: theoretical problems and applied aspects: Sat. theses. M.: Publishing House of Moscow State University. Moscow State University named after M.V. Lomonosov, 2002. P. 109-110.
6. Morkovkin V.V. On the lexicographic provision of professionally oriented teaching of the Russian language for non-Russian students // Theory and practice of scientific and technical lexicography: coll. articles. M.: Rus. 1988. P. 180-185.
7. Russian language: course-book / T.V. Krysenko, N.N. Filianina, E.A Dolgaya and others. Kharkov: NPAU: Golden Pages, 2016. 240 p.
8. Subota L.A. Russian language. Textbook for foreign students of higher educational institutions of Ukraine. In two parts. Part 1. Kharkov, 2007. 408 p.

ISSN (Online): 2455-3662
EPRA International Journal of Multidisciplinary Research (IJMR) - Peer Reviewed Journal Volume: 7| Issue: 9| September 2021|| Journal DOI: 10.36713/epra2013 || SJIF Impact Factor 2021: 8.047 || ISI Value: 1.188
2021 EPRA IJMR | www.eprajournals.com | Journal DOI URL: https://doi.org/10.36713/epra2013 270
9. Subota L.A. Russian language. Textbook for foreign students of higher educational institutions of Ukraine. Part 2. Kharkov, 2009. 405 р.
10. Sharapa A.A. Features of the presentation of medical vocabulary at the lessons of Russian as a foreign language // Karpov scientific readings: Collection of sci. art. Issue 8: in 2 parts. Part 1. Minsk, 2014. P. 217-220.
ISSN (Online): 2455-3662
EPRA International Journal of Multidisciplinary Research (IJMR) - Peer Reviewed Journal Volume: 7| Issue: 9| September 2021|| Journal DOI: 10.36713/epra2013 || SJIF Impact Factor 2021: 8.047 || ISI Value: 1.188
2021 EPRA IJMR | www.eprajournals.com | Journal DOI URL: https://doi.org/10.36713/epra2013 271
HOW LIS PROFESSIONALS ARE PREVENTING OF COVID -19 IN CENTRAL UNIVERSITY LIBRARIES IN UTTAR PRADESH STATE, INDIA: AN ANALYTICAL
STUDY
Prem Prakash Kushawaha1, Prof. M. P. Singh2
1(Ph.D. Research Scholar) DLIS, BBAU, Lucknow 2DLIS, Lucknow
ABSTRACT
The paper highlight the preventing measures of COVID-19 and implication of social distancing among library professionals of central university libraries in Uttar Pradesh. And to examine the opinion of protective against Covid-19 also investigating the medical application usage to safe themselves from COVID-19. The findings of the study, most of the library professionals were adoption of practical approaches to prevent Covid-19, and most of them, were implication themselves the social distancing their surroundings. KEYWORD: Library professionals, preventing measures, adoption, COVID-19 pandemic
1. INTRODUCTION Due to spread of COVID-19 all over world,
public health is a primary objective of the any government in the world. As we know that people depend on progressively more strained by the COVID-19 outbreak. Public health impacts are apparent various ways beyond morbidity and mortality. The numbers of the study over the world indicates that elderly populations (people aged 60 years old and older) loneliness is already a core public health disquiet that is being made not as good as by COVID-19. The mobility and mortality is an important part of the public health response to COVID-19. It was found that elderly mortality rates range from 3.6% to 14.8% in China and are similar in other countries in the world. Isolation, the negative feelings related with perceived social distancing is already a relentless public health anxiety for elderly populations (Wenger et al., 1996). Aloneness is allied with reduced happiness and satisfaction with life, and sadness, which can noticeable in physical health problems (Golden et al, 2009). There are numbers of way that isolation can be addresses as an essential element of public health responses to COVID-19. First, public health agencies of the country should aim to identify how interventions planned to
reduce the spread of COVID-19, such as physical or social distancing, might contribute to lonesomeness. Second, they can revolutionize how they distribute support to elderly. Research on other disaster in other contexts shows implementing interventions thoughtfully and with the appropriate cultural competencies can go far in ensure that affecting and corporeal needs are met during times of catastrophe (Wilkinson, 2018; North & Pfefferbaum, 2013). COVID-19 has carry attack not only China but also most of the country of the world in the present time. The India is not exceptional from its at that time all the universities consisting central, state, deemed, private , schools and colleges are closed for uncertainty period. In this pandemic situation libraries and library professionals are widely role playing to dissemination of information through using information communication technologies. But in this context, various questions arises that how library professionals of the libraries are maintain physical or social distancing during the lockdown period, what are the approaches are usage to reduces the impact of COVID-19.? , and what are frequency of sanitized them self during lockdown period. When we are talk about role of library professionals during lockdown period, it
ISSN (Online): 2455-3662
EPRA International Journal of Multidisciplinary Research (IJMR) - Peer Reviewed Journal Volume: 7| Issue: 9| September 2021|| Journal DOI: 10.36713/epra2013 || SJIF Impact Factor 2021: 8.047 || ISI Value: 1.188
2021 EPRA IJMR | www.eprajournals.com | Journal DOI URL: https://doi.org/10.36713/epra2013 272
seeing that major two aspects of professionals. Firstly without any disruption continue provides accessibility of library services and secondly initiative to sanitized themselves as well as libraries. 2. REVIEW OF LITERATURE
The conducted present study, review of literature is concerned to the library product and services during Covid- 19 pandemic. There are various studies are found related to research questions under the scope. Dadhe, P. P. and Dubey, M. N. (2020) opined that the novel coronavirus (COVID-19) disease presented a special challenges to all the library to sifting remote access facilities for users. Further said that sudden and unexpected outbreak of the virus forced the library professionals, to ascertain ways of working in a speedily time frame like manual to digital environment . Leo F. H. Ma (2020) conducted a study to examine the academic library services during Covid-19. Author mention their study, basically how academic libraries are changing their services for maximum benefits to users, the findings of the study, majority of the developed country libraries are providing remote access facilities to seek information resources and other hand libraries are more emphasizes to subscribes of e- resources . author strongly agree that Covid-19 is given an opportunity to library professional for rethinking about to library services as well as restructure the infrastructure of the library. Similarly Asif and Singh (2020) mention in their study Covid-19 given an opportunity to library for changing the current trends of providing library services to users. Authors state that Covid-19 is provides a platform to enhancing the learning and professional skills, promote the navigate through this challenge and prepared to themselves for new normal life. Rafiq, et.al (2020) discussed about to the university libraries’ response
during the COVID-19 pandemic and determines their working practices, services patterns, strategies applied, and role played. For study, authors were conducted a interview method for data collection to the librarians of seven university libraries. the findings of the study, most of the library physically closed due to Covid-19 pandemic but all the libraries were providing services to users through remote access facilitates and the university portal and other social media tools was used in few numbers for communicated to users during this pandemic. Majority of the library staff was doing work from work and there was no found work load on staff
due to of 24/7 connectivity and without any formal working policy addressing the new working routines. 3. OBJECTIVES OF THE STUDY The objectives of study are as follows -
1. To ascertain the preventing measures of Covid-19 among library professionals of central university libraries in Uttar Pradesh.
2. To find out the followed the social distancing by library professionals.
3. To assess the types of medical procedures usage by library professionals to protect yourself from COVID -19.
4. RESEARCH APPROACH/ METHODOLOGY
The study included online survey method to examine the adoption of practical and scientific approaches to the safe themselves from COVID-19 pandemic. And has tried to explore whether the working professionals have followed the social distancing to the surrounding community. A structure questionnaire containing both closed and open questions was designed that would trace the concerning problems and other aspects of the study. A questionnaire was used as a tools for data collection through using online platform likewise email, WhatsApp and telephonic interview method. In this study, total 255 questionnaires were sent to the library professionals through online and out of them 137 questionnaires were received. The MS- Excel was used as tool for data analysis. 5. SCOPE AND LIMITATIONS
The assessment of the level of preventing measures of COVID -19 in central university libraries in Uttar Pradesh state, India. The physical distancing among library professionals are not reduces the risk of COVID-19 but also implementation of COVID-19 management practices by library professionals are also break the spread COVID-19 in other worker of library staff. The present study is covered only central university libraries in Uttar Pradesh state of India. The limited universities are in Uttar Pradesh state Aligarh Muslim University, Babasaheb Bhimrao Ambedkar University, Banaras Hindu University and University of Allahabad.
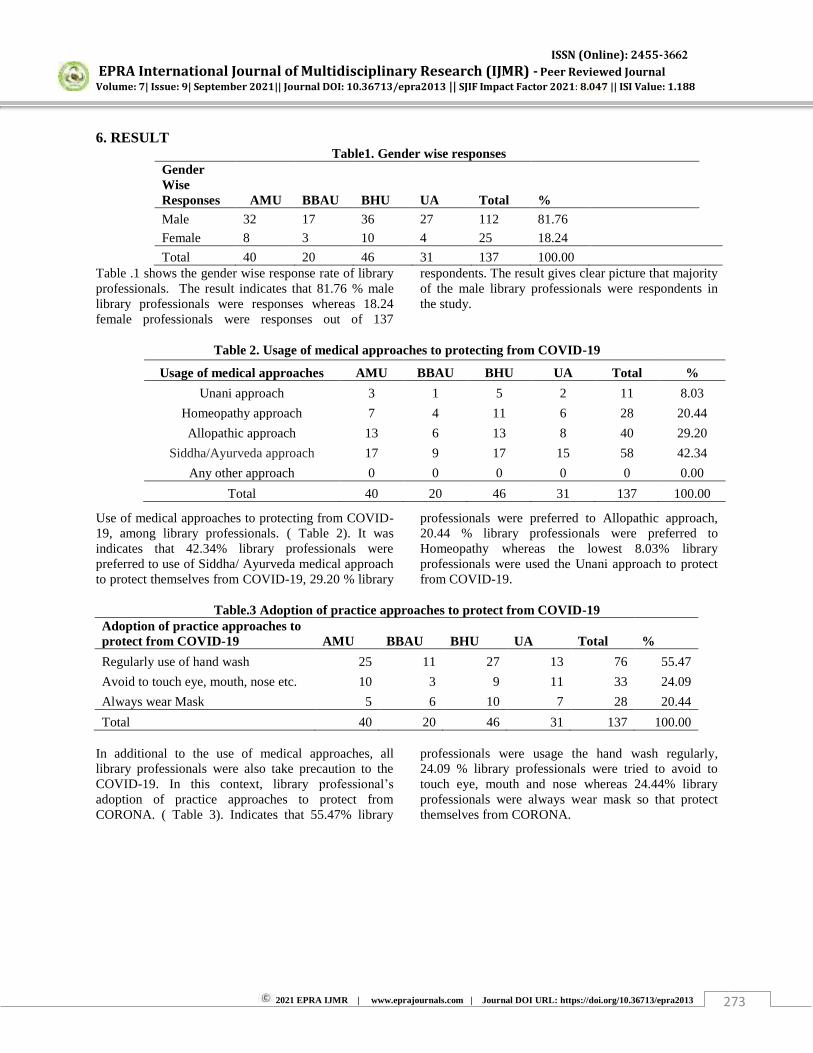
ISSN (Online): 2455-3662
EPRA International Journal of Multidisciplinary Research (IJMR) - Peer Reviewed Journal Volume: 7| Issue: 9| September 2021|| Journal DOI: 10.36713/epra2013 || SJIF Impact Factor 2021: 8.047 || ISI Value: 1.188
2021 EPRA IJMR | www.eprajournals.com | Journal DOI URL: https://doi.org/10.36713/epra2013 273
6. RESULT Table1. Gender wise responses
Gender Wise Responses AMU BBAU BHU UA Total % Male 32 17 36 27 112 81.76
Female 8 3 10 4 25 18.24
Total 40 20 46 31 137 100.00
Table .1 shows the gender wise response rate of library professionals. The result indicates that 81.76 % male library professionals were responses whereas 18.24 female professionals were responses out of 137
respondents. The result gives clear picture that majority of the male library professionals were respondents in the study.
Table 2. Usage of medical approaches to protecting from COVID-19
Use of medical approaches to protecting from COVID-19, among library professionals. ( Table 2). It was indicates that 42.34% library professionals were preferred to use of Siddha/ Ayurveda medical approach to protect themselves from COVID-19, 29.20 % library
professionals were preferred to Allopathic approach, 20.44 % library professionals were preferred to Homeopathy whereas the lowest 8.03% library professionals were used the Unani approach to protect from COVID-19.
Table.3 Adoption of practice approaches to protect from COVID-19
Adoption of practice approaches to protect from COVID-19 AMU BBAU BHU UA Total %
Regularly use of hand wash 25 11 27 13 76 55.47
Avoid to touch eye, mouth, nose etc. 10 3 9 11 33 24.09
Always wear Mask 5 6 10 7 28 20.44
Total 40 20 46 31 137 100.00 In additional to the use of medical approaches, all library professionals were also take precaution to the COVID-19. In this context, library professional’s adoption of practice approaches to protect from CORONA. ( Table 3). Indicates that 55.47% library
professionals were usage the hand wash regularly, 24.09 % library professionals were tried to avoid to touch eye, mouth and nose whereas 24.44% library professionals were always wear mask so that protect themselves from CORONA.
Usage of medical approaches AMU BBAU BHU UA Total %
Unani approach 3 1 5 2 11 8.03
Homeopathy approach 7 4 11 6 28 20.44
Allopathic approach 13 6 13 8 40 29.20
Siddha/Ayurveda approach 17 9 17 15 58 42.34
Any other approach 0 0 0 0 0 0.00
Total 40 20 46 31 137 100.00
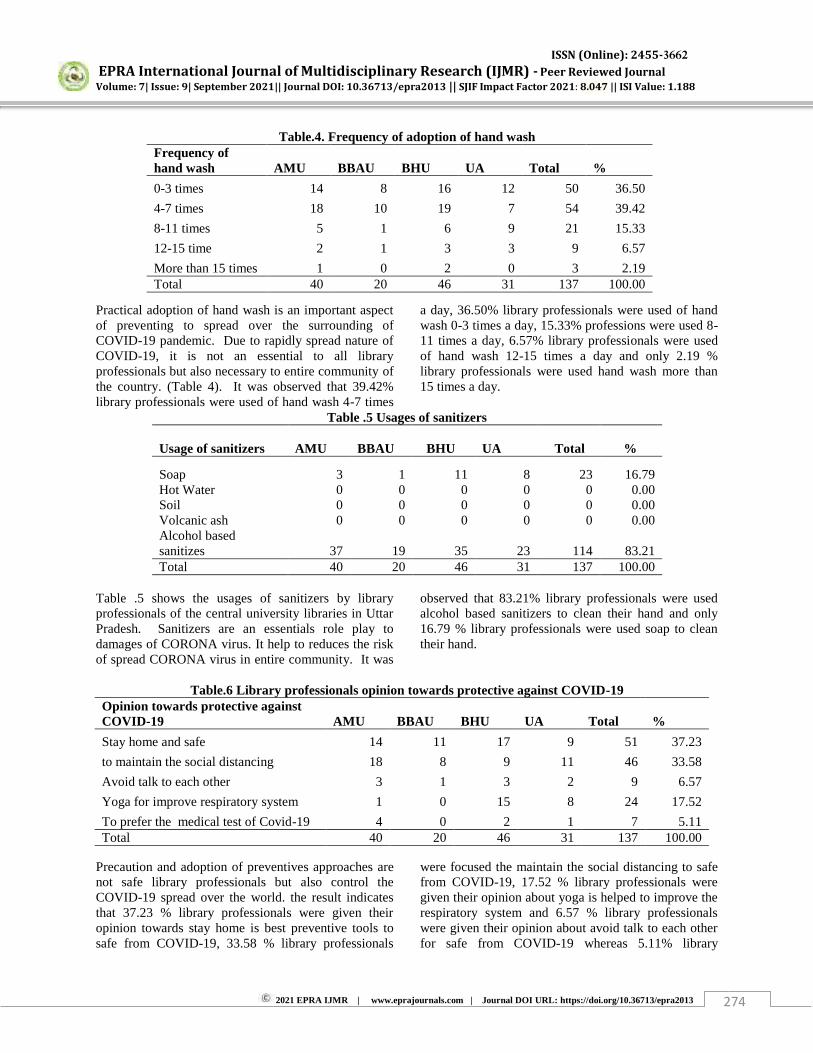
ISSN (Online): 2455-3662
EPRA International Journal of Multidisciplinary Research (IJMR) - Peer Reviewed Journal Volume: 7| Issue: 9| September 2021|| Journal DOI: 10.36713/epra2013 || SJIF Impact Factor 2021: 8.047 || ISI Value: 1.188
2021 EPRA IJMR | www.eprajournals.com | Journal DOI URL: https://doi.org/10.36713/epra2013 274
Table.4. Frequency of adoption of hand wash Frequency of hand wash AMU BBAU BHU UA Total %
0-3 times 14 8 16 12 50 36.50
4-7 times 18 10 19 7 54 39.42
8-11 times 5 1 6 9 21 15.33
12-15 time 2 1 3 3 9 6.57
More than 15 times 1 0 2 0 3 2.19 Total 40 20 46 31 137 100.00
Practical adoption of hand wash is an important aspect of preventing to spread over the surrounding of COVID-19 pandemic. Due to rapidly spread nature of COVID-19, it is not an essential to all library professionals but also necessary to entire community of the country. (Table 4). It was observed that 39.42% library professionals were used of hand wash 4-7 times
a day, 36.50% library professionals were used of hand wash 0-3 times a day, 15.33% professions were used 8-11 times a day, 6.57% library professionals were used of hand wash 12-15 times a day and only 2.19 % library professionals were used hand wash more than 15 times a day.
Table .5 Usages of sanitizers
Usage of sanitizers AMU BBAU BHU UA Total %
Soap 3 1 11 8 23 16.79 Hot Water 0 0 0 0 0 0.00 Soil 0 0 0 0 0 0.00 Volcanic ash 0 0 0 0 0 0.00 Alcohol based sanitizes 37 19 35 23 114 83.21 Total 40 20 46 31 137 100.00
Table .5 shows the usages of sanitizers by library professionals of the central university libraries in Uttar Pradesh. Sanitizers are an essentials role play to damages of CORONA virus. It help to reduces the risk of spread CORONA virus in entire community. It was
observed that 83.21% library professionals were used alcohol based sanitizers to clean their hand and only 16.79 % library professionals were used soap to clean their hand.
Table.6 Library professionals opinion towards protective against COVID-19
Opinion towards protective against COVID-19 AMU BBAU BHU UA Total %
Stay home and safe 14 11 17 9 51 37.23
to maintain the social distancing 18 8 9 11 46 33.58
Avoid talk to each other 3 1 3 2 9 6.57
Yoga for improve respiratory system 1 0 15 8 24 17.52
To prefer the medical test of Covid-19 4 0 2 1 7 5.11 Total 40 20 46 31 137 100.00
Precaution and adoption of preventives approaches are not safe library professionals but also control the COVID-19 spread over the world. the result indicates that 37.23 % library professionals were given their opinion towards stay home is best preventive tools to safe from COVID-19, 33.58 % library professionals
were focused the maintain the social distancing to safe from COVID-19, 17.52 % library professionals were given their opinion about yoga is helped to improve the respiratory system and 6.57 % library professionals were given their opinion about avoid talk to each other for safe from COVID-19 whereas 5.11% library
ISSN (Online): 2455-3662
EPRA International Journal of Multidisciplinary Research (IJMR) - Peer Reviewed Journal Volume: 7| Issue: 9| September 2021|| Journal DOI: 10.36713/epra2013 || SJIF Impact Factor 2021: 8.047 || ISI Value: 1.188
2021 EPRA IJMR | www.eprajournals.com | Journal DOI URL: https://doi.org/10.36713/epra2013 275
professionals were given the focused to the medical test of COVID -19. 6. DISCUSSION
As the result suggests that most of the library professionals are adopted of preventive approaches to safe them from COVID-19. Which shows that most of them use of sanitizers and some other professionals are used substitute of sanitizers. The following section discusses the most important preventing measures found on the library professionals- 6.1. Usage of medical approaches to protecting from COVID-19 Due the development of advance medical science and different approaches to treatment of diseases, it is necessary to examine the impact of particular approaches to control and remedies of COVID- 19. The result indicates that most of the library professionals are usages Siddha/Ayurveda approach to improve their immunity. 6.2.Adoption of practice approaches to protect from COVID-19 The adopted of various practical approaches, it must can be control and reduces of risk to spread of COVID-19 in the entire community. The study found that majority of the library professionals are regular clean their hand with alcohol based sanitizers and most of them are avoided to touch their eye, nose, mouth etc. 6.3 .Frequency of adoption of hand wash The continued use of sanitizers is major aspects to control and decrease the risk of COVID-19 in entire community. The result indicates that most of the library professionals are sanitized themselves 4 to 7 times a day to prevent the COVID-19. 6.4. Use of sanitizers The previous study indicates that alcohol based sanitizers are not only preventing the COVID-19 but also hot water, soap etc. are efficient to prevent the spread of COVID-19. In this context, asked questions to the respondents about to sanitize themselves. It was observed that majority of the library professionals are used a alcohol based sanitizers to sanitized themselves and a few professionals are used soap as sanitizers. 6.5. Library professional’s opinion towards protective against COVID-19 Due the spread nature and changing mutation of virus, it is not only essential to sanitized to geographical areas and hand, eyes and nose of human being but also necessary to followed the social distancing, stay home,
physical communication caps, to improve immune system of the body and COVID-19 testing are widely role play the minimize the effects of COVID-19. The study indicates that majority of the library professionals are agreed stay home is the best solution to protective against COVID-19. 7. RECOMMENDATION
The government of India and collaboration with international level association like WHO, Indian Council of Medical Research should be formulated minimum social distancing, sanitized policy not only library professionals but also entire community of India. Similarly the local government agencies should be framing the some standard policy so that prevent the spread of COVID-19 in local community. Further all the international and national level organization should be provide medical facilities and training program at local level and awareness program about how to prevent COVID-19 in community. 8. CONCLUSION
The adoption of precaution and use of preventive approaches are widely role play to minimize the risk of COVID-19. Due to spread nature of COVID-19, it is essential to library professionals as well as entire community of the India to reconstruction their habits, working style and follow the instruction of government about to COVID-19. There is a need of present hour to control the COVID-19 pandemics through followed the social distancing, use of sanitizes and wear mask are the major component of reducing the risk of COVID-19. The study evaluates the adoption of preventing measure fight to COVID-19 and also to examine those factor are more efficient to prevent this pandemic. The findings of the study will be helpful to entire community of India to prevent the COVID-19 and safe themselves from this pandemic. REFERENCES
1. Rafiq, M. et.al(2020). University libraries response to COVID-19 pandemic: A developingcountry perspective. The Journal of Academic Librarianship, 47
2. Asif, M. and Singh, K. K. (2020). Trends, opportunities and scope of libraries during Covid-19 pandemic. IP Indian Journal of Library Science and Information Technology, 5(1), 24-27
3. Dadhe, P. P. and Dubey, M. N.(2020). Library Services Provided During COVID-19 Pandemic: Content Analysis of Websites of Premier Technological Institutions of India. Library Philosophy and Practice
4. Leo F. H. Ma (2020) Academic Library Services during COVID-19: The Experience of CUHK
ISSN (Online): 2455-3662
EPRA International Journal of Multidisciplinary Research (IJMR) - Peer Reviewed Journal Volume: 7| Issue: 9| September 2021|| Journal DOI: 10.36713/epra2013 || SJIF Impact Factor 2021: 8.047 || ISI Value: 1.188
2021 EPRA IJMR | www.eprajournals.com | Journal DOI URL: https://doi.org/10.36713/epra2013 276
Library, International Information & Library Review, 52:4, 321-324, DOI:10.1080/10572317.2020.1834251
5. Islam, M. T., El-kersh, C. S. D. M., Jamaddar, S., Uddin, S. J., Shilpi, J. A., & Mubarak, M. S. (2020). Natural products and their derivatives against coronavirus : A review of the non-clinical and pre-clinical data. Retrieved from. https://doi.org/10.1002/ptr.6700
6. Wilkinson, O. (2018). ‘Faith can come in, but not
religion’: secularity and its effects on the disaster
response to Typhoon Haiyan. Disasters, 42, 459-474 7. Levine, E.K & Kogan, V. (2016) Pushing the City
Limits: Policy Responsiveness in Municipal Government. Urban Affairs Review, 52 (1), 3–32.
8. North, C. S., & Pfefferbaum, B. (2013). Mental health response to community disasters: a systematic review. Jama, 310(5), 507-518.
9. Golden, J., Conroy, R. M., Bruce, I., Denihan, A., Greene, E., Kirby, M., & Lawlor, B. A. (2009). Loneliness, social support networks, mood and wellbeing in community.
10. Wenger, G. C., Davies, R., Shahtahmasebi, S., & Scott, A. (1996). Social isolation and loneliness in old age: review and model refinement. Ageing & Society, 16(3), 333-358.
ISSN (Online): 2455-3662
EPRA International Journal of Multidisciplinary Research (IJMR) - Peer Reviewed Journal Volume: 7| Issue: 9| September 2021|| Journal DOI: 10.36713/epra2013 || SJIF Impact Factor 2021: 8.047 || ISI Value: 1.188
2021 EPRA IJMR | www.eprajournals.com | Journal DOI URL: https://doi.org/10.36713/epra2013 277
WOMEN’S ROLE IN INDIAN ADMINISTRATION
Dr.Vinay P.Raut Assistant Professor and Head, Department of Political Science,
Vikas College of Arts ,Science and Commerce Kannamwar Nagar – 2, Vikhroli ( East ), Mumbai – 400083,Maharashtra. India.
ABSTRACT All India Services - Indian Administrative Service (IAS) and Indian Police Service (IPS) were in existence from the British era. Before 1947 Indian Civil Services had dominance of men but the women entered these services just few decades ago. Today, though women has only 20% of decision – making positions in public and private region, and worldwide women are featured only 1% to 5 % at top positions in organizations. In 2015 mere 12% in Indian Administrative Service and 6.3% in Indian Police Service were recorded. This paper and the research reveals the factual of gender equality in the services and mainly how women are underrepresented in Indian Administrative Service and how three main factors like Organisational factor, Institutional and Cultural factor and ultimately Personal factor hurdles their participation in the services. KEYWORDS : Women, Indian Administrative Service, Civil Service, Gender Equality. INTRODUCTION
An easy political transformation of any country largely depends on its Bureaucracy or Civil Services, which also considered being a strong backbone of Indian administration. All India Services acts as a middle alliance around the gamut of governance. Maintenance of Law and Order, Policy formulation and Implementation and Public Goods and Service are key functions of Administration. Presently about 7.2 million civil servants are serving the country catering the needs of 1.3 billion population belonging to different cultural, social, economical and religious background. Few decades ago women entered the civil service, but they were appointed and restricted to the lower level positions in all sectors of administration. This paper features briefs framework of civil services, presence of women in All India Service and most importantly the challenges faced at the entry level by women in the services. GENDER DISCRIMINATION & GENDER EQUALITY
Gender standpoint has its own importance for development of any country as it refers to society’s
social, cultural and economical features and openings related to men and women. A gender is socially determined by its personal and psychological uniqueness associated with being male or female
masculinity and femininity. Hence it is very important to learn and understand the problems faced by women in phases of their life. Gender quality is not gender equity as it demands to achieve equal outcome men and women located in different socio-culture and wherein women expresses more formal and technical equivalence. Gender equity calls for reconsideration and deconstruction of dominance with dialogue to lessen gender discrimination, especially of women. CIVIL SERVICE POST INDEPENDENCE
The past generation passed on the current unified administrative system because of its unique familiarity and suitability to uphold integrity of our country, where clearly the civil services in India features academic success, career, permanence, wages and post service pension. Key posts at Union, State and District are solely reserved for the services categorizing it into three segments, firstly people serving both the centre and state are known as All India Services, secondly union government employees are known as Central Civil Services and lastly employees serving the state are known as State Civil Services. The preliminary committee did not provide constitutional status to the All India Services, it was Sardar Vallabhbhai Patel, first Home Minister of India and also known as Father of All India Services included AIS in supreme law of land and provided the
ISSN (Online): 2455-3662
EPRA International Journal of Multidisciplinary Research (IJMR) - Peer Reviewed Journal Volume: 7| Issue: 9| September 2021|| Journal DOI: 10.36713/epra2013 || SJIF Impact Factor 2021: 8.047 || ISI Value: 1.188
2021 EPRA IJMR | www.eprajournals.com | Journal DOI URL: https://doi.org/10.36713/epra2013 278
constitutional status. The main objectives of the government for creating AIS was for maintaining unity, integrity and uniform standards of administration, secular and non - sectarian outlook, efficiency, competence and professionalism and lastly integrity and idealism. REPRESENTATION OF WOMEN IN INDIAN PUBLIC ADMINISTRATION
Earlier Indian Civil Service was only male service before 1947, post Independence, Constitution of India permitted women to be hired into administrative services which was mainly in public sector. Though women were seen in the postal, medical, educational services but were posted only on lower levels, merely 25.5% women are part of the work force in India, 20% positions in public sector and sadly less than 15% of senior civil service posts in the government. Apparently, 5.6% women make up in Indian Police Services, the highest visibility of women is seen in Indian Postal Services with 23% in hand with 18.3% in Indian Account & Audit Service. FACTORS PREVENTING WOMEN PARTICIPATION IN CIVIL SERVICES Below mentioned are the open secret factors which prevents women’s visibility in civil services of India. Personal Factor –
Indian women is rooted very differently in social and family surrounding, personal factor holds women’s behavior, awareness and attitude into their
professional as well as private life. Childhood upbringing and tutoring women prioritization of their domestic role with family members, elders, marriage and childcare responsibilities take over their career ambition. The key factor of lack of education is seen as the biggest hurdle for women’s entry into civil services
and certainly gender discrimination exists from childhood and because of which there is a major gap in male and female literacy. Organisational Factor –
Male decision making styles, their dialogues and language that shut women out are seen as key hurdles that obstruct women’s career. The old organizational
culture where women are reluctant to self promote their achievements makes them institutionally invisible, whereas well – qualified women for academic positions however fails to be selected. Usually politicians and bureaucrats plays key role in gender discrimination with dirt psychology that men are more natural leaders and superior than women. Institutional and Cultural Factor –
Socio – Cultural and Institutional factors which are deeply rooted have immensely restricted women’s
participation. Gender roles with strong and different values create obstruction in the career path of women and majorly the traditional cultural attitude limits gender equality in Indian society. The key reasons that restrict openings for women in public life and political life is because of the dual burden they carry of domestic and professional responsibility and of course the economical resource constraints. Usually women are kept away from main resources like cultural, economical and political resources which are the basics of entry into public institutions. CONCLUSION
Women attaining the top of UPSC results often fail before the male firewall of civil services, looking back into the past except the year 2013m women has been bagging the most in demand slots and prestigious posts in civil services, but to eradicate gender inequality from civil services is still a distant dream. In the so called backbone of Indian administration women are not adequately represented, I can say that because if you peep in past three years figures there is decline in bright and successful women been observed in civil services. With such stereotype mentality, gender discrimination and limiting their career horizons how can our system facilitate women’s equal participation
in the civil services, and because of this institutionalization pattern beliefs and practices its naturally assumed that women are not interested or less available for leadership positions.
Why women make their career decisions considering issues of their family and men make their family decisions considering issues of their career, this impact of gender inequality is weakening the governance. If that’s not enough than the difficulties
such as class, caste and religion differences credited to women and men are recreated, manipulated and maintained in race of state power and resource allocation. Global study too indicates that women are placed differently in public institution, so it’s said that
gender in governance is more about focusing on women underrepresentation. REFERENCES
1. (2017). Attitudes, Anxieties and Aspirations of India‟s
Youth: Changing patterns. 2. http://www.civilservice.gov.uk/about/facts/statistics
CSDS-KAS Report. (2017). 3. Key findings from the Youth Study of Dwivedi, P. O.
Jain & Dua, (1989) 4. Civil Services Survey – A Report. 5. Union Public Service Commission, Annual Report
from 2002 to 2015.
ISSN (Online): 2455-3662
EPRA International Journal of Multidisciplinary Research (IJMR) - Peer Reviewed Journal
Volume: 7| Issue: 9| September 2021|| Journal DOI: 10.36713/epra2013 || SJIF Impact Factor 2021: 8.047 || ISI Value: 1.188
2021 EPRA IJMR | www.eprajournals.com | Journal DOI URL: https://doi.org/10.36713/epra2013 279
THE NEW WAVE OF AUTHORITARIANISM POPULISM: THE CRISIS OF LIBERAL DEMOCRACY IN
CONTEMPORARY INDIA
Zulafqar Ahmed
1Zulafqar Ahmed is Doctoral Fellow at the department of Political Science, Aligarh Muslim University.
ABSTRACT The crisis of liberal democracy is not new to us. It has been facing multiple crises during different phases of history. In the neo-liberal global order, liberal democracy has been facing several new challenges such as, unequal distribution of economic resources, widening income gap, authoritarianism, cynicism, and neo-liberal governability coupled with rising unemployment and militant attacks that has provided space to the rise of right-wing populism and authoritarianism across the globe and India as well. The crisis of liberal democracy is a global phenomenon in the sense that the Strongmen of 21st century are undermining it across the globe. Against this backdrop this paper try to decipher what are the factors which play pivotal role in the emergence of authoritarian populism across the world in general and India in particular.
KEYWORDS: Crisis, Democracy, Cynicism, Authoritarianism, Strongmen.
INTRODUCTION Liberal democracy has been the most suitable style of governance across the globe. Though, it has faced multiple challenges throughout the different epochs of history but despite of this, it managed to survive during the turbulent years only because of its self-correcting nature. Fortunately, it survived even during the tempestuous decade of 1920s when authoritarian regimes like Fascism and Nazism began to strengthening their footholds in Europe. The exquisiteness of this system unlike the other style of governance is; it accepts the criticism and provides space for deliberation and rectification. Ironically, liberal democracy got trapped into the crisis when we began taking it for granted. The Harvard university professor rightly pointed out in his book „People vs.
Democracy‟ that “On the one side, we see the rise of “illiberal
democracies” governments that claim to represent
the “real” people of the nation, but have little
regard for the individual or constitutional norms. Many refer to these movements as populist. At the same time, other flirt with what Mounk calls “Undemocratic liberalism”, a style of governance
which preserves rights but at the expense of democratic engagement and accountability.”(Sitaraman 2018)
With the upsurge of populist movement in liberal democracy certain section of the society stated feeling deprived or marginalized that eventually instigated them against the ruling elites. In this obnoxious cycle of populists and marginalized; it is the liberal democracy which got assaulted. Political sociologist Larry Diamond warned of „democratic recession‟. He
argues, “His apprehensions were, since 2006, democratic breakdowns have increased, the quality and stability of democracy in major emerging nations like Turkey and Hungary has declined, deepening of authoritarianism in states like Russia and China, poor performance of democracy in US and other influential counties; and lack of will to promote democracy abroad.”(Chung 2019)
There are many scholars like Larry Diamond, Yascha Mounk, Alen Toplisek, Daniel Ziblatt and Ziya Onis1 who recently warned us about the crisis of liberal democracy. According to them, there are many crises which liberal democracy is facing today like, neo-liberalism, authoritarianism, populism, Globalization etc.
1 These scholars have warned us about the crisis of liberal democracy and have suggested measures how to save it.

ISSN (Online): 2455-3662
EPRA International Journal of Multidisciplinary Research (IJMR) - Peer Reviewed Journal
Volume: 7| Issue: 9| September 2021|| Journal DOI: 10.36713/epra2013 || SJIF Impact Factor 2021: 8.047 || ISI Value: 1.188
2021 EPRA IJMR | www.eprajournals.com | Journal DOI URL: https://doi.org/10.36713/epra2013 280
This article is framed as follows. I begin with the brief discussion that how Neo-liberalism is posing threat to the liberal democracy in Neo-liberal world order by reducing its political realms to the maximum extent and by undermining the decision-making powers of sovereign states. I also discuss how the increasing income gap between rich and poor is providing fertile grounds to the protests that are erupting against economic inequality and social injustice across the globe. Further, we emphasis on how neo-liberal policies of the governments are aggravating the complications and anxieties of the marginalized. In second part of the paper, I use ideological lens to understand that how the new wave of authoritarian populism is relentlessly undermining the core of liberal democracy. In this part special emphasis has been given on countries such as, Hungary, Poland, Turkey, and India. Finally, I use multivariate analysis to show that how people across the globe are cynical about the functioning of democratic institutions in their respective countries. NEO-LIBERALISM AND THE CRISIS OF LIBERAL DEMOCRACY The emergence of Neo-liberalism came after the world wide economic crisis of 1970s and the fiscal deficit faced by the developed countries.2 Neo-liberalism was seen as a „political project‟ to overcome these
economic crises. This project made the new paradigm shift that state and society should not control the market rather market should control the state and society. It was based on the idea that economic rationality should be expanded to non-economic realms and institutions (Brown 2005). Generally, neo-liberalism aimed at to expand the economic rationality into every sphere of life and to reduce the moral and political decision into cost-benefits analysis that includes all aspects of social and political life into economic calculation. None of moral values and political decision of liberal democracy fit into this economic calculation. The nucleus of neo-liberalism is to remove the state‟s regulation from market and to reduce the
responsibilities of state from individual life. In other words, it curtails the political realm to the maximum extent and focuses more upon the expansion of economic realm in ever sphere of life. Neo-liberalism is
2 In 1970s the whole world witnessed economic crisis, especially, the countries like United States, Western Europe New Zealand, Australia, and Canada. Experts believe that these economic crises occurred due to the upsurge in oil prices.
affecting each sphere of individual life; be it the political representation or social recognition of an individual. Neo-liberalism is gradually turning democracy into „competitive oligarchies. Further, it
augments the interest of ruling class by unfair policy making (Mounk 2018). Consequently, it leads to the erosion of democracy so the trust of people from the institutions of democracy. Neo-liberalism can‟t stop
chaos and instability that arises from increasing inequality. It increases trust deficit between the people and government that eventually leads to the collapse of social infrastructure on which the foundation of liberal democracy relies. The liberal democracy in the era of neo-liberalism is unable to respond the political, economics, and social demands of public due to lack of policy orientation and financial resources (E.Stiglitz 2002). So far, we have seen that neo-liberalism is posing threat to liberal democracy by gradually intensifying inequality, reducing political realm, undermining autonomy of policy-making, distorting and neutralizing representative institutions, creating crisis of legitimacy. Democratic governments find it difficult to respond the demands of people in the era of neo-liberalism, and people trust on democracy has been declining swiftly. Therefore, people‟s call for
democratic reforms across the world is getting louder day by day. WIDENING ECONOMIC INEQUALITY Arguably, political and social equality is just a mirage without economic equality. The widening income gap between rich and poor in the neo-liberal world is quite perturbing. It is argued that no other style of governance can provide more conducive environment for capitalism to flourish than democracy. Due the advancement of capitalism the income gap between rich and poor is widening swiftly. The unequal distribution of resources in the neo-liberal world has grossly generated insecurities for the marginalized sections of society across the globe. The world Social Report 2020 says that
“Inequality in a rapid changing world comes as
we confront the harsh realities of a deeply unequal global landscape. In North and South alike, mass protest have flared up, fueled by a combination of economic woes, growing inequalities and job insecurity. Income disparities and lack of opportunities are creating a vicious cycle of inequality, frustration and discontent across generations.” (World social report 2020 2020)
ISSN (Online): 2455-3662
EPRA International Journal of Multidisciplinary Research (IJMR) - Peer Reviewed Journal
Volume: 7| Issue: 9| September 2021|| Journal DOI: 10.36713/epra2013 || SJIF Impact Factor 2021: 8.047 || ISI Value: 1.188
2021 EPRA IJMR | www.eprajournals.com | Journal DOI URL: https://doi.org/10.36713/epra2013 281
Protests have flared up across the globe from the last few years. Although, each protest has had different trigger but the underlying frustration of all the protests is same. Almost, all the protests got triggered because of economic concerns which people have been facing in the neo-liberal world. Due to economic reforms (liberalization & privatization) welfare policies of the states have taken back steps. Unresponsive and ill-formed policies of governments are unable to meet the demands of masses which eventually generate cynicism among the masses regarding ruling dispensations. According to India inequality report 2018
“The wealth held by the richest 100 billions,
increased from $49 billion in 2004 to $ 479 in 2017; the wealth held by the billionaires, increased almost 10 times in a decade. There has been a steady rise in the numbers of billionaires in 2004 to 46 in 2012 and 101 in 2017. India is fourth, behind USA, China, and Germany in the numbers of billionaires.”(India inequality report 2018) In India‟s case, from the post-economic reforms
the gap between rich and poor has got widened. Recently, Prime Minister Narendra Modi advised people to become „Atmanirbhar. To being atmanirbhar in the liberal democracy is convenient for elites but it would be brutal for marginalized. As Oshik Sircar pointed out in his recent article that “India as a state is both, political organization and mercantile company.”(Sircar 2020) This mercantile company has benefitted more to Crony capitalists than marginalized sections of the society.3
It is argued that economic inequality always leads to unrest in the society. If the economic resources of the country are distributed equally then there remain less chances of instability. The unrest often takes place in those counties where the income gap between elites and common citizens is wider. The unequal distribution of wealth and income would adversely affect the individual ability to actively participate in the democratic process. Consequently, it would generate procedural inequality to the extent that those who posses less wealth and income may not get the same benefits from the government‟s schemes and policies as
those who posses more wealth and income. Surely, equal distribution of economic resources would strengthen the democratic process and eventually it
3 It has been noticed that the number of billionaires have increased tremendously across the globe since past few years and India is not the exception to this case, whereas, the economic conditions of marginalized is deploring with every passing day.
would reduce pressure from the redistributive system. Moreover, it would restore the individual trust on the democratic institutions when a democratic regime would set a fair tax rate system for the purpose of redistribution. RISE OF AUTHORITARIANISM POPULISM It was cultural theorist Stuart Hall who coined the term „authoritarian populism‟ to refer it a specific kind of
conservative politics. He argued that “Authoritarian populism was characterized by the construction of contradiction between the common people and elites, which is then used to justify the imposition of repressive measures by the state. According to Hall, such a contradiction was constructed in part by depicting specific groups as ominous other – that is, as a threat to and an enemy of the interests of putative people. The Other-typically political dissidents and minority groups- is in made the target of repression and punitive discipline, all in the name of supposed common interest. In this process conservative forces tighten their grip on society and body politics, to the detriment, obviously, of democratic life.” (Nilsen 2018) Although, the context of Hall arguments may be
different but it proves true to countries like, India, Hungary, Poland, and Turkey. The first strategy that populist leaders adopt is to create „mythical others‟.
They create something which made putative people believe that „mythical others‟ could harm their interest.
By keeping fear, anxieties, and threat of loss of pride in mind they eventually end up to elect strongmen as their protectors. These populists divide people between elites and masses and tell them if they come to the power then they will resolve all social, political, and economic problems. They continuously create enemies because when they get failed in fulfilling demands of the people then they fall back on this narrative that national enemies still exist4. Populists often attack those institutions which they believe may pose threat to them like, media is attacked because of exposing their „hidden agendas‟ judges are ousted as making ruling
against „popular will‟ opposition parties are attacked as
they are „anti-nationals‟ or enemies of the nation.
Jason Stanley rightly pointed out that
4 Victor Orban, Reccep Tayyib Erdogan, Donald Trump, and Narendra Modi are the best examples of populists who came to power by invoking all these tactics to manipulate majority of voters in their favor.
ISSN (Online): 2455-3662
EPRA International Journal of Multidisciplinary Research (IJMR) - Peer Reviewed Journal
Volume: 7| Issue: 9| September 2021|| Journal DOI: 10.36713/epra2013 || SJIF Impact Factor 2021: 8.047 || ISI Value: 1.188
2021 EPRA IJMR | www.eprajournals.com | Journal DOI URL: https://doi.org/10.36713/epra2013 282
“Non-democratic rule has made this tactic of undermining the independent judiciary particularly salient, as both counties introduced laws to replace independent judges with the party loyalists soon after anti-democratic regimes took power officially, the justification was that prior practices of judicially neutrality were a mask for a bias against the ruling party. In the name of rooting out corruption and supposed bias, fascist politicians attack and diminish the institution that might otherwise check powers.”(Stanley 2018)
Populists tend to simplify politics and make people believe that solution of political and social problems is quite easy. They also create this discourse that if they come to the power then they will swiftly resolve all problems after considering public will. According to Muller,
“Populism is a „permanent shadow‟ and „real
danger‟ to modern representative democracy.
However, the widespread increase in populist powers in advanced, western democratic nations shares a special factor; the reaction against the helplessness and loss of legitimacy demonstrated by the liberal democracy at a time when globalization has significantly progressed. They seek to „repoliticize‟ key matters that
impact people‟s lives, rising up against
depoliticization, and warn of representative democracy‟s failure to properly represent the
people‟ will through „the direct revelation of
popular will‟.” (Mounk, 2018; Mudde, 2015) Since few years a new movement of authoritarianism populism has tightened its grip in different countries of the world. Authoritarianism populism coupled with far-right nationalism has emerged in the counties like Hungary, India, Poland, Turkey, USA and Netherlands. Recently, both Hungary and Poland witnessed swift transition from democratic state to authoritarian state. There has been a latent authoritarian force (fascism) in democracies like India, USA, Hungary, and Poland. Similar actions were taken in Turkey by the president Reccep Tayyip Erdagon. He dismissed more than 5,000 thousands Deans and Professors from their post in the suspicion that they were either having pro-democracy or pro-left
sentiments. It is argued that by that move he attacked the very idea of higher education and university. Dissenting voices were crushed in the fear of toppling of regime. It all doesn‟t stop here, in 2017, when
Erdagon won National Referendum he introduced a new educational curriculum for schools. The purpose of this move was to de-emphasis secular ideals and eliminates scientific theories that counter religious ideology. 5
India is almost replica of what happened in above mentioned countries. In 2014, when Narendra Modi led BJP government took the rein of power then authoritarianism began casting its shadow on Indian democracy. As it‟s argued, authoritarianism is inversely proportionate to liberalism. It adversely affects individual freedom such as freedom of speech, freedom of movement, dress/marriage food etc. Since past few years every freedom of individual has been crushed, universities were attacked, curriculum of the schools was changed, professors and journalists were charged in the fabricated cases. Moreover, the power-checking institutions of the state were crippled down. It won‟t be
wrong to state that a new kind of “Surveillant state” has
been created which eventually amputated „Liberal‟ from the Indian democracy.
Besides, there are some countries where populist party took over the charge like, in UK Independence Party was successful in initiating the Brexit referendum. The populist party of Sweden, Germany, Netherlands and Spain secured second or third party status in their respective general election. This is a new advancement in the field of politics as the influence of key political parties is declining and populists are setting up new agendas which are agreeable to all.
5 The very first thing populist do before the elections is they try to uproot the secular and democratic values of any society. They exploit the fault lines which exist between different groups so that the narrative of „Us‟
vs. „Them‟ could be generated for ripening the
maximum benefits.
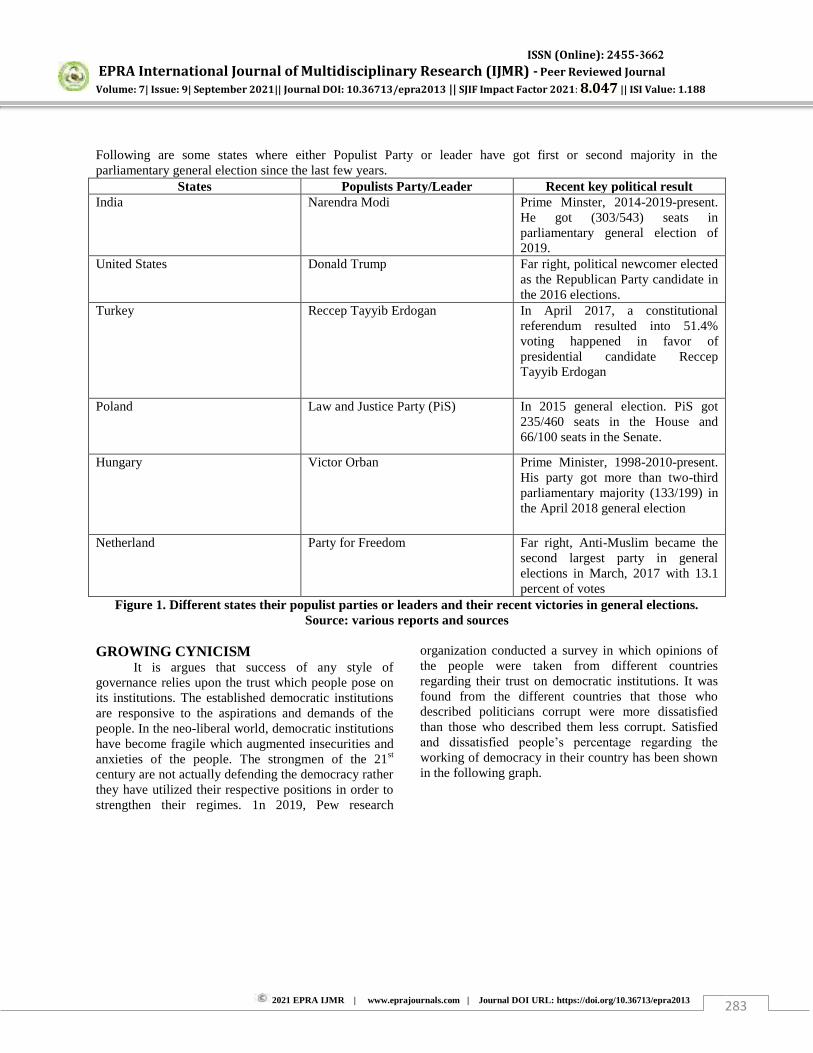
ISSN (Online): 2455-3662
EPRA International Journal of Multidisciplinary Research (IJMR) - Peer Reviewed Journal
Volume: 7| Issue: 9| September 2021|| Journal DOI: 10.36713/epra2013 || SJIF Impact Factor 2021: 8.047 || ISI Value: 1.188
2021 EPRA IJMR | www.eprajournals.com | Journal DOI URL: https://doi.org/10.36713/epra2013 283
Following are some states where either Populist Party or leader have got first or second majority in the parliamentary general election since the last few years.
States Populists Party/Leader Recent key political result India Narendra Modi Prime Minster, 2014-2019-present.
He got (303/543) seats in parliamentary general election of 2019.
United States Donald Trump Far right, political newcomer elected as the Republican Party candidate in the 2016 elections.
Turkey Reccep Tayyib Erdogan In April 2017, a constitutional referendum resulted into 51.4% voting happened in favor of presidential candidate Reccep Tayyib Erdogan
Poland Law and Justice Party (PiS) In 2015 general election. PiS got 235/460 seats in the House and 66/100 seats in the Senate.
Hungary Victor Orban Prime Minister, 1998-2010-present. His party got more than two-third parliamentary majority (133/199) in the April 2018 general election
Netherland Party for Freedom Far right, Anti-Muslim became the second largest party in general elections in March, 2017 with 13.1 percent of votes
Figure 1. Different states their populist parties or leaders and their recent victories in general elections. Source: various reports and sources
GROWING CYNICISM
It is argues that success of any style of governance relies upon the trust which people pose on its institutions. The established democratic institutions are responsive to the aspirations and demands of the people. In the neo-liberal world, democratic institutions have become fragile which augmented insecurities and anxieties of the people. The strongmen of the 21st century are not actually defending the democracy rather they have utilized their respective positions in order to strengthen their regimes. 1n 2019, Pew research
organization conducted a survey in which opinions of the people were taken from different countries regarding their trust on democratic institutions. It was found from the different countries that those who described politicians corrupt were more dissatisfied than those who described them less corrupt. Satisfied and dissatisfied people‟s percentage regarding the
working of democracy in their country has been shown in the following graph.
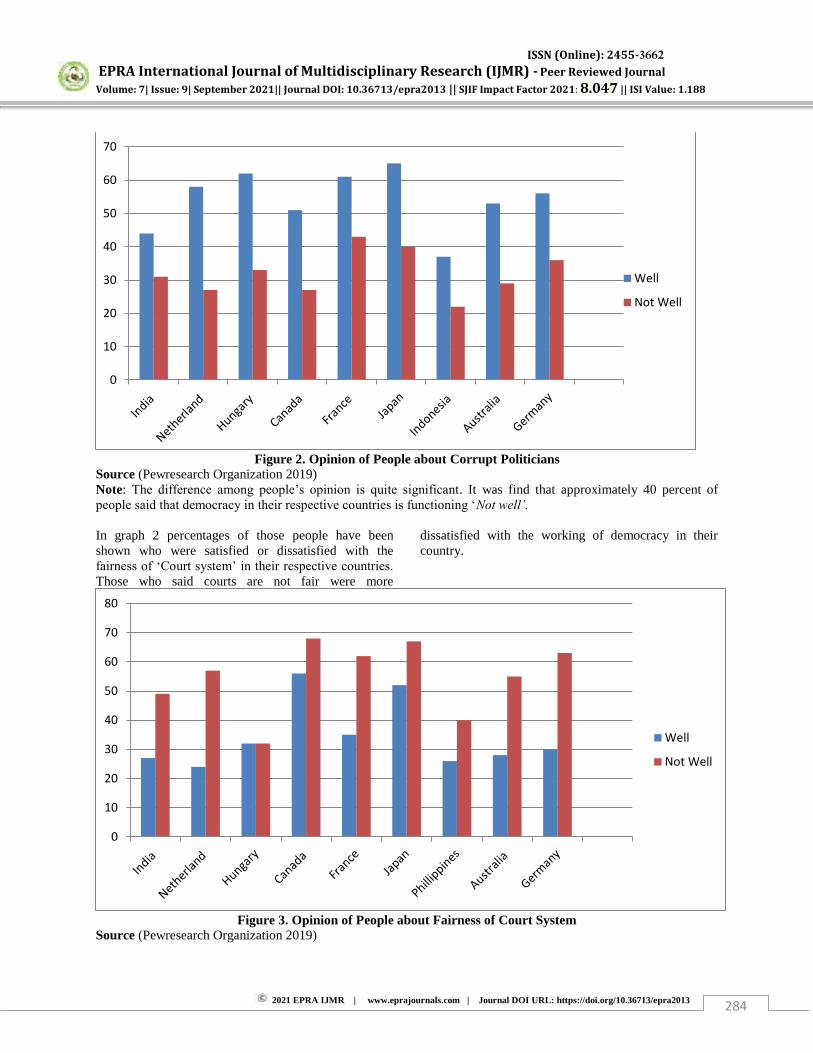
ISSN (Online): 2455-3662
EPRA International Journal of Multidisciplinary Research (IJMR) - Peer Reviewed Journal
Volume: 7| Issue: 9| September 2021|| Journal DOI: 10.36713/epra2013 || SJIF Impact Factor 2021: 8.047 || ISI Value: 1.188
2021 EPRA IJMR | www.eprajournals.com | Journal DOI URL: https://doi.org/10.36713/epra2013 284
Figure 2. Opinion of People about Corrupt Politicians
Source (Pewresearch Organization 2019) Note: The difference among people‟s opinion is quite significant. It was find that approximately 40 percent of people said that democracy in their respective countries is functioning „Not well‟. In graph 2 percentages of those people have been shown who were satisfied or dissatisfied with the fairness of „Court system‟ in their respective countries.
Those who said courts are not fair were more
dissatisfied with the working of democracy in their country.
Figure 3. Opinion of People about Fairness of Court System
Source (Pewresearch Organization 2019)
0
10
20
30
40
50
60
70
Well
Not Well
0
10
20
30
40
50
60
70
80
Well
Not Well
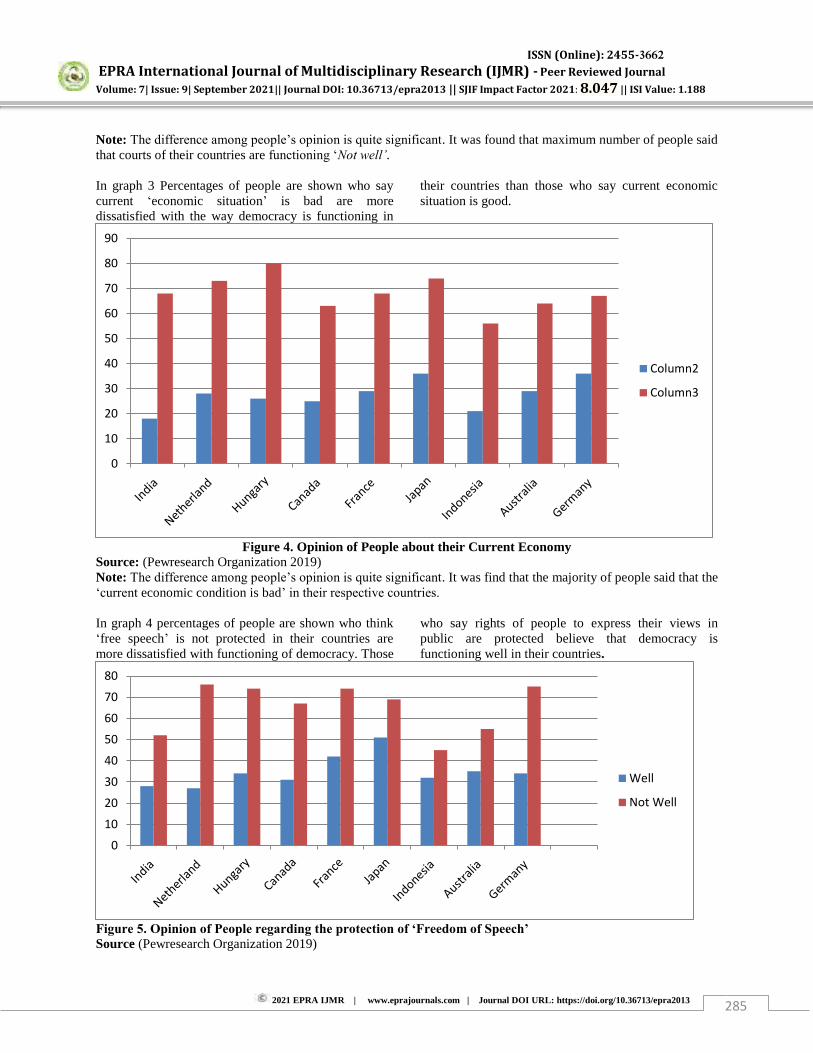
ISSN (Online): 2455-3662
EPRA International Journal of Multidisciplinary Research (IJMR) - Peer Reviewed Journal
Volume: 7| Issue: 9| September 2021|| Journal DOI: 10.36713/epra2013 || SJIF Impact Factor 2021: 8.047 || ISI Value: 1.188
2021 EPRA IJMR | www.eprajournals.com | Journal DOI URL: https://doi.org/10.36713/epra2013 285
Note: The difference among people‟s opinion is quite significant. It was found that maximum number of people said that courts of their countries are functioning „Not well‟. In graph 3 Percentages of people are shown who say current „economic situation‟ is bad are more dissatisfied with the way democracy is functioning in
their countries than those who say current economic situation is good.
Figure 4. Opinion of People about their Current Economy
Source: (Pewresearch Organization 2019) Note: The difference among people‟s opinion is quite significant. It was find that the majority of people said that the „current economic condition is bad‟ in their respective countries. In graph 4 percentages of people are shown who think „free speech‟ is not protected in their countries are more dissatisfied with functioning of democracy. Those
who say rights of people to express their views in public are protected believe that democracy is functioning well in their countries.
Figure 5. Opinion of People regarding the protection of ‘Freedom of Speech’ Source (Pewresearch Organization 2019)
0
10
20
30
40
50
60
70
80
90
Column2
Column3
0
10
20
30
40
50
60
70
80
Well
Not Well
ISSN (Online): 2455-3662
EPRA International Journal of Multidisciplinary Research (IJMR) - Peer Reviewed Journal
Volume: 7| Issue: 9| September 2021|| Journal DOI: 10.36713/epra2013 || SJIF Impact Factor 2021: 8.047 || ISI Value: 1.188
2021 EPRA IJMR | www.eprajournals.com | Journal DOI URL: https://doi.org/10.36713/epra2013 286
Note: The difference among people‟s opinion is quite significant. It was discovered that the majority of people said that „freedom of speech‟ is not well protected in their respective countries. CONCLUSION
Undoubtedly, in many countries such as India, liberal democracy is on ventilator. Warning bells are ringing, telling us liberal democracy is on the path of demolition. Global economic crisis of 1970s, 2008-09, Occupy Wall Street movement provided us opportunities to learn something but it seems that we did not learn anything yet from these crises. Major threats that liberal democracy today faces are; populism, neo-liberalism, globalization. The globalization deeply embedded with liberal democracy is reducing the realms of politics and decision-making powers of sovereign states. People anxieties and frustration of people have grown; voices against globalization are getting louder. Populism itself is threatening liberal democracy by degrading its institutions which are considered as its main pillars. Harvard University political scientists Steven Levitsky and Daniel Ziblatt rightly pointed out in their book „How democracies die‟ that “Most democratic
breakdowns have been caused not by generals or soldiers but by the elected governments themselves”
(Ziblatt 2018). Therefore, it can be argued that it is not Generals or Dictators who kill democracy rather it is demagogues who kill it by subverting the democratic institutions. Paradoxically, demagogues use electoral route to subvert the democracy and its institutions. Therefore, to rejuvenate the liberal democracy onus lies on the electorates to choose their representatives wisely. Simultaneously, we have to reassert our rights, reclaim our lost spaces, and have to forge the alliances among the marginalized sections of the society by cutting across caste, class, religion, and gender. REFERENCES
1. Brown, Wendy. "Neo-liberalism ans the End of Liberal Deocracy." In Edgework:critial Essays on knowledge and Politics, p-42. (Princeton, NJ: Princeton University Pree, 2005).
2. Chung, Jin Young. "Globalization and the Crisis of Liberal Democracy: The Political Dynamics of Neoliberalism and Populism." The Journal of Inequality and Democracy Vol-2, no. 1 (June 2019): p-47.
3. E.Stiglitz, Joseph. Globalization and its Discontents Revisited. (New York: W.W.Norton & Company , 2002).
4. India inequality report . Oxfam India, 2018, p-7. 5. Mounk, Yascha. The People Vs. Democracy: Why
Our Freedom Is In Danger & How To Save It. (Harvard University Press , 2018).
6. Mudde, Cas. "The Problem With Populism." (February 17, 2015).
7. Nilsen, Alf Gunvald. "An Authoritarian India Is Beginning to Emerge." August 31, 2018.
8. Sircar, Oishik. "Critical Legal Thinking." Postcolonial Liberalism's Double Binds. (June 19, 2020).
9. Sitaraman, Ganesh. "Three crisis of liberal deocracies." (March 17, 2018).
10. Stanley, Jason. How fascism work: the politics of Us versus them. Vol. 1. (New York: Random House, 2018).
11. Why people are dissatified with how democracy is working? Pewresearch organisation, 2019, p-4.
12. World social report 2020. UN: Department of Economic and Social Affairs, 2020, p-4.
13. Ziblatt, Steven Levitsky and Daniel. How Democracies Die. (New York. Crown Publishing Group (NY), 2018).
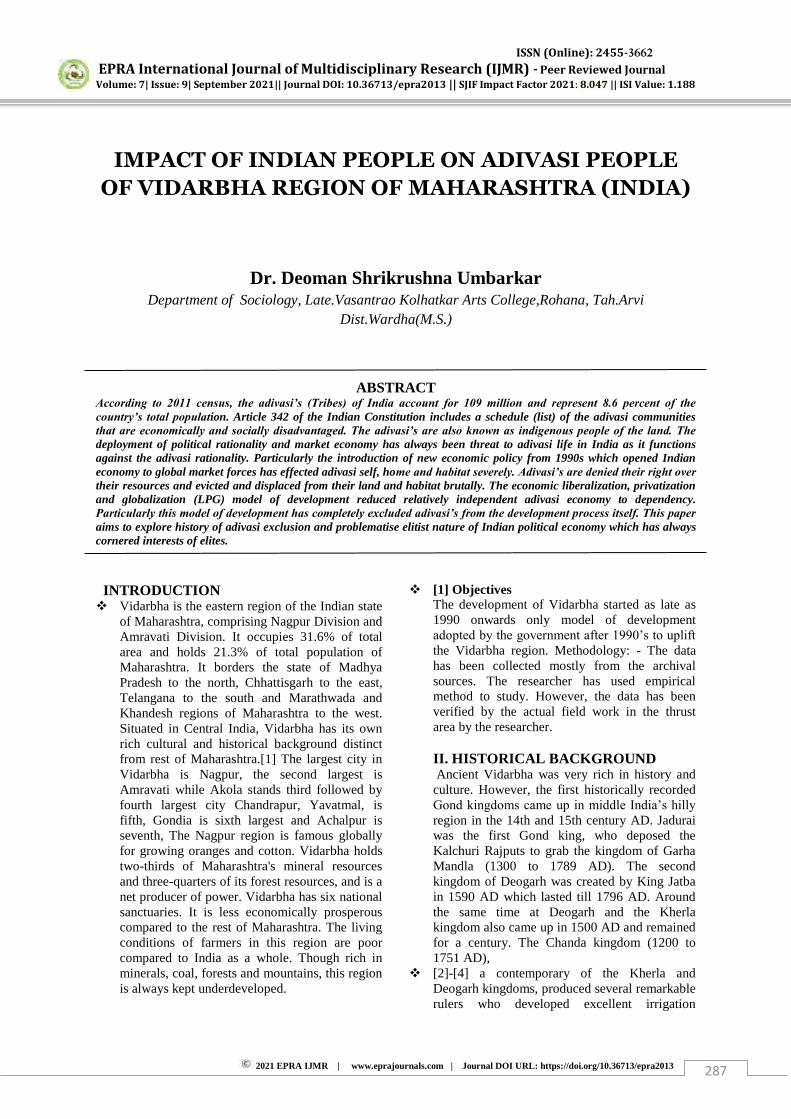
ISSN (Online): 2455-3662
EPRA International Journal of Multidisciplinary Research (IJMR) - Peer Reviewed Journal Volume: 7| Issue: 9| September 2021|| Journal DOI: 10.36713/epra2013 || SJIF Impact Factor 2021: 8.047 || ISI Value: 1.188
2021 EPRA IJMR | www.eprajournals.com | Journal DOI URL: https://doi.org/10.36713/epra2013 287
IMPACT OF INDIAN PEOPLE ON ADIVASI PEOPLE
OF VIDARBHA REGION OF MAHARASHTRA (INDIA)
Dr. Deoman Shrikrushna Umbarkar Department of Sociology, Late.Vasantrao Kolhatkar Arts College,Rohana, Tah.Arvi
Dist.Wardha(M.S.)
ABSTRACT
According to 2011 census, the adivasi’s (Tribes) of India account for 109 million and represent 8.6 percent of the
country’s total population. Article 342 of the Indian Constitution includes a schedule (list) of the adivasi communities that are economically and socially disadvantaged. The adivasi’s are also known as indigenous people of the land. The
deployment of political rationality and market economy has always been threat to adivasi life in India as it functions against the adivasi rationality. Particularly the introduction of new economic policy from 1990s which opened Indian economy to global market forces has effected adivasi self, home and habitat severely. Adivasi’s are denied their right over
their resources and evicted and displaced from their land and habitat brutally. The economic liberalization, privatization and globalization (LPG) model of development reduced relatively independent adivasi economy to dependency. Particularly this model of development has completely excluded adivasi’s from the development process itself. This paper
aims to explore history of adivasi exclusion and problematise elitist nature of Indian political economy which has always cornered interests of elites.
INTRODUCTION Vidarbha is the eastern region of the Indian state
of Maharashtra, comprising Nagpur Division and Amravati Division. It occupies 31.6% of total area and holds 21.3% of total population of Maharashtra. It borders the state of Madhya Pradesh to the north, Chhattisgarh to the east, Telangana to the south and Marathwada and Khandesh regions of Maharashtra to the west. Situated in Central India, Vidarbha has its own rich cultural and historical background distinct from rest of Maharashtra.[1] The largest city in Vidarbha is Nagpur, the second largest is Amravati while Akola stands third followed by fourth largest city Chandrapur, Yavatmal, is fifth, Gondia is sixth largest and Achalpur is seventh, The Nagpur region is famous globally for growing oranges and cotton. Vidarbha holds two-thirds of Maharashtra's mineral resources and three-quarters of its forest resources, and is a net producer of power. Vidarbha has six national sanctuaries. It is less economically prosperous compared to the rest of Maharashtra. The living conditions of farmers in this region are poor compared to India as a whole. Though rich in minerals, coal, forests and mountains, this region is always kept underdeveloped.
[1] Objectives The development of Vidarbha started as late as 1990 onwards only model of development adopted by the government after 1990’s to uplift
the Vidarbha region. Methodology: - The data has been collected mostly from the archival sources. The researcher has used empirical method to study. However, the data has been verified by the actual field work in the thrust area by the researcher.
II. HISTORICAL BACKGROUND Ancient Vidarbha was very rich in history and culture. However, the first historically recorded Gond kingdoms came up in middle India’s hilly
region in the 14th and 15th century AD. Jadurai was the first Gond king, who deposed the Kalchuri Rajputs to grab the kingdom of Garha Mandla (1300 to 1789 AD). The second kingdom of Deogarh was created by King Jatba in 1590 AD which lasted till 1796 AD. Around the same time at Deogarh and the Kherla kingdom also came up in 1500 AD and remained for a century. The Chanda kingdom (1200 to 1751 AD),
[2]-[4] a contemporary of the Kherla and Deogarh kingdoms, produced several remarkable rulers who developed excellent irrigation
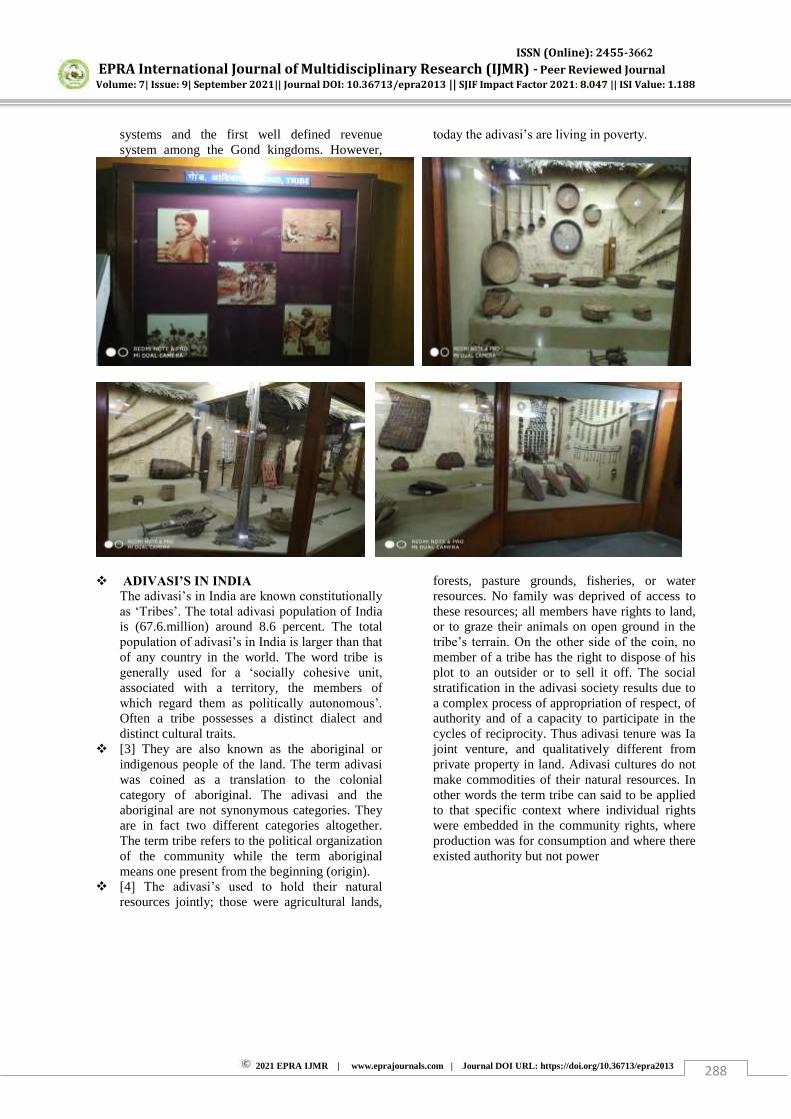
ISSN (Online): 2455-3662
EPRA International Journal of Multidisciplinary Research (IJMR) - Peer Reviewed Journal Volume: 7| Issue: 9| September 2021|| Journal DOI: 10.36713/epra2013 || SJIF Impact Factor 2021: 8.047 || ISI Value: 1.188
2021 EPRA IJMR | www.eprajournals.com | Journal DOI URL: https://doi.org/10.36713/epra2013 288
systems and the first well defined revenue system among the Gond kingdoms. However,
today the adivasi’s are living in poverty.
ADIVASI’S IN INDIA The adivasi’s in India are known constitutionally
as ‘Tribes’. The total adivasi population of India is (67.6.million) around 8.6 percent. The total population of adivasi’s in India is larger than that
of any country in the world. The word tribe is generally used for a ‘socially cohesive unit,
associated with a territory, the members of which regard them as politically autonomous’.
Often a tribe possesses a distinct dialect and distinct cultural traits.
[3] They are also known as the aboriginal or indigenous people of the land. The term adivasi was coined as a translation to the colonial category of aboriginal. The adivasi and the aboriginal are not synonymous categories. They are in fact two different categories altogether. The term tribe refers to the political organization of the community while the term aboriginal means one present from the beginning (origin).
[4] The adivasi’s used to hold their natural
resources jointly; those were agricultural lands,
forests, pasture grounds, fisheries, or water resources. No family was deprived of access to these resources; all members have rights to land, or to graze their animals on open ground in the tribe’s terrain. On the other side of the coin, no
member of a tribe has the right to dispose of his plot to an outsider or to sell it off. The social stratification in the adivasi society results due to a complex process of appropriation of respect, of authority and of a capacity to participate in the cycles of reciprocity. Thus adivasi tenure was Ia joint venture, and qualitatively different from private property in land. Adivasi cultures do not make commodities of their natural resources. In other words the term tribe can said to be applied to that specific context where individual rights were embedded in the community rights, where production was for consumption and where there existed authority but not power
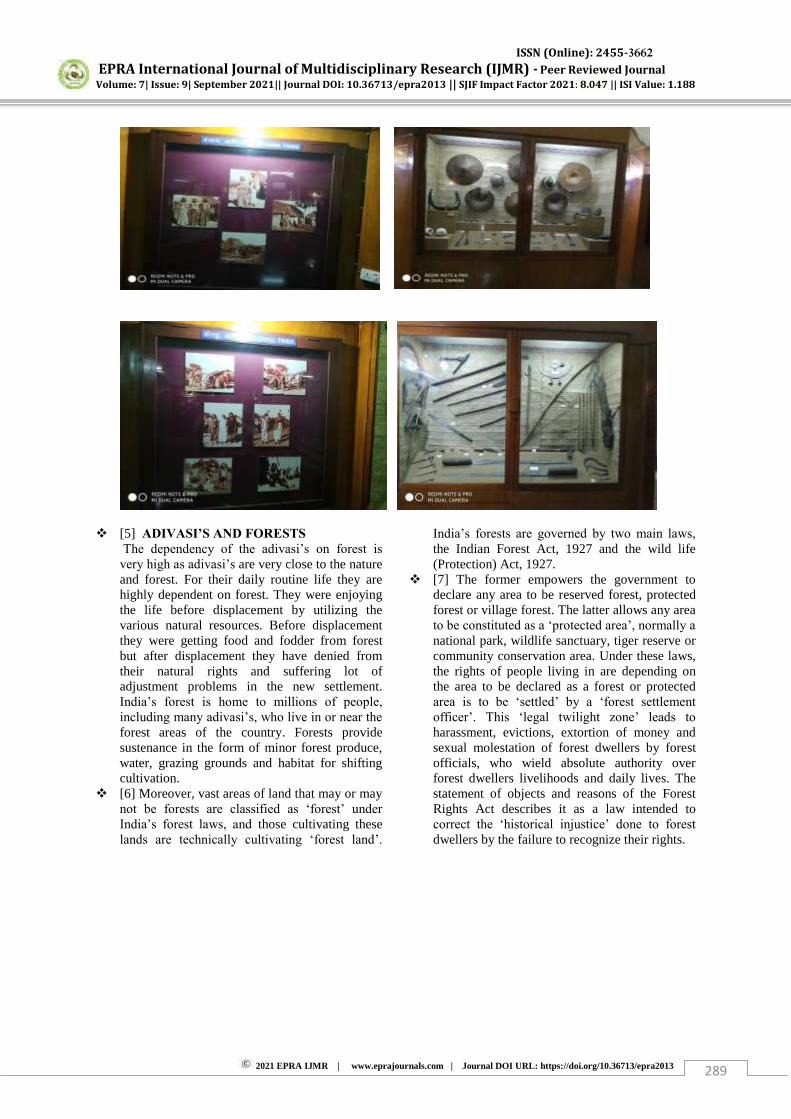
ISSN (Online): 2455-3662
EPRA International Journal of Multidisciplinary Research (IJMR) - Peer Reviewed Journal Volume: 7| Issue: 9| September 2021|| Journal DOI: 10.36713/epra2013 || SJIF Impact Factor 2021: 8.047 || ISI Value: 1.188
2021 EPRA IJMR | www.eprajournals.com | Journal DOI URL: https://doi.org/10.36713/epra2013 289
[5] ADIVASI’S AND FORESTS The dependency of the adivasi’s on forest is
very high as adivasi’s are very close to the nature and forest. For their daily routine life they are highly dependent on forest. They were enjoying the life before displacement by utilizing the various natural resources. Before displacement they were getting food and fodder from forest but after displacement they have denied from their natural rights and suffering lot of adjustment problems in the new settlement. India’s forest is home to millions of people,
including many adivasi’s, who live in or near the
forest areas of the country. Forests provide sustenance in the form of minor forest produce, water, grazing grounds and habitat for shifting cultivation.
[6] Moreover, vast areas of land that may or may not be forests are classified as ‘forest’ under
India’s forest laws, and those cultivating these lands are technically cultivating ‘forest land’.
India’s forests are governed by two main laws,
the Indian Forest Act, 1927 and the wild life (Protection) Act, 1927.
[7] The former empowers the government to declare any area to be reserved forest, protected forest or village forest. The latter allows any area to be constituted as a ‘protected area’, normally a
national park, wildlife sanctuary, tiger reserve or community conservation area. Under these laws, the rights of people living in are depending on the area to be declared as a forest or protected area is to be ‘settled’ by a ‘forest settlement
officer’. This ‘legal twilight zone’ leads to
harassment, evictions, extortion of money and sexual molestation of forest dwellers by forest officials, who wield absolute authority over forest dwellers livelihoods and daily lives. The statement of objects and reasons of the Forest Rights Act describes it as a law intended to correct the ‘historical injustice’ done to forest
dwellers by the failure to recognize their rights.
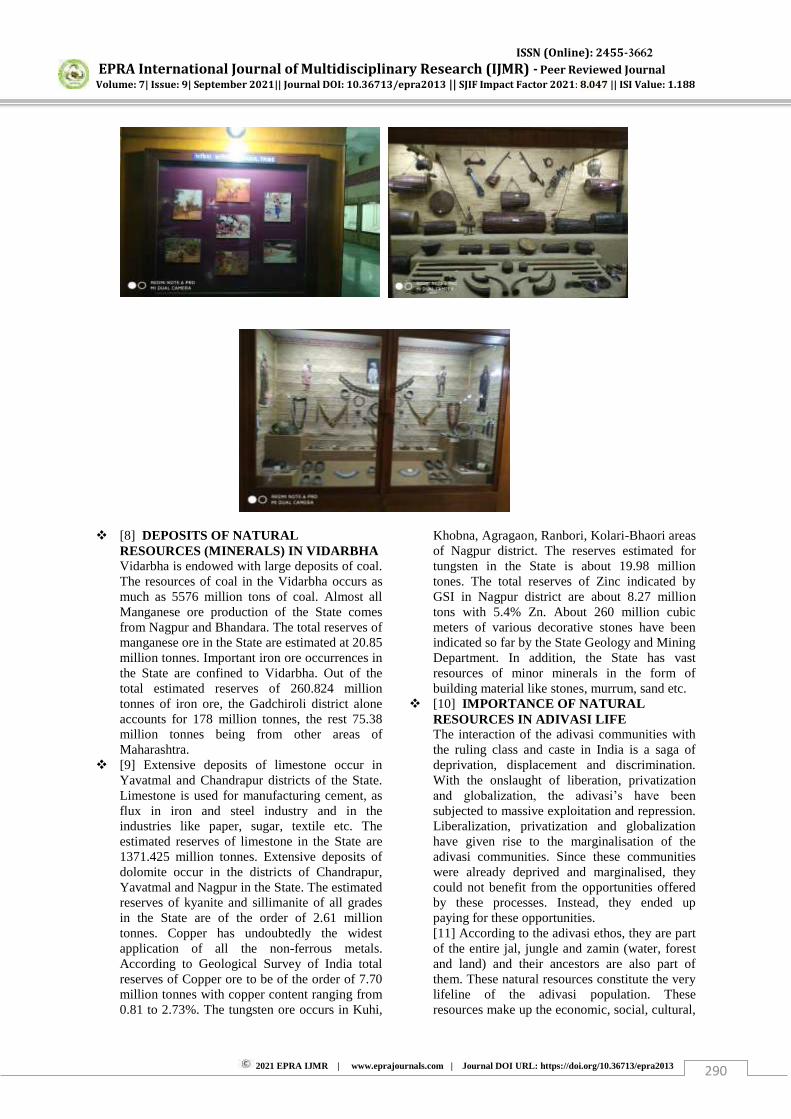
ISSN (Online): 2455-3662
EPRA International Journal of Multidisciplinary Research (IJMR) - Peer Reviewed Journal Volume: 7| Issue: 9| September 2021|| Journal DOI: 10.36713/epra2013 || SJIF Impact Factor 2021: 8.047 || ISI Value: 1.188
2021 EPRA IJMR | www.eprajournals.com | Journal DOI URL: https://doi.org/10.36713/epra2013 290
[8] DEPOSITS OF NATURAL
RESOURCES (MINERALS) IN VIDARBHA Vidarbha is endowed with large deposits of coal. The resources of coal in the Vidarbha occurs as much as 5576 million tons of coal. Almost all Manganese ore production of the State comes from Nagpur and Bhandara. The total reserves of manganese ore in the State are estimated at 20.85 million tonnes. Important iron ore occurrences in the State are confined to Vidarbha. Out of the total estimated reserves of 260.824 million tonnes of iron ore, the Gadchiroli district alone accounts for 178 million tonnes, the rest 75.38 million tonnes being from other areas of Maharashtra.
[9] Extensive deposits of limestone occur in Yavatmal and Chandrapur districts of the State. Limestone is used for manufacturing cement, as flux in iron and steel industry and in the industries like paper, sugar, textile etc. The estimated reserves of limestone in the State are 1371.425 million tonnes. Extensive deposits of dolomite occur in the districts of Chandrapur, Yavatmal and Nagpur in the State. The estimated reserves of kyanite and sillimanite of all grades in the State are of the order of 2.61 million tonnes. Copper has undoubtedly the widest application of all the non-ferrous metals. According to Geological Survey of India total reserves of Copper ore to be of the order of 7.70 million tonnes with copper content ranging from 0.81 to 2.73%. The tungsten ore occurs in Kuhi,
Khobna, Agragaon, Ranbori, Kolari-Bhaori areas of Nagpur district. The reserves estimated for tungsten in the State is about 19.98 million tones. The total reserves of Zinc indicated by GSI in Nagpur district are about 8.27 million tons with 5.4% Zn. About 260 million cubic meters of various decorative stones have been indicated so far by the State Geology and Mining Department. In addition, the State has vast resources of minor minerals in the form of building material like stones, murrum, sand etc.
[10] IMPORTANCE OF NATURAL RESOURCES IN ADIVASI LIFE The interaction of the adivasi communities with the ruling class and caste in India is a saga of deprivation, displacement and discrimination. With the onslaught of liberation, privatization and globalization, the adivasi’s have been
subjected to massive exploitation and repression. Liberalization, privatization and globalization have given rise to the marginalisation of the adivasi communities. Since these communities were already deprived and marginalised, they could not benefit from the opportunities offered by these processes. Instead, they ended up paying for these opportunities. [11] According to the adivasi ethos, they are part of the entire jal, jungle and zamin (water, forest and land) and their ancestors are also part of them. These natural resources constitute the very lifeline of the adivasi population. These resources make up the economic, social, cultural,
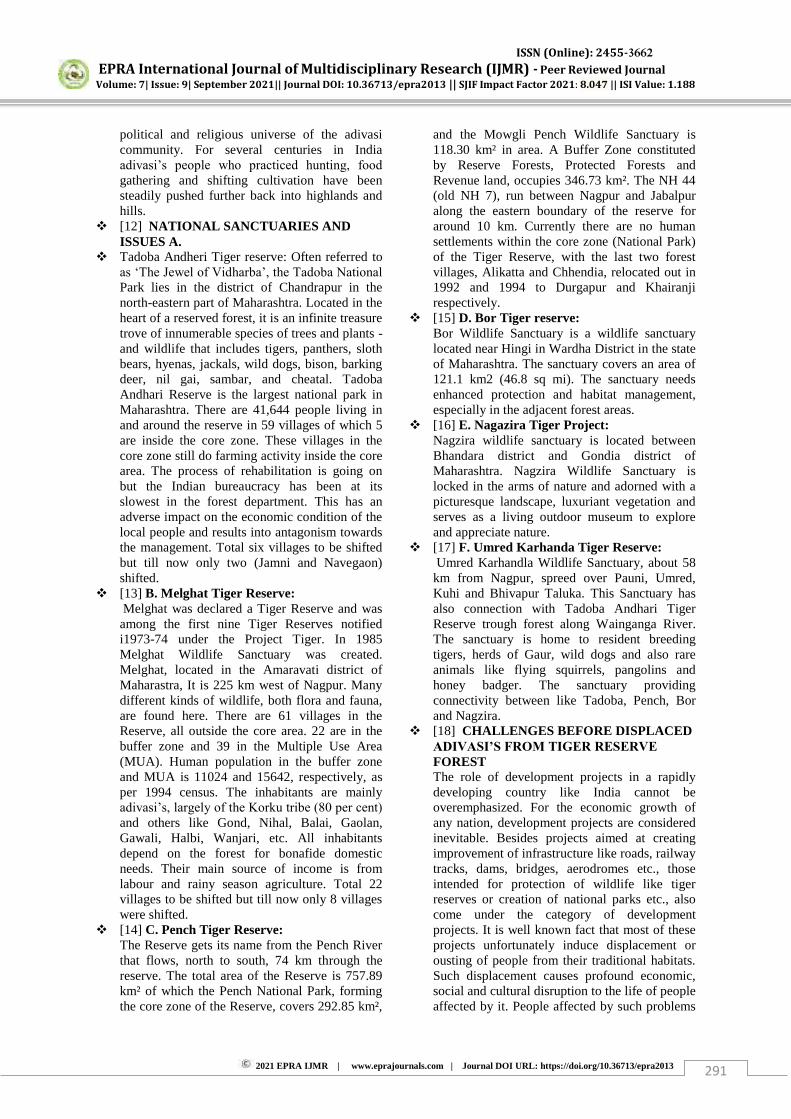
ISSN (Online): 2455-3662
EPRA International Journal of Multidisciplinary Research (IJMR) - Peer Reviewed Journal Volume: 7| Issue: 9| September 2021|| Journal DOI: 10.36713/epra2013 || SJIF Impact Factor 2021: 8.047 || ISI Value: 1.188
2021 EPRA IJMR | www.eprajournals.com | Journal DOI URL: https://doi.org/10.36713/epra2013 291
political and religious universe of the adivasi community. For several centuries in India adivasi’s people who practiced hunting, food
gathering and shifting cultivation have been steadily pushed further back into highlands and hills.
[12] NATIONAL SANCTUARIES AND ISSUES A.
Tadoba Andheri Tiger reserve: Often referred to as ‘The Jewel of Vidharba’, the Tadoba National
Park lies in the district of Chandrapur in the north-eastern part of Maharashtra. Located in the heart of a reserved forest, it is an infinite treasure trove of innumerable species of trees and plants - and wildlife that includes tigers, panthers, sloth bears, hyenas, jackals, wild dogs, bison, barking deer, nil gai, sambar, and cheatal. Tadoba Andhari Reserve is the largest national park in Maharashtra. There are 41,644 people living in and around the reserve in 59 villages of which 5 are inside the core zone. These villages in the core zone still do farming activity inside the core area. The process of rehabilitation is going on but the Indian bureaucracy has been at its slowest in the forest department. This has an adverse impact on the economic condition of the local people and results into antagonism towards the management. Total six villages to be shifted but till now only two (Jamni and Navegaon) shifted.
[13] B. Melghat Tiger Reserve: Melghat was declared a Tiger Reserve and was among the first nine Tiger Reserves notified i1973-74 under the Project Tiger. In 1985 Melghat Wildlife Sanctuary was created. Melghat, located in the Amaravati district of Maharastra, It is 225 km west of Nagpur. Many different kinds of wildlife, both flora and fauna, are found here. There are 61 villages in the Reserve, all outside the core area. 22 are in the buffer zone and 39 in the Multiple Use Area (MUA). Human population in the buffer zone and MUA is 11024 and 15642, respectively, as per 1994 census. The inhabitants are mainly adivasi’s, largely of the Korku tribe (80 per cent)
and others like Gond, Nihal, Balai, Gaolan, Gawali, Halbi, Wanjari, etc. All inhabitants depend on the forest for bonafide domestic needs. Their main source of income is from labour and rainy season agriculture. Total 22 villages to be shifted but till now only 8 villages were shifted.
[14] C. Pench Tiger Reserve: The Reserve gets its name from the Pench River that flows, north to south, 74 km through the reserve. The total area of the Reserve is 757.89 km² of which the Pench National Park, forming the core zone of the Reserve, covers 292.85 km²,
and the Mowgli Pench Wildlife Sanctuary is 118.30 km² in area. A Buffer Zone constituted by Reserve Forests, Protected Forests and Revenue land, occupies 346.73 km². The NH 44 (old NH 7), run between Nagpur and Jabalpur along the eastern boundary of the reserve for around 10 km. Currently there are no human settlements within the core zone (National Park) of the Tiger Reserve, with the last two forest villages, Alikatta and Chhendia, relocated out in 1992 and 1994 to Durgapur and Khairanji respectively.
[15] D. Bor Tiger reserve: Bor Wildlife Sanctuary is a wildlife sanctuary located near Hingi in Wardha District in the state of Maharashtra. The sanctuary covers an area of 121.1 km2 (46.8 sq mi). The sanctuary needs enhanced protection and habitat management, especially in the adjacent forest areas.
[16] E. Nagazira Tiger Project: Nagzira wildlife sanctuary is located between Bhandara district and Gondia district of Maharashtra. Nagzira Wildlife Sanctuary is locked in the arms of nature and adorned with a picturesque landscape, luxuriant vegetation and serves as a living outdoor museum to explore and appreciate nature.
[17] F. Umred Karhanda Tiger Reserve: Umred Karhandla Wildlife Sanctuary, about 58 km from Nagpur, spreed over Pauni, Umred, Kuhi and Bhivapur Taluka. This Sanctuary has also connection with Tadoba Andhari Tiger Reserve trough forest along Wainganga River. The sanctuary is home to resident breeding tigers, herds of Gaur, wild dogs and also rare animals like flying squirrels, pangolins and honey badger. The sanctuary providing connectivity between like Tadoba, Pench, Bor and Nagzira.
[18] CHALLENGES BEFORE DISPLACED ADIVASI’S FROM TIGER RESERVE
FOREST The role of development projects in a rapidly developing country like India cannot be overemphasized. For the economic growth of any nation, development projects are considered inevitable. Besides projects aimed at creating improvement of infrastructure like roads, railway tracks, dams, bridges, aerodromes etc., those intended for protection of wildlife like tiger reserves or creation of national parks etc., also come under the category of development projects. It is well known fact that most of these projects unfortunately induce displacement or ousting of people from their traditional habitats. Such displacement causes profound economic, social and cultural disruption to the life of people affected by it. People affected by such problems
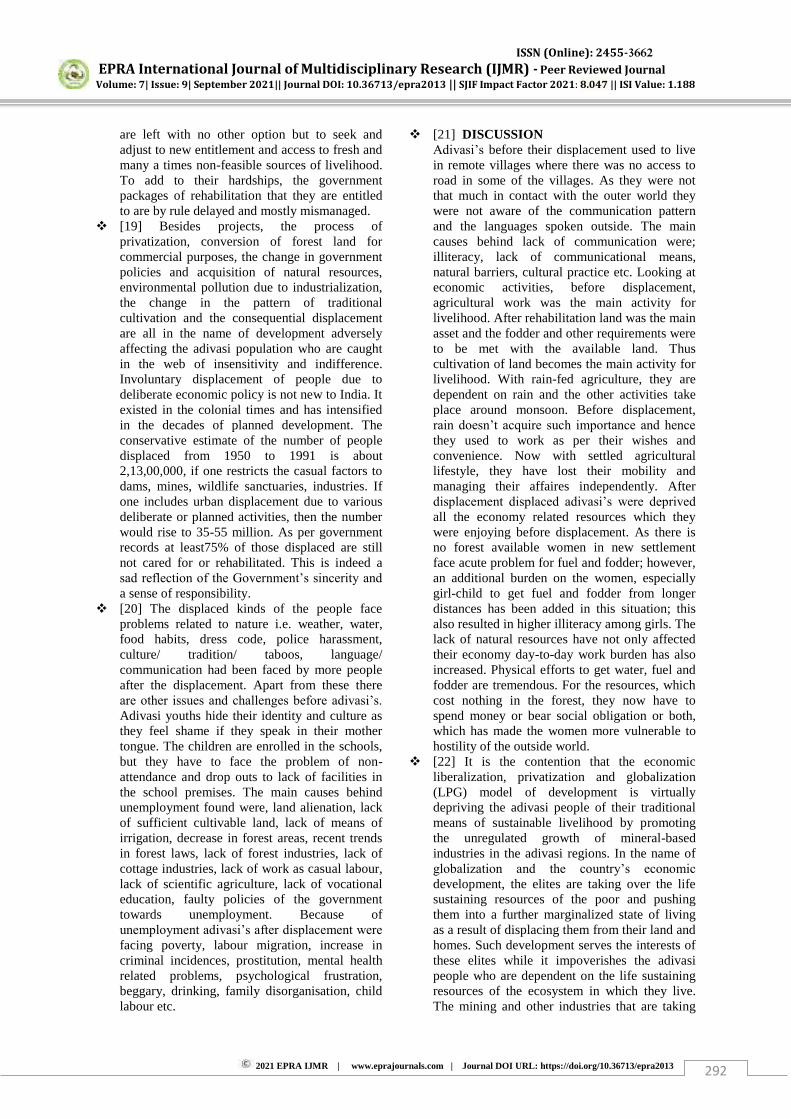
ISSN (Online): 2455-3662
EPRA International Journal of Multidisciplinary Research (IJMR) - Peer Reviewed Journal Volume: 7| Issue: 9| September 2021|| Journal DOI: 10.36713/epra2013 || SJIF Impact Factor 2021: 8.047 || ISI Value: 1.188
2021 EPRA IJMR | www.eprajournals.com | Journal DOI URL: https://doi.org/10.36713/epra2013 292
are left with no other option but to seek and adjust to new entitlement and access to fresh and many a times non-feasible sources of livelihood. To add to their hardships, the government packages of rehabilitation that they are entitled to are by rule delayed and mostly mismanaged.
[19] Besides projects, the process of privatization, conversion of forest land for commercial purposes, the change in government policies and acquisition of natural resources, environmental pollution due to industrialization, the change in the pattern of traditional cultivation and the consequential displacement are all in the name of development adversely affecting the adivasi population who are caught in the web of insensitivity and indifference. Involuntary displacement of people due to deliberate economic policy is not new to India. It existed in the colonial times and has intensified in the decades of planned development. The conservative estimate of the number of people displaced from 1950 to 1991 is about 2,13,00,000, if one restricts the casual factors to dams, mines, wildlife sanctuaries, industries. If one includes urban displacement due to various deliberate or planned activities, then the number would rise to 35-55 million. As per government records at least75% of those displaced are still not cared for or rehabilitated. This is indeed a sad reflection of the Government’s sincerity and
a sense of responsibility. [20] The displaced kinds of the people face
problems related to nature i.e. weather, water, food habits, dress code, police harassment, culture/ tradition/ taboos, language/ communication had been faced by more people after the displacement. Apart from these there are other issues and challenges before adivasi’s.
Adivasi youths hide their identity and culture as they feel shame if they speak in their mother tongue. The children are enrolled in the schools, but they have to face the problem of non-attendance and drop outs to lack of facilities in the school premises. The main causes behind unemployment found were, land alienation, lack of sufficient cultivable land, lack of means of irrigation, decrease in forest areas, recent trends in forest laws, lack of forest industries, lack of cottage industries, lack of work as casual labour, lack of scientific agriculture, lack of vocational education, faulty policies of the government towards unemployment. Because of unemployment adivasi’s after displacement were
facing poverty, labour migration, increase in criminal incidences, prostitution, mental health related problems, psychological frustration, beggary, drinking, family disorganisation, child labour etc.
[21] DISCUSSION Adivasi’s before their displacement used to live in remote villages where there was no access to road in some of the villages. As they were not that much in contact with the outer world they were not aware of the communication pattern and the languages spoken outside. The main causes behind lack of communication were; illiteracy, lack of communicational means, natural barriers, cultural practice etc. Looking at economic activities, before displacement, agricultural work was the main activity for livelihood. After rehabilitation land was the main asset and the fodder and other requirements were to be met with the available land. Thus cultivation of land becomes the main activity for livelihood. With rain-fed agriculture, they are dependent on rain and the other activities take place around monsoon. Before displacement, rain doesn’t acquire such importance and hence
they used to work as per their wishes and convenience. Now with settled agricultural lifestyle, they have lost their mobility and managing their affaires independently. After displacement displaced adivasi’s were deprived
all the economy related resources which they were enjoying before displacement. As there is no forest available women in new settlement face acute problem for fuel and fodder; however, an additional burden on the women, especially girl-child to get fuel and fodder from longer distances has been added in this situation; this also resulted in higher illiteracy among girls. The lack of natural resources have not only affected their economy day-to-day work burden has also increased. Physical efforts to get water, fuel and fodder are tremendous. For the resources, which cost nothing in the forest, they now have to spend money or bear social obligation or both, which has made the women more vulnerable to hostility of the outside world.
[22] It is the contention that the economic liberalization, privatization and globalization (LPG) model of development is virtually depriving the adivasi people of their traditional means of sustainable livelihood by promoting the unregulated growth of mineral-based industries in the adivasi regions. In the name of globalization and the country’s economic
development, the elites are taking over the life sustaining resources of the poor and pushing them into a further marginalized state of living as a result of displacing them from their land and homes. Such development serves the interests of these elites while it impoverishes the adivasi people who are dependent on the life sustaining resources of the ecosystem in which they live. The mining and other industries that are taking
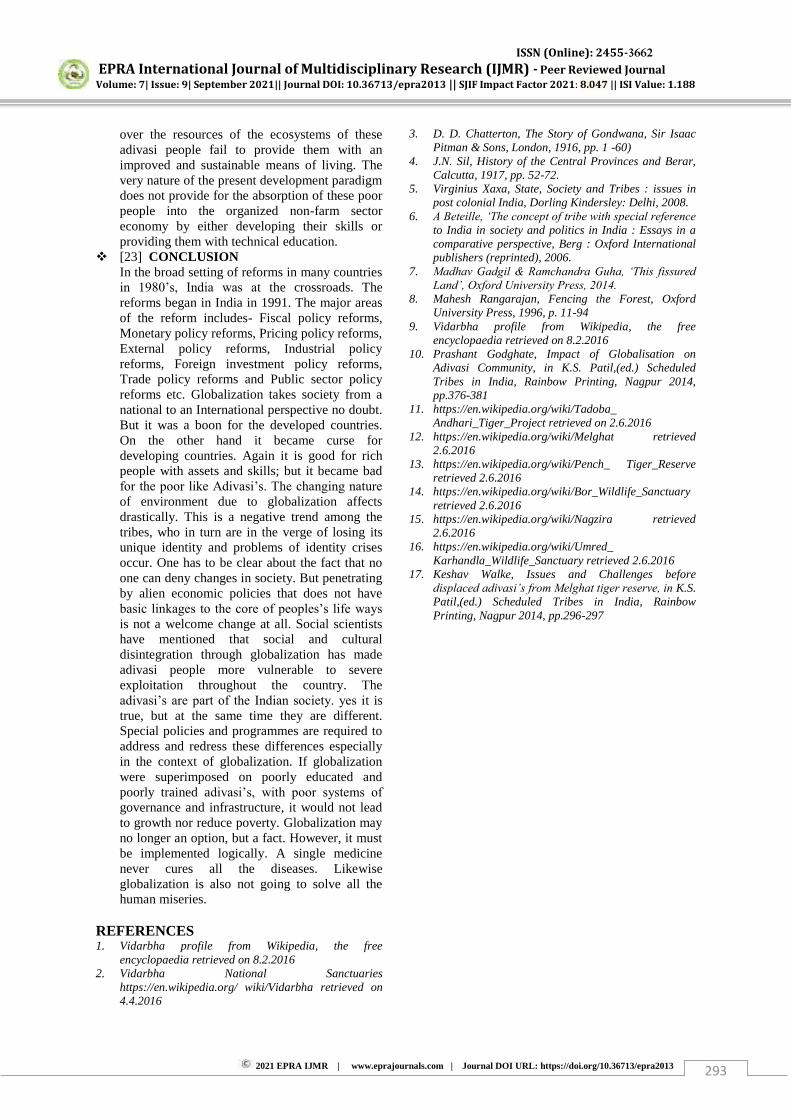
ISSN (Online): 2455-3662
EPRA International Journal of Multidisciplinary Research (IJMR) - Peer Reviewed Journal Volume: 7| Issue: 9| September 2021|| Journal DOI: 10.36713/epra2013 || SJIF Impact Factor 2021: 8.047 || ISI Value: 1.188
2021 EPRA IJMR | www.eprajournals.com | Journal DOI URL: https://doi.org/10.36713/epra2013 293
over the resources of the ecosystems of these adivasi people fail to provide them with an improved and sustainable means of living. The very nature of the present development paradigm does not provide for the absorption of these poor people into the organized non-farm sector economy by either developing their skills or providing them with technical education.
[23] CONCLUSION In the broad setting of reforms in many countries in 1980’s, India was at the crossroads. The reforms began in India in 1991. The major areas of the reform includes- Fiscal policy reforms, Monetary policy reforms, Pricing policy reforms, External policy reforms, Industrial policy reforms, Foreign investment policy reforms, Trade policy reforms and Public sector policy reforms etc. Globalization takes society from a national to an International perspective no doubt. But it was a boon for the developed countries. On the other hand it became curse for developing countries. Again it is good for rich people with assets and skills; but it became bad for the poor like Adivasi’s. The changing nature
of environment due to globalization affects drastically. This is a negative trend among the tribes, who in turn are in the verge of losing its unique identity and problems of identity crises occur. One has to be clear about the fact that no one can deny changes in society. But penetrating by alien economic policies that does not have basic linkages to the core of peoples’s life ways
is not a welcome change at all. Social scientists have mentioned that social and cultural disintegration through globalization has made adivasi people more vulnerable to severe exploitation throughout the country. The adivasi’s are part of the Indian society. yes it is true, but at the same time they are different. Special policies and programmes are required to address and redress these differences especially in the context of globalization. If globalization were superimposed on poorly educated and poorly trained adivasi’s, with poor systems of
governance and infrastructure, it would not lead to growth nor reduce poverty. Globalization may no longer an option, but a fact. However, it must be implemented logically. A single medicine never cures all the diseases. Likewise globalization is also not going to solve all the human miseries.
REFERENCES 1. Vidarbha profile from Wikipedia, the free
encyclopaedia retrieved on 8.2.2016 2. Vidarbha National Sanctuaries
https://en.wikipedia.org/ wiki/Vidarbha retrieved on 4.4.2016
3. D. D. Chatterton, The Story of Gondwana, Sir Isaac Pitman & Sons, London, 1916, pp. 1 -60)
4. J.N. Sil, History of the Central Provinces and Berar, Calcutta, 1917, pp. 52-72.
5. Virginius Xaxa, State, Society and Tribes : issues in post colonial India, Dorling Kindersley: Delhi, 2008.
6. A Beteille, ‘The concept of tribe with special reference
to India in society and politics in India : Essays in a comparative perspective, Berg : Oxford International publishers (reprinted), 2006.
7. Madhav Gadgil & Ramchandra Guha, ‘This fissured
Land’, Oxford University Press, 2014. 8. Mahesh Rangarajan, Fencing the Forest, Oxford
University Press, 1996, p. 11-94 9. Vidarbha profile from Wikipedia, the free
encyclopaedia retrieved on 8.2.2016 10. Prashant Godghate, Impact of Globalisation on
Adivasi Community, in K.S. Patil,(ed.) Scheduled Tribes in India, Rainbow Printing, Nagpur 2014, pp.376-381
11. https://en.wikipedia.org/wiki/Tadoba_ Andhari_Tiger_Project retrieved on 2.6.2016
12. https://en.wikipedia.org/wiki/Melghat retrieved 2.6.2016
13. https://en.wikipedia.org/wiki/Pench_ Tiger_Reserve retrieved 2.6.2016
14. https://en.wikipedia.org/wiki/Bor_Wildlife_Sanctuary retrieved 2.6.2016
15. https://en.wikipedia.org/wiki/Nagzira retrieved 2.6.2016
16. https://en.wikipedia.org/wiki/Umred_ Karhandla_Wildlife_Sanctuary retrieved 2.6.2016
17. Keshav Walke, Issues and Challenges before displaced adivasi’s from Melghat tiger reserve, in K.S. Patil,(ed.) Scheduled Tribes in India, Rainbow Printing, Nagpur 2014, pp.296-297
ISSN (Online): 2455-3662 EPRA International Journal of Multidisciplinary Research (IJMR) - Peer Reviewed Journal Volume: 7| Issue: 9| September 2021|| Journal DOI: 10.36713/epra2013 || SJIF Impact Factor 2021: 8.047 || ISI Value: 1.188
2021 EPRA IJMR | www.eprajournals.com | Journal DOI URL: https://doi.org/10.36713/epra2013|294 |
STUDENTS’ ATTITUDES TOWARDS RESEARCH OF
COLLEGE OF TEACHER EDUCATION: INPUT TO ACTION PLAN
Dennis N. Daran, Phd1, Aileen M. Daran, EdD2
1CTE PE Instructor 2CTE Extension Coordinator
Organization: Laguna State Polytechnic University - Main Campus, Sta Cruz Laguna
ABSTRACT Attitude is one of the important concepts in understanding teachers’ thought processes, classroom practices, change and
learning to teach which receives considerable attention in teaching and teacher education research. This paper attempts to survey students’ attitude towards research in the College of Teacher Education and therefore
come up with an action plan that the college may use to address the existing situation. Through random sampling, 50 students from the College of Teacher Education at Laguna State Polytechnic University Sta Cruz Main Campus were given the Revised Attitude Towards Research (R-ATR) questionnaires.
After this study was conducted and documented, both respondents according to their sex found research useful to them. The attitudes of the respondents towards research according to their academic year levels, the first year and second year have positive attitude towards research. On the other hand, male students are more anxious than the female respondents about research. The female students are unsure about their predisposition towards research while the male respondents have fairly positive predisposition towards research. KEYWORDS: research, attitudes, action plan
BACKGROUND OF THE STUDY
Research is the process of collecting and analyzing information to increase our understanding of the phenomenon under study (Swindoll, 2012). Research is a very important discipline that encompasses almost all other disciplines in the academe and the society. It plays a very important role in achieving deeper and wider understanding of phenomena that can contribute to national and societal goals. The development of research capacity at graduate level is essential to produce good quality researchers in the long run.
Research begins when researchers discover real world problems and try to answer those problems with the required mechanisms, tools, and methods. Therefore, research methods have gained acceptance in all branches of science and disciplines which seek to find the answer for research questions in scientific manner (Ibid). It is believed, if a research does not follow any methodology, it may produce false results. There are different types of research for different disciplines and each discipline is associated with the particular scientific tools. Social sciences are one of
those branches of sciences that follow its own research methods, methodologies, and tools. (Baha, 2016)
In the field of education, drawing teachers into the research process appears to provide a vital foundation for the development of teaching as an evidence-based profession (Karagiorgi & Papanastasiou, 2012). Teacher research has been viewed as a tool enabling the transformation of educational practice, while making important contributions to the knowledge base in education. According to West (2011), the divide between research and practice has emerged since the 1930s when University professors began distinguishing themselves as teacher educators or as researchers. Even today, teachers are criticized as being research averse (Fusarelli, 2008) while the role of the teacher as a research-based professional still resembles an ideal.
Although students are aware of the value of research in their lives, they still find it hard to develop a positive attitude towards the research procedures and even its applications to real-life (Belgrave & Jules, 2015). However, Formalejo & Ramirez (2017) and Vossen, Henze, Rippe, Van Driel, & De Vries (2018), in their respective studies, showed that students have
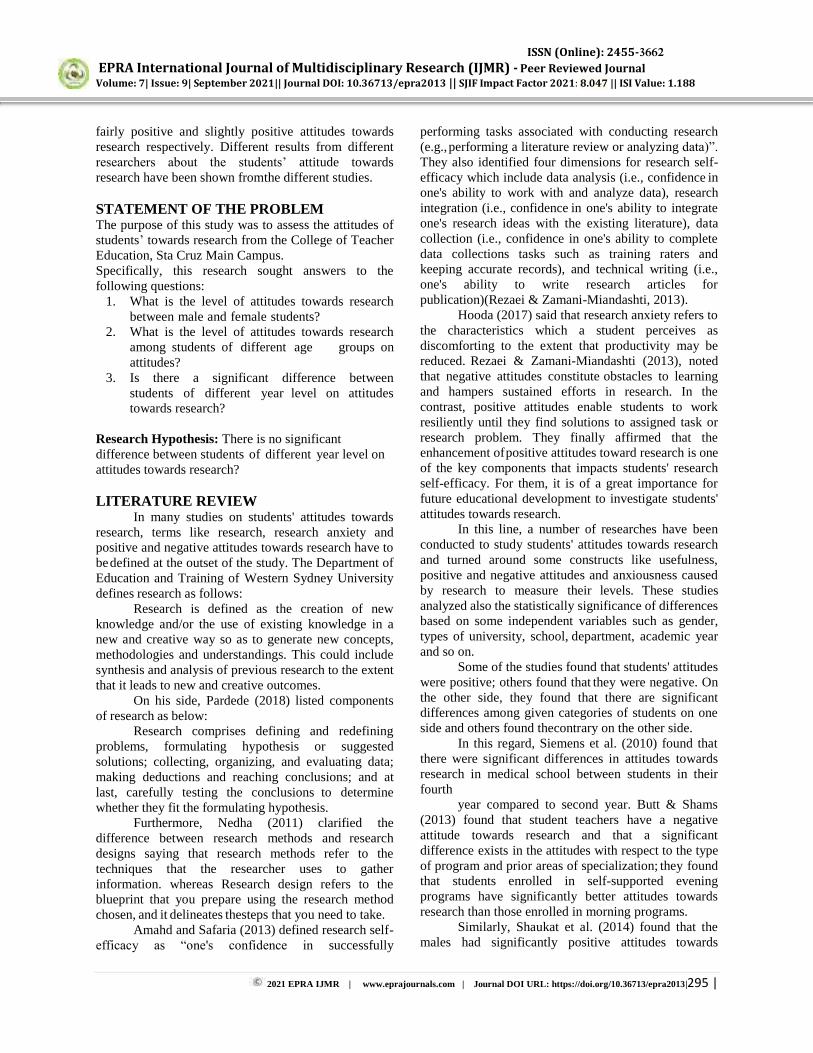
ISSN (Online): 2455-3662 EPRA International Journal of Multidisciplinary Research (IJMR) - Peer Reviewed Journal Volume: 7| Issue: 9| September 2021|| Journal DOI: 10.36713/epra2013 || SJIF Impact Factor 2021: 8.047 || ISI Value: 1.188
2021 EPRA IJMR | www.eprajournals.com | Journal DOI URL: https://doi.org/10.36713/epra2013|295 |
fairly positive and slightly positive attitudes towards research respectively. Different results from different researchers about the students’ attitude towards research have been shown from the different studies. STATEMENT OF THE PROBLEM The purpose of this study was to assess the attitudes of students’ towards research from the College of Teacher Education, Sta Cruz Main Campus. Specifically, this research sought answers to the following questions:
1. What is the level of attitudes towards research between male and female students?
2. What is the level of attitudes towards research among students of different age groups on attitudes?
3. Is there a significant difference between students of different year level on attitudes towards research?
Research Hypothesis: There is no significant difference between students of different year level on attitudes towards research? LITERATURE REVIEW
In many studies on students' attitudes towards research, terms like research, research anxiety and positive and negative attitudes towards research have to be defined at the outset of the study. The Department of Education and Training of Western Sydney University defines research as follows:
Research is defined as the creation of new knowledge and/or the use of existing knowledge in a new and creative way so as to generate new concepts, methodologies and understandings. This could include synthesis and analysis of previous research to the extent that it leads to new and creative outcomes.
On his side, Pardede (2018) listed components of research as below:
Research comprises defining and redefining problems, formulating hypothesis or suggested solutions; collecting, organizing, and evaluating data; making deductions and reaching conclusions; and at last, carefully testing the conclusions to determine whether they fit the formulating hypothesis.
Furthermore, Nedha (2011) clarified the difference between research methods and research designs saying that research methods refer to the techniques that the researcher uses to gather information. whereas Research design refers to the blueprint that you prepare using the research method chosen, and it delineates the steps that you need to take.
Amahd and Safaria (2013) defined research self-efficacy as “one's confidence in successfully
performing tasks associated with conducting research (e.g., performing a literature review or analyzing data)”. They also identified four dimensions for research self-efficacy which include data analysis (i.e., confidence in one's ability to work with and analyze data), research integration (i.e., confidence in one's ability to integrate one's research ideas with the existing literature), data collection (i.e., confidence in one's ability to complete data collections tasks such as training raters and keeping accurate records), and technical writing (i.e., one's ability to write research articles for publication)(Rezaei & Zamani-Miandashti, 2013).
Hooda (2017) said that research anxiety refers to the characteristics which a student perceives as discomforting to the extent that productivity may be reduced. Rezaei & Zamani-Miandashti (2013), noted that negative attitudes constitute obstacles to learning and hampers sustained efforts in research. In the contrast, positive attitudes enable students to work resiliently until they find solutions to assigned task or research problem. They finally affirmed that the enhancement of positive attitudes toward research is one of the key components that impacts students' research self-efficacy. For them, it is of a great importance for future educational development to investigate students' attitudes towards research.
In this line, a number of researches have been conducted to study students' attitudes towards research and turned around some constructs like usefulness, positive and negative attitudes and anxiousness caused by research to measure their levels. These studies analyzed also the statistically significance of differences based on some independent variables such as gender, types of university, school, department, academic year and so on.
Some of the studies found that students' attitudes were positive; others found that they were negative. On the other side, they found that there are significant differences among given categories of students on one side and others found the contrary on the other side.
In this regard, Siemens et al. (2010) found that there were significant differences in attitudes towards research in medical school between students in their fourth
year compared to second year. Butt & Shams (2013) found that student teachers have a negative attitude towards research and that a significant difference exists in the attitudes with respect to the type of program and prior areas of specialization; they found that students enrolled in self-supported evening programs have significantly better attitudes towards research than those enrolled in morning programs.
Similarly, Shaukat et al. (2014) found that the males had significantly positive attitudes towards
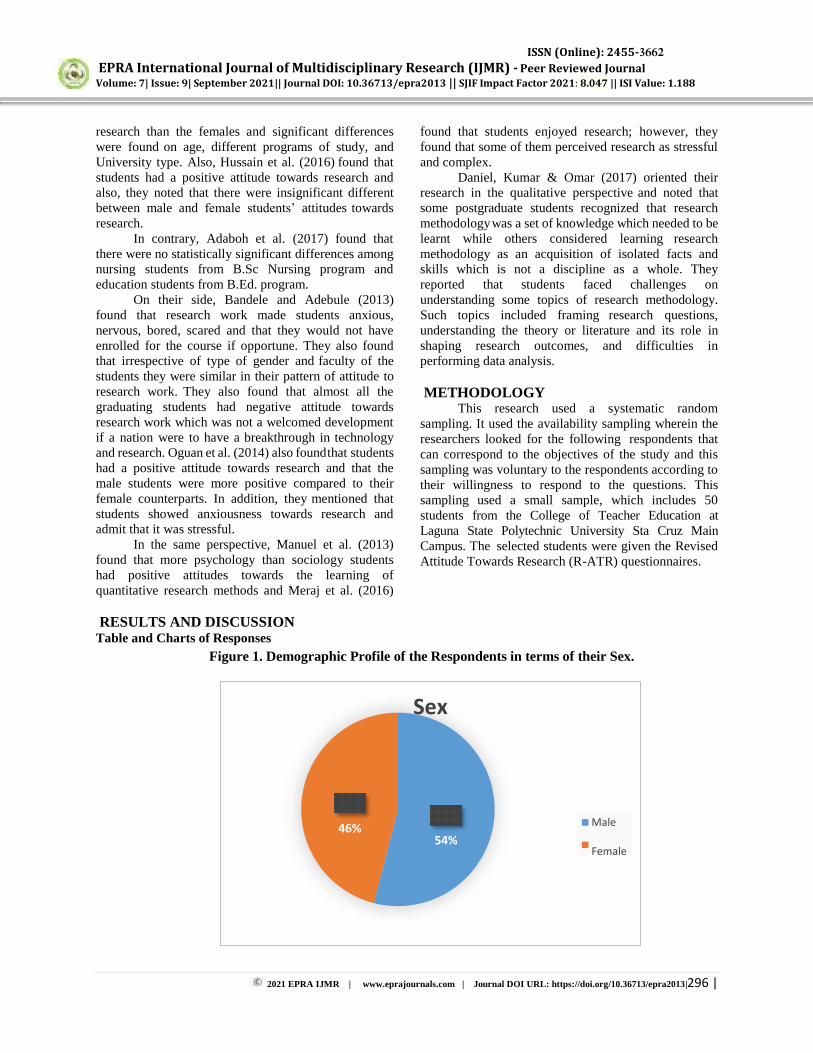
ISSN (Online): 2455-3662 EPRA International Journal of Multidisciplinary Research (IJMR) - Peer Reviewed Journal Volume: 7| Issue: 9| September 2021|| Journal DOI: 10.36713/epra2013 || SJIF Impact Factor 2021: 8.047 || ISI Value: 1.188
2021 EPRA IJMR | www.eprajournals.com | Journal DOI URL: https://doi.org/10.36713/epra2013|296 |
Sex
54% 46% Male
Female
research than the females and significant differences were found on age, different programs of study, and University type. Also, Hussain et al. (2016) found that students had a positive attitude towards research and also, they noted that there were insignificant different between male and female students’ attitudes towards research.
In contrary, Adaboh et al. (2017) found that there were no statistically significant differences among nursing students from B.Sc Nursing program and education students from B.Ed. program.
On their side, Bandele and Adebule (2013) found that research work made students anxious, nervous, bored, scared and that they would not have enrolled for the course if opportune. They also found that irrespective of type of gender and faculty of the students they were similar in their pattern of attitude to research work. They also found that almost all the graduating students had negative attitude towards research work which was not a welcomed development if a nation were to have a breakthrough in technology and research. Oguan et al. (2014) also found that students had a positive attitude towards research and that the male students were more positive compared to their female counterparts. In addition, they mentioned that students showed anxiousness towards research and admit that it was stressful.
In the same perspective, Manuel et al. (2013) found that more psychology than sociology students had positive attitudes towards the learning of quantitative research methods and Meraj et al. (2016)
found that students enjoyed research; however, they found that some of them perceived research as stressful and complex.
Daniel, Kumar & Omar (2017) oriented their research in the qualitative perspective and noted that some postgraduate students recognized that research methodology was a set of knowledge which needed to be learnt while others considered learning research methodology as an acquisition of isolated facts and skills which is not a discipline as a whole. They reported that students faced challenges on understanding some topics of research methodology. Such topics included framing research questions, understanding the theory or literature and its role in shaping research outcomes, and difficulties in performing data analysis. METHODOLOGY
This research used a systematic random sampling. It used the availability sampling wherein the researchers looked for the following respondents that can correspond to the objectives of the study and this sampling was voluntary to the respondents according to their willingness to respond to the questions. This sampling used a small sample, which includes 50 students from the College of Teacher Education at Laguna State Polytechnic University Sta Cruz Main Campus. The selected students were given the Revised Attitude Towards Research (R-ATR) questionnaires.
RESULTS AND DISCUSSION Table and Charts of Responses
Figure 1. Demographic Profile of the Respondents in terms of their Sex.
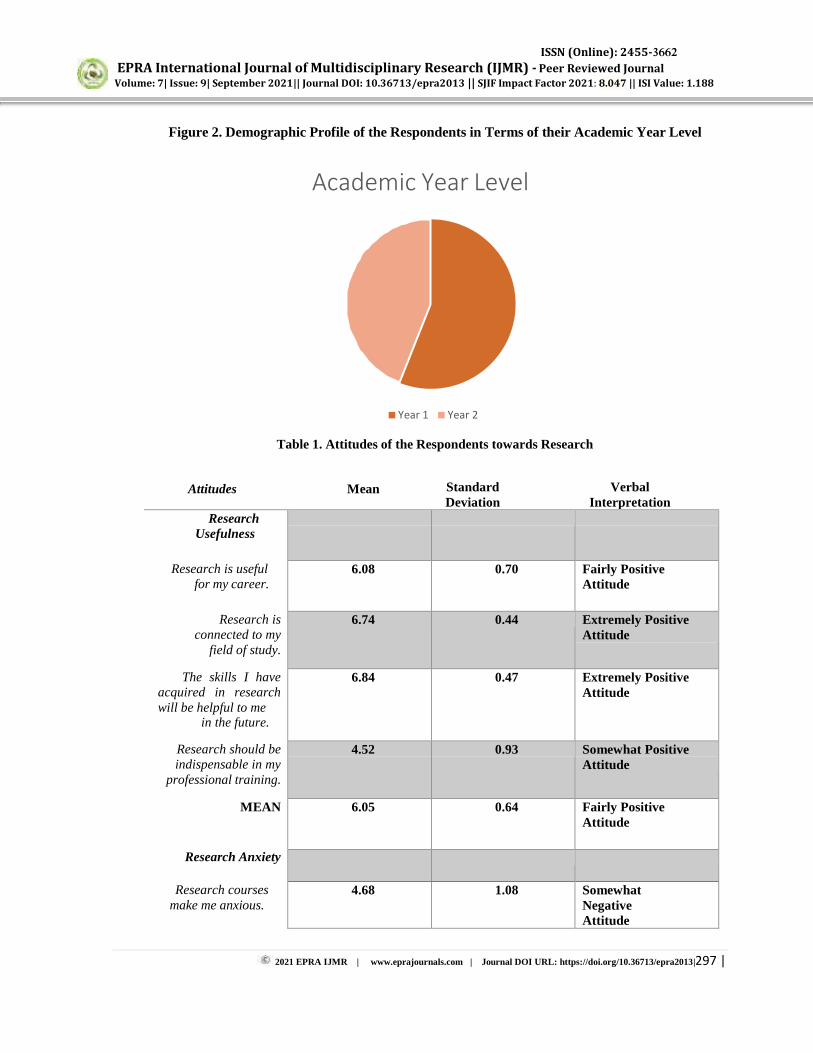
ISSN (Online): 2455-3662 EPRA International Journal of Multidisciplinary Research (IJMR) - Peer Reviewed Journal Volume: 7| Issue: 9| September 2021|| Journal DOI: 10.36713/epra2013 || SJIF Impact Factor 2021: 8.047 || ISI Value: 1.188
2021 EPRA IJMR | www.eprajournals.com | Journal DOI URL: https://doi.org/10.36713/epra2013|297 |
Figure 2. Demographic Profile of the Respondents in Terms of their Academic Year Level
Academic Year Level
Year 1 Year 2
Table 1. Attitudes of the Respondents towards Research
Attitudes Mean Standard Deviation
Verbal Interpretation
Research Usefulness
Research is useful for my career.
6.08 0.70 Fairly Positive Attitude
Research is connected to my
field of study.
6.74 0.44 Extremely Positive Attitude
The skills I have acquired in research will be helpful to me
in the future.
6.84 0.47 Extremely Positive Attitude
Research should be indispensable in my
professional training.
4.52 0.93 Somewhat Positive Attitude
MEAN 6.05 0.64 Fairly Positive Attitude
Research Anxiety
Research courses make me anxious.
4.68 1.08 Somewhat Negative Attitude
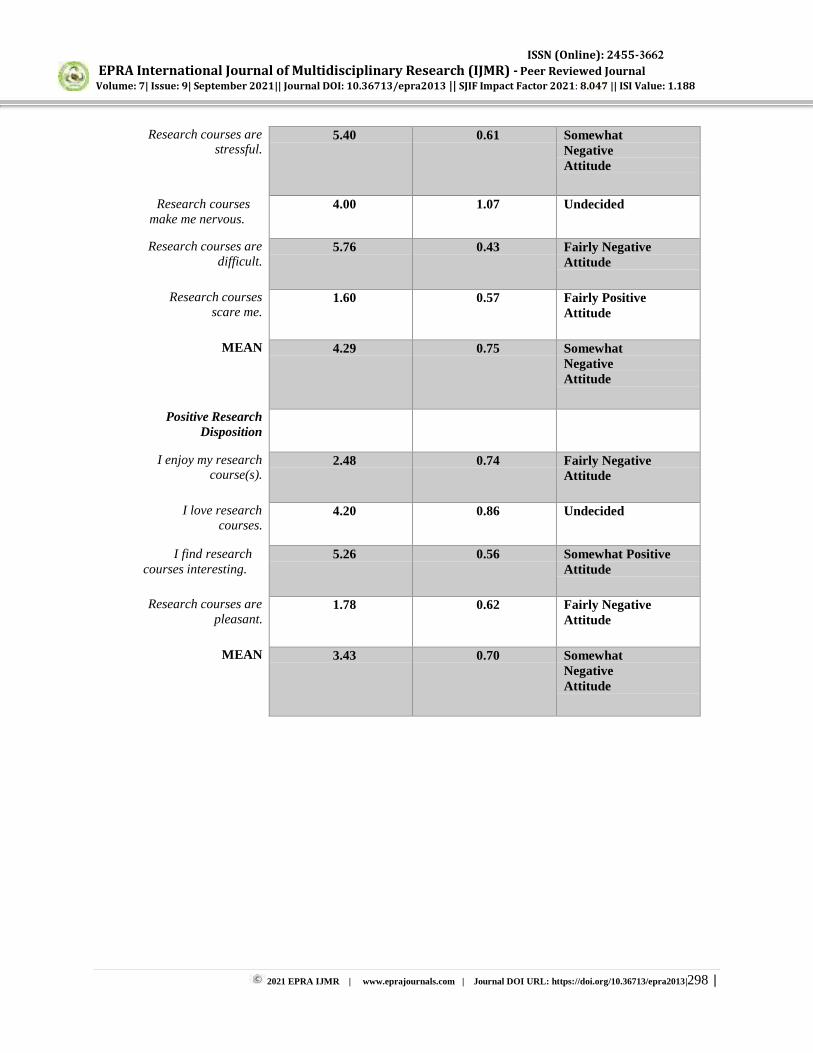
ISSN (Online): 2455-3662 EPRA International Journal of Multidisciplinary Research (IJMR) - Peer Reviewed Journal Volume: 7| Issue: 9| September 2021|| Journal DOI: 10.36713/epra2013 || SJIF Impact Factor 2021: 8.047 || ISI Value: 1.188
2021 EPRA IJMR | www.eprajournals.com | Journal DOI URL: https://doi.org/10.36713/epra2013|298 |
Research courses are stressful.
5.40 0.61 Somewhat Negative Attitude
Research courses make me nervous.
4.00 1.07 Undecided
Research courses are difficult.
5.76 0.43 Fairly Negative Attitude
Research courses scare me.
1.60 0.57 Fairly Positive Attitude
MEAN 4.29 0.75 Somewhat Negative Attitude
Positive Research Disposition
I enjoy my research course(s).
2.48 0.74 Fairly Negative Attitude
I love research courses.
4.20 0.86 Undecided
I find research courses interesting.
5.26 0.56 Somewhat Positive Attitude
Research courses are pleasant.
1.78 0.62 Fairly Negative Attitude
MEAN 3.43 0.70 Somewhat Negative Attitude
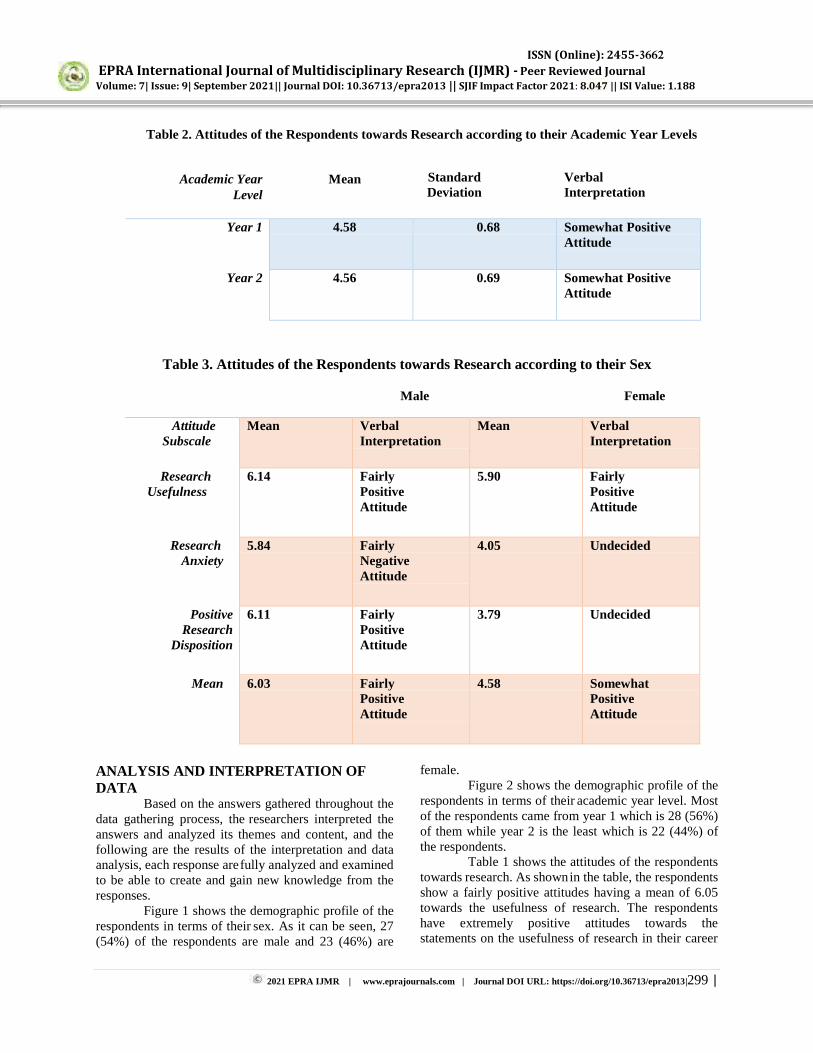
ISSN (Online): 2455-3662 EPRA International Journal of Multidisciplinary Research (IJMR) - Peer Reviewed Journal Volume: 7| Issue: 9| September 2021|| Journal DOI: 10.36713/epra2013 || SJIF Impact Factor 2021: 8.047 || ISI Value: 1.188
2021 EPRA IJMR | www.eprajournals.com | Journal DOI URL: https://doi.org/10.36713/epra2013|299 |
Table 2. Attitudes of the Respondents towards Research according to their Academic Year Levels
Academic Year Level
Mean Standard Deviation
Verbal Interpretation
Year 1 4.58 0.68 Somewhat Positive Attitude
Year 2 4.56 0.69 Somewhat Positive Attitude
Table 3. Attitudes of the Respondents towards Research according to their Sex
Male Female
Attitude Subscale
Mean Verbal Interpretation
Mean Verbal Interpretation
Research Usefulness
6.14 Fairly Positive Attitude
5.90 Fairly Positive Attitude
Research Anxiety
5.84 Fairly Negative Attitude
4.05 Undecided
Positive Research
Disposition
6.11 Fairly Positive Attitude
3.79 Undecided
Mean 6.03 Fairly Positive Attitude
4.58 Somewhat Positive Attitude
ANALYSIS AND INTERPRETATION OF DATA
Based on the answers gathered throughout the data gathering process, the researchers interpreted the answers and analyzed its themes and content, and the following are the results of the interpretation and data analysis, each response are fully analyzed and examined to be able to create and gain new knowledge from the responses.
Figure 1 shows the demographic profile of the respondents in terms of their sex. As it can be seen, 27 (54%) of the respondents are male and 23 (46%) are
female. Figure 2 shows the demographic profile of the
respondents in terms of their academic year level. Most of the respondents came from year 1 which is 28 (56%) of them while year 2 is the least which is 22 (44%) of the respondents.
Table 1 shows the attitudes of the respondents towards research. As shown in the table, the respondents show a fairly positive attitudes having a mean of 6.05 towards the usefulness of research. The respondents have extremely positive attitudes towards the statements on the usefulness of research in their career

ISSN (Online): 2455-3662 EPRA International Journal of Multidisciplinary Research (IJMR) - Peer Reviewed Journal Volume: 7| Issue: 9| September 2021|| Journal DOI: 10.36713/epra2013 || SJIF Impact Factor 2021: 8.047 || ISI Value: 1.188
2021 EPRA IJMR | www.eprajournals.com | Journal DOI URL: https://doi.org/10.36713/epra2013|300 |
having a mean of 6.08. The skills that they have acquired in research will be extremely helpful to them in the future having a mean of 6.84.
On the other hand, the respondents have a different attitude when it comes to the indicators in research anxiety. The respondents somewhat agree that research makes them feel anxious, stress with means of 4.68 and 5.40, respectively. However, the respondents show a fairly positive attitude to the scare that research brings to them having a mean of 1.60. But as a whole, the respondents have somewhat negative attitudes to the statements that measure their research anxiety with a mean of 4.29. The higher the scores obtained, the higher the anxiety level of the respondents. Interestingly, the students have somewhat negative attitudes with regards to the positive research predisposition having only a mean of 3.43.
Table 2 shows the attitudes of the respondents towards research according to their academic year levels. As table 4 indicates, students on their first and second year in graduate studies have somewhat positive attitude towards research.
Table 3 shows the attitudes of the respondents towards research according to their sex. These results show that both male and female students see the usefulness of research. On the other hand, male students are more anxious than the female respondents about research. The female students are unsure about their predisposition towards research while the male respondents have fairly positive predisposition towards research. Generally, male students have fairly positive
attitudes towards research having a mean 6.03 while female students have a somewhat positive attitude as for the attitudes that they have towards research having a mean of 4.58. CONCLUSION The study was an attempt to bring attention on attitudes towards research of the college of teacher education in Laguna State Polytechnic University Sta Cruz Main Campus. The results show that both male and female students see the usefulness of research. On the other hand, male students are more anxious than the female respondents about research. The female students are unsure about their predisposition towards research while the male respondents have fairly positive predisposition towards research. Based on the findings of the researcher, the respondents have extremely positive attitudes towards the statements on the usefulness of research in their career . The skills that they have acquired in research will be extremely helpful to them in the future. RECOMMENDATIONS 1. The college may formulate more trainings and seminars focusing on research writing. 2. The findings of the study can be a reference for future researches in the same field. 3. The action plan may be of help to encourage future educators conduct researchers.
COLLEGE OF TEACHER EDUCATION ACTION PLAN in RESEARCH for CTE
A.Y. 2021-2022 Goals Objectives Action Steps
1. Widen college’s understanding
on the status how research is used and participated.
Assess college’s research
environment -Present the college’s assessment -Apply necessary evaluation for decision – making -Benchmark with potential partners/stakeholders/clients/ community members(internally/externally) -Review the college’s research
purpose Develop a process for tracking research involvement and deciding whether to participate in future research
Organize a research committee
2. Uplift college’s understanding on Come up with research training -Update students with local
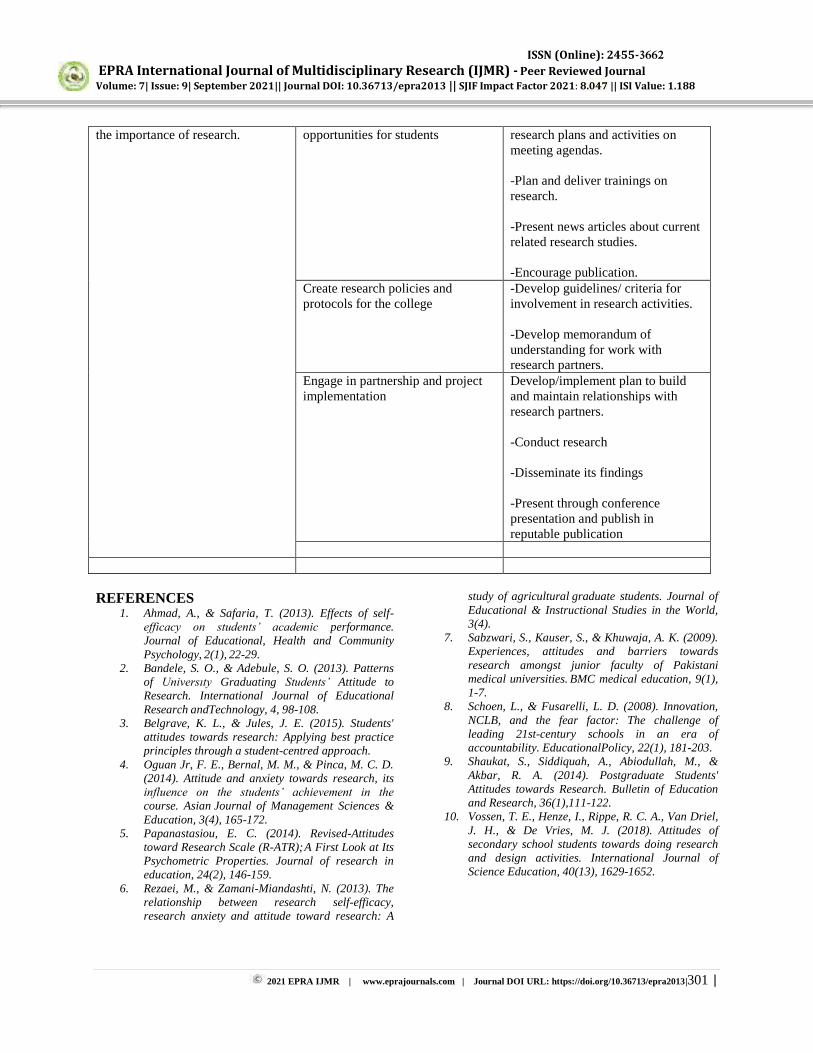
ISSN (Online): 2455-3662 EPRA International Journal of Multidisciplinary Research (IJMR) - Peer Reviewed Journal Volume: 7| Issue: 9| September 2021|| Journal DOI: 10.36713/epra2013 || SJIF Impact Factor 2021: 8.047 || ISI Value: 1.188
2021 EPRA IJMR | www.eprajournals.com | Journal DOI URL: https://doi.org/10.36713/epra2013|301 |
the importance of research. opportunities for students research plans and activities on meeting agendas. -Plan and deliver trainings on research. -Present news articles about current related research studies. -Encourage publication.
Create research policies and protocols for the college
-Develop guidelines/ criteria for involvement in research activities. -Develop memorandum of understanding for work with research partners.
Engage in partnership and project implementation
Develop/implement plan to build and maintain relationships with research partners. -Conduct research -Disseminate its findings -Present through conference presentation and publish in reputable publication
REFERENCES
1. Ahmad, A., & Safaria, T. (2013). Effects of self-efficacy on students’ academic performance. Journal of Educational, Health and Community Psychology, 2(1), 22- 29.
2. Bandele, S. O., & Adebule, S. O. (2013). Patterns of Universıty Graduating Students’ Attitude to Research. International Journal of Educational Research and Technology, 4, 98-108.
3. Belgrave, K. L., & Jules, J. E. (2015). Students' attitudes towards research: Applying best practice principles through a student-centred approach.
4. Oguan Jr, F. E., Bernal, M. M., & Pinca, M. C. D. (2014). Attitude and anxiety towards research, its influence on the students’ achievement in the
course. Asian Journal of Management Sciences & Education, 3(4), 165-172.
5. Papanastasiou, E. C. (2014). Revised-Attitudes toward Research Scale (R-ATR); A First Look at Its Psychometric Properties. Journal of research in education, 24(2), 146-159.
6. Rezaei, M., & Zamani-Miandashti, N. (2013). The relationship between research self-efficacy, research anxiety and attitude toward research: A
study of agricultural graduate students. Journal of Educational & Instructional Studies in the World, 3(4).
7. Sabzwari, S., Kauser, S., & Khuwaja, A. K. (2009). Experiences, attitudes and barriers towards research amongst junior faculty of Pakistani medical universities. BMC medical education, 9(1), 1-7.
8. Schoen, L., & Fusarelli, L. D. (2008). Innovation, NCLB, and the fear factor: The challenge of leading 21st-century schools in an era of accountability. Educational Policy, 22(1), 181-203.
9. Shaukat, S., Siddiquah, A., Abiodullah, M., & Akbar, R. A. (2014). Postgraduate Students' Attitudes towards Research. Bulletin of Education and Research, 36(1), 111-122.
10. Vossen, T. E., Henze, I., Rippe, R. C. A., Van Driel, J. H., & De Vries, M. J. (2018). Attitudes of secondary school students towards doing research and design activities. International Journal of Science Education, 40(13), 1629-1652.
ISSN (Online): 2455-3662
EPRA International Journal of Multidisciplinary Research (IJMR) - Peer Reviewed Journal Volume: 7| Issue: 9| September 2021|| Journal DOI: 10.36713/epra2013 || SJIF Impact Factor 2021: 8.047 || ISI Value: 1.188
2021 EPRA IJMR | www.eprajournals.com | Journal DOI URL: https://doi.org/10.36713/epra2013| 302 |
EMBROIDERY ART OF UZBEKISTAN
Gulirano Ravshan qizi Orifjonova Doctor of Philosophy (PhD) in Historical Sciences of the Museology. Conservation,
Restoration and Preservation of Historical and Cultural Objects
ABSTRACT This article is devoted to the features of Uzbek embroidery, its schools. The role of embroidery in household life, the types of embroidery patterns, the technique of sewing it, and the stitches are studied. KEY WORDS: ethnography, ethnographic collections, museum, object, museum collection, embroidery, art of embroidery, uzbek embroidery, suzane, ornament.
Embroidery is a profession of
embroidering; it is considered one of the ancient areas of applied art. The appearance of embroidery is associated with the appearance of skin joints and stitches. Over time passed from stone to bone awls, from it to metal awls. In addition, weaving, fabric weaving, dyeing and other related activities are also considered. The development of embroidery is preserved in the cultural monuments of Ancient Asia, Europe and America.
Uzbek national embroidery is one of the most ancient types of Applied Art. The art of embroidery attracts people with its hard work, colorful charm of threads and beautiful patterns. Artistic embroidery has a long history. This is also evidenced by archaeological findings and written sources. In Uzbek embroidery is rich in floral, geometric, floral patterns, while in Kazakh and Kyrgyz embroidery there are more elements reminiscent of animals, horns and hooves. Embroidery is one of the main decorations of the Uzbek apartment. Especially during the holidays, weddings and ceremonies, they give a special beauty to the Uzbek household.
The peoples of Central Asia decorated the rooms with colorful embroidery. Embroidery spread on the pillow-blankets in the takhmons – niches, on sandals, cradles. Depending on the use of embroidery, they are called joynamaz – prayer rug, zardevor, kirpech, choyshab, bughjoma or bughja. Joynamaz, as it is known, was used for prayer, the kirpech was caught on the shelf in which the clothes were put on, ruidjo was covered on bedding in the niche, bughja was used as choyshab to wrap the clothes. Small embroideries are hanged on room items. Large embroideries were called suzane (meaning “sewn with a needle in hand”) in many
places. The more little embroideries are called nimsuzane in Bukhara, in Nurata.
Our ancestors used embroidery since ancient times. In many places it was customary for the bride to have several embroideries – suzane, nimsuzane, ruidjo, joynamaz, sandalposh in her dowry. The embroideries were handy for the seasonable decoration. The beautiful embroideries are hung on the wall of the room at holidays, weddings, even family celebrations. The embroideries are also covered on the women’s coffin in mourning ceremony.1
Ancient suzannies have not been preserved to our day, but we can see the picture of suzane in the wall paintings of our ancient architecture. In particular, we see the suzane is hang on the mural painting in one of the rooms of the Panjakent palace dating back BC. Eight circle turundj are placed in two vertical lines in suzane. The basis of the patterns of suzane was as white fabric as in the XIXth century. This fact alone proves that suzane, embroidery was existed in Central Asia from ancient times.
From ancient times there were special artists who painted drawings on embroidery. They were called “qalamkash”, “chizmakash”. The embroideries were made on “white karbos” and on
yellow fabric by the end of the XIX century. Since the late XXth century, embroidery has been woven into purple, blue, brown silk and white colored fabrics. In addition to silk threads for embroidery, light red woolen threads were used.2
1 NOZILOV D.A. From the history of design of Central Asia. Тashkent, Fan, 1998, pp. 96-97. 2 NOZILOV D.A. From the history of design of Central Asia. Тashkent, Fan, 1998, pp. 96-97.
ISSN (Online): 2455-3662
EPRA International Journal of Multidisciplinary Research (IJMR) - Peer Reviewed Journal Volume: 7| Issue: 9| September 2021|| Journal DOI: 10.36713/epra2013 || SJIF Impact Factor 2021: 8.047 || ISI Value: 1.188
2021 EPRA IJMR | www.eprajournals.com | Journal DOI URL: https://doi.org/10.36713/epra2013| 303 |
The profession of embroidery has been one of the ancient spheres of applied art. Archaeological findings indicate that embroidery exists in almost all nations, developed in connection with the climate, natural conditions, the culture, art, types of professions of each nation.
Naksh (pattern) from Arabic, means image, flower. In the art of embroidery, each country has its own unique pattern of embroidery that uses the most. The Uzbek embroidery is rich in floral, geometric and flower patterns, while Russian embroidery features geometric, floral shapes, flowers, birds, and fruits, while Kazakh and Kyrgyz embroidery often features the elements resembling animals, horns and hooves.
Color plays the main and important role in embroidery. The color of the embroidery is chosen from its background, that is, from the basis. The coarse calico will never be as white as milk. Its slightly grey, yellow tinge is somewhat suitable for the formation of an inseparable coloration. If there is a background, then the embroidery thread of the same color is chosen. Sometimes, the background also helps to make the ornament stand out, along with silks.
In Central Asia, embroidery was so widespread that every woman in the family should know how to sew embroidery. Therefore, each family prepared for itself kirpech, suzane, dorpech, oynakhalta, choykhalta and others. The type of decorative items is very diverse, for example: suzane, kirpech, choyshab, oynakhalta, choykhalta, zardevor, palyak, gulkurpa, dorpech, bughjoma, parda, belbogh, takyapush, duppi, kuylak, dastrumol, khamyon, joynamaz, sumka, nimcha, makhsi kovush, khaltacha and others were decorated with artistic taste.3
Embroidery is the sewing of flowers on the machine on various fabrics with different colors of silk, mulina, gold thread with a needle, hook awl. Embroidery is sewn on various clothes, household items. In embroidery, fabric, leather, cardboard, linen, wool, silk, artificial threads, gold threads, thin wire, tapes made of raw leather, beads, necklaces, metal pieces, precious natural and artificial stones, beads made of glass and other materials are used. The embroidery has its own set of tools, which perform a specific operation. The needles, awls with and without hooks, brooch, thimble, scissors and rims are used in embroidery.4
The rim is made mainly of wood, it has shape of a circle, a square, a rectangular. The circle rim is used for a little embroidery, because it is
3 BULATOV S.A. Uzbek folk decorative-applied art.Тashkent, Меkhnat, 1991, pp. 313-314. 4 BULATOV S.A. Uzbek folk decorative-applied art.Тashkent, Меkhnat, 1991, p.316.
convenient. The rim is not used for all embroideries. Thread and needle are selected in such a way as to match the thickness of the embroidery fabrics. Two kinds of awls with wooden handle are used for embroidery, that is, with a hook and without a hook. The awls without a hook are used to sew without difficulty on some materials, such as leather and cardboard. Scissors with a sharp tip of 10-12 cm are used for ornaments. For convenience of sewing, the fine thread should not be longer than 50-60 cm, and if embroidery is sewn on the rim the thimble is not used. A copy of the pattern is drawn to different materials in different ways.
There are specific tools for embroidery by hand. Needles, thimbles, scissors, centimeter tape, awls with a hook and without, and rims are used in embroidery.
In embroidery, fabrics such as white, gray, light yellow, light yellow coarse calico, calico, silk, velvet, chintz or sateen are used. In such fabrics, the patterns look good when drawn, most of the colored threads are suitable for it.
For drawing a flower, a picture, patterns, you will need rulers, hard and soft pencils, notebook, album, rubber, graph paper and transparent paper. The rims are used to tighten the fabric. It consists of two rims of 20-40 cm and falls into each other. If it is difficult to get into the small rim, it is necessary to clean the inner side of the large rim with a sandpaper.
And in the early times, embroidery was sewn only from natural fibers, such as thread, that is cotton, wool and flax. Today, the strong threads made from artificial fibers, gold wires, and even braids made of raw leather are expanding in embroidery.
The mutual matching of colors of threads used in embroidery makes the embroidery attractive. The embroiderer should choose a pattern of embroidery, depending on the shape of the cloth, the color of the fabric. Embroidery threads are made of cotton fiber, four-layer, faded and are traded in the form of 50 meter skein.
Mulina made from high quality cotton fiber. It comes in 12 layers, the highest quality with special treatment, and is resistant. It is produced in the form of ten or twenty meters of skein. Silk threads are made of natural and chemical fibers. The threads are twisted, painted white on different sizes, the skein is hang (40 gr.), wrapped in coils and paper patron (50, 100, 200 m long). Silk threads number 13-18 are the threads prepared from wool, flax, artificial fibers, sewn with thin ribbons made of fine wire, gold thread, leather.
There are two types of hand embroidery: first, embroidering with counting of weft and braid threads of the fabric. The second is a type of freely embroidery, drawing the contour of the pattern, flower, and image on the fabric.
ISSN (Online): 2455-3662
EPRA International Journal of Multidisciplinary Research (IJMR) - Peer Reviewed Journal Volume: 7| Issue: 9| September 2021|| Journal DOI: 10.36713/epra2013 || SJIF Impact Factor 2021: 8.047 || ISI Value: 1.188
2021 EPRA IJMR | www.eprajournals.com | Journal DOI URL: https://doi.org/10.36713/epra2013| 304 |
Iraqi, ilma, burma, bosma, khamduzi, chamak, chinda khayol, bakhya stitches are widespread in Uzbek embroidery. In artistic embroidery in different places, the stitches are sewn differently. For example, in Tashkent is sewn mostly with bosma stitch, in Shakhrisabz with yurma, kandakhayol, iroqi, in Bukhara, Samarkand, Nurata with yurma stitch.
Yurma stitch – yurmaki is sewn with an awl with hook or needle, forming a chain of loops on the right side of the fabric, and on the reverse side straight lines. This stitch is sewn on the machine. The machine stitch is famous for its popop name. With yurma stitch mostly jiyaks, the outlines of decorative items, the filling of the inside of the embroidery, also, some parts of the large embroidery, the stalk that connects the flowers and leaves to the main branch and others were sewn in such a way from ancient times. The Samarkand, Bukhara, Kashkadarya embroiderers widely used the yurma stitch.5
Chinda khayol – duruya stitch is sewn evenly, pinned the needle on the fabric. In the same way a uniform flower is formed from the front and back side of the fabric. This stitch is used in the decoration of items visible from two sides, that is, the towel, scarf and other.
Khamduzi is a two-sided flat stitch, it was called that because it was sewn straight or slightly crooked. This stitch is used a lot to sew the gentle geometric patterns on a belt for skullcap flowers and so on.
Ilma stitches are usually used for framing the embroidery which sewn with a bosma stitch. Ilma stitch is wide spread in the Ferghana valley. First, after forming a hoop, the needle is injected into the hoop and taken over the thread, the thread on which presses the beginning of the left hand is left behind the needle, which was stuck.
Chamak stitch – is one of the stitches of embroidery, which is sewn from the left to the right along two parallel lines, and the needle through which the thread is pierced, is stuck from the right. Then it is pulled out from above to the left obliquely and and it sticks straight parallel to the bottom line, also the bottom is pulled out obliquely. Chamak stitch is used to enclose the pattern in the frame or for decorating a wide band of skullcaps. The small scissors with a sharp tip is used. Chamak stitch is called among the Russians as “kozlik” (“goat”).
Bakhya stitch - serves to strengthen the edges of the embroidery, stitched, considering the smooth seam and distance as if outlined. After that, the fabric turns around again stitched, the result is formed smooth thread line. This stitch was sewn in the
5 BULATOV S.A. Uzbek folk decorative-applied art.Тashkent, Меkhnat, 1991, p.316.p.318.
machine much earlier than later by hand. It can also be two rows, that is, the rows intersect.
Kuppa stitch is formed by sewing a plain in different directions, that is, from the left to the right, from the right to the left, from the top to the bottom, from the bottom to the top. Side-by-side stitches are even or from small to large, and from large to small in size, depending on the shape of the flower. This stitch is called by the names of duruya, (bilateral) sanama, piltaduzi. It is widely used in skullcaps and embroidery.
Embroidery is a kind with its ancient traditions among the types of decorative applied arts of Uzbekistan, is widespread in large trade centers and villages of Central Asia. This type of art, while maintaining its poetic coloring, was appreciated among the people and did not lose its essence. Embroidery is mainly divided into six territorial groups, that is, schools. In particular, Nurota, Bukhara, Samarkand, Shahrisabz, Tashkent and Ferghana embroidery schools.
Nurata, Bukhara, Samarkand, Shakhrisabz and Ferghana embroidery schools were advanced schools in Central Asia in the XIXth and early XXth centuries. Khujand, Zarafshan embroidery schools also had their own style. In particular, the Nurota embroidery school is characteristic of the following: bouquets are arranged rarely on a white background of fabric, plant patterns are depicted with images of birds. In the middle of the embroidery is placed an octagonal or vegetative turunj (flower circle), the composition of the embroidery is found in the form of a finished with bouquets in the direction of the center from the corner.
Nurota, one of the largest centers of embroidery, is distinguished from other schools by the sharpness of the image of embroidery, the iridescent of floral patterns during the centuries. In Nurota embroidery, we can often see that the plant patterns are animated with the shape of birds. And sometimes we see the human and animal forms in some of the most invisible areas. Embroideries are sewn with bosma stitch in bright and gentle colors, the edges with zanjircha (chain) stitch. The closed composition embroideries with large bouquet in the four corners of the square and eight-pointed star are wide spread in the centre of Nurota. This type of composition means in Nurota “Chor shokhu yak
mokh” – “Four horns one moon”. Nurota embroidery
differs from other embroidery schools with the branches sewn mainly in the style of “yurma” or
“zanjircha”. Among the embroidery schools, Nurata
embroidery has been remarkable for its compositional structure and bright color. In the traditional embroidery of Nurota horn, branch, leave are introduced as additional elements, but the flowers reveal the main essence. Floral patterns such as “Guli
ISSN (Online): 2455-3662
EPRA International Journal of Multidisciplinary Research (IJMR) - Peer Reviewed Journal Volume: 7| Issue: 9| September 2021|| Journal DOI: 10.36713/epra2013 || SJIF Impact Factor 2021: 8.047 || ISI Value: 1.188
2021 EPRA IJMR | www.eprajournals.com | Journal DOI URL: https://doi.org/10.36713/epra2013| 305 |
safsar”, “guli hafrang”, “guli lola”, “chinnigul”,
“mukchagul”, “khibcha”, “makhbal” are used. In the villages of the Surkhondarya region,
the current women with skillful hands can still be seen, whose products are intended to meet the demand of the local population. A large wall panel syuzane is considered panel is considered the most fashionable of the products of the craft. Wonderful embroidery samples decorated embroiderers of the oasis – joynamaz, zardevor, bolinpush and joypush, ruidjo, bughjoma, lyulabolish, belbogh or belqars, beshikpush, dasturkhon, oynakhalta, tuzkhalta, choykhalta, djiyak and etc. All these items have preserved the overall style associated with the pattern or ingredients, manner of execution. “Oynuskha” or
“tupbarggul” are the main patterns of Surkhandarya
embroidery. In some areas there are embroideries with the image of animals, which stylized forms of bird, scorpion, sheep horns, cock crowns are expressed. Generally, islimi – vegetation forms, including flowers and fruits, tulip, pomegranate, almond flower, curly leaves dominates in Surkhandarya embroidery.
The art of embroidery in Surkhandarya is known from ancient times as an integral part of folk crafts. There is also the fact that embroidery has been improved and enriched since ancient times, and the forms of the patterns and images multiplied and created separately, and raised to the level of a whole work of art. Surkhan embroidery school was formed mainly in two directions: in the style of Boysun and Kunghirot. Although these methods do not differ sharply from each other, but differ in terms of types of patterns, shapes, colors.
The circle patterns were large in Samarkand embroidery. Several of these circles are placed on the embroidery surface in both horizontal and vertical axes. Circles are composed of wide rainbow circles. The so-called “shamchiroq” (“candle”) element, used in Samarkand embroidery, gives embroidery a distinctive beauty. Because the leaves in the center circle turundj are like flames spread out in four directions, they are called “chorchiroq” – four lamps.6
Samarkand embroidery is of particular importance with its bright and originality. Despite the close proximity to the traditions of Bukhara, Nurota, Shahrisabz embroidery, the Samarkand embroidery school is distinguished by its artistic excellence, the rigidity and purity of its colors, the mobility of its forms. The main place of Samarkand embroidery is occupied by large-walled “palyak” - shaped suzannies. For their preparation, hand-woven cotton, silk fabric or factory-made colored fabric was used. And for embroidery, hand-woven or factory silk,
6 NOZILOV D.A. Ўрта Осиё дизайн тарихидан. Тashkent, Fan, 1998, p.100.
cotton or wool threads were used. Samarkand embroiderers sewed embroidery with “bosma”, sometimes with “kandakhayol” stitches. The images were formed on the basis of a “yurma” stitch. The decorative compositions of syuzane consist of the flower branches and large floral decorations surrounding with leaf rings. In 1905-1917, new directions appeared in the field of embroidery. That is, embroidery is sewn on white, sometimes red, green or purple fabrics woven in the factory, threads of yellow, blue, grey, green, purple black color have already replaced the additional decoration. “Lola”
(“tulip”) described in large form became the main decorative motif. With the disappearance of the other colors, the mutual co-ordination of red, black and white colors became a distinctive feature of Samarkand suzane from various embroideries in Uzbekistan. The image of a single flowering shrub in the center is an ornament of Samarkand suzane. At the end of the XIX beginning of the XX century, the so-called “bolishpuches” appeared in the form of a series of identical bushes, completely new to the Samarkand embroidery. A brief analysis of the images from the Samarkand suzane shows that both the methods of decorating local embroiderers and the traditions of local art are associated with a common heritage. The researchers claim that the decorations have an archaic feature. Samarkand embroiderers, along with the adoption of certain aspects from the ancient heritage, also form their own private artistic direction. This is exactly what determines the peculiarity of Samarkand embroidery. Embroidery is often used as a symbol of amulet, and has been used to protect the bride from evil eyes at major wedding ceremonies. Throughout the XXth century, women aware of the secrets of embroidery began to decline greatly. However, Samarkand embroidery traditions have been preserved in Urgut. At present, Urgut has become a local center of embroidery. Here, at the beginning of the XX century, the embroidery composition, which appeared in Samarkand, that is, a large toothed pattern, surrounded by a ring of wide leaves, was preserved. But the images of Urgut are simpler and coarser than the Samarkand embroidery. The three-color features, such as red, pink patterns and black leaf rings, have been retained. Urgut embroidery is a completely new stage in the development of image. The bunch of leaves occupied the entire surface of the embroidery, became a complex decoration property. As a result, the white fabric, which forms the basis of the embroidery, also served as an important decoration. Embroidery in such a direction is not encountered in the embroidery of the Samarkand school.
Bukhara has been considered as one of the largest centers of embroidery for many centuries. Bukhara embroidery differs from other schools because of its sharpness of the image, the graceful of
ISSN (Online): 2455-3662
EPRA International Journal of Multidisciplinary Research (IJMR) - Peer Reviewed Journal Volume: 7| Issue: 9| September 2021|| Journal DOI: 10.36713/epra2013 || SJIF Impact Factor 2021: 8.047 || ISI Value: 1.188
2021 EPRA IJMR | www.eprajournals.com | Journal DOI URL: https://doi.org/10.36713/epra2013| 306 |
the stitches and the flexibility of the floral patterns. The ring-shaped ornament is found in Bukhara embroidery. Bukhara embroidery is unique in its simplicity of embroidery. They have fewer leaves and a thin branch is slightly wider. The “three
leaves”, which are held inside the base circle, both internally and externally, make it lacy green ring. Bukhara suzane differs from Samarkand suzane, Bukhara suzane has a wide border rich in decorations. The influence of the traditions of the “palace” style is clearly felt in Bukhara suzane.
In Bukhara embroidery turundj, davra-turunj, several ring circles, star-shaped and large patterns were widely used. They are arranged in different compositions. In particular, a large round – turundj in the middle surrounded by smaller turundj or four-leaf large pattern in the middle can come in compositions in the form of surrounding around round-shaped patterns, also a thin band of flowers arranged in rhombic cells organized as a result of the intersection of the diagonal lines as well as the middle of the embroidery, and in the compositions around with large circles. 7
Shahrisabz embroidery school is one of the major schools that stands after the school of embroidery from Bukhara and is famous for its own skilful masters. It is one of the largest centers after Bukhara, is distinguished from the embroidery of another places with its high artistry. Its difference from other schools is that it used most the “kandakhayol” method. Besides, the masters also
used “yurma”, “bosma”, “iroqi” methods.
Shahrisabz embroidery differs by the brightness of colors, the width of the frame and the asymmetrical arrangement of the patterns. The decorative decoration of the embroidery made by them rose to the level of the legendary imagination.
In the center of the Shakhrisabz suzannies there is a large turundj, and in the corners there is a smaller turundj or leaf ornament and a newly opened tulip composition are used. A pattern occupies most of the surface of the suzanes.8
The surface of the embroideries of Tashkent embroidery school is completely covered by the patterns. The basis of embroidery is often used in the form of geometric circles using red and light red. In the early XIXth and XXth centuries, folk craftsmen, like other crafts, continued their traditions in embroidery. That is, oypalyak became a distinctive mass in embroidery, large inflorescences symbolizing the moon and the sun were sewn with black threads on a reddish pink fabric. The Tashkent suzanes were mostly in square shape, and the embroideries of small
7 NOZILOV D.A. From the history of design of Central Asia. Тashkent, Fan, 1998, p.101. 8 NOZILOV D.A. From the history of design of Central Asia. Тashkent, Fan, 1998, p.103.
size were called “gulkurpa”. Gulkurpa is mainly used
the floral patterns and resembles Nurota embroidery school. The embroiderers of Pskent territory, which is situated in the northeast of Tashkent, sewed the embroideries called “Palyak”. “Palyak” was sewed in
square shape printed style, they used mainly red, yellow colors.
The suzannies in Tashkent were called “palyak” and “gulkurpa”. The word palyak was filled
in large circles symbolizing the image of the moon and stars. The name of palyak was fixed according to the quantity of the circles. Such as, six circles were called as “olti oyli palyak” (“palyak with six
moons”), twelve circles as “o’n ikki oyli palyak”
(“palyak with twelve moons”). The size of circles was bigger to make easier of the composition of pattern in palyak at the end of the XIX beginning of the XX centuries. As a result, the number of circles is reduced. The names also change, that is, “oy palyak”, “kiz palyak”, and “togora palyak”.
The gulkurpa is separated from the palyak by its large open surface. Ancient gulkurpas were made of white fabric.
The star-shaped pattern on the Tashkent gulkurpas is used not only in the center but also in the corners.9
In Khujand suzanes the floral and foliage patterns on a white fabric play the main role. The complex turundj-circles located on horizontal and vertical axes on composition of ancient suzanes and large turundj in the centre of suzane is occupied the main place. Then there are patterns circles with horns. The image of the horn squeezed the complex turundj-circles from the suzane composition. And instead the patterns such as “anor guli”
(“pomegranate flower”), “lola” (“tulip”), “bodom
guli” (“almond flower”), even “qalampir guli”
(“pepper flower”) appeared. The suzannies are widespread in the
villages of the upper reaches of the Zarafshan river from Falghar to Panjakent. The small embroideries were sewn in Maschokh and other oases. Large patterns called “lola-turundj” and “chorchiroq” are
typical for Falghar suzanes. The chorchiraks (four lamps) used in the Falghars are completely different from the Samarkand suzane, they are in the structure of a four-room lamp, and several occupy the entire surface. This pattern is also known as “lolai guli rang” in the villages of Falghar. Also, the compositions with large lola-turundj in the middle of Falghar suzane and the leafy patterns flower sprout around are met.
The above shows that embroiderers tried to make the decoration of the suzane from a light
9 NOZILOV D.A. From the history of design of Central Asia. Тashkent, Fan, 1998, p.104.
ISSN (Online): 2455-3662
EPRA International Journal of Multidisciplinary Research (IJMR) - Peer Reviewed Journal Volume: 7| Issue: 9| September 2021|| Journal DOI: 10.36713/epra2013 || SJIF Impact Factor 2021: 8.047 || ISI Value: 1.188
2021 EPRA IJMR | www.eprajournals.com | Journal DOI URL: https://doi.org/10.36713/epra2013| 307 |
fabric, a light composition. For this, they used mainly curved lines and circular patterns. Circles of the same size are located on the intersection of vertical and horizontal axis. When working out circles of different sizes, there was a large one in the middle and a small one around it. Their colors were also more closely related to each other (in the close range of colors). Therefore, a general, common composition was preserved in them. It is pleasing to the eye with the integrity and simplicity of the suzane pattern composition. Hanging on the open spaces of the wall, the suzane helps to make the room look cool and solemn. That is why the composition of suzane of the early Middle Ages was still preserved.10 CONCLUSION
In conclusion, we can say that the Ferghana embroidery school was poorly studied. The study of the samples of the Ferghana school in the collection of museums serves to reveal the peculiarities of the embroidery of this region. In general, embroidery samples were important in everyday life. When a girl is born in the family, embroidery samples are sewn as her dowry in good intention by her mother, grandmother until she grows up. Girls were taught to embroider from a small age. There are edifying events among the people about the fact that if a matchmaker comes to a girl, her embroidery will be shown. Embroidery sewn by a girl gave the opportunity to determine the girl, temper, and her character. The embroidery sample was of great importance in determining the taste of women in the family as a whole. Even for the rituals associated with death, women prepared an embroidery sample on their coffins. This is a tradition that exists even though it is still preserved at present, albeit less frequently. That is, an embroidery sample is closed on a women’s coffin, in each family there is such an embroidery sample that passes from generation to generation. If it does not exist, older women have prepared such an embroidery sample. The achievements in the development of embroidery art are as follows: - leading a simple colored fabric into works of art; - the use of the drawing in weaving suzane; - the execution of a large circle, multi-faceted turundj in colors conspicuous in, which play a dominant role in the suzane pattern; − the creation of integrity compositions, formed from a combination of curved, straight-line branches of plant patterns, such as leaves, flowers, which look two or three kinds in the corners of suzane or around large circles on the surface of the suzane;
10 NOZILOV D.A. From the history of design of Central Asia. Тashkent, Fan, 1998, p.106.
- ensure the integrity of the composition of patterns on the surface of the suzane, and the harmonization of colors; - emerging to decorate the inner part of the room with suzannies; - emerging of suzane pattern for ceremonies and holidays. 11 The richest collections of Museums of Uzbekistan are associated with these embroidery samples. There are many such exhibits in museum funds that have not yet been explored.
REFERENCES
1. BULATOV, S. A. (1991). Uzbek folk decorative-applied art. Tashkent, Mekhnat, p. 316.
2. NOZILOV, D.A. (1998). From the history of design of Central Asia. Tashkent, Fan, pp. 96-97.
3. ChEPELEVETSKAYA, G.V. (1961). The suzannies of Uzbekistan. Tashkent, p.40.
4. SUKHAREVA, O.A. (2016). Central Asian decorative embroidery. Мoscow, Vostochnaya literatura, p. 99.
5. KHAKIMOV A. A. (2014). Rare suzannies from the collection of the State Fine Arts Museum of Uzbekistan. In: Art. Tashkent, No 2, pp. 14-15.
11 NOZILOV D.A. Ўрта Осиё дизайн тарихидан. Тashkent, Fan, 1998, p. 108.
ISSN (Online): 2455-3662
EPRA International Journal of Multidisciplinary Research (IJMR) - Peer Reviewed Journal Volume: 7| Issue: 9| September 2021|| Journal DOI: 10.36713/epra2013 || SJIF Impact Factor 2021: 8.047 || ISI Value: 1.188
2021 EPRA IJMR | www.eprajournals.com | Journal DOI URL: https://doi.org/10.36713/epra2013 308
ANALYSIS OF ATTITUDE TOWARDS YOGA AMONG
COLLEGE STUDENTS USING CLUSTERING TECHNIQUES
Dr. Birbal Saha1*, Dr. Subir Sen2, Anasuya Adhikari3
1Professor, 2Associate Professor & 3Research Scholar, Department of Education, Sidho-Kanho-Birsha University, Purulia, West Bengal, India
*Corresponding Author: Dr. Birbal Saha Professor, Department of Education, Sidho-Kanho-Birsha University,Purulia, West Bengal, India
Article DOI: https://doi.org/10.36713/epra8552
DOI No: 10.36713/epra8552
ABSTRACT
Yoga is an ancient practice involving physical, mental and spiritual practices. Yoga was first mentioned in the Rigveda. Yoga is seen to bring positive and holistic changes in human lives. Yoga strengthens body and relaxed the mind and hence is appreciated for its multifarious benefits. The benefits of Yoga, can be best proven on the students, looking after its memory and concentration increasing ability, developing good physic and calm mind. Present work deals with the attitude towards yoga practice of undergraduate college students of Purulia district of West Bengal, India. Response from 570 UG students is taken by a scale of attitude towards yoga. Four independent variables like Gender, Location of College, Residence of Students and Streams; and one dependent variable score of the questionnaire (attitude towards yoga practice) are considered for this study. Data Clustering is the task of grouping a set of objects in such a way that objects in the same group are more similar to each other than to those in other groups. Two-Step cluster analysis is done and five clusters are formed to take up the present study. KEYWORDS: Two-Step cluster Analysis, Undergraduate Students, Yoga, Attitude
INTRODUCTION Man has stepped into the twenty-first century.
Medical science and men are working with many better technologists to offer better health care. World health organization is engaged in taking stock of global health status and taking necessary steps to raise the health standards. Hi-tech medical facilities with fascinating advances in spare-part surgeries, although have made life more comfortable, with a life expectancy of greater than seventy years, the expected quality of life, with harmony and peace seems to be far from reality. Problems of stress, stress related ailments, unrest, breaking up families, are all on an exponential rise. Health professionals who started by giving relief to their suffering sick fellow beings, through medicines and surgeries, are
now faced with such newer questions because of the need of the hour. Most of the common health and social problems cannot be solved through germ theories, antibiotics or surgeries. The advent of fascinating diagnostic tools has started pointing to the role of mind on matter. Biochemical, psycho-neuro physiological, immunological researchers are all recognizing the role of mind, the life style, suppressed emotions, stress etc. in the causation of many of these challenges of the millennium. Several research publications on the value of positive thinking, prayer, spiritual healing, mind-body medicine, yoga, acupuncture, energy medicine are being poured into medical journals in spite of the resistance from hard core matter-based pharmaceutical and surgery oriented researchers.
ISSN (Online): 2455-3662
EPRA International Journal of Multidisciplinary Research (IJMR) - Peer Reviewed Journal Volume: 7| Issue: 9| September 2021|| Journal DOI: 10.36713/epra2013 || SJIF Impact Factor 2021: 8.047 || ISI Value: 1.188
2021 EPRA IJMR | www.eprajournals.com | Journal DOI URL: https://doi.org/10.36713/epra2013 309
The National Institutes of Health assorts Yoga, the 3000 years long-established tradition, to be a holistic, integrated approach and a form of Complementary and Alternative Medicine (CAM). Manifested for the calmness it shoulders, Yoga is imputed to endorse flexibility, greater self-control, strength, compassion, facilitates friendliness and endurance. Uninterrupted and seasoned rehearse dole out paramount culmination in life perspective, improved sense of energy and self-awareness. Yoga perpetuates a poise of the body and mind, and truncates stress.
Yoga can judiciously be called a configuration of mind-body fitness, since it comprises the structured use of muscles, engendering in reduced chronic body pains, increases in serotonin levels, increases blood flow and levels of hemoglobin and decrease the risk of heart attack and stroke. Apart from having capitalization in curing physical health complications, Yoga gravitates to alleviate mental health problems such as anxiety, depression, insomnia and stress.
Yoga lifts up students cognitive, psychological, physiological and social aspects. Cognitive skills contribute to equip one with attention, focus, concentration, mindfulness, problem solving, self-awareness, critical thinking and creativity, decision making etc. It keeps the students at ease and aids to be in a mindfulness state. This in turn improves concentration and memory power, which is much needed in academics. Yoga cater the physiological skills in a student making him/her flexible, strong, balanced, with ameliorate respiratory functions, dignified self-regulations, physical well-being, inducing acceptable health care and hygiene practices, balanced diet, suited sleep habit etc. Social skills too are an important arena in a student’s life which include inter-personal relationship, collaborative team work, social awareness, effective communication, etc. which can be boosted through Yoga.Man has stepped into the twenty-first century. Medical science and men are working with many better technologists to offer better health care. World health organization is engaged in taking stock of global health status and taking necessary steps to raise the health standards. Hi-tech medical facilities with fascinating advances in spare-part surgeries, although have made life more comfortable, with a life expectancy of greater than seventy years, the expected quality of life, with harmony and peace seems to be far from reality. Problems of stress, stress related ailments, unrest, breaking up families, are all on an exponential rise. Health professionals who started by giving relief to their suffering sick fellow beings, through medicines and surgeries, are now faced with such newer
questions because of the need of the hour. Most of the common health and social problems cannot be solved through germ theories, antibiotics or surgeries. The advent of fascinating diagnostic tools has started pointing to the role of mind on matter. Biochemical, psycho-neuro physiological, immunological researchers are all recognizing the role of mind, the life style, suppressed emotions, stress etc. in the causation of many of these challenges of the millennium. Several research publications on the value of positive thinking, prayer, spiritual healing, mind-body medicine, yoga, acupuncture, energy medicine are being poured into medical journals in spite of the resistance from hard core matter-based pharmaceutical and surgery oriented researchers LITERATURE REVIEW
Govindasamy and Velmurugan (2018) conducted research on Analysis of Student Academic Performance Using Clustering Techniques. Here various clustering algorithms are discussed and by using these algorithms, students’ performance is evaluated. In this research work, clustering algorithms k-Means, k-Medoids, FCM (Fuzzy C Means) and EM (Expectation Maximization) were examined and compared based on the performance of the algorithms using student data set.
Educational Data Mining & Students’
Performance Prediction was studied by Saa (2016). This study explores multiple factors theoretically assumed to affect students’ performance in higher
education, and finds a qualitative model which best classifies and predicts the students’ performance based
on related personal and social factors. (Sample size 270)
Natek and Zwilling (2014) focuses on the study of Student data mining solution-knowledge management system related to higher education institutions. Study concludes that the use of these techniques in real life situations is useful and promising and can provide administrators with precious tools for decision.
Borgavakar & Shrivastava (2017) conducted research on Evaluating Student’s Performance using K-Means Clustering. This paper evaluates student performance on basis of class test, mid test and final test, as we get cluster of student on this basis of student marks.
Clustering is used by Campagni, Merlini, & Verri (2014) for analyzing data concerning the evaluation of courses taken by students, linked to their results in the corresponding exams with possible correlation between the evaluation of a course and the
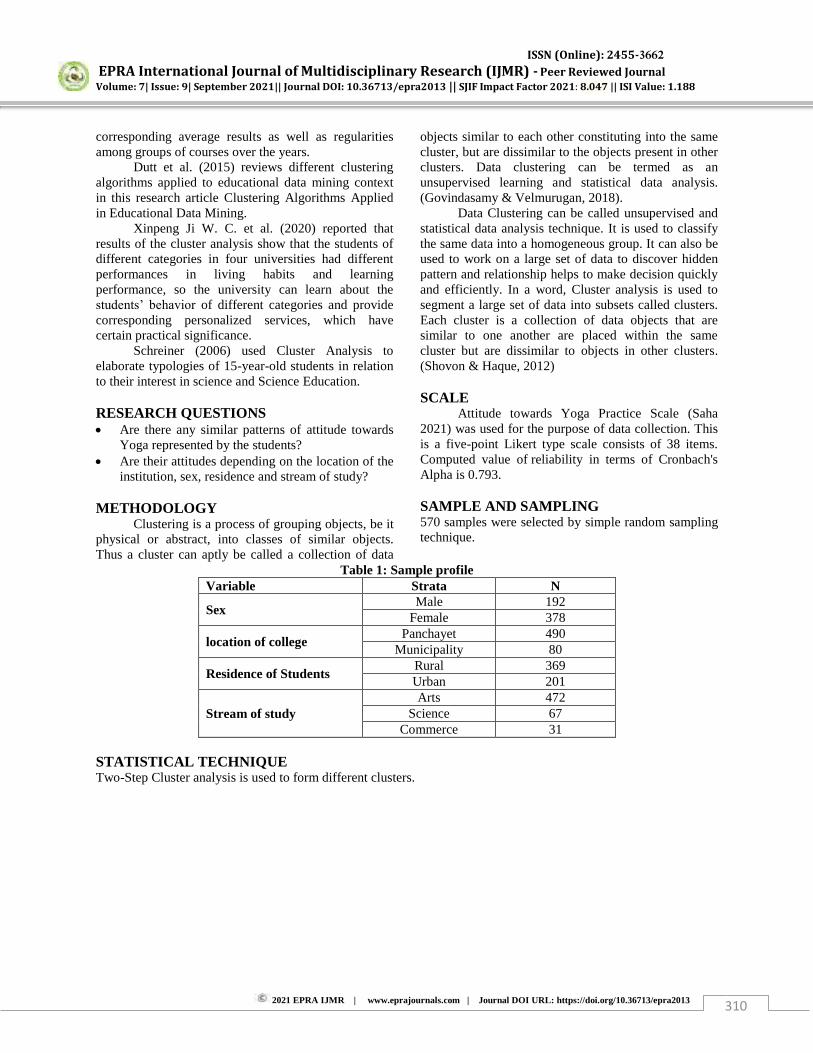
ISSN (Online): 2455-3662
EPRA International Journal of Multidisciplinary Research (IJMR) - Peer Reviewed Journal Volume: 7| Issue: 9| September 2021|| Journal DOI: 10.36713/epra2013 || SJIF Impact Factor 2021: 8.047 || ISI Value: 1.188
2021 EPRA IJMR | www.eprajournals.com | Journal DOI URL: https://doi.org/10.36713/epra2013 310
corresponding average results as well as regularities among groups of courses over the years.
Dutt et al. (2015) reviews different clustering algorithms applied to educational data mining context in this research article Clustering Algorithms Applied in Educational Data Mining.
Xinpeng Ji W. C. et al. (2020) reported that results of the cluster analysis show that the students of different categories in four universities had different performances in living habits and learning performance, so the university can learn about the students’ behavior of different categories and provide corresponding personalized services, which have certain practical significance.
Schreiner (2006) used Cluster Analysis to elaborate typologies of 15-year-old students in relation to their interest in science and Science Education. RESEARCH QUESTIONS Are there any similar patterns of attitude towards
Yoga represented by the students? Are their attitudes depending on the location of the
institution, sex, residence and stream of study? METHODOLOGY
Clustering is a process of grouping objects, be it physical or abstract, into classes of similar objects. Thus a cluster can aptly be called a collection of data
objects similar to each other constituting into the same cluster, but are dissimilar to the objects present in other clusters. Data clustering can be termed as an unsupervised learning and statistical data analysis. (Govindasamy & Velmurugan, 2018).
Data Clustering can be called unsupervised and statistical data analysis technique. It is used to classify the same data into a homogeneous group. It can also be used to work on a large set of data to discover hidden pattern and relationship helps to make decision quickly and efficiently. In a word, Cluster analysis is used to segment a large set of data into subsets called clusters. Each cluster is a collection of data objects that are similar to one another are placed within the same cluster but are dissimilar to objects in other clusters. (Shovon & Haque, 2012) SCALE
Attitude towards Yoga Practice Scale (Saha 2021) was used for the purpose of data collection. This is a five-point Likert type scale consists of 38 items. Computed value of reliability in terms of Cronbach's Alpha is 0.793. SAMPLE AND SAMPLING 570 samples were selected by simple random sampling technique.
Table 1: Sample profile Variable Strata N
Sex Male 192
Female 378
location of college Panchayet 490
Municipality 80
Residence of Students Rural 369 Urban 201
Stream of study Arts 472
Science 67 Commerce 31
STATISTICAL TECHNIQUE Two-Step Cluster analysis is used to form different clusters.
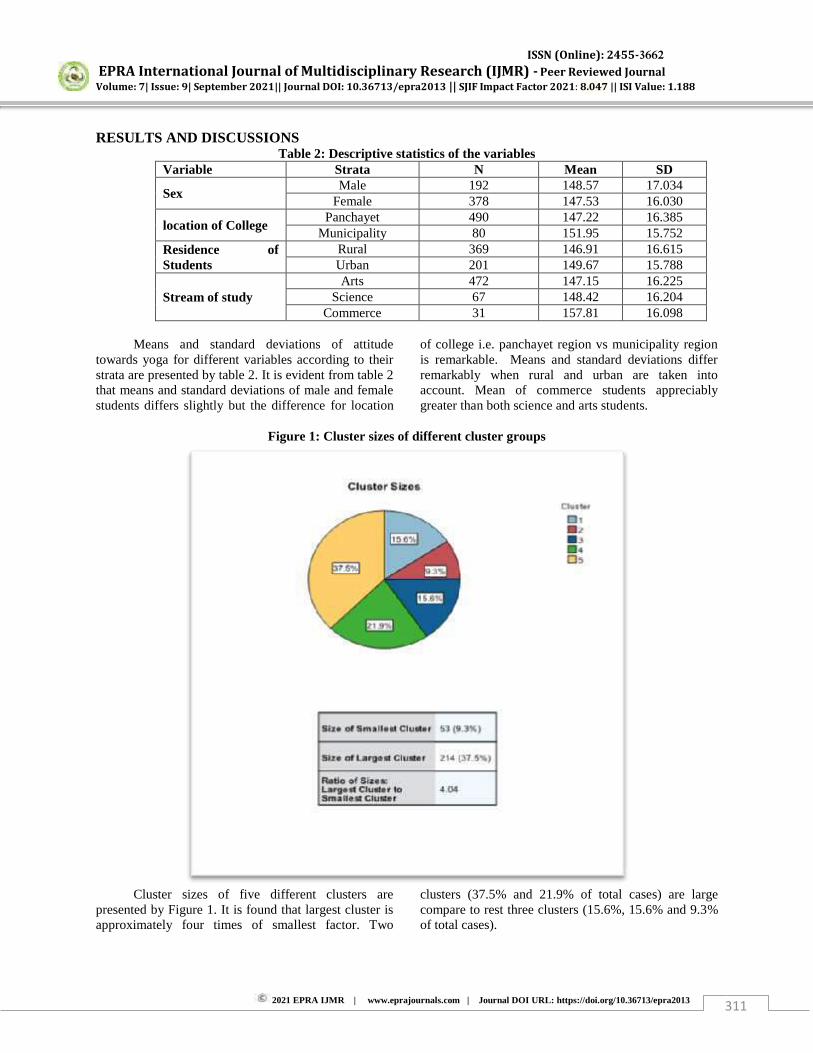
ISSN (Online): 2455-3662
EPRA International Journal of Multidisciplinary Research (IJMR) - Peer Reviewed Journal Volume: 7| Issue: 9| September 2021|| Journal DOI: 10.36713/epra2013 || SJIF Impact Factor 2021: 8.047 || ISI Value: 1.188
2021 EPRA IJMR | www.eprajournals.com | Journal DOI URL: https://doi.org/10.36713/epra2013 311
RESULTS AND DISCUSSIONS Table 2: Descriptive statistics of the variables
Variable Strata N Mean SD
Sex Male 192 148.57 17.034
Female 378 147.53 16.030
location of College Panchayet 490 147.22 16.385
Municipality 80 151.95 15.752 Residence of Students
Rural 369 146.91 16.615 Urban 201 149.67 15.788
Stream of study Arts 472 147.15 16.225
Science 67 148.42 16.204 Commerce 31 157.81 16.098
Means and standard deviations of attitude
towards yoga for different variables according to their strata are presented by table 2. It is evident from table 2 that means and standard deviations of male and female students differs slightly but the difference for location
of college i.e. panchayet region vs municipality region is remarkable. Means and standard deviations differ remarkably when rural and urban are taken into account. Mean of commerce students appreciably greater than both science and arts students.
Figure 1: Cluster sizes of different cluster groups
Cluster sizes of five different clusters are
presented by Figure 1. It is found that largest cluster is approximately four times of smallest factor. Two
clusters (37.5% and 21.9% of total cases) are large compare to rest three clusters (15.6%, 15.6% and 9.3% of total cases).
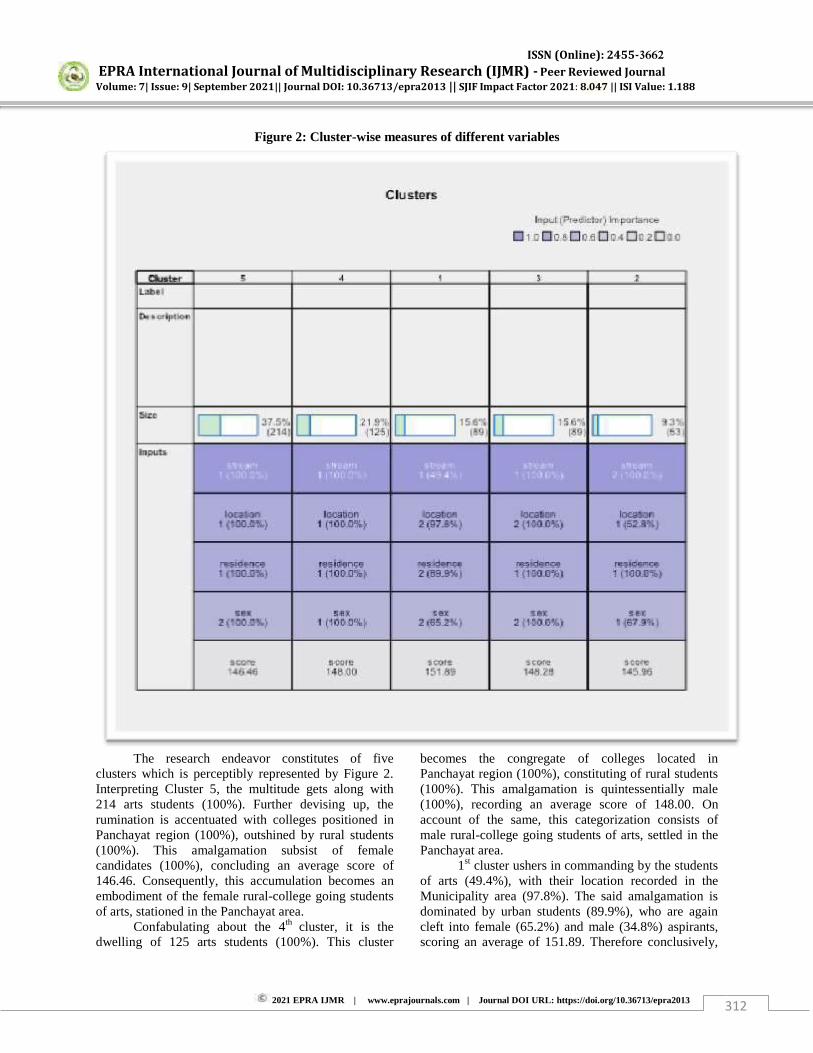
ISSN (Online): 2455-3662
EPRA International Journal of Multidisciplinary Research (IJMR) - Peer Reviewed Journal Volume: 7| Issue: 9| September 2021|| Journal DOI: 10.36713/epra2013 || SJIF Impact Factor 2021: 8.047 || ISI Value: 1.188
2021 EPRA IJMR | www.eprajournals.com | Journal DOI URL: https://doi.org/10.36713/epra2013 312
Figure 2: Cluster-wise measures of different variables
The research endeavor constitutes of five
clusters which is perceptibly represented by Figure 2. Interpreting Cluster 5, the multitude gets along with 214 arts students (100%). Further devising up, the rumination is accentuated with colleges positioned in Panchayat region (100%), outshined by rural students (100%). This amalgamation subsist of female candidates (100%), concluding an average score of 146.46. Consequently, this accumulation becomes an embodiment of the female rural-college going students of arts, stationed in the Panchayat area.
Confabulating about the 4th cluster, it is the dwelling of 125 arts students (100%). This cluster
becomes the congregate of colleges located in Panchayat region (100%), constituting of rural students (100%). This amalgamation is quintessentially male (100%), recording an average score of 148.00. On account of the same, this categorization consists of male rural-college going students of arts, settled in the Panchayat area.
1st cluster ushers in commanding by the students of arts (49.4%), with their location recorded in the Municipality area (97.8%). The said amalgamation is dominated by urban students (89.9%), who are again cleft into female (65.2%) and male (34.8%) aspirants, scoring an average of 151.89. Therefore conclusively,
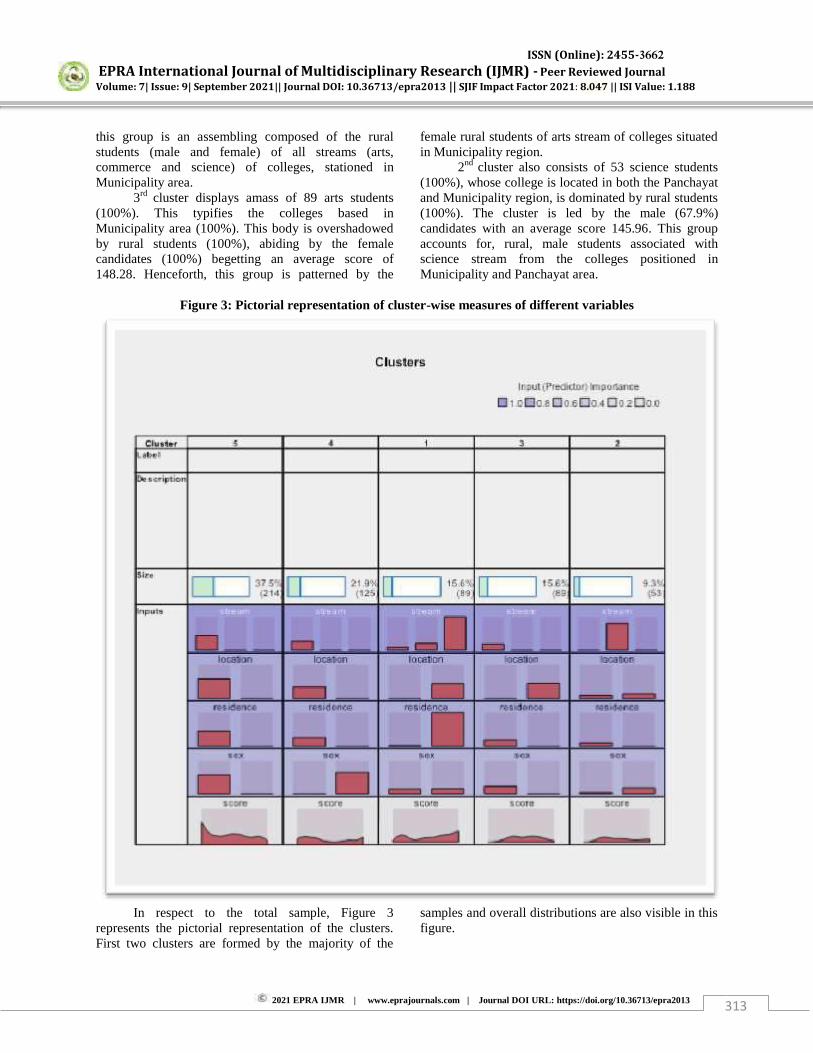
ISSN (Online): 2455-3662
EPRA International Journal of Multidisciplinary Research (IJMR) - Peer Reviewed Journal Volume: 7| Issue: 9| September 2021|| Journal DOI: 10.36713/epra2013 || SJIF Impact Factor 2021: 8.047 || ISI Value: 1.188
2021 EPRA IJMR | www.eprajournals.com | Journal DOI URL: https://doi.org/10.36713/epra2013 313
this group is an assembling composed of the rural students (male and female) of all streams (arts, commerce and science) of colleges, stationed in Municipality area.
3rd cluster displays amass of 89 arts students (100%). This typifies the colleges based in Municipality area (100%). This body is overshadowed by rural students (100%), abiding by the female candidates (100%) begetting an average score of 148.28. Henceforth, this group is patterned by the
female rural students of arts stream of colleges situated in Municipality region.
2nd cluster also consists of 53 science students (100%), whose college is located in both the Panchayat and Municipality region, is dominated by rural students (100%). The cluster is led by the male (67.9%) candidates with an average score 145.96. This group accounts for, rural, male students associated with science stream from the colleges positioned in Municipality and Panchayat area.
Figure 3: Pictorial representation of cluster-wise measures of different variables
In respect to the total sample, Figure 3
represents the pictorial representation of the clusters. First two clusters are formed by the majority of the
samples and overall distributions are also visible in this figure.
ISSN (Online): 2455-3662
EPRA International Journal of Multidisciplinary Research (IJMR) - Peer Reviewed Journal Volume: 7| Issue: 9| September 2021|| Journal DOI: 10.36713/epra2013 || SJIF Impact Factor 2021: 8.047 || ISI Value: 1.188
2021 EPRA IJMR | www.eprajournals.com | Journal DOI URL: https://doi.org/10.36713/epra2013 314
CONCLUSION Clustering is a grouping system by which one
can classify the total sample in different groups using the assigned values of the variables. Here, female students of arts formed two clusters (cluster 3 and 5), male students of arts formed one cluster (cluster 4), one cluster (cluster 2) is formed by science students and one cluster (cluster 1) is formed by arts, commerce and science students. Majority of the rural male and rural female students are quite closer according to their opinion about yoga practices. Location of college is another important aspect for formation of clusters. REFERENCES
1. Battaglia, O. R., Benedetto Di Paola, B. D. & Fazio, C. (2016). A New Approach to Investigate Students’ Behavior by Using Cluster Analysis as an
Unsupervised Methodology in the Field of Education, Applied Mathematics, 7, 1649-1673.
2. Battaglia, O. R., Paola, B. D. and Fazio, C. (2017). A quantitative analysis of Educational Data through the Comparison between Hierarchical and Not-Hierarchical Clustering, EURASIA Journal of Mathematics Science and Technology Education, 13(8), 4491-4512.
3. Borgavakar, S. P. & Shrivastava, A. (2017), Evaluating Student’s Performance using K-Means Clustering, International Journal of Engineering Research & Technology (IJERT), ISSN: 2278-0181, Vol. 6 Issue 05, May, Pp 114-116
4. Campagni, R., Merlini, D. & Verri, M. C. (2014). Finding Regularities in Courses Evaluation with K-means Clustering., CSEDU - 6th International Conference on Computer Supported Education, 2014, Vol. 2, pp. 26-33.
5. Dutt, A., Aghabozrgi, S., Ismail, M.A.B. & Mahroeian, H. (2015). Clustering algorithms applied in educational data mining. International Journal of Information and Electronics Engineering, 5, 112-116.
6. Fazio, C., Battaglia, O. R., & Di Paola, B. (2013). Investigating the quality of mental models deployed by undergraduate engineering students in creating explanations: the case of thermally activated phenomena. Phys. Rev. ST Phys. Educ. Res., 9, 020101.
7. Govindasamy, K. & Velmurugan, T. (2018). Analysis of Student Academic Performance using Clustering Techniques. International Journal of Pure and Applied Mathematics, 119(15), 309-323.
8. Ikegami, M and Neuts, B. (2020). Strategic Options for Campus Sustainability: Cluster Analysis on Higher Education Institutions in Japan. Sustainability, 12, 2527, 1-13.
9. Natek, S. & Zwilling, M. (2014). Student data mining solution–knowledge management system related to higher education institutions. Expert systems with applications, 41(14) 6400-6407.
10. Ocampo, D. M. & Neto, L. C. B. T. (2019). Cluster Analysis for Data Processing in Educational Research. Acta Scientiae, 21(4), .34-48.
11. Saa, A.A. (2016). Educational Data Mining & Students’ Performance Prediction. International Journal of Advanced Computer Science and Applications, 7(5), 212-220.
12. Saha, B. (2021); Attitude towards Yoga Practice among College Students with Regard to Gender, Residence and Stream of Study. IAR Journal of Humanities and Social Science; 2021; 2(5): 25-29.
13. Schreiner, C. (2006). Exploring a ROSE-Garden: Norwegian youth’s orientations towards science – seen as signs of late modern identities. Ph.D. Thesis – Faculty of Education, University of Oslo
14. Shovon, H.I. & Haque, M. (2012), An Approach of Improving Student’s Academic Performance by
using K-means clustering algorithm and Decision tree, International Journal of Advanced Computer Science and Applications, Vol.3, No. 8
15. Xinpeng Ji, W.C., Liu, Y., Xiao, Y., Chen, B., Liu, H. & Zhou, S. (2020). Analysis of University Students’ Behavior Based on a Fusion K-Means Clustering Algorithm. Applied Science, 10, 6566, 1-28
ISSN (Online): 2455-3662
EPRA International Journal of Multidisciplinary Research (IJMR) - Peer Reviewed Journal Volume: 7| Issue: 9| September 2021|| Journal DOI: 10.36713/epra2013 || SJIF Impact Factor 2021: 8.047 || ISI Value: 1.188
2021 EPRA IJMR | www.eprajournals.com | Journal DOI URL: https://doi.org/10.36713/epra2013 315
LEVEL OF EMOTIONAL INTELLIGENCE AND THE
ASSOCIATIONS OF THESE LEVELS TO THEIR SOCIO-DEMOGRAPHIC: A STUDY ON EMPLOYEES OF
PRIMARY COOPERATIVE CREDIT SOCIETIES IN IDUKKI DISTRICT
1Mrs. Maya Murali, 2Dr. Well Haorei 1Ph.D. Research Scholar in Rural Industries and Management,
Gandhigram Rural Institute – Deemed to be University, Dindigul, Tamil Nadu, India.
2Assistant Professor in Rural Industries and Management, Gandhigram Rural Institute – Deemed to be University, Dindigul, Tamil Nadu, India.
Article DOI: https://doi.org/10.36713/epra8534 DOI No: 10.36713/epra8534
ABSTRACT This research article is an extract of Ph.D. thesis research work. The present research paper explores the level of emotional intelligence and the associations of these levels to their socio-demographic among the employees of primary cooperative credit societies in Idukki District. In the study area, 57.5 percent of the bank employees have an emotional intelligence above average; among them, the number of male employees was more than that of women employees. And, the age of the respondents, their educational qualifications, the education streams of the respondents, their working experience, training undergone by the bank employees, and the marital status of the respondents have significant associations with their emotional intelligence level in the workplace. KEY WORDS: Emotional Intelligence, Employees, Idukki District
1. INTRODUCTION Banks are vital financial institutions in an economic system. They are the predominant source of financial support to the community. Banks offer more important sources of short-term working capital for commercial enterprises and are more and more active in recent years in extending long-term commercial enterprise loans for plants and equipment. Banks have been under tremendous pressure to achieve their objectives in preserving loans & investments and providing services to customers while complying with the government regulations. The Commercial Banks are certainly commercial enterprises organized to maximize the value of shareholder's wealth invested within the Bank at an acceptable level of risk. The
regional Rural Banks and Co-operative banks are also to working on the same way for survival though they are non profit organizations . The aggressive pursuit of such goal calls for the banking organizations lead them to a constant search for new opportunities , greater efficiency, and effective planning and control. Therefore, banks, like other organizations in the economy, are out to focus on the human resources being the key factors towards the way to progress. 2. STATEMENT OF THE PROBLEM The demanding situations on this millennium for the banking sector are enormous. The technology and banking sector reforms collectively lifting the competitive intensity of the banking business. The
ISSN (Online): 2455-3662
EPRA International Journal of Multidisciplinary Research (IJMR) - Peer Reviewed Journal Volume: 7| Issue: 9| September 2021|| Journal DOI: 10.36713/epra2013 || SJIF Impact Factor 2021: 8.047 || ISI Value: 1.188
2021 EPRA IJMR | www.eprajournals.com | Journal DOI URL: https://doi.org/10.36713/epra2013 316
banking system across the globe is in the midst of a technological revolution, which has an effect in 3 ways: Firstly, by providing efficient and effective delivery channels, Secondly, the dramatical influence of its miles in the patron profile which leads to the third change which is human resource management. As a service industry, it requires a shift in the mindset of the employees that might have a beneficial impact on customers. 3. JUSTIFICATION OF THE PRESENT STUDY This study assumes significance due to the subsequent reasons. This study pursuit in figuring out the level of emotional intelligence among the bank employees, which will help to create awareness in the need for personal development &training. Secondly, the study of the profile (includes personality traits also) of the bank employees with the level of emotional intelligence will always throw light on identifying the type of individuals who normally possess high level emotional intelligence. Thirdly, the study of the relationship among the level of emotional intelligence and their managerial performance will provide more insight into the importance of emotional intelligence amongst the respondents. Thus, an attempt is made by the researcher to pick out the level of emotional intelligence among the employees of the Bank and the numerous determinants of emotional intelligence required for a balanced state of emotion in a demanding, complicated, and ambiguous place of work. 4. OBJECTIVES OF THE STUDY The objectives of study are to explore the level of emotional intelligence and the associations of these levels to their socio-demographic among the employees of primary cooperative credit societies in Idukki District. 5. SCOPE OF THE STUDY The present study is to determine the level of emotional intelligence and the associations of these levels to the age of the respondents, the gender dimension of the respondents, marital status of the respondents, their educational qualifications, their working experience, the designation of the respondents, training undergone by the bank employees, the type of the respondents’ family, average monthly income of the
respondents’ family, and the number of dependents the
respondents.
6. DESIGN OF THE STUDY 6.1. Review of Existing Literature Several authors and researchers have contributed a lot of literature on emotional intelligence and acceptance of technology among employees. The relevant studies were perused to identify issues, problems, ideas that the current research addresses and the specific need for the present study are spelled out. 6.2. Selection of the Study Area The Idukki District Cooperative Bank (IDCB), the apex bank for the Primary Agricultural Credit Societies (PACS) in Kerala, and the Institute for Development and Research in Banking Technology (IDRBT) Hyderabad have jointly implemented a Core Banking System (CBS) in 54 Primary Agricultural credit Societies with 143 branches in Idukki district, Kerala having a total number of 725 employees. This project was the first of its kind in India, where PACS in a district are becoming part of technology up-gradation and towards common standard system and procedures . Hence, the present research area was selected purposefully for the current research. 6.3. The Sampling Framework The present study has followed a stratified sampling method: Stratum I: Employing the online sample size calculator at a confident level of 95 percent with the population size of 725 employees engaged in 213 branches, the minimum sample size required is 252 samples, Stratum II: However, to ensure more accuracy, the researcher circulated the structured questionnaire to 400 employees who were able to reach out employed in 143 branches of Primary Agricultural Credit Societies (PACS) in the Idukki District Kerala, and Stratum III: Out of which 318 respondents returned the filled-in structured questionnaire at the rate of 79.5 percent to the researcher. Of which 46 respondents were the Secretaries, 62 respondents were the Branch Managers, 74 respondents were the Accountants, 84 respondents were the Clerks, and 52 were the Cashiers of the Primary Agricultural Credit Societies (PACS) under the Primary Cooperative Credit Societies in the Idukki district, Kerala. Hence, 318 samples consisted of the current research work. 6.4. Sources of Data The present work is descriptive method research; primary and secondary data were gathered and analyzed to draw inferences and report research results. 6.5. Methods of Data Collection The study employed a combination of methods, such as field survey using a pre-tested questionnaire schedule adopting the Likert Scale method and discussions with the Primary Agricultural Credit Societies (PACS) employees, meetings with key informants, and review of secondary data sources.
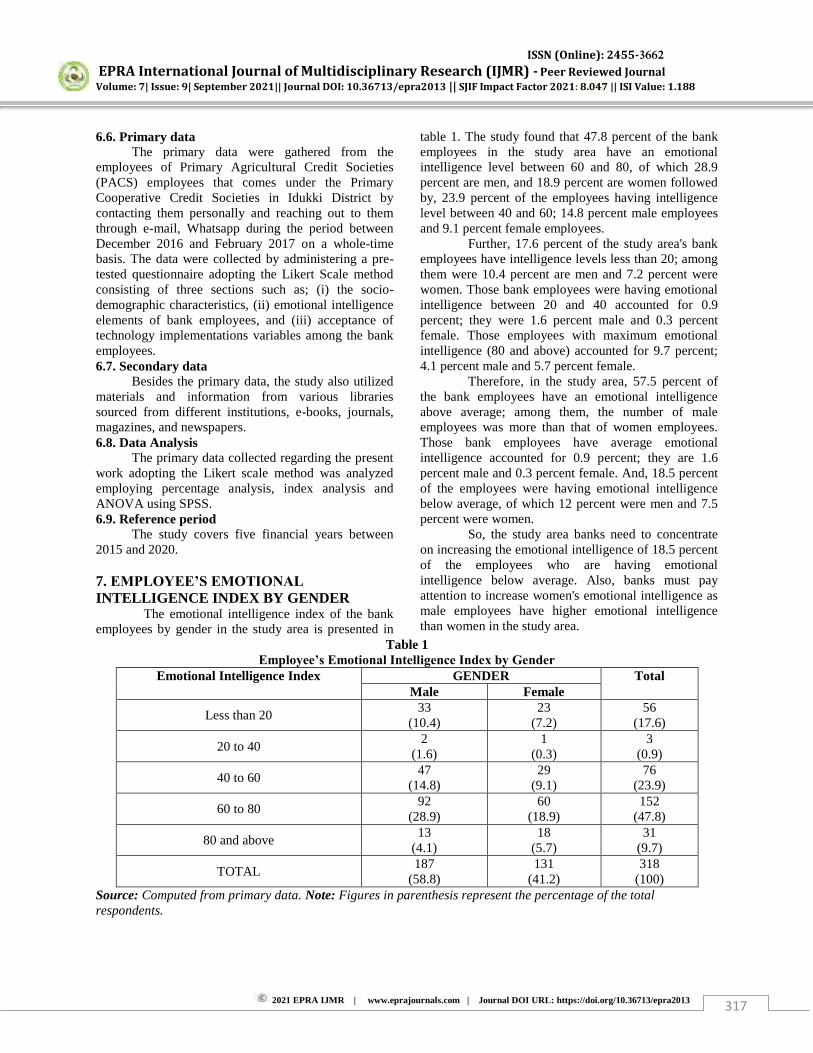
ISSN (Online): 2455-3662
EPRA International Journal of Multidisciplinary Research (IJMR) - Peer Reviewed Journal Volume: 7| Issue: 9| September 2021|| Journal DOI: 10.36713/epra2013 || SJIF Impact Factor 2021: 8.047 || ISI Value: 1.188
2021 EPRA IJMR | www.eprajournals.com | Journal DOI URL: https://doi.org/10.36713/epra2013 317
6.6. Primary data The primary data were gathered from the employees of Primary Agricultural Credit Societies (PACS) employees that comes under the Primary Cooperative Credit Societies in Idukki District by contacting them personally and reaching out to them through e-mail, Whatsapp during the period between December 2016 and February 2017 on a whole-time basis. The data were collected by administering a pre-tested questionnaire adopting the Likert Scale method consisting of three sections such as; (i) the socio-demographic characteristics, (ii) emotional intelligence elements of bank employees, and (iii) acceptance of technology implementations variables among the bank employees. 6.7. Secondary data Besides the primary data, the study also utilized materials and information from various libraries sourced from different institutions, e-books, journals, magazines, and newspapers. 6.8. Data Analysis The primary data collected regarding the present work adopting the Likert scale method was analyzed employing percentage analysis, index analysis and ANOVA using SPSS. 6.9. Reference period The study covers five financial years between 2015 and 2020. 7. EMPLOYEE’S EMOTIONAL
INTELLIGENCE INDEX BY GENDER The emotional intelligence index of the bank employees by gender in the study area is presented in
table 1. The study found that 47.8 percent of the bank employees in the study area have an emotional intelligence level between 60 and 80, of which 28.9 percent are men, and 18.9 percent are women followed by, 23.9 percent of the employees having intelligence level between 40 and 60; 14.8 percent male employees and 9.1 percent female employees. Further, 17.6 percent of the study area's bank employees have intelligence levels less than 20; among them were 10.4 percent are men and 7.2 percent were women. Those bank employees were having emotional intelligence between 20 and 40 accounted for 0.9 percent; they were 1.6 percent male and 0.3 percent female. Those employees with maximum emotional intelligence (80 and above) accounted for 9.7 percent; 4.1 percent male and 5.7 percent female. Therefore, in the study area, 57.5 percent of the bank employees have an emotional intelligence above average; among them, the number of male employees was more than that of women employees. Those bank employees have average emotional intelligence accounted for 0.9 percent; they are 1.6 percent male and 0.3 percent female. And, 18.5 percent of the employees were having emotional intelligence below average, of which 12 percent were men and 7.5 percent were women. So, the study area banks need to concentrate on increasing the emotional intelligence of 18.5 percent of the employees who are having emotional intelligence below average. Also, banks must pay attention to increase women's emotional intelligence as male employees have higher emotional intelligence than women in the study area.
Table 1 Employee’s Emotional Intelligence Index by Gender
Emotional Intelligence Index GENDER Total Male Female
Less than 20 33
(10.4) 23
(7.2) 56
(17.6)
20 to 40 2
(1.6) 1
(0.3) 3
(0.9)
40 to 60 47
(14.8) 29
(9.1) 76
(23.9)
60 to 80 92
(28.9) 60
(18.9) 152
(47.8)
80 and above 13
(4.1) 18
(5.7) 31
(9.7)
TOTAL 187
(58.8) 131
(41.2) 318
(100) Source: Computed from primary data. Note: Figures in parenthesis represent the percentage of the total respondents.
ISSN (Online): 2455-3662
EPRA International Journal of Multidisciplinary Research (IJMR) - Peer Reviewed Journal Volume: 7| Issue: 9| September 2021|| Journal DOI: 10.36713/epra2013 || SJIF Impact Factor 2021: 8.047 || ISI Value: 1.188
2021 EPRA IJMR | www.eprajournals.com | Journal DOI URL: https://doi.org/10.36713/epra2013 318
8. ASSOCIATION BETWEEN PROFILE AND EMOTIONAL INTELLIGENCE INDEX The assumption that the general profile of the study area bank employees may influence emotional intelligence index a one-way analysis of variance (ANOVA) employed. The variables of the available profile of the respondents for the present study are, namely, the age of the respondents, the gender dimension of the respondents, marital status of the respondents, their educational qualifications, their working experience, the designation of the respondents, training undergone by the bank employees, the type of the respondents’ family, average monthly income of the
respondents’ family, and the number of dependents the
respondents. Consequently, the result of the one-way analysis of variance (ANOVA) is presented in table 2. An analysis of variance test on the association of the respondents’ age with their emotional
intelligence level deduced that the calculated value of the ratio of variance F(3,314) is 2.239, which reaches significance with a p-value of 0.044. Therefore, it is concluded that there was a significant association of the respondents’ age with their emotional intelligence level
(0.044<0.05). Statistically, it follows that there was no significant association between the gender of the bank employees and their emotional intelligence level since ANOVA F(1,316) = 1.3.3 and p =0.268>0.05. Further, an analysis of variance test indicates that the calculated value of the ratio of variance F(1,316) is 2.6.6 and significant (p) at 0.035<0.05 for the marital status of the bank employees in the study area. Hence, it is concluded that there was a significant association between their marital status and emotional intelligence level. On the analysis of variance test, for there was an association between the educational qualification and their emotional intelligence level in the study area, it was found that F(2,315)=1.169 and p=0.024. Hence, there was a significant association between the educational qualification and their emotional intelligence level (p<0.05) among the bank employees in the study area. The relationship between the working experience of the bank employee respondents and their
emotional intelligence was significant in the study area since the calculated ratio of variance (F) for 2 and 315 degrees of freedom at a 5 percent level of significance was 2.089 p=0.042<0.05. A study on the association between the designation of the bank employees in the study area and their emotional intelligence employing analysis of variance test deduced that F(2,315)=0.458 and p=0.767. Therefore, it is concluded that there was no association between the designation of the bank employees in the study area and their emotional intelligence (p>0.05). An analysis of variance test on the association of the respondents’ education streams with their emotional intelligence level deduced that the calculated value of the ratio of variance F(2,315) is 1.623, which reaches significance with a p-value of 0.018. Therefore, it is concluded that there was a significant association of the respondents’ education streams with their
emotional intelligence level (0.018<0.05). Also, there was a significant association between the bank employees who underwent training while in service and their emotional intelligence level since the calculated ratio of variance (F) for 1 and 316 degree of freedom at 5 percent level of significance was 0.582 and p=0.016<0.05. The association of the bank employees’
average monthly income with their emotional intelligence level was conducted with the analysis of variance test and found that F(3,314)=0.433 and p=0.785. Hence, there was no significant association between the bank employees’ average monthly income
with their emotional intelligence level (p>0.05) in the study area. Also, there was no significant association between the employees’ type of family with their
emotional intelligence level since the calculated ratio of variance (F) for 1 and 316 degree of freedom at 5 percent level of significance was 1.057 and p=0.378>0.05. There was also no significant association between the employees’ number of dependent in their
family with their emotional intelligence level since the calculated ratio of variance (F) for 2 and 315 degree of freedom at 5 percent level of significance was 0.200 and p=0.819>0.05.
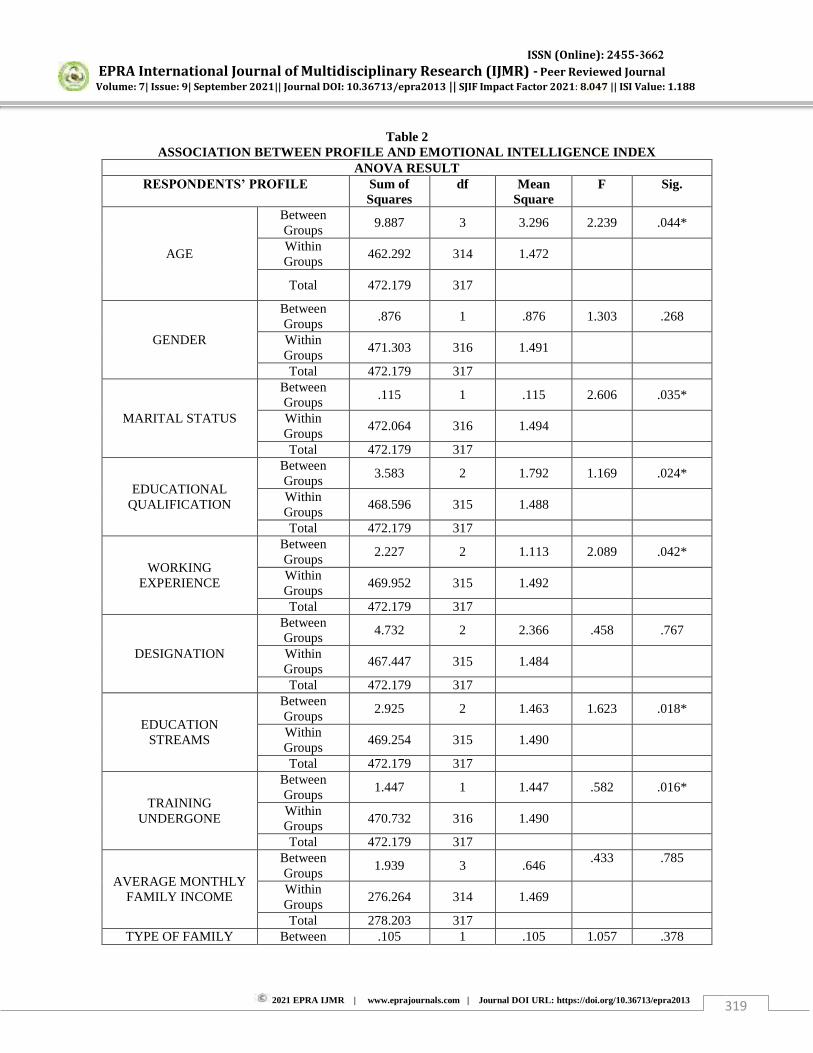
ISSN (Online): 2455-3662
EPRA International Journal of Multidisciplinary Research (IJMR) - Peer Reviewed Journal Volume: 7| Issue: 9| September 2021|| Journal DOI: 10.36713/epra2013 || SJIF Impact Factor 2021: 8.047 || ISI Value: 1.188
2021 EPRA IJMR | www.eprajournals.com | Journal DOI URL: https://doi.org/10.36713/epra2013 319
Table 2 ASSOCIATION BETWEEN PROFILE AND EMOTIONAL INTELLIGENCE INDEX
ANOVA RESULT RESPONDENTS’ PROFILE Sum of
Squares df Mean
Square F Sig.
AGE
Between Groups
9.887 3 3.296 2.239 .044*
Within Groups
462.292 314 1.472
Total 472.179 317
GENDER
Between Groups
.876 1 .876 1.303 .268
Within Groups
471.303 316 1.491
Total 472.179 317
MARITAL STATUS
Between Groups
.115 1 .115 2.606 .035*
Within Groups
472.064 316 1.494
Total 472.179 317
EDUCATIONAL QUALIFICATION
Between Groups
3.583 2 1.792 1.169 .024*
Within Groups
468.596 315 1.488
Total 472.179 317
WORKING EXPERIENCE
Between Groups
2.227 2 1.113 2.089 .042*
Within Groups
469.952 315 1.492
Total 472.179 317
DESIGNATION
Between Groups
4.732 2 2.366 .458 .767
Within Groups
467.447 315 1.484
Total 472.179 317
EDUCATION STREAMS
Between Groups
2.925 2 1.463 1.623 .018*
Within Groups
469.254 315 1.490
Total 472.179 317
TRAINING UNDERGONE
Between Groups
1.447 1 1.447 .582 .016*
Within Groups
470.732 316 1.490
Total 472.179 317
AVERAGE MONTHLY FAMILY INCOME
Between Groups
1.939 3 .646 .433 .785
Within Groups
276.264 314 1.469
Total 278.203 317 TYPE OF FAMILY Between .105 1 .105 1.057 .378
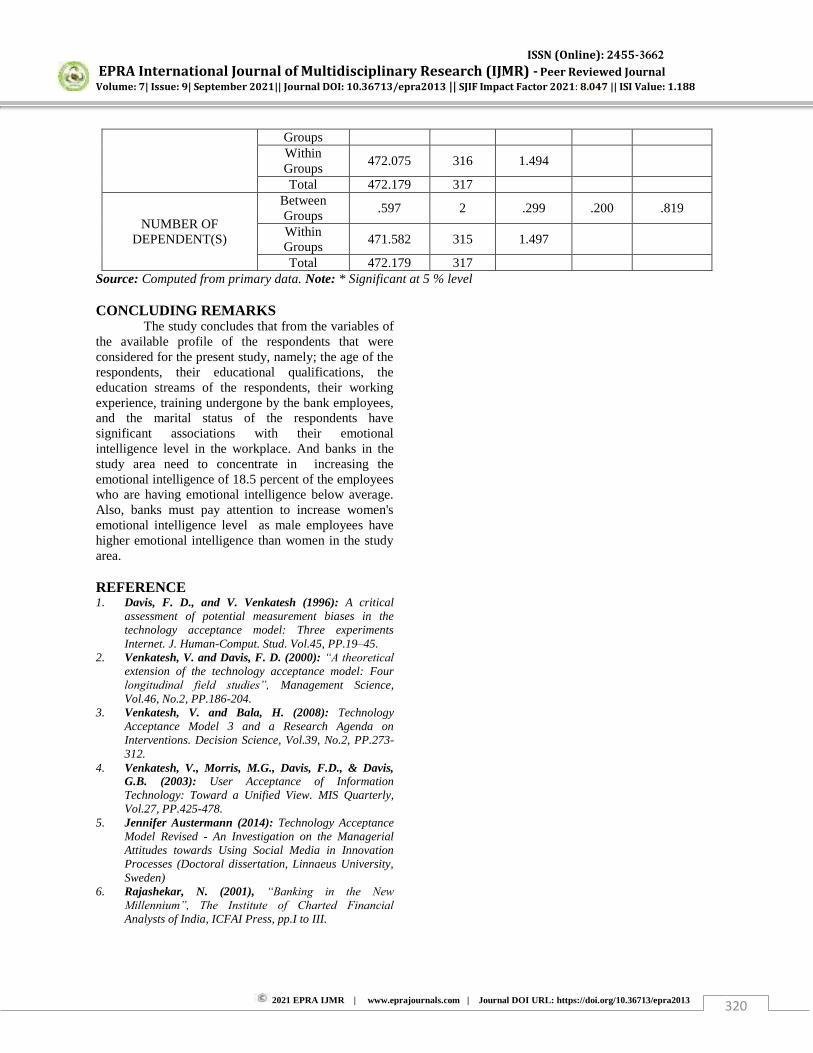
ISSN (Online): 2455-3662
EPRA International Journal of Multidisciplinary Research (IJMR) - Peer Reviewed Journal Volume: 7| Issue: 9| September 2021|| Journal DOI: 10.36713/epra2013 || SJIF Impact Factor 2021: 8.047 || ISI Value: 1.188
2021 EPRA IJMR | www.eprajournals.com | Journal DOI URL: https://doi.org/10.36713/epra2013 320
Groups Within Groups
472.075 316 1.494
Total 472.179 317
NUMBER OF DEPENDENT(S)
Between Groups
.597 2 .299 .200 .819
Within Groups
471.582 315 1.497
Total 472.179 317 Source: Computed from primary data. Note: * Significant at 5 % level CONCLUDING REMARKS The study concludes that from the variables of the available profile of the respondents that were considered for the present study, namely; the age of the respondents, their educational qualifications, the education streams of the respondents, their working experience, training undergone by the bank employees, and the marital status of the respondents have significant associations with their emotional intelligence level in the workplace. And banks in the study area need to concentrate in increasing the emotional intelligence of 18.5 percent of the employees who are having emotional intelligence below average. Also, banks must pay attention to increase women's emotional intelligence level as male employees have higher emotional intelligence than women in the study area. REFERENCE 1. Davis, F. D., and V. Venkatesh (1996): A critical
assessment of potential measurement biases in the technology acceptance model: Three experiments Internet. J. Human-Comput. Stud. Vol.45, PP.19–45.
2. Venkatesh, V. and Davis, F. D. (2000): “A theoretical
extension of the technology acceptance model: Four longitudinal field studies”, Management Science, Vol.46, No.2, PP.186-204.
3. Venkatesh, V. and Bala, H. (2008): Technology Acceptance Model 3 and a Research Agenda on Interventions. Decision Science, Vol.39, No.2, PP.273-312.
4. Venkatesh, V., Morris, M.G., Davis, F.D., & Davis, G.B. (2003): User Acceptance of Information Technology: Toward a Unified View. MIS Quarterly, Vol.27, PP.425-478.
5. Jennifer Austermann (2014): Technology Acceptance Model Revised - An Investigation on the Managerial Attitudes towards Using Social Media in Innovation Processes (Doctoral dissertation, Linnaeus University, Sweden)
6. Rajashekar, N. (2001), “Banking in the New
Millennium”, The Institute of Charted Financial
Analysts of India, ICFAI Press, pp.I to III.

ISSN (Online): 2455-3662
EPRA International Journal of Multidisciplinary Research (IJMR) - Peer Reviewed Journal Volume: 7| Issue: 9| September 2021|| Journal DOI: 10.36713/epra2013 || SJIF Impact Factor 2021: 8.047 || ISI Value: 1.188
2021 EPRA IJMR | www.eprajournals.com | Journal DOI URL: https://doi.org/10.36713/epra2013 321
EFFECT OF BEHAVIOURAL REHEARSAL TECHNIQUE ON LOW SELF-CONCEPT OF
SECONDARY SCHOOL STUDENTS IN ORLU LOCAL GOVERNMENT AREA
Ada Anyamene1, Nnanemere Gideon O.2
1Professor, Department of Guidance and Counselling, Nnamdi Azikiwe University, Akwa, Anambra State, Nigeria.
2PhD Research Scholar, Department of Guidance and Counselling, Nnamdi Azikiwe University,
Akwa, Anambra State, Nigeria.
ABSTRACT The study investigated the effects of behavioural rehearsal technique on low self-concept among senior secondary school students in Orlu Local Government Area of Imo State. Two research questions and two null hypotheses tested at 0.05 level of significance guided the study. A Quasi-experimental design of pre-test, post-test non randomized control group was adopted for this study. Purposive sampling technique was used in selecting the sample of 88 low self-concept students out of a population of 340 identified low self-concept students. All the three groups were pre-tested and post-tested using Low Self-Concept Personality Scale (LSPS) designed by Akinade (2012). Data collected were analyzed using mean and ANCOVA. Results obtained from the study indicated that behavioural rehearsal was effective in reducing low self-concept among senior secondary school students. Behavioural rehearsal was more effective in reducing low self-concept of female secondary school students. The findings further revealed that the effect of behavioural rehearsal technique on low self-concept among senior secondary school students was significant. Bassed on the findings of the study, the researcher recommended among others that behavioural rehearsal technique be adopted as effective treatment strategy in helping students with low self-concept so as to enhance their performance both academically and socially. KEYWORDS: behavioural rehearsal, technique, self-concept, students, secondary school
1. INTRODUCTION The self-concept as an organizer of behaviour is of great importance. It is an organized cognitive structure comprising of a set of attitudes, beliefs, values, variety of habits, abilities, out looks, ideas and feelings of a person. Consistency of behaviour and continuity of identity are two of the chief properties of the self-concept. People are often described as having either high self-concept, meaning they think very well of themselves and their abilities, or low self-concept, meaning they are filled with doubts and criticisms about themselves and their abilities.
Low self-concept could be traced from ones' perception of how people perceive him/her. People internalize the values and beliefs expressed by important people in their lives. They do this by observing the attitudes and actions of others and adopting these attitudes and behaviour as their own. From this theoretical perspective, when important figures reject, ignore, demean or devalue the person, low self-concept is likely to result. That means, when
one feels inferior, inadequate, and insecure and has the perception that peoples' perception of him/her is negative; the person will have low self-concept.
Self-concept refers to how positively or negatively we feel about ourselves. It is a very important aspect of personal wellbeing, happiness and adjustment. Garry (2007) noted that self-concept is the evaluation which an individual makes about his or her worth, competence and significance. According to Garry, when one gives a positive opinion of oneself like competence, confident, understanding etc., the person has high self-concept. On the contrary, when one gives a negative opinion of oneself like: incompetence, unworthy, worthless, inferior among others, the person has low self-concept (Garry, 2007). Individuals with high self-concept are less susceptible to social pressure, have fewer-interpersonal problem, are happier with their lives, achieve at a higher and more persistent level and are more capable of forming satisfying love relationships. Such qualities as susceptibility to psychological problems like anxiety, depression,
ISSN (Online): 2455-3662
EPRA International Journal of Multidisciplinary Research (IJMR) - Peer Reviewed Journal Volume: 7| Issue: 9| September 2021|| Journal DOI: 10.36713/epra2013 || SJIF Impact Factor 2021: 8.047 || ISI Value: 1.188
2021 EPRA IJMR | www.eprajournals.com | Journal DOI URL: https://doi.org/10.36713/epra2013 322
physical health problems, poor social relationships and under achievement were ascribed to people with low self-concept (Moller & Pohlmann, 2010). More so, Plucker and Stocking indicated that self-concept is related to psychological health, and that many psychological problems have their underpinnings in low self-concept, including social rejection, anxiety, depression, eating disorder and substance abuse problems. Thus, certain characteristics have been ascribed to persons who have low self-concept. They exhibit poor decision making ability and strong need for affiliation to perceived superiors. They also tend to retire quickly in the face of challenges. They feel easily defeated, helpless and conquered in the face of an otherwise not quite serious confrontation. They hardly put in extra effort. Furthermore, they yield more easily to persuasion and clues (Brown, 2008). As a result of these consequences, many youth who could have reached to certain important positions in the society are left out.
When children are growing up, they mostly receive feedback about their worth from their parents, although feedback from peers is equally effective. Parent-child relationship (parental rejection), experience of failure, unrealistic expectation, faulty thinking contribute to low self-concept in the child or adolescent (Garry, 2007).
Manifestations of low self-concept in secondary school students may include: the students’
inability to make contributions with other class members when lessons are going on; the students’
inability to ask questions in class for fear of failing it; the students’ inability to answer questions in class
when asked; a student feeling inferior to talk to opposite sex for fear of rejection; the students’
inability to perform any task before fellow students; a student feeling inadequate before other class members; a student feeling shy to tell the teacher that the subject matter is not understood; and a student’s inability to talk in front of other class members when pointed by the teacher, etc. These manifestations indeed hinder a lot of students from doing well in school. In addition, most young people abuse drugs. Some of the drugs they abuse are: alcohol, volatile substances, caffeine, marijuana, etc. The cause for such abuse of drug can be attributed to low self-concept. Some students when they are interviewed on why they abuse drugs, will tell you that they want to feel high or “be more assertive when talking in public or to opposite sex. The researcher observed these havocs militating against the fulfillment of the students’ potentials as a result of low self-concept outcome and the ineffective methods being applied by the stakeholders therefore concluded that there was a missing link that needed an effective and practical interventions such as Behaviour Rehearsal and Modelling Techniques to eradicate or reduce the
problem. Both techniques have been applied to manage many of such related problems and may therefore be applied to manage low self-concept among secondary students effectively. Behavioural rehearsal (BR) is a therapy that has been used with recorded successes among adolescents. Behaviour rehearsal is a behavioural therapy in which a client practises new behaviour in the consulting room, often aided by demonstrations and role playing by the therapist (Davison & John, 2014). In behavior rehearsal, the clients rehearse their social skills in the therapy session and eventually move to real-life situations. For instance, role playing requires the client to imagine the stressful situation very vividly, but in addition to thinking about (and feeling) the stress, the client now engages in physical actions that practise what might be done to reduce tension. The fact that the greater amount of learner takes place through social interactions shows that low self-concept students are missing a lot, because they are unable to associate with people and that makes low self-concept a behavioural problem. Thus, it is worthy to note that several researchers have used behavior rehearsal technique in bringing about desirable change in students with maladaptive behaviours. Idiwon and Onolemhehem (2014) used behavioural rehearsal technique in the treatment of adolescents’ disorderliness in Lagos and it was very
effective. Similarly, McLaughlin (2007) used behavioural rehearsal technique on students who exhibited severe behavior disorder in rural elementary school Pacific Northwest. They discovered that it had positive effects of reducing inappropriate behavior and increasing appropriate ones and improved the participants’ academic and
social behaviour. The modification of thought process is the goal of this treatment technique and as such the researcher believes that the technique if applied will serve as a veritable tool in reducing low self-concept students irrespective of gender. Gender in this context refers to the Idiwon, S.O. (2013). Effectiveness of behavioural rehearsal technique on low academic self-concept among secondary schools in Ogun State. Unpublished Thesis Ogun State University. social attributes and opportunities associated with being male or female (Bornstein 2008). Gender according to Busolo (2010) refers to the roles and responsibilities of men and women that are created in our families, our societies and cultures. The concept of gender includes the expectations held about the characteristics, aptitudes and likely behavior of both men and women. The author further opined that gender roles and expectations are learned. They can change over time and they vary within and between cultures. Systems of social differentiation
ISSN (Online): 2455-3662
EPRA International Journal of Multidisciplinary Research (IJMR) - Peer Reviewed Journal Volume: 7| Issue: 9| September 2021|| Journal DOI: 10.36713/epra2013 || SJIF Impact Factor 2021: 8.047 || ISI Value: 1.188
2021 EPRA IJMR | www.eprajournals.com | Journal DOI URL: https://doi.org/10.36713/epra2013 323
such as political’ status, class, ethnicity, physical and
mental disability, age and more modify gender roles. In Nigeria, females and males are not expected to behave in the same ways or play the same roles. Kerr and Tilton (2011) observed that there are traditional sex roles that are mutually exclusive to males and females. They stated some activities are branded abnormal for females but normal for males vice versa. Gender could be seen as the social forming of the biological sex; it is built on biological differences and transfuses those biological differences in the areas where it is completely baseless. Gender is related to how people not acceptable or perceived and expected to think and act as women and because of the way the society is organized, not because of biological differences (Zalk, Kerr and Tilton (2013).
Guay, Ratelle, Roy and Litalien (2010) revealed that females on the average are more nurturing, tender-minded, and altruistic more often and to a greater extent than males. The way a male will behave will surely be different from the way a female will handle situations. A female is soft and tender but a male is strong and vigorous. This tends to influence their reactions and the way the male handles life which will cause behavioural differences because there exists anatomical physiological differences. A female interest, ability, aspiration, belief, attitudes and other personality traits will be different from that of male counterpart. Okafor (2016) reported a significant gender difference in the effectiveness of behavioural rehearsal technique in handling lateness to school among secondary school students. Similarly, Yusuf (2013) and Isiaya (2015) indicated that female students benefited more from treatment using modeling technique than the male counterparts.
From the foregoing, one could attest to the notion that behaviour rehearsal has shown its efficacy on both male and female students. However, going by the previous studies, none have actually investigated the effect of behavioural rehearsal on low self-concept of secondary school students in in Imo state. This is a gap in literature that this current study sought to fill. Hence, the problem of this study was to determine the effect of behavioural rehearsal on low self-concept of male and female secondary school students in Orlu Local Government Area, Imo state.
2. PURPOSE OF THE STUDY The main purpose of this study was to determine the effects of behavioural rehearsal technique on low self-concept of senior secondary school students in Orlu Local Government Area of Imo State. Specifically the study sought to determine;
1. The effect of behavioural rehearsal technique on low self-concept of senior
secondary school students when compared with those treated with conventional counseling using their pre-test and post-test mean scores.
2. The effective of behavioural rehearsal technique on low self-concept of male and female senior secondary school students using their pre-test and post-test mean scores
Research Questions The following research questions guided the study:
1. What is the effect of behavioural rehearsal technique on low self-concept of senior secondary school students when compared with those treated with conventional counseling using their pre-test and post-test mean scores?
2. What is the effective of behavioural rehearsal technique on low self-concept of male and female senior secondary school students using their pre-test and post-test mean scores?
Hypotheses The following null hypotheses were stated and tested at 0.05 level of significance.
1. The effect of behavioural rehearsal technique on low self-concept of senior secondary school students will not be significant when compared with those treated with conventional counseling using their pre-test and post-test mean scores.
2. There is no significant difference in the effect of behavioural rehearsal technique on low self-concept of male and female senior secondary school students using their pre-test and post-test mean scores.
3. METHODOLOGY The procedures for carrying out the study are discussed as follows:
The study adopted quasi experimental non-randomized pre-test, post-test and control groups research design. The design is appropriate for this study because the study was conducted in a school setting where it was not possible to use pure experimental design which was considered as disruption of school academic activities.
The study was conducted in Orlu Local Government Area of Imo State. The state is situated in the south eastern Nigeria bounded to the north by Anambra State, to the east by Abia State, and to the south and west by Rivers State. Orlu local government area was chosen for this study because the schools in the area have in recent times recorded cases of maladaptive behaviour among students that could be linked to the student having low self-concept.
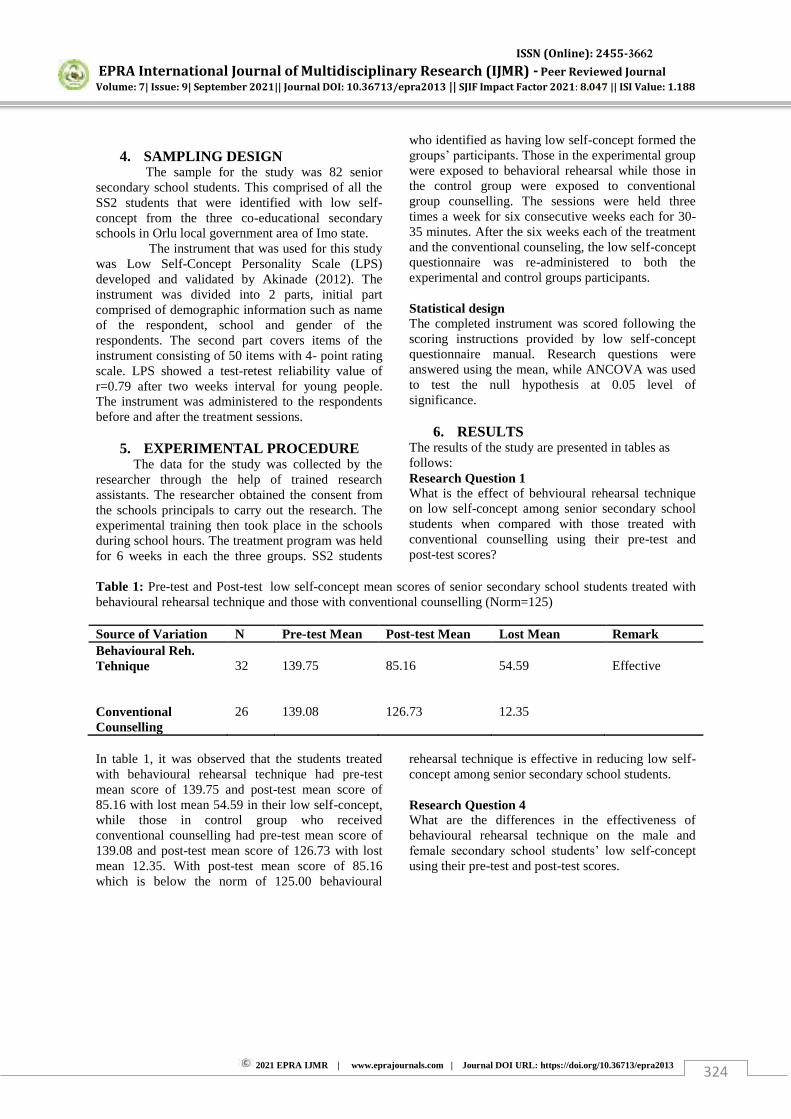
ISSN (Online): 2455-3662
EPRA International Journal of Multidisciplinary Research (IJMR) - Peer Reviewed Journal Volume: 7| Issue: 9| September 2021|| Journal DOI: 10.36713/epra2013 || SJIF Impact Factor 2021: 8.047 || ISI Value: 1.188
2021 EPRA IJMR | www.eprajournals.com | Journal DOI URL: https://doi.org/10.36713/epra2013 324
4. SAMPLING DESIGN
The sample for the study was 82 senior secondary school students. This comprised of all the SS2 students that were identified with low self-concept from the three co-educational secondary schools in Orlu local government area of Imo state. The instrument that was used for this study was Low Self-Concept Personality Scale (LPS) developed and validated by Akinade (2012). The instrument was divided into 2 parts, initial part comprised of demographic information such as name of the respondent, school and gender of the respondents. The second part covers items of the instrument consisting of 50 items with 4- point rating scale. LPS showed a test-retest reliability value of r=0.79 after two weeks interval for young people. The instrument was administered to the respondents before and after the treatment sessions.
5. EXPERIMENTAL PROCEDURE The data for the study was collected by the
researcher through the help of trained research assistants. The researcher obtained the consent from the schools principals to carry out the research. The experimental training then took place in the schools during school hours. The treatment program was held for 6 weeks in each the three groups. SS2 students
who identified as having low self-concept formed the groups’ participants. Those in the experimental group were exposed to behavioral rehearsal while those in the control group were exposed to conventional group counselling. The sessions were held three times a week for six consecutive weeks each for 30-35 minutes. After the six weeks each of the treatment and the conventional counseling, the low self-concept questionnaire was re-administered to both the experimental and control groups participants. Statistical design The completed instrument was scored following the scoring instructions provided by low self-concept questionnaire manual. Research questions were answered using the mean, while ANCOVA was used to test the null hypothesis at 0.05 level of significance.
6. RESULTS The results of the study are presented in tables as follows: Research Question 1 What is the effect of behvioural rehearsal technique on low self-concept among senior secondary school students when compared with those treated with conventional counselling using their pre-test and post-test scores?
Table 1: Pre-test and Post-test low self-concept mean scores of senior secondary school students treated with behavioural rehearsal technique and those with conventional counselling (Norm=125) Source of Variation N Pre-test Mean Post-test Mean Lost Mean Remark Behavioural Reh. Tehnique
32
139.75
85.16
54.59
Effective
Conventional Counselling
26
139.08
126.73
12.35
In table 1, it was observed that the students treated with behavioural rehearsal technique had pre-test mean score of 139.75 and post-test mean score of 85.16 with lost mean 54.59 in their low self-concept, while those in control group who received conventional counselling had pre-test mean score of 139.08 and post-test mean score of 126.73 with lost mean 12.35. With post-test mean score of 85.16 which is below the norm of 125.00 behavioural
rehearsal technique is effective in reducing low self-concept among senior secondary school students. Research Question 4 What are the differences in the effectiveness of behavioural rehearsal technique on the male and female secondary school students’ low self-concept using their pre-test and post-test scores.
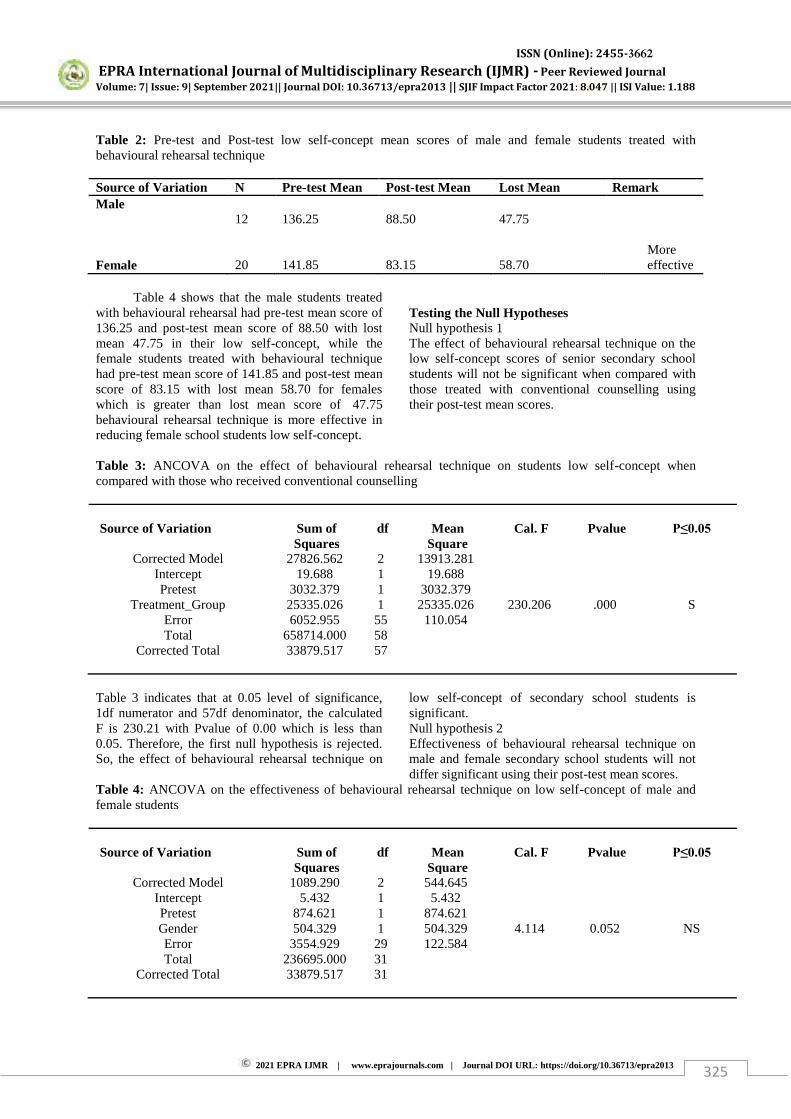
ISSN (Online): 2455-3662
EPRA International Journal of Multidisciplinary Research (IJMR) - Peer Reviewed Journal Volume: 7| Issue: 9| September 2021|| Journal DOI: 10.36713/epra2013 || SJIF Impact Factor 2021: 8.047 || ISI Value: 1.188
2021 EPRA IJMR | www.eprajournals.com | Journal DOI URL: https://doi.org/10.36713/epra2013 325
Table 2: Pre-test and Post-test low self-concept mean scores of male and female students treated with behavioural rehearsal technique Source of Variation N Pre-test Mean Post-test Mean Lost Mean Remark Male
12
136.25
88.50
47.75
Female
20
141.85
83.15
58.70
More effective
Table 4 shows that the male students treated
with behavioural rehearsal had pre-test mean score of 136.25 and post-test mean score of 88.50 with lost mean 47.75 in their low self-concept, while the female students treated with behavioural technique had pre-test mean score of 141.85 and post-test mean score of 83.15 with lost mean 58.70 for females which is greater than lost mean score of 47.75 behavioural rehearsal technique is more effective in reducing female school students low self-concept.
Testing the Null Hypotheses Null hypothesis 1 The effect of behavioural rehearsal technique on the low self-concept scores of senior secondary school students will not be significant when compared with those treated with conventional counselling using their post-test mean scores.
Table 3: ANCOVA on the effect of behavioural rehearsal technique on students low self-concept when compared with those who received conventional counselling Source of Variation Sum of
Squares df Mean
Square Cal. F Pvalue P≤0.05
Corrected Model 27826.562 2 13913.281 Intercept 19.688 1 19.688 Pretest 3032.379 1 3032.379
Treatment_Group 25335.026 1 25335.026 230.206 .000 S Error 6052.955 55 110.054 Total 658714.000 58
Corrected Total 33879.517 57
Table 3 indicates that at 0.05 level of significance, 1df numerator and 57df denominator, the calculated F is 230.21 with Pvalue of 0.00 which is less than 0.05. Therefore, the first null hypothesis is rejected. So, the effect of behavioural rehearsal technique on
low self-concept of secondary school students is significant. Null hypothesis 2 Effectiveness of behavioural rehearsal technique on male and female secondary school students will not differ significant using their post-test mean scores.
Table 4: ANCOVA on the effectiveness of behavioural rehearsal technique on low self-concept of male and female students Source of Variation Sum of
Squares df Mean
Square Cal. F Pvalue P≤0.05
Corrected Model 1089.290 2 544.645 Intercept 5.432 1 5.432 Pretest 874.621 1 874.621 Gender 504.329 1 504.329 4.114 0.052 NS Error 3554.929 29 122.584 Total 236695.000 31
Corrected Total 33879.517 31
ISSN (Online): 2455-3662
EPRA International Journal of Multidisciplinary Research (IJMR) - Peer Reviewed Journal Volume: 7| Issue: 9| September 2021|| Journal DOI: 10.36713/epra2013 || SJIF Impact Factor 2021: 8.047 || ISI Value: 1.188
2021 EPRA IJMR | www.eprajournals.com | Journal DOI URL: https://doi.org/10.36713/epra2013 326
Table 4 indicates that at 0.05 level of significance, 1df numerator and 31df denominator, the calculated F is 4.114 with Pvalue of 0.052 which is greater than 0.05. Therefore, the fourth null hypothesis is accepted. So, the effectiveness of behavioural rehearsal technique on low self-concept of male and female secondary school students does not differ significantly.
7. DISCUSSION Findings of this study are hereby discussed as follows: Effect of behavioural rehearsal technique on low self-concept among senior secondary school students Findings from the data analyzed in this study showed that behavioural rehearsal technique was effective in reducing low self-concept among senior secondary school students in the treatment group one as compared with those in the conventional counselling group. More so, there was a clear decrease in low self-concept among students in the behavioural rehearsal technique group more than the conventional counselling group. This may be through the various reinforcement processes involved in behavioural rehearsal technique, the students were able to drop those faulty thinking and beliefs that trigger low self-concept. The finding is consistent with the previous researches such as Anna Mahmood, Ashoori and Narges (2010); Oloyi (2016) whose studies suggested that behavioural rehearsal technique is effective in reducing maladaptive behaviours of secondary school students. One possible reason for the decrease in the level of low self-concept among students treated with behavioural rehearsal technique more than those in the conventional counselling group may that as students exposed to the various skills and reinforcements of behavioural rehearsal during the experiment, they were encouraged to imbibe more rational thinking patterns that would make them perform better in their interpersonal relationships and other social situations. Supporting the above statement, Skinner (1963) earlier on emphasized that through the various reinforcements involved in behavioural rehearsal technique, maladaptive behaviours such as low self-concept are gradually changed or shaped to adaptive behaviours. During behavioural rehearsal technique, a counsellor uses reinforcers such as tokens, gifts, foods, money, and verbal praise, among others as stimulus when a desired response is produced by a client. Reinforcement when presented to the client in a given situation strengthens the desired behaviour and increases the likelihood of the occurrence of the wanted behaviour.
The difference in the effectiveness of behavioural rehearsal technique on male and female secondary school students’ low self-concept The findings of this study showed that both behavioural rehearsal and modelling techniques were more effective in reducing female senior secondary school students’ low self-concept than their male counterpart. This signifies that female senior secondary school students benefited more from the two treatment packages than the male students. This finding of the result is consistent with the reports of the previous researchers such as Oscar, Obi, Ikedinobi and Olorun (2018) who found that female students benefited more from behavioural counselling intervention techniques than the male students. The reason for the above finding of the study may be because female students easily yield themselves to change, and are usually willing to participate in activities like behavioural rehearsal technique experiments that involve less physical stress, especially when the environment is peaceful and interactive.
8. CONCLUSION This study investigated the effects of behavioural rehearsal and modelling techniques on low self-concept among senior secondary school students. The study confirmed previous researches that demonstrated positive effects of behavioural rehearsal and modelling techniques in reducing maladaptive behaviours and increase adaptive behaviours among secondary school students. In line with the findings of the study, therefore, the following conclusions were drawn: The behavioural rehearsal technique was significantly effective in reducing low self-concept of senior secondary school students. More so, it was concluded from the study that the female students who participated in the behavioural rehearsal technique benefited more than their male counterparts. However, the difference in the effectiveness of behavioural rehearsal and modelling techniques on the students’ low self-concept was not significant based on the gender.
9. IMPLICATIONS OF THE STUDY The finding of this study has established that behavioural rehearsal technique was effective on senior secondary school students’ low self-concept. This implies that the technique when properly applied have the capacity to modify low self-concept of secondary school students. It was also found that female secondary school students benefited more from treatment using behavioural rehearsal technique. This implies that in using behavioural rehearsal technique on students’ low self-concept, therapists and researchers should be mindful of
ISSN (Online): 2455-3662
EPRA International Journal of Multidisciplinary Research (IJMR) - Peer Reviewed Journal Volume: 7| Issue: 9| September 2021|| Journal DOI: 10.36713/epra2013 || SJIF Impact Factor 2021: 8.047 || ISI Value: 1.188
2021 EPRA IJMR | www.eprajournals.com | Journal DOI URL: https://doi.org/10.36713/epra2013 327
difference in students’ gender. This also implies that
behavioural rehearsal and modelling techniques could be applied more in reducing low self-concept of female senior secondary school students.
10. RECOMMENDATIONS Based on the findings of this study, the following recommendations were made.
1. Guidance Counsellors working in secondary schools should adopt the use of behavioural rehearsal in handling students with maladaptive behaviour such as low self-concept.
2. Guidance Counsellors working in secondary schools should have in mind that male and female responds differently to the treatment while adopting the use of behavioural rehearsal in handling students with low self-concept.
11. REFERENCES 1. Busolo, A. J., (2010). Gender differences in
students‟ achievement in Chemistry in secondary
schools of Kakamega District, Kenya, Unpublished Med Thesis of Kenyatta University
2. Bornstein, R. & Kate, P. (2008). My gender workbook: Outline of a theory of practice. Cambridge: University Press.
3. Brown, S.O. (2008). Self-concept on childrens test performance. British Journal of Educational Psychology,73, 317-328.
4. Davison, L.O & John, S.O. (2014).Behavioural rehearsal therapy in the reduction of low academic self-concept on female students with disabilities in juvenile correctional high school Ohio.
5. Garry, O.P. (2007). Low self-concept at home and in school. In W.R Crozier & L.E Alden (Eds.). International Handbook of Social Anxiety, 159-183. Chichester: Sussex Wiley Publishers.
6. Guay, F., Ratelle, C.F., Roy, A. & Litalien, D., (2010). Academic self-concept, autonomous academic motivation and academic achievement: Mediating and additive effects. Learning and individual differences, 20, 644-653.
7. Isiaya, Y. (2015). Effects of modelling and token reinforcement technique on low self-concept behaviour among secondary school students in Kano State,
8. Idiwon, S.O. (2013). Effectiveness of behavioural rehearsal technique on low academic self-concept among secondary schools in Ogun State. Unpublished Thesis Ogun State Universit
9. McLaughlin, S.U. (2007). Use of behavioural rehearsal technique on students. International Online journal of Education Science. 2 (20), 419-440.
10. Moller, J. & Pohlmann, B., (2010). Achievement differences and self-concept differences: Stronger associations for above or below average students. Journal of Educational Psychology, 80, 435-450.
11. Plucker J., Stocking, V. (2011). Looking outside and inside: Self-concept development of gifted adolescents. Exceptional Children, 67, 535-546.
12. Zalk, N., Kerr, M & Tilton, W. (2011). Gender difference among low academic self-concept students. Scandinavian Journal of Psychology, 52(4), 341-353.
13. Isiaya, Y. (2015). Effects of modelling and token reinforcement technique on low self-concept behaviour among secondary school students in Kano State,
ISSN (Online): 2455-3662
EPRA International Journal of Multidisciplinary Research (IJMR) - Peer Reviewed Journal Volume: 7| Issue: 9| September 2021|| Journal DOI: 10.36713/epra2013 || SJIF Impact Factor 2021: 8.047 || ISI Value: 1.188
2021 EPRA IJMR | www.eprajournals.com | Journal DOI URL: https://doi.org/10.36713/epra2013 328
WATER QUALITY ASSESSMENT OF UPPER LAKE
BHOPAL WITH REFERENCE TO CONSERVATION AND
MANAGEMENT
Shabnum Farooq1, Pragya Shrivastava2, Majid Hassan Bhat3*
1Research Scholar, Department of Life Sciences, RNTU Raisen M.P.
2 Professor, Department of Life Sciences, RNTU Raisen M.P.
3* Research Scholar, Department of Zoology and Applied Aquaculture Barkatullah University Bhopal.
ABSTRACT Safety of drinking water is an important factor for health. The present study was aimed to access the health status of
Upper Lake Bhopal in relation to water quality conservation and management. Water samples were collected from two
different sites for various physiochemical, heavy metal and bacteriological analysis. The analyzed samples were
compared with the standards given in BIS-10500 and WHO. The results showed high bacteriological contamination
due to the sewage discharge from catchment areas. Regular monitoring and management of water quality is necessary
to save the water from poor quality which becomes threat for human health and aquatic life especially for fish.
KEY WORDS: Water quality, Upper Lake, Sewage discharge, etc.
INTRODUCTION Water is an essential compound for Mankind
and millions of other species living on earth (Chidambaram et al., 2010). It is important to all living organisms, ecological systems, human health, food production and economic development. Lakes have been defined as a body of standing water, occupying a basin or lacking continuity with sea (Forel, 1892). Lakes of all sizes provide us fisheries, drinking water, scenic splendour, power generation, increase in property values and act as excellent systems for ecological studies. Lakes are an important element of the natural environment that defines both landscape and its ecological functioning. Lakes and surface water reservoirs are the planet’s most important freshwater
resources and provide innumerable benefits. It is used for drinking, domestic, agricultural or industrial purpose and provide ecosystems for aquatic life especially fish, thereby functioning as a source of essential protein and for significant elements of the world’s biological diversity (Arain et al., 2008).
The quality of Portable drinking water is important for the health. The quality of drinking water is affected by various contaminants which included chemical and microbiological. The indiscriminate release of chemical fertilizers, pesticides, industrial effluents are causing heavy and varied pollution in the aquatic environment leading to the deterioration of water quality which in turn depletes the aquatic biota. The use of the contaminated water by human population results in water borne diseases, so that quality of water must be tested for both the chemical as well as for the microbial contaminants (Smitha and Shivashanker 2013). Hence it is important to check the water quality at a regularly. The present paper investigates physicochemical and bacteriological analysis of Upper Lake Bhopal and also to access the degree of pollution caused by input wastes from catchment areas which effects the aquatic life

ISSN (Online): 2455-3662
EPRA International Journal of Multidisciplinary Research (IJMR) - Peer Reviewed Journal Volume: 7| Issue: 9| September 2021|| Journal DOI: 10.36713/epra2013 || SJIF Impact Factor 2021: 8.047 || ISI Value: 1.188
2021 EPRA IJMR | www.eprajournals.com | Journal DOI URL: https://doi.org/10.36713/epra2013 329
STUDY AREA The study area selected was Upper Lake located
in the city of lakes Bhopal, Madhya Pradesh, India. (lattitude 23o 12’ to 23o 16’ N and longitude 77o 18’ to
77o 23’ E). The total area covered is 31 Sq. Km and the
depth varies from 4 to 8 metres. The lake is fed by Kolans river in rainy season The maximum length of the Upper Lake is 10.6 km while the width comes out to be 3.25Km Maximum elongation is in the east- west direction,
Fig. – Showing the map of the study area Upper Lake Bhopal.
Silent Features of Upper Lake Bhopal.
PERIOD OF CONSTRUCTION 11TH Century A.D.
TYPE OF DAM Earthen
LOCATION: Latitude Longitude
23°12' - 23°16' N 77°18' - 77°23' E
CATCHMENT AREA (Sq.km.) 361
SUBMERGENCE AREA at FTL (Sq.km.) 36.54
FULL TANK LEVEL (MSL) (m) 508.65
DEAD STORAGE LEVEL (MSL) (m) 503.53
STORAGE CAPACITY (Million Chum.) 117.05
MAXIMUM DEPTH (m) 11.7
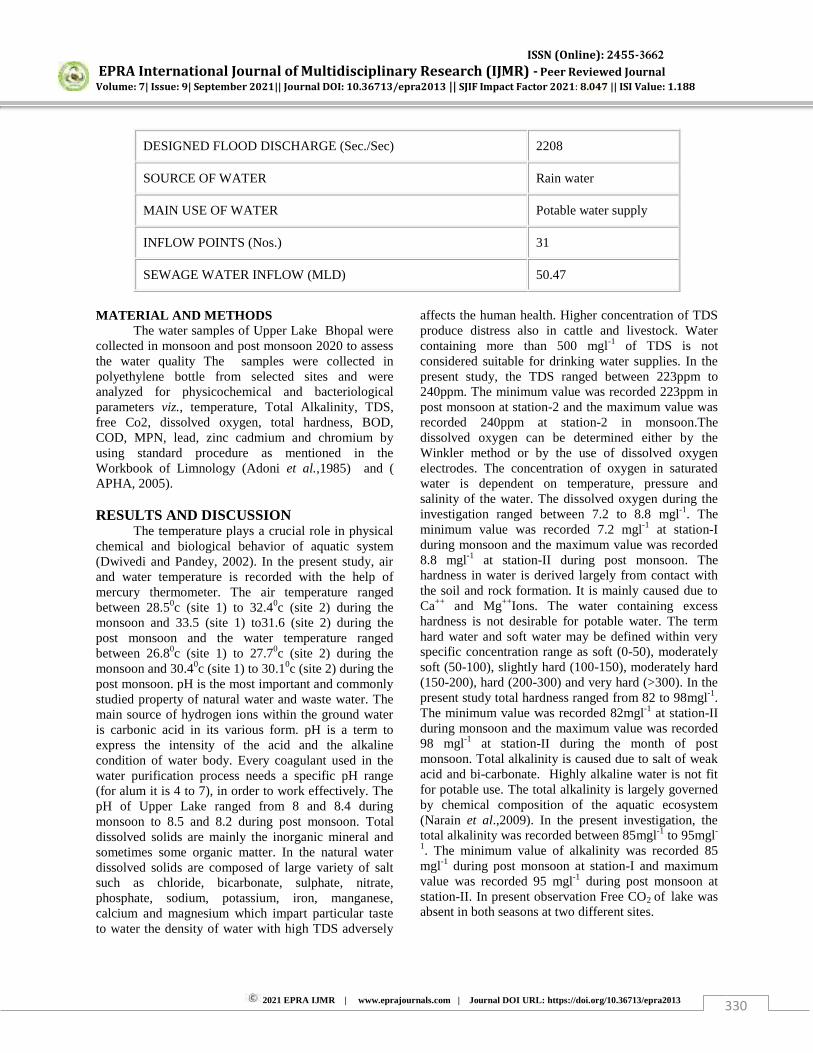
ISSN (Online): 2455-3662
EPRA International Journal of Multidisciplinary Research (IJMR) - Peer Reviewed Journal Volume: 7| Issue: 9| September 2021|| Journal DOI: 10.36713/epra2013 || SJIF Impact Factor 2021: 8.047 || ISI Value: 1.188
2021 EPRA IJMR | www.eprajournals.com | Journal DOI URL: https://doi.org/10.36713/epra2013 330
DESIGNED FLOOD DISCHARGE (Sec./Sec) 2208
SOURCE OF WATER Rain water
MAIN USE OF WATER Potable water supply
INFLOW POINTS (Nos.) 31
SEWAGE WATER INFLOW (MLD) 50.47
MATERIAL AND METHODS
The water samples of Upper Lake Bhopal were collected in monsoon and post monsoon 2020 to assess the water quality The samples were collected in polyethylene bottle from selected sites and were analyzed for physicochemical and bacteriological parameters viz., temperature, Total Alkalinity, TDS, free Co2, dissolved oxygen, total hardness, BOD, COD, MPN, lead, zinc cadmium and chromium by using standard procedure as mentioned in the Workbook of Limnology (Adoni et al.,1985) and ( APHA, 2005). RESULTS AND DISCUSSION
The temperature plays a crucial role in physical chemical and biological behavior of aquatic system (Dwivedi and Pandey, 2002). In the present study, air and water temperature is recorded with the help of mercury thermometer. The air temperature ranged between 28.50c (site 1) to 32.40c (site 2) during the monsoon and 33.5 (site 1) to31.6 (site 2) during the post monsoon and the water temperature ranged between 26.80c (site 1) to 27.70c (site 2) during the monsoon and 30.40c (site 1) to 30.10c (site 2) during the post monsoon. pH is the most important and commonly studied property of natural water and waste water. The main source of hydrogen ions within the ground water is carbonic acid in its various form. pH is a term to express the intensity of the acid and the alkaline condition of water body. Every coagulant used in the water purification process needs a specific pH range (for alum it is 4 to 7), in order to work effectively. The pH of Upper Lake ranged from 8 and 8.4 during monsoon to 8.5 and 8.2 during post monsoon. Total dissolved solids are mainly the inorganic mineral and sometimes some organic matter. In the natural water dissolved solids are composed of large variety of salt such as chloride, bicarbonate, sulphate, nitrate, phosphate, sodium, potassium, iron, manganese, calcium and magnesium which impart particular taste to water the density of water with high TDS adversely
affects the human health. Higher concentration of TDS produce distress also in cattle and livestock. Water containing more than 500 mgl-1 of TDS is not considered suitable for drinking water supplies. In the present study, the TDS ranged between 223ppm to 240ppm. The minimum value was recorded 223ppm in post monsoon at station-2 and the maximum value was recorded 240ppm at station-2 in monsoon.The dissolved oxygen can be determined either by the Winkler method or by the use of dissolved oxygen electrodes. The concentration of oxygen in saturated water is dependent on temperature, pressure and salinity of the water. The dissolved oxygen during the investigation ranged between 7.2 to 8.8 mgl-1. The minimum value was recorded 7.2 mgl-1 at station-I during monsoon and the maximum value was recorded 8.8 mgl-1 at station-II during post monsoon. The hardness in water is derived largely from contact with the soil and rock formation. It is mainly caused due to Ca++ and Mg++Ions. The water containing excess hardness is not desirable for potable water. The term hard water and soft water may be defined within very specific concentration range as soft (0-50), moderately soft (50-100), slightly hard (100-150), moderately hard (150-200), hard (200-300) and very hard (>300). In the present study total hardness ranged from 82 to 98mgl-1. The minimum value was recorded 82mgl-1 at station-II during monsoon and the maximum value was recorded 98 mgl-1 at station-II during the month of post monsoon. Total alkalinity is caused due to salt of weak acid and bi-carbonate. Highly alkaline water is not fit for potable use. The total alkalinity is largely governed by chemical composition of the aquatic ecosystem (Narain et al.,2009). In the present investigation, the total alkalinity was recorded between 85mgl-1 to 95mgl-
1. The minimum value of alkalinity was recorded 85 mgl-1 during post monsoon at station-I and maximum value was recorded 95 mgl-1 during post monsoon at station-II. In present observation Free CO2 of lake was absent in both seasons at two different sites.

ISSN (Online): 2455-3662
EPRA International Journal of Multidisciplinary Research (IJMR) - Peer Reviewed Journal Volume: 7| Issue: 9| September 2021|| Journal DOI: 10.36713/epra2013 || SJIF Impact Factor 2021: 8.047 || ISI Value: 1.188
2021 EPRA IJMR | www.eprajournals.com | Journal DOI URL: https://doi.org/10.36713/epra2013 331
Table - showing different readings of different physico-chemical, heavy metal and bacteriological parameters of different sampling sites
Parameters Monsoon Post Monsoon BIS-10500
SITE 1 SITE 2 SITE 1 SITE 2 Desirable Permissible
Air Temperature (OC) 28.5 32.4 33.5 31.6 - -
Water Temperature 25.8 26.7 30.4 30.1 - - pH 8 8.4 8.5 8.2 6.5-8.5 No
relaxation Total Alkanity mgl-1 76 94 85 95 Total hardness mgl-1 86 98 96 82 Free CO2 mgl-1 ABS ABS ABS ABS TDS 239 240 234 223 500 2000 BOD mgl-1 2.4 1.6 2.6 2.2 COD mgl-1 22 40 24 20 MPN Index 2800 2700
2100
2000
Lead µgl -1 0.001 0.002 0.003 0.002 0.01 No relaxation
Zinc µgl -1 0.001 0.003 0.002 0.002 5 15 Chromium µgl -1) 0.001 0.011 0.04 0.001 0.05 No
relaxation Cadmium µgl -1 0.002 0.003 BDL 0.001 0.003 No
relaxation
BOD reflects the dissolved oxygen amount needed by aerobic organisms to breakdown organic matter occurring in water at a given temperature, for a specified time. BOD is an indicator of sewage and industrial pollution. The BOD content of various study ranged from 1.6 to 2.6 mgl-1. The BOD values recorded from all sites were within the standards range of 3-20 mgl-1recommended BIS-10500. The BOD of unpolluted water is less than 1 mgl-1, moderately polluted water has the BOD range of 2-9 mgl-1while heavily polluted water have BOD value more than 10 mgl-1 (Adakole, 2000). The present study revealed that water of Upper Lake falls under moderately polluted category. Chemical Oxygen Demand determines the oxygen amount needed for oxidizing the biodegradable and non-biodegradable organic matter in water by a strong chemical oxidant (Mahananda et al., 2010) under specific conditions of oxidizing agent, temperature and time. This is an indication of both sewage and industrial pollution. The COD value ranged from 20 mgl-1to 40 mgl-1.
Bacterilogical examinations of lake water has a significant in pollutions study, measures deleterious effect of pollution on human health. The pathogenic bacteria contaminated into water bodies by domestic sewage and other pollutants boating, bathing and
immersion of idol and domestic sewage. Bacterial population are after considered as important indicator of pollution and eutrophication in the aquatic ecosystem. Faecal pollution of drinking water may introduce a variety of industrial pathogens i.e. bacteria viruses and other parasites. According to WHO (1978) water having MPN more than 10/100 ml is unfit for human use. During the present study the MPN value ranged from 2000/100ml to 2800/100ml.The minimum of 2000/100 ml was recorded on site-II in post monsoon while the maximum of 2800/100ml was observed on site-I in monsoon.
During investigation lead value ranged from 0.001 – 0.003 µg/l. minimum value was recorded in the monsoon and maximum value was recorded in the post monsoon. Higher value of lead concentration may be due to their surface runoff with rainwater. Zins value ranged from 0.001 to 0.003. Minimum value was observed in the monsoon and maximum value was observed in the post monsoon Chromium value ranged between 0.001 -0.004 µg/l . Minimum value was observed in the monsoon and maximum value was observed in the post monsoon. Similar results were also observed by Zafar (1997). Guideline value of chromium 0.05 mg/l is recommended by BIS. Cadmium value ranged between 0.001 – 0.003 µg/l.
ISSN (Online): 2455-3662
EPRA International Journal of Multidisciplinary Research (IJMR) - Peer Reviewed Journal Volume: 7| Issue: 9| September 2021|| Journal DOI: 10.36713/epra2013 || SJIF Impact Factor 2021: 8.047 || ISI Value: 1.188
2021 EPRA IJMR | www.eprajournals.com | Journal DOI URL: https://doi.org/10.36713/epra2013 332
Minimum value was observed in the post monsoon and maximum in the monsoon. These findings could be supported by the studies made by Pani (2008) at Upper lake Bhopal. All the analyzed parameters of heavy metal were within the desirable limits given by BIS- 10500. CONCLUSION
The results obtained from the present study shall be useful in future conservation and management of the Upper Lake Bhopal. The results obtained were compared with standards given by BIS (IS:10500). All the physico-chemical and heavy metal parameters were within the desirable limits. Bacteriological parameters showed high contamination, this may be due to direct discharge of waste from catchment areas. Based on the values of the obtained through physico-chemical and heavy metal parameters, it can be concluded that the Upper Lake water quality was not much bad and did not show much significant pollution problem in the present study. Therefore, there is need to conserve lake, and aware the people for protection of natural lake water for human as well as aquatic life. REFERENCES
1. Adakole,J.A. “The effects of domestic, agriculture
and industrial effluents on the water quality and biota of Bindare stream”, Department of Biological
Sciences, Ahmadu Bello University, Zaria, Nigeria, PhD Thesis, 2000, 256p
2. Adoni, A.D. Joshi, G., Ghosh, K., Chourasia, S.K., Vaishya, A.K. Yadav, M. and Verma, H.G. (1985). Workbook of limnology. Department of Botany. Dr. Harisingh Gour vishwavidyalaya Sagar. 1-212.
3. APHA (2005). Standard methods for the examination of water and waste water. 21st Edition, American Public Health Association/American Water Works Association/Water Environment Federation, Washington, DC.
4. Arain, M.B., T.G. Kazi, M.K. Jamali, H.I. Afridi, J.A. Baig, N. Jalbani and A.Q. Shah, 2008. Evaluation of physico-chemical parameters of manchar lake water and their comparison with other global published values. Pak. J. Anal. Environ. Chem., 9: 101-109.
5. Chidambaram, S., Ramanathan, AL., Shivanna, K., James, R.A. (Eds.) (2010) Recent trends in water research: Hydrogeological and hydrological perspectives. IK International Publishing House, Bangalore, India.
6. Forel F A. 1892.Le Léman - Monographie Limnologique. E. Rouge, Lausanne, Tome I:543p.
7. Mahananda, M.R., Mohanty, B.P., Behera, N.R. “Physico-chemical analysis of surface and ground water of Bargarh District,Orissa, India”.in
International of Research and Reviews in Applied Sciences, 2, 3, 2010, pp 284-295.
8. Pani, S., Bajpai, A.K., A., Dubey, A., Misra, S.M. (2000). Evaluation of water quality of Bhojland. In: Proceedings, National workshop on biodiversityPlanktonic Biodiversity of Bhoj Wetland, Bhopal, India.Wetland. Poll. Res. 20 (2), 147-153.
9. Smitha, D.A. and Shivashankar, P. (2013) Physico Chemical Analysis of the Freshwater at River Kapila, Nanjangudu Industrial Area, Mysore, India, International Research Journal of Environment Sciences, 2(8):59-65.
ISSN (Online): 2455-3662
EPRA International Journal of Multidisciplinary Research (IJMR) - Peer Reviewed Journal Volume: 7| Issue: 9| September 2021|| Journal DOI: 10.36713/epra2013 || SJIF Impact Factor 2021: 8.047 || ISI Value: 1.188
2021 EPRA IJMR | www.eprajournals.com | Journal DOI URL: https://doi.org/10.36713/epra2013 333
LEVEL OF EMOTIONAL INTELLIGENCE AND ITS IMPACT ON ACCEPTANCE TO TECHNOLOGY
IMPLEMENTATION: A STUDY ON EMPLOYEES OF PRIMARY COOPERATIVE CREDIT SOCIETIES IN
IDUKKI DISTRICT
1Mrs. Maya Murali, 2Dr. Well Haorei 1Ph.D. Research Scholar in Rural Industries and Management,
Gandhigram Rural Institute – Deemed to be University, Dindigul, Tamil Nadu, India.
2Assistant Professor in Rural Industries and Management, Gandhigram Rural Institute – Deemed to be University, Dindigul, Tamil Nadu, India.
Article DOI: https://doi.org/10.36713/epra8556 DOI No: 10.36713/epra8556
ABSTRACT This research article is an extract of Ph.D. thesis research work. The present paper analyses the level of emotional
intelligence and its impact on acceptance to technology implementation among the employees of primary cooperative
credit societies in Idukki District. The study concluded that multiple regression analysis indicated independent
variables, namely; social skills factor, social awareness factor, self-regulation factor, and self-awareness factor were
highly significant in supplementing emotional intelligence among the bank employees in the study area. Further, from
the analysis of Pearson’s correlation coefficient of emotional intelligence index and emotional intelligence factors, the
study concludes that all the five emotional intelligence factors are statistically significant and has a positive correlation
to emotional intelligence index. So, to increase the emotional intelligence level of the sample bank employees the higher
authorities of the study banks should impart training in those five factors.
KEY WORDS: Level of Emotional Intelligence and Impact, Employees, Idukki District
1. INTRODUCTION Banks are vital financial institutions in an economic system. They are the predominant source of credit. Banks offer more important sources of short-term working capital for commercial enterprises and are more and more active in current years in making long-term commercial enterprise loans for plants and equipment. Banks have been under tremendous pressure to carry out numerous objectives while preserving government regulations, bank policies, loans, investments, and providing services to customers in recent times. The Commercial Bank is certainly a commercial enterprise organized to maximize the value of shareholder's wealth invested within the Bank at an
acceptable level of risk. The aggressive pursuit of such a goal calls for an organization to constantly search for new opportunities, sales increase, greater efficiency, and effective planning and control. Therefore, banks, like other forms in the economy, are out to operate at a profit. 2. STATEMENT OF THE PROBLEM The demanding situations on this millennium for the banking sector are enormous. The technology and banking sector reforms collectively are lifting the competitive intensity of the banking business. The Indian banking system is in the midst of a technological revolution, which has an effect in 3 ways: Firstly, by

ISSN (Online): 2455-3662
EPRA International Journal of Multidisciplinary Research (IJMR) - Peer Reviewed Journal Volume: 7| Issue: 9| September 2021|| Journal DOI: 10.36713/epra2013 || SJIF Impact Factor 2021: 8.047 || ISI Value: 1.188
2021 EPRA IJMR | www.eprajournals.com | Journal DOI URL: https://doi.org/10.36713/epra2013 334
providing efficient and effective delivery channels. Secondly, its miles dramatically influence the patron profile, which leads to the third change, which is human resource management. As a service industry, it requires a shift in the mindset of the employees that might have a beneficial impact on customers. 3. JUSTIFICATION OF THE PRESENT STUDY This study assumes significance due to the subsequent reasons. This study pursuit at figuring out the level of emotional intelligence among the bank employees, which will help to create awareness for further imparting of training. Secondly, the study of the profile (includes personality traits also) of the bank employees with the level of emotional intelligence will always throw light on identifying the type of individuals who normally possess high level emotional intelligence. Thirdly, the study of the relationship among the level of emotional intelligence and their managerial performance will provide more insight into the importance of emotional intelligence amongst the respondents. Thus, an attempt is made by the researcher to pick out the level of emotional intelligence among the employees of the Bank and the numerous determinants of emotional intelligence required for a balanced state of emotion in a demanding, complicated, and ambiguous place of work. 4. OBJECTIVES OF THE STUDY The objectives of study are to explore the level of emotional intelligence and its impact on acceptance to technology implementation among the employees of primary cooperative credit societies in Idukki District. 5. SCOPE OF THE STUDY The present paper analyses the level of emotional intelligence and its impact on acceptance to technology implementation. To determine the factors supplementing emotional intelligence the multiple regression analysis was carried out. And, to measures the strength of the relationship between the relative movements of the emotional intelligence level and emotional intelligence factors and the sign of the correlation coefficient determinants whether their correlation is positive or negatives the Pearson correlation coefficient test was employed. 6. DESIGN OF THE STUDY 6.1. Review of Existing Literature Several authors and researchers have contributed a lot of literature on emotional intelligence and acceptance of technology among employees. The relevant studies were perused to identify issues,
problems, ideas that the current research addresses and the specific need for the present study are spelled out. 6.2. Selection of the Study Area The Idukki District Cooperative Bank (IDCB), the apex bank for the Primary Agricultural Credit Societies (PACS) in Kerala, and the Institute for Development and Research in Banking Technology (IDRBT) Hyderabad jointly implemented the Core Banking System (CBS) in 54 Primary Agricultural credit Societies with 143 branches in Idukki district, Kerala, and having a total number of 725 employees. This project was the first of its kind in India, where PACS are becoming part of technology up-gradation. Hence, the present research area was selected purposefully for the current research. 6.3. The Sampling Framework The present study has followed a stratified sampling method: Stratum I: Employing the online sample size calculator at a confident level of 95 percent with the population size of 725 employees engaged in 213 branches, the minimum sample size required is 252 samples, Stratum II: However, to ensure more accuracy, the researcher circulated the structured questionnaire to 400 employees who were able to reach out employed in 143 branches of Primary Agricultural Credit Societies (PACS) in the Idukki District Kerala, and Stratum III: Out of which 318 respondents returned the filled-in structured questionnaire at the rate of 79.5 percent to the researcher. Of which 46 respondents were the Secretaries, 62 respondents were the Branch Managers, 74 respondents were the Accountants, 84 respondents were the Clerks, and 52 were the Cashiers of the Primary Agricultural Credit Societies (PACS) under the Primary Cooperative Credit Societies in the Idukki district, Kerala. Hence, 318 samples consisted of the current research work. 6.4. Sources of Data The present work is descriptive method research; primary and secondary data were gathered and analyzed to draw inferences and report research results. 6.5. Methods of Data Collection The study employed a combination of methods, such as field survey using a pre-tested questionnaire schedule adopting the Likert Scale method and discussions with the Primary Agricultural Credit Societies (PACS) employees, meetings with key informants, and review of secondary data sources. 6.6. Primary data The primary data were gathered from the employees of Primary Agricultural Credit Societies (PACS) employees that comes under the Primary Cooperative Credit Societies in Idukki District by contacting them personally and reaching out to them through e-mail, Whatsapp during the period between
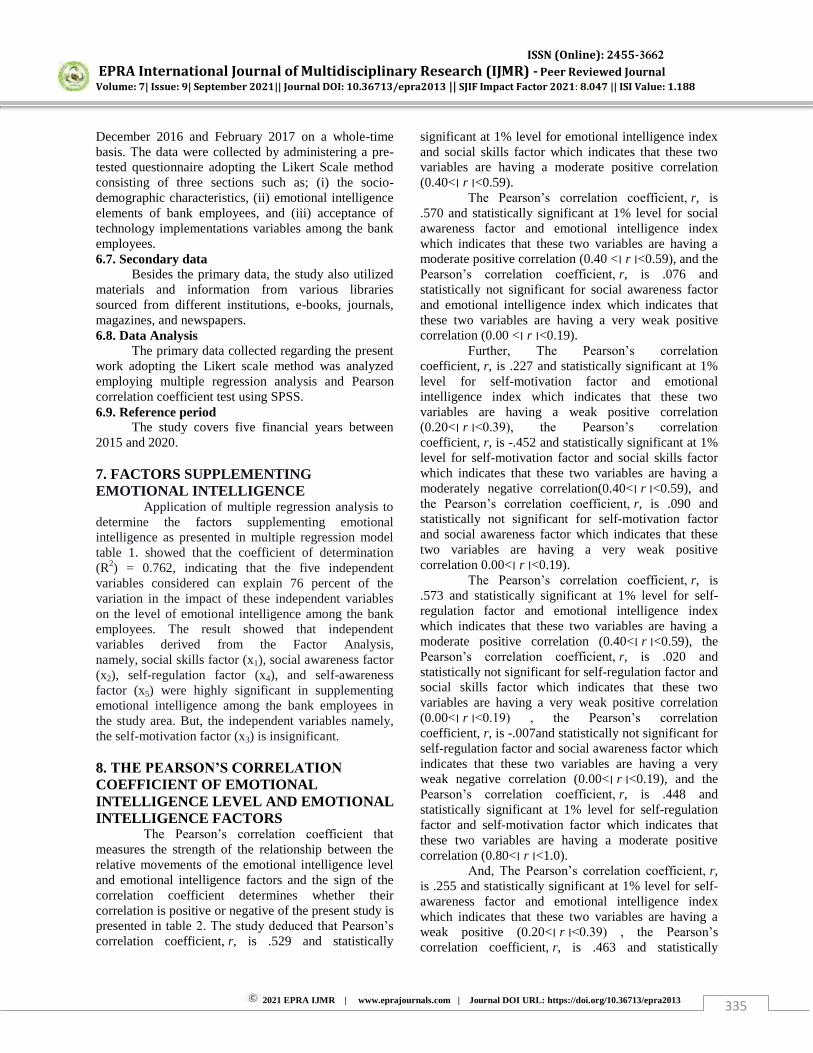
ISSN (Online): 2455-3662
EPRA International Journal of Multidisciplinary Research (IJMR) - Peer Reviewed Journal Volume: 7| Issue: 9| September 2021|| Journal DOI: 10.36713/epra2013 || SJIF Impact Factor 2021: 8.047 || ISI Value: 1.188
2021 EPRA IJMR | www.eprajournals.com | Journal DOI URL: https://doi.org/10.36713/epra2013 335
December 2016 and February 2017 on a whole-time basis. The data were collected by administering a pre-tested questionnaire adopting the Likert Scale method consisting of three sections such as; (i) the socio-demographic characteristics, (ii) emotional intelligence elements of bank employees, and (iii) acceptance of technology implementations variables among the bank employees. 6.7. Secondary data Besides the primary data, the study also utilized materials and information from various libraries sourced from different institutions, e-books, journals, magazines, and newspapers. 6.8. Data Analysis The primary data collected regarding the present work adopting the Likert scale method was analyzed employing multiple regression analysis and Pearson correlation coefficient test using SPSS. 6.9. Reference period The study covers five financial years between 2015 and 2020. 7. FACTORS SUPPLEMENTING EMOTIONAL INTELLIGENCE Application of multiple regression analysis to determine the factors supplementing emotional intelligence as presented in multiple regression model table 1. showed that the coefficient of determination (R2) = 0.762, indicating that the five independent variables considered can explain 76 percent of the variation in the impact of these independent variables on the level of emotional intelligence among the bank employees. The result showed that independent variables derived from the Factor Analysis, namely, social skills factor (x1), social awareness factor (x2), self-regulation factor (x4), and self-awareness factor (x5) were highly significant in supplementing emotional intelligence among the bank employees in the study area. But, the independent variables namely, the self-motivation factor (x3) is insignificant. 8. THE PEARSON’S CORRELATION
COEFFICIENT OF EMOTIONAL INTELLIGENCE LEVEL AND EMOTIONAL INTELLIGENCE FACTORS The Pearson’s correlation coefficient that
measures the strength of the relationship between the relative movements of the emotional intelligence level and emotional intelligence factors and the sign of the correlation coefficient determines whether their correlation is positive or negative of the present study is presented in table 2. The study deduced that Pearson’s
correlation coefficient, r, is .529 and statistically
significant at 1% level for emotional intelligence index and social skills factor which indicates that these two variables are having a moderate positive correlation .(0.59>׀ r ׀>0.40) The Pearson’s correlation coefficient, r, is .570 and statistically significant at 1% level for social awareness factor and emotional intelligence index which indicates that these two variables are having a moderate positive correlation (0.40 <׀ r 0.59>׀), and the Pearson’s correlation coefficient, r, is .076 and statistically not significant for social awareness factor and emotional intelligence index which indicates that these two variables are having a very weak positive correlation (0.00 <׀ r 0.19>׀). Further, The Pearson’s correlation
coefficient, r, is .227 and statistically significant at 1% level for self-motivation factor and emotional intelligence index which indicates that these two variables are having a weak positive correlation the Pearson’s correlation ,(0.39>׀ r ׀>0.20)
coefficient, r, is -.452 and statistically significant at 1% level for self-motivation factor and social skills factor which indicates that these two variables are having a moderately negative correlation(0.40<׀ r 0.59>׀), and the Pearson’s correlation coefficient, r, is .090 and statistically not significant for self-motivation factor and social awareness factor which indicates that these two variables are having a very weak positive correlation 0.00<׀ r 0.19>׀). The Pearson’s correlation coefficient, r, is .573 and statistically significant at 1% level for self-regulation factor and emotional intelligence index which indicates that these two variables are having a moderate positive correlation (0.40<׀ r 0.59>׀), the Pearson’s correlation coefficient, r, is .020 and statistically not significant for self-regulation factor and social skills factor which indicates that these two variables are having a very weak positive correlation the Pearson’s correlation , (0.19>׀ r ׀>0.00)
coefficient, r, is -.007and statistically not significant for self-regulation factor and social awareness factor which indicates that these two variables are having a very weak negative correlation (0.00<׀ r 0.19>׀), and the Pearson’s correlation coefficient, r, is .448 and statistically significant at 1% level for self-regulation factor and self-motivation factor which indicates that these two variables are having a moderate positive correlation (0.80<׀ r 1.0>׀). And, The Pearson’s correlation coefficient, r, is .255 and statistically significant at 1% level for self-awareness factor and emotional intelligence index which indicates that these two variables are having a weak positive (0.20<׀ r 0.39>׀) , the Pearson’s correlation coefficient, r, is .463 and statistically

ISSN (Online): 2455-3662
EPRA International Journal of Multidisciplinary Research (IJMR) - Peer Reviewed Journal Volume: 7| Issue: 9| September 2021|| Journal DOI: 10.36713/epra2013 || SJIF Impact Factor 2021: 8.047 || ISI Value: 1.188
2021 EPRA IJMR | www.eprajournals.com | Journal DOI URL: https://doi.org/10.36713/epra2013 336
significant at 1% level for self-awareness factor and social skills factor which indicates that these two variables are having a moderate positive correlation the Pearson’s correlation ,(0.59>׀ r ׀>0.40)coefficient, r, is .259 and statistically significant at 1% level for self-awareness factor and social awareness factor which indicates that these two variables are having a weak positive correlation(0.20<׀ r 0.39>׀), the Pearson’s correlation coefficient, r, is -.597 and statistically significant at 1% level for self-awareness factor and self-motivation factor which indicates that these two variables are having a moderate negative correlation (0.40<׀ r 0.59>׀)and the Pearson’s
correlation coefficient, r, is -.437 and statistically significant at 1% level for self-awareness factor and self-motivation factor which indicates that these two variables are having a moderate negative correlation .(0.59>׀ r ׀>0.40) Hence, from the analysis of Pearson’s
correlation coefficient of emotional intelligence level and emotional intelligence factors, the study concludes that all the five emotional intelligence factors are statistically significant and has a positive correlation to emotional intelligence level. So, to increase the emotional intelligence level of the sample bank employees the higher authorities of the study banks should impart training in these five factors; namely, self-awareness factor, social skills factor, social awareness factor, self-motivation factor, and self-regulation factor. CONCLUDING REMARKS The study concludes that multiple regression analysis indicated independent variables, namely; social skills factor, social awareness factor, self-regulation factor, and self-awareness factor were highly significant in supplementing emotional intelligence among the bank employees in the study area. Further, from the analysis of Pearson’s correlation coefficient of emotional intelligence index and emotional intelligence
factors, the study concludes that all the five emotional intelligence factors are statistically significant and has a positive correlation to emotional intelligence index. So, to increase the emotional intelligence level of the sample bank employees the higher authorities of the study banks should impart training in those five factors. REFERENCE 1. Davis, F. D., and V. Venkatesh (1996): A critical
assessment of potential measurement biases in the technology acceptance model: Three experiments Internet. J. Human-Comput. Stud. Vol.45, PP.19–45.
2. Venkatesh, V. and Davis, F. D. (2000): “A theoretical
extension of the technology acceptance model: Four longitudinal field studies”, Management Science, Vol.46, No.2, PP.186-204.
3. Venkatesh, V. and Bala, H. (2008): Technology Acceptance Model 3 and a Research Agenda on Interventions. Decision Science, Vol.39, No.2, PP.273-312.
4. Venkatesh, V., Morris, M.G., Davis, F.D., & Davis, G.B. (2003): User Acceptance of Information Technology: Toward a Unified View. MIS Quarterly, Vol.27, PP.425-478.
5. Jennifer Austermann (2014): Technology Acceptance Model Revised - An Investigation on the Managerial Attitudes towards Using Social Media in Innovation Processes (Doctoral dissertation, Linnaeus University, Sweden)
6. Rajashekar, N. (2001), “Banking in the New
Millennium”, The Institute of Charted Financial
Analysts of India, ICFAI Press, pp.I to III.
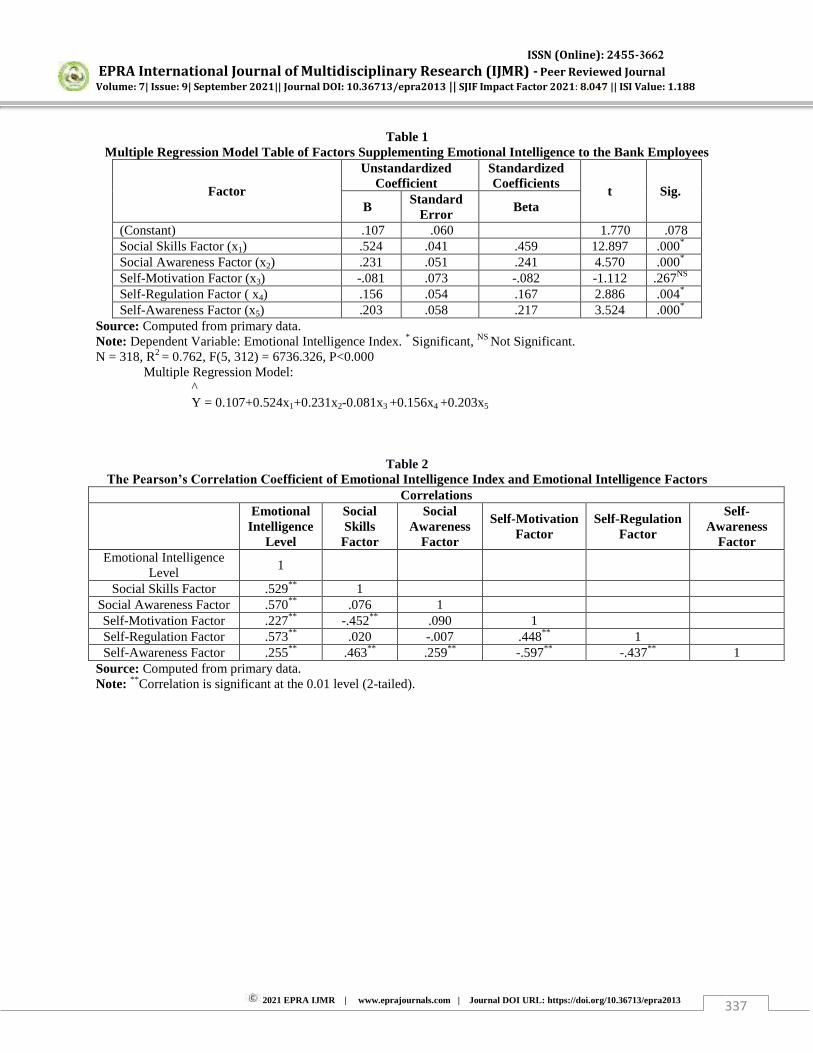
ISSN (Online): 2455-3662
EPRA International Journal of Multidisciplinary Research (IJMR) - Peer Reviewed Journal Volume: 7| Issue: 9| September 2021|| Journal DOI: 10.36713/epra2013 || SJIF Impact Factor 2021: 8.047 || ISI Value: 1.188
2021 EPRA IJMR | www.eprajournals.com | Journal DOI URL: https://doi.org/10.36713/epra2013 337
Table 1 Multiple Regression Model Table of Factors Supplementing Emotional Intelligence to the Bank Employees
Factor
Unstandardized Coefficient
Standardized Coefficients
t Sig. B
Standard Error
Beta
(Constant) .107 .060 1.770 .078 Social Skills Factor (x1) .524 .041 .459 12.897 .000*
Social Awareness Factor (x2) .231 .051 .241 4.570 .000*
Self-Motivation Factor (x3) -.081 .073 -.082 -1.112 .267NS
Self-Regulation Factor ( x4) .156 .054 .167 2.886 .004*
Self-Awareness Factor (x5) .203 .058 .217 3.524 .000*
Source: Computed from primary data. Note: Dependent Variable: Emotional Intelligence Index. * Significant, NS Not Significant. N = 318, R2 = 0.762, F(5, 312) = 6736.326, P<0.000 Multiple Regression Model: ^ Y = 0.107+0.524x1+0.231x2-0.081x3 +0.156x4 +0.203x5
Table 2 The Pearson’s Correlation Coefficient of Emotional Intelligence Index and Emotional Intelligence Factors
Correlations
Emotional
Intelligence Level
Social Skills
Factor
Social Awareness
Factor
Self-Motivation Factor
Self-Regulation Factor
Self-Awareness
Factor Emotional Intelligence
Level 1
Social Skills Factor .529** 1 Social Awareness Factor .570** .076 1 Self-Motivation Factor .227** -.452** .090 1 Self-Regulation Factor .573** .020 -.007 .448** 1 Self-Awareness Factor .255** .463** .259** -.597** -.437** 1
Source: Computed from primary data. Note: **Correlation is significant at the 0.01 level (2-tailed).
ISSN (Online): 2455-3662
EPRA International Journal of Multidisciplinary Research (IJMR) - Peer Reviewed Journal Volume: 7| Issue: 9| September 2021|| Journal DOI: 10.36713/epra2013 || SJIF Impact Factor 2021: 8.047 || ISI Value: 1.188
2021 EPRA IJMR | www.eprajournals.com | Journal DOI URL: https://doi.org/10.36713/epra2013 338
TECHNOLOGY IMPLEMENTATION ACCEPTANCE
LEVEL AND THE ASSOCIATIONS OF THESE LEVELS TO THEIR SOCIO-DEMOGRAPHIC: A STUDY ON
EMPLOYEES OF PRIMARY COOPERATIVE CREDIT SOCIETIES IN IDUKKI DISTRICT
1Mrs. Maya Murali, 2Dr. Well Haorei 1Ph.D. Research Scholar in Rural Industries and Management,
Gandhigram Rural Institute – Deemed to be University, Dindigul, Tamil Nadu, India.
2Assistant Professor in Rural Industries and Management, Gandhigram Rural Institute – Deemed to be University, Dindigul, Tamil Nadu, India.
Article DOI: https://doi.org/10.36713/epra8555 DOI No: 10.36713/epra8555
ABSTRACT
This research article is an extract of Ph.D. thesis research work. The present research paper explores the level of
acceptance to technology implementation and the associations of these levels to their socio-demographic among the
employees of primary cooperative credit societies in Idukki District. The study reveals that, 49.1 percent of the bank
employees have technology implementation acceptance above average; among them, the number of male employees was
more than that of women employees. And, the study concludes that the profile variables of the respondents that were
considered for the present study, namely; the gender dimension of the respondents, the age of the respondents, their
educational qualifications, the marital status of the respondents, the designation of the respondents, training
undergone by the bank employees, average monthly income of the respondents' family, and the type of the respondents'
family, have a significant association with the acceptance of technology change in the workplace.
KEY WORDS: Acceptance to technology implementation, Employees, Idukki District
1. INTRODUCTION Banks are vital financial institutions in an economic system. They are the predominant source of financial support to the community. Banks offer more important sources of short-term working capital for commercial enterprises and are more and more active in recent years in extending long-term commercial enterprise loans for plants and equipment. Banks have been under tremendous pressure to achieve their objectives in preserving loans & investments and providing services to customers while complying with the government regulations. The Commercial Banks are certainly commercial enterprises organized to maximize the value of shareholder's wealth invested within the Bank at an acceptable level of risk. The
regional Rural Banks and Co-operative banks are also to working on the same way for survival though they are non profit organizations . The aggressive pursuit of such goal calls for the banking organizations lead them to a constant search for new opportunities , greater efficiency, and effective planning and control. Therefore, banks, like other organizations in the economy, are out to focus on the human resources being the key factors towards the way to progress. 2. STATEMENT OF THE PROBLEM The demanding situations on this millennium for the banking sector are enormous. The technology and banking sector reforms collectively lifting the competitive intensity of the banking business. The

ISSN (Online): 2455-3662
EPRA International Journal of Multidisciplinary Research (IJMR) - Peer Reviewed Journal Volume: 7| Issue: 9| September 2021|| Journal DOI: 10.36713/epra2013 || SJIF Impact Factor 2021: 8.047 || ISI Value: 1.188
2021 EPRA IJMR | www.eprajournals.com | Journal DOI URL: https://doi.org/10.36713/epra2013 339
banking system across the globe is in the midst of a technological revolution, which has an effect in 3 ways: Firstly, by providing efficient and effective delivery channels, Secondly, the dramatical influence of its miles in the patron profile which leads to the third change which is human resource management. As a service industry, it requires a shift in the mindset of the employees that might have a beneficial impact on customers. 3. JUSTIFICATION OF THE PRESENT STUDY This study assumes significance due to the subsequent reasons. This study pursuit in figuring out the level of emotional intelligence among the bank employees, which will help to create awareness in the need for personal development &training. Secondly, the study of the profile (includes personality traits also) of the bank employees with the level of emotional intelligence will always throw light on identifying the type of individuals who normally possess high level emotional intelligence. Thirdly, the study of the relationship among the level of emotional intelligence and their managerial performance will provide more insight into the importance of emotional intelligence amongst the respondents. Thus, an attempt is made by the researcher to pick out the level of emotional intelligence among the employees of the Bank and the numerous determinants of emotional intelligence required for a balanced state of emotion in a demanding, complicated, and ambiguous place of work. 4. OBJECTIVES OF THE STUDY The objectives of study are to explore the level of acceptance to technology implementation and the associations of these levels to their socio-demographic among the employees of primary cooperative credit societies in Idukki District. 5. SCOPE OF THE STUDY The present study is to determine the level of acceptance to technology implementation and the associations of these levels to the age of the respondents, the gender dimension of the respondents, marital status of the respondents, their educational qualifications, their working experience, the designation of the respondents, training undergone by the bank employees, the type of the respondents’
family, average monthly income of the respondents’
family, and the number of dependents the respondents.
6. DESIGN OF THE STUDY 6.1. Review of Existing Literature Several authors and researchers have contributed a lot of literature on emotional intelligence and acceptance of technology among employees. The relevant studies were perused to identify issues, problems, ideas that the current research addresses and the specific need for the present study are spelled out. 6.2. Selection of the Study Area The Idukki District Cooperative Bank (IDCB), the apex bank for the Primary Agricultural Credit Societies (PACS) in Kerala, and the Institute for Development and Research in Banking Technology (IDRBT) Hyderabad jointly implemented the Core Banking System (CBS) in 54 Primary Agricultural credit Societies with 143 branches in Idukki district, Kerala, and having a total number of 725 employees. This project was the first of its kind in India, where PACS are becoming part of technology up-gradation. Hence, the present research area was selected purposefully for the current research. 6.3. The Sampling Framework The present study has followed a stratified sampling method: Stratum I: Employing the online sample size calculator at a confident level of 95 percent with the population size of 725 employees engaged in 213 branches, the minimum sample size required is 252 samples, Stratum II: However, to ensure more accuracy, the researcher circulated the structured questionnaire to 400 employees who were able to reach out employed in 143 branches of Primary Agricultural Credit Societies (PACS) in the Idukki District Kerala, and Stratum III: Out of which 318 respondents returned the filled-in structured questionnaire at the rate of 79.5 percent to the researcher. Of which 46 respondents were the Secretaries, 62 respondents were the Branch Managers, 74 respondents were the Accountants, 84 respondents were the Clerks, and 52 were the Cashiers of the Primary Agricultural Credit Societies (PACS) under the Primary Cooperative Credit Societies in the Idukki district, Kerala. Hence, 318 samples consisted of the current research work. 6.4. Sources of Data The present work is descriptive method research; primary and secondary data were gathered and analyzed to draw inferences and report research results. 6.5. Methods of Data Collection The study employed a combination of methods, such as field survey using a pre-tested questionnaire schedule adopting the Likert Scale method and discussions with the Primary Agricultural Credit Societies (PACS) employees, meetings with key informants, and review of secondary data sources.
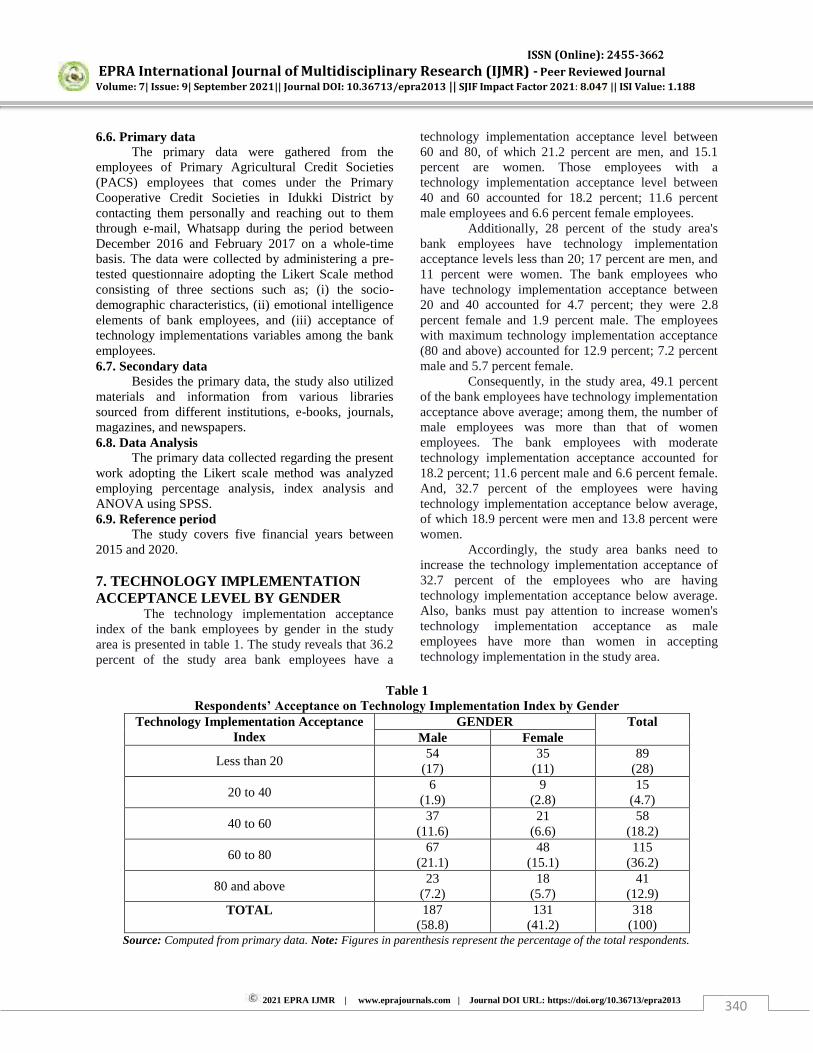
ISSN (Online): 2455-3662
EPRA International Journal of Multidisciplinary Research (IJMR) - Peer Reviewed Journal Volume: 7| Issue: 9| September 2021|| Journal DOI: 10.36713/epra2013 || SJIF Impact Factor 2021: 8.047 || ISI Value: 1.188
2021 EPRA IJMR | www.eprajournals.com | Journal DOI URL: https://doi.org/10.36713/epra2013 340
6.6. Primary data The primary data were gathered from the employees of Primary Agricultural Credit Societies (PACS) employees that comes under the Primary Cooperative Credit Societies in Idukki District by contacting them personally and reaching out to them through e-mail, Whatsapp during the period between December 2016 and February 2017 on a whole-time basis. The data were collected by administering a pre-tested questionnaire adopting the Likert Scale method consisting of three sections such as; (i) the socio-demographic characteristics, (ii) emotional intelligence elements of bank employees, and (iii) acceptance of technology implementations variables among the bank employees. 6.7. Secondary data Besides the primary data, the study also utilized materials and information from various libraries sourced from different institutions, e-books, journals, magazines, and newspapers. 6.8. Data Analysis The primary data collected regarding the present work adopting the Likert scale method was analyzed employing percentage analysis, index analysis and ANOVA using SPSS. 6.9. Reference period The study covers five financial years between 2015 and 2020. 7. TECHNOLOGY IMPLEMENTATION ACCEPTANCE LEVEL BY GENDER The technology implementation acceptance index of the bank employees by gender in the study area is presented in table 1. The study reveals that 36.2 percent of the study area bank employees have a
technology implementation acceptance level between 60 and 80, of which 21.2 percent are men, and 15.1 percent are women. Those employees with a technology implementation acceptance level between 40 and 60 accounted for 18.2 percent; 11.6 percent male employees and 6.6 percent female employees. Additionally, 28 percent of the study area's bank employees have technology implementation acceptance levels less than 20; 17 percent are men, and 11 percent were women. The bank employees who have technology implementation acceptance between 20 and 40 accounted for 4.7 percent; they were 2.8 percent female and 1.9 percent male. The employees with maximum technology implementation acceptance (80 and above) accounted for 12.9 percent; 7.2 percent male and 5.7 percent female. Consequently, in the study area, 49.1 percent of the bank employees have technology implementation acceptance above average; among them, the number of male employees was more than that of women employees. The bank employees with moderate technology implementation acceptance accounted for 18.2 percent; 11.6 percent male and 6.6 percent female. And, 32.7 percent of the employees were having technology implementation acceptance below average, of which 18.9 percent were men and 13.8 percent were women. Accordingly, the study area banks need to increase the technology implementation acceptance of 32.7 percent of the employees who are having technology implementation acceptance below average. Also, banks must pay attention to increase women's technology implementation acceptance as male employees have more than women in accepting technology implementation in the study area.
Table 1
Respondents’ Acceptance on Technology Implementation Index by Gender Technology Implementation Acceptance
Index GENDER Total
Male Female
Less than 20 54
(17) 35
(11) 89
(28)
20 to 40 6
(1.9) 9
(2.8) 15
(4.7)
40 to 60 37
(11.6) 21
(6.6) 58
(18.2)
60 to 80 67
(21.1) 48
(15.1) 115
(36.2)
80 and above 23
(7.2) 18
(5.7) 41
(12.9) TOTAL 187
(58.8) 131
(41.2) 318
(100) Source: Computed from primary data. Note: Figures in parenthesis represent the percentage of the total respondents.
ISSN (Online): 2455-3662
EPRA International Journal of Multidisciplinary Research (IJMR) - Peer Reviewed Journal Volume: 7| Issue: 9| September 2021|| Journal DOI: 10.36713/epra2013 || SJIF Impact Factor 2021: 8.047 || ISI Value: 1.188
2021 EPRA IJMR | www.eprajournals.com | Journal DOI URL: https://doi.org/10.36713/epra2013 341
8. ASSOCIATION BETWEEN PROFILE AND TECHNOLOGY IMPLEMENTATION ACCEPTANCE INDEX The present study test the association of the general profile of the study area bank employees and their acceptance towards the implementation of technology, conducting a one-way analysis of variance (ANOVA). The variables of the available profile of the respondents for the present study are, namely, the age of the respondents, the gender dimension of the respondents, marital status of the respondents, their educational qualifications, their working experience, the designation of the respondents, training undergone by the bank employees, the type of the respondents’
family, average monthly income of the respondents’
family, and the number of dependents the respondents. Consequently, the result of the one-way analysis of variance (ANOVA) is presented in table 2. An analysis of variance test on the association of the respondents' age with their emotional intelligence level deduced that the calculated value of the ratio of variance F(3,314) is 2.213, which reaches significance with a p-value of 0.043. Therefore, it is concluded that there was a significant association between the respondents' age and their acceptance of technology change in the workplace (0.043<0.05). Also, there was a significant association between the bank employees' gender and their acceptance of technology change in the workplace since the calculated ratio of variance (F) for 1 and 316 degrees of freedom at a 5 percent level of significance was 2.162 p=0.042<0.05. There was also a significant association between the employees' marital status and their acceptance of technology change in the workplace since the calculated ratio of variance (F) for 1 and 316 degree of freedom at 5 percent level of significance was 2.417 and p=0.039>0.05. On the analysis of variance test, for there was an association between the educational qualification and their acceptance of technology change in the workplace, it was found that F(2,315)=2.002 and p=0.052. Hence, it was close to significant association between the educational qualification and their acceptance of technology change in the workplace (p>0.05) among the bank employees in the study area. Further, an analysis of variance test indicates that the calculated value of the ratio of variance F(2,315) is 2.029 and significant (p) at 0.055>0.05 for
the working experience of the bank employees in the study area. Hence, it was close to significant association between the employees' working experience and their acceptance of technology change in the workplace (p>0.05) among the bank employees in the study area. Statistically, it follows a significant association between the employees' working experience and their acceptance of technology change in the workplace since ANOVA F(2,315) = 2.461 and p =0.046<0.05. The relationship between the education streams of the bank employee respondents and their acceptance of technology change in the workplace was not significant in the study area since the calculated ratio of variance (F) for 2 and 315 degrees of freedom at a 5 percent level of significance was 1.162 p=0.393>0.05. An analysis of variance test on the association of the respondents' training underwent while in service and their acceptance of technology change in the workplace deduced that the calculated value of the ratio of variance F(1,316) is 2.632, which reaches significance with a p-value of 0.032. Therefore, it is concluded that there was a significant association between the respondents' training underwent while in service and their acceptance of technology change in the workplace (0.032<0.05). Also, an association of the bank employees' average monthly income with their acceptance of technology change in the workplace was conducted with the analysis of variance test and found that F(3,314)=0.2571 and p=0.028. Hence, there was a significant association between the bank employees' average monthly income with their acceptance of technology change in the workplace (p>0.05). There was also a significant association between the employees' type of family, and their acceptance of technology change in the workplace since the calculated ratio of variance (F) for 1 and 316 degrees of freedom at a 5 percent level of significance was 2.895 p=0.024>0.05. And, it was close to significant association between the employees' number of dependent in their family with their acceptance of technology change in the workplace since the calculated ratio of variance (F) for 2 and 315 degree of freedom at 5 percent level of significance was 2.011 and p=0.054>0.05.
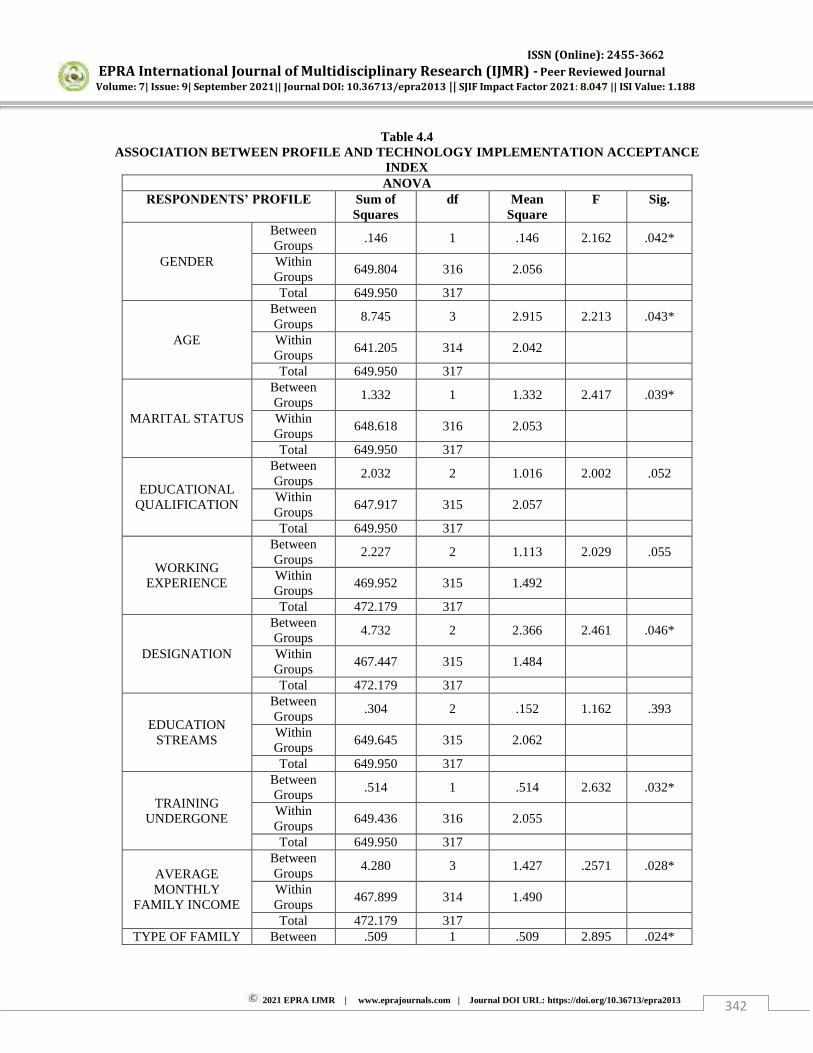
ISSN (Online): 2455-3662
EPRA International Journal of Multidisciplinary Research (IJMR) - Peer Reviewed Journal Volume: 7| Issue: 9| September 2021|| Journal DOI: 10.36713/epra2013 || SJIF Impact Factor 2021: 8.047 || ISI Value: 1.188
2021 EPRA IJMR | www.eprajournals.com | Journal DOI URL: https://doi.org/10.36713/epra2013 342
Table 4.4 ASSOCIATION BETWEEN PROFILE AND TECHNOLOGY IMPLEMENTATION ACCEPTANCE
INDEX ANOVA
RESPONDENTS’ PROFILE Sum of Squares
df Mean Square
F Sig.
GENDER
Between Groups
.146 1 .146 2.162 .042*
Within Groups
649.804 316 2.056
Total 649.950 317
AGE
Between Groups
8.745 3 2.915 2.213 .043*
Within Groups
641.205 314 2.042
Total 649.950 317
MARITAL STATUS
Between Groups
1.332 1 1.332 2.417 .039*
Within Groups
648.618 316 2.053
Total 649.950 317
EDUCATIONAL QUALIFICATION
Between Groups
2.032 2 1.016 2.002 .052
Within Groups
647.917 315 2.057
Total 649.950 317
WORKING EXPERIENCE
Between Groups
2.227 2 1.113 2.029 .055
Within Groups
469.952 315 1.492
Total 472.179 317
DESIGNATION
Between Groups
4.732 2 2.366 2.461 .046*
Within Groups
467.447 315 1.484
Total 472.179 317
EDUCATION STREAMS
Between Groups
.304 2 .152 1.162 .393
Within Groups
649.645 315 2.062
Total 649.950 317
TRAINING UNDERGONE
Between Groups
.514 1 .514 2.632 .032*
Within Groups
649.436 316 2.055
Total 649.950 317
AVERAGE MONTHLY
FAMILY INCOME
Between Groups
4.280 3 1.427 .2571 .028*
Within Groups
467.899 314 1.490
Total 472.179 317 TYPE OF FAMILY Between .509 1 .509 2.895 .024*

ISSN (Online): 2455-3662
EPRA International Journal of Multidisciplinary Research (IJMR) - Peer Reviewed Journal Volume: 7| Issue: 9| September 2021|| Journal DOI: 10.36713/epra2013 || SJIF Impact Factor 2021: 8.047 || ISI Value: 1.188
2021 EPRA IJMR | www.eprajournals.com | Journal DOI URL: https://doi.org/10.36713/epra2013 343
Groups Within Groups
649.441 316 2.055
Total 649.950 317
NUMBER OF DEPENDENT(S)
Between Groups
.597 2 .299 2.011 .054
Within Groups
471.582 315 1.497
Total 472.179 317 Source: Computed from primary data. Note: * Significant at 5 % level CONCLUDING REMARKS The study concludes that from the variables of the available profile of the respondents that were considered for the present study, namely; the gender dimension of the respondents, the age of the respondents, their educational qualifications, the marital status of the respondents, the designation of the respondents, training undergone by the bank employees, average monthly income of the respondents' family, and the type of the respondents' family, have a significant association with the acceptance of technology change in the workplace. And, the study area banks need to increase the technology implementation acceptance of 32.7 percent of the employees who are having technology implementation acceptance below average. Also, banks must pay attention to increase women's technology implementation acceptance as male employees have more than women in accepting technology implementation in the study area. REFERENCE 1. Davis, F. D., and V. Venkatesh (1996): A critical
assessment of potential measurement biases in the technology acceptance model: Three experiments Internet. J. Human-Comput. Stud. Vol.45, PP.19–45.
2. Venkatesh, V. and Davis, F. D. (2000): “A theoretical extension of the technology acceptance model: Four longitudinal field studies”, Management Science, Vol.46, No.2, PP.186-204.
3. Venkatesh, V. and Bala, H. (2008): Technology Acceptance Model 3 and a Research Agenda on Interventions. Decision Science, Vol.39, No.2, PP.273-312.
4. Venkatesh, V., Morris, M.G., Davis, F.D., & Davis, G.B. (2003): User Acceptance of Information Technology: Toward a Unified View. MIS Quarterly, Vol.27, PP.425-478.
5. Jennifer Austermann (2014): Technology Acceptance Model Revised - An Investigation on the Managerial Attitudes towards Using Social Media in Innovation Processes (Doctoral dissertation, Linnaeus University, Sweden)
6. Rajashekar, N. (2001), “Banking in the New
Millennium”, The Institute of Charted Financial Analysts of India, ICFAI Press, pp.I to III.
ISSN (Online): 2455-3662
EPRA International Journal of Multidisciplinary Research (IJMR) - Peer Reviewed Journal Volume: 7| Issue: 9| September 2021|| Journal DOI: 10.36713/epra2013 || SJIF Impact Factor 2021: 8.047 || ISI Value: 1.188
2021 EPRA IJMR | www.eprajournals.com | Journal DOI URL: https://doi.org/10.36713/epra2013 344
CONDITION OF WOMEN DURING ‘COVID-19’:
HEALTH, VIOLENCE AND ECONOMY
Vanshika Shukla
Babasaheb Bhimrao Ambedkar University, Lucknow
ABSTRACT
It is all around recorded that during a conflict, a cataclysmic event or a pandemic, women’s health bears the more regrettable brunt of the crisis. Thus, domestic violence against women is already widespread and under-reported in worldwide. Presently, at the time of the COVID-19 pandemic, the United Nations perceives domestic violence against women as a “shadow
pandemic”. However, lockdown measures and school closures influence girls and women distinctively across the world and may have long haul unfortunate consequences.
Though, the COVID-19 pandemic and its socioeconomic impacts have made a worldwide crisis, unparalleled in history. Although, antagonistic economic impact of COVID-19 has been most pressing for women, and especially women working in the informal economy. Hence, this policy brief features the vital effects of the pandemic on women who work in the informal economy in growing countries. It underlines their weakness to monetary pressure, as this segment regularly needs lawful and social insurances, and analyzes government reactions to address the economic aftermath.
INTRODUCTION Pandemics and outbreaks have differentially affected women and men. From hazard of openness and organic
vulnerability to disease to the social and economic implications, people's experiences probably going to fluctuate as indicated by their natural and gender qualities and their interaction with other social determinants. Along these lines, worldwide and national strategic plans for COVID-19 preparedness and response must be grounded in strong gender analysis and should ensure significant cooperation of affected groups, including women and girls, in dynamic and execution.
The COVID-19, First discovered in December 2019 in Wuhan province, China, it is global pandemic it has spread to more than 216 countries, areas or territories with over 210 million cases and more than 45 lakhs deaths reported worldwide as of September 2021. Thus, the most humanitarian emergency, this also amplifies existing inequalities, including that of gender inequality and subsequently excessively affects women. However, Since the beginning of the pandemic, it has been evident that men are more terrible off than women when catching COVID-19.
Notwithstanding age and other basic ailments, men are bound to encounter serious sickness and have more awful results of severe disease and have worse outcomes, such as the need for intensive care and death. Women will in general have more overactive immune systems than men, which may help them momentary cope with injuries and infections but puts them at an increased risk of developing chronic COVID-19 symptoms.
The paper analyzes how the pandemic is affecting women‟s and girl‟s health, contain their sexual and genial health and the violence against women during lockdown. On the way of women‟s health some of the ways national governments and benefactor institutions have seek to maintain the provision of essential health services; and existing vent, occasion, and promising strategies benefactor and governments should pursue to address indirect harms to women‟s and girl‟s health during the COVID-19 pandemic. Hence, it also analyzes the social and economic condition of women‟s and its various aspects. WOMEN AND COVID-19
The COVID-19 pandemic is having decimating social and economic consequences around the world. However, the quantities of infections and deaths alone don't give an exact image of the pandemic's immense gendered impact. accessible information recommend that men experience higher paces of COVID-19-related
ISSN (Online): 2455-3662
EPRA International Journal of Multidisciplinary Research (IJMR) - Peer Reviewed Journal Volume: 7| Issue: 9| September 2021|| Journal DOI: 10.36713/epra2013 || SJIF Impact Factor 2021: 8.047 || ISI Value: 1.188
2021 EPRA IJMR | www.eprajournals.com | Journal DOI URL: https://doi.org/10.36713/epra2013 345
deaths,1 women and girls are bearing a lopsided weight of the bigger effects of the pandemic and states‟ emergency
responses.2 Though, At the point when wellbeing emergencies like COVID-19 arise, the concurrent shocks to monetary,
social, and wellbeing frameworks can have various implications for women and girls, with gendered impacts across various dimensions of well-being including indirect impacts on health. Hence, seeing across some key health services, unique spotlight on sexual and conceptive health services, the restricted information accessible showed that the greatness and term of interruptions to essential services fluctuate generally across various nations, as initialed impacts on health outcomes.3 Contraception and abortion services- Whereas Kenya had just negligible interruption of services, India seemed to have a lot bigger disturbance to prophylactic services Carleigh Krubiner, Megan O‟Donnell, Julia Kaufman, and
Shelby Bourgault across all techniques, with the biggest reductions in IUDs and injectables. Nigeria had more moderate documentation of interruption (10-15 percent in April and May), however this may be more demonstrative of the low inclusion of current contraceptives preceding the pandemic and the likelihood that the pandemic slowed down significant advancement that was being made in 2020 to expand the family planning services.4 Maternal health care- Across nations, there was variable interruption in usage and admittance to facility-based deliveries. Hence, Countries like India and Nepal archived a lot bigger decreases in went to births, just as increases in adverse maternal and neonatal outcomes, when contrasted with the negligible disturbances revealed in Kenya. Thus, the evidence indicates prominent and more delayed effects on antenatal care (ANC) visits across several countries. Disruptions to ANC can be especially problematic given missed opportunities to address iron deficiency and undernutrition, just as suggestions for HIV conclusion and prevention of mother-to-child transmission.5 Violence against women-Although, as stay-at-home measures are set up, there are reports from several countries of expanded occurrence of intimate partner or domestic violence.6 Women in oppressive relationships and their children face an improved probability of openness to violence as people stay at home. As women's consideration trouble has increased, occupations are influenced, admittance to essential necessities is reduced, social and protective organizations are disturbed and services for survivors are diminished, there is increased pressure in the family. This prompts the potential for an increased risk of violence7 while survivors are losing the few sources of help, they had. Thus, the health sector has a critical role in relieving the impact of violence on women and their children as component of the COVID-19 reaction, including by guaranteeing admittance to essential services for overcomers of violence.8 Mental Health-Though, a review of 98 studies across different geographic settings that analyzed emotional mental health status among people during the COVID-19 pandemic, more than 80% demonstrated that women were experiencing greater adverse mental health effects— including more elevated levels of pressure, uneasiness, gloom, and dread of COVID-19 than men. However, several studies have also indicated disproportionate mental health
1 Jian-Min J, Peng B, Wei H, et al. Gender differences in patients with COVID-19: focus on severity and mortality.
Front Publ Health. 2020 (https://doi.org/10.3389/fpubh.2020.00152). 2 Put women and girls at centre of COVID-19 recovery: UN Secretary-General. New York: United Nations; 2020 (https://news.un.org/en/story/2020/04/1061452). 3 https://www.cgdev.org/publication/addressing-covid-19-crisis-indirect-health-impacts-women-and-girls-brief 4 https://www.cgdev.org/publication/addressing-covid-19-crisis-indirect-health-impacts-women-and-girls-brief 5 resrep30892.pdf
6 COVID-19 and violence against women: what the health sector/system can do. Geneva: World Health
Organization; 2020 (https://apps.who.int/iris/handle/10665/331699. 7 Buller AM, Peterman A, Ranganathan M, Bleile A, Hidrobo M, Heise L. A mixed-method review of cash transfers and intimate partner violence in low- and middle-income countries. World Bank Res Obs. 2018;33(2):218−58 (https://doi.org/10.1093/wbro/lky002. 8 resrep28109.pdf
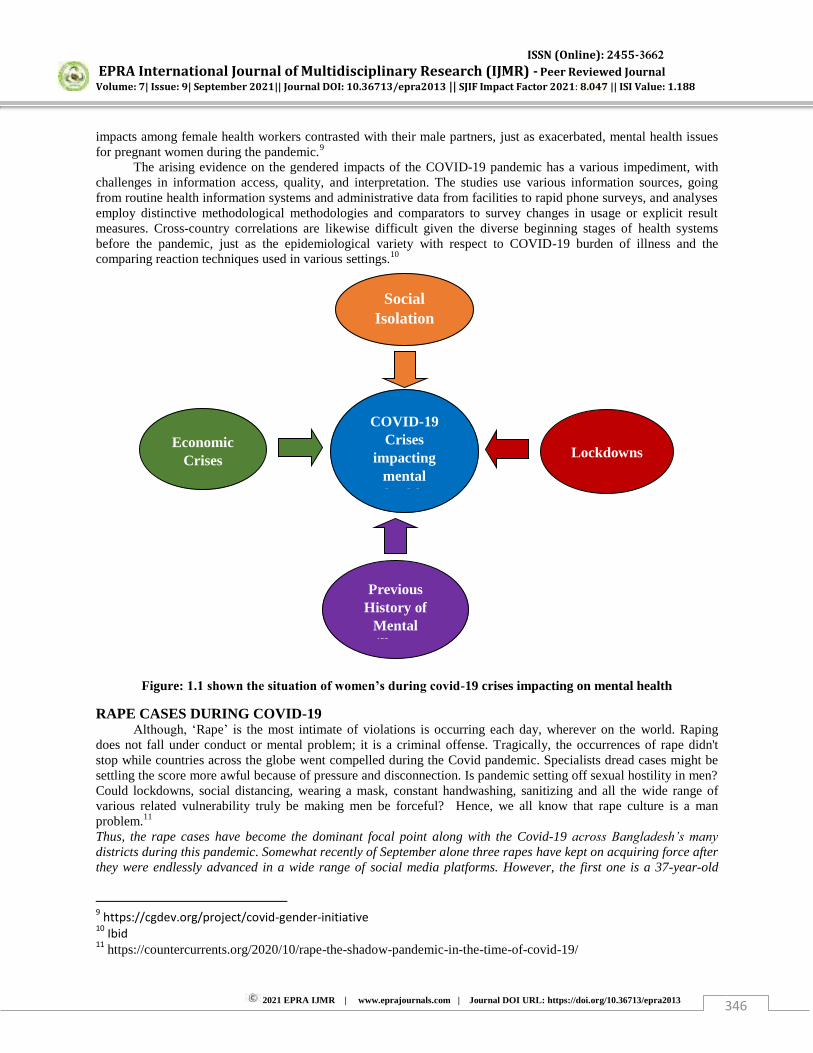
ISSN (Online): 2455-3662
EPRA International Journal of Multidisciplinary Research (IJMR) - Peer Reviewed Journal Volume: 7| Issue: 9| September 2021|| Journal DOI: 10.36713/epra2013 || SJIF Impact Factor 2021: 8.047 || ISI Value: 1.188
2021 EPRA IJMR | www.eprajournals.com | Journal DOI URL: https://doi.org/10.36713/epra2013 346
impacts among female health workers contrasted with their male partners, just as exacerbated, mental health issues for pregnant women during the pandemic.9
The arising evidence on the gendered impacts of the COVID-19 pandemic has a various impediment, with challenges in information access, quality, and interpretation. The studies use various information sources, going from routine health information systems and administrative data from facilities to rapid phone surveys, and analyses employ distinctive methodological methodologies and comparators to survey changes in usage or explicit result measures. Cross-country correlations are likewise difficult given the diverse beginning stages of health systems before the pandemic, just as the epidemiological variety with respect to COVID-19 burden of illness and the comparing reaction techniques used in various settings.10
Figure: 1.1 shown the situation of women’s during covid-19 crises impacting on mental health
RAPE CASES DURING COVID-19 Although, „Rape‟ is the most intimate of violations is occurring each day, wherever on the world. Raping
does not fall under conduct or mental problem; it is a criminal offense. Tragically, the occurrences of rape didn't stop while countries across the globe went compelled during the Covid pandemic. Specialists dread cases might be settling the score more awful because of pressure and disconnection. Is pandemic setting off sexual hostility in men? Could lockdowns, social distancing, wearing a mask, constant handwashing, sanitizing and all the wide range of various related vulnerability truly be making men be forceful? Hence, we all know that rape culture is a man problem.11 Thus, the rape cases have become the dominant focal point along with the Covid-19 across Bangladesh’s many
districts during this pandemic. Somewhat recently of September alone three rapes have kept on acquiring force after they were endlessly advanced in a wide range of social media platforms. However, the first one is a 37-year-old
9 https://cgdev.org/project/covid-gender-initiative
10 Ibid
11 https://countercurrents.org/2020/10/rape-the-shadow-pandemic-in-the-time-of-covid-19/
Social Isolation
Lockdowns Economic
Crises
COVID-19 Crises
impacting mental health
Previous History of
Mental illness

ISSN (Online): 2455-3662
EPRA International Journal of Multidisciplinary Research (IJMR) - Peer Reviewed Journal Volume: 7| Issue: 9| September 2021|| Journal DOI: 10.36713/epra2013 || SJIF Impact Factor 2021: 8.047 || ISI Value: 1.188
2021 EPRA IJMR | www.eprajournals.com | Journal DOI URL: https://doi.org/10.36713/epra2013 347
woman who was kidnapped, beaten and gang raped by a group of hooligans in Noakhali (south-eastern Bangladesh). abhorrent demonstration was recorded while the lady asked and begged them to release her.12 The third one is the rape of an underage native young girl inside a Catholic Church in Rajshahi (mid-western BD). She went missing after she went cutting grass for the dairy cattle. Later it was set up that the culprit is in all honesty Father Pradeep Gregory, area cleric of St. John Mary Vianney's Church. 41-year-old Father Gregory had saved the girl in his congregation home for three days. Later the young girl’s family and local people safeguarded her. In Bangladesh they’re the number of (1627 rape and 317 gang rape) cases recorded in the end of 2020. In India they‟re the number of cases recorded according to NCRB in end of 2020; the study given in the chart below-
13
Thus, the Covid-19 cases is stressing and overpowering the health services, and it hasn't had the option to focus on in tending to and preparing staff about violence against women during the ongoing crisis. As it is sexual violence is an under-revealed crime and it has been driven out of spotlight in light of the Covid. Indeed, even previously, a rape casualty needed to contend energetically against the socio-social and institutional boundaries in detailing crime. A woman‟s own defense team in some cases questions the legitimacy of her record and the arraignment frequently favors the culprit when the case will court.14 WOMEN AS A HEALTH WORKER
Health and social systems are likewise battling to adapt to the COVID-19 pandemic, making it hard for women to get health services in remote rural areas.15 For instance, in India, the government has suspended all non-critical services in rural communities so that the ASHA community health workers, who are all women, can divert their endeavors toward the pandemic. Spell this effort might commendable as a public health response, it is troubling for the ASHA community health workers. The services deemed as “non-critical” because of the pandemic also
happen to be “critical services” for women, especially at a time when they need to stay healthy. However, women are not getting inoculations, prenatal vitamins, and birth control.16 Yet, the decision to temporarily suspend “critical
services” can add to potential health effects, such as adverse pregnancy outcomes, infant mortality, diseases, and/or
12
Ibid 13
80 Murders, 77 Rape Cases on Average Daily in India in 2020: NCRB Report | Top Points 14 Ibid 15 United Nations Population Fund, Coronavirus Disease (COVID-19) Pandemic UNFPA Global Response Plan (New York, NY: UNFPA, 2020), https://www.unfpa.org/resources/coronavirus-disease-covid-19-pandemic-unfpa-global-response-plan 16 Puja Awasthi, “The Life of ASHA Workers in the Time of COVID-19,” This Week, April 10, 2020, https://www.theweek.in/news/india/2020/04/10/the-life-of-asha-workers-in-the-time-of-covid-19.html.
0
0.5
1
1.5
2
2.5
3
3.5
4
4.5
5
Rajasthan 5,310 Uttar Pradesh 2,769 Madhya Pradesh 2,339 Maharashtra 2,061
ISSN (Online): 2455-3662
EPRA International Journal of Multidisciplinary Research (IJMR) - Peer Reviewed Journal Volume: 7| Issue: 9| September 2021|| Journal DOI: 10.36713/epra2013 || SJIF Impact Factor 2021: 8.047 || ISI Value: 1.188
2021 EPRA IJMR | www.eprajournals.com | Journal DOI URL: https://doi.org/10.36713/epra2013 348
unplanned pregnancies. Subsequently, the United Nations is increasing its determination to keep up with progression of sexual and conceptive health services, and to ensure healthcare workers.17 ECONOMIC SITUATION
The current COVID-19 emergency profoundly impacts women‟s, men, young girls, young men, and different sexes in an unexpected way. While men make up most of the people who have passed on from the infection, ladies, and young women endure the worst part of lopsided consideration troubles, interruptions in pay and instruction, helpless admittance to wellbeing and other fundamental administrations, more serious danger of being seized of land and property, and sexual orientation computerized and pay holes. For women previously living in destitution, these effects can be a shock to their financial solidness generally speaking and hinder their capacity to buy basic necessities, like medication and food.
The COVID-19 emergency will have huge ramifications for U.S. interests in worldwide women' financial strengthening, including the Women's Global Development and Prosperity (W-GDP) drive, the Development Finance Corporation's 2X Women's drive, and U.S. interest in the Women Entrepreneurs Financing Initiative (We-Fi). The sexual orientation and accepted practice indications of COVID-19 present a pressing requirement for governments, organizations, local area pioneers, and chiefs to act.18
Though another thing is Latin American women have confronted the COVID-19 emergency in states of extraordinary monetary and social weakness. Ladies have a lower work market support than men. Women' workforce support rate is near half contrasted with a close to 75% rate for men, which brings about a sexual orientation hole of almost 25 rate points. what's more, ladies have higher joblessness rates contrasted with men.
Most of ladies who have occupations work in low efficiency areas and areas with significant degrees of work casualness. As a result, roughly 82% of Latin American ladies don't add to annuity frameworks A huge extent of female business is amassed in financial areas that have been most affected by the COVID-19 emergency, including training and social administrations, retail exchange, gastronomy, lodging action what's more, the travel industry.19
Women address 54% of all laborers in the travel industry, and they have been intensely influenced by the precarious decrease in movement in this area during the pandemic. Likewise, paid homegrown work has been especially affected by the social segregation measures executed by States to contain the spread of the infection, with lopsided impacts to the lives and jobs of millions of women.20 CONCLUSION
A pandemic intensifies and elevates every single existing disparity. These imbalances thusly shape who is influenced, the seriousness of that effect, and our endeavors at recuperation? The COVID-19 pandemic and its social and financial effects have made a worldwide emergency unmatched throughout the entire existence of the United Nations and one which requires an entire of-society reaction to coordinate with its sheer scale and intricacy. Coronavirus is communicated by drops. Notwithstanding generally separating, the basic component is fitting proportions of disinfection. Sterilization measures gathered here are suggested by different public and worldwide wellbeing control organizations. All things considered; sex real factors should be considered if existing imbalances are not to be propagated in ongoing reactions. Remember that while ladies are disproportionally affected by COVID-19, they are additionally dynamic specialists who have abilities and encounters that are imperative, particularly in the midst of crisis.
17 United Nations Population Fund, Coronavirus Disease 18 cweee_covid_and_wee_brief_final.pdf (reliefweb.int) 19 undp-rblac-CD19-PDS-Number25-onumujeres-EN.pdf 20
ibid
ISSN (Online): 2455-3662
EPRA International Journal of Multidisciplinary Research (IJMR) - Peer Reviewed Journal Volume: 7| Issue: 9| September 2021|| Journal DOI: 10.36713/epra2013 || SJIF Impact Factor 2021: 8.047 || ISI Value: 1.188
2021 EPRA IJMR | www.eprajournals.com | Journal DOI URL: https://doi.org/10.36713/epra2013 349
HISTORY OF TELUK ANSON TOWN IN THE STATE OF PERAK, MALAYSIA, 1882 - 1957
Dr.Khairi Ariffin,PhD1, Dr.Ganesan Shanmugavelu,PhD2,
Dr.Mohd.Hairy Ibrahim,PhD3, Dr.Ishak Saat,PhD4,
Mohd.Kamal Kamaruddin5, Dr.Sahul Hamid Mohamad Maidin,PhD6
Dr.Mohamed Jefferi Haji Mat Lazim,PhD7
1Associate Professor, Sultan Idris Education University, Malaysia 2Senior Lecturer, Institute of Teacher Education Ipoh Campus, Malaysia
3Associate Professor, Sultan Idris Education University, Malaysia 4Professor, Sultan Idris Education University, Malaysia 5Lecturer, Sultan Idris Education University, Malaysia
6Senior Lecturer, Sultan Idris Education University, Malaysia 7Senior Lecturer, Institute of Teacher Education Ipoh Campus, Malaysia
Article DOI: https://doi.org/10.36713/epra8566
DOI No: 10.36713/epra8566
ABSTRACT The writing of this study is about the town of Teluk Anson in the state of Perak, Malaysia, during the British colonial era. The opening of the Teluk Anson town has been a factor in the development of economic activities in Teluk Anson especially with the existence of the Teluk Anson port which is the focus of merchant ships from within and outside Perak. The availability of road and rail links has made Teluk Anson the focus of the arrival of various communities to contribute to the economic boom in Teluk Anson. This study uses a qualitative method that emphasizes on the analysis of primary and secondary documents obtained from the National Archives of Malaysia and public universities in Malaysia. The findings of the study indicate that the rapid progress and development of the Teluk Anson town under the British colonial administration has driven the Teluk Anson urbanization process by providing various infrastructure facilities for the Teluk Anson community. The construction of a medium of communication through roads, railways, and the opening of a port made Teluk Anson an important economic destination for European investors and local traders. In conclusion, the city of Teluk Anson is a very important city in developing economic activities and one of the centers of British colonial administration in the state of Perak. KEYWORDS : Teluk Anson, Municipilaty, British Colonial, Port, Infrastructure
INTRODUCTION
Teluk Anson is a strategic area because the city is located near the Sabak Bernam district, which is a growing agricultural area in the state of Selangor. Among the agricultural products produced are rubber, coconut, paddy, tobacco and more. Apart
from that, the town of Teluk Anson is also not far from the Straits of Melaka, Sungai Kinta, Sungai Bernam and Sungai Perak which makes it suitable as a port center for merchant ships, especially merchant ships passing through the Straits of Melaka (Khoo Kay Kim,1995). British colonial times, the harbor is
ISSN (Online): 2455-3662
EPRA International Journal of Multidisciplinary Research (IJMR) - Peer Reviewed Journal Volume: 7| Issue: 9| September 2021|| Journal DOI: 10.36713/epra2013 || SJIF Impact Factor 2021: 8.047 || ISI Value: 1.188
2021 EPRA IJMR | www.eprajournals.com | Journal DOI URL: https://doi.org/10.36713/epra2013 350
one of the important things to develop the economic sector in Malaya. the port is important to respect and promote the industry trade with foreign countries by sea, and among the most important route for commercial vessels is in the Straits of Malacca which is located not far from Teluk Anson, Perak is also one of the largest producers of crops such as rubber, paddy, and tin mining, making Perak need more ports to market local produce to foreign countries. Teluk Anson is ideally located as a town and port center in State of Perak.
Lord Archibald Anson, as Governor of the Straits Settlements in 1879 was particularly interested in the proposal put forward by Hugh Low by developing the area in Teluk Anson. The construction and use of steamships as well as land transport systems such as railways, caused the connection of Teluk Anson with Tapah Road to change towards the development and vibrancy of economic activities in Perak and mobilize the economy in turn helping the development of a city (Aiken, et.al., 1994). By the end of the 19th century, TelukAnson had emerged with activities that focused on economic activities and this was in line with its aim to become a major focus of international trade activities. In the early 19th century, the patterns and economic activities of world trade had changed having had an impact on the development of the colonial colonies. According to Courtenay (1972), trade could be handled effectively with products that could be exported as well as could be easily assembled for shipping purposes and this was a solution for the colonial side to facilitate economic implementation and planning. The conditions and development of economic activities in Teluk Anson and surrounding areas have encouraged the entry and arrival of Chinese, Indians, and Europeans to engage equally in economic activities (Barlow,1995). LITERATURE REVIEW
The study of Mukim Durian Sebatang in the State of Perak, 1874-1905 is a study that shows information related to the history of the existence of one of the most important mukims in the district of Lower Perak. The study has discussed the sources and information in the writing of the study that help the researcher to know more about the documents that need to be used to gain knowledge with respect to the town of Teluk Anson. Through his writing, the researcher can also find out related to the development of the town of Teluk Anson which is a very important contributor to the socio-economic activities of the community in the mukim of Durian Sebatang. Apart from that, this study also discusses the special features of the mukim Durian Sebatang which is the traditional administrative center of Perak (Siti Nur Adillah, 2013).
In other writings, it is explained that there is the ability of the town of Teluk Anson to emerge as an area of activity and a center for the collection of agricultural produce that is also focused. The impact of agricultural and plantation economic activities has revived the function of the town of Teluk Anson as a port city. This situation activates the economic and social development of the population. By the 1920s until the area around Teluk Anson, especially Hilir Perak was better known as the main agricultural area in the state of Perak. The result of this writing is also made to show the uniqueness of the port city of Teluk Anson to become one of the main cities in the state of Perak. This aspect of writing is more focused on the development and urban environment of Teluk Anson, the scope of the study is on urban development (S.R. Aiken, et.al., 1994). STUDY METHODOLOGY This study has used qualitative research methods. This study was conducted by obtaining primary sources consisting of records and files of the British colonial era in the state of Perak obtained from the National Archives of Malaysia. All relevant documents will then be analyzed and the data will be compared with relevant primary sources. Primary sources obtained from the Perak State Archives, the researcher has also used secondary sources that are the results of previous studies such as books, articles and journals have been used by the researcher. Through documents, books, journals and articles that have been obtained, researchers need to conduct an evaluation to obtain information related to the study. FINDINGS Community Settlements in Teluk Anson
The town of Teluk Anson is located on the banks of the Perak River. Teluk Anson Town is within the Mukim of Mukim Durian Sebatang. Apart from Sungai Perak, there are rivers close to the Durian sub -district, namely the Suli river and the Bidor river. The river close to the town of Teluk Anson is of great importance as a means of communication of the local community and for traders, tin miners, and of importance as carrying out fishing activities.
During the British colonial administration in Hilir Perak, the position of Teluk Anson town was also bordered by Changkat Jong sub-district, Sungai Manik sub-district, Sungai Durian sub-district, and other sub-districts in Hilir Perak such as Bagan Datoh sub-district, Rungkup sub-district, Hutan Melintang sub-district. , and the district of Kota Setia. as well as bordering the Batang Padang District in the west and south with the Sabak Bernam district in the state of Selangor. Among the villages located within Mukim Durian Sebatang are Kampung Sungai Tungku,
ISSN (Online): 2455-3662
EPRA International Journal of Multidisciplinary Research (IJMR) - Peer Reviewed Journal Volume: 7| Issue: 9| September 2021|| Journal DOI: 10.36713/epra2013 || SJIF Impact Factor 2021: 8.047 || ISI Value: 1.188
2021 EPRA IJMR | www.eprajournals.com | Journal DOI URL: https://doi.org/10.36713/epra2013 351
Kampung Sungai Suli, Kampung Bahagia, Kampung Selabak, Kampung Banjar, Kampung Padang Tembak, Kampung Batak Rabit and Kampung Pasir Berdamar, Kampung Terengganu, Kampung Gloucester, and Kampung Kebun Limau. . The Teluk Anson is seen to be free from the threat of floods indirectly launching agricultural activities such as sweet potatoes, corn, and fruits such as bananas and mangosteens (Khoo Kay Kim, 1982). Accordingly, the importance of Teluk Anson as a port and trade center mainly provides services to the Bidor and Tapah areas. Sectors of the economy of the Malays, Chinese and Indians There are three major groups of people in Teluk Anson namely the Malays, Chinese and Indians. The community is a resident of the earliest inhabited the area around Teluk Anson. The origin of the community are those who migrate come from Sumatra, Java, Kalimantan, and southern Thailand. and are a class of merchants, farmers, and merchants. Malay descent in Teluk Anson is among the Minangkabau ethnic Malays, Banjar, Javanese, Minangkabau, Bugis, Kampar, and Syed of Saudi procreation. Although they are from different generations, all this is known as the Malay community with speech and language used is English. Most Javanese live in the area of Selabak village, there are two villages known as Kampung Selabak Luar and Kampung Selabak Dalam. Ethnic Malays who inhabit and live another mixed around Teluk Anson like Kampung Terengganu, Kampung Bahagia, and the village of Gloucester.
The arrival of the Chinese to Perak was largely Chinese from the Straits Settlements and the British colonial had implemented a system of trade and good relations with the Chinese and this facilitated for the British colonial in implementing economic and development in Perak and indirectly the people. China involved in economic development in the Teluk Anson. With the British presence in Malaya, the network began to develop rapidly. The British colonial had provided a more stable trading environment in Perak (Annual Report of Perak 1896).
. The British also provide security and safety in terms of the military through military presence that they bring to the Malay states. In addition, the British colonial authorities also have uniform system of trade and commerce in Malaya (N.L Johnna, 2011). Meanwhile, the Chinese community is more concentrated in the Teluk Anson town center, which is inhabited by shop houses acting as traders and retailers. The main residential areas of the Chinese community in Teluk Anson are centered in the village of Pasir Berdamar and Pasar street. The Chinese community in Teluk Anson is made up of Hokkien, Teuchu, Hakka, Cantonese, and Hailam
ethnic groups. In the era of construction and development of Teluk Anson town, the Chinese in Teluk Anson were involved in labor work in building structures and buildings as well as shop houses in Teluk Anson town.
To implement the Teluk Anson urbanization process, the British colonial needed a workforce with a variety of expertise from ordinary labor to having expertise in the fields of road construction, railways, port work, management, administration and security. The diversity of nations have been involved in the development of Teluk Anson comprising the lower level consists of Tamils, Chinese, Bengali, Malay, Eurasian, and Sinhala. More maintenance work is carried out by the workers especially the Tamils under the supervision of European Engineers and regular road Inspectors. Railway Station Chiefs are usually Sinhala Tamils, and Chinese in turn as clerks (A. Wright & T. H. Reid 1913). Most Indians are more concentrated in estates such as Nova Scotia farms, Jenderata Farm, the headquarters of the Department of Works, Admiralty Road, and mixed in the Teluk Anson urban area. Among the Indian community is composed of ethnicities such as Telegu, Punjabi, and Tamil. Originally, Teluk Anson is a residential village community down with its original name Teluk Mak Intan. Yet the process of urbanization took place quickly after the British colonial built the town of Teluk Anson. This process of urbanization has made rural communities coming from the agricultural sector compete to carry out economic activities in the city because they have tended to economic activities in the form of manufacturing, business and trade (K. J. Pelzer, 1941) Aspects of Teluk Anson Port Facilities
To enhance the function and importance of the Teluk Anson town, the British colonial added facilities at the Teluk Anson port by carrying out improvement and maintenance work on the Teluk Anson pier. The responsibility for the maintenance of Telok Anson jetty was done by the Public Works Department around 1946. The Chief Port Officer of Telok Anson reported that the physical condition of the jetty in Telok Anson, especially for small boats needs to be improved. The Teluk Anson wharf facilities are generally unsatisfactory as a wharf that is the focus of merchant ships. The construction of rest houses and accommodation was also carried out in preparation and also showed the importance of the town of Teluk Anson which is the focus of outside officials and visitors due to the existence of farms cultivated around the district. Teluk Anson Wharf is also a center for the import and export of goods from outside Teluk Anson. In 1915 (Khoo Kay Kim, 1995), the United States and France were among the shipping destinations for shipments through shipping
ISSN (Online): 2455-3662
EPRA International Journal of Multidisciplinary Research (IJMR) - Peer Reviewed Journal Volume: 7| Issue: 9| September 2021|| Journal DOI: 10.36713/epra2013 || SJIF Impact Factor 2021: 8.047 || ISI Value: 1.188
2021 EPRA IJMR | www.eprajournals.com | Journal DOI URL: https://doi.org/10.36713/epra2013 352
services and destination coastal ships starting at the port of Teluk Anson. The export and shipment of rubber products in 1915 had obtained the approval and permission of the Rubber Export Committee to be shipped to locations such as in Boston, New York, Cenon and Marseillis.
The Master of the Teluk Anson wharf,
Flight Millard, carries out his duties in conducting surveillance and inspection of the surrounding ports. The effects of the damage during the Japanese occupation during World War II were also disrupted during the jetty under his supervision. After port overhauls, the Asiatic Petroleum Company’s
Installation and Jetty were built in early 1947 aimed at transferring gasoline fuel in bulk. The construction of this new jetty has made petrol fuel transfer activities more practical and safer. Among the fuel firms making the port of Teluk Anson an oil storage terminal are Shell Company and Standard-Vacuum Oil Company, owned by the Anglo-Saxon Petroleum Company of the Netherlands. The existence of petroleum companies helped in highlighting the importance of the Teluk Anson wharf as a port location for shipping trade.
In the late 1970s, the port of Teluk Anson finally ceased its function and was no longer in operation. This is due to severe cliff erosion on the banks of the Perak River near the port of Teluk Anson. The railway line was also later discontinued in 1991 because the line could no longer make a profit and had to bear losses. This is due to the shortage of passengers and as such, the oil company Shell has relocated its processed oil transfer operations to the port of Lumut.
The port of Teluk Anson is said to have been very busy with the entry and arrival of steamships in the 19th century. They actively picked up and unloaded goods and passengers ashore and were the main economic resource that contributed to the development of Teluk Anson at the time. In addition to the British, Dutch, German, Chinese and many more ships were setting up waterways on the shores of Teluk Anson. That was the main factor by which at that time land transport such as railways could operate in Teluk Anson.
On August 1, 1896, a steamship named The S.S. Malacca has entered the Port of Teluk Anson which is connected by the Perak railway from Teluk Anson to Tapah Road as symbolic of its inauguration (Khoo Kay Kim, 1995). It turns out that this port is actually used to bring mining and agricultural products from the Kinta area to be traded around the world.
The first port of Teluk Anson was located near the government complex around the Old Court and the old Teluk Intan Police Station before being moved to a site near Batak Rabit which is larger and
has banks that are more resistant to the erosion of the Perak River. The wharf site and railway (Supplement to FMS Gazette, 1924) at the port of Teluk Anson have suffered erosion around the banks of the Perak river since 1900. The effects of erosion have caused in 1901 the railway on Denison Road has collapsed and disrupted railway services in port. This development resulted in in 1902, the wharf in Teluk Anson being proposed to be relocated by an appointed consultant namely J.E Spring and in 1909 the wharf was finally relocated to a new location. At the site of the new Teluk Anson port, the influx of merchant ships made the Teluk Anson port play an important role as a catalyst for the development and township of Teluk Anson until the 1970s. CONCLUSION In conclusion, the town of Teluk Anson is a very important city especially in the southern part of Perak because of the strategic position of this city with port facilities and railway lines that can connect Teluk Anson with the network to the north and south of the peninsula. The municipal aspect of Teluk Anson is also growing rapidly by providing various facilities for the inner and outer communities who come to Teluk Anson. Activity-based economy, commerce, agriculture being carried out, followed by the information society of racial diversity in Teluk Anson namely Malay, Chinese, Indian, Eurasian, and Europe who were involved in developing the function and importance of Teluk Anson as the most important city in the state. Acknowledgement
This study is under the funding of University Fundamental Research Grant (GPUF) 2019 with Research Code 2019-0204-107-01 under the supervision of Research and Innovation Management Center (RMIC) Universiti Pendidikan Sultan Idris. The researchers would like to thank RMIC for funding this research.
REFERENCES 1. Annual Report on The state of Perak for the
year 1896 2. FMS Railways, Perak and Province Wellesly,
Minutes of Proceeding, vol 150, 1902. 3. Supplement to FMS Gazette, FMS Railways
Annual Report for the year 1924. 4. Arnold Wright And Thomas H. Reid, 1913, The
Malay Peninsula, T.Fisher Unwin, London.UK.
5. Johnna Noel Lash, 2011, British Perceptions And Interventions: Britsih Malaya And The Rise Of Chinese Influence, Washington State University, USA.
6. Karl J. Pelzer,1941, Part 1: Population and Land Utilization, Institute of Pacific RelationsJohn Hopkins University. USA.
ISSN (Online): 2455-3662
EPRA International Journal of Multidisciplinary Research (IJMR) - Peer Reviewed Journal Volume: 7| Issue: 9| September 2021|| Journal DOI: 10.36713/epra2013 || SJIF Impact Factor 2021: 8.047 || ISI Value: 1.188
2021 EPRA IJMR | www.eprajournals.com | Journal DOI URL: https://doi.org/10.36713/epra2013 353
7. Khoo Kay Kim,1995. Teluk Anson: 1882-1941: Port, Agriculture and Erosion. Journal of the Malaysian Branch of the Royal Asiatic Society, Vol. 68, No. 2 (269)
8. Khoo Kay Kim, 1982,Teluk Anson (Teluk Intan) 100 tahun, Persatuan Muzium Malaysia, Kuala Lumpur.
9. P.P Courtenay, 1972, A geography of trade and development in Malaya, G. Bell and Sons Ltd., London.
10. S. Robert Aiken, et.al., Pembangunan dan persekitaran di Semenanjung Malaysia, Terj. Sulong Mohamad, Dewan Bahasa dan Pustaka, Kuala Lumpur, 1994.
11. H.S. Barlow,1995, Swettenham, Southdene Sdn. Bhd. Kuala Lumpur.
12. Johan Afendi Ibrahim, et al. (2016). Tinggalan Warisan Di Sepanjang Jalan Keretapi Tapah Road-Teluk Intan : kajian Awalan dan potensi pemeliharaan. Persidangan Nasional Sejarah Melayu Kepulauan Melayu. UUM.
13. Siti Nur Adillah Mohd Zakaria, 2013, Mukim Durian Sebatang Di Negeri Perak, 1874-1905. Thesis Ilmiah Sarjana Muda Jabatan Sejarah, Tanjung Malim Perak: Universiti Pendidikan Sultan Idris,
14. S. Robert Aiken, et.al., 1994, Pembangunan dan persekitaran di Semenanjung Malaysia, Terj. Sulong Mohamad,Dewan Bahasa dan Pustaka, Kuala Lumpur.
ISSN (Online): 2455-3662
EPRA International Journal of Multidisciplinary Research (IJMR) - Peer Reviewed Journal Volume: 7| Issue: 9| September 2021|| Journal DOI: 10.36713/epra2013 || SJIF Impact Factor 2021: 8.047 || ISI Value: 1.188
2021 EPRA IJMR | www.eprajournals.com | Journal DOI URL: https://doi.org/10.36713/epra2013 354
OPTOMETRIST, A PRIMARY EYE CARE PROVIDER: AN UNDERUTILIZED AND UNTAPPED HUMAN
RESOURCE IN INDIA
Salal Khan1, Kamal Pant2, Rajat Bansal3
1B.Optometry Intern, Department of Optometry, UP University of Medical Sciences, Saifai. 2Associate Professor & HOD, Department of Optometry, UP University of Medical Sciences, Saifai
3M.Optometry Scholar, Department of Optometry, DY Patil Deemed University, Pune
Corresponding Author: Dr. Kamal Pant,Associate Professor & HOD,Department of Optometry, UP University of Medical Sciences, Saifai.
ABSTRACT
Aim The aim of this review was to elaborate upon the relevance of Optometrists in the Primary eye care services and their major role in reducing or eliminating avoidable eye related problems. Optometrists have a very crucial and pivotal role as a team member in comprehensive eye care services in India. Material & Methods This narrative review study was done to have a relook of the situation of Optometry profession in India and to understand the reasons of its underutilization per se. Recent peer reviewed articles/ studies were referred to ascertain the current primary eye care services status and the role of Optometrist as a primary eye care provider. Results Availability of eye care services at the primary level is very essential requirement in order to reduce or eliminate the avoidable visual impairment in India. The primary eye care professionals or Optometrists have a great responsibility not only to prevent but also to manage the eye related problems at their own level. Conclusion Although primary eye care services are meant to reduce the risk of avoidable visual impairment by preventing or by identifying causative factor on time or by increasing the health education. But, still the public awareness about eye care systems and their delivery mechanisms is not much in our country. Therefore, it is very much needed to device a policy and mechanism so that the primary eye care services can reach out to the grass root level with proper and adequate human resource utilization. This ultimate motive i.e. of preventing or reducing the burden of avoidable visual impairment from the country is easily achievable with proper utilization and engagement of Optometrists, the available trained & skilled human resource. KEYWORDS:Optometry, Primary Eye care, Eye Health, Visual impairment, Visual disability.
INTRODUCTION Primary eye care (PEC) services¹ provide
greater opportunity to optometrists to manage more eye care problems at primary level, thus relieving lot of pressure from other eye care professionals. Research evidence suggests that optometrists involved in these services are three times less likely to make false-positive referrals.² Primary eye care activities comprise
of the following two areas of community health services³: 1. Clinical service component 2. Eye health protection and promotion component
Most of these activities are initiated and sustained by community health members themselves. The eye care professionals help the community and
ISSN (Online): 2455-3662
EPRA International Journal of Multidisciplinary Research (IJMR) - Peer Reviewed Journal Volume: 7| Issue: 9| September 2021|| Journal DOI: 10.36713/epra2013 || SJIF Impact Factor 2021: 8.047 || ISI Value: 1.188
2021 EPRA IJMR | www.eprajournals.com | Journal DOI URL: https://doi.org/10.36713/epra2013 355
complements what they do in their day-to-day activities. PEC services may also include assessments to support people with learning disabilities⁴ and post-cataract surgery follow-up care. In some areas, triage is used to identify low risk referrals and direct them back into other primary eye care practices. And it is very understandable that the delivery of the main primary eye care services are comfortably within the core-competencies of an optometrist.
Increasingly, optometrists are gaining additional qualifications such as independent prescribing (IP), and a range of University or College of Optometry higher qualifications (professional fellowships, degree and diploma) in low vision, paediatric eye care or contact lens practice, dispensing, Binocular Vision, Neuro-Optometry and others.⁵
Minor eye condition management schemes have been successful in helping to manage patients without the need for attendances at hospital and outpatient departments, or to ensure only clinically appropriate referrals are made, so reducing false positives.6,7,8
Cataract referral pre-assessment has been shown to dramatically reduce the number of patients who do not want or do not need cataract surgery from attending hospital.⁹ Patient satisfaction is high as care is in their close proximity. Role of Optometry The optometry goes beyond the correction of refractive errors namely near-sightedness as well as far-sightedness using spectacles and contact lenses. It also includes identification, detection and monitoring and treatment of eye disease, management of paediatric and age-related ocular disorders, binocular vision problems, care of patients with low vision, offering advice on colour vision and assessing the role of vision at work and in sports.¹⁰ The need to mobilise optometry to deal with uncorrected refractive error has been accompanied by the possibility of better integration of optometry into prevention of blindness in general, with some major benefits in areas such as:
Teaching eye care personnel, especially in refraction and low vision care
Providing screening and vision care services at secondary and tertiary levels
Detection and management of potentially blinding diseases such as cataract, diabetes and glaucoma
Research into the understanding of global eye-care needs and solutions, especially in vision correction and vision care service delivery
Building economic and logistical models of self-sustainable eye-care.
As an individual, we all are well acquainted with the importance of eating healthy food (leafy vegetables, vitamins rich fruits), exercising, out-door activities and similarly we must understand the importance of regular eye checkups with your Optometrist.¹¹ Optometry as Part of the Eye-care Team
The correction of visually disabling refractive error as a component of the Global Initiative for the Elimination of Avoidable Blindness – ‗Vision 2020: The Right to Sight‘ was included by the policy makers
and also emphasised the need to deliver refraction services as an integral part of general health care systems and comprehensive eye-care.¹²
The need for glasses is also a public eye health opportunity not to be missed. Refractive care provides excellent access to the population for screening of more serious eye problems, such as cataract and diabetes. Primary care screening by optometrists and eye-care workers, with optometrists taking care of the more immediate interventions required, and referral for more ‗complicated‘ care, is ‗classical‘ health care delivery.
One effective current model, developed by the LV Prasad Eye Institute in Hyderabad, India, for the efficient and cost-effective delivery of eye-care is a community eye-care ‗team‘. For every 1,000,000
people the team has: 1 Ophthalmologist 4 Optometrists 8 Eye-care workers 8 Ophthalmic assistants 16 Ophthalmic nurses.
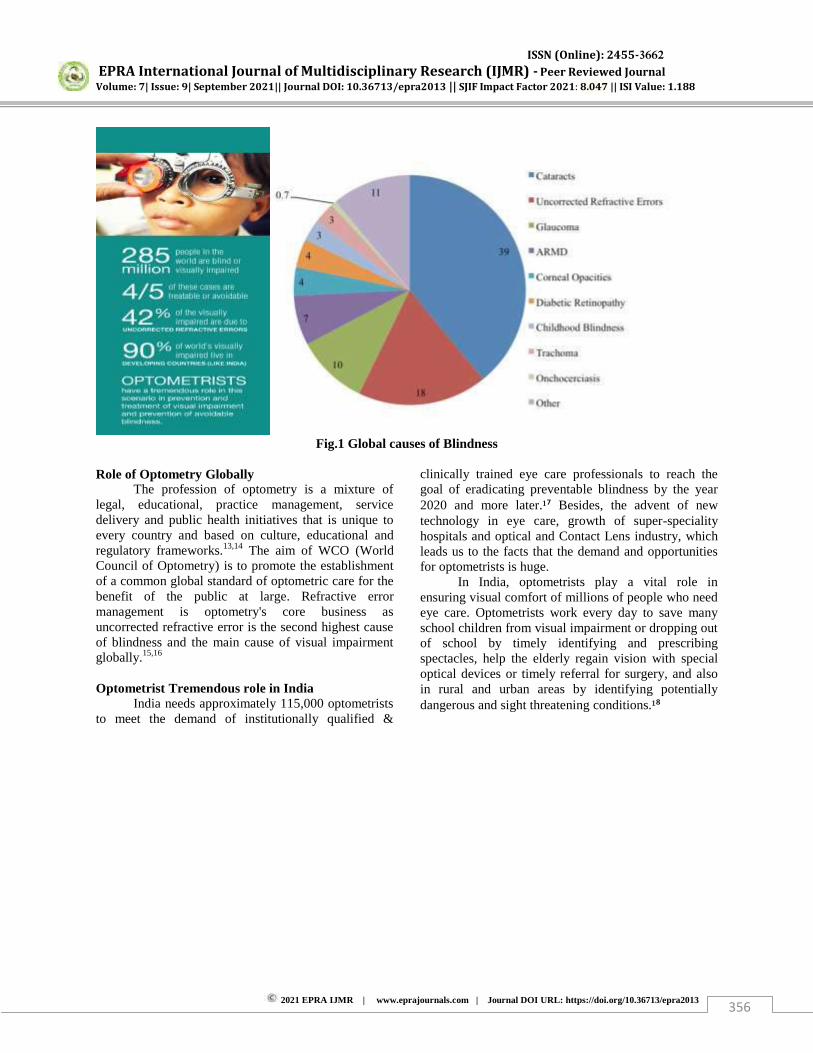
ISSN (Online): 2455-3662
EPRA International Journal of Multidisciplinary Research (IJMR) - Peer Reviewed Journal Volume: 7| Issue: 9| September 2021|| Journal DOI: 10.36713/epra2013 || SJIF Impact Factor 2021: 8.047 || ISI Value: 1.188
2021 EPRA IJMR | www.eprajournals.com | Journal DOI URL: https://doi.org/10.36713/epra2013 356
Fig.1 Global causes of Blindness
Role of Optometry Globally
The profession of optometry is a mixture of legal, educational, practice management, service delivery and public health initiatives that is unique to every country and based on culture, educational and regulatory frameworks.13,14 The aim of WCO (World Council of Optometry) is to promote the establishment of a common global standard of optometric care for the benefit of the public at large. Refractive error management is optometry's core business as uncorrected refractive error is the second highest cause of blindness and the main cause of visual impairment globally.15,16 Optometrist Tremendous role in India
India needs approximately 115,000 optometrists to meet the demand of institutionally qualified &
clinically trained eye care professionals to reach the goal of eradicating preventable blindness by the year 2020 and more later.¹⁷ Besides, the advent of new technology in eye care, growth of super-speciality hospitals and optical and Contact Lens industry, which leads us to the facts that the demand and opportunities for optometrists is huge.
In India, optometrists play a vital role in ensuring visual comfort of millions of people who need eye care. Optometrists work every day to save many school children from visual impairment or dropping out of school by timely identifying and prescribing spectacles, help the elderly regain vision with special optical devices or timely referral for surgery, and also in rural and urban areas by identifying potentially dangerous and sight threatening conditions.¹⁸

ISSN (Online): 2455-3662
EPRA International Journal of Multidisciplinary Research (IJMR) - Peer Reviewed Journal Volume: 7| Issue: 9| September 2021|| Journal DOI: 10.36713/epra2013 || SJIF Impact Factor 2021: 8.047 || ISI Value: 1.188
2021 EPRA IJMR | www.eprajournals.com | Journal DOI URL: https://doi.org/10.36713/epra2013 357
Fig.2 Visual Examination Protocol
Material & Methods
This narrative review study was done to have a relook of the situation of Optometry profession in India and to understand the reasons of its underutilization per se. Last 10 years peer reviewed articles/ studies were referred to ascertain the current primary eye care services status and the role of Optometrist as a primary eye care provider. Primary eye care services
Primary eye care is the provision of appropriate, accessible, and affordable care that meets patients‘ eye
care needs in a comprehensive and competent manner. Primary eye care provides the patient with the first contact for eye care as well as a lifetime of continuing eye care.
Primary eye care services are integrated to meet the needs of patients from a single source, so that patients can receive quality, efficient eye care that is amalgamated with general health care services. Competent and expert management and decision-making are critical in promoting the quality and efficiency of primary eye care. Salient features of Primary eye care services: 1. Educating patients about maintaining and promoting healthy vision. 2. Performing a comprehensive examination of the visual system. 3. Screening for eye diseases and conditions affecting
vision that may be asymptomatic. 4. Recognizing ocular manifestations of systemic diseases and systemic effects of ocular medications. 5. Making a differential diagnosis and definitive diagnosis for any detected abnormalities. 6. Performing refractions. 7. Fitting and prescribing optical aids, such as spectacles and contact lenses (including the specialized ones). 8. Deciding on a treatment plan and treating patients‘
eye care needs with appropriate therapies. 9. Counseling and educating patients about their eye disease conditions. 10. Recognizing and managing local and systemic effects of drug therapy. 11. Determining when to triage patients for more specialized care and referring to specialists as and when needed and seemed appropriate. 12. Coordinating care with other physicians involved in the patient‘s overall medical management.¹⁹ Eye care staff can be grouped into three main categories:²⁰
Full time eye care workers Integrated eye care workers Community eye care workers
Components of Primary eye-care services Primary eye care is a vital component of primary health care and includes the promotion of eye health and the
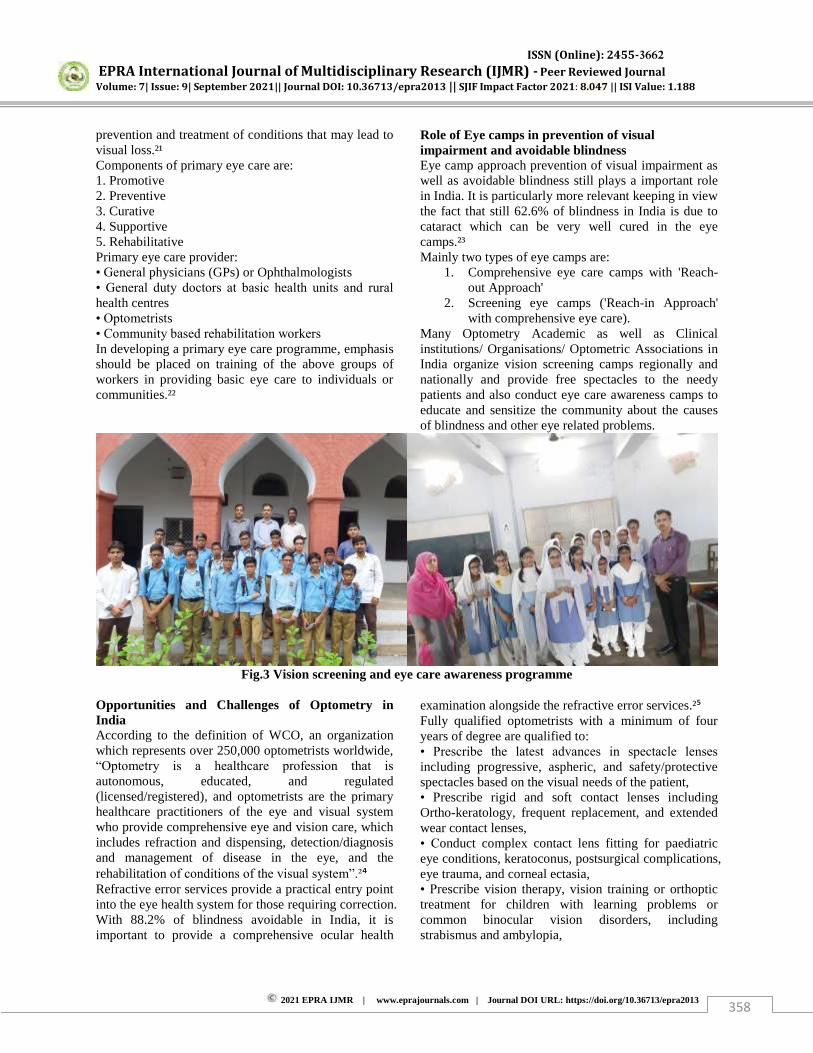
ISSN (Online): 2455-3662
EPRA International Journal of Multidisciplinary Research (IJMR) - Peer Reviewed Journal Volume: 7| Issue: 9| September 2021|| Journal DOI: 10.36713/epra2013 || SJIF Impact Factor 2021: 8.047 || ISI Value: 1.188
2021 EPRA IJMR | www.eprajournals.com | Journal DOI URL: https://doi.org/10.36713/epra2013 358
prevention and treatment of conditions that may lead to visual loss.²¹ Components of primary eye care are: 1. Promotive 2. Preventive 3. Curative 4. Supportive 5. Rehabilitative Primary eye care provider: • General physicians (GPs) or Ophthalmologists • General duty doctors at basic health units and rural
health centres • Optometrists • Community based rehabilitation workers In developing a primary eye care programme, emphasis should be placed on training of the above groups of workers in providing basic eye care to individuals or communities.²²
Role of Eye camps in prevention of visual impairment and avoidable blindness Eye camp approach prevention of visual impairment as well as avoidable blindness still plays a important role in India. It is particularly more relevant keeping in view the fact that still 62.6% of blindness in India is due to cataract which can be very well cured in the eye camps.²³ Mainly two types of eye camps are:
1. Comprehensive eye care camps with 'Reach-out Approach'
2. Screening eye camps ('Reach-in Approach' with comprehensive eye care).
Many Optometry Academic as well as Clinical institutions/ Organisations/ Optometric Associations in India organize vision screening camps regionally and nationally and provide free spectacles to the needy patients and also conduct eye care awareness camps to educate and sensitize the community about the causes of blindness and other eye related problems.
Fig.3 Vision screening and eye care awareness programme
Opportunities and Challenges of Optometry in India According to the definition of WCO, an organization which represents over 250,000 optometrists worldwide, ―Optometry is a healthcare profession that is
autonomous, educated, and regulated (licensed/registered), and optometrists are the primary healthcare practitioners of the eye and visual system who provide comprehensive eye and vision care, which includes refraction and dispensing, detection/diagnosis and management of disease in the eye, and the rehabilitation of conditions of the visual system‖.²⁴ Refractive error services provide a practical entry point into the eye health system for those requiring correction. With 88.2% of blindness avoidable in India, it is important to provide a comprehensive ocular health
examination alongside the refractive error services.²⁵ Fully qualified optometrists with a minimum of four years of degree are qualified to: • Prescribe the latest advances in spectacle lenses
including progressive, aspheric, and safety/protective spectacles based on the visual needs of the patient, • Prescribe rigid and soft contact lenses including Ortho-keratology, frequent replacement, and extended wear contact lenses, • Conduct complex contact lens fitting for paediatric eye conditions, keratoconus, postsurgical complications, eye trauma, and corneal ectasia, • Prescribe vision therapy, vision training or orthoptic treatment for children with learning problems or common binocular vision disorders, including strabismus and ambylopia,
ISSN (Online): 2455-3662
EPRA International Journal of Multidisciplinary Research (IJMR) - Peer Reviewed Journal Volume: 7| Issue: 9| September 2021|| Journal DOI: 10.36713/epra2013 || SJIF Impact Factor 2021: 8.047 || ISI Value: 1.188
2021 EPRA IJMR | www.eprajournals.com | Journal DOI URL: https://doi.org/10.36713/epra2013 359
• Provide low vision and rehabilitative services—vision aids assisting visually impaired people to use their functional vision more effectively, • Detect or diagnose ocular conditions and associated systemic health conditions, and refer them to appropriate health care professionals, and • Offer counselling services on preventive vision care. Optometry: Types of Practice in India Presently in India Optometrists can do variety of Practice such as:
Solo Private Practice. Group Practice. Retail Optometry. Ophthalmological Settings (as team member). Multi-Speciality Hospital Settings. Multi-national company (MNC) Job. Specialization area. Research and Academics.
Internationally, Optometry has been officially recognized in many jurisdictions.²⁶ Most have regulations concerning education and practice. Optometrists, like many other healthcare professionals, are required to participate in ongoing continuing education courses to stay current on the latest standards of care. The World Council of Optometry has a web resource that provides basic information on eye care providers for more than 46 countries.
In 2010, it was estimated that India needs 115,000 optometrists; whereas India has approximately 9,000 optometrists (4-year trained) and 40,000 optometric assistants/vision technicians (2-year trained).²⁷ In order to prevent blindness or visual impairment more well-trained optometrists are required in India.²⁸ The definition of optometry varies considerably country to country of the world.²⁹ India needs more and more optometry institutions offering four-year degree courses with a syllabus at par with those countries where optometry is statutorily regulated and well developed.
It was reported by Gogate P et. al. that poor spectacle compliance amongst school going children in rural Pune resulted in significant vision loss³⁰ meanwhile Thite N et. al. concluded that optometrists need to be more involved and focused in providing core optometry services like binocular vision, low vision, contact lenses etc.³¹ Training in India
At present, there are more than hundred institutions running optometry programmes in India. In 1958, Optometry education commenced with the opening of two schools of optometry, one at Gandhi
Eye Hospital, Aligarh (Uttar Pradesh) and another one at Sarojini Devi Eye Hospital, Hyderabad (Telangana), under the second five-year plan by Director General of Health Services (DGHS) of Government of India. These schools offered diplomas in optometry courses of two years duration validated respectively by their State Medical Faculties. Subsequently, four more schools were opened across India situated at Sitapur Eye Hospital, Sitapur (Uttar Pradesh), Chennai (Tamil Nadu), Bengaluru (Karnataka) and Regional Institute of Ophthalmology, Thiruvananthapuram (Kerala).³² AIIMS, New Delhi (in 1976) under the aegis of NPCB (National Programme for the Control of Blindness) started the very first degree (3years) programme in Optometry with the nomenclature B.Sc. (Hons.) in Ophthalmic Techniques and later on the Elite School of Optometry (ESO), Chennai established the first ever four-year degree course in 1985.
Now-a-days, academic degrees such as Bachelor of Optometry, Master of Optometry and Doctor of Philosophy (PhD) in Optometry are being awarded in India by the various universities recognised by University Grants Commission (India),³³ a statutory body responsible for the maintenance of standards of higher education. Many Institutes of Optometry (in India) have also commenced various specialty courses in Low vision, Contact lens, Binocular Vision, Neuro-Optometry, Sports vision and many more.
Optometrists across India are being encouraged to register with the various National and state level Optometry Associations till formation of statutory commission or council. Now after getting passed from Parliament followed by assent of the President on the 28th March, 2021 ―THE NATIONAL COMMISSION FOR ALLIED AND HEALTHCARE PROFESSIONS ACT, 2021‖ was established to regulate the Optometry
Profession as well as its education and development. The Optometry profession has been classified and defined as per the ISCO (International Standard Classification of Occupations) code 2267.34 Still in India awareness of optometry is very poor, which is about 5% amongst the educated population of India. Following the footsteps of ‗Digital India‘ &
‗Make in India‘, this Legislation of Optometry is an important step from darkness to the light.35
Primary eye care services of good standard need
to be continued as per the law of Optometry by the Government organization as well as Optometry NGOs as these can only eliminate the avoidable blindness and visual impairment from India. CONCLUSION The success of primary eye care programme lies
ISSN (Online): 2455-3662
EPRA International Journal of Multidisciplinary Research (IJMR) - Peer Reviewed Journal Volume: 7| Issue: 9| September 2021|| Journal DOI: 10.36713/epra2013 || SJIF Impact Factor 2021: 8.047 || ISI Value: 1.188
2021 EPRA IJMR | www.eprajournals.com | Journal DOI URL: https://doi.org/10.36713/epra2013 360
in the coordinated teamwork. The complementary nature of the team needs to be understood and appreciated.36 Task oriented training of all team members should be emphasized on the competency based skills which are necessary.
Although primary eye care services are meant to reduce the risk of avoidable visual impairment by preventing or by identifying causative factor on time or by increasing the health education. But, still the public awareness about eye care systems and their delivery mechanisms is not much in our country. Therefore, it is very much needed to device a policy and mechanism so that the primary eye care services can reach out to the grass root level with proper and adequate human resource utilization. This ultimate motive i.e. of preventing or reducing the burden of avoidable visual impairment from the country is easily achievable with proper utilization and engagement of Optometrists, the available trained & skilled human resource. REFERENCES
1. Primary eye care framework. Clinical Council for Eye Health Commissioning 2018, Online: http://www.ccehc.org.uk, Sep.2020.
2. Davey CJ et al. Factors influencing accuracy of referral and the likelihood of false positive referral by optometrists in Bradford, United Kingdom. Journal of Optometry 2016; 9:158–165.
3. Strategies for the Prevention of Blindness in National Programmes: A Primary Health Care Approach, WHO/Geneva, 1984: 12, Sep.2020.
4. Mythili Natkunarajah et al. Primary eye care, Community ophthalmology and General ophthalmology; 2019/PROF/387; pp,8-9.
5. Higher qualifications. The College of Optometrists. Online: https://www.college optometrists.org/cpd-and-cet/training-and-qualifications/higher qualifications.html.Sep2020.
6. Konstantakopoulou, E. et al., 2014. A qualitative study of stakeholder views regarding participation in locally commissioned enhanced optometric services. BMJ open, 4(5).
7. Konstantakopoulou, E. et al., 2016. Evaluation of a minor eye conditions scheme delivered by community optometrists. BMJ Open, 6(8).
8. Baker, H., Harper, R.A., et al., 2016. Multi-stakeholder perspectives of locally commissioned enhanced optometric services. BMJ Open, 6(10).
9. Helping NHS providers improve productivity in elective care. Online: https://www.gov.uk/government/uploads/system/uploads/attachment_data/file/466895/Elective_care_main_document_final.pdf, Sep.2020.
10. Neilsen De Souza, Yu Cui, et al. "The role of optometrists in India: An integral part of an eye health team." Indian journal of ophthalmology 60.5 (2012): 401.
11. Brien A. Holden PhD DSc, and Serge Resnikoff. "The role of optometry in Vision 2020." Community Eye Health 15.43 (2002): 33-36.
12. World Health Organization. Geneva: WHO; 2000. Elimination of avoidable visual disability due to refractive errors. (WHO/PBL/00.79).
13. Dandona, Rakhi, and Lalit Dandona. "Refractive error blindness." Bulletin of the World Health Organization 79.3 (2001): 237-243.
14. Resnikoff, Serge, et al. "Global magnitude of visual impairment caused by uncorrected refractive errors in 2004." Bulletin of the World Health Organization86.1 (2008): 63-70.
15. Holden, Brien A., et al. "Global vision impairment due to uncorrected presbyopia." Archives of ophthalmology 126.12 (2008): 1731-1739.
16. Yorston, David. "The global initiative vison 2020: the right to sight childhood blindness." Community Eye Health 12.31 (1999): 44.
17. Dandona, Rakhi. "Optometry and eye care in India." Indian journal of ophthalmology 46.3 (1998): 175.
18. https://optometrycouncilofindia.org/; Role of Optometrist in India; Sep.2020.
19. Definition of primary eye care; American academy of Ophthalmology; pp,1-2; Apr 2014, 415.561.8500.
20. Boateng Wiafe, Who can carry out primary eye care?, Community Eye Health. 1998; 11(26): 22–
24. 21. Chana HS. Primary Eye Care. In Eye Care
Programmes in Developing Countries. Majestic Printing Works, Nairobi, 1989: 58.
22. Taylor J. Appropriate methods and resources for third world ophthalmology. In Duane’s Clinical Ophthalmology Vol. 5 1989 Chapter 58 : 1–2.
23. AK Khurana, Aruj K khurana: Comprehensive ophthalmology, 7th edition, sec-5, pp;508-509, Sep.2020 ISBN 978-93-5270-686-0.
24. Smith DP. The 75th anniversary of the World Council of Optometry. Clin Exp Optom 2002;85:210-3.
25. Neena J, Rachel J, Praveen V, Murthy GV. Rapid assessment of avoidable blindness in India. PLoS One 2008;3:e2867.
26. Agarwal, R. (2000), Optometry as an international profession, British Journal of Optometry and Dispensing, 8(4), 120.
27. Anon (2010), Organization and Institution News, Plan to boost Indian optometry endorsed, Optometry and Vision Science, Volume 87, Number 7, page 520.
28. Anon (2011), Eyecare for 11 million vision impaired children in India, Optometry and Vision Science, Volume 88, Number 12, page 1532.
29. Agarwal, R. K. (1985), Optometry in the Indian sub-continent, Optometry Today, Volume 25, No. 14, page 475.
30. Gogate P, Mukhopadhyaya D, Mahadik A, Naduvilath TJ, Sane S, Shinde A, Holden B (2013). "Spectacle compliance amongst rural secondary
ISSN (Online): 2455-3662
EPRA International Journal of Multidisciplinary Research (IJMR) - Peer Reviewed Journal Volume: 7| Issue: 9| September 2021|| Journal DOI: 10.36713/epra2013 || SJIF Impact Factor 2021: 8.047 || ISI Value: 1.188
2021 EPRA IJMR | www.eprajournals.com | Journal DOI URL: https://doi.org/10.36713/epra2013 361
school children in Pune district, India". Indian J Ophthalmol. 61 (1): 8–12.
31. Thite N, Jaggernath J, Chinanayi F, Bharadwaj S, Kunjeer G (2015). "Pattern of optometry practice and range of services in India". Optom Vis Sci. 92 (5): 615–22.
32. Agarwal, R. K. (1970), Optometry in India, The Optician, 3 July, page 18 (published in London, England). "http://www.ugc.ac.in/oldpdf/regulations/specificationofDegrees. (PDF). www.ugc.ac.in. October 2009.
33. https://egazette.nic.in/WriteReadData/2021/226213.pdf (accessed on 19th September, 2021)
34. Mukhopadhyay, Debapriya; Legislation of Optometry in 21 st century in India. A brief status of Optometry regulation in India, Nov.2019. https://www.researchgate.net/publication/337388052_Subject_Legislation_of_Optometry_in_21_st_century_in_India
35. Management of Cataract in Primary Health Care Services. WHO/Geneva 1990: 26.
ISSN (Online): 2455-3662
EPRA International Journal of Multidisciplinary Research (IJMR) - Peer Reviewed Journal Volume: 7| Issue: 9| September 2021|| Journal DOI: 10.36713/epra2013 || SJIF Impact Factor 2021: 8.047 || ISI Value: 1.188
2021 EPRA IJMR | www.eprajournals.com | Journal DOI URL: https://doi.org/10.36713/epra2013 362
THE DEVELOPED AND THE DEVELOPING WORLD IN
THE BIODIVERSITY REGIME
Fahima Khanum
Article DOI: https://doi.org/10.36713/epra8592 DOI No: 10.36713/epra8592
Human societies have a major impact on their environment and with the tendency to exploit inexhaustible resources man has led to the degradation of these resources. Environmental issues became the focus of international concern due to a rising awareness of the risks and implications of international environmental problems. Due to concerns regarding species extinction, depletion of genetic varieties, destruction of natural habitats, deforestation and disruptions in atmosphere there was an increased interest in preserving biodiversity. Conservation and protection of biodiversity became important as biodiversity provides the human societies with a number of important services, which include enhancing the productivity of natural and agricultural ecosystems, providing insurance against attacks on agricultural crops by pathogens, and providing us with valuable knowledge of novel genetic and molecular forms. Biodiversity offers genetic resources for food and agriculture. Living organisms provide irreplaceable environmental services upon which humanity is critically dependent, such as keeping soil fertile, absorbing pollution, breaking down waste, and pollinating crops. One study estimates that the value of 17 such natural services is between US $16-54 trillion per year, with an average of US $33 trillion per year. Man's ability to domesticate and breed more productive animals and crops- like, hens that lay more eggs and corn that resists drought, depends upon the genetic diversity within these species. Biological diversity provides the goods and services that make life on earth possible and satisfy the needs of human societies. Another important contribution of biodiversity is insurance against attack by pathogens. An example of this is the role of biodiversity in preserving the Asian
rice crop from a new virus, the grassy stunt virus, carried by the brown plant hopper. This virus was destroying a large number of crops and so, rice breeders developed a form of rice resistant to this with the help of the International Rice Research Institute (IRRI) in the Philippines. The IRRI found a strain of wild rice not used commercially but resistant to the grassy stunt virus. The gene conveying resistance was transferred to commercial rice varieties, yielding commercial rice resistant to the threatening virus. This would not have been possible without genes from a strain of rice apparently of no commercial value.
Biodiversity is also a great source of knowledge. We can learn from natural organisms how to make chemicals that have important and valuable properties. An example is that of the polymerase chain reaction (PCR). This reaction is used in the amplification of DNA specimens for analysis in forensic tests and in many processes central to the biotechnology industry. Culturing requires an enzyme that is resistant to high temperatures. Enzymes with the right degree of temperature resistance were found in hot springs in Yellowstone National Park, and the heat resistance of these was then used to create an enzyme that could be used to culture DNA specimens. This enzyme is now central to the rapidly growing biotechnology industry. Asprin comes from the bark of willow trees. The bark of Yew trees has been used to derive a drug that is effective against ovarian cancer. A derivative of the Rosy Periwinkle flower is being used to cure childhood leukemia. Hence, plants and animals can be used to produce substances that are highly active pharmacologically. Plants that live in insect infested areas produce substances that are poisonous to insects, and these are used for making insecticides. Some
ISSN (Online): 2455-3662
EPRA International Journal of Multidisciplinary Research (IJMR) - Peer Reviewed Journal Volume: 7| Issue: 9| September 2021|| Journal DOI: 10.36713/epra2013 || SJIF Impact Factor 2021: 8.047 || ISI Value: 1.188
2021 EPRA IJMR | www.eprajournals.com | Journal DOI URL: https://doi.org/10.36713/epra2013 363
snakes produce venom that paralyses parts of the nervous system and others produce venom that reduces blood pressure. Other insects produce anti-coagulants. All of these have been adapted for medical use.
As biodiversity has so many important functions and uses attached to it, its preservation and conservation became very important to all the nations of the world.
The issue of biodiversity came on the forefront, due to two reasons:
Firstly, it was realised that there was an immediate need to conserve habitats in developing nations. By 1987, a lot of evidence started coming up which showed that the destruction of biodiversity was the result of the habitat destroying activities of the developing nations. The developed world was more concerned about how others managed their biological resources. Meanwhile the developing countries were of the view that as the developed countries have already used up their natural resources in the process of industrialisation the developing countries should also be given an equal chance to move on the path of development. They also pointed out, that the developed coutries have actually destroyed a higher portion of their own natural wealth in the process of industrialisation than the developing countries so far.1
Secondly, it was realized that countries would require additional funds to conserve their natural resources. Conservation of biological diversity is important to all and so it was decided that everyone should bear this conservation burden. As the developed countries are financially stronger than the developing countries the onus of providing funds for conservation and preservation of biodiversity falls on the developed world.
The question then arose that where would the funds come from to conserve biodiversity? There was a need to bring about an international agreement on biodiversity due to the increase in the destruction of natural habitats, genetic resources and biological organisms. International efforts at conserving biodiversity are not new and there have been in the past many global treaties on conserving environment. Prior to 1992, there were a number of conventions that dealt with biodiversity in specific regions and a number of conventions that dealt with specific aspects of biodiversity. However, there was no global convention to cover biodiversity as a whole.
Evolution of the Biodiversity Regime
1 Porter & Brown, Global Environmental Politics, (U.S.A.: Westview Press, 2000), p. 128.
The interest in the protection of biodiversity dates back in time. Infact, protected areas in India go back to 252 B.C. when the emperor of India estabilished protected areas for mammals, birds, fish and forests. The modern conservation movement has its roots in the forests of India. It was based on the realization of three core principles: humans through their activities damaged the environment, they have a duty to conserve the environment for future generations, hence scientific and empirical methods should be applied to conserve the environment. During the British rule in India, Sir James Ranald Martin brought to light reports that depicted the extensive damage done to the forests through the large scale deforestation activities of the British. Sir Martin also lobbied intensively for the creation of forest departments that would help in forest conservation activities. In 1842, the Madras Board of Revenue started forest conservation programmes. This was the first case of state management of forests in the world. Later on in 1855, Lord Dalhousie introduced the world‟s first large scale permanent forest conservation model, which later spread to other British colonies as well as the United States. In the United States environmental movement took off after the Second World War. John Muir advocated for nature to be set aside for its own sake and because of his efforts the world‟s first national park was created at Yellowstone
in 1872. In the nineteenth century many other international agreements for the protection of natural resources were signed like the River Commissions for the Rhine and the Danube which are now involved in environmental policy, emerged as arrangements for the facilitation of economic use of rivers as waterways. In 1945, the UN Food and Agricultural Organization was set up which included in its mandate the conservation of natural resources. The 1946 International Whaling Convention, estabilished a club of whaling nations for the management of harvestation of whales.
The developed countries grew richer by using the resources of the developing and underdeveloped countries. Perelman has argued that, “a rich natural
resource base makes a poor country especially a relatively powerless one, an inviting target- both politically and military- for dominant nations. In the case of oil, the powerful nations will not risk letting such a valuable resource fall under the control of an independent government, especially one that might pursue policies that do not coincide with the economic interests of the great transnational corporations.”
2 So
2 Perelman, M, “Myths of the Market”, Organisation &
Environment, Vol. 16, No. 2 (June 2003), p. 200.
ISSN (Online): 2455-3662
EPRA International Journal of Multidisciplinary Research (IJMR) - Peer Reviewed Journal Volume: 7| Issue: 9| September 2021|| Journal DOI: 10.36713/epra2013 || SJIF Impact Factor 2021: 8.047 || ISI Value: 1.188
2021 EPRA IJMR | www.eprajournals.com | Journal DOI URL: https://doi.org/10.36713/epra2013 364
according to the dependency theorists, the governments in the resource rich developing countries are allowed to indulge in economically damaging activities as long as they remain loyal to the powerful countries of the North and allow them to loot their natural resource wealth.
The 1972 Stockholm Conference was the first global United Nations conference on environment. Although it was not much of a success, it actually managed to bring to the focus of the world the problem of use and appropriation of resources. International environmental issues became institutionalized along with the recognition that states have a responsibility to cooperate in efforts for the management of the global commons and trans- boundary pollution. While the North was interested in combating the problems of population growth, conservation, industrial pollution, the South was voicing its concerns about development and how did not want the North to deprive them of the benefits of economic growth. There were clashes over who was responsible for the protection of the environment and who would pay for the said protection. Developing countries insisted that efforts to protect the environment should be linked with policies that promoted their social and economic development as the developing world was less responsible for resource depletion and global pollution. This was the first time when the relationship between environment and development was first time talked about in the context of North- South relations. Between 1970s and 1980s, a number of international environmental agreements were passed like, the 1971, Ramsar Convention to preserve the wetland habitats of waterfowl, the 1972 London Dumping Convention that estabilished a framework for restricting the dumping of toxins in the sea, the 1973 Convention on International Trade in Endangered Species of Wild Flora and Fauna which banned trade in critically endangered species and limited trade in roughly 5000 animal species and 25,000 plant species threatened with extinction to exports which were non-detrimental to the species. At the same time in India, women living in the Himalayan region in North India began the Chipko Movement to protect trees from commercial logging which was causing soil erosion and deforestation.
In the 1980s the Brundtland Commission gave a report titled „Our Common Future‟ which acted as a spark for environmental debates. It called for a transfer of technology and financial assistance to support sustainable development in the South. During this same time a lot of research was being undertaken on genetic resources. The developed nations through their advanced technology were bringing about a lot of new
innovations- better quality of seeds by using the genetic resources of the developing countries. In the beginning, access to these genetic resources was free, but later on, the developing countries recognised that this scenario was not beneficial for them as the developed countries were not sharing their knowledge and were protecting it through intellectual property rights. As a result the developing countries started talks to restrict or charge for the access of their resources. They started pushing for greater access to biotechnology that resulted from their biological wealth. In 1989, the World Conservation Union gave a proposal through which the conservation of biodiversity and access to genetic resources came together for the first time. The World Conservation Union put forward its belief that the developed nations can be obliged to pay for the conservation of the developing world genetic resources if they realised that they would loose free access to these resources. It also proposed the creation of an international fund for the conservation of genetic resources. The publication of the Brundtland report paved way for the negotiation and signing of many new treaties like, the 1985 Vienna Convention for the Protection of the Ozone Layer, the 1987 Montreal Protocol on Substances that Deplete the Ozone Layer and the 1989 Basel Convention on the Control of Transboundary Movements of Hazardous Waste and their Disposal that prevented traders from shipping hazardous waste from industrial countries to developing countries.
During the early 1990‟s thanks to the
environmental NGOs, politicians like Fidel Castro and Virgilio Barco, an idea began to take shape that the North had an ecological debt to the South. In the words of Joan Martinez- Alier, “The notion of an ecological
debt is not particularly radical. Think of the environmental liabilities incurred by firms (under the United States Superfund legislation), or of the engineering field called „restoration ecology‟, or the
proposals by the Swedish government in the early 1990s to calculate the country‟s environmental debt.
Ecologically unequal exchange is one of the reasons for the claim of the Ecological Debt. The second reason for this claim is the disproportionate use of Environmental Space by the rich countries.”
3 By the end of the 1980s the international world
was concerned that the emissions of green house gases like methane, carbon dioxide and CFCs were affecting
3 Martinez-Alier, Joan, “Marxism, Social Metabolism
and Ecologically Unequal Exchange” Paper presented
at Lund University Conference on World Systems Theory and the Environment (2003), p. 25.

ISSN (Online): 2455-3662
EPRA International Journal of Multidisciplinary Research (IJMR) - Peer Reviewed Journal Volume: 7| Issue: 9| September 2021|| Journal DOI: 10.36713/epra2013 || SJIF Impact Factor 2021: 8.047 || ISI Value: 1.188
2021 EPRA IJMR | www.eprajournals.com | Journal DOI URL: https://doi.org/10.36713/epra2013 365
the Earth‟s energy balance and leading to rapid global warming and climate change. In 1988, an international panel of scientists was set up to examine the risk of climate change, which gave a report that paved way for an international convention addressing this problem of climate change. In 1992, Club of Rome published their report titled „The Limits to Growth‟, which drew
attention to the growing pressure on natural resources as a result of mindless human activities. All these factors led to the United Nations Conference on Environment and Development in Rio in 1992, of which biodiversity became the focal point. The Rio Summit is the largest United Nations conference till date, with most countries and 117 head of states participating. The Rio Summit put environment and development on the agenda of global leaders. The Rio summit opened three conventions for signature: The United Nations Framework Convention for Climate Change, Convention to Combat Desertification and Convention on Biological Diversity.
The Convention on Biological Diversity which was opened for signature at the Rio Summit finally came into force on 29th December 1993. The Conference of Parties (COP) is the governing body of the CBD, which meets up periodically to take decisions regarding the implementation of the CBD. The COP has seven programmes of work- agricultural biodiversity, dry and sub- humid lands biodiversity, island biodiversity, coastal and marine biodiversity, mountain biodiversity, forest biodiversity and inland waters biodiversity. It sets out key issues for consideration, identifies potential outputs and the means of achieving these outputs as well as the time period in which it will achieve them. The Convention on Biological Diversity aims to achieve the biodiversity objectives of: Conservation of biological diversity, Sustainable use of its components and Fair and equitable sharing of benefits arising out of
the utilization of genetic resources. CBD can best be understood as a confluence of
different movements whose main concern is the centralized management of global land use planning. Whether the movement involved parks and protected areas, farmer rights movement or bio-prospecting the same theme occurs.4 Land is used for a variety of different purposes like agriculture, recreation, research, development etc. There is a need to divide these 4 Timothy Swanson, “Why is there a Biodiversity
Convention? The International Interest in Centralised Land Use Planning”, International Affairs, Vol. 75, No.
2, 1999, p. 308.
functions between lands used primarily for production and those set aside for other functions. In areas where land is used for multiple functions, there can be conflicting societal demands for biodiversity conservation, nature protection, tourism and recreation which could overlap. Where diverse resource users are involved, differences will emerge between human demands and the capacity of the rural landscape to satisfy them.5 As different users are linked with one another, an activity by one user will have consequences for the other user as well. This would lead to conflict amongst the users on the use of land. The topics for discussion under the terms of the Biodiversity Convention concern the mechanisms for intervening within national development choices regarding land use, to effect a diversity of functions at the global level and to provide the incentives to do so.
The convention on biological diversity can not only be looked as an effort of the countries of the world to protect their biodiversity but it has become a political issue fraught with political undertones. The two major players in this debate on the protection of biological diversity are the developed countries of the North and the developing and underdeveloped countries of the South. The bulk of the countries possessing these biological resources lie in the south, while the north possesses the technological know-how and the financial resources. It was the CBD that finally gave States the right of sovereign control over their natural resources. Article 15, of CBD makes it clear that States have sovereign rights over their genetic resources and only they can govern the right to determine access to their resources. Access where granted shall be on mutually agreed terms and subject to prior informed consent of the contracting party. There is no such concept as free scientific access to resources.
On the issue of patents and technology transfer the convention document is somewhat ambiguous as it tries to appease both the developed and developing nations. Article 16, of the convention recognises that both access to and transfer of technology among nations is very important. It also specifies that the developing countries which provide genetic resources would in return be given access to technology relevant to conserving and sustainable use of their genetic resources. This technology includes technology protected by patents and other intellectual property
5 Brouwer, F., and M. Van der Heide, Introduction in Multifunctional Rural Land Management, Economics and Policies, (London: Earthscan, 2009), pp. 1-13.
ISSN (Online): 2455-3662
EPRA International Journal of Multidisciplinary Research (IJMR) - Peer Reviewed Journal Volume: 7| Issue: 9| September 2021|| Journal DOI: 10.36713/epra2013 || SJIF Impact Factor 2021: 8.047 || ISI Value: 1.188
2021 EPRA IJMR | www.eprajournals.com | Journal DOI URL: https://doi.org/10.36713/epra2013 366
rights. But this access is subject to the terms of international law.
Article 19, of the convention document, allows the developing countries providing the genetic resources to participate in biotechnological research activities. It also promotes fair and equitable sharing of the results and benefits arising from biotechnology based upon the genetic resources of the developing countries.
The Convention on Biological Diversity legitimized access to genetic resources. It was concerned about sharing the benefits of genetic information that were the result of the developing countries genetic resources. Most of the biotechnologies, patents are found in the developed world while the genetic resources are situated in the developing world. Huge transnational corporations earn huge profits from the technology obtained from the developing countries resources but these profits do not flow back to the developing world. It is because of the CBD that the developing countries also started to get some benefits of commercial exploitation of their genetic resources.
The global issue concerned with the biodiversity convention is the division of products between reserve uses and high productivity uses. The biggest question that the world faces is what is to be preserved and what is to be consumed and how much to be consumed? If each state pursues its own narrowly defined self interest in the determination of its land uses, then each will pursue maximum productivity and this will eliminate the base of reserve lands that currently supply all other uses.6 The land should be divided on the basis of its use, that is, land primarily used for production purposes and land used for other purposes like research and knowledge, recreation and leisure. Since the developed world have already used up a substantial percentage of their land for development purposes, the onus of setting up land aside for other diverse purposes now rests on the developing world. But why would the developing countries do so? CBD provides such incentives to the developing countries that would make induce them to set aside land for these other purposes. CBD is concerned with helping the member countries make such development choices that would have an impact upon their natural resources. Our natural resources are our biggest asset and can be used as a great bargaining chip in international politics for realizing our
6 Swanson, Timothy, “Why is there a Biodiversity
Convention? The International Interest in Centralised Land Use Planning”, International Affairs, Vol. 75, No.
2 (1999), p. 331.
objectives. The developing countries provide the developed countries their genetic resources for research, but what do they actually gain from this? One such gain can be achieved through bioprospecting agreements between the owners of resources and their users. Bioprospecting agreements can provide the developing countries with financial resources for the conservation of biodiversity. For example, InBio in Costa Rica gives 10% of its research funds and 50% of its royalties to the Ministry of Natural Resources. It also makes contributions to other conservation programmes and public universities. Another example is that of an Australian pharmaceutical company AMRAD which gave US $ 380,000 in conservation projects in Australia, dedicated to the protection of rare and endangered flora and fauna and other conservation projects.
No one can acertain what the situation would have been without the CBD regime, but nevertheless the scenario could have been much worse. REFERENCES
1. Brouwer, F. and M. Van der Heide, Introduction in Multifunctional Rural Land Management, Economics and Policies (London: Earthscan, 2009).
2. Martinez-Alier, Joan, “Marxism, Social
Metabolism and Ecologically Unequal Exchange”
Paper presented at Lund University Conference on World Systems Theory and the Environment (2003).
3. Perelman, M, “Myths of the Market”, Organisation
& Environment, Vol. 16, No. 2 (June 2003) 4. Porter & Brown, Global Environmental Politics
(U.S.A.: Westview Press, 2000) 5. Timothy Swanson, “Why is there a Biodiversity
Convention? The International Interest in Centralised Land Use Planning”, International
Affairs, Vol. 75, No. 2, 1999, p. 308.
ISSN (Online): 2455-3662
EPRA International Journal of Multidisciplinary Research (IJMR) - Peer Reviewed Journal Volume: 7| Issue: 9| September 2021|| Journal DOI: 10.36713/epra2013 || SJIF Impact Factor 2021: 8.047 || ISI Value: 1.188
2021 EPRA IJMR | www.eprajournals.com | Journal DOI URL: https://doi.org/10.36713/epra2013 367
INCIDENCE OF ARTICLE 151: ITS PROPENSITY RATE
IN TIMES OF PANDEMIC
Odessa G. Lacanilao
Faculty, College of Criminology, Nueva Ecija University of Science and Technology, Cabanatuan City, Philippines
Article DOI: https://doi.org/10.36713/epra8591 DOI No: 10.36713/epra8591
ABSTRACT
This study was conducted to determine the propensity rate of Article 151 in times of pandemic, the common policies violated and the difficulties met by the police in the implementation of Community Quarantine policies. The researcher used a descriptive design of methodology by using a questionnaire-checklist. The respondents of the study were the Police Officers assigned at the Cabanatuan City Police Station. As can be deduced from the study, the common crimes committed was Resisting Authorities (Violations of Art. 151). As the government modified social interactions, the police implemented new safety measures. The changes brought some remarkable resistance to some individuals. Resistance to change is usual as we ask people to walk out from their comfort zones. The changes carried out some remarkable resistance to some people. With regard to the common community quarantine policies violated; the violations of city- wide night curfew is the most dominant. For the difficulties met by the Law Enforcers; vulnerable to physical and personal hazard such as the risk of getting infected as well as their families is the most significant. Police Officers are on the frontlines . Therefore, they are expected to earnestly implement the safety protocols. As such, a high-risk of exposure and contamination from the virus is very possible for the Law Enforcers. KEYWORDS: `incidence, Article 151, Pandemic, Resisting Authorities
I. INTRODUCTION
The COVID-19 pandemic exhibited new remarkable concern for acceptance and compliance to safety protocols in this time of the so called “ new
normal”. To ged rid of the prolifiration of the
coronavirus, different protocols and guidelines are implemented.
In the Philippines, there are different Community Quarantine Guidelines depending on the severity of the widespread of the coronavirus in a certain place.
Community Quarantine is the restriction of movement within the area of quarantine of individuals in order to reduce the transmission of COVID-19 among persons and outside the affected area.
There are array of stay-at home orders implemented by the government of the Philippines through its Inter- Agency Task Force on Emerging Infectious Diseases (IATF-EID).
On the other hand, Law Enforcement leaders around the world are facing challenges in combating the contagious effect of the coronavirus. In this time of pandemic, police officers play a major part as compared to medical professionals in providing services to alleviate the boundless spread of the coronavirus.
Implementation of lockdown manifested to be a tough task worldwide as it add ups to change the way of life of every individual. As a result, police struggles to look ways and methods on how to carry out the
aforesaid such transition. Likewise, the constraint of locomotion of people turns out to be hard to impose since the lifestyle of every human changes into three hundred sixty degrees due to this pandemic.
The COVID-19 pandemic has shown new unprecedented issues for compliance and community relations (Laufs & Waseen, 2020). Further, the pandemic related job role of police extends to the utilization of the police experience of crowd controls, public order management, investigation of criminal acts, deterrence of the law breaking behaviors and intelligence collection of anti-social activities. The acts of not obeying quarantine requirements, defying home stay or hospital stay, rules and concealing the contact history of those who catch the infection, have invoked essentially public health measures which require actions related to the domain of police experts.
There are complex issues associated with COVID-19 ranging from concerns about infringement of constitutional rights to potential sanctions for violations of an order (White & Fradella, 2020). As cases continue to rise, the government has ordered police to accompany medics and transfer any infected patients to isolation facilities.
In Cabanatuan City, due to this pandemic, it leads to enourmous duress of police work. There are individuals who follow guidelines while some resist to this protocols. Those who violate the safety protocols will be charged of the violation of Article 151 of the Revised Penal Code. This law punishes unjustifiable

ISSN (Online): 2455-3662
EPRA International Journal of Multidisciplinary Research (IJMR) - Peer Reviewed Journal Volume: 7| Issue: 9| September 2021|| Journal DOI: 10.36713/epra2013 || SJIF Impact Factor 2021: 8.047 || ISI Value: 1.188
2021 EPRA IJMR | www.eprajournals.com | Journal DOI URL: https://doi.org/10.36713/epra2013 368
disobedience of lawful orders of persons in Authority or their Agents. Police officers or Law Enforcement agents are examples of Agents of persons in authority.
The researcher, as a resident of the said city, a faculty member and as a Criminologist affirm that there is a need to understand the Incidence of Article 151.
The purpose of this study is to determine the propensity rate of Article 151 in times of pandemic, the common policies violated and the difficulties met by the police in the Implementation of Community Quarantine policies. The results of this study will serve as a baseline to design some activities that can be used as part of the departments extension program.
II. METHODOLOGY
This study used of a descriptive research design. The specific problem number one of the study was anwered through documentary analysis based from the record of the Cabanatuan City Crime Statistics.
Specific problems number two and three were answered through a a questionnaire-checklist. The survey questionnaire was designed to find out the Common Community Quarantine policies violated and the difficulties met by the Police officers in the Implementation of Community Quarantine policies. The respondents of this study were the fifty police officers assigned at the Cabanatuan City Police Station. III. RESULTS AND DISCUSSIONS 3.1. Common crimes committed
Table 1 shows that Resisting Authorities is the top common crimes committed with 460 cases followed by Laws on Reporting communicable disease with 381 cases. The figure was based from the Cabanatuan City Crime Statistics from January 01, 2020 to December 31, 2020. The data proves that in times of pandemic due to the different guidelines implemented there are people who resist to follow safety protocols.
Following the World Health Organization (WHO) declaration of COVID-19 as a pandemic in March 2020, a state of emergency was announced in many countries. This has had significant impacts on individuals, communities and various systems-as a whole, locally, nationally and globally (Lee & Johnstone, 2020).
To quell the spread of the COVID-19 pandemic, health authorities urged people to take easy-to implement precautions such as limiting social interactions, wearing a face covering and vaccinating. Many people complied, but some did not. Some of them distrusted the medical experts, some did not think of the virus would harm them (Forsyth, 2020).
Further, the present widespread of the coronavirus needed us to switch to our new way of life. While the government modified social interactions. The police carry out new safety measures. These changes brought some notable resistance to some people.
Table 1. Common Crimes Committed
CRIMES COMMITED NO. OF CASES Resisting Authorities (Art 151) 460 Laws on Reporting communicable disease 381 Anti-child Abuse 263 Anti-Gambling law 249 Anti-VAWC Act 179 Rape 196 Theft 145 Swidling (Estafa) 112 Physical Injury 104
3.2 Common Community quarantine policies violated
As reflected in table II, with regard to the Common Community Quarantine policies violated, the statement; violations of city-wide night curfew obtained the highest weighted mean of 3.64.
The respondents strongly agreed that violations of city-wide night curfew is the common community quarantine policies violated.
Due to the outbreak of the coronavirus, different measures in order to prevent the widespread of the virus was implemented. One of this is the implementation of curfew time. During the curfew time, no one was allowed to moved except the medical
and nursing staff, police and the armed forces (Khatatbeth, 2020).
Likewise, the complete curfew promotes social distancing especially during night time. In order to fully implement this policy, Police officers were tasked to conduct checkpoints and monitor people who would violate the said policy.It has been observed that during the implementation, night curfew was commonly violated by some people.
However, the degree of conformity with the lockdown policies was probably affected the police responses. Law Enforcers are anticipated to implement these new restrictions. Due to low rates of citizens compliance it entailed negative contacts between the police and the people.
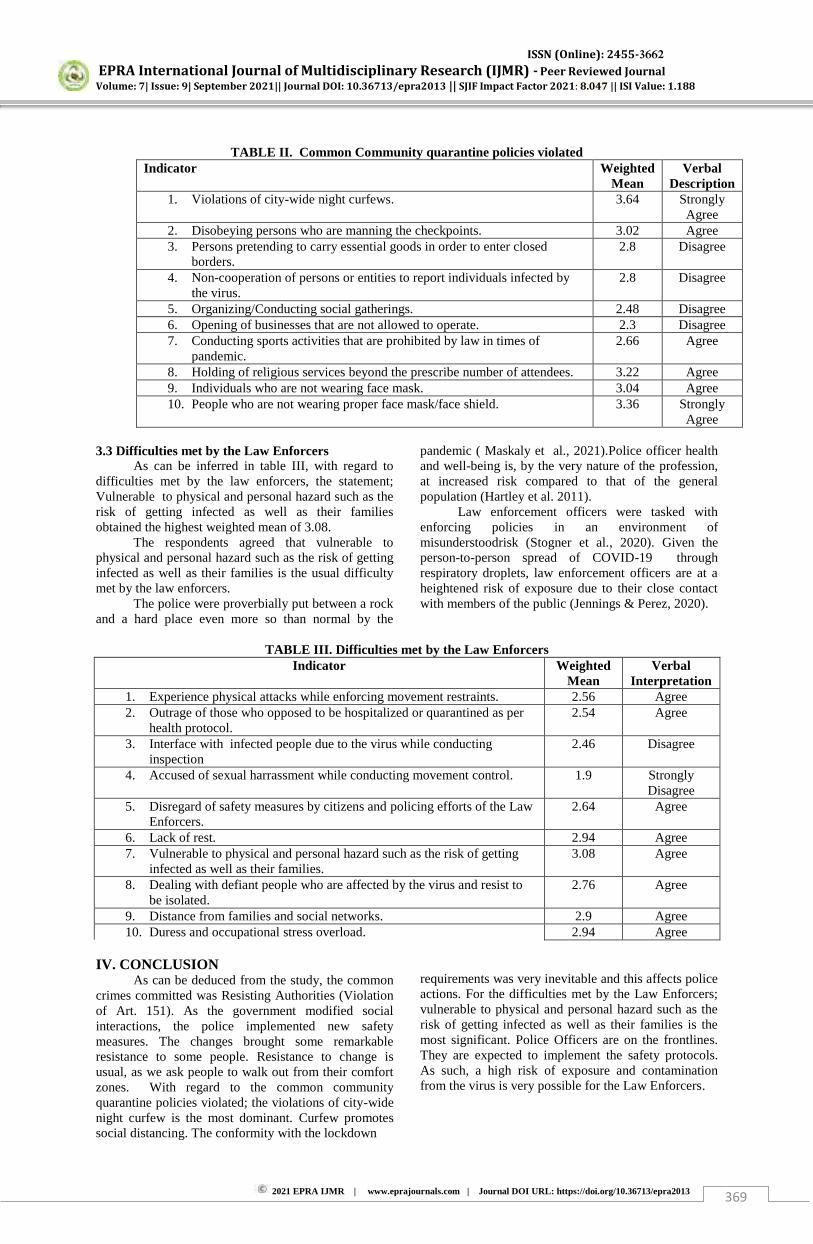
ISSN (Online): 2455-3662
EPRA International Journal of Multidisciplinary Research (IJMR) - Peer Reviewed Journal Volume: 7| Issue: 9| September 2021|| Journal DOI: 10.36713/epra2013 || SJIF Impact Factor 2021: 8.047 || ISI Value: 1.188
2021 EPRA IJMR | www.eprajournals.com | Journal DOI URL: https://doi.org/10.36713/epra2013 369
TABLE II. Common Community quarantine policies violated Indicator Weighted
Mean Verbal
Description 1. Violations of city-wide night curfews. 3.64 Strongly
Agree 2. Disobeying persons who are manning the checkpoints. 3.02 Agree 3. Persons pretending to carry essential goods in order to enter closed
borders. 2.8 Disagree
4. Non-cooperation of persons or entities to report individuals infected by the virus.
2.8 Disagree
5. Organizing/Conducting social gatherings. 2.48 Disagree 6. Opening of businesses that are not allowed to operate. 2.3 Disagree 7. Conducting sports activities that are prohibited by law in times of
pandemic. 2.66 Agree
8. Holding of religious services beyond the prescribe number of attendees. 3.22 Agree 9. Individuals who are not wearing face mask. 3.04 Agree 10. People who are not wearing proper face mask/face shield. 3.36 Strongly
Agree 3.3 Difficulties met by the Law Enforcers
As can be inferred in table III, with regard to difficulties met by the law enforcers, the statement; Vulnerable to physical and personal hazard such as the risk of getting infected as well as their families obtained the highest weighted mean of 3.08.
The respondents agreed that vulnerable to physical and personal hazard such as the risk of getting infected as well as their families is the usual difficulty met by the law enforcers.
The police were proverbially put between a rock and a hard place even more so than normal by the
pandemic ( Maskaly et al., 2021).Police officer health and well-being is, by the very nature of the profession, at increased risk compared to that of the general population (Hartley et al. 2011).
Law enforcement officers were tasked with enforcing policies in an environment of misunderstoodrisk (Stogner et al., 2020). Given the person-to-person spread of COVID-19 through respiratory droplets, law enforcement officers are at a heightened risk of exposure due to their close contact with members of the public (Jennings & Perez, 2020).
TABLE III. Difficulties met by the Law Enforcers
Indicator Weighted Mean
Verbal Interpretation
1. Experience physical attacks while enforcing movement restraints. 2.56 Agree 2. Outrage of those who opposed to be hospitalized or quarantined as per
health protocol. 2.54 Agree
3. Interface with infected people due to the virus while conducting inspection
2.46 Disagree
4. Accused of sexual harrassment while conducting movement control. 1.9 Strongly Disagree
5. Disregard of safety measures by citizens and policing efforts of the Law Enforcers.
2.64 Agree
6. Lack of rest. 2.94 Agree 7. Vulnerable to physical and personal hazard such as the risk of getting
infected as well as their families. 3.08 Agree
8. Dealing with defiant people who are affected by the virus and resist to be isolated.
2.76 Agree
9. Distance from families and social networks. 2.9 Agree 10. Duress and occupational stress overload. 2.94 Agree
IV. CONCLUSION
As can be deduced from the study, the common crimes committed was Resisting Authorities (Violation of Art. 151). As the government modified social interactions, the police implemented new safety measures. The changes brought some remarkable resistance to some people. Resistance to change is usual, as we ask people to walk out from their comfort zones. With regard to the common community quarantine policies violated; the violations of city-wide night curfew is the most dominant. Curfew promotes social distancing. The conformity with the lockdown
requirements was very inevitable and this affects police actions. For the difficulties met by the Law Enforcers; vulnerable to physical and personal hazard such as the risk of getting infected as well as their families is the most significant. Police Officers are on the frontlines. They are expected to implement the safety protocols. As such, a high risk of exposure and contamination from the virus is very possible for the Law Enforcers.

ISSN (Online): 2455-3662
EPRA International Journal of Multidisciplinary Research (IJMR) - Peer Reviewed Journal Volume: 7| Issue: 9| September 2021|| Journal DOI: 10.36713/epra2013 || SJIF Impact Factor 2021: 8.047 || ISI Value: 1.188
2021 EPRA IJMR | www.eprajournals.com | Journal DOI URL: https://doi.org/10.36713/epra2013 370
REFERENCES 1. Forsyth, D. R. (2020). Group-level resistance to
health mandates during the COVID-19 pandemic: A groupthink approach. Group Dynamics: Theory, Research, and Practice, 24(3), 139–
152. https://doi.org/10.1037/gdn0000132 2. Hartley TA, Burchfiel CM, Fekedulegn D, Andrew
ME, Violanti JM. Health disparities in police officers: comparisons to the U.S. general population. Int J Emerg Ment Health. 2011;13(4):211-220.
3. Khatatbeh M (2020) Efficacy of Nationwide Curfew to Encounter Spread of COVID-19: A Case From Jordan. Front. Public Health 8:394. doi: 10.3389/fpubh.2020.00394
4. Jennings WG, Perez NM. The Immediate Impact of COVID-19 on Law Enforcement in the United States. Am J Crim Justice. 2020 Jun 6:1-12. doi: 10.1007/s12103-020-09536-2. Epub ahead of print. PMID: 32837154; PMCID: PMC7275851.
5. Laufs J, Waseem Z. Policing in pandemics: A systematic review and best practices for police response to COVID-19. Int J Disaster Risk Reduct. 2020;51:101812. doi:10.1016/j.ijdrr.2020.101812
6. Lee E, Johnstone M. Resisting the politics of the pandemic and racism to foster humanity. Qualitative Social Work. 2021;20(1-2):225-232. doi:10.1177/1473325020973313
7. Maskály J, Ivković SK, Neyroud P. Policing the
COVID-19 Pandemic: Exploratory Study of the Types of Organizational Changes and Police Activities Across the Globe. International Criminal Justice Review. 2021;31(3):266-285. doi:10.1177/10575677211012807
8. Stogner J, Miller BL, McLean K. Police Stress, Mental Health, and Resiliency during the COVID-19 Pandemic [published online ahead of print, 2020 Jun 26]. Am J Crim Justice. 2020;1-13. doi:10.1007/s12103-020-09548-y
9. White, M.D., Fradella, H.F. Policing a Pandemic: Stay-at-Home Orders and What they Mean for the Police. Am J Crim Just 45, 702–717 (2020). https://doi.org/10.1007/s12103-020-09538-0

ISSN (Online): 2455-3662
EPRA International Journal of Multidisciplinary Research (IJMR) - Peer Reviewed Journal Volume: 7| Issue: 9| September 2021|| Journal DOI: 10.36713/epra2013 || SJIF Impact Factor 2021: 8.047 || ISI Value: 1.188
2021 EPRA IJMR | www.eprajournals.com | Journal DOI URL: https://doi.org/10.36713/epra2013 371
A STUDY WITH SPECIAL REFERENCE ON SELECT
COMMODITIES DURING PRE AND POST PANDEMIC ESTIMATION OF COMMODITY TREND THROUGH
HORDRIC PRESCOTT FILTER
Dr. P. Chellasamy1, Deepakarunya.C2
1Professor, Dept. of Commerce, Bharathiar University, Coimbatore, Tamil Nadu, India. 2M. Phil. Research Scholar, Dept. of Commerce, Bharathiar University, Coimbatore, Tamil Nadu, India.
ABSTRACT This study estimates the select commodities in Pre and Post COVID-19. The main objective of the study estimate the relationship between select commodities on macroeconomic variables during pre and post pandemic, for the study historical price of select commodities under the sector such as bullion, energy and metals, from the study period were segregated on the basis of lock down from 11 months prior to COVID-19 and 11 months after to COVID-19 (May 2019 to March 2020 and April 2020 to January 2021). Augmented Dickey Fuller Unit Root Test is used for checking the stationarity of the price series, Correlation Analysis is used to find the relationship between commodities under the sector such as bullion, energy and metals on macroeconomic variables during pre and post pandemic and Hordrick Prescott filter is employed for estimating the Trend of Gold, Silver, Copper, Zinc, Lead, Nickel, Aluminium, Crude oil and Natural gas in pre and post COVID-19. The study finally conclude that the closing price of such commodities during pre and post pandemic. KEY WORDS: Closing price, Trend, Augmented Dickey Fuller Unit Root Test, Hordrick Prescott Filter. JEL Classification: G11, G13, G14
INTRODUCTION Commodities plays a major role in day to day life and it is a symbol of wealth and prosperity some millennium years ago. As quoted by Warren Buffet “Commodities is a way of going long a fear”. It is used
as a fiat money and considered as sentimental money for people in India. It is also used as a investment in Stocks, Commodities, Securities, Currencies etc., In ancient days commodities has considered as the legalized currencies for different countries and treated as a medium of exchange for goods and services. Basically investors used commodities to hedge against political risk and inflation for their investment. The impact of COVID-19 on commodities has been uneven, and could have lasting effects," said , World Bank " When decreases in commodity prices are fugitive, policy stimulus can hedge their impact. However, when prices remain dejected for an extended period, policy makers need to find solutions immediately. Commodities is considered to be one of the safest heavens for investors. When coronavirus or COVID 19 declared as global pandemic, investors globally turned
towards commodities for some period as it was steady with its performance. The base metal performance was very bad after the coronavirus passed to over 21 countries. In order to overcome the spread of virus many countries have announced lockdown. It was after the lift of lockdown, the things started looking a bit better. So their economies can rearrange smoothly to a new normal. Thus there is a sharp decreasing trend of commodities price during the corona pandemic and turned global health crisis into an economic one. As the Corona deepened in March the investors averse the risk initially and flocked into cash to recover the loss. It was responsible for record highs for gold, and record lows for crude oil. Despite this, almost all commodity prices recovered in the third quarter of 2021.
REVIEW OF LITERATURE Chandrika (2020)1 has expressed when corona virus or COVID 19 declared as global pandemic, investors globally turned towards gold for some period as it was steady with its performance. Later, the prices have come down and now there is all
ISSN (Online): 2455-3662
EPRA International Journal of Multidisciplinary Research (IJMR) - Peer Reviewed Journal Volume: 7| Issue: 9| September 2021|| Journal DOI: 10.36713/epra2013 || SJIF Impact Factor 2021: 8.047 || ISI Value: 1.188
2021 EPRA IJMR | www.eprajournals.com | Journal DOI URL: https://doi.org/10.36713/epra2013 372
time high record in gold prices in India. Researcher focused the gold derivative market performance in India with regard to pre and post COVID 19 period. The daily closing prices of gold futures traded in Multi Commodity Exchange of India Limited are taken for a period of one year for the purpose of study. Statistical operations are performed with the help of E-views. Time series models like ADF test, are used to study the stationarity to examine the performance of gold futures during the pre and post corona virus period. Paramita Mukherjee, Samaresh Bardhan (2020)2 This paper attempts to explore the relationship between the stock prices and the prices of two mostly traded commodities in the derivatives market, viz. crude oil and gold in the Indian context. Based on the daily data during 2017-2020, the paper employs ARDL model in order to estimate the long-term relationships. It also finds out the impact of market disruptions following the recent COVID-19 pandemic, on this relationship in the context of Indian financial markets. The findings point to the fact that the stock returns and the commodity prices are closely linked with each other. Interestingly, our findings suggest that the pandemic has altered the relationship. In the pre-COVID period, there was no co integration among the stock, gold and crude oil prices. However, during the pandemic, we find evidence of co integrating relationships. The short run relationship also provides some interesting insights. In the pre-pandemic period, evidence points to a mutual impact on the two markets, e.g. past values of oil price and gold price influence the stock returns while returns on the stock market influences oil price volatility. However, during the COVID period, apart from crude oil prices, it is the volatility of gold prices that has emerged as the driver of the stock returns.
Madhu Druva Kumar, Lokanadha Reddy, Gaadha (2020)3 This paper undergone due to the devastations that emerged in the international market, the Indian financial market proportionally reacted to the pandemic and further witnessed a violent volatility. Considering the COVID-19 situation, this paper is an empirical investigation on the impact of COVID-19 on the agricultural commodities, specifically wheat, on NCDEX. Using daily closing spot and future prices of wheat on NCDEX, this study examines the impact of COVID-19 on the wheat prices over the period from 1st July 2019 to 30th April 2020. Furthermore, this study has tried to make a comparative analysis of the spot and future prices in the pre-COVID-19 period and during the COVID-19 situation, by using the help of
statistical tests. Findings reveal that the price of wheat has encountered instability during the Corona pandemic period. While comparing the results with that of the period prior to Corona, we find that wheat prices, both spot and future, were highly impacted by the COVID-19 pandemic.
Shruthi & Ramani (2020)4. This study examines volatility transmission over the financial crisis. Recently established causality in impulse response functions and variance test to everyday data from January 2020 has been implied. To recognize the effect of the food cost crisis, statistics are separated into two intervals i.e. post-COVID period and the pre-COVID period. The variance causality test indicates that the risk transmission among agricultural commodity is zero, but oil market volatility spills on the markets for agricultural products excluding sugar in the post-crisis period. Thus, this paper signifies that the statistical Trend transmission differs post food price crisis. Following, risk transmission materializes as an additional element of the statistical interrelations among agricultural and energy markets.
Christian Elleby, Ignacio Perez Dominguez, Marcel Adenauer & Giampiero Genovese, in their study Impacts of the COVID-19 Pandemic on the Global Agricultural Markets (2020)5 investigated the impact of the very first lockdown regulations imposed by governments globally, on the agricultural commodities markets, and found that there was a significantly negative impact (4-18% decrease) on the meat prices, dairy products, bio-fuel prices, maize, and oilseeds, as a result of the demand shock created from the pandemic.
Mahindra Dev and Rajeshwari Sengupta (2020)6 had highlighted the impact of Coronavirus on the overall economy by comparing the situations before the crisis and after the crisis. This paper especially talked about Informal Sector, Banking Sector, MSMEs, Financial Markets and Limited policy space. The Government announced various policies to handle the situation of crisis and how these policies are successful and implemented in the real world is also the main component of the paper. It has discussed how the country lockdown has brought all economic activities to an abrupt halt and in turn will have further spillover effects on investment, employment, income and consumption, pulling down the aggregate Growth of the economy. In last, it has discussed the measures that the Reserve Bank of India, State and Central
ISSN (Online): 2455-3662
EPRA International Journal of Multidisciplinary Research (IJMR) - Peer Reviewed Journal Volume: 7| Issue: 9| September 2021|| Journal DOI: 10.36713/epra2013 || SJIF Impact Factor 2021: 8.047 || ISI Value: 1.188
2021 EPRA IJMR | www.eprajournals.com | Journal DOI URL: https://doi.org/10.36713/epra2013 373
Government could adopt to improve the economic situations simultaneously controlling this virus.
Bharat Kumar Meher (2020)7 analysed the Impact of COVID-19 on Price volatility of Crude Oil and Natural Gas Listed on Multi Commodity Exchange of India. In this study, an attempt has been made to estimate the price volatility of crude oil and natural gas listed on multi commodity exchange of India (MCX). We measured the leverage effect of COVID-19 on price volatility of crude oil and natural gas by using the daily prices of crude oil and natural gas from May 01, 2017 to April 30, 2020. The findings of the study reveal that there is a presence of leverage effect of COVID-19 on the price volatility of crude oil. However, this leverage effect is not present on the price volatility of natural gas. The findings of the study will help investors to develop investment strategies and to the policymakers to formulate appropriate policies to overcome or minimise the impact of COVID-19. The forecasting graphs of crude oil prices indicate that there is a possibility that price volatility will be higher in the future. However, it is difficult to forecast the expected price volatility of natural gas for the future because the price volatility graph is extremely fluctuating.
Ozili and Thankom (2020)8 had highlighted the spillovers of COVID-19 on the global economy. The paper tries to highlight the impact of Coronavirus on different sectors of economy like travel industry, hospitality industry, sports industry, oil price war among countries, import dependent countries, financial sector, health sector, education sector, event industry and entertainment industry. It has also discussed some fast policy responses introduced by policy makers in various countries to avoid the harsh impact of disease spreading virus across the globe. The paper emphasizes the recession faced by most countries and the tradeoff between saving lives and saving the economy encountered by almost all the countries. It also concludes that apart from all the challenges, it has made a major move for all the countries to improvise their health sector and has led to a transition phase in the economy in terms of online education, transportation systems, health and hygiene and even an opportunity to fix both economic and financial system with great stimulus packages.
STATEMENT OF THE PROBLEM In India the growth and emergence of
derivative market is relatively a recent phenomenon. From the date of emergence derivative market has exponential growth both in terms of volume and
numbers of trade contracts. It is one of the economies that contribute to the economic development in recent years, derivative markets are found has a positive contributor to the economic development in short run but the effect disappears in long run. It has clearly replicated in the outbreak of corona virus. On January 2020 the world health organization declared global health emergency which impacted not only on health aspect but it gigantically affected the financial market internationally. Due to the depredation that emerged in the international market that made India financial market proportionally react to the pandemic. Furthermore witnessed a intemperate volatility in the market. This covid-19 situation is another savage after financial crises that happened in 2008.
The sudden declaration of pandemic lockdown all over the world have crashed the share prices as well as the commodity prices as the whole, which is and evidence that it has impacted severely on commodity market as well, which can be identified through the commodity price fluctuation throughout the pandemic. Initially commodity market prices declined for most of the commodities which lead to decrease in prices of goods and services, this is a clear picture that purchasing power of the people has also impacted o the commodity price. The currency fluctuations in forex are also reason in volatility of commodity market whether bullish or bearish.
Despite this, almost all commodity prices recovered in the third quarter. Crude oil prices have doubled since April low, supported by sharp oil supply cuts, but prices remain one-third lower than pre-pandemic. The pandemic has the potential to lead to permanent changes in the demand and supply of commodities, and especially to the supply chains that move those commodities from producers to consumers around the world. Natural gas prices have fallen substantially this year but coal prices have been less affected, since the demand for electricity has been less affected by mitigation measures. Gold prices, on the other hand, have risen as buyers have sought safety amid financial market turbulence. Gold prices have reached an all-time high in India due to the pandemic, but a large part of this has been driven by depreciating rupee and increased import duty. On the other hand, international gold prices are much lower than the all-time high price. Same as stock market, commodity market is also a good economic indicator which has been grounded across sector during this pandemic. Hence there is a necessity to understand how pandemic has impacted on commodity prices throughout the covid break and to analysis the growth and trends of select commodities along with risk and return in pre as
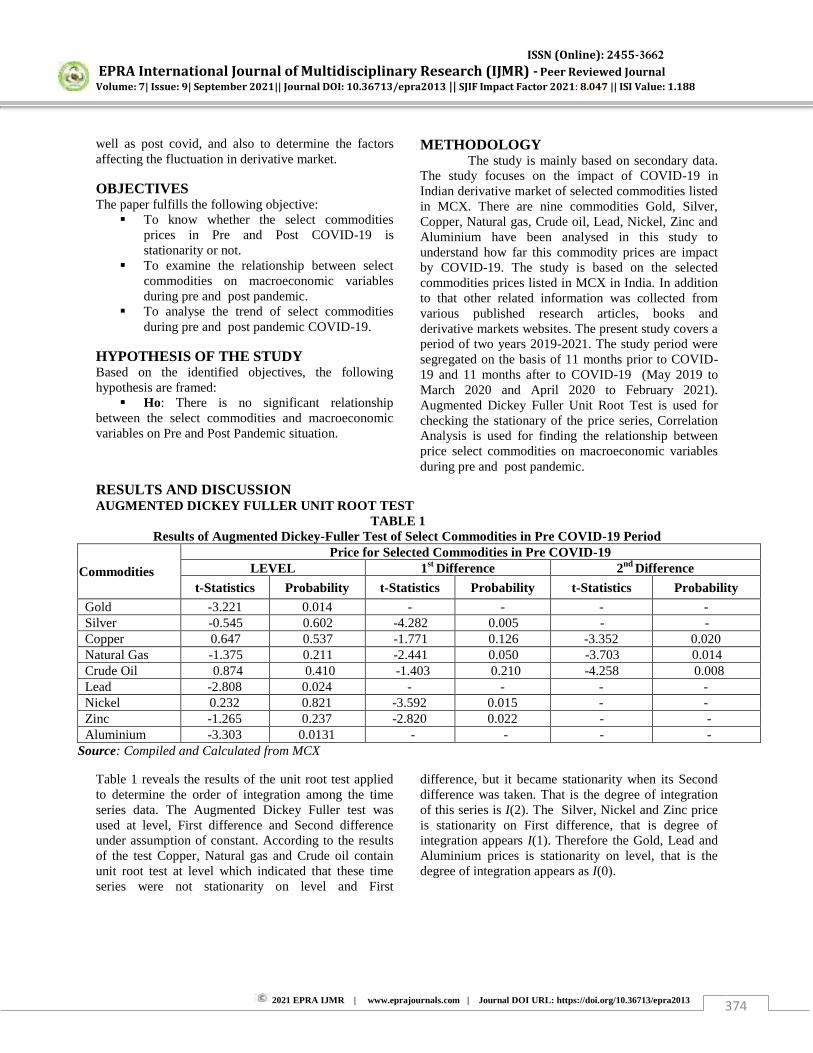
ISSN (Online): 2455-3662
EPRA International Journal of Multidisciplinary Research (IJMR) - Peer Reviewed Journal Volume: 7| Issue: 9| September 2021|| Journal DOI: 10.36713/epra2013 || SJIF Impact Factor 2021: 8.047 || ISI Value: 1.188
2021 EPRA IJMR | www.eprajournals.com | Journal DOI URL: https://doi.org/10.36713/epra2013 374
well as post covid, and also to determine the factors affecting the fluctuation in derivative market.
OBJECTIVES The paper fulfills the following objective:
To know whether the select commodities prices in Pre and Post COVID-19 is stationarity or not.
To examine the relationship between select commodities on macroeconomic variables during pre and post pandemic.
To analyse the trend of select commodities during pre and post pandemic COVID-19.
HYPOTHESIS OF THE STUDY Based on the identified objectives, the following hypothesis are framed:
Ho: There is no significant relationship between the select commodities and macroeconomic variables on Pre and Post Pandemic situation.
METHODOLOGY The study is mainly based on secondary data.
The study focuses on the impact of COVID-19 in Indian derivative market of selected commodities listed in MCX. There are nine commodities Gold, Silver, Copper, Natural gas, Crude oil, Lead, Nickel, Zinc and Aluminium have been analysed in this study to understand how far this commodity prices are impact by COVID-19. The study is based on the selected commodities prices listed in MCX in India. In addition to that other related information was collected from various published research articles, books and derivative markets websites. The present study covers a period of two years 2019-2021. The study period were segregated on the basis of 11 months prior to COVID-19 and 11 months after to COVID-19 (May 2019 to March 2020 and April 2020 to February 2021). Augmented Dickey Fuller Unit Root Test is used for checking the stationary of the price series, Correlation Analysis is used for finding the relationship between price select commodities on macroeconomic variables during pre and post pandemic.
RESULTS AND DISCUSSION AUGMENTED DICKEY FULLER UNIT ROOT TEST
TABLE 1 Results of Augmented Dickey-Fuller Test of Select Commodities in Pre COVID-19 Period
Commodities
Price for Selected Commodities in Pre COVID-19 LEVEL 1st Difference 2nd Difference
t-Statistics Probability t-Statistics Probability t-Statistics Probability
Gold -3.221 0.014 - - - - Silver -0.545 0.602 -4.282 0.005 - - Copper 0.647 0.537 -1.771 0.126 -3.352 0.020 Natural Gas -1.375 0.211 -2.441 0.050 -3.703 0.014 Crude Oil 0.874 0.410 -1.403 0.210 -4.258 0.008 Lead -2.808 0.024 - - - - Nickel 0.232 0.821 -3.592 0.015 - - Zinc -1.265 0.237 -2.820 0.022 - - Aluminium -3.303 0.0131 - - - -
Source: Compiled and Calculated from MCX
Table 1 reveals the results of the unit root test applied to determine the order of integration among the time series data. The Augmented Dickey Fuller test was used at level, First difference and Second difference under assumption of constant. According to the results of the test Copper, Natural gas and Crude oil contain unit root test at level which indicated that these time series were not stationarity on level and First
difference, but it became stationarity when its Second difference was taken. That is the degree of integration of this series is I(2). The Silver, Nickel and Zinc price is stationarity on First difference, that is degree of integration appears I(1). Therefore the Gold, Lead and Aluminium prices is stationarity on level, that is the degree of integration appears as I(0).
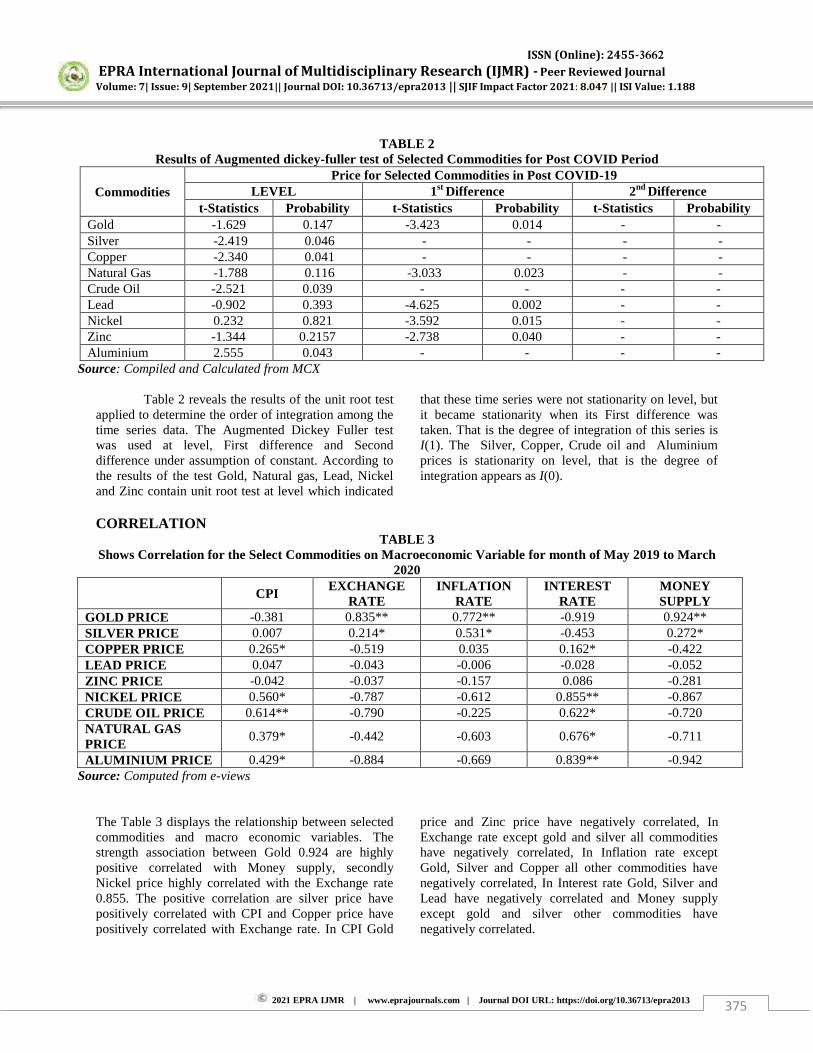
ISSN (Online): 2455-3662
EPRA International Journal of Multidisciplinary Research (IJMR) - Peer Reviewed Journal Volume: 7| Issue: 9| September 2021|| Journal DOI: 10.36713/epra2013 || SJIF Impact Factor 2021: 8.047 || ISI Value: 1.188
2021 EPRA IJMR | www.eprajournals.com | Journal DOI URL: https://doi.org/10.36713/epra2013 375
TABLE 2 Results of Augmented dickey-fuller test of Selected Commodities for Post COVID Period
Source: Compiled and Calculated from MCX
Table 2 reveals the results of the unit root test applied to determine the order of integration among the time series data. The Augmented Dickey Fuller test was used at level, First difference and Second difference under assumption of constant. According to the results of the test Gold, Natural gas, Lead, Nickel and Zinc contain unit root test at level which indicated
that these time series were not stationarity on level, but it became stationarity when its First difference was taken. That is the degree of integration of this series is I(1). The Silver, Copper, Crude oil and Aluminium prices is stationarity on level, that is the degree of integration appears as I(0).
CORRELATION TABLE 3
Shows Correlation for the Select Commodities on Macroeconomic Variable for month of May 2019 to March 2020
CPI EXCHANGE
RATE INFLATION
RATE INTEREST
RATE MONEY SUPPLY
GOLD PRICE -0.381 0.835** 0.772** -0.919 0.924** SILVER PRICE 0.007 0.214* 0.531* -0.453 0.272* COPPER PRICE 0.265* -0.519 0.035 0.162* -0.422 LEAD PRICE 0.047 -0.043 -0.006 -0.028 -0.052 ZINC PRICE -0.042 -0.037 -0.157 0.086 -0.281 NICKEL PRICE 0.560* -0.787 -0.612 0.855** -0.867 CRUDE OIL PRICE 0.614** -0.790 -0.225 0.622* -0.720 NATURAL GAS PRICE
0.379* -0.442 -0.603 0.676* -0.711
ALUMINIUM PRICE 0.429* -0.884 -0.669 0.839** -0.942 Source: Computed from e-views
The Table 3 displays the relationship between selected commodities and macro economic variables. The strength association between Gold 0.924 are highly positive correlated with Money supply, secondly Nickel price highly correlated with the Exchange rate 0.855. The positive correlation are silver price have positively correlated with CPI and Copper price have positively correlated with Exchange rate. In CPI Gold
price and Zinc price have negatively correlated, In Exchange rate except gold and silver all commodities have negatively correlated, In Inflation rate except Gold, Silver and Copper all other commodities have negatively correlated, In Interest rate Gold, Silver and Lead have negatively correlated and Money supply except gold and silver other commodities have negatively correlated.
Commodities Price for Selected Commodities in Post COVID-19
LEVEL 1st Difference 2nd Difference t-Statistics Probability t-Statistics Probability t-Statistics Probability
Gold -1.629 0.147 -3.423 0.014 - - Silver -2.419 0.046 - - - - Copper -2.340 0.041 - - - - Natural Gas -1.788 0.116 -3.033 0.023 - - Crude Oil -2.521 0.039 - - - - Lead -0.902 0.393 -4.625 0.002 - - Nickel 0.232 0.821 -3.592 0.015 - - Zinc -1.344 0.2157 -2.738 0.040 - - Aluminium 2.555 0.043 - - - -
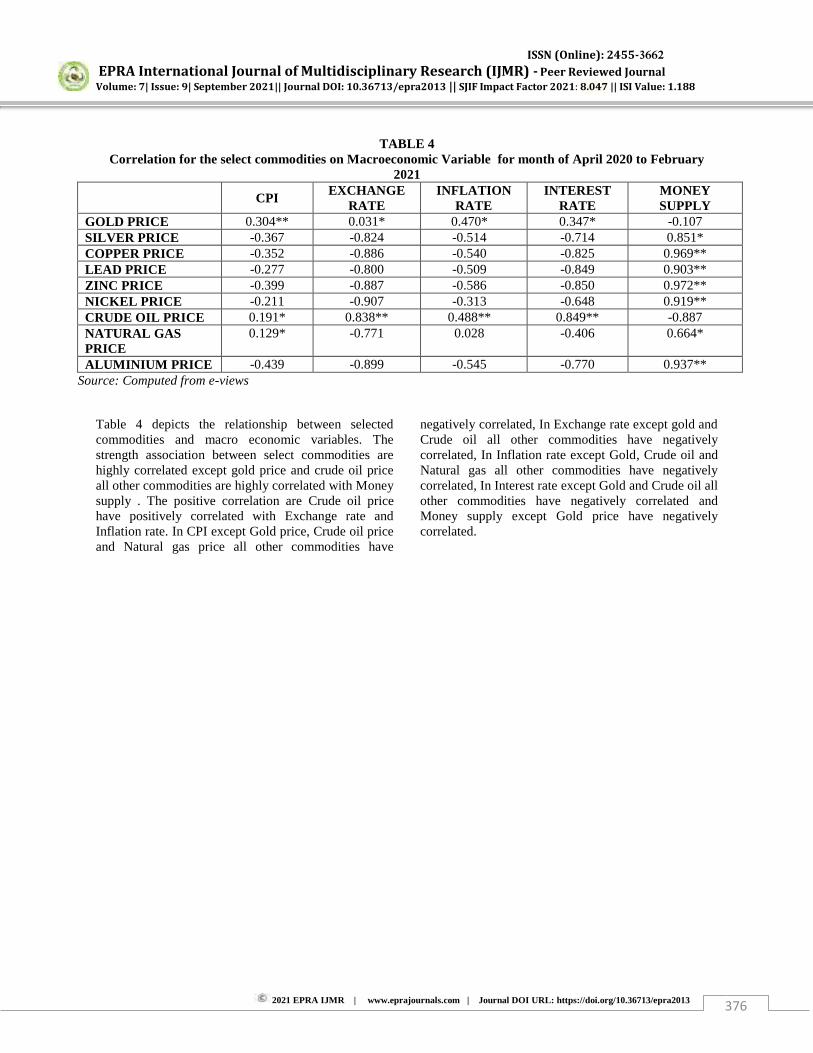
ISSN (Online): 2455-3662
EPRA International Journal of Multidisciplinary Research (IJMR) - Peer Reviewed Journal Volume: 7| Issue: 9| September 2021|| Journal DOI: 10.36713/epra2013 || SJIF Impact Factor 2021: 8.047 || ISI Value: 1.188
2021 EPRA IJMR | www.eprajournals.com | Journal DOI URL: https://doi.org/10.36713/epra2013 376
TABLE 4 Correlation for the select commodities on Macroeconomic Variable for month of April 2020 to February
2021
CPI EXCHANGE
RATE INFLATION
RATE INTEREST
RATE MONEY SUPPLY
GOLD PRICE 0.304** 0.031* 0.470* 0.347* -0.107 SILVER PRICE -0.367 -0.824 -0.514 -0.714 0.851* COPPER PRICE -0.352 -0.886 -0.540 -0.825 0.969** LEAD PRICE -0.277 -0.800 -0.509 -0.849 0.903** ZINC PRICE -0.399 -0.887 -0.586 -0.850 0.972** NICKEL PRICE -0.211 -0.907 -0.313 -0.648 0.919** CRUDE OIL PRICE 0.191* 0.838** 0.488** 0.849** -0.887 NATURAL GAS PRICE
0.129* -0.771 0.028 -0.406 0.664*
ALUMINIUM PRICE -0.439 -0.899 -0.545 -0.770 0.937** Source: Computed from e-views
Table 4 depicts the relationship between selected commodities and macro economic variables. The strength association between select commodities are highly correlated except gold price and crude oil price all other commodities are highly correlated with Money supply . The positive correlation are Crude oil price have positively correlated with Exchange rate and Inflation rate. In CPI except Gold price, Crude oil price and Natural gas price all other commodities have
negatively correlated, In Exchange rate except gold and Crude oil all other commodities have negatively correlated, In Inflation rate except Gold, Crude oil and Natural gas all other commodities have negatively correlated, In Interest rate except Gold and Crude oil all other commodities have negatively correlated and Money supply except Gold price have negatively correlated.
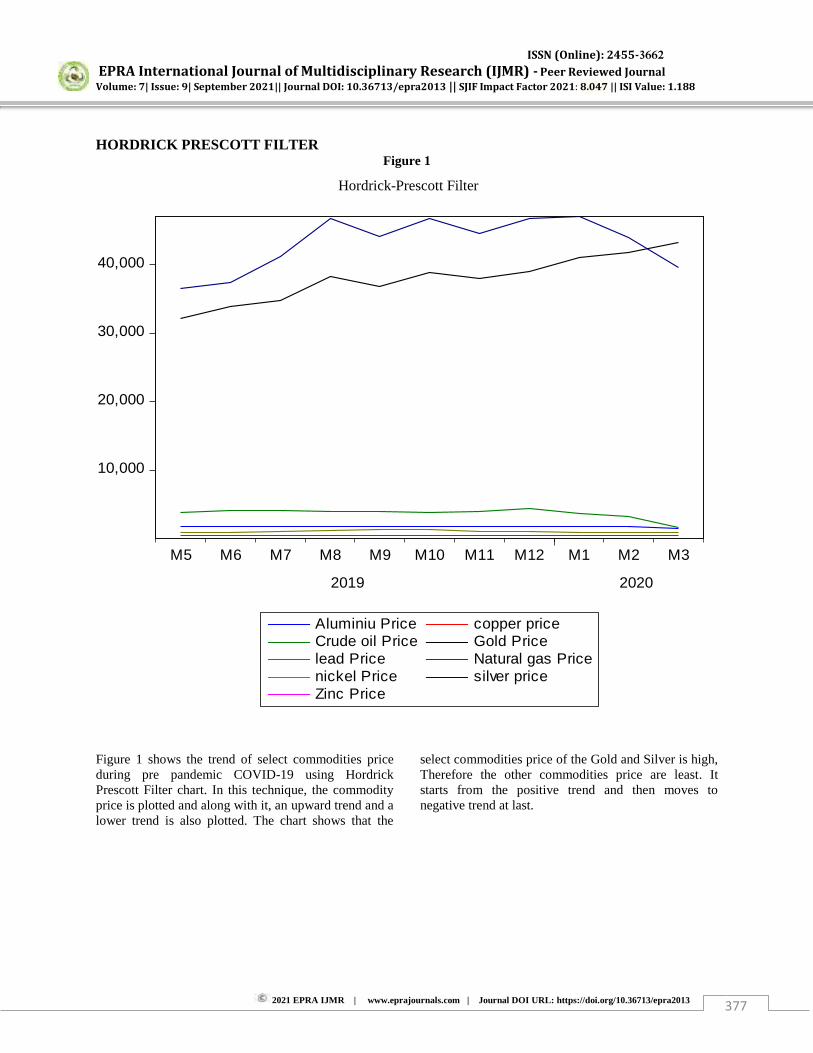
ISSN (Online): 2455-3662
EPRA International Journal of Multidisciplinary Research (IJMR) - Peer Reviewed Journal Volume: 7| Issue: 9| September 2021|| Journal DOI: 10.36713/epra2013 || SJIF Impact Factor 2021: 8.047 || ISI Value: 1.188
2021 EPRA IJMR | www.eprajournals.com | Journal DOI URL: https://doi.org/10.36713/epra2013 377
HORDRICK PRESCOTT FILTER Figure 1
Figure 1 shows the trend of select commodities price during pre pandemic COVID-19 using Hordrick Prescott Filter chart. In this technique, the commodity price is plotted and along with it, an upward trend and a lower trend is also plotted. The chart shows that the
select commodities price of the Gold and Silver is high, Therefore the other commodities price are least. It starts from the positive trend and then moves to negative trend at last.
10,000
20,000
30,000
40,000
M5 M6 M7 M8 M9 M10 M11 M12 M1 M2 M3
2019 2020
Aluminiu Price copper priceCrude oil Price Gold Pricelead Price Natural gas Pricenickel Price silver priceZinc Price
Hordrick-Prescott Filter
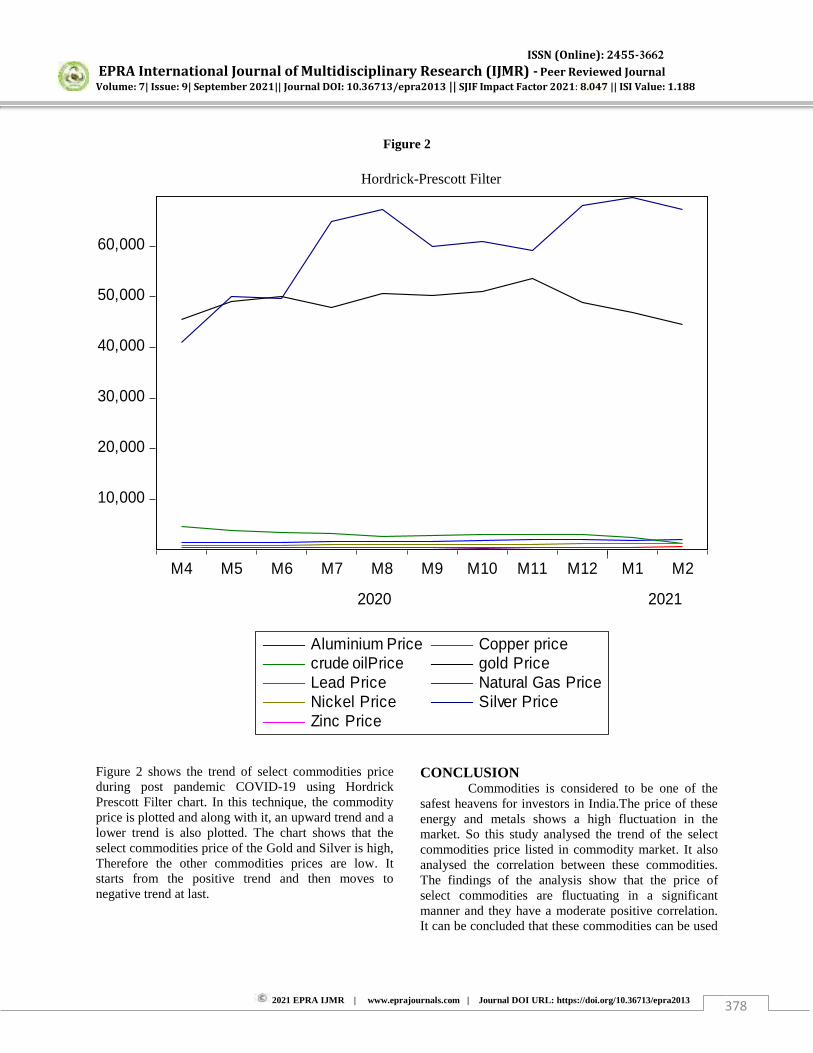
ISSN (Online): 2455-3662
EPRA International Journal of Multidisciplinary Research (IJMR) - Peer Reviewed Journal Volume: 7| Issue: 9| September 2021|| Journal DOI: 10.36713/epra2013 || SJIF Impact Factor 2021: 8.047 || ISI Value: 1.188
2021 EPRA IJMR | www.eprajournals.com | Journal DOI URL: https://doi.org/10.36713/epra2013 378
Figure 2
Figure 2 shows the trend of select commodities price during post pandemic COVID-19 using Hordrick Prescott Filter chart. In this technique, the commodity price is plotted and along with it, an upward trend and a lower trend is also plotted. The chart shows that the select commodities price of the Gold and Silver is high, Therefore the other commodities prices are low. It starts from the positive trend and then moves to negative trend at last.
CONCLUSION Commodities is considered to be one of the safest heavens for investors in India.The price of these energy and metals shows a high fluctuation in the market. So this study analysed the trend of the select commodities price listed in commodity market. It also analysed the correlation between these commodities. The findings of the analysis show that the price of select commodities are fluctuating in a significant manner and they have a moderate positive correlation. It can be concluded that these commodities can be used
10,000
20,000
30,000
40,000
50,000
60,000
M4 M5 M6 M7 M8 M9 M10 M11 M12 M1 M2
2020 2021
Aluminium Price Copper pricecrude oilPrice gold PriceLead Price Natural Gas PriceNickel Price Silver PriceZinc Price
Hordrick-Prescott Filter
ISSN (Online): 2455-3662
EPRA International Journal of Multidisciplinary Research (IJMR) - Peer Reviewed Journal Volume: 7| Issue: 9| September 2021|| Journal DOI: 10.36713/epra2013 || SJIF Impact Factor 2021: 8.047 || ISI Value: 1.188
2021 EPRA IJMR | www.eprajournals.com | Journal DOI URL: https://doi.org/10.36713/epra2013 379
for the investment purpose and use as a tool against trend as they are moderately correlated.
REFERENCES 1. Gold Reserves by Country as of May 2016(in metric
tons), retrieved from http://www.statista.com, at 21st February, 2021.
2. Gold Reserves, retrieved from http://www.tradingeconomies.com, at 21st February, 2021
3. Philip, A.P., 2003, Marketing of Spices-A Study with Special Reference to Pepper and Cardamom (Doctoral Dissertation), retrieved from http://www.shodhganga.inflibnet.ac.in,at21st February, 2021.
4. http://www.mcxindia.com,retrievedat21st February, 2021
5. ET Bureau, (2015, November 06), Prime Minister Narendra Modi Launches Three Gold Related Schemes (Daily Edition), retrieved from http://www.economictimes.com, at 21st February, 2021.
6. http://www.in.investing.com/commodities/gold-historical-data, retrieved at 21st February, 2021.
7. http://www.in.investing.com/commodities/silver-historical-data, retrieved at 21st February, 2021.
8. http://www.data.imf.org.com, retrieved at 21st February, 2021
ISSN (Online): 2455-3662
EPRA International Journal of Multidisciplinary Research (IJMR) - Peer Reviewed Journal Volume: 7| Issue: 9| September 2021|| Journal DOI: 10.36713/epra2013 || SJIF Impact Factor 2021: 8.047 || ISI Value: 1.188
2021 EPRA IJMR | www.eprajournals.com | Journal DOI URL: https://doi.org/10.36713/epra2013 380
THE ROLE OF INTESTINAL MICROFLORA IN THE
PATHOGENESIS OF PARKINSON’S DISEASE
Yakutkhon Nabievna Madjidova1, Nargiza Asrorovna Mansurova2
1Doctor of Medical Sciences, Professor, Head of the Department of Neurology, Pediatric Neurology and Medical Genetics, TashPMI,
2PhD, Assistant of the Department of Neurology, Pediatric Neurology and Medical Genetics,
Tashkent Pediatric Medical Institute
ABSTRACT Parkinson’s disease is a chronic progressive neurodegenerative disease characterized by the destruction of dopa neurons. The reason for the development of Parkinson's disease has changed today, reflecting from an exogenous nature to a genetic role in its etiology. The article describes the basic concepts of the human microbiome, which undoubtedly plays an important role in the development of pathological conditions. The reason for the death of dopa cells is associated with the accumulation of alpha-synuclein in them, in the form of pathological protein formations inside neurons, the so-called Lewy bodies. Most patients diagnosed with Parkinson's disease show gastrointestinal symptoms as one of the earliest features. In addition, an unbalanced cycle of oxidative stress caused by dysbiosis can gradually contribute to the development of a specific Parkinson’s disease phenotype. According to the theory of H. Braak, the pathological protein alpha-synuclein makes its way in an ascending order from two sides to the brain: nasally through the olfactory structures into the temporal lobe and gastrointestinal through the vagus nerve into the structures of the brain stem. Thus, the broad significance of the human microbiome is complex and requires further research to improve the current understanding of the mechanisms underlying neurodegenerative disorders such as Parkinson's disease. KEYWORDS: pre-retaining, neurodegenerative, microbiota, Ruminococcus, Bacteroides, Prevotella, Proteobacteria, Enterobacteriaceae, Escherichia.
ЗНАЧЕНИЕ МИКРОФЛОРЫ КИШЕЧНИКА В ПАТОГЕНЕЗЕ БОЛЕЗНИ ПАРКИНСОНА
Якутхон Набиевна Маджидова,
д.м.н., профессор, заведующая кафедрой Неврологии, детской неврологии и медицинской генетики ТашПМИ,
Наргиза Асроровна Мансурова,
PhD, ассистент кафедры Неврологии, детской неврологии и медицинской генетики ТашПМИ,
Аннотация: Болезнь Паркинсона – хроническое прогрессирующее нейродегенеративное заболевание
характеризирующийся разрушением дофа содержащих нейронов. Причина развития болезни Паркинсона на
сегодняшний день изменились, отражая в факторе риска от признания экзогенной природы до генетической роли в
ее этиологии. В статье описаны основные понятия микробиомы человека, которые играет несомненно важную
роль в развитии патологических состояний. Причиной гибели дофа клеток связывают с кумуляцией в них альфа-синуклеина, в виде патологических белковых образований внутри нейронов, так называемых тельца Леви. Большинство пациентов, у которых диагностируется болезнь Паркинсона, проявляют желудочно-кишечные
симптомы как одну из самых ранних особенностей. Кроме того, несбалансированный цикл окислительного стресса, вызванного дисбактериозом, может постепенно способствовать развитию специфического фенотипа болезни Паркинсона. Согласно теории Х.Браака патологический белок альфа-синуклеин пробирается в восходящем порядке
ISSN (Online): 2455-3662
EPRA International Journal of Multidisciplinary Research (IJMR) - Peer Reviewed Journal Volume: 7| Issue: 9| September 2021|| Journal DOI: 10.36713/epra2013 || SJIF Impact Factor 2021: 8.047 || ISI Value: 1.188
2021 EPRA IJMR | www.eprajournals.com | Journal DOI URL: https://doi.org/10.36713/epra2013 381
с двух сторон в головной мозг: назальным-посредством обонятельных структур в височную долю и
гастроинтестинальным - через блуждающий нерв в структуры ствола мозга. Таким образом, широкое значение
микробиома человека является сложным и требует дальнейших исследований для улучшения современного
понимания механизмов, лежащих в основе нейродегенеративных расстройств, таких как болезнь Паркинсона. Ключевые слова: дофадержащих, нейродегенеративного, микробиота, Ruminococcus, Bacteroides, Prevotella, Proteobacteria, Enterobacteriaceae, Escherichia.
Болезнь Паркинсона (БП) представляет
собой второе по частоте нейродегенеративное
заболевание в мире. По данным Всемирной организации здравоохранения (ВОЗ), в 2016 г.
зарегистрировано 6,1 миллионов случаев БП, в
т.ч. 2,9 миллиона (47,5%) у женщин, 3,2
миллиона (52,5%) у мужчин, из них 14,8%
случаев приходится на страны с низким уровнем
дохода. Проведѐнные в мире исследования указывают на увеличение заболеваемости с
возрастом. Эволюция взглядов о причинах БП на
протяжении почти 200 лет отражала уровень
развития неврологии в тот или иной период
времени, пройдя сложный путь от признания
исключительно экзогенной природы болезни до
абсолютизации роли генетики в ее этиологии.
Истина оказалась посередине: на сегодняшний
день твердо установлена значимость как
экзогенных, так и эндогенных механизмов в
развитии БП, причем в разных возрастных
группах соотношение этих факторов различно [1]. Болезнь Паркинсона традиционно
характеризовалась двигательными нарушениями,
но в настоящее время считается
мультисистемным заболеванием, проявляющим
множество немоторными симптомами. Так как, дегенерация дофадержащих клеток начинается за
несколько лет до появления первых симптомов
болезни Паркинсона, считается, что двигательные
нарушения развивается после гибели некоторого
порогового количества нейронов черного
субстанции. Причиной гибели клетки связывают с кумуляцией в них альфа-синуклеина, в виде патологических белковых образований внутри
нейронов, так называемых тельца Леви. В
поисках причин развития нейродегенеративного и
нейровоспалительного процесса все большую
роль отводят оси микробиота – кишечник – мозг . Большинство пациентов, у которых
диагностируется БП, проявляют желудочно-кишечные симптомы как одну из самых ранних
особенностей. Например, пациенты с БП часто жалуются на желудочно-кишечные расстройства
в виде запоров и тошноты. Важно отметить, что около 60% пациентов с БП страдают запорами
[2], которые могут начаться ща 20 лет до
постановки диагноза и являются одним из
продромальных синдромов [3]. Человеческие существа считаются
суперорганизмами, осознающими сложное
взаимодействие между хозяином и микробами
[4]. Например, было показано, что микробиом кишечника человека дополняет хозяина
основными функциями (трофическими,
метаболическими и защитными) и влияет на
центральную нервную систему (ЦНС) хозяина
через ось кишечник-мозг посредством модуляции нервных путей и ГАМКергических путей. и
серотонинергические сигнальные системы [5]. В человеческом организме обитает от пятисот до
тысячи видов, которые впоследствии делятся на
три энтеротипа: Ruminococcus, Bacteroides и Prevotella. Протоколы секвенирования
следующего поколения широко используются как для идентификации, так и для характеристики
этих сообществ [6, 7]. Желудочно-кишечная микробиота выполняет важнейшие
функции с целью поддержания метаболического
гомеостаза, такого как прямое ингибирование
чрезмерного роста патогенных микроорганизмов,
развитие кишечной защиты, биосинтез
витаминов, модуляция энергии, а также
иммунологические и ксенобиотические эффекты.
Кроме того, микроорганизмs способствуют
метаболизму лекарств, продуцируя такие важные
биоактивные молекулы, как короткоцепочечные
жирные кислоты (бутират, ацетат и пропионат), желчные кислоты, холин, аминокислоты и
фенольные производные, полисахарид A индол и
никотиновая, аминоэтилсульфоновая или
ретиноевая кислоты, предшественники,
участвующие в опосредующих взаимодействиях с
организмом человека путем поддержания
целостности нейрогормональных осей [8]. К сожалению, связь между микрофлорой
ЖКТ и мозгом недостаточно изучена. Влияние,
которое кишечная флора оказывает на местные
органы в непосредственной близости, а также на
те, которые расположены дистально, происходит
различными путями, например, иммунными,
кишечными и нервными путями. Таким образом,
ось кишечник-мозг можно определить как
плотную сеть, образованную клетками из
кишечной, периферической и центральной
нервной системы в сочетании с гипоталамо-гипофизарно-надпочечниковой осью (рис).
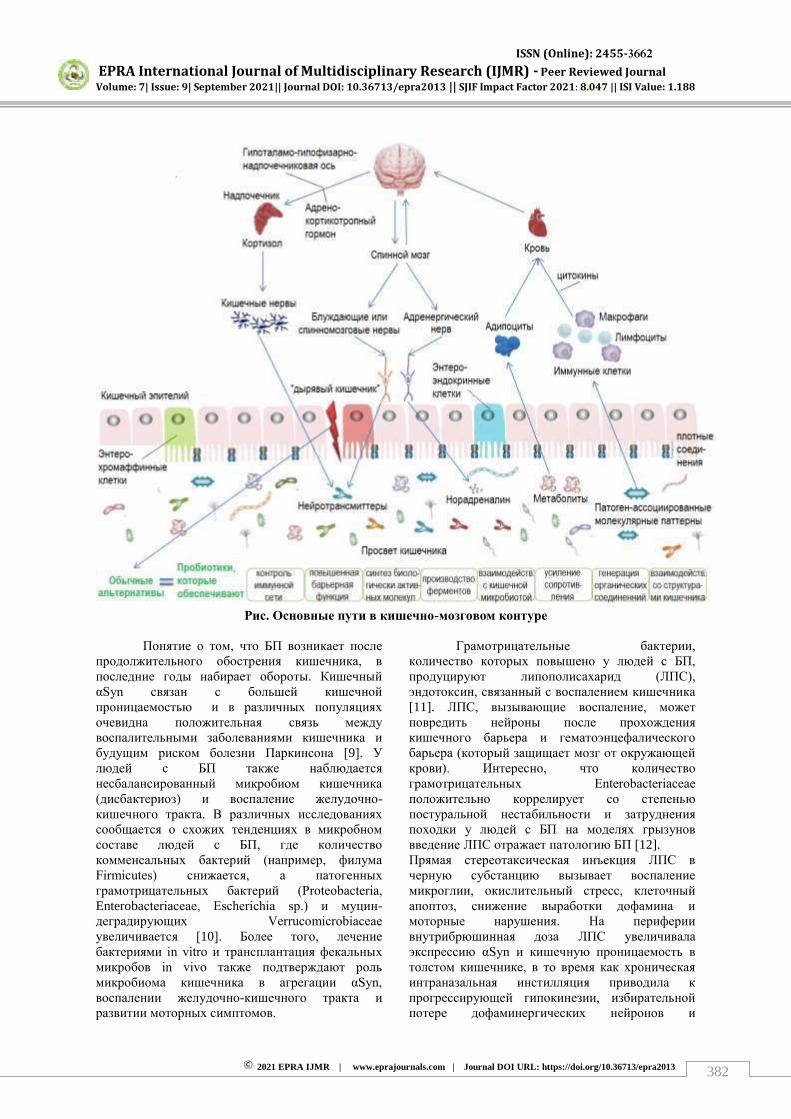
ISSN (Online): 2455-3662
EPRA International Journal of Multidisciplinary Research (IJMR) - Peer Reviewed Journal Volume: 7| Issue: 9| September 2021|| Journal DOI: 10.36713/epra2013 || SJIF Impact Factor 2021: 8.047 || ISI Value: 1.188
2021 EPRA IJMR | www.eprajournals.com | Journal DOI URL: https://doi.org/10.36713/epra2013 382
Рис. Основные пути в кишечно-мозговом контуре
Понятие о том, что БП возникает после
продолжительного обострения кишечника, в
последние годы набирает обороты. Кишечный
αSyn связан с большей кишечной
проницаемостью и в различных популяциях
очевидна положительная связь между
воспалительными заболеваниями кишечника и
будущим риском болезни Паркинсона [9]. У
людей с БП также наблюдается
несбалансированный микробиом кишечника
(дисбактериоз) и воспаление желудочно-кишечного тракта. В различных исследованиях
сообщается о схожих тенденциях в микробном
составе людей с БП, где количество
комменсальных бактерий (например, филума
Firmicutes) снижается, а патогенных
грамотрицательных бактерий (Proteobacteria,
Enterobacteriaceae, Escherichia sp.) и муцин-деградирующих Verrucomicrobiaceae
увеличивается [10]. Более того, лечение
бактериями in vitro и трансплантация фекальных
микробов in vivo также подтверждают роль
микробиома кишечника в агрегации αSyn,
воспалении желудочно-кишечного тракта и
развитии моторных симптомов.
Грамотрицательные бактерии,
количество которых повышено у людей с БП,
продуцируют липополисахарид (ЛПС),
эндотоксин, связанный с воспалением кишечника
[11]. ЛПС, вызывающие воспаление, может
повредить нейроны после прохождения
кишечного барьера и гематоэнцефалического
барьера (который защищает мозг от окружающей
крови). Интересно, что количество
грамотрицательных Enterobacteriaceae
положительно коррелирует со степенью
постуральной нестабильности и затруднения
походки у людей с БП на моделях грызунов
введение ЛПС отражает патологию БП [12]. Прямая стереотаксическая инъекция ЛПС в
черную субстанцию вызывает воспаление
микроглии, окислительный стресс, клеточный
апоптоз, снижение выработки дофамина и
моторные нарушения. На периферии
внутрибрюшинная доза ЛПС увеличивала
экспрессию αSyn и кишечную проницаемость в
толстом кишечнике, в то время как хроническая
интраназальная инстилляция приводила к
прогрессирующей гипокинезии, избирательной
потере дофаминергических нейронов и
ISSN (Online): 2455-3662
EPRA International Journal of Multidisciplinary Research (IJMR) - Peer Reviewed Journal Volume: 7| Issue: 9| September 2021|| Journal DOI: 10.36713/epra2013 || SJIF Impact Factor 2021: 8.047 || ISI Value: 1.188
2021 EPRA IJMR | www.eprajournals.com | Journal DOI URL: https://doi.org/10.36713/epra2013 383
нигростриатальной агрегации αSyn [13]. Недавно было показано, что интраректальное введение
мышам ЛПС, полученного из Proteus mirabilis,
снижает уровень маркера клеток плотного
соединения окклюдин, но повышает уровень
альфа-фактора некроза опухоли и вызывает
сверхэкспрессию толл-подобного рецептора 4 в толстой кишке через 16 дней после лечения. Эти
эффекты распространились на мозг с активацией
микроглии во всех нигростриатных областях и
агрегацией αSyn в центральных и кишечных
нейронах, что подтверждает данные о патологии
кишечника и головного мозга, вызываемой
окружающей средой, в контексте БП. Поскольку
энтеральные уровни αSyn связаны с большей
кишечной проницаемостью и транслокацией ЛПС через кишечный барьер у людей с БП, кишечная
микробиота может вызывать распространение
αSyn по периферическим нервам в направлении
ствола мозга и мозг шире [9]. Вывод: Можно сделать вывод, что
существует множество факторов, такие как
антибиотики, диета, способ рождения или стресс,
которые постепенно способствуют
возникновению кишечного дисбактериоза,
который может спровоцировать расстройства
ЦНС. Существует относительно мало
исследований, которые подчеркивают
взаимосвязь между кишечной флорой и БП;
исследователи утверждают, что эти ограничения
будут преодолены из-за того, что человеческий микробиом в настоящее время является главным
барьером для появления персонализированной
медицины. Можно сделать вывод, что более
широкое значение микробиома человека является
сложным и требует дальнейших исследований
для улучшения современного понимания
механизмов, лежащих в основе
нейродегенеративных расстройств, таких как
болезнь Паркинсона. Литература
1. Duty S., Jenner P. A nimal models of Parkinson’s
disease: a source of novel treatments and clues to the cause of the disease// Br.J.Pharmacol. 2011 (in press).-№ 26
2. Fasano A, Visanji NP, Liu LW, Lang AE, Pfeiffer RF. Gastrointestinal dysfunction in Parkinson’s
disease. Lancet Neurol. 2015;14(6):625–639 3. Cersosimo MG, Raina GB, Pecci C, Pellene A,
Calandra CR, Gutierrez C, Micheli FE, Benarroch EE. Gastrointestinal manifestations in Parkinson’s disease: prevalence and occurrence
before motor symptoms. J Neurol. 2013;260(5):1332–1338.
4. Sleator RD. The human superorganism - of microbes and men. Med Hypotheses. 2010;74(2):214–215.
5. Carabotti M, Scirocco A, Maselli MA, Severi C. The gut-brain axis: interactions between enteric microbiota, central and enteric nervous systems. Ann Gastroenterol. 2015;28(2):203–209.
6. J. A. Gilbert, M. J. Blaser, J. G. Caporaso, J. K. Jansson, S. V. Lynch, and R. Knight, “Current
understanding of the human microbiome,” Nature Medicine, vol. 24, no. 4, pp. 392–400, 2018.
7. The Human Microbiome Project Consortium, “Structure, function and diversity of the healthy human microbiome,” Nature, vol. 486, no. 7402, pp. 207–214, 2012
8. S. M. Jandhyala, R. Talukdar, C. Subramanyam, H. Vuyyuru, M. Sasikala, and D. Nageshwar Reddy, “Role of the normal gut
microbiota,” World Journal of Gastroenterology, vol. 21, no. 29, pp. 8787–8803, 2015.
9. Forsyth, C. B., Shannon, K. M., Kordower, J. H., Voigt, R. M., Shaikh, M., Jaglin, J. A., et al. (2011). Increased intestinal permeability correlates with sigmoid mucosa alpha-synuclein staining and endotoxin exposure markers in early Parkinson’s disease. PLoS One 6:e28032. doi: 10.1371/journal.pone.0028032
10. Li, W., Wu, X., Hu, X., Wang, T., Liang, S., Duan, Y., et al. (2017). Structural changes of gut microbiota in Parkinson’s disease and its
correlation with clinical features. Sci. China Life Sci. 60, 1223–1233. doi: 10.1007/s11427-016-9001-4
11. Nighot, M., Al-Sadi, R., Guo, S., Rawat, M., Nighot, P., Watterson, M. D., et al. (2017). Lipopolysaccharide-induced increase in intestinal epithelial tight permeability is mediated by toll-like receptor 4/Myeloid differentiation primary response 88 (MyD88) activation of myosin light chain kinase expression. Am. J. Pathol. 187, 2698–2710. doi: 10.1016/j.ajpath.2017.08.005
12. Scheperjans, F., Aho, V., Pereira, P. A., Koskinen, K., Paulin, L., Pekkonen, E., et al. (2015). Gut microbiota are related to Parkinson’s disease and
clinical phenotype. Mov. Disord. 30, 350–358. doi: 10.1002/mds.26069
13. He, Q., Yu, W., Wu, J., Chen, C., Lou, Z., Zhang, Q., et al. (2013). Intranasal LPS-mediated Parkinson’s model challenges the pathogenesis of
nasal cavity and environmental toxins. PLoS One 8:e78418. doi: 10.1371/journal.pone.0078418
ISSN (Online): 2455-3662
EPRA International Journal of Multidisciplinary Research (IJMR) - Peer Reviewed Journal Volume: 7| Issue: 9| September 2021|| Journal DOI: 10.36713/epra2013 || SJIF Impact Factor 2021: 8.047 || ISI Value: 1.188
2021 EPRA IJMR | www.eprajournals.com | Journal DOI URL: https://doi.org/10.36713/epra2013 383
FEATURES OF PSYCHOMOTOR DEVELOPMENT IN CHILDREN WITH SOMATIC BURDEN
Umida Tadjimuratovna Babadjanova1, Yakutkhon Nabievna Madjidova2
1Assistant at the Department of Neurology, Pediatric Neurology and Medical Genetics,
2Professor, Doctor of Medical Sciences, Head of the Department of Neurology, Child Neurology and Medical Genetics, Tashkent Pediatric Medical Institute
Tashkent city, Uzbekistan
ABSTRACT The prevalence of delayed psychomotor development (PMTCT) among the child population is 8-10% in the general structure of mental illness (Kuznetsova L.M.). PMTCT of somatogenic genesis occurs in children with chronic somatic diseases of the heart, aorta and large vessels, lungs, kidneys, endocrine system, blood diseases and etc. Nervous system disorders in somatic diseases have much in common. Most often, at first they are functional, and then they turn into organic ones, due to metabolic disorders. And this, in turn, leads to a violation of the psychomotor development of children. There are many unexplored aspects of neurological pathology in somatic diseases in children. The problem of somatically caused disorders of psychomotor development in children is widely studied in our country. However, there is not enough data on the clinical manifestations, age characteristics of the dynamics of psychosomatic disorders in children. KEYWORDS: chronic gastritis, chronic cholecystitis, cardiovascular disease, chronic pyelonephritis, euthyroid goiter, hypothyroidism, epicrisis period.
ОСОБЕННОСТИ ПСИХОМОТОРНОГО РАЗВИТИЯ У ДЕТЕЙ С СОМАТИЧЕСКОЙ ОТЯГОЩЕННОСТЬЮ
Умида Таджимуратовна Бабаджанова Ассистент кафедры неврологии, детской неврологии и медицинской генетики,
Якутхон Набиевна Маджидова
Профессор, д.м.н., зав.кафедры неврологии, детской неврологии и медицинской
генетики, Ташкентский педиатрический медицинский институт. город Ташкент, Узбекистан.
Аннотация: Распространенность задержки психомоторного развития (ЗПМР) среди детского
населения составляет 8-10% в общей структуре психических заболеваний (Кузнецова Л.М.).
ЗПМР соматогенного генеза возникает у детей с хроническими соматическими заболеваниями
сердца, аорты и крупных сосудов, легких, почек, эндокринной системы, болезни крови и др.
Нарушения состояния нервной системы при соматических заболеваниях имеют много общего.
Чаще всего вначале они функциональные, а затем переходят в органические, обусловленные
метоболическими расстройствами. А это в свою очередь приводит к нарушению
психомоторного развития детей. Имеется немало не изученных сторон неврологической
ISSN (Online): 2455-3662
EPRA International Journal of Multidisciplinary Research (IJMR) - Peer Reviewed Journal Volume: 7| Issue: 9| September 2021|| Journal DOI: 10.36713/epra2013 || SJIF Impact Factor 2021: 8.047 || ISI Value: 1.188
2021 EPRA IJMR | www.eprajournals.com | Journal DOI URL: https://doi.org/10.36713/epra2013 384
патологии при соматических заболеваниях у детей. Проблема соматически обусловленных
нарушений психомоторного развития у детей широко изучается и в нашей стране. Однако
недостаточно данных, касающихся клинических проявлений, возрастных особенностей
динамики психосоматических расстройств у детей. Ключевые слова: хронический гастрит, хронический холецистит , заболевание
сердечнососудистой систем , хронический пиелонефрит , эутиреоидной зоб , гипотиреоз,
эпикризных срока.
Цель исследования: изучить особенности
психомоторного развития у больных детей с
соматической отягощенностью. Материалы и методы исследования: для
выполнения задач научного исследования была
создана выборка с выделением двух групп клинического наблюдения: 60 детей основной
группы с соматической патологией и 25 условно-здоровых детей группы сравнения. Исследование
проводилось в соматическом отделении в
клинике Ташкентский педиатрический
медицинский институт и 3-детской городской
больнице. Средний возраст детей в основной группе
был равен 14,0±9,3 мес, в группе сравнения – 13,6±9,7 месяцев (р>0,05). Среди обследованных
детей было 35 (58,3%) мальчиков и 25 девочки
(41,7%). Основную группу составили дети с
заболеваниями желудочно-кишечного тракта. Из
группы исследования были исключены дети с
острыми инфекционными воспалительными
заболеваниями, тяжелыми формами
хромосомных и генетических заболеваний,
врожденными пороками развития в стадии
декомпенсации. Всем детям проводилось общепринятое
клиническое обследование, включающее в себя
сбор жалоб и анамнеза, общий осмотр, клинико-неврологических и психодиагностических
исследований. Анамнестические сведения были
получены при приеме ребенка в отделение из
амбулаторной карты (учетная форма 112/у)
одновременно с активным опросом матери
ребенка. Для оценки психомоторного развития
детей мы использовали шкалу оценки нервно-психического развития Г. В. Пантюхиной - К. Л.
Печоры - Э.Л. Фрухт. При этом расценивали
отсутствие той или иной способности к
выполнению того или иного действия в
настоящем времени в 0 баллов, задержку
развития способности по сравнению с
возрастными нормативами на 2-3 эпикризных
срока в 1 балл, наличие исследуемого навыка
согласно возрастному нормативу в 2 балла. Статистическая обработка результатов
проведена с применением ПО Microsoft Office
Excel и Statistica. Результаты исследований и их обсуждение:
при изучения социального анамнеза нами был
выявлено, что каждый третий ребенок основной
группы имел умеренную отягощенность
социального анамнеза (36,7%), в то время как для
детей группы сравнения характерна низкая
отягощенность социального анамнеза (80%)
(р<0,05). При анализе биологического анамнеза, как
антенатальный период, было выявлено, что у
матерей больных детей экстрагенитальные
заболевания встречались в 64% случаев, а в
группе сравнения у 14,5% женщин (р<0,01).
Достоверно чаще отмечалась железа дефицитная
анемия (51,7%, р<0,01), хронический гастрит
(60%, р<0,01), хронический холецистит (20%,
р<0,05), заболевание сердечнососудистой систем
(3,3%, р<0,05), хронический пиелонефрит (31,7%,
р<0,05), эутиреоидной зоб (36,3%, р<0,01),
гипотиреоз (23,3%, р<0,01) у матерей больных
детей, в то время как у матерей детей группы
сравнения отмечалась железа дефицитная анемия
(6,6%, р<0,01) и гипотиреоз (9,3%, р<0,01).
Частота раннего токсикоза беременных среди
матерей детей основной группы составила
(51,7%, р<0,01), позднего токсикоза (18,3%,
р<0,01), гестоз беременных (6,7%, р<0,01) а среди
матерей детей группы сравнения выявилась
только раннего токсикоза (6%, р<0,01). При этом
не было тяжелых форм раннего токсикоза,
требующих госпитализации. Патологическое
течение беременности в виде угрозы прерывания
(10% р<0,05) матери детей основной группы, у
женщин детей группы сравнения не выявлено.
При анализе особенностей интранатального
периода нами было выявлено, что течение родов
у матерей детей основной группы осложнилось
слабостью родовых сил (35,6%, р<0,01) и
кровотечением в послеродовом периоде (4,6%,
р<0,05). Высокий процент кесарева сечения
наблюдался у матерей детей основной группы по
отношению к матерям детей группы сравнения
(21,7%, р<0,05). При изучения клинико-неврологическое
особенности больных детей было выявлено
синдром двигательных нарушений 10%, синдром
нервно-рефлекторных возбудимость 20%,
миотонический синдром 11,70%, вегета-висцеральный синдром 18,30%, синдром ММД
28,3% и церебрастенический синдром 31,7% .
ISSN (Online): 2455-3662
EPRA International Journal of Multidisciplinary Research (IJMR) - Peer Reviewed Journal Volume: 7| Issue: 9| September 2021|| Journal DOI: 10.36713/epra2013 || SJIF Impact Factor 2021: 8.047 || ISI Value: 1.188
2021 EPRA IJMR | www.eprajournals.com | Journal DOI URL: https://doi.org/10.36713/epra2013 385
Задержка психомоторного развития на 1
эпикризный срок в основной группе выявилась 34
больных детям (57%), из которых 19 (32%)
мальчиков, 15 (25%) девочек. Задержка
психомоторного развития на 1 эпикризный срок в
контрольной группе составили 4 (16%) дети. Суммарная балльная оценка позволяет
обобщенно оценить развитие высших
психических функций. Нас также интересовала количественная оценка по каждому отдельному
параметру. В результате количественной оценки
психомоторного развития больных детей мы
установили, что степень задержки варьирует по
различным показателям развития ВПФ. Задержка становления моторной функции
у детей основных групп в среднем составляла 1
эпикризных срока. У детей основных групп
крупной моторики оценивалось в 1,59 баллов,
группа сравнения – в 1,93 балла (р>0,05),
развитие мелкой моторики в 1,49 баллов, группа
сравнения – в 1,84 балла (р>0,05). При оценке
функции речи, мы установили, что в большей
степени страдает функция активной речи, чем ее
понимание. Во время обследования мы получили
более низкую оценку формирования активной
речи. Средняя оценка функции активной речи у
больных детей была 1,36 – 1,49 баллов. У детей
группа сравнения активная речь оценивалось в
1,89 баллов (р>0,001). Функция способность к
пониманию речи, у больных детей формировался
с запозданием, в среднем на 1-2 эпикризных
срока, средняя оценка составляет 1,4 – 1,6 баллов
(р>0,05). У детей группы контроля пассивная
речь оценивалась на 1,9 баллов (р<0,001). При
диагностике сенсорного развития детей
основных групп формировалось с отставанием на
1 эпикризных срока по отношению к детям
группы сравнения (р>0,05). Приобретение
социальных навыков, развитие способностей к
игре детей основных групп формировалось с
отставанием на 1 эпикризных срока по
отношению к детям группы сравнения (р>0,05).
При изучении становления эмоциональной сферы
статистически достоверно различалась. У детей
основных групп преобладали негативные эмоции по отношению к детям группы сравнения, средний балл составлял 1,6 – 1,8 (р>0,05).
Таким образом, проведение
количественной оценки становления ВПФ у детей
позволяет нам определить, какие функции
страдают в большей степени, а значит, требуют
большей коррекции. Результаты по данным
психодиагностической методике показали
задержку сенсорного, речевого развития и
нарушение мелкой моторики. Выводы: соматические заболевания у
детей могут приводить к поражению нервной
системы в результате гипоксии в условиях
неустойчивого гомеостаза. Неустойчивость
гомеостаза особенно характерна для детей
перенесших перинатальную гипоксию, у которых
поражение нервной системы при соматических
заболеваниях возникает быстрее и отличается
относительной устойчивостью. Литература
1. Carabotti M, Scirocco A, Maselli MA, Severi C. The gut-brain axis: interactions between enteric microbiota, central and enteric nervous systems. Ann Gastroenterol. 2015;28(2):203–209.
2. J. A. Gilbert, M. J. Blaser, J. G. Caporaso, J. K. Jansson, S. V. Lynch, and R. Knight, ―Current
understanding of the human microbiome,‖ Nature Medicine, vol. 24, no. 4, pp. 392–400, 2018.
3. The Human Microbiome Project Consortium, ―Structure, function and diversity of the healthy human microbiome,‖ Nature, vol. 486, no. 7402, pp. 207–214, 2012
4. S. M. Jandhyala, R. Talukdar, C. Subramanyam, H. Vuyyuru, M. Sasikala, and D. Nageshwar Reddy, ―Role of the normal gut
microbiota,‖ World Journal of Gastroenterology, vol. 21, no. 29, pp. 8787–8803, 2015.
5. Демкина В.А., Воробьева H.JI., Шабалина
C.B. Частота выявления и уровень IgM
антител к основному белку миелина у
больных рассеянным склерозом//Аллергология
и иммунология, 2007 — Т.8, № 3. - с. 316.
ISSN (Online): 2455-3662
EPRA International Journal of Multidisciplinary Research (IJMR) - Peer Reviewed Journal Volume: 7| Issue: 9| September 2021|| Journal DOI: 10.36713/epra2013 || SJIF Impact Factor 2021: 8.047 || ISI Value: 1.188
2021 EPRA IJMR | www.eprajournals.com | Journal DOI URL: https://doi.org/10.36713/epra2013 386
REINFORCED CONCRETE POST WITHOUT FORMWORK FOR POWER LINE POLES WITH A
VOLTAGE OF 0.4 - 10 kV
Zulaykho Shamansurova1, Pulat Mirzaev2 1Master Student, Assistant, Department of Building Structures,
Faculty of Construction of Buildings and Structures, Tashkent Institute of Architecture and Civil Engineering
2Candidate of Technical Sciences, Professor, Department of Building Structures,
Faculty of Construction of Buildings and Structures, Tashkent Institute of Architecture and Civil Engineering
ABSTRACT When using the technology of mold residues for the production of reinforced concrete structures, industrial construction can be carried out in accordance with the requirements of modern regulations. This allows projects to be developed individually, and production can be readjusted in a short time in accordance with emerging needs. In this regard, the possibility of using reinforced concrete racks produced by the technology of stand-off formwork for high-voltage lines is being considered. The goal is to develop a design of pre stressed stands for stand-off formwork on a standard basis of the product range for overhead line supports with a voltage of 0.4 ... 10 kV. This base consists of 16 brands of racks, 11 metal forms are used for their manufacture. The problem of establishing the minimum number (two) of cross-sections with different geometric dimensions for all brands of the offered racks has been solved, subject to the operational requirements and technological conditions of production. The proposed racks are reinforced only with high-strength wire reinforcement of the Br1400 class with a diameter of 5 mm (limitation of the technology of stand-off formwork molding), therefore, during their operation, the formation of cracks in the stretched zone is not provided. Qualitative features of racks for overhead transmission lines: low material consumption, versatility, manufacturability, innovation, which lies in the fact that their implementation is associated with the design, manufacture and testing of experimental products for use by specific consumers, i.e. commercialization. KEYWORDS: post, form-less forming, cross-sectional configuration, tensile wire reinforcement, strength, fracture toughness.
INTRODUCTION
When using modern technologies in the design and construction of a power transmission line, the costs of the construction and operation of such a line are reduced, the service life of building structures of the structure and their reliability are increased, the number of structure failures is reduced, leading to material losses from a decrease in the transit of electricity to consumers [1].
The technology of manufacturing reinforced concrete structures of stand-off formwork is progressive and is used in the construction industry in economically developed countries. When using this technology, industrial construction can be carried out in accordance with the requirements of modern regulatory documents, which allow projects to be developed individually, and the production of structures can be reoriented in a very short time in
accordance with emerging needs. This means that different structural elements of buildings and structures can be produced on the same production line.
Features of non-form-forming structures are the absence of: transverse reinforcement, meshes, indirect reinforcement at the ends, reinforcement outlets, slinging loops, which is associated with the technology of manufacturing such structures. For example, for the manufacture of one linear meter of hollow-core floor slabs of stand-off formwork, 2.5 less metal is required in comparison with the manufacture according to the traditional scheme of aggregate-flow technology [2].
In Uzbekistan, the production of pre stressed hollow-core slabs of coverings, manufactured on the lines of stand-off formwork, has been established,
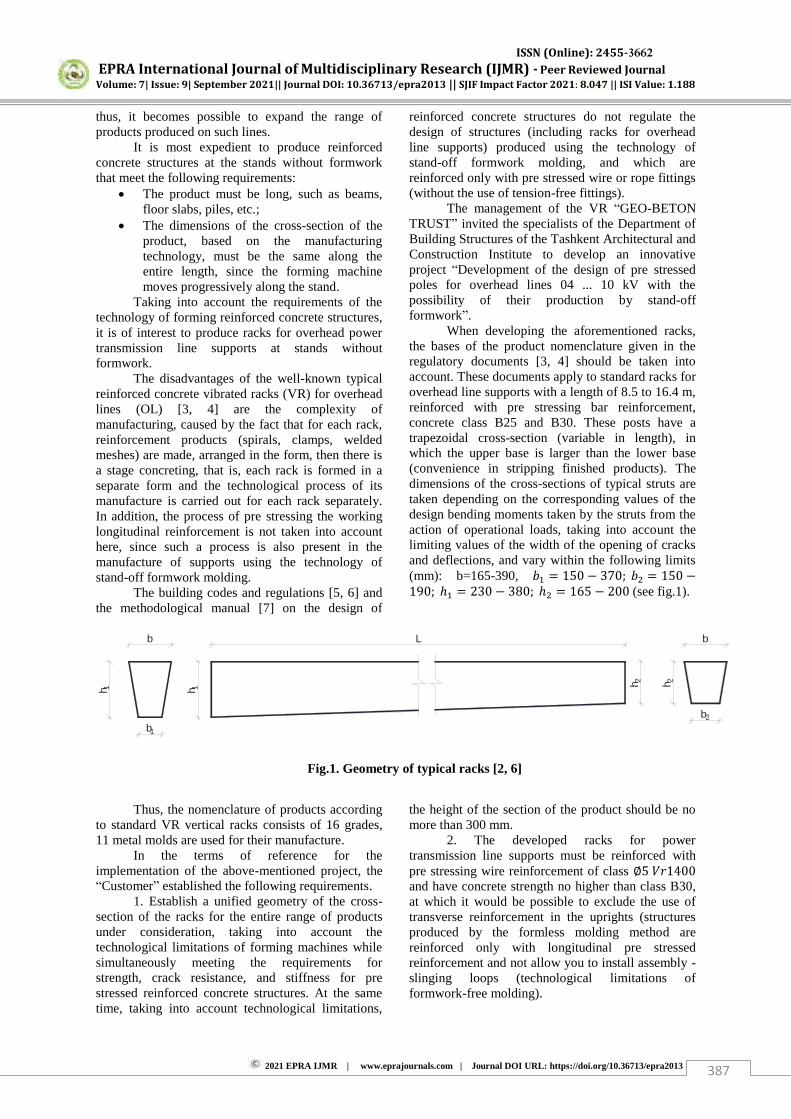
ISSN (Online): 2455-3662
EPRA International Journal of Multidisciplinary Research (IJMR) - Peer Reviewed Journal Volume: 7| Issue: 9| September 2021|| Journal DOI: 10.36713/epra2013 || SJIF Impact Factor 2021: 8.047 || ISI Value: 1.188
2021 EPRA IJMR | www.eprajournals.com | Journal DOI URL: https://doi.org/10.36713/epra2013 387
thus, it becomes possible to expand the range of products produced on such lines.
It is most expedient to produce reinforced concrete structures at the stands without formwork that meet the following requirements:
The product must be long, such as beams, floor slabs, piles, etc.;
The dimensions of the cross-section of the product, based on the manufacturing technology, must be the same along the entire length, since the forming machine moves progressively along the stand.
Taking into account the requirements of the technology of forming reinforced concrete structures, it is of interest to produce racks for overhead power transmission line supports at stands without formwork.
The disadvantages of the well-known typical reinforced concrete vibrated racks (VR) for overhead lines (OL) [3, 4] are the complexity of manufacturing, caused by the fact that for each rack, reinforcement products (spirals, clamps, welded meshes) are made, arranged in the form, then there is a stage concreting, that is, each rack is formed in a separate form and the technological process of its manufacture is carried out for each rack separately. In addition, the process of pre stressing the working longitudinal reinforcement is not taken into account here, since such a process is also present in the manufacture of supports using the technology of stand-off formwork molding.
The building codes and regulations [5, 6] and the methodological manual [7] on the design of
reinforced concrete structures do not regulate the design of structures (including racks for overhead line supports) produced using the technology of stand-off formwork molding, and which are reinforced only with pre stressed wire or rope fittings (without the use of tension-free fittings).
The management of the VR “GEO-BETON TRUST” invited the specialists of the Department of Building Structures of the Tashkent Architectural and Construction Institute to develop an innovative project “Development of the design of pre stressed poles for overhead lines 04 ... 10 kV with the possibility of their production by stand-off formwork”.
When developing the aforementioned racks, the bases of the product nomenclature given in the regulatory documents [3, 4] should be taken into account. These documents apply to standard racks for overhead line supports with a length of 8.5 to 16.4 m, reinforced with pre stressing bar reinforcement, concrete class B25 and B30. These posts have a trapezoidal cross-section (variable in length), in which the upper base is larger than the lower base (convenience in stripping finished products). The dimensions of the cross-sections of typical struts are taken depending on the corresponding values of the design bending moments taken by the struts from the action of operational loads, taking into account the limiting values of the width of the opening of cracks and deflections, and vary within the following limits (mm): b=165-390, (see fig.1).
h 1
b
b1
L
h 1 h 2 h 2
b
b2
Fig.1. Geometry of typical racks [2, 6]
Thus, the nomenclature of products according
to standard VR vertical racks consists of 16 grades, 11 metal molds are used for their manufacture.
In the terms of reference for the implementation of the above-mentioned project, the “Customer” established the following requirements.
1. Establish a unified geometry of the cross-section of the racks for the entire range of products under consideration, taking into account the technological limitations of forming machines while simultaneously meeting the requirements for strength, crack resistance, and stiffness for pre stressed reinforced concrete structures. At the same time, taking into account technological limitations,
the height of the section of the product should be no more than 300 mm.
2. The developed racks for power transmission line supports must be reinforced with pre stressing wire reinforcement of class and have concrete strength no higher than class B30, at which it would be possible to exclude the use of transverse reinforcement in the uprights (structures produced by the formless molding method are reinforced only with longitudinal pre stressed reinforcement and not allow you to install assembly - slinging loops (technological limitations of formwork-free molding).
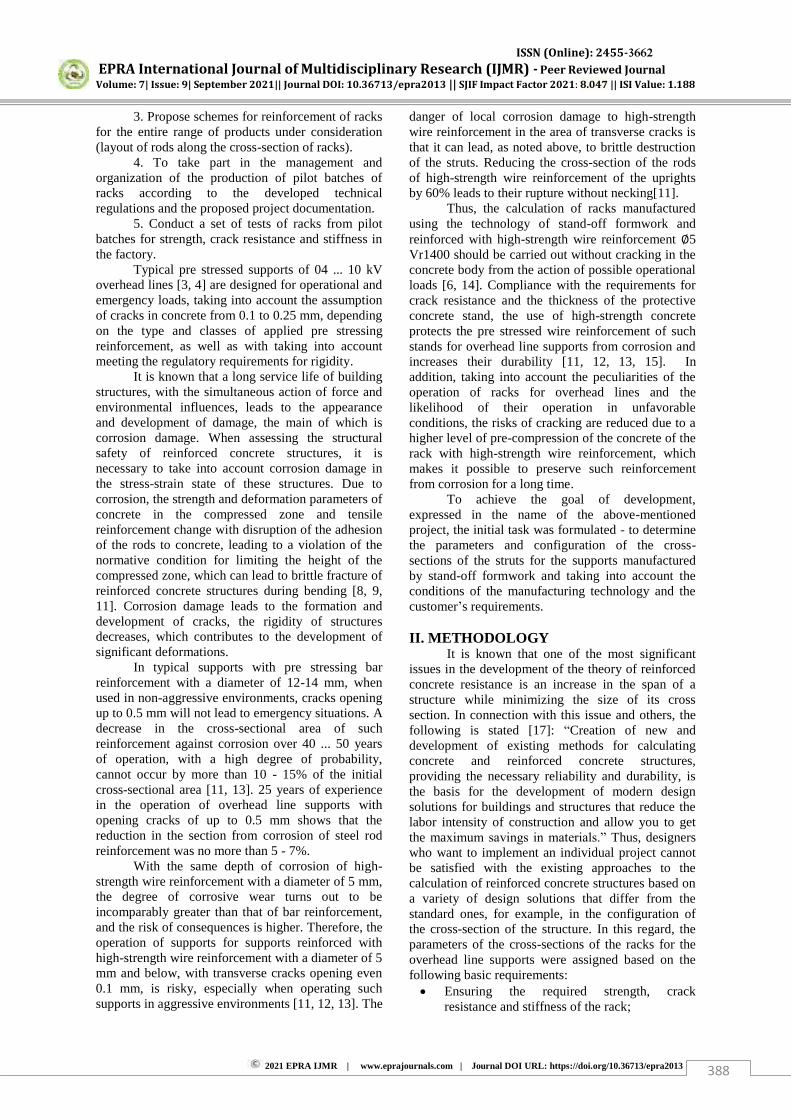
ISSN (Online): 2455-3662
EPRA International Journal of Multidisciplinary Research (IJMR) - Peer Reviewed Journal Volume: 7| Issue: 9| September 2021|| Journal DOI: 10.36713/epra2013 || SJIF Impact Factor 2021: 8.047 || ISI Value: 1.188
2021 EPRA IJMR | www.eprajournals.com | Journal DOI URL: https://doi.org/10.36713/epra2013 388
3. Propose schemes for reinforcement of racks for the entire range of products under consideration (layout of rods along the cross-section of racks).
4. To take part in the management and organization of the production of pilot batches of racks according to the developed technical regulations and the proposed project documentation.
5. Conduct a set of tests of racks from pilot batches for strength, crack resistance and stiffness in the factory.
Typical pre stressed supports of 04 ... 10 kV overhead lines [3, 4] are designed for operational and emergency loads, taking into account the assumption of cracks in concrete from 0.1 to 0.25 mm, depending on the type and classes of applied pre stressing reinforcement, as well as with taking into account meeting the regulatory requirements for rigidity.
It is known that a long service life of building structures, with the simultaneous action of force and environmental influences, leads to the appearance and development of damage, the main of which is corrosion damage. When assessing the structural safety of reinforced concrete structures, it is necessary to take into account corrosion damage in the stress-strain state of these structures. Due to corrosion, the strength and deformation parameters of concrete in the compressed zone and tensile reinforcement change with disruption of the adhesion of the rods to concrete, leading to a violation of the normative condition for limiting the height of the compressed zone, which can lead to brittle fracture of reinforced concrete structures during bending [8, 9, 11]. Corrosion damage leads to the formation and development of cracks, the rigidity of structures decreases, which contributes to the development of significant deformations.
In typical supports with pre stressing bar reinforcement with a diameter of 12-14 mm, when used in non-aggressive environments, cracks opening up to 0.5 mm will not lead to emergency situations. A decrease in the cross-sectional area of such reinforcement against corrosion over 40 ... 50 years of operation, with a high degree of probability, cannot occur by more than 10 - 15% of the initial cross-sectional area [11, 13]. 25 years of experience in the operation of overhead line supports with opening cracks of up to 0.5 mm shows that the reduction in the section from corrosion of steel rod reinforcement was no more than 5 - 7%.
With the same depth of corrosion of high-strength wire reinforcement with a diameter of 5 mm, the degree of corrosive wear turns out to be incomparably greater than that of bar reinforcement, and the risk of consequences is higher. Therefore, the operation of supports for supports reinforced with high-strength wire reinforcement with a diameter of 5 mm and below, with transverse cracks opening even 0.1 mm, is risky, especially when operating such supports in aggressive environments [11, 12, 13]. The
danger of local corrosion damage to high-strength wire reinforcement in the area of transverse cracks is that it can lead, as noted above, to brittle destruction of the struts. Reducing the cross-section of the rods of high-strength wire reinforcement of the uprights by 60% leads to their rupture without necking[11].
Thus, the calculation of racks manufactured using the technology of stand-off formwork and reinforced with high-strength wire reinforcement 5 Vr1400 should be carried out without cracking in the concrete body from the action of possible operational loads [6, 14]. Compliance with the requirements for crack resistance and the thickness of the protective concrete stand, the use of high-strength concrete protects the pre stressed wire reinforcement of such stands for overhead line supports from corrosion and increases their durability [11, 12, 13, 15]. In addition, taking into account the peculiarities of the operation of racks for overhead lines and the likelihood of their operation in unfavorable conditions, the risks of cracking are reduced due to a higher level of pre-compression of the concrete of the rack with high-strength wire reinforcement, which makes it possible to preserve such reinforcement from corrosion for a long time.
To achieve the goal of development, expressed in the name of the above-mentioned project, the initial task was formulated - to determine the parameters and configuration of the cross-sections of the struts for the supports manufactured by stand-off formwork and taking into account the conditions of the manufacturing technology and the customer’s requirements.
II. METHODOLOGY
It is known that one of the most significant issues in the development of the theory of reinforced concrete resistance is an increase in the span of a structure while minimizing the size of its cross section. In connection with this issue and others, the following is stated [17]: “Creation of new and development of existing methods for calculating concrete and reinforced concrete structures, providing the necessary reliability and durability, is the basis for the development of modern design solutions for buildings and structures that reduce the labor intensity of construction and allow you to get the maximum savings in materials.” Thus, designers who want to implement an individual project cannot be satisfied with the existing approaches to the calculation of reinforced concrete structures based on a variety of design solutions that differ from the standard ones, for example, in the configuration of the cross-section of the structure. In this regard, the parameters of the cross-sections of the racks for the overhead line supports were assigned based on the following basic requirements: Ensuring the required strength, crack
resistance and stiffness of the rack;
ISSN (Online): 2455-3662
EPRA International Journal of Multidisciplinary Research (IJMR) - Peer Reviewed Journal Volume: 7| Issue: 9| September 2021|| Journal DOI: 10.36713/epra2013 || SJIF Impact Factor 2021: 8.047 || ISI Value: 1.188
2021 EPRA IJMR | www.eprajournals.com | Journal DOI URL: https://doi.org/10.36713/epra2013 389
The manufacture of a product (rack) must be versatile and technologically advanced. The factor of versatility of racks for supports
of overhead lines without formwork is the ability to produce products (racks) of any length and operational loads required for the consumer. From the standpoint of the innovative implementation of overhead line supports, manufacturability is the ability to produce products (stands) on an industrial scale with modern equipment (stand-off mold lines) with transformed geometric parameters of standard racks that do not worsen their strength and stiffness parameters [16].
Under operational loads, alternating forces (bending moments) appear in the section of the struts for the overhead line supports, therefore, the reinforcement scheme of its section is assumed to be symmetric. In this case, the rods of the pre stressed wire reinforcement are located on all corner sections of the rack section in groups with the same number of rods in each group (by analogy with the location of the pre stressed rod reinforcement at the cross-section corners of typical vibrated racks VR.
Thus, the shape and dimensions of the cross-section of the racks depend on:
the area of the corner sections of the section with the largest number of rods in the “group”, taking into account the fact that the transfer strength of concrete (concrete strength at the moment of its compression) should be called at least 15 MPa and at least 50% of the accepted class of concrete in terms of compressive strength [7];
the thickness of the concrete protective layer, which protects the stress-strain wire reinforcement of the rack from corrosion;
strength and crack resistance of the rack section;
Limitation of the technology of manufacturing structures by stand-off formwork molding along the height of the product.
The action of operational loads on the rack causes bending and, to a lesser extent, torques in it (the value of the ratio of torque to bending is in the range of 0.1 ... 0.4) [17]. Considering this specificity of the work of reinforced concrete racks for overhead line supports, the cross section of the proposed racks is left in the form of a trapezoid (quadrangle). The difference in comparison with the cross-sectional shape of a typical VR post is as follows: a larger size of the lower base of the trapezoidal cross-sectional shape is adopted as compared to the upper one. This cross-sectional shape was adopted with the need to establish the invariability of the shape of the freshly
formed concrete body of the rack, manufactured using stand-off formwork technology.
The calculation of the supports of overhead lines, manufactured using the technology of stand-off formwork molding, and reinforced with wire reinforcement of the class , was carried out without the formation of cracks in the concrete body from the action of possible operational loads according to [6, 15]. In this case, the deflections of the racks when checking the calculated control load in terms of rigidity are less than the values of the control deflections of typical racks [3] from 4.5 to 7.6 times (depending on the brands of racks under consideration).
For racks up to 11.0 m long, a solid trapezoidal section is proposed (h = 245 mm, b = 150 mm - upper base; b1 = 180 mm - lower base).
For racks with a length of 11.0 to 16.4 m, a trapezoidal section is also proposed (h = 300 mm, b = 205 mm; b1 = 235 mm), but a cavity is provided along the entire length of the racks in the middle of the cross section of these racks.
It is known that concrete in the middle part with respect to the cross-section of reinforced concrete bending elements remains underutilized. Therefore, the design principle of floor slabs with different cross-sectional shapes is to exclude the maximum volume of concrete from the stretched section zone, leaving vertical ribs to ensure the strength of the slab along inclined sections [18]. The same factor is probably manifested in the reinforced concrete pillar of the overhead line support, if a cavity is placed along the entire length of the pillar in the middle part relative to its cross section. This cavity (void) does not impair the strength and stiffness characteristics of the proposed racks for the entire range of products under consideration. Thus, reducing the material consumption of the rack without reducing its strength ensures the economic efficiency of the structure.
It is known from the experience of designing hollow-core floor slabs that with an increase in the degree of hollowness of the slabs in excess of the “criterial value”, the bearing capacity of the slabs along normal sections is significantly reduced, due to the transition of the neutral line into the inter-cavity partitions (ribs) of the slab, as well as the strength along the inclined sections on the supporting sections of the slabs, in addition, the deformability of the slabs increases, i.e., its rigidity decreases. The same phenomenon appears in the hollow strut. Based on this reasoning, the solution of the problem under consideration is concretized. In addition, there is no need to find the optimal combination of the height and configuration parameters of the cross-section of the rack, since the criterion for the height of the cross-section is given.
ISSN (Online): 2455-3662
EPRA International Journal of Multidisciplinary Research (IJMR) - Peer Reviewed Journal Volume: 7| Issue: 9| September 2021|| Journal DOI: 10.36713/epra2013 || SJIF Impact Factor 2021: 8.047 || ISI Value: 1.188
2021 EPRA IJMR | www.eprajournals.com | Journal DOI URL: https://doi.org/10.36713/epra2013 390
205
235
300
160
60
25
ï î ëî ðòü
î òâ. äëÿðòðî ï î âêè
ï àç
à)á)
15024
5
180
Fig. 2. Proposed cross-sections of stands of stand-off formwork for overhead lines with a voltage of 0.4 ...
10 kV and length: a) from 8.5 to 11.0 m; b) from 11 to 16.4 m.
III. CONCLUSIONS 1. For the reinforcement of the proposed racks
across the entire range of products of stand-off formwork molding, 2.3 times less reinforcing steel is consumed than for typical vibrated racks throughout the range of products given in [3, 4].
2. The production of racks using the technology of stand-off formwork for overhead transmission lines is characterized by the following advantages over the production of vibrated racks (VR) according to the standard base of the nomenclature of products [3, 4].
cheaper product cost; versatility and manufacturability; Guaranteed quality of products. 3. The proposed cross-section of hollow racks
produced by stand-off formwork for overhead lines with a voltage of 0.4 ... 10 kV is declared in the Intellectual Property Agency of the Republic of Uzbekistan as a utility model with a priority date of 01.21.2020 (FAP 2020 0007).
4. Design documentation has been prepared and a draft technical specification has been developed for the production of stand-off formwork stands according to the proposed product range.
5. Work is underway to solve the following tasks on the problem under consideration:
assessment of fracture toughness and strength by control tests of racks from pilot production batches for the possibility of producing racks of stand-off formwork for overhead transmission lines in an industrial scale;
Optimization of the consumption of high-strength wire reinforcement for racks of different lengths at different values of operational loads outside the standard base of the product range [3].
Based on the results of these works, an article will be prepared for publication.
REFERENCES
1. Fursanov M. I., Sazonov P. A. Analysis of the effectiveness of using composite supports in electrical networks of the Republic of Belarus. Energy. Proceedings of higher educational institutions and power engineering associations of the CIS, Minsk, T. 62, no. 1 (2019), - p. 15-23
2. Blajko V.P. On the use of hollow-core slabs without formwork in panel and frame buildings, Housing Construction, Moscow, 2013.No. 2 – 3, - p. 7 - 10
3. Racks reinforced concrete vibrated for supports of overhead lines 0.4 ... 10 kV. Technical conditions TU 5863-007-00113557-94. RAO “UES of Russia.”
Moscow: 4. Racks reinforced concrete prestressed
vibrated for supports of overhead power lines with a voltage of 0.4 ... 10 kV. State standard UzDSt 3062: 2016. Tashkent:
5. KMK 2.03.01-96. Concrete and reinforced concrete structures, (Building regulations), Tashkent:
6. SP 63.13330.2012. Concrete and reinforced concrete structures, Moscow,
7. Methodological guide for the calculation of prestressed reinforced concrete structures. Benefit to SP 63.13330. Central Research Institute of Industrial Buildings JSC, Moscow: 2015”.
8. Merkulov S.I. Constructive safety of operational reinforced concrete structures. Industrial and civil construction. Moscow: 2009. No. 4. - pp. 53-54.
9. Bondarenko V.M. Corrosion damage as a cause of avalanche destruction of reinforced concrete structures. Structural mechanics and calculation of structures, Moscow: 2009. No. 5. - p. 13-17.
ISSN (Online): 2455-3662
EPRA International Journal of Multidisciplinary Research (IJMR) - Peer Reviewed Journal Volume: 7| Issue: 9| September 2021|| Journal DOI: 10.36713/epra2013 || SJIF Impact Factor 2021: 8.047 || ISI Value: 1.188
2021 EPRA IJMR | www.eprajournals.com | Journal DOI URL: https://doi.org/10.36713/epra2013 391
10. Bondarenko V.M., Kolchunov V.I.Concepts and directions of development of the theory of constructive safety of buildings and structures under power and environmental influences. Industrial and civil construction. Moscow: 2013. No. 2. - p. 28-21.
11. Kudryavtsev A.A. Bearing capacity of support structures of the contact network. Moscow: Transport. 1988. –p. 160.
12. Ovchinnikov I.I. Modeling the kinetics of deformation of structures in special operating environments. Monograph. Penza: PGUAS. 2014. –p. 280. ISBN 978-5-9282-1139-4
13. Ovchinnikov I.I.Modeling the kinetics of deformation of structures in special operating environments. Monograph. Penza: PGUAS. 2014. –p. 280. ISBN 978-5-9282-1139-4,
14. Shchutskiy V.L., Shilov A.V., Talipova TD Strength of conical supports of power transmission lines taking into account the restrictions on the second group of limiting states. Internet magazine “Science of Science”, http // naukovedenie. Volume 8, No. 2 (March-April 2016). 29 TVN 2016. –pp. . 1 - 10.
15. Moskvin V.M., Ivanov F.I., Alekseev S.N., Guzeev E.A.Corrosion of concrete and reinforced concrete, methods of their protection. Moscow: Sroyizdat. 1980. –p. 536.
16. Kodysh E. N. Trekin N. N. Improvement of the normative base for the design of reinforced concrete structures. Industrial and civil construction. Moscow: 2016. No. 6. -pp. 25 - 28.
17. Korotkevich M. A. Design of power transmission lines. Mechanical part / M, A. Korotkevich. – Minsk: Graduate School, 2010, –p. 574.
18. Kodysh E. M., Nikitin N. K., Trekin N. N. Calculation of reinforced concrete structures from heavy concrete in terms of strength, crack resistance and deformations. Moscow: ASV. 2010. –p. 352 .
ISSN (Online): 2455-3662
EPRA International Journal of Multidisciplinary Research (IJMR) - Peer Reviewed Journal Volume: 7| Issue: 9| September 2021|| Journal DOI: 10.36713/epra2013 || SJIF Impact Factor 2021: 8.047 || ISI Value: 1.188
2021 EPRA IJMR | www.eprajournals.com | Journal DOI URL: https://doi.org/10.36713/epra2013 392
CONVULSIVE SYNDROME OF POSTPONED ENCEPHALITIS
Y.N, Madjidova1, K.M. Dalimova2
1Doctor of Medical Sciences, Professor, Head of the Department of Neurology, Pediatric Neurology and Medical Genetics, TashPMI,
2Andijan State Medical Institute (Uzbekistan)
ABSTRACT The urgency of the problem of acute encephalitis and meningoencephalitis in children is determined by the severity of the course, a high probability of adverse outcomes such as disability and neurological consequences, as well as significant mortality among children who become ill.An in-depth examination of these patients is carried out by neurologists and infectious disease specialists, but every practicing pediatrician should suspect this pathology in children. As is often the case in infectious diseases, timely diagnosis and referral to specialized infectious or neurological departments contribute to the appointment of timely and adequate therapy and can even cope with severe forms of encephalitis, minimizing the effects of past diseases. If 30 years ago it was only possible to ascertain the etiology of encephalitis, then at present there are effective antiviral drugs for the etiotropic treatment of this group of patients. New possibilities ofdiagnosing encephalitis using serological and instrumental methods of examination, which are increasingly being introduced into clinical practice, have been developed.Special emphasis in the educational-methodical manual is made on the clinical and diagnostic aspects of encephalitis of various etiologies. KEYWORDS: convulsive syndrome, encephalitis, epilepsy, infectious diseases.
СУДОРОЖНЫЙ СИНДРОМ ПЕРЕНЕСЕННОГО ЭНЦЕФАЛИТА
Я.Н. Маджидова д.м.н., профессор, заведующая кафедрой Неврологии, детской неврологии и
медицинской генетики ТашПМИ,
К.М. Далимова Андижанский Государственный медицинский институт (Узбекистан)
Аннотация Актуальность проблемы острых энцефалитов и менингоэнцефалитов у определяется
тяжестью течения, высокой вероятностью развития неблагоприятных исходов в виде
инвалидности и неврологических последствий, а также значительной летальностью среди
заболевших детей. Углубленное обследование этих больных проводят врачи-неврологи и
инфекционисты, но заподозрить данную патологию у детей должен каждый
практикующий врач-педиатр. Как это часто бывает при инфекционной патологии,
своевременная постановка диагноза и направление в специализированные инфекционное или
ISSN (Online): 2455-3662
EPRA International Journal of Multidisciplinary Research (IJMR) - Peer Reviewed Journal Volume: 7| Issue: 9| September 2021|| Journal DOI: 10.36713/epra2013 || SJIF Impact Factor 2021: 8.047 || ISI Value: 1.188
2021 EPRA IJMR | www.eprajournals.com | Journal DOI URL: https://doi.org/10.36713/epra2013 393
неврологическое отделения способствуют назначению своевременной адекватной терапии
и позволяют справиться даже с тяжелыми формами энцефалитов, минимизируя
последствия перенесенных заболеваний. Если 30 лет назад можно было только
констатировать этиологию энцефалита, то в настоящее время есть эффективные
противовирусные препараты для этиотропного лечения этой группы больных. Разработаны
и новые возможности диагностики энцефалитов с использованием серологических и
инструментальных методов обследования, которые все шире внедряются в клиническую
практику. Особый акцент в учебно-методическом пособии сделан на
клиникодиагностические аспекты энцефалитов различной этиологии. Ключевые слова: судорожный синдром, энцефалит, эпилепсия, инфекционные болезни. Актуальность исследования. Среди всех
вирусных нейроинфекций доля острых
вирусных энцефалитов составляет около 20%.
Заболеваемость острыми вирусными
энцефалитами в мире колеблется от 4 до 7,5
на 100.000 детского населения. Согласно
данным ВОЗ, 75% всех случаев вирусных
поражений ЦНС приходятся на детей до 14
лет[1,3,7]. Актуальность изучения проблемы
вирусных энцефалитов обусловлена особой
тяжестью данной патологии у детей, высоким
уровнем летальности (1020%) и большой
частотой неврологических осложнений с
однозначно неблагоприятным
прогнозом[2,4,9,11].Острые вирусные
энцефалиты относятся к заболеваниям,
требующим проведения экстренных лечебных
вмешательств и, соответственно, раннего
установления диагноза.Клиника различных
этиологических форм острых вирусных
энцефалитов на начальном этапе во многом
сходна между собой и целым рядом
заболеваний ЦНС. Примерно в половине
случаев острые вирусные энцефалиты
манифестируют с судорог[2,5,7,13].
Дифференцировать этиологию при таком
дебюте болезни крайне сложно, так как
предположить этиологию процесса при остром появленииневрологической симптоматики
возможно лишь при наличии определенного
эпидемиологического анамнеза, сведений о
перенесенной накануне острой вирусной
инфекции. Наличие этих симптомов не
обязательно означает инфекционный генез и
может быть случайным совпадением, также как
отсутствие общеинфекционных признаков не
исключает отсутствия воспалительных
изменений в мозге. Все это определяет
необходимость применения целого комплекса
методов: клинических, иммунологических,
вирусологических, специальных методов
обследования неврологического статуса и ряда
других для постановки правильного
диагноза[4,6,8,12]. Исходы острых вирусных энцефалитов, как
непосредственные так и отдаленные, в настоящее
время нередко неблагоприятны. Наряду с
высокой летальностью, у большого числа детей,
больных острыми вирусными энцефалитами,
отмечаются инвалидизирующие исходы, что
диктует необходимость расширения наших
знаний о патогенезе этого заболевания[6,9,12].В
последние годы установлено, что при острых
вирусных энцефалитах имеет место срыв
вирусными антигенами иммунологической
толерантности к основному белку миелина - главному составляющему нервного волокна.
Однако клиническая оценка данного факта до
настоящего времени не дана. Ранее было
показано, что общие с энцефалитогенной
основного белка миелина антигенные
детерминанты выявлены у вирусов
герпетической группы, краснухи, аденовирусов и
др. Ключевым моментом патогенеза вирусных
энцефалитов является выраженное
аллергическое воспаление. Важно отметить,
что вирусы обладают способностью резко ослаблять функции иммунной системы,
вызывая иммунный дисбаланс. В связи с этим
можно полагать, что в развитии
иммунопатологических реакций в ЦНС при
острых вирусных энцефалитах принимает участие
IgE система иммунитета. Не исключено, что в
определенных условиях это может стать
причиной аутоиммунных демиелинизирующих
процессов, частота и степень выраженности
которых у детей до настоящего времени не
определены. Цель исследования. Выявление клинико-иммунологических особенностей острых
вирусных энцефалитов различной этиологии у
детей. Материалы и методы. Работа основана на
данных анализа клинико-иммунологической картины течения острых вирусных энцефалитов
(ОВЭ) у 125 детей в возрасте от 6 мес. до 15
лет, наблюдавшихся в отделениях острых
нейроинфекций клинике АГМИ г Андижане.
Среди обследованных детей мальчики составили
55,2% (69 чел.), девочки 44,8% (56 чел.).
Использование иммунологических и
иммуногенетических методов позволило
установить этиологию ОВЭ у 94 пациентов: у
25 больных был диагностирован герпетический
ISSN (Online): 2455-3662
EPRA International Journal of Multidisciplinary Research (IJMR) - Peer Reviewed Journal Volume: 7| Issue: 9| September 2021|| Journal DOI: 10.36713/epra2013 || SJIF Impact Factor 2021: 8.047 || ISI Value: 1.188
2021 EPRA IJMR | www.eprajournals.com | Journal DOI URL: https://doi.org/10.36713/epra2013 394
энцефалит, у 33 - краснушный энцефалит, у
26 -ветряночный энцефалит, у 10 - паротитный энцефалит и у 31 больного
этиология энцефалита осталась неуточненной. Результаты исследования и их обсуждение. Клиническая характеристика больных острыми вирусными энцефалитами. К
наиболее тяжелым вирусным поражениям
головного мозга, по нашим данным, относится
герпетический энцефалит. Образование некрозов,
главным образом в лобных и височно-теменных
долях мозга, предопределяет клинические
проявления заболевания в виде изменения
сознания, поведенческих нарушений и
парциальных судорожных припадков, а также
его исходы. Под нашим наблюдением находилось 25 детей с
герпетическим энцефалитом. По тяжести и
исходам герпетического энцефалита заболевшие
распределены на 2 группы. В первую группу
включены дети с неблагоприятным течением
герпетического энцефалита, имевшие в исходе
заболевания хроническое вегетативное
состояние или психоорганический дефект с
глубокой деменцией. Во вторую группу
включены дети с более благоприятным течением
процесса. Обращает на себя внимание тот
факт, что в первой группе были только
больные дети в возрасте до 1,5 лет, тогда как во
второй - лишь больные более старшего возраста
(средний возраст 4±1,3 года). У всех детей
первой группы на 1-3 сут. развилась кома
продолжительностью 26±6 дней, которой
предшествовали парциальные или вторично-генерализованные припадки, принявшие в
дальнейшем характер эпилептического статуса.
Во второй группе у 76,9% детей степень
нарушения сознания соответствовала коме, продолжительность которой составляла 9,8±2,2
дней. Эпилептический статус, развившийся на
фоне вторично-генерализованных припадков,
отмечался у 15,4% больных, у 53,8% - выявлены
повторные парциальные припадки, в том числе с
вторичной генерализацией. У 75% детей
первой группы и у 23,1% второй наблюдали
бульбарные расстройства. Парезы и параличи
отмечали у всех детей перрой группы и у
половины второй. У 75% детей первой группы
фиксировали корковую слепоту. У 23,1%
пациентов второй группы наблюдали
эмоционально-волевые нарушения в виде
вялости, плаксивости. При проведении
компьютерной томографии в острый период
болезни у первой группы пациентов в 67%
случаев было выявлено обширное поражение 3
и более долей мозга, тогда как во второй группе
определяли лишь одностороннее поражение
мозга у 10 детей. Анализ историй болезни 33
детей в возрасте от 2,5 до 15 лет, больных
краснушным энцефалитом, показал, что
энцефалитическая симптоматика появлялась на
2-7 день от начала краснухи. Дебют
заболевания характеризовался нарушением
сознания до уровня комы 1-2 степени у 54,5%
детей, у 6,1% степень изменения сознания
соответствовала сопору. По мере
восстановления сознания у больных отмечали
повышение мышечного тонуса, при этом у 12%
детей в сочетании с повышением сухожильных
рефл ексов. У 6% детей наблюдали бульбарные
расстройства и у 12% детей — парезы и
параличи. Изолированная мозжечковая
симптоматика выявлена у 12% пациентов. У 12%
больных энцефалитическая симптоматика
сочеталась с симптомами миелита. Однако она
была непродолжительной и купировалась в
течение 1-2 недель. Нарушение функций
черепных нервов наблюдали у 15% детей в
виде легкой недостаточности отводящего нерва
(VI пары), у 12% - глазодвигательного (III
пары). Эмоционально-волевые нарушения
отмечали у 82% детей в виде плаксивости,
апатии, агрессивности и негативизма. У 21%
детей зарегистрирована частичная утеря
навыков письма и счета, с последующим
быстрым, в течение 2-3 недель,
восстановлением этих функций.Компьютерная
томография, проведенная на 14-21 день болезни,
позволила выявить наличие демиелинизации у
39,3% обследованных.Анализ клинической
симптоматики 26 детей с ветряиочным
энцефалитом в возрасте от 2 до 14 лет показал,
что у 24 детей (92,3%) заболевание протекало
типично, в легкой и среднетяжелой форме, с
ведущим синдромом церебеллита. У 2 пациентов
(7,7%) отмечали атипичное течение
заболевания, по типу панэнцефалита, в
тяжелой форме, с последующей комой Энцефалитическая симптоматика, как правило,
возникала на 4-12 день от начала ветряной
оспы, с появления общемозговых симптомов, в
виде головной боли, рвоты и мозжечковых
нарушений в виде легкой атаксии у 58%
детей и резкой туловищной атаксии, вплоть до
невозможности самостоятельных передвижений,
у 35% детей. У 92% детей выявлено снижение
мышечного тонуса, в сочетании с повышением
сухожильных рефлексов. Эмоционально-волевые нарушения
отмечали у 54% детей, интеллектуальные
расстройства — у 8% детей. Нейровизуализационное исследование (КТ)
выявило у одного ребенка небольшое
расширение субарохноидальных пространств и
передних рогов боковых желудочков головного
мозга. Более легкое течение острых вирусных
энцефалитов отмечали при паротитном
энцефалите, который был диагностирован у 10
ISSN (Online): 2455-3662
EPRA International Journal of Multidisciplinary Research (IJMR) - Peer Reviewed Journal Volume: 7| Issue: 9| September 2021|| Journal DOI: 10.36713/epra2013 || SJIF Impact Factor 2021: 8.047 || ISI Value: 1.188
2021 EPRA IJMR | www.eprajournals.com | Journal DOI URL: https://doi.org/10.36713/epra2013 395
детей в возрасте от 1 года до 12 лет.
Заболевание начиналось остро, с повышения
температуры до фебрильных цифр и появления,
как правило, припухлости околоушной
слюнной железы с одной стороны. Появление
энцефалитической симптоматики происходило на
11-21 день (чаще 15-19 день) от начала болезни.
У всех детей фиксировали сниженный тонус в
конечностях, реже отмечали патологические
стопные знаки (30%) и мозжечковую атаксию
(40%). Эмоционально-волевые нарушения в виде
плаксивости, апатии, вялости присутствовали у
70% детей.У 31 пациента в возрасте от 2 до 15
лет, находившихся под нашим наблюдением,
этиология энцефалита осталась неуточненной. У
16 пациентов заболевание развилось на фоне
перенесенной ОРВИ, у 7 - на фоне гнойного
синусита, а у 8 - на фоне полного здоровья,
без видимой причины. У 13 детей (41,9%)
детей этой группы имело место
псевдотуморозное развитие заболевания, у 11
(35,5%) пациентов заболевание протекало по
типу рассеянного энцефаломиелита с
многоочаговым поражением головного и
спинного мозга, у 5 (16,1%) -по типу
панэнцефалита, с преобладанием отека мозга,
а у 2 (6,5%) — с синдромом парциальных
эпилептических припадков. Нарушение сознания
до уровня комы было выявлено у 19% детей.
Пирамидные нарушения были отмечены у 65%
детей, мозжечковая атаксия - у 55% детей.
Интеллектуальные расстройства наблюдали у
10% детей, эмоционально-волевые нарушения в
виде апатии, агрессивности, эйфоричности
либо гиперактивности зафиксированы у 32% больных. Поражения черепных нервов
определяли лишь в остром периоде,
продолжительность их не превышала неделю; так
у 6,5% детей был преходящий III пары, у 10% - VI пары, у 10% - VII пары и у 6,5% - XII пары Как
видно из рисунка 2 в исходе ОВЭ выявлено:
хроническое вегетативное состояние (ХВС) - только у 8 (10%) больных герпетическим
энцефалитом; симптоматическая эпилепсия (СЭ)
- у 9 (11,25%) детей, из них 7 детей с
герпетическим энцефалитом и 2 - с энцефалитом
неуточненной этиологии; психоорганический
синдром (ПОС) - у 10 (12,5%) больных;
мозговая дисфункция (МД) - у 6 (7,5%);
астено-невротический синдром (АНС) - у 34
(42,5%) больных; парезы и параличи (ПП) - у
8 (10%) детей; церебростенический синдром
(ЦСС) - у 2 (2,5%) детей с ПЭ и по 1-му
(1,25%) ребенку было с такими осложнениями
как гипертензиозный синдром (ГС), слепота (С)
и тугоухость (1). Таким образом, анализ клинической
симптоматики показал, что при ОВЭ, особенно
герпетической, краснушной, неуточненной
этиологии отмечено преимущественно тяжелое
течение заболевания с нередким развитием
остаточной инвалидизирующей неврологической
симптоматики, что диктует повышенный
интерес к углубленному изучению иммуно-патогенетических аспектов при данных
заболеваниях. Содержание и Е антител к
основному белку миелина в сыворотках
больных острыми вирусными энцефалитами. Исходя из того факта, что для данной
патологии свойственно нередкое развитие
вторичной аутоиммунной демиелинизации, а
ОВЭ можно считать, своего рода, моделью
развития демиелинизирующего процесса,
инициированного вирусной инфекцией, можно
предположить, что развитие аутоиммунной
демиелинизации обуславливает риск развития как
непосредственных, так и отдаленных
неврологических нарушений. В связи с этим
нами проведено исследование содержания
антител (АТ) и IЕ класса к основному белку
миелина (ОБМ) в сыворотках крови больных
ОВЭ. Как видно из таблицы, высокий уровень как так и
1IЕ АТ к ОБМ мы выявляли во всех обследуемых
группах, по сравнению с группой
сравнения.Наиболее высокие уровни АТ в
остром периоде болезни мы наблюдали при
герпетическом, краснушном энцефалитах и
энцефалите неуточненной этиологии (394±11,3,
507±13,7 и 586±12,3 соответственно). В
динамике заболевания уровень АТ нарастал
только при герпетическом энцефалите
(613±14,4), оставался прежним при энцефалитах
краснушной (521±13,7) и неуточненной
этиологии (601±11,2) и снижался при
энцефалитах ветряночной (с 270±22,8 до 67±4,7)
и паротитной этиологии (с 261±24,7 до 111±8,3),
но все же оставался достоверно выше, чем в
группе сравнения.Наиболее высокие значения
^Е АТ к ОБМ в остром периоде заболевания
мы наблюдали, также как и при гуморальном
ответе, при герпетическом и краснушном
энцефалитах и энцефалите неуточненной
этиологии (41±5,1, 24±4,2 и 10,1+0,5
соответственно). В динамике заболевания
уровень 1IЕ АТ в этих группах имел тенденцию к
росту. У детей с ветряночным и паротитным
энцефалитами значения ^Е АТ к ОБМ были
меньше 10 кЕ/л (9,4±0,4 и 8,9±0,4
соответственно), при этом в динамике
заболевания их уровень снижался до
нормативных значений (4,2±0,09 и 3,8±0,08
соответственно). Эти данные согласуются с
наибольшей частотой выявления
демиелинизации на МРТ и КТ при
герпетическом, краснушном энцефалитах и
энцефалитенеуточненной этиологии (индекс
корреляции г = 0,86) и позволяют говорить о
ISSN (Online): 2455-3662
EPRA International Journal of Multidisciplinary Research (IJMR) - Peer Reviewed Journal Volume: 7| Issue: 9| September 2021|| Journal DOI: 10.36713/epra2013 || SJIF Impact Factor 2021: 8.047 || ISI Value: 1.188
2021 EPRA IJMR | www.eprajournals.com | Journal DOI URL: https://doi.org/10.36713/epra2013 396
прогностическом значении определения данных
маркеров.В связи с этим, мы провели
сравнительное исследование содержания и АТ к
ОБМ у больных ОВЭ, отличающихся по
степени тяжести развившихся неврологических
нарушений. Средний уровень АТ к ОБМ у всех
больных, независимо от степени тяжести, был
достоверно выше, чем в группе сравнения. При
тяжелом течении вирусных энцефалитов уровень
АТ был достоверно выше (677 ± 7,7), чем при
среднетяжелом и легком течении (282 ± 5,1 и 63 ±
4,7 соответственно). Самый низкий уровень АТ к
ОБМ был отмечен при легком течении вирусных
энцефалитов и был достоверно ниже, чем при
среднетяжелом и тяжелом течении болезни.
Аналогичная закономерность прослеживалась
при изучении средних уровней 1§Е АТ к
ОБМ, который при тяжелом и среднетяжелом
течении ОВЭ (46,2 ± 1,2 и 9,8 ± 0,12 соответственно) был достоверно выше
контрольных значений (3,34 ± 0,30). При тяжелом
течении болезни уровень ^Е АТ к ОБМ был
достоверно выше, чем при среднетяжелом и
легком течении. Как и при гуморальном
ответе самый низкий уровень ^Е АТ к ОБМ
наблюдался при легком течении (4,1± 0,02)
вирусных энцефалитов и не отличался от
контрольных значений. Проведенный анализ ясно
показывает зависимость уровней как так и ^Е АТ
к ОБМ от степени тяжести вирусных
энцефалитов и может служить четким
прогностическим признаком развития
демиелинизирующего процесса в ЦНС и выбора
тактики терапии.Оценка результатов определения
среднего уровня специфических ^О и ^Е АТ у
больных ОВЭ позволила также выявить их
связь между этиологией заболевания и
активностью демиелинизирующего процесса по
данным МРТ и КТ. Очевидно, что вирусы
обладают различной степенью нейротропности
(большей или меньшей) и способностью
инициировать иммунопатологические реакции в
ЦНС. В связи с этим можно предположить
участие герпетической инфекции, и несколько
в меньшей степени краснушной и
предположительно аденовирусной в запуске
демиелинизирующего процесса. Исследование
уровня цнтокинов в сыворотках крови больных
острыми вирусными энцефалитами. Согласно
современным представлениям реализация
иммунного ответа осуществляется различными
механизмами и факторами клеточного и
гуморального иммунитета, в том числе
цитокинами. На уровне организма цитокины
осуществляют связь между иммунной, нервной,
эндокринной, кроветворной и другими
системами и служат для их вовлечения в
организацию и регуляцию защитных реакций.
Изучение уровней цитокинов позволяет
получить информацию о функциональной
активности различных типов
иммунокомпетентных клеток, о тяжести
воспалительного процесса, его переходе на
системный уровень, а также все шире
использовать их для диагностики и оценки
эффективности лечения инфекционных
заболеваний. Полученные нами данные
согласуются с тяжестью течения
патологического процесса и подтверждают
предполагаемый прогноз развития
аутоиммунной демиелинизации, наиболее
вероятный при герпетическом, краснушном
энцефалитах и энцефалите неуточненной
этиологии. Выявлен регуляторный дисбаланс
иммунной системы: снижение
провоспалительного цитокина IFNy и
одновременное повышение уровня IL4 и TNFa,
обладающего мощным противовоспалительным
действием. Более выраженный регуляторный
дисбаланс иммунного ответа определялся у
детей с ОВЭ герпетической этиологии. Резюмируя вышесказанное можно заключить,
что наиболее адекватной моделью запуска
демиелинизирующего процесса могут служить
вирусные энцефалиты герпетической этиологии.
Очевидно, что вирус простого герпеса, по
сравнению с другими вирусами обладает
наиболее выраженной способностью
инициировать гиперэргические реакции,
вызывая наибольшую демиелинизацию и
приводя к более тяжелому течению вирусного
энцефалита. Происходит это, возможно,
вследствии того, что выраженный иммунный
ответ на вирус простого герпеса может
сопровождаться активацией аутоиммунного
ответа на тканевые антигены, в данном случае
на ОБМ, и является причиной развития IgE
опосредованного ответа на антигены мозга.
Сходную, но несколько менее выраженную,
картину мы наблюдали при энцефалитах
краснушной и неуточненой этиологии, поэтому
можно предположить, что вирусы,
инициировавшие развитие данных энцефалитов,
обладают несколько меньшей способностью
отменять иммунологическую толерантность к
ОБМ. Эти данные подтверждает менее частое
выявление демиелинизации на МРТ и КТ при
этих формах энцефалитов. Выводы. 1. Характерной особенностью
современного клинического течения острых
вирусных энцефалитов у детей является
преобладание тяжелых и среднетяжелых форм
болезни при герпетическом, краснушном и
энцефалитах неуточненной этиологии (особенно
у детей раннего возраста), высокая частота
развития резидуальных последствий (64%); хроническое вегетативное состояние выявлено у
10% больных, симптоматическая эпилепсия -
ISSN (Online): 2455-3662
EPRA International Journal of Multidisciplinary Research (IJMR) - Peer Reviewed Journal Volume: 7| Issue: 9| September 2021|| Journal DOI: 10.36713/epra2013 || SJIF Impact Factor 2021: 8.047 || ISI Value: 1.188
2021 EPRA IJMR | www.eprajournals.com | Journal DOI URL: https://doi.org/10.36713/epra2013 397
11,2%, психоорганический синдром — 12,5%, мозговая дисфункция — 7,5%, астено-невротический синдром - 42,5%, парезы и
параличи — 10% и другие. Энцефалиты
ветряночной и паротитной этиологии
протекают, в основном, в легкой форме. 2. Активность \gG и ^Е ответа к основному
белку миелина определялась этиологией острых
вирусных энцефалитов, при этом наиболее
высокий уровеньантител к основному белку
миелина (более 300 мкг/мл) и 1§Е (более 10
кЕ/л) отмечали при энцефалитах герпетической,
краснушной и неуточненной этиологии, в
отличие от ветряночных и паротитных
энцефалитов, при которых их уровень был
значительно ниже. В динамике болезни при
энцефалитах герпетической, краснушной и
неуточненной этиологии отмечалось
дальнейшее нарастание титров антител ^О и
1§Е, тогда как при ветряночном и паротитном
энцефалитах - их снижение. 3. Уровень антител и ^Е класса к основному
белку миелина при острых вирусных энцефалитах
у детей прямо пропорционально коррелирует с
тяжестью течения болезни и развитием
демиелинизации в ЦНС (по данным
компьютерной и магнитно-резонансной
томографии). Список литературы.
1. Воробьева Н.Л., Демкнна В.А. Определение
противовирусных антител у больных с
демиелинизирующей патологией
ЦНС//Медицинская иммунология, 2002 - Т.4, № 2. - с. 193-194.
2. Воробьева Н.Л., Демкина В.А., Гервазиева
В.Б. Прогностическое значение определения
субклассов IgG антителк основному белку
миелина у больных с вирусными
энцефалитами//Медицинская иммунология,
2003 - Т.5, № 3-4, — с. 291. 3. Воробьева Н.Л., Демкина В.А., Гервазиева
В.Б. Исследование гуморального ответа у
больных с острыми вирусными
энцефалитами//Медицинская иммунология,
2004 - Т.б, № 3-5. - с. 300-301. 4. Воробьева Н.Л., Демкина В.А., Гервазиева
В.Б. Особенности противовирусного
иммунитета у больных с рассеянным
склерозом//Нейроиммунология, 2005-Т.З, №
1.-е. 28-32. 5. Демкина В.А., Воробьева Н.Л., Шабалина
C.B., Гервазиева В.Б. Современные аспекты
проблемы вирусных энцефалитов.
Сообщение 1. Развитие аутоиммунного
демиелинизирующего процесса в
центральной нервной системе при
вирусных энцефалитахУ/Инфекционные
болезни, 2005 - Т.З, № 2. - с. 66-70. 6. Демкина В.А., Воробьева Н.Л., Гервазиева
В.Б., Шабалина C.B. Антитела к основному
белку миелина у больных с острыми
вирусными энцефалитами/УАктуальные
проблемы инфекционной и неинфекционной
патологии: сб. науч. работ, 2005, Ростов-на-Дону, — с. 63-64.
7. Демкина В.А., Воробьева Н.Л., Шабалина
C.B., Гервазиева В.Б. Современные аспекты
проблемы вирусных энцефалитов. Сообщение
2. Роль инфекции в развитии аутоиммунной
демиелинизации в ЦНС при вирусных
энцефалитах//Инфекционные болезни, 2005 - Т.З, № 3. - с. 47-50.
8. Демкина В.А., Воробьева Н.Л., Шабалина
C.B., Гервазиева В.Б. Особенности
гуморального ответа у больных вирусными
энцефалитами//Инфекционные болезни, 2006
-Т.4, № 4. - с. 57-60. 9. Быкова Р.Н., Шабалина C.B., Демкина
В.А., Макарова Г.В., Крючкова Г.В.
Клинико-иммунологические и
нейрофизиологические аспекты
диагностики острых вирусных
энцефалитов//Сборник научных трудов
«Инфекционная клиническая больница №
2», 2007, Москва, - с. 16-18. 10. Shabalina S., Demkina V., Gervazieva V.
Level of bacterial IgG and IgM antibodies in multiple sclerosis patients//World Allergy Congress, 2007 Bangkok.
11. Демкина В.А., Воробьева H.JI., Шабалина C.B. Частота выявления и уровень IgM
антител к основному белку миелина у
больных рассеянным
склерозом//Аллергология и иммунология, 2007
— Т.8, № 3. - с. 316. 12. Демкина В.А., Горелов A.B., Шабалина C.B.
Диагностика острых вирусных энцефалитов
у детей//Сборник научных трудов 3-ей
Областной научно-практической
ISSN (Online): 2455-3662
EPRA International Journal of Multidisciplinary Research (IJMR) - Peer Reviewed Journal Volume: 7| Issue: 9| September 2021|| Journal DOI: 10.36713/epra2013 || SJIF Impact Factor 2021: 8.047 || ISI Value: 1.188
2021 EPRA IJMR | www.eprajournals.com | Journal DOI URL: https://doi.org/10.36713/epra2013 398
THE EFFECTIVENESS OF THERAPY FOR
HEREDITARY MOTOR NEURONAL NEUROPATHY IN
CHILDREN: CLINICAL AND BIOCHEMICAL
PARAMETERS
S.U. Berdibaeva1, Y.N. Madjidova2
1Independent PhD Applicant in Nervous Diseases, Tashkent Pediatric Medical Institute
2Doctor of Medical Sciences, Professor of the Department of Nervous Diseases of the Tashkent Pediatric Medical Institute
ABSTRACT Hereditary motor-sensory neuropathies belong to a heterogeneous group of diseases characterized by damage to peripheral nerves, leading to early disability and a decrease in the quality of life. Diagnosis of the disease largely depends on medical genetic counseling and prenatal DNA diagnostics. Currently, 60 genes responsible for the development of hereditary motosensory neuropathies have been mapped. However, a clinically diagnosed diagnosis using expensive DNA diagnostics is not always confirmed by molecular genetic testing. KEYWORDS: calcium, magnesium, phosphorus, axonal, within control, varus or valgus.
ЭФФЕКТИВНОСТЬ ТЕРАПИИ НАСЛЕДСТВЕННОЙ
МОТОНЕЙРОННОЙ НЕЙРОПАТИИ У ДЕТЕЙ: КЛИНИКО-БИОХИМИЧЕСКИЕ ПОКАЗАТЕЛИ
С.У. Бердибаева, Самостоятельный соискатель PhDпо нервным болезням, Ташкентский Педиатрический
Медицинский Институт
Я.Н. Маджидова, д.м.н., профессор кафедры нервных болезней Ташкентского Педиатрического
Медицинского Института
Аннотация: Наследственные мотосенсорные нейропатии относятся к гетерогенной группе заболеваний,
характеризующихся поражением периферических нервов, приводящей к ранней инвалидизации и
снижению качества жизни. Диагностика заболевания в значительной мере зависит от медико-генетического консультирования и пренатальной ДНК-диагностике. В настоящее время картировано 60 генов, ответственных за развитие наследственных
мотосенсорныхнейропатий. Однако не всегда клинически поставленный диагноз с помощью
дорогостоящей ДНК диагностики подтверждается молекулярно-генетическим тестированием. Ключевые слова: кальций, магний, фосфор, аксональный, в пределах контроля, варус или вальгус.
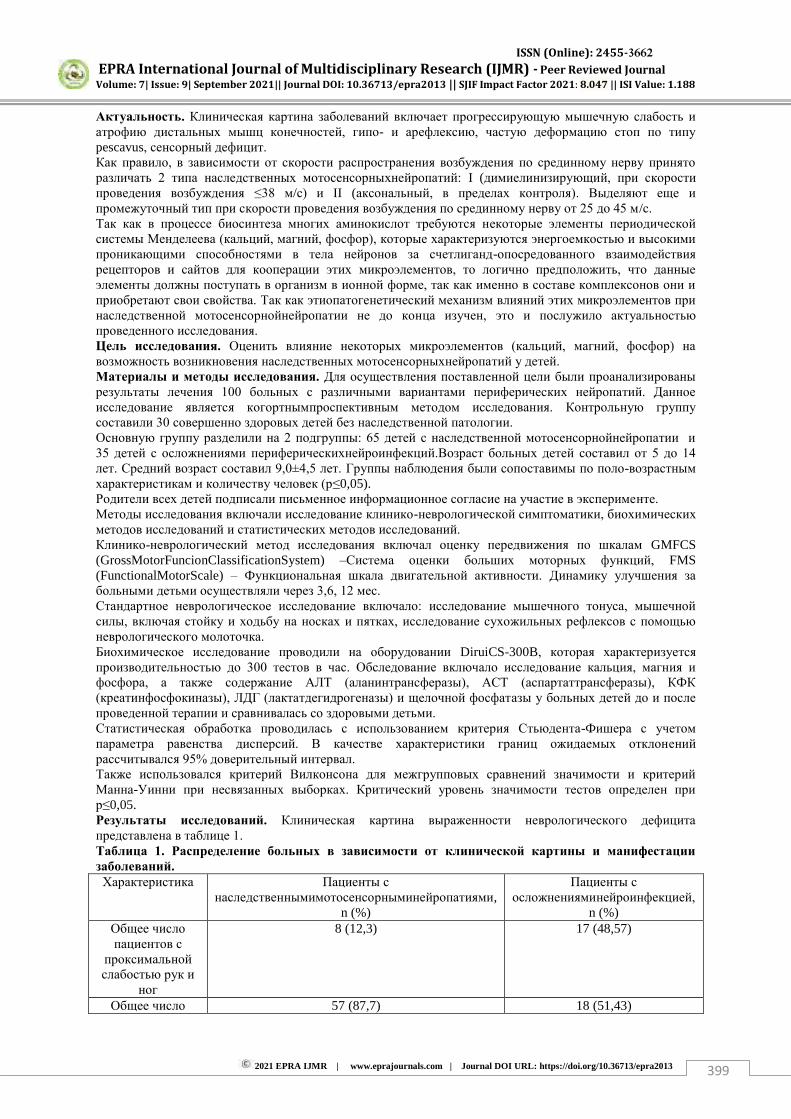
ISSN (Online): 2455-3662
EPRA International Journal of Multidisciplinary Research (IJMR) - Peer Reviewed Journal Volume: 7| Issue: 9| September 2021|| Journal DOI: 10.36713/epra2013 || SJIF Impact Factor 2021: 8.047 || ISI Value: 1.188
2021 EPRA IJMR | www.eprajournals.com | Journal DOI URL: https://doi.org/10.36713/epra2013 399
Актуальность. Клиническая картина заболеваний включает прогрессирующую мышечную слабость и
атрофию дистальных мышц конечностей, гипо- и арефлексию, частую деформацию стоп по типу
pescavus, сенсорный дефицит. Как правило, в зависимости от скорости распространения возбуждения по срединному нерву принято
различать 2 типа наследственных мотосенсорныхнейропатий: I (димиелинизирующий, при скорости
проведения возбуждения ≤38 м/с) и II (аксональный, в пределах контроля). Выделяют еще и
промежуточный тип при скорости проведения возбуждения по срединному нерву от 25 до 45 м/с. Так как в процессе биосинтеза многих аминокислот требуются некоторые элементы периодической
системы Менделеева (кальций, магний, фосфор), которые характеризуются энергоемкостью и высокими
проникающими способностями в тела нейронов за счетлиганд-опосредованного взаимодействия
рецепторов и сайтов для кооперации этих микроэлементов, то логично предположить, что данные
элементы должны поступать в организм в ионной форме, так как именно в составе комплексонов они и
приобретают свои свойства. Так как этиопатогенетический механизм влияний этих микроэлементов при
наследственной мотосенсорнойнейропатии не до конца изучен, это и послужило актуальностью
проведенного исследования. Цель исследования. Оценить влияние некоторых микроэлементов (кальций, магний, фосфор) на
возможность возникновения наследственных мотосенсорныхнейропатий у детей. Материалы и методы исследования. Для осуществления поставленной цели были проанализированы
результаты лечения 100 больных с различными вариантами периферических нейропатий. Данное
исследование является когортнымпроспективным методом исследования. Контрольную группу
составили 30 совершенно здоровых детей без наследственной патологии. Основную группу разделили на 2 подгруппы: 65 детей с наследственной мотосенсорнойнейропатии и
35 детей с осложнениями периферическихнейроинфекций.Возраст больных детей составил от 5 до 14
лет. Средний возраст составил 9,0±4,5 лет. Группы наблюдения были сопоставимы по поло-возрастным
характеристикам и количеству человек (р≤0,05). Родители всех детей подписали письменное информационное согласие на участие в эксперименте. Методы исследования включали исследование клинико-неврологической симптоматики, биохимических
методов исследований и статистических методов исследований. Клинико-неврологический метод исследования включал оценку передвижения по шкалам GMFCS (GrossMotorFuncionClassificationSystem) –Система оценки больших моторных функций, FMS (FunctionalMotorScale) – Функциональная шкала двигательной активности. Динамику улучшения за
больными детьми осуществляли через 3,6, 12 мес. Стандартное неврологическое исследование включало: исследование мышечного тонуса, мышечной
силы, включая стойку и ходьбу на носках и пятках, исследование сухожильных рефлексов с помощью
неврологического молоточка. Биохимическое исследование проводили на оборудовании DiruiCS-300B, которая характеризуется
производительностью до 300 тестов в час. Обследование включало исследование кальция, магния и
фосфора, а также содержание АЛТ (аланинтрансферазы), АСТ (аспартаттрансферазы), КФК
(креатинфосфокиназы), ЛДГ (лактатдегидрогеназы) и щелочной фосфатазы у больных детей до и после
проведенной терапии и сравнивалась со здоровыми детьми. Статистическая обработка проводилась с использованием критерия Стьюдента-Фишера с учетом
параметра равенства дисперсий. В качестве характеристики границ ожидаемых отклонений
рассчитывался 95% доверительный интервал. Также использовался критерий Вилконсона для межгрупповых сравнений значимости и критерий
Манна-Уинни при несвязанных выборках. Критический уровень значимости тестов определен при
р≤0,05. Результаты исследований. Клиническая картина выраженности неврологического дефицита
представлена в таблице 1. Таблица 1. Распределение больных в зависимости от клинической картины и манифестации
заболеваний. Характеристика Пациенты с
наследственнымимотосенсорныминейропатиями, n (%)
Пациенты с осложненияминейроинфекцией,
n (%) Общее число
пациентов с
проксимальной
слабостью рук и
ног
8 (12,3) 17 (48,57)
Общее число 57 (87,7) 18 (51,43)
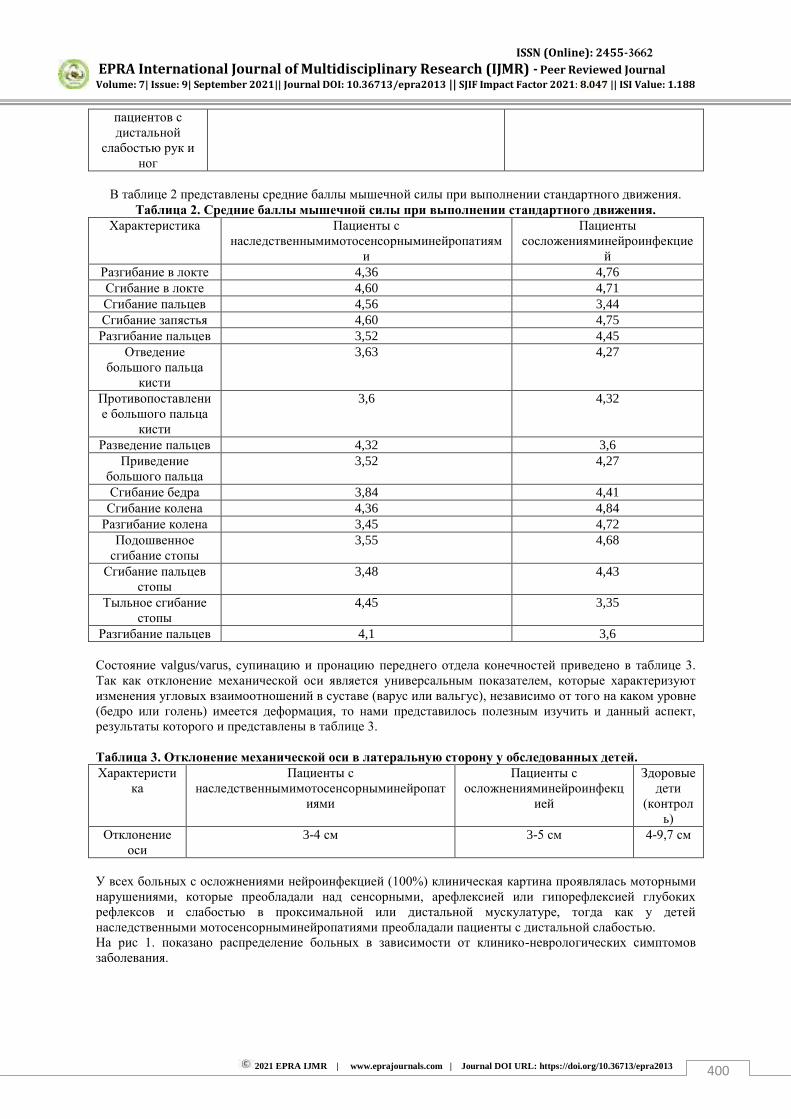
ISSN (Online): 2455-3662
EPRA International Journal of Multidisciplinary Research (IJMR) - Peer Reviewed Journal Volume: 7| Issue: 9| September 2021|| Journal DOI: 10.36713/epra2013 || SJIF Impact Factor 2021: 8.047 || ISI Value: 1.188
2021 EPRA IJMR | www.eprajournals.com | Journal DOI URL: https://doi.org/10.36713/epra2013 400
пациентов с
дистальной
слабостью рук и
ног
В таблице 2 представлены средние баллы мышечной силы при выполнении стандартного движения. Таблица 2. Средние баллы мышечной силы при выполнении стандартного движения.
Характеристика Пациенты с
наследственнымимотосенсорныминейропатиям
и
Пациенты
сосложенияминейроинфекцие
й Разгибание в локте 4,36 4,76 Сгибание в локте 4,60 4,71 Сгибание пальцев 4,56 3,44 Сгибание запястья 4,60 4,75 Разгибание пальцев 3,52 4,45
Отведение
большого пальца
кисти
3,63 4,27
Противопоставлени
е большого пальца
кисти
3,6 4,32
Разведение пальцев 4,32 3,6 Приведение
большого пальца 3,52 4,27
Сгибание бедра 3,84 4,41 Сгибание колена 4,36 4,84
Разгибание колена 3,45 4,72 Подошвенное
сгибание стопы 3,55 4,68
Сгибание пальцев
стопы 3,48 4,43
Тыльное сгибание
стопы 4,45 3,35
Разгибание пальцев 4,1 3,6 Состояние valgus/varus, супинацию и пронацию переднего отдела конечностей приведено в таблице 3.
Так как отклонение механической оси является универсальным показателем, которые характеризуют
изменения угловых взаимоотношений в суставе (варус или вальгус), независимо от того на каком уровне
(бедро или голень) имеется деформация, то нами представилось полезным изучить и данный аспект,
результаты которого и представлены в таблице 3. Таблица 3. Отклонение механической оси в латеральную сторону у обследованных детей. Характеристи
ка Пациенты с
наследственнымимотосенсорныминейропат
иями
Пациенты с осложненияминейроинфекц
ией
Здоровые
дети
(контрол
ь) Отклонение
оси 3-4 см 3-5 см 4-9,7 см
У всех больных с осложнениями нейроинфекцией (100%) клиническая картина проявлялась моторными
нарушениями, которые преобладали над сенсорными, арефлексией или гипорефлексией глубоких
рефлексов и слабостью в проксимальной или дистальной мускулатуре, тогда как у детей
наследственными мотосенсорныминейропатиями преобладали пациенты с дистальной слабостью. На рис 1. показано распределение больных в зависимости от клинико-неврологических симптомов
заболевания.

ISSN (Online): 2455-3662
EPRA International Journal of Multidisciplinary Research (IJMR) - Peer Reviewed Journal Volume: 7| Issue: 9| September 2021|| Journal DOI: 10.36713/epra2013 || SJIF Impact Factor 2021: 8.047 || ISI Value: 1.188
2021 EPRA IJMR | www.eprajournals.com | Journal DOI URL: https://doi.org/10.36713/epra2013 401
Рис. 1. Клинико-неврологические симптомы при наследственных мотосенсорныхнейропатиях.
У больных с нейроинфекцией чаще при обследовании выявляли гиперестезию по полиневротическому
типу, дорсалгию, что связано с вовлечением спинномозговых корешков. В клинической картине у всех больных доминировали чувствительные нарушения по
полиневротическому типу (97,6±2,4%) чел. По типам нарушения чувствительности чаще встречалась
болевая гиперестезия (71,4±7,0%),гипоестезия выявлялась у 28,6±7,0 % детей. Парестезии отмечались в
50±7,7% случаях. Тактильная чувствительность на подошвенной поверхности стоп была снижена у
40,5±7,6% детей. Изменения со стороны рефлекторной сферы чаще встречались на уровне нижних
конечностей (76,2±6,6%): гипорефлексия – в 84,3±6,4% случаев, арефлексия – 12,3±3,6%, гиперрефлексия – 3,4±0,6% случаев. Так как наследственные мотосенсорныенейропатии имеют length-dependentпаттерн, так как
большинство из них имеют сенситивную атаксию. Согласно шкале GMFCSстатистически значимых различий в уровнях двигательного дефицита между
группами мальчиков и девочек отмечено не было (р≤0,05). 25 детей имели относительно легкий
GMFCS(I-II) уровень двигательного дефицита и были способны перемещаться самостоятельно либо с
небольшими ограничениями; 35 детей передвигались с поддержкой и вспомогательными
приспособлениями (GMFCSIII); 40 детям требовалась значительная помощь со стороны для
осуществления повседневной деятельности (GMFCSIV-V). На рис. 2. показано состояние детей до и после терапии согласно шкале GMFCS.
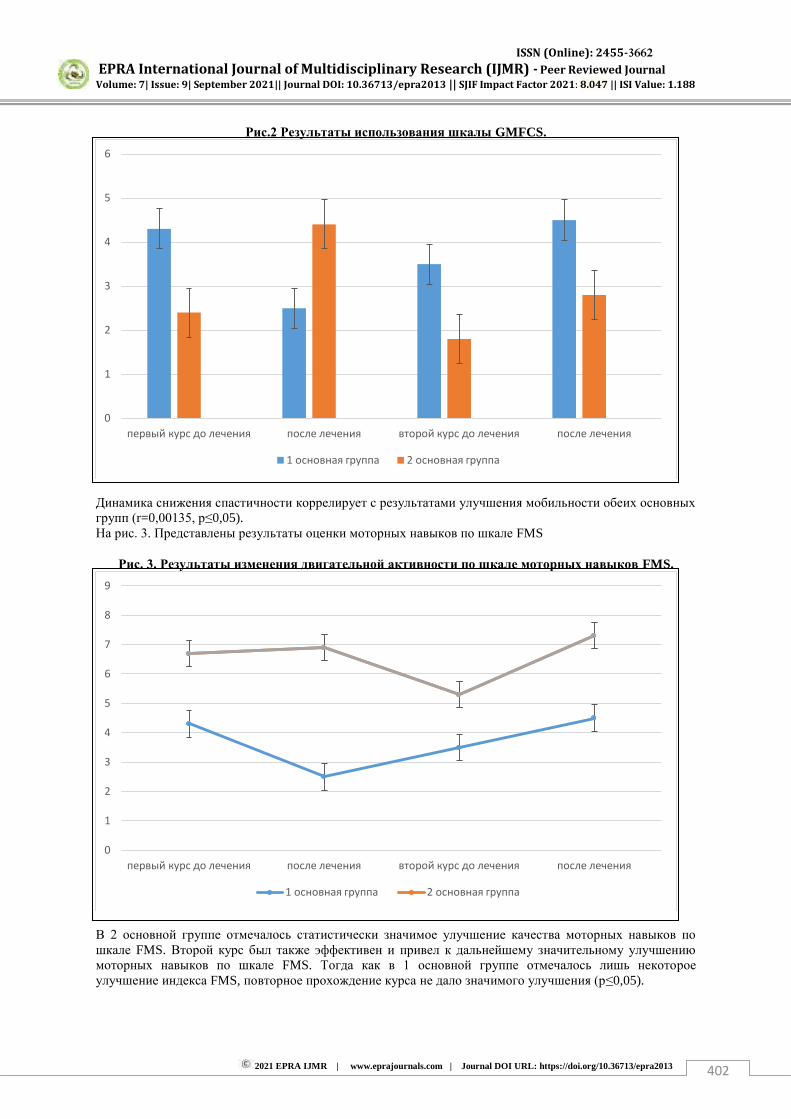
ISSN (Online): 2455-3662
EPRA International Journal of Multidisciplinary Research (IJMR) - Peer Reviewed Journal Volume: 7| Issue: 9| September 2021|| Journal DOI: 10.36713/epra2013 || SJIF Impact Factor 2021: 8.047 || ISI Value: 1.188
2021 EPRA IJMR | www.eprajournals.com | Journal DOI URL: https://doi.org/10.36713/epra2013 402
Рис.2 Результаты использования шкалы GMFCS.
Динамика снижения спастичности коррелирует с результатами улучшения мобильности обеих основных
групп (r=0,00135, р≤0,05). На рис. 3. Представлены результаты оценки моторных навыков по шкале FMS
Рис. 3. Результаты изменения двигательной активности по шкале моторных навыков FMS.
В 2 основной группе отмечалось статистически значимое улучшение качества моторных навыков по
шкале FMS. Второй курс был также эффективен и привел к дальнейшему значительному улучшению
моторных навыков по шкале FMS. Тогда как в 1 основной группе отмечалось лишь некоторое
улучшение индекса FMS, повторное прохождение курса не дало значимого улучшения (р≤0,05).
0
1
2
3
4
5
6
первый курс до лечения после лечения второй курс до лечения после лечения
1 основная группа 2 основная группа
0
1
2
3
4
5
6
7
8
9
первый курс до лечения после лечения второй курс до лечения после лечения
1 основная группа 2 основная группа
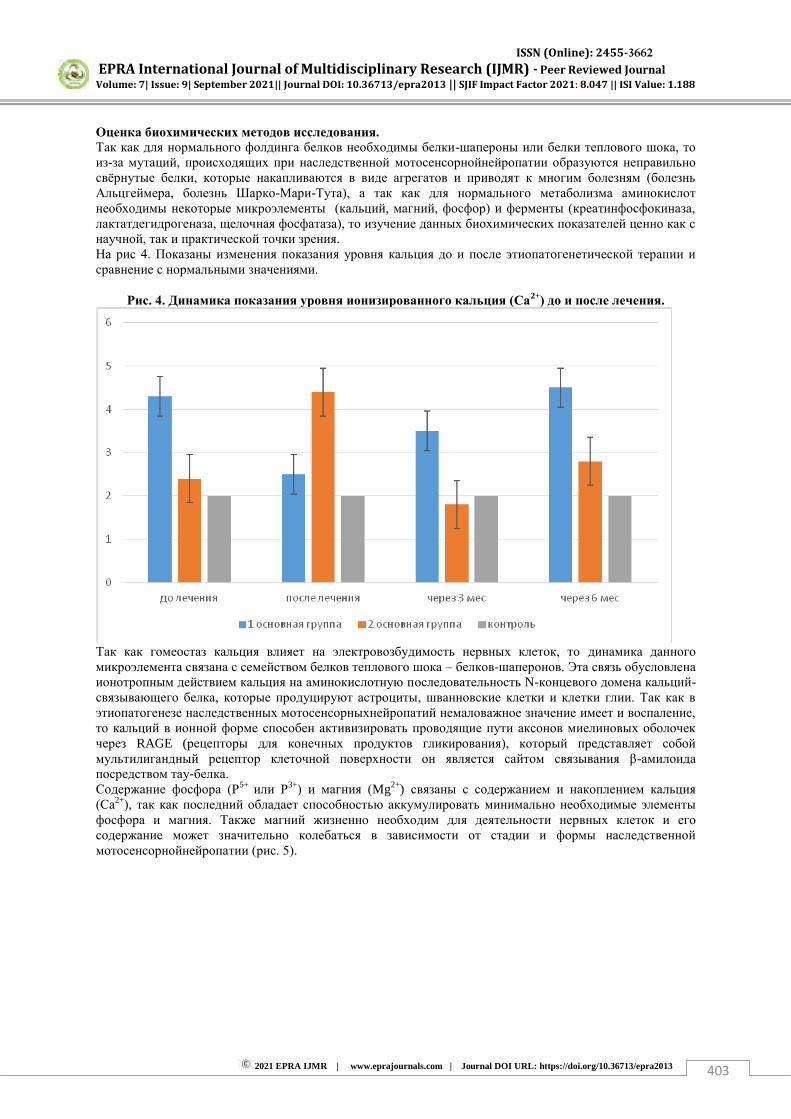
ISSN (Online): 2455-3662
EPRA International Journal of Multidisciplinary Research (IJMR) - Peer Reviewed Journal Volume: 7| Issue: 9| September 2021|| Journal DOI: 10.36713/epra2013 || SJIF Impact Factor 2021: 8.047 || ISI Value: 1.188
2021 EPRA IJMR | www.eprajournals.com | Journal DOI URL: https://doi.org/10.36713/epra2013 403
Оценка биохимических методов исследования. Так как для нормального фолдинга белков необходимы белки-шапероны или белки теплового шока, то
из-за мутаций, происходящих при наследственной мотосенсорнойнейропатии образуются неправильно
свѐрнутые белки, которые накапливаются в виде агрегатов и приводят к многим болезням (болезнь
Альцгеймера, болезнь Шарко-Мари-Тута), а так как для нормального метаболизма аминокислот
необходимы некоторые микроэлементы (кальций, магний, фосфор) и ферменты (креатинфосфокиназа,
лактатдегидрогеназа, щелочная фосфатаза), то изучение данных биохимических показателей ценно как с
научной, так и практической точки зрения. На рис 4. Показаны изменения показания уровня кальция до и после этиопатогенетической терапии и
сравнение с нормальными значениями.
Рис. 4. Динамика показания уровня ионизированного кальция (Са2+
) до и после лечения.
Так как гомеостаз кальция влияет на электровозбудимость нервных клеток, то динамика данного
микроэлемента связана с семейством белков теплового шока – белков-шаперонов. Эта связь обусловлена
ионотропным действием кальция на аминокислотную последовательность N-концевого домена кальций-связывающего белка, которые продуцируют астроциты, шванновские клетки и клетки глии. Так как в
этиопатогенезе наследственных мотосенсорныхнейропатий немаловажное значение имеет и воспаление,
то кальций в ионной форме способен активизировать проводящие пути аксонов миелиновых оболочек
через RAGE (рецепторы для конечных продуктов гликирования), который представляет собой
мультилигандный рецептор клеточной поверхности он является сайтом связывания β-амилоида
посредством тау-белка. Содержание фосфора (Р
5+ или Р
3+) и магния (Mg2+) связаны с содержанием и накоплением кальция
(Са2+
), так как последний обладает способностью аккумулировать минимально необходимые элементы
фосфора и магния. Также магний жизненно необходим для деятельности нервных клеток и его
содержание может значительно колебаться в зависимости от стадии и формы наследственной
мотосенсорнойнейропатии (рис. 5).
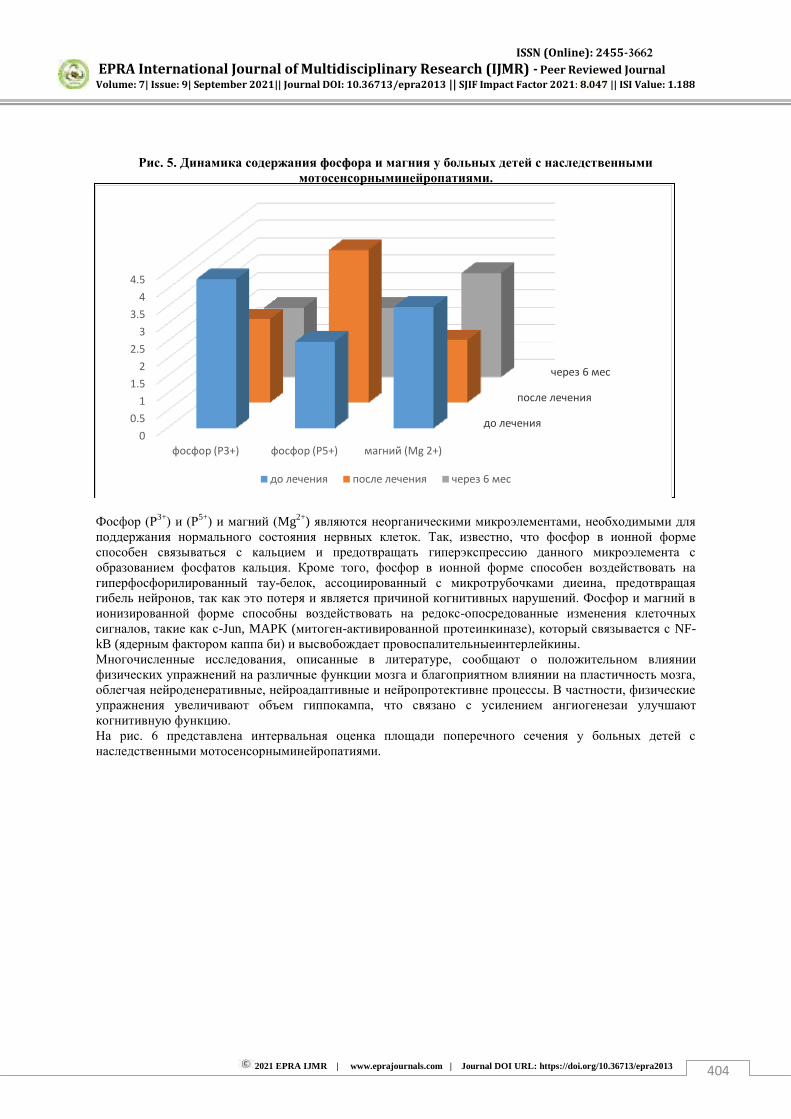
ISSN (Online): 2455-3662
EPRA International Journal of Multidisciplinary Research (IJMR) - Peer Reviewed Journal Volume: 7| Issue: 9| September 2021|| Journal DOI: 10.36713/epra2013 || SJIF Impact Factor 2021: 8.047 || ISI Value: 1.188
2021 EPRA IJMR | www.eprajournals.com | Journal DOI URL: https://doi.org/10.36713/epra2013 404
Рис. 5. Динамика содержания фосфора и магния у больных детей с наследственными
мотосенсорныминейропатиями.
Фосфор (Р
3+) и (Р
5+) и магний (Mg2+) являются неорганическими микроэлементами, необходимыми для
поддержания нормального состояния нервных клеток. Так, известно, что фосфор в ионной форме
способен связываться с кальцием и предотвращать гиперэкспрессию данного микроэлемента с
образованием фосфатов кальция. Кроме того, фосфор в ионной форме способен воздействовать на
гиперфосфорилированный тау-белок, ассоциированный с микротрубочками диеина, предотвращая
гибель нейронов, так как это потеря и является причиной когнитивных нарушений. Фосфор и магний в
ионизированной форме способны воздействовать на редокс-опосредованные изменения клеточных
сигналов, такие как с-Jun, MAPK (митоген-активированной протеинкиназе), который связывается с NF-kB (ядерным фактором каппа би) и высвобождает провоспалительныеинтерлейкины. Многочисленные исследования, описанные в литературе, сообщают о положительном влиянии
физических упражнений на различные функции мозга и благоприятном влиянии на пластичность мозга,
облегчая нейроденеративные, нейроадаптивные и нейропротективне процессы. В частности, физические
упражнения увеличивают объем гиппокампа, что связано с усилением ангиогенезаи улучшают
когнитивную функцию. На рис. 6 представлена интервальная оценка площади поперечного сечения у больных детей с
наследственными мотосенсорныминейропатиями.
до лечения
после лечения
через 6 мес
0
0.5
1
1.5
2
2.5
3
3.5
4
4.5
фосфор (Р3+) фосфор (Р5+) магний (Mg 2+)
до лечения после лечения через 6 мес
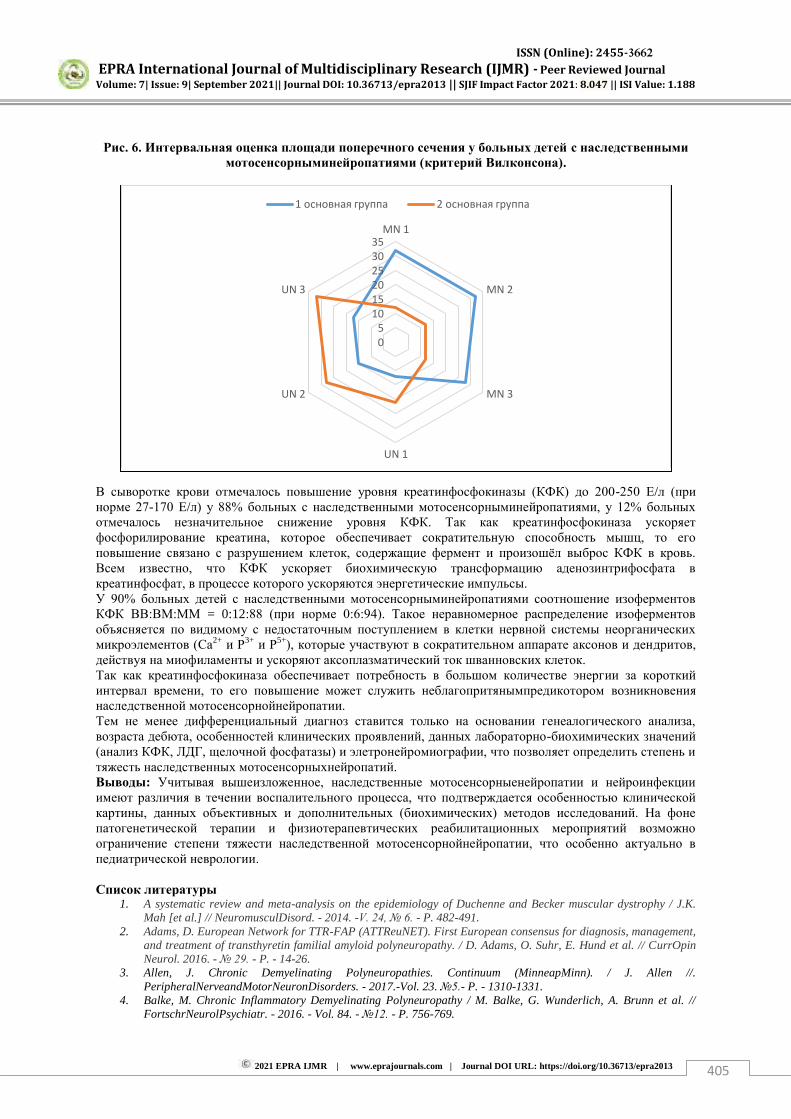
ISSN (Online): 2455-3662
EPRA International Journal of Multidisciplinary Research (IJMR) - Peer Reviewed Journal Volume: 7| Issue: 9| September 2021|| Journal DOI: 10.36713/epra2013 || SJIF Impact Factor 2021: 8.047 || ISI Value: 1.188
2021 EPRA IJMR | www.eprajournals.com | Journal DOI URL: https://doi.org/10.36713/epra2013 405
Рис. 6. Интервальная оценка площади поперечного сечения у больных детей с наследственными
мотосенсорныминейропатиями (критерий Вилконсона).
В сыворотке крови отмечалось повышение уровня креатинфосфокиназы (КФК) до 200-250 Е/л (при
норме 27-170 Е/л) у 88% больных с наследственными мотосенсорныминейропатиями, у 12% больных
отмечалось незначительное снижение уровня КФК. Так как креатинфосфокиназа ускоряет
фосфорилирование креатина, которое обеспечивает сократительную способность мышц, то его
повышение связано с разрушением клеток, содержащие фермент и произошѐл выброс КФК в кровь.
Всем известно, что КФК ускоряет биохимическую трансформацию аденозинтрифосфата в
креатинфосфат, в процессе которого ускоряются энергетические импульсы. У 90% больных детей с наследственными мотосенсорныминейропатиями соотношение изоферментов
КФК ВВ:ВМ:ММ = 0:12:88 (при норме 0:6:94). Такое неравномерное распределение изоферментов
объясняется по видимому с недостаточным поступлением в клетки нервной системы неорганических
микроэлементов (Са2+ и Р
3+ и Р5+
), которые участвуют в сократительном аппарате аксонов и дендритов,
действуя на миофиламенты и ускоряют аксоплазматический ток шванновских клеток. Так как креатинфосфокиназа обеспечивает потребность в большом количестве энергии за короткий
интервал времени, то его повышение может служить неблагопритянымпредикотором возникновения
наследственной мотосенсорнойнейропатии. Тем не менее дифференциальный диагноз ставится только на основании генеалогического анализа,
возраста дебюта, особенностей клинических проявлений, данных лабораторно-биохимических значений
(анализ КФК, ЛДГ, щелочной фосфатазы) и элетронейромиографии, что позволяет определить степень и
тяжесть наследственных мотосенсорныхнейропатий. Выводы: Учитывая вышеизложенное, наследственные мотосенсорныенейропатии и нейроинфекции
имеют различия в течении воспалительного процесса, что подтверждается особенностью клинической
картины, данных объективных и дополнительных (биохимических) методов исследований. На фоне
патогенетической терапии и физиотерапевтических реабилитационных мероприятий возможно
ограничение степени тяжести наследственной мотосенсорнойнейропатии, что особенно актуально в
педиатрической неврологии. Список литературы
1. A systematic review and meta-analysis on the epidemiology of Duchenne and Becker muscular dystrophy / J.K. Mah [et al.] // NeuromusculDisord. - 2014. -V. 24, № 6. - P. 482-491.
2. Adams, D. European Network for TTR-FAP (ATTReuNET). First European consensus for diagnosis, management, and treatment of transthyretin familial amyloid polyneuropathy. / D. Adams, O. Suhr, E. Hund et al. // CurrOpin Neurol. 2016. - № 29. - P. - 14-26.
3. Allen, J. Chronic Demyelinating Polyneuropathies. Continuum (MinneapMinn). / J. Allen //. PeripheralNerveandMotorNeuronDisorders. - 2017.-Vol. 23. №5.- P. - 1310-1331.
4. Balke, M. Chronic Inflammatory Demyelinating Polyneuropathy / M. Balke, G. Wunderlich, A. Brunn et al. // FortschrNeurolPsychiatr. - 2016. - Vol. 84. - №12. - P. 756-769.
05
101520253035
MN 1
MN 2
MN 3
UN 1
UN 2
UN 3
1 основная группа 2 основная группа
ISSN (Online): 2455-3662
EPRA International Journal of Multidisciplinary Research (IJMR) - Peer Reviewed Journal Volume: 7| Issue: 9| September 2021|| Journal DOI: 10.36713/epra2013 || SJIF Impact Factor 2021: 8.047 || ISI Value: 1.188
2021 EPRA IJMR | www.eprajournals.com | Journal DOI URL: https://doi.org/10.36713/epra2013 406
5. Bourque, P. Autoimmune peripheral neuropathies. / P.Bourque, J. Chardon, R. Massie. // ClinChimActa. - 2015. - № 449. P. - 37- 42.
6. Chang, S. Chronic inflammatory demyelinating polyneuropathy in children: a report of four patients with variable relapsing courses. / Chang SJ, Lee JH, Kim SH, et al. // Korean J Pediatr. - 2015. - Vol. 58. - № 5. - P. -194-198.
7. Franssen, H. Pathophysiology of immune-mediated demyelinating neuropathies-part 1: neuroscience. / H. Franssen, D. Straver // Muscle Nerve. - 2013. - Vol. 48. № 6. - P. - 851-864.
8. Fridman, V. Inherited Neuropathies Consortium. CMT subtypes and disease burden in patients enrolled in the Inherited Neuropathies Consortium natural history study: a cross - sectional analysis. / V. Fridman, B. Bundy, M. Reilly et al.// J NeurolNeurosurgPsychiatry. - 2015. - Vol. 86. № 8. - P. 873-878.
9. Grimm, A. Ultrasound pattern sum score, homogeneity score and regional nerve enlargement index for differentiation of demyelinating inflammatory and hereditary neuropathies. / A. Grimm, D. Vittore, V. Schubert et al. // ClinNeurophysiol. - 2016. - Vol. 127. № 7. - P. 2618-2624.
10. Hanewinckel, R. Prevalence of polyneuropathy in thegeneral middle-aged and elderly population/ R. Hanewinckel, J. Drenthen, M. van Oijen, et al. // Neurology. - 2016. - Vol. - 87. - № 18. P. - 1892-1898.
11. Heirbaut, M., Lermyte, F., Martin, E.M., Beelen, S., Sobott, F., Strelkov, S.V., and Weeks, S.D., Specific Sequences in the N-terminal Domain of Human Small Heat Shock Protein HSPB6 Dictate Preferential Heterooligomerization with the Orthologue HSPB1. JournalofBiologicalChemistry, 2017.
12. Kollmer, J. Sural nerve injury in familial amyloid polyneuropathy: MR neurography vs clinicopathologic tools. / J. Kollmer , F. Sahm , U. Hegenbart et al. // Neurology.- 2017. - Vol. 89. - № 5. - P. - 475 - 484.
13. Lancaster, E. Subtype-specific therapy for autoimmune neuropathies. / E. Lancaster, S. Scherer // NeurolNeuroimmunolNeuroinflamm. - 2015. -Vol. 2. - № 5. - P. - 152.
14. Lawson VH, Arnold WD. Multifocal motor neuropathy: a review of pathogenesis, diagnosis, and treatment. / V. H. Lawson, W.D. Arnold // Neuropsychiatr Dis Treat. 2014. - Vol. 5. - №10. - P. - 567-576.
15. Léger, J. The pathogenesis of multifocal motor neuropathy and an update on current management options. / J. Léger, R. Guimarâes-Costa, R. IancuFerfoglia // TherAdvNeurolDisord. - 2015. - Vol. 8. - № 3. - P. 109-122.
16. Mathey, E. Chronic inflammatory demyelinating polyradiculoneuropathy: from pathology to phenotype. / E. Mathey, S. Park, R. Hughes et al. // J NeurolNeurosurg Psychiatry.-2015. - Vol. 86. - P. - 973-985.
17. Mazen, M. Multifocal Motor Neuropathy, Multifocal Acquired Demyelinating Sensory and Motor Neuropathy and Other Chronic Acquired Demyelinating Polyneuropathy Variants. / M. Mazen, M. Dimachkie, J. Richard et al. // NeurolClin. - 2013. - Vol. 31. № 2. - P. 533-555.
18. Pan, Y. Hourglass-like constrictions of peripheral nerve in the upper extremity: a clinical review and pathological study. / Y. Pan , S. Wang , D. Zheng et al. // Neurosurgery. - 2014. - Vol. 75. - № 1. - P.- 10-22.
19. Pareyson, D. Mitochondrial dynamics and inherited peripheral nerve diseases. / D. Pareyson, P. Saveri, A. Sagnelli, et al. // Neurosci Lett. -2015. - Vol. 596. - P.- 66 - 77.
20. Plante-Bordeneuve, V. Transthyretin familial amyloid polyneuropathy: an update. / V. Plante-Bordeneuve // J Neurol. - 2017.
21. Reilly, M. Charcot-Marie-Tooth disease. / M. Reilly, S. Murphy, M. Laura // J PeripherNerv Syst.- 2011. - Vol. 16. № 1. - P. 1-14.
22. Rentzos, M. Chronic inflammatory demyelinating polyneuropathy:a 6 year retrospective clinical study of a hospital-based population / M. Rentzos, C. Anyfanti, A. Kaponi et al. // J. of Clinical Neuroscience.-2007.-Vol. 14. - P. 229-235.
23. Shimizu, F. Sera from patients with multifocal motor neuropathy disrupt the blood-nerve barrier.//F. Shimizu, M. Mooto, Y. Sano et al. //J NeurolNeurosurg Psychiatry.-2014.- Vol. 85. № 5. -P. 526-537.
24. Tourtellotte, W. Axon transport and neuropathy relevant perspectives on the etiopathogenesis of familial dysautonomia. / W. Tourtellotte // Am J Pathol. - 2016. - Vol. 186. - № 3. - P. - 489 - 499.
25. Watson, J. Peripheral neuropathy: a practical approach to diagnosis and symptom management. / J. Watson, P. Dyck // Mayo Clin Proc. - 2015. -Vol. 90. - № 7. - P. - 940 - 951.
ISSN (Online): 2455-3662
EPRA International Journal of Multidisciplinary Research (IJMR) - Peer Reviewed Journal Volume: 7| Issue: 9| September 2021|| Journal DOI: 10.36713/epra2013 || SJIF Impact Factor 2021: 8.047 || ISI Value: 1.188
2021 EPRA IJMR | www.eprajournals.com | Journal DOI URL: https://doi.org/10.36713/epra2013 407
CLINICAL AND NEUROLOGICAL MANIFESTATIONS IN CHILDREN WITH POST-TRAUMATIC
ENCEPHALOPATHY
Y.N. Madjidova1, D.Sh. Nasirova2
1Tashkent Pediatric Medical Institute 2Tashkent Pediatric Medical Institute
ABSTRACT The article presents the results of examination of 34 children aged 7 to 18 years old, diagnosed with post-traumatic encephalopathy. Of these, 21 (62%) are boys and 13 (38%) are girls. The majority were children from 12 to 18 years old 70%, children 7-11 years old 30%. In all children, regardless of the severity of TBI, in the period of long-term consequences, the main complaints are: headaches, asthenovegetative disorders leading to a rather long-term decrease in performance and cognitive impairment. Children of both study groups with both mild and moderate TBI had a history of disseminated microorganic symptoms, symptoms of autonomic dysfunction and asthenization of the nervous system, which was more pronounced in children of the second group. KEYWORDS: children, post-traumatic encephalopathy, autonomic dysfunction, asthenization of the nervous system.
КЛИНИКО-НЕВРОЛОГИЧЕСКИЕ ПРОЯВЛЕНИЯ У ДЕТЕЙ С
ПОСТТРАВМАТИЧЕСКОЙ ЭНЦЕФАЛОПАТИЕЙ
Я.Н. Маджидова, Ташкентский педиатрический медицинский институт
Д.Ш. Насирова
Ташкентский педиатрический медицинский институт
Аннотация: в статье приводятся результаты обследования 34 детей в возрасте от 7 до 18
лет, с диагнозом посттравматической энцефалопатии. Из них 21 (62%) мальчики и 13 (38%)
девочек. Большую часть составили дети от 12 до 18 лет 70%, дети 7-11 лет 30%. У всех детей
независимо от степени тяжести ЧМТ, в период отдалѐнных последствий основными жалобами
являются: головные боли, астеновегетативные расстройства приводящие к довольно
длительному снижению работоспособности и к когнитивным нарушениям. У детей обеих
групп исследования как с легкой степенью так и со среднетяжелой степенью ЧМТ в анамнезе
отмечалась рассеянная микроорганическая симптоматика, симптомы вегетативной
дисфункции и астенизация нервной системы, более выраженная у детей второй группы . Ключевые слова: дети, постравматическая энцефалопатия, вегетативная дисфункция,
астенизация нервной системы.
ISSN (Online): 2455-3662
EPRA International Journal of Multidisciplinary Research (IJMR) - Peer Reviewed Journal Volume: 7| Issue: 9| September 2021|| Journal DOI: 10.36713/epra2013 || SJIF Impact Factor 2021: 8.047 || ISI Value: 1.188
2021 EPRA IJMR | www.eprajournals.com | Journal DOI URL: https://doi.org/10.36713/epra2013 408
Актуальность: Черепно-мозговая травма это
повреждения механической энергии черепа и
внутричерепного содержимого [2]. Это одна из
самых распространѐнных видов травматических
патологий, составляющих до 30-40% в общей
группе травматизма. В структуре закрытых ЧМТ
у детей и подростков 76-89% случаев, приходится
на легкие и средне - тяжѐлые формы, который по
сравнению с тяжѐлыми и крайне тяжѐлыми
формами имеют относительно благоприятный
исход. Но, однако, несмотря на это, оказывают
существенное влияние на дальнейшее
гармоничное развитие детей. В течение ЧМТ выделяют три основных
периода: острый, промежуточный и отдалѐнный
[2]. Острый период – это промежуток времени от
момента повреждающего воздействия на
головной мозг с расстройством его регуляторных
и очаговых функций до стабилизации на том или
ином уровне нарушенной общемозговой
деятельности и функции организма в целом. Промежуточный период – это время от начало
относительной стабилизации общей мозговых и очаговых функции до их полного или
частичного восстановления. Отдалѐнный период
– это период полного выздоровления, либо
максимально достижимой реабилитации
нарушенных функции, однако в то же время в
этом периоде возможно прогрессирования новых
патологических признаков обусловленных
полученной травмой [1]. Выраженность психо - неврологических
последствий травм головного мозга в отдалѐнном
периоде, напрямую зависит от степени еѐ тяжести
в остром периоде. Также следует учитывать и то,
что в детском возрасте головной мозг более
пластичен чем у взрослых, это часто не даѐт
полноценного представления о последствиях
перенесѐнных травм и возможных отсроченных
патологических проявлений, не выявленных в
момент осмотра. В связи с этим совершенствование методов
своевременной диагностики и терапии
последствий травмы мозга в детском возрасте,
является актуальной проблемой не только
медицины, но и любой общественной системы в целом [3]. Целью нашего исследования, является изучение клинико-неврологических особенностей
посттравматической энцефалопатии у детей.
Материалы и методы исследования: Нами было обследовано 34 ребѐнка в возрасте от
7 до 18 лет, с диагнозом посттравматической
энцефалопатии. Из них 21 (62%) мальчики и 13
(38%) девочек. Большую часть составили дети от
12 до 18 лет 70%, дети 7-11 лет 30%. Срок давности перенесѐнной ЧМТ к моменту нашего
исследования, составлял от 2 до 6 лет в среднем
(5,3 ±2,6 лет). Для решения поставленных задач исследования
были сформированы две клинические группы. В
первую клиническую группу с последствиями
ЧМТ лѐгкой степени были включены 24 ребѐнка, из них 15 (62.5%) мальчиков и 9 (37,5%) девочек. Во вторую группу с последствиями ЧМТ средне - тяжѐлой степени вошли 10 детей, из которых 6
(60%) мальчики, 4 (40%) девочки. В обследованные группы не вошли дети с
указанием в анамнезе перинатальной патологии
ЦНС, с задержкой моторного и психического
развития, перенесшие нейроинфекции,
страдающие хроническими соматическими
заболеваниями. В исследуемых группах проводился тщательный
сбор анамнеза, путѐм расспроса пациентов и их
родственников, исследование неврологического
статуса, проводили ЭЭГ головного мозга, нейровизуализационные методы исследования
(МРТ и МСКТ головного мозга), проводили
оценку соматического статуса ребенка. Результаты и обсуждение: результаты
проведенного исследования показали, что у
детей с последствиями ЧМТ, независимо от
степени тяжести травмы, основными
предъявляемыми жалобами были головная боль в
первой группе с легкой степенью ЧМТ
встречалась у 88%, тогда как в группе детей со
средней тяжестью- у 90%, представленная преимущественно головной болью напряжения (88%), реже мигренозной головной болью (12%), часто провоцирующаяся сменой погоды,
эмоциональным и физическим напряжениями. Пациенты жаловались на периодические
головокружения, имеющие несистемный
характер, в большей части связанные с
метеолабильностью, усталостью, отмечались на
пике головной боли, соответственно 54% в
первой и 70% во второй группе.

ISSN (Online): 2455-3662
EPRA International Journal of Multidisciplinary Research (IJMR) - Peer Reviewed Journal Volume: 7| Issue: 9| September 2021|| Journal DOI: 10.36713/epra2013 || SJIF Impact Factor 2021: 8.047 || ISI Value: 1.188
2021 EPRA IJMR | www.eprajournals.com | Journal DOI URL: https://doi.org/10.36713/epra2013 409
Таблица 1 Характеристика жалоб у детей, перенесших черепно-мозговые травмы.
Основные жалобы I группа (n=24) II группа (n=10)
Абс % Абс % Головная боль 21 88 % 9 90 % Головокружение 13 54 % 7 70 % Тошнота 11 46 % 4 40 % Повышенная утомляемость 20 85 % 9 90 % Раздражительность 14 58% 7 70% Нарушение сна 13 54 % 6 60 % Снижение памяти 12 50 % 7 70 % Снижение внимания 13 54 % 6 60 % На фоне головной боли и головокружения
возникала очень часто тошнота 46% и 40%, соответственно, более выраженная у детей с
легкой степенью ЧМТ, которая часто возникала
при езде в транспорте. Такие жалобы как
нарушение сна ( 54% и 60 %), снижение памяти (50% и 70%) и внимания (54% и 60%) были более
выражены в группе детей со среднетяжелой ЧМТ.
При исследовании неврологического
статуса отмечался синдром рассеянной
церебральной микросимптоматики, куда входили
мелкоразмашистый горизонтальный нистагм у
54% детей первой группы, у 80% детей второй
группы со среднетяжелой формой ЧМТ в
анамнезе.
Таблица 2 Данные объективного неврологического обследования удетей с последствиями ЧМТ.
Основные жалобы I группа (n=24) II группа (n=10)
Абс % Абс % Нистагм (горизонтальный
мелкоразмашистый) 13 54 % 8 80 %
Точки Валле болезнены 4 16 % 4 40 % Центральный парез 7 пары 14 58 % 8 80 % Легкая девиация языка 5 21 % 8 80 % Гипотония мышц 8 33 % 7 70 % Оживление сухожильных рефлексов 18 75 % 9 90 % Интенция (легкая) при ПНП 6 25% 8 80% Неустойчивость в позе Ромберга 5 21% 7 70%
Такие симптомы как болезненность точек
Валле- у 16% и 40% детей соответственно, центральный парез 7 пары более выражен во
второй группе-80%, в первой группе составил
58%, легкая девиация языка у 80% детей второй
группы и 21% детей первой группы с легкой
степенью ЧМТ. Также у детей обследуемых
групп отмечались незначительные
координаторные нарушения в виде
неустойчивости в позе Ромберга у 70% детей,
интенции при выполнении пальценосовой пробы
у 80 %детей со среднетяжелой формой ЧМТ в
анамнезе. Тогда как в группе детей с легкой
степенью ЧМТ отмечалось у 21% детей
неустойчивость в позе Ромберга и у 25% детей
легкая интенция при проведении пальценосовой
пробы. Такие нарушения в двигательной сфере
как оживление сухожильных рефлексов у 75%
детей первой группы и 90% второй группы,
гипотония мышц у 33% первой группы и 70%
второй группы. Необходимо отметить, что более
выраженные симптомы неврологической
микросимптоматики отмечались в группе длетей
со среднетяжелой формой ЧМТ в анамнезе. При
этом синдром очаговой симптоматики отмечался
у детей старшей возрастной группы и
практически не был выявлен у детей младшего
возраста, что может объясняться высокими
компенсаторными возможностями головного
мозга у детей более младшего возраста. Почти у всех детей обследуемых групп
отмечались признаки вегетативной дисфункции в
виде в виде мраморности кожных покровов(у
33%первой группы и 60% второй группы), гипергидроза ладоней и стоп (у 70% первой
группы и 80% второй группы%),
ISSN (Online): 2455-3662
EPRA International Journal of Multidisciplinary Research (IJMR) - Peer Reviewed Journal Volume: 7| Issue: 9| September 2021|| Journal DOI: 10.36713/epra2013 || SJIF Impact Factor 2021: 8.047 || ISI Value: 1.188
2021 EPRA IJMR | www.eprajournals.com | Journal DOI URL: https://doi.org/10.36713/epra2013 410
метеолабильности (у 75% первой и 90% второй
групп), признаки астенизации нервной системы в
виде повышенной утомляемости (у 83% первой и
90% второй группы), раздражительности (у 54%
первой и 70% второй группы), нарушения сна- у
54 % первой и 60% второй групп соответственно,
выражающиеся в позднем засыпании и частых
пробуждениях среди ночи, с трудностью
засыпания, тревожности в поведении (у 41% в
первой группе и 30% детей во второй ),
эмоциональной лабильности у всех пациентов
обеих групп . Таким образом сравнительный
анализ результатов исследолвания показал как
симптомы астенизации так и вегетативную
дисфункцию более выраженную во второй группе
со среднетяжелой формой ЧМТ в анамнезе. Не менее значимые были результаты ЭЭГ, МРТ
показателей. Так по данным ЭЭГ исследования у
детей с последствиями ЧМТ независимо от
степени тяжести отмечались изменения альфа
ритма и диффузное усиление медленно - волновой активности более выраженные у детей
второй группы старшего возраста. На МРТ наблюдалось легкая кортикальная
атрофия и гипертензионный синдром, также
более выраженные во второй клинической
группе. Выводы
У всех детей независимо от степени тяжести
ЧМТ, в период отдалѐнных последствий
основными жалобами являются: головные боли,
астеновегетативные расстройства приводящие
довольно длительному снижению
работоспособности и когнитивным нарушениям. У детей обеих групп
исследования как с легкой степенью так и со
среднетяжелой степенью ЧМТ в анамнезе
отмечалась рассеянная микроорганическая
симптоматика, симптомы вегетативной
дисфункции и астенизация нервной системы
более выраженная у детей второй группы .
СПИСОК ЛИТЕРАТУРЫ 1. Немкова С.А., Заваденко Н.Н., Маслова О.И.,
Каркашадзе Г.А., Диагностика и коррекция
когнитивных нарушений у детей с
последствиями черепно-мозговой травмы.
Москва., Педиатрическая
фармакология/2014/том 11/№3. 2. Коновалов А.Н., Лихтерман Л.Б., Потапов
А.А. и др. Клиническое руководство по
черепно-мозговой травме. М., 1998.-Т. 1.-549 с.
3. Немкова С.А., Заваденко Н.Н., Нестеревский
Ю.Е., Москва/Вопросы практической
педиатрии, 2015, №3, с 48-57

ISSN (Online): 2455-3662
EPRA International Journal of Multidisciplinary Research (IJMR) - Peer Reviewed Journal
Volume: 7| Issue: 9| September 2021|| Journal DOI: 10.36713/epra2013 || SJIF Impact Factor 2021: 8.047 || ISI Value: 1.188
2021 EPRA IJMR | www.eprajournals.com | Journal DOI URL: https://doi.org/10.36713/epra2013 411
PATHOGENETIC FEATURES OF IMMUNO-BIOCHEMICAL SHIFTS IN CHILDREN
WITH IDIOPATHIC EPILEPSY
Yakutkhon Nabievna Madjidova1,
Muazzamkhon Ilkhomidinovna Abdullaeva2
1Tashkent Pediatric Medical Institute 2Andijan State Medical Institute
ABSTRACT The data obtained as a result of the studies carried out indicate the heterogeneity of patients with epilepsy from the point of view of molecular mechanisms, the development of the causes of epileptic seizures. One of the leading mechanisms of the pathogenesis of idiopathic epilepsy is a complex restructuring of neuroimmune relationships, manifested by a unidirectional increase in the level of autoantibodies to neurospecific proteins S100, GFAP, NF-200, MBP and the neurotransmitters glutamate, GABA, dopamine, serotonin and serotonine-channel. At the same time, the key link in the pathogenesis of idiopathic epilepsy is neurotransmitter imbalance. Circulating AATs to neurotropic proteins and neurotransmitter receptors in the blood serum of patients with epilepsy can be used as additional prognostic “immuno-biochemical” criteria for the course of the disease and the effectiveness of antiepileptic treatment. KEYWORDS: idiopathic epilepsy, neuroetiopathogenesis, autoantibodies to neurospecific proteins and neurotransmitters, children
ПАТОГЕНЕТИЧЕСКИЕ ОСОБЕННОСТИ ИММУНО-БИОХИМИЧЕСКИХ
СДВИГОВ У ДЕТЕЙ С ИДИОПАТИЧЕСКОЙ ЭПИЛЕПСИЕЙ
Якутхон Набиевна Маджидова Ташкентский педиатрический медицинский институт
Муаззамхон Илхомидиновна Абдуллаева
Андижанский государственный медицинский институт
Аннотация: Полученные в результате проведенных исследований данные свидетельствуют о
неоднородности пациентов с эпилепсией точки зрения молекулярных механизмов, развития
причин возникновения эпилептических приступов. Одним из ведущих механизмов патогенеза
идиопатической эпилепсии является комплексная перестройка нейроиммунных
взаимоотношений, проявляющаяся однонаправленным увеличением уровня аутоантител к
нейроспецифическим белкам S100, GFAP, NF-200, ОБМ и нейромедиаторам глутамату, ГАМК,
дофамину, серотонину, серотонину и вольтаж-зависимому Са-каналу. При этом ключевым
звеном в патогенезе идиопатической эпилепсии является нейромедиаторный дисбаланс.
Циркулирующие ААТ к нейротропным белкам и рецепторам нейромедиаторов в сыворотке
крови больных эпилепсией могут использоваться в качестве дополнительных прогностических
ISSN (Online): 2455-3662
EPRA International Journal of Multidisciplinary Research (IJMR) - Peer Reviewed Journal
Volume: 7| Issue: 9| September 2021|| Journal DOI: 10.36713/epra2013 || SJIF Impact Factor 2021: 8.047 || ISI Value: 1.188
2021 EPRA IJMR | www.eprajournals.com | Journal DOI URL: https://doi.org/10.36713/epra2013 412
«иммуно-биохимических» критериев течения заболевания и эффективности
противоэпилептического лечения. Ключевые слова: идиопатическая эпилепсия, нейроэтиопатогенез, аутоантитела к
нейроспецифическим белкам и нейромедиаторам.
Эпилепсия является одним из наиболее распространенных заболеваний нервной системы у
детей и подростков. Частота эпилепсии в популяции высока и достигает 0,5 – 0,8%, а среди детского
населения - до 1,0%. Истинная частота данного заболевания может быть только выше. Среди причин
неврологической инвалидности эпилепсия - также нередкая патология. В связи с этим лечение,
реабилитация, социальная адаптация больных эпилепсией - крайне актуальная задача [8, 13]. При
идиопатических формах эпилепсии подразумевается генетическая детерминированность заболевания.
Идиопатическая эпилепсия (ИЭ) является частой формой эпилепсии у детей и подростков, составляя до
143 всех случаев заболевания [3, 5]. В настоящее время ИЭ определяется как форма генерализованной
эпилепсии, при которой все приступы генерализованны с самого начала; в неврологическом статусе
обычно отсутствуют очаговые симптомы и признаки снижения интеллекта; паттерны ЭЭГ первично
генерализованны, билатеральны и синхронны; при нейрорадиологическом исследовании отсутствуют
грубые структурные изменения в головном мозге [4, 8]. Новым импульсом к изучению проблемы иммунопатогенеза эпилепсии должны послужить
сформировавшиеся в последнее десятилетие представления о неразрывном единстве функции двух
основных интегративных систем организма: центральной нервной и иммунной. На основании сведений
о нейроиммунном взаимодействии оформились новые научные дисциплины - нейроиммунология и
нейроиммунопатология [2, 5]. Одной из интригующих проблем нейроиммунопатологии являются
иммунологические аспекты патогенеза эпилепсии. Однако до настоящего времени не получено четких
доказательств обязательного участия иммунологических факторов в патогенезе различных форм
эпилепсии [9, 11]. В последние годы уделяется большое внимание изучению влияния дисбаланса медиаторного
метаболизма, а именно, возбуждающего нейромедиатора глутамата и тормозного ГАМК на тяжесть
течения эпилептического процесса. При этом глутамату придается более существенная роль в процессах
возбуждения и формирования эпилептогенного очага [3, 14, 15]. Иммунологические исследования
последних лет касаются в основном продукции аутоантител (аАТ) к глутаматным АМРА-рецепторам
нервных клеток при эпилепсии; показана целесообразность определения уровня этих сывороточных аАТ
для диагностики и изучения патогенеза этого заболевания [3, 4, 8, 14, 15]. Однако до сих пор
дискутируется вопрос о возможной роли аАТ к глутаматным АМРА-рецепторам в прогнозе течения
заболевания и, особенно важно, в развитии фармакорезистентности [4, 6, 7]. Исследования последних лет выявили изменение уровня сывороточных первичных
(идиотипических) аАТ и их «функциональных противовесов» - антиидиотипических аАТ (АИАТ) к ряду
нейроспецифических антигенов мозга у больных эпилепсией, указывающее на возможность
повреждения нейроглии [1, 9, 16]. Изучение аАТ к глиоспецифическнм белкам важно для понимания
механизмов повреждения при эпилепсии астроцитарной глии и гематоэнцефалического барьера (ГЭБ), а
также совершенствования способов лечения этого заболевания [4, 14]. Однако, патогенетическая роль и
диагностическая значимость аАТ к белкам мозга и рецепторам нейромедиаторов нуждаются в
дальнейшем исследовании. Целью изучение иммуно-биохимических сдвигов у детей с идиопатической эпилепсией с
помощью метода ЭЛИ-Н-Тест (Полетаев А.Б. и др., 2007) путем определения сывороточной
иммунореактивности к белкам S100, GFAP, ОБМ, NF200 и нейромедиаторамглутамату, ГАМК,
дофамину, серотонину, холину и вольтаж-зависимому Са-каналу. Материалы и методы исследования: были обследованы 36 детей с идиопатической
эпилепсией в возрасте от 6 до 16 лет (22 мальчиков; 14 девочек). Все больные проходили тщательный
предварительный анамнестический и клинический отбор, который осуществлялся методом
стратифицированной рандомизации с использованием критериев включения и исключения. Критерии включения больных в исследование: дети и подростки до 16 лет, эпилептические
припадки на момент госпитализации или в анамнезе, идиопатическая эпилепсия. Критерии исключения: подростки старше 16 лет и взрослые, криптогенная эпилепсия,
псевдоэпилептические припадки, психогенные реакции, конверсионные припадки (истерия). Объем исследования включал: клиническое неврологическое обследование, исследование
соматического статуса, нейропсихологическое тестирование высших корковых функций,
нейрофизиологическое обследование (ЭЭГ), лабораторные методики (клинический анализ крови,
ISSN (Online): 2455-3662
EPRA International Journal of Multidisciplinary Research (IJMR) - Peer Reviewed Journal
Volume: 7| Issue: 9| September 2021|| Journal DOI: 10.36713/epra2013 || SJIF Impact Factor 2021: 8.047 || ISI Value: 1.188
2021 EPRA IJMR | www.eprajournals.com | Journal DOI URL: https://doi.org/10.36713/epra2013 413
биохимия крови, анализ иммунного статуса), нейрорадиологические методы исследования (МРТ или КТ
головного мозга). Тип приступов определялся согласно Международной классификации эпилептических
приступов (1981). Диагноз эпилепсии ставился в соответствии с Международной классификацией
эпилепсии (ILAE 1989, 2007) [11,12]. Количественное определение сывороточной иммунореактивности антител (АТ1 и АИАТ2) к
рецепторам нейромедиаторов (глутаматные, ГАМК, дофаминовые, серотониновые и холинорецепторы)
проводилось с помощью твердофазного иммуноферментного метода ЭЛИ-Н-Тест и одноименных тест-наборов, производства МИЦ «Иммункулус» (Россия). За норму принимали значения
иммунореактивности аАТ от 80 до 140 У.Е., индекс иммунореактивности АТ1/АИАТ2 от 0,8 до 1,2 [9,
16]. Результаты исследования сравнивались с данными контрольной группы, в которую вошли 15 клинически здоровых детей и подростков (5 мальчиков, 10 девочек в возрасте от 6 до 16 лет).
Анализ полученных показателей проводился с помощью пакета программ «SPSS for Windows» и
«STATISTICA» Microsoft Excel с обработкой материала с помощью методов вариационной статистики.
Достоверность полученных результатов оценивали парным методом по t-критерию Стьюдента. Различия
считали достоверными при p <0,05. Результаты исследования: В структуре эпилептических припадков преобладали абсансные в
возрасте от 6 до 8 лет, тогда как генерализованные тонико-клонические приступи в возрастной группе 8-12 лет. Среди них абсансные припадки были у 5 больных (13,9%), тонико-клонические - у 26 больных
(72,2%), миклонические - у 5 больных (13,9%). При оценке результатов иммунологического исследования установлено, что показатели детей с
ИЭ отличались от контрольной группы как по уровню, так и по степени разброса изученных
иммунологических показателей. Уровень сывороточных аутоантител к нейротропным белкам у больных
детей с идиопатической эпилепсией был резко повышен от 9,5 до 47,8 раз (Р<0,001). NF200 является
специфическим белком аксонов, рост антител к нему сопровождает процессы дегенерации нервных
волокон, что и наблюдается у обследованных детей с ИЭ (30,1±4,6 против 0,63±0,11). Повышение
содержания специфического белка филаментов астроцитов (GFAP) в 9,5 раз при ИЭ (11,5±8,8 против
1,21±0,15) свидетельствует о патологических процессах разрастания астроглиальных клеток (глиоз).
Таблица 1 Уровень сывороточных аутоантител к нейротропным белкам у больных детей с идиопатической
эпилепсией, у.е.
Показатели ИЭ (n=36) Контроль
(n=15) ИЭ и КГ
Р< ↑
ИЭ/КГ
NF200 30,1±4,6 0,63±0,11 0,001 47,8
GFAP 11,5±8,8 1,21±0,15 0,001 9,5
S100 37,9±8,8 1,1±0,16 0,001 34,5
ОБМ 10,0±8,6 0,95±0,14 0,001 10,5
Высокие показатели S100 при ИЭ против данных контрольной группы (37,9±8,8 против
1,1±0,16) у обследованных детей являются признаком изменений в ЦНС, которые сопровождаются
эмоциональными нарушениями (фобии, депрессии, агрессивность). Известно, что миелин обладает выраженным иммуногенным свойством, а его разрушение
является универсальным механизмом реакции нервной ткани на различные повреждения. Появление
повышенных показателей антител к ОБМ в сыворотке крови свидетельствует о нарушении
гематоэнцефалического барьера у больных с ИЭ (10,0±8,6 против 0,95±0,14; Р<0,001). Одновременно с этим частичная или полная потеря миелина жизнеспособными отростками
может привести к выраженным нарушениям проведения нервных импульсов. Демиелинизация аксона
значительно снижает скорость проведения нервных импульсов, так что процесс проведения будет уже
не сальтоторным между перехватами Ранвье, как в миелинизированном волокне, а перемещение
электролитов (К+ и Na
+) будет происходить по всей поверхности аксона. Это может приводить к
образованию новых ионных каналов в клеточной мембране и увеличивать концентрацию ионов калия во
внеклеточном пространстве, что в свою очередь может изменять возбудимость нервных клеток и
усугублять пароксизмальную активность мозга. Таким образом, повышение нейротропных аутоантител является доказательством усугубления
нейроиммунной дизрегуляции при ИЭ. При этом увеличение уровня аутоантител к S100, учитывая их
глиальное происхождение, свидетельствует об изменениях глиальных клеток и нарушении
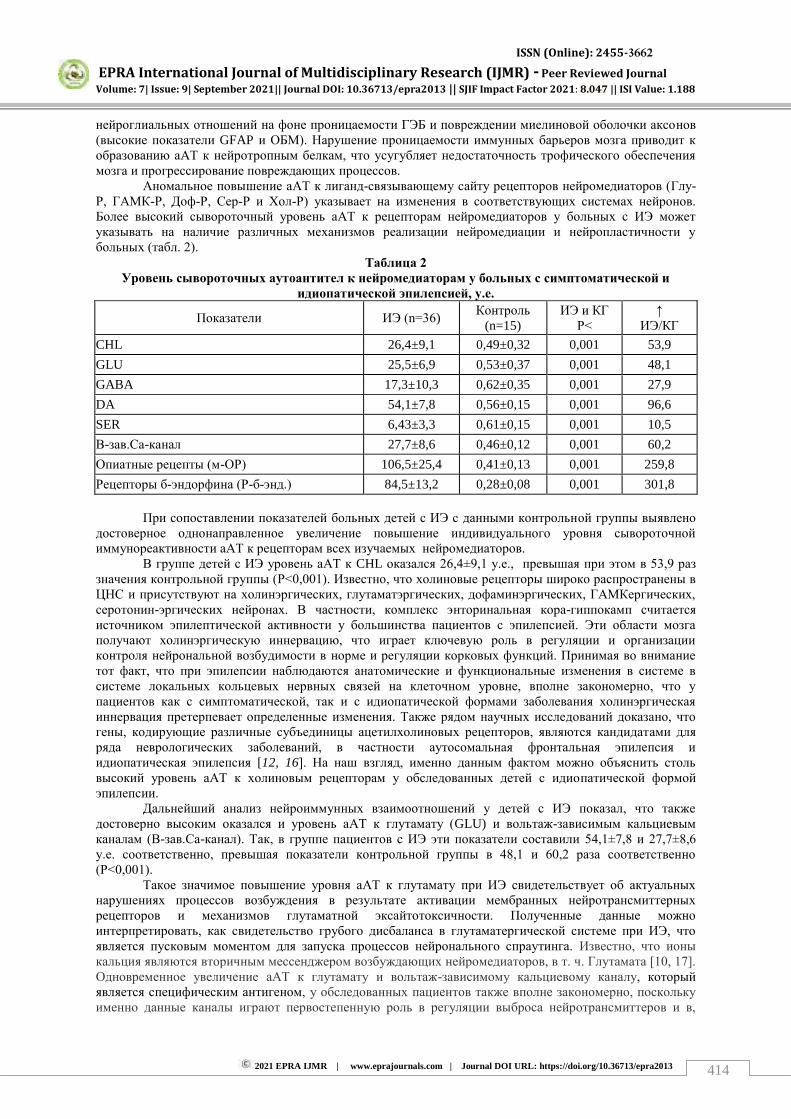
ISSN (Online): 2455-3662
EPRA International Journal of Multidisciplinary Research (IJMR) - Peer Reviewed Journal
Volume: 7| Issue: 9| September 2021|| Journal DOI: 10.36713/epra2013 || SJIF Impact Factor 2021: 8.047 || ISI Value: 1.188
2021 EPRA IJMR | www.eprajournals.com | Journal DOI URL: https://doi.org/10.36713/epra2013 414
нейроглиальных отношений на фоне проницаемости ГЭБ и повреждении миелиновой оболочки аксонов
(высокие показатели GFAP и ОБМ). Нарушение проницаемости иммунных барьеров мозга приводит к
образованию аАТ к нейротропным белкам, что усугубляет недостаточность трофического обеспечения
мозга и прогрессирование повреждающих процессов. Аномальное повышение аАТ к лиганд-связывающему сайту рецепторов нейромедиаторов (Глу-
Р, ГАМК-Р, Доф-Р, Сер-Р и Хол-Р) указывает на изменения в соответствующих системах нейронов.
Более высокий сывороточный уровень аАТ к рецепторам нейромедиаторов у больных с ИЭ может
указывать на наличие различных механизмов реализации нейромедиации и нейропластичности у
больных (табл. 2). Таблица 2
Уровень сывороточных аутоантител к нейромедиаторам у больных с симптоматической и
идиопатической эпилепсией, у.е.
Показатели ИЭ (n=36) Контроль
(n=15) ИЭ и КГ
Р< ↑
ИЭ/КГ
CHL 26,4±9,1 0,49±0,32 0,001 53,9
GLU 25,5±6,9 0,53±0,37 0,001 48,1
GABA 17,3±10,3 0,62±0,35 0,001 27,9
DA 54,1±7,8 0,56±0,15 0,001 96,6
SER 6,43±3,3 0,61±0,15 0,001 10,5
В-зав.Са-канал 27,7±8,6 0,46±0,12 0,001 60,2
Опиатные рецепты (м-ОР) 106,5±25,4 0,41±0,13 0,001 259,8
Рецепторы б-эндорфина (Р-б-энд.) 84,5±13,2 0,28±0,08 0,001 301,8 При сопоставлении показателей больных детей с ИЭ с данными контрольной группы выявлено
достоверное однонаправленное увеличение повышение индивидуального уровня сывороточной
иммунореактивности аАТ к рецепторам всех изучаемых нейромедиаторов. В группе детей с ИЭ уровень аАТ к CHL оказался 26,4±9,1 у.е., превышая при этом в 53,9 раз
значения контрольной группы (Р<0,001). Известно, что холиновые рецепторы широко распространены в
ЦНС и присутствуют на холинэргических, глутаматэргических, дофаминэргических, ГАМКергических,
серотонин-эргических нейронах. В частности, комплекс энторинальная кора-гиппокамп считается
источником эпилептической активности у большинства пациентов с эпилепсией. Эти области мозга
получают холинэргическую иннервацию, что играет ключевую роль в регуляции и организации
контроля нейрональной возбудимости в норме и регуляции корковых функций. Принимая во внимание
тот факт, что при эпилепсии наблюдаются анатомические и функциональные изменения в системе в
системе локальных кольцевых нервных связей на клеточном уровне, вполне закономерно, что у
пациентов как с симптоматической, так и с идиопатической формами заболевания холинэргическая
иннервация претерпевает определенные изменения. Также рядом научных исследований доказано, что
гены, кодирующие различные субъединицы ацетилхолиновых рецепторов, являются кандидатами для
ряда неврологических заболеваний, в частности аутосомальная фронтальная эпилепсия и
идиопатическая эпилепсия [12, 16]. На наш взгляд, именно данным фактом можно объяснить столь
высокий уровень аАТ к холиновым рецепторам у обследованных детей с идиопатической формой
эпилепсии. Дальнейший анализ нейроиммунных взаимоотношений у детей с ИЭ показал, что также
достоверно высоким оказался и уровень аАТ к глутамату (GLU) и вольтаж-зависимым кальциевым
каналам (В-зав.Са-канал). Так, в группе пациентов с ИЭ эти показатели составили 54,1±7,8 и 27,7±8,6
у.е. соответственно, превышая показатели контрольной группы в 48,1 и 60,2 раза соответственно
(Р<0,001). Такое значимое повышение уровня аАТ к глутамату при ИЭ свидетельствует об актуальных
нарушениях процессов возбуждения в результате активации мембранных нейротрансмиттерных
рецепторов и механизмов глутаматной эксайтотоксичности. Полученные данные можно
интерпретировать, как свидетельство грубого дисбаланса в глутаматергической системе при ИЭ, что
является пусковым моментом для запуска процессов нейронального спраутинга. Известно, что ионы
кальция являются вторичным мессенджером возбуждающих нейромедиаторов, в т. ч. Глутамата [10, 17].
Одновременное увеличение аАТ к глутамату и вольтаж-зависимому кальциевому каналу, который
является специфическим антигеном, у обследованных пациентов также вполне закономерно, поскольку
именно данные каналы играют первостепенную роль в регуляции выброса нейротрансмиттеров и в,
ISSN (Online): 2455-3662
EPRA International Journal of Multidisciplinary Research (IJMR) - Peer Reviewed Journal
Volume: 7| Issue: 9| September 2021|| Journal DOI: 10.36713/epra2013 || SJIF Impact Factor 2021: 8.047 || ISI Value: 1.188
2021 EPRA IJMR | www.eprajournals.com | Journal DOI URL: https://doi.org/10.36713/epra2013 415
частности, выхода глутамата в синаптическую щель. L-тип кальциевых каналов участвует в генерации
потенциала действия, Т-тип способствует синхронизации таламокортикальных связей, что лежит в
основе паттерна «спайк-волна» при эпилепсии [1, 6, 10]. Одновременно с этим активация NMDA-рецепторов под влиянием возбуждающих медиаторов (например, глутамата) может вызывать
патологический феномен эксайтотоксичности, связанный с повышенным проникновением кальция
внутрь клетки с последующей за этим гибелью нейронов. Кроме того, внутриклеточные ионы кальция
опосредованно – через регуляцию синтеза мембранных белков – влияют на рост дендритов и
синаптогенез, что модифицирует функциональную активность нейронов в соответствии с меняющимися
условиями внешней среды [5]. Уровни ААТ к ГАМК, дофамину и серотонину при ИЭ также превышали нормативные
показатели и были примерно на одном уровне (ААТ GABA 17,3±10,3 у.е., Р<0,001; ААТ DA 54,1±7,8,
Р<0,001; ААТ SER 6,43±3,3 у.е., Р<0,001). Высокий уровень аутоантител к ГАМК является доказательством нарушений работы ГАМК-
ергической системы, усиливающих нейротоксические эффекты глутамата с одной стороны, и
тормозящих структуры антиэпилептической системы с другой [5, 14]. Наличие высоких уровней ААТ к
дофамину и серотонину у пациентов с идиопатической эпилепсией и их достоверное отличие от
показателей контрольной группы подтверждает тесную связь глутаматэргической системы с системой
биогенных аминов, дизрегуляция которых приводит к губительному влиянию на нейроны и оказывает
проэпилептический эффект [8, 17]. В данном случае такое соотношение ААТ можно трактовать как
свидетельство выраженной аутоиммунной реакции со стороны нервной ткани, которая, в свою очередь,
способствует поддержанию патологической эпилептической системы при ИЭ. Таким образом, повышение ААТ к лиганд-связывающему сайту рецепторов нейромедиаторов
(Глу-Р, ГАМК-Р, Доф-Р, Сер-Р и Хол-Р) указывает на изменения в соответствующих системах нейронов.
Более высокий сывороточный уровень ААТ к рецепторам нейромедиаторов может указывать на наличие
различных механизмов реализации нейромедиации и нейропластичности у больных с ИЭ. Активация опиоидных рецепторов приводит к различным клеточным последствиям,
включающим ингибирование аденилилциклазы, что вызывает уменьшение внутриклеточной
концентрации цАМФ. Рецептор б-эндорфина - нейропептид из группы эндорфинов, образующийся во
многих клетках ЦНС и являющийся эндогенным лигандом-агонистом опиоидных рецепторов. Эти
пептиды обладают как центральными эффектами (психоневрологические и поведенческие реакции), так
и возможностью оказывать влияние на периферические центры и органы. В наших исследованиях
отмечены высокие показатели как м-ОР, так и Р-б-энд при ИЭ у детей по отношению к данных
контрольной группы (в 259,8 раз и 301,8 раз соответственно). Таким образом, циркулирующие аАТ к рецепторам нейромедиаторов, в частности к
глутаматным, ГАМК, дофаминовым, серотониновым и холинорецепторам, в сыворотке крови больных
ИЭ свидетельствуют об изменениях в соответствующих системах нейронов. Тогда как повышение
опиатных пептидов свидетельствует о нарушении в регуляции адаптивного поведения и реакций
организма на стресс. Показатели титра аАТ к указанным нейрорецепторам могут использоваться в
качестве дополнительных прогностических «иммуно-биохимических» критериев течения заболевания и
эффективности противоэпилептического лечения. Иммунологические и биохимические изменения
могут быть вовлечены в процесс эпилептогенеза и они, возможно, не связаны с применением
противоэпилептических препаратов, и свидетельствуют о характере течения заболевания. Высокий
сывороточный уровень аАТ к рецепторам нейромедиаторов у больных с ИЭ указывает на наличие
различных механизмов реализации нейромедиации и пластичности мозга при идиопатической и
симптоматической эпилепсии. Список литературы
1. Асанова Л.М., Морозов С.Г., Яковлев H.A., Зиньковский К.А., Сывороточные аутоантитела к
глиоспецифическим антигенам мозга у больных эпилепсией // Нейроиммунология. - 2003, - Т. 1., №2. - С. 57-58.
2. Ветрилэ Л.А., Евсеев В.А., Карпова М.Н. Нейроиммунопатологические аспекты эпилепсии // Вестник
РАМН. - 2004. - № 8. - С. 43-46. 3. Дзугаева Ф.К. Клинико-иммунологические, биохимические критерии и прогноз парциальной эпилепсии:
Автореф. дис. … доктора мед. наук. – М., 2004. – 32 с. 4. Зиньковский К.А. Клинико-патохимические, иммунологические изменения и их терапевтическая коррекция
у больных эпилепсией: Автореф. дис… канд. мед. наук. – М., 2004. – 30 с. 5. Крыжановский Г.Н., Магаева С.В., Макаров С.В., Сепиашвили Р.И. Нейроиммунопатология. Руководство.
М.: 2003., 438 с.
ISSN (Online): 2455-3662
EPRA International Journal of Multidisciplinary Research (IJMR) - Peer Reviewed Journal
Volume: 7| Issue: 9| September 2021|| Journal DOI: 10.36713/epra2013 || SJIF Impact Factor 2021: 8.047 || ISI Value: 1.188
2021 EPRA IJMR | www.eprajournals.com | Journal DOI URL: https://doi.org/10.36713/epra2013 416
6. Лусникова И.В. Клинические и нейро-иммунологические аспекты фармакорезистентной эпилепсии:
Автореф. дис. … канд. мед. наук. – М.: РГМУ, 2008. – 32 с. 7. Малашхия В.Ю. Иммунопатология и иммуногенетика некоторых форм детской эпилепсии // Журнал
неврол. и психиатр. - 1996. - №2. - С.18-20. 8. Морозов С.Г., Гнеденко Б.Б., Асанова Л.М. Аутоантитела к антигенам ткани мозга у больных эпилепсией
// Журнал неврол. и психиатр. – 1996. -№4. - С.71-74. 9. Полетаев А.Б., Алферова В.В., Абросимова А. А., Комиссарова И.А.,Соколов М. А., Гусев Е.И.
Естественные нейротропные аутоантитела и патология нервной системы. // Нейроиммунология. 2003. Т.1., №1. С. 11-17.
10. Прохорова А.В. Роль нейроиммуной дизрегуляции в патогенезе посттравматической эпилепсии у детей //
Журнал теоретической и клинической медицины. –2011.- №5. – С.64-67. 11. Commission on Classification and Terminology of the International League Against Epilepsy, Proposal for revised
classification of epilepsies and epileptic syndromes // Epilepsia. - 1989. -Vol. 30. - P. 796-803. 12. Engel J.J. ILAE classification of epilepsy syndromes // Epilepsia. - 2006. -Vol. 70. - P. 5-10. 13. Gusev E.I., Guekht A.B., Poletaev A.В., Lusnikova I.V., Feygina A.A., Kovaleva I.U. Сhanges of serum levels of
natural neurotropic autoantibodies in patients with partial symptomatic/cryptogenic epilepsy // Epilepsia. – 2006. - Vol. 47, suppl. 3. – P. 38.
14. Mantegazza R., Bernasconi P., Baggi F., Spreafico R., Ragona F., Antozzi C., Bernardi G., Granata T. Antibodies against GluR3 peptides are not specific for Rasmussen’s encephalitis but are also present in epilepsy patients with
severe, early onset disease and intractable seizures // Neuroimmunology. – 2002. – Vol. 131(1-2). – P. 179-185. 15. Peltola J., Kulmala P., Isojärvi J., Saiz A., Latvala K., Palmio J., Savola K., Knip M., Keränen T., Graus F.
Autoantibodies to glutamic acid decarboxylase in patients with therapy-resistant epilepsy // Neurology. – 2000. – Vol. 12;55(1). – P. 46-50.
16. Poletaev A.B., Abrosimova A.A., A.A., Socolov M.A., Gekht A.B., A.B., Alferova V.V., Gusev E.I., Nicolaeva T.Ya. Dialectics and implications of natural neurotropic autoantibodies in neurological disease and rehabilitation // Clinical and Developmental Immunology. 2004. V. 11. № 2. Р. 151-156.
17. Vincent A., Honnorat J., Antoine J.C., Giometto B., Dalmau J., Lang B. Autoimmunity in paraneoplastic neurological disorders // Neuroimmunology. – 1998. – Vol. 1; 84(1). – P. 105-109.
ISSN (Online): 2455-3662
EPRA International Journal of Multidisciplinary Research (IJMR) - Peer Reviewed Journal Volume: 7| Issue: 9| September 2021|| Journal DOI: 10.36713/epra2013 || SJIF Impact Factor 2021: 8.047 || ISI Value: 1.188
2021 EPRA IJMR | www.eprajournals.com | Journal DOI URL: https://doi.org/10.36713/epra2013 417
LOGICAL ANALYSIS OF ABDULKHALIQ GIJDUVANI’S WORK “MAQOMOTI YUSUF
HAMADONI”
N.U. Nurmatova
Candidate of Historical Sciences, Associate Professor of “Social Sciences” Bukhara Institute of Engineering and Technology,
ABSTRACT
This article discusses Abdulkhaliq Gijduvani and analyzes his work “Maqomoti Yusuf Hamadoni” dedicated to his teacher Yusuf Hamadoni. This work provides valuable information about the life and work of Yusuf Hamadoni, as well as some problematic information, and the author’s own views on the reasons for this. KEYWORSD: Sufism, Khoja Abdulkhaliq Gijduvani, “Maqomoti Yusuf Hamadoni”.
INTRODUCTION Khoja Abdulkhaliq ibn Abduljamil
Gijduvani, a great representative of mysticism, a famous saint, the founder and leader of the Central Asian sect known as Khojagon, was born in 1103 in an enlightened family in the village of Gijduvan, one of the largest trade caravan routes near Bukhara. After receiving his first education in his village, at the age of 22 he came to Bukhara to improve his knowledge. Here he receives adequate education from the great scholars and mystics of the time. Of particular importance was his meeting with the famous mystical leader Abu Yaqub Yusuf Hamadoni (d. 1140). Yusuf Hamadani converted him to the Sufi order. Yusuf Hamadoni, who has a majestic position in the history of mysticism, was born in 440 AH, 1048 AD (according to some sources, 1049 AD) in the Ghanimiya neighborhood of Hamadan, Iran. [7:3,8:19]. He died in 535 A.D., 1141 A.D. His tomb is located near the Sultan Sanjar shrine in Marv. Sufis glorify the tomb of Yusuf Hamadoni as the “Kaaba of Khorasan”.
Yusuf Hamadoni in his time was a sheikh of sheikhs, a scholar of rabbinical and divine sciences, a pole of the century - a protector of his age, a saint - a governor famous for his prophecies, a high authority - a mature sage, a piri murshid - irshad, ie to others pir, allamai zamon, who brought up a person who could rise to the level of the right to education, was awarded the title of scientist of his time.
Abdulkhaliq Gijduvani in his book “Maqomoti Yusuf Hamadoni” described the photos
and biographies of the piri murshid Yusuf Hamadoni. [1]; [2]. Abdulkhaliq Gijduvani’s “Maqomoti Yusuf
Hamadoni” consists of an introduction, Yusuf Hamadoni’s blessed teachings, Sanjar ibn Malikshah’s letter, the sheikh’s birth, morals and motives, the sheikh’s reason for coming to Samarkand, and the sheikh’s death. True, this play contains information about the biographical cases of Gijduvani, as well as information about the murids (disciples) of Yusuf Hamadoni. However, the main purpose of writing this book was to inform the people about the manners, prophecies, wisdom of Hazrat Yusuf Hamadoni, and his great services to history. THE MAIN FINDINGS AND RESULTS
In “Maqomoti Yusuf Hamadoni”, Abdulkhaliq Gijduvani followed his teachers step by step and described everything he did and said. It should be noted that Hazrat Yusuf Hamadoni visited Bukhara, Samarkand Marv (Mori), Khorezm, Baghdad, Mecca, Medina and other cities, where he studied. It is recorded in the sources that Hazrat had conversations with two hundred and thirteen great scholars and sheikhs. The Maqamati Yusuf Hamadoni also contains the genealogies of Hazrat Hamadoni, and it is noted that he was a leader of his time in the sciences of hadith, tafsir, and theology. Abdulkhaliq Gijduvani in his book “Maqomoti Yusuf Hamadoni” tells the following story about his teacher
with great respect: “One day, Hazrat Yusuf
Hamadoni looked at me and said: “You are my fourth caliph, just as I was the fourth caliph of Khoja Kalon (i.e. Formadi).” After that, her eyes filled with tears. I asked: “Who will be the caliph in your place?” The sheikh said: “O Abdulkhaliq, I will be replaced by
Abdullah Barqi, then Hoja Hasan Andoqi and then
ISSN (Online): 2455-3662
EPRA International Journal of Multidisciplinary Research (IJMR) - Peer Reviewed Journal Volume: 7| Issue: 9| September 2021|| Journal DOI: 10.36713/epra2013 || SJIF Impact Factor 2021: 8.047 || ISI Value: 1.188
2021 EPRA IJMR | www.eprajournals.com | Journal DOI URL: https://doi.org/10.36713/epra2013 418
Hoja Ahmad Yassavi. If Hoja Ahmad Yassavi travels to Turkestan, you will be the caliph instead. Always follow the rules of the Shari’ah and never do anything that is against the Shari’ah, and if you see someone doing something that is against the Shari’ah, then forbid it! ” [1:14]
According to Abdul Khaliq Gijduvani, Yusuf Hamadani performed the Hajj thirty-two times, recited the Qur’an a thousand times, and memorized 700 books on tafsir, hadith, fiqh, usul, furu, and kalam. More than seven hundred of his noble disciples reached the level of saints. It is interesting to note that Yusuf Hamadani spent most of the day fasting during the day and praying at night, as a result of which eight hundred pagans converted to Islam and many people found the path of Truth.
Abdulkhaliq Gijduvani emphasizes that the spiritual maturity of his teacher is extremely high. He asserted that Yusuf Hamadani was a crooked, wicked, arrogant, deceitful, cruel, perverted, corrupt, heretical, perverted, unjust bloodthirsty, ungodly, hypocritical rebuke and ordered them to repent and leave these vices. If they did not leave these vices, he would keep them away from the conversation. He had never insulted anyone in his life, not even the words “curse”, “unfortunate”, “dog”. Hamadani’s manners and deeds were in accordance with the Sunnah, and he was a follower of the Prophet (peace and blessings of Allaah be upon him). He earned his livelihood through farming and handicrafts (shoemaking, patching). The widow - the poor, the orphan - the captive, the blind, the stranger, the poor, the seeker of knowledge, donated the wages earned from the honest profession. He was frequently informed of the condition of the patients and treated them with kindness. He always carried a prayer rug, a miswak, a perfume, a clean handkerchief, as well as a loaf of bread, raisins, and dates, and joined the interlocutors.
Abdulkhaliq Gijduvani followed the actions of his teacher with great amazement and took an example from him and told it to his later disciples as an example. He testified that Yusuf Hamadoni cooked his own food, washed his own clothes, and patched his own clothes. He loved patched clothes. It should be noted that in those days it was customary for the rich and aristocrats to wear drums and wear gold belts. At a time when Muslims began to adorn the appearance rather than the inside, the Pir was reprimanded for wearing plain clothes, even patched ones. A patched garment is a symbol of arrogance and humility. It was the garment of those who killed their souls and humiliated their souls. This is the dress of the pious, the people of Allah, who adorn their inner world. “Hazrat did not ride a horse, but rode on a donkey when necessary.”
In the play, Yusuf Hamadoni’s paintings and biographies are presented to the reader as follows:
Yusuf Hamadoni’s clothes were made of wool and were brown. They ate little, often barley bread and vinegar. Once in forty days they ate chicken, sometimes camel and mutton. They lived unmarried for seventy-five years and then got married. His body was bent because he fasted a lot and did riyadh. According to Hazrat Abdulkhaliq Gijduvani, Yusuf Hamadoni was a very handsome man with a long, well-groomed beard, a radiant face, a smile on his lips, and divine grace in his eyes one step at a time, every word you say, every action you take, you have to program. Abdulkhaliq Gijduvani describes some of his teacher’s teachings as follows: “Hush dar dam”
(control every breath, beware of it so as not to be left in sin and negligence), “nazar bar kadam” (look
under your feet and in front of you so as not to be left in sin and negligence), “safar dar vatan” (travel in a
narrow homeland) ) and “khilvat dar anjuman” (apparently be with the people and inwardly with the Truth). He used to sit in the presence of the mashayik with politeness, bowing and respect ... Sometimes: “O great kings and the ignorant of the spiritual pleasures of the dervishes in the wilderness. Enjoy the remembrance of others with your tongue. Try to know the nafs and the perceptions (worries) that come to mind, “he would say,” Save your appearance from the chaos, because when the appearance is chaotic, the heart and the heart are even more chaotic”[2:33].
It is known that 2018 marks the 915th anniversary of the birth of Abdulkhaliq Gijduvani. Therefore, a number of events and conferences were planned to be held in our country by the orders of President Shavkat Mirziyoyev. Translated from Persian by Sayfiddin Sayfulloh, Candidate of Philological Sciences, Senior Research Fellow of the Institute of Uzbek Language, Literature and Folklore of the Academy of Sciences of Uzbekistan and Nodirkhan Hasan, Doctor of Philology, Independent Researcher of the Institute of Uzbek Language, Literature and Folklore of the Academy of Sciences of Uzbekistan, Abdulkhaliq Gijduvani’s pamphlets “Maqomoti Yusuf Hamadoni (Risolai sahibiya)* Wasiyatnoma” were republished in 2018 by the
Muslim Board of Uzbekistan, Movarounnahr Publishing House. In order to take into account the different strata of readers and increase the scientific popularity of the work, the original manuscripts are also included in this book. In the book, the translators state that there are four copies of “Maqomati Yusuf Hamadoni”. “ 1. Published by Said Nafisi on the basis of a single copy under the title “Risolai sahibiya” (Abdulkhaliq Gijduvani. Risolai sahibiya. Farhangi Eronzamin, I. 1953. 78-101-6.) 2. In Kamoliddin Haririyzoda’s work “Tibyonu vasoilil-haqayiq fi bayoni salosil it-taroiq” (Istanbul, Sulaymaniyah Library, Department of Ibrahim Efendi, № 30.1. 379a-389b. This copy is more

ISSN (Online): 2455-3662
EPRA International Journal of Multidisciplinary Research (IJMR) - Peer Reviewed Journal Volume: 7| Issue: 9| September 2021|| Journal DOI: 10.36713/epra2013 || SJIF Impact Factor 2021: 8.047 || ISI Value: 1.188
2021 EPRA IJMR | www.eprajournals.com | Journal DOI URL: https://doi.org/10.36713/epra2013 419
perfect than Nafisi’s edition). 3. Abdulkhaliq Gijduvani. “Maqomoti Yusuf Hamadoni.” UZRFASHI №2533, 20-37-v. (Mahmud Hasani and Gulbahor Muzaffar qizi published some excerpts from this work. See “Khojai Jahon Khoja
Abdulkholiq Gijduvoniy” (Tashkent, 1994, 18-22-6). 4. It is briefly narrated in the Persian work “Kandiya” prepared by Mulla Abdulhakim and published by Iraj Afshar (Tehran. 1955, 6-16-6) “[2:13]. The translators and the authors of the foreword note that they have translated the Uzbek translation of Abdulkhaliq Gijduvani’s “Maqomoti Yusuf Hamadoni (Risolai sahibiya) Wasiyatnoma” published in 2018 by comparing the copies of “Risolai sahibiya”, “Tibyon” and UzRFASHI. This book contains very valuable materials based on many years of scientific and creative achievements of translators. Every student can get rich information from it. Every seeker is well aware that there are specific challenges to working with resources. I would like to express my gratitude to the fireplace translators for this translation, which required a lot of work.
It should be noted that each calligrapher seems to have added additional information to the reproduced copies of this work, written by calligraphers over the centuries, with his own imagination. Because in “Maqomoti Yusuf Hamadoni” there are some irrationalities. It is natural that an intelligent reader will immediately understand this situation. For example, in “Maqomat”, in order to describe Yusuf Hamadoni’s high patriotic qualities, he tried to prove it with the following example, claiming that he took part in military affairs. That is, “Chata and Tokmak fought against them when they invaded” [1:15]; [2:25]. “When one
of his friends heard that he had been martyred in the battles against the Chata, Tokmak and Urus armies, he offered the funeral prayer. He would not curse anything or anyone and would not bless Chingiz. ”
[1:18]; [2:35]. Chata is also written under a different name Jete. It is known that the Mongols, led by Genghis Khan, invaded the lands of Transoxiana in 1219 and completely conquered it in 1220-1221. By the end of his reign, Genghis Khan had divided all the territories he had conquered in 1224 among his descendants. The lands of East Turkestan, Ettisuv, and Transoxiana were given to Chigatay, the second son of Genghis. In the 1440s, the Chigatay nation was divided into two parts, the Seventies, the Mongols of East Turkestan, and the Transoxiana. Russian orientalist Academician V.V. Bartold left a written record that the population of the Seven Seas and East Turkestan of the Chigatay state still preserved its ancient Mongol traditions, despite the fact that the Mongol tribes were Turkicized. The Eastern Mongol Turkmenized tribes ignored the fraternal Mongol Turkicized peoples living in
Transoxiana and called them Karaunas, i.e. mixed (mestizo) peoples. Continuing his academic thought, he notes that the Turkicized Mongol tribes living in Transoxiana disregarded the nomadic Mongol tribes living in Ettisuv and East Turkestan and called them jetas, or invaders. [3:154],[4:36] So, the jets were the Mongols, who were part of the Chigatay nation, who opposed and threatened the empire of the Great Amir Temur in the fourteenth century. If Yusuf Hamadoni died in 1141 (in the twelfth century), how could he express his reaction to this invasion, or how could he understand that he was defending his homeland against the Mongol invasion. Some of these illogicalities in “Maqomat” can be explained, as noted above, by the calligraphers (in order to increase the effectiveness of the events in the work) by trying to exaggerate the patriotic qualities of Yusuf Hamadoni.
In this regard, the study of the views of the famous scientist and organizer of science I.M. Muminov on the spread of Sufism and mysticism in Transoxiana in his work “Philosophical views of Bedil” helps to draw logical conclusions on this issue. I. Muminov emphasizes that mysticism as a philosophical doctrine first appeared in the VIII century, entered Transoxiana through Iran and had a great influence here in the XI-XII centuries. Also, evaluating Sufism as a complex philosophical direction, the scholar emphasizes that it has different currents and directions, that the study of mysticism requires a separate perfect study, the analysis of the most important directions of mysticism. [6;284-285б] The scholar notes that Sufism began to spread in Transoxiana, including in the territory of present-day Uzbekistan, in the second half of the 11th century and the beginning of the 12th century, when feudal wars and the invasion of nomadic tribes intensified. Based on V.V. Bartold’s book “History of the cultural life of Turkestan”, he acknowledges that the spread of mysticism in Transoxiana began with the school of Yusuf Hamadoni, a 12th century thinker. I.Muminov explains that the school of Yusuf Hamadoni is not uniform, there are different currents, the largest of which are two. The first describes the direction associated with the name of Abdul Hamiq Gijduvani, a disciple of Yusuf Hamadoni, and the second describes it as a direction related to the path of the disciple of Yusuf Hamadoni, Khoja Ahmad Yassavi. The first influx occurred and spread mainly in the city and suburban areas, i.e., in conditions of relative economic growth; it was directly related to real life and encouraged people to work, to craft. In particular, the teachings of Yusuf Hamadani and Abdulkhaliq Gijduvani were in the interests of urban workers. I.Muminov admits that there are basic rules, which consist of “hush dar dam, nazar bar kadam, safar dar Vatan, khilvat dar anjuman” and that they are suitable for urban dwellers.
ISSN (Online): 2455-3662
EPRA International Journal of Multidisciplinary Research (IJMR) - Peer Reviewed Journal Volume: 7| Issue: 9| September 2021|| Journal DOI: 10.36713/epra2013 || SJIF Impact Factor 2021: 8.047 || ISI Value: 1.188
2021 EPRA IJMR | www.eprajournals.com | Journal DOI URL: https://doi.org/10.36713/epra2013 420
Yusuf Hamadoni was a shoemaker who was directly involved in defending Bukhara and Samarkand from nomadic tribes, I. Muminov emphasizes that Yusuf Hamadoni called on his students to work, learn a profession, study military service. The scholar cannot conclude that this movement (i.e., the Khojagon sect N.N.) was a highly mystical current of mysticism, concluding scientifically that it played a progressive role in the development of literature and social thought in its time. Such positive conclusions about mysticism, which the scientist boldly emphasized during the Soviet era, help to approach the issue posed in this article logically. CONCLUSION In short, Abdulkhaliq Gijduvani’s work “Maqomoti Yusuf Hamadoni” is very valuable as a symbol of high respect for the teacher Yusuf Hamadoni. The lives of these great people are a great example, and the spiritual heritage they have left for generations serves to further raise the spiritual consciousness of our people. In studying this work, it is necessary to draw scientific conclusions based on the historical method and logical approach. REFERENCES
1. Khoja Abdulkhaliq Gijduvani. Maqomoti Yusuf Hamadoni. Tashkent: “Yangi asr avlodi”. 2003.
2. Khoja Abdulkhaliq Gijduvani. Authority Yusuf Hamadoni (Risolai sahibiya) “Wasiyatnoma” .Tashkent: “Transoxiana”, 2018.
3. Bartold V.V. History of Turkistan. Works by T. II. Part 1. Moscow: Publishing house of oriental literature, 1963.
4. Bartold V.V. Ulugbek and his time. Vol. II. Part 2. Moscow: Publishing house “Science”, 1964.
5. G.Navrozova, N.Nurmatova. Yusuf Hamadoni is the honored teacher of the seven pirs. Tashkent: “MASHHUR-PRESS”, 2016.
6. I. Muminov. Bedil’s philosophical views. Selected works. Volume 1, Publishing House “Uzbekistan”, Tashkent:1976.
7. Khoja Yusuf Hamadoni. Criterion of life (Rutbat ul-hayat). Etiquette. The universe and man. Tashkent: Muslim Board of Uzbekistan “MOVAROUNNAHR”, 2018.
8. Fakhruddin Ali Safiy. Rashahotu aynil-hayot. Tashkent: “Abu Ali Ibn Sino”, 2004.
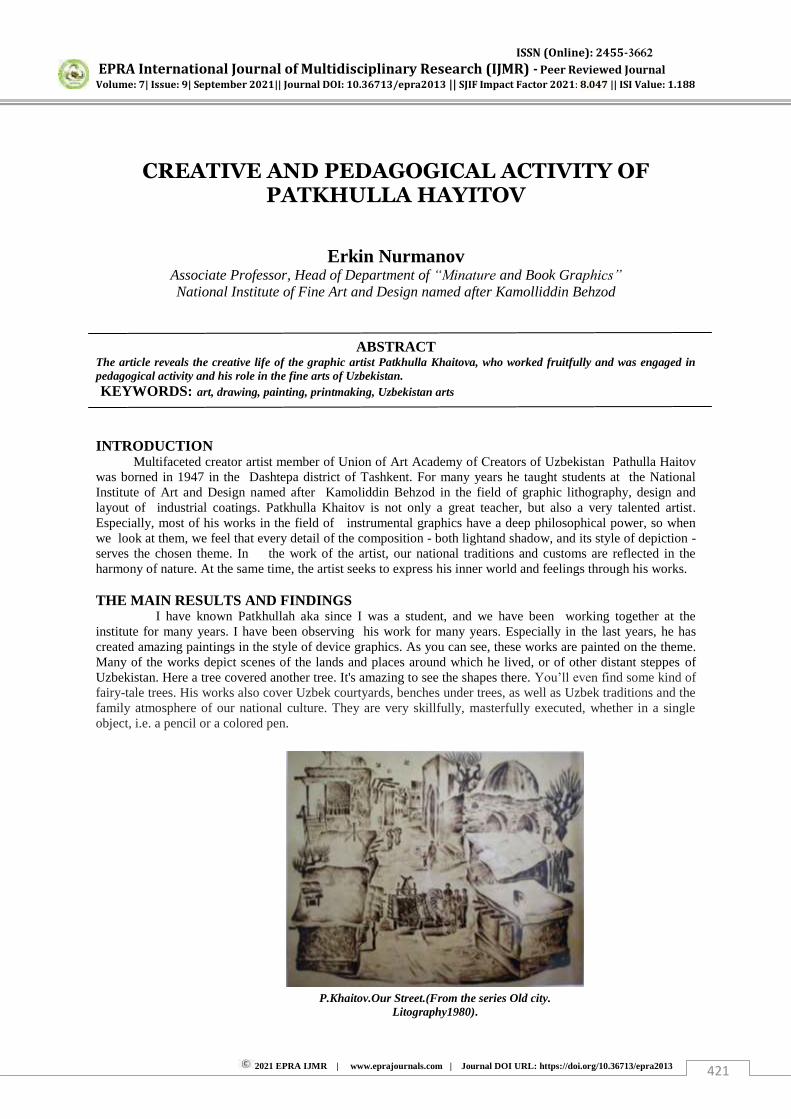
ISSN (Online): 2455-3662
EPRA International Journal of Multidisciplinary Research (IJMR) - Peer Reviewed Journal Volume: 7| Issue: 9| September 2021|| Journal DOI: 10.36713/epra2013 || SJIF Impact Factor 2021: 8.047 || ISI Value: 1.188
2021 EPRA IJMR | www.eprajournals.com | Journal DOI URL: https://doi.org/10.36713/epra2013 421
CREATIVE AND PEDAGOGICAL ACTIVITY OF PATKHULLA HAYITOV
Erkin Nurmanov Associate Professor, Head of Department of “Minature and Book Graphics” National Institute of Fine Art and Design named after Kamolliddin Behzod
ABSTRACT The article reveals the creative life of the graphic artist Patkhulla Khaitova, who worked fruitfully and was engaged in pedagogical activity and his role in the fine arts of Uzbekistan. KEYWORDS: art, drawing, painting, printmaking, Uzbekistan arts
INTRODUCTION Multifaceted creator artist member of Union of Art Academy of Сreators of Uzbekistan Pathulla Haitov
was borned in 1947 in the Dashtepa district of Tashkent. For many years he taught students at the National Institute of Art and Design named after Kamoliddin Behzod in the field of graphic lithography, design and layout of industrial coatings. Patkhulla Khaitov is not only a great teacher, but also a very talented artist. Especially, most of his works in the field of instrumental graphics have a deep philosophical power, so when we look at them, we feel that every detail of the composition - both lightand shadow, and its style of depiction - serves the chosen theme. In the work of the artist, our national traditions and customs are reflected in the harmony of nature. At the same time, the artist seeks to express his inner world and feelings through his works. THE MAIN RESULTS AND FINDINGS
I have known Patkhullah aka since I was a student, and we have been working together at the institute for many years. I have been observing his work for many years. Especially in the last years, he has created amazing paintings in the style of device graphics. As you can see, these works are painted on the theme. Many of the works depict scenes of the lands and places around which he lived, or of other distant steppes of Uzbekistan. Here a tree covered another tree. It's amazing to see the shapes there. You’ll even find some kind of fairy-tale trees. His works also cover Uzbek courtyards, benches under trees, as well as Uzbek traditions and the family atmosphere of our national culture. They are very skillfully, masterfully executed, whether in a single object, i.e. a pencil or a colored pen.
P.Khaitov.Our Street.(From the series Old city. Litography1980).

ISSN (Online): 2455-3662
EPRA International Journal of Multidisciplinary Research (IJMR) - Peer Reviewed Journal Volume: 7| Issue: 9| September 2021|| Journal DOI: 10.36713/epra2013 || SJIF Impact Factor 2021: 8.047 || ISI Value: 1.188
2021 EPRA IJMR | www.eprajournals.com | Journal DOI URL: https://doi.org/10.36713/epra2013 422
However, the creation of such paintings is very labor-intensive, time-consuming and requires a lot of
small details. Let's take a tree, it has a trunk, skin, horns, how many horns on each branch, how many leaves, there are so many of them that it is impossible to make them all natural! A started job must be completed! Patkhulla Khaitov is currently working hard on it. Look, he has found a new style for himself. For example, if you don't think about it before you draw a leaf or a stone, then deleting it becomes something else. Because using an eraser spoils the look. The graphics stand out with such subtleties. In recent years, there have been graphic artists in Uzbekistan, but they rarely attend exhibitions or special art courses. That is why the art of graphics in our country seems to be a bit backward, because the best older graphic artists are have gone(died), some have gone abroad. These works should be shown to the audience and experts in the near future. It is especially important for our youth. Because the young people who see each work acquire national culture, traditional customs, philosophical and descriptive knowledge through them. It is necessary to draw conclusions from the works he has seen, to make some intentions, and, of course, to learn a lesson from this. Like other forms of art, the artist's art teaches a person to find the right path in life. It gives him strength and courage. It shows the beauty, nobility and ingenuity of people and encourages them to love and appreciate. In our conversation with the artist Pathulla Khaitov, who is currently in the creative stage, he spoke about the places where he was born and grew up, foreign trips, new projects, new plans. - I was born on April 7, 1947 in Labzak mahalla of Tashkent in an intelligent family.
- My innocent childhood was spent among the kind people, on the streets of the old city. As a child, my love for my family and motherland began to take shape in a special way.
from series “Childhood” Garden of Stones. 2013. Paper
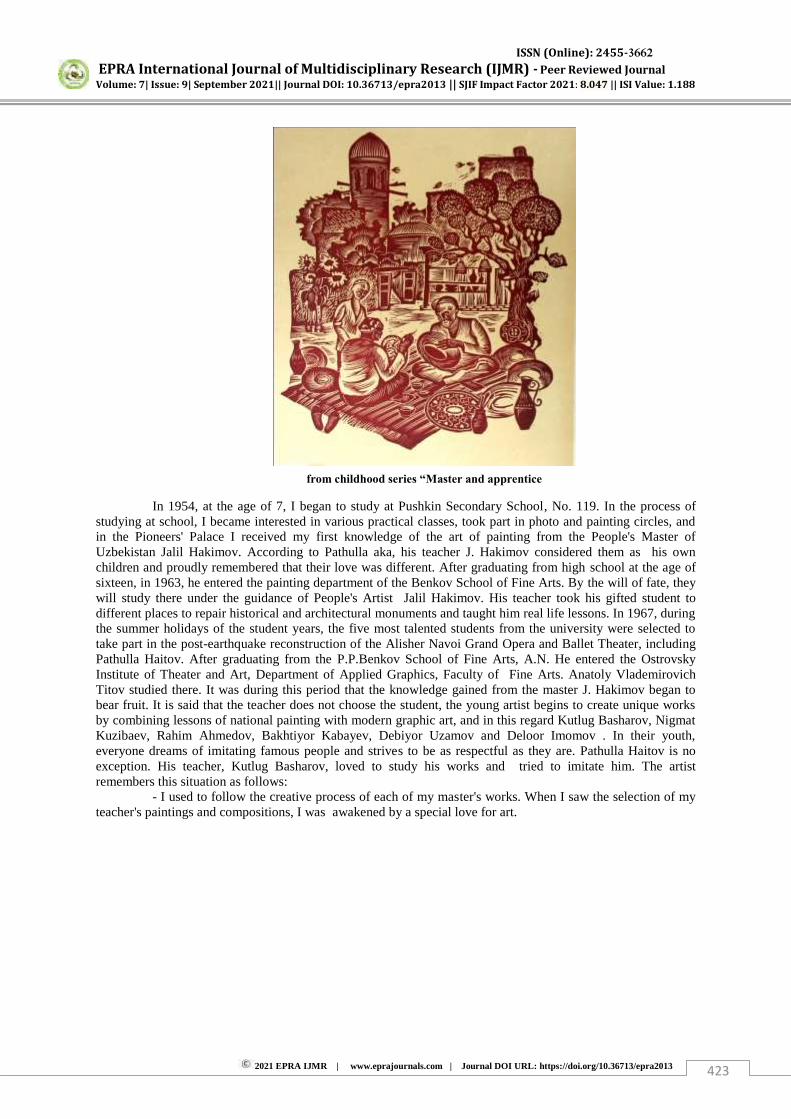
ISSN (Online): 2455-3662
EPRA International Journal of Multidisciplinary Research (IJMR) - Peer Reviewed Journal Volume: 7| Issue: 9| September 2021|| Journal DOI: 10.36713/epra2013 || SJIF Impact Factor 2021: 8.047 || ISI Value: 1.188
2021 EPRA IJMR | www.eprajournals.com | Journal DOI URL: https://doi.org/10.36713/epra2013 423
In 1954, at the age of 7, I began to study at Pushkin Secondary School, No. 119. In the process of
studying at school, I became interested in various practical classes, took part in photo and painting circles, and in the Pioneers' Palace I received my first knowledge of the art of painting from the People's Master of Uzbekistan Jalil Hakimov. According to Pathulla aka, his teacher J. Hakimov considered them as his own children and proudly remembered that their love was different. After graduating from high school at the age of sixteen, in 1963, he entered the painting department of the Benkov School of Fine Arts. By the will of fate, they will study there under the guidance of People's Artist Jalil Hakimov. His teacher took his gifted student to different places to repair historical and architectural monuments and taught him real life lessons. In 1967, during the summer holidays of the student years, the five most talented students from the university were selected to take part in the post-earthquake reconstruction of the Alisher Navoi Grand Opera and Ballet Theater, including Pathulla Haitov. After graduating from the P.P.Benkov School of Fine Arts, A.N. He entered the Ostrovsky Institute of Theater and Art, Department of Applied Graphics, Faculty of Fine Arts. Anatoly Vlademirovich Titov studied there. It was during this period that the knowledge gained from the master J. Hakimov began to bear fruit. It is said that the teacher does not choose the student, the young artist begins to create unique works by combining lessons of national painting with modern graphic art, and in this regard Kutlug Basharov, Nigmat Kuzibaev, Rahim Ahmedov, Bakhtiyor Kabayev, Debiyor Uzamov and Deloor Imomov . In their youth, everyone dreams of imitating famous people and strives to be as respectful as they are. Pathulla Haitov is no exception. His teacher, Kutlug Basharov, loved to study his works and tried to imitate him. The artist remembers this situation as follows:
- I used to follow the creative process of each of my master's works. When I saw the selection of my teacher's paintings and compositions, I was awakened by a special love for art.
from childhood series “Master and apprentice

ISSN (Online): 2455-3662
EPRA International Journal of Multidisciplinary Research (IJMR) - Peer Reviewed Journal Volume: 7| Issue: 9| September 2021|| Journal DOI: 10.36713/epra2013 || SJIF Impact Factor 2021: 8.047 || ISI Value: 1.188
2021 EPRA IJMR | www.eprajournals.com | Journal DOI URL: https://doi.org/10.36713/epra2013 424
During his student years, the artist thoroughly studied the secrets of graphic art. His first work in the
field of practical graphics began with the drawing of various orders, advertisements and booklets. This art required constant creativity and research. His graduation work was also the creation of advertisements, logos, booklets for ceramics masters, using decorative arts.
Later, Patkhulla Khaitov began to create in graphic design and created a number of graphic works in
the style of lithography, autolithography, linocut, etching, monotype. In the works of the artist, the compositional lines are expressed in a warm color. First of all, the influence of the master .Basharov is obvious, because in his formation as an artist the importance of the teacher's teachings was great. P. Khaitov also works
“Song of Mountain” 1972. Paper. Monochrome.
Monotype. 42,5х62 sm.
from the series Oriental Legends “Lovers”1976,paper,litography57х39 sm.
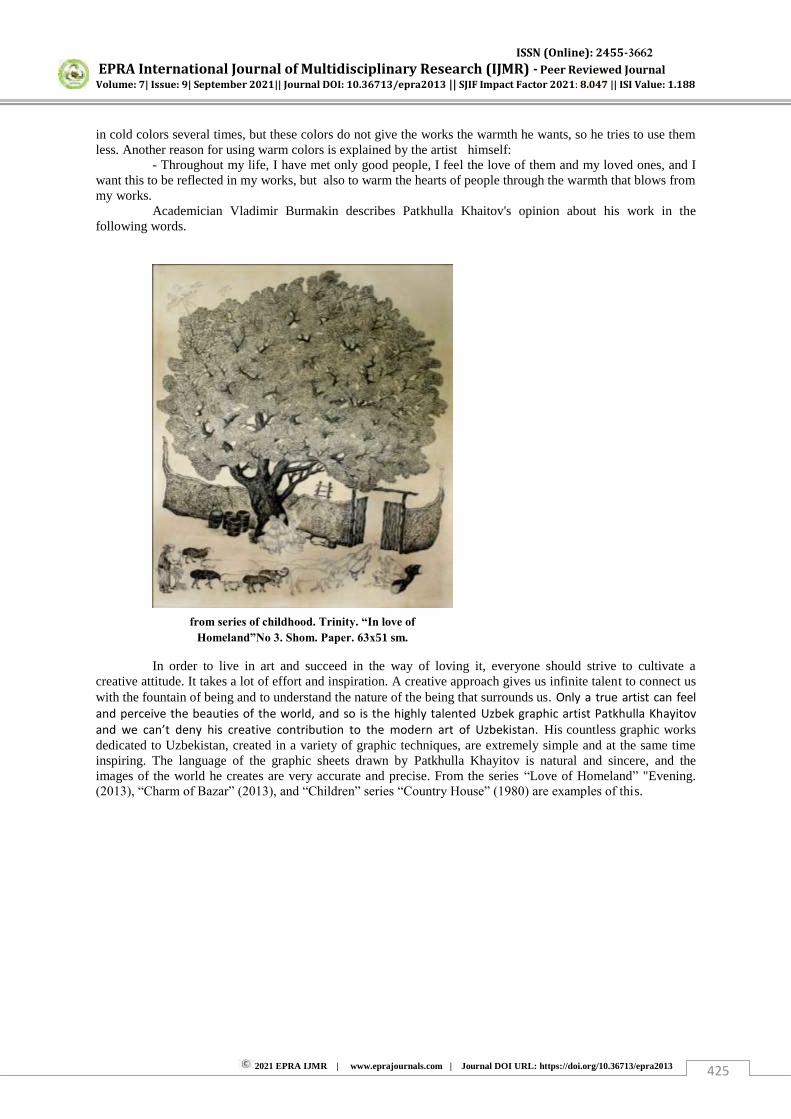
ISSN (Online): 2455-3662
EPRA International Journal of Multidisciplinary Research (IJMR) - Peer Reviewed Journal Volume: 7| Issue: 9| September 2021|| Journal DOI: 10.36713/epra2013 || SJIF Impact Factor 2021: 8.047 || ISI Value: 1.188
2021 EPRA IJMR | www.eprajournals.com | Journal DOI URL: https://doi.org/10.36713/epra2013 425
in cold colors several times, but these colors do not give the works the warmth he wants, so he tries to use them less. Another reason for using warm colors is explained by the artist himself:
- Throughout my life, I have met only good people, I feel the love of them and my loved ones, and I want this to be reflected in my works, but also to warm the hearts of people through the warmth that blows from my works.
Academician Vladimir Burmakin describes Patkhulla Khaitov's opinion about his work in the following words.
In order to live in art and succeed in the way of loving it, everyone should strive to cultivate a
creative attitude. It takes a lot of effort and inspiration. A creative approach gives us infinite talent to connect us with the fountain of being and to understand the nature of the being that surrounds us. Only a true artist can feel and perceive the beauties of the world, and so is the highly talented Uzbek graphic artist Patkhulla Khayitov and we can’t deny his creative contribution to the modern art of Uzbekistan. His countless graphic works dedicated to Uzbekistan, created in a variety of graphic techniques, are extremely simple and at the same time inspiring. The language of the graphic sheets drawn by Patkhulla Khayitov is natural and sincere, and the images of the world he creates are very accurate and precise. From the series “Love of Homeland” "Evening. (2013), “Charm of Bazar” (2013), and “Children” series “Country House” (1980) are examples of this.
from series of childhood. Trinity. “In love of
Homeland”No 3. Shom. Paper. 63х51 sm.
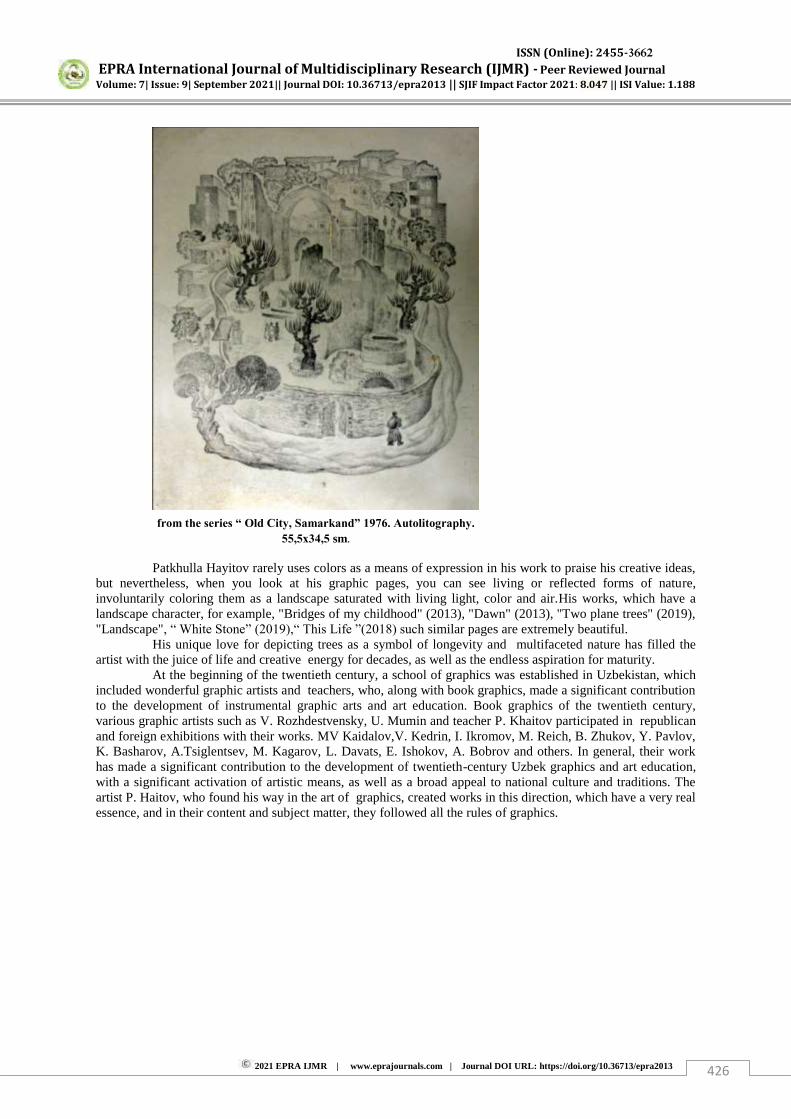
ISSN (Online): 2455-3662
EPRA International Journal of Multidisciplinary Research (IJMR) - Peer Reviewed Journal Volume: 7| Issue: 9| September 2021|| Journal DOI: 10.36713/epra2013 || SJIF Impact Factor 2021: 8.047 || ISI Value: 1.188
2021 EPRA IJMR | www.eprajournals.com | Journal DOI URL: https://doi.org/10.36713/epra2013 426
Patkhulla Hayitov rarely uses colors as a means of expression in his work to praise his creative ideas,
but nevertheless, when you look at his graphic pages, you can see living or reflected forms of nature, involuntarily coloring them as a landscape saturated with living light, color and air.His works, which have a landscape character, for example, "Bridges of my childhood" (2013), "Dawn" (2013), "Two plane trees" (2019), "Landscape", “ White Stone” (2019),“ This Life ”(2018) such similar pages are extremely beautiful.
His unique love for depicting trees as a symbol of longevity and multifaceted nature has filled the artist with the juice of life and creative energy for decades, as well as the endless aspiration for maturity.
At the beginning of the twentieth century, a school of graphics was established in Uzbekistan, which included wonderful graphic artists and teachers, who, along with book graphics, made a significant contribution to the development of instrumental graphic arts and art education. Book graphics of the twentieth century, various graphic artists such as V. Rozhdestvensky, U. Mumin and teacher P. Khaitov participated in republican and foreign exhibitions with their works. MV Kaidalov,V. Kedrin, I. Ikromov, M. Reich, B. Zhukov, Y. Pavlov, K. Basharov, A.Tsiglentsev, M. Kagarov, L. Davats, E. Ishokov, A. Bobrov and others. In general, their work has made a significant contribution to the development of twentieth-century Uzbek graphics and art education, with a significant activation of artistic means, as well as a broad appeal to national culture and traditions. The artist P. Haitov, who found his way in the art of graphics, created works in this direction, which have a very real essence, and in their content and subject matter, they followed all the rules of graphics.
from the series “ Old City, Samarkand” 1976. Autolitography.
55,5х34,5 sm.
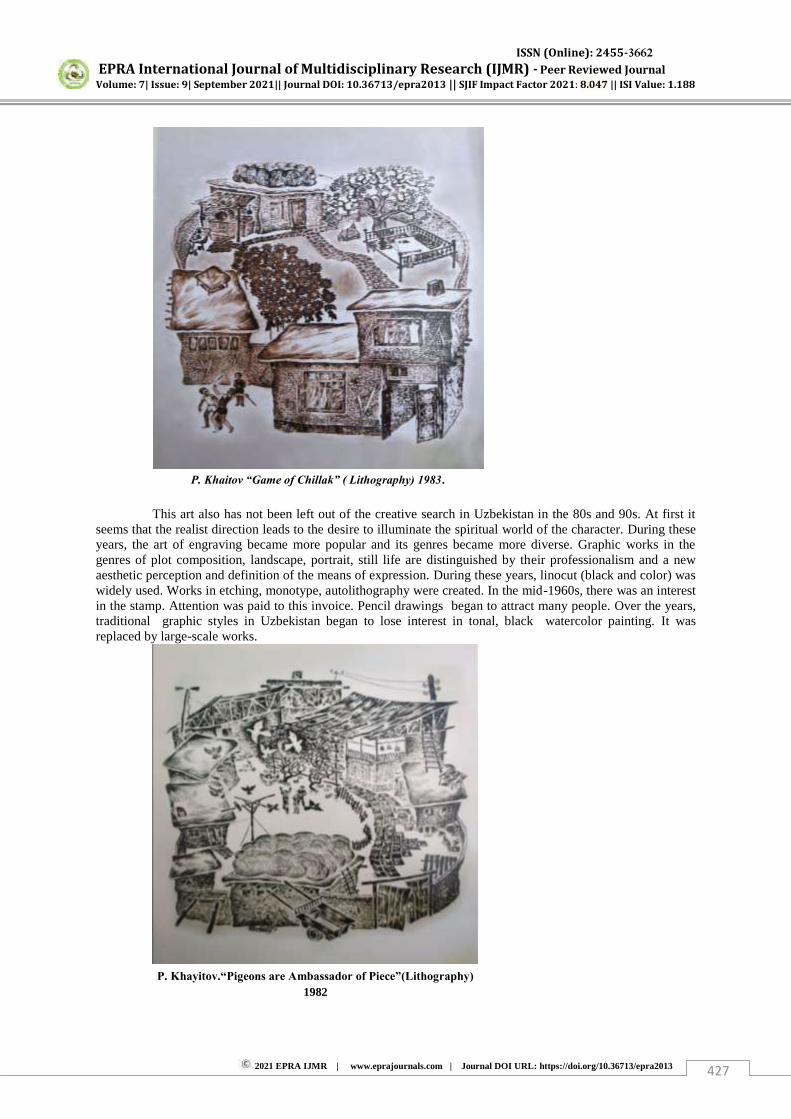
ISSN (Online): 2455-3662
EPRA International Journal of Multidisciplinary Research (IJMR) - Peer Reviewed Journal Volume: 7| Issue: 9| September 2021|| Journal DOI: 10.36713/epra2013 || SJIF Impact Factor 2021: 8.047 || ISI Value: 1.188
2021 EPRA IJMR | www.eprajournals.com | Journal DOI URL: https://doi.org/10.36713/epra2013 427
This art also has not been left out of the creative search in Uzbekistan in the 80s and 90s. At first it
seems that the realist direction leads to the desire to illuminate the spiritual world of the character. During these years, the art of engraving became more popular and its genres became more diverse. Graphic works in the genres of plot composition, landscape, portrait, still life are distinguished by their professionalism and a new aesthetic perception and definition of the means of expression. During these years, linocut (black and color) was widely used. Works in etching, monotype, autolithography were created. In the mid-1960s, there was an interest in the stamp. Attention was paid to this invoice. Pencil drawings began to attract many people. Over the years, traditional graphic styles in Uzbekistan began to lose interest in tonal, black watercolor painting. It was replaced by large-scale works.
P. Khayitov.“Pigeons are Ambassador of Piece”(Lithography)
1982
P. Khaitov “Game of Chillak” ( Lithography) 1983.
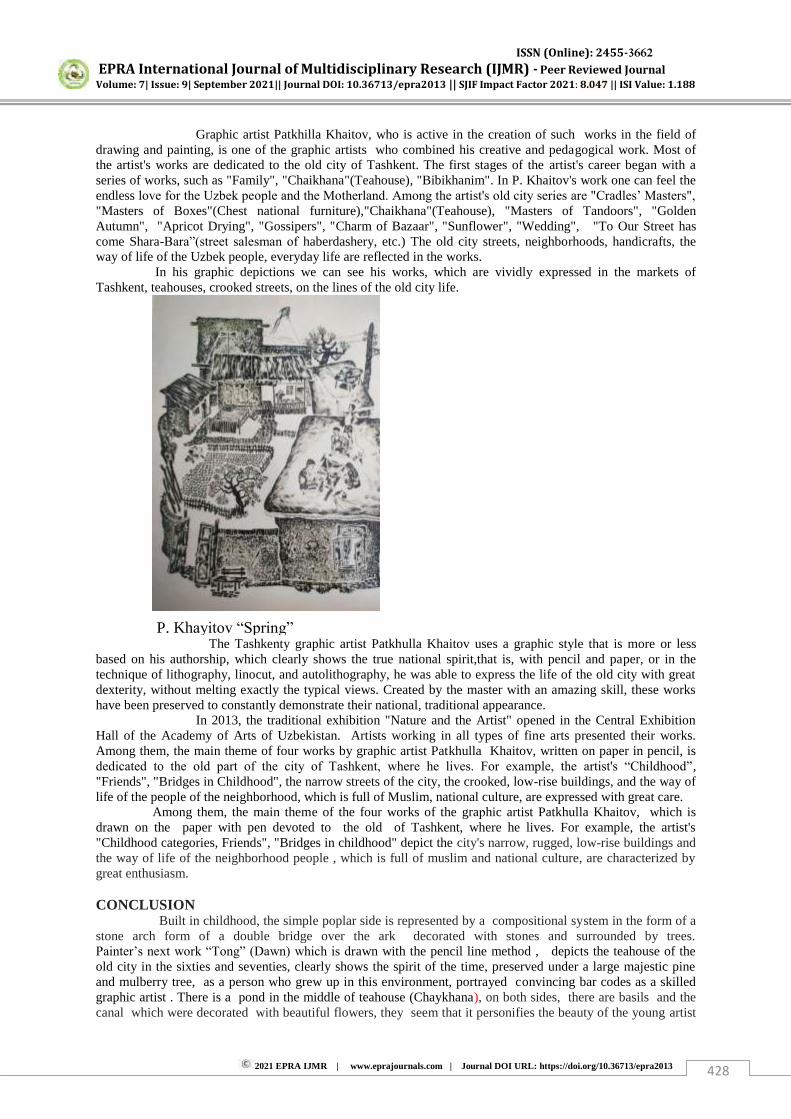
ISSN (Online): 2455-3662
EPRA International Journal of Multidisciplinary Research (IJMR) - Peer Reviewed Journal Volume: 7| Issue: 9| September 2021|| Journal DOI: 10.36713/epra2013 || SJIF Impact Factor 2021: 8.047 || ISI Value: 1.188
2021 EPRA IJMR | www.eprajournals.com | Journal DOI URL: https://doi.org/10.36713/epra2013 428
Graphic artist Patkhilla Khaitov, who is active in the creation of such works in the field of drawing and painting, is one of the graphic artists who combined his creative and pedagogical work. Most of the artist's works are dedicated to the old city of Tashkent. The first stages of the artist's career began with a series of works, such as "Family", "Chaikhana"(Teahouse), "Bibikhanim". In P. Khaitov's work one can feel the endless love for the Uzbek people and the Motherland. Among the artist's old city series are "Cradles’ Masters",
"Masters of Boxes"(Chest national furniture),"Chaikhana"(Teahouse), "Masters of Tandoors", "Golden Autumn", "Apricot Drying", "Gossipers", "Charm of Bazaar", "Sunflower", "Wedding", "To Our Street has come Shara-Bara”(street salesman of haberdashery, etc.) The old city streets, neighborhoods, handicrafts, the way of life of the Uzbek people, everyday life are reflected in the works.
In his graphic depictions we can see his works, which are vividly expressed in the markets of Tashkent, teahouses, crooked streets, on the lines of the old city life.
The Tashkenty graphic artist Patkhulla Khaitov uses a graphic style that is more or less
based on his authorship, which clearly shows the true national spirit,that is, with pencil and paper, or in the technique of lithography, linocut, and autolithography, he was able to express the life of the old city with great dexterity, without melting exactly the typical views. Created by the master with an amazing skill, these works have been preserved to constantly demonstrate their national, traditional appearance.
In 2013, the traditional exhibition "Nature and the Artist" opened in the Central Exhibition Hall of the Academy of Arts of Uzbekistan. Artists working in all types of fine arts presented their works. Among them, the main theme of four works by graphic artist Patkhulla Khaitov, written on paper in pencil, is dedicated to the old part of the city of Tashkent, where he lives. For example, the artist's “Childhood”, "Friends", "Bridges in Childhood", the narrow streets of the city, the crooked, low-rise buildings, and the way of life of the people of the neighborhood, which is full of Muslim, national culture, are expressed with great care.
Among them, the main theme of the four works of the graрhic artist Patkhulla Khaitov, which is drawn on the paper with pen devoted to the old of Tashkent, where he lives. For example, the artist's "Childhood categories, Friends", "Bridges in childhood" depict the city's narrow, rugged, low-rise buildings and the way of life of the neighborhood people , which is full of muslim and national culture, are characterized by great enthusiasm. CONCLUSION
Built in childhood, the simple poplar side is represented by a compositional system in the form of a stone arch form of a double bridge over the ark decorated with stones and surrounded by trees. Painter’s next work “Tong” (Dawn) which is drawn with the pencil line method , depicts the teahouse of the old city in the sixties and seventies, clearly shows the spirit of the time, preserved under a large majestic pine and mulberry tree, as a person who grew up in this environment, portrayed convincing bar codes as a skilled graphic artist . There is a pond in the middle of teahouse (Chaykhana), on both sides, there are basils and the canal which were decorated with beautiful flowers, they seem that it personifies the beauty of the young artist
P. Khayitov “Spring”
(Lithography) 1981

ISSN (Online): 2455-3662
EPRA International Journal of Multidisciplinary Research (IJMR) - Peer Reviewed Journal Volume: 7| Issue: 9| September 2021|| Journal DOI: 10.36713/epra2013 || SJIF Impact Factor 2021: 8.047 || ISI Value: 1.188
2021 EPRA IJMR | www.eprajournals.com | Journal DOI URL: https://doi.org/10.36713/epra2013 429
of those years.Each viewer, seeing these works in the form of a pen, can feel as significant and philosophical as a work written with a shadeless black pen and multi-colored paintings, and does not want to believe that such a complex compositional work can be created.
REFERENCES
1. Abdullayev N. “History of Uzbekistan’s Culture” Tashkent. 2007. 2. Hakimov A. A. “History of Uzbekistan’s Culture” Tashkent. 2018. 3. Khaitov P. Booklet. State Art Museum of Uzbekistan. Tashkent.2010.
ISSN (Online): 2455-3662
EPRA International Journal of Multidisciplinary Research (IJMR) - Peer Reviewed Journal Volume: 7| Issue: 9| September 2021|| Journal DOI: 10.36713/epra2013 || SJIF Impact Factor 2021: 8.047 || ISI Value: 1.188
2021 EPRA IJMR | www.eprajournals.com | Journal DOI URL: https://doi.org/10.36713/epra2013 430
INFLUENCE OF LOCAL NON-CONVENTIONAL
FERTILIZERS ON SOIL WATER PERMEABILITY
Aksungul Uzakbaevna Ismailova1, Islam Maxsetovich Tolybekov2, Uzakbergen Kurbashev3
1Assistant, Karakalpak Institute of Agriculture and Agrotechnology
2Master Student, Karakalpak Institute of Agriculture and Agrotechnology Master Student, Karakalpak Institute of Agriculture and Agrotechnology
ABSTRACT The impact of local non-traditional fertilizers (glauconite, glaucophos) on cotton yield and physical properties of soil water in the cultivation of cotton in the Republic of Karakalpakstan was studied in field experience in 2019-2020. The study found that non-conventional fertilizers applied had a positive effect on soil water permeability. It was found that when glauconite and glaucophos are used in combination with mineral fertilizers in the amount of 1200 kg / ha, they are more effective than other options for soil water permeability. KEYWORDS: soils, mineral fertilizers, saline washing, plant, glauconite and glaucophos, non-conventional.
INTRODUCTION
The soils of the Republic of Karakalpakstan are low in fertility and saline. Every year, as a result of saline washing, the nutrients in the soil are washed into the lower layers. In order to get high yields from cotton and other agricultural crops in such kind of fuelds, it is necessary to apply large amounts of mineral fertilizers. The application of large amounts of mineral fertilizers every year has a negative impact on soil properties and reduces the ecological status.
Therefore, when cultivating cotton, it is important to reduce some of the mineral fertilizers and use glauconite and glaucophos derived from local agro ores instead. Local fertilizers contain about 20 micronutrients, have a positive effect on plant growth and development, have no harm to the soil, convert nutrients in the soil into a type that can be assimilated by the plant, have a positive effect on soil reclamation.
The total reserves of local agro-ores in Karakalpakstan exceed 70 million tons. In the future, it has the potential to be widely used in agriculture to feed agricultural crops. It is economically and environmentally beneficial. EXPERIMENTAL OPTIONS AND RESEARCH METHOD
13 options were studied in the field experiment. In the control option, only mineral fertilizers N250 P175 K125 kg / ha were applied, in
options 2 and 3,only glauconite and glaucophos were used in the amount of 900 kg / ha. The amount of mineral fertilizers was reduced by 25% N185 P130 K90 kg / ha and to it were applied glauconite and glaucophos in the amount of 600 and 900 kg / ha in options 4 and 5, in 8 and 9 options glauconite and glaucophos in addition to mineral fertilizers in the amount of 1200 kg / ha, of which 600 kg / ha were used under arable land and 600 kg / ha in cultivation, in options 10-13 mineral fertilizers were given in addition to glauconite and glaucophos at 1200 and 1500 kg / ha under arable land. Research and Field Methods RESEARCH RESULTS AND THEIR ANALYSIS
The water permeability of the soil is related to its fertility, and the water permeability of soils with good structure is better. When the soil water regime is good, favorable conditions are created for the plant. The plant nutrient regime is directly related to its water regime and in a good nutrient regime the plant grows well, develops and yields are high.
We determined the effect of mineral and local non-conventional fertilizers applied in the experimental field on soil water permeability in relation to norms and application times.
Soil water permeability was 659.0–768.5 m3 / ha on average (spring) according to the options, with the lowest value being observed in the control
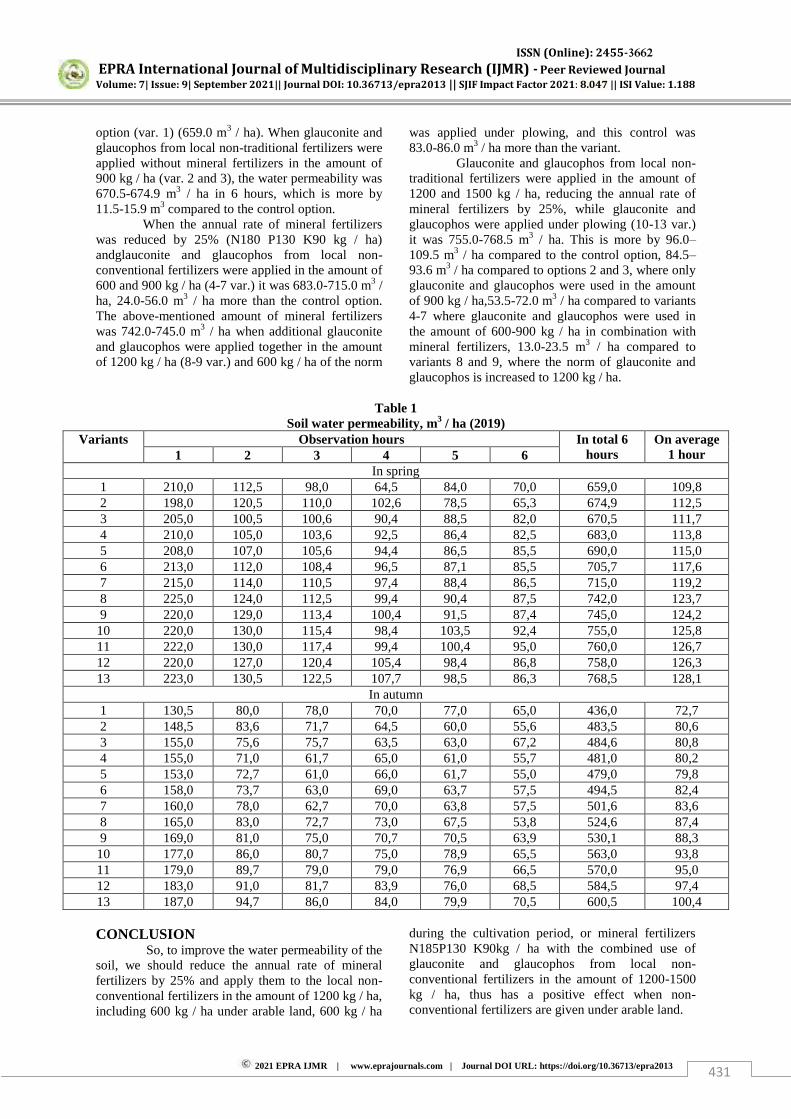
ISSN (Online): 2455-3662
EPRA International Journal of Multidisciplinary Research (IJMR) - Peer Reviewed Journal Volume: 7| Issue: 9| September 2021|| Journal DOI: 10.36713/epra2013 || SJIF Impact Factor 2021: 8.047 || ISI Value: 1.188
2021 EPRA IJMR | www.eprajournals.com | Journal DOI URL: https://doi.org/10.36713/epra2013 431
option (var. 1) (659.0 m3 / ha). When glauconite and glaucophos from local non-traditional fertilizers were applied without mineral fertilizers in the amount of 900 kg / ha (var. 2 and 3), the water permeability was 670.5-674.9 m3 / ha in 6 hours, which is more by 11.5-15.9 m3 compared to the control option.
When the annual rate of mineral fertilizers was reduced by 25% (N180 P130 K90 kg / ha) andglauconite and glaucophos from local non-conventional fertilizers were applied in the amount of 600 and 900 kg / ha (4-7 var.) it was 683.0-715.0 m3 / ha, 24.0-56.0 m3 / ha more than the control option. The above-mentioned amount of mineral fertilizers was 742.0-745.0 m3 / ha when additional glauconite and glaucophos were applied together in the amount of 1200 kg / ha (8-9 var.) and 600 kg / ha of the norm
was applied under plowing, and this control was 83.0-86.0 m3 / ha more than the variant.
Glauconite and glaucophos from local non-traditional fertilizers were applied in the amount of 1200 and 1500 kg / ha, reducing the annual rate of mineral fertilizers by 25%, while glauconite and glaucophos were applied under plowing (10-13 var.) it was 755.0-768.5 m3 / ha. This is more by 96.0–109.5 m3 / ha compared to the control option, 84.5–93.6 m3 / ha compared to options 2 and 3, where only glauconite and glaucophos were used in the amount of 900 kg / ha,53.5-72.0 m3 / ha compared to variants 4-7 where glauconite and glaucophos were used in the amount of 600-900 kg / ha in combination with mineral fertilizers, 13.0-23.5 m3 / ha compared to variants 8 and 9, where the norm of glauconite and glaucophos is increased to 1200 kg / ha.
Table 1
Soil water permeability, m3 / ha (2019) Variants Observation hours In total 6
hours On average
1 hour 1 2 3 4 5 6 In spring
1 210,0 112,5 98,0 64,5 84,0 70,0 659,0 109,8 2 198,0 120,5 110,0 102,6 78,5 65,3 674,9 112,5 3 205,0 100,5 100,6 90,4 88,5 82,0 670,5 111,7 4 210,0 105,0 103,6 92,5 86,4 82,5 683,0 113,8 5 208,0 107,0 105,6 94,4 86,5 85,5 690,0 115,0 6 213,0 112,0 108,4 96,5 87,1 85,5 705,7 117,6 7 215,0 114,0 110,5 97,4 88,4 86,5 715,0 119,2 8 225,0 124,0 112,5 99,4 90,4 87,5 742,0 123,7 9 220,0 129,0 113,4 100,4 91,5 87,4 745,0 124,2
10 220,0 130,0 115,4 98,4 103,5 92,4 755,0 125,8 11 222,0 130,0 117,4 99,4 100,4 95,0 760,0 126,7 12 220,0 127,0 120,4 105,4 98,4 86,8 758,0 126,3 13 223,0 130,5 122,5 107,7 98,5 86,3 768,5 128,1
In autumn 1 130,5 80,0 78,0 70,0 77,0 65,0 436,0 72,7 2 148,5 83,6 71,7 64,5 60,0 55,6 483,5 80,6 3 155,0 75,6 75,7 63,5 63,0 67,2 484,6 80,8 4 155,0 71,0 61,7 65,0 61,0 55,7 481,0 80,2 5 153,0 72,7 61,0 66,0 61,7 55,0 479,0 79,8 6 158,0 73,7 63,0 69,0 63,7 57,5 494,5 82,4 7 160,0 78,0 62,7 70,0 63,8 57,5 501,6 83,6 8 165,0 83,0 72,7 73,0 67,5 53,8 524,6 87,4 9 169,0 81,0 75,0 70,7 70,5 63,9 530,1 88,3
10 177,0 86,0 80,7 75,0 78,9 65,5 563,0 93,8 11 179,0 89,7 79,0 79,0 76,9 66,5 570,0 95,0 12 183,0 91,0 81,7 83,9 76,0 68,5 584,5 97,4 13 187,0 94,7 86,0 84,0 79,9 70,5 600,5 100,4 CONCLUSION
So, to improve the water permeability of the soil, we should reduce the annual rate of mineral fertilizers by 25% and apply them to the local non-conventional fertilizers in the amount of 1200 kg / ha, including 600 kg / ha under arable land, 600 kg / ha
during the cultivation period, or mineral fertilizers N185P130 K90kg / ha with the combined use of glauconite and glaucophos from local non-conventional fertilizers in the amount of 1200-1500 kg / ha, thus has a positive effect when non-conventional fertilizers are given under arable land.
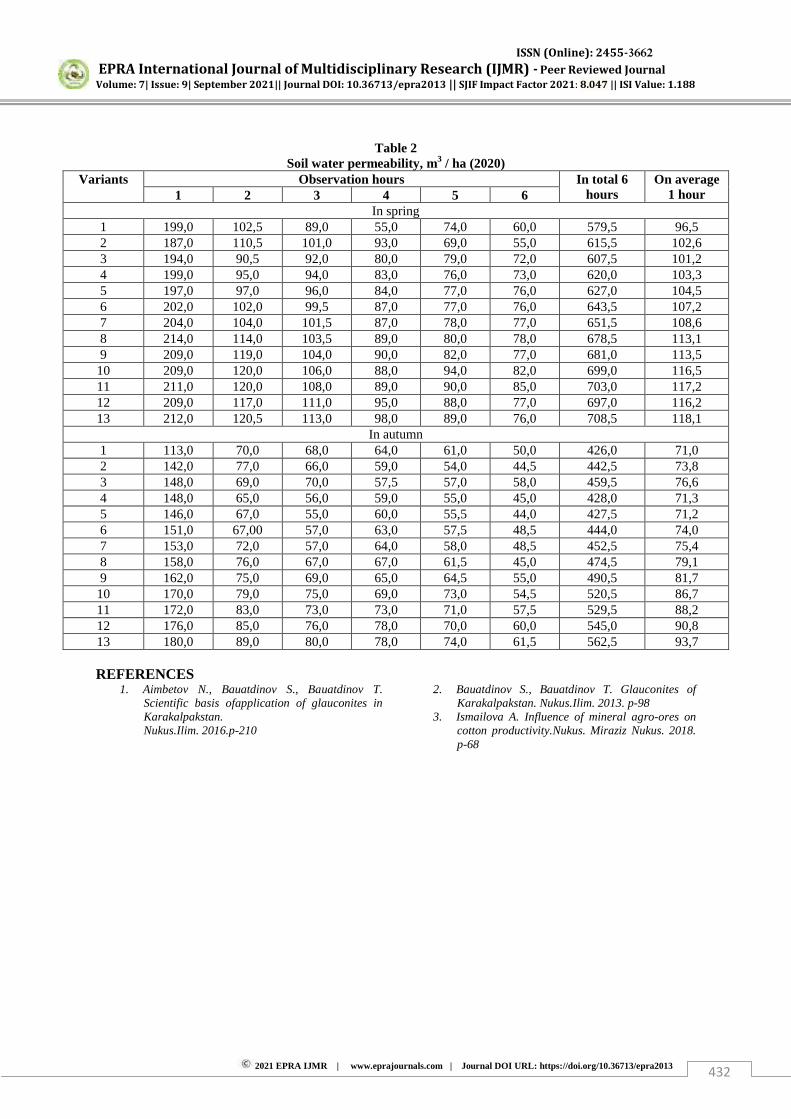
ISSN (Online): 2455-3662
EPRA International Journal of Multidisciplinary Research (IJMR) - Peer Reviewed Journal Volume: 7| Issue: 9| September 2021|| Journal DOI: 10.36713/epra2013 || SJIF Impact Factor 2021: 8.047 || ISI Value: 1.188
2021 EPRA IJMR | www.eprajournals.com | Journal DOI URL: https://doi.org/10.36713/epra2013 432
Table 2
Soil water permeability, m3 / ha (2020) Variants Observation hours In total 6
hours On average
1 hour 1 2 3 4 5 6 In spring
1 199,0 102,5 89,0 55,0 74,0 60,0 579,5 96,5 2 187,0 110,5 101,0 93,0 69,0 55,0 615,5 102,6 3 194,0 90,5 92,0 80,0 79,0 72,0 607,5 101,2 4 199,0 95,0 94,0 83,0 76,0 73,0 620,0 103,3 5 197,0 97,0 96,0 84,0 77,0 76,0 627,0 104,5 6 202,0 102,0 99,5 87,0 77,0 76,0 643,5 107,2 7 204,0 104,0 101,5 87,0 78,0 77,0 651,5 108,6 8 214,0 114,0 103,5 89,0 80,0 78,0 678,5 113,1 9 209,0 119,0 104,0 90,0 82,0 77,0 681,0 113,5
10 209,0 120,0 106,0 88,0 94,0 82,0 699,0 116,5 11 211,0 120,0 108,0 89,0 90,0 85,0 703,0 117,2 12 209,0 117,0 111,0 95,0 88,0 77,0 697,0 116,2 13 212,0 120,5 113,0 98,0 89,0 76,0 708,5 118,1
In autumn 1 113,0 70,0 68,0 64,0 61,0 50,0 426,0 71,0 2 142,0 77,0 66,0 59,0 54,0 44,5 442,5 73,8 3 148,0 69,0 70,0 57,5 57,0 58,0 459,5 76,6 4 148,0 65,0 56,0 59,0 55,0 45,0 428,0 71,3 5 146,0 67,0 55,0 60,0 55,5 44,0 427,5 71,2 6 151,0 67,00 57,0 63,0 57,5 48,5 444,0 74,0 7 153,0 72,0 57,0 64,0 58,0 48,5 452,5 75,4 8 158,0 76,0 67,0 67,0 61,5 45,0 474,5 79,1 9 162,0 75,0 69,0 65,0 64,5 55,0 490,5 81,7
10 170,0 79,0 75,0 69,0 73,0 54,5 520,5 86,7 11 172,0 83,0 73,0 73,0 71,0 57,5 529,5 88,2 12 176,0 85,0 76,0 78,0 70,0 60,0 545,0 90,8 13 180,0 89,0 80,0 78,0 74,0 61,5 562,5 93,7
REFERENCES
1. Aimbetov N., Bauatdinov S., Bauatdinov T. Scientific basis ofapplication of glauconites in Karakalpakstan. Nukus.Ilim. 2016.p-210
2. Bauatdinov S., Bauatdinov T. Glauconites of Karakalpakstan. Nukus.Ilim. 2013. p-98
3. Ismailova A. Influence of mineral agro-ores on cotton productivity.Nukus. Miraziz Nukus. 2018. p-68
ISSN (Online): 2455-3662
EPRA International Journal of Multidisciplinary Research (IJMR) - Peer Reviewed Journal Volume: 7| Issue: 9| September 2021|| Journal DOI: 10.36713/epra2013 || SJIF Impact Factor 2021: 8.047 || ISI Value: 1.188
2021 EPRA IJMR | www.eprajournals.com | Journal DOI URL: https://doi.org/10.36713/epra2013 433
EVALUATION OF THE EFFECTIVENES OF ALCEBA
IN CHILDREN WITH CERERAL PALSY ON THE BASIS OF POTENTIAL INDICATORS OF COGNITIV
IMPAIRMENT
Y.N. Madjidova1, D.M. Mukhammadjonova2, G.S. Isakova3 1Tashkent Pediatric Medical Institute
2Andijan State Medical Institute, 3Andijan State Medical Institute,
ABSTRACT We examined 72 patients with cerebral palsy at the age from 9 to 17 years (mean age 11.33 ± 2.1 years), of which 29 were girls, 43 were boys. Neuropsychological tests were performed (British Picture Vocabulary Scale (BPVS) test for verbal intelligence, Raven's test (Raven Progressive matrices) - to assess non-verbal intelligence and cognitive evoked potentials (CEP). In cerebral palsy, cognitive impairments in the form of disorders of memory, attention, thinking, verbal and non-verbal intelligence, as well as P300 cognitive evoked potentials, tend to deteriorate, conditionally, with an increase in paretic limbs. The course use of the drug memantine (alcheba) in patients with cerebral palsy has a corrective effect on cognitive impairment in this category of patients. KEYWORDS: cerebral palsy; cognitive impairment, cognitive evoked potentials, verbal intelligence, non-verbal intelligence, alcheba, memantine.
ОЦЕНКА ЭФФЕКТИВНОСТИ ПРЕПАРАТА АЛЧЕБА (МЕМАНТИН) ПО
КОГНИТИВНО ВЫЗВАННЫМ ПОТЕНЦИАЛЬНЫМ ПАРАМЕТРАМ У ДЕТЕЙ
С ДЕТСКИМ ЦЕРЕБРАЛЬНЫМ ПАРАЛИЧОМ
1Маджидова Якутхон Набиевна, 2Мухаммаджонова Дурдона
Мухаммаджон кизи, 3Исакова Гулчехра Сайиталиевна.
1Ташкентский педиатрический медицинский институт
2Андижанский государственный медицинский институт
3Андижанский государственный медицинский институт
Аннотация: Проведено обследование 72 пациентов с ДЦП в возрасте от 9 до 17 лет (средний
возраст 11,33±2,1 лет), из них 29 девочек, 43 мальчика. Проводили нейропсихологические
тестирования (тест оценки вербального интеллекта British Picture Vocabulary Scale (BPVS), тест
Равена (Raven Progressive matrices) – для оценки невербального интеллекта и когнитивные
вызванные потенциалы (КВП). При детском церебральном параличе когнитивные нарушения в
виде расстройств функций памяти, внимания, мышления, вербального и невербального
интеллекта, а также когнитивные вызванные потенциалы Р300 имеют тенденцию к
ISSN (Online): 2455-3662
EPRA International Journal of Multidisciplinary Research (IJMR) - Peer Reviewed Journal Volume: 7| Issue: 9| September 2021|| Journal DOI: 10.36713/epra2013 || SJIF Impact Factor 2021: 8.047 || ISI Value: 1.188
2021 EPRA IJMR | www.eprajournals.com | Journal DOI URL: https://doi.org/10.36713/epra2013 434
ухудшению, условно, с увеличением паретических конечностей. Курсовое применение
препарата мемантин (алчеба) у больных с ДЦП оказывает коррегирующее влияние на
когнитивные нарушения у этой категории больных. Ключевые слова: детский церебральный паралич; когнитивные нарушения,
когнитивные вызванные потенциалы, вербальный интеллект, невербальный интеллект, алчеба.
Актуальность
Детская неврологическая инвалидность, связанная с патологией перинатального периода,
составляет 60% случаев, при этом 24% из них – пациенты с детским церебральным параличом (ДЦП)
[3]. Заболеваемость ДЦП во всех странах мира занимает одно из ведущих мест в структуре хронических
болезней детей, составляя от 1,7 до 7,0 на 1000 человек детского населения [7, 8, 9, 11, 12]. Частота
встречаемости ДЦП в Узбекистане составляет 3,7 на 1000 живорожденных (2010). Детский
церебральный паралич – полиэтиологичное заболевание центральной нервной системы, которое
развивается в результате поражения, возникшего во внутриутробном, интранатальном, раннем
постнатальном периодах или вследствие аномалии головного мозга. При этом действие повреждающих
факторов на незрелый мозг определяет разнообразие сочетаний двигательных и сенсорных расстройств,
а также лежит в основе нарушений когнитивных функций, что необходимо учитывать при обосновании
восстановительного лечения и социальной реабилитации больных [1, 2, 10, 11]. По классификации К. А. Семеновой (1978), выделяют следующие формы ДЦП:
гемипаретическую, атонически-астатическую, гиперкинетическую, спастическую диплегию, двойную
гемиплегию [7]. Данные о частоте встречаемости когнитивных нарушений (КН) у детей с церебральным
параличом различны: расстройствами пространственного восприятия страдают до 80% больных, схемы
тела – до 75%, конструктивной деятельности и кинестетического праксиса – до 60%; снижение концентрации внимания отмечается у
88%, снижение памяти – у 60%, речевые расстройства – у 80%больных [4, 5]. Общепринятых рекомендаций по специфической фармакотерапии КН до настоящего времени не
разработано, поэтому выбор терапевтической тактики в отношении них всегда сопряжен с
определенными трудностями. Препараты, наиболее часто применяемые в клинической практике для
лечения КН являются: ингибиторы ацетилхолинэстеразы, холина альфосцерат, цитоколин, мемантин,
пиребедил, производные ГАМК, церебролизин, кортексин, актовегин, семак, пирацетам, ноопепт,
винпоцетин, экстракт Гинкго билоба, пентоксифиллин, нимодипин, циннаризин, ницерголин,
дигидроэргокриптин, ницерголин, гидергин. Большое разнообразие препаратов и различных их
механизмов действия подтверждает, что в развитии КН и деменций имеет место нейродегенеративной,
сосудистой и смешанной механизмы развития [6]. Препараты, модулирующие глутаматергическую передачу - мемантин, считаются
перспективными в плане коррекции КН различной степени тяжести и этиологии, поскольку
патологические механизмы с дисрегуляцией глутамата постоянно участвуют в развитии наиболее
частых форм КН [6, 13]. Эффективность мемантина в терапии КН активно изучается, исследования затрудняются
гетерогенностью и вариабельностью течения данных расстройств. В ряде открытых клинических
испытаний [6] показана способность мемантина улучшать состояние КН. Вопрос о целесообразности
назначения мемантина у пациентов с ДЦП с КН остается открытым. Необходимы дальнейшие
исследования эффективности мемантина и его нейропротективных возможностей у этой категории
больных. Цель исследования: определить эффективность препарата Алчеба (мемантина) при
когнитивных нарушениях у детей с детским церебральным параличом.
Материалы и методы. Под нашим наблюдением находилось 72 пациентов в возрасте от 9 до 17
лет (средний возраст 11,33±2,1 лет), из них 29 девочек, 43 мальчика, госпитализированных в
неврологическое отделение Ташкентского Педиатрического Медицинского Института и в
неврологическое отделение Андижанского Медицинского Института (2020-2021г). Всем больным проводили неврологическое обследование, при котором было выявлено ДЦП с
гемиплегической формой 20 пациентов, ДЦП со спастической диплегией – 17 пациентов, с двойной
гемиплегией – 13 пациентов, с атактической формой – 12 пациентов и с гиперкинетической формой – 10 пациентов. Проводили следующие методы исследования: нейропсихологические тестирования (тест
оценки вербального интеллекта British Picture Vocabulary Scale (BPVS), которая оценивается по 100
бальной системе и тест Равена (Raven Progressive matrices) (использовался цветной вариант теста для
ISSN (Online): 2455-3662
EPRA International Journal of Multidisciplinary Research (IJMR) - Peer Reviewed Journal Volume: 7| Issue: 9| September 2021|| Journal DOI: 10.36713/epra2013 || SJIF Impact Factor 2021: 8.047 || ISI Value: 1.188
2021 EPRA IJMR | www.eprajournals.com | Journal DOI URL: https://doi.org/10.36713/epra2013 435
детей в возрасте от 7 до 11 лет, черно-белый – для детей старше 11 лет, которая оценивается в
процентах) – для оценки невербального интеллекта. Когнитивные изменения определяли исследованием когнитивных вызванных потенциалов
(КВП) на аппарате Нейронспектр-5 (Нейрософт, Россия). КВП исследовали, выделяя комплексы Р300 на
счет значимых звуковых стимулов, используя 12 каналов. Для оценки моторного компонента методика
Р300 проводилась посредством нажатия клавиши при распознавании значимых слуховых стимулов. Для
дальнейшего анализа брали усредненные значения латентности и амплитуды потенциала Р300. Препарат Алчеба назначали больным с ДЦП в течение 1 месяца в каплях по схеме: в 1-ую
неделю по 5 капель утром, во 2-ую неделю – по 5 капель утром и в обед, в 3-ью неделю – 10 капель
утром и 5 капель в обед, в 4-ую неделю – по 10 капель утром и в обед. Результаты и обсуждение. Проведенные исследования выявили, что у больных с ДЦП среди когнитивных нарушений
имели место различные расстройства функций памяти, внимания, мышления, а также вербального (тест
BPVS) и невербального (тест Равена) интеллекта. Причем, если у больных с гемиплегической и
гиперкинетической формой когнитивные расстройства были на уровне нижней границы нормы, то по
мере увеличения паретических конечностей – от гемиплегической и гиперкинетической к спастической
диплегической форме, двойной гемиплегии и атактической форме выраженность КН ухудшалось
(таблица). Это возможно объясняется площадью и выраженностью поражения головного мозга при
различных формах ДЦП. При анализе когнитивных нарушений у детей с ДЦП, исследуя КВП Р300, также были выявлены
изменения в КВП Р300. Причем, у больных с гемиплегической, спастической и гиперкинетической
формой показатели латентности P300 и амплитуды P300 находились в пределах допустимой нормы. А
группах больных с двойной гемиплегии и атактической формой эти показатели были намного хуже
(таблица). Как видно из приведенных данных видно (таблица), что у больных с ДЦП когнитивные
нарушения, выявляемые когнитивными вызванными потенциалами Р300, имеют недостоверную
тенденцию к ухудшению у больных с двойной гемиплегии и атактической формой. После приема препарата Алчеба (мемантин) больными с ДЦП в течение 1 месяца в каплях были
проведены повторные исследования по тесту BPVS, Равена и КВП. Как видно из таблицы динамики функций в результате проведенного лечения вербального (тест
BPVS) и невербального (тест Равена) интеллекта свидетельствует о том, что в целом позитивные сдвиги
функций невербального интеллекта в ходе лечения были более выраженными, чем функций
вербального. Анализ полученных данных показал, что наиболее благоприятные результаты
обнаруживали больных с ДЦП гемиплегической, спастической и гиперкинетической формой, у которых
до лечения выявлялись легкие или пограничные изменений когнитивных функция. Динамика КН в
группах детей с двойной гемиплегии и атактической формой, у которых до лечения были более
тяжелыми КН, была менее выраженной. Анализ динамики по КВП Р300 (таблица) в группах больных с гемиплегической, спастической и
гиперкинетической формой, у которых КН были в пределах допустимой нормы, были недостоверные
улучшения показателей в лучшую сторону. А у больных с двойной гемиплегии и атактической формой в
КН имело место достоверное улучшение показателей по показателям КВП. Мемантин – потенциалзависимый, средней аффинности неконкурентный антагонист N-метил-
D-аспартат (NMDA)-рецепторов, оказывает модулирующее действие на глутаматергическую систему.
Мемантин представляет собой обратимый блокатор постсинаптических NMDA-рецепторов глутамата.
Применение мемантина повышает порог генерации потенциала возбуждения постсинаптической
мембраны, но не блокирует глутаматэргический синапс полностью. Известно, что при болезнях
головного мозга с картиной тяжелых когнитивных нарушений активность глутаматергической системы
повышается и в синаптическую щель выделяется больше медиатора и глутамат накапливается в
цитотоксических концентрациях, запуская процесс эксайтотоксичности, что приводит к гибели
нейронов. Таким образом, применение мемантина при КН различной этиологии способствует
нормализации паттерна глутаматергической передачи, что лежит в основе нейропротекторного и
положительного симптоматического эффекта данного препарата. Мемантин регулирует ионный
транспорт, блокирует кальциевые каналы, нормализует мембранный потенциал, улучшает процесс
передачи нервного импульса, улучшает когнитивные процессы, память, концентрацию, внимание и
способность к обучению, повышает повседневную активность, уменьшает утомляемость и симптомы депрессии. Так же мемантин блокирует глутаматные рецепторы черной субстанции, тем самым снижая
чрезмерное стимулирующее влияние кортикальных глутаматных нейронов на неостреатум,
развивающееся на фоне недостаточного выделения дофамина. Оказывает нейромодулирующее действие.
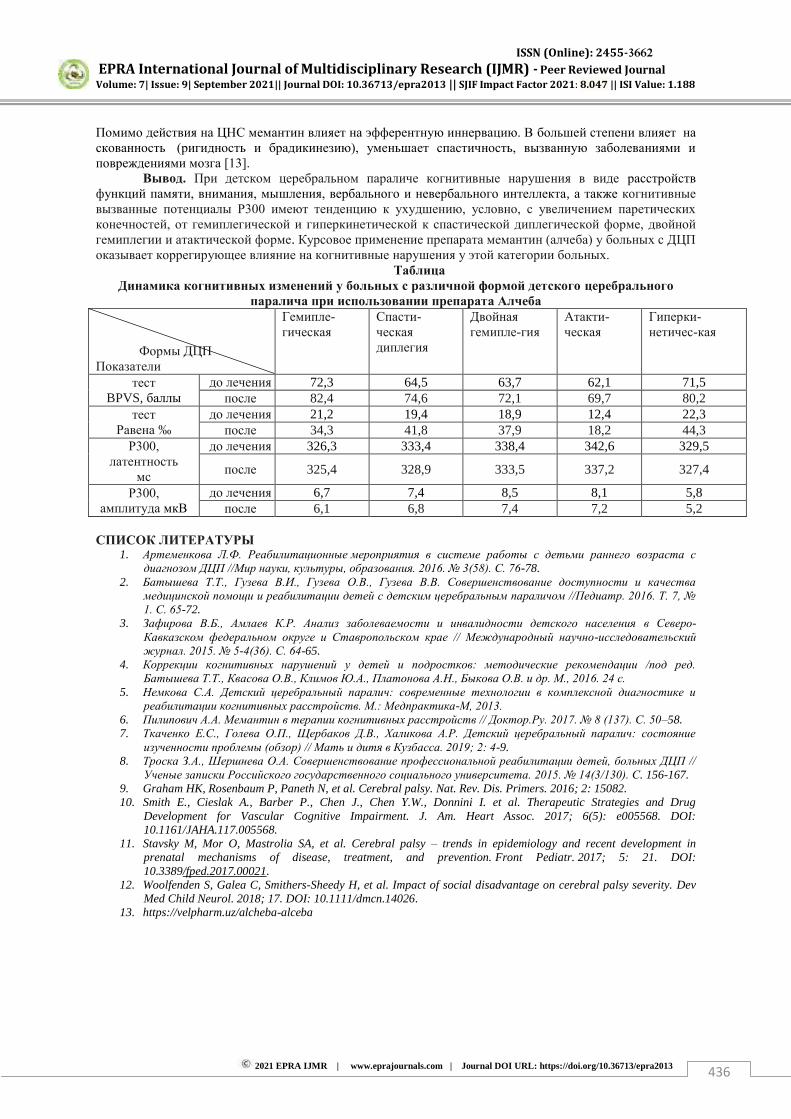
ISSN (Online): 2455-3662
EPRA International Journal of Multidisciplinary Research (IJMR) - Peer Reviewed Journal Volume: 7| Issue: 9| September 2021|| Journal DOI: 10.36713/epra2013 || SJIF Impact Factor 2021: 8.047 || ISI Value: 1.188
2021 EPRA IJMR | www.eprajournals.com | Journal DOI URL: https://doi.org/10.36713/epra2013 436
Помимо действия на ЦНС мемантин влияет на эфферентную иннервацию. В большей степени влияет на
скованность (ригидность и брадикинезию), уменьшает спастичность, вызванную заболеваниями и
повреждениями мозга [13]. Вывод. При детском церебральном параличе когнитивные нарушения в виде расстройств
функций памяти, внимания, мышления, вербального и невербального интеллекта, а также когнитивные
вызванные потенциалы Р300 имеют тенденцию к ухудшению, условно, с увеличением паретических
конечностей, от гемиплегической и гиперкинетической к спастической диплегической форме, двойной
гемиплегии и атактической форме. Курсовое применение препарата мемантин (алчеба) у больных с ДЦП
оказывает коррегирующее влияние на когнитивные нарушения у этой категории больных. Таблица
Динамика когнитивных изменений у больных с различной формой детского церебрального
паралича при использовании препарата Алчеба
Формы ДЦП Показатели
Гемипле-гическая
Спасти-ческая
диплегия
Двойная гемипле-гия
Атакти-ческая
Гиперки-нетичес-кая
тест BPVS, баллы
до лечения 72,3 64,5 63,7 62,1 71,5 после 82,4 74,6 72,1 69,7 80,2
тест Равена ‰
до лечения 21,2 19,4 18,9 12,4 22,3 после 34,3 41,8 37,9 18,2 44,3
Р300, латентность
мс
до лечения 326,3 333,4 338,4 342,6 329,5
после 325,4 328,9 333,5 337,2 327,4
Р300, амплитуда мкВ
до лечения 6,7 7,4 8,5 8,1 5,8 после 6,1 6,8 7,4 7,2 5,2
СПИСОК ЛИТЕРАТУРЫ
1. Артеменкова Л.Ф. Реабилитационные мероприятия в системе работы с детьми раннего возраста с
диагнозом ДЦП //Мир науки, культуры, образования. 2016. № 3(58). С. 76-78. 2. Батышева Т.Т., Гузева В.И., Гузева О.В., Гузева В.В. Совершенствование доступности и качества
медицинской помощи и реабилитации детей с детским церебральным параличом //Педиатр. 2016. Т. 7, №
1. С. 65-72. 3. Зафирова В.Б., Амлаев К.Р. Анализ заболеваемости и инвалидности детского населения в Северо-
Кавказском федеральном округе и Ставропольском крае // Международный научно-исследовательский
журнал. 2015. № 5-4(36). С. 64-65. 4. Коррекции когнитивных нарушений у детей и подростков: методические рекомендации /под ред.
Батышева Т.Т., Квасова О.В., Климов Ю.А., Платонова А.Н., Быкова О.В. и др. М., 2016. 24 с. 5. Немкова С.А. Детский церебральный паралич: современные технологии в комплексной диагностике и
реабилитации когнитивных расстройств. М.: Медпрактика-М, 2013. 6. Пилипович А.А. Мемантин в терапии когнитивных расстройств // Доктор.Ру. 2017. № 8 (137). С. 50–58. 7. Ткаченко Е.С., Голева О.П., Щербаков Д.В., Халикова А.Р. Детский церебральный паралич: состояние
изученности проблемы (обзор) // Мать и дитя в Кузбасса. 2019; 2: 4-9. 8. Троска З.А., Шершнева О.А. Совершенствование профессиональной реабилитации детей, больных ДЦП //
Ученые записки Российского государственного социального университета. 2015. № 14(3/130). С. 156-167. 9. Graham HK, Rosenbaum P, Paneth N, et al. Cerebral palsy. Nat. Rev. Dis. Primers. 2016; 2: 15082. 10. Smith E., Cieslak A., Barber P., Chen J., Chen Y.W., Donnini I. et al. Therapeutic Strategies and Drug
Development for Vascular Cognitive Impairment. J. Am. Heart Assoc. 2017; 6(5): e005568. DOI: 10.1161/JAHA.117.005568.
11. Stavsky M, Mor O, Mastrolia SA, et al. Cerebral palsy – trends in epidemiology and recent development in prenatal mechanisms of disease, treatment, and prevention. Front Pediatr. 2017; 5: 21. DOI: 10.3389/fped.2017.00021.
12. Woolfenden S, Galea C, Smithers-Sheedy H, et al. Impact of social disadvantage on cerebral palsy severity. Dev Med Child Neurol. 2018; 17. DOI: 10.1111/dmcn.14026.
13. https://velpharm.uz/alcheba-alceba
ISSN (Online): 2455-3662
EPRA International Journal of Multidisciplinary Research (IJMR) - Peer Reviewed Journal Volume: 7| Issue: 9| September 2021|| Journal DOI: 10.36713/epra2013 || SJIF Impact Factor 2021: 8.047 || ISI Value: 1.188
2021 EPRA IJMR | www.eprajournals.com | Journal DOI URL: https://doi.org/10.36713/epra2013 437
SUPERMOLECULAR STRUCTURE OF COTTON
CELLULOSE TREATED WITH LIQUID AMMONIA AND INCLUDED WITH ALCOHOLS
F.E. Ochilov Director of the Secondary School No. 6 of the Chirchik City Department of Public Education of the
Tashkent Region
ABSTRACT
The article studies the reactivity of cellulose is closely related to the packing density, ordering or availability of cellulose macromolecules. To determine the above indicators, various methods are used, such as X-ray, electron microscopy, etc. To obtain results comparable to the cellulose esterification rate, it is necessary to determine the availability under conditions as close as possible to the esterification conditions. KEYWORDS: cellulose, ammonia, sorption, X-ray diffraction, esterification, system, crystalline, chemical.
INTRODUCTION
Among fibrous materials, there is no material with such significant values as for cellulose, values of sorption (8-14% at a relative humidity of 65%) and swelling (60-130%). Basalt fiber filters are widely used for cleaning the dusty air of metallurgical and chemical plants with an operating temperature of 300-650oC. Filtering materials made of basalt fibers with a diameter of 17-25 microns are quite strong, permeable, brittle and flexible.
Although the main factor determining the sorption capacity of cellulose is undoubtedly the presence of OH groups, the physical structure of cellulose also plays a significant role. A developed capillary-porous system, including the intrafibrillar structure of cellulose, irregularities in packing less than 1.5 nm in size, interfibrillar voids (pores) 1.5-10 nm in size, pores resulting from the swelling of hydrated cellulose (in particular, viscose) fibers, several tens of nanometers, as well as channels and macropores in natural cellulose fibers with a diameter of several micrometers cause not only true sorption (adsorption), but also capillary condensation of water vapor. Fine sulphite pulp (bleached) and asbestos fiber filters are used in the production of wine and cognac. Depending on the amount of asbestos added to the cellulose, filter materials are of different brands: YaK-1, YaK-2 and YaK-3. Depending on the viscosity of the filtered mass, the appropriate filter grade is selected. For example, YAK-3 is used to filter medium-strength wines and dessert wines. Taking into account the above considerations, a filter material was obtained from cotton pulp and basalt fiber (coarse and ultra) and its quality indicators were studied.
METHODS AND RESULTS The morphological and supramolecular
structure of cellulose determines its reactivity to various esterification reactions, and form the properties of the resulting products based on it.
The results are presented in the tables below. Cellulose is used as the main raw material in many industries. Simple cellulose Na-CMC is produced by a number of enterprises in the country, including UzneftMakhsul LLC "CARBONAM" (production capacity of 30,000 tons per year) and other enterprises. Several high quality brands are produced, including Tashkent Paper LLC (production capacity 45,000 tons per year), Namangan Paper LLC (production capacity 18,000 tons per year) and ANGREN PACK with foreign investments. such as JSCs (production capacity 100,000 tons per year) produce paper and paper products. Most of the above enterprises are not operating at full capacity due to lack of pulp. Only LLC "CARBONAM" currently produces 200-500 tons of Na-CMC per year instead of 30,000 tons. This figure does not cover even one tenth of the republic's need for Na-KMC. Cellulose fibers are strong due to the ordered arrangement of cellulose macromolecules in the fibers. Such strong fibers are widely used in many industries and in everyday life. The aforementioned properties of cellulose make it possible to synthesize a wide range of cellulose-based ethers and esters.
Due to the low reactivity of cotton cellulose, in order to chemically process it (esterification) and modify its properties (graft copolymerization, crosslinking, etc.), preliminary activation treatments are carried out. In this regard, some treatment of cellulose samples with various chemical reagents is
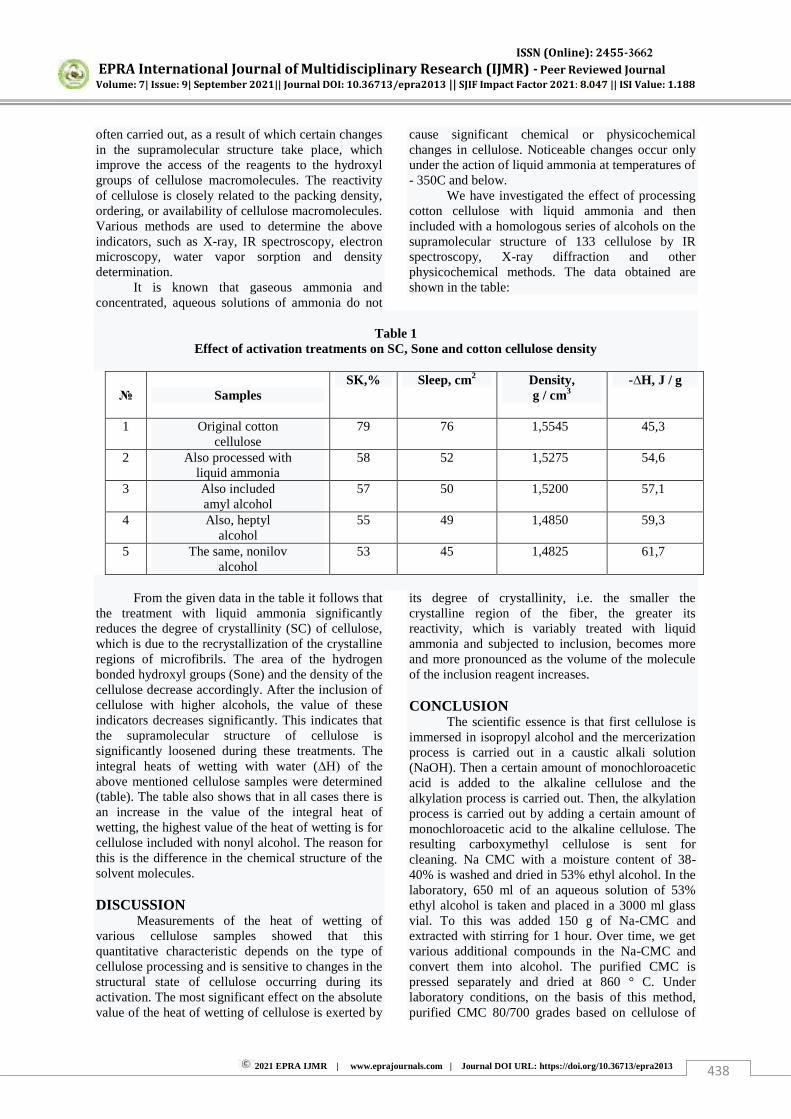
ISSN (Online): 2455-3662
EPRA International Journal of Multidisciplinary Research (IJMR) - Peer Reviewed Journal Volume: 7| Issue: 9| September 2021|| Journal DOI: 10.36713/epra2013 || SJIF Impact Factor 2021: 8.047 || ISI Value: 1.188
2021 EPRA IJMR | www.eprajournals.com | Journal DOI URL: https://doi.org/10.36713/epra2013 438
often carried out, as a result of which certain changes in the supramolecular structure take place, which improve the access of the reagents to the hydroxyl groups of cellulose macromolecules. The reactivity of cellulose is closely related to the packing density, ordering, or availability of cellulose macromolecules. Various methods are used to determine the above indicators, such as X-ray, IR spectroscopy, electron microscopy, water vapor sorption and density determination.
It is known that gaseous ammonia and concentrated, aqueous solutions of ammonia do not
cause significant chemical or physicochemical changes in cellulose. Noticeable changes occur only under the action of liquid ammonia at temperatures of - 350C and below.
We have investigated the effect of processing cotton cellulose with liquid ammonia and then included with a homologous series of alcohols on the supramolecular structure of 133 cellulose by IR spectroscopy, X-ray diffraction and other physicochemical methods. The data obtained are shown in the table:
Table 1
Effect of activation treatments on SC, Sone and cotton cellulose density
№
№
Samples SK,%
Sleep, cm2
Density, g / cm3
-∆H, J / g
1
Original cotton cellulose
79
76 1,5545 45,3
2 Also processed with liquid ammonia
58
52 1,5275 54,6
3 Also included amyl alcohol
57
50 1,5200 57,1
4 Also, heptyl alcohol
55
49 1,4850 59,3
5 The same, nonilov alcohol
53
45 1,4825 61,7
From the given data in the table it follows that
the treatment with liquid ammonia significantly reduces the degree of crystallinity (SC) of cellulose, which is due to the recrystallization of the crystalline regions of microfibrils. The area of the hydrogen bonded hydroxyl groups (Sone) and the density of the cellulose decrease accordingly. After the inclusion of cellulose with higher alcohols, the value of these indicators decreases significantly. This indicates that the supramolecular structure of cellulose is significantly loosened during these treatments. The integral heats of wetting with water (∆Н) of the
above mentioned cellulose samples were determined (table). The table also shows that in all cases there is an increase in the value of the integral heat of wetting, the highest value of the heat of wetting is for cellulose included with nonyl alcohol. The reason for this is the difference in the chemical structure of the solvent molecules. DISCUSSION
Measurements of the heat of wetting of various cellulose samples showed that this quantitative characteristic depends on the type of cellulose processing and is sensitive to changes in the structural state of cellulose occurring during its activation. The most significant effect on the absolute value of the heat of wetting of cellulose is exerted by
its degree of crystallinity, i.e. the smaller the crystalline region of the fiber, the greater its reactivity, which is variably treated with liquid ammonia and subjected to inclusion, becomes more and more pronounced as the volume of the molecule of the inclusion reagent increases. CONCLUSION
The scientific essence is that first cellulose is immersed in isopropyl alcohol and the mercerization process is carried out in a caustic alkali solution (NaOH). Then a certain amount of monochloroacetic acid is added to the alkaline cellulose and the alkylation process is carried out. Then, the alkylation process is carried out by adding a certain amount of monochloroacetic acid to the alkaline cellulose. The resulting carboxymethyl cellulose is sent for cleaning. Na CMC with a moisture content of 38-40% is washed and dried in 53% ethyl alcohol. In the laboratory, 650 ml of an aqueous solution of 53% ethyl alcohol is taken and placed in a 3000 ml glass vial. To this was added 150 g of Na-CMC and extracted with stirring for 1 hour. Over time, we get various additional compounds in the Na-CMC and convert them into alcohol. The purified CMC is pressed separately and dried at 860 ° C. Under laboratory conditions, on the basis of this method, purified CMC 80/700 grades based on cellulose of
ISSN (Online): 2455-3662
EPRA International Journal of Multidisciplinary Research (IJMR) - Peer Reviewed Journal Volume: 7| Issue: 9| September 2021|| Journal DOI: 10.36713/epra2013 || SJIF Impact Factor 2021: 8.047 || ISI Value: 1.188
2021 EPRA IJMR | www.eprajournals.com | Journal DOI URL: https://doi.org/10.36713/epra2013 439
the Paulownia plant and 85/800 grades of CMC purified based on cellulose of cotton pile were obtained. REFERENCES
1. Mirkamilov T.M. High-quality cotton mass from low-grade pile grades. Abstract. diss. Doctor of Technical Sciences. - Riga, 1983, p. 48.
2. Mirkamilov T.M. Cotton cellulose technology. // Tashkent. Fan. 1996 -S.272.
3. Primkulov MT, Rakhmanberdiev GR, Makhsudov Yu.M. Production of cellulose from annual plants T - 2008, p. - Pages 71-74.
4. Sayfutdinov R.S., Tillashaikhov M.S., Mirkamilov Sh.S. A.A. Abdurakhmonov Study of the process of cellulose hydrolysis. Proceedings of TCTI, Chemistry and Chemical Technology. 1993 Issue 2, pp. 26-30.
5. https://www.slideshare.net/sharadah22/cellulose-fibre
6. www.reade.com/.../pavlony-powder-cellulose -fiber-str
ISSN (Online): 2455-3662
EPRA International Journal of Multidisciplinary Research (IJMR) - Peer Reviewed Journal Volume: 7| Issue: 9| September 2021|| Journal DOI: 10.36713/epra2013 || SJIF Impact Factor 2021: 8.047 || ISI Value: 1.188
2021 EPRA IJMR | www.eprajournals.com | Journal DOI URL: https://doi.org/10.36713/epra2013 440
SELECTION OF THE DIAMETER OF THE
GRANULATOR MATRIX DEPENDING ON THE AGE AND WEIGHT OF THE FISH AND ITS ANALYSIS
K D Astanakulo , F J Isakov , F K Kurbono
1 Tashkent Institute of Irrigation and Agricultural Mechanization Engineers, 39, Kari Niyaziy, Tashkent State, 100000, Uzbekistan.
2 Tashkent State Agrarian University, 2, University, Tashkent State, 100140, Uzbekistan.
ABSTRACT The correct and timely balanced feeding of fish according to their age and type, that is, providing them with saturated nutrients with all the necessary ingredients, bringing them to the state of the finished product in short time is an important task. Therefore, now the demand for water-resistant granular products is growing. KEYWORDS: fish, animal husbandry, vitamins and minerals, height and weight, excessive wastefulness, vitamins and minerals.
1. INTRODUCTION
Currently, fish farming is considered a profitable business. That is why, raising and delivering fish in line with market demands is the main requirement for a fish farming. This makes to pay great attention for feeding fish with the right nutrients. Another important economic aspect of fish farming is that fish farming spends less feed consumption in comparison with animal husbandry. The main task is to choose the right diet and distribution, feeding fish with ready-made food is the easiest and most acceptable choice. Feeding fish with nutrients which contain the necessary vitamins and minerals for well growth and development[1]. 2. MATERIALS AND METHODS
There are many types of nutrients, but now the most effective way to gain the rapid growth and weight of fish is to feed them with dry granular nutrients. The advantage of these granular feeds is that they facilitate the feeding process, do not pollute the pond or cage, depending on the type, age and weight of each fish, the size of the pellets is selected and the necessary amount of nutrients is distributed. When choosing a feed, it is taken into account what and how the fish is fed. Fish are divided into meat-eating, herbivorous and omnivorous species[2]. For the above reasons, the composition and size of the pellet is selected. Fish food is divided into two types:
Plant (stems of various plants and their grains, alfalfa, wheat, oats, crushed legumes and cereals, oilcakes)
Animal (the remains of fish and other animals are ground to a flour-like state).
Besides that, various minerals are added to the granular feed, which is desirable, since they are highly effective in digesting food and increase the immunity of fish. As a result, it helps to rapid gain of height and weight of fish. The basis of fish food is a plant and animal organism. For example, in order for a Pike to gain weight - 1 kg, it needs to eat 3 kg, and a trout needs to eat 5 kg of young fish. The diet of fish is determined depending on what kind of fish it belongs to. When the fish are small, they all eat the same food, meaning they feed on plankton and larvae. As it gets bigger, so does the diet. Predatory fish are fed on small fish, and herbivores on the remains and veins of various grasses.
At least 30% of the fish diet should correspond to natural food. This is especially important for the growth of young fish. For properly usage of natural feed in the pool, first of all we need to determine what the natural feed base of the pool is. Standing water, which is more exposed to the sun's rays, will be a good condition for increasing the natural food in the pools. For this purpose, hydro biological studies are carried out in the pools. To enrich the natural food of the pool, various nutrients are filled in it.
For fish that feed above water supplied with insects that walk on water and fly above water, for fish
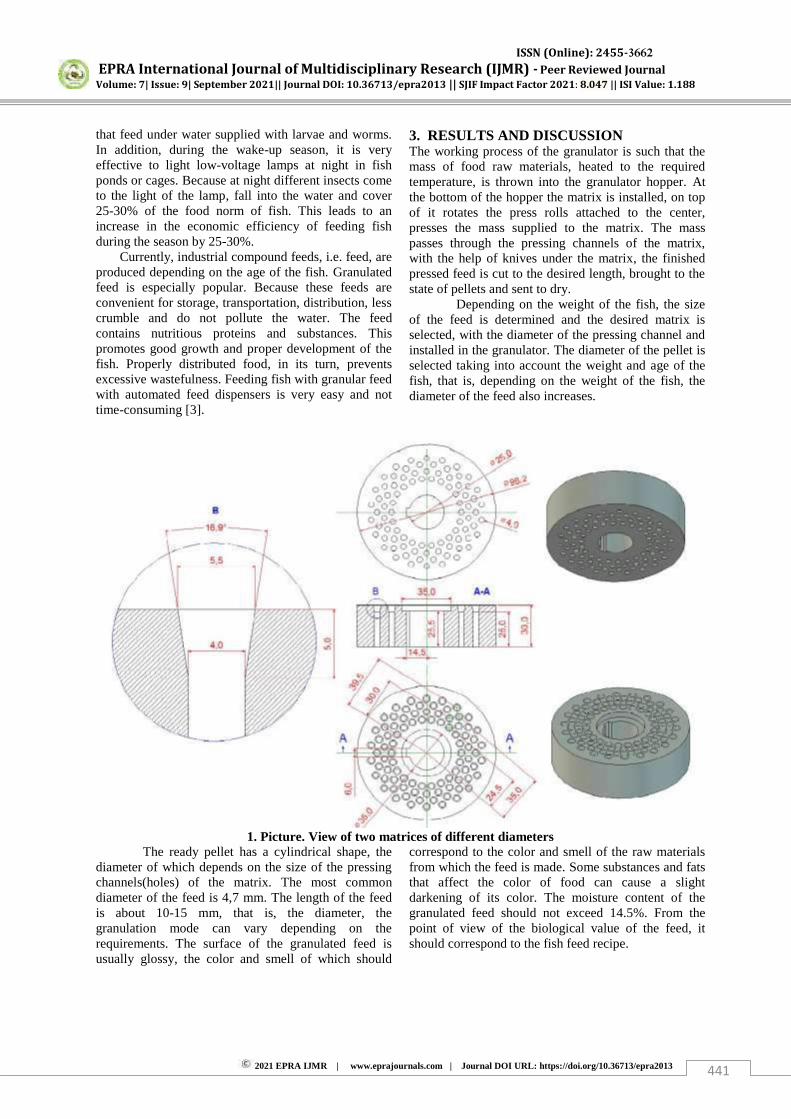
ISSN (Online): 2455-3662
EPRA International Journal of Multidisciplinary Research (IJMR) - Peer Reviewed Journal Volume: 7| Issue: 9| September 2021|| Journal DOI: 10.36713/epra2013 || SJIF Impact Factor 2021: 8.047 || ISI Value: 1.188
2021 EPRA IJMR | www.eprajournals.com | Journal DOI URL: https://doi.org/10.36713/epra2013 441
that feed under water supplied with larvae and worms. In addition, during the wake-up season, it is very effective to light low-voltage lamps at night in fish ponds or cages. Because at night different insects come to the light of the lamp, fall into the water and cover 25-30% of the food norm of fish. This leads to an increase in the economic efficiency of feeding fish during the season by 25-30%.
Currently, industrial compound feeds, i.e. feed, are produced depending on the age of the fish. Granulated feed is especially popular. Because these feeds are convenient for storage, transportation, distribution, less crumble and do not pollute the water. The feed contains nutritious proteins and substances. This promotes good growth and proper development of the fish. Properly distributed food, in its turn, prevents excessive wastefulness. Feeding fish with granular feed with automated feed dispensers is very easy and not time-consuming [3].
3. RESULTS AND DISCUSSION The working process of the granulator is such that the mass of food raw materials, heated to the required temperature, is thrown into the granulator hopper. At the bottom of the hopper the matrix is installed, on top of it rotates the press rolls attached to the center, presses the mass supplied to the matrix. The mass passes through the pressing channels of the matrix, with the help of knives under the matrix, the finished pressed feed is cut to the desired length, brought to the state of pellets and sent to dry.
Depending on the weight of the fish, the size of the feed is determined and the desired matrix is selected, with the diameter of the pressing channel and installed in the granulator. The diameter of the pellet is selected taking into account the weight and age of the fish, that is, depending on the weight of the fish, the diameter of the feed also increases.
1. Picture. View of two matrices of different diameters
The ready pellet has a cylindrical shape, the diameter of which depends on the size of the pressing channels(holes) of the matrix. The most common diameter of the feed is 4,7 mm. The length of the feed is about 10-15 mm, that is, the diameter, the granulation mode can vary depending on the requirements. The surface of the granulated feed is usually glossy, the color and smell of which should
correspond to the color and smell of the raw materials from which the feed is made. Some substances and fats that affect the color of food can cause a slight darkening of its color. The moisture content of the granulated feed should not exceed 14.5%. From the point of view of the biological value of the feed, it should correspond to the fish feed recipe.
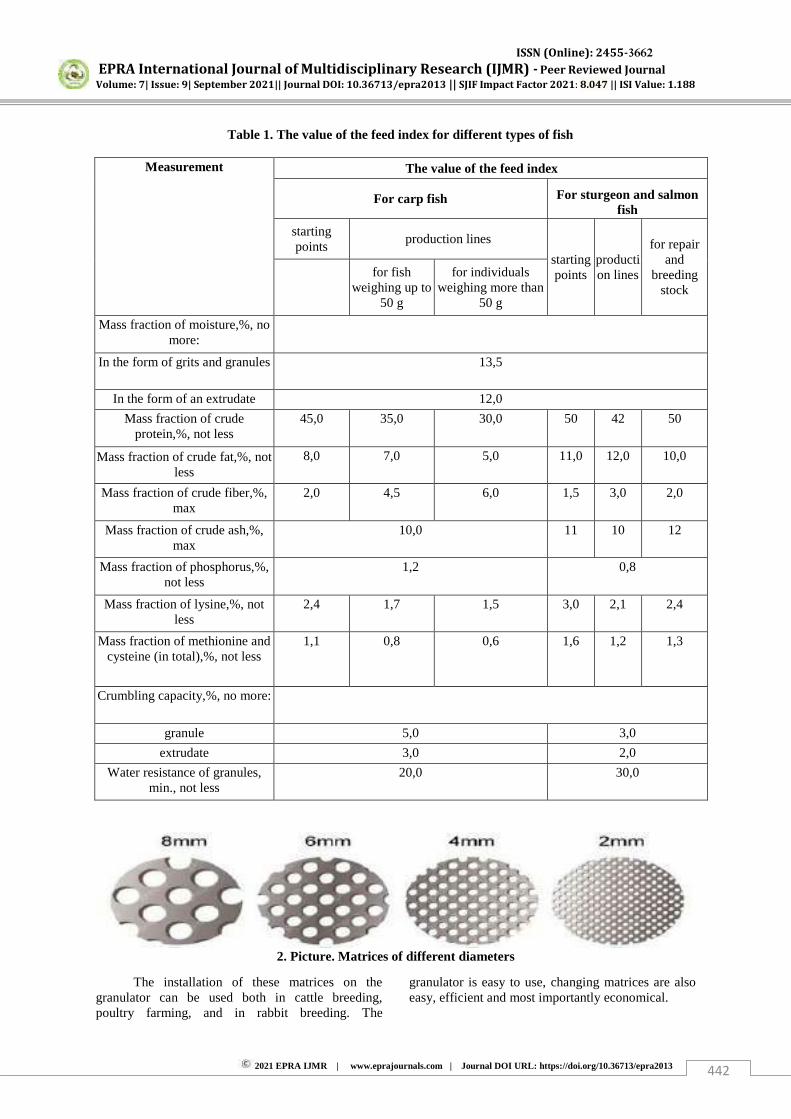
ISSN (Online): 2455-3662
EPRA International Journal of Multidisciplinary Research (IJMR) - Peer Reviewed Journal Volume: 7| Issue: 9| September 2021|| Journal DOI: 10.36713/epra2013 || SJIF Impact Factor 2021: 8.047 || ISI Value: 1.188
2021 EPRA IJMR | www.eprajournals.com | Journal DOI URL: https://doi.org/10.36713/epra2013 442
Table 1. The value of the feed index for different types of fish
Measurement The value of the feed index
For carp fish For sturgeon and salmon fish
starting points
production lines
starting points
production lines
for repair and
breeding stock
for fish weighing up to
50 g
for individuals weighing more than
50 g
Mass fraction of moisture,%, no more:
In the form of grits and granules 13,5
In the form of an extrudate 12,0
Mass fraction of crude protein,%, not less
45,0 35,0 30,0 50 42 50
Mass fraction of crude fat,%, not less
8,0 7,0 5,0 11,0 12,0 10,0
Mass fraction of crude fiber,%, max
2,0 4,5 6,0 1,5 3,0 2,0
Mass fraction of crude ash,%, max
10,0 11 10 12
Mass fraction of phosphorus,%, not less
1,2 0,8
Mass fraction of lysine,%, not less
2,4 1,7 1,5 3,0 2,1 2,4
Mass fraction of methionine and cysteine (in total),%, not less
1,1 0,8 0,6 1,6 1,2 1,3
Crumbling capacity,%, no more:
granule 5,0 3,0
extrudate 3,0 2,0
Water resistance of granules, min., not less
20,0 30,0
2. Picture. Matrices of different diameters
The installation of these matrices on the granulator can be used both in cattle breeding, poultry farming, and in rabbit breeding. The
granulator is easy to use, changing matrices are also easy, efficient and most importantly economical.
ISSN (Online): 2455-3662
EPRA International Journal of Multidisciplinary Research (IJMR) - Peer Reviewed Journal Volume: 7| Issue: 9| September 2021|| Journal DOI: 10.36713/epra2013 || SJIF Impact Factor 2021: 8.047 || ISI Value: 1.188
2021 EPRA IJMR | www.eprajournals.com | Journal DOI URL: https://doi.org/10.36713/epra2013 443
4. CONCLUSION Granulated products are enriched with various
substances that prevent diseases of the fish, as well as increase its immunity. It is enough to distribute food to the fish in the pond, in the tank once or twice a day. It can be stored in a dry place for up to one and a half to two years. Changing the ingredients can be used in other branches of animal husbandry.
5. REFERENCES 1. Sidorova V.I., Yanvareva N.I. Development of
new technologies and techniques for the production of fish feed// Fisheries. - 2017. № 4
(134). - p.- 168-180 2. Zaharov V. Mixed feed for commercial fish
farming// Mixed feed. - 2010. - № 6. - p. 34-39. 3. Shaari M.F., Aerial Fish Feeding System,
Proceedings of the 2011 IEEE, International Conference on Mechatronics and Automation, August 7 - 10, Beijing, China
4. Technologyofproductionofcompoundfeedsforvaluablefishbreedshttp://otherreferats.allbest.ru/manufacture/00633515_0.html
5. Investigation of the process of press granulation of mixed feeds in press granulators with an end restriction of the wedge-shaped working space https://otherreferats.allbest.ru/manufacture/00883023_0.html
6. Calculationofcompoundfeed http://knowledge.allbest.ru/manufacture/3c0a65635b2bd68a4c43a88421206c27_0.html
7. Astanakulov K.D., Kurbanov F.K., Isakova F.J. Substantiation of the operating mode of the pendulum feeder// The American journal of applied sciences, volume 2, issue-11, 2020. -p.- 110-115.
8. Allen Davis. Feed and feeding practices in aquaculture// Woodhead Publishing, 1st edition, 2015.https://www.elsevier.com/books/feed-and-feeding-practices-inaquaculture/davis/978-0-08-100506-4
9. Charis Galanakis. Sustainable fish production and processing// Academic Press, 1st edition, 2021.https://www.elsevier.com/books/sustainable-fish-production-and processing/galanakis/978-0-12-824296-4
10. S. Schultz, B. Vallant, M.J. Kain, Preferential feeding on high quality diets decreases methyl mercury of farm-raised common carp. http://www.sciencedirect.com/science/article/pii/S0044848612000075
11. Sean M. Lucey | Kerim Y. Aydin, Evaluating fishery management strategies using an ecosystem model as an operating model https://www.sciencedirect.com/science/article/pii/S0165783620302976
ISSN (Online): 2455-3662
EPRA International Journal of Multidisciplinary Research (IJMR) - Peer Reviewed Journal Volume: 7| Issue: 9| September 2021|| Journal DOI: 10.36713/epra2013 || SJIF Impact Factor 2021: 8.047 || ISI Value: 1.188
2021 EPRA IJMR | www.eprajournals.com | Journal DOI URL: https://doi.org/10.36713/epra2013 444
ECOLOGICAL MONITORING OF GROUND BEETLES (COLEOPTERA, CARABIDAE) OF THE LOWER
AMUDARYA STATE BIOSPHERE RESERVE
Reymov K. D.1, Eshmuratov A. Ya2., Embergenov M. A.3,
Seytmuratov A. K.4
1,2,3,4 NSPI, Institute of Zoology of the Academy of Sciences of the Republic of Uzbekistan
ABSTRACT
This article presents data on the results of the carabidae fauna of the Lower Amudarya State Biosphere Reserve. The article contains 1421 samples, which consist of 30 species and 20 genera. Of these, 7 species are recorded as widespread species, 5 species are rare species, 18 species are permanent species. KEYWORDS: ecological monitoring, Lower Amudarya State Biosphere Reserve, representatives of the ground beetle family, zoogeographic distribution of ground beetles, AA method. Blue, ground traps, light traps
ЭКОЛОГИЧЕСКИЙ МОНИТОРИНГ ЖУЖЕЛИЦ (COLEOPTERA,
CARABIDAE) НИЖНЕ-АМУДАРЬИНСКОГО
ГОСУДАРСТВЕННОГО БИОСФЕРНОГО РЕЗЕРВАТА
Реймов Қ. Д., Ешмуратов А.Я., Ембергенов М.А.,
Сейтмуратов А.К.
НГПИ, Институт Зоологии АН РУз
Аннотация: В данной статье представлены данные о результатах фауны carabidae Нижне-Амударьинского государственного биосферного заповедника. В статье собраны 1421
проб, которые состоят из 30 видов и 20 родов. Из них 7 видов зафиксированы, как широко
распространѐнные виды, 5 видов – редкие виды, 18 видов являются постоянными видами. Ключевые слова: экологический мониторинг, Нижне-Амударьинский государственный
биосферный резерват, представители семейства жужелиц, зоогеографическое распространение жужелиц, метод АА. Голуба, наземные ловушки, световые ловушки
Нижне-Амударьинский государственный биосферный резерват, является охраняемой
территорией, в которую входят наземные и водные экосистемы, которые направлены на рациональное
использование природных ресурсов, обеспечение биоразнообразия и охраны социальных,
экономических и культурных богатств. Целью и задачей биосферного резервата является сохранение, восстановление, улучшение
ландшафта биосферного резервата и экологического состояния видов растительного и животного мира
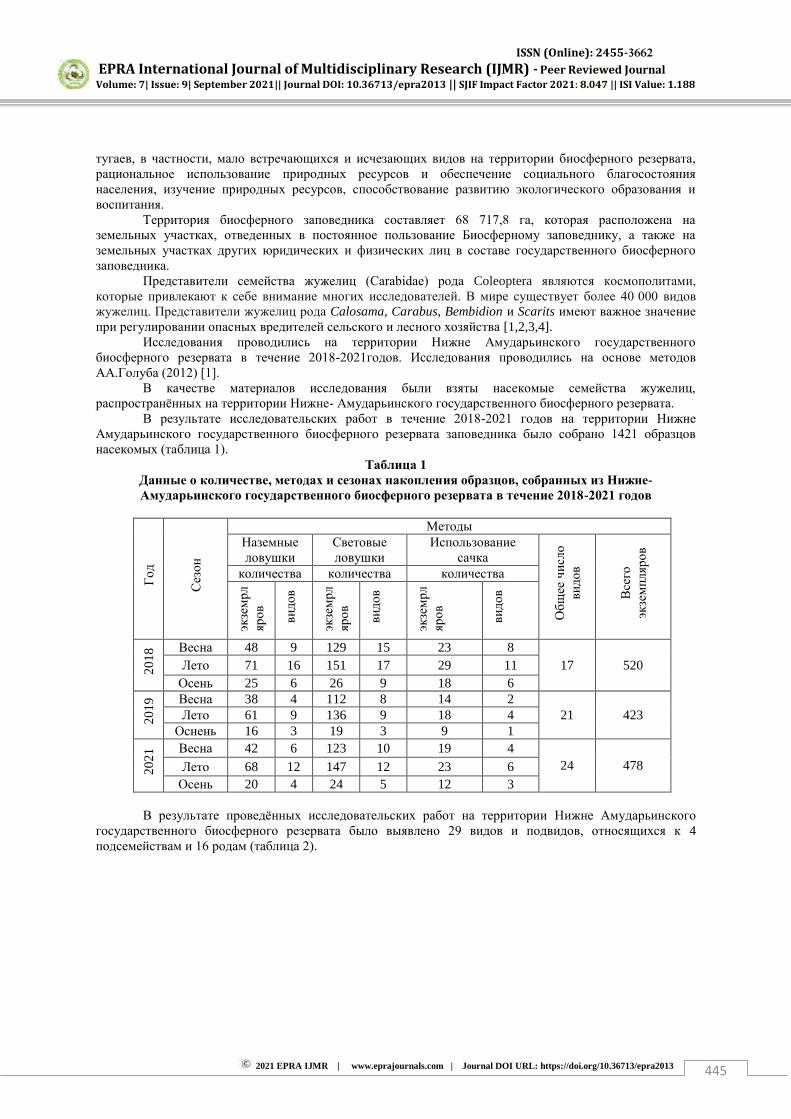
ISSN (Online): 2455-3662
EPRA International Journal of Multidisciplinary Research (IJMR) - Peer Reviewed Journal Volume: 7| Issue: 9| September 2021|| Journal DOI: 10.36713/epra2013 || SJIF Impact Factor 2021: 8.047 || ISI Value: 1.188
2021 EPRA IJMR | www.eprajournals.com | Journal DOI URL: https://doi.org/10.36713/epra2013 445
тугаев, в частности, мало встречающихся и исчезающих видов на территории биосферного резервата,
рациональное использование природных ресурсов и обеспечение социального благосостояния
населения, изучение природных ресурсов, способствование развитию экологического образования и
воспитания. Территория биосферного заповедника составляет 68 717,8 га, которая расположена на
земельных участках, отведенных в постоянное пользование Биосферному заповеднику, а также на
земельных участках других юридических и физических лиц в составе государственного биосферного
заповедника. Представители семейства жужелиц (Carabidae) рода Coleoptera являются космополитами,
которые привлекают к себе внимание многих исследователей. В мире существует более 40 000 видов
жужелиц. Представители жужелиц рода Calosama, Carabus, Bembidion и Scarits имеют важное значение
при регулировании опасных вредителей сельского и лесного хозяйства [1,2,3,4]. Исследования проводились на территории Нижне Амударьинского государственного
биосферного резервата в течение 2018-2021годов. Исследования проводились на основе методов
АА.Голуба (2012) [1]. В качестве материалов исследования были взяты насекомые семейства жужелиц,
распространѐнных на территории Нижне- Амударьинского государственного биосферного резервата. В результате исследовательских работ в течение 2018-2021 годов на территории Нижне
Амударьинского государственного биосферного резервата заповедника было собрано 1421 образцов
насекомых (таблица 1). Таблица 1
Данные о количестве, методах и сезонах накопления образцов, собранных из Нижне-Амударьинского государственного биосферного резервата в течение 2018-2021 годов
Го
д
Сез
он
Методы Наземные
ловушки Световые
ловушки Использование
сачка О
бщ
ее ч
исло
ви
до
в
Все
го
экзе
мп
ляр
ов
количества количества количества
экзе
мр
л
яр
ов
ви
до
в
экзе
мр
л
яр
ов
ви
до
в
экзе
мр
л
яр
ов
ви
до
в
2018
Весна 48 9 129 15 23 8 17 520 Лето 71 16 151 17 29 11
Осень 25 6 26 9 18 6
2019
Весна 38 4 112 8 14 2 21 423 Лето 61 9 136 9 18 4
Оснень 16 3 19 3 9 1
2021
Весна 42 6 123 10 19 4 24 478 Лето 68 12 147 12 23 6
Осень 20 4 24 5 12 3 В результате проведѐнных исследовательских работ на территории Нижне Амударьинского
государственного биосферного резервата было выявлено 29 видов и подвидов, относящихся к 4 подсемействам и 16 родам (таблица 2).
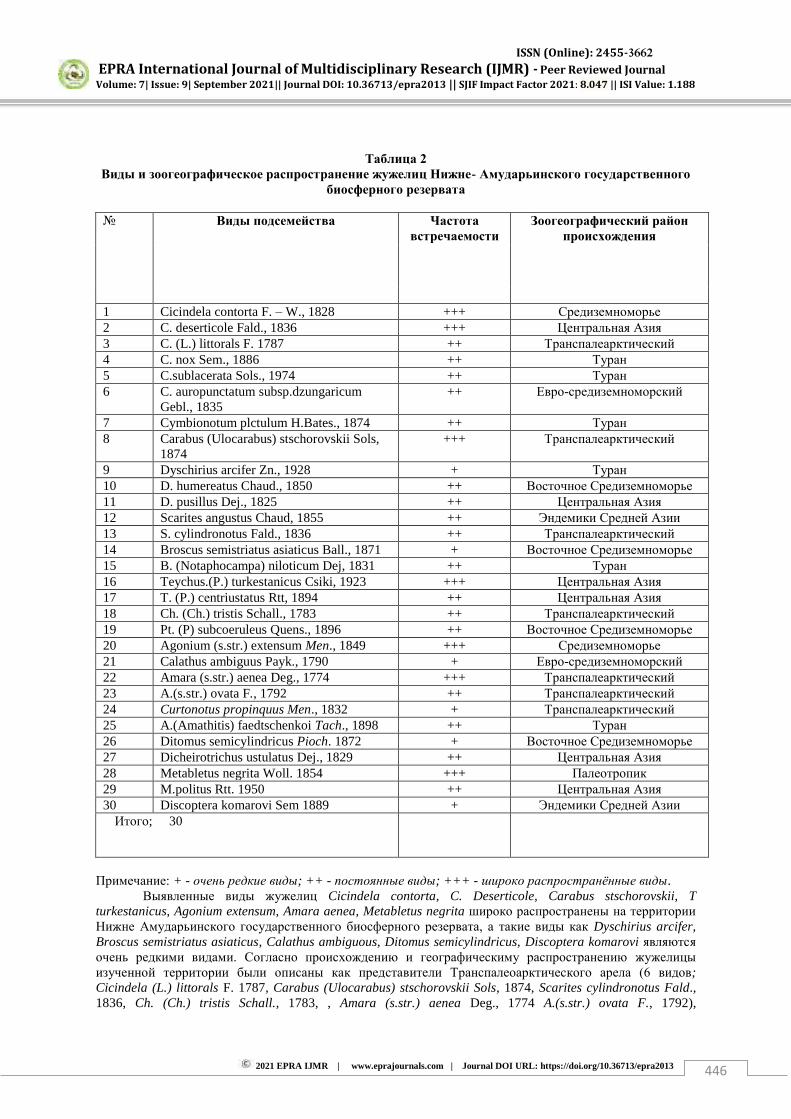
ISSN (Online): 2455-3662
EPRA International Journal of Multidisciplinary Research (IJMR) - Peer Reviewed Journal Volume: 7| Issue: 9| September 2021|| Journal DOI: 10.36713/epra2013 || SJIF Impact Factor 2021: 8.047 || ISI Value: 1.188
2021 EPRA IJMR | www.eprajournals.com | Journal DOI URL: https://doi.org/10.36713/epra2013 446
Таблица 2 Виды и зоогеографическое распространение жужелиц Нижне- Амударьинского государственного
биосферного резервата
№ Виды подсемейства Частота
встречаемости Зоогеографический район
происхождения
1 Cicindela contorta F. – W., 1828 +++ Средиземноморье 2 C. deserticole Fald., 1836 +++ Центральная Азия 3 C. (L.) littorals F. 1787 ++ Транспалеарктический 4 C. nox Sem., 1886 ++ Туран 5 C.sublacerata Sols., 1974 ++ Туран 6 C. auropunctatum subsp.dzungaricum
Gebl., 1835 ++ Евро-средиземноморский
7 Cymbionotum plctulum H.Bates., 1874 ++ Туран 8 Carabus (Ulocarabus) stschorovskii Sols,
1874 +++ Транспалеарктический
9 Dyschirius arcifer Zn., 1928 + Туран 10 D. humereatus Chaud., 1850 ++ Восточное Средиземноморье 11 D. pusillus Dej., 1825 ++ Центральная Азия 12 Scarites angustus Chaud, 1855 ++ Эндемики Средней Азии 13 S. cylindronotus Fald., 1836 ++ Транспалеарктический 14 Broscus semistriatus asiaticus Ball., 1871 + Восточное Средиземноморье 15 B. (Notaphocampa) niloticum Dej, 1831 ++ Туран 16 Teychus.(P.) turkestanicus Csiki, 1923 +++ Центральная Азия 17 T. (P.) cеntriustatus Rtt, 1894 ++ Центральная Азия 18 Ch. (Ch.) tristis Schall., 1783 ++ Транспалеарктический 19 Pt. (P) subcoeruleus Quens., 1896 ++ Восточное Средиземноморье 20 Agonium (s.str.) extensum Men., 1849 +++ Средиземноморье 21 Calathus ambiguus Payk., 1790 + Евро-средиземноморский 22 Amara (s.str.) aenea Deg., 1774 +++ Транспалеарктический 23 A.(s.str.) ovata F., 1792 ++ Транспалеарктический 24 Curtonotus propinquus Men., 1832 + Транспалеарктический 25 A.(Amathitis) faedtschenkoi Tach., 1898 ++ Туран 26 Ditomus semicylindricus Pioch. 1872 + Восточное Средиземноморье 27 Dicheirotrichus ustulatus Dej., 1829 ++ Центральная Азия 28 Metabletus negrita Woll. 1854 +++ Палеотропик 29 M.politus Rtt. 1950 ++ Центральная Азия 30 Discoptera komarovi Sem 1889 + Эндемики Средней Азии
Итого; 30
Примечание: + - очень редкие виды; ++ - постоянные виды; +++ - широко распространённые виды. Выявленные виды жужелиц Cicindela contorta, C. Deserticole, Carabus stschorovskii, T turkestanicus, Agonium extensum, Amara aenea, Metabletus negrita широко распространены на территории
Нижне Амударьинского государственного биосферного резервата, а такие виды как Dyschirius arcifer, Broscus semistriatus asiaticus, Calathus ambiguous, Ditomus semicylindricus, Discoptera komarovi являются
очень редкими видами. Согласно происхождению и географическиму распространению жужелицы
изученной территории были описаны как представители Транспалеоарктического арела (6 видов; Cicindela (L.) littorals F. 1787, Carabus (Ulocarabus) stschorovskii Sols, 1874, Scarites cylindronotus Fald., 1836, Ch. (Ch.) tristis Schall., 1783, , Amara (s.str.) aenea Deg., 1774 A.(s.str.) ovata F., 1792),
ISSN (Online): 2455-3662
EPRA International Journal of Multidisciplinary Research (IJMR) - Peer Reviewed Journal Volume: 7| Issue: 9| September 2021|| Journal DOI: 10.36713/epra2013 || SJIF Impact Factor 2021: 8.047 || ISI Value: 1.188
2021 EPRA IJMR | www.eprajournals.com | Journal DOI URL: https://doi.org/10.36713/epra2013 447
Среднеазиатские эндемические ( 2 вида; Scarites angustus Chaud, 1855, Discoptera komarovi Sem 1889), Европа-Средиземноморские (2 вида; Cicindela auropunctatum subsp.dzungaricum Gebl., 1835, Calathus ambiguus Payk., 1790), Средиземноморские (2 вида; Cicindela contorta F. – W., 1828, Agonium (s.str.) extensum Men., 1849), Восточные средиземноморские (3 вида; Dyschirius humereatus Chaud., 1850, Broscus semistriatus asiaticus Ball., 1871, Pt. (P) subcoeruleus Quens., 1896), Центральноазиатские (6 видов; Cicindela. deserticole Fald., 1836, D. pusillus Dej., 1825 , Teychus.(P.) turkestanicus Csiki, 1923, T. (P.) cеntriustatus Rtt, 1894, Dicheirotrichus ustulatus Dej., 1829, Metabletus politus Rtt. 1950), Палеотропические (1 вид; Metabletus negrita Woll. 1854), Туранские (6 видов; Cicindela nox Sem., 1886, C.sublacerata Sols., 1974, Cymbionotum plctulum H.Bates., 1874 , Dyschirius arcifer Zn., 1928, Broscus (Notaphocampa) niloticum Dej, 1831, Amara (Amathitis) faedtschenkoi Tach., 1898). В результате
исследований выявлено, что представители Транспалеоарктического, Центральноазиатского, Туранского
ареалов встречаются относительно больше. Использованная литература
1. Берлов О.Э. Новый вид рода Carabus (Coleoptera, Carabidae) с северо-востока Сибири. // Зоологический
журнал, 1989.- Том 68, N 6.- С. 151-153. 2. Крыжановский О.Л. Состав и распространение энтомофаун земного шара. Москва, 2002. – 242. - с. 3. Kryzhanovskiy O.L. et al. 1995: A Checklist of the ground-beetles of Russia and Adjacent Lands (Coleoptera,
Carabidae). - Sofia: Pensoft Series Faunist. 3, 271 pp. 4. Лопатин И.К. Зоогеография. Вышэйшая школа, Минск: ,1989.-336 с.

ISSN (Online): 2455-3662
EPRA International Journal of Multidisciplinary Research (IJMR) - Peer Reviewed Journal Volume: 7| Issue: 9| September 2021|| Journal DOI: 10.36713/epra2013 || SJIF Impact Factor 2021: 8.047 || ISI Value: 1.188
2021 EPRA IJMR | www.eprajournals.com | Journal DOI URL: https://doi.org/10.36713/epra2013 448
GRAMMATIC AND SEMANTIC PROPERTIES OF CONVERSIVE PAIRS OF EMOTIVE VERBS IN
MODERN RUSSIAN LANGUAGE
Olga Alekseevna Kukatova Associate professor, Department of Russian Philology, Faculty of Foreign Philology, National
University of Uzbekistan Named after Mirzo Ulughbek, Tashkent, Uzbekistan
ABSTRACT
Reflexive emotive verbs and their converting correlates were subjected in the Russian linguistic tradition to a complex analysis in the semantic, grammatical, combinational, and derivational planes. The distinguishing features of converting pairs of emotive verbs of the Russian language include the following: non-action (that is, the ability to denote an unintentional action), focus on the object (transitive verb) and self-isolation (reflexive verb), the ability to be used in an imperative meaning mainly in negative constructions, to describe the emotional state, emotional experience, emotional attitude. KEYWORDS: emotive verb, transitive verb, reflexive verb, conversion, emotional attitude, emotional state.
INTRODUCTION As you know, the emotional sphere of a
person in the Russian language is represented by a rich and varied vocabulary, both from the point of view of its partial belonging, and from the point of view of lexical and semantic. The names of emotions are represented by almost all independent parts of speech of the Russian language: nouns (гнев, страх, ужас, радость, грусть, тоска, печаль, веселье, восторг, восхищение); (anger, fear, horror, joy, sadness, longing, sadness, fun, delight, admiration); adjectives (гневный, радостный, грустный, восхищенный, восторженный, весѐлый); (angriness, joyful, sadness, delighted, enthusiastic, cheerful); adverbs (гневно, весело, восторженно, страшно); (angrily, funny, enthusiastically, fearfully ); verbs (бояться, раздражаться, тре-вожиться, гневаться, беспокоиться, беситься, огорчаться, волноваться, поражаться, изумляться, страшиться, ужасаться, удивляться, пугаться, стыдиться, смущаться и др.). (to be afraid, irritated, anxious, angry, worry, rage, upset, worry, amazed, amazed, dread, horrified, surprised, scared, ashamed, embarrassed, etc.). The main part of this vocabulary is made up of verbs, since the emotional state is interpreted by the Russian language as a dynamic (active) process [Seliverstova 1982]. The most important feature of most of the studied verbs is the ability to form converting pairs, in which the transitive verb expresses the meaning of the causation ('cause someone') emotion under the influence of certain
reasons [Mikheeva 2007: 10; Nedyalkov, Silnitsky 1969: 11], for example: wave - волновать 'cause excitement', scare - страшить 'cause fear'. The second verb, reflexive, has the meaning of an emotional state (беспокоиться, волноваться, сердиться, пугаться и др.) (to worry, to get angry, scared etc.) [Vasiliev 1981: 75 - 121]. Such a verb is usually called an emotive decusative, that is, one that does not have the same 'causation' [Paducheva 2000a; 2009; Kalashnikov, Sai 2006: 3]. Emotive we will call both the verb of emotional causation (типа волновать)- (such as to to excite) and emotive decusative (типа волноваться) -(such as to worry). LITERATURE REVIEW
Emotive verbs of the Russian language have repeatedly become the subject of study. In particular, the nature of their relationship with the category of voice, grammatical properties, compatibility, word-formation activity, the ability to enter synonymous series, place in the lexical-semantic system of the language, including in the semantic classification of predicates, were considered.
According to most researchers, reflexive emotive verbs are formed from the corresponding non-reflexive (transitive) verbs, which are characterized by the semantic feature of 'causation'. The addition of the postfix -ся deprives the verb of this semantic feature [Apresyan 1967: 50; Yanko-Trnitskaya 1962: 154; Chudinov 1984: 36–37; Chudinov 1984 a; Zhukovskaya 1979: 83]. In grammatical terms, postfix --ся is the carrier of the
ISSN (Online): 2455-3662
EPRA International Journal of Multidisciplinary Research (IJMR) - Peer Reviewed Journal Volume: 7| Issue: 9| September 2021|| Journal DOI: 10.36713/epra2013 || SJIF Impact Factor 2021: 8.047 || ISI Value: 1.188
2021 EPRA IJMR | www.eprajournals.com | Journal DOI URL: https://doi.org/10.36713/epra2013 449
meaning of intransition [Lopatin 1977: 87]. V.V Vinogradov notes that the postfix -ся in the morphological structure of a reflexive emotive verb has a general reflexive meaning, that is, "closes the action in the sphere of the subject" [Vinogradov 1986: 513].
However, the semantic relationship of verbs in pairs such as сердиться – сердить, страшиться – страшить (to anger – to be angry, fear – to frighten) and the same ones does not seem so unambiguous. So, according to I.S Ulukhanov, the absence of the semantic attribute 'causation' in the reflexive emotive verb and its presence in the transitive one speaks of the greater semantic complexity of the transitive verb [Ulukhanov 1977: 80, and also Zhukovskaya 1979: 83]. If we talk about the semantic relationship of utterances with transitive and reflexive verbs, then in utterances with a transitive verb there is “the advancement of the
names of inanimate objects and phenomena into the position of the grammatical subject that are incapable of being a real subject of action and state, ... causative the function of these names testifies to the secondary nature, the complexity of the composition of these sentences” [Zolotova 1973: 295].
Along with this, researchers note that in a pair of transitives - reflexive emotive verb, the latter denote an unintentional action, and their causative correlates can denote both intentional and unintentional action [Zaretsky 1961: 81; Chudinov 1986: 107; Yanko-Trinitskaya 1962: 154]. Relations in a pair of transitives - reflexive emotive verb are converting, that is, the object in a statement with a transitive verb corresponds to the subject in a statement with a reflexive verb, and the object in a statement with a reflexive verb corresponds to the subject in a statement with a transitive verb [Yanko-Trinitskaya 1962: 157; Lomtev 1973: 178].
According to N.A. Yanko-Trinitskaya, the state described by a reflexive emotive verb is represented in Russian as an action localized in time, since it can begin and end, but cannot reach its limit (начал волноваться) (he began to worry) [Yanko-Trinitskaya 1962: 68]. At the same time, reflexive emotive verbs of the Russian language "have a characterizing function in relation to the subject as a carrier of a predicative attribute", since "the action expressed by these verbs turns into a permanent static attribute, property," therefore one of their distinctive features is the impossibility to decompose the action such as волноваться, сердиться, страшиться to worry, to angry, fear and similar components [Ibid: 69]. For example, such actions as строить, возводить, исследовать to build, to erect, to explore can be represented as a series of operations related to each other.
N.A. Yanko-Trinitskaya notes that a characteristic feature of passive verbs - the
transformation of an object of a generating irreversible verb into a subject of a derivative reflexive - brings them closer to reflexive emotive verbs and separates them from verbs of physical impact such as бросать – бросаться, кидать – кидаться, бить – биться, to throw - throw, to rush up- rush up, to beat – beat. This is confirmed by the impossibility of the following transformation: I throw a stone - * The stone is thrown, but perhaps His words excite me - I am worried because of his words [Ibid: 157]. Transformations in pairs such as волноваться – волновать и строить – строиться, (to worry – excite and to build – build) are not identical, since the verb of the worry type denotes an impact, and the verb of the build type does not have this meaning [Ibid: 163]. A reflexive verb in such a pair denotes the reaction of the subject of the state to the reason indicated in the object. In contrast to them, the verbs of the type are built "are characterized by the extreme passivity of the action denoted by them" [Ibid]. In addition, in pairs of the type сердиться – сердить, волноваться – волновать (to angry - to be angry, to worry - to excite), causative relationships are observed that are absent in the pair of строить – строиться (to build - build) [Ibid: 165]. O.N. Yanko-Trinitskaya notes that one can choose an irreversible synonym for a reflexive emotive verb (пугаться – трусить), (to be scared - to be afraid), which is absolutely impossible in relation to passive reflexive verbs (to be constructed) [Ibid: 166].
Debatable in linguistic science is the question of whether the action described by reflexive verbs such as волноваться, злиться, сердиться, (to worry, to get angry, to get excited, active or passive). According to a number of researchers, statements with these verbs reflect an active process [Peshkovsky 1956: 77; Zeitlin 1976: 177; Seliverstova 1982; Babenko 1988; Kendyushenko 1990: 116; Yakovleva 2003; Zamaraeva 2010: (http: // www ...)]. This is supported by the context of use. For example: Крымов забеспокоился, начал оглядываться. Krymov got worried, started looking around. (D. Granin). However, in our opinion, the possibility of finding emotive verbs in a homogeneous row with the verbs of active activity is explained not by the presence of the 'activity' feature in their semantic structure, but by the localization of these actions on the time axis. For example, Мужчина раздражается, брюзжит, пьет водку, надоедает окружающим more: A man gets irritated, grumbles, drinks vodka, annoys others. (L.I Shestov. Creativity from nothing). O.N. Yanko-Trinitskaya rightly characterizes the action described by reflexive emotive verbs of the Russian language as inactive [Yanko-Trinitskaya 1962: 69], since the semantics of statements with these predicates contains the semantic role of the Experiment - a
ISSN (Online): 2455-3662
EPRA International Journal of Multidisciplinary Research (IJMR) - Peer Reviewed Journal Volume: 7| Issue: 9| September 2021|| Journal DOI: 10.36713/epra2013 || SJIF Impact Factor 2021: 8.047 || ISI Value: 1.188
2021 EPRA IJMR | www.eprajournals.com | Journal DOI URL: https://doi.org/10.36713/epra2013 450
participant in the situation, which is characterized by the feature - 'activity'.
In grammatical terms, emotive verbs of the Russian language are classified as a) aimed at the object (типа страшить, пугать)-(such as to scare, to frighten) and b) self-contained (типа страшиться, пугаться)-(such as to be frightened, to be scared). The first are transitional, having a direct object with them (пугать ребенка)- (to frighten the child). O.N. Yanko-Trinitskaya draws attention to the peculiarities of the category of transitivity of such verbs: “the object with such verbs
does not undergo changes, but, as it were, is included in the action” [Ibid: 71]. Attachment does not lead to the formation of a species pair. Wed:
1a. Пугаться – испугаться, пугать – напугать to be scared – to get scared, to scare – to scared. 1b. 1б. Читать – прочитать to Read – read. During perfectivities, we only observe the formation of a new way of verb action [Ibid: 71]. When combined with prefixes, emotive verbs often acquire a quantitative-temporal meaning (потревожиться, заволноваться) - (to worry, to get excited) and a quantitatively-intensive meaning (разволноваться) – (to get excited) [Ibid: 71 - 72].
In the field of view of researchers were also imperative forms of emotive verbs of the Russian language. According to V.S. Khrakovsky and A.P. Volodin, in contrast to imperative forms of controlled verbs such as читать- to read, denoting an urge (Читай!) - (Read!), Imperative forms of reflexive emotive verbs, which are uncontrollable, mean “a wish, the implementation of which depends
not so much on the will of the listener, how much depends on a whole series of external and will-independent circumstances” [Khrakovsky, Volodin 1986: 149]. In this regard, negative imperative constructions are also noted, a feature of which is the designation of “the prohibition of an action that is
already carried out at the moment of speech” (Не злись!) - (Don't be angry!) [Ibid: 148].
Emotive verbs of the Russian language were studied from the point of view of their paradigmatic structure. It is noted that the lexical-semantic groups of emotive verbs are characterized by gradual structures organized into a whole by “gradual inter-word oppositions” (испугаться, ужаснуться) - (to be frightened, horrified) [Vepreva, Kusova, Matveeva 1989: 57–58, and also Antipova 2009; Fomina 2006]. In the field of view of researchers was the composition [Kovaleva 1981: 115 - 119] and quantitative changes in the group of emotive verbs that occurred during the XI - XX centuries. [Korolkova 2004], as well as the nature of the relationship between the categories of causation and graduality [Fayzullaev 1994: 12].
In works devoted to the study of synonymous series of emotive verbs, the question is
raised whether the reference word absorbs the lexical meanings of words of the synonymous series [Shapilova 1976: 113], as well as the presence of so-called typing components. So, for synonymous series of reflexive emotive verbs of the Russian language, the typifying component is the 'experience feeling' component, and the causative correlates related to them include the 'force, induce' component [Chernyak 1981: 74 - 80].
The derivational potential of derivative / non-derivative verbs describing the emotional sphere of a person is also considered in sufficient detail. In particular, S.V. Artyukhova studied derivational paradigms with verbs nominating human emotions, the principles of formal organization of derivatives in word-formation nests with an initial verb nominating human emotion, as well as semantic relations between a non-derivative emotive verb and its derivatives [Artyukhova 2005] ...
A significant part of the research of emotive verbs of the Russian language is devoted to their classification by the nature of compatibility. So, Yu.D. Apresyan, M.L. Kryuchkova, N.A. Prokudenko and some others classify these verbs on the basis of two interdependent features: semantic and syntactic. In particular, Y.D. Apresyan identified nine distributive classes of verbs: 1) 'to experience a feeling directed at an object that is the content of a given mental state' состояния' (беспокоиться, тревожиться, волноваться о + предложный падеж); - (to worry, to bother, to care about + prepositional case); 2) 'to feel a feeling directed at a strongly desired object' (томиться, тосковать, вздыхать по + дательный падеж); ( to languish, to yearn, to sigh + dative case); 3) the feeling caused by the position, state, quality, behavior of the object' (беспокоиться, тревожиться за + винительный падеж) -( to worry about + accusative case); 4) 'to experience an evaluative (positive / negative) feeling caused by the object to which it is directed' (восторгаться, любоваться, восхищаться + творительный падеж);- (to admire, to marvel, to delight + instrumental case); 5) 'feel a feeling directed at such an object in which a mutual connection with the subject is established' (сострадать, сочувствовать + дательный падеж); - ( compassionate, , sympathize+ dative case); 6) 'feel a sense of dissatisfaction with someone' (сердиться, злиться, злобиться на + винительный падеж); - (to be angry, to peeve, accusative case); 7) 'feel constant fear or awkwardness in relation to someone / something' (трястись, трепетать, робеть перед + творительный падеж); - (бояться, страшиться, стесняться + родительный падеж); - (to be afraid, to dread, shy + genitive case); 8) 'feel a sense of fear in front of someone' (трястись, трепетать, робеть перед + творительный падеж); (shake,
ISSN (Online): 2455-3662
EPRA International Journal of Multidisciplinary Research (IJMR) - Peer Reviewed Journal Volume: 7| Issue: 9| September 2021|| Journal DOI: 10.36713/epra2013 || SJIF Impact Factor 2021: 8.047 || ISI Value: 1.188
2021 EPRA IJMR | www.eprajournals.com | Journal DOI URL: https://doi.org/10.36713/epra2013 451
tremble, to be shy before + instrumental case); 9) 'feel a sense of uncertainty' (сомневаться в + предложный падеж) - (to doubt + prepositional case) [Apresyan 1962].
The nature of the compatibility of reflexive emotive verbs was also considered in connection with the determination of their place in the semantic classification of predicates [Yanko-Trinitskaya 1962]. Many of these predicates are combined with adverbs of unspecified duration such as долго-долго, подолгу; long-long, for a long time ; the length of time- теперь, зимой, вчера, завтра, сейчас; (now, in winter, yesterday, tomorrow, now); repeatability of the action ежеминутно, вечерами; (every minute, in the evenings); discontinuity of action иногда, порой, временами; (sometimes, at times); beginning of action с давних пор, сначала, сперва; (for a long time, first, at firs)t; mode of action едва, чуть-чуть, немного, капельку (barely, slightly, a little bit, dropletly) [Ibid: 72 - 73].
The semantic classification of emotive verbs of the Russian language undertaken by L.M. Vasiliev and other researchers is based on three principles: denotative, taking into account the "natural, ontological dismemberment of reality" [Vasiliev 1982: 11], paradigmatic, taking into account the isolation of general and differential semes of the word, and syntagmatic based on the number and content of verbal valencies.
One of the main criteria in the classification of L.M. Vasiliev is the nature of the combination of words of this class. On this basis, he singled out the verbs of the emotional state (mood), emotional experience and emotional attitude.
According to the researcher, the verbs of the first group indicate the most different emotional states, “leaving, as it were, in the shadows the
feelings experienced in this state” [Vasiliev 1981:
75]. These include волноваться, сердиться, радоваться, печалиться, восторгаться, раздражаться, пугаться, ужасаться (to worry, to get angry, to rejoice, to grieve, to delight, to be irritated, to be frightened, to be horrified and others.) This group is characterized by such oppositions печалиться и опечаливаться (волновать и волноваться) as 'beingness / becoming' (sadden and to be sad), 'causative / non-causative' (to excite and worrying) [Ibid: 96].
The verbs of the second group denote "the process of emotional experience" [Ibid.]. Accordingly, they are not members of the opposition 'being / becoming' [Ibid: 108]. In this group, the researcher includes such lexemes as терпеть, претерпевать, мучиться, страдать, томиться, убиваться, страшиться, наслаждаться (to endure, suffer, to be agonize, to be languish, to be killed, to be dread , enjoy, and others.)
The verbs of an emotional attitude mainly denote the experience of a certain feeling, caused by an attitude towards someone, something and an assessment of someone, something. This group includes such lexemes as любить, уважать, презирать (to love, to respect, to despise and others.) This group is characterized by the following set of semes: 'causation / non-causation' (влюбить и полюбить) - ( fall in love and to love), 'beingness / becoming’ (любить – влюбляться)- (to love - fall in love), 'activity / passivity' (любить и нравиться) -(to love and like), 'positive / negative modality' (влю-биться и разлюбить) - (fall in love and stop loving) [Ibid: 108 - 121].
N.D Arutyunova's classification is based on the content aspect of verbal valences. By the nature of the actant, expressing the cause, the scientist divides the predicates under study into two groups: 1) event-oriented (раздражать, смущать, удивлять, изумлять, поражать, огорчать, волновать, тревожить) - (to irritate, to confuse, to surprise, to amaze, to upset, to worry, to disturb), 2) object-oriented (сердить, злить, обижать) - (to anger, to irritate, to offend). Object-oriented also includes disturb, which allow object names such as отец, ребенок, сын, сестра (father, child, son, sister,) who are the object of concern or anxiety. About object-oriented predicates, it is noted that “the
personal orientation of the feelings indicated by these verbs reflects the situation of a desire to expose one's displeasure to someone” [Arutyunova 1976: 161]. For example: сердить (злить, обижать) друга, отца, товарища, коллегу по работе. To anger (to incense, to offend) a friend, father, comrade, work colleague. In this series, “it is essential сердить- to anger that the culprit of the emotion usually occupies a lower place in the age or social hierarchy”
[Apresyan 2003: 1014]. A comprehensive analysis of emotive verbs
of the Russian language, forming both converting pairs of the type as сердиться – сердить, to be angry – to anger, and single verbs such as бояться, грустить, (fear, sadness) was carried out by S.S. Polezhaeva. The researcher considers pairs of verbs like сердиться – сердить (to be angry – to anger), as semantic, grammatical and word-formative oppositions in which conversion relations are realized. S.S Polezhaeva focuses on the ways of expressing the emotional state as a dynamic process, the relationship between the "emotional and mental activity of the subject of emotion", and also considers these oppositions from the point of view of specific characteristics [Polezhaeva 2003]. CONCLUSION
Thus, there is every reason to assert that the converting pairs of emotive verbs of the Russian language have undergone a comprehensive analysis

ISSN (Online): 2455-3662
EPRA International Journal of Multidisciplinary Research (IJMR) - Peer Reviewed Journal Volume: 7| Issue: 9| September 2021|| Journal DOI: 10.36713/epra2013 || SJIF Impact Factor 2021: 8.047 || ISI Value: 1.188
2021 EPRA IJMR | www.eprajournals.com | Journal DOI URL: https://doi.org/10.36713/epra2013 452
in grammatical, lexical-semantic and combinational terms. However, the question of their place in the semantic classification of predicates and functioning in the semantics of enunciation remained outside the field of view of researchers, that is, the nature of the relationship between the semantic features of predicates, expressed by converting pairs of emotive verbs, and the semantic features of their actants has not been revealed. This chapter is devoted to determining the place of these verbs in the semantic classification of predicates. REFERENCES
1. Apresyan, Yu. D. Distributivniy analiz znacheniy i Strukturnie semanticheskie polya / yu. D. Apresyan // Leksikograficheskiy Sbornik : c6. Nauch. tr. VIP. 5. — M., 1962. — S. 52-72.
2. Apresyan, Yu. D. Eksperimentalnoe issledovanie semantiki russkogo glagola / Yu. D Apresyan. — M. : Nauka, 1967. — 249 s.
3. Apresyan, V. Yu. Boyatsya, pugatsya, strashitsya, opasatsya, trusit, dreyfit, Robet, trepetat 2, drojat 2, tryastis 2 / V. Yu. Apresyan // Noviy ob'yasnitelniy slovar sinonimov russkogo yazika / pod obtsh. Ruk. akad. Yu. D. Apresyana. — M. : Shkola "Yaziki slavyanskoy kulturi", 2003. — S. 60-66.
4. Apresyan, V. Yu. Bespokoit 1, trevojit 1 / V. Yu. Apresyan // Noviy ob'yasnitelniy slovar sinonimov russkogo yazika / pod obtsh. Ruk. akad. Yu. D. Apresyana. — M. : Shkola "Yaziki slavyanskoy kulturi", 2003. — S. 22-25.
5. Apresyan, V. Yu. Serdit, vozmutshat, vzorvat 2, besit, zlit, razozlit, raz'yarit / V. Yu. Apresyan // Noviy ob'yasnitelniy slovar sinonimov russkogo yazika / pod obtsh. Ruk. akad. Yu. D. Apresyana. — M. : Shkola "Yaziki slavyanskoy kulturi", 2003. — S. 1013-1018.
6. Artyuxova, S. V. Slovoobrazovatelniy potentsial glagolov s semoy "emosiya" v sovremennom russkom yazike: dis. ... kand. Filol. nauk / S. V. Artyuxova. — Maxachkala, 2005. — 233 s.
7. Arutyunova, N. D. Predlojenie i ego Smisl / N. D. Arutyunova. — M. : Editorial URSS, 2000. — 352 s.
8. Babenko, L. G. Emotivnaya leksika v strukture predlojeniya // klassi slov v sintagmaticheskom aspekte / L. G. Babenko // Sbornik nauchnix trudov. — Sverdlovsk : Izd-vo Uralskogo gosudarstvennogo universiteta, 1988. — S. 145-156.
9. Vasilev, L. M. Semantika russkogo glagola / L. M. Vasilev. — M. : Visshaya shkola, 1981. — 183 s.
10. Vasilev, L. M. Printsipi semanticheskoy identifikasii glagolnoy leksiki / L. M. Vasilev // Semanticheskie klassi russkix glagolov : mejvuz. SB. Nauch. tr. — Sverdlovsk : Urgu, 1982. — S. 11-14.
11. Vepreva, I. T. Paradigmaticheskaya struktura glagola / I. T. Vepreva, M. L. Kusova, T. V. Matveeva // Leksiko-semanticheskie gruppi
russkix glagolov // Sbornik nauchnix trudov. — Irkutsk: Izd-vo Irkutskogo universiteta, 1989. — S. 57-58.
12. Vinogradov, V.V. Russkiy yazik / V. V. Vinogradov. — M. : Visshaya shkola, 1986. — 632 s.
13. Jukovskaya, E.E.K probleme semanticheskoy sootnositelnosti elementov slovoobrazovatelnogo gnezda s glagolom emosionalnogo sostoyaniya v kachestve isxodnogo elementa / E. E. Jukovskaya // klassi slov i ih vzaimodeystvie : SB. Nauch. tr. — Sverdlovsk : Uralskiy Gosudarstvenniy universitet, 1979. — S. 81-91.
14. Zamaraeva, E. V. Problemi lingvisticheskix issledovaniy glagolov emosionalnogo sostoyaniya [elektronniy resurs] / E. V. Zamaraeva. — URL: http://econf.nkras.ru/konferencii/2010/Zamaraeva.pdf (Data obratsheniya 25.02.2018).
15. Zareskiy, N. S. Formi i funktsii vozvratnix glagolov (na materiale drevnerusskogo yazika) / N. S. Zareskiy. — Kiev : Izd-vo Kievskogo universiteta, 1961. — 130 s.
16. Zolotova, G. A. Ocherki funktsionalnogo sintaksisa russkogo yazika / G. A Zolotova. — M. : Nauka, 1973. — 350 s.
17. Kalashnikova, K. V. Sistemnie otnosheniya mejdu klassami russkix refleksivnix glagolov v svyazi s ih chastotnimi xarakteristikami (po dannim korpusnogo issledovaniya) / K. V. Kalashnikova, S. S. Say // Problemi tipologii i obshey lingvistiki. Mejdunarodnaya konferentsiya, posvyatshennaya 100-letiyu so dnya rojdeniya prof. A. A. Xolodovicha : materiali, Sankt-Peterburg, 4-6 sent. 2006 g. : SB. Nauch. tr. — Spb., 2006. — S. 56-64.
18. Kendyushenko, A. G. Predlojeniya s semantikoy emosionalnogo sostoyaniya sub'ekta v xudojestvennoy rechi / A. G. Kendyushenko // tipologiya teksta v funktsionalno-stilisticheskom aspekte : SB. Nauch. tr. — Perm : Permskiy Gosudarstvenniy universitet. — S. 113-119.
19. Kovaleva, M. S. Glagoli smexa v russkom i v angliyskom yazikax / M. S. Kovaleva // Semanticheskie kategorii sopostavitelnogo izucheniya russkogo yazika. — Voronej : Izd-vo Voronejskogo universiteta, 1981. — S. 115-119.
20. Korolkova, O. O. Istoriya formirovaniya gruppi glagolov psixicheskogo vozdeystviya v russkom yazike : dis. ... kand. Filol. nauk / o. O. Korolkova. — Novosibirsk, 2004. — 160 s.
21. Lomtev, T. P. Struktura predlojeniy s glagolami emosionalnogo soderjaniya / T. P. Lomtev // Slavyanskaya filologiya : SB. Nauch. tr. — M. : Izd-vo Moskovskogo universiteta, 1973. — s. 176-178.
22. Mixeeva, N. A. Kauzasiya emosionalnogo sostoyaniya i emosionalnogo otnosheniya v ispanskom yazike : Avtoref. dis. ... kand. Filol. nauk / N. A. Mixeeva. — M. : MGIMO, 2007. — 22 s.
23. Nedyalkov, V. P. Tipologiya kauzativnix konstruktsiy / V. P. Nedyalkov, G G. Silniskiy // tipologiya kauzativnix konstruktsiy.

ISSN (Online): 2455-3662
EPRA International Journal of Multidisciplinary Research (IJMR) - Peer Reviewed Journal Volume: 7| Issue: 9| September 2021|| Journal DOI: 10.36713/epra2013 || SJIF Impact Factor 2021: 8.047 || ISI Value: 1.188
2021 EPRA IJMR | www.eprajournals.com | Journal DOI URL: https://doi.org/10.36713/epra2013 453
Morfologicheskiy kauzativ. — M. : Nauka, 1969. — s. 5-19.
24. Paducheva, E. V. Kauzativniy glagol i dekauzativ v russkom yazike [elektronniy resurs] / E. V. Paducheva // Russkiy yazik v nauchnom osvetshenii. — M. : Yaziki russkoy kulturi, 2000. — S. 52-79. — URL: http://www.vpn.int.ru/index.php?name=Files&op=view&id=7051.
25. Paducheva, E. V. Struktura sobitiya: semanticheskie roli, aspektualnost, kauzasiya / E. V. Paducheva // nauchno-texnicheskaya informasiya, seriya 2. — 2009. — № 6. — S. 38-45.
26. Peshkovskiy, A. M. Russkiy sintaksis v nauchnom osvetshenii / A. M. Peshkovskiy. — M. : Uchpedgiz, 1956. — 511 s.
27. Polejaeva, S. S. Oppozisii emotivnix glagolov: konversivnie i kauzativnie otnosheniya / S. S. Polejaeva // II Mejdunarodniy Kongress issledovateley russkogo yazika "Russkiy yazik: istoricheskie sudbi i sovremennost" : tez. dokl. — M., 2004.
28. Seliverstova, O. I. Vtoroy variant klassifikasionnoy setki i opisanie predikativnix tipov russkogo yazika / o. I. Seliverstova // Semanticheskie tipi predikatov. — M. : Nauka, 1982. — S. 87-157.
29. Uluxanov, I. S. Slovoobrazovatelnaya semantika v russkom yazike i printsipi ee opisaniya / I. S. Uluxanov. — M. : Nauka, 1977. — 255 s.
30. Xrakovskiy, V. S. Semantika i tipologiya imperativa. Russkiy imperativ / V. S. Xrakovskiy, A. P. Volodin. — L. : Nauka, 1986. — 270 s.
31. Tseytlin, N. S. Sintaksicheskie modeli so znacheniem psixicheskogo sostoyaniya i IX sinonimika / N. S. Tseytlin // sintaksis i stilistika : SB. Nauch. tr. — M. : Nauka, 1976. — S. 161-181.
32. Chernyak, V. D. Obtshee znachenie ryada v tipologicheskoy xarakteristike glagolnix sinonimicheskix ryadov / V. D. Chernyak // Glagol v leksicheskoy sisteme sovremennogo russkogo yazika : SB. Nauch. tr. — L., 1981. — S. 74-80.
33. Chudinov, A. P. Semanticheskoe varirovanie russkogo glagola / A. P. Chudinov. — Sverdlovsk : Sverdlovskiy Gosudarstvenniy pedagogicheskiy institut, 1984. — 72 s.
34. Chudinov, A. P. O regulyarnom xaraktere kontekstualnogo varirovaniya znacheniy kauzativnix glagolov / A. P. Chudinov // Problemi glagolnoy semantiki : SB. Nauch. tr. — Sverdlovsk : Sverdlovskiy Gosudarstvenniy pedagogicheskiy institut, 1984. — S. 95-102.
35. Shapilova, N. I. Otrajenie sinonimicheskix ryadov glagolov vnutrennego psixicheskogo chuvstva v slovaryax / N. I. Shapilova // Russkoe slovo v yazike i rechi : SB. Nauch. tr. — Kemerovo : Kemerovskiy Gosudarstvenniy universitet, 1976. — S. 106-114.
36. Yakovleva, I. N. Semanticheskaya kategoriya sostoyaniya i sredstva ee realizasii (na materiale russkogo i angliyskogo Yazikov) : Avtoref. dis. ...
kand. Filol. nauk / I. N. Yakovleva. — Voronej : Voronejskiy Gosudarstvenniy universitet, 2004. — 22 s.
37. Yanko-Triniskaya, N. A. Vozvratnie glagoli v sovremennom russkom yazike / N. A. Yanko-Triniskaya. — M. : Izd-vo an SSSR, 1962. — 247 s