Network analysis and building construction - Academic Journals
Upload
khangminh22Category
view
3download
0
African Journal of
Biotechnology
Volume 14 Number 12, 25 March, 2015
ISSN 1684-5315

ABOUT AJB The African Journal of Biotechnology (AJB) (ISSN 1684-5315) is published weekly (one volume per year) by Academic Journals.
African Journal of Biotechnology (AJB), a new broad-based journal, is an open access journal that was founded on two key tenets: To publish the most exciting research in all areas of applied biochemistry, industrial microbiology, molecular biology, genomics and proteomics, food and agricultural technologies, and metabolic engineering. Secondly, to provide the most rapid turn-around time possible for reviewing and publishing, and to disseminate the articles freely for teaching and reference purposes. All articles published in AJB are peer-reviewed.
Submission of Manuscript
Please read the Instructions for Authors before submitting your manuscript. The manuscript files should be given the last name of the first author Click here to Submit manuscripts online If you have any difficulty using the online submission system, kindly submit via this email [email protected]. With questions or concerns, please contact the Editorial Office at [email protected].

Editor-In-Chief George Nkem Ude, Ph.D Plant Breeder & Molecular Biologist Department of Natural Sciences Crawford Building, Rm 003A Bowie State University 14000 Jericho Park Road Bowie, MD 20715, USA
Editor N. John Tonukari, Ph.D Department of Biochemistry Delta State University PMB 1 Abraka, Nigeria
Associate Editors Prof. Dr. AE Aboulata Plant Path. Res. Inst., ARC, POBox 12619, Giza, Egypt 30 D, El-Karama St., Alf Maskan, P.O. Box 1567, Ain Shams, Cairo, Egypt
Dr. S.K Das Department of Applied Chemistry and Biotechnology, University of Fukui, Japan
Prof. Okoh, A. I. Applied and Environmental Microbiology Research Group (AEMREG), Department of Biochemistry and Microbiology, University of Fort Hare. P/Bag X1314 Alice 5700, South Africa
Dr. Ismail TURKOGLU Department of Biology Education, Education Faculty, Fırat University, Elazığ, Turkey
Prof T.K.Raja, PhD FRSC (UK) Department of Biotechnology PSG COLLEGE OF TECHNOLOGY (Autonomous) (Affiliated to Anna University) Coimbatore-641004, Tamilnadu, INDIA.
Dr. George Edward Mamati Horticulture Department, Jomo Kenyatta University of Agriculture and Technology, P. O. Box 62000-00200, Nairobi, Kenya.
Dr. Gitonga Kenya Agricultural Research Institute, National Horticultural Research Center, P.O Box 220, Thika, Kenya.

Editorial Board Prof. Sagadevan G. Mundree Department of Molecular and Cell Biology University of Cape Town Private Bag Rondebosch 7701 South Africa Dr. Martin Fregene Centro Internacional de Agricultura Tropical (CIAT) Km 17 Cali-Palmira Recta AA6713, Cali, Colombia
Prof. O. A. Ogunseitan Laboratory for Molecular Ecology Department of Environmental Analysis and Design University of California, Irvine, CA 92697-7070. USA
Dr. Ibrahima Ndoye UCAD, Faculte des Sciences et Techniques Departement de Biologie Vegetale BP 5005, Dakar, Senegal. Laboratoire Commun de Microbiologie IRD/ISRA/UCAD BP 1386, Dakar
Dr. Bamidele A. Iwalokun Biochemistry Department Lagos State University P.M.B. 1087. Apapa – Lagos, Nigeria
Dr. Jacob Hodeba Mignouna Associate Professor, Biotechnology Virginia State University Agricultural Research Station Box 9061 Petersburg, VA 23806, USA
Dr. Bright Ogheneovo Agindotan Plant, Soil and Entomological Sciences Dept University of Idaho, Moscow ID 83843, USA
Dr. A.P. Njukeng Département de Biologie Végétale Faculté des Sciences B.P. 67 Dschang Université de Dschang Rep. du CAMEROUN
Dr. E. Olatunde Farombi Drug Metabolism and Toxicology Unit Department of Biochemistry University of Ibadan, Ibadan, Nigeria
Dr. Stephen Bakiamoh Michigan Biotechnology Institute International 3900 Collins Road Lansing, MI 48909, USA Dr. N. A. Amusa Institute of Agricultural Research and Training Obafemi Awolowo University Moor Plantation, P.M.B 5029, Ibadan, Nigeria Dr. Desouky Abd-El-Haleem Environmental Biotechnology Department & Bioprocess Development Department, Genetic Engineering and Biotechnology Research Institute (GEBRI), Mubarak City for Scientific Research and Technology Applications, New Burg-Elarab City, Alexandria, Egypt. Dr. Simeon Oloni Kotchoni Department of Plant Molecular Biology Institute of Botany, Kirschallee 1, University of Bonn, D-53115 Germany. Dr. Eriola Betiku German Research Centre for Biotechnology, Biochemical Engineering Division, Mascheroder Weg 1, D-38124, Braunschweig, Germany Dr. Daniel Masiga International Centre of Insect Physiology and Ecology, Nairobi, Kenya Dr. Essam A. Zaki Genetic Engineering and Biotechnology Research Institute, GEBRI, Research Area, Borg El Arab, Post Code 21934, Alexandria Egypt

Dr. Alfred Dixon International Institute of Tropical Agriculture (IITA) PMB 5320, Ibadan Oyo State, Nigeria
Dr. Sankale Shompole Dept. of Microbiology, Molecular Biology and Biochemisty, University of Idaho, Moscow, ID 83844, USA.
Dr. Mathew M. Abang Germplasm Program International Center for Agricultural Research in the Dry Areas (ICARDA) P.O. Box 5466, Aleppo, SYRIA.
Dr. Solomon Olawale Odemuyiwa Pulmonary Research Group Department of Medicine 550 Heritage Medical Research Centre University of Alberta Edmonton Canada T6G 2S2
Prof. Anna-Maria Botha-Oberholster Plant Molecular Genetics Department of Genetics Forestry and Agricultural Biotechnology Institute Faculty of Agricultural and Natural Sciences University of Pretoria ZA-0002 Pretoria, South Africa
Dr. O. U. Ezeronye Department of Biological Science Michael Okpara University of Agriculture Umudike, Abia State, Nigeria.
Dr. Joseph Hounhouigan Maître de Conférence Sciences et technologies des aliments Faculté des Sciences Agronomiques Université d'Abomey-Calavi 01 BP 526 Cotonou République du Bénin
Prof. Christine Rey Dept. of Molecular and Cell Biology, University of the Witwatersand, Private Bag 3, WITS 2050, Johannesburg, South Africa
Dr. Kamel Ahmed Abd-Elsalam Molecular Markers Lab. (MML) Plant Pathology Research Institute (PPathRI) Agricultural Research Center, 9-Gamma St., Orman, 12619, Giza, Egypt
Dr. Jones Lemchi International Institute of Tropical Agriculture (IITA) Onne, Nigeria
Prof. Greg Blatch Head of Biochemistry & Senior Wellcome Trust Fellow Department of Biochemistry, Microbiology & Biotechnology Rhodes University Grahamstown 6140 South Africa Dr. Beatrice Kilel P.O Box 1413 Manassas, VA 20108 USA Dr. Jackie Hughes Research-for-Development International Institute of Tropical Agriculture (IITA) Ibadan, Nigeria Dr. Robert L. Brown Southern Regional Research Center, U.S. Department of Agriculture, Agricultural Research Service, New Orleans, LA 70179. Dr. Deborah Rayfield Physiology and Anatomy Bowie State University Department of Natural Sciences Crawford Building, Room 003C Bowie MD 20715,USA

Dr. Marlene Shehata University of Ottawa Heart Institute Genetics of Cardiovascular Diseases 40 Ruskin Street K1Y-4W7, Ottawa, ON, CANADA
Dr. Hany Sayed Hafez The American University in Cairo, Egypt
Dr. Clement O. Adebooye Department of Plant Science Obafemi Awolowo University, Ile-Ife Nigeria
Dr. Ali Demir Sezer Marmara Üniversitesi Eczacilik Fakültesi, Tibbiye cad. No: 49, 34668, Haydarpasa, Istanbul, Turkey
Dr. Ali Gazanchain P.O. Box: 91735-1148, Mashhad, Iran.
Dr. Anant B. Patel Centre for Cellular and Molecular Biology Uppal Road, Hyderabad 500007 India
Prof. Arne Elofsson Department of Biophysics and Biochemistry Bioinformatics at Stockholm University, Sweden
Prof. Bahram Goliaei Departments of Biophysics and Bioinformatics Laboratory of Biophysics and Molecular Biology University of Tehran, Institute of Biochemistry and Biophysics Iran
Dr. Nora Babudri Dipartimento di Biologia cellulare e ambientale Università di Perugia Via Pascoli Italy
Dr. S. Adesola Ajayi Seed Science Laboratory Department of Plant Science Faculty of Agriculture Obafemi Awolowo University Ile-Ife 220005, Nigeria
Dr. Yee-Joo TAN Department of Microbiology Yong Loo Lin School of Medicine, National University Health System (NUHS), National University of Singapore MD4, 5 Science Drive 2, Singapore 117597 Singapore Prof. Hidetaka Hori Laboratories of Food and Life Science, Graduate School of Science and Technology, Niigata University. Niigata 950-2181, Japan Prof. Thomas R. DeGregori University of Houston, Texas 77204 5019, USA
Dr. Wolfgang Ernst Bernhard Jelkmann Medical Faculty, University of Lübeck, Germany
Dr. Moktar Hamdi Department of Biochemical Engineering, Laboratory of Ecology and Microbial Technology National Institute of Applied Sciences and Technology. BP: 676. 1080, Tunisia
Dr. Salvador Ventura Department de Bioquímica i Biologia Molecular Institut de Biotecnologia i de Biomedicina Universitat Autònoma de Barcelona Bellaterra-08193 Spain
Dr. Claudio A. Hetz Faculty of Medicine, University of Chile Independencia 1027 Santiago, Chile
Prof. Felix Dapare Dakora Research Development and Technology Promotion Cape Peninsula University of Technology, Room 2.8 Admin. Bldg. Keizersgracht, P.O. 652, Cape Town 8000, South Africa

Dr. Geremew Bultosa Department of Food Science and Post harvest Technology Haramaya University Personal Box 22, Haramaya University Campus Dire Dawa, Ethiopia
Dr. José Eduardo Garcia Londrina State University Brazil
Prof. Nirbhay Kumar Malaria Research Institute Department of Molecular Microbiology and Immunology Johns Hopkins Bloomberg School of Public Health E5144, 615 N. Wolfe Street Baltimore, MD 21205
Prof. M. A. Awal Department of Anatomy and Histplogy, Bangladesh Agricultural University, Mymensingh-2202, Bangladesh Prof. Christian Zwieb Department of Molecular Biology University of Texas Health Science Center at Tyler 11937 US Highway 271 Tyler, Texas 75708-3154 USA
Prof. Danilo López-Hernández Instituto de Zoología Tropical, Facultad de Ciencias, Universidad Central de Venezuela. Institute of Research for the Development (IRD), Montpellier, France
Prof. Donald Arthur Cowan Department of Biotechnology, University of the Western Cape Bellville 7535 Cape Town, South Africa
Dr. Ekhaise Osaro Frederick University Of Benin, Faculty of Life Science Department of Microbiology P. M. B. 1154, Benin City, Edo State, Nigeria.
Dr. Luísa Maria de Sousa Mesquita Pereira IPATIMUP R. Dr. Roberto Frias, s/n 4200-465 Porto Portugal Dr. Min Lin Animal Diseases Research Institute Canadian Food Inspection Agency Ottawa, Ontario, Canada K2H 8P9 Prof. Nobuyoshi Shimizu Department of Molecular Biology, Center for Genomic Medicine Keio University School of Medicine, 35 Shinanomachi, Shinjuku-ku Tokyo 160-8582, Japan Dr. Adewunmi Babatunde Idowu Department of Biological Sciences University of Agriculture Abia Abia State, Nigeria Dr. Yifan Dai Associate Director of Research Revivicor Inc. 100 Technology Drive, Suite 414 Pittsburgh, PA 15219 USA Dr. Zhongming Zhao Department of Psychiatry, PO Box 980126, Virginia Commonwealth University School of Medicine, Richmond, VA 23298-0126, USA Prof. Giuseppe Novelli Human Genetics, Department of Biopathology, Tor Vergata University, Rome, Italy Dr. Moji Mohammadi 402-28 Upper Canada Drive Toronto, ON, M2P 1R9 (416) 512-7795 Canada

Prof. Jean-Marc Sabatier Directeur de Recherche Laboratoire ERT-62 Ingénierie des Peptides à Visée Thérapeutique, Université de la Méditerranée-Ambrilia Biopharma inc., Faculté de Médecine Nord, Bd Pierre Dramard, 13916, Marseille cédex 20. France Dr. Fabian Hoti PneumoCarr Project Department of Vaccines National Public Health Institute Finland
Prof. Irina-Draga Caruntu Department of Histology Gr. T. Popa University of Medicine and Pharmacy 16, Universitatii Street, Iasi, Romania
Dr. Dieudonné Nwaga
Soil Microbiology Laboratory, Biotechnology Center. PO Box 812, Plant Biology Department, University of Yaoundé I, Yaoundé, Cameroon
Dr. Gerardo Armando Aguado-Santacruz Biotechnology CINVESTAV-Unidad Irapuato Departamento Biotecnología Km 9.6 Libramiento norte Carretera Irapuato-León Irapuato, Guanajuato 36500 Mexico
Dr. Abdolkaim H. Chehregani Department of Biology Faculty of Science Bu-Ali Sina University Hamedan, Iran
Dr. Abir Adel Saad Molecular oncology Department of Biotechnology Institute of graduate Studies and Research Alexandria University, Egypt
Dr. Azizul Baten Department of Statistics Shah Jalal University of Science and Technology Sylhet-3114, Bangladesh
Dr. Bayden R. Wood Australian Synchrotron Program Research Fellow and Monash Synchrotron Research Fellow Centre for Biospectroscopy School of Chemistry Monash University Wellington Rd. Clayton, 3800 Victoria, Australia
Dr. G. Reza Balali Molecular Mycology and Plant Pthology Department of Biology University of Isfahan Isfahan Iran
Dr. Beatrice Kilel P.O Box 1413 Manassas, VA 20108 USA
Prof. H. Sunny Sun Institute of Molecular Medicine National Cheng Kung University Medical College 1 University road Tainan 70101, Taiwan
Prof. Ima Nirwana Soelaiman Department of Pharmacology Faculty of Medicine Universiti Kebangsaan Malaysia Jalan Raja Muda Abdul Aziz 50300 Kuala Lumpur, Malaysia
Prof. Tunde Ogunsanwo Faculty of Science, Olabisi Onabanjo University, Ago-Iwoye. Nigeria
Dr. Evans C. Egwim Federal Polytechnic, Bida Science Laboratory Technology Department, PMB 55, Bida, Niger State, Nigeria

Prof. George N. Goulielmos Medical School, University of Crete Voutes, 715 00 Heraklion, Crete, Greece
Dr. Uttam Krishna Cadila Pharmaceuticals limited , India 1389, Tarsad Road, Dholka, Dist: Ahmedabad, Gujarat, India
Prof. Mohamed Attia El-Tayeb Ibrahim Botany Department, Faculty of Science at Qena, South Valley University, Qena 83523, Egypt Dr. Nelson K. Ojijo Olang’o Department of Food Science & Technology, JKUAT P. O. Box 62000, 00200, Nairobi, Kenya
Dr. Pablo Marco Veras Peixoto University of New York NYU College of Dentistry 345 E. 24th Street, New York, NY 10010 USA
Prof. T E Cloete University of Pretoria Department of Microbiology and Plant Pathology, University of Pretoria, Pretoria, South Africa
Prof. Djamel Saidi Laboratoire de Physiologie de la Nutrition et de Sécurité Alimentaire Département de Biologie, Faculté des Sciences, Université d’Oran, 31000 - Algérie Algeria
Dr. Tomohide Uno Department of Biofunctional chemistry, Faculty of Agriculture Nada-ku, Kobe., Hyogo, 657-8501, Japan
Dr. Ulises Urzúa Faculty of Medicine, University of Chile Independencia 1027, Santiago, Chile
Dr. Aritua Valentine National Agricultural Biotechnology Center, Kawanda Agricultural Research Institute (KARI) P.O. Box, 7065, Kampala, Uganda
Prof. Yee-Joo Tan Institute of Molecular and Cell Biology 61 Biopolis Drive, Proteos, Singapore 138673 Singapore
Prof. Viroj Wiwanitkit Department of Laboratory Medicine, Faculty of Medicine, Chulalongkorn University, Bangkok Thailand Dr. Thomas Silou Universit of Brazzaville BP 389 Congo Prof. Burtram Clinton Fielding University of the Western Cape Western Cape, South Africa Dr. Brnčić (Brncic) Mladen Faculty of Food Technology and Biotechnology, Pierottijeva 6, 10000 Zagreb, Croatia. Dr. Meltem Sesli College of Tobacco Expertise, Turkish Republic, Celal Bayar University 45210, Akhisar, Manisa, Turkey. Dr. Idress Hamad Attitalla Omar El-Mukhtar University, Faculty of Science, Botany Department, El-Beida, Libya. Dr. Linga R. Gutha Washington State University at Prosser, 24106 N Bunn Road, Prosser WA 99350-8694.

Dr Helal Ragab Moussa Bahnay, Al-bagour, Menoufia, Egypt. Dr VIPUL GOHEL DuPont Industrial Biosciences Danisco (India) Pvt Ltd 5th Floor, Block 4B, DLF Corporate Park DLF Phase III Gurgaon 122 002 Haryana (INDIA) Dr. Sang-Han Lee Department of Food Science & Biotechnology, Kyungpook National University Daegu 702-701, Korea.
Dr. Bhaskar Dutta DoD Biotechnology High Performance Computing Software Applications Institute (BHSAI) U.S. Army Medical Research and Materiel Command 2405 Whittier Drive Frederick, MD 21702
Dr. Muhammad Akram Faculty of Eastern Medicine and Surgery, Hamdard Al-Majeed College of Eastern Medicine, Hamdard University, Karachi.
Dr. M. Muruganandam Departtment of Biotechnology St. Michael College of Engineering & Technology, Kalayarkoil, India.
Dr. Gökhan Aydin Suleyman Demirel University, Atabey Vocational School, Isparta-Türkiye,
Dr. Rajib Roychowdhury Centre for Biotechnology (CBT), Visva Bharati, West-Bengal, India.
Dr Takuji Ohyama Faculty of Agriculture, Niigata University
Dr Mehdi Vasfi Marandi University of Tehran
Dr FÜgen DURLU-ÖZKAYA Gazi Üniversity, Tourism Faculty, Dept. of Gastronomy and Culinary Art
Dr. Reza Yari Islamic Azad University, Boroujerd Branch
Dr Zahra Tahmasebi Fard Roudehen branche, Islamic Azad University Dr Albert Magrí Giro Technological Centre Dr Ping ZHENG Zhejiang University, Hangzhou, China Dr. Kgomotso P. Sibeko University of Pretoria Dr Greg Spear Rush University Medical Center Prof. Pilar Morata University of Malaga Dr Jian Wu Harbin medical university , China Dr Hsiu-Chi Cheng National Cheng Kung University and Hospital.
Prof. Pavel Kalac University of South Bohemia, Czech Republic Dr Kürsat Korkmaz Ordu University, Faculty of Agriculture, Department of Soil Science and Plant Nutrition Dr. Shuyang Yu Department of Microbiology, University of Iowa Address: 51 newton road, 3-730B BSB bldg. Iowa City, IA, 52246, USA Dr. Binxing Li

Dr. Mousavi Khaneghah College of Applied Science and Technology-Applied Food Science, Tehran, Iran. Dr. Qing Zhou Department of Biochemistry and Molecular Biology, Oregon Health and Sciences University Portland. Dr Legesse Adane Bahiru Department of Chemistry, Jimma University, Ethiopia. Dr James John School Of Life Sciences, Pondicherry University, Kalapet, Pondicherry

Instructions for Author
Electronic submission of manuscripts is strongly encouraged, provided that the text, tables, and figures are included in a single Microsoft Word file (preferably in Arial font).
The cover letter should include the corresponding author's full address and telephone/fax numbers and should be in an e-mail message sent to the Editor, with the file, whose name should begin with the first author's surname, as an attachment.
Article Types Three types of manuscripts may be submitted:
Regular articles: These should describe new and carefully confirmed findings, and experimental procedures should be given in sufficient detail for others to verify the work. The length of a full paper should be the minimum required to describe and interpret the work clearly. Short Communications: A Short Communication is suitable for recording the results of complete small investigations or giving details of new models or hypotheses, innovative methods, techniques or apparatus. The style of main sections need not conform to that of full-length papers. Short communications are 2 to 4 printed pages (about 6 to 12 manuscript pages) in length.
Reviews: Submissions of reviews and perspectives covering topics of current interest are welcome and encouraged. Reviews should be concise and no longer than 4-6 printed pages (about 12 to 18 manuscript pages). Reviews are also peer-reviewed.
Review Process
All manuscripts are reviewed by an editor and members of the Editorial Board or qualified outside reviewers. Authors cannot nominate reviewers. Only reviewers randomly selected from our database with specialization in the subject area will be contacted to evaluate the manuscripts. The process will be blind review. Decisions will be made as rapidly as possible, and the journal strives to return reviewers’ comments to authors as fast as possible. The editorial board will re-review manuscripts that are accepted pending revision. It is the goal of the AJFS to publish manuscripts within weeks after submission.
Regular articles
All portions of the manuscript must be typed double- spaced and all pages numbered starting from the title page.
The Title should be a brief phrase describing the contents of the paper. The Title Page should include the authors' full names and affiliations, the name of the corresponding author along with phone, fax and E-mail information. Present addresses of authors should appear as a footnote.
The Abstract should be informative and completely self- explanatory, briefly present the topic, state the scope of the experiments, indicate significant data, and point out major findings and conclusions. The Abstract should be 100 to 200 words in length.. Complete sentences, active verbs, and the third person should be used, and the abstract should be written in the past tense. Standard nomenclature should be used and abbreviations should be avoided. No literature should be cited. Following the abstract, about 3 to 10 key words that will provide indexing references should be listed.
A list of non-standard Abbreviations should be added. In general, non-standard abbreviations should be used only when the full term is very long and used often. Each abbreviation should be spelled out and introduced in parentheses the first time it is used in the text. Only recommended SI units should be used. Authors should use the solidus presentation (mg/ml). Standard abbreviations (such as ATP and DNA) need not be defined.
The Introduction should provide a clear statement of the problem, the relevant literature on the subject, and the proposed approach or solution. It should be understandable to colleagues from a broad range of scientific disciplines.
Materials and methods should be complete enough to
allow experiments to be reproduced. However, only truly new procedures should be described in detail; previously published procedures should be cited, and important modifications of published procedures should be mentioned briefly. Capitalize trade names and include the manufacturer's name and address. Subheadings should be used. Methods in general use need not be described in detail.

Results should be presented with clarity and precision. The results should be written in the past tense when describing findings in the authors' experiments. Previously published findings should be written in the present tense. Results should be explained, but largely without referring to the literature. Discussion, speculation and detailed interpretation of data should not be included in the Results but should be put into the Discussion section.
The Discussion should interpret the findings in view of the results obtained in this and in past studies on this topic. State the conclusions in a few sentences at the end of the paper. The Results and Discussion sections can include subheadings, and when appropriate, both sections can be combined.
The Acknowledgments of people, grants, funds, etc should be brief.
Tables should be kept to a minimum and be designed to be as simple as possible. Tables are to be typed double- spaced throughout, including headings and footnotes. Each table should be on a separate page, numbered consecutively in Arabic numerals and supplied with a heading and a legend. Tables should be self-explanatory without reference to the text. The details of the methods used in the experiments should preferably be described in the legend instead of in the text. The same data should not be presented in both table and graph form or repeated in the text.
Figure legends should be typed in numerical order on a separate sheet. Graphics should be prepared using applications capable of generating high resolution GIF, TIFF, JPEG or Powerpoint before pasting in the Microsoft Word manuscript file. Tables should be prepared in Microsoft Word. Use Arabic numerals to designate figures and upper case letters for their parts (Figure 1). Begin each legend with a title and include sufficient description so that the figure is understandable without reading the text of the manuscript. Information given in legends should not be repeated in the text.
References: In the text, a reference identified by means of an author‘s name should be followed by the date of the reference in parentheses. When there are more than two authors, only the first author‘s name should be mentioned, followed by ’et al‘. In the event that an author cited has had two or more works published during the same year, the reference, both in the text and in the reference list, should be identified by a lower case letter like ’a‘ and ’b‘ after the date to distinguish the works.
Examples:
Abayomi (2000), Agindotan et al. (2003), (Kelebeni, 1983), (Usman and Smith, 1992), (Chege, 1998;
1987a,b; Tijani, 1993,1995), (Kumasi et al., 2001) References should be listed at the end of the paper in alphabetical order. Articles in preparation or articles submitted for publication, unpublished observations, personal communications, etc. should not be included in the reference list but should only be mentioned in the article text (e.g., A. Kingori, University of Nairobi, Kenya, personal communication). Journal names are abbreviated according to Chemical Abstracts. Authors are fully responsible for the accuracy of the references.
Examples:
Chikere CB, Omoni VT and Chikere BO (2008). Distribution of potential nosocomial pathogens in a hospital environment. Afr. J. Biotechnol. 7: 3535-3539.
Moran GJ, Amii RN, Abrahamian FM, Talan DA (2005). Methicillinresistant Staphylococcus aureus in community-acquired skin infections. Emerg. Infect. Dis. 11: 928-930.
Pitout JDD, Church DL, Gregson DB, Chow BL, McCracken M, Mulvey M, Laupland KB (2007). Molecular epidemiology of CTXM-producing Escherichia coli in the Calgary Health Region: emergence of CTX-M-15-producing isolates. Antimicrob. Agents Chemother. 51: 1281-1286.
Pelczar JR, Harley JP, Klein DA (1993). Microbiology: Concepts and Applications. McGraw-Hill Inc., New York, pp. 591-603.
Short Communications
Short Communications are limited to a maximum of two figures and one table. They should present a complete study that is more limited in scope than is found in full-length papers. The items of manuscript preparation listed above apply to Short Communications with the following differences: (1) Abstracts are limited to 100 words; (2) instead of a separate Materials and Methods section, experimental procedures may be incorporated into Figure Legends and Table footnotes; (3) Results and Discussion should be combined into a single section. Proofs and Reprints: Electronic proofs will be sent (e- mail attachment) to the corresponding author as a PDF file. Page proofs are considered to be the final version of the manuscript. With the exception of typographical or minor clerical errors, no changes will be made in the manuscript at the proof stage.

Fees and Charges: Authors are required to pay a $650 handling fee. Publication of an article in the African Journal of Biotechnology is not contingent upon the author's ability to pay the charges. Neither is acceptance to pay the handling fee a guarantee that the paper will be accepted for publication. Authors may still request (in advance) that the editorial office waive some of the handling fee under special circumstances
Copyright: © 2015, Academic Journals. All rights Reserved. In accessing this journal, you agree that you will access the contents for your own personal use but not for any commercial use. Any use and or copies of this Journal in whole or in part must include the customary bibliographic citation, including author attribution, date and article title.
Submission of a manuscript implies: that the work described has not been published before (except in the form of an abstract or as part of a published lecture, or thesis) that it is not under consideration for publication elsewhere; that if and when the manuscript is accepted for publication, the authors agree to automatic transfer of the copyright to the publisher.
Disclaimer of Warranties
In no event shall Academic Journals be liable for any special, incidental, indirect, or consequential damages of any kind arising out of or in connection with the use of the articles or other material derived from the AJB, whether or not advised of the possibility of damage, and on any theory of liability. This publication is provided "as is" without warranty of any kind, either expressed or implied, including, but not limited to, the implied warranties of merchantability, fitness for a particular purpose, or non-infringement. Descriptions of, or references to, products or publications does not imply endorsement of that product or publication. While every effort is made by Academic Journals to see that no inaccurate or misleading data, opinion or statements appear in this publication, they wish to make it clear that the data and opinions appearing in the articles and advertisements herein are the responsibility of the contributor or advertiser concerned. Academic Journals makes no warranty of any kind, either express or implied, regarding the quality, accuracy, availability, or validity of the data or information in this publication or of any other publication to which it may be linked.

International Journal of Medicine and Medical Sciences
African Journal of Biotechnology
Table of Contents: Volume 14 Number 12, 25 March, 2015
ARTICLES
Genetic diversity of grape germplasm as revealed by microsatellite (SSR) markers Lei Wang, Juan Zhang, Linde Liu, Li Zhang, Lijuan Wei and Dechang Hu
Characterization of a hemorrhage-inducing component present in Bitis arietans venom Tahís Louvain de Souza, Fábio C. Magnoli and Wilmar Dias da Silva
Germination and in vitro multiplication of Helianthemum kahiricum, a threatened plant in Tunisia arid areas HAMZA Amina and NEFFATI Mohamed Effects of temperature, light, desiccation and cold storage on germination of Sophora tonkinensis (Leguminosae) seeds X. Pu, Y.F. Huang, C.L. Pan, L. Yao, X.R. Ai and Z. J. Deng
Effect of water deficit on Argan tree seedlings (Argania spinosa L. Skeels): Morphological and physiological aspect MESLEM Halima, DJABEUR Abderezzak, KHAROUBI Omar and KAID-HARCHE Meriem
Genetic variation of 12 rice cultivars grown in Brunei Darussalam and assessment of their tolerance to saline environment Nurul Kahrani Ishak, Zohrah Sulaiman, Kushan U. Tennakoon
Effect of artificially-generated wind on removing guttation and dew droplets from rice leaf surface for controlling rice blast disease Yoshihiro Taguchi, Mohsen Mohamed Elsharkawy and Mitsuro Hyakumachi Chemical composition and antifungal activity of essential oils of Algerian citrus Hamdani Fatima Zohra, Allem Rachida, Meziane Malika, Setti Benali, Ali Arous Samir and Bourai Meriem

Table of Contents: Volume 14 Number 12, 25 March, 2015
Chemical composition and anti-diabetic properties of Jatropha curcas leaves extract on alloxan induced diabetic wistar rats Nwamarah, J. U., Otitoju, O. and Otitoju, G. T. O. Evaluation of the antimicrobial activity of crude extracts and chromatographic fractions of Adenanthera pavonina Linn (Leguminosae) seeds Oluwatofunmilayo A. Adeyemi, Aduragbenro D. Adedapo, Adeolu A. Adedapo and Jones O. Moody Bioepoxidation of isosafrol catalyzed by radish and turnip peroxidases Micael Nunes Melo, Lucas Costa Lopes, Cláudio Dariva, Jonathan dos Santos Girardi, Angélica Maria Lucchese, Heiddy Marquez Alvarez and Alini T. Fricks Extra-pulmonary oxidative stress investigations of an over-the-counter pyrethroid insecticide product in rats Oluwatobi Temitope Somade, Ayobami Emmanuel Odekunle, Olaide Oluwasaanu and Nkoyo Michael Umanah
Vol. 14(12), pp. 990-998, 25 March, 2015
DOI: 10.5897/AJB2014.14171
Article Number: DA5410651677
ISSN 1684-5315
Copyright © 2015
Author(s) retain the copyright of this article
http://www.academicjournals.org/AJB
African Journal of Biotechnology
Full Length Research Paper
Genetic diversity of grape germplasm as revealed by microsatellite (SSR) markers
Lei Wang1, Juan Zhang2*, Linde Liu1, Li Zhang1, Lijuan Wei1 and Dechang Hu1
1School of Life Science, Ludong University, Yantai 264025, Shandong, China. 2School of Agriculture, Ludong University, Yantai 264025, Shandong, China.
Received 10 September, 2014; Accepted 17 March, 2015
In this work, cluster analysis and principal component analysis (PCA) were used to study the genetic diversity and relationships among 49 grape germplasm accessions analyzed with 19 simple sequence repeat (SSR) primer pairs. In total, 139 polymorphic loci were detected among these accessions with an average of 7.32 polymorphic loci per SSR primer pair. The average values for the effective number of alleles, Nei’s gene diversity, and Shannon’s information index were 1.5605, 0.3352 and 0.5064, respectively. The cluster analysis showed that the 49 accessions could be divided into five groups and an outgroup. The results of the PCA were nearly consistent with those of unweighted pair-group method with arithmetic averages (UPGMA) clustering analysis. These results will be useful for the exploitation of grape germplasm in basic and applied research. Key words: Vitis vinifera L., simple sequence repeat (SSR), genetic diversity, principal component analysis.
INTRODUCTION Vitis vinifera L. is a precious horticultural crop worldwide and is profoundly connected with the development of human culture (This et al., 2006). The genus Vitis L., with approximately 60 species, contains a large number of the Vitaceae and is primarily found in Europe, North America, and East Asia (Emanuelli et al., 2013). Due to the rising demand for higher-quality grape products, including fruits, raisins, juice, wine, etc., the economic value of excellent grape varieties is consistently increasing. Over the past few decades, the planting of single species with high quality and yield has resulted in the drastic reduction of
genetic diversity in both cultivated and wild grapevines (Santana et al., 2008). The narrow genetic base of cultivated varieties makes them susceptible to diseases, pests, and environmental conditions. Likewise, the genetic variation of wild V. vinifera species has slowly diminished due to the loss of natural habitat (Emanuelli et al., 2013). To avoid further losses of valuable genes and genotypes, it is of significant importance to take effective protection measures, which requires research into genetic relationships and the reconstruction of pedigrees (Bowers et al., 1999; Benjak et al., 2005; Santana et al.,
*Corresponding author. E-mail: [email protected]. Tel: +86 15563808622. Fax: +86 535 6697616. Abbreviations: PCA, principal component analysis; SSR, simple sequence repeat; UPGMA, unweighted pair-group method with
arithmetic averages. Author(s) agree that this article remains permanently open access under the terms of the Creative Commons Attribution License 4.0 International License
2008). Cultivars with desirable traits have high potential breeding value, and those with genes of enological or organoleptic interest could be important resources to plant breeders and geneticists (Santana et al., 2008). Another crucial factor in breeding success is the phylogenetic relationships between parents. Information on the amount and distribution of genetic variation in grape germplasm collections is therefore essential for the development of conservation strategies and efficient use of Vitis germplasm resources (De Andrés et al., 2012).
The development of DNA-based markers has provided widely used methods for quantifying variation within germplasm, including that of grapes (Emanuelli et al., 2013). Simple sequence repeats (SSRs), also known as microsatellite makers, have been widely applied to investigate genetic diversity, distinguish populations, and determine reproductive characteristics in various organisms due to their high degree of polymorphism, reproducibility, and codominant nature (Doulati-Baneh et al., 2013). Recently, several studies have been con-ducted to decipher the origin, construct genetic maps, and determine the genetic structure of cultivated grapes using nuclear microsatellite analysis (Bowers et al., 1996; Scott et al., 2000; Santana et al., 2010; Doulati-Baneh et al., 2013). Santana et al. (2010) reported on the origins, genetic structure, and relationships of 421 cultivated and four (allegedly) wild grapevine samples from the Castilian Plateau of Spain based on six nuclear microsatellite loci (SSRs). Doulati-Baneh et al. (2013) examined 67 grape cultivars from Iran using SSR markers and analyzed the genetic distances and population structure in the studied germplasm.
Most previous studies have focused on V. vinifera L. cultivars from a single location (Agar et al., 2012), which limits the utilization of the species to some extent. In this work, we selected 49 grape germplasm accessions originating from several different countries and investigated their genetic diversity and evolutionary relationships using 19 SSR markers. MATERIALS AND METHODS Plant materials A total of 49 accessions were collected and analyzed in this study. Accession names and their geographic origins are listed in Table 1. The accessions were all kindly provided by the grape germplasm repository of Yantai Changyu Pioneer Wine Company Limited. Young leaves were randomly sampled from adult trees and frozen in liquid nitrogen. DNA extraction and SSR analysis Total genomic DNA was extracted using the Ezup Column Plant Genomic DNA Purification Kit (Sangon, Shanghai, China) following the manufacturer’s protocol. DNA concentration and purity were determined by UV-spectrophotometry at 260/280 nm, and its integrity was confirmed using 1% agarose gel electrophoresis. PCR was performed in a 25 µL total volume containing 10 mM Tris-HCl pH
Wang et al. 991 8.3, 50 mM KCl, 1.5 mM of Mg2+, 0.2 mM of each dNTP, 0.25 µM of each primer, and 1 unit of DNA Taq polymerase (Takara Biotech Co. Ltd., Japan) with 30 ng of DNA as templates. PCR was conducted as follows: 94°C for 5 min; 36 cycles consisting of denaturation at 94°C for 30 s, annealing at 48 to 63°C (depending on primer pair) for 30 s, and synthesis at 72°C for 1 min; and a final elongation at 72°C for 10 min. Twenty grapevine SSRs were used, and a set of 19 highly polymorphic markers were considered suitable for assessing variation among the studied samples (Table 2). The PCR products were separated on 6% (w/v) polyacrylamide gels and visualized with silver staining. Genetic diversity analysis The data were used for the following statistical analyses. The number of alleles per locus (N), effective number of alleles (Ne), Nei’s gene diversity (H), and gene diversity (Shannon’s information index = I) were calculated to estimate the genetic variation level. All of the above calculations were performed using POPGENE version 1.32 (Yeh et al., 1997). Cluster analysis was performed with the Numerical Taxonomy Multivariate Analysis System (NTSYS-PC) version 2.1 (Rohlf, 2002). A dendrogram was constructed via the unweighted pair-group method with arithmetic averages (UPGMA), and similarity coefficients were employed to reveal the relationships among the 49 accessions. Principal component analysis (PCA) was performed by NTSYS 2.1.
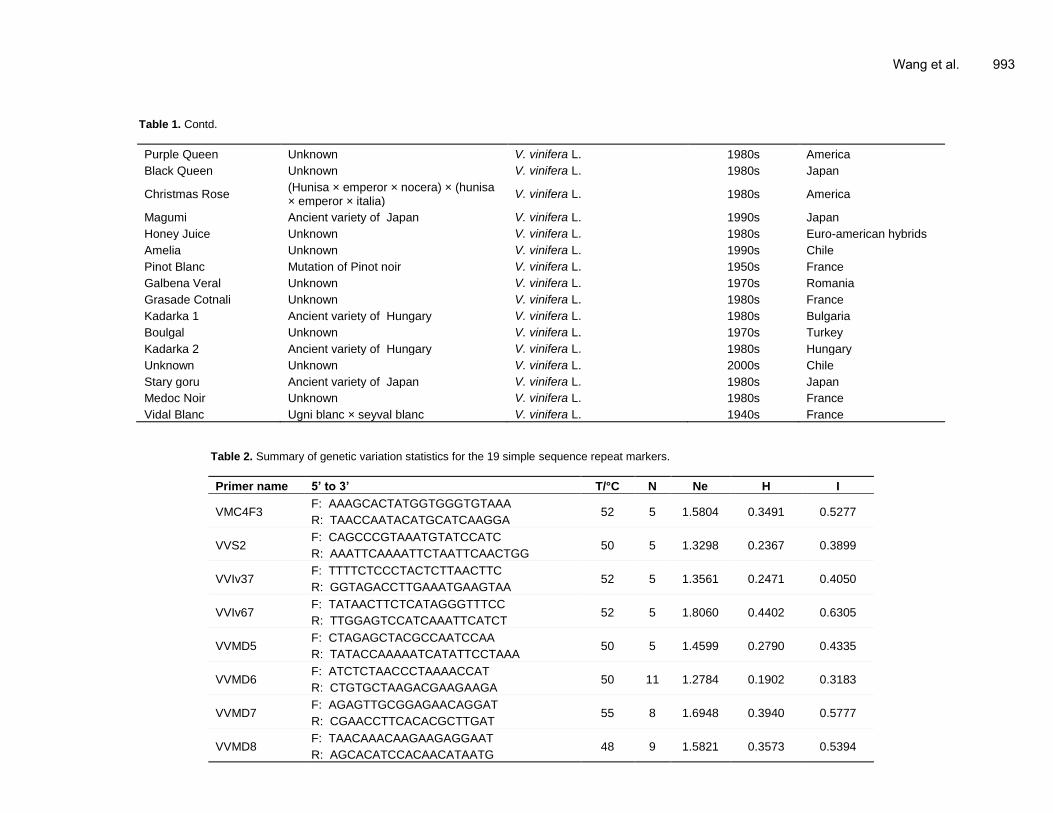
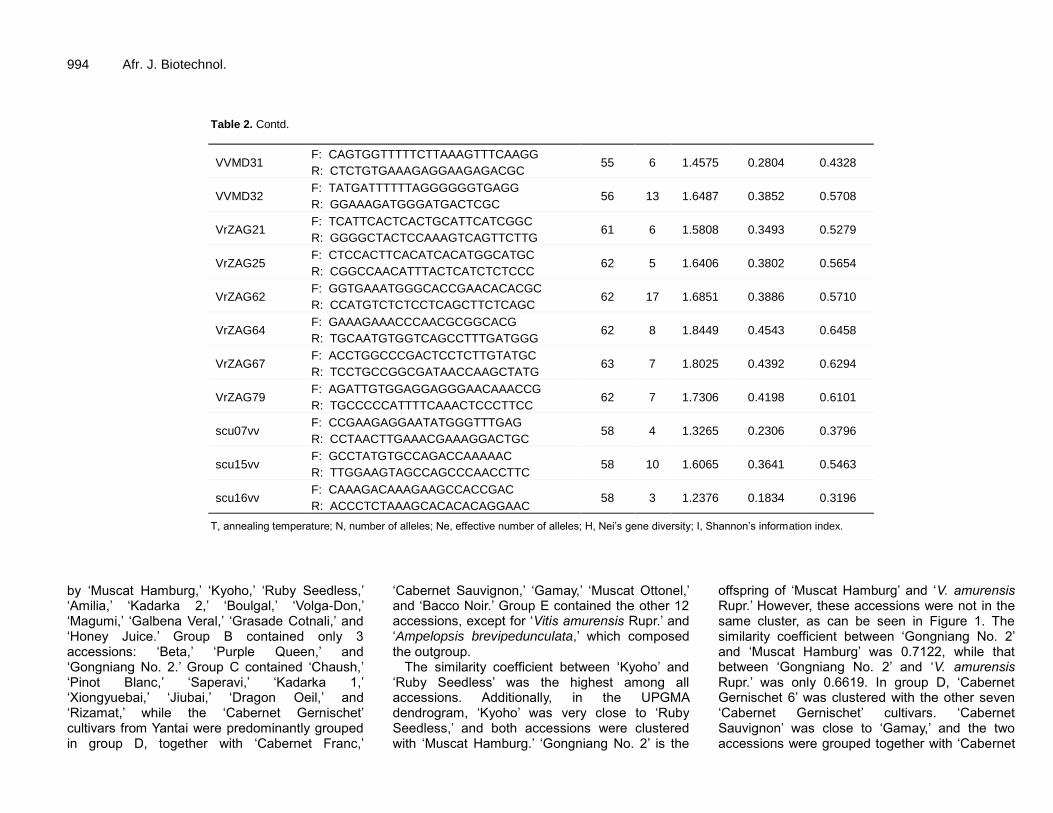
RESULTS Polymorphism of SSR markers The genetic variation statistics for the 19 SSR markers are summarized in Table 2. A total of 139 polymorphic alleles were amplified using the 19 SSR markers, ranging from 3 (scu16vv) to 17 (VrZAG62) alleles per locus. Ne among the studied markers ranged from 1.2376 (scu16vv) to 1.8449 (VrZAG64), with an average of 1.5605. The H of the 19 SSR markers ranged from 0.1834 (scu16vv) to 0.4543 (VrZAG64), with an average of 0.3352. The values of I ranged from 0.3183 (VVMD6) to 0.6458 (VrZAG64), with an average of 0.5064.
Genetic relatedness
To analyze the genetic relationships among the tested cultivars, the similarity coefficients were calculated with NTSYS-PC 2.1 using UPGMA. ‘Cabernet Gernischet’ 1–8 represent eight ‘Cabernet Gernischet’ cultivars from eight different areas in Yantai. The similarity coefficient between ‘Cabernet Gernischet 6’ and the other seven ‘Cabernet Gernischet’ cultivars, which were shown to be the same cultivar based on their similarity coefficients (1.0000), was 0.9712. The similarity coefficients of the tested grape accessions ranged from 0.4029 to 0.9856. The SSR UPGMA dendrogram partitioned the 49 tested cultivars into five main groups and an outgroup by clustering varieties with more than 60% similarity (Figure 1). Groups A, B, C, D, and E consisted of 11, 3, 8, 13, and 12 accessions, respectively. Group A was composed

992 Afr. J. Biotechnol.
Table 1. List of grape cultivars used in this study.
Cultivar Pedigree Species The introduction
year Source of collection
Chaush Unknown V. vinifera L. 1980s Russia
Cabernet Franc Ancient variety of France V. vinifera L. 1890s France
Malvasia Istriana Ancient variety of Greece V. vinifera L. 2000s Italy
BиHTA Unknown V. vinifera L. 1980s Bulgaria
Yan Tai No: 73 Muscat hamburg × alicante bouschet V. vinifera L. ---- China
Beta Unknown V. vinifera L. 1960s America
Volga-Don Unknown V. vinifera L. 1960s Uzbekistan
Xiongyuebai (Muscat Hamburg× V. Amurensis ) ×
Longyan
V. vinifera L. × V. amurensis
Rupr. ---- China
Bacco Noir Unknown V. vinifera L. × V .vulpina L. 1950s France
Gongniang No: 2 Muscat Hamburg × V. Amurensis V. vinifera L. × V. amurensis
Rupr. ---- China
Cabernet Gernischet 1 Ancient variety of France V. vinifera L. 1890s France
Cabernet Gernischet 2 Ancient variety of France V. vinifera L. 1890s France
Cabernet Gernischet 3 Ancient variety of France V. vinifera L. 1890s France
Cabernet Gernischet 4 Ancient variety of France V. vinifera L. 1890s France
Cabernet Gernischet 5 Ancient variety of France V. vinifera L. 1890s France
Cabernet Gernischet 6 Ancient variety of France V. vinifera L. 1890s France
Cabernet Gernischet 7 Ancient variety of France V. vinifera L. 1890s France
Cabernet Gernischet 8 Ancient variety of France V. vinifera L. 1890s France
Cabernet Sauvignon Cabernet franc × sauvignon blanc V. vinifera L. 1890s France
Muscat Hamburg Schiava Grossa × Muscat of Alexandria V. vinifera L. 1890s England
V.amurensis Rupr. Ancient variety of China V. amurensis ---- China
Ampelopsis brevipedunculata
Ancient variety of China A. brevipedunculata ---- China
Kyoho Campbell early × centenial V. vinifera L. × V. labrusca L. 1960s Japan
Ruby Seedless Emperor × pirovan075 V. vinifera L. 1980s Eurasian
Jiubai Unknown V. vinifera L. ---- China
Gamay Pinot noir × Gouais V. vinifera L. 1950s France
Dragon Oeil Unknown V. vinifera L. 1980s Eurasian
Muscat Ottonel Chasselas × Muscat de Saumur V. vinifera L. 2000s France
Superior Seedless Unknown V. vinifera L. 1990s America
Rizamat Uncertain V. vinifera L. 1960s Russia
Saperavi Unknown V. vinifera L. 1980s Georgia
Phoenix Uncertain V. vinifera L. 1980s West Germany
Autumn Royal Autumn black × g74-1 V. vinifera L. 1998 America
Wang et al. 993
Table 1. Contd.
Purple Queen Unknown V. vinifera L. 1980s America
Black Queen Unknown V. vinifera L. 1980s Japan
Christmas Rose (Hunisa × emperor × nocera) × (hunisa × emperor × italia)
V. vinifera L. 1980s America
Magumi Ancient variety of Japan V. vinifera L. 1990s Japan
Honey Juice Unknown V. vinifera L. 1980s Euro-american hybrids
Amelia Unknown V. vinifera L. 1990s Chile
Pinot Blanc Mutation of Pinot noir V. vinifera L. 1950s France
Galbena Veral Unknown V. vinifera L. 1970s Romania
Grasade Cotnali Unknown V. vinifera L. 1980s France
Kadarka 1 Ancient variety of Hungary V. vinifera L. 1980s Bulgaria
Boulgal Unknown V. vinifera L. 1970s Turkey
Kadarka 2 Ancient variety of Hungary V. vinifera L. 1980s Hungary
Unknown Unknown V. vinifera L. 2000s Chile
Stary goru Ancient variety of Japan V. vinifera L. 1980s Japan
Medoc Noir Unknown V. vinifera L. 1980s France
Vidal Blanc Ugni blanc × seyval blanc V. vinifera L. 1940s France
Table 2. Summary of genetic variation statistics for the 19 simple sequence repeat markers.
Primer name 5’ to 3’ T/°C N Ne H I
VMC4F3 F: AAAGCACTATGGTGGGTGTAAA
52 5 1.5804 0.3491 0.5277 R: TAACCAATACATGCATCAAGGA
VVS2 F: CAGCCCGTAAATGTATCCATC
50 5 1.3298 0.2367 0.3899 R: AAATTCAAAATTCTAATTCAACTGG
VVIv37 F: TTTTCTCCCTACTCTTAACTTC
52 5 1.3561 0.2471 0.4050 R: GGTAGACCTTGAAATGAAGTAA
VVIv67 F: TATAACTTCTCATAGGGTTTCC
52 5 1.8060 0.4402 0.6305 R: TTGGAGTCCATCAAATTCATCT
VVMD5 F: CTAGAGCTACGCCAATCCAA
50 5 1.4599 0.2790 0.4335 R: TATACCAAAAATCATATTCCTAAA
VVMD6 F: ATCTCTAACCCTAAAACCAT
50 11 1.2784 0.1902 0.3183 R: CTGTGCTAAGACGAAGAAGA
VVMD7 F: AGAGTTGCGGAGAACAGGAT
55 8 1.6948 0.3940 0.5777 R: CGAACCTTCACACGCTTGAT
VVMD8 F: TAACAAACAAGAAGAGGAAT
48 9 1.5821 0.3573 0.5394 R: AGCACATCCACAACATAATG
994 Afr. J. Biotechnol.
Table 2. Contd.
VVMD31 F: CAGTGGTTTTTCTTAAAGTTTCAAGG
55 6 1.4575 0.2804 0.4328 R: CTCTGTGAAAGAGGAAGAGACGC
VVMD32 F: TATGATTTTTTAGGGGGGTGAGG
56 13 1.6487 0.3852 0.5708 R: GGAAAGATGGGATGACTCGC
VrZAG21 F: TCATTCACTCACTGCATTCATCGGC
61 6 1.5808 0.3493 0.5279 R: GGGGCTACTCCAAAGTCAGTTCTTG
VrZAG25 F: CTCCACTTCACATCACATGGCATGC
62 5 1.6406 0.3802 0.5654 R: CGGCCAACATTTACTCATCTCTCCC
VrZAG62 F: GGTGAAATGGGCACCGAACACACGC
62 17 1.6851 0.3886 0.5710 R: CCATGTCTCTCCTCAGCTTCTCAGC
VrZAG64 F: GAAAGAAACCCAACGCGGCACG
62 8 1.8449 0.4543 0.6458 R: TGCAATGTGGTCAGCCTTTGATGGG
VrZAG67 F: ACCTGGCCCGACTCCTCTTGTATGC
63 7 1.8025 0.4392 0.6294 R: TCCTGCCGGCGATAACCAAGCTATG
VrZAG79 F: AGATTGTGGAGGAGGGAACAAACCG
62 7 1.7306 0.4198 0.6101 R: TGCCCCCATTTTCAAACTCCCTTCC
scu07vv F: CCGAAGAGGAATATGGGTTTGAG
58 4 1.3265 0.2306 0.3796 R: CCTAACTTGAAACGAAAGGACTGC
scu15vv F: GCCTATGTGCCAGACCAAAAAC
58 10 1.6065 0.3641 0.5463 R: TTGGAAGTAGCCAGCCCAACCTTC
scu16vv F: CAAAGACAAAGAAGCCACCGAC
58 3 1.2376 0.1834 0.3196 R: ACCCTCTAAAGCACACACAGGAAC
T, annealing temperature; N, number of alleles; Ne, effective number of alleles; H, Nei’s gene diversity; I, Shannon’s information index.
by ‘Muscat Hamburg,’ ‘Kyoho,’ ‘Ruby Seedless,’ ‘Amilia,’ ‘Kadarka 2,’ ‘Boulgal,’ ‘Volga-Don,’ ‘Magumi,’ ‘Galbena Veral,’ ‘Grasade Cotnali,’ and ‘Honey Juice.’ Group B contained only 3 accessions: ‘Beta,’ ‘Purple Queen,’ and ‘Gongniang No. 2.’ Group C contained ‘Chaush,’ ‘Pinot Blanc,’ ‘Saperavi,’ ‘Kadarka 1,’ ‘Xiongyuebai,’ ‘Jiubai,’ ‘Dragon Oeil,’ and ‘Rizamat,’ while the ‘Cabernet Gernischet’ cultivars from Yantai were predominantly grouped in group D, together with ‘Cabernet Franc,’
‘Cabernet Sauvignon,’ ‘Gamay,’ ‘Muscat Ottonel,’ and ‘Bacco Noir.’ Group E contained the other 12 accessions, except for ‘Vitis amurensis Rupr.’ and ‘Ampelopsis brevipedunculata,’ which composed the outgroup.
The similarity coefficient between ‘Kyoho’ and ‘Ruby Seedless’ was the highest among all accessions. Additionally, in the UPGMA dendrogram, ‘Kyoho’ was very close to ‘Ruby Seedless,’ and both accessions were clustered with ‘Muscat Hamburg.’ ‘Gongniang No. 2’ is the
offspring of ‘Muscat Hamburg’ and ‘V. amurensis Rupr.’ However, these accessions were not in the same cluster, as can be seen in Figure 1. The similarity coefficient between ‘Gongniang No. 2’ and ‘Muscat Hamburg’ was 0.7122, while that between ‘Gongniang No. 2’ and ‘V. amurensis Rupr.’ was only 0.6619. In group D, ‘Cabernet Gernischet 6’ was clustered with the other seven ‘Cabernet Gernischet’ cultivars. ‘Cabernet Sauvignon’ was close to ‘Gamay,’ and the two accessions were grouped together with ‘Cabernet

Wang et al. 995
Figure 1. Unweighted pair-group method with arithmetic averages dendrogram of 49 grape germplasm accessions based on simple sequence repeat marker data
Franc.’ ‘BиHTA’ and ‘Yan Tai No. 73’ had a particularly close genetic relationship, as indicated by their similarity coefficient of 0.9712 and grouping into the same cluster. The similarity coefficient between the unknown Chilean acces-sion and ‘Medoc Noir’ was also 0.9712, and a similar result can be seen in group E. Principal component analysis Conversely, the principal component analysis (PCA) based on the genotypic data from the SSR
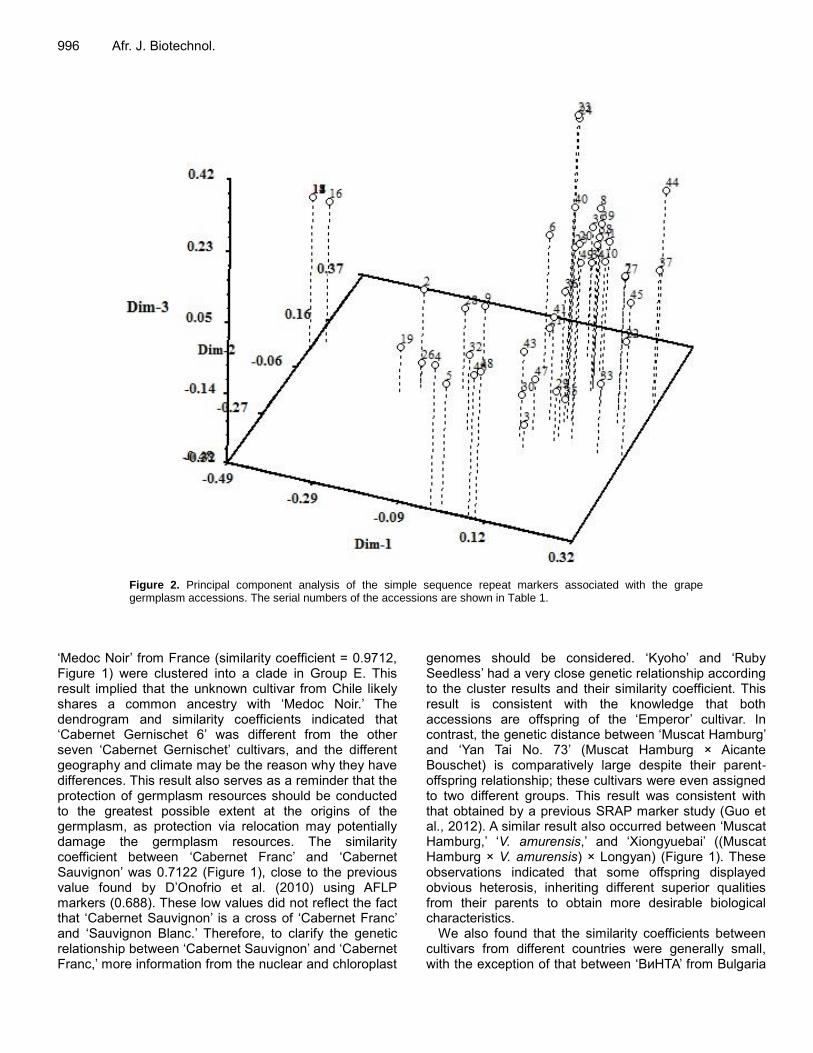
markers demonstrated the genetic divergence between the groups (Figures 2 and 3). Dim-1, dim-2, and dim-3 accounted for 17.33, 9.62, and 7.42% of the overall variation, respectively. The PCA results were nearly consistent with those of the UPGMA analysis, which had no difference among the ‘Cabernet Gernischet’ cultivars except for ‘Cabernet Gernischet 6.’ ‘Kyoho’ and ‘Ruby Seedless,’ the close genetic relationship which is shown in Figure 1, clearly overlapped in the PCA. However, the PCA results separated ‘Saperavi’ from group C. This result may have been due to dimensionality reduction.
DISCUSSION In the present study, we selected SSR markers from these previous experiments to assess the phylogenetic relationships among 49 cultivated grapevines originating from different countries. Our results show that VrZAG64 had the highest level of genetic diversity (H = 0.4543; I = 0.6458) among all of the studied SSR markers, which suggested that VrZAG64 should have priority to be considered when estimating the genetic variation of grape cultivars. In the SSR UPGMA dendrogram, the unknown cultivar from Chile and
996 Afr. J. Biotechnol.
Figure 2. Principal component analysis of the simple sequence repeat markers associated with the grape germplasm accessions. The serial numbers of the accessions are shown in Table 1.
‘Medoc Noir’ from France (similarity coefficient = 0.9712, Figure 1) were clustered into a clade in Group E. This result implied that the unknown cultivar from Chile likely shares a common ancestry with ‘Medoc Noir.’ The dendrogram and similarity coefficients indicated that ‘Cabernet Gernischet 6’ was different from the other seven ‘Cabernet Gernischet’ cultivars, and the different geography and climate may be the reason why they have differences. This result also serves as a reminder that the protection of germplasm resources should be conducted to the greatest possible extent at the origins of the germplasm, as protection via relocation may potentially damage the germplasm resources. The similarity coefficient between ‘Cabernet Franc’ and ‘Cabernet Sauvignon’ was 0.7122 (Figure 1), close to the previous value found by D’Onofrio et al. (2010) using AFLP markers (0.688). These low values did not reflect the fact that ‘Cabernet Sauvignon’ is a cross of ‘Cabernet Franc’ and ‘Sauvignon Blanc.’ Therefore, to clarify the genetic relationship between ‘Cabernet Sauvignon’ and ‘Cabernet Franc,’ more information from the nuclear and chloroplast
genomes should be considered. ‘Kyoho’ and ‘Ruby Seedless’ had a very close genetic relationship according to the cluster results and their similarity coefficient. This result is consistent with the knowledge that both accessions are offspring of the ‘Emperor’ cultivar. In contrast, the genetic distance between ‘Muscat Hamburg’ and ‘Yan Tai No. 73’ (Muscat Hamburg × Aicante Bouschet) is comparatively large despite their parent-offspring relationship; these cultivars were even assigned to two different groups. This result was consistent with that obtained by a previous SRAP marker study (Guo et al., 2012). A similar result also occurred between ‘Muscat Hamburg,’ ‘V. amurensis,’ and ‘Xiongyuebai’ ((Muscat Hamburg × V. amurensis) × Longyan) (Figure 1). These observations indicated that some offspring displayed obvious heterosis, inheriting different superior qualities from their parents to obtain more desirable biological characteristics.
We also found that the similarity coefficients between cultivars from different countries were generally small, with the exception of that between ‘BиHTA’ from Bulgaria

Wang et al. 997
Figure 3. Simple sequence repeat markers associated with grape germplasm accessions based on principal components 1 and 2. The serial numbers of the accessions are shown in Table 1.
and ‘Yan Tai No: 73’ from China (0.9712, Figure 1). Given that the parents of ‘BиHTA’ are not clear, ‘BиHTA’ and ‘Yan Tai No: 73’ likely have a similar origin. In the UPGMA dendrogram, the groupings were not obviously related with the geographic
origins of the cultivars (Figure 1). Cultivated populations from different countries may tend towards uniformity due to long-term adaptation to climate and human activities during the long history of cultivation for these accessions. Due to
the high economic value of V. vinifera L., we strongly advise that core germplasm accessions of this species should be cultivated for con-servation in their original regions instead of a single grape germplasm repository with a uniform
998 Afr. J. Biotechnol. growth environment.
In conclusion, our work shows that the polymorphism of SSR molecular markers can provide important infor-mation on the inheritance and phylogenetics of grape germplasm. We identified the unknown Chilean acces-sion using SSR markers, although we could not definitively determine its parentage. To better preserve genetic diversity, we suggest that new natural protection habitats should be established at the origins of germplasm accessions, and we recommend that the conservation and management of grape species prioritize populations with high allelic richness and heterosis (Lu et al., 2013). This work shows that assessing the genetic diversity of grape germplasm collections using SSRs is very efficient for basic and applied research. Further experiments should be performed to study grape genetic diversity. Based on the relationships among and charac-teristics of accessions, scientists can better protect germplasm resources and conduct breeding programs. Conflict of interests The authors did not declare any conflict of interest. ACKNOWLEDGEMENTS We thank Yantai Changyu Pioneer Wine Company Limited for its support of this work. This research was supported by the Natural Science Foundation of China (No. 31100218). REFERENCES Agar G, Yildirim N, Ercisli S, Ergul A, Yuksel C (2012). Determination of
genetic diversity of Vitis vinifera cv. Kabarcik populations from the Coruh Valley using SSR markers. Biochem. Genet. 50(5): 476-483.
Benjak A, Ercisli S, Vokurka A, Maletic E, Pejic I (2005). Genetic relationships among grapevine cultivars native to Croatia, Greece and Turkey. Vitis. 44(2):73-77.
Bowers JE, Dangl GS, Meredith CP (1999). Development and characterization of additional microsatellite DNA markers for grape. Am. J. Enol. Viticult. 50(3):243-246.
Bowers JE, Dangl GS, Vignani R, Meredith CP (1996). Isolation and characterization of new polymorphic simple sequence repeat loci in grape (Vitis vinifera L.). Genome 39(4):628-633.
D’Onofrio C, De Lorenzis G, Giordani T, Natali L, Cavallini A, Scalabrelli
G (2010). Retrotransposon-based molecular markers for grapevine species and cultivars identification. Tree Genet. Genomes 6(3):451-466.
De Andrés MT, Benito A, Perez-Rivera G, Ocete R, Lopez MA, Gaforio L, MuÑOz G, Cabello F, MartÍNez Zapater JM, Arroyo-GarcÍA R (2012). Genetic diversity of wild grapevine populations in Spain and their genetic relationships with cultivated grapevines. Mol. Ecol. 21(4):800-816.
Doulati-Baneh H, Mohammadi SA, Labra M (2013). Genetic structure and diversity analysis in Vitis vinifera L. cultivars from Iran using SSR markers. Sci. Hortic. 160:29-36.
Emanuelli F, Lorenzi S, Grzeskowiak L, Catalano V, Stefanini M, Troggio M, Myles S, Martinez-Zapater J, Zyprian E, Moreira F, Grando M (2013). Genetic diversity and population structure assessed by SSR and SNP markers in a large germplasm collection of grape. BMC Plant. Biol. 13(1):1-17.
Guo D, Zhang J, Liu C, Zhang G, Li M, Zhang Q (2012). Genetic variability and relationships between and within grape cultivated varieties and wild species based on SRAP markers. Tree Genet. Genomes 8(4):789-800.
Lu X, Xu H, Li Z, Shang H, Adams RP, Mao K (2013). Genetic diversity and conservation implications of four Cupressus species in China as revealed by microsatellite markers. Biochem. Genet. 52: 1-22.
Rohlf F (2002). NTSYSpc: Numerical taxonomy system, ver. 2.1 Setauket, New York: Exeter Publishing, Ltd.
Santana JC, Heuertz M, Arranz C, Rubio JA, Martínez-Zapater JM, Hidalgo E (2010). Genetic structure, origins, and relationships of grapevine cultivars from the Castilian Plateau of Spain. Am. J. Enol. Viticult. 61(2):214-224.
Santana JC, Hidalgo E, De Lucas AI et al. (2008). Identification and relationships of accessions grown in the grapevine (Vitis vinifera L.) germplasm bank of Castillay Léon (Spain) and the varieties authorized in the VQPRD areas of the region by SSR-marker analysis. Genet. Resour. Crop Evol. 55: 573-583.
Scott KD, Eggler P, Seaton G, Rossetto M, Ablett EM, Lee LS, Henry RJ (2000). Analysis of SSRs derived from grape ESTs. Theor. Appl. Genet. 100(5):723-726.
This P, Lacombe T, Thomas MR (2006). Historical origins and genetic diversity of wine grapes. Trends Genet. 22(9): 511-519.
Yeh F, Yang R, Boyle T (1997). POPGENE: a microsoft windows-based freeware for population genetic analysis: version 1.32, 32 bit University of Alberta, Edmonton, Canada

Vol. 14(12), pp. 999-1008, 25 March, 2015
DOI: 10.5897/AJB2014.14319
Article Number: AF0A87151680
ISSN 1684-5315
Copyright © 2015
Author(s) retain the copyright of this article
http://www.academicjournals.org/AJB
African Journal of Biotechnology
Full Length Research Paper
Characterization of a hemorrhage-inducing component present in Bitis arietans venom
Tahís Louvain de Souza1, Fábio C. Magnoli2 and Wilmar Dias da Silva2*
1Laboratório de Biologia do Reconhecer, Centro de Biociências e Biotecnologia, Universidade Estadual do Norte
Fluminense Darcy ribeiro, Campos dos Goytacazes, RJ, Brazil. 2Laboratório de Imunoquímica, Instituto Butantan, São Paulo, SP , Brazil.
Received 13 November, 2014; Accepted 16 February, 2015
Better characterization of individual snake venom toxins is useful for analyzing the association of their toxic domains and relevant antigenic epitopes. Here we analyzed the Bitis arietans hemorrhagic-inducing toxin present in a representative venom sample. Among the 1´ to 5´ protein peaks isolated using a Sephacryl S 100 HR chromatography column, hemorrhagic activity was expressed by all according to the following intensity, P´5 > P´3 > P´2 >, P´4. The proteins were recognized and measured with antibodies present in polyvalent horse F(ab)´2 anti-B. arietans, Bitis spp., Lachesis muta, B. atrox, Bothrops spp., Crotalus spp., and Naja spp. or in IgY anti-B. arietans and anti-Bitis spp. using enzyme-linked immunosorbent assays and western blotting. In addition, in an in vitro-in vivo assay these anti-venoms were able to block hemorrhagic-inducing activity. The evident cross-reactivity expressed by different specific anti-venoms indicates that metalloproteinases induce an immunological signature indicating the presence of similar antigenic epitopes for several snake venoms. Key words: Snake venoms, anti-venoms, Bitis arietans, hemorrhage, metalloproteinases.
INTRODUCTION In sub-Saharan Africa, snake bites are an important public health problem resulting in permanent disabilities and death (Theakston et al., 2003; Kasturiratne et al., 2008). Bitis spp., Naja spp., and Dendroaspis spp. include the greatest number of snake species that cause envenomation in Mozambique (Broadley, 1968; Manaçás, 1981-1982). Their venoms contain multiple and diverse toxins. B. arietans is a common snake found in densely populated savannah areas in sub-Saharan Africa and in the Arabian Peninsula (Navy, 1991). Victims of this snake species exhibit severe local and systemic
disturbances, such as swelling, hemorrhage and necrosis (Warrell et al., 1975; Warrell, 1996; Currier et al., 2010; Calvete et al., 2006). Anti-venom supply in the African continent, however, is scarce and often unaffordable.
In 1996, we submitted a proposal to the Conselho Nacional de Ciência Tecnologia – PROÁFRICA, Ministério de Ciência e Tecnologia do Brazil Proc. No: 4800048/2006, including among the main objectives the development of procedures for producing specific anti-Bitis spp., anti-Naja spp., and anti-Dendroaspis spp. anti-venoms. The proposal was granted, and the anti-venoms
*Corresponding author. E-mail: [email protected]. Author(s) agree that this article remains permanently open access under the terms of the Creative Commons Attribution License 4.0 International License
1000 Afr. J. Biotechnol. were developed using whole venom as the immunogens and traditional methods of immunization (de Almeida et al. 2008; Guidolin et al. 2010).
To address the specific needs of the African region, high specificity, stable, affordable anti-venoms and poly-specific and lyophilized substitutes must be developed. To accomplish this objective, the initial step is the development of mono-specific anti-venoms. We begin this objective by developing an anti-Bitis spp. mono-specific anti-venom.
The metalloproteinases (SVMPs) and A-disintegrin proteinases (ADAMs) (Juárez et al., 2006; Moura-da-Silva et al., 2011; Trummal et al., 2005) comprise the M12b subfamily of zinc-dependent reprolysins. Both enzymes, along with the non-enzyme C-type lectin-like proteins, are important snake venom components (Bode et al., 1993; Stokër et al., 1995; Bjarnason and Fox, 1995). Previous studies indicate that SVMPs and ADAMs are involved in hemorrhage, edema, hypotension, inflammation and necrosis induced by snake venoms (Gutiérrez and Rucovaldo, 2000). Although Viperidae snake venoms are rich in SVMPs, these enzymes have also been observed in certain Elapidae and Colubridae venoms (Junqueira-de-Azevedo and Ho, 2002; Guo et al., 2007; Ching et al. 2006). SVMPs act by cleaving proteins on the vascular basement membrane and surrounding connective tissues as well as by altering platelet structure and function.
The introduction of toxins responsible for hemorrhage (Gutiérrez et al., 1995; Gutiérrez et al., 2005), complement system activating factors (Tambourgi et al., 2015) and hypotension-inducing components (Kodama et al., 2015) present in Bitis sp. venom into an immunogenic mixture is considered essential to obtain high quality mono-specific anti-venom.
In this study, we purify and characterize the biological and immunological properties of a representative B. arietans 50-kDa protein endowed with hemorrhage-inducing activity. MATERIALS AND METHODS Reagents The reagents used included: Tris buffer (Tris HCl, 25 mM; pH 7.4); Complete MMT80 (2 mL of Marcol Montanide ISA 50 in 5.0 mL of sodium chloride, 0.15 M, plus 1.0 mL of Tween 80 and 1.0 mg of lyophilized BCG); incomplete MMT80 (Marcol Montanide ISA 50 without BCG); SDS buffer (Tris, 6.25 mM, pH 6.8 plus 0.2% SDS); SDS buffer plus 1 mL of β-mercaptoethanol (SDS buffer plus 8.5 mL of glycerol and 2 mL of 1% bromophenol blue); PBS buffer (potassium chloride, 2.6 mM; monobasic potassium phosphate, 1.5 mM; sodium chloride, 76 mM; disodium phosphate, 8.2 mM; pH 7.2-7.4); AP buffer (Tris HCl, 100 mM, pH 9.5 plus sodium chloride, 100 mM, and magnesium chloride, 0.1 M); NBT solution (NBT, 50 mg; dimethylformamide in 700 µL plus 300 µL of H2O). BCIP solution (BCIP, 50 mg; dimethylformamide in 1.0 mL of diluent); developing solution for western/dot blotting (AP buffer, 5.0 mL plus NBT solution, 33 and 16.5 µL of BCIP solution); citrate buffer, pH 5.0 (citric acid, 0.1 M, plus 0.2 M monobasic sodium phosphate); OPD
solution (20 mg of OPD in 1.0 mL of citric acid); substrate buffer for ELISA (5 mL of citrate buffer plus 100 µL of OPD solution and 5 µL,). All reagents were obtained from Sigma-Aldrich (USA), except for NBT and BCIP, which were obtained from Molecular Probes (USA). Snake venoms African snake venoms from B. arietans, B. nasicornis, B. rhinoceros, N. melanoleuca, and N. mossambica were purchased from Venom Supplies Pty Ltd (59 Murray Street, Tanunda, Australia). Although African snake venoms were the focus, Brazilian snake anti-venoms from Bothrops atrox, Bothrops jararaca, Lachesis muta, and Crotalus spp. were also obtained to identify cross-reactions. Brazilian snake venoms were supplied by the Laboratório de Herpetologia, Instituto Butantan, São Paulo, Brazil. All venoms were collected from healthy adult snakes following standard methods, filtered through 0.45-µm membranes, assayed for protein content, and stored at -20°C. Mice Swiss and BALB/c isogenic mice (male and female; 18-20 g) were provided by the Universidade Estadual de Campinas, sp., Brazil animal facilities. The mice were used to determine the lethality (LD50) of the venoms and the neutralizing potency (DE50) of the anti-venoms. The animals used in this work were maintained and treated under strict ethical conditions according to International Animal Welfare Recommendations (World Health Organization, 981; Remfry, 1987). This study was approved by the Comissão de Ética de Animais de Laboratório, Centro de Biociências e Biotecnologia, Universidade Estadual do Norte Fluminense – Darcy Ribeiro. Snake anti-venoms Horse polyclonal F(ab´)2 anti-B. arietans, anti-B. nasicornis plus B. rhinoceros, and anti-N. melanoleuca plus N. mossambica, anti-Lachesis muta, anti-Bothrops jararaca and anti-Crotalus durissus terrificus were supplied by the Seção de Processamento de Plasmas Hiperimunes-Divisão de Desenvolvimento Tecnológico e Produção, Instituto Butantan, São Paulo, Brazil. Chicken polyclonal IgY anti-B. arietans, anti-B. nasicornis plus B. rhinoceros, and anti-N. melanoleuca plus N. mossambica, were prepared at the Laboratório de Biologia do Reconhecer, Centro de Biociências e Biotecnologia, Universidade Estadual do Norte Fluminense - Darcy Ribeiro, Campos do Goytacazes, RJ (de Almeida et al.,2008).
Horse F(ab´)2 anti-venoms were prepared at the Seção de
Processamento de Plasmas Hiperimunes-Divisão de Desenvolvimento Tecnológico e Produção, Instituto Butantan, São Paulo, Brazil. Quantification of proteins The protein concentrations of the venoms, their purified fractions and the anti-venoms were assessed using the bicinchoninic acid method with a Pierce BCA Protein Assay Kit (Rockford, IL). Determination of venom lethality (LD50 )
The median lethal dose (LD50) of each venom was determined in mice. Five serial venom dilutions were prepared in PBS. Groups of four mice were i.p. injected with each venom dilution. The control

group was injected with PBS. The death/survival ratios were determined after 48 h of observation. The LD50 was calculated using probit analysis (Finney, 1947; World Health Organization, 1981). Evaluation of venom hemorrhagic activity (HD50) The median hemorrhagic dose was evaluated by injecting (i.c.) 50-μL aliquots of PBS-saline, pH 7.0, containing different concen-trations of crude or purified venom fractions into dorsally depilated mice anesthetized under a CO2 atmosphere. After 48 h, the mice were again anesthetized under CO2 atmosphere and bled. B. arietans venom hemorrhagic activity Groups of mice were subcutaneously injected with different amounts of crude venom, with chromatograph isolated protein peaks P´1 P´2, P´3, P´5 or with 01 M NaCl (NCs) as negative control. In some experiments, B. jararaca venom was included as positive control. 2 h later the mice were anesthetized under CO2 atmosphere, submitted to total bleeding, the skin dissected, and the hemorrhagic areas were exposed in the internal skin surface. The hemorrhagic areas (Figure 4A1 and 4A2, and 4 negative control NCs), were evaluated with a “SCANNER” program in Image J (Dias, 2007; Schneider et al., 2012), the images were plotted on a square millimeter chart, the plots corresponding to each hemorrhagic area were measured, the hemorrhagic square area was calculated in function of the square millimeter chart and referred as square percentages (Figure 4C). The tissue areas of each hemorrhagic area was removed, the hemoglobin was extracted and spectrophotometrically evaluated at 491 nm. Neutralization of venom hemorrhagic activities Samples of B. arietans crude venom, its chromatographically isolated protein peaks containing 4 HD50, and various dilutions of anti-venoms were incubated for 30 min at 37°C. The venom samples incubated only with PBS were run in parallel. After incubation, 50 µL aliquots of the mixtures were subcutaneously injected into the mice. Each mixture was tested on a group of five mice. Two hours later, the mice were anesthetized under a CO2 atmosphere, and the hemorrhagic areas were evaluated as described above. Neutralization activity was expressed as the minimal amount of antivenom reducing 50% of hemorrhagic areas (ED50) produced by untreated antivenoms (HD50).
Isolation of hemorrhagic-inducing metalloproteinases from B. arietans venom Fifty milligrams of freeze-dried venom was dissolved in 5 mL of pH 5.5 acetate buffer (50 mM sodium acetate plus 150 mM NaCl), filtered through a 0.45-µm pore size membrane, and loaded on a Sephacryl S 100 HR (2.5 x 67 cm) molecular exclusion chromatography column previously equilibrated with pH 5.5 acetate buffer in a climate-controlled room. The subsequent elution was also performed with pH 5.5 acetate buffer. The samples were collected at a 60 mL/h flow rate, and their protein content was monitored by recording the absorbance at 280 nm in a spectrophotometer. The eluted fractions corresponding to peaks, P´1, P´2, P´3 and P´5 were pooled, and their protein contents were also determined as described above. The protein concentration of each fraction was adjusted to a common value before being used as antigen in western blotting and ELISA assays or as a hemorrhagic-inducing factor in the mouse skin test.
de Souza et al. 1001 SDS-PAGE The protein samples were separated by electrophoresis (Laemmli, 1970). Crude venoms (10 µg) or purified hemorrhagins (2 µg) were treated with SDS-PAGE sample buffer under reducing conditions and resolved on a 12.5% polyacrylamide gel and stained with silver sulfate; molecular mass was determined using molecular markers running in parallel. Western blotting Samples of crude venoms (10 µg) or purified fractions (2 µg) were treated with SDS-PAGE sample buffer under reducing conditions and resolved on a 12.5% polyacrylamide gel as described (Laemmili, 1970). Some SDS-PAGE preparations were stained with silver sulfate to be used as protein band profiles. Other SDS-PAGE preparations were electro-blotted to 0.45-µm nitrocellulose membranes (Towbin et al., 1979) to identify the protein bands recognized by anti-venoms. Membranes were incubated overnight in blocking buffer (5% non-fat milk in PBS) and then washed in PBS buffer containing 5% BSA and incubated for 2 hours with primary antibodies (horse or hen IgY anti-B. arietans venom antibodies) diluted to 1:5,000 in PBS containing 0.1% BSA for 1 h at room temperature on a horizontal shaker. After washing three times with PBS containing 0.05% Tween-20, the membranes were incubated with rabbit anti-horse IgG or anti-IgY conjugated to alkaline phosphatase (whole molecule) diluted 1:7,500 in PBS containing 0.1% BSA and 0.05% Tween-20. The membranes were then incubated for 1 h at room temperature on a horizontal shaker. The results were imaged after addition of the substrate. ELISA ELISA plates (96 wells) were coated with 1.0 μg of crude Brazilian or African snake venom in 100 μL of PBS and stored overnight at 4°C. In some assays, crotoxin or PLA2 purified from C. d. terrificus or purified B. arietans metalloproteinase were used as the antigens. The wells were blocked for 2 hours at 37°C with 200 μL of PBS containing 5% BSA. The wells were then washed with 200 µL of PBS. For the initial antibodies, serial dilutions of horse IgG or F(ab’)2 preparations (1:4,000 to 2,048,000) in PBS containing 0.1% BSA were prepared, and 100 μL of each dilution was added to the individual wells. The plates were then incubated at 37°C for 1 h. The wells were then washed three times with washing buffer. As the second antibody, rabbit peroxidase-conjugated anti-horse IgG (whole molecule) (Sigma Aldrich, St. Louis, MO) diluted (1:20,000) in PBS containing 0.1% BSA and 0.05% Tween 20 (100 μL/well) was added to the plates. The plates were then incubated for 1 h at 37°C. After three washes with washing buffer, 50 μL of substrate buffer was added to each well, and the plates were incubated at room temperature for 15 min. The reaction was terminated with 50 μL of 4 N sulfuric acid per well. The absorbance was recorded at 492 nm using an ELISA plate reader (Labsystems Multiskan Ex, Thermo Fisher Scientific Inc., Walthan, MA). Horse IgG isolated from serum collected before immunization was used as a negative control. The IgG dilution giving an optical density of 0.2 was used to calculate the U-ELISA per milliliter of undiluted IgG solution. One U-ELISA is defined as the smallest dilution of antibody giving an O.D. of 0.2 under the conditions of the ELISA assay. The calculated value was then used to determine the amounts in 1.0 mL of undiluted anti-venom preparations. Statistical analysis The data were subjected to one-way ANOVA followed by Dunn´s
1002 Afr. J. Biotechnol.
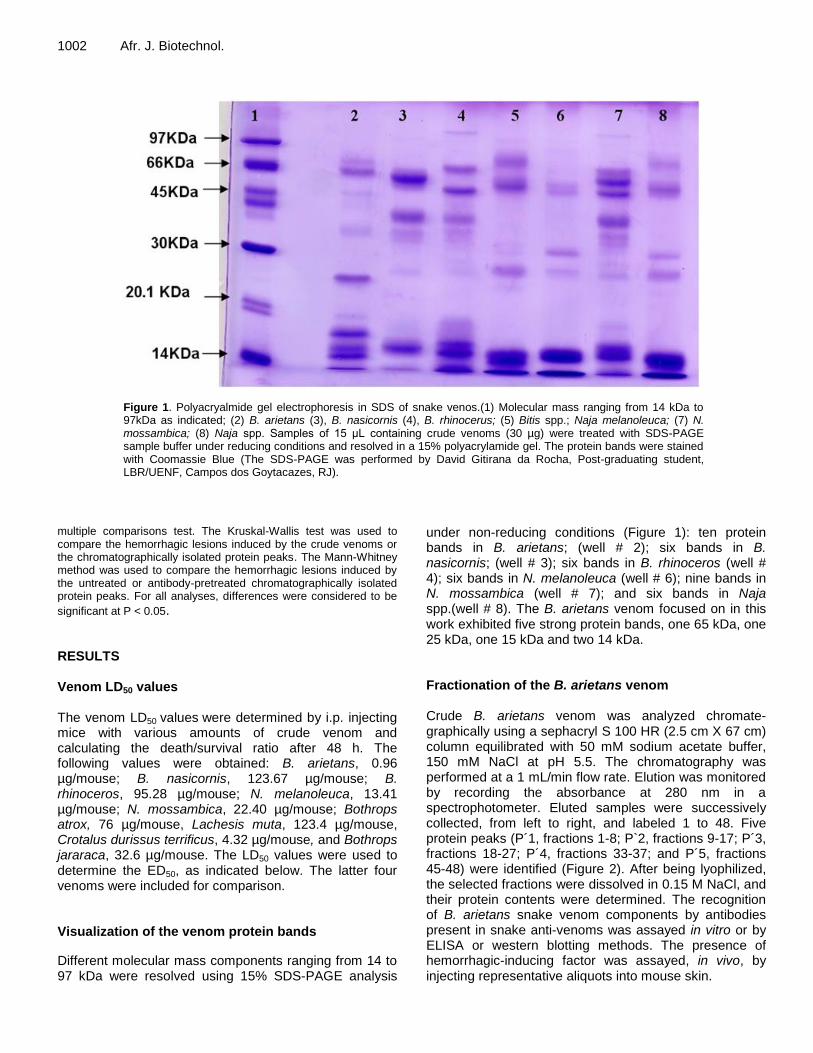
Figure 1. Polyacryalmide gel electrophoresis in SDS of snake venos.(1) Molecular mass ranging from 14 kDa to 97kDa as indicated; (2) B. arietans (3), B. nasicornis (4), B. rhinocerus; (5) Bitis spp.; Naja melanoleuca; (7) N. mossambica; (8) Naja spp. Samples of 15 μL containing crude venoms (30 µg) were treated with SDS-PAGE sample buffer under reducing conditions and resolved in a 15% polyacrylamide gel. The protein bands were stained with Coomassie Blue (The SDS-PAGE was performed by David Gitirana da Rocha, Post-graduating student, LBR/UENF, Campos dos Goytacazes, RJ).
multiple comparisons test. The Kruskal-Wallis test was used to compare the hemorrhagic lesions induced by the crude venoms or the chromatographically isolated protein peaks. The Mann-Whitney method was used to compare the hemorrhagic lesions induced by the untreated or antibody-pretreated chromatographically isolated protein peaks. For all analyses, differences were considered to be
significant at P < 0.05. RESULTS Venom LD50 values The venom LD50 values were determined by i.p. injecting mice with various amounts of crude venom and calculating the death/survival ratio after 48 h. The following values were obtained: B. arietans, 0.96 µg/mouse; B. nasicornis, 123.67 µg/mouse; B. rhinoceros, 95.28 µg/mouse; N. melanoleuca, 13.41 µg/mouse; N. mossambica, 22.40 µg/mouse; Bothrops atrox, 76 µg/mouse, Lachesis muta, 123.4 µg/mouse, Crotalus durissus terrificus, 4.32 µg/mouse, and Bothrops jararaca, 32.6 µg/mouse. The LD50 values were used to determine the ED50, as indicated below. The latter four venoms were included for comparison. Visualization of the venom protein bands
Different molecular mass components ranging from 14 to 97 kDa were resolved using 15% SDS-PAGE analysis
under non-reducing conditions (Figure 1): ten protein bands in B. arietans; (well # 2); six bands in B. nasicornis; (well # 3); six bands in B. rhinoceros (well # 4); six bands in N. melanoleuca (well # 6); nine bands in N. mossambica (well # 7); and six bands in Naja spp.(well # 8). The B. arietans venom focused on in this work exhibited five strong protein bands, one 65 kDa, one 25 kDa, one 15 kDa and two 14 kDa. Fractionation of the B. arietans venom Crude B. arietans venom was analyzed chromate-graphically using a sephacryl S 100 HR (2.5 cm X 67 cm) column equilibrated with 50 mM sodium acetate buffer, 150 mM NaCl at pH 5.5. The chromatography was performed at a 1 mL/min flow rate. Elution was monitored by recording the absorbance at 280 nm in a spectrophotometer. Eluted samples were successively collected, from left to right, and labeled 1 to 48. Five protein peaks (P´1, fractions 1-8; P`2, fractions 9-17; P´3, fractions 18-27; P´4, fractions 33-37; and P´5, fractions 45-48) were identified (Figure 2). After being lyophilized, the selected fractions were dissolved in 0.15 M NaCl, and their protein contents were determined. The recognition of B. arietans snake venom components by antibodies present in snake anti-venoms was assayed in vitro or by ELISA or western blotting methods. The presence of hemorrhagic-inducing factor was assayed, in vivo, by injecting representative aliquots into mouse skin.

de Souza et al. 1003
Elu
ted
pro
tein
(m
L/m
in)
Crude venom (mg/mL)
Figure 2. Isolation of hemorrhagic-inducing metalloproteinases from the B. arietans venom. Molecular chromatography exclusion of B. arietans venom. Five milliliter samples of crude venom (10 mg/mL) in 50 mM acetate-buffer, 150 mM NaCl, pH 5.5 were applied on Sephacryl S 100 HR (2.5 cm X 67 cm) column previously equilibrated with the some buffer. Chromatography was processed at 0.4 mL/min flow-rate. Elution was monitored by recording the absorbance at 280 nm in a UPC-900 Amersham Pharmacia Biotech. Elution samples were successively collected and labeled 1 to 48 from the left to right. Five eluted protein peaks (P´s) were obtained: P1´, fractions 1-8; P`2, fractions 9-17; P´3, fractions 18-27; P´4, fractions 33-37; P´5, fractions 45-48. The protein peaks were lyophilized. Before assays, the peaks were dissolved in the required buffer or solution and the protein contents were determined. The protein peaks were then submitted to, in vitro, ELISA and Western blotting assays by using different snake anti-venoms as the first antibodies or, in vivo, by injecting into mice skin to evaluated their ability to promote hemorrhage.
Characterization of the B. arietans protein peaks separated by sephacryl S 100 HR (2.5 cm X 67 cm) column chromatography As indicated by polyacrylamide-gel electrophoresis (15%), the main B. arietans venom protein P3´ obtained from sephacryl S 100 HR chromatography was a 50-kDa protein similar to the protein present in whole venom (Figure 3A). Densitometric analysis indicated (Figure 3B) that P3´ was also prominent but with smaller-molecular weight protein contaminations. Unexpectedly, the P3´ protein was recognized by antibodies present in the different polyvalent anti-venoms.
The chromatographi-cally isolated samples were also plated in ELISA wells. The horse F(ab)´2 polyvalent anti-venoms anti-B. arietans, anti-Bitis spp., anti-Lachesis muta, anti-B. atrox, anti-Bothrops spp., anti-Crotalus spp., and anti-Naja ssp. and the IgY anti-B. arietans, anti-Bitis spp. and anti-Naja spp. anti-venoms were used as primary antibodies (Figure 3C). P3´ was submitted to western blot analysis and subsequently recognized by polyvalent horse anti-venoms and stained (1 - control; 2 - anti-Bitis arietans; 3 - anti-Bitis spp.; 4 - anti-Bothrops spp.; 5 - anti-Lachesis muta; 6 - anti-Naja spp., 7 - anti-
Crotalus spp.) (Figure 3D). Hemorrhagic activity induced by crude venoms or by their isolated protein peaks The hemorrhagic-inducing properties of B. arietans crude venom or of its isolated hemorrhagic-inducing protein fractions were assayed by injecting aliquots of the test samples into mice skin. After 2 h, the mice were anesthetized under a CO2 atmosphere and bled; the skin was dissected, and the hemorrhagic areas were exposed in the internal skin surface. Figure 4A1 indicates that the hemorrhagic area developed with 5 µg (Figure 4A1a) of B. arietans crude venom was larger than that produced with 2 µg (Figure 4A1b) of the same venom.The amounts of hemoglobin extracted from these areas were equally proportional to injected B. arietans crude venom doses. Equivalent results were obtained when B. jararaca crude venom was used as positive control (Figure 4B). These results were also compatible when the corresponding areas were indirectly measured and expressed in percentage terms of square percentages of hemorrhagic areas: A1a = 12.8%; A1b =24.0%; A21 =11.7%; A22

1004 Afr. J. Biotechnol.
Figure 3. Characterization of the main B. arietans venom protein P3´ obtained from Sephacryl S 100 HR (2.5 X 67 cm) chromatography. (A) Polyacrilamide-gel electrophoresis (12%) of the B. arietans on Superose 12 HR column (10/30, ÄKTA FPLC, Pharmacia, Uppsala, Sweden), eluted protein P’3. A 50kDa band protein present in whole venom is prominent in isolated P’3. (B) Upon densitometry analysis the P’3 was also prominent but exhibiting smaller molecular protein contaminations. (C) P3´protein was recognized by antibodies present in different polyvalent anti-venoms. Samples of chromatographically isolated was plated on ELISA wells. The horse F(ab)´2 polyvalent anti-venoms anti-B. arietans, anti-Bitis spp, anti-Lachesis muta, anti-B. atrox, anti-Bothrops spp., anti-Crotalus spp., and anti-Naja ssp, or IgY anti- B. arietans, anti-Bitis spp. and anti-Naja spp. were used as first antibodies. (D) Western blotting analysis of P3. The eluted protein peaks were submitted to polyacrylamide-gel electrophoresis (15%), electrotransferred to nitrocellulose membrane, the protein bands recognized by polyvalent horse anti-venoms and stained. 1, control; 2, anti-Bitis arietans; 3, anti-Bitis spp.; 4, anti-Bothrops spp.; 5, anti-Lachess muta; 6, anti-Naja spp.; 7, anti-Crotalus spp.
=15.6%; A13 = 18.4%; A15 = 30.3%; NCs = 0.3% (Figure 4C). Inhibition of the isolated hemorrhagic activity by polyvalent anti-venoms Antibodies present in horse polyclonal F(ab´)2 or in chicken IgY anti-Bitis arietans, anti-Bitis spp., anti-Naja spp., anti-Lachesis muta, anti-Bothrops spp., and anti-Crotalus spp. and IgY anti-B. arietans, anti-Bitis spp., and anti-Naja spp. were able to inhibit the B. arietans inducing-hemorrhagic activity present either in whole venom or in the isolated P3´ fraction (Figure 5).
DISCUSSION The use of purified relevant snake venom toxins to immunize animals instead of crude venoms avoids anti-venom contamination with non-relevant antibodies directed to non-toxic venom components. Selecting the relevant toxins to be included in the immunogenic mixture is the first step in constructing effective mono-specific anti-venoms.
In this study, we focused on B. arietans; its large distribution in densely populated savannah areas in sub-Saharan Africa and in the Arabian Peninsula (Navy, 1991), associated with severity of its bite, justified its selection. Among their toxic components, we examined

de Souza et al. 1005
Figure 4. B. arietans venom hemorrhagic activity. Groups of mice were subcutaneously injected with different amounts of crude venom, with chromatograph isolated protein peaks P´1 P´2, P´3, P´5 or with 01M NaCl (NCs) as negative control. In some experiments, B. jararaca venom was included as positive control. Two hours later the mice were anesthetized under CO2 atmosphere, submitted to total bleeding, the skin dissected, and the hemorrhagic areas were exposed in the internal skin surface. The hemorrhagic areas (4A1 and 4A2, and negative control NCs), were evaluated with a “SCANNER” program in Image J (Schneider, 2012), the images were plotted on a square millimeter chart, the plots corresponding to each hemorrhagic area were measured, the hemorrhagic square area was calculated in function of the square millimeter chart and referred as square percentages (C). The tissue areas of each hemorrhagic area was removed, the hemoglobin was extracted and spectrophotometrically evaluated at 491 nm. (A) Skin fragments of hemorrhagic areas resulting from subcutaneous injections with 2 µg (A1a) or 5 µg (A1b) of B. arietans crude venom or with Sephacryl S 100 HR chromatography protein peaks P´1, P´ 2, ´P´3 and P´ 5 (A21, A22, A23, A25) or with 0.15 M NaCl solution (NCs). (B) Local tissue deposited hemoglobin. (C) Square percentages of hemorrhagic areas: A1a = 12.8%; A1b =24.0%; A21 =11.7%; A22 =15.6%; A13 = 18.4%; A15 = 30.3%; NCs = 0.3%.
the hemorrhage-inducing factors contained in B. arietans venom. Data from past and recent publications have indicated that the M12b subfamily of zinc-dependent reprolysins is causative agents of local tissue lesions and systemic symptoms in Bitis spp. accidents (Bode et al.1993; Stokër et al., 1995; Gutiérrez and Rucovaldo, 2000). SVMPs is remarkable present in Elapidae and Colubridae venoms (Junqueira-de-Azevedo and Ho, 2002; Guo et al. 2007).
Among the B. arietans venom isolated fractions P´1, P´2, P´3, P´4 and P´5, P´3 were identified as having 50-kDa, P´1, P´2 and P´4 and P´5 were admittedly having lesser or higher molecular mass, respectively (Figure 2); as it was expected that SVMPs include 20-30 kDa and
over 50 kDa enzymes could all mimicked venom hemorrhagic activities. In fact, the isolated B. arietans venom protein fractions, P’1, P’2, P’3 and P’5 exhibited, with different degree, hemorrhagic activity (Figure 4). Considering the relative molecular mass of 50 kDa for P’3, 20-30kDa for P’1 and P’2, over 50kDa for P’5, all described SVMPs were partially purified. P’3 protein fraction may exhibits the typical SVMP disintegrin domain in the presence of an MGD sequence replacing the RGD sequence found in many disintegrins (Nikai et al., 2000). The immunochemical properties of this protein were evaluated in vitro by standard ELISA and Western blotting methods, and the ability of this protein to induce hemorrhage was analyzed in vivo in mouse skin. As

1006 Afr. J. Biotechnol.
Figure 5. Antibodies developed by different crude snake venoms inhibit the hemorrhagic activities present in B. arietans whole venom or in their isolated fraction P3´. Mice (n=20) were subcutaneously injected with 100 µL of 0.15 M NaCl containing 20 µg of P3` eluted from on Sephacryl S 100 HR (2.5 X 67 cm) column pretreated at 37°C for 2 h with Horse F(ab´)2 anti-B. arietans, anti-Bitis, anti-Lachesis, anti-B.atrox, anti-Bothrops anti-venoms from “Instituto Butantan” or IgY anti-B. arietans, anti-Bitis spp., and anti-Naja spp. produced in hens. The hemorrhagic areas were measured, the hemoglobin extracted and spectrophotometrically quantified at 410 nm.
expected from published data, B. arietans venom protein contains antigenic epitopes recognized by antibodies generated by non-Viperidae snake venoms (Junqueira-de-Azevedo and Ho, 2002; Guo et al., 2007; Ching et al., 2006). In fact, in this study, we experimentally demon-strated that the isolated 50-kDa protein was recognized by antibodies present in horse polyclonal F(ab´)2 or in chicken IgY anti-Bitis arietans, anti-Bitis spp., anti-Naja spp., anti-Lachesis muta, anti-Bothrops spp., and anti-Crotalus spp. and IgY anti-B. arietans, anti-Bitis spp., and
anti-Naja spp. (Figure 3). These antibodies were also able to inhibit the B. arietans hemorrhagic activity present in either B. arietans venom or the isolated P3´ fraction (Figure 5).
Although not tested, the 50-kDa purified protein may exhibit some biological activities similar to SVMPs, for example, fibrinolytic activity (Retzios and Markland Jr, 1998), non-hemorrhagic fibrinolytic protease activity (Willis and Tu, 1988; Kini, 2005; Kornalik and Blombäk, 1975; Yamada et al., 1996; Siigur et al., 2004; Tans and
Rosing, 2002; Brenes et al., 2010; Trumal et al., 2005; Han et al., 2010), platelet aggregation inhibition (Kamiguti et al., 1996; Laing and Moura-da_Silva, 2005; Wang et al., 2005; Zhou et al., 1996), pro-inflammatory action (Gutiérrez et al., 2005; Moura-da-Siva et al., 2007; Rucavado et al.,1995), and blood serine protease inhibitor inactivation (Kress, 1986; Krees and Catanese, 1980; Kress and Hufnagel, 1984).
The purified 50-kDa protein fraction can therefore be included in immunogenic mixtures intended to induce mono-specific anti-Bitis spp. venoms. This mixture has been enriched by the inclusion of purified B. arietans blood pressure-hypotensive factor (Kodama et al., 2015).
The immunogenic mixture will be submitted to a pre-clinical test in mice and in laying hens. Specifically, two H-2 distinct mice inbreed strains, C57BL/6 (k) and BALB/c (b), and white leghorn lineage hens (Gallus gallus domesticus) will be used as test animals. The immunogenic mixture containing the purified 50-kDa hemorrhagic fraction and blood pressure-hypotensive factor in various proportions will be subcutaneously (in mice) or intramuscularly (in hens) injected four times at 15-day intervals. In the primary immunization, the immunogenic mixture will be adsorbed in mesoporous silica SBA-15 as an adjuvant (Carvalho et al., 2010) prior to injection. In the three subsequent boosters, the immunizations will contain venom components without adjuvants. Blood samples will be collected before each immunization, and the sera will be used to evaluate the antibody titers and their ability to neutralize B. arietans venom hemorrhage, blood pressure hypotensive and lethality-inducing activities. The obtained antibodies will be evaluated in parallel assays with horse anti- B. arietans or B. g. rhinoceros plus B. nasicornis venoms (Guidolin et al., 2012). These anti-venoms inhibit Bitis spp. toxic activities (Paixão et al., 2015).
The antibody potencies for neutralizing lethality (ED50), skin hemorrhage (EH50), complement-inactivation (ECa50), and blood-pressure hypotensive-inducing activities (EBh50) will be evaluated as recommended by WHO (2010). Antibodies endowed with high specific and affinity qualities may be the first step in producing engineered mini-anti-venom antibodies as anti-snake venoms (Holliger and Hudson, 2005).
Conflict of interest
The authors declare no conflict of interest.
ACKNOWLEDEGEMENTS
This work was supported by Grants from FAPESP -Projeto CETICS-CEPID, FAPESP No:2013/07467 – 1, CAPES-Projeto: No: 12 – 23038000814/2011-83, Fundação Butantan – Instituto Butantan, Liderança Cientifíca-Wilmar Dias da Silva, CNPq-Bolsa de Produtividade- Nível 1A, No: 301836/2005-1-Wilmar Dias
de Souza et al. 1007 da Silva.
We thank the post-graduate students Angela Alice Amadeu and Felipe R. Guidolin for their assistance in preparing and editing the manuscript.
Author contributions
Tahís Louvain de Souza carried out the experiments; Fábio C. Magnoli purified the metalloproteinases; Wilmar Dias da Silva analyzed the results and wrote the paper. REFERENCES Bjarnason JB, Fox JW (1995). Snake venom metalloendopeptidases:
reprolysins. Methods Enzymol. 248:345-368. Bode W, Gomis-Ruth FX, Stokër W (1993). Astacins, serralysins, snake
venom and matrix metalloproteinases exhibit identical zinc-binding environments (HEXXHXXGXXH and Met-turn) and topologies and 331:134-140 should be grouped into a common family, the “metzinci Lett, 331:134- 140.
Brenes O, Muñóz E, Roldán-Rodríguez R, Díaz C (2010). Cell death induced by Bothrops asper snake venom metalloproteinase on endothelial and other cell lines. Exp. Mol. Pathol. 88:424-432.
Broadley CM (1968). The venemous snakes in Central and South Africa. In Venomous animals and their venoms, Bücherl W, Buckley E, Deulofeu V, Eds. Academic Press: New York, London, Vol. 1.
Calvete JJ, Juárez P, Sanz L (2007). Snake venomics. Strategy and applications. J. Mass Spectrom 42:1405-1414.
Calvete JJ, Marcinkiewicz C, Sanz L (2006). Snake venomics of Bitis gabonica gabonica. Protein family composition, subunit organization of venom toxins, and characterization of dimeric disintegrins bitisgabonin-1 and bitisgabonin-2. J. Proteome Res. 6:326-336.
Carvalho LV, Ruiz RC, Scaramuzzi K, Marengo EB, Matos JR, Tambourgi DV, Fantini M C A, Sant ´Anna OA (2010). Immunological parameters related to the adjuvant effect of the ordered mesoporous silica SBA-15 Vaccine, 28: 7829-7836.
Cavalcante DP, Kuniyoshi AK, Portaro FCV, Dias da Silva W, Tambourgi DV (2015). African adders: partial characterization of snake venoms from three Bitis species of medical importance and their neutralization by experimental equine anti-venoms. PLOS neglected.
Ching AT, Rocha MM, Paes Leme AF, Pimenta DC, de Fátima DF, Serrano SM, Ho PL, Junqueira-de Azeved IdeL (2006). Some aspects of the venom proteome of the Colubridae snake Philodryas olfersii revealed from a Duvernoy's (venom) gland transcriptome. FEBS Lett. 580:4417-442.
Currier RB, Harrison RA, Rowley PD, Laing GD, Wagstaff SC (2010). Intra-specific variation in venom of the African Puff Adder (Bitis arietans): Differential expression and activity of snake venom metalloproteinases (SVMPs). Toxicon 55:864-873.
de Almeida CM, da Silva CL, Couto HP, Escocard Rde C, da Rocha DG, Sentinelli Lde, P, Kipnis TL, da Silva WD (2008). Development of process to produce polyvalent IgY antibodies anti-African snake venom Toxicon 52: 293-301.
Dias FC (2007). Uso do software image J para análise quantitativa de imagens de microestruturas de materiais. Masters Thesis.
Finney DJ (1947). Probit analysis. Third ed.; Cambridge University Press: Cambridge, UK, p. 253.
Guo XX, Zeng L, Lee WH, Zhang Y, Jin Y (2007). Isolation and cloning of a metalloproteinase from king cobra snake venom. Toxicon 49:954-965.
Guidolin RG, Marcelino RM, Gondo HH, Morais JF, Ferreira RA, Silva KTL, Silva JA, Fafetine, J, Dias da Silva W (2010). Polyvalent horse F(Ab')2 snake antivenom: Development of process to produce polyvalent horse F(Ab')2 antibodies anti-african snake venom. Afr. J. Biotechnol. 9:2446-2455.
Gutiérrez J, Romero M, Díaz C, Borkow G, Ovadia M (1995). Isolation and characterization of a metalloproteinase with weak hemorrhagic

1008 Afr. J. Biotechnol.
activity from the venom of the snake Bothrops asper (terciopelo). Toxicon 33:19-29.
Gutiérrez JM, Rucovaldo A (2000). Snake venom metalloproteinases: their role in the pathogenesis of local tissue damage. Biochimie 82:841-850).
Gutiérrez JM, Rucavado A, Escalante T, Díaz C (2005). Hemorrhage induced by snake venom metalloproteinases: biochemical and biophysical mechanisms involved in microvessel damage. Toxicon 45(8):997-1011.
Han SM, Weaver F A, Comerota AJ, Perler BA, Joing M (2010). Efficacy and safety of alfimeprase in patients with acute peripheral arterial occlusion (PAO) J. Vasc. Surg. 51(3):600-609.
Holliger P, Hudson PJ (2005). Engineered antibody fragments and the rise of single domains. Nat. Biotechnol. 23:1126-1136.
Juárez P, Wagstaff SC, Oliver J, Sanz L, Harrison RA, Calvete JJ (2006). Molecular cloning of disintegrin-like transcript BA-5A from a Bitis arietans venom gland cDNA library: a putative intermediate in the evolution of the long-chain disintegrin bitistatin. J. Mol. Evol. 63:142-152.
Junqueira-de-Azevedo I, Ho PL (2002). A survey of gene expression and diversity in the venom glands of the pitviper snake Bothrops insularis through the generation of xpressed sequence tags (ESTs). Gene 299:729-291.
Kamiguti A, Hay C, Zuzel M (1996). Inhibition of collagen-induced platelet aggregation as the result of cleavage of alpha-2 beta-1-integrin by the snake venom metalloproteinase jararhagin. Biochem. J. 320:635-641.
Kasturiratne A, Wickremasinghe AR, de Silva N, Gunawardena NK, Pathmeswaran A, Premaratna R, Savioli L, Lalloo DG, de Silva HJ (2008). The global burden of snakebite: a literature analysis and modelling based on regional estimates of envenoming and deaths. PLoS Med. 5:1591-1604.
Kini RM (2005). The intriguing world of prothrombin activators from snake venom. Toxicon 45:1133-1145.
Kodama RT, Carvalho DC, Kuniyoshi AK, Kitano ES, Tashima AK, Barna BF, Takakura AC, Serrano SMT, Dias-Da-Silva W, Tambourgi DV, Fernanda V, Portaro FV (2015). New proline-rich oligopeptides from the venom of African Adders. Insights into the hypotensive effect of the venoms. FEB Letter.
Kornalik F, Blombäck B (1975). Prothrombin activation induced by Ecarin-a prothrombin converting enzyme from Echis carinatus venom. Thromb. Res. 6:53-63.
Kress LF, Catanese J (1980). Enzymatic in activation of human antithrombin III limited proteolysis of the inhibitor by snake venom proteinases in the presence of heparin. Biochim. Biophys. Acta (BBA)-Enzymol. 615:178-186.
Kress LF (1986). Inactivation of human plasma serine proteinase inhibitors (serpins) by limited proteolysis of the reactive site loop with snake venom and bacterial metalloproteinases. J. Cell. Biochem. 32:51-58.
Kress LF, Hufnagel ME (1984). Enzymatic inactivation of human α1-antichymotrypsin by metalloproteinases in snake venoms of the family elapidae. Comp. Biochem. Physiol. Part B: Comp. Biochem. 77:431-436.
Laemmli UK (1970). Cleavage of structural proteins during the assembly of the head of bacteriophage T4. Nature 227(5259):680-685.
Laing D, Moura-da-Silva AM (2005). Jararhagin and its multiple effects on hemostasis. Toxicon 45:987-996.
Manaças S (1981-1982). Ofídeos venenosos da Guiné. S. Tomé, Angola e Moçambique. In Garcia de Orta: Série de zoologia 10:13-46.
Moura-da-Silva A, Butera D, Tanjoni I (2007). Importance of snake venom metalloproteinases in cell biology: effects on platelets, inflammatory and endothelial cells. Curr. Pharm. Des. 13: 2893-2905.
Moura-da-Silva A, Furlan M, Caporrino M, Grego K, Portes-Junior J, Clissa, P.; Valente R, Magalhães G (2011). Diversity of metalloproteinases in Bothrops neuwiedi snake venom transcripts: evidences for recombination between different classes of SVMPs. BMC Genet. 12:94.
Navy US (1991). Poisonous Snakes of the World. Dover Publications Inc: US Govt. New York. p. 203.
Nikai T, Taniguchi K, Komori Y, Masuda Y, Fox JW, Sugihara H (2000).
Primary structure and functional characterization of bilitoxin-1, a novel diametric P-II snake venom metalloproteinase from Agkistrodon billineatus venom. Arch. Biochem. Biophys. 378: 6-15.
Remfry J (1987). Ethical aspects of animal experimentation. In Laboratory animals: An introduction for new experiments, Tuffery AA, Ed. Interscience: New York. pp. 5-9.
Retzios AD, Markland FS Jr (1988). A direct-acting fibrinolytic enzyme from the venom of Agkistrodon contortrix contortrix: effects on various components of the human blood coagulation and fibrinolysis systems. Thromb. Res. 52:541-552.
Rucavado A, Lomonte B, Ovadia M, Gutiérrez JM (1995). Local tissue damage induced by BaP1, a metalloproteinase isolated from Bothrops asper (terciopelo) snake venom. Exp. Mol. Pathol. 63:186-199.
Schneider CA, Rasband WS, Eliceiri KW (2012. NIH Image to Image J: 25 years of image analysis. Nat. Methods 9:671-675.
Siigur E, Aaspõllu A, Trummal K, Tõnismägi K, Tammiste I, Kalkkinen N, Siigur J (2004). Factor X activator from Vipera lebetina venom is synthesized from different genes. Biochim. Biophys. Acta -Proteins and Proteomics.1702:41-51.
Stokër W, Grams, F, Baumann U, Reinemer P, Gomis-Ruth FX, MacKey DB, Bode W (1995). The metzincins--topological and sequential relations between the astacins, adamalysins, serralysins, and matrixins (collagenases) define a superfamily of zinc-peptidases. Protein Sci. 4:823-840.
Tans G, Rosing J (2002). Snake venom activators of factor X: an overview. Pathophysiol. Haemost. Thromb. 31: 225-233.
Theakston RD, Warrell DA, Griffiths E (2003). Report of a WHO workshop on the standardization and control of antivenoms. Toxicon 41:541-557.
Towbin H, Staehelin T, Gordon J (1979). Electrophoretic transfer of proteins from polyacrylamide gels to nitrocellulose sheets: procedure and some applications. Proc. Natl. Acad. Sci. 76:4350-4354.
Trummal K, Tõnismägi K, Siigur E, Aaspõllu A, Lopp, A, Sillat T, Saat R, Kasak L, Tammiste I, Kogerman P (2005). A novel metalloprotease from Vipera lebetina venom induces human endothelial cell apoptosis. Toxicon 46:46-61.
Wang WJ, Shih CH, Huang TF (2005). Primary structure and antiplatelet mechanism of a snake venom metalloproteinase, acurhagin, from Agkistrodon acutus venom. Biochimie 87 (12):1065-1077.
Warrell DA (1996). Clinical features of envenoming from snake bites In Envenomings and their treatments, Bon C, Goyffon M, Eds. Fondation Marcel Mérrieux:p 64-76.
Warrell DA, Ormerod LD, Davidson NM (1975). Bites by puff-adder (Bitis arietans) in Nigeria, and value of anti-venom. Br Med J. 4 (5998):697-700.
Willis TW, Tu AT (1988) Purification and biochemical characterization of atroxase, a non hemorrhagic fibrinolytic protease from western diamondback rattlesnake venom. Biochemistry 27: 4769-4777.
World Health Organization (2010). WHO Guidelines for the Production Control and Regulation of Snake Antivenom Immunoglobulis, (www.who.int/bloodproducts/snake antivenoms). World Health Organization: (1981).
Yamada D, Sekiya F, Morita T (1996). Isolation and characterization of carinactivase, a novel prothrombin activator in Echis carinatus venom with a unique catalytic mechanism. J. Biol. Chem. 271:5200-5207.
Zhou Q, Dangelmaier C, Smith JB (1996).The hemorrhagin catrocollastin inhibits collagen-induced aggregation by binding to collagen via its desintegrin-like domain. Biochem. Biophys. Res. Comm. 219:720-726.
Vol. 14(12), pp. 1009-1014, 25 March, 2015
DOI: 10.5897/AJB2014.13709
Article Number: 2B3138551682
ISSN 1684-5315
Copyright © 2015
Author(s) retain the copyright of this article
http://www.academicjournals.org/AJB
African Journal of Biotechnology
Full Length Research Paper
Germination and in vitro multiplication of Helianthemum kahiricum, a threatened plant in Tunisia
arid areas
HAMZA Amina* and NEFFATI Mohamed
Range Ecology Laboratory, Arid Lands Institute of Médenine, 4119 Médenine, Tunisia.
Received 9 February, 2014; Accepted 9 February, 2015
Seeds of Helianthemum kahiricum have an excellent germination rate extending to about 90% within short time not more than four days after scarification (mechanical treatment) and a good protocol of disinfection. A high frequency of sprouting and shoot differentiation was observed in the primary cultures of nodal explants of H. kahiricum on Murashige and Skoog medium (MS) free growth regulators or with less concentration of kinetin (0.5 mg L
-1 or 1.0 mg L
-1 kin). In vitro proliferated shoot were
multiplied rapidly by culture of shoot tips on MS with kinetin (0.5 mg L-1
) which produced the greatest multiple shoot formation. The kinetin had a positive effect on the multiplication and growth, but a concentration that exceeded 2.0 mg.L
-1 decreased the growth. A high frequency of rooting with
development of healthy roots was observed from shoots cultured on MS/8 medium hormone-free. Key words: Helianthemum kahiricum, in vitro germination, multiplication, axillary buds.
INTRODUCTION Helianthemum kahiricum (called R'guiga or Chaal in Tunisia) (H. kahiricum) is a perennial herb widely found around the Mediterranean basin (Raynaud, 1987). H. kahiricum is an appressed, grey-canescent perennial low shrub that reaches up to 10-25 cm long with many, branched stems. Leaves are 0.5-1.8 x 0.15-0.3 cm, oblong-Ianceolate, appressed-pubescent, with strongly revolute margins, and acute to obtuse apex. Flowers are with white-villous, violaceous calyx and yellow petals equaling the sepals and are often not opening and
arranged in 5-l2-flowered and 1-sided inflorescence. The fruit is an ovoid-globose and hairy capsule with ovoid-compressed, smooth, and brownish. This is a chaméphyte (Escudero et al., 2007), family of Cistaceae, arid regions and semi-arid areas (Perez- Garcia and Gonzalez- Benito, 2006). Despite its ecological and economic interests, this plant is a rare endemic flora of the western basin of the Mediterranean (Escudero et al., 2007), as a result of overgrazing (Aidoud et al., 2006). The size of their population or their range, or both, is
*Corresponding author. E-mail: [email protected]. Tel: +21623963566. Abbreviations: Zea, Zeatin (cytokinine); IAA, indole-3-acetic acid (auxin); IBA, indole-3-butyric acid (auxin); Kin, kinetin (cytokinine); MS, Murashige and Skoog medium; NAA, 2-naphthalene acetic acid (auxin); 2iP, 2 isopentenyladenine (cytokinine).
Author(s) agree that this article remains permanently open access under the terms of the Creative Commons Attribution License 4.0 International License

1010 Afr. J. Biotechnol.
Table 1. Culture medium for Helianthemum kahiricum seeds germination.
Concentration (mg L˗1
) Culture medium
M0 M1 M2 M3 M4
Kin 0 1 1 1 1
IBA 0 0 0.5 1 0.5
Zea 0 0 0 0 0.5
Table 2. Composition of culture medium with growth hormone (auxin and cytokinin) for the multiplication of Helianthemum kahiricum explants.
Concentration (mg L˗1
) Culture medium
MS C1 C2 C3 C4 C5 C6
Kin 0 0.5 0.5 0.5 1 2 2
IBA 0 0 1 0 0 1 0
NAA 0 0 0 1 0 0 1
restricted or is greatly diminished. The data indicates that the situation will worsen irreversibly if nothing is done to address this vulnerability. In other words, if the observed situation continues, it will anticipates the disappearance of these species more or less. Among the factors responsible, including loss or degradation of habitat, exploitation of the species, exposure to pollutants, diseases, climate change, overexploitation or other cause result in regression of range or a sustained decline in the number but the population level reaches a critical threshold. The helianthemes have a great pastoral interest. They have a very important role in the fight against desertification and stabilization of vulnerable areas (Diez et al., 2002). In addition, they are involved in the production of desert truffles (Al-Rahmah, 2001; Slama et al., 2006). Desert truffles, known locally as the "terfess" are edible and wild seasonal mushrooms hypogeal (Mandeel et al., 2007). H. kahiricum is considered threatened in an extremely precarious situation. The size of their population or their range, or both, is restricted or is greatly diminished. Thus, to maintain the genetic integrity of clones and conservation of this species, in vitro germination, cultivation microcuttings and stimulation of axillary buds are the most applied in plant micropropagation method. For the species used in this study, in vitro culture seems to be a very interesting alternative for preserving H. kahiricum. Therefore, the purpose of this work was the multiplication of the species by micropropagation highlighting the effect of the composition of the culture medium on the initiation and proliferation of plant.
MATERIALS AND METHODS
Plant material
The plant material used consists of H. kahiricum seed from region
of Médenine (Benguerdenne: latitude 32°57'09"N, longitude 11°38'26"E, with an arid climate of an average rainfall of 150 mm/year and a sandy soil (Le Floch and Boulos, 2008). The explants which are internodes were taken from 2 months aged mother plants produced in vitro. In vitro germination Three experiments were conducted by changing the time and the type of fungicide to optimize better the germination of H. kahiricum seeds on MS medium (Murashige and Skoog, 1962). In all experiments, 20 seeds/replication were soaked in sodium hypochlorite followed by rinsing with distilled water. The seeds were disinfected in 70° alcohol followed by rinsing with sterile distilled water and then applying different fungicides: 1st experiment (Exp. 1): The seeds were treated with benlate (1 g L˗ 1) (10 min), followed by rinsing with distilled water; 2nd experiment (Exp. 2): The seeds were treated with mercuric chloride (1 g L˗ 1) (20 min), followed by rinsing with distilled water; 3nd experiment (Exp. 3): Without fungicide.
After the development of an adequate protocol of seeds disinfection, they were germinated in vials (20 seeds/vial). The germination test was carried out on MS (M0) and MS modified with growth hormones (M1, M2, M3 and M4) (25 repetitions for each test) (Table 1). Incubation takes place in a growth chamber under controlled conditions with an alternating day/night (16:8 h), a relative humidity of 80 and 45%, respectively, and a temperature of 25 ± 2°C for one week. In vitro multiplication The vitropousses from in vitro germination were then stripped of their leaves, cut in microcuttings (1 or 2 cm) with 1-2 nodes. Ten explants per vial were transferred to different Culture medium: MS, MS supplemented with growth hormones (C1, C2, C3, C4, C5 and C6) (25 rehearsals for each test), and MS diluted (MS/2, MS/4, MS/6 and MS/8) (25 rehearsals for each test), without hormones (Table 2), with a view follow the morphological attributes such as, bud, the length of the main stem, number of leaves, number of nodes, root length and rooting rate. After their rooting, the vitropousses were transferred into plastic pot filled with sand to
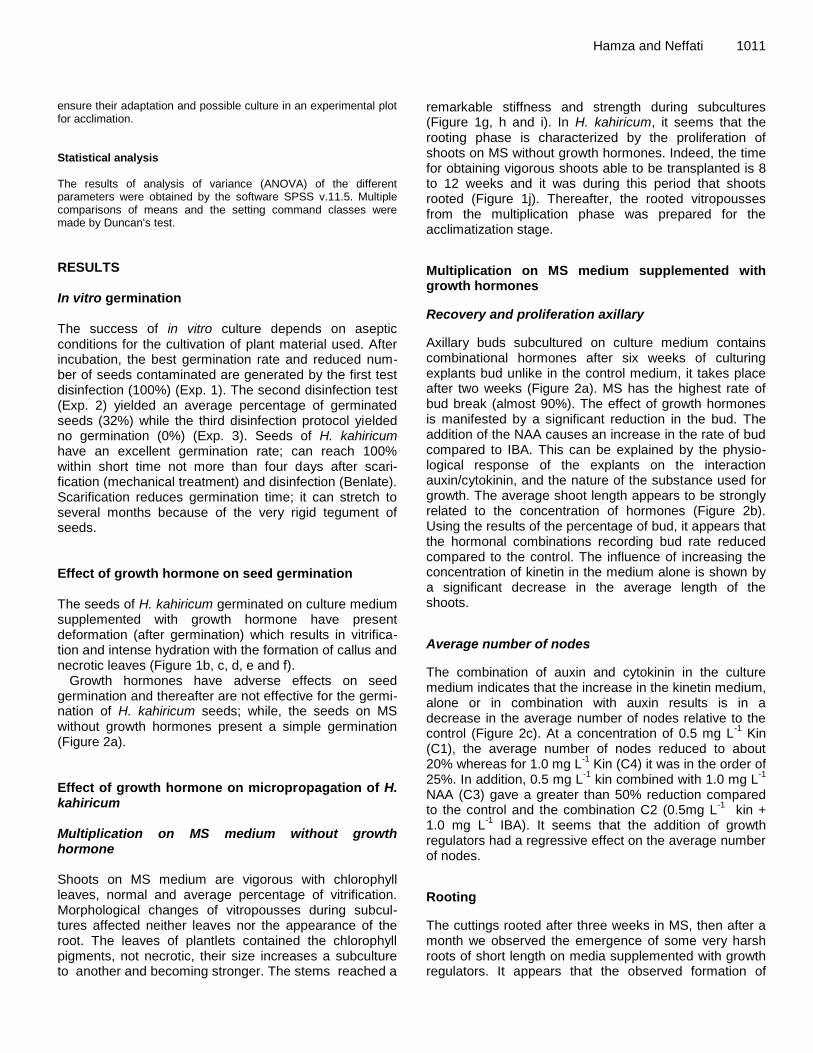
ensure their adaptation and possible culture in an experimental plot for acclimation. Statistical analysis The results of analysis of variance (ANOVA) of the different parameters were obtained by the software SPSS v.11.5. Multiple comparisons of means and the setting command classes were made by Duncan's test.
RESULTS In vitro germination The success of in vitro culture depends on aseptic conditions for the cultivation of plant material used. After incubation, the best germination rate and reduced num-ber of seeds contaminated are generated by the first test disinfection (100%) (Exp. 1). The second disinfection test (Exp. 2) yielded an average percentage of germinated seeds (32%) while the third disinfection protocol yielded no germination (0%) (Exp. 3). Seeds of H. kahiricum have an excellent germination rate; can reach 100% within short time not more than four days after scari-fication (mechanical treatment) and disinfection (Benlate). Scarification reduces germination time; it can stretch to several months because of the very rigid tegument of seeds. Effect of growth hormone on seed germination The seeds of H. kahiricum germinated on culture medium supplemented with growth hormone have present deformation (after germination) which results in vitrifica-tion and intense hydration with the formation of callus and necrotic leaves (Figure 1b, c, d, e and f).
Growth hormones have adverse effects on seed germination and thereafter are not effective for the germi-nation of H. kahiricum seeds; while, the seeds on MS without growth hormones present a simple germination (Figure 2a). Effect of growth hormone on micropropagation of H. kahiricum Multiplication on MS medium without growth hormone Shoots on MS medium are vigorous with chlorophyll leaves, normal and average percentage of vitrification. Morphological changes of vitropousses during subcul-tures affected neither leaves nor the appearance of the root. The leaves of plantlets contained the chlorophyll pigments, not necrotic, their size increases a subculture to another and becoming stronger. The stems reached a
Hamza and Neffati 1011 remarkable stiffness and strength during subcultures (Figure 1g, h and i). In H. kahiricum, it seems that the rooting phase is characterized by the proliferation of shoots on MS without growth hormones. Indeed, the time for obtaining vigorous shoots able to be transplanted is 8 to 12 weeks and it was during this period that shoots rooted (Figure 1j). Thereafter, the rooted vitropousses from the multiplication phase was prepared for the acclimatization stage.
Multiplication on MS medium supplemented with growth hormones
Recovery and proliferation axillary
Axillary buds subcultured on culture medium contains combinational hormones after six weeks of culturing explants bud unlike in the control medium, it takes place after two weeks (Figure 2a). MS has the highest rate of bud break (almost 90%). The effect of growth hormones is manifested by a significant reduction in the bud. The addition of the NAA causes an increase in the rate of bud compared to IBA. This can be explained by the physio-logical response of the explants on the interaction auxin/cytokinin, and the nature of the substance used for growth. The average shoot length appears to be strongly related to the concentration of hormones (Figure 2b). Using the results of the percentage of bud, it appears that the hormonal combinations recording bud rate reduced compared to the control. The influence of increasing the concentration of kinetin in the medium alone is shown by a significant decrease in the average length of the shoots.
Average number of nodes
The combination of auxin and cytokinin in the culture medium indicates that the increase in the kinetin medium, alone or in combination with auxin results is in a decrease in the average number of nodes relative to the control (Figure 2c). At a concentration of 0.5 mg L
-1 Kin
(C1), the average number of nodes reduced to about 20% whereas for 1.0 mg L
-1 Kin (C4) it was in the order of
25%. In addition, 0.5 mg L-1
kin combined with 1.0 mg L-1
NAA (C3) gave a greater than 50% reduction compared to the control and the combination C2 (0.5mg L
-1 kin +
1.0 mg L-1
IBA). It seems that the addition of growth regulators had a regressive effect on the average number of nodes.
Rooting
The cuttings rooted after three weeks in MS, then after a month we observed the emergence of some very harsh roots of short length on media supplemented with growth regulators. It appears that the observed formation of

1012 Afr. J. Biotechnol.
Figure 1. (a) Setting seed germination of H. kahiricum. (b) Seeds of H. kahiricum germinated on MS. (c) H. kahiricum seeds germinated on MS + 1 mg/l Kin + 0.5 mg/l IBA. (d) H. kahiricum seeds germinated on MS 1 mg/l Kin + 1 mg/l IBA. (e) H. kahiricum seeds germinated on MS + 1 mg/l Kin. (f) Seeds germinated on MS + 1 mg/l Kin + 0.5 mg/l IBA + 0.5 mg/l Zea. (g) Appearance of leaves during 4th subculture. (h) Appearance of the stems during the 4th subculture. (i) Appearance roots for 3th subculture. (j) In vitro plants rooting.
Figure 2. (a) Action of culture medium on the percentage of axillary buds of H. kahiricum, (b) action of media on the average length of H. kahiricum shoots, (c) action of media on average number of nodes, (d) effect of media on the average root length (cm) of H. kahiricum explants, (e) effect of media on rooting rate of H. kahiricum plantlets.
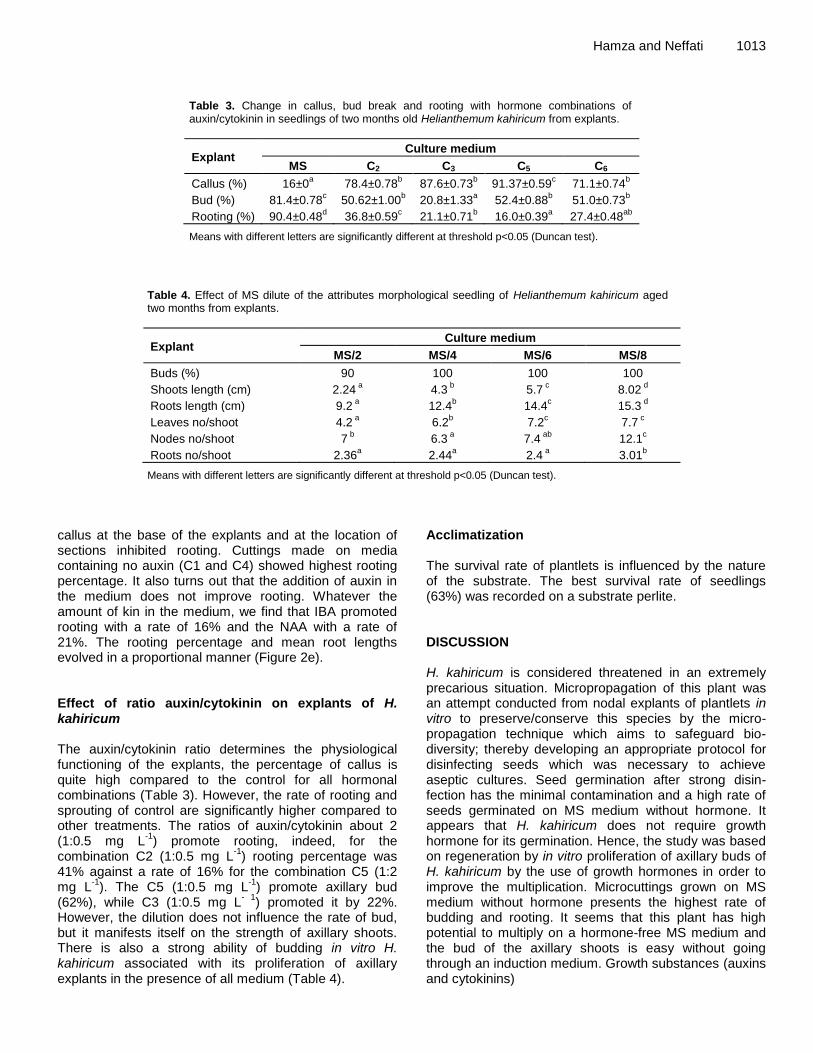
Hamza and Neffati 1013
Table 3. Change in callus, bud break and rooting with hormone combinations of auxin/cytokinin in seedlings of two months old Helianthemum kahiricum from explants.
Explant Culture medium
MS C2 C3 C5 C6
Callus (%) 16±0a 78.4±0.78
b 87.6±0.73
b 91.37±0.59
c 71.1±0.74
b
Bud (%) 81.4±0.78c 50.62±1.00
b 20.8±1.33
a 52.4±0.88
b 51.0±0.73
b
Rooting (%) 90.4±0.48d 36.8±0.59
c 21.1±0.71
b 16.0±0.39
a 27.4±0.48
ab
Means with different letters are significantly different at threshold p<0.05 (Duncan test).
Table 4. Effect of MS dilute of the attributes morphological seedling of Helianthemum kahiricum aged two months from explants.
Explant Culture medium
MS/2 MS/4 MS/6 MS/8
Buds (%) 90 100 100 100
Shoots length (cm) 2.24 a 4.3
b 5.7
c 8.02
d
Roots length (cm) 9.2 a 12.4
b 14.4
c 15.3
d
Leaves no/shoot 4.2 a 6.2
b 7.2
c 7.7
c
Nodes no/shoot 7 b 6.3
a 7.4
ab 12.1
c
Roots no/shoot 2.36a 2.44
a 2.4
a 3.01
b
Means with different letters are significantly different at threshold p<0.05 (Duncan test).
callus at the base of the explants and at the location of sections inhibited rooting. Cuttings made on media containing no auxin (C1 and C4) showed highest rooting percentage. It also turns out that the addition of auxin in the medium does not improve rooting. Whatever the amount of kin in the medium, we find that IBA promoted rooting with a rate of 16% and the NAA with a rate of 21%. The rooting percentage and mean root lengths evolved in a proportional manner (Figure 2e). Effect of ratio auxin/cytokinin on explants of H. kahiricum The auxin/cytokinin ratio determines the physiological functioning of the explants, the percentage of callus is quite high compared to the control for all hormonal combinations (Table 3). However, the rate of rooting and sprouting of control are significantly higher compared to other treatments. The ratios of auxin/cytokinin about 2 (1:0.5 mg L
-1) promote rooting, indeed, for the
combination C2 (1:0.5 mg L-1
) rooting percentage was 41% against a rate of 16% for the combination C5 (1:2 mg L
-1). The C5 (1:0.5 mg L
-1) promote axillary bud
(62%), while C3 (1:0.5 mg L- 1
) promoted it by 22%. However, the dilution does not influence the rate of bud, but it manifests itself on the strength of axillary shoots. There is also a strong ability of budding in vitro H. kahiricum associated with its proliferation of axillary explants in the presence of all medium (Table 4).
Acclimatization The survival rate of plantlets is influenced by the nature of the substrate. The best survival rate of seedlings (63%) was recorded on a substrate perlite. DISCUSSION H. kahiricum is considered threatened in an extremely precarious situation. Micropropagation of this plant was an attempt conducted from nodal explants of plantlets in vitro to preserve/conserve this species by the micro-propagation technique which aims to safeguard bio-diversity; thereby developing an appropriate protocol for disinfecting seeds which was necessary to achieve aseptic cultures. Seed germination after strong disin-fection has the minimal contamination and a high rate of seeds germinated on MS medium without hormone. It appears that H. kahiricum does not require growth hormone for its germination. Hence, the study was based on regeneration by in vitro proliferation of axillary buds of H. kahiricum by the use of growth hormones in order to improve the multiplication. Microcuttings grown on MS medium without hormone presents the highest rate of budding and rooting. It seems that this plant has high potential to multiply on a hormone-free MS medium and the bud of the axillary shoots is easy without going through an induction medium. Growth substances (auxins and cytokinins)

1014 Afr. J. Biotechnol. have a depressive effect on budding, proliferation and rooting of plantlets. The acclimatization of H. kahiricum poses no major problems and the use of substrate consisting of sand and perlite has a high survival rate. It seems that the buds during the multiplication are actually inhibited by the effect of callus at the base of H. kahiricum explants. Therefore, it seems that the hormonal combination has a regressive effect on bud break, rooting and average root length; in addition, these parameters appear to be influenced by the nature of the auxin. The addition of growth hormones does not improve the rooting or the rooting period compared to the control environment. Similar results were also reported by Souayah et al. (2003) in A. halimus for which the root is obtained on media without growth regulators with a rooting rate improved by diluting the mineral medium; while, the work of Roy et al. (2001) on Humulus lupulus and Armstrong and Johnson (2001) on Ceratopetalum gummiferum showed that in the absence of any growth regulator, rooting could not be obtained. This may be due to the richness of this species in endogenous growth regulators. Fracaro and Echeverrigaray (2001) reported that for Cunila galioides, dilution of the mineral medium does not affect the induction of rooting, but negatively affects the growth of roots. However, Pistachia vera (Chatibi, 1999), dilution of macronutrients MS basal medium bears no significant improvement for rooting and for absence of auxin, no rooting was observed. Conflict of interests The authors did not declare any conflict of interest. ACKNOWLEDGEMENTS The authors acknowledge the technical assistance rendered by all members of Range Ecology Laboratory in Arid Land Institute Tunisia, and Professor Giovanni Pacioni of the University dell Aquila, Italy. REFERENCES Aïdoud A, Le Floch E, Le Houérou HN (2006). Les steppes arides du
nord de l’Afrique. Sécheresse 17(1-2):19-30. Al-Rahmah AN (2001). Truffle of Deserts and Jungles (In Arabic), King
Saud University Publications, Riyadh, Saudi Arabia. p. 272.
Armstrong G, Johnson K (2001). Micropropagation of Ceratopetalum
gummiferum, an important Australian cut flower crop. In vitro Cell. Dev. Biol. Plant 37:137-177.
Chatibi A (1999). Les différentes potentialités de régénération in vitro du pistachier (Pistacia vera L.) CV. Mateur. Thèse de doctorat Sc. Biol. Fac. Sc. Tunis. p. 179.
Diez J, Manjon JL, Martin F (2002). Molecular phylogeny of mycorrhizal desert truffles (Terfezia and Tirmania), host specificity and edaphic tolerance. Mycologia 94:247-259.
Escudero A, Martinez I, Cruz A, Otalora MAG, Maestre FT (2007). Soil lichens have species-specific effects on the seedling emergence of three gypsophile plant species. J. Arid Environ. 70:18-28.
Fracaro F, Echeverrigaray S (2001). Micropropagation of Cunila galioides, a popular medicinal plant of south Brazil. Plant Cell Tissue Organ Cult. 64:1-4.
Mandeel QA, Al-Laith AAA (2007). Ethnomycological aspects of the desert truffle among native Bahraini and non-Bahraini peoples of the Kingdom of Bahrain. J. Ethnopharmacol. 110:118-129.
Murashige T, Skoog F (1962). A revised medium for rapid growth and bioassays with tobacco tissue cultures. Physiol. Plant. 15:473-497.
Perez-Garcia F, Gonzalez-Benito ME (2006). Seed germination of five species: Effect of temperature and presowing treatments. J. Arid Environ. 65:688-693.
Raynaud C (1987). Atlanthemum Raynaud, un nouveau genre pour la famille des Cistaceae. Anales Jard. Bot. Madrid. 44(2):309-317.
Roy A, Leggeti G, Koutoulis A (2001). Development of a shoot multiplication system for Hop (Humulus lupulus L.). In vitro Cell. Dev. Biol. Plant. 37:79-83.
Slama A, Fortas Z, Neffati M, Khabar L, Boudabous A (2006). Etude taxonomique de quelques Acsomycota hypogés (Terfeziaceae) de la Tunisie méridionale. Bull. Soc. Mycol. Fr. 122(2-3):187-195.
Souayah N, Khouja ML, Rejeb MN, Bouzid S (2003). Micropropagation d’un arbuste sylvo-pastoral, Atriplex halimus L. (Chénopodiacées). Cahiers Options Méditerranéennes

Vol. 14(12), pp. 1015-1019, 25 March, 2015
DOI: 10.5897/AJB12.2109
Article Number: 0A4AA1751686
ISSN 1684-5315
Copyright © 2015
Author(s) retain the copyright of this article
http://www.academicjournals.org/AJB
African Journal of Biotechnology
Full Length Research Paper
Effects of temperature, light, desiccation and cold storage on germination of Sophora tonkinensis
(Leguminosae) seeds
X. Pu1, Y.F. Huang2, C.L. Pan2, L. Yao1, X.R. Ai1 and Z. J. Deng1,2*
1College of Forestry and Horticulture, Hubei University for Nationalities, Enshi, Hubei Province, 445000, China.
2Guangxi Medicinal Resources Protection and Genetic Improvement Key Laboratory, Seed Bank for Medicinal Plant, Center for Conservation of Medicinal Plant, Guangxi Botanical Garden of Medicinal plant, Nanning, Guangxi zhuang
Autonomic Region, 530023, China.
Received 11 June, 2012; Accepted 8 May, 2014
Identification of the seed storage behaviour of a target species is essential prior to seed storage so that suitable storage strategies are taken. In the present experiments, germination characteristics, desiccation, and low temperature tolerance of seeds of Sophora tonkinensis was studied; a traditional Chinese medicine on the edge of extinction, were investigated for the first time in attempt to interpret their storage behaviour. The results indicate that the temperature optimum for seed germination ranged from 25 to 30°C, the seed germination was non-photoblastic, the seed viability declined with the decrease of moisture content by a silica gel desiccation, and a low temperature storage at -20°C for 3 months had no significant effects on the seeds desiccated to 5.4 ± 0.1% moisture content. These results suggest an intermediate seed storage behaviour. For germplasm long-term conservation purpose, a cryopreservation investigation was proposed. Key words: Seed, desiccation tolerance, low temperature tolerance, germination, Sophora tonkinensis.
INTRODUCTION The importance of long-term storage of plant genetic resources has been well recognized. Ex situ conservation through long-term storage of seed is, in principle, possible for a significant proportion of higher plants. Long-term seed storage, if it is feasible, is generally considered the safest, most inexpensive and most convenient method of plant genetic resources conservation (Hong and Ellis, 1996; Linington and Pritchard, 2001). However, published information on seed
storage behaviour, particularly in non-crop species, is meager in the context of the task of ex situ biodiversity conservation (Hong and Ellis, 1996).
For seed storage purpose, that is, plant genetic/ germplasm resources conservation, identification of the seed storage behaviour of a target species is essential. Three main categories of seed storage behaviour are now recognized: orthodox, intermediate and recalcitrant (each may be further subdivided) (Roberts, 1973;
*Corresponding author. E-mail: [email protected]. Author(s) agree that this article remain permanently open access under the terms of the Creative Commons Attribution License 4.0 International License

1016 Afr. J. Biotechnol. Ellis et al., 1990).
Desiccation tolerance and low temperature tolerance are the two crucial parameter to identify seed storage behaviour. Orthodox seeds undergo maturation desic-cation during development, and are shed at a relative lower moisture content, and can be desiccated further to 1-5% moisture content without damage, and can be safely stored for more than decades at a quite low moisture content. Adversely, recalcitrant seeds do not undergo maturation desiccation during development; they are shed at a relative higher moisture content and metabolic activity, and are intolerant to desiccation and sensitive to low temperature. In general, the storage lifespan of recalcitrant seeds at room temperature is only several days to weeks (Smith and Berjak, 1995). While, the storage behaviour of intermediate seeds is between orthodox and recalcitrant seeds, being desiccation-tolerant partially without the increase of storage lifespan by desiccation, being sensitive to low temperature and cannot be conserved in conventional low temperature seed bank for a long-term conservation purpose (Ellis et al., 1990). The majority of seed plants produce orthodox seeds. While, recalcitrant and intermediate seeds mainly produce from mesic plants and tropical and subtropical trees, as well as partial tropical herbs and temperate trees, such as species of Fagaceae (Song et al., 2003).
Orthodox seeds can be maintained satisfactorily ex situ over the long term in appropriate environments (5±1 %
water content,-18 °C low temperature) (IBPGR, 1976).
By contrast, the maintenance of the viability of intermediate and recalcitrant seeds storage behaviour is problematic (Hong and Ellis, 1996). In general, medium-term storage is feasible for intermediate seeds provided the storage environment is well-defined, but short-term storage is usually the best that can be achieved with recalcitrant seeds (Hong and Ellis, 1996). For recalcitrant and intermediate seed species, at present cryopreservation is the only technique available for long-term germplasm conservation (Roberts et al., 1984; Engelmann and Engels, 2002; Hor et al., 2005; Thormann et al., 2006).
Sophora tonkinensis Gagnep (Leguminosae), growing in stone hill and limestone mountain region in Guangxi, uizhou and Yunnan province in Southwest China, as well as Northern Viet Nam, is a shrub whose roots are used as traditional Chinese medicine (Chen et al., 1994; Pharmacopoeia Commission of the Ministry of Health of the People's Republic of China, 2010). Because of excessive digging, at present the wild resources of S. tonkinensis is on the edge of extinction (Qin et al., 2006). Therefore, it is extremely significant and urgent to conserve S. tonkinensis germplasm resources ex situ. During domestication and breeding, it is difficult to store S. tonkinensis seeds for a long time (Qin et al., 2011). So far, there is a few available informations on seed storage behaviour of S. tonkinensis.
The purpose of the present investigation is to identify
the storage behaviour and germination characteristics of S. tonkinensis seeds, so that suitable strategies of seed storage and germination are taken for a long-term conservation of S. tonkinensis germplasm resources.
MATERIALS AND METHODS
Seeds
Mature S. tonkinensis seeds were collected from the cultivation base (23°23'N, 105°57'E; altitude, 1090 m above sea level) in Napo county, Guangxi Zhuang Autonomous Region, China, in October, 2011. The annual mean temperature is 22.1°C. Annual mean rainfall is 1115 mm. After collection, seeds were dried at 20°C and 46% relative humidity (RH) for 72 h. When the moisture content of the seeds was 17.4 ± 0.2% (wet weight basis), seeds were used for germination, desiccation and storage experiments.
Seed viability
To evaluate the potential germinability of freshly-collected seeds, viability of seeds was assessed using a tetrazolium test (Moore, 1973). Three replicates of 50 seeds each were placed on two pieces of filter paper moistened with 5 ml of distilled water, incubated at 10°C for 16 h and then longitudinally cut into halves with a scalpel. The half-seeds were incubated in a 0.1% aqueous solution of 2, 3, 5-triphenyl tetrazolium chloride for 24 h at 30°C in the dark. Only seeds showing a strong red-stained embryo were considered viable (Meulebrouck et al., 2008) and counted.
Determination of seed moisture content
The water content of seeds was determined gravimetrically (Sershen et al., 2012). Four replicates of five seeds each were used, and the moisture content of seeds was expressed as a percentage on a wet weight basis.
Germination test
Four replicates of 50 seeds each were incubated in 9-cm-diameter Petri dishes with moist perlite (water content of perlite, 18.3 ± 0.5%) at several constant temperatures in the dark or in an alternating photoperiod (12 h light/12 h dark; PPFD, 121 µmol m-2 s-1). Germinated seeds were counted each day, and then the cumulative germination percentages were calculated. Germination test was terminated when all seeds had germinated except rotten those or no germination was noted for five consecutive days. Radicle protrusion was used as the criterion for germination.
Desiccation and cold storage
Desiccation treatment was performed by mixing seeds with silica gel in a dryer which was placed at an ambient temperature of 20-25°C. The water loss in the seeds was monitored periodically by determining the moisture content of seeds. Seeds desiccated to about 5% moisture content were subjected to a cold storage treatment at -20°C in dark for three months.
Germination test (25°C, 12 h light/day; PPFD, 121 µmol m-2 s-1) was executed to seeds that were desiccated to about 12 and 5% moisture content, and to those that were firstly desiccated to about 5% moisture content and followed by a three-month cold storage at -20°C.
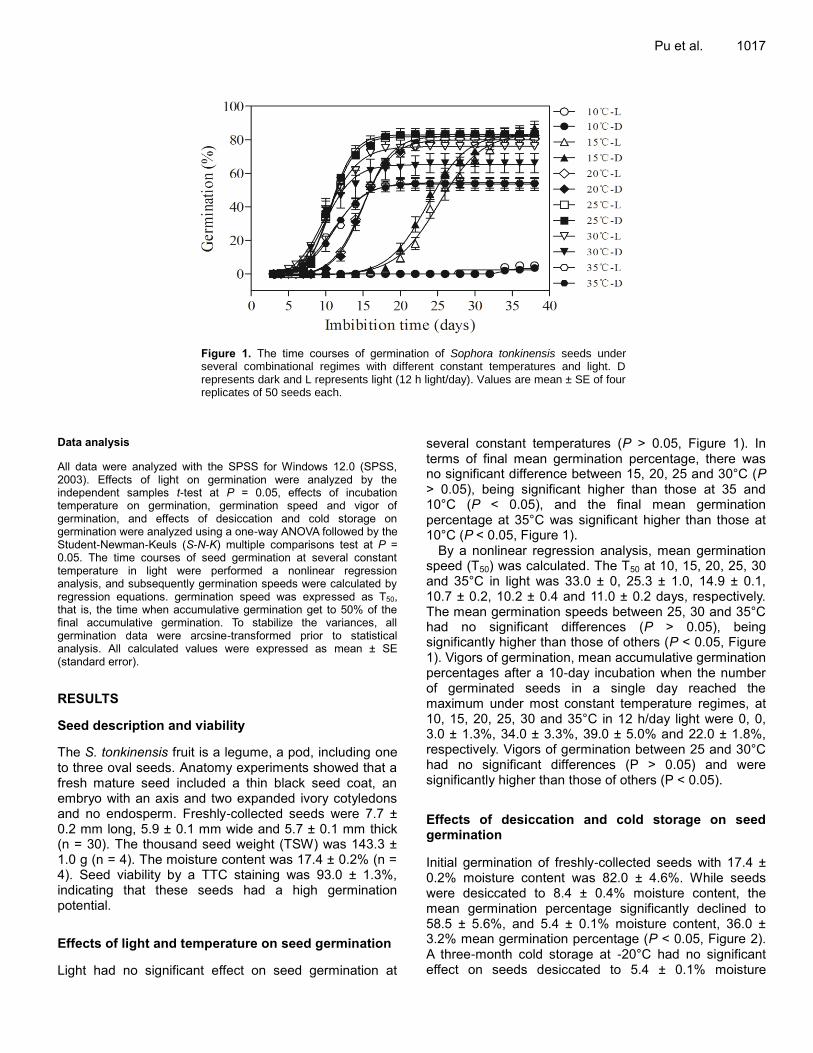
Pu et al. 1017
Figure 1. The time courses of germination of Sophora tonkinensis seeds under several combinational regimes with different constant temperatures and light. D represents dark and L represents light (12 h light/day). Values are mean ± SE of four replicates of 50 seeds each.
Data analysis
All data were analyzed with the SPSS for Windows 12.0 (SPSS, 2003). Effects of light on germination were analyzed by the independent samples t-test at P = 0.05, effects of incubation temperature on germination, germination speed and vigor of germination, and effects of desiccation and cold storage on germination were analyzed using a one-way ANOVA followed by the Student-Newman-Keuls (S-N-K) multiple comparisons test at P = 0.05. The time courses of seed germination at several constant temperature in light were performed a nonlinear regression analysis, and subsequently germination speeds were calculated by regression equations. germination speed was expressed as T50, that is, the time when accumulative germination get to 50% of the final accumulative germination. To stabilize the variances, all germination data were arcsine-transformed prior to statistical analysis. All calculated values were expressed as mean ± SE (standard error).
RESULTS
Seed description and viability
The S. tonkinensis fruit is a legume, a pod, including one to three oval seeds. Anatomy experiments showed that a fresh mature seed included a thin black seed coat, an embryo with an axis and two expanded ivory cotyledons and no endosperm. Freshly-collected seeds were 7.7 ± 0.2 mm long, 5.9 ± 0.1 mm wide and 5.7 ± 0.1 mm thick (n = 30). The thousand seed weight (TSW) was 143.3 ± 1.0 g (n = 4). The moisture content was 17.4 ± 0.2% (n = 4). Seed viability by a TTC staining was 93.0 ± 1.3%, indicating that these seeds had a high germination potential.
Effects of light and temperature on seed germination
Light had no significant effect on seed germination at
several constant temperatures (P > 0.05, Figure 1). In terms of final mean germination percentage, there was no significant difference between 15, 20, 25 and 30°C (P > 0.05), being significant higher than those at 35 and 10°C (P < 0.05), and the final mean germination percentage at 35°C was significant higher than those at 10°C (P < 0.05, Figure 1).
By a nonlinear regression analysis, mean germination speed (T50) was calculated. The T50 at 10, 15, 20, 25, 30 and 35°C in light was 33.0 ± 0, 25.3 ± 1.0, 14.9 ± 0.1, 10.7 ± 0.2, 10.2 ± 0.4 and 11.0 ± 0.2 days, respectively. The mean germination speeds between 25, 30 and 35°C had no significant differences (P > 0.05), being significantly higher than those of others (P < 0.05, Figure 1). Vigors of germination, mean accumulative germination percentages after a 10-day incubation when the number of germinated seeds in a single day reached the maximum under most constant temperature regimes, at 10, 15, 20, 25, 30 and 35°C in 12 h/day light were 0, 0, 3.0 ± 1.3%, 34.0 ± 3.3%, 39.0 ± 5.0% and 22.0 ± 1.8%, respectively. Vigors of germination between 25 and 30°C had no significant differences (P > 0.05) and were significantly higher than those of others (P < 0.05).
Effects of desiccation and cold storage on seed germination
Initial germination of freshly-collected seeds with 17.4 ± 0.2% moisture content was 82.0 ± 4.6%. While seeds were desiccated to 8.4 ± 0.4% moisture content, the mean germination percentage significantly declined to 58.5 ± 5.6%, and 5.4 ± 0.1% moisture content, 36.0 ± 3.2% mean germination percentage (P < 0.05, Figure 2). A three-month cold storage at -20°C had no significant effect on seeds desiccated to 5.4 ± 0.1% moisture
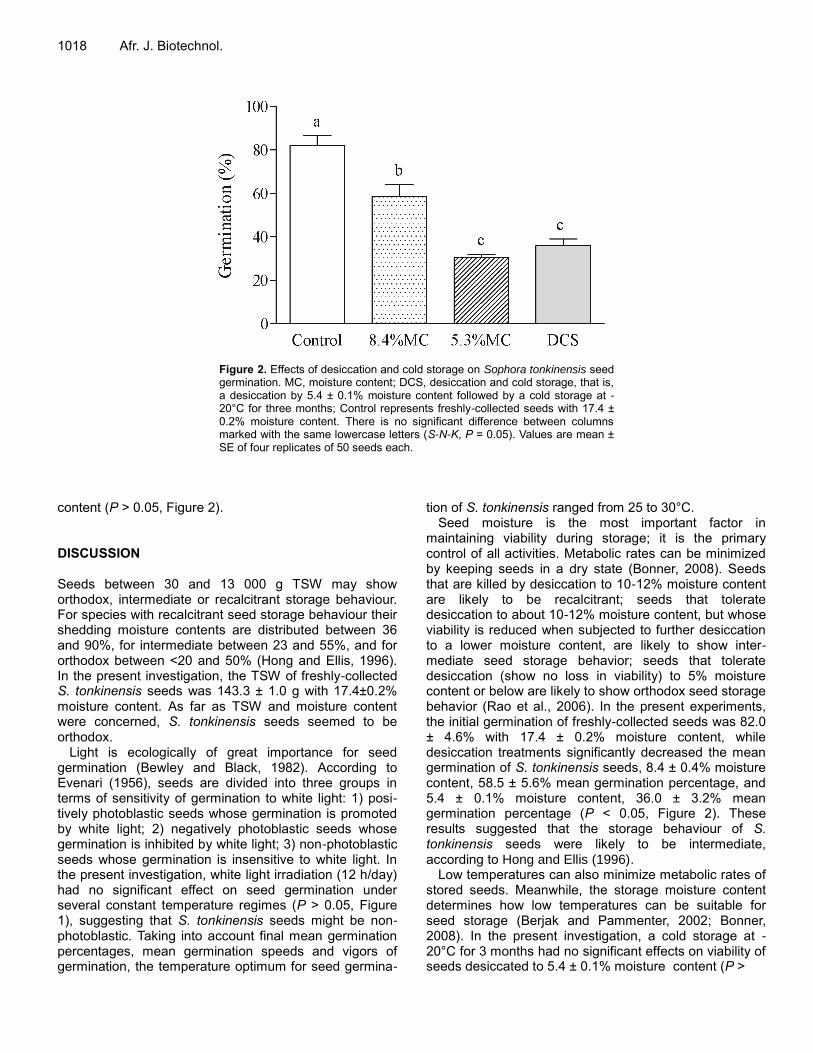
1018 Afr. J. Biotechnol.
Figure 2. Effects of desiccation and cold storage on Sophora tonkinensis seed germination. MC, moisture content; DCS, desiccation and cold storage, that is, a desiccation by 5.4 ± 0.1% moisture content followed by a cold storage at -20°C for three months; Control represents freshly-collected seeds with 17.4 ± 0.2% moisture content. There is no significant difference between columns marked with the same lowercase letters (S-N-K, P = 0.05). Values are mean ± SE of four replicates of 50 seeds each.
content (P > 0.05, Figure 2). DISCUSSION Seeds between 30 and 13 000 g TSW may show orthodox, intermediate or recalcitrant storage behaviour. For species with recalcitrant seed storage behaviour their shedding moisture contents are distributed between 36 and 90%, for intermediate between 23 and 55%, and for orthodox between <20 and 50% (Hong and Ellis, 1996). In the present investigation, the TSW of freshly-collected S. tonkinensis seeds was 143.3 ± 1.0 g with 17.4±0.2% moisture content. As far as TSW and moisture content were concerned, S. tonkinensis seeds seemed to be orthodox.
Light is ecologically of great importance for seed germination (Bewley and Black, 1982). According to Evenari (1956), seeds are divided into three groups in terms of sensitivity of germination to white light: 1) posi-tively photoblastic seeds whose germination is promoted by white light; 2) negatively photoblastic seeds whose germination is inhibited by white light; 3) non-photoblastic seeds whose germination is insensitive to white light. In the present investigation, white light irradiation (12 h/day) had no significant effect on seed germination under several constant temperature regimes (P > 0.05, Figure 1), suggesting that S. tonkinensis seeds might be non-photoblastic. Taking into account final mean germination percentages, mean germination speeds and vigors of germination, the temperature optimum for seed germina-
tion of S. tonkinensis ranged from 25 to 30°C. Seed moisture is the most important factor in
maintaining viability during storage; it is the primary control of all activities. Metabolic rates can be minimized by keeping seeds in a dry state (Bonner, 2008). Seeds that are killed by desiccation to 10-12% moisture content are likely to be recalcitrant; seeds that tolerate desiccation to about 10-12% moisture content, but whose viability is reduced when subjected to further desiccation to a lower moisture content, are likely to show inter-mediate seed storage behavior; seeds that tolerate desiccation (show no loss in viability) to 5% moisture content or below are likely to show orthodox seed storage behavior (Rao et al., 2006). In the present experiments, the initial germination of freshly-collected seeds was 82.0 ± 4.6% with 17.4 ± 0.2% moisture content, while desiccation treatments significantly decreased the mean germination of S. tonkinensis seeds, 8.4 ± 0.4% moisture content, 58.5 ± 5.6% mean germination percentage, and 5.4 ± 0.1% moisture content, 36.0 ± 3.2% mean germination percentage (P < 0.05, Figure 2). These results suggested that the storage behaviour of S. tonkinensis seeds were likely to be intermediate, according to Hong and Ellis (1996).
Low temperatures can also minimize metabolic rates of stored seeds. Meanwhile, the storage moisture content determines how low temperatures can be suitable for seed storage (Berjak and Pammenter, 2002; Bonner, 2008). In the present investigation, a cold storage at -20°C for 3 months had no significant effects on viability of seeds desiccated to 5.4 ± 0.1% moisture content (P >
0.05, Figure 2). According to Hong and Ellis (1996), together with desiccation tolerance, S. tonkinensis seeds were likely to be intermediate. So, for a purpose of long-term storage of S. tonkinensis seeds, an investigation of cryopreservation (liquid nitrogen conservation) is required.
According to a compendium (Hong et al., 1996), among investigated 1088 species within Leguminosae an overwhelming majority showed orthodox seed storage behaviour, and only a minority showed recalcitrant seed storage behaviour, and none showed intermediate seed storage behaviour. So far, intermediate seed storage behaviour in Leguminosae species was discovered for the first time. Conflict of interests The authors did not declare any conflict of interest. ACKNOWLEDGEMENTS We are grateful to Mr. Yongcai Huang and Dr. Xiaoyun Guo from the Center for Conservation of Medicinal Plants, Guangxi Garden of Medicinal Plant, Nanning, Guangxi, China for providing experimental materials, and the National Natural Science Foundation of China (81303169), the Doctoral Scientific Research Foundation of Hubei University for Nationalities (MY2013B014), Guangxi Natural Science Foundation (2013jjBA40121) and the Open Fund of Key Laboratory of Biologic Resources Protection and Utilization of Hubei Province for supporting this research. REFERENCES Berjak P, Pammenter NW (2002). Orthodox and recalcitrant seeds. In:
Vozzo, J. (Ed.), Tropical tree seed handbook. USDA, pp. 137-147. Bewley, J.D., Black, M (1982). Physiology and Biochemistry of seeds in
relation to germination. Vol. 2 viability, dormancy, and environmental control. Springer-Verlag, Berlin Heidelberg New York, pp. 126.
Bonner FT (2008). Storage of seeds. In: Bonner FT, Karrfalt RP (Eds.), Woody plant seed manual (United States Department of Agriculture, Forest Service, Agriculture Handbook 727), National Seed Laboratory, GA, USA. pp. 89-90.
Chen DZ, Chen BY, Fang YY, Zheng CZ, Zhang RH, Ding CS, Li JL, Ma QY, Wei Z (1994). Flora of China, Vol. 40, No. 1. Science press, Beijing, p. 76.
Ellis RH, Hong TD, Roberts EH (1990). An intermediate category of
seed storage behavior? Ⅰ. Coffee. J. Exp. Bot. 41:1167-1174.
Engelmann F, Engels JMM (2002). Technologies and strategies for ex situ conservation. In: Engels, JMM, Ramanatha RV, Brown AHD, Jackson MT (Eds.), Managing plant genetic diversity. CABI Publishing, Rome. pp. 89-103.
Evenari M (1956). Seed germination. In: Hollaender A (Ed.), Radiation Biology, Vol. III McGrawHill, New York. pp. 519-549.
Hong, TD, Ellis RH (1996). A protocol to determine seed storage behaviour. International board for plant genetic resources, Rome.
Pu et al. 1019
Hong TD, Linington S, Ellis RH (1996). Seed storage behaviour: A
compendium, handbooks for genebanks: No. 4. International board for plant genetic resources, Rome.
Hor YL, Kim YJ, Ugap A, Chabrillange N, Sinniah UR, Engelmann F, Dussert S (2005). Optimal hydration status for cryopreservation of intermediate oily seeds: Citrus as a case study. Annals Bot. 95:1153-1161.
Linington SH, Pritchard HW (2001). Gene banks. In: Levin S, (Ed.), Encyclopedia of Biodiversity, Vol 3. Academic Press, San Diego, CA, pp. 165-181.
Meulebrouck K, Ameloot E, Van Assche JA, Verheyen K, Hermy MM, Baskin CC (2008). Germination ecology of the holoparasite Cuscuta epithymum. Seed Sc. Res. 18:25-34.
Moore RP (1973). Tetrazolium staining for assessing seed quality. In: Heydecker W (Ed.), Seed Ecology. Butterworths, London, pp. 347-366.
Pharmacopoeia Commission of the Ministry of Health of the People's Republic of China. 2010. Pharmacopoeia of the People's Republic of China. China Medical Science Press, Beijing, pp. 25-26.
Qin LY, Tang MQ, Huang YC, Lin Y, Miao JH, Jiang N (2011). The effects of storage temperature and time on seed viability of Sophora tonkinensis. China Seed Industry 1:35-37.
Qin WL, Ling ZZ, Wu QH, Lan ZZ, Jiang N (2006). Study of the cultivation of wild Sophora tonkinsis Gapnep. Lishizhen Med. Materia Med. Res. 17(9):1668-1669.
Rao NK, Hanson J, Dulloo ME, Ghosh K, Nowell D, Larinde M (2006). Manual of seed handling in genebanks. Handbooks for Genebanks No. 8. Bioversity International, Rome, Italy.
Roberts EH (1973). Predicting the storage life of seeds. Seed Sci. Technol. 1:499-514.
Roberts EH, King MW, Ellis RH (1984). Recalcitrant seeds: Their recognition and storage. In: Holder JHW, Williamss JT (Eds.), Crop Genetic Resources: Conservation and Evaluation. George Allen & Unwin, London. pp. 38-52.
Sershen BP, Pammenter NW, Wesley-Smith J (2012). The effects of various paramenters during processing for cryopreservation on the ultrastructure and viability of recalcitrant zygotic embryos of Amaryllis belladonna. Protoplasma 249:155-169.
Smith MT, Berjak P (1995). Deteriorative changes associated with the loss of viability of stored desiccation-tolerant and desiccation-sensitive seeds. In: Galili G, Kjgel J (Eds.), Seed development and germination.Marcel Dekker Inc., New York, pp. 237-71.
Song SQ, Berjak P, Pammenter N, Ntuli TM, Fu, JR (2003). Seed recalcitrance: a current assessment. Acta Botanica Sinica 45(6):638-643.
Thormann I, Dulloo ME, Engels JMM (2006). Techniques of ex situ plant conservation. In: Henry R (Ed.), Plant Conservation genetics. The Haworth Press inc., Lismore, Australia. pp. 7-36.

Vol. 14(12), pp. 1020-1028, 25 March, 2015
DOI: 10.5897/AJB2014.14377
Article Number: 9FBF79251696
ISSN 1684-5315
Copyright © 2015
Author(s) retain the copyright of this article
http://www.academicjournals.org/AJB
African Journal of Biotechnology
Full Length Research Paper
Effect of water deficit on Argan tree seedlings (Argania spinosa L. Skeels): Morphological and
physiological aspect
MESLEM Halima1*, DJABEUR Abderezzak1, KHAROUBI Omar2 and KAID-HARCHE Meriem1
1Departement de Biotechnologie, Faculté de science de la nature et de la vie, Laboratoire des Productions, valorisations
végétale et microbienne (LP2VM), Université des Sciences et de la Technologie Oran Mohamed BOUDIAF, (USTO M.B) BP. 1505 El M’Naouer 31000 Oran, Algérie.
2Université d’Oran, Département de Biologie, Laboratoire de Biotoxicologie, Biodépollution et phytoremédiation, Oran,
Algérie.
Received 17 December, 2014; Accepted 17 March, 2015
The Argan tree, Argania spinosa L., Skeels, is an endemic species in North-West Africa perfectly adapted to aridity and drought. It is in this context that we studied the physiological impact of water deficit on the Argan tree seedlings for eight weeks at a field capacity of 30%. The obtained results reveal that the stressed seedlings manifested by the strategy of the root elongation from the second week, the roots reached 31 cm compared with 15 cm of the control. However, the seedlings showed severe dehydration of 41% in leaves and 45% in roots. Besides, the content of chlorophyll pigments has relatively decreased from the second week, a slight yellowing and leaf drop was observed. The seedlings have accumulated proteins in a very significant way in leaves (from 25 to 107 mg.g
-1 by fresh
weight) and (from 23 to 90 mg.g-1
by fresh weight) in roots. Proline was also accumulated; the content was 4 and 2 μg.g
-1 by fresh weight respectively in leaves and roots compared with 1.3 and 1.1 μg.g
-1 1 by
fresh weight in control respectively. The accumulation of the protein and proline is higher in leaves than in roots. The content of malondialdehyde was higher in leaves than in roots. This increase is significantly related to the prolongation of the stress period from the second week. The enzymatic activity of peroxidase is in relative increase according to the duration of the water stress applied in both leaves and roots. We deduce from these results that Argan seedlings possess the characteristic of xeropyhte that tolerate aridity. Key words: Argania spinosa, drought stress, proline, chlorophylls, proteins.
INTRODUCTION The Argan tree, (Argania spinosa L. Skeels), is a tropical species from the Sapotaceae family which grows in
North-West Africa. Its current natural area is limited in Morocco and in the Algerian southwest in Tindouf city
*Corresponding author. E-mail: [email protected]. Tel: +213776 22 20 56. Author(s) agree that this article remains permanently open access under the terms of the Creative Commons Attribution License 4.0 International License
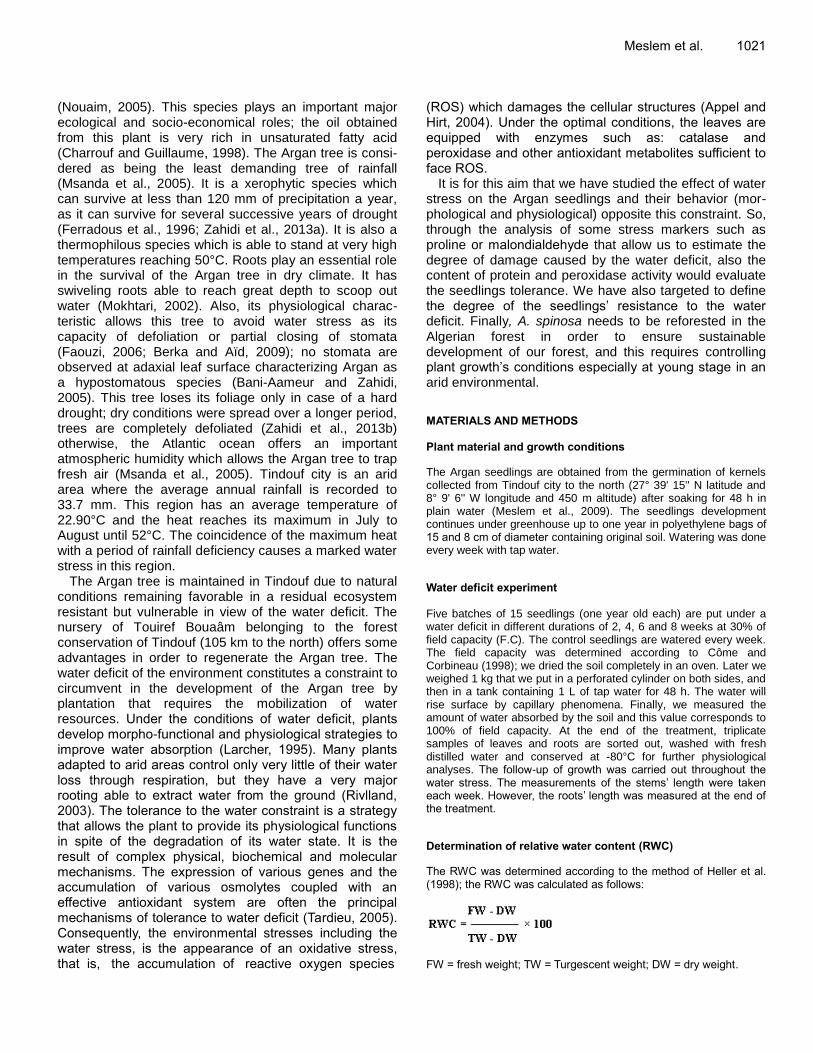
(Nouaim, 2005). This species plays an important major ecological and socio-economical roles; the oil obtained from this plant is very rich in unsaturated fatty acid (Charrouf and Guillaume, 1998). The Argan tree is consi-dered as being the least demanding tree of rainfall (Msanda et al., 2005). It is a xerophytic species which can survive at less than 120 mm of precipitation a year, as it can survive for several successive years of drought (Ferradous et al., 1996; Zahidi et al., 2013a). It is also a thermophilous species which is able to stand at very high temperatures reaching 50°C. Roots play an essential role in the survival of the Argan tree in dry climate. It has swiveling roots able to reach great depth to scoop out water (Mokhtari, 2002). Also, its physiological charac-teristic allows this tree to avoid water stress as its capacity of defoliation or partial closing of stomata (Faouzi, 2006; Berka and Aïd, 2009); no stomata are observed at adaxial leaf surface characterizing Argan as a hypostomatous species (Bani-Aameur and Zahidi, 2005). This tree loses its foliage only in case of a hard drought; dry conditions were spread over a longer period, trees are completely defoliated (Zahidi et al., 2013b) otherwise, the Atlantic ocean offers an important atmospheric humidity which allows the Argan tree to trap fresh air (Msanda et al., 2005). Tindouf city is an arid area where the average annual rainfall is recorded to 33.7 mm. This region has an average temperature of 22.90°C and the heat reaches its maximum in July to August until 52°C. The coincidence of the maximum heat with a period of rainfall deficiency causes a marked water stress in this region.
The Argan tree is maintained in Tindouf due to natural conditions remaining favorable in a residual ecosystem resistant but vulnerable in view of the water deficit. The nursery of Touiref Bouaâm belonging to the forest conservation of Tindouf (105 km to the north) offers some advantages in order to regenerate the Argan tree. The water deficit of the environment constitutes a constraint to circumvent in the development of the Argan tree by plantation that requires the mobilization of water resources. Under the conditions of water deficit, plants develop morpho-functional and physiological strategies to improve water absorption (Larcher, 1995). Many plants adapted to arid areas control only very little of their water loss through respiration, but they have a very major rooting able to extract water from the ground (Rivlland, 2003). The tolerance to the water constraint is a strategy that allows the plant to provide its physiological functions in spite of the degradation of its water state. It is the result of complex physical, biochemical and molecular mechanisms. The expression of various genes and the accumulation of various osmolytes coupled with an effective antioxidant system are often the principal mechanisms of tolerance to water deficit (Tardieu, 2005). Consequently, the environmental stresses including the water stress, is the appearance of an oxidative stress, that is, the accumulation of reactive oxygen species
Meslem et al. 1021 (ROS) which damages the cellular structures (Appel and Hirt, 2004). Under the optimal conditions, the leaves are equipped with enzymes such as: catalase and peroxidase and other antioxidant metabolites sufficient to face ROS.
It is for this aim that we have studied the effect of water stress on the Argan seedlings and their behavior (mor-phological and physiological) opposite this constraint. So, through the analysis of some stress markers such as proline or malondialdehyde that allow us to estimate the degree of damage caused by the water deficit, also the content of protein and peroxidase activity would evaluate the seedlings tolerance. We have also targeted to define the degree of the seedlings’ resistance to the water deficit. Finally, A. spinosa needs to be reforested in the Algerian forest in order to ensure sustainable development of our forest, and this requires controlling plant growth’s conditions especially at young stage in an arid environmental.
MATERIALS AND METHODS Plant material and growth conditions
The Argan seedlings are obtained from the germination of kernels collected from Tindouf city to the north (27° 39' 15'' N latitude and 8° 9' 6'' W longitude and 450 m altitude) after soaking for 48 h in plain water (Meslem et al., 2009). The seedlings development continues under greenhouse up to one year in polyethylene bags of 15 and 8 cm of diameter containing original soil. Watering was done every week with tap water.
Water deficit experiment Five batches of 15 seedlings (one year old each) are put under a water deficit in different durations of 2, 4, 6 and 8 weeks at 30% of field capacity (F.C). The control seedlings are watered every week. The field capacity was determined according to Côme and Corbineau (1998); we dried the soil completely in an oven. Later we weighed 1 kg that we put in a perforated cylinder on both sides, and then in a tank containing 1 L of tap water for 48 h. The water will rise surface by capillary phenomena. Finally, we measured the amount of water absorbed by the soil and this value corresponds to 100% of field capacity. At the end of the treatment, triplicate samples of leaves and roots are sorted out, washed with fresh distilled water and conserved at -80°C for further physiological analyses. The follow-up of growth was carried out throughout the water stress. The measurements of the stems’ length were taken each week. However, the roots’ length was measured at the end of the treatment.
Determination of relative water content (RWC)
The RWC was determined according to the method of Heller et al. (1998); the RWC was calculated as follows:
FW = fresh weight; TW = Turgescent weight; DW = dry weight.
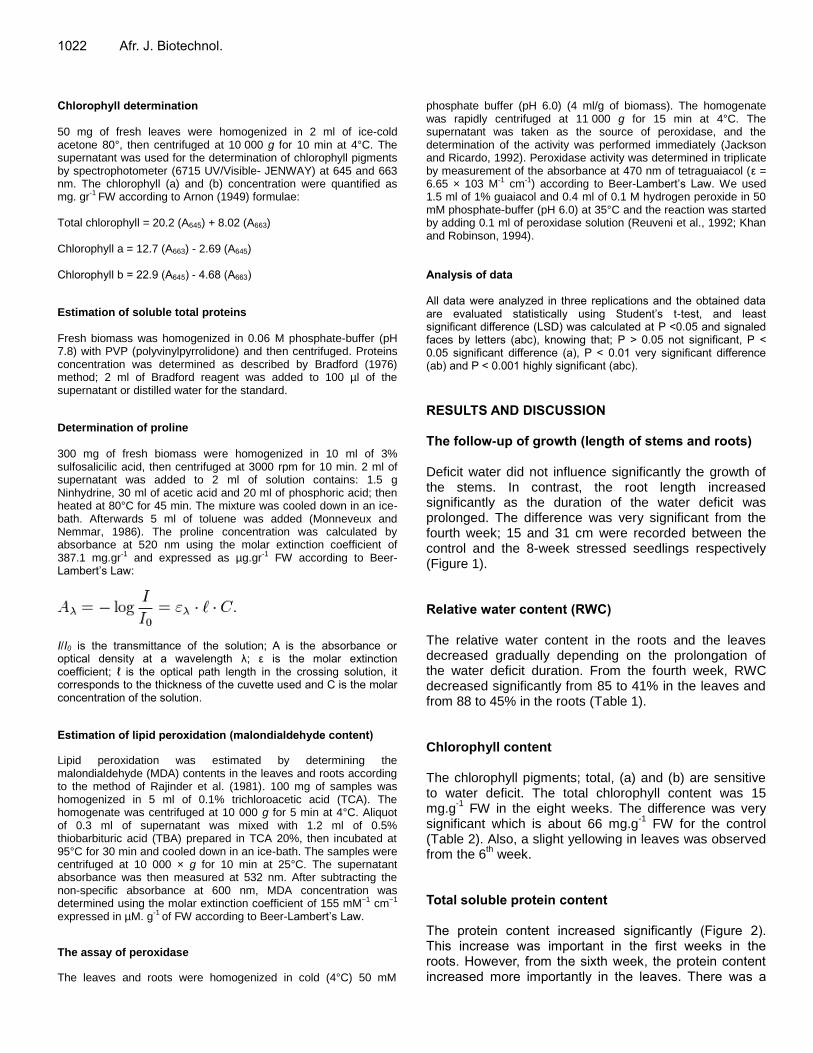
1022 Afr. J. Biotechnol. Chlorophyll determination 50 mg of fresh leaves were homogenized in 2 ml of ice-cold acetone 80°, then centrifuged at 10 000 g for 10 min at 4°C. The supernatant was used for the determination of chlorophyll pigments by spectrophotometer (6715 UV/Visible- JENWAY) at 645 and 663 nm. The chlorophyll (a) and (b) concentration were quantified as mg. gr-1 FW according to Arnon (1949) formulae: Total chlorophyll = 20.2 (A645) + 8.02 (A663) Chlorophyll a = 12.7 (A663) - 2.69 (A645) Chlorophyll b = 22.9 (A645) - 4.68 (A663)
Estimation of soluble total proteins Fresh biomass was homogenized in 0.06 M phosphate-buffer (pH 7.8) with PVP (polyvinylpyrrolidone) and then centrifuged. Proteins concentration was determined as described by Bradford (1976) method; 2 ml of Bradford reagent was added to 100 µl of the supernatant or distilled water for the standard.
Determination of proline 300 mg of fresh biomass were homogenized in 10 ml of 3% sulfosalicilic acid, then centrifuged at 3000 rpm for 10 min. 2 ml of supernatant was added to 2 ml of solution contains: 1.5 g Ninhydrine, 30 ml of acetic acid and 20 ml of phosphoric acid; then heated at 80°C for 45 min. The mixture was cooled down in an ice-bath. Afterwards 5 ml of toluene was added (Monneveux and Nemmar, 1986). The proline concentration was calculated by absorbance at 520 nm using the molar extinction coefficient of 387.1 mg.gr-1 and expressed as µg.gr-1 FW according to Beer-Lambert’s Law:
I/I0 is the transmittance of the solution; A is the absorbance or optical density at a wavelength λ; ε is the molar extinction coefficient; ℓ is the optical path length in the crossing solution, it corresponds to the thickness of the cuvette used and C is the molar concentration of the solution.
Estimation of lipid peroxidation (malondialdehyde content)
Lipid peroxidation was estimated by determining the malondialdehyde (MDA) contents in the leaves and roots according to the method of Rajinder et al. (1981). 100 mg of samples was homogenized in 5 ml of 0.1% trichloroacetic acid (TCA). The homogenate was centrifuged at 10 000 g for 5 min at 4°C. Aliquot of 0.3 ml of supernatant was mixed with 1.2 ml of 0.5% thiobarbituric acid (TBA) prepared in TCA 20%, then incubated at 95°C for 30 min and cooled down in an ice-bath. The samples were centrifuged at 10 000 × g for 10 min at 25°C. The supernatant absorbance was then measured at 532 nm. After subtracting the non-specific absorbance at 600 nm, MDA concentration was determined using the molar extinction coefficient of 155 mM−1 cm−1 expressed in µM. g-1 of FW according to Beer-Lambert’s Law.
The assay of peroxidase
The leaves and roots were homogenized in cold (4°C) 50 mM
phosphate buffer (pH 6.0) (4 ml/g of biomass). The homogenate was rapidly centrifuged at 11 000 g for 15 min at 4°C. The supernatant was taken as the source of peroxidase, and the determination of the activity was performed immediately (Jackson and Ricardo, 1992). Peroxidase activity was determined in triplicate by measurement of the absorbance at 470 nm of tetraguaiacol (ε = 6.65 × 10³ M-1 cm-1) according to Beer-Lambert’s Law. We used 1.5 ml of 1% guaiacol and 0.4 ml of 0.1 M hydrogen peroxide in 50 mM phosphate-buffer (pH 6.0) at 35°C and the reaction was started by adding 0.1 ml of peroxidase solution (Reuveni et al., 1992; Khan and Robinson, 1994). Analysis of data All data were analyzed in three replications and the obtained data are evaluated statistically using Student’s t-test, and least significant difference (LSD) was calculated at P <0.05 and signaled faces by letters (abc), knowing that; P ˃ 0.05 not significant, P ˂ 0.05 significant difference (a), P ˂ 0.01 very significant difference (ab) and P ˂ 0.001 highly significant (abc).
RESULTS AND DISCUSSION The follow-up of growth (length of stems and roots) Deficit water did not influence significantly the growth of the stems. In contrast, the root length increased significantly as the duration of the water deficit was prolonged. The difference was very significant from the fourth week; 15 and 31 cm were recorded between the control and the 8-week stressed seedlings respectively (Figure 1). Relative water content (RWC) The relative water content in the roots and the leaves decreased gradually depending on the prolongation of the water deficit duration. From the fourth week, RWC decreased significantly from 85 to 41% in the leaves and from 88 to 45% in the roots (Table 1). Chlorophyll content The chlorophyll pigments; total, (a) and (b) are sensitive to water deficit. The total chlorophyll content was 15 mg.g
-1 FW in the eight weeks. The difference was very
significant which is about 66 mg.g-1
FW for the control (Table 2). Also, a slight yellowing in leaves was observed from the 6
th week.
Total soluble protein content The protein content increased significantly (Figure 2). This increase was important in the first weeks in the roots. However, from the sixth week, the protein content increased more importantly in the leaves. There was a

Meslem et al. 1023
Figure 1. Effect of water deficit on the length of the 8-week stressed seedlings’ stems and roots [P˃0.05, not significant; P ˂0.05, significant difference (a), P ˂0.01 very significant difference (ab), and P˂0.001 highly significant difference (abc].
Table 1. Effect of water stress on RWC (P˃0.05 not significant, P ˂ 0.05 significant difference (a), P ˂0.01 very significant difference (ab), and P˂0.001highly significant difference (abc).
% RWC Control 2 Weeks 4 Weeks 6 Weeks 8 Weeks
Leaf 85±2 83±1 70±2a 65±1
ab 41±1
abc
Root 88±1 85±2 73±1ab
60±1.5abc
45±1abc
Table 2. Effect of water stress on chlorophyllian pigments content [P˃0.05 not significant, P ˂0.05 significant difference (a), P ˂0.01 very significant difference (ab), and P˂0.001highly significant difference (abc)].
Content in mg.g-1
FW Control 2 Weeks 4 Weeks 6 Weeks 8 Weeks
Chl tot 67.2 ± 0.02 66± 0.01 40±0.05a
27.7±0.045abc
15,2± 0.06abc
Chl (a) 61.2±0.3 54.22±0.7 50.88±1.2 38.12±0.35abc
30.24±0.3abc
Chl (b) 91.2±0.15 52.18±0.07ab
47.72±0.57ab
39.4±0,41ab
36.16±0.11ab
Figure 2. Effect of water deficit on the total soluble protein content [P˃0.05 not significant, P ˂0.05 significant difference (a), P ˂0.01 very significant difference (ab), and P˂0.001highly significant difference (abc)].
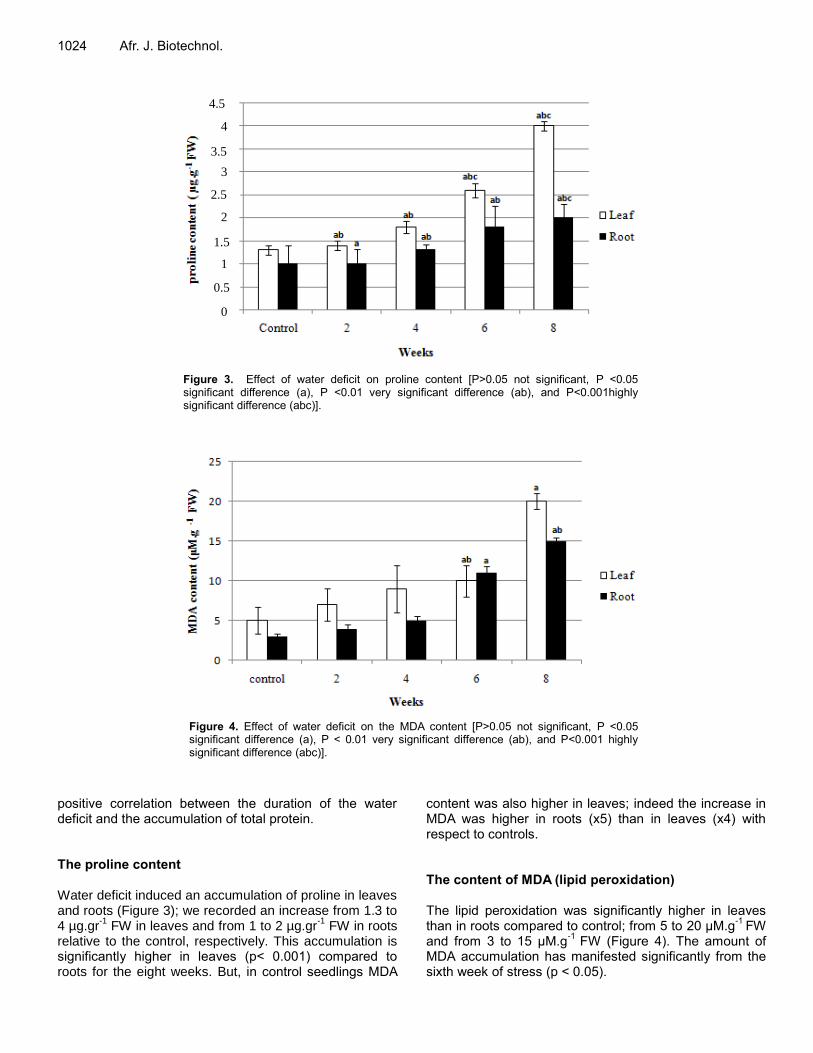
1024 Afr. J. Biotechnol.
Figure 3. Effect of water deficit on proline content [P˃0.05 not significant, P ˂0.05 significant difference (a), P ˂0.01 very significant difference (ab), and P˂0.001highly significant difference (abc)].
Figure 4. Effect of water deficit on the MDA content [P˃0.05 not significant, P ˂0.05 significant difference (a), P ˂ 0.01 very significant difference (ab), and P˂0.001 highly significant difference (abc)].
positive correlation between the duration of the water deficit and the accumulation of total protein. The proline content Water deficit induced an accumulation of proline in leaves and roots (Figure 3); we recorded an increase from 1.3 to 4 µg.gr
-1 FW in leaves and from 1 to 2 µg.gr
-1 FW in roots
relative to the control, respectively. This accumulation is significantly higher in leaves (p˂ 0.001) compared to roots for the eight weeks. But, in control seedlings MDA
content was also higher in leaves; indeed the increase in MDA was higher in roots (x5) than in leaves (x4) with respect to controls. The content of MDA (lipid peroxidation) The lipid peroxidation was significantly higher in leaves than in roots compared to control; from 5 to 20 µM.g
-1 FW
and from 3 to 15 µM.g-1
FW (Figure 4). The amount of MDA accumulation has manifested significantly from the sixth week of stress (p ˂ 0.05).
1.5
2.5
3.5
2
0.5
4.5
1
3
4
0
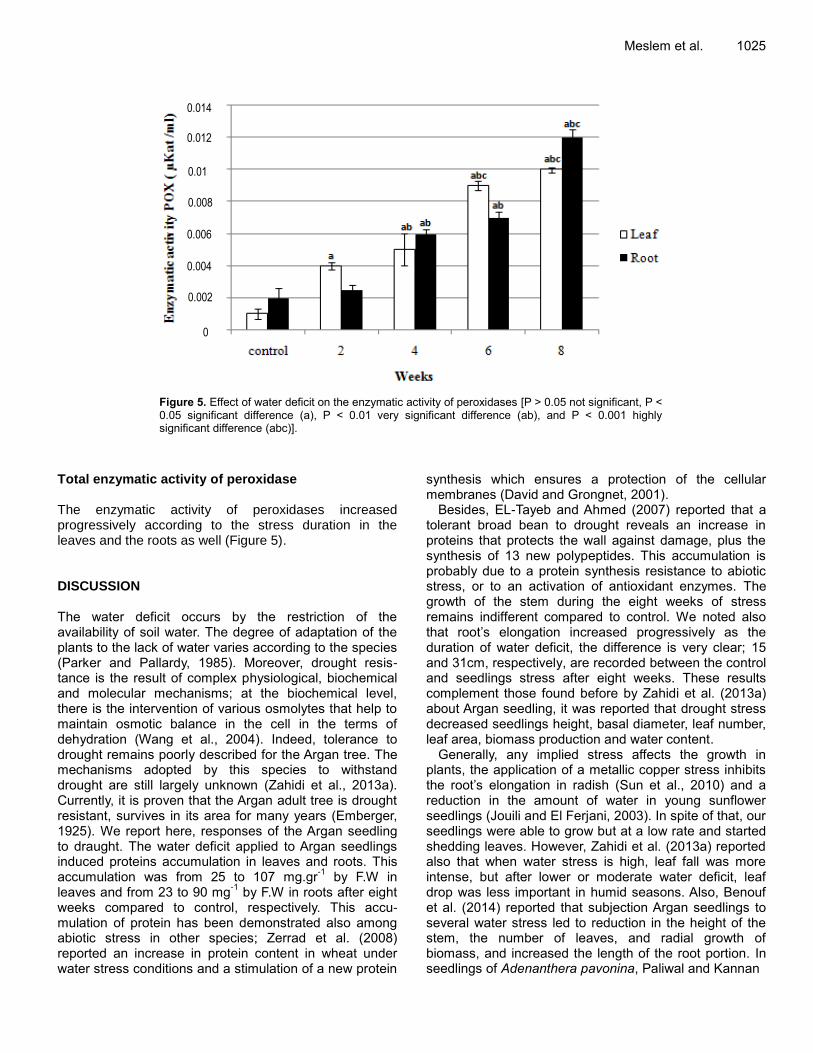
Meslem et al. 1025
Figure 5. Effect of water deficit on the enzymatic activity of peroxidases [P ˃ 0.05 not significant, P ˂ 0.05 significant difference (a), P ˂ 0.01 very significant difference (ab), and P ˂ 0.001 highly significant difference (abc)].
Total enzymatic activity of peroxidase The enzymatic activity of peroxidases increased progressively according to the stress duration in the leaves and the roots as well (Figure 5). DISCUSSION The water deficit occurs by the restriction of the availability of soil water. The degree of adaptation of the plants to the lack of water varies according to the species (Parker and Pallardy, 1985). Moreover, drought resis-tance is the result of complex physiological, biochemical and molecular mechanisms; at the biochemical level, there is the intervention of various osmolytes that help to maintain osmotic balance in the cell in the terms of dehydration (Wang et al., 2004). Indeed, tolerance to drought remains poorly described for the Argan tree. The mechanisms adopted by this species to withstand drought are still largely unknown (Zahidi et al., 2013a). Currently, it is proven that the Argan adult tree is drought resistant, survives in its area for many years (Emberger, 1925). We report here, responses of the Argan seedling to draught. The water deficit applied to Argan seedlings induced proteins accumulation in leaves and roots. This accumulation was from 25 to 107 mg.gr
-1 by F.W in
leaves and from 23 to 90 mg-1
by F.W in roots after eight weeks compared to control, respectively. This accu-mulation of protein has been demonstrated also among abiotic stress in other species; Zerrad et al. (2008) reported an increase in protein content in wheat under water stress conditions and a stimulation of a new protein
synthesis which ensures a protection of the cellular membranes (David and Grongnet, 2001).
Besides, EL-Tayeb and Ahmed (2007) reported that a tolerant broad bean to drought reveals an increase in proteins that protects the wall against damage, plus the synthesis of 13 new polypeptides. This accumulation is probably due to a protein synthesis resistance to abiotic stress, or to an activation of antioxidant enzymes. The growth of the stem during the eight weeks of stress remains indifferent compared to control. We noted also that root’s elongation increased progressively as the duration of water deficit, the difference is very clear; 15 and 31cm, respectively, are recorded between the control and seedlings stress after eight weeks. These results complement those found before by Zahidi et al. (2013a) about Argan seedling, it was reported that drought stress decreased seedlings height, basal diameter, leaf number, leaf area, biomass production and water content.
Generally, any implied stress affects the growth in plants, the application of a metallic copper stress inhibits the root’s elongation in radish (Sun et al., 2010) and a reduction in the amount of water in young sunflower seedlings (Jouili and El Ferjani, 2003). In spite of that, our seedlings were able to grow but at a low rate and started shedding leaves. However, Zahidi et al. (2013a) reported also that when water stress is high, leaf fall was more intense, but after lower or moderate water deficit, leaf drop was less important in humid seasons. Also, Benouf et al. (2014) reported that subjection Argan seedlings to several water stress led to reduction in the height of the stem, the number of leaves, and radial growth of biomass, and increased the length of the root portion. In seedlings of Adenanthera pavonina, Paliwal and Kannan
0.002
0
0.004
0.006
0.008
0.01
0.012
0.014

1026 Afr. J. Biotechnol. (1999) showed that water deficit causes a reduction of the stem height. In many species, root system in acquiring water has long been recognized as crucial to cope with drought conditions (Kashiwagi et al., 2006). Additionally, photosynthesis and growth (biomass production) are the primary processes to be affected by drought.
Our results agree with the finding in other species, so, in order to diminish consumption and increase absorption of water, plants in dry conditions often decrease their growth rate and biomass production, and contribute more biomass to roots (Wu et al., 2008). Our results show a remarkable reduction in the water content in roots and leaves; the RWC decreased progressively according to the duration of the water deficit. After eight weeks, we noted a decrease in the RWC from 85 to 41% in leaves and 88 to 45% in roots compared to the control. These results agree with those found by Berka and Aïd (2009) about the Argan tree subjected to several field capacity and by Fahmi et al. (2011) at different sampling arid areas. Several studies have showed the effect of the water stress on the RWC on other species; Zerrad et al. (2008) and Tahi (2008) about tomato and Kasraoui et al. (2004) about the Olive tree. The leaves of the Argan seedlings subjected to a water deficit present a gradual decrease in the content of chlorophyll pigments from the fourth week, and a yellowing of the leaves was also observed. This reflects the degradation of chlorophyll pigments which influences the photosynthetic capacity thereafter (M’Hamdi et al., 2009). It was reported that an oxidative stress causes the degradation of the total chlorophyll in Argan tree (Fahmi et al., 2011), in wheat (Tahri et al., 1998) and in sunflower (Ahmed et al., 2013). Also Majumdar et al. (1991) reported that chlorophyll is degraded following an activation of chlorophyllase. It was suggested that the existence of a probable connection between the synthesis of chlorophyll and proline, there is competition on the common precursor, which is the glutamate (Tahri et al., 1998).
Our data reveal an accumulation of proline much more in leaves than in roots. That was relative to the stress duration. It is a stress indicator that constitutes a source of nitrogen that can be used by the plant at the stress period (Stewart and Lee, 1974; Tal and Rosenthal, 1979) and a regulator of cytoplasmic pH (Pesci and Beffagna, 1984). It has even been recommended by several authors as an early screening test for the tolerance to water deficit (Singh et al., 1972). Our results show the conformity with the observations obtained by Berka and Aïd (2009) and Benouf et al. (2014) who reported that Argan seedlings overcome deficit water by osmotic adjustment resulting from a rapid and significant increase of active soluble sugars and a rapid accumulation of proline in leaves at several field capacity.
Tahri et al. (1998) and Chaib et al. (2010) reported that the PEG induced an accumulation of proline in wheat and a decrease in the activity of glutamine synthetase. The
reactive oxygen species at high levels can react with unsaturated acids that cause the peroxidation of the membrane essential lipids (Scandalois, 1993). The content of MDA is often considered as an indicator of tissue damage (Ding et al., 2004). Our results demon-strate that MDA was accumulated in Argan seedlings and correlated with the stress duration. These results are consistent with the observations of Tahi (2008) who reported an accumulation of MDA in tomato and radish (Sun et al., 2010). Also, Gülen et al. (2008) reported that low temperatures induced a rise of MDA in strawberry. The peroxidase is an enzyme involved in the mechanism of detoxification. The enzymatic activity was considered as an indicator of resistance to oxidative stress (Castillo, 1987). Argan seedlings submitted under water deficit showed a high peroxidase activity in leaves and roots compared to the control. At the beginning of treatment, the enzymatic activity increased significantly in the leaves. From the second week, the phenomenon was reversed, and the activity becomes more important in roots to reach its maximum at the eighth week. Many studies show that enzymes as superoxide dismutase, ascorbate peroxidase, catalase and peroxidase especially are accumulated during the water stress (Zhang and Kirkham, 1994). The capacity of the antioxidant system is crucial to maintain the integrity of the photosynthetic system (Reddy et al., 2004). In plants, the peroxydase is known by a wide distribution of iso-enzymes, which differ by their physiological role (Maciel et al., 2007).
Also, EL-Tayeb and Ahmed (2007) have shown that a variety of tolerant broad bean to water stress had a high peroxydase activity compared to other sensitive. Thus, Gülen et al. (2008), reported the appearance of new isoforms of peroxydase in Strawberry seedlings subjected to low temperature. The detoxifying enzymes can be used as important bio-markers in response to environmental stresses (Sun et al., 2010). Indeed, the response of the Argan seedlings through the enzymatic reaction reflects its great capacity to cope with water deficit.
Finally, an important factor must be looking for which is the genotype and its effect; it was be conducted by Ait Aabd et al. (2010) in order to identify promising wild Argan trees, who found that some provenances exhibited high performance yield and appeared to be the best adapted to drought conditions, contrary to others. So, it would be interesting to select tolerant genotypes. Same observations was made by Zahidi et al. (2013b) who suggested that some genotypes are resistant to dry conditions and will be useful for selecting plus trees which are essential for management and conservation practices of genetic resources in Argan forest.
Conclusion
This study demonstrates that Argan tree seedlings have
developed metabolic strategies to cope with the effect of water deficit and to minimize damage. This study has produced interesting results on the mechanisms of resistance of the Argan seedlings against a water deficit for two months, which can be useful in the applied aspect, that is, at a young stage; we can irrigate the Argan seedlings on field at least every six weeks. It would be also interesting to look further into this study by the prolongation of the duration of the stress and to follow other parameters for the successful regeneration and reforestation of this species in the Algerian forests (Tindouf) which is on the way of defacement. Conflict of interests The authors did not declare any conflict of interest.
ACKNOWLEDGEMENTS We express our thanks and gratitude to the forest sector of Tindouf city for providing seeds of the Argan tree, for their supporting for sampling and also for the documentation provided. REFERENCES Ahmed A, Hasnain A, Akhtar S, Hussain A, Yasin G, Wahid A, Mahmood
S (2013). Antioxidant enzymes as bio-markers for copper tolerance in safflower (Carthamus tinctorius L.). Afr. J. Biotechnol. 9(33):5441-5444.
Ait Aabd N, El Ayadid F, Msanda F, El Mousadik A (2010). Genetic variability of Argan tree and preselection of the candidate plus trees. Not. Bot. Hortic. Agrobot. 38(3): 293-301.
Appel H, Hirt H (2004). Reactive Oxygen Species: Metabolism, Oxidative Stress, and Signal Transduction. Annu. Rev. Plant. Biol. 155:373-399.
Arnon D (1949). Copper enzymes in isolated chloroplasts. Polyphenoloxidase in Beta vulgaris. Plant. Physiol. 24:1-15.
Bani-Aameur F, Zahidi A (2005). Variability of leaf stomatal density of adult trees of Argania spinosa (L.) Skeels in the field. Acta. Bot. Gallica. 152(3):281-288.
Benouf Z, Miloudi A, Belkhodja M (2014). The physiological and behavioural responses of argan seedlings (Argania spinosa (L.) Skeels) to water stress in the semi-arid Western Algeria. Int. J. Plant Physiol. Biochem. 6(5):44-55.
Berka S, Aïd F (2009). Réponses physiologiques des plants d’Argania spinosa (L.) Skeels soumis à un déficit hydrique édaphique. Science et changements planétaires/Sécheresse 20: 296-302.
Bradford M (1976). A rapid and sensitive method for the quantitation of microgram quantities of protein utilizing the principle of protein-dye binding. Anal. Biochem. 72(1):248-254.
Castillo S (1987). Differential antioxidative response to cadmium in roots and leaves of pea (Pisum sativum). J. Exp. Bot. 52:1101-1109.
Chaib G, Bouchibi-Baaziz N, Hazmoune T, Benlaribi M (2010). Indicateurs de tolérante au stress hydrique chez le blé dur (Tritium durum Desf.). Reg. Arid. 24:634-638.
Charrouf Z, Guillaume D (1998). Ethnoeconomical, ethnomedicaland phytochemical study of Argania spinosa L. Skeels. J. Ethnopharmacol. 67:7-14.
Côme D, Corbineau F (1998). Physiologie végétale II. Croissance et Développement. Ed. Hermann. France, Paris.
David J, Grongnet J (2001). Les protéines de stress. INRA . Prod. Anim. 14(1):29-40.
Meslem et al. 1027 Ding H, Wan Y, Qi N, Zhu W, Yang X, Shao Y (2004). Effects of Cd
+2
and Zn+2
stresses on antioxidant enzyme system of tomato seedlings. Acta. Agr. Shanghai. 20:79-82.
EL-Tayeb M, Ahmed M (2007). Apoplastic Protein Pattern, Hydrolases and Peroxidase Activity of Vicia faba Cultivars as Influenced by Drought. Int. J. Agric. Biol. 9(2):226-230.
Emberger L (1925). Le domaine naturel de l'Arganier. Bull. Soc. Bot. France 72(4): 770-774.
Fahmi F, Tahrouch S, Bouzoubaa Z , Hatimia A (2011). Effet de l’aridité sur la biochimie et la physiologie d’Argania spinosa Agadir. Actes du Premier Congrès International de l’Arganier 15/17 December: 299-308.
Faouzi H (2006). L’Arganier Argania spinosa L. Skeels, Caractéristique botanique et phénologie. Espace Marocaines Maroc Mars/ Avril: 1-11.
Ferradous A, Bani-Aameur F, Dupuis P (1996). Climat stationnel, phénologie et fructification de l'arganier (Argania spinosa L. Skeels). Acte. Inst. Agront. Vet. (Maroc) 17(1):51-60.
Gülen H, Cetinkaya C, Kadioglu M, Kesici M, Cansev A , Eris A (2008). Peroxidase Activity and Lipid Peroxidation in Strawberry (FragariaX ananassa) plants Under Low Temperature. J. Environ. Sci. 2(6):95-100.
Heller R, Esnault R, Lance C (1998). Physiologie végétale. Ed. Dunod France, Paris.
Jackson P, Ricardo C (1992). Cytochrome aided of resolution of Lumpinus albus iso-peroxidase in cathode polyacrylamide gel electrophoresis stem. Ann. Biochim. 200:36-41.
Jouili H, El Ferjani E (2003). Changes in antioxidant and lignifying enzyme activities in sunflower roots (Helianthus annuus L.) stressed with copper excess. C. R. Biol. 326(7): 639-644.
Kashiwagi J, Krishnamurthy L, Crouch JH, Serraj R (2006). Variability of root length density and its contributions to seed yield in chickpea (Cicer arietinum L.) under terminal drought stress. Field Crops Res. 95(2):171-181.
Kasraoui M, Mehri H, Braham M, Boujnah D , Attia F (2004). Comportement écophysiologique de jeunes plants d’Olivier (Olea europaea L.) suite à une déshydratation et une réhydratation. Les annales de l’INAT 1(19): 1-9.
Khan A, Robinson D (1994). Hydrogen donor specificity of mango isoperoxidases. Food Chem. 49(4): 407-410.
Larcher W (1995). Physiological plant ecology. Ed. Springer. New York. M’Hamdi M, Du Jardin P, Bettaieb T, Harbaoui Y, Mougou A (2009).
Insight into the role of catalases in salt stress in potato (Solanum tuberosum L.). Biotechnol. Agron. Soc. Environ. 13(3):373-379.
Maciel HPF, Gouvêa CMCP, Toyama M, Smolka M, Marangoni S, Pastore GM (2007). Extraction, purification and biochemical characterization of a peroxidase from Copaifera langsdorffii leaves. Quín. Nova 30(5):1067-1071.
Majumdar S, Ghosh B, Glick R, Dumbroff EB (1991). Activities of chlorophyllase, phosphoenolpyruvate carboxylase and ribulose- 1, 5-bisphosphate carboxylase in the primary leaves of soybean during senescence and drought. Physiol. Plant. 81: 473-480.
Meslem H, Djabeur A, Kaid-Harche M (2009). Effet des prétraitements physicochimiques sur l’amélioration de la germination des graines d’Argania spinosa L. skeels. Mémoire de Master. Université d’USTOMB.
Mokhtari M (2002). Production rapide de plants d’Arganier aptes à la transplantation. Bull. Mens. Inf. liaison PNTTA 95:1-4.
Monneveux P, Nemmar M (1986). Contribution à l'étude de la résistance à la sécheresse chez le blé tendre (Triticum aestivum L.) et chez le blé dur (Triticum durum Desf.): étude de l'accumulation de la proline au cours du cycle de développement. Agronomie 6(6): 583-590.
Msanda F, El Aboudi A, Peltier J-P (2005). Biodiversité et biogéographie de l’arganeraie marocaine. Cah. Agr. 14(4):357-364.
Nouaim R (2005). L'Arganier au Maroc: entre mythes et réalités: une civilisation née d'un arbre. Ed. L'Harmattan. France, Paris.
Paliwal K, Kannan D (1999). Growth and nutritional characteristics of four woody species under nursery conditions and growth after transplantation in semi arid field conditions at Madurai, India. J. Arid Environ. 43: 133-141.
Parker W, Pallardy S (1985). Genotypic variation in tissue water relations of leaves and roots of black walnut (Juglans nigra)

1028 Afr. J. Biotechnol.
seedlings. Physiol. Plant. 64:105-110. Rajinder S, Dhindsa P, Thorpe T (1981). Leaf Senescence: Correlated
with increased levels of membrane permeability and lipid peroxidation, and decreased levels of superoxide dismutase and catalase J. Exp. Bot. 32:93-101.
Reddy A, Chaitanya K, Vivekanandan M (2004). Drought-induced responses of photosynthesis and antioxidant metabolism in higher plants. J. Plant Physiol. 161:1189-1202.
Reuveni R, Shimoni M, Karchi Z, Kue J (1992). Peroxidase activity as a biochemical marker for resistance of muskmelon (Cucumis melo) to Pseudoperonospora cubensis. Phytopathology 82:749-753.
Rivlland V (2003). Amélioration et validation du modèle de fonctionnement de la végétation ISBA-A- : stress hydrique et flux de CO2. Thèse de doctorat. Université Toulouse,
Scandalois J (1993). Oxygen stress and superoxide dismutase. Plant. Physiol. 107:7-12.
Singh T, Aspinall D, Paleg LG (1972). Proline accumulation and varietal adaptability stress in plants. Ann. Rev. Plant. Phys. 37: 363-376.
Stewart C, Lee J (1974). The role of proline accumulation in halophytes. Planta 120: 273-289.
Sun B, Kan SH, Zhang YZ, Ding SH, Wu J, Yuan H, Qi H, Yang G, Li H, Zhang XH, Xiao H, Wang YJ, Peng H, Li YW (2010). Certain antioxidant enzyme and lipid peroxidation of radish (Raphanus sativus L.) as early warning biomarkers of soil copper exposer. J. Hazard. Mater. 183: 833-838.
Tahi H (2008). Efficience de l’utilisation de l’eau d’irrigation chez la tomate par la technique de PRD (Partial Root zone Drying) et étude des mécanismes physiologiques et biochimiques impliqués. Thèse de doctorat,. Université de Cadi Ayyad, Maroc.
Tahri H, Belabed A, Sadki K (1998). Effet d’un stress osmotique sur l’accumulation de proline, de chlorophylle et des ARNm codant pour la glutamine synthétase chez trois variétés de blé dur (Triticum durum). Bull. Ins. Sci. 21:81-87.
Tal M, Rosenthal I (1979). Salt tolerance in Simmondsia chenensis water balance and accumulation of chloride sodium and proline under low and high salinity. Ann. Bot. 34:701-708.
Tardieu F (2005). Plant tolerance to water deficit: physical limits and
possibilities for progress. Comptes Rendus Geoscience 337: 57-67. Wang W, Brak T, Vinocur B, Shoseyov O, Altman A (2004).
Physiological Recovery of Kentucky Bluegrass from Simultaneous Drought and Heat Stress. Crop Sci. 44:729-1736.
Wu F, Baoa W, Lia F, Wua N (2008). Effects of drought stress and N supply on the growth, biomass partitioning and water-use efficiency of Sophora davidii seedlings. Environ. Exp. Bot. 63: 248-255.
Zahidi A, Bani-Aameur F , EL Mousadik A (2013 a). Growth variability in Argania spinosa seedlings subjected to different levels of drought stress. J. Hortic. Forest. 5(11):204-217.
Zahidi A, Bani-Aameur F, El mousadik A (2013 b). Seasonal change effects on phenology of Argania spinosa (L.) in the fields. J. Ecol. Nat. Environ. 5(8):189-205.
Zerrad W, Maataoui BS, Hilali S, El Antri S, Hmyene A (2008). Étude comparative des mécanismes biochimiques de résistance au stress hydrique de deux variétés de blé dur. Leban. Sci. J. 9(2): 27- 35.
Zhang J, Kirkham M (1994). Drought-stress-induced changes in activities of superoxide dismutase, catalase and peroxidase in wheat species. Plant Cell Physiol. 35:785-791.
Vol. 14(12), pp. 1029-1038, 25 March, 2015
DOI: 10.5897/AJB2014.14385
Article Number: 454FD3A51706
ISSN 1684-5315
Copyright © 2015
Author(s) retain the copyright of this article
http://www.academicjournals.org/AJB
African Journal of Biotechnology
Full Length Research Paper
Genetic variation of 12 rice cultivars grown in Brunei Darussalam and assessment of their tolerance to saline
environment
Nurul Kahrani Ishak1, Zohrah Sulaiman1,2*, Kushan U. Tennakoon1
1Environmental and Life Sciences, Faculty of Science, Universiti Brunei Darussalam, Jln Tungku Link, Gadong BE 1410,
Brunei Darussalam. 2Institut Teknologi Brunei, Jln Tungku Link, Gadong BE1410, Brunei Darussalam.
Received 23 December, 2014; Accepted 17 March, 2015
Genetic variations of 12 different rice cultivars in Brunei Darussalam were studied using 15 different SSR markers and their salinity tolerance mechanism was also assessed. Eight SSR markers, RM 151, 187, 206, 226, 276, 310, 320 and 334, showed polymorphic alleles while the other seven were monomorphic. A total of 158 alleles were amplified for all these rice cultivars using 15 SSR markers, with an average of 10.53. The allele frequencies per locus or marker range from 0 in RM 307 to five alleles in RM 226. PIC values varied from 0.00 to 0.7521. Similarity distance varied from 0.00 to 1.00. Dendrogram showed three distinct clusters, where both Kuaci and Sp1 significantly diverted from the other ten rice cultivars. Bandul berminyak was the most tolerant to salinity. Quantum yield for B. berminyak were unaffected and it showed the least reduction in growth parameters studied when expose to salinity stress. From both salinity tolerance and genetic variation investigations for these 12 cultivars, it may probably be better to intercross between Arat (moderately tolerant) and Sp1 (susceptible) as both are from different clusters, showed low genetic similarity with 0.33 and different salinity tolerance level. Key words: Genetic variability, rice cultivars, SSR markers, salinity
INTRODUCTION Extensive efforts have been carried out in Brunei to increase rice production which includes cultivation of fast-
growing inbred paddy Laila, increase paddy cultivation area and improvements in facilities. However,
*Corresponding author. E-mail: [email protected]. Abbreviations: RFLP, Restriction fragment length polymorphism; RAPD, random amplified polymorphic DNA; AFLP, amplified fragment length polymorphism; ISSR, inter-simple sequence repeat; SSR, single sequence repeats; PIC, polymorphism information content; RM, rice marker.
Author(s) agree that this article remain permanently open access under the terms of the Creative Commons Attribution License 4.0 International License

1030 Afr. J. Biotechnol. the country has yet been able to achieve the target 20% self-sufficiency. Soil salinity is one of the major con-straints that cause this situation. Low rice productivity is also caused by narrow range of genetic variability and lack of sufficient genetic information about traits inherited (Mahajan et al., 2012). Standard conventional breeding techniques which involved selection of desired parent plants using morphology and physiology study (Allard, 1999; Collard and Mackill, 2008) has been replaced by molecular breeding. The conventional breeding tech-niques may take five to 10 years to be completed and more work on morphology and physiology are needed for studying genetic diversity among parents (Zeng et al, 2004; Collard and Mackill, 2008). Zeng et al. (2004) have reported that the morphology measurement might not reveal the actual genetic relationships among genotypes studied. Thus, both measurements might not be discrimi-native enough to differentiate all the genotypes studied (Behera et al., 2012).
The constraints encountered by conventional breeders on selection of parents can be solved by using molecular breeding techniques. Some molecular markers that can be used in molecular breeding include restriction fragment length polymorphism (RFLP), random amplified polymorphic DNA (RAPD), amplified fragment length polymorphism (AFLP), inter-simple sequence repeat (ISSR) and single sequence repeats (SSR). These techniques are different in terms of speed, cost and degree of polymorphism. According to Garcia et al. (2004), RAPD is a much simpler technique when com-pared to RFLP, as the latter requires radioactive materials. However, RAPD lack in reproducibility cause by mismatch annealing. SSR solve these limitations as its sequence present in most eukaryote genomes, infor-mative and reproducible. According to Saini et al. (2004), SSR is more efficient for differentiating rice genotypes when compared to both AFLP and ISSR and they also stated that both AFLP and SSR are more reliable and reproducible than ISSR.
According to Shams et al. (2012), SSR markers are usually utilized to study genetic variation in different rice germplasm as they are inexpensive, simple, rapid, easily detected by PCR and importantly only require small amount of tissue samples. These markers helped to increase efficiency and precision when selecting the parents before intercrossing and this would lead to the production of new cultivar with improved characteristics (Zeng et al., 2004; Collard and Mackill, 2008). Assessing salinity tolerance level of rice cultivars is also necessary to select the parental line for breeding program as it helps to understand salinity tolerance mechanism in the cultivars. Growth and photosynthetic efficiency measure-ments were taken for determining salinity tolerance of the studied rice cultivar (Cha-um et al., 2007).
Cultivar that possess high tolerance and show less reduction in these parameters would be the best parent. Rice varieties adapt to saline environments differently due
to the diverse genetic background and different salinity tolerance mechanisms. Improving salt tolerance can be achieved by selecting suitable parents before inter-crossing based on information provided from micro-satellite markers.
Different salt tolerance components can be combined into a cultivar by intercrossing parents from different microsatellite clusters with wide salt tolerance mechanisms (Zeng et al., 2004). Investigation on genetic similarity, cluster analysis and also salt tolerance ability provide useful information for plant breeders to select best parents with diverse genetic background prior to intercrossing (Kanawapee et al., 2011).
In this study, the genetic diversity of 12 different rice cultivars grown in Brunei, with different adaption to salinity stress, was assessed using 15 SSR markers. Fifteen (15) markers with high polymorphism information content (PIC) values from Temnykh et al. (2000) were selected for the study. The result obtained from this study may help breeder to increase efficiency of breeding as it provides detailed information about genetic diversity of the 12 cultivars studied, thus allowing one to select the suitable parents for crossing to produce germplasm with better traits. Besides, no extensive investigations have yet been carried out for genetic study of the rice cultivars grown in the country using microsatellites.
MATERIALS AND METHODS
Plant material
Twelve (12) different rice cultivars: Adan, Arat, Bandul berminyak, Jongkok, Kuaci, Laila, Pusu, Pulut Keladi, Pusu Merah, Raden Pinang, Salleh, and an unknown rice cultivar which was named Sp1 were used in the present study.
Genomic DNA extraction
Genomic DNA was extracted from frozen leaves (0.2 g) of the rice cultivars using GenElute Plant Genomic DNA Miniprep Kit (Sigma-Aldrich Co. LLC, St. Louis, Missouri) according to the manufacturer's instructions.
PCR amplification
A total of 15 microsatellites with high PIC value were chosen from Temnykh et al. (2000) and used for the study (Table 1). The polymerase chain reaction (PCR) amplification mixture was prepared in 0.5 ml Eppendorf tubes. Each reaction mixture contained 2.5 μl of 10X PCR buffer, 1.5 µl 50 mM MgCl2, 0.5 µl 10 mM dNTP, 5 µl of 1 μM for each primer (forward and reverse), 100 ng of DNA, 0.3 µl Taq DNA polymerase and TE buffer (pH 8.0) was added to adjust the final volume to 25 μl. The amplification programme consisted of the following cycles: 94°C for 4 min, 30 cycles of 94°C for 45 s, 39.5 to 57.2°C (standardized for each primer) for 1 min and 72°C for 1 min, and a final extension at 72°C for 10 min, following method of Nadia et al. (2014).

Ishak et al. 1031
Table 1. List of SSR markers used in this investigation.
Primer Size range
(bp) PIC
Tm (°C)
Forward primer sequence (5’-3’) Reverse primer sequence (5’-3’)
RM 72 152-198 0.85 43.8 CCGGCGATAAAACAATGAG GCATCGGTCCTAACTAAGGG
RM 151 205-317 0.87 54.2 GGCTGCTCATCAGCTGCATGCG TCGGCAGTGGTAGAGTTTGATCTGC
RM 159 238-252 0.87 57.2 GGGGCACTGGCAAGGGTGAAGG GCTTGTGCTTCTCTCTCTCTCTCTCTCTC
RM 187 136-164 0.84 45.3 CCAAGGGAAAGATGCGACAATTG GTGGACGCTTTATATTATGGG
RM 206 121-137 0.87 39.5 TAGTTTAACCAAGACTCTC GGTTGAACCCAAATCTGCA
RM 226 264-342 0.82 49.2 AGCTAAGGTCTGGGAGAAACC AAGTAGGATGGGGCACAAGCTC
RM 264 148-178 0.83 46.7 GTTGCGTCCTACTGCTACTTC GATCCGTGTCGATGATTAGC
RM 276 85-153 0.84 46.7 CTCAACGTTGACACCTCGTG TCCTCCATCGAGCAGTATCA
RM 287 98-118 0.83 42.6 TTCCCTGTTAAGAGAGAAATC GTGTATTTGGTGAAAGCAAC
RM 307 124-176 0.83 46.7 GTACTACCGACCTACCGTTCAC CTGCTATGCATGAACTGCTC
RM 310 85-120 0.83 38.5 CCAAAACATTTAAAATATCATG GCTTGTTGGTCATTACCATTC
RM 320 153-254 0.85 46.7 CAACGTGATCGAGGATAGATC GGATTTGCTTACCACAGCTC
RM 333 164-215 0.83 47.5 GTACGACTACGAGTGTCACCAA GTCTTCGCGATCACTCGC
RM 334 146-197 0.83 47.3 GTTCAGTGTTCAGTGCCACC GACTTTGATCTTTGGTGGACG
RM 335 104-155 0.84 49.2 GTACACACCCACATCGAGAAG GCTCTATGCGAGTATCCATGG
Electrophoresis of PCR products Amplified products were separated on 2.5% agarose gel containing 0.5 µg/ml ethidium bromide using 1xTBE buffer as explained by Behera et al. (2012) at 100 V for 1 h. A volume of 10 µl amplified product was mixed with 2 µl loading dye. The gel was visualized under gel documentation (Compact CCD Image System, Major Science, USA). Salinity treatments for rice cultivars in soil Salinity tolerance levels for these 12 cultivars were studied by treating the plants with 0 mM salinity (control) and at 100 mM salinity level. Once every two days, 1 L of 100 mM saline solution was supplied to salinity treatment pot and 1 L of distilled water to control pot. Experiments were carried out for three (for Laila cultivar only) to seven months (the other 11 cultivars). Three days after the first salinity treatment, the plantlets were subjected to physiological investigations which include photosynthesis efficiency and growth measurements. Quantum yield measurement Quantum yield (Fv/Fm) was taken using Fluorpen FP100 (Photon Systems Instruments, Brno, Czech Republic) once a week. Measurement was taken from the same leaf at three different locations (at the leaf base, middle and near the leaf tips). Prior to the quantum yield measurement, the leaf was dark-adapted with aluminium foil for 30 min (Wankhade et al., 2013). Growth measurements Towards the end of the project (after 3 months for paddy Laila and seven months for the other 11 cultivars), fresh and dry root weight were measured. Root fresh weights were measured immediately after harvesting. Topsoil of the extracted roots were flushed away
using tap water and dry weights were taken after plants were dried at 70°C until a constant weight was attained (Zeng et al., 2004). Plant height was measured from the stem base to the tip of the top most leaf (Zeng et al., 2004) at the commencement, mid project time (one and half month or four month) and final project time (three or seven months). Salinity tolerance scores The salinity symptoms observed in the cultivars studied were scored according to standard evaluation systems described by Lee et al. (2007) for salinity tolerance. Data analysis The amplified band or allele was scored manually as present (1) or absent (0) for each genotype and primer combination. Data was entered in binary matrix using Excel and was used to calculate simple matching similarity coefficient using DARWin 5.0 with 500 bootstraps (Perrier and Jacquemoud-Collet, 2006). Dendrogram was constructed using unweighted pair group with arithmetic mean (UPGMA) following method done by Tabkhkar et al. (2012) to separate the rice cultivars into clusters and from here genetic relatedness among cultivars studied was deduced. The procedure adopted by Nei and Li (1979) was used with FreeTree software ( Pavlicek et al., 1999) to calculate the distance matrix. To measure alleleic diversity of SSR markers, PIC was calculated using this formula: PIC=1-Ʃ(Pi j)2 Where, Pi j is the frequency of the ith allele in the jth population for each SSR locus (Botstein et al., 1980; Mahajan et al., 2012). For physiology experiment, Non parametric Kruskal Wallis (if data was not normally distributed) or Two-Way Anova Tukey Test (if data was normally distributed) was used to test the following hypothesis:

H0: There is no significant effect of salinity to parameter (quantum
1032 Afr. J. Biotechnol.
100 bp
M Sp1 R S P L K J AD AR B PK PM
900
200
500
1517
400
300
700 800
1200 1000
600
Figure 1. PCR amplification for 12 different rice cultivars (AD=Adan, AR=Arat, B=Bandul berminyak, J=Jongkok, K=Kuaci, L=Laila, P=Pusu, PK=Pulut Keladi, PM=Pusu Merah, R=Raden Pinang, S=Salih and Sp1=unnamed rice cultivar) using SSR marker RM 226 (M=marker (100 bp)).
yield for instance) of the rice cultivar; H1: there is significant effect of salinity to parameter (quantum yield for instance) of the rice cultivar.
RESULTS Polymorphism in SSR markers A total of 158 alleles were amplified for all these rice cultivars using 15 SSR markers with an average of 10.53. Out of 15 markers, 8 were polymorphic while the others were monomorphic. Rice marker (RM) 151, 187, 206, 226, 276, 310, 320 and 334 resulted in polymorphic alleles while the primers, RM 72, 159, 264, 287, 333 and 335, gave monomorphic alleles. The allele frequencies per locus or marker range from 0 in RM 307 to 5 alleles in RM 226. Figure 1 shows amplified bands or alleles for 12 different rice cultivars using SSR markers RM 226. PIC values varied from 0.00 to 0.7521 (RM 226). SSR markers that produce high PIC value with 0.5 and above were obtained from RM 151, 206, 226, 310 and 320. Genetic diversity and relationship among 12 rice cultivars studied
Both similarity distance and dendrogram were analysed using polymorphic marker RM 226. Similarity distance varied from 0.00 to 1.00 (Table 2). Genotype Laila showed highest similarity with Adan (1.00). Genotype Pusu and Adan, Pulut Keladi and Bandul berminyak and Pusu Merah with Jongkok also showed the highest similarity. Genotype Salleh or Sp1 and Kuaci showed the least similarity (0.00). The dendrogram (Figure 2) showed 3 distinct clusters. Group 1 consists of Sp1 while Group 2 consists of Kuaci and the other ten cultivars are in Group 3. Group 3 was further sub-divided into 5 groups with Salleh diverted from the other nine cultivars. Data shown in Figures 2 and 3 show that Kuaci and Sp1 were most genetically different from the other ten rice cultivars.
Salinity tolerance
Figure 4 shows the paddy of Arat, Adan and Bandul berminyak grew upright and showed healthier leaves compared to the rest of the cultivars after being exposed to salinity stress for 3 months. Leaves for some of the cultivars (Laila and Pusu) died due to the high salinity stress. The other cultivars (Jongkok, Kuaci, Pulut Keladi, Pusu Merah, Raden Pinang, Salleh and Sp1) were slightly affected due to salinity stress as some of their leaves showed symptoms of dying. According to results

summarized in Table 3, Adan and Arat can be classified as moderately tolerant to salinity stress and Bandul berminyak was tolerant. Quantum yield of Bandul
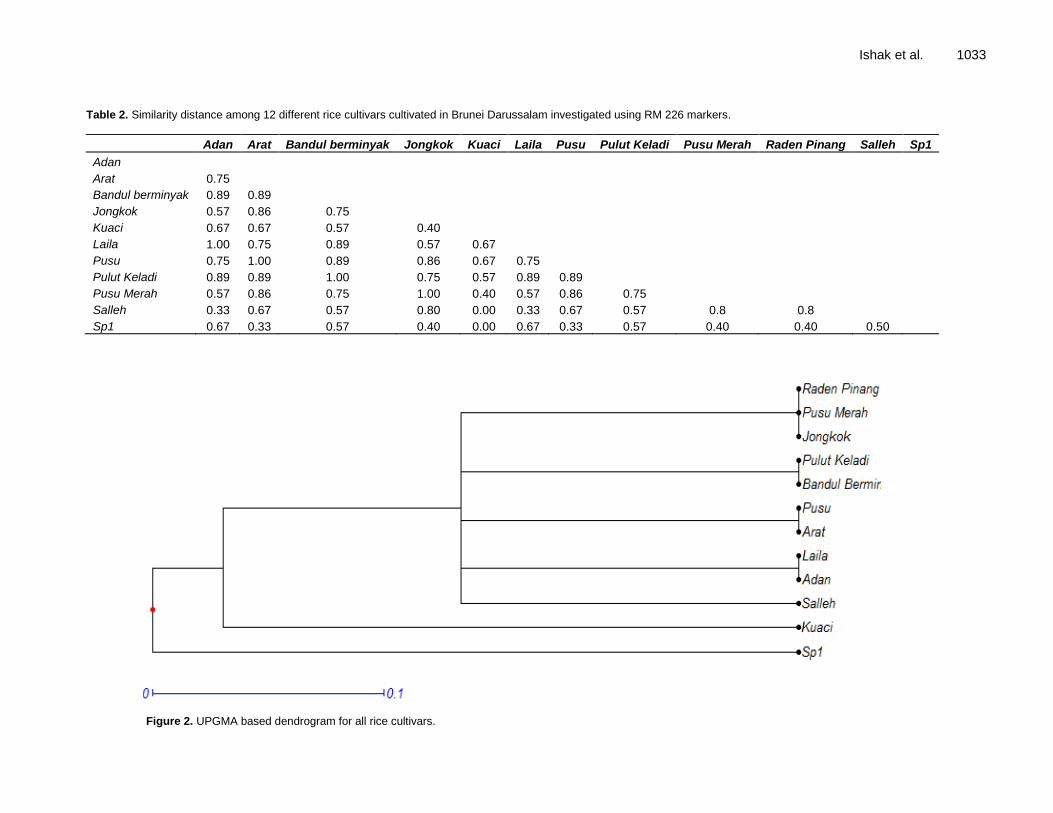
Ishak et al. 1033
Table 2. Similarity distance among 12 different rice cultivars cultivated in Brunei Darussalam investigated using RM 226 markers.
Adan Arat Bandul berminyak Jongkok Kuaci Laila Pusu Pulut Keladi Pusu Merah Raden Pinang Salleh Sp1
Adan
Arat 0.75
Bandul berminyak 0.89 0.89
Jongkok 0.57 0.86 0.75
Kuaci 0.67 0.67 0.57 0.40
Laila 1.00 0.75 0.89 0.57 0.67
Pusu 0.75 1.00 0.89 0.86 0.67 0.75
Pulut Keladi 0.89 0.89 1.00 0.75 0.57 0.89 0.89
Pusu Merah 0.57 0.86 0.75 1.00 0.40 0.57 0.86 0.75
Salleh 0.33 0.67 0.57 0.80 0.00 0.33 0.67 0.57 0.8 0.8
Sp1 0.67 0.33 0.57 0.40 0.00 0.67 0.33 0.57 0.40 0.40 0.50
Figure 2. UPGMA based dendrogram for all rice cultivars.
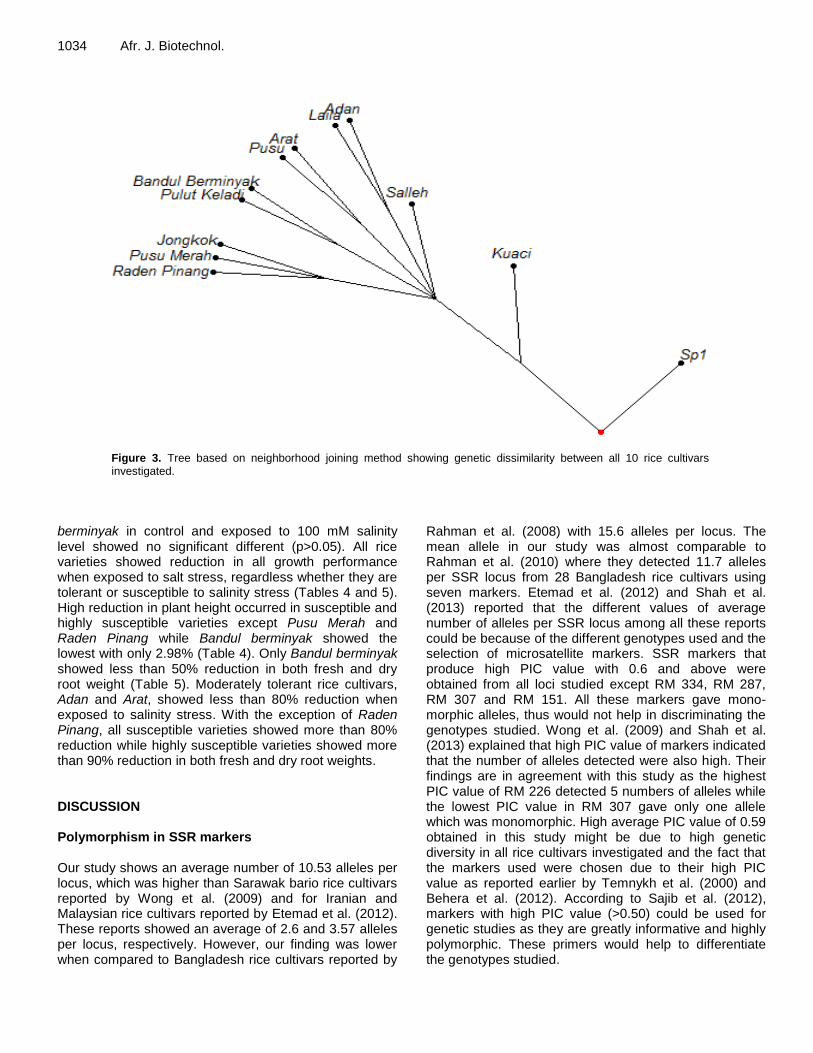
1034 Afr. J. Biotechnol.
Figure 3. Tree based on neighborhood joining method showing genetic dissimilarity between all 10 rice cultivars investigated.
berminyak in control and exposed to 100 mM salinity level showed no significant different (p>0.05). All rice varieties showed reduction in all growth performance when exposed to salt stress, regardless whether they are tolerant or susceptible to salinity stress (Tables 4 and 5). High reduction in plant height occurred in susceptible and highly susceptible varieties except Pusu Merah and Raden Pinang while Bandul berminyak showed the lowest with only 2.98% (Table 4). Only Bandul berminyak showed less than 50% reduction in both fresh and dry root weight (Table 5). Moderately tolerant rice cultivars, Adan and Arat, showed less than 80% reduction when exposed to salinity stress. With the exception of Raden Pinang, all susceptible varieties showed more than 80% reduction while highly susceptible varieties showed more than 90% reduction in both fresh and dry root weights. DISCUSSION Polymorphism in SSR markers Our study shows an average number of 10.53 alleles per locus, which was higher than Sarawak bario rice cultivars reported by Wong et al. (2009) and for Iranian and Malaysian rice cultivars reported by Etemad et al. (2012). These reports showed an average of 2.6 and 3.57 alleles per locus, respectively. However, our finding was lower when compared to Bangladesh rice cultivars reported by
Rahman et al. (2008) with 15.6 alleles per locus. The mean allele in our study was almost comparable to Rahman et al. (2010) where they detected 11.7 alleles per SSR locus from 28 Bangladesh rice cultivars using seven markers. Etemad et al. (2012) and Shah et al. (2013) reported that the different values of average number of alleles per SSR locus among all these reports could be because of the different genotypes used and the selection of microsatellite markers. SSR markers that produce high PIC value with 0.6 and above were obtained from all loci studied except RM 334, RM 287, RM 307 and RM 151. All these markers gave mono-morphic alleles, thus would not help in discriminating the genotypes studied. Wong et al. (2009) and Shah et al. (2013) explained that high PIC value of markers indicated that the number of alleles detected were also high. Their findings are in agreement with this study as the highest PIC value of RM 226 detected 5 numbers of alleles while the lowest PIC value in RM 307 gave only one allele which was monomorphic. High average PIC value of 0.59 obtained in this study might be due to high genetic diversity in all rice cultivars investigated and the fact that the markers used were chosen due to their high PIC value as reported earlier by Temnykh et al. (2000) and Behera et al. (2012). According to Sajib et al. (2012), markers with high PIC value (>0.50) could be used for genetic studies as they are greatly informative and highly polymorphic. These primers would help to differentiate the genotypes studied.
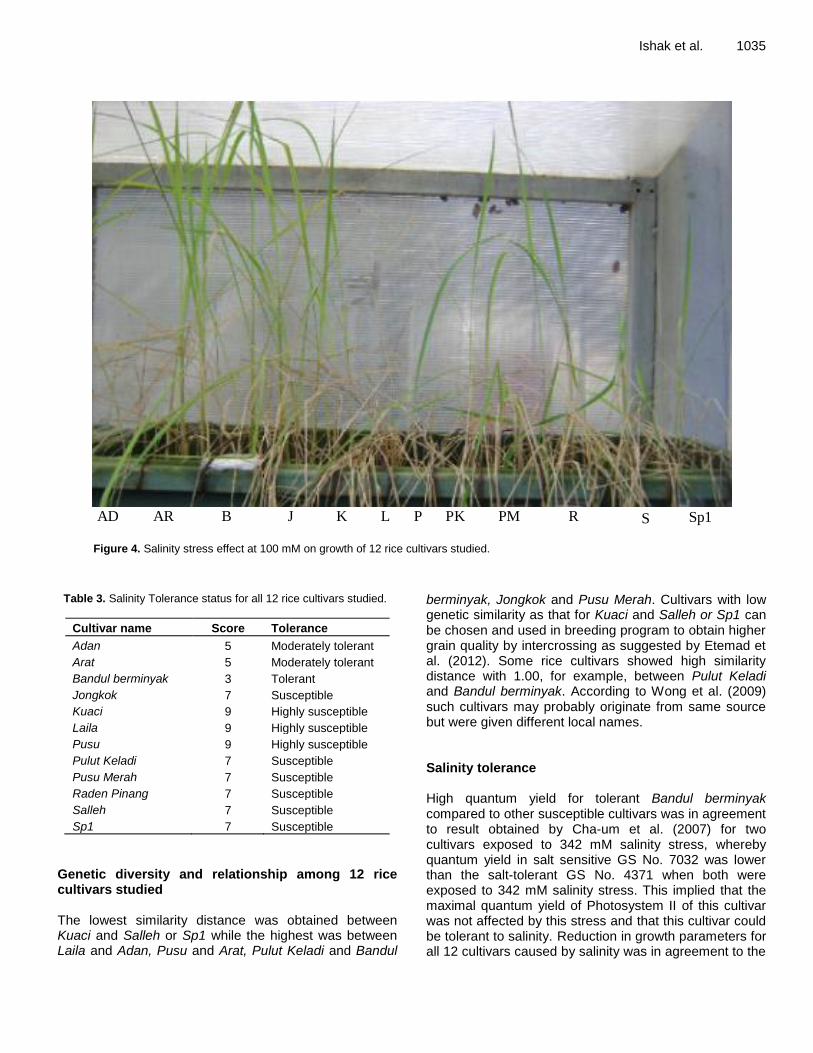
Ishak et al. 1035
AD AR B S Sp1 J K L P PK PM R
Figure 4. Salinity stress effect at 100 mM on growth of 12 rice cultivars studied.
Table 3. Salinity Tolerance status for all 12 rice cultivars studied.
Cultivar name Score Tolerance
Adan 5 Moderately tolerant
Arat 5 Moderately tolerant
Bandul berminyak 3 Tolerant
Jongkok 7 Susceptible
Kuaci 9 Highly susceptible
Laila 9 Highly susceptible
Pusu 9 Highly susceptible
Pulut Keladi 7 Susceptible
Pusu Merah 7 Susceptible
Raden Pinang 7 Susceptible
Salleh 7 Susceptible
Sp1 7 Susceptible
Genetic diversity and relationship among 12 rice cultivars studied The lowest similarity distance was obtained between Kuaci and Salleh or Sp1 while the highest was between Laila and Adan, Pusu and Arat, Pulut Keladi and Bandul
berminyak, Jongkok and Pusu Merah. Cultivars with low genetic similarity as that for Kuaci and Salleh or Sp1 can be chosen and used in breeding program to obtain higher grain quality by intercrossing as suggested by Etemad et al. (2012). Some rice cultivars showed high similarity distance with 1.00, for example, between Pulut Keladi and Bandul berminyak. According to Wong et al. (2009) such cultivars may probably originate from same source but were given different local names. Salinity tolerance High quantum yield for tolerant Bandul berminyak compared to other susceptible cultivars was in agreement to result obtained by Cha-um et al. (2007) for two cultivars exposed to 342 mM salinity stress, whereby quantum yield in salt sensitive GS No. 7032 was lower than the salt-tolerant GS No. 4371 when both were exposed to 342 mM salinity stress. This implied that the maximal quantum yield of Photosystem II of this cultivar was not affected by this stress and that this cultivar could be tolerant to salinity. Reduction in growth parameters for all 12 cultivars caused by salinity was in agreement to the

1036 Afr. J. Biotechnol.
Table 4. Percentage reduction in plant height for 12 cultivars grown in salinity stress.
Rice variety Reduction in plant height (%)
Tolerant Bandul berminyak 2.98
Moderately Tolerant Adan 9.05
Arat 8.76
Susceptible
Jongkok 14.66
Pulut Keladi 10.28
Pusu Merah 8.54
Raden Pinang 9.04
Salleh 10.55
Sp1 19.72
Highly susceptible
Kuaci 16.47
Laila 25.28
Pusu 22.86
Table 5. Fresh and dry root weight for 12 cultivars grown in 0 and 100 mM salinity levels with percentage reductions.
Rice variety Reduction in root fresh weight (%) Reduction in root dry weight (%)
Tolerant Bandul berminyak 25.25 51.13
Moderately tolerant Adan 72.11 74.54
Arat 73.48 78.83
Susceptible
Jongkok 87.65 91.20
Pulut Keladi 92.43 93.84
Pusu Merah 90.04 91.04
Raden Pinang 77.89 67.72
Salleh 76.74 81.91
Sp1 90.23 95.41
Highly susceptible
Kuaci 95.02 93.35
Laila 97.71 97.86
Pusu 93.69 94.77
result reported by Cha-um et al. (2007, 2009). The growth reduction is caused by decreased in photosyn-thesis due to salt toxicity (Cha-um et al., 2009). Photo-synthetic efficiency of salt-sensitive varieties affected more than tolerant varieties. Tolerant Bandul berminyak shows similar pattern to salt tolerant rice variety Homjan studied by Cha-um et al. (2009), whereby both showed lower reduction in growth parameters compare to salt-sensitive varieties such as KDML105.
Plant height of all 12 cultivars showed no significant variation due to exposure to salinity stress. However, Bandul berminyak showed the lowest reduction in plant height, thus confirming that it is tolerant to salinity stress. Susceptible cultivars in this study showed high reduction in plant height which was similar to susceptible japonica variety Daegudo and Guweoldo reported by Lee et al.
(2003). Reduction in plant height of susceptible varieties may have been caused by inhibition of cell expansion in leaf growth zone caused by salinity (Setter et al., 1983; Fraga et al., 2010).
In our study, highly susceptible cultivars showed the highest reduction in both fresh and dry root weights. Our results are in agreement with those reported for Daegudo and Guweoldo cultivars (Lee et al., 2003). Reduction in root weight may have been caused by the suppression in root growth cause by the production of cytokinins as a result of high saline level (Bottger et al., 1978; Hosseini et al., 2012). From this result, it can be deduced that root weight was the most affected trait by salinity stress. As stated by Lee et al. (2003) and Hosseini et al. (2012), root dry weight is a good parameter to determine salinity tolerance in these 12 cultivars. This is the most obvious

parameter affected by salinity stress, where all cultivars showed more than 50% reduction when exposed to salinity. The grouping shown in cluster and tree diagram analysis (Figure 2 and 3, respectively) does not explicitly reflect salinity tolerance levels. For example, Pusu and Arat were grouped together when the Pusu was regarded as highly susceptible and Arat was considered as moderately tolerant. This result was similar to result obtained by Kanawapee et al. (2011) whereby the moderately tolerant cultivar IR64 was grouped together with highly susceptible rice cultivar Khao Kaset and IR34. Zeng et al. (2004) had stated that it was not surprising to observe some sensitive cultivars mixing with tolerance ones in a same cluster. Cluster analysis shown by Kanawapee et al. (2011) produced from RAPD markers did show groupings based on the cultivars salinity tolerance ability. Thus, suggesting RAPD markers are more accurate in addressing cultivars affected by salinity stress. The cluster analysis produced for the 12 rice cultivars studied may have been grouped according to their location and genetic origin (Kanawapee et al., 2011).
Kanawapee et al. (2011) have recommended intercros-sing cultivars from different clusters as these cultivars possess different genetic background. Out of 30 different rice cultivars investigated by Kanawapee et al. (2011), they have suggested to intercross KDML 105 with salinity tolerant SPR90 because both possess different genetic background and different physiological tolerance levels to salinity and also have different characteristics and physiology. They reported that the KDML 105-derived progeny would possess improved characteristics than both parents. Thus, SSR markers are the promising marker for rice breeder as they provide faster and precise genetic information of potential parents than the conven-tional breeding and also helps to produce improved rice cultivar that possess better characteristics than both parents.
Results obtained for physiological responses to salinity tolerance and genetic variation studies conducted for 12 cultivars here implies that it is desirable to intercross Arat (moderately tolerant) and Sp1 (Susceptible) as both of them are from different clusters, show low genetic similarity with 0.33 and possess contrasting salinity tolerance levels. Even though Kuaci and Sp1 or Salleh showed the lowest genetic similarity, intercrossing these cultivars may not produce an improved cultivar when compared to Arat and Sp1.
Further investigations should be carried out to assess the success of interbreeding Arat and by comparing the growth performance and yield between their progeny and both parents to confirm that the progeny would show better quality. Conflict of Interests
The authors have not declared any conflict of interests.
Ishak et al. 1037 ACKNOWLEDGEMENTS This work was funded by Universiti Brunei Darussalam’s Graduate Research Scholarship. We would like to thank villagers at Kg Rambai, Tutong District, Brunei Darussalam for their generous and kind help in providing the paddy seeds.
REFERENCES Allard RW (1999). Principles of plant breeding: John Wiley & Sons Inc.,
New York Behera L, Patra B, Sahu R, Nanda A, Sahu S, Patnaik A, Rao G, Singh
O (2012). Assessment of genetic diversity in medicinal rices using microsatellite markers. Aust. J. Crop sci. 6(9): 1369.
Botstein D, White RL, Skolnick M, Davis RW (1980). Construction of a genetic linkage map in man using restriction fragment length polymorphisms. Am. J. Hum. Genet. 32: 314.
Bottger M (1978). Levels of endogenous indole-3-acetic acid and abscisic acid during the course of the formation of lateral roots. Zeitschrift fur Pflanzenphysiologie 86: 283-286.
Cha-um S, Supaibulwatana K, Kirdmanee C (2007). Glycinebetaine Accumulation, Physiological Characterizations and Growth Efficiency in Salt-tolerant and Salt-sensitive Lines of Indica Rice (Oryza sativa L. ssp. indica) in Response to Salt Stress. J. Agron. Crop Sci. 193: 157-166.
Cha-um S, Trakulyingcharoen T, Smitamana P, Kirdmanee C (2009). Salt tolerance in two rice cultivars differing salt tolerant abilities in responses to iso-osmotic stress. Aust. J. Crop Sci. 3: 221-230.
Collard BC, Mackill DJ (2008). Marker-assisted selection: an approach for precision plant breeding in the twenty-first century. Philosophical Transactions of the Royal Society B: Biological Sciences 363: 557-572.
Etemad A, Maziah M, Daud SK (2012). Determination of genetic relatedness among selected rice (Oryza sativa, L.) cultivars using microsatellite markers. Afr. J. Biotechnol. 11: 7158-7165.
Fraga TI, Carmona FDC, Anghinoni I, Marcolin E (2010). Attributes of irrigated rice and soil solution as affected by salinity levels of the water layer. Revista Brasileira de Ciência do Solo, 34(4): 1049-1057.
Garcia AA, Benchimol LL, Barbosa AM, Geraldi IO, Souza Jr CL, Souza APD (2004). Comparison of RAPD, RFLP, AFLP and SSR markers for diversity studies in tropical maize inbred lines. Genet. Mol. Biol. 27(4): 579-588.
Hosseini S, Tahmasebi S, Pirdashti H (2012). Screening of rice (Oryza sativa L.) genotypes for NaCl tolerance at early seedling stage. Int. J. Agron. Plant Prod.: 274-283.
Kanawapee N, Sanitchon J, Srihaban P, Theerakulpisut P (2011). Genetic diversity analysis of rice cultivars (Oryza sativa L.) differing in salinity tolerance based on RAPD and SSR markers. Electr. J. Biotechnol. 14: 2-2.
Lee KS, Choi WY, Ko JC, Kim TS, Gregorio GB (2003). Salinity tolerance of japonica and indica rice (Oryza sativa L.) at the seedling stage. Planta 216: 1043-1046.
Lee S, Ahn J, Cha Y, Yun D, Lee M, Ko J, Lee K, Eun M (2007). Mapping QTLs related to salinity tolerance of rice at the young seedling stage. Plant Breed. 126: 43-46.
Mahajan R, Tabia S, Raina G, Mangotra N (2012). Assessment of genetic diversity of non-basmati rice of Jammu and Kashmir using microsatellite markers. J. Cereals and Oil seeds, 3: 21-27.
Nadia I, Mohiuddin AKM, Sultana S, Ferdous J (2014). Diversity analysis of indica rice accessions (Oryza sativa L.) using morphological and SSR markers. Annals Biol. Res. 5(11)
Nei M, Li WH (1979). Mathematical model for studying genetic variation in terms of restriction endonucleases. Proceedings of the National Academy of Sciences, 76: 5269-5273.
Pavlicek A, Hrda S, Flegr J (1999). Free-tree-freeware program for construction of phylogenetic trees on the basis of distance data and bootstrap/jackknife analysis of the tree robustness. Application in the
1038 Afr. J. Biotechnol.
RAPD analysis of genus Frenkelia. Folia biologica, 45: 97. Perrier X, Jacquemoud-Collet J. 2006. DARwin software.
http://darwin.cirad.fr/darwin. Rahman L, Islam MN, Rahman MS, Islam MS (2008). Plant varieties of
Bangladesh: Morphological and Molecular Characterization. Published by Seed Wing, Ministry of Agriculture, Government of the Peoples’ Republic of Bangladesh, Vol. 2, 300 p. [In press]
Rahman M, Sohag M, Rahman L (2010). Microsatellite based DNA fingerprinting of 28 local rice (Oryza sativa L.) varieties of Bangladesh. J. Bangladesh Agric. Univer. 8:7-17.
Saini N, Jain N, Jain S, Jain RK (2004). Assessment of genetic diversity within and among Basmati and non-Basmati rice varieties using AFLP, ISSR and SSR markers. Euphytica 140 (3):133-146.
Sajib AM, Hossain MM, Mosnaz ATMJ, Hossain H, Islam MM, Ali MS, Prodhan SH (2012). SSR marker-based molecular characterization and genetic diversity analysis of aromatic landreces of rice (Oryza sativa L.). J. BioSci. Biotechnol. 1:107-116.
Setter TL, Greenway H, Kuo J (1983). Inhibition of cell division by high external NaCl concentration in synchronized cultures of Chlorella emersonis. Austr. J. Plant Physiol 9:179-196.
Shah SM, Naveed SA, Arif M (2013). Genetic diversity in basmati and non-basmati rice varieties based on microsatellite markers. Pak. J. Bot. 45:423-431.
Shams F, Kuddus M, Nasiruddin K, Begum S, Islam M (2012). Genetic Analysis of Aromatic and Quality Rice Germplasm using Microsatellite Markers. Plant Tiss. Cult. Biotechnol. 22:65-71.
Tabkhkar N, Rabiei B, Sabouri A (2012). Genetic diversity of rice
cultivars by microsatellite markers tightly linked to cooking and eating quality. Aust. J. Crop Sci. 6:980-985.
Temnykh S, Park WD, Ayres N, Cartinhour S, Hauck N, Lipovich L, Cho YG, Ishii T, McCouch SR (2000). Mapping and genome organization of microsatellite sequences in rice (Oryza sativa L.). TAG Theor. Appl. Genet. 100:697-712.
Wankhade SD, Cornejo MJ, Mateu-Andres I, Sanz A (2013). Morpho-physiological variations in response to NaCl stress during vegetative and reproductive development of rice. Acta Physiologiae Plantarum, 35:323-333.
Wong S, Yiu P, Bong S, Lee H, Neoh P, Rajan A (2009). Analysis of sarawak bario rice diversity using microsatellite markers. Am. J. Agric. Biol. Sci. 4:298.
Zeng L, Kwon TR, Liu X, Wilson C, Grieve CM, Gregorio GB (2004). Genetic diversity analyzed by microsatellite markers among rice (Oryza sativa L.) genotypes with different adaptations to saline soils. Plant Sci. 166:1275-1285.

Vol. 14(12), pp. 1039-1047, 25 March, 2015
DOI: 10.5897/AJB2015.14460
Article Number: 456AB3751730
ISSN 1684-5315
Copyright © 2015
Author(s) retain the copyright of this article
http://www.academicjournals.org/AJB
African Journal of Biotechnology
Full Length Research Paper
Effect of artificially-generated wind on removing guttation and dew droplets from rice leaf surface for
controlling rice blast disease
Yoshihiro Taguchi1, Mohsen Mohamed Elsharkawy2 and Mitsuro Hyakumachi1*
1Laboratory of Plant Pathology, Faculty of Applied Biological Sciences, Gifu University, 1-1 Yanagido, Gifu City 501-
1193, Japan. 2Department of Agricultural Botany, Faculty of Agriculture, Kafrelsheikh University, Kafr Elsheikh 33516, Egypt.
Received 29 January, 2015; Accepted 20 March, 2015
The incidence and severity of leaf and panicle blasts were efficiently reduced in the wind-treated fields. Artificially-generated wind was performed on rice paddy field in order to measure the changes in temperature and humidity during and after the blowing process and to investigate the effects of sending wind on the formation and removal of guttation and dew droplets on rice leaves. A large electric fan was used to send wind with a depression angle of 30° at 4:00 AM for 30-40 min. During the blowing process, the humidity percentage was 100% in both treated and control paddy fields, the temperature was 0.8°C higher in the treated than the control field and the dew weight was rapidly decreased from 21 to 8 g in 20 min in the treated field. After the blowing process, the temperature started to rise at 6:28 AM (10 min earlier than the control block). It reached 29°C at 6:48 AM (30 min earlier than the control block) and remained higher than the control block till 7:20 AM (1-7°C higher). The humidity decreased to 95% at 6:30 AM (20 min earlier than the control block) and remained 95% till 6:42 AM, then rapidly decreased to reach 68% at 6:46 AM, and finally reached 60% at 7:20 AM. The humidity was 5-30% lower than that in the control block. Moreover, the dew weight increased to the initial level within 10 min and then decreased rapidly in both blocks starting from 6:20 AM. Using wind speed of 4.3 m/s or 3.2 m/s for 60 s per rotation at 4:00 AM, almost all the guttation droplets except those of less than 0.5 mm were removed from the surfaces of the 1
st and 2
nd uppermost leaves after two rotations (at velocity 4.3 m/s) or three rotations (at
velocity 3.2 m/s) and the dew droplets were mostly removed after five rotations (at velocity 4.3 m/s) or nine rotations (at velocity 3.2 m/s). Sending wind at a speed of 3.2 m/s or faster removed guttation and dew droplets and suppressed the subsequent dew formation. Our data indicates that the removal of dew droplets on rice hills resulted in reduction of the disease development of Pyricularia oryzea. Key words: Generated–wind, rice blast, microclimate, guttation, dew droplets.
INTRODUCTION Rice blast disease, caused by Pyricularia oryzea, is one of the major causes of reduction of rice production in the
world. The severity of rice blast disease is strongly influenced by the prevailing weather conditions that rain,

1040 Afr. J. Biotechnol. wind, temperature and sunlight. Wind is thought to reduce the number of spores attached to rice plant and to promote removal of dew droplets on the leaves. Thus, the penetration of blast into leaves might be prevented or impeded (Adachi, 1981; Hashimoto et al., 1984; Misawa and Matsuyama, 1960; Mousanejad et al., 2009; Ono and Suzuki, 1959; Suzuki, 1969). Taguchi et al. (2014) reported that outbreaks of rice blast were remarkably prevented by sending artificial wind to the paddy fields. In their study, a fan-forced wind was generated between 11:00 PM and 4:00 AM to prevent leaf surfaces from remaining moist longer than 8 h, which is sufficient time for blast fungus infection (Hashimoto et al., 1984; Yoshino, 1979). They also reported that it is necessary to adjust wind velocity to between 3 and 6 m/s to obtain sufficient blast disease control.
It is generally presumed that artificial blowing has preventive effects on rice blast because blowing causes changes in the microclimate over paddy fields, including increased temperature and reduced humidity, promoting removal of guttation/dew droplets formed on rice leaves, or wind compulsorily blows off blast spores attached to rice plants (Adachi, 1981). However, no detailed expla-nations have been given to how wind changes the microclimate over the paddy field and how guttation/dew droplets disappear from the leaf surface. In the present work, we studied how artificially-generated blowing influences temperature and humidity on paddy field and how it promotes the disappearance of water droplets on the uppermost rice leaves.
MATERIALS AND METHODS
Effect of artificially-generated wind on dew formation on the surface of rice leaves
The experiment was conducted in a mountainous area of Gifu prefecture suffering from serious outbreaks of rice blast for several years. Rice seedlings of “Kinuhikari” cultivar with three leaves (3 weeks after sowing) were used for transplanting. A paddy field (60 m x 30 m) was planted with rice seedlings (30 cm line interval, 18 cm hill interval and 20 plants / m2). A large electric fan with a rotation angle of 180° (5 KW, blade diameter of 110 cm, wind volume of 4,020 m 3/min) was installed at the ridge of the paddy field (1 m away from the edge of the ridge). The fan was set on the top of 5 m pillar with a depression angle of 30°. By using this fan, rotating wind was sent to rice hills for 30 min starting from July 23 at 4:00 AM (each rotation lasts for 60s with 2 min interval). Sending wind was started from 6 weeks old rice seedlings (3 weeks after transplanting). A dew meter (Hokutow E-T11A, Japan) was installed 60 cm high from the ground level at a particular point in the paddy field where the wind speed was 3.5 m/s to study changes of the guttation/dew formation levels both during and after the blowing operation (Hashimoto et al., 1984). Additionally, the guttation/dew formation status of the control block, adjacent to the west side of the designated block, was studied.
Effect of artificially-generated wind on the temperature and humidity on paddy field Wind was sent to the paddy field on July 19 and August 10 as described previously. A thermometer and a hygrometer were installed at a particular point where the wind speed was 3.5 m/s (80 cm high from the ground level) to measure changes in temperature and humidity on the paddy during the blowing operation and also during the subsequent time zone between 6:20 and 7:00 AM. The blowing operation lasted for 30 min starting at 4:05 AM on July 19, and for 40 min from 3:50 to 4:30 AM on August 10. Effect of artificially-generated wind on disappearance of guttation/dew droplets from the leaf surface For evaluation of guttation/dew droplets formation on rice leaves, the total number and location of guttation droplets of 0.2 mm or larger were recorded. Additionally, the presence or absence of microscopic dew droplets was also recorded. Guttation droplets were classified according to their size to; larger than 1.5 mm, 1.0- 1.5 mm, 0.5- 1.0 mm and 0.2 - 0.5 mm. The number in each class was recorded. Since, it was difficult to count the number of dew droplets, they were evaluated collectively according to coverage area of rice leaves to: “++++” for full covering leaf surface area with dew droplets, “+++” for 2/3 of the leaf surface area covered with dew droplets “++” for 1/3 of the leaf covered with dew droplets, “+” for 1/3 or less of the leaf covered with dew droplets, and “_” for no dew droplets. For the control block, a particular position was selected in the identical paddy field to record the same measurements. The formation of guttation and dew droplets was measured at 3:50 am and at 4:50 am.
By using a large electric fan, rotating wind was sent to the paddy field for 30 min starting at 4:00 AM on July 19. Three rice hills in the zone where the wind speed was 4.3 m/s and other 2 rice hills in the zone where the wind speed was 3.2 m/s were selected to measure guttation/dew droplets formation on the unfolded first and second uppermost leaves. The measurements were performed 10 min before and after blowing process, as well as during the process. During the blowing process, the measurements were performed during the intervals of the rotation cycles. The measurements were performed 9 times (once per rotation cycle) and 5 times (every 2 rotation cycles) in the zone of wind speed 4.3 and 3.2 m/s, respectively.
RESULTS
Effect of artificially –generated wind on the dew droplets formation on the rice leaf surface
The values of the guttation/dew droplets were same in the treated and control fields just before starting the blowing operation. During the blowing process, the dew weight rapidly decreased from 21 to 8 g in 20 min. After the blowing process, the values of the dew droplets weight in the treated block were 2 g lower than the values in the control block. The weight values in both blocks decreased rapidly starting from 6:20 AM. The values of the dew droplets in the treated and control blocks were
*Corresponding author: E-mail: [email protected], Tel/Fax: 55 12 3622-4005 Author(s) agree that this article remain permanently open access under the terms of the Creative Commons Attribution License 4.0 International License
Taguchi et al. 1041
Figure 1. Dew droplets weight on the rice leaf surface in the treated and control blocks.
illustrated (Figure 1). Effect of artificially-generated wind on the temperature and humidity on paddy field Early during blowing process On July 19, the temperature was 17. 2°C at 4:05 AM then increased to 17.7°C and remained at this level during the blowing process for 30 min. In the control block, the temperature was about 0.8°C lower than those in the treated block (Figure 2A). On August 10, the temperature was 19.5°C at 3.50 AM and remained almost at the same level for 40 min during the blowing process (Figure 2B). The temperature was slightly decreased after the blowing process. On the other hand, the temperature in the control block gradually decreased and was 0.9°C lower than treated block at 4:30 AM. The humidity levels in both blocks remained at the level of 100% on both July 19 and August 10 with regardless of blowing process (Figure 2A and 2B). Later after blowing process from 6:20 to 7:20 AM On July 19, the temperature and humidity from 6:20 to 7:20 AM were recorded in both treated and control blocks. The temperature in the control block increased gradually from 6:38 AM and reached 30°C at 7:20 AM (Figure 3A). In the treated block, the temperature started to increase at 6:28 AM (10 min earlier than the control block), and reached 29°C at 6:48 AM (30 min earlier than the control
block). The temperature remained higher than the control block till 7:10 AM (1-7°C) (Figure 3A). In control block, the humidity percentage decreased gradually from 6:52 AM and reached 60% at 7:20 AM (Figure 3B). In the treated block, the humidity decreased to 95% at 6:30 AM (20 min earlier than the control block) and remained 95% till 6:42 AM, then rapidly decreased to reach 68% at 6:46 AM, which maintained for a while, and finally reached 60% at 7:20 AM. The humidity percentages in the treated block were lower than that in the control block (ranged 5- 30 %) (Figure 3B).
Although, an increase in temperature and decrease in humidity percentage were also observed in the treated block compared with the control after the blowing process on August 10, both temperature increased and humidity reduction started later after those occurred on July 19 (Figure 4). They tended to be similar changes and were consistently observed on both dates. Artificially-generated wind effectively promoted the removal of guttation/dew droplets on the leaf surface On July 19, the disappearance of guttation/dew droplets which formed on the first and second uppermost rice leaves was measured when the wind speed was 4.3 and 3.2 m/s in the treated block. Using wind speed of 4.3 m/s Just before blowing, 7 (larger than 1.5 mm in diameter), 22 (ranged from 1.0 to 1.5 mm) and many (of 0.5 -1.0

1042 Afr. J. Biotechnol.
Figure 2. Temperature and humidity values in both treated and control blocks during the blowing process on July 19 (A) and August 10 (B).
Figure 3. Temperature (A) and humidity (B) values in both treated and control blocks after the blowing process on July 19.

Taguchi et al. 1043
Figure 4. Temperature (A) and humidity (B) values in both treated and control blocks after the blowing process on August 10.
and 0.2 -0.5 mm in diameters) guttation droplets were observed on the first uppermost leaves as well as microscopic dew droplets that covered the entire leaf surface giving it white color. The first rotation of fan at wind speed of 4.3 m/s removed 1.5 mm or larger guttation droplets and those of 0.5-1.0 mm, leaving a small number of 1.0 -1.5 mm-sized droplets and many of those of 0.2-0.5 mm in diameter on leaf surfaces, as well as the majority of the dew droplets. The second rotation removed all guttation droplets of 0.5 mm or larger, but 12.3 of 0.2-0.5 mm-sized droplets were accumulated on the leaf edges immediately after ending of the second rotation. The dew droplets were reduced to 2/3 or less of the entire leaf surface. After the third rotation, the removal of re-accumulated guttation droplets and reduc-tion of dew droplets were gradually succeeded. The process repeated due to consequently re-accumulation of guttation droplets on leaf edges again but no remarkable reduction was observed after the seventh rotation. Ten min after stopping the blowing, re-formed guttation droplets grew larger (1.3 droplets of 1.5 mm or larger,
15.0 droplets of 1.0 -1.5 mm). Many of re-formed guttation droplets appeared at the same locations on the leaf surface as those observed before the blowing process. However, most of the dew droplets were removed. The distribution of guttation and dew droplets before and after fan rotations is illustrated in Table 1.
Just before blowing, 7.0 (larger than 1.5 mm), 18.5 (ranged from 1.0 mm to 1.5 mm) and many guttation droplets (0.5-1.0 and 0.2-0.5 mm) as well as microscopic dew droplets covered the entire surfaces of the second uppermost leaves. The first fan rotation at wind speed of 4.3 m/s removed the majority of guttation droplets (1.5 mm or larger) and those of 1.0 -1.5 mm. However, the majority of the guttation droplets of 0.5 -1.0 mm as well as those of 0.2-0.5 mm remained on the leaf surface. Moreover, most of the dew droplets remained unremoved. The second rotation removed all of the guttation droplets of 0.5 mm or larger. But 11.0 guttation droplets of 0.2 -0.5 mm were re-formed on the leaf and dew droplets covered over 2/3 of the leaf surface. After the third rotation, removal of the re-formed guttation and decrease of dew

1044 Afr. J. Biotechnol. Table 1. Relation between appearance /disappearance of guttation /dew on unfolded uppermost leaves a of rice hill and blowing wind at velocity of 4.3 m/s.
Leaf position
Guttation/dew droplet diameter and classes
Number of droplets before
blowing (per leaf)
Number of blowing rotationsb
10 min after blowing 1 2 3 4 5 6 7 8 9
1st
uppermost leaf a
Over 1.5 mm 7.0 0 0 0 0 0 0 0 0 0 1.3
1.0-1.5 mm 22.0 0.3 0 0 0 0 0 0 0 0 15.0
0.5-1.0 mm >30c 0 0 0 0 0 0 0 0 0 0
0.2-0.5 mm >30c >30 12.3 9.3 16.0 9.3 17.3 15.3 5.3 5.3 0
Dew droplet groups
d
++++ +++ ++ ++ + + + + + + -
2nd
uppermost leaf a
Over 1.5 mm 7.0 0 0 0 0 0 0 0 0 0 2.0
1.0-1.5 mm 18.5 0 0 0 0 0 0 0 0 0 16.0
0.5-1.0 mm >30c >30 0 0 0 0 0 0 0 0 0
0.2-0.5 mm >30c >30 11.0 3.0 3.5 8.0 17.0 19.5 9.5 0 0
Dew droplet groups
d
++++ ++++ +++ +++ ++ + + + - - -
aThe average leaf length of 1
st uppermost leaves was 36.0 cm, and that of 2
nd uppermost leaves was 38.5 cm.
b The number of exposure processes of
rice hills to the rotation wind. The blowing time in a single rotation was 60s . cThe symbol“>30” means that over 30 guttation droplets were formed on a
single leaf. dThe dew group means a colony of dew droplets . A different symbol is given to each group according to degree of the coverage over the
leaf. They are “++++” for full coverage; “+++” for 2/3 coverage; “++” for 1/3 to 2/3 coverage; “+” for smaller than 1/3; and “_” for no coverage.
droplets were repeated. At the ninth rotation of blowing, no formation of guttation droplets was observed. Ten min after the blowing, the guttation droplets accumulated forming larger droplets. 2 droplets of 1.5 mm or larger and 16 of 1.0-1.5 mm were observed (Table 1). Using wind speed of 3.2 m/s Rice hills were examined 5 times (once every 2 rotations) using wind speed of 3.2 m/s for the disappearance of guttation/dew droplets. Just before blowing, 2.0 (of 1.5 mm or larger), 9.0 (of 1.0 -1.5 mm) and many of guttation droplets (of 0.5-1.0 mm and of 0.2-0.5 mm) were observed on the surfaces of the first uppermost leaves. After the first rotation using wind speed of 3.2 m/s, the number of guttation droplets of 1.5 or larger decreased to 0.5 and those of 0.5-1.0 mm decreased to 3.5; but the majority of the guttation droplets of 1.0-1.5 mm and those of 0.2-0.5 mm as well as most of the dew droplets remained on the leaf surface. After the third rotation, the remaining guttation droplets of 1.5 mm decreased to 0.5 and those of 0.5-1.5 mm were completely removed. Immediately after third rotation of blowing, 5.0 guttation droplets of 0.2-0.5 mm were re-formed on the leaf margins and the number of dew droplets decreased slightly. After the fifth rotation, removal of the re-formed guttation droplets and decrease of dew droplets were repeated. After the ninth rotation, a fewer dew droplets were observed. Ten minutes after the blowing, larger guttation droplets were re-formed (6.5 of 1.0-1.5 mm and
3.5 of 0.5-1.0 mm). A few dew droplets remained around the bottom of the leaves (Table 2).
Just before blowing, 7 (of 1.5 mm or larger), 18.5 (of 1.0 -1.5 mm) and many guttation droplets (0.5 -1.0 mm and 0.2-0.5 mm) as well as microscopic dew droplets covered the entire surface of the second uppermost leaves leaving them white in color. After the first rotation using wind speed of 3.2 m/s, all of the guttation droplets of 0.5 mm or larger were removed, but many of 0.2 -0.5 mm were remained on the leaf surface. Similarly, the majority of the dew droplets covered most of the leaf surface. After the third rotation, all guttation droplets of 0.5 mm or larger were removed, but 11 guttation droplets of 0.2-0.5 mm were re-formed on the margins of the leaf surface. Dew droplets covered almost 2/3 of the leaf surface. After the fifth rotation onward, removal of the re-formed guttation droplets and decrease of dew droplets were repeated. After the ninth rotation, dew droplets were reduced to 1/3 or less of the leaf surface. Ten minutes later after stopping the fan, larger guttation droplets were observed (8.5 guttation droplets of 1.0-1.5 mm and 2.5 guttation droplets of 0.5-1.0 mm) on leaf surface. Few dew droplets were observed on the bottom of second upper most leaves (Table 2). DISCUSSION Rice blast severity is affected by weather factors such as daily relative humidity and temperature, amount of preci-pitation and dew, speed direction of wind and condi-
Taguchi et al. 1045
Table 2. Relation between appearance/disapperance of guttation/dew on unfolded uppermost leaves a of rice hill and blowing wind at velocity of 3.2m/s.
Leaf position Guttation/dew droplet diameter and classes
Number of droplets before blowing (per
leaf)
Number of blowing rotationsb
10 min after blowing 1 3 5 7 9
1st uppermost
leaf a
Over 1.5 mm 2.0 0.5 0.5 0 0 0 0
1.0-1.5 mm 9.0 3.5 0 0 0 0 6.5
0.5-1.0 mm >30c >30 0 0 0 0 3.5
0.2-0.5 mm >30c >30 0.5 3.5 0.5 5.5 0
Dew droplet groupsd ++++ +++ +++ +++ ++ + +
2nd
uppermost leaf a
Over 1.5 mm 7.0 0 0 0 0 0 0
1.0-1.5 mm 18.5 0 0 0 0 0 8.5
0.5-1.0 mm >30c >30 0 0 0 0 2.5
0.2-0.5 mm >30c >30 11.0 3.0 3.5 8.0 0
Dew droplet groupsd ++++ ++++ +++ +++ ++ + +
aThe average leaf length of 1
st uppermost leaves was 37.0 cm, and that of 2
nd uppermost leaves was 31.5 cm.
b The number of exposure
processes of rice hills to the rotation wind. cThe symbol“>30” means that over 30 guttation droplets were formed on a single leaf.
d The dew group
means are a colony of dew droplets . A different symbol is given to each group according to degree of the coverage over the leaf. They are “++++” for full coverage; “+++” for 2/3 coverage; “++” for 1/3 to 2/3 coverage; “+” for smaller than 1/3; and “_” for no coverage.
tion of sunshine (Adachi, 1981; Leach, 1980; Taguchi et al., 2014). Water droplets on the leaf surface are one of the important factors that are implicated in outbreaks of many fungal diseases (Burrage, 1971; El Refaei, 1977; Long, 1955; Long, 1958; Monteith and Butler, 1979; Wallin, 1963). The dew formation on the leaf surface is one of the main factors which are responsible for outbreak of rice blast (Burrage, 1971; Long, 1955; Long, 1958; Monteith and Butler, 1979; Wallin, 1963). Persistence of guttation/dew droplets for a while on the leaf surface is a requisite for contagions with rice blast (Hashimoto et al., 1984; Hemmi and Abe, 1931; Kim et al., 1975; Yoshino, 1979). In our previous study (Taguchi et al., 2014), outbreaks of rice blast (both leaf and panicle blasts) were remarkably prevented by sending artificial wind which was generated 2 times daily for 30 min each starting at 11:00 PM and 4:00 AM, respectively, to the paddy fields to prevent leaf surfaces from remaining moist longer than 8 h, which is sufficient time for blast fungus infection (Hashimoto et al., 1984; Yoshino, 1979). Our results also show that it is necessary to adjust wind velocity to between 3 and 6 m/s to obtain sufficient blast disease control. Such wind treatment was more effective than the application of chemical fungicides in controlling the outbreaks of leaf and panicle blast.
The present study investigated the influence of artificially-generated wind on removal of dew/guttation droplets from rice leaf surface based on visual observation and measurement of transitional values by dew meters and how that would effectively prevent or interfere with rice blast infection (Hashimoto et al., 1984). The correlation between guttation/dew formation and weather conditions in the natural environment have been previously reported (Arai, 1951; Crowe et al., 1978; Hsu
et al., 1980; Lioyd, 1961; Lomas, 1965; Newton and Riley, 1964; Picking and Jiusto, 1978). Likely, the formation of guttation droplets is gradually increased on the tip or margins of the leaf surface until 2:00 or 3:00 AM (Barksdale and Asai, 1961). In the present study, if the wind is artificially sent at a speed of 3.2 m/s at 4:00 AM, guttation droplets on the uppermost leaves are easily dropped off after 2 or 3 rotations of fan. The small guttation droplets were re-formed again on the leaf margins during the rotation intervals. These facts suggested that such artificially-blown wind may greatly contribute to the removal of the guttation droplets.
Dew droplets form as a water film with a high surface tension on leaf surface (Beysens, 1995), which is suitable for the germination of various species of fungi (Suzuki, 1973; Wallin, 1967). In windless days, formation of dew droplets reaches the peak level between about 4:00 and 6:00 AM (Barksdale and Asai, 1961; Hashimoto et al., 1984). If the wind velocity goes beyond a particular level in the natural environment, further dew formation is prevented and the formed dew evaporates (Hashimoto et al., 1984; Hsu et al., 1980; Suzuki, 1969). In the present experiment, several rotations of artificial-generated wind at speed of 3.2 m/s or 4.3 m/s removed most of the dew droplets on the leaves, but the dew droplets re-formed again after stopping the fan. Thus, the artificial blown wind can remove the formed dew droplets on leaves, but it cannot prevent their formation because dew formation is a dynamic process in the natural environment. The humidity on the paddy was 100% in both control and treated blocks and the temperature was 0.8°C higher in the treated block than the control. Therefore, it can be presumed that the disappearance of dew/guttation droplets was due to physical removal by the artificially-
1046 Afr. J. Biotechnol. generated wind.
The disappearance time of dew begins by drying the dew rapidly to the degree that 10 g or greater volume of dew disappears in 3 h, on the condition that the weight of dew in filter paper (29 × 80 cm) increased once and was then maintained for 3 h (Hashimoto et al., 1984). They also considered that when there is a rapid decrease in dew weight due to an intermission of rainfall, etc., the dew can be regarded as being continuously maintained if there is further rainfall within 3 h. The disappearance of dew on the leaf surface due to artificial wind can be considered as an intermission of dew formation because the disappearance occurs momentary - few minutes. Furthermore, the amount of dew formed after stopping the fan is smaller than those observed in the control block. Therefore, the increase in temperature and reduction in humidity were effectively promoted after sunshine (sunrise) on the paddy field and the drying process of the rice hills gradually progressed.
Sending wind to rice nurseries for consecutive 12 h from the evening to the following morning for 15 days prevented the formation of guttation/dew droplets on the leaf surface as well as germination and penetration of conidiospores, resulting in suppression of outbreak of leaf blast (Adachi, 1981). In addition to the disappearance of guttation/dew droplets in early morning, humidity reduc-tion and rapid increase of temperature early during sunrise could also be considered as the factors that prevent or interfere with penetration of blast fungi.
Artificially-generated wind at speed of 3.2 m/s or 4.3 m/s effectively removed the guttation/dew droplets formed on leaves. The infection rate with rice blast is correlated with the exposure time to guttation/dew droplets, thus removal of guttation/dew droplets by blowing can surely suppresses infection of blast fungi.
It can also be considered that artificial-generated wind is related to disappearance of guttation/dew droplets. Fan-generated wind speed of 3.2 m/s or 4.3 m/s at angle of 30° with a total of 9 rotations (1 min each and 2 min intervals) resulted in removing the majority of the guttation/dew droplets although a slight amount of dew remained at the bottom of leaves. On the other hand, although the guttation droplets disappeared in 20 s when wind at a speed of 3 m/s was blown in a single direction, dew droplets could not be removed even when the wind was blown continuously for 25 min (data not shown). These facts suggest that it is effective to intermittently generate wind by a large electric fan from a higher position. It can be presumed that this is because such wind can blow into the rice hills, shaking the entire rice hills. Also, rotating wind can produce frequent changes in wind speed, shaking leaves irregularly; causing the leaves to touch each other’s resulting in the promoted disappearance of the guttation droplets as well as the re-formation of guttation droplets from the leaf surface. Additionally, when guttation droplets scatter, they contact the water film of dew on the leaf surface, resulting in
promoted disappearance of dew. Hashimoto et al. (1984) suggested that dew flow on the leaf surface was partly contributed to washing conidiophores off of leaf surface. Although wind at velocity of 2 m/s could hardly blow spores off the lesions, wind at velocity of 4 and 5 m/s could remove them more effectively (Misawa and Matsuyama, 1960; Suzuki, 1969). This effect became more obvious in high humid conditions (Barksdale and Asai, 1961; Leach, 1980; Ono and Suzuki, 1959). These facts suggest that artificial sending wind influences the formation of conidiospores attached to the leaf surface. Thus, further study is necessary to investigate how artificial wind can influence germination of conidiospores as well as formation of appressoria and how blast fungus spores could be washed down by the flow of dew (Schrodter, 1960; Suzuki, 1973). Effect of weather on spore germination of rice blast has been studied by Mousanejad et al. (2009). They showed that the spore germination of rice blast was increased when relative humidity was increased and maximum temperature and sunny hours were decreased.
Conflict of interests
The authors did not declare any conflict of interest.
REFERENCES Adachi T (1981). Relationship between wind and occurrence of rice
blast disease. Ann. Phytopathol. Soc. Jpn. 47:363-364. Arai T (1951). Studies on the dew. (2) The dew traces on stood papers.
J. Agr. Met. 7:24-26. Barksdale TH, Asai GN (1961). Diurnal spore release of Pyricularia
oryzae from rice leaves. Phytopathol. 51:313-317. Beysens D (1995). The formation of dew. Atom. Res. 39:215-237. Burrage SW (1971). Dew on wheat. J. Agr. Met. 10:3-12. Crowe MJ, Coakley SM, Emage RG (1978). Forecasting dew duration
at pandelton ,Oregon, using simple weather observation. J. Appl. Met. 17:1482-1487.
El Refaei MJ (1977). Epidemiology of rice blast disease in the tropics with special reference to leaf wetness in relation to disease development. Ph.D. Thesis, Faculty of the Post- graduate School, Indian Agricultural Research Institute, New Delhi, India.
Hashimoto A, Hirano K, Matsumoto K (1984). Studies on the forecasting of rice leaf blast development by application of the computer simulation. Spec. Bull. Fukushima Pref. Agric. Exp. Stn. 2: 1-14.
Hemmi T, Abe T (1931). On the relation of temperature and period of continuous wetting to the infection of the rice plant by Pyricularia oryzae. Shokubutsu-byogai-kenkyu. 1: 33-45.
Hsu SH, Sakanoue T, Motoda Y, Hyakawa S (1980). Studies on dew ll on the formation of dew. J. Agr. Met. 36: 173-179.
Kim CK, Yoshino R, Mogi S (1975). A trial of estimating number of leaf blast lesions on rice plants on the basis of the number of trapped spores and wetting period of leaves. Ann. Phytopathol. Soc. Jpn. 41:492-499.
Leach CM (1980). Influence of humidity, red-infrared radiation, and vibration on spore discharge by Pyricularia oryzae. Phytopathol. 70:201-205.
Lioyd MG (1961). The contribution of dew to the summer water budget of Northern Idaho. Bull. Am. Meteorol. Soc. 42:572-580.
Lomas J (1965). Note on dew duration recorders under semi-arid conditions. Agric. Meteorol. 2:351-359.
Long IF (1955). Dew and guttation. Weather, 10:128. Long IF (1958). Some observation on dew. The Met. Meg. 87: 161-168.

Misawa M, Matsuyama N (1960). Studies of infection of conidiospore of
rice blast fungus. Ann Phytopathol. Soc. Jpn. 25: 3. Monteith JL, Butler DR (1979). Dew and thermal lag: a model for cocoa
pods QJR Meteorol. Soc. 105: 207-215. Mousanejad S, Alizadeh A, Safia N (2009). Effect of weather factors on
spore population dynamics of rice blast fungus in Guilan Province. J. Plant Prot. Res. 49:219-229.
Newton OH, Riley JA (1964). Dew in the mississipi delta in fall. Mon Wea Rev. 92:369-373.
Ono K, Suziki H (1959). Studies of release of blast fungus conidiospore. Bull. Hokuriku Plant. Protec. Soc. Jpn. 7:6-19.
Picking KE, Jiusto JE (1978). Observation of the relationship between dew and radiation fog. J Geophys. Res. 83:2430-2436.
Schrodter H (1960). The disease population epidemics and control.6. Dispersal by air and water. The flight and landing. Plant Pathology (Horsfall, J. G. and A. E. Dimond) Academic Press. New Yourk and London. 3:169-227.
Suzuki H (1969). Studies on the behavior of the rive blast fungus spore and the application for forecasting method of the rice blast disease.Bull.Hokuriku Agric.Exper.Sta. 10:1-118.
Taguchi et al. 1047 Suzuki H (1973). Germination of conidiospores on the leaf blast lesion
and dispersed spore. The Hokuriku Plan. Protec. Soc. Jpn. 21:4-5. Taguchi Y, Elsharkawy MM, Hassan N, Hyakumachi M (2014). A novel
method for controlling rice blast disease using fan-forced wind on paddy fields. Crop Prot. 63:68-75.
Wallin JR (1963). Dew, its significance and mesurment in phytopathology, Phytopathol. 53:1201-1216.
Wallin JR (1967). Agro-meteorological aspects of dew. Agr. Met. 4:85-102.
Yoshino R (1979). Ecological studies on the penetration rice blast fungus, Pyricularia oryzea into leaf epidermal cells. Bull. Hokuriku Agric. Exper. Sta. Jpn. 22:163-221.

Vol. 14(12), pp. 1048-1055, 25 March, 2015
DOI: 10.5897/AJB2013.12140
Article Number: DE0671B51747
ISSN 1684-5315
Copyright © 2015
Author(s) retain the copyright of this article
http://www.academicjournals.org/AJB
African Journal of Biotechnology
Full Length Research Paper
Chemical composition and antifungal activity of essential oils of Algerian citrus
Hamdani Fatima Zohra1*, Allem Rachida2 , Meziane Malika1, Setti Benali1, Ali Arous Samir3 and Bourai Meriem4
1University Hassiba Benbouali Chlef, Agronomy Institute, Hay Salem, 19 highway, 02000 Chlef, Algérie. 2University Hassiba Benbouali Chlef, Faculty of Science ,Hay Salem, 19 highway, 02000 Chlef, Algérie.
3National Institute of Plant Protection Chlef, Algeria. 4Laboratory Research, Aldar, Dar El Beida, Algeria.
Received 12 March, 2013; Accepted 23 July, 2013
The aim of this study was to determine the chemical composition of the essential oils of Algerian citrus. They were extracted by hydrodistillation from the leaves of citrus species (orange, Bigaradier, mandarin and lemon), using gas chromatography/mass spectrometry (GC/MS). Their chemical composition and antifungal activity against four phytopathogenic fungi (Fusarium oxysporum f.sp., albedinis sp, Penicelium sp., Alternaria sp. and Fusarium sp.) were studied. The inhibiting minimal concentration (CMI) effect was also given for four oils. Ten compounds were recorded jointly among the 51 identified, of which limonene (7.18 to 36.10%), β-pinene (4.35 to 30.0%) and linalool (0.21 to 63.03%) represent the principal major compounds. These results indicate that essential oils can be employed as natural fungicides against phytopathogenic fungi. Key words: GC/MS, essential oils , citrus, antifungal activity, phytopathogenic fungi.
INTRODUCTION Fungal diseases are considered as the main enemies of crops. Apart from the fact that they have the potential to cause significant yield losses and deterioration of agricultural products, many of them cause a very serious risk to consumers because they produce dangerous toxins. Control methods applied involved mainly the application of chemical fungicides. In recent years, the polemic against the use of harmful chemicals on people’ health and the environment has generated a debate on being exposed to the risk of having cancer and residual toxicity (Yaouba et al., 2010).
The increasing consciousness of consumers on the relationship between mode and health revolutionizes
food, to justify the search for new strategies and to explore other surer solutions for replacement and biodegradable industry (Combrinck et al., 2010). For the elimination of pathogenic micro-organisms in the past years, researchers were interested in composing biologically active isolates, starting from plants with the objective of providing solutions to several challenges facing producers and agricultural distributors (Combrinck et al., 2010).
Essential oils are of a great interest because of their broad acceptance by consumers and the exploitation of their potential multipurpose utilities (Sawamura, 2000). Several researches evoked the antifungal activity of
*Corresponding author. E-mail: [email protected].
Author(s) agree that this article remains permanently open access under the terms of the Creative Commons Attribution License 4.0 International License

essential oils extracted from citrus (Mishra and Dubey, 1994; Sherma and Tripathi, 2006; Espina et al., 2011). The studies reveal that essential oils and their com-ponents have a very significant antimicrobial potential.
The studies were devoted to the determination of the chemical composition of the species of Algerian citrus (Baaliouamer, 1987). The antifungal study of the capacity of these essential oils constitutes a very promising alternative vis-a-vis the problems connected to the en-vironment and the health of the consumers caused by the use of synthetic fungicides. Consequently, the objectives of this study were to determine (A) the chemical composition of essential oils of orange (Citrus sinensis (l) Osbeck), Bigaradier (Citrus aurantium), lemon (Citrus limonum) and mandarin (Citrus reticulata) by GC/SM, in order to identify the principal molecules responsible for inhibition, (b) the capacity of the antifungal activity of essential oils of the citrus against Alternaria sp. (A. sp), Fusarium oxysporum f. sp. albedinis (F. Ox), Fusarium sp. (F. sp) and Penicelium sp. (P.sp).
MATERIALS AND METHODS
Samples
Essential oils were extracted from the fresh leaves of orange, mandarin, Bigaradier and lemon from the Citrus Orchards of Chlef, Algeria in March - November 2011.
Standard cultures
Essential oils were individually examined in respect to four phytopathogenic fungi. The strain, F. Ox was provided by the Laboratory of the Pathology of Plants, the Institute of Agronomy, University of Chlef. The other three fungal strains, A. sp., F. sp. and P.sp, were from the Laboratory of Mycology of INPV Chlef. All the stocks were purified and maintained on potato dextrose agar (PDA) medium at 22 ± 2°C.
Essential oil extraction
Essential oils are obtained from the fresh leaves of orange, Bigaradier, lemon and mandarin by hydrodistillation for 3 h, using a Clevenger type apparatus. The Eos obtained are dried over anhydrous Na2SO4 and stored in sealed vials at 4°C until analysis
GC/MS analysis
GC/MS analysis was performed on a Hewlett Packard 6890 Series II capillary gas chromatography directly coupled to the mass spectrometer system (Agilant of the type 5973). HP-5MS non polar fused silica capillary column (50 m x 0.32 mm; 1.25 μm film thickness) was used under the following conditions: oven temperature program was from 60°C (2 min) to 260°C at 5°C/min and the final temperature was kept for 10 min; injector temperature, 250°C; carrier gas He, flow rate, 1 ml/min; the volume of injected sample was 0.1 µl in splitess mode during 0.1 min ionization energy 70 eV, in the electronic ionization (EI) mode; ion source temperature, 230°C; scan mass range of m/z 40 to 650 and interface line temperature, 280°C. The constituents of essential oils were identified based on their Kovats Index; they were calculated in relation to the retention time of a series of alkanes (C7 to C29) used as reference products, compared to those gathered by Adams (2001). The similarity of their mass spectra with those gathered in
Zohra et al. 1049 the NIST-MS library or reported in the literature was compared.
Antifungal activity
Analyzing mycelia growth
The inhibiting capacity of essential oils was examined. F. Ox, P sp, A. sp and F. sp were screwed using food poisoning technique (Grover and Moore, 1962). Necessary quantities of essential oils are separately dissolved in 0.5 ml of 5% (v/v). Tween-80 was added to various sterilized Petri dishes (9 X 1.5 cm) containing 9.5 ml of PDA medium in order to provide the concentration required from 0.001 to 1 mg/ml. The controls (without essential oil) were inoculated while following the same process. A mycelia disc (diameter of 5 mm) of pathogenic fungi, taken as periphery of the culture seven days backward, was inoculated aseptically in the center of the sets of Petri dish containing the treatments and control. Limp Petri was incubated with 22 ± 2°C during seven days. For each treatment, three repetitions were carried out. The diameter of the fungi colonies of the sets of treatment and diameter of positive control were measured. Mycelia inhibition of percentage was calculated by the average value of the diameters of colony by the following formula (Pandey et al., 1982).
Percentage of mycelia growth inhibition:
Where, dt is the average diameter of the fungi colonies in the control and dT and average diameter of the treated fungi colonies.
Determination of dry weight
To determine the effect of essential oils on the dry weight of tested fungi in liquid medium, various concentrations of essential oils are prepared in a liquid medium of potato dextrose (PDB). This was done in test tubes (15 ml) and inoculated spores (107 spores/ml) of the fungi quads. Positive species tested in controls (without essential oils) are prepared at the same time. After a duration of the 15 days incubation at 22 ± 2°C, the mycelium is filtered through a Wattman filter paper No. 1, washed with distilled water and dried at 60°C for 6 h; and then at 40°C for a whole night. The filter paper containing the dry mycelium was weighed. The tests are repeated three times. Inhibition is calculated starting from the dry weight of the mycelium, by taking the control positive for the100% growth (Sharma and Tripathi, 2008).
Determination of the inhibiting minimal concentration (CMI)
The CMI of essential oils necessary for inhibition of the mycelia growth of tested fungi was determined by food poisoning technique (Grover and Moore, 1962). The inhibiting concentration minimal (CMI) of essential oils against the phytopathogenic fungi A was determined and the oil showed an absolute fungitoxicity. Various concentrations of the oil from 0.001 to 1 mg/ml as well as the control (without essential oils) were prepared by separately dissolving its necessary quantity in 0.5 ml 5% (v/v) tween-80 and then mixing it with 9.5 ml of medium PDA. Limp Petri inoculated was incubated during seven days at 22 ± 2°C. The weakest concentrations without observable growth (with the binocular magnifying glass) were defined like the inhibiting minimal concentration (CMI). For each concentration, three tests were carried out. The nature of toxicity (fungistatique/fungicide) A was given according to the study of Thomson (1989).

1050 Afr. J. Biotechnol. Production and germination of spores The colonies of spore previously exposed to the oil (until the spores formed) of F. ox, P. sp., A. sp. and F. sp. were gathered by adding 5 ml of 0.1 ml/100 ml containing sterile distilled water and Tween-80 in each Petri dish. The suspension of spore was gathered and then centrifuged. A hemocytometer was used to count the number of spores. The percentage of inhibition of the production of spore (PIs%) was calculated relative to the control. The fungi spores are obtained starting from 10 days old fungi cultures to 6 to 10 days old F. ox, P sp., A. sp. and F. sp.; they were taken and placed on blades of glass in three specimens. The blades were incubated in an incubator at 22 ± 2°C during 48 h. For each treatment, 200 spores were examined and the germination of spores was evaluated by seeking the appearance of the tubes germinated as described by Grbic et al. (2011). The spore, whose germ tube reaches 50% of its size, is considered to be germinated. The percentage of inhibition of germination (PIg%) was calculated relative to the control as positive.
Statistical analysis
Each experiment was carried out in triples, and the average values were calculated. Statistical analysis was carried out using ANOVA and the differences between the values were given, using Duncan’s test (p < 0.05).
RESULTS
Profile of chemical essential oils
Essential oils are extracted from the sheets of orange, Bigaradier, mandarin and lemon by hydro distillation. The yields obtained are 0.96, 1.02, 0.51 and 0.73% respectively for orange, lemon, mandarin and Bigaradier. The qualitative and quantitative analysis of the chemical profiles of essential oils is indicated in Table 1. The table includes the time of retention and percentage of the 51 components identified, accounting for 92.47 to 98.82% of all the components. The outputs obtained from the essential oils are: The results obtained proved that there are qualitative similarities between the four essential oils, although the quantities of some corresponding com-pounds are different. 10 componds were recorded jointly among the 51 identified, where limonene (7.18 - 36.10%), β- pinene (4.35 - 30.0%) and linalool (0.21 - 63.03%) represented the principal major compounds. The greatest volatile fraction returns of monoterpenes hydrocarbons for orange, mandarin and lemon tree are 73.64, 63.75 and 61.41%, respectively. The oxygenated monoterpenes explained approximately 71.85% of the identified compo-nents of the essential oil of Bigaradier. GC/SM of the essential oil of mandarin revealed the presence of strong concentrations in γ Terpinene (26.62%), limonene (22.52%) and β-pinene (4.35%) representing 53.49% of the total surface of the peak (Table 1). The essential oil of lemon is characterized by the prevalence of limonene (36.10%) and β-pinene (14.88%). The essential oil of orange is characterized by high concentrations in β-pinene (30%), limonene (9.37%) and the presence of two isomers sesquiterpenes (Z) and (E) β - elemene with a preponderance of the isomer (E) β - elemene
(8.97%). For the essential oil of Bigaradier, linalool (63.03%) constituted the major component dominating with limonene (7.18 %) and β-pinene (5.25 %).
Antifungal activity
Inhibiting effect of essential oils on mycelia mass growth
The antifungal activity of oils essential of the Algerian citrus species with various concentrations is evaluated with respect to four phytopathogenic fungi, F. ox, P. sp, A. sp and F. sp. in-vitro, expressed by the inhibition percentage of the radial growth (Peak %). The results in Table 2 show the inhibiting capacity of the radial growth with a remarkable difference for the total essential oils tested. Fungi susceptibility to essential oils produces high percentages of inhibition (inhibition 100% of the mycelia growth) and has absolute toxicity. Radial growth and the biomass (Figure 1) of F. ox, A. sp and F. sp were significantly reduced in response to the various concentrations of essential oils of Bigaradier, mandarin and lemon tree, with energy of 1à 0.05 mg/ml.
Determination of inhibiting minimal concentration (CMI)
More precise data on the antifungal properties of essential oils of the Algerian citrus were obtained by determining the minimal inhibiting concentrations (CMI mg/ml) as well as the nature of the fungitoxicity (Table 3). Mandarin and lemon respectively have weakest CMI 0.01 mg/ml in respect to F. ox and A. sp. 0.05 mg/ml concentration is judged to be fungicidal as follows: Bigaradier, mandarin and lemon for F. sp; Bigaradier and lemon fort F. ox and Bigaradier for A. sp. The fungi species P. sp have been shown to be more resistant to four tested essential oils. The CMI obtained was 0.1, 1.1 and > 1.0 mg/ml respectively for mandarin, lemon, Bigaradier and orange .
Inhibiting effect of essential oils on the production and germination of spores
The results of the effects of inhibition on the production and germination of spores by essential oils are represented in Figures 2 and 3. Compared with the control, they are expressed by the inhibition percentage of the production of spores (PIs %) and the inhibition percentage of the germination of spores (PIg %). Spores production was strongly inhibited by essential oils of orange, Bigaradier, mandarin and lemon in F. ox, P. sp and A. sp. The highest inhibition percentage of the production of spores was recorded in P. sp with lemon (97, 85%). One note a stimulation of spores production with F. sp for essential oils of lemon and mandarin tree.
The capacity of citrus to inhibit spores germination was

Zohra et al. 1051
Table 1. Chemical composition of life EOs of Algerian citrus.
Component RT (min) Mandarin (% area)
Lemon (% area)
Orange (% area)
Bigaradier (% area)
1-hexanol 4.68
- - 3 hexen- 1-ol 4.71 - - - 0.91 α-Thujene 5.81 2.00 0.21 1.49 0.02 α -Pinene 5.99 4.36 1.28 2.04 0.38 camphene 6.37 0.10 0.13 - 0.03 β - Pinene 7.12 4.35 14.88 30.0 5.25 β - Myrcene 7.46 1.19 2.56 4.52 1.40 α Phellandrene 7.86 0.10 0.21 0.68 - 3 Carene 8.02 - 0.98 6.41 0.16 (+)-4-Carene 8.20 0.38 0.34 2.77 - Limonene 8.71 22.52 36.10 9.37 7.18 β Ocimene 8.74 - - 0.74 - 1,3,6-octatriene,3,7-dimethyl- 9.11 0.94 3.01 8.59 1.13 γ Terpinene 9.41 26.62 1.22 4.42 - Cis sabinene hydrate 9.77 - - 0.21 - Terpinolene 10.25 1.16 0.43 2.53 - Linalool 10.71 0.21 1.40 1.24 63.03 Z Alloocimene 11.38 0.03 0.06 0.08 - Citronellal 12.06 - 1.21 0.90 - Terpinen-4-ol 12.94 0.15 0.74 2.14 0.43 α Terpineol 13.34 0.10 0.79 0.07 1.00 Citronellol 14.36 - - 1.05 - Citral 14.70 - 6.79 - 0.46 1,6-octadien-3-ol,3,7-dimethyl 14.87 0.11 1.10 5.79 2,6-octadienal,3,7-dimethyl 15.45 - 6.79 0.22 0.15 Thymol 16.97 0.30 - - - σ-Elemene 17.23 - - - 0.05 Cis-2,6-Dimethyl-2,6octadiene 17.53 - - 0.45 - Benzoic acid 2-amino- methyl 17.79 0.09 - - - 2,6-octadien-1-ol,3,7dimethyl 17.84 - 10.49 0.22 0.99 Copaene 18.20 - - - - (Z) β Elemene 18.45 - - 0.44 - (E) β - Elemene 18.71 - - 8.97 0.08 Caryophylene 19.41 - 1.65 3.48 2.62 Methyl N-methylanthranilate 19.74 34.02 - - - Aromadendrene 19.93 - - - 0.05 (E) β Famesene 20.20
- 0.65 0.12
α -humulene 20.29 - 0.41 1.33 0.39 β -Selinene 21.13 - - 0.47 - γ Elemene 21.35 - 0.10 - 0.26 α -Farnesene 21.49 - - 0.61 - γ -cadinene 21.80 - - 0.56 0.01 δ -Cadinene 21.95 - - 0.22 0.08 Nerolidol 22.95 - - - 0. 37 Caryophylene oxide 23.50 0.09 0.19 0.23 0.04 α Cadinol 25.26 - - - 0.04 β Sinensal 26.04 - - 0.72 - α Sinensal 27.27 - - 0.30 - β Farnesol 33.89 - 0.34 - - Phytol 34.36 - - - 0.05 Monoterpene hydrocarbons (%) 63.75 61.41 73.64 15.55 Oxygenated monoterpenes (%) 34.98 28.65 6.05 71.85 Sesquiterpene hydrocarbons (%) - 02.16 15.95 3.66 Oxygenated sesquiterpene (%) 0.09 0.53 1.25 0.45 Other (%) - - - 0.96 Total identified (%) 98.82 92.75 96.89 92.47
RT: Retention time , - not detected.
studied based on spores from the cultures previously exposed to essential oils. Orange, Bigaradier, mandarin
and lemon exposed inhibitions of the different germinated spores. The most effective one against all the tested

1052 Afr. J. Biotechnol.
Table 2. Zones of growth inhibition in Percentage Inhibition (PIc %) showing antifungal activity of Citrus EOs.
Essential oil Dose (mg/ml) Percentage Inhibition ( PIc %)
a ( mean ± SE,n=3)
Fusarium sp Fusarium oxysporum fsp albedinis Alternaria sp Penicellium sp
Orange
1 100±00.0A 100±00.0
A 100±00.0
A 63.92±0.3
AB
0.8 100±00.0A 76.84±7.8
A 100±00.0
A 60.62±4
AB
0.6 100±00.0A 76.59±3.5
A 100±00.0
A 56.91±10.0
AB
0.4 100±00.0A 65.90±6.3
AB 100±00.0
A 13.02±5.6
C
0.2 88.43±0.7A 50.33±8.3
B 73.07±4.3
A N.A.
0.1 12.35±3.3 C
19.40±5.5C
23.33±2.6 BC
N.A.
0.05 3.92±0.8 D
9.53±0.7C 8.46±8.6
C N.A.
0.01 N.A. 2.86±0.5D 5.12±1.7
CD N.A.
0.001 N.A. N.A. N.A. N.A.
Bigaradier
1 100±00.0A 100±00.0
A 100±00.0
A 100±00.0
A
0.8 100±00.0A 100±00.0
A 100±00.0
A 100±00.0
A
0.6 100±00.0A 100±00.0
A 100±00.0
A 100±00.0
A
0.4 100±00.0A 100±00.0
A 100±00.0
A 100±00.0
A
0.2 100±00.0A 100±00.0
A 100±00.0
A 100±00.0
A
0.1 100±00.0A 100±00.0
A 100±00.0
A 100±00.0
A
0.05 100±00.0A 100±00.0
A 100±00.0
A 64.92±19.3
AB
0.01 N.A. 34.11±3.0BC
22.25± 2.5BC
18.0±5.6C
0.001 N.A. 21.50±1.02BC
13.16± 3.5 C
N.A.
Mandarin
1 100±00.0A 100±00.0
A 100±00.0
A 100±00.0
A
0.8 100±00.0A 100±00.0
A 100±00.0
A 83.92±0.47
A
0.6 100±00.0A 100±00.0
A 100±00.0
A 84.51±0.21
A
0.4 100±00.0A 100±00.0
A 100±00.0
A 80.20±0.63
A
0.2 100±00.0A 100±00.0
A 100±00.0
A 74.51±0.62
A
0.1 100±00.0A 100±00.0
A 100±00.0
A N.A.
0.05 100±00.0A 100±00.0
A 71.87±0.13
AB N.A.
0.01 73.45±0.05A 100±00.0
A N.A. N.A.
0.001 N.A. 37.93±0.27 BC
N.A. N.A.
Lemon
1 100±00.0A 100±00.0
A 100±00.0
A 100±00.0
A
0.8 100±00.0A 100±00.0
A 100±00.0
A 83.14±0.20
A
0.6 100±00.0A 100±00.0
A 100±00.0
A 72,16±0.16
AB
0.4 100±00.0A 100±00.0
A 100±00.0
A 71.18±0.49
AB
0.2 100±00.0A 100±00.0
A 100±00.0
A 65.29±0.43
AB
0.1 100±00.0A 100±00.0
A 100±00.0
A N.A.
0.05 100±00.0A 100±00.0
A 100±00.0
A N.A.
0.01 N.A. 30.56±0.17 BC
100±00.0A N.A.
0.001 N.A. 35.25±0.10 BC
45.42±0.11B N.A.
aValues followed by same alphabetic letters are not significantly different according to ANOVA and Duncan’s Multiple Range Test (p≤ 0.05). N.A.,
non-active zones of growth inhibition values are presented as mean ± standard deviation.
fungi stocks was the oil of orange, with a strong inhibition percentage of spores germination of (PIg 58.66 to 100 %). A stimulation of the germination of spores was observed in A. sp with lemon and mandarin tree.
DISCUSSION The bioactivity of the oils essential extracted from the sheets of Algerian citrus in respect to four phyto-
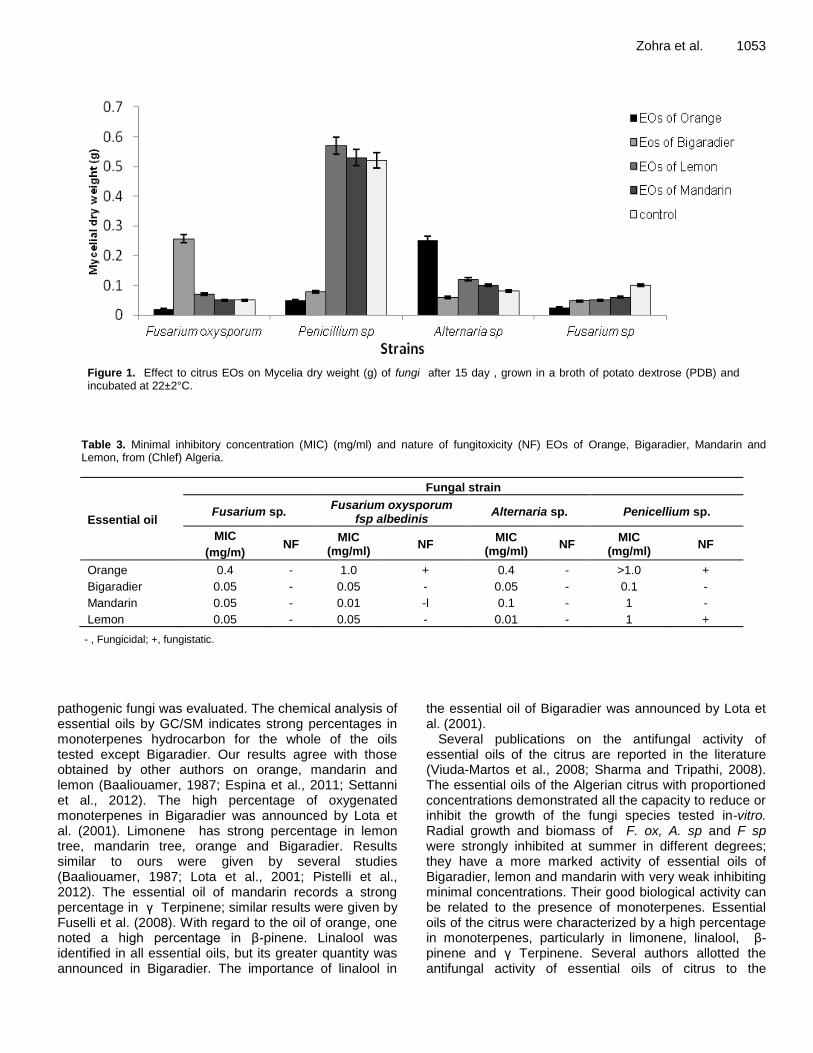
Zohra et al. 1053
Figure 1. Effect to citrus EOs on Mycelia dry weight (g) of fungi after 15 day , grown in a broth of potato dextrose (PDB) and incubated at 22±2°C.
Table 3. Minimal inhibitory concentration (MIC) (mg/ml) and nature of fungitoxicity (NF) EOs of Orange, Bigaradier, Mandarin and Lemon, from (Chlef) Algeria.
Essential oil
Fungal strain
Fusarium sp. Fusarium oxysporum
fsp albedinis Alternaria sp. Penicellium sp.
MIC
(mg/m) NF
MIC (mg/ml)
NF MIC
(mg/ml) NF
MIC (mg/ml)
NF
Orange 0.4 - 1.0 + 0.4 - >1.0 +
Bigaradier 0.05 - 0.05 - 0.05 - 0.1 -
Mandarin 0.05 - 0.01 -l 0.1 - 1 -
Lemon 0.05 - 0.05 - 0.01 - 1
+
- , Fungicidal; +, fungistatic.
pathogenic fungi was evaluated. The chemical analysis of essential oils by GC/SM indicates strong percentages in monoterpenes hydrocarbon for the whole of the oils tested except Bigaradier. Our results agree with those obtained by other authors on orange, mandarin and lemon (Baaliouamer, 1987; Espina et al., 2011; Settanni et al., 2012). The high percentage of oxygenated monoterpenes in Bigaradier was announced by Lota et al. (2001). Limonene has strong percentage in lemon tree, mandarin tree, orange and Bigaradier. Results similar to ours were given by several studies (Baaliouamer, 1987; Lota et al., 2001; Pistelli et al., 2012). The essential oil of mandarin records a strong percentage in γ Terpinene; similar results were given by Fuselli et al. (2008). With regard to the oil of orange, one noted a high percentage in β-pinene. Linalool was identified in all essential oils, but its greater quantity was announced in Bigaradier. The importance of linalool in
the essential oil of Bigaradier was announced by Lota et al. (2001).
Several publications on the antifungal activity of essential oils of the citrus are reported in the literature (Viuda-Martos et al., 2008; Sharma and Tripathi, 2008). The essential oils of the Algerian citrus with proportioned concentrations demonstrated all the capacity to reduce or inhibit the growth of the fungi species tested in-vitro. Radial growth and biomass of F. ox, A. sp and F sp were strongly inhibited at summer in different degrees; they have a more marked activity of essential oils of Bigaradier, lemon and mandarin with very weak inhibiting minimal concentrations. Their good biological activity can be related to the presence of monoterpenes. Essential oils of the citrus were characterized by a high percentage in monoterpenes, particularly in limonene, linalool, β-pinene and γ Terpinene. Several authors allotted the antifungal activity of essential oils of citrus to the

1054 Afr. J. Biotechnol.
Figure 2. Percentage inhibition (compared with positive controls) of spore produced of fungi in colonies previously exposed to Citrus EOs. Data are means ± standard deviations (error bars).
Figure 3. Percentage inhibition (compared with positive controls) of spore germination of fungi in colonies previously exposed to citrus Eos. Data are means ± standard deviations (error bars).
presence of monoterpenes such as linalool, limonene or central etc (Sharma and Tripathi, 2006, 2008; Viuda-Martos et al., 2008). They act on hyphas mycelia, lead to the loss of rigidity and integrity of the cellular wall of the hyphas, resulting in the death of the mycelium (Sharma and Tripathi, 2008). The capacity of citrus essential oils to inhibit the production and germination of the spores of tested fungi was evaluated in vitro. The tests of produc-tion and germination of spores showed the inhibiting
effect of essential oils of orange, Bigaradier, mandarin and lemon on F. ox, F. sp., P. sp. and A. sp.
The capacity of citrus essential oils to inhibit the production and germination of spores was reported by several authors (Sharma and Tripathi, 2006, 2008; Chutia et al., 2009; Grbic et al., 2011). The best percentages of inhibition were presented by the oil of orange in respect to F. ox, F. sp. and A. sp. Sharma and Tripathi (2008) announce that the oil of orange was extremely toxic to
the germination of the spores of Aspergillus niger and that oil treatment led to distortions, thinning of the wall of the hyphas, reduction of the diameter of the hyphas and the absence of conidiophores. It is remarkable that the essential oil of the lemon stimulated the production of the spores of F. sp whereas the essential oil of the mandarin supported the germination of the spores of A sp. French (1985) recalled that it is extremely difficult to correlate the fungitoxic activity of simple compounds or classes of compounds. The various components of oil can act in a synergistic way while the association of several com-pounds can have a stimulating action on the germination of fungi spores.
The results obtained justify future research, stressing the antifungal properties of the major components of essential oils, on one hand, and the capacity of these oils to inhibit the fungi tested in vivo, on the other hand. Conclusion The data presented here shows the inhibiting powerful potential of essential oils extracted from the sheets species of Algerian citrus in respect to F. ox, P. sp, A. sp and F. sp in vitro and their possible integration in the programs of protection against the phytopathogenic fungi. The fungi anti capacities of essential oils of the Algerian citrus proved to be a very interesting field for applications in agro- alimentary industry.
Conflict of interest
The authors declare no conflict of interest.
REFERENCES
Adams RP (2001). Identification of essential oil components by gaz chromatography: quadrupole mass spectroscopy. Allured Pub. Corp.: Carol stream. p. 456.
Baaliouamer A (1987). Essential oil qualitative and Semi-quantitative analysis of Citrus Coming from the Experimental Station of arboriculture of Boufarik. Thesis of Doctorate University of Algiers.
Chutia M , Deka Bhuyan P, Pathak MG, Sarma TC, Boruah P (2009). Antifungal activity and chemical composition of Citrus reticulata Blanco essential oil against phytopathogens from North East India. Food Sci . Technol. 42:777-780.
Combrinck S, Regnier T, Kamatou GPP ( 2010). In vitro activity of eighteen essential oils and some major components against common postharvest fungal pathogens of fruit. Ind Crops. Prod. 33(2):344-349.
Espina L, Somolinos M, Lorán S, Conchello P, Garcia D, Pagan R (2011). Chemical composition of commercial citrus fruit essential oils and evaluation of their antimicrobial activity acting alone or in combined processes. Ann. Rev.Phytopatol. 23:173-199.
French RC (1985) The bio-regulatory action of flavor compounds on fungal spores and other propagules. Ann. Rev.Phytopatol. 23:173-199.
Fuselli SR , Garci de la Rosa SB , Eguaras MJ, Fritz R (2008). Chemical composition and antimicrobial activity of Citrus Essences on honeybee bacterial pathogen Paenibacillus larvae, the causal agent of American foulbrood. World. J. Microbiol. Biotechnol .24:2067-2072.
Zohra et al. 1055 Grbic ML, Stupar M , Vukojević J, Grubišić D (2011). Inhibitory effect of
essential oil from Nepeta rtanjensis on fungal spore germination. Cent. Eur. J. Biol. 6(4):583-586.
Grover RK, Moore JD (1962). Toxicometric studies of fungicides against brown rot organisms Sclerotinia fructicola and S. laxa. Phytopathologie. 52:876-880.
Lota ML, Serra DR, Jacquemond C, Tomi F, Casanova J (2001). Chemical variability of peel and leaf essential oils of sour orange. Flav. Flagr. J. 16:89-96.
Mishra AK, Dubey NK (1994). Evaluation of some essential oils for their toxicity against fungi causing deterioration of stored food commodities. Appl. and Environ. Microbiol. 60(4):1101-1105.
Pandey DK, Tripathi NN, Tripathi RD, Dixit SN (1982). Fungitoxic and phytotoxic properties of the essential oil of Hyptis suaveolens. Zeitschrift für Pflanzenkrankheiten und Pflanzenschutz. 89(6):344-349.
Pistelli L, Mancianti F , Bertoli A; Cioni PL, Leonardi M, Pisseri F, Mugnaini L, Nardoni S (2012). Antimycotic activity of some aromatic plants essential oils against canine isolates of Malassezia pachydermatis An in vitro Assay. Open Mycol. J. 6:17-21.
Sawamura M (2000). Aroma and functional properties of Japaneseyuzu (Citrus junos Tanaka). Essent. oil. Aroma Res.1:14-19.
Settanni L, Palazzolo E, Guarrasi V, Aleo A, Mammina C, Moschetti G, Germanà MA (2012). Inhibition of foodborne pathogenic bacteria by essential oils extracted from citrus fruits cultivated in Sicily. Food Cont. 26:326-330.
Sharma N, Tripathi A (2008).Effects of Citrus sinensis ( L) Obseck epecarp essential oil on growth and morphogenesis of Aspergillus niger (L) Van Tieghem. Microbiol. Res.163:337-344.
Sharma N, Tripathi A ( 2006). Fungitoxicity of the essential oil of Citrus sinensis on post-harvest pathogen. World. J. Microbiol. Biotechnol. 22:587-593.
Thomson DP (1989). Fungitoxic activity of essential oil components on food storage fungi. Mycologia. 81 (1):151-153.
Viuda-Martos M, Ruiz-Navajas Y, Fernandez-Lopez J, Perez-Alvarez J (2008) . Antifungal activity of lemon (Citrus lemon L.), mandarin (Citrus reticulata L.), grapefruit (Citrus paradisi L.) and orange (Citrus sinensis L.) essential oils. Food Cont. 19:1130-1138.
Yaouba A, Tatsadjieu NL, Jazet Dongmo PM, Etoa FX, Mbofung CM (2010). Antifungal properties of essential oils and some constituents to reduce foodborne pathogen. J. Yeast Fungal Res. 11:001-008

Vol. 14(12), pp. 1056-1066, 25 March, 2015
DOI: 10.5897/AJB2015.14432
Article Number: 76DACE651751
ISSN 1684-5315
Copyright © 2015
Author(s) retain the copyright of this article
http://www.academicjournals.org/AJB
African Journal of Biotechnology
Full Length Research Paper
Chemical composition and anti-diabetic properties of Jatropha curcas leaves extract on alloxan induced
diabetic wistar rats
Nwamarah, J. U.1, Otitoju, O.2 and Otitoju, G. T. O.1
1Home Science, Nutrition and Dietetics Department, University of Nigeria Nsukka, Enugu State, Nigeria.
2Department of Biochemistry, Federal University Wukari, Taraba State, Nigeria.
Received 16 January, 2015; Accepted 25 February, 2015
This study evaluates the chemical composition and anti-diabetic properties of fresh and shade dried Jatropha curcas aqueous leaves extracts (JCLE) on alloxan induced diabetic female wistar rats. Seven (7) kg of J. curcas leaves were pulverized and aqueous extracts produced. Thirty five (35) mature female rats were grouped into seven of five animals per group according to their body weights. Blood samples were collected for baseline data before inducing diabetes. Various groups of rats were fed graded doses (100, 200 and 300 mg of JCLE, respectively. Blood glucose was tested every seven days using glucometer. The animals were treated for 21 days with JCLE, blood samples were collected for liver enzyme function test, liver and pancreas tissues collected for histopathology. The results obtained were analysed statistically using analysis of variance (ANOVA) and Duncan Multiple range student test. Result shows that proximate composition of JCLE had higher protein, fat and carbohydrate concentrations in shade dried than the fresh samples. The vitamin, mineral and phytochemical compositions varied but higher in shade dried JCLE also than the fresh. Rats treated had significant (p<0.05) reduction in blood glucose level. Liver enzymes was higher with shade dried JCLE. The current study provides some useful insight into the anti-hyperglycemic potency of JCLE in alloxan induced diabetics and seems to repair some organs damages. Key words: Blood glucose, Jatropha curcus, liver enzymes, diabetic.
INTRODUCTION In Sub-Saharan Africa, there is a growing need to fight the scourge of diabetes among the populace. Although access to primary health care is low, diabetic patients tend to fight this disease through natures endowed plant
resources. Prevalence and burden of type 2 diabetes are rising quickly and may be due to the rapid uncontrolled urbanization, environmental degradation and major changes in lifestyle of the people (Jean et al., 2010;
*Corresponding author. E-mail: [email protected]. Abbreviations: JCLE, Jatropha curcas aqueous leaves extracts; AST, Aspartate aminotransferase.
Author(s) agree that this article remains permanently open access under the terms of the Creative Commons Attribution License 4.0 International License

Mohan et al., 2013). This increase presents a substantial public health and socioeconomic burden in the face of scarce resources. Therefore, there is a concomitant increase in alternative but cheaper means of treating this disease condition among the rural and low economic income earners. In 2003, the International Diabetes Federation estimated that approximately 194 million people around the world had diabetes and by 2025 this figure will be expected to rise to 333 million, amounting to 6.3% of the world‟s population living with diabetes (Atlas, 2003). The Diabetes Association of Nigeria (2011) also reported that over 140 million people based on Nigerian Census of 2006, had an estimated six million persons with full blown diabetes mellitus. Reports from hospital records indicate the alarming increase in both prevalence and incidence of diabetes among all ethnic groups and social classes in Nigeria (DAN, 2011). Indeed, diabetes has in the last two decades become a household disease that requires urgent health care intervention.
Jatropha curcas is a drought resistant shrub or tree belonging to the family Euphorbiaceae, which is cultivated in Central and South America, South-East Asia, India and Africa (Martinez-Herrera et al., 2006). Recently, there is an increasing use of J. curcas in the management of diabetes and other carbohydrate metabolic related syndromes. Other ethnomedical uses of the extracts of J. curcas leaves include use as a remedy for cancer, as an abortifacient, antiseptic, diuretic, purgative and haemostatic (Dalziel,1995; Mishra et al., 2010). J. curcas leaves have been observed to be consumed by people with many ailments traditionally including diabetes mellitus in the North-east of Nigeria without scientific explanation. Thus, the main objective of this work was to assess the chemical, phytochemical and anti-diabetic properties of J. curcas leaves extract. MATERIALS AND METHODS
Samples preparation
The J. curcas leaves were harvested, sorted by removing extraneous materials; the sample leaves were then taken to the taxonomic unit in the Department of Plant Science and Biotechnology, University of Nigeria, Nsukka for identification. The leaves were rinsed with distilled water and divided into two parts; 5 kg fresh and 5 kg was shade dried for 5 days at room temperature. The dried leaves were pulverized into powder using Warburg laboratory blender and packaged in labelled polyethylene bags for further use.
Preparation of vegetable extracts for rat studies
Two hundred grammes (200 g) each of the pulverized vegetable samples were soaked separately in 500 ml boiled distilled water and agitated intermittently for 24 h. They were filtered using fine sieve of 4.75 mm mesh (No. 4) to obtain the aqueous extracts. The extracts were stored in air tight containers at 4°C and later reconstituted in distilled water to give the required doses to be administered during the study using the formula:
Nwamarah et al. 1057
Chemical analysis
Proximate analysis Portions of J. curcas leaves were analysed for their proximate values using AOAC methods (2005).
Moisture The moisture content of the samples was determined using the hot oven method as described by Pearson (1976). Petri dishes were thoroughly washed and dried in the oven at 100°C for 30 min and allowed to cool inside a desiccator. These various weights were determined by weighing them with a weighing balance. 2 g of finely ground sample was weighed into the dishes and placed inside the oven at 100°C for 4 h. The dishes together with the sample they contain were removed, cooled in a desiccator and weighed. They were placed back into the oven, dried for further 30 min, cooled and weighed. The drying was continued and weighed repeatedly until a constant weight was obtained. The percentage moisture content was calculated from the weight loss of the sample. Thus:
Protein Total nitrogen was estimated using micro kjeidahl method as described by Pearson (1976). One gram of sample was digested with concentrated sulphuric acid. The digested samples were distilled and titrated. The crude protein was calculated by multiplying the total nitrogen by the conversion factor of 6 to 25. P = TN × 6.25
Fat The fat content of the samples were determined using Soxhlet extraction method as described by Pearson (1976). The fat content was determined using Soxhlet fat extraction unit/system. The Soxhlet extraction cup was washed and dried in oven and weighed in an analytical balance. One gram sample was weighed and placed in a folded filter paper inside the thimble. The thimble was immersed into an aluminium cup containing 30 ml of petroleum ether. It was further placed in the extraction unit and the extraction process began. After the extraction process the aluminium cup together with the oil it contains was sent to the oven for drying before weighing.
Where, A = weight of empty cup; B = weight of cup + fat; and C = weight of sample used in grams.
Carbohydrate
Carbohydrate This was determined by difference % carbohydrate = 100 - (% ash + protein + fat + fibre + moisture).
Weight of rat x conc. of extracts Dosage x 1000
Wt. of dish + sample – wt. of dish + sample after drying Wt. of sample 1
% moisture = × 100
A – B × 100 C 1 % of wt. =

1058 Afr. J. Biotechnol. Ash Ashing method by Osborne and Voogt (1973) was used. Two grams each of the samples was subjected to ashing, in a silica crucible until the food matrix was destroyed. The sample was heated gently at first at about 1500C to clay it and at 500°C in a muffle furnace to completely destroy it.
Where, B = weight of crucible (empty); C = weight of crucible + Ash; and F = weight in grams of sample used.
Crude fibre The fibre content was determined using the AOAC method (1995). Three grams of sample was defatted by Soxhlet extraction or by stirring, setting and decanting with petroleum ether. The defatted sample was placed in a beaker with 200 ml of boiling H2SO4. It was filtered under suction, washed with distilled water and boiled again for another 30 min with 200 ml of NaOH. The digested sample was washed with 0.1 m HCl to neutralize the NaOH and severally with hot distilled water. It was washed 2 times with ethanol and three times with ether. The ash is then cooled and weighed.
Where, M2 = weight after drying; M3 = weight after ignition; M0 = weight of sample.
VITAMINS Vitamin A (βeta carotene) The method of AOAC (2005) was used. One gram of the sample was extracted with 50 ml of petroleum ether in triplicate. The ether extract was concentrated and evaporated to dryness. The residue was dissolved with 0.2 ml of chloroform-acetic anhydride (1:1). 2 ml of trichloroacetic acid-chloroform (1:1) was added and the absorbance taken at 620 nm every 15 s interval.
Vitamin B1 (Thiamine) One (1) ml of the filtrate was transferred into three test tubes, 2 ml of water; 0.4 ml of 50% sodium acetate, 0.1 ml of diazotized reagent was added and shaken. 0.2 ml of 5.5% sodium carbonate was added, mixed and the absorbance taken at 540 nm against a reagent blank.
Mineral analysis Calcium Two grams of sample was ashed followed by classical precipitation and titration (Paul and Southgate, 1978). Iron and zinc The method of AOAC method (1995) was used. Two grams of sample (powdered) is weighed into a crucible and ashed in a muffle
furnace at 550°C for 6 h. The ash was cooled and 6 HCl added and boiled for 10 min, while covering the crucible with a watch glass. After boiling, the sample was cooled and filtered into 100 ml volumetric flask. The crucible washed with distilled water and the washing added to ash filtrate. The ash filtrate was made to 100 ml with distilled water.
An aliquot of the filtrate was aspirated into the atomic absorption spectrophotometer (Pye Unicam) and the absorbance values corresponding to the different minerals read. Solutions of Zn and Fe were prepared and aspirated into the atomic absorption spectrophotometer and their absorbance values recorded. The percentage of element present was calculated from the absorbance values of the sample and standard solution.
Potassium
Potassium content of the samples was determined using the atomic absorption spectrometric method as described by Collins and Polkinhorne (1952). 5 g of the sample was ashed, then ash was transferred to 400 ml beaker using 100 ml distilled water. About 10 ml concentrated of HCl was added and boiled for several minutes then cooled and diluted with water to 500 ml and filtered, diluted to final conc. of solution (approximately 15 mg/L K2O) prepared. A series of solution from the freshly prepared diluted potassium solution containing 10, 12, 14, 16, 18 and 20 mg/l K2O was read against blank (the concentration was read between 766 to 770 nm in an atomic absorption spectrophotometry (AAS). Results were extrapolated from an already prepared calibration curve. K = 0.88 x k20
Phosphate The method of AOAC (2005) was used. 2 ml of sample was transferred into three test tubes and 3 ml of water added; the pH was adjusted to 7.0 with dilute ammonia and 2.5 ml of vanadate molybdate reagent added. The solution was made up with 10 ml and after 10 min the absorbance was taken at 470 nm against a blank.
Experimental design
Toxicity test The acute toxicity and mean lethal dose (LD50) of the extracts were determined in mice using the method described by Lorke (1983) (Table 1b). The experimental animals were healthy female Wistar rats weighing between 150 to 200 g. Thirty five rats were randomly divided into seven groups (1 to 7) of five rats each (Table 1a). These rats were distributed in metabolic cages and maintained under standard environmental conditions. They were fed with commercial rat chow and water ad libitum. Mature female Wistar rats were procured from the Faculty of Veterinary Medicine, University of Nigeria Nsukka, for this study. The test sample J. curcas leaves were obtained from No. 57 Ibagwa road, Nsukka, Nigeria.
Ethical consent Ethical consent was obtained from the Ministry of Veterinary Control Enugu, Enugu state Nigeria.
Induction of diabetes
Diabetes mellitus was induced in groups‟ 1-6 rats by single intra-
C – B × 100 F 1
% Ash =
M2 – M3 M0
% fibre = × 100
Table 1a. Grouping of Wistar rats administered graded doses of J. curcas.
Group Sample Dose (mg/kg bwt)
1 Shade dried J. curcas 100
2 Shade dried J. curcas 200
3 Shade dried J. curcas 300
4 Fresh J. curcas 100
5 Fresh J. curcas 200
6 Fresh J. curcas 300
7 Control
Table 1b. LD50 value of the aqueous extract of J. curcas leaves.
No. of mice Dose (mg/kg) No. of death of animals
3 5 0
3 50 0
3 300 0
3 2000 1
3 3000 3
LD50 value = 2000 mg/kg, animals used = albino mice, weight of animals = 20-25 g. No. of animals = 3, Route = oral.
peritonial injection of 150 mg/kg body weight of alloxan monohydrate (Sigma, St. Louis, USA) suspended in normal saline, after an overnight fasting on the 5th day. After 48h (7th day), diabetes was confirmed using one touch glucometer. Animals that had fasting blood glucose level ≥200 mg/dl were considered diabetic and included in the study according to Luka and Tijjani (2013). Collection of blood samples Blood samples were collected from the retro-bulba plexus of the medial canthus of the eye of the rat for biochemical analysis. Blood glucose estimation Blood glucose was estimated on day 0, 7, 14 and 21 using glucometer (One Basic, Inc.). Assay of activities of some liver function enzymes Serum enzymes; aspartate aminotransferase (AST), alkaline phosphatase (ALP) and alanine aminotransferase (ALT) were determined using Randox laboratory reagent kit, UK, BT 29 4QY based on method by Reitman and Frankel (1957). Histopathology examination At the end of the experiment, the rats were anesthetized and dissected. The liver and the pancreas tissues were extracted, rinsed in normal saline for histopathological examination after which they were fixed in 10% formalin. Thereafter, the tissues were cleared in chloroform overnight, infiltrated and embedded in molten paraffin wax. The blocks were later trimmed and sectioned at 5 to 6 microns. The sections were deparaffinized in xylene, taken to water
Nwamarah et al. 1059 and subsequently stained with Haematoxylin and Eosin (H and E) for light microscopy (Bancroft and Stevens, 1977). Statistical analysis Data obtained were analyzed using descriptive statistics including mean and standard deviation. Duncan new multiple range test and least significant difference (LSD) were used to separate the means. Significant differences were accepted at p< 0.05.
RESULTS AND DISCUSSIONS
Acute toxicity study (Table 1b) is generally carried out for the determination of LD50 value in experimental animals. The LD50 determination was done in mice by OECD guidelines 423. The aim of performing acute toxicity study was for establishing the therapeutic index of a particular treatment and to ensure the safety in vivo. The LD50 of the 50% aqueous extract of J. curcas was found to be 2500 mg/kg. The proximate composition of shade dried and fresh J. curcas leaves extracts (JCLE) as displayed in Table 2 revealed that shade dried samples contained higher percentage of protein, ash, fat and carbohydrate as compared with the fresh. However, the fresh JCLE had higher percentage of moisture content (94.12%) as compared with the shade dried leaves extract (90.00%). The lower moisture content observed in the shade dried JCLE could possibly be due to loss of moisture during the shade drying periods. Fresh vegetables are known to contain more water than either sun or shade dried vegetables. Udofia and Obizoba (2005) reported the same observation in fresh „attama and sweet potato leaves. The protein content (1.90 and 2.01%) of fresh and dried JCLE were lower than 3.3% recorded by USDA Nutrient Database for Standard Reference (Hall, 1998). This may be because some protein fractions may still be embedded in the leave samples. Chima and Igyor (2007) also reported lower protein values for (Pterocarpuss oyauxii) “Oha” (2.0%) and Gnetum africanum “Okazi” (1.5%). Incorporating J. curcas vegetable in diet can furnish it with appreciable amount of protein which provides enormous benefits such as maintenance of fluid balance, formation of hormones and enzymes and contribution to immune function. Ash, carbohydrate and fat were generally lower than other authors who reported Ipomea batata (11.10%) and Moringa oleifera (15.09% DW) (Antia et al., 2006; Lockeett et al., 2000) and Hibscus esculentus (8.00% DW) reported by Akindahunsi and Salawu (2005). Ash content which is an index of mineral contents in biota was 0.69 and 0.98%, respectively, for fresh and dried JCL. Carbohydrate value for dried leaves was 6.04% lower than that observed by Akubugwo et al. (2007) in Amaranthus hybrids (52.18%) fresh samples, but higher than Thuja occidentalis (4.72%). As far as vegetables are concerned, some of them are rich sources while others contain traces of some the nutrients.
Table 3 shows the vitamin composition of shade dry and

1060 Afr. J. Biotechnol.
Table 2. Proximate composition of shade dry and fresh Jatropha curcas aqueous leaves extract.
Sample Protein (%) Ash (%) Fibre (%) Fat (%) Moisture (%) CHO
Shade dry 2.01±0.03 0.98±0.03 - 0.97±0.04 90.00±0.33 6.04±0.30
Fresh 1.90±0.06 0.69±0.10 - 0.55±0.05 94.12±1.16 2.73±1.09
Mean ±SD of three determinations.
Table 3. Vitamin composition of shade dry and fresh Jatropha curcas leaves extract
Sample Pro-vitamin A (IU) Vitamin C
(mg/100 g)
Vitamin B1
(mg/100 g)
Vitamin B2
(mg/100 g)
Vitamin B3
(mg/100 g)
Shade dry 1491.30±28.48 0.98±0.03 90.00±0.33 6.04±0.30 10.00±0.33
Fresh 1312.80±46.9 0.65±0.11 4.40±0.87 0.07±0.01 2.63±0.15
Mean ±SD of three determinations.
Table 4. Mineral composition of shade dry and fresh Jatropha curcas aqueous leaves extract.
Sample Iron (mg/100 g) Calcium (mg/100 g) Potassium (mg/100 g) Zinc (mg/100 g)
Shade dry 0.33±0.0 0.74±0.06 63.81±0.32 42.33±2.52
Fresh 0.60±0.02 0.49±0.01 76.45±1.77 32.00±2.00
Mean ±SD of three determinations.
Table 5. Phytochemical composition of shade dry and fresh Jatropha curcas aaqueous leaves extract.
Sample Alkaloid (mg/100 g) Tannin (mg/100 g) Oxalate (mg/100 g) Flavonoids (mg/100 g)
Shade dry 2.26±0.24 1.63±0.32 8.60±0.60 3.83±0.21
Fresh 0.99±0.04 0.07±0.02 4.58±0.20 2.23±0.12
Mean ±SD of three determinants.
fresh J. curcas leaves extract. The result shows that the vitamin composition of shade dried JCLE was higher (vitamin B190.00 mg, Vitamin B26.04 mg and Vitamin B310.00 mg) than the fresh JCLE (vitamin B1 4.40 mg, Vitamin B2 0.07 mg and Vitamin B3 2.63 mg). Pro-vitamin A and vitamin C contents were also higher in the shade dried samples than the fresh samples. This is similar to the result of other researchers who reported higher vitamin contents in dried samples than the fresh samples (USDA, 2012; Reddy and Love, 1999). Generally, vegetables are rich in vitamin, minerals, dietary fibre and protein (Otitoju et al., 2014; Humphrey et al., 1993; Mathenge, 1997). The result in this study shows that JCLE is a rich source of pro-vitamin A and vitamin B. Pro-vitamin A protects the body cells from the damaging effects of free radicals, they act as good source of vitamin A and enhance the functioning of the immune system; it also helps the reproductive system to function properly (Handelman, 2001; Young and Lowe, 2001). Table 4 shows the mineral composition of shade dried and fresh J. curcas leaves extracts. The fresh
samples had higher iron content (0.60 mg) than the dried samples (0.33 mg). A similar trend was observed for potassium (76.45 and 63.81 mg), respectively. In shade dried J. carcus, calcium (0.74 and 0.49 mg) and zinc (42.33 and 32.00 mg) were higher in the dried than the fresh samples, respectively. Quantitative phytochemical compositions result (Table 5) shows that shade dried samples had higher alkaloids (2.26 mg), tannins (1.63 mg), oxalate (8.60 mg) and flavonoid (3.83 mg), respectively than the fresh samples which contained alkaloid (0.99 mg), tannins (0.07 mg), oxalate (4.58 mg) and flavonoid (2.23 mg), respectively. Oladele et al. (1995) have also reported that medicinal plants with hypoglycemic and anti-diabetic effect usually contain high concentration of alkaloids and flavonoids. This finding is in line with the result obtained from this study.
This study demonstrates hypoglycaemic effect on the fasting blood glucose level of the rats (Table 6) and had significant (p < 0.05) increase in the blood glucose levels after induction with 150 mg/kg alloxan. The highest percentage (70.68%) reduction of the blood glucose

Nwamarah et al. 1061
Table 6. Effects of aqueous leaves extract of J. curcas (JCLE) on blood glucose levels in alloxan induced diabetic rats.
Group Baseline (mg/dl) After induction (mg/dl) After treatment (mg/dl)
1 87.00±6.32a 222.60±143.15
a 112.33±1.53
a
2 87.60±9.21a 374.0±163.21
b 177.67±118.25
a
3 93.40±7.79a 383.8±185.86
b 112.50±6.36
a
4 75.80±8.44a 313.8±198.09
b 125.80±82.65
a
5 67.80±4.66a 429.0±203.75
b 155.25±139.09
a
6 82.60±8.82a 350.4±216.47
b 131.60±117.62
a
7 81.60±1345a
75.0±7.42a
75.0±13.34a
LSD 0.002 0.056 0.80
Mean ± SD Mean values of different superscripts in the same row and significant at p < 0.05.
Table 7. Effect of aqueous leaves extract of J. curcas on aspartate amino transferase (AST) activity (IU/L) in alloxan induced diabetic rats.
Group Baseline After induction After treatment
1 88.40±6.69a 120.80±12.85
b 118.67±4.16
b
2 83.0±11.27a 112.0±8.28
b 105.33±9.45
b
3 93.20±6.06a 108.20±7.95
b 101.00±970
ab
4 88.60±6.39a 119.40±15.47
b 84.60±9.10
a
5 89.0±5.96a 116.40±3.65
b 89.40±3.13
a
6 84.60±3.85a 109.40±9.86
b 89.40±3.13
a
7
LSD
95.60±4.04a
0.077
96.80±7.92 b
0.014
91.60±7.83a
0.000
Mean ±SD. Mean values of different superscripts in the same row and significant at p < 0.05.
levels was observed with the administrations of shade dried JCLE dose (300 mg) and for fresh (63.81%) with dose (200 mg) after-treatment compared with after-induction period. Similar results of hypoglycaemic effects of J. curcas leaves have been reported by Mishra et al. (2010) and Omale et al. (2011). Though there was significant decrease in the blood glucose level after-treatment as compared with the after-induction period, the blood glucose level was significantly (p<0.05) higher than the baseline blood glucose level. However, the shade dried and fresh aqueous extracts could not reverse the high blood glucose level observed in after-treatment to the initial baseline blood glucose level as reported by Mishra et al. (2010) in their work; this may be attributed to the use of the 50% ethanol extract while this study used aqueous extract for their treatments. It may also be a proof that the ethanol extract may be more effective as antidiabetic agent than the aqueous extract. Table 7 shows the mean aspartate aminotransferase (AST) level of the rats. The activity of AST after-treatment was signi-ficantly (p < 0.05) higher than the baseline values and the control group (group 7). Aspartate amino-transferase
(AST) is an enzyme produced by the liver cells, elevated amounts of serum AST may signal toxicity which may lead to health problems. The levels of AST in the body are indicative of tissue damage and diseases and the amount released is proportional to the level of damage sustained (Evelson et al., 2005) increased with liver diseases in all species.
A number of other plants have been reported to have anti-hyperglycemic and insulin stimulatory effects (Latha and Pari, 2003; Latha and Pari, 2004; Pari and Venkateswaran, 2002). Increase in the activities of serum AST, ALT, and ALP may be mainly due to the leakage of these enzymes from the liver cytosol into the blood stream (El-Demerdash and Abou, 2005), which gives an indication of the hepatotoxic effect of J. curcas. The levels of AST, ALT and ALP have been reported to increase in alloxan-induced diabetic rats (Nnodim et al., 2012). Both shade dried and fresh aqueous extract of J. curcas caused significant increase (P<0.05) in the level of some serum AST, ALT and ALP values after-treatment as compared with after-induction period as shown in Tables 7 to 9. However, though both the shade dried and fresh aqueous extract of J. curcas caused significant decrease (p<0.05) in the level of serum AST, ALT and ALP after-treatment when compared with after-induction, the levels of AST, ALT and ALP in the serum for the groups fed with shade dried extract were significantly (p<0.05) higher than the baseline values. These significantly (p<0.05) higher AST, ALT and ALP values obtained in after-treatment as compared with the baseline values could imply that the shade dried J. curcas extract had not completely revert induced diabetes in the experimental rats. Similarly, it could also imply that the hepato-protective effects of JCLE worked more in the groups treated with fresh leaves extracts than the groups treated with the shade dried leaf extract. Thus, it could be said that the fresh leaves extracts had more hepato-protective potentials than the shade dried leaves extracts.
Although, there was no significant difference in the weight of the rats following induction of diabetes and
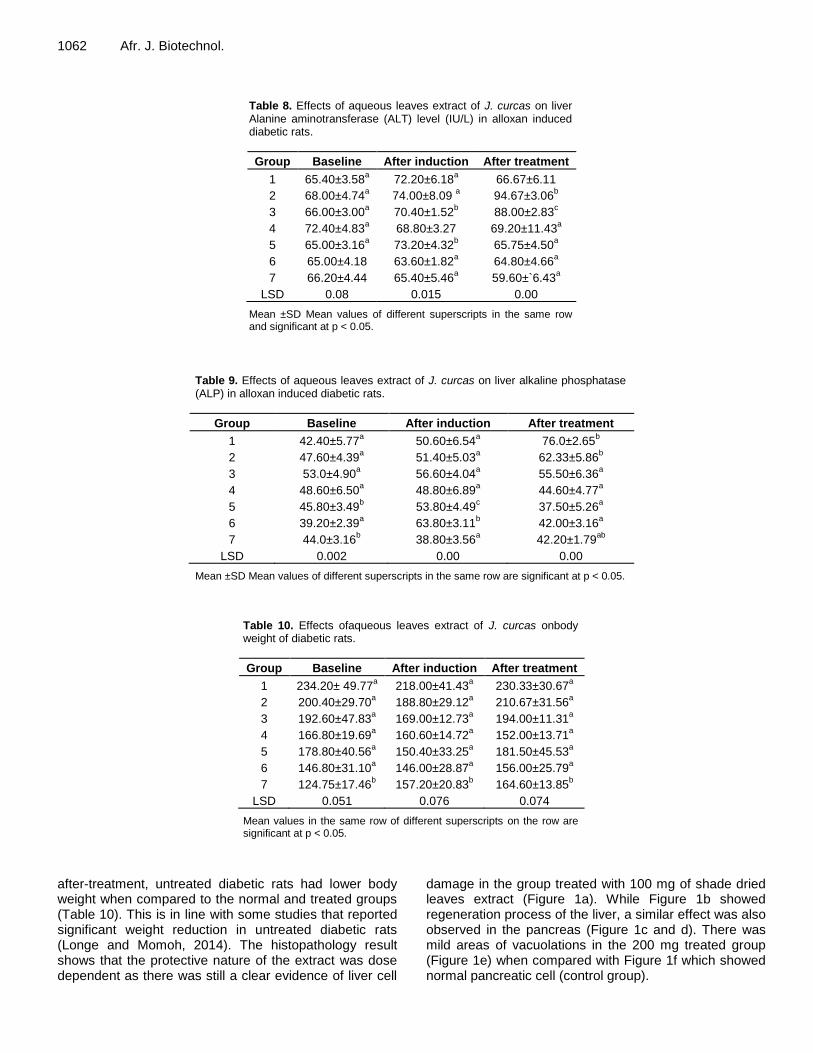
1062 Afr. J. Biotechnol.
Table 8. Effects of aqueous leaves extract of J. curcas on liver Alanine aminotransferase (ALT) level (IU/L) in alloxan induced diabetic rats.
Group Baseline After induction After treatment
1 65.40±3.58a 72.20±6.18
a 66.67±6.11
2 68.00±4.74a 74.00±8.09
a 94.67±3.06
b
3 66.00±3.00a 70.40±1.52
b 88.00±2.83
c
4 72.40±4.83a 68.80±3.27 69.20±11.43
a
5 65.00±3.16a 73.20±4.32
b 65.75±4.50
a
6 65.00±4.18 63.60±1.82a 64.80±4.66
a
7
LSD
66.20±4.44
0.08
65.40±5.46a
0.015
59.60±`6.43a
0.00
Mean ±SD Mean values of different superscripts in the same row and significant at p < 0.05.
Table 9. Effects of aqueous leaves extract of J. curcas on liver alkaline phosphatase (ALP) in alloxan induced diabetic rats.
Group Baseline After induction After treatment
1 42.40±5.77a 50.60±6.54
a 76.0±2.65
b
2 47.60±4.39a 51.40±5.03
a 62.33±5.86
b
3 53.0±4.90a 56.60±4.04
a 55.50±6.36
a
4 48.60±6.50a 48.80±6.89
a 44.60±4.77
a
5 45.80±3.49b 53.80±4.49
c 37.50±5.26
a
6 39.20±2.39a 63.80±3.11
b 42.00±3.16
a
7
LSD
44.0±3.16b
0.002
38.80±3.56a
0.00
42.20±1.79ab
0.00
Mean ±SD Mean values of different superscripts in the same row are significant at p < 0.05.
Table 10. Effects ofaqueous leaves extract of J. curcas onbody weight of diabetic rats.
Group Baseline After induction After treatment
1 234.20± 49.77a
218.00±41.43a
230.33±30.67a
2 200.40±29.70a
188.80±29.12a
210.67±31.56a
3 192.60±47.83a
169.00±12.73a
194.00±11.31a
4 166.80±19.69a
160.60±14.72a
152.00±13.71a
5 178.80±40.56a
150.40±33.25a
181.50±45.53a
6 146.80±31.10a
146.00±28.87a 156.00±25.79
a
7
LSD
124.75±17.46b
0.051
157.20±20.83b
0.076
164.60±13.85b
0.074
Mean values in the same row of different superscripts on the row are significant at p < 0.05.
after-treatment, untreated diabetic rats had lower body weight when compared to the normal and treated groups (Table 10). This is in line with some studies that reported significant weight reduction in untreated diabetic rats (Longe and Momoh, 2014). The histopathology result shows that the protective nature of the extract was dose dependent as there was still a clear evidence of liver cell
damage in the group treated with 100 mg of shade dried leaves extract (Figure 1a). While Figure 1b showed regeneration process of the liver, a similar effect was also observed in the pancreas (Figure 1c and d). There was mild areas of vacuolations in the 200 mg treated group (Figure 1e) when compared with Figure 1f which showed normal pancreatic cell (control group).
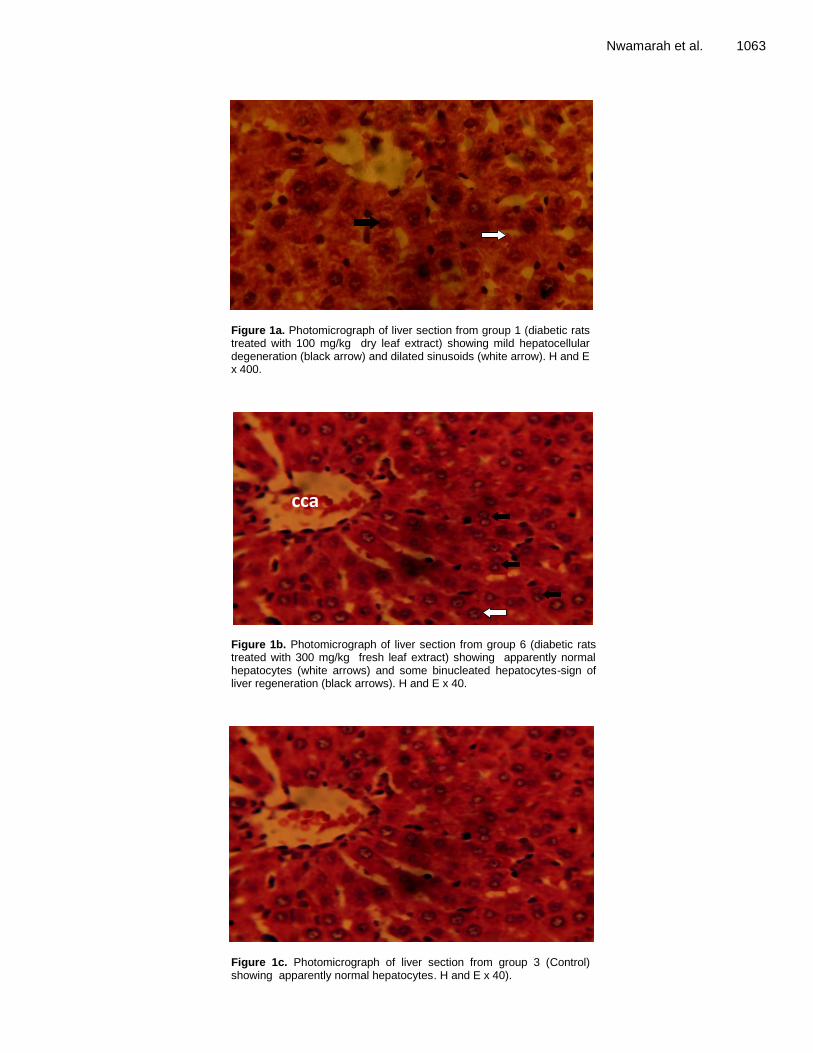
Nwamarah et al. 1063
Figure 1a. Photomicrograph of liver section from group 1 (diabetic rats treated with 100 mg/kg dry leaf extract) showing mild hepatocellular degeneration (black arrow) and dilated sinusoids (white arrow). H and E x 400.
Figure 1b. Photomicrograph of liver section from group 6 (diabetic rats treated with 300 mg/kg fresh leaf extract) showing apparently normal hepatocytes (white arrows) and some binucleated hepatocytes-sign of liver regeneration (black arrows). H and E x 40.
Figure 1c. Photomicrograph of liver section from group 3 (Control) showing apparently normal hepatocytes. H and E x 40).
cca
va
va
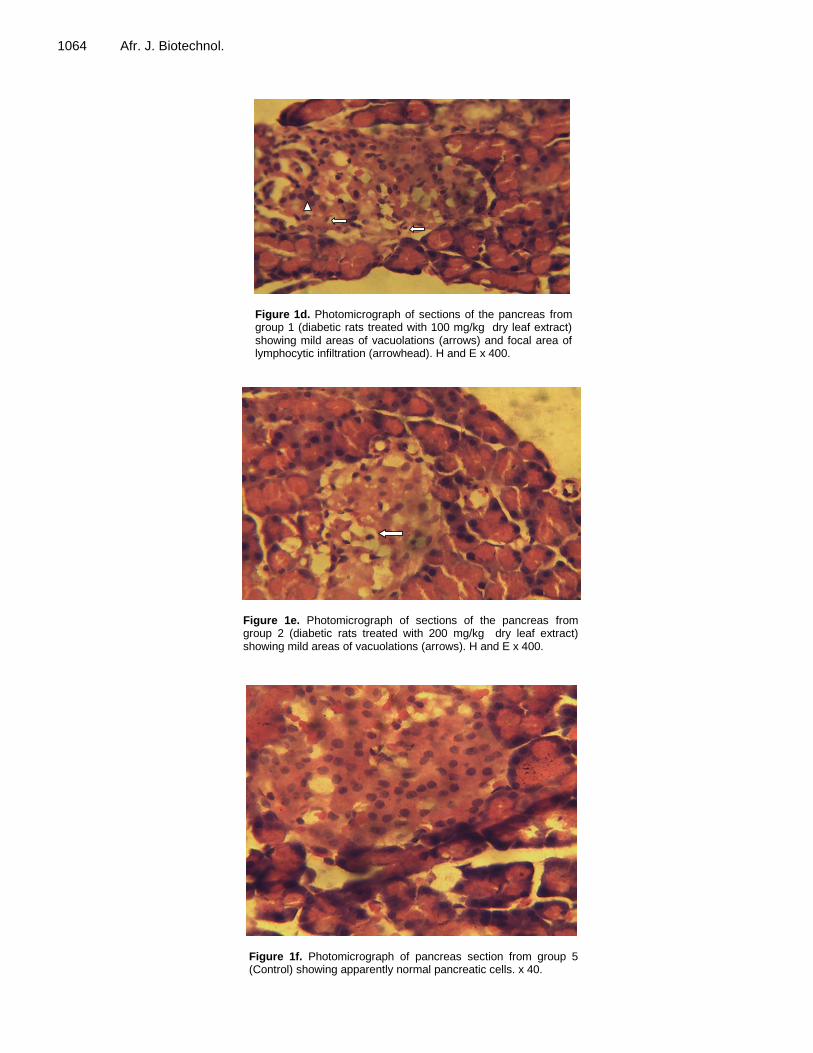
1064 Afr. J. Biotechnol.
Figure 1d. Photomicrograph of sections of the pancreas from group 1 (diabetic rats treated with 100 mg/kg dry leaf extract) showing mild areas of vacuolations (arrows) and focal area of lymphocytic infiltration (arrowhead). H and E x 400.
Figure 1e. Photomicrograph of sections of the pancreas from group 2 (diabetic rats treated with 200 mg/kg dry leaf extract) showing mild areas of vacuolations (arrows). H and E x 400.
Figure 1f. Photomicrograph of pancreas section from group 5 (Control) showing apparently normal pancreatic cells. x 40.
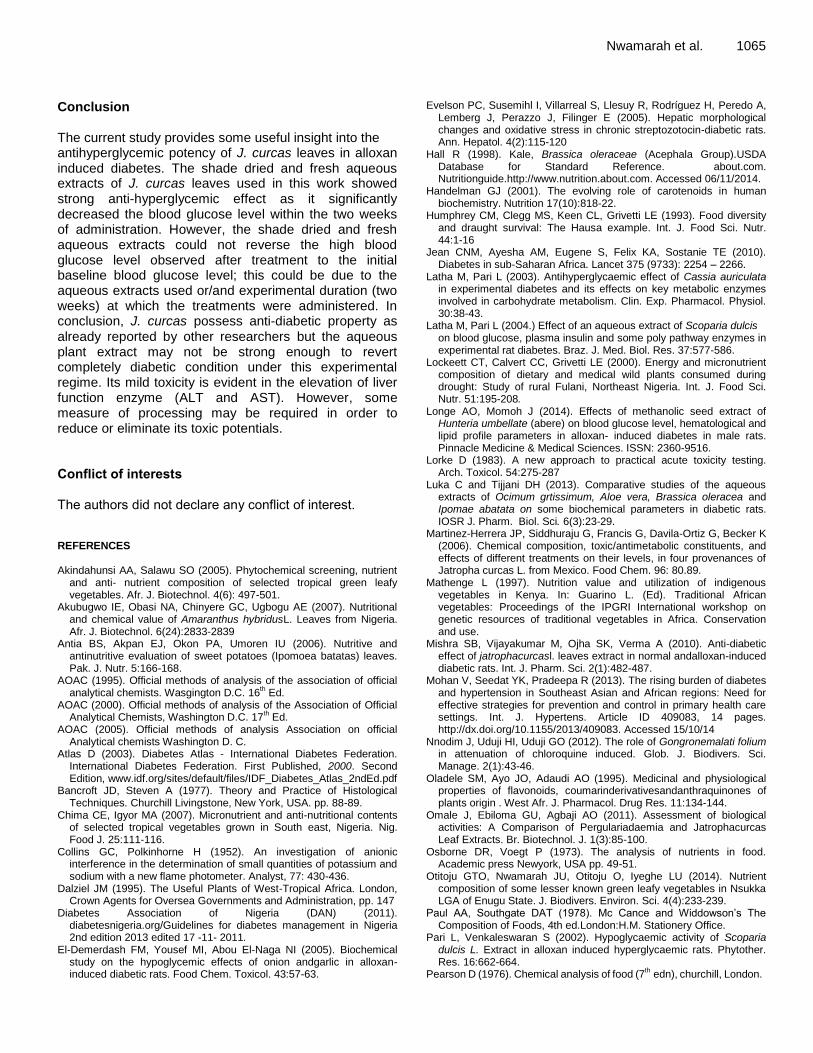
Conclusion The current study provides some useful insight into the antihyperglycemic potency of J. curcas leaves in alloxan induced diabetes. The shade dried and fresh aqueous extracts of J. curcas leaves used in this work showed strong anti-hyperglycemic effect as it significantly decreased the blood glucose level within the two weeks of administration. However, the shade dried and fresh aqueous extracts could not reverse the high blood glucose level observed after treatment to the initial baseline blood glucose level; this could be due to the aqueous extracts used or/and experimental duration (two weeks) at which the treatments were administered. In conclusion, J. curcas possess anti-diabetic property as already reported by other researchers but the aqueous plant extract may not be strong enough to revert completely diabetic condition under this experimental regime. Its mild toxicity is evident in the elevation of liver function enzyme (ALT and AST). However, some measure of processing may be required in order to reduce or eliminate its toxic potentials. Conflict of interests The authors did not declare any conflict of interest. REFERENCES Akindahunsi AA, Salawu SO (2005). Phytochemical screening, nutrient
and anti- nutrient composition of selected tropical green leafy vegetables. Afr. J. Biotechnol. 4(6): 497-501.
Akubugwo IE, Obasi NA, Chinyere GC, Ugbogu AE (2007). Nutritional and chemical value of Amaranthus hybridusL. Leaves from Nigeria. Afr. J. Biotechnol. 6(24):2833-2839
Antia BS, Akpan EJ, Okon PA, Umoren IU (2006). Nutritive and antinutritive evaluation of sweet potatoes (Ipomoea batatas) leaves. Pak. J. Nutr. 5:166-168.
AOAC (1995). Official methods of analysis of the association of official analytical chemists. Wasgington D.C. 16
th Ed.
AOAC (2000). Official methods of analysis of the Association of Official Analytical Chemists, Washington D.C. 17
th Ed.
AOAC (2005). Official methods of analysis Association on official Analytical chemists Washington D. C.
Atlas D (2003). Diabetes Atlas - International Diabetes Federation. International Diabetes Federation. First Published, 2000. Second Edition, www.idf.org/sites/default/files/IDF_Diabetes_Atlas_2ndEd.pdf
Bancroft JD, Steven A (1977). Theory and Practice of Histological Techniques. Churchill Livingstone, New York, USA. pp. 88-89.
Chima CE, Igyor MA (2007). Micronutrient and anti-nutritional contents of selected tropical vegetables grown in South east, Nigeria. Nig. Food J. 25:111-116.
Collins GC, Polkinhorne H (1952). An investigation of anionic interference in the determination of small quantities of potassium and sodium with a new flame photometer. Analyst, 77: 430-436.
Dalziel JM (1995). The Useful Plants of West-Tropical Africa. London, Crown Agents for Oversea Governments and Administration, pp. 147
Diabetes Association of Nigeria (DAN) (2011). diabetesnigeria.org/Guidelines for diabetes management in Nigeria 2nd edition 2013 edited 17 -11- 2011.
El-Demerdash FM, Yousef MI, Abou El-Naga NI (2005). Biochemical study on the hypoglycemic effects of onion andgarlic in alloxan-induced diabetic rats. Food Chem. Toxicol. 43:57-63.
Nwamarah et al. 1065 Evelson PC, Susemihl I, Villarreal S, Llesuy R, Rodríguez H, Peredo A,
Lemberg J, Perazzo J, Filinger E (2005). Hepatic morphological changes and oxidative stress in chronic streptozotocin-diabetic rats. Ann. Hepatol. 4(2):115-120
Hall R (1998). Kale, Brassica oleraceae (Acephala Group).USDA Database for Standard Reference. about.com. Nutritionguide.http://www.nutrition.about.com. Accessed 06/11/2014.
Handelman GJ (2001). The evolving role of carotenoids in human biochemistry. Nutrition 17(10):818-22.
Humphrey CM, Clegg MS, Keen CL, Grivetti LE (1993). Food diversity and draught survival: The Hausa example. Int. J. Food Sci. Nutr. 44:1-16
Jean CNM, Ayesha AM, Eugene S, Felix KA, Sostanie TE (2010). Diabetes in sub-Saharan Africa. Lancet 375 (9733): 2254 – 2266.
Latha M, Pari L (2003). Antihyperglycaemic effect of Cassia auriculata in experimental diabetes and its effects on key metabolic enzymes involved in carbohydrate metabolism. Clin. Exp. Pharmacol. Physiol. 30:38-43.
Latha M, Pari L (2004.) Effect of an aqueous extract of Scoparia dulcis on blood glucose, plasma insulin and some poly pathway enzymes in experimental rat diabetes. Braz. J. Med. Biol. Res. 37:577-586.
Lockeett CT, Calvert CC, Grivetti LE (2000). Energy and micronutrient composition of dietary and medical wild plants consumed during drought: Study of rural Fulani, Northeast Nigeria. Int. J. Food Sci. Nutr. 51:195-208.
Longe AO, Momoh J (2014). Effects of methanolic seed extract of Hunteria umbellate (abere) on blood glucose level, hematological and lipid profile parameters in alloxan- induced diabetes in male rats. Pinnacle Medicine & Medical Sciences. ISSN: 2360-9516.
Lorke D (1983). A new approach to practical acute toxicity testing. Arch. Toxicol. 54:275-287
Luka C and Tijjani DH (2013). Comparative studies of the aqueous extracts of Ocimum grtissimum, Aloe vera, Brassica oleracea and Ipomae abatata on some biochemical parameters in diabetic rats. IOSR J. Pharm. Biol. Sci. 6(3):23-29.
Martinez-Herrera JP, Siddhuraju G, Francis G, Davila-Ortiz G, Becker K (2006). Chemical composition, toxic/antimetabolic constituents, and effects of different treatments on their levels, in four provenances of Jatropha curcas L. from Mexico. Food Chem. 96: 80.89.
Mathenge L (1997). Nutrition value and utilization of indigenous vegetables in Kenya. In: Guarino L. (Ed). Traditional African vegetables: Proceedings of the IPGRI International workshop on genetic resources of traditional vegetables in Africa. Conservation and use.
Mishra SB, Vijayakumar M, Ojha SK, Verma A (2010). Anti-diabetic effect of jatrophacurcasl. leaves extract in normal andalloxan-induced diabetic rats. Int. J. Pharm. Sci. 2(1):482-487.
Mohan V, Seedat YK, Pradeepa R (2013). The rising burden of diabetes and hypertension in Southeast Asian and African regions: Need for effective strategies for prevention and control in primary health care settings. Int. J. Hypertens. Article ID 409083, 14 pages. http://dx.doi.org/10.1155/2013/409083. Accessed 15/10/14
Nnodim J, Uduji HI, Uduji GO (2012). The role of Gongronemalati folium in attenuation of chloroquine induced. Glob. J. Biodivers. Sci. Manage. 2(1):43-46.
Oladele SM, Ayo JO, Adaudi AO (1995). Medicinal and physiological properties of flavonoids, coumarinderivativesandanthraquinones of plants origin . West Afr. J. Pharmacol. Drug Res. 11:134-144.
Omale J, Ebiloma GU, Agbaji AO (2011). Assessment of biological activities: A Comparison of Pergulariadaemia and Jatrophacurcas Leaf Extracts. Br. Biotechnol. J. 1(3):85-100.
Osborne DR, Voegt P (1973). The analysis of nutrients in food. Academic press Newyork, USA pp. 49-51.
Otitoju GTO, Nwamarah JU, Otitoju O, Iyeghe LU (2014). Nutrient composition of some lesser known green leafy vegetables in Nsukka LGA of Enugu State. J. Biodivers. Environ. Sci. 4(4):233-239.
Paul AA, Southgate DAT (1978). Mc Cance and Widdowson‟s The Composition of Foods, 4th ed.London:H.M. Stationery Office.
Pari L, Venkaleswaran S (2002). Hypoglycaemic activity of Scoparia dulcis L. Extract in alloxan induced hyperglycaemic rats. Phytother. Res. 16:662-664.
Pearson D (1976). Chemical analysis of food (7th edn), churchill, London.

1066 Afr. J. Biotechnol. Reddy MB, Love M (1999). The impact of food processing on the
nutritional quality of vitamins and minerals. Adv. Exp. Med. Biol. 459:99-106.
Reitman S, Frankel S (1957). A colorimetric method for the determination of serum glutamic oxalacetic and glutamic pyruvic transaminases. Am. J. Clin. Pathol. 28:56-63.
Udofia US, Obizoba IC (2005). Effects of sun and shade drying on nutrient and antinutrient content of some green leafy vegetables consumed in Uyo communities, Akwa Ibom State. J. Biomed. Investig. 3(1):1-5.
USDA (2012). Composition of Foods Raw, Processed, Prepared USDA
National Nutrient Database for Standard Reference, Release 25: 1-128.
Young AJ, Lowe GM (2001). Antioxidant and proxidant properties of carotenoids. Arch. Biochem. Biophys. 385(1):20-27.
Vol. 14(12), pp. 1067-1073, 25 March, 2015
DOI: 10.5897/AJB2015.14437
Article Number: 8B3D8D451761
ISSN 1684-5315
Copyright © 2015
Author(s) retain the copyright of this article
http://www.academicjournals.org/AJB
African Journal of Biotechnology
Full Length Research Paper
Evaluation of the antimicrobial activity of crude extracts and chromatographic fractions of Adenanthera
pavonina Linn (Leguminosae) seeds
Oluwatofunmilayo A. Adeyemi1, Aduragbenro D. Adedapo2, Adeolu A. Adedapo3* and Jones O. Moody1
1Department of Pharmacognosy, University of Ibadan, Ibadan, Nigeria.
2Department of Pharmacology and Therapeutics, University of Ibadan, Ibadan, Nigeria.
3Department of Veterinary Physiology, Biochemistry and Pharmacology, University of Ibadan, Ibadan, Nigeria.
Received 20 January, 2015; Accepted 12 March, 2015
Most available reports on the biological activity of Adenanthera pavonina (AP) are on the bark or leaves and very few are on the seeds. In particular, there are no reports on the biological effects of the chromatographic fractions of A. pavonina seeds hence the present study aimed to evaluate the antimicrobial activity of the crude extract and chromatographic fractions of A. pavonina seeds. The methanolic extract was fractionated and all of the column chromatographic fractions as well as the crude extract were evaluated against different strains of Staphylococcus aureus. The methanolic extract (100 mg/ml) produced zones of inhibition on PHM 002 and PHM 005 while the 50 and 100 mg/ml of the hexane extract only produced inhibition on PHM 001. On the other hand, fractions ST 10-12 F exhibited activity PHM 002 at 50 and 100 mg/ml while fractions ST-13-15F exhibited activity at all concentrations (6.25, 12.5 25, 50 and 100 mg/ ml) against S. aureus PHM 002 strain from the skin. The study provides some justifications for the folkloric use of AP seed powder as an antiseptic paste and warrants further studies to determine the structure of the active compound in chromatographic fraction ST 13 -15F. Key words: Adenanthera pavonina, antimicrobial activity, chromatographic fractions, methanolic extract.
INTRODUCTION Plants are valuable as sources of medicine. The use of natural products with therapeutic properties is as ancient as human civilization and, for a long time, mineral, plant and animal products were the main sources of drugs
(Rates, 2001). In the recent decades, there has been growing interest in alternative therapies and the therapeutic use of natural products, especially those derived from plants (Vulto and Smet, 1988; Rates, 2001).
*Corresponding author. E-mail: [email protected]. Tel: +234 816 2746 222. Author(s) agree that this article remains permanently open access under the terms of the Creative Commons Attribution License 4.0 International License

1068 Afr. J. Biotechnol. This may be due to the fact that the conventional medicine can be inefficient (such as having side effects and ineffective therapy), abusive and/or incorrect use of synthetic drugs results in side effects and other problems. Also, a large percentage of the world‟s population does not have access to conventional pharmacological treatment. Medicinal plants have served as valuable starting materials for drug development in both developing and developed countries. Today, more than 80% of the people living in Africa depend on medicinal plants and animal based medicines to satisfy their healthcare requirements (Yedjou et al., 2008). It has also been suggested that folk medicine and ecological awareness suggest that “natural” products are harmless. Many pharmaceutical products are from plants; though pharmaceutical industries have produced a number of new antibiotics in recent times, resistance by micro-organism remains a challenge. Action must therefore be taken to reduce this problem by controlling the use of antibiotics, developing research to better understand the mechanism of resistance and embarking on studies to develop new drugs either natural or synthetic (Ahmed et al., 1998; Hussain et al., 2011).
Adenanthera pavonina Linn (AP) is a medium to large deciduous tree of the family Leguminosae also called Fabaceae. The tree is common throughout the lowland tropics up to 300 to 400 m (Jayakumari et al., 2012). In terms of medicinal uses, it has been reported that bark and leaves are astringent, vulnerary and aphrodisiac and are used in ulcers, pharyngopathy and even the heart wood is astringent, aphrodisiac, haemostatic and is useful in dysentery, hemorrhages and gout (Vaidyaratnam and Variers, 1994). The root on the other hand is emetic in nature (Jayakumari et al., 2012). It has been reported that the plant have antiseptic and anti-inflammatory activities. The red powder is used as an antiseptic paste. Effects of A. pavonina include anti-inflammatory and analgesic from methanolic seed extract (Olajide et al., 2004) and ethanolic leaf extract (Mayuren and Ilavarasan, 2009); and antimicrobial from the bark extract (Ara et al., 2010). The blood pressure lowering effect of the seed extract has also been reported (Adedapo et al., 2009). The main important constituents are flavonoid compounds (Rastogi and Mehrotra, 1991). It is used as an antiseptic paste and also used to treat boils and inflammations (Chopra et al., 1956).
Most available reports on the biological activity of A. pavonina are on the bark or leaves and very few are on the seeds. In particular, there are no reports on the biological effects of the chromatographic fractions of A. pavonina seeds. Chromatography is the key to obtaining pure compounds for structure elucidation, for pharma-cological testing or for development into therapeuticals. It also plays a fundamental role as an analytical technique for quality control and standardisation of phytothera-peuticals (Marston, 2007).
In this study, the chromatographic fractions of the
seeds of A. pavonina are being explored for its antimicrobial properties with a view to determine the fraction responsible for this effect.
MATERIALS AND METHODS Chemical and solvent This includes: ammonia, acetone, Benedict‟s solution, chloroform, Dragendorff‟s reagents, distilled water, ethyl acetate, ferric chloride, hydrochloric acid, hexane, lead acetate, methanol, Mayer‟s reagent, potassium hydroxide, sodium hydroxide, sulphuric acid, toluene and Wagner‟s reagent. Test organisms Reference strains were used as suggested by Cos et al. (2006). These are different strains of Staphylococcus aureus; from the nose (strain 1) PHM 001, from the skin (strain 2) PHM 002, from the eye area (strain 3) PHM 003, from the armpit (strain 4) PHM 004 and the standard (strain 5) PHM 005. All microorganisms were obtained from the Department of Pharmaceutical Microbiology, University of Ibadan, Nigeria. Plant material The seeds of A. pavonina were collected from the Staff School Compound in the University of Ibadan, Oyo State throughout the month of September 2009. They were authenticated at the Forestry Research Institute (FRIN), Ibadan where a voucher specimen was deposited. Sample preparation The seeds were air dried and powdered. The powdered seeds were extracted using cold maceration. The powdered seeds sample (1335.09 g) was put in a large flask and defatted for 24 h using 1280 ml- hexane. It was stirred occasionally and filtered. The marc was air dried and placed in a flask. The plant material was covered with 2000 ml of methanol and allowed to stand for four days after which it was filtered and the filtrate concentrated to dryness to yield 30.77 g of extract. The residue was again extracted with another 1,300 ml of methanol and the filtrate was again concentrated to dryness to yield a further 20.61 g of crude methanolic extract.
Phytochemical screening The phytochemical analysis was performed on the ground (powered) leaf of A. pavonina for identification of the constituents. The constituents tested for were alkaloids, tannins, saponins, anthraquinones, cardiac glycosides and flavonoids as described by Shale et al. (1999), Moody et al. (2006) and Sawadogo et al. (2006).
Chromatographic analysis Thin layer chromatography (TLC) The TLC plates of dimensions 20 × 20 cm were used. The thickness of the adsorbent layer was 1 mm. Thin layer chromatography was used to monitor fractions obtained from

Adeyemi et al. 1069
Table 1. TLC analysis of crude methanolic and hexane extract of Adenanthera pavonina seeds.
Extract Solvent system Colour in daylight Colour in UV 365 nm Rf Value
Hexane extract SS4 Yellow Blue 0.85
Hexane extract SS1 Yellow Colourless 0.69
Hexane extract SS3 Yellow Colourless 0.12
Hexane extract SS2 Yellow Yellow 0.43, 0.60
Methanolic extract SS4 Yellow Blue 0.64
Methanolic extract SS1 Yellow Blue 0.73
Methanolic extract SS3 Yellow Blue 0.17
Methanolic extract SS2 Yellow Blue 0.53, 0.67, 0.84
column chromatography fractionation of the crude methanolic extract as well as that of the crude hexane extract. The solvent systems used were: SS1-chloroform: methanol 9:1, SS2 toluene: acetone: ethyl acetate 8:2:1, SS3 chloroform: methanol 19:1, SS4 hexane: ethyl acetate 8:2, SS5 chloroform: methanol 7:3, SS6 toluene: acetone 4:1 and SS7 toluene: acetone: ethyl acetate 80:40:20. The plates used were examined under daylight and ultraviolet (UV) at 365 nm and were sprayed with Dragendorff to detect the presence of any alkaloid present (Harborne, 1984). Column chromatographic separation The methanolic extract was further subjected to silica gel chromatographic separation using standard procedures. The chromatographic column of length 50 cm and internal diameter 3.5 cm was rinsed with acetone and allowed to dry. It was then clamped vertically with a retort stand, and a plug of cotton wool was inserted at the bottom of the column using a clean glass rod. The column was filled with hexane, and the silica gel slurry was mixed with hexane in a beaker. The slurry was poured into the column and tapped intermittently for uniform distribution of the gel and to avoid bubbles in the column. The column was allowed to drain for some minutes to stabilize it. A portion (20.61 g) of the crude methanolic extract was subjected to chromatography in column silica gel, was eluted with solvent mixtures of increasing polarity and dissolved in methanol by warming on a water bath. The cooled methanolic extract was then introduced on top of the silica gel adsorbent in the column. The column was eluted with solvent mixtures of increasing polarity. Fractions were collected and monitored by thin layer chromatography using appropriate solvent systems. Fractions showing similar TLC patterns were pooled together (Li et al., 2012). Nutrient agar (28 g) was mixed with distilled water to make up 1 L. The mixture was heated to boiling on a hot water bath. The molten agar was poured into universal bottles and autoclaved for 30 min at 121 psi. Nutrient broth (4 g) was dissolved with distilled in a conical flask and was made up to 500 ml. The mixture was measured in 10 ml aliquots into test tubes and sterilized in an autoclave for 20 min at 121 psi. The methanolic extract and pooled chromatographic fractions were tested for antimicrobial activity using the reference organisms stated earlier. The respective organisms were sub-cultured into the nutrient broth from the stock. The overnight culture (0.2 ml) was inoculated into 10 ml of sterile distilled water in a test tube. From the diluted organism, 0.2 ml was taken and inoculated into the cooled nutrient agar and shaken for homogeneity. The sterilized agar was poured into Petri dishes and allowed to set. It was dried and bore holed with a cork borer of diameter 8 mm. Six holes were made on each plate. Different concentrations of the extracts and fractions of A. pavonina seeds were then introduced into the holes. The plates were allowed to stand for 30 min to
achieve diffusion after which they were incubated for 24 h at 37°C (Gurib-Fakim, 2006; Jimoh et al., 2011).
RESULTS The phytochemical screening of methanolic extract of the seeds of A. pavonina showed the presence of tannins, saponins, alkaloids, flavonoids and cardiac glycosides while Tables 1 to 6 show the TLC analysis of crude methanolic and hexane extract of A. pavonina seeds; column chromatographic separation of the crude methanolic extract of A pavonina seeds; TLC analysis of column chromatographic fractions of the methanolic extract of A. pavonina seeds using mobile phase SS5 (chloroform: methanol 7:3); TLC analysis of column chromatographic fractions of the methanolic extract of A. pavonina seeds using mobile phase SS7 (toluene: acetone: ethylacetate 80:40:20); TLC analysis of column chromatographic fractions of the methanolic extract of A. pavonina seeds using mobile phase SS6 (toluene: acetone 4:1) and anti-microbial screening of the crude methanolic extract, hexane extract and chromatographic fractions of A. pavonina seeds, respectively. Column chromatographic analysis of the methanolic extract of A. pavonina seeds resulted in 15 fractions on elution with different solvent mixtures. Similar fractions were bulked on the basis of thin layer chromatographic analysis. Fraction 15 was found to be the one with highest yield providing enough material for anti-microbial evaluations. TLC analysis of the fractions was done using three different solvent systems. Solvent system 6 (toluene: acetone 4:1) was found to be the most appropriate among the solvent systems as it gave the best resolution of the components. The most suitable solvent system for TLC analysis of the crude methanolic and hexane extracts, solvent system 2 (toluene: acetone: EtOAc 8:2:1) which found to be most appropriate gave 3 spots (Rf values: 0.53, 0.67, 0.84) for the methanolic extract and 2 spots (Rf values: 0.43, 0.60) for the hexane extract. The methanolic extract (100 mg/ml) produced zones of inhibition on PHM 002 and PHM 005 while the 50 and 100 mg/ml of the hexane extract only produced inhibition

1070 Afr. J. Biotechnol.
Table 2. Column chromatographic separation of the crude methanolic extract of Adenanthera pavonina seeds.
Fraction collected Solvent mixture Volume collected (ml) Yield (g)
ST 1F Hex: Chloroform 70:30 25
ST 2-4F
Hex: Chloroform 60:40 25
1.955 Hex: Chloroform 60:40 25
Hex: Chloroform 60:40 25
ST 5-7F
Hex: Chloroform 60:40 25
3.731 Hex: Chloroform 60:40 25
Hex: Chloroform 60:40 25
ST 8-9F Hex: Chloroform 60:40 25
3.275 Hex: Chloroform 40:60 25
ST 10-12F
Methanol: Chloroform 10:90 25
3.451 Methanol: Chloroform 10:90 25
Methanol: Chloroform 20:80 25
ST 13-14F EtoAC: Methanol 80:20 25
1.437 EtoAC: Methanol 50:50 25
ST 15F 100% Methanol 25 4.344
Table 3. Thin layer chromatography (TLC) analysis of column chromatographic fractions of the methanolic extract of Adenanthera pavonina seeds using mobile phase SS5 (chloroform: methanol 7:3).
Fraction Colour in daylight Colour in UV 365 nm Rf Value
ST 2-4F Colourless Reddish-brown
ST 5-7F Blue Reddish-brown 0.87
ST 8-9F Reddish-brown Yellow 0.80
ST 10-12F Reddish-brown Yellow 0.95
ST 13-14F Reddish-brown Yellow 0.87
ST 15F Reddish-brown Yellow -
Table 4. Thin layer chromatography (TLC) analysis of column chromatographic fractions of the methanolic extract of Adenanthera pavonina seeds using mobile phase SS7 (toluene: acetone: ethylacetate 80:40:20).
Fraction Colour in daylight Colour in UV 365 nm Rf
ST 2-4F Reddish-brown Yellow 0.93
ST 5-7F Yellow Colourless
ST 8-9F Reddish-brown Colourless
ST 10-12F Reddish-brown Colourless
ST 13-14F Yellow Colourless
ST 15F Yellow Colourless
on PHM 001. On the other hand, only fractions ST 10-12 F and ST 13-15 F produced inhibition. The results of
chromatographic analysis and antimicrobial assay are as shown in the Tables 1 to 6.

Adeyemi et al. 1071
Table 5. Thin layer chromatography (TLC) analysis of column chromatographic fractions of the methanolic extract of Adenanthera pavonina seeds using mobile phase SS6 (Toluene: Acetone 4:1).
Fraction Colour in daylight Colour in UV 365nm Rf
ST 2-4F Yellow Blue 0.27
ST 5-7F Yellow Reddish-brown 0.28
ST 8-9F Yellow Reddish-brown 0.15
ST 10-12F Yellow Reddish-brown 0.38
ST 13-14F Yellow Reddish-brown 0.13
ST 15F Yellow Reddish-brown 0.07
Table 6. Anti-microbial screening of the crude methanolic extract, hexane extract and chromatographic fractions of Adenanthera pavonina seeds.
Extract/fraction Microorganism / Zone of inhibition (mm)
Concentration mg/ml
Staph aureus PHM 001
Staph aureus PHM 002
Staph aureus PHM 003
Staph aureus PHM 004
Staph aureus PHM 005
Methanolic extract
100 - 9 - - 14
50 - - - - -
25 - - - - -
12.5 - - - - -
6.25 - - - - -
Gentamicin 28 18 12 28 20
Hexane extract
100 12 - - - -
50 10 - - - -
25 - - - - -
12.5 - - - - -
6.25 - - - - -
Gentamicin 28 13 12 24 22
ST 2-7 F
100 - - - - -
50 - - - - -
25 - - - - -
12.5 - - - - -
6.25 - - - - -
Gentamicin 22 13 10 11 15
ST 10 -12 F
100 - 4 - - -
50 - 3 - - -
25 - - - - -
12.5 - - - - -
6.25 - - - - -
Gentamicin
ST 13 -15 F
100 - 20 - - -
50 - 11 - - -
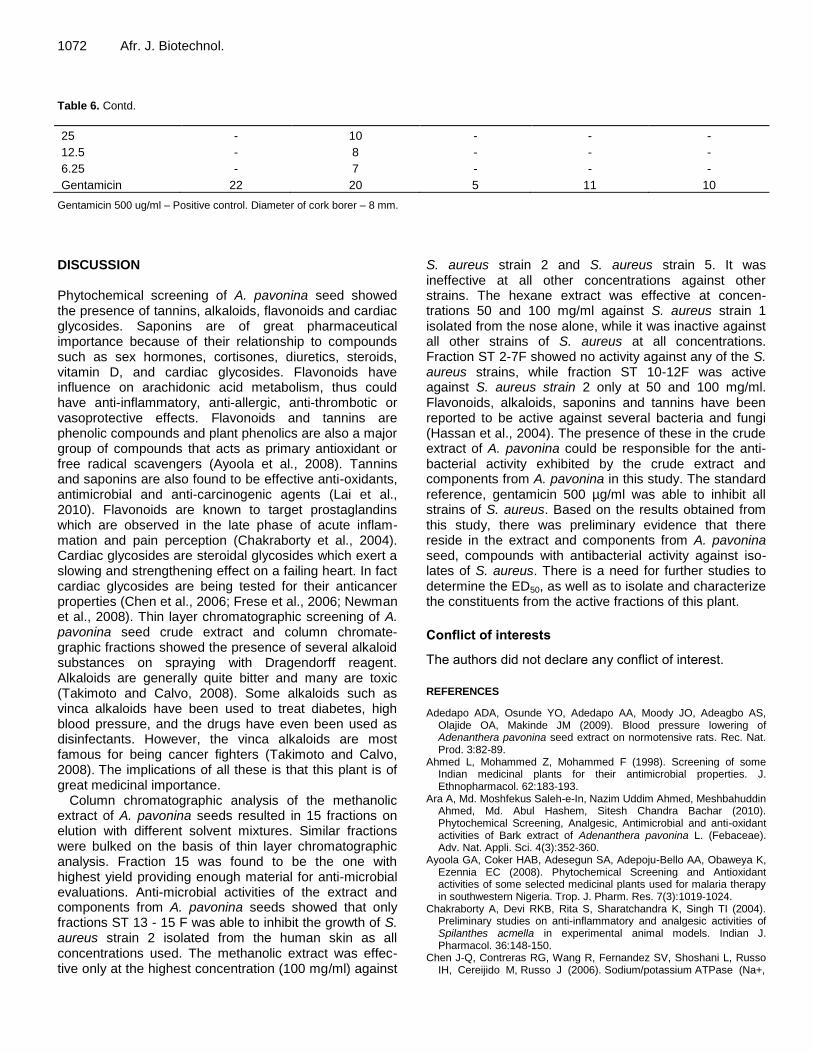
1072 Afr. J. Biotechnol. Table 6. Contd.
25 - 10 - - -
12.5 - 8 - - -
6.25 - 7 - - -
Gentamicin 22 20 5 11 10
Gentamicin 500 ug/ml – Positive control. Diameter of cork borer – 8 mm.
DISCUSSION Phytochemical screening of A. pavonina seed showed the presence of tannins, alkaloids, flavonoids and cardiac glycosides. Saponins are of great pharmaceutical importance because of their relationship to compounds such as sex hormones, cortisones, diuretics, steroids, vitamin D, and cardiac glycosides. Flavonoids have influence on arachidonic acid metabolism, thus could have anti-inflammatory, anti-allergic, anti-thrombotic or vasoprotective effects. Flavonoids and tannins are phenolic compounds and plant phenolics are also a major group of compounds that acts as primary antioxidant or free radical scavengers (Ayoola et al., 2008). Tannins and saponins are also found to be effective anti-oxidants, antimicrobial and anti-carcinogenic agents (Lai et al., 2010). Flavonoids are known to target prostaglandins which are observed in the late phase of acute inflam-mation and pain perception (Chakraborty et al., 2004). Cardiac glycosides are steroidal glycosides which exert a slowing and strengthening effect on a failing heart. In fact cardiac glycosides are being tested for their anticancer properties (Chen et al., 2006; Frese et al., 2006; Newman et al., 2008). Thin layer chromatographic screening of A. pavonina seed crude extract and column chromate-graphic fractions showed the presence of several alkaloid substances on spraying with Dragendorff reagent. Alkaloids are generally quite bitter and many are toxic (Takimoto and Calvo, 2008). Some alkaloids such as vinca alkaloids have been used to treat diabetes, high blood pressure, and the drugs have even been used as disinfectants. However, the vinca alkaloids are most famous for being cancer fighters (Takimoto and Calvo, 2008). The implications of all these is that this plant is of great medicinal importance.
Column chromatographic analysis of the methanolic extract of A. pavonina seeds resulted in 15 fractions on elution with different solvent mixtures. Similar fractions were bulked on the basis of thin layer chromatographic analysis. Fraction 15 was found to be the one with highest yield providing enough material for anti-microbial evaluations. Anti-microbial activities of the extract and components from A. pavonina seeds showed that only fractions ST 13 - 15 F was able to inhibit the growth of S. aureus strain 2 isolated from the human skin as all concentrations used. The methanolic extract was effec-tive only at the highest concentration (100 mg/ml) against
S. aureus strain 2 and S. aureus strain 5. It was ineffective at all other concentrations against other strains. The hexane extract was effective at concen-trations 50 and 100 mg/ml against S. aureus strain 1 isolated from the nose alone, while it was inactive against all other strains of S. aureus at all concentrations. Fraction ST 2-7F showed no activity against any of the S. aureus strains, while fraction ST 10-12F was active against S. aureus strain 2 only at 50 and 100 mg/ml. Flavonoids, alkaloids, saponins and tannins have been reported to be active against several bacteria and fungi (Hassan et al., 2004). The presence of these in the crude extract of A. pavonina could be responsible for the anti-bacterial activity exhibited by the crude extract and components from A. pavonina in this study. The standard reference, gentamicin 500 µg/ml was able to inhibit all strains of S. aureus. Based on the results obtained from this study, there was preliminary evidence that there reside in the extract and components from A. pavonina seed, compounds with antibacterial activity against iso-lates of S. aureus. There is a need for further studies to determine the ED50, as well as to isolate and characterize the constituents from the active fractions of this plant.
Conflict of interests
The authors did not declare any conflict of interest.
REFERENCES
Adedapo ADA, Osunde YO, Adedapo AA, Moody JO, Adeagbo AS, Olajide OA, Makinde JM (2009). Blood pressure lowering of Adenanthera pavonina seed extract on normotensive rats. Rec. Nat. Prod. 3:82-89.
Ahmed L, Mohammed Z, Mohammed F (1998). Screening of some Indian medicinal plants for their antimicrobial properties. J. Ethnopharmacol. 62:183-193.
Ara A, Md. Moshfekus Saleh-e-In, Nazim Uddim Ahmed, Meshbahuddin Ahmed, Md. Abul Hashem, Sitesh Chandra Bachar (2010). Phytochemical Screening, Analgesic, Antimicrobial and anti-oxidant activities of Bark extract of Adenanthera pavonina L. (Febaceae). Adv. Nat. Appli. Sci. 4(3):352-360.
Ayoola GA, Coker HAB, Adesegun SA, Adepoju-Bello AA, Obaweya K, Ezennia EC (2008). Phytochemical Screening and Antioxidant activities of some selected medicinal plants used for malaria therapy in southwestern Nigeria. Trop. J. Pharm. Res. 7(3):1019-1024.
Chakraborty A, Devi RKB, Rita S, Sharatchandra K, Singh TI (2004). Preliminary studies on anti-inflammatory and analgesic activities of Spilanthes acmella in experimental animal models. Indian J. Pharmacol. 36:148-150.
Chen J-Q, Contreras RG, Wang R, Fernandez SV, Shoshani L, Russo IH, Cereijido M, Russo J (2006). Sodium/potassium ATPase (Na+,

K+-ATPase) and ouabain/related cardiac glycosides: A new paradigm for development of anti-breast cancer drugs? Breast Cancer Res. Treat. 96:1-15.
Chopra RN, Nayar SL, Chopra IC (1956). Glossary of Indian medicinal plants, (CSIR, New Dehli p.6.
Cos P, Vlietinck AJ, Berghe DV, Maes L (2006). Anti-infective potential of natural products: How to develop a stronger in vitro „proof-of-concept‟. J. Ethnopharmacol. 106:290-302.
Frese, S., Frese-Schaper, M., Anne-Catherine, A., Miescher, D., Zumkehr, B., and Schmid, R.A. (2006). Cardiac glycosides initiate Apo2L/TRAIL induced apoptosis in non-small cell lung cancer cells by up-regulation of death receptors 4 and 5. Cancer Res. 66:6867–5874.
Gurib-Fakim A (2006). Medicinal plants: traditions of yesterday and drugs of tomorrow. Mol. Asp. Med. 27:1-93.
Harborne JB. 1984. Phytochemical Methods, 2nd edn. Chapman and Hall: London. 9-15.
Hassan MM, Oyewale AO, Amupitan JO, Abdullahi MS, Okonkwo EM (2004). Preliminary phytochemical and antibacterial investigation of crude extracts of the root bark of Datarium microcarpum. J. Chem. Soc. Nig. 29:26-29.
Hussain A, Rizvi A, Wahab S, Zareen I, Ansari S, Hussain S (2011). Antibacterial screening of the bark of Adenanthera pavonina. Int. J. Biomed. Res. 2(2):110-112.
Jayakumari S, Ravichandiran V, Velraj M, Kumar A, Singh A, Lakshmi V (2012). Anti-inflammatory activity of Adenanthera pavonina Linn leaves. J. Nat. Rem. 12(1):56-62.
Jimoh FO, Adedapo AA, Afolayan AJ (2011). Comparison of the nutritive value, antioxidant and antibacterial activities of Sonchus asper and Sonchus oleraceus. Rec. Nat. Prod. 5(1):29-42.
Lai FR, Wen QB, Li L, Wu H, Li XF (2010). Antioxidant activities of water soluble polysaccharides extracted from mung bean (Vigna radiata L.) hull with ultrasonic assisted treatment. Carbohyd. Polym. 81: 323-329.
Li W, Li-Hong G, Han-Bing H, Hai-Hang L (2012). Column-chromatographic extraction and separation of polyphenols, caffeine and theanine from green tea. Food Chem. 131(4):1539-1545.
Marston A (2007). Role of advances in chromatographic techniques in phytochemistry. Phytochemistry 68:2785-2797.
Mayuren C, Ilavarasan R (2009). Anti-inflammatory activity of ethanolic leaf extracts from Adenanthera pavonina (L) in rats. Pharmacognosy 1:125-128.
Adeyemi et al. 1073 Moody JO, Robert VA, Connolly JD, Houghton PJ (2006). Anti-
inflammatory activities of the methanol extracts and an isolated furanoditerpene constituent of Sphenocentrum jollyanum Pierre (Menispermaceae). J. Ethnopharmacol. 104:87-91.
Newman RA, Yang P, Pawlus AD, Keith I. Block KI (2008). Cardiac glycosides as novel therapeutic agents in cancer. Mol. Interv. 8(1):36-49.
Olajide OA, Echianu CA, Adedapo ADA, Makinde JM (2004). Anti-inflammatory studies on Adenanthera pavonina seed extract. Inflammopharmacology 12(2):197-201.
Rastogi A, Mehrotra H (1991). Compendium Indian Medicinal plants. Vol. 2, PID, New Delhi p. 23.
Rates SMK (2001). Plant as source of drugs. Toxicon 39:603-613. Sawadogo WR, Boly, Lompo M, Some N (2006). Anti-inflammatory,
analgesic and antipyretic activities of Dicliptera verticillata. Int. J. Pharmacol. 2:435-438.
Shale TL, Stirk WA, Van Staden J (1999). Screening of medicinal plants used in Lesotho for antibacterial and anti-inflammatory activity. J. Ethnopharmacol. 67: 347-354.
Takimoto CH, Calvo E (2008). Principles of Oncologic Pharmacotherapy. In: Pazdur, R.; Wagman, L. D.; Camphausen, K. A.; Hoskins, W. J. Cancer Management: A Multidisciplinary Approach (11th ed.). ISBN 978-1-891483-62-2.
Vaidyaratnam PS, Variers P (1994). Indian Medicinal Plants, Orient Longman Limited, New Delhi, 1: 58- 59.
Vulto AG, Smet PAGM (1988). In: Dukes, M.M.G. (Ed.). Meyler‟s Side Effects of Drugs, 11th Ed.. Elsevier, Amsterdam. pp. 999-1005.
Yedjou C, Izevbigie E, Tchounwou P (2008). Preclinical assessment of Vernonia amygdalina leaf extracts as DNA damaging anti-cancer agent in the management of breast cancer. Int. J. Environ. Res. Public Health 5(5): 337-341.

Vol. 14(12), pp. 1074-1080, 25 March, 2015
DOI: 10.5897/AJB2014.14342
Article Number: 6C59E8151764
ISSN 1684-5315
Copyright © 2015
Author(s) retain the copyright of this article
http://www.academicjournals.org/AJB
African Journal of Biotechnology
Full Length Research Paper
Bioepoxidation of isosafrol catalyzed by radish and turnip peroxidases
Micael Nunes Melo1, Lucas Costa Lopes1, Cláudio Dariva1, Jonathan dos Santos Girardi3, Angélica Maria Lucchese2, Heiddy Marquez Alvarez2 and Alini T. Fricks1*
1Universidade Tiradentes, Instituto de Tecnologia e Pesquisa. Laboratório de Engenharia de Bioprocessos. Av. Murilo
Dantas, 300, 49032-490, Farolândia, Aracaju, SE, Brazil. 2Laboratório de Química de Produtos Naturais e Bioativos, Universidade Estadual de Feira de Santana (UEFS), Av.
Transnordestina S/N, Novo Horizonte, 44036-900, Campus Universitário, Feira de Santana, BA, Brazil. 3Programa de Pós-Graduação em Engenharia Química, Departamento de Engenharia Química e Engenharia de
Alimentos, Universidade Federal de Santa Catarina (UFSC), Campus Universitário, Trindade, Florianópolis, SC, 88040-900, Brazil.
Received 26 November, 2014; Accepted 17 March, 2015
Peroxidases (PODs) from radish (Raphanus sativus L.) and turnip (Brassica napus L.) were extracted and precipitated with ammonium sulfate using a simple, low cost and quick method. The activities of all steps performed by the vegetable PODs were measured via guaiacol assay. The epoxidation of isosafrol, catalyzed by radish (R. sativus L.) and turnip (B. napus L.) peroxidases was conducted in 20% (v/v) aqueous ethanol solution using 30% (v/v) H2O2 as the terminal oxidant. High conversion (88%) and selectivity (>98%) were obtained after 48 h. The products of the reaction were analyzed by high resolution gas chromatography (GC) and mass spectrometry. Key words: Raphanus sativus L, Brassica napus L., peroxidase, epoxidation, isosafrol.
INTRODUCTION Peroxidases (PODs) are heme proteins involved in the oxidation of a wide variety of organic and inorganic substrates that use H2O2 or organic peroxides as terminal oxidants (Hamid and Rehman, 2009; Veitch, 2004). PODs can be found in multiple isoforms in several species of fruits and vegetables, and are related to changes in flavor, texture and color, during post-harvest ageing and/or the processing of vegetables and fruits (Lopes et al., 2015). In spite of being ubiquitous in nature,
horseradish (Armoracia rusticana) is the only commercial source of these enzymes. The commercially available horseradish peroxidase (HRP) is normally used in immunoassays, diagnostic kits (Veitch, 2004) and for development of biofuel cells (Ramanavicius et al., 2015; Ramanavicius and Ramanaviciene, 2009), but it is expensive due to its elevated purification costs. Many reactions catalyzed by HRP can be found in the literature: in addition, demethylation, epoxidation, hydroxylation,
*Corresponding author: E-mail: [email protected], Tel: (+55) 79 3218 2632 Abbreviations: HRP, Horseradish peroxidase; GC, gas chromatography; POD, peroxidases.
Author(s) agree that this article remain permanently open access under the terms of the Creative Commons Attribution License 4.0 International License

polymerization of phenolic compounds (Cheng and Harper Jr, 2012; Savic et al., 2013; Gilabert et al., 2004), electro-oxidation of phenol by heterogeneous catalysis (Carvalho et al., 2007) and the oxidation of bisphenol, which is a common industrial pollutant (Hong-Mei and Nicell, 2008). Hydroxylation and epoxide production are conducted by monooxygenases or peroxidases, which have biological functions that control the transfer of one oxygen atom from the dioxygen or H2O2 to an organic compound (Lin et al., 2011). Several studies reported the selective oxidation of alkenes using these biocatalysts (García-Granados et al., 2004; Hirata et al., 1998, Kim et al., 2007).
Epoxides are relevant compounds in the phar-maceutical industry, as they are important synthetic intermediates (Liang et al., 2004; Choudhary et al., 2004; Lambert et al., 2005; Piovezan et al., 2005). This fact is due to the versatility of the oxirane function, which can be converted into numerous chemicals with biological activity (Archellas et al., 1997). One important example is the oxidation of isosafrol, which products epoxides, that also can be converted to aldehyde (piperonal for example), an intermediate on the route to L-Dopa (Santos et al., 2004), used in the treatment of Parkinson’s disease, and to α-methyldopa, used as an anti-hypertensive agent (Gu et al., 2012).
Chemical methods to synthesize epoxides are generally based on heavy metal catalysis and/or the use of stoichiometric reagents, such as m-chloroperbenzoic acid (MCPBA), which generate highly polluting chlorinated byproducts (Costas et al., 2000). Some reports in the literature describe the catalytic oxidation of isosafrol in the presence of 30% H2O2 or other oxidants with vanadium catalysts at reflux. These conditions promote the cleavage of the double bond (C=C) to form the corresponding aldehydes and epoxides (Alvarez et al., 2006; Alvarez et al., 2007). However, this reaction was not yet reported using plant POD catalysis. The study of olefin epoxidation mediated by peroxidases under mild conditions is of great interest for the synthesis of chiral building blocks.
In this work, peroxidases from radish (Raphanus sativus L.) and turnip (Brassica napus L.) were extracted and concentrated by precipitation with ammonium sulfate using a simple, low cost and quick method. These partially purified protein fractions were used in the epoxidation of isosafrol in 20% (v/v) aqueous ethanol solution using 30% (v/v) H2O2 as the terminal oxidant. MATERIALS AND METHODS Chemicals Isosafrol (a mixture of isomers) was obtained from “Geroma do Brasil” (PR/Brazil) and consists of isosafrol Z (15%) and isosafrol E (majority species, 85%). All solvents were purchased from Vetec (Brazil) as PA grade. All other chemicals used for the broth media were of analytical grade and purchased from Sigma–Aldrich (USA).
Melo et al. 1075 m-chloro-perbenzoic acid (MCPBA) was purified according to the methodology already established in the literature. Briefly, the peracid was dissolved in ether and washed with buffer solution (410 mL 0.1 M NaOH, 250 mL 0.2 M KH2PO4 made up to 1 L, pH 7.5). The ether layer was dried over Na2SO4 and carefully evaporated under reduced pressure. Preparation of the raw extract Turnip and radish were obtained at a local market, and were washed, pilled, homogenized and stored in freezer in fractions of 25 g up to the experiments. Extraction of the crude enzyme was carried out according to the procedure described in the literature (Fricks et al., 2006; Fricks et al., 2010). The vegetable (25 g) was homogenized with 50 mL of 100 mM phosphate buffer Na2HPO4·2H2O (pH 6.5). The extract was filtered and centrifuged at 2300 x g (5000 rpm) for 60 min at 4°C. The supernatant solution, which contained the enzymes, was stored at 4°C. Precipitation and determination of proteins 21 g of (NH4)2SO4 was slowly added to a volume of 30 mL of the raw extract, reaching up to 85% saturation. After the dissolution of the salt, the solution was placed in the freezer at -18°C for 1 h. Next, the solution was centrifuged at 2300 x g (5000 rpm) for 40 min at 4°C and the supernatant was discarded. The precipitate was dissolved in around 5 mL of 100 mM phosphate buffer Na2HPO4·2H2O, pH 6.0 and was used as a source of peroxidases. The total concentration of proteins obtained in the solutions was determined by the Bradford method, using bovine serum albumin as standard (Bradford, 1976). Determination of peroxidase activity The enzymatic activity of peroxidases was determined by a colorimetric method based on the change of absorbance at 470 nm due to the formation of tetraguaicol, the product of guaiacol oxidation (Fricks et al., 2006; Fricks et al., 2010). Peroxidase assay medium was composed of 2.78 mL of 100 mM phosphate buffer (pH 6.0), 0.02 mL of enzyme (previously diluted 20 x), 0.1 mL of the 100 mM guaiacol solution and 0.1 mL of 2.0 mM H2O2 solution at 25°C. One unit of enzyme (U) was defined as the quantity of enzyme capable of forming 1 µmol of product in a minute at 25°C and pH 6.0, εtetraguaiacol= 26.6 mM-1cm-1 (Hirata et al., 1998). The reaction progress was followed with a UV-Vis UV-HP8452-Diode array spectrophotometer. Control experiments were carried out in the absence of peroxidases. Stability test of the enzyme in organic solvents Aqueous solutions of ethanol and acetonitrile were prepared with concentrations of 20, 40 and 60% (v/v). The enzymatic samples (0.1 mL) were incubated in 25 mL of the ethanolic solution and 0.9 mL of 0.1 M guaiacol solution. At certain time intervals, aliquots (2.9 mL) were collected and added to a 2 mM solution (0.1 mL) of H2O2 to start the enzymatic reaction. Thus, the residual activity of the enzyme pre-incubated in the aqueous solutions of ethanol was determined. An analogous methodology has been described in the literature (Azevedo et al., 2003).
Standard oxidation reaction
10 mL of dry solvent, 0.06 or 0.08 mmol of dry m-chloro-perbenzoic

1076 Afr. J. Biotechnol.
Table 1. Radish and turnip peroxidases activities.
Parameter
Radish Turnip
Raw
extract
Precipitation
(NH4)2SO4
Raw
Extract
Precipitation
(NH4)2SO4
Total protein (mg) 21.6±0.55* 11.3±0.14 44.2±0.24* 15.0±0.36
Specific activity (U/mg) 13.3±0.35 20.1±0.56 41.1±2.51 36.7±1.84
Total activity (U) 96.0±2.82 76.0±3.73 605±10.08 212±5.00
Recovery of activity (%) 100.0±5.00 78.0±2.51 100±5.44 35±2.47
*mg protein/ g tissue: radish (1.72±0.12) and turnip (3.54±0.21).
acid (MCPBA) and 0.04 mmol of isosafrol were stirred in a 20 mL flask under an inert atmosphere for 48 h at room temperature. Next, the reaction medium was washed with a NaHCO3 solution to eliminate excess MCPBA. The reaction products were extracted with CH2Cl2 and the organic phase was treated with anhydrous Na2SO4 and subjected to chromatographic analysis (GC). Biotransformation by POD R. sativus L. and/or POD B. napus L. 0.04 mmol of isosafrol, 20 µL of the enzymatic solution and 0.04 mmol of 30% (v/v) H2O2 were added to 10 mL of 20% (v/v) ethanol solution. The reaction medium was stirred (at 120 rpm) for 48 h at 25°C. After the medium was extracted with dichloromethane and dried with anhydrous Na2SO4, the reaction products were analyzed by GC and GC-MS. Methods for identification and quantification of substrate and product Reactions were monitored by high resolution gas chromatography. An HP5890 chromatograph with an HP WCOT (25 m x 0.32 mm ID) column was used in this study. H2 was used as a carrier gas at a flow rate of 3 mL/min (96 cm/seg), with a pressure of 20 psi. The initial temperature was 100°C and the final temperature was 250°C, with a ramp rate of 3°C/min. The injector was held at 150°C and the detector at 240°C. The injection was operated in splitless mode for 0.2 µL of the injected solution. Retention times of authentic standards and their respective retention indices were obtained from a mixture of homologous hydrocarbons and used as identification parameters. Selectivity values for each product were calculated from GC data, using the products peak area, according to the following expression: Selectivity (%) = (area peak of the product / total area peak of the products formed) * 100 Mass spectrometry was employed to confirm the identification of the product through the use of electronic libraries and published data. The analysis was performed in a HP5973 gas chromatograph connected to a HP5972 mass spectrometer, with ionization by electronic impact at 70 eV (1 scan/min, acquisition m/z: 40-400). H2
was used as a carrier gas, with speed of 1.0 mL/min in accordance with the conditions already described.
RESULTS AND DISCUSSION Activity assays of radish and turnip PODs were performed
based on previous experience (Lopes et al., 2015), through the reaction of a guaiacol/H2O2 (100 mM) system. Guaiacol was selected as a standard substrate for peroxidase activity monitoring. In recent study Kumar and co-authors showed that a plant peroxidase (Euphorbia cotinifolia) has maximum activity with guaiacol as reducing substrate compared with pyrogallol, dianisidine-dihydrochloride, o-phenelene diamine, α-aminopterin and phloroglucinol (Kumar et al., 2011). Table 1 presents the results of extraction and pre-purification of PODs from radish and turnip. The main reason for performing the precipitation of proteins from the crude extract with ammonium sulfate at 85% saturation was allowed to concentrate the vegetable peroxidases in small volumes with an easy by easily and practical method, thus reducing the volume of peroxidase solution in the epoxidation medium. 30 ml of crude extract of each plant provided 4.5 and 6.0 ml of radish and turnip precipitate, respectively. For radish POD, 78% of the enzyme was precipitated, value indicated by the recovery of the activity. However, for turnip POD, a low recovery level was observed (35%). In terms of purification, It should be noted that the precipitation of the radish raw extract with (NH4)2SO4 was efficient, due to the increased in the specific activity (13.3 to 20.1 U/mg, purification factor 1.51) with good recovery level (78%). However, a decrease in the specific activity (41.1 to 36.7 U/mg) was observed for turnip, which indicates that part of the POD turnip activity was lost during the process.
Biochemical systems involving aqueous/organic media and mild conditions are of extreme importance due to an increased demand for environmentally friendly processes. The possibility of using peroxidases in organic solvents enhances their application in the oxidation of hydrophobic molecules. Figure 1 shows that while both extracts retain part of their original activity in aqueous ethanolic mixtures, a decrease is observed at the beginning of the exposure time. After 5 h of treatment, the activity remains constant. Higher organic solvent concentrations lead to a decrease in enzyme activity. The partially purified protein fraction of the radish extract indicated that around 50 and 15% of its initial activity is preserved after 26 h of incubation in solutions of 20 and 40% (v/v) of ethanol/water solution, respectively. The
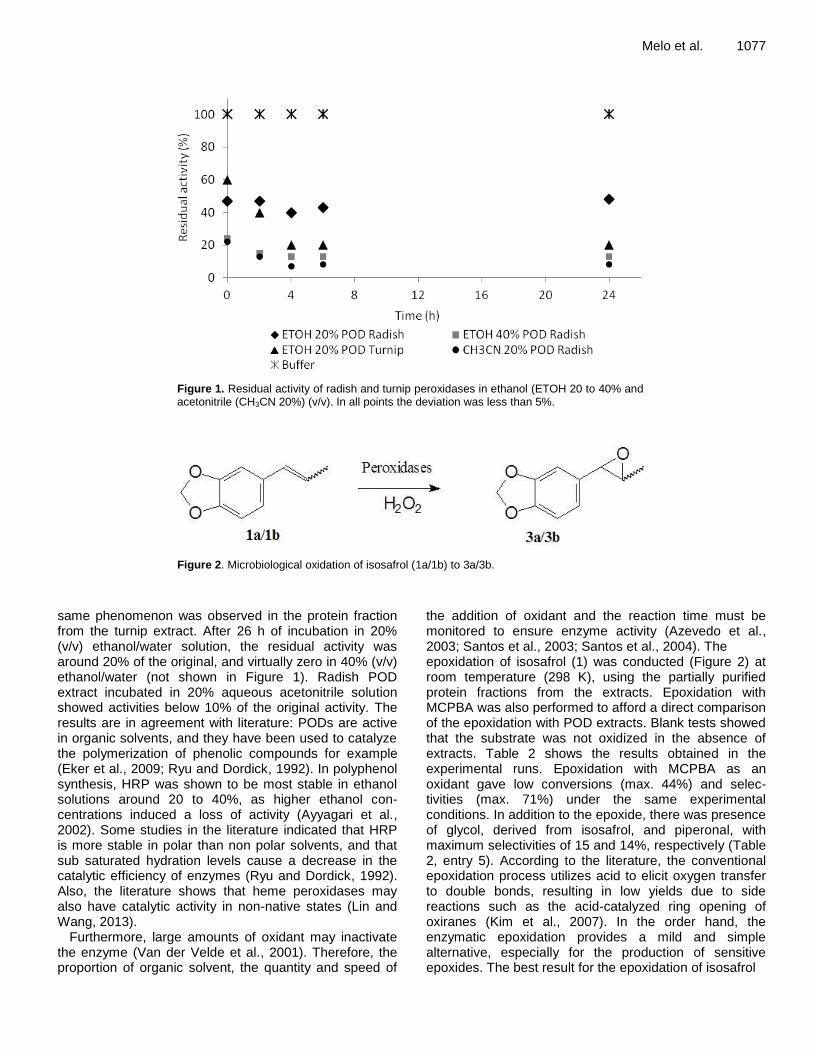
Melo et al. 1077
Figure 1. Residual activity of radish and turnip peroxidases in ethanol (ETOH 20 to 40% and acetonitrile (CH3CN 20%) (v/v). In all points the deviation was less than 5%.
Figure 2. Microbiological oxidation of isosafrol (1a/1b) to 3a/3b.
same phenomenon was observed in the protein fraction from the turnip extract. After 26 h of incubation in 20% (v/v) ethanol/water solution, the residual activity was around 20% of the original, and virtually zero in 40% (v/v) ethanol/water (not shown in Figure 1). Radish POD extract incubated in 20% aqueous acetonitrile solution showed activities below 10% of the original activity. The results are in agreement with literature: PODs are active in organic solvents, and they have been used to catalyze the polymerization of phenolic compounds for example (Eker et al., 2009; Ryu and Dordick, 1992). In polyphenol synthesis, HRP was shown to be most stable in ethanol solutions around 20 to 40%, as higher ethanol con-centrations induced a loss of activity (Ayyagari et al., 2002). Some studies in the literature indicated that HRP is more stable in polar than non polar solvents, and that sub saturated hydration levels cause a decrease in the catalytic efficiency of enzymes (Ryu and Dordick, 1992). Also, the literature shows that heme peroxidases may also have catalytic activity in non-native states (Lin and Wang, 2013).
Furthermore, large amounts of oxidant may inactivate the enzyme (Van der Velde et al., 2001). Therefore, the proportion of organic solvent, the quantity and speed of
the addition of oxidant and the reaction time must be monitored to ensure enzyme activity (Azevedo et al., 2003; Santos et al., 2003; Santos et al., 2004). The epoxidation of isosafrol (1) was conducted (Figure 2) at room temperature (298 K), using the partially purified protein fractions from the extracts. Epoxidation with MCPBA was also performed to afford a direct comparison of the epoxidation with POD extracts. Blank tests showed that the substrate was not oxidized in the absence of extracts. Table 2 shows the results obtained in the experimental runs. Epoxidation with MCPBA as an oxidant gave low conversions (max. 44%) and selec-tivities (max. 71%) under the same experimental conditions. In addition to the epoxide, there was presence of glycol, derived from isosafrol, and piperonal, with maximum selectivities of 15 and 14%, respectively (Table 2, entry 5). According to the literature, the conventional epoxidation process utilizes acid to elicit oxygen transfer to double bonds, resulting in low yields due to side reactions such as the acid-catalyzed ring opening of oxiranes (Kim et al., 2007). In the order hand, the enzymatic epoxidation provides a mild and simple alternative, especially for the production of sensitive epoxides. The best result for the epoxidation of isosafrol

1078 Afr. J. Biotechnol.
Table 2. Description of catalytic systems to oxidize Isosafrol 1 (0.04 mmol), 25°C.
# Catalyst Oxidant
(mmol)
Solvent
(10 mL)
Time (h)
Conversion
(%)a*
Selectivity (%)
Epoxide Glycol Piperonal By products
1 Radish -Ia (1,0 U) H2O2 30% (0.04) 20% C2H5OH / H2O 48 88 > 98 - - -
2 Turnip - Ia (1,8 U) H2O2 30% (0.04) 20% C2H5OH / H2O 48 7 > 98 - - -
3 - MCPBA (0.06) CH2Cl2 48 14 63 22 - 10
4 - MCPBA (0.06) CH3CN 48 32 71 18 8 -
5 - MCPBA (0.08) CH3CN 48 44 70 15 14 - a*
Determined by GC. Piperonal and glycol had retention times of 6.75 and 10.8 min, respectively.
A B C
Figure 3. Chromatograms of the GC analysis of the reaction products. A) Control reaction. Retention times: Z-isosafrol (7.64 min) and E-isosafrol (8.65 min). B) Catalysis by POD Raphanus sativus L. (entry 1). C) Catalysis by POD Brassica napus (entry 2). Peak at 11.7 min is attributed to epoxide 3 (oxirane), which is validated by the mass spectrum.
was obtained with the POD extract obtained from radish as the catalyst, with the production of 3-methyl-[3´,4´-methylenedioxiphenyl]-oxirane 3 as the sole product (88% conversion and 98%
selective for forming the epoxide). POD derived from turnip resulted in lower conversions of the reactant (7%), likely due to its lower stability in alcohol compared to radish POD, but with high
selectivity for the epoxide (greater than 98%). Figure 3 presents the chromatograms of the GC analysis of the reaction products for the control (Figure 3A) and POD-catalyzed runs (Figure 3B,

C). Peaks derived from the isosafrol isomers are identified at 7.64 min (Z isomer) and 8.65 min (E-isomer). Control sample analysis showed only the presence of the isosafrol isomers (Figure 3A). The peak at 11.7 min is attributed to epoxide 3 (oxirane), which is validated by the mass spectrum.
The results indicate that it is possible to obtain higher conversions and selectivity with the use of plant POD as a catalyst for the epoxidation of isosafrol. In comparison, epoxidation using other plant peroxidases as catalyst show low yield. Hirata and colleagues performed the epoxidation of styrene using peroxidase from Nicotiana tabacum, reaching maximum yield of only 7.5% using cis-2-methylstyrene as substrate (Hirata et al., 1998). Our group report the oxidation of E- and Z-4-(1-propenyl)-1,2-methylenedioxybenzene (E- and Z-isosafrole) into 4-carboxaldehydro-1,2-methylene-dioxybenzene (piperonal) using different strains of Aspergillus, Cladosporium, Peacilomyces and Pseudomonas. These microorganisms are able to oxidize the above compounds to piperonal, in the presence of H2O2, but not in its absence, indicating that this biotransformation is catalyzed by peroxidases in these microorganisms (Santos et al., 2003; Santos et al., 2004). Also, heme-monooxygenases (P-450 CIT), ω-monooxygenases and methane monooxygenases are capable of catalyzing an epoxidation reaction (Archellas and Furstoss, 1997). Some authors have also reported the oxidation of olefins using chloroperoxidase (CPO) (Allain et al., 1993). Enzymes from other sources, such as Coprinus cinereus
peroxidase, myeloperoxidase (Tuynman et al., 2000) and chloroperoxidases (Dexter et al., 1995; Hu and Hager, 1999), are capable of catalyzing epoxidation both mildly and selectively.
Conclusion
Peroxidases from radish (R. sativus L.) and turnip (B. napus L.) were extracted and precipitated with ammonium sulfate. By this methodology only radish POD was pre-purified (purification factor 1.51). The protein fractions from the radish and turnip extracts applied in the epoxidation of isosafrol in 20% (v/v) aqueous ethanol solution using 30% (v/v) H2O2 as the terminal oxidant are effective catalysts to epoxidize isosafrol with high selectivity (> 98); but only with POD derived from radish, excellent chemical conversion is observed (88%).
Conflict of interests
The authors did not declare any conflict of interest.
REFERENCES
Allain EJ, Lowell LP, Deng L, Jacobsen EN (1993). Highly enantioselective epoxidation of disubstituted alkenes with hydrogen peroxide catalyzed by chloroperoxidase. J. Am. Chem. Soc. 115:4415-4416.
Melo et al. 1079 Alvarez HM, Andrade JL, Pereira Jr N, Muri EMF, Horn Jr A, Barbosa
DP, Antunes OAC (2007). Catalytic oxidation of isosafrol by vanadium complexes. Catal. Comm. 8:1336-1340.
Alvarez HM, Barbosa DP, Fricks AT, Aranda DAG, Valdes RH, Antunes OAC (2006). Production of Piperonal, Vanillin, and p-Anisaldehyde via Solventless Supported Iodobenzene Diacetate Oxidation of Isosafrol, Isoeugenol, and Anethol Under Microwave Irradiation. Org. Proc. Research & Develop. 10:941-943.
Archellas A, Furstoss R (1997). Synthesis of enantiopure epoxides through biocatalytic approaches. Ann. Rev. Microbiol. 51: 491-525.
Ayyagari MSR, Kaplan DL, Chatterjee S, Walker JE, Akkara JA (2002). Solvent effects in horseradish peroxidase-catalyzed polyphenol synthesis. Enzyme Microb. Technol. 30: 3-9.
Azevedo AM, Martins VC, Prazeres DMF, Vojinović V, Cabral JMS, Fonseca LP (2003). Stability of free and immobilized peroxidase in aqueous-organic solvents mixtures. Biotech. Annual Rev. 9: 199-247.
Bradford MM (1976). A Rapid and Sensitive Method for the Quantitation of Microgram Quantities of Protein Utilizing the Principle of Protein-Dye Binding. Anal. Biochem. 72: 248-254.
Carvalho RH, Lemos F, Lemos MANDA, Cabral JMS, Ribeiro F R (2007). Electro-oxidation of phenol on a new type of zeolite/graphite biocomposite electrode with horseradish peroxidase. J. Mol. Catal. A. Chemical. 278:47-52.
Cheng W, Harper Jr WF (2012). Chemical kinetics and interactions involved in horseradish peroxidase-mediated oxidative polymerization of phenolic compounds. Enzyme Microb. Technol. 50:204-208.
Choudhary VR, Patil NS, Chaudhari NK, Bhargava SK (2004). Biphasic selective epoxidation of styrene by t-butyl hydroperoxide to styrene oxide using potassium chromate or dichromate catalyst in aqueous medium. Catal. Comm. 5:205-208.
Costas M, Chen K, Que Jr. L (2000). Biomimetic nonheme iron catalysts for alkane hydroxylation. Coord. Chem. Rev. 200: 517-544.
Dexter AF, Lakner FJ, Campbell RA, Hager LP (1995). Highly enantioselective epoxidation of 1,1-disubstituted alkenes catalyzed by chloroperoxidase. J. Am. Chem. Soc. 117: 6412-6413.
Eker B, Zagorevski D, Zhu G, Linhardt RJ, Dordick JS (2009). Enzymatic polymerization of phenols in room-temperature ionic liquids. J. Mol. Catal. B: Enzymatic. 59: 177-184.
Fricks AT, Dariva C, Alvarez HM, Santos AF, Fortuny M, Queiroz MLB, Antunes OAC (2010). Compressed propane as a new and fast method of pre-purification of radish (Raphanus sativus L.) peroxidase. J. Supercritical Fluids. 54: 153-158.
Fricks AT, Souza DPB, Oestreicher EG, Antunes OAC, Girardi JS, Oliveira D, Dariva C (2006). Evaluation of radish (Raphanus sativusL.) peroxidase activity after high-pressure treatment with carbon dioxide. J. Supercritical Fluids. 38:347-353.
García-Granados A, Fernández A, Gutiérrez M C, Martínez A, Quirás R, Rivas F, Arias J M (2004). Biotransformation of ent-13-epi-manoyl oxides difunctionalized at C-3 and C-12 by filamentous fungi. Phytochem. 65: 107-115.
Gilabert MA, Hiner ANP, García-Ruiz PA, Tudela J, Garcá-Molina F, Acosta M, García-Cánovas F, Rodríguez-López JN (2004). Differential substrate behavior of phenol and aniline derivatives during oxidation by horseradish peroxidase: kinetic evidence for a two-step mechanism. Biochem. Biophy. Acta. 1699: 235-243.
Gu Q; Burt VL; Dillon CF, Yoon S (2012). Trends in Antihypertensive Medication Use and Blood Pressure Control Among United States Adults With Hypertension. Circulation. 126: 2105-2114.
Hamid M, Rehman K (2009). Potential applications of peroxidases. Food Chem. 115:1177-1186.
Hirata T, Izumi S, Ogura M, Yawata T (1998). Epoxidation of styrenes with the preoxidase from the cultured cells of Nicotiana tabacum.Tetrahedron. 54: 15993-16003.
Hong-Mei L, Nicell JA (2008). Biocatalytic oxidation of bisphenol A in a reverse micelle system using horseradish peroxidase. Bioresour. Technol. 99: 4428-4437.
Hu S, Hager LP (1999). Asymmetric Epoxidation of Functionalized cis-Olefins Catalyzed by Chloroperoxidase. Tetrahedron Lett. 40: 1641-1644.
Kim YH, An ES, Park SY, Song BK (2007). Enzymatic epoxidation and polymerization of cardanol obtained from a renewable resource and curing of epoxide-containing polycardanol. J. Molecular Catal. B.

1080 Afr. J. Biotechnol.
Enzym. 45:39-44. Kumar R, Singh KA, Singh VK, Jagannadham MV (2011). Biochemical
characterization of a peroxidase isolated from Caribbean plant: Euphorbia cotinifolia. Proc. Biochem. 46: 1350-1357.
Lambert RM, Williams FJ, Cropley RL, Palermo A (2005). Heterogeneous alkene epoxidation: past, present and future. J. Mol. Catal. A. Chem. 228:27-33.
Liang J, Zhang Q, Wu H, Meng G, Tang Q, Wang Y (2004). Iron-based heterogeneous catalysts for epoxidation of alkenes using molecular oxygen. Catal. Comm. 5:665-669.
Lin Y, Wang J (2013). Structure and function of heme proteins in non-native states: A mini-review. J. Inorganic Biochem. 129:162-171.
Lin H, Liu J, Wang H, Ahmed AAQ, Wu Z (2011). Biocatalysis as an alternative for the production of chiral epoxides: A comparative review. Journal of Molecular Catalysis B: Enzymatic. 72:77-89.
Lopes LC, Barreto MTM, Gonçalves KM, Alvarez HM, Heredia MF, Souza ROMA, Cordeiro Y, Dariva C, Fricks AT (2015). Stability and structural changes of horseradish peroxidase: Microwave versus conventional heating treatment. Enzyme Microbial Technol. 69:10-18.
Piovezan C, Castro KADF, Drechsel SM, Nakagaki S (2005). Epoxidation using non-heme iron complexes in solution and immobilized on silica gel as catalysts. Appl. Catal. A. Gen. 293:97-104.
Ramanavicius A, Kausaite-Minkstimiene A, Morkvenaite-Vilkonciene I, Genys P, Mikhailova R, Semashko T, Voronovic J, Ramanaviciene A (2015). Biofuel cell based on glucose oxidase from Penicillium funiculosum 46.1 and horseradish peroxidase. Chem. Eng. J. 264:165-173.
Ramanavicius A, Ramanaviciene A (2009). Hemoproteins in Design of Biofuel Cells. Fuel Cells. 9:25-36.
Ryu K, Dordick JS (1992). How do organic solvents affect peroxidase
structure and functions? Biochemistry. 31: 2588-2598. Santos AS, Pereira Jr N, Silva IM, Antunes OAC (2003). Microbiological
oxidation of isosafrole into piperonal. Appl. Biochem. Biotechnol. 107:649-658.
Santos AS, Pereira Jr N, Silva IM, Sarquis MIM, Antunes OAC (2004). Peroxidase catalyzed microbiological oxidation of isosafrol into piperonal. Proc. Biochem. 39: 2269-2275.
Savic S, Vojinovic K, Milenkovic S, Smelcerovic A, Lamshoeft M, Petronijevic Z (2013). Enzymatic oxidation of rutin by horseradish peroxidase: Kinetic mechanism and identification of a dimeric product by LC–Orbitrap mass spectrometry. Food Chem. 141: 4194-4199.
Tuynman A, Spelberg JL, Kooter I , Schoemaker HE, Wever R (2000). Enantioselective epoxidation and carbon-carbon bond cleavage catalyzed by Coprinus cinereus peroxidase and myeloperoxidase. J. Biol. Chem. 275: 3025-3030.
Van der Velde F, Rantwijk F, Sheldon RA (2001). Improving the catalytic performance of peroxidases in organic synthesis. Trends in Biotechnol. 19: 73-80.
Veitch NC (2004). Horseradish peroxidase: a modern view of a classic enzyme. Phytochem. 65: 249-259.

Vol. 14(12), pp. 1081-1087, 25 March, 2015
DOI: 10.5897/AJB2015.14462
Article Number: 911FB3C51766
ISSN 1684-5315
Copyright © 2015
Author(s) retain the copyright of this article
http://www.academicjournals.org/AJB
African Journal of Biotechnology
Full Length Research Paper
Extra-pulmonary oxidative stress investigations of an over-the-counter pyrethroid insecticide product in rats
Oluwatobi Temitope Somade*, Ayobami Emmanuel Odekunle, Olaide Oluwasaanu and Nkoyo Michael Umanah
Department of Biochemistry, College of Biosciences, Federal University of Agriculture Abeokuta, Abeokuta,
Ogun State, Nigeria.
Received 31 January, 2015; Accepted 20 March, 2015
Extra-pulmonary oxidative stress investigations of exposure to aerosol, of an over-the-counter pyrethroid insecticide product in Nigeria in Wistar rats were carried out. Four groups of five animals each were used in this study, and were exposed to different concentrations of the insecticide aerosol. Malondialdehyde (MDA) and reduced glutathione (GSH) concentrations were determined in the liver, kidney and testes, while the activities of catalase (CAT), superoxide dismutase (SOD), glutathione peroxidase (GPx) and glutathione S-transferase (GST) were determined in liver only. Liver, kidney and testes showed no significant difference in their weights and relative weights when compared with control, except groups II and III where significant increase in liver weight was recorded. There was no significant increase in liver, kidney and testis MDA concentration when compared with the control. There was significant decrease in testis GSH for all groups, while significant increase was seen in groups III and IV for kidney GSH and group II only for liver GSH. The activities of liver CAT, SOD, GST and GPx were reduced, but showed no significant difference when compared with the control. Our investigations therefore reveal that the compositions of the pyrethroid insecticide product may not play any role in extra-pulmonary tissue oxidative damage. Key words: Insecticide aerosol, pyrethroid, oxidative stress, lipid peroxidation, rats.
INTRODUCTION Eliminating mosquito vectors of the malaria parasite is one of the most effective measures against malaria. Pyrethroids are human-made forms of pyrethrins. There are two types that differ in chemical structure and symptoms of exposure. Type I pyrethroids include allethrin, tetramethrin, resmethrin, d-phenothrin, bioresmethrin and permethrin (Klaassen et al., 1996;
Ray, 1991). Some examples of type II pyrethroids are cypermethrin, cyfluthrin, deltamethrin, cyphenothrin, fenvalerate, and fluvalinate (Klaassen et al., 1996; Ray, 1991). They act primarily on the nervous system by prolonging the open state of voltage-sensitive sodium channels (Soderlund et al., 2002). Since the nervous system of all the animals is quite similar, these
*Corresponding author. E-mail: [email protected]. Tel: +2348058860299. Author(s) agree that this article remain permanently open access under the terms of the Creative Commons Attribution License 4.0 International License

1082 Afr. J. Biotechnol. compounds have the potential for non-target species (Soderlund et al., 2002).
Pyrethroid insecticide products are commonly used in the control of mosquitoes in Nigeria. The active insect-cidal ingredients of pyrethroid insecticide product used in this study include cyfluthrin, imiprothrin and prallethrin. β-Cyfluthrin is a newer pyrethroid insecticide used all over the world. It is reported to be neurotoxic (Satpathy et al., 1997), hepatotoxic (Omotuyi et al., 2006) and teratogenic (Soni et al., 2011). β-Cyfluthrin toxicity is exhibited by its metabolites which in turn generate free radicals (El-Demerdash, 2007). In vitro study on human erythrocytes has demonstrated that cyfluthrin generates the reactive oxygen species (ROS) in cells (Sadowaska-Woda et al., 2010).
A study of imiprothrin in rats has indicated that repeated non-contiguous inhalation of an insecticide that contains imiprothrin can have immunotoxic effects in sites distal to the lungs (Emara and Draz, 2007). In human volunteers who were exposed regularly to prallethrin containing mosquito repellent, alterations in the bioche-mical composition of erythrocyte membranes, erythrocytic osmotic haemolysis, and plasma levels of nitrite and nitrate were found (Narendra et al., 2007).
In addition to the active insecticidal ingredients, insecticide aerosols also contain „„inert‟‟ ingredients which are referred to as “trade secrets” by their manufacturers. Inert ingredients may not be inert in the usual sense of the word; often they are not chemically, biologically or toxicologically inert. Occupational exposure to these solvents has been associated with an increased rate of leukemia and a range of lymphoma types (McMichael, 1988; Cocco et al., 2010).
Pesticides induce oxidative stress as well as alter the defense mechanisms of detoxification and scavenging enzymes (Rasoul et al., 2012; Mossa et al., 2012; Mansour and Mossa, 2010a, 2011; Marzouk et al., 2011). Overproduction of ROS can exacerbate oxidative stress and ROS generation has been linked to a number of disease processes, such as heart disease (Giordano, 2005), diabetes (Rolo and Palmeira, 2006), liver injury (Mansour and Mossa, 2010a, 2011; Mossa, 2004; Jaeschke, 2000), cancer (Klaunig and Kamendulis, 2004) and aging (Bokov et al., 2004). It is therefore necessary to maintain the balance between ROS generation and antioxidant enzymes. This balance has been suggested to have an important role in preventing pesticides toxicity (Mansour and Mossa, 2010a, 2011; Mossa, 2004; Jaeschke, 2000).
There is a widespread misuse, incessant and inadvertent exposure to pyrethroid insecticide products in Nigeria, and there is still a dearth of information on the toxicological consequences of frequent exposure. In this study, we therefore assessed the risk and the hazard associated with exposure to aerosols of a commonly used over-the-counter pyrethroid insecticide product,
using rats as an experimental animal model. We investi-gated if exposure to the insecticide could lead to extra-pulmonary oxidative damage by monitoring the activities of liver catalase (CAT), superoxide dismutase (SOD), glutathione peroxidase (GPx) and glutathione S-transferase (GST), as well as concentrations of reduced glutathione (GSH) and malondialdehyde (MDA) in liver, kidney and testes of rats.
MATERIALS AND METHODS
Animals, test materials and reagents
Twenty albino Wistar rats with an average weight of 150 g used for this study were obtained from the animal house of the College of Veterinary Medicine, Federal University of Agriculture, Abeokuta, Nigeria. BaygonTM multi-purpose pyrethroid insecticide product of Johnson Wax Nigeria Limited, Lagos (composition Cyfluthrin, 0.015%; Imiprothrin, 0.05%; Prallethrin, 0.05%; and undisclosed inert ingredients, 99.885%) was purchased from a local supermarket near the university. All other reagents and chemicals were of analytical grade, products of Sigma Chemical Co., Saint Louis, MO, USA or BDH Chemical Ltd, Poole, England.
Animal handling and insecticide aerosol exposure chamber design
The experimental animals were handled and used in accordance with the international guide for the care and use of laboratory animals (National Research Council, 1996). They were allowed to acclimatize, and kept in standard laboratory conditions under natural light-dark cycle. The experimental animals had access to diet and water ad libitum throughout the duration of the experiment. Four identical wooden-glass exposure chambers each with internal volume of 0.167 m3 (0.405 x 0.800 x 0.515 m) were used. Into each chamber (containing five rats) was sprayed 0, 1, 2, or 3 ml respective volume of the pyrethroid product multi-purpose insect killer. This is equivalent to 0, 6.0, 12.0 and 18.0 mL m-3 of the exposure chamber, respectively. The chambers were closed for 1 h immediately after spraying. A glass top enabled observations to be made on reactions of the animals to the aerosols. These procedures were carried out once a day for 6 weeks. Effective light usage of the insecticide in Nigerian homes ranges from about 3.5 - 6.0 mL m-3.
Three different doses, multiples of this light usage, were experimented within different groups of rats exposed to the insecticide aerosols thereby giving allowance for heavy aerosols spray and high level of exposure to the insecticide. The volume of the insecticide sprayed as aerosols usually depend on the users and the perceived population of insects in the house.
Experimental animals and treatments
The rats were divided randomly into four groups (I to IV) of five animals per group as follows: group I (control), not exposed to insecticide aerosols; group II, exposed to 6.0 mL of the aerosols per 1 m3 treatment chamber volume (1 mL of the insecticide product in 0.167 m3 exposure chamber); group III, exposed to the aerosols at 12.0 mL m-3; group IV, exposed to the aerosols at 18.0 mL m-3.
Sample preparation
At the end of the experimental period, the animals were sacrificed

Somade et al. 1083 Table 1. Liver, kidney and testis weights of control and experimental rats exposed to pyrethroid insecticide aerosols.
Group Liver weight
(g) Kidney
weight (g) Testis weight
(g) Relative liver
weight (%) Relative kidney
weight (%) Relative testis
weight (%)
I 6.51 ± 0.67 1.09 ± 0.07 2.36 ± 0.18 3.05 ± 0.24 0.51 ± 0.02 1.11 ± 0.09
II 5.15 ± 0.33a 1.00 ± 0.03 2.56 ± 0.08 2.67 ± 0.14 0.52 ± 0.01 1.33 ± 0.06
III 5.17 ± 0.22a 0.99 ± 0.05 2.23 ± 0.15 2.73 ± 0.21 0.52 ± 0.03 1.19 ± 0.10
IV 5.58 ± 0.38 1.06 ± 0.06 2.51 ± 0.06 2.77 ± 0.04 0.53 ± 0.02 1.26 ± 0.06
Each value is a mean of 5 rats ± SEM. aSignificantly different from negative control group (p<0.05). Relative organ (liver/kidney/testis) weight = (organ
weight/final body weight) x 100. I, Group of rats not exposed to aerosols. II, Rats in this group were exposed to 1 mL of the insecticide product aerosols in 0.167 m
3 treatment chamber (equivalent to 6.0 mL m
-3 treatment chamber volume). III, Animals in this group were exposed to 2 mL of the
aerosols (equivalent to 12.0 mL m-3 treatment chamber volume). IV, Rats in this group were exposed to 3 mL of the aerosols (equivalent to 18.0 mL m
-
3 treatment chamber volume).
and liver, kidney and testis were harvested. They were washed in ice-cold saline (0.9% w/v) solution, and were blotted dry before suspension in 0.1 M phosphate buffer (pH 7.4) and homogenized (1:4 w/v), followed by centrifugation at 5000 rpm for 10 min. The homogenate was kept frozen until used. Assay for biochemical parameters CAT activity was determined by the method of Sinha (1972), and expressed in µmole/min/mg protein. SOD was determined by the method of Misra and Fridovich (1972), and expressed in unit/mg protein, GPx was determined by the method of Paglia and Valentine (1967), expressed in µg/ml/mgprotein, and GST was determined by the method of Habig et al. (1974), expressed in µmole/min/mgprotein. MDA levels, a marker of lipid peroxidation was determined by the method of Beuge and Aust (1978) and expressed in nmol/mg, while GSH levels was determined by the method of Moron et al. (1979), and expressed in µg/ml. Protein concentration was done according to the method of Gornall et al. (1949).
Data were analyzed by one-way analysis of variance (ANOVA), followed by least significant difference (LSD) to test for significant differences among the groups of rats using Statistical Package for Social Sciences program version 17.0. Data were expressed as mean ± standard error of mean. P values less than 0.05 were considered statistically significant.
RESULTS Liver, kidney, testis weights and relative weights of control and experimental rats exposed to pyrethroid insecticide aerosols are shown in Table 1. Exposure of rats to the insecticide aerosol did not produce any significant effect (p > 0.05) on liver, kidney and testis relative weights as compared to the control. Apart from 6.0 and 12.0 mL m
-3 of the insecticide aerosol that
produced significant difference (p < 0.05) in liver weights, there was no significant difference (p > 0.05) in kidney and testis weights as compared to the control.
The effects of pyrethroid insecticide aerosol on liver, kidney and testis MDA concentrations are shown in Figure 1. The obtained results showed no significant increase (p > 0.05) in the liver and testis MDA
concentrations as compared to control, while 18.0 mL m-3
of the insecticide aerosol significantly increased (p < 0.05) the kidney MDA concentration as compared to the control.
Effects of the insecticide aerosol on liver, kidney and testis levels of GSH are represented also in Figure 2. All the concentrations of insecticide aerosol assessed (Groups II to IV) significantly reduced (p < 0.05) the levels of GSH in testis as compared to the control. A significant increase (p < 0.05) in kidney levels of GSH was recorded by 12.0 and 18.0 mL m
-3 of the insecticide, while only 6.0
mL m-3
of the aerosol significantly raised (p < 0.05) the liver GSH level as compared to the control.
Lastly, exposure to the insecticide aerosol did not give significant reductions (p > 0.05) in liver GST, SOD, GPx and CAT activities as compared to the control. DISCUSSION Misuse of pyrethroids insecticides could cause toxicity in non-target species (Cantalamessa, 1993). Insecticides exposure constitutes a source of potent hazard especially in children and animals (Eisler, 1989; Nebeker et al., 1992; Menegaux et al., 2006). The multipurpose insect killer used, a pyrethroid insecticide product, is a popular brand for the eradication of mosquito in households in Nigeria and in some cases, it is used daily in homes. This increases the exposure of people, especially children sleeping under the aerosol.
Our investigation on the pyrethroid insecticide aerosol revealed no significant effects on liver, kidney and testes weights (Table 1), as well as their relative weights (Table 2). Measurement of MDA is mostly used to monitor lipid peroxidation and indirectly, oxidative stress in- vitro and vivo (Beltowski et al., 2000). The lipid oxidation causes disruption of the bilayer and cell integrity accompanied by leakage of cellular content from the damaged organ into the blood stream (Ologundudu et al., 2010). Our investigations in the present study revealed that the insecticide aerosol caused no significant increase (p >

1084 Afr. J. Biotechnol.
*
Figure 1. Effects of pyrethroid insecticide aerosols on liver, kidney and testes MDA concentrations. I, Group of rats not exposed to aerosols. II, Rats in this group were exposed to 1 mL of the insecticide product aerosols in 0.167 m3 treatment chamber (equivalent to 6.0 mL m-3 treatment chamber volume). III, Animals in this group were exposed to 2 mL of the aerosols (equivalent to 12.0 mL m-3 treatment chamber volume). IV, Rats in this group were exposed to 3 mL of the aerosols (equivalent to 18.0 mL m -3 treatment chamber volume). Values are mean ± SEM; n = 5. *Significantly different from control group I (p < 0.05).
Table 2. Relative liver, kidney, and testis weights of control and experimental rats exposed to pyrethroid insecticide aerosols.
Group Relative liver weight (%) Relative kidney weight (%) Relative testis weight (%)
I (Control) 3.05 ± 0.24 0.51 ± 0.02 1.11 ± 0.09
II (6.0 mL m-3
of insecticide as aerosols) 2.67 ± 0.14 0.52 ± 0.01 1.33 ± 0.06
III (12.0 mL m-3
of insecticide as aerosols) 2.73 ± 0.21 0.52 ± 0.03 1.19 ± 0.10
IV (18.0 mL m-3
of insecticide as aerosols) 2.77 ± 0.04 0.53 ± 0.02 1.26 ± 0.06
No significant difference from negative control group (p<0.05). Relative organ (liver/kidney/testis) weight = (organ weight/final body weight) x 100.
I, Group of rats not exposed to aerosols. II, Rats in this group were exposed to 1 mL of the insecticide product aerosols in 0.167 m3 treatment chamber (equivalent to 6.0 mL m-3 treatment chamber volume). III, Animals in this group were exposed to 2 mL of the aerosols (equivalent to 12.0 mL m-3 treatment chamber volume). IV, Rats in this group were exposed to 3 mL of the aerosols (equivalent to 18.0 mL m-3 treatment chamber volume).
0.05) in the concentrations of liver and testis MDA (Figure 1), except for kidney MDA concentration in Group IV. Deltamethrin, a pyrethroid insecticide was reported to significantly increase the MDA level in testis, liver and
kidney of rats (Sharma et al., 2014; Manna et al., 2005; Rehman et al., 2006). Cyfluthrin administered to rats has been reported to increase the concentration of MDA in liver and kidney of rats (Yilmaz et al., 2015).

Somade et al. 1085
* *
*
* * *
Figure 2. Effects of pyrethroid insecticide aerosols on liver, kidney and testes GSH levels. I, Group of rats not exposed to aerosols. II, Rats in this group were exposed to 1 mL of the insecticide product aerosols in 0.167 m3 treatment chamber (equivalent to 6.0 mL m-3 treatment chamber volume). III, Animals in this group were exposed to 2 mL of the aerosols (equivalent to 12.0 mL m-3 treatment chamber volume). IV, Rats in this group were exposed to 3 mL of the aerosols (equivalent to 18.0 mL m-3 treatment chamber volume). Values are mean ± SEM; n = 5. *Significantly different from control group I (p < 0.05).
Also, in the present study, our investigations revealed that the insecticide aerosol increased significantly (p < 0.05) the levels of GSH in the kidney (Groups 3 and 4) of rats (Figure 2), while it significantly (p < 0.05) decreased the levels of GSH in testis in all the groups. The elimination of H2O2 is either affected by catalase or glutathione peroxidase, with the latter predominating (using reduced glutathione as substrate) in the case of testes (Zini and Schlegel, 1996; Peltola et al., 1992). This could be responsible for the decrease in testes GSH levels seen in our investigations. Incubation of testis homogenate with different concentrations of insecticide mixture for different time intervals significantly decreased the activity of antioxidant enzymes, like GST, SOD and CAT, and the level of GSH (El-Demerdash et al., 2013). Cypermethrin-induced toxicity has been reported to decrease the level of GSH in testis of rats (Huq et al., 2014). GSH participate in the elimination of ROS, acting both as non-enzymatic oxygen radical scavenger and as a substrate for various enzymes such as GPx (Ashar and Muthu, 2012). The liver is the primary site for the detoxification of xenobiotics, and it is rich in drug metabolizing enzymes. All these factors may protect the liver from the overwhelming toxic effects of the insecticide. Again, from our investigations, the non-significant decrease (p > 0.05) in liver GST, GPx, CAT
and SOD activities (Figure 3) following exposure to the insecticide aerosol could be also due to the prompt and balanced response of these tissues to the increased and continuous generation of ROS particularly superoxide radical (O2
.-), which can be dismutated to H2O2 by SOD,
and then to H2O and O2 by CAT, GPx and GST. It has been reported that 14 days exposure to beta-cyfluthrin caused a significant decrease in CAT and SOD activity as compared to the control in a dose dependent manner (Verma et al., 2013). Cyfluthrin has been reported to increase the generation of free radical and decrease SOD and CAT activity in mice (Omotuyi et al., 2006; Eraslan et al., 2007) and in cultured human erythrocytes (Sadowaska-Woda et al., 2010). Cyfluthrin administration was reported to lower the activities of CAT and GPX in liver and kidney of rats (Yilmaz et al., 2015). It was recently reported that the activities of kidney SOD and GPx, as well as activities of liver SOD, GST and CAT were significantly decreased by prallethrin administration in rats (Rafaie et al., 2014; Mossa et al., 2013). Cypermethrin-induced toxicity has been reported to decrease the activities of CAT, SOD, GST and GPx in testis of rats (Huq et al., 2014). Deltamethrin administration has been reported to significantly reduce the activities of SOD, CAT, GST and GPx, as well as levels of GSH in liver, testis and kidney of rats exposed to

1086 Afr. J. Biotechnol.
Figure 3. Effects of pyrethroid insecticide aerosols on liver GST, SOD, GPx and CAT activities. I, Group of rats not exposed to aerosols. II, Rats in this group were exposed to 1 mL of the insecticide product aerosols in 0.167 m3 treatment chamber (equivalent to 6.0 mL m-3 treatment chamber volume). III, Animals in this group were exposed to 2 mL of the aerosols (equivalent to 12.0 mL m-3 treatment chamber volume). IV, Rats in this group were exposed to 3 mL of the aerosols (equivalent to 18.0 mL m-3 treatment chamber volume). Values are mean ± SEM; n = 5GST, SOD, GPx, and CAT activities are expressed as µmole/min/mgprotein, unit/mgprotein, µg/ml/mgprotein, and µmole/min/mgprotein, respectively.
it (Sharma et al., 2014; Manna et al., 2005; Rehman et al., 2006).
In conclusion, results from these investigations reveals that the concentrations of the active pyrethroid ingredients in the aerosol of this commonly used over-the-counter pyrethroid insecticide product at the dose assessed may not be associated or implicated in extra-pulmonary oxidative tissue damage.
Conflict of interests
The authors did not declare any conflict of interest. REFERENCES
Ashar WMP, Muthu MHS (2012). Fenvalerate induced hepatotoxicity and its amelioration by quercetin. Int. J. Pharm. Tech. Res. 4(4):1391-1400.
Beltowski J, Wójcicka G, Górny D, Marciniak A (2000). The effect of dietary-induced obesity on lipid peroxidation, antioxidant enzymes and total plasma antioxidant capacity. J. Physiol. Pharmacol. 51:883-896.
Bokov A, Chaudhuri A, Richardson A (2004). The role of oxidative damage and stress in aging. Mech. Ag. Dev. 125(10-11):811-826.
Buege JA, Aust SD (1978). Microsomal lipid peroxidation. Methods Enzymol. 52:302-310.
Cantalamessa F (1993). Acute toxicity of two pyrethroids, permethrin, and cypermethrin in neonatal and adult rats. Arch. Toxicol. 67(7):510-513.
Cocco P, T‟Mannetje A, Fadda D, Melis M, Becker N, de Sanjose S, Foretova L, et al (2010). Occupational exposure to solvents and risk of lymphoma subtypes: results from the Epilymph case-control study. Occup. Environ. Med. 67(5): 341-347.
Eisler R (1989). Pentachlorophenol hazards to fish, wildlife and invertebrates: A synoptic review. US fish and wildlife service. Biol. Rep. 85:72.
El-Demerdash FM (2007). Lambdacyhalothrin-induced changes in oxidative stress biomarkers in rabbit erythrocytes and alleviation effects of some antioxidants. Toxicol. In-Vitro. 21: 392-397.
El-Demerdash FM, Jebur AB, Nasr HM (2013). Oxidative stress and biochemical perturbations induced by insecticides mixture in rat testes. J. Environ. Sci. Health B. 48(7): 593-599.
Emara AM, Draz EI (2007). Immunotoxicological study of one of the most common over the counter pyrethroid insecticide products in Egypt. Inhal. Toxicol. 19(12): 997-1009.
Eraslan G, Saygi S, Essiz D (2007). Evaluation of aspect of some oxidative stress parameters using vitamin E, proanthocynidin and N-acetylcysteine against exposure to cyfluthrin in mice. Pest. Biochem. Physiol. 88:43-49.
Giordano FJ (2005). Oxygen, oxidative stress, hypoxia, and heart failure. J. Clin. Invest. 115(3): 500-508.
Gornall AG, Bardawill CJ, David MM (1949). Determination of serum protein by biuret method. J. Biol. Chem. 117: 751-766.
Habig WH, Pabst MJ, Jakoby WB (1974). Glutathione S-transferases: The first enzymatic step in mercapturic acid formation. J. Biol. Chem. 249:7130-7139.
Huq AU, Sharma P, Singh R (2014). Cypermethrin-induced reproductive

toxicity in the rat is prevented by resveratrol. J. Hum. Reprod. Sci. 7(2):99-106.
Jaeschke H (2000). Reactive oxygen and mechanisms of inflammatory liver injury. J. Gastroenterol. Hepatol. 15(7):718-724.
Klaassen CD, Amdur MO, Doull J Eds (1996). Casarett & Doull‟s Toxicology. The Basic Science of Poisons (5 ed.). Toronto: th McGraw-Hill Companies, Inc.
Klaunig JE, Kamendulis LM (2004). The Role of oxidative stress in carcinogenesis. Ann. Rev. Pharmacol. Toxicol. 44: 239-267.
Manna S, Bhattacharyya D, Mandal TK, Das S (2005). Repeated dose toxicity of deltamethrin in rats. Ind. J. Pharmacol. 37(3): 160-164.
Mansour SA, Mossa ATH (2010a). Oxidative damage, biochemical and histopathological alterations in rats exposed to chlorpyrifos and the antioxidant role of zinc. Pest. Biochem. Physiol. 96(1):14-23.
Mansour SA, Mossa ATH (2011). Adverse effects of exposure to low doses of chlorpyrifos in lactating rats. Toxicol. Ind. Health. 27(3):213-224.
Marzouk MA, Abbassy MA, Mansour SA, Mossa AH, Elsayed SR (2011). Effect of dimethoate, dicofol and voltaren on oxidant/antioxidant status in male rats: role of selenium. J. Agric. Environ. Sci. 10(2): 40-60.
McMichael AJ (1988). Carcinogenicity of benzene, toluene and xylene: Epidemiological and experimental evidence. IARC Scientific Publications. 85:3-18.
Menegaux F, Baruchel A, Bertrand Y, Lescoeur B, Leverger G, Nelken B, et al (2006). Household exposure to pesticides and risk of childhood acute leukaemia. Occup. Environ. Med. 63(2):131-134.
Misra HP, Fridovich I (1972). The role of superoxide anion in the auto-oxidation of epinephrine and a simple assay for superoxide dismutase. J. Biol. Chem. 247:3170-3175.
Moron MS, Depierre JW, Mannervik B (1979). Levels of glutathione. Glutathione reductase and glutathione S-transferase activities in rat lung and liver. Biochem. Biophys. Acta. 582:67-78.
Mossa AH (2004). Genotoxicity of pesticides [Ph.D. thesis], Pesticide Chemistry and Toxicology, Faculty of Agriculture, Damanhour, Alexandria University.
Mossa AH, Refaie AA, Ramadan A, Bouajila J (2013). Amelioration of prallethrin-induced oxidative stress and hepatotoxicity in rat by the administration of Origanum majorana essential oil. BioMed Research International, doi.org/10.1155/2013/8590851-11.
Mossa AT, Heikal TM, Omara EA (2012). Physiological and histopathological changes in the liver of male rats exposed to paracetamol and diazinon. Asian Pac. J. Trop. Biomed. 2:S1683-S1690.
Narendra M, Bhatracharyulu NC, Padmavathi P, Varadacharyulu NC (2007). Prallethrin induced biochemical changes in erythrocyte membrane and red cell osmotic haemolysis in human volunteers. Chemosphere 67(6):1065-1071.
Nebeker AV, Griffis WL, Stutzman TW, Schuytema GS, Carey LA, Scherer SM (1992). Effects of aqueous and dietary exposure of dieldrin on survival, growth and bioconcentration in mallard ducklings. Environ. Toxicol. Chem. 11(5):687-699.
Ologundudu A, Ologundudu AO, Oluba OM, Omotuyi IO, Obi FO (2010). Effect of Hibiscus sabdariffa anthocyanins on 2,4-dinitrophenyl hydrazine-induced tissue damage in rabbits. J. Toxicol. Environ. Health Sci. 2(1):1-6.
Omotuyi IO, Oluyemi KA, Omofoma CO, Josiah SJ, Adesanya OA, Saalu LC (2006). Cyfluthrin- induced hepatotoxicity in rats. Afr. J. Biotech. 5(20):1909-1912.
Omotuyi IO, Oluyemi KA, Omofoma CO, Josiah SJ, Adesanya OA, Saalu LC (2006). Cyfluthrin- induced hepatotoxicity in rats. Afr. J. Biotech. 5(20):1909-1912.
Paglia DE, Valentine WN (1967). Studies on the quantitative and qualitative characterization of erythrocyte glutathione peroxidase. J. Lab. Clin. Met. 70:158-169.
Peltola V, Huhtaniemi I, Ahotupa M (1992). Antioxidant enzyme activity in the maturing rats testis. J. Androl. 13:450-455.
Rasoul MA, Marei GI, Abdelgaleil SA (2012). Evaluation of antibacterial properties and biochemical effects of monoterpenes on plant pathogenic bacteria. Afr. J. Microbiol. Res. 6(15):3667-3672.
Somade et al. 1087 Ray DE (1991). Pesticides derived from plants and other organisms. In:
Hayes WJ, Jr. & Laws ER (Eds.), Handbook of Pesticide Toxicology, 2:585-593. Toronto: Academic Press.
Rehman H, Ali M, Atif F, Kaur M, Bhatia K, Raisuddin S (2006). The modulatory effect of deltamethrin on antioxidants in mice. Clin. Chim. Acta. 369(1):61-65.
Rolo AP, Palmeira CM (2006). Diabetes and mitochondrial function: role of hyperglycemia and oxidative stress. Toxicol. Appl. Pharmacol. 212(2):167-178.
Sadowaska-Woda I, Wojcik N, Agata K, Bieszczad-bedrejczuk E (2010). Effect of selected antioxidants in cyfluthrin-induced oxidative stress in human erythrocytes in vitro. Toxicol. In-Vitro. 24:879-884.
Sadowaska-Woda I, Wojcik N, Agata K, Bieszczad-bedrejczuk E (2010). Effect of selected antioxidants in cyfluthrin-induced oxidative stress in human erythrocytes in vitro. Toxicol. In-vitro. 24: 879-884.
Satpathy SK, Tyagi PK, Das BS, Srivastava P, Yadav RS (1997). Evaluation of possible toxic effects of cyfluthrin during short-term, relevant community exposue. Environ. Contam. Toxico. 59: 681-687.
Sharma P, Singh R, Jan M (2014). Dose-dependent effect of deltamethrin in testis, liver, and kidney of wistar rats. Toxicol. Int. 21:131-139.
Sinha AK (1972). Colorimetric Assay of Catalase. Anal. Biochem. 47:389-394.
Soderlund DM, Clark JM, Sheets LP, Murlin LS, Piccirillo VJ, Weiner ML (2002). Mechanisms of pyrethroid neurotoxicity: Implications for cumulative risk assessment. Toxicol. 171:3-59.
Soni I, Syed F, Bhatnagar P, Mathur R (2011). Perinatal toxicity of cyfluthrin in mice: developmental and behavioural effects. Hum. Exp. Toxicol. 30(8):1096-1105.
Verma R, Awasthi KK, Soni I, John PJ (2013). Evaluation of Cytogenetic Effects of -Cyfluthrin in Swiss Albino Mice. Int. J. Curr. Microbiol. Appl. Sci. 2(6):30-40.
Yilmaz M, Rencuzogullari E, Canli M (2015). The effects of cyfluthrin on some biomarkers in the liver and kidney of wistar rats. Environ. Sci. Poll. Res. 22(6):4747-4752.
Zini A, Schlegel PN (1996). Catalase mRNA expression in the male rat reproductive tract. J. Androl. 17:473-480.

African Journal of
Biotechnology
Related Journals Published by Academic Journals Biotechnology and Molecular Biology Reviews African Journal of Microbiology Research African Journal of Biochemistry Research African Journal of Environmental Science and Technology African Journal of Food Science African Journal of Plant Science Journal of Bioinformatics and Sequence Analysis International Journal of Biodiversity and Conservation
Copyright © 2022 FDOKUMEN