biotechnology in animal husbandry
180
UDC636 Print ISSN 1450-9156 Online ISSN 2217-7140 BIOTECHNOLOGY IN ANIMAL HUSBANDRY VOL 30, 1 Founder and publisher INSTITUTE FOR ANIMAL HUSBANDRY 11080 Belgrade-Zemun Belgrade 2014 CONTENTS Review papers M. Sahraei EFFECTS OF FEED RESTRICTION ON METABOLICE DISORDERS IN BROILER CHICKENS: A REVIEW....................................................................... Original scientific paper R. Mosharraf, J. Shodja, M. Bohlouli, S. Alijani, S.A. Rafat ESTIMATION OF (CO)VARIANCE COMPONENTS AND BREEDING VALUES FOR TEST-DAY MILK PRODUCTION TRAITS OF HOLSTEIN DAIRY CATTLE VIA BAYESIAN APPROACH................................................... Ts. Maslev, Ts. Hristova, S. Stoycheva STUDY ON THE PERFORMANCE OF GONADOTROPIN-RELEASING HORMONE (GnRH) IN THE PUERPERAL PERIOD OF BEEF COWS........... N. Deliæ, S. Aleksiæ, M.M. Petroviæ, V. Panteliæ, D. Ostojiæ-Andriæ, M. Petrièeviæ, D. Nikšiæ METHODS FOR DETERMINING STRESS SYNDROME IN CALVES AND ITS RELEVANCE TO QUALITY OF MEAT......................................................... A. Selim, M. El-haig, W. Gaede DUPLEX REAL-TIME PCR ASSAY TARGETING INSERTION ELEMENTS IS1081 AND IS6110 FOR DETECTION OF MYCOBACTERIUM BOVIS IN LYMPH NODES OF CATTLE................................................................................. S. Sadeghi, A. Rafat, M. Bohlouli EFFECT OF CROSSBREEDING ON LINEAR UDDER SCORES AND THEIR PHENOTYPIC RELATIONSHIPS IN IRANIAN FAT-TAILED EWE’S........................................................................................................................ A. Yakubu, M.M. Muhammed, I.S. Musa-Azara APPLICATION OF MULTIVARIATE LOGISTIC REGRESSION MODEL TO ASSESS FACTORS OF IMPORTANCE INFLUENCING PREVALENCE OF ABORTION AND STILLBIRTH IN NIGERIAN GOAT BREEDS........................ H. Khosravinia HYPOLIPIDEMIC EFFECTS OF CARVACROL IN RELATION WITH SEX HORMONES IN BROILER CHICKEN ..............................................................… M. Lalev, N. Mincheva, M. Oblakova, P. Hristakieva, I. Ivanova ESTIMATION OF HETEROSIS, DIRECT AND MATERNAL ADDITIVE EFFECTS FROM CROSSBREEDING EXPERIMENT INVOLVING TWO WHITE PLYMOUTH ROCK LINES OF CHICKENS.......................................... V. Petrièeviæ, M. Lukiæ, Z. Pavlovski, Z. Škrbiæ, . Jokiæ, D. Vitoroviæ, M. Petrièeviæ THE EFFECT OF RAW SOYBEANS IN MIXTURES FOR LAYING HENS ON PRODUCTION PERFORMANCE AND THE RELATIVE WEIGHT OF THE PANCREAS.............................................................................................................. D. M. Ogah, M. Kabir VARIABILITY IN SIZE AND SHAPE IN MUSCOVY DUCK WITH AGE: PRINCIPAL COMPONENT ANALYSIS................................................................ N. Stojanac, O. Stevanèeviæ, B. Saviæ, I. Stanèiæ, A. Potkonjak COMPARISON SEROPREVALENCE OF SALMONELLA SPP. IN LARGE FARMS AND INDIVIDUAL PRODUCERS IN SERBIA...................................... 1 15 29 37 45 61 79 89 103 115 125 137
-
Upload
khangminh22 -
Category
Documents
-
view
11 -
download
0
Transcript of biotechnology in animal husbandry

UDC636 Print ISSN 1450-9156Online ISSN 2217-7140
BIOTECHNOLOGY
IN ANIMAL HUSBANDRY
VOL 30, 1Founder and publisher
INSTITUTE FOR
ANIMAL HUSBANDRY
11080 Belgrade-Zemun
Belgrade 2014
CONTENTS
Review papers
M. SahraeiEFFECTS OF FEED RESTRICTION ON METABOLICE DISORDERS IN
BROILER CHICKENS: A REVIEW.......................................................................
Original scientific paper
R. Mosharraf, J. Shodja, M. Bohlouli, S. Alijani, S.A. RafatESTIMATION OF (CO)VARIANCE COMPONENTS AND BREEDINGVALUES FOR TEST-DAY MILK PRODUCTION TRAITS OF HOLSTEIN
DAIRY CATTLE VIA BAYESIAN APPROACH...................................................Ts. Maslev, Ts. Hristova, S. StoychevaSTUDY ON THE PERFORMANCE OF GONADOTROPIN-RELEASING
HORMONE (GnRH) IN THE PUERPERAL PERIOD OF BEEF COWS...........N. Deliæ, S. Aleksiæ, M.M. Petroviæ, V. Panteliæ, D. Ostojiæ-Andriæ, M. Petrièeviæ,D. NikšiæMETHODS FOR DETERMINING STRESS SYNDROME IN CALVES ANDITS RELEVANCE TO QUALITY OF MEAT.........................................................
A. Selim, M. El-haig, W. GaedeDUPLEX REAL-TIME PCR ASSAY TARGETING INSERTION ELEMENTSIS1081 AND IS6110 FOR DETECTION OF MYCOBACTERIUM BOVIS IN
LYMPH NODES OF CATTLE.................................................................................
S. Sadeghi, A. Rafat, M. BohlouliEFFECT OF CROSSBREEDING ON LINEAR UDDER SCORES AND THEIR
PHENOTYPIC RELATIONSHIPS IN IRANIAN FAT-TAILED
EWE’S........................................................................................................................A. Yakubu, M.M. Muhammed, I.S. Musa-AzaraAPPLICATION OF MULTIVARIATE LOGISTIC REGRESSION MODEL TO
ASSESS FACTORS OF IMPORTANCE INFLUENCING PREVALENCE OFABORTION AND STILLBIRTH IN NIGERIAN GOAT BREEDS........................
H. KhosraviniaHYPOLIPIDEMIC EFFECTS OF CARVACROL IN RELATION WITH SEXHORMONES IN BROILER CHICKEN ..............................................................…
M. Lalev, N. Mincheva, M. Oblakova, P. Hristakieva, I. IvanovaESTIMATION OF HETEROSIS, DIRECT AND MATERNAL ADDITIVEEFFECTS FROM CROSSBREEDING EXPERIMENT INVOLVING TWO
WHITE PLYMOUTH ROCK LINES OF CHICKENS..........................................
V. Petrièeviæ, M. Lukiæ, Z. Pavlovski, Z. Škrbiæ, �. Jokiæ, D. Vitoroviæ, M.PetrièeviæTHE EFFECT OF RAW SOYBEANS IN MIXTURES FOR LAYING HENS ON
PRODUCTION PERFORMANCE AND THE RELATIVE WEIGHT OF THEPANCREAS..............................................................................................................D. M. Ogah, M. KabirVARIABILITY IN SIZE AND SHAPE IN MUSCOVY DUCK WITH AGE:PRINCIPAL COMPONENT ANALYSIS................................................................
N. Stojanac, O. Stevanèeviæ, B. Saviæ, I. Stanèiæ, A. PotkonjakCOMPARISON SEROPREVALENCE OF SALMONELLA SPP. IN LARGEFARMS AND INDIVIDUAL PRODUCERS IN SERBIA......................................
1
15
29
37
45
61
79
89
103
115
125
137

V. Mandiæ, A. Simiæ, S. Vuèkoviæ, R. Stanisavljeviæ, Z. Tomiæ, Z. Bijeliæ, V.KrnjajaMANAGEMENT PRACTICES EFFECT ON SEED FEATURES OF ITALIAN
RYEGRASS FOLLOWING STORAGE PERIOD...................................................J. Ksiê¿ak, J. BojarszczukEVALUATION OF THE VARIATION OF THE CONTENTS OF ANTI-
NUTRIENTS AND NUTRIENTS IN THE SEEDS OF LEGUMES........................V. Krnjaja, J. Leviæ, S. Stankoviæ, T. Petroviæ, V. Mandiæ, Z. Tomiæ, A. ObradoviæPRESENCE OF DEOXYNIVALENOL IN WINTER WHEAT TREATED WITH
FUNGICIDES............................................................................................................
145
153
167

Journal for the Improvement of Animal Husbandry
UDC636 Print ISSN 1450-9156 Online ISSN 2217-7140
BIOTECHNOLOGY IN ANIMAL HUSBANDRY
Belgrade - Zemun 2014

Biotechnology in Animal Husbandry 30 (1), p 1-173, 2014 ISSN 1450-9156 Publisher: Institute for Animal Husbandry, Belgrade-Zemun UDC 636
Editorial Council Prof. Dr Milica Petrović, president Prof. Dr Lidija Perić, full prof. Prof. Dr Vojislav Pavlović, full prof. Dr. Zoran Lugić, science advisor Editor’ s Office Prof. Dr. Martin Wähner, Germany Dr. Branislav Živković, Serbia Dr. Marin Todorov, Bulgaria Dr. Milan M. Petrović, Serbia Prof. Dr. Kazutaka Umetsu, Japan Prof. Dr. Dragan Glamočić, Serbia Prof. Dr. Vigilijus Jukna, Lithuania Dr. Elena Kistanova, Bulgaria
Dr Miroslav Blagojević Dr Branka Vidić, science advisor Prof. Dr. Wladyslaw Migdal, Poland Prof. Dr. Colin Whitehead, United Kingdom Dr. Branislav Bobček, Slovak Republic Prof. Dr. Sandra Edwards, United Kingdom Dr. Vojislav Mihailović, Serbia Prof. Dr. Giacomo Biagi, Italy Prof. Dr. Stelios Deligeorgis, Greece Prof. Dr. Hasan Ulker, Turkey Dr. Catalin Dragomir, Romania
On behalf of publisher Miloš Lukić, PhD, Research Fellow, Director of the Institute for Animal Husbandry, Belgrade-Zemun, Serbia Editor in Chief Zlatica Pavlovski, PhD, Science Advisor, Institute for Animal Husbandry, Belgrade-Zemun, Serbia Deputy Editor in Chief Zorica Tomić, PhD, Science Advisor, Institute for Animal Husbandry, Belgrade-Zemun, Serbia Editor Miloš Lukić, Ph.D, Research Fellow, Institute for Animal Husbandry, Belgrade-Zemun, Serbia Section Editors Genetics and breeding Milan P. Petrović, Ph.D, science advisor Reproduction and management Miroslav Žujović, Ph.D, science advisor Nutrition and physiology of domestic animals Dragana Ružić-Muslić, Ph.D, senior research fellow
Food safety, technology and quality of animal products Stevica Aleksić, Ph.D, science advisor Sustainability of feed production and ecology Zorica Bijelić, Ph.D, research fellow Alternative production in livestock Zdenka Škrbić, Ph.D, senior research fellow
Language editor Olga Devečerski, grad. prof. Address of the Editor’s office Institute for Animal Husbandry, Autoput 16, P. Box 23, 11080 Belgrade-Zemun, Republic of Serbia Tel. 381 11 2691 611, 2670 121; Fax 381 11 2670 164; e-mail: [email protected]; www.istocar.bg.ac.rs Biotechnology in Animal Husbandry is covered by Agricultural Information Services (AGRIS) -Bibliographic coverage of abstracts; Electronic Journal Access Project by Colorado Altiance Research Libraries -Colorado, Denver; USA; Matica Srpska Library -Referal Center; National Library of Serbia; University Library "Svetozar Markovic", Belgrade, Serbia; EBSCO, USA; DOAJ and European Libraries
According to CEON bibliometrical analysis citation in SCI index 212, in ISI 9, impact factor (2 and 5) of journal in 2012: 0,667 and 0,467, - M51 category Annual subscription: for individuals -500 RSD, for organizations 1200 RSD, -foreign subscriptions 20 EUR. Bank account Institut za stočarstvo, Beograd-Zemun 105-1073-11 Aik banka Niš Filijala Beograd. Journal is published in four issues annually, circulation 100 copies. The publication of this journal is sponsored by the Ministry of Education and Science of the Republic of Serbia. Printed: "Mladost birošped", Novi Beograd, St. Bulevar AVNOJ-a 12, tel. 381 11 2601-506

Biotechnology in Animal Husbandry 30 (1), p 1-13, 2014 ISSN 1450-9156 Publisher: Institute for Animal Husbandry, Belgrade-Zemun UDC 636.084.5'635
DOI: 10.2298/BAH1401001S
EFFECTS OF FEED RESTRICTION ON METABOLIC DISORDERS IN BROILER CHICKENS: A REVIEW M. Sahraei Assistant Professor in Research Center of Agriculture and Natural Resources in Ardabil Province, Ardabil, Iran. Corresponding author: [email protected] Review paper
Abstract: Continuous genetic selection and improvement in nutrition have led to a very fast growth rate in modern strains of broiler chickens. Metabolic disorders such as ascits, sudden death syndrome and leg problems are related to a rapid early growth rate in poultry, especially in broilers, and their incidence can be decreased by slowing early growth. The use of management tools to reduce metabolic disorders that rely primarily on decreasing feed consumption, The feed restriction programs is on of the main techniques in growth curve manipulation for increasing production efficiency in broiler chicken in alleviate the incidence of some metabolic disorders and can be used to reduction the unfavorable effects of fast growth rate in broiler chicken production industry, and could be profitable in broiler chickens production efficiency. This article implicated on new findings in about different feed restriction programs effects on these problems in broiler chickens.
Key words: broiler chicken, feed restriction, metabolic disorders Introduction
Metabolic disorders have been a fact of life in poultry productions farms for at least the last few decades, exacerbated by the fast pace of improvements in the genetic potential of poultry for growth and efficiency. The genetic potential for growth and feed efficiency has been greatly improved in the last 50 years, during the last 50 years, the amount of time required reaching market weight, and the quantity of feed needed to produce a pound of meat, have been reduced by 50% (Anthony, 1998). While concomitant significant improvements have been accomplished in husbandry practices, disease prevention and nutrition, it has been estimated that 90% of the phenotypic changes in poultry have come from genetic progress (Havenstein et al., 1994).Unfortunately this growth rate is accompanied by increased body fat deposition, high mortality and high incidence of metabolic diseases and skeletal disorders (Zubair and Leeson, 1996). These situations more
M. Sahraei
2
commonly observed in fast growing broilers that are ad libitum fed that led to metabolic disorders in broiler chickens (Pasternak and Shalev, 1983; Nir et al., 1996). This fact is of economical concern because high incidence mortality and be come uneconomical product production efficiency. To saving of production cost and reducing the unfavorable effect of fast growth rate, there is interest in manipulate growth curve in broilers. Also about 60-70 % of the expenditures involved in poultry production are feeding costs. As such, the most reasonable phase in reducing the cost of broiler chicken production would be find possible methods, which are cheap, adequate and readily available for feeding livestock. One such method is restricting the amount of daily feed offer for sometime (Novele et al., 2009). Thus feed restriction programs have been proposed to overcome these problems. Feed Restriction Definition
Feed restriction is method of feeding that is time, duration and amount of feed were limited, has an impact on whether a bird is capable of achieving the same body weight as unrestricted birds (Ballay et al., 1992; Yu and Robinson, 1992). In general, feed restriction included of quantitative and qualitative restriction that is in quantitative to limiting the amount of feed daily given to the animals whereas a qualitative restriction is related to nutrient dilution in the diet. Feed Restriction Methods
Quantitative and qualitative feed restriction are procedures that con be applied to manipulate the feeding strategies of poultry in order to decrease growth, and metabolic rate to some extent and so alleviate the incidence of some metabolic disorders as well as improving feed conversion in broiler chickens. These methods include: physical feed restriction, limiting the level of consumption of feed in time (skip-a-day feeding) or reducing the time of illumination of feeding (Religious et al., 2001), diet dilution, chemical methods of feed restriction and use of low protein or low energy diets (Zubair and Lesson, 1996). Physical feed restriction
This method is one of the common procedure was used in controlling feed intake in poultry. Physical feed restriction supply a calculated amount of feed per bird, which is often just enough to meet maintenance requirements (Plavnik and Hurwitz, 1989). But practical application of physical feed restriction is not simple due to the problems of regularly weighing birds, and calculating feed consumption on a daily basis. Moreover, it is necessary to provide sufficient feeder space in order to prevent competition among restricted birds and to prevent unequal growth of birds within a flock. Also in this method should be attention to educate consuming of micronutrient, coccideoastat and etc. Physical feed restriction programs for broilers have been extensively studied (Sahraei and Mohammadi

Effects of feed restriction on metabolice ...
3
hadloo, 2012; Scheideler and Baughman, 1993). Severity of feed restriction, length of restriction, and age at marketing are the main factors to take into account in a feed restriction program for broilers. Quantitative feed restriction has been observed to reduce mortality and culling (Fontana at al., 1992), improve feed conversion ratio (Lee and Lesson, 2001) and allow a complete recovery of body weight if the degree of restriction was not too severe and slaughter ages were extended beyond 6 weeks (Deaton, 1995). Dozier et al. (2002), referred to feed restriction programs of yielding inconsistent results in the literature and that variation maybe partially attributed to differences in bird management, lighting, strain and ventilation. Although the level of early feed restriction is an important factor influencing the broiler chicken response, early feed restriction at 30% of ad libitum intake was not able to influence broiler chicken performance at market age of 49 days (Giachetto et al., 2003). Skip-a-day feeding
Skip-a-day deprivation of feed is a technique for restricting early growth and has not been extensively studied in broiler chickens (Dozier et al., 2002). But these programs providing limited allotments are commonly used in broiler breeder’s growth restriction. Removing feed for 8-24 hour periods during the starter period reduces early rapid growth and meat yield in broiler chickens. Skip-a-day feed removal has been reported in other studies to decrease early growth and reduce the incident of ascites without affecting final body weight (Arce et al., 1992; Ballay et al., 1992). Oyedeji and Atteh (2005) reported reduction in feed intake after exposing the birds to fasting on every other day, also showed that skip-a day feeding for 3 weeks starting at day-old would improve carcass quality and reduce sudden death syndrome which is often associated with birds that are on ad libitum feed intake. Lighting programs
Birds are very sensitive to light. Light allows the birds to establish rhythmcity and synchronize many essential functions, including body temperature and various metabolic steps that facilitate feeding and digestion (Olanrenwaju et al., 2006). Light intensity, color, and the photoperiodic regime can affect the physical activity of broiler chickens (Lewis and Morris, 1998). In the common production methods, broiler chickens are raising under 23 h light per day, because it is thought that under this light regimen feed intake is greater and therefore growth rate is suitable. Although lighting programs are not categorized in the literature as a feed restriction method it has been applied. It is known that by changing lighting periods by either reducing the hours of light or developing intermittent schedules feed utilization is improved (Apeldoorn et al., 1999). The incidence of leg abnormalities is also lowered by reducing the hours of light per day (Classen and Riddell, 1989) as is mortality and specifically sudden death

M. Sahraei
4
syndrome (Blair et al., 1993). The so called step-don and step-up lighting programs (Classen and Riddell, 1989) have attained popularity because of reduced incidence of leg abnormalities, sudden death syndrome and mortality while maintaining the same market weight for age. Broilers under different reduced lighting programs therefore, will reduce their feed intake, and so this program can be included within the definition of feed restriction. However, broilers do learn to eat during darkness when hours of lighting are low (Morris, 1986). Buyse et al. (1998), who showed improved feed conversion and compensatory growth in male broiler chickens at 41 days with a light schedule from day 7 of 1L: 3D repeated six times daily. The use of lighting programs has the advantage of reducing electricity costs, the incidence of leg abnormalities and sudden death syndrome, and of improving feed efficiency with no reduction of weight at market age. Diet dilution
The most problems form of physical feed restriction is usually considered to be maintenance allowance, described by Plavnik and Hurwitz (1989) at 1.5 kcal ME/gBW0.67/d. But for very young birds, this means a very small quantity of feed is distributed daily, and so this leads to the alternate concept of diet dilution. Therefore many investigators have used diet dilution as an alternative method of nutrient restriction because of the advantage of attaining a more consistent growth pattern within a flock ( Sahraei and Shariatmadari, 2007). In this method diets are mixed with non-digestible ingredients such as fiber, and so are of reduce nutrient density. The use of diluted diets relies upon the fact that broiler chickens eat close to their physical intake capacity (Newcombe and Summers, 1984). Jones and Farrell (1992) used 50 to 65% diet dilution with rice hulls in order to retard early growth. This technique appeared to be successful, and even though these birds ate more feed, adjustment was insufficient to normalize nutrient intake, and so growth rate was reduced. In many of these physical feed restriction or diet dilution studies, there are reports of reduced body fat deposition, although this effect seems variable. The most consistent feature of all these studies, regardless of method of implementation, is improved feed efficiency. Griffiths et al. (1977) lowered the energy of a broiler chicken diet to 2233 kcal ME/kg DM from 3087 kcal ME/kg DM of feed by substituting ground yellow corn with oat meal as the main ingredient. Chickens fed the low energy diet consumed significantly more feed than those fed the high energy diet. When fed the low energy diet from 0 to 3 weeks of age, the chicks were not significantly different in body weight or in abdominal fat pad development from the ad libitum birds at 4 weeks of age. Sahraei and Shariatmadari(2007) was used of different levels of finisher diet diluted with sand and wheat bran (wt:wt) (in levels 7, 14, 21 or 28%) of Arian strain. showed that feed intake in different levels was more than control birds. But live weight (at 45 ages), body weight gain only in 28% levels were less than control birds.

Effects of feed restriction on metabolice ...
5
Use of low protein or low energy diets For retardations of growth rate in broiler chickens can be used of diets with
low energy and protein concentrations. This method has an advantage in that it does not need any additional labor of weighing the feed, and is accomplished by lowering the level of either protein or energy. In normal conditions broilers are given 22%, 20%, and 18% of crude protein in the starter, grower, and finisher periods respectively, and 3200 kcal ME kg diet (NRC, 1994). When broilers are fed with low nutrient dense diets they will increase their feed intake in an attempt to maintain nutrient intake (Leeson and Summers, 1997). The study of Plavnik and Hurwitz (1989) showed that broilers fed ad libitum with a 9.4% crude protein diet from 8 to 14 days markedly reduced their feed intake and weight gain by about 57% and 41% respectively. This reduction in feed intake may have been due to of a protein and amino acid deficiency, since other nutrients were at normal levels. But Rosebrough and McMurtry (1993) showed the effect of 6 days of diet energy restriction in broiler chickens, the restriction period was from 6 to 12 days and was designed to only support the maintenance requirements for body weight. Body weight at 54 days was achieved for birds given feed ad libitum from day 13 to 54, and for those fed ad libitum from 21 days onward. Feed efficiency was not significantly different between restricted and unrestricted birds. Leeson and Summers (1997) utilized finisher diets varying in energy level from 2700 to 3300 kcal ME kg and showed no significant difference in body weight at 49 days. There was increased feed intake by birds fed the lower energy level diets. Leeson et al. (1996) reported that diluting commercial broiler chicken diets from 35 to 49 days of age with oat hulls and sand, which led to the diets deficient in energy content, caused a significant reduction in body weight at 42 days of age, although the growth was compensated thereafter. Birds seemed to maintain energy intake, therefore there was increased feed intake with energy deficient diet. Feed textures
Feed forms such as pellet, crumble, mash and particle size also influences broiler growth and development (Jones et al., 1995). Broilers fed crumble-pellet diets show improved weight gain, feed intake, and feed conversion ratio compared to birds fed mash (Calet, 1965). Also, the consumption of mash feed at different phases of the broiler's growth may be employed as a method of limiting feed intake. Birds offered mash spend more time consuming their feed compare to birds fed pellets (Savory, 1996), and therefore, expend more energy in this process. Nir et al. (1995) fed male and female broilers to 49 days with mash or crumble diets during the starter and grower periods, and mash or pellets for the finisher period. Males showed a significant increase in body weight and improved feed conversion when fed pelleted compared to mash diets. On the other hand, the improvement in performance was not evident for females, which showed no significant difference either in body weight or feed conversion ratio at 49 days of age. Mortality was

M. Sahraei
6
higher in birds fed pelleted diets. These results are in agreement with those of Jones et al. (1995) and Hamilton and Proudfoot (1995) where an improved weight gain and feed conversion at 6 weeks of age were obtained in birds fed pelleted compared to mash diets. The improvement in broiler performance with pelleted diets may be attributable to a greater digestibility of carbohydrates together with increased daily nutrient intake(Hamilton and Proudfoot, 1995), Also because chicks fed pelleted diets spend less time and energy feeding, they were less active than mash-fed birds (Nir et al., 1994), and so spend less energy for maintenance. Chemical Methods
The other method that has been used to reduce feed intake in broilers is the use of chemicals or pharmacological agents. It has an advantage of equally distributing the feed among flock and so decreasing the variations in growth than can take place with physical feed restriction. Restriction of feed intake of broiler chickens by chemical methods was suggested by Fancher and Jensen (1988). Also Pînchasov and Jensen (1989) used 1.5 or 3% glycolic acid as an anorectic agent from 7 to 14 days in order to suppress the feed intake of chicks. Feed intake was severely reduced, resulting in 22% and 50% weight reduction with 1.5% or 3.0% glycolic acid inclusion respectively. Oyawoye and Krueger (1990) showed that 400 and 300 mg of phenylpropanolamine hydrochloride or monensin sodium per kg of diet, respectively, significantly decreased body weight of the broiler chickens at 4 weeks of age. Savory et al.(1974) used of 50g/kg of calcium propionate as an appetite suppressor and showed that weight gains of chemically restricted birds were close to those obtaining under a recommended program of quantitative feed restriction for female broiler breeders between 2 to 6 weeks of age. Effect of feed restriction on metabolic disorders
Metabolic disorders may be classed as illness associated with a failure in one of the body hormone or enzyme systems, storage disease related to lack of metabolism of secretary products because of the lack of production of a specific enzyme, or the failure or reduced activity of some metabolic function, in poultry it is usual to include under the heading of ‘metabolic disorders’ those conditions associated with increased metabolism, rapid growth rate or high egg production that result in the failure of a body system because of the increased work-load on that organ or system(Julian, 2005), Early fast growth in modern broilers is associated with increased stress on the birds and can result in metabolic and skeletal disorders that lead to economic losses due to reduced animal performance, high mortality rates and carcass condemnation at slaughter houses (Cuddington, 2004). The benefits of early feed restriction are the monetary savings obtained by improved feed conversion, reduced sudden death syndrome (Bhatt and Banday, 2000), reduced death losses, ascites (Arce et al., 1992) and reduced skeletal disease (Robinson et al., 1992).

Effects of feed restriction on metabolice ...
7
Ascites Ascites is not a disease; it is a sign or lesion that may result from one or
more of four physiological changes that cause an increased production or decreased removal of peritoneal lymph. Ascites may be associated with obstruction of lymph drainage as occurs in peritoneal carcinosis secondary to carcinoma of the oviduct; ascites may result from decreased plasma oncotic pressure, as occurs in anaemia or hypoproteinaemia. Ascites or edema may result from fluid leakage secondary to increased vascular permeability following oxidative or chemical damage but by far the most frequent cause of ascites in birds is increased portal pressure, secondary to right ventricular failure (RVF) or liver damage(Julian, 1993). The growth rate or body weight gain in broilers has been shown to positively correlate with incidence of ascites. Broilers genetically selected for fast muscle growth seem more susceptible to ascites compared with slow-growing strains. Manipulation of the early growth cycle of broilers, with a subsequent compensatory gain, seems a practical and viable method to minimize losses caused by ascites. In this context, various feed restriction programs have been tested. Acar et al.(1995) studied the effect of early age feed restriction on the subsequent growth and the incidence of ascites in broilers. A feed restriction regimen was used from either 4-11 (feed restriction) or 7-14 (feed restriction) days of age, consisting of limiting daily intake of the birds to 75% of the ME required for normal growth. It was concluded that although ascites mortality could be significantly reduced in early feed-restricted birds, there was a decrease in body weight and breast meat yield in restricted vs. full-fed birds Increases in the incidence of ascites in broiler chickens coincide with continuing genetic and nutritional improvements in enhanced feed efficiency and rate of growth. Ascites is a condition in which the body cavity accumulates serous fluid, leading to carcass condemnation or death. It is a consequence of cardiopulmonary insufficiency in rapidly growing broiler chickens (Julian et al., 2000; Buyse et al., 1998). Changes in feeding and lighting regimens can cause growth restriction (Baghbanzadeh and Decuypere, 2008). The hypoxemia related to a high metabolic rate in broilers can be partially prevented by limiting the intake energy via feed restriction (Balog, 2003). Sudden death syndrome (SDS)
Sudden death syndrome (SDS) is the name given to death in healthy, fast-growing, commercial meat type broilers that die suddenly. It has been recognized as a specific condition since the 1950s when broiler chickens began to be grown commercially in large numbers. SDS occurs in all countries where broilers are grown rapidly under intensive conditions, young, healthy, fast-growing boiler chickens die suddenly while standing, walking, sparring or feeding; they die with a short terminal wing-beating convulsion and frequently are found on their back (Julian, 1996). The important disorders that in feed restriction researches had been interested, is SDS, this problems is own of the costly factors in broiler chickens

M. Sahraei
8
production industry. This syndrome mostly is taking placed in heavier birds in the flock. Sudden death syndrome (SDS) has been recognized for over 30 years, and is also referred to as acute death syndrome or “flip-overs”. It is most common in males when their growth rate is maximized. Mortality may start as early as 3 to 4 days, but most often peaks at around 3to 4 weeks of age, with affected birds being found dead on their back. Mortality may be found at 1.5 to 2.0% in mixed-sex flocks and as high as 4% in male flocks only (George, 2007). Poultry nutritionist suggested that the high growth rate in modern broiler chicks is the main reason for these problems. In the experiments of Bowes et al.(1998) by feed restriction about 25 % of ad libitum feed intake showed that SDS occurrence in feed restriction groups 0 % and in ad libitum feed intake groups 3.33 %. But in some experiments no significant difference were observed between control and feed restriction groups (Deaton, 1995; Scheideler and Baughman, 1993). The reduction in body weight for the high-density group was attributed to an increase in metabolic stress, because there was an increase in mortality (SDS and ascites) in broilers fed the high-density ration in contrast to those fed the low-density ration (Scott, 2002). Lowering energy intake by changing feed texture or density (mash), or management methods such as feed restriction or long dark periods (Classen and Riddell, 1989) will reduce mortality from SDS. Leg problems
Failure of change of the proliferating avascular, prehypertrophying, growth plate cartilage to hypertrophying cartilage to allow it to be replaced by bone at the lower edge of the growth plate results in an abnormal mass of cartilage under the growth plate. This lesion is called dyschondroplasia (Farquharson and Jefferies, 2000). In growing birds of meat-type strains, which have been selected over the past 50 years for fast growth, the most common skeletal defects occur in leg bones and joints. It has been generally assumed that rapid weight gain has been a major cause of TD (Tibial dyschondroplasia). Despite evidence that there is no genetic correlation between TD and body weight (Kuhlers and McDaniel, 1996), nutritional evidence suggests that dietary regimens that depress growth rate decrease the incidence of TD (Lilburn et al.1989). The retardation in growth rate can be achieved by either qualitative or quantitative food restriction (Edwards and Sorensen,1987).Robinson et al.(1992)demonstrated that severe feed restriction in the second week of growth significantly reduced the incidence of skeletal disease in broiler chickens. These researchers reported that in three separate experiments, the incidence of skeletal disease was three-fold higher in full-fed birds compared to birds that were feed restricted. A reduction in the incidence of leg disorders and sudden death syndrome was also observed in broiler chickens exposed to intermittent light or a step-up lighting regimen (Wilson et al., 1984, Ononiwu et al., 1979). One strategy to reduce leg weakness includes manipulating the rate of growth. Altering dietary energy and protein levels, implementing early feed

Effects of feed restriction on metabolice ...
9
restriction, and offering various feed forms have all been strategies previously used to manipulate the growth rate in broilers (Lilburn et al. 1989). The use of low-density rations has been shown to significantly reduce the early growth rate of broiler chickens; however, regulating broiler lighting programs is also a management factor that can be manipulated to lessen the occurrence of skeletal abnormalities, by increasing exposure to darkness, the growth rate of broiler chickens can be reduced (Edwards, 2000). In conjunction with this reduced rate of growth, a corresponding decrease in the incidence of leg abnormalities and metabolic disorders has been reported (Wilson et al., 1984; Lilburn et al. 1989). Conclusion
In general, the potential of feed restriction programs as a management’s tool, related to decreasing the incidence of metabolic disease, carcass fat deposition, reduce maintenance requirements and improvement of feed efficiency in broiler chickens production. Also can be lead to economical saving in cost of feeding in broiler chicken production, thus may be usefulness for commercial broiler chicks production farms. Efekti restriktivne ishrane na metaboličke poremećaje kod brojlera M. Sahraei Rezime
Kontinuirana genetska selekcija i poboljšanje ishrane doveli su do veoma brze stope rasta u savremenim hibridima brojlera. Metabolički poremećaji, kao što su sindrom iznenadne smrti i problemi nogu se odnose na brzi početni porast živine, posebno brojlera, a njihova pojava može biti smanjena usporavanjem ranog porasta.Upotreba metoda za smanjenje metaboličkih poremećaja se oslanja pre svega na smanjenje potrošnje hrane. Restriktivni program ishrane je jedan od glavnih tehnika u manipulaciji krive rasta za povećanje efikasnosti proizvodnje brojlerskih pilića i ublažavanju pojave nekih metaboličkih poremećaja i može da se koristi do smanjenja nepovoljnih efekata izazvanih brzom stopom porasta u brojlerskoj proizvodnji, odnosno živinarskoj industriji, i može biti profitabilan u povećanju efikasnosti brojlerske proizvodnje. Ovaj rad ukazuje na nova saznanja u vezi sa uticajem različitih restriktivnih programa ishrane na ove probleme kod brojlera.

M. Sahraei
10
References ACAR N., SIZEMORE F.G., LEACH G.R., WIDEMAN R.F., OWEN R.L., BARBATO G.F.(1995): Growth of broiler chickens in response to feed restriction regimens to reduce ascites. Poult.Sci. 74 : 833-843. ANTHONY N.B. (1998): A review of genetic parameters in poultry: Efforts to improve meat quality. J. Muscle Foods. 9:25-33. APELDOORN E.J., SCHARAMA J.W., MACHALY M.M., PARMENTIER H.K. (1999): Effect of melatonin and lighting schedule on energy metabolism in broiler chickens. Poult. Sci. 78: 223-229. ARCE J., BERGER M., COELLO C.L.(1992): Control of ascites syndrome by feed restriction techniques. J. Appl. Poult. Res. 1:1–5. BAGHBANZADEH A., DECUYPERE, E. (2008): Ascites syndrome in broilers: Physiological and nutritional perspectives. Avian Pathol. 37:117–126. BHATT G.A., BANDAY M.T. (2000): Effect of feed restriction on the performance of broiler chickens during the winter season. Indian J. of Poult. Sci. 35:112-114. BALOG J.M. (2003): Ascites syndrome (pulmonary hypertension syndrome) in broiler chickens: are we seeing the light at the end of the tunnel? Avian Poult. Biol. Rev. 14:99–126. BALLAY M., DUNNINGTON E.A., GROSS B.W., SIEGEL P.B. (1992): Restricted feeding and broiler performance: age at initiation and length of restriction. Poult. Sci. 71: 440-447. BLAIR R., NEWBERRY R.C., GARDINER E.E. (1993): Effects of lighting pattern and dietary tryptophan supplementation on growth and mortality of broilers. Poult. Sci. 72:495–502. BOWES V.A., JULIAN R.J., JULIAN L.S., STIRTZINGER L., STIRTZINGER T. (1988): Effect of feed restriction on feed efficiency and incidence of sudden death syndrome in broiler chickens. Poult. Sci., 67(7): 1102-1104. BUYSE J., DECUYPERE E. (1988) The influence of intermittent light on broiler performance and on paterns of food intake. Pages 133-134 in: Leanness in restrict Birds. Genetics, Metabolic and Hormonal Aspects. BUYS N., BUYSE J., HASSANZADEH M., LADMAKHI DECUYPERE E. (1998)Intermittent lighting reduces the incidence of ascites in broilers: an interaction with protein content of feed on performance and the endocrine system. Poult. Sci. 77:54-61. CALET C.( 1965) The relative value of pellets versus mash and grain in poultry nutrition. World Poult. Sci.J. 21: 23-52. CLASSEN H.L., RIDDELL C. (1989) Early growth rate and lighting effects on broiler skeletal disease. Poult. Sci. 69(Suppl. 1):35. (Abstr.)

Effects of feed restriction on metabolice ...
11
CUDDINGTON S. (2004) High energy diets affect broiler chicken welfare. http://www.facs.sk.ca/pdf/animal_care_award/articles_2004/cuddington_chickens.pdf DEATON J.W.(1995) The effect of early feed restriction on broiler performance. Poult. Sci. 74:1280-1286. DOZIER W.A., LIEN R.J., HESS J.B., BILGILI S.F., GORDON R.W., LASTER C.P., VIEIRA S.L. (2002) Effects of Early Skip-a-Day Feed Removal on Broiler Live Performance and Carcass Yield. J. Appl. Poult. Res. 11:297–303. EDWARDS, H.M.JR., SORENSEN P. (1987) Effect of short fasts on the development of tibial dyschondroplasia in chickens. J. of Nutr. 117, 194-200. EDWARDS JR. H.M. (2000) Nutrition and skeletal problems in poultry.Poultry Science 79,1018–1023. FANCHER B I., JENSEN L.S. (1988) Induction of voluntary feed intake restriction in broiler chicks by dietary glycolic acid supplementation. Poult. Sci. 67:1469–1482. FARQUHARSON C., JEFFERIES D. (2000) Chondrocytes and longitudinal bone growth: the development of tibial dyschondroplasia. Poult. Sci. 79, 994–1004. FONTANA E.A., WEAVER W.D., WATKINS JR.B.A., DENBOW D.M. (1992) Effect of early feed restriction on growth, feed conversion, and mortality in broiler chickens. Poult. Sci. 71:1296 – 1305. GEORGE Q. (2007) Reduction of Early Mortality in Broiler Chickens through Nutrition and Management: Champion Feed service limited:www.championfeeds.com, www.championfeeds.com., pp. 1-2. GIACHETTO P.F., GUERREIRO E.N., FERRO J.A., FERRO M.I.T., FURLAN R.L., MACARI M. (2003)Desempenho e perfil hormonal de frangos alimentados com diferentes niveis energeticos apos restrição alimentar. Pesquisa Agropecuaria Brasileira 38(6): 697-702. GRIFFITHS L., LEESON S., SUMMERS J.D. (1977) Fat deposition in broilers: Effect of dietary energy to protein balance and early life caloric restriction on productive performance and abdominal fat pad size. Poult. Sci. 56: 638-646. JONES G.P.D., FARRELL D.J.(1992)Early life food restriction of the chicken. I. Methods of application, amino acid supplementation and the age at which restriction should commence. Br.Poult. Sci. 33:579 - 587. JONES F.T., ANDERSON K.E., FERKET P.R.(1995) Effect of extrusion on feed characteristics and broiler chicken performance. J. Appl. Poult. Res. 4:300-309. JULIAN R.J. (1996) Cardiovascular disease. In: Jordan, F.T.W.,Pattison, M. (Eds.), Poultry Diseases, fourth ed. W.B. Saunders Company Ltd., London, pp. 343–374. JULIAN R.J. (1993) Ascites in poultry. Review article. Avian Pathol, 22, 419–454. JULIAN R.J. (2000) Physiological management and environmental triggers of the ascites syndrome. Avian Pathol, 29:519–527.

M. Sahraei
12
JULIAN R.J. (2005) Production and growth related disorders and other metabolic diseases of poultry – A review. The Vet. J.169 : 350–369 HAMILTON R. M. G., PROUDFOOT F. G. (1995) Ingredient particle size and feed texture: effects on the performance of broiler chickens. Anim. Feed Sci. Technol. 51: 203–210. HAVENSTEIN G.B., FERKET P.R., SCHEIDELER S.E., LARSON B. T. (1994) Growth, livability, and feed conversion of 1957 vs 199 1 broilers when fed Typical"1957 and 1991 broiler diets. Poult. Sci. 73: 1785-1794. KUHLERS D. L., MCDANIEL, G. R. (1996) Estimates of heritabilities and genetic correlations between tibial dyschondroplasia expression and body weight at two ages in broilers. Poul. Sci. 75, 959-961. LEESON S., CASTON L., SUMMERS J.D. (1997) Broiler response to energy or energy and protein dilution in the finisher diet. Poult. Sci. 75: 522-528. LEESON S., ZUBAIR K. (1997) Nutrition of the broiler chicken around the period of compensatory growth. Poult. Sci. 76: 992-999. LEE K.H., LEESON S. (2001) Performance of broilers fed limited quantities of feed or nutrients during seven to fourteen days of age. Poult. Sci. 80:446–454. LEWIS P.D., MORRIS, T.R. (1998) Responses of domestic poultry to various light sources. Word’s Poult. Sci. J. 54:72-75. LILBURN M. S., LAUTERIO T.J., NGIAM-RILLING, K., SMITH, J. H. (1989) Relationships among mineral balance in the diet, early growth manipulation and incidence of tibial dyschondroplasia in different strains of meat type chickens, Poult. Sci. 68, 1263-1273. MORRIS T.R. (1986)Light requirement of the fowl. In: environmental control in poultry production. Carter, T.C. (Ed), Edinburgh, Oliver and Boyod, pp. 15-39. NRC (1994) Nutrient Requirements of Poultry. 9th Revised edition, National Academy Press, Washington, DC. NEWCOMBE M., SUMMERS J.D. (1984) Effect of pervious diet on feed intake and body weight gain of broiler and Leghorn chicks. Poult. Sci. J., 63:1237-1242. NIR I., HILLEL R., PTICHI I., SHEFET G. (1995) Effect of particle size on performance. 3. Grinding pelleting interactions. Poult. Sci. 74:771–783. NIR I., NITSAN Z., DUNNINGTON E.A., SIEGEL P.B.(1996) Aspects of food intake in young domestic fowl: Metabolic and genetic considerations. World Poult. Sci.J. 52: 251-266. NOVELE D.J., NG’AMBI J.W., NORRIS D., MBAJIORGU C.A. (2009) Effect of different feed restriction regimes during the starter stage on productivity and carcass characteristics of male and female Ross 308 broiler chickens. Int. J. Poult. Sci., 8(1): 35-39. OLANREWAJU H.A., THAXTON J.P., DIZIER W.P., PURSUEL, J., ROUSH W.B., BRANTON S.L. (2006) A review of lighting programs for broiler production. Inter. J.of poult. Sci. 5(4): 301-308. Ononiwu J.C., Tbomson RG., Carlson H.C., Julian RJ. (1979) Studies on the effect of lighting on "sudden death syndrome" in broiler chickens. Can. Vet. J.

Effects of feed restriction on metabolice ...
13
OYEDEJI J.O., ATTEH J.O. (2005) Response of broilers to feeding manipulations. Inter. J. of Poult.Sci. 4(2): 91-95. F.(1990) Potential of chemical regulation of food intake and body weight of broiler breeder chick. Br. Poult. Sci. 31:735-742. PASTERNAK H., SHALEV B.A. (1983) Genetic economic evaluations of traits in a broiler enterprise: reduction of food intake due to increased growth rate. Br.Poult. Sci. 24531-536. PINCHASOV Y., JENSEN L.S. (1989) Comparison of physiological and chemical means of feed restriction in broiler chicks. Poult. Sci. 68:61-69. PLAVNIK I., HURWITZ S. (1989) Effect of dietary protein, energy and feed pelleting on the response of chicks to early feed restriction. Poult. Sci. 68:1118 – 1125. RELIGIOUS K.B., TESSERAUD. S., PICCADY O.A. (2001) Food neonatale and early development of table fowl. 2001, INRA. Production. Animal., 14, 219-230. ROBINSON F., CLESSEN H L., HPNSON J.A., ONDERKP D.K. (1992) Growth performance, feed efficient and the incidence of skeletal and metabolic disease in fa-fed and feed restricted broiler and roaster chickens. J. Appl. Poultry Res. 1:33-41. ROSEBROUGH R.W., MCMURTRY J.P. (1993) Energy repletion and lipid metabolism during compensatory gain in broiler chickens. Growth Dev. and Aging. 57:73-83. SAHRAEI M., SHARIATMADARI F. (2007) Effect of different levels of diet dilution during finisher period on broiler chickens performance and carcass characteristics. Int. J. Poult. Sci., 6(4): 280-282. SAHRAEI M., MOHAMMADI HADLOO M. (2012) Effect of Physical Feed Restriction in Finisher Period on Carcass Traits and Broiler Chickens Performance Global Vet. 9 (2): 201-204, 2012 SAVORY C.J. (1974) Growth and behavior of chickens fed on pellets or mash.Br. Poult. Sci. 15:281-286. SCHEIDELER S.E., BAUGHMAM G.R. (1993) Computerized early feed restriction programs for various strains of broilers. Poult. Sci 72: 236-242. SCOTT T. A. (2002) Evaluation of lighting programs, diet density, and short-term use of mash as compared to crumbled starter to reduce incidence of sudden death syndrome in broiler chicks to 35 days of age. Can. J. Anim. Sci. 82:375–383. WILSON L.J., WEAVER JR., W.D., BEANE, W.L., CHERRY, A.(1984) Effects of light and feeding space on leg abnormalities in broilers. Poult. Sci. 63:565-567. YU, M.E., ROBINSON F.E. (1992) The application of short-term feed restriction to broiler chicken production: A review. J.of Appl. Poult. Res.1:147 – 153. ZUBAIR A.K., LEESON S. (1996) Compensatory growth in the broiler chicken: a review. World's Poult. Sci. 52:189-201. Received 25 November 2013; accepted for publication 25 January 2014

Biotechnology in Animal Husbandry 30 (1), p 15-28, 2014 ISSN 1450-9156 Publisher: Institute for Animal Husbandry, Belgrade-Zemun 082'632
DOI: 10.2298/BAH1401015M
UDC 636.
ESTIMATION OF (CO)VARIANCE COMPONENTS AND BREEDING VALUES FOR TEST-DAY MILK PRODUCTION TRAITS OF HOLSTEIN DAIRY CATTLE VIA BAYESIAN APPROACH R. Mosharraf, J. Shodja, M. Bohlouli*, S. Alijani, S.A. Rafat Department of Animal Science, University of Tabriz, 29th Bahman Bolvard East Azarbaijan, Tabriz, Iran Corresponding author: [email protected] Original scientific paper
Abstract: Genetic parameters of milk, fat, and protein yields were estimated
in the first lactation of Holstein dairy cattle. The records were collected during the period 2006 to 2011 and analyzed fitting the random regression model. The data included 41178, 25397 and 18716 test-day records of milk, fat and protein yields, respectively that produced by 4746, 3437 and 2525 cows respectively. Fixed effects in model included herd-year-month of test day and age-season of calving. The fixed and random regressions were modeled with normalized Legendre polynomials and (co)variance components were estimated by Bayesian method and Gibbs sampling was used to obtain posterior distributions. Estimates of heritability for milk, fat and protein yields ranged from 0.18 to 0.26; 0.06 to 0.11 and 0.09 to 0.22, respectively. Heritabilities for 305-d milk, fat and protein yields were 0.36, 0.23 and 0.29, respectively. For milk and protein yields, heritabilities were lower at the early of lactation due to the trends of lower additive genetic variance, higher permanent environmental variance. Genetic correlations for milk, fat and protein yields ranged from 0.14 to 1.00; 0.39 to 1.00 and 0.27 to 1.00, respectively. Ranges of estimated breeding values for 305-d yield of milk, fat and protein yields were from -1194.48 to 1412.44; -210.57 to 271.22 and -194.08 to 203.25, respectively. According to the results of this study, random regression model seems to be a flexible and reliable procedure for the genetic evaluation of milk production traits and it can be useful in the breeding programs for Iranian dairy cattle.
Key words: Bayesian method, genetic correlation, heritability, test day
record

R. Mosharraf et el.
16
Introduction
The topic of genetic evaluation of dairy cattle using random regression model (RRM) has been investigated by several researches, and some countries have already implemented routine genetic evaluation of large commercial dairy populations using a RRM. Random regression model were introduced by Henderson (1982). Schaeffer and Dekkers (1994) suggested their use in dairy cattle breeding for the analysis of test day production records. There are several advantages of using RRM compared with 305-d of lactation. The 305-d yields are predicted from few observations may give rise to bias (Jakobsen et al., 2002). Furthermore, short lactations on culled cows or records in progress must be extended, which also may lead to bias. In a RRM, extension procedures are not needed, and temporal environmental effects of individual test days can be taken into account (Ptak and Schaeffer, 1993; VanRaden, 1997). Areas of dairy cattle breeding that have already utilized RRM include milk production, persistency, body weight, fertility, disease, feed intake.
In milk production traits, the RRM analysis provides many solutions for each animal, and from these solutions, estimated breeding value (EBV) of each animal can be calculated for each part of lactation. Variance and covariance components for the RRM were estimated by Jamrozik and Schaeffer (1997) from a data file of records for 6516 Canadian Holstein cows and 50,412 test-days (TD). A total of 45 parameters were estimated for a single-trait RRM for milk, fat, and protein yields during first lactation. In recent years, there has been increased emphasis on estimating genetic parameters of milk production traits using RRM that have been reported for several cow populations by fitting various functions to model (Jakobsen et al., 2002; Hammami et al., 2008; Bohlouli et al., 2013). Nevertheless, national genetic evaluation for production traits is carried out using 305 days records by Animal Breeding Center of Iran.
The main purpose of present study was to estimate the genetic parameters of milk production traits of Holstein dairy cattle via RRM. This paper describes how the RRM solutions can be utilized for selection.
Material and Methods Data:
Data consisted of TD records milk, fat and protein yields of Holstein dairy cows and were collected by Animal Breeding Center of Esfahan, Iran. Records of the first lactation of cows calving between 2006 and 2011 were considered in the analyses. Daily records for milk, fat, and protein yields were in the ranges 2.0 to 64 kg, 0.07 to 3.62 kg and 0.09 to 2.20 kg respectively. Cows were required to have a
Estimation of (co)variance ...
17
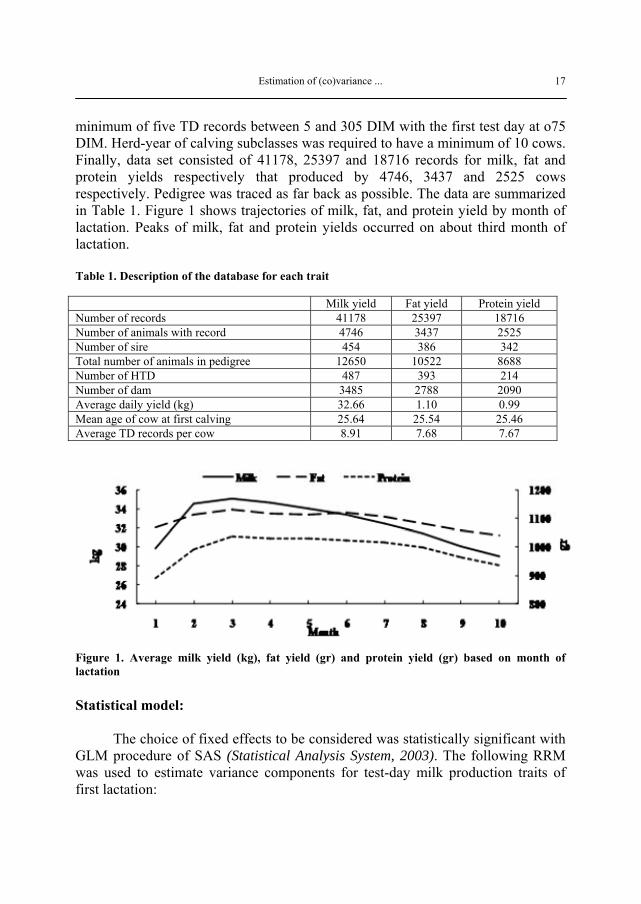
minimum of five TD records between 5 and 305 DIM with the first test day at o75 DIM. Herd-year of calving subclasses was required to have a minimum of 10 cows. Finally, data set consisted of 41178, 25397 and 18716 records for milk, fat and protein yields respectively that produced by 4746, 3437 and 2525 cows respectively. Pedigree was traced as far back as possible. The data are summarized in Table 1. Figure 1 shows trajectories of milk, fat, and protein yield by month of lactation. Peaks of milk, fat and protein yields occurred on about third month of lactation.
Table 1. Description of the database for each trait
Milk yield Fat yield Protein yield Number of records 41178 25397 18716 Number of animals with record 4746 3437 2525 Number of sire 454 386 342 Total number of animals in pedigree 12650 10522 8688 Number of HTD 487 393 214 Number of dam 3485 2788 2090 Average daily yield (kg) 32.66 1.10 0.99 Mean age of cow at first calving 25.64 25.54 25.46 Average TD records per cow 8.91 7.68 7.67
Figure 1. Average milk yield (kg), fat yield (gr) and protein yield (gr) based on month of lactation Statistical model:
The choice of fixed effects to be considered was statistically significant with GLM procedure of SAS (Statistical Analysis System, 2003). The following RRM was used to estimate variance components for test-day milk production traits of first lactation:

R. Mosharraf et el.
18
where was the lth test-day record of the kth cow; was a fixed effect of the ith herd-year-month of test day; was the jth fixed regression coefficient specific to the jth age-season class by DIM (j=24); was the nth random regression coefficient for the additive genetic effect of kth cow by DIM; was the nth random regression coefficient for the permanent environmental effect of kth cow by DIM; was a vector of covariates of size n describing the shape of the lactation curve of fixed and random regressions evaluated at dth DIM; and was the random residual effect that residual variances were considered homogeneous along the lactation. The (co)variance structure follows:
where is covariance matrices of random regression coefficients of dimension for direct genetic effects by DIM; A is the additive genetic relationship matrix; is (co)variance matrix of random regression coefficients for permanent environmental effects by DIM; and is residual variance. and were 5×5 (co)variance matrices; is an identity matrix of size k × k for the permanent environmental effect (k is the number of cows with records) and is an identity matrix of size l × l for the residual (l is the number of test-day records). The fixed and random regressions were modeled with normalized Legendre polynomials (Kirkpatric et al., 1990). The first five polynomials were calculated by the following formula:
; ;
; and
Where, is a standardized unit of the DIM and ranged from -1 to +1 and is derived as:
Estimation of (co)variance ...
19
Where, and are equal to 5 and 305 DIM, respectively. The additive genetic and permanent environmental (co)variances matrices as a function of DIM were calculated as and respectively; Where, is a 301×5 matrix of Legendre polynomial function of DIM; and diagonal of these (co)variances matrices were additive genetic variances ( ) and permanent
environmental variances ( ). Therefore, heritability for ith DIM was
calculated as:
where, is additive genetic variances of ith DIM; is permanent variances
of ith DIM; and is residual variance. Vector of 305-d polynomials ( ) were obtained by summing up the coefficients of Legendre polynomials from day 5 to day 305 and the additive genetic variance and permanent environmental variance of 305-d yield were calculated as and respectively. Then heritability for 305-d yield was calculated as:
Solutions for the random regression coefficients for each animal can be used to EBVs for any point in the lactation curve between 5 and 305 DIM. For example, EBV for the animal l at 150 DIM will be: where represents solution for animal l, and is the vector of coefficients of the Legendre polynomial corresponding to 150 DIM and therefore EBV of 305 day yield for the animal l ( ) was derived as follows via summation of the EBV for each day in the period from 5 to 305 DIM:
Analyses were performed by using the GIBBS2F90 software (Misztal et al.,
2002), which is a Fortran 90 program using a Bayesian approach via the Gibbs sampling algorithm. A single chain of 200,000 samples was run, with the first

R. Mosharraf et el.
20
20,000 samples discarded as burn-in and posterior means and standard deviations of parameters were calculated from every 100th sample of 180,000 samples. Results and Discussion
Posterior means of additive genetic and permanent environment variances of random regression coefficients estimated based on animal model for milk production traits given in Table 2. The correlations between additive genetic random regression coefficients of milk, fat and protein yields ranged from -0.57 to 0.74, -0.76 to 0.45 and -0.53 to 0.56, respectively; and for permanent environment random regression coefficients ranged from -0.39 to 0.15, -0.72 to 0.52 and -0.80 to 0.27, respectively. Posterior standard deviations for additive genetic curve parameters were in the range from 2.39 to 0.06, 0.004 to 0.002 and 0.002 to 0.00007 for milk, fat and protein yields, respectively and for permanent environment curve parameters were in the range from 1.92 to 0.08, 0.003 to 0.0001 and 0.002 to 0.0001 for milk, fat and protein yields, respectively. Residual variances were considered homogeneous over the lactation period and were equal to 10.72, 0.04 and 0.01 for milk, fat and protein yields, respectively.
Table 2. Posterior means of additive genetic (Gn) and permanent environment (Pn) variances of random regression coefficients estimated with forth-order of Legendre polynomials (n= 0 to 4) for each trait. Genetic correlations between curve parameters are in bold. (Values for fat and protein yields are multiplied by 10+3)
Trait G0 G1 G2 G3 G4 P0 P1 P2 P3 P4
G0 18.20 1.91 -1.51
0.61 -0.55
P0 32.17 2.09 -1.44
0.13 -0.52
G1 0.42 1.15 -0.12
0.43 -0.26
P1 0.15 5.80 -0.20
-0.77
0.02
G2 -0.53 -0.17
0.44 -0.19
0.05 P2 -0.18 -0.06
2.02 -0.39
-0.20
G3 0.26 0.74 -0.53
0.30 -0.04
P3 0.03 -0.34
-0.29
0.89 -0.28
Milk yield
G4 -0.31 -0.57
0.17 -0.17
0.18 P4 -0.12 0.01 -0.18
-0.39
0.61
G0 11.32 1.53 -0.17
-0.02
-0.16
P0 39.01 3.58 -1.47
0.21 -1.69
G1 0.37 1.48 -0.17
-0.07
0.03 P1 0.25 5.41 -1.01
-1.12
0.78
G2 -0.07 -0.19
0.53 -0.22
0.09 P2 -0.14 -0.25
3.00 -1.31
-0.08
G3 -0.02 -0.15
-0.76
0.16 -0.08
P3 0.03 -0.46
-0.72
1.11 -0.14
Fat yield
G4 -0.18 0.09 0.45 - 0.07 P4 -0.42 0.52 - - 0.42

Estimation of (co)variance ...
21
0.75 0.07 0.20 G0 8.64 1.99 -
0.66 0.14 -
0.10 P0 21.01 2.53 -
0.61 0.10 0.02
G1 0.56 1.48 -0.20
-0.04
0.08 P1 0.27 4.05 -0.09
-1.07
-0.01
G2 -0.42 -0.31
0.28 -0.08
0.04 P2 -0.11 -0.04
1.55 -0.44
0.02
G3 0.17 -0.13
-0.53
0.08 0.00 P3 0.03 -0.80
-0.53
0.44 -0.05
Protein yield
G4 -0.16 0.35 0.42 0.00 0.04 P4 0.01 -0.01
0.03 -0.13
0.37
Additive genetic, permanent environment and residual variances by DIM for milk, fat, and protein yields are shown in Figure 2. Generally, permanent environment variances had more irregular trends over the lactation when compared with genetic variances.
Milk yield Protein yield
DIM
0
5
10
15
20
25
30
5 65 125 185 245 305
Var
ianc
e (k
g2 )
G PE R
DIM
0
5
10
15
20
5 65 125 185 245 305
Var
ianc
e (g
r2 )
G PE R
Fat yield Protein yield
DIM
0
10
20
30
40
50
5 65 125 185 245 305
Var
ianc
e (g
r2 )
G PE R
DIM
0
5
10
15
20
5 65 125 185 245 305
Var
ianc
e (g
r2 )
G PE R
Figure 2. Additive genetic (G), permanent environmental (PE) and residual (R) variances of milk, fat and protein yields as a function of days in milk (DIM)
Heritabilities as a function of DIM, calculated from the (co)variance estimates in animal models for milk, fat, and protein test-day yields are shown in

R. Mosharraf et el.
22
Figure 3. Estimates of heritability for milk, fat and protein yields ranged from 0.18 to 0.26; 0.06 to 0.11 and 0.09 to 0.22, respectively; and heritabilities for 305-d milk, fat and protein yields were 0.36, 0.23 and 0.29, respectively.
DIM0
0.05
0.1
0.15
0.2
0.25
0.3
5 65 125 185 245 305
Her
itabi
lity Milk
Fat
Protein
Figure 3. Heritability for milk, fat and protein yields as a function of days in milk (DIM)
Genetic and permanent environmental correlations between test-day milk yields, test-day fat yields, and test-day protein yields at different stages of lactation are shown in Figure 4. Estimates of genetic correlation for milk, fat and protein yields ranged from 0.14 to 1.00, 0.39 to 1.00 and 0.27 to 1.00, respectively. The genetic correlations between DIM close together are close to unity, and the correlations gradually decline as the distance between DIM increases and the low genetic correlations observed between early period of lactation and other days.
Permanent environmental correlations were always positive and for milk, fat and protein yields ranged from 0.33 to 1.00, 0.20 to 1.00 and 0.36 to 1.00, respectively.

Estimation of (co)variance ...
23
Milk
Fat
Protein
Figure 4. Additive genetic (G) and permanent environmental (PE) correlations between test-day milk yields, test-day fat yields, and test-day protein yields at different days in milks (DIM)
Ranges of EBV for 305-d yield of milk, fat and protein yields were from -
1194.48 to 1412.44, from -210.57 to 271.22 and from -194.08 to 203.25, respectively; and standard deviations were 282.97, 148.23 and 136.64, respectively. The random regression solutions and EBV for 305-d milk, fat and protein yields of best bulls are given in Table 3.

R. Mosharraf et el.
24
Table 3. Additive genetic random regression solutions ( ) and estimated breeding values of 305-d yield (EBV305d) of 5 best sires for each trait.
Trait Sire No. of daughters EBV305d
1 29 6.11 -0.14 0.44 0.64 0.29 1301.44 2 102 5.08 -0.11 -0.88 0.09 -0.58 1079.21 3 68 4.80 -0.58 0.38 -0.51 0.55 1023.62 4 59 4.78 0.49 -0.06 -0.71 -0.37 1016.64
Milk yield
5 151 4.72 0.88 1.22 0.06 0.58 1008.75 1 92 0.88 1.79 -0.28 1.42 1.15 189.60 2 175 0.82 -0.49 -0.86 -0.23 0.06 172.37 3 109 0.77 0.55 0.96 -0.87 0.57 166.09 4 23 0.76 -0.06 0.27 0.71 -0.68 160.52
Fat yield
5 45 0.72 -0.49 -0.12 -1.29 -0.18 152.89 1 37 0.76 -0.47 -0.46 0.06 -1.14 158.44 2 125 0.70 -0.50 -0.77 0.07 0.35 149.16 3 103 0.65 0.20 1.47 -1.14 0.83 143.35 4 81 0.65 -0.02 -0.69 0.38 -0.47 135.91
Protein yield
5 70 0.60 -0.81 -0.45 -0.34 0.35 127.99
Clearly the estimates of heritability were not constant throughout the lactation. For all traits, permanent environment variances were higher at the beginning of lactation. These trends shown that non-genetic factors tend to influence the production traits in the beginning of lactation (Ludwick and Petersen, 1943); therefore, heritabilities are lower in the beginning of lactation (Figure 3). These results are similar to those observed by Cobuci et al. (2011) and Bohlouli and Alijani (2012). The ratio of residual variance to phenotypic variance of traits might indicate that the model of analysis was more suitable for milk yield than for fat and protein yields, which had higher proportion of residual variances. It could be that there are other critical factors influencing fat and protein yields which the model did not account for (Abdullahpour et al., 2013).
Heritabilities for fat yield were lower than for milk and protein yields. This is in accordance with other studies (Gengler et al., 1999; Jakobsen et al., 2002; Bohlouli and Alijani, 2012). For milk and protein yields, heritabilities were lower at the early of lactation due to the trends of lower additive genetic variance, higher permanent environmental variance and similar residual variance in comparison with other stages of lactation. For milk there was a tendency towards higher heritability estimates in the middle of lactation, which is in accordance with many other similar investigations (Jakobsen et al., 2002; Bohlouli et al., 2013). For protein yield, daily heritabilities increased during the lactation. Daily heritabilities for fat yield were decreasing from beginning of the lactation until around DIM 50 and then slowly increased afterward. Results reported by Biassus et al. (2011), Hammami (2009) are similar to these estimations. Nevertheless, current study found higher heritabilities for milk production records that collected from one province. Heritabilities obtained from the data of one herd (Ahrabi et al., 2005) or

Estimation of (co)variance ...
25
providing a new source of information into the model of analysis such as temperature-humidity index (Bohlouli et al., 2013) were significantly higher compared to estimated heritabilities of great number of herds within several provinces (Razmkabir et al., 2009). For this reason, in circumstances of high diversity of climates, environmental changes, management and feeding systems like Iran, about traits like milk yield, for which an animal is highly sensitive to these factors, a test day model might result in much greater residual variance and hence lower heritability (Abdullahpour et al., 2013).
The low genetic correlations that observed between early period of lactation and other days means that the phenotypic expressions in the different DIM should be considered as separate traits, determined by partly different sets of genes. The figures of Genetic and permanent environmental correlations are typical of several studies that modeled the lactation curve using random regression model (e.g. Biassus et al., 2011; Bohlouli et al., 2013; Abdullahpour et al., 2013). Generally, different heritability and genetic parameters among population are related to variation in data structure, genetic potential of milk production traits, climate changes, herd management, statistical models and estimation methods of (co)variances.
RRM assumes heterogeneous additive genetic effects throughout the lactation. Therefore, RRM allows for different between cows in the shape and level of the distribution of the additive genetic effect throughout lactation. This is done by regression of the additive genetic effect on individual DIM via a lactation curve function. Thus, a 305 days estimate of a cow’s breeding value corresponds to the area under lactation curve. Conclusion
Currently, genetic evaluations for dairy cattle are performed in most countries using TD models rather than traditional lactation models. Advantages of the RRM are that the environmental effects peculiar to each TD can be analyzed, the shape of the lactation curve is allowed to differ for each animal and the solutions allow calculation of EBV for partial lactation yields. A disadvantage of RRM is an increased computational requirement because more TD records need to be processed compared with 305-d yields. Currently research should be focused on defining the RRM to be implemented, investigating the environmental effects to be included in the model and estimating the covariance structure among observations and genetic parameters for traits to be included in the breeding programs for dairy cattle in Iran.
According to the results of this study, random regression model seems to be a flexible and reliable procedure for the genetic evaluation of milk production traits of used data. Then, when computationally feasible, RRM is recommended for the

R. Mosharraf et el.
26
routine genetic evaluation of national dairy cattle. In addition, current random regression model assume homogeneous residual variance throughout lactation. In the future, models may account for heterogeneous residual variance and this could increase accuracy of genetic evaluation. Acknowledgements The authors thank the Animal Breeding Center of Esfahan, Iran for providing the data. Procena komponenti (ko) varijanse i priplodne vrednosti za test-dan proizvodne osobine mleka holštajn muznih krava korišćenjem bajesovski pristupa R. Mosharraf, J. Shodja, M. Bohlouli, S. Alijani, S.A. Rafat Rezime
Procenjivani su genetski parametri prinosa mleka, masti i proteina u prvoj
laktaciji holštajn muznih krava. Podaci su prikupljani u periodu od 2006 do 2011 godine i analizirani korišćenjem random regression model-a. Podaci uključuju 41.178, 25.397 i 18.716 test – dnevnih podataka o prinosu mleka, mlečne masti i proteina, poreklom od 4.746, 3.437 i 2.525 krava. Kao fiksni efekti u modelu uključeni su zapat, godina i mesec testiranja, starost i sezona teljenja. Fiksne i slučajne regresije su modelirane putem normalizovanih Legendre-ovih polinoma dok su komponente kovarijanse utvrđene korišćenjem Bayes-ove metode, a Gibbs-ovo uzorkovanje je korišćeno za dobijanje posteriornih distribucija. Procene heritabiliteta za prinos mleka, masti i proteina kretale su se rasponu od 0,18 do 0,26; 0,06 do 0,11 i 0,09 do 0.22, respektivno. Heritabiliteti za prinos mleka u laktaciji od 305 dana, prinos masti i proteina iznosili su 0,36, 0,23 i 0,29, respektivno. Heritabiliteti za prinos mleka i proteina bili su niži u ranoj laktaciji, zbog trenda niže aditivne genetičke varijanse odnosno permanentno više varijanse životne sredine. Genetske korelacije za prinos mleka, masti i proteina kretale su se od 0,14 do 1,00; 0,39 do 1,00 i 0,27 do 1,00, respektivno. Opsezi procenjene priplodne vrednosti za prinos mleka, masti i proteina u laktaciji od 305 dana kretali su se od -1194,48 do 1412,44; -210,57 do 271,22 i -194,08 do 203.25, respektivno. Prema rezultatima ove studije, random regression model je fleksibilan i pouzdan postupak za genetsko vrednovanje proizvodnih osobina mleka i kao takav može biti od koristi u programima oplemenjivanja iranskih mlečnih goveda.

Estimation of (co)variance ...
27
References ABDULLAHPOUR R., MORADI SHAHRBABAK M., NEJATI-JAVAREMI A., VAEZ TORSHIZI R., MRODE R. (2013): Genetic analysis of milk yield, fat and protein content in Holstein dairy cows in Iran: legendre polynomials random regression model applied. Arch. Tierz., 56, 48, (In press). AHRABI S.M., ESKANDARINASAB M.P., ALIJANI S., ABBASI M.A. (2005): Genetic evaluation of a Holstein dairy cattle herd for milk and fat traits using test day records and random regression model. Journal of Agricultural Science and Natural Resources, 12, 7-16 (In Persian). BIASSUS I.O., COBUCI J.A., COSTA C.N., ROBERTO P., RORATO N., NETO J.B., CARDOSO L.L. (2011): Genetic parameters for production traits in primiparous Holstein cows estimated by random regression. Revista Brasileira de Zootecnia, 40: 85-94. BOHLOULI M., ALIJANI S. (2012): Estimation of genetic parameters of milk production traits of Iranian Holstein dairy cattle using multi-trait random regression model. Livestock Research for Rural Develment, 24, 11. BOHLOULI M., SHODJA J., ALIJANI S., EGHBAL A. (2013): The relationship between temperature-humidity index and test-day milk yield of Iranian Holstein dairy cattle using random regression model. Livestock Science, 157, 414–420. COBUCI J.A., COSTA C.N., NETO J.B., DE FREITAS A.F. (2011): Genetic parameters for milk production by using random regression models with different alternatives of fixed regression modeling. Revista Brasileira de Zootecnia, 40, 557-567. GENGLER N., TIJANI A., WIGGANS G.R., VAN TASSEL C.P., PILPOT J.C. (1999): Estimation of (co)variances of test day yields for first lactation Holsteins in the United States. Journal of Dairy Science, 82, 225-e1. HAMMAMI H., REKIK B., SOYEURT H., BEN GARA A., GENGLER N. (2008): Genetic parameters for Tunisian Holsteins using a test-day random regression model. Journal of Dairy Science, 91, 2118–2126. HAMMAMI H. (2009): Genotype by environment interaction for production traits of holsteins using two countries as model: Luxembourg and Tunisia. Ph.D. Thesis, Animal Science Unit, Gembloux Agricultural University, Gembloux, Belgium. HENDERSON JR C.R. (1982): Analysis of covariance in the mixed model: Higher-level nonhomogeneous and random regressions. Biometrics, 38, 623–640. JAKOBSEN J.H., MADSEN P., JENSEN J., PEDERSEN J., CHRISTENSEN L.G., SORENSEN D.A. (2002): Genetic parameters for milk production and persistency for Danish Holsteins estimated in random regression models using REML. Journal of Dairy Science, 85: 1607–1616.
R. Mosharraf et el.
28
JAMROZIK J., SCHAEFFER L.R. (1997): Estimates of genetic parameters for a test day model with random regressions for yield traits of first lactation Holsteins. Journal of Dairy Science, 80, 762-770. KIRKPATRIC M., LOFSVOLD D., BULMER M. (1990): Analysis of the inheritance, selection and evolution of growth trajectories. Genetics, 124, 979–993. LUDWICK T.M., PETERSEN W.E. (1943): A measure of persistency of lactation of dairy cattle. Journal of Dairy Science, 26, 439-445. MISZTAL I., TSURUTA S., STRABEL T., AUVRAY B., DRUET T., LEE D.H. (2002): BLUPF90 and related programs. Commun. No. 28-07 in Proc. 7th World Congr. Genetic Applied Livestock Production, Montpellier, France. PTAK E., SCHAEFFER L.R. (1993): Use of test day yields for genetic evaluation of dairy sires and cows. Livestock Production Science, 34, 23–34. RAZMKABIR M., JAVAREMI AN., SHAHRBABAK MM., RASHIDI A., SAYADNEJAD M.B. (2009): Estimation of genetic trend for production traits of Holstein cattle in Iran. Iranian Journal Animal Science, 40, 7-11 (In Persian). SCHAEFFER L.R., DEKKERS J.C.M. (1994): Random regressions in animal models for test-day production in dairy cattle. Proc. 5th World Congress Genetics Applied Livestock Production, Guelph, Ontario, Canada, 18, 443–446. STATISTICAL ANALYSIS SYSTEM (SAS). (2003): SAS 9.1.3 Help and Documentation, Cary, NC: SAS Institute Inc. VANRADEN P.M. (1997): Lactation yields and accuracies computed from test day yields and (co)variances by best prediction. Journal of Dairy Science, 80, 3015–3022. Received 30 October 2013; accepted for publication 31 January 2014

Biotechnology in Animal Husbandry 30 (1), p 29-36, 2014 ISSN 1450-9156 Publisher: Institute for Animal Husbandry, Belgrade-Zemun 082.4'632
DOI: 10.2298/BAH1401029M
UDC 636.
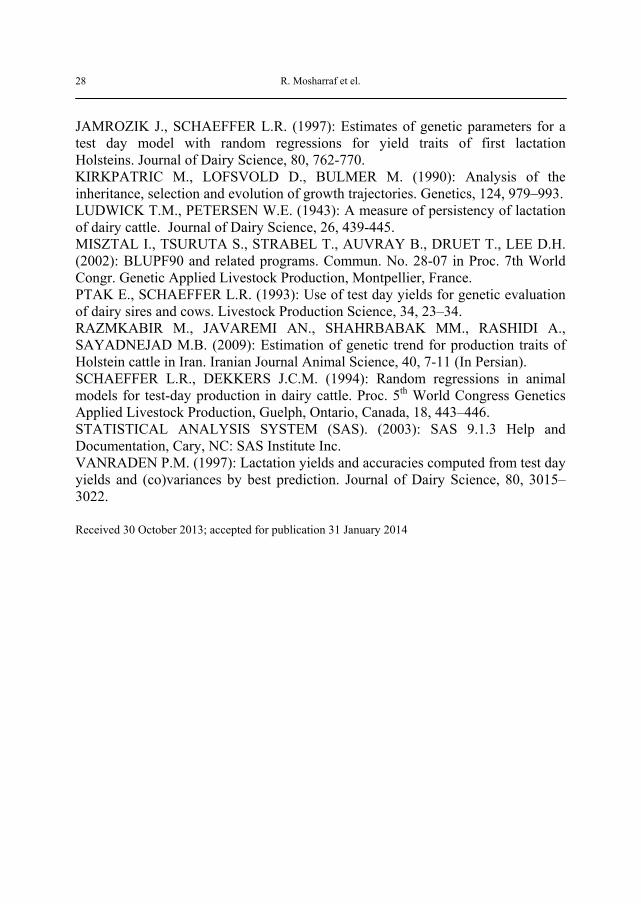
STUDY ON THE PERFORMANCE OF GONADOTROPIN-RELEASING HORMONE (GnRH) IN THE PUERPERAL PERIOD OF BEEF COWS Ts. Maslev, Ts. Hristova*, S. Stoycheva Institute of Mountain Stockbreeding and Agriculture, 281 Vasil Levski Str., Troyan, Bulgaria *Corresponding author: [email protected] Original scientific paper
Abstract: The effect of the intravenous injection of 100 mcg (2 ml) gonadotropin-releasing hormone (Ovarelin, Ceva) from the 1st to the 20th day after calving of beef cows was monitored in the article, in regard to the occurrence of the first oestrus and the possibilities for its controlling. It was established that in the first minutes of intravenous application of Ovarelin the concentration of luteinizing hormone (LH) increased. By increasing the number of days increased the amount of secreted LH. Maximum effect of the injection of 100 mcg GnRH occurred between the 10th and 15th day. The physiological dose (100 mcg) GnRH injected intravenously on the 1st day after birth of cows led to increased content of LH in blood circulation.
Key words: puerperal period, beef cows, gonadotropin hormones Introduction
It is known that the successful reproduction is a result of a number of endocrine, paracrine, follicular and gametogenesis factors. The pattern of folliculogenesis after birth is a series of physiological phenomena involving the growth of germinal and somatic cells, creation, differentiation, atresia and ovulation of the dominant follicle (Roche and Diskin, 1995).
Timely insemination of cows in the postpartum period shortens the period between calvings and increases efficiency in their breeding. Pregnancy and the duration of the service period are the components defining this. Recovery of normal ovarian function after puerperium and getting each year one calf from a cow is determined by a number of other factors. They are the following: the course of the birthing process, nutrition, milk yield, sucking of the calf and the presence of male animals (Kawashima et al., 2008).
It is found that after the calving the dominant follicle is temporarily suppressed, which is normally obtained during part of the oestrous cycle and during pregnancy but not all factors are completely known to us (Hirshfield, 1994).

Ts. Maslev et el.
30
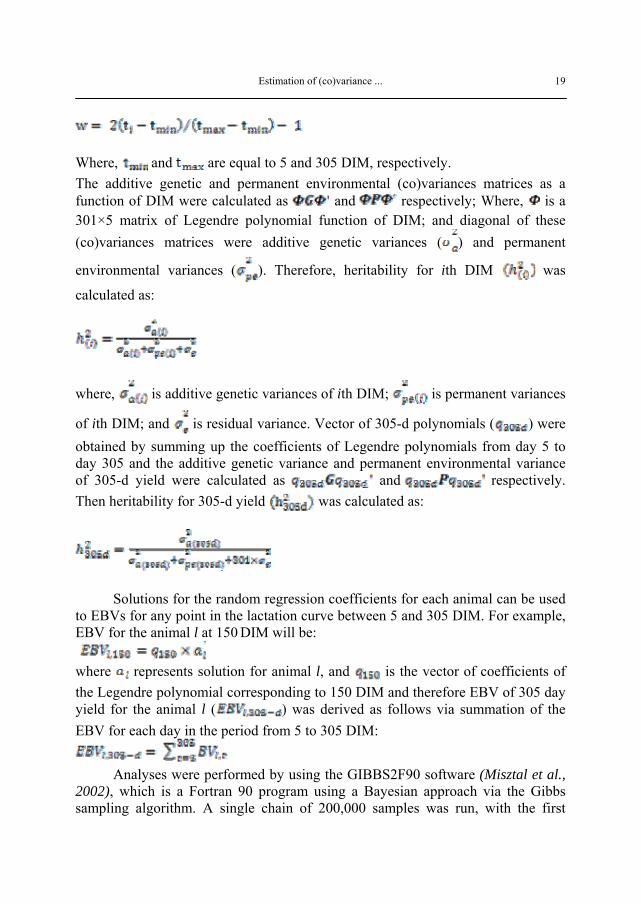
Therefore, knowledge of the hormonal dynamics in the puerperium is a precondition for obtaining better results in cattle breeding. The process of maturing of follicles and the first ovulation occurs within the first 45 days, but in the majority of animals that is not accompanied by clinical expression of oestrus (Sheldon, 2004). Adenohypophyseal hormones and the stimulating effect on them of hypothalamic gonadotropin-releasing hormone (GnRH) have essential importance for these processes. After synthesis of GnRH, it has found wide application in practice. The effects of various pharmacological doses (over 100 mcg) have been studied comparatively well. But the question of the influence of smaller doses and their physiological performance has not been elucidated yet. In this regard the main objective of performed experiment was to investigate the possibility of shortening the postpartum period by the application of physiological doses GnRH (100 mcg). Material and Methods
The study was conducted in the Experimental base in the Institute of Mountain stockbreeding and agriculture in Troyan, using 15 cows from Limousine breed, (multiparous) divided into 5 groups. Calving seasons at spring. Each of the groups was injected with 100 mcg GnRH (2 ml, Ovarelin – Ceva) intravenously, on the 1st, 5th, 10th, 15th and 20th day after calving respectively. Blood samples were obtained by puncture of the opposite vena jugularis in the 1st, 5th, 10th, 15th, 20th, 30th and 120th minutes after injection, respectively. It was taken 10 ml of blood in pre-heparinized test tubes. Blood plasma was exuded after centrifugation at 3000 rpm, per 10 minutes.
The values of LH hormone were determined by radio-immunological methods Beckman LS-800, by marking with I125. Results and Discussion
The changes in the serum concentration of LH in cows treated with 100 mcg GnRH at different days after birth are shown in Figure 1.
Study on the performance of ...
31
0,00
1,00
2,00
3,00
4,00
5,00
6,00
7,00
1st 5th 10th 15th 20th
day after birth
(LH
ng/
ml)
before injection
after injection
Figure 1. Concentration of LH (ng/ml) before and after i/v injection of 100 mcg GnRH
(Ovarelin) (Summarized values)
Chart of the average values of LH in the particular groups of animals allows monitoring of the changes in the reactivity of the hypophysis during the first 20 days after calving birth. The measured amount of LH of the group treated with 100 mcg GnRH on the 1st day after calving was 1.20±0.35 ng/ml (Figure 2).
0,00
0,50
1,00
1,50
2,00
2,50
3,00
3,50
4,00
4,50
-1 0 1 5 10 15 20 30 120
time of obtaining of blood samples (minutes)
LH
(ng/
ml)
Figure 2. Amount of LH (ng/ml) in blood plasma serum of beef cows, in the 1st day after
parturition birth
Already in the first minute after the intravenous injection of 2 ml Ovarelin (100 mcg GnRH), the values of the hormone started to rise – 3.55±1.20 ng/ml, nevertheless that the amounts in the individual animals varied greatly. Maximum measured values of LH 4.20±0.45ng/ml were established in the 15th minute. Then its amount decreased and in the 120th minute was 3.30±0.87 ng/ml.
As a whole, the data showed that the response of hypophysis regarding the quantitative secretion of LH was comparatively weak.
The LH level was 1.53±0.89 ng/ml in cows treated on the 5th day after calving (Figure 3).

Ts. Maslev et el.
32
0,00
0,50
1,00
1,50
2,00
2,50
3,00
3,50
4,00
4,50
5,00
-1 0 1 5 10 15 20 30 120
time of obtaining of blood samples (minutes)
LH
(ng/
ml)
Figure 3. Amount of LH (ng/ml) in blood plasma serum of beef cows, in the 5th day after
parturition birth In comparison to the results obtained in cows treated on the 1st day after
calving, in this group in all animals was established increasing of values, 2.69±1.17 ng/ml in 1st minute, 4.21±1.09 ng/ml in 5th minute, 8.14±0.80 ng/ml in 10th minute, 6.09±0.74 ng/ml in 15th minute and 3.22±0.41 ng/ml in 20th minute. Monitoring the values till the 120th minute showed that the amount of LH decreased (3.55±1.15 ng/ml). Higher were the basal values in cows in the group treated on the 10th day after calving (2.39±0.28 ng/ml). Maximum values of LH were measured in the 15th minute after the injection (9.50±1.01 ng/ml). On the 15th day after the treatment, in the basal values of 2.40±0.50 ng/ml, the total amount of LH was decreased – average 6.70±0.56 ng/ml, as the highest value was in the 15th minute 8.29±1.40 ng/ml (Figure 4).
0,00
1,00
2,00
3,00
4,00
5,00
6,00
7,00
8,00
9,00
-1 0 1 5 10 15 20 30 120
time of obtaining of blood samples (minutes)
LH
(ng/
ml)
Figure 4. Amount of LH (ng/ml) in blood plasma serum of beef cows, in the 15th day after
parturition birth
On the 20th day the amounts of LH were 3.30±0.32 ng/ml – basal and 5.01±0.33 ng/ml – average, respectively.

Study on the performance of ...
33
It was found that in all cows involved in the experiment, at higher values of LH before calving, were obtained higher values after treatment in different periods of the puerperium.
The obtained results showed that the pituitary gland reacted with increasing of LH production immediately after injection of GnRH, and the highest average values were obtained on the 10th day (6.89±0.57 ng/ml).
Number of authors found that after calving there were formed ovarian follicles which estrogen hormones had primary role in gonadotropin secretion (Kaltenback et al., 1974; Kesler et al., 1977).
These estrogens influencing on the hypophysis increased its reactive sensitivity to exogenously applied GnRH. This gave grounds to suppose that after hormone treatment we can achieve an early recovery of the function of the chain hypophysis-ovary.
Lishman and Inskeep (1991) established that already in the first week after birth may develop a dominant follicle, but it did not ovulate and the performance did not manifest oestral clinical traits. Follicles most often were luteinized and after short-term luteal phase began recovery of the normal ovarian and ovulatory function. It is proved that different agonists of GnRH gave good results for improvement of sexual cyclic activity of cows after calving birth. The effect depended mainly on the dose and the way of application (Kunchev et al., 2010). As the sensitivity of the hypophysis to the performance of GnRH was recovered to the 10th day, then the earliest use was pertinent in the period 10-15 days after calving birth. This procedure led to acceleration of the involution of uterus, shortened the independence period, fertilization with smaller number of insemination and improvement of all reproductive indices in cows.
In her studies about postpartum period in dairy cows, Deyanova (1995) established that the concentration of serum progesterone (Pg) and LH increased progressively. Physiological doses of 5 mg GnRH injected in the 8th minute increased the LH content to 4.46 ± 0.59 ng/ml. With increasing the number of days after birth the LH secretion was increased, and the highest values were on the 15th day after calving.
Studies of Easter (1978) confirmed the conclusion that the response of the pituitary gland to a large extent was dependent on the amount of steroid hormone in blood. The changes in the sensitivity of the pituitary gland after birth were determined by the activity of the hypothalamus. According to Fernandes et al., (1978) this occurred between the 7th and the 10th day after birth. From the absence of a clear reaction in some cows treated with GnRH it is supposed that it may be necessary a longer period for negative effect. The correct answer is probably the natural diversity in the physiology of the course of the follicular phase from the sexual cycle of different animals.
Peters and Lamming (1993) conducted extensive studies on the puerperium of beef cows. They found that the duration of the postpartum period for them was 57.3 days, which was highly influenced by the body weight at birth and by the

Ts. Maslev et el.
34
season. Cows with better body weight showed oestrus earlier and the duration of postpartum anoestrus in autumn was 35.9 days, and in winter – 60.8 days. The same authors established that plasma concentration of LH from the 1st to 10th day was very low. Probably the refracterness of adenohypophysis in this period was due to the lack of stimulation of the hypothalamus because of reduced or absent pulses in the release of GnRH. It was found that the gonadotropins were secreted in two types – tonic and cyclic (Di Zerega and Hodgen, 1979). The cyclic one was characterized by the release of larger amount of hormone, but in shorter intervals of time. Probably this type of secretion was inhibited in the first days after birth. Therefore, more complete determination of the role of hypothalamus in causing the hypogonadotropism which was a main trait in the postpartum period (e.g. hypergonadotropic hypogonadissm), contributed to a large extent to clarify the reasons causing the puerperal anoestrus. After this period, the release of LH started at pulsations (from 1 to 6 till 1 to 4 hours). The secretion of LH at frequency of less than 0.2 pulses per hour was prerequisite for the first ovulation after calving. It was found that the first increase in gonadotropin before ovulation was related to increasing the concentration of progesterone. The reason for this is not known, but it is supposed to be due to luteinization of some later follicle or early release of PgF2α from the uterus. It is also considered that increasing concentrations of prolactin, leads to more prolonged inactivation of the sexual cycle, especially well manifested in cows with sucking calves. A number of authors associated the duration of the postpartum period with the providing the best possible nutrition of newborn animals. But it is known that sucking is hormone-dependent process, because of which non-endocrinological formulation of postpartum anoestrus is difficult to be accepted. It is supposed that the mechanical irritations of teats and the contact between cow and sucking calf caused release of prolactin and oxyitocin, which suppressed the growth of follicles, ovulation and fertilization and reduced the release of gonadotropins (Kunchev, 1988). Since such formulation associated with sucking has profound biological meaning, it should not be neglected. But the complexity of the subject is caused by the fact that in some mammals the influence of sucking is determinative and until it is stopped, the sexual cycle is not recovered. The same is in the pig insufficient! But the situation is different in cows. Many of them are fertilized during lactation and sucking. However, some authors (Edgerton, 1990; Hanzen, 1996) established that cows feeding calves showed features of oestrus later in comparison with those that do not feed. Now it is more brought into question the assumption that sucking in cows influences on the lack of ovulation after calving birth. All this imposes the question of postpartum anoestrus to be considered very carefully. For its clarification it is necessary to take into account the role of oxytocin and glucocorticoids. Goodman et al., (1989) found that by peptide neurophysin, oxytocin was transferred from supraoptical and paraventricular nucleus of the hypothalamus, where it was synthesized by the posterior pituitary. But it is not clear yet whether the hormone is involved in causing anoestrus in different animal species!? We also know that the amount of glucocorticoids in the peripheral blood circulation can change the

Study on the performance of ...
35
gonadotropin secretion (Wagner and Li, 1982). Steroid synthesis of the adrenal cortex was also activated during the process of milking and sucking. In this way the increased concentration of the hormone in blood was preserved during the birth process and also in the early days of postpartum period. What are the actuating mechanisms for tonic inhibition of LH secretion have not been entirely clear yet. Most probably this is due to the reduced sensitivity of the hypophysis to the performance of GnRH, as Dobson et al., (1987) establish reduction of the cyclic release of LH after injection of GnRH in cows with increased amount of glucocorticoids in blood. Conclusion
The physiological dose (100 mcg GnRH) injected intravenously on the 1st day after birth of cows led to increased content of LH in blood circulation.
With increasing the number of days, the secretion of LH from hypophysis was also increased. The maximum effect occurred after treating with 100 mcg GnRH and it was between the 10th and 15th day after calving. Ispitivanje dejstva gonadotropin-oslobađajućeg hormona (GnRH) u puerperalnom periodu kod tovnih krava Ts. Maslev, Ts. Hristova, S. Stoycheva Rezime
U ovom istraživanju praćen je efekat intravenske injekcije 100 mcg (2 ml)
gonadotropin-oslobađajućeg hormona (Ovarelin, Ceva) od 1. do 20. dana po telenju krava tovnih rasa, u pogledu pojave prvog estrusa i mogućnosti za njegovu kontrolu. Utvrđeno je da je u prvim minutima intravenske primene Ovarelina koncentracija luteinizirajućeg hormona (LH) bila povećana. Uporedo sa povećanjem broja dana povećavala se i količina izlučenog LH. Maksimalan efekat injekcije 100 mcg GnRH postignut je između 10. i 15. dana. Fiziološka doza (100 mcg) GnRH ubrizgana intravenozno 1. dana po teljenja dovodi do povećane koncentracije LH u krvotoku. References DEYANOVA P. D. (1995): Endocrine characteristic in dairy cows and possibilities for influence on it. Thesis: 107. KUNCHEV L. (1988): Endocrine control of reproduction. Sofia, Zemizdat: 131. KUNCHEV L., BAYCHEV ZH., KACHEVA D. (2010): Assisted reproductive technologies in animal breeding, Sofia: 233.

Ts. Maslev et el.
36
DI ZENEGA C., HODGEN C. (1979): Pregnancy – associated ovarian refracterness to gonadotropin. A. mith Anim. J. Obstet. Ginecol., 134: 819-822. DOBSON H., ALLAM M. G., KANCHEV L. (1987): Effect of batamethasone treatment on luteal lifespam and the LH response to GnRH in dairy cows. J. Reprod. Fert., 80, 25 – 30. EASTER R. D. (1978): The role of the vomeronazal organ in mammalian reproduction. Mammalia, 36, 315. EDGERTON L. A. (1990): Effect of lactation upon the interval postpartum. J. Animal. Sci. suppl. 2, 51, 29 – 39. FERNANDES L. C., THATCHER W., WILCOX C. (1978): LH release in response to GnRH during the postpartum period of dairy cows. J. Anim. Sci., 46, 443 – 448. GOODMAN G., TUCKER H. A., CONVEY E. M. (1989): Presence of the calf effect secretion of prolactin in cows. Proc. Soc. Exp. Biol. Med., 169, 421 – 424. HIRSHFIELD A. N. (1994): Relationship between the supply of primordial follicles and the onset of follicular growth in rats. Biol. Reprod. 50, 421-428. HANZEN C. H. (1996): Endocrine regulation of postpartum ovarian activity in cattle. Reprod. Nutr. Develop., 26, 1219 – 1239. LISHMAN A. W., INSKEEP E. K. (1991): Deficiencies in luteal function during re-imitation of cyclic breeding activity in beef cows and in ewes. S. African J. Animals Sci., 21, 59 – 76. KLATENBACK C., DUNN T., KISER T., COCAH L. (1974): Release of FSN and LH in beef heifers by Synthetic GnRH, J. Anim. Sci., 38, 2, 357 – 362. KESLER D., GARVERICK J., ELMORE R. (1977): Effect of days postpartum and endogenous reproductive hormones on GnRH – induced LH release in dairy cows. J. Anim. Sci., 46 4, 797 – 803. KAWASHIMA C., KIDA K., MATSUHASMI M., MATSUI M., SHIMIZU T. (2008): Effect of suckling on the reproductive performance and metabolic status of obese Japanese black cattle during the early postpartum period, J. Reprod. Dev., 54, 46 – 51. PETERS A., LAMMING E. (1993): Hormone patterns and reproduction in cattle. Vet. Rec. Supl. In Practice, 5, 153-158. ROCHE G., DISKIN M. (1995): Hormonal regulation of reproduction and interaction with nutritional in female ruminants. In: “Ruminant Physiology: Digestion Metabolism, Growths and Reproduction: Eds Engelhande Leonhard-Marek S, 409-428. SHELDON I. M. (2004): The postpartum uterus, Vet. Clin. North. Anim. Food. Anim. Pract., 20, 569 – 591. WAGNER W. C., LI P. S. (1982): Influence of adrenal cortex on posterior pituitary and avarian function. In: Factors affecting fertility in the postpartum cows. (H. Card, E. Schalenberger) Acad. Press., London, 197 – 219. Received 31 August 2013; accepted for publication 28 February 2014

Biotechnology in Animal Husbandry 30 (1), p 37-44, 2014 ISSN 1450-9156 Publisher: Institute for Animal Husbandry, Belgrade-Zemun 05'632
DOI: 10.2298/BAH1401037D
UDC 637.
METHODS FOR DETERMINING STRESS SYNDROME IN BEEF CATTLE AND ITS RELEVANCE TO QUALITY OF MEAT N. Delić, S. Aleksić*, M.M. Petrović, V. Pantelić, D. Ostojić, M. Petričević, D. Nikšić
Institute for Animal Husbandry, Autoput 16, 11080 Belgrade-Zemun, Republic of Sebia *Correspronding author: [email protected] Original Scintific paper
Abstract: Methods for determining stress syndrome in beef cattle is of great importance to identify the physiological state of young cattle before slaughter in order for such animals to be properly treated and restored to a normal physiological state. As a consequence of the state of stress prior to slaughter, meat is obtained which is different from normal. These are non-typical post-mortem changes in meat: "PSE" (pale, soft, exudative) and "DFD" (dark, firm, dry) meat, "watery" meat, usually pork, and "dark" mostly meat of young bulls. Tests were performed on bulls originating from a farm located 50 km from the slaughterhouse and another farm located 150 km from the slaughterhouse. Young bulls were kept in a free system and loading and unloading was done on unloading ramps and animals taken to the boxes using the lane corridor. Also, attention was paid to avoid mixing with unfamiliar animals during transport. The study included 20 males. The same vehicle was used to transport cattle from the farm to the slaughterhouse. The rectal temperature was taken from 20 young bulls, at the time of loading of cattle into a vehicle during transport and immediately before slaughter. The results of measurements of rectal temperature of investigated bulls suggest that prolonging of transport increases the rectal temperature which can serve as an indicator of stress syndrome in bulls. In addition to measuring of rectal temperature as an indicator of bulls’ stress syndrome, other methods are still used, such as the measurement of cortisol in saliva and blood, or the latest methods of measuring cortisol in hair. This is the latest method of the 21st century, which can even determine the time of occurrence of stress. This method is the future that will determine whether the stress occured few days, weeks or even months ago.
Keywords: beef cattle, stress, transport, assessment methods, rectal
temperature, meat quality

N. Delić et el.
38
Introduction The stressors may be physical, associated with excessive activity, temperament, humidity, atmospheric pressure, the outside temperature, ionizing radiation, electric shock, etc. Stress can be psychological, such as fear, excitement and the most important social stress, such as stress of interference with unfamiliar animals. The word "stress" is of Anglo-Saxon origin, and this term is understood as the medical condition in which the body is under the influence of a stimulus. The first research of stress and the stressors was initiated by Hans Saley (1936; 1953) Viennese internist in human medicine. Studying stress in humans Hans Saley has discovered one of the most important theories of modern medicine, which is the theory of stress and overall the adaptation syndrome. Saley’s General Adaptation Syndrome found the application in explanation of the stress syndrome in animals. Today, there are standard procedures to prepare the animals for slaughter, their preparation is related to the farm where the animals come from, to the transport, to short or long stay in the slaughter depot premises, the method of stunning and bleeding. Holding and tansport of animals just before slaughter are important factors in beef cattle stress syndrome manifested as anxiety, fear, roaring, aggression, etc. (Aleksić et al., 1995; Aleksić et al., 2006; Broom et al. 2002; Knowles and Warriss, 2007).
As a consequence of the state of stress prior to slaughter, meat is obtained which is different from normal. These are non-typical post-mortem changes in meat: "PSE" (pale, soft, exudative) and "DFD" (dark, firm, dry) meat, "watery" meat, usually pork, and "dark" mostly meat of young bulls. According to the frequency occurrence of DFD - syndrome, young bulls are the most susceptible, in relation to the other categories of cattle. Today, this problem is associated with a number of factors such as breed, animal housing, food and especially the treatment of animals before slaughter. The basis of this problem is the stress of young bulls, especially their reactions to the new unfamiliar environment during transport and stay in the depot sacrifices. Therefore, it is important to identify the state of stress of young cattle before slaughter in order to adequately treat such animals in order to bring them to a normal physiological state prior to slaughter. Stress is a term for the physiological state of the organism under the influence of a stimulus or psychological burden, therefore mechanism of action involves irritation and reactions of the organism to a given stimulus.
Stimulus (stressor) acts on the body in two ways: specifically, fostering in it a specific defensive reaction, for example, antigen-specific antibody response and nonspecific stimulating defense reaction. This reaction is stereotypical, defensive and adaptive mechanism by which the body tries to defend the stimulus, regardless of its nature. Those stimuli (there are countless), which stimulate the body to mostly nonspecific defense mechanism, are stressors which affect the
Methods for determining ...
39
process of postmortem muscle. Stressor, i.e. stimulus, perceived by the animals’ senses, is transmitted by neuro - hormonal paths and causes a general non-specific reaction called Saley 's General Adaptation Syndrome. It is “general” because it is the result of a general stress which affects the entire body, and it is called “adaptation” because the the body tends to adapt to one or more stimuli, which act on the organism, and “syndrome” because its individual responses are coordinated and even dependent on each other. The General Adaptation Syndrome occurs in three stages, namely: the alarm stage, the second stage - reparation, and third stage - exhaustion, the collapse or shock. Although the mechanism of general adaptation syndrome has not been fully tested, we can say that all animals receive through certain senses stimuli that are transmitted through the nerve to the hypothalamus. Processed information from the hypothalamus is transmited in the form of CRF, secreted by the hypothalamus, to pituitary gland. Pituitary gland now has the task to identify the severity and intensity of stressor and by secretion of ACTH stimulate the adrenal glands to secrete adrenaline and corticosteroids. Adrenaline is transmitted by humoral paths to all muscles, and affects the discharge of muscle glycogen, and corticoids, primarily glucocorticoids, affect the enhanced synthesis of glycogen, so as to return the spent glycogen to pre-stress level. Because of this, the meat of stressed animals has less glycogen in muscles, and therefore less of lactic acid after the post-mortem glycolysis.
Of all the hormones which are found in the blood stream, due to the stress, cortisol is likely to act on the particularly strong and long-term response of the organism; its activation of neo-glucogenesis and of pituitary gland, this hormone contributes to the re-depositing of glycogen in muscles. Glycogenic effect of glucocorticoids is exhibited by inhibiting the use of amino acids for synthesis of proteins, which then serve for the production of carbon hydrates. Accordingly, the occurrence of DFD meat, in which the muscle glycogen depot is empty, is caused by the stress of such a nature and the intensity which induces strong secretion of adrenaline necessary to exhaust the glycogen restoration hormones of the adrenal cortex, which, in normal conditions, are able to maintain the required level of glycogen in the muscles, but in the above mentioned stress conditions they are not able to maintain the required glycogen level. Studies have shown that the concentration of cortisol in the blood of stressed bulls is increased, whereby in case of weaker stresses, first comes to a short-term initial decrease (Warriss et al., 1984), while in case of high intensity of stress, content of blood cortisol rises faster and lasts longer (Kallweit et al., 1981). Usually after the second day, the concentration of cortisol begins to decline gradually, but reaches pre-stress level only after seven days. In contrast to cortisol, which can be taken as an indicator of long-term stress (Kallweit et al., 1981), aldosterone increases in the first few hours of the beginning of stress, usually only during the transport of animals to slaughter (and therefore can be considered as an indicator of short-term stress).

N. Delić et el.
40
Materials and Methods
Tests were performed on bulls that come from the farm, which is located 50 km from slaughterhouse (farm A) and another farm, which is located 150 km from slaughterhouse (farm B). Beef cattle was housed in the free system and loading and unloading was carried out on unloading ramps and animals taken to boxes using a lane corridor. Also, attention was paid to avoid mixing with unfamiliar animals during transport. The study included 20 males. The same vehicle was used to transport cattle from the farm to the slaughterhouse. Measurement of rectal temperature was carried out on 20 young bulls, at the time of loading of cattle into transportation vehicle, during transport and immediately before slaughter. The same mercury thermometer for large animals was always used. After each individual use, the thermometer was properly washed and disinfected. Results and Discussion
The results of measurements of rectal temperature, before transport, during transport and at slaughter, of young bulls originating from farm A are shown in Table 1. Based on the measurement results in Table 1 it can be seen that the bulls’ rectal temperature increased from the time of loading to the time of slaughter. Normal range for the rectal temperature of cattle is from 36.7°C to 39.3°C (Gregory and Grandin, 1998). The average rectal temperature of bulls tested before transport was in the normal range - 37.7°C, while during transportation and especially before slaughter it increased to 40.0°C. Table 1. Rectal temperature (°C) of young bulls from farm A before and during transportation and before slaughter
No. of bull Before transport
During transport Pre-slaughter
1 36,9 37,4 38,6 2 38,7 38,8 39,6 3 37,1 37,3 38,5 4 38,2 38,4 40,2 5 37,3 38,5 40,3 6 37,8 38,6 39,9 7 37,5 37,6 40,1 8 38,0 37,7 42,0 9 39,0 38,8 42,2 10 37,2 37,3 39,3
Average 37,77 38,04 40,07
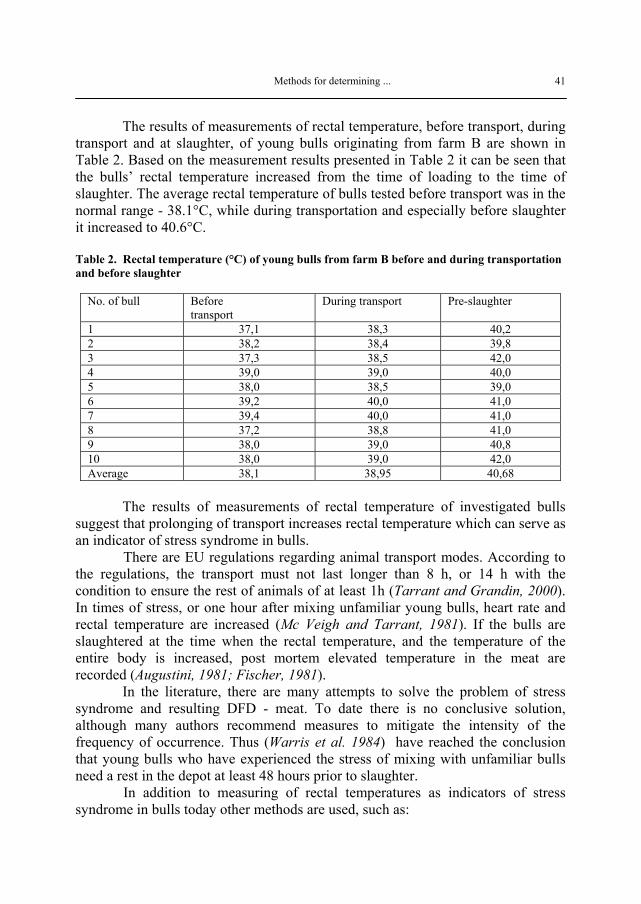
Methods for determining ...
41
The results of measurements of rectal temperature, before transport, during transport and at slaughter, of young bulls originating from farm B are shown in Table 2. Based on the measurement results presented in Table 2 it can be seen that the bulls’ rectal temperature increased from the time of loading to the time of slaughter. The average rectal temperature of bulls tested before transport was in the normal range - 38.1°C, while during transportation and especially before slaughter it increased to 40.6°C. Table 2. Rectal temperature (°C) of young bulls from farm B before and during transportation and before slaughter
No. of bull Before transport
During transport Pre-slaughter
1 37,1 38,3 40,2 2 38,2 38,4 39,8 3 37,3 38,5 42,0 4 39,0 39,0 40,0 5 38,0 38,5 39,0 6 39,2 40,0 41,0 7 39,4 40,0 41,0 8 37,2 38,8 41,0 9 38,0 39,0 40,8 10 38,0 39,0 42,0 Average 38,1 38,95 40,68
The results of measurements of rectal temperature of investigated bulls suggest that prolonging of transport increases rectal temperature which can serve as an indicator of stress syndrome in bulls.
There are EU regulations regarding animal transport modes. According to the regulations, the transport must not last longer than 8 h, or 14 h with the condition to ensure the rest of animals of at least 1h (Tarrant and Grandin, 2000). In times of stress, or one hour after mixing unfamiliar young bulls, heart rate and rectal temperature are increased (Mc Veigh and Tarrant, 1981). If the bulls are slaughtered at the time when the rectal temperature, and the temperature of the entire body is increased, post mortem elevated temperature in the meat are recorded (Augustini, 1981; Fischer, 1981). In the literature, there are many attempts to solve the problem of stress syndrome and resulting DFD - meat. To date there is no conclusive solution, although many authors recommend measures to mitigate the intensity of the frequency of occurrence. Thus (Warris et al. 1984) have reached the conclusion that young bulls who have experienced the stress of mixing with unfamiliar bulls need a rest in the depot at least 48 hours prior to slaughter.
In addition to measuring of rectal temperatures as indicators of stress syndrome in bulls today other methods are used, such as:

N. Delić et el.
42
- Measurement using infrared tomography - temperature measurement using infrared tomography - Measurement of cortisol in saliva and blood - General adaption syndrome, i.e. physiology of stress, indicates an increased concentration of cortisol during stress. Nowadays, as a method for the determination of cortisol, saliva and blood are used. - Measuring cortisol in hair - This is the latest method of the 21st century, which can even determine the time of occurrence of stress . This method is the future that will determine whether the stress was created a few days, weeks or even months ago. Conclusion
The results of measurements of rectal temperature before transport, during transport and at slaughter of bulls originating from farm A and farm B indicated that prolonging of transport increases rectal temperature which can serve as an indicator of stress syndrome in bulls. In order to minimize the influence of transport on bulls’ stress syndrome it is neccessary to enact specific legislation on the conditions and method of transport. Examples include the EU regulations regarding animal transport modes. According to the regulations the transport must not last longer than 8 hours, or up to 14 hours provided that the rest for animals of at least 1 hour is ensured. Acknownledgment This research is part of the Project TR31053 financial supported by Ministry of Education, Science and Technological Development of the Republic of Serbia Metode utvrdjivanja stres sindrom junadi i njegov značaj za kvalitet mesa N. Delić, S. Aleksić, M.M. Petrović, V. Pantelić, D. Ostojić-Andrić, M. Petričević, D. Nikšić
Rezime
Metode za utvrdjivanje stres sindoma junadi imaju veliki značaj u identifikaciji fiziološkog stanja junadi pre klanja, kako bi se takva grla adekvatno tretirala i povratila u normalno fiziološko stanje. Kao posledica stresnog stanja pre klanja dobija se meso koje se razlikuje od normalnog mesa. Ovo obuhvata

Methods for determining ...
43
netipične postmortalne promene mesa kao što su “BMV” meso (bledo, mekano i vodnjikavo meso) najčešće svinjsko i “TTS” (tamno, tvrdo i suvo meso), najčešće juneće meso. Ispitivanja su vršena na junadima koja potiču sa farme udaljene 50 km od klanice i sa druge farme koja je udaljena 150 km od klanice. Junad su držana u slobodnom sistemu a utovar i istovar obavljani su na istovarnoj rampi pri čemu su životinje koridorom odvođene u boksove štala. Takodje se vodilo računa da ne dodje do mešanja nepoznatih životinja u toku transporta. Ukupno je ispitano 20 muških grla. Istim vozilom junad su transportovana od farme do klanice. Rektalna temperature merena je kod 20 junadi, i to u momentu utovara u stočno vozilo, za vreme transporta i neposredno pre klanja. Rezultati merenja rektalne temperature ispitivane junadi ukazuju da prolongiranjem transporta raste i rektalna temperatura što može poslužiti kao pokazatelj stres sindroma junadi. Pored merenja rektalne temperature kao indikatora stres sindroma junadi danas se koriste i druge metode kao što su merenje kortizola u pljuvački i krvi ili najnovija metoda merenje kortizola iz dlake. Ovo je najnovija metoda 21. veka kojom se čak može odrediti vreme nastanka stresa. Ova metoda predstavlja budućnost kojom će se utvrditi da li je stres nastao pre nekoliko dana, nedelja pa čak i meseci. References ALEKSIĆ S., LAZAREVIĆ R., JOVANOVIĆ S., MIŠČEVIĆ B., PETROVIĆ M. (1995): Uticaj tovilišta, dužine transporta i dužine odmora pre klanja na kvalitet mesa junadi. Biotehnologija u stočarstvu, Vol 11, br. 3-6. ALEKSIĆ S., PETROVIĆ M.M., MIŠČEVIĆ B., SRETENOVIĆ LJ., PANTELIĆ V., JOSIPOVIĆ S., TOMAŠEVIĆ D., TRENKOVSKI S. (2006): Tehnological improvement of the quality of beef from the aspect of tranport of young cattle to slaughtering. Biotechnology in Animal Husbandry, 22, 1-2, 47-53. AUGUSTINI CHR. (1981): Influence of holding animals before slaughtering. The Problem of dark cutting in beef, Martinus Nijhoff Publishers. BROOM D. M., P. BARTON GADE, A. FERLAZZO, J. HARATUNG, X. MANTECA, P. WARRIS (2002): The Welfare of Animals during Transport. Report of the Scientific Committee on Animal Health and Animal Welfare. Eur. Comm., Brussels, Belgium. FISCHER, K. (1981): Influence of temperature, fasting and transportation. The Problem of dark cutting in beef. Martinus Nijhoff Publishers. GREGORY N.G. and GRANDIN T. (1998): Animal Welfare and Meat Science. CABI Publishing, Oxon, Wallingford, UK. KALWEIT E, UNSHELM J., WEMKEN K., SMIDT D. (1981): Effects of transportation and pre-slaghter holding on some blood parameters and on meat quality in fattening bulls. The problem of dark cutting in beef, Martinus Nijhoff Publishers, The Hague/Boston/London.

N. Delić et el.
44
KNOWELS T. G., P. WARRISS (2007): Stress physiology of animals during transport. Pages 312–328 in Livestock Handling andTransport. T. Grandin, ed. CAB Int., Cambridge, MA. McVEIGH J.M., TARRANT, P.V (1981): The breakdown of muscle glicogen during behavioural stress in normal and beta-adreno-receptor blocked young bulls. The Problem dark cutting in beef, The Martinus Nijhoff Publishers. SELEY H. (1953): Lehre von Adaptions syndrom, Georg Thiem, Stutgart. SELEY H. (1936): A syndrome produced by diverse noxious agent. Nature. 138: 32. TONG A. K. W., A. L. SCHAEFER AND S. D. M. JONES (1995): Detection of poor quality beef with infrared thermography. Meat Focus Int. 4:443–445. TARRANT V., T. GRANDIN (2000): Cattle Transport. pp. 151-173. (In: Livestock Handling and Transport. Ed. T. Grandin). CABI Publishing, New York. WARRIS P.D. KESTIN S.C., BROWN S.N., WIKIS L.J. (1984): The time required for recovery from mixing stress zoung bulls and prevention of dark cutting beef, Meat Science 10, 53. Received 31 January 2014; accepted for publication 20 March 2014

Biotechnology in Animal Husbandry 30 (1), p 45-59, 2014 ISSN 1450-9156 Publisher: Institute for Animal Husbandry, Belgrade-Zemun UDC 636.09'632
DOI: 10.2298/BAH1401045S
DUPLEX REAL-TIME PCR ASSAY TARGETING INSERTION ELEMENTS IS1081 AND IS6110 FOR DETECTION OF MYCOBACTERIUM BOVIS IN LYMPH NODES OF CATTLE A. Selim1*, M. El-haig2, W. Gaede3 1Faculty of Veterinary Medicine, Benha University, Toukh, Egypt. 2Faculty of veterinary Medicine, Suez Canal University, Ismailia, Egypt. 3State institute for Consumer protection of Saxsony-anhalt, Stendal, Germany *Corresponding author: [email protected] Original scientific paper
Abstract: The development of a reliable and rapid screening test for detection of Mycobacterium bovis (M. bovis) helps in control of bovine tuberculosis. The aim of this study was evaluate a sensitive and specific assay for detecting M. bovis DNA in lymph nodes with lesions suggestive to tuberculosis taken from slaughtered cattle. A duplex real-time PCR assay was developed for the identification of M. bovis targeting insertion elements (IS) IS1081 and IS6110 in one internally controlled reaction. M. bovis DNA extraction protocols from tissue samples were evaluated. The specificity and sensitivity of the assay were evaluated for detecting serial dilutions of reference Mycobacteria strains as well as from spiked lymph node homogenate. Results revealed that microscopical examination of 600 lymph nodes with tuberculous-like lesion for detection of Acid-fast bacilli (AFB) showed a detection rate of 96.6%, compared to 98% M. bovis with duplex real-time PCR. The reproducible detection limit of the IS1081-PCR was 10 M. bovis cells/ml and the IS6110-PCR was 100 M. bovis cells/ml. Besides, both primer set of PCR protocol could detect 20 M. bovis cells/ml in spiked lymph node tissue. The assay was evaluated on 19 bacterial strains and was determined to be 100% specific for M. bovis. We suggest that the IS1081-PCR is a good candidate assay for routine screening of cattle lymph nodes and other tissue for M. bovis infection.
Key words: M. bovis, IS1081, IS6110, Lymph nodes.
Introduction
Mycobacterium bovis (M. bovis) is the causative agent of bovine tuberculosis (BTB) which affects cattle and a wide range of other mammals,
A. Selim et el.
46
including humans. (Dye et al., 1999). BTB is considered one of the most important zoonotic diseases known to humans. WHO, in conjunction with FAO and OIE, classified BTB as a neglected zoonotic disease (Michel et al., 2009). Infection of human hosts with M. bovis can result from zoonotic exposure to TB infected animals and/or consumption of unpasteurized dairy products and meat products (Allix-Be`guec et al., 2010).
Tuberculosis in cattle and other domestic animals is above all caused by two members of Mycobacterium tuberculosis complex (MTC): M. bovis and M. caprae (Prodinger et al., 2005). However, occasional occurrence of tuberculosis due to M. tuberculosis species with concurrent tuberculous lesions has been reported in cattle (Popluhar et al., 1974; Pavlik et al., 2005), and other animals (Pavlik, 2006; Popluhar et al., 1974). In addition, Mycobacteria other than M. bovis are routinely isolated from tissues submitted for diagnostic culture (OIE 2001). Aerosol exposure to M. bovis is considered to be the most frequent route of infection of cattle, but infection by ingestion of contaminated material also occurs. After infection, nonvascular nodular granulomas known as tubercles may develop (Cousin, 2001). Characteristic tuberculous lesions occur most frequently in the lungs and the retropharyngeal, bronchial and mediastinal lymph nodes. Lesions can also be found in the mesenteric lymph nodes, liver, spleen, and in other organs. These lesions are visually detectable at slaughterhouses and should be followed by confirmation and identification of mycobacterium agent by other techniques (OIE, 2001).
Detection of bovine tuberculosis in cattle and other susceptible animal species is often made on history, clinical and necropsy findings, tuberculin skin tests and abattoir meat inspections. Definitive diagnosis is made on culture with morphological appearance and biochemical tests for differential identification of members of genus Mycobacterium in most clinical laboratories (Kent and Kubica, 1985). However, these conventional methods are time consuming and are difficult to assimilate into precise identification of closely related species and difficult to identify species. Molecular genotypic assays using biological techniques like PCR that use specific genetic elements have shown promise as alternative diagnostic tools (Rodriguez et al., 1995).
Genotyping of M. bovis probably lacks sufficiently informative methods. IS6110 restriction fragment length polymorphism (RFLP) typing has been considered a gold standard method for differentiation of M. tuberculosis strains for a long time; this has provided only limited discrimination among M. bovis populations where the majority of the isolates harbor only one or few IS copies (Haddad et al., 2004). PCR-based spoligotyping (Kamerbeek et al., 1997) has been widely used to genotype M. bovis isolates (Haddad et al., 2004); it is highly reproducible and rapid and represents the first universally recognized typing system for M. bovis populations. However, studies performed on M. bovis isolates showed a limited discrimination power of this method (Haddad et al., 2001).

Duplex real-time pcr assay targeting ...
47
Rapid identification of isolates to the level of M. tuberculosis complex and specific identification of M. bovis can be made by Gen Probe TB complex DNA probe or polymerase chain reaction (PCR) targeting 16S–23S rRNA; the insertion sequences (IS) IS6110 and IS1081 and genes coding for M. tuberculosis-complex-specific proteins and targeting a mutation at specific nucleotides in oxyR gene, pncA gene, gyrB gene and presence/absence of Regions of Difference (RDs) (Niemann et al., 2000; Huard et al., 2006; Shitaye et al., 2006; Taylor et al., 2007; Reddington et al., 2011).
The development of a reliable and rapid screening test would be of great help in the control of the disease and in specific situation such as faster confirmation of bovine TB infection in slaughterhouse cases. Therefore, this study aimed evaluated real-time PCR protocols based on two targets IS1081 and IS6110 as a sensitive screening method and specific confirmatory test for bovine TB. Material and methods Animals and postmortem examination: A total of 600 lymph nodes with visible suspected tuberculous lesions were collected from 300 carcasses of slaughtered cattle from different abattoir in Egypt at the period from February 2008 to January 2010. The prescapular, axillary, supra mammary, prefemoral, suprarenal, mesenteric, ileocaecal, popliteal, retropharyngeal, hepatic and pulmonary lymph nodes were inspected and incised in situ. Caseated, suppurative and granulomatous lymph nodes were considered suggestive for tuberculosis. Samples were collected aseptically in polyethylene bags and quickly delivered to the laboratory in ice for further investigation. Microscopic detection of acid fast bacilli by Zeihl-Neelsen stain. Collected specimens from each macroscopic tuberculous-like lesion were examined for the presence of Acid-Fast Bacilli (AFB) in direct smear films that were prepared from tissue exudate using Ziehl-Neelsen staining according to Wentworth (1987). DNA extraction from Lymph nodes: a) Cetyl-trimethyl-ammonium-bromide (CTAB) Extraction: Tissue specimens from suspected lymph nodes were homogenized in a tissue-grinding mortar with 10 ml of sterile saline for isolation of M. bovis. Genomic DNA of Mycobacteria was extracted by from tissue homogenate by acetyl-trimethyl-ammonium-bromide (CTAB) method described by Van Soolingen et al., (1991), which included a combination of chloroform/isoamylalcohol and isopropanol for extraction and precipitation of the DNA. After extraction, nucleic acid concentrations were measured by spectrophotometer (Du640 Photometer, Beckman Coulter GmbH, Krefeld, Germany) at 260 and 280 nm. According to
A. Selim et el.
48
calculation of Ravva and Stanker (2005), they calculate 5.1 fg of Mycobacterium DNA equal genome copy of one cell. a) DNA extraction from lymph node samples: 400 µl of lysis buffer was added to 1gm lymph node sample in disruption tube containing beads, followed by adding 80 µl protinase k, followed by mechanical mixing in ribolyser at 6.5 ms-1 for 4x45 sec (Hybaid, Ashford, United Kingdom). The samples were incubated immediately at 56oC overnight, incubated at 95 °C for 15 min to kill Mycobacterium and centrifuged at 5000 xg for 5 min. 200 µl of supernatant were mixed with 5 µl lysozyme solution, and the sample was incubated in thermomixer (Eppendorf) at 37 °C and 550 rpm for 15 min. Then 300µl binding buffer was added. The samples were incubated immediately at 70 °C for 10 min, spined and the spined solution was added to the DNA binding columns provided by High Pure PCR Template Preparation kits (Roche) and processed as described by the kit manufacturer’s procedure. Finally, the DNA template was eluted in 100 µl of the elution buffer and 5 µl aliquots were used as template in PCR-protocol. Development of real-time PCR protocol to detect M. bovis: The detection of Mycobacterium DNA by real-time PCR was performed based on two primer set. The first one based on IS1081 which presents multiple copies (6 copies) in Mycobacterium gene. The primer designed as MTC IS1081 F (FAM-5`-CTC TCG ACG TTCA TCG CCG-3`) and MTC IS1081 R (5`- TGG CGG TAG CCG TTG CGC-3`) while the probe is FAM-ATT GGA CCG CTC ATC GCT GCG TTC-BHQ1 according to Gerstmair (2011)and another primer set designed according to (Cleary et al., 2003) based on IS6110 gene sequence as IS6 forward primer (5`-GGC TGT GGG TAG CAG ACC-3`), IS7 reverse primer (5`-CGG GTC CAG ATG GCT TGC-3`) and probe (FAM-5`-TGT CGA CCT GGG CAG GGT TCG-3`). PCR reactions to detect mammalian β-actin were performed parallel with each sample. The primers ACT-F 5`-AGC GCA AGT ACT CCG TGT G-3`, ACT-R 5`- CGG ACT CAT CGT ACT CCT GCT T-3` and yakima yellow labeled probe ACT-5`-TCG CTG TCC ACC TTC CAG CAG ATG T-BHQ1 were designed according to Wernik et al., (2011). β-actin was included as a positive control for the PCR reaction and to evaluate successful DNA extraction from tissue homogenate. Lack of amplification was assumed to indicate that the PCR reaction was inhibited. Primers were synthesized by BioTez-Berlin-Buch GmbH, Berlin, Germany. The probes were synthesized by Eurogentec S.A., Seraing, Belgium. Protocol of duplex real-time PCR: Duplex real-time The PCR mixtures were prepared from QuantiTect Multiplex Norox MasterMix (Qiagen, Germany), forward and reverse primers (0.5 mM final conc.), (FAM, yakima yellow labelled probes) (0.2 mM final conc.), template DNA and adjusted to a final volume of 25ml with the addition of nuclease free dH2O.

Duplex real-time pcr assay targeting ...
49
The PCR reaction was performed in Stratagene thermocycler with the following program: Initial denaturation and activation of Taq-polymerase for 15 min at 95oC followed by 45 cycles of 1 min at 94oC, 1 min at 60oC then cooling for 30 sec at 40oC. Analytical sensitivity of duplex real-time PCR: The analytical sensitivity of real-time PCR was determined of purified DNA from cultures of M. bovis BCG strain (bacillus Calmette-Gue´rin strain). The serial dilution of M. bovis BCG strain was prepared in sterile distilled water in broad range of DNA dilutions equivalent to 108 to 101 M. bovis cells/ml. These serial dilutions of DNA were 3-fold examined with IS1081 and IS6110 real-time PCR in internally controlled reaction with β-actin followed by calculation of mean Ct-values and standard deviations (SD). Analytical specificity of real-time PCR protocol: The real-time PCR protocols targeting IS1081 and IS6110 were evaluated for specificity to 19 Mycobacterium species reference isolates. DNA extracted from each isolate was diluted to two dilutions, 5 ng/µl and 5 pg/µl as listed in table 1. All mycobacterium reference strains were isolated and identified by Friedrich-Loffler Institute (FLI), Jena, Germany. Preparation of spiked lymph node tissue homogenate samples: Ten-fold serial dilutions of M. bovis BCG ranged from 2x101 to 2x10⁷ cells/ml were prepared. Afterward, 1ml from each dilution was added and mixed to 1gm of lymph node homogenate samples which previously confirmed negative to mycobacterium with cultural and molecular techniques. Positive and negative controls were included. Results and discussion Sensitivity of duplex Real-time-PCR compared microscopic detection of M. bovis: Results revealed that out of 600 lymph node sample with lesions suggestive to tuberculosis 580 (96.6%) was positive for AFB detected by microscopic examination of ZN stained smears. However, by duplex real-time PCR 588 (98%) was confirmed to M. bovis infection. Analytical specificity: The specificity of real-time PCR targeting IS1081 and IS6110 was evaluated to 19 strains of different Mycobacterial species. The real-time PCR targeting both IS1081 and IS6110 sequences showed negative result with all Mycobacterial
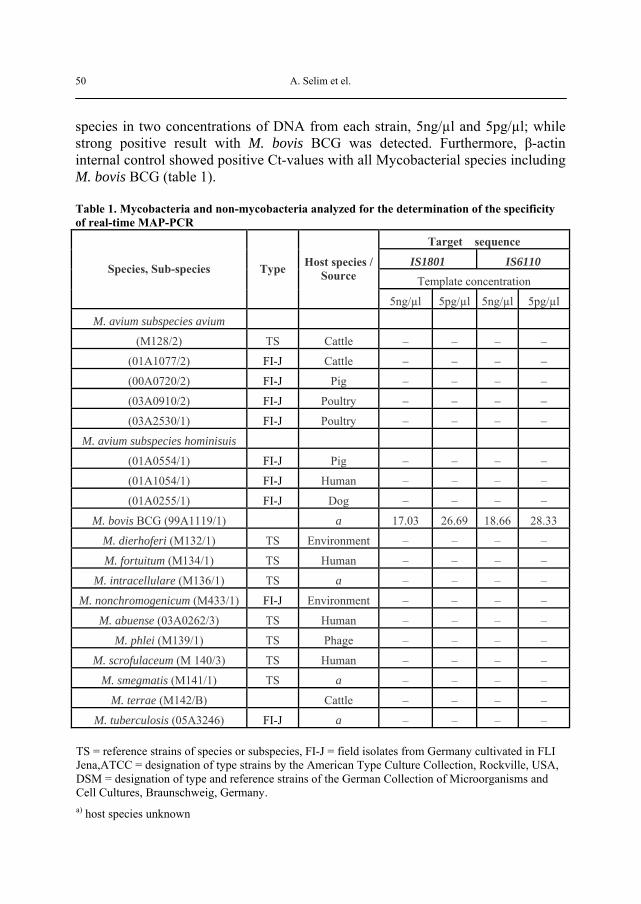
A. Selim et el.
50
species in two concentrations of DNA from each strain, 5ng/µl and 5pg/µl; while strong positive result with M. bovis BCG was detected. Furthermore, β-actin internal control showed positive Ct-values with all Mycobacterial species including M. bovis BCG (table 1). Table 1. Mycobacteria and non-mycobacteria analyzed for the determination of the specificity of real-time MAP-PCR
Target sequence
IS1801 IS6110 Template concentration
Species, Sub-species Type Host species / Source
5ng/µl 5pg/µl 5ng/µl 5pg/µl
M. avium subspecies avium
(M128/2) TS Cattle – – – –
(01A1077/2) FI-J Cattle – – – –
(00A0720/2) FI-J Pig – – – –
(03A0910/2) FI-J Poultry – – – –
(03A2530/1) FI-J Poultry – – – –
M. avium subspecies hominisuis
(01A0554/1) FI-J Pig – – – –
(01A1054/1) FI-J Human – – – –
(01A0255/1) FI-J Dog – – – –
M. bovis BCG (99A1119/1) a 17.03 26.69 18.66 28.33
M. dierhoferi (M132/1) TS Environment – – – –
M. fortuitum (M134/1) TS Human – – – –
M. intracellulare (M136/1) TS a – – – –
M. nonchromogenicum (M433/1) FI-J Environment – – – –
M. abuense (03A0262/3) TS Human – – – –
M. phlei (M139/1) TS Phage – – – –
M. scrofulaceum (M 140/3) TS Human – – – –
M. smegmatis (M141/1) TS a – – – –
M. terrae (M142/B) Cattle – – – –
M. tuberculosis (05A3246) FI-J a – – – –
TS = reference strains of species or subspecies, FI-J = field isolates from Germany cultivated in FLI Jena,ATCC = designation of type strains by the American Type Culture Collection, Rockville, USA, DSM = designation of type and reference strains of the German Collection of Microorganisms and Cell Cultures, Braunschweig, Germany. a) host species unknown

Duplex real-time pcr assay targeting ...
51
Analytical sensitivity: The analytical sensitivity of real-time PCR based on IS1081 and IS6110 gene sequences in combination with β-actin showed a nearly similar reproducible detection level that was 10 M. bovis cells/ml for IS1081,While; the reproducible detection limit of SI6110-PCR was 100 M. bovis cells/ml (table 2). Table 2. Ct-values and standard deviation of real-time PCR based on IS1081 and IS6110 gene sequences with serial dilution of M. bovis cells
IS1081 IS6110 M.bovis cells/ml Mean Ct SD Mean Ct SD
1.00+08 17.4 0.2 17.4 0.8 1.00+07 20.8 0.2 21.5 0.8 1.00+06 24 0.1 24.6 0.6 1.00+05 27.2 0.4 27.9 0.8 1.00+04 30.2 0.3 30.9 0.8 1.00+03 33.5 0.1 34.1 0.6 1.00+02 37.1 0.5 37.4 0.8 1.00+01 39.2 0.3 - -
The calculation of amplification efficiency of IS6110 and IS1081-PCR showed strong linear relationship between Ct-values and the corresponding concentration of M. bovis cells in PCR. The regression coefficient was (R2=0.9985) while the regression coefficient in case of IS6110-PCR was (R2=0.9971), (figure 1).
Figure 1. Semilogartihmic relationship between Ct-value and log concentration of M. bovis in spiked lymph node

A. Selim et el.
52
The accuracy of the assay for detection of M. Bovis in spiked LN tissue samples After DNA extraction from spiked lymph nodes samples were processed using High Pure PCR Template Preparation Kit. By real-time PCR targeting IS1081 and IS6110 in combination β-actin internal. Up to 20 cells/1 gm Lnn could be detected (table 3). Table 3. Results of direct detection of M. bovis in spiked lymph node using real time PCR based on IS1081 and IS6110
Ct-values Conc. of M. bovis cells in 1gm of spiked Lnn tissue IS1081-PCR IS6110-PCR
2x10⁷ 21.35 22.7
2x10⁶ 24.1 26.03
2x10⁵ 27.9 28.78
2x10⁴ 31.21 31.65
2x10³ 33.9 34.1
2x10² 36.8 37.2
2x101 39.4 39.7
This study included detection of M. bovis in lymph nodes with visible
lesions suggestive to tuberculosis in cattle slaughtered in a slaughterhouse. This constitutes a tentative diagnosis for bovine tuberculosis that is routinely performed during the meat inspection in slaughterhouses. However, the presence of caseous and/or calcified lesions and even lesions resembling tuberculous lesions may not always found to be of mycobacterial origin. Lesions can be caused by any other intracellular organisms or parasites that could mislead a veterinarian to consider the non tuberculous cattle as being tuberculous. Therefore, postmortem examination followed by bacteriological examination of suspected lesions in cattle is important tools to confirm BTB infection (Corner, 1994). Accurate molecular detection enables to make definitive diagnosis of M. bovis (Haddad et al., 2004). It has been reported that PCR is 28 times more sensitive in the diagnosis of M. tuberculosis complex than traditional culture and direct microscopy (Romero et al., 1999). Molecular technique has the advantage of being fast. In addition, it is simple to implement and easy to adapt to any laboratory since it does not require sophisticated equipment or expensive reagents.
In our study, a high detection rate of AFB by microscopical examination of lymph nodes with tuberculous-like lesions was recorded. Although it is considered a tentative diagnosis and lacking of confirmation of BTB and its differentiation
Duplex real-time pcr assay targeting ...
53
from other related mycobacteriosis, it is the most rapid and cost-effective screening method. Our results were in consistent with Asil et al., (2012) who sustained microscopy as a useful and accessible technique for detecting AFB. In contrary, M. bovis are often low in bovine specimens and they can be visualized by ZN only if a sufficient quantity (at least 5 × 10⁴ mycobacteria/ml) of materials is present (Quinn et al., 1994). Result of ZN staining may also be affected by the sample taking technique during smear preparation as mycobacteria are not be evenly distributed in the tissue sample (Shitaye et al., 2006).
Tuberculosis in cattle and other domestic animals is above all caused by two members of Mycobacterium tuberculosis complex (MTC): M. bovis and M. caprae (Prodinger et al., 2005). However, M. bovis is the most prominent member of MTC associated with BTB infections. Results of this study revealed that 98% were confirmed to M. bovis by real-time PCR, indicating that M. bovis was the most predominated cause of BTB with high zoonotic potential. The negative results of 2% could be related to other type of mycobacteria or non-tuberculosis causes of detectable tuberculosis-like lesions.
IS1081-PCR result showed higher sensitivity than IS6110-PCR. In similar scale, our result showed high sensitivity than that reported by Thacker et al., (2011), the limit of detection of IS6110-PCR was 100 fg of M. bovis DNA (equal 20 M. bovis cells). The IS6110 PCR has been reported to detect M. bovis in PCR reaction (Shitaye et al., 2006). Reddington et al., (2011) developed a multiplex real-time PCR assay using novel molecular targets to identify and differentiate between the phylogenetically closely related M. bovis BCG and M. caprae.
However, the result of IS1081-PCR showed bit lower sensitivity than other detection limit one copy M. bovis reported by Taylor et al., (2007). The IS1081 PCR is a realistic screening method for rapid identification of positive cases but the sensitivity of single copy methods; this is almost certainly due to the multi-copy nature of the target (Taylor et al., 2007).
Assay developed in the present study could detect up to 20 M. bovis cells/ml in spiked lymph nodes. Numerous works have evaluated the use of PCR as a tool for diagnosing mycobacterial infection in various clinical samples. Some have detected M. bovis in milk samples (Antognoli et al., 2001), whereas others have detected M. bovis directly in bovine tissue (Roring et al., 2000; Taylor et al., 2007). Furthermore, Zanini et al., (2001) described a more effective use of this diagnostic tool applying the system in tissue samples with presence of gross lesions compatible with tuberculosis. Miller et al., (1997) demonstrated that PCR is a reliable technique for the identification of M. bovis in tissues embedded in paraffin in which M. bovis could not be cultured.
Efficient DNA extraction is crucial to the success rate of PCRs applied to such tissues. The extraction procedure should deliver effective lysis of Mycobacteria, good recovery of the DNA from a complex mixture of tissue debris and lastly, removal of PCR inhibitors. It was reported that the discrepancy between

A. Selim et el.
54
sensitivity of detection found with purified mycobacterial DNA and direct testing of field samples was due to limited mycobacterial DNA recovery from tissue homogenates rather than PCR inhibition (Taylor et al., 2007). This may be a cause of concern; they are irrelevant if primers and probes with sufficient specificity are not available. In the present study, efficient DNA extraction from lymph nodes was applied to overcome the PCR inhibitors by combination of commercial DNA extraction kits with bead beating technique and optimal lysis buffer. The use of commercial kits with lysis reagents was reported (Aldous et al., 2005). Silica based methods of DNA extraction have been widely evaluated and found to be one of the most efficient with columns generally more efficient than slurries (Bouwman and Brown, 2002). Combination of these various DNA extraction approaches were also evaluated (Heginbotham et al., 2003). A number of studies have addressed the problem of initial processing of mycobacterial samples and a number of procedures as described (Afghani and Stutman, 1996; Heginbotham et al., 2003; Tell et al., 2003; Mangiapan et al., 1996; Roring et al., 2000; Boom et al., 1990). Several of these studies have compared procedures, often with differing conclusions. The use of internal control in a real-time PCR reaction enables evaluation of DNA extraction and purification procedures and prevents misdiagnosis of M. bovis in clinical specimens. Conclusion
The duplex real-time PCR assay described in this study is a diagnostic assay for the identification of M. bovis, which are obtained two diagnostic targets in one internally controlled reaction. The assay was evaluated with 19 bacterial strains and was determined to be 100% specific for the members of the M. bovis targeted. We suggest that the IS1081-PCR is a good candidate assay for routine screening of cattle lymph nodes and other tissue for M. bovis infection. Efficient DNA extraction is crucial to the success rate of PCRs applied to such tissues. Duplex real-time pcr analiza usmerenih elemenata insercije is1081 i is6110 za detekciju micobacterium bovis u limfnim čvorovima goveda A. Selim, M. El-haig, W. Gaede

Duplex real-time pcr assay targeting ...
55
Rezime
Razvoj pouzdanog i brzog skrining testa za detekciju Micobacterium bovis (M. bovis) pomaže u kontroli tuberkuloze goveda. Cilj ovog rada bio je da se oceni osetljiv i specifičan test za detekciju DNA M. bovis u limfnim čvorovima sa lezijama suspektnim na tuberkulozu, uzetim od zaklanih goveda. Dvostruki PCR test u realnom vremenu (real-time PCR) razvijen je za identifikaciju M. bovis sa pretragom umetnutih elemenata (IS) IS1081 i IS6110 u jednoj interno kontrolisanoj reakciji. Ocenjivani su protokoli ekstrakcije DNA M. bovis iz uzoraka tkiva. Specifičnost i osetljivost testa procenjivani su za detekciju serijskih razblaženja referentnih sojeva mikobakterija kao i homogenata limfnih čvorova. Rezultati su pokazali da je mikroskopsko ispitivanje 600 limfnih čvorova sa lezijama sličnim tuberkulozi - za utvrđivanje Acid-fast bacilli (AFB) pokazalo stopu detekcije od 96,6 %, u poređenju sa 98 % za M. bovis sa real-time PCR-om. Limit izvodljivosti detekcije IS1081 – PCR je bio 10 M. bovis ćelija/ml dok je za IS6110 - PCR bio 100 M. bovis ćelija/ml. Pored toga, oba prajmer set PCR protokola mogu detektovati 20 M. bovis ćelija/ml u tkivu limfnih čvorova. Test je ocenjen na 19 bakterijskih sojeva i utvrđeno je da je 100% specifičan za M. bovis. Može se zaključiti da je IS1081 - PCR odgovarajući kandidat za rutinski skrining test limfnih čvorova i drugih tkiva goveda na M. bovis infekcije. References AFGHANI B., STUTMAN H.R. (1995): Polymerase chain reaction for diagnosis of M. tuberculosis: comparison of simple boiling and a conventional method for DNA extraction. Biochemical Molecular Medicine, 57, 14-18. ALDOUS W.K., POUNDER J.I., CLOUD J.L., WOODS G.L. (2005): Comparison of six methods of extracting Mycobacterium tuberculosis DNA from processed sputum for testing by quantitative real-time PCR. Journal of Clinical Microbiology, 43, 2471-2476. ALLIX-BE´GUEC C., FAUVILLE-DUFAUX M., STOFFELS K., OMMESLAG D., WALRAVENS K. (2010): Importance of identifying Mycobacterium bovis as a causative agent of human tuberculosis. European Respiratory Journal, 35, 692–694. ANTOGNOLI M.C., SALMAN M.D., TRIANTIS J., HERNÁNDEZ J., KEEFE T. (2001): A one tube nested PCR for the detection of Mycobacterium bovis in spiked milk samples: an evaluation of different concentration and lytic techniques for M. bovis. Journal of Veterinary Diagnostic Investigation, 13, 111-6. ASIL E.T., EL SANOUSI S.M., GAMEEL A., EL BEIR H., FATHELRAHMAN M., TERAB N.M., MUAZ M.A., HAMID M.E. (2012): Bovine tuberculosis in South Darfur State, Sudan: an abattoir study based on microscopy and molecular detection methods. Tropical Animal Health Production, 29, 1-4.

A. Selim et el.
56
BOOM R., SOL C.J.A., SALIMANS M.M.M., JANSEN C.L., WERTHEIM-VAN DILLEN P.M.E., VAN DER NOORDAA J. (1990): Rapid and simple method for purification of nucleic acids. Journal of Clinical Microbiology, 28, 495-503. BOUWMAN A.S., BROWN T.A. (2002): Comparison between silica based methods for the extraction of DNA from human bones’ from 18th-19th century London. Ancient Biomolecules, 4, 173-178. CLEARY T.J., ROUDEL G., CASILLAS O., MILLER N. (2003): Rapid detection of Mycobacterium tuberculosis by using the smart instrument and specific fluorogenic probe. Journal of Clinical Microbiology, 41, 4783-4786. CORNER L.A. (1994): Post mortem diagnosis of Mycobacterium bovis infection in cattle. Veterinary Microbiology, 40, 53-63. COUSINS D.V. (2001): Mycobacterium bovis infection and control in domestic livestock. Revue Scientifique et technique, 20, 71–85. DYE C., SCHEELE S., DOLIN P., PATHANIA V., RAVIGLIONE M.C. (1999): Global burden of tuberculosis: estimated incidence, prevalence, and mortality by country. Journal of American Medical Association, 282, 677–686. GERSTMAIR E.M. (2011): Validierung molekularbiologischer undimmunologischer Nachweisverfahren für die Tuberkulose bei Rindern und Tuberkulose monitoring beim Rotwild. (Dissertation med. Vet). Ludwig-Maximilians-Universität München. München. HADDAD N., OSTYN A., KAROUI C., MASSELOT M., THREL M.F., HUGHES S.L., INWALD J., HEWINSON R.G., DURAND B. (2001): Spoligotype diversity of Mycobacterium bovis strains isolated in France from 1979 to 2000. Journal of Clinical Microbiology, 39, 3623–3632. HADDAD N., MASSELOT M., DURANT B. (2004): Molecular differentiation of Mycobacterium bovis isolates: review of techniques and applications. Research Veterinary Science, 76, 1–18. HEGINBOTHAM M.L., MAGEE J.T., FLANAGAN P.G. (2003): Evaluation of the Idaho technology LightCycler PCR for the direct detection of Mycobacterium tuberculosis in respiratory specimens. International Journal of Tuberculosis and Lung Disease, 7, 78-83. HUARD R.C., FABRE M., DE HAAS P., CLAUDIO OLIVEIRA LAZZARINI L., VAN SOOLINGEN D. (2006): Novel Genetic Polymorphisms That Further Delineate the Phylogeny of the Mycobacterium tuberculosis Complex. Journal of Bacteriology, 188, 4271–4287. KAMERBEEK J., SCHOULS L., KOLK A., VAN AGTERVELD M., VAN SOOLINGEN D., KUIJPER S., BUNSCHOTEN A., MOLHUIZEN H., SHAW R., GOYAL M., VAN EMBDEN J. (1997): Simultaneous detection and strain differentiation of Mycobacterium tuberculosis for diagnosis and epidemiology. Journal of Clinical Microbiology, 35, 907–914. KENT P.T., KUBICA G.P. (1985): Public Health Mycobacteriology a guide for the level III laboratory. US Department of Health and Human Services, Public Health

Duplex real-time pcr assay targeting ...
57
Service, Centers for Disease Control Atlanta, Georgia, USA, Pp. 207. MANGIAPAN G., VOKURA M., SCHOULS L., CADRANEL J., LECOSSIER D., VAN EMBDEN J., HANCE A.J. (1996): Sequence capture-PCR improves detection of Mycobacterial DNA in clinical specimens. Journal of Clinical Microbiology, 34, 1209-1215. MICHEL A.L., MULLER B., DAVID P., HELDEN V. (2009): Mycobacterium bovis at the animal-human interfere: a problem or not?. Veterinary Microbiology, 140, 371-381. MILLER J.M., JENNY A., RHYAN J., SAARI D., SUAREZ D. (1997): Detection of Mycobacterium bovis in formalin-fixed, paraffin-embedded tissues of cattle and elk by PCR amplification an IS6110 sequence specific for Mycobacterium tuberculosis complex organisms. Journal of Veterinary Diagnostic Investigation, 9, 244-9. NIEMANN S., HARMSEN D., RUSCH-GERDES S., RICHTER E. (2000): Differentiation of clinical Mycobacterium tuberculosis complex isolates by gyrB DNA sequence polymorphism analysis. Journal of Clinical Microbiology, 38, 3231–3234. OIE (2001): H. Bercovier (1) & V. Vincent (2) Rev. sci. tech. Off. int. Epiz., 20 (1), 265-290. PAVLIK I., TRCKA I., PARMOVA I., SVOBODOVA J., MELICHAREK I., NAGY G., CVETNIC Z., OCEPEK M., PATE M., LIPIEC M. (2005): Detection of bovine and human tuberculosis in cattle and other animals in six Central European countries during the years 2000–2004. Veterinarni Medicina, 50, 291–299. PAVLIK I. (2006): The experience of new European UnionMember States concerning the control of bovine tuberculosis. Veterinary Microbiology, 112, 221–230. POPLUHAR L., HALADEJ S., HAVELKA B., ZUBAJ J. (1974): Occurrence of tuberculosis in husbandry animals in Slovakia in 1972 (in Slovak). Veterinarstvi, 24, 33–34. PRODINGER W.M., BRANDSTATTER A., NAUMANN L., PACCIARINI M., KUBICA T. (2005): Characterization of Mycobacterium caprae Isolates from Europe by Mycobacterial Interspersed Repetitive Unit Genotyping. Journal of Clinical Microbiology, 43, 4984–4992. QUINN P.J., CARTER M.E., MARKEY B., CARTER G.P. (1994): Mycobacterium species: In: Clinical Veterinary Microbiology’, Wolfe Publishing, London. 156–170. RAVVA S.V., STANKER L.H. (2005): Real-time quantitative PCR detection of Mycobacterium avium subsp. paratuberculosis and differentiation from other mycobacterium using SYBR Green and TaqMan assays. Journal of Microbiological Methods, 63, 305-317. REDDINGTON K., O’GRADY J., DORAI-RAJ I., STEFAN N., VAN

A. Selim et el.
58
SOOLINGEN D., BARRY T. (2011): A Novel Multiplex Real-Time PCR for the Identification of Mycobacteria Associated with Zoonotic Tuberculosis. PloS ONE, 6, 23-48. RODRIGUEZ J.G., MEJIA G.A., DEL PROTILLO P., PATARROYO M.E., MURILLO L.A. (1995): Species-specific identification of Mycobacterium bovis by PCR. Microbiology, 141, 2131-2141. ROMERO R.E., GARZÓN D.L., MEJÍA G.A., MONROY W., PATARROYO M.E., MURILLO L.A. (1999): Identification of Mycobacterium bovis in bovine clinical samples by PCR species-specific primers. Candian Journal of Veterinary Research, 63, 101-6. RORING S., HUGHES M.S., SKUCE R.A., NEILL S.D. (2000): Simultaneous detection and strain differentiation of Mycobacterium bovis directly from bovine tissue specimens by spoligotyping. Veterinary Microbiology, 70, 227-36. SHITAYE J.E., PARMOVA I., MATLOVA L., DVORSKA L., HORVATHOVA A., VRBAS V., PAVLIK I. (2006): Mycobacterial and Rhodococcus equi infections in pigs in the Czech Republic between the years 1996 and 2004: the causal factors and distribution of infections in the tissues. Veterinarni Medicina, 51, 497–511. TAYLOR G.M., WORTH D.R., PALMER S., JAHANS K., HEWINSON R.G. (2007): Rapid detection of Mycobacterium bovis DNA in cattle lynph nodes with visible lesions using PCR. BMC Veterinary Research, 3, 12. TELL L.A., FOLEY J., NEEDHAM M.L., WAIKER R.L. (2003): Comparison of four rapid DNA extraction techniques for conventional polymerase chain reaction testing of three Mycobacterium spp. That affects birds. Avian Disease, 47, 1486-1490. Thacker T.C., Harris B., Palmer M.V., Waters W.R. (2011): Improved specificity for detection of Mycobacterium bovis in fresh tissues using IS6110 real-time PCR. BMC Veterinary Research, 7, 50. VAN SOOLINGEN D., HERMANS P.W., DE HAAS P.E., SOLL D.R., VAN EMBDEN J.D. (1991): Occurrence and stability of insertion sequences in Mycobacterium tuberculosis complex strains: evaluation of an insertion sequence-dependent DNA polymorphism as a tool in the epidemiology of tuberculosis. Journal of Clinical Microbiology, 29, 2578–2586. WHO (2006): The control of neglected zoonotic diseases: a route to poverty alleviation’, Report of a joint WHO/DFIAD-AHP Meeting, 20-21 September2005, WHO Headquarters Geneva, with the participation of FAO and OIE. WENTWORTH, B.B. (1987): Diagnostic procedures for bacterial infections’, 7th ed. American Public Health Association, Washington, DC.
WERNIK K., HOFFMANN B., KALTHOFF D., KÖNIG D., BEER M. (2011): Development and validation of atriplex real-time PCR assay fort he rapid detection and differentiation of wild-type and glycoprotein E-detected vaccine strains of Bovine herpesvirus type 1. Journal of Virological Methods, 77, 174.

Duplex real-time pcr assay targeting ...
59
ZANINI M.S., MOREIRA E.C., LOPES M.T., OLIVEIRA R.S., LEÃO S.C., FIORAVANTI R.L. (2001): Mycobacterium bovis: Polymerase chain reaction identification in bovine lymph node biopsies and genotyping in isolates from southeast Brazil by spolygotyping and restriction fragment length polymorphism. Memorias do Instituto Oswaldo Cruz, 96, 1-5 Received 25 November 2013; accepted for publication 31 January 2014


Biotechnology in Animal Husbandry 30 (1), p 61-77, 2014 ISSN 1450-9156 Publisher: Institute for Animal Husbandry, Belgrade-Zemun UDC 636.052'636.8
DOI: 10.2298/BAH1401061S
EFFECT OF CROSSBREEDING ON LINEAR UDDER SCORES AND THEIR PHENOTYPIC RELATIONSHIPS IN IRANIAN FAT-TAILED EWE’S S. Sadeghi 1*, A. Rafat2, M. Bohlouli2
1*Department of Animal Science, University of Tabriz, Novin Daneshmand Research & development institute, Iran
2Department of Animal Science, University of Tabriz, Tabriz, Iran Corresponding author: [email protected] Original scientific paper
Abstract: Now, image processing is a better technique than the subjectively assessments for linear scoring of morphologic traits, especially in fat-tailed ewe’s. The objective of this study was to assess this application in animal characterization on a case study in order to comparing of, udder morphological characteristics in two Iranian crossbred sheep populations including Ghezel-Arkhamerino (GH-MR; 25 ewes), Moghani-Arkharmerino (MG-MR; 25 ewes) and a pure one that was Ghezel ewes (20 ewes). Ten udder factors and five milk traits were measured on seventy ewes during three stages of lactation. Digital pictures were analyzed by Digimizer 3.6 software. Statistical analysis of udder liner scores was performed by using the MIXED procedure of SAS 9.1 software. Results showed that long udders were more frequent in the Ghezel ewes than in crossbred’s ewes. Least variation was observed for teat placement score in Ghezel purebred ewes. The means of udder depth in the Ghezel ewes were larger than in the crossbreds (P<0.01). A positive correlation between left and right teat length scores were found in the all genetic groups (rp=0.47-0.65). Milking rate (rp= 0.81) and milking time (rp= 0.37) showed significant correlations with milk yield (P <0.001). The most useful udder scores for predicting daily milk yield appears to be the left teat length, teat placement and attachment width in Ghezel ewes. Phenotypic correlations variations within linear scores and their relationships with daily milk showed the potential of improvement of these traits in breeding programs of dairy sheep.
Keywords: crossbreeding, milk yield, sheep, udder conformation traits Introduction Milking traits (Sanna et al., 2001; Dzidic et al., 2004; Casu et al., 2010) and udder morphology traits (Rovai et al., 1999; Marie-Etancelin et al., 2003; Casu et

S. Sadeghi et el.
62
al., 2010) are factors determining milking ability in dairy ewes. The transformation from hand to machine milking requires that the relationships among morphological udder characteristics and milk production be investigated (Mavrogenis et al., 1988). A better understanding of morphological variations and milking traits would allow identifying those traits which are most suitable for a synchronous selection program (Dzidic et al., 2004). Previously, breeding selection criteria were focused on production traits, which may have negatively affected the mammary morphology traits by increasing udder depth and reducing teat verticality. Thus, there is a need to introduce improve udder traits in sheep breeding schemes. Additionally, improved adaptation of udder morphology to machine milking may positively affect udder health (Gutiérrez-Gil et al., 2008). In dairy sheep, the most important functional traits are those related to udder morphology, because they determine the machine milking efficiency of the animal and have a substantial effect on its functional lifetime (Gutiérrez -Gil et al., 2008). The evaluation of udder morphology traits during lactation might be useful auxiliary traits for the genetic improvement of milking ability due to close genetic correlations (Rovai et al., 1999).
Knowledge of milk yield, milking time and udder conformation is necessary for optimal adaptation of the milking environment to the needs of the animal (Dzidic et al., 2004). In the last decades machine milking has been introduced more widely into dairy sheep husbandry. This evokes attention of breeders and scientists for morphological and functional characteristics of udder traits in order to enable an easy and uniform milking routine (Milerski et al., 2006). It is important to investigate which traits show the closest relationships to machine milking ability, such as: udder and teat measurements, milking time, milk flow rate and their relationship to milk yield (Peris et al., 1999). It is necessary to identify traits that are simple to measure and correlated with milk yield to select ewes for dairying from existing populations of sheep in Australia (Morrissey et al., 2007). Several authors investigated the relationship between morphological udder traits and milkability or milk performance. Deep and well-attached udders are strongly correlated with high production (Legarra and Ugarte, 2005). According to Izadifard and Zamiri (1997), correlations between udder’s measurements and milk yield can be useful in preparation of cross breeding programmes. Cistern size and udder morphology traits are correlated with milk secretion rate and milk emission kinetics during machine milking in dairy sheep (Ayadi et al., 2011). Phenotypic and genetic correlations indicate that selection for milk yield will produce worse udder morphology in dairy breeds, mainly in udder height and teat placement, giving as a result baggy udders which are inadequate for machine milking (Caja et al., 2000). The purposes of the present study were to determine effective factors on linear udder score and evaluate their phenotypic relationships with milk traits in the Ghezel× Arkhamerino (GH-MR) and Moghani×Arkharmerino (MG-MR) crossbreds and the Ghezel purebred ewes.

Effect of crossbreeding ...
63
Materials and Methods
This study was carried out at the animal research station, College of Agriculture in University of Tabriz. Seventy ewes were available in the experiment, out of them 20 Ghezel purebred ewes, 25 Ghezel × Arkharmerino and 25 Moghani × Arkharmerino crossbreds. All ewes were machine milked once a day during lactation. Animals were recorded repeatedly during their first and second lactations in three lactation stages, including early (week 2), middle (week 11) and end of lactation (week 23). Measured traits were linear udder traits, milking rate and time, milk composition and daily milk yield. Linear udder scores were derived from digital photos of each ewe directly taken before the machine milking. The linear assessment scheme contained ten characteristics of udder and teats including: udder depth (1-low, 9-high; UD), left and right cistern depth below the teat level (1-none, 9-high; LCD for left and RCD for right), teat placement (1- horizontal, 9- vertical; TP), left and right teat length (1-short, 9-long; LTL for left and RTL), udder attachment (1-narrow, 9-wide; UA), udder shape (1-bad, 9-ideal; US) by following the protocol proposed by De la Fuente et al. (1996), and Ugarte (2007), and teat vertical position of lateral view (1-high, 9-none; LD) and teat horizontal position of lateral view (1-frontal, 9-posterior; LTP) measured based on the protocol proposed by Hajihosseinlo et al., (2012). Four pictures of the udder were analyzed: fore and lateral views of the whole udder and two particular views of the right and left teat. Digimizer 3.6 software was used for extraction and calculation of udder scores from digital pictures, and also milk composition, milking rate and machine milked time (second) were recorded in the 2nd, 11th and 23rd week postpartum.
Statistical analysis of udder liner scores was performed by using the MIXED procedure of SAS 9.1 (2003). The CORR procedure was applied for calculation of correlations between traits. The final regression equations of daily milk yield on udder linear scores were determined using the stepwise selection. The following statistical model was used: yijklm = µ+ Bi + Sj+ Pk+Anl+ Bi×S j+ Bi×Pk +eijklm
Where: yijklm= dependent variables studied; μ= mean; Bi= fixed effect of genetic group (i=1, 2, 3); Sj= fixed effect of stage of lactation (j=1, 2, 3); Pk=fixed effect of parity (k=1, 2); Anl= random effect of animal; Bi×Sj= interaction of breed with stage of lactation; Bi×Pk = interaction of breed with parity.
Results and discussion
Factors affecting udder scores traits Least squares means of linear udder scores and daily milk yield for genetic
groups, parity and different stages of lactation are summarized in Table 1. Least

S. Sadeghi et el.
64
squares means of daily milk yield and udder depth in the Ghezel ewes were higher than in crossbreds. The least squares mean of left teat position for Ghezel× Arkharmerino crossbreds was higher than for Moghani × Arkharmerino (P<0.05). The average cross-section areas of cistern were much larger in Ghezel than in crossbreds for both variants of scores, from the side and from the bottom. On the other hand, teats were positioned more horizontally in Ghezel ewes. Table 1.Least squares means of linear udder scores and daily milk yield (DMY) for Ghezel (GH), Ghezel × Arkharmerino (GH-MR) and Moghani × Arkharmerino (MG-MR) ewes in different stages of lactation and numbers of parity.
Least squares means DMY(gram) UD LTL RTL TP LTP US RCD LCD UA LD
Genetic groups GH 734a 3.09a 4.44 4.39 4.49b 3.64ab 3.64 2.33 2.34ab 4.18 3.80a GH-MR 497b 2.55b 4.39 4.38 5.40a 3.89a 3.90 2.18 2.02a 4.05 4.31ab MG-MR 569b 2.70b 4.54 4.56 4.90ab 3.22b 3.22 2.35 2.67b 3.98 4.43b Parity First 650a 2.97a 4.54 4.5 4.9 3.56 3.79a 2.34 2.39 4.21 4.14 Second 550b 2.6b 4.38 4.38 4.97 3.59 3.33b 2.24 2.3 3.92 4.23 Stage of lactation Early 868 a 3.15a 3.96a 3.93a 3.68a 2.53 3.04a 2.56a 2.55a 4.65a 4.74a Middle 674b 2.74b 4.59b 4.52b 5.12b 2.52 2.29b 2.26ab 2.39ab 3.91b 4.1b End 260c 2.71b 4.82b 4.88c 5.9b 3.69 2.14b 2.03b 2.10b 3.65b 3.70b Different letters in the same column for each effect differ significant at P <0.05. Udder depth (UD), left and right teat length (LTL and RTL), teat placement (TP), teat horizontal position of lateral view (LTP), udder shape (US), left and right cistern depth (LCD and RCD), udder attachment (UA) and teat vertical position of lateral view (LD).
The distributions of the frequency of udder linear scores in genetic groups are
showed in Figure 1. 75- 95% ewes had score 2 and 3 for udder shape score. Long udders (udder depth scores ≤ 4) were more frequent in the Ghezel ewes than in crossbred’s ewes. The lowest variations were observed for teat position scores. These differences may be due to the genetic differences between the three populations.
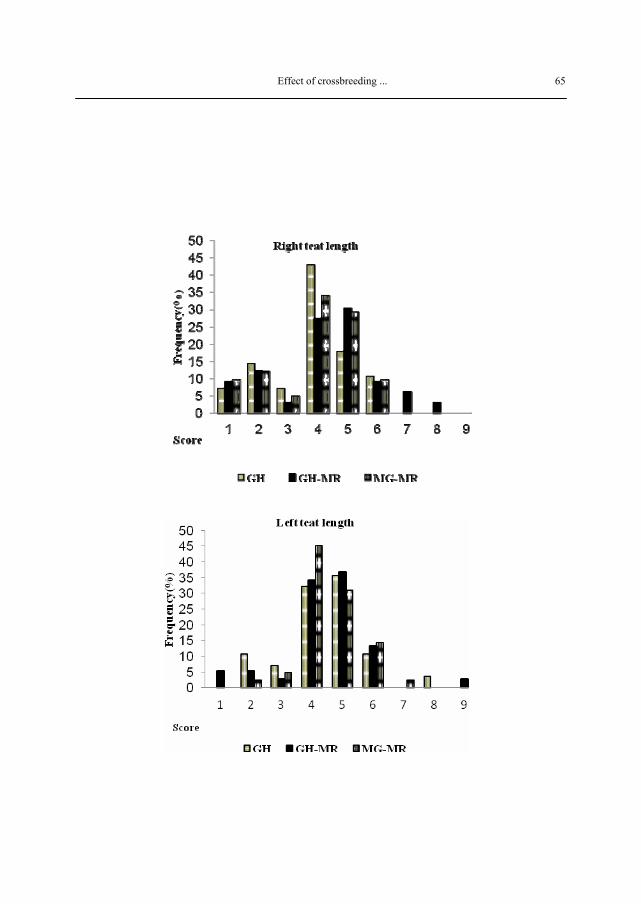
Effect of crossbreeding ...
65

S. Sadeghi et el.
66
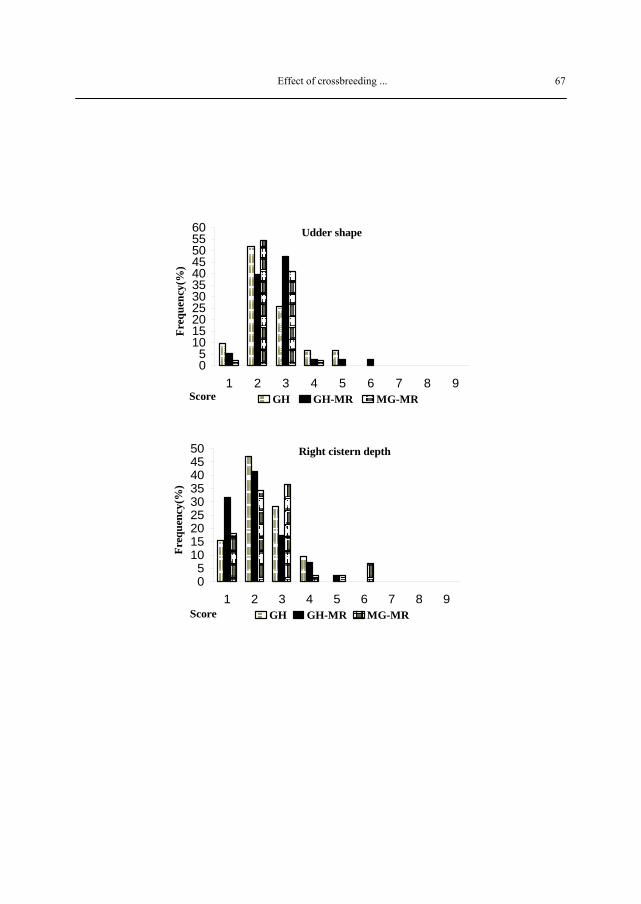
Effect of crossbreeding ...
67
Udder shape
05
1015202530354045505560
1 2 3 4 5 6 7 8 9Score
Freq
uenc
y(%
)
GH GH-MR MG-MR
Right cistern depth
05
101520253035404550
1 2 3 4 5 6 7 8 9Score
Freq
uenc
y(%
)
GH GH-MR MG-MR

S. Sadeghi et el.
68
Udder depth
07
142128354249
1 2 3 4 5 6 7 8 9Score
Freq
uenc
y(%
)
GH GH-MR MG-MR

Effect of crossbreeding ...
69
Figure 1. Frequent distribution of linear scores for Ghezel×Arkhamerino (GH-MR), Moghani× Arkharmerino (MG-MR) crossbreds and purebred Ghezel ewes (GH).
Correlation between linear udder scores and milk traits Correlation analyses were done for the examined genetic groups separately
in Tables 2, 3 and 4 for Ghezel, Ghezel × Arkharmerino and Moghani × Arkharmerino, respectively. Positive phenotypic correlation was found between daily milk yield and udder shape in Ghezel, Moghani × Arkharmerino (P<0.01) and Ghezel × Arkharmerino (P> 0.05). In all genetic groups, positive phenotypic correlations found between right and left cistern depth score and also left and right of teat length scores were detected, that suggesting that they are nearly identical traits. The high coefficient of variation for the all linearly scored traits is probably due to the high individual variability between ewes.

S. Sadeghi et el.
70
Table 2. Phenotypic correlation coefficients between subjectively assessed linear scores treats and daily milk yield for Ghezel ewes
Linear scores RTL LTL TP LTP US RCD LCD UA LD Daily milk UD n.s. n.s. n.s. n.s. n.s. n.s. n.s. n.s. n.s. n.s. RTL 0.490** 0.402* n.s. n.s. n.s. n.s. n.s. -0.387* -0.544** LTL n.s. n.s. n.s. n.s. n.s. n.s. n.s. n.s. TP n.s. n.s. n.s. n.s. n.s. n.s. -0.451** LTP n.s. n.s. -0.377* n.s. n.s. n.s. US n.s. n.s. 0.528** n.s. 0.450** RCD 0.652*** n.s. n.s. n.s. LCD n.s. n.s. n.s. UA n.s. 0.471** LD n.s. *P<0.05; **P<0.01; ***P<0.001; n.s.: Non Significant. Udder depth (UD), left and right teat length (LTL and RTL), teat placement (TP), teat horizontal position of lateral view (LTP), udder shape (US), left and right cistern depth (LCD and RCD), udder attachment (UA) and teat vertical position of lateral view (LD).
Table 3. Phenotypic correlation coefficients between subjectively assessed linear scores of udder traits for Ghezel × Arkharmerino ewes.
Linear scores RTL LTL TP LTP US RCD LCD UA LD Daily milk UD n.s. n.s. n.s. n.s. 0.561*** 0.444** 0.510** n.s. n.s. 0.405* RTL 0.474** n.s. n.s. n.s. n.s. -0.392* n.s. -0.370* -0.382* LTL n.s. 0.484** n.s. n.s. n.s. n.s. n.s. n.s. TP n.s. n.s. n.s. n.s. n.s. -0.412** n.s. LTP n.s. n.s. n.s. n.s. n.s. n.s. US 0.362* 0.333* n.s. n.s. n.s. RCD 0.653*** n.s. 0.354* n.s. LCD n.s. n.s. n.s. UA n.s. n.s. LD n.s. *P<0.05; **P<0.01; ***P<0.001; n.s.: Non Significant. Udder depth (UD), left and right teat length (LTL and RTL), teat placement (TP), teat horizontal position of lateral view (LTP), udder shape (US), left and right cistern depth (LCD and RCD), udder attachment (UA) and teat vertical position of lateral view (LD).
Table 4. Phenotypic correlation coefficients between subjectively assessed linear scores of udder traits for Moghani × Arkharmerino (MG-MR) ewes.
Linear scores RTL LTL TP LTP US RCD LCD UA LD Daily Milk UD n.s. n.s. n.s. n.s. n.s. 0.464** 0.382* 0.394* 0.474** n.s. RTL 0.653*** n.s. n.s. n.s. n.s. n.s. n.s. n.s. n.s. LTL n.s. n.s. n.s. n.s. n.s. n.s. n.s. n.s. TP n.s. n.s. -0.471** n.s. n.s. n.s. -0.437** LTP 0.523*** n.s. -0.483** n.s. n.s. n.s. US n.s. n.s. n.s. n.s. 0.404** RCD 0.762*** n.s. n.s. n.s. LCD n.s. n.s. n.s. UA n.s. n.s. LD n.s. *p<0.05; **p<0.01; ***p<0.001; n.s.: Non Significant. Udder depth (UD), left and right teat length (LTL and RTL), teat placement (TP), teat horizontal position of lateral view (LTP), udder shape (US), left and right cistern depth (LCD and RCD), udder attachment (UA) and teat vertical position of lateral view (LD).

Effect of crossbreeding ...
71
Correlation coefficients between milk dependent characteristics mutually are summarized for all genetic groups in Table 5.Milking rate and daily milk yield were highly correlated (r = 0.81, P < 0.001). Protein percentage was silently negative correlated with daily milk yield.
Table 5. Phenotypic correlation coefficients between daily milk yield and compositions, milking rate and milking time.
Milking rate Milking time Fat% Protein % Dry matter% Daily milk 0.811*** 0.373** n.s. -0.201* n.s. Milking rate n.s. n.s. n.s. n.s. Milking time n.s. n.s. n.s. Fat% n.s. n.s. Protein% 0.204* *P<0.05; ***P<0.001; n.s.: Non Significant.
Correlation between milk yield and linear udder scores during of lactation Phenotypic correlation coefficients between linear udder scores and daily
milk yield during of lactation are summarized in Table 6. The approaching to end of lactation, numbers of significant phenotypic correlations between daily milk yields with linear udder scores were decreased.
Table 6. Phenotypic correlation coefficients between linear udder scores with daily milk yield various stages of lactation
Stage of lactation Effect Early Middle End Udder depth n.s. 0.374** n.s. Right teat length -0.281* n.s. n.s. Left teat length n.s. n.s. n.s. Teat position n.s. -0.310* n.s. Teat horizontal position of lateral view n.s. n.s. n.s. Udder shape 0.462** n.s. 0.346** Right cistern depth 0.306* n.s. n.s. Left cistern depth 0.324* n.s. n.s. Udder attachment n.s. n.s. n.s. Teat vertical position of lateral view n.s. n.s. n.s. *p<0.05; **p<0.01; n.s.: Non significant.
Regression equations were built (Stepwise method) for estimation of daily milk yield from related parameters. The following equations were obtained when all udder scores were included as independent variables: Daily milk yield Ghezel= 886.29-86.77RTL-93.34TP+ 119.59 UA (R2
adjusted = 0.68) (1)
Where: RTL is right teat length; TP is teat placement; UA is attachment width.The most useful udder scores for predicting daily milk yield appears to be the right teat length, teat placement and attachment width in Ghezel ewes.

S. Sadeghi et el.
72
Regression equations were not reliable for crossbreds due to low R2 adj. Furthermore udder depth appears to be the most useful of the udder scores for predicting milking rate in the Ghezel purebreds (R2 adj= 0.56; P<0.01). However, the utilization of these equations for practical purposes needs to be investigated further as the sample size in this study was rather small.
Discussions
Evaluation of udder morphology can be performed by subjective
assessment of udder traits using linear scales (De la Fuente et al., 1996) or by direct measurements of the udder (Marie-Etacelin et al., 2003). Direct measurements provide objective information, but they are time consuming and laborious for applying on a large scale (De la Fuente et al., 1996). On the other hand, linear traits are more useful for large scale evaluations, but rely on subjective information. The stage of lactation (De la Fuente et al., 1996; Caja et al., 2000), parturition number (Serrano et al., 2002; De la Fuente et al., 1996; Gelasakis et al., 2012) and animal (Gelasakis et al., 2012) had significant effects on linear udder scores.
Marie-Etacelin et al. (2003), reported that mean teat position, udder cleft, udder depth and udder attachment in the Lacaune and Sarda ewes were 7.28 and 7.79, 5.65 and 6.25, 6.42 and 6.29 and 5.19 and 4.05 scores, respectively. Milerski et al. (2006), reported that line scores for Lacaune ewes were larger than for improved Walachian and Tsigai ewes for udder depth, cistern depth, udder attachment, udder shape and udder position, while for teat size and udder cleft the scores were lower. Average udder depth, udder attachment, teat placement, teat size and udder shape in Churra ewes were 5.16, 5.14, 4.48, 4.78, and 4.76, respectively (De la Fuente et al., 1996). No significant difference were detected between teat position score in Churra ewes by Fernandez et al. (1995), and teat left and teat right in Chios ewes by Gelasakis et al. (2012), according to our results.
According to Fernandez et al. (1997), verticality teats were favourable for machine milking contrary to the results of present study (horizontal teats). The distribution of the most frequent score in the Sarda × Lacaune backcross ewes and their progeny was slightly different. In the Sarda × Lacaune crossbreeds 45% of ewes had score of 7. Short udders were more frequent in the Sarda × Lacaune ewes (Casu et al., 2010), compared to our results for Ghezel × Arkharmerino crossbred. Udder depth was lowest variation in the Lori Bakhtiari ewes, where 85% of ewes had score 2 and 3 (Sadeghi et al., 2013).
Linear Scores
Milerski et al. (2006), describe significant phenotypic correlations between udder depth and attachment score for Tsigai (rp= 0.67) and Walachian (rp= 0.54),

Effect of crossbreeding ...
73
but no significant relationship was detected for Lacaune ewes. There was no significant phenotypic correlation between udder depth and teat position according to the results of Fernandez et al. (1997), and McKusick et al. (2000). Significant phenotypic correlations were found between udder shape with teat placement, teat size, udder depth and udder attachment (De la Fuente et al., 1996). Phenotypic correlations between teat placement score and teat size score for each genetic groups were positive and contrary with Fernandez et al. (1997), results. The high changes of phenotypic coefficient for linear udder scores was due to the high individual variability present in the morphological traits of the population used and has been reflected in the scoring of linear udder traits.
Milking characteristics Results of phenotypic correlations between milking
traits in sheep and goat breeds found in literature are quite inconsistent (Sung et al., 1999; Sinapis et al., 2007 and Sinapis, 2007). Positive and significant (P<0.001) correlations were observed between all milking traits in the Istrian dairy crossbreed ewes by Dzidic et al. (2004). The authors describe a positive phenotypic correlation between milking time and rate with milk volume and a negative phenotypic correlation between milk compositions with milk volume. The high positive and significant phenotypic correlation between milking rate and daily milk yield can be explained by direct linear relationship between them.
Correlation between milk and udder linear scores during lactation Izadifard and Zamiri (1997), the largest correlation coefficient with udder
shape in an early stage of lactation (r = 0.46, P < 0.01). However, in the early stage of lactation, several udder measurements were correlated with the yield milk. A high phenotypic correlation was between milk yield with depth (r = 0.75) and circumference (r = 0.72) of the udder in early stage of lactation (Izadifard and Zamiri, 1997). In Australian Merinos (Bencini and Purvis, 1990) udder volume and milk yield in the first nine weeks of lactation were significantly correlated (r = 0.71).
The relationship between the linear scores with milk production could be established jointly explained 68% of the variation of the daily milk yield(s) for Ghezel ewes. Arkharmerino breed is a wool sheep that has not been selected for dairy production traits, so it seems that, reducing of correlation in the Ghezel × Arkhamerino and Moghani × Arkharmerino crossbred ewe’s in comparisioin with Ghezel was due to crossbreeding of Ghezel and Moghani with Arkharmerino. Moderate and high association between the udder measurements and milk production explained 45% and 72% of the variation of the milk yield for Frizarta (Kominakis et al., 2009) and Ghezel (Izadifard and Zamiri, 1997) dairy sheep, respectively.

S. Sadeghi et el.
74
Conclusion Results of the present experiment showed that udder morphological traits
are related to daily milk yield and play evident roles in dairy sheep. The subjectively appraised linear scores for cistern udder (left and right) showed high correlations (rp = 0.65 – 0.76) in all genetic groups, therefore, this trait may be useful to simplify the design of the udder assessment scheme. It seems that the used current linear scoring system yields useful information for evaluating and improving for Ghezel × Arkhamerino, Moghani × Arkharmerino and Ghezel ewes in Iran. Nevertheless, for the final designing of linear scoring scheme in Iran try to increase the knowledge of relationships between udder trait assessments and milk yield and/or machine milk flow characteristics is needed. The knowledge of the relationships between morphological udder traits would permit to predict future correlated responses in milk-oriented selection schemes. Results of the present study showed that milk potential for Ghezel ewes can be estimated with reasonable accuracy by reducing udder characteristics.
Uticaj ukrštanja na linearne ocene vimena i njihove fenotipske odnose kod ovaca iranske masno-repe rase S. Sadeghi, A. Rafat, M. Bohlouli
Rezime
Obrada slike je sada bolja tehnika nego subjektivna procena za linearnu ocenu morfoloških osobina, posebno kod ovaca iranske masno-repe rase. Cilj ove studije bio je da proceni ovu aplikaciju u karakterizaciji životinja na studiji slučaja, kako bi se poredile morfolške karakteristike dve iranske ukrštane populacije ovaca uključujući Ghezel - Arkhamerino (GH - MR; 25 ovaca), Moghani - Arkharmerino (MG- MR ; 25 ovaca) i ovce čiste rase - Ghezel (20 ovaca). Deset faktora vimena i pet osobina mleka su mereni na sedamdeset ovaca tokom tri faze laktacije. Digitalne fotografije su analizirane Digimizer 3.6 softverom. Statistička analiza linearnih ocena vimena je izvedena korišćenjem MIKSED postupka SAS 9.1 softvera. Rezultati su pokazali da su dugačka vimena češća u Ghezel ovaca nego u ovaca meleza. Najmanje varijacije zabeleženo je za položaj sisa kod čistokrvnih ovaca rase Ghezel. Srednje vrednosti za dubinu vimena u Ghezel ovaca bile su veće nego u meleza (P<0,01). Pozitivna korelacija izmeđulinearnih ocena dužine levih i desnih sisa utvrđeni su u svim genetskim grupama (rp=0.47-0.65). Brzina muže (rp= 0.81) i trajanje muže (rp = 0.37) pokazuju značajne korelacije sa prinosom mleka (p<0,001). Najkorisniji linearni rezultati osobina vimena za predviđanje dnevnog prinosa mleka je, kako se čini, dužina levih sisa, položaj sisa

Effect of crossbreeding ...
75
i širina vezevimena u Ghezel ovaca. Varijacije fenotipskih korelacije unutar linearnih rezultata i njihova povezanost sa dnevnim prinosom mleka pokazale su potencijal u unapređenja ovih osobina u programima oplemenjivanja muznih ovaca.
References
AYADI M., SUCH X., EZZEHIZI N., ZOUARI M., NAJAR T., BEN M., RAD M., CASALS R. (2011): Relationship between mammary morphology traits and milk yield of Sicilo-Sarde dairy sheep in Tunisia. Small Ruminant Research, 96, 41–45. BENCINI R., PURVIS I.W. (1990): The yield and composition of milk from Merino sheep. Australian Society of Animal Production, 18, 144-147. CAJA G., SUCH X., ROVAI M. (2000): Udder morphology and machine milking ability. Proc, 6th Great Lakes Dairy Sheep Symposium, Guelph Ontario, Canada, 25-48. CASU S., SECHI S., SALARIS S.L., CARTA A. (2010): Phenotypic and genetic relationships between udder morphology and udder health in dairy ewes. Small Ruminant Research, 88, 77–83. DE LA FUENTE L.F., FERNANDEZ G., SAN PRIMITIVO F. (1996): A linear evaluation system for udder traits of dairy ewes. Livestock Production Science, 45, 171- 178. DZIDIC A., KAPS M., BRUCKMAIER., R.M. (2004): Machine milking of Istrian dairy crossbreed ewes udder morphology and milking characteristic. Small Ruminant Research 55, 183–189. FERNANDEZ G., ALVAREZ P., SAN PRIMITIVO F., DE LA FUENTE L.F. (1995): Factors affecting variation of udder traits of dairy ewes. Journal of Dairy Science, 78, 842-849. FERNANDEZ G., BARO J.A., DE LA FUENTE L.F., SAN PRIMITIVO F. (1997): Genetic parameters for linear udder traits of dairy ewes. Journal of Dairy Science, 80, 601–605. GELASAKIS A.I., ARSENOS G., VALERGAKIS G.E., OIKONOMOU G., KIOSSIS E., FTHENAKIS GC. (2012): Study of factors affecting udder traits and assessment of their interrelationships with milking efficiency in Chios breed ewes. Small Ruminant Research, 103, 232– 239. GUTIÉRREZ-GIL B., EL-ZAREI M.F., ALVAREZ L., BAYÓN Y., DE LA FUENTE L.F., SAN PRIMITIVO F., ARRANZ J.J. (2008): Quantitative trait loci underlying udder morphology traits in dairy sheep. Journal of Dairy Science, 91, 3672–3681.
S. Sadeghi et el.
76
HAJIHOSSINLO A., SADEGHI S., RAFAT S.A., REZAZADEH R., SHERO N. (2012): Study of udder morphology traits and their importance in estimated daily milk. Prod. 5th Conf Animal Science, Isfahan, Iran. IZADIFARD J., ZAMIRI M.J. (1997): Lactation performance of two Iranian fat-tailed sheep breeds. Small Ruminant Research, 24, 69–76 KOMINAKIS A.P., PAPAVASILIOU D., ROGDAKIS E. (2009): Relationships among udder characteristics milk yield and non-yield traits in Frizarta dairy sheep. Small Ruminant Research, 84, 82–88. LEGARRA A., UGARTE E. (2005): Genetic parameters of udder traits somatic cell score and milk yield in Latxa sheep. Journal of Dairy Science, 88, 2238–2245. MARIE-ETACELIN C., CASU S., AUREL M.R., BARILLET F., CARTA A., DEIANA S., JACQUIN M., PAILLER F., PORTE D., TOLU S. (2003): New tools to appraise udder morphology and milkability in dairy sheep. CIHEAM-Options Mediterannes, 55, 71–80. MAVROGENIS A.P., PAPACHRISTOFOROU C., LYSANDRIDES P., ROUSHIAS A. (1988): Environmental and genetic factors affecting udder characters and milk production in Chios sheep. Genetics Selection Evolution 20, 477-488. MCKUSICK B.C., MARNET P.G., BERGER Y.M., THOMAS D.L. (2000): Preliminary observations on milk flow and udder morphology traits of east Friesian crossbred dairy ewe’s. Prod. 6th Great Lakes Dairy Sheep Symposium, Guelph Ontario, Canada, 110-116. MILERSKI M., MARGETIN M., CAPISTRAK A., APOLEN D., SPANIK J., ORAVCOVA M. (2006): Relationships between external and internal udder measurements and the linear scores for udder morphology traits in dairy sheep. Czech Journal of Animal Science, 51, 383–390. MORRISSEY A.D., CAMERON A.W.N., CADDY D.J., TILBROOK A.J. (2007): Predicting milk yield in sheep used for dairying in Australia. Journal of Dairy Science, 90, 5056–5061. PERIS S., CAJA G., SUCH X. (1999): Relationships between udder and milking traits in Murciano Granadina dairy goats. Small Ruminant Research, 33, 171-179. ROVAI M., SUCH X., PIEDRAFITA J., CAJA G., PUJOL M.R. (1999): Evolution of mammary morphology traits during lactation and its relationship with milk yield in Manchega and Lacaune dairy sheep. Wageningen Pers Wageningen EAAP Publication, 95, 107–109. SADEGHI S., RAFAT S.A., GHADERI ZEFREI M., KHALIGH F., ROSTAMI K.H., BOHLOULI M., BAHRANI BEHZADI M.R., MOHAGHEGH M. (2013): Factors affecting external and internal mammary morphology traits and assessment of their interrelationships with milk yield in Lori Bakhtiari breed ewes. Livestock Research for Rural Development, 25, 3. SANNA S.R., CASU S., RUDA G., CARTA A., LIGIOS S., MOLLE G. (2001): Comparison between native and synthetic sheep breeds for milk production in

Effect of crossbreeding ...
77
sardinia. Livestock Production Science, 71, 11–16. SERRANO M., PEREZ-GUZMAN M.D., MONTORO V., JURADO J.J . (2002): Genetic analysis of udder traits in Manchega ewes. Livestock Production Science, 77, 355–361. SAS INSTITUTE INC. (2003): SAS 9.1.3 Help and documentation, Cary, NC: SAS Institute Inc. SINAPIS E. (2007): The effect of machine or hand milking on milk production composition and scc in mountainous greek breed. (boutsiko): ewes. Small Ruminant Research, 69, 242-246. SINAPIS E., MARNET P.G., SKAPETAS B., HATZIMINAOGLOU I. (2007): Vacuum level for opening the teat sphincter and the change of the teat end wall thickness during the machine milking of mountainous Greek breed. (Boutsiko): ewes. Small Ruminant Research, 69, 136–143. SUNG Y.Y., WU T.I., WANG P.H. (1999): Evaluation of milk quality of Alpine Nubian Saanen and Toggenburg breeds in Taiwan. Small Ruminant Research, 33, 17-23. UGARTE E. (2007): The breeding program of Latxa breed. Biotechnology Animal Husbandry, 23, 97 – 111. Received 31 August 2013; accepted for publication 15 February 2014


Biotechnology in Animal Husbandry 30 (1), p 79-88, 2014 ISSN 1450-9156 Publisher: Institute for Animal Husbandry, Belgrade-Zemun UDC 636.082'636.39
DOI: 10.2298/BAH1401079Y
APPLICATION OF MULTIVARIATE LOGISTIC REGRESSION MODEL TO ASSESS FACTORS OF IMPORTANCE INFLUENCING PREVALENCE OF ABORTION AND STILLBIRTH IN NIGERIAN GOAT BREEDS A. Yakubu1*, M. M. Muhammed2, I. S. Musa-Azara2
1Department of Animal Science, Faculty of Agriculture, Nasarawa State University, Keffi, Shabu-Lafia Campus, P.M.B. 135 Lafia, Nasarawa State, Nigeria. 2Department of Animal Science, College of Agriculture, Lafia, Nasarawa State, Nigeria. *Corresponding author: [email protected] Original scientific paper
Abstract: The aim of the study was to investigate the application of binary logistic regression to assess the potential factors associated with the prevalence of abortion and stillbirth in indigenous goat breeds in Nasarawa State, north central Nigeria. 5,268 kidding records of does from a total of 105 traditional goat herders from the year 2010-2011 were utilized in the study. The goats which were of West African Dwarf (WAD), Red Sokoto (RS), Sahel (SH) and WAD x RS crossbred (WR) genetic groups originated from different flocks and were reared under the traditional extensive system. The risk factors investigated were dam breed group, season, parity and number of foetuses. Of the 5,268 kidding records, 570 (10.8%) and 520 (9.87%) were cases of abortion and stillbirth, respectively. The logistic regression analysis revealed that season, parity and number of foetuses were the parameters of utmost importance (P<0.05) influencing the prevalence of abortion and stillbirth in the four genetic groups investigated. The logistic regression models were able to predict correctly 89.2 and 90.1% cases of abortion and stillbirth, respectively. The present information may be exploited in management practices to attenuate the incidence of abortion and stillbirth parturition, thereby increasing the productivity of the animals.
Key words: abortion, goats, logistic regression, Nigeria, stillbirth.
Introduction
Livestock form key components of the livelihood strategies of many of the world's poorest people, with different species fulfilling different functions in the household economy (Anderson, 2003; Petrović et al., 2013). In Nigeria, goat

A. Yakubu et el.
80
production plays an important role in the economic improvement of poor farmers and contributes to poverty alleviation (Yakubu et al., 2011). However, one of the major constraints to a successful development of goat industry is the menace of abortion and stillbirth (Odo, 2003; Adamu et al., 2012). Abortion implies expulsion of a foetus before full term and viability outside of the uterus. Stillbirth or premature delivery is expulsion of a term foetus that is considered viable. Antepartum death is characterized by variable degrees of autolysis, accumulations of blood-tinged fluids in body cavities, soft autolytic kidneys, and variable degrees of liquefaction of the brain (Holler, 2012). Deaths associated with the parturition process are often less autolytic and display evidence of viability. Animals that have survived the birth process and died shortly after will have blood clots in umbilical vessels, aerated lungs, and minimal free fluid in body cavities. These early losses are associated with a wide range of physiologic, nutritional, environmental, and non-infectious causes that often go unrecognized. Abortion in goat herds at a level that significantly affects productivity is a common clinical problem (Menzies, 2011). Reproductive failure due to abortion disease remains a significant revenue drain in many ruminant livestock production systems (Simsek et al., 2012). Abortion rates vary among producers, production systems, and management styles, but in most situations, a rate much higher than 5% to 8% is usually deemed unacceptable and worthy of investigation (Holler, 2012). Therefore, identification of the risk factors associated with abortion and stillbirth can aid in optimizing herd reproductive efficiency (Yakubu et al., 2013).
There is dearth of information on links between various hypothesized risk factors and cases of abortion and stillbirth in Nigeria. The aim of this study therefore, was to investigate the application of logistic regression to assess the potential factors associated with the prevalence of abortion and stillbirth in indigenous goat breeds in north central Nigeria. Materials and Methods
5268 kidding records of does from a total of 105 traditional goat herders
within Nasarawa state north central Nigeria from the year 2010-2011 were utilized in the study. The goats which were of West African Dwarf (WAD), Red Sokoto (RS), Sahel (SH) and WAD x RS crossbred (WR) genetic groups originated from different flocks and were reared under the traditional extensive system. They grazed during the day on natural pasture containing forages such as stylo (Stylosanthes gracilis), leucaena (Leucaena leucocephala) and guinea grass (Panicum maximum), and scavenged on kitchen wastes such as dried yam peels whenever available. Sampling was restricted to only farmers that were able to give information on kid, buck and doe identification as well as occurrence of abortion, stillbirth (defined as a kid born dead or dying within 24 h after birth), kidding date
Application of multivariate ...
81
or period, parity and number of foetuses. Three seasons of abortion or stillbirth were generated according to the month of the year: rainy season (from May to October), dry season (from February to April) and harmattan season (from November to January). The rainy season is characterized by high temperatures, rain and abundant pasture. The dry season is characterized by high temperatures, lack of rain and scarce pasture. The harmattan season has lower temperatures with winds. No etiological diagnosis was made in aborted foetuses and stillbirths. Statistical analysis
The logit of the probability of an abortion or stillbirth was modelled using logistic regression assuming an asymptotic binomial distribution. Logistic regression allows the prediction of group membership from a set of categorical and/or continuous variables (x). Generally, the dependent variable is dichotomous and can take the value 1 (member of the group) with a probability of success y, or the value 0 (non-member) with probability of failure 1 – y. The relationship between the dependent and independent variables is not a linear function. Instead, the logistic regression function is used, which is the logit transformation of y (Dossa et al., 2008). First, the univariate analysis for all hypothesized risk factors (dam breed group, season, parity and number of foetuses) and the occurrence of abortion or stillbirth in the present study was carried out using Pearson’s Chi-square (χ2) test. Subsequently, a multivariate model was built by including every hypothesized risk factor which had p-value of P<0.200 from the univariate analysis, following the description of Santos et al. (2012) and Ryan et al. (2012). Variables were retained, if p-value from the logistic regression was P<0.05, otherwise they were removed from the final model. Backward stepwise elimination based on Wald method was applied (Noordhuizen et al., 2001). The Chi-square goodness-of-fit test was performed to check if the multivariate logistic model fit the data well (P>0.05) (Hosmer and Lemeshow, 2000). A further test of the accuracy of the logistic model was determined through the number of cases of abortion and stillbirth predicted correctly.
The multivariate model employed (Czopowicz et al., 2012) was: P (Y=1) = 1
1 + exp [–(B0 + B1 × X1 +...+ Bn × Xn)]
where, P(Y=1) = probability of a final outcome (abortion or stillbirth) B0 = intercept B1, Bn = regression coefficients for individual risk factors

A. Yakubu et el.
82
X1, Xn = risk factors (dam breed group, season, parity and number of foetuses) The statistical package employed in the analysis was SPSS (2010). Results and discussion
The relationship between risk factors and the prevalence of abortion and stillbirth in Nigerian goats are shown in Table 1. Of the 5268 kidding records, 570 (10.8%) and 520 (9.87%) were cases of abortion and stillbirth, respectively. Following univariate statistical analysis, season (χ2 =13.9; P=0.001) and parity (χ2 =16.5; P=0.005) showed a clear association with the incidence of abortion while number of foetuses was the only single variable highly related to the occurrence of stillbirth (χ2 =13.9; P=0). However, dam breed group, season, parity and number of foetuses (abortion) and season, parity and number of foetuses (stillbirth) were the eventual parameters fitted into the multivariate logistic regression models based on the significance level P<0.20. Table 1. The association between risk factors and the prevalence of abortion and stillbirth in Nigerian goats Parameters No.of
calvings No.of abortion (%)
Chi-square (P-value)*
No.of stillbirth (%)
Chi-square (P-value)*
Breeds of goats Red Sokoto 1165 143 (12.3) 4.96 (0.175) 100 (8.6) 4.29 (0.232) Sahel 1003 108 (10.8) 100 (10) West African Dwarf 2200 236 (10.7) 236 (10.7) Crossbred (WR) 900 83 (9.2) 84 (9.3) Season Rainy 2077 265 (12.8) 13.9 (0.001) 227 (10.9) 4.45 (0.108) Dry 1480 148 (10) 139 (9.4) Harmattan 1711 157 (9.2) 154 (9.0) Parity number 1 1668 215 (12.9) 6.54 (0.005) 179 (10.7) 7.42 (0.191) 2 1163 129 (11.1) 120 (10.3) 3 895 92 (10.3) 90 (10.1) 4 647 63 (9.7) 64 (9.9) 5 500 42 (8.4) 38 (7.6) >5 395 29 (7.3) 29 (7.3) No. of foetuses 1 2209 218 (9.9) 4.02 (0.134) 155 (7) 35.3 (0) 2 1597 178 (11.1) 196 (12.3) 3 1462 174 (11.9) 169 (11.6)
• Only parameters with P<0.2 were included in the subsequent multivariate logistic regression analysis.

Application of multivariate ...
83
Table 2. Logistic regression predicting the prevalence of abortion and stillbirth in Nigerian goats Risk factor B S.E. Wald’s χ2 P-value Odds ratio CI (95%) Abortion Intercept -1.700 0.156 119 0 0.183 -
Season -0.197 0.054 13.5 0 0.822 0.740-0.912
Parity -0.117 0.029 15.9 0 0.889 0.839-0.942
Number of foetuses 0.138 0.054 6.57 0.010 1.148 1.03-1.28
Stillbirth Intercept -2.32 0.166 194 0 0.099 -
Season -0.135 0.055 5.96 0.015 0.874 0.784-0.974
Parity -0.080 0.030 7.17 0.007 0.923 0.870-0.979
Number of foetuses 0.295 0.056 27.6 0 1.343 1.20-1.50
B= regression coefficient, S.E.= standard error of B, CI= confidence interval Hosmer and Lemeshow test: χ2 = 10.3 versus 11.9; P= 0.242 versus 0.154 for prevalence of abortion and stillbirth, respectively.
The logistic regression models showed that season (odds ratio = 0.822 versus 0.874; P=0 versus 0.015), parity (odds ratio = 0.889 versus 0.923; P=0 versus 0.007) and number of foetuses (odds ratio =1.148 versus 1.343; P=0.010 versus 0) were associated with the prevalence of abortion and stillbirth, respectively (Table 2). The positive or negative sign of the coefficient (B) indicates the direction of the relationship between a given independent variable (X) and the dependent variable while the odds ratio gives the magnitude of the change in the odds of having the dependent variable event for a one unit change in the given independent variable. Hosmer and Lemeshow Chi-square goodness-of-fit test [χ2 =10.3; P=0.242 (abortion); χ2 =11.9; P=0.154 (stillbirth)] showed that the multivariate model proved to fit the observations and to explain the observed variations well.
The logistic model was quite reliable in predicting the prevalence of abortion and stillbirth in a herd, being able to identify 89.2% cases of abortion and 90.1 % cases of stillbirth, respectively (Table 3).
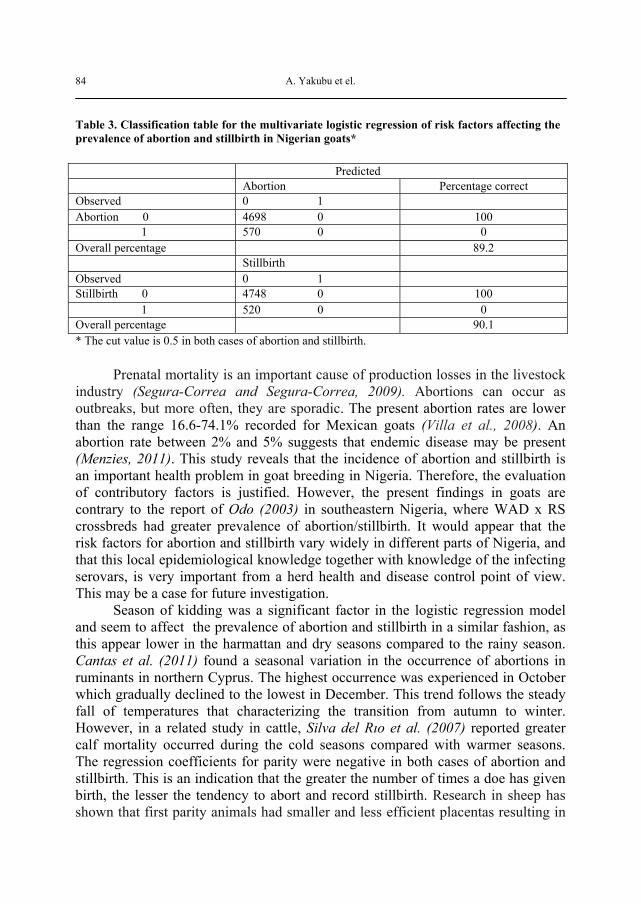
A. Yakubu et el.
84
Table 3. Classification table for the multivariate logistic regression of risk factors affecting the prevalence of abortion and stillbirth in Nigerian goats*
Predicted Abortion Percentage correct Observed 0 1 Abortion 0 4698 0 100 1 570 0 0 Overall percentage 89.2 Stillbirth Observed 0 1 Stillbirth 0 4748 0 100 1 520 0 0 Overall percentage 90.1 * The cut value is 0.5 in both cases of abortion and stillbirth.
Prenatal mortality is an important cause of production losses in the livestock industry (Segura-Correa and Segura-Correa, 2009). Abortions can occur as outbreaks, but more often, they are sporadic. The present abortion rates are lower than the range 16.6-74.1% recorded for Mexican goats (Villa et al., 2008). An abortion rate between 2% and 5% suggests that endemic disease may be present (Menzies, 2011). This study reveals that the incidence of abortion and stillbirth is an important health problem in goat breeding in Nigeria. Therefore, the evaluation of contributory factors is justified. However, the present findings in goats are contrary to the report of Odo (2003) in southeastern Nigeria, where WAD x RS crossbreds had greater prevalence of abortion/stillbirth. It would appear that the risk factors for abortion and stillbirth vary widely in different parts of Nigeria, and that this local epidemiological knowledge together with knowledge of the infecting serovars, is very important from a herd health and disease control point of view. This may be a case for future investigation.
Season of kidding was a significant factor in the logistic regression model and seem to affect the prevalence of abortion and stillbirth in a similar fashion, as this appear lower in the harmattan and dry seasons compared to the rainy season. Cantas et al. (2011) found a seasonal variation in the occurrence of abortions in ruminants in northern Cyprus. The highest occurrence was experienced in October which gradually declined to the lowest in December. This trend follows the steady fall of temperatures that characterizing the transition from autumn to winter. However, in a related study in cattle, Silva del Rıo et al. (2007) reported greater calf mortality occurred during the cold seasons compared with warmer seasons. The regression coefficients for parity were negative in both cases of abortion and stillbirth. This is an indication that the greater the number of times a doe has given birth, the lesser the tendency to abort and record stillbirth. Research in sheep has shown that first parity animals had smaller and less efficient placentas resulting in

Application of multivariate ...
85
less viable lambs than those of older sheep. Similar report has been documented in beef cattle (Segura-Correa and Segura-Correa, 2009). Atashi (2011) also reported that the stillbirth frequency was found to be significantly higher for first parity cows. The high stillbirth rate for the first kidding may be partly because of a disproportion between the size of the kid and the pelvic area, which causes a difficult kidding and increases stillbirth parturition incidence. The positive association between the number of foetuses and the prevalence of abortion and stillbirth indicates that the more the number of foetuses, the greater the propensity for abortion and stillbirth rate in the goat populations. However, Segura-Correa and Segura-Correa (2009) reported low values for the incidence of abortion and stillbirth in cattle. The high percentage of prediction of abortion as well as stillbirth is a justification of the fitness of the logistic regression model, which is increasingly being used in biological studies such as diagnosis decision processes and epidemiology (Solorio-Rivera et al., 2007; Kalil et al., 2010; Ryan et al., 2012; Czopowicz et al., 2012).
The prospects for increased productivity based on efficient and sustainable exploitation of goats inherent unique features, such as adaptability, ability to thrive in harsh environmental conditions, resistance to disease etc should have the objective of increasing goat population in harmony with the carrying capacity of the veldt. Herd managers should review calving procedures with their veterinarian to ensure that proper timing and calving assistance techniques are used when providing assistance during parturition (Atashi, 2011). In addition, providing a good environment for heifers and does to minimize stress before parturition can reduce stillbirth incidence. It is noteworthy that appropriate precautions should be taken to avoid zoonotic infection of personnel (in clinical or diagnostic settings) with reproductive pathogens. Biosecurity is an important consideration for any abortion control program, and should be promoted regardless of whether an abortion problem exists in the flock (Menzies, 2011). Appropriate immunization to prevent infection often can reduce reproductive losses in domestic animals (Givens and Marley, 2008). Prospective field studies of abortion or stillbirth are very expensive and not routinely applicable in the field. Therefore, the present study on Nigerian goats has significant implications for farmers and veterinary practitioners/herd health consultants as informed risk analysis is the key to successful decision making in relation to reproductive problem control on farms.
Conclusion
In the present study, the multivariate logistic models showed that season, parity and number of foetuses were the most important parameters affecting the prevalence of abortion and stillbirth in WAD, RS, SH and WR goats. The present

A. Yakubu et el.
86
information may therefore be exploited in management practices to reduce to the minimum the incidence of abortion and stillbirth parturition in order to improve the production level of the goat farmers. Primena multivarijacionog logističkog regresionog modela za utvrđivanje faktora koji imaju značajan uticaj na rasprostranjenost abortusa i prevremenog porođaja u nigerijskoj rasi koza A. Yakubu, M.M. Muhammed, I.S. Musa-Azara
Rezime
Cilj studije bio je da se istraži primena binarne logističke regresije za procenu potencijalne faktora povezanih sa rasprostranjenošću abortusa i prevremenog porođaja u autohtonim rasama koza u državi Nasarava, u severno-centralnoj Nigeriji. Podaci o 5.268 jarenja od ukupno 105 koza tradicionalnih uzgajivača iz 2010-2011 godine su korišćeni u studiji. Koze rasa/genetskih grupa West African Dwarf (WAD), Red Sokoto (RS), Sahel (SH) i melezi WAD x RS (WR) poreklom iz različitih stada su držane u tradicionalnom ekstenzivnom sistemu. Faktori rizika koji su ispitivani su sledeći: grupa rasa ženskih grla, sezona, paritet i broj fetusa. Od 5.268 podataka o jarenju, 570 (10,8 %) i 520 (9.87 %) su bili slučajevi abortusa i prevremenog porođaja, respektivno. Logistička regresiona analiza pokazala je da sezona, paritet i broj fetusa su parametri od izuzetnog značaja (P < 0.05 ) koji utiču na rasprostranjenost abortusa i prevremenog porođaja u četiri ispitivane genetske grupe. Logistički regresioni modeli su bili u stanju da predvide ispravno 89,2 i 90,1 % slučajeva abortusa i prevremenog porođaja, respektivno. Ove informacije se mogu eksploatisati u praksi upravljanja da ublaže pojavu abortusa i mrtvorođene jaradi, čime se povećava produktivnost životinja . References ADAMU M., MSHELIA G.D., ELELU N., OUDA L., EGWU G.O. (2012): Studies on farmer awareness on caprine abortion and the presence of Brucella abortus and Brucella melitensis in selected flocks in an arid zone of Nigeria. Journal of Veterinary Medicine and Animal Health, 4, 17-21. ANDERSON S. (2003): Animal genetic resources and livelihoods. Ecological Economics 45, 331-339.
Application of multivariate ...
87
ATASHI H. (2011): Factors affecting stillbirth and effects of stillbirth on subsequent lactation performance in a Holstein dairy herd in Isfahan. Iranian Journal of Veterinary Research 1, 24-30. CANTAS H., MUWONGE A., SAREYYUPOGLU B., YARDIMCI H., SKJERVE E. (2011) : Q fever abortions in ruminants and associated on-farm risk factors in northern Cyprus. BMC Veterinary Research, 7, 13, http://www.biomedcentral.com/1746-6148/7/13 CZOPOWICZ M., KABA J., SZALUŚ-JORDANOW O., NOWICKI M., WITKOWSKI L. AND FRYMUS T. (2012): Multivariate model for the assessment of risk of fetal loss in goat herds. Polish Journal of Veterinary Science, 15, 67-75. DOSSA L. H., RISCHKOWSKY B., BIRNER R. AND WOLLNY C. (2008): Socio-economic determinants of keeping goats and sheep by rural people in southern Benin. Agriculture and Human Values, 25, 581–592. GIVENS M.D. AND MARLEY M.S.D. (2008): Infectious causes of embryonic and fetal mortality. Theriogenology, 70, 270-285. HOLLER L. D. (2012): Ruminant abortion diagnostics. Veterinary Clinic of North America: Food Animal Practice 28, 407–418. HOSMER, D. W. AND LEMESHOW S. (2000): Applied Logistic Regression. 2nd ed. John Wiley and Sons, New York, USA. p 375. KALIL A.C., MATTEI J., FLORESCU D.F., SUN, J., KALIL R.S. (2010): Recommendations for the assessment and reporting of multivariable logistic regression in transplantation literature. American Journal of Transplantation, 10, 1686-1694. MENZIES P. I. (2011): Control of important causes of infectious abortion in sheep and goats. Veterinary Clinic of North America: Food Animal Practice, 27, 81–93. NOORDHUIZEN J.P., THRUSFIELD M.V., FRANKENA K., GRAAT E.A.M. (2001): Application of quantitative methods in veterinary epidemiology. 2nd ed., Wageningen Pers, Wageningen, Holland. ODO B. I. (2003): Comparative study of some prevalent diseases of ecotype goats reared in southeastern Nigeria. Small Ruminant Research, 50, 203-207. PETROVIĆ M.M., ALEKSIĆ S., PETROVIĆ M.P., PETROVIĆ M., V. PANTELIĆ V., NOVAKOVIĆ Z., RUŽIĆ-MUSLIĆ D. (2013): Potentials of Serbian livestock production- outlook and future. Biotechnology in Animal Husbandry, 29, 1-17. RYAN E.G., LEONARD N., O’GRADY L., DOHERTY M.L., MORE S.J. (2012): Herd-level risk factors associated with Leptospira Hardjo seroprevalence in Beef/Suckler herds in the Republic of Ireland. Veterinary Journal 65, 6, (http://www.irishvetjournal.org/content/65/1/6). SANTOS C.S.A.B., PIATTI R.M., AZEVEDO S.S., ALVES C.J., HIGINO, S.S.S., SILVA M.L.C.R., BRASIL A. W.L., GENNARI S.M. (2012): Seroprevalence and risk factors associated with Chlamydophila abortus infection in

A. Yakubu et el.
88
dairy goats in the Northeast of Brazil. Pesquisa Veterinária Brasileira, 32, 1082-1086. SEGURA-CORREA J.C., SEGURA-CORREA V.M. (2009): Prevalence of abortion and stillbirth in a beef cattle system in Southeastern Mexico. Tropical Animal Health and Production, 41, 1773–1778. SILVA DEL RIO N., STEWART S., RAPNICKI P., CHANG, Y.M. AND P.M. FRICKE (2007): An observational analysis of twin births, calf sex ratio, and calf mortality in Holstein dairy cattle. Journal of Dairy Science 90, 1255-1264. SIMSEK S., RISVANLI A., ZONTURLU A.G., DEMIRAL O., SAAT N. (2012): Absence of link between abortion and seropositivity of cystic hydatid disease in ewes and female goats in Turkey. Veterinaria Italiana, 48, 323-327. SOLORIO-RIVERA J.L., SEGURA-CORREA J.C., SANCHEZ-GIL L.G. (2007): Seroprevalence of and risk factors for brucellosis of goats in herds of Michoacan, Mexico. Preventive Veterinary Medicine, 82, 282–290. SPSS (2010): Statistical Package for Social Sciences. SPSS Inc., 444 Michigan Avenue, Chicago, IL60611. VILLA R., PEREA M., APARICIO E.D., MOBARAK A.S., ANDRADE L.H., GÜEMES F.S. (2008): Abortions and stillbirths in goats immunized against brucellosis using RB51, rfbK and Rev 1 vaccines. Tec Pecu Mex, 46, 249-258. YAKUBU A., SALAKO A.E., IMUMORIN I.G. (2011): Comparative multivariate analysis of biometric traits of West African Dwarf and Red Sokoto goats. Tropical Animal Health and Production, 43, 561-566. Received 25 November 2013; accepted for publication 31 January 2014

Biotechnology in Animal Husbandry 30 (1), p 89-102, 2014 ISSN 1450-9156 Publisher: Institute for Animal Husbandry, Belgrade-Zemun UDC 636.082'635
DOI: 10.2298/BAH1401089K
HYPOLIPIDEMIC EFFECTS OF CARVACROL IN RELATION WITH SEX HORMONES IN BROILER CHICKEN H. Khosravinia Department of Animal Science, Faculty of Agricultural, Lorestan University, Khorramabad- 68137-17133, Lorestan, Iran. Corresponding author: [email protected] Original scientific paper
Abstract: Two experiments were conducted to evaluate the effects of high and low doses of carvacrol on blood lipid constituents and sex hormones in broiler chicks. Inclusion of carvacrol into the drinking water at 0.5 and 0.3 g/ L in Experiments 1 and 2, respectively, modulated serum cholesterol and high density lipoproteins (HDL) levels, albeit the differences were not significant when compared to the corresponding control groups (P> 0.05). Carvacrol at 0.5 g/ L significantly decrease (16%) abdominal fat percentage of the birds at 28 d (Trial 1; P<0.05). In trail 2, concentration of estradiol in serum significantly reduced in all carvacrol-receiving birds compared with the control- birds (P> 0.05). Serum testosterone, however, increased in the birds received carvacrol at doses greater than 0.2 g/ L in comparison with the control birds (P<0.05). The results propose the possibility of testosterone-coupled hypolipidemic properties for carvacrol in broiler chicken.
Key words: broiler chicken, carvacrol, estradiol, hypolipidemic effect, testosterone Introduction
Carvacrol is described as a phenolic, caustic and bitter tasting compound (ARS, 2000) which demonstrates significant antioxidant (Guppett and Hall, 1998) and antimicrobial (Burt, 2004) properties. Accordingly, it has been reported that the carvacrol-bearing essential oils from Lamiaceae family plants such as savory has antioxidant (Abdollahi, et al., 2003, Radonic and Milos, 2003), antiviral (Yamasaki et al., 1998), antibacterial (Azaz et al., 2002) and antifungal (Skocibusic and Bezic. 2004) effects.
Recently particular attention has been focused on hypolipidemic effects of phytogenic remedies in poultry meat and egg. Among many herbal spices or

H. Khosravinia
90
extracts examined, essential oils of onion and garlic (Sklan et al., 1992, Konjufca et al., 1997), thyme (Case et al., 1995, Lee et al., 2004a, Lee et al., 2004b), turmeric (Honda et al., 2006, Sugiharto et al., 2011) and oregano (Brenes and Roura, 2010) exhibited superior hypocholesterolemic effects in chicken. It has been suggested that such effects are mainly induced through the inhibition of the key enzymes in cholesterol and lipid synthesis (Qureshi et al., 1983, Elson and Qureshi 1995, Crowell, 1999). On the other hand, many clinical investigations showed that certain herbal extracts are able to alter the reproductive functions in animals through affecting sex hormones secretion and their physiological balance (Dehghani et al., 2008, Grigorova et al., 2008). Considering the anabolic effects of androgens, the hypolipidemic effects of herbal extracts may be the consequence of abovementioned alterations in the sex hormones.
In spite of a significant decrease in serum triglyceride levels observed with a carvacrol reached plant extract from savory in diabetic and hyperlipidemic rats and no change in cholesterol level in hyperlipidemic rats (Abdollahi, et al., 2003), the hypolipidemic properties of carvacrol and carvacrol-reached plant extracts remain largely uninvestigated. In view of the scarce experimental results on hypolipidemic properties of carvacrol in connection with sex hormones in avian species, two studies were undertaken to examine the effect of high and low doses of carvacrol, on blood fat constituents and sex hormones, while it was administrated through drinking water into broiler chicks. Materials and methods Preparation of carvacrol Carvacrol, with 94 percent purity, was freshly provided from a particular species of savory herbs known as Satureja khuzistanica Jamzad, an endemic plant distributed in southern part of Iran (Hadian et al., 2011, Zargari, 1990). The aerial parts of the plant collectively contain up to 3 percent of essential oils which is spectacularly rich in carvacrol (up to 95 percent) (Khosravinia et al., 2013). The aerial parts of Satureja khuzistanica were manually harvested during the flowering stage of plant. The collected materials were air dried at ambient temperature in the shade and hydrodistilled using a Clevenger type apparatus for 5 h, giving yellow oil in 3 percent yield. The oils were dried over anhydrous sodium sulfate and stored at 4 ºC. A random sample of the stored oil was analyzed for the composition of essential oils using the methods described by Hadian et al. (2011). The resulting composition verified that it is highly-reached in carvacrol by >94 percent. The major constituents in the remaining impurity were determined as p-Cymene (0.96 %) and γ-Terpenene ( 0.51 %) (Table 1).

Hypolipidemic effects of ...
91
Table 1. Composition of Satureja khuzistanica essential oil. Compound
RI1
Composition (%) Identification2
Carvacrol 1282 94.16±0.46 RI, MS, CoI p-Cymene 1017 0.96±0.86 RI, MS, CoI γ-Terpenene 1053 0.51±0.23 RI, MS, CoI (Z)- β-Oeimene 1036 0.42±0.08 RI, MS α -terpinole 1175 0.32±0.45 RI, MS Myreene 981 0.21±0.19 RI, MS α-Terpinene 1013 0.18±0.12 RI, MS, CoI α-Thujene 925 0.14±0.14 RI, MS α- Pinene 933 0.12±0.05 RI, MS, CoI 1 RI; Retention indices determined relative to n-alkanes (C6-C24) on a DB-5GC column. 2 RI; Retention indices, MS; mass spectra, CoI; co-injection.
Experimental flocks In Experiment 1, 420 day-old Cobb 500, broiler chicks (43.65±1.2 g) were provided from a local commercial hatchery. The birds were housed in a concrete floor, cross-ventilated windowless shed where they were randomly placed in 21 pens (90×180 cm; at density of 0.08 m2/bird). Each pen was equipped with an infra-red brooder. The treatments were arranged into 3 blocks to account for variations in the ventilation system. Seven experimental treatments including 0 (control-), 0.5, 1.0, 1.5, 2.0, and 2.5 g/ L carvacrol or 3.0 g/ L Polysorbate-80 as emulsifier agent (control+) were administrated ad libitum via drinking water to 3 replicate pens of 20 birds each, up to the day 28 of age. The solution was prepared for each treatment in a daily basis and the remaining was discarded. The chicks were maintained on a 24-h light schedule. Feed and water supplied to the birds through a tube feeder and a manual waterer in each pen, respectively. Corn and soybean meal based starter and grower diets were formulated using UFFDA software according to the NRC (1994) recommendations (Table 2). The Diets and water were provided for ad libitum consumption throughout the 28-d experimental period.

H. Khosravinia
92
Table 2. The ingredients and the nutrient composition of the experimental diets. Experiment 1 Experiment 2
Item
Starter (1-14d)
Grower (15-28d)
Pre-starter (1-7d)
Starter (8-21d)
Grower (22-35d)
Finisher (36-42d)
Ingredient Corn 55.00 63.00 45.3 47.9 46.7 47.8 Soybean meal 36.00 28.10 34.8 33.9 26.9 23.6 Fish meal 3.17 3.20 - - - - Wheat - - 7 12 20 22 Soybean oil 3.40 3.20 1.3 1.2 1.3 1.4 Corn gluten - - 6 - - - Calcium carbonate - - 1.20 1.10 1.11 1.15 Dicalcium phosphate 1.20 1.00 2.16 1.94 2.01 2.07 DL-methionine 0.10 0.15 0.34 0.31 0.32 0.33 L-lysine 0.15 0.15 0.15 0.13 0.14 0.14 Vitamin permix1 0.25 0.30 0.28 0.25 0.26 0.27 Mineral permix2 0.30 0.30 0.28 0.25 0.26 0.27 Salt 0.25 0.25 0.39 0.35 0.36 0.38 Coline cloride - - 0.14 0.13 0.13 0.14 Calculated value ME (kcal/ kg) 3100 3220 2962 2880 2952 2993 Crude protein (%) 23.00 19.12 24.28 21.15 18.82 17.63 Crude fat (%) 3.90 3.70 4.32 3.13 3.50 3.74 Crude fiber (%) 3.01 2.87 3.74 3.75 3.48 3.33 Calcium (%) 0.85 1.00 1.10 1.00 1.00 1.00 Available P (%) 0.42 0.50 0.55 0.50 0.50 0.50 Methionine (%) 0.51 0.40 0.59 0.51 0.45 0.43 Lysine (%) 1.44 1.03 1.29 1.09 0.95 0.88 1Supplied per kg of diet: Mn, 55 mg; Zn, 50 mg; Fe, 80 mg; Cu, 5 mg; Se, 0.1 mg; I, 0.18 mg. 2 Supplied per kg of diet: vitamin A, 18000 IU; vitamin D3, 4000 IU; vitamin E, 36 mg; vitamin K3, 4 mg; vitamin B12, 0.03 mg; thiamine, 1.8 mg; riboflavin, 13.2 mg; pyridoxine, 6 mg; niacin, 60 mg; calcium pantothenate, 20 mg; folic acid, 2 mg; biotin, 0.2 mg; choline chloride, 500 mg.
In the second experiment, 720 one-day-old Arian broiler chicks were obtained from a commercial hatchery and housed in the same shed with similar flocking density as Experiment 1 up to 42 days of age. The chicks were randomly assigned to 36 pens arranged in 6 rows (blocks/ replicates). Corn and soybean meal based super starter, starter, grower and finisher diets (Table 2) and water was provided for ad libitum consumption throughout the 42-d experimental period. Diets were pelleted and the pellet sizes adjusted to the age of the birds. The six experimental treatments consisting 0 (control-), 0.2, 0.3, 0.4 and 0.5 g/ L carvacrol or 0.5 g/ L Polysorbate-80 (at 1:1 ratio v/v; control+) were continuously provided (through drinking water) for 6 replicate pens of 20 birds each, up to 42 days of age. Data collection
At the end of Experiment 1 (28 d) two male and two female birds per pen, ±50 g of the mean pen weight for each sex, and at close of Experiment 2 (42 d),

Hypolipidemic effects of ...
93
one male bird with the closest mean to the mean pen weight for males were killed for blood and abdominal fat collection. Abdominal fat (in Experiment 1) was manually collected and recorded as the summation of fat deposited around proventriculus and gizzard plus fat pad for each bird. Serum low-density lipoprotein (LDL), High-density lipoprotein (HDL), total cholesterol (TC), and triglyceride (TG) concentrations were estimated in both experiments using SEPPIM Diagnostic Kits (SEPPIM S.A.S., Zone Industrielle, 61500, SEES, France) in two replicate / sex per pen, at 25 ºC. The concentration of estradiol and testosterone in serum were measured by a solid-phase RIA in Experiment 2 using reagents provided by IMMUNOTECH kits (IMMUNOTECH SAS, 130 av. De Lattre de Tassugny – B.P. 177 – 13276 Marseille Cedex 9 France) in 6 male birds per treatment. Statistical Analysis
The collected data were analyzed using PROC MIXED of SAS 9.3 (SAS, 2003). The LSD test was used for multiple treatment comparisons using the LSMEANS statement of SAS 9.3 (2003) with letter grouping obtained using the SAS pdmix800 macro (1998). For all variables in Experiment 2, the effect of birds' live weight before slaughter, as a continuous random variable, was also included in the statistical model. For the different statistical tests, significance was declared at P ≤ 0.05.
1
1.2
1.4
1.6
1.8
2
2.2
2.4
cont+ 0 0.5 1 1.5 0.2 2.5
Abd
omin
al f
at (%
)
Carvacrol (g/ L)
a a
ababab
b
b
P<0.0167
Figure 1. Effect of high doses of carvacrol in drinking water on abdominal fat (%) in broiler chicks at 28 days of age (Experiment 1). Means without a common superscript (a-b) differ significantly (P<0.0167).

H. Khosravinia
94
Results and discussion Experiment 1
aba
bc
c c c
0
2
4
6
8
10
12
14
16
0+ 0- 0.2 0.3 0.4 0.5
Seru
m e
stra
diol
(nm
/ml)
Carvacrol (g/ L)
P<0.001
Figure 2. Effect of low doses of carvacrol in drinking water on serum estradiol level in male broiler chicken at day 42 of age (Experiment 2). Means without a common superscript (a-c) differ significantly (P<0.001). Data for Experiment 1 are presented in Tables 3 and 4, and Figures 1 and 2. Administration of carvacrol through drinking water had no significant effect on serum TG, LDL, HDL and total cholesterol (TC) levels of the birds at day 28 of age (P>0.05). However, the concentrations of TC and HDL (pooled data over sexes) were reduced by 1.41 and 8.50%, respectively, in the birds received 0.5 g/ L carvacrol compared to control- birds (Table 3). In sexwise analysis of data, male and female serum LDL, HDL and TC levels, but not triglycerides, were affected by carvacrol-treated water in dissimilar ways (Table 4). As shown in figure 1, accumulation of fat in abdominal cavity of the birds was reduced by carvacrol-added water (P=0.0262). Supplementation of 0.5 g/ L carvacrol caused approximately 16% decrease in abdominal fat-to-body weight ratio (AFP) at 28 d. Addition of carvacrol in drinking water at doses >0.5 g/ L exhibited adverse effect of AFP (Figure 1). The serum TC and HDL level was significantly influenced by the sex of the birds. The Male broilers were found to have 8.55 and 9.01 percent lower TC and HDL, respectively, in serum. No parameter of consideration was affected by sex × carvacrol interaction in the Experiment 1 (Table 3).

Hypolipidemic effects of ...
95
Table 3. Effect of high doses of carvacrol in drinking water on serum concentration of triglycerides (TG), total cholesterol (TC), low density lipoproteins (LDL) and high density lipoproteins (HDL) in broiler chicks at day 28 of age (Experiment 1). Factor\level TG TC LDL HDL _____________ mg/ 100 ml _____________ Carvacrol (g/ L) Control+1 35.50 150.16a 62.25 75.58a Control-1 36.83 157.26a 66.83 74.91a 0.5 40.17 122.75b 52.08 60.92b 1.0 37.08 125.51b 56.50 65.25ab 1.5 38.16 132.59ab 55.83 71.50ab 2.0 40.50 128.83ab 56.67 66.25ab 2.5 37.33 129.41ab 57.58 65.25ab Sex Male 38.77 135.46 57.39 68.97 Female 37.11 136.35 52.32 68.10 SEM2 1.087 2.546 1.300 1.321 _______________ P > F _______________ Carvacrol 0.8859 0.0094 0.1463 0.0270 Sex 0.4765 0.8464 0.1135 0.7257 Carvacrol × Sex 0.2480 0.0511 0.0115 0.0344 1Control+; The birds received drinking water supplemented with 3.0 g/L polysorbate-80 throughout the experiment, and Control-; The birds received drinking water with no additive. 2 Standard error for overall mean. a-b Means within a column for each factor without a common superscript differ significantly (P<0.05).
Experiment 2
Incorporation of low doses of carvacrol (ranging from 0.2 to 0.5 g/ L) in drinking water did not affect plasma TG, LDL, HDL and TC levels of the birds at the day 42 of age (P>0.05; Table 5). The concentrations of TC, LDL, and HDL, nevertheless, were modulated by approximately 8, 9 and 5%, respectively, by carvacrol-treated water at 0.3 g/ L compared to the control- birds (Table 5). In contrast to the Experiment 1, live body weight of the birds before slaughter showed significant effects on serum LDL and TC levels.
Significant differences were found among treatments in mean serum estradiol and testosterone levels. Administration of carvacrol into drinking water at 0.3, 0.4 and 0.5 g/ L significantly reduced the serum estradiol level to 52, 50 and 48 percent of the concentration measured in the control- birds, respectively (Figure 2). The mean serum testosterone significantly elevated in the birds received 0.2, 0.3, 0.4 and 0.5 g/ L carvacrol by about 2, 4, 4 and 5 folds, respectively, compared to the control- birds (Figure 3).

H. Khosravinia
96
Table 4. Effect of high doses of Carvacrol (g/ L) in drinking water on serum concentration of triglycerides (TG), total cholesterol (TC), low density lipoproteins (LDL) and high density lipoproteins (HDL) in male and female broiler chicks at 28 days of age separated by sex (Experiment 1). Factor\level TG TC LDL HDL ______________ mg/ 100 ml _______________ Males Control+1 37.37 141.25 55.62 71.62 Control-1 41.00 131.33 56.00 68.67 0.5 42.50 130.33 53.17 62.83 1.0 38.67 140.50 60.17 72.67 1.5 40.33 156.83 70.50 78.50 2.0 41.25 126.62 55.62 65.25 2.5 50.33 123.33 51.17 62.83 SEM2 2.606 3.944 1.940 1.881 P >F 0.8893 0.3009 0.1597 0.2223 Females Control+1 31.75 125.50 53.00 61.00 Control-1 35.44 122.22 45.22 63.67 0.5 37.83 115.17 51.00 59.00 1.0 35.50 118.83 52.83 57.83 1.5 36.00 125.00 51.17 64.50 2.0 39.00 138.25 58.75 68.25 2.5 44.17 137.17 62.33 67.67 SEM2 1.492 2.637 1.823 1.422 P >F 0.5365 0.1874 0.1598 0.3944 1Control+; The birds received drinking water supplemented with 3.0 g/ L polysorbate-80 throughout the experiment, and Control-; The birds received drinking water with no additive. 2 Standard error for overall mean. a-b Means within a column for each factor without a common superscript differ significantly (P<0.05).
The results of analysis of variance in the Experiments 1 and 2 (Tables 3, 4
and 5) indicated that the administrated doses of carvacrol had no effect on plasma lipid constituents. However, the serum cholesterol and HDL levels were the lowest for the birds receiving 0.5 g/ L carvacrol (Table 3). These observations were coincided with the significantly reduced abdominal fat at 0.5 g/ L carvacrol in Figure 1, indicating the potential of carvacrol as a hypolipidemic water additive. Thus, from the results in table 3 and figure 3, it appears that the “optimum inclusion level” for carvacrol in water for broilers is between 0.3 to 0.5 g/ L water.
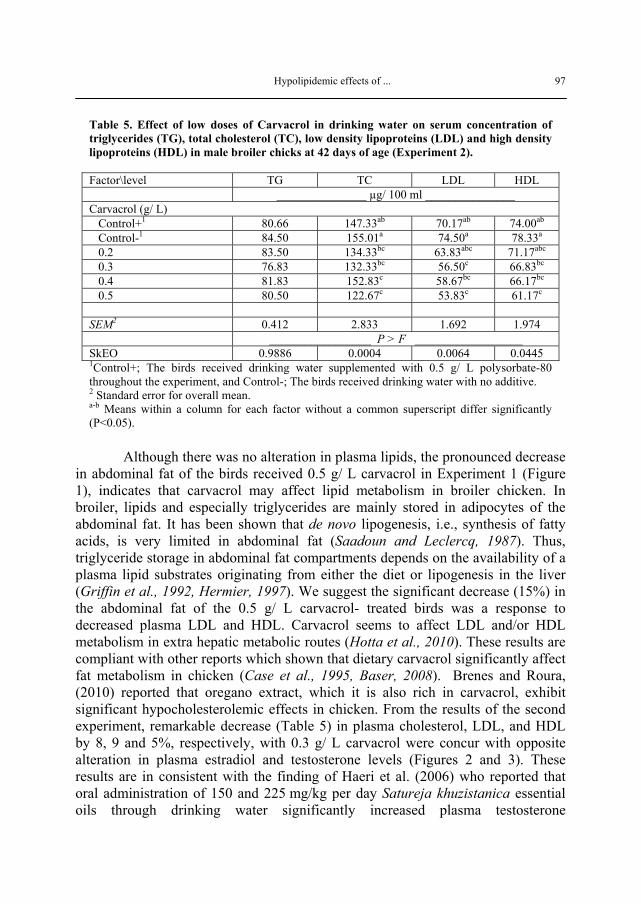
Hypolipidemic effects of ...
97
Table 5. Effect of low doses of Carvacrol in drinking water on serum concentration of triglycerides (TG), total cholesterol (TC), low density lipoproteins (LDL) and high density lipoproteins (HDL) in male broiler chicks at 42 days of age (Experiment 2). Factor\level TG TC LDL HDL _______________ µg/ 100 ml _______________ Carvacrol (g/ L) Control+1 80.66 147.33ab 70.17ab 74.00ab Control-1 84.50 155.01a 74.50a 78.33a 0.2 83.50 134.33bc 63.83abc 71.17abc 0.3 76.83 132.33bc 56.50c 66.83bc 0.4 81.83 152.83c 58.67bc 66.17bc 0.5 80.50 122.67c 53.83c 61.17c SEM2 0.412 2.833 1.692 1.974 _________________ P > F __________________ SkEO 0.9886 0.0004 0.0064 0.0445 1Control+; The birds received drinking water supplemented with 0.5 g/ L polysorbate-80 throughout the experiment, and Control-; The birds received drinking water with no additive. 2 Standard error for overall mean. a-b Means within a column for each factor without a common superscript differ significantly (P<0.05).
Although there was no alteration in plasma lipids, the pronounced decrease
in abdominal fat of the birds received 0.5 g/ L carvacrol in Experiment 1 (Figure 1), indicates that carvacrol may affect lipid metabolism in broiler chicken. In broiler, lipids and especially triglycerides are mainly stored in adipocytes of the abdominal fat. It has been shown that de novo lipogenesis, i.e., synthesis of fatty acids, is very limited in abdominal fat (Saadoun and Leclercq, 1987). Thus, triglyceride storage in abdominal fat compartments depends on the availability of a plasma lipid substrates originating from either the diet or lipogenesis in the liver (Griffin et al., 1992, Hermier, 1997). We suggest the significant decrease (15%) in the abdominal fat of the 0.5 g/ L carvacrol- treated birds was a response to decreased plasma LDL and HDL. Carvacrol seems to affect LDL and/or HDL metabolism in extra hepatic metabolic routes (Hotta et al., 2010). These results are compliant with other reports which shown that dietary carvacrol significantly affect fat metabolism in chicken (Case et al., 1995, Baser, 2008). Brenes and Roura, (2010) reported that oregano extract, which it is also rich in carvacrol, exhibit significant hypocholesterolemic effects in chicken. From the results of the second experiment, remarkable decrease (Table 5) in plasma cholesterol, LDL, and HDL by 8, 9 and 5%, respectively, with 0.3 g/ L carvacrol were concur with opposite alteration in plasma estradiol and testosterone levels (Figures 2 and 3). These results are in consistent with the finding of Haeri et al. (2006) who reported that oral administration of 150 and 225 mg/kg per day Satureja khuzistanica essential oils through drinking water significantly increased plasma testosterone

H. Khosravinia
98
concentration in male rats. In the study of caponization and testosterone effects on blood lipid in male chicken it has been demonstrated that testosterone decreases lipid storage capacity and inhibit lipid accumulation in male chicks (Chen et al., 2005). These results are interesting since the current knowledge proposed that the inhibitory action of essential oils on lipid metabolism regulatory enzymes is independent of the diurnal cycle of many hormones such as insulin, glucocortocoids, T3 and glucagons (Middleton and Hui. 1982).
bb
b
aa
a
0
0.2
0.4
0.6
0.8
1
1.2
1.4
0+ 0- 0.2 0.3 0.4 0.5
Seru
m te
stos
tero
n (n
m/m
l)
Carvacrol (g/ L)
P<0.001
Figure 3. Effect of low doses of carvacrol in drinking water on serum testosterone level in male broiler chicken at 42 days of age (Experiment 2). Means without a common superscript (a-b) differ significantly (P<0.001).
The modulated serum LDL and cholesterol in the first experiment could be attributed to the elevated serum testosterone level in the birds received 0.3 g/ L carvacrol-added water. The results from sex-disconnect analysis of data in Experiment 1 also supported the above conclusion where an apparent dose-dependent response in serum LDL, HDL and TC levels were exhibited in male chicks, but not in females (Table 4). Chen et al. (2005) in conformity with the idea confirmed by Whitehead et al. (1984) reported that testosterone implantation in capons decreased the serum LDL and cholesterol level while triglycerides remained unaffected. Considering all variables in Experiments 1 and 2, it is barely credible to attribute the differences between the treated and control- birds as regards blood fat constituents to random variability. Therefore, two reasons could be pointed out to propose the possibility of hypolipidemic properties for carvacrol in broiler chicken under the circumstances which the current experiments were conducted. 1) The decreased abdominal fat in 0.5 g/ L carvacrol-treated birds could be caused by modulated serum cholesterol, LDL, and HDL in trial 1. 2) The

Hypolipidemic effects of ...
99
decreased levels of the same blood lipid constituents in 0.3 g/ L carvacrol-treated birds could be associated with elevated serum testosterone, as an anabolic hormone, in trial 2. Conclusion
Results propose the possibility of testosterone-linked hypolipidemic properties for carvacrol as well as carvacrol-reached plant extracts in broiler chicken under the circumstances which the current experiments were conducted. Acknowledgment
This study was supported by a grant from Lorestan Medical Plant Lab., Khorraman, Khorramabad-68135-579, Iran. Hipolipidemijski efekti karvakrola na polne hormone kod brojlerskih pilića H. Khosravinia Rezime
Dva eksperimenta su sprovedena kako bi se procenio uticaj visokih i niskih doza karvakrola na sastojke lipida u krvi i polne hormone u brojlerskih pilića. Uključivanje karvakrola u pijaću vodu u količini od 0,5 i 0,3 g/L u ogledima 1 i 2, respektivno, uticalo je na serumski holesterol i nivo lipoproteina velike gustine (HDL), mada razlike nisu bile značajne u odnosu na odgovarajuće kontrolne grupe (P> 0.05). Karvakrol u količini od 0,5 g/L značajno smanjuje (16%) sadržaj abdominalne masnoće živine, u uzrastu od 28 dana (ogled 1, P<0,05). U ogledu 2, koncentracija estradiola u serumu značajno je smanjena u svim grlima koja su dobijala karvakrol u poređenju sa kontrolnim-grlima (P>0,05). Serum testosteron, međutim, se povećao kod pilića koji su dobili karvakrol u dozama većim od 0,2 g/L u poređenju sa kontrolnim pilićima (P<0.05). Rezultati ukazuju na mogućnost hipolipidemijskih svojstva testosterona vezanog za karvakrol u brojlerskih pilića. References ABDOLLAHI, M., SALEHNIA, A., MORTAZAVI, S. H., EBRAHIMI, M., SHAFIEE, A., FOULADIAN, F. (2003): Antioxidant, antidiabetic,

H. Khosravinia
100
antihyperlipidemic, reproduction stimulatory properties and safety of essential oil of Satureja khuzestanica in rat in vivo: a oxicopharmacological study. Medical Science Monitor 9, 331–335. AGRICULTURAL RESEARCH SERVICE (ARS) (2002): Dr. Duke's phytochemical and ethnobotanical databases. Assessed at June, 2002. http://www.ars-grin.gov/duke. AZAZ, D., DEMIRCI, F., SATIL, F., KURKCUOGLU, M., BASER, K.H. (2002): Antimicrobial activity of some Satureja essential oils. Zeitschrift für Naturforschung 57, 817-821. BASER, K.H. (2008): Biological and pharmacological activities of carvacrol and carvacrol bearing essential oils. Current Pharmaceutical Design 14 ,3106 – 3119. BRENES, A., ROURA, E. (2010): Essential oils in poultry nutrition: Main effects and modes of action. Animal Feed Science and Technology 158, 1-14. BURT, S. (2004): Essential oils: Their antibacterial properties and potential applications in food-A review. International Journal of Food Microbiology 94, 223–253. CASE, G.L., HE, L., MO, H., ELSON, C.E. (1995): Induction of geranyle pyrophosphatase activity by cholesterol-suppressive isoprenoids. Lipids 30, 357-359. CHEN, K.L., CHI, W.T., CHIOUT, P.W.S. (2005): Caponization and testosterone implantation effects on blood lipid and lipoproteins profile in male chicken. Poultry Science 84, 547-552. CROWELL, P.L. (1999): Prevention and therapy of cancer by dietary monoterpenes. Journal of Nutrition 129, 775-778. DEHGHANI, F., AZIZI, M., PANJEHSHAHIN, M.R. (2008): Toxic effects of hydroalcoholic extract of Citrullus colocynthis on pregnant mice. Iranian Journal of Veterinary Research 9, 42-5. ELSON, C.E., QURESHI, A.A. (1995): Coupling the cholesterol- and tumor-suppressive actions of palm oil to the impact of its minor constituents on 3-hydroxy-3-methylglutaryl coenzyme A reductase activity. Prostaglandins, Leukocytes and Essential Fatty Acids 52, 205-208. GRIFFIN, H.D., GUO, K., WINDSOR, D., BUTTERWITH, S.C. (1992): Adipose tissue lipogenesis and fat deposition in leaner broiler chickens. Journal of Nutrition 122, 363-368. GRIGOROVA, G., KASHAMOV, B., SREDKOVA, V., SURDJIISKA, S., ZLATEV, H. (2008): Effect of tribulus terrestris extract on semen quality and serum total cholesterol content in white plymouth rock-mini cocks. Biotechnology and Animal Husbandry 24, 139-146. GUPPETT, S.L., HALL, C.A. (1998): Antioxidant activity of Labiatae. Advances in Food and Nutrition Research 42, 245–271. HADIAN, J., MIRJALILI, M.H., KANANI, M.R. SALEHNIA, A., GANJIPOOR, P. (2011): Phytochemical and morphological characterization of

Hypolipidemic effects of ...
101
Satureja khuzistanica Jamzad populations from Iran. Chemistry and Biodiversity 8, 902- 915. HAERI, S., MINAIE, B., AMIN, G., NIKFAR, S., KHORASANI, S., ESMAILY, H., SALEHNIA, A., ABDOLLAHI, M. (2006): Effect of Satureja khuzistanica essential oil on male rat fertility. Fitoterapia 77, 495–499. HERMIER, D. (1997): Avian Lipoprotein Metabolism: An update on "Lipoprotein metabolism and fattening in poultry". Journal of Nutrition 127, 805S-808S. HONDA, S.F., AOKI, F., TANAKA, H., KISHIDA, H., NISHIYAMA, T., OKADA, S., MATSUMOTO, I., ABE, K., MAE, T. (2006): Effects of ingested turmeric oleoresin on glucose and lipid metabolisems in obese diabetic mice: A DNA microarrey study. Journal of Agriculture Food and Chemistry 54, 9055-9062. HOTTA, M., NAKATA, R., KATSUKAWA, M., HORI, K., TAKAHASHI, S., INOUE, H. (2010): Carvacrol, a component of thyme oil, activates PPAR and suppresses COX-2 expression. Journal of Lipid Research 51, 132- 139. KHOSRAVINIA, H., GHASEMI, S. AND RAFIEI ALAVI, E. (2103): Effect of savory (Satureja khuzistanica) essential oils on performance, liver and kidney functions in broiler chicks. Journal of Animal and Feed Sciences 22 (1), 50-55. KONJUFCA, V.H., PESTI, G.M., BAKALLI. R. I. (1997): Modulation of cholesterol levels in broiler meat by dietary garlic and copper. Poultry Science 76, 1264-1271. LEE, K.W., EVERTS, H., BEYNEN, A.C. (2004b): Essential oils in broiler nutrition. International Journal of Poultry Science 3, 738-752. LEE, K.W., EVERTS, H., KAPPERT, H.J., FREHNER, M., WOUTERSE, H., BEYNEN, A.C. (2004a): Cinnamanaldehyde, but not thymol, counteracts the carboxymethyl cellulose-induced growth depression in female broiler chickens. International Journal of Poultry Science 3, 608-612. MIDDLETON, B., HUI, K.P. (1982): Inhibition of hepatic S-3-hydroxy-3-methylglutaryl-CoA reductase and in vivo rates of lipogenesis by a mixture of pure cyclic monoterpenes. Biochemical Pharmacology 31, 2897-2901. NRC, (1994): Nutrient Requirements of Poultry. 9th Edn., National Academy Press, Washington, DC., USA., ISBN: 9780309048927, Pages: 155. QURESHI, A.A., DIN, Z.Z., ABUIRMEILEH, N., BURGER, W.C., AHMED, Y., ELSON, C.E. (1983): Suppression of avian hepatic lipid metabolisem by solvent extracts of garlic: impact on serum lipids. Journal of Nutrition 113, 1746-1755. RADONIC, A., MILOS, M. (2003): Chemical composition and in vitro evaluation of antioxidant effect of free volatile compounds from Satureja montana L. Free Radical Research 37, 673–9. SAADOUN, A., LECLERCQ, B. (1987): In vivo lipogenesis of genetically lean and fat chicken: effects of nutritional state and dietary fat. Journal of Nutrition 117, 428-435. SAS INSTITUTE. (2003): SAS/STAT® Guide for personal computers. Version 9.1 Edition. SAS Institute, Inc., Cary, NC.

H. Khosravinia
102
SAXTON, A. M. (1998): A macro for converting mean separation output to letter grouping in Proc Mixed. Pages 1243-1264 in Proc. 23rd SAS User Group Intl. SAS Institute, Cary, NC. SKLAN, D., BERNER, Y.N., RABINOWITCH, H.D. (1992): The effect of dietary onion and garlic on hepatic lipid concentration and activity of antioxidative enzymes in chicks. Journal of Nutrition Biochemistry 3, 322-325. SKOCIBUSIC, M, BEZIC, N. (2004): Photochemical analysis and in vitro antimicrobial activity of two Satureja species essential oils. Phytotherapy Research 18, 967–70. SUGIHARTO, I., WIDIASTUTI, E., PRABOWO, N.S. (2011): Effects of turmeric extract on blood parameters, feed efficiency and abdominal fat content in broilers. Journal of Indonesian Tropical Animal Agriculture 36, 21-26. WHITEHEAD, C.C., HOOD, R.L., HEARD, G.C., PYM, R.A.E. (1984): Comparison of plasma very low density lipoproteins and lipogenic enzymes as predictors of fat content and food conversion efficiency in selected lines of broiler chickens. British Poultry Science 72, 1479-1491. YAMASAKI K., NAKANO, M., KAWAHATA, T., MORI, H., OTAKE, T., UEBA, N., OISHI, I., INAMI, R., YAMANE, M., NAKAMURA, M., MURATA, H., NAKANISHI, T. (1998): Anti-HIV-1 activity of herbs in Labiatae. Biological and Pharmaceutical Bulltain 21, 829-833. ZARGARI A. (1990): Medicinal Plants. 4th ed. Tehran University Publications, Tehran, pp. 42–45. Received 15 January 2014; accepted for publication 18 March 2014

Biotechnology in Animal Husbandry 30 (1), p 103-114, 2014 ISSN 1450-9156 Publisher: Institute for Animal Husbandry, Belgrade-Zemun UDC 636.052'635
DOI: 10.2298/BAH1401103L
ESTIMATION OF HETEROSIS, DIRECT AND MATERNAL ADDITIVE EFFECTS FROM CROSSBREEDING EXPERIMENT INVOLVING TWO WHITE PLYMOUTH ROCK LINES OF CHICKENS M. Lalev, N. Mincheva*, M. Oblakova, P. Hristakieva, I. Ivanova Agricultural Institute - Stara Zagora, Bulgaria *Corresponding author:[email protected] Original scientific paper
Abstract: Eight hundred one-day-old female chickens from two White Plymouth Rock lines (line L and line K) and their reciprocal crosses obtained from 40 male and 480 females were used to form four genetic groups (LxL, KxK, LxK and KxL). Differences among genotypes, the direct and maternal additive effects, and the heterosis were investigated with regard to the following traits: body weight from 2 to 10 weeks of age and at 18, 26 and 30 weeks of age, age at sexual maturity, egg production per hen-day until 46 weeks of age, average egg weight (between 32 and 46 weeks of age), liveability during the production period, egg fertility, hatchability of set and fertile eggs. The results demonstrated a statistically significant effect of the genotype on body weight during the different age periods (p<0.001), age at sexual maturity (p<0.001), egg production (p<0.01) and livability (p<0.05). On the basis of analysis of direct additive effects, it could be concluded that line L was superior for obtaining combinations with more intensive growth rate. Although the lack of direct additive effect with respect to the other traits studied, there was a positive tendency favouring line K. Maternal additive effects had a substantial effect on body weight in most studied periods and livability, favouring line L. The heterosis was important for body weights at different periods of life (3.76-22.33 %), age at sexual maturity (-8.32 %) and egg production (8.25 %) with positive effects on these traits. The results pointed at a mutual complementary effect between both lines as a result of crossbreeding.
Key words: crossbreeding, direct additive effect, maternal additive effect,
heterosis
M. Lalev et al.
104
Introduction
Crossbreeding results in alteration of genetic variance and allows combining the valuable traits of parent lines in their progeny. An objective evaluation of the value of a given strain and its exact place in combinations is performed on the basis of diallel cross experiments. The analysis of results contributes to establish the combinations with one or more heterotic traits (Saadey et al., 2008). From a theoretical point of view, the hybrid vigor is inversely proportional to the extent of genetic similarities between parental populations (Wilham and Pollak, 1985) and it is expected to be proportional to the extent of heterozygocity of crosses (Sheridan, 1981). Thus, heterosis results from non-additive genetic effects and is usually higher for reproduction rather than growth traits. It is influenced by maternal effects (Lui et al., 1995), which are higher in cases with small heterosis (Fairfull et al., 1983). According to some researchers (Fairfull and Gowe, 1990; Abou El-Ghar et al., 2003 and Abou El-Ghar and Abdou, 2004) the anticipated dominant effect is high for egg production traits, while others affirm that the additive effect is markedly higher that the dominant effect (Szydlowski and Szwaczkowski 2001 and Abou El-Ghar 2009). It is shown that the main mechanism of heterosis in poultry is epistasis; this is supported by evidence provided by Sheridan (1980) and Fairfull et al. (1985, 1987). Iraqi et al. (2005) believes that in most cases, hybrid vigor due to the epistatic effect of genes was hard to be predicted, as the number of type of interactions are usually unknown and could be affected by dominance. Testing various combinations of available lines is the essence of breeding programmes in poultry farming. In the view of Wolf and Knizetova (1994) the determination of crossbreeding effects is of great significance. The characterization of genetic and maternal effects related to each strain or combination contributes to improvement of production. That is why, the present study aimed at determination of the direct additive effect, maternal additive effect and heterosis of most important economic traits – body weight, age at sexual maturity, egg production, egg weight, livability, egg fertility and egg hatchability after crossing two White Plymouth Rock lines, which would be used as maternal form for production of three-line broiler chickens.
Materials and methods
The tests on line combinations were carried out in the Selection Base of the Poultry Breeding Unit at the Institute of Agriculture – Stara Zagora in 2010-2011.A total of 480 chickens from the K and L lines (240 from each line) were

Estimation of heterosis, direct ...
105
distributed in 40 pens with sex ratio of 1:12 and wood shavings litter. At 48 weeks of age, hens from each line were divided in two equal groups (120 birds each). The first group was mated with roosters from the same line whereas the second, with roosters of the alternative line to obtain reciprocal crosses. Eggs from the four genetic groups – L♂xL♀, K♂xK♀, L♂xK♀ and K♂xL♀ were collected on a daily basis and incubated in the same incubator. After determination of the sex of one-day-old chickens using a sexascope, 200 female chickens were wing banded depending on their genetic group. The different genotypes were reared in equal conditions, in the same premise on deep permanent litter according to technological requirements for housing and feeding up to 18 weeks of age, used in the Selection Base. After 18 weeks of age, the birds were housed 12 in a breeding pen on deep permanent litter, with equal main technological parameters – density, feeding and drinking width. Until 2 weeks of age, chickens were fed ad libitum, and thereafter - according a restriction schedule with weekly daily ration according to the age. During the different age periods, the content of rations was as followed: prestarter – 19 % CP, 2900 kcal/kg ME, starter – 17 % CP, 2800 kcal/kg ME, grower – 15 % CP, 2700 kcal/kg ME and egg production period – 16 % CP, 2750 kcal/kg ME. The following parameters were monitored during the experimental period; egg fertility, egg hatchability from eggs set and fertile eggs in %, body weight – per fortnight basis between 2 and 10 weeks of age, and at 18, 26 and 30 weeks of age, age at sexual maturity – when reaching 50% egg production for each group, egg production per hen-day until 46 weeks of age, average egg weight (by weighing eggs laid every day at 2-week intervals between 32 and 46 weeks of age), liveability during the production period The analysis of data was performed with Statistica software (Stat Soft), using one-way analysis of variance and the following statistical model: Yij = μ + gi + eij, where Yij – jth observation of the respective trait µ - grand mean of the trait gi – fixed effect of the ith genotype (i=1-4) ei – random effect of non-observed factors The LSD-test was used for estimation of mean values with statistically significant differences at p<0.05. Crossbreeding parameters – direct additive effect (GI), maternal additive effect (GM) and heterosis (HI) were analysed by means of Software Package CBE (Wolf, 1996) following the model of Dickerson (1969):
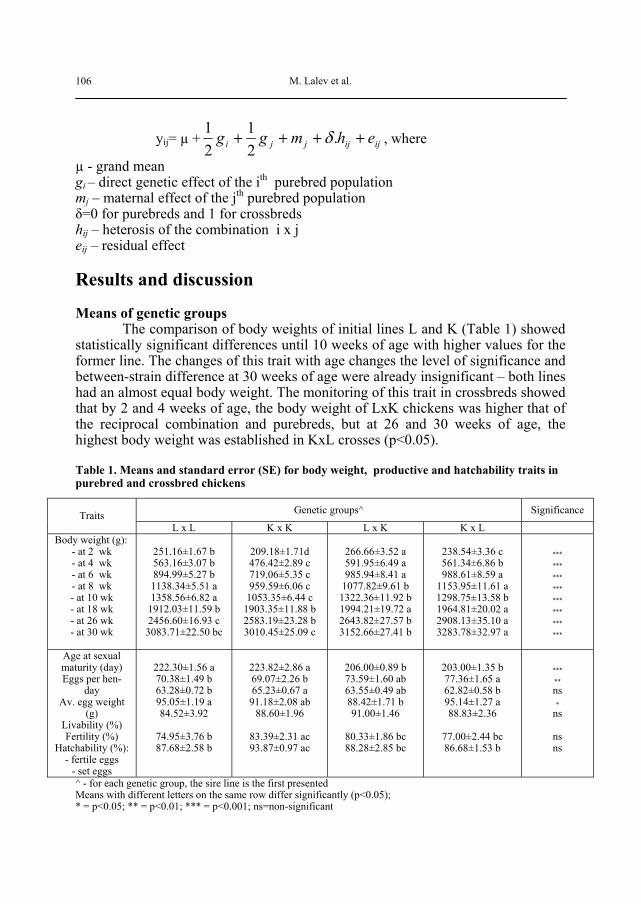
M. Lalev et al.
106
yij= µ + ijijjji ehmgg ++++ .21
21 δ , where
µ - grand mean gi – direct genetic effect of the ith purebred population mj – maternal effect of the jth purebred population δ=0 for purebreds and 1 for crossbreds hij – heterosis of the combination i x j eij – residual effect Results and discussion Means of genetic groups The comparison of body weights of initial lines L and K (Table 1) showed statistically significant differences until 10 weeks of age with higher values for the former line. The changes of this trait with age changes the level of significance and between-strain difference at 30 weeks of age were already insignificant – both lines had an almost equal body weight. The monitoring of this trait in crossbreds showed that by 2 and 4 weeks of age, the body weight of LxK chickens was higher that of the reciprocal combination and purebreds, but at 26 and 30 weeks of age, the highest body weight was established in KxL crosses (p<0.05). Table 1. Means and standard error (SE) for body weight, productive and hatchability traits in purebred and crossbred chickens
^ - for each genetic group, the sire line is the first presented
Genetic groups^ Significance Traits L x L K x K L x K K x L
Body weight (g): - at 2 wk - at 4 wk - at 6 wk - at 8 wk - at 10 wk - at 18 wk - at 26 wk - at 30 wk
251.16±1.67 b 563.16±3.07 b 894.99±5.27 b 1138.34±5.51 a 1358.56±6.82 a
1912.03±11.59 b 2456.60±16.93 c 3083.71±22.50 bc
209.18±1.71d 476.42±2.89 c 719.06±5.35 c 959.59±6.06 c
1053.35±6.44 c 1903.35±11.88 b 2583.19±23.28 b 3010.45±25.09 c
266.66±3.52 a 591.95±6.49 a 985.94±8.41 a
1077.82±9.61 b 1322.36±11.92 b 1994.21±19.72 a 2643.82±27.57 b 3152.66±27.41 b
238.54±3.36 c 561.34±6.86 b 988.61±8.59 a
1153.95±11.61 a 1298.75±13.58 b 1964.81±20.02 a 2908.13±35.10 a 3283.78±32.97 a
***
***
***
***
***
***
***
***
Age at sexual maturity (day) Eggs per hen-
day Av. egg weight
(g) Livability (%) Fertility (%)
Hatchability (%): - fertile eggs
- set eggs
222.30±1.56 a 70.38±1.49 b 63.28±0.72 b 95.05±1.19 a 84.52±3.92
74.95±3.76 b 87.68±2.58 b
223.82±2.86 a 69.07±2.26 b 65.23±0.67 a 91.18±2.08 ab
88.60±1.96
83.39±2.31 ac 93.87±0.97 ac
206.00±0.89 b 73.59±1.60 ab 63.55±0.49 ab 88.42±1.71 b 91.00±1.46
80.33±1.86 bc 88.28±2.85 bc
203.00±1.35 b 77.36±1.65 a 62.82±0.58 b 95.14±1.27 a 88.83±2.36
77.00±2.44 bc 86.68±1.53 b
***
** ns *
ns
ns ns
Means with different letters on the same row differ significantly (p<0.05); * = p<0.05; ** = p<0.01; *** = p<0.001; ns=non-significant

Estimation of heterosis, direct ...
107
Straightbred and reciprocal crosses attained sexual maturity at an earlier age and began laying eggs at 203–206 days of age (p<0.05). The differences between breeder lines were however insignificant. The comparison of egg production showed that it was the highest in the KxL combinations (77.36 eggs), with statistically significant difference vs both parental lines (p<0.05), but not vs the reciprocal LxK. Maternal and paternal lines did not differ considerably with respect to this trait. Eggs of hens from the K line were heavier than those laid by line L (p<0.05) and KxL crosses. Both combinations had similar weights of their eggs, comparable to those of line K. The livability during the production cycle was the highest for pure lines and KxL crossbreds, and the lowest – in LxK (p<0.05) – 88.42 %. Data about eggs incubation traits presented in Table 1 demonstrates that the fertility percentages of pure lines and crossbreds did not differ substantially. The fertility was slightly although insignificantly higher in LxK chickens. Hatchability from eggs set and fertile eggs was higher in line K compared to line L (p<0.05), but no statistically significant difference could be found either between combinations or vs. pure lines. Table 2. Estimates of direct additive effects (GI) and their percentages for body weight, productive and hatchability traits
Traits GI L±S.D. GI
L % Significance Body weight (g): - at 2 wk - at 4 wk - at 6 wk - at 8 wk - at 10 wk - at 18 wk - at 26 wk - at 30 wk
35.05±2.71 58.67±5.17 86.63±7.09 51.31±8.58
164.41±10.18 19.04±16.32
-195.45±26.56 -28.93±27.27
15.23 11.29 10.73 4.89 13.63 1.00 -7.76 -0.95
** ** ** ** ** ns ** ns
Age at sexual maturity (day) Eggs per hen-day Av. egg weight (g) Livability (%)
0.74±1.82 -1.23±1.78 -0.61±0.62 -1.43±1.60
0.33 -1.76 -0.95 -1.54
ns ns ns ns
Fertility (%) Hatchability (%): - fertile eggs - set eggs
-0.96±2.59
-2.55±2.69 -2.30±2.12
-1.11
-3.22 -2.31
ns
ns ns
GI
K = - GI L; ns=non-significant; ** = p<0.01
Direct additive effects (GI)
The estimates of direct additive effects (Table 2) for body weight up to 10 weeks of age were positive and highly significant (p<0.01) for line L. Presented as
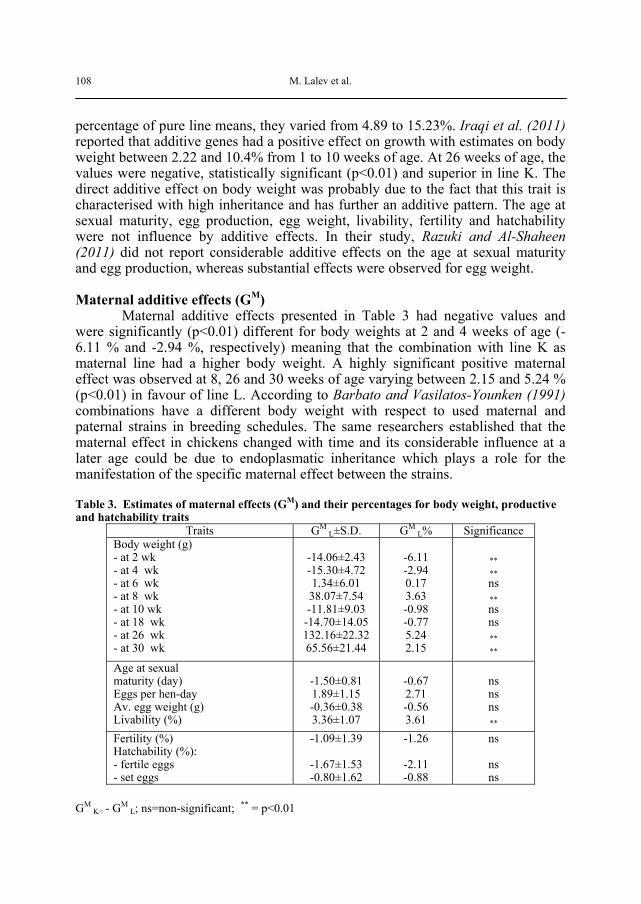
M. Lalev et al.
108
percentage of pure line means, they varied from 4.89 to 15.23%. Iraqi et al. (2011) reported that additive genes had a positive effect on growth with estimates on body weight between 2.22 and 10.4% from 1 to 10 weeks of age. At 26 weeks of age, the values were negative, statistically significant (p<0.01) and superior in line K. The direct additive effect on body weight was probably due to the fact that this trait is characterised with high inheritance and has further an additive pattern. The age at sexual maturity, egg production, egg weight, livability, fertility and hatchability were not influence by additive effects. In their study, Razuki and Al-Shaheen (2011) did not report considerable additive effects on the age at sexual maturity and egg production, whereas substantial effects were observed for egg weight. Maternal additive effects (GM) Maternal additive effects presented in Table 3 had negative values and were significantly (p<0.01) different for body weights at 2 and 4 weeks of age (- 6.11 % and -2.94 %, respectively) meaning that the combination with line K as maternal line had a higher body weight. A highly significant positive maternal effect was observed at 8, 26 and 30 weeks of age varying between 2.15 and 5.24 % (p<0.01) in favour of line L. According to Barbato and Vasilatos-Younken (1991) combinations have a different body weight with respect to used maternal and paternal strains in breeding schedules. The same researchers established that the maternal effect in chickens changed with time and its considerable influence at a later age could be due to endoplasmatic inheritance which plays a role for the manifestation of the specific maternal effect between the strains. Table 3. Estimates of maternal effects (GM) and their percentages for body weight, productive and hatchability traits
Traits GM L±S.D. GM
L% Significance Body weight (g) - at 2 wk - at 4 wk - at 6 wk - at 8 wk - at 10 wk - at 18 wk - at 26 wk - at 30 wk
-14.06±2.43 -15.30±4.72 1.34±6.01 38.07±7.54 -11.81±9.03
-14.70±14.05 132.16±22.32 65.56±21.44
-6.11 -2.94 0.17 3.63 -0.98 -0.77 5.24 2.15
** ** ns ** ns ns ** **
Age at sexual maturity (day) Eggs per hen-day Av. egg weight (g) Livability (%)
-1.50±0.81 1.89±1.15 -0.36±0.38 3.36±1.07
-0.67 2.71 -0.56 3.61
ns ns ns **
Fertility (%) Hatchability (%): - fertile eggs - set eggs
-1.09±1.39
-1.67±1.53 -0.80±1.62
-1.26
-2.11 -0.88
ns
ns ns
GM
K= - GM L; ns=non-significant; ** = p<0.01

Estimation of heterosis, direct ...
109
With respect to the other studied traits, maternal additive effects were not statistically significant except for livability (p<0.01). The estimates were negative and low for age at sexual maturity, egg weight, fertility of eggs, hatchability and ranged between -0.56 and -2.11 % and were positive for egg production (1.89 %) and livability (3.36 %). The lack of maternal effects on egg production and egg weight agrees with the data of Iraqi (2008) and Razuki and Al-Shaheen (2011), while others emphasized on a substantial maternal effect on age at sexual maturity and egg production (Khalil et al., 2004; Iraqi et al. 2007). Maternal additive effects have contributed to higher livability of crossbred chickens with L strain as maternal line over the production cycle. In general, the analysis of maternal additive effects on age of sexual maturity and egg production revealed again a trend towards superiority of the L strain, whereas the progeny of the K strain as maternal line tended to have higher egg weight, and higher egg fertility and hatchability percentages. Direct heterosis (HI) The data about the effect of heterosis shown in Table 4 showed statistically significant values for body weights during the different studied ages. The heterosis effect on body weight was positive and varied from 3.76 to 22.33 %, and was the most obvious at the age of 6 weeks. Lamont and Deeb (2001) reported that the hybrid vigor with respect to body weight depended on age, while according to Williams et al. (2002) its power is variable and estimates could be positive or negative. Most studies provided evidence about positive hybrid vigor during the different life periods (Sabri and Hataba, 1994; Khalil et al., 1999; Sabri et al., 2000, Razuki and Al-Shaheen, 2011). The possible causes are non-additive genetic effects – dominance, overdominance and epistasis, which, together with maternal effect contributed to improved growth potential of crosses (Fairfull, 1990).

M. Lalev et al.
110
Table 4. Estimates of heterosis effects (HI) and their percentages for body weight, productive and hatchability traits
Traits HI±S.D. HI % Significance Body weight (g): - at 2 wk - at 4 wk - at 6 wk - at 8 wk - at 10 wk - at 18 wk - at 26 wk - at 30 wk
22.43±2.71 56.85±5.17
180.25±7.09 66.92±8.58
104.60±10.18 71.82±16.32 256.08±26.56 171.14±27.27
9.74
10.94 22.33 6.38 8.67 3.76
10.16 5.62
**
**
**
**
**
**
**
** Age at sexual maturity (day) Eggs per hen day Av. egg weight (g) Livability (%)
-18.56±1.82 5.75±1.78 -1.07±0.62 -1.34±1.60
-8.32
8.25 -1.67 -1.44
** ** ns ns
Fertility (%) Hatchability (%): - fertile eggs - set eggs
3.36±2.59
-0.51±2.69 -3.29±2.12
3.88
-0.64 -3.62
ns
ns ns
** = p<0.01; ns=non-significant; The hybrid vigor with respect to age of sexual maturity was also proved, but was negative and beneficial as the time for attaining sexual maturity of crosses decreased by about 19 days or 8.32% (p<0.01). Some authors (Bordas et al, 1996; Mohammed, 1997; Williams et al., 2002) outlined that heterosis estimates for the age of sexual maturity varied between -25 and 11.5 %. The calculated heterosis for egg production and egg fertility were positive, but a statistically significant heterosis effect was established only for egg production – 8.25 % (p<0.01). Negative and insignificant heterosis estimates were observed for egg weight, livability, hatchability from eggs set and fertile eggs. The data of Iraqi et al. (2007) reported hybrid vigor values between -22.2 and 20.1 %. Saadey et al. (2008) reported that breeding White Leghorn (WL) roosters and Rhode Island (RIR) hens with Fayoumi chickens did not result in higher egg weight and egg production, and pointed at negative values of heterosis for these traits –3.82 and –3.15 % for the combination WLhF, -2.18 and -15.6 % for RIRhF. The estimated heterosis for egg weight in our study was comparable to the value obtained by Bais et al. (2008), i.e. -1.83 %. According to Abou El- Ghar et al. (2010) the negative heterosis could be to the epistasis effect of genes of original strains. After crossbreeding of 24 Leghorn strains Fairfull (1990) found out that the hybrid vigor for livability varied from -6.1 % to 9.1 %. The lack of heterosis effect on fertility and hatchability of eggs was also established by El-Gendy (2000), although Hossari and Dorgham (2000) reported heterosis for egg fertility of 2.73 % in two-line and 3.04 % in

Estimation of heterosis, direct ...
111
three-line crosses and outlined the presence of heterosis effect on hatchability in two-line crosses only.
Conclusion The results demonstrated a statistically significant effect of the genotype on body weight during the different periods of life (p<0.001), age at sexual maturity (p<0.001), egg production (p<0.01) and livability (p<0.05). On the basis of analysis of direct additive effects, it could be concluded that line L was superior for obtaining combinations with more intensive growth rate. Although the lack of evidence for a direct additive effect with respect to the other traits studied, there was a positive tendency favouring line K. Maternal additive effects had a substantial effect on body weight in most studied periods and livability, favouring line L. The heterosis was important for body weights at different periods of life (3.76-22.33 %), age at sexual maturity (-8.32 %) and egg production (8.25 %) with positive effects on these traits. The results pointed at a mutual complementary effect between both lines as a result of crossbreeding.
Procena heterozisa, direktni i maternji aditivni efekti ukrštanja dve linije pilića white plymoth rock M. Lalev, N. Mincheva, M. Oblakova, P. Hristakieva, I. Ivanova Rezime
Osam stotina jednodnevnih ženskih pilića dve linije white plymoth rock (linija L i linija K) i njihovih recipročnih meleza dobijenih od 40 muških i 480 ženskih grla su korišćeni za formiranje četiri genetske grupe (LxL, KxK, LxK i KxL). Razlike između genotipova, direktnih i maternjih aditivnih efekata, kao i heterozisa su ispitivani u vezi sa sledećim osobinama: telesne mase od 2 do 10 nedelja starosti i u uzrastu od 18, 26 i 30 nedelja, uzrast kod dostizanja polne zrelosti, proizvodnja jaja po kokoši - dnevno do 46 nedelja starosti, prosečna težina jaja (između 32 i 46 nedelja starosti), oplođenost i izleženost.
Rezultati su pokazali statistički značajan efekat genotipa na telesnu težinu tokom različitih starosnih perioda (p<0,001), uzrast polne zrelosti (p<0,001), proizvodnja jaja (p<0,01) i dugovečnost (p<0,05).

M. Lalev et al.
112
Na osnovu analize direktnih aditivnih efekata, moglo bi se zaključiti da je linija L bila superiorna za dobijanje kombinacije sa intenzivnijom stopom rasta. Iako nedostatak direktnog aditivnog efekta u odnosu na ostala ispitivana svojstava, utvrđena je pozitivna tendencija koja favorizuje liniju K.
Maternji aditivni efekti imali su značajan efekat na telesne težine u većini ispitivanih perioda i tokom životnog veka, čime se favorizuje linija L. Heterozis je važan za telesne težine u različitim periodima života (3.76-22.33 %), starost seksualne zrelosti (-8.32 %) i proizvodnju jaja (8,25%) sa pozitivnim efektima na ove osobine. Rezultati ukazuju na uzajamni komplementarni efekat između obe linije, kao rezultat ukrštanja. References ABOU EL-GHAR, R.SH., ABDOU, F.H., GEBRIEL, G.M., ENAB, A.A. AND T.H. MAHMOUD (2003): Combining ability and genetic gain of Some economic traits in Norfa chickens. Egypt. Poult. Sci. 23:687-704. ABOU EL-GHAR, R.SH. AND F.H. ABDOU (2004): Evaluation of genetic variance components based on the concept of generation means for some economic traits in chickens. Egypt. Poult. Sci. 24:687-699. ABOU EL-GHAR, R.SH. (2009): Genetic analysis of generation means for a cross between two local breeds of chickens: ІІ- comparisons between f3 and backcrosses for egg production traits. Egypt. Poult. Sci. 29:667-676 ABOU EL- GHAR, R.SH; GHANEM, H.H. AND ALY, O.M. (2010): Genetic improvement of egg production from crossing two developed strains with commercial laying hen. Egypt. Poult. Sci. Vol. (30) 2: 457 – 472. BAIS R.K., KATARIA M.C., SHARMA D., HAZARY R.C., R.D.SHARMA (2008): Performance and heterosis for production traits of White Leghorn under family index selection. Indian Journal of Poultry Science 43 (3): 283-288. BARBATO, G.F. AND R. VASILATOS-YOUKEN (1991): Sex-linked and maternal effects on growth in chickens. Poult. Sci., 70: 709-718 BORDAS, A; MERAT, P. AND F . MINUIVELLE (1996): Heterosis in egg laying lines under divergent selection for residual feed consumption. Poultry Sci./America Associations of Instructors and Investigation in Poultry husbandary 75(1) :20-24. EL-GENDY, E. A. (2000): Heterosis in reciprocal crosses between two lines of chickens divergently selected short-term for heat tolerance, with an approach to genetic distance between the selected lines. Egyptian Poultry Science Journal 20 (1): 25-48 FAIRFULL, R.W., R.S. GOWE AND J.A.B. EMLEY (1983): Diallel cross of six long-term selected Leghorn strains with emphasis on heterosis and reciprocal effects. Br. Poult. Sci., 24: 133 -158

Estimation of heterosis, direct ...
113
FAIRFULL, R.W., GOWE, R.S. AND J. NAGAI (1985): Heterosis in White Leghorn strain crosses. Proc. Brit. Poultry Breeders Roundtable (Edinburgh). FAIRFULL, R.W., GOWE, R.S. AND J. NAGAI (1987): Dominance and epistasis in heterosis of White Leghorn strain crosses. Can. J. Animal Sci. 67:663-680. FAIRFULL, R. W. AND R.S. GOWE (1990): In: R. D. Crawford (Ed.) Poultry Breeding and Genetics. p 705. Elsevier, Amsterdam, The Netherlands. FAIRFULL, R.W. (1990): Heterosis: in poultry breeding and genetics. Crawford, R.D. ed. Elsevier Amsterdam, the Netherlands. 913-933 HOSSARI, M. A. AND S. A. DORGHAM (2000): Effect of heterosis on fitness traits in some Fayoumi crosses. Egyptian Poultry Science Journal 20 (2): 285-293 IRAQI, M., AFIFI, E.A., ABDEL-GHANY, A.M. AND M. AFRAM (2005): Diallel crossing analysis for livability data involving two standard and two native Egyptian chicken breeds. Livestock Research for Rural Development 17(7) IRAQI, M.M., AFIFI, E.A., EL-LABBAN, A.M. AND M. AFRAM (2007): Heterotic and genetic components in 4x4 diallel mating experiment for egg production traits in chickens. 4th World’s Poultry Conference 27-30 Mrach 2007, Sharm El-Sheikh, Egypt. IRAQI, M. M. (2008): Estimation of crossbreeding effects for egg production traits in a crossbreeding experiment involving two local strains of chickens. Egyptian Poultry Science, 28(3): 867-882. IRAQI, M., HANAFI, M., EL-MOGHAZY, G., EL-KOTAIT A. AND M. ABDEL A’AL. (2011): Estimation of crossbreeding effects for growth and immunological traits in a crossbreeding experiment involving two local strains of chickens. Livestock Research for Rural Development 23(4) KHALIL, M. H., HERMES I. H. AND A. H. AL-HOMIDAN (1999): Estimation of heterotic components for growth and livability traits in a crossbreeding experiment of Saudi chickens with White Leghorn. Egyptian Journal of Poultry Science, 19: 491-507. KHALIL, M.K., AL-HOMIDAN, A. H. AND HERMES H.I. (2004): Crossbreeding components in age at first egg and egg production for crossing Saudi chickens with White Leghorn. Livestock Research for Rural Development 16 (1):10 LAMONT, S.J. AND N. DEEB (2001): Genetics of body composition in a novel broiler cross. In: Proceedings XV European Symposium on Quality of Poultry Meat. WPSA Turkish Banch, Ege Univ., Izmir, Turkey, pp: 23-28 LIU, G., E.A. DUNNINGTON AND P.B. SIEGEL (1995): Growth related traits in body weight selected lines and their crosses reared under different nutritional regimes. British Poultry Science, 36: 209-219. MOHAMMED, K. A. (1997): Improvement of some Egyptian strains of chickens by crossing with egg-type commercial breeds. Second Hungarian Egyptian Poultry Conference, 16-19 September 1997. Godollo, Hungary

M. Lalev et al.
114
RAZUKI, W.M. AND SAJIDA A. AL-SHAHEEN (2011): Use of full diallel cross to estimate crossbreeding effects in laying chickens. International Journal of Poult. Sci. 10(3) : 197-204 SAADEY, S. M., GALAL, A.., ZAKY, H.I. AND A. ZEIN EL-DEIN (2008): Diallel Crossing Analysis for Body Weight and Egg Production Traits of Two Native Egyptian and Two Exotic Chicken Breeds. International Journal of Poultry Science 7 (1): 64-71 SABRI, H. M., AND N. A. HATABA (1994): Genetic studies on some economical traits of some local chicken breeds and their crosses. 1- Growth and viability. Egypt. Journal of Applied Science, 9(5): 949-963 SABRI, H. M., KHATTAB, M. S. AND A. M. ABDEL-GHANY (2000): Genetic analysis for body weight traits of a diallel crossing involving Rhode Island Red, White Leghorn, Fayoumi and Dandarawi Chickens. Annals of Agricultural Science Moshtohor, 38: 1869-1883 SHERIDAN, A.K.(1980): A new explanation for egg production heterosis in crosses between White Leghorns and Australorps. Br. Poult. Sci., 21:85-88. SHERIDAN, A.K. (1981): Crossbreeding and heterosis. Animal Breeding Abstracts, 49:131-144. SZYDLOWSKI M. AND T. SZWACZKOWSKI (2001): Bayesian segregation analysis of production traits in two strains of laying chickens. Poultry Science 80: 125-131. WILLHAM, R. L. AND E. POLLAK (1985): Theory of heterosis. Journal of Dairy Science, 68: 2411-2417. WILLIAMS, S.M., S.E. PRICE AND P.B. SIEGEL (2002): Heterosis of growth and reproductive traits in fowl. Poult. Sci., 81 : 1109-1112 WOLF, J. AND H. KNIZETOVA (1994): Crossbreeding effects for body weight and carcass traits in pekin duck. Br. Poult. Sci., 35: 33-45 WOLF, J. (1996): User’s Manual for the Software Package CBE, Version 4.0 (A universal program for estimating crossbreeding effects). Research Institute of Animal Production, Prague – Uhrineves, Czech Republic Received 25 November 2013; accepted for publication 31 January 2014

Biotechnology in Animal Husbandry 30 (1), p 115-123, 2014 ISSN 1450-9156 Publisher: Institute for Animal Husbandry, Belgrade-Zemun UDC 636.085.1'635
DOI: 10.2298/BAH1401115P
THE EFFECT OF RAW SOYBEANS IN MIXTURES FOR LAYING HENS ON PRODUCTION PERFORMANCE AND THE RELATIVE WEIGHT OF THE PANCREAS
V. Petričević1*, M. Lukić1, Z. Pavlovski1, Z. Škrbić1, Ž. Jokić2, D. Vitorović2, M. Petričević1 1Institute for Animal Husbandry, Autoput 16, 11080, Belgrade-Zemun, Republic of Serbia 2Faculty of Agriculture, University of Belgrade, Belgrade-Zemun, Republic of Serbia *Corresponding author: [email protected] Original scientific paper Abstract: The study was conducted on Isa Brown hybrid hens at the age of 49-57 weeks. The effect of using different levels of share of raw soybean of two varieties in mixtures for feeding hens on egg production, body weight, food consumption, the occurrence of defective eggs, mortality and the relative weight of the pancreas was studied. The possibility of replacing the heat-treated soybean grains, varieties Lana, with reduced trypsin inhibitor (TI) and Lydia with a standard level of TI, with raw soybean grains was examined. The research was conducted on the principle of two factorial experiment 2 x 4 (2 varieties x 4 levels of share of raw grain in the mixture) with a total of 8 diet treatments and 4 replicates per each treatment. In the first 5 weeks of the study, the differences in the number of eggs produced under the influence of tested factors were not significant. Under the influence of soybean varieties, the level of share of raw soybean and interaction of the studied factors showed significant differences (p<0.01) after 53 week of age. The use of soy with lower TI in the diet for laying hens resulted in a significantly greater capacity compared to standard variety. The share of raw soybean grains of 8 % in the mixtures significantly reduced the number of eggs laid. The differences in body weights, food consumption, occurrence of defective eggs and the relative weight of the pancreas were not significantly influenced by the studied factors or by their interaction effect.
Key words: soybean, trypsin inhibitor, layer hens, egg production, pancreas
Introduction
The introduction of soybean grain into diet of laying hens to a large extent can meet the requirements in protein and essential amino acids. Soybeans should have the higher protein content, with the full level of all the necessary amino acids,

V. Petričević et al.
116
high oil content and lower content of anti-nutritional factors. Heat process reduces the presence of anti-nutritional factors, but increases costs of food preparation that significantly burdens the overall cost of production. Trypsin inhibitors (TI) are the most important soybean antinutritive factors (Perez-Maldonado et al., 2003; Ruiz et al., 2004).
The varieties with reduced content of specific anti-nutritive substances have been created as the result of breeding work. As a result of the domestic soybean breeding program aimed at reducing the TI activity in our conditions a variety Lana was created with lower TI level compared to standard varieties.
Comparing the nutritional value of soy with lower TI in the experiments conducted on chickens (Han et al., 1991; Jokić et al., 2004; Petričević et al., 2013), on layer hens (Zhang et al., 1991) and on pigs and chickens (Palasios et al., 2004), have determined better product results when compared with standard soybean. Cook et al. (1988), in a study with pigs, have found that the negative effects of the use of raw soybeans decreased with the age of the animal. Senkoylu et al. (2005) and Koci et al. (1997) have not established significant differences in production performance between laying hens fed diets with different levels of participation of full-fat soybean.
The aim of this study was to investigate the effects of replacing a portion of heat-treated soybean of Lydia standard variety and variety with reduced TI content Lana, with raw grains in mixtures for laying hens on production performance and the relative weight of the pancreas. Materials and methods
The study was conducted at the experimental farm of the Institute of Animal Husbandry in Zemun, using light line hybrid hens Isa Brown. The mixtures for laying hens used two varieties of raw and heat-treated, Lana variety with reduced trypsin inhibitor and variety Lydia with standard level of TI (Table 1). The research was conducted on the principle of two factorial experiment 2 x 4 (2 varieties x 4 levels of participation of raw grain in the mixture) with a total of 8 diet treatments and 4 replicates per treatment (a total of 512 animals). Table 1. Level of trypsin inhibitor in soybean
Treatment Raw soybean Heat-treated (extruded) soybean Variety Lana Lydia Lana Lydia
TI (mg/g) 17.71 36.74 4.38 14.03 The experiment was conducted on hens at the age of 49-57 weeks. In the
preparation of the meal/diet, recommendations for the studied hybrid were used. Raw material composition of the mixture was the same with adjustment for

The effect of raw soybeans ...
117
soybean variety and the relationship between heat-treated and raw grain to achieve the objective of the research. Participation of thermally processed grains of both varieties was 8 % in the mixture in the two control treatments (K). In groups (I), with 8 % of full-fat soybean in the mixture, 6 % was heat-treated and 2 % raw. In groups (II) 4 % heat treated and 4 % raw soybean was added to the mixture. In groups (III) only 8 % of the raw soybeans was included. Ingredients of mixtures and the chemical composition of the mixture used in the experiment, determined in the laboratory, are given in Table 2. Tabela 2. Ingredients and chemical composition of mixtures–diet for layer hens during the experiment (%)
Groups (Treatments) Lana Lydia Feeds
K I II III K I II III Heat-treated (extruded)
soybean 8 6 4 0 8 6 4 0
Raw soybean 0 2 4 8 0 2 4 8 Corn 59 59 59 59 59 59 59 59
Soybean meal 15 15 15 15 15 15 15 15 Sunflower meal 6 6 6 6 6 6 6 6
Livestock lime, granules 8 8 8 8 8 8 8 8 Livestock lime, powder 2 2 2 2 2 2 2 2 Monocalcium phosphate 1 1 1 1 1 1 1 1
Salt 0.3 0.3 0.3 0.3 0.3 0.3 0.3 0.3 Mikozel 0.2 0.2 0.2 0.2 0.2 0.2 0.2 0.2 Premix 0.5 0.5 0.5 0.5 0.5 0.5 0.5 0.5 Σ (%) 100 100 100 100 100 100 100 100
Chemical composition ME, MJ/kg 11.84 11.78 11.76 11.70 11.84 11.78 11.76 11.70 Crude protein 15.30 15.60 15.80 15.40 15.90 15.40 15.30 15.10
Crude fat 5.12 5.11 5.16 5.14 4.99 4.99 4.93 4.91 Crude fibre 4.87 4.64 4.51 4.40 4.18 4.33 4.25 4.35
Ash 12.4 12.75 12.43 12.9 13.1 12.5 13.04 13.14 Calcium 3.53 3.97 3.72 3.66 3.69 4.01 3.65 3.87
Total phosphorus 0.65 0.58 0.60 0.63 0.62 0.57 0.59 0.60
During the experiment, the number of eggs produced was daily registered. Based on the data obtained the laying capacity was determined. The incidence of defective eggs was monitored and recorded (change in shape, size and defective egg shells) and the overall frequency of defective eggs calculated.
Body weight of laying hens was determined by measuring of all hens at the beginning and end of the experiment, using weighing scales with an accuracy of

V. Petričević et al.
118
10-2 kg. The unconsummated food was collected and measuredweekly in order to determine food consumption and calculate the average daily food consumption. Followed by the health condition and mortality of animals were monitored. At the end of the study, 6 layers in each group were taken randomly (a total of 48 layers) that were sacrificed and the pancreas taken in order to determine the relative masses and morphological changes.
The software package STATISTICA, version 12 (Stat Soft Inc.) was used for statistical analyses. The level of statistical significance of differences between groups was determined by Tukey-test. Results and discussion
In order to assess the impact of the variety and level of participation of raw soybeans in mixtures for laying hens, average weekly capacity was calculated (Graphs 1 and 2). Based on the results obtained it can be seen that the layers of all groups had uniform capacity between 49 and 53 weeks of age. The variety and level of participation of raw soybeans had no effect on the capacity.
Statistically significantly lower (p<0.01) laying capacity was determined from 54 up to 57 weeks of age in hens fed diets which included the standard variety Lydia (Graph 1), with the lower capacity in that period by an average of 5 % compared to the soybean with lower TI lelvel. Similar to our results (Perez-Maldonado et al., 2003) have reported that feeding laying hens diets that include soy with lower level of TI resultsin significantly higher laying capacity compared the standard soybean.
Lana Lydia
49 50 51 52 53 54 55 56 57
Age of layers (weeks)Vertical lines: Confidence interval 95%
7274767880828486889092
Layi
ng c
apac
ity, %
Graph 1. Changes in laying capacity depending on the diet containing different soybean varieties Increasing the level of share of raw soybeans in diets for laying hens also exhibited statistically significant effect (p<0.01) on the laying capacity from 54 to 57th week. Significantly lower capacity was recorded in hens fed diet with 8 % of the raw soybeans compared to other groups of hens (Graph 2). Differences in laying capacity that occurred between the groups fed with 0 %, 2 % and 4 % of the

The effect of raw soybeans ...
119
raw soybeans in the diet were not significant. Zhang et al. (1991) have reported that the increase of the share of raw soybeans with standard or lower TI levels, in diets for laying hens, gradually reduces capacity.
K, 0% I, 2% II, 4% III, 8%
49 50 51 52 53 54 55 56 57
Age of layers (weeks) Vertical lines: Confidence interval 95%
6870727476788082848688909294
Layi
ng c
apac
ity, %
Graph 2. Changes in laying capacity depending on the diet containing different shares of raw soybean
Interactions between studied factors had statistically significant effect (p<0.01) on the total capacity (Graph 3). At all levels of participation (0, 2, 4 and 8 %), raw soybean with lower TI level influenced greater number of eggs laid in relation to the standard variety. Best laying capacity was achieved in groups Lana K, Lana I and Lana II. Significantly lower (p<0.01) capacity was determined in groups of Lana III and Lydia I and II, whereas, significantly lower (p<0.01) capacity compared to all other groups was found in the group Lydia III. Senkoylu et al. (2005), Koci et al. (1997) and Han et al. (1988) have not established significant difference in the laying capacity in hens fed diets with different shares of the full-fat extruded soybean.
F test: Variety x LevelCalculated values: F(3, 2016) = 0.708, p=0.004
Vertical lines: Confidence interval 95%
Lana LydiaK (0%) I (2%) II (4%) III (8%)
Level of raw soybean
77787980818283848586878889
Layi
ng c
apac
ity, %
Graph 3. Average laying capacity by treatments for entire trial period

V. Petričević et al.
120
Average initial body weights of laying hens in the experiment (Table 3) were consistent. In the analysis of the impact of studied factors on body weight at the end of the experiment no significant differences were found. Food consumption (Table 3) ranged from 114 g in hens of group Lana K to 116 g in groups Lydia I and Lydia II. Determined differences in average daily food consumption of laying hens under the influence of the studied factors were not significant. Similar to our results, Zhang et al., (1991) and Perez-Maldonado et al., (2003) have reported no influence of the different varieties of soybean in diets for hens on food consumption. Table 3. Production indicators in layer hens and share of pancreas
Var
iety
Leve
l of r
aw
soyb
ean
(%)
Para
met
ers
BW
Tria
l be
ginn
ing
(g)
BW
Tria
l end
(g
)
Food
co
nsum
ptio
n (g
)
Def
ectiv
e eg
gs
(%)
Mor
talit
y (%
)
Shar
e of
pa
ncre
as (%
)
x 1834 1871 114 0.21 0.23 0%(K) Sd 169.1 185.5 8.7 0.02 1.56 0.03 x 1813 1841 115 0.11 0.24 2%(I) Sd 147.2 149.8 7.7 0.01 0 0.03 x 1811 1828 115 0.17 0.23 4%(II) Sd 126.9 163.1 5.8 0.02 1.56 0.01 x 1854 1876 115 0.09 0.29
Lana
8%(III) Sd 171.2 182.4 6.5 0.01 1.56 0.04 x 1868 1888 115 0.32 0.24 0%(K) Sd 162.5 176.3 9.8 0.03 0 0.03 x 1841 1870 116 0.14 0.26 2%(I) Sd 148.3 165.7 6.9 0.01 1.56 0.04 x 1861 1885 116 0.35 0.29 4%(II) Sd 146.4 179.0 7.0 0.03 1.56 0.03 x 1827 1846 115 0.17 0.32
Lydi
a
8%(III) Sd 156.2 209.8 6.6 0.02 1.56 0.02 As deficiencies of eggs (Table 3) mostly eggs with thin or no shell
occurred, alsoeggs with rough and pimply shell. Statistical analysis of data revealed that the studied factors have a significant impact on the occurrence of defective eggs. The lowest incidence of defective eggs (0.09 %) was determined in the group of hens Lana III, while the hens in the group Lydia K most often laid defective eggs (0.32 %) . The occurrence of death of hens was not observed among hens of group Lana I and Lydia K, in all other groups, one hen in each group has died (1.56 %).
The lowest relative weight of the pancreas (0.23 %) was in the group of hens Lana K (mixture withoutraw soybeans) and the highest relative weight of the pancreas (0.32 %) in group Lydia III (mixture with 8 % of the raw soybeans). Zhang et al. (1991) and Perez-Maldonado et al. (2003) have reported that hens fed

The effect of raw soybeans ...
121
diets containing raw soybeans with a standard level of TI have higher shares of pancreas compared to hens fed diets containing raw soybeans with lower TI level. Conclusions
Based on the study of the individual influence of varieties and levels of participation raw soybeans, as well as the interactive influence of both factors in the diet for laying hens from 49 to 57 weeks of age, the followingcan be concluded:
• Analysis of the impact of variety on the total number of eggs laid, showed significantly lower (p<0.01) laying capacity in hens fed diets which includedsoybean variety Lydia.
• The level of participation of raw soybean in the mixture of 8 % showed statistically significant effect on the lower (p<0.01) laying capacity in relation to other groups of hens.
• Interaction of investigated factors confirmed a significant effect (p<0.01) on the laying capacity. The share of raw soybean of variety Lana, of 2 and 4 % in the diet did not cause significant differences in capacity compared to the group with 0 % raw soybeans of both varieties, while in other groups significantly lower capacity (p<0.01) was determined.
• In general it can be concluded that soybean with lower TI may be included indiet for older laying hens in the form of untreated grain to 4 %, while the use of untreated soybeans with a standard level of TI exerted a negative impact on the laying capacity of hens.
• In the statistical analysis of data, the influence of the studied factors on body weight of laying hens, feed intake and the occurrence of defective eggs was not established.
• The highest share of the pancreas was determined in the group Lydia III. The differences found in relation to the groups of hens fed a mixture with lower participation of raw soybean, were not statistically significant.
Acknowledgments
The research was funded by the Ministry of Education, Science and Technological Development, Republic of Serbia, project TR-31033. Efekat upotrebe sirove soje u smešama za ishranu kokoši nosilja na proizvodne rezultate i relativnu masu pankreasa
V. Petričević, M. Lukić, Z. Pavlovski, Z. Škrbić, Ž. Jokić, D. Vitorović, M. Petričević

V. Petričević et al.
122
Rezime
Cilj ovih istraživanja je bio da se ispitaju mogućnosti zamene termički obrađenog sojinog zrna, sorteLana sa smanjenim sadržajem tripsin inhibitora (TI) i sorte Lidija sa standardnim nivoom TI, sirovim zrnom. Ispitan je efekat korišćenja različitog nivoa učešća sirove soje obe sorte u smešama za ishranu kokoši nosilja hibrida Isa Brown na proizvodnju jaja, telesne mase, konzumaciju hrane, pojavu defektnih jaja, mortalitet i relativnu masu pankreasa. Istraživanje je izvedeno po principu dvofaktorijalnog ogleda 2 x 4 (2 sorte soje x 4 nivoa učešća sirovog zrna u smeši) sa ukupno 8 tretmana ishrane i 4 ponavljanja po tretmanu. U prvih 5 nedelja ispitivanja razlike u broju ukupno smešenih jaja pod uticajem ispitivanih faktora nisu bile značajne. Pod uticajem sorte soje, nivoa učešća sirovog sojinog zrna i interakcije ispitivanih faktora utvrđene su značajne razlike (p<0,01) nakon 53. nedelje uzrasta. Korišćenje soje sa nižim nivoom TI u ishrani nosilja uticalo je na značajno bolju nosivost u odnosu na standardnu sortu soje. Sa učešćem sirovog sojinog zrna od 8 % u smešama značajno se smanjio broj ukupno snešenih jaja. Razlike u ostvarenim telesnim masama, konzumaciji hrane, pojavi defektnih jaja i relativnoj masi pankreasa koje su se javile nisu bile pod značajnim uticajem ispitivanih faktora kao ni pod uticajem njihovog interakcijskog dejstva. References COOK D. A., JENSEN A. H., FRALEY J. R., HYMOWITZ T. (1988): Utilization by growing and finishing pigs of raw soybeans of low Kunitz trypsin inhibitor content. J. Anim. Sci. 66:1686-1691. HAN Y., PARSONS С. M., HYMOWITZ Т. (1991): Nutritional evaluation of soybeans varying in trupsin inhibitor content. Poultry Science 70(4): 896-906. HAN I. K., CHOI Y. J., CHU K. S. (1988): Thе utilization of full fat soybeam for egg productioim and egg quality in the laying hens. AJAS Vol. 1(3) 173-178. JOKIĆ Ž., JOVANOVIĆ R., TODOROVIĆ M., SINOVEC Z. (2004): Sirovo i termički obradeno zrno soje u smešama za brojlere. Veterinarski glasnik. 58, 5-6, 639-646. KOCI S., KOCIOVA Z., CERESNAKOVA Z., PALANSKA O., MATRAI T. (1997): The effect of full fat extruded soya on the performance and produce quality in layers and broilers. Zivocisna Vyroba 42: 67–71. PALACIOS M. F., EASTER R. A., SOLTWEDEL K. T., PARSONS C. M., DOUGLAS M. W., HYMOWITZ T., PETTIGREW J. E. (2004): Effect of soybean variety and processing on growth performance of young chicks and pigs. J. Anim. Sci. 82: 1108–1114.

The effect of raw soybeans ...
123
PEREZ-MALDONADO R.A., MANNION P.F., FARRELL D.J. (2003): Effects of heat treatment on the nutritional value of raw soybean selected for low trypsin inhibitor activity. British Poultry Science, 44, 299–308. PETRIČEVIĆ V., JOKIĆ Ž., LUKIĆ M., ŠKRBIĆ Z., PAVLOVSKI Z., VITOROVIĆ D., PETRIČEVIĆ M. (2013): Effect of use of raw soybean in the final mixtures for broiler chickens on body weight, relative weight of the pancreas and the edible inner organs. Proceedings of the 10th International Syposium "Modern Trends in Livestock Production" Belgrade, Republic of Serbia 2-4 October 2013. (CD of Proceedings, ISBN: 987-86-8243169-5 p 902-910). RUIZ N., BELALCAZAR F., DIAZ G. J. (2004): Quality control parameters for commercial full-fat soybeans processed by two different methods and fed to broilers. J. Appl. Poult. Res. 13:443-450. SENKOYLU N., SAMLI H. E., AKYUREK H., AGMA A., YASAR S. (2005): Use of high levels of full-fat soybeans in laying hen diets. J. Appl. Poult. Res. 14: 32-37. ZHANG Y., PARSONS M., HYMOWITZ T. (1991): Effect of soybeans varying in trypsin inhibitor content on performance of laying hens. Poultry Science 70: 2210-2213. Received 25 December 2013; accepted for publication 31 January 2014


Biotechnology in Animal Husbandry 30 (1), p 125-136, 2014 ISSN 1450-9156 Publisher: Institute for Animal Husbandry, Belgrade-Zemun 597
DOI: 10.2298/BAH1401125O
UDC 636.
VARIABILITY IN SIZE AND SHAPE IN MUSCOVY DUCK WITH AGE: PRINCIPAL COMPONENT ANALYSIS D. M. Ogah1*, M. Kabir2
1Animal Science Department, Faculty of Agriculture Nasarawa State University keffi, Shabu-lafia campus 2Genetics and Animal Breeding Unit, Department of Animal Science, Ahmadu Bello University, Zaria *Corresponding author: [email protected] Original scientific paper
Abstract: Body weight and six linear body measurements, body length (BL), breast circumference (BCC), thigh length (TL), shank length (SL), total leg length (TLL) and wing length were recorded on 150 male and female muscovy ducklings and evaluated at 3, 5, 10, 15 and 20 weeks of age. Principal component analysis was used to study the dependence structure among the body measurements and to quantify sex differences in morphometric size and shape variations during growth. The first principal components at each of the five ages in both sexes accounted between 71.54 to 92.95% of the variation in the seven measurements and provided a linear function of size with nearly equal emphasis on all traits. The second principal components in all cases also accounted for between 6.7 to 16.17% of the variations in the dependence structure of the system in the variables as shape, the coefficient for the PCs at various ages were sex dependent with males showing higher variability because of spontaneous increase in size and shape than females. Contribution of the general size factor to the total variance increase with age in both male and female ducklings, while shape factor tend to be stable in males and inconsistent in females.
Keywords: body weight , linear measurements, muscovy duck, principal component. Introduction
Because of the sexual dimorphism in Muscovy duck and its marked effect on muscular and body growth, the assessment of changes in shape and size in muscovy duck will be sex dependent (Leclerq, 1990; Baeza et al., 1999; Ogah et al., 2009 ). Growth is related to increase in cell number and volume. It is a complex

D. M. Ogah et al.
126
and highly dynamic physiological process that exist from conception until maturity (Yakubu and Salako, 2009). It involves an increase in body mass and changes in shape (conformation) of the various components of the body (Shahin et al., 2002). These dynamic processes of multidimensional growth are accompanied by concomitant changes in the phenotypic variance and covariances and their components (Atchney and Rutledge, 1980). The multivariate technique of principal component have been used to combine weight and body measurements into indexes for defining body size and shape. Brown et al. (1973) and Carpenter et al. (1978) used principal component analysis to measure the tendency of bull to retain the same shape throughout their pre yearling development (at 4, 8 and 12 months) and found out that the correlation among principal component at different ages imply that selection on a composite character such as weight or general size (first principal component) at younger age may yield bulls which differ in shape at older ages. Similarly, Shahin and Hassan (2002) used principal factor analysis to examine changes in sources of variability in body size and shape in three breeds of rabbits (at 6, 8, 10 and 12 weeks) found out that there was an increase in the amount of variation associated with shape characters and decreases in the amount of variation associated with body size with advancing in age .
The concept of size and shape are fundamental to the analysis of variation in living organisms. Parting biometrical variations into size and shape components are often highly desirable, as the size of most organisms is more affected than shape by fluctuation of the external environment (Jolicoeur and Mosimann, 1960).
An attempt have been made to evaluate size and shape in muscovy duck at adult age Ogah et al. (2009), using principal component analysis. Since size and shape changes with age, the need to assess these components during growth and there implications to selection and improvement is required.
The objectives of this study were to investigate the potentials of principal components as a means of identifying variation in body size and shape in indigenous muscovy duck, and to also quantify differences between sexes in morphometric size and shape variation during growth. Materials and methods Sources of data One hundred and fifty muscovy ducklings hatched by 60 dams and 10 sires under a mating ratio of 1:6 at the duck unit of the College of Agriculture, Teaching and Research Farm, Lafia, Nasarawa State, Nigeria. The ducklings are made up of 63 males and 87 females. They were selected randomly at 3 weeks of age for evaluation to 20 weeks.

Variability in size and shape in...
127
Management of the birds The ducklings were sexed, wing band and reared separately in a deep litter pens. They were fed on a grower marsh formulated at 20% CP and 2880kcal/kg. They were allowed access to green vegetation through a walk way attached to each pen. Water was supplied ad libitum. Traits measured The body weight in grams and dimension in centimetres were recorded for each ducklings at 3, 5, 10, 15, and 20 weeks of age. The linear body dimensions considered were body length (BL), length between the base of the neck and that of caudal end, Shank length (SL), distance from the shank joint to the extremity of the digitus pedis, breast circumference (BCC), measured under the wing through the anterior border of the breast bone crest and the central thoracic vertebrae, thigh length (TL), from the end of the drumstick to the body flank, total leg length (TLL), measured as the total length of the leg from the thigh to the extremity of the digitus pedis, wing length (WL) taken from the shoulder joint to the extremity of the terminal phalanx. To ensure accuracy each measurement was taken twice and the mean was use in subsequent analysis. The same person took all measurements and weighing throughout, thus eliminating errors due to person differences as suggested by (Shahin and Hassan, 2000). Statistical analysis The data was subjected to analysis using the general linear model for the effects of age and sex. The mean, standard errors and coefficient of variation for the body weight and linear measurement at various ages were obtained. Coefficient of correlation between body weight and linear traits in the birds at all ages were estimated. Principal components (PCs) were obtained separately for each sex at various ages (3, 5, 10, 15 and 20 weeks) body weight and linear measurements were all considered, using SPSS (2004) statistical package.
The technique of principal component analysis involves making linear combination of the available variables into factor or component. The procedure reduces a correlation matrix into a set of orthogonal axes or components. Each component explained a proportion of the variation in the correlation matrix and each is independent of the other. The major component explains the largest amount of variation in the variance and covariance structure and minimizes the residual correlation among the variables. Each successive component will explain the largest possible portion of the remaining variation while satisfying the requirement that each component be independent of the other. When the number of components equal the number of original variables 100% of the variation will be explained (Morrison, 1967 and Gorsuch, 1974). Because the response variate were in

D. M. Ogah et al.
128
different unit ie (g and cm) the correlation matrix and standardized variate were use in place of the variance and covariance matrix and the actual body measured.
Kaiser-Meyer-Olkin measures of sampling adequacy and Bathlett's test of sphericity were computed to test the validity of the factor analysis of each of the data sets. The first principal component can be expressed as follows: Yi=a11x1+q21x2+………..ap1xp Or in matrix form Y=ax The a11 are scaled such that a1 a1 =1, Y1, accounted for the maximum variability of the P variables of any combination. The variance of Y1=λ1 Next principal component Y2 is formed such that its variance λ2 is maximum amount of the remaining variance and that it is orthogonal to the first principal component. That is a1 a2 =0
The weight used to create the principal component are the eigen vectors of the characteristics equation (R- λ1)a=0, where R is the correlation matrix. The λ are the eigen values. Results and Discussion
Table 1 presents means, standard errors and coefficient of variation for live weight and body measurements at various ages (3, 5, 10, 15 and 20weeeks of age) for male and female of the Nigerian indigenous ducklings. Sex differences were significant for almost all traits in all the ages. For the male ducklings body weight were 193.04±2.47g and 2691.60±30.70g at 3 and 20 weeks respectively, while female recorded 154.60±6.50g and 1504±9.60g also at 3 and 20 weeks respectively. The significant difference in weight and other body measurements with the male having higher weight and larger body dimensions than female ducks noticed in this study have been reported in previous studies (Baeza et al., 2001; Teguia et al., 2008; Ogah et al., 2009 and Yakubu, 2009). The values obtained for both sexes for body weight at 10 weeks were slightly lower than what Teguia et al.( 2008) obtained from African Muscovy duck in Cameroon, the variations might result from genetic composition and level of inbreeding in the population under consideration.

Variability in size and shape in...
129
Table 1 . Mean±standard error and coefficient of variation for live body weight and measurements in male and female muscovy duck at different ages.
Male
mean±se CV Female
mean±se CV sign. diff At week 3 Body weight (g) 193.04±2.47 17.44 154.60±0.50 26.41 ** Body length (cm) 13.90±0.41 16.09 12.34±0.12 14.17 * Breast circumference(cm) 12.26±0.24 6.67 12.38±0.23 10.33 ns Thigh length (cm) 1.74±0.03 5.67 1.55±0.06 14.75 ns Shank length (cm) 2.83±0.06 6.93 2.20±0.05 8.83 * Total length (cm) 6.77±0.02 12.62 5.43±0.03 2.67 ** Wing length(cm) 6.89±0.11 5.48 5.66±0.07 5.57 * At week 5 Body weight (g) 470.99±3.33 14.23 357.99±1.07 18.12 *** Body length (cm) 17.88±0.12 24.42 15.35 ±0.12 19.41 ** Breast circumference(cm) 16.87±0.23 9.61 14.83±0.23 16.18 ** Thigh length (cm) 2.83±0.03 8.73 2.58±0.05 20.41 * Shank length (cm) 4.29±0.08 11.25 2.94±0.08 16.18 ** Total length (cm) 9.84±0.03 21.6 8.48±0.08 4.21 * Wing length(cm) 7.50±6.08 9.21 6.68±0.10 7.13 * At week 10 Body weight (g) 1348.50±19.8 14.41 1094.30±11.40 17.11 *** Body length (cm) 26.46±0.25 19.23 24.33±0.13 15.21 ** Breast circumference(cm) 26.85±0.36 8.92 25.10±0.27 14.21 ** Thigh length (cm) 5.61±0.01 7.43 2.84±0.08 20.13 *** Shank length (cm) 5.80±0.05 7.88 4.30±0.08 13.01 ** Total length (cm) 14.48±0.05 16.34 10.17±0.12 4.32 *** Wing length(cm0 20.56±0.10 7.77 19.02±0.16 7.23 ** At week 15 Body weight (g) 2399.20±24.10 12.32 1290.90±8.70 16.21 *** Body length (cm) 36.68±0.15 15.22 30.61±0.16 13.71 ** Breast circumference(cm) 33.07±0.34 8.01 27.83±0.23 10.51 ** Thigh length (cm) 7.65±0.06 6.44 4.63±0.11 12.11 *** Shank length (cm) 6.53±0.06 9.47 6.18±0.08 11.01 ns Total length (cm) 18.71±0.19 11.76 14.45±0.12 3.12 *** Wing length(cm0 32.49±0.11 7.76 29.17±0.23 4.21 ** At week 20 Body weight (g) 2691.60±30.70 10.21 1504.40±9.60 8.4 *** Body length (cm) 47.87±0.20 11.54 37.71±0.87 7.32 ***
Breast circumference(cm) 39.33±0.12 8.33 31.89±0.28 9.41 *** Thigh length (cm) 8.88±0.03 5.98 6.84±0.12 8.53 *** Shank length (cm) 6.59±0.05 8.82 6.59±0.12 6,71 ns Total length (cm) 20.52±0.23 10.34 16.86±0.33 2.97 *** Wing length(cm) 36.99±0.16 5.23 32.95 ±0.23 2.21 **
***=P<0.001, **=P<0.01, *=P<0.05

D. M. Ogah et al.
130
In both sexes the variation in weight and other body measurements
decreases with advancing in age, with variability higher in the body weight than other body measurements. This similar trend was recorded by Shahin and Hassan (2002) on rabbit breeds. Between the sexes variation in both body measurements and weight were higher in females than in males. Bivariate correlation Coefficient of correlation between body weight and body measurements for the male and female at 3, 5, 10, 15 and 20 weeks of age are given in Table 2. The magnitude of the correlations among variables was similar for male and female at between 3 to 10 weeks except at 20 weeks of age. Highly significant (P<0.01) correlation existed among the body weight and the linear body measurements of the duck. Body weight was positively correlated with various body dimension at weeks 3 for both sexes. In males, negative correlation between body weight and thigh length was noticed at week 10, similarly, in female negative correlation was noticed between body length and other linear traits at week 20. The estimate of correlation in this study are comparable to those reported earlier by (Teguia et al., 2008; Ngopongora et al., 2004 and Ogah et al., 2009). The high positive correlation among traits suggest that they are under same gene action and can be predicted from one another singly or in combination. Whereas, the varying correlation between the phenotypic traits at adult stage between the male and female duck was similar to what Yakubu (2009) reported and suggested sexual differences in the genetic architecture of the birds.

Variability in size and shape in...
131
Table 2 . Phenotypic correlation among body weight and linear type traits of the two sexes of muscovy duck by age
Male Female BW BL BCC Tl Sl TLL WL BW BL BCC TL SL TLL Wl At Week 3 BL 0.92 0.93 BCC 0.96 0.88 0.86 0.84 TL 0.7 0.72 0.72 0.73 0.56 0.6 SL 0.45 0.48 0.45 0.82 0.75 0.72 0.6 0.5 TLL 0.45 0.44 0.54 0.71 0.81 0.83 0.7 0.7 0.93 0.57 Wl 0.65 0.59 0.62 0.87 0.59 0.6 0.77 0.67 0.5 0.64 0.7 0.77 At Week 5 BL 0.8 0.85 BCC 0.76 0.72 0.92 0.79 TL 0.93 0.72 0.76 0.76 0.69 0.9 SL 0.78 0.82 0.8 0.81 0.77 0.56 0.7 0.57 TLL 0.88 0.71 0.76 0.91 0.75 0.68 0.59 0.7 0.51 0.62 Wl 0.95 0.77 0.76 0.98 0.84 0.94 0.94 0.83 0.8 0.71 0.84 0.63 At week 10 10 BL 0.56 0.48 BCC 0.99 0.54 0.8 0.53 TL -0.12 0.06 -0.13 0.94 0.72 0.8 SL 0.94 0.66 0.94 -0.41 0.92 0.68 0.8 0.96 TLL 0.92 0.62 0.92 -0.19 0.86 0.55 0.7 0.6 0.67 0.65 Wl 0.96 0.49 0.96 -0.03 0.85 0.82 0.98 0.58 0.9 0.96 0.96 0.65 At week 15 BL 0.96 0.85 BCC 0.97 0.9 0.92 0.9 TL 0.5 0.43 0.55 0.95 0.83 1 SL 0.89 0.82 0.87 0.53 0.78 0.68 0.9 0.89 TLL 0.94 0.95 0.85 0.33 0.87 0.92 0.76 0.9 0.96 0.95 Wl 0.91 0.98 0.83 0.32 0.82 0.95 0.85 0.89 0.9 0.82 0.71 80 At week 20 BL 0.61 0.4 BCC 0.5 0.72 0.87 -0.2 TL 0.92 0.68 0.62 0.9 -0.1 1 SL 0.7 0.61 0.73 0.75 0.64 -0.2 0.8 0.79 TLL 0.9 0.73 0.56 0.83 0.69 0.98 0.1 0.9 0.92 0.67 Wl 0.76 0.58 0.68 0.7 0.95 0.76 0.87 0.56 0.8 0.88 0.69 92
BW= body weight, BL= body length , BCC= breast circumference, TL= thigh length , TLL= total leg length and WL= wing length .

D. M. Ogah et al.
132
Varimax rotated independent factors Principal component at week 3. The principal component obtained for male and female muscovy duck at 3 weeks of age are presented in Table 3. The first principal component from week 3 represented as (PC13) for the male and female show nearly identical coefficient for each of the seven traits considered. The two PCs obtained representing 87.71 and 85.53% of the variability of the original variables leaving 12.29 % to 14.47% to the special factors, for male and female respectively. The fact that all coefficient are positive indicates that animals are being contrasted on a within measurement bases i.e. animal above average for same measures and below for others will show positive or negative deviations (Brown et al., 1973). They further added that the larger a PC (either negatively or positively) they greater its value as a discriminatory measure. On this basis PC1 was interpreted as a measure of general size (Wright, 1933; Jolicoeur and Mosimann; 1960; Carpenter et al., 1971). In this study PC13 (general size) is characterized by high positive loading (factor –variate correlation) on all traits except for shank length and total leg length in male and thigh length in female ducklings.
The second principal component (PC2) accounted for additional 16.172% and 10.338% of the total variation in male and female respectively. Magnitude of coefficient in the PC are non identical in both sexes, similarly, not all measurements have same signs. The inequalities of the respective coefficient for the two sexes will cause differences of an indeterminate magnitude in the relationship of these PC values to the individual body measurements. Shank and total leg length had the highest loading for the male while thigh length had the highest loading for the female. In both cases representing “length” .This factor is mutually orthogonal to the first, present pattern of variation in the different part of the body (shape) independently of general body size (Brown et al., 1973; Shahin and Hassan, 2002). Principal component at week 5. Principal components were obtain using the body measurements at week 5 , the two PCs in both sexes accounted for 90.805% and 95.108% of the total variation in male and female respectively . The PC15 (the general size component ) accounted for a larger portion of variation in female than in male(85.393% and 84.331%).The respective coefficient were also sex specific, an indication of sex effect in growth as earlier outline by (Baeza et al., 2001). The PC15 loaded high for most variable except body length, breast circumference and shank length for the male, and shank length and total leg length for the female. Dimensional relationship changes with age when compare the two PCs at week 3 and week 5. Similar to what Brown et al. (1973) reported, indicating the effect of age in shape and size in the bird.

Variability in size and shape in...
133
Table 3. Explained variation associated with rotated factor analysis with communalities of each variable by sex and age
Male female Common factor communality Common factor communality Week 3 F1 F2 F1 F2 BWT 0.949 ,266 0.971 0.817 0.541 0.961 BL 0.909 0.282 0.906 0.893 0.341 0.913 BCC 0.917 0.307 0.935 0.757 0.412 0.743 TL 0.552 0.78 0.913 0.272 0.937 0.951 SL 0.191 0.919 0.88 0.833 0.233 0.748 TLL 0.217 0.881 0.823 0.436 0.882 0.968 WL 0.516 0.668 0.712 0.586 0.599 0.707 % var 71.536 16.172 75.19 10.338 Week 5 BWT 0.808 0.521 0.924 0.747 0.616 0.938 BL 0.404 0.832 0.866 0.792 0.415 0.799 BCC 0.472 0.761 0.802 0.84 0.461 0.918 TL 0.869 0.458 0.965 0.892 0.248 0.858 SL 0.482 0.811 0.89 0.346 0.843 0.813 TLL 0.859 0.431 0.923 0.302 0.805 0.739 WL 0.858 0.5 0.986 0.65 0.687 0.895 % var 84.336 6.47 77.012 8.386 Week 10 BWT 0.98 -0.101 0.971 0.959 0.223 0.969 BL 0.668 0.23 0.526 0.301 0.888 0.879 BCC 0.974 -0.122 0.964 0.819 0.332 0.781 TL -0.043 0.979 0.964 0.851 0.492 0.966 SL 0.975 0.035 0.952 0.855 0.457 0.94 TLL 0.947 -0.158 0.921 0.341 0.839 0.82 WL 0.93 -0.028 0.867 0.928 0.36 0.991 % var 73.016 14.982 79.265 11.381 Week 15 BWT 0.931 0.334 0.978 0.653 0.701 0.917 BL 0.953 0.226 0.96 0.383 0.894 0.946 BCC 0.853 0.426 0.911 0.7 0.693 0.971 TL 0.195 0.97 0.979 0.776 0.602 0.964 SL 0.834 0.403 0.858 0.916 0.344 0.958 TLL 0.972 0.132 0.963 0.864 0.49 0.987 WL 0.967 0.111 0.947 0.424 0.858 0.916 % var 82.202 12.007 88.356 6.752 Week 20 BWT 0.481 0.853 0.959 0.947 0.227 0.948 BL 0.107 0.939 0.893 -0.022 0.993 0.987 BCC 0.849 0.111 0.734 0.965 -0.02 0.932 TL 0.695 0.615 0.862 0.976 -0.054 0.956 SL 0.815 0.384 0.862 0.806 -0.15 0.672 TLL 0.546 0.731 0.811 0.972 0.118 0.959 WL 0.881 0.391 0.929 0.925 -0.224 0.909 % var 92.952 13.061 74.81 16.08

D. M. Ogah et al.
134
Principal component at week 10. The first PC (general size) in male and female accounted for 73.02% and 79.29% of the total variation respectively, is characterized with positive high loading for all traits other than thigh length in male and body length and total leg length in female. The second PC210 loaded high for thigh length in male and body length and total leg length in female. There were also changes in dimensionality in the variable coefficient result from changes in age in both sexes. Principal component at week 15. Variation occur also in the general size factor –variate correlation in male and female (82.20% and 88.36%) . There was similarity in factor loading in the PC1 and PC2 between week 10 and week 15 in male with slight variation in the female, an indication of maturity and little differentiation as the bird get older. Principal component at week 20. The first PC 120 accounted for 92.95% and 74.81% of the total variation in male and female representing the general size. There was similarity in variable loading between male and female at this age, with body length loading high in the second PC in both sex. The coefficient for PC1 for the male were all positive and significant., while in female negative values were obtained for body length , this could be sex dependent outlying the non significance of body length in size description at this stage of development. Conclusion Separating biometrical variations into size and shape component is often desirable as these components explain the genetic and environmental influence on performance of animal which changes with age. Contributions of the general size factor to the total variance increases with age while shape factor tend to be fairly stable in male, in female similar pattern was noticed from week 3 to 15, while shape factor have no specific pattern. These results explain that variations associated with body size in Muscovy duck increases with age. Varijabilnost veličine i oblika u mošusne patke sa uzrastom: analiza glavne komponente D. M. Ogah, M. Kabir Rezime
Telesna masa i šest linearnih mera tela, dužina tela (BL), obim grudi (PKB), dužina bataka (TL), dužina metatarzusa (SL), ukupna dužina nogu (TLL) i dužina krila su evidentirani na 150 muških i ženskih mošusnih pačića i procenjena
Variability in size and shape in...
135
u uzrastu od 3 , 5 , 10 , 15 i 20 nedelja. Analiza glavnih komponenti je korišćena za proučavanje strukture zavisnosti između telesnih mera i kvantifikovanje polnih razlika u veličini i obliku morfometrijskih varijacija tokom rasta. Prve glavne komponente u svakom od pet uzrasta u oba pola iznosile su između 71.54 i 92.95 % varijacije u sedam merenja i obezbedio linearnu funkciju veličine sa skoro jednakim naglaskom na sve osobine. Druge glavne komponente u svim slučajevima takođe čine između 6,7 do 16,17 % razlika u strukturi zavisnosti sistema u varijablama kao što su oblik, koeficijent za računare za različite uzraste bile su zavisne od pola u slučaju muških grla, pokazujući veću varijabilnost zbog spontanog povećanja u veličini i obliku, nego kod ženskih grla. Doprinos faktora opšte veličine na ukupno varijansu povećava se sa starošću/uzrastom u oba pola, kod muških i ženskih pačića, dok faktor oblik pokazuje tendenciju da bude stabilan kod muških pačića i nedoslednost kod ženskih pačića. References ATCHLEY, W. R., RUTLEDGE, J. J. (1980): Genetic components of size and shape. Dynamics of component of phenotypic variability and covariability during ontogeny in laboratory rat. Evolution 34:1161-1173. BAEZA, E., MARCHE, G., WACRENIER, N. (1999): Effect of sex on muscular development of muscovy ducks. Reprod. Nutr. Dev. 39:675-682. BAEZA, E., WILLIAMS, J., GUEMENE, D., DUCLOS, M. J. (2001): Sexual dimorphism of growth in Muscovy duck and changes in Insulin like growth factor 1 (IGF-1) growth hormone (GH) 14 173-19. BROWN, J. E., BROWN, C. J., BUTTS, W. T. (1973): Evaluating relationship among immature measures of size, shape and performance of beef bulls 1. Principal component as measures of size and shape in young Hereford and Angus bull. J. Anim. Sc. 36:1010-1020. CARPENTER, JR. J. A., FITZHUGH, JR. H. A., CARTWRIGHT, T. C., MELTTON, A. A., THOMAS, R. C. (1978): Principal component for size of Herford cows, J. Anim.Sci.33:197. GORSUCH, R. L. (1974): Factor analysis W B Saunders company, Philadelphia. JEFFERY J. B., BERG, J. (1972): An evaluation of several measurements of beef cow size as related to progeny performance. Can J. Anim. Sc. 52:23. LECLERCQ, B. (1990): Croissance et composition corporelle du canard de Barbarie. In: Le Canard de Barbarie (Sauveur B. et de Carville H., Ed.). Institut National de la Recherche Agronomique, Paris: 23–29. MORRISON, D. F. (1967): Multivariate statistical methods. McGraw-Hill Book Co New York. JOLICOEUR, P. AND MOSIMANN, J. E. (1960): Size and shape in the painted turtle: A principal component analysis. Growth 24: 339

D. M. Ogah et al.
136
NGAPONGORA, J. M. N., MBAGA, S. H., MUTAYOBA, S. K. (2004): Study on the performance of growing native muscovy ducks under semi and fully confined rearing systems. www.husdyr. kvi.dk&u=w.Retrieved on 4/8/2009. OGAH, D. M., ALAGA, A. A., MOMOH, O. M. (2009): Principal component factor analysis of the morphostructural traits of muscovy duck. Inter. J. Poult. Sc.8(11) 1100-1103. SALAKO, A. E. (2006): Principal component factor analysis of the morphostructure of immature Uda sheep. Inter. J. Morph.24(4) 571-774. SHAHIN, K. A., HASSAN N. S. (2002): Changes in sources of shared variability of the body size and shape in Egyptian local and New Zealand White breeds of rabbit during growth. Arch. Tierz. Dummerstorf 45(3)269-277. SHAHIN, K. A., HASSAN, N. S. (2000): Sources of shared variability among body shape characters at marketing age in New Zealand White and Egyptian rabbit breeds. Ann.Zootec.49:435-445. SPSS, (2004): Statistical Package for Social Sciences. SPSS Inc., (14.0) 444 Michigan Avenue, Chicago, IL60611. TEGUIA, A., NGONDJOU, H. M., DEFANG. H. AND TCHOUMBONE, J. (2007): Studies of the live body weight and body characteristics of the African Muscovy duck. Trop. Animal Health and Prod. 40: 5-10. WRIGHT, S. (1932): General group and special size factors. Genetics 17: 603. YAKUBU, A. (2009): An Assessment of Sexual Dimorphism in African Muscovy ducks (Cairina moshata) using Morphological Measurements and Discriminant Analysis. In proc. of 4th World Water Fowl Conf. Thrissur India. YAKUBU, A. AND SALAKO A. E. (2009): Path coefficient analysis of body weight and morphological traits of Nigerian indigenous chicken. Egypt. Poult. Sc. 29 (111) 837-850 . Received 25 November 2013; accepted for publication 15 February 2014

Biotechnology in Animal Husbandry 30 (1), p 137-143, 2014 ISSN 1450-9156 Publisher: Institute for Animal Husbandry, Belgrade-Zemun 09
DOI: 10.2298/BAH1401137S
UDC 636.
COMPARISON SEROPREVALENCE OF SALMONELLA SPP. IN LARGE FARMS AND INDIVIDUAL PRODUCERS IN SERBIA
N.Stojanac1*, O. Stevančević1, B. Savić2, I. Stančić1, A. Potkonjak1
1Department of Veterinary Medicine, Faculty of Agriculture, University of Novi Sad, 21000 Novi Sad, Republic of Serbia 2Institute of Veterinary Medicine Belgrade, Serbia, Vojvode Toze 14, 11000 Belgrade, Serbia *Corresponding author: e-mail: [email protected] Original scientific paper
Abstract: Salmonella is one of the most frequently reported food-borne (alimentary) infections in the world. The study objective was to evaluate seroprevalence of Salmonella spp. in the farrow-to-finish farms and individual producers. Examined fattened pigs were divided into two groups: the first group was comprised of fatteners from 4 large farms in northern Serbia, and fatteners from the other group originating from individual producers from northern Serbia and the region of eastern Serbia. Individual blood serum samples were collected from 100 pigs per farrow-to-finish farms and 300 fattening pigs from individual producers and analysed for the presence of Salmonella antibodies. A blood serum sample from each pig was frozen, and blood serum was examined for specific anti-bodies against Salmonella spp. using an indirect ELISA. Salmonella seroprevalence ranging from 0% to 56% was found in 4 farrow-to-finish farms. Seroprevalence of 79% was found in individual producers (300 blood serum samples). This study shows that the results of serological tests for Salmonella were different (p<0.01) for slaughtered pigs from farms and from individual producers. Pig production in Serbia is under better supervision on large farrow-to-finish farms than in the individual sector. This study is an introduction to reducing of public health risks associated with Salmonella in pork.
Keywords: pig, production system, Salmonella, seroprevalence, food safety Introduction Salmonella in normal situations doesn’t cause clinical diseases of pigs, but subclinical Salmonella infections are an important issue in food safety around the world. From the consumer standpoint, there are constant efforts to reduce the incidence of Salmonella in pork. In order to achieve this, information on the

N.Stojanac et al.
138
dynamics of Salmonella infection in a herd of pigs over time (e.g., duration of infection and disease transmission patterns) can be a useful tool. Salmonella is identified at all stages of pig production. This means that efforts to reduce Salmonella have a task to target different stages of the production chain. A growing number of European countries are focusing on the first phase of pork production. One of major challenges of this approach is identification of effective risk reduction strategies that can be implemented at the herd level. For that reason, it is important to examine all factors that can increase the risk of introduction and transmission of Salmonella (Lo Fo Wong et al., 2004). On-farm intervention to reduce the prevalence of Salmonella is difficult to perform; nevertheless, this is important in reducing the risk of this pathogen's presence on pig skins and consequently pork carcasses at abattoirs (Blagojevic et al., 2011). The presence of antibodies indicates that the pigs were exposed to the enteric pathogen in a period of development, but on the other hand the time needed for seroconversion suggests that pigs are carriers of salmonella while still seronegative, and also different immune responses can affect the serological tests (Miller et al., 2011; Šišak et al., 2011). Salmonella seroprevalence differences between different systems of pig production have been investigated. In some studies, individual producers (outdoor production systems) had a higher seroprevalence than the farm production (Bonde and Sørensen 2012). The aim of this study was to investigate the effects of different systems of pig production on the presence of Salmonella antibodies, in order to assess the pathogen transfer risk into the food chain. Materials and methods Sampling
Samples for analysis were collected at the slaughterhouse with slaughtering capacity of 200 pigs per hour. This study was conducted in the period from April to November 2012. All pigs spent 24 hours on livestock depot before being slaughtered. Examined fattened pigs were divided into two groups: the first group was comprised of fatteners from 4 large farms in northern Serbia, and fatteners from the other group originating from individual producers from northern Serbia and the region of eastern Serbia. In the first group testing was carried out on 400 fattened pigs (100 from each farm), while in the second investigation was carried out on 300 fatteners (over 70 individual producers). A blood serum sample from each pig was frozen, and blood serum (harvested after thawing) was examined for specific anti-bodies against Salmonella spp. using an indirect ELISA (Nielsen et al., 1998).

Comparison seroprevalence of...
139
Data analysis Data were entered into an Excel spreadsheet (Microsoft Excel 2007) and imported into Stata (Stata 8 Intercooled for Windows 9x) in which data were analyzed. Descriptive analysis was done in MiniTab version 14 (MiniTabR14b) and Excel (Microsoft Excel 2007). The data were processed by ANOVA and Post Hoc Test was used for comparison of the means of treatments. Statistical significance of differences between means was determined at the level of p<0.01. Results
The sera from 700 fattening pigs, originating from 4 different farrow-to-finish farms and 300 fattening pigs from more 70 different individual producers, were examined by ELISA test for the presence of Salmonella antibodies. The seroprevalences of Salmonella in the different farrow-to-finish farms are illustrated in Table 1. Table 1. Distribution and presence of Salmonella spp. in blood samples from 4 farrow-to-finish swine farms
Farm Numberd tested Number positive Prevalence estimates (%)
I 100 23 23.00
II 100 56 56.00
III 100 36 36.00
IV 100 0 0.00
Total 400 115 28.75
Salmonella seroprevalence in the 4 farrow-to-finish farms were 23 (23/100), 56 (56/100), 36 (36/100) and 0 (0/100). Seroprevalence in the individual producers was 79 (237/300) (Table 2). Table 2. Salmonella spp. prevalence estimates provided by blood sample collected from fattening pigs from individual producers
Individual producers Numberd tested Number positive Prevalence estimates
(%)
>70 300 237 79.00

N.Stojanac et al.
140
Discussion
This study provided a unique opportunity to compare seroprevalence of Salmonella spp. on a large farms (farrow-to-finish) and individual producers. It also allowed comparison presence of Salmonella antibodies within 4 different farrow-to-finish farms. From the four investigated farms with intensive mode of breeding pigs, Salmonella antibodies were found in fatteners from three farms, while on one farm all fattened pigs were seronegative. Seroprevalence of 75% (3/4) on examined farms is similar to that in other countries with intensive modes of keeping pigs (Baptista et al., 2009; Funk 2008; Hernandez et al., 2013; Šišak et al., 2011). Out of 400 samples tested, 115 (28.75%) were positive, with percents on three positive farms ranging from 23% to 56%. This is a higher level compared to the results of other researchers (Bonde and Sørensen 2012; Lo Fo Wong et al., 2004; Wacheck et al., 2012) (Table 1). While Kranker et al., (2003) found higher level of Salmonella spp. seroprevalence in fattened pigs (40-80%).
For all farrow-to-finish farms combined, serology consistently overestimated the 28.75% (Table 1). This finding is not surprising considering that serology reflects the exposure history of pigs, not the current infection status. The seroprevalence estimate obtained in the individual producers was three times higher (p<0.01) than the estimate provided on a large farms (farrow-to-finish), 79.00 vs. 28.75%.
This indicates a higher risk for salmonellosis in pigs in the sector of individual producers, primarily for the following reasons: a) no all-in/all-out pig flow; b) no control feed (can be contaminated with Salmonella); c) biosecurity (humans and other animals as vectors).
In the survey we found difference (p<0.01) in Salmonella seroprevalences on a large farrow-to-finish farm and at individual production system. Similar results were reported in comparison to the level of Salmonella infections in conventional and alternative systems in the UK (Smith et al., 2010). A study in Switzerland found a higher risk of Salmonella in conventional farms than in animal-friendly systems (Ledergerber et al., 2003). The effect of herd size is associated with the manifestation of the shorter presence of high seroprevalence in larger herds. This can be explained by a combination of factors such as the implementation of biosecurity measures in larger herds (van der Wolf et al., 2001), and poorer health status and mixing pigs of different ages in small herds. In addition, it is expected from bigger number of individual producers to buy food that has been found to have a higher risk factor for Salmonella (Dahl, 2007), while large farms mainly use home-mixed feed.

Comparison seroprevalence of...
141
Conclusion Pig production in Serbia is under better supervision on large farrow-to-
finish farms than in the individual sector. This is confirmed by the fact that nearly three times as many Salmonella antibodies were found in pigs in sector of individual producers, and therefore there’s also a higher risk of Salmonella presence in pigs and subsequent contamination and potential human infection. Acknowledgement
This research was financially supported by the Ministry of Education, Science and Technological Development of the Republic of Serbia, Project No. TR31034. Poređenje seroprevalence Salmonella spp. u velikim farmama i kod individualnim proizvođačima u Srbiji N. Stojanac, O. Stevančević, B. Savić, I. Stančić, A. Potkonjak Rezime
Salmonela je jedna od najčešće prijavljivanih alimentarnih infekcija u svetu. Predmet istraživanja ovog rada je bio da se ispita seroprevalenca Salmonella spp. u farmama sa zatvorenim ciklusom proizvodnje i kod individualnih proizvođača. Ispitivani tovljenici su bili podeljini u dve grupe: u prvoj grupi su bili tovljenici sa 4 velike farme sa područja severne Srbije, a u drugoj grupi su bili tovljenici od individualnih proizvođača sa područja severne i istočne Srbije. Krvni serumi su pojedinačno prikupljani od 100 tovljenika sa svake farme i od 300 tovljenika od individualnih proizvođača i ispitivani su na prisustvo antitela za Salmonelu. Serumi su čuvani u smrznutom stanju i ispitivanje na prisustvo specifičnih antitela na Salmonelu je vršeno indirektnom ELISA testom. U 4 ispitivane farme seroprevalenca se kretala od 0% do 65%. Kod tovljenika od individualnih proizvođača utvrđena je seroprevalenca od 79% (300 uzoraka krvnih seruma). Ovo ispitivanje pokazuje razlike (p<0.01) u seroprevalenci Salmonele zaklanih tovljenika sa farmi u odnosu na individualne proizvođače. Proizvodnja svinja u Srbiji je pod boljom kontrolom na velikim farmama u odnosu na individualni sektor. Ovo istraživanje predstavlja uvod u smanjenje rizika javnog zdravlja povezanog sa Salmonelom u svinjskom mesu.

N.Stojanac et al.
142
References BAPTISTA F.M., ALBAN L., ERSBOLL A.K., NIELSEN L.R. (2009): Factors affecting persistence of high Salmonella serology in Danish pig herds. Prev. Vet. Med., 92, 301–308. BLAGOJEVIC B., ANTIC D., DUCIC M., BUNCIC S. (2011): Ratio between carcass- and skin- microflora as an abattoir process hygiene indicator. Food Cont, 22, 186-190. BONDE M., SORENSEN J.T. (2012): Faecal Salmonella shedding in fattening pigs in relation to the presence of Salmonella antibodies in three pig production systems. Livest. Sci., 150, 236–239. DAHL J. (1997): Cross-sectional epidemiological analysis of the relations between different herd factors and Salmonella-seropositivity. In: Proceedings of the Eighth International Symposium on Veterinary Epidemiology and Economics. Paris, 1–7 July, 1–3. FUNK J. (2008): Control of Salmonella in the pork production chain. London swine conference – Facing the new reality 1-2 April, 73-78. HERNANDEZ M., GOMEZ-LAGUNA J., TARRADAS C., LUQUE I., GARCIA-VALVERDE R., REGUILLO L., ASTORGA R.J. (2013): A serological Survey of Brucella spp., Salmonella spp., Toxoplasma gondii and Trichinella spp. in Iberian Fattening Pigs Reared in Free-Range Systems. Transboundary and Emerging Diseases, Jan 7. doi: 10.1111/tbed.12049. [Epub ahead of print]. KRANKER S., ALBAN L., BOES J., DAHL J. (2003): Longitudinal study of Salmonella enterica serotype Typhimurium infection in three Danish farrow-to-finish swine herds. Journal of Clinical Microbiology, 41, 2282–2288. LEDERGERBER U., REGULA G., DANUSER J., BISSIG-CHOISAT B., JEMMI T., STARK K.D.C. (2003): Prevalence of latent zoonoses in pigs and pork from animal-friendly farms. Archiv Fur Lebensmittelhygiene, 54, 90–94. LO FO WONG D.M.A., DAHL J., STEGE H., van der WOLF P. J., LEOTIDES L., von ALTROCK A., THORBERG B.M. (2004): Herd-level risk factors for subclinical Salmonella infection in European finishing-pig herds. Prev. Vet. Med., 62, 253–266. MILLER A.J., TWOMEY D.F., DAVIES R.H., TEALE C.J., WILLIAMSON S. M., REICHEL R., FEATHERSTONE C.A., COOK A.J.C., SNOW L.C., ARMSTRONG J.D. (2011): Salmonella Serovars and Antimicrobial Resistance Patterns on a Sample of High Seroprevalence Pig Farms in England and Wales (2003–2008). Zoonoses and Public Health, 58, 549-559. NIELSEN B., EKEROTH L., BAGER F., LIND P. (1998): Use of muscle fluid as a source of antibodies for serologic detection of Salmonella infection in slaughter pig herds. J. Vet. Diagn. Invest., 10, 158–163.
Comparison seroprevalence of...
143
ŠIŠAK F., HAVLIČKOVA H., MATIAŠOVIĆ J., KARPIŠKOVA R. (2011): Serological and Bacteriological Evaluation of Salmonella status in swine herds. Czech J. Food Sci., 29, 102-108. SMITH R.P., CLOUGH H.E., COOK A.J.C. (2010): Analysis of meat juice ELISA results and questionnaire data to investigate farm-level risk factors for Salmonella infection in UK pigs. Zoonoses and Public Health, 57 (Suppl.1), 39–48. van der WOLF P.J., WOLBERS W.B., ELBERS A.R.W., van der HEIJDEN H.M.J.F., KOPPEN J.M.C.C., HUNNEMAN W.A., van SCHIE F.W., TIELEN M.J.M. (2001): Herd level husbandry factors associated with the serological Salmonella prevalence in finishing pig herds in The Netherlands. Vet. Microbiol., 78, 205–219. WACHECK S., SARNO E., MARTLBAUER E., ZWEIFEL C., STEPHAN R. (2012): Seroprevalence of Anti-Hepatitis E Virus and Anti-Salmonella Antibodies in Pigs at Slaughter in Switzerland. Journal of Food Protection, 75, 8, 1483-1485. Received 15 January 2014; accepted for publication 28 February 2014


Biotechnology in Animal Husbandry 30 (1), p 145-152, 2014 ISSN 1450-9156 Publisher: Institute for Animal Husbandry, Belgrade-Zemun UDC 631.563'633.2
DOI: 10.2298/BAH1401145M
MANAGEMENT PRACTICES EFFECT ON SEED FEATURES OF ITALIAN RYEGRASS FOLLOWING STORAGE PERIOD V. Mandić1, A. Simić2, S. Vučković2, R. Stanisavljević3, Z. Tomić1, Z. Bijelić1, V. Krnjaja1 1Institute for Animal Husbandry, Autoput 16, 11080 Belgrade, Serbia 2University of Belgrade, Faculty of Agriculture, Nemanjina 6, 11080 Belgrade, Serbia 3Institute for Plant Protection and Environment, Teodora Drajzera 9, 11080 Belgrade, Serbia Corresponding author: [email protected] Original scientific paper
Abstract: Italian ryegrass seed crop was established in 2007 with two sowing densities (D1 = 60 cm row spacing and 5 kg ha-1 seeding rate; D2 = 20 cm row spacing and 20 kg ha-1 seeding rate) and using two spring nitrogen rates (0 and 150 kg N ha-1). Seed germination and thousand seed weight (TSW) of Italian ryegrass was observed in first production year. After harvest in June, seeds were stored under standard storage conditions and sampled 90 days after harvest (DAH), and then 2000 DAH. At 90 DAH, seeds were tested for TSW, as well as germination energy and total germination percentage at incubation temperatures of 10, 15, 20 and 25°C. Ryegrass seeds had the best germination energy 90 DAH at 20°C and maximum total germination at 15°C, which implies that early autumn (September-October) is proper sowing period for freshly harvested seeds of Italian ryegrass. Italian ryegrass seeds could maintain satisfactory germination energy (59.3%) and total germination (77.3%) up to 2000 DAH. High seed quality was obtained and applied treatments did not change seed quality significantly unlike storage period which had considerable influence on seed quality. The data can serve for the determination of a proper storage duration management between harvest and sowing of the tested species under ambient conditions of Serbia.
Key words: Italian ryegrass, nitrogen application, seed features, sowing
density, storage period
Introduction
Historically, grass seed quality has been synonymous with germination, i.e. the measurement of the percentage of seeds growing normally under standardised, controlled, optimum laboratory conditions, set so that seed is given every chance to germinate to its full potential (ISTA, 2010). During post-harvest maturation,

V. Mandić et al.
146
different species vary in the length of dormancy breaking or germination increases. Seed dormancy and slow seedling development often limit establishment of forage grass stands (Stanisavljević et al., 2011). However, seed dormancy and delayed germination of forage grasses under natural conditions can be beneficial because they postpone germination and the initial growth of seedlings until environmental conditions improve (Stanisavljević et al., 2012). Maximum germination is achieved after the period of seed maturation and dormancy loss. Further seed storage leads to certain physiological and biochemical processes that result in seed ageing and germination decreases (Bewley and Black, 1994). Seed germination conservation in the course of ageing depends largely on storage conditions (Walters et al., 2004). In Serbian conditions, approximately two and a half months elapses between the time of seed collection and the sowing of forage grasses during the autumn. Sowing in this period provides sufficient time for germination, seedling development, and survival during the winter. Compared with sowing seed during the spring of the following year, autumn sowing provides for substantially better turf formation, more forage yield, and increased seed yield (Salehi and Khosh-Khui, 2005). Harvested seeds can be used to establish new crop by sowing in autumn (August-September) of the same year or in spring (March-April) of the succeeding year. Laws and regulations governing the seed trade mainly determine minimum germination standards of approximately 70–75%. Seed size, usually measured as thousand seed weight (TSW), may be an indicator of quality, as increasing TSW can result in improved seedling growth (Hill et al., 1998). Bean (1973) pointed out that TSW was significantly and positively correlated with subsequent seedling dry weight for Italian ryegrass. Hampton (1986) reported that increasing seed weight from 3.2 g to 5 g, seedling performance was increased in field sowings in Italian ryegrass from 68% to 85%. Efficient germination of Italian ryegrass seeds is essential for successful establishment of meadows and pastures. Italian ryegrass is one of the best forage grasses in Serbia, producing high quality forage. Lolium species account for about 23% of the 52 million ha of grassland in Europe with Italian ryegrass being the most prevalent species (Humphreys et al., 2010). According to Simić et al. (2009) excellent ryegrass seed yield was achieved in Serbia in the first year, but local production covers only 50% of forage production needs for this seed. The application of different nitrogen rates and seeding techniques affected Italian ryegrass seed yield in Serbia (Vučković et al., 2003; Simić et al., 2009), but it is not clear whether management practice influenced ryegrass seed quality (Simić et al., 2010). Vučković et al. (1998) achieved higher germination energy of Italian ryegrass seed grown at row distance of 50 cm and applying seeding rate of 4 kg ha-1 than at the distance of 20 cm and applying higher seeding rates. Seeds reach maximum germination during storage, but if storage is prolonged germination is decreased and lost, which signifies the process of seed ageing. Stanisavljević et al. (2011) noticed that a reduction in seed germination of Italian ryegrass was not recorded before 750 DAH. Furthermore,
Management practices effect
147
acceptable germination was recorded up to 810 DAH (81%) and without a reduction of the seedling vigour. In practice, there may also be also interest in storing the seeds of Italian ryegrass over the next two autumn sowings.
Successfully growing Italian ryegrass requires a high and consistent germination energy, coupled with fast and vigorous seedling growth. Italian ryegrass seed crop is usually harvests or disperses under natural conditions mainly in June. This experiment was conducted to determine the differences among Italian ryegrass seed parameters obtained by management practices of the seed crop in the first production year, using different sowing density and spring nitrogen application. Also, the aim of the experiment was to determine TSW, the level of seed dormancy at the different incubation temperatures, germination energy and total germination of Italian ryegrass seeds, immediately upon harvesting (90 DAH) and 5.5 years after harvesting. Materials and Methods
The experiment was set up in autumn 2007 with seeds of the tetraploid Italian ryegrass K-29t in the vicinity of the city Šabac, western Serbia (44°47’ N, 19°35’ E, 80 m asl). The plot for harvest was 10 m2, and it was replicated four times in a randomized complete block design. Soil in the experimental area was humofluvisol (2.54% humus), with rinsed limestone, pH in KCl: 5.25; K2O: 15 mg kg−1; P2O5: 3 mg kg−1. Italian ryegrass seed crop was established with two sowing densities (D1 = 60 cm row spacing and 5 kg ha-1 seeding rate; D2 = 20 cm row spacing and 20 kg ha-1 seeding rate) and using two spring nitrogen rates (0 and 150 kg N ha-1). Seed from the primary growth in 2008 was harvested at the peak of seed ripeness, in the first production year after the establishment. Harvested seeds were cleaned manually, placed into paper bags and stored dry under ambient storage conditions. Seed samples were drawn 90 days after harvest (DAH) and then 2000 DAH.
Three characters were measured 90 DAH to provide an estimate of seed quality: (1) 1000-seed weight (TSW), (2) germination energy and (3) total germination and two characters were measured 2000 DAH: (1) germination energy and (2) total germination. Four replicates of 100 seeds were germinated on filter paper according to the ISTA Rules (ISTA, 2010). The seeds were incubated 90 DAH at different temperatures of 10, 15, 20 and 25°C and 2000 DAH at temperature 20°C. Germination energy count was made after 5 days and the total seedling after 14 days.
The data were analysed by two-way ANOVA using Statistica 10.0 (StatSoft, Inc. Tulsa, OK, USA) software. LSD multiple range test was used to detect significant differences among means at the 5% level of probability.

V. Mandić et al.
148
Results and Discussion
Average TSW varied among different seed sowing densities and nitrogen rates from 3.89 g to 4.32 g (Table 1), and that variation could be explained by environmental conditions during seed development and ripening. Sparse plants at D1 density enabled to take more nutrients and had full light treatment. On the other hand, dense sward affected assimilates supply and may have limited seeds from achieving their potential final weight, consequently reducing TSW. Nitrogen application at seed crop had diminishing effect on sowing density treatments, either decreasing TSW at D1 density or increasing TSW at D2 density. This is in accordance with former results of Akpan and Bean (1980), who reported that the seed from spaced plants had a higher TSW and seedling dry weight than the seed from narrow drills. Otherwise, TSW as seed quality indicator was conditioned by the factors of vegetation area in crop establishment, whereas nitrogen had an influence only in extremely different densities (sparse and dense crop). It is in agreement with findings of Choi et al. (2002) who noted the TSW increase when the inter-row space was raised from 15 cm to 45 cm. Table 1. Effect of Italian ryegrass sowing density and nitrogen rate on thousand seed weight
Treatment Nitrogen rate Sowing density N1 N2 Average D1 4.316 4.071 4.193 D2 3.887 4.066 3.977 Average 4.102 4.068 LSD 0,05(D, N) = 0.115 LSD 0,05(DxN) = 0.163
D1 = 60 cm row spacing and 5 kg ha-1 seeding rate; D2 = 20 cm row spacing and 20 kg ha-1 seeding rate; N1 = 0 kg N ha-1; N2 = 150 kg N ha-1
Unlike results for TSW, seed germination energy and total germination was not affected by sowing density and nitrogen rate in any investigated temperature traits (Table 2). This is in agreement with results of Choi et al. (2002). At all incubation temperatures 90 DAH (from 10 to 25°C), as well as 2000 DAH at 20°C there was not a statistically significant differences among seeds produced in dense or sparse sward, with or without N application. Physiological immaturity of seed was a possible cause of the low germination energy at temperature treatment of 10°C (<5% germination energy for 5 days), but total germination after two weeks reached 90% (tab. 2). Akpan and Bean (1980) reported that an increase in temperature from a 15°/10°C regime to a constant 25°C environment increased germination energy. An increase in germination energy occurred between temperatures 10 and 15°C, indicating the start of dormancy loss 90 DAH. Starting

Management practices effect
149
from 15°C, germination energy was increased (> 80%) and such was at 20 and 25°C. After 2000 DAH germination energy was decreased to 59.3%. Total seed germination of K-29t was high and uniform, except for 2000 DAH. Table 2. Effect of sowing density and nitrogen rate on germination energy and total germination (%)
Days after harvest (DAH) 90 2000 90 2000
Germination energy (%) Total germination (%) Temperature
Treatment
10°C 15°C 20°C 25°C 20°C 10°C 15°C 20°C 25°C 20°C Sowing density T1 T2 T3 T4 T5 T1 T2 T3 T4 T5 D1 4.9 92.7 89.6 85.3 61.5 91.6 96.0 94.7 92.0 78.5 D2 3.6 80.4 86.4 82.0 57.2 90.9 93.6 91.8 92.0 76.2 LSD 0.05 8.45 13.81 9.53 8.52 8.45 5.43 3.88 7.19 4.22 7.67 Nitrogen rate N1 5.3 89.6 87.8 84.0 57.7 91.1 94.7 92.9 92.9 77.8 N2 3.1 83.6 88.2 83.3 61.0 91.3 94.9 93.6 91.1 76.8 LSD 0.05 8.45 13.81 9.53 8.52 8.45 5.43 3.88 7.19 4.22 7.67 Mean 4.2 86.6 88.0 83.7 59.3 91.2 94.8 93.2 92.0 77.3 SD 4.9 1.2 6.4 5.6 5.9 4.0 2.7 4.6 2.9 4.8
D1 = 60 cm row spacing and 5 kg ha-1 seeding rate; D2 = 20 cm row spacing and 20 kg ha-1 seeding rate; N1 = 0 kg ha-1 nitrogen rate; N2 = 150 kg ha-1 nitrogen rate; SD-standard deviation
There is no complete concordance between our results and data of
Stanisavljevic et al. (2011). They reported the best germination and vigour of Italian ryegrass seedlings between 270 and 330 DAH, which equates to spring sowing time (March-April) in the succeeding year. Italian ryegrass seeds maintained satisfactory germination levels up to 630 DAH (81%) and 810 DAH (81%), respectively. The results indicated that early spring is the best sowing period for Italian ryegrass, but our results indicated that temperate autumn conditions are also suitable sowing period for Italian ryegrass.
Immediately after harvest and breaking seed dormancy (90 DAH) was highest correlation between germination energy and total germination (Table 3), but 2000 DAH that correlation was decreased to twice lower (0.69 and 0.36%, respectively). Correlation between total germinations and germination energies (DAH90/DAH2000) was similar (0.49% and 0.44, respectively). Table 3. Correlation coefficients between germination energy and total germination following different storage period of seed
TG/90 TG/2000 GE/2000 GE90 0.69 0.44 GE/2000 0.36 TG/90 0.49
GE/90 = germination energy 90 DAH; TG/90 = total germination 90 DAH; GE/2000- germination energy 2000 DAH; TG/2000- total germination 2000 DAH.

V. Mandić et al.
150
Conclusion
The high seed quality of Italian ryegrass was confirmed with this research and it is slightly influenced by different variants of establishment or by N spring application, but much more by storage period. The data can serve for the determination of a proper storage duration management between harvest and sowing of Italian ryegrass. Although there was a reduction in the total germination during seed ageing of Italian ryegrass up to 2000 DAH (77.3%), this reduction gave almost satisfactory germination in a sense of the market requirement (77%). Average TSW varied from 3.89 to 4.32 g. TSW was influenced by factors forming crop density, while nitrogen had a lower influence on that parameter. Germination increased with the increase temperatures from 10 to 25°C. The results of germination in this study provide aspects for recommendation the best sowing date and, in particular, about the minimum and maximum storage period between harvests and sowing of Italian ryegrass.
Acknowledgements
Research was financed by the Ministry of Education, Science and Technological Development of the Republic of Serbia, the Republic of Serbia, Projects TR 31053 and TR 31016.
Uticaj agrotehnike na osobine semena italijanskog ljulja pri različitim dužinama skladištenja V. Mandić, A. Simić, S. Vučković, R. Stanisavljević, Z. Tomić, Z. Bijelić, V. Krnjaja
Rezime
Semenski usev italijanskog ljulja je zasnovan u 2007 godini sa dve gustine setve (D1=60 cm međuredno i 5 kg ha-1 setvena norma; D2=20 cm međuredno i 20 kg ha-1 setvena norma) i primenom dve količine azota u prihrani (0 and 150 kg ha-
1). Posmatran je klijavost i masa 1000 semena italijanskog ljulja u prvoj proizvodnoj godini. Posle žetve u junu, seme je skladišteno u standardne skladišne uslove i uzorkovano 90 dana posle žetve (DPŽ), a potom 2000 DPŽ. Posle 90 DPŽ seme je ispitivano na masu 1000 semena, energiju klijanja i ukupnu klijavost na temperaturama klijanja od 10, 15, 20 i 25°C. Seme ljulja je imalo najbolju životnu sposobnost 90 DPŽ na 20°C i maksimalnu ukupnu klijavost na 15°C, što sugeriše da je rana jesen (septembar-oktobar) odgovarajući period za setvu sveže

Management practices effect
151
požnjevenog semena italijanskog ljulja. Seme italijanskog ljulja može zadržati zadovoljavajuću energiju klijanja (59,3%) i klijavost (77,3%) i 2000 DPŽ. Dobijeno je kvalitetno seme i primenjeni tretmani pri gajenju semenskog useva nisu menjali značajno kvalitet semena, za razliku od vremena skladištenja, koje je imalo značajan uticaj na kvalitet semena.
Podaci mogu poslužiti za određivanje pogodnog vremena skladištenja i upravljanjem semenom između žetve i setve italijanskog ljulja u uslovima Srbije.
References AKPAN E.E.J., BEAN E.W. (1980): The effects of density, date of inflorescence emergence, date of harvesting and temperature upon seed quality in tetraploid hybrid ryegrasses. Grass Forage Science, 35, 1, 55-61. BEAN E.W. (1973): Seed quality: its variation, control and importance in breeding and varietal assessment. Report of the Welsh Plant Breeding Station, 194-208. CHOI G.J., JUNG E.S., RIM Y.W., LIM Y.C., KIM K.Y., SUNG B.R., PARK G.J. (2002): Effects of drill widths and nitrogen application levels in early spring on the growth characteristics and seed productivity of Italian ryegrass (Lolium multiflorum Lam.). Journal of the Korean Society of Grassland Science, 22, 3, 221-226. BEWLEY J.D., BLACK M. (1994): Seeds: physiology of development and germination. New York, 445p. HAMPTON J.G. (1986): Effect of seed and seed lot 1000 seed weight on vegetative and reproductive yields of “Grasslands Moata” tetraploid Italian ryegrass (Lolium multiflorum). New Zealand Journal of Experimental Agriculture, 14, 13-18. HILL M.J., HAMPTON J.G., HILL K.A. (1998): Seed quality of grasses and legumes. In: Fairey, D.T., Hampton, J.G. (Eds.), Forage seed production. Vol. 1: temperate species. CAB International, 219-242. HUMPHREYS M. ET AL. (2010): Ryegrasses. In: Boller, B.; Posselt, U.K.; Veronesi, F. Fodder Crops and Amenity Grasses. New York: Springer., 211-260. ISTA - INTERNATIONAL SEED TESTING ASSOCIATION (2010): International Rules for Seed Testing. Bassersdorf, Switzerland. SALEHI H, KHOSH-KHUI M (2005): Enhancing seed germination rate of four turfgrass genera by acid treatments. Journal of Agronomy and Crop Science, 191, 346-350. SIMIĆ A., VUČKOVIĆ S., MALETIĆ R., SOKOLOVIĆ D., ĐORĐEVIĆ N. (2009): Impact of seeding rate and interrow spacing on Italian ryegrass for seed in the first harvest year. Turkish Journal of Agriculture and Forestry, 33, 5, 425-433.
V. Mandić et al.
152
SIMIĆ A., VUČKOVIĆ S., ĆUPINA B., KRSTIĆ Đ., STANISAVLJEVIĆ R., MILIVOJEVIĆ M. (2010): Impact of management practices on Italian ryegrass seed quality. Journal of Agricultural Sciences, 55, 2, 131-140. STANISAVLJEVIĆ R., DRAGIĆEVIĆ V., MILENKOVIĆ J., DJUKANOVIĆ L. (2010): Effects of the duration of after-ripening period on seed germinations and seedling size in three fescue species. Spanish Journal of Agricultural Research, 8, 2, 454-459. STANISAVLJEVIĆ R., ĐOKIĆ D., MILENKOVIĆ J., ÐUKANOVIĆ L., STEVOVIĆ V., SIMIĆ A., DODIG D. (2011): Seed germination and seedling vigour of Italian ryegrass, cocksfoot and timothy following harvest and storage. Revista Ciência e Agrotecnologia, 35, 6, 1141-1148. STANISAVLJEVIĆ R., VUČKOVIĆ S., SIMIĆ A., MARKOVIĆ J., LAKIĆ Ž., TERZIĆ D., ĐOKIĆ D. (2012): Acid and Temperature Treatments Result in Increased Germination of Seeds of Three Fescue Species. Notulae Botanicae Horti Agrobotanici Cluj-Napoca, 40, 2, 220-226. VUČKOVIĆ S., NEDIĆ M., ZARIĆ D., ZIVANOVIĆ LJ. (1998): Effect of row spacing and sowing rate on Italian ryegrass (Lolium italicum) seed yield and quality. Proceedings of 2nd Balkan Symposium on Filed Crops, 16-20 June, Novi Sad, Yugoslavia, , 469-473. VUČKOVIĆ S., SIMIĆ A., ĆUPINA B. STOJANOVIĆ I., STANISAVLJEVIĆ R. (2003): The effect of vegetation area size on grass seed yield. Journal of Agricultural Sciences, 1, 125-134. WALTERS C., WHEELER L.M., STANWOOD P.C. (2004): Longevity of cryogenically stored seeds. Cryobiology, San Diego, 48, 2, 229-244. Received 24 February 2014; accepted for publication 17 March 2014

Biotechnology in Animal Husbandry 30 (1), p 153-166, 2014 ISSN 1450-9156 Publisher: Institute for Animal Husbandry, Belgrade-Zemun UDC 633.31
DOI: 10.2298/BAH1401153K
EVALUATION OF THE VARIATION OF THE CONTENTS OF ANTI-NUTRIENTS AND NUTRIENTS IN THE SEEDS OF LEGUMES J. Księżak, J. Bojarszczuk Institute of Soil Science and Plant Cultivation - State Research Institute in Puławy, Department of Forage Crop Production, Czartoryskich St. 8, 24-100 Puławy, Poland Corresponding author: [email protected] Original scientific paper
Abstract: It is assumed that the content of anti-nutrients in legumes seeds
and find out the dependency among their content and the amount of important nutrients. The influence of the agri-environmental conditions on concentration of anti-nutrients was evaluated on the basis of the analysis of the material collected from the experiments carried out in the years 2010-2011, located in different regions of Poland. The analyses were performed in the Main Chemical Laboratory of IUNG-PIB Puławy and in Laboratory of Research Centre for Cultivar Testing (COBORU) in Słupia Wielka, near Poznań. The obtained results indicate that the region of cultivation did not have a significant impact on the concentration of these substances in the seeds of faba bean. Seeds of fodder pea of Muza and Marych cultivars contain significantly less tannins than Roch and Wiato cultivars. In the case of faba bean, however, fewer of these compounds were found at white-flowering cultivars. The average content of total alkaloids in lupine was definitely greater in blue lupine than in yellow lupine. The location of cultivation of yellow lupine did not have an influence on the level of total alkaloids and gramine. Blue lupine collected much less alkaloids in the location of Central Poland and significantly more in the North and West of Poland. Key words: anti-nutrient substances, legumes, location of cultivation, nutrients, seeds Introduction
Species belonging to the legumes are important group of major economic importance in the global scale (Mikic, 2006). They are grown for seeds used for the purpose of industry (oil production), consumption and fodder, and also as a raw material for the production of nutritive fodder, green forage, green manure and for reclamation of fallow ground. They are characterized, as one of the few groups of crops, by a positive balance of organic matter in the soil. They are also an excellent

J. Księżak et al.
154
forecrop for cereal, industrial and root crops. Climatic conditions in Poland allow to the cultivation of these plants in the whole country (Księżak et al., 2009). They can be cultivated both in holdings with organic farming and sustainable production system. Because of the economic importance and natural values, they play an important role in crop production. In the last several years, cropping area under cultivation has undergone large changes. The largest area of 385 thousand hectares was taken by legumes in 1989. Their share in the cropping pattern amounted to 3.6%. It was connected to the marketing plan based on the country's self-sufficiency in raw materials for the production of nutritive fodder, in which the legume seeds, were the main source of protein. International situation, which creates problems with obtaining high protein soy pellets is also significant. The interest of farmers in cultivating legumes has been varied over time and depended largely on the demand for seeds and the profitability of their cultivation.
The main factor, which determines the size of cultivation area of this group of plants is the availability and soy pellets price. The introduction of free market economy in the late 1980s and 1990s resulted in many changes in agriculture that affected the evolution of the economic factors, agrarian structure and the associated structures under cultivation. The cultivation area of legumes decreased rapidly in this period. However, in the last 2-3 years, there has been an increase of cultivation area (in the year 2011 over 150 000 hectares and the share in the cropping pattern by more than 1,2%) (data not published).
An important feature of seeds legume is the content of the anti-nutritional substances, which negatively affect the use of nutrients and compounds negatively affected the health and growth of animals called: growth depressing factors (Alonso et al., 1998; Gatel and Grosjean, 1990). Anti-nutritive and antinutrional components have or may have a harmful effect on the nutritive, technological and sensory value of seeds or the products obtained from them. The researches of experiments on these compounds are meant to clarify their role and deepen knowledge about their action, which does not change the fact that their presence limits the full use of high-value protein in the legumes seeds. They cause a decrease in the consumption of feed, as well as a reduction in the use of the nutrients, and often cause a damage to the cells of intestinal epithelium and excessive growth of internal organs (Leontowicz et al., 1999; Mosenthin and Jezierny, 2010; Matić et al., 2005). Negative impact on digestion and utilization of nutrients - proteins, carbohydrates and mineral compounds was shown by inhibitors of enzymes: trypsin, chymotrypsin, amylase, phenolic compounds, and especially condensed tannins, most lectin and oligosaccharides (Piastowska and Gralak, 2004). In order to reduce the quantities of anti-nutrients in legume seeds, various thermal and hydrothermal processes are used, such as dry heating, steam heating or cooking, autoclaving or mechanical heating (e.g. removing a seed coat). There have been attempts to use some of the industrial methods which combine thermal

Evaluation of the variation of...
155
and mechanical actions such as microionization, extrusion, flaking and pelleting (Akande and Fabiyi, 2010; Conan and Carré, 1989; Van der Poel, 1990; Almeida et al. 1991, Kim and Barbeau, 1991; Gujska and Khan, 1991; Bishnoi, Khetarpaul, 1993; Fŕias et al. 1995; Bau et al. 1997; Wang et al., 1997). In addition, Alkande and Fabiyi (2010) indicate that in many cases, the use one method only, may be not effective enough, and it is then necessary to combine two or more methods. At the same time, heating feed for too long and in too high temperature causes the decrease of availability of amino acids and the possibility of binding tannins in complexes with protein. Moreover, carrying out these experiments requires additional financial input, which raises the cost of feed production. Technological processes aimed at improving the nutritive value of legume seeds of have not yet come out of the phase of the experiments. The standards of technological conditions for this treatment have not been developed. Inappropriate conditions cause the decrease in the availability of amino acids, as well as in the nutritional value of the proteins. Mechanical removal of the seed coat of faba bean and lupine causes an increase of the energy value of these seeds and may be economically justifiable only in poultry feeding. There is only little information about the impact of the agri-environmental factors on accumulation of ant-nutrients in the legumes seeds. It was shown with that the environment can affect the activity of trypsin inhibitor (Mikić et al., 2009). The relationship between content of these compounds in seeds legume and quantity of the important nutrients has also been little recognized. The aim of the research was to determine the content of anti-nutrients in seeds legume and find out the dependency among their content and the amount of nutrients.
Materials and Methods
The influence of the agri-environmental conditions on concentration of anti-nutrients was evaluated on the basis of the analysis of the material collected from the experiments carried out in the years 2010-2011, located in different location of the country.
Simples of all species seeds were marked for the contents of major nutrients (crude fibre - by weight method, crude fat - by Soxhlet’s weight method, N - by flow spectrophotometry, crude ash - by weight method at 580° C, sugars and starches).
Field and laboratory experiments were performed on 9 different faba bean cultivars, 13 fodder pea, 8 yellow lupine,14 blue lupine, derived from harvests.
The determination of alkaloid contamination in yellow lupine (gramine) and blue lupine (total alkaloids) has been made by the Spanish method of capillary gas-liquid chromatography (GLC). Alkaloid extracts were separated by gas

J. Księżak et al.
156
chromatography on fused-silica capillary columns (15 m long, 0,25 mm diameter; SE 30 or DB 1; J&W Scientific; obtained from ICT, Frankfurt, FRG). Conditions for GLC: injector: 250° C; detector: 320°C; oven: 150-300° C, 15° C min-1, at 300°
C isothermal for 10 min; carrier gas: helium (1 bar); make-up gas: 20 ml min-1 helium; split injection: 1:25. Sparteine was used as an external standard (Wink, 1983).
The seeds of faba bean and fodder pea were marked for the content of tannins by method of Kuhla and Emmeier, 1981. Simples were determined by the vanillin method with using sulphuric acid.
The analyses were performed in the Main Chemical Laboratory and in the Department of Biochemistry and Crop Quality of Institute of Soil Science and Plant Cultivation–State Research Institute in Puławy and in Laboratory of Research Centre for Cultivar Testing (COBORU) in Słupia Wielka, near Poznań.
Results and Discussion
Tannins are important compounds in the seeds of cultivars of faba bean and fodder pea. They cause the reduction of the digestibility of the proteins and carbohydrates, reduce the availability of methionine and iron and deteriorate the feed taste. Seeds of fodder pea of Muza and Marych cultivars contain significantly fewer of these compounds. More of them were found at Roch and Wiato cultivars (Table 1). The seeds of white-flowering cultivars of faba bean including Leo, Kasztelan, Albus, Amulet, and Olga, were characterized by a smaller amount of these compounds, and more of them were found at Boskovic, Sonet, Granit, and Optimal (Table 1). According to Alonso et al., 1998, the seeds of Ballet cultivar of pea contained significantly more of tannins than Renata and Solara cultivars. Racevičiūtė-Stupelienė et al. (2006) recorded large variation in the total oligosaccharides in seeds of cultivars of pea. According to Mikić et al., 2009, tannins are most often present in the seeds of cultivars of colorful flowers which may be used in the production of feed, although they are often characterized by a lower digestibility of proteins compared to other cultivars of pea. Duc (1997) shows that low content of tannins is related to white colour of flowers, which is controlled by at least two recessive genes. Bond and Smith state that an alternative method to the chemical method used to reduce of content of tannins is breeding cultivars with a low concentration of tannins, which is controlled by the same gene as the white colour of the flowers. However, according to Mikić et al. (2009), the seeds of cultivars without tannins have a wide application both in human and animal feeding.
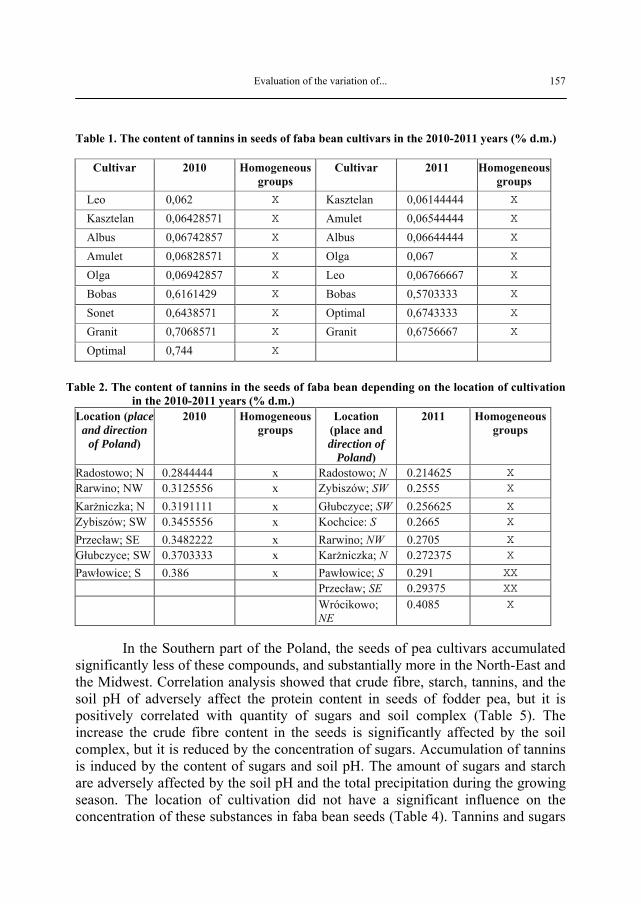
Evaluation of the variation of...
157
Table 1. The content of tannins in seeds of faba bean cultivars in the 2010-2011 years (% d.m.)
Cultivar 2010 Homogeneous groups
Cultivar 2011 Homogeneous groups
Leo 0,062 X Kasztelan 0,06144444 X
Kasztelan 0,06428571 X Amulet 0,06544444 X
Albus 0,06742857 X Albus 0,06644444 X
Amulet 0,06828571 X Olga 0,067 X
Olga 0,06942857 X Leo 0,06766667 X
Bobas 0,6161429 X Bobas 0,5703333 X
Sonet 0,6438571 X Optimal 0,6743333 X
Granit 0,7068571 X Granit 0,6756667 X
Optimal 0,744 X
Table 2. The content of tannins in the seeds of faba bean depending on the location of cultivation
in the 2010-2011 years (% d.m.) Location (place
and direction of Poland)
2010 Homogeneous groups
Location (place and direction of
Poland)
2011 Homogeneous groups
Radostowo; N 0.2844444 x Radostowo; N 0.214625 X
Rarwino; NW 0.3125556 x Zybiszów; SW 0.2555 X
Karżniczka; N 0.3191111 x Głubczyce; SW 0.256625 X
Zybiszów; SW 0.3455556 x Kochcice: S 0.2665 X
Przecław; SE 0.3482222 x Rarwino; NW 0.2705 X
Głubczyce; SW 0.3703333 x Karżniczka; N 0.272375 X
Pawłowice; S 0.386 x Pawłowice; S 0.291 XX
Przecław; SE 0.29375 XX
Wrócikowo; NE
0.4085 X
In the Southern part of the Poland, the seeds of pea cultivars accumulated
significantly less of these compounds, and substantially more in the North-East and the Midwest. Correlation analysis showed that crude fibre, starch, tannins, and the soil pH of adversely affect the protein content in seeds of fodder pea, but it is positively correlated with quantity of sugars and soil complex (Table 5). The increase the crude fibre content in the seeds is significantly affected by the soil complex, but it is reduced by the concentration of sugars. Accumulation of tannins is induced by the content of sugars and soil pH. The amount of sugars and starch are adversely affected by the soil pH and the total precipitation during the growing season. The location of cultivation did not have a significant influence on the concentration of these substances in faba bean seeds (Table 4). Tannins and sugars

J. Księżak et al.
158
found in seeds of faba bean cause a temporary limit in the content of protein, crude fibre and crude ash and increase in the amount of crude fat. Protein content in seeds was increased by the content of crude fibre but reduced by crude fat. The content of the evaluated nutrients in the faba bean seeds was insignificantly impacted by the total precipitation during the growing period and soil pH. Table 3. The correlation coefficients among the content of nutritional substances, tannins and
some agronomic factors in faba bean
Characteristic protein crude fibre
crude fat crude ash tannins sugars
crude fibre 0.9607* crude fat -0.2775 -0.0628 crude ash 0.9787 0.9516 -0.2842 tannins -0.9816 -0.9552 0.2697 -0.9758 sugars -0.9844 -0.9760 0.3933 -0.9707 0.9809 soil pH -0.0476 -0.0374 -0.0938 0.0072 0.0250 0.2383 precipitations for growing season
0.1633
0.1548
-0.1469
0.1690
-0.1250
-0.1436
*- numbers in bold indicate significant differences (for α = 0.05)
Table 4. The content of tannins in the seeds of fodder pea depending on the location of cultivation (% d.m.)
Cultivar Content Homogeneous groups
Location (place and direction of
Poland)
Content Homogeneous groups
Muza 0.06716882 X Pawłowice; S 0.3119797 X
Marych 0.07041882 X Kościelec; Central 0.3537525 XX
Milwa 0.2023688 X Świebodzin; W 0.3558404 XX
Gwarek 0.3782688 X Tomaszów Bol.; W 0.3622988 XX
Klif 0.4157188 XX Głodowo; Central 0.3748434 XX
Hubal 0.4158688 XX Białogard; NW 0.3812525 XX
Sokolik 0.4332188 XX Wyczechy; N 0.3815071 XX
Model 0.4441922 XX Bobrowniki; W 0.3853821 XX
Eureka 0.4641688 X Ruska Wieś; SE 0.3920042 XX
Pomorska 0.4706688 X Cicibór Duży; E 0.4219654 XX
Turnia 0.4847637 XX Marianowo; E 0.482158 X
Roch 0.5440188 XX
Wiato 0.5763188 X
Alkaloids occurring in yellow and blue lupine can act as stimulants, anesthetics, and even poisons. They affect central nervous system causing its paralysis, and furthermore, they may cause severe stomach pains and vomiting. If

Evaluation of the variation of...
159
consumed in small quantities, they decrease the absorption of feed and growth of animals. Seeds of cultivars of yellow lupine contain a similar amount of alkaloids. More of them were found at cultivars of blue lupine such as Mirela and Karo (Table 2). Other cultivars contained a significantly smaller amount of them. A greater quantity of alkaloids in the seeds of Mirela and Karo cultivars was recorded in previously researches by Ksieżak et al. (2011). In addition, the average total alkaloids in lupine were definitely higher in the seeds of blue lupine than at yellow lupine. The indole alkaloid gramine is toxic to animals and may play a defensive role in plants, especially if it occurs in significant quantities. All evaluated cultivars of yellow lupine contain little of gramine, but its slightly higher amount was found at Parys cultivar (Table 3). Cowling et al. (1998) consider that breeding cultivars of lupine with low content of alkaloids (called: sweet) is one of the greatest achievements of breeders. New lupine cultivars usually contain less than 200 mg kg-1 of alkaloids (Cowling et al., 1998). The location, where lupine was grown did not have an effect on the level of total alkaloids and gramine in the seeds. The data obtained from the correlation analysis suggests that the contents of crude fibre and crude fat adversely affect the protein content of lupine, and that the soil complex is positively correlated with protein content. Increase the crude fibre content in seeds is significantly affected by the content of crude fat and forecrop after, which lupine is cultivated. The amount of crude fat was reduced by the total of precipitation during the growing season. Accumulation of alkaloids was induced by soil quality and the sugars - by forecrop. According to Christiansen (1996), there is a correlation among the level of alkaloids in lupine and the level of precipitation in the period of flowering of plants. According to this author, the drought in this period significantly increases the level of alkaloids in lupine. A similar tendency of changes in the content of alkaloids in white lupine (Hetman cultivar) and blue lupine (Saturn cultivar) was observed by Wasilewko and Buraczewska (1999). Much less of these compounds were collected from the seeds of blue lupine in the region of Central of Poland and significantly more in the North and West of Poland. The protein content in blue lupine, similarly as in yellow lupine, was negatively correlated with crude fat content, crude fibre content and the soil pH. An increase in the crude fibre content in seeds was positively affected by quantity of sugars, and adversely affected by agro-environmental factors. Crude fat content was positively correlated with soil quality and negatively correlated with the content of sugars, forecrop and total of precipitation. The quantity of alkaloids and starch was not correlated with any of the evaluated nutrients and habitat conditions.

J. Księżak et al.
160
Table 5. The correlation coefficients among the content nutritional substances, tannins and some agronomic factors in seeds of fodder pea cultivars
Characteristic protein crude fibre taninns sugars starch
crude fibre -0.1505 taninns -0.1620 0.0000 sugars 0.2728 -0.1902 0.1329 starch -0.4571 0.2730 -0.0625 -0.1907 soil complex 0.1746 0.2266 -0.0598 -0.1148 0.2141 soil pH -0.2464 0.0159 0.2265 -0.1283 -0.5945 forecrop 0.2010 -0.0858 -0.0342 0.2807 -0.2141 precipitation for growing season
-0.0408
-0.0732
0.1083
-0.0150
-0.4566
*- numbers in bold indicate significant differences (for α = 0,05) Table 6. The content of total alkaloids in seeds of yellow lupine cultivars depending on cultivar and location of cultivation (% d.m.)
Cultivar Content Homogeneous groups
Location (place and direction of
Poland)
Content Homogeneous groups
Baryt 0.01296481 X Marianowo; E 0.01194179 X
Parys 0.01335641 X Bobrowniki; W 0.01322236 X
Talar 0.01713766 X Głodowo; Central 0.01382236 X
Perkoz 0.01902516 X Uhnin; E 0.01510902 X
Taper 0.01929391 X Świebodzin; W 0.01579893 X
Dukat 0.02106266 X Ruska Wieś; NE 0.01593569 X
Lord 0.02578766 X Nowy Lubliniec; SE
0.01998464 X Mister 0.02915016 X Cicibór Duży; E 0.0247275 X
Nowa Wieś Ujska; W
0.02485607 X
Tomaszów Bol.; W 0.03008464 X
Sulejów; Central 0.03146236 X
The seeds of cultivar of multiuse pea contain traces of tannins. The accumulation of protein was induced by the quality of soil and total precipitation, but negatively impacted by sugars and soil pH. The accumulation of crude fibre was enhanced by greater total of precipitation, but limited by soil pH. Increase in the content of sugars was caused by the soil pH and forecrop, but limited by soil quality, total precipitation and starch content.

Evaluation of the variation of...
161
Table 7. The content of gramine in the seeds of yellow lupine cultivars depending on cultivar and location of cultivation (% d.m.) Cultivar Content Homogeneous
groups Location (place and direction of
P l d)
Content Homogeneous groups
Lord -0.0003843506 X Uhnin; E -0.0002545094 X Mister -0.0003843506 X Sulejów; Central -0.0001656205 X Talar -0.0003843506 X Bobrowniki; W -0.0001545094 X Perkoz -0.0003843506 X Nowy Lubliniec;
SE-0.00009863636 X
Dukat -0.0003843506 X Świebodzin; W -0.00008435065 X Taper 0.0006307062 X Głodowo; Central -0.00003228716 X Parys 0.003036956 X Ruska Wieś; NE 0.00005660173 X Marianowo; E 0.0001870779 X Cicibór Duży; E 0.0008727922 X Nowa Wieś
Uj k W0.0009156494 X
Tomaszow Bol.; W
0.001501364 X Table 8. The correlation coefficients among the content of anti-nutritional substances (alkaloids and gramine), nutritional substances and some agronomic factors in yellow lupine seeds Characteristic protein crude
fibrecrude fat alkaloids gramine sugars starch
crude fibre -0.3102 crude fat -0.2341 0.1771 alkaloids 0.0794 0.0390 0.0276 gramine 0.1012 -0.0151 0.1470 -0.0857 sugars -0.0632 0.0329 -0.1096 0.0821 -0.0002 starch -0.0216 0.1851 0.2196 0.4489 -0.8310 0.1732 soil complex 0.1734 -0.0365 0.1214 0.1982 0.0773 0.0643 -0.0116 soil pH -0.0048 -0.1115 -0.0660 0.0621 0.0352 -0.1299 -0.0327 forecrop 0.0118 0.2253 -0.2162 0.0335 -0.0395 0.1806 0.0533 precipitation for growing season
0.0645 0.0089 -0.2250 0.0438 -0.0339 -0.0022 0.0409
*- numbers in bold indicate significant differences (for α = 0,05)

J. Księżak et al.
162
Table 9. The content of total alkaloids in the seeds of blue lupine depending on the cultivar and location of cultivation (% d.m.)
Cultivar Content Homogeneous groups
Location (place and direction of
Poland)
Content Homogeneous groups
Dalbor 0.001373278 X Głodowo; Central 0.05260664 X
Heros 0.005573278 X Wyczechy; N 0.1526019 XX
Regent 0.006265688 X Nowy Lubliniec, SE
0.1580213 XX
Neptun 0.01197759 X Wrócikowo; N 0.1593477 XX
Graf 0.01252997 X Rarwino; NW 0.1638559 XX
Zeus 0.01368712 X Marianowo; S 0.1752227 XX
Kalif 0.01399188 X Cicibór Duży; S 0.1759497 XX
Baron 0.0179676 X Bobrowniki; W 0.1789386 XX
Kadryl 0.02164426 X Kawęczyn; Central
0.1870463 XX
Sonet 0.02206331 X Ruska Wieś; NS 0.215429 X
Boruta 0.03128712 X Kościelec; Central
0.2293867 X
Bajor 0.0469395 X Mirela 1.062815 X Karo 1.084401 X
Table 10. The correlation coefficients among the content of anti-nutritional substance (alkaloids), nutritional substances and some agronomic factors in blue lupine seeds
Characteristic protein crude fibre crude fat sugars starch alkaloids
crude fibre -0.2684 crude fat -0.2468 0.0026 sugars -0.0086 0.1783 -0.1332 starch -0.0433 0.0280 0.0394 -0.2848 alkaloids 0.0959 -0.0297 -0.0774 -0.2143 -0.1884 soil complex -0.1057 -0.1607 0.1289 0.1332 -0.0551 -0.0363 soil pH -0.1621 -0.1455 0.0564 0.0162 0.1160 0.0145 forecrop 0.1254 -0.2861 -0.1650 0.0212 -0.0734 -0.0002 precipitation for growing season
-0.0243 0.0067 -0.3635 0.1781 0.0509 0.0069
*- numbers in bold indicate significant differences (for α = 0,05)

Evaluation of the variation of...
163
Table 11. The correlation coefficients among the content of nutritional substances and some agronomic factors in seeds of multiuse pea cultivars
Characteristic protein crude fibre sugars starch crude fibre 0.0922 sugars -0.2003 -0.1138 starch -0.1804 0.1276 -0.4830 soil complex 0.1541 -0.0194 -0.1269 0.1601 soil pH -0.2713 -0.1710 0.2993 0.0941 forecrop -0.0835 -0.0212 0.3148 -0.1695 precipitation for growing season
0.3875 0.1928 -0.3945 0.1588
*- numbers in bold indicate significant differences (for α = 0,05) Conclusion
Seeds of fodder pea of Muza and Marych cultivars contain significantly less tannins than Roch and Wiato cultivars. In the case of faba bean, however, fewer of these compounds were found at white-flowering cultivars such as Leo, Kasztelan, Albus, Amulet and Olga. Multipurpose cultivars of peas contain traces of tannin. In the southern part of the country, seeds of pea accumulated much less of these compounds, while significantly more in the North-Eastern of Poland and the Midwest. The region of cultivation did not have a significant impact on the concentration of these substances in the seeds of faba bean.
The average content of total alkaloids in lupine was definitely greater in blue lupine than in yellow lupine. Seeds of yellow lupine cultivars contained a similar amount of alkaloids, while the cultivars of blue lupine such as Mirela and Karo were characterized by their higher amount than other cultivars. All the evaluated cultivars of yellow lupine contained little of gramine, and only slightly more of it was found at Parys cultivar. The region of cultivation of yellow lupine did not have an influence on the level of total alkaloids in the seeds and gramine. Blue lupine collected much less alkaloids in Central of Poland and significantly more in the North and West of Poland. Acknowledgment Article performed under Ini Tech project “The possibility of increasing of protein production from seeds of national leguminous varieties cultivated in differentiated climatic conditions”, financed by The National Centre for Research and Development (no 64692).

J. Księżak et al.
164
Ocena variranja sadržaja antinutritivnih i hranljivih materija u semenu leguminoza J. Księżak, J. Bojarszczuk Rezime
Pretpostavlja se da sadržaj anti- nutritivnih materija u semenu leguminoza i zavisnost njihovog sadržaja i količine važnih hranljivih sastojaka. Uticaj agro-ekoloških uslova na koncentraciju anti- nutritivnih materija je ocenjen na osnovu analize prikupljenog materijala iz ogleda sprovedenih u godinama 2010-2011, u različitim regionima Poljske. Analize su izvršene u Glavnoj hemijskoj laboratoriji IUNG-PIB Puławy i u Laboratoriji Istraživačkog centra za ispitivanje sorti (Research Centre for Cultivar Testing (COBORU) u mestu Słupia Wielka, blizu Poznanja. Dobijeni rezultati ukazuju da region gajenja nije imao značajan uticaj na koncentracije ovih materija u semenu boba. Seme stočnog graška za sortu Muza i Marych sadrže znatno manje tanina nego Roch i Wiato sorte. U slučaju boba, međutim, manje ovih jedinjenja je evidentirano na sortama belog - cvetanja. Prosečan sadržaj ukupnih alkaloida u lupini je definitivno veći u plavoj lupini nego u žutoj. Lokacija gajenja žute lupine nije imala uticaj na nivo ukupnih alkaloida i gramina. Plava lupina prikupljena na lokaciji u Centralnoj Poljskoj je imala mnogo manje alkaloida, a znatno više na severu i zapadu Poljske. References
AKANDE K.E. FABIYI, E. F. (2010): Effect of Processing Methods on Some Antinutritional Factors in Legume Seeds for Poultry Feeding. International Journal of Poultry Science, 9, 996-1001. ALMEIDA N.G., CALDER�N DE LA BARCA A.M., MAURO E.V. (1991): Effect of different heat treatments on the nutritional activity of Phaseolus vulgaris (variety Ojo de Cabra) lectin. Journal of Agricultural and Food Chemistry, 39, 1627-1630. ALONSO R., ORÚE E., MARZO F. (1998): Effects of extrusion and conventional processing methods on protein and antinutritional factor contents in pea seeds. Food chemistry, 63, 4, 505-512. BAU H.M., VILLAUME C., NICOLAS J-P., MÉJEAN L. (1997): Effect of germination on chemical composition, biochemical constituents and antinutritional factors of soya bean (Glycine max) seeds. Journal of the Science of Food and Agriculture, 73, 1-9.

Evaluation of the variation of...
165
BISHNOI S., KHETARPAUL N. (1993): Effect of domestic processing and cooking methods on in-vitro starch digestibility of different pea cultivars (Pisum sativum). Food Chemistry, 177-182. BOND D.A, SMITH D.B. (1989): Possibilities for the reduction of antinutritional factors in grain legumes by breeding. In recent Advances of research in antinutritional Factors in Legume Seeds, 285-296. (J. Huisman, A.F.B. van der Poel and I.E. Liener, editors). Wageningen: Pudoc. CHRISTAINSEN J.L., BUSKOV S., JORNSGARD J. (1996): Effect of drought stress od seeds alkaloid content in Lupiniu angustifolius. Proc. of 8th Inter. Lupin Conf., California, 24. CONAN L., CARRÉ B. (1989): Effect of autoclaving on metabolizable energy value of smooth pea seed (Pisum sativum) in growing chicks. Animal Feed Science and Technology, 1989, 26, 337–345. COWLING W.A., BUIRCHELL B.J., TAPIA M.E. (1998): Lupin. Lupinus L. Institute of Plant Genetics and Crop Plant Research, Gatersleben. Germany-International Plant Genetic Resources Institute, Rome, Italy, 105. DUC G. (1997): Faba bean (Vicia faba L.). Field Crops Research, 53, 99-109. FŔIAS J., �IAZ-POLLAN C., HEDLEY C.L., VIDAL-VALVERDE C. (1995): Evolution of trypsin inhibitor activity during germination of lentils. Journal of Agricultural and Food Chemistry, 2231-2234. GATEL F., GROSJEN F. (1990): Composition and nutritive value of peas for pigs: a review of European results. Livestock Production Science, 26, 155-175. GUJSKA E., KHAN K. (1991): Feed moisture effects on functional properties, trypsin inhibitor and hemagglutinating activities of extruded bean high starch fractions. Journal of Food Science, 56, 443-447. KIM Y.A., BARBEAU W.E. (1991): Changes in the nutritive value of soy protein concentrate during autoclaving. Plant Foods for Human Nutrition, 41, 179-192. KSIĘŻAK J. STANIAK M., BOJARSZCZUK J. (2009): The regional differentiation of legumes cropping area in Poland within 2001-2007. Pol. J. Agri, 1, 25-31. KSIĘŻAK J., STANIAK M., BOJARSZCZUK J. (2011): Differentiation of anti-nutritional substances in legume seeds. Acta Bioch. Pol., 58 (suppl. 3), 40-42. KUHLA S., EMMEIER C. (1981): Untersuchungen zum Taningehalt in Ackerbohnen. Arch. Tierenaehr. 31, 573-588. LEONTOWICZ H., LEONTOWICZ M., KOSTYRA H., GRALAK M.A., KULASEK G.W. (1999): The influence of extrusion or boiling on trypsin inhibitor and lectin activityin leguminous seeds and protein digestibility in rats. Pol. J. Food. Nutr. Sci., 4, 77-87. MATIĆ R., NAGEL S., ROBERTSON S., YOUNG I., MIHAILOVIĆ V., MIKIĆ A., KIRBY G. (2005): Vetch (Vicia ssp) expansion and use in Australia. Biot. in Animal Husbandry, 21, 5-6, 2, 203-207.

J. Księżak et al.
166
MIKIĆ A., ĆUPINA B., KATIĆ S., KARAGIĆ D. (2006): Importance of annual forage legumes in supplying plant proteins. A Periodical of Scientific Research on Field and Vegetable Crops, 42, I, 91-103. MIKIĆ A., PERIĆ V., ĐORĐEVIĆ V., SREBRIĆ M., MIHAILOVIĆ V. (2009): Antinutritional factors in some grain legumes. Biotechnology in Animal Husbandry, 25 (5-6), 1181-1188. MOSENTHIN, R. JEZIERNY, D. (2010): Nutritional significance of secondary plant metabolites in pigs and poultry, 19 International Science Symposium on Nutrition of Domestic Animals, 227-236. PIASTOWSKA A.W., GRALAK M.A. (2004): Wpływ nasion roślin strączkowych zawartych w diecie na układ kostny. Postępy Nauk Rolniczych, 6, 17-27. RACEVIČIŪTĖ-STUPELIENĖ A., ŠAŠYT Ė V., GRUŽAUSKAS R. (2006): Antinutritioanl feed factors in varieties of oilseed rape (Brassica napus L.) and peas (Pisum sativum L.) grown in Lithuania.Acta Biol. Univ. Daugavp., 6 (1-2): 141-149. VAN DER POEL A.F.B. (1990): Effect of processing on antinutritional factors and protein nutritional value of dry beans (Phaseolus vulgaris L.). A review. Animal Feed Science and Technology, 29, 179-208. WANG N., LEWIS M.J., BERNNAN J.G., WESTBY A. (1997): Effect of processing methods on nutrients and anti-nutritional factors in cowpea. Food Chemistry, 58, 59-68. WASILEWKO J., BURACZEWSKA L. (1999): Chemical composition including content of amino acids, minerals and alkaloids in seeds of three lupin species cultivated in Poland. Journal of Animal and Feed Science, 8, 1-12. WINK M. (1983): Inhibition of seed germination by quinolizidine alkaloids. Aspect of allelopathy in Lupinus albus L. Planta, 158, 365-368. Received 7 February 2014; accepted for publication 19 March 2014

Biotechnology in Animal Husbandry 30 (1), p 167-173 , 2014 ISSN 1450-9156 Publisher: Institute for Animal Husbandry, Belgrade-Zemun UDC 632.4'633.11
DOI: 10.2298/BAH1401167K
PRESENCE OF DEOXYNIVALENOL IN WINTER WHEAT TREATED WITH FUNGICIDES V. Krnjaja1, J. Lević2, S. Stanković2, T. Petrović3, V. Mandić1, Z. Tomić1, A. Obradović2 1Institute for Animal Husbandry, Autoput 16, 11080, Belgrade-Zemun, Serbia 2Maize Research Institute “Zemun Polje“, Slobodana Bajića 1, 11185, Belgrade-Zemun, Serbia 3Institute of Food Technology and Biochemistry, Faculty of Agriculture, University of Belgrade, Nemanjina 6, 11080, Belgrade-Zemun, Serbia Corresponding author: [email protected] Original scientific paper
Abstract: Natural occurrence of Fusarium spp. and concentrations of mycotoxin deoxynivalenol (DON) in the grain of the winter wheat moderately susceptible to Fusarium head blight (FHB) has been studied. Grain samples were collected from wheat crops intended for human and animal consumption. All wheat crops were treated with fungicides before (a.i. flutriafol – formulated as Fluoco, applied in dose of 0.5 l ha-1) and during the flowering phase of growing (a.i. thiophanate-methyl + epoxiconazole formulated as Eskorta plus and a.i. thiophanate-methyl formulated as Funomil, applied in doses of 0.75 and 0.5 l ha-1, respectivily). Among of Fusarium species only F. graminearum, as a well known producer of DON, was identified. This fungus was identified in 15 of 19 samples (78.9%) with incidence in positive samples of 2 to 28% (average, 14.0%). Presence of DON was established in 13 of a total 19 investigated wheat grain samples (68.4%). In positive samples DON was detected in concentrations from 69 to 918 μg kg-1 (average, 478 μg kg-1). DON showed a significant and positive correlation at P≤0.05 with grain moisture content (r = 0.52*). Between the frequency of F. graminearum and concentration of DON and between the frequency of F. graminearum and grain moisture content, positive correlation was determined, but without statistical significance (r = 0.44 and r = 0.29, respectively). Key words: Fusarium head blight, Fusarium graminearum, deoxynivalenol, winter wheat
Introduction Wheat is one of the most important crop cultures grown in Serbia, on approximately 500,000 ha, with average yield of 3,700 kg/ha (Statistical Yearbook of Serbia, 2012). It has been used for thousands of years to provide food for humans. For livestock feeding wheat grain can be used as concentrated livestock feed, whereas whole plant can be used as fodder.

V. Krnjaja et al.
168
There are several toxigenic species of Fusarium that are also a major pathogens of cereal plants, causing Fusarium head blight (FHB) in wheat. It is the major wheat disease occurring worldwide, especially in temperate climate regions, causing reductions in yield and quality of wheat (Parry et al., 1995). In our agro-climatic condition, F. graminearum has been isolated as the most present species from Fusarium-infected grains (Lević et al., 2008; Krnjaja et al., 2011). This fungus produces different mycotoxins, mainly deoxynivalenol, which contaminate grain (Nakajima, 2007a; Stanković et al., 2012). Fusarium species produce a wide range of mycotoxins of diverse structure and chemistry. Deoxynivalenol (DON) is a trichothecene mycotoxin with toxic effects on animals and human health. Testing of grains and animal feed on the occurrence of Fusarium mycotoxins attracts considerable attention and has been the subject of extensive investigations over the recent years. DON concentration in Fusarium-damaged grain generally increases with the percentage of damaged grain in a given sample. It was reported that the amount of DON produced by F. graminearum was positively correlated with fungal biomass (Wegulo, 2012). Semaškiené et al. (2006) have established a slight reduction in Fusarium infection in the plants treated with fungicides compared to untreated plants of spring cereals. Wegulo (2013) has been demonstrated the importance of applying of integrated management in cultivation of wheat, with an emphasis on application of fungicides and host resistance.
In this paper the results of the occurrence of F. graminearum and DON concentrations in samples of winter wheat grains collected from crops treated by fungicides have been presented. Materials and Methods The total of 19 samples of wheat grains of variety Takovčanka collected in 2013 from crops cultivated in Institute for Animal Husbandry, Belgrade, were used for mycological and mycotoxicological analysis. Wheat crops were treated twice with fungicides during the period of wheat growing. In the first half of April, the samples were treated with fungicide based on flutriafol (formulated as Fluoco) at a dose of 0.5 l ha-1 wheras the combination of fungicides based on epoxiconazole + thiophanate-methyl (formulated as Excorta Plus) and thiophanate-methyl (formulated as Funomil) at doses 0.75 and 0.5 l ha-1, respectively, has been applied in the second half of May, in the flowering phase. Average weight of 1 kg per sample of wheat grains was taken immediately after the harvest in July 2013 using standard methods (European Commission, 2006). The moisture content of wheat grains was determined using a moisture analyzer (OHAUS MB35, USA). For the mycological analysis the wheat grains, were first disinfected in 1% sodium hypochlorite solution (NaOCl) 3-5 minutes and rinsed twice in distilled water. After drying of grains on filter paper, 50 grains of each sample was
Presence of deoxynivalenol in winter wheat treated with fungicides
169
distributed in 5 Petri plates (9 cm in diameter) containing water agar (WA) (10 grains per one plate) and kept in incubator (Memmert) at 25ºC during 7 days. Identification of colonies of fungi that overgrowth the wheat grains was done by microscopic examination of mycelium and spores, according to Burgess et al. (1994) and Watanabe (1994). The frequency and incidence of individual species was calculated per sample according to Lević et al. (2012).
The presence of DON was detected by enzyme-linked immunosorbent assay (ELISA). Five grams of sample was mixed with 1 g of NaCl and homogenized in 25 ml of 70% (v/v) methanol in a 250 ml Erlenmeyer flask on the orbital shaker (GFL 3015, Germany) for 30 minutes. Homogenate was filtered through a Whatman filter paper 1. The filtrate was further analysed according to the manufacturer's instructions Celery Techna ® ELISA kits. Absorbance was measured at a wavelength of 450 nm on an ELISA reader spectrophotometer (Biotek EL x 800TM, USA).
Correlation between individual values obtained for grain moisture content, frequency of F. graminearum and concentration of DON was determined using Pearson's correlation coefficient. Results Moisture content of the samples of wheat grains ranged from 12.1 to 15.0%, with an average of 13.7%, for all tested samples (data not presented).
Based on mycological analysis F. graminearum, as well known producer of DON, was identified. This fungus was found in 15 out of 19 samples with incidence of 2 to 28% (average, 14.0%) in positive samples. In all investigated samples, species of genus Alternaria were identified, with an incidence of 84.8% (range 70-100%). Epicoccum spp. and Penicillium spp. were determined in 15.8% of samples, and A. flavus and Rhizopus in 5.3% of the samples, while in 10.5% of samples the isolated species have not been sporulated (Mycelia sterilia) (Table 1). Table 1. Frequency and incidence of fungal species in samples of wheat grain
Frequency Incidence (%) Fungal species Positive/total sample Percentage Range Average Alternaria spp. 19/19 100.0 70-100 84.8
Aspergillus flavus 1/19 5.3 2 2 Epiccocum spp. 3/19 15.8 6 6
Fusarium graminearum 15/19 78.9 2-28 14.0 Penicillium spp. 3/19 15.8 2-8 6 Rhizopus spp. 1/19 5.3 10 10
Mycelia sterilia 2/19 10.5 14-16 15
Mycotoxicological analysis of wheat samples revealed the presence of DON in 68.4% of the tested samples. The concentration of DON in positive

V. Krnjaja et al.
170
samples of wheat ranged from 69 to 918 μg kg-1 with an average concentration of 478 μg kg-1 (Table 2). The concentration of DON was exceeded the permissible limit (750 μg kg-1) prescribed by the Serbian Regulation (Official Gazzete, 2011) in only two samples (data not shown). Table 2. Concentrations of DON mycotoxin in wheat grain samples
Item DON Sample sizea 13/19 Incidence % 68.4 Range (μg kg-1) 69-918 Meanb (μg kg-1) 478 a Number of positive samples/Number of total samples b Mean concentration in positive samples
A positive correlation was established between concentration of DON and the grain moisture content (r = 0.52*, P≤0.05), between concentration of DON and the frequency of F. graminearum (r = 0.44), as well as between the grain moisture content and the frequency of F. graminearum (r = 0.29).
Discussion In the samples of wheat collected in 2013, the F. graminearum species was identified as a FHB disease-causing species, with an average incidence of 14.0%. In the study of Krnjaja et al. (2011b), it has been reported the incidence of F. graminearum of 82.50% in wheat grains collected in 2009, not treated with fungicides, whereas in untreated samples collected in 2010, the incidence of F. graminearum was 99.05% (Krnjaja et al., 2011a). Since in this study the grains were treated with fungicide, the lower incidence of F. graminearum was obtained, compared to the previous results of Krnjaja et al. (2011a,b). This finding confirmed the assumption that the application of fungicides could be a suitable preventive measure for the control of the occurrence of Fusarium spp. during the growing season of wheat.
In this study, 68.4% DON positive samples of wheat were determined with an average concentration of 478 μg kg-1, whereas Krnjaja et al. (2011a,b) have established 100% DON positive samples with an average concentrations of 490 μg kg-1 in 2009 and 214 μg kg-1 in 2010. It could be assumed that these differences in an average concentration of DON has been the results of differences among the tested varieties of wheat, the differences in grain moisture content at harvest as well as climatic conditions, particularly in terms of temperature and rainfall during flowering and early stages of grain development.
By applying the fungicide tebuconazole and thiophanate-methyl, Wachowska et al. (2012), have effectively controlled FHB and isolated the lower level of Fusarium spp. in treated wheat grains in comparison with the control

Presence of deoxynivalenol in winter wheat treated with fungicides
171
plants. By examining the efficiency of seven fungicides in order to reduce mycotoxins Nakajima (2007b) has found that preparations based on thiophanate-methyl have significantly reduced the content of DON and nivalenol (NIV) mycotoxin in wheat grain. Metcalfe et al. (2000) have found that the use of the sterol 14-α-demethylase inhibitors (DMI) fungicides (fluquinconazole, flutriafol and prochloraz) in full recommended doses had not caused resistance of pathogenic fungi of wheat to these fungicides. Nakajima (2007b) found that the efficacy of the control of DON and NIV was consistently lower than that of FHB severity and assumed that critical control point of DON and NIV might be different from that of FHB severity. The high levels of DON and NIV could be produced beyond 20 days after anthesis even by early infection and infection at a late stage. For this reason, the frequency of fungicide application has been important in the prevention of infection by Fusarium spp. and likewise for mycotoxin reduction. The general recommendation for timing of fungicide application is the beginning of flowering phase of growth, in which the plants are most susceptible to Fusarium infection. Likewise, developing control strategies that cover the late stage as well as the early stage would be desirable to reduce the risk of mycotoxin contamination in wheat (Nakajima, 2007b). Based on the regulated maximum permissible concentration of mycotoxins in food and feed in Serbia (Official Gazette of RS, 2011), it could be concluded that the examined batches/lots of unprocessed wheat grains can be used as food and feed because its contained a concentration of DON under the safe limit (1250 μg kg-1). However, for direct human consumption only wheat containing DON less than 750 μg kg-1 can be used.
Conclusion In conclusion, the use of fungicides in wheat crops significantly reduces the presence of the disease-causing species of FHB and thus prevents considerable DON production. These results may be of great importance especially in years when outbreaks of causal agents of wheat head fusariosis are expected. The use of fungicides in conjunction with other preventive measures to protect the wheat from the appearance of FHB is important to promote the development of integrated pest management strategy. Acknowledgment
This work was supported by the Ministry of Education, Science and Technological Development, Republic of Serbia (projects TR-31023, TR-31053 and TR-46010) and FP7 project - AREA (316004).

V. Krnjaja et al.
172
Prisustvo deoksinivalenola u ozimoj pšenici tretiranoj s fungicidima
V. Krnjaja, J. Lević, S. Stanković, T. Petrović, V. Mandić, Z. Tomić, A. Obradović
Rezime
U radu je proučavana prirodna pojava Fusarium spp. i koncentracija
mikotoksina deoksinivalenola (DON) u zrnu ozime pšenice srednje osetljive prema fuzariozi klasa (FHB). Uzorci zrna su prikupljeni sa proizvodnih useva pšenice namenjene za ishranu ljudi i životinja. Svi usevi pšenice bili su tretirani sa fungicidima pre (a.m. flutriafol – formulisana kao preparat Fluoco, primenjen u dozi 0,5 l ha-1) i tokom cvetanja biljaka (a.m. tiofanat-metil + epoksikonazol formulisana kao preparat Eskorta plus i a.m. tiofanat-metil formulisana kao Funomil, primenjeni u dozi 0.75 i 0.5 l ha-1, respektivno). Među Fusarium vrstama jedino je identifikovana F. graminearum, koja je poznati producent DON. Ova gljiva je bila identifikovana u 15 od 19 uzoraka (78.9%) sa incidencom od 2 do 28% (prosek 14.0%) u pozitivnim uzorcima. Prisustvo DON je utvrđeno u 13 od ukupno 19 proučavanih uzoraka pšenice (68.4%). U pozitivnim uzorcima DON je detektovan u koncentracijama od 69 do 918 μg kg-1 (prosek 478 μg kg-1). DON je pokazao značajnu i pozitivnu korelaciju pri P≤0.05 sa sadržajem vlage zrna (r = 0.52*). Između učestalosti F. graminearum i koncentracije DON i učestalosti F. graminearum i sadržaja vlage zrna utvrđena je, takođe, pozitivna korelacija ali statistički nije značajna (r = 0.44 i r = 0.29, respektivno).
References BURGESS L.W., SUMMERELL B.A., BULLOCK S., GOTT K.P., BACKHOUSE D. (1994): Laboratory Manual for Fusarium Research. Third edition. Fusarium Research Laboratory, Department of Crop Sciences, University of Sydney and Royal Botanic Gardens, Sydney, pp. 133. EUROPEAN COMMISSION (2006): Commision regulation (EC) No. 401/2006. Official Journal of the European Union, L70, 12. KRNJAJA V.S., LEVIĆ J.T., STANKOVIĆ S.Ž., STEPANIĆ A.M. (2011a): Fusarium species and their mycotoxins in wheat grain. Proc. Nat. Sci, Matica Srpska Novi Sad, 120, 41-48. KRNJAJA V.S., STANKOVIĆ S.Ž., LEVIĆ J.T., (2011b): The presence of toxigenic Fusarium species and fusariotoxins deoxynivalenol and zearalenone in winter wheat. Biotechnology in Animal Husbandry, 27, 1, 63-73.

Presence of deoxynivalenol in winter wheat treated with fungicides
173
LEVIĆ J., STANKOVIĆ S., KRNJAJA V., BOČAROV-STANČIĆ A., IVANOVIĆ D. (2012): Distribution frequency and incidence of seed-borne pathogens of some cereals and industrial crops in Serbia. Pesticide and Phytomedicine 27, 1, 33-40. LEVIĆ J., STANKOVIĆ S., KRNJAJA V., KOVAČEVIĆ T., TANČIĆ S. (2008): Fusarium head blight and grain yield losses of Serbian wheat. Cereal Research Communications 26, Suppl. B, 513-514. METCALFE R.J., SHAW M.W., RUSSEL P.E. (2000): The effect of dose and mobility on the strenght of selection for DMI fungicide resistance in inoculated field experiments. Plant Pathology, 49, 546-557. NAKAJIMA T. (2007a): Making evidence-based good agricultural practice for the reduction of mycotoxin contamination in cereals. Food and Fertilizer Technology Center, Annual Report, 05-17, 111-120. NAKAJIMA T. (2007b): Progress and outlook for the control of nivalenol and deoxynivalenol contamination due to Fusarium head blight in wheat. Mycotoxins, 57, 2, 129-134. PARRY D.W., JENKINSON P., McLEOD L. (1995): Fusarium ear blight (scab) in small grain cereals - a review. Plant Pathology, 44, 207-238. OFFICIAL GAZETTE OF RS (2011): Regulation on amendment of Regulation on the maximum allowed residue levels of pesticides in food and animal feed for which maximum allowed residue quantities of plant protection products. No. 28/11. STANKOVIĆ S., LEVIĆ J., IVANOVIĆ D., KRNJAJA V., STANKOVIĆ G., TANČIĆ S. (2012): Fumonisin B1 and its co-occurrence with other fusariotoxins in naturally-contaminated wheat grain. Food Control 23, 384-388. STATISTICAL YEARBOOK OF SERBIA (2012): Statistical Office of the Republic of Serbia, Belgrade, pp. 410. WACHOWSKA U., MIKOłAJCZYK W., KUCHARSKA K. (2012): The effectiveness of tebuconazole and thiophanate-methyl in reducing the Fusarium pathogens development on winter wheat heads. Progress in Plant Protection, 52, 3, 671-675. WATANABE T. (1994): Pictorial atlas of soil and seed fungi: Morphologies of cultured fungi and key to species. Lewis Publishers, Boca Raton, Boston, London, Washington D.C. pp. 410. WEGULO S.N. (2012): Factors influencing deoxynivalenol accumulation in small grain cereals. Toxins, 4, 1157-1180. WEGULO S.N., BOCKUS W.W., HERNANDEZ NOPSA J.F., PEIRIS K.H.S., DOWELL F.E. (2013): Integration of fungicide application and cultivar resistance to manage Fusarium head blight in wheat. Chapter 2. DOI: 10.5772/53096 Received 21 February 2014; accepted for publication 21 March 2014

Instruction for authors
Papers for publishing in the Biotechnology in Animal Husbandry journal should be submitted to the Editorial Board. Address: Institute for Animal Husbandry, Autoput 16, 11080 Belgrade-Zemun, P.O.box 23, Republic of Serbia (for Biotechnology in Animal Husbandry).
Original papers in English, (on a CD-ROM or by e-mail: [email protected]) 6 pages of typed text using, Paper size: Custom size, Width 17 cm, Height 24 cm; formata (Portrait), normal spacing (Single Space). Margine: Top 2,0 cm, Left 2.0 cm, Bottom 2.0 cm, Right 2,0 cm, no pagination. Use font Times New Roman, size 11 (except where it is stated otherwise). Title of the paper should be Times New Roman, font size 14, bold:
Example 1 TABLE EGGS OF KNOWN ORIGIN AND GUARANTEED QUALITY - BRAND EGG Authors, Times New Roman, font size 12, bold Z. Pavlovski, Z. Škrbić, M. Lukić
Institute for Animal Husbandry, Autoput 16, P. Box 23, 11080, Belgrade-Zemun, Republic of Serbia Corresponding author: [email protected] Invited paper Example 2 THE EFFECT OF PARAGENETIC FACTORS ON REPRODUCTIVE TRAITS OF SIMMENTAL COWS M. D. Petrović1, Z. Skalicki2, V. Bogdanović2, M. M. Petrović3
1Faculty of Agronomy, Cara Dušana 34, 32000, Čačak, Republic of Serbia 2Faculty of Agriculture, Nemanjina 6, 11080, Belgrade-Zemun, Republic of Serbia 3Institute for Animal Husbandry, Autoput 16, P. Box 23, 11080, Belgrade-Zemun, Republic of Serbia Corresponding author: [email protected] Original scientific paper use 1,2, ... numbers in suffix to refer to addresses of authors, under affilations of authors should be mentioned e-mail of corresponding author and category of paper, Times New Roman, font size 9 Original scientific paper should contain following paragraphs with single spacing (title of paragraphs should be in Times New Roman 14 bold, except for Abstract and Key words where font size is 11 bold): Abstract: 250 words
Key words: state key words (not more than 6) Introduction - present the review of previous research and objective of the paper. Materials and Methods - state methods applied in the paper. Results and Discussion - present investigation results separately from discussion or together in one paragraph. Presentation of the results should be precise and without repetitions, and include the evaluation of significant differences and other parameters.
Text and titles of tables, figures and graphs, Times New Roman, font size 9, bold, in the following form: Table 1. Least square means for the reproductive traits of cows Tables and figures should be numbered and with adequate title and legend, width and height not exceeding 12 cm and 17 cm, respectively. Tables should be prepared according to instruction for forming of tables in Office Word. Each column in table must have heading and, when necessary, abbreviations should be explained in the legend/footnote.
Conclusion - containing the most important issues of the paper Acknowledgment - for example: Research was financed by the Ministry of Science and Technological Development, Republic of Serbia, project TR 6885. After Acknowledgment the title of the paper in Serbian in Times New Roman 14 bold, is stated, followed by authors in Times New Roman 11 italic, example: Konzumna jaja poznatog porekla i garantovanog kvaliteta - brand jaja Z. Pavlovski, Z. Škrbić, M. Lukić
Summary - should contain the most important issues of the paper. It should be in English, and Serbian for domestic authors (min. 250 words). References - should be in alphabetical order. Names of the authors must be given in capital letters followed by the year of publicationin brackerts, titles in the language of the original, examples: PAVLOVSKI Z. (2004): Novi propisi EU, dobrobit živine, zahtevi potrošača. Živinarstvo, 8-9, 49-58. PAVLOVSKI Z., MAŠIĆ B. (1994): Odnos potrošača prema živinskim proizvodima. Živinarstvo, 7-9, 77-82.

PETROVIĆ D.M., GUTIĆ M., BOGOSAVLJEVIĆ-BOŠKOVIĆ S. (2004): Masa teladi pri rođenju i njena varijabilnost kod krava simentalske rase. Agroznanje, 5, 1, 111-116. Citations in the text are presented in italic form, examples: ...results of Pavlovski (2004)...; (Pavlovski and Mašić, 1994); (Petrović et al., 2004); (Pavlovski, 2004; Pavlovski and Mašić, 1994; Petrović et al., 2004). Authors are fully responsible for the contents of the papers. Biotechnology in Animal Husbandry contains three categories of papers: - Original scientific paper, - Review paper, and - Communication. Review papers must have minimum 5 self-citations (by the first author). All papers are published in English, and reviewed. Abbreviation for journal Biotechnology in Animal Husbandry is: Biotechnol Anim Husb Editorial Staff