BIOTECHNOLOGY OF BIOPOLYMERS
376
BIOTECHNOLOGY OF BIOPOLYMERS Edited by Magdy Elnashar
-
Upload
khangminh22 -
Category
Documents
-
view
1 -
download
0
Transcript of BIOTECHNOLOGY OF BIOPOLYMERS

BIOTECHNOLOGY OF BIOPOLYMERS
Edited by Magdy Elnashar

Biotechnology of Biopolymers Edited by Magdy Elnashar Published by InTech Janeza Trdine 9, 51000 Rijeka, Croatia Copyright © 2011 InTech All chapters are Open Access articles distributed under the Creative Commons Non Commercial Share Alike Attribution 3.0 license, which permits to copy, distribute, transmit, and adapt the work in any medium, so long as the original work is properly cited. After this work has been published by InTech, authors have the right to republish it, in whole or part, in any publication of which they are the author, and to make other personal use of the work. Any republication, referencing or personal use of the work must explicitly identify the original source. Statements and opinions expressed in the chapters are these of the individual contributors and not necessarily those of the editors or publisher. No responsibility is accepted for the accuracy of information contained in the published articles. The publisher assumes no responsibility for any damage or injury to persons or property arising out of the use of any materials, instructions, methods or ideas contained in the book. Publishing Process Manager Romina Krebel Technical Editor Teodora Smiljanic Cover Designer Martina Sirotic Image Copyright rkucharek, 2010. Used under license from Shutterstock.com First published June, 2011 Printed in Croatia A free online edition of this book is available at www.intechopen.com Additional hard copies can be obtained from [email protected] Biotechnology of Biopolymers, Edited by Magdy Elnashar p. cm. ISBN 978-953-307-179-4

free online editions of InTech Books and Journals can be found atwww.intechopen.com

Contents
Preface IX
Part 1 Immobilization Using Biopolymers and Protection of the Environment 1
Chapter 1 The Art of Immobilization Using Biopolymers, Biomaterials and Nanobiotechnology 3 Magdy M.M. Elnashar
Chapter 2 Polysaccharides from Wastes of Vegetable Industrial Processing: New Opportunities for Their Eco-Friendly Re-Use 33 Annarita Poli, Gianluca Anzelmo, Gabriella Fiorentino, Barbara Nicolaus, Giuseppina Tommonaro and Paola Di Donato
Chapter 3 Conversion of Biomass into Bioplastics and Their Potential Environmental Impacts 57 Lei Pei, Markus Schmidt and Wei Wei
Chapter 4 Natural Rubber Biosynthesis and Physic-Chemical Studies on Plant Derived Latex 75 Christian Schulze Gronover, Daniela Wahler and Dirk Prüfer
Part 2 Chitin/Chitosan and Their Preparation, Characterization and Applications 89
Chapter 5 Characterization and Properties of Chitosan 91 Elson Santiago de Alvarenga
Chapter 6 The Development, Characterization and Application of Water Soluble Chitosan 109 Zanariah Ujang, Mazita Diah, Ahmad Hazri Abdul Rashid and Ahmad Sukari Halim
VI Contents
Chapter 7 Perspectives of Chitin Deacetylase Research 131 Yong Zhao, Wan-Taek Ju, Gyung-Hyun Jo, Woo-Jin Jung and Ro-Dong Park
Part 3 Theoretical, Experimental and Mathematical Models of Biopolymers 145
Chapter 8 Mechanisms Controlling the Expression of the Exopolysaccharide of Burkholderia and Role in Niche Adaptation 147 Ana S. Ferreira, Inês N. Silva and Leonilde M. Moreira
Chapter 9 Zimm-Bragg Model Applied to Sorption of Dyes by Biopolymers: Alginic Acid and Xanthan 165 Juan Jáuregui-Rincón, Juan Antonio Lozano-Alvarez and Iliana Medina-Ramírez
Part 4 Macro and Micro Characterization of Biopolymers 191
Chapter 10 Macro and Micro Characterization of Biopolymers: Case of Cotton Fibre 193 Omar Harzallah and Jean-Yves Drean
Chapter 11 SR-IMS Molecular Spectroscopic Image of Functional Groups in Biopolymers in Feed Systems 219 Peiqiang Yu
Part 5 Biosynthesis and Biosynthesis Pathway of Biopolymers 241
Chapter 12 New Conceptions about Structure Formation of Biopolymers 243 Shabalkin I.P. and Shabalkin P.I.
Chapter 13 Activated Sugar Precursors: Biosynthetic Pathways and Biological Roles of an Important Class of Intermediate Metabolites in Bacteria 257 Sílvia A. Sousa, Joana R. Feliciano and Jorge H. Leitão
Chapter 14 Biofunctional Xerography 275 Felix Löffler, Yun-Chien Cheng, Tobias Förtsch, Edgar Dörsam, Ralf Bischoff, Frank Breitling and Alexander Nesterov-Müller
Chapter 15 Thermodynamics of Nucleic Acid Structural Modifications for Biotechnology Applications 299 Stefan Franzen

Contents VII
Chapter 16 Nutraceutical Properties of Milk Fat Globular Membrane 321 Korry J. Hintze, Dallin Snow, Ian Burtenshaw and Robert E. Ward
Chapter 17 The Development of Novel In Vitro Binding Assays to Further Elucidate the Role of tRNAs in Protein Synthesis 343 Anthony J. Bell, Jr., Suzanna Ellzey, Devin McDougald and Crystal Serrano


Preface
Biotechnology, according to the European Federation of Biotechnology, is defined as
“the integration of natural sciences and engineering in order to achieve the application
of organisms, cells, parts thereof and molecular analogues for products and servicesʺ.
In other words, Biotech applications can be divided into 5 key sectors: biomedicine,
bioagriculture, industrial biotechnology, bioenergy and bioenvironment. Whereas, Bi‐
opolymers are polymers produced by living organisms. There are three main classes of
biopolymers: a) Polysaccharides which are often linear bonded polymeric carbohy‐
drate structures, b) Polynucleotides long polymers which are composed of 13 or more
nucleotide monomers, and c) Polypeptides short polymers of amino acids. Examples
of the most used biopolymers are chitosan, cellulose, carrageenans, alginate, polyes‐
ters, and proteins such as enzymes and DNA. The applications of biopolymers are
immense and could be found in many fields such as food, pharmaceutical, cosmetics,
agriculture, biomedicine and many chemical industries using enzymes. This diversity
could be regarded to the biocomptability of biopolymers and their biodegradations.
The book comprises 17 chapters covering occurrence, synthesis, isolation and produc‐
tion, properties and applications, biodegradation and modification, the relevant analy‐
sis methods to reveal the structures and properties of biopolymers and a special sec‐
tion on the theoretical, experimental and mathematical models of biopolymers. The
Editor has classified the sections according to their title and content to five parts,
However, some chapters could fit into more than one section.
Part 1. Immobilization using biopolymers and protection of the environment via
production of polysaccharides from waste, biodegradable biopolymers, bioplastic and
natural rubber
Part 2. Chitin/chitosan and their preparation, characterization and applications in
different fields
Part 3. Theoretical, experimental and mathematical models of biopolymers
Part 4. Macro and micro characterization of Biopolymers such as morphology,
maturity, length, mechanical test and surface properties using SR‐IMS Molecular
Spectroscopic

X Preface Part 5. Biosynthesis and biosynthesis pathway of biopolymers, biofunctional
xerography, nutraceutical properties of milk fat and ribosomes and the role of tRNA in
aminoacylation and aa‐tRNA transport.
This book will hopefully be supportive to many scientists, physicians, pharmaceutics,
engineers and other experts in a wide variety of different disciplines, in academia and
in industry. It may not only support research and development but may be also
suitable for teaching.
Publishing of this book was achieved by choosing authors of the individual chapters
for their recognized expertise and for their excellent contributions to the various fields
of research. I am very grateful to these scientists for their willingness to contribute to
this reference work and for their engagement. Without them and without their
commitment and enthusiasm it would have not been possible to compile such a book.
I am also very grateful to the publisher InTech for recognizing the demand for such an
important topic, Biotechnology of Biopolymers. Special thanks are due to the process
manager of InTech, Miss Romina Krebel, for her constant effort and suggestions till we
accomplished this book.
Last but not least, I would like to thank my family for their patience, and I have to
excuse for the many hours spent on the preparation of this book, which kept me away
from them.
Assoc. Prof. Dr. Magdy M. Elnashar
Laboratory of Advanced Materials & Nanotechnology,
Polymers and Pigments Department,
Centre of Excellence for Advanced Sciences,
National Research Centre,
Cairo, Egypt


Part 1
Immobilization Using Biopolymers and Protection of the Environment

1
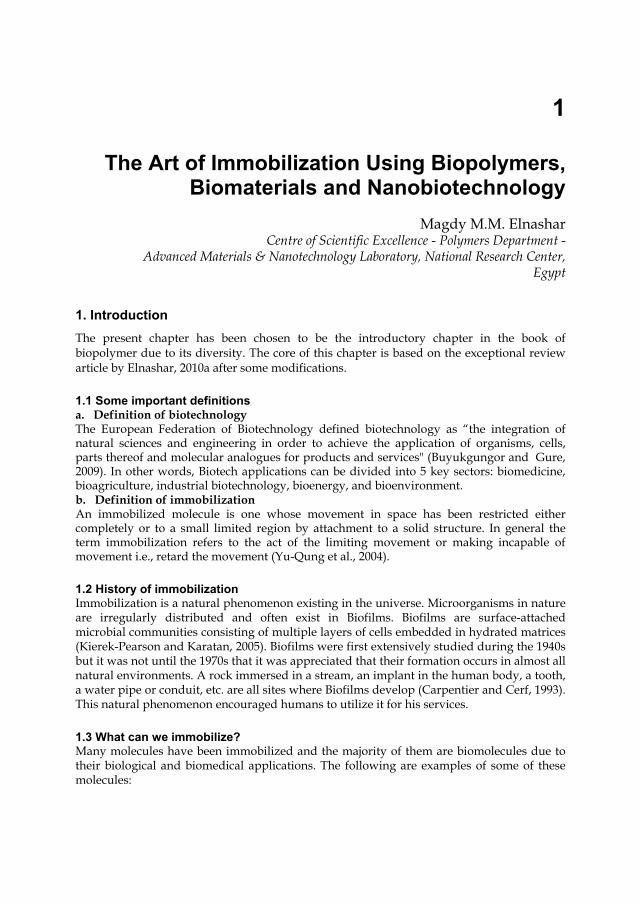
The Art of Immobilization Using Biopolymers, Biomaterials and Nanobiotechnology
Magdy M.M. Elnashar Centre of Scientific Excellence - Polymers Department -
Advanced Materials & Nanotechnology Laboratory, National Research Center, Egypt
1. Introduction The present chapter has been chosen to be the introductory chapter in the book of biopolymer due to its diversity. The core of this chapter is based on the exceptional review article by Elnashar, 2010a after some modifications.
1.1 Some important definitions a. Definition of biotechnology The European Federation of Biotechnology defined biotechnology as “the integration of natural sciences and engineering in order to achieve the application of organisms, cells, parts thereof and molecular analogues for products and services" (Buyukgungor and Gure, 2009). In other words, Biotech applications can be divided into 5 key sectors: biomedicine, bioagriculture, industrial biotechnology, bioenergy, and bioenvironment. b. Definition of immobilization An immobilized molecule is one whose movement in space has been restricted either completely or to a small limited region by attachment to a solid structure. In general the term immobilization refers to the act of the limiting movement or making incapable of movement i.e., retard the movement (Yu-Qung et al., 2004).
1.2 History of immobilization Immobilization is a natural phenomenon existing in the universe. Microorganisms in nature are irregularly distributed and often exist in Biofilms. Biofilms are surface-attached microbial communities consisting of multiple layers of cells embedded in hydrated matrices (Kierek-Pearson and Karatan, 2005). Biofilms were first extensively studied during the 1940s but it was not until the 1970s that it was appreciated that their formation occurs in almost all natural environments. A rock immersed in a stream, an implant in the human body, a tooth, a water pipe or conduit, etc. are all sites where Biofilms develop (Carpentier and Cerf, 1993). This natural phenomenon encouraged humans to utilize it for his services.
1.3 What can we immobilize? Many molecules have been immobilized and the majority of them are biomolecules due to their biological and biomedical applications. The following are examples of some of these molecules:

Biotechnology of Biopolymers
4
• Proteins: - Enzymes, antibodies, antigens, cell adhesion molecules and “Blocking” proteins
• Peptides: - Substances composed of amino acids
• Drugs: - Anticancer agents, antithrombogenic agents, antibiotics, contraceptives, drug
antagonists and peptide/protein drugs • Saccharides:
- Sugars, oligosaccharides and polysaccharides • Lipids:
- Fatty acids, phospholipids, glycolipids and any fat-like substances. • Ligands:
- Hormone receptors, cell surface receptors, avidin and biotin - In immunology, small molecules that are bound to another chemical group or
molecule • Nucleic acids and nucleotides:
- DNA, RNA - High MW substances formed of sugars, phosphoric acid, and nitrogen bases
(purines and pyrimidines). • Others:
- Conjugates or mixtures of any of the above
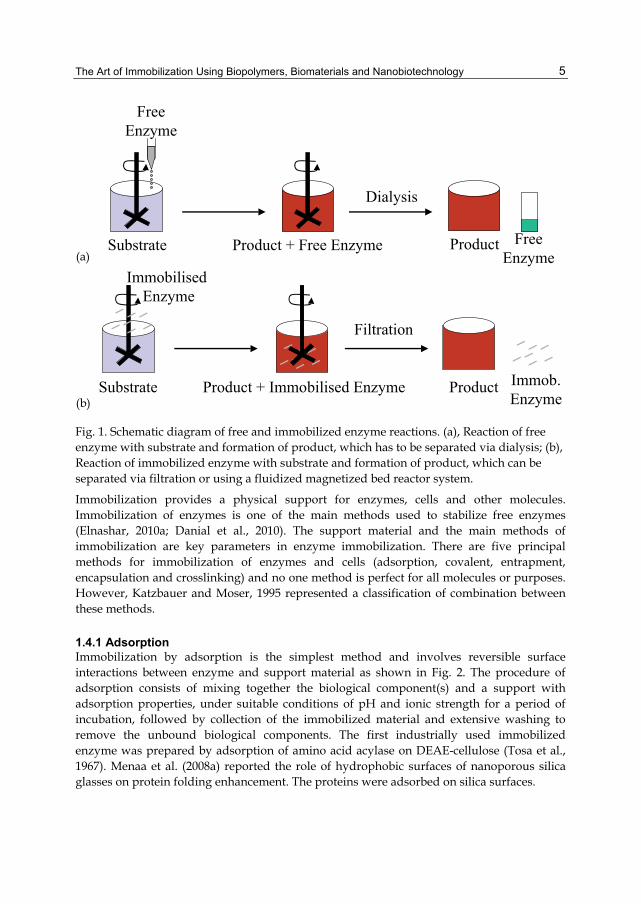
1.4 Methods of immobilization The methods of immobilization of the different molecules are almost the same. However, according to Cao, L. 2005 there is no general universally applicable method of certain molecule immobilization. As enzyme molecules alone or in combination with drugs, antibodies and antigens, are the most used in industries, we will be focusing on the immobilization techniques used for enzymes as a model of other immobilized molecules. The enzyme market in 2005 was around 2.65 billion dollars, with an expected annual growth of more than 9% (Ayala and Torres, 2004). On the industrial level, 75% of the enzymes were used, which is around 2 billion dollars. However, expensive enzymes are not favored to be used in industries in the Free State as they are difficult to be separated from the products (Fig. 1a) and consequently are lost after the first use. They were alternatively immobilized on solid supports (Fig. 1b) so that they can be easily separated from the products by simple filtration or using a fluidized magnetized bed reactor system (Danial et al., 2010, Elnashar, 2010a-c; Elnashar et al., 2008, 2009a, 2009b; Elnashar and Yassin 2009a, 2009b; Mansour et al., 2007). The main advantage for enzyme immobilization is the easy separation of the enzyme from the reaction mixture (substrates and products) and its reusability for tens of time, which reduces the enzyme and the enzymatic products cost tremendously. Beside this splendid advantage, the immobilization process imparts many other advantages to the enzyme such as: • The ability to stop the reaction rapidly by removing the enzyme from the reaction
solution (or vice versa) • Product is not contaminated with the enzyme • Easy separation of enzyme from the product (especially useful in food and
pharmaceutical industries) • Enhancement of enzyme stability against pH, temperature, solvents, contaminants, and
impurities.
The Art of Immobilization Using Biopolymers, Biomaterials and Nanobiotechnology
5
(a)
(b)
Dialysis
A = a1Filtration
FreeEnzyme
Substrate Product + Free Enzyme Product FreeEnzyme
Substrate Product + Immobilised Enzyme Product Immob.Enzyme
Immobilised Enzyme
Fig. 1. Schematic diagram of free and immobilized enzyme reactions. (a), Reaction of free enzyme with substrate and formation of product, which has to be separated via dialysis; (b), Reaction of immobilized enzyme with substrate and formation of product, which can be separated via filtration or using a fluidized magnetized bed reactor system.
Immobilization provides a physical support for enzymes, cells and other molecules. Immobilization of enzymes is one of the main methods used to stabilize free enzymes (Elnashar, 2010a; Danial et al., 2010). The support material and the main methods of immobilization are key parameters in enzyme immobilization. There are five principal methods for immobilization of enzymes and cells (adsorption, covalent, entrapment, encapsulation and crosslinking) and no one method is perfect for all molecules or purposes. However, Katzbauer and Moser, 1995 represented a classification of combination between these methods.
1.4.1 Adsorption Immobilization by adsorption is the simplest method and involves reversible surface interactions between enzyme and support material as shown in Fig. 2. The procedure of adsorption consists of mixing together the biological component(s) and a support with adsorption properties, under suitable conditions of pH and ionic strength for a period of incubation, followed by collection of the immobilized material and extensive washing to remove the unbound biological components. The first industrially used immobilized enzyme was prepared by adsorption of amino acid acylase on DEAE-cellulose (Tosa et al., 1967). Menaa et al. (2008a) reported the role of hydrophobic surfaces of nanoporous silica glasses on protein folding enhancement. The proteins were adsorbed on silica surfaces.

Biotechnology of Biopolymers
6
_ _ _ _ _ _ _ _ _ _ _ _ _ _ _ _ _
Enzyme
Support
Fig. 2. Immobilization of enzymes using the adsorption technique. Advantages of enzymes immobilized using the adsorption technique: • Reversibility, which enables not only the purification of proteins but also the reuse of
the carriers; • Simplicity, which enables enzyme immobilization under mild conditions; • Possible high retention of activity because there is no chemical modification (Çetinus et
al., 2009); • Cheap and quick method; • No chemical changes to the support or enzyme occurs. Disadvantages of enzymes immobilized using the adsorption technique: • The immobilized enzymes prepared by adsorption tend to leak from the carriers, owing
to the relatively weak interaction between the enzyme and the carrier, which can be destroyed by desorption forces such as high ionic strength, pH, etc,
• Contamination of product, • Non-specific binding, • Overloading on the support and • Steric hindrance by the support. Consequently, a number of variations have been developed in recent decades to solve this intrinsic drawback. Examples are adsorption–cross-linking; modification–adsorption; selective adsorption–covalent attachment; and adsorption–coating, etc. For more details, the reader is recommended to read the book of Cao L, 2005.
1.4.2 Covalent binding This method of immobilization involves formation of a covalent bond between the enzyme and support material as shown in Fig. 3. Covalent bonds usually provide the strongest linkages between enzyme and carrier, compared with other types of enzyme immobilization methods. Thus, leakage of enzyme from the matrix used is often minimized with covalently bound immobilized enzymes (Cao, 2005). The bond is normally formed between functional groups present on the surface of the support and functional groups belonging to amino acid residues on the surface of the enzyme.
_ _ _ _ _ _ _ _ _ _ _ _ _ _ _ _ _
Enzyme
Support
Fig. 3. Immobilization of enzymes using the covalent technique.
Multi-step immobilization is one of the technologies to enhance enzyme covalent immobilization (Xie et al., 2009). There are many reaction procedures for coupling an

The Art of Immobilization Using Biopolymers, Biomaterials and Nanobiotechnology
7
enzyme to a support via covalent bond however, most reactions fall into the following categories: formation of an isourea linkage; formation of a diazo linkage; formation of a peptide bond or an alkylation reaction as shown in Table 1.
Reaction
Support – Enzyme Linkage
Diazotization SUPPORT--N=N---ENZYME SUPPORT--CH2-NH---ENZYME
Alkylation and arylation
SUPPORT--CH2-S---ENZYME
Schiff's base formation SUPPORT---CH=N---ENZYME
Amide bond formation SUPPORT---CO-NH---ENZYME
Amidation reaction SUPPORT---CNH-NH---ENZYME
Thiol-Disulfide interchange SUPPORT---S-S---ENZYME
Carrier binding with bifunctional reagents
SUPPORT---O(CH2)2 N=CH(CH2)3 CH=N---ENZYME
Table 1. Different methods for covalent binding of enzymes to supports Advantages of enzymes immobilized using the covalent technique: • No leakage of enzyme. • The enzyme can be easily in contact to substrate due to the localization of enzyme on
support materials. • Increase of the thermal stability. Disadvantages of enzymes immobilized using the covalent technique: • The cost is quite high as the good supports are very expensive (e.g. Eupergit C and
Agaroses). • Loss of enzyme activity (e.g. mismatched orientation of enzyme on the carriers such as
involvement of active centre in the binding).
1.4.3 Entrapment Immobilization by entrapment differs from adsorption and covalent binding as shown in Fig. 4 in that enzyme molecules are free in solution, but restricted in movement by the lattice structure of a gel (Bickerstaff, 1995). The porosity of the gel lattice is controlled to ensure that the structure is tight enough to prevent leakage of enzyme or cells, yet at the same time allows free movement of substrate and product. The support also acts as a barrier and can be advantageous as it protects the immobilized enzyme from microbial contamination by harmful cells, proteins, and enzymes in the microenvironment (Riaz et al., 2009).

Biotechnology of Biopolymers
8
Support
Enzyme
Fig. 4. Immobilization of enzyme using the entrapment technique.
Entrapment can be achieved by mixing an enzyme with a polyionic polymer material, such as carrageenan, and by crosslinking the polymer with multivalent cations, e.g. hexamethylene diamine, in an ion-exchange reaction to form a lattice structure that traps the enzymes, this is termed ionotropic gelations. Advantages of enzymes immobilized using the entrapment technique: • Enzyme loading is very high Disdvantages of enzymes immobilized using the entrapment technique: • Enzyme leakage from the support. • Diffusion of the substrate to the enzyme and of the product away from the enzyme
(diffusion limitation).
1.4.4 Encapsulation Encapsulation of enzymes as shown in Fig. 5 can be achieved by enveloping the biological components within various forms of semipermeable membranes (Groboillot et al., 1994). It is similar to entrapment in that the enzyme is free in solution, but restricted in space. Large proteins or enzymes can not pass out of, or into the capsule, but small substrates and products can pass freely across the semipermeable membrane. Many materials have been used to construct microcapsules varying from 10-100 μm in diameter. For example, nylon and cellulose nitrate have proven popular. Ionotropic gelation of alginates have proven it efficacy as well for encapsulation of drugs, enzymes and cells (Patil et al., 2010). On the nano scale level, Menaa et al., 2008b, 2009 & 2010 used Silica-based nanoporous sol-gel glasses for the study of encapsulation and stabilization of some proteins.
Enzyme
Support
Fig. 5. Immobilization of enzymes using the encapsulation technique.

The Art of Immobilization Using Biopolymers, Biomaterials and Nanobiotechnology
9
Advantages of enzymes immobilized using the encapsulation technique: • The enzymes could be encapsulated inside the cell. • Possibility of coimmobilization. Where cells and/or enzymes may be immobilized in
any desired combination to suit particular applications. Disdvantages of enzymes immobilized using the entrapment technique: • The problems associated with diffusion are acute and may result in rupture of the
membrane if products from a reaction accumulate rapidly.
1.4.5 Crosslinking This type of immobilization is support-free as shown in Fig. 6 and involves joining enzyme molecules to each other to form a large, three-dimensional complex structure, and can be achieved by chemical or physical methods (Xie et al., 2009). Chemical methods of crosslinking normally involve covalent bond formation between the enzymes by means of a bi- or multifunctional reagent, such as glutaraldehyde, dicarboxylic acid or toluene diisocyanate. Flocculating agents, such as polyamines, polyethyleneimine, polystyrene sulfonates, and various phosphates, have been used extensively to cross-link cells using physical bonds. Crosslinking is rarely used as the only means of immobilization, because poor mechanical properties of the aggregates are severe limitations. Crosslinking is most often used to enhance the other methods of immobilization described.
Enzyme
Fig. 6. Crosslinking technique. Advantages of enzymes immobilized using the crosslinking technique: • The immobilization is support-free. • Cross-linking between the same enzyme molecules stabilises the enzymes by increasing
the rigidity of the structure. Disdvantages of enzymes immobilized using the crosslinking technique: • Harshness of reagents of crooslinking is a limiting factor in applying this method to
many enzymes. • The enzyme may partially lose activity or become totally inactivated in case the cross-
linking reagent reacted across the active site.
1.5 Examples of matrices and shapes for immobilization Matrices for immobilization can be classified according to their chemical composition as organic and inorganic supports. The former can be further classified into natural and synthetic matrices as in Table 2 (Elnashar, 2005).

Biotechnology of Biopolymers
10
Organic
Inorganic
Natural polymers Polysaccharides Cellulose Dextran Starch Agar and agarose Alginate Carrageenans Chitin and chitosan Proteins Collagen Gelatin Albumin Ferritin
Minerals Attapulgite clays Bentonite Kieselgur Pumic stone Hornblend Diatomaceous earth Sand
Synthetic polymers Polystyrene Polyacrylate and polymethacrylate Polyacrylamides Hydroxyalkyl methacrylate Vinyl polymer Maleic anhydride polymer Polyethyleneglycol Aldehyde-based polymer
Fabricated materials Non-porous glass Controlled pore glass Controlled pore metal oxides Alumina catalyst Porous silica Silochrome Iron oxide Stainless steel
Table 2. Chemical classification of enzyme matrices.
The shape of the carrier can be classified into two types, i.e. irregular and regular shapes such as (A): beads; (B): fibres; (C): hollow spheres; (D): thin films; (E): discs and (F): membranes. Selection of the geometric properties for an immobilized molecule is largely dependent on the peculiarity of certain applications. Gel disks are widely used in the literature. Researchers usually use the casting method, e.g. a Petri dish, to make a single film of gel and then cut it into disks using cork borers. Elnashar et al., 2005, invented a new equipment to make many uniform films in one step and with high accuracy using the equipment "Parallel Plates" as shown in Fig. 7. Gel beads are mostly used in industries as they have the largest surface area and can be formed by many techniques such as the interphase technique, ionic gelation methods, dripping method and the Innotech Encapsulator (Danial et al., 2010; Elnashar et al., 2009a). The Innotech Encapsulator as shown in Fig. 8 has the advantage of high bead production (50 – 3000 beads per second depending on bead size and encapsulation-product mixture viscosity), which is suitable for the scaling up production on the industrial scale.

The Art of Immobilization Using Biopolymers, Biomaterials and Nanobiotechnology
11
Circular plates
Supportd (
Rod Spacing blocks Gel-Sheet
Beaker (1 L)
A B
Fig. 7. Parallel plates equipment for making uniform k-carrageenan gel disks.
Fig. 8. Inotech Encapsulator IE-50 R
Biotechnology of Biopolymers
12
1.6 Properties of matrices for immobilization The supports on which molecules such as enzymes, antibodies, antigens, etc will be immobilized are of great interest. The term support or media is usually understood to refer to a combination of a ligand that is firmly attached often by covalent means, and a solid insoluble matrix. These supports have to exhibit good chemical and physical stability and contain available functional groups to bind to the active molecule. To use a support for immobilization of active molecules such as enzymes, a range of fundamental properties are required, which are summarised as follows (Bickerstaff, 1995).
a. Availability of matrix from a reliable commercial source
b. Matrix has an abundance of easily derivatizable functional groups
c. Matrix has good mechanical and chemical stability
d. Matrix has good capacity for the target molecule
e. Matrix material is “user friendly”
2. Applications of immobilized molecules 2.1 Drug delivery systems Advanced drug delivery systems (ADDS) have found applications in many biomedical fields (Lin, 2006; Pollauf and Daniel, 2006). Drug delivery is a combination of material science, pharmaceutics and biology (Pack et al., 2005). Adoption of different types of membranes in ADDS has made it possible to release drug in an optimal fashion according to the nature of a disease (Grayson et al., 2003). Examples of drug delivery systems include glucose-sensitive insulin and drug loaded magnetic nanoparticles.
2.1.1 Development of glucose-sensitive insulin The swelling or shrinking of smart hydrogel beads in response to small changes in pH or temperature can be used successfully to control drug release, because the diffusion of the drug out of the beads depends on the gel state (Kim et al., 1995). Drug-delivery systems in which a drug is liberated in response to a chemical signal (e.g. insulin release in response to rising glucose concentration) can be achieved using this system. The exposure of a glucose-sensitive insulin releasing system to glucose resulted in the oxidation of glucose to gluconic acid and thus a decrease in the pH, protonation and shrinking of the polymer, leading to an increased release of insulin. The polymer swells in size at normal body pH (pH = 7.4) and closes the gates. It shrinks at low pH (pH = 4) when the blood glucose level increases, thus opening the gates and releasing the insulin from the nanoparticles (Sona, 2010).
2.1.2 Drug loaded magnetic manoparticles Nanotechnology offers the means to send the drugs to targeted sites, and has the drug released in a controlled manner, which reduce side effects due to lower dosage and minimize or prevent drug degradation by using pathways other than gastrointestinal. Magnetic nanoparticles are recently applied in various fields such as MRI imaging, water treatment, hyperthermia and drug delivery systems. Drug loaded magnetic nanoparticles

The Art of Immobilization Using Biopolymers, Biomaterials and Nanobiotechnology
13
(DLMNP) have several advantages such as: small particle size; large surface area; magnetic response; biocompatibility and non-toxicity. DLMNP is introduced through injection and directed with external magnets to the right organ, which requires smaller dosage because of targeting, resulting in fewer side effects. Recently, Yu et al., 2008 reported a novel In Vivo strategy for combined cancer imaging and therapy by employing thermally cross-linked superparamagnetic iron oxide nanoparticles as a drug-delivery carrier. Whereas, Kettering et al., 2009 used magnetic iron nanoparticles with cisplatin adsorbed in them for drug release in magnetic heating treatments for cancer.
2.2 Enzyme-Linked Immunosorbent Assays (ELISA) ELISA is a test used as a general screening tool for the detection of antibodies or antigens in a sample (Farré et al., 2007). ELISA technology links a measurable enzyme to either an antigen or antibody. The procedure for detection of Ab in patient’s sample as follows: - Immobilize Ag on the solid support (well) - Incubate with patient sample - Add antibody-enzyme conjugate - Amount of antibody-enzyme conjugate bound is proportional to amount of Ab in the
sample - Add substrate of enzyme - Amount of color is proportional to amount of Ab in patient’s sample. However, ELISA technique in some cases is regarded as time consuming and it needs special equipment to run the assay (not portable). Thus many techniques have been developed to fasten the process such as that of Xin et al., 2009, where he developed a chemiluminescence enzyme immunoassay using magnetic particles to monitor 17β-estradiol (E2) in environmental water samples. Another technique is using simple/rapid (S/R) test. The development of simple/rapid S/R tests has been extended from pregnancy detection of HIV antibodies in whole blood in addition to serum and plasma (World Health Organization, 2002).
2.3 Antibiotics production Penicillins are the most widely used β-lactam antibiotics, with a share of about 19 % of the estimated world-wide antibiotic market (Table 3) (Elnashar, 2005 & 2010). Production of antibiotics is one of the key areas in the field of applied microbiology. The conventional method of production is in stirred tank batch reactors. Since it is a no growth associated process, it is difficult to produce the antibiotic in continuous fermentations with free-cells. But it is a suitable case for cell immobilization, since growth and metabolic production can be uncoupled without affecting metabolite yields. Therefore, several attempts have been made to immobilize various microbial species on different supports matrices for antibiotic production. The most widely studied system is the production of penicillin G using immobilized cells of Penicillium chrysogenum (Ogaki et al., 1983). In a recent study by Elnashar et al., they were successful to covalently immobilize pencillin G acylase on carrageenan modified gels with retention of 100% activity after 20 reuses (Elnashar et al., 2008).

Biotechnology of Biopolymers
14
R
Beta-lactam ring
S
N
CH3CH3
COOHO
N
H
Penicillin core structure
R = Penicillin Variant H - 6-Amino-penicillanic acid (6-APA)
CH2 CO
Penicillin G
CH CO
NH2
Ampicillin
OCH3
OCH3
CO
Methicillin
CH CO
COONa
Carbenecillin
Cl
CO
NO
CH3
Cloxacillin
Table 3. Some semi-synthetic penicillins and naturally produced penicillin G.

The Art of Immobilization Using Biopolymers, Biomaterials and Nanobiotechnology
15
0
25
50
75
100
125
0 2 4 6 8 10 12 14 16 18 20
Number of Operations
Rel
ativ
e Im
mob
ilize
d PG
A A
ctiv
ity (%
)
Carr/PEI+/GA/PGACarr/KCl/PGA
Fig. 9. Operational stability of immobilized PGA. Using modified gel (Carr/PEI+/GA) and unmodified gel (Carr/KCl) for immobilization of PGA.
2.4 Medical applications particularly in therapy Medical applications of immobilized enzymes include (Piskin, 1993) diagnosis and treatment of diseases, among those enzyme replacement therapies, as well as artificial cells and organs, and coating of artificial materials for better biocompatibility. Examples of potential medical uses of immobilized enzyme systems are listed below. For more applications, readers are encouraged to read the review article of Soetan et al., 2010, where he reviewed the biochemical, biotechnological and other applications of enzymes. • Asparaginase (3.5.1.1) for leukemia • Arginase (3.5.3.1) for cancer • Urease (3.5.1.5) for artificial kidney, uraemic disorders • Glucose oxidase (1.1.3.4) for artificial pancreas • Carbonate dehydratase (4.2.1.1) and catalase (1.11.1.6) for artificial lungs • Glucoamylase (3.2.1.3) for glycogen storage disease • Glucose-6-phosphate dehydrogenase (1.1.1.49) for glucose-6-phosphate dehydrogenase
deficiency • Xanthine oxidase (1.1.3.22) for Lesch–Nyhan disease • Phenylalanine ammonia lyase (4.3.1.5) for phenylketonuria • Urate oxidase (1.7.3.3) for hyperuricemia • Heparinase (4.2.2.7) for extracorporeal therapy procedures In addition to the above applications, we will focus the light on some important applications as solving the problem of lactose Intolerant people, production of fructose for diabetics and for people on diet regimen, and treatment of rheumatoid arthritis and joint diseases.

Biotechnology of Biopolymers
16
2.4.1 Solving the problem of lactose intolerant people β-galactosidase is widely used in milk industries for hydrolysis of lactose to glucose and galactose. Lactose is the main carbohydrate contained in milk at a concentration between 5% and 10% (w/v) depending on the source of milk (Ordoñez, 1998). Lactose could also be found in whey permeate at higher concentrations. The consumption of foods with a high content of lactose is causing a medical problem for almost 70% of the world population, especially in the developing countries, as the naturally present enzyme (β-galactosidase) in the human intestine, loses its activity during lifetime (Richmond & Stine, 1981). Undigested lactose in chyme retains fluid, bacterial fermentation of lactose results in production of gases, diarrhoea, bloating and abdominal cramps after consumption of milk and other dairy products. Unfortunately, there is no cure to "lactose intolerance". This fact, together with the relatively low solubility and sweetness of lactose, has led to an increasing interest in the development of industrial processes to hydrolyze the lactose contained in dairy products (milk and whey) with both the free and immobilized conditions (German, 1997). The studies have shown that glucose and galactose, the two monosaccharides hydrolosates of lactose (products hydrolyzed from lactose), are four times sweeter than lactose, more soluble, more digestible (Sungur & Akbulut, 1994), and can be consumed by ‘lactose intolerant’ people. Immobilized β-galactosidase on thermostable biopolymers of grafted carrageenan were studied recently by Elnashar and Yassin and interesting results were obtained (Elnashar and Yassin, 2009a, 2009b).
CarrageenanGel disk(-OSO3
-)
ChitosanHardener
(-NH3+, NH2)
Glutaraldehyde(Spacer arm)
(-CHO)
β-Galactosidase(Enzyme)
(-NH2)
---
+++
Chitosan-N=CH-(CH2)3-HC=N-Enz
CarrageenanGel disk(-OSO3
-)
ChitosanHardener
(-NH3+, NH2)
Glutaraldehyde(Spacer arm)
(-CHO)
β-Galactosidase(Enzyme)
(-NH2)
---
+++
Chitosan-N=CH-(CH2)3-HC=N-Enz
Fig. 10. Carrageenan coated chitosan followed by glutaraldehyde (GA) as a spacer arm to immobilize covalently β-galactosidase (Enz) to the chitosans amino groups via Schiff's base formation.
2.4.2 Fructose for diabetics and for people on diet regimen People on diet regimen and patients suffering from diabetes are highly recommended to consume fructose rather than any other sugar. Fructose can be produced from starch by enzymatic methods involving α-amylase, amyloglucosidase, and glucose isomerase, resulting in the production of a mixture consisting of oligosaccharides (8%), fructose (45%),

The Art of Immobilization Using Biopolymers, Biomaterials and Nanobiotechnology
17
and glucose (50%) (Gill et al., 2006). However, separation of fructose from this high content fructose syrup is costly and thus makes this method uneconomical. In industries, inulinases are used to produce 95% of pure fructose after one step of the enzymatic hydrolysis of inulin. Industrial inulin hydrolysis is carried out at 60 °C to prevent microbial contamination and also because it permits the use of higher inulin substrate concentration due to increased solubility., Elnashar et al., have succeeded recently to produce a thermostable inulinolytic immobilized enzyme, which would be expected to play an important role in food and chemical industries, in which fructose syrup is widely applied (Elnashar et al., 2009; Danial et al., 2010).
0
200
400
600
800
1000
1200
1400
1600
1800
U/g
Gel
Bea
ds
U 97 178 270 548 962 1433 1627
1:20 1:15 1:10 1:5 1:3 1:2 1:1
Fig. 11. Optimization of the enzyme loading capacity using grafted alginate beads prepared by the one-step method. Where 0.5g of the gel beads were soaked in 5 ml of 1:20, 1:15, 1:10, 1:5, 1:3, 1:2 and 1:1 dil enzyme in 0.1 M acetate phosphate buffer at pH 4.8 for 16 h.
2.4.3 Treatment of rheumatoid arthritis and joint diseases Superoxide dismutase (SOD) and catalase (CAT) have been encapsulated in biodegradable microspheres (MS) to obtain suitable sustained protein delivery (Giovagnoli, 2004). A modified water/oil/water double emulsion method was used for poly (D,L-lactide-co-glycolide) (PLGA) and poly (D, L-lactide) PLA MS preparation co-encapsulating mannitol, trehalose, and PEG400 for protein stabilization. SOD release from PLGA MS may be potentially useful for long-term sustained release of the enzyme for the treatment of rheumatoid arthritis or other intra-articular and joint diseases (inflammatory manifestation).

Biotechnology of Biopolymers
18
2.5 Non medical applications of immobilized enzymes 2.5.1 Treatment of pesticide-contaminated waste Application of pesticide in agriculture serves to lower the cost of production, increase crop yields, provide better quality produce and also reduce soil erosion. Although pesticides are toxic and have adverse effect on human health and the environment, their use is inevitable in many cases as an effective means of controlling weeds, insect, and fungus, parasitic and rodent pests. One of the most important technologies to be applied for this approach is immobilized enzyme. The immobilized enzyme is capable of breaking down a range of pesticide-contaminated waste as organophosphate insecticides (Horne et al., 2002; Sharmin et al., 2007).
2.5.2 Neutralizing dangerous chemical gases or vapors The use of immobilized enzymes in the national security arena has shown to be promising. For example, they could include infiltrating items such as air filters, masks, clothing, or bandages with the concentrated immobilized enzymes to neutralize dangerous chemical gases or vapors (Ackerman and Lei, 2008).
2.6 Purification of proteins Protein purification is an important objective in industrial enzymes in order to increase the enzyme's specific activity and to obtain an enzyme in its pure form for a specific goal. Affinity ligands is the most used technique for purification of target molecules as it can reduce the number of chromatographic steps in purification procedures to one or two steps. Immobilization of affinity ligands to an insoluble support can be a powerful tool in isolation of particular substances (e.g. protein) from a complex mixture of proteins. Some examples of affinity ligands are immobilized carbohydrate-binding proteins and immobilized metal ions. Another technique for protein purification is using Electric field gradient focusing (EFGF). For more information on the principles and methods of protein purification, readers should refer to the handbook "Purifying challenging proteins: principles and methods" in 2007.
2.6.1 Immobilized carbohydrates-binding proteins Purification of proteins could be performed using immobilized carbohydrates such as mannose, lactose and melibiose. For example, immobilized lactose on sepharose 4B™ will be selective for purification of lactase from a mixture of other proteins. More information on this technique can be found in the book "Immobilized affinity ligand techniques" (Hermanson et al., 1992).
2.6.2 Electric Field Gradient Focusing (EFGF) Electric field gradient focusing is a member of the family of equilibrium gradient focusing techniques (e.g gel electrophoresis). It depends on an electric field gradient and a counter-flow to focus, concentrate and separate charged analytes, such as peptides and proteins. Since analytes with different electrophoretic mobilities have unique equilibrium positions, EFGF separates analytes according to their electrophoretic mobilities, similar to the way isoelectric focusing (IEF: electrophoresis is a pH gradient where the cathode is at a higher pH value than the anode) separates analytes according to isoelectric points. The constant
The Art of Immobilization Using Biopolymers, Biomaterials and Nanobiotechnology
19
counter flow is opposite to the electrophoretic force that drives the analytes. When the electrophoretic velocity of a particular analyte is equal and opposite to the velocity of the counter flow, the analyte is focused in a narrow band because at this position the net force on it is zero. However, EFGF avoids protein precipitation that often occurs in IEF when proteins reach their isoelectric points and, therefore, can be applied to a broad range of proteins. Sun (2009) in his Ph.D. thesis demonstrated that protein concentration exceeding 10,000-fold could be concentrated using such devices.
2.7 Extraction of biomolecules using magnetic particles The traditional methods for biomolecules purification such as centrifugation, filtration, and chromatography can today be replaced by the use of magnetic particles. They are reactive supports for biomolecules capturing. Their use is simple, fast, and efficient for the extraction and purification of biomolecules. In the biomedical Weld, numerous publications deal with the use of magnetic particles for biomolecule extraction (Delair and Meunier, 1999), cell sorting (Kemshead et al., 1985), and drug delivery (Langer, 1990). Magnetic beads are widely used in molecular biology (Andreadis and Chrisey, 2000), medical diagnosis (Myrmel et al., 2000), and medical therapy (Kemshead et al., 1985). The major application concerns the extraction of biomolecules such as proteins (Ding and Jiang, 2000), antibodies, and nucleic acids (Rouquier and Tracks, 1995). Magnetic beads carrying antibodies are also used for specific bacteria (Kemshead et al., 1985) and virus captures (Myrmel et al., 2000). Krupey in 1994 patented a method for virus capture process. The method was based on interactions between viruses and anionic polymers, leading to the precipitation of complexes by charge neutralization. After the capture step, viruses were extracted by centrifugation. At the current time, to our knowledge, only one method using magnetic beads has been published recently (Ifiata et al., 2003). In these studies, some DNA and RNA viruses were concentrated more than 100 and 1000 times, respectively, using polyethyleneimine (PEI)1-conjugated magnetic beads.
2.8 Heavy metals removal Heavy metal pollution is an environmental problem of worldwide concern. Several industrial wastewater streams may contain heavy metals such as; Pb, Cr, Cd, Ni, Zn, As, Hg, Cu, Ag. Traditionally, precipitation, solvent extraction, ion-exchange separation and solid phase extraction are the most widely used techniques to eliminate the matrix interference and to concentrate the metal ions. Many materials have been used to remove them such as sorbents (Abdel Hameed and Ebrahim, 2007) (e.g. silica, chitosan, sponge, etc) and biosorbents (Shareef, 2009) (e.g. immobilized algae). Biosorbents: can be defined as the selective sequestering of metal soluble species that result in the immobilization of the metals by microbial cells such as cyanobacteria. It is the physicochemical mechanisms of inactive (i.e. non-metabolic) metal uptake by microbial biomass. Metal sequestering by different parts of the cell can occur via various processes: complexation, chelation, coordination, ion exchange, precipitation, reduction. Size of immobilized bead for metals removal is a crucial factor for use of immobilized biomass in bio-sorption process. It is recommended that beads should be in the size range between 0.7 and 1.5 mm, corresponding to the size of commercial resins meant for removing metal ions.
Biotechnology of Biopolymers
20
Abdel Hameed and Ebrahim, 2007 in their review article, has revealed some of the immobilized algae on different matrices that have potential in heavy metals removal due to its high uptake capacity and abundance.
2.9 Production of biosensors Biosensors are chemical sensors in which the recognition system utilizes a biochemical mechanism (Jianrong et al., 2004). A biosensor is a sensing device made up of a combination of a specific biological element and a transducer. The ”specific biological element” such as antibodies, (Rodriguez-Mozaz et al., 2004) enzymes (Nistor, 2002), bacteria (Philp et al., 2003; Petanen and Romantschuk, 2002) and DNA (Marrazza et al., 1999) recognizes a specific analyte such as pollutions (toxicity caused by pesticides, phenols, mercury, arsenic, etc) and the changes in the biomolecule are usually converted into electrical signal (which is in turn calibrated to a certain scale) by a transducer.
2.10 Production of biodiesel The idea of using biodiesel as a source of energy is not new (Sawayama et al., 1995), but it is now being taken seriously because of the escalating price of petroleum and, more significantly, the depletion of fossil fuels (oil and gas) within the next 35 years and the emerging concern about global warming that is associated with burning fossil fuels (Gavrilescu and Chisti, 2005). Biodiesel is much more environmentally friendly than burning fossil fuels, to the extent that governments may be moving towards making biofuels mandatory (Biodiesel review, 2006). The global market survey of biodiesel has shown a tremendous increase in its production. Biodiesel is made by chemical combination of any natural oil or fat with an alcohol such as methanol and a catalyst (e.g. lipases) for the transesterification process. Transesterification is catalyzed by acids, alkalis (Meher et al., 2006) and lipase enzymes (Sharma et al., 2006). Use of lipases offers important advantages as it is more efficient, highly selective, involves less energy consumption (reactions can be carried out in mild conditions), and produces less side products or waste (environmentally favorable). However, it is not currently feasible because of the relatively high cost of the catalyst (Fukuda et al., 2001). On the industrial level, a number of methods for the immobilization of lipases on solid supports have been reported (Pedersen and Christensen, 2000). Commercially available lipases are supplied both as lyophilised powders, which contain other components in addition to the lipase (Salis et al., 2005). The immobilized lipases most frequently used for biodiesel production are lipase B from Candida Antarctica (Chang et al., 2005). This is supplied by Novozymes under the commercial name Novozym 435® (previously called SP435) and is immobilized on an acrylic resin. The Mucor miehei commercial lipase (Lipozyme IM60 – Novozym) immobilized on a macroporous anionic exchange resin has also been extensively used for the same purpose (De Oliveira et al., 2004).
2.11 Life detection and planetary exploration Analytical techniques based on mass spectrometry have been traditionally used in space science. Planetary exploration requires the development of miniaturized apparatus for in situ life detection. Recently, a new approach is gaining acceptance in the space science

The Art of Immobilization Using Biopolymers, Biomaterials and Nanobiotechnology
21
community: the application of the well-known, highly specific, antibody–antigen affinity interaction for the detection and identification of organics and biochemical compounds. Antibody microarray technology allows scientists to look for the presence of thousands of different compounds in a single assay and in just one square centimeter. The detection of organic molecules of unambiguous biological origin is fundamental for the confirmation of present or past life. Preservation of biomarkers on the antibody stability under space environments, smaller biomolecules, such as amino acids, purines, and fatty acids, are excellent biomarkers in the search for life on Mars, but they may be much less resistant to oxidative degradation. Recent work by Kminek and Bada, 2006 showed that amino acids can be protected from radiolysis decomposition as long as they are shielded adequately from space radiation. They estimated that it is necessary to drill to a depth of 1.5 to 2 m to detect the amino acid signature of life that became extinct about three billion years ago. A microfabricated capillary (Barron, 2008) electrophoresis device (kind of new immobilization technology) for amino acid chirality determination was developed for extraterrestrial exploration (Hutt et al., 1999). Recently, antibody microarray, a new immobilization technology that kept the stability of antibody under space environment allowed it to be applied for planetary exploration Exomars mission, 2005.
3. Recent advances in supports and technologies used in enzyme immobilization In the search for suitable supports for enzyme immobilization, it was found that physical and chemical properties (e.g. pore size, hydrophilic/hydrophobic balance, aquaphilicity and surface chemistry) of support could exert effect on enzyme immobilization and its catalytic properties (Cao et al., 2003). Thus there was a need for new immobilization techniques/supports to avoid such shortcomings (Xie et al., 2009). The following are some examples of the recent carriers and technologies used for enzyme immobilization.
3.1 New carriers used in immobilization 3.1.1 Mesoporous support Over the last few years, mesoporous support such as silica and silicates having pore size of 2–50 nm has been developed and being considered as one of the most promising carriers for enzyme immobilization (Chen et al., 2007b; Kim et al., 2007; Rosales-Hernandez et al., 2007; Wang et al., 2007; Wang et al., 2008a). The exploitation of novel carriers that enable high enzyme loading and activity retention has become the focus of recent attention (Boller et al., 2002). The large surface areas and greater pore volumes of these materials could enhance the loading capacity of an enzyme and the large pores in the support facilitate transport of substrate and product (Chong and Zhao, 2004). Functional mesoporous material resulted in exceptionally high immobilization efficiency with enhanced stability, while conventional approaches yielded far lower immobilization efficiency (Lei et al., 2002). Additionally, the increase in the thermal stability of immobilized enzyme indicated that protein inside a confined space could be stabilized by some folding forces which did not exist in proteins in bulk solutions (Wang et al., 2008b). Confinement of the support nanopore could be similar to the macromolecular crowding (Cheung and Thirumalai, 2006), and could also stabilize the enzyme at high temperature.

Biotechnology of Biopolymers
22
Nanoporous gold (Szamocki et al., 2007) and nanotube (Chen et al., 2001; Wan et al., 2008) have also been used to immobilize enzymes. Most of the obtained immobilized enzymes were used in the electrode preparation and biosensor applications. The modified porous gold electrode shows an overall increased signal, and therefore a better detection limit and higher sensitivity when used as sensors.
3.1.2 Magnetic hybrid support The use of magnetic supports for enzyme immobilization enables a rapid separation in an easily stabilized fluidized bed reactor for continuous operation of enzyme. It can also reduce the capital and operation costs (Bayramoglu et al., 2008). Due to the functionalization (Dyal et al., 2003) of enzyme and its suitable microenvironment, magnetic materials were often embedded in organic polymer or inorganic silica to form hybrid support (Liu et al., 2005). Recently, because of the low enzyme loading on the conventional magnetic beads (Liu et al., 2005), further attention was paid to the magnetic mesoporous support (Sadasivan and Sukhorukov, 2006). Magnetite mesoporous silica hybrid support was fabricated by the incorporation of magnetite to the hollow mesoporous silica shells, which resulted in the perfect combination of mesoporous materials properties with magnetic property. The produced hybrid support has shown to improve the enzyme immobilization (Kim et al., 2005).
3.2 New technologies for enzyme immobilization 3.2.1 Single enzyme nanoparticles In the field of industrial enzymes, there is a great research for improving the enzyme stability under harsh conditions. As an innovative way of enzyme stabilization, “single-enzyme nanoparticles (SENs)” technology was rather attractive because enzyme in the nanoparticle exhibited very good stability under harsh conditions (Hegedus and Nagy, 2009; Yan et al., 2006). Kim and Grate (2003) have developed armored SENs that surround each enzyme molecule with a porous composite organic/ inorganic network of less than a few nanometers thick. They significantly stabilized chymotrypsin and trypsin and the protective covering around chymotrypsin is so thin and porous that a large mass transfer limitation on the substrate could not take place. Yan et al. (2006) provided a simple method that yields a single enzyme capsule with enhanced stability, high activity and uniformed size. The 2-step procedure including surface acryloylation and in situ aqueous polymerization to encapsulate a single enzyme in nanogel to provide robust enzymes for industrial biocatalysis. The immobilized horseradish peroxidase (HRP) exhibited similar biocatalytic behavior (Km and kcat) to the free enzyme. However, the immobilization process significantly improved the enzyme\s stability at high temperature in the presence of polar organic solvent.
3.2.2 Enzymatic immobilization of enzyme The use of green chemistry rather than using harsh chemicals is one of the main goals in enzyme industries to avoid the partial denaturation of enzyme protein. An emerging and novel technology is to fabricate solid protein formulations (Tanaka et al., 2007; Wong et al., 2008). As model proteins, enhanced green fluorescent protein (EGFP) and glutathione S-transferase (GST) were tagged with a neutral Gln-donor substrate peptide for MTG (Leu-
The Art of Immobilization Using Biopolymers, Biomaterials and Nanobiotechnology
23
Leu-Gln-Gly, LLQG-tag) at their C-terminus and immobilized onto the casein-coated polystyrene surface (Tanaka et al., 2007). Luciferase (Luc) and glutathione-S-transferase (GST) ybbR-fusion proteins were immobilized onto PEGA resin retaining high levels of enzyme activity using phosphopantetheinyl transferase (Sfp) mediating site-specific covalent immobilization (Wong et al., 2008). In general, the Sfp-catalyzed surface ligation is mild, quantitative and rapid, occurring in a single step without prior chemical modification of the target protein.
3.2.3 Microwave irradiation The use of porous supports for immobilization of enzymes is difficult to distribute because of diffusion limitations (Buchholz, 1979) and they often remain only on external channel (Chen et al., 2007a). For enzymes having large dimensions, such as penicillin acylase (PA), the mass transfer is even slower. The immobilization of such enzyme to porous materials can prove tedious using conventional techniques (Van Langen et al., 2002). Wang et al., 2008b & 2009a have recently succeeded to immobilize papain and PA using the adsorption technique into the mesocellular siliceous foams (MCFs) using microwave irradiation technology. Reaction time of 80 and 140 s were enough for papain and PA to attach on the wall of MCFs, respectively. The activities of papain and penicillin acylase immobilized with microwave-assisted method were 779.6 and 141.8 U/mg, respectively. In another experiment, macromolecules crowding was combined with small molecular quenching to perfect microwave-assisted covalent immobilization (Wang et al., 2009a).
3.2.4 Photoimmobilization technology In the field of immobilization of biomolecules, potential applications of photoimmobilization using nitrene groups could take place. Nitrene groups have a property of insertion into C-H bond. When photoreactive polymer and horseradish peroxidase or glucose oxidase are exposed to ultraviolet (UV) light at 365 nm, the reactive nitrene immobilizes the protein molecules in 10 to 20 min through covalent bonding (Naqvi and Nahar, 2004). Horseradish peroxidase (HRP) and glucose oxidase (GOD) have been immobilized onto the photoreactive cellulose membrane by the ultraviolet and sunlight Kumar and Nahar (2007). They found that sunlight intensity required for optimum immobilization was 21,625 lux beyond which no appreciable increase in immobilization was observed. Moreover, sunlight exposure gave better immobilization compared to 365 nm UV light.
3.2.5 Ionic liquids Ionic liquids, the green solvents for the future, are composed entirely of ions and they are salts in the liquid state. In the patent and academic literature, the term “ionic liquid” now refers to liquids composed entirely of ions that are fluid around or below 100 °C (e.g. ethanolamine nitrate, m.p. 52-55 oC). The date of discovery of the "first" ionic liquid is disputed, along with the identity of the discoverer. Room-temperature ionic liquids are frequently colorless, fluid and easy to handle (Rogers and Seddon, 2003). Versatile biphasic systems could be formed by controlling the aqueous miscibility of ionic liquid (Gutowski et al., 2003). Based on a biphasic catalytic system where the enzyme is immobilized into an ionic liquid (IL), Mecerreyes and co-workers (Rumbau et al., 2006) have reported a new method which allows recycling and re-using of the HRP enzyme in the

Biotechnology of Biopolymers
24
biocatalytic synthesis of PANI. The HRP enzyme was dissolved into the IL 1-butyl-3-methylimidazolium hexafluorophosphate and the IL/HRP phase acts as an efficient biocatalyst and can be easily recycled and reused several times. Due to the immiscibility between the IL and water, the immobilized HRP could be simply recovered by liquid/ liquid phase separation after the biocatalytic reaction (Sheldon et al., 2002; van Rantwijk et al., 2003). Although this new method is faster and easier than the classical immobilization of HRP into solid supports, it is not widely applied in the industries because of the ionic liquids' expenses. However, according to Taubert, A (2005), there will be a bright future for ionic liquids by using inorganic materials synthesis.
4. Recommendation for the future of immobilization technology At present, a vast number of methods of immobilization are currently available. Unfortunately, there is no a universal enzyme support, i.e. the best method of immobilization might differ from enzyme to enzyme, from application to application and from carrier to carrier. Accordingly, the approaches currently used to design robust industrial immobilized enzymes are, without exception, labeled as “irrational”, because they often result from screening of several immobilized enzymes and are not designed. As a consequence, some of the industrial enzymes are working below their optimum conditions. Recently, Cao L. (2005) in his book "Carrier bound immobilized enzymes" tackled this problem as he surmised that the major problem in enzyme immobilization is not only the selection of the right carrier for the enzyme immobilization but it is how to design the performance of the immobilized enzyme. The author of this review article is suggesting from his point of view as he is working in that field for the last ten years to follow these steps in order to get to this goal in the shortest time: 1. build a data base containing all information on the available biomolecules (enzymes,
antibodies, etc) and carriers (organic, inorganic, magnetic hybrid, ionic liquids, etc) then 2. use the dry lab (bioinformatics) to validate the probability of success and the efficiency
of the immobilization process then 3. starting the experiment in the wet lab. The author believes that if this strategy could be performed, we should expect immobilized molecules working at their optimum conditions, with higher stability and efficiency, which will save money, time and effort for the prosperity of human being.
5. Acknowledgment The author would like to thank the Centre of Excellence for Advanced Sciences, NRC, Egypt, the Research and Development Innovation (RDI) program and the Science and Technology Development Fund STDF/IMC for supporting this work, and highly appreciates the efforts of Mrs Joanne Yachou for her contribution towards editing.
6. References Abdel Hameed M, Ebrahim O (2007). Review: Biotechnological potential uses of
immobilized algae. Int. J. Agri. Biol. 9, 183.

The Art of Immobilization Using Biopolymers, Biomaterials and Nanobiotechnology
25
Ackerman E, Lei C (2008). Immobilizing enzymes for useful service. http//www.google. 19.11.2008.
Andreadis JD, Chrisey LA (2000). Use of immobilized PCR primer to generate covalently immobilized DNAs for in vitro transcription/translation reaction, Nucleic Acids Res. 28, e5.
Ayala M. Torres E. (2004). Enzymatic activation of alkanes: constraints and prospective. Appl. Catal. A: General. 272, 1.
Barron LD (2008). Chirality and life. Space Sci. Rev.135, 187. Bayramoglu G, Kiralp S, Yilmaz M, Toppare L, Arica MY (2008). Covalent immobilization of
chloroperoxidase onto magnetic beads: Catalytic properties and stability. Biochem. Eng. J. 38, 180.
Bickerstaff GF (1995) Impact of genetic technology on enzyme technology. Genet. Eng. Biotechnol. 15, 13.
Biodiesel Review (2006). In Google: http://www.sipef.be/pdf/biodiesel_presentation.pdf
Boller T, Meier C, Menzler S (2002). Eupergit oxirane acrylic beads: How to make enzymes fit for biocatalysis. Org. Process Res. Dev. 6, 509.
Buchholz K (1979). Non uniform enzyme distribution inside carriers. Biotechnol. Lett. 1, 451. Buyukgungor H, Gurel L (2009) .The role of biotechnology on the treatment of wastes.
African J. Biotechnol. 8, 7253. Cao L, Schmid RD (2005). Carrier-bound Immobilized Enzymes: Principles, Application and
Design. WILEY-VCH Verlag GmbH & Co. Weinheim. Cao, L. (2005). Immobilized enzymes: science or art? Curr. Opinion Chem. Biol. 9, 217. Carpentier B, Cerf O (1993). Biofilms and their consequences, with particular reference to
hygiene in the food industry. J. Appl. Bacteriol. 75, 499. Çetinus S, Sahin E, Saraydin D (2009) Preparation of Cu(II) adsorbed Chitosan beads for
catalase immobilization. Food Chem. 114, 962 Chang HM, Liao HF, Lee CC, Shieh CJ (2005). Optimized synthesis of lipase-catalyzed
biodiesel by Novozym 435. J. Chem. Technol. Biotechnol. 80, 307. Chen B, Miller EM, Miller L, Maikner JJ, Gross RA (2007a). Effects of macroporous resin size
on Candida antarctica lipase B adsorption, fraction of active molecules, and catalytic activity for polyester synthesis. Langmuir. 23, 1381.
Chen B, Miller ME, Gross RA (2007b). Effects of porous polystyrene resin parameters on Candida antarctica lipase B adsorption, distribution, and polyester synthesis activity. Langmuir. 23, 6467.
Chen RJ, Zhang YG, Wang DW, Dai HJ (2001). Noncovalent sidewall functionalization of single-walled carbon nanotubes for protein immobilization. J. Am. Chem. Soc. 123, 3838.
Cheung MS, Thirumalai D (2006). Nanopore-protein interactions dramatically alter stability and yield of the native state in restricted spaces. J. Mol. Biol. 357, 632.
Chong ASM, Zhao XS (2004). Design of large-pore mesoporous materials for immobilization of penicillin G acylase biocatalyst. Catal. Today, 93-95, 293.

Biotechnology of Biopolymers
26
Danial EN, Elnashar MM, Awad GE (2010). “Immobilized Inulinase on Grafted Alginate Beads Prepared by the One-Step and the Two-Steps Methods”. Indus. Eng. Chem. Res. 49, 3120.
De Oliveira D, Di Luccio M, Faccio C, Rosa CD, Bender JP, Lipke N, Menoncin S, Amroginski C, De Oliveira JV (2004). Optimization of enzymatic production of biodiesel from castor oil in organic solvent medium. Appl. Biochem. Biotechnol. 113–116, 771–780.
Delair T, Meunier F (1999). Amino-containing cationic latex oligo-conjugates: application to diagnostic test sensitivity enhancement, Colloids Surf. 153, 341.
Ding X, Jiang Y (2000). Adsorption/desorption of protein on magnetic particles covered by thermosensitive polymers, J. Appl. Polym. Sci. 278, 459.
Dyal A, Loos K, Noto M, Chang SW, Spagnoli C, Shafi K, Ulman A, Cowman M, Gross RA (2003). Activity of Candida rugosa lipase immobilized on gamma-Fe2O3 magnetic nanoparticles. J. Am. Chem. Soc. 125, 1684.
Elnashar MM (2005). Ph.D. thesis entitled Development of a Novel Matrix for the Immobilization of Enzymes for Biotechnology. Leeds University, UK.
Elnashar, MM (2010a): Review article: “Immobilized Molecules Using Biomaterials and Nanobiotechnology". Journal of Biomaterials and Nanobiotechnology 1, 61.
Elnashar, MM (2010b). Low-Cost Foods and Drugs Using Immobilized Enzymes on Biopolymers, Biopolymers, Magdy Elnashar (Ed.), ISBN: 978-953-307-109-1, Sciyo, Available from: http://www.intechopen.com/articles/show/title/low-cost-foods-and-drugs-using-immobilized-enzymes-on-biopolymers.
Elnashar, MM (2010c), Book of Biopolymers, http://www.intechopen.com/books/show/title/biopolymers
Elnashar MM, Millner PA, Johnson AF, Gibson TD (2005). Parallel plate equipment for preparation of uniform gel sheets. Biotechnol. Lett. 27, 737.
Elnashar MM, Danial EN, Awad GE (2009a). “Novel Carrier of Grafted Alginate for Covalent Immobilization of Inulinase”. Indus. Eng. Chem. Res. 48, 9781.
Elnashar MM, Yassin AM (2009a). “Covalent immobilization of β-galactosidase on carrageenan coated chitosan”. J. Appl. Polym. Sci. 114, 17.
Elnashar MM, Yassin AM (2009b). Lactose Hydrolysis by β-Galactosidase Covalently Immobilized to Thermally Stable Biopolymers. J. Appl. Biochem. Biotechnol. 159, 426.
Elnashar MM, Yassin AM, Abdel Moneim AA, Abdel Bary EM (2009b). Surprising Performance of Alginate Beads for the Release of Low Molecular Weight Drugs. J. Appl. Polym. Sci. Accepted in Nov. 2009.
Elnashar MM, Yassin AM, Kahil T (2008). Novel thermally and mechanically stable hydrogel for enzyme immobilization of penicillin G acylase via covalent technique. J. Appl. Polym. Sci. 109, 4105.
Exomars mission conference (2005). In Google: http://www.aurora.rl.ac.uk/Report_of_Pasteur_9_Sept. pdf.
Farre, M.; Kuster, M.; Brix, R.; Rubio, F.; Alda, M.-J. L. d.; Barcelo, D. (2007) Comparative study of an estradiol enzyme-linked immunosorbent assay kit, liquid chromatography-tandem mass spectrometry, and ultra performance liquid

The Art of Immobilization Using Biopolymers, Biomaterials and Nanobiotechnology
27
chromatography-quadrupole time of flight mass spectrometry for part-per-trillion analysis of estrogens in water samples. J. Chromatog. A. 1160, 166.
Fukuda H, Kondo A, Noda H (2001). Biodiesel fuel production by transesterification of oils. J. Biosci. Bioeng. 92, 405.
Future of biodiesel (2007). In Google: http://www.emergingmarkets.com/biodiesel/press/Biodiesel2020_Futurist_0707.pdf
Gavrilescu M, Chisti Y (2005). Biotechnology: a sustainable alternative for chemical industry. Biotechnol. Adv. 23, 471.
German JH (1997). Applied enzymology of lactose hydrolysis. In Milk powders for the future, pp. 81.
Gill P, Manhas R, Singh P (2006). Hydrolysis of inulin by immobilized thermostable extracellular exoinulinase from Aspergillus fumigatus. J. Food Eng. 76, 369.
Giovagnoli S (2004). Biodegradable Micropheres as carriers for native Superoxide Dismutase and Catalase delivery. AAPS Pharm. Sci. Tech. 5, 51.
Grayson ACR, Choi IS, Tyler BM, Wang PP, Michael BH (2003). Multi-pulse drug delivery from a resorbable polymeric microchip device, Nat. Mater. J. Cima. 2, 767.
Groboillot A, Boadi DK, Poncelot D, Neufled RJ (1994). Immobilization of cells for application in the food industry. Crit. Rev. Biotechnol. 14, 75.
Gutowski KE, Broker GA, Willauer HD, Huddleston JG, Swatloski RP, Holbrey JD, Rogers RD (2003). Controlling the aqueous miscibility of ionic liquids: Aqueous biphasic systems of water-miscible ionic liquids and water-structuring salts for recycle, metathesis, and separations. J. Am. Chem. Soc. 125, 6632.
Hand book from GE Healthcare (2007) Purifying challenging proteins: principles and methods. Publisher: General Electric Co.
Hegedus I, Nagy E (2009). Improvement of chymotrypsin enzyme stability as single enzyme nanoparticles. Chem. Eng. Sci. 64, 1053.
Hermanson G, Mallia A, Smith P (1992). Immobilized affinity ligand techniques. Academic Press Incorporation.
Horne I, Sutherland TD, Harcourt RL, Russell RJ, Oakeshott JG (2002). Identification of an (organophosphate degradation) gene in an Agrobacterium isolate. Appl. Environ. Microbiol. 68, 3371.
Hutt LD, Glavin DP, Mathies RA (1999). Microfabricated Capillary Electrophoresis Amino Acid Chirality Analyzer for Extraterrestrial Exploration. Anal. Chem. 71, 4000.
Ifiata A, Satoh K, Murata M, Hikata M, Hayakawa T, Yamaguchi T (2003). Virus concentration using sulfonated magnetic beads to improve sensitivity in nucleic acid amplification tests. Biol. Pharm. Bull. 26, 1065.
Jianrong C, Yuqing M, Nongyue H, Xiaohua W, Sijiao L (2004). Nanotechnology and biosensors. Biotechnol. Adv. 22, 505.
Kantipuly C, Katragadda S, Chow A, Gesser HD (1990). Chelating polymers and related supports for separation and preconcentration of trace metals. Talanta. 37, 491.
Katzbauer B, Narodoslawsky M, Moser A (1995). Classification system for immobilization techniques. Bioprocess Eng. 12, 173.

Biotechnology of Biopolymers
28
Kemshead JT, Treleaven JG, Gibson FM, Ugallstad J, Rembaum A, Philip T (1985). Removal of malignant cells from marrow using magnetic microspheres and monoclonal antibodies, Prog. Exp. Tumor Res. 29, 249.
Kettering M, Zorn H, Bremer-Streck S, Oehring H, Zeisberger M, Bergemann C, Hergt R, Halbhuber J, Kaiser A, Hilger I (2009) Characterization of iron oxide nanoparticles adsorbed with cisplatin for biomedical applications. Phys. Medicine Biol. 54, 5109.
Kierek-Pearson K, Karatan E (2005) Biofilm development in bacteria. Adv. Appl. Microbiol. 57, 79.
Kim J, Grate JW (2003). Single-enzyme nanoparticles armored by a nanometer-scale organic/inorganic network. Nano Lett. 3, 1219.
Kim J, Lee J, Na HB, Kim BC, Youn JK, Kwak JH, Moon K, Lee E, Park J, Dohnalkova A (2005). A magnetically separable, highly stable enzyme system based on nanocomposites of enzymes and magnetic nanoparticles shipped in hierarchically ordered, mesocellular, mesoporous silica. Small. 1, 1203.
Kim MI, Kim J, Lee J, Jia H, Bin Na H, Youn JK, Kwak JH, Dohnalkova A, Grate JW, Wang P (2007). Crosslinked enzyme aggregates in hierarchically-ordered mesoporous silica: A simple and effective method for enzyme stabilization. Biotechnol. Bioeng. 96, 210.
Kim YH, Kwon IC, Bae YH, Kim SW (1995) Saccharide effect on the cloud point of thermosensitive polymers, Macromolecules. 28, 939.
Kminek G. Bada JL (2006). The effect of ionizing radiation on the preservation of amino acids on Mars. Earth Planet. Sci. Letters. 245, 1-5.
Krupey J (1994). Water insoluble cross-linked acid composition, U.S. Patent 5,294,681. Kumar S, Nahar P (2007). Sunlight-induced covalent immobilization of proteins. Talanta. 71,
1438. Langer R (1990). New methods of drug delivery. Science. 249, 1527. Menaa B, Torres C, Herrero M, Rives V, Gilbert ARW, Eggers DK (2008a) Protein adsorption
to organically-modified silica glass leads to a different structure than sol-gel encapsulation. Biophys. J., 95, 51.
Menaa B, Menaa F, Aiolfi-Guimaraes C, Sharts O (2010) Silica-based nanoporous sol-gel glasses: from bioencapsulation to protein folding studies. Internatl. J. Nanotechnol. 7, 1-45.
Menaa B, Miyagawa Y, Takahashi M, Herrero M, Rives V, Menaa F, Eggers DK (2009) Bioencapsulation of apomyoglobin in nanoporous organosilica sol-gel glasses: influence of the siloxane network on the conformation and stability of a model protein. Biopolymers, 91, 895-906.
Menaa B, Herrero M, Rives V, Lavrenko M, Eggers DK (2008) Favorable influence of hydrophobic surfaces on protein structure in porous organically-modified silica glasses. Biomaterials, 29, 2710-2718.
Lei CH, Shin YS, Liu J, Ackerman EJ (2002). Entrapping enzyme in a functionalized nanoporous support. J. Am. Chem. Soc. 124, 11242.
Lin CC, Metters AT (2006). Hydrogels in controlled release formulations: network design and mathematical modeling, Adv. Drug Deliv. Rev. 58, 1379.
Liu XQ, Guan YP, Shen R, Liu HZ (2005). Immobilization of lipase onto micron-size magnetic beads. J. Chromatogr. B. Analyt. Technol. Biomed. Life Sci. 822, 97

The Art of Immobilization Using Biopolymers, Biomaterials and Nanobiotechnology
29
Mansour ME, Elnashar MM, Hazem ME (2007). “Amphoteric hydrogels using template polymerization technique”. J. Appl. Polym. Sci. 106, 3571.
Marrazza G, Chianella I, Mascini M (1999). Disposable DNA electrochemical biosensors for environmental monitoring. Analytica Chimica Acta. 387, 297.
Meher LC, Sagar DV, Naik SN (2006). Technical aspects of biodiesel production by transesterification - a review. Ren. Sustain. Energ. Rev. 10, 248.
Myrmel M, Rimstad E, Wasteson Y (2000). IMS of Norwalk-like virus (geno group I) in artificially contaminated environmental water samples, Int. J. Food Microbiol. 62, 17.
Naqvi A, Nahar P (2004). Photochemical immobilization of proteins on microwave-synthesized photoreactive polymers. Anal. Biochem. 327, 68.
Nistor C, Rose A, Farre M, Stocia L, Wollenberger U, Ruzgas T, Pfeiffer D, Barcelo D, Gorton L, Emneus J (2002). In-field monitoring of cleaning efficiency in waste water treatment plants using two phenol-sensitive biosensors. Analytica Chimica Acta. 456, 3.
Ogaki M, Sonomoto K, Nakajima H, Tanaka A (1986). Continuous production of oxytetracycline by immobilized growing Streptomyces rimosus cells. Appl. Microbiol. Biotechnol. 24, 6.
Ordoñez JA, Cambero MA, Fernandez L, Garcia ML, Garcia G, Hoz L (1998). Componentes de los alimentos y procesos. Tecnologia de los alimentos (Vol. I.). Madrid, Spain: Editorial Sintesis.
Pack DW, Hoffman AS, Pun S, Stayton PS, (2005). Design and development of polymers for gene delivery, Nat. Rev. Drug Discov. 4, 581.
Patil JS, Kamalapur MV, Marapur SC, Kadam DV (2010) Ionotropic gelation and polyelectrolyte complexation: The novel techniques to design hydrogel particulate sustained, modulated drug delivery system: A Review. Digest J. Nanomat. Biostruct. 5, 241.
Pedersen S, Christensen MW (2000). Immobilized biocatalysts. Applied biocatalysis. P. Adlercreutz. Amsterdam, Harwood Academic Publishers: 213–228.
Petanen T, Romantschuk M (2002). Use of bioluminescent bacterial biosensors as an alternative method for measuring heavy metals in soil extracts. Analytica Chimica Acta 456, 55.
Philp JC, Balmand S, Hajto E, Bailey MJ, Wiles S, Whiteley AS, Lilley AK, Hajto J, Dunbar SA (2003). Whole cell immobilized biosensors for toxicity assessment of a wastewater treatment plant treating phenolics-containing waste. Analytica Chimica Acta 487, 61.
Pieters BR. (1989). Magnetic separation in biotechnology. MSc thesis, University of Manchester, Faculty of Technology. p 84.
Piskin AK (1993). Therapeutic potential of immobilized enzymes. NATO ASI Series, Ser E. 252,191.
Pollauf EJ, Pack DW (2006). Use of thermodynamic parameters for design of double-walled microsphere fabrication methods. Biomaterials. 27, 2898.
Biotechnology of Biopolymers
30
Riaz A, Qader S, Anwar A, Iqbal S (2009) Immobilization of a Thermostable á-amylase on Calcium Alginate Beads from Bacillus Subtilis KIBGE-HAR. Aust. J. Basic & Appl. Sci. 3, 2883.
Richmond M, Gray J. Stine C (1981). Beta-galactosidase: Review of recent research related to technological application, nutritional concerns, and immobilization. J. dairy sci. 1759, 64.
Rodriguez-Mozaz S, Reder S, Lopez de Alda MJ, Gauglitz G, Barcelo D. (2004). Simultaneous multi-analyte determination of estrone, isoproturon and atrazine in natural waters by the RIver ANAlyser (RIANA), an optical immunosensor. Biosens. Bioelectron. 19, 633.
Rogers RD, Seddon KR (2003). Ionic liquids-Solvents of the future? Science, 302, 793. Rosales-Hernandez MC, Mendieta-Wejebe JE, Correa-Basurto J, Vazquez-Alcantara JI,
Terres-Rojas E, Trujillo-Ferrara J (2007). Catalytic activity of acetylcholinesterase immobilized on mesoporous molecular sieves. Int. J. Biol. Macromol. 40, 444.
Rouquier S, Tracks BJ (1995). Direct selection of cDNAs using whole chromosomes. Nucleic Acids Res. 21, 4415.
Rumbau V, Marcilla R, Ochoteco E, Pomposo JA, Mecerreyes D (2006). Ionic liquid immobilized enzyme for biocatalytic synthesis of conducting polyaniline. Macromolecules. 39, 8547.
Sadasivan S, Sukhorukov GB (2006). Fabrication of hollow multifunctional spheres containing MCM-41 nanoparticles and magnetite nanoparticles using layer-by-layer method. J. Colloid. Interface Sci. 304, 437.
Salis A, Sanjust E, Solinas V, Monduzzi M (2005). Commercial lipase immobilization on Accurel MP1004 porous polypropylene. Biocatal. Biotransf. 23, 381.
Sawayama S, Inoue S, Dote Y, Yokoyama SY (1995). CO2 fixation and oil production through microalga. Energy Convers. Manag. 36, 729.
Shareef K (2009). Sorbents for contaminents uptake from aqueous solutions. Part 1 Heavy metals. World J. Agricul. Sci. 5, 819.
Sharma R, Chisti Y, Banerjee UC (2001). Production, purification, characterization, and applications of lipases. Biotechnol Adv. 19, 627.
Sharmin F, Rakshit S, Jayasuriya H (2007). “Enzyme mmobilization on Glass surfaces for the development of Phosphate detection Biosensors”. Agricultural Engineering International: the CIGR Ejournal. Manuscript FP 06 019. Vol. IX. April.
Sheldon RA, Lau RM, Sorgedrager MJ, Van Rantwijk F, Seddon KR (2002). Biocatalysis in ionic liquids. Green Chem. 4, 147.
Soetan K, Aiyelaagbe O, Olaiya C (2010). Review of the biochemical, biotechnological and other applications of enzymes. Afr. J. Biotechnol. 9, 382.
Sona P (2010). Nanoparticulate drug delivery systems for the treatment of diabetes. Digest J. Nanomat. Biostruct. 5, 441.
Sun X, Ph.D. (2009). Thesis entitled "Polymeric microfluidic devices for bioanalysis", Brigham Young University, China.
Sungur S, Akbulut U (1994). Immobilization of β-galactosidase onto gelatin by glutaraldehyde and chromium(III) acetate. J. Chem. Technol. Biotechnol. (Oxford, Oxfordshire) 59, 303.

The Art of Immobilization Using Biopolymers, Biomaterials and Nanobiotechnology
31
Szamocki R, Velichko A, Mucklich F, Reculusa S, Ravaine S, Neugebauer S, Schuhmann W, Hempelmann R, Kuhn A (2007). Improved enzyme immobilization for enhanced bioelectrocatalytic activity of porous electrodes. Electrochem. commun. 9, 2121.
Tanaka Y, Tsuruda Y, Nishi M, Kamiya N, Goto M (2007). Exploring enzymatic catalysis at a solid surface: a case study with transglutaminase-mediated protein immobilization. Org. Biomol. Chem. 5, 1764.
Taubert, A (2005). Inorganic Materials Synthesis – a Bright future for ionic liquids? Acta Chimica Slovenica. 52, 183–186
Tosa T, Mori T, Fuse N, Chibata I (1967). Studies on continuous enzyme reactions Part V Kinetics and industrial application of aminoacylase column for continuous optical resolution of acyl-dl amino acids. Biotechnol Bioeng, 9, 603.
Turner APF, Karube I, Wilson GS (eds.) (1987). Biosensors, Fundamentals and Applications. Oxford University Press, Oxford.
Van Langen LM, Janssen MHA, Oosthoek NHP, Pereira SRM, Svedas VK, van Rantwijk F, Sheldon RA (2002). Active site titration as a tool for the evaluation of immobilization procedures of penicillin acylase. Biotechnol. Bioeng. 79, 224.
Van Rantwijk F, Lau RM, Sheldon RA (2003). Biocatalytic transformations in ionic liquids. Trends Biotechnol. 21, 131.
Wan LS, Ke BB, Xu ZK (2008). Electrospun nanofibrous membranes filled with carbon nanotubes for redox enzyme immobilization. Enz. Microb. Technol. 42, 332.
Wang A, Wang H, Zhu S, Zhou C, Du Z, Shen S (2008a). An efficient immobilizing technique of penicillin acylase with combining mesocellular silica foams support and p-benzoquinone cross linker. Bioprocess Biosyst. Eng. 31, 509.
Wang AM, Liu MQ, Wang H, Zhou C, Du ZQ, Zhu SM, Shen SB, Ouyang PK (2008b). Improving enzyme immobilization in mesocellular siliceous foams by microwave irradiation. J. Biosci. Bioeng. 106, 286.
Wang AM, Zhou C, Liu MQ, Du ZQ, Zhu SM, Shen SB, Ouyang PK (2009a). Enhancement of microwave-assisted covalent immobilization of penicillin acylase using macromolecular crowding and glycine quenching. J. Biosci. Bioeng. 107, 219.
Wang AM, Zhou C, Wang H, Shen SB, Xue JY, Ouyang PK (2007). Covalent Assembly of Penicillin Acylase in Mesoporous Silica Based on Macromolecular Crowding Theory. Chin. J. Chem. Eng. 15, 788.
Wong LS, Thirlway J, Micklefield J (2008). Direct site-selective covalent protein immobilization catalyzed by a phosphopantetheinyl trans ferase. J. Am. Chem. Soc. 130, 12456.
World Health Organization (WHO), (2002). HIV simple/rapid assays: Operational characteristics (phase I). In Google: http://www.who.int/3by5/en/simplerapidassays.pdf
Xie T., Wang A., Huang L., Li H., Chen Z., Wang Q., and Yin X. (2009) Review: Recent advance in the support and technology used in enzyme immobilization Afr. J. Biotechnol. 8, 4724.
Xin T, Wang X, Jin H,Liang S, Lin J, Li Z (2009). Development of magnetic particle-based chemiluminescence enzyme immunoassay for the detection of 17β-estradiol in environmental water. Appl. Biochem. Biotechnol. 158, 582.

Biotechnology of Biopolymers
32
Yan M, Ge J, Liu Z, Ouyang PK (2006). Encapsulation of single enzyme in nanogel with enhanced biocatalytic activity and stability. J. Am. Chem. Soc. 128, 11008.
Yu M, Jeong Y, Park J, Park S, Kim J, Min J, Kim K, Jon S (2008). Drug-loaded superparamagnetic iron oxide nanoparticles for combined cancer imaging and therapy in vivo. Angew. Chem. Int. Ed., 47, 5362.
Yu-Qung ZT, Mei-Lin S, Wei-De Z, Yu-Zhen D, Yue M, Wen-Ling Z (2004). Immobilization of L-asparaginase of the microparticles of the natural silk serum protein and its characters. Biomaterials. 25, 3151.

2
Polysaccharides from Wastes of Vegetable Industrial Processing: New Opportunities
for Their Eco-Friendly Re-Use Annarita Poli1, Gianluca Anzelmo1, Gabriella Fiorentino1,2,
Barbara Nicolaus1, Giuseppina Tommonaro1 and Paola Di Donato1,2
1C.N.R. National Research Council, Institute of Biomolecular Chemistry (ICB), 2University of Naples ‘Parthenope’,
Department of Environmental Sciences, Centro Direzionale, Italy
1. Introduction Polysaccharides are the most abundant natural biopolymers and represent by far the largest group of polymers produced in the world: indeed more than 150,000 M tons of polysaccharides per year are produced in comparison with about 140 M tons of synthetic polymers (Navard, 2005). Polysaccharides are widely diffused in nature: they can be found in plants, animals and microorganisms, performing different fundamental biological functions. Depending on their functional role, they can be distinguished in: energy reserve substances (e.g. starch or inulin in plants, glycogen in animals), structural elements maintaining mechanical shape and rigidity of the living cells (cellulose, hemicellulose and pectin in plant cell wall, chitin in arthropod exoskeletons), and water-binding elements (agar, pectin and alginates in plants, mucopolysaccharides in animals). About 99% of total natural polysaccharides are located in plants and vegetables that consequently represent a major renewable source of these biopolymers exploitable for different purposes. Indeed, polysaccharides are presently used in all sectors of human activities and in several application such as: food nutrients, food additives and feed production; material science concerning the formulation of polymeric materials for different biotechnological applications; health care for biocompatible materials, drug delivery or as source of biologically active molecules; sustainable energy production by means of biofuels generation (Persin et al., 2010). The main and most abundant polysaccharides from plants and vegetables include starch, cellulose and hemicelluloses, inulin and pectins that, thanks to their useful physical-chemical properties such as emulsifying power, viscoelasticity, polyelectrolyte conformation, adherence, bio-compatibility, stabilizing power, et cetera are usually exploited in the above mentioned fields of application. In addition, several other polysaccharides with different structures and properties are continuously isolated and are under investigation in relation to their features and potential employment in several industrial sectors.

Biotechnology of Biopolymers
34
Plant polysaccharides are used in food production mainly as source of carbohydrates, monomer sugars, sweet syrups, sweeteners and dietary fibres. Starch from potato, corn and other starchy plants, is the main source of sweeteners such as maltose, glucose or fructose syrups in addition to other products including prebiotics, mannose, sorbitol and vitamin C, ethanol, et cetera. Inulin and related oligofructoses, from chicory and Jerusalem artichoke, are used as functional food ingredients and can contribute to reduce the risk of many diseases by stimulating the immune system, decreasing the levels of intestine pathogenic bacteria, and lowering the synthesis of triglycerides and fatty acids in the liver, et cetera (Kaur & Gupta, 2002). Pectin, from apple and citrus fruits, is widely used as functional food ingredient and it is listed among the ingredients of innumerable food products: its worldwide annual consumption is estimated to be around 45 million kilograms, with a global market value of to be least 400 million euros. Its industrial utilisation is based mainly on its gelling properties for the production of jams and jellies, fruit juice, confectionary products and bakery fillings; nevertheless, pectin is also used for the stabilisation of acidified milk drinks and yogurts (Willats et al., 2006). Non-starch polysaccharides isolated from fruits and vegetables (cellulose, hemicelluloses, pectins) are the main constituents of the so-called dietary fibres, which include a host of different polymers, highly variable in terms of molecular size, structure and monomeric composition. They are widely employed in the industrial food production also as additives, thickeners, emulsifiers, gelling and texturizing agents, fat and/or sugar replacers in low-calories food preparations, (Sanjay & Gross. 2001). Natural polysaccharides from plants are non-toxic, biocompatible, biodegradable and water soluble. Such properties make them suitable for different pharmaceutical and biomedical uses. Indeed, several polysaccharides (starch, pectins, cellulose and others) find manifold medical applications as drug delivers, inert diluent for drugs, wound dressing, as constituents for scaffolds and implants in tissue engineering, et cetera. Medical uses of polysaccharides also rely on their direct beneficial effects on human health like for example blood cholesterol reduction displayed by pectins in a wide variety of subjects and experimental conditions (Sriamornsak, 2003). Dietary fibres positively affect health by decreasing intestinal transit time and increasing stools bulk, reducing blood total and/or LDL cholesterol levels, or reducing post-prandial blood glucose and/or insulin levels (Champ et al., 2003). In addition, it is noteworthy that plant polysaccharides can be considered also as an emerging class of bioactive molecules displaying anti-cancer, anti-oxidant, anti-bacterial, anti-virus and chemo-preventive effects. They could play important roles in several physiological and pathological conditions and in this context many researches have been carried out to assess their biological activity. Some interesting examples include polysaccharides extracted from mulberry leafs, showing anti-oxidant properties (tested as DPPH-scavenging activity) and good anti-bacterial effects against some common pathogens such as B. subtilis, E. coli and S. aureus (Wang & Jiang, 2010); high molecular weight polysaccharides from Opuntia ficus-indica accelerating re-epithelization in a model of dermal wound (Trombetta et al., 2006) or those from Salvia chinensis eliciting B lymphocytes in vivo (Liu et al., 2002) or even some pectic polysaccharides from ginseng that are able to rescue cell viability from rotavirus infection (Baek et al., 2010). Finally, polysaccharides extracted from plants such as Aloe barbadensis Miller, Lentinus edodes, Ganoderma lucidum, Coriolus versicolor, resulted to exert both anti-genotoxic and anti-tumor promoting activities in vitro models and thus might be considered as potential cancer chemo-preventive substances (Hyung et al., 1999).

Polysaccharides from Wastes of Vegetable Industrial Processing: New Opportunities for Their Eco-Friendly Re-Use
35
Other potential medical applications of polysaccharides have been recently envisaged also in the fields of tissue engineering and regenerative medicine: thanks to their similarities with the extracellular matrix, to their chemical versatility as well as to their good biological performance (commonly they are used in nature as structural materials), these biopolymers (for instance starch, cellulose, arabinogalactan) are among the most studied and promising natural polymers that have been suggested for tissue engineering (Mano et al., 2007). The well known self-assembly capabilities and stimuli responsiveness of polysaccharides make them suitable bio-materials for different applications in fields like biodegradable plastic production, nano-material science and the already discussed bio-compatible materials production for medical uses. Polysaccharides are used with or without chemical modifications that have been the object of several researches in order to obtain new biodegradable and sustainable materials (Gandini, 2008). Starch has been extensively exploited for the realisation of biodegradable plastic and resins that can be blown into film, injection moulded and thermoformed; it is also fermented to lactic acid producing poly-lactic acid polymers and co-polymers employed for biodegradable plastic production (Narayan, 1994); in addition. it is currently object of massive research efforts for the production of the so-called thermoplastic starch and the processing of foamed materials for loose-fill packaging (Gandini, 2008). Cellulose from wood pulp is mostly used for the production of paper and cardboard and the regeneration of fibres and films (for coatings, laminates, optical films), as well as for building materials, pharmaceuticals, foodstuffs, and cosmetics (Klemm et al., 2005); microfibrils are also employed in nano-material science for manufacturing nano-paper or as reinforcing elements in composite materials (Gandini, 2008); cellulose whiskers have been used as mechanical reinforcing agents for low-thickness polymer electrolytes for lithium battery applications, in the reference (Azizi Samir et al., 2005). Starch, cellulose and pectin have been together also the subject of intense research to assess their use as electroactive polymers. These latter are a new class of materials that can be potentially used for several applications as biosensors, environmentally sensitive membranes, artificial muscles, solar materials, et cetera (Finkenstadt, 2005). The rising global energy requirements together with the depletion of fossil fuel reserves have highlighted the importance of developing technologies to exploit renewable energy sources and for clean carbon-neutral fuel productions, i.e. biofuels. Polysaccharides are renewable sources of monomer sugars to ferment for the production of bioethanol, one of the most used biofuel in the world. Starch from corn is nowadays one of the main sources of bioethanol, although also cellulosic biomasses are under investigation because they could allow ethanol production without displacing agricultural food crops like corn. Nevertheless, biological transformation of cellulose to ethanol is a technology still under investigation because of the harsh conditions required for the industrial process that make it still far from being efficient and costly effective (Chang, 2007).
2. Vegetable wastes: new polysaccharides’ sustainable sources Polysaccharides recovered from plants and vegetables represent a renewable source of food, chemicals, materials and energy. They are ubiquitous and constitute carbon-neutral feedstock for several production processes. For these reasons they may offer potential solutions to the actual need of a sustainable development thus fulfilling the increasing demand of energy or materials and at the same time facing the depletion of fossil reservoirs.
Biotechnology of Biopolymers
36
As mentioned above, different types of polysaccharides are currently extracted from a variety of vegetable sources in order to obtain biopolymers for multiple uses: all these processes have both economical and environmental costs, not only depending on the chemical and/or thermal treatments required for the extraction of the biopolymers, but also affected by the starting materials, mostly represented by feedstock (e.g. cereals or potatoes for starch; bran for cellulose; citrus fruits for pectins, et cetera). Therefore, the search of alternative polysaccharide sources is crucial in order to reduce the constraints of food/non-food competition and to ensure the sustainable use of biomasses without negatively interfering with the food chain. A good candidate to this purpose is represented by under-utilised biomasses such as residues of vegetable processing for food production. Indeed, transformation and packaging of fruits and vegetables by food industry generate every year a huge amount of wastes that represent a worldwide problem for both the environmental and the economical aspects. Processing of fruits and vegetables is wasteful due to materials discarded from wholesale markets and food waste stuff; in addition, by-products come from processing and packing procedures since only a fraction of the incoming biomass is effectively used for food production (Mahro & Timm, 2007). As an example, industrial processing of vegetables for juices production or canning generates huge amounts of wastes constituted by peels, seeds, pulps that account for 30-50 % of input materials; on the other hand selection for packing and preservation discards about 5-30 % of the original feedstock, mainly including fruits or vegetable that are unripe, damaged during transportation or that lack the required features for packing and selling. The management of such wastes represents a critical issue for food industries that process tons of feedstock every year. In fact, disposal of vegetable residues has a notable spin off both in terms of costs and environmental pollution, because of their high organic matter content. Usually, food industry by-products are disposed in landfills and only partially reused by composting or drying for animal feeding and land fertilizing. Nevertheless, modern eco-compatible technologies offer more efficient strategies to recycle these wastes in order to use them as a sustainable source for the extraction of value added-chemicals such as different kinds of polysaccharides useful for manifold applications. In addition, it is remarkable that many plant polysaccharides have not yet been discovered and therefore the further exploitation of alternative biomasses, like vegetable wastes, for the sustainable production of materials, drugs and energy can deeply be implemented in the next future.
2.1 Polysaccharides from vegetable wastes: exploitation of residues from industrial processing of fruits, legumes and cereals for food production Several examples concerning the exploitation of vegetable wastes for the production of useful polysaccharides are available in literature: some of them are well established industrial processes, as in the case of pectin extraction, many others refer to new potentially valuable sources, largely unexplored that have stimulated research interest in relation to “green” extraction methods implementation, novel polysaccharide identification and investigation about their potential applications. In Table 1 selected examples of vegetable wastes rich in polysaccharides are reported, including some of the most diffused and abundant fruits, vegetable, legume and cereal crops processed by food industry. Data shown here refer in particular to isolation techniques used, extraction yields and polysaccharide chemical composition.

Polysaccharides from Wastes of Vegetable Industrial Processing: New Opportunities for Their Eco-Friendly Re-Use
37
Waste source
Extraction technique
Total Yield (% )
Molecular Weight (KDa)
Monosaccharide Composition (% molar ratio or mg/g dry weight)
Reference
Apple pomace
EtOH (85%) at 70 °C; oxalic acid-ammonium oxalate (pH 4.6) at 85°C
7.7 233.4 GalA/Ara/ Gal / Glc/ Rha/Xyl (853.5/37.3/23.3/16.9/9.6/7.3) (mg/g dry weight)
Min et al., 2011
Apple pomace
Mixing in H2O; homogenization; autoclave at 121 °C; β-glucanase (Viscozyme® L)
4.6 231.7 GalA/Ara/ Gal / Rha/Glc/ Xyl (693.2/78.04/26.2/ 15.47/14.8/13.2) (mg/g dry weight)
Min et al., 2011
Apple pomace
Phenol/acetic acid/H2O; CDTA chlorbutol; 1M KOH; 4 M KOH
4.1 N.D. Fuc/Ara/Xyl/Man/Gal/Glc/UronicA (5.6/1.2/25.3/6.9/12/46.2/2.8) (% molar ratio)
Watt et al., 1999
Orange peels Microwave pre-treatment; drying at 60 °C; 0.5M HCl at 80 °C
18 64 GalA (665) (mg/g dry weight)
Kratchanova et al., 2004
Citrus peels Enzyme extraction (protease, cellulase)
12.6 180 Rha/Fuc/Ara/Xyl/Man/Gal/Glc/GalA (10/2/71/7/10/34/12/756) (mg/g dry weight)
Zykwinska et al. 2008
Citrus peels Sequential Extraction: EtOH/H2O
3.6 - 8.6 N.D. Identified as pectin according to Yu & Love, (1996)
Wang et al., 2008
Bergamot peels (Citrus bergamia Risso)
Sequential Extraction: EtOH/H2O (EtOH insoluble fraction)
45.2 N.D. Glc/GalA/Ara/Gal/Xyl/Man/Rha/Fuc (217.1/216.6/66.2/48.1/29.7/24.6/7.8/5.1) (mg/g dry weight)
Mandalari et al., 2006
Bergamot peels (Citrus bergamia Risso)
Sequential Extraction: EtOH/H2O (EtOH soluble fraction)
29.8 N.D. Glc/Ara/Rha/Man/GalA/Gal/Xyl/Fuc (328.6/43.7/36.4/24.3/19.2/4.7/2.8/2.2) (mg/g dry weight)
Mandalari et al., 2006
Banana peels Sequential Extraction: H2O/ Chelating agent/ Acid solution
21.7 573-249 GalA/Rha/Ara/Xyl/Man/Glc/Gal (69.1/ 0.5/1.7/ 0.5/ 1.2/ 4.3/ 1.0) (% molar ratio)
Happi Emaga et al., 2008
Plantain peels
Sequential Extraction: H2O/ Chelating agent/ Acid solution
14.6 570-129 GalA/Rha/Ara/Xyl/Man/Glc/Gal (48.3/0.5/9.0/6.5/2.7/6.6/4.0) (% molar ratio)
Happi Emaga et al., 2008
Peanut cakes EtOH extraction
25.8 N.D. Gal (main component) Song et al., 2011
Agro-waste materials
Distilled H2O, pH 11 under stirring
8.1 - 54.8 N.D Cellulose, hemicelluloses, galactans, arabans, pentosans
Kuan & Liong, 2008
Soy hull 0.1 M HCl at 95°C; precipitation with 2-propanol, pH 3.5
28 N.D. GalA (720) (mg/g dry weight)
Kalapathy & Proctor, 2001
Table 1. Exploitation of wastes from fruit and vegetable processing for polysaccharide productions. Abbreviations: Glc=glucose, Xyl=xylose, Gal=galactose, GalA=galacturonic acid, Fuc=fucose, Man=mannose, Ara=arabinose, Rha=rhamnose, Uronic A= uronic acids.

Biotechnology of Biopolymers
38
Apple and citrus wastes are traditionally the main sources of commercial pectin (Thibault & Ralet, 2003). They are generated from processing industries for apple and citrus fruits after juice extraction that are among the foremost food industries, producing about 3-4.2 × 10⁶ and 15.6 × 10⁶ M tons per year of wastes, respectively (Min et al., 2011). Therefore, the exploration of proper disposal methods for apple pomace and citrus peels, the residue left after processing, has been the focus of several studies aimed at improving the extraction methods and to recover further biopolymers. Pectins are industrially obtained from apple pomace and citrus peels by means of acid extraction (i.e. oxalic, hydrochloric, nitric and sulphuric acid) at high temperatures (80-90°C). A new eco-friendly extraction technique was tested for apple pomace: based on combined physical and enzyme treatments (Min et al., 2011), it afforded amounts of pectin comparable to those obtained by means of classical chemical treatments (about 10-15% of dry matter waste). Besides pectin, other main components of apple pomace are the cell wall polysaccharides cellulose and xyloglucan. Recent investigations were focused on the pomace xyloglucan component that was isolated by means of alkaline extraction and was identified as a fucogalacto-xyloglucan. Such xyloglucan (after derivatisation procedures similar to cellulose conversion into methylcellulose, hydroxypropylcellulose, carboxymethylcellulose) might be useful as thickening agent, texture modifier or as a source of biologically active oligosaccharides (Watt et al., 1999). Citrus fruits are particularly rich in pectin (ranging from 20 to 30% of dry matter waste) and the large quantities of citrus wastes generated by the fruit juice industry represent one of the most important raw material for the production of commercial pectin. Several varieties of citrus fruits (including lemon, lime, orange and grapefruit) have been investigated as polysaccharides sources and different extraction techniques have been tested: in Table 1 some examples found in literature regarding different fruit species and alternative isolation methods are reported. The yields and quality of the pectins extracted can be improved by means of pre-treatment with microwaves as shown by studies carried out on orange peels. Microwaves are able to destroy the plant tissue thus increasing the porosity and the water absorption capacity of the plant material that results in a considerable increase in the yield of extractable pectin and improvement of its parameters (e.g. degree of esterification, molecular mass and gel strength) (Kratchanova et al., 2004). Milder extraction methods have been tested on different wastes and have been applied also to citrus wastes: a remarkable example is represented by treatment with non-pectinolytic enzymes such as cellulases (which are able to degrade cellulose and the cellulose-like backbone of xyloglucan) as well as proteases (that are able to degrade proteins) acting synergistically to deconstruct the cellulose/xyloglucan and protein networks, thus facilitating pectins liberation from the cell walls. This method has been validated by extraction yields higher than those obtained by acid treatment, generally used for pectin extraction (Zykwinska et al., 2008). Sequential ethanol/water extraction has been used for different varieties of citrus cultivated in Taiwan and largely employed for juices production: about 33,000 hectares are dedicated to citrus cultivation in Taiwan and the production is about 534,000 tons/year. Peels are the primary by-product of citrus fruits processing for juice production and, if not properly treated, they become a possible source of environmental pollution. The total pectin (including alcohol and water soluble fractions) yields obtained with ethanol/water extraction were evaluated for eight varieties of Taiwan citrus species (i.e. Citrus reticulata Blanco, C. tankan Hayata, C. reticulate - C. sinensis, C. grandis Osbeck, C. grandis Osbeck CV, C. microcarpa, C. sinensis (L.), C. limon). As reported in Table 1, pectin yields from waste peels ranged from 3.6% (w/w) in the case of Citrus tankan Hayata to 8.64% (w/w) for Citrus grandis Osbeck (Wang et al., 2008). Another interesting example of citrus waste biomass

Polysaccharides from Wastes of Vegetable Industrial Processing: New Opportunities for Their Eco-Friendly Re-Use
39
is represented by bergamot, Citrus bergamia Risso, residues: bergamot is used in Italy mostly for the extraction of its essential oil, obtained by wash-scraping the fruit. The annual Italian production of bergamot amounts to 25,000 tons and peel is an underutilized by-product of the essential oil and juice processing industry that likewise other citrus waste peels still contains exploitable biopolymers such as pectins. A sequential ethanol/water extraction has been used and it afforded 29.8% polysaccharide’s yield in the 70% ethanol soluble fraction and a 45.2% yield in the alcohol insoluble fraction. Chemical analysis of the isolated fractions showed that both of them were mainly composed of pectic substances encasing the cellulose microfibrils (Mandalari et al., 2006). Besides the above mentioned examples, other fruits and vegetable processing residues produced in huge amounts from important crops typical of different geographical areas, have been investigated for their polysaccharides content in order to determine their sustainability as profitable polysaccharides sources. In Table 1 some data are shown about banana and plantain processing wastes that were investigated for their content of neutral detergent fibre, acid detergent fibre, cellulose, hemicelluloses and pectin. These fruits are important food crops in tropical and subtropical regions and represent one of the main agricultural economic resources in African countries. The development of the processing industries based on these crops and the increasing production generated a significant amount of wastes that pose the problem of their disposal without causing environmental pollution. In fact banana and plantain wastes, mainly consisting of peels, represent the 40% of the total weight of fresh fruit. Different strategies have been proposed for the valorisation of these agro-wastes like the production of methane, alcohol, adsorbents for water purification, biomass, but the authors also point to their use as potential source of pectins and dietary fibres that represent about 50% (w/w) of dried banana and plantain peels. Such wastes, undergone to a sequential extraction treatment, showed to be an interesting polysaccharide source, with particular regard to pectin quality (Happi Emaga et al., 2008). Residues remaining after processing of legumes and cereals could also be used for polysaccharides production, thanks to their fibre content. Peanut, for instance, is a major legume oilseed crop grown in many areas of the world, whose annual production totals approximately 29 million metric tons with China, India and the U.S. being the world’s three largest producers (http://www.soyatech.com/peanut_facts.htm). The processing of peanut generates a residual cake that has been the focus of several researches aimed at the characterization of the functional ingredients and properties of these residues, with regard to their rheological properties, hypoglycemic capacity, water holding capacity, et cetera. Peanut cake is also particularly rich in fibres and therefore it was investigated by means of response surface methodology in order to assess the best polysaccharides extraction conditions. Crude polysaccharides extracted from defatted peanut cakes were also subjected to preliminary structural analyses and resulted to be mainly composed of α-galactose (Song et al., 2011), although further studies to assess their functional and biological properties are still required. Other potential sources of polysaccharides are okara (Glycine max), corn cob (Zea mays sp.), wheat straw (Triticum sp.) and rice husk (Oryza sativa), deriving from legumes and cereal processing: approximately 700,000 tons of okara are generated every year by the production of tofu in Japan, whereas 880 million tons of cereals are produced annually worldwide, of which 550 million tons are represented by wheat straw. Traditionally, these waste materials are used as bedding for animals and livestock feeding, burned in the fields, or added into soil as green fertilizer but in the cited study they were evaluated for their content of dietary fibres whose chemical, physicochemical and functional properties were studied for determining potential applications in foods. In particular the dietary fiber
Biotechnology of Biopolymers
40
fractions isolated from corn cob and okara showed the highest water- and oil-holding capacities, emulsifying activities and emulsion stabilities, thus suggesting possible applications as functional ingredients in foods (Kuan & Liong, 2008). Another legume processing waste that is generated in significant amounts is soy hull, a co-product of the soybean industry: it is available in large quantities and might be a good and inexpensive source of pectin (about 25%), recoverable by adapting the acid extraction method usually employed for industrial pectin production (see data in Table 1). By means of 0.1 M HCl treatment followed by alcohol precipitation, it is possible to recover from soy hull amounts of pectin comparable to those obtained from citrus fruits, usually employed as commercial feedstock for the production of this polysaccharide (Kalapathy & Proctor, 2001).
2.2 Polysaccharides from tomato, granadilla and lemon wastes: new opportunities from alkaline treatment of residues In this context, the search of alternative biomasses to be used as renewable sources of polysaccharides stimulated the investigation of wastes from the industrial processing of fruits and vegetables. Special attention has been paid to residues of the industrial transformation of tomato and lemon, two examples of typical Italian crops destined to canning and liquors production, respectively, and granadilla, a fruit highly diffused in Southern America and used for fruit salads, beverages and the production of tropical fruit juices. Food production based on processing and preservation of fruits and vegetables, like tomato and lemon, is an important industrial sector for Italian economy, even though generating tons of wastes every year. Indeed, the total Italian tomato production totally amounts to nearly 9,000,000 tons/year (data from ISTAT, National Institute of Statistics, http://www.istat.it) mainly processed by food canning industry: about 1.8-2.3% (i.e. 162,000-207,000 tons) is constituted by peels and seeds that are discarded as wastes. The total amount of lemons harvested per year is about 570,000 tons (data from ISTAT), mainly used for the production of juices and liquors, another crucial sector of food industry in Italy, with particular regard to Southern Italy for “limoncello” liquor production. In contrast with other types of fruits, lemons have a small edible portion and consequently their processing produces larger amounts of waste material (lemon pomace) constituted by peels, pulps and seeds, thus representing a serious environmental issue. Notably, tomato and lemon wastes have been recently tested for their capability to promote and sustain microbial growth of biotechnologically useful microorganisms: by means of dialysis fermentation, using wastes as cheap growth media, it has been possible to produce either enzymes and biopolymers from extremophilic bacteria (Di Donato et al., 2011). Granadilla (Passiflora liguralis) fruits belong to the genus Passiflora (Passifloraceae) comprising about 500 species of herbaceous vines or trees largely distributed in the warm temperate and tropical regions of America and Africa, with a smaller number of species occurring in South-Eastern Asia, India, Malaysia, and Australia. Beyond their domestic use in fruit salads and in beverages, granadilla fruits can be processed industrially to produce tropical fruit juices: processing of fruits yields about 30% of juice, 52% of peels and 11% of seeds, whose disposal represents a considerable problem for the countries producing Passiflora juices. All the selected wastes were treated by means of a newly developed extraction technique aiming at a more eco-friendly exploitation of residues (Strazzullo et al., 2003; Tommonaro et al., 2008). In recent years isolation of polysaccharides has been the focus of several research papers dealing with the implementation of technologies for their extraction from various natural sources (e.g. plants or fungi). Different approaches have been proposed including hot

Polysaccharides from Wastes of Vegetable Industrial Processing: New Opportunities for Their Eco-Friendly Re-Use
41
water extraction, acid or alkaline extraction, ultrasound-assisted and microwave-assisted extraction. In general, hot-water extraction is the most widely used method for polysaccharide recovery, but it does not provide high yields, and requires long extraction times and high temperatures; using ultrasound or microwave assisted water extractions it is possible to accelerate the recovery process but without increasing the extraction yield, since a plenty of polysaccharides usually remain in the water extraction residues. A recent report by Huang et al. (2010) has been focused on the optimization of the alkaline extraction of polysaccharides from the fungus Ganoderma lucidum employing NaOH solutions at 60.1 ºC: such conditions afforded an experimental yield value of 8.30%, close to the expected value of 8.21%, calculated by means of a response surface methodology design. Notably, comparable polysaccharides yields (7.5%) were previously obtained by means of KOH extraction at room temperature (Strazzullo et al., 2003; Tommonaro et al., 2008): this is a rapid method conceived to recover high grade polysaccharides in elevated yields with a lower environmental impact. The alkaline method has been implemented in a previous study dealing with the recovery of minor polysaccharides from tomato canning residues, and it has been successively applied also to granadilla processing wastes (Tommonaro et al., 2007). Below are reported data previously published about tomato and granadilla treatment by means of alkaline extraction that has enabled isolation of new polysaccharides possessing interesting biological activity and chemical-physical features useful for biotechnological applications (Tommonaro et al., 2008). Furthermore, results obtained applying the same method to lemon processing wastes are described in the following sections.
2.2.1 Extraction and chemical-physical analyses of polysaccharides from tomato, granadilla and lemon wastes Tomato canning wastes (Lycopersicon esculentum variety “Hybrid Rome”) were kindly supplied by Fontanella Industry (Salerno, Italy). They mainly consisted of peels, seeds, rotten and unripe fruits. Fruits of granadilla (Passiflora liguralis) were grown in Perú in subtropical pedo-climatic conditions, at a temperature ranging from 15 to 20°C and an altitude of 1,800-2,200 m. The fruits were harvested at the end of April, corresponding to the peak of their ripening. Samples were brought to Italy and kept at -20°C before being analyzed. After peeling, pulp was removed, whereas peels were freeze-dried in order to prevent microbial alteration and used for the polysaccharides extraction procedures. Lemon wastes (Citrus limon), generated from industrial processing of lemons for juice extraction and liquor production, were kindly supplied by Solagri s.c. (Sant' Agnello di Sorrento, Naples, Italy). They are identified as “lemon pomace”, mainly constituted by albedo, exhausted peels, seeds and the remaining pulps after juice and essential oil recovery. Each waste sample was freeze-dried in order to prevent microbial alteration and the resulting solid dried material was finely ground to a homogeneous powder in a laboratory blender. Samples of the three selected wastes were treated by means of an eco-compatible method, implemented for the extraction of polysaccharides from industrial tomato wastes (Strazzullo et al., 2003; Tommonaro et al., 2008), subsequently applied to peels of granadilla fruits (Tommonaro et al., 2007) and more recently employed for lemon pomace. Briefly, wastes were treated with 5N KOH (1:20 g dry waste/mL KOH) for 72 hours, under stirring at room temperature. For tomato wastes, yields of polysaccharides extraction were determined at different KOH concentrations (0.5N, 1N, 2N and 5 N) and different extraction times (24, 48 and 72 hours), whilst for lemon pomace only 5N KOH was tested at different extraction times (24, 48 and 72 hours). After extraction, the suspensions were sieved and centrifuged at 10,000g for 40’ in order to separate the solid

Biotechnology of Biopolymers
42
residues. The supernatants were then added with cold ethanol 96% (v/v) dropwise under stirring. The alcoholic solutions were stored at – 20°C overnight and then centrifuged at 10,000g for 1 h at 4 °C. The pellets, solved in hot water, cooled at room temperature and dialyzed for 3 days against tap water in Spectrapore dialysis tubes (10,000-14,000 MW cut-off), were finally frozen and lyophilized under vacuum. The extraction yields obtained by means of this procedure for the different wastes are reported in Table 2: the lowest value was registered in the case of granadilla peels (about 1%), followed by tomato wastes (7.5-10.0%) and the highest value (about 14%) was displayed by lemon pomace. The lyophilized samples thus obtained were utilized for chemical and physical analyses. First of all, aqueous solutions of extracted polysaccharides underwent colorimetric assays for the determination of carbohydrate content, according to the phenol/sulfuric acid method with glucose as standard (Dubois, 1956), total protein content, according to Bradford’s method (Bradford, 1976) and uronic acid content, according to Blumenkrantz and Asboe-Hansen’s method (Blumenkrantz & Asboe-Hansen, 1973). Nucleic acid content was also estimated spectrophotometrically by measuring the absorbance at 260 nm. All the extracted biopolymers were characterized by low protein and nucleic acid contents (< 5.0%) and high carbohydrate contents, corresponding to 100%, 75.5% and 65.5% in tomato, granadilla and lemon polysaccharides, respectively. The presence of uronic acids was notable in the lemon polysaccharide (27.5%), due to the high content of cell-wall pectins in lemon pomace matter (MacDougall et al., 1996), and lower amounts of uronic acids were detected in polysaccharides extracted from granadilla peels and tomato wastes (5.5% and 20%, respectively).
Parameters
Lycopersicon esculentum L. var. San Marzano
(solid tomato wastes from processing industry)a
Passiflora liguralis called granadilla or
passion fruits (peels)b
Citrus limon (lemon pomace from processing
industry)c Yield (%) 7.5-10.0 1.0 14.3 Molecular Weight (Da) ≥1,000,000 ≥1,000,000 ≈1,500,000
Carbohydrates (%) 100 75.5 65.5
Uronic Acids (%) 20 5.5 27.5
Proteins (%) 1.0 1.0 3.5
Nucleic acids (%) 1.0 <1.0 1.5
Monosaccharidee composition (% molar ratio )
Glc/Xyl/Gal/GalN/ GlcN/Fuc
(1:0.9:0.5:0.4:0.2:tr)
Xyl/Glc/Gal/GalN/ uk/Fuc (1:0.5:0.2:0.06:0.05:tr)
Gal/GalA/Man/ Ara/Rha
(1:0.7:0.6:0.5:tr)
TGA (°C) 250°C 280°C 295°C
[α]D 25
(1 mg/ml H2O) – 177.58 – 186.42 – 98.65d
a Data from Tommonaro et al. 2008; b Data from Tommonaro et al., 2007; c data from present study; d concentration 1.4 mg/ml H2O; eabbreviations for monosaccharide composition: Glc=glucose, Xyl=xylose, Gal=galactose, Fuc=fucose, GalA=galacturonic acid, Man=mannose, Ara=arabinose, GalN= galactosammine, GlcN= glucosamine, Rha=rhamnose, uk= unknown sugar, tr= trace.
Table 2. Physical-chemical characteristics of polysaccharides recovered from vegetable sources.
Polysaccharides from Wastes of Vegetable Industrial Processing: New Opportunities for Their Eco-Friendly Re-Use
43
Isolated polysaccharides were then purified by means of gel filtration on a Sepharose DEAE CL-6B column, eluted with distilled H2O (100 ml) and a linear gradient of NaCl (400 ml) from 0 to 1M at a flow rate of 0.3 ml/min. Fractions (5 ml) were collected, spotted on a pre-coated thin- layer chromatography (TLC) plate (silica gel F254, 0.25 mm thick, Merk) and sprayed with α-naphtol to preliminarily identify carbohydrates-containing fractions. For each purification step, both protein and nucleic acid contents were verified, monitoring the absorbance at 280 nm and 260 nm, respectively. The fractions that resulted to contain higher amounts of carbohydrates, according to Dubois assays, were pooled and freeze-dried for further analyses. Polysaccharides from tomato wastes were purified as previously described, showing three main peaks: a first major peak with the highest carbohydrate content (90%) and a second peak (carbohydrate content corresponding to 50%) were eluted in water, while a third peak (carbohydrate content of 41%) was eluted in 0.2 M NaCl. Only the first pool underwent further analyses. Purification of raw polysaccharide from granadilla peels gave three sugar pooled fractions: the first pool, eluted in water, presented a high sugar content (75%), whereas the second pool, eluted in 0,1 M NaCl, and the third pool, eluted in 0,25 M NaCl, contained 21.5% and 6.5% of carbohydrates, respectively. Also in this case, only the first pool underwent further analyses. In the case of lemon pomace, two main peaks were collected: the first peak, with a carbohydrate content corresponding to 44%, was eluted in 0.55 M NaCl and the second peak, containing 10% of carbohydrates, was eluted in 0.7 M NaCl. Protein and nucleic acid contents were lower than 1% in both fractions, and only the first peak was further analysed. Molecular weight of purified samples (at a concentration of 10 mg/ml in distilled H2O) was estimated by gel filtration on Sepharose CL-6B column (1x80 cm), using H2O as mobile phase at a flow rate of 0.3 ml/min. Fractions (3.5 ml) were collected and tested as described before. Molecular weight values were evaluated by interpolation of elution volumes of fractions with higher carbohydrate contents on calibration curves of standard dextrans (150,000, 670,000 and 1,800,000 Daltons, Fluka). In the case of polysaccharides extracted from tomato waste and granadilla peels, values greater than 1,000,000 Da were detected, whilst the lemon pomace polysaccharide resulted to have a molecular weight of approximately 1,500,000 Da. In order to verify the monosaccharide composition, the purified polysaccharide fractions were hydrolysed with 2M trifluoroacetic acid (TFA) at 120°C for 2 hours. Sugar components were firstly detected by TLC, using a mix of acetone/butanol/H2O (8:1:1, v/v/v) as mobile phase and standard monosaccharides for qualitative determination. Afterwards monosaccharide composition was defined by High Pressure Anion Exchange-Pulsed Amperometric Detector (HPAE-PAD, DIONEX) equipped with Carbopac PA1 column. Sugars were eluted isocratically with 16 mM NaOH and identified by comparison with reference standards. The results are reported in Table 2. In the case of tomato polysaccharide the following neutral sugar composition was found: glucose/ xylose/ galactose/ galactosamine/ glucosamine/ fucose in a relative molar ratio of 1:0.9:0.5:0.4:0.2:trace; in addition, the presence of galacturonic acid was also detected in the sample. The sugar components of granadilla peels polysaccharide were: xylose/ glucose/ galactose/ galactosamine/ unknown sugar/ fucose in the relative proportion of 1:0.5:0.2:0.06:0.05:trace, whilst in the case of lemon pomace polysaccharide, galactose/ galacturonic acid/ arabinose/ fructose/ rhamnose were identified in a relative molar ratio of 1:0.7: 0.6:0.5:trace. The determination of optical rotation values as well as thermogravimetrical analyses (TGA) of polysaccharides were also performed, and the results are shown in Table 2. Optical rotation values were acquired with a Perkin-Elmer 243 B polarimeter at 25° C in water.

Biotechnology of Biopolymers
44
Thermogravimetrical analyses were carried out using a Mettler TGA apparatus. Each sample (5 mg) was heated from 30 to 400°C at a heating rate of 20 °C/min under nitrogen. The degradation temperatures of tomato waste and granadilla peel polysaccharides were estimated to be approximately 250°C (Tommonaro et al., 2008) and 280°C (Tommonaro et al., 2007), respectively (Table 2). The thermogravimetrical analysis of lemon pomace polysaccharide showed a weight loss due to water presence, centered at 60-80°C (Fig. 1). From such temperatures up to 290°C, the biopolymer was very stable and started to decompose at 295°C.
Fig. 1. Thermogravimetrical analysis of lemon pomace polysaccharides.
Polysaccharide structures were further investigated by means of classical spectroscopic techniques such as NMR and IR spectroscopy. NMR spectra of purified samples (15 mg/ml D2O) were performed on a Bruker AMX- 300 MHz (1H-NMR) and 400 MHz (13C-NMR) at 70 °C. Samples were prepared according to Poli et al. (2009). Briefly, each sample was exchanged twice with D2O with a lyophilization step in-between and finally dissolved in 500 μl of D2O. Chemical shifts were reported in parts per million (ppm) with reference to sodium 2,2,3,3-d4-(trimethylsilyl) propanoate and to CDCl3 for 1H and 13C-NMR spectra, respectively. The 1H-NMR spectrum of the tomato waste polysaccharide showed a complex profile, with main signals at δ values as reported in Table 3. The anomeric region of the spectrum (from δ 4.5 to δ 5.5) exhibited eight peaks: five of them were well resolved doublets (d) with the same coupling constant value of J1-2 (3.8-4.0 Hz), probably due to a gluco-galacto sugar configuration, whereas the other three anomeric peaks, almost singlets (s) with a small J1-2 (0.5-1 Hz), indicated the occurrence of a manno configuration. The upfield region of the spectrum showed a doublet peak at δ 1.20 indicating the presence of deoxy-sugars in the polysaccharide. The eight anomeric signals suggested the incidence of eight different monosaccharides, with regard to the type or the glycosidic linkage position. The eight monosaccharides were labelled from A to H with respect to decreasing δ (Table 3). On the base of the chemical shifts and the coupling constant data, the residues A, D, F had probably an α-manno configuration, the residues B, C, E, G probably possessed an α-gluco-galacto configuration and the H residue had probably a β-gluco-galacto configuration.

Polysaccharides from Wastes of Vegetable Industrial Processing: New Opportunities for Their Eco-Friendly Re-Use
45
Typeb δ1H Multiplicity J1-2c Configuration A 5.30 pseudo s 0.5-1 Hz α-manno B 5.27 d 3.8-4.0 Hz α -gluco-galacto C 5.26 d 3.8-4.0 Hz α -gluco-galacto D 5.18 pseudo s 0.5-1 Hz α -manno E 5.09 d 3.8-4.0 Hz α -gluco-galacto F 5.07 pseudo s 0.5-1 Hz α -manno G 5.06 d 3.8-4.0 Hz α -gluco-galacto H 4.94 d 3.8-4.0 Hz β-gluco-galacto
Table 3. Chemical shifts and coupling constant of anomeric signals in 1H-NMR spectrum of tomato polysaccharide*. aData from Strazzullo et al., 2003 and Tommonaro et al., 2008; blabels refer to signals with decreasing δ; c coupling constant; doublets (d); singlets (s).
The 1H-NMR data relative to analyses of granadilla peel polysaccharide are reported in Table 4. The 1H-NMR spectrum showed six well resolved peaks in the anomeric region: at δ 4.87 (pseudo singlet, J< 1.0 Hz); δ 4.94 (d, J=5.7 Hz); δ 5.08 (s); δ 5.27 (s); δ 5.47 (d, J=10.3 Hz); δ 5.60 (s) (Table 4). The signals in the upfield region of the spectrum indicated the presence of deoxy-sugars (δ 1.29) and acetamino sugars (δ 2.45-2.55). Remaining signals (δ ranging from 3.5 to 4.5) were due to ring protons confirming the occurence of pyrosidic exose. The six anomeric signals, labelled in Table 4 from A to F, indicated the presence of six different monosaccharides, presented in the repeating unit. Chemical shifts and coupling constant values pointed out that the residues B, E and F probably had an α-gluco-galacto, a β-gluco-galacto and a β -manno configuration, respectively.
Typeb δ 1H Multiplicity J1-2c Configuration A 5.60 s - - B 5.47 d 10.3 Hz α-gluco-galacto C 5.27 s - - D 5.08 s - - E 4.94 d 5.7 Hz β-gluco-galacto F 4.87 pseudo s < 1.0 Hz β -manno
Table 4. Chemical shifts and coupling constant of anomeric signals in 1H-NMR spectrum of granadilla polysaccharide*. aData from Tommonaro et al., 2007; blabels refer to signals with decreasing δ; c coupling constant; doublets (d); singlets (s).
The 1H-NMR and the 13C-NMR analysis of raw lemon pomace polysaccharide resulted in a very complex signal pattern. The 1H-NMR spectrum of lemon polysaccharide showed inter alia four signals in the anomeric region (Fig. 2) at δ 5.28 (pseudo singlet, J<1.0 Hz), δ 5.19 (d, J=8.7 Hz), δ 5.12 (pseudo singlet, J<1.0 Hz) and δ 4.67 (d, J=8.7 Hz). The signals in the upfield region of the spectrum indicated the presence of deoxy-sugars (δ 1.3). The four anomeric signals highlighted the incidence of four different monosaccharides, with regard to the type or the glycosidic linkage position. On the basis of the chemical shifts and coupling constant data three residues were supposed to have an α-configuration, whilst the fourth showed a β-configuration.
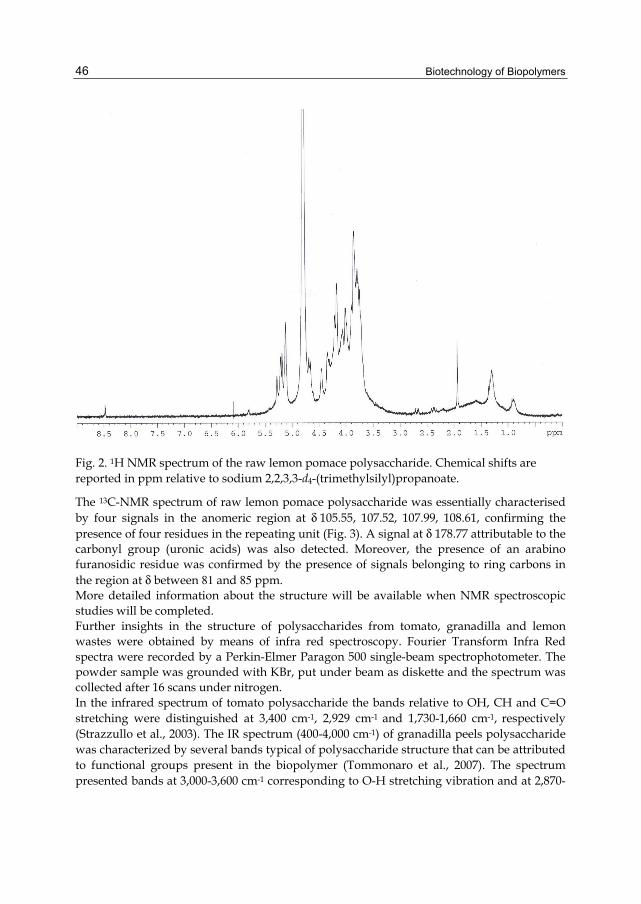
Biotechnology of Biopolymers
46
Fig. 2. 1H NMR spectrum of the raw lemon pomace polysaccharide. Chemical shifts are reported in ppm relative to sodium 2,2,3,3-d4-(trimethylsilyl)propanoate.
The 13C-NMR spectrum of raw lemon pomace polysaccharide was essentially characterised by four signals in the anomeric region at δ 105.55, 107.52, 107.99, 108.61, confirming the presence of four residues in the repeating unit (Fig. 3). A signal at δ 178.77 attributable to the carbonyl group (uronic acids) was also detected. Moreover, the presence of an arabino furanosidic residue was confirmed by the presence of signals belonging to ring carbons in the region at δ between 81 and 85 ppm. More detailed information about the structure will be available when NMR spectroscopic studies will be completed. Further insights in the structure of polysaccharides from tomato, granadilla and lemon wastes were obtained by means of infra red spectroscopy. Fourier Transform Infra Red spectra were recorded by a Perkin-Elmer Paragon 500 single-beam spectrophotometer. The powder sample was grounded with KBr, put under beam as diskette and the spectrum was collected after 16 scans under nitrogen. In the infrared spectrum of tomato polysaccharide the bands relative to OH, CH and C=O stretching were distinguished at 3,400 cm-1, 2,929 cm-1 and 1,730-1,660 cm-1, respectively (Strazzullo et al., 2003). The IR spectrum (400-4,000 cm-1) of granadilla peels polysaccharide was characterized by several bands typical of polysaccharide structure that can be attributed to functional groups present in the biopolymer (Tommonaro et al., 2007). The spectrum presented bands at 3,000-3,600 cm-1 corresponding to O-H stretching vibration and at 2,870-
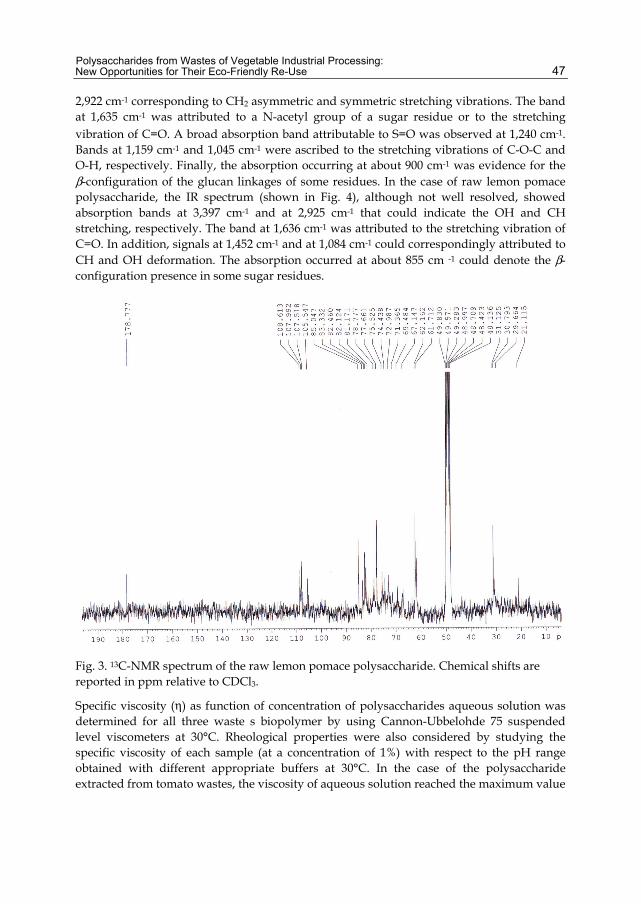
Polysaccharides from Wastes of Vegetable Industrial Processing: New Opportunities for Their Eco-Friendly Re-Use
47
2,922 cm-1 corresponding to CH2 asymmetric and symmetric stretching vibrations. The band at 1,635 cm-1 was attributed to a N-acetyl group of a sugar residue or to the stretching
vibration of C=O. A broad absorption band attributable to S=O was observed at 1,240 cm-1. Bands at 1,159 cm-1 and 1,045 cm-1 were ascribed to the stretching vibrations of C-O-C and O-H, respectively. Finally, the absorption occurring at about 900 cm-1 was evidence for the β-configuration of the glucan linkages of some residues. In the case of raw lemon pomace polysaccharide, the IR spectrum (shown in Fig. 4), although not well resolved, showed absorption bands at 3,397 cm-1 and at 2,925 cm-1 that could indicate the OH and CH stretching, respectively. The band at 1,636 cm-1 was attributed to the stretching vibration of C=O. In addition, signals at 1,452 cm-1 and at 1,084 cm-1 could correspondingly attributed to CH and OH deformation. The absorption occurred at about 855 cm -1 could denote the β-configuration presence in some sugar residues.
Fig. 3. 13C-NMR spectrum of the raw lemon pomace polysaccharide. Chemical shifts are reported in ppm relative to CDCl3.
Specific viscosity (η) as function of concentration of polysaccharides aqueous solution was determined for all three waste s biopolymer by using Cannon-Ubbelohde 75 suspended level viscometers at 30°C. Rheological properties were also considered by studying the specific viscosity of each sample (at a concentration of 1%) with respect to the pH range obtained with different appropriate buffers at 30°C. In the case of the polysaccharide extracted from tomato wastes, the viscosity of aqueous solution reached the maximum value
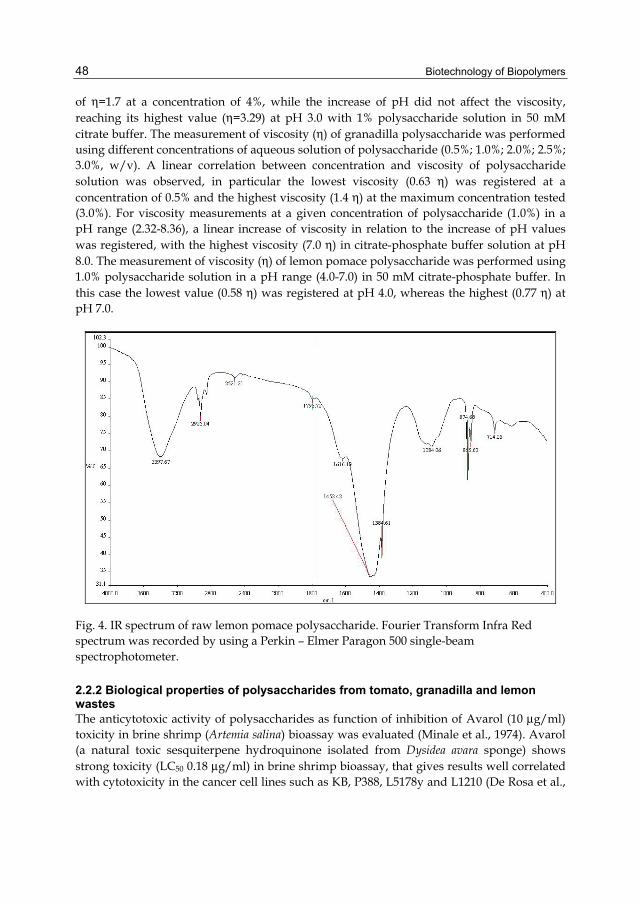
Biotechnology of Biopolymers
48
of η=1.7 at a concentration of 4%, while the increase of pH did not affect the viscosity, reaching its highest value (η=3.29) at pH 3.0 with 1% polysaccharide solution in 50 mM citrate buffer. The measurement of viscosity (η) of granadilla polysaccharide was performed using different concentrations of aqueous solution of polysaccharide (0.5%; 1.0%; 2.0%; 2.5%; 3.0%, w/v). A linear correlation between concentration and viscosity of polysaccharide solution was observed, in particular the lowest viscosity (0.63 η) was registered at a concentration of 0.5% and the highest viscosity (1.4 η) at the maximum concentration tested (3.0%). For viscosity measurements at a given concentration of polysaccharide (1.0%) in a pH range (2.32-8.36), a linear increase of viscosity in relation to the increase of pH values was registered, with the highest viscosity (7.0 η) in citrate-phosphate buffer solution at pH 8.0. The measurement of viscosity (η) of lemon pomace polysaccharide was performed using 1.0% polysaccharide solution in a pH range (4.0-7.0) in 50 mM citrate-phosphate buffer. In this case the lowest value (0.58 η) was registered at pH 4.0, whereas the highest (0.77 η) at pH 7.0.
Fig. 4. IR spectrum of raw lemon pomace polysaccharide. Fourier Transform Infra Red spectrum was recorded by using a Perkin – Elmer Paragon 500 single-beam spectrophotometer.
2.2.2 Biological properties of polysaccharides from tomato, granadilla and lemon wastes The anticytotoxic activity of polysaccharides as function of inhibition of Avarol (10 μg/ml) toxicity in brine shrimp (Artemia salina) bioassay was evaluated (Minale et al., 1974). Avarol (a natural toxic sesquiterpene hydroquinone isolated from Dysidea avara sponge) shows strong toxicity (LC50 0.18 μg/ml) in brine shrimp bioassay, that gives results well correlated with cytotoxicity in the cancer cell lines such as KB, P388, L5178y and L1210 (De Rosa et al.,

Polysaccharides from Wastes of Vegetable Industrial Processing: New Opportunities for Their Eco-Friendly Re-Use
49
1994). For this assay 10 ppm Avarol were used in order to obtain the death of all the brine shrimp larvae. Briefly, for each dose tested, surviving shrimps were counted after 24 h, and the data statistically analysed by the Finney program, which affords LD50 values with 95% confidence intervals (Finney, 1971). The biopolymer isolated from granadilla peels was found to be an anticytotoxic compound in this bioassay, increasing the value of Avarol LD50 from 0.18 μg/ml up to 2.13 μg/ml when present at a concentration of 500 ppm (Table 5). Lemon pomace polysaccharide behaved in a similar way (Table 5), with a value of Avarol LD50 of 2.32 μg/ml when present at a concentration of 500 ppm. Finally, the protective effect of the tomato waste polysaccharide against the toxic role of Avarol was more evident even at a lower concentration (5 ppm). Tomato polysaccharide in a concentration of 500 ppm caused an increase of Avarol LD50 up to 11 μg/ml, thus resulting the most powerful anti-toxic agent (Table 5).
500 ppmd 50 ppmd 20 ppmd 5 ppmd LD50 ppm Granadilla polysaccharide 28/30e 26/30 n.d. 28/30 n.a. Granadilla polysaccharide +Avarol 10 ppm 10/30 0/30 n.d. 0/30 2.13f
Lemon pomace polysaccharide 29/30 30/30 30/30 n.d. n.a. Lemon pomace polysaccharide +Avarol 10 ppm 11/30 8/30 8/30 n.d. 2.32f
Tomato waste polysaccharide 28/30 28/30 n.d. 26/30 n.a. Tomato waste polysaccharide +Avarol 10 ppm 25/30 23/30 n.d. 11/30 11f
Table 5. Inhibition of Avarol Toxic Activity in Artemia salina bioassay by granadilla peela, lemon pomaceb and tomato waste polysaccharidesc. aData from Tommonaro et al., 2007; bdata from present study; cdata from Tommonaro et al., 2008; dconcentration of polysaccharide in 1% DSMO; esurvivals/total larvae of Artemia salina after 24 h of incubation in artificial sea water; fvalues of 95% confidence intervals; n.d. not determinate; n.a. no activity.
Additional biological properties of tomato polysaccharide were studied by De Stefano et al. (2007) that reported the effects of this polymer on the J774 mouse monocyte/macrophage cell line. The authors pointed out that polysaccharide inhibited in a concentration-dependent manner the nitrite and ROS productions as well as the iNOS protein expression induced by LPS in stimulated macrophages. Incubation of cells with polysaccharide determined a significant decrease of nuclear factor-κB (NF-κB)/DNA binding activity which was correlated with a marked reduction of the iNOS mRNA levels. These results indicated that tomato polysaccharide inhibited NF-κB activation and iNOS gene expression by preventing the reactive specie productions, thus suggesting a role for this biopolymer in the control of oxidative stress and/or inflammation process.
2.2.3 Biotechnological aspects of tomato wastes polysaccharides In order to verify the biodegradability of tomato waste polysaccharide, a growth test using a thermohalophilic bacterium Thermus thermophilus strain Samu-Sa1 isolated from

Biotechnology of Biopolymers
50
hot springs of Mount Grillo (Baia, Naples, Italy) was performed (Romano et al., 2004). Tomato polysaccharide was added as a sole carbon source (1g/L) in M162 medium (Degryse et al., 1978) modified with 2g/L NaCl at pH 7.2. For comparison, strain Samu-SA1 was grown on TH standard medium as described in Romano et al. (2004). The growth was monitored by measuring the absorbance at 540 nm and converted into cell dry weight by means of an appropriate calibration curve. The depletion of polysaccharide content was observed with Dubois method. After 30 h of batch incubation at 75°C (the optimal temperature of growth for strain Samu-Sa1), the tomato polysaccharide had been completely hydrolysed, as confirmed by the Dubois assay applied to the cell-free cultural broth. Moreover, the growth curves of strain Samu-Sa1 on polysaccharide medium were 2.6 fold higher than that obtained in TH medium (standard medium) with a yield of 1.2 g of dry cells/L. Furthermore, a useful application of polysaccharides extracted from tomato processing industrial wastes and from granadilla peels is the development of biodegradable films by means of biopolymers and glycerol solutions (Strazzullo et al., 2003; Tommonaro et al., 2007). Applying the procedure previously described, solid, clear and elastic films were obtained from both polysaccharides, able to recover small deformations produced by tensile stress applied. These biofilms could have interesting biotechnological applications in different fields, such as agriculture, e.g. for protecting cultivations with mulching operation techniques. In the case of polysaccharide extracted from lemon pomace, no results were obtained using the same procedure for biofilm production and, therefore, further studies are needed.
3. Conclusion The need for a more sustainable production of polysaccharides based on agricultural feedstock has stimulated the search for renewable sources of such biopolymers, that should not compete with the food chain. Accordingly, waste biomasses produced by fruits and vegetable processing have shown to be promising raw materials either for polysaccharides industrial production and for the discovery of new ones. In fact, such waste biomasses are produced every year in huge amounts by food production based on transformation of fruits and vegetables: they comprise mainly peels, seeds and pulps in which many kinds of molecules and biopolymers are still retained after processing for juice extraction, canning, beverages production, et cetera. Polysaccharides are the most abundant biopolymers that can be recovered from these food by-products and several examples are indeed available in literature concerning their exploitation for polysaccharide extractions. In this regard, the search for under-utilized waste biomass has been paralleled also by the implementation of processes and technologies that are safe for the environment and that allow a more complete exploitation of such wastes for a sustainable production of polysaccharides. In this section, besides remarkable examples present in literature, we also reported our results about the use of fruit and vegetable residues for the extraction of polysaccharides by means of a newly developed method based on alkaline treatment of waste biomasses. The investigated biomasses are representative of some significant food production based on fruits and vegetables cultivated in European and South American countries.

Polysaccharides from Wastes of Vegetable Industrial Processing: New Opportunities for Their Eco-Friendly Re-Use
51
A new extraction methodology, based on alkali treatment of biomass at room temperature, has been implemented for tomato waste exploitation and has been successively employed for polysaccharides isolation from granadilla wastes and more recently also for lemon pomace and new unpublished data related to lemon pomace were reported here. By means of the alkali treatment new polysaccharides have been isolated from the selected waste vegetable biomass whose biochemical properties have been studied. Tomato waste polysaccharide, showing a structure similar to a xyloglucan biopolymer, was investigated for its biological activity and showed to be anticytotoxic in the Brine Shrimp bioassay; moreover it also exerted an interesting anti-oxidant activity, as confirmed by ROS inhibition assay, suggesting a role for this compound in the control of oxidative stress and/or inflammation. Biotechnological application for this biopolymer were suggested by its capability to form biofilms, that could be used in different fields such as agriculture, i.e. for protected cultivation with mulching operation technique. In addition, tomato waste polysaccharide biodegradability was assessed by using it as sole carbon source for microbial growth, thus highlighting also its employment for cheap biomass production. Granadilla and lemon polysaccharides, showing a xylan-like and a pectin-like structure, respectively, were also investigated for their rheological properties and for their biological activities, both confirming to be anticytotoxic compounds in the Brine Shrimp bioassay. Future perspectives of this research include further characterization of lemon polysaccharide properties, investigation of other vegetable biomass generated in significant amounts and useful for polysaccharide biopolymers production and finally improvement of extraction technologies. Incidentally, it can be underlined that the wastes investigated were used without any chemical or physical pre-treatment, therefore polysaccharide yields from vegetable wastes could be improved by employing physical (e.g. ultrasound or microwave treatment) or enzyme methods. In conclusion, resources depletion and environmental concerns have triggered new regulations and growing awareness throughout the world, thus promoting the use of renewable resources to produce chemicals and energy. Accordingly, the production of useful biopolymers like polysaccharides starting from cheap and abundant renewable resources, such as residues of fruits and vegetables processed for food production, could contribute to the issue of waste management and to the implementation of the “biorefinery” strategy.
4. Acknowledgment This work was partially supported by Regione Campania Lg.5 and Ministry of Foreign Affairs (MAE-Italy). The authors are grateful to the NMR Service of Institute of Biomolecular Chemistry of CNR (Pozzuoli, Italy).
5. References Azizi Samir, M.A.; Alloin, F. & Dufresne, A. (2005). Review of recent research into cellulosic
whiskers, their properties and their application in nanocomposite

Biotechnology of Biopolymers
52
field. Biomacromolecules, Vol.6, No.2, (March-April 2005), pp. 612– 626, ISSN 1526-4602
Baek, S.H.; Lee, J.G.; Park, S.Y.; Bae, O.N.; Kim, D.H. & Park, J.H. (2010). Pectic polysaccharides from Panax ginseng as the antirotavirus principals in ginseng, Biomacromolecules, Vol.11, No.8, (August 2010), pp. 2044–2052, ISSN 1526-4602
Blumenkrantz, N. & Asboe-Hansen, G. (1973). New method for quantitative determination of uronic acids. Analytical Biochemistry, Vol.54, No.2, (August 1973), pp. 484-489, ISSN 0003-2697
Bothast, R.J. & Schlicher, M.A. (2005) Biotechnological processes for conversion of corn into ethanol, Applied Microbiology and Biotechnology, Vol.67, No.1, (April 2005), pp. 19–25, ISSN 1432-0614
Bradford, M.M. (1976). A rapid and sensitive method for the quantification of microgram quantities of protein utilizing the principle of protein-dye binding. Analytical Biochemistry, Vol.72, No.1-2, (May 1976), pp. 248-254, ISSN 0003-2697
Champ, M.; Langkilde, A.M.; Brouns, F.; Kettlitz, B. & Le Bail Collet, Y. (2003). Advances in dietary fiber characterization. 1. Definition of dietary fiber, physiological relevance, health benefits and analytical aspects. Nutrition Research Reviews, Vol.16, No.1, (June 2003), pp. 71-82, ISSN 1475-2700
Chang M.C.Y. (2007). Harnessing energy from plant biomass, Current Opinion in Chemical Biology, Vol.11, No.6, (December 2007), pp. 677-684, ISSN 1367-5931
De Rosa, S.; De Giulio, A. & Iodice, C. (1994). Biological effects of prenylated hydroquinones: structure-activity relationship studies in antimicrobial, brine shrimp, and fish lethality assays. Journal of Natural Products, Vol.57, No.12, (December 1994), pp. 1711-1716, ISSN 0163-3864
De Stefano, D.; Tommonaro, G.; Simeon, V.; Poli, A.; Nicolaus, B.; Carnuccio, R. (2007). A Polysaccharide from Tomato (Lycopersicon esculentum) Peels, Affects NF-κB Activation in LPS-Stimulated J774 Macrophages. Journal of Natural Products, Vol.70, No.12, (October 2007), pp. 1636-1639, ISSN 0163-3864
Degryse, E.; Glansdorff, N. & Pierard A. (1978). A comparative analysis of extreme thermophilic bacteria belonging to the genus Thermus. Archives of Microbiology, Vol.117, No.2, (May 1978), pp. 189-196, ISSN 0302-8933
Di Donato, P.; Fiorentino, G.; Anzelmo, G.; Tommonaro, G.; Nicolaus, B. & Poli, A. (2011). Re-Use of Vegetable Wastes as Cheap Substrates for Extremophile Biomass Production, Waste and Biomass Valorization, in press DOI: 10.1007/s12649-011-9062-x.
Dubois, M.; Gilles, K. A.; Hamilton, J. K.; Rebers, P. A. & Smith, F. (1956). Colorimetric methods for determination of sugars and related substances. Analytical Chemistry, Vol.28, No.3, (March 1956), pp. 350-356, ISSN 0003-2700
Finkenstadt, V.L. (2005). Natural polysaccharides as electroactive polymers, Applied Microbiology and Biotechnology, Vol.67, No.6, (June 2005), pp. 735–745, ISSN 1432-0614
Finney, D.J. (1971). Probit Analysis, Cambridge University Press (3rd ed.), ISBN-13: 978-0521080415, Cambridge, United Kingdom, June 1971

Polysaccharides from Wastes of Vegetable Industrial Processing: New Opportunities for Their Eco-Friendly Re-Use
53
Gandini, A. (2008). Polymers from Renewable Resources: A Challenge for the Future of Macromolecular Materials, Macromolecules, Vol. 41, No.24, (December 2008) pp. 9491–9504, ISSN 1520-5835
Happi Emaga, T.H.; Robert, C.; Ronkart, S.N.; Wathelet, B. & Paquot, M. (2008). Dietary fibre components and pectin chemical features of peels during ripening in banana and plantain varieties. Bioresource Technology, Vol. 99, No.10, (July 2008), pp. 4346–4354, ISSN 0960-8524
Huang, S.Q., Li, J.W.; Wang, Z.; Pan, H.X.; Chen, J.X. & Ning, Z.X. (2010) Optimization of Alkaline Extraction of Polysaccharides from Ganoderma lucidum and Their Effect on Immune Function in Mice, Molecules, Vol.15, No.5, (May 2010), pp. 3694-3708, ISSN 1420-3049
Hyung, S.K.; Kacew, S. & Mu Lee, B. (1999). In vitro chemopreventive effects of plant polysaccharides (Aloe barbadensis Miller, Lentinus edodes, Ganoderma lucidum and Coriolus versicolor), Carcinogenesis, Vol.20, No.8, (August 1999), pp. 1637-1640, ISSN 1460-2180
Kalapathy, U. & Proctor, A. (2001). Effect of acid extraction and alcohol precipitation conditions on the yield and purity of soy hull pectin, Food Chemistry, Vol.73, No.4, (June 2001), pp. 393-396, ISSN 0308-8146
Kaur, N. & Gupta, A.K. (2002). Applications of inulin and oligofructose in health and nutrition, Journal of Biosciences, Vol.27, No.7, (December 2002), pp. 703–714, ISSN 0250-5991
Klemm, D.; Heublein, B.; Fink, H.P. & Bohn, A. (2005). Cellulose: Fascinating Biopolymer and Sustainable Raw Material, Angew. Chem. Int. Ed., Vol.44, No.22, (April 2005), pp. 3358 – 3393, ISSN 1521-3773
Kratchanova, M.; Pavlovaa, E. & Panchev, I. (2004). The effect of microwave heating of fresh orange peels on the fruit tissue and quality of extracted pectin, Carbohydrate Polymers, Vol.56, No.2, (June 2004), pp. 181–185, ISSN 0144-8617
Kuan, Y.H. & Liong, M.T. (2008). Chemical and physicochemical characterization of agrowaste fibrous materials and residues, Journal of Agriculture and Food Chemistry, Vol. 56, No.19, (September 2008), pp.9252–9257, ISSN 1520-5118
Liu, C. P.; Fang, J. N.; Li, X.Y. & Xiao, X. Q. (2002). Structural characterization and biological activities of SC4, an acidic polysaccharide from Salvia chinensis, Acta Pharmacol. Sin, Vol. 23, No.2, (February 2002), pp. 162–166, ISSN 1671-4083
MacDougall, A. J.; Needs, P. W.; Rigby, N. M. & Ring, S. G. (1996). Calcium gelation of pectic polysaccharides isolated from unripe tomato fruit. Carbohydrate Research, Vol.923, No.2, (October 1996), pp. 235-249, ISSN 0008-6215
Mahro, B. & Timm, M. (2007). Potential of biowaste from the food industry as a biomass resource, Engineering in Life Sciences, Vol. 7, No.5, (October 2007), pp. 457-468, ISSN 1618-2863
Majdoub, H.; Roudesli, S. & Deratani, A. (2001). Polysaccharides from prickly pear peel and nopals of Opuntia ficus-indica: extraction, characterization and polyelectrolyte behavior. Polymer International, Vol. 50, No.5, (May 2001), pp. 552-560, ISSN 0959-8103

Biotechnology of Biopolymers
54
Mandalari, G.; Bennett, R.N.; Bisignano, G.; Saija, A.; Dugo, G.; Lo Curto, R.B.; Faulds, C.B. & Waldron, K.W. (2006). Characterization of Flavonoids and Pectins from Bergamot (Citrus bergamia Risso) Peel, a Major Byproduct of Essential Oil Extraction, Journal of Agriculture and Food Chemistry, Vol.54, No.1, (January 2006), pp. 197-203, ISSN 1520-5118
Mano, J.F.; Silva, G.A.; Azevedo, H.S.; Malafaya, P.B. ; Sousa, R.A.; Silva, S.S.; Boesel, L.F.; Oliveira, J.M.; Santos, T.C.; Marques, A.P.; Neves, N.M. & Reis, R.L. (2007). Natural origin biodegradable systems in tissue engineering and regenerative medicine: present status and some moving trends, Journal of Royal Society Interface, Vol.47, No.17, (April 2007), pp. 999–1030, ISSN 1742-5662
Meyer, H.P. (2011). Sustainability and Biotechnology, Organic Process Research & Development, Vol. 15, No.1, (October 2010), pp. 180–188, ISSN 1083-6160
Min, B.; Lim, J.; Ko, S.; Lee, K.G.; Lee, S.H & Lee, S. (2011). Environmentally friendly preparation of pectins from agricultural byproducts and their structural/rheological characterization, Bioresource Technology, Vol. 102, No.4, (February 2011), pp. 3855-3860, ISSN 1873-2976
Minale, L.; Riccio, R. & Sodano, G. (1974). Avarol, a novel sesquiterpenoid hydroquinone with a rearranged skeleton from the sponge Dysidea avara. Tetrahedron Letters, Vol.15, No.38, ( September 1974), pp. 3401- 3404, ISSN 0040-4039
Narayan, R. (1994). Polymeric Materials from Agricultural Feedstocks, In: Polymers from Agricultural Coproducts, Fishman M.L., Friedman R.B., Huang S.J., pp. 2-28, American Chemical Society, ISBN13: 9780841230415, Washington, DC.
Navard, P. (2005). Editorial: EPNOE: The New European Polysaccharide Network of Excellence, Cellulose, Vol.12, No.4, (August 2005), pp. 337-338, ISSN 1572- 882X.
Persin, Z.; Stana-Kleinschek, K.; Foster, T.J.; van Dam, J.E.G.; Boeriu, C.G. & Navard, P. (2010). Challenges and opportunities in polysaccharides research and technology: The EPNOE views for the next decade in the areas of materials, food and health care, Carbohydrate Polymers, Vol.84, No.1, (February 2011), pp. 22-32, ISSN 0144-8617
Poli, A.; Manca, M. C.; De Giulio, A.; Strazzullo, G.; De Rosa, S. & Nicolaus, B. (2006). Bioactive Exopolysaccharides from the Cultured Cells of Tomato Lycopersicon esculentum L. var. San Marzano. Journal of Natural Products, Vol.69, No.4, (February 2006), pp. 658-661, ISSN 1520-6025
Poli, A.; Kazak, H.; Gürleyendag, B.; Tommonaro, G.; Pieretti, G.; Toksoy Öner, E. & Nicolaus, B. (2009). High level synthesis of levan by a novel Halomonas species growing on defined media. Carbohydrate Polymers, Vol.78, No.4, (November 2009), pp. 651-657, ISSN 0144-8617
Romano, I.; Lama, L.; Schiano Moriello, V.; Poli, A.; Gambacorta, A. & Nicolaus, B. (2004). Isolation of a new thermohalophilic Thermus thermophilus strain from hot spring, able to grow on a renewable source of polysaccharides. Biotechnology Letters, Vol.26, No.1, (January 2004), pp. 45-49, ISSN 1573-6776
Sanjay, K. & Gross, R.A. (2001). Overview: Introduction to Polysaccharides, Agroproteins and Poly(amino acids), In: Biopolymers from Polysaccharides and Agroproteins, Gross

Polysaccharides from Wastes of Vegetable Industrial Processing: New Opportunities for Their Eco-Friendly Re-Use
55
R.A., Scholz C., pp. 2-40, American Chemical Society, ISBN13 9780841236455, Washington, DC.
Song, Y.; Du, B.; Zhou, T.; Han, B.; Yu, F.; Yang, R.; Hu, X.; Ni, Y. & Li, Q. (2011). Optimization of extraction process by response surface methodology and preliminary structural analysis of polysaccharides from defatted peanut (Arachis hypogaea) cakes. Carbohydrate Research, Vol. 346, No. 2, (February 2011) pp. 305–310, ISSN 0008-6215
Sriamornsak, P. (2003). Chemistry of Pectin and Its Pharmaceutical Uses : A Review, Silpakorn University International Journal, Vol.3, No.1-2, (January-December 2003), pp. 206-228, ISSN 1513-4717
Strazzullo, G.; Schiano Moriello, V.; Poli, A.; Immirzi, B.; Amazio, P. & Nicolaus, B. (2003). Solid wastes of tomato-processing industry (Lycopersicon esculentum “Hybride Rome”) as renewable sources of polysaccharides. Journal of Food Technology, Vol.1, No.3, (June 2003), pp. 102-105, ISSN 1993-6036
Thibault, J.F. & Ralet, M.C. (2003). Physico-chemical properties of pectins in the cell walls after extraction, In: Advances in pectin and pectinase research, Voragen F., Schols H., Visser R. pp. 91-105, Kluwer Academic Publishers, ISBN 1-4020-1144-X, Dordrecht, The Netherlands.
Tommonaro, G.; Segura Rodriguez, C. S.; Santillana, M.; Immirzi, B.; De Prisco, R.; Nicolaus, B. & Poli, A. (2007). Chemical Composition and Biotechnological Properties of a Polysaccharide from the Peels and Antioxidative Content from the Pulp of Passiflora liguralis. Journal of Agricultural and Food Chemistry, Vol.55, No.18, (June 2007), pp. 7427-7433, ISSN 0021-8561
Tommonaro, G.; Poli, A.; De Rosa, S. & Nicolaus, B. (2008). Tomato Derived Polysaccharides for Biotechnological Applications: Chemical and Biological Approaches. Molecules, Vol. 13, No.6, (June 2008), pp. 1384-1398, ISSN 1420-3049
Trombetta, D.; Puglia, C.; Perri, D.; Licata, A.; Pergolizzi, S.; Lauriano, E. R.; De Pasquale, A.; Saija, A. & Bonina, F.P. (2006). Effect of polysaccharides from Opuntia ficus-indica (L.) cladodes on the healing of dermal wounds in the rat, Phytomedicine, Vol. 13, No.5, (May 2006), pp. 352–358, ISSN 0944-7113
Wang, F.; Li, J. & Jiang, Y. (2010). Polysaccharides from mulberry leaf in relation to their antioxidant activity and antibacterial ability, Journal of Food Process Engineering, Vol.33, No. 1, (February 2010), pp. 39–50, ISSN 1745-4530
Wang, Y.-C.; Chuang, Y.-C. & Hsu, H.-W. (2008). The flavonoid, carotenoid and pectin content in peels of citrus cultivated in Taiwan, Food Chemistry, Vol.106, No.1, (January 2008), pp. 277–284, ISSN 0308-8146
Watt, D.K.; Brasch, D.J.; Larsen, D.S. & Melton L.D. (1999). Isolation, characterisation, and NMR study of xyloglucan from enzymatically depectinised and non-depectinised apple pomace. Carbohydrate Polymers, Vol. 39, No. 2, (June 1999), pp. 165–180, ISSN 0144-8617
Willats, W.G.T.; Knox, J.P. & Mikkelsen, J.D. (2006). Pectin: new insights into an old polymer are starting to gel, Trends in Food Science & Technology, Vol. 17, No.3, (March 2006), pp. 97–104, ISSN 0924-2244

Biotechnology of Biopolymers
56
Zykwinska, A.; Boiffard, M.H.; Kontkanen, H.; Buchert, J.; Thibault, J.F. & Bonnin, E. (2008). Extraction of green labeled pectins and pectic oligosaccharides from plant byproducts, Journal of Agriculture and Food Chemistry, Vol.56, No.19, (September 2008), pp. 8926-8935, ISSN 1520-5118
3
Conversion of Biomass into Bioplastics and Their Potential Environmental Impacts
Lei Pei1, Markus Schmidt1 and Wei Wei2 1Organisation for International Dialog and Conflict Management,
2Institute of Botany, Chinese Academy of Sciences, 1Austria
2China
1. Introduction To build our economy on a sustainable basis, we need to find a replacement for fossil carbon as chemical industry feedstocks (Andrady and Neal, 2009). There are growing concerns about current petroleum based production, accumulation of waste in landfills and in natural habitats including the sea, physical problems for wildlife resulting from ingestion or entanglement in plastic, the leaching of chemicals from plastic products and the potential for plastics to transfer chemicals to wildlife and humans (Thompson et al., 2009). Bioplastics, derived from bio-based polymers, may provide a solution. Unlike the chemically synthesized polymers, the bio-based polymers are produced by living organisms, such as plants, fungi or bacteria. Some microorganisms are particularly capable in converting biomass into biopolymers while employing a set of catalytic enzymes. Attempts to transfer biomass to produce industrially useful polymers by traditional biotechnological approaches have obtained only very limited success, suggesting that an effective biomass-conversion requires the synergistic action of complex networks. As an interdisciplinary research field which is a unique combination of life science and engineering, synthetic biology can provide new approaches to redesign biosynthesis pathways for the synergistic actions of biomass-conversion and may ultimately lead to cheap and effective processes for conversion of biomass into useful products such as biopolymers. In the following sections of this review, we will give first an introduction on bioplastics and synthetic biology (section 2). The properties of bio-based polymers for bioplastics equal to or better than their chemical synthetic counter parts will be compared. The subfields of synthetic biology related to polymer biosynthesis will be reviewed. In the Section 3, we will focus on synthetic biological approaches to improve the biological system to produce polymers for bioplastics, such as polyhydroxyalkanoates (PHAs). The fourth section then goes on to evaluate the environmental impacts of the synthetic biology derived bioplastics. In this section, we will review the current methods to measure the environmental impacts on bioplastics on greenhouse gases (GHGs) emission, direct or indiret land usage, energy consumptions and waste management, as well as the current regulation guidelines on bioplastics in Europe. And in the last section, we will summarize the perspectives of synthetic biology and bioplastics.

Biotechnology of Biopolymers
58
2. Synthetic biology and bioplastics Since industrialization, human beings have relied largely on chemicals derived from fossil carbon. Due to the unsustainable nature of petroleum and coal, it is essential to develop better alternatives to produce chemicals from renewable sources. The implementation of biological processing in industrial scale may help to reduce the undesirable damage to the environment caused by the massive scale productions from the current fossil fuel based chemical industry. Among the commodity chemicals, polymers for plastics are becoming independent for our modern lifestyle (Andrady and Neal, 2009). Plastic have transformed our everyday life and their usage is increasing. Based on the report from Plastic EU 2009, the average annual increase of plastic production and consumption is 9% globally (PlasticsEurope, 2009). The plastic demand in EU was 48.5 million tones in 2008, of which 75% was composed by mainly five high volume families- polyethylene (PE), polypropylene (PP), polyvinylchloride (PVC), polystyrene (PS) and polyethylene terephthalate (PET). Majority of them are produced by chemical synthesis starting with petroleum feedstocks. These synthesized plastics are durable which make them resistant to biological degradation. Due to the toxic additives, for example, plasticizers like adipates and phthalate, burning plastic can release toxic pollutants. And the manufacturing of chemical industrial processes often creates environmental hazards. Due to the concerns over the climate change, limitation of the fossil carbon source and environmental mitigation, there are renewed interests in bioplastics. There are mainly three types of bioplastics in the commercial scale of production (Table 1). a. Plastics derived from fossil carbon source but biodegradable, and b. Plastics derived from polymers converted from biomass and biodegradable, and c. Plastics derived from polymers converted from biomass but not biodegradable. In our current review, we will focus on the biodegradable, compostable and bio-based plastics. In our paper, we use the term ‘bioplastics’ only referring plastics made from this type of polymers.
Polymer Company (example) Scale (ton/year) Biodegradable but not bio-based Synthetic polyesters Ecoflex (BASF) 14 000 Polyvinyl alcohol (PVA) Wanwei 100 000 Biodegradable and bio-based Starch based materials Novamont 60 000 Cellulose based materials Innovia Films 30 000 Polylactide (PLA) Natureworks 140 000 Polyhydroxyalkanoate (PHA) Metabolix (ADM) 50 000
Biobased but non-biodegradable PDO from biobased glycerol Tate & Lyle (DuPont) 45 000 PE from Bioethanol Braskem (DOW) 200 000 (planned) PVC from Bioethanol Solvay 360 000 (planned) Polyamides (PA) from oils Arkema 6 000 (planned)
Table 1. Polymers for bioplastics on the market (Kaeb, 2009).

Conversion of Biomass to Bioplastics and Their Potential Environmental Impacts
59
The bioplastics available in the market are made from polymers such as starch-based, polyhydroxyalkanoates (PHAs), polylactic acid (PLA) and other polymers derived from renewable sources. Polylactic acid (PLA) is a type of thermoplastic polyester resulting from the chemical polymerization of the D- and L- lactic acids obtained from fermentation (Madhavan Nampoothiri et al., 2010). Bioplastics made from PLA shows the similar properties as those made from petroleum derived polyethylene terephthalate polymer. Besides applications in plastics, PLA derived bioplastics are also used extensively in biomedical applications, such as sutures, stents, dialysis devices, drug capsules, and evaluated as a matrix for tissue engineering (Park et al., 2008; Shi et al., 2010; Shi et al., 2009; Yao et al., 2009). Polyhydroxyalkanoates (PHAs) derived plastics are considered as the best candidates to replace the current petroleum-based plastics due to their durability in use and wide spectrum of properties. The family of PHAs polymers is one of the most promising biodegradable materials to emerge in recent years. Up to date, there are more than 100 different monomers of PHA polyesters (Chen, 2009). The PHA monomers have been divided into two classes- short-chain-length hydroxyalkanoate (scl-HA, monomer of 3 to 5 carbons) and medium-chain-length HA (mcl-HA, monomer of 6 to 14 carbons) (Tsuge, 2002). Unlike other ‘degradable’ polymers such as those based on petrochemicals, PLA and starch polymers, PHAs have useful natural properties and, therefore, do not need to sacrifice their true biodegradability to improve their properties further. They have properties similar to those of PE and PP, ranging in properties from strong, mouldable thermoplastics to highly elastic materials to soft, sticky compositions. PHAs can be blended in the large number of copolymers which allow further engineer of polymers to the desired properties for a wide range of applications. Similar to those derived from PLA, PHAs have been used in a variety of biomedical applications such as sutures and surgical meshes. Polyhydroxybutyrate (PHB) is the simplest yet best known polyester of PHAs, which was first discovered as an intracellular biopolyester produced by the Gram-positive bacterium Bacillus megaterium (Lenz and Marchessault, 2005). PHB derived bioplastics are heat tolerant with a melting point at 175 °C. PHB is commonly used to make heat tolerant and clear packaging film. Since PHAs have many properties that are superior to those of PLA, there are more renewed interests in PHAs development (Chen, 2009). Thus, we will focus our review on the latest research on PHAs. Bioplastics are currently only in a small portion (under 1%) of market share of plastics (EuropaBioplastics, 2011). In Europe, bioplastics on the market are defined as the plastics made from polymers according to standards (EN 13432). The polymers for bioplastics are usually produced in the biological fermentation processes using renewable and sustainable agricultural feedstocks, such as sugar, starch, oil, or lignocellulosic biomass. There are also non fermentative processes (thermochemical ones) in development to convert biological feedstocks to chemicals which have been reviewed elsewhere (Gong et al., 2008; Gray et al., 2006; Hames, 2009; Mu et al., 2010). In addition, some of the polymers can also be produced directly in planta by industrial crops constructed via genetic modification (GM) routes (Matsumoto et al., 2009; Poirier, 2001; Valentin et al., 1999). Up to date, most of the research on the production of biopolymers is at the concept or early research stage of development, while a few have been on commercial scales (Chen, 2009). Most of these polymers are manufactured via the microbial fermentation routes. A concept of a new branch of biotechnology termed white biotechnology, has been developed, referring to the industrial development and implement strategies for chemical production based on biomass-derived carbon sources (EuropaBio, 2003; Hermann and Patel, 2007;

Biotechnology of Biopolymers
60
Soetaert, 2007). Although the technologies were developed many years ago, large scale production of polymers from biomass was not feasible because those technologies were too expensive. However, in recent years, the innovations from the research sectors, particularly those on biotechnology, have made some of the biological conversions able to compete with the existing fossil based processes. To mention a few, there are productions of vitamins, antibiotics and ethanol using biotechnological approaches (DSM, 2004; EuropaBio, 2003; Hermann and Patel, 2007; Soetaert, 2007).
Applications Examples Reference Production of anti-malaria drugs precursor in engineered yeast (Ro et al., 2006)
Noval polio virus vaccine (Coleman et al., 2008) Medical applications
Controlling transgene expression in subcutaneous implants (Gitzinger et al., 2009)
Non-fermentative pathways for synthesis of branched-chain higher alcohols as biofuels (Atsumi et al., 2008)
Fuels & Energy Biological system as a template for photocatalytic nanostructures (Nam et al., 2010)
Synthetic protein scaffolds (Dueber et al., 2009) Chemicals Improved production of glucaric aicid in
engineered E. coli (Moon et al., 2010)
Synthetic oscillatory network of transcriptional regulator
(Elowitz and Leibler, 2000)
Tunable synthetic mammalian oscillator (Tigges et al., 2009) Biological computing
Synchronized quorum of genetic clocks (Danino et al., 2010) Synthetic microbes (Gibson et al., 2010) Organisms Genetic modified insects for pest control (Fu et al., 2007) Arsenic sensor (iGEM, 2006) Environmental
applications Biosensors seek and destroy herbicide (Sinha et al., 2010) Table 2. Achievements in Synthetic Biology
Synthetic biology (SB) has been considered as a new way of doing biotechnology. It is an emerging science and engineering field that applies engineering principles to biology. The potential benefits of SB include the development of novel medicines, renewable chemicals and fuels (Gaisser et al., 2009). Due to the infancy of SB, a variety of definitions are circulating in the scientific community, and no consensus definition is drawn. SB-related research has been performed in several fields such as DNA synthesis (or synthetic genomics) (Carlson, 2009; Carr and Church, 2009; Gibson, 2009; Gibson et al., 2008a; Gibson et al., 2008b; Gibson et al., 2010; Gibson et al., 2009), engineering DNA-based biological circuits (Canton et al., 2008; Endy, 2005), minimal genome (or minimal cell) (2009; Luisi, 2007; Mushegian, 1999; Wegrzyn, 2001), protocells (or synthetic cells) (Bedau et al., 2009, Luisi, 2007) and xenobiology (or chemical synthetic biology) (Benner and Ricardo, 2005; Deplazes and Huppenbauer, 2009, Schmidt 2010). Among all these activities, engineering DNA-based biological circuits has contributed significantly to design advanced genetic constructs and to redesign biosynthesis pathways or fine tuned genetic circuits for biopolymer production. One of the notable examples of SB derived biological circuits is the

Conversion of Biomass to Bioplastics and Their Potential Environmental Impacts
61
design of a metabolic pathway to produce a precursor of the anti-malaria compound Artemisinin, naturally found in the wormwood plant (Artemisia annua). The design and construction of this plant derived compound in engineered microbes, showed off the state of the art of enhanced metabolic engineering via SB (Hale et al., 2007; Keasling, 2008; Martin et al., 2003). A handful of successful circuits have been constructed to convert biomass to fuels and chemicals (Table 2). Besides working on practical applications, the research community also works on building so called standard biological parts (aka biobricks whereas ‘biopart’ is the technical expression) intending to rationalize and reduce the design complexity (Shetty et al., 2008; Smolke, 2009). By building such bioparts, it would provide a useful set of well-characterized, pre-fabricated, standardized and modularized genetic compounds (such as sequences of DNA) for (re)engineering biological pathways with defined functions. If succeeded, these bioparts will provide useful elements to build up systems to execute the designed functions, such as microbial fermentation to brew new biopolymers for plastics.
3. Synthetic biological approaches to convert biomass to bioplastics PHAs can be produced in almost all bacteria in the form of intracellular inclusions. In response to a certain deficient growth conditions, the biosynthesized PHAs can make up to 90% of the dry cell mass (Garcia et al., 2004; Haywood et al., 1990; Lee et al., 1999; Madison and Huisman, 1999; Yim et al., 1996). Some microbes in their wild type forms can already produce PHAs in sufficient quantity (ranging from 50% to 80% of the dry cell mass), such as Rolstonia eutropha (>80%), Alcaligenes latus (>75%), and Pesudomonas oleovorans (>60%) (Chen, 2009). There are three well known natural biosynthesis pathways of PHAs (Tsuge, 2002). The pathway I is most common which is found in many bacteria. It leads to generate 3-hydroxybutyryl (3HB) monomers from acetyl-CoA derived from sugars while a set of enzymes are involved in this process, such as PhaA (3-ketothiolase which converts acetyl-CoA to acetoacetly-CoA), PhaB (NADPH-dependent acetocaetly-CoA reductase, resulting in 3-HB-CoA) and PhaC (PHA synthase, polymerizing 3HB-CoA to the final monomers). The pathway II and III are more commonly found in the genus of pseudomonas. They are pathways using either sugars or fatty acids as carbon source to convert to either acetyl-CoA or acyl-CoA, resulting mainly in mcl-(R)-hydrooxyacly (3HA) monomers. The (R)- specific enoyl-CoA hydratase (PhaJ) and (R)–3-hydroxyacyl-ACP-CoA transferase (PhaG) play similar roles as PhaB in the pathway I to obtain 3HA-CoA. PHAs are truly natural polymers yet with properties similar to those of the synthetic ones. There is a renewed interest in producing PHAs in a biological process fed with sustainable sources. Several refactored microbes have been constructed to produce PHAs (Aldor and Keasling, 2003; Garcia, et al., 2004; Hofer et al., 2010; Lee, et al., 1999; Li et al., 2007; Park et al., 2002; Qiu et al., 2006; Sandoval et al., 2007; Zhang et al., 2009). One commonly used engineering strain is E. coli. Recombinant E. coli strains harbouring a set of PHAs biosysthesis genes (phaCac from Aeromonas caviae, phaCABa1 from Alcaligenes latus, or phbCAB from Ralstonia eutropha) were constructed (Taguchi et al., 1999). Sufficient amount of PHAs can be produced, while using sugars or fatty acids as carbon sources. Besides E. coli, Aeromonas hydrophila harbouring phbAB or phaPCJ were also constructed to produce PHAs using lauric acid as carbon source (Chen et al., 2001). Some of the natural PHAs producing strains have been subjected to genetic modification to enhance their productivity. For instance, double knockout mutant of P. putida was generated using suicide plasmid bearing beta-oxidation genes fadA and fadB. The mutant strains produced more PHAs (84%) than its wild type strains (50%) (Ouyang et al., 2007).

Biotechnology of Biopolymers
62
Based on these strains, a couple of biotechnology based fermentation processes have been developed for the industrial scale productions of PHAs (Chen, 2009). These fermentations are usually performed in two phases. The first phrase is a cell growth phrase to obtain high cell density and the second phrase is a PHA-production phrase of which cell growth deficient conditions are deployed in favour of the metabolic shift to PHA biosynthesis. To date, most of the PHAs production via microbial fermentations relies mainly on sugars and fatty acids as carbon sources (Chen, 2009). They are derived from the sustainable resources but with limitations while used in large scale. For instance, sugars are usually derived from starch (corn) that is also major food sources. Thus, PHAs produced by the current biotechnology processes are still far more expensive than those derived from fossil carbons. In order to make a biological based process compete with the traditional chemical processes, the PHAs will have to be produced at a higher yield preferably from a non-food biomass, more advanced PHA monomers with novel properties, less energy consumption and less green house gases (GHGs) emission while full life cycle analysis (LCA) is taken into consideration. It is highly expended that the novel approaches developed by SB may help to achieve these goals. One of the contributions from SB is to develop better PHA production strains. Nearly all previous work using genetic engineering approaches has focused on reorganizing PHA biosynthesis genes derived from natural organisms. In contrast, SB will provide an integration of genetic engineering, metabolic engineering, chemistry and bioinformatics. For instance, using SB methods, microbes will not only harbour genetic circuits coding for PHA biosynthesis pathway, but also metabolic pathways which will enhance productivity. A research group of Tsinghua University has worked on such genetic circuits to enhance the production of PHAs in engineered microorganisms such as E. coli, P. putida and A. hydrophila (Jian et al., 2010; Li et al., 2010; Wei et al., 2009). In order to convert lab scale fermentation to produce PHAs into the industrial scale, cells must be engineered to be able to grow in high density. It has been proposed that the limited oxygen supply is a hurdle that cells face while growing to high density. The problem was solved by constructing synthetic pathways that are turned on in response to micro- or anaerobic condition (Jian, et al., 2010). This approach has been also applied to produce poly-3-hydroxybutyrate (PHB) (Li et al., 2009), which is currently produced from starch or glucose based feedstock by bacteria. The synthetic pathways were constructed to enhance PHB production from 29% to 48% of the cell dry weight under anaerobic conditions. One of the key obstacles to produce renewable polymers by fermentations lies on the cost intensive downstream processing steps. A novel approach has been developed to remove this obstacle by equipping engineered strains with programmed autolysis genetic circuits. An inducing lysis system has been implemented in cyanobacterium Synechocystis sp. to facilitate extracting lipids for biofuel production (Liu and Curtiss, 2009). This inducible lytic system is composed of a lytic circuit from bacteriophage-derived lysis genes and an inducible circuit of genes encoding a nickel-inducible signal transduction system. If such programmed autolysis system is implemented in PHA producing strains, the efficiency of PHA fermentation will be increased. To maximize the benefit of SB derived PHA production, it has been suggested to design producing strains to product PHAs with desired properties for applications of high added value. There were a couple of reports on PHAs with unusual properties, such as adding functional groups side groups to the PHA monomer mediated by low specific PHA synthases (Hiraishi et al., 2006; Luengo et al., 2003; Sandoval, et al., 2007; Tsuge et al., 2005),

Conversion of Biomass to Bioplastics and Their Potential Environmental Impacts
63
PHA monomer of high molecular weight by mutated synthases (Zheng et al., 2006), and funtionalized PHAs containing C-C double bonds when fed unsaturated fatty acids (methanol) (Hofer, et al., 2010). One of the key issues hindering the large scale biopolymer production is the cost of sugars and fatty acids as feed stocks. This issue is an obstacle not only to the production of PHAs but also other commodity chemicals and fuels. World food prices reached a record high recently, according to a report from the Food and Agriculture Organization (FAO) of the United Nations. The Food Price Index reached 214.7 points in December 2010 and slightly above the previous peak of 213.5 points during food crisis in 2008 (BBC News Bussiness, 2011). It has already been in debut that increasing biofuel production from starch and sugar may post further threat to the food safety. Thus, it is a key challenge to develop biological processes on how to harness the non-food biomass. In theory, cellulose biomass may be the best sustainable carbon source which could fill the gap left in crop supplies as stocks have been diverted for commodity chemicals (mainly biofuels) production. A great deal of work has been carried out to convert cellulosic biomass into useful products. It has been suggested by Christopher E. French that the ideal microbes should be equipped with a couple of properties such as the ability to hydrolyse cellulosic material effectively, with minimal requirement for pre-processing; the ability to convert the sugars released into molecules useful as liquid fuels and/or chemical industry feedstocks; self-tolerance to these molecules at a high concentration, and suitable respects for use in industrial bioreactors (French, 2009). Since such microbes are not known to exist in nature, they can be only constructed via complex engineering, something that SB is expected to be capable of. Most of the non edible biomass is made up by long cellulose fibres of hemi-cellulose and lignin (Lynd et al., 2002; Lynd and Zhang, 2002). With respect to their chemical composition, hemi-cellulose is a mixture of monomers including D-xylose, L-arabinose, D-mannose and D-galactose, together with sugar derivatives such as 4-O-methyl-D-glucuronic acid. Lignin is a complex formed by polymerization of aromatic monomers. Such cellulose can be digested to D-glucose by enzymatic or non-enzymatic hydrolysis. A typical enzymatic hydrolysis of cellulose involves a multiple step process mediated by several enzymes. A handful of enzymes have been identified to degrade cellulose efficiently from different microbes (Lynd, et al., 2002), to mention a few, endogulcanases (enzymes able to cleave cellulose chains at random positions), exoglucanases (enzymes that move along the chain cleaving cellobiose residues from either the reducing or non-reducing end), and β-glucosidases (enzymes hydrolysis cellobiose to glucose). There is research on cellulosomes which are complexes of cellulolytic enzymes produced by bacteria (Bayer et al., 1994). Cellulosomes can be used for the degradation of cellulose and hemicellulose, and they have in fact been considered as one of nature’s most elaborate and highly efficient nanomachines (Fontes and Gilbert, 2010). Integration of cellulosomal components occurs via highly ordered protein-protein interactions between two proteins: cohesins and dockerins, which specificity allow the incorporation of cellulases and hemicellulases onto a molecular scaffold. Cellulosomes can be used for a range of SB applications, from clothes whitening to paper waste treatment or chemical production from lignocellulosic biomass, and the first synthetic cellulosomes have already been constructed (Mitsuzawa et al., 2009). SB will play an important role in developing cellulose degradation module along with the chemical producing module where the standardization of biological parts and interdisciplinary nature of SB enable combination of multiple modules. As it has been mentioned above, SB approaches could create artificial enzymes that are tailored for enzymatic activities that do not exist in nature. To date,

Biotechnology of Biopolymers
64
degradation of lignin and cellulose is still problematic though they can be degraded by enzymes produced by very few fungi. Using SB methods may develop lignin degradation enzymes with enhanced capability and that do not exist in nature. In addition, one possible solution is to make the biomass easy in hydrolysis such as the biomass from genetic modified plants. Such attempt has been tried by lignin deficient genetically modified plants (Baucher et al., 2003). The same idea has been applied to develop genetically modified potatoes for industrial applications which have been approved to cultivate in EU (Ryffel, 2010). Thus, no doubt, biomass with properties that is more suitable for industrial scale of fermentation will be developed as well.
4. Environmental impacts of synthetic biological production of bioplastics The plastics made from fossil derived synthetic polymers have posted serious problem for environments (Thompson et al., 2009). Each year, millions tons of synthetic plastics discarded and less than one tenth has been recovered and recycled. Majority of them are end up in landfill or enter the natural habitats (waters and surface land) (Hopewell, et al., 2009). Some disposed synthetic plastics can remain in the environment for up to thousands of year (Andrady, 1994). Furthermore, the predicted depletion of fossil fuel resources, the building up landfill of plastic waste and the implementation of low-carbon environmental protection initiatives call for an intensive search for alternatives to synthetic plastics (Prieto, 2007). Bioplastics may offer benefits relative to fossil-based plastics, particularly environmental benefits. Today bioplastics have been considered as a better solution to the increasing demands for truly sustainable growth. In developing the new generation of plastic products made from renewable feedstock, the ability of biodegradability, compostability and the evaluation measured by Life Cycle Analysis (LCA) should be all taken into account to evaluate the contributions to the environmental impacts of bioplastics. Biodegradability is the ability of organic substances and materials to be entirely converted into simple inorganic molecules such as water, carbon dioxide and methane through the biological processing mediated by microbial enzymes (Novamont, 2011a). Such a processing is part of the natural life cycle of carbon recycling of the earth. Ideally, organic waste from human activities should be removed through biodegradation to minimize their impacts to nature. It is critical to identify the key components in this processing to reach maximum efficiency. As it is known, it takes different time to biologically degrade different types of organic waste, for instance, straw and wood take longer than starch and cellulose. This implies that biodegradation is strongly influenced by the chemical nature of the substance or material to be biodegraded. To facilitate the processing, the industrial biodegradation has been used to process the urban waste. It occurs at a consistent step of composting and anaerobic digestion. Composting will produce mature compost which turns into a fertiliser, while anaerobic digestion followed by stabilisation through composting will produce biogas. Compostability is the capacity of an organic material to be transformed into compost through the composting process (Novamont, 2011b). Composting can be conducted at a small scale such as home-hold composting bin, or at an industrial level. The production of compost and its use in agriculture represent the closure of the environmental cycle and constitute a simple way to address the problem caused by the removal of organic substances from agricultural soils, reduced soil fertility and the onset of desertification. Composting is
Conversion of Biomass to Bioplastics and Their Potential Environmental Impacts
65
currently applied to selected waste that only contains biodegradable organic matter where the traditional plastics are not included in composting because they resist to the biodegradation. In contrast, biodegradable plastics can be included in composting, but only if they satisfy the criteria established by the standards that define compostable materials. Incompatible materials were composted in the past in the absence of rules and in a context of unregulated definitions and test methods. This caused significant damage, not least to the trust of users and technicians responsible for composting facilities. Bioplastics that comply with these standards can play a fundamental role in the valuation and optimisation of the composting process and in the production of high quality compost. Bioplastics, particularly those made from PHAs are truly biodegradable. PHAs can be broken down into carbon dioxide and water by hydrolysis and microbial fermentations. PHAs-degrading enzymes have been identified in some bacteria and fungi, termed depolymerises (Elbanna et al., 2004; Jendrossek and Handrick, 2002; Kim do et al., 2007; Tokiwa and Calabia, 2004). PHAs degrading microorganisms can be enriched from samples collected from various ecosystems where PHAs have been supplemented as a sole source of carbon and energy. There are mainly two types of such microbial degradation- extracellular and intracellular ones (Jendrossek et al., 1996). Besides using the native PHAs degrading strains, an advanced PHAs degrading system may be built up using the SB methods, for instances, better deploymerases or fermenting strains (Knoll et al., 2009). With more knowledge accumulating on the biodegradation of PHAs, we may expect that plastics made from polymers - which are easy to be broken down - will have more applications in the future. We also need to point out that not all bioplastics will degrade to the same extent in the anaerobic digestion step and they may perform differently in the different technologies. For this reason more research is needed on the behaviour of different bioplastics in different anaerobic systems. In addition, it has been suggested that the anaerobic fermentation on bioplastics may be combined with the production of biogas because bioplastics are carbohydrates with little or no nitrogen and therefore with a high C/N ratio, making them more suitable for energy generation during fermentation than the traditional organic waste (urban organic waste, agricultural waste, etc). SB derived degradation processes that enable the combination of degradation and energy generation will maximize the benefits of bioplastics further. Life Cycle Analysis (LCA) has become essential in evaluating the environmental impact of a product (Novamont, 2011c). It is a method for evaluating and quantifying the energy and environmental consequences and potential impacts associated with a product/process/activity throughout the entire life cycle, involving the assessment on the entire product chain (“from cradle to grave”). Evaluations on the feedstocks, their production, use and end of life in the same context have enormous potential for many biomass derived products, particular biofuels and chemicals like bioplastics. To assess the non-renewable energy consumption and greenhouse gas emissions of PHB, the environmental performance of PHB derived from corn grain was evaluated through LCA (Kim and Dale, 2008). It showed that corn derived PHB offers environmental advantages over fossil polymers- with less non-renewable energy consumption (95% reduction) and less greenhouse gas emissions (200 % reduction) as compared to the petroleum-based plastics. Calculating the overall environmental benefits, particularly on GHGs and energy saving, attributed to lignocellulosic biomass derived products is challenging because whole production chains are complex. It can be expected that different approaches and interpretations on LCA will provoke a debate about the environmental merit of bioplastics.

Biotechnology of Biopolymers
66
A recent study on biofuel converting from lignocellulose conducted by Slade et al. showed that the most important factors affecting GHGs emission are the emissions from biomass production, the use of electricity in the conversion process; and from the potentially consequential impacts: (in)direct land-use change and fertiliser replacement (Slade et al., 2009). GHGs from land use change (the so-called "carbon debt") is one of the major contributors to the environmental impacts of biomass derived products. The GHGs of biofuel was studied, and it showed the time required for biofuels to overcome the potential carbon debt and begin providing GHGs benefits would be 100-1000 years depending on the ecosystem that was replaced. Thus, using crop biomass as feedstocks for chemical productions may take a long time to gain environmental benefits from the carbon debt. Using non-crop biomass, such as lignocelluloses, may maximize the environmental gains. Furthermore, there is ongoing research on using other inexpensive carbon sources for bioplastics productions. For example, xylose which is one of the abundant sugars in food industrial waste can be converted to lactic acid and acetic acid by an anaerobic fermentation. They can subsequently be used as feasible feedstocks for PHA production (Tsuge, 2002). Eventually, carbon dioxide would serve as an ultimate source for PHA production (Tsuge, 2002). It is known that several research groups are working using SB methods to engineer photosynthetic organisms (cyanobacteria or micro algae) that can catch carbon dioxide directly and convert it to biofuels (Fischer et al., 2008; Rosenberg et al., 2008). The same techniques can be applied to implement the PHA synthesis pathways instead of the ethanol or fatty acids synthesis pathways in the engineered microbes. One important problem will arise: should synthetic biology be able to help solve the above technical issues, namely that more and more agricultural land will be devoted to plant energy-crops instead of food crops. In order to avoid such competition with food, we suggest also using non-food-competing biological resources such as perennial plants grown on degraded lands abandoned for agricultural use, crop residues, sustainable harvested wood and forest residues, double crops and mixed cropping systems, as well as municipal and industrial organic wastes. Besides the potential environmental benefits of bioplastics, it is worthwhile to point out another benefit of bioplastics due to the biological processing in their industrial productions. From this perspective, SB based techniques have the potential to avert the use or by-product of toxic molecules in the production process (DSM; EuropaBio, 2003; Hermann and Patel, 2007; Schmidt and Pei, 2011; Soetaert, 2007). While these productions will be at bulk chemical scale, the environmental impacts will be marked- less pollution releasing to the environment, less processing cost on industrial waste and etc. As it mentioned above, the synthetic plastics have been entered into the environment in large quantity since the last half century. And plastics are now one of the most common and persistent pollutants. Besides replacing synthetic plastics with more environmental friendly bioplastics which are degraded and compost, SB based techniques may provide new solutions for the already existing plastic waste- new approaches to break down the chemicals which are difficult to degrade and take long time. Microbes using synthetic polymers as substances might be created although there are none existed in nature. However, the consequences of the environmental leakage of the engineered plastic-eating microbes that could degrade plastic would be serious and the research should be subjected to thorough considerations (Collins, 2008). The current legislation on bioplastics in the EU has been focused on sustainability, carbon footprint, and labelling. The European Directive 94/62 EC and Directive 2004/12/EC

Conversion of Biomass to Bioplastics and Their Potential Environmental Impacts
67
provide reference to European standard (EC Packaging, 2004). The EN 13432 defined the biodegradable and compostable polymers as that the plastics made from at least 90% of the organic material must be converted into CO2 within 6 months. Directive 2004/12/EC on Packaging & Packaging Waste specifies what bio-based products are. Further more, the EU environmental regulations played a role in providing incentives for the emergence of the bio-based product market. There are different rationales in supporting the R&D in bioplastics. For the industrial stakeholders, bioplastics have high market potential. For the agricultural stakeholders, bioplastics will be a new market potential for agriculture derived raw materials. For the environmental protective agencies, bioplastics might contribute to reduce the so-called carbon footprint. At the national level, some countries (for instance, Germany) set specific targets, e.g. that the more than 75% of the packaging should be from renewable sources (the Federal Environment Ministry Germany, 2009).
5. Conclusion Bioplastics, defined as plastics derived from renewable carbon sources that are also biodegradeable, have been considered as good candidates for sustainable development as well as eco-friendly environment. The R&D on SB approaches is highly expected to deliver feasible approaches to bulk production of bioplastics. There are many aspects where SB can contribute to obtain this goal (Figure 1). Both SB and bioplastics are in their early stage of development. Most of the SB related research on bioplastics is focused on improving production of PHAs. More matured processes for large-scale conversion of biomass to
Fig. 1. Synthetic biology, Bioplastics and Environment.
Biotechnology of Biopolymers
68
polymer by SB design approaches could significantly influence the bulk production of bioplastics. However, adoption by industry on a new biological processing is expected to be slow, even though there are clear benefits on environmental perspectives over the long-term. Regarding to the market potential of bioplastics, the incentives and subsidy from the legislation body are currently the main driving force of the R&D of bioplastics and have high influence to the marketing of the end products. Bioplastics derived from lignocellulosic sources hold promise for emission reductions yet the techniques in harnessing lignocellulosic biomass is at the development stages. If the techniques become feasible, it will make the feedstock price of bio-based products lower and competed with those of fossil sources. Designer polymers with new properties will broaden the application of bioplastics- not only in packaging (currently), but also in other applications (medicine, textile, electronics etc). Improvements in biodegradation of bioplastics particularly combining with energy generation will make the benefits maximized.
6. Acknowledgment This work was supported by a grant by the FWF (Austrian Science Fund) project ‘‘Investigating the biosafety and risk assessment needs of synthetic biology in Austria (Europe) and China,’’ project number I215-B17; the EC-FP7 KBBE-2009 project TARPOL Targeting environmental pollution with engineered microbial systems à la carte (Grant agreement no.: 212894); and National Natural Science Foundation of China (NSFC 30811130544). Some of this work is based in part on the TARPOL project report, authored by Schmidt M, Mahmutoglu I, Porcar M, Armstrong R, Bedau MA, Morange M, Pei L, Danchin A, Schachter V, and Chanal A., titled Assessing economic, environmental and ethical implications of synthetic biology applications in environmental biotechnology.
7. References Aldor, I. S. and Keasling, J. D. (2003). Process design for microbial plastic factories:
metabolic engineering of polyhydroxyalkanoates. Curr Opin Biotechnol 14, 475-83. Andrady, A. L. (1994). Assessment of environmental biodegradation of synthetic polymers.
Polymer Reviews 34, 25-76. Andrady, A. L. and Neal, M. A. (2009). Applications and societal benefits of plastics. Philos
Trans R Soc Lond B Biol Sci 364, 1977-84. Atsumi, S., Hanai, T. and Liao, J. C. (2008). Non-fermentative pathways for synthesis of
branched-chain higher alcohols as biofuels. Nature 451, 86-9. Baucher, M., Halpin, C., Petit-Conil, M. and Boerjan, W. (2003). Lignin: genetic engineering
and impact on pulping. Crit Rev Biochem Mol Biol 38, 305-50. Bayer, E. A., Morag, E. and Lamed, R. (1994). The cellulosome--a treasure-trove for
biotechnology. Trends Biotechnol 12, 379-86. BBC news (2011). World food prices at fresh high, says UN. BBC. Available from:
www.bbc.co.uk/news/business-12119539. Bedau, M. A., Parke, E. C., Tangen, U. and Hantsche-Tangen, B. (2009). Social and ethical
checkpoints for bottom-up synthetic biology, or protocells. Syst Synth Biol 3, 65-75. Benner, S. A. and Ricardo, A. (2005). Planetary systems biology. Mol Cell 17, 471-2. Canton, B., Labno, A. and Endy, D. (2008). Refinement and standardization of synthetic
biological parts and devices. Nat Biotechnol 26, 787-793.

Conversion of Biomass to Bioplastics and Their Potential Environmental Impacts
69
Carlson, R. (2009). The changing economics of DNA synthesis. Nat Biotechnol 27, 1091-4. Carr, P. A. and Church, G. M. (2009). Genome engineering. Nat Biotechnol 27, 1151-62. Chen, G. Q. (2009). A microbial polyhydroxyalkanoates (PHA) based bio- and materials
industry. Chem Soc Rev 38, 2434-46. Chen, G. Q., Zhang, G., Park, S. J. and Lee, S. Y. (2001). Industrial scale production of poly(3-
hydroxybutyrate-co-3-hydroxyhexanoate). Appl Microbiol Biotechnol 57, 50-5. Coleman, J. R., Papamichail, D., Skiena, S., Futcher, B., Wimmer, E. and Mueller, S. (2008).
Virus attenuation by genome-scale changes in codon pair bias. Science 320, 1784-7. Collins, J. J. (2008). Collins: Boston University University Professor Lecture titled Biology by
Design. Available from: wyss.harvard.edu/viewpage/145/collins-boston-university-university-professor-lecture.
Danino, T., Mondragón-Palomino, O., Tsimring, L. and Hasty, J. (2010). A synchronized quorum of genetic clocks. Nature 463, 326-330.
Deplazes, A. and Huppenbauer, M. (2009). Synthetic organisms and living machines : Positioning the products of synthetic biology at the borderline between living and non-living matter. Syst Synth Biol 3, 55-63.
DSM (2004). Industrial (white) biotechnology: An effective route to increase EU innovation and sustainable growth.
Dueber, J. E., Wu, G. C., Malmirchegini, G. R., Moon, T. S., Petzold, C. J., Ullal, A. V., Prather, K. L. and Keasling, J. D. (2009). Synthetic protein scaffolds provide modular control over metabolic flux. Nat Biotechnol 27, 753-9.
EC Packaging (2004). Directive 2004/12/EC of the European Parliament and of the Council of 11 February 2004 amending Directive 94/62/EC on packaging and packaging waste Available from: eur-lex.europa.eu/LexUriServ/LexUriServ.do?uri=CONSLEG:1994L0062:20050405:EN:HTML.
Editorial NBT (2009). Unbottling the genes. Nat Biotechnol 27, 1059-1059. Elbanna, K., Lutke-Eversloh, T., Jendrossek, D., Luftmann, H. and Steinbuchel, A. (2004).
Studies on the biodegradability of polythioester copolymers and homopolymers by polyhydroxyalkanoate (PHA)-degrading bacteria and PHA depolymerases. Arch Microbiol 182, 212-25.
EN 13432 Standard EN 13432 and EN 14995 – Proof of compostability of plastic products. Available from: www.european-bioplastics.org/index.php?id=158.
Endy, D. (2005). Foundations for engineering biology. Nature 438, 449-53. Elowitz, M. B. and Leibler, S. (2000). A synthetic oscillatory network of transcriptional
regulators. Nature 403, 335-8. EuropaBio (2003). White Biotechnology: Gateway to a More Sustainable Future. EuropaBioplastics (2011). Bioplastics at a Glance. Available from: www.european-
bioplastics.org/index.php?id=182. Fischer, C. R., Klein-Marcuschamer, D. and Stephanopoulos, G. (2008). Selection and
optimization of microbial hosts for biofuels production. Metab Eng 10, 295-304. Fontes, C. M. and Gilbert, H. J. (2010). Cellulosomes: highly efficient nanomachines
designed to deconstruct plant cell wall complex carbohydrates. Annu Rev Biochem 79, 655-81.
French, C. E. (2009). Synthetic biology and biomass conversion: a match made in heaven? Journal of The Royal Society Interface 6, S547-S558.
Biotechnology of Biopolymers
70
Fu, G., Condon, K. C., Epton, M. J., Gong, P., Jin, L., Condon, G. C., Morrison, N. I., Dafa'alla, T. H. and Alphey, L. (2007). Female-specific insect lethality engineered using alternative splicing. Nat Biotechnol 25, 353-7.
Gaisser, S., Reiss, T., Lunkes, A., Muller, K. and Bernauer, H. (2009). Making the most of synthetic biology. Strategies for synthetic biology development in Europe. EMBO reports 10 Suppl 1, S5-8.
Garcia, B., Olivera, E. R., Sandoval, A., Arias-Barrau, E., Arias, S., Naharro, G. and Luengo, J. M. (2004). Strategy for cloning large gene assemblages as illustrated using the phenylacetate and polyhydroxyalkanoate gene clusters. Appl Environ Microbiol 70, 5019-25.
Gibson, D. G., Benders, G. A., Axelrod, K. C., Zaveri, J., Algire, M. A., Moodie, M., Montague, M. G., Venter, J. C., Smith, H. O. and Hutchison, C. A., 3rd (2008b). One-step assembly in yeast of 25 overlapping DNA fragments to form a complete synthetic Mycoplasma genitalium genome. Proc Natl Acad Sci U S A 105, 20404-9.
Gibson, D. G. (2009). Synthesis of DNA fragments in yeast by one-step assembly of overlapping oligonucleotides. Nucleic Acids Res 37, 6984-90.
Gibson, D. G., Young, L., Chuang, R. Y., Venter, J. C., Hutchison, C. A., 3rd and Smith, H. O. (2009). Enzymatic assembly of DNA molecules up to several hundred kilobases. Nat Methods 6, 343-5.
Gibson, D. G., Glass, J. I., Lartigue, C., Noskov, V. N., Chuang, R. Y., Algire, M. A., Benders, G. A., Montague, M. G., Ma, L., Moodie, M. M., Merryman, C., Vashee, S., Krishnakumar, R., Assad-Garcia, N., Andrews-Pfannkoch, C., Denisova, E. A., Young, L., Qi, Z. Q., Segall-Shapiro, T. H., Calvey, C. H., Parmar, P. P., Hutchison, C. A., Smith, H. O. and Venter, J. C. (2010). Creation of a Bacterial Cell Controlled by a Chemically Synthesized Genome. Science 329, 52-56.
Gitzinger, M., Kemmer, C., El-Baba, M. D., Weber, W. and Fussenegger, M. (2009). Controlling transgene expression in subcutaneous implants using a skin lotion containing the apple metabolite phloretin. Proc Natl Acad Sci USA 106, 10638-10643Gibson, D. G., Benders, G. A., Andrews-Pfannkoch, C., Denisova, E. A., Baden-Tillson, H., Zaveri, J., Stockwell, T. B., Brownley, A., Thomas, D. W., Algire, M. A., Merryman, C., Young, L., Noskov, V. N., Glass, J. I., Venter, J. C., Hutchison, C. A., 3rd and Smith, H. O. (2008a). Complete chemical synthesis, assembly, and cloning of a Mycoplasma genitalium genome. Science 319, 1215-20.
Gong, R., Zhong, K., Hu, Y., Chen, J. and Zhu, G. (2008). Thermochemical esterifying citric acid onto lignocellulose for enhancing methylene blue sorption capacity of rice straw. J Environ Manage 88, 875-80.
Gray, K. A., Zhao, L. and Emptage, M. (2006). Bioethanol. Curr Opin Chem Biol 10, 141-6. Hale, V., Keasling, J. D., Renninger, N. and Diagana, T. T. (2007). Microbially derived
artemisinin: a biotechnology solution to the global problem of access to affordable antimalarial drugs. Am J Trop Med Hyg 77, 198-202.
Hames, B. R. (2009). Biomass compositional analysis for energy applications. Methods Mol Biol 581, 145-67.
Haywood, G. W., Anderson, A. J., Ewing, D. F. and Dawes, E. A. (1990). Accumulation of a Polyhydroxyalkanoate Containing Primarily 3-Hydroxydecanoate from Simple Carbohydrate Substrates by Pseudomonas sp. Strain NCIMB 40135. Appl Environ Microbiol 56, 3354-9.
Conversion of Biomass to Bioplastics and Their Potential Environmental Impacts
71
Hermann, B. G. and Patel, M. K. (2007). Today’s and Tomorrow’s Bio-Based Bulk Chemicals From White Biotechnology. Appl Biochem Biotechnol 136, 361-88.
Hiraishi, T., Hirahara, Y., Doi, Y., Maeda, M. and Taguchi, S. (2006). Effects of mutations in the substrate-binding domain of poly[(R)-3-hydroxybutyrate] (PHB) depolymerase from Ralstonia pickettii T1 on PHB degradation. Appl Environ Microbiol 72, 7331-8.
Hofer, P., Choi, Y. J., Osborne, M. J., Miguez, C. B., Vermette, P. and Groleau, D. (2010). Production of functionalized polyhydroxyalkanoates by genetically modified Methylobacterium extorquens strains. Microb Cell Fact 9, 70.
Hopewell, J., Dvorak, R. and Kosior, E. (2009). Plastics recycling: challenges and opportunities. Philos Trans R Soc Lond B Biol Sci 364, 2115-26.
iGEM (2006). Arsenic biosendor. Available from: parts.mit.edu/wiki/index.php/Arsenic_Biosensor.
Jendrossek, D. and Handrick, R. (2002). Microbial degradation of polyhydroxyalkanoates. Annu Rev Microbiol 56, 403-32.
Jendrossek, D., Schirmer, A. and Schlegel, H. G. (1996). Biodegradation of polyhydroxyalkanoic acids. Appl Microbiol Biotechnol 46, 451-63.
Jian, J., Li, Z. J., Ye, H. M., Yuan, M. Q. and Chen, G. Q. (2010). Metabolic engineering for microbial production of polyhydroxyalkanoates consisting of high 3-hydroxyhexanoate content by recombinant Aeromonas hydrophila. Bioresour Technol 101, 6096-102.
Kaeb, H. (Year). Bioplastics: Technology, Markets, Policies. Available from: www.ecoembes.com/es/envase/prevencion/.../HaraldKaeb.pdf.
Keasling, J. D. (2008). Synthetic biology for synthetic chemistry. ACS Chem Biol 3, 64-76. Kim do, Y., Kim, H. W., Chung, M. G. and Rhee, Y. H. (2007). Biosynthesis, modification,
and biodegradation of bacterial medium-chain-length polyhydroxyalkanoates. J Microbiol 45, 87-97.
Kim, S. and Dale, B. E. (2008). Energy and greenhouse gas profiles of polyhydroxybutyrates derived from corn grain: a life cycle perspective. Environ Sci Technol 42, 7690-5.
Knoll, M., Hamm, T. M., Wagner, F., Martinez, V. and Pleiss, J. (2009). The PHA Depolymerase Engineering Database: A systematic analysis tool for the diverse family of polyhydroxyalkanoate (PHA) depolymerases. BMC Bioinformatics 10, 89.
Lee, S. Y., Choi, J. and Wong, H. H. (1999). Recent advances in polyhydroxyalkanoate production by bacterial fermentation: mini-review. Int J Biol Macromol 25, 31-6.
Lenz, R. W. and Marchessault, R. H. (2005). Bacterial polyesters: biosynthesis, biodegradable plastics and biotechnology. Biomacromolecules 6, 1-8.
Li, Q., He, Y. C., Xian, M., Jun, G., Xu, X., Yang, J. M. and Li, L. Z. (2009). Improving enzymatic hydrolysis of wheat straw using ionic liquid 1-ethyl-3-methyl imidazolium diethyl phosphate pretreatment. Bioresour Technol 100, 3570-5.
Li, R., Zhang, H. and Qi, Q. (2007). The production of polyhydroxyalkanoates in recombinant Escherichia coli. Bioresour Technol 98, 2313-20.
Li, Z. J., Jian, J., Wei, X. X., Shen, X. W. and Chen, G. Q. (2010). Microbial production of meso-2,3-butanediol by metabolically engineered Escherichia coli under low oxygen condition. Appl Microbiol Biotechnol 87, 2001-9.
Liu, X. and Curtiss, R., 3rd (2009). Nickel-inducible lysis system in Synechocystis sp. PCC 6803. Proc Natl Acad Sci U S A 106, 21550-4.
Biotechnology of Biopolymers
72
Luengo, J. M., Garcia, B., Sandoval, A., Naharro, G. and Olivera, E. R. (2003). Bioplastics from microorganisms. Curr Opin Microbiol 6, 251-60.
Luisi, P. L. (2007). Chemical aspects of synthetic biology. Chem Biodivers 4, 603-21. Lynd, L. R., Weimer, P. J., van Zyl, W. H. and Pretorius, I. S. (2002). Microbial cellulose
utilization: fundamentals and biotechnology. Microbiol Mol Biol Rev 66, 506-77, table of contents.
Lynd, L. R. and Zhang, Y. (2002). Quantitative determination of cellulase concentration as distinct from cell concentration in studies of microbial cellulose utilization: analytical framework and methodological approach. Biotechnol Bioeng 77, 467-75.
Madhavan Nampoothiri, K., Nair, N. R. and John, R. P. (2010). An overview of the recent developments in polylactide (PLA) research. Bioresour Technol 101, 8493-501.
Madison, L. L. and Huisman, G. W. (1999). Metabolic engineering of poly(3-hydroxyalkanoates): from DNA to plastic. Microbiol Mol Biol Rev 63, 21-53.
Martin, V. J. J., Pitera, D. J., Withers, S. T., Newman, J. D. and Keasling, J. D. (2003). Engineering a mevalonate pathway in Escherichia coli for production of terpenoids. Nat Biotechnol 21, 796-802.
Matsumoto, K., Murata, T., Nagao, R., Nomura, C. T., Arai, S., Arai, Y., Takase, K., Nakashita, H., Taguchi, S. and Shimada, H. (2009). Production of short-chain-length/medium-chain-length polyhydroxyalkanoate (PHA) copolymer in the plastid of Arabidopsis thaliana using an engineered 3-ketoacyl-acyl carrier protein synthase III. Biomacromolecules 10, 686-90.
Mitsuzawa, S., Kagawa, H., Li, Y., Chan, S. L., Paavola, C. D. and Trent, J. D. (2009). The rosettazyme: a synthetic cellulosome. J Biotechnol 143, 139-44.
Moon, T. S., Dueber, J. E., Shiue, E. and Prather, K. L. (2010). Use of modular, synthetic scaffolds for improved production of glucaric acid in engineered E. coli. Metab Eng 12, 298-305.
Mu, D., Seager, T., Rao, P. S. and Zhao, F. (2010). Comparative life cycle assessment of lignocellulosic ethanol production: biochemical versus thermochemical conversion. Environ Manage 46, 565-78.
Mushegian, A. (1999). The minimal genome concept. Curr Opin Genet Dev 9, 709-14. Nam, Y. S., Magyar, A. P., Lee, D., Kim, J. W., Yun, D. S., Park, H., Pollom, T. S., Jr., Weitz,
D. A. and Belcher, A. M. (2010). Biologically templated photocatalytic nanostructures for sustained light-driven water oxidation. Nat Nanotechnol 5, 340-4.
Novamont (2011a).BIODEGRADABILITY. Available from: www.novamont.com/default.asp?id=491.
Novamont (2011b). COMPOSTABILITY. Available from: www.novamont.com/default.asp?id=493.
Novamont (2011c). Life Cycle Assessment Available from: www.novamont.com/default.asp?id=958.
Ouyang, S. P., Luo, R. C., Chen, S. S., Liu, Q., Chung, A., Wu, Q. and Chen, G. Q. (2007). Production of polyhydroxyalkanoates with high 3-hydroxydodecanoate monomer content by fadB and fadA knockout mutant of Pseudomonas putida KT2442. Biomacromolecules 8, 2504-11.
Park, S. J., Park, J. P. and Lee, S. Y. (2002). Metabolic engineering of Escherichia coli for the production of medium-chain-length polyhydroxyalkanoates rich in specific monomers. FEMS Microbiol Lett 214, 217-22.
Conversion of Biomass to Bioplastics and Their Potential Environmental Impacts
73
Park, Y. M., Shin, B. A. and Oh, I. J. (2008). Poly(L-lactic acid)/polyethylenimine nanoparticles as plasmid DNA carriers. Arch Pharm Res 31, 96-102.
PlasticsEurope (2009). The Compelling Facts About Plastics 2009. Available from: www.plasticsconverters.eu/docs/Brochure_FactsFigures_Final_2009.pdf.
Poirier, Y. (2001). Production of polyesters in transgenic plants. Adv Biochem Eng Biotechnol 71, 209-40.
Prieto, M. A. (2007). From oil to bioplastics, a dream come true? J Bacteriol 189, 289-90. Qiu, Y. Z., Han, J. and Chen, G. Q. (2006). Metabolic engineering of Aeromonas hydrophila
for the enhanced production of poly(3-hydroxybutyrate-co-3-hydroxyhexanoate). Appl Microbiol Biotechnol 69, 537-42.
Ro, D.-K., Paradise, E. M., Ouellet, M., Fisher, K. J., Newman, K. L., Ndungu, J. M., Ho, K. A., Eachus, R. A., Ham, T. S., Kirby, J., Chang, M. C. Y., Withers, S. T., Shiba, Y., Sarpong, R. and Keasling, J. D. (2006). Production of the antimalarial drug precursor artemisinic acid in engineered yeast. Nature 440, 940-943.
Rosenberg, J. N., Oyler, G. A., Wilkinson, L. and Betenbaugh, M. J. (2008). A green light for engineered algae: redirecting metabolism to fuel a biotechnology revolution. Curr Opin Biotechnol 19, 430-6.
Ryffel, G. U. (2010). Making the most of GM potatoes. Nat Biotechnol 28, 318. Sandoval, A., Arias-Barrau, E., Arcos, M., Naharro, G., Olivera, E. R. and Luengo, J. M.
(2007). Genetic and ultrastructural analysis of different mutants of Pseudomonas putida affected in the poly-3-hydroxy-n-alkanoate gene cluster. Environ Microbiol 9, 737-51.
Schmidt, M. and Pei, L. (2011). Synthetic Toxicology: Where engineering meets biology and toxicology. Toxicol Sci. 120, Suppl 1:S204-24.
Shetty, R. P., Endy, D. and Knight, T. F., Jr. (2008). Engineering BioBrick vectors from BioBrick parts. J Biol Eng 2, 5.
Shi, X., Jiang, J., Sun, L. and Gan, Z. (2010). Hydrolysis and biomineralization of porous PLA microspheres and their influence on cell growth. Colloids Surf B Biointerfaces.
Shi, X., Sun, L., Jiang, J., Zhang, X., Ding, W. and Gan, Z. (2009). Biodegradable polymeric microcarriers with controllable porous structure for tissue engineering. Macromol Biosci 9, 1211-8.
Sinha, J., Reyes, S. J. and Gallivan, J. P. (2010). Reprogramming bacteria to seek and destroy an herbicide. Nat Chem Biol 6, 464-70.
Slade, R., Bauen, A. and Shah, N. (2009). The greenhouse gas emissions performance of cellulosic ethanol supply chains in Europe. Biotechnol Biofuels 2, 15.
Smolke, C. D. (2009). Building outside of the box: iGEM and the BioBricks Foundation. Nat Biotechnol 27, 1099-102.
Soetaert, W. (2007). White biotechnology: A key technology for building the biobased economy.
Taguchi, K., Aoyagi, Y., Matsusaki, H., Fukui, T. and Doi, Y. (1999). Co-expression of 3-ketoacyl-ACP reductase and polyhydroxyalkanoate synthase genes induces PHA production in Escherichia coli HB101 strain. FEMS Microbiol Lett 176, 183-90.
The Federal Environment Ministry (Germany) (2009). Ordinance on the Avoidance and Recovery of Packaging Wastes Available from: www.bmu.de/english/waste_management/downloads/doc/37115.php.
Biotechnology of Biopolymers
74
Tigges, M., Marquez-Lago, T. T., Stelling, J. and Fussenegger, M. (2009). A tunable synthetic mammalian oscillator. Nature 457, 309-12.
Thompson, R. C., Moore, C. J., vom Saal, F. S. and Swan, S. H. (2009). Plastics, the environment and human health: current consensus and future trends. Philos Trans R Soc Lond B Biol Sci 364, 2153-66.
Tokiwa, Y. and Calabia, B. P. (2004). Degradation of microbial polyesters. Biotechnol Lett 26, 1181-9.
Tsuge, T. (2002). Metabolic improvements and use of inexpensive carbon sources in microbial production of polyhydroxyalkanoates. J Biosci Bioeng 94, 579-84.
Tsuge, T., Yano, K., Imazu, S., Numata, K., Kikkawa, Y., Abe, H., Taguchi, S. and Doi, Y. (2005). Biosynthesis of polyhydroxyalkanoate (PHA) copolymer from fructose using wild-type and laboratory-evolved PHA synthases. Macromol Biosci 5, 112-7.
Valentin, H. E., Broyles, D. L., Casagrande, L. A., Colburn, S. M., Creely, W. L., DeLaquil, P. A., Felton, H. M., Gonzalez, K. A., Houmiel, K. L., Lutke, K., Mahadeo, D. A., Mitsky, T. A., Padgette, S. R., Reiser, S. E., Slater, S., Stark, D. M., Stock, R. T., Stone, D. A., Taylor, N. B., Thorne, G. M., Tran, M. and Gruys, K. J. (1999). PHA production, from bacteria to plants. Int J Biol Macromol 25, 303-6.
Wegrzyn, G. (2001). The minimal genome paradox. J Appl Genet 42, 385-92. Wei, X. X., Shi, Z. Y., Yuan, M. Q. and Chen, G. Q. (2009). Effect of anaerobic promoters on
the microaerobic production of polyhydroxybutyrate (PHB) in recombinant Escherichia coli. Appl Microbiol Biotechnol 82, 703-12.
Yao, D., Zhang, W. and Zhou, J. G. (2009). Controllable growth of gradient porous structures. Biomacromolecules 10, 1282-6.
Yim, K. S., Lee, S. Y. and Chang, H. N. (1996). Synthesis of poly-(3-hydroxybutyrate-co-3-hydroxyvalerate) by recombinant Escherichia coli. Biotechnol Bioeng 49, 495-503.
Zhang, X., Luo, R., Wang, Z., Deng, Y. and Chen, G. Q. (2009). Application of (R)-3-hydroxyalkanoate methyl esters derived from microbial polyhydroxyalkanoates as novel biofuels. Biomacromolecules 10, 707-11.
Zheng, Z., Li, M., Xue, X. J., Tian, H. L., Li, Z. and Chen, G. Q. (2006). Mutation on N-terminus of polyhydroxybutyrate synthase of Ralstonia eutropha enhanced PHB accumulation. Appl Microbiol Biotechnol 72, 896-905.
4
Natural Rubber Biosynthesis and Physic-Chemical Studies on Plant Derived Latex Christian Schulze Gronover1, Daniela Wahler2 and Dirk Prüfer2
1Fraunhofer Institut für Molekularbiologie und Angewandte Ökologie, 2Biologie und Biotechnologie der Pflanzen, Westfälische Wilhelms-Universität,
Germany
1. Introduction 1.1 Natural rubber is an indispensable biopolymer Natural rubber is a biopolymer of high economic importance with incomparable performance properties such as high elasticity, resilience and efficient heat dispersion (van Beilen and Poirier, 2007a). This high molecular mass polymer is formed from isopentenyl diphosphate units (IPP) which are linked in cis-configuration building poly(cis-1,4-isoprene) (Nor and Ebdon, 1998; Wititsuwaannakul et al., 2003; Bushman et al., 2006). 300 to 70,000 isoprene molecules are coupled to form an irregular structure that cannot crystallize under normal conditions mediating the amorphous, rubbery texture (Nor and Ebdon, 1998; Kang et al., 2000a). Upon harvest from plants and processing, along with the biopolymer itself also non-rubber compounds are co-extracted and remain in the natural rubber product (Nor and Ebdon, 1998). Therefore, the final product consists of about 94% poly(cis-1,4-isoprene) and 6% non-rubber contents such as proteins and fatty acids (Sakdapipanich, 2007). These contaminations are thought to contribute to the extraordinary characteristics of natural rubber (Nor and Ebdon, 1998). The plant-derived commodity is required for the production of more than 40,000 consumer products including tires, footwear and medical devices (Davis, 1997; Mooibroek and Cornish, 2000; Hagel et al., 2008). After harvest natural rubber is either kept in solution through addition of solvents and stabilizers or it is coagulated and dried. Solubilised natural rubber is used for products such as gloves or condoms but most of the harvested natural rubber is processed as so called bulk rubber in solid sheets or granules (van Beilen and Poirier, 2007b). Currently, the sole crop exploited for commercial production of high quality natural rubber in viable quantities is Hevea brasiliensis Muell. Arg. (Figure 1A). H. brasiliensis – a tree indigenous to the Amazon Basin – is the most recently domesticated plant among major crops. In their natural environment trees grow widely distributed within the forest, but for large-scale rubber production H. brasiliensis trees are planted in monoculture (Davis, 1997). The main rubber-producing countries presently are Thailand, Indonesia, Malaysia, India and the People’s Republic of China, which together accounted for 89% or 9.33 million tons of the global rubber production in 2005 (Figure 2B) (Hayashi, 2009). With a yield potential of more than 2500 kg ha-1 year-1 H. brasiliensis is a valuable crop in tropical and subtropical countries where its cultivation is possible (Cornish, 2001a; Hayashi, 2009).

Biotechnology of Biopolymers
76
Fig. 1. Cultivation of H. brasiliensis A) H. brasiliensis tree and common method of harvesting latex from trees by manual tapping the bark and collection of extruding latex in small bins (adapted from uni-stuttgart.de). B) Soil erosion in an area that was cleared for foundation of a rubber plantation (adapted from Qui, 2009). C) Infestation of H. brasiliensis with M. ulei; left panel: conidiophores of fungi breaking through epidermis of leaf, right panel: lesions on leaf (adapted from Lieberei, 2007).
However, cultivation of H. brasiliensis on plantations has severe environmental consequences (Mann, 2009). For example, the People’s Republic of China faces problems due to deforestation and conversion of large regions of tropical forest to rubber plantations (Mann, 2009; Qui, 2009; Ziegler, 2009). Primarily, cultivation of H. brasiliensis was promising since farmers of the strongly developing country could earn up to five times more than by growing traditional crops such as rice or tea (Qui, 2009). Yet, reshaping of the landscape provoked lowering of the groundwater table coupled with increased soil erosion and subsequent loss of soil quality (Figure 1B) (Mann, 2009; Qui, 2009; Ziegler, 2009). Next to environmental impacts, biotic and abiotic stresses may lead to massive failure in rubber production from H. brasiliensis. The tree is propagated through cuttings whereby all clones cultivated originate from only a small sample of seeds and, therefore, lack genetic diversity (Cornish, 2001a). This uniform genetic background renders H. brasiliensis very susceptible to pathogens when planted as monoculture. The most threatening pathogen is the ascomycete Microcyclus ulei, which causes defoliation or even death of the tree and which wiped out plantations in the domestic country (Figure 1C) (Davis, 1997; Le Guen et al., 2003). At present, outbreaks of this disease called South American Leaf Blight are rare in the rubber-producing countries of Southeast Asia due to strict pest control standards but an

Natural Rubber Biosynthesis and Physic-Chemical Studies on Plant Derived Latex
77
accidental spread of M. ulei might have devastative consequences (Davis, 1997; van Beilen and Poirier, 2007b). Additionally, anthropogenic factors such as the political and economical instability in rubber-producing countries lead to diminishing acreage (Davis, 1997). Growers shift to seemingly more lucrative crops while the global demand on natural rubber increased to more then 10 million tons in 2010. Shortages in rubber supply are already forecasted (Davis, 1997; Cornish, 2001a; van Beilen and Poirier, 2007a). For all stated reasons, combined with the fact that minor non-rubber components tightly attached to the natural rubber polymer of H. brasiliensis cause allergies, countries depending on the import of natural rubber have an interest in establishing alternative domestic rubber crops or engineering alternative substitutes (Cornish, 2001a; Wagner and Breiteneder, 2005; Mooney, 2009).
2. Supplemental commodities and alternative sources of natural rubber Some petroleum-based materials are potent substitutes for natural rubber. Examples for high-quality synthetic rubbers are polyvinyl chloride (PVC), styrene butadiene and acrylonitrile butadiene, which are commercially produced but cannot match the price-performance ratio of natural rubber (van Beilen and Poirier, 2008). In some special divisions the development of new but application-restricted materials led to the successful replacement of the natural polymer. Progressively, even biodegradable goods could supplement in many applications, which are good alternatives for conventional petroleum-based plastics (Mooney, 2009). These biodegradable goods comprise polymers such as derivative forms of cellulose like cellophane for food packaging, fibrous proteins like silk which are used in Lycra® and Keflar® and hydroxyalkanoate polyesters (PHA) that are gained in fermentation processes (van Beilen and Poirier, 2008; Mooney, 2009). In times of resource constraints these organic compounds that can be totally degraded in municipal landfills might be of high value (Wackernagel et al., 2002). Nevertheless, neither synthetic rubbers nor biodegradable polymers will be capable to fully replace natural rubber since the biopolymer is unique in its economical competitiveness and no substitute can provide equivalent properties that are required in many industrial applications (van Beilen and Poirier, 2008). All synthetic rubbers produced presently neither have such a high degree of cis-bond content (99.5% in natural rubber), nor the high molecular mass, nor contain the non-rubber components that are also responsible for the extraordinary characteristics of natural rubber (Nor and Ebdon, 1998; Hayashi, 2009). Thus, natural rubber still accounts for 40% of the market share and interest in the research of further rubber-producing plants has been renewed (Cornish, 2001a; Mooney, 2009).
2.1 Latex cells Approximately 2,500 plants synthesize natural rubber (Bonner, 1991). Rubber biosynthesis is restricted to latex cells where the cytoplasm comprises a milky or colorless sap called latex (Schnepf, 1974; Fineran, 1983; Hagel et al., 2008). Mostly, latex cells occur as highly differentiated laticifers – a cell type described in dicotyledonous as well as in monocotyledonous plant orders, ferns and conifers (Metcalfe, 1967; Lewinson, 1991). They seem to have evolved convergently several times as their distribution throughout the whole plant kingdom appears arbitrary, indicating a polyphyletic origin. Based on their morphology laticifers are classified into two major groups (Hagel et al., 2008). Non-articulated laticifers are found as single cells with no direct connection to each other

Biotechnology of Biopolymers
78
(Kekwick, 2001). They form giant coenocytic cells that might intrude into different tissues while they grow. Non-articulated laticifers are described, for example, in Asclepias spp. and in Moraceae such as Ficus elastica and Nerium oleander (Mahlberg et al., 1968; Fineran, 1983; Kekwick, 2001). In contrast, articulated laticifers as described in Papaveraceae and Asteraceae, e.g. Sonchus asper, and Taraxacum spp. or the Euphorbiaceae H. brasiliensis are associated to the vascular tissue (Fineran, 1983; Hagel et al., 2008; Sando et al., 2009). They form discrete longitudinal rows of superimposed cells and can form a continuous cytoplasmic network since they fuse with their apical ends and also often generate anastomoses at longitudinal cell walls (Hagel et al., 2008). However, next to the two major morphological types of laticifers, in some plants latex-bearing cells are embedded in the epidermis or bark parenchyma, as it is the case for the desert shrub Parthenium argentatum (Backhaus, 1985; Hagel et al., 2008). The reason why some plants possess latex cells remains elusive and an appropriate physiological function could yet not be identified. Rubber biosynthesis is not a compulsory ability of latex cells since only around 2,500 out of approximately 20,000 laticiferous plant species produce natural rubber as observed, for instance, in H. brasiliensis, Ficus elastica, Lactuca sativa, P. argentatum and T. koksaghyz (Bonner, 1991; Cornish et al., 1999; Kang et al., 2000b; Bushman et al., 2006; Schmidt et al., 2010). Therefore, latex cells have superimposed functions to rubber biosynthesis. Based on transcriptomic and proteomic studies of various laticiferous plants, a unique metabolism in comparison to other cell types was stated (El Moussaoui et al., 2001; Ko et al., 2003; Chow et al., 2007). Apparently, common to all surveyed laticiferous species, e.g. Lactuca sativa, Ficus spp., H. brasiliensis, Calotropis procera, Papaver somniferum and Morus spp. – independent of the ability for rubber biosynthesis – is the high abundance of stress- and defense-related proteins in the latex (Decker et al., 2000; El Moussaoui et al., 2001; Stubbe et al., 2005; Kim et al., 2003; Chow et al., 2007; Freitas et al., 2007; Wasano et al., 2009).
2.2 New rubber crops Among rubber-producing plants only few provide high quality natural rubber. Thereby the quality is defined by the amount and composition of the non-rubber components and essentially by the molecular mass of the poly(cis-1,4-isoprene) polymer. For most industrial applications it is crucial that the molecular mass exceeds 4 × 10⁵ Da (Swanson et al., 1979; Bushman, 2006). Therefore, an alternative rubber crop needs to possess commercially viable amounts of high quality rubber, but also has to meet the criteria of rapid growing, large biomass production, domestic cultivation and needs to be an annual crop (Cornish, 2001a). In addition to H. brasiliensis only two other rubber-producing species have been described as potential, promising rubber crops – P. argentatum and T. koksaghyz (van Beilen and Poirier, 2007b; Hayashi, 2009). P. argentatum is already cultivated in the United States of America for rubber production and is among all potential rubber crops closest to commercial production. The Mexican brush is a perennial plant that can be cultivated in semi-arid regions (Cornish, 2001a). A maximum productivity of 2,000 kg ha-1 year-1 has been reported (van Beilen and Poirier, 2008). However, the natural rubber gained from bark parenchyma cells needs to be processed soon after harvest since otherwise it becomes unfeasible. Furthermore, a high proportion of low molecular biopolymer lowers the quality and big amounts of resin associated to the natural rubber prevent utilization in bulk rubber applications (Schloman, 2005). Since bulk rubber cannot be gained from P. argentatum, which is needed for tire

Natural Rubber Biosynthesis and Physic-Chemical Studies on Plant Derived Latex
79
production that accounts for approximately 70% of total natural rubber consumption, P. argentatum is not fully capable of filling the gap in the worldwide increasing demand on natural rubber (Hayashi, 2009). Nevertheless, due to a low abundance and diversity of proteins in the natural rubber product from P. argentatum, the Yulex Corporation is successfully marketing P. argentatum rubber as hypoallergenic and thus useful in medical applications (Cornish, 2001a; van Beilen and Poirier, 2008; Hamilton and Cornish, 2010). Taraxacum species infest habitats in all temperate regions of the northern hemisphere (Holm et al., 1997; van Djik, 2003). Among 500 species T. officinale is the most common (van Djik, 2003). Its typical jagged leaves build a rosette lying close to the ground with single heads of flowers consisting of numerous strapshaded bright yellow florets. A major tap root with an average diameter of 2.5 cm produces large amounts of latex but an all-encompassing vessel network of laticifers spans the whole plant body (Steward-Wade et al., 2002).
Fig. 2. Taraxacum brevicorniculatum as an alternative source of natural rubber. A) Adult T. brevicorniculatum plant. B) Countries cultivating H. brasiliensis are marked in green on a map of the world; countries that successfully used T. koksaghyz as a rubber crop during and after World War II are shaded in yellow (adapted from Suomela, 1950).
However, in T. officinale natural rubber is only observed in tiny amounts whereas in its close relative T. koksaghyz (Russian dandelion) high quantities have been described (Figure 2A). T. koksaghyz was discovered as a potential rubber crop during World War II in East-Kazakhstan and was brought to cultivation in several countries including the United States of America, Spain, the United Kingdom, Germany, Sweden and the former Uzbek Soviet Socialist Republic (Uzbek SSR) (Figure 2B) (Suomela, 1950). Natural rubber production from T. koksaghyz compensated for the missing import of H. brasiliensis natural rubber, which was due to an import embargo enforced by the Japanese (Javorsky, 1944; Suomela, 1950; van Beilen and Poirier, 2007b). Wild-growing plants of T. koksaghyz are described as diploid with sexual reproduction that exhibit an immense phenotypic variance in terms of morphology but also in the amount and quality of natural rubber. For cultivation a tetraploid accession was chosen which contained up to 37% of natural rubber in its latex (Javorsky, 1944). In general, cultivation of T. koksaghyz was facilitated since damage due to pathogens was almost not observed and within five months plants were grown to optimal size and rubber content for harvest (Suomela, 1950). Nevertheless, cultivation of T. koksaghyz could not be justified after import of natural rubber from the tropics was resumed. Since cultivation of T. koksaghyz was labour-intensive and a yield of no more than 100 kg ha-1 year-1 in Germany was obtained T. koksaghyz could not compete in price with H. brasiliensis (Suomela, 1950).

Biotechnology of Biopolymers
80
At present, cultivation of a closely related Taraxacum species – T. brevicorniculatum – as a rubber crop might be of economic profit. T. brevicorniculatum is a triploid plant that was shown to contain approximately 32% of high quality rubber with a unimodal mass distribution of 2 × 10⁶ Da in its latex (Table 1) (Schmidt et al., 2010). Even after extensive storage of harvested plant material up to 90% of the natural rubber can be recovered and exhibits the same good quality parameters after processing as natural rubber from H. brasiliensis. This allows application as solubilised as well as bulk rubber (Suomela, 1950; van Beilen and Poirier, 2007b; Schmidt et al., 2010). Nevertheless, a severe problem with rubber production from T. koksaghyz and T. brevicorniculatum is the separation of the biopolymer from the plants´ biomass. Due to fast coagulation of the latex the natural rubber agglutinates with the remaining biomass and only by dint of chemicals, purification is possible (Suomela, 1950). However, it was shown that latex coagulation in T. brevicorniculatum is due to the activity of the most abundant protein in latex, a polyphenol oxidase (Wahler et al., 2009). Through breeding of Taraxacum plant lines with reduced PPO activity in the latex the problem of fast latex coagulation can be circumvented, i.e. such plants might be employed as a new rubber crop. Rubber yields of 1000 kg ha-1 year-1 are expected.
species cultivation area rubber content in latex (w/v) [%]
Mw of poly(cis-1,4-isoprene) [Da]
by-products
H. brasiliensis*1 Southeast Asia 30 1x10⁵ and 2x10⁶ rubber wood
P. argentatum*2,*3 South USA, Central America 6 <1×10⁶ and >1×10⁶ bagasse
T. koksaghyz*4 all temperate regions 32 2x10⁶ inulin
*1 Tangpakdee et al., 1996; *2 van Beilen and Poirier, 2007; *3 McIntyre et al., 2001; *4 Schmidt et al., 2010
Table 1. Rubber-producing plant species with the potential for cultivation as rubber crops. Indicated are the climatic requirements, the latex content, the molecular mass of the natural rubber and valuable by-products.
3. Rubber biosynthesis Despite an emerging strong interest in rubber-producing plants the molecular mechanism of rubber biosynthesis has not been studied in detail. Natural rubber is a huge linear biopolymer with IPP as the monomeric subunit. As IPP is the monomer of all isoprenoids, rubber biosynthesis is just one of numerous biosynthetic pathways using IPP (Kharel and Koyama, 2003). Plant isoprenoids comprise around 23,000 compounds and are the most diverse class of natural compounds including substances such as gibberellins, carotenoids, chlorophyll side chains, plastochinone side chains, sesquiterpenes, sterols, brassinosteroids, dolichol and mitochondrial ubiquinone side chains (Lichtenthaler et al., 1997; Lichtenthaler, 1999; Newman and Chappell, 1999; Kasahara et al., 2002; Nagata et al., 2002; Kasahara et al., 2004). IPP is produced via two biosynthetic pathways in higher plants. In the cytosol the well described mevalonate (MVA) pathway synthesizes IPP from acetyl-CoA (Spurgeon and Porter, 1981). Another metabolic pathway for IPP synthesis is called 1-deoxy-D-xylulose-5-phosphate/2-C-methyl-D-erythritol-4-phosphate (DOXP/MEP) pathway, which is

Natural Rubber Biosynthesis and Physic-Chemical Studies on Plant Derived Latex
81
located in the plastids (Rohmer et al., 1996; Lichtenthaler et al., 1997). Both pathways form IPP and its isomer dimethylallyl diphosphate (DMAPP). Radiolabeling of intermediates of the cytosolic MVA pathway provided evidence that synthesized IPP is incorporated into natural rubber (Skilleter and Kekwick, 1971). Although expression of an enzyme of the DOXP/MEP pathway could be proven in laticifers of H. brasiliensis, in feeding experiments using [1-13C]1-deoxy-D-xylulose triacetate, an intermediate of the MEP pathway, no rubber molecules could be detected that carry an isotope label (Ko et al., 2003; Sando et al., 2008). However, incorporation of IPP derived from the DOXP/MEP pathway into natural rubber cannot be excluded, because crossover of both pathways under certain conditions (e.g. depletion of MVA pathway enzymes) could be demonstrated in Arabidopsis thaliana and tobacco Bright Yellow-2 cells (BY-2) (Kasahara et al., 2002; Hemmerlin et al., 2003). For initiation of rubber biosynthesis a priming allylic diphosphate is needed (Cornish, 2001a). IPP is isomerized to DMAPP by IPP-isomerase and is used as a substrate by trans-prenyltransferase (TPT) to synthesize an allylic initiator molecule (Priya et al., 2006; Koyama et al., 1996). It could be shown that initiation of rubber biosynthesis is most efficient with farnesyl diphosphate (FPP) in H. brasiliensis, Ficus elastica and P. argentatum in in vitro experiments (Xie et al., 2008). 13C nuclear magnetic resonance (NMR) analysis revealed a trans-trans-cis sequence, typical for FPP, at the initiating terminal of rubber molecules in H. brasiliensis (Tanaka et al., 1996; Tangpakdee, 1996). These results combined with the finding that FPP is synthesized in the cytosol of H. brasiliensis indicate that FPP is the most likely initiator molecule (da Costa et al., 2006). The sequential condensation of the non-allylic IPP in cis-configuration proceeds during rubber biosynthesis at the priming allylic substrate (Cornish, 2001a; Kharel and Koyama, 2003). The polymerization of IPP to natural rubber is thought to be located at specific organelles. The natural rubber polymer is found as suspended particles encased by a contiguous monolayer biomembrane (Cornish and Backhaus, 1990; Cornish et al., 1999). In articulated laticifers and latex cells of P. argentatum these particles are found within the cytosol, while localization to the vacuome is described in non-articulated laticifers (Wilson and Mahlberg, 1980; Cornish, 2001a). Within the monolayer biomembrane of these rubber particles, the hydrophilic phospholipid headgroups point towards the cytosol to compartmentalize the hydrophobic rubber molecules (Archer et al., 1963; Cornish et al., 1999). The colloidal stability of rubber particles is maintained since they have an overall negative surface charge that leads to a charge-to-charge repulsion preventing coalescence (Southorn and Yip, 1969; Cornish et al., 1999). With regard to the architecture rubber particles resemble oil bodies (Cornish et al., 1999). Hence, it is likely that rubber particles originate, likewise to other vesicle-like structures carrying insoluble material, from the endoplasmic reticulum (ER) (Hermann, 2008). This view is supported by the finding that phosphatidylcholine, phosphatidylethanolamin and glycoproteins are abundant in the monolayer biomembrane as it is described for oil bodies and typical for the cytoplasmic part of the ER bilayer biomembrane (Cornish et al., 1999; Hermann, 2008). Rubber biosynthesis is catalyzed at the surface of rubber particles by integrated proteins or protein complexes. After incubation of rubber particles from H. brasiliensis or P. argentatum with [1-14C]IPP, radiolabelled rubber could be observed (Archer et al., 1963; Benedict et al., 1990; Cornish and Backhaus, 1990; Siler and Cornish, 1993).

Biotechnology of Biopolymers
82
Fig. 3. Biosynthesis of poly(cis-1,4-isoprene) at rubber particles A) The monomeric subunit of natural rubber IPP is synthesized by the MVA pathway and the DOXP/MEP pathway in higher plants from acetyl-CoA or glyceraldehydes-3-phosphate and pyruvate, respectively. B) IPP is used for the synthesis of isoprenoids such as allylic diphosphates, as side chains of chlorophylls, and natural rubber. C) Natural rubber is synthesized and regulated by the activity of rubber particle-associated proteins such as a rubber transferase (EC 2.5.1.2.0) and other proteinaceous factors at the monolayer biomembrane surface of rubber particles. D) chemical structure of the natural rubber polymer – poly(cis-1,4-isoprene). DOXP/MEP - 2-1-deoxy-D-xylulose-5-phosphate/2-C-methyl-D-erythritol-4-phosphate, G3P – glyceraldehyde 3-phosphate, IPP – isopentenyl diphosphate, MVA – mevalonate, PP- diphosphate
The enzyme catalyzing the rubber molecule elongation is designated as rubber transferase (EC 2.5.1.20) (Cornish, 2001b). Even after extensive research the enzymatic nature of the rubber transferase remains elusive and no sequence is deposited at the comprehensive enzyme information system BRENDA (Chang et al., 2009). Since natural rubber is a poly(cis-1,4-isoprene) it is speculated that the rubber transferase is similar to cis-prenyltransferases (CPT). This view is supported by data about the biosynthesis of isoprenoids, which are synthesized through the action of prenyltransferases catalyzing the transfer of IPP to prenyl groups (Oh et al., 2000; Kharel and Koyama, 2003). Prenyltransferases are divided into two classes due to their amino acid sequence, the resulting protein fold and due to the reactions they mediate: trans-prenyltransferases catalyze the formation of short chain prenyls in trans-configuration such as the priming allylic molecule used for the initiation of rubber biosynthesis (Tarshis et al., 1994; Fujihashi et al., 2001). In contrast, CPTs catalyze the transfer of IPP units to substrates in cis-configuration and some can mediate the formation

Natural Rubber Biosynthesis and Physic-Chemical Studies on Plant Derived Latex
83
of long-chain polyprenylphosphates. For example, dehydrodolichyl phosphates, which act as a sugar carrier lipid in the biosynthesis of GPI-anchored proteins, are synthesized in Saccharomyces cerevisiae through the catalytic action of the long-chain CPT RER2 (Sato et al., 1999). In H. brasiliensis, two CPTs (HRT1 and HRT2) were cloned, which were mainly expressed in laticifers. HRT2 could be demonstrated to exhibit IPP-condensation activity when heterologously expressed in Escherichia coli and co-incubated with H. brasiliensis latex extract. Thereby, the observed product mainly was polyisoprene of a molecular mass of 2 × 10⁵ to 106 Da (Asawatreratanakul et al., 2003). These data suggest that the rubber transferase might indeed be a CPT. However, immunogold labeling of rubber particles from H. brasiliensis using an antibody raised against a synthetic peptide with a consensus sequence for a highly conserved region of CPTs failed to detect CPTs on rubber particles and unlike CPTs, the rubber transferase does not synthesize products of predetermined size but can synthesize products of a wide range of molecular mass (Castillion and Cornish, 1999; Singh et al., 2003; da Costa et al., 2005). However, the varying size of the natural rubber product was shown not to be solely dependant on the rubber transferase. Through in vitro studies measuring the incorporation of labeled allylic diphosphate and IPP into isolated rubber particles from H. brasiliensis, P. argentatum and Ficus spp., it was demonstrated that the concentration of these two substrates determine the initiation of new natural rubber molecules and for this reason also the termination of chain elongation (Castillon and Cornish, 1999). In general, if IPP supply is limited, with an increasing concentration of FPP, more FPP is incorporated into rubber particles, inducing the initiation of new natural rubber molecules and simultaneously leading to a decrease in molecular mass of natural rubber molecules. Vice versa, under limiting concentration of FPP an increasing concentration of IPP raises the molecular mass since condensation of IPP to the natural rubber chain is not terminated (Castillion and Cornish, 1999; da Costa et al., 2005). Furthermore, elongation of natural rubber molecules seems also to be dependent on the presence of divalent cations. Incorporation of IPP only occurs if divalent cations such as Mg2+ are supplied as co-fatcors (Cornish et al., 2000; Kang et al., 2000b; Scott et al., 2003; da Costa et al., 2005; da Costa et al., 2006). Analysis of the internal concentrations of FPP, IPP and Mg2+ could reflect the correlation between rubber molecular mass and rubber transferase activity since the FPP to IPP ratio and the Mg2+ concentration were in the optimal range for the specific rubber transferase in surveyed species (da Costa et al., 2005). Therefore, it was stated that these are the main factors for high molecular mass of natural rubber molecules in H. brasiliensis and P. argentatum (Castillon and Cornish, 1999; Kang et al., 2000b; Scott et al., 2003; da Costa et al., 2006). Next to sufficient supply of substrate and metal co-factor for rubber transferase activity, additional proteins appear to be involved in rubber biosynthesis. A positive effect was observed when small rubber particle protein (SRPP) and rubber elongation factor (REF), both proteins belonging to the REF superfamily, were added to washed rubber particles in H. brasiliensis (Oh et al., 1999; Wititsuwannnakul et al., 2003). As shown by immunogold labeling SRPPs are the most abundant proteins on rubber particles in H. brasiliensis (Oh et al., 1999; Singh et al., 2003; Sando et al., 2009). Other factors have not been identified as crucial for rubber biosynthesis so far. Hence, the actual biomolecular process of rubber biosynthesis and its regulation have not been elucidated in detail. Rubber biosynthesis in T. brevicorniculatum and T. koksaghyz is very likely to follow the described processes. Rubber particles of T. koksaghyz could be shown to share the architecture as described for rubber particles of all surveyed rubber-producing plants and
Biotechnology of Biopolymers
84
exhibit rubber transferase activity when included in [1-14C]IPP incorporation assays with Mg2+ and FPP (Schmidt et al., 2010). This is consistent with previously reported results gained from studies of biosynthetic activity of rubber particles in P. argentatum, Ficus spp. and H. brasiliensis (Kang et al., 2000b; Cornish, 2001a). Furthermore, several proteins such as CPTs, SRPPs and REF, sharing high sequence similarity with the H. brasiliensis proteins, have been identified in the latex of Taraxacum spp. (Schmidt et al., 2009). Thus T. koksaghyz and T. brevicorniculatum could due to their rapid life cycle and the possibility for genetic modifications serve as model plants for researching rubber biosynthesis.
4. References Archer BL, Audley BG, Cockbain EG, McSweeney GP (1963). The biosynthesis of rubber.
Incorporation of mevalonate and isopentenyl pyrophosphate into rubber by Hevea brasiliensis-latex fractions. Biochem J 89: 565-574
Asawatreratanakul K, Zhang YW, Wititsuwannakul D, Wititsuwannakul R, Takahashi S, Rattanapittayaporn A, Koyama T (2003). Molecular cloning, expression and characterization of cDNA encoding cis-prenyltransferases from Hevea brasiliensis. Eur J Biochem 270: 4671-4680
Backhaus RA (1985). Rubber formation in plants: a mini review. Israel J Bot 34: 283-293 Benedict CR, Madhavan S, Greenblatt GA, Venkatachalam KV, Foster MA (1990). The
enzymatic synthesis of rubber polymer in Parthenium argentatum Gray. Plant Physiol 92: 816-821
Bonner J (1991). The history of rubber. 1-6 (eds) in: J.W. Whitworth and E.E. Whitehead Guayule Natural Rubber. Office of Arid Lands Studies, University of Arizona, Tucson
Bushman BS, Scholte AA, Cornish K, Scott DJ, Brichta JL, Vederas JC, Ochoa O, Michelmore RW, Shintani DK, Knapp SJ (2006). Identification and comparison of natural rubber from two Lactuca species. Phytochemistry 67: 2590-2596
Castillon J, Cornish K (1999). Regulation of initiation and polymer molecular weight of cis-1,4-polyisoprene synthesized in vitro by particles isolated from Parthenium argentatum (Gray). Phytochemistry 51: 43-51
Chang A., Scheer M., Grote A., Schomburg I., Schomburg D. (2009). BRENDA, AMENDA and FRENDA the enzyme information system: new content and tools in 2009. Nucleic Acids Res 37: 588-592
Chow KS, Wan KL, Isa MN, Bahari A, Tan SH, Harikrishna K, Yeang HY (2007). Insights into rubber biosynthesis from transcriptome analysis of Hevea brasiliensis latex. J Exp Bot 58: 2429-2440
Cornish K, Backhaus R (1990). Rubber transferase activity in rubber particles of guayule. Phytochemistry 29: 3809-3813
Cornish K, Siler D, Grosjen O, Goodman N (1993). Fundamental similarities in rubber particle architecture and function in three evolutionarily divergent plant species. J Nat Rubb Res 8: 275-285
Cornish K, Wood DF, Windle JJ (1999). Rubber particles from four different species, examined by transmission electron microscopy and electron-paramagnetic-resonance spin labeling, are found to consist of a homogeneous rubber core enclosed by a contiguous, monolayer biomembrane. Planta 210: 85-96
Natural Rubber Biosynthesis and Physic-Chemical Studies on Plant Derived Latex
85
Cornish K, Castillon J, Scott DJ (2000). Rubber molecular weight regulation, in vitro, in plant species that produce high and low molecular weights in vivo. Biomacromolecules 1: 632-641
Cornish K (2001a). Similarities and differences in rubber biochemistry among plant species. Phytochemistry 57: 1123-1134
Cornish K (2001b). Biochemistry of natural rubber, a vital raw material, emphasizing biosynthetic rate, molecular weight and compartmentalization, in evolutionarily divergent plant species. Nat Prod Rep 18: 182-189
da Costa BMT, Keasling JD, Cornish K (2005). Regulation of rubber biosynthetic rate and molecular weight in Hevea brasiliensis by metal cofactor. Biomacromolecules 6: 279-289
da Costa BMT, Keasling JD, McMahan CM, Cornish K (2006). Magnesium ion regulation of in vitro rubber biosynthesis by Parthenium argentatum Gray. Phytochemistry 67: 1621-1628
Davis W (1997). The rubber industry´s biological nightmare. Fortune 86-95 Decker G, Wanner G, Zenk MH, Lottspeich F (2000). Characterization of proteins in latex of
the opium poppy (Papaver somniferum) using two-dimensional gel electrophoresis and microsequencing. Electrophoresis 21: 3500-3516
El Moussaoui A, Nijs M, Paul C, Wintjens R, Vincentelli J, Azarkan M, Looze Y (2001). Revisiting the enzymes stored in the laticifers of Carica papaya in the context of their possible participation in the plant defence mechanism. Cell Mol Life Sci 58: 556-570
Fineran B (1983). Differentiation of non-articulated laticifers in poinsettia (Euphorbia pulcherrima Willd.). Ann Bot 52: 279-293
Freitas CDT, Oliveira JS, Miranda MRA, Macedo NMR, Sales MP, Villas-Boas LA, Ramos MV (2007). Enzymatic activities and protein profile of latex from Calotropis procera. PPB 45: 781-789
Fujihashi M, Zhang YW, Higuchi Y, Li XY, Koyama T, Miki K (2001). Crystal structure of cis-prenyl chain elongating enzyme, undecaprenyl diphosphate synthase. PNAS 98: 4337-4342
Hagel JM, Yeung EC, Facchini PJ (2008). Got milk? The secret life of laticifers. Trends Plant Sci 13: 631-639
Hamilton RG, Cornish K (2010). Immunogenicity studies of guayule and guayule latex in occupationally exposed workers. Ind Crops Prod 31: 197-201
Hayashi Y (2009). Production of natural rubber from Para rubber tree. Plant Biotechnology 26: 67-70
Hemmerlin A, Hoeffler JF, Meyer O, Tritsch D, Kagan IA, Grosdemange-Billiard C, Rohmer M, Bach TJ (2003). Cross-talk between the cytosolic mevalonate and the plastidial methylerythritol phosphate pathways in tobacco bright yellow-2 cells. J Biol Chem 278: 26666-26676
Herman EM (2008). Endoplasmic reticulum bodies: solving the insoluble. Curr Opin Plant Biol 11: 672-679
Holm LRG, Doll J, Holm E, Pancho J, Herberger J (1997). World weeds: natural histories and distribution. John Wiley & Sons Inc, New York
Javorsky L (1944). Die neue Kautschukpflanze Kok-Sagys und ihr Anbau in Sowjet-Russland. Der Tropenpflanzer 1: 1-48
Kang H, Soo Kim Y, Chung GC (2000a). Characterization of natural rubber biosynthesis in Ficus benghalensis. Plant Physiol Biochem 38: 979-987
Kang H, Kang MY, Han KH (2000b). Identification of natural rubber and characterization of rubber biosynthetic activity in fig tree. Plant Physiol 123: 1133-1142

Biotechnology of Biopolymers
86
Kasahara H, Hanada A, Kuzuyama T, Takagi M, Kamiya Y, Yamaguchi S (2002). Contribution of the mevalonate and methylerythritol phosphate pathways to the biosynthesis of gibberellins in Arabidopsis. J Biol Chem 277: 45188-45194
Kasahara H, Takei K, Ueda N, Hishiyama S, Yamaya T, Kamiya Y, Yamaguchi S, Sakakibara H (2004). Distinct isoprenoid origins of cis- and trans-zeatin biosyntheses in Arabidopsis. J Biol Chem 279: 14049-14054
Kekwick RGO (2001). Latex and laticifers. Encyclopedia of Life Sciences 1-6 Kharel Y, Koyama T (2003). Molecular analysis of cis-prenyl chain elongating enzymes. Nat
Prod Rep 20: 111-118 Kim JS, Kim YO, Ryu HJ, Kwak YS, Lee JY, Kang H (2003). Isolation of stress-related genes
of rubber particles and latex in fig tree (Ficus carica) and their expressions by abiotic stress or plant hormone treatments. Plant Cell Physiol 44: 412-414
Ko JH, Chow KS, Han KH (2003). Transcriptome analysis reveals novel features of the molecular events occurring in the laticifers of Hevea brasiliensis (para rubber tree). Plant Mol Biol 53: 479-492
Koyama T, Wititsuwannakul D, Asawatreratanakul K, Wititsuwannakul R, Ohya N, Tanaka Y, Ogura K (1996). Isopentenyl diphosphate isomerase in rubber latex. Phytochemistry 43: 769-772
Le Guen V, Lespinasse D, Oliver G, Rodier-Goud M, Pinard F, Seguin M (2003). Molecular mapping of genes conferring field resistance to South American Leaf Blight (Microcyclus ulei) in rubber tree. Theor Appl Genet 108: 160-167
Lewinsohn TM (1991). The geographical distribution of plant latex. Chemoecology 2: 64-68 Lichtenthaler HK, Schwender J, Disch A, Rohmer M (1997). Biosynthesis of isoprenoids in
higher plant chloroplasts proceeds via a mevalonate-independent pathway. FEBS Lett 400: 271-274
Lichtenthaler HK (1999). The 1-deoxy-D-xylulose-5-phosphate pathway of isoprenoid biosynthesis in plants. Annu Rev Plant Biol 50: 47-65
Lieberei R (2007). South American leaf blight of the rubber tree (Hevea spp.): new steps in plant domestication using physiological features and molecular markers. Ann Bot 100: 1125-1142
Mahlberg P (1968). Development of non-articulated laticifers in seedling axes of Nerium oleander. Bot Gaz 4: 224-231.
Mann CC (2009). Addicted to rubber. Science 325: 564-566 McIntyre D, Stephens HL, Schloman Jr. WW, Bhowmick AK (2001). Guayule rubber. In
Handbook of Elastomers, second edition, revised and expanded - AK Bhowmick, HL Stephens, eds, Eastern Hemisphere Distribution, Marcel Dekker Inc. 1-28
Metcalfe CR (1967). Distribution of latex in the plant kingdom. Econ Bot 21: 115-127 Mooibroek H, Cornish K (2000). Alternative sources of natural rubber. Appl Microbiol
Biotechnol 53: 355-365 Mooney BP (2009). The second green revolution? Production of plant-based biodegradable
plastics. Biochem J 418: 219-232 Nagata N, Suzuki M, Yoshida S, Muranaka T (2002). Mevalonic acid partially restores
chloroplast and etioplast development in Arabidopsis lacking the non-mevalonate pathway. Planta 216: 345-350
Newman JD, Chappell J (1999). Isoprenoid biosynthesis in plants: carbon partitioning within the cytoplasmic pathway. Crit Rev Biochem Mol Biol 34: 95-106
Nor HM, Ebdon JR (1998). Telechelic liquid natural rubber: A review. Prog Polym Sci 23:143-177

Natural Rubber Biosynthesis and Physic-Chemical Studies on Plant Derived Latex
87
Oh SK, Han KH, Kang H (2000). Molecular cloning, expression, and functional analysis of a cis-prenyltransferase from Arabidopsis thaliana. J Biol Chem 275: 18482–18488
Ozias-Akins P, van Dijk PJ (2007). Mendelian genetics of apomixis in plants. Annu Rev Genet 41: 509-537
Priya P, Venkatachalam P, Thulaseedharan A (2006). Molecular cloning and characterization of the rubber elongation factor gene and its promoter sequence from rubber tree (Hevea brasiliensis): A gene involved in rubber biosynthesis. Plant Sci 171: 470-480
Qui J (2009). Where the rubber meets the garden. Nature 457: 246-247 Rohmer M, Seemann M, Horbach S, Bringer-Meyer S, Sahms H (1996). Glyceraldehyde 3-
phosphate and pyruvate as precursors of isoprenic units in an alternative non-mevalonate pathway for terpenoid biosynthesis. J Am Chem Soc 118: 2564-2566
Sakdapipanich JT (2007). Structural characterization of natural rubber based on recent evidence from selective enzymatic treatments. J Biosci Bioeng 103: 287-292
Sando T, Hayashi T, Takeda T, Akiyama Y, Nakazawa Y, Fukusaki E, Kobayashi A (2009). Histochemical study of detailed laticifer structure and rubber biosynthesis-related protein localization in Hevea brasiliensis using spectral confocal laser scanning microscopy. Planta 230: 215-225
Sato M, Sato K, Nishikawa S, Hirata A, Kato J, Nakano A (1999). The yeast RER2 gene, identified by endoplasmic reticulum protein localization mutations, encodes cis-prenyltransferase, a key enzyme in dolichol synthesis. Mol Cell Biol 19: 471-483
Schloman WW (2005). Processing guayule for latex and bulk rubber. Ind Crops Prod 22: 41-47 Schmidt T, Hillebrand A, Wurbs D, Wahler D, Lenders M, Schulze Gronover C, Prüfer D.
(2009). Molecular cloning and characterization of rubber biosynthetic genes from Taraxacum koksaghyz. Plant Mol Biol Rep DOI 10.1007/s11105-009-0145-9
Schmidt T, Lenders M, Hillebrand A, vanDeenen N, Munt O, Reichelt R, Eisenreich W, Fischer R, Prüfer D, Schulze Gronover C (2010). Characterization of rubber particles and rubber chain elongation in Taraxacum koksaghyz. BMC Biochemistry 11:11
Schnepf E (1974). Gland cells. In: Dynamic aspects of plant ultrastructure – Robards AW, Maidenhead: McGraw-Hill Book Company. 331-357
Schwanitz F (1951). Untersuchungen an polyploiden Pflanzen - XII. Der Gigas-Charakter der Kulturpflanzen und seine Bedeutung für die Polyploidiezüchtung. Der Züchter 21: 65-75
Scott DJ, da Costa BMT, Espy SC, Keasling JD, Cornish K (2003). Activation and inhibition of rubber transferases by metal cofactors and pyrophosphate substrates. Phytochemistry 64: 123-134
Siler DJ, Cornish K (1993). A protein from Ficus elastica rubber particles is related to proteins from Hevea brasiliensis and Parthenium argentatum. Phytochemistry 32: 1097-1102
Singh AP, Wi SG, Chung GC, Kim YS, Kang H (2003). The micromorphology and protein characterization of rubber particles in Ficus carica, Ficus benghalensis and Hevea brasiliensis. J Exp Bot 54: 985-992
Skilleter DN, Kekwick RGO (1971). The enzymes forming isopentenyl pyrophosphate from 5-phosphomevalonate (mevalonate-5-phosphate) in the latex of Hevea brasiliensis. Biochem J 124: 407-415
Southorn WA, Yip E (1969). Latex flow studies. III. Electrostatic considerations in the colloidal stability of fresh Hevea latex. J Nat Rubb Res 20: 201-215
Spurgeon SL, Porter JW (1981). Biosynthesis of isoprenoid compounds. 1: 1-46 Stewart-Wade SM, Neumann S, Collins LL, Boland GJ (2002). The biology of Canadian
weeds. Can J Plant Sci 82: 825-853

Biotechnology of Biopolymers
88
Stubbe JA, Tian J, He A, Sinskey AJ, Lawrence AG, Liu P (2005). Non-template dependent polymerization processes: polyhydroxyalkanoate synthases as a paradigm. Annu Rev Biochem 74: 433-480
Suomela H (1950). On the possibilities of growing Taraxacum kok-saghyz in Finland on basis of the investigations conducted in the years 1943-1948. valtion maatalous koetoiminnan julkaisuja state agricultural research publications of Finland, Helsinki University
Swanson C, Buchanan R, Otey F (1979). Molecular weights of natural rubbers from selected temperate zone plants. J Appl Polym Sci 23: 743-748
Tarshis L, Proteau P, Kellogg B, Sacchettini J, Poulter, C (1996). Regulation of product chain length by isoprenyl diphosphate synthases. Proc. Natl. Acad. Sci. USA 93: 15018–15023
Tanaka Y, Aik-Hwee E, Ohya N, Nishiyama N, Tangpakdee J, Kawahara S, Wititsuwannakul R (1996). Initiation of rubber biosynthesis in Hevea brasiliensis: characterization of initiating species by structural analysis. Phytochemistry 41: 1501-1505
Tangpakdee J, Tanaka Y, Wititsuwannakul R, Chareonthiphakorn N (1996). Possible mechanisms controlling molecular weight of rubbers in Hevea brasiliensis. Phytochemistry 42: 353-355
Ulmann M (1951). Wertvolle Kautschukpflanzen des gemässigten Klimas - dargestellt auf Grund von sowjetischen Forschungsarbeiten. Akademie Verlag GmbH, Berlin
van Beilen JB, Poirier Y (2007a). Establishment of new crops for the production of natural rubber. Trends Biotechnol 25: 522-529
van Beilen JB, Poirier Y (2007b). Guayule and Russian dandelion as alternative sources of natural rubber. Crit Rev Biotechnol 27: 217-231
van Beilen JB, Poirier Y (2008). Production of renewable polymers from crop plants. Plant J 54: 684-701
van Dijk PJ (2003). Ecological and evolutionary opportunities of apomixis: insights from Taraxacum and Chondrilla. Phil Trans R Soc Lond 358: 1113-1121
Wackernagel M, Schulz NB, Deumling D, Linares AC, Jenkins M, Kapos V, Monfreda C, Loh J, Myers N, Norgaard R (2002). Tracking the ecological overshoot of the human economy. Proc Natl Acad Sci U S A 99: 9266-9271
Wagner S, Breiteneder H (2005). Hevea brasiliensis latex allergens: current panel and clinical relevance. Int Arch Allergy Immunol 136: 90-97
Wahler D, Schulze Gronover C, Richter C, Foucu F, Twyman RM, Moerschbacher BM, Fischer R, Muth J, Prüfer D (2009). Polyphenoloxidase silencing affects latex coagulation in Taraxacum species. Plant Phys 151:334-346
Wasano N, Konno K, Nakamura M, Hirayama C, Hattori M, Tateishi K (2009). A unique latex protein, MLX56, defends mulberry trees from insects. Phytochemistry 70: 880-888
Wilson KJ, Mahlberg PG (1980). Ultrastructure of developing and mature nonarticulated laticifers in the milkweed Asclepias syriaca L.(Asclepiadaceae). Am J Bot 67: 1160-1170
Wititsuwannakul D, Rattanapittayaporn A, Wititsuwannakul R (2003). Rubber biosynthesis by a Hevea latex bottom-fraction membrane. J Appl Polym Sci 87: 90-96
Xie W, Mcmahan CM, Whalen MC, Distefano M, Degraw A, Cornish K, Shintani D (2008). Initiation of rubber biosynthesis: in vitro comparisons of benzophenone-modified diphosphate analogue structure in three natural rubber-producing species. Phytochemistry 69: 2539-2545
Ziegler AD, Fox JM, Xu J (2009). The rubber juggernaut. Science 324: 1024-1025

Part 2
Chitin/Chitosan and Their Preparation, Characterization and Applications


5
Characterization and Properties of Chitosan Elson Santiago de Alvarenga
Universidade Federal de Viçosa, Departamento de Química, Viçosa, MG, Brazil
1. Introduction The biopolymer is characterized as either chitin or chitosan according to the degree of deacetylation (DD) which is determined by the proportion of D-glucosamine and N-acetyl-D-glucosamine. Structurally, chitosan is a straight-chain copolymer composed of D-glucosamine and N-acetyl-D-glucosamine being obtained by the partial deacetylation of chitin. Chitosan is the most abundant basic biopolymer and is structurally similar to cellulose, which is composed of only one monomer of glucose (Fig. 1). Chitosan solubility, biodegradability, reactivity, and adsorption of many substrates depend on the amount of protonated amino groups in the polymeric chain, therefore on the proportion of acetylated and non-acetylated D-glucosamine units. The amino groups (pKa from 6.2 to 7.0) are completely protonated in acids with pKa smaller than 6.2 making chitosan soluble. Chitosan is insoluble in water, organic solvents and aqueous bases and it is soluble after stirring in acids such as acetic, nitric, hydrochloric, perchloric and phosphoric (Guibal, 2004; Kluget al., 1998; Kubota et al., 2000; Kurita, 2006; Anthonsen & Smidsroed, 1995; Rinaudo, 2006; Sankararamakrishnan & Sanghi, 2006).
OOHO
NHO
OH
O
HONH
OH
O
HONH
OHCH3
O
OO
CH3
O OCH3
Chitin
Chitosan
OOHO
NH2
O
OH
O
HONH2
OH
O
HONH
OH
OO
OCH3
OOHO
OHO
OH
O
HOOH
OH
O
HOOH
OH
OO
Cellulose Fig. 1. Structures of chitin, chitosan, and cellulose

Biotechnology of Biopolymers 92
Food contaminations and the negative environmental impact of packaging materials currently in use have prompted the research of safer materials. Chitosan have shown great promise to be used in food industry as preservative because of its high antimicrobial activity against various microorganisms. The quality of a variety of food products are maintained by chitosan based films (Dutta et al., 2009). Chitosan is considered one of the most valuable polymer for biomedical and pharmaceutical applications due to its biodegradability, biocompatibility, antimicrobial, non-toxicity, and anti-tumor properties. Nanoparticles, microspheres, hydrogels, films, and fibers are typical chitosan based forms for biomedical and pharmaceutical applications. Examples of such applications include nasal, ocular, oral, parenteral and transdermal drug delivery (Kumar, 2000). The science for creating three dimensional body parts by seeding cellular material in vitro on a scaffold, to replace diseased body parts is defined as tissue engineering. The scaffold should be biodegradable and elastic for contractile tissues such as blood vessels and heart valves. It is therefore necessary to develop tissue like matrix with interconnected network, to act as templates to guide cell growth, transfer of nutrients, oxygen and waste products (Kathuria et al., 2009). Cross-linked chitosan hydrogels as potential tissue engineering scaffold can be prepared by Schiff base reaction between the N-succinyl-chitosan and the aldehyde group from the oxidized hyaluronic acid. Encapsulation of bovine chondrocytes within the cross-linked hydrogel demonstrated that the composite hydrogel supported cell survival and the cells retained chondrocytic morphology. Hydrogels are attractive candidates for tissue regeneration due to its extracellular matrix mimic structure and the ability to form under mild conditions (Tan et al., 2009). Chitosan microspheres as delivery drug carriers can be prepared by the water-in-oil emulsion solvent diffusion method, being ethyl acetate the oil phase. Figure 2 displays Scanning Electron Microscopy (SEM) image of the chitosan microspheres with drug entrapment (Phromsopha & Baimark, 2010).
Fig. 2. Scanning Electron Microscopy (SEM) of drug-loaded chitosan microparticles (reproduced from Phromsopha & Baimark, 2010).
Chitosan has been largely employed in many areas, such as photography, biotechnology, cosmetics, food processing, biomedical products (artificial skin, wound dressing, contact lens, etc.), system of controlled liberation of medicines (capsules and microcapsules), treatment of industrial effluents for removal of metallic and coloring ions. The amino groups are responsible for the distinct characteristics attributed to this basic polymer (compared to an acidic biopolymer). Therefore, the characterization of the polymer in either chitin or

Characterization and Properties of Chitosan 93
chitosan is extremely important according to the structure-properties relationship, defining a possible industrial application. Thus many techniques are available to determine the degree of deacetylation, such as: • Elemental analysis (Davies & Hayes, 1988; dos Santos et al., 2009); • Titration (Arcidiacono & Kaplan, 1992; Balázs & Sipos, 2007; de Alvarenga et al., 2010;
Hattori et al., 1999; Park et al., 1983; Raymond et al., 1993; Tôei & Kohara, 1976; Zhanga et al., 2011);
• Hydrolytic methods (Davies & Hayes, 1988; Nanjo et al., 1991; Niola et al., 1993; Sato et al., 1998; Zamani et al., 2008);
• HPLC - Ultraviolet (Aiba, 1986; Muzzarelli & Rocchetti, 1985); • Infrared (Baxter et al., 1992; Duarte et al., 2002; Kasaai, 2008; Miya et al., 1980; Moore &
Roberts, 1980; Sannan et al., 1978); • 1H nuclear magnetic resonance (Brugnerotto et al., 2001; de Alvarenga et al., 2010;
Fernandez-Megia et al., 2005; Lavertu et al., 2003; Varum et al., 1991); • CP-MAS 13C NMR (Heux et al., 2000; Manni et al., 2010; Raymond et al., 1993); • CP-MAS 15N NMR (Kasaai, 2009; Yu et al., 1999); • Many other methods are described in the literature but with a somewhat smaller
appeal. Some of these methods are: steric exclusion chromatography (Brugnerotto et al., 2001), nitrous acid deamination (Sashiwa et al., 1991), thermal analysis (Garcia Alonso et al., 1983), gas chromatography with columns packed with chitin and chitosan (Muzzarelli et al., 1980), etc.
2. Elemental analysis A known amount of chitosan is heated for 1 h at 600ºC, and the residue is weighed to find the quantity of inorganic material. The percentages of nitrogen in fully deacetylated chitosan (8.695), in fully acetylated chitin (6.896), and in the organic fraction of the analyzed material (%N) are related to the DA by formula (1).
(8.695 - %N)%DA = · 1008.695 - 6.896
(1)
Samples with varying DA (degree of acetylation) present relatively small variations in nitrogen content, thus results obtained by elemental analysis (EA) are not precise, especially if contaminants are present. This technique was used to define chitosan as having a nitrogen content of more than 7% and chitin with less than 7% nitrogen (Davies & Hayes, 1988; dos Santos et al., 2009).
3. Titration methods 3.1 Acid-base titration A known amount of chitosan was solubilized in 0.1 N HCl with gentle shaking overnight. Titration with 0.1 N NaOH was performed on an automatic titration system. D-glucosamine and N-acetyl-D- glucosamine were used as 100% and 0% deacetylated controls, respectively. The DA is determined from first and second inflection points of the titration curve. Some samples presented large standard deviations possibly due to solution viscosity and precipitate formation (Arcidiacono & Kaplan, 1992; Park et al., 1983).

Biotechnology of Biopolymers 94
3.2 Potentiometric titration Chitosan (ca. 100 mg) is dissolved in a known volume of aqueous HCl (0.010 mol L-1) and the solution is then titrated with 0.1 mol L-1 NaOH, while the pH of the solution is measured at constant ionic strength (0.1 mol L-1 NaCl). The graph with the variation of pH versus the added volume of base has two inflexion points: the first corresponds to neutralization of HCl, and the second to neutralization of the ammonium ions from chitosan. The difference between the two inflexion points gives the amount of amino groups in chitosan (degree of deacetylation, DD). The degree of acetylation (DA) is obtained from formula (2):
% 100 %DA DD= − (2)
This method presented some difficulties such as: The chitosan samples have to be purified and dried prior to measurements. The moisture and ash contents have to be determined and the weighed chitosan mass corrected. Low grade samples are not adequately measured by potentiometric titration (Balázs & Sipos, 2007; Zhanga et al., 2011).
3.3 Colloid titration The principle of this method is based on a stoichiometric combination between positive and negative ions. In colloid titration, normality of the titer solution is defined by the number of equivalents of the dissociable groups of the polymer in 1 liter of solution. A chitosan sample (1 a 10 x 10-5 mol) was dissolved in aqueous acetic acid (5 mL, 3 mol-1) and diluted with deionized water (100 mL). The solution was titrated with potassium poly(vinyl sulfate) (PVS, 2.5 x 10⁻³ mol L-1) using 3-amino-7-dimethylamino-2-methylphenothiazin-5-ium chloride (toluidine blue, 1% m/v solution) as indicator. The positive ammonium groups of the protonated chitosan were directly bound to negatively charged sulfate groups of PVS. After the equivalent point is reached a minute excess of PVS binds to toluidine blue and the color change from blue to red. This method presented some difficulties such as: The PVS had to be purified by dialysis before use and its solution had to be padronized by acid base titration. The chitosan samples suspended in aqueous acid had to be filtered to remove insoluble matter and the resulting solution had to be purified by dialysis. A clear change of color was observed for some chitosan samples and the end-point for other samples was determined only by precipitation. However neither change of color nor precipitation was observed for low DA chitosan samples. The low stability constant of the chitosan-PVS complex was attributed as the cause for the discrepant results (Hattori et al., 1999; Tôei & Kohara, 1976).
3.4 Conductometric titration Conductimetry is the measurement of a solution conductance. During conductometric titration the solution electrical conductivity is constantly measured while the chemical reactions occur. H+and OH- contribute greatly for the solution conductance as these are the most conductive ions. The chitosan samples (0.2000 g) were dissolved in HCl (54.00 x 10⁻³ mol L-1, 40.00 mL) and titrated with portions of 0.500 mL of NaOH (165.0 x 10⁻³mol L-1) in 20 sec. interval. The values of conductance (mS cm-1) with the corresponding titrant volumes were plotted in a graphic to find the linear variation before and after the equivalence point (Fig. 3). Three line segments are observed. The first rapid descending branch corresponds to neutralization of HCl in excess (A–B), the second segment refers to neutralization of the ammonium group (B–C) and the third to the excess of base (D). The two stoichiometry points are found by intersection of the three lines and the difference between the two points corresponds to the volume of base required to neutralize the ammonium groups (de Alvarenga et al., 2010).
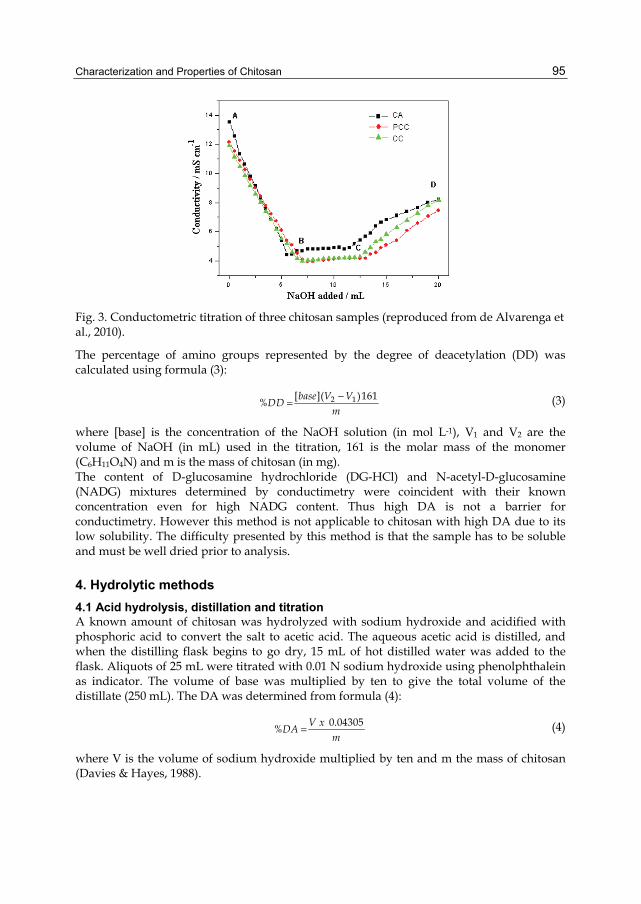
Characterization and Properties of Chitosan 95
Fig. 3. Conductometric titration of three chitosan samples (reproduced from de Alvarenga et al., 2010).
The percentage of amino groups represented by the degree of deacetylation (DD) was calculated using formula (3):
2 1[ ]( )161% base V VDDm
−= (3)
where [base] is the concentration of the NaOH solution (in mol L-1), V1 and V2 are the volume of NaOH (in mL) used in the titration, 161 is the molar mass of the monomer (C6H11O4N) and m is the mass of chitosan (in mg). The content of D-glucosamine hydrochloride (DG-HCl) and N-acetyl-D-glucosamine (NADG) mixtures determined by conductimetry were coincident with their known concentration even for high NADG content. Thus high DA is not a barrier for conductimetry. However this method is not applicable to chitosan with high DA due to its low solubility. The difficulty presented by this method is that the sample has to be soluble and must be well dried prior to analysis.
4. Hydrolytic methods 4.1 Acid hydrolysis, distillation and titration A known amount of chitosan was hydrolyzed with sodium hydroxide and acidified with phosphoric acid to convert the salt to acetic acid. The aqueous acetic acid is distilled, and when the distilling flask begins to go dry, 15 mL of hot distilled water was added to the flask. Aliquots of 25 mL were titrated with 0.01 N sodium hydroxide using phenolphthalein as indicator. The volume of base was multiplied by ten to give the total volume of the distillate (250 mL). The DA was determined from formula (4):
0.04305% V xDAm
= (4)
where V is the volume of sodium hydroxide multiplied by ten and m the mass of chitosan (Davies & Hayes, 1988).

Biotechnology of Biopolymers 96
The drawback of this method is that it requires many tedious manipulations such as sample drying, hydrolysis with base, acidification, azeotropic distillation, and titration. However no expensive apparatus and reagents difficult to acquire are necessary for this method.
4.2 Acid hydrolysis - HPLC A Varian Model 5000 equipped with 300 x 7.8 mm cation-exchange resin column and UV detector was employed for the HPLC measurements. The finely powdered polymer was hydrolyzed with aqueous sulfuric, oxalic and propionic acids at 155ºC for 1 hour. After cooling for 2 hours the mixture was filtered and 10 µL was injected in the HPLC. The detection of the carboxylic acids was carried out with a UV detector at 210 nm. The calibration curve was made with various dilutions of acetic acid and the DA was calculated according to formula (5).
161% 10043 42
MDAM
= ⋅−
(5)
Where M is the amount of acetyl groups liberated by acid hydrolysis divided by the mass of organic material (mass of analyzed material discounted the inorganic matter); 161 is the molar mass of 2-amino-2-deoxy-D-glucose; and 43 the molar mass of the acetyl group. M is calculated from the areas of the acetic acid (AAc) and the internal standard (AIS) peaks and from the mass of propionic acid (MIS) according to formula (6). K is the response factor. Ac
ISIS
AM K MA
= ⋅ ⋅ (6)
The HPLC chromatogram of the chitosan reaction mixture is shown in Fig.4. Formic acid is formed by hydrolysis of oxalic acid (peak 1), acetic acid (2) is liberated from the hydrolysis of chitosan, and propionic acid (3) is the internal standard.
Fig. 4. HPLC of the reaction mixture of chitosan: (1) formic acid, (2) acetic acid, and (3) propionic acid (reproduced from Niola et al., 1993).
4.2.1 Drawbacks - A calibration curve with various concentrations of acetic acid is required. - The content of water and inorganic material in the sample must be determined prior to
analysis.

Characterization and Properties of Chitosan 97
- A long analysis time is required even after calibration and sample preparation. - Sample degradation due to the high temperature employed for the hydrolysis. - Separation of the acetic acid from the other carboxylic acids is not very trivial. A
suitable HPLC column is required. - The hydrolytic conditions employed degrade the HPLC column life time.
4.2.2 Advantages - This method is valid over the complete range of DA. - The HPLC equipment is quite affordable compared to solid state NMR. - Insoluble chitin samples can be analyzed by this method (Niola et al.,1993; Zamani et
al., 2008).
4.3 Enzymatic hydrolysis – colorimetry - HPLC A Waters HPLC equipped with C-R3A integrator, column YMC-Pack PA-03(4.6 x 250 mm) and R-410 differential refractometer detector was employed in this technique. Chitosan was hydrolyzed by cooperative action of exo-β-D-glucosaminidase, β-N-acetylhexosaminidase, and chitosanase and the amounts of D-glucosamine and N-acetyl-D-glucosamine were determined by colorimetry and HPLC. The analysis by HPLC was carried out on 0.2 mL solution of the aqueous hydrolysate. The peak area was converted into a molar concentration with standard curves obtained with authentic D-glucosamine and N-acetyl-D-glucosamine. Fig. 5 shows the HPLC chromatograms of the standards and of hydrolyzed chitosan.
Fig. 5. HPLC chromatograms of: (A) Standard D-glucosamine (DG) and N-acetyl-D-glucosamine(NADG); B) Products of hydrolysis of chitosan (reproduced from Nanjo et al., 1991).
The degree of deacetylation (DD) was calculated according to formula 7:
( )% 100 /DD xDG DG NADG= + (7)
Where DG and NADG are the concentration in µmol/mL of D-glucosamine and of N-acetyl-D-glucosamine, respectively. These concentrations are obtained from the HPLC peak areas.
4.3.1 Drawbacks - Standard curves with authentic samples of D-glucosamine and N-acetyl-D-glucosamine
are required.
Biotechnology of Biopolymers 98
- A longer analysis time is required for the colorimetric than the HPLC method. - The HPLC results are affected by the presence of impurities in the enzyme extracts. - The reaction conditions must be carefully controlled to ensure complete hydrolysis of
chitosan (especially for distinct enzymes). - These methods are valid only for samples soluble in 2% aqueous acetic acid.
4.3.2 Advantages - The HPLC equipment is quite affordable compared to solid state NMR. - No expensive apparatus and reagents are necessary for the colorimetric method. - The HPLC column from the enzymatic method possess a longer life time than the
HPLC column from the acid hydrolysis method (4.2) (Nanjo et al., 1991).
4.4 Pyrolysis – gas chromatography A gas chromatograph equipped with a flame ionization detector (FID) and a vertical microfurnace pyrolyzer were used to characterize chitosan. GC / mass spectrometer was used to identify the fragments. The chitosan sample (ca. 50 µg) suspended in aqueous oxalic acid (3 µL, 1.0 mol-1) in a platinum cup was heated at 450 ºC in pyrolyzer under helium atmosphere. The flow rate of 50 mL/min of carrier gas at the pyrolyzer was reduced to 1.0 mL/min at the capillary column by means of a splitter. A metal capillary column coated with immobilized poly(ethylene glycol) (PEG) (0.25 µm thickness) was used. The column temperature was initially set at 35 °C for 5 min and then heated to 220 °C at a rate of 5 °C/min. N-acetyl-D-glucosamine (NADG) was employed as standard to calculate the degree of acetylation (DA) of chitosan. This assumption is correct only if the characteristic products (acetonitrile, acetic acid, and acetamide) are quantitatively formed from both chitosan and NADG (Sato et al., 1998).
4.4.1 Drawbacks - DA is overestimated by carbohydrate contamination. - Excess of oxalic acid alters the DA. - Life time of GC column is shortened by acid. - The sample is destroyed by pyrolysis (destructive method).
4.4.2 Advantages - This method can be used for entire range of DA. - Very small amount of sample needed for analysis. - Very short analysis time. - Adequate for routine analysis.
5. Spectrometric methods 5.1 HPLC - ultraviolet spectroscopy A Shimadzu LC-3A equipped with an integrator C-R1A, column Shimpack DIOL-300 and UV detector was employed for the gel permeation chromatography (GPC) measurements. Characterized chitosan samples (C-1, 2, 3, 4, 5, and 6) were employed as standards to determine the DA of the unknown polymers. The chitosan standards (C-2, 3, 4, 5, and 6)

Characterization and Properties of Chitosan 99
were prepared by hydrolysis of sample C-1. The NADG was not used as standard because its concentration was not matched with the peak areas. The DA could be estimated because the UV absorption peak areas of the acetamide groups were proportional to the concentration of the chitosan samples (Fig. 6).
Fig. 6. Relationship between peak areas and concentration of acetamide groups of four different chitosan samples.o, C-1 chitosan; •, C-2 chitosan; ∆, C-4 chitosan; ▲, C-5 chitosan (reproduced from Aiba, 1986).
The GPC can be applied also for following chitosan reactions with low molecular weight reagents as the latter possess different retention time from chitosan and laborious purification of the chitosan derivative is avoided. The results of the GPC method were reasonably coincident for 50% of the samples with the results obtained by colloid titration and IR.
5.1.1 Drawbacks - Standard curves with characterized chitosan samples are required. - Chitosan standards with varying DA have to be prepared and purified. - This method is valid only for samples soluble in aqueous acetic acid. - The DA obtained by GPC, colloid titration, and IR were coincident for only 50% of the
samples evaluated.
5.1.2 Advantages - The HPLC equipment is quite affordable compared to solid state NMR. - Chitosan reactions with low molecular weight reagents can be accompanied by GPC. - Chitosan molecular weight can be determined by GPC (Aiba, 1986).
5.2 Infrared spectroscopy Infrared absorption spectroscopy can be employed in quantitative analyses and structure determination of compounds. The fact of certain groups of atoms presenting bands at or near the same frequency and the unique IR fingerprint of molecules allow the chemists, with

Biotechnology of Biopolymers 100
the aid of other technics, elucidate the structure of a compound. The DA is calculated by formula 8, where A1655 and A3450 are the absorbance of bands at 1655 and 3450 cm-1
respectively.
( )1655 3450/ 115DA A A= × (8)
This relationship is valid for samples with DA up to 55%. The amount of sample in the beam must be small enough to ensure that the 3450 cm-1 band has a transmission of at least 10%. Samples prepared by N-acetylation of chitosan, must be kept in 0.5 mol-1 ethanolic KOH prior to recording the spectrum, to hydrolyze the esters. The IR spectra can be obtained with KBr disk or as film. The disk is prepared by pressing the sample mixed with dry KBr. A film of aqueous acetic acid solution of chitosan is washed with methanolic ammonia, distilled water and methanol, and dried overnight in vacuum desiccator to afford the chitosan film. Fig. 7 shows the IR spectrum of chitosan and the baselines for calculating the absorbance ratio A1655/A3450.
Fig. 7. IR spectrum of chitosan showing the baselines for calculating the absorbance ratio A1655/A3450 (reproduced from Baxter et al., 1992).
5.2.1 Drawbacks - The ester groups of synthetically N-acetylated chitosan have to be hydrolyzed in
ethanolic KOH prior to analysis. - This method is valid only for chitosan with DA in the range of 0-55%. - Spectra with bad resolution for samples with low DA. - Problems associated with OH absorption from water and polysaccharides. Thus
samples have to be purified and well dried. - DA results obtained by IR have quite a large margin of error.
5.2.2 Advantages - Infrared spectrometers are widely available. - This technique is the best choice considering only cost and time required for analysis.
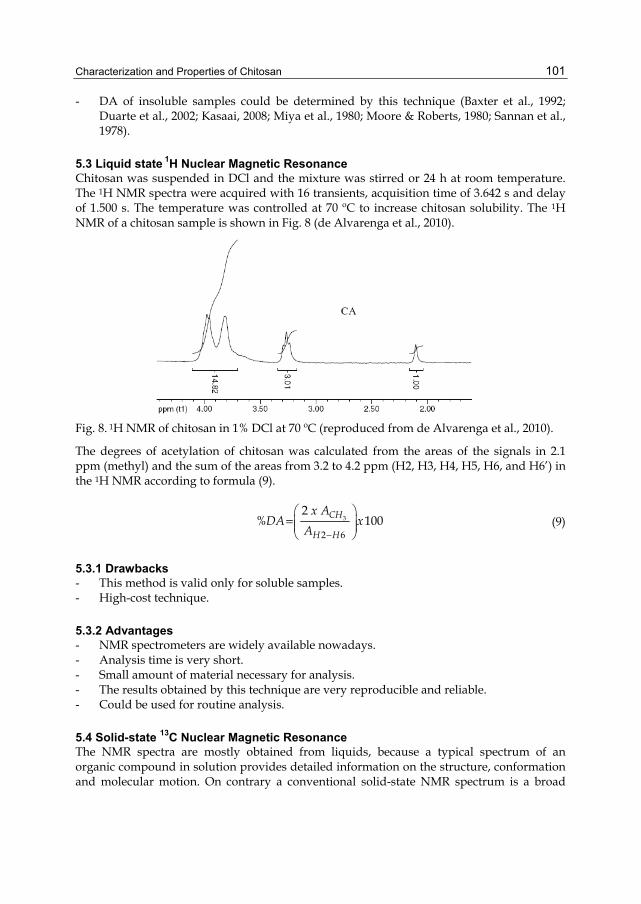
Characterization and Properties of Chitosan 101
- DA of insoluble samples could be determined by this technique (Baxter et al., 1992; Duarte et al., 2002; Kasaai, 2008; Miya et al., 1980; Moore & Roberts, 1980; Sannan et al., 1978).
5.3 Liquid state 1H Nuclear Magnetic Resonance
Chitosan was suspended in DCl and the mixture was stirred or 24 h at room temperature. The 1H NMR spectra were acquired with 16 transients, acquisition time of 3.642 s and delay of 1.500 s. The temperature was controlled at 70 ºC to increase chitosan solubility. The 1H NMR of a chitosan sample is shown in Fig. 8 (de Alvarenga et al., 2010).
Fig. 8. 1H NMR of chitosan in 1% DCl at 70 ºC (reproduced from de Alvarenga et al., 2010).
The degrees of acetylation of chitosan was calculated from the areas of the signals in 2.1 ppm (methyl) and the sum of the areas from 3.2 to 4.2 ppm (H2, H3, H4, H5, H6, and H6’) in the 1H NMR according to formula (9).
3
2 6
2% 100CH
H H
x ADA x
A −
⎛ ⎞=⎜ ⎟⎜ ⎟⎝ ⎠
(9)
5.3.1 Drawbacks - This method is valid only for soluble samples. - High-cost technique.
5.3.2 Advantages - NMR spectrometers are widely available nowadays. - Analysis time is very short. - Small amount of material necessary for analysis. - The results obtained by this technique are very reproducible and reliable. - Could be used for routine analysis.
5.4 Solid-state 13C Nuclear Magnetic Resonance The NMR spectra are mostly obtained from liquids, because a typical spectrum of an organic compound in solution provides detailed information on the structure, conformation and molecular motion. On contrary a conventional solid-state NMR spectrum is a broad

Biotechnology of Biopolymers 102
hump hiding most structural information, as the nuclei are static and cannot average out the anisotropic interactions. However an adequate dissolution of a sample for NMR analysis cannot always be obtained (Heux et al., 2000; Manni et al., 2010; Raymond et al., 1993). The integral area of the CH3 peak was compared to the area of the glucoside carbons in solid-state 13C NMR (Raymond et al., 1993) to determine the DD (degree of deacetylation) of chitosan samples (Fig. 9). The DD could be calculated also by the integrated areas of the acetate carbonyl in relation to the C1 carbon of the glucoside ring (Pelletier et al., 1990).
Fig. 9. Solid-state 13C NMR spectrum of chitosan. Integration 1 corresponds to the glucosidic carbon atoms, whereas integration 2 corresponds to the methyl group, which is proportional to the acetyl content (reproduced from Raymond et al., 1993).
DD obtained by solid-state 13C NMR for low acetyl chitosan was not coincident with the results from other technics. However, solid-state NMR is the method recommended for high DA samples, as these samples are insoluble in most common solvent.
5.4.1 Drawbacks - This method requires high-cost accessories for the NMR machine. - Very long analysis time. - These accessories are not widely available yet. - This technique could not be used for routine analysis, unless a dedicated NMR for solid
state analysis is available in the laboratory. - The results for low DA samples are not coincident with other techniques. - DA is underestimated by carbohydrate contamination.
5.4.2 Advantages - Small amount of material necessary for analysis. - DA of insoluble samples could be determined by this technique, where most of the
techniques are not applicable. - Dry samples are not necessary. - The sample is recovered intact after analysis (nondestructive method) (Heux et al., 2000;
Manni et al., 2010; Pelletier et al., 1990; Raymond et al., 1993).

Characterization and Properties of Chitosan 103
5.5 Solid-state 15N Nuclear Magnetic Resonance There is no unique technique that can measure the DA with high precision for all chitin/chitosan samples. For example, the lack of solubility of chitin points to solid-state 15N NMR spectroscopy as one of the technics for its analysis. 13C, 31P, and 15N are the nuclei most studied by solid-state NMR, because of the difficulties involved in obtaining high-resolution solid-state 1H NMR spectra. The drawbacks of directly detecting 13C and 15N are low isotopic abundances, low spin polarization, and low signal intensity. Quadrupolar nuclei (e.g. 14N, spin 1 nucleus) possess a nonspherical charge distribution that can couple to electric-field gradients present in most solid-state materials. Therefore solid-state 14N NMR spectra are highly affected by this quadrupolar coupling. A spectrometer operating at 30.35 MHz equipped with cross-polarization (CP) magic-angle spinning nitrogen NMR (CP-MAS 15N NMR) has been used to record the spectra of chitin/chitosan samples. Samples were spun at 4000 Hz and the spectra were obtained with ca 80000 scans and recycle delay of 1 s. The CP technique is used to transfer the polarization from the abundant 1H to the rare 15N nuclei thus enhancing the signals. The MAS (magical angle spinning) technique removes the dipolar broadening of signals by spinning the sample at the magic angle (ca. 54.74º) with respect to the direction of the magnetic field, increasing the resolution for better analysis of the spectrum. Figure 10 shows solid state 15N NMR spectrum for chitosan. The amide, amine and ammonium nitrogen atoms are displayed at = ~ 101, 0, and 13 ppm respectively. The solid-state 15N NMR spectra are simpler than the 13C NMR spectra, because the latter have more distinct nuclei than the first. Besides determination of DA, solid-state 15N NMR could be used also to evaluate the extent of grafting poly(3-hydroxybutyrate) to chitosan. The DA is calculated by formula 10, where A101 and A0 are the integral areas of peaks at δ = 101 and 0 ppm, respectively (Kasaai, 2009; Yu et al., 1999).
( )101 101 0/DA A A A= + (10)
Fig. 10. Solid state 15N NMR spectra of chitosan (reproduced from Yu et al., 1999).
5.5.1 Drawbacks - This method requires high-cost accessories for the NMR machine. - Very long analysis time. - The accessories are not universally available.

Biotechnology of Biopolymers 104
- This technique could not be used for routine analysis, unless a dedicated NMR for solid state analysis is available in the laboratory.
- Impurities containing nitrogen (like proteins) alter the DA obtained by this technique.
5.5.2 Advantages - Relatively small amount of material necessary for analysis. - DA of insoluble samples could be determined by this technique, where most of the
techniques are not applicable. - Time demanding drying of samples is avoided. - The chitosan samples are not destroyed by analysis. - Could be employed to characterize synthetically modified chitosan, where solid state
13C NMR could not be used. - The spectra are very easy to interpret as only two signals are observed. - DA is not affected by polysaccharide contamination.
6. Conclusion The DA can be determined by elemental analysis, titration, conductometry, hydrolytic methods, HPLC – ultraviolet, infrared, NMR spectrometry, and other techniques. Many factors have to be considered before choosing the method of analysis, such as cost, analysis time, and accuracy. For example, some methods present the price of analysis at its favor, but are not very accurate. Some of these methods are not viable for chitosan samples with high DA, due to solubility problems. The samples have to be purified for some of these techniques to remove impurities such as insoluble highly acetylated chitosan, proteins, humidity and inorganic matter. Considering the costs of analysis, titrations are the most indicated methods. One drawback is that these techniques demand tedious preparations and very long time of analysis. Errors associated with the arbitrary definition of the baseline and the need of very well dried samples is a problem for the infrared spectroscopy. The advantage is that the sample can be blended with KBr for the infrared spectroscopy (no need to prepare a solution with the sample). Solubility is one limiting factor for conductometry and liquid state 1H NMR analysis. Therefore CP-MAS 15N and 13C NMR are the techniques most indicated for insoluble chitin where the other techniques could not be employed. The drawback in the solid state NMR analysis is the availability of the accessories (probe and console for solid-state analysis attached to the NMR machine), which are very expensive and not commonly used for routine analysis. The 1H NMR is the technique most widely used for chitosan characterization, because of its accuracy, low variation of results, and analysis time. American Standart Test Method organization has adopted the 1H NMR as a standard method to determine the DA for chitosan.
7. Acknowledgment
I am greatly indebted to my family for the happy moments, love and understanding during my absence. I would like to thank FAPEMIG (Fundação de Amparo a Pesquisa do Estado de Minas Gerais) for financial support.
Characterization and Properties of Chitosan 105
8. References Aiba, S. (1986). Studies on chitosan: 1. Determination of the degree of N-acetylation of
chitosan by ultraviolet spectrophotometry and gel permeation chromatography. Int. Journal of Biological Macromolecules, Vol. 8, pp. 173–176.
American Standard Test Method (ASTM). Method for determining degree of deacetylation in chitosan salts by proton nuclear magnetic resonance (1H NMR) spectroscopy, 13.01, F2260-03. http://www.astm.org, 2003.
Anthonsen, M. W. & Smidsroed, O. (1995). Hydrogen ion titration of chitosans with varying degrees of N-acetylation by monitoring induced 1H NMR chemical shifts. Carbohydrate Polymers, 26, 303–305.
Arcidiacono, S. & Kaplan, D. L. (1992). Molecular weight distribution of chitosan isolated from Mucorrouxii under different Culture and processing conditions. Biotechnology and Bioengineering, Vol. 39, pp. 281-286.
Balázs, N. & Sipos, P. (2007). Limitations of pH-potentiometric titration for the determination of the degree of deacetylation of chitosan. Carbohydrate Research, Vol. 342, pp. 124–130.
Baxter, A., Dillon, M., Taylor, K. D. A. & Roberts, G. A. F. (1992). Improved method for i.r. determination of the degree of N-acetylation of chitosan. Int. J. Biol. Macromol., Vol. 14, pp. 166-169
Brugnerotto, J., Desbrières, J., Roberts, G. & Rinaudo, M. (2001). Characterization of chitosan by steric exclusion chromatography. Polymer, Vol. 42, Issue 25, pp. 9921-9927.
de Alvarenga, E. S., de Oliveira, C. P. & Bellato, C. R. (2010). An approach to understanding the deacetylation degree of chitosan. Carbohydrate Polymers, Vol. 80, pp. 1155–1160.
dos Santos, Z. M., Caroni, A. L. P. F., Pereira, M. R., da Silva, D. R., Fonseca, J. L. C. (2009). Determination of deacetylation degree of chitosan: a comparison between conductometric titration and CHN elemental analysis. Carbohydrate Research, Vol. 344, pp. 2591–2595.
Davies, D. H. & Hayes, E. R. (1988). Determination of the degree of acetylation of chitin and chitosan, Methods in Enzymology, Vol. 161, pp. 442-446.
Duarte, M. L., Ferreira, M. C., Marvão, M. R. & Rocha, J. (2002). An optimized method to determine the degree of acetylation of chitin and chitosan by FTIR spectroscopy. Int. Journal of Biological Macromolecules, Vol. 31, pp. 1–8.
Dutta, P. K., Tripathi, S., Mehrotra G. K., Dutta J. (2009). Perspectives for chitosan based antimicrobial films in food applications. Food Chemistry, Vol. 114, pp. 1173–1182.
Fernandez-Megia, E., Novoa-Carballal, R., Quiñoá, E. & Riguera, R. (2005). Optimal routine conditions for the determination of the degree of acetylation of chitosan by 1H NMR. Carbohydrate Polymers, Vol. 61, pp. 155–161.
Garcia Alonso, I., Peniche-Covas, C. & Nieto, J. M. (1983). Determination of the degree of acetylation of chitin and chitosan by thermal analysis. Journal of Thermal Analysis, Vol. 28, pp. 189—193.
Guibal, E. (2004). Interactions of metal ions with chitosan-based sorbents: A review. Separation and Purification Technology, Vol. 38, pp. 43–74.

Biotechnology of Biopolymers 106
Hattori, T., Katai, K., Kato, M., Izume, M. & Mizuta, Y. (1999). Colloidal titration of chitosan and critical unit of chitosan to the potentiometric colloidal titration with poly(vinyl sulfate) using toluidine blue as indicator. Bull. Chem. Soc. Jpn, Vol. 72, pp. 37-41.
Heux, L., Brugnerotto, J., Desbrieres, J., Versali, M. -F. & Rinaudo, M. (2000). Solid state NMR for determination of degree of acetylation of chitin and chitosan. Biomacromolecules, Vol. 1, pp. 746–751.
Kasaai, M. R. (2008). A review of several reported procedures to determine the degree of N-acetylation for chitin and chitosan using infrared spectroscopy. Carbohydrate Polymers, Vol. 71, pp. 497–508.
Kasaai, M. R. (2009). Various methods for determination of the degree of N-acetylation of chitin and chitosan: A review. J. Agric. Food Chem., Vol. 57, pp. 1667–1676.
Kathuria, N., Tripathi, A., Kar, K. K. & Kumar, A., (2009). Synthesis and characterization of elastic and macroporous chitosan–gelatin cryogels for tissue engineering. Acta Biomaterialia, Vol. 5, pp. 406–418
Klug, M., Sanches, M. N. M., Laranjeira, M. C. M., Favere, V. T. &Rodrigues, C. A. (1998). Análise das isotermas de adsorção de Cu(II), Cd(II), Ni(II) e Zn(II) pela N-(3, 4-dihidroxibenzil) quitosana empregando o método da regressão não linear. Quimica Nova, Vol. 21, pp. 410–413.
Kubota, N., Tastumoto, N., Sano, T. & Toya, K. (2000). A simple preparation of half N-acetylated chitosan highly soluble in water and aqueous organic solvents. Carbohydrate Research, Vol. 324, pp. 268–274.
Kumar, M. N. V. R. (2000). A review of chitin and chitosan applications. Reactive & Functional Polymers, Vol. 46, pp. 1–27.
Kurita, K. (2006). Chitin and chitosan: Functional biopolymers from marine crustaceans. Marine Biotechnology, Vol. 8, pp. 203–226.
Lavertu, M., Xia, Z., Serreqi, A.N., Berrada, M., Rodrigues, A., Wang, D., Buschmann, M.D., Gupta, A. (2003). A validated 1H NMR method for the determination of the degree of deacetylation of chitosan. Journal of Pharmaceutical and Biomedical Analysis, Vol. 32, pp. 1149-1158.
Manni, L., Ghorbel-Bellaaj, O., Jellouli, K., Younes, I. & Nasri, M. (2010). Extraction and characterization of chitin, chitosan, and protein hydrolysates prepared from shrimp waste by treatment with crude protease from Bacillus cereus SV1. ApplBiochemBiotechnol, Vol. 162, pp. 345–357.
Miya, M., Iwamoto, R., Yoshikawa, S. & Mima, S. (1980). I.R. spectroscopic determination of CONH content in highly deacylated chitosan. Int. J. Biol. Macromol., Vol. 2, pp. 323.
Moore, G. K. & Roberts, G. A. F. (1980). Determination of the degree of N-acetylation of chitosan. Int. J. Biol. Macromol., Vol. 2, pp. 115-116.
Muzzarelli, R. A. A. & Rocchetti, R. (1985). Determination of the degree of acetylation of chitosans by first derivative ultraviolet spectrophotometry. Carbohydrate Polymers, Vol. 5, pp. 461-472.
Muzzarelli, R. A. A., Tanfani, F., Scarpini, G. & Laterza, G. (1980). The degree of acetylation of chitins by gas chromatography and infrared spectroscopy. Journal of Biochemical and Biophysical Methods, Vol. 2, pp. 299—306.
Characterization and Properties of Chitosan 107
Nanjo, F., Katsumi, R. & Sakai, K. (1991). Enzymatic method for determination of the degree of deacetylation of chitosan. Analytical Biochemistry, Vol. 193, pp. 164-167.
Niola, F., Basora, N., Chornet, E. & Vidal, P. F. (1993). A rapid method for the determination of the degree of N-acetylation of chitin-chitosan samples by acid hydrolysis and HPLC. Carbohydr. Res., Vol. 238, pp. l-9.
Park, J. W., Choi, K-H.& Park, K. K. (1983). Acid-Base equilibria and related properties of chitosan. Bulleting of Korean Chemical Society, Vol. 4, No 2, pp. 68-72.
Pelletier, A.,Lemire, I., Sygusch, J., Chornet, E. &Overend, R. P. (1990). Chitin/Chitosan transformation by thermo-mechano-chemical treatment including characterization by enzymatic depolymerization. Biotechnology and Bioengineering, Vol. 36, pp. 310-315.
Phromsopha, T. & Baimark, Y. (2010). Chitosan microparticles prepared by the water-in-oil emulsion solvent diffusion method for drug delivery. Biotechnology, Vol. 9, pp. 61-66.
Raymond, L., Morin, F. G. & Marchessault, R. H. (1993). Degree of deacetylation of chitosan using conductometric titration and solid-state NMR. Carbohydrate Research, Vol. 246, pp. 331–336.
Rinaudo, M. (2006). Chitin and chitosan: Properties and applications. Progress in Polymer Science, Vol. 31, pp. 603–632.
Sankararamakrishnan, N. & Sanghi, R. (2006). Preparation and characterization of a novel xanthated chitosan. Carbohydrate Polymers, Vol. 66, pp. 160–167.
Sannan, T., Kurita, K., Ogura, K. & Iwakura, Y. (1978). Studies on chitin: 7. I.R. spectroscopic determination of degree of deacetylation. Polymer, Vol 19, pp. 458-459.
Sato, H.; Mizutani, S.; Tsuge, S.; Aoi, K.; Takasu, A.; Okada, M.; Kobayashi, S.; Kiyosada, T. & Shoda, S. (1998). Determination of the degree of acetylation of chitin/chitosan by pyrolysis-gas chromatography in the presence of oxalic acid. Anal. Chem., Vol. 70, pp. 7–12.
Sashiwa, H., Saimoto, H., Shigemasa, Y., Ogawa, R. & Tokura, S. (1991). Distribution of the acetamide group in partially deacetylated chitins. Carbohydrate Polymers, Vol. 16, pp. 291-296.
Tan, H., Chu, C. R., Payne, K. A. & Marra, K. G. (2009). Injectable in situ forming biodegradable chitosan–hyaluronic acid based hydrogels for cartilage tissue engineering. Biomaterials, Vol. 30, pp. 2499–2506.
Tôei, K. & Kohara, T. (1976). A conductometric method for colloid titrations. AnalyticaChimicaActa, Vol. 83, pp. 59-65
Varum, K. M., Anthonsen, M. W., Grasdalen, H., & Smidsrod, O. (1991). Determination of the degree of N-acetylation and the distribution of N-acetyl groups in partially N-deacetylated chitins (chitosans) by high-field n.m.r spectroscopy. Carbohydrate Research, Vol. 211, pp. 17–23.
Zamani, A., Jeihanipour, A., Edebo, L., Niklasson, C. & Taherzadeh, M. J. (2008). Determination of glucosamine and N-Acetyl glucosamine in fungal cell walls. J. Agric. Food Chem., Vol. 56, pp. 8314–8318.

Biotechnology of Biopolymers 108
Zhanga Y., Zhanga, X., Dinga, R., Zhanga, J. & Liub, J. (2011). Determination of the degree of deacetylation of chitosan by potentiometric titration preceded by enzymatic pretreatment. Carbohydrate Polymers, Vol. 83, pp. 813–817
Yu, G., Morin, F. G., Nobes, G. A. R. & Marchessault, R. H. (1999). Degree of acetylation of chitin and extent of grafting PHB on chitosan determined by solid state 15N NMR. Macromolecules, Vol. 32, pp. 518–520.

6
The Development, Characterization and Application of Water Soluble Chitosan
Zanariah Ujang1, Mazita Diah1, Ahmad Hazri Abdul Rashid1 and Ahmad Sukari Halim2
1SIRIM Berhad, 2Science University of Malaysia,
Malaysia
1. Introduction Chitosan is a linear polysaccharide composed of randomly distributed β-(1-4)-linked D-glucosamine (deacetylated unit) and N-acetyl-D-glucosamine (acetylated unit). Chitosan is produced commercially by the deacetylation of chitin, a long-chain polymer of N-acetylglucosamine which is the structural element in the exoskeleton of crustaceans (crabs, shrimp, etc.) and cell walls of fungi. The degree of deacetylation (%DD) can be determined by NMR spectroscopy, and the %DD in commercial chitosans is in the range 60-100 %. A common method for the synthesis of chitosan is the deacetylation of chitin using excess concentrated sodium hydroxide as a reagent. It has the same β- (1-4)-D-glucopyranose unit’s backbone as cellulose, except that the 2-hydroxy is replace by an acetamide group. Owing to its specific structure and property, chitosan has attracted significant interest in a broad range of areas such as pharmaceutical (Kato et al., 2003, Kumar et al., 2004), biomedical (Suh and Matthew, 2000, Tucci and Rigotti, 2003, Ng and Swami, 2005) water treatment(Northcott et al., 2005, Crini, 2005), cosmetics (Rinoudo, 2006, Sun et al., 2006 ), agriculture (Boonletniruni et al., 2008,El Hadrami et al., 2010) and food industry (Ham-Pichavant 2005,De Lima et al., 2010). As chitosan is a linear cationic biopolymer, it is only soluble in acidic aqueous solution in which the primary amino groups are protonated and precipitates when neutralized. The presence of rigid crystalline domains, formed by intra-and/or intermolecular hydrogen bonding, is considered to be responsible for the poor solubility of chitosan in high pH solutions (Nishimura et al., 1991). ) The extended applications of chitosan, is therefore frequently limited by its solubility behaviour. The solubility of chitosan can be improved by depolymerization and its chemical modification (Cravotto et al., 2005). Chitosan has reactive amino, primary hydroxyl and secondary hydroxyl groups which can be used for chemical modifications under mild reaction conditions to alter its properties. In particular, chitosan and its derivatives have been considered as biomaterials because of their biocompatibility, biodegradability, low immunogenicity and biological activities. (Hirano 1999, Molinaro et al., 2002) Chitosan has been well known to possess valuable properties for biomedical applications [Li et al, 1997] and being able to accelerate the healing of wound (Kwaeon et al., 2003, Khnor and Lim, 2003). It has also been documented that
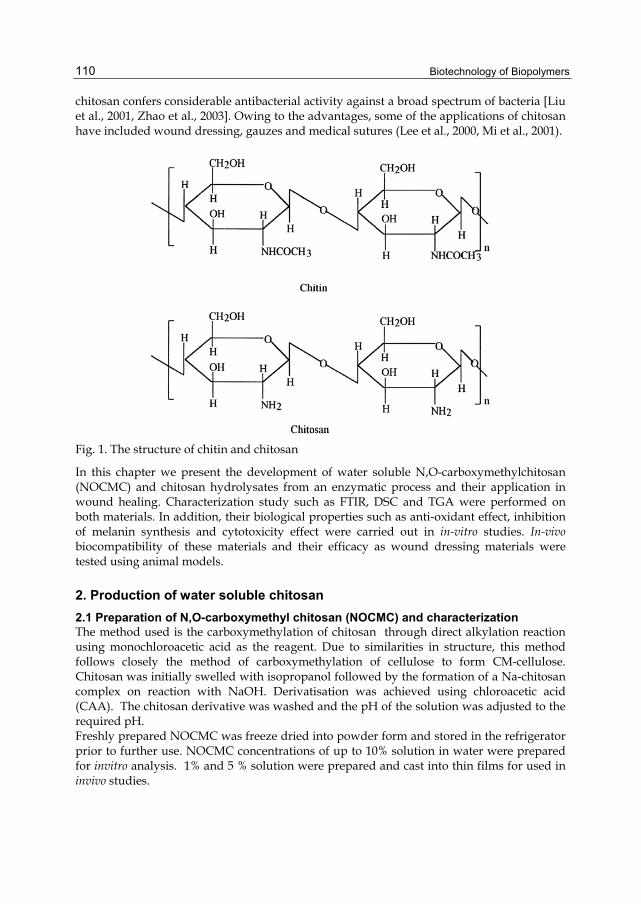
Biotechnology of Biopolymers
110
chitosan confers considerable antibacterial activity against a broad spectrum of bacteria [Liu et al., 2001, Zhao et al., 2003]. Owing to the advantages, some of the applications of chitosan have included wound dressing, gauzes and medical sutures (Lee et al., 2000, Mi et al., 2001).
Fig. 1. The structure of chitin and chitosan
In this chapter we present the development of water soluble N,O-carboxymethylchitosan (NOCMC) and chitosan hydrolysates from an enzymatic process and their application in wound healing. Characterization study such as FTIR, DSC and TGA were performed on both materials. In addition, their biological properties such as anti-oxidant effect, inhibition of melanin synthesis and cytotoxicity effect were carried out in in-vitro studies. In-vivo biocompatibility of these materials and their efficacy as wound dressing materials were tested using animal models.
2. Production of water soluble chitosan 2.1 Preparation of N,O-carboxymethyl chitosan (NOCMC) and characterization The method used is the carboxymethylation of chitosan through direct alkylation reaction using monochloroacetic acid as the reagent. Due to similarities in structure, this method follows closely the method of carboxymethylation of cellulose to form CM-cellulose. Chitosan was initially swelled with isopropanol followed by the formation of a Na-chitosan complex on reaction with NaOH. Derivatisation was achieved using chloroacetic acid (CAA). The chitosan derivative was washed and the pH of the solution was adjusted to the required pH. Freshly prepared NOCMC was freeze dried into powder form and stored in the refrigerator prior to further use. NOCMC concentrations of up to 10% solution in water were prepared for invitro analysis. 1% and 5 % solution were prepared and cast into thin films for used in invivo studies.
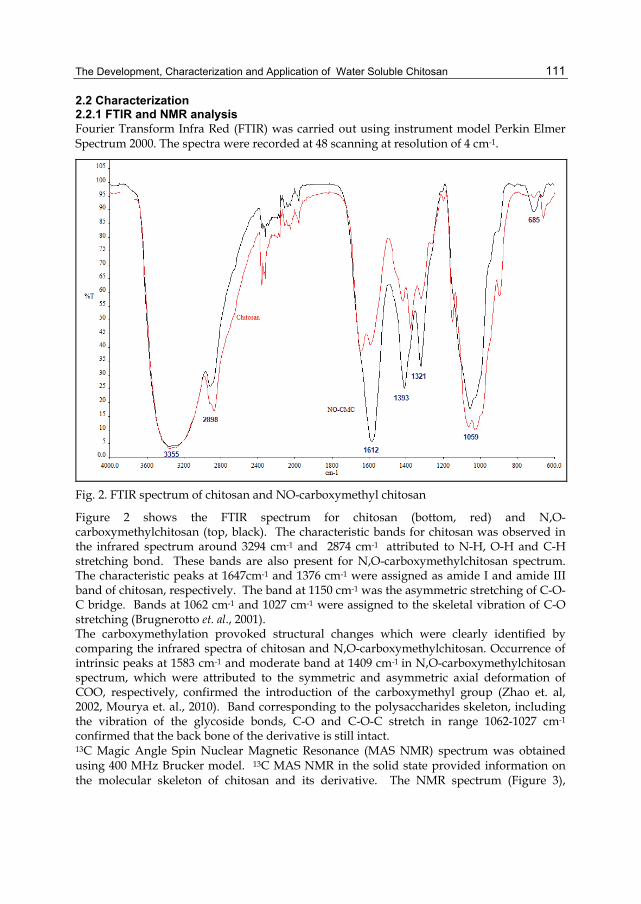
The Development, Characterization and Application of Water Soluble Chitosan
111
2.2 Characterization 2.2.1 FTIR and NMR analysis Fourier Transform Infra Red (FTIR) was carried out using instrument model Perkin Elmer Spectrum 2000. The spectra were recorded at 48 scanning at resolution of 4 cm-1.
Fig. 2. FTIR spectrum of chitosan and NO-carboxymethyl chitosan
Figure 2 shows the FTIR spectrum for chitosan (bottom, red) and N,O-carboxymethylchitosan (top, black). The characteristic bands for chitosan was observed in the infrared spectrum around 3294 cm-1 and 2874 cm-1 attributed to N-H, O-H and C-H stretching bond. These bands are also present for N,O-carboxymethylchitosan spectrum. The characteristic peaks at 1647cm-1 and 1376 cm-1 were assigned as amide I and amide III band of chitosan, respectively. The band at 1150 cm-1 was the asymmetric stretching of C-O-C bridge. Bands at 1062 cm-1 and 1027 cm-1 were assigned to the skeletal vibration of C-O stretching (Brugnerotto et. al., 2001). The carboxymethylation provoked structural changes which were clearly identified by comparing the infrared spectra of chitosan and N,O-carboxymethylchitosan. Occurrence of intrinsic peaks at 1583 cm-1 and moderate band at 1409 cm-1 in N,O-carboxymethylchitosan spectrum, which were attributed to the symmetric and asymmetric axial deformation of COO, respectively, confirmed the introduction of the carboxymethyl group (Zhao et. al, 2002, Mourya et. al., 2010). Band corresponding to the polysaccharides skeleton, including the vibration of the glycoside bonds, C-O and C-O-C stretch in range 1062-1027 cm-1 confirmed that the back bone of the derivative is still intact. 13C Magic Angle Spin Nuclear Magnetic Resonance (MAS NMR) spectrum was obtained using 400 MHz Brucker model. 13C MAS NMR in the solid state provided information on the molecular skeleton of chitosan and its derivative. The NMR spectrum (Figure 3),

Biotechnology of Biopolymers
112
correspond to the structure of chitosan and have defined as C1 peak (δ103.7), C2 (δ56.1), C3 (δ74.1), C4 (δ81.5), C5 (δ74.1) and C6 (δ59.6). C3 and C5 peaks appear as an only peak at δ 74.1 ppm (Paulino, 2006). In N,O-carboxymethyl chitosan, the basic structure of chitosan is still present but a new peak was observed at δ 177.7 ppm. This peak corresponds to the carbon from carboxyl group (COOH), due to the incorporation of carboxylmethyl group in the chitosan structure.
(c)
Fig. 3. 13C MAS NMR spectra of (a) N,O-carboxymethyl chitosan and (b) chitosan. (c) structure of carboxymethylchitosan
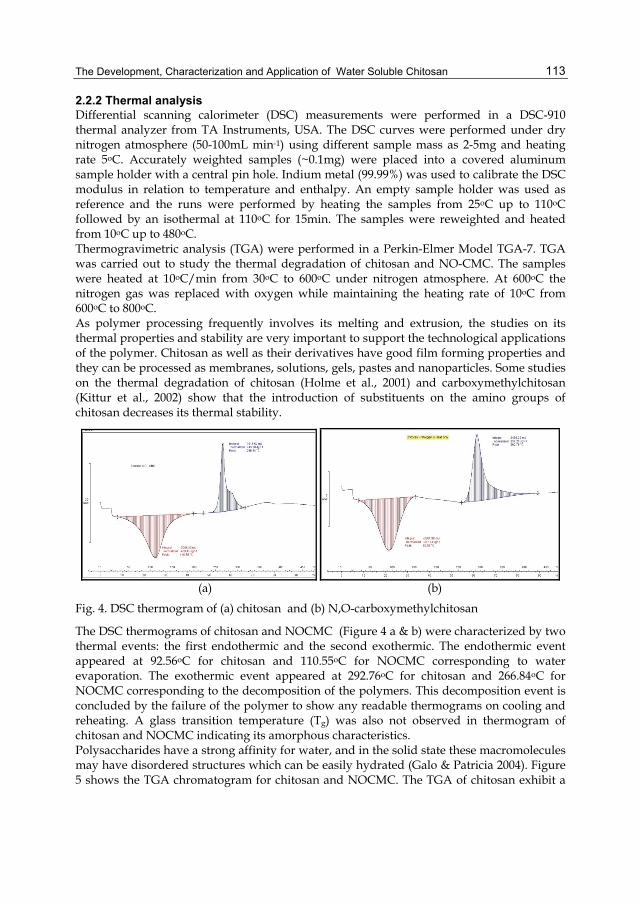
The Development, Characterization and Application of Water Soluble Chitosan
113
2.2.2 Thermal analysis Differential scanning calorimeter (DSC) measurements were performed in a DSC-910 thermal analyzer from TA Instruments, USA. The DSC curves were performed under dry nitrogen atmosphere (50-100mL min-1) using different sample mass as 2-5mg and heating rate 5oC. Accurately weighted samples (~0.1mg) were placed into a covered aluminum sample holder with a central pin hole. Indium metal (99.99%) was used to calibrate the DSC modulus in relation to temperature and enthalpy. An empty sample holder was used as reference and the runs were performed by heating the samples from 25oC up to 110oC followed by an isothermal at 110oC for 15min. The samples were reweighted and heated from 10oC up to 480oC. Thermogravimetric analysis (TGA) were performed in a Perkin-Elmer Model TGA-7. TGA was carried out to study the thermal degradation of chitosan and NO-CMC. The samples were heated at 10oC/min from 30oC to 600oC under nitrogen atmosphere. At 600oC the nitrogen gas was replaced with oxygen while maintaining the heating rate of 10oC from 600oC to 800oC. As polymer processing frequently involves its melting and extrusion, the studies on its thermal properties and stability are very important to support the technological applications of the polymer. Chitosan as well as their derivatives have good film forming properties and they can be processed as membranes, solutions, gels, pastes and nanoparticles. Some studies on the thermal degradation of chitosan (Holme et al., 2001) and carboxymethylchitosan (Kittur et al., 2002) show that the introduction of substituents on the amino groups of chitosan decreases its thermal stability.
(a) (b)
Fig. 4. DSC thermogram of (a) chitosan and (b) N,O-carboxymethylchitosan
The DSC thermograms of chitosan and NOCMC (Figure 4 a & b) were characterized by two thermal events: the first endothermic and the second exothermic. The endothermic event appeared at 92.56oC for chitosan and 110.55oC for NOCMC corresponding to water evaporation. The exothermic event appeared at 292.76oC for chitosan and 266.84oC for NOCMC corresponding to the decomposition of the polymers. This decomposition event is concluded by the failure of the polymer to show any readable thermograms on cooling and reheating. A glass transition temperature (Tg) was also not observed in thermogram of chitosan and NOCMC indicating its amorphous characteristics. Polysaccharides have a strong affinity for water, and in the solid state these macromolecules may have disordered structures which can be easily hydrated (Galo & Patricia 2004). Figure 5 shows the TGA chromatogram for chitosan and NOCMC. The TGA of chitosan exhibit a

Biotechnology of Biopolymers
114
small curve at 90oC while NOCMC exhibit a small curve at 100oC mainly from adsorbed humidity. NOCMC loses substantially more water (20.72%) compared to chitosan (13.73%) which can be attributed to the higher hydrophilicity of NOCMC leading to higher bound water as compared to chitosan. According to Mourya et al., The increase in water holding capacity with the increasing N-deacetylation and carboxymethylation is attributed to newly created hydrophilic centers (amine and carboxymethyl) in the polymer chain (Mourya et.al., 2010). Figure 5A shows the decomposition peaks at 310oC and 53.87% corresponding to decomposition of glucosamine group. Figure 5B showed decomposition peaks at 270 oC and 410oC corresponding to decomposition of carboxylic group and glucosamine unit.
(a)
(b)
Fig. 5. TGA thermogram of (a) chitosan and (b)N,O-carboxymethylchitosan
2.3 Preparation of oligo chitosan Oligochitosan samples were prepared by an enzymatic hydrolysis reaction. A number of cellulose hydrolytic enzymes such as chitosanase (Shee. et. al., 2008), chitinase (Lopatin, et.al., 1995), and cellulase (Xie, et. al., 2009) may be utilized for the hydrolysis, with the two most efficient being chitosanase and chitinase with chitosan being their natural substrate. In this work pure chitosanase from Streptomyces species, supplied by Sigma Chemical Co, St Louise USA, was chosen as the hydrolytic enzyme. The enzyme loading was 1U/30 g

The Development, Characterization and Application of Water Soluble Chitosan
115
chitosan/L solution. The hydrolysis reaction was run 50ºC and reaction without enzyme was also run for control. The enzymatic hydrolysis was performed in 10 litres of 3% acidic chitosan solution. Hydrolysed samples were taken for 0, 1,2, 4,6,7 and after 24 hours and the enzyme was inactivated at 100°C. Viscosity for all samples were measured upon cooling using a Brookfield Viscometer model DV -11+ Pro with spindle 29 at 100rpm. All the oligo chitosan samples were freeze dried and refrigerated prior to further use to prevent further autohydrolysis. Oligo chitosan samples with concentrations of up to 5% solution in water were prepared for invitro analysis. 1% and 5 % solution were prepared and cast into thin films for used in invivo studies.
2.4 Characterization 2.4.1 Measurement of viscosity Degradation of chitosan may be achieved by chemical (acid) hydrolysis (Qin et al 2002, Jia and Shen 2002, Hsu et al. 2002) or enzymatic hydrolysis (Qin et al., 2003, Shin- ya et al., 2001) Although hydolysis of chitosan with acids is fast and less expensive, the chemical structure of residues is easily damaged. The use of enzyme for degradation is generally more suitable as the course of the hydrolysis process and the product distribution are easier to control. Moreover, enzymatic hydrolysis may lend itself to production of less polymerized chitosan products which retain their original polymeric nature. In our reaction, the enzymatic hydrolysis reaction was performed up to 7 hours with the final oligochitosan solution having a viscosity of around 400 centipoise down from the initial viscosity of 3% chitosan at 5400 centipoise ( Figure 6).
0
1000
2000
3000
4000
5000
6000
0 2 4 6 8
sample (hr)
visc
ocity
(cP)
Fig. 6. Measurement of viscosity of 3 % chitosan solution after addition of enzyme
2.4.2 FTIR analysis Figure 7 shows the FTIR spectrum for oligochitosan samples taken at several time course. Its structural composition were found to be similar to the original structure of chitosan, except for the peak occurring at 1550 cm-1. This peak at 1550 cm-1 is assigned to the COO- residue shifting from the acetic acid to amine residue of chitosan (Seung et al., 2001).

Biotechnology of Biopolymers
116
4000.0 3600 3200 2800 2400 2000 1800 1600 1400 1200 1000 800 600.0cm-1
%T
oligo 3% t=0
oligo 3% t=1
oligo 3% t=2
oligo 3% t=3
oligo 3% t=4
oligo 3% t=6
oligo 3% t=7
chitosan
Fig. 7. FTIR spectrum for chitosan and oligochitosan
2.4.3 Thermal stability study
Sample Water
evaporation onset temperature (oC)
Heat capacity (mJ)
Decomposition temperature
(oC)
Heat capacity (mJ)
Chitosan 92.56 3081.00 292.79 2466.22 3% Oligo chitosan
t = 1 hr 88.87 1128.74 284.64 620.87
3% Oligo chitosan t = 3 hr 79.36 667.31 281.98 1441.15
3% Oligo chitosan t = 7 hr 84.36 751.94 281.68 743.81
Table 1. Summary of DSC thermograms
The DSC thermograms of chitosan and oligochitosan (Figure 8) were characterized by two thermal events: first endothermic and the second is exothermic. The endothermic event appeared at 92.56, 88.87, 79.36 and 84.36oC, for chitosan, oligochitosan t =1 hr, oligochitosan t =3 hr and oligochitosan t =7 hr respectively corresponding to the onset of the evaporation of bound water, the event lasting until slightly over 100oC,. The exothermic event appeared at 292.76, 284.64, 281.98 and 281.68oC for chitosan, oligochitosan t =1 hr, oligochitosan t =3 hr and oligochitosan t =7 hr respectively, corresponding to the decomposition of the polymers as explained in a previous work (Mourya et al. 2010). The degradation temperature of chitosan is

The Development, Characterization and Application of Water Soluble Chitosan
117
higher compared to oligochitosan due to the higher molecular weight chitosan and the higher number of bonds that need to be broken. Reduction in molecular weights is also translated to viscosity reductions from chitosan to oligochitosan (Figure 6).
Fig. 8. DSC thermogram of (a) overlay (b) chitosan (c) oligochitosan t = 1 hr (d) oligochitosan t = 3 hr and (e) oligochitosan t = 7 hr
(b)
(d)
(c)
(e)
(a)

Biotechnology of Biopolymers
118
3. Biological activity The main research associated with this work was to investigate the biological activities of the water soluble chitosan in the area of wound healing in general. This involved the assaying of the chitosan samples for inhibition of melanogenesis, anti-oxidant and wound healing which forms part of a series of bioactivities in wound healing technology. Apart from the biological activity of interest it is also important to ascertain the toxicity limits of the chitosan samples with respect to its contact with the cells and tissues of the human body. Two different toxicity assays were performed namely the MTT cell viability which is an assessment on the raw materials and was carried out concurrently with the melanogenesis assay on the same cells. The other toxicity evaluation is the direct contact method whereby the final wound healing product is assessed when in contact with the skin cells.
3.1 Melanogenesis assay Melanogenesis is the process of the production of melanin by certain melanin producing cells such as melanocytes which forms part of the skin epidermis layer. The melanogenesis assay is the determination of the ability of the samples to inhibit the production of melanin by selected cells. A high melanin inhibition activity also imparts on the materials potential prospect to be utilized as functional skin care product in the treatment of over expression of melanin such as hyperpigmentation.
3.1.1 Materials The B16-F1 (CRL-6323) melanoma cells were purchased from American Type Culture Collection. Cells were first cultured in DMEM medium supplemented with antibiotics (100U/mL of penicillin and 100U/mL of streptomycin) and 10% heat-inactivated fetal calf serum (Gibro-BRL) and maintained at 37°C in a humidified incubator containing 5% CO2 . Melanin synthetic, kojic acid, diphenyl tetrazolium bromide (MTT) and trichloroacetic acid (TCA) were purchased from Sigma.
3.1.2 Method The B16-F1 melanoma cells were seeded into 24 well plates at 1X10⁵ cells/ml and cultured until they reached 90% confluence. They were then treated with sample at various sample for 24 hrs using kojic acid as standard. Cells were then harvested for melanin content and MTT assay.
3.1.3 Melanin content The extracellular melanin content of cells treated with and without extracts were determined. Medium cultured were collected and incubated with 5% TCA at room temperature. Medium were centrifuged then dissolved in 1 N NaOH and shake for 15 minutes at room temperature. Absorbance was measured using Spectrophotometer at 475 nm and compared against the standard curve of melanin synthetic (Sigma).
3.1.4 Cell viability (MTT) 5mg/ml MTT agent was added into each well and cells incubated for 3 hours at 37°C in a humidified incubator containing 5% CO2. Cells were then centrifuged and dissolved with DMSO. Absorbance was measured using Spectrophotometer at 530/690 nm.
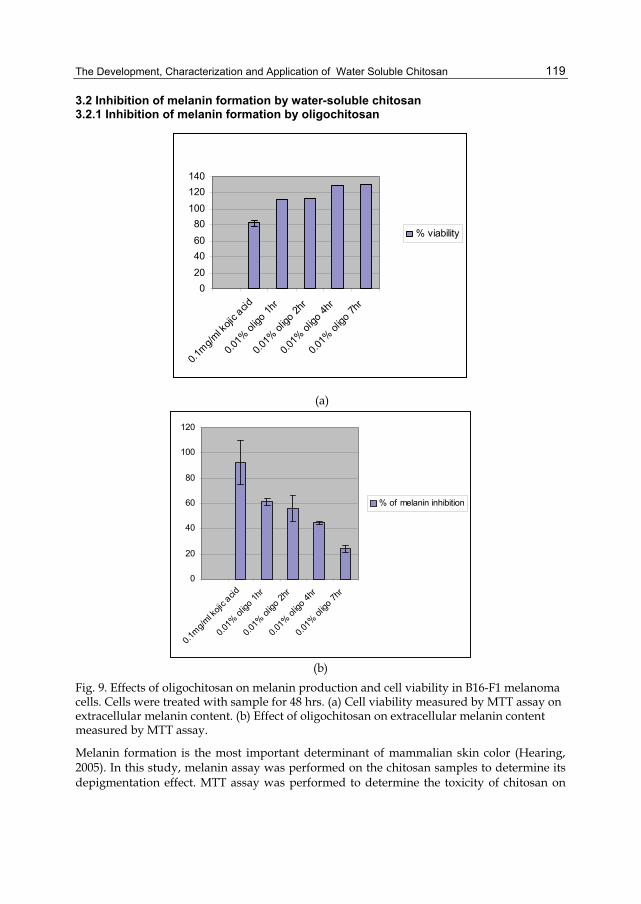
The Development, Characterization and Application of Water Soluble Chitosan
119
3.2 Inhibition of melanin formation by water-soluble chitosan 3.2.1 Inhibition of melanin formation by oligochitosan
(a)
0
20
40
60
80
100
120
0.1mg/m
l koji
c acid
0.01%
oligo
1hr
0.01%
oligo
2hr
0.01%
oligo
4hr
0.01%
oligo
7hr
% of melanin inhibition
(b)
Fig. 9. Effects of oligochitosan on melanin production and cell viability in B16-F1 melanoma cells. Cells were treated with sample for 48 hrs. (a) Cell viability measured by MTT assay on extracellular melanin content. (b) Effect of oligochitosan on extracellular melanin content measured by MTT assay.
Melanin formation is the most important determinant of mammalian skin color (Hearing, 2005). In this study, melanin assay was performed on the chitosan samples to determine its depigmentation effect. MTT assay was performed to determine the toxicity of chitosan on
020406080
100120140
0.1mg/m
l koji
c acid
0.01%
oligo
1hr
0.01%
oligo
2hr
0.01%
oligo
4hr
0.01%
oligo
7hr
% viability

Biotechnology of Biopolymers
120
melanocytes. Measurements of extracellular melanin content in the melanocytes are shown in figure 9b, while % cell viability is shown in figure 9a. Kojic acid was used as standard which gave the % melanin inhibition of 92.31 ± 17.2 with % cell viability 82.34 ± 4.02. The oligochitosan samples inhibit the formation of melanin in skin cells with 60% inhibition showed by the hydrolysis sample after I hour. All samples tested are non-toxic to the skin cells. The ability of the oligo chitosan to regulate melanin formation is useful in reducing scar color during wound healing and recovery process.
3.2.2 Inhibition of melanin formation by N,O-carboxymethylchitosan No melanin inhibition effect was observed with the NOCMC samples. The samples are non toxic to melanocytes with cell viability of more than 100% observed in all samples.
3.3 Anti- oxidant effect ABTS [2,2’-azinobis (3-ethylbenzothiazoline-6-sulfonic acid) diammonium salt ] assay is basically a radical cation decolourisation test, which is also a spectrophotometric method widely used for the assessment of antioxidant activity of various substances. Any substance which possesses anti-oxidant activity has a high potential of being a good wound healing material.
3.3.1 ABTS method Phosphate buffer (PBS) 5mM, pH 7.4
The Solution A was prepared with 0.13609g of KH2PO4 (acidic) was dissolved in 200 ml of distilled water. The solution B was prepared with 2.1742 of K2HPO4 (alkaline) were dissolved in 200 ml of distilled water. Solution B was mixed with solution A using a magnetic stirrer along with pH meter to control the pH at 7.4.
ABTS Stock Reagents
ABTS stock reagents were prepared by dissolving 0.0768 ABTS. + and 0.0132g potassium persulfate in 20ml of distilled water. The stock reagent was kept in dark for 12 to 16 hours at room temperature before use. This stock reagent can be kept in the freezer under 20°C until further use.
ABTS working solutions
Working solution of ABTS was prepared by adding 19 ml of phosphate buffer (PBS) 5mM, pH 7.4 to 1 ml of the stock reagent.
Method for ABTS
A total of 200µl of the working solution was added to 20µl of the plant extracts to make a final volume of 220 µl and the absorbance was read after 6 minutes incubation. The absorbance value was measured at 690nm. Ethanol/ distilled water were used as the negative control with the same volume as the extracts. L-ascorbic acid (20 µl) plus ABTS reagent (200 µl) was used as positive control. This assay was performed in triplicates.
A neg control-A simple% Inhibition= 100%A neg control
×

The Development, Characterization and Application of Water Soluble Chitosan
121
L- ascorbic acid was used as standard in this assay and are prepared fresh prior to use.
3.3.2 Anti-oxidant activity The anti-oxidant activity of chitosan and its derivatives has indicated that the active hydroxyl and amino groups in the polymer chains may take part in free radical scavenging and contributed to the anti-oxidant activity. The contents of active hydroxyl, amino, amido groups in their polymer chains as well as molecular weight affect the anti-oxidant activity of chitosan and derivatives (Feng et al., 2008, Guo et al., 2005)
Sample IC50 (mg/ml) Standard - Vit.C 0.09 ± 0.00 OC (1 hr) 3.99 ± 0.13 OC (2 hrs) 3.47 ± 0.048 OC (3 hrs) 4.31 ± 0.10 OC (6 hrs) 3.81 ± 0.05 OC (7 hrs) 4.66 ± 0.20 NOCMC 0.98 ± 0.07
Table 2. IC50 value of Oligo chitosan and NO carboxymethyl chitosan
Table 2 shows the concentration of oligo chitosan and NOCMC in inhibiting 50 % of ABTS radical formation. Oligochitosan displayed IC50 values of between 3.5 to 4.6 mg/ml while NOCMC is more effective as a free radical scavenger compared to oligo chitosan. Sun et al, 2007 has shown that carboxymethyl chitosans showed molecular weight dependent scavenging activity against superoxide anion.
3.4 Cytotoxicity test-direct contact method The direct contact cell culture evaluation of materials was employed to assess the cytotoxicity of the biomaterials. Fibroblast (6x10⁴ cells/ml) in Dulbecco’s modified Eagle’s Medium (DMEM) with 10% fetal bovine serum (FBS) was seeded in each well of 24-well culture plates (Nunc, Denmark). Plates were incubated overnight at 37oC in humidified 5% CO2 atmosphere until a monolayer (> 80% confluency) was formed. The culture medium was aspirated and test material pieces (chitosan film, 0.5 cm2) were placed carefully on the cell layer in a minimum culture medium. In order to evaluate the effect of chitosan film on fibroblast cells, cultures were incubated with or without test materials for 24, 48 and 72 hours. Morphology of cells was assessed using inverted microscope and quantitative evaluation of cytotoxicity was done using tetrazolium salt (MTT) reduction assay.
3.4.1 Cytotoxicity of the water soluble chitosan Oligo Chitosan film was found to be non-toxic to human skin fibroblasts. Our results show that oligo chitosan film prepared from 1% solution did not induce any cytotoxicity effect to fibroblasts in vitro as they represent more than 80% of cells viability . Figure 10 shows the cytotoxicity results for oligochitosan on fibroblasts culture using direct contact test. Results demonstrated that, O-C 1% derivatives exhibit high percentage of cell viability in terms of their biocompatibility. Time exposure did not significantly affect the number of fibroblasts growth.

Biotechnology of Biopolymers
122
% of Cell Viability ± SD Test Materials 24 HOURS 48 HOURS 72 HOURS
O-C 1% (1H) 89.92 ± 15.15 99.05 ±18.6 99.23 ± 4.40 O-C 1% (3H) 92.52 ± 16.26 102.15 ± 23.01 99.35 ± 5.88 O-C 1% (6H) 94.19 ± 14.83 103.22 ± 15.53 98.50 ± 6.13
Table 3. Cell viability of oligo chitosan tested at 24, 48 and 72 hours. Results represent the mean viability of six replicates on fibroblast obtained from different donor.
020406080
100120140
1Test Materials
Perc
enta
ge o
f cel
ls
viab
ility
24 HOURS48 HOURS72 HOURS
O-C 1% (6H)
Fig. 10. Quantitative cytotoxicity test: Fibroblasts survival in the presence of oligo chitosan sample(direct contact) at 6 h. MTT reduction capacity values are expressed as the percentage of control values obtained by cell incubations in the absence of test materials. Graph represents the mean value of fibroblast cell viability from different donor.
% of Cell Viability ± SD Test Materials
24 HOURS 48 HOURS 72 HOURS NOCMC 1% 75.37 ± 18.47 58.82 ± 5.14 44.17 ± 14.53
Table 4. Cell viability of NOCMC tested at 24, 48 and 72 hours. Results represent the mean viability of three replicates on fibroblast obtained from different donor
NOCMC showed a higher toxicity effect to fibroblast compared to oligochitosan especially at longer incubation period as cell viability drop to less than 50%. Chitosan is a cationic polymer having an amino group in its chemical structure. The N-acetylglucosamine moiety in chitosan is structurally similar to glycosaminoglycans (GAGs), heparin, chondroitin sulphate and hyaluronic acid in which they are biocompatible, and have specific interactions with various growth factors, receptors and adhesion proteins besides being the biologically important mucopolysaccharides in all mammals. Therefore, the analogous structure in chitosan may also exert similar bioactivity and biocompatibility. In our previous research paper, in vitro biocompatibility evaluation of biomedical-grade oligochitosan ) and N,O-carboxymethyl-chitosan (NOCMC) derivatives (oligochitosan 1%, oligochitosan 5%, NO-CMC 1% and NO-CMC 5%) correlated well with in vivo results (Lim et al., 2007), in which oligochitosan 1% remained the most cytocompatible chitosan film compared with oligochitosan 5% and NO-CMC. This suggests the reliability of the in vitro model as a tool to evaluate the cytotoxicity of biomedical grade chitosan.

The Development, Characterization and Application of Water Soluble Chitosan
123
4. In vivo study In-vitro studies have demonstrated the excellent prospect for the water soluble chitosan to be used as wound healing materials. However this study need to be extended to an in vivo study on an animal model (rats and rabbits) to further elucidate its effectiveness for this particular application. The study was undertaken in two parts namely: • the biocompatibility study on rats via the implantation method to determine the
reaction of the animal to foreign material implanted into their bodies, • the wound dressing study on rabbits to determine the effectiveness of the water soluble
chitosan as in the treatment of surface wounds. Both methods are described below.
4.1 Implantation method 4.1.1 Creation of subcutaneous pockets Healthy male Sprague-Dawley rats weighing between 300-500g were used in this study. The rats were subjected to the implantation period of 4 days, 7 days, 14 days, 21 days and 28 days. On the day of implantation, the rat was placed in ventral position and immobilized on their abdomen for the surgery. The dorsum of the rat was shaved. Immediately before operation the rat was anaesthetized with intramuscular injection of Ketamine 35.0 mg/kg and Xylazine 5.0 mg/kg on gluteal area. When fully anesthetized, the shaved area was cleaned three times with povidone iodine. The operation site was then isolated with sterile towel. Wounds were created under sterile technique for subcutaneous implantation. Paravertebrally, at both side of the spinal column, two longitudinal incisions were made through the full-thickness incisions of the skin. Subsequently, lateral to the incisions a subcutaneous pocket was created by blunt dissection with scissors. The implant was inserted in these pockets. The contra lateral pocket served as control site. Finally the wounds were carefully closed intracutaneously with ethilon 3-0. At 4 days post-implantation, the rats were euthanized and the implant and the control with surrounding tissue were retrieved. The remaining implants and control site were retrieved at 7 days, 14 days, 21 days and 28 days post-implantations. Implants from all rats were randomly chosen, sectioned and analyzed by histological examination.
4.1.2 Microscopic examination Immediately after retrieval, specimens were fixed in a 10% buffered formalin solution. Subsequently, the tissue blocks were dehydrated in a series of ethanol (from 10% (v/v) to 100%) and embedded in paraffin block. After polymerization, non-decalcified thin (10 µm) sections were prepared in a transversal direction to the axis of the implant using a modified sawing microtome technique. Six histological sections were made for each tissue block. These sections were stained with Hematoxylin and Eosin (H&E) staining and examined using a light microscope. A light microscope was used for the histological evaluation. The histological evaluation consisted of a concise description of the observed specimens and an analysis of the tissue response. The histological evaluation will be done in six randomly determined fields along the implant-tissue interface. Results obtained from in vivo test for biocompatibility evaluation of films prepared from 1% solution of oligochitosan and NOCMC are shown in Table 5 and 6 respectively.

Biotechnology of Biopolymers
124
Implants Day-4 Day-7 Day-14 Day-21 Day-28 Inflammation Chronic moderate Moderate Moderate Few Few Angiogenesis Intense Few Few - - Granuloma Few - - - - Epithelioid cell Few Few - - - Giant cell - - - Few Few Fibroblast Few Few Moderate Few Few
Implants Intact Mild degradation
Moderate degradation
Moderate degradation
Moderate degradation
Table 5. Oligochitosan Film: Histological Findings at Days 4,7,14,21 and 28 – Post Implantation
Implants Day-4 Day-7 Day-14 Day-21 Day-28 Inflammation Chronic few Chronic few Moderate Moderate Moderate Angiogenesis - Few Few Moderate Few Granuloma - - Few Few Moderate Epithelioid cell - - - Few Few Giant cell - - - Few Few Fibroblast Few Few Few Moderate Moderate
Implants Intact Mild degradation
Mild degradation
Moderate degradation
Moderate degradation
Table 6. NOCMC film- Histological Findings at Days 4,7,14,21 and 28 – Post Implantation
The inflammatory reactions seen in all the implants were fairly organized, from severe inflammation to a mild phase in the final stage of implantation. Occasionally, granuloma formation was seen in all the implants especially in the early period of implantation. Multinucleated giant cells were also present in all the implants especially towards the end of the implantation period. Angiogenesis was rather intense during the first three weeks of all implants. However, this process markedly decreased towards the end of inflammatory phase. Fibroblasts increased with longer implantation period for all of the implants and gradually decreased towards the end. However, collagen depositions were abundant especially 28 days post implantation. The implants of films prepared from oligochitosan and NOCMC undergone from mild to moderate degradation. The material was still abundantly present 28 day-post implantation. In conclusion, all film implants were biocompatible when implanted in vivo.
4.2 In Vivo evaluation of oligochitosan film as wound dressing New Zealand white rabbits (n=18) with weight between 2.0 – 3.5 kg were used in this study. Four partial thickness wounds (0.5 mm, 5 x 2.5 cm2) were created using a humby knife at the lumbar region. Oligochitosan and NOCMC films were used as test material for dressing the wound and Aquacel® was used as control. The wounds were examined at day 5, day 14, and day 21.

The Development, Characterization and Application of Water Soluble Chitosan
125
Fig. 11. Result of in vivo evaluation of NOCMC and oligochitosan films as wound dressing materials.
Day 0
Treatment with commercial dressing
Treatment with oligo chitosan
Dressing after 14 days
Dressing after 21 days Both healed (almost without scar)
Treatment with NOCMC

Biotechnology of Biopolymers
126
Split skin graft donor site is a good example of partial-thickness wound. The performances of all the chitosan derivatives as wound dressings were compared to a commercial dressing, Aquacel® which is widely used in actual clinical setting. On day 7 and 14 post-implantation with oligochitosan and NOCMC, histological findings revealed that severe neutrophilic infiltration occurred in all chitosan derivatives specimens at similar level of intensity compared with that in the control. Migration of macrophages was also accelerated by the chitosan derivatives implants. These findings were in accordance with the histological results in partial-thickness wound model where intense acute inflammations were observed in the early phase of wound healing of all the chitosan derivatives including the commercial dressing, Aquacel®. However, the inflammation intensity was significantly lower for oligochitosan compared to the treatments with NOCMC. In wound healing model, however, though fibroblasts presence in oligochitosan was lower than NOCMC, the collagen depositions were notably higher for oligochitosan which was comparable to Aquacel®. The study on animal model for wound healing showed that both materials, oligochitosan and NOCMC are biocompatible and proved to be an effective mean of managing wound.
5. Conclusion Chitosan is a multifunctional biopolymer with many interesting applications. However, its appeal is limited by its insolubility in neutral pH solutions and other relevant solvents. In an age where environmental considerations is of high importance, having a water soluble chitosan polymer is of great significance as it eliminates the need for employing and managing acidic solutions. The two methods employed to enhance its water solubility and processability are derivatization with identified functional groups and decreasing its chain length. Derivatization of the chitosan polymer and hydrolysis to a lower molecular weight polymer also imparts on the resulting polymer enhance activity in certain applications. In this work we have reported on a derivatization process to produce N,O-carboxymethylchitosan and an enzymatic hydrolysis process to obtain low molecular weight chitosan polymer which we have called oligochitosan. We have also reported on our work to establish the biological activities of the water soluble chitosan derivatives to meet two applications namely • the ability of the derivative polymers to inhibit melanogenesis and formation of
melanin • the ability of the polymers to enhance or increase wound healing activities. A high activity or a strong ability of the polymers to inhibit melanogenesis implies that the the polymers may be used in the development of topical products for the treatment of excess production of melanin. This occurs as melasma or simply as a darkening of the skin on exposure to environmental stress such as ultraviolet radiation or free radicals. It is possible to use the oligochitosan in the treatment of post inflammatory hyperpigmentation condition such as scar and skin darkening. In this work we have reported that the oligochitosan demonstrated a high activity in the inhibition of then formation of melanin in in-vitro cell based assays. Exudates from non-healing wounds contain elevated levels of proteolytic enzymes, like elastase from polymorphonuclear granulocytes (PMN elastase), reactive oxygen species (ROS) and reactive nitrogen species (RNS). Thus, the reduction of protein-degrading

The Development, Characterization and Application of Water Soluble Chitosan
127
enzymes and scavenging of ROS and RNS seem to be suitable ways to support the healing process of chronic stagnating wounds. The water soluble polymers described in this work possess free radical scavenging activity which may assist in the treatment of chronic wound in conjunction with growth factors and hormones. A strong ability to increase wound healing activities indicate that the polymers possess high potential to be developed as wound management products thereby increasing the choices of the medical practitioners in the treatment of chronic wounds.
6. Acknowledgements The authors would like to acknowledge the Ministry of Science, Technology and Innovation, Malaysia for providing the grant to undertake the research described in this work. The authors would also like to express their gratitude to their respective organizations for the support given.
7. References Boonlertniruni, S., Boobraung, C. & Suvanasara,R. (2008). Application of Chitosan in Rice
Production.Journal of Metals, Materials and Minerals, 18, 47-52. Brugnerotto, J., Lizardi, J., Goycoobea, F.M., Arqüelles-Monal, W., Desbrieres, J. and
Rinauso, M. (2001). An infrared investigation in relation with chitin and chitosan characterization. Polymer, 42, 3569-3580.Carbohydr Polym. 66, 168-175.
Cravotto, G., Tagliapietra, S., Robaldo, B. & Trotta, M. (2005).Chemical modification of chitosan under high-intensity ultrasound. Ultrason. Sonochem. 12, 95-98.
Crini, G. (2005). Recent developments in polysaccharide-based materials used as adsorbents in wastewater treatment. Prog. Polym. Sci. 30, 38-70.
De Lima R., Feitosa,L., Santo Pereira, AE., De Moura, MR., Fauze Ahmad Aouada,FA., mattoso,LHC., Fraceto, LF.(2010). Evaluation of the Genotoxicity of Chitosan Nanoparticles for Use in Food Packaging Films. J. Food Sci. 75, 89-96.
El Hadrami, A., Adam, LR., El Hadrami,I., & Daayf, F. (2010). Chitosan in Plant Protection. Mar Drugs. 8, 968–987.
Feng, T., Du, Y., Li, J., & Kennedy, JF.(2008). Enhancement of antioxidant activity of chitosan by irradiation. Carbohydr Polym. 73, 126-132.
Galo Cardenas and S. Patricia Miranda (2004). FTIR and TGA studies of chitosan composite films. . J. Chil. Chem. Soc., 49, 291-295.
Guo, Z., Xing, R., Liu, S., Yu, H., Wang, P., Li, C., &Li, P. (2005). The synthesis and antioxidant activity of the Schiff bases of chitosan and carboxymethyl chitosan. Bioorg Med. Chem. Lett. 15, 4600-4603.
Ham-Pichavant, F., Sebe, G., Pardon, P., & Coma, V.( 2005). Fat resistance properties of chitosan-based paper packaging for food applications. Carbohydr Polym. 61, 259-265.
Hearing, V.J. (2005). Biogenesis of pigment granules: a sensitive way to regulate melanocyte function. J Dermatological Sciences, 31, 3-14.
Hirano, S. (1999). Chitin and chitosan as novel biotechnological materials. Polym.Int., 48, 732-734.

Biotechnology of Biopolymers
128
Holme, H.K., Foros, H., Pettersen, H., Dornish, M., Smidsrod, O. (2001) Thermal depolymerization of chitosan chloride. Carbohydrate polym., 46, 3, 287-294.
Hsu, SC., Don, TM., & Chiu, WY. (2002). Free radical degradation of chitosan with potassium persulfate. Polym Degrad. Stab, .75, 73-83.
Jia, Z. & Shen, D.(2002). Effect of reaction temperature and reaction time on the preparation of low-molecular-weight chitosan using phosphoric acid.Carbohydr. Polym. 49, 393-396.
Kato Y., Onishi H., & Machida, Y.(2003). Application of chitin and chitosan derivatives in the pharmaceutical field. Current Pharmaceutical Biotechnology, 4, 303-309.
Khnor, E. & Lim L. (2003). Implantated applications of chitin and chitosan. Biomaterials, 24, 2339-2349.
Kittur FS, Harish Prashanth KV, Udaya Sankar K, Tharanathan RN. Characterization of chitin, chitosan and their carboxymethyl derivatives by differential scanning calorimetry. Carbohydrate Polymers. 2002;49:185-193.
Kumar, M.N.V.R., Muzzarelli,R.A.A., Muzzareli,C., Sashiwa,H.,& Domb,A.J. (2004). Chitosan chemistry and pharmaceutical perspectives. Chemical Reviews, 104, 6017–6084.
Kwaeon, DK., Song SB., & Park YY.(2003). Preparation of water-soluble chitosan/heparin complex and its application as wound healing accelerator. Biomaterials, 24, 1595-1601.
Lee, Y.M., Kim, S.S., Park, M.H., Song, K.W., Sung, Y.K., Kang, I.K. β-Chitin-based wound dressing containing silver Sulfurdiazine. J Materials Science 2000;11:817-823.
Li, Q., Lunn, ET., Grandmason, EW. & Goosen MF (1997). In Applications and properties of chitosan, Goosen, MFA., Ed., Technomic Publishing Co., Inc. Lancaster, p3.
Lim, C.K., Halim, A.S., Lau, H.Y., Ujang, Z. and Hazri,A. (2007). In vitro cytotoxicity model of oligochitosan and N,O-carboxymethyl chitosan using primary normal human epidermal keratinocytes cultures. Journal of Applied Biomaterials and Biomechanics, 5, 82-87.
Liu, X. F., Guan, Y. L., Yang, D. Z., Li, Z. and Yao, K. D. (2001). Antibacterial action of chitosan and carboxymethylated chitosan. Journal of Applied Polymer Science, 79, 1324-1335.
Lopatin S. A., Ilyin M. M., Pustobaev V. N., Bezchetnikova Z. A., Varlamov V. P. and Davankov V. A. (1995). Mass-Spectrometric Analysis of N-Acetylchitooligosaccharides Prepared through Enzymatic Hydrolysis of Chitosan, Anal.Biochem., 227, 2, 285-288.
Mi,F.L., Shyu, S.S., Wu, Y.B., Lee, S.T., Shyong, J.Y. & Huang R.N.(2001) Fabrication and characterization of a sponge-like asymmetric chitosan membrane as a wound dressing. Biomaterials; 22:165-173.
Molinaro, G., Leroux J., Damas, J. & Adam, A.(2002). Biocompatibility of thermosensitive chitosan-based hydrogels: an in vivo experimental approach to injectable biomaterials. Biomaterials, 23, 2717-2722.
Mourya V.K., Inamdar, N.N and Tiwari, A. (2010). Carboxymethyl chitosan and its applications. Advanced Materials Letter. 1(1), 11-33.

The Development, Characterization and Application of Water Soluble Chitosan
129
Ng, L.T. & Swami, S. (2005). IPNs based on chitosan with NVP and NVP/HEMA synthesised through photoinitiator-free photopolymerisation technique for biomedical applications. Carbohydr. Polym. 60, 523-528.
Nishimura, S., Kohgo, O., Kurita, K. & Kuzuhara, H. (1991). Chemospecific manipulations of a rigid polysaccharide: syntheses of novel chitosan derivatives with excellent solubility in common organic solvents by regioselective chemical modifications. Macromolecules, 24 , 4745–4748.
Northcott, K.A., Snape, I., Scales, P.J., & Stevens, G.W. (2005). Dewatering behaviour of water treatment sludges associated with contaminated site remediation in Antarctica.
Paulino, A.T. et. al. (2006). Characterisation of chitosan and chitin produces from silkworm chrysalides. Carbohydr Polym., 64. 98-103
Qin, C., Du, Y., Zong, L., Zeng, F., Lui, Y., & Zhou, B.(2003). Effect of hemicellulase on the molecular weight and structure of chitosan. Polym Degrad. Stab., 80, 435-441.
Qin, C.Q., Du, Y.M., & Xiao, L. (2002). Effect of hydrogen peroxide treatment on the molecular weight and structure of chitosan. Polym Degrad. Stab., 76, 211-218.
Rinoudo, M. (2006). Chitin and chitosan: Properties and applications. Prog. Polym. Sci. 31,603-632.
Seung, S.S., Young, C.L. and Chan, L., (2001). The degradation of chitosan with the aid of lipase from Rhizopus japonicus for the production of soluble chitosan. Journal of Food Biochemistry. 25, 307-321.
Shee, L.F.T.., Arul, J, S. Brunet and Bazinet, (2008). L. Effect of bipolar membrane electrobasification on chitosanase activity during chitosan hydrolysis, J. of Biotech, 134, 3-4, 305-311.
Shin- Ya, Y., Lee, M.Y., Hinode, H., & Izume, M.(2001). Effects of N-acetylation degree on N-acetylated chitosan hydrolysis with commercially available and modified pectinases. Biochem Engineer J., 7, 85-88.
Suh, J.K.F. & Matthew H.W.T.(2000). Application of chitosan-based polysaccharide biomaterilas in cartilage tissue engineering: a review. Biomaterials, 21, 2589-2598.
Sun, L., Du, Y., Yang, J.H., Shi, X.W., Li, J., & Wang, X.H & Kennedy, J.F. (2006 ). Conversion of crystal structure of the chitin to facilitate preparation of a 6-carboxychitin with moisture absorption–retention abilities. Tucci MG and Rocotti G.(2003).Chitosan and gelatin as engineered dressing for wound repair. J. Bioactive & Compatible Polym, 16, 145-157.
Sun T., Zhou, D., Mao, F.& Zu, Y. (2007). Preparation of low molecular weight carboxymethyl chitosan and their superoxide anion scavenging activity. Eur. Polym. J., 3, 652-656.
Xie, Y., Hu, J., Wei, Y., Hong, X. (2009), Preparation of chitooligosaccharides by the enzymatic hydrolysis of chitosan, Polymer degradation and stability, 94,10, 1895-1899.
Zhao, Z., Wang, Z., Ye, N. and Wang, S. (2002). A novel N,O-carboxymethylchitosan amphoteric chitosan/poly(ethersulfone) composite MF membrane and its charged characteristic. Desalinisation, 144, 35-39.

Biotechnology of Biopolymers
130
Zhao, L., Mitomo, H., Zhai, M., Yoshii, F., Nagasawa, N., & Kume, T. (2003). Synthesis of antibacterial PVA/CM-chitosan blend hydrogels with electron beam irradiation. Carbohydr Polym. 53, 439-446.

7
Perspectives of Chitin Deacetylase Research Yong Zhao, Wan-Taek Ju, Gyung-Hyun Jo,
Woo-Jin Jung and Ro-Dong Park Department of Agricultural Chemistry,
Graduate School, Chonnam National University, Korea
1. Introduction Chitin and chitosan are copolymers of N-acetyl-D-glucosamine (GlcNAc) and D-glucosamine (GlcN) units linked with β-(1-4) glycosidic bond, where the predominant units are GlcNAc for chitin or GlcN for chitosan in their polymeric chains (Fig. 1). While chitin remained an unused natural resource for a long term, interest in chitosan and chitooligosaccharides (COS) has increased in recent years due to their unique biodegradability, biorenewability, biocompatibility, physiological inertness, and hydrophilicity. Based on these properties, chitosan and COS have been widely and continuously applied in various fields, such as agriculture, cosmetics, water treatment, food industry, pharmaceuticals and biomedicine. Actually, most biological activities of chitosan are strongly dependent on its degree of polymerisation (DP) which defines the molecular mass of the polymers, degree of acetylation (DA) which defines its charge density and pattern of acetylation (PA) which defines the distribution of GlcNAc and GlcN moieties in the chitosan chain.
Fig. 1. Structure of chitin (a) and chitosan (b). Cited from Prashanth and Tharanathan (2007).
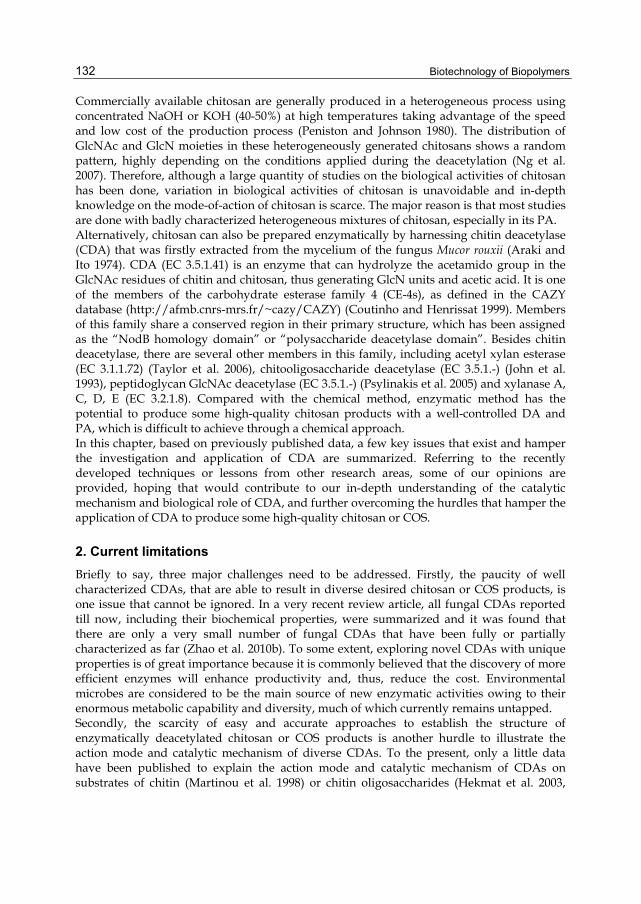
Biotechnology of Biopolymers
132
Commercially available chitosan are generally produced in a heterogeneous process using concentrated NaOH or KOH (40-50%) at high temperatures taking advantage of the speed and low cost of the production process (Peniston and Johnson 1980). The distribution of GlcNAc and GlcN moieties in these heterogeneously generated chitosans shows a random pattern, highly depending on the conditions applied during the deacetylation (Ng et al. 2007). Therefore, although a large quantity of studies on the biological activities of chitosan has been done, variation in biological activities of chitosan is unavoidable and in-depth knowledge on the mode-of-action of chitosan is scarce. The major reason is that most studies are done with badly characterized heterogeneous mixtures of chitosan, especially in its PA. Alternatively, chitosan can also be prepared enzymatically by harnessing chitin deacetylase (CDA) that was firstly extracted from the mycelium of the fungus Mucor rouxii (Araki and Ito 1974). CDA (EC 3.5.1.41) is an enzyme that can hydrolyze the acetamido group in the GlcNAc residues of chitin and chitosan, thus generating GlcN units and acetic acid. It is one of the members of the carbohydrate esterase family 4 (CE-4s), as defined in the CAZY database (http://afmb.cnrs-mrs.fr/~cazy/CAZY) (Coutinho and Henrissat 1999). Members of this family share a conserved region in their primary structure, which has been assigned as the “NodB homology domain” or “polysaccharide deacetylase domain”. Besides chitin deacetylase, there are several other members in this family, including acetyl xylan esterase (EC 3.1.1.72) (Taylor et al. 2006), chitooligosaccharide deacetylase (EC 3.5.1.-) (John et al. 1993), peptidoglycan GlcNAc deacetylase (EC 3.5.1.-) (Psylinakis et al. 2005) and xylanase A, C, D, E (EC 3.2.1.8). Compared with the chemical method, enzymatic method has the potential to produce some high-quality chitosan products with a well-controlled DA and PA, which is difficult to achieve through a chemical approach. In this chapter, based on previously published data, a few key issues that exist and hamper the investigation and application of CDA are summarized. Referring to the recently developed techniques or lessons from other research areas, some of our opinions are provided, hoping that would contribute to our in-depth understanding of the catalytic mechanism and biological role of CDA, and further overcoming the hurdles that hamper the application of CDA to produce some high-quality chitosan or COS.
2. Current limitations Briefly to say, three major challenges need to be addressed. Firstly, the paucity of well characterized CDAs, that are able to result in diverse desired chitosan or COS products, is one issue that cannot be ignored. In a very recent review article, all fungal CDAs reported till now, including their biochemical properties, were summarized and it was found that there are only a very small number of fungal CDAs that have been fully or partially characterized as far (Zhao et al. 2010b). To some extent, exploring novel CDAs with unique properties is of great importance because it is commonly believed that the discovery of more efficient enzymes will enhance productivity and, thus, reduce the cost. Environmental microbes are considered to be the main source of new enzymatic activities owing to their enormous metabolic capability and diversity, much of which currently remains untapped. Secondly, the scarcity of easy and accurate approaches to establish the structure of enzymatically deacetylated chitosan or COS products is another hurdle to illustrate the action mode and catalytic mechanism of diverse CDAs. To the present, only a little data have been published to explain the action mode and catalytic mechanism of CDAs on substrates of chitin (Martinou et al. 1998) or chitin oligosaccharides (Hekmat et al. 2003,

Perspectives of Chitin Deacetylase Research
133
Tokuyasu et al. 2000, Tsigos et al. 1999), which may at least partially due to the technological limitations. Thirdly, the scarcity of an efficient method to break the crystalline structure of chitin, that is so recalcitrant that cannot be easily tackled by CDA, is also a key issue to overcome. In this case, two ways may be considered: physical or chemical pre-treatment of chitin substrate or integration of a chitin-binding protein (CBP) along with CDA.
3. Exploring novel CDAs and biological roles 3.1 Novel CDAs To date, only a small number of microorganisms have been reported to produce CDAs by either identification of CDA encoding genes or determination of CDA activity in vitro. By contrast, most of environmental microorganisms remain unexplored but have a strong potential for the discovery of CDAs with unique properties for biotechnological application. It has already becomes apparent that CDA from different sources may differ in their activity, stability, specificity and efficiency. Well-defined COS products have been identified and characterized using novel CDAs from different sources. For instance, CDAs from C. lindemuthianum (Tokuyasu et al. 1997) and Thermococcus kodakaraensis KOD1 (Tanaka et al. 2004) could exclusively convert GlcNAc-GlcNAc into GlcN-GlcNAc. Besides that, CDAs from C. lindemuthianum could also be used for an enzymatic synthesis of GlcNAc-GlcN from GlcN-GlcN (Tokuyasu et al. 1999) and Thermococcus kodakaraensis KOD1 could also convert GlcNAc into GlcN (Tanaka et al. 2004). CDA from Vibrio cholerae could exclusively convert GlcNAc-GlcNAc into GlcNAc-GlcN (Li et al. 2007), while CDA from M. rouxii and Absidia corulea could not deacetylate GlcNAc-GlcNAc at all (Gao et al. 1995, Kafetzopoulos et al. 1993). Finding suitable enzyme candidates depends on efficient and sensitive screening strategies and the greatest possible input of diverse candidate genes and organism. The traditional method of obtaining novel enzymes by cultivation and subsequent screening of pure strains of organisms is a standard and powerful approach. For instance, recently, by the traditional method, two fungi have been isolated from environmental soils and identified to Mortierella sp. DY-52 (Kim et al. 2008) and Absidia corymbifera DY-9 (Zhao et al. 2010a), both of which can produce an extracellular CDA with a higher enzymatic activity than that from Mucor rouxii. In a more recent work, a novel CDA producing strain Penicillium oxalicum ITCC 6965 was isolated from residual materials of sea food processing industries and it was also indicated that a following mutagenesis using ethidium bromide and microwave irradiation resulted into a mutant having a two-fold increase in CDA production (Pareek et al. 2011). Compared with traditional pathways, recent advancements in molecular technologies offer an opportunity to exploit the uncultivable microbes for biotechnological processes (Hess et al. 2011). A metagenomic approach is currently considered the most viable method to search for these elusive enzymes and there has already been some success with the use of several enzymes discovered using metagenomics in the fine chemical and pharmaceutical industries (Lorenz and Eck 2005, Cowan et al. 2005). Metagenomics involves the extraction of the total genetic material from all organisms present in an environmental sample without the need to culture them. The genetic material is then transferred into surrogate organisms to generate a metagenome clone library. To search for specific activities with the metagenome, the surrogate organisms can be screened for particular enzymes, either via DNA sequences or enzymatic functions. Moreover, for functional screening, the number of clones can be
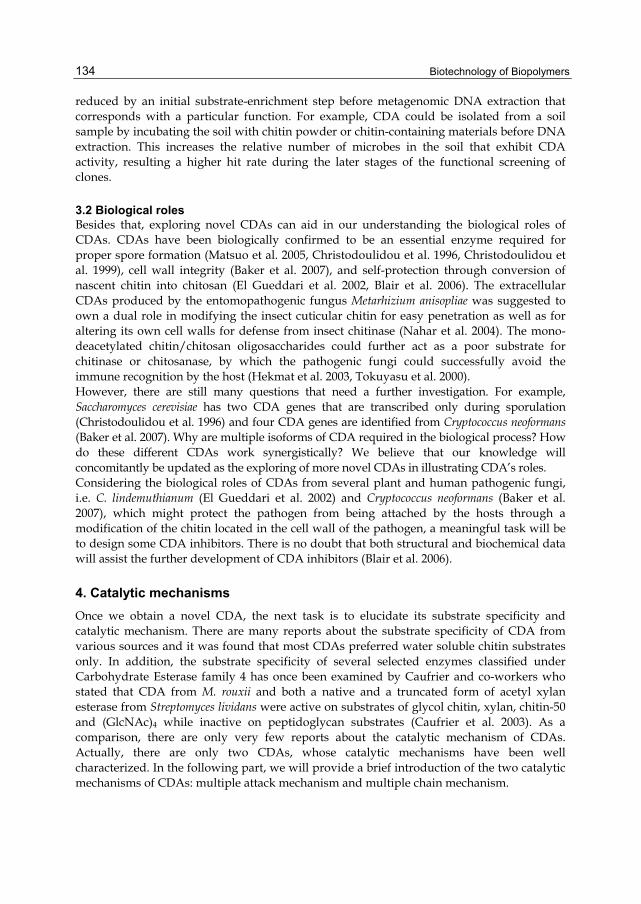
Biotechnology of Biopolymers
134
reduced by an initial substrate-enrichment step before metagenomic DNA extraction that corresponds with a particular function. For example, CDA could be isolated from a soil sample by incubating the soil with chitin powder or chitin-containing materials before DNA extraction. This increases the relative number of microbes in the soil that exhibit CDA activity, resulting a higher hit rate during the later stages of the functional screening of clones.
3.2 Biological roles Besides that, exploring novel CDAs can aid in our understanding the biological roles of CDAs. CDAs have been biologically confirmed to be an essential enzyme required for proper spore formation (Matsuo et al. 2005, Christodoulidou et al. 1996, Christodoulidou et al. 1999), cell wall integrity (Baker et al. 2007), and self-protection through conversion of nascent chitin into chitosan (El Gueddari et al. 2002, Blair et al. 2006). The extracellular CDAs produced by the entomopathogenic fungus Metarhizium anisopliae was suggested to own a dual role in modifying the insect cuticular chitin for easy penetration as well as for altering its own cell walls for defense from insect chitinase (Nahar et al. 2004). The mono-deacetylated chitin/chitosan oligosaccharides could further act as a poor substrate for chitinase or chitosanase, by which the pathogenic fungi could successfully avoid the immune recognition by the host (Hekmat et al. 2003, Tokuyasu et al. 2000). However, there are still many questions that need a further investigation. For example, Saccharomyces cerevisiae has two CDA genes that are transcribed only during sporulation (Christodoulidou et al. 1996) and four CDA genes are identified from Cryptococcus neoformans (Baker et al. 2007). Why are multiple isoforms of CDA required in the biological process? How do these different CDAs work synergistically? We believe that our knowledge will concomitantly be updated as the exploring of more novel CDAs in illustrating CDA’s roles. Considering the biological roles of CDAs from several plant and human pathogenic fungi, i.e. C. lindemuthianum (El Gueddari et al. 2002) and Cryptococcus neoformans (Baker et al. 2007), which might protect the pathogen from being attached by the hosts through a modification of the chitin located in the cell wall of the pathogen, a meaningful task will be to design some CDA inhibitors. There is no doubt that both structural and biochemical data will assist the further development of CDA inhibitors (Blair et al. 2006).
4. Catalytic mechanisms Once we obtain a novel CDA, the next task is to elucidate its substrate specificity and catalytic mechanism. There are many reports about the substrate specificity of CDA from various sources and it was found that most CDAs preferred water soluble chitin substrates only. In addition, the substrate specificity of several selected enzymes classified under Carbohydrate Esterase family 4 has once been examined by Caufrier and co-workers who stated that CDA from M. rouxii and both a native and a truncated form of acetyl xylan esterase from Streptomyces lividans were active on substrates of glycol chitin, xylan, chitin-50 and (GlcNAc)4 while inactive on peptidoglycan substrates (Caufrier et al. 2003). As a comparison, there are only very few reports about the catalytic mechanism of CDAs. Actually, there are only two CDAs, whose catalytic mechanisms have been well characterized. In the following part, we will provide a brief introduction of the two catalytic mechanisms of CDAs: multiple attack mechanism and multiple chain mechanism.

Perspectives of Chitin Deacetylase Research
135
4.1 Multiple attack mechanism In the multiple attack mechanism, binding of CDA on a chitin chain is followed by a number of sequential deacetylations after which the enzyme binds to another chain (Fig. 2A). As an example, the mode of action of CDA from M. rouxii has been studied on substrate of partially N-acetylated chitosans (Martinou et al. 1998) and N-acetylchitooligosaccharides (Tsigos et al. 1999). The enzyme could only effectively deacetylate chitin oligomers with a DP higher than two and the first deacetylation takes place at the nonreducing-end residue of the oligomer. In addition, the extent of deacetylation depends on the length of the substrate. Among chitin oligomers (DP 3-7) tested, (GlcNAc)4 and (GlcNAc)5 could be fully deacetylated, whereas the reducing-end residue of (GlcNAc)3, (GlcNAc)6 and (GlcNAc)7 always remains intact with a unknown reason (Tsigos et al. 1999). To explain this, a steady-state kinetic study and structural characterization of the enzyme are required.
A BA B
Fig. 2. The pathway of (GlcNAc)4 deacetylation by an exo-type chitin deacetylase from M. rouxii (A) (Tsigos et al. 1999) and an endo-type chitin deacetylase from C. lindemuthianum (B) (Tokuyasu et al. 2000, Hekmat et al. 2003). GlcNAc and GlcN are represented by shaded and open circles, respectively. The reducing end residue was indicated by the circle containing X inside. The arrows indicated the sequence by which (GlcNAc)4 was deacetylated. In Fig. 2A, (GlcNAc)4 was deacetylated by M. rouxii chitin deacetylase from the nonreducing end in a progressive multiple attack mode. In Fig. 2B, (GlcNAc)4 was deacetylated by C. lindemuthianum chitin deacetylase in a multiple chain mode and four subsites are suggested as -2, -1, 0, +1. Among them, only subsite 0 was responsible for the catalysis. Cited from Zhao et al. (2010b).

Biotechnology of Biopolymers
136
4.2 Multiple chain mechanism Compared with M. rouxii CDA, a more detailed investigation was carried out on C. lindemuthianum CDA. In contrast to the results of M. rouxii CDA, the extracellular CDA from C. lindemuthianum (ATCC 56676) catalyzed the hydrolysis of acetamido groups according to a multiple chain mechanism, in which the enzyme forms an active enzyme-polymer complex and catalyses the hydrolysis of only one acetyl group before it dissociates and forms a new active complex (Fig. 2B). The enzyme could fully deacetylate (GlcNAc)3 and (GlcNAc)4 whereas the reducing-end residue of (GlcNAc)2 could not be deacetylated (Tokuyasu et al. 1997). In a further study, Tokuyasu and his colleagues carried out a structural analysis of the partially deacetylated products of (GlcNAc)2-6 formed by CDAH (the recombinant non-glycosylated CDA from C. lindemuthianum). (GlcNAc)4 could be exclusively deacetylated to the product of GlcNAcGlcNAcGlcNGlcNAc by CDAH in an initial deacetylation process (Tokuyasu et al. 2000).
Fig. 3. Details of the ClCDA active site. Close up of the active sites of the native ClCDA structure in complex with acetate product (panel A, ClCDA_Ac) (acetate molecules shown as sticks with green carbons) and a docked GlcNAc3 complex [panel B, ClCDA_GlcNAc3 (docked)]. Ribbon diagrams of the active sites are shown, with conserved side chains shown as sticks with magenta carbons. The experimentally observed acetate is shown as sticks with yellow carbons. GlcNAc3 is shown as green sticks with subsites labeled -1, 0, and +1. The five conserved sequence motifs (MT1-5) are shown in yellow. Water molecules (red spheres) are also shown. Unbiased |Fo|-|Fc|, øcalc maps are shown in blue. Hydrogen bonds are shown in dashed magenta lines (ClCDA Tyr145 backbone nitrogen atom is not shown) and zinc-ligand interactions as dashed cyan lines. Cited and modified from Blair et al. (2006).

Perspectives of Chitin Deacetylase Research
137
For a better understanding of the reaction mechanisms, it was proposed that the enzyme has four subsites (-2, -1, 0 and +1). The enzyme strongly recognizes a sequence of four GlcNAc residues of the substrate, and the N-acetyl group in GlcNAc residue positioned at subsite 0 is exclusively deacetylated. Among the four subsites, only subsite -2 strongly recognized the N-acetyl group of the GlcNAc residue of the substrate, while the deacetylation rate was not affected when either subsite -1 or +1 was occupied with a GlcN reside instead of GlcNAc residue. Afterwards, to confirm the proposed subsites of the enzyme, a full steady-state kinetic characterizatioin of CDAH was carried out (Hekmat et al. 2003). The presence of four enzyme subsites that interact with GlcNAc residues from the non-reducing end to the reducing end of the substrate was experimentally confirmed. The turnover number is independent of n and represents the intrinsic rate constant for the hydrolysis of the acetamido group in subsite 0. The steady-state kinetic parameters for the second deacetylation reaction of (GlcNAc)4 were also determined using GlcNAcGlcNAcGlcNGlcNAc as the substrate. The results suggest that the mono-deacetylated substrate binds strongly in a non-productive mode occupying all four subsites, thereby inhibiting the second deacetylation reaction (Hekmat et al. 2003). In a more recent report, the structural data in combination with biochemical data revealed that the catalysis of C. lindemuthianum CDA proceeds through a tetrahedral oxyanion intermediate (Fig. 3). It can be proposed that the catalytic base Asp49 abstracts a proton from the water molecule, generating a nucleophile to attach the substrate carbonyl carbon. This produces a tetrahedral oxyanion intermediate, the charge of which is stabilized by the metal Zn and the backbone nitrogen of Tyr145. The pKa-tuned His206 then protonates the reaction intermediate on the nitrogen as it breaks down, generating a free amine and also the acetate product (Blair et al. 2006).
5. Technological aspects The scarcity of easy and accurate approaches for structural and quantitative analysis of the mixtures of hetero-COS (Fig. 4) is a limiting issue in understanding the catalytic mechanism of CDA. As we know, COS can be divided into homo-COS and hetero-COS, where homo-COS exclusively consist of GlcNAc or GlcN, while hetero-COS are composed of both types of monomer units GlcNAc and GlcN. Analysis of homo-COS by MS is rather straightforward. As there are no isomers, their structures are easily deduced from their molecular mass, which are a multiple of the number of GlcNAc or GlcN residues. The molecular mass of a hetero-COS reveals, however, only its DP and DA, but is silent about structure, since any hetero-COS of the composition (GlcNAc)m(GlcN)n can exist as a number of constitutional isomers only differing in the position of the GlcNAc and GlcN residues in the oligosaccharide chain. Characterization of heter-COS is therefore a formidable structural challenge, in particular when a sample is only available as an intractable mixture of isomers. In the past, an approach harnessing two specific exo-glycosidases in conjunction with HPLC, ion exchange chromatography, NMR spectroscopy or mass spectroscopy (MS) has been used to separate and verify the hetero-COS from enzymatic deacetylation of chitin oligomers by CDA, by which the action modes and kinetic mechanisms of CDA from both M. rouxii and C. lindemuthianum were elucidated (Fig. 2) (Tsigos et al. 1999, Tokuyasu et al. 2000, Hekmat et al. 2003). However, the above method is very complicated and time-consuming. Besides that, for a complete analysis, a large amount of expensive enzymes and chitin oligomers are required.

Biotechnology of Biopolymers
138
Fig. 4. Examples of heter-COS. Cited from Peter and Eberlin (2010).
Fig. 5. Summary of the different techniques employed for the quantitative analysis of mixtures containing heterochitooligomers, homologs, and isomers. The first step in any case is gel permeation chromatography (GPC) (on Biogel P4™) resulting in the quantification of oligomers. Ion exchange chromatography (IEC) (on Resource S™) of the GPC fractions allows for the quantification of homologs. Alternatively, MALDI-TOF MS of the GPC fractions after N-deuterioacetylation allows for the quantification of homologs. For the quantification of isomers MALDI-LTQ MSn after derivatisation of the desalted IEC fractions with Ac2O-d6 (free amino groups) and 3-(acetylamino)-6-aminoacridine (AMCR) (reducing end) is employed. Cited from the Ph.D. thesis of Bahrke (2008).

Perspectives of Chitin Deacetylase Research
139
Compared with the above method, MSn has been shown to be a powerful technique for structural elucidation of hetero-COS (Bahrke et al. 2002, Cederkvist et al. 2006, Haebel et al. 2007, Issaree 2008), which was recently reviewed by Peter and Eberlin (2010). Bahrke summarized different techniques employed for the quantitative analysis of mixtures containing heterochitooligomers, homologs, and isomers (Fig. 5) and the principles of structure analysis of COS by MS (Bahrke 2008). Additionally, in a very recent report, Vijayakrishnan et al. (2011) successfully applied the ESI(+)-MSn into the sequence analysis of six isomers of di-N-acetylchitotetraoses (AADD,ADDA, ADAD, DADA,DAAD, and DDAA, where D stands for GlcN and A for GlcNAc). The advantages of applying this method are the requirement of minute quantities of sample, allowing rapid detection of nano- to picomol quantities of sample, and the possibility to separate the components of even complex mixtures by mass. By taking advantage of MSn, the structure of the mixtures of hetero-COS in the enzymatic reaction process could be easily analyzed so that the action mode of CDAs could be further elucidated. Information of the action mode of CDA will further guide us to understand the biological role of CDA, i.e., why and how the chitin or GlcNAc residues located the fungal or bacterial cell wall are modified by CDA?
6. Dealing with the crystalline chitin Enzymatic conversion of chitin into chitosan has been investigated for several decades since the discovery of CDA from an extract of Mucor rouxii (Araki and Ito 1974), however, a high degree of enzymatic deacetylation is still hard to achieve, mainly due to the insoluble and crystalline nature of chitin. With the ultimate aim of an efficient biotransformation of chitin into chitosan, several studies on improving the substrate properties have been done (Win and Stevens 2001, Beaney et al. 2007). Keeping in mind the enzymatic biotransformation of nascent chitin by CDA in nature, an open and amorphous structure of the chitin is desirable for CDA access to an increased surface area. Additionally, recent studies on the enzymatic degradation of chitin have provided an important new insight into the mechanism that would allow improved substrate accessibility. Chitin-degradation organisms were found to produce a non-hydrolytic accessory protein, such as the chitin-binding protein (CBP21) from Serratia marcescens (Vaaje-Kolstad et al. 2005a, Vaaje-Kolstad et al. 2005b), which promotes hydrolysis of crystalline chitin via non-hydrolytic degradation of the substrate. Such work, which will no doubt expand greatly, begins to shed light on how they may be exploited in chitin deacetylation processes.
6.1 Non-biological modifications Chitin, without further modification to reduce crystallinity and to open up the solid substrate structure, is found to be a poor substrate for the heterogeneous solid-liquid enzymatic catalysis. Beaney and co-workers found that the solvent and drying method used in modifying the chitins had significant impact on the final efficiency of the enzymatic deacetylation reaction. The most successful modifications through freeze drying of a colloidal chitin suspension increased the degree of enzymatic deacetylation by 20 fold. In addition, several evidences indicated that these processes indeed reduce the crystallinity of the chitin making it easier for the enzymes to access their internal structure (Beaney et al. 2007). Win and Stevens carried out a series of experiments to improve the enzymatic deacetylation efficiency by various physical and chemical modifications of chitin such as heating,

Biotechnology of Biopolymers
140
sonicating, grinding, derivatization and interaction with saccharides (Win and Stevens 2001). It was found that none of those above treatments of the substrate resulted in a more efficient enzymatic deacetylation. In another test, dissolution of chitin in specific solvents followed by fast precipitation by changing the composition of the solvent was not successful either. However, by treating chitin in the specific solvents followed by the fast precipitation, a decrystallized chitin with a very small particle size called superfine chitin could be obtained. This superfine chitin, pretreated with 18% formic acid, appeared to be a good substrate for fungal CDA. Since formic acid is able to dissolve chitin, it must be capable of overcoming intermolecular binding forces in the crystal structure (Win and Stevens 2001). In our lab, the enzyme activities of two newly screened extracellular CDAs from Mortierella sp. DY-52 (Kim et al. 2008) or Absidia corymbifera DY-9 (Zhao et al. 2010a) were compared on various chitinous substrates (Table 1). It was found that both crude CDAs preferred water soluble chitin with a degree of deacetylation around 50% (WSCT-50), glycol chitin, chitosan with a DDA between 70% and 90%, while were inactive on other physically or chemically modified alpha-chitin or beta-chitin (Table 1). Although both crude CDAs cannot handle chitin monomer (GlcNAc), comparable with the other fungal CDAs reported till now, it indeed shows enzyme activity on chitin oligomers with a DP ranging from 2 to 7 and their activities increase with the increasing DP (Kim et al. 2008, Zhao et al. 2010a). In a more recent report, Zhao et al. (2011) indicated that a chemical modification of crystalline chitin using phosphate acid could indeed increase the CDA enzyme activity to 3-4 fold, however, the enzyme activity was still very low compared to water soluble chitin.
6.2 Biological modifications The enzymatic degradation of insoluble polysaccharides, such as chitin, cellulose, glucan, xylan, mannan and starch, is one of the most important reactions on earth. Despite this, glycoside hydrolases attack such polysaccharides relatively inefficiently as their target glycosidic bonds are often inaccessible to the active site of the appropriate enzymes. In order to overcome these problems, many of the glycoside hydrolases that utilize insoluble substrates are modular, comprising catalytic modules appended to one or more non-catalytic carbohydrate-binding modules (CBMs). The most recognized function of these auxiliary domains is to bind polysaccharides, bringing the biocatalyst into close and prolonged vicinity with its substrate, allowing carbohydrate hydrolysis (Boraston et al. 2004). Among the functions proposed for CBMs, substrate disruption has been a controversial topic, nevertheless information proving this function for some CBMs is convincing. Binding of CBMs to a crystalline substrate leads to polysaccharide chains disorganization and enhancement of substrate availability. Evidence for this substrate disruption, is given by the independent chitin-binding protein CBP21, which belongs to CBM family 33 and is produced by Serratia marcesens (Vaaje-Kolstad et al. 2005a). It was suggested that CBP21 promotes efficient crystalline chitin degradation by chitinases through polar interactions that modify the substrate arrangement (Vaaje-Kolstad et al. 2005a). Previously, CBP21 was suggested as a non-catalytic protein, nevertheless, in a recently published elegant work, Vaaje-kolstad and co-workers provided a strong evidence to indicate that CBP21 is actually an oxidative enzyme that catalyzes cleavage of glycosidic bonds in crystalline chitin and its activity could be boosted by ascorbic acid to a much higher level (Vaaje-Kolstad et al. 2010). Their findings not only demonstrated the existence of a hitherto unknown enzyme but also opened up the inaccessible polysaccharide material for hydrolysis by normal glycoside hydrolases.
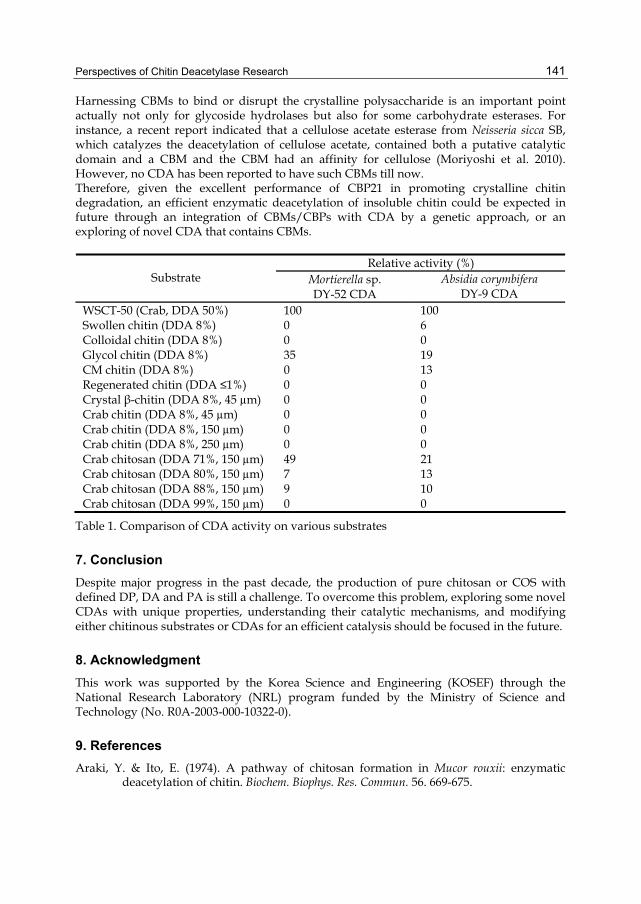
Perspectives of Chitin Deacetylase Research
141
Harnessing CBMs to bind or disrupt the crystalline polysaccharide is an important point actually not only for glycoside hydrolases but also for some carbohydrate esterases. For instance, a recent report indicated that a cellulose acetate esterase from Neisseria sicca SB, which catalyzes the deacetylation of cellulose acetate, contained both a putative catalytic domain and a CBM and the CBM had an affinity for cellulose (Moriyoshi et al. 2010). However, no CDA has been reported to have such CBMs till now. Therefore, given the excellent performance of CBP21 in promoting crystalline chitin degradation, an efficient enzymatic deacetylation of insoluble chitin could be expected in future through an integration of CBMs/CBPs with CDA by a genetic approach, or an exploring of novel CDA that contains CBMs.
Relative activity (%) Substrate Mortierella sp.
DY-52 CDA Absidia corymbifera
DY-9 CDA WSCT-50 (Crab, DDA 50%) 100 100 Swollen chitin (DDA 8%) 0 6 Colloidal chitin (DDA 8%) 0 0 Glycol chitin (DDA 8%) 35 19 CM chitin (DDA 8%) 0 13 Regenerated chitin (DDA ≤1%) 0 0 Crystal β-chitin (DDA 8%, 45 µm) 0 0 Crab chitin (DDA 8%, 45 µm) 0 0 Crab chitin (DDA 8%, 150 µm) 0 0 Crab chitin (DDA 8%, 250 µm) 0 0 Crab chitosan (DDA 71%, 150 µm) 49 21 Crab chitosan (DDA 80%, 150 µm) 7 13 Crab chitosan (DDA 88%, 150 µm) 9 10 Crab chitosan (DDA 99%, 150 µm) 0 0
Table 1. Comparison of CDA activity on various substrates
7. Conclusion Despite major progress in the past decade, the production of pure chitosan or COS with defined DP, DA and PA is still a challenge. To overcome this problem, exploring some novel CDAs with unique properties, understanding their catalytic mechanisms, and modifying either chitinous substrates or CDAs for an efficient catalysis should be focused in the future.
8. Acknowledgment This work was supported by the Korea Science and Engineering (KOSEF) through the National Research Laboratory (NRL) program funded by the Ministry of Science and Technology (No. R0A-2003-000-10322-0).
9. References Araki, Y. & Ito, E. (1974). A pathway of chitosan formation in Mucor rouxii: enzymatic
deacetylation of chitin. Biochem. Biophys. Res. Commun. 56. 669-675.

Biotechnology of Biopolymers
142
Bahrke, S. (2008). Mass spectrometric analysis of chitooligosaccharides and their interaction with proteins. PhD Thesis, University of Potsdam. URL: http://opus.kobv.de/ubp/volltexte/2008/2017/.
Bahrke, S., Einarsson, J. M., Gislason, J., Haebel, S., Letzel, M. C., Peter-Katalinić, J. & Peter, M. G. (2002). Sequence analysis of chitooligosaccharides by matrix-assisted laser desorption ionization postsource decay mass spectrometry. Biomacromolecules 3. 696-704.
Baker, L. G., Specht, C. A., Donlin, M. J. & Lodge, J. K. (2007). Chitosan, the deacetylated form of chitin, is necessary for cell wall integrity in Cryptococcus neoformans. Eukaryot. Cell 6. 855-867.
Beaney, P. D., Gan, Q., Magee, T. R. A., Flealy, M. & Lizardi-Mendoza, J. (2007). Modification of chitin properties for enzymatic deacetylation. J. Chem. Technol. Biotechnol. 82. 165-173.
Blair, D. E., Hekmat, O., Schuttelkopf, A. W., Shrestha, B., Tokuyasu, K., Withers, S. G. & van Aalten, D. M. (2006). Structure and mechanism of chitin deacetylase from the fungal pathogen Colletotrichum lindemuthianum. Biochemistry 45. 9416-9426.
Boraston, A. B., Bolam, D. N., Gilbert, H. J. & Davies, G. J. (2004). Carbohydrate-binding modules: fine-tuning polysaccharide recognition. Biochem. J. 382. 769-781.
Caufrier, F., Martinou, A., Dupont, C. & Bouriotis, V. (2003). Carbohydrate esterase family 4 enzymes: substrate specificity. Carbohydr. Res. 338. 687-692.
Cederkvist, F., Zamfir, A. D., Bahrke, S., Eijsink, V. G. H., Sørlie, M., Peter-Katalinić, J. & Peter, M. G. (2006). Identification of a high-affinity-binding oligosaccharide by (+) nanoelectrospray quadrupole time-of-flight tandem mass spectrometry of a noncovalent enzyme-ligand complex. Angew. Chem. Int. Ed. 45. 2429-2434.
Christodoulidou, A., Bouriotis, V. & Thireos, G. (1996). Two sporulation-specific chitin deacetylase-encoding genes are required for the ascospore wall rigidity of Saccharomyces cerevisiae. J. Biol. Chem. 271. 31420-31425.
Christodoulidou, A., Briza, P., Ellinger, A. & Bouriotis, V. (1999). Yeast ascospore wall assembly requires two chitin deacetylase isozymes. FEBS Lett. 460. 275-279.
Coutinho, P. M. & Henrissat, B. (1999). Carbohydrate-active enzymes: An integrated database approach. in Gilbert, H. J., Davies, G., Hendrich, B. & Svensson, B. (ed.), Recent Advances in Carbohydrate Bioengineering, The Royal Society of Chemistry, Cambridge, UK, pp. 3-12.
Cowan, D., Meyer, Q., Stafford, W., Muyanga, S., Cameron, R. & Wittwer, P. (2005). Metagenomic gene discovery: past, present and future. Trends Biotechnol. 23. 321-329.
El Gueddari, N. E., Rauchhaus, U., Moerschbacher, B. M. & Deising, H. B. (2002). Developmentally regulated conversion of surface-exposed chitin to chitosan in cell walls of plant pathogenic fungi. New Phytol. 156. 103-112.
Gao, X. D., Katsumoto, T. & Onodera, K. (1995). Purification and characterization of chitin deacetylase from Absidia coerulea. J. Biochem. 117. 257-263.
Haebel, S., Bahrke, S. & Peter, M. G. (2007). Quatitative sequencing of complex mixtures of heterochitooligosaccharides by vMALDI-linear ion trap mass spectrometry. Anal. Chem. 79. 5557-5566.
Hekmat, O., Tokuyasu, K. & Withers, S. G. (2003). Subsite structure of the endo-type chitin deacetylase from a deuteromycete, Colletotrichum lindemuthianum: an investigation using steady-state kinetic analysis and MS. Biochem. J. 374. 369-380.
Hess, M., Sczyrba, A., Egan, R., Kim, T. W., Chokhawala, H., Schroth, G., Luo, S. J., Clark, D. S., Chen, F., Zhang, T., Mackie, R. I., Pennacchio, L. A., Tringe, S. G., Visel, A.,

Perspectives of Chitin Deacetylase Research
143
Woyke, T., Wang, Z. & Rubin, E. M. (2011). Metagenomic discovery of biomass-degrading genes and genomes from cow ruman. Science 331. 463-467.
John, M., Röohrig, H., Schmidt, J., Wieneke, U. & Schell, J. (1993). Rhizobium NodB protein involved in nodulation signal synthesis is a chitooligosaccharide deacetylase. Proc. Natl. Acad. Sci. USA 90. 625-629.
Kafetzopoulos, D., Martinou, A. & Bouriotis, V. (1993). Bioconversion of chitin to chitosan: Purification and characterization of chitin deacetylase from Mucor rouxii. Proc. Natl. Acad. Sci. USA 90. 2564-2568.
Kim, Y. J., Zhao, Y., Oh, K. T., Nguyen, V. N. & Park, R. D. (2008). Enzymatic deacetylation of chitin by extracellular chitin deacetylase from a newly screened Mortierella sp. DY-52. J. Microbiol. Biotechnol. 18. 759-766.
Li, X., Wang, L. X., Wang, X. & Roseman, S. (2007). The chitin catabolic cascade in the marine bacterium Vibrio cholerae: characterization of a unique chitin oligosaccharide deacetylase. Glycobiology 17. 1377-1387.
Lorenz, P. & Eck, J. (2005). Metagenomics and industrial applications. Nat. Rev. Microbiol. 3. 510-516.
Martinou, A., Bouriotis, V., Stokke, B. T. & Vårum, K. M. (1998). Mode of action of chitin deacetylase from Mucor rouxii on partially N-acetylated chitosans. Carbohydr. Res. 311. 71-78.
Matsuo, Y., Tanaka, K., Matsuda, H. & Kawamukai, M. (2005). cda1+, encoding chitin deacetylase is required for proper spore formation in Schizosaccharomyces pombe. FEBS Lett. 579. 2737-2743.
Moriyoshi, K., Koma, D., Yamanaka, H., Ohmoto, T. & Sakai, K. (2010). Functional analysis of the carbohydrate-binding module of an esterase from Neisseria sicca SB involved in the degradation of cellulose acetate. Biosci. Biotechnol. Biochem. 74. 1940-1942.
Nahar, P., Ghormade, V. & Deshpande, M. V. (2004). The extracellular constitutive production of chitin deacetylase in Metarhizium anisopliae: possible edge to entomopathogenic fungi in the biological control of insect pests. J. Invertebr. Pathol. 85. 80-88.
Ng, C. H., Hein, S., Ogawa, K., Chandrkrachang, S. & Stevens, W. F. (2007). Distribution of d-glucosamine moieties in heterogeneously deacetylated cuttlefish chitin. Carbohydr. Polym. 69. 382-390.
Pareek, N., Vivekanand, V., Dwivedi, P. & Singh, R. P. (2011). Penicillium oxalicum SAEM-51: a mutagenised strain for enhanced production of chitin deacetylase for bioconversion to chitosan. New Biotechnol. In Press.
Peniston, Q. P. & Johnson, E. L. (1980). Process for the manufacture of chitosan. Patent No. 4195175, United States.
Peter, M. G. & Eberlin, M. N. (2010). Applications of mass spectrometry to analysis of structure and bioactivity of chitooligosaccharides. In Kim, S. K. (ed.), Chitin, Chitosan, oligosaccharides and their derivatives. CRC Press, Boca Raton, USA, pp. 127-148.
Prashanth, K. V. H. & Tharanathan, R. N. (2007). Chitin/chitosan: modifications and their unlimited application potential-an overview. Trends Food Sci. Technol. 18. 117-131.
Psylinakis, E., Boneca, I. G., Mavromatis, K., Deli, A., Hayhurst, E., Foster, S. J., Vårum, K. M. & Bouriotis, V. (2005). Peptidoglycan N-acetylglucosamine deacetylases from Bacillus cereus, highly conserved proteins in Bacillus anthracis. J. Biol. Chem. 280. 30856-30863.
Tanaka, T., Fukui, T., Fujiwara, S., Atomi, H. & Imanaka, T. (2004). Concerted action of diacetylchitobiose deacetylase and exo-beta-D-glucosaminidase in a novel

Biotechnology of Biopolymers
144
chitinolytic pathway in the hyperthermophilic archaeon Thermococcus kodakaraensis KOD1. J. Biol. Chem. 279. 30021-30027.
Taylor, E. J., Gloster, T. M., Turkenburg, J. P., Vincent, F., Brzozowski, A. M., Dupont, C., Shareck, F., Centeno, M. S. J., Prates, J. A. M., Puchart, V., Ferreira, L. M. A., Fontes, C. M. G. A., Biely, P. & Davies, G. J. (2006). Structure and activity of two metal ion-dependent acetylxylan esterases involved in plant cell wall degradation reveals a close similarity to peptidoglycan deacetylases. J. Biol. Chem. 281. 10968-10975.
Tokuyasu, K., Mitsutomi, M., Yamaguchi, I., Hayashi, K. & Mori, Y. (2000). Recognition of chitooligosaccharides and their N-acetyl groups by putative subsites of chitin deacetylase from a deuteromycete, Colletotrichum lindemuthianum. Biochemistry 39. 8837-8843.
Tokuyasu, K., Ono, H., Hayashi, K. & Mori, Y. (1999). Reverse hydrolysis reaction of chitin deacetylase and enzymatic synthesis of β-D-GlcNAc-(1-4)-GlcN from chitobiose. Carbohydr. Res. 322. 26-31.
Tokuyasu, K., Ono, H., Ohnishi-Kameyama, M., Hayashi, K. & Mori, Y. (1997). Deacetylation of chitin oligosaccharides of dp 2-4 by chitin deacetylase from Colletotrichum lindemuthianum. Carbohydr. Res. 303. 353-358.
Tsigos, I., Zydowicz, N., Martinou, A., Domard, A. & Bouriotis, V. (1999). Mode of action of chitin deacetylase from Mucor rouxii on N-acetylchitooligosaccharides. Eur. J. Biochem. 261. 698-705.
Vaaje-Kolstad, G., Horn, S. J., van Aalten, D. M., Synstad, B. & Eijsink, V. G. (2005a). The non-catalytic chitin-binding protein CBP21 from Serratia marcescens is essential for chitin degradation. J. Biol. Chem. 280. 28492-28497.
Vaaje-Kolstad, G., Houston, D. R., Riemen, A. H., Eijsink, V. G. & van Aalten, D. M. (2005b). Crystal structure and binding properties of the Serratia marcescens chitin-binding protein CBP21. J. Biol. Chem. 280. 11313-11319.
Vaaje-Kolstad, G., Westereng, B., Horn, S. J., Liu, Z., Zhai, H., Sorlie, M. & Eijsink, V. G. (2010). An oxidative enzyme boosting the enzymatic conversion of recalcitrant polysaccharides. Science 330. 219-222.
Vijayakrishnan, B., Issaree, A., Corilo, Y. E., Ferreira, C. R., Eberlin, M. N., & Peter, M. G. (2011). MSn of the six isomers of (GlcN)2(GlcNAc)2 aminoglucan tetrasaccharides (diacetylchitotetraoses): Rules of fragmentation for the sodiated molecules and application to sequence analysis of hetero-chitooligosaccharides. Carbohydr. Polym. 84. 713-726.
Win, N. N. & Stevens, W. F. (2001). Shrimp chitin as substrate for fungal chitin deacetylase. Appl. Microbiol. Biotechno. 57. 334-341.
Zhao, Y., Kim, Y. J., Oh, K. T., Nguyen, V. N. & Park, R. D. (2010a). Production and characterization of extracellular chitin deacetylase from Absidia corymbifera DY-9. J. Korean Soc. Appl. Biol. Chem. 53. 119-126.
Zhao, Y., Park, R. D. & Muzzarelli, R. A. (2010b). Chitin deacetylases: properties and applications. Mar. Drugs 8. 24-46.
Zhao, Y., Jo, G. H., Ju, W. T., Jung, W. J. & Park, R. D. (2011). A highly N-glycosylated chitin deacetylase derived from a novel strain of Mortierella sp. DY-52. Biosci. Biotechnol. Biochem. 75. 960-965.

Part 3
Theoretical, Experimental and Mathematical Models of Biopolymers


8
Mechanisms Controlling the Expression of the Exopolysaccharide of Burkholderia and
Role in Niche Adaptation Ana S. Ferreira, Inês N. Silva and Leonilde M. Moreira
IBB- Institute for Biotechnology and Bioengineering, CEBQ, Instituto Superior Técnico, Portugal
1. Introduction Bacteria from the genus Burkholderia are widespread in nature, with strains being isolated from rhizosphere, aquatic environments, man-made environments and in association with hosts causing disease or beneficial interactions. One common feature across the genus is the ability to produce an exopolysaccharide (EPS) termed cepacian. This ability is confirmed by the presence of the bce biosynthetic genes in all Burkholderia sequenced genomes with the exception for Burkholderia mallei (Ferreira et al., 2010). Cepacian is composed of a branched acetylated heptasaccharide repeat-unit with D-glucose, D-rhamnose, D-mannose, D-galactose and D-glucuronic acid in the ratio of 1:1:1:3:1 (Cescutti et al., 2000). Cepacian biosynthesis starts with the synthesis of the nucleotide sugar precursors, catalyzed by isomerases, mutases, epimerases, among other enzymes (Ferreira et al., 2010). This step is followed by the assembly of the repeat-units by the sequential addition of sugars to an isoprenoid lipid by dedicated glycosyltransferases. The last step of cepacian biosynthesis comprises polymerization and export of the polysaccharide to the extracellular environment. A multienzyme complex including a repeat-unit translocase, a polysaccharide polymerase, an outer membrane protein, among others are involved in this process (Ferreira et al., 2010; Moreira et al., 2003). Insights into the biosynthetic steps will be covered in this chapter. Within the genus Burkholderia, a particular group of strains belonging to the so called Burkholderia cepacia complex (Bcc) have been isolated from the lungs of patients suffering of cystic fibrosis (CF). The analysis of sequential isolates from the same patient revealed that during the bacterial process of lung infection and colonization, a transition between mucoid to nonmucoid phenotype occurs (Zlosnik et al., 2008). This phenotypic conversion is predominantly from mucoid to nonmucoid and the relevance of it in disease progression is still under debate. It is therefore of importance not only to understand the factors triggering the mucoid phenotype conversion, but also the molecular mechanisms involved in cepacian biosynthesis regulation. Concerning EPS biosynthesis regulation, the present knowledge includes regulation at transcriptional level, namely through quorum sensing mechanisms. Indeed, it is known that exopolysaccharide production in plant-associated Burkholderia is regulated by N-acyl homoserine lactones (Suarez-Moreno et al., 2010). Another Burkholderia gene recently characterized and implicated in cepacian production is hfq encoding a RNA chaperone involved in the riboregulation of target mRNAs by small regulatory non-coding

Biotechnology of Biopolymers
148
RNAs (Sousa et al., 2010). Cepacian biosynthesis is also regulated at post-translational level through a mechanism of phosphorylation and dephosphorylation of conserved tyrosine residues in specific proteins. Involved in this process are two enzymes, namely the tyrosine autokinase BceF and the phosphotyrosine phosphatase BceD (Ferreira et al., 2007). BceF tyrosine phosphorylation activity is entirely required for cepacian biosynthesis, while BceD activity is not. The possible role of the two enzymes in controlling EPS chain length will be discussed. Lastly, is our aim to present and discuss data on the role of cepacian in cell adaptation to different environments such as the rhizosphere or eukaryotic host cells. For example, the role of cepacian in protecting cells against desiccation and high concentration of ion metals and some considerations on EPS involvement in biofilm formation and as a putative virulence factor both in vitro and in vivo models will be covered.
2. Burkholderia genus The genus Burkholderia includes one of the most versatile group of gram-negative bacteria, being able to occupy a wide range of ecological niches that include soil, water, plant rhizosphere and fungal mycelia. Some Burkholderia species are able to cause plant disease while others bring beneficial effects to crops; some can degrade natural and man-made pollutants and others are important opportunistic pathogens. The first Burkholderia isolate was described by Burkholder in the 40’s as being a phytophatogenic bacterium, causing rot of onion bulbs (Burkholder, 1950). This isolate was then called cepacia, meaning “onion”, and was included in the Pseudomonas genus for many years due to broad and vague phenotypic characteristics. After molecular taxonomic analysis in 1992, several Pseudomonas species were transferred to Burkholderia genus, being Burkholderia cepacia the type species (Yabuuchi et al., 1992). There are currently more than 50 Burkholderia species and candidates identified. Phylogenetic trees, based on 16S rRNA sequence analysis, separate the genus Burkholderia into two major clusters (Caballero-Mellado et al., 2007). The first cluster includes pathogens such as B. glumae, B. pseudomallei, B. mallei and bacteria belonging to Burkholderia cepacia complex. B. glumae has become an important plant pathogen in Japan, Korea and Taiwan, due to its ability to rot of rice grains and seedlings (Coenye & Vandamme, 2007). B. mallei and B. pseudomallei are known primary pathogens. The first species causes glanders in horses, mules and donkeys, which is characterized by the formation of nodular lesions in the lungs and ulceration of the mucous membranes in the upper respiratory tract. B. pseudomallei is the etiological agent of melioidosis in humans and animals. The disease can be an asymptomatic infection or cause severe lung nodulation, pneumonia or skin infections (Coenye & Vandamme, 2007). Burkholderia cepacia complex are a group of phenotypically similar bacteria that share a high degree of similarity at 16S rRNA gene sequence (98% to 100%) and of recA gene sequence (94% to 95%) as well as moderate levels of DNA-DNA hybridization (30% to 50%) (Coenye et al., 2001; Vandamme et al., 1997; Vandamme et al., 2000; Vandamme et al., 2002b; Vandamme et al., 2003; Vermis et al., 2004). There are currently seventeen species belonging to the Bcc complex where B. cepacia, B. multivorans and B. cenocepacia are the most studied species, due to the high percentage of patients infected by these species. Bcc bacteria have emerged as important opportunistic pathogens, mainly for patients with cystic fibrosis, chronic granulomatous disease and immunocompromised patients; are easily transmissible by social contact between patients and intrinsically resistant to several antibiotics (Nzula et al., 2002). Bcc infections clinical outcome may vary greatly, ranging from chronic lung infection with little or no impact

Mechanisms Controlling the Expression of the Exopolysaccharide of Burkholderia and Role in Niche Adaptation
149
on lung function to rapid deterioration that in the worst cases can lead to septicemia and death (Isles et al., 1984). The second Burkholderia cluster based on 16S rRNA sequence analysis comprises more than 25 environmental non-pathogenic species, the majority found in association with plants. Bacteria belonging to this second cluster have the ability to colonize the rhizosphere or the internal intercellular spaces in several plants. Some species were shown to promote plant growth, such as B. kururiensis and B. phytofirmans, and others to increase plant nutrient availability via nitrogen fixation and/or phosphate solubilization, like B. unamae, B. tropica and B. silvatlantica (Caballero-Mellado et al., 2007; Mattos et al., 2008; Perin et al., 2006; Reis et al., 2004). Many species have the ability to form symbiotic interactions with plants or with mosses, like B. tuberum, B. phymatum, B. mimosarum, B. nodosa, B. sabiae, B. megapolitana and B. bryophila (Chen et al., 2007; Chen et al., 2008; Elliott et al., 2007; Vandamme et al., 2002a). Even though these Burkholderia species seem to be very promising from the biotechnological point of view, the specific molecular mechanisms that enable such potential are poorly understood and only a few studies are available on this second Burkholderia cluster. Overall, bacteria belonging to Burkholderia genus have large genomes, with two or more chromosomal replicons, encoding in average more than 7000 genes (Mahenthiralingam et al., 2005). The enormous amount of genomic information contained in such a large genome, enables Burkholderia to grow on a wide range of substrates, being able to use several different carbon sources and survive to the most diverse stress conditions.
3. Exopolysaccharides produced by Burkholderia genus Exopolysaccharides (EPSs) have been described in many bacteria as being important in adaptation to different stress conditions and being involved in the establishment of symbiotic and pathogenic relationships. Several EPSs have been isolated from Burkholderia and their chemical structure determined, but only EPS-II was shown to be produced by the majority of the species, thereby designated cepacian. This EPS was shown to be produced by both clinical and environmental Bcc isolates (Chiarini et al., 2004; Cunha et al., 2004; Richau et al., 2000a; Zlosnik et al., 2008). Even though most of the studies were conducted in species belonging to Bcc complex, recent literature shows that cepacian biosynthesis also occurs in non-Bcc species (Ferreira et al., 2010; Hallack et al., 2010). Ferreira and co-authors showed that the rhizosphere non-Bcc bacteria B. xenovorans, B. phymatum and B. phytofirmans were able to produce large amounts of an exopolysaccharide in EPS-promoting media, confirmed to be cepacian by Fourier transform infrared spectrometry (FTIR) (Ferreira et al., 2010). Cepacian production was also recently confirmed in the diazotrophic B. kururiensis (Hallack et al., 2010). Fig. 1 shows the mucoid phenotype presented by colonies of different Burkholderia species grown in yeast extract-mannitol (YEM) medium. Mucoidy is due to the over-production of cepacian. B. cenocepacia J2315 is unable to produce cepacian, thereby displaying nonmucoid colonies when growing under the same conditions (Fig. 1). The primary structure of the exopolysaccharide cepacian produced by the clinical isolate Burkholderia cepacia IST408 has been determined. Cepacian is an acetylated acidic polysaccharide with a branched heptasaccharide repeat-unit composed of D-glucose, D-rhamnose, D-mannose, D-galactose and D-glucuronic acid in the molar ratio of 1:1:1:3:1 (Table 1) (Cescutti et al., 2000; Richau et al., 2000a; Sist et al., 2003). The amount of acetyl groups per repeat-unit seems to be strain dependent, varying from 2 to 4 groups. The location of the O-acetyl groups was recently described in the polymeric structure produced by B. kururiensis using a Smith degradation analysis. The results indicated that some

Biotechnology of Biopolymers
150
B. lata sp. 383
B. multivorans ATCC 17616
B. xenovoransLB400
B. phytofirmansPsJN
B. phymatumSTM815
Environmentalnon-Bcc species
EnvironmentalBcc species
Clinical Bcc species
B. cepaciaIST408
B. multivorans D2095
B. cenocepacia J2315
(non-producer)
B. lata sp. 383
B. multivorans ATCC 17616
B. xenovoransLB400
B. phytofirmansPsJN
B. phymatumSTM815
Environmentalnon-Bcc species
EnvironmentalBcc species
Clinical Bcc species
B. cepaciaIST408
B. multivorans D2095
B. cenocepacia J2315
(non-producer)
Fig. 1. EPS production by different Burkholderia strains gives the colonies a mucoid phenotype when growing in EPS-promoting medium. Contrastingly, the clinical isolate B. cenocepacia J2315 is unable to produce cepacian and is therefore nonmucoid.
galactosyl units were substituted by the acetyl group at O-4 and the other O-acetylation site might be the O-4 position of the rhamnose residue (Hallack et al., 2010). Besides cepacian, other exopolysaccharides have been identified and characterized from the structural point of view. For instance, several B. pseudomallei clinical strains were shown to produce a linear tetrasaccharide repeat-unit consisting of three galactose residues, one bearing a 2-linked O-acetyl group, and a 3-deoxy-D-manno-2-octulosonic acid residue (Table 1) (Nimtz et al., 1997). This polymer was also identified in a B. cepacia clinical isolate, which also produce levan, an exopolysaccharide composed of D-frutose monomers (Table 1) (Nogueira et al., 2005). Cérantola and co-authors identified a third EPS structure produced by a B. cepacia clinical isolate and named EPS-I. As presented in Table 1, such EPS repeat-unit is composed of D-galactose and D-glucose with carboxyethylidene as substituent (Cerantola et al., 1996). Furthermore, B. kururiensis, which is an endophytic diazotrophic bacterium, was shown to produce large amounts of two acidic EPSs that were designated EPS A and EPS B being, respectively, a pentasaccharide composed of D-glucose, L-rhamnose and D-glucuronic acid in the proportion 2:2:1 (Table 1) and a mixture of two polymers composed of a hepta- and octasaccharide repeat-unit, that differ only by the presence of a terminal glycosyl residue (Table 1). The heptasaccharide repeat-unit was identified as being cepacian and the octasaccharide repeat-unit as being EPS B (Hallack et al., 2010; Mattos et al., 2001). Interestingly, the authors also showed that the production of EPS A and EPS B by B. kururiensis could be modulated under different growth conditions. This was proposed to play an important role in the endophytic-host plant association, as has been described in the case of Sinorhizobium meliloti (Hallack et al., 2010). The variety of EPSs being produced, the ability to control their production according to nutrient availability and the production of a common EPS among the Burkholderia genus, seem to indicate an important function of these polymeric structures in multiple environments colonized by these bacteria. As will be discussed, several authors have hypothesized the importance of Burkholderia EPS in the establishment of symbiotic and pathogenic interactions. Thereby several studies have been conducted to understand EPS biosynthesis and its role in Burkholderia life style. Since cepacian is the most common EPS among the Burkholderia genus, it will be further described within this chapter.

Mechanisms Controlling the Expression of the Exopolysaccharide of Burkholderia and Role in Niche Adaptation
151
Polymer Repeat-unit structure Producing strain/reference
Cepacian or EPS-II
Many Bcc and non-Bcc (Ferreira et al., 2010)
EPS B
B. kururiensis (Hallack et al., 2010)
Levan →6)-β-D-Fruf-(2→
B. cepacia (Nogueira et al., 2005)
EPS-I →3)-β-D-Glcp-(1→3)-[4,6-O-(1-carboxyethylidene)]-α-D-Galp-(1→
B. cepacia (Cerantola et al., 1996)
EPS A →4)-α-D-Glcp-(1→2)-α-L-Rhap-(1→4)-α-D-GlcpA-(1→3)-β-L-Rhap[2OAc]-(1→4)-β-D-Glcp-(1→
B. kururiensis (Mattos et al., 2001)
→5)-β-D-Kdop-(2→3)-β-D-Galp2Ac-(1→4)-α-D-Galp-(1→3)-β-D-Galp-(1→
B. pseudomallei (Nimtz et al., 1997)
1-α-D-Galp
→3)-α-D-GlcpA-(1→3)-α-D-Manp-(1→3)-β-D-Glcp-(1→
1-β-D-Galp
1-α-D-Rhap2←1-β-D-Galp
1-β-D-Glcp(+/-)
↓ 2
↓ 6
4 ↑
3 ↑
1-α-D-Galp
→3)-β-D-Glcp-(1→3)-α-D-GlcpA-(1→3)-α-D-Manp-(1→
1-β-D-Galp
1-α-D-Rhap2←1-β-D-Galp
↓ 2
↓ 6
4 ↑
Abbreviations: Gal – galactose; Glc – glucose; GlcA – glucuronic acid; Man – mannose; Rha – rhamnose; Fru – fructose; Kdo - 3-deoxy-D-manno-2-octulosonic acid.
Table 1. Exopolysaccharides identified in Burkholderia. The table shows the structural formula of the different EPSs repeat-units found in the literature.
4. Cepacian biosynthesis and regulation The first studies on cepacian biosynthesis were reported by Richau and co-authors in the year 2000 (Richau et al., 2000b). By that time, the chemical structure of cepacian’s repeat-unit was determined and this information was used to postulate a pathway leading to the biosynthesis of the activated sugar precursors UDP-D-glucose, UDP-D-galactose, UDP-D-glucuronic acid, GDP-D-mannose and GDP-D-rhamnose. Still, at the time, nothing was
Biotechnology of Biopolymers
152
known about the genes encoding the enzymes involved in activated sugar precursor biosynthesis or the ones involved in the latter steps. This was clarified by the identification of the bce gene cluster (Burkholderia cepacia exopolysaccharide) encoding several enzymes involved in cepacian biosynthesis (Ferreira et al., 2010; Moreira et al., 2003).
4.1 Genes involved in cepacian biosynthesis The first cluster of genes involved in cepacian biosynthesis was described in the year 2003. The cluster was identified by using random plasposon insertion mutagenesis to screen mutants unable to produce EPS on the clinical strain B. cepacia IST408 (Moreira et al., 2003). Three of the obtained mutants had the transposon inserted into the same genetic location. This region located in chromosome 2, is composed of 11 genes designated bceA through bceK (Fig. 2a). Homology studies indicated that the cluster encoded two proteins, BceA and BceC, involved in the formation of activated nucleotide sugars; five glycosyltransferases, BceB, BceG, BceH, BceJ and BceK; and four proteins putatively involved in the polymerization and export of cepacian, that include BceD and BceF hypothesized to be involved in the post- translational control of exopolysaccharide biosynthesis; BceE, encoding a putative outer membrane auxiliary protein; and BceI, a putative polysaccharide polymerase protein (Fig. 2a) (Moreira et al., 2003). Despite the identification of these gene products, several enzymes required for cepacian biosynthesis were still missing. Further insight came after full genome sequences of several Burkholderia strains from different species became available on-line. Comparative genomic studies showed that gene bceA through bceK (now named bce-I cluster) was present in all Bcc and non-Bcc sequenced strains with the exception of B. mallei. Furthermore, the bioinformatic approach used, showed that the non-Bcc species B. xenovorans LB400, B. phymatum STM815, B. phytofirmans PsJN and B. graminis C4D1M contained 8 additional genes encoding proteins putatively involved in polysaccharide biosynthesis, located immediately downstream the bceK gene. The search for a homologous region in the genome of other sequenced Burkholderia species showed that it was present in all Bcc and in the remaining non-Bcc strains, approximately 155 to 314 kb downstream of the bce-I cluster depending on the strain (Fig. 2a) (Ferreira et al., 2010). This second genomic region was named gene cluster bce-II and the genes present were denominated bceM through bceU. In silico analysis of bce-II genes indicated that they encode proteins putatively involved in nucleotide sugar biosynthesis (bceM, bceN and bceT), repeat-unit formation and translocation through the inner membrane (bceR and bceQ respectively), acyltransferases (bceO, bceS and bceU) and a gene of unknown function (bceP) (Ferreira et al., 2010). These genes are present in all Bcc and non-Bcc species, with the exception of bceM and bceU genes, that are absent from Burkholderia species with bce genes clustered together - B. xenovorans LB400, B. phymatum STM815, B. phytofirmans PsJN and B. graminis C4D1M. Clusters bce-I and bce-II account for most of the genes needed for cepacian biosynthesis. Still, some of the genes required for the formation of the nucleotide sugar precursors are absent. These genes encode phosphoglucomutase (PGM), phosphoglucose isomerase (PGI), phosphomannomutase (PMM) and UDP-D-glucose epimerase enzymes. However, since these enzymes are also involved in other metabolic processes, their encoding genes can be located outside the genomic regions involved in cepacian biosynthesis. Indeed, search for genes encoding these four proteins in Burkholderia cenocepacia J2315 genome sequence revealed that they are present with more than one copy and distributed in different locations of chromosomes 1 and 2.
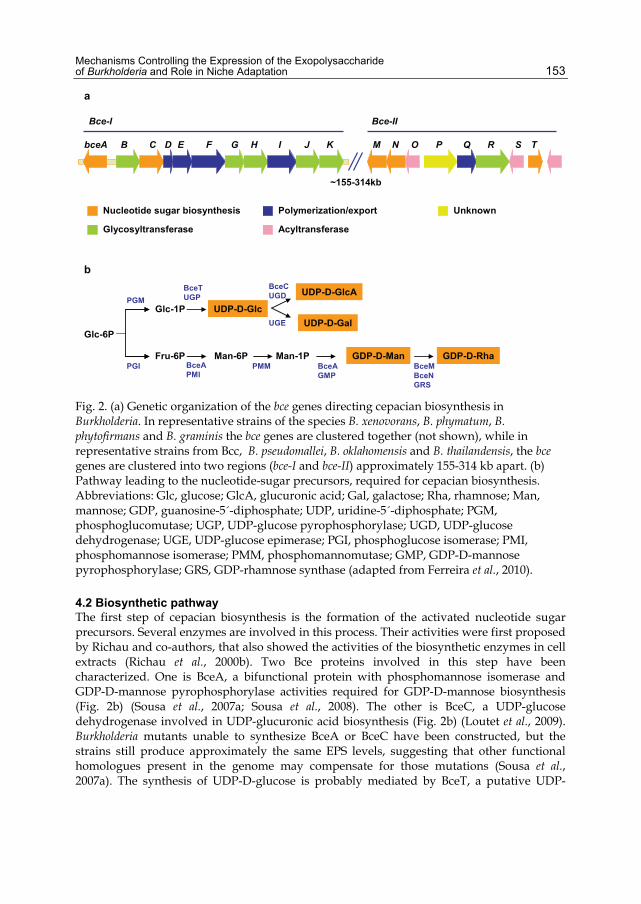
Mechanisms Controlling the Expression of the Exopolysaccharide of Burkholderia and Role in Niche Adaptation
153
Nucleotide sugar biosynthesis
Glycosyltransferase
Polymerization/export
Acyltransferase
Unknown
bceA B C D E F G H I J K M N O P Q R S T
Bce-I Bce-II
~155-314kb
a
b
Glc-6P
Glc-1P UDP-D-GlcUDP-D-Gal
UDP-D-GlcA
Fru-6P Man-6P Man-1P GDP-D-Man GDP-D-Rha
PGMBceTUGP
BceCUGD
UGE
BceMBceNGRS
PGI BceAPMI
BceAGMP
PMM
Fig. 2. (a) Genetic organization of the bce genes directing cepacian biosynthesis in Burkholderia. In representative strains of the species B. xenovorans, B. phymatum, B. phytofirmans and B. graminis the bce genes are clustered together (not shown), while in representative strains from Bcc, B. pseudomallei, B. oklahomensis and B. thailandensis, the bce genes are clustered into two regions (bce-I and bce-II) approximately 155-314 kb apart. (b) Pathway leading to the nucleotide-sugar precursors, required for cepacian biosynthesis. Abbreviations: Glc, glucose; GlcA, glucuronic acid; Gal, galactose; Rha, rhamnose; Man, mannose; GDP, guanosine-5´-diphosphate; UDP, uridine-5´-diphosphate; PGM, phosphoglucomutase; UGP, UDP-glucose pyrophosphorylase; UGD, UDP-glucose dehydrogenase; UGE, UDP-glucose epimerase; PGI, phosphoglucose isomerase; PMI, phosphomannose isomerase; PMM, phosphomannomutase; GMP, GDP-D-mannose pyrophosphorylase; GRS, GDP-rhamnose synthase (adapted from Ferreira et al., 2010).
4.2 Biosynthetic pathway The first step of cepacian biosynthesis is the formation of the activated nucleotide sugar precursors. Several enzymes are involved in this process. Their activities were first proposed by Richau and co-authors, that also showed the activities of the biosynthetic enzymes in cell extracts (Richau et al., 2000b). Two Bce proteins involved in this step have been characterized. One is BceA, a bifunctional protein with phosphomannose isomerase and GDP-D-mannose pyrophosphorylase activities required for GDP-D-mannose biosynthesis (Fig. 2b) (Sousa et al., 2007a; Sousa et al., 2008). The other is BceC, a UDP-glucose dehydrogenase involved in UDP-glucuronic acid biosynthesis (Fig. 2b) (Loutet et al., 2009). Burkholderia mutants unable to synthesize BceA or BceC have been constructed, but the strains still produce approximately the same EPS levels, suggesting that other functional homologues present in the genome may compensate for those mutations (Sousa et al., 2007a). The synthesis of UDP-D-glucose is probably mediated by BceT, a putative UDP-

Biotechnology of Biopolymers
154
glucose pyrophosphorylase. The nucleotide sugar precursor, GDP-D-rhamnose, is putatively synthesized by the concerted action of BceM and BceN. BceN is predicted to be a GDP-mannose-4,6-dehydratase (GMD), catalyzing the dehydration of GDP-D-mannose to the unstable intermediate GDP-6-deoxy-D-lyxo-4-hexulose, which is further converted to the final GDP-D-rhamnose by GDP-6-deoxy-D-lyxo-4-hexulose reductase (RMD), predicted to be encoded by bceM. The synthesis of UDP-D-galactose from UDP-D-glucose is catalyzed by a UDP-glucose epimerase enzyme, putatively encoded by gene Bmul_2501 in Burkholderia multivorans ATCC 17616. The second step of cepacian biosynthesis is the assembly of the heptasaccharide repeat-unit, which requires the presence of an undecaprenyl phosphate glycosyl-phosphate transferase (UndPGPT) catalyzing the transfer of the first sugar to the lipid carrier, and six other glycosyltransferases adding the remaining sugars in a specific order. The priming glycosyltransferase is BceB, catalyzing the addition of the first sugar, glucose, to the lipid carrier (Fig. 3) (Videira et al., 2005). The sequential addition of the six remaining sugars must be performed by the deduced BceG, H, J, K and R glycosyltransferases, but none is yet characterized and the specific activity of each enzyme cannot be predicted from their amino acid sequences. An insertion mutant on bceR gene confirmed that this protein with two glycosyltransferase domains is essential for cepacian biosynthesis (Ferreira et al., 2010).
Peptidoglycan layer
Innermembrane
Outermembrane
BceB
BceQ BceI BceF
BceE
BceG, H, J,K, R
BceD
BceO, S, U
ATPPi
PGlycosyltransferases
Tyrosinekinase
PhosphatasePolymerase
Flipase
Acyltransferases
Proteinchannel
Galactose
Phosphate Lipid carrier
Glucose RhamnoseMannoseGlucuronic acid
Peptidoglycan layer
Innermembrane
Outermembrane
BceB
BceQ BceI BceF
BceE
BceG, H, J,K, R
BceD
BceO, S, U
ATPPi
PGlycosyltransferases
Tyrosinekinase
PhosphatasePolymerase
Flipase
Acyltransferases
Proteinchannel
Galactose
Phosphate Lipid carrier
Glucose RhamnoseMannoseGlucuronic acid
Fig. 3. Model for assembly and export of cepacian. Activated sugar nucleotides are sequentially added to a lipid carrier (undecaprenyl pyrophosphate (und-PP)) to form cepacian repeat-units by sequential activity of BceBGHJKR glycosyltransferases. These synthesized und-PP-linked repeat-units are then translocated across the inner membrane in a process requiring BceQ and polymerized by BceI. The BY-kinase BceF and the phosphotyrosine phosphatase BceD proteins are central in regulation of the EPS biosynthetic complex, possibly connecting polymerization and export, and regulating polysaccharide chain length. Cepacian is exported by BceE, which may act as a channel. (Draws are not at scale).

Mechanisms Controlling the Expression of the Exopolysaccharide of Burkholderia and Role in Niche Adaptation
155
By using mass spectrometric analysis, Cescutti and collaborators detected ions belonging to the tri-, tetra-, penta-, and hexasaccharide biosynthetic intermediates of the cepacian repeat-unit and proposed the sequence order for sugar addition (Cescutti et al., 2010). According to these authors, to the trisaccharide composed of glucose and mannose substituted with galactose, would follow the addition of glucuronic acid, then galactose as the first substituent of glucuronic acid and a rhamnose followed by galactose, as a second substituent of glucuronic acid (Cescutti et al., 2010). Non-saccharide substitutions occur during the repeat-unit assembly process, such as acetylation. The number of acetyl groups per repeat-unit seems to be strain dependent (Cescutti et al., 2000; Cescutti et al., 2010). Three putative acyltransferases were found to be encoded within the bce-II cluster. These are BceS, BceT and BceU (Fig. 3). Their orthologues are membrane proteins, involved in the acylation of carbohydrate moieties of extracytoplasmic molecules. Disruption of bceS gene from B. multivorans ATCC 17616 was shown to cause a decrease in cepacian acetylation content, suggesting that it may be involved in repeat-unit acetylation (Ferreira et al., 2010). Hydrophobicity analysis of the putative amino acid sequences of BceO, BceS and BceU suggests that they are probably located in the inner membrane with eight to nine transmembrane domains. The fact that they might be present in the inner membrane is consistent with their possible role in cepacian acetylation since the repeat-unit is synthesized on the cytoplasmic face of the inner membrane attached to an undecaprenol diphosphate lipid carrier. It is then possible that the acetylation reaction takes place prior to the translocation of the repeat-unit, linked to undecaprenol diphosphate, to the periplasmic face of the cytoplasmic membrane, although no evidence is yet available. After assembly, the oligosaccharide repeat-unit coupled to the lipid carrier should be transferred across the cytoplasmic membrane to the periplasmic face of the membrane, where the polymerization is carried out by a polysaccharide polymerase. Data available points out that cepacian biosynthesis proceeds via the Wzy-dependent pathway. In this pathway, the lipid carrier-linked heptasaccharide repeat-units are exported across the inner membrane by the putative flippase BceQ, being polymerized at the periplasmic face of the inner membrane by the putative polymerase BceI (Fig. 3). BceQ and BceI are predicted integral membrane proteins and their involvement in cepacian biosynthesis was demonstrated by the EPS deficient phenotype of the B. cepacia IST408 insertion mutants for bceI and bceQ genes (Ferreira et al., 2010; Moreira et al., 2003). BceD, BceF and BceE proteins are also involved in the polymerization and export process (Fig. 3). The putative BceE protein is a Wza homologue and therefore is predicted to be an outer membrane auxiliary protein acting as a channel. The activities of BceF as a bacterial tyrosine autokinase and BceD as phosphotyrosine phosphatase protein have been determined and the two proteins are believed to be involved in the regulation of cepacian production and perhaps in the control of the polymer molecular weight (Ferreira et al., 2007).
4.3 Regulation of cepacian biosynthesis Several studies indicate that bacteria colonizing cystic fibrosis lungs undergo through a process of adaptation which involves several phenotypic changes, including EPS production ability. For example, in Pseudomonas aeruginosa, it was observed that bacteria initially not producing alginate, become mucoid during the course of lung infection. That phenomenon was shown to be tightly regulated at the transcriptional level by several proteins, such as the transcriptional sigma factor AlgU, which controls the expression of alginate biosynthetic operon; MucA that is an anti-sigma factor and regulates AlgU; or AlgR, a response regulator
Biotechnology of Biopolymers
156
responsible for of expression algC gene encoding a protein involved in the formation of the activated sugar precursors; among many others regulators that have been described (reviewed in Ramsey & Wozniak, 2005). Recent studies indicate that phenotypic changes involving exopolysaccharide production are also frequent in Burkholderia clinical isolates (Zlosnik et al., 2008). Furthermore, the importance of EPS biosynthesis regulation has also been suggested in the establishment of interactions between Burkholderia and host plants (Hallack et al., 2010). Still, the genes directly involved in the regulation of cepacian biosynthesis have not been identified. Nevertheless, there are evidences of the involvement of quorum sensing at the transcriptional level and tyrosine phosphorylation/dephosphorylation at the post-translational level.
4.3.1 Regulation at transcriptional level Quorum sensing (QS) consists of a chemical communication process that enables cells to modulate gene expression in neighboring cells, by synthesizing and detecting QS molecules. Several QS molecules have been identified, but the most studied are N-Acyl Homoserine Lactones (AHL). AHLs are synthesized by synthase proteins and are detected by transcriptional regulators, which regulate the expression of many different target genes. The presence of well conserved QS systems have been described within Bcc species, where the system is composed of the synthase CepI and the regulator CepR (Lewenza et al., 1999); and in plant associated Burkholderia, which have a system based on the synthase BraI and the regulator BraR (Lewenza et al., 1999; Suarez-Moreno et al., 2008). These two conserved systems are not homologous and were found to be based on different AHL molecules: CepI/R system secretes and responds to C6-HSL and C8-HSL; and the BraI/R system to 3-oxo-C12-HSL and 3-oxo-C14-HSL depending in the strain (Lewenza et al., 1999; Suarez-Moreno et al., 2008). Recent studies on the plant associated bacteria B. kururiensis, B. xenovorans and B. unamae, indicate that BraI/R system is involved in the regulation of EPS biosynthesis. The mutants on braI and braR genes were shown to produce reduced amount of EPS, but the mucoid phenotype of colonies was re-gained by the addition of 3-oxo-C14-HSL to the braI mutant and by introducing the regulator gene in trans into the braR mutant. Although these results showed that EPS production is positively controlled by quorum sensing in plant associated Burkholderia (Suarez-Moreno et al., 2010), the targets of such regulation are still unknown and the question whether quorum sensing is able to regulate EPS production in all Burkholderia species still needs confirmation. Another Burkholderia gene that has been recently associated to cepacian production is hfq encoding a RNA chaperone involved in the riboregulation of target mRNAs by small regulatory non-coding RNAs (Sousa et al., 2010). B. cepacia IST408 hfq mutant showed a strong decrease in cepacian production over time. The meaning of such findings is not clarified and no small RNA involved in controlling the expression of EPS-related genes is known (Sousa et al., 2010).
4.3.2 Regulation at post-translational level Protein phosphorylation is an important and widespread post-translational covalent modification in both eukaryotes and prokaryotes, being responsible for the regulation of many cellular functions. It consists in a reversible modification in which phosphoryl groups are added by protein kinases and removed by phosphoprotein phosphatases. In particular, the control of tyrosine phosphorylation and dephosphorylation mediated by bacterial-

Mechanisms Controlling the Expression of the Exopolysaccharide of Burkholderia and Role in Niche Adaptation
157
tyrosine kinases (BY-kinases) and phosphotyrosine phosphatases (PTP) has an important role in EPS biosynthesis by bacteria. Although their precise role is not yet known, several studies indicate their involvement in the regulation of polysaccharide amount and chain length (Bugert & Geider, 1997; Minic et al., 2007; Vincent et al., 2000; Wugeditsch et al., 2001). Genes encoding BY-kinase and PTP proteins are well conserved within polysaccharide gene clusters and are also present on bce gene cluster, being encoded by bceF and bceD genes, respectively (Moreira et al., 2003). Like other members of the BY-kinase family, BceF possesses two transmembrane domains, a periplasmic domain and an intracellular catalytic domain. BceF catalytic domain contains a well conserved Walker A and Walker B ATP-binding motifs, and a tyrosine-rich cluster at C-terminal end. The importance of Walker A motif for the autophosphorylation process was demonstrated by site-directed mutagenesis on a well conserved lysine residue followed by immunoblotting assays, indicating that replacement of the conserved lysine to an alanine causes loss of BceF autophosphorylation activity (Ferreira et al., 2007). Phosphotyrosine phosphatases, such as BceD, promote autokinases dephosphorylation, regulating their biological function. The PTP protein encoded by bceD gene was demonstrated to be a phosphatase by its ability to cleave the artificial p-nitrophenol phosphate (PNPP) substrate. The dephosphorylation of BceF by BceD was demonstrated in vitro by immunoblotting, using an antibody against the presence of phosphotyrosine residues (Ferreira et al., 2007). Disruption of bceF gene abolished cepacian production, but bceD mutant was still able to accomplish 75% of the production. Still, the EPS produced by bceD mutant showed a lower viscosity in solution than the one recovered from the parental strain, suggesting that the EPS produced might have a lower molecular weight. The role of tyrosine phosphorylation and dephosphorylation of BY-kinase proteins in polysaccharide biosynthesis is not yet established but, some hypotheses have been raised. Structural studies on E. coli Wza protein, a BceE homologue, showed that the protein forms complex structures with the cognate BY-kinase protein Wzc, which are important for capsular polysaccharide translocation to the cell exterior (Collins et al., 2006). According to this, it was proposed that the phosphorylated state of the BY-kinase protein could regulate the export of polysaccharides by introducing conformation changes to the Wza-Wzc complex, which could control the EPS export. Even though attractive, this hypothesis needs further investigation. Another hypothesis is that BY-kinases could also be involved in the regulation of early steps of the EPS production. It is known that BY-kinases can phosphorylate heterologous substrates, including enzymes involved in the biosynthesis of nucleotide sugar precursors. For instance the E. coli UDP-glucose dehydrogenase (UGD), involved in colanic acid biosynthesis, is phosphorylated by Wzc and UGD tyrosine phosphorylation state influences the amount of colanic acid formed by E. coli. Therefore, it was proposed that tyrosine phosphorylation and dephosphorylation can act at two different levels: the polymerization/export of the polysaccharide and on the synthesis of the repeat-unit (Lacour et al., 2008). Concerning cepacian biosynthesis, no studies have been done on the role of tyrosine phosphorylation within the EPS biosynthetic complex.
5. Role of cepacian in Burkholderia adaptation to different environments Extracellular polysaccharides produced by bacteria have been described as essential virulence determinants in pathogens of humans, livestock and plants; as important in symbiotic interactions between bacteria and plants, and as a barrier to harmful compounds.

Biotechnology of Biopolymers
158
Depending on the ecological niche of bacteria, exopolysaccharides play important roles on the adaptation to environmental conditions and endow bacteria with tools for the colonization of adverse environments. In Bcc bacteria, the production of EPS has been pointed out as a virulence factor, contributing to the overall pathogenicity of those bacteria.
5.1 Cepacian as a virulence factor The importance of the EPS produced by Bcc bacteria as a virulence factor in human lung infections has been studied in vitro and in vivo models of infection. For instance, B. cepacia mutants unable to produce cepacian were less virulent than EPS producing wild-type strain in gp91phox-/-mice (Sousa et al., 2007b). Also, the EPS produced by a mucoid B. cenocepacia clinical isolate was shown to interfere with phagocytosis of bacteria by human neutrophils in vitro when compared to a nonmucoid clonal isolate from the same CF patient (Conway et al., 2004). Additionally, the overproduction of EPS was demonstrated to facilitate the bacterial persistence in a mouse model of infection and it was suggested that the EPS masks bacterial surface structures, normally recognized by neutrophils and macrophages, and thus interfering with recognition and clearance in mice (Conway et al., 2004). Cepacian was shown to inhibit chemotactic migration of human neutrophils and to scavenge reactive oxygen species (ROS) produced by activated cells (Bylund et al., 2006). Since EPS can neutralize ROS and render neutrophils unable to kill Bcc bacteria by oxidative means, the antimicrobial action of those cells will be entirely dependent on the non-oxidative cationic antimicrobial peptides. However, Bcc bacteria are also resistant to non-oxidative antimicrobial peptides and this ability was attributed to the presence of EPS (Herasimenka et al., 2005). In fact, due to the negative charge given by acetyl substituents, cepacian was shown to interact with positively charged antimicrobial peptides forming complexes that lower the antimicrobial peptides biological activity (Herasimenka et al., 2005). If EPS produced by Bcc can both neutralize oxidative species and interact with non-oxidative antimicrobial peptides, then it might be an important virulence factor, since it would leave neutrophils without means to clear the offending bacteria. Against the importance of EPS in virulence is the study of Bartholdson and colleagues where Bcc clinical and environmental strains were assessed for EPS production and onion tissue maceration ability (Bartholdson et al., 2008). According to their results no correlation could be established between EPS production and onion tissue maceration. In another study, a survey of the clinical outcome in patients colonized with EPS and non-EPS producing Burkholderia isolates, concluded that no correlation could be established between EPS production ability and the persistence or virulence of bacteria in the lungs (Cunha et al., 2004). Despite the evidence that EPS interacts with the host immune system, the precise role of EPS production in Burkholderia infection process remains an open question.
5.1.1 Mucoid to nonmucoid phenotype switch Phenotypic variation during the course of an infection is a common phenomenon in pathogenic bacteria. In P. aeruginosa, the conversion to a mucoid phenotype with the bacteria overproducing alginate in advanced stages of the disease is well described. The initial lung colonizer is usually a non-producer strain, which eventually converts to the mucoid phenotypic over the infection period. The overproduction of EPS is also followed by other phenotypic changes, such as decreased motility and lower toxin production, being associated to the establishment of chronic infections (reviewed in Ramsey & Wozniak, 2005).

Mechanisms Controlling the Expression of the Exopolysaccharide of Burkholderia and Role in Niche Adaptation
159
In the case of Bcc infections, it was reported the existence of such phenotypic conversion in CF clinical isolates. Zlosnik and co-authors analyzed EPS production by Burkholderia sequential isolates from hundred CF patients and observed thirteen mucoid to nonmucoid conversions and only two nonmucoid to mucoid conversions (Zlosnik et al., 2008). The nonmucoid to mucoid conversions occurred in B. cenocepacia and B. vietnamiensis isolates and the mucoid to nonmucoid conversions occurred in isolates from B. multivorans, B. cenocepacia and B. vietnamiensis species. The high frequency of mucoid phenotype transition raises the possibility that while mucoid phenotype may be associated to persistence in CF lung, nonmucoid isolates may be associated to increased disease severity. It is possible that EPS may be required for colonization and persistence in the CF lung during the early stages of infection, but once bacteria have colonized the CF lung, the EPS production is no longer required and its production can be shutdown, since it represents a great spending of energy to the cell. The nonmucoid bacteria can then present a competitive advantage in the lung. Interestingly, the Bcc species considered the most virulent and responsible for infection outbreaks, B. cenocepacia has many strains unable to produce cepacian. The nonmucoid phenotype was proposed to be associated with an increase of Bcc virulence, which can be consistent with the development of cepacia syndrome, characterized by the development of septicemia. Still, no conclusive studies are available and the importance of such transitions in Bcc infections is not understood. Also, the molecular mechanisms by which Bcc undergo mucoid phenotype switch still need to be investigated as well as the environmental factors triggering the mucoid phenotype conversion.
5.1.2 Biofilm formation The ability of opportunistic pathogens to colonized lung tissues, forming microcolonies that eventually will evolve into mature biofilm structures has been suggested by many authors. Bcc ability to form microcolonies and mature biofilms has been shown on abiotic surfaces and on well-differentiated human epithelial cells (Schwab et al., 2002). Studies on clinical isolates from four cystic fibrosis patients indicated that the size of the biofilms formed by the isolates increases over the infection period. This suggests an in vivo microevolution that selects Burkholderia populations with higher ability to survive in the CF lung context, which includes survival under antibiotic stress (Savoia & Zucca, 2007). The EPS produced by Bcc bacteria seems to play an important role in the establishment of thick and mature biofilms, even though in vitro assays indicate that is not essential for the initial steps of the biofilm formation (Cunha et al., 2004). Since bacteria within biofilms can more efficiently withstand host immune responses and antibiotic action than plancktonic cells, it was hypothesized that by promoting the formation of mature biofilms, the EPS may enhance bacterial survival in the CF lung during the course of infection. The importance of cepacian in the formation of mature biofilms has also been confirmed by mutants constructed on bce genes. Mutants unable to produce cepacian, such as bceF and bceE insertion mutants, and mutants that were shown to produce cepacian with lower molecular weight or having a lower amount of acetyl groups per repeat-unit, such as bceD and bceS insertion mutants, respectively, exhibited a thinner biofilm when compared to the one produced by the corresponding parental strains (Ferreira et al., 2007; Ferreira et al., 2010).
5.2 Protection against environmental stress Protective functions against desiccation and toxic metal ions concentration have also been attributed to EPS and these roles are of major importance concerning the adaptation of

Biotechnology of Biopolymers
160
bacteria to different environments. Given its hygroscopic properties, EPS may decrease the rate of water loss from the cells and provide bacterial cells with means to survive drying and desiccation (Potts, 1994). In Burkholderia, EPS was suggested to play a role in the survival of bacteria by contributing to their ability to withstand desiccation. The external addition of EPS to B. xenovorans LB400 and B. multivorans ATCC 17616 isolates prior desiccation was shown to enhance their survival (Ferreira et al., 2010). Other studies in cyanobacteria Nostoc commune (Tamaru et al., 2005) and Chroococcidiopsis sp. CCMEE 5056 also correlated the amount of EPS produced to the drying and freezing tolerance of bacteria (Knowles & Castenholz, 2008). Ferreira and co-authors also demonstrated a protective effect of cepacian on Burkholderia isolates exposed to metal ion stress (Ferreira et al., 2010). The protection conferred by EPS to toxic concentrations of metal ions was also demonstrated in other bacteria as it is the case of Klebsiella oxytoca (Baldi et al., 2009). The metal-binding properties of EPS might be due to the occurrence of carbonyl, carboxyl and hydroxyl groups within the EPS matrix that attach cations and scavenge metals (Potts, 1994). The ability of Burkholderia strains to withstand desiccation and metal ion stress in the presence of the exopolysaccharide cepacian suggest that this EPS plays a role in survival of these bacteria, thus representing an advantage for bacteria to thrive in adverse environments.
6. Conclusion Cepacian biosynthesis ability is a common feature among the Burkholderia genus. Although some knowledge about the genes and enzymes involved in its biosynthesis already exists, the regulatory mechanisms underlying its production are almost unknown. Quorum sensing seems to be important, but the transcriptional regulators mediating bce gene expression are not yet identified. That knowledge would be crucial to understand mucoid to nonmucoid transitions, a phenomenon that occurs with frequency in chronically infected lungs of CF patients. Moreover, a better understanding of the environmental factors that trigger this phenotypic conversion would also be relevant in order to control this process, with expected health benefits for CF patients colonized with Burkholderia.
7. Acknowledgments This work was supported by FEDER and Fundação para a Ciência e a Tecnologia, Portugal (contract PTDC/BIA-MIC/66977/2006), Ph.D. grant to I.N.S., and a Post-doc grant to A.S.F..
8. References Baldi, F., Marchetto, D., Battistel, D., Daniele, S., Faleri, C., De Castro, C. & Lanzetta, R.
(2009). Iron-binding characterization and polysaccharide production by Klebsiella oxytoca strain isolated from mine acid drainage. J Appl Microbiol 107, 1241-1250.
Bartholdson, S. J., Brown, A. R., Mewburn, B. R., Clarke, D. J., Fry, S. C., Campopiano, D. J. & Govan, J. R. (2008). Plant host and sugar alcohol induced exopolysaccharide biosynthesis in the Burkholderia cepacia complex. Microbiology 154, 2513-2521.
Bugert, P. & Geider, K. (1997). Characterization of the amsI gene product as a low molecular weight acid phosphatase controlling exopolysaccharide synthesis of Erwinia amylovora. FEBS letters 400, 252-256.

Mechanisms Controlling the Expression of the Exopolysaccharide of Burkholderia and Role in Niche Adaptation
161
Burkholder, W. H. (1950). Sour skin, a bacterial rot of onion bulbs. Phytopathology 40, 115-117.
Bylund, J., Burgess, L. A., Cescutti, P., Ernst, R. K. & Speert, D. P. (2006). Exopolysaccharides from Burkholderia cenocepacia inhibit neutrophil chemotaxis and scavenge reactive oxygen species. J Biol Chem 281, 2526-2532.
Caballero-Mellado, J., Onofre-Lemus, J., Estrada-de Los Santos, P. & Martinez-Aguilar, L. (2007). The tomato rhizosphere, an environment rich in nitrogen-fixing Burkholderia species with capabilities of interest for agriculture and bioremediation. Appl Environ Microbiol 73, 5308-5319.
Cerantola, S., Marty, N. & Montrozier, H. (1996). Structural studies of the acidic exopolysaccharide produced by a mucoid strain of Burkholderia cepacia, isolated from cystic fibrosis. Carbohydr Res 285, 59-67.
Cescutti, P., Bosco, M., Picotti, F., Impallomeni, G., Leitão, J. H., Richau, J. A. & Sá-Correia, I. (2000). Structural study of the exopolysaccharide produced by a clinical isolate of Burkholderia cepacia. Biochem Biophys Res Commun 273, 1088-1094.
Cescutti, P., Foschiatti, M., Furlanis, L., Lagatolla, C. & Rizzo, R. (2010). Isolation and characterisation of the biological repeating unit of cepacian, the exopolysaccharide produced by bacteria of the Burkholderia cepacia complex. Carbohydr Res 345, 1455-1460.
Chen, W. M., de Faria, S. M., James, E. K. & other authors (2007). Burkholderia nodosa sp. nov., isolated from root nodules of the woody Brazilian legumes Mimosa bimucronata and Mimosa scabrella. Int J Syst Evol Microbiol 57, 1055-1059.
Chen, W. M., de Faria, S. M., Chou, J. H., James, E. K., Elliott, G. N., Sprent, J. I., Bontemps, C., Young, J. P. & Vandamme, P. (2008). Burkholderia sabiae sp. nov., isolated from root nodules of Mimosa caesalpiniifolia. Int J Syst Evol Microbiol 58, 2174-2179.
Chiarini, L., Cescutti, P., Drigo, L. & other authors (2004). Exopolysaccharides produced by Burkholderia cenocepacia recA lineages IIIA and IIIB. J Cyst Fibros 3, 165-172.
Coenye, T., Vandamme, P., Govan, J. R. & LiPuma, J. J. (2001). Taxonomy and identification of the Burkholderia cepacia complex. J Clin Microbiol 39, 3427-3436.
Coenye, T. & Vandamme, P. (2007). Burkholderia : molecular microbiology and genomics. Wymondham: Horizon Bioscience.
Collins, R. F., Beis, K., Clarke, B. R., Ford, R. C., Hulley, M., Naismith, J. H. & Whitfield, C. (2006). Periplasmic protein-protein contacts in the inner membrane protein Wzc form a tetrameric complex required for the assembly of Escherichia coli group 1 capsules. J Biol Chem 281, 2144-2150.
Conway, B.-A. D., Chu, Karen K., Bylund, J., Altman, E. & Speert, D. P. (2004). Production of exopolysaccharide by Burkholderia cenocepacia results in altered cell-surface interactions and altered bacterial clearance in mice. J Infect Dis 190, 957-966.
Cunha, M. V., Sousa, S. A., Leitão, J. H., Moreira, L. M., Videira, P. A. & Sá-Correia, I. (2004). Studies on the involvement of the exopolysaccharide produced by cystic fibrosis-associated isolates of the Burkholderia cepacia complex in biofilm formation and in persistence of respiratory infections. J Clin Microbiol 42, 3052-3058.
Elliott, G. N., Chen, W. M., Bontemps, C., Chou, J. H., Young, J. P., Sprent, J. I. & James, E. K. (2007). Nodulation of Cyclopia spp. (Leguminosae, Papilionoideae) by Burkholderia tuberum. Ann Bot 100, 1403-1411.
Ferreira, A. S., Leitão, J. H., Sousa, S. A., Cosme, A. M., Sá-Correia, I. & Moreira, L. M. (2007). Functional analysis of Burkholderia cepacia genes bceD and bceF, encoding a phosphotyrosine phosphatase and a tyrosine autokinase, respectively: role in

Biotechnology of Biopolymers
162
exopolysaccharide biosynthesis and biofilm formation. Appl Environ Microbiol 73, 524-534.
Ferreira, A. S., Leitão, J. H., Silva, I. N., Pinheiro, P. F., Sousa, S. A., Ramos, C. G. & Moreira, L. M. (2010). Distribution of cepacian biosynthesis genes among environmental and clinical Burkholderia strains and role of cepacian exopolysaccharide in resistance to stress conditions. Appl Environ Microbiol 76, 441-450.
Hallack, L. F., Passos, D. S., Mattos, K. A., Agrellos, O. A., Jones, C., Mendonca-Previato, L., Previato, J. O. & Todeschini, A. R. (2010). Structural elucidation of the repeat unit in highly branched acidic exopolysaccharides produced by nitrogen fixing Burkholderia. Glycobiology 20, 338-347.
Herasimenka, Y., Benincasa, M., Mattiuzzo, M., Cescutti, P., Gennaro, R. & Rizzo, R. (2005). Interaction of antimicrobial peptides with bacterial polysaccharides from lung pathogens. Peptides 26, 1127-1132.
Isles, A., Maclusky, I., Corey, M., Gold, R., Prober, C., Fleming, P. & Levison, H. (1984). Pseudomonas cepacia infection in cystic fibrosis: an emerging problem. J Pediatr 104, 206-210.
Knowles, E. J. & Castenholz, R. W. (2008). Effect of exogenous extracellular polysaccharides on the desiccation and freezing tolerance of rock-inhabiting phototrophic microorganisms. FEMS Microbiol Ecol 66, 261-270.
Lacour, S., Bechet, E., Cozzone, A. J., Mijakovic, I. & Grangeasse, C. (2008). Tyrosine phosphorylation of the UDP-glucose dehydrogenase of Escherichia coli is at the crossroads of colanic acid synthesis and polymyxin resistance. PLoS One 3, e3053.
Lewenza, S., Conway, B., Greenberg, E. P. & Sokol, P. A. (1999). Quorum sensing in Burkholderia cepacia: identification of the LuxRI homologs CepRI. J Bacteriol 181, 748-756.
Loutet, S. A., Bartholdson, S. J., Govan, J. R., Campopiano, D. J. & Valvano, M. A. (2009). Contributions of two UDP-glucose dehydrogenases to viability and polymyxin B resistance of Burkholderia cenocepacia. Microbiology 155, 2029-2039.
Mahenthiralingam, E., Urban, T. A. & Goldberg, J. B. (2005). The multifarious, multireplicon Burkholderia cepacia complex. Nat Rev Microbiol 3, 144-156.
Mattos, K. A., Jones, C., Heise, N., Previato, J. O. & Mendonca-Previato, L. (2001). Structure of an acidic exopolysaccharide produced by the diazotrophic endophytic bacterium Burkholderia brasiliensis. Eur J Biochem 268, 3174-3179.
Mattos, K. A., Padua, V. L., Romeiro, A. & other authors (2008). Endophytic colonization of rice (Oryza sativa L.) by the diazotrophic bacterium Burkholderia kururiensis and its ability to enhance plant growth. An Acad Bras Cienc 80, 477-493.
Minic, Z., Marie, C., Delorme, C., Faurie, J.-M., Mercier, G., Ehrlich, D. & Renault, P. (2007). Control of EpsE, the phosphoglycosyltransferase initiating exopolysaccharide synthesis in Streptococcus thermophilus, by EpsD tyrosine kinase. J Bacteriol 189, 1351-1357.
Moreira, L. M., Videira, P. A., Sousa, S. A., Leitão, J. H., Cunha, M. V. & Sá-Correia, I. (2003). Identification and physical organization of the gene cluster involved in the biosynthesis of Burkholderia cepacia complex exopolysaccharide. Biochem Biophys Res Commun 312, 323-333.
Nimtz, M., Wray, V., Domke, T., Brenneke, B., Haussler, S. & Steinmetz, I. (1997). Structure of an acidic exopolysaccharide of Burkholderia pseudomallei. Eur J Biochem 250, 608-616.

Mechanisms Controlling the Expression of the Exopolysaccharide of Burkholderia and Role in Niche Adaptation
163
Nogueira, C. E., Ruggiero, J. R., Sist, P., Cescutti, P., Urbani, R. & Rizzo, R. (2005). Conformational features of cepacian: the exopolysaccharide produced by clinical strains of Burkholderia cepacia. Carbohydr Res 340, 1025-1037.
Nzula, S., Vandamme, P. & Govan, J. R. W. (2002). Influence of taxonomic status on the in vitro antimicrobial susceptibility of the Burkholderia cepacia complex. J Antimicrob Chemother 50, 265-269.
Perin, L., Martinez-Aguilar, L., Paredes-Valdez, G., Baldani, J. I., Estrada-de Los Santos, P., Reis, V. M. & Caballero-Mellado, J. (2006). Burkholderia silvatlantica sp. nov., a diazotrophic bacterium associated with sugar cane and maize. Int J Syst Evol Microbiol 56, 1931-1937.
Potts, M. (1994). Desiccation tolerance of prokaryotes. Microbiol Rev 58, 755-805. Ramsey, D. M. & Wozniak, D. J. (2005). Understanding the control of Pseudomonas aeruginosa
alginate synthesis and the prospects for management of chronic infections in cystic fibrosis. Mol Microbiol 56, 309-322.
Reis, V. M., Estrada-de los Santos, P., Tenorio-Salgado, S. & other authors (2004). Burkholderia tropica sp. nov., a novel nitrogen-fixing, plant-associated bacterium. Int J Syst Evol Microbiol 54, 2155-2162.
Richau, J. A., Leitão, J. H., Correia, M., Lito, L., Salgado, M. J., Barreto, C., Cescutti, P. & Sá-Correia, I. (2000a). Molecular typing and exopolysaccharide biosynthesis of Burkholderia cepacia isolates from a Portuguese cystic fibrosis center. J Clin Microbiol 38, 1651-1655.
Richau, J. A., Leitão, J. H. & Sá-Correia, I. (2000b). Enzymes leading to the nucleotide sugar precursors for exopolysaccharide synthesis in Burkholderia cepacia. Biochem Biophys Res Commun 276, 71-76.
Savoia, D. & Zucca, M. (2007). Clinical and environmental Burkholderia strains: biofilm production and intracellular survival. Curr Microbiol 54, 440-444.
Schwab, U., Leigh, M., Ribeiro, C., Yankaskas, J., Burns, K., Gilligan, P., Sokol, P. & Boucher, R. (2002). Patterns of epithelial cell invasion by different species of the Burkholderia cepacia complex in well-differentiated human airway epithelia. Infect Immun 70, 4547-4555.
Sist, P., Cescutti, P., Skerlavaj, S., Urbani, R., Leitão, J. H., Sá-Correia, I. & Rizzo, R. (2003). Macromolecular and solution properties of Cepacian: the exopolysaccharide produced by a strain of Burkholderia cepacia isolated from a cystic fibrosis patient. Carbohydr Res 338, 1861-1867.
Sousa, S. A., Moreira, L. M., Wopperer, J., Eberl, L., Sá-Correia, I. & Leitão, J. H. (2007a). The Burkholderia cepacia bceA gene encodes a protein with phosphomannose isomerase and GDP-D-mannose pyrophosphorylase activities. Biochem Biophys Res Commun 353, 200-206.
Sousa, S. A., Ulrich M, Bragonzi, A. & other authors (2007b). Virulence of Burkholderia cepacia complex strains in gp91phox-/- mice. Cell Microbiol 9, 2817-2825.
Sousa, S. A., Ramos, C. G., Almeida, F., Meirinhos-Soares, L., Wopperer, J., Schwager, S., Eberl, L. & Leitão, J. H. (2008). Burkholderia cenocepacia J2315 acyl carrier protein: A potential target for antimicrobials' development? Microbial Pathog 45, 331-336.
Sousa, S. A., Ramos, C. G., Moreira, L. M. & Leitão, J. H. (2010). The hfq gene is required for stress resistance and full virulence of Burkholderia cepacia to the nematode Caenorhabditis elegans. Microbiology 156, 896-908.
Suarez-Moreno, Z. R., Caballero-Mellado, J. & Venturi, V. (2008). The new group of non-pathogenic plant-associated nitrogen-fixing Burkholderia spp. shares a conserved

Biotechnology of Biopolymers
164
quorum-sensing system, which is tightly regulated by the RsaL repressor. Microbiology 154, 2048-2059.
Suarez-Moreno, Z. R., Devescovi, G., Myers, M., Hallack, L., Mendonca-Previato, L., Caballero-Mellado, J. & Venturi, V. (2010). Commonalities and differences in regulation of N-acyl homoserine lactone quorum sensing in the beneficial plant-associated Burkholderia species cluster. Appl Environ Microbiol 76, 4302-4317.
Tamaru, Y., Takani, Y., Yoshida, T. & Sakamoto, T. (2005). Crucial role of extracellular polysaccharides in desiccation and freezing tolerance in the terrestrial cyanobacterium Nostoc commune. Appl Environ Microbiol 71, 7327-7333.
Vandamme, P., Holmes, B., Vancanneyt, M. & other authors (1997). Occurrence of multiple genomovars of Burkholderia cepacia in cystic fibrosis patients and proposal of Burkholderia multivorans sp. nov. Int J Syst Bacteriol 47, 1188-1200.
Vandamme, P., Mahenthiralingam, E., Holmes, B., Coenye, T., Hoste, B., De Vos, P., Henry, D. & Speert, D. P. (2000). Identification and population structure of Burkholderia stabilis sp. nov. (formerly Burkholderia cepacia genomovar IV). J Clin Microbiol 38, 1042-1047.
Vandamme, P., Goris, J., Chen, W. M., de Vos, P. & Willems, A. (2002a). Burkholderia tuberum sp. nov. and Burkholderia phymatum sp. nov., nodulate the roots of tropical legumes. Syst Appl Microbiol 25, 507-512.
Vandamme, P., Henry, D., Coenye, T., Nzula, S., Vancanneyt, M., LiPuma, J. J., Speert, D. P., Govan, J. R. & Mahenthiralingam, E. (2002b). Burkholderia anthina sp. nov. and Burkholderia pyrrocinia, two additional Burkholderia cepacia complex bacteria, may confound results of new molecular diagnostic tools. FEMS Immunol Med Microbiol 33, 143-149.
Vandamme, P., Holmes, B., Coenye, T., Goris, J., Mahenthiralingam, E., LiPuma, J. J. & Govan, J. R. W. (2003). Burkholderia cenocepacia sp. nov.-a new twist to an old story. Res Microbiol 154, 91-96.
Vermis, K., Coenye, T., LiPuma, J. J., Mahenthiralingam, E., Nelis, H. J. & Vandamme, P. (2004). Proposal to accommodate Burkholderia cepacia genomovar VI as Burkholderia dolosa sp. nov. Int J Syst Evol Microbiol 54, 689-691.
Videira, P. A., Garcia, A. P. & Sá-Correia, I. (2005). Functional and topological analysis of the Burkholderia cenocepacia priming glucosyltransferase BceB, involved in the biosynthesis of the Cepacian exopolysaccharide. J Bacteriol 187, 5013-5018.
Vincent, C., Duclos, B., Grangeasse, C., Vaganay, E., Riberty, M., Cozzone, A. J. & Doublet, P. (2000). Relationship between exopolysaccharide production and protein-tyrosine phosphorylation in gram-negative bacteria. J Mol Biol 304, 311-321.
Wugeditsch, T., Paiment, A., Hocking, J., Drummelsmith, J., Forrester, C. & Whitfield, C. (2001). Phosphorylation of Wzc, a tyrosine autokinase, is essential for assembly of group 1 capsular polysaccharides in Escherichia coli. J Biol Chem 276, 2361-2371.
Yabuuchi, E., Kosako, Y., Oyaizu, H., Yano, I., Hotta, H., Hashimoto, Y., Ezaki, T. & Arakawa, M. (1992). Proposal of Burkholderia gen. nov. and transfer of seven species of the genus Pseudomonas homology group II to the new genus, with the type species Burkholderia cepacia (Palleroni and Holmes 1981) comb. nov. Microbiol Immunol 36, 1251-1275.
Zlosnik, J. E. A., Hird, T. J., Fraenkel, M. C., Moreira, L. M., Henry, D. A. & Speert, D. P. (2008). Differential mucoid exopolysaccharide production by members of the Burkholderia cepacia complex. J Clin Microbiol 46, 1470-1473.
9
Zimm-Bragg Model Applied to Sorption of Dyes by Biopolymers: Alginic Acid and Xanthan
Juan Jáuregui-Rincón, Juan Antonio Lozano-Alvarez and Iliana Medina-Ramírez
Universidad Autonoma de Aguascalientes, Mexico
1. Introduction Dyes and dyeing processes are widely used as a means of introducing color into fibers or fabrics. Dyes should be easily introduced into the fiber and then, the color must be reasonably permanent (wash-fast) and stable to light (light-fast). Dyes exhibit considerable structural diversity and are classified by their chemical structure, application to the fiber type and/or solubility. A general classification accommodates these compounds as anionic (acid, direct and reactive dyes); cationic (basic dyes); and non ionic (disperse dyes). Disperse Yellow 54 (DY54) is a typical dye which can be used in dispersed form to color polyester, polyamides, nylon, acrylic fibers and plastics. Direct Black 22 (DB22) is a cationic compound (at neutral pH) that imparts color to cotton, cellulose, leather, wool and silk (Holme, 2000; Alí, 2005). The chemical structures of DY54 and DB22 are represented in table 1. Despite the fact that supercritical methods (Ozcan et al., 1997; Joung & Yoo, 1998; Guzel and Akgerman, 1999; Lee et al., 1999; Sung & Shim, 1999; Shinoda and Tamura, 2003; Hou & Dai, 2005) have been developed to improve the performance of dyeing processes, still conventional (dye baths) methods are widely used (Holme, 2000). During dyeing processes great amounts of unfixed dyes (which vary considerably depending on dye-fiber affinity and dyeing process parameters) may be lost to the effluent. The release of these effluents in water streams results in serious environmental impacts. The development of an environmentally benign methodology for the removal of dyes from textile wastewaters still represents a major technological challenge. It is well known that textile industries, pulp mills and dyestuff manufacturing discharge highly colored wastewaters which represent an aesthetic problem and reduce photosynthetic activity in the receiving water into which they are discharged. Nowadays, many dyes are designed for their chemical stability (wash and light fastness) and do not undergo biochemical degradation readily. For instance, anthraquinone based dyes are more resistant to biodegradation (oxidation rates are very slow) due to their fused aromatic structures (Baughman & Weber, 1994). Since azo dyes are the most widely used, several degradation methods have been implemented to remove them from water, among them, anaerobic treatments predominate. The main drawbacks of this approach are its elevated cost and the production of carcinogenic aromatic amines which limits macro-scale application (Ogawa & Yatome, 1990; Knapp & Newby, 1995; Weber & Adams, 1995).

Biotechnology of Biopolymers 166
Dye Structure
Disperse Yellow 54 (DY54)
Direct Black 22 (DB22)
Table 1. Structure of disperse Yellow 54 (DY54) and Direct Black 22 (DB22).
Adsorption has been observed to be an effective process for color removal from dye wastewater. Use of activated carbon (powdered, nanotubes and chemically modified) has been found to be effective, however, the cost of this adsorbent has led to the search for new, less expensive alternatives for the treatment of polluted waters (Choy et al., 2000, 2004; Mittal, 1996; Fugetsu et al., 2004). Recently, numerous studies have focused on biomaterials (wood sawdust, lichens, plant residues and biopolymers) that are capable to remove dyes from wastewaters (Chakraborty et al., 2006; Poots & McKay, 1976; Sun & Xu, 1997; McKay et al., 1982, 2003; Trung et al., 2003; Gibbs et al., 2004; Wong et al., 2004; Hu et al., 2006). In a recent report, several polysaccharides (chitin, chitosan, locust bean gum, guar gum, corn starch, wheat starch, pectin, carrageenan, dextrin, alginic acid, tamarind gum and cassia gum) were evaluated as adsorbents to remove color from synthetic dyeing effluents. Elevated degrees of color removal were encountered for chitosan (94%), Locust bean gum (85%) and cassia gum (81%) (Blackburn, 2004). Although the study remarks the sorption capacities of the biopolymers, kinetic and equilibrium sorption parameters were not described. The adsorption behavior of modified alginate (MA) was studied toward the removal of basic dyes (Nasr et al., 2006). The equilibrium time for the adsorption process was found to be 70 min. Electrostatic interactions between the dyes and the adsorbent govern the adsorption mechanism. The results revealed that the adsorption of basic dyes onto MA fit well with both Freundlich and Langmiur isotherms. To our knowledge, the sorption capability of xanthan for the removal of dyes has never been evaluated. In this work we report the sorption capacities of alginic acid and xanthan for the removal of DY54 and DB22. Mathematical models were applied in order to elucidate the adsorption mechanism of the biopolymers and process variables were optimized.
1.1 Alginic acid Alginic acid is an anionic polysaccharide which consists of long chains of β(1→4)-linked homopolymeric β-D-mannuronate (M) blocks and linear chains of α(1→4)-linked α-L-guluronate (G) residues. The conformation of alginic acid varies, thus, homopolymeric blocks of consecutive G or M-residues (poly G and poly M, respectively) and heteropolymeric blocks of alternating M and G (M-G-M-G-M) chains can be encountered

Zimm-Bragg Model Applied to Sorption of Dyes by Biopolymers: Alginic Acid and Xanthan 167
depending upon the source of extraction of this polymer. This saccharide is mainly produced by brown algae and bacteria (Azotobacter vinelandii). Sodium alginate absorbs water quickly, which makes it useful as an additive (gelling and thickening agent) in the food industry and in the manufacture of paper, dyestuffs and textiles. Due to calcium alginate´s biocompatibility it is widely used in different types of medical products (tablets, syrups, creams, etc.) for cell immobilization and appetite suppressant. (Lee et al., 2003). It has been shown that the physical properties of alginates depend on the relative proportion of the three types of blocks. Alginates with a high proportion of G blocks produce rigid gels that form fairly quickly as calcium ion concentration increases. The opposite holds for alginates with mainly M blocks; the gels form gradually and are softer and more elastic. The early hypotheses for gel formation was that calcium ions displaced hydrogen ions on the carboxylic acid groups of adjacent chains and formed simple ionic bridges between the chains. Rees (1969) argued why that was unlikely and later he put forward the "egg-box model" (Grant et al., 1973), now generally accepted. In this model, pairs of helical chains are packed with the calcium ions located between them (Glazer & Nikaido, 1995; Siew & Williams, 2005). Initially it was believed that the G chains were the only ones responsible for Ca+2-Alginate gel formation since the distances between carboxyl and hydroxyl groups are ideal for Ca+2 packing. Recently Donati et al. (2005) suggested that not only G blocks but also random GM blocks contribute to the Ca+2-alginate interaction. Whereas the monovalent cation (Na+, K+, NH4+) salts of alginic acid, are soluble in water, alginic acid and calcium alginate are not; therefore, this property can be exploited for the simple removal of alginate from solution. Alginates are more stable in the pH range of 5-9 (pKa(M) = 3.38, pKa(G) = 3.65) (Maurstad et al; 2003; Hughet et al; 1994). Below pH 5, the free carboxilate ions in the polymer chains start to become protonated, therefore, the electrostatic repulsion between chains is reduced and the proximity of the chains promotes hydrogen bond formation, producing higher viscosities. If the pH is quickly reduced from 6 to 2, a gelatinous precipitate of alginic acid will form. In this work, we employed alginic acid as adsorbent to remove dyes from aqueous solution. The complex alginate-dye was easily removed from solution upon addition of Ca+2 ions or lowering the pH of the solution.
1.2 Xanthan Xanthan is an exopolysaccharide produced by the bacterium Xanthomonas campestris. Due to its unique rheological properties (high viscosity, tolerance to a wide range of temperature, pH and salt concentration) it is widely used in the food industry as thickening, stabilizing or suspending agent. The chemical structure of xanthan has been elucidated. It is an acidic polymer made up of pentasaccharide subunits, forming a cellulose backbone with trisaccharide side-chains composed of mannose β(1→4)glucuronic-acid β(1→2)mannose attached to alternate glucose residues in the backbone by α(1→3) linkages (Jansson et al., 1975). On approximately half of the terminal mannose residues a pyruvic acid moiety is joined by a ketal linkage. Acetyl groups are often present as 6-O substituents on the internal mannose residues. Some external mannoses contain a second 6-O-acetyl substituent. The degree of pyruvate substitution depends on the fermentation process and on the strain of xanthomonas bacteria. (Glazer & Nikaido, 1995; Goodall & Norton, 1987). In the solid state, xanthan gum is a two-stranded polymer that presents a highly symmetric helix conformation. The two antiparallel polysaccharide strands wind in a right-handed

Biotechnology of Biopolymers 168
manner (Glazer &Nikaido, 1995; Goodall & Norton, 1987). A significant feature of this structure is that the trisaccharide side chains are arranged close to (and hydrogen bonded to) the glucan backbone, which could be expected to stabilize a stiff helical conformation in solution. In aqueous solutions, the average molecular weight of xanthan (single helix) ranges from 2 to 15 megadaltons (MDa). The substituents (pyruvil and acetyl groups) play a moderate role on conformational stability and rheology of xanthan in solution (Rinaudo, 2004). Conformational transition (helix-coil transition) is often observed to be dependent on solution conditions. A mixture of single and double helical conformation predominates in the presence of concentrated salt solutions. Rod et al. (2001a; 2001b) reported that in the presence of trivalent ions, in particular, aluminum ion, xanthan solutions form a semireversible gel that sets with the addition of heat. The aluminum ion favors intermolecular associations of xanthan gum which renders a marked reduced solubility and ease of separation of the polymer from solution. In this work we utilized this approach to separate the xanthan-dye complex once the adsorption process was terminated.
1.3 Zimm Bragg model Adsorption is often described in terms of isotherms, which show the relationship between the bulk aqueous phase activity (concentration) of adsorbate and the amount adsorbed at constant temperature. One of the initial models for the adsorption of a species onto a simple surface was put forth by Irving Langmuir in 1916. Langmuir assumed that a surface consists of a given number of equivalent sites where a species can physically or chemically stick. It is important to realize that the processes of adsorption and the opposite process (desorption) is dynamic; a rate law can be written for each process, and when the rates become equal an equilibrium state will exist characterized by a constant fractional coverage of the original sites. Motivated by the dependence structure-function of biomolecules, conformational transitions in biopolymers have been a subject of extensive research; especially, since these conformational transitions can be induced (or manipulated) by a variety of stimuli (temperature, pH and ionic concentration). The coil to helix transition of polymers in solutions is a common and very important phenomenon that affects the adsorption capabilities of these biomolecules. This transition occurs from a randomly coiled conformation with considerable freedom of reorientation around the bonded repeating units to a helix conformation, characterized by bond rotational angles that are fixed within very narrow limits. The cooperative nature of conformational transitions of polypeptides has been understood for three decades through the theoretical work of Zimm and Bragg and later refinements, however, an explanation for the range of conformations possible in polysaccharides and the principles governing intramolecular interactions are less well understood (Zimm & Bragg, 1959). The polydispersity of polymers results in competing adsorption of the thermodynamically favored larger molecules for surface sites filled initially by smaller molecules. Different segments of a block copolymer may exhibit quite different adsorption characteristics, complicating the rearrangement process further. Despite the difficulties encountered in polymers behavior, predictions of conformational enthalpy and heat capacity have been reported using the Zimm-Bragg theory (Kromhout, 2001). Pioneering work on the application of Zimm-Bragg theory to polysaccharide-surfactant systems was conducted by Satake & Yang (1976). The features of interaction between surfactant and polymer can be represented on binding isotherms. One of the binding features is the cooperative nature of interaction. The cooperativity of the binding is taken
Zimm-Bragg Model Applied to Sorption of Dyes by Biopolymers: Alginic Acid and Xanthan 169
into account by an additional cooperativity factor, and the Zimm-Bragg model is then applied to the array of occupied and unoccupied sites. Binding isotherms can be constructed by plotting β (binding coefficient, defined as fraction polymer sites occupied by an exogenous molecule (i.e. surfactant, dye) divided by total potential sites of binding) versus log Ce (surfactant concentration at equilibrium) resulting on a sigmoid curve. From this, it was concluded that not only electrostatic interactions govern adsorption of hydrophobic molecules (such as surfactants) to polymers, but also hydrophobic interactions (micelle formation) contribute to the sorption process. It was proposed that two processes are responsible for aggregate formation: Nucleation and aggregation. Nucleation is the process in which one surfactant molecule binds to a site adjacent to a site already occupied by other surfactant molecule; this step is determined by the magnitude of Ku, and is represented by the following equation:
(1)
Where DD denotes two adjacent sites occupied by two surfactant molecules and E indicates an empty site in the polymer. The cooperativity parameter u, is defined as:
(2)
The equation that correlates β with Ku is as follows:
1 – (3)
Where s represents Ku Ce. The other parameters are defined as
. (4)
and . √ (5)
Optimization processes can be applied in order to determine the best values of u and Ku that describe the polypeptide-surfactant system. Although there are numerous reports regarding interaction of polypeptides to surfactants, few works have been published related to polymer-surfactant interactions. Polymer-surfactant interactions can be divided into two classes: binding to neutral polymers and to polyelectrolytes (Liu et al., 1997). In the latter case, polyelectrolytes are viewed as a one dimensional array of binding sites that bind ionic surfactant ions with opposite electric charge. In the present study we will describe the interaction of dyes (DY54 and DB22) to the biopolymers, alginate and xanthate.
2. Experimental procedures 2.1 Optimization of adsorption conditions 2.1.1 Dye purification In order to elucidate the adsorption mechanism of dye-polymer, dye additives (dispersing agent, salts, binder, etc.) were removed. A solution of the commercial dye was prepared and cleaned trough a silica column. The purity of the dyes was evaluated by HPLC.

Biotechnology of Biopolymers 170
2.1.2 pH optimization Samples of 500 mg of biopolymer (sodium alginate or sodium xanthan) were placed in a flask, and 50 ml of distilled water were added. The mixture stood for a period of 5 h to facilitate hydration. 40 ml of dye solution (250 ppm) were added. The pH was adjusted to the desired value by the addition of acid or alkaline solution, and control of the medium ionic strength was achieved by addition of NaCl crystals. The flask was then closed and placed in a bath at 28oC, for 20 h. After the contact time period, 30 ml of jellifying agent solution (CaCl2 5% w/w, HCl 20% w/w, AlCl3 5% w/w) were added. For alginate, calcium chloride and hydrochloric acid solutions were employed as jellifying agents, whereas xanthanate was treated with and without aluminum chloride. In the case when AlCl3 solution was omitted, the same volume of water was added. The supernatants were separated from the solid phase by centrifugation, and the concentrations of dyes in solution were determined from the respective analytical curves. The quantity of the dyes adsorbed was determined by the following equation:
% (6)
where Ci is the initial concentration of dye in solution (mgL-1), and Ce is the final concentration of dye in solution (mgL-1).
2.2 Adsorption isotherms The adsorption isotherms were obtained by the batch method, employing 500 mg of biopolymer and 50 mL of the dye solution at different concentrations (5-2000 ppm). The dye solutions were prepared at a pH and ionic strength values, optimal for adsorption. These solutions were stirred until they reached adsorption equilibrium (20 h at 28oC). The complex dye-polymer was separated and the quantity of dye adsorbed was determined by employing a UV-Vis spectrophotometer, Thermospectronic model Genesys, in the respective λmax of each dye.
2.2.1 Surfactant influence The adsorption isotherms were obtained in the presence of different surfactants (sodium dodecyl benzenesulfonate (SDS), dodecyl trimethylammonium bromide (DTA) and Tween 80 (T80). The adsorption procedure was the same as the one indicated in previous paragraph differing only in the preparation of dye solution. In this case, different amounts of surfactants were added in order to evaluate their effects at different concentrations (0 – 100 ppm).
2.3 Adsorption models To evaluate the applicability of Langmuir and Freundlich isotherm models, the adsorption capacities were determined and data was fitted within the model. Experimental data was analyzed via the following equation:
(7)
Where qe, is the amount of dye adsorbed on determined mass of the biopolymer (mol of dye adsorbed by mol of biopolymer) at equilibrium, Ci is the initial dye concentration (molL-1), Ce, is the equilibrium dye concentration (molL-1), V is the volume of the dye solution (L),

Zimm-Bragg Model Applied to Sorption of Dyes by Biopolymers: Alginic Acid and Xanthan 171
and m, is the mass of the biopolymer (mol). There are several isotherms models available for analyzing experimental data and for describing the equilibrium of adsorption. Every model was analyzed using the software Statistica. The data was optimized against the different models.
2.4 IR and Raman analysis IR and Raman spectroscopy were used in order to determine the functional groups involved in the dye-polymer adsorption process. The complexes dye-alginate and dye-xanthanate were washed with distilled water and dried for a period of 24 to 36 h at 60oC. The dried powders were used for the analysis. Dye-biopolymer complexes, pure dyes and pure polymers were analyzed by IR (KBr pellet) and Raman (microRaman) spectroscopy.
3. Results and discussion 3.1 UV-Vis spectroscopy Solution behavior of DY54 was studied by UV-Vis spectroscopy. The absorption spectrum of the dye (15 ppm or 5x10 -5 M solution) was found to be pH sensitive (Figure 1). Our results showed that a variation in the pH value from 11 to 11.3 produced a shift on the maximum absorption peak from λ= 376 nm to λ = 373 nm, moreover, a small hypsochromic displacement was also observed (from λ= 223 to λ = 220) when the pH was changed from 11.3 to 11.8. We do believe that the pKa values of the dye are within this range of pH, thus the shifts observed on the absorption spectrum correspond to the protonated and deprotonated forms of DY54. It is important to remark that the shifts observed on Figure 1 correspond to the influence of pH on the monomeric form of the dye since variable concentration experiments indicated that DY54 forms aggregates at concentrations higher than 100 ppm. The absorption spectrum of DY54 exhibits a spectral blue shift as dye concentration is increased in aqueous solution. There are some reports that discuss on the formation of dye aggregates in concentrated solutions. Lai et al (1984) investigated the spectral properties of thionine in aqueous solutions at different concentrations and observed that the absorption maxima were shifted gradually and continuously to shorter wavelengths (blue shift) as the concentration of thionine was increased. In accordance to the McRae-Kasha exciton model, they attributed these observations to the formation of H aggregates (for hypsochromic). Later reports indicated that concentrated aqueous solutions of pseudoisocyanine dyes also present ordered molecular assemblies of dyes. In contrast to the blue shift observed for thionine type dyes, cyanine aggregates exhibit a spectral shift toward longer wavelengths with respect to the monomer absorption. (Berlepsch et al., 2000). The kind of aggregates formed for cyanine dyes are called J-aggregates (named in honor of the researchers who discovered the phenomenon). In the case of J-aggregates, the monomeric molecules are arranged in one dimension to achieve a parallel orientation of their transition moments with a zero angle between the transition moments and the line joining the molecular centers. Intermolecular interactions involving substituents on the aromatic rings act to stabilize J-aggregates. On the other hand, H-aggregates assemble strongly coupled monomeric dye molecules in one dimension to achieve a parallel orientation of their transition moments and a perpendicular alignment of the transition moments to the line of molecular centers.

Biotechnology of Biopolymers 172
Fig. 1. UV-visible absorption spectra of DY54 (5x 10⁻⁵ M) in water at different pH values (with permison of J. Mex. Chem. Soc.)
The π-π interactions between aromatic rings stabilize H-aggregates. (Karukstis, 2002). The blue shift observed in the absorption spectrum of DY54 suggests the formation of H aggregates in aqueous solution. To confirm our hypothesis of dye aggregates formation, the absorption spectrum of DY54 was evaluated at different temperatures. It is well known that increasing temperature will increase the dissociation of the dye aggregates. The absorption spectra of DY54 at the temperatures of 20, 30, 50, 60 and 80oC are given in figure 2.
Fig. 2. UV-visible absorption spectra of DY54 (125 ppm) in aqueous solution at different temperatures
We observed that as temperature was raised, the absorption maxima shift gradually to longer wavelengths; from here we concluded that concentrated solutions of DY54 form H aggregates that dissociate into smaller aggregates which explain the red-shifted band.
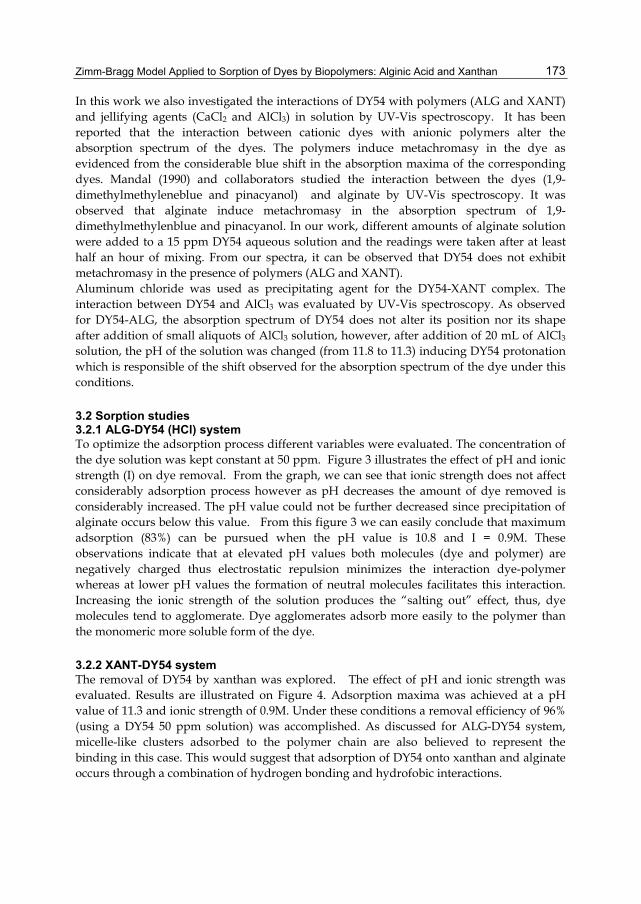
Zimm-Bragg Model Applied to Sorption of Dyes by Biopolymers: Alginic Acid and Xanthan 173
In this work we also investigated the interactions of DY54 with polymers (ALG and XANT) and jellifying agents (CaCl2 and AlCl3) in solution by UV-Vis spectroscopy. It has been reported that the interaction between cationic dyes with anionic polymers alter the absorption spectrum of the dyes. The polymers induce metachromasy in the dye as evidenced from the considerable blue shift in the absorption maxima of the corresponding dyes. Mandal (1990) and collaborators studied the interaction between the dyes (1,9-dimethylmethyleneblue and pinacyanol) and alginate by UV-Vis spectroscopy. It was observed that alginate induce metachromasy in the absorption spectrum of 1,9-dimethylmethylenblue and pinacyanol. In our work, different amounts of alginate solution were added to a 15 ppm DY54 aqueous solution and the readings were taken after at least half an hour of mixing. From our spectra, it can be observed that DY54 does not exhibit metachromasy in the presence of polymers (ALG and XANT). Aluminum chloride was used as precipitating agent for the DY54-XANT complex. The interaction between DY54 and AlCl3 was evaluated by UV-Vis spectroscopy. As observed for DY54-ALG, the absorption spectrum of DY54 does not alter its position nor its shape after addition of small aliquots of AlCl3 solution, however, after addition of 20 mL of AlCl3 solution, the pH of the solution was changed (from 11.8 to 11.3) inducing DY54 protonation which is responsible of the shift observed for the absorption spectrum of the dye under this conditions.
3.2 Sorption studies 3.2.1 ALG-DY54 (HCl) system To optimize the adsorption process different variables were evaluated. The concentration of the dye solution was kept constant at 50 ppm. Figure 3 illustrates the effect of pH and ionic strength (I) on dye removal. From the graph, we can see that ionic strength does not affect considerably adsorption process however as pH decreases the amount of dye removed is considerably increased. The pH value could not be further decreased since precipitation of alginate occurs below this value. From this figure 3 we can easily conclude that maximum adsorption (83%) can be pursued when the pH value is 10.8 and I = 0.9M. These observations indicate that at elevated pH values both molecules (dye and polymer) are negatively charged thus electrostatic repulsion minimizes the interaction dye-polymer whereas at lower pH values the formation of neutral molecules facilitates this interaction. Increasing the ionic strength of the solution produces the “salting out” effect, thus, dye molecules tend to agglomerate. Dye agglomerates adsorb more easily to the polymer than the monomeric more soluble form of the dye.
3.2.2 XANT-DY54 system The removal of DY54 by xanthan was explored. The effect of pH and ionic strength was evaluated. Results are illustrated on Figure 4. Adsorption maxima was achieved at a pH value of 11.3 and ionic strength of 0.9M. Under these conditions a removal efficiency of 96% (using a DY54 50 ppm solution) was accomplished. As discussed for ALG-DY54 system, micelle-like clusters adsorbed to the polymer chain are also believed to represent the binding in this case. This would suggest that adsorption of DY54 onto xanthan and alginate occurs through a combination of hydrogen bonding and hydrofobic interactions.
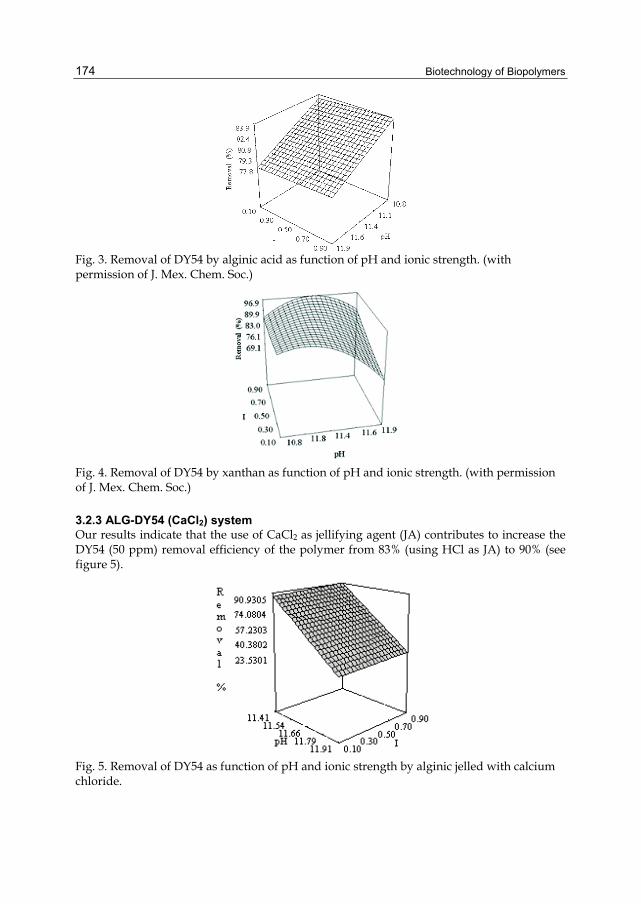
Biotechnology of Biopolymers 174
Fig. 3. Removal of DY54 by alginic acid as function of pH and ionic strength. (with permission of J. Mex. Chem. Soc.)
Fig. 4. Removal of DY54 by xanthan as function of pH and ionic strength. (with permission of J. Mex. Chem. Soc.)
3.2.3 ALG-DY54 (CaCl2) system Our results indicate that the use of CaCl2 as jellifying agent (JA) contributes to increase the DY54 (50 ppm) removal efficiency of the polymer from 83% (using HCl as JA) to 90% (see figure 5).
Fig. 5. Removal of DY54 as function of pH and ionic strength by alginic jelled with calcium chloride.

Zimm-Bragg Model Applied to Sorption of Dyes by Biopolymers: Alginic Acid and Xanthan 175
The adsorption capacity of biopolymers depends on their physical structural parameters such as crystallinity, surface area, porosity, particle type, particle size and water content. Alginate hydrogels consist of three dimensional, hydrophilic, polymeric networks which macromolecular conformation depend on the composition of alginate and on the JA used for gel formation. The ability to control the pore properties of the alginate gels is difficult due to rapid gelation mechanism. We observed an increased capacity for dye adsorption of ALG(CaCl2) compared to ALG(HCl). This observation may have different justifications since the pore size and pore properties of the gels are different. Despite the fact that acid gels are more flexible that Ca-ALG gels, it is possible that the pore size is smaller impeding dye molecules (aggregates) diffuse freely into the gel. In the case of Ca-ALG besides the amount of dye adsorbed on the surface, there is the possibility that the gel is able to encapsulate dye aggregates within its network, increasing the adsorption capacity of the gel.
3.2.4 XANT-DY54 (Al) system The addition of aluminum chloride as gelling agent to XANT-DY54 system increased in notable way the removal of DY54 (figure 6 ). The polymeric network formed by the interaction between Al3+ and xanthan molecule favors the adsorption of DY54 molecules. Rod et al (2001 a; 2001 b) proposed that the carboxilate group of the glucuronic moiety of xanthan molecule interacts with aluminum ion promoting an increase in the size of the “cluster”. We do believe that the elevated adsorption shown for XANT(Al) is the result of two independent processes, first, the cavities within the XANT(Al) cluster are big enough to entrap dye molecules in their interior; and second, aluminum ion decreases the negative charge on the XANT molecule favoring interaction with dye molecules.
Fig. 6. Removal of DY54 as function of pH and ionic strength by alginic jelled with aluminum chloride in the system Xant-DY54 (Al).
3.3 Adsorption isotherms Adsorption isotherms are an equilibrium expression for the amount of adsorbed solute (S) versus the solute concentration in solution (C). They can conveniently be used to describe how pollutants interact with adsorbent materials and are very important for optimization of adsorption systems. There are several isotherm models available for analyzing experimental data and for describing the equilibrium of adsorption. An isotherm can be constructed by plotting qe versus Ce, where qe , represents the amount of dye adsorbed on the adsorbent material (in this particular work, biopolymers) at
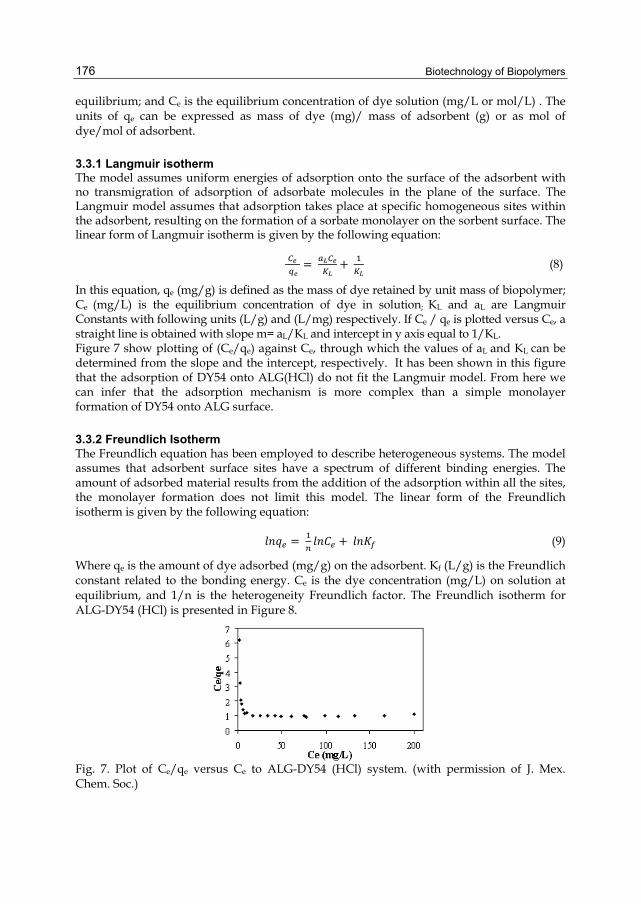
Biotechnology of Biopolymers 176
equilibrium; and Ce is the equilibrium concentration of dye solution (mg/L or mol/L) . The units of qe can be expressed as mass of dye (mg)/ mass of adsorbent (g) or as mol of dye/mol of adsorbent.
3.3.1 Langmuir isotherm The model assumes uniform energies of adsorption onto the surface of the adsorbent with no transmigration of adsorption of adsorbate molecules in the plane of the surface. The Langmuir model assumes that adsorption takes place at specific homogeneous sites within the adsorbent, resulting on the formation of a sorbate monolayer on the sorbent surface. The linear form of Langmuir isotherm is given by the following equation:
(8)
In this equation, qe (mg/g) is defined as the mass of dye retained by unit mass of biopolymer; Ce (mg/L) is the equilibrium concentration of dye in solution; KL and aL are Langmuir Constants with following units (L/g) and (L/mg) respectively. If Ce / qe is plotted versus Ce, a straight line is obtained with slope m= aL/KL and intercept in y axis equal to 1/KL. Figure 7 show plotting of (Ce/qe) against Ce, through which the values of aL and KL can be determined from the slope and the intercept, respectively. It has been shown in this figure that the adsorption of DY54 onto ALG(HCl) do not fit the Langmuir model. From here we can infer that the adsorption mechanism is more complex than a simple monolayer formation of DY54 onto ALG surface.
3.3.2 Freundlich Isotherm The Freundlich equation has been employed to describe heterogeneous systems. The model assumes that adsorbent surface sites have a spectrum of different binding energies. The amount of adsorbed material results from the addition of the adsorption within all the sites, the monolayer formation does not limit this model. The linear form of the Freundlich isotherm is given by the following equation:
(9)
Where qe is the amount of dye adsorbed (mg/g) on the adsorbent. Kf (L/g) is the Freundlich constant related to the bonding energy. Ce is the dye concentration (mg/L) on solution at equilibrium, and 1/n is the heterogeneity Freundlich factor. The Freundlich isotherm for ALG-DY54 (HCl) is presented in Figure 8.
Fig. 7. Plot of Ce/qe versus Ce to ALG-DY54 (HCl) system. (with permission of J. Mex. Chem. Soc.)

Zimm-Bragg Model Applied to Sorption of Dyes by Biopolymers: Alginic Acid and Xanthan 177
Fig. 8. Plot of lnqe versus ln Ce to obtain Freundlich parameters (KF and 1/n parameters) in system ALG-DY54 (HCl). (with permission of J. Mex. Chem. Soc.)
The values of the Freundlich constants together with the correlation coefficient are presented in table 2.
SystemModel ALG-DY54 (HCl)
Parameter values Average error R2
Langmuir KL=0.3755aL=-0.003449 48.13 % 0.7445
Freundlich KF=0.2346n=0.7564 26.11 % 0.8694
Zimm-Bragg Ku=3000U=4 16.6 % 0.9878
Table 2. Sorption parameters for ALG-DY54 (HCl) system.
The Freundlich equation predicts that the dye concentration on the adsorbent will increase so long as there is an increase in the dye concentration in the liquid. Based on the correlation coefficient (0.8694) and the shape of the isotherm, it was concluded that neither Langmuir nor Freundlich models were appropriate to fit the experimental data. Despite the fact of a more complex interaction (heterogeneous surface, sorbate-sorbate interactions, sorbate migration and absorption into the pores of adsorbent) between sorbate-adsorbate considered by Freundlich model, our results do not fit accurately with this empirical model, suggesting a different mechanism of adsorption.
3.3.3 Zimm-Bragg model Binding of surfactants to polymers is observed to start at a rather well-defined surfactant concentration, somewhat below the critical micelle concentration (cmc). Some theoretical models have been presented for polymer-surfactant interactions, all based on the structure of micelle-like clusters bound to the polymer. An approach often used in the case of polyelectrolyte-surfactant interaction is to treat the binding of the surface as site binding to the polymer. The cooperativity of the binding is taken into account by an additional cooperativity factor, and the Zimm-Bragg model can be applied to the array of occupied and unoccupied sites. Langmuir and Freundlich models were applied to our system, however the degree of correlation between the experimental results and the sorption models was low as summarized in the information presented on Table 2. The Zimm-Bragg model was applied to our experimental data. The isotherm for the system ALG-DY54 (HCl) is presented in figure 9 and the binding parameters tabulated on table 3. The correspondence of experimental data with Zimm-Bragg isotherm and the theoretical model is evident.

Biotechnology of Biopolymers 178
Fig. 9. Zimm-Bragg isotherm for ALG-DY54 (HCl) system. (with permission of J. Mex. Chem. Soc.)
Table 3 summarizes the binding parameters for all the dye-polymer systems [ALG-DY54 (HCl),ALG-DY54 (CaCl2), XANT-DY54 and XANT-DY54 (Al)] studied in this work. A typical Zimm-Bragg isotherm is presented in figure 10 which corresponds to the XANT-DY54 system. Since our study involves a homogeneous system, the Zimm-Bragg model is the most appropriate to describe the interactions between dye-polymer.
System Zimm Bragg Parameters* R2
ALG-DY54 (HCl) Ku=3000 u=4 R2 =0.9878 ALG-DY54 (CaCl2) Ku=685 u=200 R2 = 0.4179
XANT-DY54 Ku=900 u=2 R2 = 0.9811 XANT-DY54 (Al) Ku=3100 u=200 R2 = 0.9957
Table 3. Parameters obtained with the Zimm Bragg model in the different systems.
Fig. 10. Zimm-Bragg isotherm for XANT-DY54 system. (with permission of J. Mex. Chem. Soc.)
This model takes into account the formation of nucleation centers and the propagation in size to form aggregates when the dye molecules are in contact with the “molecular surface” of the biopolymer, both adsorbate (dye) and adsorbent are presents in solution and the interaction between these chemical species are always in aqueous environment. In contrast the Langmuir and Freundlich models (more specific for heterogeneous systems) consider that adsorbent is present in solid phase and adsorbate molecules are present in gas or liquid phase. In all systems where DY54 is involved all the components (DY54, biopolymers ALG

Zimm-Bragg Model Applied to Sorption of Dyes by Biopolymers: Alginic Acid and Xanthan 179
and XANT) are present as soluble species and DY54 interacts with them so that the experimental data is best described with this model. The ALG-DY54(CaCl2) system presents a very low correlation coefficient value. At the working pH for this system we observed precipitation of calcium hydroxide making the solution turbid and difficult to evaluate by UV-Vis. It is possible that this system might be better described by the Freundlich model due to the presence of hydroxide salt. Currently, we are working on the elucidation of the adsorption mechanism of this system.
3.4 Infrared (IR) spectroscopy Nuclear Magnetic Resonance (NMR) studies were conducted in order to gain a better understanding of the behavior of DY54 in solution. DY54 exists as two tautomeric forms that are illustrated on Figure 11. Our results indicate that in aqueous solution the dye adopts the keto form whereas that in the solid state (confirmed by IR) or dissolved in organic solvents, the enol tautomer conformation predominates.
Fig. 11. Tautomeric forms of DY54: Keto (a) and enol (b).
The chemical structure of DY54, sodium alginate and ALG-DY54 (HCl) were analyzed by IR spectroscopy. The absorption spectra of the chemical species above mentioned are presented on figure 12 and a summary of absorption bands on table 4. The IR spectrum (figure 12b) of DY54 shows two main absorption bands (1656 cm-1 and 1547cm-1) that correspond to the C=O and C=C vibrations of the DY54 enol form. The IR spectrum of ALG-DY54 (HCl) is depicted on figure 12c. The main features of the spectrum are: the absorption band at 3421 cm-1 that indicates hydrogen bonding among molecules (ALG-DY54) and the signal at 1736 cm-1 which corresponds to protonated carboxilate groups in alginate as a result of using HCl as jellifying agent.
Fig. 12. FTIR spectrum of (a) alginic acid as sodium salt, (b) DY54 and (c) ALG-DY54 (HCl).
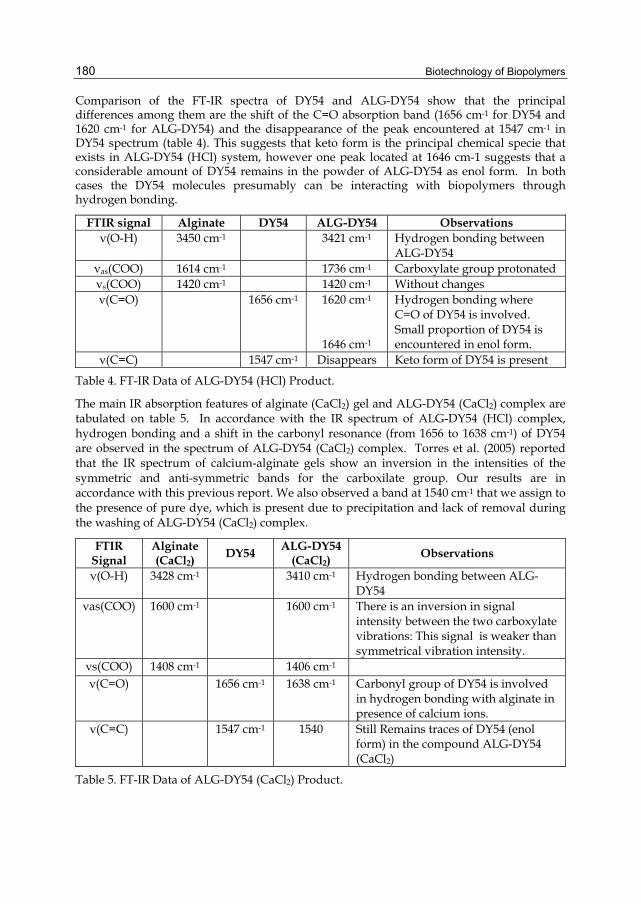
Biotechnology of Biopolymers 180
Comparison of the FT-IR spectra of DY54 and ALG-DY54 show that the principal differences among them are the shift of the C=O absorption band (1656 cm-1 for DY54 and 1620 cm-1 for ALG-DY54) and the disappearance of the peak encountered at 1547 cm-1 in DY54 spectrum (table 4). This suggests that keto form is the principal chemical specie that exists in ALG-DY54 (HCl) system, however one peak located at 1646 cm-1 suggests that a considerable amount of DY54 remains in the powder of ALG-DY54 as enol form. In both cases the DY54 molecules presumably can be interacting with biopolymers through hydrogen bonding.
FTIR signal Alginate DY54 ALG-DY54 Observations ν(O-H) 3450 cm-1 3421 cm-1 Hydrogen bonding between
ALG-DY54 νas(COO) 1614 cm-1 1736 cm-1 Carboxylate group protonated νs(COO) 1420 cm-1 1420 cm-1 Without changes ν(C=O) 1656 cm-1 1620 cm-1
1646 cm-1
Hydrogen bonding where C=O of DY54 is involved. Small proportion of DY54 is encountered in enol form.
ν(C=C) 1547 cm-1 Disappears Keto form of DY54 is present
Table 4. FT-IR Data of ALG-DY54 (HCl) Product.
The main IR absorption features of alginate (CaCl2) gel and ALG-DY54 (CaCl2) complex are tabulated on table 5. In accordance with the IR spectrum of ALG-DY54 (HCl) complex, hydrogen bonding and a shift in the carbonyl resonance (from 1656 to 1638 cm-1) of DY54 are observed in the spectrum of ALG-DY54 (CaCl2) complex. Torres et al. (2005) reported that the IR spectrum of calcium-alginate gels show an inversion in the intensities of the symmetric and anti-symmetric bands for the carboxilate group. Our results are in accordance with this previous report. We also observed a band at 1540 cm-1 that we assign to the presence of pure dye, which is present due to precipitation and lack of removal during the washing of ALG-DY54 (CaCl2) complex.
FTIR Signal
Alginate (CaCl2)
DY54 ALG-DY54 (CaCl2)
Observations
ν(O-H) 3428 cm-1 3410 cm-1 Hydrogen bonding between ALG-DY54
νas(COO) 1600 cm-1 1600 cm-1 There is an inversion in signal intensity between the two carboxylate vibrations: This signal is weaker than symmetrical vibration intensity.
νs(COO) 1408 cm-1 1406 cm-1 ν(C=O) 1656 cm-1 1638 cm-1 Carbonyl group of DY54 is involved
in hydrogen bonding with alginate in presence of calcium ions.
ν(C=C) 1547 cm-1 1540 Still Remains traces of DY54 (enol form) in the compound ALG-DY54 (CaCl2)
Table 5. FT-IR Data of ALG-DY54 (CaCl2) Product.

Zimm-Bragg Model Applied to Sorption of Dyes by Biopolymers: Alginic Acid and Xanthan 181
Xanthan and XANT-DY54 complex were analyzed by IR spectroscopy. Results are presented in table 6. As expected, a resonance at 1730 cm-1 that correspond to the acetyl group (C=O) was observed in the xanthan’s IR spectrum. As previously discussed, the formation of XANT-DY54 complex was favored at high pH values, under this condition, the acetyl group undergoes saponification, and this explains the absence of acetyl band in the IR spectrum of XANT-DY54 complex. As it was encountered for ALG-DY54 (HCl) complex, the carbonyl resonance shifts suggesting hydrogen bonding formation between dye and polymer. FTIR signal Xanthan DY54 XANT-
DY54 Observations
ν (O-H) 3420 cm-1 3381 cm-1 Hydrogen bonding among XANT-DY54
ν (C=O) acetyl group
1730 cm-1 Very weak Carbonyl groups in xanthan undergo saponification reaction
νas(COO) pyruvate and glucuronate groups
1613 cm-1 1617 cm-1 Carboxylate group as sodium salt (no changes)
νs(COO) pyruvate and glucuronate groups
1450 cm-1 1450 cm-1 Without changes
ν(C=O) 1656 cm-1 1640 cm-1
1617 cm-1
Some of the enol form of DY54 is present in product. Hydrogen bonding where C=O of DY54 is involved.
ν(C=C) 1547 cm-1 1556 cm-1 Some of the enol form of DY54 is present in product.
Table 6. FT-IR Data of XANT-DY54 Product
The data from the IR analysis of XANT-DY54 (Al) are summarized in table 7. The band at 1547 cm-1 indicates that in the DY54-XANT complex, the DY54 is in the enol form. IR data is in accordance to Raman analysis pointing toward the formation of XANT-DY54 complexes being the dye molecule in the enol form. A proper description of the phenomenon observed is complicated due to the numerous chemical processes (such as pH modification, coagulation, interaction among aluminum ion with polymer) involved upon addition of AlCl3 to the dye-polymer system. Ethanolic solutions of ALG-DY54 (HCl), ALG-DY54 (CaCl2), XANT-DY54 and XANT-DY54 (Al) complexes were prepared. For the three first examples it was observed that the solution turned yellow due to desorption of dye from the complexes. This observation supports our assumption that hydrogen bonding is responsible of dye adsorption within the polymers. The color intensity for the alcoholic solution of complex XANT-DY54 (Al) was very weak compared to the other examples just discussed; this observation supports our proposal of the formation of cavities in the tridimensional network of XANT(Al) gel. As previously discussed we assume that these cavities are filled with dye molecules. The strength of this network cannot be broken by interaction with ethanol, thus, in solution we only observe the presence of the dye molecules that were adsorbed on the surface of XANT(Al) gel.

Biotechnology of Biopolymers 182
FTIR Signal XANT (Al)
DY54 XANT-DY54 (Al)
Observations
ν (O-H) 3421 cm-1 3421 cm-1 Hydrogen bonding present in XANT-DY54 (Al) complex.
νas(COO) pyruvate and glucuronate groups
1629 cm-1 1629 cm-1 Without changes.
νs(COO) pyruvate and glucuronate groups
1401 cm-1 1401 cm-1 Without changes.
ν(C=O) 1656 cm-1 1656 cm-1 The enol form of DY54 is present in XANT-DY54 (Al) complex.
ν(C=C) 1547 cm-1 1547 cm-1 DY54 is encountered in enol form in the product XANT-DY54 (Al)
Table 7. FT-IR Data of XANT-DY54 (Al)
3.5 Raman spectroscopy DY54 and biopolymer-DY54 complexes were analyzed by Raman spectroscopy. The Raman spectra of DY54, ALG-DY54 (HCl), ALG-DY54 (CaCl2), XANT-DY54 and XANT-DY54 (Al) are represented in Figure 13. For DY54 a characteristic absorption band at 1376 cm-1 (C-C=C
Fig. 13. Raman spectra of (a) DY54, (b) ALG-DY54 (HCl), (c)ALG-DY54 (CaCl2), (d) XANT-DY54 and (e) XANT-DY54 (Al)

Zimm-Bragg Model Applied to Sorption of Dyes by Biopolymers: Alginic Acid and Xanthan 183
vibration) was encountered as the main component of Raman spectrum. The Raman spectra of ALG-DY54 (Figure 13 b and c) and XANT –DY54 (figure 13c) show a red shift (from 1378 to 1080 cm-1) of the main resonance which indicates a change of the tautomeric form of the dye. As previously discussed, in the solid state, DY54 exists predominantly in the enol form upon aqueous dissolution (basic pH), the keto form predominates and is the one that binds to the polymers. The Raman spectrum of XANT-DY54 (Al) (figure 13 e) resembles the one of pure DY54. This result confirms our assumption of different interaction are involved including electrostatic interaction between DY54 and XANT (Al). The resonance indicates that DY54 binds in the enol form. We can conclude that hydrogen bonding is the main feature of “bonding” among DY54 and ALG(HCl), ALG(CaCl2) and XANT, meanwhile a “mixture” of different interaction predominates in the XANT-DY54(Al) system.
3.6 Adsorption isotherms for DY54 (commercial presentation) Since we are interested on the implementation of this process for the treatment of textile effluents, we evaluated the removal of the commercial presentation of DY54 by XANT and ALG. Our results are very similar to the ones observed for the purified form of the dye and can also be described by the Zimm-Bragg model. Interestingly, for all the systems we observed an increase in the Ku value. These results indicate that the additive(s) contained in the commercial presentation of the dye, contribute to increase the removal efficiency of the polymers.
3.7 Direct Black 22 (DB22) 3.7.1 UV-Vis spectroscopy The solution behavior of DB22 was studied by UV-Vis spectroscopy. The absorption spectrum of DB22 was analyzed at different pH values. The spectra recorded are illustrated on Figure 14. We can see that the maximum absorption peak depends on the pH value. At a pH value of 8.35, the absorption maximum appears at 467 nm whereas that increasing the pH to 10.4 shifts the absorption maximum to 590 nm. The UV-Vis analysis for DB22 is in accordance with previous reports regarding spectroscopic studies of azo dyes in solution. The data indicate that azo dyes are affected by interactions with their environment. In our particular case, the red shift (pH related) observed for DB22 indicates a conversion of the azo form of the dye to the hydrazone and common anion forms of the dye (Abbot et al., 2004). The formation of direct dye aggregates in solution has been reported (Monahan et al., 1970, 1971; Reeves et al., 1979; Hamada et al., 1993; Tiddy et al., 1995; Ferus-Camelo & Greaves, 2002). It was also reported that the structure of the dye determines aggregates formation (Abbot et al., 2004). The aryl groups (and the orientation of substituents) of the dye molecules facilitate the formation of aggregates via π-π stacking.
Fig. 14. UV-Visible absorption spectrum of DB22 in aqueous solution at different pH values.
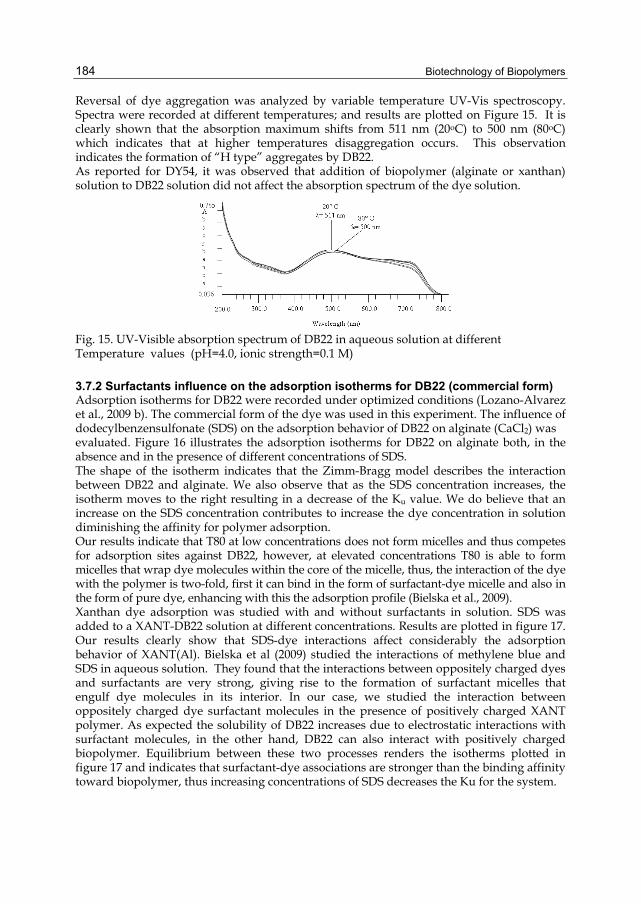
Biotechnology of Biopolymers 184
Reversal of dye aggregation was analyzed by variable temperature UV-Vis spectroscopy. Spectra were recorded at different temperatures; and results are plotted on Figure 15. It is clearly shown that the absorption maximum shifts from 511 nm (20oC) to 500 nm (80oC) which indicates that at higher temperatures disaggregation occurs. This observation indicates the formation of “H type” aggregates by DB22. As reported for DY54, it was observed that addition of biopolymer (alginate or xanthan) solution to DB22 solution did not affect the absorption spectrum of the dye solution.
Fig. 15. UV-Visible absorption spectrum of DB22 in aqueous solution at different Temperature values (pH=4.0, ionic strength=0.1 M)
3.7.2 Surfactants influence on the adsorption isotherms for DB22 (commercial form) Adsorption isotherms for DB22 were recorded under optimized conditions (Lozano-Alvarez et al., 2009 b). The commercial form of the dye was used in this experiment. The influence of dodecylbenzensulfonate (SDS) on the adsorption behavior of DB22 on alginate (CaCl2) was evaluated. Figure 16 illustrates the adsorption isotherms for DB22 on alginate both, in the absence and in the presence of different concentrations of SDS. The shape of the isotherm indicates that the Zimm-Bragg model describes the interaction between DB22 and alginate. We also observe that as the SDS concentration increases, the isotherm moves to the right resulting in a decrease of the Ku value. We do believe that an increase on the SDS concentration contributes to increase the dye concentration in solution diminishing the affinity for polymer adsorption. Our results indicate that T80 at low concentrations does not form micelles and thus competes for adsorption sites against DB22, however, at elevated concentrations T80 is able to form micelles that wrap dye molecules within the core of the micelle, thus, the interaction of the dye with the polymer is two-fold, first it can bind in the form of surfactant-dye micelle and also in the form of pure dye, enhancing with this the adsorption profile (Bielska et al., 2009). Xanthan dye adsorption was studied with and without surfactants in solution. SDS was added to a XANT-DB22 solution at different concentrations. Results are plotted in figure 17. Our results clearly show that SDS-dye interactions affect considerably the adsorption behavior of XANT(Al). Bielska et al (2009) studied the interactions of methylene blue and SDS in aqueous solution. They found that the interactions between oppositely charged dyes and surfactants are very strong, giving rise to the formation of surfactant micelles that engulf dye molecules in its interior. In our case, we studied the interaction between oppositely charged dye surfactant molecules in the presence of positively charged XANT polymer. As expected the solubility of DB22 increases due to electrostatic interactions with surfactant molecules, in the other hand, DB22 can also interact with positively charged biopolymer. Equilibrium between these two processes renders the isotherms plotted in figure 17 and indicates that surfactant-dye associations are stronger than the binding affinity toward biopolymer, thus increasing concentrations of SDS decreases the Ku for the system.

Zimm-Bragg Model Applied to Sorption of Dyes by Biopolymers: Alginic Acid and Xanthan 185
Fig. 16. Zimm-Bragg isotherms for ALG-DB22 (CaCl2) with different amounts of surfactant A) SDS, B) DTA C) T 80.
Fig. 17. Zimm-Bragg isotherms for XANT-DB22 (Al) with different amounts of surfactant SDS
The interactions between XANT(Al) and DB22 were studied in the presence of DTA. It can clearly be seen that Ku decreases as DTA concentration increases. Since both molecules (surfactant and dye) are positively charged, there is a competition for negatively charged adsorption sites on polymer. Oakes & Dixon (2003) studied the adsorption of dyes to cotton with and without surfactants in solution. It was encountered that cationic surfactants can displace adsorbed dye molecules from cotton fiber, due to higher affinity of surfactant to cotton fiber compared to dye affinity. In our particular system, XANT-DB22(DTA), we observe similar behavior, predominating DTA affinity for polymer adsorption sites. Bielska et al (2009) reported that when the same-charge dye and surfactant were used, it was found
Biotechnology of Biopolymers 186
that electrostatic repulsion forces were strong limiting surfactant-dye micelle formation. From here, we can infer that DB22 does not associate with DTA, thus interaction of DB22 with polymer is always limited for DTA interaction.
4. Conclusion The Zimm-Bragg model that was originally designed to describe helix coil transition in peptides fits properly to experimental data of adsorption of dyes (DY54 and DB22) onto biopolymers (alginic acid and xanthan). The binding of dye molecules to water soluble polymers can take place either by electrostatic interaction between charged groups or by other interactions leading to the formation of polymer-dye complexes. Hydrophobic interactions result in dye and dye-polymer micelle-like hydrophobes in water. The concordance between the experimental data and theoretical predictions within the Zimm-Bragg model is due to the consideration by Satake and Yang that the interaction between surfactant-biopolymer occurs by two processes, nucleation and aggregation (considered in the Ku and U parameters). In the polymer surfactant systems, the hydrodynamic properties of the biopolymer favors the formation of micelles decreasing de CMC (critical micellar concentration) of the surfactant, thus favoring interaction polymer-surfactant. In our systems (polysaccharide-dye) we determined the Ku and U values for ALG-DY54 and XANT-DY54 systems with DY54 in commercial and purified form. Interestingly in both cases Zimm-Bragg model describes the interactions. These findings suggest that the dye molecules tend to form aggregates that have similar behavior to that observed with biopolymer-surfactant systems and these aggregates favor the interaction with the alginic acid and xanthan molecules, mainly through hydrogen bonding, electrostatic and hidrofobic interactions. For DY22 this behavior is observed even in the presence of cationic, anionic and neutral surfactants due to the strong tendency of the dye to form aggregates. Currently, we are working with some other biopolymers, such as pectin and polygalacturonic acid in order to expand our understanding of the nature of interactions involved in the removal of dyes by biopolymers.
5. References Abbot, L.C.; Batchelor, S.N.; Oakes, J.; Lindsay-Smith, J.R.; Moore, J.N. (2004) Spectroscopic
Studies of the Intermolecular Interactions of A Bis-Azo Dye, Direct Blue 1, on Di- and Trimerization in Aqueous Solution and in Cellulose, J. Phys. Chem. B, 108, 36, (September 2004) pp. 13726-13735, ISSN: 1520-6106.
Alí, M.F. (2005) Dyes: Chemistry and applications. In Handbook of Industrial Chemistry, Organic Chemicals. Alí, M. F.; El-Alí, B.M.; Speight, J.G. Editors 259-288. McGraw-Hill, ISBN- 0-07-141037-6, USA.
Baughman, G. L. and Weber, E. J. (1994) Transformation of Dyes and Related Compounds in Anoxic Sediment: Kinetics and Products Environ. Sci. Technol., 28, 2, (February1994), pp. 267-276, ISSN: 1520-5851
Berlepsch, H. V., Bottcher, C y Dohne, L. (2000) Structure of J aggregates of Pseudoisocyanine dye in aqueous solution J Phys chem B, 104, 37, (September 2000), pp. 8792-8799, ISSN: 0021-9606.
Zimm-Bragg Model Applied to Sorption of Dyes by Biopolymers: Alginic Acid and Xanthan 187
Bielska, M.; Sobczynska, A.; Prochaska, K. (2009) Dye-Surfactant Interaction in aqueous solutions. Dyes and pigments 80, 2 (February 2009), pp. 202-205, ISSN: 0143-7208.
Blackburn, R.S. (2004) Natural Polysaccharides and Their Interactions with Dyes Molecules: Applications in Effluente Treatment Environ. Sci. Technol. 38, 24, (December 2004), pp. 4905-4909, ISSN: 1520-5851.
Chakraborty, S.; Basu, J.K.; De, S.; Dasgupta, S. (2006) Adsorption of Reactive Dyes from a Textile Effluent Using Sawdust as the Adsorbent. Ind. Eng. Chem. Res. 45, 13, (June 2006), pp. 4731-4741, ISSN: 0088-5885.
Choy, K.K.H.; Porter, J.F.; McKay, G. (2000) Langmuir Isotherm Models Applied to the Multicomponent Sorption of Acids from Effluent onto Activated Carbon. J. Chem. Eng. Data 45,4, (July 2000), pp. 575-584, ISSN: 1520-5134.
Choy, K.K.H.; Porter, J.F.; McKay, G. (2004) Single and Multicomponent Equilibrium Studies for the adsorption of Acidic Dyes on Carbon from Effluents. Langmuir 20,22, (October 2004), pp. 9646-9656 ISSN: 0743-7463.
Donati, I., Holtan,S., Morch, Y.A., Borgogna, M., Dentini, M. y Skjak-Braek, G. (2005) New Hypothesis on the Role of Alternating Sequences in Calcium-Alginate Gels. Biomacromolecules 6, 2, (March 2005), pp. 1031-1040, ISSN: 1526-4602.
Ferus-Camelo, M.; Greaves, A.J. (2002) An investigation intro Direct Dye Agreggation Color. Technol. 118, 1, (January 2002), pp. 15-19, ISSN: 1478-4408
Fugetsu, B.; Satoh, S.; Shiba, T.; Mizutani, T.C; Lin, Y.B.; Terui, N.; Nodasaka, Y.; Sasa, K.; Shindoh, M.; Shibata, K.; Mori, M.; Tanaka, K.; Sato, Y.; Tohji, K.; Tanaka, S.; Nishi, N.; Watari, F. (2004) Caged Multiealled Carbon Nanotubes as the Adsorbents for affinity-Based Elimination of Ionic Dyes. Environ. Sci. Technol. 38, 24, (December 2004), pp. 6890-6896, ISSN: 1520-5134.
Freundlich, H.M.F. (1906) Ueber die adsorption in Ioezungen Z. Phys. Chem. 57, (February 1906), pp. 385-471, ISSN: 0044-3336
Glazer, N. A. and Nikaido, H. (1995) Microbal Biotechnology, Fundamentals of Applied Microbiology W.H. Freeman and Company, second edition, ISBN: 978-0-521-84210-5. USA.
Goodall, D.M. and Norton, I.T. (1987) Polysaccharide conformations and kinetics, Acc. Chem. Res. 20, 2, (February 1987), pp. 59-65. ISSN: 0001-4842
Grant, G.T., Morris, E.R., Rees, D.A., Smith, P.J.C.; Thom, D. (1973) Biological Interaction Between Polysaccharides and Divalent Cations: The Egg Box Model FEBS Lett. 32, (January 1973), pp. 195-199, ISSN: 0014-5793.
Gibbs, G.; Tobin, J.M.; Guibal, E. (2004) Influence of Chitosan Preprotonation on Reactive Black 5 sorption Isotherms and Kinetics. Ind. Eng. Chem. Res. 43, 1, (January 2004), pp. 1-11, ISSN: 0088-5885.
Guzel, B.; Akgerman, A. (1999) Solubility of Disperse and Mordant Dyes in Supercritical CO2, J. Chem. Eng. Data, 44, 1, (December 1999), pp. 83-85, ISSN: 1520-5134.
Hamada, K., Mitshuishi, M., Ohira, M., Miyazaki, K. (1993) Positional effects of Trifluoromethyl Group on the aggregation of Azo Dyes In Aqueous Solutions J. Phys Chem 97,19, (May 1993), pp. 4926, ISSN: 0021-9606.

Biotechnology of Biopolymers 188
Holme, I. (2000) Coloration of Technical Textiles, in: Handbook of Technical Textiles; Horrocks, A. R.; Anand, S.C., Editors. 187-222. Woddhead Publishing, ISBN: 1 855733854, Cambridge, U.K.
Hou, A. and Dai, J. (2005) Kinetics of dyeing of polyester with CI Disperse Blue 79 in supercritical carbon dioxide. Color. Technol., 121, 1 (January 2005), pp. 18-20 ISSN: 1472-3581.
Hu, Z.G.; Zhang, J.; Chan, W.L.; Szeto, Y.S. (2006) The Sorption of Acid Dye on to chitosan nanoparticles. Polymer, 47, 16, (July 2006), 5838-5842, ISSN: 0032-3861
Karukstis, K.K.; Perelman, L.A.; Wong, W.K. (2002) Spectroscopic Characterization of Azo Dyes Aggregation on Dendrimer Surfaces, Langmuir, 18, 26, (December 2002), pp. 10363-10371, ISSN: 0743-7463.
Knapp, J.S. and Newby, P.S. (1995) The microbiological Decolorization o fan Industrial Effluent Containing a Diazo-linked Chromophore. Water Res. 29, 7, (July 1995), pp. 1807-1809, ISSN: 0043-1354.
Kromhout, R.A.; Linder, B. (2001) Prediction of Conformational Enthalpy and Heat Capacity from the Zimm Bragg-Theory. J. Phys. Chem. B 105, 21, (May 2001), pp. 4987-4991 ISSN: 1520-6106.
Lai, W.C., Dixit, N.S y Mackay, R. A. (1984) Formation of H aggregates of Thionine Dye in Water J. Phys Chem. 88, 22, (October 1984), pp. 5364-5368, ISSN: 0021-9606.
Langmuir, I. (1916) The Constitution and Fundamental Properties of Solids and Liquids J. Am. Chem. Soc. 38, 11, ( November 1916), pp. 2221-2295, ISSN: 0002-7863.
Lee, D.W., Choi, W.S., Byun, M.W., Park, H.J., Yu, Y.M. y Lee, M. C. (2003) Effect of Gama Irradiation on Degradation of Alginate J. Agric. Food. Chem. 51, 16, (July 2003), pp. 4819-4823, ISSN 0021-8561.
Lee, J.W.; Min, J.M.; Bae, H.K. (1999) Solubility Measurement of Disperse Dyes in Superciritical Carbon Dioxide J. Chem. Eng. Data, 44, 4, (July 1999), pp. 684-687, ISSN: 1520-5134.
Liu, J. ; Takisawa, N. ; Shirahama, K. ; Abe, H.; Sakamoto, K. (1997) Effect of Polymer Size on the Polyelectrolyte-Surfactant Interaction. J. Phys. Chem. B 101, 38, (September 1997), pp. 7520-7523 ISSN: 1520-6106.
Lozano-Alvarez, J.A.; Jauregui-Rincon, J.; Mendoza-Diaz, G.; Rodriguez-Vazquez, R. Claudio Frausto-Reyes. (2009 b) Study of Sorption equilibrium of Biopolymers Alginic Acid and Xanthan with C.I. Disperse Yellow 54. J. Mex. Chem Soc. 53, 2, (April-June 2009), pp. 59-70 ISSN: 1665-9686.
Maurstad, G.; Danielsen, S.; Stokke, B.T. (2003) Analysis of Compacted Semiflexible Polyaniona Visualizad by Atomic Force Microscopy: Influence of Chain Stiffness on The Morphologies of Polyelectrolyte Complexes. J. Phys chem. 107, 40, (october 2003), pp. 8172-8180 ISSN: 0021-9606.
McKay, G.; Blair, H.S.; Gardner, J.R. Adsorption of Dyes on Chitin.I. (1982) Equilibrium Studies. J. Applied Poly Sci. 27, 8, (August 1982), pp. 3043-3057, ISSN: 0021-8995
McKay, G., Wong, Y.C., Szeto, Y.S. y Cheung, W.H. (2003) Equilibrium Studies For Acid Dye Adsorption onto Chitosan Langmuir 19, 19, (September 2003), pp. 7888-7894, ISSN: 0743-7463.

Zimm-Bragg Model Applied to Sorption of Dyes by Biopolymers: Alginic Acid and Xanthan 189
Mittal, A. K. and Venkobachar, C. (1996) Uptake of cationic Dyes by Sulfonated Coal: Sorption Mechanism. Ind. Eng. Chem. Res. 35, 4, (April 1996), pp. 1472-1474, ISSN: 0088-5885.
Monahan, A. R., Germano, N.J., Blossey, D.F. (1970) Aggregation of Arylazonaphtols.I. Dimerization of Bonadure Red in aqueous and Methanolic systems J. Phys Chem. 74, 23, (November 1970), pp. 4014, ISSN: 0021-9606.
Monahan, A. R., Blossey, D.F. (1971) Aggregation of Arylazonaphtols.II.Steric effects on Dimers Structure J. Phys Chem. 75, 9, (April 1971), pp. 1227-1233 ISSN: 0021-9606.
Nasr, M.F., El-Ola,S.M.A.,Ramadan,A. y Hazme,A. (2006) A Comparative Studie Between the Adsorption Behavior of Activated Carbon fiber and Modified Alginate I. Basic dyes. Polymer-Plastics Technology and Engineering 45, 3, (March 2006), pp. 335-340, ISSN: 1525-6111
Oakes, J.; Dixon, S. (2003) Adsorption of dyes to cotton and inhibition by surfactants, polymers and surfactant-polymer mixtures. Color. Technol. 119, 6, (November 2003), pp. 315-323, ISSN: 1472-3581.
Ogawa, T. and Yatome, C. (1990) Biodegradation of Azo Dyes in Multistage Rotating Biological Contractor Inmobilized by assimilating Bacteria. Bull. Environ. Cont. Toxicol. 44, 4, (April 1990), pp. 561-566. ISSN: 1432-0800
Özcan, A.S.; Clifford, A.A.; Bartle, K.D. (1997) Solubility of Disperse Dyes in Supercritical Carbon Dioxide J. Chem. Eng. Data, 42, 3, (May 1997), pp. 590-592, ISSN: 1520-5134
Poots, V.J.P. and McKay, J.J. (1976) The Removal of Acid dye from Effluent Using Natural Adsorbents-II Wood. Water Res. 10, 12, (December 1976), pp. 1067-1070, ISSN: 0043-1354
Reeves, R.L., Maggio,M.S., Harkaway, S.A. (1979) A critical spectrophoptometric analysis of the Dimerization of some ionic Azo Dyes in Ionic solution J. Phys Chem 83, 18, (September 1979), pp. 2359-2368, ISSN: 0021-9606.
Rinaudo, M. (2004) Role of sustituents on the properties of some polysaccharides, Biomacromolecules 5, 4, (July 2004), pp.1155-1165, ISSN: 1526-4602.
Rodd, A.B., Cooper-White, J.J., Dunstan, D.E. y Boger, D.V. (2001 a) Gel Point studies for chemically modified biopolymer netwoeks using small amplitude scillatory rheometry Polymer 42, 1, (January 2001), pp. 185-198, ISSN: 1097-0126.
Rodd, A.B., Cooper-White, J.J., Dunstan, D.E. y Boger, D.V. (2001 b) Polymer Concentration dependence of the Gel point for Chemically Modified Biopolymer Networks Using Small Amplitude Oscillatory Rheometry Polymer, 42, 3, (February 2001), pp. 3923-3928, ISSN: 1097-0126.
Satake, I.; Yang, J. T. (1976) Interaction of Sodium Decyl Sulfate with Poly(L-ornithine) and Poly(L-lysine) in Aqueous Solution Biopolymers 15, 11, (November 1976), pp. 2263-2275, ISSN: 0006-3525.
Shinoda, T.; Tamura, K. Solubilities of C.I. (2003) Disperse Orange 25 and C.I. Disperse Blue 354 in Supercritical Carbon Dioxide. J. Chem. Eng. Data 48, 4, (July 2003), pp. 869-873. ISSB: 1520-5134.
Siew, C. K. and Williams, P.A. (2005) New Insights Into Mechanism of Gelation of Alginate and Pectin: Charge Annihilation and Reversal Mechanism Biomacromolecules 6, 2, (March 2005), pp. 963-969, ISSN: 1526-4602

Biotechnology of Biopolymers 190
Sun, G.; Xu, X. (1997) Sunflower Stalks as Adsorbents for Color Removal from Textile Wastewater. Ind. Eng. Chem. Res. 36, 3, (March 1997), pp. 808-812 ISSN: 0088-5885.
Sung, H.D.; Shim, J.J. (1999) Solubility of C.I. Disperse Red 60 and C.I. Disperse Blue 60 in Supercritical Carbon Dioxide J. Chem. Eng. Data. 44, 5, (September 1999), pp. 985-989 ISSN: 1520-5134.
Tiddy, G. J. T., Mateer, D.L. Ormedrod, A.P., Harrison, W.J., Edwuards, D.J. (1995) Highly Ordered aggregates In Dilute Dye-Water Systems Langmuir 11, 2, (February 1995), pp. 390-393, ISSN: 0743-7463.
Torres, E., Mata, Y.N., Blázquez, M.L., Muñoz, J.A., González, F. y Ballester, A. (2005) Gold and Silver Uptake and nanoprecipitation on Calcium Alginate Beads Langmuir 21, 17, ( August 2005), pp. 7951-7958, ISSN: 0743-7463.
Trung, T.S.; Ng, C.H.; Stevens, W.F. (2003) Characterization of Decrystallized chtitosan and its application in biosorption of Textile dyes. Biotechnology Letters 25, (July 2003), pp. 1185-1190 ISSN: 0141-5492.
Wong, Y.C.; Szeto, Y.S.;, Cheung, W.H.; McKay, G.M. (2004) Adsorption of Acid Dyes on Chitosan-equilibrium Isotherms analyses. Process Biochem. 39, 6, (February 2004), pp. 695-704, ISSN: 1359-5113.
Zimm, B.H. and Bragg, J.K. (1959) Theory of Phase Transition Between Helix and Random Coil in Polypeptide Chains J. Chem. Phys. 31, 2, (August, 1959), pp. 526-535, ISSN: 0021-9606.

Part 4
Macro and Micro Characterization of Biopolymers


10
Macro and Micro Characterization of Biopolymers: Case of Cotton Fibre
Omar Harzallah and Jean-Yves Drean Laboratoire de Physique et Mécanique Textiles EAC 7189 CNRS,
Université de Haute Alsace, France
1. Introduction This chapter’s aim is to give the reader an overview of different methods used to characterise biopolymers based on the case of cotton fibre. It is not meant to be an exhaustive list of methods, but to give examples that illustrate as clearly as possible the most used and most efficient methods. The cotton fibre is a very complex biopolymer whose properties depend on varietal and environmental conditions. Cotton fibre is a very well adapted example to describe the different methods to characterise the morphology, the mechanical properties on single fibres or on fibre bundles and the surface properties. Reference methods are described as well as more advanced methods based on experiments which have been carried out by the authors and their co-workers.
2. Development of cotton fibre 2.1 Origin of cotton The Cotton plant belongs to the order of Malvales, the family Malvaceae, the tribe Hibiscus, and the genus Gossypium. There are four domesticated species of cotton of commercial importance: G. barbadense, G. hirsutum, G. arboreum and G. herbaceum. Each one of these commercially important species contains many different varieties developed through breeding programmes to produce various types of cotton with continually improving properties such as faster maturing, improved insect and disease resistance, greater length, better strength and uniformity. At various periods, the G. barbadense L., native South America, was transported to various parts of the world and grown as a commercial crop. Breeding and selection in this species resulted in varieties known for their superior fibre quality. These belong to the long staple varieties of cotton and are known for their length exceeding 33 mm, fine fibres with exceptional tensile strength. They supply about 8% of the current world production of cotton fibre. This group includes the commercial varieties of Egyptian, Sea Island, and Pima cottons. G. hirsutum L., which produces medium to long fibres (25 mm to 32 mm), is developed in the United States from cotton native to Mexico and Central America and includes all the many commercial varieties of American Upland cotton. Upland cotton, now provides over 90 % of the world production of raw cotton fibre. Fibre from G. hirsutum L. is widely used in apparel,
Biotechnology of Biopolymers
194
home furnishing and industrial products. G. barbadense L. Pima is used for the production of high-quality fabrics. The other species, G. arboreum L. and G. herbaceum L. are the shortest staple types of cotton cultivated (inferior to 25 mm) and are coarse. Both are of minor commercial importance worldwide but are still grown commercially in Pakistan and India. According to projections by the International Cotton Advisory Committee (ICAC), world cotton production is expected to grow by nearly 10% in 2010/11 upto 24.2 million tons, against 22.2 Mt in 2009/10. The main cotton producers are China (31%), India (23%), the United States (12%), Pakistan (10%) and Brazil with 5% of world production.
2.2 Morphology The cotton plant has a branched taproot capable of going down to several meters below the ground surface in optimum conditions. This root part has the dual role of supporting the plant and absorbing nutrients from the soil. The sowing date of cotton seed is determined by climatic conditions (temperature, rainfall). It varies from one region to another and may extend over several seasons depending on climate. According to varietal and environmental conditions, the phase of emergence (10 to 30 days from germination to the spreading of the cotyledons) as well as the plantlet stage last about 50 to 65 days. They are followed by anthesis announcing the end of the vegetative phase and the beginning of the flowering phase. The rate of flowering can vary after the varietal and climatic conditions. Pollination occurs in the few hours after the opening of flowers, fertilization is completed within thirty hours after the opening of the flower. Certain ovules may not be fertilized, others may abort despite normal fertilization. These are the causes of aborted seeds, usually called dead. Flowering is spread over time, the phases of flowering and maturation overlap. The maturation phase of the capsules (fruits of cotton) may last 40 to 80 days, or more depending on the variety, growing conditions and position of the capsule in the plant. After this phase, the mature capsules open and the seed cotton is dry. Seed cotton is the subject of the harvesting and is constituted of the seeds and fibres they carry. Flowers can continue their development despite the fact that the first capsules are open. It is a characteristic of the cotton plant to present simultaneously flower buds, flowers, capsules closed or opened during its development. In the mature stage fibres are constituted of about 95% of cellulose; other not cellulosic constituents: mineral substances (1.4%), wax (0.9%), proteins (1.6%), pectic acids (0.9%) and other organic acids are located in the secondary membrane and in the lumen (Parry, 1982).
2.3 Cotton fibre structure The cotton fibre is unicellular; it develops from the epidermal cell of the ovule (called seed after maturation). Its development begins before the anthesis (Joshi and al, 1967; Lagière, 1966; Parry, 1982) or on the same day of the anthesis (Beasley, 1975; Stewart, 1975). Following flowering, each cell elongates until reaching its final length in about 20 to 25 days. The ultimate length is determined by the cotton variety and environmental conditions. During this growth, the cells are encircled by a primary cell wall (less than 1 μm thick) and covered by a wax layer or cuticle (Lewin & Pearce, 1998). This waxy and smooth layer has a significant impact on the smoothness and the handling of cotton during processing. During this development stage, the fibre begins to be thickened by deposition of regular layers of secondary-wall cellulose inside the primary cell wall (Fig. 1).

Macro and Micro Characterization of Biopolymers: Case of Cotton Fibre
195
Fig. 1. Fibre structure (Seagull & Alpspaugh, 2001)
The central layers of the secondary wall are characterised by a thickness (approximately 4 μm thick) that constitutes about 90% of the weight of the lint (Seagull & Alpspaugh, 2001) and their structure represents the major portion of the strength of the fibre. Between seven and nine weeks most fibres terminate wall thickening. Cellulose in the crystalline state begins to form 15-19 days post-anathesis, and by maturity, tubular fibres contain 96% (Lewin & Pearce, 1998) of cellulose with 90% in the secondary wall (Kohel, 1999). Shenai (Shenai, 1988) has shown that strength and elongation increase with the increasing crystalline microfibril spiral arrangement and orientation within the cotton fibres. In fact, the structure contains parallel wrinkles at a slight angle relative to its axis, forming a helical structure. In the winding layer the cellulose microfibrils are aligned at angles ranging 40-70° relative to the fibre axis, whereas each microfibril in the primary wall spirals at 20-30° relative to the fibre axis. In the thick secondary wall, the fibrils are approximately oriented at a 45° angle. The helical orientation can be shown up in various ways: optical birefringence, for direction of the molecule chains measurement; X-ray diffraction, for the axis of the crystal lattice evaluation; electron microscopy, for the microfibrils observation; optical microscopy, for the coarse fibrils observation. The final stage appends when the boll opening begins at maturity leaving the fibres fully exposed to air and sunlight. The fibre water content rapidly decreases as the cytoplasm dries against the inner surface of the wall. The lumen collapses causing a convoluted surface of the cotton fibre. The fibre assumes a twisted conformation. These twists, or convolutions, make it possible for the fibres to be spun into yarns. If the fibre does not produce a thick secondary wall, the fibre is said to be immature. When such fibres are dried, they form thin, flattened ribbons with minimal twisting. Because fibres begin development at different times, on a mature seed there may be fibres with differing levels of maturity. An accurate assessment of the degree of maturity is essential since the presence of immature fibres can cause many problems during processing (Thibodeaux & Rajasekaran, 1999). The reduced strength and resilience of the immature fibre lead to excessive damage and waste at ginning and carding operations. It could also lead to weak and uneven yarns, increase the tendency of fibres to tangle and form neps. In addition, the effect of maturity on the dyestuff

Biotechnology of Biopolymers
196
picking is well known. The Goldthwait test is based on this effect (Goldthwait & al., 1947). In fact, because of the relative low dye affinity of immature fibre due to low cellulose content, numerous dyeing imperfections could appear in fabrics. These defects are commonly known as white specs (Xu & Pourdeyhimi, 1994). The characteristics of the cell wall-thickness which represents the maturity of the fibre are largely environmental (nutrition water supply, temperature, etc…) in nature and may be somewhat modified by varieties. Other important factors are the day of flowering, the beginning and the end of the season. Different places on the seed differ markedly in wall development.
3. Physical properties of cotton fibres 3.1 Cotton fibre maturity Maturity is one of the determinants in evaluating cotton quality because it can affect many properties of cotton fibres. Mature fibres usually possess greater strength and better resilience. The presence of immature fibres may cause excessive waste during processing and may weaken yarn strength (Raes & Verschraege, 1981). Immature fibres have also been recognized as one of the main causes of neps formation in carded webs, yielding a rough and uneven appearance of yarns and fabrics. Due to their relatively low dye affinity (Thibodeaux & Evans, 1986), neps easily show up as imperfections in a dyed fabric. Hence information about cotton maturity is desirable and essential for cotton growers and processors. The experimental methods of testing cotton maturity can be classified into direct and indirect approaches (Thibodeaux & Evans, 1986).
3.1.1 Direct methods One direct method is based on microprojection in order to measure the perimeter and area of fibres and lumens, which are subsequently used to calculate maturity. Another method determines the proportion of immature fibres by counting the number of mature fibres present in the sample. This procedure (Brown & al., 1996) involves using an 18% solution of sodium hydroxide as the mounting medium to swell the fibres. The swollen fibres are then examined under a microscope at a magnification of 400X. If a fibre is swollen into an un-convoluted and rod-like shape, it can be counted as a mature fibre. The main drawbacks of these methods are low efficiency and accuracy.
3.1.2 Indirect methods Indirect methods are those based on some fibre characteristics that are associated with the degree of wall thickening of the fibre, such as air permeability (Powland & al., 1976; Raes & Verschraege, 1981), birefringence and dyeability (ASTM D1464-79). The Micronaire instrument (ASTM D1448-84) measures the resistance to an air flow through a pre-weighed cotton tuft and this method is the most frequently used. Micronaire Index (Mic) represents a combined measure of cotton fineness H and maturity M (Lord, 1956). Fibre fineness or coarseness is defined as the weight per unit length or the linear density of the fibre (ASTM D1769-77); expressed in millitex (mtex, micrograms per meter). The method of measurement carried out by the Advanced Fibre Information System (AFIS) is based on detecting the attenuation of light amount that is diffracted by a fibre. Fibres which are individually transported by a fast air stream, cross a beam of light. The reflected light will be detected by an electro-optical sensor placed at 40° from the normal direction of the beam (Bragg & Shofner, 1993). The diffraction signal is related to the shape of the fibre.

Macro and Micro Characterization of Biopolymers: Case of Cotton Fibre
197
Much research has been conducted with image analysis technology to measure the cotton maturity and other parameters from fibre cross sections (Xu & al.; 1992; Xu & al., 1993). The success of a cross sectional method using image analysis largely relies on two techniques i.e. fibre cross sectioning and image segmentation. Cross-sectioning is the most significant step in obtaining analysable images of fibres. A bundle of fibres embedded in a polymer resin is cut (Annis & al., 1992; Boylston & al., 1995) and the surface containing the fibre cross sections is imaged on a microscope by reflected light (Annis & al., 1992). Image segmentation is a computational process that separates cotton cross sections from the image background from one another. Due to variations in the cross sectional shape and thickness of sliced samples, fibres in different regions exhibit different levels of contrast and focus in an image. The image analysis system for processing cotton cross sectional images often requires operator assistance to draw separation lines between touching fibres, to locate lumens, and to connect broken edges. Therefore, Image Analysis presents a quick and reliable technique for determining the cotton fibre maturity which consists of performing cotton fibre cross-section, acquiring and analyzing their image to determine: Perimeter, Area and Theta (degree of secondary wall thickening of cotton fibres). (Xu & Huang, 2004) Figure 2 shows a schematic cross section of the cotton fibre; the shaded area is the secondary cell wall and the linear dimension measured along the outer periphery of the fibre is called the perimeter.
Fig. 2. Schematic cross section of the cotton fibre
From this schematic cross section of the cotton fibre, we can deduce this relationship (equation 1):
( )2 22 1wA R Rπ= − (1)
Where wA is the cell-wall area (cross-sectional area minus lumen area) in microns and respectively, 1R and 2R is the inside and outside diameter. Since the degree of thickening (Theta) was defined as the ratio of the cross sectional area of the total fibre wall to the area of a circle of the same perimeter (equation 2). Then:
( )2 2
2 12 2 2 22 2 22
4
2
w w wR R A A A
R R PP
π πθπ π
ππ
−= = = =
⎛ ⎞⎜ ⎟⎝ ⎠
(2)
Where θ is equal to the degree of secondary wall thickening (no unit) and 2P is the outside perimeter of the fibre expressed in microns.
D=2R2d=2R1

Biotechnology of Biopolymers
198
Completely circular fibres, regardless of their perimeter, have a value of theta equal to unity (based on completely round and solid cross sections). Mature fibres typically have kidney bean shaped cross sections and a high theta value. Immature fibres, which collapse to a greater extent upon boll opening, have lower theta value.
3.1.3 Results The authors of this chapter conducted experiments (Harzallah & al., 2010) based on the image analysis method to characterise four types of cotton (Figs. 3a to 3d), which were selected based on their distinct physical properties, and compared the results obtained with AFIS measurements. These types of cotton consisted in Upland varieties from the 2003 harvest. The method principle is based on measuring the fibre perimeter (P) and cross sectional area (S) to calculate the degree of secondary wall thickening of cotton fibres (Fig.4).
Fig. 3a. Microscopic observation for the section of the cotton I (X 400)
Fig. 3b. Microscopic observation for the section of the cotton II (X 400)
Fig. 3c. Microscopic observation for the section of the cotton III (X 400)
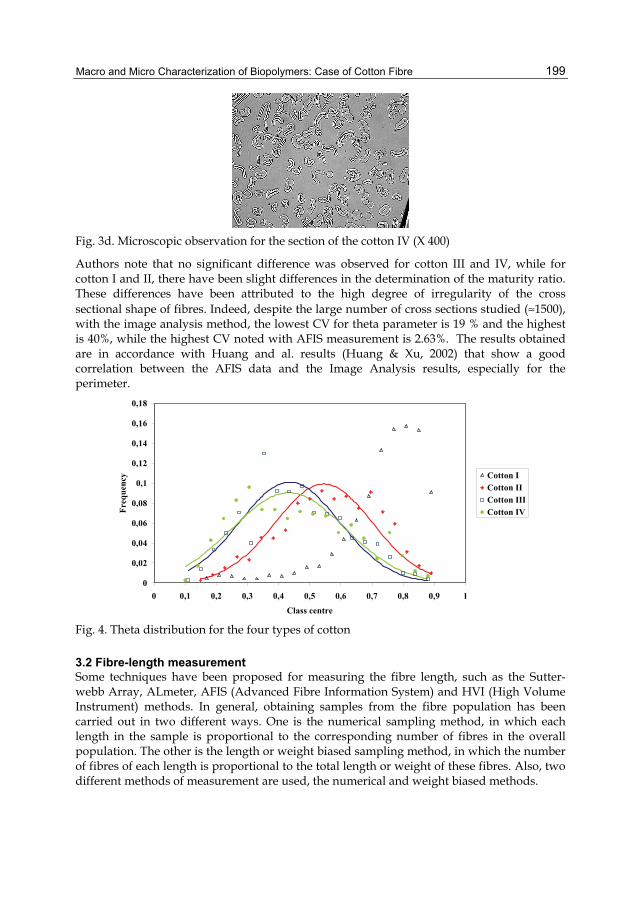
Macro and Micro Characterization of Biopolymers: Case of Cotton Fibre
199
Fig. 3d. Microscopic observation for the section of the cotton IV (X 400)
Authors note that no significant difference was observed for cotton III and IV, while for cotton I and II, there have been slight differences in the determination of the maturity ratio. These differences have been attributed to the high degree of irregularity of the cross sectional shape of fibres. Indeed, despite the large number of cross sections studied (≈1500), with the image analysis method, the lowest CV for theta parameter is 19 % and the highest is 40%, while the highest CV noted with AFIS measurement is 2.63%. The results obtained are in accordance with Huang and al. results (Huang & Xu, 2002) that show a good correlation between the AFIS data and the Image Analysis results, especially for the perimeter.
0
0,02
0,04
0,06
0,08
0,1
0,12
0,14
0,16
0,18
0 0,1 0,2 0,3 0,4 0,5 0,6 0,7 0,8 0,9 1Class centre
Freq
uenc
y Cotton ICotton IICotton IIICotton IV
Fig. 4. Theta distribution for the four types of cotton
3.2 Fibre-length measurement Some techniques have been proposed for measuring the fibre length, such as the Sutter-webb Array, ALmeter, AFIS (Advanced Fibre Information System) and HVI (High Volume Instrument) methods. In general, obtaining samples from the fibre population has been carried out in two different ways. One is the numerical sampling method, in which each length in the sample is proportional to the corresponding number of fibres in the overall population. The other is the length or weight biased sampling method, in which the number of fibres of each length is proportional to the total length or weight of these fibres. Also, two different methods of measurement are used, the numerical and weight biased methods.

Biotechnology of Biopolymers
200
3.2.1 Reference method The reference method is a method where the length of every group of fibre is measured and allows a histogram to be plotted from which the average, the coefficient of variation and others statistical parameters are deducted. In this paragraph, we will describe the Zweigle sorter method. This method is based on using a Johannsen-Zweigle apparatus consisting of two steel comb fields which allow to straighten and align the fibres. For cotton, the comb spacing is 4 mm. Here the weight of the test specimen is 100 mg. The weighed sample is prepared by one of the zoning methods (Morton & Hearle, 2008). Then, by repeated drawing and doubling, it is formed into a narrow bundle of fibres, which are straight and parallel as possible. The aim of this method is to sort the fibres into groups of predetermined length intervals by using the special tweezers. The fibres of each group are then weighed to obtain a mass distribution for the sample. In this procedure, each group's length interval is determined by the spacing of the combs, which must therefore be such as to provide at least ten groups from the sample of material under examination and must extend over at least the length of the longest fibre. So, the longest fibres are pulled and weighed first and then the shortest. The time taken by an experienced worker in making a single Zweigle sorter test, excluding sampling and analyzing of data, ranges from about ¾ hour for a short-stapled Indian cotton to 1½ hours for long stapled Egyptian or Sea Island Cotton.
3.2.2 Capacitance scanning Peyer Texlab System, which was introduced in the 1960s, is based on the same measurement method and is still currently used. This apparatus is composed of two systems which sort and align a fibre beard and measure its length distribution. The Fibroliner (FL-101) mechanically combs either sliver or ginned lint specimens into a parallel beard. The straight and aligned fibres are placed between a pair of carrier films for measurements. The ALmeter (AL-101) scans the beard using capacitance measurements to produce an output signal that is proportional to the cumulative mass distribution. The capacitor scans the fibres of the test specimen every 0.125 mm. The microprocessor can convert the mass distribution to a number distribution when the linear density of the fibres is assumed to be constant. The ALmeter test can be performed in approximately 15 minutes, while it takes about two hours to make the Zweigle sorter test. The ALmeter can supply different sets of array information from the raw data, including a weight based distribution, an area based distribution and a Fibrograph. From these distributions parametric values such as the mean length biased by cross-section, mean length biased by weight, coefficients of variation and other useful statistical parameters can be extracted.
3.2.3 Photo-electric scanning method The original idea of the photoelectric scanning or Fibrograph method (ASTM D1447-83) has been developed by Hertel in 1940 for testing cotton lint (Hertel, 1940). This test method covers the measurement of the length and length uniformity of cotton fibres. By using the fibrosamplers, beard of fibres are randomly caught on combs to obtain an equal probability of selecting any given fibre length. The beard formed by the captured fibres is scanned photoelectrically from base to tip (no more fibres). The amount of light passing through the beard is a measure of the number of fibres that extend various distances from the combs. In the early 1980s, a fast fibre testing system called high volume instruments (HVI) was developed. This system is now produced by Uster Technologies to test a number of key fibre

Macro and Micro Characterization of Biopolymers: Case of Cotton Fibre
201
properties including fibre length (ASTM D4605-86). This apparatus uses automatic preparation to ensure that all points along the length of each fibre have an equal chance of coinciding with the line of the comb teeth. The fibres clamped in this comb are then combed and brushed to form a fibre beard of parallel and straight fibres. Then an automatic feeding of fringes through photoelectric sensing is realized. When the fibre beard is analyzed, the HVI measures the fibre length based on the Fibrograph method. The auto-sampling has increased the rapidity of the preparation for analysis. With the original Fibrograph, the time required to make a complete test, including preparation of the beard and analysis of the Fibrogram (Fig. 5), is about 10 minutes. In the automated HVI tests, the analysis is computerized and testing takes only few minutes.
Fig. 5. a Fibrogram
There are two interpretation systems for the Fibrogram: Span length (SL) or Mean Length (ML). The x% SL was defined as being the length exceeded by only x % of the beard fibres scanned by the instrument. The commercial practices have retained the 50% SL and the 2.5% SL. The 50% SL represents an approximation of the average length of the fibres scanned, while the 2.5% SL was used as commercial length. Until 1995, the standard ICCS (International Standard Calibration Cotton) gave the lengths according to this interpretation of the Fibrogram. The interpretation system by “Mean Lengths” is graphically equivalent to the tracing of tangents to the Fibrogram tuft at characteristic points. Mean length (ML) is obtained by drawing a tangent to the Fibrogram from the 100 % point of fibres and extrapolating to the lengths axis (Figure 5). This value represents the average length of all fibres constituting the beard (Equation 3).
100
% 0100
% 0
%
%
i
i
i in
in
n
Mean lengthn
=
=
⋅
=∑
∑ (3)
Where %in is the percentage of fibres of length i .

Biotechnology of Biopolymers
202
The tangent to the Fibrograph drawn from the 50 % point of fibres and extrapolating to the lengths axis indicates the Upper Half Mean length (UHML) which indicates the average length of the longer half of the fibres (Equation 4).
50
% 050
% 0
%
%
i
i
i in
in
n
Upper Half Mean lengthn
=
=
⋅
=∑
∑ (4)
Where %in is the percentage of fibres of length i . Ratios of uniformity are deducted from both systems of interpretation of the Fibrograph. Uniformity Index (UI %) is the ratio of the mean length ML to the upper half mean length UHML. It is a measure of the uniformity of fibre lengths in the sample expressed as a percent. It is typically just above 0.8 in HVIs and 0.7 in comb sorters. On the other hand, Uniformity Ratio (UR %) is determined by dividing the 50 % span length by the 2.5 % span length and expressed as a percentage. It is a smaller value than the uniformity index by a factor close to 1.8. Larger values indicate a more uniform fibre length distribution, while lower values tend to be associated with manufacturing waste, more difficult processing, and lower the product quality. The uniformity index (or the uniformity ratio) represents the most commonly used shape parameter of the length distribution. The Fibrograph uses the theory of Span Lengths while the HVI, further to recent decisions of standardization, uses the system of Mean Lengths.
4. Mechanical properties 4.1 Bundle fibre testing Before studying the measuring methods, let us see the definition of the tenacity, the notion appropriate for the domain of the fibres science and fundamentally different from the measurable variable "tenacity" used in the mechanics of materials. The tenacity in the textile domain, expressed as cN/tex, can be linked through the density to the stress notion in tensile test generally used for materials (Equation 5).
4
3
( )( ) 10( / )( )( / )
at breakF cNstress PaTenacity cN texlinear density texdensity Kg m
−×= = (5)
The stress corresponds to the break load by unit of the breakage surface, generally expressed in Pascal or daN/cm2. As it is not possible to measure the surface broken for textile materials, the mass per unit length (g/1000 m) is used which is a correct estimation when the density of materials is constant and known ; it is known that the density of the cellulose is 1.52 g/cm3 (Morton & Hearle, 1975). The assumption of homogeneity of density appears to us debatable for the following reasons. First the area of the broken section can be different from the mean value estimated by a mean value of the fineness. The second reason is assigned to the differences of the structure organization in the diverse layers which compose the fibres and lead probably to the density variation. The mass per unit length and the density would not, then, be equivalent in both main layers of cotton fibres. In 1999, Kunzel and al. mentioned several literature references on the subject.
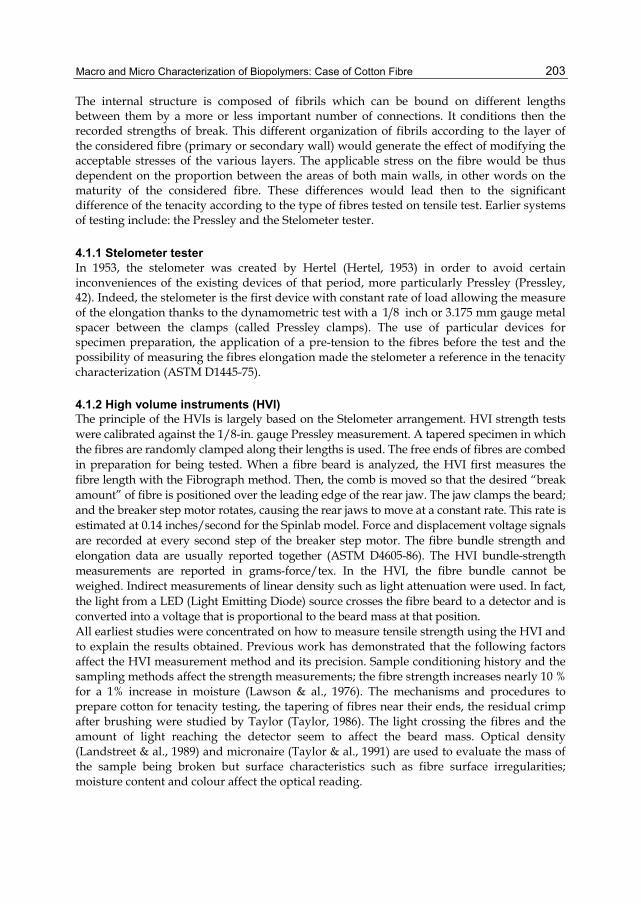
Macro and Micro Characterization of Biopolymers: Case of Cotton Fibre
203
The internal structure is composed of fibrils which can be bound on different lengths between them by a more or less important number of connections. It conditions then the recorded strengths of break. This different organization of fibrils according to the layer of the considered fibre (primary or secondary wall) would generate the effect of modifying the acceptable stresses of the various layers. The applicable stress on the fibre would be thus dependent on the proportion between the areas of both main walls, in other words on the maturity of the considered fibre. These differences would lead then to the significant difference of the tenacity according to the type of fibres tested on tensile test. Earlier systems of testing include: the Pressley and the Stelometer tester.
4.1.1 Stelometer tester In 1953, the stelometer was created by Hertel (Hertel, 1953) in order to avoid certain inconveniences of the existing devices of that period, more particularly Pressley (Pressley, 42). Indeed, the stelometer is the first device with constant rate of load allowing the measure of the elongation thanks to the dynamometric test with a 1 8 inch or 3.175 mm gauge metal spacer between the clamps (called Pressley clamps). The use of particular devices for specimen preparation, the application of a pre-tension to the fibres before the test and the possibility of measuring the fibres elongation made the stelometer a reference in the tenacity characterization (ASTM D1445-75).
4.1.2 High volume instruments (HVI) The principle of the HVIs is largely based on the Stelometer arrangement. HVI strength tests were calibrated against the 1/8-in. gauge Pressley measurement. A tapered specimen in which the fibres are randomly clamped along their lengths is used. The free ends of fibres are combed in preparation for being tested. When a fibre beard is analyzed, the HVI first measures the fibre length with the Fibrograph method. Then, the comb is moved so that the desired “break amount” of fibre is positioned over the leading edge of the rear jaw. The jaw clamps the beard; and the breaker step motor rotates, causing the rear jaws to move at a constant rate. This rate is estimated at 0.14 inches/second for the Spinlab model. Force and displacement voltage signals are recorded at every second step of the breaker step motor. The fibre bundle strength and elongation data are usually reported together (ASTM D4605-86). The HVI bundle-strength measurements are reported in grams-force/tex. In the HVI, the fibre bundle cannot be weighed. Indirect measurements of linear density such as light attenuation were used. In fact, the light from a LED (Light Emitting Diode) source crosses the fibre beard to a detector and is converted into a voltage that is proportional to the beard mass at that position. All earliest studies were concentrated on how to measure tensile strength using the HVI and to explain the results obtained. Previous work has demonstrated that the following factors affect the HVI measurement method and its precision. Sample conditioning history and the sampling methods affect the strength measurements; the fibre strength increases nearly 10 % for a 1% increase in moisture (Lawson & al., 1976). The mechanisms and procedures to prepare cotton for tenacity testing, the tapering of fibres near their ends, the residual crimp after brushing were studied by Taylor (Taylor, 1986). The light crossing the fibres and the amount of light reaching the detector seem to affect the beard mass. Optical density (Landstreet & al., 1989) and micronaire (Taylor & al., 1991) are used to evaluate the mass of the sample being broken but surface characteristics such as fibre surface irregularities; moisture content and colour affect the optical reading.

Biotechnology of Biopolymers
204
The authors of this chapter with the help of Hequet’s team (Fiber and Biopolymer Research Institute, Lubbock, TX - USA) have conducted a work (Benzina & al., 2007) to attempt to calibrate the high volume instrument elongation measurements. This study found that the negative correlation between fibre tenacity and elongation measured with HVI instruments was weak and it was possible to have different types of cotton with good tenacity and elongation. The bundle elongation and tenacity of cotton fibres were measured using a modified tensile testing instrument to which Pressley clamps ( 1 8 inch gage length) were adapted. Work of rupture were correlated to the product tenacity x elongation as determined by HVI in order to detect possible drifts of the HVI tensile measurements. The authors are also emphasizing the importance of measuring the work of rupture when evaluating the potential textile performance of fibres. Work of rupture, a function of tenacity and elongation, indicates the amount of energy that would be necessary to break a bundle of fibres. This study suggests breeders should work to improve fibre elongation in their programmes because the data indicate that improving fibre tenacity while ignoring fibre elongation may inhibit the ability to increase work to rupture values (Fig. 6).
Fig. 6. Percentage change of work of rupture vs. HVI tenacity (Benzina & al., 2007) Variety A: 28 cN/tex, 4% elongation; Variety B: 24 cN/tex, 8% elongation Variety B would perform better in spinning and weaving than variety A
4.2 Single fibre testing In investigating the influence of the microstructure of synthetic fibres on the physico- mechanical properties, micro-stress equipment has been found to be very useful (Isings, 1964). Although results obtained for fibres of relatively regular cross section are more simply interpreted than those for fibres with less regular cross section, e.g., cotton, useful data can be obtained in the latter cases also. The breakage of a single fibre is considered as one of the recent tools to understand this relationship between the mechanical behaviour and the fine microstructure of fibres.
4.2.1 Tensile and fatigue tester Today Favimat (Textechno Herbert Stein GmbH and Co.KG, Germany) and Mantis (Zellweger-Uster, Charlotte, NC) testing determine the traditional single fibre data, the

Macro and Micro Characterization of Biopolymers: Case of Cotton Fibre
205
tensile strength and the elongation at a constant rate of extension. The Favimat testing instrument allows to obtain additional fibre parameters such as capturing fibre crimps, tenacity, linear density, and work to rupture. Parameters measured with the Mantis were the breaking load or force to break, Tb (g), and the fibre ribbon width, RW (μm). Another strength tester, which was used mainly in research domain of man made fibre, is the Universal Fibre Testing Machine (UFT). This apparatus was developed by Bunsell and al. (Bunsell & al., 1971) at the beginning of the 1970s. The UFT allows to carry out the testing of single fibres in tension, creep, relaxation and fatigue. Early research (Bunsell & Hearle, 1971) carried out, on PA 6.6 fibres, using UFT and scanning electron microscope have showed a distinctive tensile fatigue process. Since then, this machine has been greatly used to highlight the behaviour in fatigue of thermoplastic fibres (Oudet & Bunsell, 1987; Ramirez & Bunsell, 2006; Elamri & Lallam, 2007), aramid fibres (Lafitte & Bunsell, 1985) and carbon fibres (Bunsell & Somer, 1992). The technique of mounting the individual fibre in the testing machine was described in the handbook of the tensile properties of textile and technical fibres (Bunsell, 2009). Based on a variety of testing procedures, the results suggest that the UFT appears satisfactory for measuring current and future cotton properties.
4.2.2 Tensile failure The authors of this chapter have used this machine to bring out the single cotton fibre breakage with both tensile and fatigue testing. The simple tensile test is carried out by setting a constant deformation rate of 20 mm/min under a pre-tension of 0.2 cN/tex to avoid the crimp. The deformation rate used is often adjusted to result in fibre failure after approximately 20 seconds. The fatigue tests are realised by imposing a sinusoidal load using a vibrating pot and controlling the amplitude of the maximum and minimum load at a determined frequency. As regards to the tensile results, authors revealed that there are good correlations between single-fibre strength and bundle strength, measured by the HVI, of cotton fibres (Harzallah & al., 2010). These results are also in agreement with Thibodeaux and al. results (Thibodeaux & al., 1998). These points make the evaluation of bundle strength more beneficial to predict the strength of the yarn. Basically, the yarn strength is determined not only by fibre strength, but also by fibre-to-fibre interactions as induced by length, friction and degree of twist. On the other hand, in order to elucidate the fundamental problem of the bundle fibre tests by understanding the fundamental nature of fibre fracture under stress. Hearle and al. (Hearle & al., 1998) presents, in his book, different shapes of failure and classify them into categories. This classification is based on a combination of the fracture appearance examination, the microscopic cause, and the structural mechanism. The fibre fracture of cotton fiber after tensile and fatigue testing were discussed in previous works (Benzina & al., 2007; Harzallah & al., 2010). In these works, two types of cotton have been chosen. Cotton I is very coarse with low tenacity (20.6 cN/tex), while cotton II is fine and has a high tenacity (36.4 cN/tex). The electron micrographs (Figures 7a and 7b) of individual fibres taken under tension show that the reversal area tends to untwist in order to elongate the fibre; this generates stresses that can cause an axial splitting between the frills. The split runs around the fibre until it reaches the line of weakness and then breaks. Meredith (Meredith, 1951) explained that the uneven exterior of a dry cotton fibre’s structure contains parallel wrinkles at a slight angle to its axis, forming a helical structure directly related to fibre reversals and twists. These reversals are related to the orientation of secondary walls and represent areas of variation in breaking strength. The adjacent reversal areas are constricted and are less dense which is the weak point (Hsieh, 1999).

Biotechnology of Biopolymers
206
Fig. 7a. Elongated fibre during the tensile test (cotton III)
Fig. 7b. Morphology of fibre after tensile test (cotton III)
4.2.3 Fatigue failure Harzallah and co-workers (Drean & al., 2005; Benzina & al., 2007; Harzallah & al., 2010) have conducted experiments to understand the fatigue mechanisms of cotton fibre. These experiments have shown that under cycling loading conditions, approximately 50 to 70% of the breaking load, the fibrils are axially oriented (Fig. 8b) at the reversal point of the fibre. This generates an area of high stress concentration inducing a separation of fibrils adjacent to this point before failure. The failure of macro-fibrils seems to be the mechanism precursor to the initiation and propagation of a crack. The rupture of macro-fibrils is initiated by a defect while applying the fatigue solicitation in the fibre.
Fig. 8a. Before the fatigue test (cotton I)
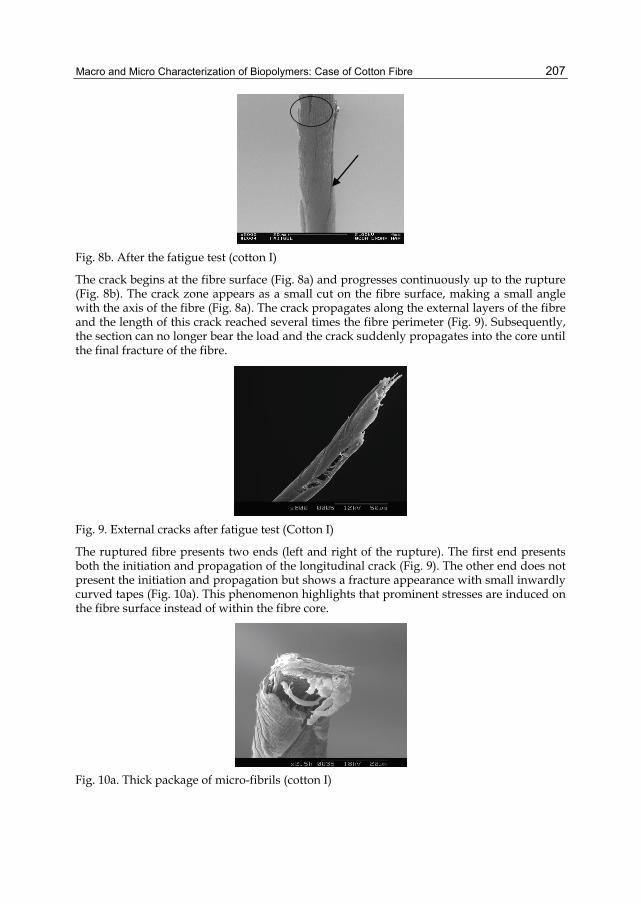
Macro and Micro Characterization of Biopolymers: Case of Cotton Fibre
207
Fig. 8b. After the fatigue test (cotton I)
The crack begins at the fibre surface (Fig. 8a) and progresses continuously up to the rupture (Fig. 8b). The crack zone appears as a small cut on the fibre surface, making a small angle with the axis of the fibre (Fig. 8a). The crack propagates along the external layers of the fibre and the length of this crack reached several times the fibre perimeter (Fig. 9). Subsequently, the section can no longer bear the load and the crack suddenly propagates into the core until the final fracture of the fibre.
Fig. 9. External cracks after fatigue test (Cotton I)
The ruptured fibre presents two ends (left and right of the rupture). The first end presents both the initiation and propagation of the longitudinal crack (Fig. 9). The other end does not present the initiation and propagation but shows a fracture appearance with small inwardly curved tapes (Fig. 10a). This phenomenon highlights that prominent stresses are induced on the fibre surface instead of within the fibre core.
Fig. 10a. Thick package of micro-fibrils (cotton I)
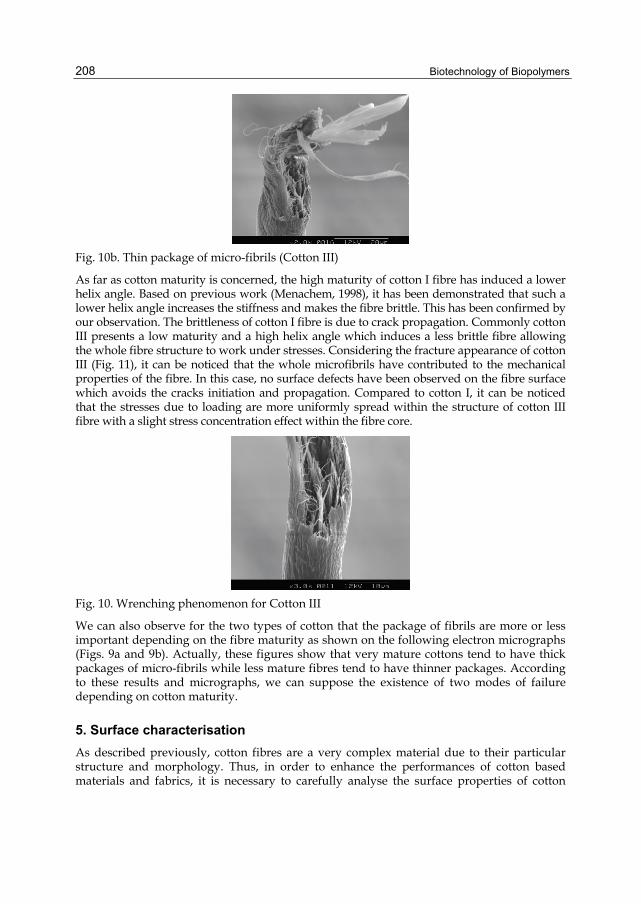
Biotechnology of Biopolymers
208
Fig. 10b. Thin package of micro-fibrils (Cotton III)
As far as cotton maturity is concerned, the high maturity of cotton I fibre has induced a lower helix angle. Based on previous work (Menachem, 1998), it has been demonstrated that such a lower helix angle increases the stiffness and makes the fibre brittle. This has been confirmed by our observation. The brittleness of cotton I fibre is due to crack propagation. Commonly cotton III presents a low maturity and a high helix angle which induces a less brittle fibre allowing the whole fibre structure to work under stresses. Considering the fracture appearance of cotton III (Fig. 11), it can be noticed that the whole microfibrils have contributed to the mechanical properties of the fibre. In this case, no surface defects have been observed on the fibre surface which avoids the cracks initiation and propagation. Compared to cotton I, it can be noticed that the stresses due to loading are more uniformly spread within the structure of cotton III fibre with a slight stress concentration effect within the fibre core.
Fig. 10. Wrenching phenomenon for Cotton III
We can also observe for the two types of cotton that the package of fibrils are more or less important depending on the fibre maturity as shown on the following electron micrographs (Figs. 9a and 9b). Actually, these figures show that very mature cottons tend to have thick packages of micro-fibrils while less mature fibres tend to have thinner packages. According to these results and micrographs, we can suppose the existence of two modes of failure depending on cotton maturity.
5. Surface characterisation As described previously, cotton fibres are a very complex material due to their particular structure and morphology. Thus, in order to enhance the performances of cotton based materials and fabrics, it is necessary to carefully analyse the surface properties of cotton

Macro and Micro Characterization of Biopolymers: Case of Cotton Fibre
209
fibres. Many investigation techniques are available to observe or to characterise the fibres’ surface depending on the observation scale. The following techniques can be quoted: Scanning electron microscope (SEM), which can produce very high-resolution images of a sample surface; Transmission electron microscopy (TEM), which allows the observation of ultra-thin specimen; Atomic Force Microscope (AFM), which is a very high-resolution type of scanning probe microscopy, with a resolution on the order of fractions of a nanometer; Electron Spectroscopy for Chemical Analysis (ESCA), which is a very outstanding tool to characterize the polymers surface up to 10nm depth (Cheetham & Day, 1987; Prutton, 1994); Infra-Red and Raman Spectroscopy, which is nowadays a very common tool for the chemical and physical characterisation of surfaces (Siesler & Holland-Moritz, 1980); Inverse Gas Chromatography (ICG) to determine the thermodynamic surface properties and some morphological aspect of fibres. In the following paragraphs, the SEM, AFM and ICG techniques will be described as tools to evaluate the surface characteristics of cotton fibres before and after chemical treatment.
5.1 SEM observation The sample’s image is generated by scanning it with a high-energy beam of electrons in a raster scan pattern. The interaction between electrons and the atoms constituting the sample produces signals that contain information related to the sample's surface topography and composition. The main signals produced by SEM are secondary electrons, back-scattered electrons, characteristic X-rays, light and transmitted electrons. The most common detector in all SEMs consists in secondary electron detectors. SEM is essentially used for the observation of the fibre surface, fibre breakage and fibre diameter measurement. Hearle & al en 1970 (Hearle & Cross, 1970) were the first researchers who to use SEM for the observation of fibre breakage. This technique gives high resolution image, however one of the main disadvantages of SEM in characterization of polymer surface is the surface heating caused by the polymer’s non-conductive property. Consequently, fibres need to be made conductive by covering the sample, by means of a sputter coater, with a thin layer of conductive material like gold. To illustrate this, Drean and co-workers have conducted experiments to understand the evolution of surface characteristics of cotton fibres before and after a chemical treatment (Rjiba & al, 2007). These experiments have been conducted on different types of raw cotton which have been treated by soxhlet ethanol extraction performed for 6 hours with hot 95% ethanol to remove sugars, mineral, non-cellulosic and organic maters as well as wax and pectic maters. The figures 11a and 11b illustrate the results. It can be noticed that the raw cotton fibre presents thin scratches that are the result of the treatment making the fibre pores more attainable.
Fig. 11a. SEM observation for raw C21 cotton fibre (X 5000)

Biotechnology of Biopolymers
210
Fig. 11b. SEM observation for ethanol treated C21 cotton fibre (X 5000)
5.2 AFM observation As mentioned above, Atomic Force Microscope (AFM) is a very high-resolution type of scanning probe microscopy, with a resolution on the order of fractions of a nanometer. The AFM is composed of a cantilever with a sharp tip at its end which is used to scan the specimen surface (Figure 12). When the tip is in the vicinity of a sample surface, forces between the tip and the sample induce a bending of the cantilever. Theses forces can be van der Waals forces, capillary forces, chemical bonding, electrostatic forces… The cantilever deflection is measured with the help of laser beam which is reflected from the surface of the cantilever to a photodetector. Usually, the sample is placed on a piezoelectric tube which can move the sample in x and y directions for scanning the sample and in z direction for maintaining a constant force.
Photodetector
A
B
C
D
Laser Beam
Cantilever
Sample surface Tip
Piezoelectric Tube
z [V(A)+V(B)]-[V(C)+V(D)] Constant Force
Z feed back �
Topographic Image
F �
F ≅ Δ[V(A)+V(B)]-[V(C)+V(D)] Constant Height
no feed back
Force Image
Feed back
Control
Fig. 12. Atomic Force Microscope block diagram
Three main operating modes are available for imaging the surface: the contact mode, the non-contact mode and the tapping mode. Contact mode can be used when all forces are repulsive and the operation mode consists in maintaining a constant force between surface and tip during the surface scanning by keeping the cantilever deflection constant. In non-contact mode, the cantilever oscillates at a frequency a little higher than its resonant frequency. The van der Waals forces on the surface lead to decrease the cantilever resonance frequency. The feed back control then adjusts the tip to sample distance to maintain a constant cantilever frequency. Based on the data collected at each (x,y) point, a topographic image of the sample surface can be reconstructed. In tapping mode imaging is implemented in ambient air by oscillating the cantilever at a frequency close to the cantilever's resonant

Macro and Micro Characterization of Biopolymers: Case of Cotton Fibre
211
frequency using a piezoelectric crystal. During scanning, the tip vertically oscillates and alternately contacts the surface and lifts off. A tapping AFM image is then completed by imaging the force of the intermittent contacts of the tip with the sample surface. AFM is a very well adapted tool to image the topography of the surface as well as to calculate the surface roughness. In our case, the surface roughness is defined as Ra parameter which is the mean value of overall y ordinate of the analyzed profile for a given length. The cottons previously observed with the help of SEM (raw and soxhlet ethanol extracted cottons) have been characterised by means of a Digital Instrument DI-3000 AFM. The cotton fibres have been stuck on a stainless steel plate and then scanned in tapping mode. Such an experiment is quite difficult to carry out because of the fibre vibration during the scan. The experiments have been carried out on a 250 nm2 surface at a 1Hz frequency. The 5µm2 AFM images of C17 cotton are given in figures. 13. It can be noticed in figure 13a that in case of raw fibre, the fibrils are visible and well parallel organised. After treatment, figure 13b, a surface modification can be highlighted; the fibrils are less parallel and the surface seems to be less rough.
Fig. 13a. AFM observation for raw C17 cotton fibre (5µm2)
Fig. 13b. AFM observation for ethanol treated C17 cotton fibre (5µm2)

Biotechnology of Biopolymers
212
Figures 14 give an example of an AFM profile for C17 cotton. From the profiles obtained by scanning, the Ra value can be calculated. At 5µm scale, Ra values are respectively 67.2 and 49.4 for raw and ethanol extracted fibres and at 2µm scale, Ra values are respectively 26.2 and 23.0 for raw and ethanol extracted fibres. These results confirm the observation given by AFM images Figures 13a and b and corroborate the dependence between cotton surface characteristics and quantity of foreign matter at the surface of the fibre.
nm
100
0
-100
0 2.50 5.00
Section analysis
µm Fig. 14a. AFM roughness profile for raw C17 cotton fibre
nm
100
0
-100
0 2.50 5.00
Section analysis
µm Fig. 14b. AFM roughness profile for ethanol treated C17 cotton fibre
5.3 Inverse gas chromatography surface characterisation Inverse gas chromatography (IGC) is a very sensitive gas phase technique developed to study the surface properties of particles and fibrous materials. In IGC the roles of solid and gas are inverted compared to classical analytical gas chromatography. In IGC, a column filled with the solid sample to be investigation and a single gas (probe molecule) is injected. The aim of this characterisation technique is to determine the thermodynamic surface properties and surface morphological aspect of cotton fibre. The surface characterisation by Inverse Gas Chromatography (IGC) has been recommended by several papers (Papirer & al., 2000; Santos & al., 2001). This method is based on the analysis of gaseous probe adsorption on a solid surface to determine the dispersive component D
Sγ of the surface energy.
Macro and Micro Characterization of Biopolymers: Case of Cotton Fibre
213
5.3.1 Theoretical aspects of inverse gas chromatography IGC, under "infinite dilution" conditions, i.e very high dilution of the probe into the carrier gas (helium), permits the determination of both dispersive and polar surface properties of a solid. The dispersive component D
Sγ of the surface energy of cotton fibres is calculated from the retention times (tR) of a series of n-alkanes injected into the column containing the fibres. From tR, the following quantities can be calculated:
0( )N c RV D t t= − (6)
ln( )a NG RT VΔ = − (7) where VN is the retention volume, t0 is the retention time of a probe that is not adsorbed on the cotton , Dc is the helium flow rate, and T is the absolute temperature at which the measurement is carried out. aGΔ is the standard variation of the free energy of adsorption. Then, according to Dorris and Gray (Dorris & Gray, 1980), the dispersive component D
Sγ of the surface energy is then given by the following equation:
2 2
22( )1
4 .D aS
CH CH
G CHN a
γγ
⎛ ⎞Δ⎜ ⎟=⎜ ⎟⎝ ⎠
(8)
where 2CHγ ≈36,5 mJ/m2 at 20°C, N is Avogrado’s number and aCH2 (cross-sectional area of
an adsorbed CH2 group)≈ 6 Å2 . From IGC measurements, based on the comparison of the retention times tN of linear n-alkanes and of branched and/or cyclic alkanes, a morphological parameter ( χ ) has been recently defined. Then, an index of morphology of the cotton fibre surface can be defined (Rjiba & al., 2007; Rjiba & al., 2010) as follows:
( )exp
100 100T T
TT T
IMχ χ
χχ χ
− Δ= × = × (9)
5.3.2 ICG experimental characterisation The experiments are carried out on different types of cotton fibres and as an example C17 cotton has been chosen. This cotton from Senegal has a wax content of 0.5% and a maturity ratio MR=0.818. Two types of fibres have been tested, raw material and soxhlet ethanol extracted fibres (extraction performed for 6 hours with hot 95% ethanol). The main problem of the experiment is the preparation of the column. In fact, IGC is carried out in good conditions if the filling of the column is homogeneous. A specific column filling technique has been developed. With the help of microspinning facilities of CIRAD (French Agricultural Research Center for International Development) cotton fibres have been spun in sliver then drawn into rowing. Then, these 2.8g/m rowings have been twisted and introduced into the column. This preparation leads to a homogeneous packing into the chromatography column. Chromatograms were obtained with a Varian 3800 programmable gas chromatography equipped with a flame ionization detector; helium was used as the carrier gas and n-alkanes as probes. As a result, the variation of the dispersive component D
Sγ of the surface energy of C17 cotton fibre as a function of temperature is shown figure 15.

Biotechnology of Biopolymers
214
Fig. 15. Variation of DSγ vs. temperature
It can be noticed that the values of DSγ of extracted cotton fibres are lower than raw cotton
fibres. This result highlights that the waxes play a key role on surface energy of cotton fibres. Moreover, D
Sγ decreases with the temperature, decrease related to thermal dilatation of the fibres. The calculation of TIMχ (Rjiba & al., 2010) for extracted cotton fibres gives a value close to zero. This result shows that the cotton fibre surface after extraction is very smooth and homogeneous from a morphological point of view. Such an example clearly demonstrates that IGC is a very convenient technique to determine the surface properties of cotton fibres.
6. Acknowledgments We would like to thanks Dr. Eric Hequet – FBRI, Lubbock, Texas, USA – and his team for their kind help in carrying out specific experiments.
7. References ASTM D1769-77. (1984). Standard Test Method for Linear Density of Cotton Fibers (Array
Sample), Annual Book of ASTM Standards. Vol. 07.02, 389-392, Philadelphia, PA ASTM D1445-75. (1984). Standard Test Method for Breaking Strength and Elongation of
Cotton Fibres (Flat bundle Method). Annual Book of ASTM Standards, 330- 339, Philadelphia, PA, 1984.
ASTM D1447-83. (1984). Standard Test Method for Length and Length Uniformity of Cotton Fibers by Fibrograph Measurement, Annual Book of ASTM Standards, Vol. 07.02, 340-346, Philadelphia, PA.
ASTM D1448-84. (1984). Standard Test Method for Micronaire Reading of Cotton Fibers, Annual Book of ASTM Standards, Vol. 07.02, 347-350, Philadelphia, PA.
ASTM D1464-79. (1984). Standard Test Method for Differential Dyeing Behaviour of Cotton, Annual Book of ASTM Standards, Vol. 07.02, 351-353, Philadelphia, PA.
ASTM D 4605-86. (1994). Standard Test Methods for Measurement of Cotton Fibres by High Volume instruments (HVI). Annual Book of ASTM Standards, Vol. 07.02, 486-494, Philadelphia, PA.
Annis, P.A.; Quigley, T.W.Jr. & Kyllo, K.E. (1992). Useful Techniques in Textile Microscopy, J. AATCC, 24(8), 19-22.
5
10
15
20
25
30
35
40
45
50
20 30 40 50 60 70 80 90 100
T°C
γ sD(m
J/m
ol)
Avant extraction
Après extraction
γsD (mJ/mol) Raw cotton
Ethanol extracted cotton

Macro and Micro Characterization of Biopolymers: Case of Cotton Fibre
215
Beasley, C.A. (1975). Developmental morphology of cotton flowers and seed as seen with the scanning electron microscope, American Journal of Botany, 62(6), 584-592
Benzina, H.; Harzallah, O. & Drean, J.Y. (2007). Morphological study of the cotton by specifying the breakage of a single fiber, The Fiber Society Conference, May 23-25, Greenville - South Carolina.
Benzina, H.; Hequet, E.; Abidi, N.; Gannaway, J.; Drean, J.Y. & Harzallah, O. (2007). Using Fiber Elongation to Improve Genetic Screening in Cotton Breeding Programs, Textile Research Journal, 77(10), 770-778.
Boylston, E.K.; Evans, J.P. & Thibodeaux, D.P. (1995). A Quick Embedding Method for Light Microscopy and Image Analysis of Cotton fibres, J. Biotech. Histochem., 70(1), 24-27.
Bragg, C.K. & Shofner, F.M. (1993). Rapid direct measurement of short fibre content, Textile Research Journal, 63(3), 171-176.
Brown, R.M.J.; Saxena, I.M.; & Kudlicka, K. (1996). Cellulose biosynthesis in higher plants, Trends in plant science, 1, 149-156.
Bunsell, A.R.; Hearle, J.W.S.; & Hunter, R.D. (1971). An apparatus for fatigue-testing of fibres, J. Phys. E. Sc. Instrum., 4, 868-872.
Bunsell, A.R.; & Hearle, J.W.S.; (1971). A mechanism of Fatigue Failure in Nylon Fibres, Journal of Materials Science., 6, 1303-1311.
Bunsell, A.R.; & Somer, A.; (1992). Plastics, Rubber & Comp, Processing and Applications, 18, 263-267.
Bunsell, A.R.; (2009). Handbook of tensile properties af textile and technical fibres, Woodhead Publishing Limited, ISBN 978-1-84569-387-9, Cambridge, U.K.
Cheetham. A.K.; & Day. P., (1987). X-ray Photoelectron Spectroscopy and Related Methods, in Solid State Chemistry Techniques, Oxford University Press: New York. 1987, 84-120.
Dorris, G.M. & Gray, D.G. (1980). Adsorption of n-alkanes at zero surface coverage on cellulose paper and wood fibers, Journal of Colloid and Interface Science, 77, 353-362
Drean, J.Y.; Benzina, H. & Harzallah, O.; (2005). Fine Study of Cotton Fiber: Methodology and Feasibility, Beltwide Cotton Conference, New Orleans (Louisiana-USA), 2307-23011; 4-7 janvier 2005.
Elamri, A.; Lallam, A.; Harzallah, O. & Bencheikh, L. (2007). Mechanical characterization of melt spun fibers from recycled and virgin PET blends, Journal of Materials Science, 42, 8271-8278.
Goldthwait, C.F.; Smith, H.O. & Barnett, M.P. (1947). New dye technique shows maturity of cotton, Textile World, July issue, 105-110.
Harzallah, O.; Benzina, H. & Drean, J.Y. (2010). Physical and mechanical properties of cotton fibres: Single-fiber failure, Textile Research Journal, 80(11), 1093-1102.
Hearle, J.W.S.; Cross, P.M.; (1970). The fractography of thermoplastic textile fibers, Journal of Materials Science, 5, 507-516.
Hearle, J.W.S.; An atlas of fiber fracture, Textile Manufacturer, 100, no.1177, 1973, p 24-25. Hearle, J.W.S.; Lomas, B.; Bunsell, A.R.; 1974)The study of fiber fracture, Applied Polymer
Symposia, , no.23, p 147-156. Hearle, J.W.S.; Lomas, B. & Cooke, W.D. (1998). Atlas of fibre fracture and damage to textiles,
Second edition, Woodhead Publishing Limited, ISBN 1-85573-319-6, 1998. Hertel, K.L. (1940). A method of fibre length analysis using the fibrograph, Textile Research
Journal, 10(12), 510-525.
Biotechnology of Biopolymers
216
Hertel, K.L. (1953). Fibre strength and extensibility as measured by stelometer, Cotton Research Clinic report, National Cotton Council, 18-25.
Hsieh, Y. (1999). Structural development of cotton and linkages to fibre quality.In: Cotton fibres development biology, Quality Improvement, and Textile Processing, A. Basra (ed). pp.167-183, Food Product Press, Binghamton, NY,
Huang, Y. & Xu, B. (2002). Image Analysis for Cotton Fibers, Part I: Longitudinal Measurements, Textile Research Journal, 72(8), 713-720.
Isings, J. (1964). The Influence of Stress and deformation on the structure of the Cotton Fiber, Textile Research Journal, 236-246.
Joshi, P.C.; Wadhwani A.M. & Johri, B.M. (1967). Morphological and embryological studies of Gossypium L., Proc. Nat. Inst. Sci., India 33B
Kohel, R. (1999). Cotton Germplasm Resources and the potential for Improvement Fiber Productivity and Quality, Cotton Fibers, Developmental Biology, Quality Improvement, and Textile Processing. A. Basra Ed., Food Product Press, Binghamton, New York
Kunzek, H.; Kabbaert, R. & Gloyna, D. (1999). Aspects of material science in food processing: changes in plant cell walls of fruits and vegetables, Z. Lebensm Unters Fersch, A, 208, 233-250.
Lafitte, M.H. & Bunsell, A.R., (1985). The creep of kevlar-29 fibers, Polymer Engineering & Science, 25, 182-187.
Lagière R., Le Cotonnier, Maisonneuve & Larose, Paris, 1966. Landstreet, C.B.; Waggoner, C.M. & Guggenheim, G.N. (1989). The mass fibrogram: a
method for increased precision in measuring short fiber content and uniformity ratios with scanning instruments, Beltwide Cotton Conference, January 2-7, Nashville, TE, National Cotton Council of America, 610-612.
Lawson, R.; Ramey, H.H.Jr.; & krowicki, R.S. (1976) Cotton Fibre Tenacity and Elongation in Rapidly Changing Humidity, Textile Research Journal, 46,715-719.
Lewin, M. & Pearce E.M. (1998). Handbook of Fibre Chemistry, 2nd ed., Marcell Dekker. New York
Lord, E. (1956). Relation between different measures of maturity and fineness of cotton, Journal of the Textile Institute, 47, 209-221.
Menachem, L. (1998). Handbook of Fibre Chemistry, second edition, Marcel Dekker, ISBN 0-8247-9471-0, New York
Meredith, R. (1951). Cotton Fiber Tensile Strength and X-ray Orientation, Journal of the Textile Institute, 42, T291-T299.
Morton, W.E. & Hearle, J.W.S. (1975) Physical properties of textile fibres, 2nd edition, The Textile Institute, ISBN 1-870812-41-7, London, England.
Morton, W.E. & Hearle, J.W.S. (2008), Physical properties of textile fibres, 4th edition, Woodhead Publishing Limited, ISBN 978-1-84569-220-9, Cambridge, England.
Oudet, CH. & Bunsell, A.R. (1987). Effects of structure on the tensile, creep and fatigue properties of polyester fibres, Journal of Materials Science, 22(2), 4292-4298.
Papirer, E.; Brendle, E.; Balard, H.; Vergelati, C. (2000). Inverse gas chromatography investigation of the surface properties of cellulose, Journal of Adhesion Science and Technology, 14, 321-337
Parry, G. (1982). Le cotonnier et ses produits : origine et constitution, Maisonneuve & Larose , coll. Techniques agricoles et productions tropicales, Paris V,.
Macro and Micro Characterization of Biopolymers: Case of Cotton Fibre
217
Powland, S.P.; Nelson, M.L.; Welch, C.M. & Hebert, J.J. (1976) Cotton fibre morphology and textile performance properties, Textile Research Journal, 46, 194-214.
Pressley, E.H. (1942). A cotton fibre strength tester, ASTM bulletin, 10, 13-17. Prutton, M., (1994). Introduction to Surface Physics.1994: Oxford University Press. Raes, A.T.J. & Verschraege, L. (1981). A consideration of the real maturity of cotton fibres,
Journal of the Textile Institute, 72, 191-200. Rjiba, N.; Nardin, M.; Drean, J.-Y. & Frydrych, R. (2007). A study of the surface properties of
cotton fibers by inverse gas chromatography, Journal of Colloid and Interface Science, 314, 373-380
Rjiba, N.; Nardin, M.; Drean, J.-Y.; Frydrych, R. (2010). Comparison of surfaces properties of different types of cotton by inverse gas chromatography, Journal of Polymer Research, 17, 25-32
Roberty, G. (1949). Variation de longueur dans les poils d’une même graine de coton, Coton et Fibres Tropicales, 4(1), 25-32
Santos, J; Gil, MH; Portugal, A; Guthrie, JT. (2001). Characterisation of the Surface of a Cellulosic Multi-Purpose Office Paper by Inverse Gas Chromatography, Cellulose Communications, (8), 217-224
Seagull, R. & Alspaugh, P. (2001). Cotton fibre development and processing. Cotton Incorporated, International Textile Center, Texas Tech University, Lubbock – Texas, USA
Shenai, V. (1988). Technology of Mercerizing. Part 10: Cotton fibres, Textile Dyer Print, 21(2), 25-29.
Siesler, H.W. & Holland-Moritz K., (1980) Infrared and Raman Spectroscopy of Polymers, 1980, 389 p, M.Dekker, New-York
Stewart, J.M. (1975). Fibre initiation on the cotton ovule (Gossypium hirsutum), American Journal of Botany, 62(7), 723-730
Taylor, R.A. (1986). Cotton Tenacity Measurements with High Speed Instruments, Textile Research Journal, 56, 86-94 (1986).
Taylor, R.A.; Brown, R.S. & Godbey, L.C. (1991). Reducing HVI strength variability by sensing humidity, Beltwide Cotton Conferences.
Thibodeaux, D.P. & Evans, J.P. (1986). Cotton fibre maturity by image analysis, Textile Research Journal, 56, 130-139.
Thibodeaux, D.P.; Herbert, J.J.; Abd El-Gawad, S. & Moraitis, J.S. (1998). Quality measurements-relating bundle strength to mantis single fibre strength measurements, The Journal of Cotton Science, 2, 62-67.
Thibodeaux, D.P. & Rajasekaran, K. (1999). Development of New Reference Standards for Cotton Fibre Maturity. The Journal of Cotton Science, 3, 188-193
Waterkeyn, L. (1987). Light microscopy of the cotton fibre, Cotton fibres : their development and properties, A technical monograph from the Belgian Cotton Research Group. International Institute for Cotton, Manchester, U.K.
Xu, B.; Pourdeyhimi, B. & Sobus J. (1992). Charaterization of fibre crimp by image analysis: definition, algorithms and techniques, Textile Research Journal, 62, 73-80.
Xu, B.; Pourdeyhimi, B. & Sobus, J. (1993). Fibre cross-sectional shape analysis using imaging processing techniques, Textile Research Journal, 63, 717-730.
Xu, B. & Pourdeyhimi, B. (1994). Evaluating maturity of cotton fibres using image analysis: Definition and Algorithm, Textile Research Journal, 64(6), 330-335.

Biotechnology of Biopolymers
218
Xu, B. & Huang Y. (2004). Image Analysis for Cotton Fibers Part II: Cross-Sectional Measurements, Textile Research Journal, 74(5), 409-416.
11
SR-IMS Molecular Spectroscopic Image of Functional Groups in Biopolymers
in Feed Systems Peiqiang Yu
College of Agriculture and Bioresources, University of Saskatchewan, Canada
1. Introduction 1.1 Powerful SR-IMS research tool for imaging in complex feed systems Advanced ultra-spatially resolved synchrotron-radiation Fourier transform infrared micorspectroscopy (SR-IMS) has been developed as a bioanalytically probing technique to study biomaterials at cellular and molecular levels within intact tissue (1-3). This technique, taking advantage of bright synchrotron light which is millions time brighter than sunlight, is able to provide four kind of information simultaneously: tissue chemistry, tissue composition, tissue environment and tissue structure (4, 5). Compared with conventional chemical analysis in the lab, this technique can link chemical information to structure information without destruction of original structure information. No harsh chemicals are involved. The use of harsh chemicals and derivatization can result in altering the native structures and possibly generating artifacts in complex plant system (5).
1.2 Objective The objective of this study was to use the advanced ultra-spatially resolved synchrotron radiation-based infrared microspectroscopy (SR-IMS) as a non-invasive and non-destructive tool to study microstructural features of the embryo (germ) in sorghum (Sorghum bicolor L.) seeds within cellular dimension within intact embryo tissue.
2. Materials ahd methods 2.1 Seed embryo tissue preparation and synchrotron FTIR window Sorghum seed (feed-type), obtained from Dr. Liu Dasen (Northeast Agriculture University, China), were cut into thin cross sections (6 μm thick) using a microtome at The Western College of Veterinary Medicine, University of Saskatchewan and then transferred to BaF2 windows (size: 13×1 mm disk; Spectral Systems, NY) for transmission mode synchrotron FTIR microspectroscopic work.
2.2 Synchrotron light source and synchrotron-based IR microspectroscopy The experiment was carried out on U2B beamline at the National Synchrotron Light Source located in Brookhaven National Laboratory (NSLS-BNL, U.S. Department of Energy, New
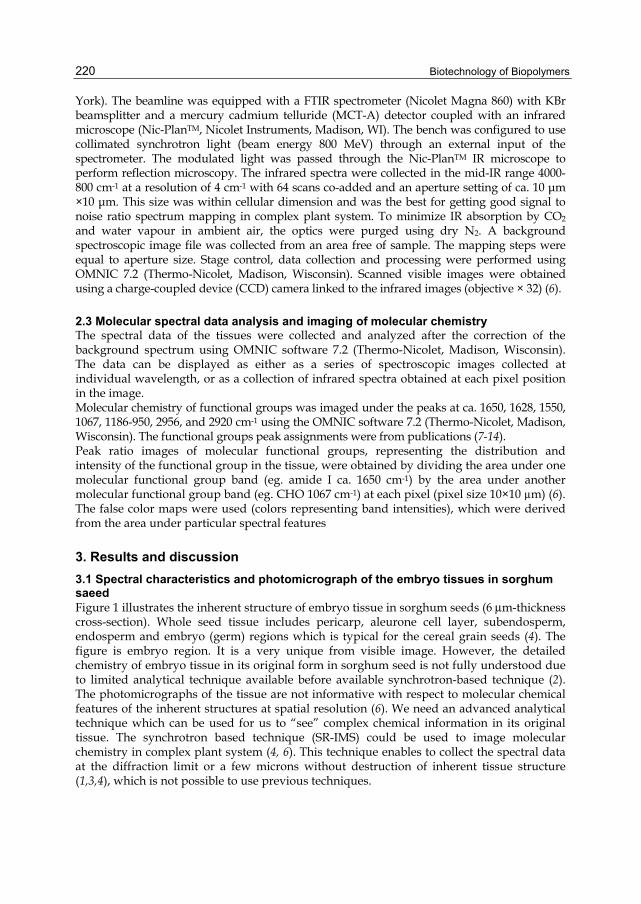
Biotechnology of Biopolymers
220
York). The beamline was equipped with a FTIR spectrometer (Nicolet Magna 860) with KBr beamsplitter and a mercury cadmium telluride (MCT-A) detector coupled with an infrared microscope (Nic-PlanTM, Nicolet Instruments, Madison, WI). The bench was configured to use collimated synchrotron light (beam energy 800 MeV) through an external input of the spectrometer. The modulated light was passed through the Nic-PlanTM IR microscope to perform reflection microscopy. The infrared spectra were collected in the mid-IR range 4000-800 cm-1 at a resolution of 4 cm-1 with 64 scans co-added and an aperture setting of ca. 10 μm ×10 μm. This size was within cellular dimension and was the best for getting good signal to noise ratio spectrum mapping in complex plant system. To minimize IR absorption by CO2 and water vapour in ambient air, the optics were purged using dry N2. A background spectroscopic image file was collected from an area free of sample. The mapping steps were equal to aperture size. Stage control, data collection and processing were performed using OMNIC 7.2 (Thermo-Nicolet, Madison, Wisconsin). Scanned visible images were obtained using a charge-coupled device (CCD) camera linked to the infrared images (objective × 32) (6).
2.3 Molecular spectral data analysis and imaging of molecular chemistry The spectral data of the tissues were collected and analyzed after the correction of the background spectrum using OMNIC software 7.2 (Thermo-Nicolet, Madison, Wisconsin). The data can be displayed as either as a series of spectroscopic images collected at individual wavelength, or as a collection of infrared spectra obtained at each pixel position in the image. Molecular chemistry of functional groups was imaged under the peaks at ca. 1650, 1628, 1550, 1067, 1186-950, 2956, and 2920 cm-1 using the OMNIC software 7.2 (Thermo-Nicolet, Madison, Wisconsin). The functional groups peak assignments were from publications (7-14). Peak ratio images of molecular functional groups, representing the distribution and intensity of the functional group in the tissue, were obtained by dividing the area under one molecular functional group band (eg. amide I ca. 1650 cm-1) by the area under another molecular functional group band (eg. CHO 1067 cm-1) at each pixel (pixel size 10×10 µm) (6). The false color maps were used (colors representing band intensities), which were derived from the area under particular spectral features
3. Results and discussion 3.1 Spectral characteristics and photomicrograph of the embryo tissues in sorghum saeed Figure 1 illustrates the inherent structure of embryo tissue in sorghum seeds (6 μm-thickness cross-section). Whole seed tissue includes pericarp, aleurone cell layer, subendosperm, endosperm and embryo (germ) regions which is typical for the cereal grain seeds (4). The figure is embryo region. It is a very unique from visible image. However, the detailed chemistry of embryo tissue in its original form in sorghum seed is not fully understood due to limited analytical technique available before available synchrotron-based technique (2). The photomicrographs of the tissue are not informative with respect to molecular chemical features of the inherent structures at spatial resolution (6). We need an advanced analytical technique which can be used for us to “see” complex chemical information in its original tissue. The synchrotron based technique (SR-IMS) could be used to image molecular chemistry in complex plant system (4, 6). This technique enables to collect the spectral data at the diffraction limit or a few microns without destruction of inherent tissue structure (1,3,4), which is not possible to use previous techniques.

SR-IMS Molecular Spectroscopic Image of Functional Groups in Biopolymers in Feed Systems
221
Fig. 1. Photomicrograph of cross-section of the enlarged embryo (germ) tissue in whole sorghum seeds (6 μm) showing the intrinsic visible structure of sorghum germ.
Figure 2 presents a typical spectrum (pixel size: 10×10 μm) from the sorghum embryo tissue, showing broad N-H and O-H stretching band at ca. 3270 cm-1, CH2 and CH3 anti-symmetric and symmetric stretching bands at the region of ca. 2990-2780 cm-1, amide I and II bands at ca. 1650 cm-1 and 1550 cm-1, respectively and cellulosic compound bands region of ca. 1200-800 cm-1, using ultra-spatially resolved synchrotron-based FTIR microspectroscopy. From these functional groups bands, we can see the embryo tissue has complex plant system.
Fig. 2. Typical spectrum of sorghum germ tissue within cellular and sub-cellular dimensions showing broad N-H and O-H stretching band at ca. 3270 cm-1, CH2 and CH3 anti-symmetric and symmetric stretching bands at the region of ca. 2990-2780 cm-1, amide I and II bands at ca. 1650 cm-1 and 1550 cm-1, respectively and cellulosic compound bands region of ca. 1200-800 cm-1, using ultra-spatially resolved synchrotron-based FTIR microspectroscopy at National Synchrotron Light Source, Brookhaven National Lab (U.S. Dept of Energy, NY).
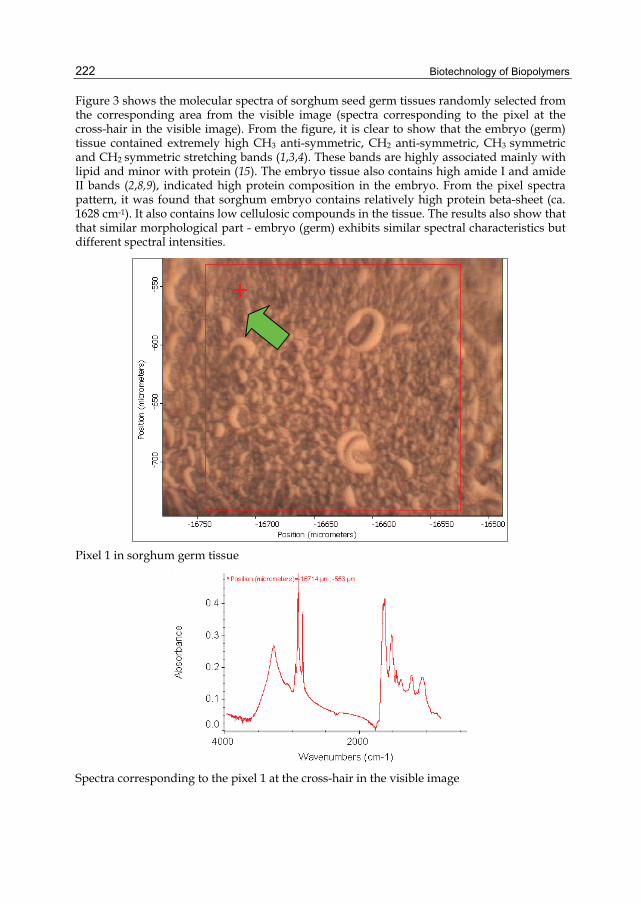
Biotechnology of Biopolymers
222
Figure 3 shows the molecular spectra of sorghum seed germ tissues randomly selected from the corresponding area from the visible image (spectra corresponding to the pixel at the cross-hair in the visible image). From the figure, it is clear to show that the embryo (germ) tissue contained extremely high CH3 anti-symmetric, CH2 anti-symmetric, CH3 symmetric and CH2 symmetric stretching bands (1,3,4). These bands are highly associated mainly with lipid and minor with protein (15). The embryo tissue also contains high amide I and amide II bands (2,8,9), indicated high protein composition in the embryo. From the pixel spectra pattern, it was found that sorghum embryo contains relatively high protein beta-sheet (ca. 1628 cm-1). It also contains low cellulosic compounds in the tissue. The results also show that that similar morphological part - embryo (germ) exhibits similar spectral characteristics but different spectral intensities.
Pixel 1 in sorghum germ tissue
Spectra corresponding to the pixel 1 at the cross-hair in the visible image

SR-IMS Molecular Spectroscopic Image of Functional Groups in Biopolymers in Feed Systems
223
Pixel 2 in sorghum germ tissue
Spectra corresponding to the pixel 2 at the cross-hair in the visible image
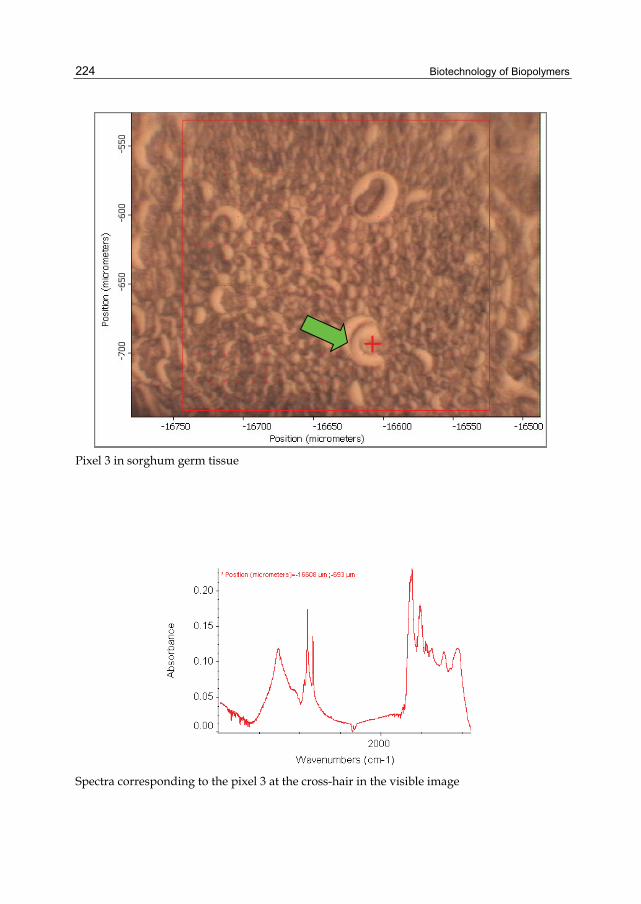
Biotechnology of Biopolymers
224
Pixel 3 in sorghum germ tissue
Spectra corresponding to the pixel 3 at the cross-hair in the visible image
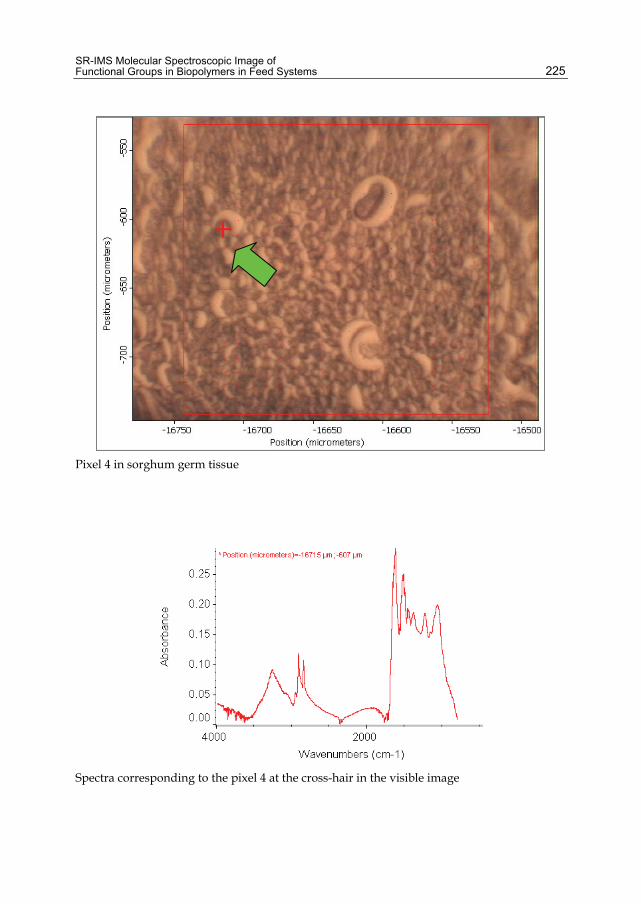
SR-IMS Molecular Spectroscopic Image of Functional Groups in Biopolymers in Feed Systems
225
Pixel 4 in sorghum germ tissue
Spectra corresponding to the pixel 4 at the cross-hair in the visible image

Biotechnology of Biopolymers
226
Pixel 5 in sorghum germ tissue
Spectra corresponding to the pixel 5 at the cross-hair in the visible image
Fig. 3. Molecular spectra (pixel size 10 ×10 µm) of sorghum seed germ tissues randomly selected from corresponding area from the visible images, showing that similar morphological parts exhibit similar spectral characteristics but different spectral intensities, ultra-spatially resolved synchrotron-based FTIR microspectroscopy at National Synchrotron Light Source, Brookhaven National Lab (U.S. Dept of Energy, NY)

SR-IMS Molecular Spectroscopic Image of Functional Groups in Biopolymers in Feed Systems
227
3.2 Detect the microstructural features through molecular chemistry mapping of functional groups The big advantage of the synchrotron-based technique-SR-IMS is able to image the tissue chemistry at an ultra-spatial resolution. It can reach diffraction limit (a few microns) without damage of the original tissue structure. Electric microscopy (EM) can only give us a visible image, not chemical image. We cannot get any chemical sense from EM technique. Figure 4 represents color maps of functional groups of sorghum embryo tissue and each single pixel size was 10×10 μm. The Figure 4 shows visible, chemical and three-D images in false-color representation of chemical component intensities, and spectra at various pixels in the embryo tissue. The results clearly show that with the SR-IMS, the distribution, intensity and relative concentration of the chemical functional groups associated with the inherent structure could be imaged. The images were taken from the region of the visible image outlined by the rectangle area. The molecular functional groups were imaged under either functional group infrared peak height or area, such as amide I intensity image (ca. 1650 cm-1) in Figure 4(a), cellulosic compounds (ca. 1420-1330 cm-1) intensity image in Figure 4(b), total carbohydrate image (ca. 1185-950 cm-1) in Figure 4(d), protein beta-sheet structure image (ca. 1628 cm-1) in Figure 4(d), CH stretching bands (ca. 2800-3000 cm-1) image (CH3 and CH2
groups of the acyl chains) in Figure 4(e), as well as CH3 (ca. 2956 cm-1) and CH2 anti-symmetric stretching bands (ca. 2920 cm-1) in Figure 4 (f,g).
Visible image of selected germ area in sorghum seeds
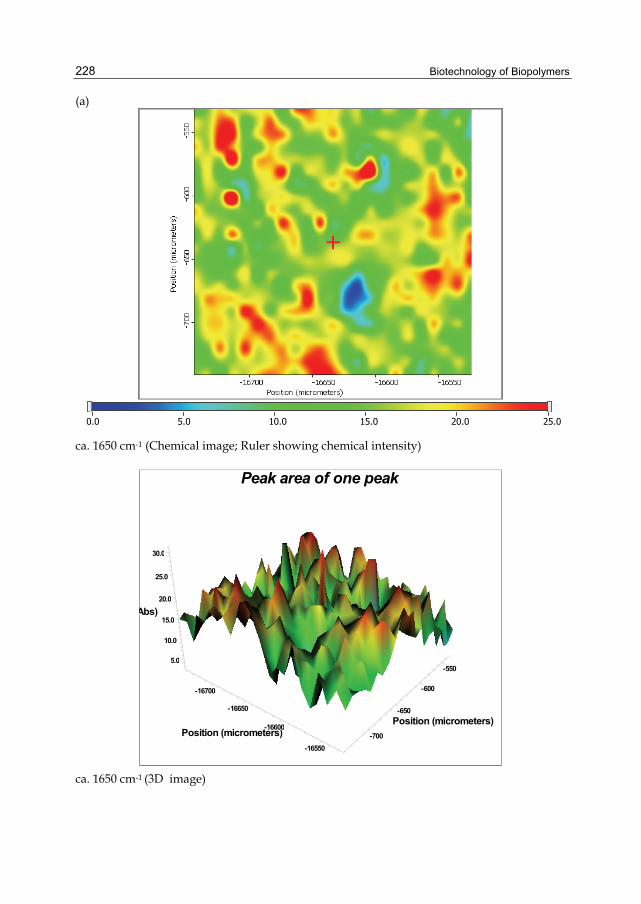
Biotechnology of Biopolymers
228
(a)
0.0 5.0 10.0 15.0 20.0 25.0 ca. 1650 cm-1 (Chemical image; Ruler showing chemical intensity)
Position (micrometers)Position (micrometers)
-16700-16700
-16650-16650
-16600-16600
-16550-16550
Abs)Abs)
30.030.0
25.025.0
20.020.0
15.015.0
10.010.0
5.05.0
Position (micrometers)Position (micrometers)-700-700
-650-650
-600-600
-550-550
Peak area of one peakPeak area of one peak
ca. 1650 cm-1 (3D image)

SR-IMS Molecular Spectroscopic Image of Functional Groups in Biopolymers in Feed Systems
229
(b)
0.30 0.40 0.50 0.60 0.70 0.80 0.90 1.00 1.10 1.20 1.30 1.40 1.50 1.60 1.70 1.80 1.90 2.00 ca. 1420-1330 cm-1 (Chemical image; Ruler showing chemical intensity)
Peak area of one peakPeak area of one peak
Position (micrometers)Position (micrometers)
-16700-16700
-16650-16650
-16600-16600
-16550-16550
e (Abs)e (Abs)
2.002.00
1.501.50
1.001.00
0.500.50
Position (micrometers)Position (micrometers)
-700-700
-600-600
ca. 1420-1330 cm-1 (3D image)

Biotechnology of Biopolymers
230
(c)
5.0 5.5 6.0 6.5 7.0 7.5 8.0 8.5 9.0 9.5 10.0 10.5 11.0 11.5 12.0 12.5 13.0 13.5 14.0 14.5 15.0 15.5 16.0 ca. 1185-950 cm-1 (Chemical image; Ruler showing chemical intensity)
Position (micrometers)Position (micrometers)
-16700-16700
-16650-16650
-16600-16600
-16550-16550
e (Abs) (Abs)
15.015.0
10.010.0
5.05.0
Position (micrometers)Position (micrometers)-700-700
-650-650
-600-600
-550-550
Peak area of one peakPeak area of one peak
ca. 1185-950 cm-1 (3D image)
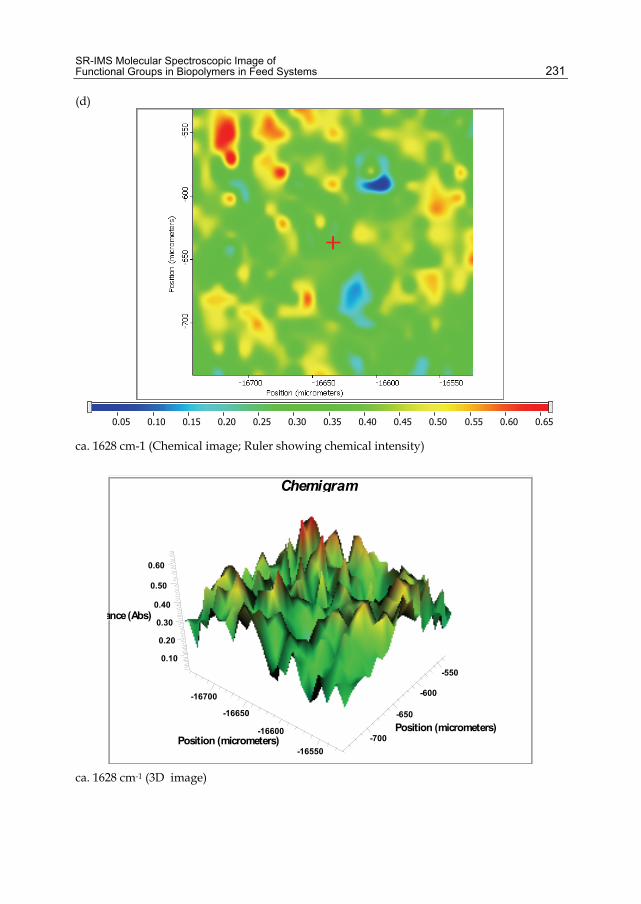
SR-IMS Molecular Spectroscopic Image of Functional Groups in Biopolymers in Feed Systems
231
(d)
0.05 0.10 0.15 0.20 0.25 0.30 0.35 0.40 0.45 0.50 0.55 0.60 0.65 ca. 1628 cm-1 (Chemical image; Ruler showing chemical intensity)
ChemigramChemigram
Position (micrometers)Position (micrometers)
-16700-16700
-16650-16650
-16600-16600
-16550-16550
ance (Abs)ance (Abs)
0.600.60
0.500.50
0.400.40
0.300.30
0.200.20
0.100.10
Position (micrometers)Position (micrometers)-700-700
-650-650
-600-600
-550-550
ca. 1628 cm-1 (3D image)

Biotechnology of Biopolymers
232
(e)
5.0 10.0 15.0 20.0 25.0 30.0 35.0 40.0 CH3, CH2 (peak center 2960, 2929, 2877, 2848 cm-1) (Chemical image; Ruler showing chemical intensity)
Peak area of one peakPeak area of one peak
Position (micrometers)Position (micrometers)
-16700-16700
-16650-16650
-16600-16600
-16550-16550
nce (Abs)nce (Abs)
40.040.0
30.030.0
20.020.0
10.010.0
Position (micrometers)Position (micrometers)-700-700
-600-600
CH3, CH2 (peak center 2960, 2929, 2877, 2848 cm-1) (3D image)
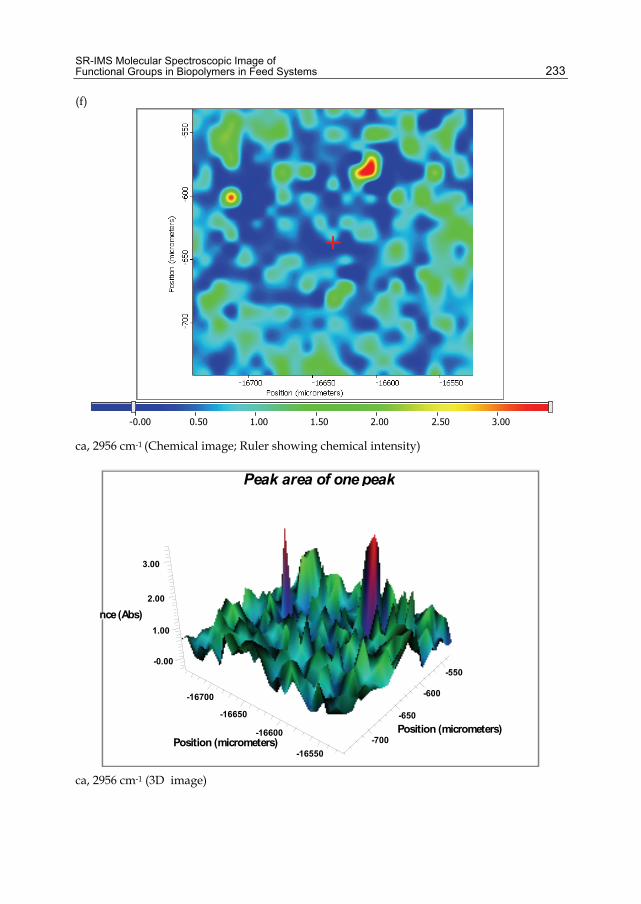
SR-IMS Molecular Spectroscopic Image of Functional Groups in Biopolymers in Feed Systems
233
(f)
-0.00 0.50 1.00 1.50 2.00 2.50 3.00 ca, 2956 cm-1 (Chemical image; Ruler showing chemical intensity)
Position (micrometers)Position (micrometers)
-16700-16700
-16650-16650
-16600-16600
-16550-16550
ance (Abs)nce (Abs)
3.003.00
2.002.00
1.001.00
-0.00-0.00
Position (micrometers)Position (micrometers)-700-700
-650-650
-600-600
-550-550
Peak area of one peakPeak area of one peak
ca, 2956 cm-1 (3D image)
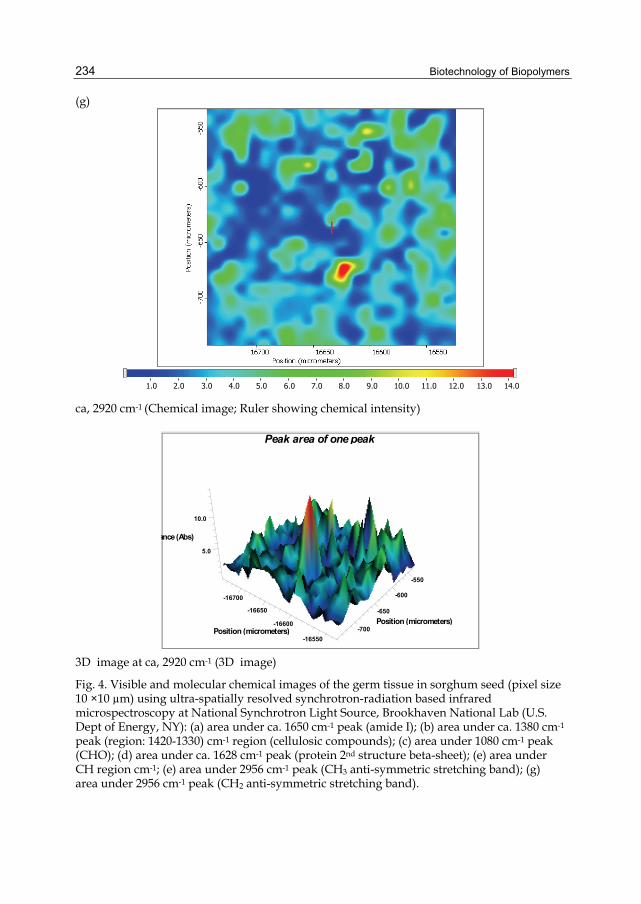
Biotechnology of Biopolymers
234
(g)
1.0 2.0 3.0 4.0 5.0 6.0 7.0 8.0 9.0 10.0 11.0 12.0 13.0 14.0 ca, 2920 cm-1 (Chemical image; Ruler showing chemical intensity)
Position (micrometers)Position (micrometers)
-16700-16700
-16650-16650
-16600-16600
-16550-16550
ance (Abs)ance (Abs)
10.010.0
5.05.0
Position (micrometers)Position (micrometers)-700-700
-650-650
-600-600
-550-550
Peak area of one peakPeak area of one peak
3D image at ca, 2920 cm-1 (3D image)
Fig. 4. Visible and molecular chemical images of the germ tissue in sorghum seed (pixel size 10 ×10 µm) using ultra-spatially resolved synchrotron-radiation based infrared microspectroscopy at National Synchrotron Light Source, Brookhaven National Lab (U.S. Dept of Energy, NY): (a) area under ca. 1650 cm-1 peak (amide I); (b) area under ca. 1380 cm-1 peak (region: 1420-1330) cm-1 region (cellulosic compounds); (c) area under 1080 cm-1 peak (CHO); (d) area under ca. 1628 cm-1 peak (protein 2nd structure beta-sheet); (e) area under CH region cm-1; (e) area under 2956 cm-1 peak (CH3 anti-symmetric stretching band); (g) area under 2956 cm-1 peak (CH2 anti-symmetric stretching band).
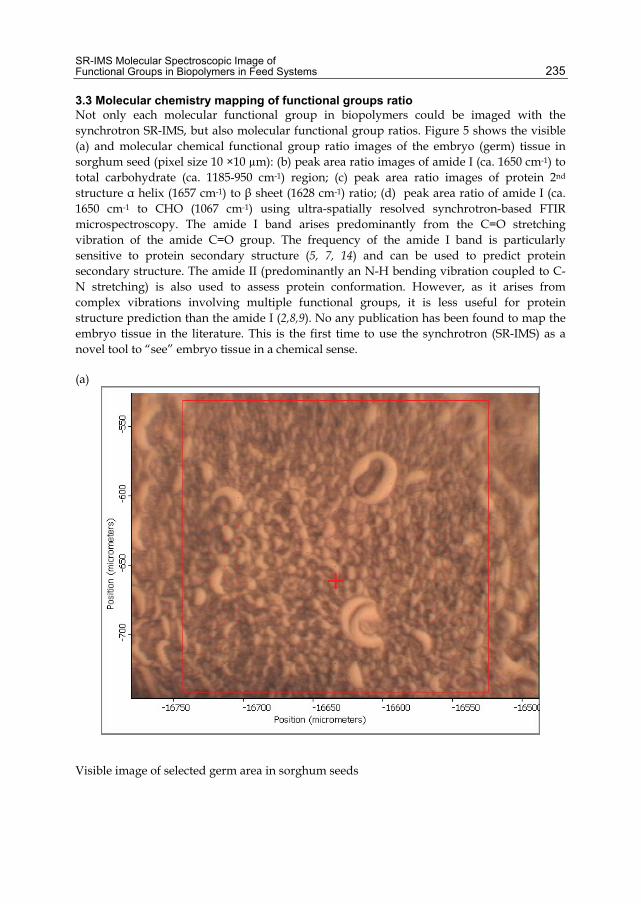
SR-IMS Molecular Spectroscopic Image of Functional Groups in Biopolymers in Feed Systems
235
3.3 Molecular chemistry mapping of functional groups ratio Not only each molecular functional group in biopolymers could be imaged with the synchrotron SR-IMS, but also molecular functional group ratios. Figure 5 shows the visible (a) and molecular chemical functional group ratio images of the embryo (germ) tissue in sorghum seed (pixel size 10 ×10 µm): (b) peak area ratio images of amide I (ca. 1650 cm-1) to total carbohydrate (ca. 1185-950 cm-1) region; (c) peak area ratio images of protein 2nd structure α helix (1657 cm-1) to β sheet (1628 cm-1) ratio; (d) peak area ratio of amide I (ca. 1650 cm-1 to CHO (1067 cm-1) using ultra-spatially resolved synchrotron-based FTIR microspectroscopy. The amide I band arises predominantly from the C=O stretching vibration of the amide C=O group. The frequency of the amide I band is particularly sensitive to protein secondary structure (5, 7, 14) and can be used to predict protein secondary structure. The amide II (predominantly an N-H bending vibration coupled to C-N stretching) is also used to assess protein conformation. However, as it arises from complex vibrations involving multiple functional groups, it is less useful for protein structure prediction than the amide I (2,8,9). No any publication has been found to map the embryo tissue in the literature. This is the first time to use the synchrotron (SR-IMS) as a novel tool to “see” embryo tissue in a chemical sense. (a)
Visible image of selected germ area in sorghum seeds

Biotechnology of Biopolymers
236
(b)
0.50 1.00 1.50 2.00 2.50 3.00 3.50 Peak area ratio at ca. 1650 / 1185-950 cm-1 (Chemical image)
Position (micrometers)Position (micrometers)
-16700-16700
-16650-16650
-16600-16600
-16550-16550
(Abs)(Abs)
3.503.50
3.003.00
2.502.50
2.002.00
1.501.50
1.001.00
0.500.50
Position (micrometers)Position (micrometers)-700-700
-650-650
-600-600
-550-550
Peak area ratio of two peaksPeak area ratio of two peaks
Peak area ratio at ca. 1650 / 1185-950 cm-1 (3D image)

SR-IMS Molecular Spectroscopic Image of Functional Groups in Biopolymers in Feed Systems
237
(c)
0.65 0.70 0.75 0.80 0.85 0.90 0.95 1.00 1.05 1.10 1.15 1.20 1.25 1.30 Peak height ratio ca. 1657/1628 cm-1 (Chemical image)
Peak height ratio of two peaksPeak height ratio of two peaks
Position (micrometers)Position (micrometers)
-16700-16700
-16650-16650
-16600-16600
-16550-16550
e (Abs)e (Abs)
1.301.30
1.201.20
1.101.10
1.001.00
0.900.90
0.800.80
0.700.70
Position (micrometers)Position (micrometers)-700-700
-650-650
-600-600
-550-550
Peak height ratio ca. 1657/1628 cm-1 (3D image)

Biotechnology of Biopolymers
238
(d)
0.50 1.00 1.50 2.00 2.50 3.00 3.50 4.00 4.50 5.00 5.50 Peak area ratio ca. 1650/1067 cm-1 (Chemical image)
Position (micrometers)Position (micrometers)
-16700-16700
-16650-16650
-16600-16600
-16550-16550
ce (Abs)ce (Abs)
6.006.00
5.005.00
4.004.00
3.003.00
2.002.00
1.001.00
Position (micrometers)Position (micrometers)-700-700
-650-650
-600-600
-550-550
Peak area ratio of two peaksPeak area ratio of two peaks
Peak area ratio ca. 1650/1067 cm-1 (3D image)
Fig. 5. Visible (a) and molecular chemical functional group ratio images of the germ tissue in sorghum seed (pixel size 10 ×10 µm): (b) Peak area ratio images of amide I (1650 cm-1) to carbohydrate (1185-950 cm-1) region; (c) Peak area ratio images of protein 2nd structure α helix (1657 cm-1) to β sheet (1628 cm-1) ratio; (d) Peak area ratio of amide I to 1067 cm-1, using ultra-spatially resolved synchrotron-based FTIR microspectroscopy at National Synchrotron Light Source, Brookhaven National Lab (U.S. Dept of Eenergy, NY).

SR-IMS Molecular Spectroscopic Image of Functional Groups in Biopolymers in Feed Systems
239
4. Conclusions and implications In conclusion, with the synchrotron SR-IMS, the molecular chemistry within intact embryo (germ) tissue could be imaged within cellular dimensions. The intensity and distribution of the various chemical functional groups of CH3 (ca. 2956 cm-1) and CH2 antisymmetric stretching bands (ca. 2920 cm-1), amide I (ca. 1650 cm-1), amide II (ca. 1550 cm-1), protein secondary structures (ca. 1657, 1628 cm-1), cellulosic compounds (ca. 1420-1330 cm-1), and carbohydrate compounds (1185-950 cm-1) as well as the functional group ratio could be chemically mapped. To my knowledge, this is the first time that the embryo (germ) tissue could be “seen” in a chemical sense without destruction of inherent structure at cellular dimensions with the synchrotron-based analytical technique (SR-IMS)
5. Acknowledgments This research has been supported by grants from Natural Sciences and Engineering Research Council of Canada (NSERC- Individual Discovery Grant), Saskatchewan Agricultural Development Fund (ADF) and Ministry of Agriculture Strategic Research Chair fund. The National Synchrotron Light Source in Brookhaven National Laboratory (NSLS-BNL, New York, USA) is supported by the U.S. Department of Energy contract DE-AC02-98CH10886. The Center for Synchrotron Biosciences, The Center for Proteomics at Case Western Reserve University is supported by the National Institute for Biomedical Imaging and Bioengineering under P41-EB-01979. We are grateful to Dr. Dasen Liu (visiting professor, Northeast Agricultural University) for providing Chinese sorghum seeds (feed-type), Megan Bourassa, Jennifer Bohon, Nebojsa Marinkovic, Adele Qi Wang, Lisa Miller (NSLS-BNL, New York, USA) for helpful data collection at U2B and U10B experimental stations, and Tim May for helpful data collection and discussion at 01B1-1 station, Canadian Light Sources (CLS).
6. References [1] Miller, L. M.; Dumas, P. Chemical imaging of biological tissue with synchrotron infrared
light. Biochim. Biophys. Acta. 2006, 1758, 846-857. [2] Yu, P. Plant-Based Food and Feed Protein Structure Changes Induced by Gene-
Transformation, Heating and Bio-Ethanol Processing: A Novel Synchrotron-Based Molecular Structure and Nutrition Research Program. Mol. Nutr. Food Res. 2010, In press (Invited)
[3] Marinkovic, N. S.; Chance, M. R. Synchrotron Infrared Microspectroscopy. In: Meyers, R. (Ed), Encyclopedia of Molecular Cell Biology and Molecular Medicine, 2nd ed., Vol 13, Wiley Inc. 2006, pp 671-708.
[4] Wetzel, D. L.; Eilert, A. J.; Pietrzak, L. N.; Miller, S. S.; Sweat, J. A. Ultraspatially resolved synchrotron infrared microspectroscopy of plant tissue in situ. Cell. Mol. Bio. 1998, 44, 145-167.
[5] Budevska, B. O. Applications of Vibrational Spectroscopy in Life, Pharmaceutical and Natural Sciences. In: Chalmers, J. M., Griffiths, P. R. (Eds). Handbook of Vibrational Spectroscopy, Vol. 5. John Wiley and Sons, Inc., New York, NY, USA, 2002, pp 3720-3732.

Biotechnology of Biopolymers
240
[6] Yu, P.; McKinnon, J. J.; Christensen, C. R.; Christensen, D. A. 2004. Imaging molecular chemistry of Pioneer corn. J. Agric. Food Chem. 2004, 52, 7345-7352.
[7] Stewart, D., McDougall, G.J.; Baty, A. Fourier transform infrared microspectroscopy of Anatomically Different Cells of Falx (Linum usitatissimum) stems during development. J. Agric. Food Chem. 1995. 43, 1853-1858.
[8] Jackson, M.; Mantsch, H. H. The use and misuse of FTIR spectroscopy in the determination of protein structure. Biochemistry and Molecular Biology. 1995. 30: 95-120.
[9] Jackson, M., Mantsch, H. H., Biomedical Infrared Spectroscopy, In: Mantsch, H. H., Chapman, D. (Eds), Infrared Spectroscopy of Biomolecules, Wiley-Liss, New York, 1996, pp 311-340.
[10] Marinkovic, N. S.; Huang, R., Bromberg, P.; Sullivan, M.; Toomey, J.; Miller, L. M.; Sperber, E.; Moshe, S.; Jones, K. W.; Chouparova, E.; Lappi, S.; Franzen, S.; Chance, M. R. Center for Synchrotron Biosciences' U2B beamline: an international resource for biological infrared spectroscopy. J. Synchrotron Rad. 2002. 9, 189-197.
[11] Doiron, K. J.; Yu, P.; Christensen, C. R.; Christensen, D. A.; McKinnon, J. J. Detecting molecular changes in Vimy flaxseed protein structure using synchrotron FTIRM and DRIFT spectroscopic techniques: Structural and biochemical characterization. Spectroscopy. 2009. 23, 307–322.
[12] Himmelsbach, D. S.; Khalili, S.; Akin, D. E. FT-IR microspectroscopic imaging of flax (linum usitatissimum L.) stems. Cell. Mol. Bio. 1998, 44, 99-108.
[13] Raab, T.K; Martin, M.C. Visualizing rhizosphere chemistry of legumes with mid-infrared synchrotron radiation. Planta. 213, 881-887.
[14] Colthup, N. B.; Daly, L.H.; Wiberley, S. E.. Introduction to infrared and Raman spectroscopy. 3rd ed. Academic Press, Boston, 1990, pp 547.
[15] Yu, P.; Christensen, C.R.; Christensen, D.A.; McKinnon, J.J. Ultrastructural-chemical makeup of yellow- (Brassica Rapa) and brown-seeded (Brassica Napus) canola within cellular dimensions, explored with synchrotron reflection FTIR microspectroscopy. Can. J. Plant Sci. 2005, 85, 533-541

Part 5
Biosynthesis and Biosynthesis Pathway of Biopolymers


12
New Conceptions about Structure Formation of Biopolymers
Shabalkin I.P. and Shabalkin P.I. Cancer Research Center of RAMS,
Laboratory of Molecular Biological Investigation Methods, Russia
1. Introduction The primary structure of protein (L.Pauling) and DNA (J.Watson and F.Crick) was elucidated more than 50 years ago. According to Pauling's model the backbone of the polypeptide chain consists of monomers, each of which includes amino and carboxylic group residues. In Watson-Crick model (Watson a. Crick, 1953) each DNA chain backbone structure consists of monomers composed from saccharide - deoxyribose and phosphoric acid residue - phosphatic group (PO4). A common feature of these models is that protein and nucleic acid monomers should follow strictly one after another in the same position set by model in the polymer chain backbones. It is one of the essential drawbacks of both models. In particular, processes involving transpositions of repeated units in the polymer chain backbone are not considered in the given models though it is known that transposition (rearrangement) is a typical phenomenon for the majority of polymeric compounds. So, if we designate iminogroup (-NH-) in the peptide bond (CO - NH) of the protein as "I", and double bond C=O as "D" then dimers having 4 different types of transpositions in the primary structure of the protein chain backbone are possible: [(I-D) + (D-I)], [(I-D) + (I-D)], [(D-I) + (D-I)], [(D-I) + (I-D)]. Accordingly, it is possible to conclude that during polymerization of such biopolymers as DNA, RNA and proteins transpositions should exist in their backbone, i.e. given process is a universal phenomenon. And monomer units transpositions should meet the requirement of optimum compactization of molecular structure in the limited space. Let’s consider as an example what properties DNA molecule should possess to correspond to the compactization principle existing in the nature. It is known, that the total length of DNA macromolecule in cell can be as large as 2 metres. In this case DNA in cell nucleus (with average size of 5-7 microns) should be packed so that its length has decreased not less than 10000 times (Zbarskii, 1988). In other words, there should be some means for DNA compactization in nucleus at minimum energy cost either on the compactization or on information signal transfer.
2. Primary DNA structure One of mechanisms of DNA linear size contraction is a possibility of existence of bend deformation of short segments in DNA chain. However according to Watson-Crick model of

Biotechnology of Biopolymers
244
DNA B-form is a rigid rod with the limited macroscopic flexibility. Curling of such a long molecule demands extremely major energy expenditures. By common measure of the macromolecule flexibility, defined in the length of a geometrical segment A («Kuhn’s segment»), calculations show that for DNA А=900 - 1000 Å (angstrom). Big length of Kuhn’s segment means that monomer rotation is severely hindered in the DNA macromolecule. Regarding aforesaid we have assumed that in the backbone of each DNA molecule chains [considering that monomer consists of saccharide ("s") and phosphate («p»)] monomers transpositions can occur (Polymer Encyclopedia, 1977), i.e. dimers of different types can be present: 1. (p-s) + (s-p); 2. (p-s) + (p-s); 3. (s-p) + (s-p); 4. (s-p) + (p-s). Different interaction modes between monomers in the backbone of DNA polymer chains allow us to mark out dimers with different bonding strength between monomers. It means that in DNA: 1. there are dimers with phosphodiesther bond P-O-C, [(s-p) + (s-p)]; [(p-s) + (p-s)]; 2. there are dimers with phosphatic bonds P-O-P, [(s-p) + (p-s)]; 3. there are sections with glycosidic bonds C-O-C, [(p-s) + (s-p)]. As phosphodiesther bond P-O-S includes units of both Р-О and С-О bonds then differences in the bond characteristics between different heteroatoms are reduced in our case to an assessment of properties of Р-О and С-О bonds (table №1) actually.
Ionic part in bonding (%) Bond energy (kJ/mol) Effectiveness of hydrolytic cleavage (%)
Р-О С-О Р-О С-О Р-О С-О 39 22 342 332 10 90
Table 1. Р-О and С-О bonds characteristics according to the data published in literature (Allcook, 1967; Ingold, 1973).
From table №1 follows that С-О bond is weaker than Р-О one. Presence of dimers with different extent of bonding strength between monomers in the DNA chain promotes augmentation of molecular flexibility. It dilates DNA molecule compactization possibilities in cell nucleus as short segments of the chain can be packed in the limited space in the most dense way. However there is an open question whether DNA primary structure formation taking into account different types of dimers in the course of chemical evolution occurred by chance or due to some law. On the basis of statements that «a chance is the form of unknown law», and that harmony of the world is reduced to the harmony of numbers (Shevelev, 1990) we have assumed that polymerization of DNA chain in nature goes according to the mathematical law known as a Fibonacci numerical series. Fibonacci numbers are units of a numerical recursive sequence 1; 1; 2; 3; 5; 8; 13; 21... (Fibonacci series) in which each succedent, since the third, is equal to the sum of two previous (Renji, 1980). Considering possibility of existence of inverted monomers let’s examine process of formation of primary structure of single-stranded DNA, assuming that the first term of the series in the numerical sequence (we will note it as 1а) is a monomer in which phosphate is on the first place and saccharide is on the second place: (p-s). Then the second term of Fibonacci series (1в) is an inverted monomer: (s-p).

New Conceptions about Structure Formation of Biopolymers
245
Considering this condition, each term of Fibonacci number series consisting of certain number of segments of DNA chain accordingly, looks like the following:
1а = (p-s); 1в = (s-p); 2=1в + 1а = [(s-p) + (p-s)]; 3=2+1в = [(s-p) + (p-s) + (s-p)]; 5=3+2 = [(s-p) + (p-s) + (s-p) + (s-p) + (p-s)] etc.
As a result of consecutive addition of each succedent of Fibonacci number sequence to previous (1а+1в+2+3+5+8 +...) we have a segment of DNA molecule primary structure:
(p-s) + (s-p) + [(s-p) + (p-s)] + [(s-p) + (p-s) + (s-p)] + [(s-p) + (p-s) + (s-p) + (s-p) + (p-s)] + [(s-p) + (p-s) + (s-p) + (s-p) + (p-s) + (s-p) + (p-s) + (s-p)] + [(s-p) +... etc.
Having observed principles of segment’s primary structure organization of one strand (we will name it "lagging" for convenience) of DNA molecule, it is necessary to discuss structural features of second strand ("leading"). For a "leading" strand of DNA the first term of Fibonacci series (1а) is (s-p), and second (1в) - (p-s). Accordingly:
1а = (s-p); 1в = (p-s); 2=1в+1а = [(p-s) + (s-p)]; 3=2+1в = (p-s) + (s-p) + (p-s)]; 5=3+2 = [(p-s) + (s-p) + (p-s) + (p-s) + (s-p)] etc.
As a result we have a segment of primary structure of "leading" strand of DNA molecule consisting of 21 monomers:
(s-p) + (p-s) + [(p-s) + (s-p)] + [(p-s) + (s-p) + (p-s)] + [(p-s) + (s-p) + (p-s) + (p-s) + (s-p)] + [(p-s) + (s-p) + (p-s) + (p-s) + (s-p) + (p-s) + (s-p) + (p-s)] + [(p-s) +...
Thus, a special feature of DNA structural organization model that we offer is possibility of existence of monomers transpositions in the molecule backbone. And as a result of transpositions in DNA there are dimers with different values of bend angles in three-dimensional space. According to literary data in dimer [(p-s) + (s-p)] angle between monomers equals 60º (Finean, 1967), in dimer [(s-p) + (p-s)] bend angle is 90º (Wiser a. Kleiton, 1965), in dimers [(s-p) + (s-p)], [(p-s) + (p-s)] bend deformation correspond to an angle of 120º (Smith et al., 1976). Different angles in dimers promote selective arrangement of side groups (nitrogen bases) in primary structure of a biopolymer. Aforesaid process is based on the principle of maximum compactization of molecule in limited space that is allocation of side groups in the interior space of dimer depends on their molecular mass. Considering that the principle of maximum structure compactization acts at all levels of polymeric compound organizations, we admit that nitrogen bases guanine and adenine should be placed where the dimers having an angle of 120º are formed as they have the greatest size among other nitrogen bases. Then cytosine should be linked with dimers having an angle of 60º and thymine should be linked with dimers having an angle of 90º as thymine occupies more space than cytosine because of the presence of СН3-group in this base. At once another question arises. Is it possible to establish what nitrogen base corresponds to the first monomer in a dimer and what to the second? Positive answer can be obtained if we proceed from the conception that value of bend angle during dimer formation depends on a position occupied by every second monomer in relation to the first. For clearness let’s observe a trimer of the strand consisting of monomers №1-3:

Biotechnology of Biopolymers
246
1 2 3 1 2 [(p-s) + (s-p) + (s-p)]. According to our hypothesis, in dimer [(p-s) + (s-p)] angular deformation equals 60º, that assumes cytosine addition to monomer №2. 2 3 Dimer [(s-p) + (s-p)] has bend angle of 120º. In this case nitrogen base for monomer №3 should be purine (A or G) for purines as the bulkiest nitrogen bases the easiest way to be placed is to be in space of the dimer having a bend angle 120º. In case of dimer [(s-p) + (p-s)] where the bend angle equals 90º the second monomer has thymine as a side group. If we proceed our analysis of nitrogen bases allocation in monomers of DNA chain backbone depending on the role of the second monomer in each dimer one should admit that biopolymer chain structure actually can be established completely. At the same time we have not yet solved the next problem: whether nitrogen bases should be placed outside or inside each chain? There are three possible options. The first option: all nitrogen bases are located inside backbone composed from two chains of DNA. Watson-Crick model of DNA corresponds to this alternative (Watson a. Crick, 1953). The second option is Pauling-Corey model of DNA. Nitrogen bases are located outside molecule’s backbone (Pauling a. Corey, 1953). The third option is offered in this paper. It is supposed in this variant that part of nitrogen bases lies outside from polymer backbone. Why are we not satisfied by the first two options and in particular by the first one? At first, in this variant the hierarchical principle of the DNA macromolecular organization is violated as on high levels of compactization of such giant polymeric compound as DNA complementarity principle is absent because of bases hidden in the lowest level of DNA structural organization have no opportunity to form complementary pairs between the fragments belonging to higher supramolecular levels of DNA structural organization. Secondly, lack of bases outside of backbone of DNA molecule does not allow cellular systems to control processes of growth, development and organism functioning because «signal molecules» are absent on subunits surfaces belonging to various levels of the structural organization of molecule. These “signal molecules” are "coded" nitrogen bases which switch on or off various biochemical processes in the cell as DNA is the carrier of genetical information of organism life. The second model of DNA does not meet the requirements for DNA structure for two reasons: 1. it does not have complementarity of bases in DNA chains at all that reduces
stabilization of DNA molecule; 2. DNA represents the structure composed from three chains. The third option takes account of advantages and drawbacks of the first two variants and therefore corresponds as it seems to us optimal structure of DNA. In this variant allocation of nitrogen bases in each chain goes in turn. In other words, in a dimer of each chain one nitrogen base is outside concerning other nitrogen base which is a part of this dimer. Such order of bases distribution in each chain is stipulated by the fact during dimer formation the bend angle of one monomer concerning another does not allow disposing both bases (which are parts of this dimer) in interior space of dimer. Thus in dimers [(s-p) + (p-s)], [(p-s) + (s-p)] saccharide of one monomer can be in other position concerning saccharide of adjacent monomer like alteration of saccharide position during pre-mRNA capping (Patrushev, 2000).

New Conceptions about Structure Formation of Biopolymers
247
Fig. 1. Cap mRNA. (Patrushev, 2000).
On fig. 2 the fragment of DNA molecule including 2 chains (left and right) is presented. Each chain is composed of 4 monomers. The backbone of left chain includes monomers:
1 2 3 4 1 2 3 4 (s-p) + (p-s) + (p-s) + (s-p); backbone of right is (p-s) + (s-p) + (s-p) + (p-s).
We consider the left chain as "leading" because it starts with the most ancient nucleotide - deoxyadenylic acids (Shabalkin et al. 2003). The right chain called "lagging" is biased on one nucleotide concerning the left chain. It allows "lagging" chain to form the first complementary pair of DNA molecule: T+A. That process became possible because it has already been determined in the first dimer of "leading" chain as we have shown what nitrogen base should be the second monomer of dimer [(s-p) + (p-s)]. It is necessary to note, that nitrogen base of the first monomer of "leading" chain - adenine (A) - should be outside the chain for it has a function of the first signal molecule which starts DNA structure formation. Pattern of nitrogen bases located partially outside the backbone of chains allows stabilization of fragments of supramolecular structures at various levels of DNA molecular organization by means of complementary pairs formation. All aforesaid means that the model of DNA structural organization introduced in this paper better corresponds the role that DNA plays in the life of an organism than the first two models mentioned above. So, what is the advantage of our model in comparison with already existing models of biopolymers? At first, in existing models the processes of monomers transposition in polymer chain backbone haven’t been taken into account in spite of the fact that monomers’ rearrangements allow to have mini-segments in a chain with different extent of bonding strength between monomers. Secondly, difference in bonding between monomers specifies the existence of relatively weakly bonded segments promoting augmentation of chain flexibility that dilates possibilities of compactization of molecule in space and of identification of sites of preferable location and coordination binding of ligands. Thereby

Biotechnology of Biopolymers
248
Fig. 2. A fragment of DNA double helix where the part of nitrogen bases of each DNA chain lies outside polymeric backbone.
transpositions of monomers in polymer chain suppose creation of the brand new molecular biosystems meeting the requirements of maximum compactization of molecule in limited space and of augmentation of biopolymer structure informational capacity owing to existence of different variants of monomers’ compactization. And these processes are carried out not in a random way but obey to mathematical laws. In the third, proceeding from the assumption that polymerization of biopolymer chain in nature goes according to the
New Conceptions about Structure Formation of Biopolymers
249
mathematical law known as Fibonacci numerical series we have found the order of formation of the backbone of polymeric chain primary structure, that is possibility of synthesis of molecular systems with predicted disposition of separate fragments of chain in space is established. Thus, if we take into account that transcription is a process of synthesis of informational RNA (mRNA) which carries the information containing on the dubbed section of DNA, and mRNA is used as a template in the course of translation defining sequence of amino acids in the growing protein polymer chain, then actually backbones of mRNA chains as well as protein molecules repeat the order and method of alternation of monomers described in the backbone of DNA chain.
3. Supramolecular DNA structure During the study of the primary DNA structure, a question arose about the size of a minimum fragment of single DNA strand that can be a moiety participating in the formation of a supramolecular structure of the molecule. To this end, we analyzed division of a linear segment into two parts according to the golden proportion rule. The golden section principle is based on the fundamental property: the ratio of the greater part to the total segment is equal to the ratio of the smaller part to the greater part (Renji, 1980). In numerical terms, the equality of these two ratios (golden proportion) is expressed by an irrational number ≈0.618…, i.e. m/M=M/T (where m and M are the smaller and greater parts and T is the total). Since the backbone of the primary structure of DNA molecule is a linear structure consisting of monomer moieties of the same length, we can select a mini-fragment that is the first building block of DNA molecule. Imagine that we divide a singlestrand DNA fragment consisting of 144 monomers. The given segment (so called «the nucleosome core») – a unit of supramolecular DNA structure, which virtually does not duffer from the data of other authors (Chentsov, 2004; Zbarskii, 1988), who consider that the nucleosome core contains 140-147 monomers. let us assume that the first fragment of the DNA chain primary structure (144 monomers long, according to the new model of DNA structure (Shabalkin I., Shabalkin P., 2006)) looks as follows: 1 2 3 4 5 6 7 8 9 10 (P–S)+(S–P)+[(S–P)+(P–S)]+[(S–P)+(P–S)+(S–P)]+[(S–P)+(P–S)+(S–P)+ 11 12 13 14 15 16 17 18 19 20 (S–P)+(P–S)]+[(S–P)+(P–S)+(S–P)+(S–P)+(P–S)+(S–P)+(P–S)+(S–P)]+ 21 22 23 24 25 26 27 28 29 30 [(S–P)+(P–S)+(S–P)+(S–P)+(P–S)+(S–P)+(P–S)+(S–P)+(S–P)+(P–S)+ 31 32 33 34 35 36 37 38 39 40 (S–P)+(S–P)+(P–S)]+[(S–P)+(P–S)+(S–P)+(S–P)+(P–S)+(S–P)+(P–S)+ 41 42 43 44 45 46 47 48 49 50 (S–P)+(S–P)+(P–S)+(S–P)+(S–P)+(P–S)+(S–P)+(P–S)+(S–P)+(S–P)+ 51 52 53 54 55 56 57 58 59 60 (P–S)+(S–P)+(P–S)+(S–P)]+[(S–P)+(P–S)+(S–P)+(S–P)+(P–S)+(S–P)+ 61 62 63 64 65 66 67 68 69 70 (P–S)+(S–P)+(S–P)+(P–S)+(S–P)+(S–P)+(P–S)+(S–P)+(P–S)+(S–P)+ 71 72 73 74 75 76 77 78 79 80 (S–P)+(P–S)+(S–P)+(P–S)+(S–P)+(S–P)+(P–S)+(S–P)+(S–P)+(P–S)+ 81 82 83 84 85 86 87 88 89 90 (S–P)+(P–S)+(S–P)+(S–P)+(P–S)+(S–P)+(S–P)+(P–S)]+[(S–P)+(P–S)+ 91 92 93 94 95 96 97 98 99 100 (S–P)+(S–P)+(P–S)+(S–P)+(P–S)+(S–P)+(S–P)+(P–S)+(S–P)+(S–P)+

Biotechnology of Biopolymers
250
101 102 103 104 105 106 107 108 109 110 (P–S)+(S–P)+(P–S)+(S–P)+(S–P)+(P–S)+(S–P)+(P–S)+(S–P)+(S–P)+ 111 112 113 114 115 116 117 118 119 120 (P–S)+(S–P)+(S–P)+(P–S)+(S–P)+(P–S)+(S–P)+(S–P)+(P–S)+(S–P)+ 121 122 123 124 125 126 127 128 129 130 (S–P)+(P–S)+(S–P)+(P–S)+(S–P)+(S–P)+(P–S)+(S–P)+(P–S)+(S–P)+ 131 132 133 134 135 136 137 138 139 140 (S–P)+(P–S)+(S–P)+(S–P)+(P–S)+(S–P)+(P–S)+(S–P)+(S–P)+(P–S)+ 141 142 143 144 (S–P)+(P–S)+(S–P)]+[(S–P)+… The process of division of a DNA chain fragment 144 monomers long can be described by stages of this fragment division on condition that each of the two different (by length) parts of the initial fragment (let us call them segments) are fragments (shorter than the initial one!) also capable of dividing in accordance with the golden ratio rule until the equality of two proportions remains valid (Fig. 3). Hence, at stage I the fragment (total) divides in point 0 into two segments, one of them consisting of 89 monomers (longer segment) and the other has 55 monomers (shorter one). According to the golden ratio, we have two equal proportions: 55/89=89/144 or 55/89≈0.617...; 89/144≈0.618... The two proportions remain equal (0.62) after this division of the initial fragment into two parts. This equality (0.62) is retained at other stages of the initial fragment division: 34/55=55/89 or 34/55≈0.618; 55/89≈0.618; 21/34=34/55 or 21/34≈0.618; 34/55≈0.618; 13/21=21/34 or 13/21≈0.619; 21/34≈0/618; 8/13=13/21 or 8/13≈0.615; 13/21≈0.619. The process of the initial fragment division is over at stage VI (Fig. 3) by the formation of one minifragment consisting of 13 monomers. It consists of two mini-segments of different length: large (8 monomers) and small (5 monomers): 5/8=8/13 or 5/8≈0.625; 8/13≈0.615. The next stages of fragmentation of the minifragments consisting of 8 or 5 monomers each do not correspond to the golden ratio rule, as the equality of the two proportions is violated: 3/5≠5/8 or 0.6≠0.625; 2/3≠3/5 or 0.67≠0.6. Hence, the results of analysis indicate that the last mini-fragment, which determines the number of monomers, components of the unit participating in the nucleosome core formation; the unit is to have 5 or 8 monomers.
Fig. 3. Scheme of division of one DNA strand fragment (144 monomers long) into two segments according to the “golden ratio” rule. I-VI: stages of the initial fragment division to the minimum size, meeting the golden ratio requirement. Arabic figures show the number of monomers.

New Conceptions about Structure Formation of Biopolymers
251
A
B
C
D
Fig. 4. Scheme of DNA strand nucleosomal loop formation in a twodimensional space. Arabic figures: orderly numbers of monomers.
The structure assembled by stages (in opposite order; Fig. 3) from these mini-segments is geometrically similar to a plus (Fig. 4). In this case the chain curvature is realized at the interface of two segments in points having dimers [(S–P)+(P–S)]. The figure of a cross (fig. 4) represents itself an example of creation of braiding structures during the nucleosome crust forming. The segments №1-5 and №140-144 are the basis of a such loop. Besides the ordering of such a loop is put into effect in 6 stages. During stage I, a small loop is formed consisting of two fragments: one of them includes 8 monomers and the other contains 5 monomers. During stage II, a loop consisting of 73 monomers is formed. It includes 13 monomers forming a loop during stage I of nucleosome assembly and 60 additional monomers. During stage III, 63 monomers are added to the preexisting 73 monomers constituting the macro-loop structure. The assembly process during which new monomers are added to preexisting complex of monomers is completed at stage IV, when the last 8 monomers are added to 136 preexisting monomers. Stages V and VI consist in the formation of the two-dimentional macronucleosome into three-dimentional structure-nucleosome. Why the Nature has chosen the loop for compactization of the DNA strand? First, appearance of lateral segments (loops), distant from the main chain, leads to shortening of

Biotechnology of Biopolymers
252
the linear length of DNA chain. Second, it promotes cooperation of the loops (Polymer Encyclopedia, 1977) due to local orientation ordering of the segments which became closer to each other in space during condensation of the main chain (Khokholov, 1988). The segments brought closer to each other stabilize the chain carcass at the expense of the formation of extra bonds. Third, transition of a chain site from linear to annular form (loop) is more advantageous energetically and for compactization of DNA structure. This closed circular structure can fold into a more complex structure to three-dimensional one, e.g. by dividing the loop in the horizontal plane into 4 blocks (a-d) followed by bending of each block by 90o relative to the other one (fig.4). Generally, the three-dimensional structure of the nucleosome can be presented by a hollow rectangular structure, which is formed by certain kinds of histones, which take part into the process of blocks joining. In this model of macronucleosome loop we only demonstrated the role of [(S–P)+(P–S)] dimers in compaction of the loop, but did not take into account the peculiarities of compaction of the structure including other types of dimers [(S–P)+(S–P)] and [(P–S)+(S–P)]. The participation of the latter should considerably modify the structure of nucleosome loop, because of different strength of bonds between the monomers in different types of dimers. Taking into account this fact and different angles between the monomers in these three types of dimers (60o, 90o, 120o) and bearing in mind that the process of structure compaction obeys the principle of least surface at the same volume we conclude that DNA should include geometrical forms that are presented by regular polygons. Moreover, DNA is a liquid crystal and combines the properties of a fluid and a solid, therefore it should include the elements of regular 3D crystalline lattice consisting of regular tetrahedrons and octahedrons. We believe that these are the geometrical figures that participate in loop formation. The first mini-segment of the loop including four monomers consists of regular tetrahedron and octahedron, the moieties of regular crystalline lattice (Fig. 5), because crystalline lattice cannot be constricted with only one type of geometrical figure (Varga, 1978). For illustration let us trace the formation of the first least structural unit, participating in the construction of the nucleosome core, in mini-segment consisting of 5 first monomers (fig. 5): 1 2 3 4 5 (P–S)+(S–P)+(S–P)+(P–S)+(S–P)+…
Fig. 5. Minimum crystalline lattice unit consisting of regular tetrahedron and octahedron. 1-4: fragment chain including monomers: 1 2 3 4 [(P–S)+(S–P)+(S–P)+(P–S)]

New Conceptions about Structure Formation of Biopolymers
253
The order of the monomers location in the analyzed segment indicates the formation of dimers of all three possible types. In the first dimer [(P–S)+(S–P)] monomers 1 and 2 form an angle of 60o. The second dimer [(S–P)+(P–S)] is a result of monomers 3 and 4 binding at an angle of 90o. The third dimer [(S–P)+(S–P)] forms as a result of monomers 2 and 3 binding at an angle of 120o. It is involved as a binding component in the formation of the first and second dimers into one structural unit. In fact, the mechanism of the nucleosome core fragment assembly is a process repeating (in a certain sequence) all 3 types of dimers, which suggests the formation of a compact structure, that is, the short fragments of the chain with different shape of bending deformation can be packed most compactly. The minisegment of DNA chain carcass including 5 monomers little resembles the unit of a correct crystal lattice constituted (as we have mentioned above) from correct tetrahedron and octahedron. It is more likely a fragment of a broken line assembled from similar components bending at different angles. However, this structure is a unit of a correct crystal lattice, as the monomers constituting it form dimers with angles corresponding to the angles of polygonal geometrical figures of this unit. The fact that it has “vacant” spaces indicates that initially it was similar to a common broken line, but later (in the course of biochemical evolution) all these spaces were presumably filled, and the structural unit of the crystal lattice was fully realized. The “vacant” spaces are most likely the zones in which the DNA repeats are located, serving for improving the stability of the biological system, as the more repeats a system contains, the more reliable it is. So we can say, that a nucleosome – is a three-dimentional hollow structure. Its segments consist of 5 or 8 monomers and besides they have structures similar to a regular tetrahedron or octahedron. The last is a unit of a regular crystalline array. The existence of such structures is explained by the fact that a biopolymer is in need of them not only for realizing of functions of a storage of information, but for transferring of information too. This structure corresponds to chain fragments where acoustic signals propagate without energy loss. The types of transformations described by us for the formation of nucleosomic moiety of one DNA chain are completely valid for the other DNA chain with consideration for rearrangement of monomers in its primary structure. Bearing in mind that DNA molecule consists of two strands starting from either (S–P), or inverted (P–S) monomer, we assume that two types of nucleosomic moieties correspond them in different strands. These two moieties are the monomers similar to monomers of the primary DNA structure and participate in the formation of the structure of each of two supramolecular DNA strands. However, it remains unknown where nucleosomes are arranged along the DNA chain according to certain regularity or this is a random process. If the primary structure of biopolymers obeys certain mathematical regularities, the assembly of supramolecular structural moieties corresponding to different levels of biopolymer organization should comply the regularities characteristic of its primary structure. Let us assume that we assemble individual nucleosomes into a chain corresponding to a higher level of structural organization of DNA. To this end, it is reasonable to use the principle of primary structure based on permutation of (P–S) monomers in the chain backbone according to Fibonacci number sequence. Let the monomer corresponding to the first member in the Fibonacci sequence (1a) be a nucleosome , which begins with a segment (so called “Head”) and ends with another segment (“Tail”) is defined as a monomer (“H-T”). Then, another nucleosome will become similar to a monomer of the second rank of Fibonuchi (1b), and during the process of segments’ rearrangement will correspond to a monomer “Tail-Head” (“T-H”). So

Biotechnology of Biopolymers
254
using the rearrangement we can devide nucleosomes into 2 types, which help to organize one chain from of a sum of Fibonacci numbers: 1a+1b+2+3+5+…etc. This chain can be presented as a “primary” structure and transformed into a 3D structure according to the golden proportion principle. Since supramolecular structure of DNA molecule is organized by the hierarchical principle, the formation of multicomplexes of nucleosomes should basically repeat the stages of assembly of a single nucleosome.
4. Features of DNA synthesis In is interesting to consider the mechanism of functioning of DNA polymerases, because these processes include break and transfer of DNA chain to another active center. It is known that the chain can be broken due to interaction of the growing active center with introduced second monomer increasing chain rigidity. Chain transfer is a transfer of active center of the molecule to another molecule initiating the growth of a new chain (Polymer Encyclopedia. 1977) These processes directly depends on [(S–P)+(P–S)] dimers. The point is that enzymes catalyzing the growth of polynucleotide chain (e.g. DNA polymerase) do not work in this case, because they normally attach the next monomer only to the 3’-hydroxyl group of the sugar in the end monomer, which should not be phosphorylated at the stage of chain elongation. When DNA polymerase approach the dimer [(S–P)+(P–S)], the chain is broken. In order to continue the process of chain elongation, the enzyme should find the transition point. Let us discuss these processes in more detail on the basis of matrix (template) backbone monomer synthesis of the “leading” and “lagging” chains also presented by their monomers (Fig. 6). Eukaryotes have several types of DNA polymerases (Patrushev, 2000); let the first type of DNA polymerase start working and transcribe the “leading” chain, where the first monomer is (S-P). After synthesis of the first daughter domain (P–S) complimentary to the first monomer in the “leading” chain matrix, transcription of this chain is terminated, because the second monomer in the chain starts from the phosphate group. The synthesis of the daughter DNA chain is paused (!) for a while. Several processes take place in the cell during this pause. Break hydrogen bond between the nitrogenous bases of the second monomer of the “leading” chain and the first monomer of the “lagging” chain leads to outside displacement of the sugar and nitrogenous base (adenine) of the first monomer in the “lagging” chain. This phenomenon was observed by investigators using a magnetic forceps for untwisting of the B-DNA (Allemand et al., 1998). The first nucleotide of the “lagging” chain in the new position becomes available to other DNA polymerase, which can use single-strand structures starting from (P–S) monomers as the template. After synthesis of the first daughter monomer (S–P) in the “lagging” chain, this DNA polymerase cannot work on the same template, because monomers are unavailable, because they are shield by type I DNA polymerase. When type I DNA polymerase finds a new matrix, in particular the second monomer of the “lagging” chain and moves to this new active center, type II DNA polymerase jumps from the “lagging” chain to the “leading” one and starts DNA synthesis using the second and third monomers of this chain as the template. Generally, during replication the synthesis of the daughter fragment on one template DNA chain is broken and the catalyzing enzyme moves to a new active center, i.e. to the second template DNA chain. This is a cyclic process associated with changes of active center. During replication, the “leading” chain is by one nucleotide ahead to the “lagging” chain. Every time the pause occurs between termination and activation of DNA synthesis in new active center, when no DNA is synthesized; hence, DNA synthesis has a successively interrupted nature.

New Conceptions about Structure Formation of Biopolymers
255
It should be noted that the hypothesis on the interrupted nature of DNA synthesis was put forward by some authorities (Cornberg, 1974; Eigen a. Schster, 1982; Finean, 1967; Shabalkin, 1977), and was even experimentally proven (Shabalkin, 1976). According to Shabalkin΄s hypothesis (Shabalkin, 1976) synthesis of a DNA daughter strand fragment occurs in a limited region of only one DNA matrix strand. There is no DNA synthesis in complementary region of the second matrix strand at this moment. On completion of the replication in the DNA first matrix strand the DNA synthesis is over. After a pause the replication proceeds in a limited region of the DNA second matrix strand. Thus, we can conclude that the process of biochemical evolution of biopolymers led to the appearance of mechanisms based on the principle of maximum structural compaction in a limited space. This was associated with selective distribution of nitrogenous bases or R-groups of proteins in biopolymer macromolecules to certain locations determined by bending deformations of dimers in the biopolymer backbone.
Fig. 6. Scheme of functioning of DNA polymerases involving break and transfer of DNA chain to another active center.
1 (S–P): the first monomer of the “leading” DNA chain; 1º (P–S): the first monomer of the “lagging” DNA chain.
5. Conclusion To make the conclusion, we may say: the main feature of biopolymers’ structure is a rearrangement if its monomers. Besides the order of monomers in this chain is presupposed by mathematic regularity, known as numerals of Fibonuchi. As a result of this rearrangement new dimmers appear with new bends in space. Different bends of dimmers promote a proper arrangement of side groups in the biopolymer’s structure. Besides in a dimer’s chain there is one group is situated on the outside of the other one. So outside groups stabilize structures of biopolymers and have a function of “signal” molecules in biological process. The next feature of our model is forming of a supramolecular structure of a biopolymer with the help of fragments of the initial structure, which are formed by a mathematic regularity “gold proportion”. So according to this proportion, the initial mini-fragment of this chain includes two mini-segments: a large one containing 8 monomers and a smaller one containing 5 monomers. So the forming structure of the elements of supramolecular

Biotechnology of Biopolymers
256
structure should correspond to the “principle of solidness“, which is presupposed to take into account economy of space but not volume. The given condition could be fulfilled if the biopolymer’s structure have elements of proper forms: tetrahedron and octahedron, formed by monomers of a proper chain. Together proper tetrahedron and octahedron is a unit of a regular crystalline array, which is the most favorable conformation, where short parts of its chain of different forms can be combined tightly. The fact that this system consists of structural elements presented by regular geometric figures creates prerequisites for assignment of biology and medicine to exact sciences at the modern level of nanotechnology development. For instance, deciphering of information encoded by biopolymers provides the possibility for the synthesis of drugs strictly identical by their stereo structure to biological targets in cells and for the creation of artificial compounds regulating functional activity of biopolymer.
6. References Allcook H. R. (1967). Heteroatom ring system and polymers. N-Y., Lon. Allemand J.F. Bensimon D., Lavery R., and Croqette V. (1998). Proc. Natl. Acad. Sci. Vol. 95,
№ 24, pp, 14152-14157. Chentsov Yu. S. (2004). Introduction in cell biology. (in Russian), Moscow. Cornberg A. , (1974). DNA synthesis. San Francisco. Eigen M. a. Schuster P. (1982). A principle of natural self-organization. (in Russian),
Moscow. Finean J.B. (1967). Biological ultrastructure. N.-Y., Lon. Ingold C. (1973). Teoreticheskie of an organic chemistry bottom. (in Russian), Moscow, pp.
979-983. Khokhlov A. R. (1988). Liquid crystal polymers. (in Russian), Moscow, pp. 32-38. Patrushev L.I. (2000). Expression of genes. (in Russian), Moscow. Pauling L., Corey R.B. (1953). Proc. Natl. Acad. Sci. USA. Vol. 39. pp. 84-97. Polymer encyclopedia. (1977), Vol. 2. (in Russian), Moscow, pp. 101-102, pp. 383-384, pp.
405-406, p. 959, p. 580. Renji A. (1980) Trilogija about the mathematics. (in Russian), Moscow. Shabalkin I.P. (1976). Arkh. Anat. Vol. 71., № 9, pp. 29-35. Shabalkin I.P. (1977). Thilologia. Vol. 19., № 5, pp. 474-477. Shabalkin I.P., Shabalkin P. I, Jagubov A.S. (2003). The Log of evolutionary biological
chemistry and physiology. Vol. 49, №5, pp. 488-495. Shabalkin I.P. a. Shabalkin P.I. (2006). Akt. Probl. Sovr. Nauki. (in Russian), Moscow, №3,
pp. 269-271. Shevelev I.S. (1990). The Golden section. (in Russian), Moscow. Smith I., Smith M.J., Dore C.F. (1976). “Model for macromolecules: nucleic acids and
proteins”. In “Chromatographic and Electrophoretic Techniques”. Vol. 2., chapter 16. pp. 409-453.
Varga T. (1978). Mathematics. (in Russian), Moscow. Watson J.D., Crick F.H.C. (1953). Nature. Vol. 171, pp.737-738. Weser D.V. and Кleiton F.K. (1965). Macromolecule on the basis of phosphorus. In the book
"Inorganic polymers". (in Russian), Moscow, pp. 31-83. Zbarsky I.B. (1988). Organization of a cell nucleus. (in Russian), Moscow.

13
Activated Sugar Precursors: Biosynthetic Pathways and Biological Roles of an Important
Class of Intermediate Metabolites in Bacteria Sílvia A. Sousa, Joana R. Feliciano and Jorge H. Leitão
IBB – Institute for Biotechnology and Bioengineering, CEBQ, Instituto Superior Técnico,
Portugal
1. Introduction Activated sugar precursors are energy-rich forms of monosaccharides, mainly nucleoside diphosphate sugars, that contain the energy required for the assembly of their sugar moiety in carbohydrate sequences on appropriate carrier molecules (Fig. 1).
GDP-D-Mannose
H
OH
CH2OH
OH
H
OH OH
H
H
O PO
O-
O PO
O-
O Guanosine
UDP-N-Acetylglucosamine
H
OH
CH2OH
OH
H
OH H
NH
H
O PO
O-
O PO
O-
O Uridine
C OCH3
GDP-D-Mannose
H
OH
CH2OH
OH
H
OH OH
H
H
O PO
O-
O PO
O-
O Guanosine
H
OH
CH2OH
OH
H
OH OH
H
H
O PO
O-
O PO
O-
O Guanosine
UDP-N-Acetylglucosamine
H
OH
CH2OH
OH
H
OH H
NH
H
O PO
O-
O PO
O-
O Uridine
C OCH3
UDP-N-Acetylglucosamine
H
OH
CH2OH
OH
H
OH H
NH
H
O PO
O-
O PO
O-
O Uridine
C OCH3
Fig. 1. Structures of the sugar nucleotides GDP-D-mannose and UDP-N-acetylglucosamine.
In bacteria, these ubiquitous metabolites are required for the synthesis of all the carbohydrate-containing polymers. Sugar nucleotides are the donors of the sugar moieties found in oligo- and polysaccharides (e.g. exopolysaccharides - EPS, lipopolysaccharides - LPS). Sugar nucleotides are also required for the glycosylation of proteins and lipids, for the phase 2 metabolization of xenobiotics, and for the metabolism of secondary metabolites with antibiotic activities (Gronow and Brade, 2001; Nedal and Zotchev, 2004). LPS and EPS can form highly complex structures at the bacterial outer surface, and are often involved in the molecular recognition and virulence of pathogens. Therefore, the targeting of the biosynthesis of specific carbohydrates is considered of interest for the development of new therapeutic agents (Green, 2002; Foret et al., 2009).
Biotechnology of Biopolymers
258
2. Methods used in sugar nucleotide analysis Nucleotide sugars were identified for the first time almost 45 years ago (Leloir, 1971). Investigations of the metabolism of activated nucleotide sugars require rapid analytical assays that allow the separation, structural characterization and quantification of substrates, intermediates and end products. Since the late 1970s, several high-performance liquid chromatography (HPLC) methods for nucleotide analysis have been developed, including ion exchange chromatography, reversed-phase liquid chromatography and more recently the ion-pair chromatography (Ramm et al., 2004). All these HPLC applications enabled the separation of nucleotide sugars and their detection was based on absorption of light of wavelengths within the UV range. This is due to the fact that all the nucleotides exhibit an absorption maximum around 260 nm. However, these methods cannot differentiate sugar nucleotides according to the nature of the nucleotide diphosphate moiety (ADP, CDP, GDP, dTDP, UDP) that is linked to C-1 of the sugar residue. For this reason, to identify the HPLC peaks, co-chromatography with reference compounds is required, although no structural information can be obtained. Currently, the analysis of the nucleotide sugars is performed by HPLC methods coupled with other methods such as diode-array detection (DAD), electrospray ionization mass spectrometry (ESI-MS) or nuclear magnetic resonance (NMR) (Ramm et al., 2004). Capillary electrophoresis (CE) has also been used to resolve closely related sugar nucleotides, together with NMR spectroscopy to identify their chemical structures (Lehmann et al., 2000; King et al., 2009). Recently, porous graphitic carbon (PGC) liquid chromatography-electrospray ionization-mass spectrometry (LC-ESI-MS) was successfully applied to sugar nucleotide separation and analysis (Pabst et al., 2010).
3. Enzymatic synthesis of nucleotide sugars Glucose-1P (G1P) and Fructose-6P (F6P) can be regarded as the starting materials in metabolic pathways leading to various sugar nucleotides. G1P is formed from the glycolysis intermediate G6P by the enzyme activity phosphoglucomutase (Pgm; EC 5.4.2.2) (Mehra-Chaudhary et al., 2011). The glycolysis intermediate F6P is also of central importance in sugar nucleotides biosynthesis. The vast majority of sugar nucleotides can be synthesised by living organism using either G1P or F6P as starting materials. Among the few exceptions are galactose and mannose sugars. Although these two sugars can be synthesized from G1P or F6P, they can also result from the uptake of substrates like lactose found in milk, or mannose, a sugar that occurs in fruits such as cranberry. The majority of the nucleoside diphosphate sugars are synthesized by the condensation of a nucleoside triphosphate (XTP, where X can be any nucleoside, being uridine, guanosine, cytidine, thymidine, and adenosine the more common ones) with a sugar 1-phosphate (where the sugar can be D-glucose, D-galactose, D-mannose, 2-acetamido-2-deoxy-D-glucose, L-fucose, D-glucuronic acid, or another sugar) by a specific pyrophosphorylase enzyme activity, as shown in the following reaction:
XTP glycosyl phosphate XDP glycose PPi+ ↔ − +Pyrophosphorylase

Activated Sugar Precursors: Biosynthesis and Biological Roles of an Important Class of Intermediate Metabolites in Bacteria
259
The resulting sugar nucleotide can also be inter-converted to different monosaccharides by several mechanisms. These include epimerisation/isomerisation, decarboxylation, dehydration, dehydrogenation, oxidation or reduction reactions (Field and Naismith, 2003). For example, a common strategy is the oxidation of a hydroxyl group to a ketone, being used to activate the protons to the ketone group, for amination and for direct epimerization. Subsequently, the nucleotide sugar will be transferred to the appropriate acceptor by specific glycosyltransferases. In this work, we review the nucleotide sugars that are more commonly found in bacterial cells, and the enzyme activities required for their biosynthesis.
4. Sugar nucleotides: occurrence and biosynthesis 4.1 GDP-D-mannose GDP-D-mannose is the donor of D-mannose, a sugar residue found in many bacterial extracellular polysaccharides, as is the case of xanthan, cepacian, acetan, and some sphingans (Becker et al., 1998; Cescutti et al., 2000; Richau et al., 2000; Griffin et al., 1997; Fialho et al., 2008). The synthesis of GDP-D-mannose from F6P requires the enzyme activities phosphomannose isomerase (PMI; EC 5.3.1.8), phosphomannose mutase (PMM; EC 5.4.2.8) and GDP-D-mannose pyrophosphorylase (GMP; EC 2.7.7.13) (Fig. 2). In many bacteria, the PMI and GMP enzyme activities are carried out by a bifunctional protein that belongs to the type II PMIs family of proteins (Sousa et al., 2007; Griffin et al., 1997). These proteins have two separate conserved domains: the mannose-6-phosphate isomerase family 2 domain in the C-terminus, and the nucleotidyl transferase domain in the N-terminus (Jensen and Reeves, 1998). These enzymes catalyse the reversible isomerization of fructose-6-phosphate into mannose-6-phosphate and transfer mannose-1-phosphate to GTP forming GDP-D-mannose, respectively (Fig. 2; Wu et al., 2002).
Glucose-6-P Fructose-6-P
Mannose-6-P
Mannose-1-P
GDP-D-mannose
GDP-D-rhamnose
PMI
GMP
GDP-L-fucose
PMM
PGI
GDP-D-mannuronic acid
Glucose-6-P Fructose-6-P
Mannose-6-P
Mannose-1-P
GDP-D-mannose
GDP-D-rhamnose
PMI
GMP
GDP-L-fucose
PMM
PGI
GDP-D-mannuronic acid Fig. 2. Metabolic pathway leading to GDP-D-mannose. PGI, phosphoglucose isomerase; PMI, phosphomannose isomerase; PMM, phosphomannose mutase; GMP, GDP-D-mannose pyrophosphorylase.
For example, GDP-D-mannose is one of the sugar nucleotides necessary for the synthesis of the exopolysaccharide Cepacian (Richau et al., 2000). This EPS is composed of a branched

Biotechnology of Biopolymers
260
acetylated heptasaccharide repeating unit with D-glucose, D-rhamnose, D-mannose, D-galactose, and D-glucuronic acid, in the ratio 1:1:1:3:1 (Cescutti et al., 2000). Cepacian is produced by environmental, and human, animal and plant pathogenic isolates belonging to several Burkholderia species (Ferreira et al., 2010). In B. cepacia IST408, a clinical isolate from a cystic fibrosis patient, the lack of the type II PMI BceA significantly affected the ability of the mutant strain to form biofilms (Sousa et al., 2007).
4.2 GDP-D-Rhamnose D-Rhamnose is a relatively rare deoxyhexose. This sugar is mainly found in the LPS of pathogenic bacteria, where it is involved in host-bacterium interactions and in the establishment of infection (Webb et al., 2004). For example, it is a constituent of the opportunistic pathogen Pseudomonas aeruginosa A-band of the O polysaccharide of LPS (Rocchetta et al., 1999). This glycan is also present in the S-layer of the Gram positive thermophile Aneurinibacillus thermoaerophilus (Kneidinger et al., 2001). Due to the D-rhamnose association with bacterial structures related to virulence, enzymes leading to its biosynthesis have been studied as promising targets for the development of novel antibacterial agents. Biosynthesis of GDP-D-rhamnose, the precursor for D-rhamnose, starts with the dehydration of GDP-D-mannose to GDP-4-keto-6-deoxy-D-mannose, in a reaction catalyzed by the GDP-D-mannose-4,6 dehydratase (GMD; EC 4.2.1.47) (Fig. 3). The mechanism of this reaction has been proposed to involve a protein-bound pyridine dinucleotide (NAD+ or NADP+) as responsible for the transfer of a hydrogen from the C-4 to the C-6 position of the deoxy-monosaccharide (Sturla et al., 1997). The 4-keto moiety of the intermediate is then reduced to GDP-D-rhamnose by the enzyme activity GDP-4-keto-6-deoxy-D-mannose reductase (RMD; EC 1.1.1.281) (Fig. 3). The joint GMD and RMD enzyme activities are also known as GDP-rhamnose synthase (GRS).
GDP-4-keto-6-deoxy-D-mannose
GDP-D-mannose GDP-D-RhamnoseGMD RMD
H2O NAD(P)NAD(P)H
GDP-4-keto-6-deoxy-D-mannose
GDP-D-mannose GDP-D-RhamnoseGMD RMD
H2O NAD(P)NAD(P)H
Fig. 3. Metabolic pathway leading to GDP-D-rhamnose. GMD, GDP-D-mannose-4,6 dehydratase; RMD, GDP-4-keto-6-deoxy-D-mannose reductase.
The two proteins involved in this pathway are members of the nucleotide diphosphate (NPD)-sugar modifying subfamily of the short-chain dehydrogenase/reductase (SDR) superfamily (Kavanagh et al., 2008). This family share low sequence identity, but their three-dimensional structures are quite conserved (Fig. 4). The most conserved feature of these proteins is the Rossman-fold motif, involved in dinucleotide binding (Webb et al., 2004). The Rossman fold is composed of a α/β folding pattern, with 7 β-strands flanked by 6-7 α-helices on each side (Fig. 4). The glycine-rich Wierenga motif, GXXGXXG, is also present in the N-terminus region. The Wierenga motif is the specific region for the binding of the cofactor NADP(H) (Fig. 4). These proteins also share the conserved triad Tyr-XXX-Lys and Ser/Thr in their catalytic centers (Fig. 4).

Activated Sugar Precursors: Biosynthesis and Biological Roles of an Important Class of Intermediate Metabolites in Bacteria
261
GMD_E.coli ---MSKVALITGVTGQDGSYLAEFLLEKGYEVHGIKRRASSFNTERVDHIYQDPHTCNPK 57 GMD_P.aeruginosa ---MTRSALVTGITGQDGAYLAKLLLEKGYRVHGLVARRSSDTRWRLRELGIEG-----D 52 RMD_E.coli MTDAGKHALITGINGFTGRYVAAELSAAGYRVFGLGAGSVPYDGP--------------- 45 RMD_P.aeruginosa ---MTQRLFVTGLSGFVGKHLQAYLAAAHTPWALLPVP---------------------- 35 GalE_E.coli -----MRVLVTGGSGYIGSHTCVQLLQNGHDVIILDNLCNSKRSVLPVIERLGG----KH 51 GalE_P.aeruginosa -----MRVLVTGGAGFIGSHVLVELLGQGAKVVVLDNLVNGSSESLKRVERITG----HP 51 GMER_E.coli --MSKQRVFIAGHRGMVGSAIRRQLEQRGDVELVLRTR---------------------- 36 :::* * * * :
GMD_E.coli FHLHYGDLSDTSNLTRILREVQPDEVYNLGAMS-HVAVSFESPEYTADVDAMGTLRLLEA 116 GMD_P.aeruginosa IQYEDGDMADACSVQRAVIKAQPQEVYNLAAQS-FVGASWNQPVTTGVVDGLGVTHLLEA 111 RMD_E.coli -DYYQVDLMDVTALTNVVTSIKPNVVVHLAAIA-FVGHG--DADAFYNINLLGTRNLLQA 101 RMD_P.aeruginosa ---HRYDLLEPDSLGDLWP-ELPDAVIHLAGQT-YVPEAFRDPARTLQINLLGTLNLLQA 90 GalE_E.coli PTFVEGDIRNEALMTEILHDHAIDTVIHFAGLK-AVGESVQKPLEYYDNNVNGTLRLISA 110 GalE_P.aeruginosa VGFVLGDVRDSLLVERLLIDEKVDAVIHLAGLK-AVGESVDDPLEYYESNVQGTISLLRA 110 GMER_E.coli ---DELNLLDSRAVHDFFASERIDQVYLAAAKVGGIVANNTYPADFIYQNMMIESNIIHA 93 :: : : : * .. : . : :: *
GMD_E.coli IRFLGLEKKTRFYQASTSELYG--LVQEIPQKETTPF-----YPRSPYAVAKLYAYWITV 169 GMD_P.aeruginosa IR--QFSPETRFYQASTSEMFG--LIQAERQDENTPF-----YPRSPYGVAKLYGHWITV 162 RMD_E.coli LSHCDNSLDAVLLASSA-NVYG--NGTAGKLSETTAP-----NPANDYAVSKLAMEYMAR 153 RMD_P.aeruginosa LKARG-FSGTFLYISSG-DVYGQVAEAALPIHEELIP-----HPRNPYAVSKLAAESLCL 143 GalE_E.coli MRAAN---VKNFIFSSSATVYG--DQPKIPYVESFPTG----TPQSPYGKSKLMVEQILT 161 GalE_P.aeruginosa MQRVG---VFKIVFSSSATIYQ--MPGTLPISESSKVG----GVASPYGRTKLTAEHMLD 161 GMER_E.coli AHQND---VNKLLFLGSSCIYP--KLAKQPMAESELLQGTLEPTNEPYAIAKIAGIKLCE 148 : . :: * . *. :*: :
GMD_E.coli NYR-ESYGMYACNGILFNHESPR------RGETFVTRKITRAIAN-IAQGLESCLYLG-- 219 GMD_P.aeruginosa NYR-ESFGLHASSGILFNHESPL------RGIEFVTRKVTDAVAR-IKLGKQQELRLG-- 212 RMD_E.coli LW---MDKLPVFITRPFNYTGVG------QADNFLLPKIVKHFK-----AKAPVIELG-- 197 RMD_P.aeruginosa QWG-ITEGWRVLVARPFNHIGPG------QKDSFVIASAARQIARMKQGLQANRLEVG-- 194 GalE_E.coli DLQKAQPDWSIALLRYFNPVGAHPSGDMGEDPQGIPNNLMPYIAQVAVGRRDSLAIFGND 221 GalE_P.aeruginosa DLARSDTRWSIAVLRYFNPIGAHESGLIGEDPCGTPNNLLPYIAQVAVGRLSRLTVHGGD 221 GMER_E.coli SYN-RQYGRDYRSVMPTNLYGPHDN--FHPSNSHVIPALLRRFHEATAQNAPDVVVWG-- 203 * . . *
GMD_E.coli ----NMDSLRDWGHAKDYVKMQWMMLQ---------QEQP-EDFVIATGVQYSVRQFVEM 265 GMD_P.aeruginosa ----NVDAKRDWGFAGDYVEAMWLMLQ---------QDKA-DDYVVATGVTTTVRDMCQI 258 RMD_E.coli ----NIDVWRDFTDVRALSQAYVKLLQ---------AKPTGEVINICSGRTYSLRKIIEL 244 RMD_P.aeruginosa ----DIDVSRDFLDVQDVLSAYLRLLS---------HGEAGAVYNVCSGQEQKIRELIEL 241 GalE_E.coli YPTEDGTGVRDYIHVMDLADGHVVAMEKL------ANKPGVHIYNLGAGVGNSVLDVVNA 275 GalE_P.aeruginosa YPTIDGTGVRDYIHVCDLAAGHTRALEYL------GQGHGYHVWNLGTGTGYSVLQVIEA 275 GMER_E.coli ----SGTPMREFLHVDDMAAASIHVMELAHEVWLENTQPMLSHINVGTGVDCTIRDVAQT 259 . *:: . :. : :* .: .. :
GMD_E.coli AAAQLGIKLRFEGTGVEEKGIVVSVTGHDAPGVKPGDVIIAVDPRYFRPAEVETLLGDPT 325 GMD_P.aeruginosa AFEHVGLDYR---------------------------DFLKIDPAFFRPAEVDVLLGNPA 291 RMD_E.coli CEKITGHHLE-----------------------------IQVNQAFVRANEVKTLSGDTT 275 RMD_P.aeruginosa LADIAQVELE-----------------------------IVQDPARMRRAEQRRVRGSHA 272 GalE_E.coli FSKACGKPVN-------------------------------YHFAPRREGDLPAYWADAS 304 GalE_P.aeruginosa FERVSGRRIP-------------------------------FTVSGRRPGDVAECWADVS 304 GMER_E.coli IAKVVGYKGR-------------------------------VVFDASKPDGTPRKLLDVT 288 : . :
GMD_E.coli KAHEKLGWKPEITLREMVSEMVANDLEAAKKHSLLKSHGYDVAIALES 373 GMD_P.aeruginosa KAQRVLGWKPRTSLDELIRMMVEADLRRVSRE---------------- 323 RMD_E.coli KLQSFIPEWDVPPLEDTLRWMLESD----------------------- 300 RMD_P.aeruginosa RLHDTTGWKPEITIKQSLRAILSDWESRVREE---------------- 304 GalE_E.coli KADRELNWRVTRTLDEMAQDTWHWQSRHPQGYPD-------------- 338 GalE_P.aeruginosa KAERELGWKAGLGLECMIADAWRWQVSNPSGYS--------------- 337 GMER_E.coli RLH-QLGWYHEISLEAGLASTYQWFLENQDRFRG-------------- 321 : . :
5 20 30 45
60 70 80 100
130 160
180 200
Wierenga motif
Catalytic triad
Fig. 4. Amino acid sequence alignment of E. coli GMD (AAC77842), P. aeruginosa GMD (AAG08838), E. coli RMD (ACV53840), P. aeruginosa RMD (AAG08839), E. coli GalE (AAC73846), P. aeruginosa GalE (AAG04773), and E. coli GMER (AAC77843). The Wierenga motif and the catalytic triad typical of the SDR family of proteins are highlighted. Asterisks indicate the amino acid residues that are identical in all proteins. One or two dots indicate semi-conserved or conserved substitutions, respectively. The conserved secondary structure elements are shown above the alignment segments, where cylinders represent α-helices and arrows represent β-sheets. Alignments and the secondary structure predictions were performed with ClustalW2 and the PSIPRED software, respectively.

Biotechnology of Biopolymers
262
The GMD enzyme activity is widespread in nature, and also catalyzes the first step in the biosynthesis of other sugars, including L-fucose, D-talose and D-perosamine (King et al., 2009). Bioinformatic analysis suggests that the closest paralog of RMD is GMD (Fig. 4). This conclusion is also supported by the existence of GMD proteins with bifunctional activity, which catalyzes the dehydration of GDP-D-mannose and the reduction of the 4-keto sugar nucleotide to a 6-deoxysugar nucleotide (King et al., 2009).
4.3 GDP-L-Fucose L-Fucose is a 6-deoxy-sugar widely distributed in nature, occurring in glycoconjugate compounds in microorganisms, plants and animals. This sugar nucleotide is commonly found in complex carbohydrates that are constituents of the cell wall and of LPS of some Gram-negative bacteria. The presence of L-fucose in these polysaccharides has been shown to play an important role on the interaction between bacteria and the host tissues. For example, Helicobacter pylori fucosylated glycoconjugates are involved in adhesion mechanisms and in evasion of bacteria from the host immune system (Moran, 2008). This H. pylori fucosylated glycoconjugate is closely related to antigens of the Lewis system that are commonly present on the surface of human cells (Rosano et al., 2000). In 1960, Ginsburg identified the highly conserved metabolic pathway leading to the synthesis of GDP-L-fucose via GDP-D-mannose (Ginsburg, 1960; Fig. 5).
GDP-4-keto-6-deoxy-D-mannose
GDP-D-mannose GDP-L-FucoseGMD GMER
H2O NAD(P)NAD(P)H
GDP-4-keto-6-deoxy-L-galactose
GMERGDP-4-keto-6-deoxy-D-mannose
GDP-D-mannose GDP-L-FucoseGMD GMER
H2O NAD(P)NAD(P)H
GDP-4-keto-6-deoxy-L-galactose
GMER
Fig. 5. Metabolic pathway leading to GDP-L-fucose. GMD, GDP-D-mannose-4,6 dehydratase; GMER, GDP-4-keto-6-deoxy-D-mannose epimerase/reductase.
The first step of this pathway is the dehydration of GDP-D-mannose by GMD, leading to the formation of the unstable intermediate GDP-4-keto-6-deoxy-D-mannose. This intermediate undergoes subsequent epimerization at C-3 and C-5 hexose ring centers that changes the D- to L-configuration of the monosaccharide. This results in the production of GDP-4-keto-6-deoxy-L-galactose. A NADPH-dependent reduction of the keto group at C-4 occurs subsequently, leading to the formation of GDP-L-fucose. The enzyme responsible for these two last steps is the bifunctional enzyme with both GDP-4-keto-6-deoxy-D-mannose epimerase/reductase activities (GMER; EC 1.1.1.271) (Rosano et al., 2000). Amino acid sequence analysis indicated that the protein also belongs to the SDR family. The GDP-L-fucose formed is the substrate for various fucosyltransferases that are responsible for the incorporation of L-fucose in glycoproteins, glycolipids and oligosaccharides (Ma et al., 2006).
4.4 GDP-D-mannuronic acid GDP-D-mannuronic acid is the precursor of the acidic sugars mannuronic acid and guluronic acid, mainly found in bacterial alginates. GDP-D-mannuronic acid is synthesized from GDP-D-mannose, in a redox reaction catalyzed by GDP-mannose dehydrogenase (GMdh; EC 1.1.1.132). The reaction involves the irreversible oxidation of GDP-D-mannose via a 4-electron transfer using NAD+ as the cofactor (Fig. 6).

Activated Sugar Precursors: Biosynthesis and Biological Roles of an Important Class of Intermediate Metabolites in Bacteria
263
L-guluronic acidGDP-D-mannose GDP-D-mannuronic acidGMdh
2 NADH2 NAD+
L-guluronic acidGDP-D-mannose GDP-D-mannuronic acidGMdh
2 NADH2 NAD+
Fig. 6. Metabolic pathway leading to GDP-D-mannuronic acid and L-guluronic acid. GMdh, GDP-mannose dehydrogenase.
GMdh is a member of the NAD-dependent 4-electron transfer dehydrogenases. This protein family also includes UDP-glucose dehydrogenases (UGD) (Snook et al., 2003). Both the GMdh and UGD enzyme activities are mechanistically similar, using a unique active site to catalyze the two-step conversion of an alcohol group to the corresponding acid, via a thiohemiacetal intermediate. GDP-D-mannuronic acid is the activated sugar precursor for alginate polymerization in P. aeruginosa, which is a partially O-acetylated linear polymer of D-mannuronic acid and L-guluronic acid, linked via β-1,4 glycosidic bonds (Shankar et al., 1995). In the case of the P. aeruginosa alginate, after polymerization, some D-mannuronic acid residues can be further converted to L-guluronic acid by the extracellular enzyme activity polymannuronic acid C-5-epimerase (Jerga et al., 2006). P. aeruginosa is able to cause severe and life-threatening infections in immunosuppressed patients, such as burn and cancer chemotherapy patients (Wagner and Iglewski, 2008), as well as in patients suffering from cystic fibrosis (CF). Alginate allows the bacterium to resist to antipseudomonal antibiotics and to the host immune system (Wagner and Iglewski, 2008). In addition, long-term infection with P. aeruginosa leads to lung tissue damage of CF patients, to which contribute, among others, extracellular proteases and lipases produced by the bacterium. Tavares et al. (1999) demonstrated that the step catalyzed by GMdh is critical for the control of the alginate pathway in P. aeruginosa, channelling GDP-D-mannose into the alginate pathway instead of A-band LPS biosynthesis. Therefore, inhibition of GMdh activity may lead to the prevention of alginate biosynthesis by P. aeruginosa. Recently, Li and colleagues (2008) demonstrated that ambroxol (2-amino-3,5-dibromo-N-[trans-4-hydroxycyclohexyl] benzylamine) was able to partially inhibit the production of alginate by P. aeruginosa strains via the reduction of the activity of the GMdh enzyme.
4.5 dTDP-L-rhamnose L-rhamnose is a fundamental constituent of the O-antigen of LPS in several gram-negative bacteria. For example, in Shigella and Salmonella species, the O-antigen repeating unit is mainly constituted by L-rhamnose (Van den Bosch et al., 1997). The L-rhamnosyl residue has also an essential structural role in the cell wall of Mycobacterium tuberculosis (Ma et al., 2001). The donor of the L-rhamnose moiety found in bacterial structures is deoxythymidine-diphosphate (dTDP)-L-rhamnose. dTDP-L-rhamnose is synthesized from glucose-1-phosphate and deoxythymidine triphosphate (dTTP) in a four-step pathway (Fig. 7). The first-step is catalysed by glucose-1-P deoxythymidilyl transferase (RmlA; EC 2.7.7.24) that leads to dTDP-D-glucose from glucose-1-P and dTTP. In bacteria, dTDP-D-glucose is a key metabolite for the production of several monosaccharides that are components of the cell wall polysaccharides, or that are components of some antibiotics, such as the macrolide erythromycin A (Vara and Hutchinson, 1988). The second-step is the dehydration of dTDP-D-glucose to dTDP-4-keto-6-deoxy-D-glucose, a reaction catalysed by dTDP-D-glucose 4,6

Biotechnology of Biopolymers
264
dehydratase (TGD or RmlB; EC 4.2.1.46). The unstable intermediate dTDP-4-keto-6-deoxy-D-glucose is the precursor for the synthesis of dideoxyhexoses and aminohexoses that are common components of antibiotic glycosides, like novobiocin and streptomycin (Nedal and Zotchev, 2004). Alternatively, this intermediate can undergo two additional conversion steps to originate dTDP-L-rhamnose. First, dTDP-4-keto-6-deoxy-D-glucose-3,5 epimerase (RmlC; EC 5.1.3.13) catalyses the C-3 and C-5 epimerization. A NADPH-dependent reduction of C-4 is followed, catalysed by dTDP-6-deoxy-L-lyxo-4-hexulose reductase (RmlD; EC 1.1.1.133).
Glucose-6-P Glucose-1-P
dTDP-glucose
dTDP-4-keto-6-deoxy-D-glucose
dTDP-L-rhamnose
RmlA
RmlC
dTDP-L-lyxo-6-deoxy-4-hexulose
RmlB
PGM
RmlD
Glucose-6-P Glucose-1-P
dTDP-glucose
dTDP-4-keto-6-deoxy-D-glucose
dTDP-L-rhamnose
RmlA
RmlC
dTDP-L-lyxo-6-deoxy-4-hexulose
RmlB
PGM
RmlD
Fig. 7. Metabolic pathway leading to dTDP-L-rhamnose. PGM, phosphoglucose mutase; RmlA, glucose-1-P deoxythymidilyl transferase; RmlB, dTDP-D-glucose 4,6 dehydratase; RmlC, dTDP-4-keto-6-deoxy-D-glucose-3,5 epimerase; RmlD, dTDP-6-deoxy-L-lyxo-4-hexulose reductase.
The described multi-step pathway does not exist in humans, being these four enzyme activities potential targets for the design of new therapeutic agents, as is the case of the development of new antimycobacterial agents, an area of intensive research (Ma et al., 2001).
4.6 UDP-D-glucose UDP-D-glucose is the sugar precursor for the synthesis of several sugar-containing bacterial structures that are recognized virulence factors or determinants, such as the peptidoglycan, LPS and EPS. In gram-positive bacteria, UDP-D-glucose is the substrate for the glycosylation of teichoic acids and for biosynthesis of the glycolipid diglucosyldialcylglycerol (Glc2-DAG), the membrane anchor of lipoteichoic acids (Chassaing and Auvray, 2007). UDP-D-glucose is also an important sugar precursor for the biosynthesis of hyaluronic acid (HA) by streptococci, being the encapsulation of these bacteria by HA considered an important virulence factor (Stollerman and Dale, 2008). HA is a linear polymer of the repeating disaccharide composed of glucuronic acid (GlcA) and N-acetyl-glucosamine (GlcNAc) (Stollerman and Dale, 2008). UDP-D-glucose is the precursor for the synthesis of GlcA. UDP-glucose is the product of the enzyme activity UDP-glucose pyrophosphorylase (UGP; EC 2.7.7.9). This enzyme catalyses the reversible formation of UDP-glucose from UTP and glucose-1-phosphate (Fig. 8; Kim et al., 2010).

Activated Sugar Precursors: Biosynthesis and Biological Roles of an Important Class of Intermediate Metabolites in Bacteria
265
Glucose-1-PGlucose-6-P UDP-D-GlucosePGM UGP
PPiUTP
Glucose-1-PGlucose-6-P UDP-D-GlucosePGM UGP
PPiUTP Fig. 8. Metabolic pathway leading to UDP-D-glucose. PGM, phosphoglucose mutase; UGP, UDP-glucose pyrophosphorylase; UTP, uridine triphosphate; PPi, pyrophosphate.
These enzymes have two typical domains, the N-terminal motif GXGTRXLPXTK for the activator binding site, and the VEKP motif that is essential for substrate binding (Marques et al., 2003). UGPases are present in animals, plants and microorganims. However, prokaryotic and eukaryotic proteins are quite distinct, being the former regarded as appropriate targets for the development of novel antibacterial agents.
4.7 UDP-D-glucuronic acid UDP-D-glucuronic acid is synthesized from UDP-D-glucose, in a NAD+-dependent oxidation, catalyzed by the enzyme activity UDP-glucose dehydrogenase (UGD; EC 1.1.1.22) (Fig. 9; Ge et al., 2004; Field and Naismith, 2003).
UDP-D-Glucose UDP-D-Glucuronic AcidUGD
2 NADH2 NAD+
UDP-D-Glucose UDP-D-Glucuronic AcidUGD
2 NADH2 NAD+
Fig. 9. Metabolic pathway leading to UDP-D-glucuronic acid. UGD, UDP-glucose dehydrogenase.
The first step in the reaction is the transfer of the pro-R hydride from C-6 to NAD+ and deprotonation of O-6, generating an aldehyde. This first intermediate is converted into a covalent thioester by the transfer of a second hydride to a new NAD+ molecule. The thioester is then hydrolyzed to liberate the free carboxylic acid, thus regenerating the protein thiol. These proteins have the three typical conserved domains of the UGD protein family, namely the NAD+-binding domain, the central domain, and the UDP-binding domain (Kereszt et al., 1998). In B. cepacia complex (Bcc) bacteria, Ara4N is present in the lipid A and in the core of LPS. Synthesis of UDP-Ara4N is essential for Bcc bacteria viability and to their high resistance to antimicrobial peptides (Ortega et al., 2007). The first step in the synthesis of UDP-Ara4N is the conversion of UDP-D-glucose to UDP-D-glucuronic acid by UGD. Recently, it was shown that the UGDBCAL2946 and UGDBCAM0855 of B. cenocepacia are essential for survival, being the UGDBCAL2946 protein also required for polymyxin B resistance (Loutet et al., 2009). Bcc is a group of 17 phenotypically similar bacterial species that are opportunistic pathogens in cystic fibrosis (CF) patients, causing chronic and sometimes fatal pulmonary infections in these patients (Leitão et al., 2010). Treatment of these infections is difficult since Bcc bacteria are intrinsically resistant to most of the clinically relevant antimicrobial agents (Leitão et al., 2008).
4.8 UDP-D-galactose UDP-D-galactose is essential for the biosynthesis of the galactosyl residues found in complex polysaccharides and glycoproteins. This sugar nucleotide can be synthesized by the Leloir pathway of the galactose metabolism when bacteria grow in lactose or galactose as energy and carbon sources (Holden et al., 2003; Fig. 10). This pathway includes three enzyme activities, galactokinase (GalK, EC. 2.7.1.6), galactose-1-P uridylyltransferase (GalT,

Biotechnology of Biopolymers
266
EC 2.7.7.10) and UDP-galactose 4-epimerase (UGE or GalE; EC 5.1.3.2). First, galactose is phosphorylated by GalK forming galactose-1-P. Then, galactose-1-P is epimerized to glucose-1-P by GalT. This reaction requires the transfer of UDP from UDP-glucose, also generating UDP-galactose. UDP-galactose can be epimerized to UDP-glucose by GalE and glucose-1-P can be converted to glucose-6-P by phosphoglucose mutase (PGM).
D-Galactose
Galactose-1-P
Glucose-1-P
UDP-D-Galactose
GalK
PGM
GalT
Glucose-6-P
ATP
ADP
UDP-D-Glucose
GalE
Glucose
D-Galactose
Galactose-1-P
Glucose-1-P
UDP-D-Galactose
GalK
PGM
GalT
Glucose-6-P
ATP
ADP
UDP-D-Glucose
GalE
Glucose
Fig. 10. Metabolic pathways leading to UDP-D-galactose. GalK, galactokinase; GalT, galactose-1-P uridylyltransferase; Gal E, UDP-galactose 4-epimerase; PGM, phosphoglucose mutase.
UDP-D-galactose can also be synthesized from UDP-D-glucose by GalE, when bacteria grow in glucose or fructose containing medium. GalE oxidizes C-4 (hydride abstraction) and then reduces the resulting ketone from the opposite face of the UDP-D-glucose, resulting in UDP-D-galactose by a free conversion between a gluco- to a galacto-configured pyranose ring (Fig. 10, Holden et al., 2003). GalE is also a member of the SDR superfamily, with the typical Tyr-X-X-X-Lys motif involved in catalysis, and the N-terminal NAD+-binding motif GXXGXXG (Fig. 4, Kavanagh et al., 2008).
4.9 UDP-N-acetylglucosamine In bacteria, uridine 5’-diphospho-N-acetyl-D-glucosamine (UDP-GlcNAc) is the activated form of N-acetylglucosamine, an essential precursor for the biosynthesis of various important carbohydrate-containing structures, as is the case of the cell wall peptidoglycan, LPS and teichoic acids (Milewski, 2002). Enzymes leading to the synthesis of UDP-GlcNAc are essential for the cell wall formation, being regarded as attractive targets for the development of antibacterial compounds (Kotnik et al., 2007). Glucosamine-6-phosphate synthase (GlcN-6-P synthase or GlmS in bacteria, EC 2.6.1.16) catalyses the first step in the pathway that leads to the formation of UDP-GlcNAc (Milewski, 2002) (Fig. 11). The irreversible reaction catalyzed by this enzyme involves the transfer of an amino group from L-glutamine to D-fructose-6-phosphate (F6P), followed by an isomerisation of the sugar moiety, yielding D-glucosamine-6-phosphate. GlmS is a large ubiquitous protein present in a large number of organisms and tissues. GlmS proteins contain two typical domains, the glutamine-binding domain in the N-terminus region, and the F-6-P binding domain in the C-terminus region. However, sequence alignments revealed large differences between

Activated Sugar Precursors: Biosynthesis and Biological Roles of an Important Class of Intermediate Metabolites in Bacteria
267
prokaryotic and eukaryotic GlcN-6-P synthases, being the latter 70-90 amino acid residues longer (Milewski, 2002). This enzyme activity is also an important point of metabolic control in the biosynthesis of amino sugar - containing molecules. Several inhibitors targeting this enzyme activity have been developed, like anticapsin, tetaine, and chlorotetaine (Milewski, 2002).
Glucosamine-6-P
Glucosamine-1-P
Fructose-6-P
UDP-N-Acetylglucosamine
GmlS
PGI
Glucose-6-P
L-Glutamine
L-Glutamate
GmlM
Acetyl CoA
CoAGmlU
N-acetylglucosamine-1-P
UTP
PPiGmlU
UDP-N-Acetylmannosamine
UDP-N-Acetylgalactosamine
Glucosamine-6-P
Glucosamine-1-P
Fructose-6-P
UDP-N-Acetylglucosamine
GmlS
PGI
Glucose-6-P
L-Glutamine
L-Glutamate
GmlM
Acetyl CoA
CoAGmlU
N-acetylglucosamine-1-P
UTP
PPiGmlU
UDP-N-Acetylmannosamine
UDP-N-Acetylgalactosamine
Fig. 11. Metabolic pathway leading to UDP-N-acetylglucosamine. PGI, phosphoglucose isomerase; GmlS, Glucosamine-6-phosphate synthase; GmlM, phosphoglucosamine mutase; GmlU, glucosamine-1-P acetyltransferase and N-acetylglucosamine-1-P uridyltransferase.
After its formation by GlmS, the resulting D-glucosamine-6-phosphate is further isomerised into D-glucosamine 1-phosphate by the phosphoglucosamine mutase enzyme activity (GlmM in bacteria; EC 5.4.2.10) (Fig. 11). In bacteria, the last two reactions necessary for the formation of UDP-GlcNAc are carried by the bifunctional protein with both activities of glucosamine-1-P acetyltransferase and N-acetylglucosamine-1-P uridyltransferase (GlmU in bacteria; EC 2.7.7.23 and EC 2.3.1.157) (Fig. 11). These enzyme activities first transfer an acetyl group from acetyl-CoA to form N-acetyl-glucosamine 1-phosphate, and then transfers the uridyl group to finally form UDP-GlcNAc. UDP-GlcNAc is the precursor of other sugar nucleotides, such as UDP-N-acetylgalactosamine (UDP-GalNAc) and UDP-N-acetyl-D-mannosamine (UDP-ManNAc). UDP-ManNAc is the precursor of N-acetylneuraminic acid (Sialic acid). Sialic acid is rarely found in prokaryotes, being present in certain pathogenic bacteria as a component of capsular polysaccharides (e.g. Neisseria meningitidis, Escherichia coli K1) or lipooligosaccharides (e.g. Campylobacter jejuni). In C. jejuni it is involved in evasion of the immune system by molecular mimicry of the host cells (Severi et al., 2007). In gram positive bacteria, ManNAc residues act as a bridge between the peptidoglycan and teichoic acids (D’Elia et al., 2009).

Biotechnology of Biopolymers
268
5. Biotechnological potential of nucleotide sugar metabolic pathways The biosynthesis of the sugar moieties of the various sugar-containing cell structures starts by the synthesis of the repeating units of sugar nucleotides. The supply of the activated sugars for the biosynthesis of these polymers is dependent on the intracellular sugar nucleotide levels that are influenced by the activities of the intracellular enzymes involved in their biosynthesis. Therefore these key enzymes are potential targets for the development of new antimicrobials. The L-rhamnose residues play an essential structural role in the cell wall of Mycobacterium tuberculosis. The mycobacterial cell wall core consists of three interconnected macromolecules, the mycolic acids, arabinogalactan (AG) and peptidoglycan. The outermost part is composed of mycolic acids that are esterified to the middle component, the AG. This component is connected, via the linker disaccharide α-L-rhamnosyl-(1→3)-α-D-N-acetyl-glucosaminosyl-1-phosphate, to the 6 position of a muramic acid residue of the inner component peptidoglycan. Presently, it is known that M. tuberculosis strains have increased resistance to the antimicrobials agents in use, and therefore new antituberculosis drugs are necessary (Ma et al., 2001). In this context, the four enzyme activities (RmlA to RmlD) involved in the dTDP-L-rhamnose biosynthetic pathway have been studied as attractive targets for the development of new antimicrobials. Helicobacter pylori is the causative agent of active chronic gastritis, being associated with peptic ulcer disease and increased risk for the development of gastric adenocarcinoma and primary gastric lymphoma (Edwards et al., 2000). The pathogen expresses the Lewis (Le) antigen in the O-chain of LPS (Moran, 2008). Serological and chemical structural studies have shown that H. pylori Le antigens mimic the human Lewis blood group determinants, having a role in gastric colonization and bacterial adhesion (Moran, 2008). Le antigen expression also affects the inflammatory response and T-cell polarization after infection. One of the factors that affect this antigen expression is the availability of activated sugar intermediates. H. pylori lacks galactokinase enzyme activity and is not able to use exogenous galactose. This points out that the UGE activity is an absolute requirement for the biosynthesis of UDP-galactose. In fact, H. pylori knockout mutants in galE produce truncated LPS and no Lewis antigen expression, causing a decreased ability of the mutant strain to colonize mice (Moran et al., 2000). Inactivation of rfbM, encoding a GMP activity that is required for GDP-L-fucose synthesis, resulted in a mutant strain with a fucose-lacking O-antigen and not able to express the Lex antigen (Edwards et al., 2000). This mutant exhibited a reduced ability to colonize a mouse model of infection and was not able to interact with the human gastric mucosa of biopsy specimens in situ. Some sugar polymers have applications in the food and pharmaceutical industries, like alginate, xanthan, gelan and polysaccharides from lactic acid bacteria (LAB) (Sabra et al., 2001; Becker et al., 1998; Fialho et al., 2008; Boels et al., 2001). These applications led to an increased interest in the study of the metabolic pathways leading to the formation of these polymers and their regulation, with the objective to optimize the microbial production process. Alginate is a polymer composed of D-mannuronic acid and L-guluronic acid residues arranged in an irregular sequence (Sabra et al., 2001). It is produced by bacterial species of the Pseudomonas and Azotobacter genera, as well as by brown algae (Sabra et al., 2001). The viscosity and gel-forming properties of this polymer have important commercial applications in the pharmaceutical industry. For example, high-quality alginates have been

Activated Sugar Precursors: Biosynthesis and Biological Roles of an Important Class of Intermediate Metabolites in Bacteria
269
studied for the reversal of type I diabetes by immobilising insulin-producing cells within alginate capsules that could be transplanted to the body of the patient (Dufrane et al., 2010). The D-mannuronic acid blocks of alginate seems to stimulate the immune cells to secrete cytokines (e.g. tumour necrosis factor, interleukin-1 and interleukin-6) (Otterlei et al., 1991). The polymer has also several applications in the food industry. For example, alginate is used to enhance foam in beer production and to help in the suspension of fruit pulp in fruit drinks (Sabra et al., 2001). The textile and paper industries also use alginates to improve the surface properties of cloth and paper, and to improve the adherence of dyes and inks (Sabra et al., 2001). Alginate-immobilised cell systems are used as biocatalysts in several industrial processes, like in ethanol production by yeast cells, and in the production of monoclonal antibodies from hybridoma cells (Sabra et al., 2001; Selimoglu and Elibol, 2010). Currently, the vast majority of the alginates commercially in use are produced from brown algae. However, environmental concerns raised due to intensive algae harvesting and processing turned the attention to bacterial alginates, which are now considered as potential commercial products. Lactic acid bacteria (LAB) produce a wide variety of structurally different EPSs that are responsible for the rheological characteristics and texture properties of specific fermented dairy and food products (Boels et al., 2001). In addition, LAB as food additives may confer health benefits to the consumer, having immunostimulatory, antitumoral and cholesterol-lowering activities (Boels et al., 2001). LAB EPSs are preferable over presently used stabilizers, like xanthan, since they are produced by food-grade microorganisms. However, these EPSs are produced in low amounts (40 to 800 mg per liter), compared with the commercially produced EPS xanthan (10 to 25 g per liter) (Boels et al., 2003). LAB EPSs are produced from intracellular sugar nucleotides, including glucose, galactose, rhamnose, glucuronic acid, fucose, N-acetylglucosamine (GlcNAc), and N-acetylgalactosamine (GalNAc). A study of the enzymes involved in the biosynthetic pathways of these sugar nucleotides revealed some key enzyme activities, like the UDP-galactose epimerase (GalE). In a Lactococcus lactis galE mutant, undetectable levels of UDP-D-galactose and null EPS production were described when the organisms were cultured on glucose as the sole carbon source (Boels et al., 2001). The availability of dTDP-rhamnose that is incorporated on the side chain of EPS is also a bottleneck in EPS production by LAB (Boels et al., 2001). Several molecules with antibacterial, antifungal, antiparasitic or anticancer activity contain sugar moieties. These are of crucial importance for the biological activity and pharmacological properties of the compound (Nedal and Zotchev, 2004). Some microorganisms, like the actinomycetes, are able to produce deoxyaminosugars. The amino group of these metabolites can be ionized under physiological pH, being involved in both electrostatic interactions with other ionisable groups or in the formation of hydrogen bonds with specific chemical groups on the target molecule (Nedal and Zotchev, 2004). For example, some macrolide antibiotics containing these metabolites bind to the peptidyl transferase ring on the ribosome and block the tunnel that channels the nascent peptide into the center of the ribosome (Schlunzen et al., 2001). Macrolide antibiotics (e.g. erythromycin and streptomycin) can be divided in two classes, being the major difference between the two classes the structure of the sugar precursors (Nedal and Zotchev, 2004) (Table 1).

Biotechnology of Biopolymers
270
Deoxyaminosugar Antibiotic D-Desosamine Erythromycin
Oleandomycin Pikromycin
D-Mycaminose Tylosin D-Mycosamine Polyene Macrolides D-Perosamine Polyene Macrolides N-methyl-L-glucosamine Streptomycin Dimethylforosamine Spinosyns -Methylthio lincosaminide Lincomycin L-Daunosamine Daunorubicin
Table 1. Deoxyaminosugars present in antibiotics (Nedal and Zotchev, 2004).
The 12- to 16- macrolide aminosugar moieties (e.g. D-desosamine and D-mycaminose) originate from TDP-D-glucose. The polyene macrolides (e.g. mycosamine and perosamine) derive from GDP-D-mannose. The study of the synthesis of the deoxyaminosugars moities and the mechanisms of attachment to their targets is of critical importance for the elaboration of new macrolide derivatives with potential antimicrobial activity.
6. Concluding remarks Sugar nucleotides are essential precursors for the biosynthesis of various sugar-containing bacterial cell structures. In pathogenic bacteria, some of these structures are important virulence factors involved, in the majority of the cases, in the evasion of the bacteria from the host immune system. Other sugar-containing structures, like peptidoglycan, have important roles in bacterial viability. In addition, some of these structures and their biosynthetic pathways are being regarded as attractive targets for the development of new antimicrobial drugs. Some sugar polymers also have applications in the food, pharmaceutical, textile and paper industries, having important economical significance. Therefore, the study of these metabolic pathways and their regulation is of critical importance for the optimization of the microbial production processes of carbohydrate-containing polymers. In the present work, some examples of these studies were presented and discussed.
7. Acknowledgments This work was partially funded by FEDER and Fundação para a Ciência e Tecnologia (FCT), Portugal, through contract PTDC/EBB-BIO/098352/2008, and a post-doctoral grant to Sílvia A. Sousa.
8. References Becker A, Katzen F, Pühler A, Ielpi L (1998) Xanthan gum biosynthesis and application: a
biochemical/genetic perspective. Appl. Microbiol. Biotechnol. 50:145-152.
Activated Sugar Precursors: Biosynthesis and Biological Roles of an Important Class of Intermediate Metabolites in Bacteria
271
Boels IC, Ramos A, Kleerebezem M, de Vos WM (2001) Functional analysis of the Lactococcus lactis galU and galE genes and their impact on sugar nucleotide and exopolysaccharide biosynthesis. Appl. Environ. Microbiol. 67:3033–3040.
Boels IC, Van Kranenburg R, Kanning MW, Chong BF, De Vos WM, Kleerebezem M (2003) Increased exopolysaccharide production in Lactococcus lactis due to increased levels of expression of the NIZO B40 eps gene cluster. Appl. Environ. Microbiol. 69:5029-5031.
Cescutti P, Bosco M, Picotti F, Impallomeni G, Leitão JH, Richau JA, Sá-Correia I (2000) Structural study of the exopolysaccharide produced by a clinical isolate of Burkholderia cepacia. Biochem. Biophys. Res. Commun. 273:1088-1094.
Chassaing D, Auvray F (2007) The lmo1078 gene encoding a putative UDP-glucose pyrophosphorylase is involved in growth of Listeria monocytogenes at low temperature. FEMS Microbiol. Lett. 275:31-37.
D'Elia MA, Henderson JA, Beveridge TJ, Heinrichs DE, Brown ED (2009) The N-acetylmannosamine transferase catalyzes the first committed step of teichoic acid assembly in Bacillus subtilis and Staphylococcus aureus. J. Bacteriol. 191:4030-4034.
Dufrane D, Goebbels RM, Gianello P (2010) Alginate Macroencapsulation of Pig Islets Allows Correction of Streptozotocin-Induced Diabetes in Primates up to 6 Months Without Immunosuppression. Transplantation 90:1054-1062.
Edwards NJ, Monteiro MA, Faller G, Walsh EJ, Moran AP, Roberts IS, High NJ (2000) Lewis X structures in the O antigen side-chain promote adhesion of Helicobacter pylori to the gastric epithelium. Mol. Microbiol. 35:1530-1539.
Ferreira AS, Leitão JH, Silva IN, Pinheiro PF, Sousa SA, Ramos CG, Moreira LM (2010) Distribution of cepacian biosynthesis genes among environmental and clinical Burkholderia strains and role of cepacian exopolysaccharide in resistance to stress conditions. Appl. Environ. Microbiol. 76:441-450.
Fialho AM, Moreira LM, Granja AT, Popescu AO, Hoffmann K, Sá-Correia I (2008) Occurrence, production, and applications of gellan: current state and perspectives. Appl. Microbiol. Biotechnol. 79:889-900.
Field RA, Naismith JH (2003) Structural and mechanistic basis of bacterial sugar nucleotide-modifying enzymes. Biochemistry. 42:7637-7647.
Foret J, de Courcy B, Gresh N, Piquemal JP, Salmon L (2009) Synthesis and evaluation of non-hydrolyzable D-mannose 6-phosphate surrogates reveal 6-deoxy-6-dicarboxymethyl-D-mannose as a new strong inhibitor of phosphomannose isomerases. Bioorg. Med. Chem. 17:7100-7107.
Ge X, Penney LC, van de Rijn I, Tanner ME (2004) Active site residues and mechanism of UDP-glucose dehydrogenase. Eur. J. Biochem. 271:14–22.
Ginsburg V (1960) Formation of guanosine diphosphate L-fucose from guanosine diphosphate D-mannose. J. Biol. Chem. 235:2196-2201.
Green DW (2002) The bacterial cell wall as a source of antibacterial targets. Expert. Opin. Ther. Targets. 6:1-19.
Griffin AM, Poelwijk ES, Morris VJ, Gasson MJ (1997) Cloning of the aceF gene encoding the phosphomannose isomerase and GDP-mannose pyrophosphorylase activities involved in acetan biosynthesis in Acetobacter xylinum. FEMS Microbiol. Lett. 154:389-396.
Biotechnology of Biopolymers
272
Gronow S, Brade H (2001) Lipopolysaccharide biosynthesis: which steps do bacteria need to survive? J. Endotoxin Res. 7:3-23.
Holden HM, Rayment I, Thoden JB (2003) Structure and function of enzymes of the Leloir pathway for galactose metabolism. J. Biol. Chem. 278:43885–43888.
Jensen SO, Reeves PR (1998) Domain organisation in phosphomannose isomerases (types I and II). Biochem. Biophys. Acta 1382: 5-7.
Jerga A, Raychaudhuri A, Tipton PA (2006) Pseudomonas aeruginosa C5-mannuronan epimerase: steady-state kinetics and characterization of the product. Biochemistry 45:552-560.
Kavanagh KL, Jörnvall H, Persson B, Oppermann U (2008) The SDR superfamily: functional and structural diversity within a family of metabolic and regulatory enzymes. Cell Mol. Life Sci. 65:3895-3906.
Kereszt A, Kiss E, Reuhs BL, Carlson RW, Kondorosi A, Putnoky P (1998) Novel rkp gene clusters of Sinorhizobium meliloti involved in capsular polysaccharide production and invasion of the symbiotic nodule: the rkpK gene encodes a UDP-glucose dehydrogenase. J. Bacteriol. 180: 5426-5431.
Kim H, Choi J, Kim T, Lokanath NK, Ha SC, Suh SW, Hwang HY, Kim KK (2010) Structural basis for the reaction mechanism of UDP-glucose pyrophosphorylase. Mol. Cells 29:397-405.
King JD, Poon KK, Webb NA, Anderson EM, McNally DJ, Brisson JR, Messner P, Garavito RM, Lam JS (2009) The structural basis for catalytic function of GMD and RMD, two closely related enzymes from the GDP-D-rhamnose biosynthesis pathway. FEBS J. 276:2686-2700.
Kneidinger B, Graninger M, Adam G, Puchberger M, Kosma P, Zayni S, Messner P (2001) Identification of two GDP-6-deoxy-D-lyxo-4-hexulose reductases synthesizing GDP-D-rhamnose in Aneurinibacillus thermoaerophilus L420-91T. J. Biol. Chem. 276:5577-5583.
Kotnik M, Anderluh PS, Prezelj A (2007) Development of novel inhibitors targeting intracellular steps of peptidoglycan biosynthesis. Curr. Pharm. Des. 13:2283-2309.
Leitão JH, Sousa SA, Cunha MV, Salgado MJ, Melo-Cristino J, Barreto MC, Sá-Correia I (2008) Variation of the antimicrobial susceptibility profiles of Burkholderia cepacia complex clonal isolates obtained from chronically infected cystic fibrosis patients: a five-year survey in the major Portuguese treatment center. Eur. J. Clin. Microbiol. Infect. Dis. 27:1101-1111.
Leitão JH, Sousa SA, Ferreira AS, Ramos CG, Silva IN, Moreira LM (2010) Pathogenicity, virulence factors, and strategies to fight against Burkholderia cepacia complex pathogens and related species. Appl. Microbiol. Biotechnol. 87:31-40.
Leloir LF (1971) Two decades of research on the biosynthesis of saccharides. Science 172: 1299–1303.
Lehmann R, Huber M, Beck A, Schindera T, Rinkler T, Houdali B, Weigert C, Häring HU, Voelter W, Schleicher ED (2000) Simultaneous, quantitative analysis of UDP-N-acetylglucosamine, UDP-N-acetylgalactosamine, UDP-glucose and UDP-galactose in human peripheral blood cells, muscle biopsies and cultured mesangial cells by capillary zone electrophoresis. Electrophoresis 21:3010-3015.
Li F, Yu J, Yang H, Wan Z, Bai D (2008) Effects of ambroxol on alginate of mature Pseudomonas aeruginosa biofilms. Curr. Microbiol. 57:1-7.
Activated Sugar Precursors: Biosynthesis and Biological Roles of an Important Class of Intermediate Metabolites in Bacteria
273
Loutet SA, Bartholdson SJ, Govan JR, Campopiano DJ, Valvano MA (2009) Contributions of two UDP-glucose dehydrogenases to viability and polymyxin B resistance of Burkholderia cenocepacia. Microbiology 155:2029-2039.
Ma Y, Stern RJ, Scherman MS, Vissa VD, Yan W, Jones VC, Zhang F, Franzblau SG, Lewis WH, McNeil MR (2001) Drug targeting Mycobacterium tuberculosis cell wall synthesis: genetics of dTDP-rhamnose synthetic enzymes and development of a microtiter plate-based screen for inhibitors of conversion of dTDP-glucose to dTDP-rhamnose. Antimicrob. Agents Chemother. 45:1407-1416.
Ma B, Simala-Grant JL, Taylor DE (2006) Fucosylation in prokaryotes and eukaryotes. Glycobiology 12:158-184.
Marques AR, Ferreira PB, Sá-Correia I, Fialho AM (2003) Characterization of the ugpG gene encoding a UDP-glucose pyrophosphorylase from the gellan gum producer Sphingomonas paucimobilis ATCC 31461. Mol. Genet. Genomics 268:816-824.
Mehra-Chaudhary R, Mick J, Tanner JJ, Henzl MT, Beamer LJ (2011). Crystal structure of a bacterial phosphoglucomutase, an enzyme involved in the virulence of multiple human pathogens. Proteins 79:1215-1229.
Milewski S (2002) Glucosamine-6-phosphate synthase - the multi-facets enzyme. Biochim. Biophys. Acta 1597:173-192.
Moran AP, Sturegård E, Sjunnesson H, Wadström T, Hynes SO (2000) The relationship between O-chain expression and colonisation ability of Helicobacter pylori in a mouse model. FEMS Immunol. Med. Microbiol. 29:263-270.
Moran AP (2008) Relevance of fucosylation and Lewis antigen expression in the bacterial gastroduodenal pathogen Helicobacter pylori. Carbohydr. Res. 343:1952-1965.
Nedal A, Zotchev SB (2004) Biosynthesis of deoxyaminosugars in antibiotic-producing bacteria. Appl. Microbiol. Biotechnol. 64:7-15.
Ortega XP, Cardona ST, Brown AR, Loutet SA, Flannagan RS, Campopiano DJ, Govan JR, Valvano MA (2007) A putative gene cluster for aminoarabinose biosynthesis is essential for Burkholderia cenocepacia viability. J. Bacteriol. 189:3639–3644.
Otterlei M, Ostgaard K, Skjak-Braek G, Smidsrod O, Soon-Shiong P, Espevik T (1991) Induction of cytokine production from human monocytes stimulated with alginate. J. Immunother. 10:286–291.
Pabst M, Grass J, Fischl R, Léonard R, Jin C, Hinterkörner G, Borth N, Altmann F (2010) Nucleotide and nucleotide sugar analysis by liquid chromatography-electrospray ionization-mass spectrometry on surface-conditioned porous graphitic carbon. Anal. Chem. 82:9782-9788.
Ramm M, Wolfender JL, Queiroz EF, Hostettmann K, Hamburger M (2004) Rapid analysis of nucleotide-activated sugars by high-performance liquid chromatography coupled with diode-array detection, electrospray ionization mass spectrometry and nuclear magnetic resonance. J. Chromatogr. A 1034:139-148.
Richau JA, Leitão JH, Sá-Correia I (2000). Enzymes leading to the nucleotide sugar precursors for exopolysaccharide synthesis in Burkholderia cepacia. Biochem. Biophys. Res. Commun. 276:71-76.
Rocchetta HL, Burrows LL, Lam JS (1999) Genetics of O-antigen biosynthesis in Pseudomonas aeruginosa. Microbiol. Mol. Biol. Rev. 63:523-553.
Rosano C, Bisso A, Izzo G, Tonetti M, Sturla L, De Flora A, Bolognesi M (2000) Probing the catalytic mechanism of GDP-4-keto-6-deoxy-d-mannose Epimerase/Reductase by

Biotechnology of Biopolymers
274
kinetic and crystallographic characterization of site-specific mutants. J. Mol. Biol. 303:77-91.
Sabra W, Zeng AP, Deckwer WD (2001) Bacterial alginate: physiology, product quality and process aspects. Appl. Microbiol. Biotechnol. 56:315–325.
Schlunzen F, Zarivach R, Harms J, Bashan A, Tocilj A, Albrecht R, Yonath A, Franceschi F (2001) Structural basis for the interaction of antibiotics with the peptidyl transferase centre in eubacteria. Nature 413:814–821.
Selimoglu SM, Elibol M (2010) Alginate as an immobilization material for MAb production via encapsulated hybridoma cells. Crit. Rev. Biotechnol. 30:145-159.
Severi E, Hood DW, Thomas GH (2007) Sialic acid utilization by bacterial pathogens. Microbiology 153:2817-2822.
Shankar S, Ye RW, Schlictman D, Chakrabarty AM (1995) Exopolysaccharide alginate synthesis in Pseudomonas aeruginosa: enzymology and regulation of gene expression. Adv. Enzymol. Relat. Areas Mol. Biol. 70:221–255.
Snook CF, Tipton PA, Beamer LJ (2003) Crystal structure of GDP-mannose dehydrogenase: a key enzyme of alginate biosynthesis in P. aeruginosa. Biochemistry 42:4658-4668.
Sousa SA, Moreira LM, Wopperer J, Eberl L, Sá-Correia I, Leitão JH (2007) The Burkholderia cepacia bceA gene encodes a protein with phosphomannose isomerase and GDP-D-mannose pyrophosphorylase activities. Biochem. Biophys. Res. Commun. 353:200-206.
Stollerman GH, Dale JB (2008) The importance of the group a streptococcus capsule in the pathogenesis of human infections: a historical perspective. Clin. Infect. Dis. 46:1038-1045.
Sturla L, Bisso A, Zanardi D, Benatti U, De Flora A, Tonetti M (1997) Expression, purification and characterization of GDP-D-mannose 4,6-dehydratase from Escherichia coli. FEBS Lett. 412:126-130.
Tavares IM, Leitão JH, Fialho AM, Sá-Correia I (1999) Pattern of changes in the activity of enzymes of GDP-D-mannuronic acid synthesis and in the level of transcription of algA, algC and algD genes accompanying the loss and emergence of mucoidy in Pseudomonas aeruginosa. Res. Microbiol. 150:105-116.
Van den Bosch L, Manning PA, Morona R (1997) Regulation of O-antigen chain length is required for Shigella flexneri virulence. Mol. Microbiol. 23:765-775.
Vara JA, Hutchinson CR (1988) Purification of thymidine-diphospho-D-glucose 4,6-dehydratase from an erythromycin-producing strain of Saccharopolyspora erythraea by high resolution liquid chromatography. J. Biol. Chem. 263:14992-14995.
Wagner VE, Iglewski BH (2008) P. aeruginosa Biofilms in CF Infection. Clin. Rev. Allergy Immunol. 35:124-134.
Webb NA, Mulichak AM, Lam JS, Rocchetta HL, Garavito RM (2004) Crystal structure of a tetrameric GDP-D-mannose 4,6-dehydratase from a bacterial GDP-D-rhamnose biosynthetic pathway. Protein Sci. 13:529-539.
Wu B., Zhang Y, Zheng R, Guo C, Wang PG (2002) Bifunctional phosphomannose isomerase/GDP-mannose pyrophosphorylase is the point of control for GDP-D-mannose biosynthesis in Helicobacter pylori. FEBS Lett. 519: 87-92.

14
Biofunctional Xerography Felix Löffler1,3, Yun-Chien Cheng2,3, Tobias Förtsch3, Edgar Dörsam2,
Ralf Bischoff3, 1Frank Breitling1 and Alexander Nesterov-Müller1 1Karlsruhe Institute of Technology, Institute of Microstructure Technology,
2Institute of Printing Science and Technology, Darmstadt University of Technology, 3German Cancer Research Center, Dep. Chip based peptide libraries,
Germany
1. Introduction Xerography is a well established technology that has revolutionized document processing (Borsenberger & Weiss, 1993). The word “xerography” has its origin from the Greek words “xerox” – dry and “graphos” – writing. In a laser printer, micrometer sized electrically charged toner particles are assembled by means of electric fields on a development drum and afterwards transferred to a substrate. This basic xerographic process, forming arbitrary particle patterns on a substrate, can be exploited to conduct the combinatorial synthesis of peptide arrays. Specially designed bioparticles can be used to transport amino acids to the dedicated synthesis areas and hence, we call our approach “biofunctional xerography”. The increased interest in novel fabrication methods of molecular arrays results from the large application potential in life sciences. The groundbreaking development of high-density oligonucleotide arrays (>40.000 per cm2) boosted the field of genomics both in scientific and in economic terms (Fodor et al., 1991). However, these elegant methods are not suited for the synthesis of peptide arrays, mainly due to increased number of coupling cycles (one cycle per monomer) needed to complete one layer in a peptide array (20 different monomers) when compared to an oligonucleotide array (4 different monomers). Biofunctional xerography resolved this drawback of the lithographical method with only a single coupling cycle per layer (Beyer et al., 2007). Other methods, based on printing liquids, address the different monomers at once to the support, but all of these methods have to handle tiny droplets in the nano- or picoliter range which tend to evaporate, intermingle with adjacent droplets, or clog the printing mechanics. These difficulties obviously prohibit the use of a piezo- or inkjet printers for the combinatorial synthesis of peptide arrays. Therefore, the available state-of-the-art is still dominated by the 15-years-old SPOT technology that yields until now only 25 peptides per cm2, at a cost of >5 € per peptide spot (Frank, 1992). Compared to fluid droplets, solid particles keep their shape, even at the nanometer regime, they do not spread or evaporate during deposition and they do not dissolve previously deposited materials. Furthermore, chemicals and monomers which are embedded inside of the particles are protected against decay (Adler, 1999). This unique property of solid 1shared corresponding authors: [email protected]; [email protected]

Biotechnology of Biopolymers
276
particles encouraged further research on selective particle deposition with xerographic methods: One of the most impressive among them being nanoxerography (Jacobs & Whitesides, 2001; Jacobs et al., 2002), which demonstrated the possibility of patterning charged submicron particles by the use of conductive stamp generated electric fields in thin PMMA layers. Modifications of this method use an ion beam instead of a stamp to generate latent electric field images (Fudouzi et al., 2002). The following proposed method of biofunctional xerography for peptide synthesis is based on a computer chip and allows for complete freedom in combinatorial particle deposition, i.e. all arbitrary particle patterns can be deposited on the same substrate. In this chapter we will consider the three basic elements needed for biofunctional xerography: bioparticles, solid phase polymer chemistry with particles and combinatorial particle deposition on a solid support.
2. Bioparticles 2.1 Composition of bioparticles As mentioned in the introduction, solid particles are used to transfer activated monomers to a synthesis area. In our case, Fmoc protected amino acids are embedded and immobilized in a solid particle matrix. If the particles are deposited and melted at temperatures up to 90 °C, the monomers can diffuse inside the melted matrix and couple to the solid support according to the classical Merrifield peptide chemistry (Figure 1). Thus, the biofunctional xerography exploits the possibility to form peptide bonds in the melted polymer phase at relatively high temperatures.
Fig. 1. Solid amino acid particles for combinatorial peptide synthesis
Besides the commercially available standard amino acid monomers suitable for peptide synthesis (Fmoc transient protection group; OPfP ester activation of the C-terminus), the particle composition includes a resin, building the particle polymer matrix and serving for the physical particle stability, charge transfer agents and anti-aggregation components (Table 1). The charge transfer agents provide for the stabilization of the electrical charge on the surface of toner particles. Indeed, all 20 different Fmoc-amino acids, which have C-terminal OPfp-ester activation groups, proved to be stable for months at room temperature when embedded in the particle matrix, with the single exception of Fmoc-arginine-OPfp. This compound decayed at a moderate rate of 4% per month. It is a remarkable finding, considering that carboxy-activated Fmoc-arginine derivatives are notoriously unstable in other solvents (Cezari & Juliano, 1996).

Biofunctional Xerography
277
Component Function Relative amount (w/w) Fmoc-L-aminoacid-OPfpester Activated amino acid, monomer 10% SLEC PLT 7547 Resin for physical stability 84.5% Pyrazolone orange Charge stabilizer 4.4% (Fe)2 naphthol complex Charge stabilizer 1% Silica particles, Aerosil 812 Anti-aggregation 0.1%
Table 1. Components of amino acid particles (Stadler et al., 2008)
2.2 Generation of bioparticles In order to produce a toner mass with uniformly dispersed particle components, a mixture of one Fmoc-amino acid OPfp-ester, a polymer and charge stabilizers is dissolved, homogenized and then solidified. The toner mass finally has to be milled with an air jet mill (50AS, Hosokawa). During sieving the milled particles, silica nanoparticles are added which prevents the tendency of particles to agglomerate and enhance their flow ability. The particle size distribution was measured with a Mastersizer (Malvern, type 2000). Figure 2 shows the air and product transport in an air jet mill 50AS (Hosokawa ALPINE AG & Co. OHG). Small pieces of the mass are introduced into the funnel (a). The drive air (c) is sucked in at the injector (b) and mixed with the raw mass. This mixture is transported to the mill chamber (g). The milling air (d) passes through the air ring (e) and jet apertures (f) to the mill chamber. The particle mass is accelerated by the spiral air jets (h). The milling of the particles occurs by their collision with other particles or with the jet ring wall (i). The fine product leaves the mill trough the outlet (j) in the chamber center. The raw product remains in the chamber and is accelerated again. The separation limit depends on the pressure of the milling air.
Fig. 2. Air jet mill2: funnel (a), injector (b), drive air (c), milling air (d), air ring (e), jet apertures (f), mill chamber (g), spiral air jets (h), jet ring wall (i), outlet (j)
2 http://www.alpinehosolawa.com

Biotechnology of Biopolymers
278
The influence of milling air pressure on particle size is shown in Figure 3. In principle, the higher the milling air pressure is, the smaller is the resulting particle size. This experimental dependence can be derived from the particle separation conditions at the outlet: Fcent = Fd, where Fcent is the centripetal force and Fd the drag force. Since Fcent ~ d3v2 and Fd ~ dv, where d is the particle diameter and v the velocity, the relation v ~ d-2 results. In this estimate, the relation between the normal and tangential components of the particle velocity in the milling chamber is assumed to be independent of the pressure.
Fig. 3. Distribution of the particle diameter as a function of the milling pressure.
The last expression can be rewritten with the milling pressure as p ~ d-2, because v is proportional to p according to the operating manual of the mill. Figure 4 presents the comparison between the obtained dependence and the experimental data, whereby the maximum of the size distribution in Figure 3 is taken as the particle size.
Fig. 4. Maximum values of the size distributions in Figure 3 versus the reciprocal root of the milling pressure (p-1/2).
However, this dependence is not valid at higher pressures. Higher pressures do not lead to finer products but rather to a stronger precipitation of the melted mass on the milling chamber wall. Due to the higher kinetic energy of the particles, it is partially converted into heat by inelastic collisions and causes the melting of the particles. Such inelastic collisions occur at critical velocities which are reached by increasing the pressure in the mill chamber. In this case, the size of the milled product depends on the melting point of the different components of the raw mass. The introduction of components with higher melting temperature enables the fabrication of the finer particles in the air jet mill. Further adjustment of the particle size distribution can be realized by sieving.
Biofunctional Xerography
279
2.3 Electricity and charge of bioparticles The q/m-value (the ration of particle charge q and particle mass m) is one of the most important characteristics determining particle behavior in electrical fields. The measurement of triboelectric charging of bioparticles is used for particle characterization and optimization in xerographic processing.
Amino acid type
q/m-value,10³ [C/kg]
error stand. deviation
Amino acid type
q/m-value, 10³ [C/kg]
error stand. deviation
Cys -3.48 0.70 Val -1.78 0.26 His -2.08 0.20 Pro -1.32 0.11 Trp -2.05 0.34 Glu -2.57 0.42 Arg -1.70 0.31 Ser -2.28 0.18 Gln -1.72 0.56 Leu -2.87 0.24 Phe -2.55 0.22 Asp -2.26 0.34 Met -3.40 0.25 Tyr -1.79 0.23 Ile -2.66 0.18 Gly -1.76 0.33 Thr -2.14 0.35 Asn -1.49 0.08 Val -1.78 0.26 Ala -1.07 0.27
Table 2. q/m-values of amino acid particles
The set up illustrated in Figure 5 was used to measure the q/m-values of the amino acid particles (Nesterov et al., 2007a, 2007b). This method possesses some advantages over conventional methods based on measuring and collecting the particles in a Faraday cup. The charge of the particles is measured without influencing the particle motion, the measurement is contact-free. Hence, the charging and discharging processes can be monitored during the particle motion. The measurement benefits from the real time data, acquired in the process, because rapid changes in the charging processes occur in less than a second. The particle charge can be measured without any further undesired particle contact with the walls of different tubes before they pass into the filter. On the other hand, a Faraday cup with the particles must be weighed to obtain the particle mass. Since a Faraday cup is made of metal, it is rather heavy. The particle filter in the here presented method can be fabricated of a lighter material, which makes weighing easier.
Fig. 5. Measurement of the q/m–values with the inductive cylindrical probe.

Biotechnology of Biopolymers
280
The amino acid particles with a relatively narrow size distribution around 10 µm (size distribution generated at a milling air pressure of 4.2 bar, see Figure 3) were electrically activated by contacting the walls of an acrylic glass cone chamber and passed a cylindrical inductive probe into a particle filter. The triboelectric charging of the particles reaches its saturation with an air flow above 30 l/min. The charge of the particle cloud was obtained by the evaluation of the amplitude of the corresponding inductive current. The mass was measured as the difference of the particle filter mass before and after the particles were guided through the experiment. Table 2 summarizes the measured q/m-values for biogenic amino acid particles used in the combinatorial peptide synthesis. The 20 different amino acid particles are composed of similar components: solid matrix, special additives and chemically activated amino acid (see Table 1). The only variable component was the amino acid, which makes up 10% of the composition. This variability and a certain deviation in the mean particle diameter caused the different q/m-values of particles in triboelectric charging. All the amino acid particles have negative q/m-values, which corresponds to the average surface charge densities of -0.5⋅10-5 to -2⋅10-5 C/m2. Thus, an activated particle has several thousand elementary charges. It is a rather effective charging process, compared to the critical air breakdown charge density of σ = -2.6⋅10-5 C/m2 (Hughes, 1984), at which air breakdown occurs on a conductive surface. Remarkably, the cysteine and methionine amino acid particles, i.e. particles including amino acids with a sulfur atom in the side chain, possess the largest q/m-values.
3. Combinatorial peptide synthesis with particles The amino acids can polymerize with each other by forming peptide bonds. The peptide bond arises as a result from the chemical reaction between the amino group and the carboxyl group of two different amino acids accompanied by releasing a water molecule (Figure 6). However, it is not trivial to synthesize a defined peptide chain from several amino acids in a test tube. A large number of random oligomers or cyclic bipetides is generated at the simple mixing of activated amino acids.
Fig. 6. Formation of peptide bond in reaction between two amino acids
The first synthesis of defined peptides was conducted by T. Curtius at the Ruprecht-Karls-University in Heidelberg in 1881 (Jakubke & Jeschkeit, 1973). The azide-method developed

Biofunctional Xerography
281
by him turned out to be of large practical importance. The method utilizes chemical protecting groups for the suppression of uncontrolled formation of peptide bonds. About 50 various protecting group procedures are known today. Nevertheless only a few procedures have been established for routine application. The invention of the Nobel prize awarded peptide synthesis on a solid substrate (solid phase peptide synthesis) made by R.B. Merrifield at Rockefeller-Institute in New York in 1963 was a breakthrough in peptide chemistry (Merrifield, 1963). The solid phase peptide synthesis enabled routine production of peptides in technical scale for the first time. Figure 7 schematically shows the principle of the Merrifield synthesis (Koch & Mahler, 2002). The method consists of binding an amino acid by its C-terminal carboxyl group to the insoluble polymer and consequent assembling of the peptide chain at the N-terminal end. Each cycle begins with the removal of the protecting group and results in the growth of the peptide chain by one further amino acid. The multiple repetition of the cycle leads to the synthesis of amino acid chains. Some amino acids possess side chains with hydroxyl, amino or carboxyl groups, which must be chemically neutralized by special protecting groups during synthesis. After the complete synthesis of the peptide, these protecting groups are removed with one chemical step. Two main peptide synthesis strategies are distinguished according to the kind of protecting groups: Fmoc-(9-fluorenylmethyloxycarbonyl) and BOC-(tert-butyloxycarbonyl) synthesis. The BOC protecting group can be removed with TFA (trifluoroacetic acid) solution without influence on side chain protecting groups of the benzyl type. Finally, the side chain protecting groups are detached with HF (hydrofluoric acid). The BOC strategy goes back to Merrifield. Fmoc synthesis is a chemically milder procedure. The Fmoc protecting group can be removed with a mild base, as a rule piperidin, and is stable in strong acids like TFA or HBr.
Fig. 7. Solid phase peptide synthesis cycle

Biotechnology of Biopolymers
282
The main advantage of the solid phase peptide synthesis is that one can omit the complex cleaning procedures. The removal of reagent excesses and byproducts is carried out through the washing of the substrate, whereas the main product remains on the substrate. Repeatable work cycles allow for automation. The possible aggregation of growing peptide chains is one of the limits of the solid phase synthesis. Due to the formation of peptide chain loops, ends become inaccessible and further assembly of the peptide strand is impossible. The reason for these side reactions are hydrogen bonds and hydrophobic interactions. Some amino acids like alanine, valine, isoleucine, asparagine and glutamine favour such side reactions. Thus, the synthesis of peptides with more then 15-20 amino acids becomes difficult. Particle based peptide synthesis has, albeit pursuing the same chemical reactions, several special features: the chemical reaction occurs in the melted polymer matrix with a limited diffusion and this polymer matrix has to be removed during the washing step after coupling amino acids to the surface. Figure 8 illustrates the principle of the particle based peptide synthesis. First, toner particles with a diameter of about 10 µm, imbedding different activated amino acids into the polymer matrix, are deposited onto a substrate with free amino groups on the surface (Figure 8a). The transition of the particles to a gel-like phase allows for the diffusion and coupling of the imbedded amino acids to the surface (Figure 8b). Thereby, the standard Merrifield peptide synthesis is initiated by melting the particles. This results in an excess of soluble monomer over free amino groups on the array support (~15 nmol free amino groups per cm2). The coupling step is conducted for 90 min at 90 °C. Afterwards, particle matrix and uncoupled amino acids have to be washed away with DMF (dimethylformamide) (Figure 8c). The next step provides for the removal of the N-terminal protecting groups of the amino acids with 20% piperidine diluted in DMF (Figure 8d). Finally, the support is cleaned with DMF and methanol, before the next layer of amino-acid-particles is deposited on the dried array. Eventually, these steps are repeated layer by layer until the final peptide array is rendered (Figure 8e, f). The side chain protecting groups are removed by washing the array for 2 hours in 91% TFA, 4% DCM, 3% triisobutylsilane, and 2% H2O (Jones, 2002). The completed peptide array is rinsed with methanol and dried in a stream of nitrogen.
Fig. 8. Schematic peptide synthesis: First, the particles are transferred to a substrate (a). Each particle type imbeds a different amino acid. Afterwards, the particles are melted and the amino acids couple to the surface (b). Then, excess particles and amino acids are washed away (c) and finally, the protective groups are removed (d). The process can be repeated with different particle patterns, until the desired peptide array is completed (e, f).
Biofunctional Xerography
283
As the particles can be deposited on glass supports or silicon wafers, a wide choice of chemical methods is available to produce polymeric films with N-termini as the starting points for peptide synthesis. Depending on the desired application, those can be monolayer or polymeric films. In principle, the biofunctional xerography can be adopted for the synthesis of any artificial polymer such as peptoids, oligocarbamates or oligourea, where the protection group strategy is applicable.
4. Combinatorial particle deposition on microelctronic chips 4.1 Particularities of selective deposition of particles on chips The key element of biofunctional xerography is the combinatorial particle deposition that allows for significant reduction of the number of chemical cycles. The complexity of the produced peptide array is determined by the complexity of the deposited particle patterns. Combinatorial deposition means that many kinds of particles can be deposited on the same substrate. Our approach uses microelectronic chips on which surfaces electric field patterns can be generated. In this section, we will consider results of experiments and simulations on precise particle deposition on these chips, proof-of principle peptide synthesis and a xerographic technique based on a CMOS chip as a printing head. An electronic microchip can be used for generating a particle pattern. Figure 9 illustrates the application principle of the chip for combinatorial solid phase peptide synthesis. Several kinds of amino acid particles are selectively deposited according to the consecutively generated electric field patterns (a)-(d). After the completed deposition of a particle layer, the layer is melted (e). The coupling of amino acids occurs during the melting procedure. The matrix substance and the rest of the uncoupled amino acids are removed by washing (e). The chip is then ready for the combinatorial synthesis of the next amino acid residue layer (f). High electric fields emanating from the chip are required to overcome the forces participating in the transport. Such chips can be fabricated routinely in the framework of the commercially available high voltage chip technology according to the design rules. Modern high voltage technologies enable the integration of high and low voltage transistors, such that the sequence of generated patterns can be completely automated.
Fig. 9. Solid phase peptide synthesis on the electronic microchip

Biotechnology of Biopolymers
284
In comparison to nano particles, micro particles are rather heavy, no Brownian motion occurs in air. Their motion is mainly determined by the drag force and, in absence of the drag force, also by the gravitational force. Therefore the amino acid particles can be transported with the air stream to the chip surface. The transport forces must be smaller than the selective electrical forces on the chip surface. It is known that adhesion forces are relatively large especially for particles with a diameter below 10 µm (Novick et al., 1989; Desai et al., 1999). The addressing of amino acid particles onto the chip is conducted onto a chemically modified surface. The chip surface is coated with a polymer layer, which is necessary to start the peptide synthesis (see section 3). Thus, one must take into account the influence of those layers on the adhesion and electrical forces.
4.2 Microelectronic chips Two passive chips (without transistors) with a pixel to pixel raster of 100 and 50 µm were fabricated at the Institute for Microelectronics Stuttgart (Figure 10). The chips have the following structure: (1) Si-Wafer; (2) metal layer I (AlSiCu 800 nm); (3) insulator (1000 nm SiO2); (4) metal layer II (AlSiCu 1000 nm); (5) Passivation (550 nm SiO2+ 300 nm Si3N4). A grid electrode on the chip (between two pixels) serves for electrical shielding purposes. The passive chip has pixels with a window above the pixel electrode. Thus, the peptide synthesis is conducted on an aluminum surface. The passive chips allowed only for a limited number of electric field patterns. A chess board like pattern was originally used to study the particle transport processes and for a proof of principle peptide synthesis with solid particles (Nesterov et al., 2010).
Fig. 10. Fragment of a passive chip (left). Pixel of the passive chip (middle) and its schematic structure (right)
The full combinatorial freedom can be achieved if the voltage can be applied on each pixel separately. A microelectronic chip with such function was designed in a high voltage CMOS (Complementary Metal Oxide Semiconductor) process (König et al., 2010). The total silicon area of the chip is 19.9mm×19.0mm. It is mounted on a PCB support with the dimensions of a standard microscope glass slide (75.8mm×25.9mm×1.0 mm) (Figure 11). The array of 128×128 pixel electrodes (16,384 potential synthesis spots) is located in the center of the chip. Voltages of up to 100 V can be applied independently on each pixel electrode, i.e. arbitrary combinatorial electric field patterns can be generated on the chip surface. Figure 12 schematically shows the circuit of the HV part in the fabricated CMOS chip. This circuit is a voltage divider, which determines the voltage at the pixel electrode through the gate-source voltage VGS (0 or 5 V). In the case of 0 V, the resistance of the HV-NMOS transistor RTR is significantly larger than the constant resistance R in the circuit and therefore the voltage of 100 V is applied to the pixel electrode. In the case VGS = 5 V, RTR << R and the

Biofunctional Xerography
285
pixel electrode is grounded. The resistance R is obtained by using a PMOS-transistor in the chip. The gate voltage of the PMOS transistor was fixed to a bias voltage close to its threshold voltage. The HV part was connected to the LV part through the gate of the HV-NMOS transistor which enabled the programmable control of the voltage VGS and consequently the voltage at the pixel electrode.
Fig. 11. CMOS chip for peptide synthesis
Fig. 12. Principle of the circuit used in the HV part of the CMOS chip
4.3 Particle deposition on microelectronic chips 4.3.1 Forces participating in particle deposition The forces participating in the particle transport and their deposition are shown graphically in Figure 13. The image force Fimg = q2 / (4π ε0 d2), which results from the interaction of the particle charge with the metal chip surface, and the gravitational force Fgrav = m . g can be neglected, being at least one order of magnitude smaller than the drag force and the
HV-CMOStransistor
0 V
0 or 5 V
100 V
R
pixel electrode

Biotechnology of Biopolymers
286
Fig. 13. (left) Forces in the deposition process acting on an aerosol particle with the diameter of 20 µm in a distance of 100 µm from the chip surface; (right) forces as in the latter but for a particle diameter of 2 µm.
electrical force. A particle mass density of 1100 kg/m³ was used to estimate the gravitational force. A q/m-value of 3.10-3 C/kg was chosen for the estimation of the electrical force Fel = E . q (with E = U/L) resulting from a pixel electrode with the length L and the voltage U. We estimated the electric force for two different pixel voltages: 30 V and 100 V. The drag force basically depends on the particle size and on the respective velocity between a particle and the surrounding air. For further calculations and simulations, we use the Khan-Richardson (Coulson & Richardson, 1999) force FKR instead of the standard drag force Fdrag, which is a good approximation of the drag force for a wide range of particle diameters.
( ) ( ) ( )3.450.31 0.062
KR air air part air part part partF π / 4 d ρ v - v v - v 1.84 Re 0.293 Re ,−⎛ ⎞= +⎜ ⎟
⎝ ⎠⋅ ⋅ ⋅ (1)
part air part air airwith Re v - v d ρ /η .= ⋅ ⋅ (2)
d is the particle diameter, vpart and vair are the corresponding velocities of the particle and the surrounding air that can assumed as a laminar fluid with the dynamic viscosity ηair and the density ρair. If we assume that particle movement does not influence the surrounding air flow and if particle-particle interaction (e.g. collision) is negligible due to a low aerosol density, we can limit the calculations of the forces acting in particle deposition to two forces: the Khan-Richardson force and the electrical force.
4.3.2 Simulation Using this approach, simulations of the particle deposition process can be used to improve the deposition quality and significantly reduce contaminations (Löffler et al., 2011). Especially the particle parameters like charge and size are the key players in spatial defined particle deposition. The following simulations for particle deposition analysis were obtained with the commercially available program COMSOL Multiphysics (COMSOL, Inc., USA), a finite

Biofunctional Xerography
287
element analysis solver, and simulation software. First, the stationary Navier-Stokes equation for the incompressible airflow and the Poisson equation for the electrical field on the chip surface were solved. Then, the particle trajectories were simulated, established on the solutions for the air velocity field and the electrical field. A two-dimensional simulation model has been designed to investigate the particle dynamics. As shown in Figure 14, particles with a predefined size and negative charge can be attracted by the electrical field of the chip. The chip is modeled by two active pixels set at 100 V separated by three inactive pixels at 0 V each. The electrical fields between chip and sieve selectively guide the aerosol particles to the activated deposition areas. We experimentally verified that the more pixels are switched off in a voltage pattern on the chip surface, the more contaminations on these pixels can be observed after deposition.
Fig. 14. Schematic particle deposition on a chip; particles move towards the chip and are manipulated by electrical fields resulting from the voltage pattern on the chip surface to enable spatial defined particle deposition
To investigate the causes of contamination, a pattern was modeled which consisted of two active pixels separated by seven inactive pixels as this combination showed a high probability of contamination. Particles were injected into the air stream in a distance of 1 cm away from the chip surface with an initial particle and air stream velocity of v0 = 1 m/s in chip direction. The exponential decay of the electrical field intensity emanating from the chip confines the region of interest, where the selective effect of the chip is dominating particle manipulation. Therefore, this region extends only 200µm from the chip surface, as the subsequent simulations demonstrate. We systematically varied the charge per mass ratio (q/m value) of the particles and the particle diameter in the simulations. Pixel voltages on the chip were set to either 100 V, which yields the highest possible electrical attraction, or to 0 V, to obtain minimal attraction. The voltage of the grid electrode was set to 0 V (Figure 15a) or 30 V (Figure 15b). The grid electrode plays an important role in particle deposition: In Figure 15, particle trajectories are represented as black lines and the electrical potential in V is shown in grey scale. Above the trajectories, the voltage pattern of the chip surface is indicated (similar to Figure 14). Two pixels are switched to 100 V and in between, seven grounded pixels are located. Figure 15 shows the simulation of particles with a diameter of 10 µm and a q/m value of -3.10-3 C/kg. In Figure 15a, the grid electrode is grounded and the particles reach the chip surface. Several of them are not only deposited on the grid electrode, but also on the grounded pixels, causing contaminations. In contrast to this, Figure 15b shows the same

Biotechnology of Biopolymers
288
Fig. 15. Simulation of particle deposition on a chip; particles are 10 µm in diameter and feature a q/m value of -3.10-3 C/kg; (a) the voltage of the grid electrode is 0 V, several particles are deposited as contaminations on deactivated pixels; (b) voltage of the grid electrode is 30 V, excess particles are solely deposited on the grid electrode (Löffler et al., 2011) (Reprinted with permission)
configuration, but the grid electrode is set to 30 V. Here, particles, which are not deposited on the desired pixels, are solely deposited on the grid electrode. Therefore, the grid electrode serves as an adsorber for excess particles, as long as not too many particles accumulate on the grid electrode. This effect is important for contamination free particle deposition. Thus, in all further simulations, the grid electrode is set to 30 V.
4.3.3 Effect of the particle diameter on deposition The particle size has an abundant effect on the selective particle deposition. In Figure 16, the particle size was altered between 3 and 10 µm ((a) 3 µm; (b) 5 µm; (c) 10 µm) and the charge per mass ratio (q/m value) of the particles was defined as -3.10-3 C/kg in all three cases. As shown in Figure 16a, the simulated deposition features very few overall deposition events on the chip surface. In Figure 16b and c, the total number of deposition events rises with particle diameter (i.e. increased number of trajectories). All particles are deposited either on the 100 V pixels or on the grid electrode, which resembles the ideal and desired deposition pattern. In contrast to these simulations, experiments exhibit a crucial difference: Particles with a mean diameter of 10 µm or greater tend to cause contaminations; they are deposited on both active and grounded pixels. Hence, the q/m value was altered in one order of magnitude. In Figure 17, all initial conditions were kept as in Figure 16, but a q/m value of -3.10-2 C/kg was used. The overall number of deposition events on the chip surface has risen because the particles experience a higher attract ion due to the higher q/m value. In Figure 17a and b the particle deposition is still as desired, without contamination. In the case shown in Figure 17c, many particle trajectories end on grounded pixels, indicating contamination. However, due to the lack of adhesion forces, some trajectories near the 100 V pixels are making unrealistic bends near the chip surface. Nevertheless, significant conclusions can be derived from these simulations.
(a)
(b)

Biofunctional Xerography
289
Fig. 16. Simulation of particle deposition on a chip; particle trajectories are represented as black lines, grayscale represents the electrical potential [V]; particle diameters are (a) 3 µm, (b) 5 µm, (c) 10 µm; with q/m value of -3.10-3 C/kg; in all cases no contamination on grounded pixels occurs (Löffler et al., 2011) (Reprinted with permission)
Fig. 17. Simulation of particle deposition on a chip; particle trajectories are represented as black lines, grayscale represents the electrical potential [V]; particle diameters are (a) 3 µm, (b) 5 µm, (c) 10 µm; with q/m value of -3.10-2 C/kg; in (a, b) no contamination on grounded pixels occurs in contrast to (c) (Löffler et al., 2011) (Reprinted with permission)
(a)
(b)
(c)
(a)
(b)
(c)
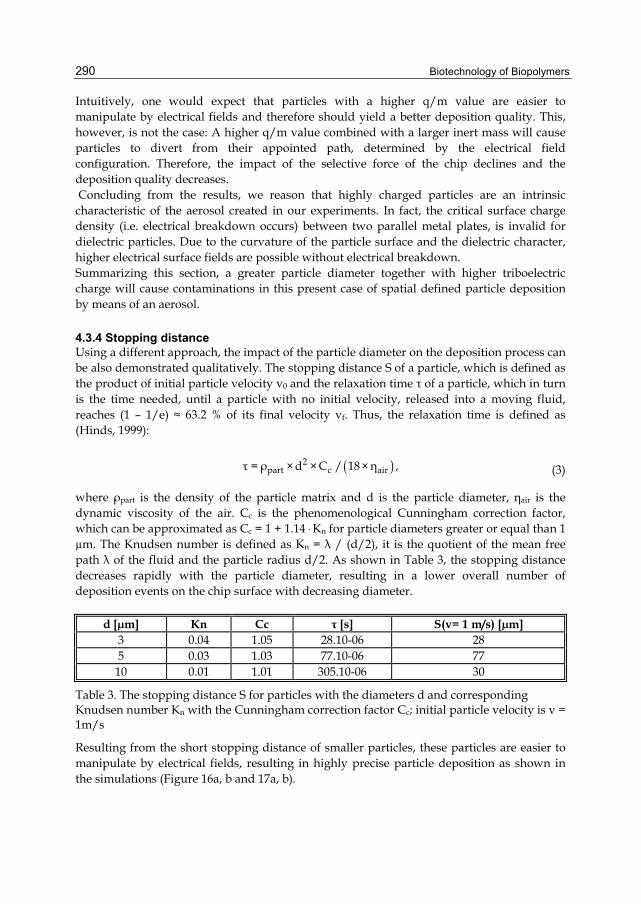
Biotechnology of Biopolymers
290
Intuitively, one would expect that particles with a higher q/m value are easier to manipulate by electrical fields and therefore should yield a better deposition quality. This, however, is not the case: A higher q/m value combined with a larger inert mass will cause particles to divert from their appointed path, determined by the electrical field configuration. Therefore, the impact of the selective force of the chip declines and the deposition quality decreases. Concluding from the results, we reason that highly charged particles are an intrinsic characteristic of the aerosol created in our experiments. In fact, the critical surface charge density (i.e. electrical breakdown occurs) between two parallel metal plates, is invalid for dielectric particles. Due to the curvature of the particle surface and the dielectric character, higher electrical surface fields are possible without electrical breakdown. Summarizing this section, a greater particle diameter together with higher triboelectric charge will cause contaminations in this present case of spatial defined particle deposition by means of an aerosol.
4.3.4 Stopping distance Using a different approach, the impact of the particle diameter on the deposition process can be also demonstrated qualitatively. The stopping distance S of a particle, which is defined as the product of initial particle velocity v0 and the relaxation time τ of a particle, which in turn is the time needed, until a particle with no initial velocity, released into a moving fluid, reaches (1 – 1/e) ≈ 63.2 % of its final velocity vf. Thus, the relaxation time is defined as (Hinds, 1999):
( )2part c airτ = ρ ×d × C / 18×η , (3)
where ρpart is the density of the particle matrix and d is the particle diameter, ηair is the dynamic viscosity of the air. Cc is the phenomenological Cunningham correction factor, which can be approximated as Cc = 1 + 1.14 . Kn for particle diameters greater or equal than 1 µm. The Knudsen number is defined as Kn = λ / (d/2), it is the quotient of the mean free path λ of the fluid and the particle radius d/2. As shown in Table 3, the stopping distance decreases rapidly with the particle diameter, resulting in a lower overall number of deposition events on the chip surface with decreasing diameter.
d [µm] Kn Cc τ [s] S(v= 1 m/s) [µm] 3 0.04 1.05 28.10-06 28 5 0.03 1.03 77.10-06 77
10 0.01 1.01 305.10-06 30
Table 3. The stopping distance S for particles with the diameters d and corresponding Knudsen number Kn with the Cunningham correction factor Cc; initial particle velocity is v = 1m/s
Resulting from the short stopping distance of smaller particles, these particles are easier to manipulate by electrical fields, resulting in highly precise particle deposition as shown in the simulations (Figure 16a, b and 17a, b).

Biofunctional Xerography
291
4.3.5 Restriction of deposition layer thickness An important restrictive effect in the selective particle deposition is illustrated in Figure 18: A simulation of particles with a diameter of 5 µm is shown. In Figure 18a and b, a 10 µm thick pre-deposited particle layer is shown, represented by a black rectangle with a surface charge of 2.7.10-5 C/m2 (a) and 5.4.10-5 C/m2 (b), which represents the possible surface charge range of a deposited particle layer. Fewer particles are deposited on the 100 V pixel in the bottom left picture, because of the increased repulsive force of the particle layer. In Figure 18 c and d, a 20 µm thick pre-deposited particle layer is shown, again represented by a black rectangle with a surface charge of 2.7.10-5 C/m2 (c) and 5.4.10-5 C/m2 (d). Here, the effect of the particle layer becomes more dominant (c) and eventually prevents any further particle deposition on the 100 V pixel. Moreover, in (d), one particle trajectory ends on an adjacent 0 V pixel, causing contamination.
Fig. 18. Simulation of particles with a diameter of 5 µm, deposited onto a chip; (a, b) show a 10 µm particle layer (black rectangle), surface charge is 2.7.10-5 C/m2 (a) and 5.4.10-5 C/m2 (b); (c, d) show a 20 µm particle layer, surface charge is 2.7.10-5 C/m2 (c) and 5.4.10-5 C/m2 (d).
These simulations imply that it is not only important to study the selective effect on single particles: Especially the effect of already deposited particles on afterwards following particles is not yet fully investigated. Experiments suggest that the selectivity of the CMOS chip slowly declines with increasing particle load on the chip surface. Thus, each pattern has a critical limit of maximum particle load, where further particle deposition will lead to contaminations on the chip surface. Hence, it will be a topic of future research.
4.3.6 Improvements and consistency of experiments with simulations Concluding from the preceding simulations, this section shows the improvements achieved by applying the theoretical results in practical particle deposition. In Figure 19 left, a deposition pattern of four different deposition patterns (chess board, 1 of 16, 1 of 36, 1 of 64) of particles with a mean diameter of 15.6 µm is shown. A lot of contaminating particles are visible. In comparison, Figure 19 right shows the same deposition pattern, but with a mean particle diameter of only 2.3 µm, it is almost free of contaminations.
(a)
(b)
(c)
(d)

Biotechnology of Biopolymers
292
Fig. 19. Four different deposition patterns of micro particles on each chip surface: (left) high degree of contamination wide particle size distribution, mean diameter 15.6 µm; (right) almost free of contamination; mean particle diameter 2.3 µm
To illustrate the consistency of simulations and experiments, we simulated the electric potential of a detail of the chip surface. In Figure 20 left, a simulation of a 5 x 5 pixel checkerboard pattern on the CMOS chip surface is shown. Only the highest electric potential (between 99.8 V and 100 V) is shown in yellow, pixels are colored in grey, the grid electrode is shown in brown. In Figure 20 right, the experimental result of particle deposition with a diameter of 2.3 µm on the CMOS chip is shown. The particle deposition clearly resembles the simulation of the highest electric potential, small particles tend to be deposited in good agreement with the selective electrical field. Even the pincushion shape (effect described in Löffler et al., 2011) of the on the pixels deposited particles can be found in both cases.
Fig. 20. (left) Simulation of a checkerboard pattern on the CMOS chip surface, only the highest electric potential (99.8 - 100 V) is shown in yellow, pixels are grey, the grid electrode is shown in brown; (right) experimental result of particle deposition (mean diameter of 2.3 µm)

Biofunctional Xerography
293
4.4 Particle-based synthesis on microelectronic chips The first successful proof-of-principle peptide synthesis (Nesterov-Müller, 2008) with amino acid particles was conducted on passive chips (see section 4.2). Two kinds of peptides NH2-DYKDDDDK-substrate and NH2-YPYDVPDYA-substrate were synthesized in a chess-board like pattern. Here, the letters are the standard notation for the amino acids: D is aspartic acid, Y tyrosine, K lysine, P proline, V valine, and A alanine. The first peptide can be recognized by the monoclonal mouse antibody called anti-FLAG. The second peptide epitope is an amino acid sequence characteristic for the hemagglutinin (HA) – a protein found on the surface of the influenza virus. Six different aerosol chambers were used according to the number of different amino acids. Two kinds of particles were deposited per layer. After the peptide synthesis as described in section 3, the chip was exposed to the antibodies to anti-FLAG and anti-HA antibodies which were stained with fluorescent labeled secondary antibodies. Alexa Fluor 488 and Alexa Fluor 546 (fluorescein derivates) were used as tag molecules for detection of the binding events. Finally, the chip was processed by the standard microarray scanner (Axon scanner GenePix 4000A) usually applied for the fluorescence measurement of the DNA microarrays. The results of immunostaining confirmed the principle possibility of fabrication of the peptide epitopes on the microelectronic chips. Lately, the same experiment has been repeated on the CMOS chip (Figure 21)3. Prior to the synthesis, the chips have been coated with a ca. 100-nm thick copolymer layer of 80% MMA (methylmethacrylate) and 20% PEG (poly(ethyleneglycol)methylmethacrylate). This layer has two functions: it protects the surface of the microelectronic chips – silicon nitride and aluminum electrodes against the chemicals used by peptide synthesis and serves at the same time as covalent binding partner for the initial amino acid groups.
Fig. 21. Fluorescence scan of CMOS chip with Flag (green) and HA (red) epitopes synthesized and fluorescence-labelled by appropriate antibody combinations. The image was merged from two fluorescence scans at different wavelengths, contrast and brightness were adjusted. Pixel pitch is 100 µm. This demonstrates the high uniformity of signals and signal intensities over the whole chip and the compact coverage of all pixels (König et al., 2010).
3Reprinted from Sens. Act. B: V. 147, K König et al. Programmable high voltage CMOS chips for particle-based high-density combinatorial peptide synthesis, 418-427 (2010) with permission from Elsevier.

Biotechnology of Biopolymers
294
Specially designed Teflon chambers were used to protect the bonding wires of the chip and the PCB support during the peptide synthesis.
4.5 Chip printer The peptide synthesis on the chip has several disadvantages. After 10-15 synthesis cycles and the removal of the protective groups with trifluoroacetic acid in the last step, the chip cannot be recycled for the synthesis of new arrays. This obstacle is not practical at today’s manufacturing cost of high voltage microelectronic chips (up to 500 Euro/mm² manufacturing cost in the many project wafers run4). The chip cannot be separated from its PCB support and thus requires a relatively complicated Teflon protection during the peptide synthesis. The other drawback is that the size of the surface of the chip is limited by the technical process. Thus, a considerable part of this expensive surface should be reserved for mechanical Teflon protection contact (see black margins on the chip surface in Figure 11).
Fig. 22. Chip printer, (top) schematic drawing and (bottom) photo
Hence, a CMOS-chip-based xerographic printing machine (Cheng et al., 2010) has been developed to allow for the combinatorial particle deposition on dielectric surfaces (Figure 22). The CMOS chip is used as a printing head in this machine. The chip is mounted onto a tilt stage, which can be moved in the x, y, and z direction. The combinatorial deposition of particles consists of three steps: First, the electrical field pattern is generated on the surface
4 http://www.europractice-ic.com/docs/MPW2011-general-v2.pdf
Substrate
Print head
Microscope
Particle loadingChip
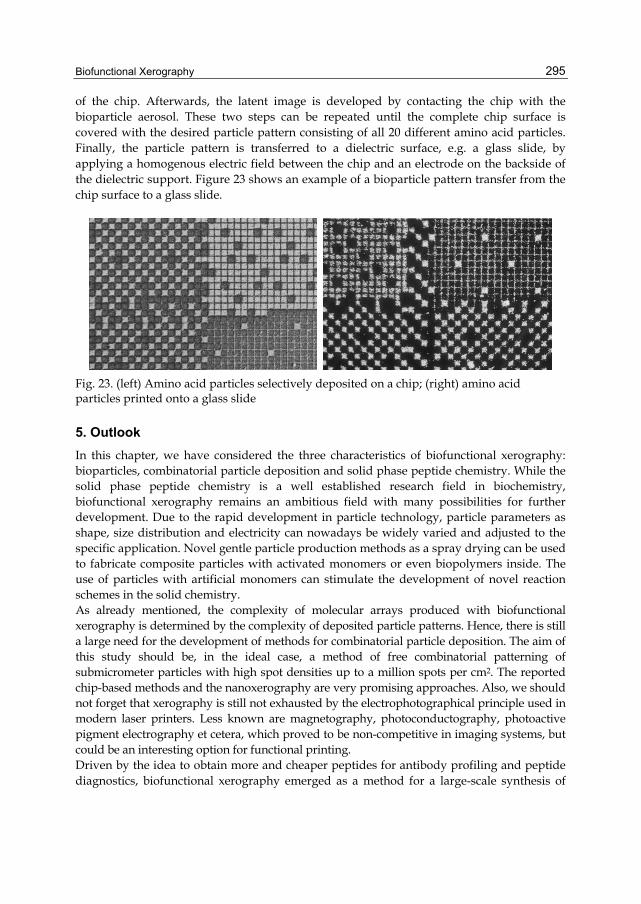
Biofunctional Xerography
295
of the chip. Afterwards, the latent image is developed by contacting the chip with the bioparticle aerosol. These two steps can be repeated until the complete chip surface is covered with the desired particle pattern consisting of all 20 different amino acid particles. Finally, the particle pattern is transferred to a dielectric surface, e.g. a glass slide, by applying a homogenous electric field between the chip and an electrode on the backside of the dielectric support. Figure 23 shows an example of a bioparticle pattern transfer from the chip surface to a glass slide.
Fig. 23. (left) Amino acid particles selectively deposited on a chip; (right) amino acid particles printed onto a glass slide
5. Outlook In this chapter, we have considered the three characteristics of biofunctional xerography: bioparticles, combinatorial particle deposition and solid phase peptide chemistry. While the solid phase peptide chemistry is a well established research field in biochemistry, biofunctional xerography remains an ambitious field with many possibilities for further development. Due to the rapid development in particle technology, particle parameters as shape, size distribution and electricity can nowadays be widely varied and adjusted to the specific application. Novel gentle particle production methods as a spray drying can be used to fabricate composite particles with activated monomers or even biopolymers inside. The use of particles with artificial monomers can stimulate the development of novel reaction schemes in the solid chemistry. As already mentioned, the complexity of molecular arrays produced with biofunctional xerography is determined by the complexity of deposited particle patterns. Hence, there is still a large need for the development of methods for combinatorial particle deposition. The aim of this study should be, in the ideal case, a method of free combinatorial patterning of submicrometer particles with high spot densities up to a million spots per cm2. The reported chip-based methods and the nanoxerography are very promising approaches. Also, we should not forget that xerography is still not exhausted by the electrophotographical principle used in modern laser printers. Less known are magnetography, photoconductography, photoactive pigment electrography et cetera, which proved to be non-competitive in imaging systems, but could be an interesting option for functional printing. Driven by the idea to obtain more and cheaper peptides for antibody profiling and peptide diagnostics, biofunctional xerography emerged as a method for a large-scale synthesis of

Biotechnology of Biopolymers
296
peptide arrays. We suppose that biofunctional xerography will become an efficient method for the construction of molecular machines in a trial-and-error process and for the search of artificial molecules with properties of broad interest. Obviously, biofunctional xerography can be applied to fabricate high density arrays of artificial molecules such as PNA, peptoides, oligoureas or metallopeptides. All these molecules possess a modular structure with well defined distances between atoms and chemical groups. Thus, varying the residues of synthesized polymers, one can systematically study in high density array format the dependence of electrical, chemical, and optical properties of materials. Measuring the response to variations and improving it with an evolutionary method by combinatorially mutating the found molecules, one can create an unforeseen diversity in biofunctional polymers.
6. Acknowledgment We thank K. König (currently at ABB Ladenburg) and H. Richter (Institute for Microelectronics Stuttgart) for the design of the chips used in the experiments. Furthermore, we thank our colleagues M. Beyer, I. Block, T. Felgenhauer, S. Fernandez, K. Leibe, G. Torralba, M. Hausmann, U. Trunk, V. Lindenstruth and V. Stadler whose contributions are cited in this chapter. Also we thank D. Rambow, J. Kretschmer, and S. Heß for technical assistance. We gratefully acknowledge the funding of the Baden-Württemberg Stiftung.
7. References Adler, M. (1999). Sprüheinbettung von Proteinen in Gerüstbildner: Stabilität und
Oberflächenanalyse. Dissertation Pharmazeutische Technologie. Nürnberg, Universität Erlangen.
Beyer, M.,* Nesterov, A.,* Block, I., König, K., Felgenhauer, T., Fernandez, S., Leibe, K., Torralba, G., Hausmann, M., Trunk, U., Lindenstruth, V., Bischoff, F.R., Stadler, V. & Breitling, F. (2007). Combinatorial synthesis of peptide arrays onto a computer chip’s surface. Science 318, 1888; *shared 1st author.
Borsenberger, P. M. & Weiss, D. S. (1993). Organic photoreceptors for imaging systems. Marcel Dekker, New York.
Cezari, M. H. S. & Juliano, L. (1996). Studies on lactam formation during coupling procedures of N alpha-N omega-protected arginine derivatives. Peptide research 9(2), 88-91.
Cheng, Y.C., Löffler, F., König, K., Nesterov, A., Dörsam, E. & Breitling, F. (2010). Chip printer. Proceedings of the 2nd WSEAS International Conference on Nanotechnology. ISSN: 1790-5117, 19-22.
Coulson, J. M. & Richardson, J. F. (1999). Motion of Particles in a Fluid, In: Particle Technology and Separation Processes, Ch. 3. Chemical Engineering vol. 2, Oxford: Butterworth-Heinemann.
Desai, A., Lee, S.-W. & Tai, Y.-C. (1999). A MEMS electrostatic particles transportation system. Sensors and Actuators 73, 37-44.

Biofunctional Xerography
297
Fodor, S.P., Read, J.L., Pirrung, M.C., Stryer, L., Lu, A.T., & Solas, D. (1991). Light-directed, spatially addressable parallel chemical synthesis. Science 251, 767–773.
Frank, R. (1992) Spot synthesis: An easy technique for the positionally addressable, parallel chemical synthesis on a membrane support. Tetrahedron 48, 9217–9232.
Fudouzi, H., Kobayashi, M. & Shinya, N. (2002). Site-Controlled Deposition of Microsized Particles Using an Electrostatic Assembly. Adv. Mater. 14, 1649-1652.
Hinds, W.C. (1999). Aerosol Technology. New York: Wiley Interscience. Hughes J.F. (1984). Electrostatic Powder Coatings. Research Studies Press. Jacobs, H.O., Campball, S.A. & Steward, M.G. (2002). Approaching nanoxerography: The
use of electrostatic forces to position nanoparticles with 100 nm scale resolution Adv. Mater. 12, 1553-1557.
Jacobs, H.O. & Whitesides, G.M. (2001). Submicrometer pattering of charge in thin-film electrets. Science 291, 1763-1766.
Jakubke, H.D. & Jeschkeit, H. (1973). Aminosäuren-Peptide-Proteine. Berlin: Akademie-Verlag. Jones, J. (2002). Oxford Chemistry Primers. Oxford University Press, Oxford, pp. 1-92. König, K., Block, I., Nesterov, A., Torralba, G., Fernandez, S., Felgenhauer, T., Leibe, K.,
Schirwitz, C., Löffler, F., Painke, F., Wagner, J., Trunk, U., Bischoff, F.R., Breitling, F., Stadler, V., Hausmann, M. & Lindenstruth, V. (2010). Programmable high voltage CMOS chips for particle-based high-density combinatorial peptide synthesis. Sens. Act. B, 147, 418-427.
Löffler, F., Wagner, J., König, K., Märkle, F., Fernandez, S., Schirwitz, C., Torralba, G., Hausmann, M., Lindenstruth, V., Bischoff, F.R., Breitling, F. & Nesterov, A. (2011). High-precision combinatorial deposition of micro particle patterns on a microelectronic chip. Aerosol Science and Technology, 45, 65–74.
Merrifield, R.B. (1963). Solid Phase Peptide Synthesis. I. The Synthesis of a Tetrapeptide. Journal of the American Chemical Society, 85, 2149.
Nesterov, A., Löffler, F., König, K., Trunk, U., Leibe, K., Felgenhauer, T., Bischoff, F.R., Breitling, F., Lindenstruth, V., Stadler, V. & Hausmann, M. (2007). Measurement of triboelectric charging of moving micro particles by means of an inductive cylindrical probe. Journal of Physics D Appl. Phys. 40, 6115-6120.
Nesterov, A., Löffler, F., König, K., Trunk, U., Leibe, K., Felgenhauer, T., Stadler, V., Bischoff, F.R., Breitling, F., Lindenstruth, V. & Hausmann, M. (2007). Non - contact charge measurement of moving microparticles contacting dielectric surfaces. Review of Scientific Instruments, 78, 075111.
Nesterov-Müller, A. (2008). Physical Aspects of Combinatorial Fabrication and Processing of Microchip Based Peptide Libraries, Habilitation, Universität Heidelberg.
Nesterov, A., Löffler, F., Hausmann, M., Stadler, V., Bischoff, F.R. & Breitling, F. (2010). Manipulation of solid particle aerosols for combinatorial fabrication of molecular libraries. SPIE Proc. ILLA'09, ISSN: 1314-068X, Smolyan, October 18-22, 2009, 332-341.
Novick, V.J., Hummer, C.R., Dunn, P.F. (1989). Minimum electric field requirements for removing powder layers from a conductive surface. J. of Appl. Phys. 65, 3242-3247.
Koch, J. & Mahler, M. (2002). Peptide Arrays on Membrane Support. Springer.

Biotechnology of Biopolymers
298
Stadler, V., Felgenhauer, T., Beyer, M., Fernandez, S., Leibe, K., Güttler, S., Gröning, M., König, K., Torralba, G., Hausmann, M., Lindenstruth, V., Nesterov, A., Block, I., Pipkorn, R., Poustka, A., Bischoff, F.R. & Breitling, F. (2008). Combinatorial synthesis of peptide arrays with a laser printer, Angew. Chem. Inter. Ed. 47, 7132.

15
Thermodynamics of Nucleic Acid Structural Modifications for Biotechnology Applications
Stefan Franzen Department of Chemistry, North Carolina State University,
USA
1. Introduction The repertoire of chemistry available to native nucleotides in DNA and RNA is limited to the purine and pyrimidine functional groups, along with the special role of the 2’-hydroxyl of RNA. The nucleobases have exocyclic amino groups and imines, neither of which is highly reactive or a good candidate for catalytic function. One might argue that the limited range of chemical reactivity is an evolutionary advantage in molecules whose functions are primarily to store (DNA) and process (RNA) genetic information. The most important attribute of both DNA and RNA is the molecular recognition through base pairing. The hydrogen bond pattern combined with the conformation of the ribose sugar gives rise to the specific B-form double helix in DNA and A-form helix with a range of additional standard folds in RNA, loops, bulges and pseudoknots. These structures are well known for their ability to interact with proteins to provide a scaffold for transcription (DNA → RNA) to create messenger RNA (mRNA), and processing of mRNA by enzymes that have active components composed of RNA molecules. The chemical action of RNA on other RNAs by means of the 2’-hydroxyl is an exception to the lack or reactivity of DNA and RNA. Self-splicing by action of the 2’-hydroxyl as a nucleophile was the process that broke the dogma that RNA is always a passive molecule that simply transmits information [1]. Indeed, RNA is very active in processing other RNAs using the 2’-hydroxyl as a nucleophile for hydrolysis of the phosphodiester bond leading to cleavage or to rearrangements of structure such as RNA splicing. Outside of this reactivity, the components of the purine and pyrimidine rings are largely inert. Aromatic amines are poor nucleophiles, and imines are even less reactive. The purine and pyrimidine rings are not particularly electrophilic because of the nitrogen heteroatoms and carbonyls. Using in vitro selection (also known as SELEX) [2-4], and appropriate modification, RNA and DNA have been developed for numerous applications that transcend their biological functions. In this chapter we will consider the modifications of the nucleobase as a means to expand upon the native function. The extensive literature on modifications of the phosphodiester backbone and the ribose sugar will not be considered in this chapter due to space limitations. Base modifications may consist of expansions of the purine/pyrimidine ring, appended functional group or chemical modification to increase the stability of the backbone with respect to hydrolysis. Expanded DNA or xDNA has been developed as mimics of native DNA with potential biotechnology applications [5, 6]. In these molecules, the purine and pyrimidine rings are fused to phenyl or naphthyl rings to give rise to

Biotechnology of Biopolymers
300
extended nucleobases. RNA and DNA aptamers have been obtained through in vitro selection using both native nucleobases and modifications in the 5-position of uracil [7-10] or the 8-position and 7-deaza positions of adenine [8, 10, 11]. In both of these cases, the ability of polymerases to tolerate the modifications is crucial to the development of novel technologies. The additional feature that is omnipresent in the strategy for the development of new structure and function is the role played by divalent ions. We consider this as well since it is a technological modification and non-natural ion concentrations are routinely used in selections and in the technologies developed. One can divide technological applications into two structural categories. 1.) the interaction with nucleic acids and 2.) interactions with other classes of molecules, amino acids, or other ligands or substrates that are completely unnatural. This chapter is concerned with the role of modified nucleic acids in determining the structure of an oligonucleotide. The large number of modified nucleosides and nucleotides for clinical applications are not considered here [12]. The structure of RNA and DNA is defined to promote interaction with other nucleic acids. Both the base stacking and electrostatic repulsion of the phosphodiester backbone provides a specific driving force and ionic atmosphere that favors interaction with a complementary shaped molecule. The practical applications that involve nucleic interactions and molecular recognition include ribozymes [13] which can play a role in gene regulation similar to microRNA [14]. Therapeutic ribozymes catalytically hydrolyze transcripts and thereby regulate gene expression, often by translational repression. The therapeutic implications of the RNA regulation pathways are largely beyond the scope of this chapter, but one comment is in order. The development of modified nucleobases may play a significant role in the development of therapeutic RNA. However, the selections and functional testing must then be carried out under the condition of low divalent ion concentration that mimics intracellular conditions. This issue is discussed below further since it is relevant to the development of strategies in the laboratory. Secondly, modified RNA for in vivo application may also be fortified by alterations of the phosphodiester backbone to prevent degradation by hydrolysis. One further point is that RNA is most adapted to the modification of other RNA. RNA hybridization and the positioning of the 2’-hydroxyl are unique structural features that will likely be important in therapeutic strategies. Precisely, for this reason therapeutic RNA development is a separate topic from the thermodynamics of the modifications. Given the susceptibility of RNA to hydrolysis a variety of alternatives have been sought in the laboratory to permit the development of technologies that use the evolutionary advantage of RNA and DNA. Modified nucleosides are needed to extend the functional range of binding and catalysis beyond those of nucleic acids. For example, RNA and DNA catalysts have been developed through in vitro selection using bases modified in the 5-U and 8-A,G positions [8, 15, 16]. DNA catalysts have been also designed using intercalators that contain metal centers [17, 18]. Templated structures that use the advantage of recognition in chemistry have been employed to advantage in the development of novel hydrolysis catalysts using both divalent ions and embedded amino acid functionality [19-21]. Addition of chemical functionality that causes large changes in DNA or RNA properties requires consideration of the structural and chemical aspects of nucleic acids in applications ranging from binding interactions to enzymatic catalysis. In this chapter we consider the effect of nucleobase modification on the stability of RNAs and DNAs for applications as aptamers or enzymes. The relationship between the modified nucleobase and polyanionic phosphodiester backbone requires consideration in the design of new molecules for catalytic and binding applications. When DNA and RNA come into contact with proteins the electrostatic repulsion can reduce binding constants and specificity of binding. For this

Thermodynamics of Nucleic Acid Structural Modifications for Biotechnology Applications
301
reason the majority of (deoxy)ribozyme and aptamer applications to date involve the processing or binding of other RNA and DNA molecules. While the majority of the altered DNA and RNA structures involve hydrophilic groups that may be charged and may interact with the phosphodiester backbone, there has also been a concerted effort to develop hydrophobic groups for modification of DNA binding properties. The thermodynamics of the hydrophobic effect and the ramifications for structure and binding of amphipathic molecules will be applied to an understanding of the behavior of DNA in protein binding assays based on these new modifications.
2. Thermodynamics of DNA and RNA structure Calorimetric data and melting behavior have been used to determine the thermodynamic stability of DNA and RNA. Breslauer et al. have tabulated the free energies of base pair formation in DNA based on the calorimetric data [22]. Such analyses have led to accurate prediction of the stability of base pairs used in design of primers, polymerase chain reaction, and a host of other common applications that involve DNA. RNA thermodynamics and structure have likewise been studied [23], tabulated and used in RNA structure prediction programs such as mfold [24] and frabase [25]. The thermodynamic data do not account for the changes in stability that occur when altered nucleobases are incorporated into the sequence. There are three main contributions to formation of stable hybridized structures 1.) electrostatic repulsion of the phosphodiester backbone, 2.) hydrophobic interactions due to base stacking and 3.) hydrogen bonding interactions leading to molecular recognition in base pairing. In terms of the magnitude, contribution 3.) is clearly the weakest, although it is the essential feature of DNA and RNA recognition. Hydrogen bonding of the nucleobases in DNA or RNA must be referenced to hydrogen bonding in water. Since the hydrogen bond strength with water is significant, it is the molecular fit of the bases in the sequential base alignment rather than strength of the individual hydrogen bonds that dominates the hydrogen bonding contribution (effect 3). The hydrophobic effect, effect 2, is a major thermodynamic driving force for assembly leading to base stacking and self-assembly. The hydrophobic effect results primarily from the unfavorable entropy of solvation of hydrophobic molecules. The water molecules surrounding a hydrophobic solute do not have strong interactions with the solute and this leads to an altered structure, which can be described as an organized cage of hydrogen bonds around the solute. There is a driving force for aggregation of hydrophobic solutes in order to reduce the surface area-to-volume ratio, and hence to reduce the unfavorable entropy of solvation. The magnitude of this effect is sufficiently large that it is considered a dominant thermodynamic contribution in protein folding, membrane formation and DNA and RNA folding. The phosphodiester backbone is a polyanion (effect 1), which leads to unfavorable interactions that are overcome only when the ionic strength of the solution is sufficiently large to screen the charge on adjacent nucleic acid strands. Screening and specific structural interactions of divalent ions play a special role, particularly in RNA folding. RNA forms predominately A-form helices that are part of hairpins, bulges and pseudo-knots. DNA has a smaller conformational space than RNA. Hairpins form but the thermodynamic stability decreases dramatically with increasing loop size [26]. The thermodynamic contributions to the total folding or hybridization energy are affected by specific changes to DNA or RNA structure due to chemical modification or solvent conditions. For example, base stacking depends on base size, which is an important consideration in technologies based on expanded bases such as x- and yDNA shown in Figure 1. [27-29]

Biotechnology of Biopolymers
302
Modified nucleosides capable of photocrosslinking reactions include 4-thio and 4-halogeno derivatives of uridine of deoxyribouridine shown in Figure 2. Photocrosslinking with DNA or DNA/RNA strands depends on appropriate conformations, which are accessible transiently in DNA, and hence is dependent on the dynamics of the structure. Base modifications that consist of charged and hydrogen-bonding nucleophilic groups tend to increase solubility and stability as measured by melt temperature (Figures 3E and 3F). On the other hand, hydrophobic base modifications reduce solubility by increasing the tendency for aggregation and reducing the role played by base stacking in stabilizing the overall structure (Figure 3A-D and 3G). Hydrophobic pendant groups could conceivably induce formation of a hydrophobic core as observed in micelles or proteins. This possibility is considered in detail in this chapter. In view of the complex chemistry of DNA and RNA, this chapter strives to examine the thermodynamic studies available to explain the various modifications and their effects.
N
N
O
HOH
HH
HH
HON
N
NH2
N
N
O
HOH
HH
HH
HO
NN
NH2A B
Fig. 1. The expanded 2’-deoxyadenosine used in the synthesis of x- and y-DNA.
O
OH
HH
HH
HO N
NH
Y
O
X
X = F, Cl, Br, I , Y = O, S , Z = H, OH, OCH3
Z
Fig. 2. 4-thio and 5-halogeno modifications of uridine. The X substituent in the 5-position can be any of the halogens, F, Cl, Br or I. The 4-oxo position shown as Y can be substituted with a sulfur to produce the 4-thio derivative. Most frequently these modified uridines are synthesized as the 2’-deoxy (Z = H) or the 2’-O methyl (Z = OCH3) derivatives.

Thermodynamics of Nucleic Acid Structural Modifications for Biotechnology Applications
303
O
OH
HH
HH
HO N
NH
O
O
X
NNH3+
HE) X = F) X =
NH2+
NH2
*
HN
O
NH
NH) X =
A) X =
C) X =O
N
H
O
N
B) X =
H
D) X =O
N
O
N
NH
G) X =
H
H
I) X =
O
N
NH
NH
N
N
H
O
YY = H for DNAY = OH for RNA
Fig. 3. Modification of 2’deoxyuridine in the 5-position. The modifications shown A) indolyl carboxamide, B) isopropyl carboxamide, C) phenyl carboxamide, D) naphthyl carboxamide, E) amino ethenyl, F) guanidinium ethenyl G) pyridinyl carboxamide H) imidazolyl ethenyl carboxamide and I) imdazolyl carboxamide ethynyl.
3. Expanded DNA and modification of the base stack The concept of modification of the nucleobase to create a new kind of genetic code has been implemented in x- and yDNA nucleobases shown in Figure 1. Quantum chemical calculations estimate that interactions in a double helix composed of xDNA are 10-15% stronger in expanded DNA compared to typical interactions native DNA [30]. The origin of the effect is not hydrogen bond strength, which should be nearly identical in xDNA and yDNA compared to native DNA [31]. Rather the base stacking interactions are the origin of the increased stability, which is manifest in the change in melting temperature from [27]. The melting or denaturation temperature is the temperature at which the duplex is in equilibrium with single-stranded DNA (ssDNA),
( ) ( )1 2 1 2:ssDNA ssDNA ssDNA ssDNA↔ + (1)
where the equilibrium constant
[ ][ ]( ) ( )
1 2
1 2=
:ssDNA ssDNA
KssDNA ssDNA⎡ ⎤⎣ ⎦
(2)
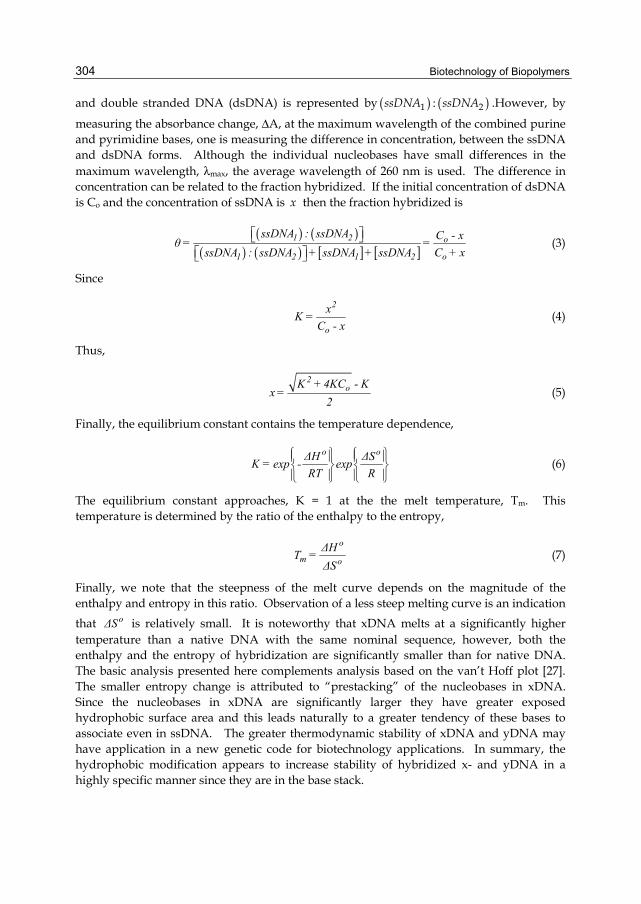
Biotechnology of Biopolymers
304
and double stranded DNA (dsDNA) is represented by ( ) ( )1 2:ssDNA ssDNA .However, by
measuring the absorbance change, ΔA, at the maximum wavelength of the combined purine and pyrimidine bases, one is measuring the difference in concentration, between the ssDNA and dsDNA forms. Although the individual nucleobases have small differences in the maximum wavelength, λmax, the average wavelength of 260 nm is used. The difference in concentration can be related to the fraction hybridized. If the initial concentration of dsDNA is Co and the concentration of ssDNA is x then the fraction hybridized is
( ) ( )
( ) ( ) [ ] [ ]⎡ ⎤⎣ ⎦
⎡ ⎤⎣ ⎦
1 2 o
o1 2 1 2
ssDNA : ssDNA C - xθ= =C + xssDNA : ssDNA + ssDNA + ssDNA
(3)
Since
2
o
xK =C - x
(4)
Thus,
2
oK + 4KC - Kx =
2 (5)
Finally, the equilibrium constant contains the temperature dependence,
⎧ ⎫ ⎧ ⎫⎪ ⎪ ⎪ ⎪⎨ ⎬ ⎨ ⎬⎪ ⎪ ⎪ ⎪⎩ ⎭ ⎩ ⎭
o oΔH ΔSK = exp - expRT R
(6)
The equilibrium constant approaches, K = 1 at the the melt temperature, Tm. This temperature is determined by the ratio of the enthalpy to the entropy,
o
m oΔHT =ΔS
(7)
Finally, we note that the steepness of the melt curve depends on the magnitude of the enthalpy and entropy in this ratio. Observation of a less steep melting curve is an indication that oΔS is relatively small. It is noteworthy that xDNA melts at a significantly higher temperature than a native DNA with the same nominal sequence, however, both the enthalpy and the entropy of hybridization are significantly smaller than for native DNA. The basic analysis presented here complements analysis based on the van’t Hoff plot [27]. The smaller entropy change is attributed to “prestacking” of the nucleobases in xDNA. Since the nucleobases in xDNA are significantly larger they have greater exposed hydrophobic surface area and this leads naturally to a greater tendency of these bases to associate even in ssDNA. The greater thermodynamic stability of xDNA and yDNA may have application in a new genetic code for biotechnology applications. In summary, the hydrophobic modification appears to increase stability of hybridized x- and yDNA in a highly specific manner since they are in the base stack.

Thermodynamics of Nucleic Acid Structural Modifications for Biotechnology Applications
305
4. Photocrosslinking agents Photocrosslinking is a known technique for structural biology applications. The crosslinking requires that pairs of nucleobases are in proximity, which is dependent on the range of their motion at a given temperature. Natural intrastrand crosslinking in DNA involves the formation of thymine dimers, which is facile when these two pyrimidines are adjacent in the base stack. However, photocrosslinking probes can also be introduced artificially into the base stack to provide information on three-dimensional structure. The naturally occurring modified nucleic acid 4-thiouridine (4-thioU) in RNA is capable of inducing crosslinks upon excitation with 330 nm light [32]. RNA or DNA made with 4-thioU provides a means to study the proximity of bases in a complex structure [33]. Photocrosslinking followed by digestion of the nucleic acid uses nucleases can be used to deduce the location of specific crosslinks. 5-halogeno uridines have been used as artificial crosslinking agents to determine the interaction of polynucleotides with proteins or as the basis technologies based on photocrosslinking selections based on 5-bromouridine [34]. Based on this observation a recent innovation using 5-fluoro-4-thuouridine (FSU) has been demonstrated to induce crosslinks to thymidine, which result in the creation of a fluorescent molecule [35]. While 4-thiouridine forms a number of 6-4 and other crosslinks [33, 36], FSU forms a highly specific crosslink with thymidine that have a fluorescence quantum yield of ~0.5 for excitation at 370 nm and emission at 470 nm [35]. The thermodynamics of formation of the FSU fluorocrosslink has an analogy in the protein world. The formation of the chromophore in green fluorescent protein (GFP) involves ring formation (like the fluorocrosslink of FSU). In both cases the processes is apparently driven thermodynamically by a second step that involves loss of a stable molecule. In GFP there is an oxidative dehydrogenation step that results in the loss of water. In the fluorocrosslink, HF is lost in the process of formation of the fluorescent product [35]. The formation of covalent crosslinks has application in structural studies (4-thioU), detection of crosslinked binding partners (5-BrU) and fluorescent detection of DNA hybridization (5-fluoro- and 5-chloro-4-thioU). These crosslinks have the potential to inform on dynamic states of DNA and RNA since two nucleobases must be in proximity in order for photochemical crosslinking to succeed.
5. DNAzyme templates for enhanced nucleophilicity Reactivity in DNA can be modulated using a templating approach that holds the catalytic nucleophile of non-native ribose sugar in an appropriate geometry can be positioned to accelerate hydrolysis [19]. This structural modification can be called templating since it brings two strands into proximity using the molecular recognition of the DNA binding arms to permit catalysis as shown in Figure 4. This idea has been tested using RNA-DNA hybrids containing either the 2’-OH and 3’-OH with an adjacent triphosphate [37], and more recently using the incorporation of amino acids serine and tyrosine into the DNA sequence [21]. The template approach is useful, but requires synthesis to prepare appropriate starting materials that can hybridize to the flanking regions shown in Figure 4. DNA-templated polymerization of peptide nucleic acid (PNA) aldehydes has been used to generate tetramer and pentamer PNA building blocks with one, two or three lysine side chains at various positions in the building block [38]. Controlled structural arrangement by hybridization

Biotechnology of Biopolymers
306
provides a method to immobilize co-factors or selected nucleic acid catalytic structures, which can serve as catalytic sites [39, 40]. The templating approach obviously has little or no effect on the thermodynamic stability of the DNA in the binding arms, which are the essential interaction for templating. This method is fairly conservative with regard to modification of structure, which is one of the reasons it is regarded as a robust method. However, the method also relies on high divalent ion concentrations for reactivity, but the identities of the ions required depends strongly on the DNA sequence. Based on the recent demonstration the a two-site mutant of 10MD5 DNAzyme switches from both Mg2+ and Zn2+ to a requirement of only Zn2+, one may consider the DNAzyme as a kind of metalloenzyme [20]. However, the mechanistic role of the divalent ions in the DNAzymes is unknown at this time.
Hydrolysis Target
Variable Region for in vitro selection
Fixed Region Fixed Region
A
O OH
OOPO
O-
OO OH
OP-OO-
O
BaseBase
O OH
OOPOH
O-
OO OH
OP-OO-
O
BaseBase
O
OPO
O
OPO
OHO
Ligation TargetB
2'-OH or 3'-OH to 5'-Phosphate ester bond formation
3'-O-5'-ester bond cleavage
Fig. 4. Templating strategies that use DNA to hold modified structures in place to promote catalytic efficiency. A.) a hydrolysis reaction is shown. B. a ligation reaction is shown.
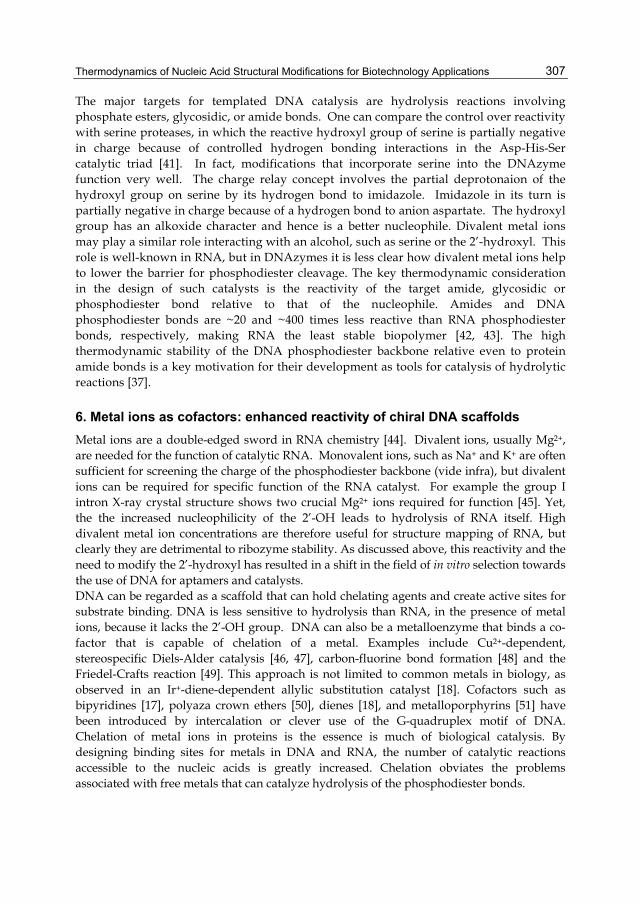
Thermodynamics of Nucleic Acid Structural Modifications for Biotechnology Applications
307
The major targets for templated DNA catalysis are hydrolysis reactions involving phosphate esters, glycosidic, or amide bonds. One can compare the control over reactivity with serine proteases, in which the reactive hydroxyl group of serine is partially negative in charge because of controlled hydrogen bonding interactions in the Asp-His-Ser catalytic triad [41]. In fact, modifications that incorporate serine into the DNAzyme function very well. The charge relay concept involves the partial deprotonaion of the hydroxyl group on serine by its hydrogen bond to imidazole. Imidazole in its turn is partially negative in charge because of a hydrogen bond to anion aspartate. The hydroxyl group has an alkoxide character and hence is a better nucleophile. Divalent metal ions may play a similar role interacting with an alcohol, such as serine or the 2’-hydroxyl. This role is well-known in RNA, but in DNAzymes it is less clear how divalent metal ions help to lower the barrier for phosphodiester cleavage. The key thermodynamic consideration in the design of such catalysts is the reactivity of the target amide, glycosidic or phosphodiester bond relative to that of the nucleophile. Amides and DNA phosphodiester bonds are ~20 and ~400 times less reactive than RNA phosphodiester bonds, respectively, making RNA the least stable biopolymer [42, 43]. The high thermodynamic stability of the DNA phosphodiester backbone relative even to protein amide bonds is a key motivation for their development as tools for catalysis of hydrolytic reactions [37].
6. Metal ions as cofactors: enhanced reactivity of chiral DNA scaffolds Metal ions are a double-edged sword in RNA chemistry [44]. Divalent ions, usually Mg2+, are needed for the function of catalytic RNA. Monovalent ions, such as Na+ and K+ are often sufficient for screening the charge of the phosphodiester backbone (vide infra), but divalent ions can be required for specific function of the RNA catalyst. For example the group I intron X-ray crystal structure shows two crucial Mg2+ ions required for function [45]. Yet, the the increased nucleophilicity of the 2’-OH leads to hydrolysis of RNA itself. High divalent metal ion concentrations are therefore useful for structure mapping of RNA, but clearly they are detrimental to ribozyme stability. As discussed above, this reactivity and the need to modify the 2’-hydroxyl has resulted in a shift in the field of in vitro selection towards the use of DNA for aptamers and catalysts. DNA can be regarded as a scaffold that can hold chelating agents and create active sites for substrate binding. DNA is less sensitive to hydrolysis than RNA, in the presence of metal ions, because it lacks the 2’-OH group. DNA can also be a metalloenzyme that binds a co-factor that is capable of chelation of a metal. Examples include Cu2+-dependent, stereospecific Diels-Alder catalysis [46, 47], carbon-fluorine bond formation [48] and the Friedel-Crafts reaction [49]. This approach is not limited to common metals in biology, as observed in an Ir+-diene-dependent allylic substitution catalyst [18]. Cofactors such as bipyridines [17], polyaza crown ethers [50], dienes [18], and metalloporphyrins [51] have been introduced by intercalation or clever use of the G-quadruplex motif of DNA. Chelation of metal ions in proteins is the essence is much of biological catalysis. By designing binding sites for metals in DNA and RNA, the number of catalytic reactions accessible to the nucleic acids is greatly increased. Chelation obviates the problems associated with free metals that can catalyze hydrolysis of the phosphodiester bonds.

Biotechnology of Biopolymers
308
7. Thermodynamics of RNA and DNA aptamer binding The stability of aptamers and the thermodynamics of their binding can be measured by calorimetry and CD to reveal that the melting temperature and structural changes associated the binding to a target. One key conclusion from such studies is that electrostatic interactions are a dominant force in binding to amino acids, peptides and proteins. For example, L-argininamide binds to its aptamer with a ΔGo = -5.1 kcal/mol and ΔHo = -8.7 kcal/mol [52]. The unfavorable entropy of binding, TΔSo = +3.6 kcal/mol, arises from the ordering of the loop region when L-argininamide binds to the hairpin structure. The melting temperature is 50.1 oC for this monomeric aptamer, but this value increases proportional to L-argininamide concentration indicative of the stabilizing effect of the bound cognate ligand [52]. The stabilization of DNA and RNA by cationic ligands and proteins is a consequence of the interaction of the negatively charged phosphodiester backbone. In the general case ligands such as L-tyrosinamide bind by electrostatic, hydrophobic and hydrogen bonding interactions [53]. Typically, a conformational change in the RNA or DNA aptamer is a hallmark of the small molecule binding [54]. However, the driving force for binding by the small molecules has a large electrostatic component. This holds true for the most studied of aptamer protein complexes. The thrombin aptamer binds primarily by electrostatic binding at a surface fold that contains many exposed arginine and lysine residues [55, 56]. The change in conformation associated with aptamer recognition stands in contrast to the entropically-driven minor groove binding of many hydrophobic drugs to dsDNA. Dyes such as Hoechst 33258 bind with little change in DNA structure leading to a reduction in hydrophobic surface area [57]. Thus, the thermodynamics of minor groove binding is clearly driven by the hydrophobic effect. On the other hand intercalators, such as the anthracyclines have significant contributions from the hydrophobic effect by insertion into the base stack and an electrostatic effect due to the charge-charge interactions, and hydrogen bonding effects [58]. Hydrogen bonding effects are considered the smallest contribution, e.g. ~1 kcal/mol, in the case of the anthracyclines. Intercalators also lead to unwinding of DNA, which gives rise to an unfavorable entropy contribution that essentially cancels the hydrobphobic effect. Thus, binding of intercalators is largely enthalpic. One can conclude that for both intercalators and cognate ligands such as L-arginamide, ionic effects are particularly important determinants of aptamer binding strength. Since DNA and RNA are polyelectrolytes it is useful to include the effects of ion displacement in the measurement of free energies of binding by determination of the binding constant as a function of salt. Using the relation between the equilibrium binding constant, K and the free energy,
oΔG = -RTlnK (8)
The polyelectrolyte contribution to the binding free energy can be obtained from the equation,
o +p +
δlnKΔG = - RTln Naδln Na
⎛ ⎞⎜ ⎟ ⎡ ⎤
⎣ ⎦⎜ ⎟⎡ ⎤⎜ ⎟⎣ ⎦⎝ ⎠в (9)
Thermodynamics of Nucleic Acid Structural Modifications for Biotechnology Applications
309
opвΔG is the excess binding free energy relative that at Na+⎡ ⎤
⎣ ⎦ = 1. The non-electrostatic free energy change of binding is
o o ot pΔG = ΔG - ΔG в (10)
oGtΔ is useful for comparison of charged and uncharged ligands since it contains a minimal contribution due to the ligand charge. This particularly important in cases where the structure of phosphodiester backbone is altered. Any conformational change that brings the charged phosphodiester groups in proximity will be highly dependent on the ionic strength of the solution. Aside from hybridization itself, which requires an ionic strength of at least 0.1 M, conformational changes in DNA that will cause it to deviate from an extended B-helix must depend strongly on ionic strength. These considerations lead to separate discussion of the major types of modification of DNA that are current in use. Hydrophilic modifications can also carry a positive charge and partially neutralize the phosphodiester backbone. This effect can mitigate the repulsion and permit different folds and can also enhance certain types of reactivity. The effect of hydrophobic modifications of nucleobases is more difficult to predict. However, since the short chemical linkers used for nucleobase modification (Figure 3) precludes intercalation, there is a competition between standard B-form helix and a potentially new fold of DNA.
8. Modification of aptamers and (deoxy)ribozymes with hydrogen-bonding groups Polypeptides serve as one source for design of novel function in DNA and RNA. Nucleobase modifications that include polypeptide functional groups involve the use of pendant imidazoles, amines, or guanidinium groups, which mimic the amino acids lysine, histidine and arginine, respectively [8]. In addition to those shown in Figure 3 for modified uridine, there are also the modifications at the 8-position of adenosine and guanosine shown in Figure 5. These groups provide reactivity that is normally absent in nucleic acid chemistry. These modifications increase the range of catalytic activity of (deoxy)ribozymes. These are water-soluble groups that tend not to interact with the hydrophobic interior of the nucleic acid. They may have some tendency to interact with the anionic phosphodiester backbone since they tend to be cationic with pKa at ~7, ~9 and ~12, respectively. These types of modification have been successfully employed in strategies to make a new class of phosphodiesterases for in vitro application [8]. The charged groups may enhance substrate binding for recognition or catalysis [15]. Changes in pendant groups in the 5-position of uridine or 8-position of guanine or adenine do not have a major impact on the thermodynamic stability of DNA or RNA. However, specific charge interactions of guanidinium and amine groups with the phosphodiester backbone can increase the stability of modified DNA. The utility of these modifications has been shown recently in the development of DNA phosphatases that function at physiological concentrations of Mg2+ [8]. There are numerous protein enzymes that function without a requirement for a metal ion. Acid-base catalysis and nucleophilic displacement reactions are two common types of mechanism that can be catalyzed using acidic or basic amino acids. By including these functions in DNA structure, new tools can be developed for therapeutic degradation of RNA sequences.

Biotechnology of Biopolymers
310
N
NN
NH2
O
OH
HH
HH
HO
AH2N
N
NN
N
NH2
O
OH
HH
HH
HO
N
H
N
N
H
BH
H
Fig. 5. Modified 2’-deoxyadenosine molecules A. modification by an amino group in the 7-deaza position. B. modification by an imidazole ring in the 8-position.
9. Hydrophobic modifications: thermodynamic effects in amphipathic systems Hydrophobic pendant groups have been used to structurally modify nucleobases in a number of recent applications. While the initial concept for these groups was tested on RNA aptamers and in vitro selection for enzymes, the field moved to DNA aptamers because of their greater thermodynamic stability. The hydrophobic pendant groups shown in Figure 3A-3D in modified DNA and the pyridyl group in Figure 3G has been used in RNA various applications. The phenyl, indolyl, and isopropyl groups mimic the hydrophobic amino acids, phenylalanine, tryptophan and valine, respectively. The hydrophobic modifications
Thermodynamics of Nucleic Acid Structural Modifications for Biotechnology Applications
311
have the potential to dramatically change the properties of both RNA and DNA. It is essential to understand the thermodynamic properties of these amphipathic structures to make sense of the consequences of the structural changes. If a single base is modified, as is the case in most studies where each uridine carries the modification, then 25% of the sites on the DNA or RNA sequence will contain the hydrophobic modification on average. The naphthyl group is the most drastic change. It has a larger hydrophobic surface area than the RNA and DNA nucleobases themselves. The question for the structural library that is intended with these modifications is whether the balance of forces leading to hybridization can be significantly altered by these modifications. One can envision that a sufficient number of such modifications leads to a change in the structure that deviates from the dominant B-form DNA. Alternatively, if the thermodynamics that lead to B-form helix dominate then the hydrophobic groups will be on the exterior and will present a hydrophobic surface. In this case, the exposed hydrophobic surface area has the potential to produce aggregation. In applications that involve evolution of aptamers the exposed surface area may lead to greater interaction with proteins. However, give the nature of hydrophobic effects, this is unlikely to be a specific interaction. In essence the hydrophobic modification of polynucleotides can be regarded as the creation of a kind of organized surfactant, and the same properties must be considered as one would consider for traditional surfactants including aggregation and protein denaturation. The hydrophobic effect is considered the dominant effect in biological self-assembly ranging from membrane formation to protein folding. The role of hydrophobic amino acids is mainly to nucleate folding by providing a hydrophobic core for a protein. By analogy, extensive use of hydrophobic amino acids and other even more hydrophobic groups such as the naphthyl group can lead to some changes in structure and properties of nucleic acids. Based on the foregoing considerations, there are two significant alternatives that one can call refolding and hydrophobic surfactant formation, respectively. In the following we discuss the thermodynamic factors that govern the structural dichotomy. The free energy that accompanies the transfer of a hydrophobic solute into aqueous solvent has been viewed as the key measurement to determine the relative contribution of a group to protein folding and other self-assembly phenomena. The magnitude of hydrophobic transfer can be quantified using the partitioning coefficient γ, where,
Cγ =C
w
v (11)
In this definition wC is the concentration in water and vC is the concentration in the vapor phase, i.e. the vapor pressure of the organic solute [59]. Although benzene and naphthalene are considered less hydrophobic than isopropanol on the γ scale, their absolute solubilities in water are significantly lower. DNA structures have a more limited repertoire than RNA structures, and consist mainly of hairpin structures. One can consider the effects of alterations of nucleobases in the stem and loop of a hairpin. In order to make a quantitative estimate of competing effects one can compare the thermodynamic stability of B-form DNA to the hydrophobic contribution of the added groups on modified nucleic acids. For DNA ΔGo per base pair is estimated to range from -0.9 to -3.6 kcal/mol [60]. This interaction energy, which is mostly driven by

Biotechnology of Biopolymers
312
hydrophobic interactions, can be compared with the gas phase dimerization energy for naphthalene, which is ca. 4 kcal/mol [61]. The structure of benzene differs significantly from that of naphthalene. While naphthalene tends to form cofacial dimers, benzene molecules interact in a T-conformation in H2O with significant induced dipolar effects [62]. The solvation energy of benzene has been calculated to 1.5 kcal/mol less than that of naphthalene [63]. Sequestration of naphthalene dimers in hydrophobic surfaces has been demonstrated by the formation 2:2 complexes (two naphthalenes joining two cyclodextrins) with a free energy change of -11.8 kcal/mol [64]. This suggests that sequestration of naphthalenes in the loop region would certainly solidify the loop region by means of the hydrophobic effect. Nucleobases interact with hydrophobic molecules, such as naphthalimide [65], leading to the possibility that these groups can either intercalate, or bind in the major groove on the hydrophobic surface of the double-helical base stack. Binding to the major groove is mainly enthalpic, while binding to the minor groove has a large entropic contribution due to the displacement of bound water in the A-T rich regions [66]. However, the pendant groups attached to nucleobases in the 5-uridinyl or 8-adenosynyl positions have limited mobility and can neither intercalate nor associate with the minor groove unless they significantly modify the double-helical structure of DNA. Given that there is an average of one hydrophobic group for every four nucleobases, this means that the average hydrophobic interaction would need to overcome a hybridization free energy in the range from 4.2 – 12.4 kcal/mol [60] in order to alter the structure from B-form helix to another kind of fold. The given range spans the possible sequence-dependent combinations of four nucleobases from weakest to strongest [60]. The basic considerations of loop and stem stability lead to the conclusion that hydrophobic base modifications will have the greatest effect on loop stabilization rather than modification of the double helix. Such stabilization is analogous to the binding of ethidium bromide to loops, which leads to increases in the free energy of formation of loops with n = 3, 5, 7 nucleotides [26]. Beyond these effects, the structural effects on the double helical regions are likely to be very small for single base modifications. Overall only a small structural effect is expected although there may be formation of a hydrophobic core in the loop regions by hydrophobic groups. Similar considerations apply to pyridine-modified RNA and have been examined structurally as discussed below.
9.1 Effect of hydrophobic interactions on ribozyme catalysis A pyridyl-modified RNA, DA22, has been proposed to be capable of carbon-carbon bond formation [7]. The mechanism of the reaction can be understood in terms of hydrophobic surface presented by pyridyl-modified RNA (Figure 3G,Y = OH), which promotes binding of Diels-Alder reactants and thereby facilitates carbon-carbon bond formation as shown in Figure 6. Typical reactants in the Diels-Alder reaction are called the diene, a molecule containing a double bonded carbon, and the dienophile, a molecule containing two double bonds that reacts with the diene as shown in Figure 6. The diene and dienophile are themselves quite hydrophobic. For this reason the hydrophobic effect has a long history in acceleration of rates of Diels-Alder and related reactions in water using molecules like cyclodextrin to provide a hydrophobic surface for the two participants in the Diels-Alder reaction to find one another in a confined space [67]. The pyridyl-modified RNA, DA22, behaves essentially like a cyclodextrin in its ability to bind the
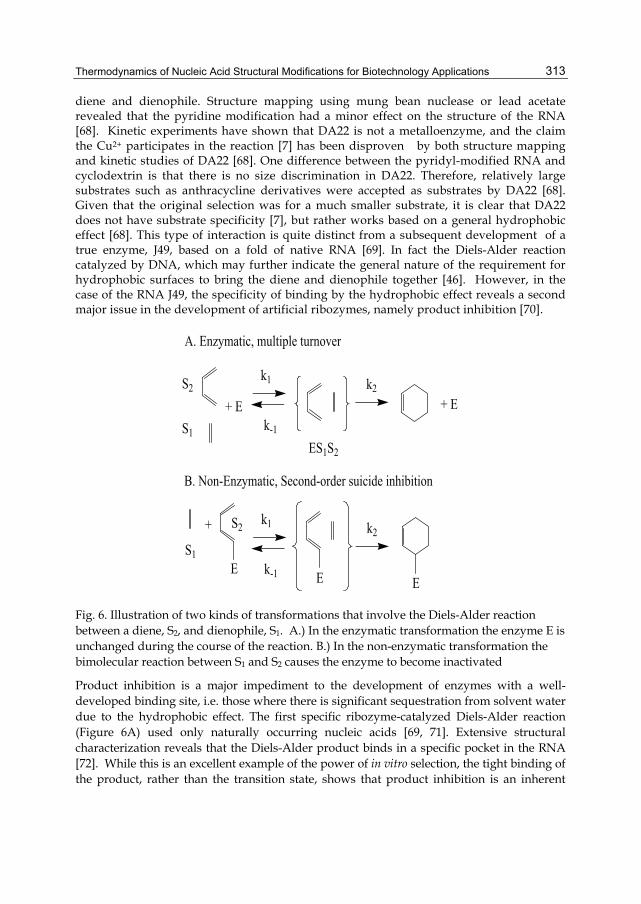
Thermodynamics of Nucleic Acid Structural Modifications for Biotechnology Applications
313
diene and dienophile. Structure mapping using mung bean nuclease or lead acetate revealed that the pyridine modification had a minor effect on the structure of the RNA [68]. Kinetic experiments have shown that DA22 is not a metalloenzyme, and the claim the Cu2+ participates in the reaction [7] has been disproven by both structure mapping and kinetic studies of DA22 [68]. One difference between the pyridyl-modified RNA and cyclodextrin is that there is no size discrimination in DA22. Therefore, relatively large substrates such as anthracycline derivatives were accepted as substrates by DA22 [68]. Given that the original selection was for a much smaller substrate, it is clear that DA22 does not have substrate specificity [7], but rather works based on a general hydrophobic effect [68]. This type of interaction is quite distinct from a subsequent development of a true enzyme, J49, based on a fold of native RNA [69]. In fact the Diels-Alder reaction catalyzed by DNA, which may further indicate the general nature of the requirement for hydrophobic surfaces to bring the diene and dienophile together [46]. However, in the case of the RNA J49, the specificity of binding by the hydrophobic effect reveals a second major issue in the development of artificial ribozymes, namely product inhibition [70].
+ ES2
S1ES1S2
k1
k-1
k2+ E
E
S2
S1
E
k1
k-1
k2+
E
A. Enzymatic, multiple turnover
B. Non-Enzymatic, Second-order suicide inhibition
Fig. 6. Illustration of two kinds of transformations that involve the Diels-Alder reaction between a diene, S2, and dienophile, S1. A.) In the enzymatic transformation the enzyme E is unchanged during the course of the reaction. B.) In the non-enzymatic transformation the bimolecular reaction between S1 and S2 causes the enzyme to become inactivated
Product inhibition is a major impediment to the development of enzymes with a well-developed binding site, i.e. those where there is significant sequestration from solvent water due to the hydrophobic effect. The first specific ribozyme-catalyzed Diels-Alder reaction (Figure 6A) used only naturally occurring nucleic acids [69, 71]. Extensive structural characterization reveals that the Diels-Alder product binds in a specific pocket in the RNA [72]. While this is an excellent example of the power of in vitro selection, the tight binding of the product, rather than the transition state, shows that product inhibition is an inherent

Biotechnology of Biopolymers
314
problem for the tethered substrate selection strategy [72]. It was later shown that product inhibition can be potentially overcome with appropriate selection design using an in vitro compartmentalization strategy [70]. In this strategy the reaction takes place under multiple turnover conditions in a single droplet so that selection of a true enzyme can be accomplished. However, pyridyl-modified RNA, DA22, cannot show product inhibition since the product is itself a suicide inhibitor as shown in Figure 6B. Given the large hydrophobic surface area in DA22 it is likely that there are many “active sites” on the hydrophobic surface that can promote the second order reaction of the tethered dienophile with a biotin labeled diene [68]. In considering the role of inhibition, one can use classical competitive kinetics to describe the inhibition of a single substrate.
[ ] [ ]
[ ] , cat offoo I
m on
k kE SK
K S kαcat +k
v = =+
(12)
Where
[ ] [ ][ ][ ]1 , I
I
I E IK
K EIα = + = (13)
The rate constants in this model are kcat, kon and koff, which are the catalytic rate constant, substrate on and off rates for binding, respectively. The competition of substrate, S, and inhibitor, I, is expressed in terms of the magnitude of the inhibitor dissociation constant, KI relative to the inhibitor dissociation constant, which is related to the ratio of the off rate, koff divided by the on rate, kon. While these equations are well-known textbook examples, they are derived for protein catalysis and have been used incorrectly in some treatments of ribozyme kinetics. The equations should only be used for multi-turnover catalysts such as the J49. Eqns. 12 and 13 have no meaning for second-order reactions such as carbon-carbon bond formation by DA22. The original discovery of RNA “catalysis” required a proof that RNA can function as a true catalyst, which means that it is not changed structurally by the chemical transformation. A second caveat is that product inhibition requires a more involved treatment than Eqn. 13 above since the concentration of inhibitor I starts at zero concentration and increases with time in the case of product inhibition. It is absolutely incorrect to use methods such as Morrisons’s quadratic equation which is only valid for tight-binding inhibitors when [I] ~ [E] [7]. Finally, the maximum substrate concentration needs to be carefully checked since accurate fitting of the equation is only possible when [S]max > Km. In cases where data are limited due to lack of solubility of hydrophobic solutes, this should be noted and the accuracy of the result will clearly be less. Double reciprocal plots of the type used in Lineweaver-Burke analysis should be avoided since these plots mask this problem and can give rise to incorrect parameters [7].
9.2 Hydrophobic effect in RNA-mediated materials synthesis RNA-mediated materials synthesis is a relatively new concept that extends the potential role of RNA processing to include inorganic materials. This challenging idea requires an
Thermodynamics of Nucleic Acid Structural Modifications for Biotechnology Applications
315
in vitro selection for a templating reaction or catalysis of starting materials that will lead to formation of a structure that is by definition much larger than the RNA itself. The first example of this type used two sequences of pyridyl-modified RNA. The sequences identified as Pd17 and Pd34 were reported to form Pd hexagons and cubes, respectively, in aqueous solution [73]. In this case the hydrophobic effect is a major contributor to the chemistry since the starting material in the synthesis is the zero-valent Pd complex trisdibenzylideneacetone dipalladium(0), Pd2(dba)3, which is insoluble in water [74]. For this reason approximately 50% THF was used in the experiments in Ref. 73, as was revealed later as the mechanism of the formation was considered in more detail [75]. The potential effect of such high concentrations of organic solvent on the hydrophobically modified RNA is likely to be quite large. Although the goal was the production of Pd nanoparticles [76], it is apparent from the data that aggregates of Pd2(dba)3 were formed instead [77-79]. These aggregates form spontaneously in hexagonal shaped crystalline form, but degrade quickly at room temperature. One can liken the phenomenon of particle formation to the formation of organometallic snowflakes composed of Pd2(dba)3
[78]. Given the increased hydrophobicity of pyridyl-labeled RNA, its solubility may be enhanced in THF, which may in turn accelerate the process of nucleation of crystalline aggregates of Pd2(dba)3, although no specific role for the modified RNA has been established in this process.
9.3 Amphpathic effects in the design of aptamers for proteomic applications Aptamers are structured RNA or DNA molecules selected by in vitro selection methods to bind to certain targets. Since RNA and DNA are polyanions, the binding of these molecules is limited to certain regions of surface charge. Although polynucleotides are amphipathic there is little evidence to date to suggest that the hydrophobic effect plays a major role in the interaction of aptamers of native RNA or DNA with their cognate targets. The hydrophobic modifications shown in Figure 3A-3D increase the amphipathic nature of DNA aptamers. In order to understand the thermodynamics of amphipathic modes of binding we can compare the possible modes of binding to the class of amphipathic transcription activation domains, which bind to kinase-inducible (KIX) domain of histone acetyl transferase CREB binding protein [80]. The KIX-transcription regulators are amphipathic proteins consisting of alternating regions of negatively-charged aspartates/glutamates and the range of hydrophobic amino acids. These amphipathic proteins have multiple binding sites on their target CREB, which underscores the lack of specificity of the binding of hydrophobic groups [80]. Moreover, competitive inhibition by hydrophobic isooxazolidene molecules considerably smaller than the transcription activator peptides strongly suggests that the mode of binding is hydrophobic. This mode of interaction stands in contrast to the known modes of aptamer binding to proteins such as the electrostatic binding of the thrombin aptamer (vide supra) [55, 56]. The electrostatic mode of binding is a common mode of binding in proteins such as cytochrome c, which docks via positive charged lysines to negative patches on its electron transfer partners. In fact, the KIX-transcription regulators represent a relatively unusual amphipathic mode of binding. The point of this comparison is that hydrophobic or amphipathic binding is possible, but it is difficult to obtain specificity as reported in a study of the binding affinity of these aptamers [81]. Studies of the binding of 1-anilino-8-naphthalene sulfonate (ANS) , a small amphipathic molecule that is widely used as a probe of protein structure, show that it

Biotechnology of Biopolymers
316
has a predominantly electrostatic mode of binding [82, 83]. Thus, one might interpret this as a general observation that electrostatic interactions supercede hydrophobic interactions. While this statement is relatively clear for small molecules, it is harder to ascertain for typical aptamers with 40 nucleotides, of which 10 are modified on average. The novel concept of using hydrophobic groups to increase binding affinity can clearly lead to high affinity binding. The question that needs to be addressed is what structures are produced and can they be made to confer high specificity? The binding of the hydrophobically modified DNA aptamers designed for proteomic analysis has recently been measured using gel electrophoresis and competition binding assays [81]. These experiments demonstrated non-specific binding to the protein targets both in the multiple bands in the gel and in the non-exponential dependence of binding in the competition assay for a generic anionic substrate. The lack of specificity for the target may be due to the amphipathic nature of the modifications introduced, which could lead to several modes of binding similar to the multiple modes of binding of KIX-domain transcription regulatory proteins [80]. These experiments demonstrate the need for a comprehensive examination of the functional groups used from the point of view of the structural folds accessible to DNA. Approaches using multiple modifications that mimic the exterior electrostatic properties of proteins more closely may increase binding specificity [8].
10. Conclusion This chapter discusses the effects of base modification from a thermodynamic perspective. The use of modifications of nucleic acids must strike a balance between the opposing aspects that determine DNA and RNA structure, the polyanion backbone and the hydrophobic base stack. Base modification can be an advantage for design of catalysts because of the intrinsic reactivity of the functional group attached to the base. The functional groups provide the nucleophilicity of an amine, acid-base catalysis of an imidazole or the charge-withdrawing ability of guanidinium. Based on these chemical contributions to nucleic acids, properties well known in enzymatic catalysis are now being exploited to advantage in DNAzymes. The data available suggest that the melting temperature is increased by these modifications, which also means implicitly that DNA B-form structure is conserved. Less is known about hydrophobic modifications. The thermodynamic consequences could be a change in structure that would create new fold of DNA. However, no melting or spectroscopic data have been published, so even the most basic aspects of the structural and energetic consequences of the modifications remain unknown. There is a major difference between the formation of a hydrophobic core in a modified DNA and a protein. DNA has a strong propensity to form linear strands due to base stacking and electrostatic repulsion. The hydrophobic effect of each modification would need to overcome free energy of stabilization in the range of 4.2-12.4 kcal/mol for each 4 nucleobases in stem regions in order dramatically alter the structure from B-form DNA to another kind of structure. Loop regions of DNA may be stabilized by hydrophobic interactions, which may lead to formation of larger loops. Whether they form a hydrophobic core or remain exposed on the surface of a linear B-form helix, the hydrophobicity of the structure may increase binding interactions with proteins either by presentation of negative charge or by denaturation of proteins onto the exposed hydrophobic surfaces. Hydrophobic groups tend to have low specificity as exemplified by the Diels-Alderase case, where DA22 plays only a role a non-specific

Thermodynamics of Nucleic Acid Structural Modifications for Biotechnology Applications
317
environment that permits the the diene and dienophile to react without providing a specific binding pocket for catalysis. We conclude judicious use of hydrophobic groups with an appropriate mixture of charged or hydrophilic groups may provide a great repertoire of functional DNAzymes and DNA aptamers in the future.
11. References [1] K. Kruger, P.J. Grabowski, A.J. Zaug, J. Sands, D.E. Gottschling, T.R. Cech, Cell 31 (1982)
147-157. [2] A.D. Ellington, J.W. Szostak, Nature 346 (1990) 818-822. [3] C. Tuerk, L. Gold, Science 249 (1990) 505-510. [4] R. Stoltenburg, C. Reinemann, B. Strehlitz, Biomol. Eng. 24 (2007) 381-403. [5] H.G. Lu, A.T. Krueger, J.M. Gao, H.B. Liu, E.T. Kool, Org. Biomol. Chem. 8 (2010) 2704-
2710. [6] H.B. Liu, J.M. Gao, S.R. Lynch, Y.D. Saito, L. Maynard, E.T. Kool, Science 302 (2003) 868-
871. [7] T.M. Tarasow, S.L. Tarasow, B.E. Eaton, Nature 389 (1997) 54-57. [8] M. Hollenstein, C.J. Hipolito, C.H. Lam, D.M. Perrin, Nucl. Acids Res. 37 (2009) 1638-
1649. [9] S.W. Santoro, G.F. Joyce, K. Sakthivel, S. Gramatikova, C.F. Barbas, J. Am. Chem. Soc. 122
(2000) 2433-2439. [10] S.E. Lee, A. Sidorov, T. Gourlain, N. Mignet, S.J. Thorpe, J.A. Brazier, M.J. Dickman,
D.P. Hornby, J.A. Grasby, D.M. Williams, Nucl. Acids Res. 29 (2001) 1565-1573. [11] T. Gourlain, A. Sidorov, N. Mignet, S.J. Thorpe, S.E. Lee, J.A. Grasby, D.M. Williams,
Nucl. Acids Res. 29 (2001) 1898-1905. [12] L.M. Alvarez-Salas, Current Topics in Medicinal Chemistry 8 (2008) 1379-1404. [13] T. Fiskaa, A.B. Birgisdottir, New Biotechnology 27 194-203. [14] A.J.V. Thompson, K. Patel, Clinics in Liver Disease 13 (2009) 375-+. [15] C.H. Lam, D.M. Perrin, Bioorg. Med. Chem. Lett. 20 (2010) 5119-5122. [16] J.M. Thomas, D.M. Perrin, J. Am. Chem. Soc. 130 (2008) 15467-15475. [17] A.J. Boersma, J.E. Klijn, B.L. Feringa, G. Roelfes, J. Am. Chem. Soc. 130 (2008) 11783-
11790. [18] P. Fournier, R. Fiammengo, A. Jaschke, Angew. Chem.-Intl. Ed. 48 (2009) 4426-4429. [19] S.K. Silverman, Ang. Chem.-Intl. Ed. 49 (2010) 7180-7201. [20] Y. Xiao, E.C. Allen, S.K. Silverman, Chem. Comm. 47 (2011) 1749-1751. [21] A. Sachdeva, S.K. Silverman, Chemical Communications 46 (2010) 2215-2217. [22] T.V. Chalikian, J. Volker, G.E. Plum, K.J. Breslauer, Proc. Natl. Acad. Sci. U.S.A. 96
(1999) 7853-7858. [23] I. Tinoco, P.N. Borer, B. Dengler, M.D. Levine, Uhlenbec.Oc, D.M. Crothers, J. Gralla,
Nature 246 (1973) 40-41. [24] M. Zuker, Nucl. Acids Res. 31 (2003) 3406-3415. [25] M. Popenda, M. Szachniuk, M. Blazewicz, S. Wasik, E.K. Burke, J. Blazewicz, R.W.
Adamiak, BMC Bioinform. 11 (2010). [26] D. Rentzeperis, K. Alessi, L.A. Marky, Nucl. Acids Res. 21 (1993) 2683-2689. [27] H.B. Liu, S.R. Lynch, E.T. Kool, J. Am. Chem. Soc. 126 (2004) 6900-6905.

Biotechnology of Biopolymers
318
[28] H.G . Lu, K.Z. He, E.T. Kool, Angew. Chem.-Intl. Ed. 43 (2004) 5834-5836. [29] K.P. Moder, N.J. Leonard, J. Am. Chem. Soc. 104 (1982) 2613-2624. [30] T.L. McConnell, S.D. Wetmore, J. Phys. Chem. B 111 (2007) 2999-3009. [31] L.A. Lait, L.R. Rutledge, A.L. Millen, S.D. Wetmore, J. Phys. Chem. B 112 (2008) 12526-
12536. [32] A. Favre, A.M. Michelson, M. Yaniv, J. Mol. Biol. 58 (1971) 367-&. [33] A. Favre, J.L. Fourrey, Acc. Chem. Res. 28 (1995) 375-382. [34] L. Gold, Mol. Cell. Proteom. 3 (2004) S2-S2. [35] B. Skalski, K. Taras-Goslinska, A. Dembska, Z. Gdaniec, S. Franzen, J. Org. Chem. 75
(2010) 621-626. [36] A. Favre, C. Saintome, J.L. Fourrey, P. Clivio, P. Laugaa, Journal of Photochemistry and
Photobiology B-Biology 42 (1998) 109-124. [37] S.K. Silverman, Chem. Comm. (2008) 3467-3485. [38] R.E. Kleiner, Y. Brudno, M.E. Birnbaum, D.R. Liu, J. Am. Chem. Soc. 130 (2008) 4646-
4659. [39] E. Bindewald, R. Hayes, Y.G. Yingling, W. Kasprzak, B.A. Shapiro, Nucl. Acids Res. 36
(2008) D392-D397. [40] A.V. Garibotti, S.M. Knudsen, A.D. Ellington, N.C. Seeman, Nano Lett. 6 (2006) 1505-
1507. [41] A. Warshel, G. Naray-Szabo, F. Sussman, J.K. Hwang, Biochemistry 28 (1989) 3629–
3637. [42] A. Radzicka, R. Wolfenden, J. Am. Chem. Soc. 118 (1996) 6105-6109. [43] Y. Li, R.R. Breaker, J. Am. Chem. Soc. 121 (1999) 5364-5372. [44] B. Cuenoud, J.W. Szostak, Nature 375 (1995) 611-614. [45] J.H. Cate, A.R. Gooding, E. Podell, K.H. Zhou, B.L. Golden, C.E. Kundrot, T.R. Cech,
J.A. Doudna, Science 273 (1996) 1678-1685. [46] M. Chandra, S.K. Silverman, J. Am. Chem. Soc. 130 (2008) 2936-2937. [47] G. Roelfes, Mol. Biosys. 3 (2007) 126-135. [48] N. Shibata, H. Yasui, S. Nakamura, T. Toru, Synlett (2007) 1153-1157. [49] A.J. Boersma, B.L. Feringa, G. Roelfes, Ang. Chem.-Intl Ed. 48 (2009) 3346-3348. [50] U. Jakobsen, K. Rohr, S. Vogel, Toward a catalytic site in DNA: Polyaza crown ether as
non-nucleosidic building blocks in DNA conjugates, 2007, pp. 1419-1422. [51] Z. Tang, D.P.N. Goncalves, M. Wieland, A. Marx, J.S. Hartig, Chembiochem 9 (2008)
1061-1064. [52] G.R. Bishop, J.S. Ren, B.C. Polander, B.D. Jeanfreau, J.O. Trent, J.B. Chaires, Biophys.
Chem. 126 (2007) 165-175. [53] P.H. Lin, S.L. Yen, M.S. Lin, Y. Chang, S.R. Louis, A. Higuchi, W.Y. Chen, J. Phys.
Chem. B 112 (2008) 6665-6673. [54] M. Jing, M.T. Bowser, Analytica Chimica Acta 686 (2010) 9-18. [55] J.A. Kelly, J. Feigon, T.O. Yeates, Journal of Molecular Biology 256 (1996) 417-422. [56] S.B. Long, M.B. Long, R.R. White, B.A. Sullenger, RNA 14 (2008) 2504-2512. [57] I. Haq, J.E. Ladbury, B.Z. Chowdhry, T.C. Jenkins, J.B. Chaires, J. Mol. Biol. 271 (1997)
244-257.

Thermodynamics of Nucleic Acid Structural Modifications for Biotechnology Applications
319
[58] J.B. Chaires, S. Satyanarayana, D. Suh, I. Fokt, T. Przewloka, W. Priebe, Biochemistry 35 (1996) 2047-2053.
[59] J. Hine, P.K. Mookerjee, J. Org. Chem. 40 (1975) 292-298. [60] K.J. Breslauer, R. Frank, H. Blocker, L.A. Marky, Proc. Natl. Acad. Sci. U.S.A. 83 (1986)
3746-3750. [61] C. Gonzalez, E.C. Lim, J. Phys. Chem. A 104 (2000) 2953-2957. [62] W.L. Jorgensen, D.L. Severance, J. Am. Chem. Soc. 112 (1990) 4768-4774. [63] T.Z.M. Denti, T.C. Beutler, W.F. vanGunsteren, F. Diederich, J. Phys. Chem. 100 (1996)
4256-4260. [64] S. Sau, B. Solanki, R. Orprecio, J. Van Stam, C.H. Evans, Journal of Inclusion Phenomena
and Macrocyclic Chemistry 48 (2004) 173-180. [65] S. McMasters, L.A. Kelly, J. Phys. Chem. B 110 (2006) 1046-1055. [66] P.L. Privalov, A.I. Dragan, C. Crane-Robinson, K.J. Breslauer, D.P. Remeta, C. Minetti, J.
Mol. Biol. 365 (2007) 1-9. [67] D.C. Rideout, R. Breslow, J. Am. Chem. Soc. 102 (1980) 7816-7817. [68] K.T. Gagnon, S.Y. Ju, M.B. Goshe, E.S. Maxwell, S. Franzen, Nucl. Acids Res. 37 (2009)
3074-3082. [69] B. Seelig, A. Jaschke, Chem. Biol. 6 (1999) 167-176. [70] J.J. Agresti, B.T. Kelly, A. Jaschke, A.D. Griffiths, Proc. Natl. Acad. Sci. U.S.A. 102 (2005)
16170-16175. [71] B. Seelig, S. Keiper, F. Stuhlmann, A. Jaschke, Angew. Chem.-Intl. Ed. 39 (2000)
4576-+. [72] S. Keiper, D. Bebenroth, B. Seelig, E. Westhof, A. Jaschke, Chem. Biol. 11 (2004) 1217-
1227. [73] L.A. Gugliotti, D.L. Feldheim, B.E. Eaton, J. Am. Chem. Soc. 127 (2005) 17814-17818. [74] S. Franzen, J. Chem. Ed. ASAP (2011). [75] S.W. Chung, A.D. Presely, S. Elhadj, S. Hok, S.S. Hah, A.A. Chernov, M.B. Francis, B.E.
Eaton, D.L. Feldheim, J.J. De Yoreo, Scanning 30 (2008) 474-474. [76] L.A. Gugliotti, D.L. Feldheim, B.E. Eaton, Science 304 (2004) 850-852. [77] S. Franzen, M. Cerruti, D.N. Leonard, G. Duscher, J. Am. Chem.Soc. 129 (2007) 15340-
15346. [78] D.N. Leonard, M. Cerruti, G. Duscher, S. Franzen, Langmuir 24 (2008) 7803-7809. [79] D.N. Leonard, S. Franzen, J. Phys. Chem. C 113 (2009) 12706-12714. [80] S.J. Buhrlage, C.A. Bates, S.P. Rowe, A.R. Minter, B.B. Brennan, C.Y. Majmudar, D.E.
Wemmer, H. Al-Hashimi, A.K. Mapp, Acs Chem. Biol. 4 (2009) 335-344. [81] L. Gold, D. Ayers, J. Bertino, C. Bock, A. Bock, E.N. Brody, J. Carter, A.B. Dalby, B.E.
Eaton, T. Fitzwater, D. Flather, A. Forbes, T. Foreman, C. Fowler, B. Gawande, M. Goss, M. Gunn, S. Gupta, D. Halladay, J. Heil, J. Heilig, B. Hicke, G. Husar, N. Janjic, T. Jarvis, S. Jennings, E. Katilius, T.R.K.N. Kim, T.H. Koch, S. Kraemer, L. Kroiss, N. Le, D. Levine, W. Lindsey, B. Lollo, W. Mayfield, M. Mehan, R. Mehler, S.K. Nelson, M. Nelson, D. Nieuwlandt, M. Nikrad, U. Ochsner, R.M. Ostroff, M. Otis, T. Parker, S. Pietrasiewicz, D.I. Resnicow, J. Rohloff, G. Sanders, S. Sattin, D. Schneider, B. Singer, M. Stanton, A. Sterkel, A. Stewart, S. Stratford, J.D. Vaught, M.

Biotechnology of Biopolymers
320
Vrkljan, J.J. Walker, M. Watrobka, S. Waugh, A. Weiss, S.K. Wilcox, A. Wolfson, S.K. Wolk, C. Zhang, D. Zichi, PloS One 5 (2010) e15004-.
[82] R.F. Latypov, D.J. Liu, K. Gunasekaran, T.S. Harvey, V.I. Razinkov, A.A. Raibekas, Protein Science 17 (2008) 652-663.
[83] K. Takehara, K. Yuki, M. Shirasawa, S. Yamasaki, S. Yamada, Anal. Sci. 25 (2009) 115-120.

16
Nutraceutical Properties of Milk Fat Globular Membrane
Korry J. Hintze, Dallin Snow, Ian Burtenshaw and Robert E. Ward Utah State University,
USA
1. Introduction Milk fat globule membrane (MFGM) is a protein-lipid biopolymer that originates from the apical surface of mammary epithelial cells and surrounds fat globules in milk. During milk synthesis, fat droplets originate in the endoplasmic reticulum and travel directly to the cell’s apical surface. As they travel from the epithelial cells into the alveolar lumen, they pass through the apical membrane and are encapsulated in the plasma membrane complete with the exterior glycocalyx resulting in discrete globules. These milk fat globules have a nonpolar lipid core composed primarily of triglycerides that is surrounded by the MFGM which contains both membrane polar lipids and glycoproteins. While MFGM is in all dairy products containing milk fat, it is especially enriched in churn buttermilk, a co product of butter production. When milk fat is churned, the membrane surrounding the fat globules is disrupted, and the free fat released from the globules coalesces. This process ultimately results in a solid fat phase, butter, and an aqueous phase, also known as churn buttermilk. This material, buttermilk, has a long history of anecdotal health-promoting associations, yet it does not currently generate any added value in the market place for delivering nutritional benefit. MFGM has recently been shown in lipidomic and proteomic characterizations to have an interesting carbohydrate, lipid and protein profile. The phospholipids and membrane glycoproteins found in MFGM likely interact extensively with the gut epithelia during digestion, both physically and biochemically. Moreover, MFGM has a relatively high concentration of sphingolipids, which in purified form have been demonstrated to be protective against colon cancer. The unique composition of MFGM has led to the idea that it may have remarkable nutraceutical properties, however, few studies have tested this hypothesis. Recent studies from our laboratory have demonstrated that dietary MFGM improves gut barrier function in cell and animal models and is protective against colon cancer in a rodent model. In this chapter we will discuss the isolation, composition, biochemical properties and intestinal health promoting effects of the biopolymer MFGM.
1.1 Milk fat globule membrane The role of milk in biology is to nourish infant mammals and to provide vigor, while not overtaxing the biosynthetic capacity of the mother. This functionality has been refined and developed over time via evolutionary selective pressure. Like much of molecular evolution, components of mammalian milks have been repurposed from other functions in biology,

Biotechnology of Biopolymers
322
and the rationale for this is often not clear. While the nutritive value of milk has long been recognized from a compositional perspective, research into the nutritional functionality of milk components has consistently revealed novel pleiotropic beneficial effects which go beyond simple nutrient content (2002; Ward and German 2004; Ward et al. 2004). As unnecessary components would likely be selected against over time, it is hard to imagine there is much that is in milk that would not be interesting from a nutritional perspective. For example, while casein and whey proteins are each recognized as good sources of essential amino acids, current studies are finding novel peptides, which are produced during digestion of these proteins, which positively affect health beyond delivery of amino acids. One interesting, yet underappreciated dairy-derived ingredient is the milk fat globular membrane. Milk fat has a complex native structure which is the result of a novel synthesis and secretion process (reviewed in (Ward, German, and Corredig 2005)). Milk triglycerides are synthesized and/or assembled in the endoplasmic reticulum (ER) of the lactating epithelial cell, and after budding off, are transported to the apical surface of the cell complete with a monolayer of polar lipids derived from the ER. As the fat droplets reach the surface of the cell they pass through the apical membrane and in the process are coated in a bilayer of cell surface membrane. The result of this process is that all native milk fat droplets contain 3 layers of polar membrane lipids, and the surface of the droplets has the molecular characteristics of epithelia. In human, bovine, caprine and ovine milks (the only ones reported), fat globules are present in a bimodal distribution with the diameter of the small globules centered at roughly 0.4 μm and the larger at about 3μm (Figure 1). Based on this size distribution, Ruegg and Blanc have estimated that there is up to 500cm2 of membrane surface area in one ml of milk (Ruegg and Blanc 1981). A scanning electron micrograph of native milk fat globules (left) and MFGM recovered from buttermilk via ultrafiltration (right) is shown Figure 2. Because each fat globule is enrobed in a coating of apical membrane from the lactating epithelial cell, the outside surface is covered in glycocalyx. Interestingly, when this material is removed from the fat globules, it may be recovered in a form which appears to be an empty sac of membrane. A scanning electron micrograph of MFGM isolated via an ultrafiltration process is shown on the right side of Figure 2.
Fig. 1. Distribution of milk fat droplets by volume (left) and number (right) measured with laser diffraction particle size analyzer. The majority of the fat in milk is present in the large fat droplets (left), while the majority of the droplets are less than 1 µm in diameter (right).
When milk fat is churned, as in the production of butter, the membrane surrounding the fat globules is disrupted and free fat released from the globules coalesces. This process ultimately results in a solid fat phase (butter) and an aqueous phase, also known as churn buttermilk. This material (buttermilk) has a long history of anecdotal health-promoting

Nutraceutical Properties of Milk Fat Globular Membrane
323
associations, yet it does not currently generate any added value in the market place for delivering nutritional benefit. As large quantities are produced in the US annually, and as it gets spray dried and used as an ingredient in many products, it seems worthy of investigating potential benefits its consumption might confer. In November of 2008, 7.2 M lbs of (dried) buttermilk were produced in the US (http://www.ams.usda.gov). As approximately 8% of buttermilk is MFGM (Astaire et al. 2003), annual production of this material is estimated to be roughly 7 M lbs.
Fig. 2. Scanning electron micrographs of native milk fat globules (left) and milk fat globular membrane isolated from buttermilk with ultrafiltration (right).
2. MFGM composition As a result of the synthetic process that produces it, MFGM has an interesting profile of carbohydrates, lipids and proteins. The main lipid and protein constituents are listed in Table 1 and were, for the most part, discovered and characterized using basic protein and lipid analysis techniques. While this list of lipids is in the table is fairly comprehensive, the proteins listed are the main components that have been studied using one dimensional gel electrophoresis which is not particularly sensitive. However, recently several groups have begun to detect many more proteins present at trace levels using proteomics techniques. For example, Reinhart and Lippolis (2006) detected up to 120 proteins using a combination of one dimensional SDS gel electrophoresis and micro-capillary HPLC nanospray-tandem mass spectrometry of tryptic digests from the gel. Of the proteins detected, 71% were membrane associated and the balance were identifies as either cytoplasmic proteins or secreted proteins. The molecular function of the proteins identifies were membrane/protein trafficking (23%) cell signaling (23%), unclassified (21%), fat metabolism/transport (9%), protein synthesis/folding (7%), immune proteins 4%) and milk proteins (2%). Fong et al (2007) investigated both protein and lipid constituents of the MFGM using mass spectrometry. In this study, eight novel proteins were detected in the MFGM and a more complete analysis of the lipid fraction was reported. A third group used direct liquid chromatography-tandem mass spectrometry (LC-MS) and 2D gel electrophoresis followed by matrix assisted laser desorption ionization-time-of-flight mass spectrometry (MALDI-TOF) of individual protein gel spots to characterize minor proteins (Smolenski et al. 2007).
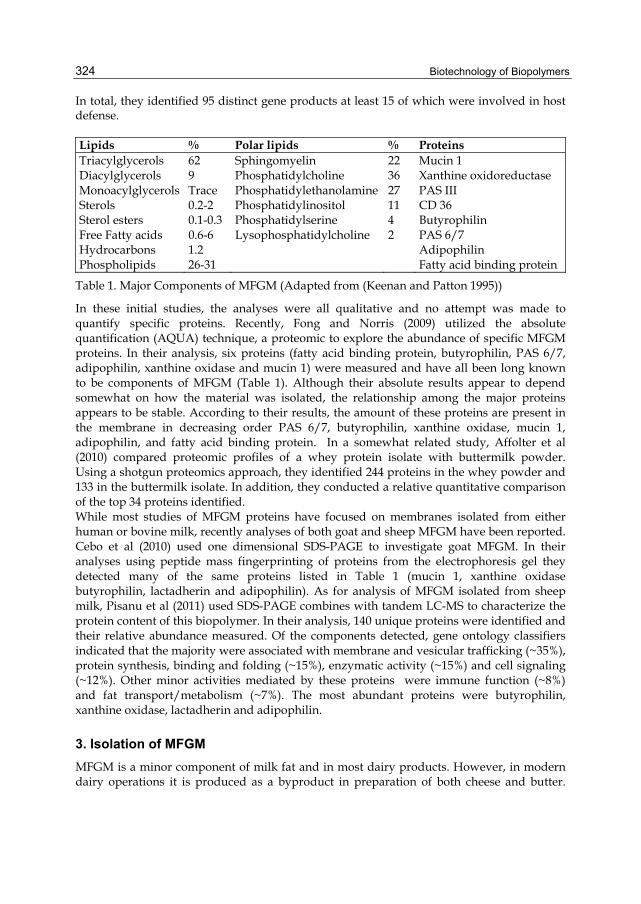
Biotechnology of Biopolymers
324
In total, they identified 95 distinct gene products at least 15 of which were involved in host defense. Lipids % Polar lipids % Proteins Triacylglycerols 62 Sphingomyelin 22 Mucin 1 Diacylglycerols 9 Phosphatidylcholine 36 Xanthine oxidoreductase Monoacylglycerols Trace Phosphatidylethanolamine 27 PAS III Sterols 0.2-2 Phosphatidylinositol 11 CD 36 Sterol esters 0.1-0.3 Phosphatidylserine 4 Butyrophilin Free Fatty acids 0.6-6 Lysophosphatidylcholine 2 PAS 6/7 Hydrocarbons 1.2 Adipophilin Phospholipids 26-31 Fatty acid binding protein
Table 1. Major Components of MFGM (Adapted from (Keenan and Patton 1995))
In these initial studies, the analyses were all qualitative and no attempt was made to quantify specific proteins. Recently, Fong and Norris (2009) utilized the absolute quantification (AQUA) technique, a proteomic to explore the abundance of specific MFGM proteins. In their analysis, six proteins (fatty acid binding protein, butyrophilin, PAS 6/7, adipophilin, xanthine oxidase and mucin 1) were measured and have all been long known to be components of MFGM (Table 1). Although their absolute results appear to depend somewhat on how the material was isolated, the relationship among the major proteins appears to be stable. According to their results, the amount of these proteins are present in the membrane in decreasing order PAS 6/7, butyrophilin, xanthine oxidase, mucin 1, adipophilin, and fatty acid binding protein. In a somewhat related study, Affolter et al (2010) compared proteomic profiles of a whey protein isolate with buttermilk powder. Using a shotgun proteomics approach, they identified 244 proteins in the whey powder and 133 in the buttermilk isolate. In addition, they conducted a relative quantitative comparison of the top 34 proteins identified. While most studies of MFGM proteins have focused on membranes isolated from either human or bovine milk, recently analyses of both goat and sheep MFGM have been reported. Cebo et al (2010) used one dimensional SDS-PAGE to investigate goat MFGM. In their analyses using peptide mass fingerprinting of proteins from the electrophoresis gel they detected many of the same proteins listed in Table 1 (mucin 1, xanthine oxidase butyrophilin, lactadherin and adipophilin). As for analysis of MFGM isolated from sheep milk, Pisanu et al (2011) used SDS-PAGE combines with tandem LC-MS to characterize the protein content of this biopolymer. In their analysis, 140 unique proteins were identified and their relative abundance measured. Of the components detected, gene ontology classifiers indicated that the majority were associated with membrane and vesicular trafficking (~35%), protein synthesis, binding and folding (~15%), enzymatic activity (~15%) and cell signaling (~12%). Other minor activities mediated by these proteins were immune function (~8%) and fat transport/metabolism (~7%). The most abundant proteins were butyrophilin, xanthine oxidase, lactadherin and adipophilin.
3. Isolation of MFGM MFGM is a minor component of milk fat and in most dairy products. However, in modern dairy operations it is produced as a byproduct in preparation of both cheese and butter.

Nutraceutical Properties of Milk Fat Globular Membrane
325
Nevertheless, to obtain it in a relatively concentrated form it must be separated from other components. Isolation of MFGM may be conducted on a lab scale for detailed anayses and/or functional characterization. In addition, in recent years several groups have published methods for isolation of MFGM from byproducts such as cheese whey and churn buttermilk. In work conducted in our laboratories MFGM is isolated using a combination of casein precipitation and ultrafiltration. The process begins with raw milk and cream is collected via centrifugation. The cream is churned in a Waring Blender for 30 minutes at 4°C. The resulting butter is removed from the buttermilk using filtration through cheese cloth to remove butter particles. To precipitate caseins in the buttermilk the pH is lowered to 4.6 using acetic acid and the temperature raised to 37 °C for 30 minutes with constant stirring. Precipitated caseins are removed via centrifugation at 1000 × g for 30 min. The pH is readjusted to 6.7 with 1M NaOH, and the buttermilk is ultrafiltered with a Millipore Prep/Scale benchtop unit using a MWCO filter of 300kD. The buttermilk is diafiltered for several hours at 4°C, until 6 volumes of the starting material are collected as permeate. The retained material, or retentate, issubsequently freeze dried. In the past several years several groups have developed methods to isolate MFGM from both cheese whey and buttermilk. Astaire et al (2003) used a two step process to produce a MFGM isolate enriched in phospholipids. In the first step MFGM was subjected to microfiltration with a 0.8 micron pore size filter. To remove nonpolar lipids the resulting material was then subjected to supercritical fluid extraction. One drawback of isolating MFGM from buttermilk with microfiltration is that casein micelles are also retained in the process. Corredig et al (2003) addressed this problem by adding sodium citrate to the process, which facilitates the dissolution of the micelles and their removal in the permeate. Other groups have shown that MFGM may also be isolated from other dairy products, such as butter serum. For example, Rombaut et al (2006) used microfiltration with both sodium citrate and ethanol additions to facilitate the removal of casein micelles and reported obtaining a relatively pure product. This group has also demonstrated that a similar process is effective for recovering MFGM from acid buttermilk cheese whey (Rombaut, Dejonckheere, and Dewettinck 2007). In an improvement on this process, it was found that increased recoveries of MFGM can be achieved via a process termed thermocalcic aggregation (Rombaut and Dewettinck 2007). This process utilizes pH adjustments as well as heat and added calcium to facilitate the precipitation of MFGM aggregates. More recently, Damodaran (2010) showed that zinc is a more effective divalent cation than ether magnesium or calcium in causing MFGM components to aggregate.
4. Interactions of MFGM with microbiota The large surface area of MFGM and its glycocalyx exterior suggests there may some interaction with the human microbiota and several studies have focused on this interaction. For example, Clare et al (2008) utilized an in vitro screening assay to test for antimicrobial activity of intact MFGM and peptide hydrolysates against several human pathogens and commensal bacteria. Interestingly, they found there was some activity against Salmonella enteric Typhimurium and Pseudomonas fluorescens that the results were variable depending on the growth media selected. They attributed these differential results to the presence of purines in the active media, which can be used by the xanthine oxidase of MFGM to generate peroxide. Other studies have focused on the interaction of microbes with the surface of MFGM. For example, Brisson et al (2010) characterized the relationship between
Biotechnology of Biopolymers
326
Lactobacillus reuteri and the surface of MFGM. According to their study, binding of L. reuteri to the surface of MFGM was dependent on the hydrophobicity of the bacteria and was correlated with a cell surface protein. In addition, this study involved determining binding force measurements which were generated with optical tweezers. Other studies have investigated the effects of dietary MFGM on the colonic microbiota. For example, the ability of MFGM to inhibit intestinal β-glucuronidase activity was measured by Ito et al. (1993). This enzyme is a product of colonic enterobacteria, and when present in the colon has the ability to activate carcinogenic precursors into carcinogens (Simon and Gorbach, 1984). However, this activity is inhibited by sialoglycoproteins from porcine salivary glands (Sakamoto, 1975). To test the hypothesis that sialoglycoproteins from bovine milk might provide this benefit, Ito et al. (1993) conducted in vitro enzymatic assays and in vivo feeding studies with mice. In the enzyme assay, 0.2% w/v MFGM inhibited β-glucuronidase activity on the substrate p-phenolphthalein β-D-glucuronide by 90%, while κ-casein at the same concentration inhibited the reaction by 35%. To determine whether this activity would survive gastrointestinal transit, the authors fed mice diets supplemented with 5%, 10%, and 20% MFGM for five days, and measured β-glucuronidase activity in feces. The 5% and 10% diets caused roughly a 15-20% inhibition of fecal β-glucuronidase activity, whereas the effect rose to 50% when 20% MFGM was added to the standard diet.
5. In-Vitro studies conducted with MFGM 5.1 In vitro MFGM digestions One model in which to study the bioactivities of MFGM is with cells in culture. However, treating cultured cells with a complex material isolated from milk is not necessarily physiologically relevant, and pursuing the effects of the digestion process on the integrity of MFGM components is warranted. Using a method adapted from Adkins and Lonnerdal, in vitro proteolysis of MFGM was conducted by incubating the material with porcine pepsin for 30 minutes at a pH of 3, and then raising the pH to 7 and continuing the process with porcine pancreatin (Adkins and Lonnerdal 2003). To characterize the effects of the proteolysis, aliquots of the digestion process were seperated using SDS-PAGE with 4-20% gels, stained the proteins with silver reagent (results not shown). Based on the peptide migration patterns in the gels from before and after digestion, very little of the native proteins escape digestion by gut proteases. While the porcine pancreatin used in the proteolysis experiment also contains pancreatic lipase, there is no commercial source for gastric lipase. However, von Ebner glands of rat tongues are a rich source, and this enzyme was isolated according to the method of Hamosh (Hamosh, Ganot, and Hamosh 1979). Lipolytic activity was confirmed using para-nitrophenyl palmitate (Gupta, Rathi, and Gupta 2002). MFGM was adjusted to a pH of 3.0 with phosphate buffer, and crude isolate of rat tongues was added. The reaction was allowed to proceed for 30 minutes, the pH was raised to 7.0, and pancreatin was added along with CaCl2 and bile salts according to the method of Bernback (Bernback, Blackberg, and Hernell 1990). The reaction was allowed to proceed for 1 hour and then terminated by submerging the sample in a 90°C water bath for 30 minutes. Samples were freeze dried, lipids extracted by the method of Folch (Folch, Lees, and Sloane Stanley 1957), and separated using thin layer chromatography. Lipids were visualized by spraying plates with cupric sulfate, and heating to 180 °C for 20 minutes. It is clear in left side of Figure 3 that the lipase treatment of MFGM causes significant degradation of the polar lipids, and the majority of this activity was mediated by the
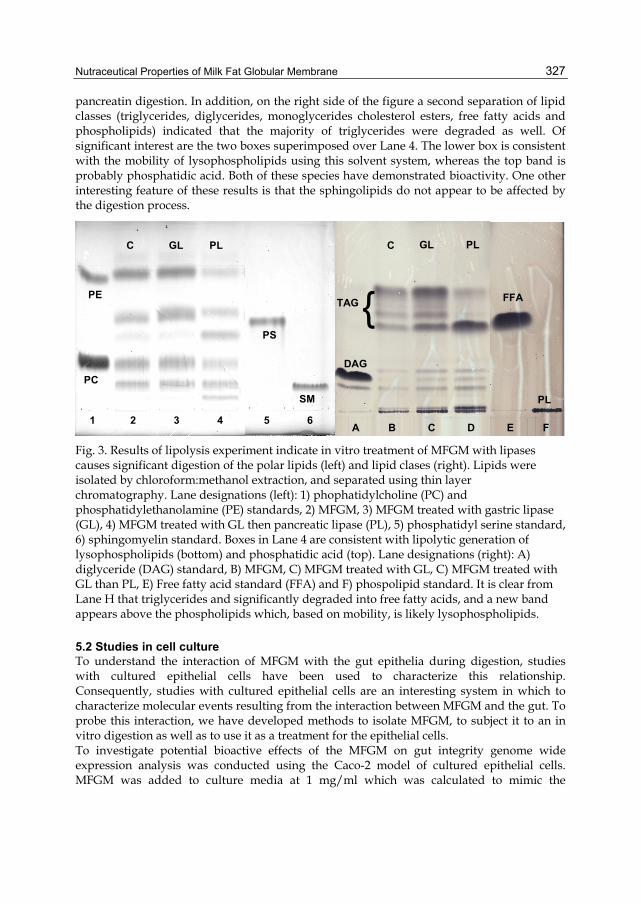
Nutraceutical Properties of Milk Fat Globular Membrane
327
pancreatin digestion. In addition, on the right side of the figure a second separation of lipid classes (triglycerides, diglycerides, monoglycerides cholesterol esters, free fatty acids and phospholipids) indicated that the majority of triglycerides were degraded as well. Of significant interest are the two boxes superimposed over Lane 4. The lower box is consistent with the mobility of lysophospholipids using this solvent system, whereas the top band is probably phosphatidic acid. Both of these species have demonstrated bioactivity. One other interesting feature of these results is that the sphingolipids do not appear to be affected by the digestion process.
PE
PC
PS
SM
1 2 3 4 5 6
C GL PL
{TAG FFA
PL
DAG
C GL PL
A B C D E F
PE
PC
PS
SM
1 2 3 4 5 6
C GL PL
{TAG FFA
PL
DAG
C GL PL
A B C D E F Fig. 3. Results of lipolysis experiment indicate in vitro treatment of MFGM with lipases causes significant digestion of the polar lipids (left) and lipid clases (right). Lipids were isolated by chloroform:methanol extraction, and separated using thin layer chromatography. Lane designations (left): 1) phophatidylcholine (PC) and phosphatidylethanolamine (PE) standards, 2) MFGM, 3) MFGM treated with gastric lipase (GL), 4) MFGM treated with GL then pancreatic lipase (PL), 5) phosphatidyl serine standard, 6) sphingomyelin standard. Boxes in Lane 4 are consistent with lipolytic generation of lysophospholipids (bottom) and phosphatidic acid (top). Lane designations (right): A) diglyceride (DAG) standard, B) MFGM, C) MFGM treated with GL, C) MFGM treated with GL than PL, E) Free fatty acid standard (FFA) and F) phospolipid standard. It is clear from Lane H that triglycerides and significantly degraded into free fatty acids, and a new band appears above the phospholipids which, based on mobility, is likely lysophospholipids.
5.2 Studies in cell culture To understand the interaction of MFGM with the gut epithelia during digestion, studies with cultured epithelial cells have been used to characterize this relationship. Consequently, studies with cultured epithelial cells are an interesting system in which to characterize molecular events resulting from the interaction between MFGM and the gut. To probe this interaction, we have developed methods to isolate MFGM, to subject it to an in vitro digestion as well as to use it as a treatment for the epithelial cells. To investigate potential bioactive effects of the MFGM on gut integrity genome wide expression analysis was conducted using the Caco-2 model of cultured epithelial cells. MFGM was added to culture media at 1 mg/ml which was calculated to mimic the

Biotechnology of Biopolymers
328
concentration in milk. MFGM was reconstituted in culture media and confluent cells were treated for 24 hours. mRNA was isolated and cleaned up with a commercial kit, and analyzed using the Illumina whole genome gene expression system with the human-6 v2 chip which was conducted by Genome Quebec. Gene expression of MFGM treated cells was compared to controls cells (no MFGM). Triplicate samples were run for both MFGM treatment and controls. Data was analyzed using Flex Array, a proprietary software program developed by Genome Quebec. All replicates were normalized, and several statistical programs were run to determine genes that were differentially expressed in response to MFGM (Empirical Bayes, Significance Analysis of Microarrays, 2 sample Bayes algorithm). Surprisingly, of the roughly 47,000 features on the array, very few genes were differentially regulated using the limits of a 2 fold change and a significance level of p<0.05, and agreement was good between algorithms. The majority of the genes identified were metallothioneins (MT), which code for small molecular weight, cystein-rich proteins with redox and metal binding activities. MTs are induced in the liver by a range of metals, and in the gut and pancreas they respond to zinc status (Coyle et al. 2002). MTs are thought to confer protection from heavy metal exposure and oxidative damage, and the coordinate expression of several isoforms in our cell system raised the possibility that MFGM treatment of the cells may have led to toxic exposure of heavy metals, or perhaps may have induced oxidative stress. Alternatively, we hypothesized that MFGM may be rich in zinc, and that induction of MT genes was part of mechanisms by which this metal is delivered in milk. In support of the oxidative stress hypothesis, one of the main MFGM proteins, xanthine oxidoreductase (XOR) can catalyze the formation of reactive oxygen (ROS) and nitrogen species (RNS), and is thought to be part of the innate immune system (Vorbach, Capecchi, and Penninger 2006). Perhaps not surprisingly, XOR has been implicated as a pathological factor in gut damage induced by ischemia/reperfusion injury via the generation of ROS and RNS (Blikslager, Roberts, and Argenzio 1999). These findings compelled us to determine the metal composition of the MFGM we isolated. To achieve this end, 200 mg of MFGM was wet ashed by successive digestion with nitric acid and hydrogen peroxide and analyzed in a Thermo Electron Iris Advantage Inductively-coupled plasma (ICP) spectrophotometer in a Utah State core analytical facility. Trace metals which were above the detection limit are listed in Table 2. From the results we have concluded that MTs are probably not induced by heavy metal contaminants of MFGM, which left the possibility the effect was due to oxidative stress or due the relatively high concentration of zinc. As we moved forward, we kept in mind these two possibilities, as is discussed below.
metal Ca Co Cu Mg Ni Zn Ppm 880 9 25 246 10 126
Table 2. Results of trace metal analysis of MFGM using ICP
Treatment of Caco-2 cells with digested MFGM resulted in the differential regulation of only 62 genes using the limits of a 2-fold change and a significance level of p<0.05. Similar to the treatment with the native MFGM, several MT genes were upregulated, although not as highly. In addition, genes coding for several other zinc binding proteins were induced. To gain insight into the major cellular processes affected by MFGM treatment, an online tool for pathway analysis of microarray data

Nutraceutical Properties of Milk Fat Globular Membrane
329
(http://www.pantherdb.org/tools/genexAnalysis.jsp) was utilized. This tool uses gene expression data to indicate whole sets of genes whose regulation would be predicted to be affected by the treatment, and generates statistical p-values indicating the likelihood the effect is due to chance. The results of the pathway analysis with the digested MFGM are listed in Table 3. According to the analysis, several pathways appear to be affected by the treatment, and the majority are downregulated. Two interesting pathways affected, in terms of our data, are those involved in histamine and angiotension signaling. The former would suggest the treatment is associated with a reduction in inflammation and the latter with increased blood flow. While these preliminary observations support our overall hypothesis, we have noted some seeming contradictions. For example, some proinflammatory pathways seem to be downregulated while others are upregulated by treatment with MFGM. Nonetheless, due to the large volume of data generated in such studies, analysis is ongoing. Because this data was generated from cultured enterocytes the data must be interpreted with caution; therefore we are eager to adapt this model to whole animals.
Pathway Numberof genes Change P-value
Histamine H1 receptor mediated signaling pathway 42 - 2.20E-03 Ubiquitin proteasome pathway 80 + 4.13E-03 Blood coagulation 60 - 4.27E-03 Thyrotropin-releasing hormone receptor signaling pathway 64 - 4.62E-03 5HT4 type receptor mediated signaling pathway 35 - 6.98E-03 5HT2 type receptor mediated signaling pathway 71 - 1.07E-02 Endogenous_cannabinoid_signaling 26 - 1.09E-02 Alpha adrenergic receptor signaling pathway 31 - 1.15E-02 Proline biosynthesis 4 - 1.36E-02 Huntington disease 158 - 1.40E-02 Angiotensin II-stimulated signaling through G proteins and beta-arrestin 54 - 1.87E-02
Beta3 adrenergic receptor signaling pathway 29 - 1.99E-02
Table 3. Biological pathways predicted to be significantly affected in Caco-2 cells by MFGM subjected to an in vitro digestion process as determined by the free software tool, Panther (Clark et al. 2003). Pathways that are upregulated by treatment are marked with a (+)and those downregulated with a (-).
5.3 Effects of MFGM on membrane permeability Based on the large membrane surface area in milk provided by the MFGM, we hypothesized that this material may have positive effects on the gut epithelia. To test this hypothesis, we conducted a barrier permeability assay with Caco-2 cells. Caco-2 cells were seeded on Corning Transwell membranes inserts (0.4 µM pore size) and placed in 6-well plates creating a bi-cameral chamber. Caco-2 cells were grown for 21 days on membrane inserts to ensure polarization and formation of tight junctions. Culture media was changed every 3 days. As our proteolysis and lipolysis results indicated that MFGM is substantially degraded by the digestion process, we compared the effect of treating cells with material

Biotechnology of Biopolymers
330
resulting from this process, as well as native material. To test the effects of MFGM on membrane integrity, cells were incubated with either: control, 1 mg/ml MFGM, 1 mg/ml proteolyzed MFGM or 1 mg/ml lypolozized MFGM for 24 hours. After treatment, the media was changed and mucosal barrier integrity was stressed by the addition of 2 mM EGTA, which has been shown in previous studies to reduce the integrity of tight junctions (Prosser et al. 2004). To determine Caco-2 membrane integrity we measured the flux of phenol red from the upper chamber to the lower chamber which contained media without phenol red. At 2.5 hours, 50 µl of media was sampled from the lower chamber and the phenol red concentration was determined by spectroscopy using the method of (Jovov, WIlls, and Lewis 1991). Our results, shown in Figure 4, indicate that MFGM reduced permeability in the control (no EGTA) as well as the treated cells. Furthermore, this effect was amplified when the MFGM was previously subjected to the in vitro digestion process described above.
Fig. 4. Results of membrane permeability study. Caco-2 cells were grown to polarization, and treated with either: control (no MFGM), 1 mg/ml MFGM, 1 mg/ml proteolyzed MFGM (P-MFGM), or 1 mg/ml lipolyzed (MFGM) for 24 hours. After treatment, media was changed and a cohort of cells were stressed by the addition 2 mM EGTA (a known stressor of barrier integrity) for 2 hours. Media in the upper chamber contained phenol red, whereas the media in the lower chamber did not. The y-axis represents phenol red concentration, which is indicative of membrane leakiness. It is clear that application of EGTA to the control cells increases permeability, and MFGM treatment reduces this effect. Interestingly, protease and lipase treated MFGM reduces permeability to a greater extent. Differently letter columns are statistically different (p<0.05.)
5.4 Summary To summarize our cell culture work, we have demonstrated that MFGM treatment of Caco-2 cells results in a very specific induction of MT genes. This effect may be due to the zinc concentration (or perhaps Cu or Mn), or perhaps due to the activity of XOR in generating ROS and/or RNS. We have subsequently showed that MFGM is substantially degraded by the digestion process, and that the products of these processes appear to be more efficacious in promoting mucosal integrity in the Caco-2 cell model than native, untreated MFGM.
Nutraceutical Properties of Milk Fat Globular Membrane
331
6. MFGM and colon cancer Colon cancer is the third most commonly diagnosed cancer in the United States and the second most common cause of cancer-related deaths (Society 2009). Diet is a well recognized contributing factor to the etiology of cancer and may be associated with 35–70% of the incidence of colon cancer (Doll and Peto 1981). Although various carcinogens are present in foods, their effects may be minor when compared with dietary components that inhibit the cancer process (Doll and Peto 1981). As a consequence, many dietary treatments have been tested specifically for their ability to inhibit colon cancer. Previous studies have demonstrated that purified sphingolipids, such as sphingomyelin, are protective against colon cancer in animal models (Duan and Nilsson 2009; El Alwani et al. 2006). Sphingolipids are composed of a ceramide core, which in turn, is composed of a sphingosine backbone with a fatty acid covalently bonded via an amide linkage. Several different head groups may be covalently attached to the ceramide, each resulting in a different class of sphingolipid. Examples include sphingomyelin, with a phosphocholine headgroup, glycosphingolipids with one or more monosaccharides in the headgroup and gangliosides, which have at least three sugars in head group including at least one sialic acid. The anticancer activity of sphingolipids is primarily associated with their metabolites, ceramide and sphingosine (Jayadev, Linardic, and Hannun 1994). Ceramide is an important second messenger implicated in various physiological functions, like apoptosis, and has recently been associated with targeting mitochondrial activity in colon cancer cells (Dahm et al. 2008; Dindo et al. 2006). Sphingolipid digestion is slow and occurs along the entire length of both the small intestine and the colon which results in high levels of ceramide and sphingosine in the lumen producing the potentially beneficial effects (Nilsson and Duan 2006). Dietary sphingomyelin and glycosphingolipids isolated from milk have been shown to inhibit chemically induced colon cancer in a mouse model (Dillehay et al. 1994; Schmelz et al. 2000), and administration either before or after tumor initiation reduced tumor formation (Lemonnier et al. 2003). One significant source of dietary sphingolipids is the milk fat globule membrane (MFGM), a protein-lipid complex that is derived from the apical surface of mammary epithelial cells and surrounds the fat globules in milk. Milk fat globules are composed of a nonpolar lipid core (mainly triglycerides) surrounded by the MFGM, which is composed of phospholipids and membrane glycoproteins (see Table 1 for major components of MFGM). Triglycerides are the dominant lipid class, and account for approximately 98% of milk fat, while the balance is composed of phospholipids (0.8%), diglycerides (0.3%), monoglycerides (0.03%), cholesterol (0.3%), and free fatty acids (0.1%) (MacGibbon and Taylor 2006). Because of its unique lipid profile, relative sphingolipid enrichment and widespread availability, MFGM is a good candidate for a colon chemopreventive, bioactive ingredient. MFGM has an interesting profile of carbohydrates, lipids and proteins, and is the most diverse fraction of milk. The unique compositional feature has led to the suggestion that MFGM may have interesting nutraceutical properties (Spitsberg 2005), and several research groups have conducted studies to facilitate its recovery from buttermilk (Astaire et al. 2003; Corredig, Roesch, and Dalgleish 2003; Morin et al. 2007; Morin, Pouliot, and Jimenez-Flores 2006; Rombaut, Dejonckheere, and Dewettinck 2006, 2007; Rombaut and Dewettinck 2007; Spence et al. 2009, 2009)
6.1 Experimental design Although very few studies have been conducted to determine any nutritional benefits of MFGM, some indicate positive effects. A recent study concluded digestion products of

Biotechnology of Biopolymers
332
MFGM may have antimicrobial activity (Clare et al. 2008). Because of its unique biochemical nature, sphingolipid enrichment and resulting putative chemoprotective properties, we investigated whether diets containing MFGM are protective against colon cancer in Fischer-344 rats using the aberrant crypt foci (ACF) model. Diets were formulated to differ only in the composition of the fat. The control diet contained 5% fat provided as corn oil. The MFGM diet also contained 5% fat, but half of the fat for the MFGM diet was provided as anhydrous milk fat and half was provided as MFGM isolate. MFGM isolate is approximately 60% triglycerides and 40% polar lipids. Besides dietary fat source, both diets were identical in macro and micro-nutrients. Experimental diets were fed for 13 weeks and rats were injected with 1,2-dimethylhydrazine (DMH, 25 mg/kg BW) weeks 3 and 4. After 13 weeks, rats were euthanized, tissues were collected and ACF were scored by light microscopy using the method of (Finley et al. 2001). The Utah State University Institutional Animal Care and Use Committee approved all protocols involving animals.
6.2 Effect of dietary MFGM on appearance of Aberrant Crypt Foci The 1,2-dimethylhydrazine induced ACF model is a well established model of colon cancer and has been used extensively in nutritional studies (Dillehay et al. 1994; Lemonnier et al. 2003; Schmelz et al. 2000; Schmelz et al. 1996; Finley et al. 2001; Pretlow et al. 1992; Tudek, Bird, and Bruce 1989). Rats fed the MFGM (n=16) diet had a significantly reduced number of ACF (P<0.005) compared to the control (n=17) (20.9 ± 5.7 vs. 31.3 ± 9.5) and AMF (n=16) diets (29.8 ± 11.4), and ACF was not significantly different between control and AMF treatments (Figure 5-A). Dietary treatment had no effect on ACF size (Figure 5-B) nor was there a significant difference in the number of ACF with four or more crypts/focus (data not shown) possibly suggesting that MFGM treatment is more relevant to preventing ACF initiation as opposed to ACF growth progression.
Fig. 5. Effect of experimental diets on (A) 1,2-dimethylhydrazine induced aberrant crypt foci (ACF) and (B) ACF size. Values are means (n=17 control diet, n=16 anhydrous milk fat diet, n=16 milk fat globular membrane diet) ± standard deviation. Significant differences were determined by ANOVA and Fisher’s LSD test. Adapted from (Snow et al. 2010)
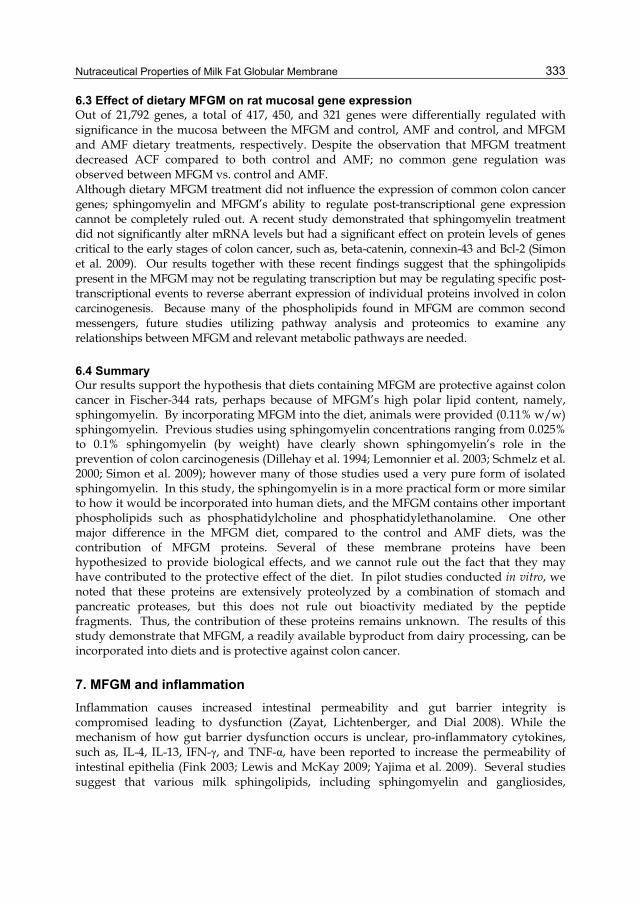
Nutraceutical Properties of Milk Fat Globular Membrane
333
6.3 Effect of dietary MFGM on rat mucosal gene expression Out of 21,792 genes, a total of 417, 450, and 321 genes were differentially regulated with significance in the mucosa between the MFGM and control, AMF and control, and MFGM and AMF dietary treatments, respectively. Despite the observation that MFGM treatment decreased ACF compared to both control and AMF; no common gene regulation was observed between MFGM vs. control and AMF. Although dietary MFGM treatment did not influence the expression of common colon cancer genes; sphingomyelin and MFGM’s ability to regulate post-transcriptional gene expression cannot be completely ruled out. A recent study demonstrated that sphingomyelin treatment did not significantly alter mRNA levels but had a significant effect on protein levels of genes critical to the early stages of colon cancer, such as, beta-catenin, connexin-43 and Bcl-2 (Simon et al. 2009). Our results together with these recent findings suggest that the sphingolipids present in the MFGM may not be regulating transcription but may be regulating specific post-transcriptional events to reverse aberrant expression of individual proteins involved in colon carcinogenesis. Because many of the phospholipids found in MFGM are common second messengers, future studies utilizing pathway analysis and proteomics to examine any relationships between MFGM and relevant metabolic pathways are needed.
6.4 Summary Our results support the hypothesis that diets containing MFGM are protective against colon cancer in Fischer-344 rats, perhaps because of MFGM’s high polar lipid content, namely, sphingomyelin. By incorporating MFGM into the diet, animals were provided (0.11% w/w) sphingomyelin. Previous studies using sphingomyelin concentrations ranging from 0.025% to 0.1% sphingomyelin (by weight) have clearly shown sphingomyelin’s role in the prevention of colon carcinogenesis (Dillehay et al. 1994; Lemonnier et al. 2003; Schmelz et al. 2000; Simon et al. 2009); however many of those studies used a very pure form of isolated sphingomyelin. In this study, the sphingomyelin is in a more practical form or more similar to how it would be incorporated into human diets, and the MFGM contains other important phospholipids such as phosphatidylcholine and phosphatidylethanolamine. One other major difference in the MFGM diet, compared to the control and AMF diets, was the contribution of MFGM proteins. Several of these membrane proteins have been hypothesized to provide biological effects, and we cannot rule out the fact that they may have contributed to the protective effect of the diet. In pilot studies conducted in vitro, we noted that these proteins are extensively proteolyzed by a combination of stomach and pancreatic proteases, but this does not rule out bioactivity mediated by the peptide fragments. Thus, the contribution of these proteins remains unknown. The results of this study demonstrate that MFGM, a readily available byproduct from dairy processing, can be incorporated into diets and is protective against colon cancer.
7. MFGM and inflammation Inflammation causes increased intestinal permeability and gut barrier integrity is compromised leading to dysfunction (Zayat, Lichtenberger, and Dial 2008). While the mechanism of how gut barrier dysfunction occurs is unclear, pro-inflammatory cytokines, such as, IL-4, IL-13, IFN-γ, and TNF-α, have been reported to increase the permeability of intestinal epithelia (Fink 2003; Lewis and McKay 2009; Yajima et al. 2009). Several studies suggest that various milk sphingolipids, including sphingomyelin and gangliosides,

Biotechnology of Biopolymers
334
positively affect the gut by exhibiting a protective effect against colon cancer (Dillehay et al. 1994; Duan and Nilsson 2009; Nilsson and Duan 2006; Schmelz et al. 1996; Schmelz et al. 2000), and other studies have linked sphingolipids and other milk fat fractions containing phospholipids and gangliosides to the inhibition of a pro-inflammatory response and gut barrier protection (Dalbeth et al. 2009; El Alwani et al. 2006; Park et al. 2007; Park et al. 2005; Park, Thomson, and Clandinin). One source of a variety of dietary sphingolipids is MFGM. The phospholipids and membrane glycoproteins found in MFGM likely interact extensively with the gut epithelia during digestion, both physically and biochemically. Its unique composition has led to the idea that MFGM could have remarkable nutraceutical properties (Spitsberg 2005), and various research groups are conducting studies to ease its recovery from buttermilk (Astaire et al. 2003; Corredig, Roesch, and Dalgleish 2003; Morin et al. 2007; Morin, Jimenez-Flores, and Pouliot 2006; Morin, Pouliot, and Jimenez-Flores 2006; Rombaut, Dejonckheere, and Dewettinck 2006, 2007; Rombaut and Dewettinck 2007; Spence et al. 2005; Spence et al. 2009, 2009). Although MFGM’s recovery is well documented, very few studies have been conducted to determine any nutritional benefits of MFGM, although some indicate beneficial effects of its components. One study demonstrated that milk fat globule–EGF factor-8/lactadherin, a major protein component associated with MFGM, is an important factor in maintaining epithelial homeostasis and mucosal integrity of the intestinal tract (Bu et al. 2007), and other groups have demonstrated the MFGM-derived polar lipids improve the resistance of epithelia to stress (Dial and Lichtenberger 1987; Kivinen et al. 1995). We investigated whether diets containing MFGM will promote gut mucosal integrity in BALB/c mice challenged with lipopolysaccharide (LPS). LPS induces an inflammatory response mimicking gastrointestinal injury (Zayat, Lichtenberger, and Dial 2008), and has been used in numerous studies to emulate the inflammatory response seen in gram negative bacterial infections. Because of MFGM’s phospholipid enrichment and unique biochemical nature, we hypothesized that diets providing MFGM as a fat source might protect against an exaggerated inflammatory response and corresponding compromised gut barrier integrity.
7.1 Experimental design Diets were formulated to differ only in the composition of the fat. The control diet contained 5% fat provided as corn oil. The MFGM diet also contained 5% fat, but half of the fat for the MFGM diet was provided as anhydrous milk fat and half was provided as MFGM isolate. MFGM isolate is approximately 60% triglycerides and 40% polar lipids. Besides dietary fat source, both diets were identical in macro and micro nutrients. The measurement of protein, total fat, ash and lactose were conducted as previously described (Spence et al. 2009). Ash was further analyzed for specific minerals by inductively coupled plasma spectroscopy (ICP-AES) at a core facility on the USU campus. To test the hypothesis that MFGM confers protective effects against LPS induced inflammation and improves gut barrier protection; a 2 Х 2 factorial design was used. Weanling, male BALB/c mice (n=24/time point) were randomly assigned to one of the following treatments: 1) control diet (AIN-76A), saline vehicle control injection (n=6); 2) control diet, LPS injection (n=6); 3) MFGM diet (AIN-76A with milk fat), saline vehicle control injection (n=6); or 4) MFGM diet, LPS injection (n=6) (Figure 6). Mice were fed experimental diets for five weeks. This timeframe is precedented by a previous investigation examining dietary Zn and LPS induced inflammation (Peterson et al. 2008). On day 35, Mice were injected intraperitoneally (i.p.) with a dose of saline vehicle control or

Nutraceutical Properties of Milk Fat Globular Membrane
335
LPS (10 mg/kg body weight) known to induce inflammatory cytokines and compromise gut barrier integrity. This dose of LPS (i.p.) has previously been shown to induce monocyte adhesion and infiltration into intestinal tissues of mice and induce intestinal distress (Peterson et al. 2008). To assess intestinal permeability, mice were gavaged with 4000 Da Dextran-FITC (Sigma) suspended in PBS immediately after vehicle control or LPS injection (Krimsky et al. 2000). After injection and gavage, animals were serially harvested at 24 h and 48 h by CO2 asphyxiation. In a preliminary study we saw no changes in the appearance of plasma fluorescence after LPS injection at 0 and 12 h with peak fluorescence occurring at 24 h (data not shown). These time points and animal numbers have been used successfully to determine statistical differences in membrane integrity (Krimsky et al. 2000). Serum, liver, femur, and muscle samples were taken and stored for future analysis. To assess gut barrier integrity, serum samples from all time points were assayed for dextran-FITC (Amersham Typhoon Trio+® and ImageQuant© TL software, GE Healthcare Bio-Sciences, Uppsala, Sweden). Dextran-FITC permeation of the gut has shown to be a sensitive indicator of gut barrier integrity in vivo and serum dextran-FITC levels are positively correlated with intestinal insult (Krimsky et al. 2000). Serum cytokine analysis was performed on samples from all time points using the Q-Plex™ Mouse Cytokine - Screen (16-plex) array (Quansys Biosciences, Logan, UT, USA). Cytokines analyzed include: IL-1α, IL-1β, IL-2, IL-3, IL-4, IL-5, IL-6, IL-10, IL-12p70, IL-17, MCP-1, IFNγ, TNFα, MIP-1α, GMCSF, and RANTES. LPS has been shown to elevate serum concentrations of various cytokines in mice, specifically IL-6, IL-10, IL-12, MCP-1, IFNγ, and TNFα (Nandi et al. 2009).
7.2 Effect of MFGM on gut permeability Analysis of dextran-FITC levels in serum showed that gut permeability decreased significantly at 24 h in animals fed MFGM diet (MFGM diet/LPS/24h: 5.92 ± 0.59 µg/mL) versus control diet (control diet/LPS/24h: 10.8 ± 0.18 µg/mL; P<0.05) when challenged with LPS, which is a 45% decrease. Animals injected with the vehicle control had the same serum
Fig. 6. Effect of experimental diets and treatments on gut permeability at 24g. Serum fluorescence levels of LPS challenged mice fed MFGM diet did not differ significantly from those receiving vehicle injection but were significantly lower (P<0.05) than LPS challenged mice fed control diet at 24 h. Data are mean dextran-FITC concentrations ± standard deviations. Differently labeled columns are significantly different (P<0.05).

Biotechnology of Biopolymers
336
fluorescence levels of LPS challenged animals fed the MFGM diet at 24 and 48 h (control diet/saline/24h: 6.37 ± 1.29 µg/mL; control diet/saline/48h: 5.63 ± 0.39 µg/mL; MFGM diet/saline/24h: 5.80 ± 0.31 µg/mL; MFGM diet/saline/48h: 5.75 ± 0.46 µg/mL; MFGM diet/LPS/48h: 5.68 ± 0.55 µg/mL). All animals fed control diet and challenged with LPS died before the 48 h time point. Serum fluorescence of animals fed control diet and challenged with LPS was significantly higher than animals fed MFGM diet and challenged with LPS, illustrating that MFGM plays a role in protecting against gastrointestinal injury. Also, animals fed MFGM diet and challenged with LPS had serum fluorescence levels that did not differ significantly from animals fed control and MFGM diets receiving vehicle injections, (Figure 6) further demonstrating MFGM’s protective effect on gut barrier integrity.
7.3 Effect of MFGM on serum cytokines At the 24 h time point, six of the 16 total cytokines had a significantly lower serum concentration among animals fed the MFGM diet versus the control diet. IL-6 was the most significant difference (2.24 pg/mg serum protein ± 0.34 vs. 4.00 pg/mg serum protein ± 0.42; P<0.002). Other serum cytokine concentrations that were significantly lower were IL-10 (3.12 fg/mg serum protein ± 0.04 vs. 3.61 fg/mg serum protein ± 0.30; P<0.04); IL-17 (2.79 fg/mg serum protein ± 0.60 vs. 3.71 fg/mg serum protein ± 0.64; P<0.03); MCP-1 (1.90 pg/mg serum protein ± 0.67 vs. 3.07 pg/mg serum protein ± 0.83; P<0.05); IFNγ (2.87 fg/mg serum protein ± 0.29 vs. 4.13 fg/mg serum protein ± 0.61; P<0.025); TNFα (2.47 fg/mg serum protein ± 0.12 vs. 3.21 fg/mg serum protein ± 0.40; P<0.03); and IL-12p70 (2.67 fg/mg serum protein ± 0.02 vs. 3.52 fg/mg serum protein ± 0.24; P<0.002). Serum concentrations of IL-3 were below the detection limit at 24 h and 48 h. Serum cytokines did not differ significantly in any of the following cytokines at 24 h: IL-1α, IL-1β, IL-5, MIP-1α, GMCSF, and RANTES. Cytokines IL-2 and IL-4 were not affected by LPS challenge (For summary see Table 4).
Cytokine Effect of Diet on Serum Cytokine Concentrations 24 hours post 5 mg/kg bodyweight LPS Challenge
GMCSF No difference between control and MFGM dietary treatments IL-1α No difference between control and MFGM dietary treatments IL1-β No difference between control and MFGM dietary treatments IL-3 Below detection limit in MFGM dietary treatment IL-5 No difference between control and MFGM dietary treatments IL-6 Significantly lower in MFGM dietary treatment compared to control (P <0.005) IL-10 Significantly lower in MFGM dietary treatment compared to control (P <0.05) IL-12p70 Significantly lower in MFGM dietary treatment compared to control (P <0.005) IL-17 Significantly lower in MFGM dietary treatment compared to control (P <0.05) INFγ Significantly lower in MFGM dietary treatment compared to control (P <0.05) MCP-1 Significantly lower in MFGM dietary treatment compared to control (P <0.05) MIP-1 No difference between control and MFGM dietary treatments RANTES No difference between control and MFGM dietary treatments TNF-α Significantly lower in MFGM dietary treatment compared to control (P <0.05)
Table 4. Significant effects of dietary treatment on serum cytokine levels after LPS challenge at 24h.
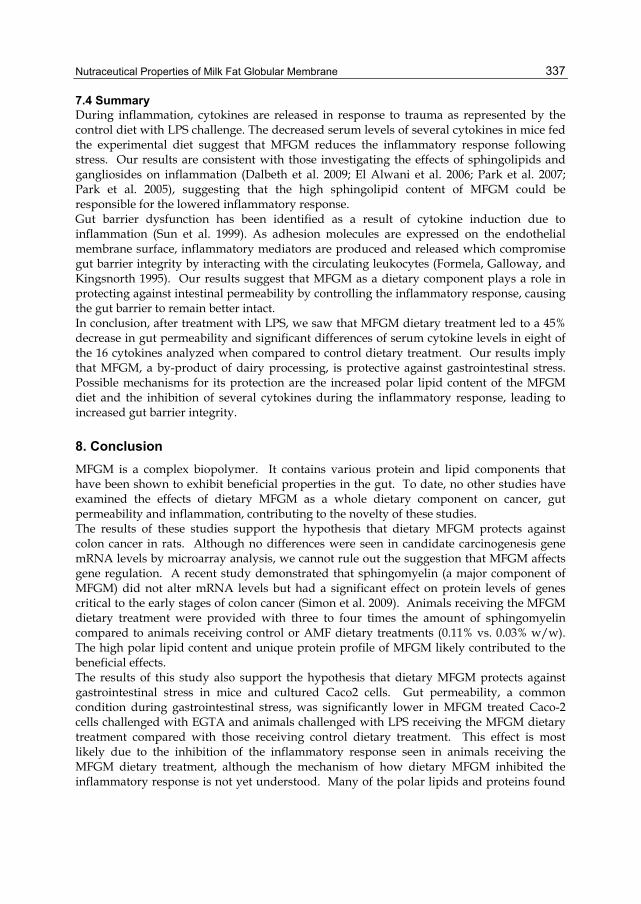
Nutraceutical Properties of Milk Fat Globular Membrane
337
7.4 Summary During inflammation, cytokines are released in response to trauma as represented by the control diet with LPS challenge. The decreased serum levels of several cytokines in mice fed the experimental diet suggest that MFGM reduces the inflammatory response following stress. Our results are consistent with those investigating the effects of sphingolipids and gangliosides on inflammation (Dalbeth et al. 2009; El Alwani et al. 2006; Park et al. 2007; Park et al. 2005), suggesting that the high sphingolipid content of MFGM could be responsible for the lowered inflammatory response. Gut barrier dysfunction has been identified as a result of cytokine induction due to inflammation (Sun et al. 1999). As adhesion molecules are expressed on the endothelial membrane surface, inflammatory mediators are produced and released which compromise gut barrier integrity by interacting with the circulating leukocytes (Formela, Galloway, and Kingsnorth 1995). Our results suggest that MFGM as a dietary component plays a role in protecting against intestinal permeability by controlling the inflammatory response, causing the gut barrier to remain better intact. In conclusion, after treatment with LPS, we saw that MFGM dietary treatment led to a 45% decrease in gut permeability and significant differences of serum cytokine levels in eight of the 16 cytokines analyzed when compared to control dietary treatment. Our results imply that MFGM, a by-product of dairy processing, is protective against gastrointestinal stress. Possible mechanisms for its protection are the increased polar lipid content of the MFGM diet and the inhibition of several cytokines during the inflammatory response, leading to increased gut barrier integrity.
8. Conclusion MFGM is a complex biopolymer. It contains various protein and lipid components that have been shown to exhibit beneficial properties in the gut. To date, no other studies have examined the effects of dietary MFGM as a whole dietary component on cancer, gut permeability and inflammation, contributing to the novelty of these studies. The results of these studies support the hypothesis that dietary MFGM protects against colon cancer in rats. Although no differences were seen in candidate carcinogenesis gene mRNA levels by microarray analysis, we cannot rule out the suggestion that MFGM affects gene regulation. A recent study demonstrated that sphingomyelin (a major component of MFGM) did not alter mRNA levels but had a significant effect on protein levels of genes critical to the early stages of colon cancer (Simon et al. 2009). Animals receiving the MFGM dietary treatment were provided with three to four times the amount of sphingomyelin compared to animals receiving control or AMF dietary treatments (0.11% vs. 0.03% w/w). The high polar lipid content and unique protein profile of MFGM likely contributed to the beneficial effects. The results of this study also support the hypothesis that dietary MFGM protects against gastrointestinal stress in mice and cultured Caco2 cells. Gut permeability, a common condition during gastrointestinal stress, was significantly lower in MFGM treated Caco-2 cells challenged with EGTA and animals challenged with LPS receiving the MFGM dietary treatment compared with those receiving control dietary treatment. This effect is most likely due to the inhibition of the inflammatory response seen in animals receiving the MFGM dietary treatment, although the mechanism of how dietary MFGM inhibited the inflammatory response is not yet understood. Many of the polar lipids and proteins found
Biotechnology of Biopolymers
338
in MFGM have been shown to encourage mucosal integrity, maintain epithelial homeostasis and improve the resistance of epithelia to stress; therefore, MFGM’s high polar lipid content and unique protein profile likely contribute to its decrease in gut permeability. Through the course of these studies, we have demonstrated that MFGM can be incorporated into diets. And, as a dietary component, MFGM plays a role in a protection mechanism against colon cancer and gastrointestinal stress.
9. References Adkins, Y., and B. Lonnerdal. 2003. Potential host-defense role of a human milk vitamin B-
12-binding protein, haptocorrin, in the gastrointestinal tract of breastfed infants, as assessed with porcine haptocorrin in vitro. Am J Clin Nutr 77 (5):1234-40.
Affolter, Michael, Laetitia Grass, Frank Vanrobaeys, Begoña Casado, and Martin Kussmann. 2010. Qualitative and quantitative profiling of the bovine milk fat globule membrane proteome. Journal of Proteomics 73 (6):1079-1088.
Astaire, J. C., R. Ward, J. B. German, and R. Jimenez-Flores. 2003. Concentration of polar MFGM lipids from buttermilk by microfiltration and supercritical fluid extraction. Journal of Dairy Science 86 (7):2297-2307.
Bernback, S., L. Blackberg, and O. Hernell. 1990. The complete digestion of human milk triacylglycerol in vitro requires gastric lipase, pancreatic colipase-dependent lipase, and bile salt-stimulated lipase. J Clin Invest 85 (4):1221-6.
Blikslager, A. T., M. C. Roberts, and R. A. Argenzio. 1999. Prostaglandin-induced recovery of barrier function in porcine ileum is triggered by chloride secretion. Am J Physiol 276 (1 Pt 1):G28-36.
Brisson, Guillaume, Hannah F. Payken, John P. Sharpe, and Rafael Jimenez-Flores. 2010. Characterization of Lactobacillus reuteri Interaction with Milk Fat Globule Membrane Components in Dairy Products. Journal of Agricultural and Food Chemistry 58 (9):5612-5619.
Bu, H. F., X. L. Zuo, X. Wang, M. A. Ensslin, V. Koti, W. Hsueh, A. S. Raymond, B. D. Shur, and X. D. Tan. 2007. Milk fat globule-EGF factor 8/lactadherin plays a crucial role in maintenance and repair of murine intestinal epithelium. J Clin Invest 117 (12):3673-83.
Cavaletto, M., M. G. Giuffrida, and A. Conti. 2004. The proteomic approach to analysis of human milk fat globule membrane. Clin Chim Acta 347 (1-2):41-8.
Cavaletto, M., M.G. Giuffrida, M. G. and A. Conti. 2008. Milk fat globule membrane components--a proteomic approach. Adv Exp Med Biol 606:129-41.
Cavaletto, M., M. G. Giuffrida, D. Fortunato, L. Gardano, G. Dellavalle, L. Napolitano, C. Giunta, E. Bertino, C. Fabris, and A. Conti. 2002. A proteomic approach to evaluate the butyrophilin gene family expression in human milk fat globule membrane. Proteomics 2 (7):850-6.
Cebo, C., H. Caillat, F. Bouvier, and P. Martin. 2010. Major proteins of the goat milk fat globule membrane. Journal of Dairy Science 93 (3):868-876.
Clare, D. A., Z. Zheng, H. M. Hassan, H. E. Swaisgood, and G. L. Catignani. 2008. Antimicrobial properties of milkfat globule membrane fractions. J Food Prot 71 (1):126-33.
Clark, A. G., S. Glanowski, R. Nielsen, P. D. Thomas, A. Kejariwal, M. A. Todd, D. M. Tanenbaum, D. Civello, F. Lu, B. Murphy, S. Ferriera, G. Wang, X. Zheng, T. J.

Nutraceutical Properties of Milk Fat Globular Membrane
339
White, J. J. Sninsky, M. D. Adams, and M. Cargill. 2003. Inferring nonneutral evolution from human-chimp-mouse orthologous gene trios. Science 302 (5652):1960-3.
Corredig, M., R. R. Roesch, and D. G. Dalgleish. 2003. Production of a novel ingredient from buttermilk. J Dairy Sci 86 (9):2744-50.
Coyle, P., J. C. Philcox, L. C. Carey, and A. M. Rofe. 2002. Metallothionein: the multipurpose protein. Cell Mol Life Sci 59 (4):627-47.
Dahm, F., A. Bielawska, A. Nocito, P. Georgiev, Z. M. Szulc, J. Bielawski, W. Jochum, D. Dindo, Y. A. Hannun, and P. A. Clavien. 2008. Mitochondrially targeted ceramide LCL-30 inhibits colorectal cancer in mice. Br J Cancer 98 (1):98-105.
Dalbeth, N., E. Gracey, B. Pool, K. Callon, F. M. McQueen, J. Cornish, A. McGibbon, and K. Palmano. 2009. Identification of dairy fractions with anti-inflammatory properties in models of acute gout. Ann Rheum Dis.
Damodaran, Srinivasan. 2010. Zinc-Induced Precipitation of Milk Fat Globule Membranes: A Simple Method for the Preparation of Fat-Free Whey Protein Isolate. Journal of Agricultural and Food Chemistry 58 (20):11052-11057.
Dial, E. J., and L. M. Lichtenberger. 1987. Milk protection against experimental ulcerogenesis in rats. Dig Dis Sci 32 (10):1145-50.
Dillehay, D. L., S. K. Webb, E. M. Schmelz, and A. H. Merrill, Jr. 1994. Dietary sphingomyelin inhibits 1,2-dimethylhydrazine-induced colon cancer in CF1 mice. J Nutr 124 (5):615-20.
Dindo, D., F. Dahm, Z. Szulc, A. Bielawska, L. M. Obeid, Y. A. Hannun, R. Graf, and P. A. Clavien. 2006. Cationic long-chain ceramide LCL-30 induces cell death by mitochondrial targeting in SW403 cells. Mol Cancer Ther 5 (6):1520-9.
Doll, R., and R. Peto. 1981. The causes of cancer: quantitative estimates of avoidable risks of cancer in the United States today. J Natl Cancer Inst 66 (6):1191-308.
Duan, R. D., and A. Nilsson. 2009. Metabolism of sphingolipids in the gut and its relation to inflammation and cancer development. Prog Lipid Res 48 (1):62-72.
El Alwani, M., B. X. Wu, L. M. Obeid, and Y. A. Hannun. 2006. Bioactive sphingolipids in the modulation of the inflammatory response. Pharmacol Ther 112 (1):171-83.
Fink, M. P. 2003. Intestinal epithelial hyperpermeability: update on the pathogenesis of gut mucosal barrier dysfunction in critical illness. Curr Opin Crit Care 9 (2):143-51.
Finley, J. W., C. Ip, D. J. Lisk, C. D. Davis, K. J. Hintze, and P. D. Whanger. 2001. Cancer-protective properties of high-selenium broccoli. J Agric Food Chem 49 (5):2679-83.
Folch, J., M. Lees, and G. H. Sloane Stanley. 1957. A simple method for the isolation and purification of total lipides from animal tissues. J Biol Chem 226 (1):497-509.
Fong, B. Y., and C. S. Norris. 2009. Quantification of milk fat globule membrane proteins using selected reaction monitoring mass spectrometry. J Agric Food Chem 57 (14):6021-8.
Fong, BY, CS Norris, and AKH MacGibbon. 2007. Protein and lipid composition of bovine milk-fat-globule membrane. International Dairy Journal 17 (4):275-88.
Formela, L. J., S. W. Galloway, and A. N. Kingsnorth. 1995. Inflammatory mediators in acute pancreatitis. Br J Surg 82 (1):6-13.
German, J. B., and C. J. Dillard. 2006. Composition, structure and absorption of milk lipids: a source of energy, fat-soluble nutrients and bioactive molecules. Crit Rev Food Sci Nutr 46 (1):57-92.

Biotechnology of Biopolymers
340
German, J. B., C. J. Dillard, and R. E. Ward. 2002. Bioactive components in milk. Current Opinion in Clinical Nutrition and Metabolic Care 5 (6):653-658.
Gupta, N., P. Rathi, and R. Gupta. 2002. Simplified para-nitrophenyl palmitate assay for lipases and esterases. Anal Biochem 311 (1):98-9.
Hamosh, M., D. Ganot, and P. Hamosh. 1979. Rat lingual lipase. Characteristics of enzyme activity. J Biol Chem 254 (23):12121-5.
Jayadev, S., C. M. Linardic, and Y. A. Hannun. 1994. Identification of arachidonic acid as a mediator of sphingomyelin hydrolysis in response to tumor necrosis factor alpha. J Biol Chem 269 (8):5757-63.
Jovov, B, NK WIlls, and SA Lewis. 1991. A spectroscopic method for assessing confluence of epithelial cell cultures. am j physiol cell physiol 261 (6):C1196-C1203.
Keenan, T.W., and S. Patton. 1995. The structure of milk: implications for sampling and storage A. The milk lipid globular membrane. In Handbook of Milk Composition, edited by R. G. Jensen. San Diego: Academic Press.
Kivinen, A., S. Tarpila, T. Kiviluoto, H. Mustonen, and E. Kivilaakso. 1995. Milk and egg phospholipids act as protective surfactants against luminal acid in Necturus gastric mucosa. Aliment Pharmacol Ther 9 (6):685-91.
Krimsky, M., A. Dagan, L. Aptekar, M. Ligumsky, and S. Yedgar. 2000. Assessment of intestinal permeability in rats by permeation of inulin-fluorescein. J Basic Clin Physiol Pharmacol 11 (2):143-53.
Lemonnier, L. A., D. L. Dillehay, M. J. Vespremi, J. Abrams, E. Brody, and E. M. Schmelz. 2003. Sphingomyelin in the suppression of colon tumors: prevention versus intervention. Arch Biochem Biophys 419 (2):129-38.
Lewis, K., and D. M. McKay. 2009. Metabolic stress evokes decreases in epithelial barrier function. Ann N Y Acad Sci 1165:327-37.
MacGibbon, AKH, and MW Taylor. 2006. Composition and Structure of Bovine Milk Lipids. In Advanced Dairy Chemistry Lipids, edited by P. F. Fox and P. L. H. McSweeney. New York: Springer.
Morin, P., M. Britten, R. Jimenez-Flores, and Y. Pouliot. 2007. Microfiltration of buttermilk and washed cream buttermilk for concentration of milk fat globule membrane components. J Dairy Sci 90 (5):2132-40.
Morin, P., R. Jimenez-Flores, and Y. Pouliot. 2006. Effect of processing on the composition and structure of buttermilk and of its milk fat globule membranes. Journal of Animal Science 84:317-317.
Morin, P., Y. Pouliot, and R. Jimenez-Flores. 2006. A comparative study of the fractionation of regular buttermilk and whey buttermilk by microfiltration. Journal of Food Engineering 77 (3):521-528.
Nandi, D., M. K. Mishra, A. Basu, and B. Bishayi. 2009. Protective effects of interleukin-6 in lipopolysaccharide (LPS)-induced experimental endotoxemia are linked to alteration in hepatic anti-oxidant enzymes and endogenous cytokines. Immunobiology.
Nilsson, A., and R. D. Duan. 2006. Absorption and lipoprotein transport of sphingomyelin. J Lipid Res 47 (1):154-71.
Park, E. J., M. Suh, B. Thomson, D. W. Ma, K. Ramanujam, A. B. Thomson, and M. T. Clandinin. 2007. Dietary ganglioside inhibits acute inflammatory signals in

Nutraceutical Properties of Milk Fat Globular Membrane
341
intestinal mucosa and blood induced by systemic inflammation of Escherichia coli lipopolysaccharide. Shock 28 (1):112-7.
Park, E. J., M. Suh, B. Thomson, A. B. Thomson, K. S. Ramanujam, and M. T. Clandinin. 2005. Dietary ganglioside decreases cholesterol content, caveolin expression and inflammatory mediators in rat intestinal microdomains. Glycobiology 15 (10):935-42.
Park, E. J., A. B. Thomson, and M. T. Clandinin. Protection of intestinal occludin tight junction protein by dietary gangliosides in lipopolysaccharide-induced acute inflammation. J Pediatr Gastroenterol Nutr 50 (3):321-8.
Peterson, D. G., A. G. Scrimgeour, J. P. McClung, and E. A. Koutsos. 2008. Moderate zinc restriction affects intestinal health and immune function in lipopolysaccharide-challenged mice. J Nutr Biochem 19 (3):193-9.
Pisanu, Salvatore, Stefania Ghisaura, Daniela Pagnozzi, Grazia Biosa, Alessandro Tanca, Tonina Roggio, Sergio Uzzau, and Maria Filippa Addis. 2011. The sheep milk fat globule membrane proteome. Journal of Proteomics 74 (3):350-358.
Pretlow, T. P., M. A. O'Riordan, G. A. Somich, S. B. Amini, and T. G. Pretlow. 1992. Aberrant crypts correlate with tumor incidence in F344 rats treated with azoxymethane and phytate. Carcinogenesis 13 (9):1509-12.
Prosser, C., K. Stelwagen, R. Cummins, P. Guerin, N. Gill, and C. Milne. 2004. Reduction in heat-induced gastrointestinal hyperpermeability in rats by bovine colostrum and goat milk powders. J Appl Physiol 96 (2):650-4.
Reinhardt, T. A., and J. D. Lippolis. 2006. Bovine milk fat globule membrane proteome. J Dairy Res 73 (4):406-16.
Rombaut, R., V. Dejonckheere, and K. Dewettinck. 2006. Microfiltration of butter serum upon casein micelle destabilization. J Dairy Sci 89 (6):1915-25.
Cavaletto, M., M.G., Giuffrida and A. Conti. 2007. Filtration of milk fat globule membrane fragments from acid buttermilk cheese whey. J Dairy Sci 90 (4):1662-73.
Rombaut, R., and K. Dewettinck. 2007. Thermocalcic aggregation of milk fat globule membrane fragments from acid buttermilk cheese whey. J Dairy Sci 90 (6):2665-74.
Ruegg, M., and B. Blanc. 1981. The fat globule size distribution in human milk. Biochim. Biophys. Acta 666:7-14.
Schmelz, E. M., D. L. Dillehay, S. K. Webb, A. Reiter, J. Adams, and A. H. Merrill, Jr. 1996. Sphingomyelin consumption suppresses aberrant colonic crypt foci and increases the proportion of adenomas versus adenocarcinomas in CF1 mice treated with 1,2-dimethylhydrazine: implications for dietary sphingolipids and colon carcinogenesis. Cancer Res 56 (21):4936-41.
Schmelz, E. M., M. C. Sullards, D. L. Dillehay, and A. H. Merrill, Jr. 2000. Colonic cell proliferation and aberrant crypt foci formation are inhibited by dairy glycosphingolipids in 1, 2-dimethylhydrazine-treated CF1 mice. J Nutr 130 (3):522-7.
Simon, K. W., P. C. Roberts, M. J. Vespremi, S. Manchen, and E. M. Schmelz. 2009. Regulation of beta-catenin and connexin-43 expression: targets for sphingolipids in colon cancer prevention. Mol Nutr Food Res 53 (3):332-40.
Smolenski, G., S. Haines, F. Y. Kwan, J. Bond, V. Farr, S. R. Davis, K. Stelwagen, and T. T. Wheeler. 2007. Characterisation of host defence proteins in milk using a proteomic approach. J Proteome Res 6 (1):207-15.

Biotechnology of Biopolymers
342
Snow, D. R., R. Jimenez-Flores, R. E. Ward, J. Cambell, M. J. Young, I. Nemere, and K. J. Hintze. Dietary milk fat globule membrane reduces the incidence of aberrant crypt foci in Fischer-344 rats. J Agric Food Chem 58 (4):2157-63.
Society, American Cancer. 2009. Cancer Facts & Figures 2009. Atlanta: American Cancer Society.
Spence, A. J., R. Jimenez-Flores, M. Qian, and L. Goddik. 2009. Phospholipid enrichment in sweet and whey cream buttermilk powders using supercritical fluid extraction. Journal of Dairy Science 92 (6):2373-2381.
Spence, A. J., R. Jimenez-Flores, M. Qia and L. Goddik. 2009. The influence of temperature and pressure factors in supercritical fluid extraction for optimizing nonpolar lipid extraction from buttermilk powder. J Dairy Sci 92 (2):458-68.
Spence, A., J. Yee, M. Qian, and R. Jimenez-Flores. 2005. Concentration of polar MFGM lipids from buttermilk using supercritical carbon dioxide. Journal of Animal Science 83:144-144.
Spitsberg, V. L. 2005. Invited review: Bovine milk fat globule membrane as a potential nutraceutical. J Dairy Sci 88 (7):2289-94.
Spitsberg, V.L. 2005. Invited Review: Bovine Milk Fat Globule Membrane as a Potential Nutraceutical. J. Dairy Sci 88:2289-2294.
Sun, Z., X. Wang, A. Lasson, A. Borjesson, P. Leveau, P. Haraldsen, and R. Andersson. 1999. Roles of platelet-activating factor, interleukin-1beta and interleukin-6 in intestinal barrier dysfunction induced by mesenteric arterial ischemia and reperfusion. J Surg Res 87 (1):90-100.
Tudek, B., R. P. Bird, and W. R. Bruce. 1989. Foci of aberrant crypts in the colons of mice and rats exposed to carcinogens associated with foods. Cancer Res 49 (5):1236-40.
Vorbach, C., M. R. Capecchi, and J. M. Penninger. 2006. Evolution of the mammary gland from the innate immune system? Bioessays 28 (6):606-16.
Ward, R. E., and J. B. German. 2004. Understanding milk's bioactive components: a goal for the genomics toolbox. J Nutr 134 (4):962S-7S.
Ward, R. E., J.B. German, and M Corredig. 2005. Composition, applications, fractionation, technological and nutritional significance of milk fat globule membrane material. In Advanced Dairy Chemistry-2. Lipids, edited by P. F. Fox and P. L. H. McSweeney. New York: Klewer Academic Publishers.
Ward, R. E., H. J. Watzke, R. Jimenez-Flores, and J. B. German. 2004. Bioguided processing: A paradigm change in food production. Food Technology 58 (5):44-48.
Yajima, S., H. Morisaki, R. Serita, T. Suzuki, N. Katori, T. Asahara, K. Nomoto, F. Kobayashi, A. Ishizaka, and J. Takeda. 2009. Tumor necrosis factor-alpha mediates hyperglycemia-augmented gut barrier dysfunction in endotoxemia. Crit Care Med 37 (3):1024-30.
Zayat, M., L. M. Lichtenberger, and E. J. Dial. 2008. Pathophysiology of LPS-induced gastrointestinal injury in the rat: role of secretory phospholipase A2. Shock 30 (2):206-11.

17
The Development of Novel In Vitro Binding Assays to Further Elucidate the
Role of tRNAs in Protein Synthesis Anthony J. Bell, Jr.*, Suzanna Ellzey, Devin McDougald and Crystal Serrano
Department of Chemistry and Biochemistry, The University of Southern Mississippi, USA
1. Introduction The accurate translation of the genetic information encoded by mRNA into proteins is critical for proper cellular function. Transfer ribonucleic acids (tRNAs) are essential biomolecular linkers that help maintain translational fidelity by accurately connecting genotype (mRNA) to phenotype (protein) during protein synthesis. The initial stages of ribosomal protein synthesis are controlled by aminoacyl-tRNA synthetases (AARSs). AARSs initiate protein synthesis by catalyzing the acylation of tRNAs to their cognate amino acids. The resulting aminoacyl-tRNAs (aa-tRNAs) are transported to the ribosome by the translation factor Elongation Factor (EF-Tu) to undergo peptide bond formation. The synergistic interplay among the protein translational machinery involved in this process is highly regulated and extremely accurate. In E. coli, the error rate for protein synthesis correlates to roughly 1 misincorporation per 104 codons translated (Husaain et al., 2006; Loftield & Vanderjagt, 1972; Ogle & Ramakrishnan, 2005; Rosenberger & Foskett, 1981; Roy & Ibba, 2006). The high level of stringency is the result of substrate discrimination that can occur at four different translation checkpoints: 1) amino acid activation, 2) aminoacylation, 3) aa-tRNA transport to the ribosome (via EF-Tu) and 4) initial binding of aa-tRNAs within the ribosome. The molecular recognition events mediated by AARSs in checkpoints 1 and 2 provide the highest level of stringency. In vitro studies have shown that AARSs possess a discrimination factor of 200 – 10,000 during amino acid activation; the stringency factor increases to > 10,000 during aminoacylation (Giege et al., 1998; Ling et al., 2009; Reynolds et al., 2010). EF-Tu binding interactions provide an additional, albeit lower, degree of stringency in step 3. Reports show that EF-Tu binds cognate aa-tRNAs with nearly identical affinities, while noncognate or misaclyated aa-tRNAs possess extremely broad EF-Tu binding affinity profiles (~ 700-fold difference between noncognate aa-tRNAs) (Dale & Uhlenbeck; 2005). It is presumed that these species are removed from the translation pathway by EF-Tu to further enhance fidelity. Despite the large amount of studies focused on defining the intricacies of translation, there are still a number of unanswered questions regarding the basic tenants of translation. Two intriguing questions are: i) do tRNAs play an active or passive role in the regulation of translation and ii) why is ribosomal protein synthesis limited to 20 amino acids? An interrelated question that we would like to address is: can in vitro binding assays be used to accurately define the mechanisms of cellular protein synthesis? This chapter focuses on current and the development of two in vitro binding assays that are designed to investigate the role of tRNA in the initial and intermediate stages of translation. The new assays offer rapid, sensitive and straightforward techniques to monitor the role of tRNA in: activation,

Biotechnology of Biopolymers
344
aminoacylation and aminoacyl transport. A more detailed view of the role of tRNA in ribosomal protein synthesis could provide invaluable insight into the evolutionary role of tRNA in protein synthesis. Moreover, this information could prove essential in the development/adaptation of in vitro bacterial translation systems to synthesize novel biomolecules (i.e. peptidomimetics).
2. The adaptor hypothesis The characterization of tRNA has been a focal point of chemical biology since first postulated by Francis Crick in the Adaptor hypothesis in the late 1950s (Crick, 1958). According to Crick, accurate protein synthesis required: i) a nucleic acid template, ii) an adaptor molecule that carried an amino acid to the template and iii) an organized binding arrangement between the template and the adaptor. Research would later reveal the template as mRNA and the adaptor as tRNA – while the organized binding interactions correlate to hydrogen-bonds between the codon and the anticodon of each species. Crick’s hypothesis went further to accurately predict the existence (and editing capability) of AARSs. Although certain aspects of the Adaptor Hypothesis related to AARS functionality were disproven (i.e. a single AARS is not solely dedicated to the aminoacylation of an individual tRNA) (Martin et al., 1977; Wilcox & Nirenber, 1968; White & Bayley, 1972) the ideas put forth by Crick helped enable a more accurate conceptualization protein synthesis. The Adaptor Hypothesis also laid the groundwork for establishing and ultimately deciphering the genetic code.
2.1 Protein translation tRNAs enter the protein synthesis pathway during the second stage of protein synthesis (Figure 1). tRNAs are acylated or “charged” with amino acids by AARSs and the resulting aa-tRNAs are transported to the ribosome by EF-Tu (step 3). The final stages of protein translation are initiated in step 4 as each aa-tRNA undergoes initial binding to mRNA within the A-site of the ribosomal 50S large subunit. The remaining translation factors EF-Ts and EF-G are responsible for the reactivation of EF-Tu and movement (or translocation) of each aa-tRNA along the mRNA template. Finally, ribosomal release factors (RFs1–3 and RRF) mediate the termination and release of the protein from the ribosome. After completing one round of synthesis, the translational machinery (i.e. tRNAs, AARSs and translation factors) is free to re-enter the synthesis pathway to generate new proteins. Each translational component is critical but tRNA is extremely important because it is involved in nearly every stage of protein synthesis.
Fig. 1. Schematic of E. coli ribosomal protein synthesis.

The Development of Novel In Vitro Binding Assays Used to Elucidate the Role of tRNAs in Protein Synthesis
345
2.1.1 Characterization of transfer ribonucleic acids (tRNAs) Zamecnick and Hoagland achieved one of the first major breakthroughs toward the discovery of tRNA in 1957. Their work showed that a radiolabelled amino acid becomes covalently attached to a “soluble RNA” species (later reclassified as tRNA) when incubated with ATP and cellular extracts (Hoagland et al., 1957). In the following year Zachau et al., demonstrated that an ester bond (between a nucleic acid 3’ adenine and 14C-Lue) provided the attachment site (Zachau et al., 1958). Robert Holley and his colleagues reached another major milestone in 1965 by successfully determining the complete sequence of tRNAAla from yeast (Holley et al., 1965). These achievements helped confirm the existence of tRNA as the adaptor molecule proposed by Crick and have ushered in a series of discoveries devoted to the characterization of tRNAs.
2.1.2 Structural features of tRNAs tRNAs may be most well known for their cloverleaf-like shape. Figure 2a displays the cloverleaf structure embedded within a precursor tRNA. Prior to translation, E. coli precursor tRNAs undergo enzymatic cleavage reactions at their 5’ and 3’ ends. 5’-end processing is carried out by the endonuclease RNase P (Frank & Pace, 1998), while 3’processing is mediated by a variety of endo- and exonucleases (Morl & Marchfelder, 2001). The exact sequence of events and identity of the nucleases involved in 3’ processing are still undetermined. Once fully processed, the resulting tRNA is composed of the five canonical structural regions labelled in Figure 2b; clockwise from the 3’ end is the: acceptor stem, T-arm, variable loop, anti-codon loop and D-arm. The acceptor stem and the anticodon loop are arguably, the most well known of the five structural regions (Figure 2b). The acceptor stem encompasses both ends of the molecule, including the -CCA terminal sequence. The –CCA sequence is encoded in all E. coli tRNAs genes and serves as the site of attachment for amino acids. Aminoacylation does not occur if the integrity of the –CCA terminal sequence is not intact. In the event of mutations or damage to the 3’ end, the tRNA maturation/repair enzyme tRNA nucleotidyltransferase (TNT) is upregulated. In eukaryotes, TNT is responsible for 3’ end maturation by accurately synthesizing the final three nucleotides (–CCA) in a template independent fashion (Deutscher, 1982; Sprinzl & Cramer, 1979; Yue et al., 1996). TNT carries out a similar task in E. coli if the –CCA end is altered (Zhu & Deutscher, 1987). The anticodon loop is located on the opposite end of the molecule. The anticodon loop is composed of 7 nucleotides, including the anticodon triplet. The first nucleotide of the anticodon can deviate from Watson-Crick hydrogen-bond patterns. This phenomenon known as “wobble” facilitates the degeneracy of the genetic code by permitting mRNA codons to bind multiple tRNA anticodons. The identity and composition of tRNA bases are also very intriguing. tRNAs contain a number of highly conserved bases within the arms (T- and D-) and the anticodon loop (labelled white in Figure 2c). Conserved bases serve a variety of functions ranging from maintaining structural integrity to providing favourable contact sites for AARSs and EF-Tu during aminoacylation and aa-tRNA transport. A number of tRNA bases also possess additional or nonstandard functional groups (i.e. thiol and methyl groups). This class of nucleotides is referred to as “hyper-modified”. To date > 100 tRNA hyper-modified bases have been characterized, with some such as pseudouridine possessing strong evolutionary conservation (Dunin-Horkawicz et al., 2006; Iwata-Reuyl, 2008; Rozenski et al., 1999). These structural and chemical characteristics indicate that tRNAs are highly conserved biomolecules that are equipped with an appreciable amount of chemical diversity.

Biotechnology of Biopolymers
346
Fig. 2. tRNA structures before and after 5’ and 3’ end processing. Panel a) displays precursor tRNA. Panel b) displays the acceptor stem and anticodon loop regions. Panel c) displays the five canonical tRNA secondary structural elements including the T-arm, variable loop and D-arm. Bases indicated in panel c): A = adenosine, G = guanine, C = cytosine, U = uracil, Pu = purine, Py = pyrimidine and ψ = pseudouridine.
2.1.3 Aminoacylation of tRNAs Aminoacylation is initiated by AARSs. AARSs are highly specific enzymes that bind their cognate amino acid in the presence of ATP and transfer the innermost phosphate from ATP to the amino acid. This process is referred to as “activation” because the resulting adenylate species, AA-AMP, is highly energetic. AA-AMPs remains tightly associated with their AARS until the AARS•AA-AMP complex encounters a tRNA molecule. At this stage translational fidelity is based on the interplay between the AARS and the tRNA, in that only cognate (correct) tRNAs are acylated at a much higher level than noncognate tRNAs. Figure 3 displays a schematic of activation (step i) and aminoacylation (step ii).
Fig. 3. Schematic of the translational machinery that mediate the early stages of ribosomal protein synthesis: step i) amino acid activation and step ii) aminoacylation.
A more detailed view of each reaction is shown in Figure 4. During activation, the AARS binds the amino acid and orients the α-carboxylate of the amino acid toward the α-phosphate of ATP. This alignment promotes an in-line nucleophilic displacement reaction as shown in panel a. The resulting adenylate (AA-AMP) remains bound to the AARS until it encounters a tRNA molecule (panel b). The incoming tRNA binds the AARS, which subsequently aligns the AA-AMP and tRNA. Next, the 2’ or 3’ hydroxyl of the tRNA initiates acylation via nucleophilic attack on the α-carboxylate of the amino acid adenylate as shown in panel c. Finally, the aa-tRNA is generated, AMP is released and the AARS is free to catalyze new activation and aminoacylation reactions.

The Development of Novel In Vitro Binding Assays Used to Elucidate the Role of tRNAs in Protein Synthesis
347
Fig. 4. Graphical representation of activation (b) and aminoacylation (d).
3. Importance of in vitro tRNA aminoacylation assays Activation and aminoacylation are closely linked; in fact these steps are often depicted as a single reaction. Although both reactions occur at a rapid rate, it is important to understand the mechanistic details of both separately in order to determine the influence that each has on translational fidelity. The section of this chapter will focus on the latter, aminoacylation. In vitro aminoacylation assays are advantageous because this reaction format enables the user to measure both the rate and the level of aminoacylation. While in vivo assays, despite being the physiological benchmark for translation, only provide data that reflects the level of aminoacylation. Despite a large amount of research using both assay formats, there are several examples of conflicting results between in vitro and in vivo experiments. It is not surprising that in vivo and in vitro data generate conflicting results since proteins are the product of a biological paradox. In that, native proteins (i.e. full-length proteins without mutations or truncations etc.) possess an enormous level of accuracy despite being manufactured over a short period of time. Developing in vitro and in vivo assays that accurately define how the two seemingly opposing forces of: translational speed and translational accuracy coexist is a very complicated task. This point is more clearly shown by the discrepancies that exist between in vivo and in vitro experiments designed to determine the effect that the G3•U70 tRNAAla recognition element on aminoacylation. In vitro assays showed that mutations within the recognition element drastically reduced aminoacylation (Beuning et al, 1997; Frankyln & Schimmel, 1989; Hou & Schimmel, 1988; McClain et al., 1988; Musier-Forsyth et al., 1991). While in vivo experiments indicated that mutations within the recognition element had a minimal effect (Gabriel et al., 1996; McClain et al., 1999). Despite advancements in in vitro and in vivo assays, a number of discrepancies between the two formats remain. This section will focus on current and new assays designed to provide a more clear view of aminoacyaltion.
3.1 In vitro aminoacylation assays using radioactive amino acids The most predominately used in vitro aminoacylation assay is based on the techniques developed by Zamecnick et al. using 14C labelled amino acids (Hoagland et al, 1957). The assay measures the rate of formation of radiolabelled aa-tRNAs under steady state conditions. The reaction is initiated by titrating a labelled amino acid into a reaction vessel containing the cognate AARS, tRNA and ATP (complete buffer composition detailed in Figure 6).

Biotechnology of Biopolymers
348
Fig. 5. Schematic of L-alanine illustrating the potential isotopic labelling sites for 14C (red) and 3H (grey).
Aminoacylation is recorded by: i) removing aliquots at different time points, ii) spotting each aliquot onto pre-soaked nitrocellulose filters [soaked with tricholoroacetic acid (TCA)], iii) washing each filter with excess TCA and 95% ethanol. Finally, each filter is dried and placed into a scintillation vial. The amount of 14C or 3H precipitated onto the filter is recorded using a scintillation counter. The major steps of this reaction are displayed below in Figure 6.
Fig. 6. Diagram of common method to measure aminoacylation using radioactive amino acid substrates. Reaction buffer: 50 mM HEPES (or Tris-HCl) pH 7.5, 2 mM ATP, 10 mM MgCl2, 4 mM DTT, 20 mM KCl, bovine serum albumin (0.2 mg/mL). Nitrocellulose membranes pre-soaked in excess TCA to ensure the maximum level of precipitation.
The level of aminoacylation is determined indirectly by first calculating the amount radiolabelled amino acid that is bound to a filter (at time x) (Eigner & Loftield, 1974; Loftield, 1974). The amount of precipitated amino acid is determined from the specific activity of the amino acid and the scintillation counting efficiency. The level of aminoacylation is determined by dividing the amount of labelled aminoacyl tRNA (bound to the filter) by the total input tRNA. Although this assay is widely used, there are significant drawbacks associated with it. One major limitation is related to the indirect nature of the readout. The assay does not stringently distinguish active (acylated) from inactive (non-acylated) tRNAs. This is a large potential source of error that could lead to incorrect aminoacylation values. Other limitations are related to the use of 14C and 3H labelled amino acids. Radiolabelled amino acids are generally limited to the 20 L-amino acids. Hence, the analysis of unnatural (non-L) amino acids is prohibited. Also large amounts of substrate are required due to the low affinity AARS have toward their cognate amino acid (KM values range of μM to mM) (Eriani et al., 1993; Hill & Schimmel, 1989; Ibba et al., 1996). To offset the accompanying high levels of radioactivity, extremely high amounts of tRNA must be supplied or the concentration of the amino acid must be reduced

The Development of Novel In Vitro Binding Assays Used to Elucidate the Role of tRNAs in Protein Synthesis
349
to levels that are below saturating conditions. The latter set of conditions (i.e. reducing amino acid concentrations) prohibits the use of this assay to monitor pre-steady state kinetics because the specific activity of each radioisotope is too low to generate a reliable signal. Based on these issues, there is clearly a need to develop alternate methods to measure aminoacylation.
3.2 In vitro aminoacylation assays using radioactive tRNAs 3.2.1 Aminoacylation of nicked 32P labelled tRNAs One technique that has emerged as an alternative to the radiolabelled amino acid assay is based upon on using 32P-labeled tRNAs. This approach, pioneered by the Uhlenbeck laboratory offers a number of advantages vs. the classical aminoacylation assay. Their initial strategy employed 32P-labeled “nicked” tRNAs as substrates (Wolfson et al, 1998). The tRNA was prepared by annealing a longer unlabelled ribonucleic strand to a shorter 32P-labeled strand. The longer strand (57-nt) encompassed the majority of the tRNA (5’ acceptor region, D-arm, anticodon, variable loop and part of the T-arm); while the shorter strand (19-nt) encompassed a portion of the T-arm and acceptor stem. The longer strand was generated via in vitro transcription using T7 RNA polymerase. The shorter strand was generated via standard chemical synthesis and subsequently labelled with 32P-γ-ATP using T4 polynucleotide kinase (T4PNK). A schematic of the resulting tRNA is shown in Figure 7b, the position of the radiolabel within the T-arm is denoted with an arrow.
Fig. 7. Schematic of intact (a) vs. nicked (b) tRNAs. The in vitro transcribed strand is shown in black and the chemically synthesized strand is shown in grey.
To initiate the assay, radiolabelled tRNA is incubated with an amino acid and AARS of interest. The reaction is then quenched and loaded onto an acid denaturing polyacrylamide gel. Since aa-tRNAs possess a relatively larger positive charge than non-acylated tRNAs, aa-tRNAs migrate slower than the non-acylated tRNAs. The level of aminoacylation is measured by dividing the number of counts of the aminoacylated tRNA by the number of counts of non-acylated tRNA (counts measured via Phosphorimager analysis). The ability to distinguish aa-tRNAs from nonacylated tRNAs in a straightforward manner significantly reduces the level of error associated with this assay vs. the assay using radiolabelled amino acids. The 32P isotope also provides a much stronger signal than 14C and 3H, this feature permits the use of much lower amounts of

Biotechnology of Biopolymers
350
amino acid. As a result, this assay is capable of measuring aminoacylation at pre- and steady state conditions. The expense and variable stability of 14C or 3H amino acids also add to the attractiveness of an alternate assay. Finally, the use of 32P labelled tRNAs provides a method to measure the aminoacylation of unnatural amino acids. Despite its advantages, the nicked tRNA assay has drawbacks related to safety, compatibility and run time. The high-energy 32P isotope requires the use of protective shielding and typical run times range from 12-16 h to fully separate the acylated and non-acylated tRNAs. Taken as a whole the benefits of this assay outweigh the disadvantages, but there is still room for improvement.
3.2.2 Aminoacylation of full-length 32P labelled tRNAs Uhlenbeck et al. improved the nicked tRNA assay by making several key adjustments (Wolfson & Uhlenbeck, 2002). The first was related to the positioning of the 32P radiolabel. The repair/processing enzyme terminal nucleotidyl transferase (TNT) was used to label the 3’-end of the tRNA. TNT labels tRNAs by exchanging the 3’-terminal non-labelled (“cold”) adenosine with a 32P-α-adenosine to yield a new 3’ radiolabelled tRNA. This step is displayed in Figure 8a; the radiolabelled product is denoted in red. This labelling procedure circumvents the two-step process associated with the preparation of nicked tRNAs. The aminoacylation reaction is identical to the approach described in section 3.2.1. The next major change involves the use of nuclease P1 or S1 to separate aminoacylated from non-acylated tRNAs. Both endonucleases digest aa-tRNAs to yield two products: 32P-AA-AMP and 5’ monophosphates. aa-tRNAs represent the former and nonacylated tRNAs the latter. Each radioactive species is separated clearly and rapidly via thin layer chromatography (TLC). This step obviates the lengthy run times associated with acid gel electrophoresis. The level of aminoacylation is recorded by dividing the number of counts of the 32P-AA-AMP species by the counts of 5’ monophosphates (32P-AMP). Figure 8 displays a schematic of the labelling (step a) and hydrolysis of 3’-32P-aa-tRNAs. Due to the sensitivity of the 32P isotope, this assay can measure the rate of aminoacylation at pre- and steady state conditions. As stated earlier, pre-steady state analysis is essentially not feasible with the conventional aminoacylation assay. The 32P tRNA assay also provides enhanced user flexibility. As a result, the steady state reaction conditions can be altered to more closely resemble in vivo conditions. Wolfson & Uhlenbeck exploited this feature to investigate the discrepancies between in vitro and in vivo assays, describing the role of the G3•U70 tRNAAla recognition element (Wolfson & Uhlenbeck, 2002). As discussed in section 3, in vitro assays indicated that changes within the recognition element significantly reduced the rate of aminoacylation, while in vivo experiments showed that mutations within the recognition element produced a minimal effect. Since the reaction conditions of the 32P assay are more amenable to alerations, the amounts of inorganic pyrophosphatase (PiPase) and EF-Tu were increased to levels that more closely resemble in vivo conditions. The level and rate of aminoacylation were shown to be clearly dependent upon the reaction conditions. Under standard in vitro conditions (i.e. reduced levels of PiPase and in the absence of EF-Tu), the rate and the level of aminoacylation was strongly affected by the integrity of the G3•U70 tRNAAla recognition element. Mutations within the recognition element showed a significant reduction in the both the rate (reduced kcat/KM) and the level of aminoacylation. Upon

The Development of Novel In Vitro Binding Assays Used to Elucidate the Role of tRNAs in Protein Synthesis
351
increasing the concentration of PiPase and EF-Tu to near in vivo levels, the level of aminoacylation showed the opposite effect (a marked increase in aminoacylation). These results clearly show the power of this assay. As a result, the intricacies of aminoacylation can be investigated over a wider range of conditions that conventional in vitro and in vivo assays cannot.
Fig. 8. Panel a) Schematic of the 3’-32P labelling procedure using the repair/processing enzyme terminal nucleotidyl transferase (TNT). Panel b) displays the hydrolysis products following enzymatic digestion with either nuclease S1 or P1.
The versatility of this assay can also be extended to monitor the aminoacylation of unnatural amino acids. We have used this assay to successfully aminoacylate a variety of natural and unnatural amino acids. As shown in Figure 9, tRNAVal is aminoacylated with L-Val and two unnatural amino acids: N-methyl val and α-hydroxy valine. The level of aminoacylation of each residue is shown in the accompanying bar graph. Figure 9b clearly shows that ValRS efficiently acylates both L- and N-methyl val, while α-hydroxy val is largely non-acylated. Although more detailed analysis is required to determine the exact mechanism(s) of discrimination, one can surmise that the reduced level of acylation of α-hydroxy valine is the result of the editing domain of ValRS that works in concert with tRNAVal to hydrolyze the α-hydroxy residue.

Biotechnology of Biopolymers
352
Fig. 9. Panel (a) displays the TLC image from a typical aminoacylation reaction of tRNAVal with three different amino acids: L-Val, N-methyl val and α-hydroxy valine with ValRS*. Panel (b) bar graph representation of the level of aminoacylation of each amino acid. *The concentration of ValRS (0.5 uM) was optimized/reduced to ensure the level(s) of aminoacylation of N-methyl val and α-hydroxy valine were not contaminated with L-Val. Bell et al. unpublished results.
3.3 Development of a novel aminoacylation assay using 32P labelled amino acids We are currently developing a novel assay to measure the level of aminoacylation that merges the basic principles of the assays described sections in 3.1 and 3.2.2. In our assay, 32P labelled amino acids are used as substrates. 32P labelled amino acids are prepared using a modified version of the assay developed in the Perona laboratory (Gruic-Sovulj et al., 2005). Amino acids are radiolabelled, by incubating the substrate in the presence of 32P-α-ATP and an AARS. The newly formed 32P-labelled amino acid serves as a substrate for aminoacylation. This process is shown in Figure 10b. Aminoacylation is again initiated by introducing tRNA and the reaction proceeds to yield two species: acylated tRNA (aa-tRNA) and AMP. 32P is highlighted in each step and serves as the readout to measure the level or rate of aminoacylation.
Fig. 10. Panel a) schematic displaying the formation of the 32P radiolabelled amino acid [32P]AA-AMP during activation. Panel b) schematic of the formation of 32P-α-ATP during aminoacylation.

The Development of Novel In Vitro Binding Assays Used to Elucidate the Role of tRNAs in Protein Synthesis
353
The readout for aminoacylation is based upon the “release” of 32P-α-AMP from the activated substrate ([32P]AA-AMP) as the 2’ OH of the tRNA attacks the carbonyl group of the activated amino acid. The level of aminoacylation corresponds with the increase in 32P-α-AMP counts and a decrease in [32P]AA-AMP counts. Each reaction component can be separated and quantified via TLC and Phoshorimager analysis. An idealized schematic displaying the electrophoretic mobility of an activated amino acid is shown in Figure 11. The radiolabelled activated (adenylate) species is denoted with the grey arrow, note there is also a measurable amount of AMP present due to spontaneous (albeit lower) hydrolysis of the activated species. The intensity (or number of counts) of the [32P]AA-AMP correlates to the relative amount of activated substrate that can undergo aminoacylation.
Fig. 11. Schematic of the separation of an activated amino acid generated by incubating an amino acid of interest with its cognate AARS.
In order to initiate the aminoacylation reaction, tRNAs are added in increasing amounts. The level of aminoacylation generates a measurable readout when the amounts of tRNA, AARS and amino acid approach equivalence. At this point, the level of [32P]AA-AMP decreases while 32P-α-AMP increases (as the radiolabelled monophosphate is released). Figure 12 displays a schematic of the change in counts of each species during a typical aminoacylation reaction. We have used this assay to measure the aminoacylation of tRNATyr as shown in Figure 13. Eight identical reactions (containing 10 μM L-Tyr and 10 μM TyrRS) were prepared without tRNA to ensure an appreciable amount of amino acid was activated. Next, eight different amounts of tRNA was added to each tube and the reaction was incubated for 5 min. As shown in the bar graph the level of aminoacylation (32P-AMP) remains relatively constant until the tRNA concentration increases to 0.50 μM (position 6, Figure 13). At this point, the 32P-AMP counts begin to increase significantly. Aminoacylation is complete at tRNA levels ≥ 5 μM (position 8, Figure 13). Under these conditions, the highest amount of 32P-AMP was released as noted by the large increase in 32P-α-AMP counts. Conversely, the level of activated amino acid is completely consumed.
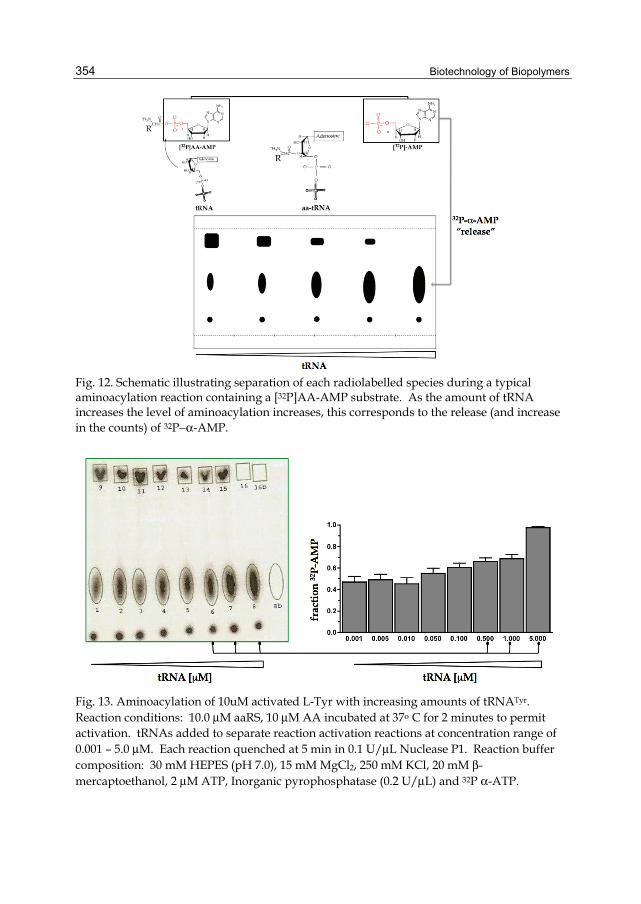
Biotechnology of Biopolymers
354
Fig. 12. Schematic illustrating separation of each radiolabelled species during a typical aminoacylation reaction containing a [32P]AA-AMP substrate. As the amount of tRNA increases the level of aminoacylation increases, this corresponds to the release (and increase in the counts) of 32P−α-AMP.
Fig. 13. Aminoacylation of 10uM activated L-Tyr with increasing amounts of tRNATyr. Reaction conditions: 10.0 μM aaRS, 10 μM AA incubated at 37o C for 2 minutes to permit activation. tRNAs added to separate reaction activation reactions at concentration range of 0.001 – 5.0 μM. Each reaction quenched at 5 min in 0.1 U/μL Nuclease P1. Reaction buffer composition: 30 mM HEPES (pH 7.0), 15 mM MgCl2, 250 mM KCl, 20 mM β-mercaptoethanol, 2 μM ATP, Inorganic pyrophosphatase (0.2 U/μL) and 32P α-ATP.

The Development of Novel In Vitro Binding Assays Used to Elucidate the Role of tRNAs in Protein Synthesis
355
This reaction format has a number of advantages. Like the 32P tRNA assay, the sensitivity of the 32P signal should permit the alteration of reaction components to more closely resemble in vivo conditions. The assay provides a straightforward and rapid technique to measure acylation that does not require labelling of tRNAs. As a result, this assay could be used to rapidly evaluate the selectivity of tRNAs with various AARS/AA pairs. In that, tRNAs can be rapidly screened with noncognate [32P]AA-AMP substrates to determine any potential selectivity embedded within tRNAs toward noncognate amino acids. We have also used this assay to aminoacylate in vitro transcribed tRNAs as well (data not shown). Finally, the aminoacylation of unnatural amino acids can also be monitored. We have evaluated several unnatural amino acids (i.e. 3-fluoro tyr, 3-NO2 tyr etc.) using this assay and each analogue displayed a similar aminoacylation trend as shown in Figure 13 (data not shown). At this stage, this assay is being used in our laboratory primarily as a qualitative tool to monitor the level of aminoacylation but we believe that it offers a tremendous level of potential to help elucidate the role of tRNAs in aminoacylation.
4. Importance of in vitro aa-tRNA: EF-Tu binding assays As stated earlier, the third step in the protein synthesis pathway is the transport of aa-tRNAs to the ribosome by the bacterial translation factor EF-Tu. The process begins immediately after aminoacylation as EF-Tu binds aa-tRNAs to form a stable aa-tRNA:EF-Tu•GTP ternary complex. X-Ray crystallography data reveals that EF-Tu binds the acceptor stem and t-arm of each aa-tRNA (Figure 2) (Nissen et al., 1995; Nissen et al., 1999) to effectively “protect” the aminoacyl bond during translation. At this stage, translational fidelity is largely mediated by EF-Tu. Uhlenbeck et al. have used RNase protection assays to elegantly show that EF-Tu binds cognate aa-tRNAs within a narrow binding range (LaRiviere et al., 2001; Pleiss & Uhlenbeck, 2001; Dale et al., 2004; Ashara & Uhlenbeck, 2005; Sanderson & Uhlenbeck 2007). Their data shows that EF-Tu binds cognate aa-tRNAs with dissociation constant (KD) values that range from 5 – 50 nM (Dale & Uhlenbeck; 2005). It is presumed EF-Tu binds cognate aa-tRNAs with near uniformity to deliver these substrates to the ribosome to undergo translation whereas misacylated or non-cognate aa-tRNAs are removed from the translational pathway. The narrow binding profile that EF-Tu has towards a limited, yet diverse set of substrates presents an interesting scenario that can be best described from an evolutionary standpoint. Uhlenbeck and others postulate that individual tRNAs and their respective cognate amino acid have co-evolved. As a result, each aa-tRNA has undergone evolutionary fine-tuning and EF-Tu binds each cognate aa-tRNA with near uniformity to mediate the next step of translation. The exact mechanism(s) that EF-Tu uses to eliminate misaclyated aa-tRNAs are unclear. Two plausible outcomes are: i) EF-Tu binds misacylated aa-tRNAs with a very low affinity (KD >> 50 nM) and as a result AARSs may intervene to hydrolyze/remove the misaclyated amino acid or ii) EF-Tu binds the misacylated aa-tRNA with an extremely high affinity (KD << 5 nM) that prevents proper loading of the aa-tRNA onto the ribosome. There is also growing evidence that shows EF-Tu works in concert with the ribosome during the “initial binding” phase to ensure cognate aa-tRNAs are translated. The focus of this chapter, however, will describe the individual binding interactions between aa-tRNAs and EF-Tu.
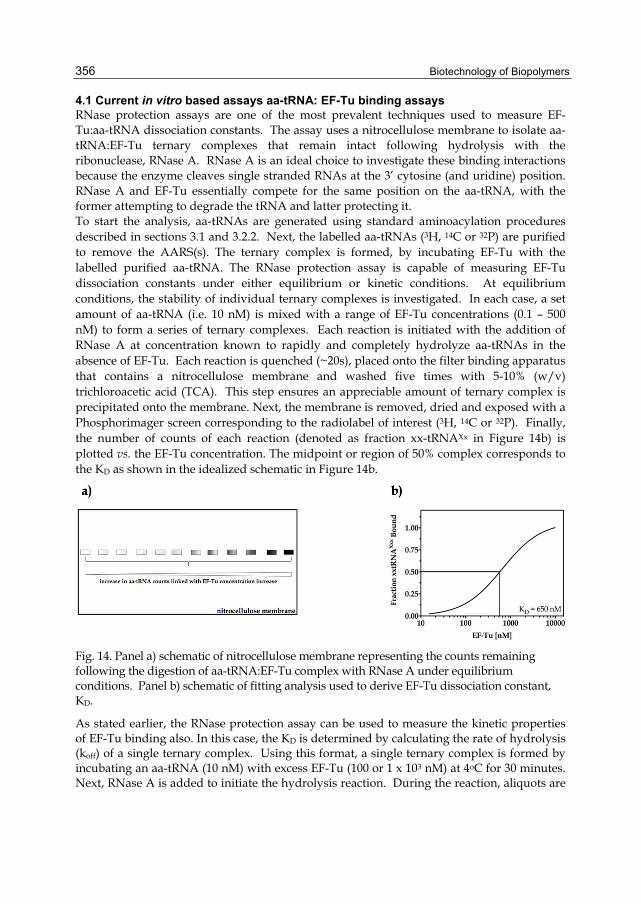
Biotechnology of Biopolymers
356
4.1 Current in vitro based assays aa-tRNA: EF-Tu binding assays RNase protection assays are one of the most prevalent techniques used to measure EF-Tu:aa-tRNA dissociation constants. The assay uses a nitrocellulose membrane to isolate aa-tRNA:EF-Tu ternary complexes that remain intact following hydrolysis with the ribonuclease, RNase A. RNase A is an ideal choice to investigate these binding interactions because the enzyme cleaves single stranded RNAs at the 3’ cytosine (and uridine) position. RNase A and EF-Tu essentially compete for the same position on the aa-tRNA, with the former attempting to degrade the tRNA and latter protecting it. To start the analysis, aa-tRNAs are generated using standard aminoacylation procedures described in sections 3.1 and 3.2.2. Next, the labelled aa-tRNAs (3H, 14C or 32P) are purified to remove the AARS(s). The ternary complex is formed, by incubating EF-Tu with the labelled purified aa-tRNA. The RNase protection assay is capable of measuring EF-Tu dissociation constants under either equilibrium or kinetic conditions. At equilibrium conditions, the stability of individual ternary complexes is investigated. In each case, a set amount of aa-tRNA (i.e. 10 nM) is mixed with a range of EF-Tu concentrations (0.1 – 500 nM) to form a series of ternary complexes. Each reaction is initiated with the addition of RNase A at concentration known to rapidly and completely hydrolyze aa-tRNAs in the absence of EF-Tu. Each reaction is quenched (~20s), placed onto the filter binding apparatus that contains a nitrocellulose membrane and washed five times with 5-10% (w/v) trichloroacetic acid (TCA). This step ensures an appreciable amount of ternary complex is precipitated onto the membrane. Next, the membrane is removed, dried and exposed with a Phosphorimager screen corresponding to the radiolabel of interest (3H, 14C or 32P). Finally, the number of counts of each reaction (denoted as fraction xx-tRNAXx in Figure 14b) is plotted vs. the EF-Tu concentration. The midpoint or region of 50% complex corresponds to the KD as shown in the idealized schematic in Figure 14b.
Fig. 14. Panel a) schematic of nitrocellulose membrane representing the counts remaining following the digestion of aa-tRNA:EF-Tu complex with RNase A under equilibrium conditions. Panel b) schematic of fitting analysis used to derive EF-Tu dissociation constant, KD.
As stated earlier, the RNase protection assay can be used to measure the kinetic properties of EF-Tu binding also. In this case, the KD is determined by calculating the rate of hydrolysis (koff) of a single ternary complex. Using this format, a single ternary complex is formed by incubating an aa-tRNA (10 nM) with excess EF-Tu (100 or 1 x 10³ nM) at 4oC for 30 minutes. Next, RNase A is added to initiate the hydrolysis reaction. During the reaction, aliquots are
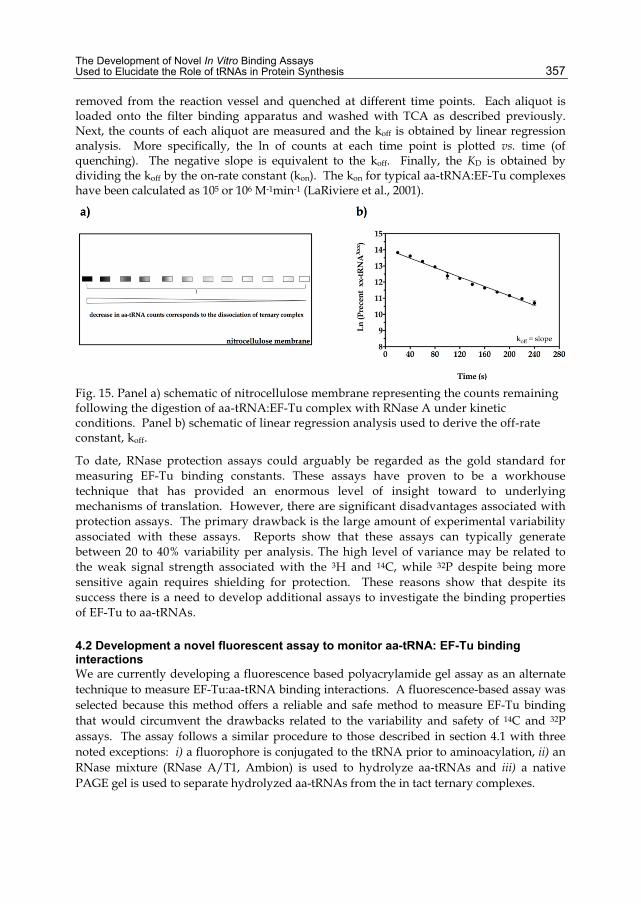
The Development of Novel In Vitro Binding Assays Used to Elucidate the Role of tRNAs in Protein Synthesis
357
removed from the reaction vessel and quenched at different time points. Each aliquot is loaded onto the filter binding apparatus and washed with TCA as described previously. Next, the counts of each aliquot are measured and the koff is obtained by linear regression analysis. More specifically, the ln of counts at each time point is plotted vs. time (of quenching). The negative slope is equivalent to the koff. Finally, the KD is obtained by dividing the koff by the on-rate constant (kon). The kon for typical aa-tRNA:EF-Tu complexes have been calculated as 105 or 106 M-1min-1 (LaRiviere et al., 2001).
Fig. 15. Panel a) schematic of nitrocellulose membrane representing the counts remaining following the digestion of aa-tRNA:EF-Tu complex with RNase A under kinetic conditions. Panel b) schematic of linear regression analysis used to derive the off-rate constant, koff.
To date, RNase protection assays could arguably be regarded as the gold standard for measuring EF-Tu binding constants. These assays have proven to be a workhouse technique that has provided an enormous level of insight toward to underlying mechanisms of translation. However, there are significant disadvantages associated with protection assays. The primary drawback is the large amount of experimental variability associated with these assays. Reports show that these assays can typically generate between 20 to 40% variability per analysis. The high level of variance may be related to the weak signal strength associated with the 3H and 14C, while 32P despite being more sensitive again requires shielding for protection. These reasons show that despite its success there is a need to develop additional assays to investigate the binding properties of EF-Tu to aa-tRNAs.
4.2 Development a novel fluorescent assay to monitor aa-tRNA: EF-Tu binding interactions We are currently developing a fluorescence based polyacrylamide gel assay as an alternate technique to measure EF-Tu:aa-tRNA binding interactions. A fluorescence-based assay was selected because this method offers a reliable and safe method to measure EF-Tu binding that would circumvent the drawbacks related to the variability and safety of 14C and 32P assays. The assay follows a similar procedure to those described in section 4.1 with three noted exceptions: i) a fluorophore is conjugated to the tRNA prior to aminoacylation, ii) an RNase mixture (RNase A/T1, Ambion) is used to hydrolyze aa-tRNAs and iii) a native PAGE gel is used to separate hydrolyzed aa-tRNAs from the in tact ternary complexes.
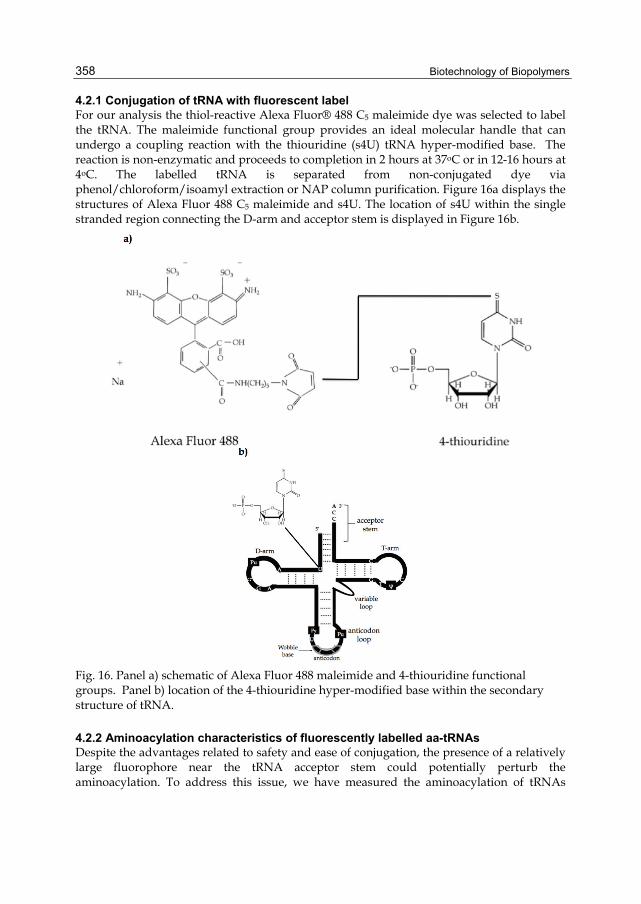
Biotechnology of Biopolymers
358
4.2.1 Conjugation of tRNA with fluorescent label For our analysis the thiol-reactive Alexa Fluor® 488 C5 maleimide dye was selected to label the tRNA. The maleimide functional group provides an ideal molecular handle that can undergo a coupling reaction with the thiouridine (s4U) tRNA hyper-modified base. The reaction is non-enzymatic and proceeds to completion in 2 hours at 37oC or in 12-16 hours at 4oC. The labelled tRNA is separated from non-conjugated dye via phenol/chloroform/isoamyl extraction or NAP column purification. Figure 16a displays the structures of Alexa Fluor 488 C5 maleimide and s4U. The location of s4U within the single stranded region connecting the D-arm and acceptor stem is displayed in Figure 16b.
Fig. 16. Panel a) schematic of Alexa Fluor 488 maleimide and 4-thiouridine functional groups. Panel b) location of the 4-thiouridine hyper-modified base within the secondary structure of tRNA.
4.2.2 Aminoacylation characteristics of fluorescently labelled aa-tRNAs Despite the advantages related to safety and ease of conjugation, the presence of a relatively large fluorophore near the tRNA acceptor stem could potentially perturb the aminoacylation. To address this issue, we have measured the aminoacylation of tRNAs

The Development of Novel In Vitro Binding Assays Used to Elucidate the Role of tRNAs in Protein Synthesis
359
labelled with both 32P and Alexa Fluor 488. Figure 17 displays a TLC image of the aminoacylation profile of tRNATyr with L-Tyr and series of unnatural amino acids. As evidenced in the high levels of acylation (> 70%) for L-Tyr (position 1) and 3-fluoro tyr (position 3), the presence of the dye does not have a deleterious effect on aminoacylation. The reduced level of acylation for the remaining unnatural amino acids (positions 2, 4 and 5) is consistent with data using tRNAs labelled solely with 32P (data not shown). Hence, the reduced aminoacylation levels for these samples are presumably the result of editing by TyrRS and not the fluorophore.
Fig. 17. Aminoacylation of dual labelled tRNATyr. The tRNA is labelled with 32P and Alexa Fluor 488. The level of aminoacylation is recorded based on the technique discussed in section 3.2.2. The resulting aa-tRNAs correspond to tRNATyr acylated with the following amino acids in lanes 1 – 5: L-Tyr(lane 1), 3-nitro tyr (lane2), 3-fluouro tyr (lane 3), N-methyl tyr (lane 4) and α-hydroxy tyr (lane 5).
4.2.3 Hydrolysis of fluorescently labelled aa-tRNAs The positioning/conjugation of the fluorophore to a uridine base within a single stranded region of the tRNA is a critical feature of the assay. As stated earlier, RNase A hydrolyzes substrates at cytosine and uridine residues. Therefore, the fluorescent aa-tRNA should be hydrolyzed in a similar fashion as described in section 4.1. To ensure the aa-tRNA undergoes complete hydrolysis, we employed an RNase enzyme mixture composed of the RNases A and T1. RNase T1 is an exonuclease that cleaves at single stranded guanine residues. We presume that RNase A will provide the driving force to initiate hydrolysis due to its relatively higher activity than RNase T1. A comparison of the hydrolytic activity of the RNase A/T1 mixture vs. RNase III and RNase VI reveal that RNase A/T1 is the most effective (data not shown). Figure 18 displays the hydrolysis of the fluorescent ValtRNAVal-
488, in the presence of RNase A/T1. Lane 1 corresponds to the intact aa-tRNA in the absence of the RNase cocktail. Lanes 2 – 8 correspond to ValtRNAVal-488 hydrolyzed with RNase A/T1 at time points of 5, 10, 15, 20, 25, 30 and 60 seconds. As noted in lanes 2-8, intact ValtRNAVal-488 is rapidly hydrolyzed. The major hydrolyzed species is presumably a longer segment(s) of the labelled 5’end; while the faster running species correspond to a heterogeneous mixture of hydrolyzed labelled tRNAs.
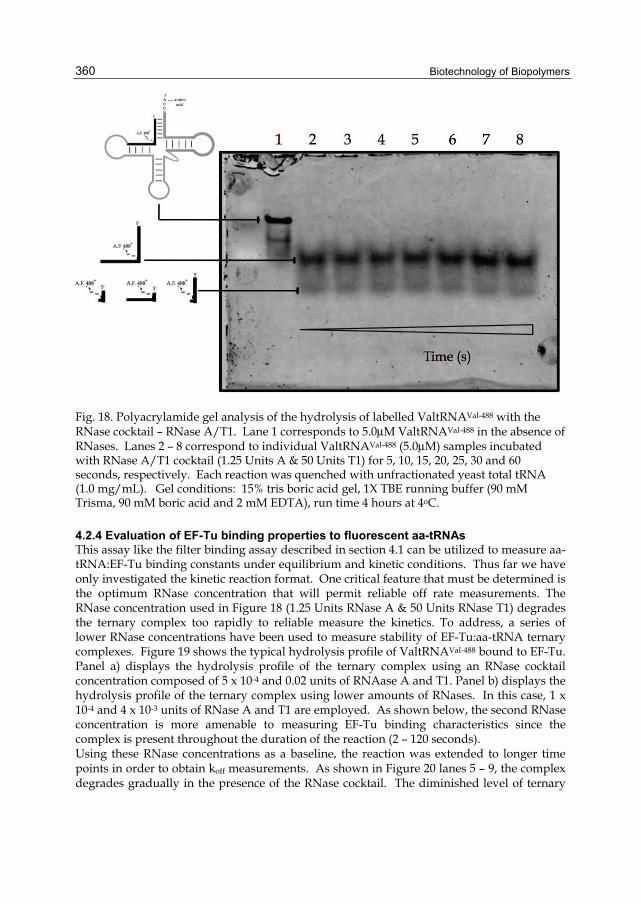
Biotechnology of Biopolymers
360
Fig. 18. Polyacrylamide gel analysis of the hydrolysis of labelled ValtRNAVal-488 with the RNase cocktail – RNase A/T1. Lane 1 corresponds to 5.0μM ValtRNAVal-488 in the absence of RNases. Lanes 2 – 8 correspond to individual ValtRNAVal-488 (5.0μM) samples incubated with RNase A/T1 cocktail (1.25 Units A & 50 Units T1) for 5, 10, 15, 20, 25, 30 and 60 seconds, respectively. Each reaction was quenched with unfractionated yeast total tRNA (1.0 mg/mL). Gel conditions: 15% tris boric acid gel, 1X TBE running buffer (90 mM Trisma, 90 mM boric acid and 2 mM EDTA), run time 4 hours at 4oC.
4.2.4 Evaluation of EF-Tu binding properties to fluorescent aa-tRNAs This assay like the filter binding assay described in section 4.1 can be utilized to measure aa-tRNA:EF-Tu binding constants under equilibrium and kinetic conditions. Thus far we have only investigated the kinetic reaction format. One critical feature that must be determined is the optimum RNase concentration that will permit reliable off rate measurements. The RNase concentration used in Figure 18 (1.25 Units RNase A & 50 Units RNase T1) degrades the ternary complex too rapidly to reliable measure the kinetics. To address, a series of lower RNase concentrations have been used to measure stability of EF-Tu:aa-tRNA ternary complexes. Figure 19 shows the typical hydrolysis profile of ValtRNAVal-488 bound to EF-Tu. Panel a) displays the hydrolysis profile of the ternary complex using an RNase cocktail concentration composed of 5 x 10⁻⁴ and 0.02 units of RNAase A and T1. Panel b) displays the hydrolysis profile of the ternary complex using lower amounts of RNases. In this case, 1 x 10⁻⁴ and 4 x 10⁻³ units of RNase A and T1 are employed. As shown below, the second RNase concentration is more amenable to measuring EF-Tu binding characteristics since the complex is present throughout the duration of the reaction (2 – 120 seconds). Using these RNase concentrations as a baseline, the reaction was extended to longer time points in order to obtain koff measurements. As shown in Figure 20 lanes 5 – 9, the complex degrades gradually in the presence of the RNase cocktail. The diminished level of ternary
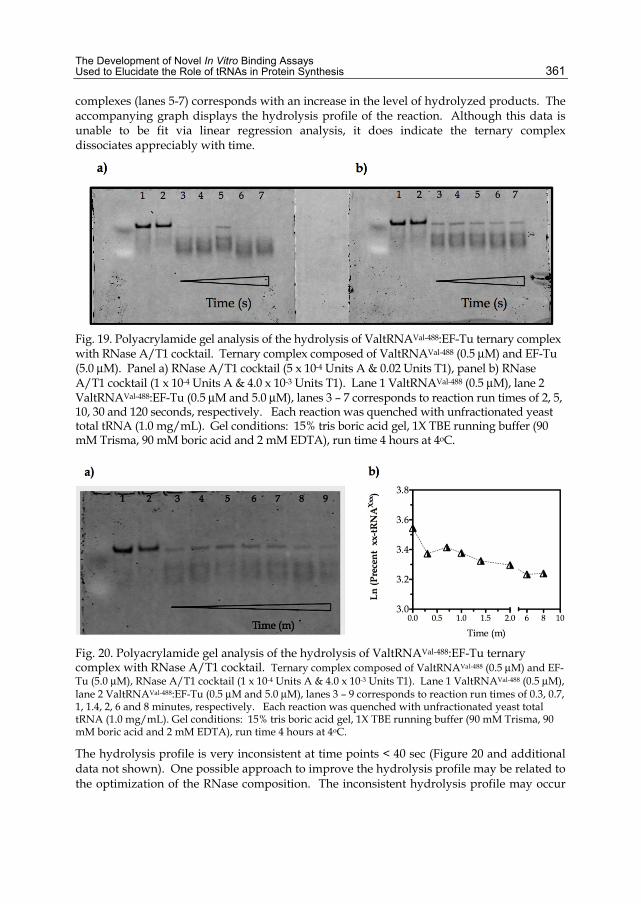
The Development of Novel In Vitro Binding Assays Used to Elucidate the Role of tRNAs in Protein Synthesis
361
complexes (lanes 5-7) corresponds with an increase in the level of hydrolyzed products. The accompanying graph displays the hydrolysis profile of the reaction. Although this data is unable to be fit via linear regression analysis, it does indicate the ternary complex dissociates appreciably with time.
Fig. 19. Polyacrylamide gel analysis of the hydrolysis of ValtRNAVal-488:EF-Tu ternary complex with RNase A/T1 cocktail. Ternary complex composed of ValtRNAVal-488 (0.5 μM) and EF-Tu (5.0 μM). Panel a) RNase A/T1 cocktail (5 x 10⁻⁴ Units A & 0.02 Units T1), panel b) RNase A/T1 cocktail (1 x 10⁻⁴ Units A & 4.0 x 10⁻³ Units T1). Lane 1 ValtRNAVal-488 (0.5 μM), lane 2 ValtRNAVal-488:EF-Tu (0.5 μM and 5.0 μM), lanes 3 – 7 corresponds to reaction run times of 2, 5, 10, 30 and 120 seconds, respectively. Each reaction was quenched with unfractionated yeast total tRNA (1.0 mg/mL). Gel conditions: 15% tris boric acid gel, 1X TBE running buffer (90 mM Trisma, 90 mM boric acid and 2 mM EDTA), run time 4 hours at 4oC.
Fig. 20. Polyacrylamide gel analysis of the hydrolysis of ValtRNAVal-488:EF-Tu ternary complex with RNase A/T1 cocktail. Ternary complex composed of ValtRNAVal-488 (0.5 μM) and EF-Tu (5.0 μM), RNase A/T1 cocktail (1 x 10⁻⁴ Units A & 4.0 x 10⁻³ Units T1). Lane 1 ValtRNAVal-488 (0.5 μM), lane 2 ValtRNAVal-488:EF-Tu (0.5 μM and 5.0 μM), lanes 3 – 9 corresponds to reaction run times of 0.3, 0.7, 1, 1.4, 2, 6 and 8 minutes, respectively. Each reaction was quenched with unfractionated yeast total tRNA (1.0 mg/mL). Gel conditions: 15% tris boric acid gel, 1X TBE running buffer (90 mM Trisma, 90 mM boric acid and 2 mM EDTA), run time 4 hours at 4oC.
The hydrolysis profile is very inconsistent at time points < 40 sec (Figure 20 and additional data not shown). One possible approach to improve the hydrolysis profile may be related to the optimization of the RNase composition. The inconsistent hydrolysis profile may occur

Biotechnology of Biopolymers
362
since three enzymes are effectively competing for a single aa-tRNA. RNAse T1 is present at nearly 50-fold excess to RNase A but despite the large excess of RNase T1 this enzyme is much less reactive. As a result, RNase T1 may actually inhibit or reduce the efficacy of RNase A at the initial stage(s) of the reaction. We are currently investigating the hydrolysis of ternary complexes using RNase A alone.
5. Conclusion We have presented two new assays that we believe can be used to further elucidate the role of tRNA in aminoacylation and aa-tRNA transport. The aminoacylation assay merges concepts from established techniques, while offering a novel approach to measure aminoacylation. The new assay does not require labelling of tRNAs. Therefore, the aminoacylation procedure is more straightforward. The presence of the 32P radioisotope provides an extremely sensitive signal. Therefore, the reaction conditions can be readily changed – this feature enables the investigation of aminoacylation under standard in vitro and in vivo-like conditions. The second assay uses fluorescently labelled aa-tRNAs as substrates to monitor the stability of aa-tRNA:EF-Tu ternary complexes. The assay is unique in that it uses a fluorophore that is site specifically conjugated to a single-stranded region of the tRNA. The location of the fluorophore within this region is critical for two reasons: i) labels (moieties) located at the 5’ or 3’ terminus could deleteriously affect aminoacylation and ii) standard RNases (i.e. RNase A) should generate a predictable hydrolysis profile. Despite the ease of use of this system the fluorophore does not supply the same sensitivity as provided by 32P. However, the lack of sensitivity may be offset by the fact that the “entire” reaction volume can be loaded onto a gel and subsequently quantified.
6. References Asahara, H. & Uhlenbeck, O.C. (2005) Predicting the binding affinities of miscacylated
tRNAs for Thermus thermophilus EF-Tu.GTP, Biochemistry, Vol. 23 No. 44 pp. 11254-11261.
Beuning, P.J., Yang, F., Schimmel, P. & Musier-Forsyth, K. (1997) Specific atomic groups and RNA helix geometry in acceptor stem recognition by a tRNA synthetase, Proc Natl
Acad Sci U. S. A., Vol. 16 No. 19 pp. 10150-10154. Crick, F.H. (1958) On protein synthesis, Symp. Soc. Exp. Biol., Vol. 12 pp. 138-163. Dale, T., Sanderson, L.E. & Uhlenbeck, O.C. (2004) The affinity of elongation factor Tu for an aminoacyl-tRNA is modulated by the esterified amino acid, Biochemistry, Vol. 43
No. 20 pp. 6159-6166. Dale, T. & Uhlenbeck, O.C. (2005) Amino acid specificity in translation, Trends Biochem Sci., Vol. 30 No. 12 pp. 659-665. Deutscher, M.P. (1982) tRNA nucleotidyl transferase, The Enzymes, Vol. 15 pp. 183-215. Dunin-Horkawicz, S., Czerwoniec, A., Gajda, M.J., Feder, M., Grosjean, H. & Bujnicki, J.M. (2006) MODOMICS: a database of RNA modification pathways, Nucleic Acids Res., Vol. 34 (Database issue) D145-149. Eigner, E.A. & Loftfield, R.B. (1974) Kinetic techniques for the investigation of amino acid:
tRNA ligases (aminoacyl-tRNA synthetases, amino acid activating enzymes), Methods Enzymol., Vol. 29 pp. 601-619.
Eriani, G., Cavarelli, J., Martin, F., Dirheimer, G., Moras, D. & Gangloff, J. (1993) Role of dimerization in yeast aspartyl-tRNA synthetase and importance of the class II invariant proline, Proc Natl Acad Sci U.S.A., Vol. 90 No. 22 pp. 10816-108120.

The Development of Novel In Vitro Binding Assays Used to Elucidate the Role of tRNAs in Protein Synthesis
363
Francklyn, C. & Schimmel, P. (1989) Aminoacylation of RNA minihelices with alanine, Nature, Vol. 337 No. 6206 pp. 478-481.
Frank, D.N. & Pace, N.R. (1998) Ribonuclease P: unity and diversity in a tRNA processing ribozyme, Annu. Rev. Biochem., Vol. 67 pp.153-180.
Gabriel, K., Schneider, J. & McClain, W.H. (1996) Functional evidence for indirect recognition of G.U in tRNA(Ala) by alanyl-tRNA synthetase, Science, Vol. 271 No. 5246 pp. 195-197.
Giegé, R., Sissler, M., & Florentz C. (1998) Universal rules and idiosyncratic features in tRNA identity, Nucleic Acids Res. Vol. 15 No. 26, pp. 5017-5035.
Gruic-Sovulj, I., Uter, N., Bullock, T. & Perona, J.J. (2005) tRNA-dependent amionayl-adenylate hydrolysis by a nonediting class I aminoacyl-tRNA synthetase, J Biol
Chem., Vol. 280 pp. 23978-23986. Hill, K. & Schimmel, P. (1989) Evidence that the 3' end of a tRNA binds to a site in the adenylate synthesis domain of an aminoacyl-tRNA synthetase, Biochemistry, Vol 28 No. 6 pp. 2577-2586. Hoagland, M.B., Zamecnik, P.C. & Stephenson, M.L., (1957) Intermediate reactions in
protein biosynthesis, Biochim Biophys Acta, Vol. 24 pp. 215-216. Holley, R.W., Everett, G.A., Madison, J.T. & Zamir, A. (1965) Nucleotide sequences in the
yeast alanine transfer nucleic acid, J Biol Chem. Vol. 240 pp. 2122-2128. Hou, Y.M. & Schimmel, P. (1988) A simple structural feature is a major determinant of the
identity of a transfer RNA, Nature, Vol. 333 No. 6169 pp. 140-145. Hussain, T., Kruparani, S.P., Pal, B., Dock-Bregeon, A.C., Dwivedi, S., Shekar, M.R.,
Sureshbabu, K. & Sankaranarayanan, R. (2006). Post-transfer editing mechanism of a D- aminoacyl-tRNA deacylase-like domain in threonyl-tRNA synthetase from archaea, EMBO Journal, Vol. 25 No. 17, pp. 4152-4162.
Ibba, M., Hong, K.W., Sherman, J.M., Sever, S. & Söll, D. (1996) Interactions between tRNA identity nucleotides and their recognition sites in glutaminyl-tRNA synthetase,
determine the cognate amino acid affinity of the enzyme, Proc Natl Acad Sci U.S.A., Vol. 93 No. 14 pp. 6953-6958.
Iwata-Reuyl, D. (2008) An embarrassment of riches: the enzymology of RNA modification, Curr Opin Chem Biol. Vol. 12 No. 2 pp. 126-133.
LaRiviere,. F.J., Wolfson, A.D. & Uhlenbeck, O.C. (2001) Uniform binding of aminoacyl-tRNAs to elongation factor Tu by thermodynamic compensation, Science, Vol. 294
No. 5540 pp. 165-168. Ling, J., Reynolds, N. & Ibba M. (2009) Aminoacyl-tRNA synthesis and translational quality
control, Annu Rev Microbiol., Vol. 63 pp. 61-78. Loftield, R.B. & Vanderjagt, D. (1972) The frequency of errors in protein biosynthesis,
Biochem J., Vol. 128 No. 5, pp. 1353-1356. Loftfield, R.B. (1972) The mechanism of aminoacylation of transfer RNA, Prog Nucleic Acid
Res Mol Biol., Vol. 12 pp. 87-128. Martin, N.C., Rabinowitz, M. & Fukuhara, H. (1977) Yeast mitochondrial DNA specifies
tRNA for 19 amino acids. Deletion mapping of the tRNA genes, Biochemistry, Vol. 16 No. 21 pp. 4672-4677.
McClain, W.H., Chen, Y.M., Foss, K. & Schneider, J. (1988) Association of transfer RNA acceptor identity with a helical irregularity, Science, Vol. 242 No. 4886 pp. 1681-1684.
McClain, W.H., Jou, Y.Y., Bhattacharya, S., Gabriel K, Schneider J. (1999) The reliability of in vivo structure-function analysis of tRNA aminoacylation, J Mol Biol., Vol. 290 No.
2pp. 391-409.

Biotechnology of Biopolymers
364
Morl, M. & Marchfelder, A. (2001) The final cut. The importance of tRNA 3’-processing, EMBO reports, Vol. 2 No. 1 pp. 17-20.
Musier-Forsyth, K., Usman, N., Scaringe, S., Doudna, J., Green, R., & Schimmel P. (1991) Specificity for aminoacylation of an RNA helix: an unpaired, exocyclic amino group in the minor groove, Science, Vol. 253 No. 5021 pp. 784-786.
Nissen, P., Kjeldgaard, M., Thirup, S., Polkenhina, S., Reshetnikova, L., Clark, B.F. & Nyborg J. (1995) Crystal structure of the ternary complex of Phe-tRNAPhe, EF-Tu, and a
GTP analog, Science, Vol. 270 pp.1464-1472. Nissen, P., Thirup, S., Kjeldgaard, M. & Nyborg J. (1999) The crystal structure of Cys-
tRNACys-EF-TuGDNP reveals general and specific features in the ternary complex and in tRNA, Structure Fold. Des, Vol. 7 pp. 143-156.
Ogle, J.M. & Ramakrishnan, V. (2005) Structural insights into translational fidelity, Annu Rev Biochem., Vol. 74 pp. 129-177. Pleiss, J.A. & Uhlenbeck, O.C. (2001) Identification of thermodynamically relevant
interactions between EF-Tu and backbone elements of tRNA, J Mol Biol., Vol. 308 No. 5 pp. 895-905.
Sanderson, L.E. & Uhlenbeck, O.C. (2007) Exploring the specificity of bacterial elongation factor Tu for different tRNAs, Biochemistry, Vol. 46 No. 21 pp. 6194-6200.
Reynolds, N.M., Lazazzera, B.A. & Ibba, M. (2010) Cellular mechanisms that control mistranslation, Nat Rev Microbiol., Vol. 8 pp. 849-856.
Rosenberger, R.F. & Foskett, G. (1981) An estimate of the frequency of in vivo transcriptional errors at a nonsense codon in Escherichia coli, Mol Gen Gent, Vol. 183 No. 3, pp. 561-563.
Roy, H. & Ibba, M. (2006) Molecular biology: sticky end in protein synthesis, Nature, Vol. 443 No. 7107 pp. 41-42.
Rozenski, J., Crain, P.F. & McCloskey, J.A. (1999) The RNA Modification Database: 1999 update, Nucleic Acids Res., Vol. 27 No. 1 pp. 196-197.
Sprinzl, M. & Cramer, F. (1997) The -C-C-A end of tRNA and its role in protein biosynthesis, Prog Nucleic Acid Res Mol Biol., Vol. 22 pp. 169. Wilcox, M. & Nirenberg, M. (1968) Transfer RNA as cofactor coupling amino acid synthesis
with that of protein, Proc. Natl. Acad. Sci. U.S.A., Vol. 61 pp. 229-236. White, B.N. & Bayley, S. T. (1972) Further codon assignments in an extremely halophilic
bacterium using a cell-free protein-synthesizing system and a ribosomal binding assay, Can. J. Biochem., Vol. 50 pp. 600-609.
Wolfson, A.D., Pleiss, J.A. & Uhlenbeck, O.C. (1998) A new assay for tRNA aminoacylation kinetics, RNA, Vol. 4 No. 8 pp. 1019-1023.
Wolfson, A.D. & Uhlenbeck, O.C. (2002) Modulation of tRNAAla identity by inorganic pyrophosphatase, Proc Natl Acad Sci U.S.A., Vol. 99 No. 9 pp. 5965-5970.
Yue, D., Maizels, N. & Weiner, A.M. (1996) CCA-adding enzymes and poly(A) polymerases are all members of the same nucleotidyltransferase superfamily: characterization of
the CCA-adding enzyme from the archaeal hyperthermophile Sulfolobus shibatae, RNA, Vol. 2 No. 9 pp. 895-908.
Zachau, H.G., Acs, G. & Lipmann F. (1958) Isolation of adenosine amino acid esters from a ribonuclease digest of soluble, liver ribonucleic acid, Proc. Natl. Acad. Sci., U.S.A., Vol. 44 No. 9 pp. 885-889
Zhu, L. & Deutscher, M.P. (1987) tRNA nucleotidyltransferase is not essential for Escherichia coli viability, EMBO J., Vol. 6 No. 8 pp. 2473-2477.