Product Validation Report - PVR-61-90 - H SAF
122
Product Validation Report - PVR-61-90 (Products H61B – P-AC-SEVIRI-PMW and H90 – P-AC-SEVIRI_E) Doc. No: SAF/HSAF/PVR-61-90 Date: 27/02/2022 Page: 1/122 EUMETSAT Satellite Application Facility on Support to Operational Hydrology and Water Management Product Validation Report (PVR) for products P-AC-SEVIRI-PMW (H61B) and P-AC-SEVIRI_E (H90) Accumulated precipitation at ground by blended MW and IR Reference Number: SAF/HSAF/PVR-61-90 Issue/Revision Index: 2.0 Last Change: 27 February 2022 About this document This Document has been prepared by the Product Validation Cluster Leader, with the support of the Project Management Team and of the Validation and Development Teams of the Precipitation Cluster
-
Upload
khangminh22 -
Category
Documents
-
view
3 -
download
0
Transcript of Product Validation Report - PVR-61-90 - H SAF

Product Validation Report - PVR-61-90
(Products H61B – P-AC-SEVIRI-PMW and H90 – P-AC-SEVIRI_E)
Doc. No: SAF/HSAF/PVR-61-90 Date: 27/02/2022 Page: 1/122
EUMETSAT Satellite Application Facility on Support to Operational Hydrology and Water Management
Product Validation Report (PVR) for products P-AC-SEVIRI-PMW (H61B)
and P-AC-SEVIRI_E (H90)
Accumulated precipitation at ground by blended MW and IR
Reference Number: SAF/HSAF/PVR-61-90 Issue/Revision Index: 2.0 Last Change: 27 February 2022 About this document This Document has been prepared by the Product
Validation Cluster Leader, with the support of the Project Management Team and of the Validation and Development Teams of the Precipitation Cluster

Product Validation Report - PVR-61-90
(Products H61B – P-AC-SEVIRI-PMW and H90 – P-AC-SEVIRI_E)
Doc. No: SAF/HSAF/PVR-61-90 Date: 27/02/2022 Page: 2/122
DOCUMENT CHANGE RECORD
Issue / Revision Date Description
- 31/08/2021 Draft document
1.0 30/09/2021 Final document
2.0 27/02/2022 Updated document

Product Validation Report - PVR-61-90
(Products H61B – P-AC-SEVIRI-PMW and H90 – P-AC-SEVIRI_E)
Doc. No: SAF/HSAF/PVR-61-90 Date: 27/02/2022 Page: 3/122
Index
1 Introduction to the Product Validation Report ................................................................................. 9 2 H61B (P-AC-SEVIRI-PMW) and H90 (P-AC-SEVIRI_E) products ........................................................ 10
2.1 Sensing principle ...................................................................................................................... 10 2.2 Algorithm principle ................................................................................................................... 10 2.3 Main operational characteristics .............................................................................................. 12
3 Validation results: case study analysis ............................................................................................. 13 3.1 Introduction ............................................................................................................................. 13 3.2 Product information ................................................................................................................. 13 3.3 Case study analysis in Belgium (RMI) ....................................................................................... 14
3.3.1 Case study: 27 September 2020 ....................................................................................... 14 3.4 Case study analysis in Bulgaria (NIMH) .................................................................................... 16
3.4.1 Case study: 16 August 2020 .............................................................................................. 16 3.5 Case study analysis in Hungary (OMSZ) ................................................................................... 20
3.5.1 Case study: 13-15 April 2021 ............................................................................................ 20 3.6 Case study analysis in Slovakia (SHMI) ..................................................................................... 27
3.6.1 Case study: 12 July 2020 ................................................................................................... 27 3.6.2 Case study: 26 September 2020 ....................................................................................... 31
4 Validation results: long-term analysis ............................................................................................. 36 4.1 Overview .................................................................................................................................. 36 4.2 Validation results over EU area ................................................................................................ 36
4.2.1 Monthly accuracy ............................................................................................................. 36 4.2.2 Monthly continuous statistical scores .............................................................................. 37 4.2.3 Multi-categorical statistics ................................................................................................ 38 4.2.4 Product requirement compliance ..................................................................................... 39
4.3 Validation results over FD area (TC) ......................................................................................... 41 4.3.1 Monthly accuracy ............................................................................................................. 41 4.3.2 Multi-categorical statistics ................................................................................................ 42 4.3.3 Product requirement compliance ..................................................................................... 44
5 Inter-comparison results between H61B and H90 products ........................................................... 45 5.1 Large statistics analysis ............................................................................................................ 45 5.2 Case study analysis ................................................................................................................... 47
5.2.1 Case study: April 2021 in Hungary (OMSZ)) ...................................................................... 47 6 Conclusions ...................................................................................................................................... 61 Appendix 1 Validation strategy, methods and tools ............................................................................ 62 Appendix 2 Ground data used for validation activities ........................................................................ 83 Appendix 3 Continuous statistical scores .......................................................................................... 117 Appendix 4 Multi-categorical statistics .............................................................................................. 118 Appendix 5 H61B maps ...................................................................................................................... 119 Appendix 6 Acronyms ........................................................................................................................ 121

Product Validation Report - PVR-61-90
(Products H61B – P-AC-SEVIRI-PMW and H90 – P-AC-SEVIRI_E)
Doc. No: SAF/HSAF/PVR-61-90 Date: 27/02/2022 Page: 4/122
List of tables
Table 1: Statistical scores obtained from the comparison between H61B and radar acquisition, valid for 27 September 2020. ................................................................................................................................ 15 Table 2: Statistical scores obtained by the comparison between H61B and GRISO map. ....................... 18 Table 3: POD, FAR and CSI statistical scores obtained by the comparison between H61B and GRISO map ................................................................................................................................................................. 18 Table 4 Selected scores of continuous statistics for radar QI > 0.3 ......................................................... 30 Table 5 Selected scores of dichotomous statistics for radar QI > 0.3 ...................................................... 30 Table 6 Selected scores of continuous statistics for radar QI > 0.3 ......................................................... 35 Table 7 Selected scores of dichotomous statistics for radar QI > 0.3 ...................................................... 35 Table 8: Accuracy requirements for product P-AC-SEVIRI-PMW in term of FSE(%). ............................... 36 Table 9: Multi-categorical table for product H61B – radar validation over land, sea and coast areas. The precipitation classes along the columns (rows) are relative to ground (satellite) precipitation. ............ 39 Table 10: Multi-categorical table for product H61B – rain gauge validation over land. The precipitation classes along the columns (rows) are relative to ground (satellite) precipitation. ................................. 39 Table 11: Multi-categorical table for product H61B – Overall validation. The precipitation classes along the columns (rows) are relative to ground (satellite) precipitation. ....................................................... 39 Table 12: Product requirement and compliance analysis for product H61B ........................................... 40 Table 13: Multi-categorical table for product P-AC-SEVIRI-PMW versus GLDAS over 24h – Overall FD validation. The precipitation classes along the columns (rows) are relative to GLDAS (H SAF) precipitation. ........................................................................................................................................... 43 Table 14: Multi-categorical table for product P-AC-SEVIRI-PMW versus GPCC over 24h – Overall FD validation. The precipitation classes along the columns (rows) are relative to GPCC (H SAF) precipitation. ................................................................................................................................................................. 43 Table 15: Multi-categorical table for GLDAS versus GPCC (and vice versa) over 24h Overall FD validation. The precipitation classes in the first columns are relative to GLDAS dataset; in the second columns are relative to GPCC dataset. ......................................................................................................................... 43 Table 16: UR and compliance analysis for P-AC-SEVIRI-PMW (24h) product over FD area by TC methodology. .......................................................................................................................................... 44 Table 17: Comparison scores between H90 and H61B ............................................................................ 45 Table 18: Probability Of Detection (POD), False Alarm Ratio (FAR), Missing (MISS) and Critical Success Index (CSI) for H90 vs H61B products for different rain rate thresholds over the overlapping area. ..... 46 Table 19: Multi-categorical table for product H90 in comparison with product H61B over the overlapped area. The precipitation classes along the columns (rows) are relative to H61B (H90) precipitation. ..... 46 Table 20: Structure of the Precipitation products validation team. ........................................................ 62 Table 21: List of the people involved in the validation of H SAF precipitation products (PPVG) ............ 63 Table 22: Number and density of raingauges within H SAF validation Group ......................................... 65 Table 23: Number and density of radars used by the H SAF PPVG. * Not used in validation activities. 66 Table 24: Classes for evaluating cumulated precipitation products ........................................................ 79 Table 25: Continuous statistical scores ................................................................................................... 79 Table 26: Precipitation products user requirements (UR) ....................................................................... 80 Table 27: UR for accumulated precipitation products using TC methodology ........................................ 80 Table 28: Multi-categorical statistics contingency table ......................................................................... 80 Table 29: Multi-categorical statistics scores ............................................................................................ 81 Table 30: Meteorological radars in Belgium, main features ................................................................... 84 Table 31: Precipitation data used at BfG for validation of H SAF products ............................................. 89

Product Validation Report - PVR-61-90
(Products H61B – P-AC-SEVIRI-PMW and H90 – P-AC-SEVIRI_E)
Doc. No: SAF/HSAF/PVR-61-90 Date: 27/02/2022 Page: 5/122
Table 32: Location of the 16 meteorological radar sites of the DWD ..................................................... 91 Table 33: Main characteristics of the Hungarian radar network ............................................................. 93 Table 34: Characteristics of the four radar instruments in Hungary ....................................................... 94 Table 35: Radars in Poland .................................................................................................................... 105 Table 36: Operational foreign radars. ................................................................................................... 106 Table 37: Non-operational foreign radars. ............................................................................................ 107 Table 38: New radars with forthcoming installation ............................................................................. 107 Table 39: Characteristics of the SHMÚ radars ....................................................................................... 110 Table 40: The precipitation data QA tests are summarized as follows. ................................................ 112 Table 41: Continuous statistical scores for H61B vs Ground over European area. ............................... 117 Table 42: Probability Of Detection (POD), False Alarm Ratio (FAR), Missing (MISS) and Critical Success Index (CSI) for H61B vs Radar over Land, Sea, Coast, Gauge over Land and Overall surfaces for different accumlated precipitation thresholds over the European area. ............................................................. 118

Product Validation Report - PVR-61-90
(Products H61B – P-AC-SEVIRI-PMW and H90 – P-AC-SEVIRI_E)
Doc. No: SAF/HSAF/PVR-61-90 Date: 27/02/2022 Page: 6/122
List of figures
Figure 1: P-AC-SEVIRI-PMW coverage and P-AC-SEVIRI_E coverage (from left to right, respectively). .. 10 Figure 2: SEVIRI-MSG based instantaneous and cumulated precipitation products chains architecture. ................................................................................................................................................................. 11 Figure 3: Analysis charts valid for 26 (left) and 27 (right) September 2020 at 18:00 and 00:00 UTC respectively (Contains public sector information licensed under the Open Government Licence v3.0). 14 Figure 4: Upscaled radar (left) and H61B (right) valid for 27 September 2020. ...................................... 15 Figure 5: 500 hPa Geopotential chart (color shades) from CSFR reanalysis (unit: hPa) valid for the 16th of August 2020 at 00 UTC. ....................................................................................................................... 16 Figure 6: Infrared image EUMETSAT valid for the 15th August 2020 at 21 UTC. .................................... 17 Figure 7: Location maps of the lightning strikes. On the left at 15 UTC, at the right at 20 UTC on 15-08-2020. ........................................................................................................................................................ 17 Figure 8: On the left H61B product (24 hourly precipitation sum in mm) image over Bulgaria for 06 UTC on 16-08-2020. On the right - precipitation as interpolated from daily rain gages data for 06:00 UTC. 18 Figure 9: Countrywide average of daily precipitation sum and their long term mean (mm) .................. 20 Figure 10: Synoptic situation on 13 April 2021, 00 UTC .......................................................................... 20 Figure 11: 24-hour precipitation (left) and snow cover (right) until 06 UTC 14 April 2021. .................... 21 Figure 12: Quality indices in the H SAF H61B netCDF file 14 April 2021, 00UTC, red values are “0”s. .... 22 Figure 13: Precipitation fields (1-4) for 13 April 2021. 00:00 UTC ........................................................... 23 Figure 14: Precipitation fileds (1-4) for 13 April 2021. 06:00 UTC ........................................................... 24 Figure 15: Precipitation fields (1-4) for 14 April 2021. 00:00 UTC ........................................................... 25 Figure 16: Precipitation fields (1-4) for 15 April 2021. 00:00 UTC ........................................................... 26 Figure 17: MSG HRV imagery showing development of thunderstorm over Slovakia during studying period. Left: 2 July 2020 03:15 UTC early morning storms. Right: 2 July 2020 17:00 UTC, afternoon storms. ................................................................................................................................................................. 28 Figure 18: MSG Airmass RGB imagery is showing scattered thunderstorms over southern and central Europe: 3:15, 5:00, 17:00 and 19:00 UTC 2 July 2020. ............................................................................ 28 Figure 19: Accumulated precipitation fields from 2 July 2020 observed by H61B product (left column), SHMU radars upscaled to satellite grid (middle) and SHMU radars in original 1km resolution (right column). Data in rows: MSG timeslots 2 July 2020 06:00, 12:00, 18:00 and 24:00 UTC. The radar precipitation values are corresponding to satellite IFOVs projected over the radar domain. Comparison is limited to area where overall radar quality index QI > 0.3. ................................................................. 29 Figure 20: Accumulated precipitation fields from 26 September 2020 observed by H61B product (left column), SHMU radars upscaled to satellite grid (middle) and SHMU radars in original 1km resolution (right column). Data in rows: MSG timeslots 26 September 2020 00:00, 06:00, 12:00 and 18:00 UTC. The radar precipitation values are corresponding to satellite IFOVs projected over the radar domain. Comparison is limited to area where overall radar quality index QI > 0.3. ............................................. 34 Figure 21: H61B monthly accuracy using Radar (a) and Gauge (b) as ground reference. The Overall Q.A. is shown in the panel c). Background colours highlight the requirement accuracy thresholds in terms of FSE as reported in Table 8 and Table 12. The horizontal black dotted line indicates the mean annual value. The single ground percentage contribution is shown in the panel d). ......................................... 37 Figure 22: Monthly continuous statistical scores resulting for H61B relatively to the accumulated precipitation above 1 mm/24h. ............................................................................................................... 38 Figure 23: Monthly validation results (July 2020 – April 2021) in terms of CC (UR) score obtained by the P-AC-SEVIRI-PMW (daily) product (blue bars) using the TC methodology. Background colours highlight the UR thresholds (optimal/target/threshold). ....................................................................................... 42

Product Validation Report - PVR-61-90
(Products H61B – P-AC-SEVIRI-PMW and H90 – P-AC-SEVIRI_E)
Doc. No: SAF/HSAF/PVR-61-90 Date: 27/02/2022 Page: 7/122
Figure 24: Comparison of H05B, H61B and H90 at 00:00 UTC 13 April 2021 .......................................... 48 Figure 25: Comparison of H05B, H61B and H90 at 00:00 UTC 15 April 2021 .......................................... 48 Figure 26: Comparison of H05B, H61B and H90 at 00:00 UTC 15 April 2021 in European subimage ..... 49 Figure 27: Comparison of H05B, H61B and H90 at 00:00 UTC 06 April 2021. ......................................... 49 Figure 28: Comparison of H05B, H61B and H90 at 00:00 UTC 07 April 2021. ......................................... 50 Figure 29: Same as Fig 4 for Hungary with quality flags in the bottom line and radar data (bottom left) ................................................................................................................................................................. 50 Figure 30: Same as Fig 5 for Hungary with quality flags in the bottom line and radar data (bottom left) ................................................................................................................................................................. 51 Figure 31: Countrywide average of daily precipitation sum and their long term mean (mm) ................ 51 Figure 32: Synoptic situation on 13 April 2021, 00 UTC .......................................................................... 52 Figure 33: 10. 24-hour precipitation (left) and snow cover (right) until 06 UTC 14 April 2021. .............. 52 Figure 34: The location of the cold front at 00 UTC on 22nd (left) and 23rd (right) of April 2021. ......... 52 Figure 35: 24 h precipitation measured until 06:00 UTC on 23rd April 2021. ......................................... 53 Figure 36: Precipitation fields for 13 April 2021. 00:00 UTC ................................................................... 54 Figure 37: Precipitation fields for 13 April 2021. 06:00 UTC ................................................................... 55 Figure 38: 24 h precipitation from Synop stations interpolated by GRISO software for 00 UTC on 13 April 2021 ......................................................................................................................................................... 55 Figure 39: Precipitation fields for 14 April 2021. 00:00 UTC ................................................................... 56 Figure 40: 24 h precipitation from Synop stations interpolated by GRISO software for 00 UTC on 14 April 2021 ......................................................................................................................................................... 56 Figure 41: Precipitation fields for 15 April 2021. 00:00 UTC ................................................................... 57 Figure 42: Precipitation fields for 15 April 2021. 06:00 UTC ................................................................... 57 Figure 43: 24 h precipitation from Synop stations interpolated by GRISO software for 00 (left) and 06 (right) UTC on 15 April 2021. ................................................................................................................... 58 Figure 44: Precipitation fields for 22 April 2021. 00:00 UTC ................................................................... 58 Figure 45: Precipitation fields for 23 April 2021. 00:00 UTC ................................................................... 59 Figure 46: 24 h precipitation from Synop stations interpolated by GRISO software for 00 UTC on 22 (left) and 23 (right) April 2021 ......................................................................................................................... 59 Figure 47: The network of 8,404 rain gauges used for H SAF precipitation products validation ............ 65 Figure 48: The networks of 74 C-band radars used by the H SAF PPVG. Note1: Turkish radars are not used in validation activities. Note2: Only one out of four belgian radars is shown. ............................... 66 Figure 49: The GPM Core Observatory and the GMI and DPR ground tracks. ........................................ 70 Figure 50: Different DPR scanning modes with respect to the flight direction. The Normal Scan corresponds to Ka-band radar, whereas matched and high sensitivity scans are performed by Ka-band radar. ....................................................................................................................................................... 70 Figure 51: Example of data available in GPCC. The daily precipitation data used in TC methodology have the spatial extent as shown in the figure and the spatial resolution of 1.0 degree ................................ 73 Figure 52: Example of data available in GLDAS. The 3-hourly precipitation data used in TC methodology have the spatial extent as shown in the figure and the spatial resolution of 0.25 degree ..................... 74 Figure 53: Cross correlated errors between GPCC and GLDAS over global scale for the year 2017. ...... 75 Figure 54: Cross correlated errors between GPCC and GLDAS over H SAF extened area for the year 2017. ................................................................................................................................................................. 75 Figure 55: Coverage areas for H60B (blue) and H63 (green) products. Overlapped H63-H60B area is highlighted in red. ................................................................................................................................... 76 Figure 56: Border-masked areas for H60B (blue) and H63 (green) products. The overlapped H63-H60B area analyzed is highlighted in purple. .................................................................................................... 77

Product Validation Report - PVR-61-90
(Products H61B – P-AC-SEVIRI-PMW and H90 – P-AC-SEVIRI_E)
Doc. No: SAF/HSAF/PVR-61-90 Date: 27/02/2022 Page: 8/122
Figure 57: Extension of area (fraction) respect to the overlapped area as function of the distance among nearest neighbor (NN) pixels (H63 vs H60B). More than 80% of domain is covered for distance equals to 6 km. ........................................................................................................................................................ 78 Figure 58: Meteorological radars in Belgium (elevation data from Danielson, J.J., and Gesch, D.B., 2011, Global multi-resolution terrain elevation data 2010 (GMTED2010): U.S. Geological Survey Open-File Report 2011–1073, 26 p.) ........................................................................................................................ 84 Figure 59: Spatial distribution of automatic telemetric gauges in Bulgaria (NIMH) ................................ 86 Figure 60: Distribution of the automatic stations of the Bulgaria network collected by NIMH. ............. 87 Figure 61: The area in Bulgaria used for H SAF validation with hourly accumulated rain data ............... 88 Figure 62: (left): Network of rain gauges in Germany - Figure 63: (right): Pluvio with Remote Monitoring Module .................................................................................................................................................... 90 Figure 64: (left) radar compound in Germany (March 2011) ; Figure 65: (right) location of ombrometers for online calibration in RADOLAN; squares: hourly data provision (about 500), circles: event-based hourly data provision (about 800 stations). ............................................................................................ 91 Figure 66: Flowchart of online calibration RADOLAN (DWD, 2004) ........................................................ 92 Figure 67: Hungarian automated precipitation measurement network. ................................................ 95 Figure 68: Correlation between rainrates detected by two close stations as function of the distance between the two stations. Colors refer to the month along 2009 .......................................................... 96 Figure 69: Distribution of the raingauge stations of the Italian network collected by DPC. ................... 97 Figure 70: Italian radar network coverage. The green and blue radar symbol stands for dual- and single-polarization system, respectively. ........................................................................................................... 98 Figure 71: Schematic representation of the Italian radar data processing chain. ................................. 100 Figure 72: ATS national network in Poland ........................................................................................... 103 Figure 73: Radar dislocation in Poland .................................................................................................. 105 Figure 74: Radar composite map in Poland ........................................................................................... 106 Figure 75: Map of SHMÚ rain gauge stations: green – automatic (98), blue – climatological (586), red - hydrological stations in H SAF selected test basins (37) ........................................................................ 108 Figure 76: Map of SHMÚ radar network; the rings represent maximum operational range of the radars – 240 km ................................................................................................................................................ 109 Figure 77: Map of relative RMSE (left) and Mean Error (right) over the SHMÚ radar composite ........ 111 Figure 78: Map Turkish rain gauge stations .......................................................................................... 112 Figure 79: H01 and H02 products footprint centers with a sample footprint area as well as the Awos ground observation sites. ...................................................................................................................... 114 Figure 80: Meshed structure of the sample H01 and H02 products footprint. ..................................... 115 Figure 81: RMSE map over FD area. Mean value equals 9.8 mm/24h. ................................................. 119 Figure 82: CC map over FD area. Mean value equals 0.58 (between threshold and target). ................ 120 Figure 83: CC maps over FD area computed for best and worst month: April 2021 (on the left) and September 2020 (on the right). Mean values are also indicated. ......................................................... 120

Product Validation Report - PVR-61-90
(Products H61B – P-AC-SEVIRI-PMW and H90 – P-AC-SEVIRI_E)
Doc. No: SAF/HSAF/PVR-61-90 Date: 27/02/2022 Page: 9/122
1 Introduction to the Product Validation Report The Product Validation Report (PVR) contains all the useful information for users to acquire more about the limits and potentials of the precipitation product. The document collects all the information and all the results obtained from the Quality and Monitoring Assessment cluster. The precipitation product under review, during the analyzes carried out by the cluster, is on “in-development” phase. The objective of this report is to determine and quantify both the limits and the potential of the product in order to assess the overall quality and make it available to end users. The report is structured as follows: In Chapter 2 there is a brief description of the product and the precipitation algorithm retrieval. More details about this can be found on the PUM (Product User Manual) and on the ATBD (Algorithm Theoretical Baseline Document) of the products themselves. The main part of this document is contained in Chapters 3, 4 and 5, dedicated to the description of the validation results obtained for case studies, analyses over a long period, and intercomparison between two SEVIRI products, respectively. For more information about the analysis, validation, and quality assessment methodology, compare Appendix 1. All detailed information on the data used to compare the products is contained in Appendix 2. Please note that Appendix 1 and 2 are common to all PVRs. Any further results obtained and not included in chapters 3-5, are included from Appendix 3 onwards. Finally, the last Appendix 6 is dedicated to the list of numerous acronyms used in this document. For any errors, oversights, or requests for updates or changes, please contact us via H SAF project website: http://h-saf.eumetsat.int
Product Validation Report - PVR-61-90
(Products H61B – P-AC-SEVIRI-PMW and H90 – P-AC-SEVIRI_E)
Doc. No: SAF/HSAF/PVR-61-90 Date: 27/02/2022 Page: 10/122
2 H61B (P-AC-SEVIRI-PMW) and H90 (P-AC-SEVIRI_E) products P-AC-SEVIRI-PMW and P-AC-SEVIRI_E products are two accumulated precipitation products based on SEVIRI acquisitions blended with LEO MW measurements (i.e. PUM document). The spatial coverage of P-AC-SEVIRI-PMW product includes the H SAF area (Europe and Mediterranean basin), Africa and Southern Atlantic Ocean, while the spatial coverage of the P-AC-SEVIRI_E product corresponds to the MSG IODC Full Disk and it includes the Mediterranean basin, Africa, Middle East, and Indian Ocean. Both products are provided on the MSG SEVIRI grid. Figure 1 shows the geographical regions covered by the two products.
Figure 1: P-AC-SEVIRI-PMW coverage and P-AC-SEVIRI_E coverage (from left to right, respectively).
2.1 Sensing principle P-AC-SEVIRI-PMW and P-AC-SEVIRI_E products are based on 15 minutes time frequency rainfall measurements as retrieved by blending LEO MW-derived precipitation rate measurements and GEO IR imagery. Input data are P-IN-SEVIRI-PMW for P-AC-SEVIRI-PMW and P-IN-SEVIRI_E for P-AC-SEVIRI_E, thus the algorithms provide a Level 3 accumulated precipitation product based on the exploitation of all available cross-track and conically scanning passive microwave radiometers, equipped with precipitation sensing channels, on board Low Earth Orbit (LEO) satellites orbiting around the globe. 2.2 Algorithm principle P-AC-SEVIRI-PWM and P-AC-SEVIRI_E products have been proposed as Level 3 precipitation products, providing hourly the 1 hour accumulated precipitation and every six hours (at 00, 06, 12 and 18 UTC) the 24-hour accumulated precipitation. The accumulated precipitation rate is obtained from the H SAF product P-IN-SEVIRI-PMW and P-IN-SEVIRI_E instantaneous precipitation rate respectively based on inter-calibrated Level 2 PMW instantaneous precipitation rate estimates blended with 10.8 mm channel from SEVIRI instrument. P-AC-SEVIRI-PMW product is an

Product Validation Report - PVR-61-90
(Products H61B – P-AC-SEVIRI-PMW and H90 – P-AC-SEVIRI_E)
Doc. No: SAF/HSAF/PVR-61-90 Date: 27/02/2022 Page: 11/122
evolution of P-AC-SEVIRI product; compared to this last product, P-AC-SEVIRI-PMW considers all the available MW precipitation estimations, it provides a different treatment of convective clouds, and the output is parallax corrected. For its characteristics, the product can be well exploited for hydrological applications and for data assimilation in hydrological models and it can be easily compared to global rainfall gridded datasets (i.e., GPCP). The P-AC-SEVIRI-PMW algorithm mainly consists of one module: integration module. The basic operational algorithm for computing the cumulated precipitation relies on the assumption that:
• instantaneous derivative (the retrieved rain rate) is constant along the integration period; • spatial resolution will be kept constant, no upscaling is performed along time integration of highest
space time resolution rain rate products (IR+MW); • one value is considered for tentative accuracy (i.e. 30 %) regardless the integration period.
These assumptions minimize the error resulting from the precipitation extension and maximize accumulated precipitation accuracy. [Bove et al. 2005] The architecture of the SEVIRI-MSG based instantaneous and cumulated precipitation products generation chains are shown in Figure 2. In the scheme it is highlighted as the 24h accumulated precipitation takes advantage from the delayed P-IN-SEVIRI-PMW chain (see P-IN-SEVIRI-PMW ATBD) to include contribution from all MW rain estimations available. Operational chain outputs consist of NetCDF 4 format files containing four variables, i.e., the rain rate (mm/h), the quality flag and the georeferenced coordinates for each pixel of the SEVIRI grid. Moreover, PNG (Portable Network Graphics) format files are also provided to the users as a reference. Before user distribution, output files are subjected to integrity check through an automatic algorithm.
Figure 2: SEVIRI-MSG based instantaneous and cumulated precipitation products chains architecture.

Product Validation Report - PVR-61-90
(Products H61B – P-AC-SEVIRI-PMW and H90 – P-AC-SEVIRI_E)
Doc. No: SAF/HSAF/PVR-61-90 Date: 27/02/2022 Page: 12/122
2.3 Main operational characteristics The main products characteristics considered are the horizontal resolution (Dx), the timeliness, and the generation frequency. Products are generated for each SEVIRI pixel. The SEVIRI IFOV is 4.8 km at nadir, and it degrades moving away from nadir, becoming about 8 km over Europe. Therefore, Δx ranges from about 4.8 to 8 km, and the sampling distance is about 3 km at the sub-satellite point. Resolution Δx ranges from 4.8 to 8 km and sampling distance is about ~ 3 km at the sub-satellite point. The generation frequency is the reference time interval for calculating the cumulated precipitation. Two generation frequencies are provided: an hourly frequency for the 1 hour accumulated precipitation product, and a six-hour frequency for the 24 hours accumulated precipitation. The timeliness is usually defined as the time difference between end of image acquisition at satellite level and output data reception time at the end-user. Within H SAF this definition has been adopted once the specification of EUMETCast as the main dissemination; it includes the time needed by the SAF to process the data, generate a L2 product, disseminate it to the EUMETSAT and the time for dissemination to the end users. The timeliness δ is ~ 30 min. Finally, the accuracy is evaluated a-posteriori by means of the validation activity. Validation results are contained in this PVR document.

Product Validation Report - PVR-61-90
(Products H61B – P-AC-SEVIRI-PMW and H90 – P-AC-SEVIRI_E)
Doc. No: SAF/HSAF/PVR-61-90 Date: 27/02/2022 Page: 13/122
3 Validation results: case study analysis
3.1 Introduction As reported in Appendix 1 the common validation methodology is composed of large statistic (multi-categorical and continuous), and case study analysis. Both components are considered complementary in assessing the accuracy of the implemented algorithms. Large statistics helps in identifying existence of pathological behavior, selected case studies are useful in identifying the roots of such behavior, when present. This Chapter collects the case study analysis performed by PPVG. The Chapter is structured by Country / Team, one section each. The analysis has been conducted to provide information to the User of the product on the variability of the performances with climatological and morphological conditions, as well as with seasonal effects. Each section presents the case studies analysed giving the following information: • description of the meteorological event; • comparison of ground data and satellite products; • visualization of ancillary data deduced by nowcasting products or lightning network; • discussion of the satellite product performances; • indication on the ground data (if requested) availability into the H SAF project.
3.2 Product information Some main product information are summarized in table. PRODUCT NAME: P-AC-SEVIRI-PMW (H61B)
PRODUCT DEVELOPER INSTITUTE: GEO-K
Developers: Giorgi C. (Leader) Melfi D.
Contact point: [email protected] [email protected]
OPERATIONAL CHAIN INSTITUTE: COMET
Responsables: Zauli F., Melfi D.
Contact points: [email protected] [email protected]

Product Validation Report - PVR-61-90
(Products H61B – P-AC-SEVIRI-PMW and H90 – P-AC-SEVIRI_E)
Doc. No: SAF/HSAF/PVR-61-90 Date: 27/02/2022 Page: 14/122
3.3 Case study analysis in Belgium (RMI)
3.3.1 Case study: 27 September 2020
PRODUCT NAME H61B CASE STUDY PERIOD 27 September 2020 CASE STUDY AREA Belgium METEOROLOGICAL EVENT Autumn showers VALIDATION INSTITUTE RMI PRODUCT DEVELOPER INSTITUTE GEO-K OPERATIONAL CHAIN INSTITUTE COMET
METEOROLOGICAL EVENT DESCRIPTION A vast system of low pressure over Europe accompanied by many fronts is influencing the weather in Belgium and the surrounding countries. During the night of 26 to 27 September, an active perturbation associated with this system traversed the country from northeast and produced locally abundant rain with moderate to strong winds. The barometric state of the atmosphere, including fronts, is summarized in the following maps.
Figure 3: Analysis charts valid for 26 (left) and 27 (right) September 2020 at 18:00 and 00:00 UTC respectively (Contains public sector information licensed under the Open Government Licence v3.0).
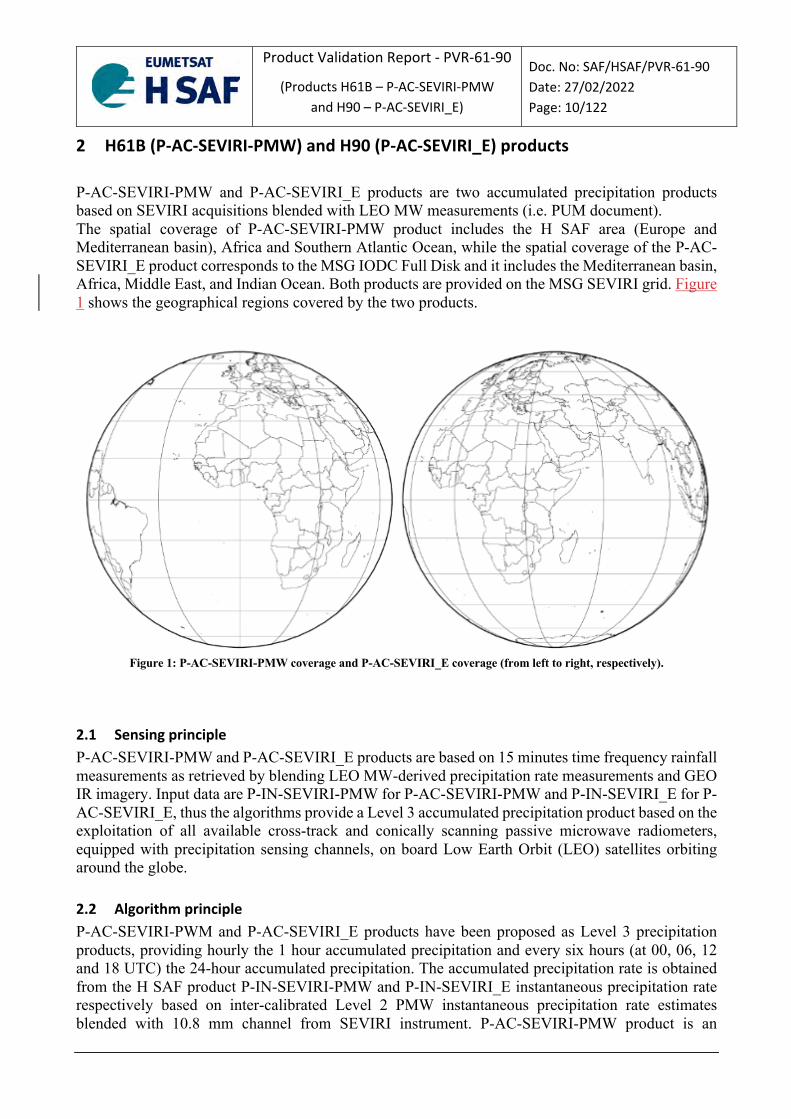
DATA/PRODUCTS USED Reference data: Belgian Radar located at Wideumont, Wallonia (RMI) Precipitation product H61B (H-SAF/EUMETSAT) Weather charts (MetOffice analyses from Wetterzentrale archive) RESULTS OF COMPARISON In Figure 4 we can see the result of upscaling of radar data to the H61B grid on 27 September 2020, together with the corresponding H61B data. The upscaled radar data serve as basis for comparison between radar and H61B.The displayed precipitation values result from cumulation over 24 hours from the previous day at 06:00 UTC up to the current day at 06:00 UTC.
Product Validation Report - PVR-61-90
(Products H61B – P-AC-SEVIRI-PMW and H90 – P-AC-SEVIRI_E)
Doc. No: SAF/HSAF/PVR-61-90 Date: 27/02/2022 Page: 15/122
Figure 4: Upscaled radar (left) and H61B (right) valid for 27 September 2020.
The product image shows precipitation everywhere. In fact, 98% of the domain has precipitation values exceeding 5 mm, while 100% has more than 2 mm. The corresponding percentages for the radar image are 76% and 96%. On the other hand, the precipitation distribution in the product image appears more homogeneous spatially than in the radar image. The latter shows also much higher maximum values than the former (55 mm for the radar and 25 mm for the product). For the case depicted in Figure 4 we have computed statistical scores shown in the following table.
H61B vs. RADAR 0.25 mm < rr < 1 mm 1 mm < rr < 10 mm rr > 0.25 mm ME [mm] 4.46 8.02 -3.54 STD [mm] 2.63 4.38 6.95 MB [-] 5.83 2.48 0.79 RMSE [mm] 5.18 9.14 7.80 FSE [%] 5.61 1.69 0.46
H61B vs. RADAR rr > 0.25 mm rr > 1 mm POD [-] 1.00 1.00 FAR [-] 0.00 0.00 CSI [-] 1.00 1.00 Table 1: Statistical scores obtained from the comparison between H61B and radar acquisition, valid for 27 September 2020.
FINAL COMMENTS In the present case of intense showers, there is at least 1 mm of rain in the whole domain for both the radar and the H61B product images. Of interest is the change in the bias sign. While at lower precipitation values it is positive, it becomes negative when all precipitation classes are considered in the calculations. This is due to the fact that in the radar detection we have an area with much higher values than in the product H61B.
Product Validation Report - PVR-61-90
(Products H61B – P-AC-SEVIRI-PMW and H90 – P-AC-SEVIRI_E)
Doc. No: SAF/HSAF/PVR-61-90 Date: 27/02/2022 Page: 16/122
3.4 Case study analysis in Bulgaria (NIMH)
3.4.1 Case study: 16 August 2020
PRODUCT NAME H61B CASE STUDY PERIOD 16 August 2020 CASE STUDY AREA Bulgaria METEOROLOGICAL EVENT Intensive precipitation VALIDATION INSTITUTE NIMH - Bulgaria PRODUCT DEVELOPER INSTITUTE GEO-K OPERATIONAL CHAIN INSTITUTE COMET
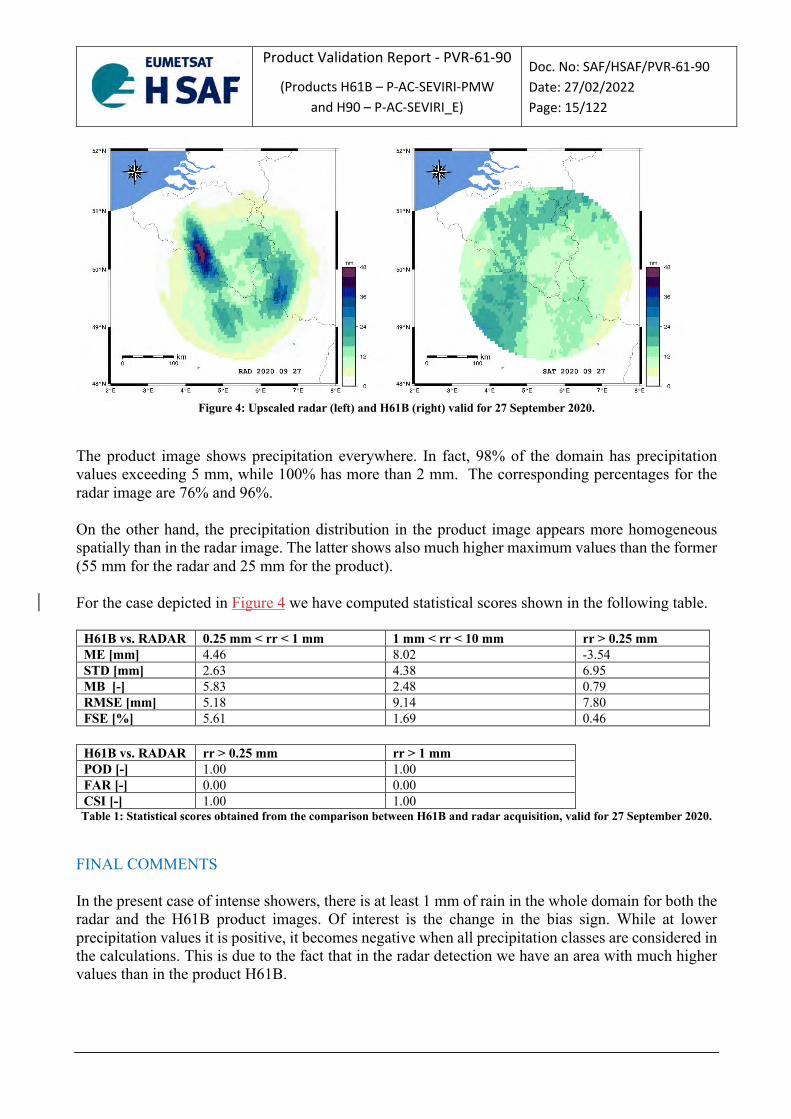
METEOROLOGICAL EVENT DESCRIPTION The synoptic situation over SE Europe in the period of 16 August 2020, as shown on the 500hPa geopotential (Figure 5) is characterized, as general, with low gradient baric field.
Figure 5: 500 hPa Geopotential chart (color shades) from CSFR reanalysis (unit: hPa) valid for the 16th of August 2020 at 00
UTC.

Product Validation Report - PVR-61-90
(Products H61B – P-AC-SEVIRI-PMW and H90 – P-AC-SEVIRI_E)
Doc. No: SAF/HSAF/PVR-61-90 Date: 27/02/2022 Page: 17/122
Figure 6: Infrared image EUMETSAT valid for the 15th August 2020 at 21 UTC.
A shallow low is formed on the 15th of August over the western part of Bulgaria. The air mass over the country is labialized (Figure 6), which favors strong convection. Clear evidence for the convective phenomenology of the event is the number of lightning strikes on 15 August (Figure 7).
Figure 7: Location maps of the lightning strikes. On the left at 15 UTC, at the right at 20 UTC on 15-08-2020.
The map of the lightning (see Figure 7), shows intense lightning activity over in north-western and later over south-western part of the country after noon and in the evening of the 15th of August 2020.
DATA/PRODUCTS USED EUMETSAT products Weather charts (Wetterzentrale - www.wetterzentrale.de ) www.blitzortung.org (All data remain under the CC-BY-SA 4.0 license)

Product Validation Report - PVR-61-90
(Products H61B – P-AC-SEVIRI-PMW and H90 – P-AC-SEVIRI_E)
Doc. No: SAF/HSAF/PVR-61-90 Date: 27/02/2022 Page: 18/122
Interpolated daily rain map ( NIMH ) RESULTS OF COMPARISON Region into consideration is the territory of Bulgaria – about 111 000 km2. The full range of existing network of manually and automatically measuring rain gages was used (up to 328 rain gages measured daily at 6 UTC). 24 h totals were computed for the rain gauges measuring hourly totals. For the day of 16-08-2020 from the total number of 328 gages 285 gages reported the measure. The remaining gages either didn’t have measured rain or bad data quality was detected for them.
Figure 8: On the left H61B product (24 hourly precipitation sum in mm) image over Bulgaria for 06 UTC on 16-08-2020.
On the right - precipitation as interpolated from daily rain gages data for 06:00 UTC.
The statistical scores have been computed with “Unique Common Code version 2.0” script and shown in Table 2 and Table 3 (H61B in comparison with GRISO). There is underestimation of the most intense precipitation (>10 mm) shown as number of cases (Table 2).
H61B VS GRISO >0.25 <999 mm >0.25 < 1 mm >1 < 10 mm >10 mm Number (Sat) 3792 585 2203 1004 Number (Rain) 5696 0 2343 3353 ME [mm/24h] 16.39 15.99 18.70 MAE [mm/24h] 17.55 16.50 21.98 STD [mm/24h] 17.65 17.09 20.46 MB [-] 3.13 4.86 1.95 RMSE [mm/24h] 24.08 23.41 27.72 FSE [%] 3.13 5.64 1.41 CC [-] 0.42 0.26 0.06
Table 2: Statistical scores obtained by the comparison between H61B and GRISO map.
It is seen from Table 2 that there is no values of interpolated rain from GRISO software between 0 and 1 mm within the GRISO interpolated data while such data exists in input data series.
>0.25 mm 1 mm POD [-] 1.00 1.00 FAR [-] 0.33 0.44 CSI [-] 0.67 0.56
Table 3: POD, FAR and CSI statistical scores obtained by the comparison between H61B and GRISO map
FINAL COMMENTS

Product Validation Report - PVR-61-90
(Products H61B – P-AC-SEVIRI-PMW and H90 – P-AC-SEVIRI_E)
Doc. No: SAF/HSAF/PVR-61-90 Date: 27/02/2022 Page: 19/122
The H61B product reproduces well the high intensity events but their location is slightly shifted. Though the ME for the low intensity events is comparatively high, the POD and CSI are respectively high. Product quality for this type of events over Bulgaria is acceptable.

Product Validation Report - PVR-61-90
(Products H61B – P-AC-SEVIRI-PMW and H90 – P-AC-SEVIRI_E)
Doc. No: SAF/HSAF/PVR-61-90 Date: 27/02/2022 Page: 20/122
3.5 Case study analysis in Hungary (OMSZ)
3.5.1 Case study: 13-15 April 2021
PRODUCT NAME H61B 24h cumulated rain CASE STUDY PERIOD 13-15 April 2021 CASE STUDY AREA Hungary METEOROLOGICAL EVENT Frontal rain, with some snow at hilly parts of the country VALIDATION INSTITUTE OMSZ – Hungarian Meteorological Service PRODUCT DEVELOPER INSTITUTE GEO-K OPERATIONAL CHAIN INSTITUTE COMET
METEOROLOGICAL EVENT DESCRIPTION In April 2021 most of the precipitation was measured on 13th as it can be seen on Figure 9.
Figure 9: Countrywide average of daily precipitation sum and their long term mean (mm)
Figure 10: Synoptic situation on 13 April 2021, 00 UTC
On the 13th of April 2021, a waving front was located over the middle part of Europe spreading from Finland to Italy (Figure 10). At the southern edge of this system, over Northern Italy a cyclone evolved and passed over the Carpathian basin, which caused lots of precipitation in Hungary in form of rain, snowy rain and snow. In the daytime in the Transdanubian region snowy rain and snow occured in the plain areas also. In mountain Bakony (north of Lake Balaton) significant snow cover was formed, the snow depth was between 10 and 20 cm generally, but in Bakonybél it reached 33

Product Validation Report - PVR-61-90
(Products H61B – P-AC-SEVIRI-PMW and H90 – P-AC-SEVIRI_E)
Doc. No: SAF/HSAF/PVR-61-90 Date: 27/02/2022 Page: 21/122
cm. In the nighttime precipitation occured in several places, mainly rain, in some places snowy rain, in the mountainous regions snow. The daily precipitation values in the country were between 2 and 35 mm (Figure 11).
Figure 11: 24-hour precipitation (left) and snow cover (right) until 06 UTC 14 April 2021.
DATA/PRODUCTS USED Product to validate:
24h accumulated precipitation values from the H61B products (EUMETSAT H SAF)
Reference data: Precipitation values from the Hungarian radar network (OMSZ), precipitation from synop
data, operational H05B H SAF product (24h accumulated precipitation) SAF products, radar images and synop maps were visualised with the HAWK-3 (Hungarian Advanced Weather WorKStation) software, which is the operational visualisation tool developed by the Hungarian Meteorological Service. RESULTS OF COMPARISON As H61B is a daily sum, we compared the H SAF fields for the 13th of April and the following days as well. For the first sight we saw that the quality index field contains quite a lot of 0 values which will result in N.A.N values in the precipitation field (Figure 12). Fortunately, most of them are outside Europe and partly correspond to the less frequent availability of microwave data.

Product Validation Report - PVR-61-90
(Products H61B – P-AC-SEVIRI-PMW and H90 – P-AC-SEVIRI_E)
Doc. No: SAF/HSAF/PVR-61-90 Date: 27/02/2022 Page: 22/122
Figure 12: Quality indices in the H SAF H61B netCDF file 14 April 2021, 00UTC, red values are “0”s.
During the comparison we used the following fields, as they will appear on the images below:
1 2
3 4
1. H SAF H05B operational daily (24h) accumulated precipitation 2. H SAF H61B daily (24h) accumulated precipitation 3. 24h accumulation of precipitation measured by automated synop stations operated by OMSZ -
Hungarian Meteorological Service and interpolated by GRISO software (generally used in H SAF verification)
4. Composite accumulated (24h) precipitation field from the Radar Network of OMSZ - Hungarian Meteorological Service
On the image at 00:00 UTC on 13th April (Figure 13) the ground reference values shows the precipitation of the previous day at the North-Western part of Hungary, while at 06:00 UTC (Figure 14) already the Eastern part of the country is rainy. The H SAF precipitation fields (both the H61B and the operational H05B (P-AC-SEVIRI; Accumulated precipitation by merging MW images from operational sun-synchronous satellites and IR images from GEO satellites)) show the maximum values shifted to the East. The Eastern side of the country is better represented by H61B then H05B at 06:00 UTC. On the 14th April image (Figure 15) the maximum values are in the central part of the country on H05B which can be seen on ground data as well. The H61B field is inhomogeneous, strange stripes are cutting the image. It is possibly coming from the 2.5x2.5 degree box calculations of the H60B (15 minutes) products, as inputs for H61B product generation, but it is not referred in the (draft) ATBD of H61B-H90.

Product Validation Report - PVR-61-90
(Products H61B – P-AC-SEVIRI-PMW and H90 – P-AC-SEVIRI_E)
Doc. No: SAF/HSAF/PVR-61-90 Date: 27/02/2022 Page: 23/122
On 15th April (Figure 16) in the North-Eastern part of the country we can find similarity between H SAF fields and ground fields, but the precipitation field measured on the southern part is missing from H SAF products (both H05B and H61B).
Figure 13: Precipitation fields (1-4) for 13 April 2021. 00:00 UTC

Product Validation Report - PVR-61-90
(Products H61B – P-AC-SEVIRI-PMW and H90 – P-AC-SEVIRI_E)
Doc. No: SAF/HSAF/PVR-61-90 Date: 27/02/2022 Page: 24/122
Figure 14: Precipitation fileds (1-4) for 13 April 2021. 06:00 UTC

Product Validation Report - PVR-61-90
(Products H61B – P-AC-SEVIRI-PMW and H90 – P-AC-SEVIRI_E)
Doc. No: SAF/HSAF/PVR-61-90 Date: 27/02/2022 Page: 25/122
Figure 15: Precipitation fields (1-4) for 14 April 2021. 00:00 UTC

Product Validation Report - PVR-61-90
(Products H61B – P-AC-SEVIRI-PMW and H90 – P-AC-SEVIRI_E)
Doc. No: SAF/HSAF/PVR-61-90 Date: 27/02/2022 Page: 26/122
Figure 16: Precipitation fields (1-4) for 15 April 2021. 00:00 UTC
FINAL COMMENTS The examined situation was difficult to monitor by satellite due to the late snowfalls in April, which is not frequent in Hungary. The inhomogeneous fields originating from box-calculations of H60B makes it difficult to use the product. In the future there will be more and more microwave measurements, therefore more frequent update of collocating areas with MSG (MTG) will improve such geostationary H SAF products.

Product Validation Report - PVR-61-90
(Products H61B – P-AC-SEVIRI-PMW and H90 – P-AC-SEVIRI_E)
Doc. No: SAF/HSAF/PVR-61-90 Date: 27/02/2022 Page: 27/122
3.6 Case study analysis in Slovakia (SHMI)
3.6.1 Case study: 12 July 2020
PRODUCT NAME H61B 24h cumulated rain CASE STUDY PERIOD 12 July 2020 00 – 24 UTC CASE STUDY AREA Slovakia METEOROLOGICAL EVENT Thunderstorms on a convergence line moving over
Slovakia VALIDATION INSTITUTE Slovak Hydrometeorological Institute (SHMI) RESPONSIBLE/CONTACT POINT [email protected]
[email protected] PRODUCT DEVELOPER INSTITUTE GEO-K OPERATIONAL CHAIN INSTITUTE COMET
METEOROLOGICAL EVENT DESCRIPTION Ahead of cold front approaching from Western Europe, a convergence line formed in the warm, originally tropical air mass in the Central Europe. Associated thunderstorms were moving over Slovakia in the SW-NE direction during the day 2 July 2021 00:00UTC. The movement of cold front is evident from synoptical analyses at the end of the day, dated 3 July 2021 00:00UTC.
DATA/PRODUCTS USED P-AC-SEVIRI-PMW (H61B, Full disk product) precipitation intensity fields from following satellite timeslots (mean scan times of SHMI radar domain are stated): 2 July 2020 00-23:15 UTC Meteosat imagery to document synoptic situation: 2 July 2020 03:15, 5:00, 17:00 and 19:00 UTC. Accumulated precipitation fields from SHMI radars derived from CAPPI 2km product using quality indices, thresholded to overall radar QI > 0.3. Statistical results (RMSE, bias, correlation, Fractional Standard Error, Nash-Sutcliffe Coefficient) of radar and satellite data comparison and evaluation.
Product Validation Report - PVR-61-90
(Products H61B – P-AC-SEVIRI-PMW and H90 – P-AC-SEVIRI_E)
Doc. No: SAF/HSAF/PVR-61-90 Date: 27/02/2022 Page: 28/122
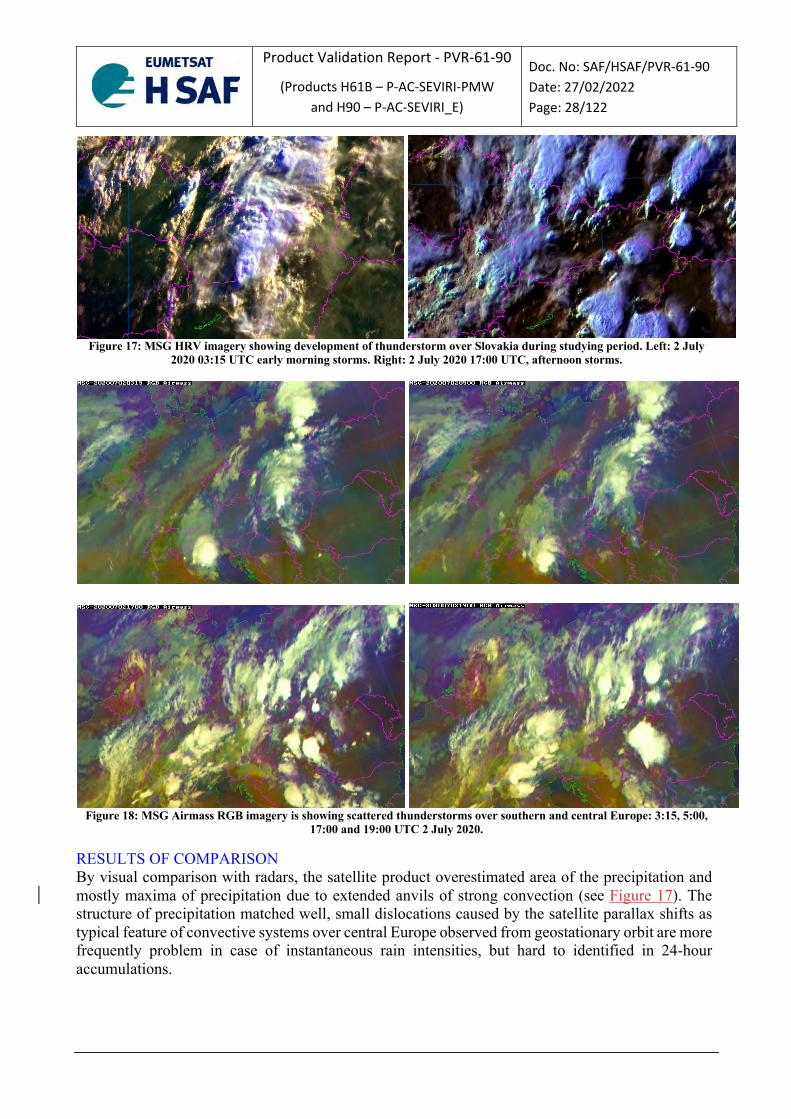
Figure 17: MSG HRV imagery showing development of thunderstorm over Slovakia during studying period. Left: 2 July
2020 03:15 UTC early morning storms. Right: 2 July 2020 17:00 UTC, afternoon storms.
Figure 18: MSG Airmass RGB imagery is showing scattered thunderstorms over southern and central Europe: 3:15, 5:00,
17:00 and 19:00 UTC 2 July 2020.
RESULTS OF COMPARISON By visual comparison with radars, the satellite product overestimated area of the precipitation and mostly maxima of precipitation due to extended anvils of strong convection (see Figure 17). The structure of precipitation matched well, small dislocations caused by the satellite parallax shifts as typical feature of convective systems over central Europe observed from geostationary orbit are more frequently problem in case of instantaneous rain intensities, but hard to identified in 24-hour accumulations.

Product Validation Report - PVR-61-90
(Products H61B – P-AC-SEVIRI-PMW and H90 – P-AC-SEVIRI_E)
Doc. No: SAF/HSAF/PVR-61-90 Date: 27/02/2022 Page: 29/122
06:00 UTC: Satellite H61B Radar upscaled QI > 0.3 Original radar resolution
12:00 UTC: Satellite H61B Radar upscaled QI > 0.3 Original radar resolution
18:00 UTC: Satellite H61B Radar upscaled QI > 0.3 Original radar resolution
24:00 UTC: Satellite H61B Radar upscaled QI > 0.3 Original radar resolution
Figure 19: Accumulated precipitation fields from 2 July 2020 observed by H61B product (left column), SHMU radars
upscaled to satellite grid (middle) and SHMU radars in original 1km resolution (right column). Data in rows: MSG timeslots 2 July 2020 06:00, 12:00, 18:00 and 24:00 UTC. The radar precipitation values are corresponding to satellite IFOVs projected
over the radar domain. Comparison is limited to area where overall radar quality index QI > 0.3.

Product Validation Report - PVR-61-90
(Products H61B – P-AC-SEVIRI-PMW and H90 – P-AC-SEVIRI_E)
Doc. No: SAF/HSAF/PVR-61-90 Date: 27/02/2022 Page: 30/122
Because of lower quality, also radar data in more distant ranges taken into account in validation statistics. Results of statistical comparison of the satellite product with radars for the whole case study period are shown in the following tables.
Precipitation class (mm) 1 - 8 8 - 32 32 - 64 64 - 128 ≥ 128 ≥ 1 Number of satellite obs. 8841 14575 3350 755 0 27521 Number of radar obs. 13079 12547 773 76 2 26477 Mean error (mm/h) 8.445 7.515 -15.793 -45.300 -97.326 7.134 Multiplicative bias 3.084 1.514 0.619 0.429 0.303 1.687 Correlation coefficient 0.297 0.125 0.088 0.167 -1.000 0.291 URD-RMSE (%) 4.763 1.548 0.545 0.611 0.696 3.514 Fractional Standard Error (%)
4.006 1.313 0.558 0.633 0.702 1.746
Nash-Sutcliffe Coefficient -63.584 -11.141 -7.244 -10.221 -88.249 -2.633 Table 4 Selected scores of continuous statistics for radar QI > 0.3
Precipitation threshold (mm/h) ≥ 1 ≥ 8 POD 0.920 0.823 FAR 0.115 0.410 CSI 0.822 0.524
Table 5 Selected scores of dichotomous statistics for radar QI > 0.3
High negative values of Mean error and low close to zero Multiplicative bias for all precipitation classes of 24-hour accumulations (see Table 4) are in agreement with the observed underestimation of precipitation by H61B. The correlation coefficient reached rather low values for individual precipitation classes. For overall precipitation class (AP ≥ 1 mm) the correlation coefficient reached low value of 0.291 for 24-hour accumulations. The results of dichotomous statistics for 24-hour accumulations (Table 5) are acceptable, with the FAR not exceeding POD for both precipitation thresholds. COMMENTS In this case study, the radar data come from 4 Doppler radars which were replaced in frame of building of new SHMI radar network in 2015.

Product Validation Report - PVR-61-90
(Products H61B – P-AC-SEVIRI-PMW and H90 – P-AC-SEVIRI_E)
Doc. No: SAF/HSAF/PVR-61-90 Date: 27/02/2022 Page: 31/122
3.6.2 Case study: 26 September 2020
PRODUCT NAME H61B 24h cumulated rain CASE STUDY PERIOD 26 September 2020 00 – 24 UTC CASE STUDY AREA Slovakia METEOROLOGICAL EVENT Rain event breaking
the drought period in Slovakia VALIDATION INSTITUTE Slovak Hydrometeorological Institute (SHMI) RESPONSIBLE/CONTACT POINT [email protected]
[email protected] PRODUCT DEVELOPER INSTITUTE GEO-K OPERATIONAL CHAIN INSTITUTE COMET
METEOROLOGICAL EVENT DESCRIPTION Central European region covered by low-pressure system connected with waved cold front. Associated rain field brought significant precipitation amounts to this region after long duration drought. Rain deficit started in April 2020 and lasted until End of September 2020. This study is considering about possibility to monitor drought interruption by means of satellite accumulated rain product H61B.
DATA/PRODUCTS USED P-AC-SEVIRI-PMW (H61B, Full disk product) precipitation intensity fields from following satellite timeslots (mean scan times of SHMI radar domain are stated): 26 September 2020 00-24:00 UTC Accumulated precipitation fields from SHMI radars derived from CAPPI 2km product using quality indices, using threshold to overall radar QI > 0.3. Statistical results (RMSE, bias, correlation, Fractional Standard Error, Nash-Sutcliffe Coefficient) of radar and satellite data comparison and evaluation.

Product Validation Report - PVR-61-90
(Products H61B – P-AC-SEVIRI-PMW and H90 – P-AC-SEVIRI_E)
Doc. No: SAF/HSAF/PVR-61-90 Date: 27/02/2022 Page: 32/122
Plots are showing the precipitation deficit in southern part of Slovakia started in April 2020. This drought period was interrupted only small convective events during summer, which did not stop the dry season. First significant break occurred in the end of September 2020.

Product Validation Report - PVR-61-90
(Products H61B – P-AC-SEVIRI-PMW and H90 – P-AC-SEVIRI_E)
Doc. No: SAF/HSAF/PVR-61-90 Date: 27/02/2022 Page: 33/122
RESULTS OF COMPARISON By visual comparison of H61B satellite product with radars, the satellite product is overestimated the precipitation accumulations in the south-west of the radar domain. This is because of IR very cold cloud tops detected by MSG imagery. However, the vertical stripe observed by radars in the center of domain practically not detected by H61B product, or shifted far to the east.

Product Validation Report - PVR-61-90
(Products H61B – P-AC-SEVIRI-PMW and H90 – P-AC-SEVIRI_E)
Doc. No: SAF/HSAF/PVR-61-90 Date: 27/02/2022 Page: 34/122
00:00 UTC: Satellite H61B Radar upscaled QI > 0.3 Original radar resolution
06:00 UTC: Satellite H61B Radar upscaled QI > 0.3 Original radar resolution
12:00 UTC: Satellite H61B Radar upscaled QI > 0.3 Original radar resolution
18:00 UTC: Satellite H61B Radar upscaled QI > 0.3 Original radar resolution
Figure 20: Accumulated precipitation fields from 26 September 2020 observed by H61B product (left column), SHMU radars upscaled to satellite grid (middle) and SHMU radars in original 1km resolution (right column). Data in rows: MSG timeslots 26 September 2020 00:00, 06:00, 12:00 and 18:00 UTC. The radar precipitation values are corresponding to satellite IFOVs
projected over the radar domain. Comparison is limited to area where overall radar quality index QI > 0.3.

Product Validation Report - PVR-61-90
(Products H61B – P-AC-SEVIRI-PMW and H90 – P-AC-SEVIRI_E)
Doc. No: SAF/HSAF/PVR-61-90 Date: 27/02/2022 Page: 35/122
Because of lower quality, also radar data in more distant ranges taken into account in validation statistics. Results of statistical comparison of the satellite product with radars for the whole case study period are shown in the following tables.
Precipitation class (mm) 1 - 8 8 - 32 32 - 64 64 - 128 ≥ 128 ≥ 1 Number of satellite obs. 17840 21424 1345 0 0 40609 Number of radar obs. 14680 25866 1350 0 0 41896 Mean error (mm/h) 5.011 -3.695 -22.910 - - -1.264 Multiplicative bias 1.984 0.754 0.379 - - 0.897 Correlation coefficient -0.236 0.198 0.050 - - 0.141 URD-RMSE (%) 4.457 0.635 0.657 - - 2.688 Fractional Standard Error (%) 2.110 0.638 0.666 - - 0.882 Nash-Sutcliffe Coefficient -32.446 -1.756 -31.957 - - -0.805
Table 6 Selected scores of continuous statistics for radar QI > 0.3
Precipitation threshold (mm/h) ≥ 1 ≥ 8 POD 0.950 0.557 FAR 0.016 0.334 CSI 0.939 0.435
Table 7 Selected scores of dichotomous statistics for radar QI > 0.3
Because of stratiform clouds and precipitation type only lower three categories in continuous statistics were catch the comparison results. No accumulations above 64 mm detected. According Mean error values accumulations below 8 mm are overestimated, and higher values are underestimated. The results of dichotomous statistics for 24-hour accumulations (Table 7) are acceptable, with low FAR values (False Alarm Rates), overall CSI (Critical Success Index) is too high. Overall POD (probability of detection is 0.95 (95%), but for accumulations above 8 mm only 56%. This is corresponding to the findings that the main stripe of intense precipitation over west Slovakia did not observe by satellite product, or shifted more to the east. COMMENTS In this study, the radar data come from 4 Doppler radars installed in the frame of building of new SHMI radar network in 2015.

Product Validation Report - PVR-61-90
(Products H61B – P-AC-SEVIRI-PMW and H90 – P-AC-SEVIRI_E)
Doc. No: SAF/HSAF/PVR-61-90 Date: 27/02/2022 Page: 36/122
4 Validation results: long-term analysis
4.1 Overview Product ID (Acronym) H61B (P-AC-SEVIRI-PMW) Product name Precipitation/Soil Moisture integrated product Algorithm version number
Latest version: 1.0 Version considered for Q.A.: 1.0
Covered period 01/07/2020 – 30/04/2021 Q.A. methods applied Continuous statistics ME, SD, MAE, MB, RMSE, CC, FSE
Multi-categorical statistics
POD, FAR, CSI
Contributing countries
BE, BU, DE, HU, IT, PL, SK, TU
The validation has been performed over the period between July 2020 and April 2021 by European countries belonging to PPVG and supervised by DPC. The product release currently in force at the time of writing has been evaluated. The results are showed both for European (EU) area in comparison with ground (radar and rain gauge) data (section 4.2), and over the MSG Full Disk (FD) area using the TC methodology (section 4.3). The surface type classification is taken in account (land, sea and coast areas) as well as the three precipitation classes (Table 24). The validation procedure evaluates only high-quality precipitation values (for both reference and satellite data). Moreover, satellite Field Of Views not fully covered by reference data (or with percentage of coverage less than 50%) are discarded by the Q.A. procedure in order to increase the significance of the statistical sample.
4.2 Validation results over EU area Validation has been performed using rain gauge and radar data as reference in Belgium, Bulgaria, Germany, Italy, Hungary, Poland, Slovakia and Turkey, for the whole period as above descripted. Each institute has used the Unique Common Code (UCC Version 2.0) developed by PPVG to evaluate every H SAF precipitation product in terms of different statistical scores. About 20 million of ground and satellite pairs of data were analyzed. For H61B product, the UR is defined by FSE score as indicated in Table 8.
Precipitation class
Threshold Target Optimal
≥ 1 mm/24h
200 150 100
Table 8: Accuracy requirements for product P-AC-SEVIRI-PMW in term of FSE(%).
The FSE score (mathematical formula shown in Table 25) defines the accuracy of the H SAF product under analysis. 4.2.1 Monthly accuracy The monthly accuracy computed for H61B in comparison with radar, rain gauge and overall ground observations is shown in Figure 21 in panel a, b and c respectively. In every panel, the background

Product Validation Report - PVR-61-90
(Products H61B – P-AC-SEVIRI-PMW and H90 – P-AC-SEVIRI_E)
Doc. No: SAF/HSAF/PVR-61-90 Date: 27/02/2022 Page: 37/122
color indicates the region inside each requirement accuracy threshold as defined in Table 8 and also used in Table 12. The black dotted line represents the mean FSE value over the whole period (10 months). Panel d shows the percentage contribution for different instruments and observation’s surfaces respect to the full dataset. P-AC-SEVIRI-PMW shows a similar trend for radar ang gauge results. Generally, a tendency to decrease the error during the period analyzed is observable. Scores range between 240% and 120% with better values respect to radar data. For both ground instruments, results are between target and threshold. The overall results indicate an accuracy slightly above the target (166%). The percentage contribution highlights how radar data represent the three quarter of the whole dataset (76%).
Figure 21: H61B monthly accuracy using Radar (a) and Gauge (b) as ground reference.
The Overall Q.A. is shown in the panel c). Background colours highlight the requirement accuracy thresholds in terms of FSE as reported in Table 8 and Table 12.
The horizontal black dotted line indicates the mean annual value. The single ground percentage contribution is shown in the panel d).
4.2.2 Monthly continuous statistical scores In Figure 22 the monthly trend for H61B product respect to radar over land (green line), sea (blue line), coast (red line) and rain gauge (black dotted line) for all precipitation rates above 1 mm/day is shown for six continuous statistical scores: ME, SD, MAE, MB, RMSE and FSE. Results for both radar and gauge, independently by surface types, have a similar trend: as previously observed, a clear trend towards decreasing error is evident. In details, the mean error shows a change of sign moving

Product Validation Report - PVR-61-90
(Products H61B – P-AC-SEVIRI-PMW and H90 – P-AC-SEVIRI_E)
Doc. No: SAF/HSAF/PVR-61-90 Date: 27/02/2022 Page: 38/122
from + 5 to – 1 mm/24h. All other scores also show improved results, in particular from December to April: during this period the FSE is quite stable around 120% (close to the otptimal requirement). More continuous statistical scores are shown in Annex 1.
Figure 22: Monthly continuous statistical scores resulting for H61B
relatively to the accumulated precipitation above 1 mm/24h.
4.2.3 Multi-categorical statistics The multi-categorical statistics are below shown. In each table, the first column indicates the precipitation classes of the satellite product, while along the columns are reported the ground precipitation classes. The first class detects the very low accumulated rain class with PC<1 mm/24h,

Product Validation Report - PVR-61-90
(Products H61B – P-AC-SEVIRI-PMW and H90 – P-AC-SEVIRI_E)
Doc. No: SAF/HSAF/PVR-61-90 Date: 27/02/2022 Page: 39/122
the second class identifies the accumulated rain between 1≤PC<10 mm/24h, while the last one classifies the higher accumulated rains (PC≥10 mm/24h). The H61B product reaches maximum values of detection for low accumulated precipitation class (~75%). Intermediate class is mainly underestimated with a percentage of detection about 41%. Finally, the half part of all accumulated precipitation above 10 mm/24h is correctly identified, with best performances over sea (56%). Generally, the comparison with the radar data is better than the rain gauge data. More multi-categorical statistics are shown in Annex 2.
Radar Land | Sea | Coast Multi-Categorical Statistics
< 1 mm/day [1 – 10 [ mm/day ≥10 mm/day < 1 mm/day 76% 78% 77% 36% 35% 37% 14% 14% 16% [1 - 10[ mm/day 20% 17% 19% 43% 42% 42% 36% 31% 32% ≥10 mm/day 3% 4% 4% 22% 23% 21% 50% 56% 52%
Table 9: Multi-categorical table for product H61B – radar validation over land, sea and coast areas. The precipitation classes along the columns (rows) are relative to ground (satellite) precipitation.
Gauge Land
Multi-Categorical Statistics < 1 mm/day [1 - 10[ mm/day ≥10 mm/day < 1 mm/day 66% 43% 24% [1 - 10[ mm/day 27% 39% 34% ≥10 mm/day 7% 18% 42%
Table 10: Multi-categorical table for product H61B – rain gauge validation over land. The precipitation classes along the columns (rows) are relative to ground (satellite) precipitation.
Overall
Multi-Categorical Statistics < 1 mm/day [1 - 10[ mm/day ≥10 mm/day < 1 mm/day 75% 38% 17% [1 - 10[ mm/day 21% 41% 34% ≥10 mm/day 4% 21% 49%
Table 11: Multi-categorical table for product H61B – Overall validation. The precipitation classes along the columns (rows) are relative to ground (satellite) precipitation.
4.2.4 Product requirement compliance The accuracy of H61B for the whole validation period (July 2020 – April 2021) respect to ground measurements and overall results are reported below in Table 12. All scores are between threshold and target requirements. Better values are obtained in comparison with radar estimates (~160%) respect to gauge measurements (171%). The overall result of 166% confirm the good accuracy of H61B product in assessment with ground data.
Between target and optimal
Between threshold and target
Threshold exceeded by < 50 %
Threshold exceeded by ≥ 50 %
Product Validation Report - PVR-61-90
(Products H61B – P-AC-SEVIRI-PMW and H90 – P-AC-SEVIRI_E)
Doc. No: SAF/HSAF/PVR-61-90 Date: 27/02/2022 Page: 40/122
H61B vs Ground Annual average of FSE (%) Precipitation
Class Requirement (FSE %) Radar
(Land) Radar (Sea)
Radar (Coast)
Gauge (Land) OVERALL
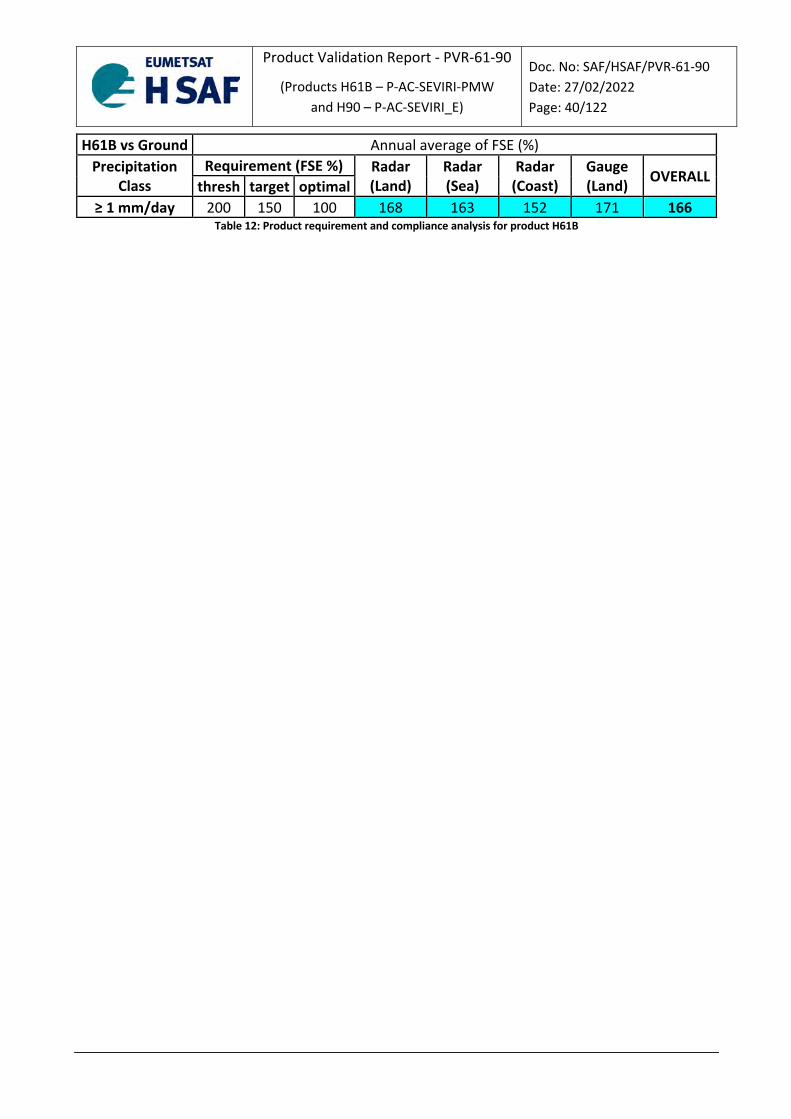
thresh target optimal ≥ 1 mm/day 200 150 100 168 163 152 171 166
Table 12: Product requirement and compliance analysis for product H61B
Product Validation Report - PVR-61-90
(Products H61B – P-AC-SEVIRI-PMW and H90 – P-AC-SEVIRI_E)
Doc. No: SAF/HSAF/PVR-61-90 Date: 27/02/2022 Page: 41/122
4.3 Validation results over FD area (TC) The validation procedure over FD area has been developed by the IRPI-CNR and conducted by Italian DPC. TC methodology is applied between P-AC-SEVIRI-PMW, GPCC and GLDAS datasets over the overlapped domains. The accuracy of the satellite product is evaluated by the CC score: results for different areas and on monthly-basis are here shown. More maps over the FD area are shown in Annex 3. 4.3.1 Monthly accuracy The UR score used in the TC methodology is the CC. The monthly trend obtained for the triplet of datasets used is shown in the Figure 23.The blue bars indicate the results for the H SAF satellite product (P-AC-SEVIRI-PMW); in green those obtained from GPCC data, while in orange those from GLDAS dataset. The colored background highlights the areas where thresholds are set for the chosen UR. Focusing on the results related to H SAF product, the values range from 0.44 for the worst month (April 2021) to 0.65 for the best months (September 2020). The average value calculated on an annual basis is 0.58, which is between target (0.65) and threshold (0.50). Spatial distributions of CC are shown in maps of Figure 82 and Figure 83 (Annex 3). GPCC obtains comparable results to H SAF product, with a very similar monthly trend (from July to January). On the other hand, GLDAS has results in terms of CC that are lower than the previous ones, even if, unlike from SEVIRI product, GLDAS shows a good similar monthly trend respect to GPCC results in the last three months (FMA).

Product Validation Report - PVR-61-90
(Products H61B – P-AC-SEVIRI-PMW and H90 – P-AC-SEVIRI_E)
Doc. No: SAF/HSAF/PVR-61-90 Date: 27/02/2022 Page: 42/122
Figure 23: Monthly validation results (July 2020 – April 2021) in terms of CC (UR) score obtained by
the P-AC-SEVIRI-PMW (daily) product (blue bars) using the TC methodology. Background colours highlight the UR thresholds (optimal/target/threshold).
4.3.2 Multi-categorical statistics In the following tables, the percentages of corrected estimates in three different precipitation classes are indicated. The percentages are normalized along each column that represent the reference for the precipitation (GLDAS and GPCC for the first two tables respectively). The first class detects the very low accumulated rain class with PC<1 mm/24h, the second class identifies the accumulated rain between 1≤PC<10 mm/24h, while the last one classifies the higher accumulated rains (PC≥10 mm/24h). Comparing the first two tables in which P-AC-SEVIRI-PMW estimates are classified respect to GLDAS and GPCC dataset respectively, it is possible to note better agreement with the first respect to second one, particularly for medium and higher precipitation class: 27% vs 19% and 52% vs 37%. Generally, the precipitation is correctly detected mainly for low accumulated class (85%) and for higher class (52%). On the other hand, there is a tendency towards underestimation for the intermediate precipitation class.
Overall

Product Validation Report - PVR-61-90
(Products H61B – P-AC-SEVIRI-PMW and H90 – P-AC-SEVIRI_E)
Doc. No: SAF/HSAF/PVR-61-90 Date: 27/02/2022 Page: 43/122
Multi-Categorical Statistics !"#$"%&'()("!*+,,-.,/01#%,
< 1 mm/24h, [1 - 10[ mm/24h, ≥10 mm/24h,
< 1 mm/24h, 86% 54% 26% [1 - 10[ mm/24h, 10% 27% 22% ≥10 mm/24h, 4% 19% 52%
Table 13: Multi-categorical table for product P-AC-SEVIRI-PMW versus GLDAS over 24h – Overall FD validation. The precipitation classes along the columns (rows) are relative to GLDAS (H SAF) precipitation.
Overall Multi-Categorical Statistics
!"#$"%&'()("!*+,,
-.,/!$$,< 1 mm/24h, [1 - 10[ mm/24h, ≥10 mm/24h,
< 1 mm/24h, 85% 67% 37% [1 - 10[ mm/24h, 10% 19% 26% ≥10 mm/24h, 5% 14% 37%
Table 14: Multi-categorical table for product P-AC-SEVIRI-PMW versus GPCC over 24h – Overall FD validation. The precipitation classes along the columns (rows) are relative to GPCC (H SAF) precipitation.
In the table below, the percentages of estimates in comparison between the two datasets GLDAS and GPCC for three different precipitation classes are shown. The percentages are normalised along each column represented by GPCC for the first columns and GLDAS for the second columns in each class, respectively. The agreement is good for lower precipitation class (97-93%), but it decreases by increasing the precipitation accumulates. In fact, the agreement for the intermediate accumulated class ranges between 32% and 48%, while for higher accumulates ranges between 31 and 37% with respect GPCC and GLDAS, respectively.
Overall Multi-Categorical Statistics
/01#%, -., /!$$,,234,-567,-78.2,
< 1 mm/24h, [1 - 10[ mm/24h, ≥10 mm/24h,
< 1 mm/24h, 97% 93% 58% 38% 32% 16% [1 - 10[ mm/24h, 3% 6% 32% 48% 37% 47% ≥10 mm/24h, 0% 1% 10% 14% 31% 37% Table 15: Multi-categorical table for GLDAS versus GPCC (and vice versa) over 24h Overall FD validation. The precipitation
classes in the first columns are relative to GLDAS dataset; in the second columns are relative to GPCC dataset.
In conclusion, the better agreements are reached by GLDAS (vs GPCC) for the low class (97%), by GPCC (vs GLDAS) for the medium class (48%) and by P-AC-SEVIRI-PMW (vs GLDAS) for higher precipitation class (52%).

Product Validation Report - PVR-61-90
(Products H61B – P-AC-SEVIRI-PMW and H90 – P-AC-SEVIRI_E)
Doc. No: SAF/HSAF/PVR-61-90 Date: 27/02/2022 Page: 44/122
4.3.3 Product requirement compliance
User requirements and compliance analysis for H SAF product are reported below. The UR result for the P-AC-SEVIRI-PMW product is satisfactory with a value of 0.58 which agrees with the requirement between threshold and target.
P-AC-SEVIRI-PMW by TC methodology Annual average of CC
Precipitation Class Requirement (CC)
OVERALL thresh target optimal
≥ 0 mm/24h 0.50 0.65 0.80 0.58 Table 16: UR and compliance analysis for P-AC-SEVIRI-PMW (24h) product over FD area by TC methodology.
Between target and optimal
Between threshold and target
Threshold exceeded by <50%
Threshold exceeded by ≥ 50%

Product Validation Report - PVR-61-90
(Products H61B – P-AC-SEVIRI-PMW and H90 – P-AC-SEVIRI_E)
Doc. No: SAF/HSAF/PVR-61-90 Date: 27/02/2022 Page: 45/122
5 Inter-comparison results between H61B and H90 products The results of the comparison between H61B and H90 in the overlapping area of the two products are shown here. The methodology used to compare the two products is described in Appendix 1 in section A1.6. The analyzed dataset available for this review is the quarter between February and April 2021. All precipitation values (rr≥0mm/24h) whose grid points (between H61B and H90) are close to each other (and not far beyond 6 km) with a quality value - defined by both products themselves - not less than 50% (q> 50%) have been considered for this inter-comparison. 5.1 Large statistics analysis The continuous statistical scores obtained by analyzing the 3 months of H90 data in comparison with H61B are shown in Table 17.
H90 vs H61B ≥0 mm/24h Num H90 [#] 181,241,159 Num H61B [#] 181,241,611 ME [mm/24h] -0.50 STD [mm/24h] 8.92 MAE [mm/24h] 2.69 MB [-] 0.96 CC [-] 0.92 RMSE [mm/24h] 8.95
Table 17: Comparison scores between H90 and H61B
The results are the intersection of over 180 million pixels. The similar number of pixels of H61B and H90 highlights how both products identify the same extension of the precipitation area. The main result is the mean error between the two products (ME) equal to -0.5 mm/24h. This indicates a very similar way to estimate the accumulation of precipitation from one sensor and the other. As expected, the correlation between the two products is very high (0.92) and a Mean Absolute error of only 2.69 mm/24h. Generally, all errors are limited and demonstrate the strong relationship between the two products, regardless of the different longitude position of the two MeteoSats. The contingency table (Table 18) allows you to evaluate the probability of success of H90 in identifying the estimated accumulated precipitation from H61B. The POD is very good (0.92 and 0.86 for the thresholds at 0.25 and 10 mm/24h). The FAR is very low (0.13 and 0.16). Even lower is the fraction of pixels with missed precipitation (0.08 and 0.14). The summary index (CSI) indicates very good performance (0.81 and 0.74) for the rainfall analyzed.

Product Validation Report - PVR-61-90
(Products H61B – P-AC-SEVIRI-PMW and H90 – P-AC-SEVIRI_E)
Doc. No: SAF/HSAF/PVR-61-90 Date: 27/02/2022 Page: 46/122
H90 vs
H61B
≥0.25 mm/24h
POD 0.92 FAR 0.13 MISS 0.08 CSI 0.81
≥10 mm/24h
POD 0.86 FAR 0.16 MISS 0.14 CSI 0.74
Table 18: Probability Of Detection (POD), False Alarm Ratio (FAR), Missing (MISS) and Critical Success Index (CSI) for H90 vs H61B products for different rain rate thresholds over the overlapping area.
The results of the multi-categorical statistics for H90 in comparison with H61B are shown in Table 19. The first column indicates the precipitation classes of the H90 product, while along the columns are reported the H61B precipitation classes. The first class detects the very low accumulated rain class with PC<1 mm/24h, the second class identifies the accumulated rain between 1≤PC<10 mm/24h, while the last one classifies the higher accumulated rains (PC≥10 mm/24h).
H90 vs H61B
Multi-Categorical Statistics < 1 mm/24h [1 - 10[ mm/24h ≥10 mm/24h < 1 mm/24h 96% 14% 1% [1 - 10[ mm/24h 3% 74% 13% ≥10 mm/24h 0% 12% 86%
Table 19: Multi-categorical table for product H90 in comparison with product H61B over the overlapped area. The precipitation classes along the columns (rows) are relative to H61B (H90) precipitation.
The results show that all precipitation classes are in good agreement between the two products. In particular, the low-precipitation area is in agreement in 96% of cases; intermediate precipitation is correctly identified in 74%; finally, higher precipitation class is identified in 86% of total cases. In all classes, the largest percentage lies in the correct class which indicates the excellent agreement between the two products. The evaluation of H90 in comparison with H61B continues with a qualitative analysis of an event that occurred in Hungary using various products available. Hungary is well suited to this type of inter-comparison between the two products as it is positioned along the intermediate longitude of the two Meteosats.

Product Validation Report - PVR-61-90
(Products H61B – P-AC-SEVIRI-PMW and H90 – P-AC-SEVIRI_E)
Doc. No: SAF/HSAF/PVR-61-90 Date: 27/02/2022 Page: 47/122
5.2 Case study analysis 5.2.1 Case study: April 2021 in Hungary (OMSZ))
PRODUCT NAME H90 24h cumulated rain for IODC service (41.5°) CASE STUDY PERIOD April 2021 CASE STUDY AREA Hungary METEOROLOGICAL EVENT Frontal rain cases with and without convection VALIDATION INSTITUTE OMSZ – Hungarian Meteorological Service PRODUCT DEVELOPER INSTITUTE GEO-K OPERATIONAL CHAIN INSTITUTE COMET
INTRODUCTION
The H90 24h accumulated precipitation product derived from IODC service (presently Meteosat-8 at 41.5° East) has the same algorithm as H61B which is derived from the operational MSG satellite (presently Meteosat-11 at 0°). They are integrated from H63 (41.5°) and H60B (0°) respectively, unlike their predecessor H05B, which is integrated from H03B products. Since all H60B, H63 and H61B are under validation presently, the comparison of H90 to H61B should be complemented by comparison to H05B and to ground data as well. Hungary is in a good location for the comparison as it is situated between 16-23 degree latitude (East). The H90 products were available for validation in the period February to April 2021. Some cases from April 2021 were chosen. On 22 April we had convection evolved on a cold front but there were only small cells. It would be advantageous to do the comparison for summer cases as well. In Hungary in April 2021 was very cold, it was the 15th coldest since 1901. After a dry March the precipitation of April was around average. The number of the days with precipitation was around normal value but because of the unusual cold weather, there were more snow than usual on hilly parts of the country. DATA/PRODUCTS USED Product to validate:
24h accumulated precipitation values from the H90 products (EUMETSAT H SAF) derived from Meteosat-8 IODC service (41.5°E)
Reference data:
24h accumulated precipitation values from the H61B products (EUMETSAT H SAF) Precipitation values from the Hungarian radar network (OMSZ), precipitation from synop
data, operational H05B H SAF product (24h accumulated precipitation) SAF products, radar images and synop maps were visualised with the HAWK-3 (Hungarian Advanced Weather WorKStation) software, which is the operational visualisation tool developed by the Hungarian Meteorological Service. GENERAL COMPARISON OF H90 AND H63 ON GLOBAL SCALE

Product Validation Report - PVR-61-90
(Products H61B – P-AC-SEVIRI-PMW and H90 – P-AC-SEVIRI_E)
Doc. No: SAF/HSAF/PVR-61-90 Date: 27/02/2022 Page: 48/122
At first sight H61B and H90 resembles to each other on global scale and also to H05B (Figure 24 and Figure 25) but locally there can be bigger differences as well as it can see in the European zoom (Figure 26). In zoomed images some boxes can be seen originating from the H60B-H63 algorithm, where histograms are computed in 2.5x2.5 degree boxes. It is recommended to check why this features are so explicit, while in H60B-H63 precipitation fields the boxes are smoothed, only the quality map of H60B-H63 can show them. Of course the accumulation enhances such inhomogeneity. The edge of global images (Figure 24 and Figure 25) are cut differently and in H90 there are remaining noise at the edge. (It was observed in H63 images as well, depending on diurnal cycle. Maybe the Meteosat-8 to Meteosat-9 transition at IODC service will improve this, but it should be checked in spring 2022). In the figures H61B and H90 “nodata” pixels appear in grey like background, corresponding quality indices have 0 values for these pixels.
Figure 24: Comparison of H05B, H61B and H90 at 00:00 UTC 13 April 2021
Figure 25: Comparison of H05B, H61B and H90 at 00:00 UTC 15 April 2021

Product Validation Report - PVR-61-90
(Products H61B – P-AC-SEVIRI-PMW and H90 – P-AC-SEVIRI_E)
Doc. No: SAF/HSAF/PVR-61-90 Date: 27/02/2022 Page: 49/122
Figure 26: Comparison of H05B, H61B and H90 at 00:00 UTC 15 April 2021 in European subimage
On 6-7 April (Figure 27 and Figure 28) in every 6 hourly products the 24h accumulated rain of H90 resembles more to H05B than to H61B, which has lower precipitation values. Maybe some inputs were missing. When we check the quality files and Hungarian radar data for 6 April (Figure 29) we can see that the lower values of H61B are closer to ground data, and the corresponding quality flags are higher for H61B. On 7th April (Figure 30) the H90 product had higher quality flags for Hungary, the radar resembles to both products in Eastern Hungary but none of them in Western Hungary, where radar showed no rain.
Figure 27: Comparison of H05B, H61B and H90 at 00:00 UTC 06 April 2021.

Product Validation Report - PVR-61-90
(Products H61B – P-AC-SEVIRI-PMW and H90 – P-AC-SEVIRI_E)
Doc. No: SAF/HSAF/PVR-61-90 Date: 27/02/2022 Page: 50/122
Figure 28: Comparison of H05B, H61B and H90 at 00:00 UTC 07 April 2021.
Figure 29: Same as Fig 4 for Hungary with quality flags in the bottom line and radar data (bottom left)

Product Validation Report - PVR-61-90
(Products H61B – P-AC-SEVIRI-PMW and H90 – P-AC-SEVIRI_E)
Doc. No: SAF/HSAF/PVR-61-90 Date: 27/02/2022 Page: 51/122
Figure 30: Same as Fig 5 for Hungary with quality flags in the bottom line and radar data (bottom left)
For better understanding the behavior of the H90 H SAF products two cases were selected for detailed comparison. METEOROLOGICAL DESCRIPTION OF THE SELECTED CASES IN APRIL 2021 In April 2021 most of the precipitation was measured on 13th as it can be seen on Figure 31. Since H90 is a daily sum the following days were also compared. 22nd and the following day were chosen as there were convective rain as well and during H60B validation we found that it is better in convective situations.
Figure 31: Countrywide average of daily precipitation sum and their long term mean (mm)
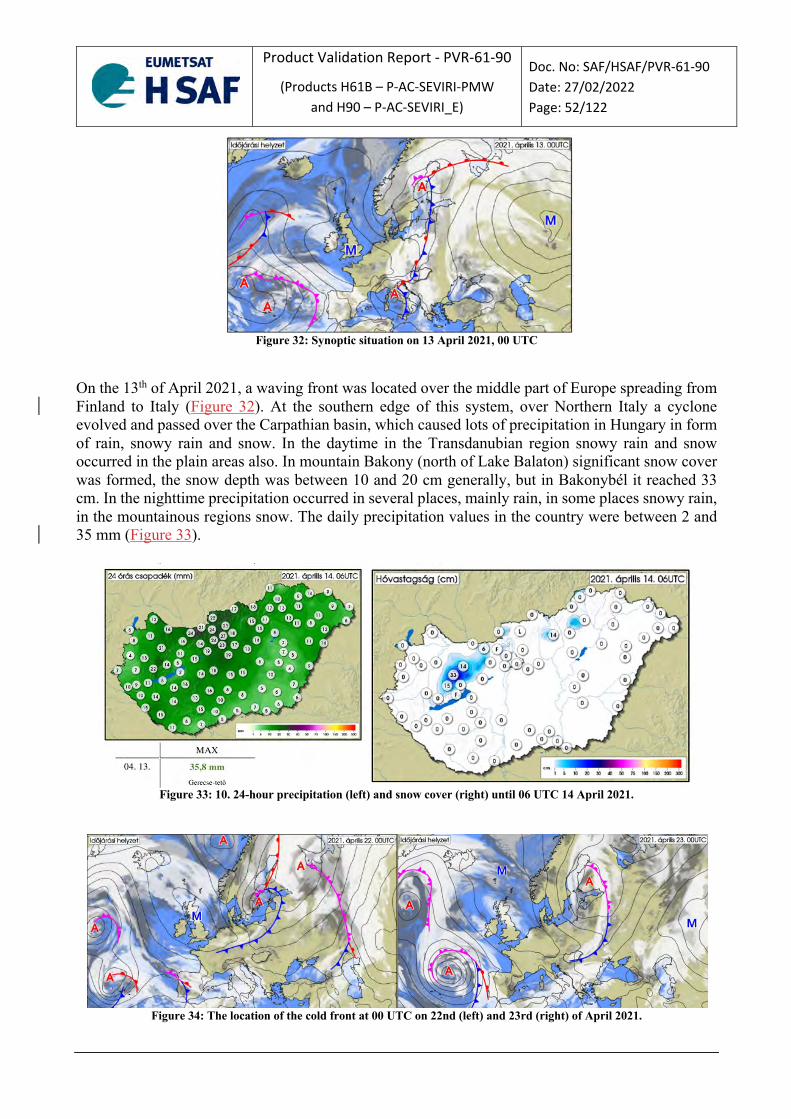
Product Validation Report - PVR-61-90
(Products H61B – P-AC-SEVIRI-PMW and H90 – P-AC-SEVIRI_E)
Doc. No: SAF/HSAF/PVR-61-90 Date: 27/02/2022 Page: 52/122
Figure 32: Synoptic situation on 13 April 2021, 00 UTC
On the 13th of April 2021, a waving front was located over the middle part of Europe spreading from Finland to Italy (Figure 32). At the southern edge of this system, over Northern Italy a cyclone evolved and passed over the Carpathian basin, which caused lots of precipitation in Hungary in form of rain, snowy rain and snow. In the daytime in the Transdanubian region snowy rain and snow occurred in the plain areas also. In mountain Bakony (north of Lake Balaton) significant snow cover was formed, the snow depth was between 10 and 20 cm generally, but in Bakonybél it reached 33 cm. In the nighttime precipitation occurred in several places, mainly rain, in some places snowy rain, in the mountainous regions snow. The daily precipitation values in the country were between 2 and 35 mm (Figure 33).
Figure 33: 10. 24-hour precipitation (left) and snow cover (right) until 06 UTC 14 April 2021.
Figure 34: The location of the cold front at 00 UTC on 22nd (left) and 23rd (right) of April 2021.

Product Validation Report - PVR-61-90
(Products H61B – P-AC-SEVIRI-PMW and H90 – P-AC-SEVIRI_E)
Doc. No: SAF/HSAF/PVR-61-90 Date: 27/02/2022 Page: 53/122
In the dawn of the 22nd of April 2021, a cold front spread from Finland over Poland to Luxembourg. During the day this quick-moving cold front passed over Hungary from northwest to southeast (Figure 34). The frontal cloud and the evolved convective clouds caused showers and thunderstorms in numerous places of the country, in some places even hail occurred. In the night precipitation ended in most parts of Hungary, but in the north-eastern counties showers, in mountain Bükk snow shower occurred. The daily sum of precipitation was between trace and 15 mm (Figure 35).
Figure 35: 24 h precipitation measured until 06:00 UTC on 23rd April 2021.
RESULTS OF COMPARISON During the detailed comparison we used the following fields, as they will appear in the images below (and also in Figure 29 and Figure 30):
1 2 3 4 5 6
1. H SAF H05B operational daily (24h) accumulated precipitation 2. H SAF H61B daily (24h) accumulated precipitation (0°) 3. H SAF H90 daily (24h) accumulated precipitation (41.5°E) 4. Composite accumulated (24h) precipitation field from the Radar Network of OMSZ - Hungarian
Meteorological Service 5. Quality flags of H61B 6. Quality flags of H90
For some cases an extra image is shown with 24h accumulation of precipitation measured by automated synop stations operated by OMSZ - Hungarian Meteorological Service and interpolated by GRISO software (generally used in H SAF verification) On the image at 00:00 UTC on 13th April (Figure 36) the ground reference values show, including synop data on Figure 38, the precipitation of the previous day at the North-Western part of Hungary, while at 06:00 UTC (Figure 37) already the Eastern part of the country is rainy. The H SAF

Product Validation Report - PVR-61-90
(Products H61B – P-AC-SEVIRI-PMW and H90 – P-AC-SEVIRI_E)
Doc. No: SAF/HSAF/PVR-61-90 Date: 27/02/2022 Page: 54/122
precipitation fields (all the H61B, H90 and the operational H05B) show the maximum values shifted to the East. The Eastern side of the country is better represented by H61B then H05B at 06:00 UTC.
Figure 36: Precipitation fields for 13 April 2021. 00:00 UTC

Product Validation Report - PVR-61-90
(Products H61B – P-AC-SEVIRI-PMW and H90 – P-AC-SEVIRI_E)
Doc. No: SAF/HSAF/PVR-61-90 Date: 27/02/2022 Page: 55/122
Figure 37: Precipitation fields for 13 April 2021. 06:00 UTC
Figure 38: 24 h precipitation from Synop stations interpolated by GRISO software for 00 UTC on 13 April 2021 F In the 14th April image (Figure 39) the maximum values are in the central part of the country in H05B which can be seen on ground data as well. The H61B field is inhomogeneous, strange stripes are cutting the image coming from the 2.5x2.5 degree box calculations of the H60B (15 minutes) products, as inputs for H61B product generation. H90 has also stripes but less and it resembles more to H05B and also to ground data.

Product Validation Report - PVR-61-90
(Products H61B – P-AC-SEVIRI-PMW and H90 – P-AC-SEVIRI_E)
Doc. No: SAF/HSAF/PVR-61-90 Date: 27/02/2022 Page: 56/122
Figure 39: Precipitation fields for 14 April 2021. 00:00 UTC
Figure 40: 24 h precipitation from Synop stations interpolated by GRISO software for 00 UTC on 14 April 2021
On 15th April at 00UTC (Figure 41) in the North-Eastern part of the country we can find similarity between H SAF fields and ground fields, but the precipitation field measured on the southern part is missing from H SAF products (all H05B, H61B and H90).

Product Validation Report - PVR-61-90
(Products H61B – P-AC-SEVIRI-PMW and H90 – P-AC-SEVIRI_E)
Doc. No: SAF/HSAF/PVR-61-90 Date: 27/02/2022 Page: 57/122
Figure 41: Precipitation fields for 15 April 2021. 00:00 UTC
Figure 42: Precipitation fields for 15 April 2021. 06:00 UTC
At 06 UTC (Figure 42) the differences are even higher. Fortunately, the low quality indexes warning us in case of Western Hungary. Synop values are similar to radar images (Figure 43)

Product Validation Report - PVR-61-90
(Products H61B – P-AC-SEVIRI-PMW and H90 – P-AC-SEVIRI_E)
Doc. No: SAF/HSAF/PVR-61-90 Date: 27/02/2022 Page: 58/122
Figure 43: 24 h precipitation from Synop stations interpolated by GRISO software for 00 (left) and 06 (right) UTC on 15
April 2021.
On 21 and 22 April there were some convective precipitations, on 22nd some thunderstorms were formed with lightning activity (see case study for H60B). The accumulated precipitation fields until 00UTC on 22 and 23 April can be seen on Figure 44 and Figure 45. H SAF fields resemble to radar and synop (Figure 46) data, but on 23rd higher than that. Quality flags show big uncertainty.
Figure 44: Precipitation fields for 22 April 2021. 00:00 UTC

Product Validation Report - PVR-61-90
(Products H61B – P-AC-SEVIRI-PMW and H90 – P-AC-SEVIRI_E)
Doc. No: SAF/HSAF/PVR-61-90 Date: 27/02/2022 Page: 59/122
Figure 45: Precipitation fields for 23 April 2021. 00:00 UTC
Figure 46: 24 h precipitation from Synop stations interpolated by GRISO software for 00 UTC on 22 (left) and 23 (right)
April 2021

Product Validation Report - PVR-61-90
(Products H61B – P-AC-SEVIRI-PMW and H90 – P-AC-SEVIRI_E)
Doc. No: SAF/HSAF/PVR-61-90 Date: 27/02/2022 Page: 60/122
FINAL COMMENTS The cases beginning of April were difficult to monitor by satellite due to the late snowfalls in April, which is not frequent in Hungary. The inhomogeneous fields originating from box-calculations of H63 (P-IN-SEVIRI_E) makes it difficult to use the product. Quality values should be used together with rain rate values. In the future there will be more and more microwave measurements, therefore more frequent update of collocating areas with MSG (MTG) will improve such geostationary H SAF products.

Product Validation Report - PVR-61-90
(Products H61B – P-AC-SEVIRI-PMW and H90 – P-AC-SEVIRI_E)
Doc. No: SAF/HSAF/PVR-61-90 Date: 27/02/2022 Page: 61/122
6 Conclusions The H61B (P-AC-SEVIRI-PMW) product has been validated by the PPVG over a period of ten-months of data (July 2020 – April 2021). Each Country/Team has provided long statistics analysis and case studies using ground data (radar and rain gauge) as reference following the common validation methodology reported in section 2. A huge effort has been made in the development of the Unique Common Code (UCC) used by all members of the validation cluster to improve it. The use of a UCC guarantees that the results obtained by every partner are obtained in the same way. In addition, a validation outside the European area was performed. The Quality Assessment of H61B product (24h time accumulation) was also evaluated over the full MSG disk coverage area using the TC methodology. This new validation procedure was developed by the CNR-IRPI and results were managed by Italian DPC and reported in this document. The Q. A. procedure takes into account the status of the background surface (including snow or frozen soil), the precipitation regime (deep convective, convective, stratiform and light stratiform) and the quality values by ground/reference datasets and by satellite estimates. Precipitation with poor and missing quality flags are rejected by the procedure that correspond to data seriously corrupted not suitable for validation. Each Country/Team has independently evaluated the quality of its radar data to optimize the satellite data validation. Much effort has been made to define a standard radar quality data. Also rain gauge quality data has been standardized to all members by use of the same interpolation method (GRISO). Different case studies have been reported in section 3 to better analyse the H61B product. Stratiform and convective precipitations during summer and winter periods have been analysed in different geographical regions. Rain gauges with high-frequency refresh time, radar data and nowcasting tools have been used to highlight different characteristics of the H SAF product. The case studies proposed have pointed out as H61B product shows good POD and CSI scores but generally tends to underestimate slightly all precipitation classes. In section 4 statistical analysis obtained for the whole period have been presented. To assess the degree of compliance of the product with user requirements, each Country/Team has provided the monthly statistical scores. The results have been showed using both European ground (radar and rain gauge) data over land, sea and coast areas and by TC methodology using measurements provided by GLDAS and GPCC projects. The results of the Precipitation Validation Programme are reported in this Product Validation Report (PVR). All results computed for H61B product in terms of product requirement ranges between threshold and target using both methodologies: TC over FD area and ground-data pixel-based comparison over EU area. Analysis highlights as H61B product shows a (negative) mean bias very close to zero, relatively high probability of detection of the precipitation, but a general trend to underestimate all precipitation classes, mainly higher accumulated classes. The inter-comparison in the overlapping area between H61B and H90 both based on SEVIRI sensors highlighted the strong relationship between the two products. The very close to zero bias (-0.5 mm/24h), the very high correlation (0.92) and the excellent detection of areas with the same accumulated precipitation confirm the equality of the two products based on SEVIRI sensors, independent of their different position in longitude (0° vs 41.5°E).

Product Validation Report - PVR-61-90
(Products H61B – P-AC-SEVIRI-PMW and H90 – P-AC-SEVIRI_E)
Doc. No: SAF/HSAF/PVR-61-90 Date: 27/02/2022 Page: 62/122
Appendix 1 Validation strategy, methods and tools The quality assessment procedure, methodologies and instruments used to assess the performances of precipitation products are described in this chapter.
A1.1 Validation team and work plan
To evaluate the satellite precipitation product accuracy, a Validation Group has been established by the beginning of the Validation Phase in the H SAF project. The Precipitation Product Validation team is composed of experts from the National Meteorological and Hydrological Institutes of Belgium, Bulgaria, Germany, Hungary, Italy, Poland, Slovakia, and Turkey (Table 20). Hydrologists, meteorologists, and precipitation ground data experts, coming from these countries are involved in the product validation activities (Table 21).
Table 20: Structure of the Precipitation products validation team.
Validation team for precipitation products
Name Institute Country e-mail Silvia Puca (Leader) Civil Protection Department (DPC) Italy [email protected]
Marco Petracca Civil Protection Department (DPC) National Research Council (CNR - ISAC) Italy [email protected]
Alexander Toniazzo Civil Protection Department (DPC) Italy [email protected]
Alessandra Mascitelli Civil Protection Department (DPC) Italy [email protected]
Gianfranco Vulpiani Civil Protection Department (DPC) Italy [email protected]
Emanuela Campione Civil Protection Department (DPC) Italy [email protected]
Pierre Baguis Royal Meteorological Institute of Belgium (RMI) Belgium [email protected]
Emmanuel Roulin Royal Meteorological Institute of Belgium (RMI) Belgium [email protected]
Eram Artinyan National Institute of Meteorology and Hydrology (NIMH) Bulgaria [email protected]
Petko Tsarev National Institute of Meteorology and Hydrology (NIMH) Bulgaria [email protected]
Georgy Koshinchanov
National Institute of Meteorology and Hydrology (NIMH) Bulgaria [email protected]
Claudia Rachimow Bundesanstalt für Gewässerkunde (BfG) Germany [email protected]
Peter Krahe Bundesanstalt für Gewässerkunde (BfG) Germany [email protected]
Márta Diószeghy Hungarian Meteorological Service (OMSZ) Hungary [email protected]
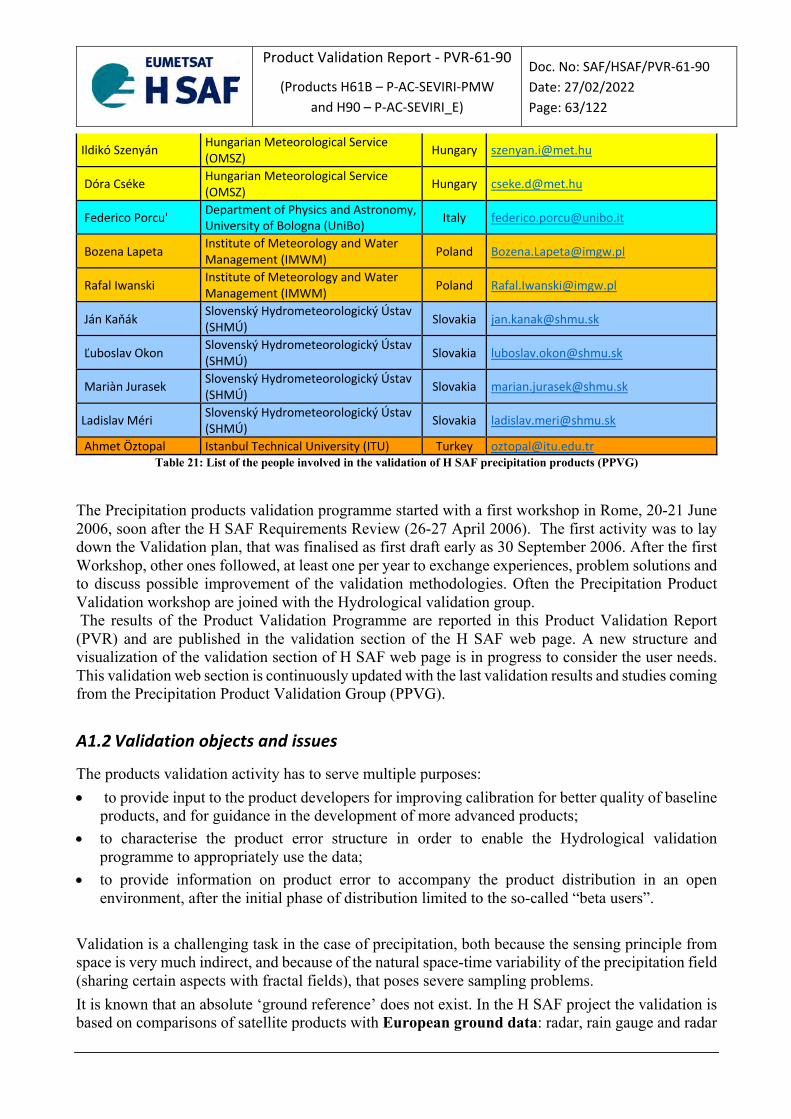
Product Validation Report - PVR-61-90
(Products H61B – P-AC-SEVIRI-PMW and H90 – P-AC-SEVIRI_E)
Doc. No: SAF/HSAF/PVR-61-90 Date: 27/02/2022 Page: 63/122
Ildikó Szenyán Hungarian Meteorological Service (OMSZ) Hungary [email protected]
Dóra Cséke Hungarian Meteorological Service (OMSZ) Hungary [email protected]
Federico Porcu' Department of Physics and Astronomy, University of Bologna (UniBo) Italy [email protected]
Bozena Lapeta Institute of Meteorology and Water Management (IMWM) Poland [email protected]
Rafal Iwanski Institute of Meteorology and Water Management (IMWM) Poland [email protected]
Ján Kaňák Slovenský Hydrometeorologický Ústav (SHMÚ) Slovakia [email protected]
Ľuboslav Okon Slovenský Hydrometeorologický Ústav (SHMÚ) Slovakia [email protected]
Mariàn Jurasek Slovenský Hydrometeorologický Ústav (SHMÚ) Slovakia [email protected]
Ladislav Méri Slovenský Hydrometeorologický Ústav (SHMÚ) Slovakia [email protected]
Ahmet Öztopal Istanbul Technical University (ITU) Turkey [email protected]
Table 21: List of the people involved in the validation of H SAF precipitation products (PPVG)
The Precipitation products validation programme started with a first workshop in Rome, 20-21 June 2006, soon after the H SAF Requirements Review (26-27 April 2006). The first activity was to lay down the Validation plan, that was finalised as first draft early as 30 September 2006. After the first Workshop, other ones followed, at least one per year to exchange experiences, problem solutions and to discuss possible improvement of the validation methodologies. Often the Precipitation Product Validation workshop are joined with the Hydrological validation group. The results of the Product Validation Programme are reported in this Product Validation Report (PVR) and are published in the validation section of the H SAF web page. A new structure and visualization of the validation section of H SAF web page is in progress to consider the user needs. This validation web section is continuously updated with the last validation results and studies coming from the Precipitation Product Validation Group (PPVG).
A1.2 Validation objects and issues
The products validation activity has to serve multiple purposes: • to provide input to the product developers for improving calibration for better quality of baseline
products, and for guidance in the development of more advanced products; • to characterise the product error structure in order to enable the Hydrological validation
programme to appropriately use the data; • to provide information on product error to accompany the product distribution in an open
environment, after the initial phase of distribution limited to the so-called “beta users”. Validation is a challenging task in the case of precipitation, both because the sensing principle from space is very much indirect, and because of the natural space-time variability of the precipitation field (sharing certain aspects with fractal fields), that poses severe sampling problems. It is known that an absolute ‘ground reference’ does not exist. In the H SAF project the validation is based on comparisons of satellite products with European ground data: radar, rain gauge and radar

Product Validation Report - PVR-61-90
(Products H61B – P-AC-SEVIRI-PMW and H90 – P-AC-SEVIRI_E)
Doc. No: SAF/HSAF/PVR-61-90 Date: 27/02/2022 Page: 64/122
integrated with rain gauge. During the Development phase some main problems have been pointed out. First of all, the importance to characterize the error associated to the ground data used by PPVG. Secondly to develop software for all steps of the Validation Procedure, a software available to all the members of the PPVG. The radar and rain gauge Working Group (WG) have been composed to solve these problems. In CDOP-3, with the release of more than 30 products over the MSG full disk area, the Validation Cluster had to develop new methodologies to compare precipitation estimates on almost global area coverage. The Associated Scientist analysis (H_AS16_03 DPC/CNR-ISAC 2016) has been identified the DPR (Dual-frequency Precipitation Radar) onboard of GPM-CO (Global Precipitation Measurement – Core Observatory) satellite as worthy instrument reference for the estimation of instantaneous precipitation on a global scale. In particular, the 2A-DPR NS V05 (DPR) was considered as most suitable product for potential use within the H SAF Precipitation Product Validation activity for instantaneous precipitation estimates. For more details, refer to Sebastianelli, 2017. For accumulated precipitation products, instead, the Triple Collocation (TC) methodology (Brocca et al., 2014) was used to perform the validation activity. TC requires the simultaneous availability of three products with mutually uncorrelated errors with similar spatial coverage, resolution and accumulation time. In the following three sections, the validation methodologies and data used as reference to perform the comparisons are described.
A1.3 Validation methodology respect to GROUND reference data From the beginning of the project it was clear the importance to define a common validation procedure in order to make the results obtained by several institutes comparable and to better understand their meanings. The main steps of this methodology have been identified during the development phase inside the validation group, in collaboration with the product developers, and with the support of ground data experts. This common procedure has given rise to a single common code for all members of the PPVG, named Unique Common Code (UCC). This common validation methodology is based on ground data (radar and rain gauge) comparisons to produce large statistic (multi-categorical and continuous), and case study analysis. Both components (large statistic and case study analysis) are considered complementary in assessing the accuracy of the implemented algorithms. Large statistics helps in identifying existence of pathological behaviour, selected case studies are useful in identifying the roots of such behaviour, when present. The main steps of the validation procedure are:
• ground data error analysis: radar and rain gauge; • point measurements (rain gauge) spatial interpolation; • up-scaling of radar data versus satellite grid (radar data gridded on satellite grid); • temporal comparison of precipitation products (satellite and ground); • statistical scores (continuous and multi-categorical) evaluation; • case study analysis.

Product Validation Report - PVR-61-90
(Products H61B – P-AC-SEVIRI-PMW and H90 – P-AC-SEVIRI_E)
Doc. No: SAF/HSAF/PVR-61-90 Date: 27/02/2022 Page: 65/122
Ground data and tools used for validation Both rain gauge and radar data have been used for H SAF product validation. Working groups have been set up to solve specific items in the validation procedure and to develop a common software. A complete knowledge of the ground-based data characteristics, used within the PPVG, was the first step necessary to define the procedure to select the most reliable data (ground reference) and to understand the validation results.
Figure 47: The network of 8,404 rain gauges used for H SAF precipitation products validation
The rain gauge networks of PPVG is composed of approximately 8400 stations across 8 Countries (Figure 47). A key characteristic of such networks is the distance between each raingauge and the closest one, averaged over all the instruments considered in the network and it is a measure of the raingauge density. Instruments number and density are summarized in the following Table 3.
Country Total number of gauges * Average minimum
distance (km) Belgium 92 15.2 Bulgaria 123 25.2 Germany 2,299 12.9 Hungary 270 17.0 Italy 2,934 11.3 Poland 540 24.0 Slovakia 911 13.6 Turkey 1,235 26.5
* the number of raingauges could vary from day to day due to operational efficiency within a maximum range of 10-15%.
Table 22: Number and density of raingauges within H SAF validation Group
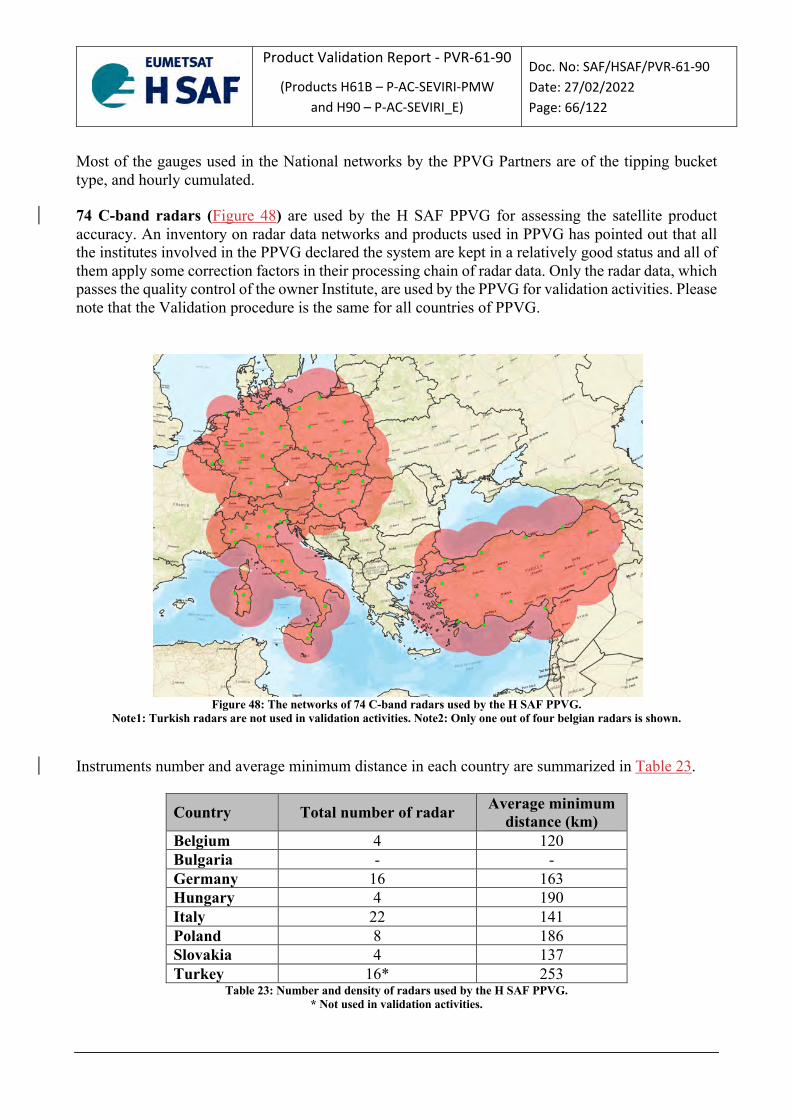
Product Validation Report - PVR-61-90
(Products H61B – P-AC-SEVIRI-PMW and H90 – P-AC-SEVIRI_E)
Doc. No: SAF/HSAF/PVR-61-90 Date: 27/02/2022 Page: 66/122
Most of the gauges used in the National networks by the PPVG Partners are of the tipping bucket type, and hourly cumulated. 74 C-band radars (Figure 48) are used by the H SAF PPVG for assessing the satellite product accuracy. An inventory on radar data networks and products used in PPVG has pointed out that all the institutes involved in the PPVG declared the system are kept in a relatively good status and all of them apply some correction factors in their processing chain of radar data. Only the radar data, which passes the quality control of the owner Institute, are used by the PPVG for validation activities. Please note that the Validation procedure is the same for all countries of PPVG.
Figure 48: The networks of 74 C-band radars used by the H SAF PPVG.
Note1: Turkish radars are not used in validation activities. Note2: Only one out of four belgian radars is shown.
Instruments number and average minimum distance in each country are summarized in Table 23.
Country Total number of radar Average minimum distance (km)
Belgium 4 120 Bulgaria - - Germany 16 163 Hungary 4 190 Italy 22 141 Poland 8 186 Slovakia 4 137 Turkey 16* 253
Table 23: Number and density of radars used by the H SAF PPVG. * Not used in validation activities.

Product Validation Report - PVR-61-90
(Products H61B – P-AC-SEVIRI-PMW and H90 – P-AC-SEVIRI_E)
Doc. No: SAF/HSAF/PVR-61-90 Date: 27/02/2022 Page: 67/122
Common procedure for the validation The UCC developed by PPVG during CDOP-2 and improved in CDOP-3 has been used to validate satellite data respect to radar and rain gauge data considered as ground reference.
Common procedure for the validation with RADAR data Selection of satellite pixels falling into the region of interest In order to avoid time-consuming useless calculation, every country restricts the validation to a specific Area of Interest (normally the area covered by the RADAR data of the country), which is detected implicitly by the common validation algorithm. Taking into account quality index information The UCC considers the quality index for each radar pixel. It depends mainly by distance from radar site and by interferences or beam-blocking. Each country independently calculates the quality of its data. This quality information is used for validation purposes since CDOP2. Selection of the RADAR data time-synchronous with the satellite ones The RADAR data whose temporal characteristics are congruent with the data of the satellite product to be compared (instantaneous or mean value or daily cumulated) are selected. For instantaneous acquisitions, the maximum time difference allowed for satellite comparison is 10 minutes. Up-scaling of RADAR data at the product satellite resolution Radar data, whose spatial resolution (0.25 ÷1 km) is typically greater than satellite products (5 ÷25 km), is rescaled to the satellite product grid (we refer it as “radar upscaled”). The information on the radar data density for each grid point is kept in order to eliminate those grid points that are not representative of the radar data (whose spatial coverage is limited or less than 50%). Calculation of corresponding satellite and RADAR rainfall values For each single satellite file, a separate up-scaling procedure reads the look up table and assigns to each satellite pixel the RADAR rainfall average calculated from the values of the radar pixels belonging to the satellite pixel in the look-up table. Averaging is simply arithmetical as investigations so far have shown that the averaging method does not have an impact on the statistical scores. The flag indicating if the satellite pixel is coast, land or sea is matched to each satellite-radar data pair calculated in this step.
Common procedure for the validation with RAIN GAUGE data Selection of satellite pixels falling into the region of interest: In order to avoid time-consuming useless calculation, every country restricts the validation to a specific Area of Interest (normally the area covered by the rain gauge data of the country), which is detected implicitly by the common validation algorithm. Selection of rain gauge data synchronous with the satellite ones Gauges with different cumulation intervals are considered, and if the interval is longer than the time resolution of the product (15 or 30 minutes), more satellite images are averaged. For H68 product two

Product Validation Report - PVR-61-90
(Products H61B – P-AC-SEVIRI-PMW and H90 – P-AC-SEVIRI_E)
Doc. No: SAF/HSAF/PVR-61-90 Date: 27/02/2022 Page: 68/122
consecutive images (2 x 30’ every image) are summed for comparing with one-hourly accumulated gauges. Interpolation of the rain gauge data: All partners of the Validation Group have been used the same interpolation technique, named GRISO (a like-Kriging interpolation technique for rain gauge data, Pignone et al. 2010; Feidas et al. 2018), to get spatially continuous rainfall maps (over 5x5 km grid) from individual gauge measurements. The GRISO technique is the interpolation method chosen for the common validation. Taking into account quality index information GRISO technique produces a quality index map for each instantaneous acquisition as function of distance from each rain gauge station. This quality information was used for validation purposes in CDOP2. Matching between satellite and rain gauge data: The satellite data is matched with the rain gauge interpolated grid using the nearest-neighbor method.
A1.4 Validation methodology of INstantaneous precipitation products over Full Disk coverage
As the validation with respect to ground data, even this methodology was developed in communion with European experts belonging to the VC. But, differently from the first one, this is not performed by all countries but only by Italian DPC because all DPR products over global area are freely available from GPM website. All instantaneous satellite precipitation products, with extension area over FD area, are evaluated following these main steps:
• regridding of DPR and H SAF data versus a regular 0.5° equi-distance grid; • temporal and spatial matching between precipitation products; • statistical scores (continuous and multi-categorical) evaluation;
The methodology, as the previous one, produces large statistic (multi-categorical and continuous) scores.
DPR products used for validation The spatial coverage of both rain gauge and ground radar networks is not suitable to detect precipitation on a global scale. At the contrary, satellite observations provide estimates on a synoptic scale, although there are some issues related to their accuracy. It was discussed in the Visiting Associated analysis in comparison with ground radar network (Sebastianelli, 2017). The DPR is a Dual frequency Precipitation Radar located on board of the GPM Core Observatory (Figure 49). It uses the Ka (~35 GHz) and Ku bands (~13 GHz) to construct three-dimensional precipitation and drop size distribution maps. The GPM Core Observatory (Figure 49) flies in a non-sun-synchronous orbit at 65° inclination to cover a larger latitudinal extension with respect to the TRMM orbit, which extended from 35°S to 35°N. Both Ku- and Ka-band radars perform cross-track type scans (perpendicular to the direction of the satellite motion) estimating the precipitation during the day and the night over land and ocean. The Ku-band radar performs a normal scan (NS) acquisition mode that is composed by 49 footprints (IFOV) of 5 km in diameter. In fact, away from the scanning center,
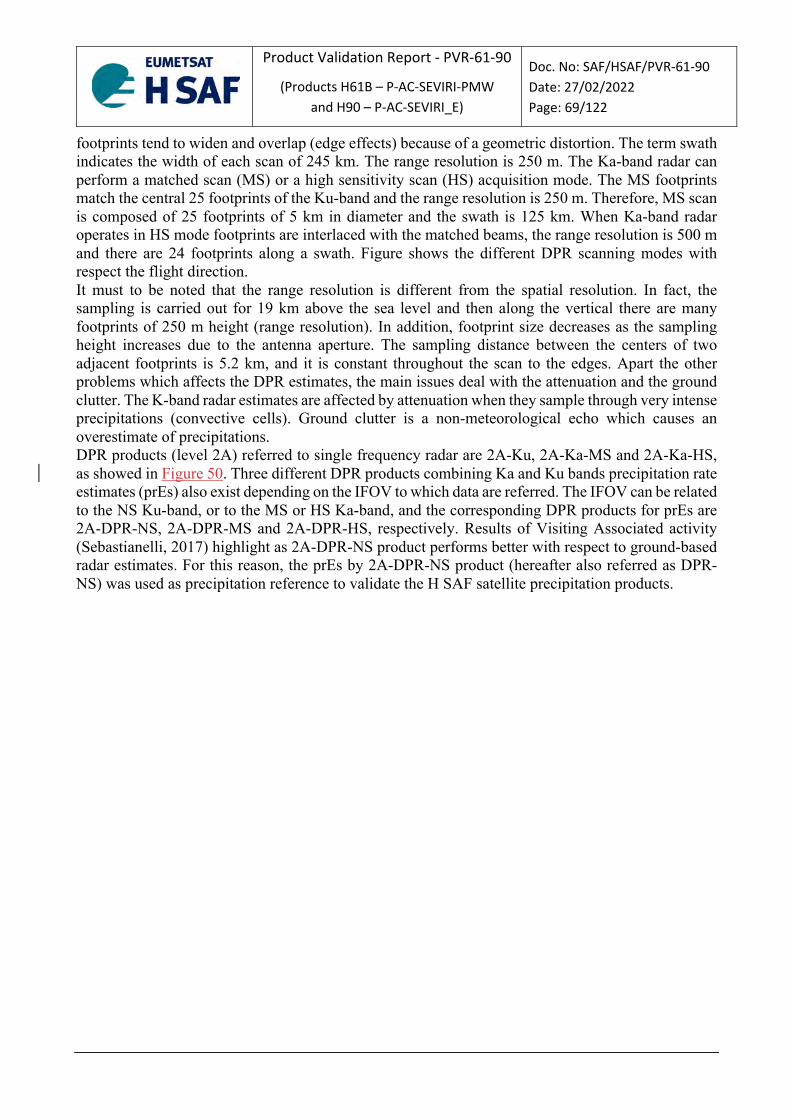
Product Validation Report - PVR-61-90
(Products H61B – P-AC-SEVIRI-PMW and H90 – P-AC-SEVIRI_E)
Doc. No: SAF/HSAF/PVR-61-90 Date: 27/02/2022 Page: 69/122
footprints tend to widen and overlap (edge effects) because of a geometric distortion. The term swath indicates the width of each scan of 245 km. The range resolution is 250 m. The Ka-band radar can perform a matched scan (MS) or a high sensitivity scan (HS) acquisition mode. The MS footprints match the central 25 footprints of the Ku-band and the range resolution is 250 m. Therefore, MS scan is composed of 25 footprints of 5 km in diameter and the swath is 125 km. When Ka-band radar operates in HS mode footprints are interlaced with the matched beams, the range resolution is 500 m and there are 24 footprints along a swath. Figure shows the different DPR scanning modes with respect the flight direction. It must to be noted that the range resolution is different from the spatial resolution. In fact, the sampling is carried out for 19 km above the sea level and then along the vertical there are many footprints of 250 m height (range resolution). In addition, footprint size decreases as the sampling height increases due to the antenna aperture. The sampling distance between the centers of two adjacent footprints is 5.2 km, and it is constant throughout the scan to the edges. Apart the other problems which affects the DPR estimates, the main issues deal with the attenuation and the ground clutter. The K-band radar estimates are affected by attenuation when they sample through very intense precipitations (convective cells). Ground clutter is a non-meteorological echo which causes an overestimate of precipitations. DPR products (level 2A) referred to single frequency radar are 2A-Ku, 2A-Ka-MS and 2A-Ka-HS, as showed in Figure 50. Three different DPR products combining Ka and Ku bands precipitation rate estimates (prEs) also exist depending on the IFOV to which data are referred. The IFOV can be related to the NS Ku-band, or to the MS or HS Ka-band, and the corresponding DPR products for prEs are 2A-DPR-NS, 2A-DPR-MS and 2A-DPR-HS, respectively. Results of Visiting Associated activity (Sebastianelli, 2017) highlight as 2A-DPR-NS product performs better with respect to ground-based radar estimates. For this reason, the prEs by 2A-DPR-NS product (hereafter also referred as DPR-NS) was used as precipitation reference to validate the H SAF satellite precipitation products.
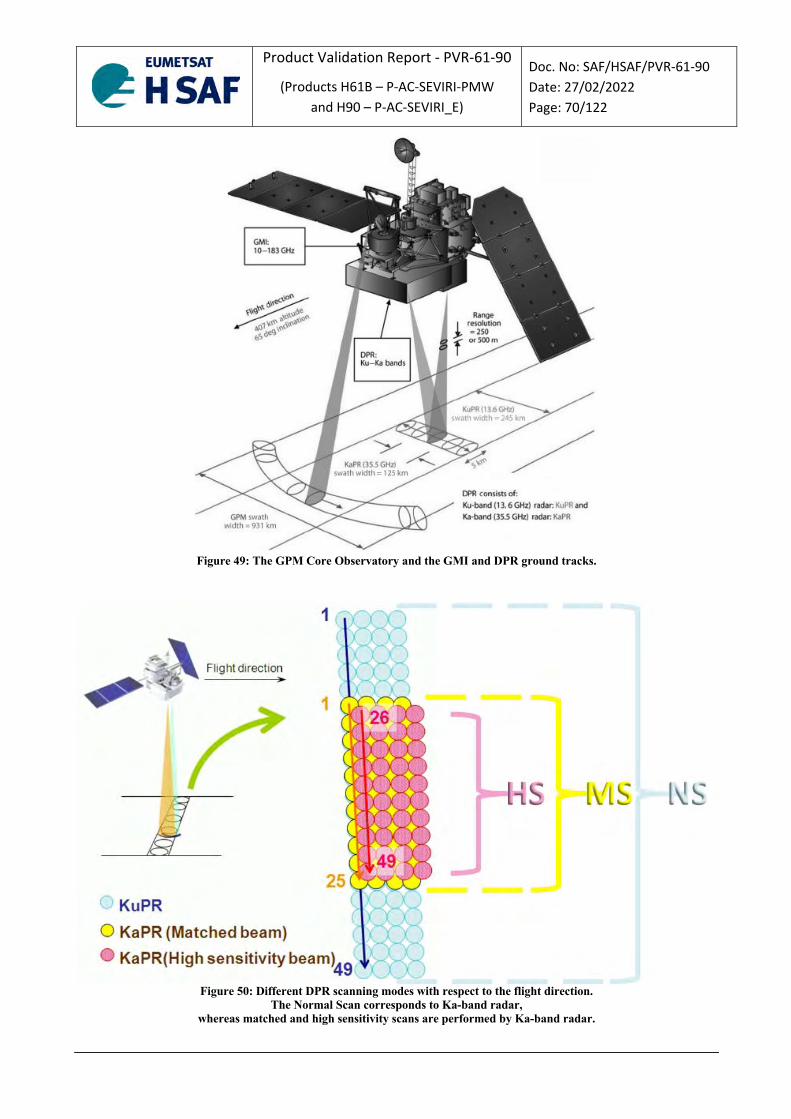
Product Validation Report - PVR-61-90
(Products H61B – P-AC-SEVIRI-PMW and H90 – P-AC-SEVIRI_E)
Doc. No: SAF/HSAF/PVR-61-90 Date: 27/02/2022 Page: 70/122
Figure 49: The GPM Core Observatory and the GMI and DPR ground tracks.
Figure 50: Different DPR scanning modes with respect to the flight direction.
The Normal Scan corresponds to Ka-band radar, whereas matched and high sensitivity scans are performed by Ka-band radar.

Product Validation Report - PVR-61-90
(Products H61B – P-AC-SEVIRI-PMW and H90 – P-AC-SEVIRI_E)
Doc. No: SAF/HSAF/PVR-61-90 Date: 27/02/2022 Page: 71/122
Common procedure for the validation with DPR-NS The comparison between DPR-NS and H SAF precipitation products is performed following the procedure below described. Selection of synchronous data (first check) Both DPR and H SAF filenames contain the start and finish time. Only files with consistent time intervals are considered and evaluated to avoid time-consuming useless computation. Data re-gridding over regular grid Both, DPR and H SAF data are re-gridded over the same equi-distance 0.5° grid. All satellite parameter (continuous) values are averaged over the new grid cell. For discrete parameters (such as sea/coast/land flag or precipitation phase flag) the most frequent value is considered. Temporal and spatial matching between the two regridded data DPR and H SAF gridded data are temporal- and spatial- matched. Only overlapping grid cells with maximum time difference within ±15 minutes (from the average time of validity of the H SAF product) are stored and evaluated for statistical score analysis.
A1.5 Validation methodology of ACcumulated precipitation products over Full Disk coverage
In order to assess the quality of accumulated precipitation products over FD area the new TC methodology analysis was successfully tested by Brocca et al. (2014). This technique requires three wholly independent rainfall datasets on global scale without the availability of ground-based rainfall accumulation data. Given three estimates of the same variable, the main assumptions of the TC method are the (i) stationarity of the statistics, (ii) linearity between the three estimates (vs. the same target) across all timescales and (iii) existence of uncorrelated error between the three estimates. TC provides error and correlations of three products if each of the ones is afflicted by mutually independent errors. The main steps of the TC validation procedure are:
• temporal (daily) and spatial (0.5° x 0.5° grid) matching between three precipitation datasets; • TC main procedure; • statistical scores (continuous and multi-categorical) evaluation;
The methodology, as the previous one, produces large statistic (multi-categorical and continuous) scores. For more details on the TC main procedure, see the H SAF Visiting Scientist Final Report titled “Leveraging coincident soil moisture and precipitation products for improved global validation of

Product Validation Report - PVR-61-90
(Products H61B – P-AC-SEVIRI-PMW and H90 – P-AC-SEVIRI_E)
Doc. No: SAF/HSAF/PVR-61-90 Date: 27/02/2022 Page: 72/122
satellite-based rainfall products” by Chen F. and Crow W. T. : https://hsaf.meteoam.it/VisitingScientist/GetDocument?fileName=Final_Report_H_AS18_04.pdf
Data and products used In this analysis, TC is applied to the rainfall accumulation estimates derived from H SAF satellite product and by GPCC (Global Precipitation Climatology Centre, https://climatedataguide.ucar.edu/climate-data/gpcc-global-precipitation-climatology-centre) and GLDAS (Global Land Data Assimilation System, https://ldas.gsfc.nasa.gov/gldas) projects.
GPCC The GPCC provides gridded gauge-analysis products derived from quality-controlled station data. In this analysis is used the GPCC First Guess Daily Product (hereafter named as GPCC): daily global land-surface precipitation based on the station database (SYNOP) available via the Global Telecommunication System (GTS) of the World Meteorological Organization (WMO) at the time of analysis (3 - 5 days after end of the analysis month). This product contains the daily totals for a month on a regular latitude/longitude grid with a spatial resolution of 1.0° x 1.0° latitude by longitude. Interpolation is made for the daily relative quota of the monthly total, i.e., the daily total divided by the monthly total, the latter has the DOI:10.5676/DWD_GPCC/FG_M_100. The temporal coverage of the dataset ranges from January 2009 to the most recent month for which GTS based SYNOP data is available, i.e. the previous month, 3-5 days after its completion. In Figure 51 is shown an example of spatial extension and resolution of the GPCC product.

Product Validation Report - PVR-61-90
(Products H61B – P-AC-SEVIRI-PMW and H90 – P-AC-SEVIRI_E)
Doc. No: SAF/HSAF/PVR-61-90 Date: 27/02/2022 Page: 73/122
Figure 51: Example of data available in GPCC. The daily precipitation data used in TC methodology have the spatial extent
as shown in the figure and the spatial resolution of 1.0 degree
GLDAS NASA Global Land Data Assimilation System Version 2 (GLDAS-2) has three components: GLDAS-2.0, GLDAS-2.1, and GLDAS-2.2. GLDAS-2.0 is forced entirely with the Princeton meteorological forcing input data and provides a temporally consistent series from 1948 through 2014. GLDAS-2.1 is forced with a combination of model and observation data from 2000 to present. GLDAS-2.2 product suites use data assimilation (DA), whereas the GLDAS-2.0 and GLDAS-2.1 products are "open-loop" (i.e., no data assimilation). The choice of forcing data, as well as DA observation source, variable, and scheme, vary for different GLDAS-2.2 products. The 3-hourly data product was simulated with the Noah Model 3.6 in Land Information System (LIS) Version 7 (https://lis.gsfc.nasa.gov/sites/default/files/LIS/public_7_3_releases/LIS_usersguide.06-dec-2021.pdf). The data product contains 36 land surface fields from January 2000 to present. In this analysis GLDAS-2.1 data are used. These data are archived and distributed in NetCDF format (DOI:10.5067/E7TYRXPJKWOQ). In Figure 52 is shown an example of spatial extension and resolution of the GLDAS product used.

Product Validation Report - PVR-61-90
(Products H61B – P-AC-SEVIRI-PMW and H90 – P-AC-SEVIRI_E)
Doc. No: SAF/HSAF/PVR-61-90 Date: 27/02/2022 Page: 74/122
Figure 52: Example of data available in GLDAS. The 3-hourly precipitation data used in TC methodology have the spatial
extent as shown in the figure and the spatial resolution of 0.25 degree
GLDAS 2.1 uses GPCC observations via the ingestion of the disaggregated Global Precipitation Climatology Project (GPCP) V1.3 Daily Analysis precipitation fields. In order to assess whether this has an impact on the TC analysis, pixel-based cross-correlated errors between GPCC and GLDAS by quadruple collocation (QC) analysis have been calculated (Perdicca et al., 2015, Gruber et al., 2016) using GPCC first guess data, GLDAS 2.1, ERA5 and SM2RAIN-ASCAT derived daily rainfall at the global scale. QC is a viable way to estimate the cross-correlated errors between two of the datasets included in the quadruplet (see Chen et al. 2020). The analysis has been carried out at 0.25° of spatial resolution for the year 2017. Despite the use of a single year, the analysis shows that cross correlated errors between GPCC and GLDAS are very low (R=0.05 in median). If we zoom over the H SAF Extended Area (HEA) the median value decreases to 0.044 (see Figure 53 and Figure 54). In the inset it is reported the histogram of the R-values, showing how most of the pixels provided very low values of error correlation. This point should assure the independence of the datasets used for performing the analysis and thus, should allow to use TC analysis for validating H SAF products not only over the HEA, but also at the global scale.

Product Validation Report - PVR-61-90
(Products H61B – P-AC-SEVIRI-PMW and H90 – P-AC-SEVIRI_E)
Doc. No: SAF/HSAF/PVR-61-90 Date: 27/02/2022 Page: 75/122
Figure 53: Cross correlated errors between GPCC and GLDAS over global scale for the year 2017.
Figure 54: Cross correlated errors between GPCC and GLDAS over H SAF extened area for the year 2017.

Product Validation Report - PVR-61-90
(Products H61B – P-AC-SEVIRI-PMW and H90 – P-AC-SEVIRI_E)
Doc. No: SAF/HSAF/PVR-61-90 Date: 27/02/2022 Page: 76/122
A1.6 Inter-comparison procedure between two SEVIRI FD products The product H63 is available from February 2021. At the time the analysis of the product started, a dataset limited to 3 months (FMA) is available. For this reason, it is not possible to assess the quality of the product H63 using the methodology as above described. It was therefore agreed to compare H63 with H60B on the common area in order to extend the Q.A. results obtained for H60B to H63. Both products share a common domain comprising Europe and Africa, as shown below in Figure 55.
Figure 55: Coverage areas for H60B (blue) and H63 (green) products. Overlapped H63-H60B area is highlighted in red.
In order to perform the comparison, it was decided to exclude the area close to the edges as it was not observed very well by the SEVIRI sensors. An a-priori mask was then applied to both products to

Product Validation Report - PVR-61-90
(Products H61B – P-AC-SEVIRI-PMW and H90 – P-AC-SEVIRI_E)
Doc. No: SAF/HSAF/PVR-61-90 Date: 27/02/2022 Page: 77/122
exclude the pixels close to the edge. In the figure below (Figure 56) the domains are shown after the application of the edge mask.
Figure 56: Border-masked areas for H60B (blue) and H63 (green) products.
The overlapped H63-H60B area analyzed is highlighted in purple.
Subsequently, the corresponding nearest pixel point (NN) belonging to the domain of H60B was identified for each pixel point of H63. The search for the nearest point was limited to a distance of 6 km. The threshold was defined by assessing how the total coverage varies as a function of distance:

Product Validation Report - PVR-61-90
(Products H61B – P-AC-SEVIRI-PMW and H90 – P-AC-SEVIRI_E)
Doc. No: SAF/HSAF/PVR-61-90 Date: 27/02/2022 Page: 78/122
as shown in Figure 57, at a distance of 6km the 80% of the domain is considered in the analysis, while for much greater distances the percentage of coverage does not increase appreciably.
Figure 57: Extension of area (fraction) respect to the overlapped area
as function of the distance among nearest neighbor (NN) pixels (H63 vs H60B). More than 80% of domain is covered for distance equals to 6 km.
The data pairs thus identified were processed and analysed in order to generate continuous and multi-categorical statistics as described below, as well as an analysis of a case study occurring in Europe within the available dataset. The results obtained are presented in the section 5.
A1.7 Large statistic The large statistical analysis allows to point out the existence of pathological behavior in the satellite product performance. The application of the same validation technique step by step is guaranteed in all institutes take part of the PPVG and in both validation methodologies above described. The large statistical analysis in PPVG is based on the evaluation of monthly and seasonal Continuous verification and Multi-Categorical statistical scores on one full year of data. It was decided to evaluate both continuous and multi-categorical statistics to give a complete view of the error structure associated to the H SAF product. Since the accuracy of precipitation measurements depends on the type of precipitation or, to simplify matters, on the intensity or accumulated precipitation, the verification is carried out on three precipitation classes (for accumulated precipitation products) as descripted in Table 24: Classes for evaluating cumulated precipitation products.

Product Validation Report - PVR-61-90
(Products H61B – P-AC-SEVIRI-PMW and H90 – P-AC-SEVIRI_E)
Doc. No: SAF/HSAF/PVR-61-90 Date: 27/02/2022 Page: 79/122
Accumulated Precipitation Classes (CR)
1 2 3 ≥ 1 mm/24h ≥5 mm/24h ≥ 10 mm/24h
Table 24: Classes for evaluating cumulated precipitation products
The impact of different background is also considered in the product performances. Statistical scores are separately computed for land, sea and coast areas. The Precipitation Product Validation Leader collects all validation results as computed by European institutes, verifies the consistency of these results and evaluates the monthly and seasonal common statistical results as reported in Chapter 4.
Continuous statistics Continuous statistics are provided for each month and season of assessment. The main statistical scores are here listed:
Score Acronym Range Perfect score Calculation
Number of Satellite samples NS N.A. N.A. N.A.
Number of Reference (radar/rain gauge) samples
N N.A. N.A. N.A.
Mean Error or Bias ME - ∞ to ∞ 0
Mean Absolute Error
MAE 0 to ∞ 0
Standard Deviation
SD 0 to ∞ 0
Multiplicative Bias MB - ∞ to ∞ 1
Correlation Coefficient CC - 1 to 1 1
Root Mean Square Error (or Root Mean Square Difference)
RMSE 0 to ∞ 0
Fractional Standard Error (%) FSE 0 to ∞ 0 FSE = [RMSE / 𝑜𝑏𝑠$$$$$] *100%
Table 25: Continuous statistical scores
In the Table 25: - N represents the total number of observation samples and equivales to all satellite/observation pairs for computing all the statistical scores;
å=
-=N
1kkk )obs(sat
N1ME
å=
-=N
1kkk |obssat|
N1MAE
( )å=
--=N
1k
2kk MEobssat
N1SD
MB =
1N
satK1
N
∑1N
obsK1
N
∑
( )å=
-=N
1k
2kk obssat
N1RMSE

Product Validation Report - PVR-61-90
(Products H61B – P-AC-SEVIRI-PMW and H90 – P-AC-SEVIRI_E)
Doc. No: SAF/HSAF/PVR-61-90 Date: 27/02/2022 Page: 80/122
- NS indicates the number of product satellite estimates with given characteristics (e.g.; with estimated rain rate > 1 mm/h); - the index “k” represents the spatial and temporal grid point at the scale of the common reference grid; - obs and sat stand for rainfall value acquired by reference observations and satellite estimations, respectively. The FSE score represents the accuracy for H SAF satellite precipitation products. The User requirements thresholds are below indicated: Accuracy for CR ≥ 1 mm/daily Threshold Target Optimal FSE% = 200% FSE% = 150% FSE% = 100%
Table 26: Precipitation products user requirements (UR)
The FSE score is not appropriate to define the accuracy in the TC methodology. In this case the Correlation Coefficient (CC) is used to define the product accuracy with thresholds as below indicated: Accuracy for all precipitation rates (CR ≥ 0 mm/daily) Threshold Target Optimal CC = 0.50 CC = 0.65 CC = 0.80
Table 27: UR for accumulated precipitation products using TC methodology
Multi Categorical statistics Multi categorical statistics are derived by the following contingency table:
Observation yes no total
yes hits false alarms forecast yes Satellite no misses correct negatives forecast no
total observed yes observed no total Table 28: Multi-categorical statistics contingency table
where: hit: Satk≥Rth and Obsk≥Rth miss: Satk<Rth and Obsk≥Rth false alarm: Satk≥Rth and Obsk<Rth correct negative: Satk<Rth and Obsk<Rth Rth is the threshold between the “rain” and “no rain” conditions. The scores evaluated from the contingency table are:

Product Validation Report - PVR-61-90
(Products H61B – P-AC-SEVIRI-PMW and H90 – P-AC-SEVIRI_E)
Doc. No: SAF/HSAF/PVR-61-90 Date: 27/02/2022 Page: 81/122
Score Acronym Range Perfect score Calculation
Probability Of Detection POD 0 to 1 1
False Alarm Rate FAR 0 to 1 0
Critical Success Index CSI 0 to 1 1
Table 29: Multi-categorical statistics scores
A1.8 Case study analysis
Each institute, in addition to the large statistics verification, produces a case study analysis based on the knowledge and experience of the institute itself, following a standard format as below reported. The institute decides whether to use ancillary data such as lightning data, SEVIRI images, the output of numerical weather prediction and nowcasting products. The main sections of the standard format are: • description of the meteorological event; • comparison of ground data and satellite products; • visualization of ancillary data; • discussion of the satellite product performances; • indication on the ground data (if requested) availability into the H SAF project. Case study analysis are reported in Chapter 3.
References Chen, F., Crow, W.T., Ciabatta, L., Filippucci, P., Panegrossi, G., Marra, A.C., Puca, S., Massari, C., 2020. Enhanced large-scale validation of satellite-based land rainfall products. Journal of Hydrometeorology 1. https://doi.org/10.1175/JHM-D-20-0056.1 Feidas, H., F. Porcù, S. Puca, A. Rinollo, C. Lagouvardos, and V. Kotroni, 2018: Validation of the H SAF precipitation prod- uct H03 over Greece using rain gauge data. Theor. Appl. Cli- matol., 131, 377–398, https://doi.org/10.1007/s00704-016-1981-9. Gruber, A., C.-H. Su, W. T. Crow, S. Zwieback, W. A. Dorigo, and W. Wagner, 2016a: Estimating error cross-correlation in soil moisture data sets using extended collocation analysis. J. Geophys. Res. Atmos., 121, 1208–1219. Pierdicca, N., F. Fascetti, L. Pulvirenti, R. Crapolicchio, and J. Muñoz-Sabater, 2015: Quadruple collocation analysis for soil moisture product assessment. IEEE Geosci. Remote Sens. Lett., 12, 1595–1599. Pignone, F., N. Rebora, F. Silvestro, and F. Castelli, 2010: GRISO (Generatore Random di Interpolazioni Spaziali da Osservazioni incerte) - Piogge. Rep. 272/2010, 353 pp.
yesobservedhits
misseshitshitsPOD =+
=
yesforecastalarmsfalse
alarmsfalsehitsalarmsfalseFAR =
+=
alarmfalsemisseshitshitsCSI++
=

Product Validation Report - PVR-61-90
(Products H61B – P-AC-SEVIRI-PMW and H90 – P-AC-SEVIRI_E)
Doc. No: SAF/HSAF/PVR-61-90 Date: 27/02/2022 Page: 82/122
Sebastianelli, 2017: Potentials and limitations of the use of GPM-DPR for validation of H SAF precipitation products: study over the Italian territory, Associated Visiting Scientist H SAF, Final Report,116 pp. https://hsaf.meteoam.it/VisitingScientist/GetDocument?fileName=Final_Report_Stefano_Sebastianelli.pdf
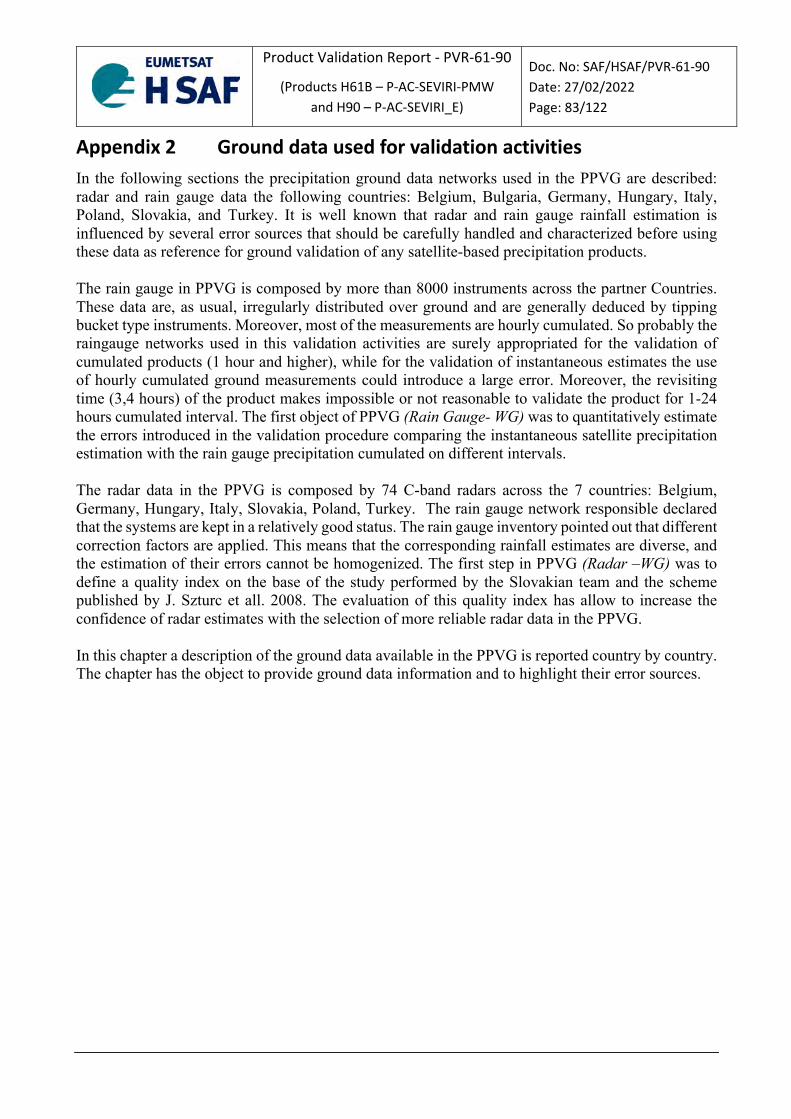
Product Validation Report - PVR-61-90
(Products H61B – P-AC-SEVIRI-PMW and H90 – P-AC-SEVIRI_E)
Doc. No: SAF/HSAF/PVR-61-90 Date: 27/02/2022 Page: 83/122
Appendix 2 Ground data used for validation activities In the following sections the precipitation ground data networks used in the PPVG are described: radar and rain gauge data the following countries: Belgium, Bulgaria, Germany, Hungary, Italy, Poland, Slovakia, and Turkey. It is well known that radar and rain gauge rainfall estimation is influenced by several error sources that should be carefully handled and characterized before using these data as reference for ground validation of any satellite-based precipitation products. The rain gauge in PPVG is composed by more than 8000 instruments across the partner Countries. These data are, as usual, irregularly distributed over ground and are generally deduced by tipping bucket type instruments. Moreover, most of the measurements are hourly cumulated. So probably the raingauge networks used in this validation activities are surely appropriated for the validation of cumulated products (1 hour and higher), while for the validation of instantaneous estimates the use of hourly cumulated ground measurements could introduce a large error. Moreover, the revisiting time (3,4 hours) of the product makes impossible or not reasonable to validate the product for 1-24 hours cumulated interval. The first object of PPVG (Rain Gauge- WG) was to quantitatively estimate the errors introduced in the validation procedure comparing the instantaneous satellite precipitation estimation with the rain gauge precipitation cumulated on different intervals. The radar data in the PPVG is composed by 74 C-band radars across the 7 countries: Belgium, Germany, Hungary, Italy, Slovakia, Poland, Turkey. The rain gauge network responsible declared that the systems are kept in a relatively good status. The rain gauge inventory pointed out that different correction factors are applied. This means that the corresponding rainfall estimates are diverse, and the estimation of their errors cannot be homogenized. The first step in PPVG (Radar –WG) was to define a quality index on the base of the study performed by the Slovakian team and the scheme published by J. Szturc et all. 2008. The evaluation of this quality index has allow to increase the confidence of radar estimates with the selection of more reliable radar data in the PPVG. In this chapter a description of the ground data available in the PPVG is reported country by country. The chapter has the object to provide ground data information and to highlight their error sources.

Product Validation Report - PVR-61-90
(Products H61B – P-AC-SEVIRI-PMW and H90 – P-AC-SEVIRI_E)
Doc. No: SAF/HSAF/PVR-61-90 Date: 27/02/2022 Page: 84/122
A1.1 Ground data in Belgium (IRM)
Radar Data
The network There are four radars in Belgium (Figure 58 and Table 30): two operated by the RMI (in Wideumont - Ardennes range - and Jabbeke - near the coast), one by Belgocontrol (Zaventem airport near Brussels) and the radar coverage is also provided by a fourth radar in France, operated by Meteo France. Of particular interest is the Wideumont radar, located in one of the highest locations of the country with clear horizon in every direction. This is very important in order to have the best possible precipitation picture in this hilly area giving rise to many tributaries of the Meuse river.
Figure 58: Meteorological radars in Belgium (elevation data from Danielson, J.J., and Gesch, D.B., 2011, Global multi-
resolution terrain elevation data 2010 (GMTED2010): U.S. Geological Survey Open-File Report 2011–1073, 26 p.)
Radar location Frequency Band Polarization Reflectivity Z = aRˆb Wideumont C Single a = 200, b = 1.6 Jabbeke C Dual a = 200, b = 1.6 Zaventem C Single a = 200, b = 1.6 Avesnes C Dual a = 200, b = 1.6
Table 30: Meteorological radars in Belgium, main features
Data processing Raw reflectivity data are contaminated by off-shore wind farms and marine traffic clutter over the North Sea. The sea clutter is detected and removed using the module available in Selex Rainbow 5

Product Validation Report - PVR-61-90
(Products H61B – P-AC-SEVIRI-PMW and H90 – P-AC-SEVIRI_E)
Doc. No: SAF/HSAF/PVR-61-90 Date: 27/02/2022 Page: 85/122
software for this purpose. Rainfall rate estimation is based on a PCAPPI at a given height (depending on the radar) combined with the Marshall-Palmer relationship between reflectivity and rainrate. For grid points where several estimates are available from different radars, the maximum value is taken. A 5-min accumulation is generated based on the rainrates at t and t-5. If the rainrate at t-5 is missing, the rainrate at t-10 is used to generate the 5-min accumulations at both t and t-5. This means than 1 missing file is tolerated. Accumulations of higher durations are made by summing accumulations of lower duration. Acknowledgement (elevation data for the radar map) Danielson, J.J., and Gesch, D.B., 2011, Global multi-resolution terrain elevation data 2010 (GMTED2010): U.S. Geological Survey Open-File Report 2011–1073, 26 p.

Product Validation Report - PVR-61-90
(Products H61B – P-AC-SEVIRI-PMW and H90 – P-AC-SEVIRI_E)
Doc. No: SAF/HSAF/PVR-61-90 Date: 27/02/2022 Page: 86/122
A1.2 Ground data in Bulgaria (NIMH)
Rain gauge The network The maximum number of available manually measured daily accumulated rain gauges is up-to 300, irregularly distributed over the country. These stations are measured every day at 6:30 UTC by emptying the collected in the past 24hours rain. The hourly measuring automatic rain gauges are varying on daily basis and range from 70 units to 130 units. Number of stations is varying mainly because in winter months not heating gauges data is discarded from the operational database when air temperature drops below 0° C. Other specific measurement errors that are detected by the operators as funnel clogging, sensor failure etc. The average minimum distance between closest stations is about 20 km. Most dense network of automatic gauges is built in South-Central Bulgaria where a number of European funded projects permitted to purchase and install more than 50 telemetric gauges. Spatial distribution of automatic gauges is described in (Naldzhiyan et al., 2017)1. One of main objectives was to consider mountain structures because of the need to measure snowfall accumulation in winter months. This points out that the distribution of gauges could be able to describe the spatial structures of precipitation fields in case of wintertime rainfall. This objective is reached in central and South Bulgaria but much less in Western and Eastern parts of the country.
Figure 59: Spatial distribution of automatic telemetric gauges in Bulgaria (NIMH)
In following figure the distribution of working stations over Bulgaria is shown.
1 Naldzhyian A, Georguiev O., Artinyan E., 2017: “From the sensors to the models, integrated hydro-meteorological systems in NIMH – BAS, Bulgaria”. International Conference on Automatic weather stations ICAWS-2017.

Product Validation Report - PVR-61-90
(Products H61B – P-AC-SEVIRI-PMW and H90 – P-AC-SEVIRI_E)
Doc. No: SAF/HSAF/PVR-61-90 Date: 27/02/2022 Page: 87/122
Figure 60: Distribution of the automatic stations of the Bulgaria network collected by NIMH.
The instruments – hourly measuring rain gauges:
¾ About 50 raingauges are of weighing type so they can measure snowfall without heating; however some of them have orifice heating (where 220V supply is available). Examples of such sensors are Vaisala VRG101, SEBA TRW 200cm2 and SUTRON TPG
¾ About 80 raingauges are of tipping bucket type so they need 220 V supply to switch on the heater in winter conditions, however half of them are installed beside rivers so 220V supply is not available; The sensors types are mostly SEBA RG50, DELTA-OHM 400cm2 and MTX 400 cm2
¾ Most of the raingauges have a minimum detected quantity of 0.1 mm, others have 0.2 mm. ¾ The maximum rain rate (with acceptable quality) that can be measured by the gauges ranges
between 33 and 120 mm-1 over one minute, depending on the manufacturer. The rainrate is measured over 1 minute and 1-hour accumulation intervals depending on the hardware specifications. At the moment, the NIMH officially provides only daily data from manually measured rain gauges. Shorter accumulation times could be available for scientific studies but not publicly distributed. The data processing Quality control is performed on the data, after daily visual comparison check, but only on YES/NO basis. When rain sensor fails it may be seen in few days or not be seen by the operators specially when it doesn’t rain.
For NIMH internal usage hourly accumulated rain data is converted into 3 h sums and then interpolated using a kriging technique to 8 km regular grid. The method also incorporates the 24h

Product Validation Report - PVR-61-90
(Products H61B – P-AC-SEVIRI-PMW and H90 – P-AC-SEVIRI_E)
Doc. No: SAF/HSAF/PVR-61-90 Date: 27/02/2022 Page: 88/122
accumulated data from manually measured tin cans, thus enhancing the spatial and vertical quality of the field (Artinian et al., 2007)2
For H SAF validations a subset of country’s automatic gauges is used (between 70 and 90) because of the much denser network in South-Central Bulgaria – an area of about 34000 km2. Other parts of the country have much sparse gauge networks, data from which is not suitable to be interpolated using the GRISO technique.
Figure 61: The area in Bulgaria used for H SAF validation with hourly accumulated rain data
2 Artinyan, E. et al, 2007: “Modelling the water budget and the riverflows of the Maritsa basin in Bulgaria”, Modelling the water budget and the riverflows of the Maritsa basin in Bulgaria. Hydrology and Earth System Sciences. 12. 10.5194/hessd-4-475-2007.

Product Validation Report - PVR-61-90
(Products H61B – P-AC-SEVIRI-PMW and H90 – P-AC-SEVIRI_E)
Doc. No: SAF/HSAF/PVR-61-90 Date: 27/02/2022 Page: 89/122
A1.3 Ground data in Germany (BfG) The H SAF products are validated for the territory of Germany by use of two observational ground data sets: SYNOP - precipitation data based on the network of synoptical stations, provided by the German Weather Service (DWD) and RADOLAN-RW - calibrated precipitation data based on the radar network of DWD and calibrated by DWD by use of measurements at precipitation stations.
Data Number/Resolution Time interval
Delay Annotation
Synoptical stations
~ 200 6h / 12h Near-real-time
Precipitation stations
~ 1100 hourly Near-real-time
Automatic precipitation stations
RADOLAN RW
16 German radar sites, ~1 km x ~1 km
1 hour,
Near-real-time
Quantitative radar composite product RADOLAN RW (Radar data after adjustment with the weighted mean of two standard procedures)
Table 31: Precipitation data used at BfG for validation of H SAF products
Rain gauge The network The data used are compiled from ~1300 rain gauges. About 1000 are operated by DWD while about 300 are operated by other German authorities. The average minimum distance between stations is 17 km. The instruments The measurement instruments are precipitation sensors OTT PLUVIO of Company Ott3 4. They continually and precisely measure quantity and intensity of precipitation in any weather, based on balance principle with temperature compensation (heated funnel) and by an electronic weighing cell. The absolute measuring error is less than 0.04 mm for a 10 mm precipitation amount and the long-term (12months) stability is better than 0.06 mm. The operating temperature ranges from –30°C to +45°C. The minimum detected quantity (sensitivity) is 0,05 mmh-1. The maximum possible measured rain rate is 3000 mmh-1. The operational accumulation interval theoretically is one minute. The data processing Continuous, automatic measurement of liquid and solid precipitation data are collected, accumulated (intervals: from 1hour until 1day) and provided as SYNOP tables by DWD. These data are error corrected and quality controlled in four steps with checks of completeness, climatologic temporal/spatial consistency and marginal checks.
3 http://www.ott.com/web/ott_de.nsf/id/pa_ottpluvio2_vorteile.html?OpenDocument&Click= 4 Precipitation amount and intensity measurements with the Ott Pluvio, Wiel Wauben, Instrumental Department, INSA-IO, KNMI, August 26, 2004

Product Validation Report - PVR-61-90
(Products H61B – P-AC-SEVIRI-PMW and H90 – P-AC-SEVIRI_E)
Doc. No: SAF/HSAF/PVR-61-90 Date: 27/02/2022 Page: 90/122
Figure 62: (left): Network of rain gauges in Germany - Figure 63: (right): Pluvio with Remote Monitoring Module
Radar data Radar-based real-time analyses of hourly precipitation amounts for Germany (RADOLAN) is a quantitative radar composite product provided in near-real time by DWD. Spatial and temporal high-resolution, quantitative precipitation data are derived from online adjusted radar measurements in real-time production for Germany. Radar data are calibrated with hourly precipitation data from automatic surface precipitation stations. 5 The combination of hourly point measurements at the precipitation stations with the five-minute-interval radar signals of the 16 weather radars (C-Band Doppler) provides gauge-adjusted hourly precipitation sums for a ~1km x ~1km raster for Germany in a polar stereographic projection. Radar site Latitude
(N) Longitude (E)
WMO No.
Radar site Latitude (N)
Longitude (E)
WMO No.
München 48° 20’ 14’’
11° 36’ 46’’
10871 Rostock 54° 10’ 35’’
12° 03’ 33’’
10169
Frankfurt 50° 01’ 25’’
08° 33’ 34’’
10630 Ummendorf 52° 09’ 39’’
11° 10’ 38’’
10356
Hamburg 53° 37’ 19’’
09° 59’ 52’’
10147 Feldberg 47° 52’ 28’’
08° 00’ 18’’
10908
Berlin-Tempelhof
52° 28’ 43’’
13° 23 17’’
10384 Eisberg 49° 32’ 29’’
12° 24’ 15’’
10780
Essen 51° 24’ 22’’
06° 58’ 05’’
10410 Flechtdorf 51° 18’ 43’’
08° 48’ 12’’
10440
Hannover 52° 27’ 47’’
09° 41’ 54’’
10338 Neuheilenbach 50° 06’ 38’’
06° 32’ 59’’
10605
5 http://www.dwd.de/bvbw/appmanager/bvbw/dwdwwwDesktop?_nfpb=true&_windowLabel=dwdwww_main_book&T14609949251144921180881gsbDocumentPath=Navigation%2FWasserwirtschaft%2FUnsere__Leistungen%2FRadarniederschlagsprodukte%2FRADOLAN%2Fradolan__node.html%3F__nnn%3Dtrue&switchLang=en&_pageLabel=_dwdwww_spezielle_nutzer_forschung_fkradar

Product Validation Report - PVR-61-90
(Products H61B – P-AC-SEVIRI-PMW and H90 – P-AC-SEVIRI_E)
Doc. No: SAF/HSAF/PVR-61-90 Date: 27/02/2022 Page: 91/122
Emden 53° 20’ 22’’
07° 01’ 30’’
10204 Türkheim 48° 35’ 10’’
09° 47’ 02’’
10832
Neuhaus 50° 30’ 03’’
11° 08’ 10’’
10557 Dresden 51° 07’ 31’’
13° 46’ 11’’
10488
Table 32: Location of the 16 meteorological radar sites of the DWD
Figure 64: (left) radar compound in Germany (March 2011) ; Figure 65: (right) location of ombrometers for online calibration in RADOLAN; squares: hourly data provision (about 500), circles: event-based hourly data provision (about 800
stations)6.
The flowchart of online calibration method applied in RADOLAN is depicted in Figure 66.
6 Bartels, H.: Projekt RADOLAN. Routineverfahren zur Online-Aneichung der Radarniederschlagsdaten mit Hilfe von automatischen Bodenniederschlagsstationen (Ombrometer), Abschlussbericht 2004
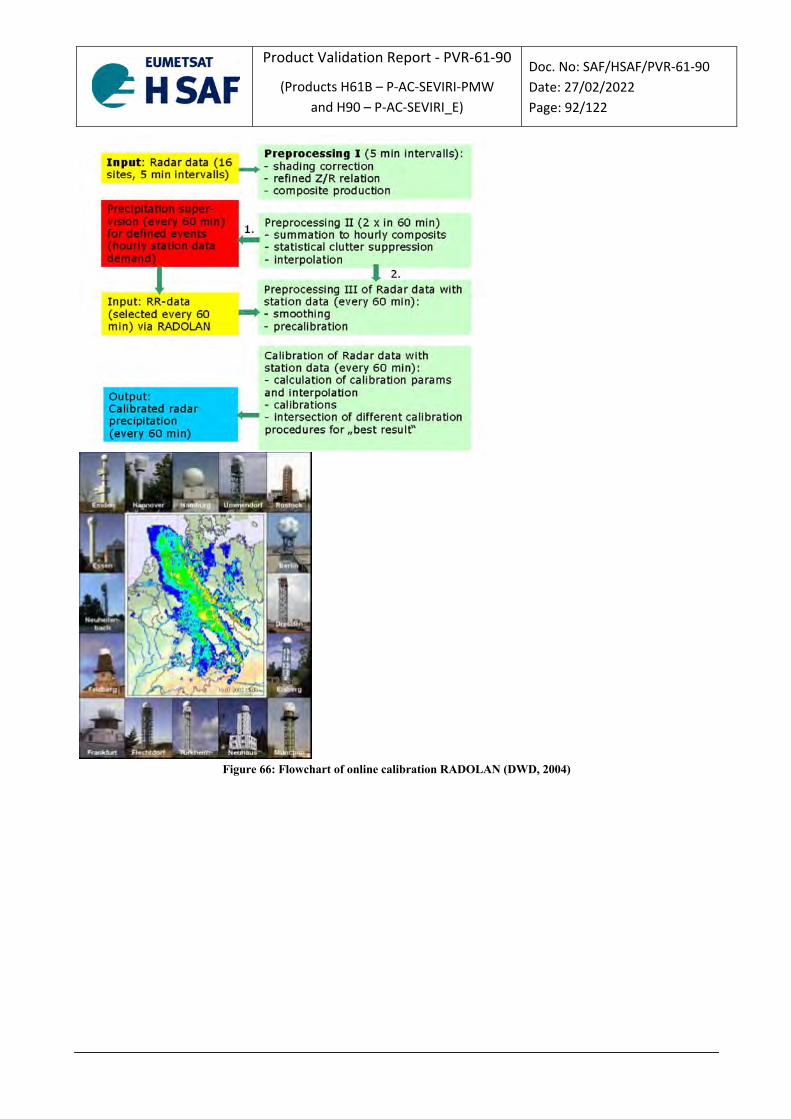
Product Validation Report - PVR-61-90
(Products H61B – P-AC-SEVIRI-PMW and H90 – P-AC-SEVIRI_E)
Doc. No: SAF/HSAF/PVR-61-90 Date: 27/02/2022 Page: 92/122
Figure 66: Flowchart of online calibration RADOLAN (DWD, 2004)

Product Validation Report - PVR-61-90
(Products H61B – P-AC-SEVIRI-PMW and H90 – P-AC-SEVIRI_E)
Doc. No: SAF/HSAF/PVR-61-90 Date: 27/02/2022 Page: 93/122
A1.4 Ground data in Hungary (OMSZ)
The radar network The main data used for validation in Hungary would be the data of meteorological radars. There are four C-band dual polarized Doppler weather radars operated routinely by the OMSZ-Hungarian Meteorological Service. The location of the four Hungarian radars and the measurement characteristics are listed in Table 33. All four radars are calibrated periodically, with an external (calibrated) TSG, the periodicity is kept every 1 year.
Year of installation Location Radar type Parameters measured
1999 Budapest Dual-polarimetric Doppler radar
Z,ZDR,KDP,ΦDP
2003 Napkor Dual-polarimetric Doppler radar
Z,ZDR,KDP,ΦDP
2004 Poganyvar Dual-polarimetric Doppler radar
Z,ZDR,KDP,ΦDP
2014 Szentes Dual-polarimetric Doppler radar
Z,ZDR,KDP,ΦDP
Table 33: Main characteristics of the Hungarian radar network
Instrument characteristics The Hungarian radar network is composed by four Doppler radars, which are measuring in the C-band, mainly at same frequencies. The scan strategy is the same for all the radars. The parameters of the instruments and the measurement campaigns are listed in Table 34.
Budapest Napkor Poganyvar Szentes
Frequency band
C-Band, 5625MHz
C-Band, 5610MHz
C-Band, 5610MHz
C-Band, 5640MHz
Polarization (Single/Double) double double double double
Doppler capability (Yes/No)
Yes Yes Yes Yes
Scan strategy: elevations, maximum nominal range
scan freq: 5 min Elevaions(deg):
scan freq: 5 min Elevaions(deg):
scan freq: 5 min Elevaions(deg):
scan freq: 5 min Elevaions(deg):

Product Validation Report - PVR-61-90
(Products H61B – P-AC-SEVIRI-PMW and H90 – P-AC-SEVIRI_E)
Doc. No: SAF/HSAF/PVR-61-90 Date: 27/02/2022 Page: 94/122
distance, range resolution
0 0.5 1.1 1.9 3.0 4.7 7.0 10.0 14.2
Range 240 Km Resolution:125m
0 0.5 1.1 1.9 3.0 4.7 7.0 10.0 14.2
Range 240 Km Resolution:125 m
0 0.5 1.1 1.9 3.0 4.7 7.0 10.0 14.2
Range 240 Km Resolution:125m
0 0.5 1.1 1.9 3.0 4.7 7.0 10.0 14.2
Range 240 Km Resolution:125m
Table 34: Characteristics of the four radar instruments in Hungary
Data processing and radar products Radar field corrections Radar measurements are influenced by many error sources that should be minimized as much as possible. As such, in case of the Hungarian radar data many correction methods are applied to filter out false radar reflectivity measurements. Clutter removal, WLAN filter and clear-air echo filter is implemented in the processing chain of all four-radar data. The beam blockage correction is also implemented in the processing chain in order to correct serious underestimation of precipitation amounts behind mountains. Attenuation correction (the attenuation of electromagnetic waves in water environment, water drops) was implemented in 2019. Hungary does not apply VPR (Vertical Profile Reflectivity) correction. Precipitation intensity is derived from radar reflectivity with the help of an empirical formula, the Marshall-Palmer equation (R=a*Z^b, where a=200, b=1.6). From the four radar images a composite image over the territory of Hungary is derived every 5 minutes applying the maximum reflectivity in one column method, in order to make adjustments in overlapping regions. Rain gauge correction of the radar precipitation fields The non-corrected precipitation field can be corrected by rain gauge measurements. In Hungary, we do not make corrections to instantaneous 5 minutes radar data. In our institute, we only use a correction for the total precipitation for 1, 3-, 6-, 12- and 24-hour periods. For the accumulated products, we use a special method to accumulate rainfalls: we interpolate the 5-minutes measurements for 1-minute grid by the help of displacement vectors also measured by the radar, and then sum up the images which we got after the interpolation. It is more precise especially when we have storm cells on the radar picture, because a storm cell moves for 5 minutes and thus we do not get continuous precipitation fields when we sum up only with 5 minute periods. This provides satisfying results. However, there is still a need for rain-gauge adjustment because there are obviously places (behind mountains) that the radar does not see. The radars are corrected with rain gauge data every hour. The correction method using rain gauge data for 1-hour total precipitation consists of two kinds of corrections: the spatial correction which becomes dominant in the case of precipitation extended over a large area, whereas the other factor, the distance correction factor prevails in the case of sparse precipitation. These two factors are weighted according to the actual situation. The weighting factor depends on the actual effective local station density, and also on the variance of the differences of the bias between radar and rain gauge measurements. On the whole, we can say that our correction method is efficient within a radius of 100 km from the radar. In this region, it gives a final underestimation of about 10%, while at bigger distance; the underestimation of precipitation fields slightly increases. Resolution, projection, threshold of detection
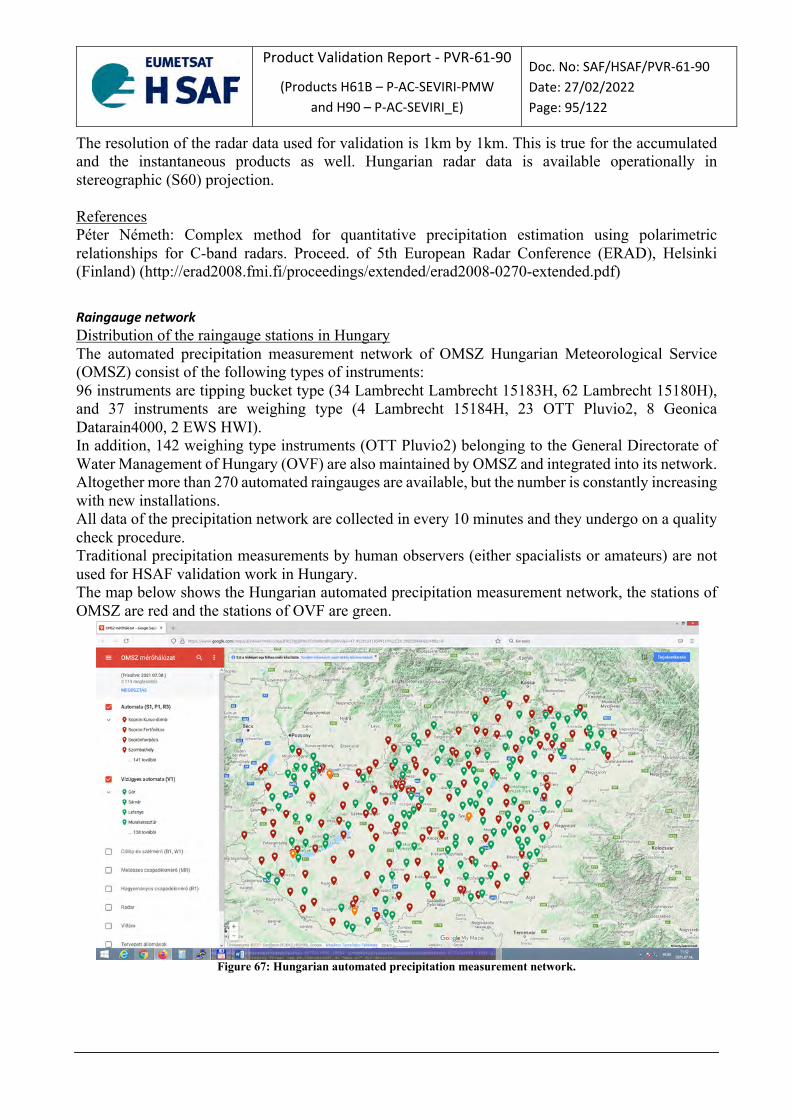
Product Validation Report - PVR-61-90
(Products H61B – P-AC-SEVIRI-PMW and H90 – P-AC-SEVIRI_E)
Doc. No: SAF/HSAF/PVR-61-90 Date: 27/02/2022 Page: 95/122
The resolution of the radar data used for validation is 1km by 1km. This is true for the accumulated and the instantaneous products as well. Hungarian radar data is available operationally in stereographic (S60) projection. References Péter Németh: Complex method for quantitative precipitation estimation using polarimetric relationships for C-band radars. Proceed. of 5th European Radar Conference (ERAD), Helsinki (Finland) (http://erad2008.fmi.fi/proceedings/extended/erad2008-0270-extended.pdf)
Raingauge network Distribution of the raingauge stations in Hungary The automated precipitation measurement network of OMSZ Hungarian Meteorological Service (OMSZ) consist of the following types of instruments: 96 instruments are tipping bucket type (34 Lambrecht Lambrecht 15183H, 62 Lambrecht 15180H), and 37 instruments are weighing type (4 Lambrecht 15184H, 23 OTT Pluvio2, 8 Geonica Datarain4000, 2 EWS HWI). In addition, 142 weighing type instruments (OTT Pluvio2) belonging to the General Directorate of Water Management of Hungary (OVF) are also maintained by OMSZ and integrated into its network. Altogether more than 270 automated raingauges are available, but the number is constantly increasing with new installations. All data of the precipitation network are collected in every 10 minutes and they undergo on a quality check procedure. Traditional precipitation measurements by human observers (either spacialists or amateurs) are not used for HSAF validation work in Hungary. The map below shows the Hungarian automated precipitation measurement network, the stations of OMSZ are red and the stations of OVF are green.
Figure 67: Hungarian automated precipitation measurement network.

Product Validation Report - PVR-61-90
(Products H61B – P-AC-SEVIRI-PMW and H90 – P-AC-SEVIRI_E)
Doc. No: SAF/HSAF/PVR-61-90 Date: 27/02/2022 Page: 96/122
A1.5 Ground data in Italy (DPC, UniBo)
Rain gauge The network The maximum number of available raingauges is about 3000, irregularly distributed over the surface. On the average, however, a number of stations have low quality data, failure or data transmission problems and their data are missing (-9999 recorded). This number of no data stations is highly varying on hourly/daily basis and ranges from few units to a hundred. In case of data acquired but not transmitted/recorded, the first transmitted measure is the cumulated value over the time when the data were not transmitted. The average minimum distance between closest stations is about 11 km, with a very high variance: in some regions (such as Tuscany in central Italy) it is below 5 km, while in Emilia Romagna (Po Valley) it is more than 20 km. A study of the decorrelation distance between stations as function of the mutual distance has been carried out for the 2009 dataset. The decorrelation distance is defined as the minimum distance between two observations that makes the Pearson correlation coefficient between the two measures decrease below e-1. Results are shown in Figure 68, where the decorrelation distance is plotted as function of the distance between stations. It appears that there is a large variability of this parameter from higher values (around 60 km for cold months when large precipitating systems dominate and reduces to roughly 10 km when small scale convection is more likely to occur (warm months). This points out that the distribution of gauges could be able to describe the spatial structures of precipitation fields in case of wintertime rainfall, while may be inadequate for spring/summer convective events.
Figure 68: Correlation between rainrates detected by two close stations as function of the distance between the two stations.
Colors refer to the month along 2009
In Figure 69 the distribution of working stations over Italy is shown.

Product Validation Report - PVR-61-90
(Products H61B – P-AC-SEVIRI-PMW and H90 – P-AC-SEVIRI_E)
Doc. No: SAF/HSAF/PVR-61-90 Date: 27/02/2022 Page: 97/122
Figure 69: Distribution of the raingauge stations of the Italian network collected by DPC.
The instruments This section provides the following information:
¾ All the available raingauge are of tipping bucket type; ¾ Most of the raingauge have a minimum detected quantity of 0.2 mm, others have 0.1 mm. ¾ The maximum rainrate that can be measured by the gauges ranges between 300 and 500 mm-
1 over one minute, depending on the manufacturer. The rainrate is measured over different cumulation intervals by the different local administrations managing the network, but the data disseminated are all integrated over 60 minutes. At the moment, the National network made available by DPC provides only hourly data, shorter cumulation times could be available for case studies after specific agreements with local management authorities. Only a small subset (about 300 stations) of gauges have heated funnel, especially in alpine regions (such as Valle d’Aosta and Piedmont), and this is a clear source of errors in both summer (due to hailfall) and in autumn/winter (due to snowfall). The data processing To homogenize the two ground datasets, rain gauge data, preprocessed according to range, persistence, step, and spatial consistency (Shafer et al. 2000) to screen out suspect values, have been interpolated over a regular grid (5 km x 5 km) through the Random Generator of Spatial Interpolation from uncertain Observations (GRISO). The GRISO (Pignone et al. 2010; Feidas et al. 2018) is an improved kriging-based technique implemented by the International Centre on Environ- mental Monitoring (CIMA Research Foundation). This technique preserves the values observed at the rain

Product Validation Report - PVR-61-90
(Products H61B – P-AC-SEVIRI-PMW and H90 – P-AC-SEVIRI_E)
Doc. No: SAF/HSAF/PVR-61-90 Date: 27/02/2022 Page: 98/122
gauge location, allowing for a dynamical definition of the covariance structure associated with each rain gauge by the interpolation procedure. Each correlation structure depends both on the rain gauge location and on the accumulation time considered. GRISO is adopted by all European participating countries in the H SAF validation procedure (Puca et al. 2014). The resulting grid is a 5x5 km regular grid with 240 columns and 288 lines. Moreover, a Digital elevation model is used to provide a mask of Italy in order to: 1) screen out sea-pixels too far from the coastlines and 2) process the pixels with the elevation above sea level.
Radar data The network The Italian Department of Civil Protection (DPC) is the authority leading the national radar coverage project in order to integrate the pre-existent regional systems. Currently, the radar network is composed by 22 systems (20 C-band and 2 X-band systems), most of them with dual-polarization. The network is composed by 8 C-band fixed regional installations (five of them are polarimetric), five systems owned by the Italian company for air navigation services (ENAV), 9 dual-polarization systems managed by DPC (7 using C-band and 2 X-band). The Figure 70 shows the spatial radar coverage of the Italian territory.
Figure 70: Italian radar network coverage. The green and blue radar symbol stands for dual- and single-polarization system,
respectively.
Radar Data processing

Product Validation Report - PVR-61-90
(Products H61B – P-AC-SEVIRI-PMW and H90 – P-AC-SEVIRI_E)
Doc. No: SAF/HSAF/PVR-61-90 Date: 27/02/2022 Page: 99/122
The operational radar processing chain is briefly described in this section. It aims at compensating or at least identifying most of the uncertainty sources conditioning the radar rainfall estimation process (Friedrich et al., 2006). Among them, the following error sources are primarily considered: contamination by non-weather returns (clutter), Partial Beam Blocking (PBB), beam broadening at increasing distances, vertical variability of precipitation (Germann and Joss, 2002; Joss and Lee, 1995; Marzano et al., 2004) and rain path attenuation (Bringi and Chandrasekar, 2001; Carey et al., 2000; Testud et al., 2000; Vulpiani et al., 2008). Every error source is quantified through specific tests ending with the estimation of specific (partial) quality matrices and, when possibile, is compensated for. The overall data quality (Q) is then obtained as a combination of the partial quality matrices. The quality model described in Rinollo et al. (2013) is embedded within the overall processing chain schematically depicted in Figure 24. In this schematic representation, the sequential flow among consecutive computational steps is specified by black arrows, while the blue ones identify the data input (or output) to (or from) a specific processing module. The processing chain can be summarized through the following few steps as follows:
i. As typical, the raw volumetric data must be first filtered from non-weather returns. This step is here achieved using the fuzzy-logic approach proposed in Vulpiani et al. (2012) for polarimetric radar systems.
ii. The next step is the correction for Partial Beam Blocking (PBB) based on the retrieved 3-D occlusion map (Bech et al., 2003) that, assuming the e.m. waves propagate in a standard atmosphere, is evaluated only once for a given radar scanning strategy.
iii. The rain path attenuation is just qualitatively evaluated in case the considered radar system has single-polarization capability (Rinollo et al., 2013), otherwise it is compensated for by means of the differential phase shift that needs to be preliminarly processed. In this framework, the iterative moving-window range derivative approach proposed in Vulpiani et al. (2012) is applied here.
iv. The range-related deterioration of radar data quality is modeled through a non-linear function as in Rinollo et al. (2013).
v. Once the attenuation is evaluated and, eventually, compensated for through the so-called ZPHI method (Testud et al., 2000), the overall data quality is computed as geometric mean of the partial quality matrices.
Q = qclutter ×qvertical ×qPBB×qdistance ×qattenuation vi. The retrieved mean Vertical Profile of Reflectivity (VPR) is applied to the entire
volumetric scan with the aim to use all the observations along the vertical to retrieve the surface rainfall rate. All the clutter-filtered and attenuation-corrected (if applicable) PPIs are projected at ground by means of the average Vertical Profile of Reflectivity (VPR).
vii. The Surface Rainfall Intensity (SRI) map is computed as a quality-weighted average of each rain rate map, obtained by each ground-projected reflectivity sweep (Vulpiani et al., 2014).
viii. The SRI composite is built by combining the single-radar rainfall maps through a squared-quality-weighted approach. In case of dual-polarization systems, the composite rainfall retrieval algorithm proposed in Vulpiani and Baldini (2013).
As descripted in Petracca et al. (2018), only radar data with Q values greater than 0.60 are used for comparison with satellite data.

Product Validation Report - PVR-61-90
(Products H61B – P-AC-SEVIRI-PMW and H90 – P-AC-SEVIRI_E)
Doc. No: SAF/HSAF/PVR-61-90 Date: 27/02/2022 Page: 100/122
Figure 71: Schematic representation of the Italian radar data processing chain.

Product Validation Report - PVR-61-90
(Products H61B – P-AC-SEVIRI-PMW and H90 – P-AC-SEVIRI_E)
Doc. No: SAF/HSAF/PVR-61-90 Date: 27/02/2022 Page: 101/122
References
Bech, J., B. Codina, J. Lorente, and D. Bebbington, 2003: The sensitivity of single polarization weather radar beam blockage correction to variability in the vertical refractivity gradient. J. Atmos. Oceanic Technol., 20, 845–855. Bringi, V. N. and V. Chandrasekar, 2001: Polarimetric doppler weather radar. Cambridge University Press, 636 pp. Carey, L. D., S. A. Rutledge, and D. A. Ahijevych, 2000: Correcting propagation effects in c-band polarimetric radar observations of tropical convection using differential propagation phase. J. Appl. Meteor., 39, 1405–1433. Feidas, H., F. Porcù, S. Puca, A. Rinollo, C. Lagouvardos, and V. Kotroni, 2018: Validation of the H SAF precipitation prod- uct H03 over Greece using rain gauge data. Theor. Appl. Cli- matol., 131, 377–398, https://doi.org/10.1007/s00704-016-1981-9. Friedrich, K., M. Hagen, and T. Einfalt, 2006: A quality control concept for radar reflectivity, polarimetric parameters, and doppler velocity. J. Atmos. Ocean. Tech., 23, 865–887. Germann, U. and J. Joss, 2002: Mesobeta profiles to extrapolate radar precipitation measurements above the alps to the ground level. J. Appl. Meteorol., 41, 542–557. Joss, J. and R. Lee, 1995: The application of radar-gauge comparisons to operational precipitation profile corrections. J. Appl. Meteorol., 34, 2612–2630. Petracca, M., D'Adderio, L.P., Porcù, F., Vulpiani, G., Sebastianelli, S., Puca, S., Validation of GPM Dual-frequency Precipitation Radar (DPR) rainfall products over Italy, Journal of Hydrometeorology, 19, 907-925, 2018, doi: 10.1175/JHM-D-17-0144.1 Pignone, F., N. Rebora, F. Silvestro, and F. Castelli, 2010: GRISO (Generatore Random di Interpolazioni Spaziali da Osservazioni incerte)-Piogge. Rep. 272/2010, 353 pp. Puca, S., Baguis, P., Campione, E., Ertürk, A., Gabellani, S., Iwański, R., Jurašek, M., Kaňák, J., Kerényi, J., Koshinchanov, G., Kozinarova, G., Krahe, P., Łapeta, B., Lábó, E., Milani, L., Okon, L., Öztopal, A., Pagliara, P., Pignone, F., Porcù, F., Rachimow, C., Rebora, N., Rinollo, A., Roulin, E., Sönmez, İ., Toniazzo, A., Vulpiani, G., Biron, D., Casella, D., Cattani, E., Dietrich, S., Laviola, S., Levizzani, V., Melfi, D., Mugnai, A., Panegrossi, G., Petracca, M., Sanò, P., Zauli, F., Rosci, P., De Leonibus, L. “The validation service of the hydrological SAF geostationary and polar satellite precipitation products”, Nat. Hazards Earth Syst. Sci., 14, 871–889, 2014 www.nat-hazards-earth-systsci.net/14/871/2014/ doi:10.5194/nhess-14-871-2014 Rinollo, A., Vulpiani, G., Puca, S., Pagliara, P., Kanák, J., Lábó, E., Okon, L’., Roulin, E., Baguis, P., Cattani, E., Laviola, S., and Levizzani, V.: Definition and impact of a quality index for radar-based reference measurements in the H SAF precipitation product validation, Nat. Hazards Earth Syst. Sci., 13, 2695–2705, doi:10.5194/nhess-13-2695-2013, 2013.

Product Validation Report - PVR-61-90
(Products H61B – P-AC-SEVIRI-PMW and H90 – P-AC-SEVIRI_E)
Doc. No: SAF/HSAF/PVR-61-90 Date: 27/02/2022 Page: 102/122
Shafer, M. A.,C.A. Fiebrich, D. S. Arndt, S. E. Fredrickson, andT.W. Hughes, 2000: Quality assurance procedures in the Oklahoma Mesonetwork. J. Atmos. Oceanic Technol., 17, 474–494, https:// doi.org/10.1175/1520-0426(2000)017,0474:QAPITO.2.0.CO;2. Testud, J., E. L. Bouar, E. Obligis, and M. Ali-Mehenni, 2000: The rain profiling algorithm applied to polarimetric weather radar. J. Atmos. Oceanic Technol., 17, 332–356. Vulpiani, G. and L. Baldini, 2013: Observations of a severe hail-bearing storm by an operational X-band polarimetric radar in the mediterranean area. Proceed. of the 36th AMS Conference on Radar Meteorology, Breckenridge, CO, USA. Vulpiani, G., M. Montopoli, L. D. Passeri, A. Gioia, P. Giordano, and F. S. Marzano, 2012: On the use of dual-polarized C-band radar for operational rainfall retrieval in mountainous areas. J. Appl. Meteor and Clim., 51, 405–425. Vulpiani, G., P. Tabary, J. P. D. Chatelet, and F. S. Marzano, 2008: Comparison of advanced radar polarimetric techniques for operational attenuation correction at c band. J. Atmos. Oceanic Technol., 25, 1118–1135. Vulpiani, G., A. Rinollo, S. Puca, m. Montopoli, 2014: A quality-based approach for radar rain field reconstruction and the H SAF precipitation products validation. The eighth European Radar conference on radar in meteorology and hydrology. Garmish-Partenkirken (Germany) 1-5 Sept., 2014.

Product Validation Report - PVR-61-90
(Products H61B – P-AC-SEVIRI-PMW and H90 – P-AC-SEVIRI_E)
Doc. No: SAF/HSAF/PVR-61-90 Date: 27/02/2022 Page: 103/122
A1.6 Ground data in Poland (IMWM)
Rain gauge The network The maximum number of rain gauges in the Polish ATS (Automatic Telemetric Station) national network is 950. Each ATS post is equipped with two independent rain gauges of the same sort. One of them is heated during the winter period and the other one is not. Therefore precipitation information is derived from 475 points at the time. Fact that rainfall is measured by two equally sensitive instruments two meters away from each other at the same post, enables to apply simple in situ data quality control during summertime. During winter non-heated rain gauge is covered with a cup to prevent it from being clogged by the ice and damaged. Because of that the precipitation information derived from ATS network in winter cannot be verified using this method. It can be stated that during the wintertime precipitation information might be a slightly bigger measuring error. The number of rain gauges available for H SAF validation activities varies from day to day due to operational efficiency of ATS network in Poland and depends on large number of independent factors. It can be stated that the number varies between 330 and 475 rain gauges for each day of operational work. Mean minimum distance between precipitation measuring ATS posts (between each pair of rain gauges) in Polish national network is 13,3 km.
Figure 72: ATS national network in Poland
The instruments All rain gauges working within Polish ATS national network are MetOne tipping bucket type instruments. Minimum detected quantity that can be measured by those rain gauges is 0,1 mm/h which means that each tilt of rain gauge bucket adds 0,1mm to the total sum of the measured precipitation. During very heavy precipitation events MetOne rain gauges tend to underestimate real precipitation by factor of 10%. Maximum measured rainrate (mmh-1) by MetOne instruments in Poland was

Product Validation Report - PVR-61-90
(Products H61B – P-AC-SEVIRI-PMW and H90 – P-AC-SEVIRI_E)
Doc. No: SAF/HSAF/PVR-61-90 Date: 27/02/2022 Page: 104/122
recorded in 5.06.2007 at ATSO Koscielisko Kiry at the foot of Tatra Mountains. The recorded values reached 65 mm/h. Operational cumulation interval (min) of ATS network rain gauges is set for 10 minutes and can be adjusted according to given needs. There is possibility to have very short cumulation intervals for case studies - theoretically 1 minute - but not on every given precipitation post. It depends on local DCS settings. The data processing As stated above the data quality control can be achieved by comparison on two rainfall datasets collected by two independent rain gauges at the same ATS post. It is done operationally during summertime. There is no such possibility during the winter because of lack of non-heated rain gauge dataset. In case that one pair of rain gauges at the same ATS post provide two different rainfall readings the higher one is taken into account. No specialization technique is used for standard validation process. However, for some case studies, the Natural Neighbor technique is applied for satellite and ground precipitation data. To match the precipitation information with satellite data spatial and temporal matching are applied.
• Spatial matching: for each given satellite pixel, the posts situated within that pixel were found. The pixel size was taken into account, however, its shape was assumed to be rectangular. If more than one rain gauge were found within one satellite pixel, the ground rain rate value was calculated as a mean of all rain gauges measurements recorded within that pixel;
• Temporal matching: satellite derived product is combined with the next corresponding ground measurement. As the ground measurements are made with 10 minute time resolution, the maximum interval between satellite and ground precipitation is 5 minutes.
Radar data
The Polish meteorological radar network called POLRAD (initially Doppler Radar System METEOR) consists of eight devices and was produced by Gematronic Weather Radar Systems GmbH SELEX Sistemi Integrati GmbH. The system had been installed in Poland starting from year 2001 and has its 20th anniversary this year. The software running within this system is Rainbow 5 (and it’s later updates). The radars are using band C (frequency 5,6 GHz and subsequently 5,4 cm wavelength). All of the radars are Doppler instruments operationally run in 10 min. scan frequency and two of them (Ramża and Pastewnik) in dual polarisation mode. Eight basic radars working within the POLRAD network.
Station location Latitude Longitude Elevation
a.m.s.l. Antenna
height a.t.l. Radar type
Legionowo 52°24’18,79’’ 20°57’39,28’’ 89,0 m 29,0 m Doppler radar METEOR 1500 C
Rzeszów 50°06’49,79’’ 22°02’12,09’’ 206,5 m 30,0 m Doppler radar METEOR 1500 C
Brzuchania 50°23’39,13’’ 20°05’00,35’’ 388,5 m 35,0 m Doppler radar METEOR 500 C
Ramża 50°09’04,59’’ 18°43’29,86’’ 320,7 m 36,0 m Dual polarisation
Doppler radar METEOR 1600C

Product Validation Report - PVR-61-90
(Products H61B – P-AC-SEVIRI-PMW and H90 – P-AC-SEVIRI_E)
Doc. No: SAF/HSAF/PVR-61-90 Date: 27/02/2022 Page: 105/122
Pastewnik 50°53’32,81’’ 16°02’22,17’’ 666,5 m 23,5 m
Dual polarisation Doppler radar
METEOR 1600C
Poznań 52°24’47,73’’ 16°47’49,40’’ 95,1 m 35,0 m Doppler radar METEOR 500 C
Świdwin 53°47'40,25'' 15°50'16,97'' 121,1 m 30,0 m Doppler radar METEOR 500 C
Gdańsk 54°23’03,17’’ 18°27’23,00’’ 135,2 m 20,0 m Doppler radar METEOR 1500 C
Table 35: Radars in Poland
The original radar arrangement in Poland (when installed).
Figure 73: Radar dislocation in Poland
The radar ranges drawn above represent both 125 km and 250 km ranges respectively. The spatial resolution of the radar scan is 1 km, the data resolution in azimuth is 1° on average,
hence within a circumference of a given radius 200 km one elevation angle returns 72 000 virtual measurement points. The basic max reflectance radar information is gathered from 10 elevation angles so one measurement cycle (max reflectance only, no Doppler wind information received) returns 720 000 points. To make this information valid, one point requires 256 levels – 8 bits of information. Concluding, one reflectance only measurement cycle requires 720 kB.
Since the beginning of the millennium Poland has operational meteorological radar data exchange with neighbouring countries. The current composite radar map of Poland looks as follows (incorporating radar data received on the basis of transnational radar data exchange).

Product Validation Report - PVR-61-90
(Products H61B – P-AC-SEVIRI-PMW and H90 – P-AC-SEVIRI_E)
Doc. No: SAF/HSAF/PVR-61-90 Date: 27/02/2022 Page: 106/122
Figure 74: Radar composite map in Poland
The operational radar data exchange is maintained with Germany, Czechia, Denmark and
Slovak Republic. The cooperation was initiated in 1998 within Baltrad and Opera projects and is still kept valid. Foreign radars that provide data on operational basis.
Station location Longitude Latitude Brdy-Praha 13.817800 49.658300 Skalky 16.788500 49.501100 Kojsovska 20.987277 48.782895 Maly Javornik 17.153100 48.256100 Kubinska Hola 19.249350 49.271670 Spani Laz 19.257430 48.240430 Protzel 13.858210 52.648660 Rostock 12.058070 54.175660 Dresden 13.768630 51.124630 Bornholm 14.887517 55.112750
Table 36: Operational foreign radars.

Product Validation Report - PVR-61-90
(Products H61B – P-AC-SEVIRI-PMW and H90 – P-AC-SEVIRI_E)
Doc. No: SAF/HSAF/PVR-61-90 Date: 27/02/2022 Page: 107/122
The non-operational radar data exchange is carried out with Belarus, Ukraine and Latvia. The
data aren’t operationally provided and sometimes are very burdened with artificial errors, hence they are not included in the operational composite radar map of Poland. Foreign radars that provide test or non-operational data.
Station location Longitude Latitude Laukuva 22.239500 55.609040 Traky 25.106780 54.626220 Grodno 24.048889 53.651943 Minsk 28.040277 53.865833 Brzesc 23.898611 52.115276 Lviv 23.900514 49.848378
Table 37: Non-operational foreign radars.
It is worth mentioning that in the current year 2022 the POLRAD system is being upgraded to new instruments and software. The work will continue in the next year (2023). All new radars will be Doppler class magnetron instruments with dual polarisation. In addition, there will be two completely new radars located in Użranki and Góra Św. Anny. The new radars that will be installed in 2023.
Station location Longitude Latitude Użranki 21,4121 53,8557 Góra Św. Anny 18,1530 50,4640
Table 38: New radars with forthcoming installation

Product Validation Report - PVR-61-90
(Products H61B – P-AC-SEVIRI-PMW and H90 – P-AC-SEVIRI_E)
Doc. No: SAF/HSAF/PVR-61-90 Date: 27/02/2022 Page: 108/122
A1.7 Ground data in Slovakia (SHMÚ)
Rain gauge The network In Slovakia there are overall 98 automatic rain gauge stations potentially available for the H SAF project. The real number of usable gauges varies with time because on average about 20 of them are out of operation. Mean minimum distance between rain-gauges in the complete network is 7,74 km. Map of the rain gauge network in Slovakia containing also climatological and selected hydrological stations is shown in next figure.
Figure 75: Map of SHMÚ rain gauge stations: green – automatic (98), blue – climatological (586),
red - hydrological stations in H SAF selected test basins (37)
The instruments Type of all the automatic rain gauges is tipping bucket (without heating of the funnel). The gauges are able to measure precipitation rates ranging from 0,1 to 200 mm/h at 10 min operational accumulation interval. Shorter accumulation interval of 1 min is also possible which makes the instruments suitable for case studies in the H SAF project. The data processing The rain gauge data are not used at SHMÚ directly for the H SAF precipitation validation but they are utilized as the input to the INCA precipitation analysis system which is supposed to become a new validation tool. Prior the INCA analysis the rain gauge data are interpolated onto the regular 1x1 km grid using the inverse-distance-squared (IDS) interpolation method. Only the 8 nearest rain gauge stations are taken into account in the interpolation in order to reduce occurrence of precipitation bull-eyes artifact. SHMÚ performs the offline automatic and manual quality check of the rain gauge data. In frame of the INCA system a quality control technique called blacklisting has been developed which avoids the data from systematically erroneous rain gauges to enter the analysis. Currently the blacklisting is used in manual mode only.

Product Validation Report - PVR-61-90
(Products H61B – P-AC-SEVIRI-PMW and H90 – P-AC-SEVIRI_E)
Doc. No: SAF/HSAF/PVR-61-90 Date: 27/02/2022 Page: 109/122
Radar data The network
The Slovak meteorological radar network consists of 4 radars (see next figure). One is situated at the top of Maly Javornik hill near city Bratislava, second one is on the top of Kojsovska hola hill close to the city Kosice. The third and fourth radars are installed on Kubinska hola in Orava region and on Spani laz in the south of Central Slovakia. All of them are Doppler, dual-polarization C-band radars of the same type.
Figure 76: Map of SHMÚ radar network; the rings represent maximum operational range of the radars – 240 km
The instruments The radars are operated and technically maintained by SHMÚ. Receivers of radars are calibrated regularly by means of internal test signal generator (TSG) every 6 months. The peak power of the transmitted pulses is calibrated with the same periodicity using calibrated power meters.
The basic parameters of SHMÚ radars are summarized in following table.
Maly Javornik Kojsovska hola Kubinska hola Spani laz
Frequency band C-Band, Yes 5605 MHz
C-Band, Yes 5645 MHz
C-Band, Yes 5630 MHz
C-Band, Yes 5615 MHz
Polarization (Single/Double) Double Double Double Double
Doppler capability (Yes/No) Yes Yes Yes Yes
Scan strategy: scan frequency,
Scan frequency: 5 min
Scan frequency: 5 min
Scan frequency: 5 min
Scan frequency: 5 min

Product Validation Report - PVR-61-90
(Products H61B – P-AC-SEVIRI-PMW and H90 – P-AC-SEVIRI_E)
Doc. No: SAF/HSAF/PVR-61-90 Date: 27/02/2022 Page: 110/122
elevations, maximum nominal range distance, range resolution
Elevations (deg): 0.0 0.5 1.0 1.5 2.0 2.7 3.4 4.4 7.0 11.4 18.3 26.7 Range: 240 km Resolution: 250m
Elevations (deg): 0.0 0.5 1.0 1.5 2.0 2.7 3.4 4.4 7.0 11.4 18.3 26.7 Range: 240 km Resolution: 250m
Elevations (deg): 0.0 0.5 1.0 1.5 2.0 2.7 3.4 4.4 7.0 11.4 18.3 26.7 Range: 240 km Resolution: 250m
Elevations (deg): 0.0 0.5 1.0 1.5 2.0 2.7 3.4 4.4 7.0 11.4 18.3 26.7 Range: 240 km Resolution: 250m
Table 39: Characteristics of the SHMÚ radars
The data processing For ground clutter removal the GIP frequency domain filter is used. Isolated bins in the range and azimuth direction are removed by the speckle removal filters. The data with intensities around the noise level and below are eliminated using the LOG threshold. The measured radar reflectivity is corrected for atmospheric (clear-air) attenuation of the radar beam. RLAN interference is removed using the Interference filter and SQI thresholding in the signal processor. The radar reflectivity is then corrected for attenuation of the radar beam in the precipitation. In the final step, dual-pol filtering of the non-meteorological echoes is applied on the reflectivity data which removes also most of the remaining interference. Correction for vertical profile of reflectivity (VPR) is not applied at SHMÚ. However beam blocking correction is being used in the quality-checking step for the H SAF validation due to complicated orographical conditions in Slovakia. Software filter for the RLAN interference detected by radars is currently in development at SHMÚ. Quality-based radar composite CAPPI 2 km products from all radars is used for the H SAF validation. The composition algorithm uses several quality-checking algorithms, where distance from radar, beam-blockage, spike-detection (similarity with neighbor values) and comparison with NWCSAF cloud-type and clout-top-height are considered and evaluated as quality indexes. The resulting value in the overlapping area of several radars is computed as weighted average of values from different radars, where weights are evaluated quality indexes. Precipitation intensity is derived from radar reflectivity according to the Marshall-Palmer equation (Z=a*R^b) with constant coefficients valid for stratiform rain (a=200, b=1.6). No raingauge correction of the derived instantaneous precipitation is applied. Effect of elevating radar beam with increasing range and beam attenuation is reduced by limiting the validation area to rain effective range of 120 km for both radars in the composite. The instantaneous precipitation products are provided in Mercator projection with approximately 1 km resolution. Threshold for precipitation detection is 0,02 mm/h. Time resolution of the current instantaneous products is 5 minutes, for the products prior to April 2010 it was 10 minutes and prior to August 2009 15 minutes. Precipitation accumulation in case of 3-hourly interval is based on integration of 5 (10 or 15) minutes instantaneous measurements in time period of 3 hours. Accumulated precipitation for intervals of 6, 12 and 24 hours is calculated as a sum of the 3-hourly accumulated precipitation. At least 92% of instantaneous measurements must exist in relevant time period for the 3-hourly accumulated product to be produced. No rain gauge correction of the accumulated precipitation is applied but the same limitation of validation area is used as for the instantaneous product. Threshold for precipitation detection of the 3-hourly accumulated product is 0,5 mm. Geographical projection and space resolution of the accumulated products are the same as those of instantaneous product (see above).

Product Validation Report - PVR-61-90
(Products H61B – P-AC-SEVIRI-PMW and H90 – P-AC-SEVIRI_E)
Doc. No: SAF/HSAF/PVR-61-90 Date: 27/02/2022 Page: 111/122
For validation of H SAF precipitation products it is necessary to know errors distribution of used ground truth data – in case of SHMÚ it is precipitation intensity and accumulated precipitation measured by Slovak radar network. For this purpose a study called “SHMU study on evaluation of radar measurements quality indicator with regards to terrain visibility” has been elaborated (/hsaf/WP6000/WP6100/precipitation/WG_groups/WG2-radar/WG-2-3_radar quality indication_v1.doc). To find distribution of errors in radar range next steps had to be done:
• simulations of terrain visibility by radar network using 90m digital terrain model • statistical comparison of radar data against independent rain gauge data measurements • derivation of dependence (regression equation) describing the errors distribution in radar
range with regard to terrain visibility, based on rain gauge and radar data statistical evaluation computation of error distribution maps using regression equation and terrain visibility
Main results of this study are shown in next figure. It is evident that the best visibility of SHMU radars corresponds to the lowest PR-RMSE-RMSE of 60% displayed by light violet colors. PR-RMSE-RMSE is of quite homogeneous distribution with average of 69% in prevalent lowlands of Slovakia displayed by bluish colors. But in central and north-west mountainous areas this error exceeds 100%.
Figure 77: Map of relative RMSE (left) and Mean Error (right) over the SHMÚ radar composite
Similar studies that have been carried out in the PPVG on comparison of radar data with rain gauge data have shown in general that RMSE error associated with radar fields depends considerably on radar minimum visible height above the rain gauge especially in mountainous countries. In lowlands this dependence is not so significant, but no negligible. The reason can be the location of radar sites at the top of hills and impossibility of the lowest elevation to reach the lowland’s surface. In case of Slovakia the PR-RMSE error of radar accumulated fields is between 60-90%, with an average PR-RMSE value of 69,3%. Mean Error specified for 24-hours cumulated precipitation is -4,42mm or converted into instantaneous precipitation -0,184 mm/h. RMSE specified for 24-hours cumulated precipitation is 9,48mm or converted into instantaneous precipitation 0,395 mm/h. Complete SHMU study is available on the H SAF ftp server: /hsaf/WP6000/WP6100/precipitation/WG_groups/WG2-radar/WG-2-3_radar quality indication_v1.doc

Product Validation Report - PVR-61-90
(Products H61B – P-AC-SEVIRI-PMW and H90 – P-AC-SEVIRI_E)
Doc. No: SAF/HSAF/PVR-61-90 Date: 27/02/2022 Page: 112/122
A1.8 Ground Data in Turkey
Rain gauge The network 356 Automated Weather Observation Station (AWOS) distributed over the country are used for the validation of the satellite precipitation products in the H SAF project. The average distance between the AWOS sites is 40.5 km.
Figure 78: Map Turkish rain gauge stations
The instruments The gauge type of the network is tipping bucket where each has a heated funnel. The minimum detection capability of the gauge is 0.2 mm per tip. In the maximum capacity of the instrument is 720 mm/h at most. The operational accumulation interval is 1 minute, so that alternative cumulation intervals such as 5, 10, 20, 30 minutes are possible. Data processing Quality control High quality of the ground data is critical for performing the validation of the precipitation products. The validation results or statistics can provide meaningful feedbacks for the product developers and additionally the products can be used reliably only if there is a confidence present about the ground data at a certain level. For this reason, some predefined quality assurance (QA) tests are considered for the precipitation data in order to define the confidence level. First of all, a flagging procedure is defined as described in next table
QA Flag Value QA Status Brief Description
0 Good Datum has passed all QA Test 1 Suspect There is concern about accuracy of datum 2 Failure Datum is unstable
Table 40: The precipitation data QA tests are summarized as follows.

Product Validation Report - PVR-61-90
(Products H61B – P-AC-SEVIRI-PMW and H90 – P-AC-SEVIRI_E)
Doc. No: SAF/HSAF/PVR-61-90 Date: 27/02/2022 Page: 113/122
Range Test This test is used to see if any individual precipitation observation falls within the climatological lower and upper limits. The test procedures applied in the study are as follows.
IF LimLower Obserj,t LimUpper THEN Obserj,t flag is ‘Good’ IF Obseri > LimUpper OR Obserj,t < LimLower THEN Obserj,t flag is ‘Failure’ LimLower and LimUpper thresholds are separately determined for each station on a monthly basis. At any specific site, all the observed monthly data is considered for determination of the upper and lower limits. By applying this test, each observation is flagged either by ‘Good’ or ‘Failure’ label depending on the comparison tests mentioned above. Step Test
It is used to see if increment/decrement between sequential observations in time domain is in acceptable range or not. The applied test procedure is,
IF |Obserj,t-Obserj,t-1| < Stepj THEN Obseri,t flag is ‘Good’ IF |Obserj,t-Obserj,t-1| > Stepj THEN Obseri,t flag is ‘Suspect’ Stepj threshold is determined again for each site on a monthly basis. For each site, the dataset containing the absolute difference of the sequential observations is determined by considering the observations for the matching month. The 99.9 % cumulative histogram value of the dataset is set as the Stepj threshold for the related site and month. Persistence Test
Persistence test is used to determine if any group of observations are due to instrument failures. The test procedure applied is defined as, IF T < Δ THEN Flag for all Obser in T : ‘Good’ IF T > Δ THEN Flag for all Obser in T : ‘Suspect’ where T is the total number of the sequentially repeating observations forward in time and Δ is the possible maximum number of sequentially repeating observations. As in the other two tests, Δ threshold is determined for each site on a monthly basis. For any site, the data belonging to the same month is taken into account to determine the repeating number of the sequential observations. Then, 99.9 % cumulative histogram value of the repeating number dataset is assigned as the Δ amount for the corresponding site and month. Since there is a high possibility of no-precipitation data (zero), the sequential zero observations are excluded in this test during the determination of the Δ threshold amount and application of the test. QA Test procedure By applying the control procedures of the QA test mentioned above, each individual precipitation observation receives three flags referring to the corresponding test. For the corresponding observation if all the test flag is not ‘Good’ then the observation is excluded from the validation process. Use of spatialization technique Due to the time and space structure of precipitation and to the sampling characteristics of both the precipitation products and observations used for validation, care has to be taken to bring data into comparable and acceptable range. At a given place, precipitation occurs intermittently and at highly fluctuating rates. Various maps, time series analysis, statistical and probabilistic methodologies are employed in the validation procedure classically, but some additional new aspects such as the spatial
£ £

Product Validation Report - PVR-61-90
(Products H61B – P-AC-SEVIRI-PMW and H90 – P-AC-SEVIRI_E)
Doc. No: SAF/HSAF/PVR-61-90 Date: 27/02/2022 Page: 114/122
coverage verification model of point cumulative semivariogram (PCSV) approach (Şen and Habib, 1998) are proposed for usage in this work. Each precipitation product within the H SAF project represents a foot print geometry. Among these, H01 and H02 products represent an elliptical geometry while H03B and H05B have a rectangular geometry. On the other hand, the ground observation (rain gauge) network consists of point observations. The main problem in the precipitation product cal/val activities occurs in the dimension disagreement between the product space (area) and the ground observation space (point). To be able to compare both cases, either area to point (product to site) or point to area (site to product) procedure has to be defined. However, the first alternative seems easier. The basic assumption in such an approach is that the product value is homogenous within the product footprint. Next figure presents satellite footprint (FOV) centers of the H01 and H02 products, an elliptical footprint for the corresponding center (area within the yellow dots) and Awos ground observation sites. The comparison statistic can be performed by considering just the sites in the footprint area. Although this approach is reasonable on the average but it is less useful in spatial precipitation variability representation. The comparison is not possible when no site is available within the footprint area.
Figure 79: H01 and H02 products footprint centers with a sample footprint area as well as the Awos ground observation sites.
Alternatively, the point to area approach is more appealing for the realistic comparison of the precipitation product and the ground observation. This approach is simply based on the determination of the true precipitation field underneath the product footprint area. To do so, the footprint area is meshed and precipitation amounts are estimated at each grid point by using the precipitation observations at the neighboring Awos sites as shown in Figure 80. A 3x3 km grid spacing is considered for the products with elliptical geometry while 2x2 km spacing is considered for the products with rectangular geometry. For any grid point, Awos sites within the 45 km for the time period of April-September (convective type) and 125km for the rest (stratiform type) are taken into consideration. At each grid point, the precipitation amount is estimated by,
(4.13.1) ZW r Z
W rm
i m ii
n
i mi
n= =
=
å
å
( )
( )
,
,
1
1

Product Validation Report - PVR-61-90
(Products H61B – P-AC-SEVIRI-PMW and H90 – P-AC-SEVIRI_E)
Doc. No: SAF/HSAF/PVR-61-90 Date: 27/02/2022 Page: 115/122
where Zm is the estimated value and W(ri,m) is the spatially varying weighting function between the i-th site and the grid point m.
Figure 80: Meshed structure of the sample H01 and H02 products footprint.
Determination of the W(ri,m) weighting function in Equation 1 is crucial. In open literature, various approaches are proposed for determining this function. For instance, Thiebaux and Pedder (1987) suggested weightings in general as,
(4.13.2)
where R is the radius of influence, ri,m is the distance from point i to point m to the point and a is a power parameter that reflects the curvature of the weighting function. Another form of geometrical weighting function was proposed by Barnes (1964) as,
(4.13.3)
Unfortunately, none of these functions are observation dependent but suggested on the basis of the logical and geometrical conceptualizations only. They are based only on the configuration, i.e. geometry of the measurement stations and do not take into consideration the natural variability of the meteorological phenomenon concerned. In addition, the weighting functions are always the same from site to site and time to time. However, in reality, it is expected that the weights should reflect to a certain extent the regional and temporal dependence behavior of the phenomenon concerned. For the validation activities, the point cumulative semi-variogram technique proposed by Şen and Habib (1998) is used to determine the spatially varying weighting functions. In this approach, the weightings not only vary from site to site, but also from time to time since the observed data is used. In this way, the spatial and temporal variability of the parameter is introduced more realistically to the validation activity. Matching approach
W rR r
R rfor r R
for r R
i m
i m
i mi m
i m
( ),
,
,,
,
=
-
+
æ
èçç
ö
ø÷÷ £
³
ì
íïï
îïï
2 2
2 2
0
a
W rrRi mi m( ) exp,,
= -æ
èç
ö
ø÷
é
ëêê
ù
ûúú
4a

Product Validation Report - PVR-61-90
(Products H61B – P-AC-SEVIRI-PMW and H90 – P-AC-SEVIRI_E)
Doc. No: SAF/HSAF/PVR-61-90 Date: 27/02/2022 Page: 116/122
The temporal and spatial matching approaches are applied separately in the validation of the satellite products. As for the temporal matching, the product time is taken into account and 5 minute window (t-2 to t+3) is considered for estimation of the average rainrate for each site. For the spatial matching, the mesh grid size of 3kmX3km is constructed for each IFOV area. For each grid point, the rainrate is estimated by taking the 5 minute averaged rainrate amounts observed at the nearby AWOS sites within the radius distance of 45 km(for convective type) or 125 km(for stratiform type) considering the weighting of each site with respect to the grid point(Equation 1). The weighting amounts are derived from the spatially varying weighting functions obtained by using the semi-variogram approach (Şen and Habib,1998). Finally, the Gaussian filter is applied to the estimations at the mesh grid of the IFOV area to get the average rainrate. Then, this amount is compared with the satellite precipitation product amount for the validation purposes.
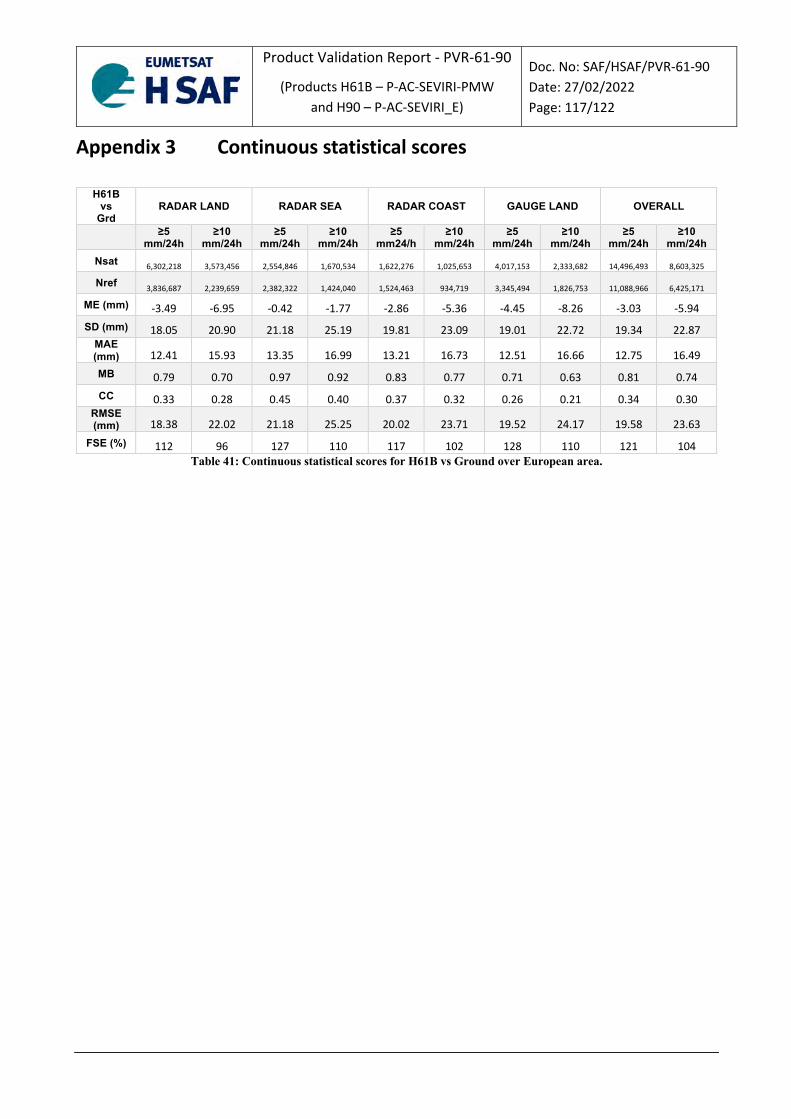
Product Validation Report - PVR-61-90
(Products H61B – P-AC-SEVIRI-PMW and H90 – P-AC-SEVIRI_E)
Doc. No: SAF/HSAF/PVR-61-90 Date: 27/02/2022 Page: 117/122
Appendix 3 Continuous statistical scores
H61B vs
Grd RADAR LAND RADAR SEA RADAR COAST GAUGE LAND OVERALL
≥5 mm/24h
≥10 mm/24h
≥5 mm/24h
≥10 mm/24h
≥5 mm24/h
≥10 mm/24h
≥5 mm/24h
≥10 mm/24h
≥5 mm/24h
≥10 mm/24h
Nsat 6,302,218 3,573,456 2,554,846 1,670,534 1,622,276 1,025,653 4,017,153 2,333,682 14,496,493 8,603,325
Nref 3,836,687 2,239,659 2,382,322 1,424,040 1,524,463 934,719 3,345,494 1,826,753 11,088,966 6,425,171
ME (mm) -3.49 -6.95 -0.42 -1.77 -2.86 -5.36 -4.45 -8.26 -3.03 -5.94 SD (mm) 18.05 20.90 21.18 25.19 19.81 23.09 19.01 22.72 19.34 22.87
MAE (mm) 12.41 15.93 13.35 16.99 13.21 16.73 12.51 16.66 12.75 16.49 MB 0.79 0.70 0.97 0.92 0.83 0.77 0.71 0.63 0.81 0.74 CC 0.33 0.28 0.45 0.40 0.37 0.32 0.26 0.21 0.34 0.30
RMSE (mm) 18.38 22.02 21.18 25.25 20.02 23.71 19.52 24.17 19.58 23.63
FSE (%) 112 96 127 110 117 102 128 110 121 104 Table 41: Continuous statistical scores for H61B vs Ground over European area.
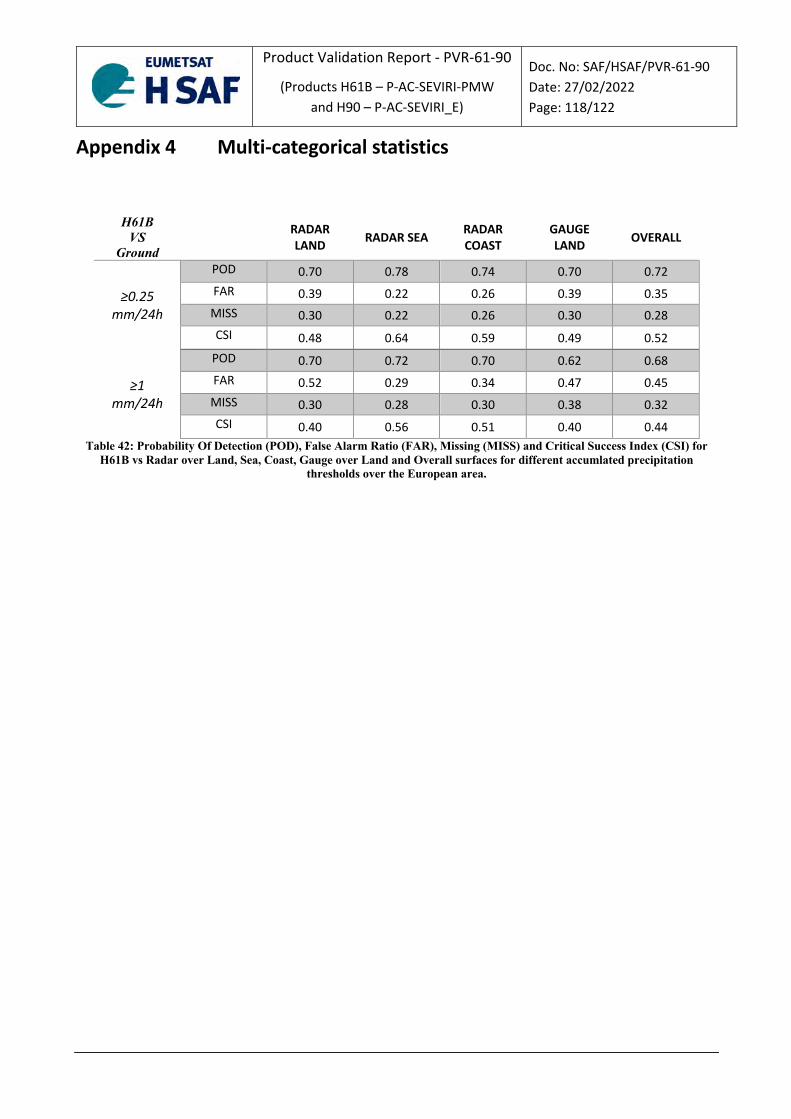
Product Validation Report - PVR-61-90
(Products H61B – P-AC-SEVIRI-PMW and H90 – P-AC-SEVIRI_E)
Doc. No: SAF/HSAF/PVR-61-90 Date: 27/02/2022 Page: 118/122
Appendix 4 Multi-categorical statistics
H61B VS
Ground RADAR
LAND RADAR SEA RADAR COAST
GAUGE LAND OVERALL
≥0.25 mm/24h
POD 0.70 0.78 0.74 0.70 0.72 FAR 0.39 0.22 0.26 0.39 0.35 MISS 0.30 0.22 0.26 0.30 0.28 CSI 0.48 0.64 0.59 0.49 0.52
≥1 mm/24h
POD 0.70 0.72 0.70 0.62 0.68 FAR 0.52 0.29 0.34 0.47 0.45 MISS 0.30 0.28 0.30 0.38 0.32 CSI 0.40 0.56 0.51 0.40 0.44
Table 42: Probability Of Detection (POD), False Alarm Ratio (FAR), Missing (MISS) and Critical Success Index (CSI) for H61B vs Radar over Land, Sea, Coast, Gauge over Land and Overall surfaces for different accumlated precipitation
thresholds over the European area.

Product Validation Report - PVR-61-90
(Products H61B – P-AC-SEVIRI-PMW and H90 – P-AC-SEVIRI_E)
Doc. No: SAF/HSAF/PVR-61-90 Date: 27/02/2022 Page: 119/122
Appendix 5 H61B maps
Figure 81: RMSE map over FD area. Mean value equals 9.8 mm/24h.

Product Validation Report - PVR-61-90
(Products H61B – P-AC-SEVIRI-PMW and H90 – P-AC-SEVIRI_E)
Doc. No: SAF/HSAF/PVR-61-90 Date: 27/02/2022 Page: 120/122
Figure 82: CC map over FD area. Mean value equals 0.58 (between threshold and target).
Figure 83: CC maps over FD area computed for best and worst month:
April 2021 (on the left) and September 2020 (on the right). Mean values are also indicated.

Product Validation Report - PVR-61-90
(Products H61B – P-AC-SEVIRI-PMW and H90 – P-AC-SEVIRI_E)
Doc. No: SAF/HSAF/PVR-61-90 Date: 27/02/2022 Page: 121/122
Appendix 6 Acronyms
AMSU Advanced Microwave Sounding Unit ATMS Advanced Technology Microwave Sounder ATS Automatic Telemetric Station AWOS Automated Weather Observation Station BE Belgium BfG German Federal Institute of Hydrology CAPPI Constant altitude plan position indicator CSI Critical Success Index DE Germany DPC Italian Department of Civil Protection ECMWF European Centre for Medium-Range Weather Forecasts EFOV pixel Extension Field Of View ENAV Italian air navigation service provider EU European FAR False Alarm Ratio FD Full Disk FMI Finnish Meteorological Institute GRD Ground GRISO Rainfall Generator of Spatial Interpolation from Observation HU Hungary IFOV Instantaneous Field Of View IMWM Institute of Meteorology and Water Management - Poland INCA Integrated Nitrogen model for CAtchments IRM Institut Royal Météorologique - Belgium IT Italy ITAF-COMET ITalian Air Force – Operational Meteorological Center MAE Multiplicative Absolute Error MB Multiplicative Bias ME Mean Error METOP Meteorological Operational Satellites MHS Microwave Humidity Sounder MW MicroWave NE North-East NW North-West OMSZ Hungarian Meteorological Service PL Poland POD Probability Of Detection PPVG Precipitation Product Validation Group PR Precipitation Rate PR-RMSE Product Requirement Root Mean Square Error PUM Product User Manual PVR Product Validation Report RD Radar RG Raingauge RMSE Root Mean Square Error SAF Satellite Application Facility SE South-East SHMU Slovak hydrometeorological institute SK Slovakia SRI Surface Rainfall Intensity STD Standard Deviation SW South-West TSMS Turkish State Meteorological Service

Product Validation Report - PVR-61-90
(Products H61B – P-AC-SEVIRI-PMW and H90 – P-AC-SEVIRI_E)
Doc. No: SAF/HSAF/PVR-61-90 Date: 27/02/2022 Page: 122/122
TU Turkey UCC Unique Common Code WG Working Group ZAMG Zentralanstalt für Meteorologie und Geodynamik