City Union Bank Initiating Coverage Report - Dalal & Broacha
Upload
khangminh22Category
view
3download
0
A MOVIE WORTH WAITING FOR PVR & Inox leisure Initiation Report
Senior Research Analyst: Mayank Babla 022 67141412 Research Associate: Suraj Nandu 022 67141438
[email protected]; [email protected]
Strong exhibition business negatively impacted due to Covid-19 blues are ready to roar back into action. Read further to know the efforts taken by the two for sustenance, survival
and to come out stronger in a Post COVID world.

Movie Exhibition: Inox Leisure & PVR September 2, 2020
Page 1
Analyst: Mayank Babla 022 67141412
Associate: Suraj Nandu 022 67141438
Initiating Coverage Report @ Dalal & Broacha
Summary Table CMP Rating Applied
EV/EBITDA Multiple
Target (on FY23 EBITDA)
Upside Market
Cap (INR Mn)
Volumes (BSE+NSE) in
000’s
Inox (INOXLEISURE) 290 BUY 9.5x 398 37% 29,839 1813
PVR (PVR) 1,400 BUY 12x 1,804 29% 72,397 2493
Key Investment triggers
Monthly Cash burn reduction: Inox, has reduced their monthly fixed cost to Rs. 120-130mn from Rs. 300-
350mn in pre-Covid times whereas PVR has reduced it by 75% to ~ Rs. 350mn. This will release pressure on
their cashflows during these hard times
Capital raise: PVR had Rs. 2.27bn of Cash on books (Cash & Bank stood at Rs.3.16bn as of Q4FY20). PVR also
raised Rs. 3bn through Rights Issue by offering 38,23,872 equity shares at INR 784 per share on 10/07/2020
(ratio of 7 for every 94 shares). Objects of the rights issue were to repay principal and/or prepay interest to the
tune of Rs. 2.34bn and use Rs.725mn towards General Corporate Purposes. Inox on the other hand has
reduced their monthly cash burn rate to Rs. 120-130mn from Rs. 300-350mn earlier. Furthermore, they have
cash and bank balance of Rs. 360mn as of 31st July, 2020 and the company has sold treasury shares worth Rs.
1bn in mid-August. In addition to this, the company has also got final approval from the board to raise another
Rs. 2.5bn through equity or any other means favourable to a shareholder if necessary and lastly, they own 6
cinema properties and a head office which at market valuation is Rs. 3.5bn.
Survival of the fittest: Taking a contrary view, COVID-19 pandemic can in fact aid multiplexes as single screen
theatres come under financial stress due to inoperability. We believe that multiplexes are much better
equipped in the survival of the fittest due to corporatized and professionalized nature of their business and
hence access to capital vis-à-vis single screen theatres. Therefore, we believe that we will see the share of
multiplex to single screen theatre shift towards multiplexes during the pandemic. For example, Central Plaza –
Girgaun (which was a Main Cinema in the pre-Multiplex era) had to shut shop in the COVID pandemic.
Co-existence of OTT and Exhibitors: OTT platforms cannot match the kind of collections that a Box Office
release can garner, and an OTT release also caps the revenue for a producer. For example, Gunjan Saxena and
Gulabo Sitabo both were released on OTT platforms and garnered INR 60 Cr and INR 65 Cr respectively,
however, collections were incomparable to Uri or Kabir Singh which garnered INR 250 Cr and INR 379
respectively. We believe OTT and Exhibitors to co-exist with content specifically made for both streams along
with sharing of content i.e. in a post Covid world, a movie will have a theatrical release first, followed by either
a satellite or OTT platform.
Outlook & Valuation: We believe both companies have enough capital to survive for the next few months even without revenues
coming in and it is only a matter of time before government allows theatres to re-open. This being said, it is
prudent to note that currently any guideline on re-opening of theatres, operational timings, seating
arrangement and capacity, if the re-opening will take place nationwide or only state-wise (depending on the
number of active cases and recovery rates in each state) is currently unknown.

Movie Exhibition: Inox Leisure & PVR September 2, 2020
Page 2
Analyst: Mayank Babla 022 67141412
Associate: Suraj Nandu 022 67141438
Initiating Coverage Report @ Dalal & Broacha
YE March (INR Mn) FY19 FY20 FY21E FY22E FY23E
Net Sales 16,922 18,974 4,732 20,075 25,546
Growth % 25.5% 12.1% (75.1%) 324.2% 27.3%
EBITDA 3,083 5,968 445 6,193 8,002
Growth % 45.7% 89.9% -90.2% 952.6% 28.4%
Net Profit 1,335 150 -2,303 656 1,583
Growth % 16.4% (88.8%) N.A. N.A. 141.4%
Diluted EPS 13.0 1.5 (22.4) 6.4 15.4
Growth % 9.1% -88.8% N.A. N.A. 141.4%
No. of Shares 102.6 102.7 102.7 102.7 102.7
EBITDA Margins % 18.9% 32.1% 12.3% 31.4% 31.7%
EBIT Margins % 13.3% 18.3% -26.8% 16.4% 18.6%
NPM (%) 7.8% 0.8% -47.1% 3.2% 6.2%
RoE (%) 13.9% 2.4% -54.3% 13.4% 24.4%
RoCE (%) 21.9% 47.0% -22.3% 59.0% 69.1%
BV/Per Share INR 94 61 41 48 63
P/E(x) 22.3x 198.3x N.A. 45.4x 18.8x
EV/EBITDA 9.8x 9.6x 133.6x 9.9x 8.1x
P/BV(x) 3.1x 4.8x 7.0x 6.1x 4.6x
EV/Sales(x) 1.8x 3.0x 12.6x 3.0x 2.5x
Market Cap./Sales(x) 1.8x 1.6x 6.3x 1.5x 1.2x
Inox Leisure Key Financials
YE March (INR Mn)
Valuation Ratios
Currently, on EV/EBITDA basis, PVR is trading at 13.3x and 9.6x FY22e and FY23e on an EBITDA of INR 6,201.7
Mn and INR 8,546 Mn, respectively. We assign an EV/EBITDA multiple of 12x to FY23e EBITDA and arrive at a
target price of Rs. 1804 (upside of 29%).
Inox on EV/EBITDA basis, is trading at 9.8x and 8x FY22e and FY23e EBITDA of INR 6,192.5mn and INR 8,002.4
Mn respectively. Please note Inox’s numbers are on Post IND-AS 116 whereas PVR is on Pre-Ind-AS 116 basis.
We value Inox on EV/EBITDA basis, assigning a 9.5x (~14% discount to PVR’s multiple on account of higher
screen count, and stronghold in South through SPI Cinemas), to FY23e EBITDA and arrive at a target price of
Rs. 398 i.e. upside of 37%.
We initiate coverage on PVR and Inox leisure and recommend investors to BUY the stock with a long-term
horizon (minimum of 18-24 months) and point out that market and exhibition stocks may display volatility
depending on the rise and fall of COVID infections, recoveries, lockdowns etc. However, any sort of big dip in
these stocks should be considered as a buying opportunity
YE March (INR Mn) FY19 FY20 FY21E FY22E FY23E
Net Sales 30,856 34,144 11,075 40,304 52,181
Growth % 32.2% 10.7% (67.6%) 263.9% 29.5%
EBITDA 5,863 5,762 (2,295) 6,202 8,546
Growth % 45.9% -1.7% N.A. N.A. 37.8%
Net Profit 1,894 1,661 (5,720) 1,637 2,663
Growth % 50.5% (12.3%) N.A. N.A. 62.7%
Diluted EPS 39.3 32.6 (109.5) 32.7 52.6
Growth % 47.3% -17.1% N.A. N.A. 60.6%
No. of Shares 46.7 51.3 51.7 51.7 51.7
EBITDA Margins % 19.0% 16.9% -20.7% 15.4% 16.4%
EBIT Margins % 12.8% 10.1% -41.7% 8.6% 8.9%
NPM (%) 6.1% 4.9% -51.6% 4.1% 5.1%
RoE (%) 15.9% 12.6% -45.4% 16.8% 21.6%
RoCE (%) 18.0% 12.8% -18.0% 14.8% 19.6%
BV/Per Share INR 265 272 217 189 238
P/E(x) 35.6x 43.2x -12.7x 44.1x 27.1x
EV/EBITDA 13.1x 14.3x -36.0x 13.3x 9.6x
P/BV(x) 5.3x 5.1x 6.5x 7.4x 5.9x
EV/Sales (x) 2.5x 2.4x 7.5x 2.0x 1.6x
Market Cap./Sales(x) 2.1x 2.1x 6.5x 1.8x 1.4x
PVR Key Financials
Valuation Ratios
YE March (INR Mn)
Movie Exhibition: Inox Leisure & PVR September 2, 2020
Page 3
Analyst: Mayank Babla 022 67141412
Associate: Suraj Nandu 022 67141438
Initiating Coverage Report @ Dalal & Broacha
2009
2011
2013
2015
2016
2017
2018
Multiplex 925 1,22 1,50 2,10 2,45 2,75 2,95
Single Screen 9,71 9,12 8,45 7,40 7,03 6,78 6,65
Total 10,6 10,3 9,95 9,50 9,48 9,53 9,60
925
1,2
25
1,5
00
2,1
00
2,4
50
2,7
50
2,9
50 9
,710
9,1
21
8,4
51
7,4
00
7,0
31
6,7
80
6,6
51
10,6
35
10,3
46
9,9
51
9,5
00
9,4
81
9,5
30
9,6
01
-
2,000
4,000
6,000
8,000
10,000
12,000Multiplex Single Screen Total
9% 12%
15
%
22%
26%
29%
31%
40%
91%
88%
85%
78%
74%
71%
69%
60%
0%
20%
40%
60%
80%
100%
2009 2011 2013 2015 2016 2017 2018 2023
Multiplex
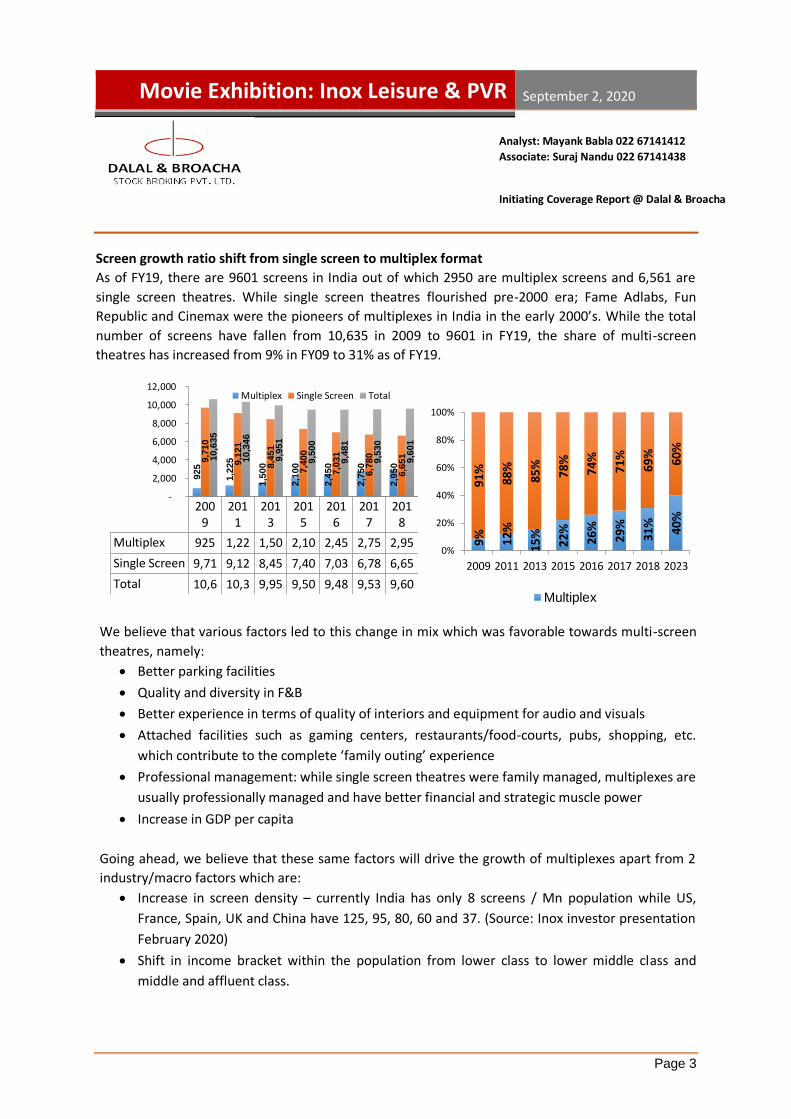
Screen growth ratio shift from single screen to multiplex format
As of FY19, there are 9601 screens in India out of which 2950 are multiplex screens and 6,561 are
single screen theatres. While single screen theatres flourished pre-2000 era; Fame Adlabs, Fun
Republic and Cinemax were the pioneers of multiplexes in India in the early 2000’s. While the total
number of screens have fallen from 10,635 in 2009 to 9601 in FY19, the share of multi-screen
theatres has increased from 9% in FY09 to 31% as of FY19.
We believe that various factors led to this change in mix which was favorable towards multi-screen
theatres, namely:
• Better parking facilities
• Quality and diversity in F&B
• Better experience in terms of quality of interiors and equipment for audio and visuals
• Attached facilities such as gaming centers, restaurants/food-courts, pubs, shopping, etc.
which contribute to the complete ‘family outing’ experience
• Professional management: while single screen theatres were family managed, multiplexes are
usually professionally managed and have better financial and strategic muscle power
• Increase in GDP per capita
Going ahead, we believe that these same factors will drive the growth of multiplexes apart from 2
industry/macro factors which are:
• Increase in screen density – currently India has only 8 screens / Mn population while US,
France, Spain, UK and China have 125, 95, 80, 60 and 37. (Source: Inox investor presentation
February 2020)
• Shift in income bracket within the population from lower class to lower middle class and
middle and affluent class.

Movie Exhibition: Inox Leisure & PVR September 2, 2020
Page 4
Analyst: Mayank Babla 022 67141412
Associate: Suraj Nandu 022 67141438
Initiating Coverage Report @ Dalal & Broacha
We believe that both these factors will be a function of GDP per capita. Screens in China grew from
9,000 to 60,000 between 2011 and 2018 and this was mainly due to increase in GDP per capita and
the consequent increase in the share of discretionary spend vis-à-vis necessity in the household
consumption. Lowest Screen Density per Million Population… Progress of earners towards higher income brackets by 2025
% of population progressing to higher income brackets… And change in spending patterns therein…
As per reports and studies1, India had 93% of its population (or 702 Mn individuals) in the Lower Class
(LC), 6% (or 45 Mn) in Lower Middle Class (LMC) and 1% (or 8 Mn) in Middle & Affluent Class (MAC) in
1985. As of 2015, there were 35% or (447 Mn individuals) in LC, 43% (or 550 Mn) in LMS and 22% (or 281
Mn) in MAC.
It is expected that by 2025, 22% (or 314 Mn) will be in LC, 36% (or 514 Mn) in LMS and 42% (or 600
Mn) in MAC. Anecdotal evidence suggests that as GDP per capita increases in a particular economy, the
mix in spend between Necessities and Discretionary Items tilts more towards Discretionary spend like
Luxury goods and Services. Therefore, while Indians spent 61% of their income on Necessities and 39%
1 Source: Mckinsey - Tracking the growth of Indias Middle Class – 2017 and Inox Leisure February 2020 Investor Presentation
702 742598
447 314
45167 454
550514
819
55 281 600
0
200
400
600
800
1000
1200
1400
1600
1985 1995 2005 2015 2025
In U
nit
s M
illio
ns
Lower Class Lower Middle Class
Middle & Affluent Class
93%80%
54%35%
22%
6% 18%
41%
43%
36%
1% 2% 5%22%
42%
0%
20%
40%
60%
80%
100%
1985 1995 2005 2015 2025Lower Class
Lower Middle Class
Middle & Affluent Class
61%48%
39%30%
39%52%
61%70%
0%
20%
40%
60%
80%
100%
1995 2005 2015 2025
Necessities Discretionary
125
95
80
60 57
40 3726 25
12 10 8
0
20
40
60
80
100
120
140
Screen/Million Population

Movie Exhibition: Inox Leisure & PVR September 2, 2020
Page 5
Analyst: Mayank Babla 022 67141412
Associate: Suraj Nandu 022 67141438
Initiating Coverage Report @ Dalal & Broacha
on Discretionary items in 1995, this mix changed to 39% on necessities and 61% on discretionary in
2015. By 2025, it is believed that spend on Necessities will fall to 30% and on Discretionary it will
increase to 70%.
We believe that this shift in demographics and macros and the spending pattern therein will be
beneficial for the Cinema industry as multiplexes will have the ability to charge higher prices for tickets
(thereby improving ATPs in the longer term).
Wider Screen releases due to technology and penetration of multiplexes in Tier II and III cities to drive
Box Office Collections and Theatrical revenues. Digital technology through digitization of content and
penetration of multiplexes in tier II and III has enabled faster and wider screen releases. This
phenomenon is evident from the following graph depicting number of screens films have released on
over the past 10 years:
Box office collections are directly proportional to wider screen releases as evident from the charts
above. While 3 Idiots was released on 1,000 screens in 2009, there was only 1 film in the same year that
grossed in the range of INR 2 to 2.99 Bn. Saaho, which released on 6,000 screens, that year recorded 12
movies in the +INR 1Bn club, 5 in +INR 2Bn club and 2 in INR 3Bn club.
While the Indian theatrical revenues have grown at 6.9% CAGR between FY15 and FY19 and are
estimated to grow at 5.3% CAGR between FY19 and FY24e, we believe that factors such as an explosion
in GDP per capita and higher Tier II and III cities penetration might pose as positive surprises to these
estimates.
Theatrical Revenue Trend… INR Mn FY15 FY16 FY17 FY18 FY19 CAGR (%) FY20e FY21e FY22e FY23e FY24e CAGR (%)
Domestic Theatrical Revenue
95.5 100.8 101.4 108.9 124.9 6.9% 132.8 142 147.9 153.6 162 5.3%
1,0
00
1,5
98
2,0
65
2,1
01
2,6
38
3,0
14
3,4
46
3,3
59
5,2
00
4,5
00
5,3
00
6,5
00
4,5
00
6,9
00
6,0
00
-
1,000
2,000
3,000
4,000
5,000
6,000
7,000
8,000
No. of Screens Released…
12
5
9
6 75
87
1012
1
21
1
1
2
5
1
1
2 2
3
2
0
2
4
6
8
10
12
14
16
18
20
2008 2009 2010 2011 2012 2013 2014 2015 2016 2017 2018 2019
INR 1 -199Bn INR 2 - 2.99Bn INR 3Bn+
Source: KPMG India’s Media and Entertainment report 2019

Movie Exhibition: Inox Leisure & PVR September 2, 2020
Page 6
Analyst: Mayank Babla 022 67141412
Associate: Suraj Nandu 022 67141438
Initiating Coverage Report @ Dalal & Broacha
India is currently at USD 1700-1800 per capita and might be at the cusp of a GDP per capita explosion
over the next 5-7 years as anecdotal evidence suggests that GDP per capita for several developing
economies has reported a sudden spurt of growth post these levels. If this spurt of GDP per capita does
infact materialize, we believe that ATP might have a major positive surprise in store over the next few
years. Additionally, penetration of multiplexes into Tier II and Tier III cities due to an increase of
audience’s propensity to consume content in the local language and ability of regional films to break
language barriers (for example Bahubali was originally a Telugu Film but crossed over to several other
languages) has provided fodder to footfall growth.
Screen & Property Count
PVR is the clear leader by the number of screens with 845 screens as of FY20 while Inox comes 2nd at 626
screens. Though Inox was a market leader in FY12 with 257 screens compared to PVR’s 166 screens; PVR
overtook Inox with a growth of 22% CAGR between FY12 and 9MFY20 whereas Inox Screens grew at 12%
CAGR. As seen in the table above, PVR has added screens faster than its competitor Inox but in terms of
geographical spread (explained later) there is not much difference. Pre-Covid, both exhibitors had guided
to add ~10% of their screens each year. Barring FY21e due to Covid led temporary disruptions, company is
confident on maintaining their screen addition guidance for the long term. During Covid-19, it is expected
Particulars FY15 FY16 FY17 FY18 FY19 FY20 FY21e FY22e FY23e
PVR 464 516 579 625 771 845 885 1005 1150
additions 52 63 46 146 74 40 120 145
Inox 372 420 468 492 583 626 661 725 797
additions 48 48 24 91 43 35 64 72
PVR 104 112 126 134 165 176 184 209 240
additions 8 14 8 31 11 8 25 31
Inox 96 107 118 123 141 147 155 171 189
additions 11 11 5 18 6 8 16 18
PVR 43 47 50 51 67 71
additions 4 3 1 16 4
Inox 52 57 58 61 67 68
additions 5 1 3 6 1
PVR 4 5 5 5 5 5 5 5 5
Inox 4 4 4 4 4 4 4 4 4
Screens
Properties
Cities
Screen per property
Movie Exhibition: Inox Leisure & PVR September 2, 2020
Page 7
Analyst: Mayank Babla 022 67141412
Associate: Suraj Nandu 022 67141438
Initiating Coverage Report @ Dalal & Broacha
that multiplexes will further gain share from single plexes as well as other unlisted multiplexes due to
cashflow issues.
Inox in their Q1FY21 presentation, has guided for 41 screen additions in FY21e (86-90% of work is done for
most screens as these were planned to be open in FY20 but was delayed due to lockdown). Additionally,
Inox has signed agreements with a further 989 screens, across 142 properties and 1,84,642 seats which
will bring their total Post FY21e to 300 properties, 1656 screens and 335,483 seats. This shows the belief
the company has in the exhibition business in India.
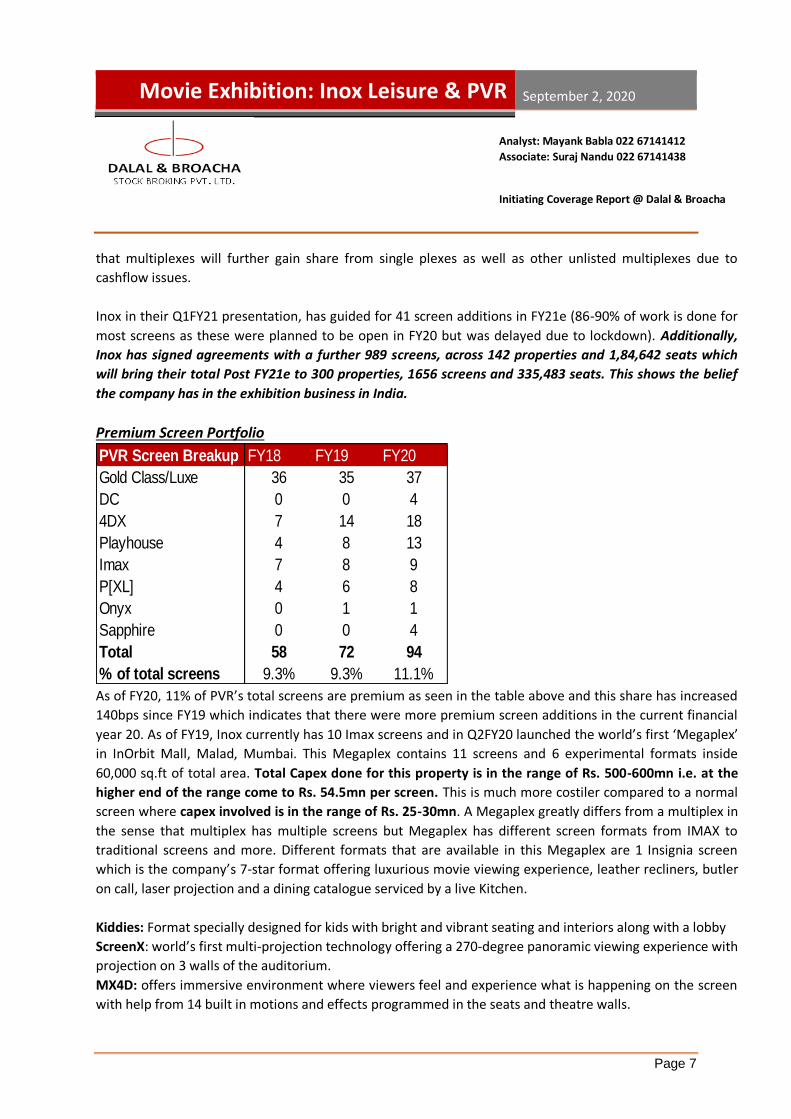
Premium Screen Portfolio
As of FY20, 11% of PVR’s total screens are premium as seen in the table above and this share has increased
140bps since FY19 which indicates that there were more premium screen additions in the current financial
year 20. As of FY19, Inox currently has 10 Imax screens and in Q2FY20 launched the world’s first ‘Megaplex’
in InOrbit Mall, Malad, Mumbai. This Megaplex contains 11 screens and 6 experimental formats inside
60,000 sq.ft of total area. Total Capex done for this property is in the range of Rs. 500-600mn i.e. at the
higher end of the range come to Rs. 54.5mn per screen. This is much more costiler compared to a normal
screen where capex involved is in the range of Rs. 25-30mn. A Megaplex greatly differs from a multiplex in
the sense that multiplex has multiple screens but Megaplex has different screen formats from IMAX to
traditional screens and more. Different formats that are available in this Megaplex are 1 Insignia screen
which is the company’s 7-star format offering luxurious movie viewing experience, leather recliners, butler
on call, laser projection and a dining catalogue serviced by a live Kitchen.
Kiddies: Format specially designed for kids with bright and vibrant seating and interiors along with a lobby
ScreenX: world’s first multi-projection technology offering a 270-degree panoramic viewing experience with
projection on 3 walls of the auditorium.
MX4D: offers immersive environment where viewers feel and experience what is happening on the screen
with help from 14 built in motions and effects programmed in the seats and theatre walls.
PVR Screen Breakup FY18 FY19 FY20
Gold Class/Luxe 36 35 37
DC 0 0 4
4DX 7 14 18
Playhouse 4 8 13
Imax 7 8 9
P[XL] 4 6 8
Onyx 0 1 1
Sapphire 0 0 4
Total 58 72 94
% of total screens 9.3% 9.3% 11.1%

Movie Exhibition: Inox Leisure & PVR September 2, 2020
Page 8
Analyst: Mayank Babla 022 67141412
Associate: Suraj Nandu 022 67141438
Initiating Coverage Report @ Dalal & Broacha
IMAX: offers 40% larger image, a dual projection system and highest quality 3D.
Samsung Onyx LED: world’s first cinema LED technology, with 10x brighter visuals and JBL’s surround
sound.
Dolby ATMOS sound and laser projection in the mainstream auditoriums that complete the cinematic
offering.
Ticket prices in this megaplex ranges from Rs. 150-1000 depending on the screen format the viewer
chooses, and the company exhibits about 60 shows a day.
Company has planned to add another such Megaplex in Lucknow, which is currently under construction.
Furthermore, Inox in their existing properties, as part of refurbishments will change traditional screens to
Samsung Onyx LED, IMAX or any other premium type wherever possible. Addition of premium screens in
the future will bode well as it will further improve key metrics such as Average Ticket Price (ATP), Footfalls
and Spend Per Head (SPH).
Geographical Breakup and Inorganic Route has driven screen growth In the recent past, both companies have acquired local players to strengthen their position in existing
geographies as well as enter new states. This is more evident in their screen geographical breakup.
In PVR, as seen there is a big jump in screen additions in the south region in FY19. In August 2018 (Q2FY19),
the company acquired 71.6% stake in SPI Cinemas during which time they had 76 screens across 17
properties primarily in the South region. They had 10 brands namely, Sathyam, Escape, Palazzo, The
Cinema and S2 Cinema. The deal amount was all cash Rs. 6.33bn.
In June 2016, PVR acquired DT cinemas from realty major DLF for Rs. 4.33bn. During the time of deal, DT
cinemas had a total screen of 39 across NCR and Chandigarh region. PVR acquired 32 screens from them.

Movie Exhibition: Inox Leisure & PVR September 2, 2020
Page 9
Analyst: Mayank Babla 022 67141412
Associate: Suraj Nandu 022 67141438
Initiating Coverage Report @ Dalal & Broacha
In 2013, PVR acquired 69.27% stake in Cinemax for Rs. 3.95bn. At the time of acquisition, PVR acquired 138
screens which put him as the player with the highest number of screens in the country.
Inox has also strengthened its position through acquisitions over the years. In 2007, the company acquired
Calcutta Cine which operated 89 screens at the time of acquisition and gave access to West Bengal and
Assam markets.
From 2010-2013 after a hard battle against Reliance MediaWorks’ Big Cinemas, Inox acquired 43.28% stake
in Srinagar Cinemas Ltd which operates Fame Cinemas for Rs. 66.48 crores. The company acquired 95
screens from Fame which strengthened their position in key states such as Maharashtra.
In 2014, Inox acquired 100% stake in Satyam Cineplexes for Rs. 1.82bn and 38 screens in total primarily
situated in Delhi, Gurgaon, Greater Noida and Faridabad. Prior to the acquisition only PVR was present in
the Indian Capital.
PVR acquired Cinemax, DT Cinemas (Delhi NCR Region) and SPI Cinemas (South India based) at INR 2.93
Cr/screen, INR 13.53 Cr/screen and INR 8.32/screen respectively, whereas Inox acquired Fame Adlabs and
Satyam Cinemas at INR 0.69 Cr/screen and INR 4.82 Cr/screen respectively.
PVR’s acquisitions were highly strategic in nature as it mainly focused on acquiring market leaders whereas
Inox used acquisitions as a mode of entry into newer markets. For example, PVR’s acquisition of Cinemax
consolidated its position in West India and through acquisition of DT Cinemas and SPI Cinemas, PVR
consolidated its position in Delhi NCR and South India respectively.
Loyalty Program can do a “Jet Miles” in the movie exhibition industry
During FY20, PVR launched its loyalty program wherein 5% of amount spent are credits rewarded to
the customer. Once 50 points are collected, one can start redeeming against movie tickets and F&B.
As of Q3FY20, membership base crossed 1 crore mark versus 45 lacs in the previous year. We believe
that PVR’s loyalty program can be a huge success (similar to JetMiles) given the exhibitor’s
leadership status and brand recall.
PVR
Cinemax (FY13)
135 screens @INR 395 Cr
DT Cinemas (FY17)
32 screens @INR 433 Cr SPI Cinemas
(FY19)
76 screens @INR 633 Cr
Inox
89 Cinemas (FY07)
Fame Adlabs (FY11)
95 screens @INR 66 Cr Satyam
(FY15)
38 screens @INR 182 Cr
PVR’s acquisition of SPI
Cinemas seems to be a solid
value-add as occupancy rate of
SPI cinemas (57%) is not only
higher than PVR consol but
higher than other theatres in
the south as well.
SPI acquired at EBITDA of INR
1.62 Cr/screen

Movie Exhibition: Inox Leisure & PVR September 2, 2020
Page 10
Analyst: Mayank Babla 022 67141412
Associate: Suraj Nandu 022 67141438
Initiating Coverage Report @ Dalal & Broacha
Inox Launched its own rewards program titled “Inox Rewards” in FY20 which consisted of 3
membership levels which were Blue, Gold and Black Categories. The way it works is that, people
would get up to 5% of the ticket price and up to 10% of the F&B purchase depending on their
membership level along with access to the Insignia 7-star lounge.
While membership to the loyalty program is free of charge (and therefore no source of upfront
revenue), we believe that it will successfully provide impetus to:
• Footfalls: Loyalty programs drive brand recall and ensure a strong churn rate or higher footfalls in
this case. For example, JetMiles managed to create strong loyalty towards Jet Airways in its hay
days as individuals would collect ‘JetMiles’ by spending on their Credit/Debit Card and redeem
these miles against flights.
• Advertising Revenue: A strong loyalty program translates into loads of usable customer data.
Data such as Age, Sex, Taste (through genre of movies booked), Spending patterns, frequency and
mode, Location, etc. could be used by PVR to monetize by selling it to advertisers. Advertisers
could then utilize this data to create a more precise and apt ad content and distribution.

Movie Exhibition: Inox Leisure & PVR September 2, 2020
Page 11
Analyst: Mayank Babla 022 67141412
Associate: Suraj Nandu 022 67141438
Initiating Coverage Report @ Dalal & Broacha
F&B has been a differentiator and a key propelling force in driving topline growth and margin
expansion for PVR & Inox
PVR
SPH to ATP (%) comparable to global peers… SPH to ATP (%) of PVR…
PVR’s F&B Sales (top right chart) and Spend Per Head (SPH) (top left chart) have grown at a CAGR
of 25% and 4% between FY18 and FY20 respectively. Additionally, the SPH to ATP ratio has shown a
healthy increase from 36% in FY15 to 48.5% as of FY20. Notably, F&B is a high margin business with
Gross Margins as high as 72.6% as of Q4FY20.
More importantly, PVR’s SPH to ATP ratio at 48.5% (as of FY20) comes in the Top 5 global peers
(bottom left chart). Notably, top global peers are from countries such as Canada (Cineplex), America
(Cinemark and AMC), Belgium (Kinepolis) and UK (Cineworld) – which are comparatively very high
GDP per capita economies.
We expect FY21e to be a completely washout and a “blip” year as cinemas were shut in H1FY21. We
have assumed that Cinemas will re-open from Q3FY21 onwards with capacity restrictions and
vaccines to be commercially rolled out by Q4FY21e. In line with our assumptions:
• We expect footfalls to grow from 76 Mn in FY18 to 147 Mn in FY23e at a CAGR of 13%
• ATP to increase at a CAGR of 2.7% between FY20 and FY23e from INR 205 to INR 216
25%
32%
48%
40%45%
50% 50%
60% 61%
0%
10%
20%
30%
40%
50%
60%
70%
SPH TO ATP (%)
CAGR 4% CAGR 3%
CAGR 25% CAGR 16.6%
43.0
%
44.1
% 48.5
%
48.4
%
47.8
%
49.9
%38.0%
40.0%
42.0%
44.0%
46.0%
48.0%
50.0%
52.0%
FY18 FY19 FY20 FY21E FY22E FY23E
SPH to ATP (%)

Movie Exhibition: Inox Leisure & PVR September 2, 2020
Page 12
Analyst: Mayank Babla 022 67141412
Associate: Suraj Nandu 022 67141438
Initiating Coverage Report @ Dalal & Broacha
• Occupancy rate to return to dip to 7% in FY21e, bounce-back to 30% in FY22e and return to
normalcy to 34% in FY23e
• Ticket Sales to grow at CAGR of 15.7% between FY20 and FY23e
We believe that FY22e will serve as the bounce-back year and the year of “revenge-buying” wherein
individuals and families will flood the theatres due to pent-up demand from the lockdowns.
However, occupancy will still be lower than normal (30%) in FY22e as people will very slowly return
to theatres. Expect footfalls and occupancy to revert to normalcy or pre-COVID levels.
Inox Leisure
Food & Beverages was the fastest growing segment for Inox as seen in the chart on the right, with a CAGR of 27% between FY18-20. Company also witnessed a 9% CAGR between FY18-20 in Spend Per Head (SPH) from Rs. 67 in FY18 to Rs. 80 in FY20. There is a dip in SPH and F&B revenues in FY21e, primarily due to the shutdowns but we believe even when theatres are allowed re-open, people would still be mindful about their food choices and thus
6774
8076
8489
0
10
20
30
40
50
60
70
80
90
100
FY18 FY19 FY20 FY21e FY22e FY23e
Inox SPH (Rs.)
SPH (Rs.)
3060
4355
4970
1025
5334
7111
0
1000
2000
3000
4000
5000
6000
7000
8000
FY18 FY19 FY20 FY21e FY22e FY23e
Inox- F&B revenues (Rs. Mns)
33% 34% 35% 35%38%
40%38%
41% 42%
0%
5%
10%
15%
20%
25%
30%
35%
40%
45%
FY15 FY16 FY17 FY18 FY19 FY20 FY21e FY22e FY23e
Inox's SPH to ATP (%)

Movie Exhibition: Inox Leisure & PVR September 2, 2020
Page 13
Analyst: Mayank Babla 022 67141412
Associate: Suraj Nandu 022 67141438
Initiating Coverage Report @ Dalal & Broacha
spending would be curtailed. As mentioned earlier, in the proposal that Multiplex association of India presented to the government, both the companies have introduced truncated menu mostly consisting of food items are either ready to eat or packaged and which involves minimum human contact.
Going forward, we believe there will be a sharp jump in spending once a vaccine is successfully developed and has been distributed globally as it would lead to a reduction in fear psychosis of consumers. Eating food whilst watching entertaining movies or shows is a force of habit may it be in theatres or at home on OTT platforms and thus also becomes a primary reason of support for future growth in SPH and subsequently Food & Beverages revenues. SPH to ATP (%) for Inox and PVR stands at 40% & 48.5% in FY20, which is among the highest globally. PVR is among the top 5 in the world after Cineplex, Cinemark, AMC and Kinepolis.
33% in-cinema advertising market share (PVR), highest footfalls and marquee properties had ensured strong ad revenue growth in the pre-COVID era. Expect similar growth momentum only from FY23e onwards
Ad revenue for PVR has grown at a CAGR of 16% between FY16 and FY20 respectively and has
contributed ~11-13% to consolidated revenues over the last 5 years. Acquisition of SPI cinemas have
been accretive to FY19-20 ad revenue growth as it has the highest occupancy ratio in the South at
51% for 9MFY20 and thus the highest eyeball reach. Going ahead, we believe that Ad Revenue will
grow at a relatively lower rate of 8% CAGR between FY20 and FY23e due to the COVID pandemic and
resultant impacted footfalls and eyeball reach. The COVID pandemic has not only impacted overall
ad spend globally but also caused a shift in the medium of advertising to digital / mobile.
Lastly, we believe that some sort of normalcy will start creeping in from FY23e only as footfalls and
occupancy rates begin to normalize, in turn attracting advertiser back to in-cinema advertising.
CAGR 8.6%
2,1
45
2,5
18
2,9
69
3,5
35
3,7
59
2,3
24 4,0
99
4,7
61
-
500
1,000
1,500
2,000
2,500
3,000
3,500
4,000
4,500
5,000
FY16 FY17 FY18 FY19 FY20 FY21EFY22EFY23E
Advertising Revenue (INR Mn)
CAGR 16%

Movie Exhibition: Inox Leisure & PVR September 2, 2020
Page 14
Analyst: Mayank Babla 022 67141412
Associate: Suraj Nandu 022 67141438
Initiating Coverage Report @ Dalal & Broacha
Ticket Sales – Expect Ticket Sales to pick up from Q1FY22
PVR Annual Ticket Sales… Average Ticket Price (INR)…
Footfalls (Mn)… Occupancy Rate (%)…
We expect FY21e to be a completely washout and a “blip” year as cinemas were shut in H1FY21. We
have assumed that Cinemas will re-open from Q3FY21 onwards with capacity restrictions and
vaccines to be commercially rolled out by Q4FY21e. In line with our assumptions:
• We expect footfalls to grow from 76 Mn in FY18 to 147 Mn in FY23e at a CAGR of 13%
• ATP to increase at a CAGR of 2.7% between FY20 and FY23e from INR 205 to INR 216
• Occupancy rate to dip to 7% in FY21e, bounce-back to 30% in FY22e and return to normalcy
to 34% in FY23e
• Ticket Sales to grow at CAGR of 15.7% between FY20 and FY23e
Movie Exhibition: Inox Leisure & PVR September 2, 2020
Page 15
Analyst: Mayank Babla 022 67141412
Associate: Suraj Nandu 022 67141438
Initiating Coverage Report @ Dalal & Broacha
Inox Leisure
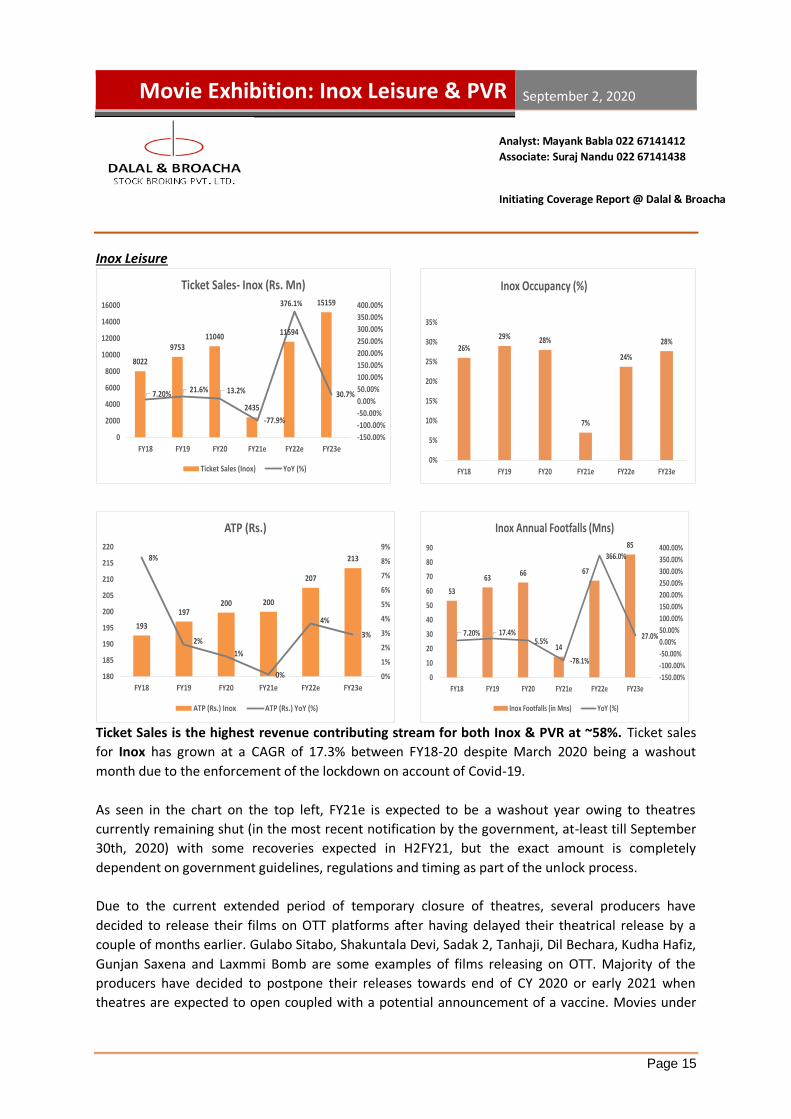
Ticket Sales is the highest revenue contributing stream for both Inox & PVR at ~58%. Ticket sales
for Inox has grown at a CAGR of 17.3% between FY18-20 despite March 2020 being a washout
month due to the enforcement of the lockdown on account of Covid-19.
As seen in the chart on the top left, FY21e is expected to be a washout year owing to theatres
currently remaining shut (in the most recent notification by the government, at-least till September
30th, 2020) with some recoveries expected in H2FY21, but the exact amount is completely
dependent on government guidelines, regulations and timing as part of the unlock process.
Due to the current extended period of temporary closure of theatres, several producers have
decided to release their films on OTT platforms after having delayed their theatrical release by a
couple of months earlier. Gulabo Sitabo, Shakuntala Devi, Sadak 2, Tanhaji, Dil Bechara, Kudha Hafiz,
Gunjan Saxena and Laxmmi Bomb are some examples of films releasing on OTT. Majority of the
producers have decided to postpone their releases towards end of CY 2020 or early 2021 when
theatres are expected to open coupled with a potential announcement of a vaccine. Movies under
8022
975311040
2435
11594
15159
7.20% 21.6% 13.2%
-77.9%
376.1%
30.7%
-150.00%
-100.00%
-50.00%
0.00%
50.00%
100.00%
150.00%
200.00%
250.00%
300.00%
350.00%
400.00%
0
2000
4000
6000
8000
10000
12000
14000
16000
FY18 FY19 FY20 FY21e FY22e FY23e
Ticket Sales- Inox (Rs. Mn)
Ticket Sales (Inox) YoY (%)
26%
29% 28%
7%
24%
28%
0%
5%
10%
15%
20%
25%
30%
35%
FY18 FY19 FY20 FY21e FY22e FY23e
Inox Occupancy (%)
193
197200 200
207
2138%
2%
1%
0%
4%
3%
0%
1%
2%
3%
4%
5%
6%
7%
8%
9%
180
185
190
195
200
205
210
215
220
FY18 FY19 FY20 FY21e FY22e FY23e
ATP (Rs.)
ATP (Rs.) Inox ATP (Rs.) YoY (%)
53
6366
14
67
85
7.20% 17.4%5.5%
-78.1%
366.0%
27.0%
-150.00%
-100.00%
-50.00%
0.00%
50.00%
100.00%
150.00%
200.00%
250.00%
300.00%
350.00%
400.00%
0
10
20
30
40
50
60
70
80
90
FY18 FY19 FY20 FY21e FY22e FY23e
Inox Annual Footfalls (Mns)
Inox Footfalls (in Mns) YoY (%)

Movie Exhibition: Inox Leisure & PVR September 2, 2020
Page 16
Analyst: Mayank Babla 022 67141412
Associate: Suraj Nandu 022 67141438
Initiating Coverage Report @ Dalal & Broacha
the Marvel Banner, Sooryanvashi, 83 are part of the postponement and which are also deemed
“Blockbusters” at the Box office. It is definitely in agreement, that currently a theatrical release is
the most profitable course for any film and producer and we believe this will continue to remain as
such in the longer term, with some temporary headwinds due to closures.
As seen in the top left graph on the previous page, we have expected recoveries to be at pre-Covid
levels by end of FY22e (revenue of Rs. 11594mn in FY22e and revenue of Rs. 11040mn in FY20) on
expectations of pent up content which is ready for release and for films which were in different
stages of production in CY2020 but was delayed due to the pandemic and is only expected to be
completed at a later stage. Ticket sales is growing at CAGR of 11.1% between FY20-23.
PVR’s occupancy has been higher at 30% and above historically and recording its highest level at
36% in 9MFY20 before the pandemic impacted the business for both exhibitors. Inox as seen in the
chart above, has occupancy levels ranging between 25%-29% historically between FY15-FY20.
The Multiplex Association of India (MAI) which includes PVR, Inox, Carnival cinemas and other
exhibitors have collectively submitted a proposal for business restart once government allows
theatres to open. In the proposal, it is mentioned that they would leave 1 seat empty after each
specific booking as they believe there is less chance of virus transmission between close Family and
friends. This will result in Exhibitors losing ~25% capacity post re-opening. The Government of
India still has to accept or counter the proposal.
We believe post re-opening, there will be a gradual recovery in business as early on, consumers will
be fearful to step out and in such a scenario “Word of Mouth” will play a key role. Furthermore, new
content release will only take place from November end, December onwards, impacting majority of
business in Q3FY21e. As such, for Inox, occupancy for FY21e drops significantly but recovers majorly
in FY22e at 24% as seen in the graph above and conservatively, reaches original levels of 28% by
FY23e.
A Lower occupancy (%) converts into lower footfalls for the exhibitor and as such drops to about
14mn (H1FY21 with zero footfalls), but recovers sharply in FY22e back to its normal levels of footfalls
at 67mn owing to more and better content releases and a potential announcement and mass
distribution of a vaccine. Footfalls for Inox has grown at a CAGR of 11.3% between FY18-20 and it is
expected to increase at 9% between FY20-23e.
Average Ticket Price (ATP), for the company remains flat at Rs. 200 for FY21e as we believe,
company will not reduce prices early on recoveries earlier will be impactful in terms of cashflows for
future sustenance and expansion. Historically, the gap between the ATP of PVR and Inox has reduced
from Rs. 13 in FY15 to Rs. 4 in FY20. This was led by Inox expanding its premium screen portfolio and
introducing the new concept of “Megaplexes” which is explained earlier. Going forward, we believe
this trend to continue with Inox’s ATP rising to Rs. 207 & 213 respectively in FY22e and FY23e (see

Movie Exhibition: Inox Leisure & PVR September 2, 2020
Page 17
Analyst: Mayank Babla 022 67141412
Associate: Suraj Nandu 022 67141438
Initiating Coverage Report @ Dalal & Broacha
bottom left chart on the earlier page) whereas for PVR, the ATP will be Rs. 215 and Rs. 216
respectively making the difference Rs. 8 and Rs. 3 in FY22e and FY23e.
OTT release provide a temporary relief in the current pandemic as they cannot match Box
Office Collections With the release of several movies on OTT platforms, there is a justified debate that will OTT
platforms become the new normal for premiers in the long run? We believe that this is merely a
temporary phenomenon due to following factors:
1. OTT platforms cannot match the kind of collections that a Box Office release can garner, and an
OTT release also caps the revenue for a producer. For example, Gunjan Saxena and Gulabo Sitabo
both were released on OTT platforms and garnered INR 60 Cr and INR 65 Cr respectively, however,
collections were incomparable to Uri or Kabir Singh which garnered INR 250 Cr and INR 379
respectively
a. Gunjan Saxena was made with a budget of INR 40 Cr and premier rights sold to Netflix for
INR 50 Cr + INR 10 Cr for audio and satellite rights (paid to Zee Studios and Dharma
Productions)2
b. Gulabo Sitabo was sold to Amazon Prime for INR 65 Cr
2. OTT platforms cannot replace or replicate the cinema going experience of a Movie Theatre. We
believe that Cinema has become a part of the Indian lifestyle in terms of “family’s day out”
experience and/or “blow-off some steam”.
3. Compared to western economies, the Indian consumer has limited avenues to blow-off the steam.
For example, developed markets have more adventure sports or activities as substitutes in their
lifestyles compared to an Indian consumer. Higher working hours, relatively faster lifestyle (at least
in the metro cities) and comparatively lower GDP per capita means that the Indian consumer looks
to relax or pullback in a shorter time period and the only avenues are Restaurants, Bars, Malls or
Movies in our opinion. Therefore, the typical Indian consumer is bound to return slowly to theatres
as lockdowns open gradually and flood in numbers once the vaccine is launched.
4. Taking a contrary view, COVID-19 pandemic can in fact aid multiplexes as single screen theatres
come under financial stress due to inoperability. We believe that multiplexes are much better
equipped in the survival of the fittest due to corporatized and professionalized nature of their
business and hence access to capital vis-à-vis single screen theatres. Therefore, we believe that we
will see the share of multiplex to single screen theatre shift towards multiplexes during the
pandemic. For example, Central Plaza – Girgaun (which was a Main Cinema in the pre-Multiplex era)
had to shut shop in the COVID pandemic.

Movie Exhibition: Inox Leisure & PVR September 2, 2020
Page 18
Analyst: Mayank Babla 022 67141412
Associate: Suraj Nandu 022 67141438
Initiating Coverage Report @ Dalal & Broacha
We believe OTT and Exhibitors to co-exist with content specifically made for both streams along
with sharing of content i.e. in a post Covid world, a movie will have a theatrical release first, followed
by either a satellite or OTT platform.
Response to Theatres opening-up globally and performance of current blockbusters
Daily Covid-19 cases in several countries have peaked, particularly outside Asia, and many countries
have re-opened theatres and cinema halls as part of the unlock process.
Source: Inox Leisure Q1FY21 Presentation
As seen above, movies such as Pennisula released in multiple countries where the initial response
was good considering the situation, but did dry up after a week. Currently, two of the biggest
potential blockbusters in Hollywood namely, “Tennet” and X-Men spin off “The new Mutants” had
a theatrical release over the weekend in several international markets such as Most of Europe,
South Korea and Canada. Tennet collected approximately $53 million in the opening weekend across
41 overseas markets with “IMAX” collection $5mn alone. Tennet had a overall budget of
approximately $200mn and given the current situation, the film collecting 25% of the budget in the
opening weekend itself re-iterates our belief that willingness to go watch good content in theatres
and demand for good content is absolute. The film is yet to debut (expected in the 1st week of
September) in China and U.S, which are the two biggest markets and where cumulatively about 60%
of the screens have re-opened.
The New Mutants, also released with tepid reviews (delayed release since April 2018) and has
garnered close to $10mn after being release in United States first and then globally. Domestic

Movie Exhibition: Inox Leisure & PVR September 2, 2020
Page 19
Analyst: Mayank Babla 022 67141412
Associate: Suraj Nandu 022 67141438
Initiating Coverage Report @ Dalal & Broacha
collections for the film were $7.7mn during the opening weekend. The overall budget of the film is
close to $67mn.
Another Disney movie titled “Mulan” will be released theatrically in Q4CY20, and be available
approximately a month after its theatrical release on their home OTT Platform Disney+.
There is generally a 6-7-week window post a theatrical release when a movie is showcased on either
satellite or OTT platforms. Considering the current situation, that window might have shortened but
since more and more theatres are opening, distributors would be willing to release it in newer

Movie Exhibition: Inox Leisure & PVR September 2, 2020
Page 20
Analyst: Mayank Babla 022 67141412
Associate: Suraj Nandu 022 67141438
Initiating Coverage Report @ Dalal & Broacha
geographies as and when they are able to, which can bode well for India as these potential
“Blockbusters” would give a good kickstart to cater to the pent up demand as well as meet the
excitement of viewing new content in theatres after 5 months of lockdown.
Fund raising and survivability
PVR had Rs. 2.27bn of Cash on books (Cash & Bank stood at Rs.3.16bn as of Q4FY20). PVR also raised
Rs. 3bn through Rights Issue by offering 38,23,872 equity shares at INR 784 per share on 10/07/2020
(ratio of 7 for every 94 shares). Objects of the rights issue were to repay principal and/or prepay
interest to the tune of Rs. 2.34bn and use Rs.725mn towards General Corporate Purposes. Lastly, the
main purpose of the Rights Issue is to ensure liquidity till the financial year end at least. Their Gross
debt stands at Rs. 12.94bn. PVR’s monthly cash burn rate as per their Q4FY20 results and
conference call was reduced by 75% to Rs. 350mn.
Inox on the other hand has reduced their monthly cash burn rate to Rs. 120-130mn from Rs. 300-
350mn earlier. Furthermore, they have cash and bank balance of Rs. 360mn as of 31st July, 2020 and
the company has sold treasury shares worth Rs. 1bn in mid-August. In addition to this, the company
has also got final approval from the board to raise another Rs. 2.5bn through equity or any other
means favourable to a shareholder if necessary and lastly, they own 6 cinema properties and a head
office which at market valuation is Rs. 3.5bn. As of 31st July, 2020, the company’s net debt stands at
Rs. 1.78bn. Taking into account only the cash and bank, treasury shares and the potential capital
raise, Inox has about 1 year of funding to survive even without any revenues flowing into the
company.

Movie Exhibition: Inox Leisure & PVR September 2, 2020
Page 21
Analyst: Mayank Babla 022 67141412
Associate: Suraj Nandu 022 67141438
Initiating Coverage Report @ Dalal & Broacha
11471335
150
-2303
656
1583
-2500
-2000
-1500
-1000
-500
0
500
1000
1500
2000
FY18 FY19 FY20 FY21e FY22e FY23e
PAT (Post Ind-AS 116 from FY20 onwards) (Rs. Mn)
15%18%
31%
9%
31%31%
10%13%
18%
-27%
16% 19%
-30%
-20%
-10%
0%
10%
20%
30%
40%
FY18 FY19 FY20 FY21e FY22e FY23e
EBITDA & EBIT Margins
EBITDA Margins (Post Ind-AS 116 from FY20 onwards) (Rs. Mn)
EBIT Margins (Post Ind-AS 116 from FY20 onwards) (Rs. Mn)
2073
3083
5968
445
6193
8002
0
1000
2000
3000
4000
5000
6000
7000
8000
9000
FY18 FY19 FY20 FY21e FY22e FY23e
EBITDA (Post Ind-AS 116 from FY20 onwards) (Rs. Mn)
Financials of PVR (in INR Mn) (Top Half) & Inox Leisure (In INR Mn) (Bottom Half)
13481
1692218974
4732
20075
25546
0
5000
10000
15000
20000
25000
30000
FY18 FY19 FY20 FY21e FY22e FY23e
Revenues (Rs. Mn)
2334
1
3085
6
3414
4
1107
5
4030
4
5218
1
0
10000
20000
30000
40000
50000
60000
FY18 FY19 FY20 FY21E FY22E FY23E
Revenue (INR Mn)
4018
5863
5761
-229
5
6202
8546
-4000
-2000
0
2000
4000
6000
8000
10000
FY18 FY19 FY20 FY21E FY22E FY23E
EBITDA (INR Mn)
4018
5863
5761
-229
5
6202
8546
-4000
-2000
0
2000
4000
6000
8000
10000
FY18 FY19 FY20 FY21E FY22E FY23E
EBITDA (INR Mn)
17.2% 19.0% 16.9%
-20.7%
15.4% 16.4%
10.6% 12.8% 10.1%
-41.7%
8.6% 8.9%
-50.0%
-40.0%
-30.0%
-20.0%
-10.0%
0.0%
10.0%
20.0%
30.0%
FY18 FY19 FY20 FY21E FY22E FY23E
EBITDA Margin (%) EBIT Margin (%)

Movie Exhibition: Inox Leisure & PVR September 2, 2020
Page 22
Analyst: Mayank Babla 022 67141412
Associate: Suraj Nandu 022 67141438
Initiating Coverage Report @ Dalal & Broacha
Outlook
We believe both companies have enough capital to survive for the next few months even without
revenues coming in and it is only a matter of time before government allows theatres to re-open.
This being said, it is prudent to note that currently any guideline on re-opening of theatres,
operational timings, seating arrangement and capacity, if the re-opening will take place nationwide
or only state-wise (depending on the number of active cases and recovery rates in each state) is
currently unknown.
There are several developments in the race to find the vaccine for COVID-19 with Russia being the
first to announce its discovery by 10/08/2020 and Serum Institute of India (Pune) in association with
Oxford University is also is also in the 3rd stage of clinical trials as of date. Assuming that either of the
vaccines are successful, we believe that Movie Exhibition stocks will be first to react and factor in the
positive news and revert to pre-COVID levels followed by quick recovery in earnings post mass
release of the vaccine.
However, if the above-mentioned vaccines fail and lower visibility of a successful vaccine in the near
term, we believe that Cinemas will be allowed to open with severe restrictions (like other countries
globally + in line with current debate between exhibitors which are pushing for 50% capacity and
Government which is pushing for 30% capacity). We believe that earnings recovery and stock
recovery will be a very gradual and slow process under this scenario. This is mainly because
occupancy rates will suffer due to social distancing and seating restrictions therein and fear will play
out as a highly discouraging factor amongst cinema goers which will result in Exhibitors struggling to
break-even initially followed up by gradual scaling up of profits after making cost rationalizations (on
rent, CAM and employee costs) as cinemas adjust to new normal.
In Conclusion, from a long term perspective, we believe that PVR and Inox are a BUY as despite
recent launch of movies on OTT platforms, we believe that these releases have failed to garner the
interest, eyeballs or collections that a theatrical releases would and that exhibitors will adapt in any
scenario that plays out.
Valuation
Currently, on EV/EBITDA basis, PVR is trading at 13.3x and 9.2x FY22e and FY23e on an EBITDA of
INR 6,201.7 Mn and INR 8546 Mn, respectively. We assign an EV/EBITDA multiple of 12x to FY23e
EBITDA and arrive at a target price of Rs. 1804 (upside of 29%).
Inox on EV/EBITDA basis, is trading at 9.8x and 8x FY22e and FY23e EBITDA of INR 6,192.5mn and
INR 8,002.4 Mn respectively. Please note Inox’s numbers are on Post IND-AS 116 whereas PVR is on
Pre-Ind-AS 116 basis. We value Inox on EV/EBITDA basis, assigning a 9.5x (~25% discount to PVR’s
multiple on account of higher screen count, and stronghold in South through SPI Cinemas (highest

Movie Exhibition: Inox Leisure & PVR September 2, 2020
Page 23
Analyst: Mayank Babla 022 67141412
Associate: Suraj Nandu 022 67141438
Initiating Coverage Report @ Dalal & Broacha
occupancy rates of over 50%)), to FY23e EBITDA and arrive at a target price of Rs. 398 i.e. upside of
37%.
We initiate coverage on PVR and Inox leisure and recommend investors to BUY the stock with a
long-term horizon (minimum of 18-24 months) and point out that market and exhibition stocks
may display volatility depending on the rise and fall of COVID infections, recoveries, lockdowns etc.
However, any sort of big dip in these stocks should be considered as a buying opportunity.
Valuation Table
Please Note: Gross Debt of Inox optically looks large in number but in reality, it is on account of IND-
AS 116. Due to the accounting change, EBITDA margins of the company increases to ~31% and in
valuation, to negate the effect of the rise in margins, we have included expected Lease Liability of Rs.
35289mn in FY23e.
Particulars PVR Inox
Financials (Rs. Mn) FY23e FY23e
EBITDA 8546 8002
Multiple (x) 12 9.5
EV 102552 76023
Gross Debt 9800 35715
Cash 495 503
Market Value 93247 40811
per share 1804 398
CMP 1400 290
Upside 29% 37%

Movie Exhibition: Inox Leisure & PVR September 2, 2020
Page 24
Analyst: Mayank Babla 022 67141412
Associate: Suraj Nandu 022 67141438
Initiating Coverage Report @ Dalal & Broacha
PVR Financials (INR Mn)
YE March (Rs. mn) FY19 FY20 FY21F FY22F FY23F
Total Revenue 30856 34144 11075 40304 52181Growth % 32% 11% -68% 264% 29%
Less:
Fi lm Dis tributors Share 7019 7335 1869 8713 11502
F&B cost 2387 2637 681 3032 4181
Employee cost 3373 3938 2897 3927 5821
Rent 5059 5763 2720 6991 8176
Other expenses 7154 8711 5204 11440 13955
Total Operating Expenditure 24992 28383 13369 34102 43635
EBIDTA 5863 5762 -2295 6202 8546Growth % 46% -2% -140% -370% 38%EBITDA Margin (%) 19% 17% -21% 15% 16%
Less : Depreciation 1912.8 2324.2 2321 2735 3909
EBIT 3951 3437 -4615 3467 4637
EBIT Margin 13% 10% -42% 9% 9%Growth % 59% -13% -234% -175% 34%
Interest Pa id 1280.1 1521.4 1477 1442 1407
Non-operating Income 331.4 377.9 424.8 400.0 400.0
Exceptional Items - - - - -
Profit Before Tax 3002 2294 -5668 2425 3630
Adjusted PBT 3002 2294 -5668 2425 3630
Tax 1096.6 627.4 0 736 915
Profi t/(Loss ) from JV -12 -5 -52 -52 -52
Net Profit 1894 1661 -5720 1637 2663
Adjusted Profit 1894 1661 -5720 1637 2663Growth % 51% -12% -444% -129% 63%Net Profit Margin (%) 6% 5% -52% 4% 5%
Reported Diluted EPS Rs 39.3 32.6 -109.5 32.7 52.6
Growth % 47% -17% -436% -130% 61%
Adjusted Diluted EPS Rs 39.3 32.6 -109.5 32.7 52.6
Profit & Loss A/c
Year to December FY19 FY20F FY21F FY22F FY23F
ASSETS
Current Assets
Cash in hand and at banks 352 375 121 342 476
Accounts receivable 1,839 1,590 455 1,877 3,288
Inventories 303 290 61 342 443
Total Current Assets 3,934 3,565 1,001 4,108 6,494
Non-current Assets
Gross Block 20,056 23,476 24,676 29,276 34,626
Less Depriciation 5,157 7,487 9,808 12,542 16,451
Net Block 14,900 15,989 14,869 16,734 18,175
Capita l Work in progress 2,208 2,208 1,100 1,100 1,100
Investments 100 100 100 100 100
Total non-current assets 21,578 22,507 16,675 22,902 27,237
TOTAL ASSETS 25,512 26,071 17,676 27,010 33,732
LIABILITIES AND EQUITY
Current liabilities
Trade & notes payable 7,287 8,419 3,944 9,496 11,437
Advance money from customer 1,850 131 981 2,638 4,663
Total Current Liabilities 11,713 11,350 6,230 16,993 21,675
Noncurrent liabilities
Secured Loans 11,461 10,800 10,300 10,300 9,800
Total noncurrent liabilities 11,461 10,800 10,300 10,300 9,800
TOTAL LIABILITIES 23,174 22,150 16,530 27,293 31,475
Goodwill 13,108 13,108 13,108 13,108 13,108
Minority Interest 2,566 2,562 2,557 2,552 2,547
SHAREHOLDERS' EQUITY
Share Capita l 467 513 517 517 517
Share Premium 2,941
Retained Earnings 11,928 13,470 7,755 9,272 11,816
Total Shareholders' Equity 12,395 13,983 11,213 9,789 12,333
Balance Sheet
YE March (Rs . Mn) FY19 FY20 FY21E FY22E FY23E
PAT 1836 1676 -5715 1641 2668
Add: Depreciation 1913 2324 2321 2735 3909
Add: Interest Pa id 1280 1521 1477 1442 1407
Operating Profit before WC Changes 5418 5895 -1497 6213 8379
(Inc)/Dec in Current Assets -837 378 2081 -2604 -2152
Inc/(Dec) in Current Liabi l i ties 5606 -363 -5120 10762 4683
Changes in Inventory -105 13 229 -282 -101
Net Cash Generated From Operations 10082 5924 -4307 14090 10809
Cash Flow from Investing Activities
(Inc)/Dec in Fixed Assets -5543 -3414 -1200 -4600 -5350
(Inc)/Dec in Investment (Others ) -1130 161 3603 -4362 -2894
Net Cash Flow from Investing Activities -15855 -2880 3931 -8567 -7849
Cash Flow from Financing Activities
Inc/(Dec) in Tota l Loans 4847 -661 -500 0 -500
Inc/(Dec) in Equity -83 46 2945 -2941 0
Dividend Pa id -94 -103 0 -103 -103
Less : Interest Pa id -1280 -1521 -1477 -1442 -1407
Net Cash Flow from Financing Activities 5787 -3022 123 -5302 -2826
Net Inc/Dec in cash equivalents 14 23 -253 221 134
Opening Balance 339 352 375 121 342
Closing Cash and Cash Equivalents 352 375 121 343 476
Cash Flow Statement
YE March (Rs . Mn) FY19 FY20 FY21E FY22E FY23E
EBITDA 13017 14472 2909 17642 22501
FC Investment -13869 -3420 -1200 -4600 -5350
WC Changes 4664 28 -2810 7877 2429
Depreciation Tax Shield 699 636 0 830 985
Tax Expenses -4755 -3958 0 -5357 -5670
FCFF -244 7758 -1101 16393 14895
Free Cash Flow to Firm Statement
YE March (Rs. mn) FY19 FY20 FY21F FY22F FY23F
P/E (x) 35.6 43.2 -12.7 44.1 27.1
P/BV (x) 5.3 5.1 6.5 7.4 5.9
EV/EBIDTA (x) 13.1 14.3 -36.0 13.3 9.6
EV/Sales 2.5 2.4 7.5 2.0 1.6
Market Cap./ Sales (x) 2.1 2.1 6.5 1.8 1.4
Dividend Yield (%) 0% 0% 0% 0% 0%
Valuation Ratios
YE March (Rs. mn) FY19 FY20 FY21F FY22F FY23F
RoE (%) 15.9% 12.6% -45.4% 16.8% 21.6%
RoCE (%) 18.0% 12.8% -18.0% 14.8% 19.6%
Current Ratio (x) 0.3 0.3 0.1 0.2 0.3
Dividend Payout (%) 6% 7% 0% 8% 5%
Interest Coverage (x) 3.1 2.3 -3.1 2.4 3.3
Debt to Equity Ratio 0.8 0.7 0.7 0.8 0.7
Ratio Analysis

Movie Exhibition: Inox Leisure & PVR September 2, 2020
Page 25
Analyst: Mayank Babla 022 67141412
Associate: Suraj Nandu 022 67141438
Initiating Coverage Report @ Dalal & Broacha
Inox Financials (Rs. Mn)
P&L (Rs mn) FY18 FY19 FY20 FY21E FY22E FY23E Cash Flow St. (Rs. mn) FY18 FY19 FY20 FY21E FY22E FY23E
Net Sales 13,481.2 16,921.8 18,974.4 4,732.1 20,074.7 25,546.1 Net Profit 1,146.6 1,334.9 150.1 (2,302.8) 656.0 1,583.5
Add: Dep. & Amort. 867.0 954.9 2,641.9 1,912.5 3,026.1 3,375.5
Expenses 11,407.7 13,838.4 13,006.0 4,286.9 13,882.1 17,543.7 Minority Interest - - - - - -
Cash profits 2,013.6 2,289.8 2,792.0 (390.3) 3,682.1 4,959.0
Operating Profit 2,073.5 3,083.4 5,968.4 445.2 6,192.5 8,002.4 (Inc)/Dec in
-Sundry debtors (293.0) (123.3) 254.9 303.4 (335.9) (179.9)
Depreciation 867.0 954.9 2,641.9 1,912.5 3,026.1 3,375.5 -Inventories (3.1) (27.9) (14.6) 94.4 (106.1) (49.4)
PBIT 1,206.5 2,128.5 3,326.5 (1,467.2) 3,166.4 4,626.9 -Loans/advances (66.6) (143.2) (160.8) (50.8) (111.1) (122.0)
Other income 144.7 149.2 171.7 157.7 153.7 147.7 '-Current Liab and Provisions 612.5 718.1 (262.9) (968.5) 1,114.4 460.3
Interest 289.0 236.7 2,212.4 1,236.0 2,443.1 2,657.6 '- Other Assets (43.4) (417.4) 472.4 173.3 (151.9) (167.1)
Change in working capital 206.5 6.3 289.0 (448.2) 409.4 (58.1)
Profit before tax 1,062.2 2,041.0 1,285.8 (2,545.6) 877.0 2,117.0
Exceptional and Extra Ordinary Items 85.4 50.0 - - - - CF from Oper. activities 2,220.1 2,296.1 3,081.0 (838.5) 4,091.5 4,900.9
share of profit/loss in JV - - - - - -
PBT ( Post Extra Ordinary) 976.8 1,991.0 1,285.8 (2,545.6) 877.0 2,117.0
Provision for tax (169.9) 656.1 1,135.7 (242.8) 221.0 533.5 CF from Inv. activities (1,488.1) (2,435.5) 1,553.7 (47.9) (3,128.7) (4,447.8)
Reported PAT 1,146.6 1,334.9 150.1 (2,302.8) 656.0 1,583.5
CF from Fin. activities (714.2) 126.4 (4,325.1) 726.7 (900.0) (300.0)
Cash generated/(utilised) 17.8 (13.0) 309.6 (159.7) 62.8 153.0
Cash at start of the year 279.9 150.3 137.3 446.9 287.2 350.0
Cash at end of the year 150.3 137.3 446.9 287.2 350.0 503.0
Balance Sheet FY18 FY19 FY20 FY21E FY22E FY22E Ratios FY18 FY19 FY20 FY21E FY22E FY23E
Equity capital 961.6 1,026.1 1,026.5 1,026.5 1,026.5 1,026.5 OPM 15.4 18.2 31.5 9.4 30.8 31.3
Reserves 5,734.5 8,612.0 5,192.3 3,216.2 3,872.2 5,455.7 NPM 8.5 7.9 0.8 (48.7) 3.3 6.2
Net worth 6,696.2 9,638.1 6,218.8 4,242.7 4,898.7 6,482.2 Tax rate (16.0) 32.1 88.3 9.5 25.2 25.2
Minority Interest 0.1 0.1 0.1 0.1 0.1 0.1
Non Current Liabilites 3,412.9 1,456.7 27,040.6 28,777.6 31,407.8 35,545.2 Growth Ratios (%)
Net Sales 4,008.9 25.5 12.1 (75.1) 324.2 27.3
Current Liabilites 2,741.0 3,693.9 4,894.6 4,329.5 4,604.9 4,866.2 Operating Profit (147.6) 48.7 93.6 NA NA 29.2
PBIT (127.7) 76.4 56.3 NA NA 141.4
CAPITAL EMPLOYED 12,850.1 14,788.7 38,154.0 37,349.9 40,911.4 46,893.6 PAT 275.0 16.4 (88.8) NA NA 141.4
Non Current Assets 11,415.6 13,274.8 36,411.4 36,121.7 39,126.7 44,669.9 Per Share (Rs.)
Net Earnings (EPS) 11.92 13.01 1.46 -22.43 6.39 15.43
Fixed Assets 8,082.0 9,686.4 32,109.8 31,985.6 34,779.4 40,090.1 Cash Earnings (CPS) 20.9 22.3 27.2 (3.8) 35.9 48.3
Non Current Investments 12.1 6.1 1.6 1.6 1.6 1.6 Dividend - 1.0 - - - -
Non Current tax assets (DTA+ITA) 902.5 616.3 1,846.5 1,846.5 1,846.5 1,846.5 Book Value 69.6 93.9 60.6 41.3 47.7 63.1
Long Term Loans and Advances 741.8 892.2 1,016.4 1,067.2 1,173.9 1,291.3 Free Cash Flow 7.6 (1.4) 45.2 (8.6) 9.4 4.4
Other NON Current Assets 1,502.1 1,898.7 1,262.0 1,045.7 1,150.2 1,265.2
Goodwill 175.1 175.1 175.1 175.1 175.1 175.1
Current Assets 1,434.5 1,513.9 1,742.6 1,228.2 1,784.7 2,223.7 Valuation Ratios
Current investments 123.9 6.1 10.1 10.1 10.1 10.1 P/E(x) 24.3 22.3 198.3 (12.9) 45.4 18.8
Inventories 94.0 121.9 136.5 42.1 148.2 197.6 P/B(x) 4.2 3.1 4.8 7.0 6.1 4.6
T rade Receivables 759.1 882.4 627.5 324.1 660.0 839.9 EV/EBIDTA(x) 14.6 9.8 9.6 133.6 9.9 8.1
Cash and Bank Balances 150.3 137.3 446.9 287.2 350.0 503.0 Div. Yield(%) - 0.3 - - - -
Short Term Loans and Advances 59.0 51.8 88.4 88.4 92.8 97.5 FCF Yield(%) 2.6 (0.5) 15.6 (3.0) 3.2 1.5
Other Current Assets 248.2 314.4 433.2 476.3 523.6 575.7
Return Ratios (%)
ROE 17 14 2 -54 13 24
` 12,850.1 14,788.7 38,154.0 37,349.9 40,911.4 46,893.6 ROCE 15 22 47 -22 59 69
Inox Leisure

Movie Exhibition: Inox Leisure & PVR September 2, 2020
Page 26
Analyst: Mayank Babla 022 67141412
Associate: Suraj Nandu 022 67141438
Initiating Coverage Report @ Dalal & Broacha
40
90
140
190
240
Inox PVR Sensex
Company Information
Particulars PVR Inox Leisure
CMP 1400 290
Market Cap (Rs. Bn) 77.58 29.84
Market Cap ($ Mn) 1063 409
Number of Shares (Mn) 51.70 102.85
Face Value (Rs.) 10 10
Average Volume (BSE+NSE) (000’s) 2493 1813
BSE Code 532689 532706
NSE Code PVR INOXLEISUR
Bloomberg Code PVRL: IN INOL: IN
Shareholding Pattern
PVR Inox Leisure
Share Price Data
18.79%
36.53%16.87%
13.19%
14.40%
Shareholding for June 2020
Promoter FII Mutual Funds Non Instituations Others
51.89%
9.32%
22.32%
15.49%
0.98%
Shareholding for June 2020
Promoter FII Mutual Funds Non Instituations Others

Movie Exhibition: Inox Leisure & PVR September 2, 2020
Page 27
Analyst: Mayank Babla 022 67141412
Associate: Suraj Nandu 022 67141438
Initiating Coverage Report @ Dalal & Broacha
Disclaimer
Dalal & Broacha Stock Broking Pvt Ltd, hereinafter referred to as D& B (CIN_U67120MH1997PTC111186) was established in 1997 and is
an integrated financial services player offering an extensive range of financial solutions and services to a wide spectrum of customers with varied
needs ranging from equities to mutual funds to depository services.
D&B is a corporate trading member of Bombay Stock Exchange Limited (BSE), National Stock Exchange of India Limited (NSE). D&B along with
its affiliates offers the most comprehensive avenues for investments and is engaged in the securities businesses including stock broking
(Institutional and retail), depository participant, portfolio management and services rendered in connection with distribution of primary market
issues and financial products like mutual funds, fixed deposits. Details of associates are available on our website i.e. www.dalal-broacha.com
D&B is registered as Research Analyst with SEBI bearing registration Number INH000001246 as per SEBI (Research Analysts) Regulations,
2014.
D&B hereby declares that it has not defaulted with any stock exchange nor its activities were suspended by any stock exchange with whom it is
registered in any time in the past. It has not been debarred from doing business by any Stock Exchange / SEBI or any other authorities; nor has
its certificate of registration been cancelled by SEBI at any point of time.
SEBI and Stock Exchanges have conducted the routine inspection and based on their observations have issued advice letters or levied minor
penalty on D&B for certain operational deviations in routine course of business.
D&B offers research services to clients as well as prospects. The analyst for this report certifies that all of the views expressed in this report
accurately reflect his or her personal views about the subject company or companies and its or their securities, and no part of his or her compensation was, is or will be, directly or indirectly related to specific recommendations or views expressed in this report. Other disclosures by D&B (Research Entity) and its Research Analyst under SEBI (Research Analyst) Regulations, 2014 with reference to the subject company(s) covered in this report-: D&B or its associates may have financial interest in the subject company. D&B or its associates do not have any material conflict of interest in the subject company. The Research Analyst or Research Entity (D&B) has not been engaged in market making activity for the subject company. D&B or its associates may have actual/beneficial ownership of 1% or more securities of the subject company at the end of the month immediately preceding the date of publication of Research Report. Disclosures in respect of Research Analyst:
Whether Research Analyst or his/her relatives have actual/beneficial ownership of 1% or more securities of the subject company at the end of the month immediately preceding the date of publication of Research Report:
No
Whether the Research Analyst or his/her relative’s financial interest in the subject company. No
Whether the research Analyst has served as officer, director or employee of the subject company No
Whether the Research Analyst has received any compensation from the subject company in the past twelve months No
Whether the Research Analyst has managed or co‐managed public offering of securities for the subject company in the past twelve months
No
Whether the Research Analyst has received any compensation for investment banking or merchant banking or brokerage services from the subject company in the past twelve months
No
Whether the Research Analyst has received any compensation for products or services other than investment banking or merchant banking or brokerage services from the subject company in the past twelve months
No
Whether the Research Analyst has received any compensation or other benefits from the subject company or third party in connection with the research report
No
D&B and/or its affiliates may seek investment banking or other business from the company or companies that are the subject of this material. Our
salespeople, traders, and other professionals may provide oral or written market commentary or trading strategies to our clients that reflect
opinions that are contrary to the opinions expressed herein, and our proprietary trading and investing businesses may make investment decisions
that may be inconsistent with the recommendations expressed herein.
In reviewing these materials, you should be aware that any or all of the foregoing, among other things, may give rise to real or potential conflicts
of interest including but not limited to those stated herein. Additionally, other important information regarding our relationships with the company
or companies that are the subject of this material is provided herein. This report is not directed to, or intended for distribution to or use by, any
person or entity who is a citizen or resident of or located in any locality, state, country or other jurisdiction where such distribution, publication,
availability or use would be contrary to law or regulation or which would subject D&B or its group companies to any registrat ion or licensing
requirement within such jurisdiction. Specifically, this document does not constitute an offer to or solicitation to any U.S. person for the purchase
or sale of any financial instrument or as an official confirmation of any transaction to any U.S. person. Unless otherwise stated, this message
should not be construed as official confirmation of any transaction. No part of this document may be distributed in Canada or used by private
customers in United Kingdom. All material presented in this report, unless specifically indicated otherwise, is under copyright to D&B. None of the
material, nor its content, nor any copy of it, may be altered in any way, transmitted to, copied or distributed to any other party, without the prior
express written permission of D&B . All trademarks, service marks and logos used in this report are trademarks or registered trademarks of D&B

Movie Exhibition: Inox Leisure & PVR September 2, 2020
Page 28
Analyst: Mayank Babla 022 67141412
Associate: Suraj Nandu 022 67141438
Initiating Coverage Report @ Dalal & Broacha
or its Group Companies. The information contained herein is not intended for publication or distribution or circulation in any manner whatsoever
and any unauthorized reading, dissemination, distribution or copying of this communication is prohibited unless otherwise expressly authorized.
Please ensure that you have read “Risk Disclosure Document for Capital Market and Derivatives Segments” as prescribed by Securities and
Exchange Board of India before investing in Indian Securities Market. In so far as this report includes current or historic information, it is believed
to be reliable, although its accuracy and completeness cannot be guaranteed.
Contact Email ID Contact No. Sector
Mr. Kunal Bhatia [email protected] 022 67141442 Auto, Auto Ancillary, FMCG
Mrs.Charulata Gaidhani [email protected] 022 67141446 Pharma /Healthcare
Mr. Mayank Babla mayank.babladalal-broacha.com 022 67141412 I.T/Media
Mr. Avinash Tanawade [email protected] 022 67141449 BFSI
Mr. Akshay Ashok [email protected] 022 67141486 BFSI
Mr. Suraj Nandu [email protected] 022 67141438 Associate
Mr. Tanush Mehta [email protected] 022 67141441 Associate
Address: - 508, Maker Chambers V, 221 Nariman Point, Mumbai 400 021
Tel: 91-22- 2282 2992, 2287 6173, Fax: 91-22-2287 0092
E-mail: [email protected]
Copyright © 2022 FDOKUMEN