
Self-made - Dalal Street Investment Journal
72
G R INFRAPROJECTS LTD. | BIRLASOFT LTD. | MEDPLUS HEALTH SERVICES LTD. Market Overview Exclusive Interview Prominent Headlines Q&A with Head of Equities Mutual Fund Overview Stock Picks Monthly Insight Performance Sector Outlook - Technology Management Concall Highlights Economy Review Startup Corner 2021 Equity Market Flashback Technical View World Economic Event Calendar January 2022 IN SIGHT LIMITED EDITION Self-made jewels of india
-
Upload
khangminh22 -
Category
Documents
-
view
2 -
download
0
Transcript of Self-made - Dalal Street Investment Journal

G R InfRapRojects Ltd. | BIRLasoft Ltd. | MedpLus HeaLtH seRvIces Ltd.
Market Overview Exclusive InterviewProminent Headlines Q&A with Head of Equities
Mutual Fund Overview Stock Picks Monthly Insight Performance Sector Outlook - Technology
Management Concall HighlightsEconomy Review Startup Corner 2021 Equity Market Flashback
Technical View World Economic Event Calendar
January 2022
insight Limited editionSelf-made
jewels of indiaHaldiram Group
2January 2022 INSIGHT
INSIDE THIS ISSUE
Marketoverview2
29 Monthlyinsight performance
49 Startupcorner
EconomyReview 43
Stock Picks• G R Infraprojects Ltd.• Birlasoft Ltd.• Medplus Health
Services Ltd.20
2121Equity market flashback 50
Worldeconomic calendar 64
15 Mutualfund overview
10 Prominent headlines December 2021
Exclusive interview with Mr. Manoharlal Agarwal, MD - Haldiram Snacks Pvt. Ltd. 4
prominentheadlines
Q&A with Mr. Neelotpal Sahai, Head of Equities, HSBC Asset Management (India) Pvt. Ltd. 12
Sector -Technology 33
37 Management Concall highlights
61 Technicalview
1 January 2022INSIGHT
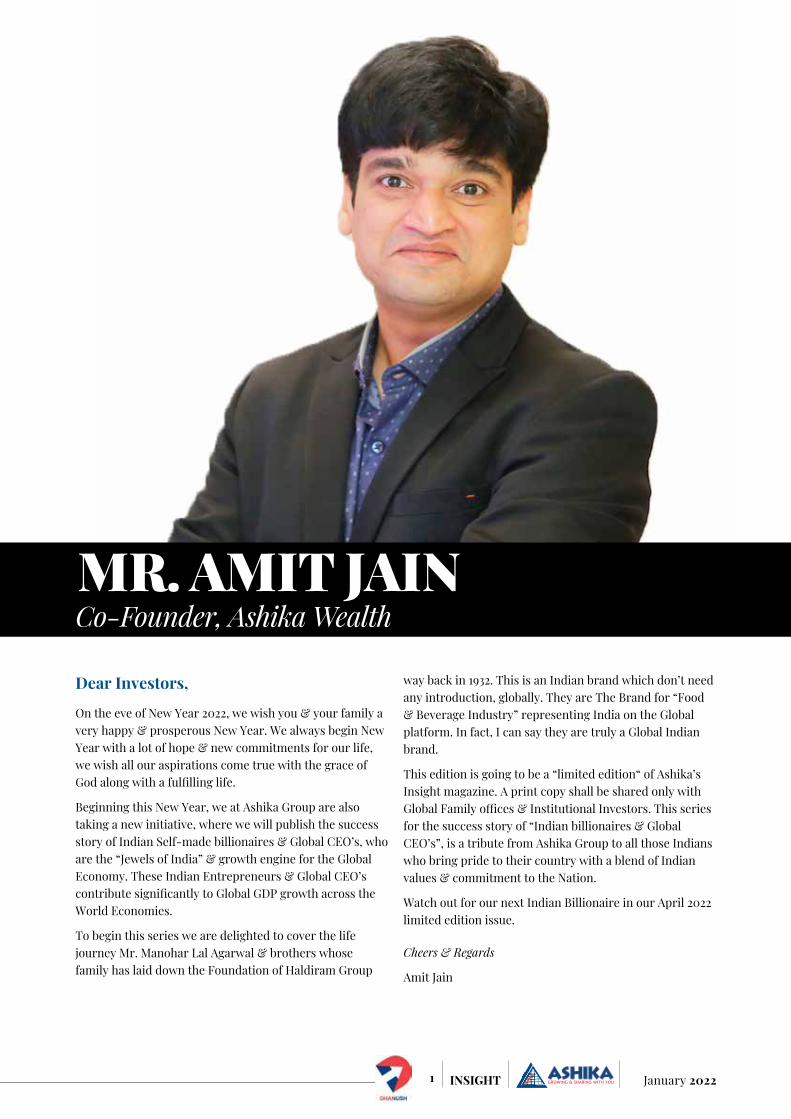
Mr. AMit JAin Co-Founder, Ashika Wealth
Dear Investors,
On the eve of New Year 2022, we wish you & your family a very happy & prosperous New Year. We always begin New Year with a lot of hope & new commitments for our life, we wish all our aspirations come true with the grace of God along with a fulfilling life.
Beginning this New Year, we at Ashika Group are also taking a new initiative, where we will publish the success story of Indian Self-made billionaires & Global CEO’s, who are the “Jewels of India” & growth engine for the Global Economy. These Indian Entrepreneurs & Global CEO’s contribute significantly to Global GDP growth across the World Economies.
To begin this series we are delighted to cover the life journey Mr. Manohar Lal Agarwal & brothers whose family has laid down the Foundation of Haldiram Group
way back in 1932. This is an Indian brand which don’t need any introduction, globally. They are The Brand for “Food & Beverage Industry” representing India on the Global platform. In fact, I can say they are truly a Global Indian brand.
This edition is going to be a “limited edition“ of Ashika’s Insight magazine. A print copy shall be shared only with Global Family offices & Institutional Investors. This series for the success story of “Indian billionaires & Global CEO’s”, is a tribute from Ashika Group to all those Indians who bring pride to their country with a blend of Indian values & commitment to the Nation.
Watch out for our next Indian Billionaire in our April 2022 limited edition issue.
Cheers & Regards
Amit Jain
2January 2022 INSIGHT
Market OverviewAs the year 2021 wraps up, there are a lot of things to ponder in retrospect. No wonder we have been educated over the risks and ways to tackle the new and emerging variants of Covid-19, however one thing’s for sure the covid-19 pandemic is far from turning into an endemic.
Omicron triggered a new wave of Covid-19 in South Africa, the UK, France, Italy and several other regions albeit Delta still remains the dominant one in India. Worldwide cases hit 1.44 million recently, the highest single-day number on record. Besides, the seven-day rolling average of daily cases, just above 840,000, is at its worst, too, and likely to rise as 2022 rolls in, states Live Mint. The new variant’s hyper-infectivity is to be blamed and yet it shows us how hard it is indeed difficult to predict the evolution path of the virus. The best way to tackle the virus is to take precautions and that is precisely what the Union Government has asked states and many of them have already imposed restrictions while others are contemplating to impose some. However, the equity markets have been rather calm albeit these restrictions will again push the service sectors and the rather popular 2nd wave unlock trades. Thus, risks of an imminent 3rd wave could be looming large, however at the same time there are few facts to tame the soothing nerves of investors; (a) the Omicron variant is perceived to be
rather milder one (when compared with Delta) (b) > 42% of population is inoculated (with 2 doses) and >60% with at least one dose (c) there are newer vaccines approved and new covid-19 antivirals. Thus, when people have overcome Delta, it gives them enough confidence to get over Omicron. There is a raging debate over the vaccine effectiveness and booster shots over Omicron and more importantly how long antibodies last for different makes of vaccines. Regarding booster doses and precautionary jabs, which are expected to be rolled out early next year, the Centre has clarified that those aged 60 and above will not need to show a doctor’s certificate of co-morbidity, although the vulnerable in this age bracket are eligible for a third shot only if nine months have elapsed since their second dose. Meanwhile, pre-adults aged 15-18 are to be offered Covaxin jabs, while frontline health workers will be able to get Covishield as well. Emerging nations (with significant population still left to be inoculated) following in footsteps of developed ones and jumping on the bandwagon to provide
booster jabs has always been debated against. So far, there’s still uncertainty with regards to risks posed by the new variant. Apart from overwhelming health infrastructure, the key question is always with regards to restrictions and their repercussions on business and more importantly on trades and burgeoning freight rates and then there’s inflationary concerns (both domestic and imported). India Inc has already passed on some input costs pressure, the effect of the same on demand is yet to be witnessed. At the same time, organized sector gains market share at the cost of unorganized and smaller ones which perish. Thus, there are lot of moving parts which goes into forecasting the future, needless to say, it is extremely challenging to grasp. And yet despite those challenges, NSE Nifty and BSE Sensex already delivered YTD returns of 23% and 21% respectively. Investor enthusiasm & confidence can also be gauged from a vibrant primary market.
The minutes of the December monetary policy of RBI reveal that the monetary policy committee (MPC) members are concerned with
3 January 2022INSIGHT
Omicron variant and are hesitant to adopt an aggressive stance due to concerns over durable growth in the economy. RBI governor Shaktikanta Das said it was too premature to gauge as to how the effects of the Omicron variant on growth and inflation would pan out. RBI has off late has been questioned whether being behind the curve and for the dichotomy between the stance of global central banks and that of RBI. Even the 10-year bond yields have discounted inflationary scenario ahead when RBI largely adopts dovish stance, this challenges financial soundness. MPC members like Michael Patra however believes that although there are limits to dichotomy, there has been differences between growth scenarios between developed economies and domestic one. He stated that the global growth momentum and that of world trade faded even before being affected by Omicron. Mridul K Saggar, executive director, RBI and an MPC member, added that the prospect of higher inflation and lower growth has raised the spectre of stagflation in the developed economies where population inoculation is high. Mr. Patra observed that India is on a trajectory divergent from global situation where bank credit is picking up, tax revenues are buoyant, exports are growing robustly and the current account balance is set to swing into a deficit on the back of strong import demand. “Overall, out of the 59 high frequency indicators that have become available for October out of 67 that I track, 88% of the indicators exhibited month-on-month improvement after a somewhat weak August and September,” added Mridul K Saggar. What has echoed unanimously among all MPC members has been the drag in consumption over the GDP growth which suggests income loss (particularly for the informal sector). Thus, the key question which perplexed MPC members was whether economy withstand the output sacrifice it may bring (on aggressive monetary policy), at a time when the recovery is nascent. However, decoupling from other central banks
will lead to depreciation for Indian rupee. While RBI could tolerate up to a certain point since rupee is already overvalued as expressed by REER and it helps exports, at the same time it fuels imported inflation. History suggests that in order to protect value of currencies significant forex is lost without achieving any remarkable outcome, thus making the rupee further weak. Thus, albeit challenges galore on the external front, some economists are on the same page with the RBI Governor that inflation dynamics of India differs that of US. In short, Indian economic trends are comparable to Malaysia, Philippines, and Thailand rather than of US or even Brazil.
Both Union Govt. and states have shown restraints when it comes to GFD and maintained fine balance between growth and fiscal consolidation for H1FY22. Post fiscal and monetary policy supports, GDP has slowly recovered to pre-pandemic levels while maintaining fiscal consolidation. The same is achieved on the back of robust tax collections and higher distribution of surplus from RBI (than budgeted). Govt. has been unsuccessful to take advantage of a vibrant capital markets and divestments lag far behind, hopefully H2FY22 see some action there. Most importantly, the expenditure is expected to be more skewed towards capital outlays than revenue, unless of course Omicron changes the plans. A recently released RBI report however believes that “notwithstanding renewed concerns associated with the new omicron variant of the virus, as economic revival gains further traction, the Centre and States should provide credible medium-term glide paths towards fiscal policy normalisation so that fiscal buffers can be replenished to deal with future economic shocks, if any.” Rating agencies are now taking cognizance and while FY23 growth was expected between 7% to 8%, recently ICRA raised the bars with 9% growth forecast. The belief was on the back of strong performance
of 7 of 13 leading indicators above pre-covid levels. However, Sudipto Mundle is distinguished fellow, National Council of Applied Economic Research, New Delhi believes that “…appropriate fiscal and monetary policies alone will not get us to the sustained high growth rates of 7%-8% necessary to overcome our massive problem of unemployment and under-employment. That can only come through deep, wide-ranging structural reforms of the kind seen in 1991”. Probably, the Govt. is preparing the platform and already announced PLI schemes for broad ranging industries with latest being semi-conductors having received global interest. In the midst of China plus one strategy, India is probably the right fit, at least by size. Expectations are building up for something extraordinary to be announced for the upcoming budget given the dynamic changes brought about by Covid-19 as well as ESG norms. Moreover, despite the developed central banks being all aggressive, the same is not reflected in long term yields, suggests that investors expect central banks to fall back or tame their aggressive stance. Besides, improved economic parameters for the domestic economy is getting reflected in corporate earnings. The primary market exuberance is expected to continue in 2022 as well with new age companies & start-ups changing hands from private to becoming widely-held public companies. 2021 was already a blockbuster year where a total of 65 companies raised a record Rs 1.31 lakh crore from the public particularly for the new age companies like Paytm, Zomato, Policybazaar, Nykaa, CarTrade Tech, Fino Payments Bank, MapmyIndia, and Nazara Technologies. 2022 would also witness the biggest IPO till date of LIC, which if brought within March, would also help the Govt. to bridge its divestment shortfall and help focus towards capital expenditure projects. Thus, in a way and probably the first, the equity markets will help propel the economic growth and that is beyond correlation.
Research DeskEmail - [email protected]: +91 33 4010 2500
4January 2022 INSIGHT
How has the journey been for Haldiram to become a Global Brand name?
If a moment can be pinned on the fabric of time as the one that seeded the glorious future for this Agarwal family and led to Haldiram’s becoming the business giant that it is today, this was probably the moment when young Haldiram used moth dal flour to make bhujia that was thinner, crispier and far better tasting than what they had been making earlier. It was a paradigm shift in thinking; that of making what the customer wanted rather than selling what they could make.
Haldiram, our grandfather, was born to Chandmal Agarwal in 1902 and was named Ganga Bishen. He was blessed with an unusual but lovely fair complexion for a Marwari, which had a tinge of turmeric’s (Haldi) yellow adding to its uniqueness. This prompted his mother, Tulsi Devi, to fondly nickname him Haldia, which later morphed into Haldiram.
Haldiram, conscientious and
responsible that he was, learnt how to make the bhujia from his Bua and persuaded his father and grandfather to sell it at their shop. At the age of 12, when most children went to school Ganga Bhishen Agarwal spent his days in Bikaner inventing the ubiquitous snack we today know as Haldiram’s bhujia and reiterating the product to make it more irresistible to customers. He in his early days in business also demonstrated a knack for marketing by setting the price point such that the product was more exclusive and not just considered a commodity
Having a small shop but much bigger vision & goal for family in the early 1950s, Ganga Bhishen, along with his sons (Moolchand and Rameshwar Lal), took a leap of faith with the help of well-wishers and opened a business in Kolkata (Haldiram Bhujiawala which later split into Haldiram’s Prabhuji and Haldiram) that became a huge success within a few years. There was no looking back after that. In the next three decades, the business migrated to Nagpur
(Shiv Kishan Agarwal) and then the national capital (Manohar Lal Agarwal and Madhusudan Agarwal) and now a behemoth in Global Food & Beverage Industry
Nagpur was the third city, apart from Bikaner and Kolkata, that welcomed the famed Haldiram’s bhujia. Nagpur was a lazy, laid back city that was in the infancy of development and did not appear promising to young Shiv Kishan Ji as a place for business. He realized that just namkeen would not provide business sustainability due to its low sales volume. He felt that there was dire need to supplement it with some other product. One being to add variety and range to his products and the second was to open an eatery and serve the people food that they could consume there and then. So he started making and selling Kaju Katli, Kalakand, Peda, Malai Laddu etc along with the traditional Bengali sweets especially the famed Rasgullas. His concerted efforts at raising the bar of business growth and working tirelessly at making it happen raised the sales figures and the worth of his gut feel about the sweets being a good prospect and there was no looking back thereafter. In 1973, he started a 35-seater restaurant in Nagpur that sold dosas and tea amongst other products that he was already making and selling.
For him, Nagpur became his destiny, the arena where Shiv Kishan Ji would prove his mettle as an entrepreneur. An exceptionally successful one at that.
Then, my brother Madhusudanji and I expanded to Delhi, we had to fight out independently when the time came to invest in Delhi. We have built our business empire brick by brick & remained steadfast.
As bhujia was not a unique product in Delhi , we brothers faced immense competition from established players , however we strategically differentiated by focusing on
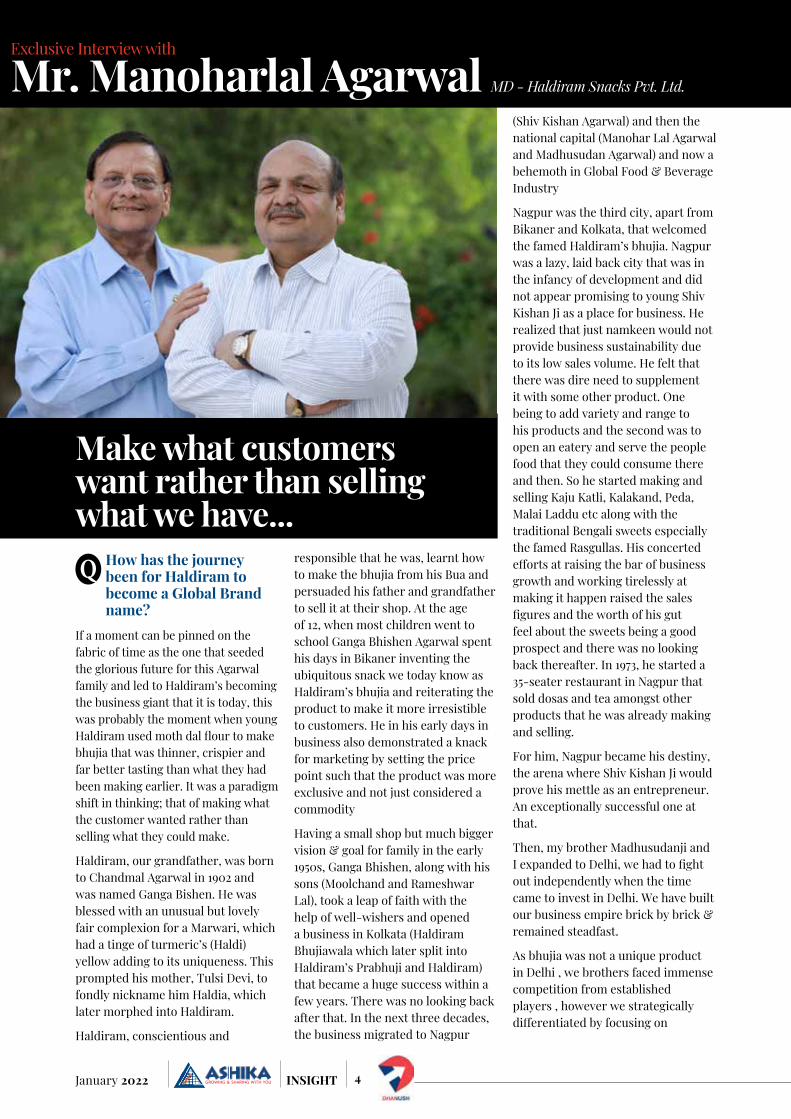
Make what customers want rather than selling what we have...
Exclusive Interview with
Mr. Manoharlal Agarwal MD - Haldiram Snacks Pvt. Ltd.

5 January 2022INSIGHT
adjusting flavours and innovating to meet the needs of the market and make Haldiram what it is today.
What was your initial goal when you started from scratch and how did you kept changing your Goal Post in life journey of your success?
Building a business whose products would reach people in the farthest corners of the country was the dream of all our 4 brothers and we fought the quintessential battle with our father to strike out independently. We did our sincere efforts and left the rest to GOD
Shiv Kishan Ji had also been busy in Nagpur with his characteristic brand of dynamic growth and expansion. An ever-increasing demand for his products in Nagpur prompted him to decide upon shifting his production operations to a dedicated factory instead of continuing to make them at the rear of their shops. This not only freed space at the shop for better selling with more room for the customers. It would also make the product quality more consistent across all sales outlets since it would be made at one place in a consolidated manner. So he purchased his first factory in Jalalpura in 1974 and added another 5000 sq ft of space to it in 1975. His workforce was also steadily increasing and by this time, Shiv Kishan Ji had some 45-50 people working for him.
In Delhi, We faced immense competition from established players such as Ghantewala and Bikanerwala. Strategically, we differentiated ourselves by focusing on adjusting flavours and innovating to meet the needs of the market and soon began to break even.
Innovation and automation were the pillars for achieving our goal. We started with rebuilding our shop after the shop and apartment were burnt down in a fire during the 1984 Sikh riots. Once business picked up, we turned our apartment
into a factory overnight, where the entire family pulled long sleepless nights, trying to keep up with demand. Soon, the Chandni Chowk location was not enough and we began looking for factory space for large-scale production. The first factory was set up in the late ’80s. After that, distribution became one of our greatest strengths and one of the secrets to our success in the national capital region. A testament of our success is that today at railway stations and stalls around the country, the 5 Haldiram’s bhujia packet is used as currency, as a substitute for loose change.
How did you envision Haldiram to be a global brand from a small shop in Chandni Chowk? What was the inspiration for you to dream big?
Many businesses survive because of an uncanny sense of how to run operations, an understanding of customers and differentiation in products. In addition to these, the one thing that sets us apart is the indefatigable grit and ability to persist regardless of the obstacles.
Hard work and growth always go hand in hand. There is no substitute to hard work and there is no greater or better goal in life than to have an endless desire to learn, work and grow.
The company started its export arm in 1993 to USA, today the company has found global success in more than 80 countries.
We have been pushing boundaries in business and the ambitions for international expansion have driven us. At a time when the bhujia’s shelf life was hardly a week, the company extended it to six months. Given Indians’ penchant for fresh food, this was a risk, but the company successfully attempted to change the habits of customers, a feat, that even large brands find difficult to achieve.
How did you manage to fund your growth organically throughout as compared to new age startups who raise funds within two years of their business?
We always believed in building our Business model so strong and never
We always believed in building our Business model so strong and never rely on external funds to run our business...

6January 2022 INSIGHT
rely on external funds to run our business.
The Agarwal family was vehemently opposed to the idea of debt or taking loans. Organic growth was their mantra. We always believed in funding our growth through internal accruals & reinvesting in the business to make it a success.
Slow, patient and steady growth that resisted biting into bigger chunks of possibilities than what the available resources would be able to support, had always been the hallmark of the Agarwal family since Haldiram’s time. And the same pragmatic, measured and sagacious approach to expansion remains embedded in their ethos a century and more hence.
Today, the Haldiram’s Empire is a proud debt free global enterprise.
During the journey of more than 8 decades
what challenges/ struggles did you face?
As a pioneer in the industry we faced several challenges. Haldiram was the first company in India to convert traditional snacks (Namkeen) from unorganized sector to organized sector. However we kept innovating, automating and researching to overcome the challenges.
Some of the Challenges we faced were:
Traditional namkeen was manufactured by hand by skilled karigar followed by frying in conventional batch fryer hence it was difficult to get consistency in quality because industry was depended on karigar. (skilled labour)
Production limitations.
Shelf life 6 days only therefore product cannot be distributed widely.
Difficult to maintain hygiene conditions.
Packaging had been one of the biggest limitations for the expansion of their business even when they were based solely in Bikaner and not capable of producing namkeen in high volumes
Our Vision as leaders is to always motivate the teams to work towards enhancing customer experience through our Product Quality, Taste & Hygiene. Thus, the above obstacles never stopped us as we kept learning and overcoming the challenges with grit to become a Global brand.
Being a close knit family business what joint efforts were taken to make Haldiram’s a strong brand recall?
The Haldiram’s family demonstrates a level of cross-generation synergy is a rare find within a group as large
7 January 2022INSIGHT
as ours and where the stakes are big enough to be game changers for more than a few smaller organizations. Such a harmony in mindsets is not just exceptional but also a significant factor in Haldiram’s outstanding success.
The lineage of families, while they are commonplace, is usually lost in the mists of time. It is only when a generation goes on the ascendant that their true glory bursts forth for all to see.
While the brand is thrilled that we have debuted on the 2019 Forbes India Rich List, the attitude of the family is still grounded.
This is also the result of the dedication, loyalty and hard work of our employees and customers who make us what we are today.
Which principles in business remained intact to keep Haldiram’s a sustainable success?
Everyone believes that there is God in this world, even though no one has seen Him. For us, our customers are our God. We see them and they are the ones who help us earn our livelihood and that of our workers. The customer establishes our goodwill. There is no greater God for us than our customer.
Always be honest. Dishonesty with the customer harms the seller more than it harms the customer. The one who is dishonest and gets away with it once will only become more dishonest with each passing day. The customer was his victim only for one instance but he shall be his own victim for the rest of his life.
Which products and segments are explored after being traditional sweets and snacks brand?
Haldiram’s has been a unique mix of the traditional and the modern. And this fusion is visible across all aspects
of their lives, enterprises, products and the values and ethics that guide their business principles. Haldiram Snacks Pvt. Ltd. is synonymous to traditional snacks in India. The range includes traditional snacks, western snacks, package sweets, bakery, RTE, Frozen, syrups, papad, non-salty products like pasta, macaroni, vermicelli, rusk, pickle and sattu. The portfolio targets to all GENRE AGES AND DEMOGRAPHICS distributing across the country and 70 countries worldwide. The products range are available in all modern trader’s chain across the country and worldwide
We began including sweets such as canned rasgullas and soan papdi, pani puri and now desi wraps. This would be a precursor to Haldiram’s 400+ product range that includes traditional namkeens, western snacks, Indian sweets, cookies, sherbets, papads and pickles.
In 2003, the company started the process of developing convenience foods that could be marketed to consumers. These products in the ready-to-eat format included paneer, pulao, dal and vegetables. Expanding into this market, we began competing with well-established incumbents such as MTR, Tasty Bites & ITC.
But Haldiram’s wasn’t satisfied with newer products as it always aspired to become a Global Brand.Its product basket has also expanded beyond sweets and snacks for global markets. These would include cookies, biscuits, fruit juice concentrates, frozen Indian food which all have a growing demand in the international markets.
What is the strategy fuelled the growth globally?
Time, technology and techniques are constantly changing, ever evolving but they remain mere tools for an enterprise. Putting these tools to the best use for progress and betterment is an act of judgment and character.
Haldiram’s epitomize these attributes most visibly and possessing them has been their biggest strength.
Developing entire eco-systems around a business aspect or even a product is one trait that has been a hallmark of Haldiram’s. And this happens primarily due to the extreme diligence and attention to detail that they give towards developing any and every product in their repertoire.
Haldiram has managed details of right technology, packaging standardizations, consumer affordability, quality tasty products, and volume deliverables extremely well to weave the magical success saga. Following aspects helped it in growing:
Authentic taste know-how, plus delivery in product
Complex flavors, wide spectrum
Proven high quality content
Standardized packaging
Accurate pricing know-how ( what is “reasonable”)
Pack size know-how
Deep understanding of distribution
Channel contribution : general trade dominance
What message would you like to give to the young entreprenuers starting their career?
Hard work and growth always go hand in hand. There is no substitute to hard work and there is no better goal in life than to have an endless desire to learn, work and grow.
Having a vision and sheer determination with focused mindset is necessary.
An execution with planning and taking calculated risks is important in every aspect of entreprenuership.
Being grounded towards your beliefs and values in life should be inculcated as a life principle.

8January 2022 INSIGHT
9 January 2022INSIGHT
10January 2022 INSIGHT
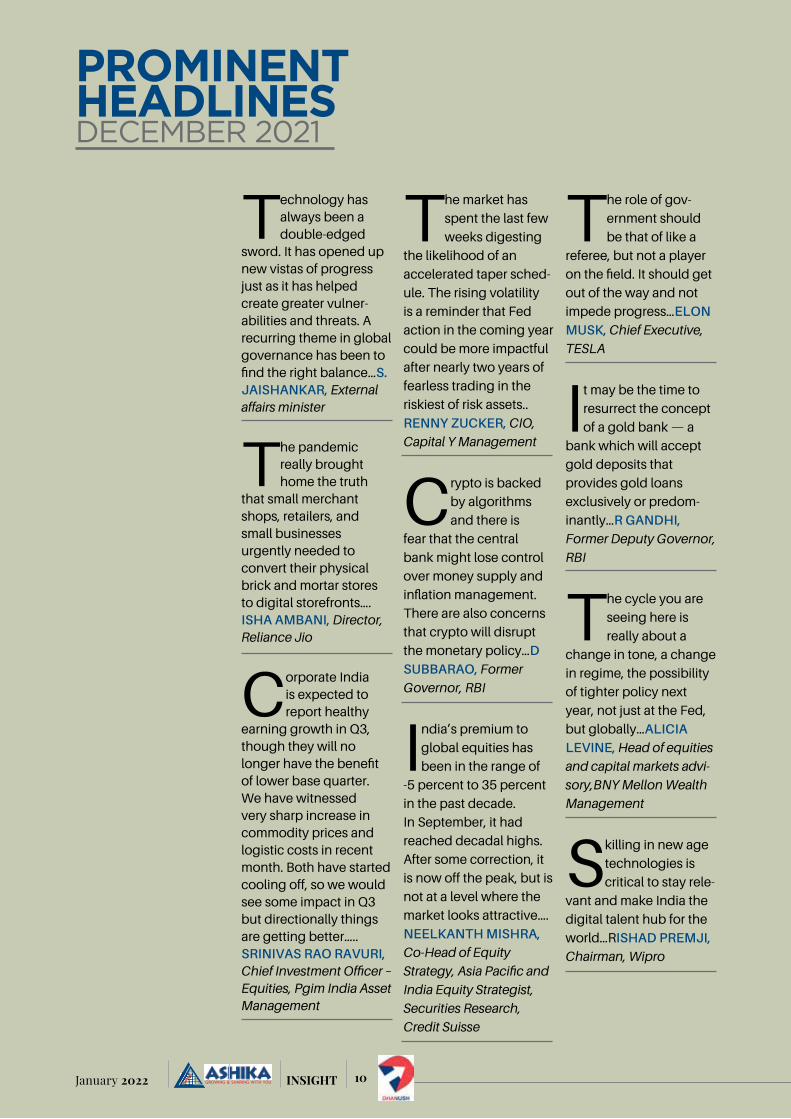
Technology has always been a double-edged
sword. It has opened up new vistas of progress just as it has helped create greater vulner-abilities and threats. A recurring theme in global governance has been to find the right balance…S. JAISHANKAR, External affairs minister
The pandemic really brought home the truth
that small merchant shops, retailers, and small businesses urgently needed to convert their physical brick and mortar stores to digital storefronts….ISHA AMBANI, Director, Reliance Jio
Corporate India is expected to report healthy
earning growth in Q3, though they will no longer have the benefit of lower base quarter. We have witnessed very sharp increase in commodity prices and logistic costs in recent month. Both have started cooling off, so we would see some impact in Q3 but directionally things are getting better…..SRINIvAS RAo RAvuRI, Chief Investment Officer – Equities, Pgim India Asset Management
The market has
spent the last few
weeks digesting
the likelihood of an
accelerated taper sched-
ule. The rising volatility
is a reminder that Fed
action in the coming year
could be more impactful
after nearly two years of
fearless trading in the
riskiest of risk assets..
RENNY ZuCKER, CIO,
Capital Y Management
Crypto is backed
by algorithms
and there is
fear that the central
bank might lose control
over money supply and
inflation management.
There are also concerns
that crypto will disrupt
the monetary policy…D SuBBARAo, Former
Governor, RBI
India’s premium to
global equities has
been in the range of
-5 percent to 35 percent
in the past decade.
In September, it had
reached decadal highs.
After some correction, it
is now off the peak, but is
not at a level where the
market looks attractive….
NEElKANtH MISHRA, Co-Head of Equity
Strategy, Asia Pacific and
India Equity Strategist,
Securities Research,
Credit Suisse
The role of gov-
ernment should
be that of like a
referee, but not a player
on the field. It should get
out of the way and not
impede progress…EloN MuSK, Chief Executive,
TESLA
It may be the time to
resurrect the concept
of a gold bank — a
bank which will accept
gold deposits that
provides gold loans
exclusively or predom-
inantly…R GANDHI, Former Deputy Governor,
RBI
The cycle you are
seeing here is
really about a
change in tone, a change
in regime, the possibility
of tighter policy next
year, not just at the Fed,
but globally…AlICIA lEvINE, Head of equities
and capital markets advi-
sory,BNY Mellon Wealth
Management
Skilling in new age
technologies is
critical to stay rele-
vant and make India the
digital talent hub for the
world…RISHAD PREMJI, Chairman, Wipro
Prominent headLines deceMber 2021

11 January 2022INSIGHT
There is more
uncertainty than I
think most people
thought we’d see here
as they were anticipating
aSanta Claus rally. Volatility
and uncertainty are the key
terms that will lead us into
the new year…vICtoRIA FERNANDEZ, Chief market
strategist, Crossmark Global
Investments
Government’s strong
emphasis on public
works, timely inter-
ventions to boost liquidity
and several reforms carried
out in the recent months
including easing regula-
tions, PLI scheme, RoDTEP
and several other bold
reforms have buoyed the
optimism on higher eco-
nomic growth…t v NAREN-DRAN, President, CII
The market is
witnessing a
shift in consumer
behaviour... Consumers are
now preferring technologi-
cally advanced appliances
that are connected, energy
efficient and easy to use,
enabling them to multi-
task….MANISH SHARMA CHAIRMAN AND CEO,
PANASONIC INDIA
The market is lower-
ing its expectations
for growth due to
Omicron and lower liquid-
ity as the year ending is
potentially amplifying the
moves. We have to be a bit
careful of reading too much
into the weakness…..PEtER GARNRY, Head-equity
strategy, Saxo Bank
We continue to
have a view
of marginal
under weight on small and
midcaps because of their
valuation, and marginal
overweight on large caps.
Its time to be neutral to
equity as an asset, as it
is fairly priced….NIlESH SHAH, Group President
Kotak Mahindra AMC
Monetary policy
authorities avoid
discussions on
inequity. They like to be
seen in a macro stabiliza-
tion role and prefer leaving
distributional issues to
fiscal authorities. Yet,
increasingly, they realize
that financial inclusion
impacts the conduct of
policy more fundamen-
tally than they thought….
MICHAEl PAtRA, RBI
Deputy Governor.
Macroeconomic
data shows
boom (2003-04
to 2010-11), slowdown/
deceleration (2013-14
to 2018-19), collapse
(2019-20) but... National
Income Accounts data
shows steady GDP growth,
accelerating consumption.
Measurement problem
(is) particularly serious in
2019-20….ARvIND SuBRA-MANIAN, Former CEA
It is a fact that chemi-cals and fertilizers have played a crucial role in the green revolution. But it is also impera-tive to work on their alternatives. It is the right time to take big steps before the issues related to farming become severe… NARENDRA MoDI, Prime Minister of India
India strongly believes that the pricing of liquid hydrocarbons should be reasonable, responsible and be determined by market forces… RAMESWAR tElI, Minister of State for Petroleum and Natu-ral Gas
12January 2022 INSIGHT
1) Which sectors could do well over the next 12 months in your opinion? What are some of the mega structural themes that you are currently betting on in India?ß
Over the next 1-2 years, stock returns will largely come from earnings growth rather than valuation multiple expansion as the latter is on the higher side as compared to its own history. Earnings growth expectation from the market over remainder of FY22 and FY23 is robust. Hence, differentiation among the sectors will come from which sectors will contribute more towards the earnings growth. We believe, Financials (led by large banks), Auto, Industrials, and Technology will contribute more towards earnings growth in this period. We have a positive stance on rate sensitives
followed by domestic cyclicals and exporters.
The structural themes that we are looking at is not from 1-year perspective but from multi-year perspective.
First, a macro theme which will encompass multiple sectors. The macro theme that we are most bullish on, over the next 3 years is the ‘capex cycle’. We see this as the single biggest driver of corporate earnings over the next 2-3 years. As a result, our portfolios reflect a pro-cyclical stance and our order of preference for sectors (above mentioned) is driven by this broader theme (i.e. rate sensitives followed by domestic cyclicals and exporters).
Second, is a segment specific theme but that is also a multi-year
theme. It is that of the outsourced manufacturing. Right now manufacturing is a smaller segment of our GDP but expected to grow to a larger share of the pie over the next few years. This theme will benefit more from exports and then on account of revival in domestic growth. Conducive policy measures (Make in India, PLI schemes) and change in global supply chain considerations are helping on this front. The pockets of opportunities lie in Speciality chemicals and in the durable manufacturing segments.
2) So far consumer facing corporate have absorbed significant amount of input cost pressure in Q2FY22, however has since passed on a major part. How do you see the demand scenario and earnings expectation for H2FY22 and FY23?
There had been considerable input cost pressure on consumer facing corporates. The cost pressure had come from both raw material as well as power and fuel cost. Commodity prices had risen sharply in H1FY22 and stayed high. Only recently there has been slight moderation in commodity and fuel costs. Companies were able to pass on the cost but only partially. More than half companies in the consumer universe showed decline in EBITDA margin despite demand holding up. But,
Mr. Neelotpal Sahai - Head of Equities, HSBC Asset Management (India) Pvt. Ltd.
Q&A with heAd of eQuities
First, a macro theme which will encompass multiple sectors. The macro theme that we are most bullish on, over the next 3 years is the ‘capex cycle’. We see this as the single biggest driver of corporate earnings over the next 2-3 years.
13 January 2022INSIGHT
from the post-result commentary, we realize that price increase (forced due to rise in raw material cost) has been unprecedented in some cases and very high in many other cases. These companies are bracing for impact on demand once pent-up demand moderates.
Nifty companies’ Q2FY22 earnings came in slightly ahead of estimates, largely driven by metals and energy sector. Key trends that we witnessed during the quarter a) Recovery has been faster than expected (on back of vaccination) – demand was strong; and b) Margin pressure due to high commodity and fuel prices.
As a result, Bloomberg consensus earnings estimate for Nifty companies for FY22 has remained unchanged but FY23 earnings estimate has been upgraded by 2-3%.
3) With the economy showing signs of pickup, do you see the NPA woes behind for the banking sector? Any views on the formation of the bad bank?
Large banks have been showing robust asset quality since 2QFY21
– initially driven by moratorium on classifying a loan as NPA and later on due to rebound and recovery in the economy. However, large banks made excess provision in anticipation of asset quality to worsen after moratorium was lifted. Since, asset quality has held up, the banks are sitting comfortable with high provision coverage ratio. The trend of sequential improvement in loan quality was visible in this quarter too.
Improvement in the economy has meant that smaller banks and NBFCs, too, have been able to see improvement in disbursement and collection efficiency.
There is one pocket of loan book (those SMEs which have availed benefit ECLGS scheme), which hasn’t yet normalized. This normalization will happen over the next 2-3 quarters. However, we believe that the excess provision, that the large banks are carrying, should be sufficient.
IBC process has been working well over the last 4-5 years and major chunky NPAs have been resolved. Therefore, in the near term, formation of the bad bank will not have a significant change loan book of large banks.
4) Do you expect any big bang reforms from the upcoming Union Budget?
We have seen in the past that big bang reforms like GST implementation, Demonetization, PLI Scheme, IBC etc have been undertaken outside Union Budget. We believe, that is how it should be. However, at the same time we have seen that Union Budget has been used to set long term direction in many fields. For example, in the first term of 5 years of the government there was a trend to improve social security. Progressively, schemes were brought to increase insurance (both life and health) improve private sector participation in pension scheme as well as long term savings.
In the current tenure of 5 years, there is a trend towards improving ease of doing business as well as giving long term direction of government finances and expenditure. We expect the latter trend to continue in this upcoming union budget too.
5) With divestment not keeping up with estimates, do you expect action to intensify in H2FY22? What are your views on PSU stocks?
Yes, we do expect the government to intensify its effort in H2FY22 to meet its divestment estimates. But, we do believe that it may not be able meet its estimates. In any year, that would mean that fiscal deficit would slip to that extent. However, in the current fiscal tax collection (both direct as well as indirect) has been running ahead of estimates. Therefore, we believe that slippage in fiscal deficit may not be there and the government
Nifty companies’ Q2FY22 earnings came in slightly ahead of estimates, largely driven by metals and energy sector. Key trends that we witnessed during the quarter a) Recovery has been faster than expected (on back of vaccination) – demand was strong; and b) Margin pressure due to high commodity and fuel prices.
We have seen in the past that big bang reforms like GST implementation, Demonetization, PLI Scheme, IBC etc have been undertaken outside Union Budget. We believe, that is how it should be. However, at the same time we have seen that Union Budget has been used to set long term direction in many fields. For example, in the first term of 5 years of the government there was a trend to improve social security.
14January 2022 INSIGHT
doesn’t need to compromise capex expenditure (vital for growth) too.
PSU stocks are not one basket and each company is different. Therefore, we view PSU stocks like any other stock. That means we look at PSU stocks on the parameters of sustainable return on equity, allocation of capital, near-term earnings growth and potential for medium to long term earnings growth, valuations, management quality and ESG parameters.
6) What is your view on the current IPO market in India? Where do you stand in the debate between new and old economy stocks?
Year 2021 has been very good for IPO markets. In terms of money raised, this year should be among top years. Equity culture augurs well for long term health of Indian entrepreneurship. It demonstrates two things – On one hand it demonstrates vibrancy of Indian entrepreneurship and on the other hand it unlocks domestic pool of risk capital. IPO market brings the two together.
We do not bracket stocks and companies as new and old economy. As mentioned above, we look at stocks on the parameters
of sustainable return on equity, allocation of capital, near-term earnings growth and potential for medium to long term earnings growth, valuations, management quality and ESG parameters. However, we do note that there are companies without near term earnings and/or return on equity. In those cases, it important to see the potential of the addressable market and that company’s ability to capture the market. It is worthwhile re-iterating that we not only look near term return on equity but on sustainable return on equity which these companies can generate when their operations stabilizes.
7) The PLI scheme could be a game changer for India, however similar strategies have been adopted by other nations as well. Which areas you think India has a chance of succeeding the most given Govt.’s preparedness?
I agree that the PLI scheme can be a game changer. If initial indications are to be extrapolated then India can be a major manufacturing hub in 5-10 years. However, it is going easier said than done as you have rightly pointed that similar strategies have been adopted by other nations as well. It is therefore important that India is able to differentiate by targeting specific sectors and industries. We believe, initial success is most likely in those sectors where India is already present in global supply chain. The pockets of opportunities lie in Speciality chemicals and in the durable manufacturing segments (including mobile phones). Subsequently, success stories in these sectors can lead to belief in India as manufacturing destination. That, in turn, could lead to success many other sectors. In parallel, the Govt could look to attract marquee names in many sectors. Success of
these marquee names will attract investments from other players too. In the latter case, success in a particular sector will depend upon success of the marquee name of that sector.
8) Your advice for retail investors on playing this difficult phase in Indian equity markets.
Allocation to specific market cap category of funds will depend on the risk appetite of the individual. Investors with a lower risk appetite can consider aggressive hybrid or large cap funds. Investors with a higher risk appetite along with a longer investment horizon can consider flexi-cap funds. We expect the near term to be unpredictable given the backdrop of high valuations. Earnings growth should eventually catch-up with valuations and this will mean that the equity market returns will be mirroring earnings growth over the medium to long term.
Year 2021 has been very good for IPO markets. In terms of money raised, this year should be among top years. Equity culture augurs well for long term health of Indian entrepreneurship.
I agree that the PLI scheme can be a game changer. If initial indications are to be extrapolated then India can be a major manufacturing hub in 5-10 years. However, it is going easier said than done as you have rightly pointed that similar strategies have been adopted by other nations as well.
Mutual fund investments are subject to market risks, read all scheme related documents carefully.
15 January 2022INSIGHT
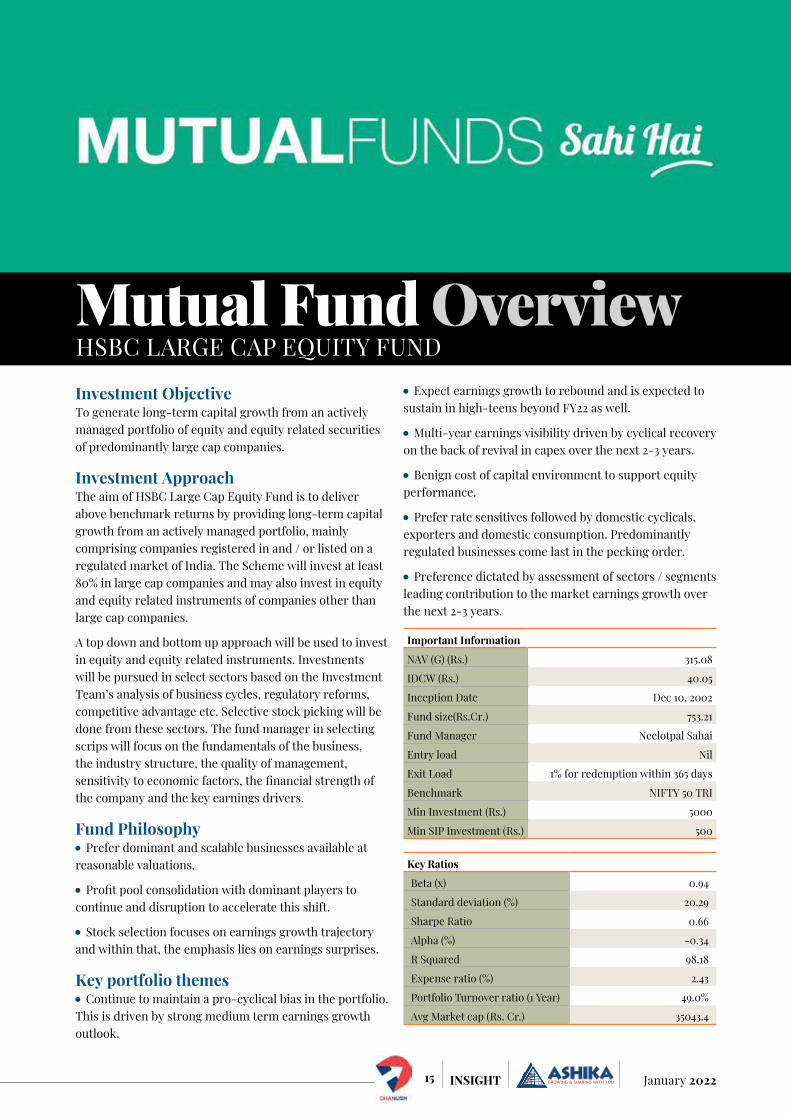
Investment ObjectiveTo generate long-term capital growth from an actively managed portfolio of equity and equity related securities of predominantly large cap companies.
Investment ApproachThe aim of HSBC Large Cap Equity Fund is to deliver above benchmark returns by providing long-term capital growth from an actively managed portfolio, mainly comprising companies registered in and / or listed on a regulated market of India. The Scheme will invest at least 80% in large cap companies and may also invest in equity and equity related instruments of companies other than large cap companies.
A top down and bottom up approach will be used to invest in equity and equity related instruments. Investments will be pursued in select sectors based on the Investment Team’s analysis of business cycles, regulatory reforms, competitive advantage etc. Selective stock picking will be done from these sectors. The fund manager in selecting scrips will focus on the fundamentals of the business, the industry structure, the quality of management, sensitivity to economic factors, the financial strength of the company and the key earnings drivers.
Fund Philosophy Prefer dominant and scalable businesses available at
reasonable valuations.
Profit pool consolidation with dominant players to continue and disruption to accelerate this shift.
Stock selection focuses on earnings growth trajectory and within that, the emphasis lies on earnings surprises.
Key portfolio themes Continue to maintain a pro-cyclical bias in the portfolio.
This is driven by strong medium term earnings growth outlook.
Expect earnings growth to rebound and is expected to sustain in high-teens beyond FY22 as well.
Multi-year earnings visibility driven by cyclical recovery on the back of revival in capex over the next 2-3 years.
Benign cost of capital environment to support equity performance.
Prefer rate sensitives followed by domestic cyclicals, exporters and domestic consumption. Predominantly regulated businesses come last in the pecking order.
Preference dictated by assessment of sectors / segments leading contribution to the market earnings growth over the next 2-3 years.
Important Information
NAV (G) (Rs.) 315.08
IDCW (Rs.) 40.05
Inception Date Dec 10, 2002
Fund size(Rs.Cr.) 753.21
Fund Manager Neelotpal Sahai
Entry load Nil
Exit Load 1% for redemption within 365 days
Benchmark NIFTY 50 TRI
Min Investment (Rs.) 5000
Min SIP Investment (Rs.) 500
Key Ratios
Beta (x) 0.94
Standard deviation (%) 20.29
Sharpe Ratio 0.66
Alpha (%) -0.34
R Squared 98.18
Expense ratio (%) 2.43
Portfolio Turnover ratio (1 Year) 49.0%
Avg Market cap (Rs. Cr.) 35043.4
Mutual Fund Overview HSBC LARGE CAP EQUITY FUND
16January 2022 INSIGHT
Performance of the Fund alongwith Benchmark (as on Dec 27, 2021)1 month 3 months 6 months 1 year 3 Years 5 Years Since Inception
Fund (%) 1.93 -2.36 7.73 22.39 17.44 15.65 19.84Benchmark (%) -0.02 -3.91 8.34 26.44 17.67 17.63
Asset Allocation
Equity Cash
99.04% 0.96%
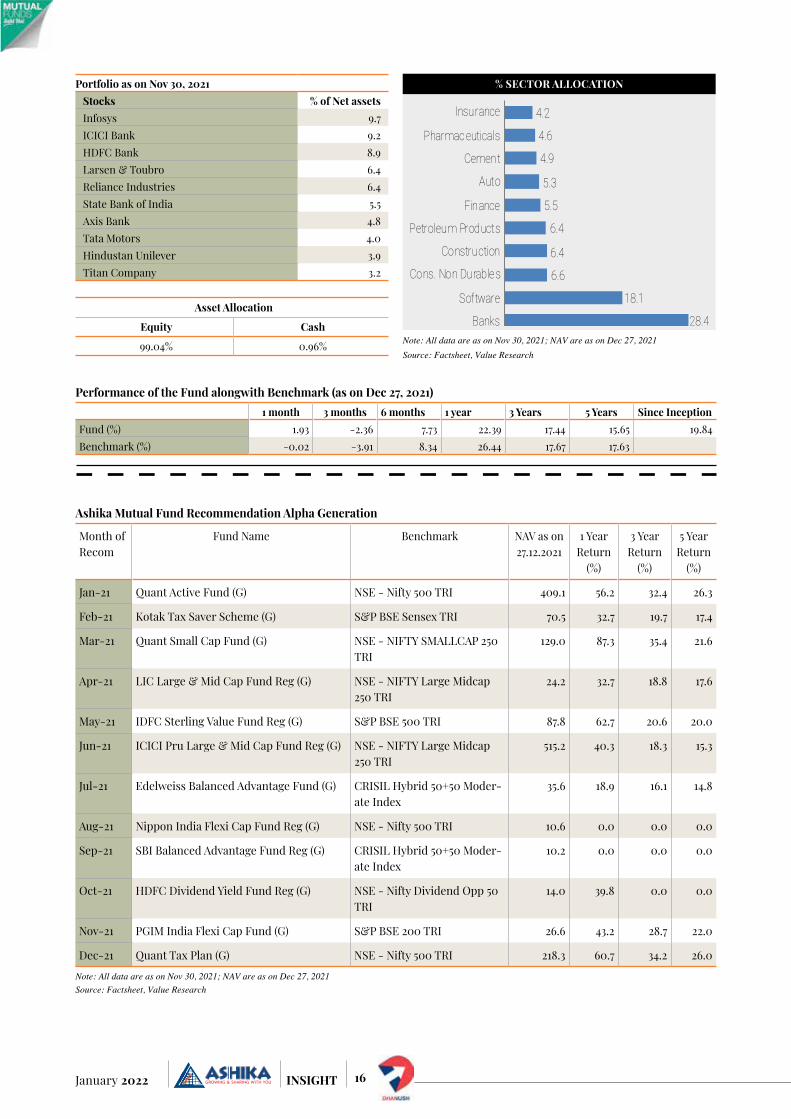
28.4
18.1
6.6
6.4
6.4
5.5
5.3
4.9
4.6
4.2
Banks
Software
Cons. Non Durable s
Construction
Petroleum Products
Finance
Auto
Cement
Pharmaceuticals
Insurance
% SECTOR ALLOCATION Portfolio as on Nov 30, 2021Stocks % of Net assetsInfosys 9.7ICICI Bank 9.2HDFC Bank 8.9Larsen & Toubro 6.4Reliance Industries 6.4State Bank of India 5.5Axis Bank 4.8Tata Motors 4.0Hindustan Unilever 3.9Titan Company 3.2
Note: All data are as on Nov 30, 2021; NAV are as on Dec 27, 2021Source: Factsheet, Value Research
Ashika Mutual Fund Recommendation Alpha Generation
Month of Recom
Fund Name Benchmark NAV as on 27.12.2021
1 Year Return
(%)
3 Year Return
(%)
5 Year Return
(%)
Jan-21 Quant Active Fund (G) NSE - Nifty 500 TRI 409.1 56.2 32.4 26.3
Feb-21 Kotak Tax Saver Scheme (G) S&P BSE Sensex TRI 70.5 32.7 19.7 17.4
Mar-21 Quant Small Cap Fund (G) NSE - NIFTY SMALLCAP 250 TRI
129.0 87.3 35.4 21.6
Apr-21 LIC Large & Mid Cap Fund Reg (G) NSE - NIFTY Large Midcap 250 TRI
24.2 32.7 18.8 17.6
May-21 IDFC Sterling Value Fund Reg (G) S&P BSE 500 TRI 87.8 62.7 20.6 20.0
Jun-21 ICICI Pru Large & Mid Cap Fund Reg (G) NSE - NIFTY Large Midcap 250 TRI
515.2 40.3 18.3 15.3
Jul-21 Edelweiss Balanced Advantage Fund (G) CRISIL Hybrid 50+50 Moder-ate Index
35.6 18.9 16.1 14.8
Aug-21 Nippon India Flexi Cap Fund Reg (G) NSE - Nifty 500 TRI 10.6 0.0 0.0 0.0
Sep-21 SBI Balanced Advantage Fund Reg (G) CRISIL Hybrid 50+50 Moder-ate Index
10.2 0.0 0.0 0.0
Oct-21 HDFC Dividend Yield Fund Reg (G) NSE - Nifty Dividend Opp 50 TRI
14.0 39.8 0.0 0.0
Nov-21 PGIM India Flexi Cap Fund (G) S&P BSE 200 TRI 26.6 43.2 28.7 22.0
Dec-21 Quant Tax Plan (G) NSE - Nifty 500 TRI 218.3 60.7 34.2 26.0
Note: All data are as on Nov 30, 2021; NAV are as on Dec 27, 2021Source: Factsheet, Value Research
17 January 2022INSIGHT
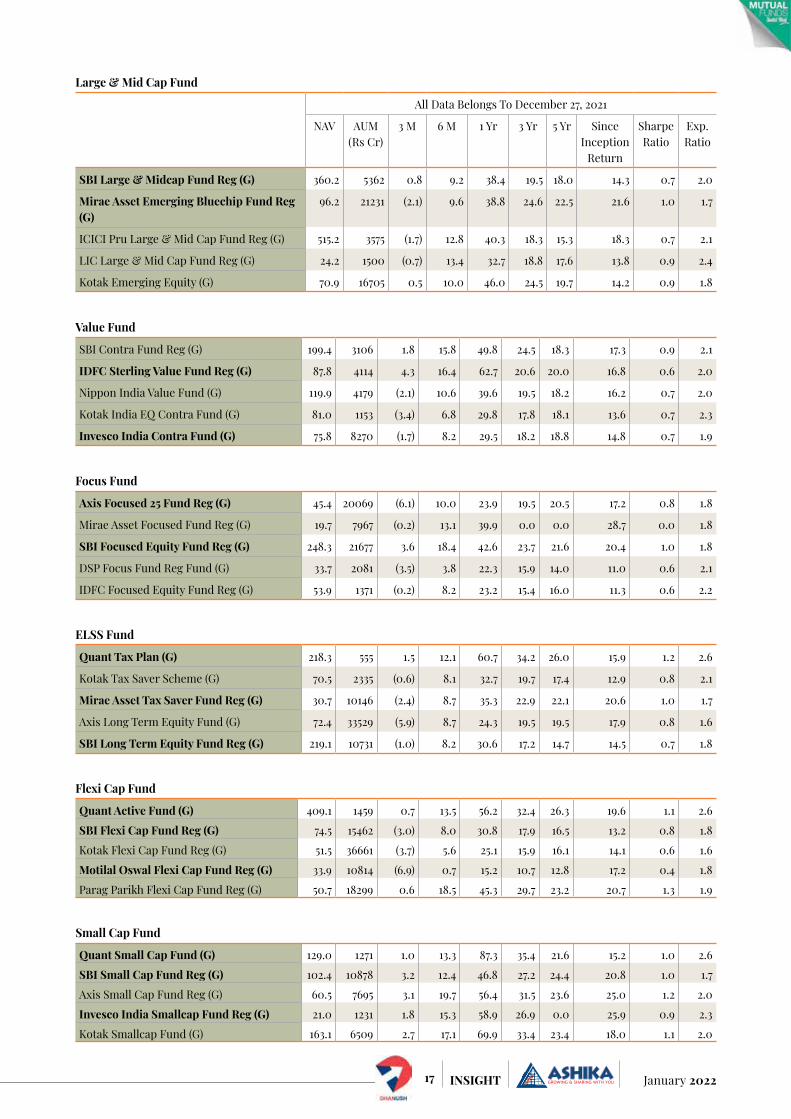
All Data Belongs To December 27, 2021
NAV AUM (Rs Cr)
3 M 6 M 1 Yr 3 Yr 5 Yr Since Inception
Return
Sharpe Ratio
Exp. Ratio
SBI Large & Midcap Fund Reg (G) 360.2 5362 0.8 9.2 38.4 19.5 18.0 14.3 0.7 2.0
Mirae Asset Emerging Bluechip Fund Reg (G)
96.2 21231 (2.1) 9.6 38.8 24.6 22.5 21.6 1.0 1.7
ICICI Pru Large & Mid Cap Fund Reg (G) 515.2 3575 (1.7) 12.8 40.3 18.3 15.3 18.3 0.7 2.1
LIC Large & Mid Cap Fund Reg (G) 24.2 1500 (0.7) 13.4 32.7 18.8 17.6 13.8 0.9 2.4
Kotak Emerging Equity (G) 70.9 16705 0.5 10.0 46.0 24.5 19.7 14.2 0.9 1.8
Large & Mid Cap Fund
Value Fund
SBI Contra Fund Reg (G) 199.4 3106 1.8 15.8 49.8 24.5 18.3 17.3 0.9 2.1
IDFC Sterling Value Fund Reg (G) 87.8 4114 4.3 16.4 62.7 20.6 20.0 16.8 0.6 2.0
Nippon India Value Fund (G) 119.9 4179 (2.1) 10.6 39.6 19.5 18.2 16.2 0.7 2.0
Kotak India EQ Contra Fund (G) 81.0 1153 (3.4) 6.8 29.8 17.8 18.1 13.6 0.7 2.3
Invesco India Contra Fund (G) 75.8 8270 (1.7) 8.2 29.5 18.2 18.8 14.8 0.7 1.9
Focus Fund
Axis Focused 25 Fund Reg (G) 45.4 20069 (6.1) 10.0 23.9 19.5 20.5 17.2 0.8 1.8
Mirae Asset Focused Fund Reg (G) 19.7 7967 (0.2) 13.1 39.9 0.0 0.0 28.7 0.0 1.8
SBI Focused Equity Fund Reg (G) 248.3 21677 3.6 18.4 42.6 23.7 21.6 20.4 1.0 1.8
DSP Focus Fund Reg Fund (G) 33.7 2081 (3.5) 3.8 22.3 15.9 14.0 11.0 0.6 2.1
IDFC Focused Equity Fund Reg (G) 53.9 1371 (0.2) 8.2 23.2 15.4 16.0 11.3 0.6 2.2
ELSS Fund
Quant Tax Plan (G) 218.3 555 1.5 12.1 60.7 34.2 26.0 15.9 1.2 2.6
Kotak Tax Saver Scheme (G) 70.5 2335 (0.6) 8.1 32.7 19.7 17.4 12.9 0.8 2.1
Mirae Asset Tax Saver Fund Reg (G) 30.7 10146 (2.4) 8.7 35.3 22.9 22.1 20.6 1.0 1.7
Axis Long Term Equity Fund (G) 72.4 33529 (5.9) 8.7 24.3 19.5 19.5 17.9 0.8 1.6
SBI Long Term Equity Fund Reg (G) 219.1 10731 (1.0) 8.2 30.6 17.2 14.7 14.5 0.7 1.8
Flexi Cap Fund
Quant Active Fund (G) 409.1 1459 0.7 13.5 56.2 32.4 26.3 19.6 1.1 2.6
SBI Flexi Cap Fund Reg (G) 74.5 15462 (3.0) 8.0 30.8 17.9 16.5 13.2 0.8 1.8
Kotak Flexi Cap Fund Reg (G) 51.5 36661 (3.7) 5.6 25.1 15.9 16.1 14.1 0.6 1.6
Motilal Oswal Flexi Cap Fund Reg (G) 33.9 10814 (6.9) 0.7 15.2 10.7 12.8 17.2 0.4 1.8
Parag Parikh Flexi Cap Fund Reg (G) 50.7 18299 0.6 18.5 45.3 29.7 23.2 20.7 1.3 1.9
Small Cap Fund
Quant Small Cap Fund (G) 129.0 1271 1.0 13.3 87.3 35.4 21.6 15.2 1.0 2.6
SBI Small Cap Fund Reg (G) 102.4 10878 3.2 12.4 46.8 27.2 24.4 20.8 1.0 1.7
Axis Small Cap Fund Reg (G) 60.5 7695 3.1 19.7 56.4 31.5 23.6 25.0 1.2 2.0
Invesco India Smallcap Fund Reg (G) 21.0 1231 1.8 15.3 58.9 26.9 0.0 25.9 0.9 2.3
Kotak Smallcap Fund (G) 163.1 6509 2.7 17.1 69.9 33.4 23.4 18.0 1.1 2.0
18January 2022 INSIGHT
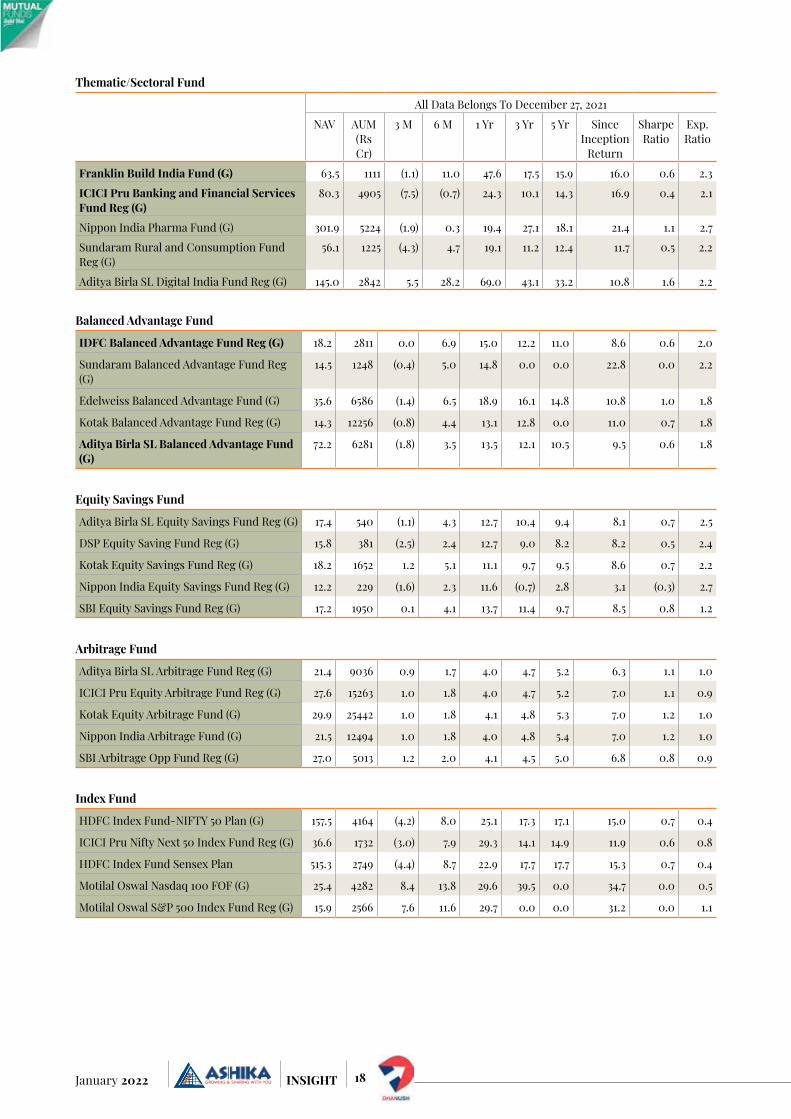
Balanced Advantage Fund
IDFC Balanced Advantage Fund Reg (G) 18.2 2811 0.0 6.9 15.0 12.2 11.0 8.6 0.6 2.0
Sundaram Balanced Advantage Fund Reg (G)
14.5 1248 (0.4) 5.0 14.8 0.0 0.0 22.8 0.0 2.2
Edelweiss Balanced Advantage Fund (G) 35.6 6586 (1.4) 6.5 18.9 16.1 14.8 10.8 1.0 1.8
Kotak Balanced Advantage Fund Reg (G) 14.3 12256 (0.8) 4.4 13.1 12.8 0.0 11.0 0.7 1.8
Aditya Birla SL Balanced Advantage Fund (G)
72.2 6281 (1.8) 3.5 13.5 12.1 10.5 9.5 0.6 1.8
Equity Savings Fund
Aditya Birla SL Equity Savings Fund Reg (G) 17.4 540 (1.1) 4.3 12.7 10.4 9.4 8.1 0.7 2.5
DSP Equity Saving Fund Reg (G) 15.8 381 (2.5) 2.4 12.7 9.0 8.2 8.2 0.5 2.4
Kotak Equity Savings Fund Reg (G) 18.2 1652 1.2 5.1 11.1 9.7 9.5 8.6 0.7 2.2
Nippon India Equity Savings Fund Reg (G) 12.2 229 (1.6) 2.3 11.6 (0.7) 2.8 3.1 (0.3) 2.7
SBI Equity Savings Fund Reg (G) 17.2 1950 0.1 4.1 13.7 11.4 9.7 8.5 0.8 1.2
Arbitrage Fund
Aditya Birla SL Arbitrage Fund Reg (G) 21.4 9036 0.9 1.7 4.0 4.7 5.2 6.3 1.1 1.0
ICICI Pru Equity Arbitrage Fund Reg (G) 27.6 15263 1.0 1.8 4.0 4.7 5.2 7.0 1.1 0.9
Kotak Equity Arbitrage Fund (G) 29.9 25442 1.0 1.8 4.1 4.8 5.3 7.0 1.2 1.0
Nippon India Arbitrage Fund (G) 21.5 12494 1.0 1.8 4.0 4.8 5.4 7.0 1.2 1.0
SBI Arbitrage Opp Fund Reg (G) 27.0 5013 1.2 2.0 4.1 4.5 5.0 6.8 0.8 0.9
Thematic/Sectoral Fund
All Data Belongs To December 27, 2021
NAV AUM (Rs Cr)
3 M 6 M 1 Yr 3 Yr 5 Yr Since Inception
Return
Sharpe Ratio
Exp. Ratio
Franklin Build India Fund (G) 63.5 1111 (1.1) 11.0 47.6 17.5 15.9 16.0 0.6 2.3
ICICI Pru Banking and Financial Services Fund Reg (G)
80.3 4905 (7.5) (0.7) 24.3 10.1 14.3 16.9 0.4 2.1
Nippon India Pharma Fund (G) 301.9 5224 (1.9) 0.3 19.4 27.1 18.1 21.4 1.1 2.7
Sundaram Rural and Consumption Fund Reg (G)
56.1 1225 (4.3) 4.7 19.1 11.2 12.4 11.7 0.5 2.2
Aditya Birla SL Digital India Fund Reg (G) 145.0 2842 5.5 28.2 69.0 43.1 33.2 10.8 1.6 2.2
Index Fund
HDFC Index Fund-NIFTY 50 Plan (G) 157.5 4164 (4.2) 8.0 25.1 17.3 17.1 15.0 0.7 0.4
ICICI Pru Nifty Next 50 Index Fund Reg (G) 36.6 1732 (3.0) 7.9 29.3 14.1 14.9 11.9 0.6 0.8
HDFC Index Fund Sensex Plan 515.3 2749 (4.4) 8.7 22.9 17.7 17.7 15.3 0.7 0.4
Motilal Oswal Nasdaq 100 FOF (G) 25.4 4282 8.4 13.8 29.6 39.5 0.0 34.7 0.0 0.5
Motilal Oswal S&P 500 Index Fund Reg (G) 15.9 2566 7.6 11.6 29.7 0.0 0.0 31.2 0.0 1.1
19 January 2022INSIGHT
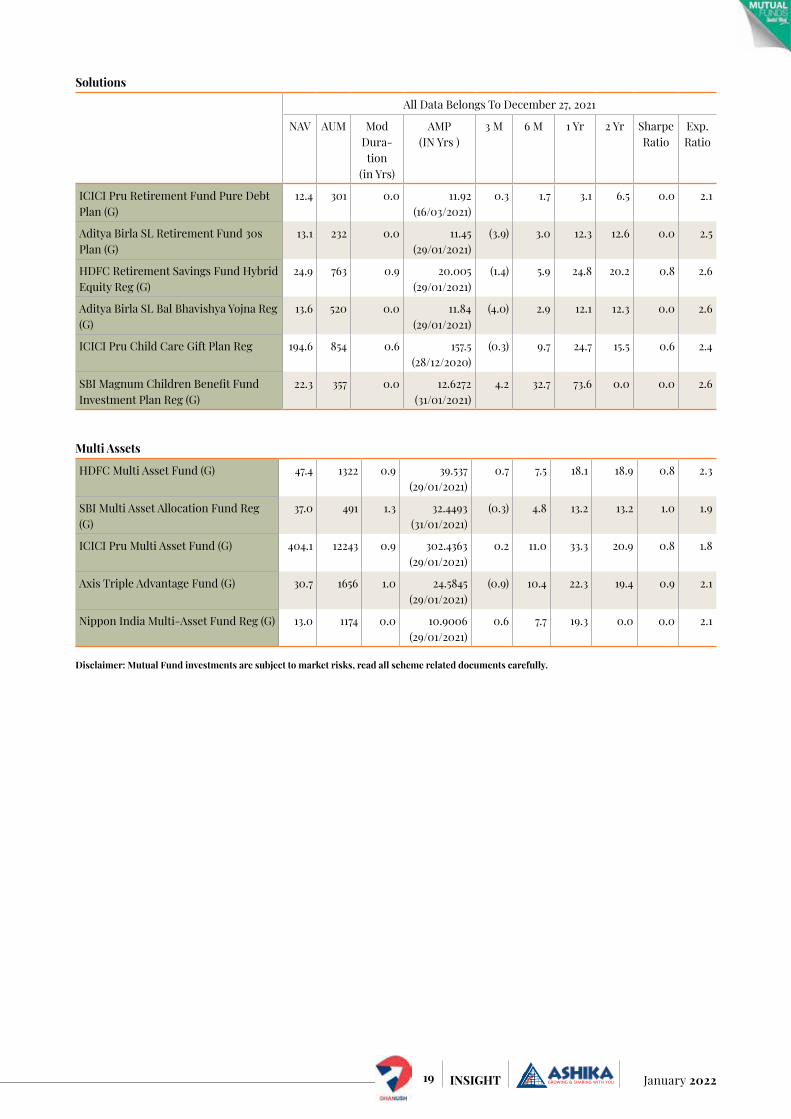
Multi Assets
HDFC Multi Asset Fund (G) 47.4 1322 0.9 39.537 (29/01/2021)
0.7 7.5 18.1 18.9 0.8 2.3
SBI Multi Asset Allocation Fund Reg (G)
37.0 491 1.3 32.4493 (31/01/2021)
(0.3) 4.8 13.2 13.2 1.0 1.9
ICICI Pru Multi Asset Fund (G) 404.1 12243 0.9 302.4363 (29/01/2021)
0.2 11.0 33.3 20.9 0.8 1.8
Axis Triple Advantage Fund (G) 30.7 1656 1.0 24.5845 (29/01/2021)
(0.9) 10.4 22.3 19.4 0.9 2.1
Nippon India Multi-Asset Fund Reg (G) 13.0 1174 0.0 10.9006 (29/01/2021)
0.6 7.7 19.3 0.0 0.0 2.1
Disclaimer: Mutual Fund investments are subject to market risks, read all scheme related documents carefully.
Solutions
All Data Belongs To December 27, 2021
NAV AUM Mod Dura-tion
(in Yrs)
AMP (IN Yrs )
3 M 6 M 1 Yr 2 Yr Sharpe Ratio
Exp. Ratio
ICICI Pru Retirement Fund Pure Debt Plan (G)
12.4 301 0.0 11.92 (16/03/2021)
0.3 1.7 3.1 6.5 0.0 2.1
Aditya Birla SL Retirement Fund 30s Plan (G)
13.1 232 0.0 11.45 (29/01/2021)
(3.9) 3.0 12.3 12.6 0.0 2.5
HDFC Retirement Savings Fund Hybrid Equity Reg (G)
24.9 763 0.9 20.005 (29/01/2021)
(1.4) 5.9 24.8 20.2 0.8 2.6
Aditya Birla SL Bal Bhavishya Yojna Reg (G)
13.6 520 0.0 11.84 (29/01/2021)
(4.0) 2.9 12.1 12.3 0.0 2.6
ICICI Pru Child Care Gift Plan Reg 194.6 854 0.6 157.5 (28/12/2020)
(0.3) 9.7 24.7 15.5 0.6 2.4
SBI Magnum Children Benefit Fund Investment Plan Reg (G)
22.3 357 0.0 12.6272 (31/01/2021)
4.2 32.7 73.6 0.0 0.0 2.6
20January 2022 INSIGHT
stoCK PiCKs
G r infraprojects Ltd.
Company overviewGR Infraprojects is an integrated road EPC company with experience in design and construction of various road/highway projects across 15 States in India and recently forayed into projects in the railway sector. The company undertakes construc-tion business in an integrated man-ner as the company has developed key competencies and resources in-house to deliver a project from conceptualization until completion. Its principal business operations are broadly divided into three categories namely Civil construction activities, under which they provide EPC
services, Development of roads, highways on a Build Operate Transfer (BOT) basis, including under annuity and Hybrid Annuity Model (HAM) and Manufacturing activities, under which they process bitumen, manu-facture thermoplastic road-marking paint, electric poles and road signage and fabricate and galvanize metal crash barriers.
Investment RationaleIntegrated business modelGR infra projects is an integrated EPC company, with 25 years of proven track record. As part of their in-house integrated model, they
have developed in-house resources with key competencies to deliver a project from conceptualization to completion that includes their design and engineering team, 3 manufacturing units at Udaipur, Rajasthan, Guwahati, Assam and Sandila, processing bitumen in UP, thermoplastic road-marking paint and road signage and a fabrication and galvanization unit at Ahmedabad, manufacturing metal crash barriers and electric poles at Gujarat. In addition, company’s equipment base is comprised over 7,000 construction equipment and vehicles. GR infra’s in-house integrated model reduces
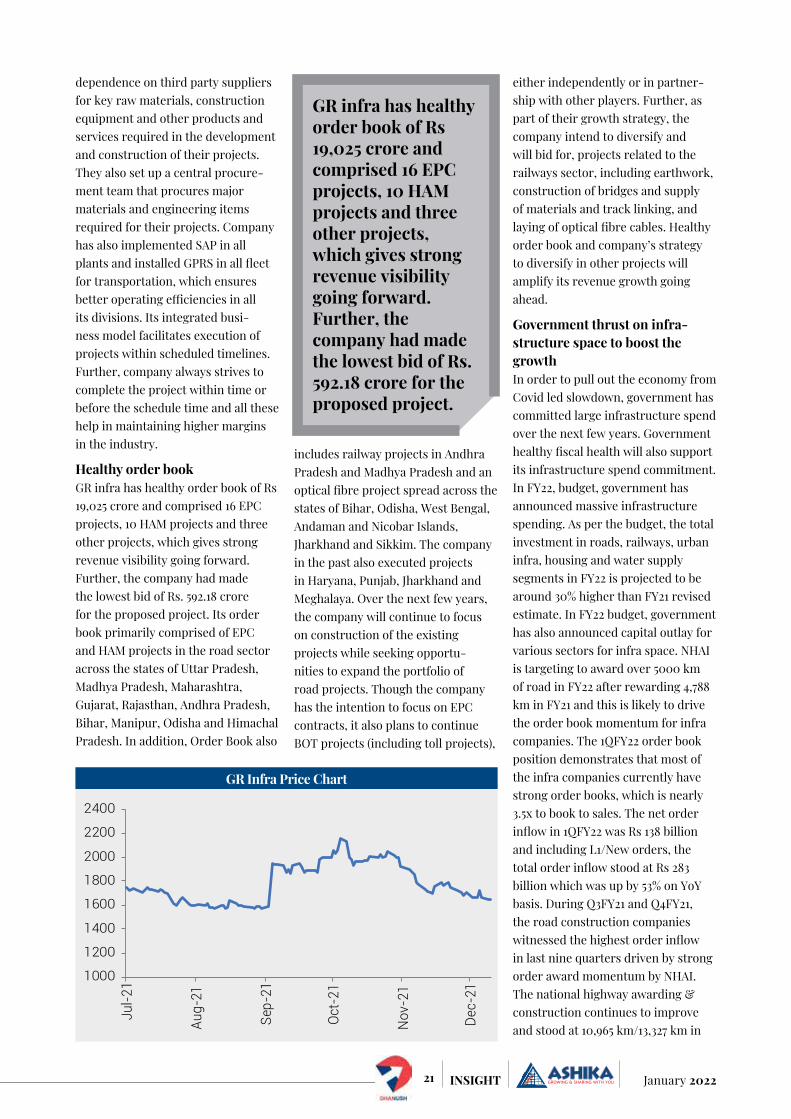
Company InformationBSE Code 543317NSE Code GRINFRABloomberg Code GRINFRA INISIN INE201P01022Market Cap (Rs. Cr) 16,805Outstanding shares(Cr) 9.6652-wk Hi/Lo (Rs.) 2,267.3/1,543Avg. daily volume (1yr. on NSE) 262,910Face Value(Rs.) 5.0Book Value (Rs) 410.5
CMP: Rs 1,740 Rating: BUY Target: Rs 2,029
Promoters, 86.54%
DIIs, 7.09%FIIs, 2.87%Others, 3.50%
Shareholding Pattern as on 30th Sept. 2021
21 January 2022INSIGHT
dependence on third party suppliers for key raw materials, construction equipment and other products and services required in the development and construction of their projects. They also set up a central procure-ment team that procures major materials and engineering items required for their projects. Company has also implemented SAP in all plants and installed GPRS in all fleet for transportation, which ensures better operating efficiencies in all its divisions. Its integrated busi-ness model facilitates execution of projects within scheduled timelines. Further, company always strives to complete the project within time or before the schedule time and all these help in maintaining higher margins in the industry.
Healthy order bookGR infra has healthy order book of Rs 19,025 crore and comprised 16 EPC projects, 10 HAM projects and three other projects, which gives strong revenue visibility going forward. Further, the company had made the lowest bid of Rs. 592.18 crore for the proposed project. Its order book primarily comprised of EPC and HAM projects in the road sector across the states of Uttar Pradesh, Madhya Pradesh, Maharashtra, Gujarat, Rajasthan, Andhra Pradesh, Bihar, Manipur, Odisha and Himachal Pradesh. In addition, Order Book also
includes railway projects in Andhra Pradesh and Madhya Pradesh and an optical fibre project spread across the states of Bihar, Odisha, West Bengal, Andaman and Nicobar Islands, Jharkhand and Sikkim. The company in the past also executed projects in Haryana, Punjab, Jharkhand and Meghalaya. Over the next few years, the company will continue to focus on construction of the existing projects while seeking opportu-nities to expand the portfolio of road projects. Though the company has the intention to focus on EPC contracts, it also plans to continue BOT projects (including toll projects),
either independently or in partner-ship with other players. Further, as part of their growth strategy, the company intend to diversify and will bid for, projects related to the railways sector, including earthwork, construction of bridges and supply of materials and track linking, and laying of optical fibre cables. Healthy order book and company’s strategy to diversify in other projects will amplify its revenue growth going ahead.
Government thrust on infra-structure space to boost the growthIn order to pull out the economy from Covid led slowdown, government has committed large infrastructure spend over the next few years. Government healthy fiscal health will also support its infrastructure spend commitment. In FY22, budget, government has announced massive infrastructure spending. As per the budget, the total investment in roads, railways, urban infra, housing and water supply segments in FY22 is projected to be around 30% higher than FY21 revised estimate. In FY22 budget, government has also announced capital outlay for various sectors for infra space. NHAI is targeting to award over 5000 km of road in FY22 after rewarding 4,788 km in FY21 and this is likely to drive the order book momentum for infra companies. The 1QFY22 order book position demonstrates that most of the infra companies currently have strong order books, which is nearly 3.5x to book to sales. The net order inflow in 1QFY22 was Rs 138 billion and including L1/New orders, the total order inflow stood at Rs 283 billion which was up by 53% on YoY basis. During Q3FY21 and Q4FY21, the road construction companies witnessed the highest order inflow in last nine quarters driven by strong order award momentum by NHAI. The national highway awarding & construction continues to improve and stood at 10,965 km/13,327 km in
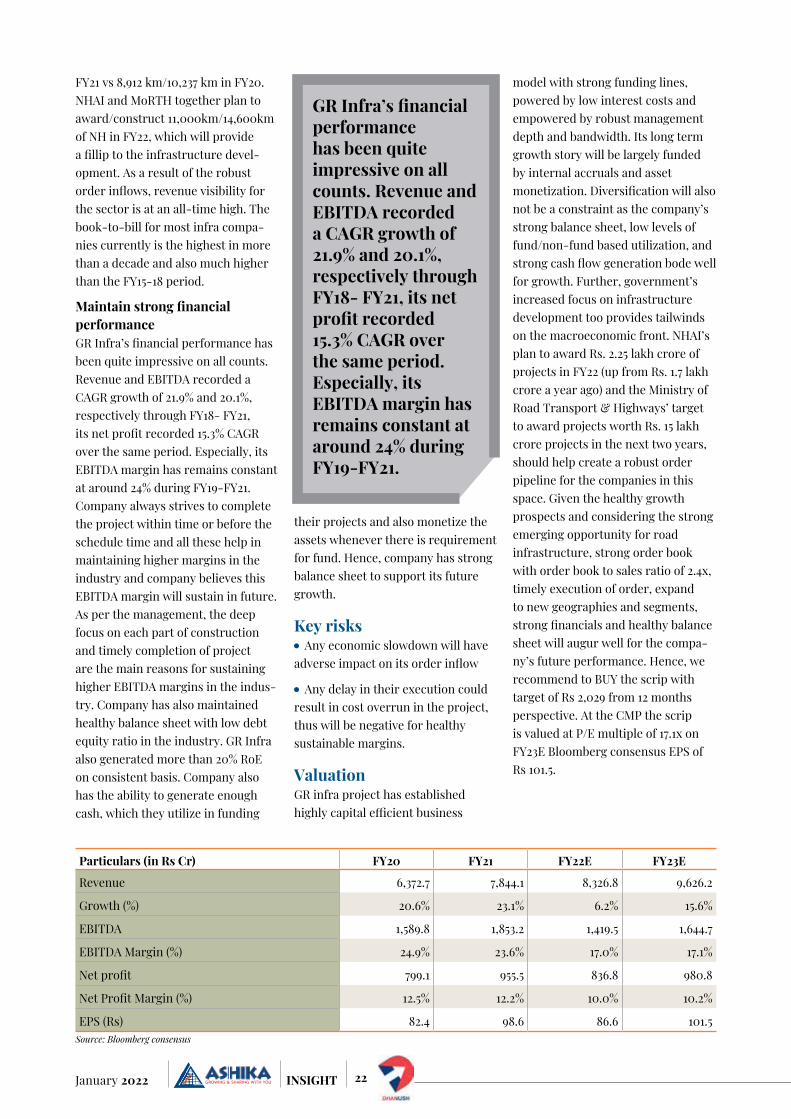
GR Infra Price Chart
1000
1200
1400
1600
1800
2000
2200
2400
Jul-2
1
Aug-
21
Sep-
21
Oct-
21
Nov
-21
Dec-
21
GR infra has healthy order book of Rs 19,025 crore and comprised 16 EPC projects, 10 HAM projects and three other projects, which gives strong revenue visibility going forward. Further, the company had made the lowest bid of Rs. 592.18 crore for the proposed project.
22January 2022 INSIGHT
FY21 vs 8,912 km/10,237 km in FY20. NHAI and MoRTH together plan to award/construct 11,000km/14,600km of NH in FY22, which will provide a fillip to the infrastructure devel-opment. As a result of the robust order inflows, revenue visibility for the sector is at an all-time high. The book-to-bill for most infra compa-nies currently is the highest in more than a decade and also much higher than the FY15-18 period.
Maintain strong financial performanceGR Infra’s financial performance has been quite impressive on all counts. Revenue and EBITDA recorded a CAGR growth of 21.9% and 20.1%, respectively through FY18- FY21, its net profit recorded 15.3% CAGR over the same period. Especially, its EBITDA margin has remains constant at around 24% during FY19-FY21. Company always strives to complete the project within time or before the schedule time and all these help in maintaining higher margins in the industry and company believes this EBITDA margin will sustain in future. As per the management, the deep focus on each part of construction and timely completion of project are the main reasons for sustaining higher EBITDA margins in the indus-try. Company has also maintained healthy balance sheet with low debt equity ratio in the industry. GR Infra also generated more than 20% RoE on consistent basis. Company also has the ability to generate enough cash, which they utilize in funding
their projects and also monetize the assets whenever there is requirement for fund. Hence, company has strong balance sheet to support its future growth.
Key risks Any economic slowdown will have
adverse impact on its order inflow
Any delay in their execution could result in cost overrun in the project, thus will be negative for healthy sustainable margins.
ValuationGR infra project has established highly capital efficient business
model with strong funding lines, powered by low interest costs and empowered by robust management depth and bandwidth. Its long term growth story will be largely funded by internal accruals and asset monetization. Diversification will also not be a constraint as the company’s strong balance sheet, low levels of fund/non-fund based utilization, and strong cash flow generation bode well for growth. Further, government’s increased focus on infrastructure development too provides tailwinds on the macroeconomic front. NHAI’s plan to award Rs. 2.25 lakh crore of projects in FY22 (up from Rs. 1.7 lakh crore a year ago) and the Ministry of Road Transport & Highways’ target to award projects worth Rs. 15 lakh crore projects in the next two years, should help create a robust order pipeline for the companies in this space. Given the healthy growth prospects and considering the strong emerging opportunity for road infrastructure, strong order book with order book to sales ratio of 2.4x, timely execution of order, expand to new geographies and segments, strong financials and healthy balance sheet will augur well for the compa-ny’s future performance. Hence, we recommend to BUY the scrip with target of Rs 2,029 from 12 months perspective. At the CMP the scrip is valued at P/E multiple of 17.1x on FY23E Bloomberg consensus EPS of Rs 101.5.
Particulars (in Rs Cr) FY20 FY21 FY22E FY23E
Revenue 6,372.7 7,844.1 8,326.8 9,626.2
Growth (%) 20.6% 23.1% 6.2% 15.6%
EBITDA 1,589.8 1,853.2 1,419.5 1,644.7
EBITDA Margin (%) 24.9% 23.6% 17.0% 17.1%
Net profit 799.1 955.5 836.8 980.8
Net Profit Margin (%) 12.5% 12.2% 10.0% 10.2%
EPS (Rs) 82.4 98.6 86.6 101.5 Source: Bloomberg consensus
GR Infra’s financial performance has been quite impressive on all counts. Revenue and EBITDA recorded a CAGR growth of 21.9% and 20.1%, respectively through FY18- FY21, its net profit recorded 15.3% CAGR over the same period. Especially, its EBITDA margin has remains constant at around 24% during FY19-FY21.
23 January 2022INSIGHT
stoCK PiCKs
Company overviewBirlasoft Ltd. (BSOFT) was incor-porated in 1990 as part of the diversified CK Birla Group, one of India’s premier commercial and industrial houses. Birlasoft is the global technology services division of the CK Birla Group, with strategic equity participation by GE Capital. Birlasoft combines the power of domain, enterprise and digital technologies to reimagine business processes for customers and their
ecosystem. The company’s consul-tative and design thinking approach makes societies more productive by helping customers run businesses. Birlasoft offers IT services worldwide from development centers in India and Australia. BSOFT and KPIT’s IT services business has merged to form a leading publicly listed Enterprise Digital and IT Services company. Birlasoft had strengths primarily on the non-ERP digital businesses, while KPIT IT services possessed core
strengths on the enterprise software solutions and capabilities in digital transformation services.
Investment RationaleAnnuity revenues and deal wins to drive growthBirlasoft is aiming to achieve a target of US$1 billion in revenues in the next four years (implying a CAGR of 20%). The company aims to achieve this via organic and inorganic reve-nues (US$150-200 million). Higher
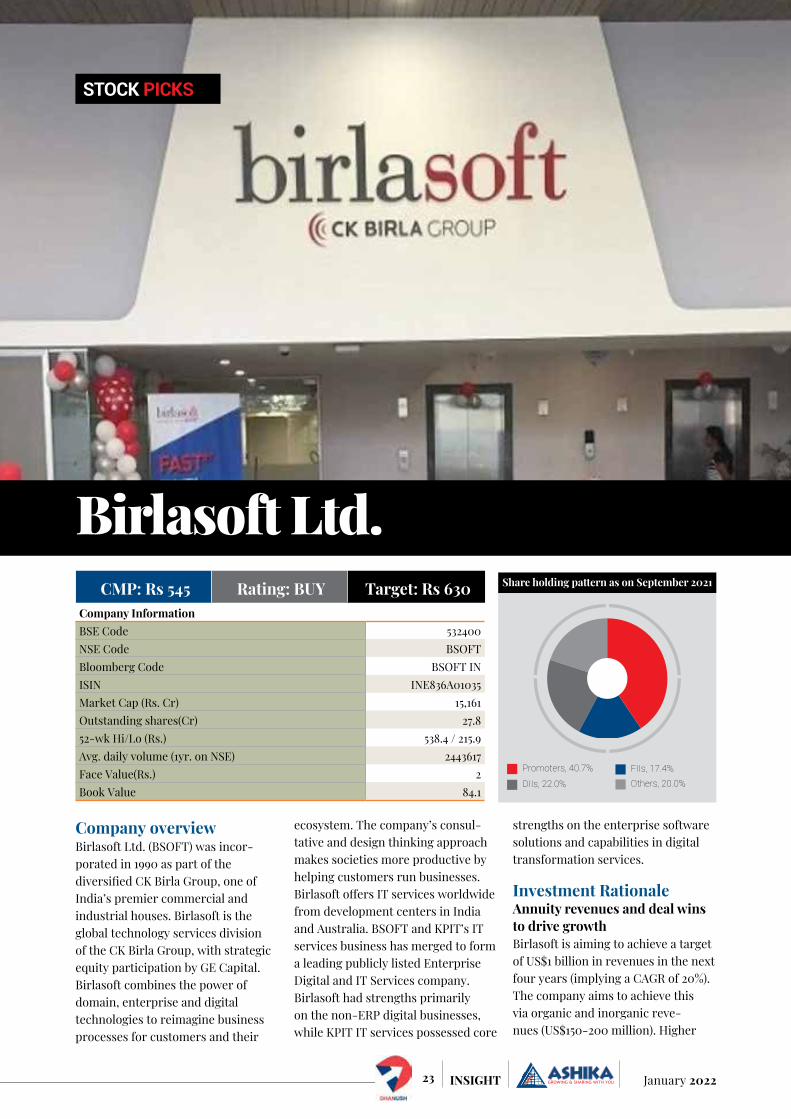
Birlasoft Ltd.Company InformationBSE Code 532400NSE Code BSOFTBloomberg Code BSOFT INISIN INE836A01035Market Cap (Rs. Cr) 15,161Outstanding shares(Cr) 27.852-wk Hi/Lo (Rs.) 538.4 / 215.9Avg. daily volume (1yr. on NSE) 2443617Face Value(Rs.) 2Book Value 84.1
CMP: Rs 545 Rating: BUY Target: Rs 630
Promoters, 40.7%
DIIs, 22.0%FIIs, 17.4%Others, 20.0%
Share holding pattern as on September 2021
24January 2022 INSIGHT
spending on platform-based digital initiatives, Cloud adoption, and aggressive automation would be the company’s growth driver in FY22. On the platform side, the company accel-erated customers’ cloud adoption journey by achieving AWS advanced consulting partner status, which is expected to further strengthen its cloud portfolio. The management indicated that Cloud revenues has started improving because of the partnerships with google, Microsoft. The management reckons that clients are now accelerating cloud trans-formation, which should help in the growth journey. The management also highlighted that its SAP and ERP pipeline in terms of both transfor-mation and implementation side increased. Birlasoft has significantly improved its annuity revenues from 60% in FY20 to 70% in FY21. The company continued to maintain its annuity-based revenue contribution at 71% during the quarter, while project-based traction picked up especially in the enterprise IT area. Management expects this would lead to higher annuity-based revenue at the later stages of the project and maintain the annuity-based revenue contribution at 75% by the end of FY22. Going forward, it is expected that the company to continue to improve annuity revenues, cross sell to clients and focus on niche verti-cals. This coupled with Birlasoft’s
focus on client mining, expansion in Europe & APAC, improving growth in top 30 accounts, healthy deal pipe-line, healthy order book, increase in deal sizes, project ramp ups, reversal of discounts, and focused ERP channel sales bode well for revenue growth in coming years. Further, management indicated that BSOFT will continue to make investments to capitalize on demand. As part of its micro vertical strategy, BSOFT has identified medical devices (part of Life sciences), high tech (part of Manufacturing; growing at over 20%), heavy industries (Cement, Building Materials; part of Manufacturing), and lending and payment (part of BFSI) as key micro verticals to focus on in order to accelerate growth.
Strengthening global partner-ship ecosystem Over the last two years, the company strengthened its global partnership and alliances with key platform players and OEMs to provide cus-tomers a broader range of solutions to accelerate the execution of digital transformation. Birlasoft enjoys strong partnerships with SAP, Oracle, Salesforce.com, ServiceNow, Microsoft, Amazon, etc. With the recent collaboration with Microsoft, Birlasoft has strategically positioned itself to support its enterprise clients with their cloud transformation needs, right from infrastructure to business applications. In August 2020, BSOFT announced Global Stra-tegic Cloud Alliance with Microsoft to help its clients accelerate their digital journey. BSOFT has plans to scale it Microsoft channel business to US$ 100 mn. The company also became AWS partner recently and in advance stage to penetrate Google in the same fashion. These investments coupled with investment in right talent will help the company in building hori-zontal levers such as cloud migration, IoT and industry 4.0 adoption, data and analytics, blockchain. All these will allow the BSOFT to be technology agonistic in the cloud migration opportunities.
Margins to improve despite headwinds Birlasoft reported an improvement in margins due to revenue growth, higher billing and lower bad debt partially offset by higher wage hikes, higher recruitment, higher subcontracting costs and strategic investments in domain and technol-ogy capabilities. Going forward, there are margin headwinds due to higher employee cost, lower utilisation and reskilling of employees. Though the expenses would increase with opening of travel in H2FY22, manage-ment remains confident to maintain the margin level despite the impact of wage revision, by optimizing the cost structure and higher revenue growth. Management believes that
Birlasoft 3Yr. Price Chart
0
100
200
300
400
500
600
Jan-
19
Apr-
19
Jul-
19
Oct-1
9
Jan-
20
Apr-
20
Jul-
20
Oct-2
0
Jan-
21
Apr-
21
Jul-
21
Oct-2
1
Birlasoft is aiming to achieve a target of US$1 billion in revenues in the next four years (implying a CAGR of 20%). The company aims to achieve this via organic and inorganic revenues (US$150-200 million).
25 January 2022INSIGHT
the attrition is expected to soften in next 2-3 quarters as the economy normalises and fresher hiring increases across the industry. Given large deal wins, strong deal pipelines, healthy growth momentum in key verticals, strong growth across top 20 accounts, and sharpening focus on top 30 accounts, management remains optimistic for 15% reve-nue growth in FY22. Management indicated that the company’s priority currently is to make the required investments to capture high demand and that it is comfortable with operating at ~15% margins in the near term.
Management OutlookManagement remains confident of accelerating revenue growth on the back of broad-based demand and increased traction in the areas of Cloud, Digital and Cybersecurity. While the shortage of talent is a constraint on achieving higher growth (20%), BSOFT is confident of delivering revenue growth in the mid-teens in FY22 with at least 15% EBITDAM. Birlasoft is planning to expand its presence in the Europe region to drive growth in the BFSI vertical. Birlasoft expects Europe performance to improve on the back of deal wins. Management remains confident of sustaining revenue growth momentum and delivering midteen revenue growth in FY22 on the back of broad-based demand, healthy deal intake (ACV (Annual Contract Value) remains robust
although reported Total Contract Value (TCV) not reflecting strength on YoY basis), robust deal pipeline (up 50% YoY) and improving win rates, growing annuity revenue, and anticipated recovery in Enterprise Solutions. Management expects to sustain EBITDA Margin at the current level with an upward bias in FY22 as it anticipates headwinds stemming from wage hikes and investments in capability building and talent, which would be partially offset by revenue growth-led operating leverage, higher offshoring and other effi-ciencies. Higher spending on plat-form-based digital initiatives, Cloud adoption, and aggressive automation would be the company’s growth driver in FY22. Management reiter-ated its aspiration to reach USD1bn revenue by Mar’25, with an EBITDAM of 18%. The management expects supply-side challenges to ease by Q4 because of higher offshoring revenue and cost-efficiency measures.
Key Risks Deterioration of demand for IT
services in the wake of third wave of COVID-19
Softness in SAP and IES
Loss of any large clients
ValuationManagement has reiterated the strong demand environment and that demand will continue to remain robust for the next 3-4 years. The
company is benefitting from its strong partnership with hyperscalers like AWS, Microsoft Azure and Google Cloud. Management remains confi-dent of accelerating revenue growth on the back of broad-based demand and increased traction in the areas of Cloud, Digital and Cybersecurity. Further, management indicated that BSOFT will continue to make investments to capitalize on demand. Given strong demand recovery for ERP services, acceleration in digital technologies, improving client mining, healthy deal pipeline, cross selling opportunities, increase in deal sizes, healthy order book, focus on niche verticals, reversal of discounts and expansion in Europe & APAC, it is expected that the company would register healthy growth in earnings going ahead. Management expects to sustain EBITDA Margin at the current level with an upward bias in FY22 as it anticipates headwinds stemming from wage hikes and investments in capability building and talent, which would be partially offset by revenue growth led operating leverage, higher offshoring and other efficiencies. Further, robust margins and healthy cash balance could lead to inorganic expansion or healthy dividend payout. Thus, we recommend our investors to BUY the scrip with target of Rs. 630 from 12 months investment perspective. At the CMP, the scrip is valued at P/E multiple of 27.1x on FY23E Bloomberg consensus EPS of Rs. 20.1.
Particulars (in Rs Cr) FY20 FY21 FY22E FY23E
Net Sales 3291.0 3555.7 4110.4 4850.3
Growth (%) -16.5 8.0 15.6 18.0
EBITDA 390.2 518.2 645.3 785.7
EBITDA Margin (%) 11.9 14.6 15.7 16.2
Net profit 224.3 320.8 456.3 557.8
Net Profit Margin (%) 6.8 9.0 11.1 11.5
EPS (Rs) 8.1 11.6 16.4 20.1Consensus Estimate: Bloomberg, Ashika Research
26January 2022 INSIGHT
stoCK PiCKs
Medplus Health Services Ltd.
Company overviewMedplus Health Services Limited (“Medplus”) is the 2nd largest pharmacy retailer in India, in terms of (i) revenue from operations for the financial year 2021, and (ii) number of stores as of March 31, 2021. Medplus offers a wide range of products, including (i) pharmaceutical and wellness products, including med-icines, vitamins, medical devices and test kits, and (ii) fast-moving consumer goods, such as home and personal care products, including toiletries, baby care products, soaps and detergents, and sanitizers. Medplus has 3 manufacturing plants in Telangana, manufacturing range of plastic products, optical frames, spectacles and liquid disinfectants etc. Medplus holds strong market share in Chennai, Bangalore, Hyder-abad and Kolkata of approximately 30%, 29%, 30% and 22%, respectively in organized pharmacy retail market. As of Sep’21, the company operated 2326 stores across Karnataka (546), Tamil Nadu (475), Telangana (474),
Andhra Pradesh (297), West Bengal (224), Maharashtra (221) and Odi-sha (89). In 2020 company started focusing on online sales, by virtue of which company was able to deliver their online purchases customers within 2 hours of purchase in select cities of Hyderabad, Bangalore, Kolkata, Pune and Nagpur. Medplus employs a data analytics driven cluster-based approach to their store network expansion. A strong omni channel platform (store, website, app, telephone ordering, order online, pick physically) which enables it to leverage the strong offline presence to establish and grow its online channel.
Investment RationaleMedplus major beneficiary of increasing share for E-com-merce channelWhile traditional retail channels continue to constitute mammoth share (89% as of FY21) of pharmacy retail market in India, there has been a recent shift towards modern retail
channels such as e-commerce and brick & mortar (B&M). The share of the modern retail (e-commerce and B&M) is expected to inch higher on the back of 27% CAGR between FY21 and FY25 vs 8% for traditional channel. Courtesy of high growth, traditional retail channels’ share is expected to come down to 80% by FY25. Within modern retail, e-com-merce (together with omni-retail channel) is expected to grow at a robust CAGR of 42% between the same period. The shift is expected to be driven by change in consumer perception who are now inclined to purchase regular prescription drugs and other wellness products from modern organized pharmacy retail outlets that offer the benefit of an enhanced retail environment, the assurance of authentic drugs, transparent discounts and a wide variety of products. This trend has been further accelerated by the outbreak of the COVID-19 pandemic. Medplus with (i) well-established brand, (ii) genuine and good quality
Company InformationBSE Code 543427NSE Code MEDPLUSBloomberg Code MEDPLUS INISIN INE804L01022Market Cap (Rs. Cr) 12,340Outstanding shares(Cr) 11.9352-wk Hi/Lo (Rs.) 1143.10/993.35Avg. daily volume (1yr. on NSE) 6,276,730 Face Value(Rs.) 2Book Value (Rs) 131
CMP: Rs 1,032 Rating: BUY Target: Rs 1,320
Promoters, 40.93%
DIIs, 11.44%FIIs, 3.41%Others, 44.22%
Shareholding Pattern as on 20 Dec’2021
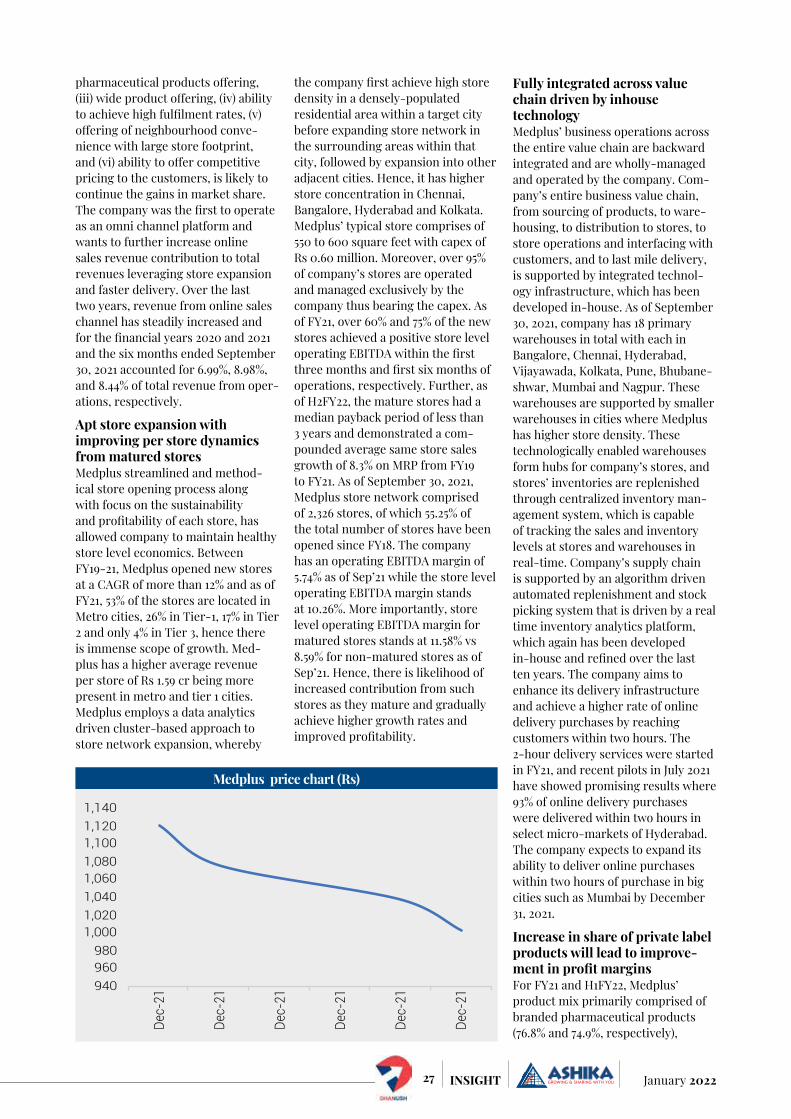
27 January 2022INSIGHT
pharmaceutical products offering, (iii) wide product offering, (iv) ability to achieve high fulfilment rates, (v) offering of neighbourhood conve-nience with large store footprint, and (vi) ability to offer competitive pricing to the customers, is likely to continue the gains in market share. The company was the first to operate as an omni channel platform and wants to further increase online sales revenue contribution to total revenues leveraging store expansion and faster delivery. Over the last two years, revenue from online sales channel has steadily increased and for the financial years 2020 and 2021 and the six months ended September 30, 2021 accounted for 6.99%, 8.98%, and 8.44% of total revenue from oper-ations, respectively.
Apt store expansion with improving per store dynamics from matured storesMedplus streamlined and method-ical store opening process along with focus on the sustainability and profitability of each store, has allowed company to maintain healthy store level economics. Between FY19-21, Medplus opened new stores at a CAGR of more than 12% and as of FY21, 53% of the stores are located in Metro cities, 26% in Tier-1, 17% in Tier 2 and only 4% in Tier 3, hence there is immense scope of growth. Med-plus has a higher average revenue per store of Rs 1.59 cr being more present in metro and tier 1 cities. Medplus employs a data analytics driven cluster-based approach to store network expansion, whereby
the company first achieve high store density in a densely-populated residential area within a target city before expanding store network in the surrounding areas within that city, followed by expansion into other adjacent cities. Hence, it has higher store concentration in Chennai, Bangalore, Hyderabad and Kolkata. Medplus’ typical store comprises of 550 to 600 square feet with capex of Rs 0.60 million. Moreover, over 95% of company’s stores are operated and managed exclusively by the company thus bearing the capex. As of FY21, over 60% and 75% of the new stores achieved a positive store level operating EBITDA within the first three months and first six months of operations, respectively. Further, as of H2FY22, the mature stores had a median payback period of less than 3 years and demonstrated a com-pounded average same store sales growth of 8.3% on MRP from FY19 to FY21. As of September 30, 2021, Medplus store network comprised of 2,326 stores, of which 55.25% of the total number of stores have been opened since FY18. The company has an operating EBITDA margin of 5.74% as of Sep’21 while the store level operating EBITDA margin stands at 10.26%. More importantly, store level operating EBITDA margin for matured stores stands at 11.58% vs 8.59% for non-matured stores as of Sep’21. Hence, there is likelihood of increased contribution from such stores as they mature and gradually achieve higher growth rates and improved profitability.
Fully integrated across value chain driven by inhouse technologyMedplus’ business operations across the entire value chain are backward integrated and are wholly-managed and operated by the company. Com-pany’s entire business value chain, from sourcing of products, to ware-housing, to distribution to stores, to store operations and interfacing with customers, and to last mile delivery, is supported by integrated technol-ogy infrastructure, which has been developed in-house. As of September 30, 2021, company has 18 primary warehouses in total with each in Bangalore, Chennai, Hyderabad, Vijayawada, Kolkata, Pune, Bhubane-shwar, Mumbai and Nagpur. These warehouses are supported by smaller warehouses in cities where Medplus has higher store density. These technologically enabled warehouses form hubs for company’s stores, and stores’ inventories are replenished through centralized inventory man-agement system, which is capable of tracking the sales and inventory levels at stores and warehouses in real-time. Company’s supply chain is supported by an algorithm driven automated replenishment and stock picking system that is driven by a real time inventory analytics platform, which again has been developed in-house and refined over the last ten years. The company aims to enhance its delivery infrastructure and achieve a higher rate of online delivery purchases by reaching customers within two hours. The 2-hour delivery services were started in FY21, and recent pilots in July 2021 have showed promising results where 93% of online delivery purchases were delivered within two hours in select micro-markets of Hyderabad. The company expects to expand its ability to deliver online purchases within two hours of purchase in big cities such as Mumbai by December 31, 2021.
Increase in share of private label products will lead to improve-ment in profit marginsFor FY21 and H1FY22, Medplus’ product mix primarily comprised of branded pharmaceutical products (76.8% and 74.9%, respectively),
Medplus price chart (Rs)
940960980
1,0001,0201,0401,0601,0801,1001,1201,140
Dec-
21
Dec-
21
Dec-
21
Dec-
21
Dec-
21
Dec-
21

28January 2022 INSIGHT
private label pharmaceutical prod-ucts (5.6% and 6.7%, respectively), branded fast-moving consumer goods (12.9% and 11.6%, respec-tively) and private label consumer goods (4.8% and 6.9%, respectively). Percentage of store revenues from private label pharmaceutical prod-ucts and private label consumer goods together have increased from 4.48% in FY19 to 10.36% in FY21 and further to 13.54% in H1FY22. This has helped to improve gross margins from 18.86% in FY19 to 21.02% in FY21 and further to 21.3% in H1FY22. Company has stated that 1% increase in private label share will increase the margins by 0.5%. Company intends to (i) increase the penetration of private label pharmaceutical products by introducing private label products for more therapeutic areas, in particular for sub-chronic and chronic ailments and (ii) introduce new private label products for FMCG in particular, in the consumer categories of nutrition and wellness. Besides, the company also plans to spend on advertising for private label products and train staff to push for more private label products particularly for stores where share of revenue is less from private label products. Besides, Medplus aims to keep a tight con-trol over costs through inhouse management of all supply chain and infrastructure and logistics and also has inhouse technology team. Besides, pharmaceutical products are also procured directly from pharmaceutical companies or their carry forward agents, which helps to keep costs under check. Besides, as store matures, albeit absolute costs increase, as % of revenue, store EBITDA margins improve. On finan-cial front, during FY19-21, Medplus’ revenue and EBITDA grew at a CAGR of 16.2% (to Rs. 3069 cr) and 34.9%
(to Rs. 217), respectively, while PAT grew at a CAGR of 130% to Rs. 63 cr. EBITDA margins improved by 182bps to 7.1%, while PAT margins improved by 153bps to 2.1%. EBITDA and PAT margins have further increased to 8.4% and 3.5% respectively in H1FY22.
Key risks Increase in competitive intensity
from online players
Delay in EBITDA break-even at new stores
ValuationMedplus Health Services Limited (“Medplus”) is the 2nd largest pharmacy retailer in India, in terms of (i) revenue from operations for the financial year 2021, and (ii) number of stores as of March 31, 2021. The share of the modern retail (e-commerce and B&M) is expected to inch higher to 20% vs (11% as of FY21) driven by 27% CAGR between FY21 and FY25 vs 8% for traditional channel. Medplus has been growing its stores at a CAGR of more than 12% and presently holds 2326 stores. 53% of the stores are located in Metro cities, 26% in Tier-1, 17% in Tier 2 and only 4% in Tier 3, hence there is immense scope of growth. Medplus has a higher average revenue per store of Rs 1.59 cr being more present in metro and tier 1 cities. Medplus employs a data analytics driven cluster-based approach to store network expansion, whereby the company first achieve high store density in a densely-pop-ulated residential area within a target city before expanding store network in the surrounding areas within that city, followed by expansion into other adjacent cities. Hence, it has higher store concentration in Chennai, Bangalore, Hyderabad and Kolkata. Moreover, over 95% of
company’s stores are operated and managed exclusively by the company and 55.25% of the total number of stores have been opened since FY18 and hence are not matured. Store level operating EBITDA margin for matured stores stands at 11.58% vs 8.59% for non-matured stores as of Sep’21. Hence, there is likelihood of increased contribution from such stores as they mature and gradually achieve higher growth rates and improved profitability. Besides, the company has been gradually increas-ing share of private label products from 4.48% in FY19 to 10.36% in FY21 and further to 13.54% in H1FY22. This has helped to improve gross margins from 18.86% in FY19 to 21.02% in FY21 and further to 21.3% in H1FY22. Company has stated that 1% increase in private label share will increase the margins by 0.5%. Company’s entire business value chain, from sourcing of products, to warehous-ing, to distribution to stores, to store operations and interfacing with customers, and to last mile delivery, is supported by integrated technol-ogy infrastructure, which has been developed in-house. These strategies helped the company to contain costs and as more stores matures and the company exploits economies of scale, EBITDA margins will expand. Medplus also sources pharmaceutical products directly from pharmaceuti-cal companies or their carry forward agents, which helps to keep costs under check. Thus, given industry dynamics and company positioning, we expect Medplus to reap benefits from this shift towards modern retail. At the CMP, the scrip trades at EV/EBITDA of 34.16x FY23E EBITDA. Investors are advised to ‘BUY’ the scrip for a target price of Rs 1320 at a target EV/EBITDA of 42x FY23E EBITDA.
Particulars (in Rs Cr) FY20 FY21 FY22E FY23ERevenue 2,871 3,069 3,888 4,570Growth (%) 26% 7% 27% 18%EBITDA 134 217 307 370 EBITDA Margin (%) 4.7% 7.1% 7.9% 8.1%Net Profit 2 63 113 142Net Profit Margin (%) 0.1% 2.1% 2.9% 3.1%EPS (Rs) 0.2 5.3 9.5 11.9
Source: Ashika Research
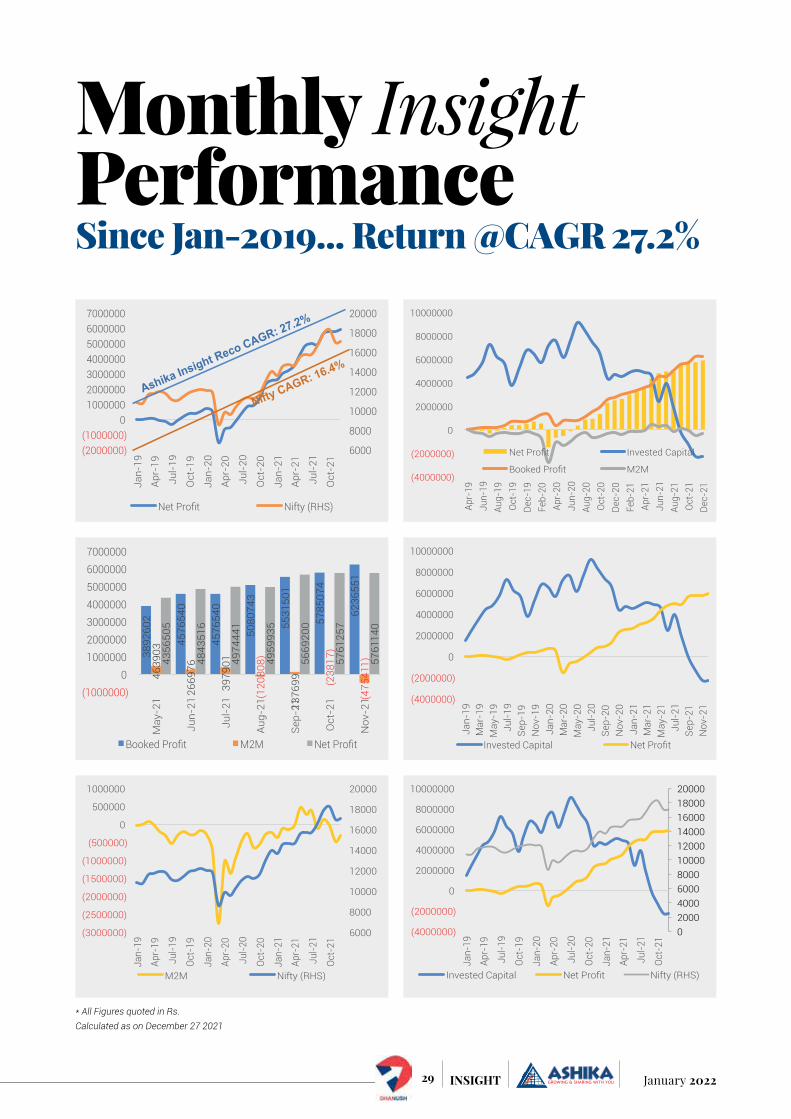
29 January 2022INSIGHT
Monthly InsightPerformanceSince Jan-2019... return @CAGr 27.2%
6000
8000
10000
12000
14000
16000
18000
20000
(2000000) (1000000)
0 1000000 2000000 3000000 4000000 5000000 6000000 7000000
Jan-
19
Apr-
19
Jul-
19
Oct
-19
Jan-
20
Apr-
20
Jul-
20
Oct
-20
Jan-
21
Apr-
21
Jul-
21
Oct
-21
Net Profit Nifty (RHS)
3892
602
4576
540
4576
540
5080
743
5531
501
5785
074
6236
551
4639
03
2669
76
3979
01
(120
808)
1376
99
(238
17)
(475
411)
4356
505
4843
516
4974
441
4959
935
5669
200
5761
257
5761
140
(1000000) 0
1000000 2000000 3000000 4000000 5000000 6000000 7000000
May
-21
Jun-
21
Jul-
21
Aug-
21
Sep-
21
Oct
-21
Nov
-21
Booked Profit M2M Net Profit
6000
8000
10000
12000
14000
16000
18000
20000
(3000000)
(2500000)
(2000000)
(1500000)
(1000000)
(500000)
0
500000
1000000
Jan-
19
Apr-
19
Jul-1
9
Oct-
19
Jan-
20
Apr-
20
Jul-2
0
Oct-
20
Jan-
21
Apr-
21
Jul-2
1
Oct-
21
M2M Nifty (RHS)
(4000000)
(2000000)
0
2000000
4000000
6000000
8000000
10000000
Apr-
19
Jun-
19
Aug-
19
Oct-
19
Dec-
19
Feb-
20
Apr-
20
Jun-
20
Aug-
20
Oct-
20
Dec-
20
Feb-
21
Apr-
21
Jun-
21
Aug-
21
Oct-
21
Dec-
21
Net Profit Invested Capital
Booked Profit M2M
(4000000)
(2000000)
0
2000000
4000000
6000000
8000000
10000000
Jan-
19
Mar
-19
May
-19
Jul-1
9 Se
p-19
N
ov-1
9 Ja
n-20
M
ar-2
0 M
ay-2
0 Ju
l-20
Sep-
20
Nov
-20
Jan-
21
Mar
-21
May
-21
Jul-2
1 Se
p-21
N
ov-2
1
Invested Capital Net Profit
0 2000 4000 6000 8000 10000 12000 14000 16000 18000 20000
(4000000)
(2000000)
0
2000000
4000000
6000000
8000000
10000000
Jan-
19
Apr-
19
Jul-1
9
Oct-
19
Jan-
20
Apr-
20
Jul-2
0
Oct-
20
Jan-
21
Apr-
21
Jul-2
1
Oct-
21
Invested Capital Net Profit Nifty (RHS)
* All Figures quoted in Rs.Calculated as on December 27 2021
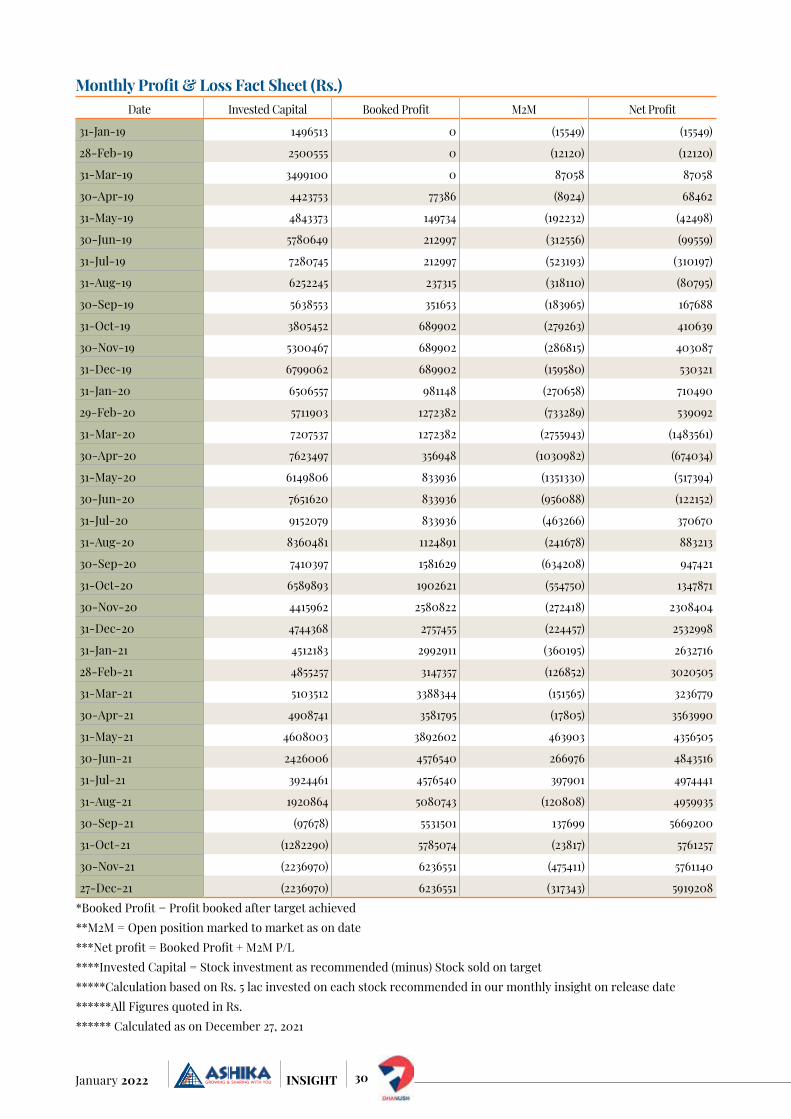
30January 2022 INSIGHT
Monthly Profit & Loss Fact Sheet (Rs.) Date Invested Capital Booked Profit M2M Net Profit
31-Jan-19 1496513 0 (15549) (15549)
28-Feb-19 2500555 0 (12120) (12120)
31-Mar-19 3499100 0 87058 87058
30-Apr-19 4423753 77386 (8924) 68462
31-May-19 4843373 149734 (192232) (42498)
30-Jun-19 5780649 212997 (312556) (99559)
31-Jul-19 7280745 212997 (523193) (310197)
31-Aug-19 6252245 237315 (318110) (80795)
30-Sep-19 5638553 351653 (183965) 167688
31-Oct-19 3805452 689902 (279263) 410639
30-Nov-19 5300467 689902 (286815) 403087
31-Dec-19 6799062 689902 (159580) 530321
31-Jan-20 6506557 981148 (270658) 710490
29-Feb-20 5711903 1272382 (733289) 539092
31-Mar-20 7207537 1272382 (2755943) (1483561)
30-Apr-20 7623497 356948 (1030982) (674034)
31-May-20 6149806 833936 (1351330) (517394)
30-Jun-20 7651620 833936 (956088) (122152)
31-Jul-20 9152079 833936 (463266) 370670
31-Aug-20 8360481 1124891 (241678) 883213
30-Sep-20 7410397 1581629 (634208) 947421
31-Oct-20 6589893 1902621 (554750) 1347871
30-Nov-20 4415962 2580822 (272418) 2308404
31-Dec-20 4744368 2757455 (224457) 2532998
31-Jan-21 4512183 2992911 (360195) 2632716
28-Feb-21 4855257 3147357 (126852) 3020505
31-Mar-21 5103512 3388344 (151565) 3236779
30-Apr-21 4908741 3581795 (17805) 3563990
31-May-21 4608003 3892602 463903 4356505
30-Jun-21 2426006 4576540 266976 4843516
31-Jul-21 3924461 4576540 397901 4974441
31-Aug-21 1920864 5080743 (120808) 4959935
30-Sep-21 (97678) 5531501 137699 5669200
31-Oct-21 (1282290) 5785074 (23817) 5761257
30-Nov-21 (2236970) 6236551 (475411) 5761140
27-Dec-21 (2236970) 6236551 (317343) 5919208 *Booked Profit = Profit booked after target achieved**M2M = Open position marked to market as on date***Net profit = Booked Profit + M2M P/L****Invested Capital = Stock investment as recommended (minus) Stock sold on target *****Calculation based on Rs. 5 lac invested on each stock recommended in our monthly insight on release date******All Figures quoted in Rs.****** Calculated as on December 27, 2021
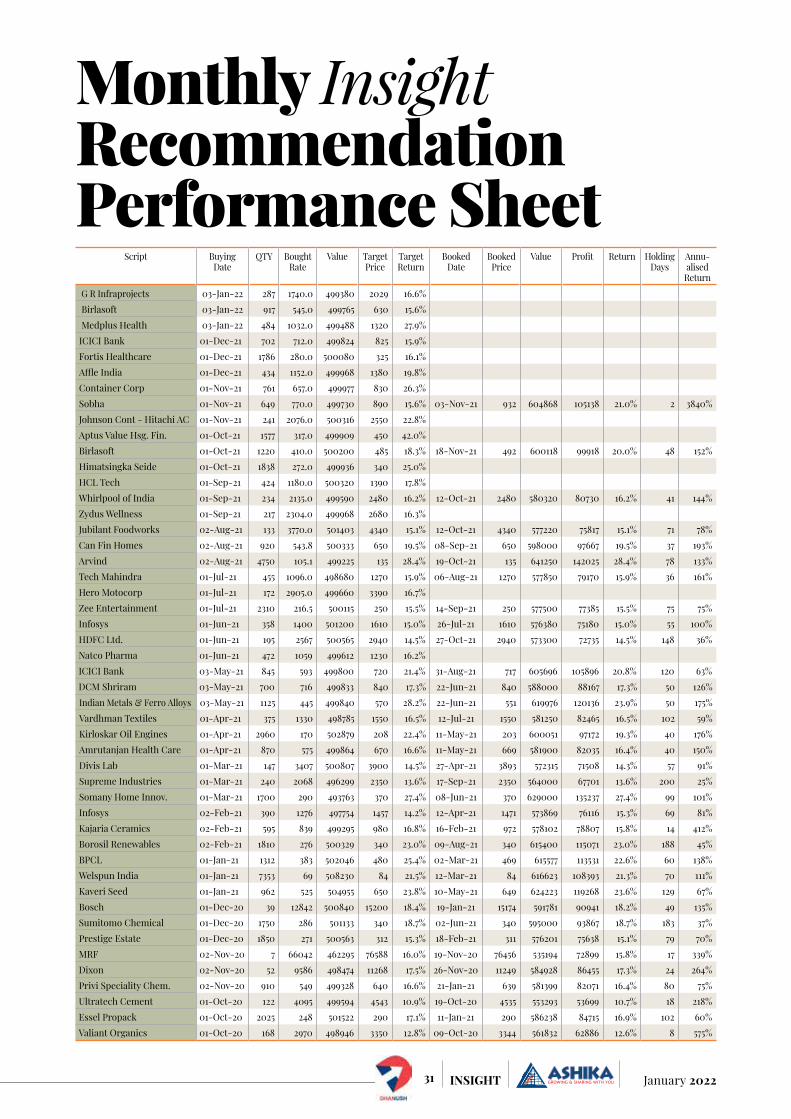
31 January 2022INSIGHT
Script Buying Date
QTY BoughtRate
Value TargetPrice
TargetReturn
BookedDate
BookedPrice
Value Profit Return Holding Days
Annu-alised
Return G R Infraprojects 03-Jan-22 287 1740.0 499380 2029 16.6% Birlasoft 03-Jan-22 917 545.0 499765 630 15.6% Medplus Health 03-Jan-22 484 1032.0 499488 1320 27.9% ICICI Bank 01-Dec-21 702 712.0 499824 825 15.9% Fortis Healthcare 01-Dec-21 1786 280.0 500080 325 16.1% Affle India 01-Dec-21 434 1152.0 499968 1380 19.8% Container Corp 01-Nov-21 761 657.0 499977 830 26.3% Sobha 01-Nov-21 649 770.0 499730 890 15.6% 03-Nov-21 932 604868 105138 21.0% 2 3840%Johnson Cont - Hitachi AC 01-Nov-21 241 2076.0 500316 2550 22.8% Aptus Value Hsg. Fin. 01-Oct-21 1577 317.0 499909 450 42.0% Birlasoft 01-Oct-21 1220 410.0 500200 485 18.3% 18-Nov-21 492 600118 99918 20.0% 48 152%Himatsingka Seide 01-Oct-21 1838 272.0 499936 340 25.0% HCL Tech 01-Sep-21 424 1180.0 500320 1390 17.8% Whirlpool of India 01-Sep-21 234 2135.0 499590 2480 16.2% 12-Oct-21 2480 580320 80730 16.2% 41 144%Zydus Wellness 01-Sep-21 217 2304.0 499968 2680 16.3% Jubilant Foodworks 02-Aug-21 133 3770.0 501403 4340 15.1% 12-Oct-21 4340 577220 75817 15.1% 71 78%Can Fin Homes 02-Aug-21 920 543.8 500333 650 19.5% 08-Sep-21 650 598000 97667 19.5% 37 193%Arvind 02-Aug-21 4750 105.1 499225 135 28.4% 19-Oct-21 135 641250 142025 28.4% 78 133%Tech Mahindra 01-Jul-21 455 1096.0 498680 1270 15.9% 06-Aug-21 1270 577850 79170 15.9% 36 161%Hero Motocorp 01-Jul-21 172 2905.0 499660 3390 16.7% Zee Entertainment 01-Jul-21 2310 216.5 500115 250 15.5% 14-Sep-21 250 577500 77385 15.5% 75 75%Infosys 01-Jun-21 358 1400 501200 1610 15.0% 26-Jul-21 1610 576380 75180 15.0% 55 100%HDFC Ltd. 01-Jun-21 195 2567 500565 2940 14.5% 27-Oct-21 2940 573300 72735 14.5% 148 36%Natco Pharma 01-Jun-21 472 1059 499612 1230 16.2% ICICI Bank 03-May-21 845 593 499800 720 21.4% 31-Aug-21 717 605696 105896 20.8% 120 63%DCM Shriram 03-May-21 700 716 499833 840 17.3% 22-Jun-21 840 588000 88167 17.3% 50 126%Indian Metals & Ferro Alloys 03-May-21 1125 445 499840 570 28.2% 22-Jun-21 551 619976 120136 23.9% 50 175%Vardhman Textiles 01-Apr-21 375 1330 498785 1550 16.5% 12-Jul-21 1550 581250 82465 16.5% 102 59%Kirloskar Oil Engines 01-Apr-21 2960 170 502879 208 22.4% 11-May-21 203 600051 97172 19.3% 40 176%Amrutanjan Health Care 01-Apr-21 870 575 499864 670 16.6% 11-May-21 669 581900 82035 16.4% 40 150%Divis Lab 01-Mar-21 147 3407 500807 3900 14.5% 27-Apr-21 3893 572315 71508 14.3% 57 91%Supreme Industries 01-Mar-21 240 2068 496299 2350 13.6% 17-Sep-21 2350 564000 67701 13.6% 200 25%Somany Home Innov. 01-Mar-21 1700 290 493763 370 27.4% 08-Jun-21 370 629000 135237 27.4% 99 101%Infosys 02-Feb-21 390 1276 497754 1457 14.2% 12-Apr-21 1471 573869 76116 15.3% 69 81%Kajaria Ceramics 02-Feb-21 595 839 499295 980 16.8% 16-Feb-21 972 578102 78807 15.8% 14 412%Borosil Renewables 02-Feb-21 1810 276 500329 340 23.0% 09-Aug-21 340 615400 115071 23.0% 188 45%BPCL 01-Jan-21 1312 383 502046 480 25.4% 02-Mar-21 469 615577 113531 22.6% 60 138%Welspun India 01-Jan-21 7353 69 508230 84 21.5% 12-Mar-21 84 616623 108393 21.3% 70 111%Kaveri Seed 01-Jan-21 962 525 504955 650 23.8% 10-May-21 649 624223 119268 23.6% 129 67%Bosch 01-Dec-20 39 12842 500840 15200 18.4% 19-Jan-21 15174 591781 90941 18.2% 49 135%Sumitomo Chemical 01-Dec-20 1750 286 501133 340 18.7% 02-Jun-21 340 595000 93867 18.7% 183 37%Prestige Estate 01-Dec-20 1850 271 500563 312 15.3% 18-Feb-21 311 576201 75638 15.1% 79 70%MRF 02-Nov-20 7 66042 462295 76588 16.0% 19-Nov-20 76456 535194 72899 15.8% 17 339%Dixon 02-Nov-20 52 9586 498474 11268 17.5% 26-Nov-20 11249 584928 86455 17.3% 24 264%Privi Speciality Chem. 02-Nov-20 910 549 499328 640 16.6% 21-Jan-21 639 581399 82071 16.4% 80 75%Ultratech Cement 01-Oct-20 122 4095 499594 4543 10.9% 19-Oct-20 4535 553293 53699 10.7% 18 218%Essel Propack 01-Oct-20 2025 248 501522 290 17.1% 11-Jan-21 290 586238 84715 16.9% 102 60%Valiant Organics 01-Oct-20 168 2970 498946 3350 12.8% 09-Oct-20 3344 561832 62886 12.6% 8 575%
Monthly Insight recommendation Performance Sheet
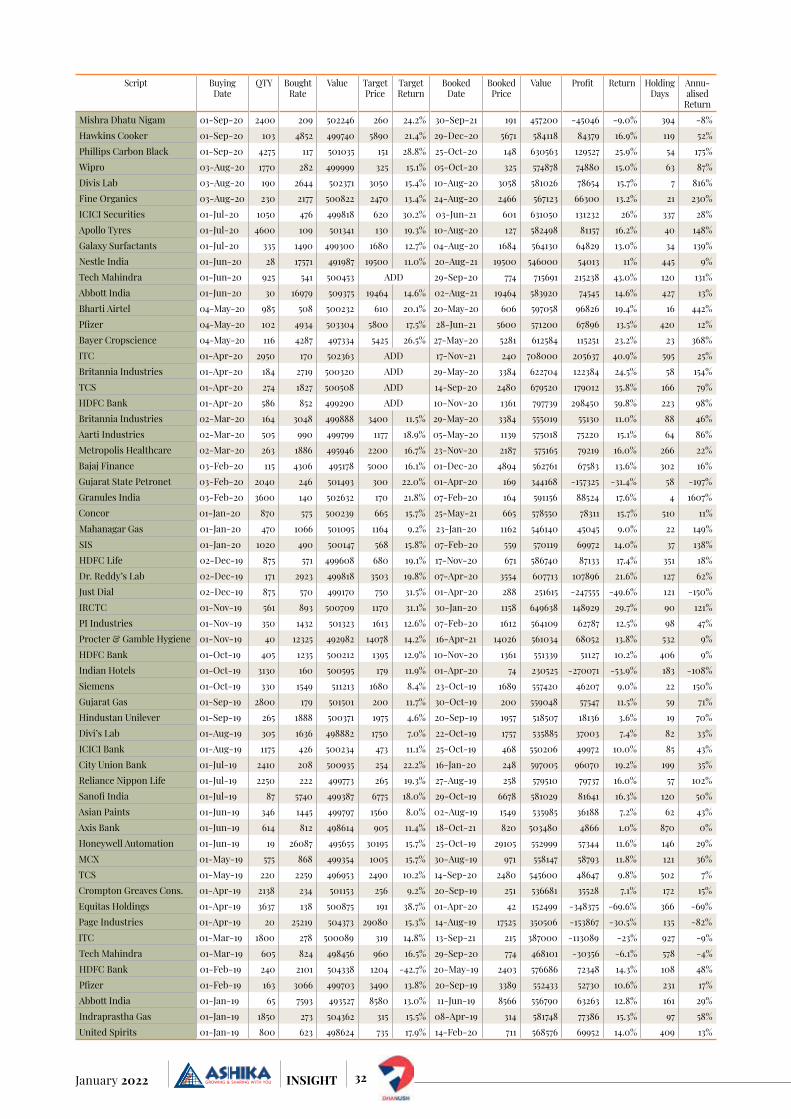
32January 2022 INSIGHT
Script Buying Date
QTY BoughtRate
Value TargetPrice
TargetReturn
BookedDate
BookedPrice
Value Profit Return Holding Days
Annu-alised
ReturnMishra Dhatu Nigam 01-Sep-20 2400 209 502246 260 24.2% 30-Sep-21 191 457200 -45046 -9.0% 394 -8%Hawkins Cooker 01-Sep-20 103 4852 499740 5890 21.4% 29-Dec-20 5671 584118 84379 16.9% 119 52%Phillips Carbon Black 01-Sep-20 4275 117 501035 151 28.8% 25-Oct-20 148 630563 129527 25.9% 54 175%Wipro 03-Aug-20 1770 282 499999 325 15.1% 05-Oct-20 325 574878 74880 15.0% 63 87%Divis Lab 03-Aug-20 190 2644 502371 3050 15.4% 10-Aug-20 3058 581026 78654 15.7% 7 816%Fine Organics 03-Aug-20 230 2177 500822 2470 13.4% 24-Aug-20 2466 567123 66300 13.2% 21 230%ICICI Securities 01-Jul-20 1050 476 499818 620 30.2% 03-Jun-21 601 631050 131232 26% 337 28%Apollo Tyres 01-Jul-20 4600 109 501341 130 19.3% 10-Aug-20 127 582498 81157 16.2% 40 148%Galaxy Surfactants 01-Jul-20 335 1490 499300 1680 12.7% 04-Aug-20 1684 564130 64829 13.0% 34 139%Nestle India 01-Jun-20 28 17571 491987 19500 11.0% 20-Aug-21 19500 546000 54013 11% 445 9%Tech Mahindra 01-Jun-20 925 541 500453 ADD 29-Sep-20 774 715691 215238 43.0% 120 131%Abbott India 01-Jun-20 30 16979 509375 19464 14.6% 02-Aug-21 19464 583920 74545 14.6% 427 13%Bharti Airtel 04-May-20 985 508 500232 610 20.1% 20-May-20 606 597058 96826 19.4% 16 442%Pfizer 04-May-20 102 4934 503304 5800 17.5% 28-Jun-21 5600 571200 67896 13.5% 420 12%Bayer Cropscience 04-May-20 116 4287 497334 5425 26.5% 27-May-20 5281 612584 115251 23.2% 23 368%ITC 01-Apr-20 2950 170 502363 ADD 17-Nov-21 240 708000 205637 40.9% 595 25%Britannia Industries 01-Apr-20 184 2719 500320 ADD 29-May-20 3384 622704 122384 24.5% 58 154%TCS 01-Apr-20 274 1827 500508 ADD 14-Sep-20 2480 679520 179012 35.8% 166 79%HDFC Bank 01-Apr-20 586 852 499290 ADD 10-Nov-20 1361 797739 298450 59.8% 223 98%Britannia Industries 02-Mar-20 164 3048 499888 3400 11.5% 29-May-20 3384 555019 55130 11.0% 88 46%Aarti Industries 02-Mar-20 505 990 499799 1177 18.9% 05-May-20 1139 575018 75220 15.1% 64 86%Metropolis Healthcare 02-Mar-20 263 1886 495946 2200 16.7% 23-Nov-20 2187 575165 79219 16.0% 266 22%Bajaj Finance 03-Feb-20 115 4306 495178 5000 16.1% 01-Dec-20 4894 562761 67583 13.6% 302 16%Gujarat State Petronet 03-Feb-20 2040 246 501493 300 22.0% 01-Apr-20 169 344168 -157325 -31.4% 58 -197%Granules India 03-Feb-20 3600 140 502632 170 21.8% 07-Feb-20 164 591156 88524 17.6% 4 1607%Concor 01-Jan-20 870 575 500239 665 15.7% 25-May-21 665 578550 78311 15.7% 510 11%Mahanagar Gas 01-Jan-20 470 1066 501095 1164 9.2% 23-Jan-20 1162 546140 45045 9.0% 22 149%SIS 01-Jan-20 1020 490 500147 568 15.8% 07-Feb-20 559 570119 69972 14.0% 37 138%HDFC Life 02-Dec-19 875 571 499608 680 19.1% 17-Nov-20 671 586740 87133 17.4% 351 18%Dr. Reddy’s Lab 02-Dec-19 171 2923 499818 3503 19.8% 07-Apr-20 3554 607713 107896 21.6% 127 62%Just Dial 02-Dec-19 875 570 499170 750 31.5% 01-Apr-20 288 251615 -247555 -49.6% 121 -150%IRCTC 01-Nov-19 561 893 500709 1170 31.1% 30-Jan-20 1158 649638 148929 29.7% 90 121%PI Industries 01-Nov-19 350 1432 501323 1613 12.6% 07-Feb-20 1612 564109 62787 12.5% 98 47%Procter & Gamble Hygiene 01-Nov-19 40 12325 492982 14078 14.2% 16-Apr-21 14026 561034 68052 13.8% 532 9%HDFC Bank 01-Oct-19 405 1235 500212 1395 12.9% 10-Nov-20 1361 551339 51127 10.2% 406 9%Indian Hotels 01-Oct-19 3130 160 500595 179 11.9% 01-Apr-20 74 230525 -270071 -53.9% 183 -108%Siemens 01-Oct-19 330 1549 511213 1680 8.4% 23-Oct-19 1689 557420 46207 9.0% 22 150%Gujarat Gas 01-Sep-19 2800 179 501501 200 11.7% 30-Oct-19 200 559048 57547 11.5% 59 71%Hindustan Unilever 01-Sep-19 265 1888 500371 1975 4.6% 20-Sep-19 1957 518507 18136 3.6% 19 70%Divi’s Lab 01-Aug-19 305 1636 498882 1750 7.0% 22-Oct-19 1757 535885 37003 7.4% 82 33%ICICI Bank 01-Aug-19 1175 426 500234 473 11.1% 25-Oct-19 468 550206 49972 10.0% 85 43%City Union Bank 01-Jul-19 2410 208 500935 254 22.2% 16-Jan-20 248 597005 96070 19.2% 199 35%Reliance Nippon Life 01-Jul-19 2250 222 499773 265 19.3% 27-Aug-19 258 579510 79737 16.0% 57 102%Sanofi India 01-Jul-19 87 5740 499387 6775 18.0% 29-Oct-19 6678 581029 81641 16.3% 120 50%Asian Paints 01-Jun-19 346 1445 499797 1560 8.0% 02-Aug-19 1549 535985 36188 7.2% 62 43%Axis Bank 01-Jun-19 614 812 498614 905 11.4% 18-Oct-21 820 503480 4866 1.0% 870 0%Honeywell Automation 01-Jun-19 19 26087 495655 30195 15.7% 25-Oct-19 29105 552999 57344 11.6% 146 29%MCX 01-May-19 575 868 499354 1005 15.7% 30-Aug-19 971 558147 58793 11.8% 121 36%TCS 01-May-19 220 2259 496953 2490 10.2% 14-Sep-20 2480 545600 48647 9.8% 502 7%Crompton Greaves Cons. 01-Apr-19 2138 234 501153 256 9.2% 20-Sep-19 251 536681 35528 7.1% 172 15%Equitas Holdings 01-Apr-19 3637 138 500875 191 38.7% 01-Apr-20 42 152499 -348375 -69.6% 366 -69%Page Industries 01-Apr-19 20 25219 504373 29080 15.3% 14-Aug-19 17525 350506 -153867 -30.5% 135 -82%ITC 01-Mar-19 1800 278 500089 319 14.8% 13-Sep-21 215 387000 -113089 -23% 927 -9%Tech Mahindra 01-Mar-19 605 824 498456 960 16.5% 29-Sep-20 774 468101 -30356 -6.1% 578 -4%HDFC Bank 01-Feb-19 240 2101 504338 1204 -42.7% 20-May-19 2403 576686 72348 14.3% 108 48%Pfizer 01-Feb-19 163 3066 499703 3490 13.8% 20-Sep-19 3389 552433 52730 10.6% 231 17%Abbott India 01-Jan-19 65 7593 493527 8580 13.0% 11-Jun-19 8566 556790 63263 12.8% 161 29%Indraprastha Gas 01-Jan-19 1850 273 504362 315 15.5% 08-Apr-19 314 581748 77386 15.3% 97 58%United Spirits 01-Jan-19 800 623 498624 735 17.9% 14-Feb-20 711 568576 69952 14.0% 409 13%
33 January 2022INSIGHT
teCHnOLOGy SeCtOr: DIGITAL TRANSFORMATION jOURNEY LONG WAY TO GO
seCtoR outLooK
The pandemic which hit in the late 2019, has changed the human life to large extent on technological front. The COVID-19 pandemic has further accelerated the pace of digital
technologies. The digitally savvy enterprises were better placed compared to the others in the Covid 19 pandemic. In addition, due to pandemic consumer have now adopted a digital life wherein they prefer product/services at the convenience of an app instead of physical transaction. This has led to virtualization of business models. In addition, in order to keep the business going on and increasing need for work from home, technology is gaining traction. The pandemic which hit the world in the late 2019, had started to intensify in the early 2020 and brought the world to grinding halt. Corporate find it difficult to continue its functionality amid the stringent lockdown across the world. Hence, the corporate realize the faster adoption of technological changes which happening around the world. As a result, new age technologies like cyber security (to protect business from hybrid work model), app development (to help customer transact virtually) and Cloud (to enable seamless & efficient online transaction) are witnessing robust growth. Enterprises across industries are undertaking efforts to lower the spend on maintenance of legacy applications and rapidly scaling up investments in digital technologies to fuel growth. As a result, the growth in IT spending is expected to be largely driven by
investments in digital technologies as the enterprises are scaling up the digital transformation efforts across the business units. It has been estimated that the investment in digital technologies to grow at a CAGR of 16% to USD 2.4 trillion between FY20-24, thus would provide a 3 year up cycle for technological companies. It has been 3 stage transformation of digitization of business commenced with IT spend on cloud. The cloud spend is minimum 3-4 years opportunity for IT sector. Second round of IT spend is on artificial intelligence, augmented reality, virtual reality, data analytics and IoT. In the last phase, there will be emergence of new business models, which could leverage technology to drive growth in ancillary business. Hence, the growth opportunity on account of rapid digital transformation is long way to go for Indian IT companies.
Digital transformation majorly lead by cloudCurrently, the IT sector is in the first phase of a multi-year technology transformation phase. In the current phase, enterprises are building a cloud-based foundation that will serve as a resilient, secure, scalable digital core. In next phase, enterprises will see new age technologies like artificial intelligence, augmented reality, virtual reality, data analytics and Internet of Things (IOT) to be developed around cloud leading to a multi-year technology spends. Thereafter, in next 4-5 years, every major company is expected to migrate to cloud and use of Artificial Intelligence (AI) will be at a very
Currently, the IT sector is in the first phase of a multi-year technology transformation phase. In the current phase, enterprises are building a cloud-based foundation that will serve as a resilient, secure, scalable digital core.
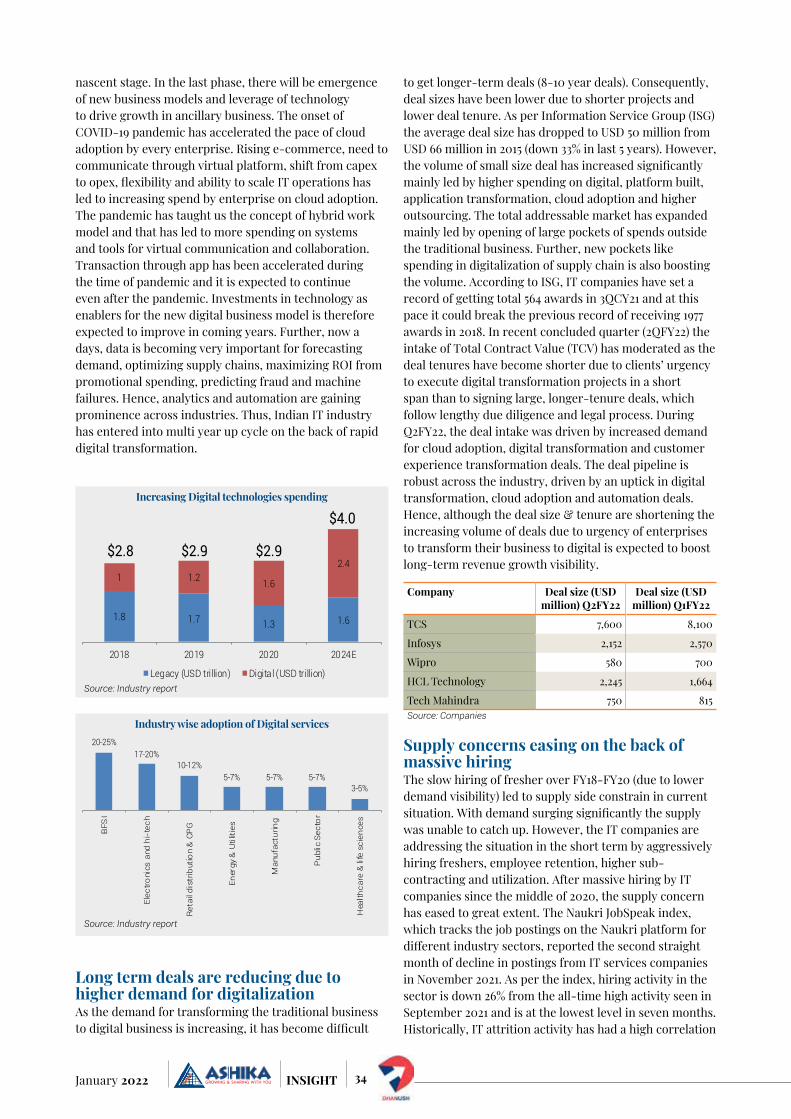
34January 2022 INSIGHT
nascent stage. In the last phase, there will be emergence of new business models and leverage of technology to drive growth in ancillary business. The onset of COVID-19 pandemic has accelerated the pace of cloud adoption by every enterprise. Rising e-commerce, need to communicate through virtual platform, shift from capex to opex, flexibility and ability to scale IT operations has led to increasing spend by enterprise on cloud adoption. The pandemic has taught us the concept of hybrid work model and that has led to more spending on systems and tools for virtual communication and collaboration. Transaction through app has been accelerated during the time of pandemic and it is expected to continue even after the pandemic. Investments in technology as enablers for the new digital business model is therefore expected to improve in coming years. Further, now a days, data is becoming very important for forecasting demand, optimizing supply chains, maximizing ROI from promotional spending, predicting fraud and machine failures. Hence, analytics and automation are gaining prominence across industries. Thus, Indian IT industry has entered into multi year up cycle on the back of rapid digital transformation.
Long term deals are reducing due to higher demand for digitalizationAs the demand for transforming the traditional business to digital business is increasing, it has become difficult
to get longer-term deals (8-10 year deals). Consequently, deal sizes have been lower due to shorter projects and lower deal tenure. As per Information Service Group (ISG) the average deal size has dropped to USD 50 million from USD 66 million in 2015 (down 33% in last 5 years). However, the volume of small size deal has increased significantly mainly led by higher spending on digital, platform built, application transformation, cloud adoption and higher outsourcing. The total addressable market has expanded mainly led by opening of large pockets of spends outside the traditional business. Further, new pockets like spending in digitalization of supply chain is also boosting the volume. According to ISG, IT companies have set a record of getting total 564 awards in 3QCY21 and at this pace it could break the previous record of receiving 1977 awards in 2018. In recent concluded quarter (2QFY22) the intake of Total Contract Value (TCV) has moderated as the deal tenures have become shorter due to clients’ urgency to execute digital transformation projects in a short span than to signing large, longer-tenure deals, which follow lengthy due diligence and legal process. During Q2FY22, the deal intake was driven by increased demand for cloud adoption, digital transformation and customer experience transformation deals. The deal pipeline is robust across the industry, driven by an uptick in digital transformation, cloud adoption and automation deals. Hence, although the deal size & tenure are shortening the increasing volume of deals due to urgency of enterprises to transform their business to digital is expected to boost long-term revenue growth visibility.
Company Deal size (USD million) Q2FY22
Deal size (USD million) Q1FY22
TCS 7,600 8,100
Infosys 2,152 2,570
Wipro 580 700
HCL Technology 2,245 1,664
Tech Mahindra 750 815 Source: Companies
Supply concerns easing on the back of massive hiringThe slow hiring of fresher over FY18-FY20 (due to lower demand visibility) led to supply side constrain in current situation. With demand surging significantly the supply was unable to catch up. However, the IT companies are addressing the situation in the short term by aggressively hiring freshers, employee retention, higher sub-contracting and utilization. After massive hiring by IT companies since the middle of 2020, the supply concern has eased to great extent. The Naukri JobSpeak index, which tracks the job postings on the Naukri platform for different industry sectors, reported the second straight month of decline in postings from IT services companies in November 2021. As per the index, hiring activity in the sector is down 26% from the all-time high activity seen in September 2021 and is at the lowest level in seven months. Historically, IT attrition activity has had a high correlation
Increasing Digital technologies spending
Source: Industry report
1.8
$2.8 $2.9 $2.9
$4.0
1.7 1.3 1.6
1 1.2 1.6
2.4
2018 2019 2020 2024E
Legacy (USD trillion) Digital (USD trillion)
Industry wise adoption of Digital services
Source: Industry report
20-25%17-20%
10-12%5-7% 5-7% 5-7%
3-5%
BFS
I
Elec
troni
cs a
nd h
i-te
ch
Ret
ail d
istr
ibut
ion
& C
PG
Ener
gy &
Util
ities
Man
ufac
turin
g
Pub
lic S
ecto
r
Hea
lthca
re &
life
sci
ence
s
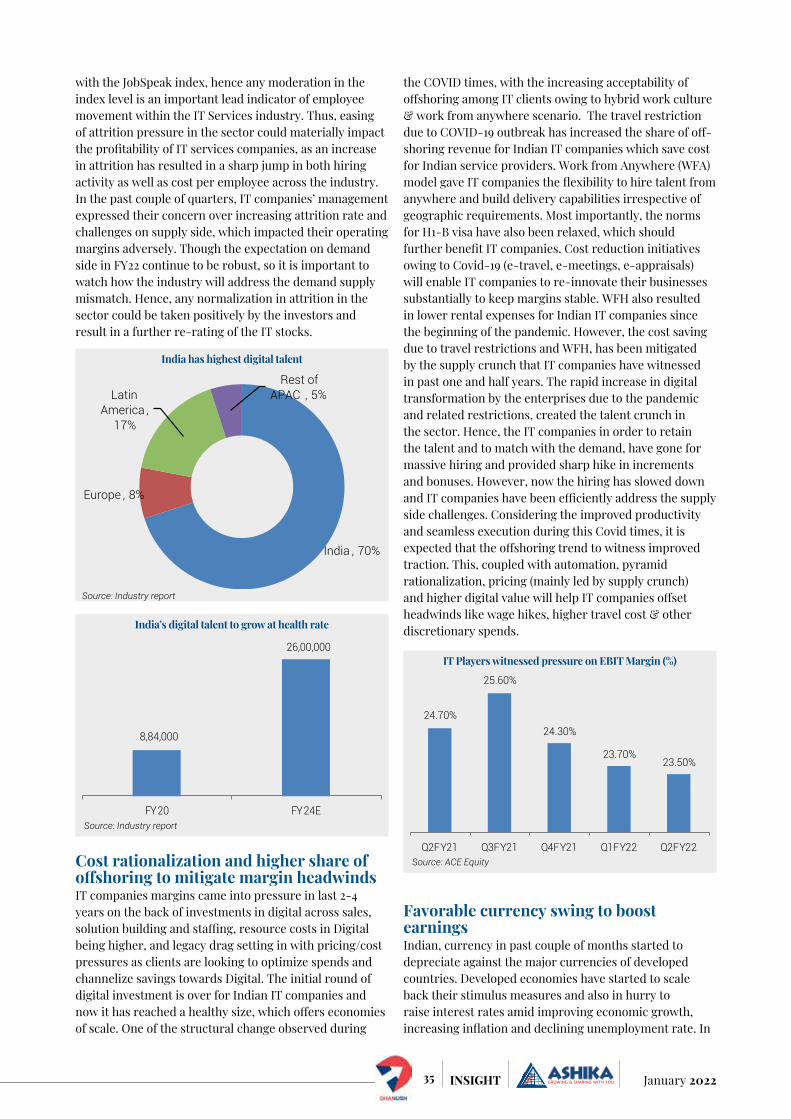
35 January 2022INSIGHT
with the JobSpeak index, hence any moderation in the index level is an important lead indicator of employee movement within the IT Services industry. Thus, easing of attrition pressure in the sector could materially impact the profitability of IT services companies, as an increase in attrition has resulted in a sharp jump in both hiring activity as well as cost per employee across the industry. In the past couple of quarters, IT companies’ management expressed their concern over increasing attrition rate and challenges on supply side, which impacted their operating margins adversely. Though the expectation on demand side in FY22 continue to be robust, so it is important to watch how the industry will address the demand supply mismatch. Hence, any normalization in attrition in the sector could be taken positively by the investors and result in a further re-rating of the IT stocks.
Cost rationalization and higher share of offshoring to mitigate margin headwindsIT companies margins came into pressure in last 2-4 years on the back of investments in digital across sales, solution building and staffing, resource costs in Digital being higher, and legacy drag setting in with pricing/cost pressures as clients are looking to optimize spends and channelize savings towards Digital. The initial round of digital investment is over for Indian IT companies and now it has reached a healthy size, which offers economies of scale. One of the structural change observed during
the COVID times, with the increasing acceptability of offshoring among IT clients owing to hybrid work culture & work from anywhere scenario. The travel restriction due to COVID-19 outbreak has increased the share of off-shoring revenue for Indian IT companies which save cost for Indian service providers. Work from Anywhere (WFA) model gave IT companies the flexibility to hire talent from anywhere and build delivery capabilities irrespective of geographic requirements. Most importantly, the norms for H1-B visa have also been relaxed, which should further benefit IT companies. Cost reduction initiatives owing to Covid-19 (e-travel, e-meetings, e-appraisals) will enable IT companies to re-innovate their businesses substantially to keep margins stable. WFH also resulted in lower rental expenses for Indian IT companies since the beginning of the pandemic. However, the cost saving due to travel restrictions and WFH, has been mitigated by the supply crunch that IT companies have witnessed in past one and half years. The rapid increase in digital transformation by the enterprises due to the pandemic and related restrictions, created the talent crunch in the sector. Hence, the IT companies in order to retain the talent and to match with the demand, have gone for massive hiring and provided sharp hike in increments and bonuses. However, now the hiring has slowed down and IT companies have been efficiently address the supply side challenges. Considering the improved productivity and seamless execution during this Covid times, it is expected that the offshoring trend to witness improved traction. This, coupled with automation, pyramid rationalization, pricing (mainly led by supply crunch) and higher digital value will help IT companies offset headwinds like wage hikes, higher travel cost & other discretionary spends.
Favorable currency swing to boost earningsIndian, currency in past couple of months started to depreciate against the major currencies of developed countries. Developed economies have started to scale back their stimulus measures and also in hurry to raise interest rates amid improving economic growth, increasing inflation and declining unemployment rate. In
India has highest digital talent
Source: Industry report
India , 70%
Europe , 8%
Latin America ,
17%
Rest of APAC , 5%
India’s digital talent to grow at health rate
Source: Industry report
8,84,000
26,00,000
FY20 FY24E
IT Players witnessed pressure on EBIT Margin (%)
Source: ACE Equity
24.70%
25.60%
24.30%
23.70%23.50%
Q2FY21 Q3FY21 Q4FY21 Q1FY22 Q2FY22

36January 2022 INSIGHT
an anticipation of rising interest rates in US, the emerging countries like India witnessed withdrawal of foreign money from the stock market, which put further pressure on INR as the depreciating INR will impact the overall return of foreign investors. However, the depreciating INR will be augur well for Indian IT companies as they earn more than 90% of their revenue from US and Europe. Indian IT Services sector has enjoyed favorable YoY cross currency tailwinds through the past 15 months. Indian Tier I techs have enjoyed ~100-400 bps YoY cross currency tailwinds since 1QFY21 which has aided reported USD revenue growth for the companies. However, the current situation is unlikely of 2013, when US started taper tantrum and INR plunged significantly. Now, RBI has enough forex reserve to arrest the fall of INR against the Dollar. Hence, INR depreciation is likely to be limited in coming quarters. However, the IT companies are likely
to witness some margin improvement in coming quarter due to INR depreciation against the dollar.
Indian IT companies are expected to report healthy growth rate in FY22. The growth will be driven by lower furloughs, improvement in demand post Covid-19 and ramp up of deals won in the past few quarters. This, coupled with cross currency tailwind, will further boost revenue growth in the coming quarters. The IT companies are also witnessing a demand tailwind in terms of cost takeout by clients (led by higher offshoring & automation), vendor consolidation opportunities, captive carve outs and traction in cloud & customer experience that could further propel demand in coming quarters. Further, global technology giant Accenture’s recent earnings update and optimistic outlook indicate a strong and sustainable demand environment, with continued spend on digital and cloud adoption. The pandemic has made industries across the globe bring about changes to adapt to the work-from-home environment with minimal disruption to their business models. This also led businesses to change their models from captive to outsourcing, which is expected to benefit Indian IT companies. Further, Indian IT companies have efficiently addressed the supply side challenges to large extent. Hence, as the IT companies have slowed down their hiring, it has been expected the margins to improve from here on. Indian IT sector is in sweet spot and has entered into multi year up cycle on the back of robust demand from enterprises for rapid digital transformation.
INR depreciating agains dollar (USD/INR)
Source: Investing.com
70
7172
737475
7677
Nov
-20
Dec
-20
Jan-
21
Feb-
21
Mar
-21
Apr-
21
May
-21
Jun-
21
Jul-
21
Aug-
21
Sep-
21
Oct
-21
Nov
-21
Dec
-21
Peer SetCompany Name Mcap
(Rs crs)Revenue (Rs crs)
EBIT (Rs crs)
PAT (Rs crs)
EBIT Margin
(%)
PAT Margin
(%)
ROE (%)
1 Yr Forward
P/E (x)
1 Yr Forward P/Bvps
(x)
1 Yr For-ward EV/EBITDA
(x)
Tata Consultancy Services Ltd.
1,357,644 164,177 44,397 32,562 27.0% 19.8% 38.6 31.1 12.7 22.1
Infosys Ltd. 783,780 100,472 26,823 19,423 26.7% 19.3% 27.5 30.5 9.3 21.3
HCL Technologies Ltd. 343,306 75,379 16,364 11,169 21.7% 14.8% 20.1 22.4 5.0 14.1
Wipro Ltd. 382,868 61,943 14,399 10,855 23.2% 17.5% 19.8 27.6 5.4 18.6
Tech Mahindra Ltd. 167,276 37,855 6,126 4,352 16.2% 11.5% 19.0 24.6 5.1 17.5
Larsen & Toubro Infotech Ltd.
125,604 12,370 2,667 1,938 21.6% 15.7% 30.8 45.8 12.1 32.7
Mphasis Ltd. 60,357 9,722 1,694 1,217 17.4% 12.5% 19.9 34.9 7.8 23.1
Mindtree Ltd. 76,182 7,968 1,549 1,111 19.4% 13.9% 29.8 44.2 12.0 30.6
L&T Technology Services Ltd.
56,359 5,450 943 667 17.3% 12.2% 21.6 50.4 11.9 34.4
Tata Elxsi Ltd. 34,262 1,826 519 368 28.4% 20.2% 30.2 53.9 NA NA
Coforge Ltd. 34374.77 4662.8 610.5 466 13.1% 10.0% 19.4 39.2 10.0 24.1
Persistent Systems Ltd. 35323.25 4187.89 615.24 450.68 14.7% 10.8% 17.7 43.3 9.3 29.1
Source: Ace Equity and Bloomberg

37 January 2022INSIGHT
Management Concall highlights
MAnAgeMent ConCALL
ITC Ltd.ITC Next strategy• Driving Scale and Profitability
o ITC Synergy, future ready port-folio, strong growth platforms, power brands
o Agile & purposeful innovation anchored on new age insight and science-based R&D platforms
o Structural interventions to drive margin expansion & capital productivity
o Accelerating Digital to power growth & productivity
o Harnessing opportunities at the intersection of Digital & Sustainability
o Value Accretive M&A and exports: additional growth vectors
• Top notch ESG credentials - Bold Sustainability 2.0 agenda raising the bar
• Strategy of Organisation redefined to sharpen Consumer Centricity, Agility & Focus
• Engaged and motivated world-class talent pool driven by a ‘proneurial’ spirit
Cigarette business• Legal cigarette industry in India comprises 8% of total tobacco consumption, however contribution to exchequer stands at 80% clearly indicating how skewed cigarette taxation is in India thus resulting in tepid volume growth over the last decade
• The government had recently set up an expert panel to determine a roadmap for taxation of tobacco in India. This is not the first time the government/Finance Ministry has sought recommendations from the Health Ministry and other stake-holders. However, this time a panel would be making recommendations for the broader Tobacco industry as opposed to just Cigarettes, and the management is hopeful of a reason-able outcome.
• Cigarette volume have recovered to pre-covid levels and management believes stable taxation regime will
The government had recently set up an expert panel to determine a roadmap for taxation of tobacco in India. This is not the first time the government/Finance Ministry has sought recommendations from the Health Ministry and other stakeholders. However, this time a panel would be making recommendations for the broader Tobacco industry as opposed to just Cigarettes, and the management is hopeful of a reasonable outcome…ITC Ltd
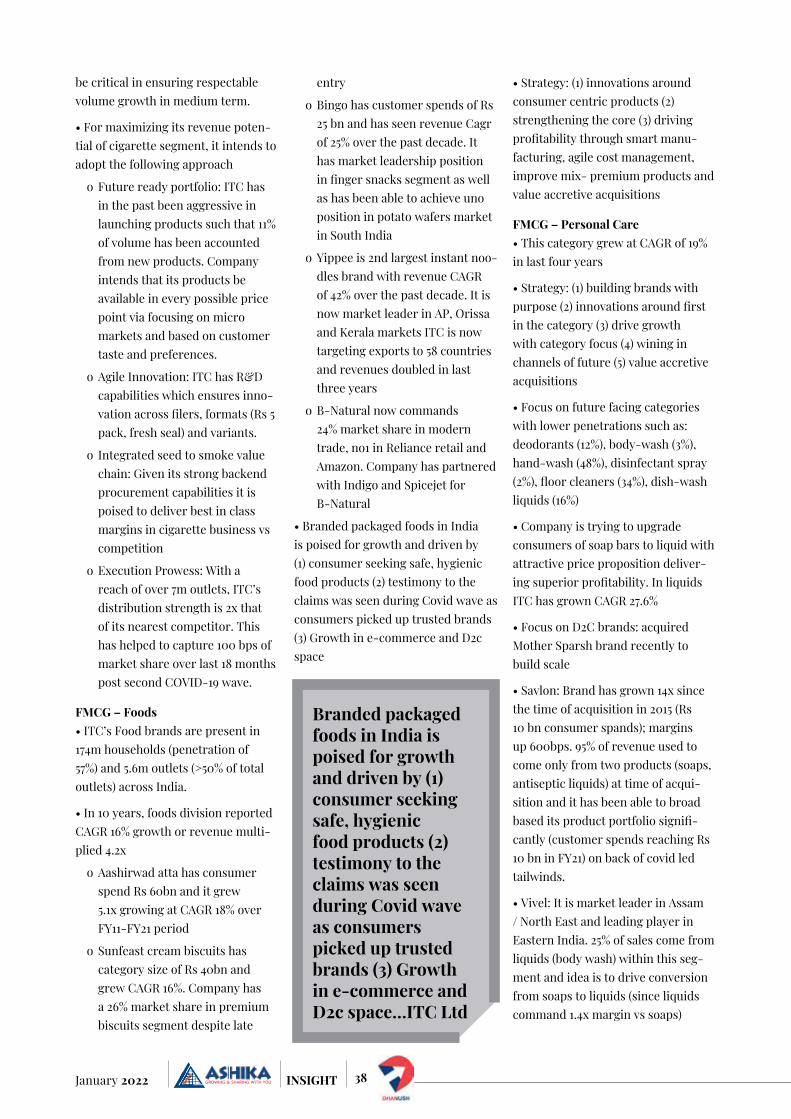
38January 2022 INSIGHT
be critical in ensuring respectable volume growth in medium term.
• For maximizing its revenue poten-tial of cigarette segment, it intends to adopt the following approach
o Future ready portfolio: ITC has in the past been aggressive in launching products such that 11% of volume has been accounted from new products. Company intends that its products be available in every possible price point via focusing on micro markets and based on customer taste and preferences.
o Agile Innovation: ITC has R&D capabilities which ensures inno-vation across filers, formats (Rs 5 pack, fresh seal) and variants.
o Integrated seed to smoke value chain: Given its strong backend procurement capabilities it is poised to deliver best in class margins in cigarette business vs competition
o Execution Prowess: With a reach of over 7m outlets, ITC’s distribution strength is 2x that of its nearest competitor. This has helped to capture 100 bps of market share over last 18 months post second COVID-19 wave.
FMCG – Foods• ITC’s Food brands are present in 174m households (penetration of 57%) and 5.6m outlets (>50% of total outlets) across India.
• In 10 years, foods division reported CAGR 16% growth or revenue multi-plied 4.2x
o Aashirwad atta has consumer spend Rs 60bn and it grew 5.1x growing at CAGR 18% over FY11-FY21 period
o Sunfeast cream biscuits has category size of Rs 40bn and grew CAGR 16%. Company has a 26% market share in premium biscuits segment despite late
entry
o Bingo has customer spends of Rs 25 bn and has seen revenue Cagr of 25% over the past decade. It has market leadership position in finger snacks segment as well as has been able to achieve uno position in potato wafers market in South India
o Yippee is 2nd largest instant noo-dles brand with revenue CAGR of 42% over the past decade. It is now market leader in AP, Orissa and Kerala markets ITC is now targeting exports to 58 countries and revenues doubled in last three years
o B-Natural now commands 24% market share in modern trade, no1 in Reliance retail and Amazon. Company has partnered with Indigo and Spicejet for B-Natural
• Branded packaged foods in India is poised for growth and driven by (1) consumer seeking safe, hygienic food products (2) testimony to the claims was seen during Covid wave as consumers picked up trusted brands (3) Growth in e-commerce and D2c space
• Strategy: (1) innovations around consumer centric products (2) strengthening the core (3) driving profitability through smart manu-facturing, agile cost management, improve mix- premium products and value accretive acquisitions
FMCG – Personal Care• This category grew at CAGR of 19% in last four years
• Strategy: (1) building brands with purpose (2) innovations around first in the category (3) drive growth with category focus (4) wining in channels of future (5) value accretive acquisitions
• Focus on future facing categories with lower penetrations such as: deodorants (12%), body-wash (3%), hand-wash (48%), disinfectant spray (2%), floor cleaners (34%), dish-wash liquids (16%)
• Company is trying to upgrade consumers of soap bars to liquid with attractive price proposition deliver-ing superior profitability. In liquids ITC has grown CAGR 27.6%
• Focus on D2C brands: acquired Mother Sparsh brand recently to build scale
• Savlon: Brand has grown 14x since the time of acquisition in 2015 (Rs 10 bn consumer spands); margins up 600bps. 95% of revenue used to come only from two products (soaps, antiseptic liquids) at time of acqui-sition and it has been able to broad based its product portfolio signifi-cantly (customer spends reaching Rs 10 bn in FY21) on back of covid led tailwinds.
• Vivel: It is market leader in Assam / North East and leading player in Eastern India. 25% of sales come from liquids (body wash) within this seg-ment and idea is to drive conversion from soaps to liquids (since liquids command 1.4x margin vs soaps)
Branded packaged foods in India is poised for growth and driven by (1) consumer seeking safe, hygienic food products (2) testimony to the claims was seen during Covid wave as consumers picked up trusted brands (3) Growth in e-commerce and D2c space…ITC Ltd
39 January 2022INSIGHT
• Nimyle floor cleaner: It has grown 5x since acquisition and proposition is largely based on natural solutions
Other businesses
Agri: • Company is looking to move up the value chain & focusing on value added ingredient & niche products like spices, fruits, vegetable.
• Agri business to focus on 1) delivering sustainable competitive advantage to FMCG businesses 2) future ready portfolio of value-added products to drive growth & margins 3) ITC MAARs – transformative busi-ness model building on e-Choupal and 4) NextGen Indian agriculture
Paperboards, Paper & Packaging:
• Market leader in scale, profitability and sustainability.
• Will invest 25-30% of total capex to expand capacity.
• Key strategic pillars 1) one-stop packaging solutions provider 2) sustainability 2.0 3) sustainable paperboard/ packaging solutions 4) leverage industry 4.0 and digital 5) augment renewable and cost-com-petitive chains and 6) scale up value added product portfolio
Hotels: • 110 properties spread across 75+ locations.
• Strategy refresh to focus on 1) Asset right Strategy 2) Augment revenue streams/ sweat assets 3) Leverage digital and 4) extreme cost cuts.
ITC Infotech: • The IT division has done well under the new leadership, with revenue growing at 10.6% CAGR over FY19-21. EBITDA margin expanded by 1,720bp over the same period to 25.2% in FY21. This momentum continued in 1HFY22, with revenue/EBITDA growing 24%/63%YoY.
• It is delivering business friendly
solutions to clients across 29 coun-tries, including 60+ Fortune listed clients. Its top management has revolutionized the concept of ‘Work from Anywhere’.
• The management sees great potential in this segment and is open to M&A opportunities keeping its domain focus in mind.
• As a 100% subsidiary, separate listing of this segment is a possibility and is often discussed by the board. The latter regularly examines oppor-tune times for the same, but no fixed timeline has been shared
Capex plans: ITC plans to invest Rs 10,000 crore (with a run rate of Rs 3,000 cr p.a) in the next three years to create growth vectors. Of this, 35-40% would be invested in FMCG capacity expansion, 25-30% towards Paperboards, 10% on ongoing Hotel projects and the balance towards Agri business, building digital capabilities and sustainability agenda. ITC is coming up with spices facility in Guntur to become preferred supplier for customers in Food Safe Markets with product tested for over 470 pesticide residues. It is also coming up with a plant in Mysuru (ITC Indi-Vision Ltd) for Nicotine and related products
Dividend Policy: The company would continue to maintain 80-85% divi-dend payout and would prefer main-taining ordinary dividend instead of
giving special dividend. Total cash on the books of | 25000 crore would not increase, going forward.
Demerger plan: De-merger plan of hotels business would be taken at an appropriate time once the business stabilises from the current disruption. The company is actively pursuing M&A opportunity in the FMCG & IT space
City Union BankHistory of the Bank• CUB is oldest private sector bank in India which has completed 117 years in India.
• Bank has completed 100 years of profitability and dividend payout. Many banks around the world didn’t have so impressive track record.
• Bank is first local bank to help the local farmers by providing the funds.
• In the past multiple community launched banks in India to channelize their savings.
• In 1960, there had been structural changes in Indian banking system by way of nationalization.
• CUB first started with crop loans and then entered into gold loans. Later, CUB entered into term loan segment and working capital loan.
• In Indian banking system, the entire orientation has changed.
• CUB was listed during 1997-1998 in the stock exchange.
Financial metrics• In 2010, the bank had networth of Rs 200 cr, internal accruals of Rs 600 cr and other investments of Rs 400 cr.
• Bank has track record of maintain-ing stable RoE, RoA, Cost efficiency ratios. Bank has lowest CASA ratio in the industry. Lower CASA ratio resulted in lower NIMs for the bank.
• Banks prime source of fund are
City Union Bank: CUB first started with crop loans and then entered into gold loans. Later, CUB entered into term loan segment and working capital loan.
40January 2022 INSIGHT
retail deposits. Bank has started the LIC distribution and become LIC distributor.
• Bank has been doing the techno-logical up gradation since long time. Bank’s core banking system came in early 2000.
• Bank had 11-12% NPA at the time of 2000 when the situation was worse.
• L&T, LIC became the largest insti-tutional shareholders for the bank in early years.
• CUB has 700 branches with Rs 82000 cr of business and loan book of Rs 37,000 cr now. CUB reported net profit of Rs 700 cr in FY19 before the COVID year.
• Post COVID bank reported 1.3% ROA and there are very few banks in India which maintain RoA of 1.3%
• CUB has 19% capital adequacy and 15% RoE.
• Bank’s motive is to lend in order to create business assets not for consumption. CUB’s 60% of loan is Working capital loan and 37% are agriculture and other loans.
National Presence• 480 branches are located in Tamil Nadu out of 700 branches.
• In Kolkata, bank has couple of branches and has limited presence in Eastern India.
• Government will not give banking license to corporate houses.
Technological transformation• The second leg of digitalization started in 2014. During COVID times nearly 89-90% of transaction hap-pened through digital channels only and 12% of transaction happened through bank’s physical channels
• Arrival of fintech has accelerated the pace of loan disbursal which earlier take long time.
• Other income is mainly contributed
by commission, brokerages, etc, which are also considered as fee based income.
• As interest rate come down, bank has huge opportunity in treasury income.
Other important points• Pre Lehman period, Finance ministry was keen to consolidate the small banks. However, post Lehman, people said that big the bank, bigger the problem was and then the con-solidation thinking disappeared.
• Bank of Rajashthan, Lakshmi Vilas Bank cases highlights that there had been corporate governance issues from Promoter side.
• For CUB, out of 700 branches, 500 branches were opened in last 10 years, thus bank was able to hire young generation employees
• CUB kept itself away from national level Bank Union associations. Bank has gone for contributory pension scheme which differentiate bank from other public sector banks.
• Despite having focus in textile sector, there has been least NPA contribution from textile sector in the history. Textile business has done extremely well only important thing is that they should not divert the funds in other avenues.
• Bank does the bulk of gold loan financing from rural and semi urban areas. Bulk of gold loan also for agricultural loan.
• Some of the NBFCs are also
sourcing gold loans and co-lending is progressing well for the banking system.
• There are limitations for old generation banks and that is for both private or public sector banks. It is imperative to align the HR policies to performance-based incentives for employees in order to achieve better operating efficiencies.
• Gold finance companies charge higher interest rate for gold lending as compared to public sector or private sector banks.
• Corporate lending started moving from early 2000. In next 10 years, there will be more corporate bonds coming into the market and banks will be restricted to corporate lending.
• If a bank starts a micro finance business, then it will be a bump. CUB is not going to micro finance busi-ness. Micro finance business will not work for CUB’s DNA.
• Small banks are continuously investing in digitalization. End of the day, the question is whether they are creating value for your shareholders.
• Gold loan is for rural and semi urban areas as they use gold loan to fund their business or agriculture land.
Outlook• CUB grew at 20% in last 20 years. Bank will continue to grow 3-4% over and above the industry growth rate in next 5-10 years.
• Average utilization is currently at 70% and as investment cycle starts, utilization will cross 85% level.
Indian Energy Exchange Ltd.Sector view• India intend to increase the Renew-able Energy capacity to 500 GW by 2030 from 102 GW.
CUB grew at 20% in last 20 years. Bank will continue to grow 3-4% over and above the industry growth rate in next 5-10 years.
41 January 2022INSIGHT
• Generation 390 GW capacity of which 48% are private. 102 GW renewable and 20 GW merchant.
• India is now power surplus country previously it was deficit of 10%.
• Capacity grew by 8% CAGR in last 10 years while demand grew by 5%.
• The PPAs account nearly 89% of total electricity sector and it is upto 25 years while the Short term market is 11%.
• Company has 6.4% share in elec-tricity sector and company has 95% market share in exchanges.
• Exchanges are growing fastest at 18.6% and its now 6.4% which increased from 3% of total electricity market.
• In other developed markets the electricity exchange share is higher while India share is very low thus has great opportunity.
• Energy consumption in India is set to grow and average per capita consumption in India is low in the world.
• Per capital income is expected to double in the next 5 years because of rapid urbanization and increasing economic activities.
IEX overview• Company commenced operations in 2008 and regulated by CERC.
• All the distribution companies are on board with the company and IEX is market leader with 95% market share.
• Electricity volumes grew by CAGR of 32% since 2008.
• Company provides benchmark prices for all electricity transactions.
• The high liquidity on exchanges has ensured lowest cost and assured supply.
• Continuous investment in transmission result in seamless
transmission across the country.
• Any customers want to procure power can buy power in 24x7 and power is delivered by 1 hr. The pricing is very competitive.
• Company has robust ecosystem.
• Company has 6 different market segments. Company has started the journey with day ahead market, followed by term ahead contracts, real time market, green term ahead market and there are more 2 certificates including renewable energy certificates and energy saving certificates.
• Real time market accounts nearly 25% of electricity market and green market accounts nearly 6% of total electricity market.
• IEX is technological oriented com-pany and keep working on automa-tion and technological upgradation. Technology platform is really the state of the art.
• Company is driven by customers centric and fulfill the demand of customers.
• Company has done 4-5 product launches in last 1 year.
• Company’s revenue mix including transaction fees account 86%, admis-sion and annul fees 4% and others income 10%.
• Company has showcased robust financials growth in the past years.
• During COVID times, there was
no lockdown in IEX and company supported the distribution companies in 24x7.
• IEX is a technology platform and company is going all automations. Company has global partnerships and company is transforming to future tech.
• Company is providing platform access beyond 70+members.
• The outlook of the company is very positive as the electricity of the demand is growing very fast on the back of rapid urbanization, increasing per capita consumption of electricity.
• Draft national electricity policy which is intended to increase the spot electricity market across the country is one of the main growth driver for the company.
• Company has very efficient price discovery mechanism.
• The launch of derivatives will also help the company to grow in the future.
Key highlights• Company is already operating in competitive environment and com-petition is on from day 1 of 2008.
• Company will be able to maintain the market share because of its new product launches and strong techno-logical platform.
• Power is a perishable commodity and it cannot be store hence the gen-erators should sell power otherwise it will be the lost opportunity.
• 22 lacks of Renewable energy (RE) are sold and 1.2 cr RE will be sold in FY22 and IEX will sell nearly 80-90 laks RE.
• Government is considering to bring all the carbon credits under carbon trading platform.
• Carbon trading is expected to start from 2023 onwards.
IEX: Company will be able to maintain the market share because of its new product launches and strong technological platform.
42January 2022 INSIGHT
• Real time market, company has started in June 2020 and company is getting much apprehension. Real time market is getting good volume and company is expecting the volume to grow because of more renewable energy is coming in the market.
• There is no cannibalization in to day ahead market as this segment is also growing at good rate.
• Exchange volume growth only happen when there will be conducive regulatory frame work and this is happening now.
• Green market which accounts 6% of total electricity market and company is working on it. Price discovery in green market is much higher than the others.
• 100 GW and is going to be 500 GW in the green capacity. Solar capacity is Rs 2/unit and even wind energy is around Rs2.1/unit much competitive than thermal power cost.
• Thus, the green energy will come big in coming years because of its competitive cost.
• Government intend to increase the spot electricity market from 6% to 25% in next 3 and half years.
• There will be lot of policy initiatives from government to boost the green energy power.
• Company is working continuously to harness any opportunity emerge in the market.
• Company is regulated by CERC and thus there is risk of regulating the transaction fees. CERC has approved
the transaction fees of 2 paisa for Rs 3/unit.
• India is also adopted the European power exchange model. In GER-MANY, in last 5-6 years the exchange transactions has reached to 50% from 20% and this is because of increasing share of green energy.
• The bilateral transaction happening between the trading companies are declining in the past few years.
• In most of the countries, there is one exchange which dominant the market by having more than 90% market share.
• Exchange work on 100% deliverable contract. In 2010, MCX introduced electricity derivatives. MCX will use IEX price to settle the electricity derivatives contract and there is price sharing between the companies.
• There is revenue sharing between
MCX and due to this partnership IEX volume will also increase going ahead.
• In next 5-6 years, the exchange transaction will increase in India, otherwise it will be difficult to deal with RE as it requires vast storage capacity.
• Distribution companies are not going to long term PPA in last 4-5 years. Distribution companies are both buyer and seller depending on the demand for power during the day or season.
• Company has started the cross border transaction in April 2021 and has started with Nepal and also in talk with Bangladesh. Company is also talking with Bhutan.
• Trading with neighboring countries will only happen when there will be electrical connectivity. Further, the demand for electricity in neighboring countries are not so high and thus the opportunity is small.
• In gas the opportunity is huge as the gas consumption is only 6% of total energy consumption while the other developed countries gas consumption is around 25%
• Government has vision to increase the gas consumption from 6% to 15% by 2030.
• Gas exchange revenue potential could be as large as electricity trading in next 5 years.
• PTC is doing around 20-21% of electricity transaction through exchanges.
IEX: India is also adopted the European power exchange model. In GERMANY, in last 5-6 years the exchange transactions has reached to 50% from 20% and this is because of increasing share of green energy.
43 January 2022INSIGHT
India’s GDP is expected to grow at 9% to 10% in FY22 primarily driven by low base in FY21 (which witnessed contraction of 7.3%). However, the focus has now shifted to how the economy would perform in FY23 since there will be no advantage of base effect. Mr. Sudipto Mundle, distinguished fellow, National Council of Applied Economic Research, estimates the growth to be at 5.2%, much lower than 7.8% projected by Reserve Bank of India (RBI). However, it is still higher than pre-pandemic growth of 4% clocked in FY20 and similar to growth scenarios projected by the 15th Finance Commission. He believes that ‘actual outcomes in 2022-23 will depend a great deal on the policies that are pursued during the year’. He even hailed how the RBI conducted its policies particularly in a difficult year and complemented Govt. in framing policies which are conducive for growth. However,
core inflation has remained firm and WPI inflation have risen above 14% and hence RBI cannot ignore inflationary pressures for long. More importantly, at a time when
central banks of developed economies have been turning gradually aggressive, decoupling will take a toll on rupee. RBI might actually let the rupee to devalue fair bit as the currency is overvalued than signified by its value reflected by REER. RBI’s aim to protect value of rupee above their market clearing level (if at all) would eventually fail, as suggested by history and the same would result in burning up significant amount of forex reserves. Since, the focus will now be shifted to the fiscal policy and what Govt. delivers in 2022-23 budget. Mr. Mundle states that focus on growth and food support for the poor would undoubtedly be the prime focus of the Govt. Mr. Mundle believes that ‘The central government needs
economy review
eConoMy Review
India’s GDP is expected to grow at 9% to 10% in FY22 primarily driven by low base in FY21 (which witnessed contraction of 7.3%). However, the focus has now shifted to how the economy would perform in FY23 since there will be no advantage of base effect.

44January 2022 INSIGHT
to adjust its spending programme in favour of growth-promoting infrastructure, including social infrastructure such as education and health. It also needs to ensure through its transfer programme that states have enough spending headroom to do the same.’
It is worthwhile to look at the performance of the Govt. and current state of economic parameters in particularly challenging circumstances. A recent report by RBI reviews the Govt finances for H1FY22 and there are quite a few areas which has shown remarkable improvement, particularly in the context of higher spends by Govt. over food and welfare expenses induced by 2nd wave of Covid-19. Most importantly, state finances also recovered to their pre-pandemic level and states collected 46.9% of their budgeted receipts which is higher than the corresponding figures for the past three years. Despite higher pandemic induced expenditure, H1FY22 expenditure was 37.8% of the budgeted target, broadly in line with the average during the pre-pandemic years. On the positive aspect, higher tax buoyancy resulted in higher tax receipts while non-tax receipts were helped by higher than budgeted dividend transfer from RBI. For centre, direct tax collections grew 83.7% yoy in H1FY22 led by growth in income tax and corporation tax by 64.7% and 105.1%, respectively, on the back of strong corporate performance. For states, stamp duties which account for more than 85% of own direct tax revenues, more than doubled in Q1FY22; Q2 recorded a yoy growth of 53.4%. Even indirect taxes increased in H1FY22 led by more than 100% growth in customs duty (driven by higher import demand) and 33% yoy growth in Union excise duties (79% over H1FY20). GST collections (Centre + States) increased by 50.1% and 12.5% in H1FY22 over H1FY21 and H1FY20 levels respectively. The Union government has also transferred the entire amount of Rs 1.59 lakh crore that was to be released to States in 2021-22 under the back-to-back loan facility in lieu of GST compensation cess. The front-loading has been done to enable States to plan their expenditure effectively. States’ GST collections recorded a yoy growth of 71.6% in Q1 and 27.3% in Q2, 2021-22, with many States like Gujarat, Uttarakhand, Andhra Pradesh, Himachal Pradesh, Maharashtra and Punjab registering a yoy growth of over 50% in H1FY22 over H1FY21. Union Govt.’s non-tax revenues also increased in H1FY22 primarily led by higher than budgeted surplus transfers from the RBI. However, Govt. couldn’t cash in on the vibrant stock markets and failed to get anywhere close to the budgeted levels of divestment target set. Of the budgeted 1.75 lakh cr, the Union Govt. could only raise 5.2% in H1FY22. After brilliant bull run, the stock markets could face both internal and external challenges and hence it is unlikely that the shortfall in divestment would be met up in H2FY22. However, stake sale in LIC could
change the metrics in favour of the Govt. Besides, the Govt. also aims to raise Rs 0.88 lakh cr in FY22 out of Rs 6 lakh cr asset monetization plan over FY22 to FY25. For States, non-tax revenues increased by 40.2% and 53.1% in Q1 and Q2 of 2021-22, respectively (compared to Q1 and Q2 of 2019-20 at 15.9% and 20.6%, respectively).
Total Receipts
Source: RBI
Total Expenditure
Source: RBI
Revenue receipts
Source: RBI
Non-Debt Capital Receipts
Source: RBI
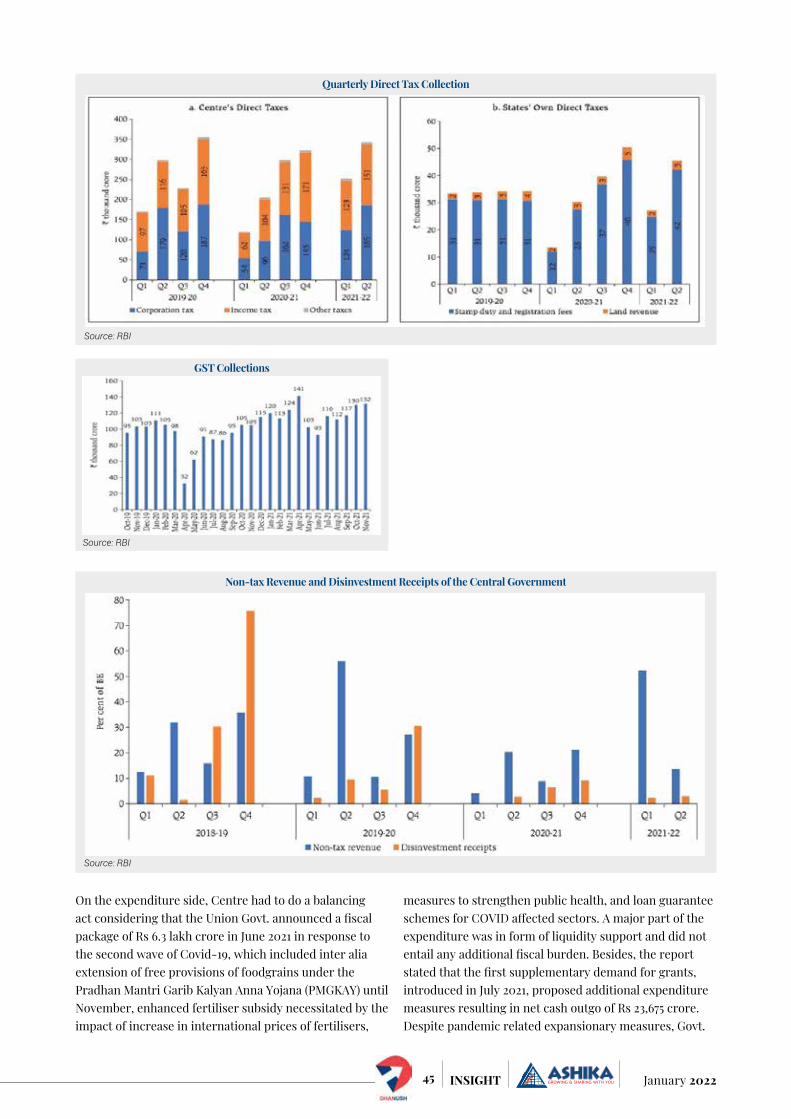
45 January 2022INSIGHT
On the expenditure side, Centre had to do a balancing act considering that the Union Govt. announced a fiscal package of Rs 6.3 lakh crore in June 2021 in response to the second wave of Covid-19, which included inter alia extension of free provisions of foodgrains under the Pradhan Mantri Garib Kalyan Anna Yojana (PMGKAY) until November, enhanced fertiliser subsidy necessitated by the impact of increase in international prices of fertilisers,
measures to strengthen public health, and loan guarantee schemes for COVID affected sectors. A major part of the expenditure was in form of liquidity support and did not entail any additional fiscal burden. Besides, the report stated that the first supplementary demand for grants, introduced in July 2021, proposed additional expenditure measures resulting in net cash outgo of Rs 23,675 crore. Despite pandemic related expansionary measures, Govt.
GST Collections
Source: RBI
Quarterly Direct Tax Collection
Source: RBI
Non-tax Revenue and Disinvestment Receipts of the Central Government
Source: RBI
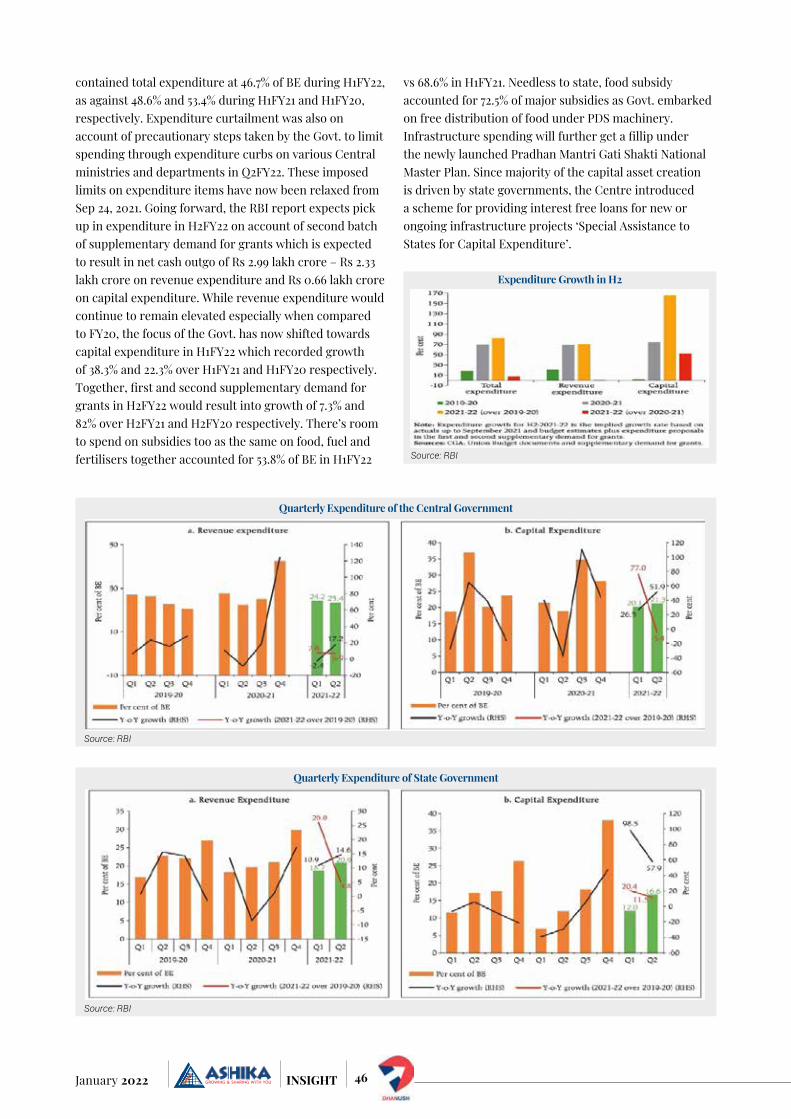
46January 2022 INSIGHT
contained total expenditure at 46.7% of BE during H1FY22, as against 48.6% and 53.4% during H1FY21 and H1FY20, respectively. Expenditure curtailment was also on account of precautionary steps taken by the Govt. to limit spending through expenditure curbs on various Central ministries and departments in Q2FY22. These imposed limits on expenditure items have now been relaxed from Sep 24, 2021. Going forward, the RBI report expects pick up in expenditure in H2FY22 on account of second batch of supplementary demand for grants which is expected to result in net cash outgo of Rs 2.99 lakh crore – Rs 2.33 lakh crore on revenue expenditure and Rs 0.66 lakh crore on capital expenditure. While revenue expenditure would continue to remain elevated especially when compared to FY20, the focus of the Govt. has now shifted towards capital expenditure in H1FY22 which recorded growth of 38.3% and 22.3% over H1FY21 and H1FY20 respectively. Together, first and second supplementary demand for grants in H2FY22 would result into growth of 7.3% and 82% over H2FY21 and H2FY20 respectively. There’s room to spend on subsidies too as the same on food, fuel and fertilisers together accounted for 53.8% of BE in H1FY22
vs 68.6% in H1FY21. Needless to state, food subsidy accounted for 72.5% of major subsidies as Govt. embarked on free distribution of food under PDS machinery. Infrastructure spending will further get a fillip under the newly launched Pradhan Mantri Gati Shakti National Master Plan. Since majority of the capital asset creation is driven by state governments, the Centre introduced a scheme for providing interest free loans for new or ongoing infrastructure projects ‘Special Assistance to States for Capital Expenditure’.
Expenditure Growth in H2
Source: RBI
Quarterly Expenditure of the Central Government
Source: RBI
Quarterly Expenditure of State Government
Source: RBI
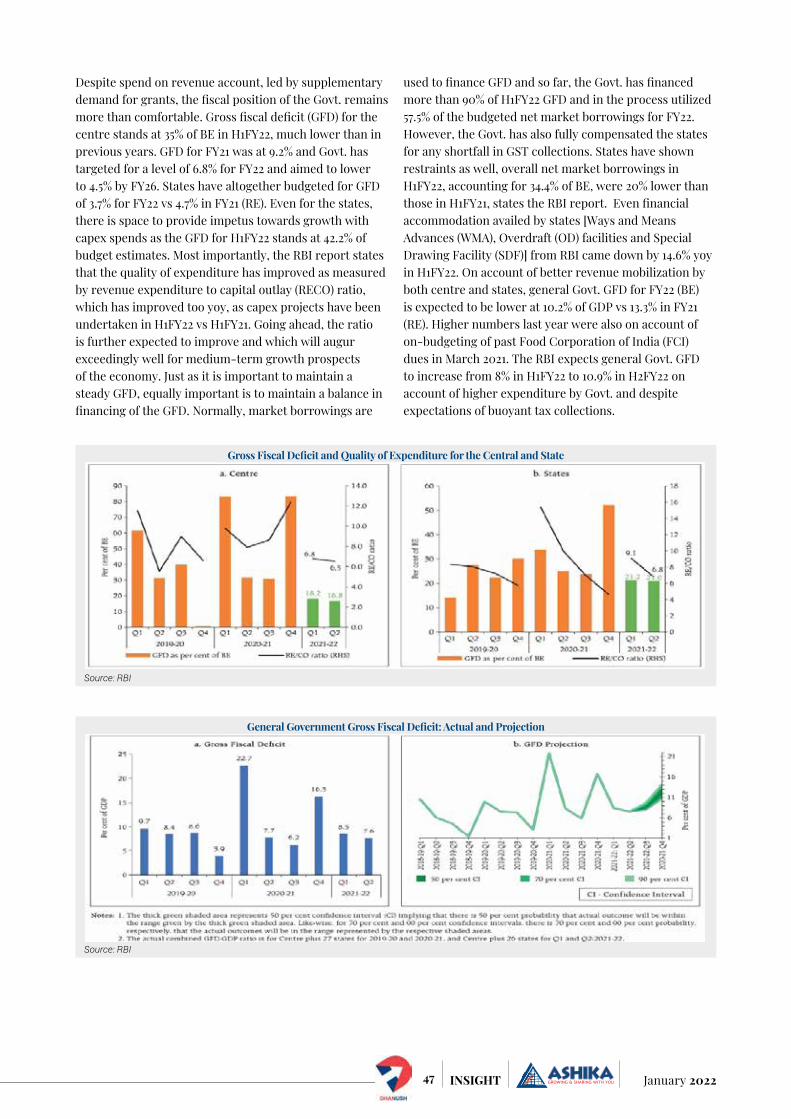
47 January 2022INSIGHT
Despite spend on revenue account, led by supplementary demand for grants, the fiscal position of the Govt. remains more than comfortable. Gross fiscal deficit (GFD) for the centre stands at 35% of BE in H1FY22, much lower than in previous years. GFD for FY21 was at 9.2% and Govt. has targeted for a level of 6.8% for FY22 and aimed to lower to 4.5% by FY26. States have altogether budgeted for GFD of 3.7% for FY22 vs 4.7% in FY21 (RE). Even for the states, there is space to provide impetus towards growth with capex spends as the GFD for H1FY22 stands at 42.2% of budget estimates. Most importantly, the RBI report states that the quality of expenditure has improved as measured by revenue expenditure to capital outlay (RECO) ratio, which has improved too yoy, as capex projects have been undertaken in H1FY22 vs H1FY21. Going ahead, the ratio is further expected to improve and which will augur exceedingly well for medium-term growth prospects of the economy. Just as it is important to maintain a steady GFD, equally important is to maintain a balance in financing of the GFD. Normally, market borrowings are
used to finance GFD and so far, the Govt. has financed more than 90% of H1FY22 GFD and in the process utilized 57.5% of the budgeted net market borrowings for FY22. However, the Govt. has also fully compensated the states for any shortfall in GST collections. States have shown restraints as well, overall net market borrowings in H1FY22, accounting for 34.4% of BE, were 20% lower than those in H1FY21, states the RBI report. Even financial accommodation availed by states [Ways and Means Advances (WMA), Overdraft (OD) facilities and Special Drawing Facility (SDF)] from RBI came down by 14.6% yoy in H1FY22. On account of better revenue mobilization by both centre and states, general Govt. GFD for FY22 (BE) is expected to be lower at 10.2% of GDP vs 13.3% in FY21 (RE). Higher numbers last year were also on account of on-budgeting of past Food Corporation of India (FCI) dues in March 2021. The RBI expects general Govt. GFD to increase from 8% in H1FY22 to 10.9% in H2FY22 on account of higher expenditure by Govt. and despite expectations of buoyant tax collections.
General Government Gross Fiscal Deficit: Actual and Projection
Source: RBI
Gross Fiscal Deficit and Quality of Expenditure for the Central and State
Source: RBI
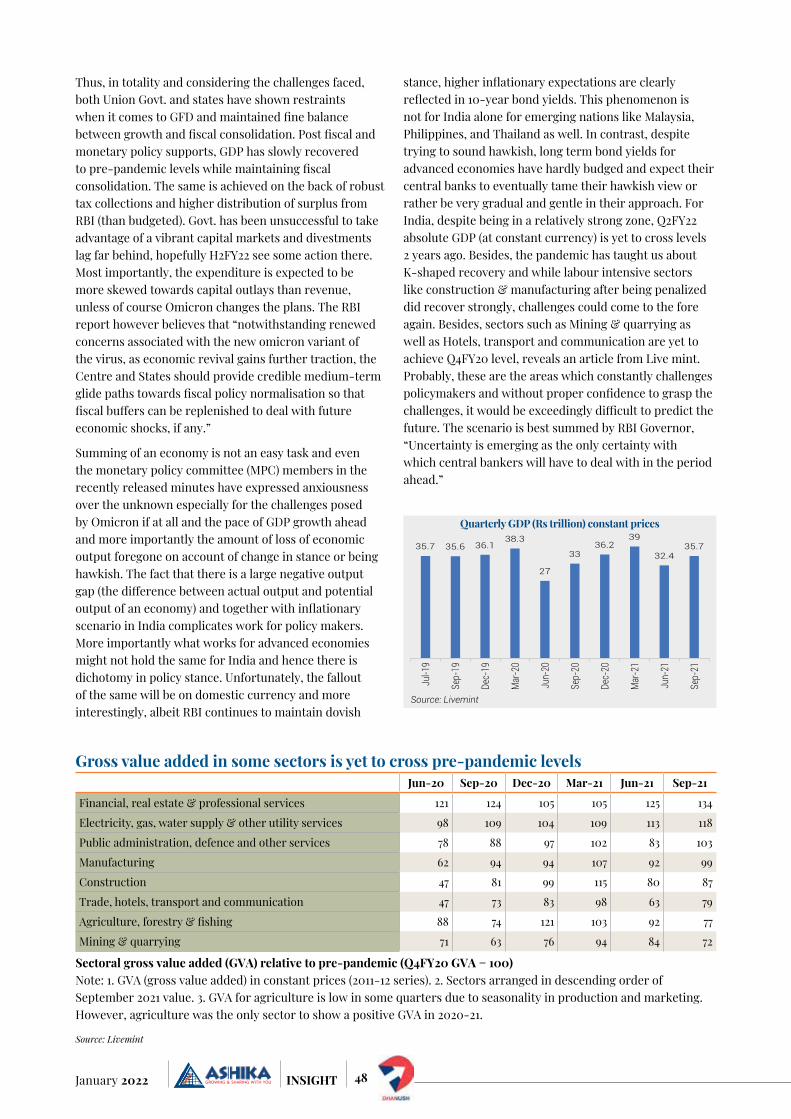
48January 2022 INSIGHT
Thus, in totality and considering the challenges faced, both Union Govt. and states have shown restraints when it comes to GFD and maintained fine balance between growth and fiscal consolidation. Post fiscal and monetary policy supports, GDP has slowly recovered to pre-pandemic levels while maintaining fiscal consolidation. The same is achieved on the back of robust tax collections and higher distribution of surplus from RBI (than budgeted). Govt. has been unsuccessful to take advantage of a vibrant capital markets and divestments lag far behind, hopefully H2FY22 see some action there. Most importantly, the expenditure is expected to be more skewed towards capital outlays than revenue, unless of course Omicron changes the plans. The RBI report however believes that “notwithstanding renewed concerns associated with the new omicron variant of the virus, as economic revival gains further traction, the Centre and States should provide credible medium-term glide paths towards fiscal policy normalisation so that fiscal buffers can be replenished to deal with future economic shocks, if any.”
Summing of an economy is not an easy task and even the monetary policy committee (MPC) members in the recently released minutes have expressed anxiousness over the unknown especially for the challenges posed by Omicron if at all and the pace of GDP growth ahead and more importantly the amount of loss of economic output foregone on account of change in stance or being hawkish. The fact that there is a large negative output gap (the difference between actual output and potential output of an economy) and together with inflationary scenario in India complicates work for policy makers. More importantly what works for advanced economies might not hold the same for India and hence there is dichotomy in policy stance. Unfortunately, the fallout of the same will be on domestic currency and more interestingly, albeit RBI continues to maintain dovish
stance, higher inflationary expectations are clearly reflected in 10-year bond yields. This phenomenon is not for India alone for emerging nations like Malaysia, Philippines, and Thailand as well. In contrast, despite trying to sound hawkish, long term bond yields for advanced economies have hardly budged and expect their central banks to eventually tame their hawkish view or rather be very gradual and gentle in their approach. For India, despite being in a relatively strong zone, Q2FY22 absolute GDP (at constant currency) is yet to cross levels 2 years ago. Besides, the pandemic has taught us about K-shaped recovery and while labour intensive sectors like construction & manufacturing after being penalized did recover strongly, challenges could come to the fore again. Besides, sectors such as Mining & quarrying as well as Hotels, transport and communication are yet to achieve Q4FY20 level, reveals an article from Live mint. Probably, these are the areas which constantly challenges policymakers and without proper confidence to grasp the challenges, it would be exceedingly difficult to predict the future. The scenario is best summed by RBI Governor, “Uncertainty is emerging as the only certainty with which central bankers will have to deal with in the period ahead.”
Quarterly GDP (Rs trillion) constant prices
Source: Livemint
35.7 35.6 36.138.3
27
3336.2
39
32.435.7
Jul-1
9
Sep-
19
Dec-
19
Mar
-20
Jun-
20
Sep-
20
Dec-
20
Mar
-21
Jun-
21
Sep-
21
Gross value added in some sectors is yet to cross pre-pandemic levelsjun-20 Sep-20 Dec-20 Mar-21 jun-21 Sep-21
Financial, real estate & professional services 121 124 105 105 125 134
Electricity, gas, water supply & other utility services 98 109 104 109 113 118
Public administration, defence and other services 78 88 97 102 83 103
Manufacturing 62 94 94 107 92 99
Construction 47 81 99 115 80 87
Trade, hotels, transport and communication 47 73 83 98 63 79
Agriculture, forestry & fishing 88 74 121 103 92 77
Mining & quarrying 71 63 76 94 84 72
Sectoral gross value added (GVA) relative to pre-pandemic (Q4FY20 GVA = 100)Note: 1. GVA (gross value added) in constant prices (2011-12 series). 2. Sectors arranged in descending order of September 2021 value. 3. GVA for agriculture is low in some quarters due to seasonality in production and marketing. However, agriculture was the only sector to show a positive GVA in 2020-21.
Source: Livemint
49 January 2022INSIGHT
At Ashika Capital, we are extremely passionate about fostering symbiotic relationships that are aimed at building and sustaining high-growth founder led businesses. We strongly believe that financial capital is the first stepping stone to build a scalable, sustainable and impactful business. Therefore, our endeavour is to identify great entrepreneurs in pursuit of building businesses that carry magnanimous investment potential. Here is an INSIGHT into businesses that we have worked/working with –
Start-up Corner
These are the top three business opportunities that interested stakeholders can pursue from an investment standpoint. If you are interested to know more about these companies from the perspective of business operations, investment thesis, exit opportunities and more, please drop in a line to us at [email protected].
FarmexFarmex is an Agrit-Tech startup that is working for small-holder farmers. Farmex has created a platform through which it engages with farmers to provide them with knowledge & data. They employ agro-entrepreneurs to collect soil, crop & other inputs through which
their proprietary platform assesses the risk of the farm. Based on this data, the platform also recommends the risk-mitigation steps that are required to be taken by the farmers which include recommendations on planning the farming process, type of seeds & fertilizers to be bought etc.
Started by Founders who have spent decades on ground working with farmers & having their work covered by World Bank, Bill & Melinda Gates Foundation etc, this start-up is creating large scale impact for 510 mn smallholder farmers globally by reducing their risks & increasing their revenues.
Since inception, they have been working with farmers not only in India but also in Africa & have entered into strategic partnerships with multiple stakeholders in India & Africa to create strong value for these small scale farmers. They are looking to raise $1 mn in a seed round.
Mr. Mihir Mehta
SnackibleSnackible - a one-stop destination for a health conscious consumer’s snacking needs.
Snackible, an online-first snacks brand markets a robust range of healthier, differentiated, and innovative snacking options predominantly through their own online portal. Identifying
a sheer lack of choice of healthy, nutritious and tasty snacks, Aditya Sanghavi conceptualised Snackible to solve everyone’s “snack life crisis” by providing snacks which are not only tasty but also that don’t punish one’s waistline.
The company is currently at an annualized revenue run-rate of approximately INR 14 Cr. and has created an omnichannel sales approach. In a month, Snackible fulfills more than 20,000 orders across both the brands Snackible & Dipsters.
Allern Enterprises Private Limited Allern is an enterprise born out of Mr. Mahesh Shetty’s vision and backed by a strong cumulative experience of over 100 years in the education segment. After having taught over 5 lac+ students in his four decade long stint, Mahesh Ji & his team have now created a
revolutionary platform that fuses technology in daily use books for students and provides a 24*7 teacher experience to the learning student.
Quick excerpts on the product & business -- One of its kind secure system to ensure that practice books, guide books etc. are digitally empowered with in-house content of over 40000+ videos
- A holistic business ecosystem that involves Allern, publishers, schools & the final consumers i.e. students
- Rapidly scalable PaaS platform with adequate entry barriers and adept management team
- Already working with some of India’s leading publisher houses like Chetna, Subhas etc.

50January 2022 INSIGHT
2021 equity MArket FLASHBACkThe year started on a wave of optimism with the start of the vaccination program and the sharp revival of the economy. However, the intensity of the second wave tempered some of this initial optimism. This was soon followed by the return of inflation, led primarily by supply chain disruptions. However, strong commitment on the part of central banks, both globally and domestically, towards ensuring strong revival in growth through the continuation of easy money policies saw liquidity remaining benign, fuelling strong inflows into financial markets and other risky assets. Multi-year low-interest rates, new generation reforms, adequate availability of capital and the revival of the real estate sector have created the framework for a multi-year earnings growth cycle.
As if wanting to be an antidote to the coronavirus pandemic, the Indian stock market adorned carnival robes in 2021 with a tsunami of liquidity unleashed by global central banks coupled with supportive domestic policies and the world’s largest vaccination drive sparking off a world-beating rally on Dalal Street, despite bouts of uneasiness over fizzy valuations. While the wider economy shuttled between recovery and relapse, dictated by multiple mutations of the virus, equity market benchmarks appeared headed in just one direction -- skywards. The dizzying upward journey has added a whopping Rs 72 lakh crore during 2021
to investors’ wealth, measured as the cumulative value of all listed shares in the country, taking it to nearly Rs 260 lakh crore.
The BSE Sensex made history this year by breaching the 50,000-mark for the first time ever, and went on to scale the 60,000 level within the next seven months. It closed at its lifetime high of 61,765.59 on October 18. Despite the year-end gyrations due to the Omicron threat, Sensex has posted returns of nearly 20% so far this year, eclipsing most of its global peers. However, Sensex is also the most expensive large market in the world, trading at a price-to-earnings
ratio of 27.11. But, the Indian market is not the only one witnessing such exuberance.
Global central banks, led by the US Federal Reserve, have pumped in trillions of dollars into the financial markets since the onset of the pandemic to boost liquidity and prop up growth. The US Fed has been buying bonds worth USD 120 every month for the past one-and-a-half years, nearly doubling its balance sheet to an astounding USD 8.3 trillion. This unprecedented sea of liquidity has induced what experts have termed the ‘everything bubble’ -- an across-the-board increase in asset prices, be it stocks, real estate or commodities, not to mention more exotic instruments like crypto-currencies and non-fungible tokens (NFTs).
With a tsunami of liquidity unleashed by global central banks coupled with supportive domestic policies and the world’s largest vaccination drive sparking off a world-beating rally on Dalal Street, despite bouts of uneasiness over fizzy valuations.
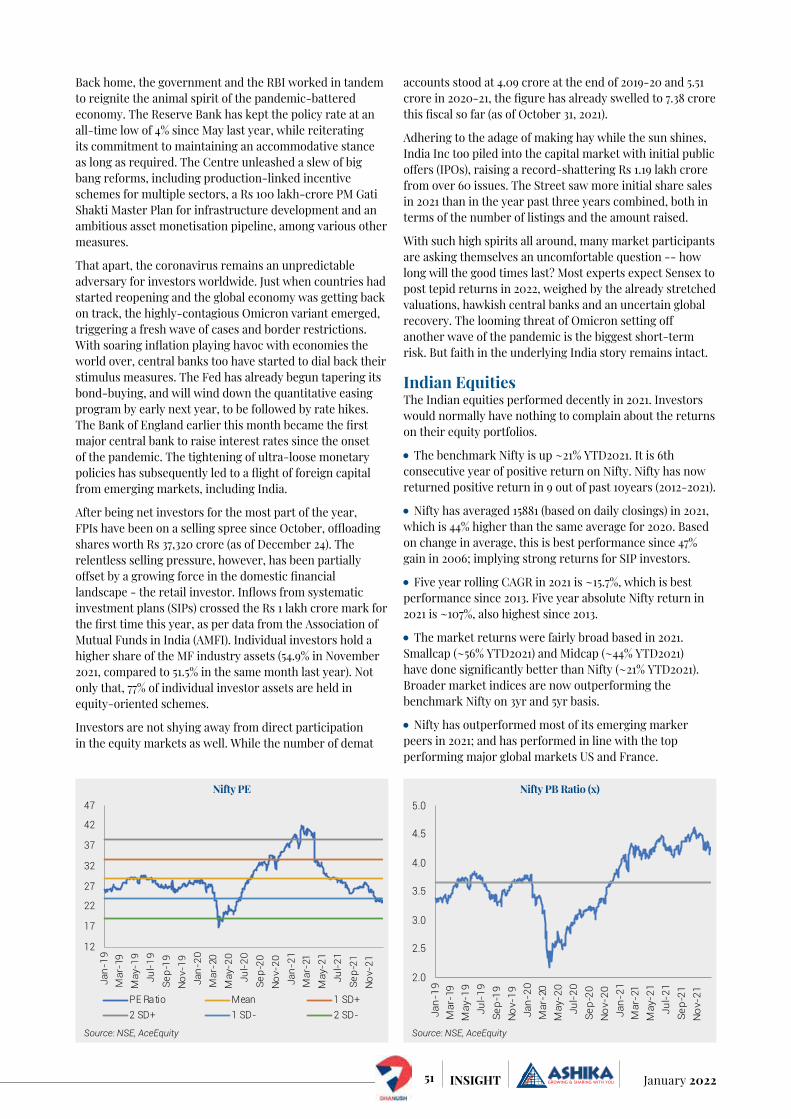
51 January 2022INSIGHT
Back home, the government and the RBI worked in tandem to reignite the animal spirit of the pandemic-battered economy. The Reserve Bank has kept the policy rate at an all-time low of 4% since May last year, while reiterating its commitment to maintaining an accommodative stance as long as required. The Centre unleashed a slew of big bang reforms, including production-linked incentive schemes for multiple sectors, a Rs 100 lakh-crore PM Gati Shakti Master Plan for infrastructure development and an ambitious asset monetisation pipeline, among various other measures.
That apart, the coronavirus remains an unpredictable adversary for investors worldwide. Just when countries had started reopening and the global economy was getting back on track, the highly-contagious Omicron variant emerged, triggering a fresh wave of cases and border restrictions. With soaring inflation playing havoc with economies the world over, central banks too have started to dial back their stimulus measures. The Fed has already begun tapering its bond-buying, and will wind down the quantitative easing program by early next year, to be followed by rate hikes. The Bank of England earlier this month became the first major central bank to raise interest rates since the onset of the pandemic. The tightening of ultra-loose monetary policies has subsequently led to a flight of foreign capital from emerging markets, including India.
After being net investors for the most part of the year, FPIs have been on a selling spree since October, offloading shares worth Rs 37,320 crore (as of December 24). The relentless selling pressure, however, has been partially offset by a growing force in the domestic financial landscape - the retail investor. Inflows from systematic investment plans (SIPs) crossed the Rs 1 lakh crore mark for the first time this year, as per data from the Association of Mutual Funds in India (AMFI). Individual investors hold a higher share of the MF industry assets (54.9% in November 2021, compared to 51.5% in the same month last year). Not only that, 77% of individual investor assets are held in equity-oriented schemes.
Investors are not shying away from direct participation in the equity markets as well. While the number of demat
accounts stood at 4.09 crore at the end of 2019-20 and 5.51 crore in 2020-21, the figure has already swelled to 7.38 crore this fiscal so far (as of October 31, 2021).
Adhering to the adage of making hay while the sun shines, India Inc too piled into the capital market with initial public offers (IPOs), raising a record-shattering Rs 1.19 lakh crore from over 60 issues. The Street saw more initial share sales in 2021 than in the year past three years combined, both in terms of the number of listings and the amount raised.
With such high spirits all around, many market participants are asking themselves an uncomfortable question -- how long will the good times last? Most experts expect Sensex to post tepid returns in 2022, weighed by the already stretched valuations, hawkish central banks and an uncertain global recovery. The looming threat of Omicron setting off another wave of the pandemic is the biggest short-term risk. But faith in the underlying India story remains intact.
Indian EquitiesThe Indian equities performed decently in 2021. Investors would normally have nothing to complain about the returns on their equity portfolios.
The benchmark Nifty is up ~21% YTD2021. It is 6th consecutive year of positive return on Nifty. Nifty has now returned positive return in 9 out of past 10years (2012-2021).
Nifty has averaged 15881 (based on daily closings) in 2021, which is 44% higher than the same average for 2020. Based on change in average, this is best performance since 47% gain in 2006; implying strong returns for SIP investors.
Five year rolling CAGR in 2021 is ~15.7%, which is best performance since 2013. Five year absolute Nifty return in 2021 is ~107%, also highest since 2013.
The market returns were fairly broad based in 2021. Smallcap (~56% YTD2021) and Midcap (~44% YTD2021) have done significantly better than Nifty (~21% YTD2021). Broader market indices are now outperforming the benchmark Nifty on 3yr and 5yr basis.
Nifty has outperformed most of its emerging marker peers in 2021; and has performed in line with the top performing major global markets US and France.
Nifty PE
Source: NSE, AceEquity
12
17
22
27
32
37
42
47
Jan-
19M
ar-1
9M
ay-1
9Ju
l-19
Sep-
19N
ov-1
9Ja
n-20
Mar
-20
May
-20
Jul-2
0Se
p-20
Nov
-20
Jan-
21M
ar-2
1M
ay-2
1Ju
l-21
Sep-
21N
ov-2
1
PE Ratio Mean 1 SD+2 SD+ 1 SD- 2 SD-
Nifty PB Ratio (x)
Source: NSE, AceEquity
2.0
2.5
3.0
3.5
4.0
4.5
5.0
Jan-
19M
ar-1
9M
ay-1
9Ju
l-19
Sep-
19N
ov-1
9Ja
n-20
Mar
-20
May
-20
Jul-2
0Se
p-20
Nov
-20
Jan-
21M
ar-2
1M
ay-2
1Ju
l-21
Sep-
21N
ov-2
1
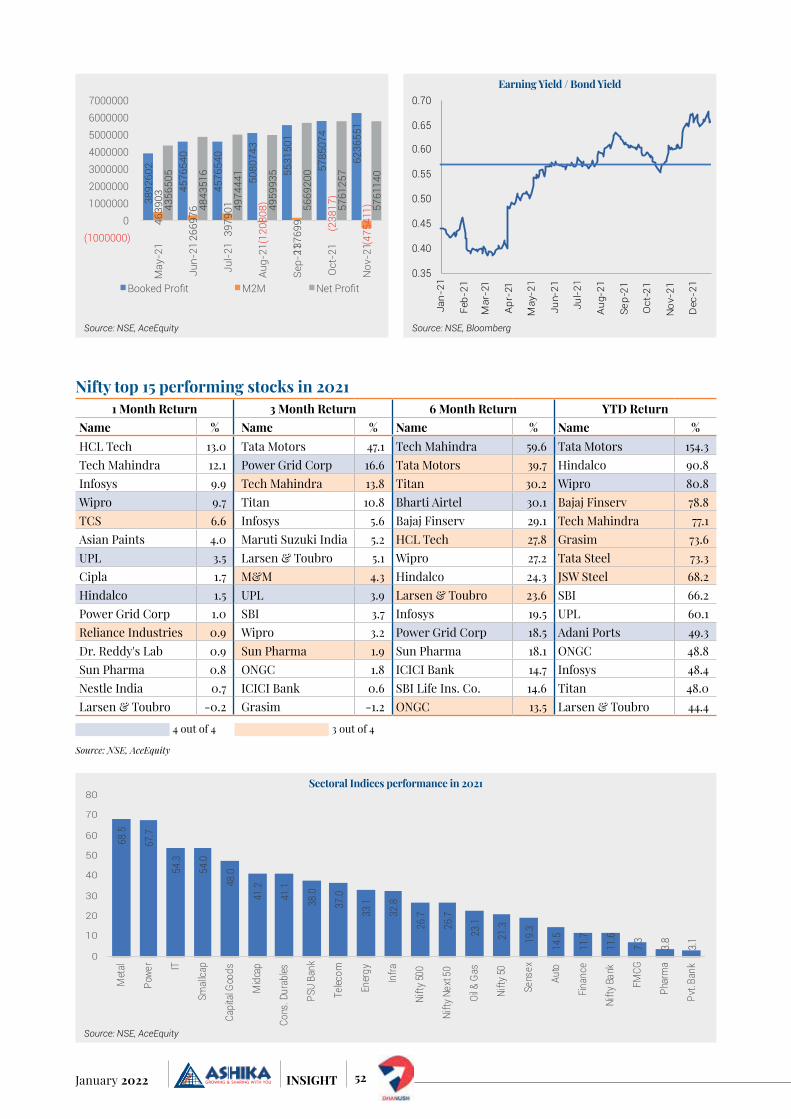
52January 2022 INSIGHT
Source: NSE, AceEquity
3892
602
4576
540
4576
540
5080
743
5531
501
5785
074
6236
551
4639
03
2669
76
3979
01
(120
808)
1376
99
(238
17)
(475
411)
4356
505
4843
516
4974
441
4959
935
5669
200
5761
257
5761
140
(1000000) 0
1000000 2000000 3000000 4000000 5000000 6000000 7000000
May
-21
Jun-
21
Jul-
21
Aug-
21
Sep-
21
Oct
-21
Nov
-21
Booked Profit M2M Net Profit
Earning Yield / Bond Yield
Source: NSE, Bloomberg
0.35
0.40
0.45
0.50
0.55
0.60
0.65
0.70
Jan-
21
Feb-
21
Mar
-21
Apr
-21
May
-21
Jun-
21
Jul-2
1
Aug
-21
Sep-
21
Oct
-21
Nov
-21
Dec
-21
Nifty top 15 performing stocks in 20211 Month Return 3 Month Return 6 Month Return YTD Return
Name % Name % Name % Name %HCL Tech 13.0 Tata Motors 47.1 Tech Mahindra 59.6 Tata Motors 154.3Tech Mahindra 12.1 Power Grid Corp 16.6 Tata Motors 39.7 Hindalco 90.8Infosys 9.9 Tech Mahindra 13.8 Titan 30.2 Wipro 80.8Wipro 9.7 Titan 10.8 Bharti Airtel 30.1 Bajaj Finserv 78.8TCS 6.6 Infosys 5.6 Bajaj Finserv 29.1 Tech Mahindra 77.1Asian Paints 4.0 Maruti Suzuki India 5.2 HCL Tech 27.8 Grasim 73.6UPL 3.5 Larsen & Toubro 5.1 Wipro 27.2 Tata Steel 73.3Cipla 1.7 M&M 4.3 Hindalco 24.3 JSW Steel 68.2Hindalco 1.5 UPL 3.9 Larsen & Toubro 23.6 SBI 66.2Power Grid Corp 1.0 SBI 3.7 Infosys 19.5 UPL 60.1Reliance Industries 0.9 Wipro 3.2 Power Grid Corp 18.5 Adani Ports 49.3Dr. Reddy's Lab 0.9 Sun Pharma 1.9 Sun Pharma 18.1 ONGC 48.8Sun Pharma 0.8 ONGC 1.8 ICICI Bank 14.7 Infosys 48.4Nestle India 0.7 ICICI Bank 0.6 SBI Life Ins. Co. 14.6 Titan 48.0Larsen & Toubro -0.2 Grasim -1.2 ONGC 13.5 Larsen & Toubro 44.4
Source: NSE, AceEquity
4 out of 4 3 out of 4
68.5
67.7
54.3
54.0
48.0
41.2
41.1
38.0
37.0
33.1
32.8
26.7
26.7
23.1
21.3
19.3
14.5
11.7
11.6
7.3
3.8
3.1
0
10
20
30
40
50
60
70
80
Met
al
Powe
r IT
Smal
lcap
Capi
tal G
oods
Mid
cap
Cons
. Dur
ables
PSU
Bank
Telec
om
Ener
gy
Infra
Nifty
500
Nifty
Nex
t 50
Oil &
Gas
Nifty
50
Sens
ex
Auto
Finan
ce
Nifty
Ban
k
FMCG
Phar
ma
Pvt. B
ank
Sectoral Indices performance in 2021
Source: NSE, AceEquity
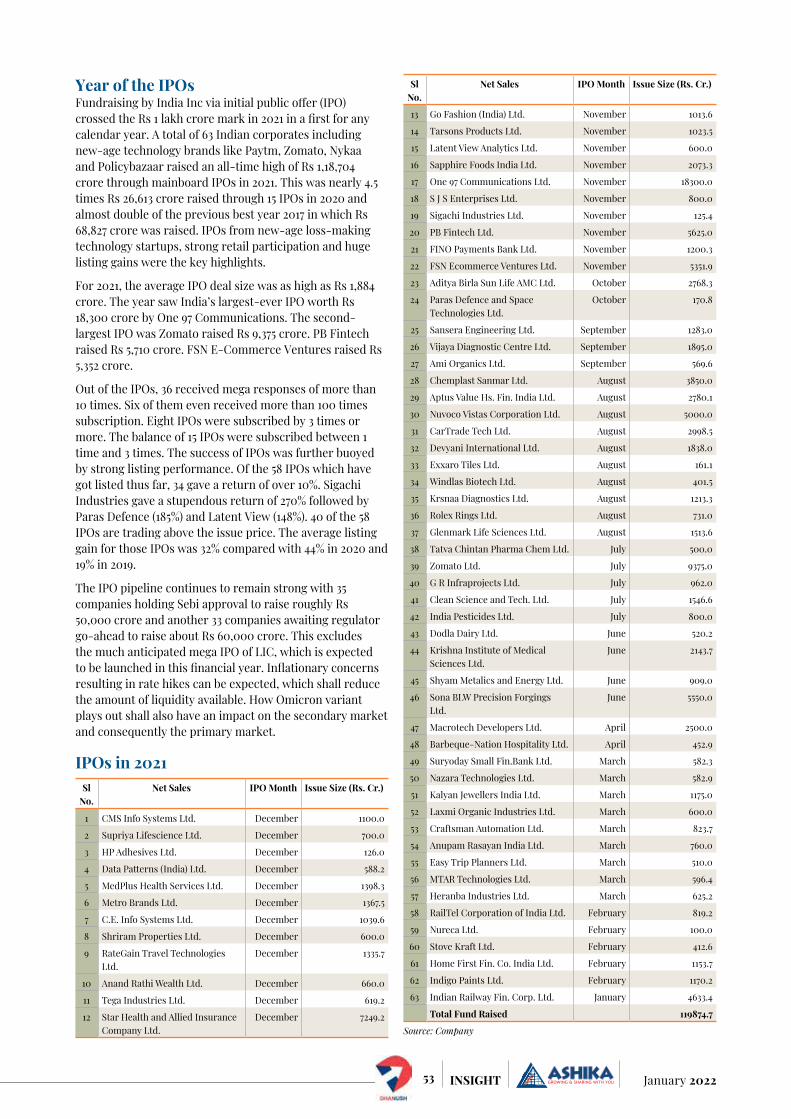
53 January 2022INSIGHT
Year of the IPOsFundraising by India Inc via initial public offer (IPO) crossed the Rs 1 lakh crore mark in 2021 in a first for any calendar year. A total of 63 Indian corporates including new-age technology brands like Paytm, Zomato, Nykaa and Policybazaar raised an all-time high of Rs 1,18,704 crore through mainboard IPOs in 2021. This was nearly 4.5 times Rs 26,613 crore raised through 15 IPOs in 2020 and almost double of the previous best year 2017 in which Rs 68,827 crore was raised. IPOs from new-age loss-making technology startups, strong retail participation and huge listing gains were the key highlights.
For 2021, the average IPO deal size was as high as Rs 1,884 crore. The year saw India’s largest-ever IPO worth Rs 18,300 crore by One 97 Communications. The second-largest IPO was Zomato raised Rs 9,375 crore. PB Fintech raised Rs 5,710 crore. FSN E-Commerce Ventures raised Rs 5,352 crore.
Out of the IPOs, 36 received mega responses of more than 10 times. Six of them even received more than 100 times subscription. Eight IPOs were subscribed by 3 times or more. The balance of 15 IPOs were subscribed between 1 time and 3 times. The success of IPOs was further buoyed by strong listing performance. Of the 58 IPOs which have got listed thus far, 34 gave a return of over 10%. Sigachi Industries gave a stupendous return of 270% followed by Paras Defence (185%) and Latent View (148%). 40 of the 58 IPOs are trading above the issue price. The average listing gain for those IPOs was 32% compared with 44% in 2020 and 19% in 2019.
The IPO pipeline continues to remain strong with 35 companies holding Sebi approval to raise roughly Rs 50,000 crore and another 33 companies awaiting regulator go-ahead to raise about Rs 60,000 crore. This excludes the much anticipated mega IPO of LIC, which is expected to be launched in this financial year. Inflationary concerns resulting in rate hikes can be expected, which shall reduce the amount of liquidity available. How Omicron variant plays out shall also have an impact on the secondary market and consequently the primary market.
IPOs in 2021Sl
No.Net Sales IPO Month Issue Size (Rs. Cr.)
1 CMS Info Systems Ltd. December 1100.0
2 Supriya Lifescience Ltd. December 700.0
3 HP Adhesives Ltd. December 126.0
4 Data Patterns (India) Ltd. December 588.2
5 MedPlus Health Services Ltd. December 1398.3
6 Metro Brands Ltd. December 1367.5
7 C.E. Info Systems Ltd. December 1039.6
8 Shriram Properties Ltd. December 600.0
9 RateGain Travel Technologies Ltd.
December 1335.7
10 Anand Rathi Wealth Ltd. December 660.0
11 Tega Industries Ltd. December 619.2
12 Star Health and Allied Insurance Company Ltd.
December 7249.2
Sl No.
Net Sales IPO Month Issue Size (Rs. Cr.)
13 Go Fashion (India) Ltd. November 1013.6
14 Tarsons Products Ltd. November 1023.5
15 Latent View Analytics Ltd. November 600.0
16 Sapphire Foods India Ltd. November 2073.3
17 One 97 Communications Ltd. November 18300.0
18 S J S Enterprises Ltd. November 800.0
19 Sigachi Industries Ltd. November 125.4
20 PB Fintech Ltd. November 5625.0
21 FINO Payments Bank Ltd. November 1200.3
22 FSN Ecommerce Ventures Ltd. November 5351.9
23 Aditya Birla Sun Life AMC Ltd. October 2768.3
24 Paras Defence and Space Technologies Ltd.
October 170.8
25 Sansera Engineering Ltd. September 1283.0
26 Vijaya Diagnostic Centre Ltd. September 1895.0
27 Ami Organics Ltd. September 569.6
28 Chemplast Sanmar Ltd. August 3850.0
29 Aptus Value Hs. Fin. India Ltd. August 2780.1
30 Nuvoco Vistas Corporation Ltd. August 5000.0
31 CarTrade Tech Ltd. August 2998.5
32 Devyani International Ltd. August 1838.0
33 Exxaro Tiles Ltd. August 161.1
34 Windlas Biotech Ltd. August 401.5
35 Krsnaa Diagnostics Ltd. August 1213.3
36 Rolex Rings Ltd. August 731.0
37 Glenmark Life Sciences Ltd. August 1513.6
38 Tatva Chintan Pharma Chem Ltd. July 500.0
39 Zomato Ltd. July 9375.0
40 G R Infraprojects Ltd. July 962.0
41 Clean Science and Tech. Ltd. July 1546.6
42 India Pesticides Ltd. July 800.0
43 Dodla Dairy Ltd. June 520.2
44 Krishna Institute of Medical Sciences Ltd.
June 2143.7
45 Shyam Metalics and Energy Ltd. June 909.0
46 Sona BLW Precision Forgings Ltd.
June 5550.0
47 Macrotech Developers Ltd. April 2500.0
48 Barbeque-Nation Hospitality Ltd. April 452.9
49 Suryoday Small Fin.Bank Ltd. March 582.3
50 Nazara Technologies Ltd. March 582.9
51 Kalyan Jewellers India Ltd. March 1175.0
52 Laxmi Organic Industries Ltd. March 600.0
53 Craftsman Automation Ltd. March 823.7
54 Anupam Rasayan India Ltd. March 760.0
55 Easy Trip Planners Ltd. March 510.0
56 MTAR Technologies Ltd. March 596.4
57 Heranba Industries Ltd. March 625.2
58 RailTel Corporation of India Ltd. February 819.2
59 Nureca Ltd. February 100.0
60 Stove Kraft Ltd. February 412.6
61 Home First Fin. Co. India Ltd. February 1153.7
62 Indigo Paints Ltd. February 1170.2
63 Indian Railway Fin. Corp. Ltd. January 4633.4
Total Fund Raised 119874.7
Source: Company
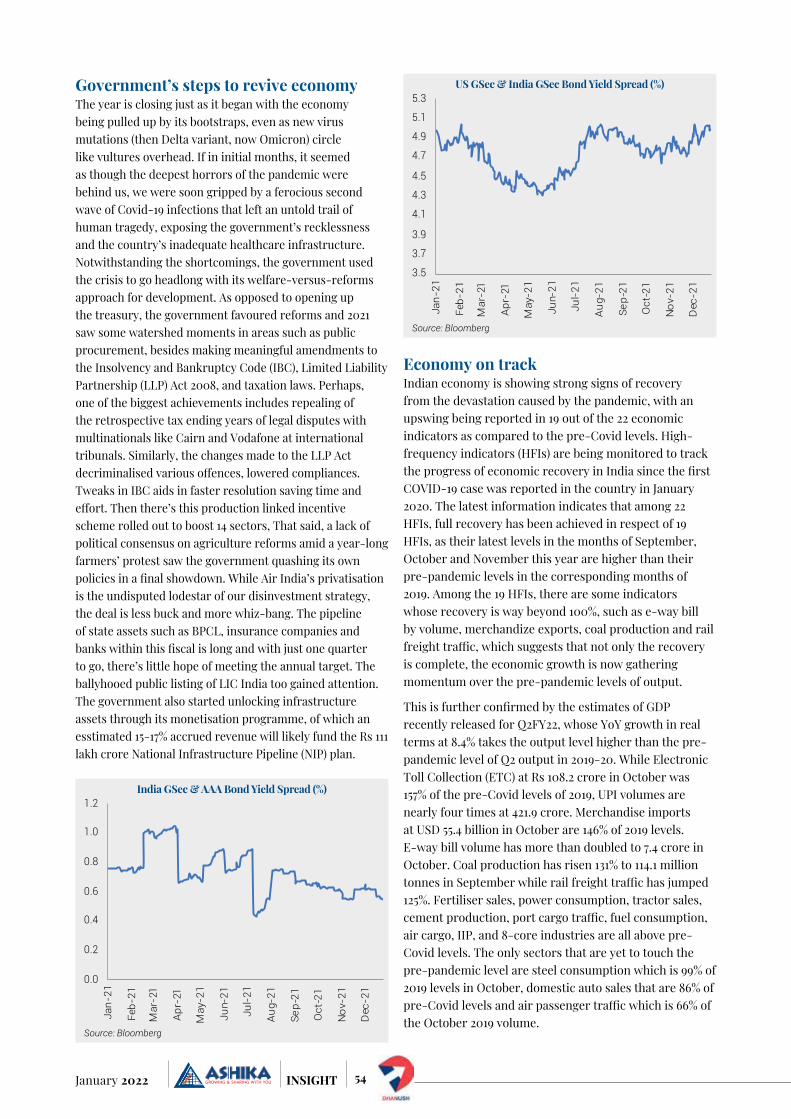
54January 2022 INSIGHT
Government’s steps to revive economyThe year is closing just as it began with the economy being pulled up by its bootstraps, even as new virus mutations (then Delta variant, now Omicron) circle like vultures overhead. If in initial months, it seemed as though the deepest horrors of the pandemic were behind us, we were soon gripped by a ferocious second wave of Covid-19 infections that left an untold trail of human tragedy, exposing the government’s recklessness and the country’s inadequate healthcare infrastructure. Notwithstanding the shortcomings, the government used the crisis to go headlong with its welfare-versus-reforms approach for development. As opposed to opening up the treasury, the government favoured reforms and 2021 saw some watershed moments in areas such as public procurement, besides making meaningful amendments to the Insolvency and Bankruptcy Code (IBC), Limited Liability Partnership (LLP) Act 2008, and taxation laws. Perhaps, one of the biggest achievements includes repealing of the retrospective tax ending years of legal disputes with multinationals like Cairn and Vodafone at international tribunals. Similarly, the changes made to the LLP Act decriminalised various offences, lowered compliances. Tweaks in IBC aids in faster resolution saving time and effort. Then there’s this production linked incentive scheme rolled out to boost 14 sectors, That said, a lack of political consensus on agriculture reforms amid a year-long farmers’ protest saw the government quashing its own policies in a final showdown. While Air India’s privatisation is the undisputed lodestar of our disinvestment strategy, the deal is less buck and more whiz-bang. The pipeline of state assets such as BPCL, insurance companies and banks within this fiscal is long and with just one quarter to go, there’s little hope of meeting the annual target. The ballyhooed public listing of LIC India too gained attention. The government also started unlocking infrastructure assets through its monetisation programme, of which an esstimated 15-17% accrued revenue will likely fund the Rs 111 lakh crore National Infrastructure Pipeline (NIP) plan.
Economy on trackIndian economy is showing strong signs of recovery from the devastation caused by the pandemic, with an upswing being reported in 19 out of the 22 economic indicators as compared to the pre-Covid levels. High-frequency indicators (HFIs) are being monitored to track the progress of economic recovery in India since the first COVID-19 case was reported in the country in January 2020. The latest information indicates that among 22 HFIs, full recovery has been achieved in respect of 19 HFIs, as their latest levels in the months of September, October and November this year are higher than their pre-pandemic levels in the corresponding months of 2019. Among the 19 HFIs, there are some indicators whose recovery is way beyond 100%, such as e-way bill by volume, merchandize exports, coal production and rail freight traffic, which suggests that not only the recovery is complete, the economic growth is now gathering momentum over the pre-pandemic levels of output.
This is further confirmed by the estimates of GDP recently released for Q2FY22, whose YoY growth in real terms at 8.4% takes the output level higher than the pre-pandemic level of Q2 output in 2019-20. While Electronic Toll Collection (ETC) at Rs 108.2 crore in October was 157% of the pre-Covid levels of 2019, UPI volumes are nearly four times at 421.9 crore. Merchandise imports at USD 55.4 billion in October are 146% of 2019 levels. E-way bill volume has more than doubled to 7.4 crore in October. Coal production has risen 131% to 114.1 million tonnes in September while rail freight traffic has jumped 125%. Fertiliser sales, power consumption, tractor sales, cement production, port cargo traffic, fuel consumption, air cargo, IIP, and 8-core industries are all above pre-Covid levels. The only sectors that are yet to touch the pre-pandemic level are steel consumption which is 99% of 2019 levels in October, domestic auto sales that are 86% of pre-Covid levels and air passenger traffic which is 66% of the October 2019 volume.
India GSec & AAA Bond Yield Spread (%)
Source: Bloomberg
0.0
0.2
0.4
0.6
0.8
1.0
1.2
Jan-
21
Feb-
21
Mar
-21
Apr-
21
May
-21
Jun-
21
Jul-2
1
Aug-
21
Sep-
21
Oct
-21
Nov
-21
Dec
-21
US GSec & India GSec Bond Yield Spread (%)
Source: Bloomberg
3.5
3.7
3.9
4.1
4.3
4.5
4.7
4.9
5.1
5.3
Jan-
21
Feb-
21
Mar
-21
Apr
-21
May
-21
Jun-
21
Jul-2
1
Aug
-21
Sep-
21
Oct
-21
Nov
-21
Dec
-21
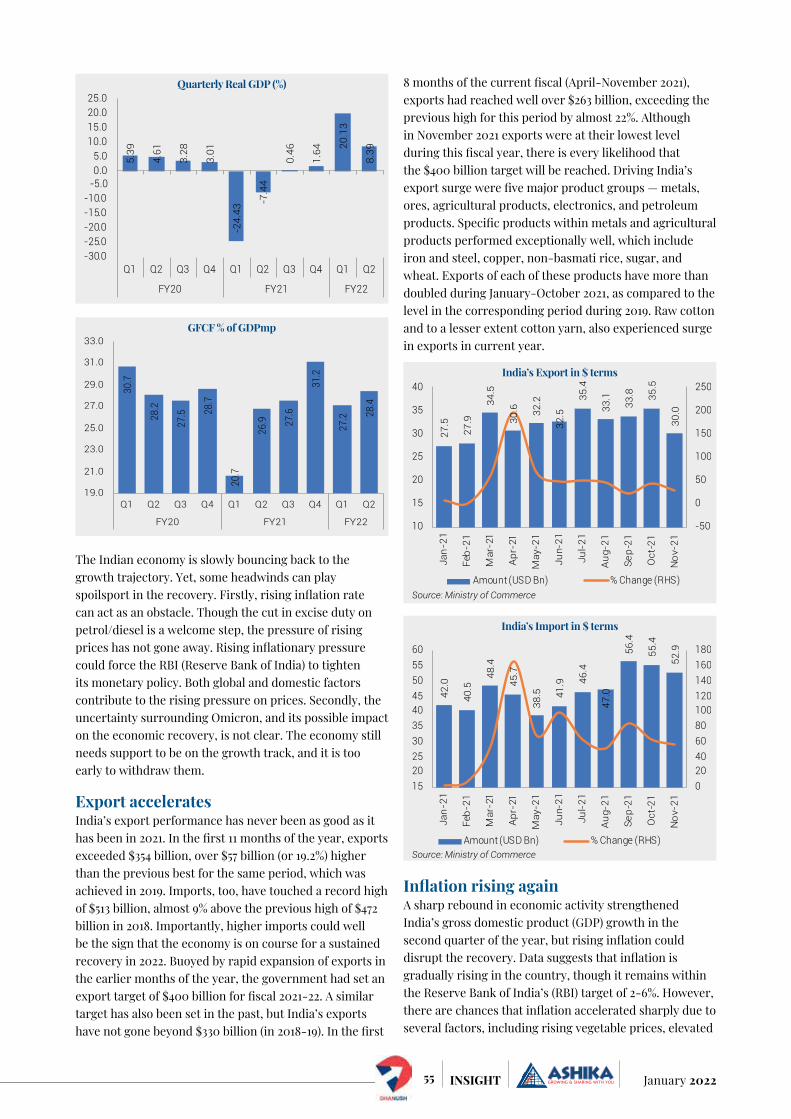
55 January 2022INSIGHT
The Indian economy is slowly bouncing back to the growth trajectory. Yet, some headwinds can play spoilsport in the recovery. Firstly, rising inflation rate can act as an obstacle. Though the cut in excise duty on petrol/diesel is a welcome step, the pressure of rising prices has not gone away. Rising inflationary pressure could force the RBI (Reserve Bank of India) to tighten its monetary policy. Both global and domestic factors contribute to the rising pressure on prices. Secondly, the uncertainty surrounding Omicron, and its possible impact on the economic recovery, is not clear. The economy still needs support to be on the growth track, and it is too early to withdraw them.
Export acceleratesIndia’s export performance has never been as good as it has been in 2021. In the first 11 months of the year, exports exceeded $354 billion, over $57 billion (or 19.2%) higher than the previous best for the same period, which was achieved in 2019. Imports, too, have touched a record high of $513 billion, almost 9% above the previous high of $472 billion in 2018. Importantly, higher imports could well be the sign that the economy is on course for a sustained recovery in 2022. Buoyed by rapid expansion of exports in the earlier months of the year, the government had set an export target of $400 billion for fiscal 2021-22. A similar target has also been set in the past, but India’s exports have not gone beyond $330 billion (in 2018-19). In the first
8 months of the current fiscal (April-November 2021), exports had reached well over $263 billion, exceeding the previous high for this period by almost 22%. Although in November 2021 exports were at their lowest level during this fiscal year, there is every likelihood that the $400 billion target will be reached. Driving India’s export surge were five major product groups — metals, ores, agricultural products, electronics, and petroleum products. Specific products within metals and agricultural products performed exceptionally well, which include iron and steel, copper, non-basmati rice, sugar, and wheat. Exports of each of these products have more than doubled during January-October 2021, as compared to the level in the corresponding period during 2019. Raw cotton and to a lesser extent cotton yarn, also experienced surge in exports in current year.
Inflation rising againA sharp rebound in economic activity strengthened India’s gross domestic product (GDP) growth in the second quarter of the year, but rising inflation could disrupt the recovery. Data suggests that inflation is gradually rising in the country, though it remains within the Reserve Bank of India’s (RBI) target of 2-6%. However, there are chances that inflation accelerated sharply due to several factors, including rising vegetable prices, elevated
Quarterly Real GDP (%)
5.39
4.61
3.28
3.01
-24.
43
-7.4
4
0.46
1.64 20
.13
8.39
-30.0-25.0-20.0-15.0-10.0
-5.00.05.0
10.015.020.025.0
Q1 Q2 Q3 Q4 Q1 Q2 Q3 Q4 Q1 Q2
FY20 FY21 FY22
GFCF % of GDPmp
30.7
28.2
27.5 28
.7
20.7
26.9 27
.6
31.2
27.2 28
.4
19.0
21.0
23.0
25.0
27.0
29.0
31.0
33.0
Q1 Q2 Q3 Q4 Q1 Q2 Q3 Q4 Q1 Q2
FY20 FY21 FY22
India’s Export in $ terms
Source: Ministry of Commerce
27.5
27.9
34.5
30.6 32
.2
32.5
35.4
33.1
33.8 35
.5
30.0
-50
0
50
100
150
200
250
10
15
20
25
30
35
40
Jan-
21
Feb-
21
Mar
-21
Apr
-21
May
-21
Jun-
21
Jul-2
1
Aug
-21
Sep-
21
Oct
-21
Nov
-21
Amount (USD Bn) % Change (RHS)
India’s Import in $ terms
Source: Ministry of Commerce
42.0
40.5
48.4
45.7
38.5 41
.9 46.4
47.0
56.4
55.4
52.9
020406080100120140160180
15202530354045505560
Jan-
21
Feb-
21
Mar
-21
Apr
-21
May
-21
Jun-
21
Jul-2
1
Aug
-21
Sep-
21
Oct
-21
Nov
-21
Amount (USD Bn) % Change (RHS)

56January 2022 INSIGHT
fuel costs and rising input costs for companies. While vegetable prices and fuel demand may fade away over the next few months, India could face a period of persistently high inflation due to rising input costs. Many companies across the spectrum from automakers to electronic goods manufacturers have hiked prices of their products due to prolonged disruption in global supply chains and severe shortage of semiconductors. Car manufacturers are already going for another round of price hikes in January 2022. Simply put, rising inflation in the non-food category, arising from global supply chain disruptions and fresh restrictions due to the new Omicron variant of coronavirus, seem to be the biggest hurdle in the path of swift economic recovery.
USD/INR range-boundOmicron worries, higher inflation and expectations of tighter monetary policies globally were the key factors that led to a sharp depreciation of the INR against the USD. Moreover, the recent selling of Indian equities by FPIs has added to downward pressure on the INR. Amid rising global headwinds, it is expected that the INR to continue to trade with a downward bias in the near term. However, a combination of the improved fiscal position, healthy foreign exchange reserves and a surplus balance-of payments position should protect the
significant downside. Thus, the performance of USD/INR is expected to be range-bound over the medium term.
Precious metals lacked momentumPrecious metals like gold and silver began to weaken towards the end of 2020, and thus, right from the beginning of 2021, they lacked momentum. A key reason was a change in investor sentiment. “As vaccination cover increased and the global economy limped back to normalcy post the Covid disruptions, risk-on of investors drove assets like equities up, even as gold prices softened from their life-time highs of 2020,” says PR Somasundaram, President, World Gold Council (WGC), India. Precious metals were further impacted by the rising dollar on the back of the expectation of the US Fed tapering measures and the start of interest rate upcycle. In contrast, gold was not supported by fundamental factors. Investment demand — which drove the price in the preceding two years — saw a slump in 2021. According to WGC data, investment demand in 2021 (first three quarters) stood at 700 tonnes, a drop of about 38% y-o-y. Precious metals are likely to stay positive in the next year. Rising expectations of inflation and uncertainty about interest rate across the globe will continue to support gold price. Moreover, strategic investors have not really moved out of gold and the long-term upward momentum continues to stay.
CPI Inflation (%)
Source: MOSPI
4.1
5.0
5.5
4.2
6.3 6.3
5.65.3
4.34.5
4.9
4.0
4.5
5.0
5.5
6.0
6.5
7.0
Jan-
21
Feb-
21
Mar
-21
Apr-
21
May
-21
Jun-
21
Jul-2
1
Aug-
21
Sep-
21
Oct
-21
Nov-
21
WPI Inflation (%)
Source: Economic Adviser
2.5 4.
8
7.9
10.7
13.1
12.1
11.6
11.6
11.8 12
.5 14.2
0
2
4
6
8
10
12
14
16
Jan-
21
Feb-
21
Mar
-21
Apr-
21
May
-21
Jun-
21
Jul-2
1
Aug-
21
Sep-
21
Oct
-21
Nov-
21
INR performance against USD in 2021
Source: Bloomberg
72
73
73
74
74
75
75
76
76
77
Jan-
21
Feb-
21
Mar
-21
Apr-
21
May
-21
Jun-
21
Jul-2
1
Aug-
21
Sep-
21
Oct-2
1
Nov-
21
Dec-
21
Gold price trend in 2021 (USD per Oz)
Source: Bloomberg
1650
1700
1750
1800
1850
1900
1950
2000
Jan-
21
Feb-
21
Mar
-21
Apr-
21
May
-21
Jun-
21
Jul-2
1
Aug-
21
Sep-
21
Oct
-21
Nov-
21
Dec
-21
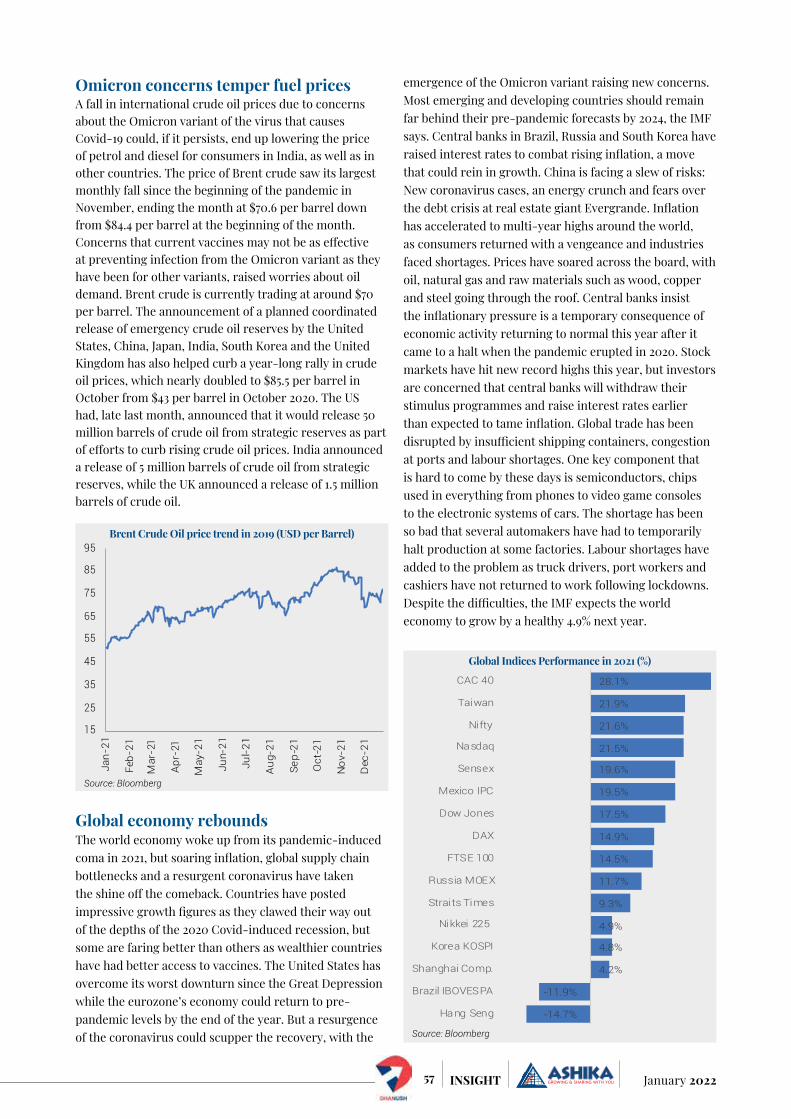
57 January 2022INSIGHT
Omicron concerns temper fuel pricesA fall in international crude oil prices due to concerns about the Omicron variant of the virus that causes Covid-19 could, if it persists, end up lowering the price of petrol and diesel for consumers in India, as well as in other countries. The price of Brent crude saw its largest monthly fall since the beginning of the pandemic in November, ending the month at $70.6 per barrel down from $84.4 per barrel at the beginning of the month. Concerns that current vaccines may not be as effective at preventing infection from the Omicron variant as they have been for other variants, raised worries about oil demand. Brent crude is currently trading at around $70 per barrel. The announcement of a planned coordinated release of emergency crude oil reserves by the United States, China, Japan, India, South Korea and the United Kingdom has also helped curb a year-long rally in crude oil prices, which nearly doubled to $85.5 per barrel in October from $43 per barrel in October 2020. The US had, late last month, announced that it would release 50 million barrels of crude oil from strategic reserves as part of efforts to curb rising crude oil prices. India announced a release of 5 million barrels of crude oil from strategic reserves, while the UK announced a release of 1.5 million barrels of crude oil.
Global economy reboundsThe world economy woke up from its pandemic-induced coma in 2021, but soaring inflation, global supply chain bottlenecks and a resurgent coronavirus have taken the shine off the comeback. Countries have posted impressive growth figures as they clawed their way out of the depths of the 2020 Covid-induced recession, but some are faring better than others as wealthier countries have had better access to vaccines. The United States has overcome its worst downturn since the Great Depression while the eurozone’s economy could return to pre-pandemic levels by the end of the year. But a resurgence of the coronavirus could scupper the recovery, with the
emergence of the Omicron variant raising new concerns. Most emerging and developing countries should remain far behind their pre-pandemic forecasts by 2024, the IMF says. Central banks in Brazil, Russia and South Korea have raised interest rates to combat rising inflation, a move that could rein in growth. China is facing a slew of risks: New coronavirus cases, an energy crunch and fears over the debt crisis at real estate giant Evergrande. Inflation has accelerated to multi-year highs around the world, as consumers returned with a vengeance and industries faced shortages. Prices have soared across the board, with oil, natural gas and raw materials such as wood, copper and steel going through the roof. Central banks insist the inflationary pressure is a temporary consequence of economic activity returning to normal this year after it came to a halt when the pandemic erupted in 2020. Stock markets have hit new record highs this year, but investors are concerned that central banks will withdraw their stimulus programmes and raise interest rates earlier than expected to tame inflation. Global trade has been disrupted by insufficient shipping containers, congestion at ports and labour shortages. One key component that is hard to come by these days is semiconductors, chips used in everything from phones to video game consoles to the electronic systems of cars. The shortage has been so bad that several automakers have had to temporarily halt production at some factories. Labour shortages have added to the problem as truck drivers, port workers and cashiers have not returned to work following lockdowns. Despite the difficulties, the IMF expects the world economy to grow by a healthy 4.9% next year.
Brent Crude Oil price trend in 2019 (USD per Barrel)
Source: Bloomberg
15
25
35
45
55
65
75
85
95
Jan-
21
Feb-
21
Mar
-21
Apr
-21
May
-21
Jun-
21
Jul-2
1
Aug
-21
Sep-
21
Oct
-21
Nov
-21
Dec
-21
Global Indices Performance in 2021 (%)
Source: Bloomberg
-14.7%
-11.9%
4.2%
4.8%
4.9%
9.3%
11.7%
14.5%
14.9%
17.5%
19.5%
19.6%
21.5%
21.6%
21.9%
28.1%
Hang Seng
Brazil IBOVESPA
Shanghai Comp.
Korea KOSPI
Nikkei 225
Straits Times
Russia MOEX
FTSE 100
DAX
Dow Jones
Mexico IPC
Sensex
Nasdaq
Nifty
Taiwan
CAC 40
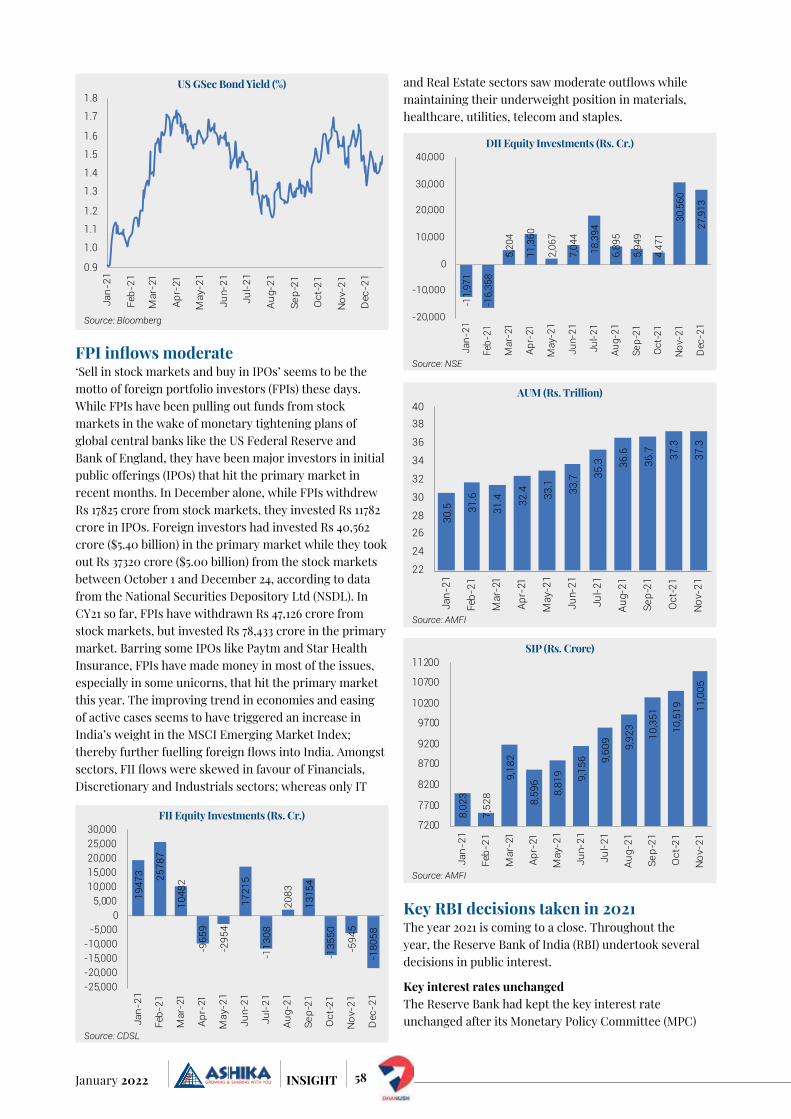
58January 2022 INSIGHT
FPI inflows moderate‘Sell in stock markets and buy in IPOs’ seems to be the motto of foreign portfolio investors (FPIs) these days. While FPIs have been pulling out funds from stock markets in the wake of monetary tightening plans of global central banks like the US Federal Reserve and Bank of England, they have been major investors in initial public offerings (IPOs) that hit the primary market in recent months. In December alone, while FPIs withdrew Rs 17825 crore from stock markets, they invested Rs 11782 crore in IPOs. Foreign investors had invested Rs 40,562 crore ($5.40 billion) in the primary market while they took out Rs 37320 crore ($5.00 billion) from the stock markets between October 1 and December 24, according to data from the National Securities Depository Ltd (NSDL). In CY21 so far, FPIs have withdrawn Rs 47,126 crore from stock markets, but invested Rs 78,433 crore in the primary market. Barring some IPOs like Paytm and Star Health Insurance, FPIs have made money in most of the issues, especially in some unicorns, that hit the primary market this year. The improving trend in economies and easing of active cases seems to have triggered an increase in India’s weight in the MSCI Emerging Market Index; thereby further fuelling foreign flows into India. Amongst sectors, FII flows were skewed in favour of Financials, Discretionary and Industrials sectors; whereas only IT
and Real Estate sectors saw moderate outflows while maintaining their underweight position in materials, healthcare, utilities, telecom and staples.
Key RBI decisions taken in 2021The year 2021 is coming to a close. Throughout the year, the Reserve Bank of India (RBI) undertook several decisions in public interest.
Key interest rates unchangedThe Reserve Bank had kept the key interest rate unchanged after its Monetary Policy Committee (MPC)
US GSec Bond Yield (%)
Source: Bloomberg
0.9
1.0
1.1
1.2
1.3
1.4
1.5
1.6
1.7
1.8Ja
n-21
Feb-
21
Mar
-21
Apr
-21
May
-21
Jun-
21
Jul-2
1
Aug
-21
Sep-
21
Oct
-21
Nov
-21
Dec
-21
FII Equity Investments (Rs. Cr.)
Source: CDSL
1947
3 2578
7
1048
2
-965
9
-295
4
1721
5
-113
08
2083
1315
4
-135
50
-594
5
-180
58
-25,000-20,000-15,000-10,000
-5,0000
5,00010,00015,00020,00025,00030,000
Jan-
21
Feb-
21
Mar
-21
Apr
-21
May
-21
Jun-
21
Jul-2
1
Aug
-21
Sep-
21
Oct
-21
Nov
-21
Dec
-21
DII Equity Investments (Rs. Cr.)
Source: NSE
-11,
971
-16,
358
5,20
4
11,3
60
2,06
7
7,04
4
18,3
94
6,89
5
5,94
9
4,47
1
30,5
60
27,9
13
-20,000
-10,000
0
10,000
20,000
30,000
40,000
Jan-
21
Feb-
21
Mar
-21
Apr-
21
May
-21
Jun-
21
Jul-2
1
Aug-
21
Sep-
21
Oct
-21
Nov-
21
Dec
-21
AUM (Rs. Trillion)
Source: AMFI
30.5 31
.6
31.4 32
.4 33.1 33
.7 35.3 36
.6
36.7 37
.3
37.3
22
24
2628
30
32
34
36
3840
Jan-
21
Feb-
21
Mar
-21
Apr-
21
May
-21
Jun-
21
Jul-2
1
Aug-
21
Sep-
21
Oct
-21
Nov-
21
SIP (Rs. Crore)
Source: AMFI
8,02
3
7,52
8
9,18
2
8,59
6
8,81
9 9,15
6 9,60
9 9,92
3
10,3
51
10,5
19 11,0
05
7200
7700
8200
8700
9200
9700
10200
10700
11200
Jan-
21
Feb-
21
Mar
-21
Apr
-21
May
-21
Jun-
21
Jul-2
1
Aug
-21
Sep-
21
Oct
-21
Nov
-21
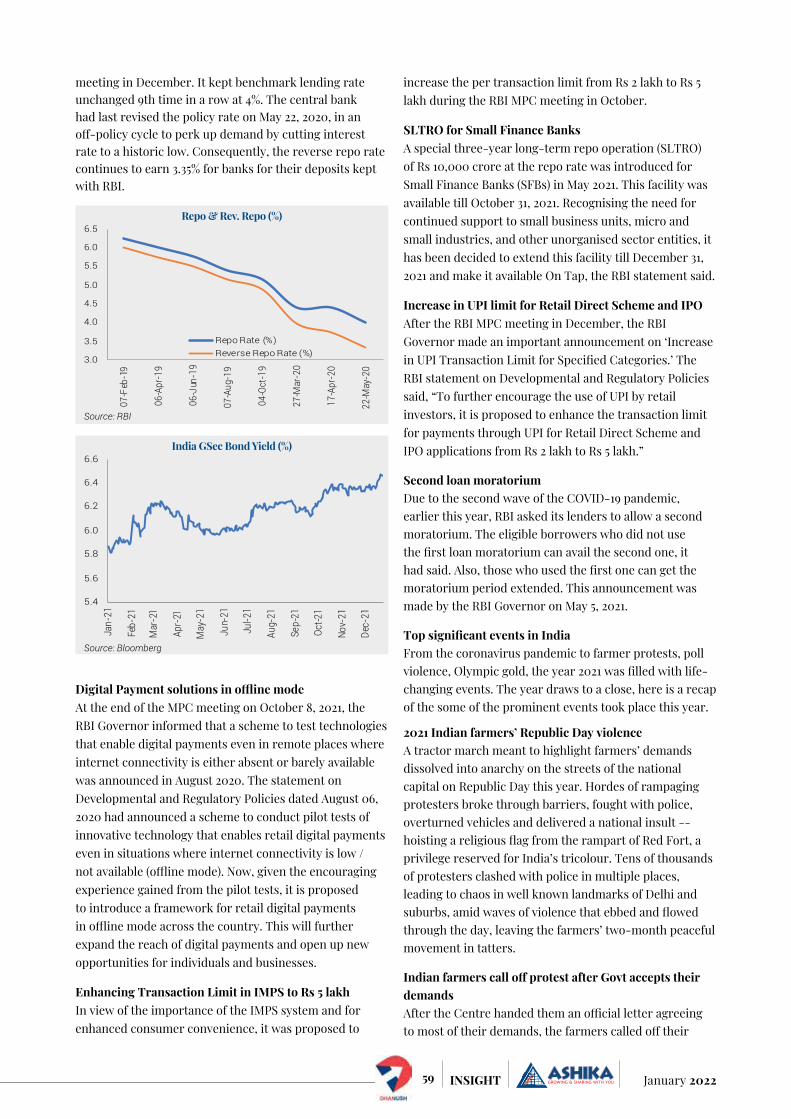
59 January 2022INSIGHT
meeting in December. It kept benchmark lending rate unchanged 9th time in a row at 4%. The central bank had last revised the policy rate on May 22, 2020, in an off-policy cycle to perk up demand by cutting interest rate to a historic low. Consequently, the reverse repo rate continues to earn 3.35% for banks for their deposits kept with RBI.
Digital Payment solutions in offline modeAt the end of the MPC meeting on October 8, 2021, the RBI Governor informed that a scheme to test technologies that enable digital payments even in remote places where internet connectivity is either absent or barely available was announced in August 2020. The statement on Developmental and Regulatory Policies dated August 06, 2020 had announced a scheme to conduct pilot tests of innovative technology that enables retail digital payments even in situations where internet connectivity is low / not available (offline mode). Now, given the encouraging experience gained from the pilot tests, it is proposed to introduce a framework for retail digital payments in offline mode across the country. This will further expand the reach of digital payments and open up new opportunities for individuals and businesses.
Enhancing Transaction Limit in IMPS to Rs 5 lakhIn view of the importance of the IMPS system and for enhanced consumer convenience, it was proposed to
increase the per transaction limit from Rs 2 lakh to Rs 5 lakh during the RBI MPC meeting in October.
SLTRO for Small Finance BanksA special three-year long-term repo operation (SLTRO) of Rs 10,000 crore at the repo rate was introduced for Small Finance Banks (SFBs) in May 2021. This facility was available till October 31, 2021. Recognising the need for continued support to small business units, micro and small industries, and other unorganised sector entities, it has been decided to extend this facility till December 31, 2021 and make it available On Tap, the RBI statement said.
Increase in UPI limit for Retail Direct Scheme and IPOAfter the RBI MPC meeting in December, the RBI Governor made an important announcement on ‘Increase in UPI Transaction Limit for Specified Categories.’ The RBI statement on Developmental and Regulatory Policies said, “To further encourage the use of UPI by retail investors, it is proposed to enhance the transaction limit for payments through UPI for Retail Direct Scheme and IPO applications from Rs 2 lakh to Rs 5 lakh.”
Second loan moratoriumDue to the second wave of the COVID-19 pandemic, earlier this year, RBI asked its lenders to allow a second moratorium. The eligible borrowers who did not use the first loan moratorium can avail the second one, it had said. Also, those who used the first one can get the moratorium period extended. This announcement was made by the RBI Governor on May 5, 2021.
Top significant events in IndiaFrom the coronavirus pandemic to farmer protests, poll violence, Olympic gold, the year 2021 was filled with life-changing events. The year draws to a close, here is a recap of the some of the prominent events took place this year.
2021 Indian farmers’ Republic Day violence A tractor march meant to highlight farmers’ demands dissolved into anarchy on the streets of the national capital on Republic Day this year. Hordes of rampaging protesters broke through barriers, fought with police, overturned vehicles and delivered a national insult -- hoisting a religious flag from the rampart of Red Fort, a privilege reserved for India’s tricolour. Tens of thousands of protesters clashed with police in multiple places, leading to chaos in well known landmarks of Delhi and suburbs, amid waves of violence that ebbed and flowed through the day, leaving the farmers’ two-month peaceful movement in tatters.
Indian farmers call off protest after Govt accepts their demandsAfter the Centre handed them an official letter agreeing to most of their demands, the farmers called off their
Repo & Rev. Repo (%)
Source: RBI
3.0
3.5
4.0
4.5
5.0
5.5
6.0
6.5
07-F
eb-1
9
06-A
pr-1
9
06-J
un-1
9
07-A
ug-1
9
04-O
ct-1
9
27-M
ar-2
0
17-A
pr-2
0
22-M
ay-2
0
Repo Rate (%)Reverse Repo Rate (%)
India GSec Bond Yield (%)
Source: Bloomberg
5.4
5.6
5.8
6.0
6.2
6.4
6.6
Jan-
21
Feb-
21
Mar
-21
Apr-
21
May
-21
Jun-
21
Jul-2
1
Aug-
21
Sep-
21
Oct-2
1
Nov-
21
Dec-
21
60January 2022 INSIGHT
year-long protest on December 9.Farmers have been staging a sit-in protest against three farm legislation since November, which the government has now abolished.
Bengal post-poll violence Violence erupted after the Mamata Banerjee-led Trinamool Congress returned to power for a third consecutive term. The opposition alleged alleged murders, rapes, and vandalism that happened in across the state following the announcement of the results of the 2021 West Bengal Legislative Assembly election. The Calcutta high court had pulled up the West Bengal government for its failure in compensating the victims of the alleged post-poll violence.
COVID-19: India’s Oxygen Crisis After a new coronavirus variant unleashed a brutal second wave of infections in India, hospitals in the country faced worst nightmare with shortage of oxygen tanks and beds. Many hospitals in Delhi and around the country ran out of oxygen, with hundreds dying from a shortage of oxygen. However, the centre has claimed no deaths due to oxygen shortage were reported by states and UTs during the second COVID-19 wave.
Indians named in Pandora Paper leaks The ‘’Pandora Papers’’ have named 300 Indian individuals, including Sachin Tendulkar, Anil Ambani, Nirav Modi, Jackie Shroff, Ajit Kerkar and Kiran Mazumdar-Shaw. Millions of leaked documents dubbed as the ‘’Pandora Papers’’ by a worldwide journalistic partnership on October 3, claimed to have uncovered financial secrets of current and former world leaders, politicians and public officials in 91 countries and territories, including India. There are over 300 Indian names in the Pandora Papers leak, including over 60 prominent ones.
Air India returns to Tata after 70 years Tata Sons won Air India bid, the airline it founded nearly 90 years back - as the government accepted its winning bid of Rs 18,000 crore to acquire 100% of the debt-laden state-run carrier. The deal completed a full circle as Air India was founded in 1932 under the name Tata Airlines by family scion and aviation enthusiast Jehangir Ratanji Dadabhoy Tata.
India to monetise $81 billion worth of state assets over next 4 yearsIndia stated on August 23 that it would monetise 6 trillion rupees ($80.90 billion) in public assets over the next four years, as part of a strategy unveiled earlier in the 2021/2022 budget to increase infrastructure expenditure and drive economic growth in Asia’s third largest economy.
2022 OutlookPost a super show in 2021, valuation levels in Indian equities could make most people cautious on India within EMs and Asia. Also, uncertainties on crude and commodity prices, speed of US tapering, and Covid recurrence are other factors that lead to a cautious view. Indian equities are running into many challenges, including the US rate cycle, rising oil prices, elections in key states, potential Covid wave 3, upward inflexion in domestic interest rates, rich headline valuations and strong relative trailing performance. However, the market still has potential to positively surprise, as a macro construct (GDP growth, tax collections, flush liquidity, the start of a Capex cycle, a listing of start-ups leading to risk on sentiments, supportive monetary policy, better than expected pace of macro recovery post-pandemic, and strong vaccination drive) and earnings remain largely supportive.
In the US, for instance, while growth has been picking up, inflation is rearing its ugly head and the stubborn core inflation perhaps has turned the US Federal Reserve distinctively hawkish, indicating an earlier-than-expected end to its taper timeline and the start of an interest rate hike cycle. Emerging markets such as India have already felt the tremor with foreign fund outflows and are now staring at an interest rate hike as well. With inflation refusing to soften and competitive pressure to prevent significant depreciation of the currency, the writing seems to be on the wall.
While the sequence of events appears to reflect copybook macroeconomic theory, the emergence of the highly transmissible Omicron variety could turn out to be a joker in the pack. Inflation, which is the biggest bugbear now, could moderate if growth takes a beating on a decisive third wave of Covid. Central banks and governments could also find it difficult to reverse easy liquidity or fiscal support should Covid turn out to be disruptive despite the wide availability and decent coverage of vaccines, especially in the developed world.
Unlike the past when FIIs used to rule the bourses, the long-term journey of Indian markets will ride on domestic liquidity. India’s changing demographics with a young population having no social security benefits coupled with negative real interest rates, augur well for domestic inflows to equities. The record number of new demat account openings and the soaring monthly contribution to SIP (systematic investment plan) stand testimony to the same. This domestic liquidity should provide downside support to equities.
Note: All data are of as on December 24, 2021
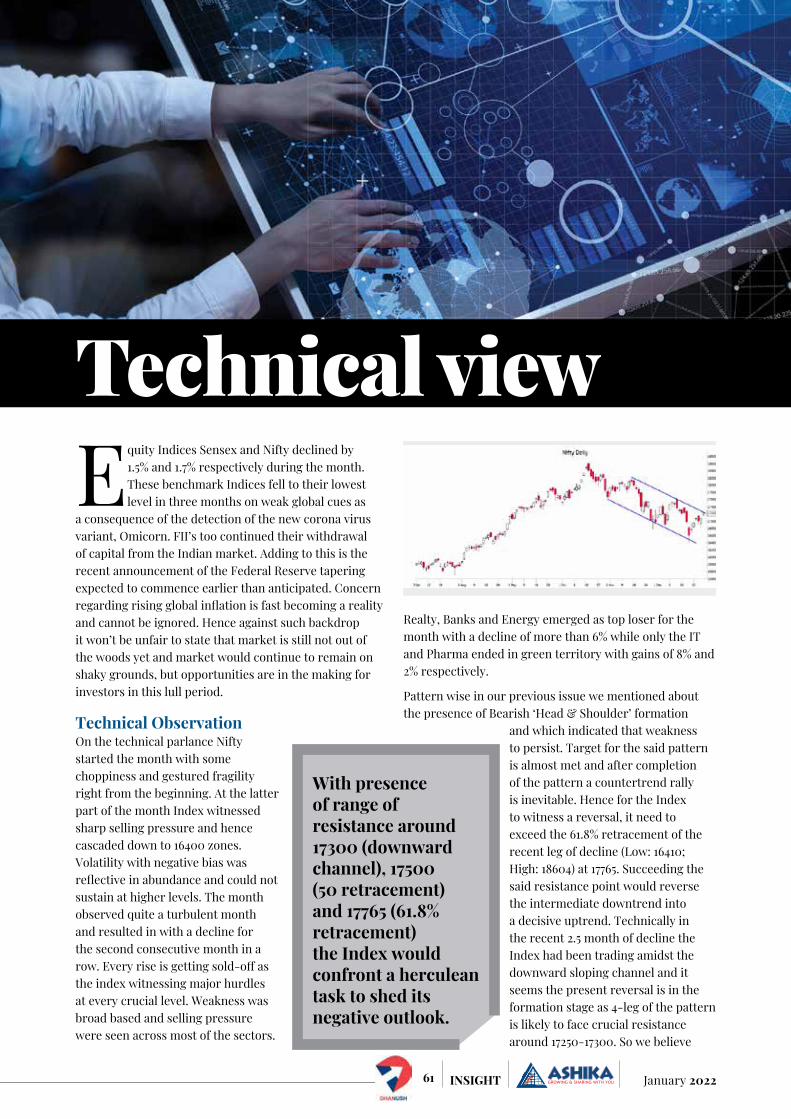
61 January 2022INSIGHT
technical view Equity Indices Sensex and Nifty declined by
1.5% and 1.7% respectively during the month. These benchmark Indices fell to their lowest level in three months on weak global cues as
a consequence of the detection of the new corona virus variant, Omicorn. FII’s too continued their withdrawal of capital from the Indian market. Adding to this is the recent announcement of the Federal Reserve tapering expected to commence earlier than anticipated. Concern regarding rising global inflation is fast becoming a reality and cannot be ignored. Hence against such backdrop it won’t be unfair to state that market is still not out of the woods yet and market would continue to remain on shaky grounds, but opportunities are in the making for investors in this lull period.
Technical ObservationOn the technical parlance Nifty started the month with some choppiness and gestured fragility right from the beginning. At the latter part of the month Index witnessed sharp selling pressure and hence cascaded down to 16400 zones. Volatility with negative bias was reflective in abundance and could not sustain at higher levels. The month observed quite a turbulent month and resulted in with a decline for the second consecutive month in a row. Every rise is getting sold-off as the index witnessing major hurdles at every crucial level. Weakness was broad based and selling pressure were seen across most of the sectors.
Realty, Banks and Energy emerged as top loser for the month with a decline of more than 6% while only the IT and Pharma ended in green territory with gains of 8% and 2% respectively.
Pattern wise in our previous issue we mentioned about the presence of Bearish ‘Head & Shoulder’ formation
and which indicated that weakness to persist. Target for the said pattern is almost met and after completion of the pattern a countertrend rally is inevitable. Hence for the Index to witness a reversal, it need to exceed the 61.8% retracement of the recent leg of decline (Low: 16410; High: 18604) at 17765. Succeeding the said resistance point would reverse the intermediate downtrend into a decisive uptrend. Technically in the recent 2.5 month of decline the Index had been trading amidst the downward sloping channel and it seems the present reversal is in the formation stage as 4-leg of the pattern is likely to face crucial resistance around 17250-17300. So we believe
With presence of range of resistance around 17300 (downward channel), 17500 (50 retracement) and 17765 (61.8% retracement) the Index would confront a herculean task to shed its negative outlook.
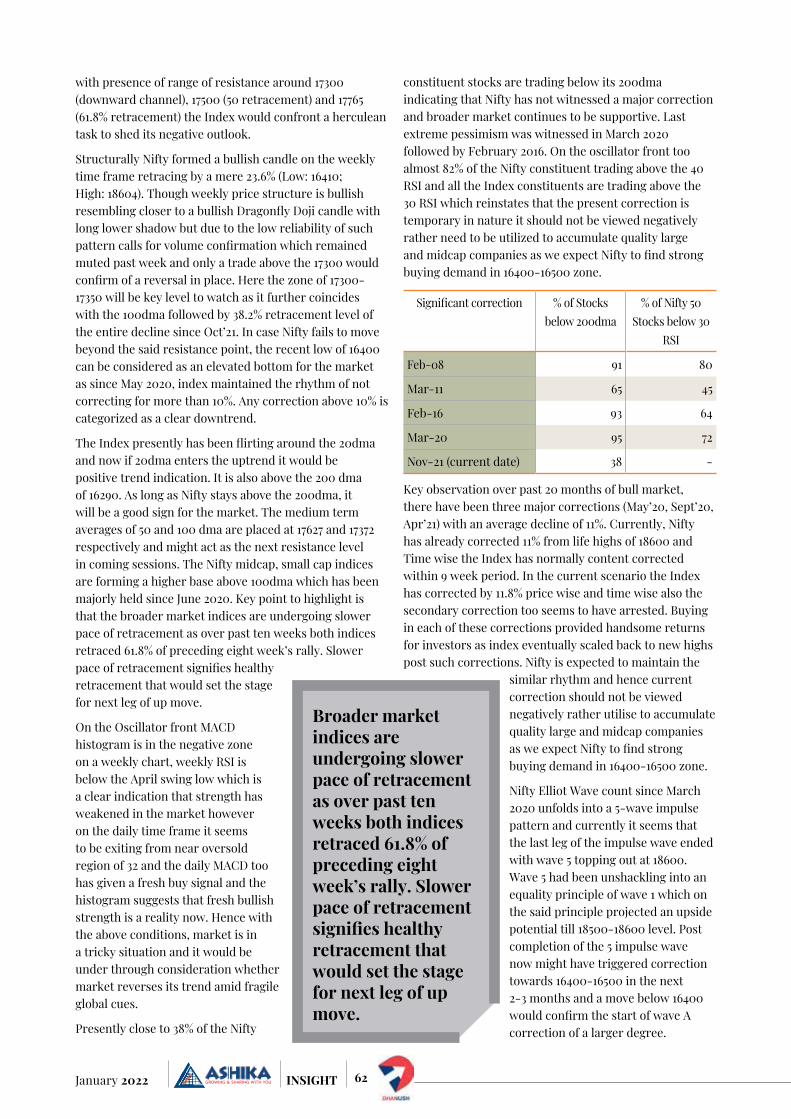
62January 2022 INSIGHT
with presence of range of resistance around 17300 (downward channel), 17500 (50 retracement) and 17765 (61.8% retracement) the Index would confront a herculean task to shed its negative outlook.
Structurally Nifty formed a bullish candle on the weekly time frame retracing by a mere 23.6% (Low: 16410; High: 18604). Though weekly price structure is bullish resembling closer to a bullish Dragonfly Doji candle with long lower shadow but due to the low reliability of such pattern calls for volume confirmation which remained muted past week and only a trade above the 17300 would confirm of a reversal in place. Here the zone of 17300-17350 will be key level to watch as it further coincides with the 100dma followed by 38.2% retracement level of the entire decline since Oct’21. In case Nifty fails to move beyond the said resistance point, the recent low of 16400 can be considered as an elevated bottom for the market as since May 2020, index maintained the rhythm of not correcting for more than 10%. Any correction above 10% is categorized as a clear downtrend.
The Index presently has been flirting around the 20dma and now if 20dma enters the uptrend it would be positive trend indication. It is also above the 200 dma of 16290. As long as Nifty stays above the 200dma, it will be a good sign for the market. The medium term averages of 50 and 100 dma are placed at 17627 and 17372 respectively and might act as the next resistance level in coming sessions. The Nifty midcap, small cap indices are forming a higher base above 100dma which has been majorly held since June 2020. Key point to highlight is that the broader market indices are undergoing slower pace of retracement as over past ten weeks both indices retraced 61.8% of preceding eight week’s rally. Slower pace of retracement signifies healthy retracement that would set the stage for next leg of up move.
On the Oscillator front MACD histogram is in the negative zone on a weekly chart, weekly RSI is below the April swing low which is a clear indication that strength has weakened in the market however on the daily time frame it seems to be exiting from near oversold region of 32 and the daily MACD too has given a fresh buy signal and the histogram suggests that fresh bullish strength is a reality now. Hence with the above conditions, market is in a tricky situation and it would be under through consideration whether market reverses its trend amid fragile global cues.
Presently close to 38% of the Nifty
constituent stocks are trading below its 200dma indicating that Nifty has not witnessed a major correction and broader market continues to be supportive. Last extreme pessimism was witnessed in March 2020 followed by February 2016. On the oscillator front too almost 82% of the Nifty constituent trading above the 40 RSI and all the Index constituents are trading above the 30 RSI which reinstates that the present correction is temporary in nature it should not be viewed negatively rather need to be utilized to accumulate quality large and midcap companies as we expect Nifty to find strong buying demand in 16400-16500 zone.
Significant correction % of Stocks below 200dma
% of Nifty 50 Stocks below 30
RSI
Feb-08 91 80
Mar-11 65 45
Feb-16 93 64
Mar-20 95 72
Nov-21 (current date) 38 -
Key observation over past 20 months of bull market, there have been three major corrections (May’20, Sept’20, Apr’21) with an average decline of 11%. Currently, Nifty has already corrected 11% from life highs of 18600 and Time wise the Index has normally content corrected within 9 week period. In the current scenario the Index has corrected by 11.8% price wise and time wise also the secondary correction too seems to have arrested. Buying in each of these corrections provided handsome returns for investors as index eventually scaled back to new highs post such corrections. Nifty is expected to maintain the
similar rhythm and hence current correction should not be viewed negatively rather utilise to accumulate quality large and midcap companies as we expect Nifty to find strong buying demand in 16400-16500 zone.
Nifty Elliot Wave count since March 2020 unfolds into a 5-wave impulse pattern and currently it seems that the last leg of the impulse wave ended with wave 5 topping out at 18600. Wave 5 had been unshackling into an equality principle of wave 1 which on the said principle projected an upside potential till 18500-18600 level. Post completion of the 5 impulse wave now might have triggered correction towards 16400-16500 in the next 2-3 months and a move below 16400 would confirm the start of wave A correction of a larger degree.
Broader market indices are undergoing slower pace of retracement as over past ten weeks both indices retraced 61.8% of preceding eight week’s rally. Slower pace of retracement signifies healthy retracement that would set the stage for next leg of up move.
63 January 2022INSIGHT
The volatility index (India VIX) increased by 16.1% from 17.91 to 16.66 levels in Nov series. With VIX closing above the 18 level mark bears in all probability will dominate the market for some time. History too has been the witnessed the same during the top of 2014 where VIX has broken out of the range and closed above the 18 level mark on a closing basis. Hence with a VIX close above the 18 mark would be a red flag which it did during the month but managed to close below it. An uptick would be the first sign of caution for the market and would depict of an upcoming volatile days.
Other correlated marketsOther correlated markets like Gold prices rose last month, as rising inflation, US-Russia geopolitical tensions over the Ukraine issue and decline in dollar index boosted the demand for safe haven metal. Further, gold prices were also supported on risks posed to global economic growth from a surge in Omicron variant cases and rising inflation. However, sharp upsides were capped by better than expected GDP and Consumer confidence data from US. Going forward gold prices are likely to trade in the range of 1750-1885 with positive bias.
Crude oil prices gained 1.47% in the previous week on the back of decline in US crude oil inventories. Further, prices were supported on the expectations of lower supply from Opec, rising geopolitical tensions between Iran and Israel, between US and Russia over Ukraine issue and expectations that the Omicron coronavirus variant will have only a limited impact on global demand.
Going forward Investors are awaiting an OPEC+ meeting on Jan. 4, at which the alliance will decide whether to go ahead with a planned 400,000 barrels-per-day production increase in February. Hence Crude oil prices are likely to trade with a positive bias.
Indian rupee is expected to rise against the U.S. currency, tracking broad dollar weakness and rise in risk appetite in the global markets. Market sentiments improved on ebbing concerns over severity of micron variant, fueling hopes that governments across the globe may not need to widen restrictions. However, sharp gains may be capped on a surge in crude oil prices and consistent FII outflows.
To sum up, extended correction from hereon should not be construed as negative instead dips should be capitalised on as buying opportunity as it seems that Index is unlikely
to breach the key support threshold of 16400-16500 zone as it coincides with the 50% retracement of the rally since Apr 2021. On the higher side 50-day moving average placed at 17500-17600 would act as an immediate hurdle in the current pull backs. Therefore, ongoing correction should be used as an incremental buying opportunity to ride structural uptrend. However aggressive or higher leveraged positions are not advisable as index is undergoing healthy consolidation (17200-16600), only a decisive close above 17500 levels backed by improvement in market breadth would lead to extension of pullback towards 17600. Failure to do so would lead to prolonged consolidation amid stock specific action in broader. Sectorally, Capital goods, IT and Realty are expected to outperform.
Aggressive or higher leveraged positions are not advisable as index is undergoing healthy consolidation (17200-16600), only a decisive close above 17500 levels backed by improvement in market breadth would lead to extension of pullback towards 17600.
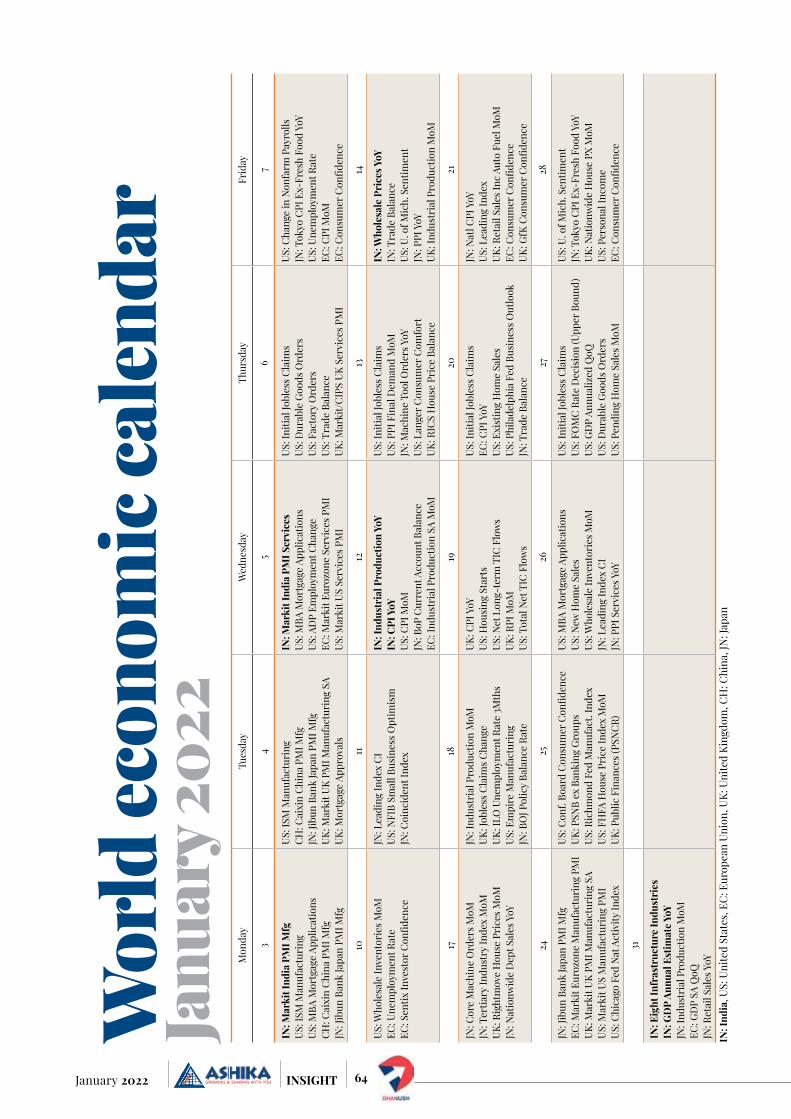
64January 2022 INSIGHT
Mon
day
Tues
day
Wed
nesd
ayTh
ursd
ayFr
iday
34
56
7
IN: M
arki
t Ind
ia P
MI M
fgUS
: ISM
Man
ufac
turi
ngUS
: MBA
Mor
tgag
e Ap
plic
atio
nsCH
: Cai
xin
Chin
a PM
I Mfg
JN: J
ibun
Ban
k Ja
pan
PMI M
fg
US: I
SM M
anuf
actu
ring
CH: C
aixi
n Ch
ina
PMI M
fgJN
: Jib
un B
ank
Japa
n PM
I Mfg
UK: M
arki
t UK
PMI M
anuf
actu
ring
SA
UK: M
ortg
age
Appr
oval
s
IN: M
arki
t Ind
ia P
MI S
ervi
ces
US: M
BA M
ortg
age
Appl
icat
ions
US: A
DP
Empl
oym
ent C
hang
eEC
: Mar
kit E
uroz
one
Serv
ices
PM
IUS
: Mar
kit U
S Se
rvic
es P
MI
US: I
nitia
l Job
less
Cla
ims
US: D
urab
le G
oods
Ord
ers
US: F
acto
ry O
rder
sUS
: Tra
de B
alan
ceUK
: Mar
kit/
CIPS
UK
Serv
ices
PM
I
US: C
hang
e in
Non
farm
Pay
rolls
JN: T
okyo
CPI
Ex-
Fres
h Fo
od Y
oYUS
: Une
mpl
oym
ent R
ate
EC: C
PI M
oMEC
: Con
sum
er C
onfid
ence
1011
1213
14
US: W
hole
sale
Inve
ntor
ies M
oMEC
: Une
mpl
oym
ent R
ate
EC: S
entix
Inve
stor
Con
fiden
ce
JN: L
eadi
ng In
dex
CIUS
: NFI
B Sm
all B
usin
ess O
ptim
ism
JN: C
oinc
iden
t Ind
ex
IN: I
ndus
tria
l Pro
duct
ion
YoY
IN: C
PI Y
oYUS
: CPI
MoM
JN: B
oP C
urre
nt A
ccou
nt B
alan
ceEC
: Ind
ustr
ial P
rodu
ctio
n SA
MoM
US: I
nitia
l Job
less
Cla
ims
US: P
PI F
inal
Dem
and
MoM
JN: M
achi
ne T
ool O
rder
s YoY
US: L
ange
r Con
sum
er C
omfo
rtUK
: RIC
S H
ouse
Pri
ce B
alan
ce
IN: W
hole
sale
Pri
ces Y
oYIN
: Tra
de B
alan
ceUS
: U. o
f Mic
h. S
entim
ent
JN: P
PI Y
oYUK
: Ind
ustr
ial P
rodu
ctio
n M
oM
1718
1920
21
JN: C
ore
Mac
hine
Ord
ers M
oMJN
: Ter
tiary
Indu
stry
Inde
x M
oMUK
: Rig
htm
ove
Hou
se P
rice
s MoM
JN: N
atio
nwid
e D
ept S
ales
YoY
JN: I
ndus
tria
l Pro
duct
ion
MoM
UK: J
oble
ss C
laim
s Cha
nge
UK: I
LO U
nem
ploy
men
t Rat
e 3M
ths
US: E
mpi
re M
anuf
actu
ring
JN: B
OJ P
olic
y Ba
lanc
e Ra
te
UK: C
PI Y
oYUS
: Hou
sing
Sta
rts
US: N
et L
ong-
term
TIC
Flo
ws
UK: R
PI M
oMUS
: Tot
al N
et T
IC F
low
s
US: I
nitia
l Job
less
Cla
ims
EC: C
PI Y
oYUS
: Exi
stin
g H
ome
Sale
sUS
: Phi
lade
lphi
a Fe
d Bu
sine
ss O
utlo
okJN
: Tra
de B
alan
ce
JN: N
atl C
PI Y
oYUS
: Lea
ding
Inde
xUK
: Ret
ail S
ales
Inc
Auto
Fue
l MoM
EC: C
onsu
mer
Con
fiden
ceUK
: GfK
Con
sum
er C
onfid
ence
2425
2627
28
JN: J
ibun
Ban
k Ja
pan
PMI M
fgEC
: Mar
kit E
uroz
one
Man
ufac
turi
ng P
MI
UK: M
arki
t UK
PMI M
anuf
actu
ring
SA
US: M
arki
t US
Man
ufac
turi
ng P
MI
US: C
hica
go F
ed N
at A
ctiv
ity In
dex
US: C
onf.
Boar
d Co
nsum
er C
onfid
ence
UK: P
SNB
ex B
anki
ng G
roup
sUS
: Ric
hmon
d Fe
d M
anuf
act.
Inde
xUS
: FH
FA H
ouse
Pri
ce In
dex
MoM
UK: P
ublic
Fin
ance
s (PS
NCR
)
US: M
BA M
ortg
age
Appl
icat
ions
US: N
ew H
ome
Sale
sUS
: Who
lesa
le In
vent
orie
s MoM
JN: L
eadi
ng In
dex
CIJN
: PPI
Ser
vice
s YoY
US: I
nitia
l Job
less
Cla
ims
US: F
OM
C Ra
te D
ecis
ion
(Upp
er B
ound
)US
: GD
P An
nual
ized
QoQ
US: D
urab
le G
oods
Ord
ers
US: P
endi
ng H
ome
Sale
s MoM
US: U
. of M
ich.
Sen
timen
tJN
: Tok
yo C
PI E
x-Fr
esh
Food
YoY
UK: N
atio
nwid
e H
ouse
PX
MoM
US: P
erso
nal I
ncom
eEC
: Con
sum
er C
onfid
ence
31
IN: E
ight
Infr
astr
uctu
re In
dust
ries
IN: G
DP
Annu
al E
stim
ate Y
oYJN
: Ind
ustr
ial P
rodu
ctio
n M
oMEC
: GD
P SA
QoQ
JN: R
etai
l Sal
es Y
oYIN
: Ind
ia, U
S: U
nite
d St
ates
, EC:
Eur
opea
n Un
ion,
UK:
Uni
ted
King
dom
, CH
: Chi
na, J
N: J
apan
wor
ld ec
onom
ic ca
lend
ar
Janu
ary 2
022

65 January 2022INSIGHT
For institution business please contactMr. Dilip Minny (Co-founder- Institution); Mobile: +91 90070 66096; Email: [email protected]
Products Products Contact
• Dhanush (Mobile App & Web base) • Online Equity, Derivative,
Currency and Commodity Trading Facility
• DhanushMF (Mobile App & Web base)• A One Stop Solution to all
your Mutual Funds needs online.
• Back Office Reports on WhatsApp. Ashika BOT on Whatsapp / Telegram.
• Ask ACIRA - • Online Customer service for
clients on our website.
• Margin Trading Facility (MTF)• With this MTF facility client
can trade inspite of debits beyond T+7.
• EKYC • It now takes just 30 mins to open an
Account.
• ReKYC • Hassle-free & paperless modification
without stepping out.
• Research Services• A galaxy of potential research team
to provide the best equity research reports, ideas, solving queries and many more.
• Online Fund Transfer Facility
• Securities Lending and Borrowing (SLB) • Provide securities lending and
borrowing at a market competitive rate
• Depository Services (CDSL/NSDL) • Provide one roof solution wherein
seamless trading could be ensured through DP maintained with Ashika
For Business Opportunity please contact
Mr. Amit Jain (Executive Director)Mobile: +91 90070 66000E-mail: [email protected]
Mr. Niraj Sarawgi (CEO - PCG) Mobile: +91 91676 16989Email: [email protected]
For Services please contact Mr. Nand Kishore Jajoo (Head - DP & KYC) Mobile: +91 90070 66028Email: [email protected]
Services at Ashika Stock Broking Limited
For start-up investing please contactMr. Chirag Jain (CEO); Contact: +91 22 66111700; E-mail: [email protected]
Capital Markets Fund Raising Advisory Contact
• Issue Management • IPO / FPO• Right Issue• Qualified
Institutional Placement
• Open Offer • Takeover • Buyback • Delisting
• Overseaslisting
• Underwriting
• Private Equity• Venture / Growth
Capital• Pipe
• Debt Syndication• Project Finance• Team Loan• Working Capital
Loan• Acquisition
Funding• Construction
Finance
• M&A• Merger / Acquisition /
Disposal• Management buy-outs /
buy-ins• Leveraged buy-outs• Joint Ventures• Strategic Partnership• Spin-Offs• Divestment
• Corporate restructuring• Capital Restructuring • Finance Restructuring
• Business Valuation• ESOP Valuation • Fairness Opinion
For Debt Fund Raising / Mergers & Acquisition / Business Opportunity please contact
Mr. Mihir Mehta Contact: +91 22 6611 1770Email: [email protected]
Mr. Yogesh ShetyeContact: + 91 22 6611 1770E-mail: [email protected]
Services at Ashika Capital Limited

66January 2022 INSIGHT
Ashika Global Securities Pvt. Ltd is the holding company of Ashika Group, a RBI-registered non-deposit taking NBFC engaged in providing long term and short-term loans & advances to individual & body corporate and Investment in shares and securities. It has 6 subsidiaries and 1 associate company i.e. Ashika Credit Capital Ltd.
Ashika Global Securities Pvt. Ltd.
It is the Flagship company of the group and incorporated in the year 1994. RBI registered Non-banking Financial Company carrying on NBFI Activities i.e. investment in shares & securities and providing Loan to Individuals, corporates HNI etc. The company floated its shares to public in 2000 and got listed with CSE. Thereafter, in 2011, the shares were traded on BSE under permitted category and in 2014 got listed with MSEI. It has a registered FII as one of its investors.
Ashika Credit Capital Ltd.
Ashika Investment Managers Private Limited, a private limited company incorporated on July 13, 2017, is a wholly owned subsidiary of Ashika Global Securities Private Limited. It is acting as the Investment Manager to Ashika Alternative Investments, a Trust being registered as a Category III Alternative Investment Fund (Registration Number: IN/AIF3/20-21/0811) with the Securities and Exchange Board of India (“SEBI”) under the SEBI (Alternative Investments Funds) Regulations, 2012 (“AIF Regulations”).
Ashika Investment Managers Pvt. Ltd.

67 January 2022INSIGHT
AWARDS
Helping Clients Reach for Better Via SIP – National from Franklin Templeton Investments, 2018NSDL STAR PERFORMANCE AWARD 2018
NSE Market Achievers Award 2018REGEIONAL RETAIL MEMBER OF THE YEAR 2018 -
EASTERN INDIA
NSE Market Achievers Award 2017REGEIONAL RETAIL MEMBER OF THE YEAR 2017 -
EASTERN INDIA
NSDL Stock Performer Awards of the Year 2019
BTVI Emerging Company of the Year 2019
CDSL Excellent Performer in Depository Services
BTVI Young Business Leader of the Year 2019

68January 2022 INSIGHT
Ashika Stock Broking Ltd.Ashika Stock Broking Limited (“ASBL”) started its journey in the year 1994 and is presently offering a wide bouquet of services to its valued clients including broking services, depository services and distributorship of financial prod-ucts (Mutual funds, IPO & Bonds). It became a “Research Entity” under SEBI (Research Analyst) Regulations 2014 in the year of 2015 (Reg No. INH000000206).
ASBL is a wholly owned subsidiary of Ashika Global Securities (P) Ltd., a RBI registered non-deposit taking NBFC Company. ASHIKA GROUP (details enumerated on our website www.ashikagroup.com) is an integrated financial service provider inter alia engaged in the business of Investment Banking, Corporate Lending, Com-modity Broking, Debt Syndication & Other Advisory Services.
There were no significant and mate-rial disciplinary actions against ASBL taken by any regulatory authority during last three years except routine matters.
DISCLOSUREResearch reports are being prepared and distributed by ASBL in the sole capacity of being a Research Analyst under SEBI (Research Analyst) Regu-lations 2014. The following disclosures and disclaimer are an essential part of any Research Report so being distributed.
1) ASBL or its associates, its Research
Analysts (including their relatives) may have financial interest in the subject company(ies). And, the said financial interest is not limited to having an open stock market position in /acting as advisor to /having a loan transaction with the subject com-pany(ies) apart from registration as clients.
2) ASBL or its Research Analysts (including their relatives) do not have any actual / beneficial ownership of 1% or more of securities of the subject company(ies) at the end of the month immediately preceding the date of publication of the source research report or date of the concerned public appearance. However, ASBL’s associates may have actual / beneficial ownership of 1% or more of securities of the subject company(ies).
3) ASBL or its Research Analysts (including their relatives) do not have any other material conflict of interest at the time of publication of the source research report or date of the concerned public appearance. However, ASBL’s associates might have an actual / potential conflict of interest (other than ownership).
4) ASBL or its associates may have received compensation for investment banking, merchant banking, broker-age services and for other products and services from the subject compa-nies during the preceding 12 months. However, ASBL or its associates or its
Research analysts (forming part of Research Desk) have not received any compensation or other benefits from the subject companies or third parties in connection with the research report/ research recommendation. Moreover, Research Analysts have not received any compensation from the companies mentioned in the research report/ recommendation in the past twelve months.
5) The subject companies in the research report/ recommendation may be a client of or may have been a client of ASBL during the twelve months preceding the date of con-cerned public appearance for invest-ment banking/ merchant banking / brokerage services.
6) ASBL or their Research Analysts have not managed or co–managed public offering of securities for the subject company(ies) in the past twelve months. However, ASBL’s associates may have managed or co–managed public offering of securities for the subject company(ies) in the past twelve months.
7) Research Analysts have not served as an officer, director or employee of the companies mentioned in the report/ recommendation.
8) Neither ASBL nor its Research Analysts have been engaged in market making activity for the companies mentioned in the report / recommendation.
DISCLAIMERThe research recommendations and information are solely for the personal information of the authorized recipient and does not con-strue to be an offer document or any investment, legal or taxation advice or solicitation of any action based upon it. This report is not for public distribution or use by any person or entity, where such distribution, publication, availability or use would be contrary to law, regulation or subject to any registration or licensing requirement. We will not treat recipients as customer by virtue of their receiving this report. The report is based upon the information obtained from public sources that we consider reliable, but we do not guarantee its accuracy or completeness. ASBL shall not be in anyways responsible for any loss or damage that may arise to any such person from any inadvertent error in the information contained in this report. The recipients of this report should rely on their own investigations.

69 January 2022INSIGHT
Gyanada e-learning initiative launching soon!Ashika Group supports charitable foundation to fuel the aspirations of young girls in India.With our vision to develop essential 21st century capacities, computational thinking and working with computer-based systems, we will be launching our e-learning module by September,2020.It has been designed as two sub-initiatives: Every Child Can Code (ECCC) and Makers in the making (MIM).
Updates on the Binary Story In-School programWe are super glad to share that we have set and started our fully functional lab with 30 Raspberry Pi 400 at Ramji Assar Vidyalaya. Raspberry Pi systems are low-cost, portable and low maintenance. They work the best for learning and tinkering.Meanwhile let us share some of our updates for the month of December: • We set up out first school lab in Mumbai with 30 computer systems• We had visitors from Teach For India X visiting our program, who had focused group discussions with our students on Safety and technological- the new future • We have finalised 4 low budget schools for the next academic year 2022 in Mumbai
• We are collaborating with Responsible Netism, a non-profit working on online safety for curriculum and training on Safety• We are concluding our paper on why Inclusion of sustainability is essential when we are learning computer in school • We are preparing for our Teachers training in the last week of Decem-ber, to introduce them to electronics.
Inviting edu-enthusiast be part of our learning experience at our classrooms We are inviting more tech enthusiasts to come and experience our leaning ses-sions. covering a wide range of topics according to the level of understanding, as per the age of the students.
If you are interested to join one of the sessions to experience our way of learning, feel free to reach out to our founder, Rinsa at +91 8451856662 or write to us at [email protected]
We, at Gyanada Foundation, engage students in practical learning. For this we provide kids with Gyanada Lab Kits. To help us fund these kits, visit: https://gyanada.org/donate.html. You can also write to us at [email protected] or connect with us at 9819044922. Our bank details are:
GYANADA FOUNDATION HDFC Bank, Stephen House Branch, Current A/c No. 50200002885400
IFSC CODE: HDFC0000008
MICR CODE: 700240002

70January 2022 INSIGHT
A
Pr
od
uct
| in
fo@
tris
ysco
m.c
om
Registered OfficeTrinity226/1, A.J.C. Bose Road7th Floor, Kolkata-700020Phone: 033-4010 2500Fax No: 033-4010 2543
Toll Free No.: 1800 212 2525For any research related query: [email protected]
Corporate Office1008, Raheja Centre,214, Nariman Point, 10th FloorMumbai-400021Phone: 022-6611 1700Fax No: 022-6611 1710
Group CompaniesAshika Stock Broking Ltd.
(Member: NSE, BSE, MSEI, MCX, NCDEX, ICEX Depository par-ticipant of CDSL / NSDL, Research Analyst, AMFI- Registered
Mutual Fund Distributor)
CIN No. U65921WB1994PL217071SEBI Registration No: INZ000169130
SEBI Registration No: INH00000006 (RA)
Ashika Credit Capital Ltd.(RBI Registered NBFC)
CIN No. L67120WB1994PLC062159
Ashika Capital Ltd.(SEBI Authorised Merchant Banker)CIN No. U30009WB2000PLC091674SEBI Registration No: INM000010536
Ashika Investment Managers Pvt. Ltd.(Investment Manger to Ashika Alternative Investments, a Category III AIF registered with SEBI)CIN number – U65929MH2017PTC297291SEBI Registration No: IN/AIF3/20-21/0811
Ashika Global Securities Pvt. Ltd.(RBI Registered NBFC)CIN No. U65929WB1995PTC069046
www.ashikagroup.com