City Union Bank Initiating Coverage Report - Dalal & Broacha
16
CITY UNION BANK (INITIATING COVERAGE REPORT) (BUSINESS IS NOT SCIENCE, IT'S MUCH MORE AN “ART OF ECONOMICS”)
-
Upload
khangminh22 -
Category
Documents
-
view
0 -
download
0
Transcript of City Union Bank Initiating Coverage Report - Dalal & Broacha

CITY UNION BANK
(INITIATING COVERAGE REPORT)
(BUSINESS IS NOT SCIENCE, IT'S MUCH
MORE AN “ART OF ECONOMICS”)

City Union Bank Ltd. November 5, 2020
Page 1
Initiating Coverage @ Dalal & Broacha
Analyst: Avinash Tanawade 022 67141442
Financials (In INR Mn)
BUY
Current Price 158
Target Price 198
Upside (%) 25
52 Week Range 110/249
SLOW AND STEADY WINS THE RACE City Union Bank (CUB) is one of the very few banks, which has reported consistent returns (RoA &
RoE above 1.5% & 15% for the last 12 yrs except for FY20) over the years. The returns were
supported by stable margins (NIM above 3% for the last 10 yrs) and better operating efficiency (C/I
ratio below 45% for the last 20 yrs). Bank has a strong understanding of local markets (ie. Tamil Nadu)
and focused largely on working capital finance to small manufacturers and traders. Its lending
philosophy is founded on the principle of providing small-ticket secured loans (~1:1 loan to collateral
ratio) that helps it to control asset quality. Over the years, the bank has been growing steadily with a
conservative approach and aims to continue with this strategy for the next two or three years before
embarking on an aggressive growth trajectory. We strongly believe that there is an ample opportunity
for the Bank in the years to come to expand its presence across the length & breadth of the country
and become a major player in the National Banking Space.
Asset quality to bounce back strongly: The bank’s stable asset quality was supported by its granular
nature of advances, high level of collateralization, and greater exposure towards working capital
facilities (over 2/3 of advances). However, we believe slippages will be elevated in the next 2-3
quarters not just for CUB but also for the whole banking industry as the asset classification standstill
benefit ended on Aug 31, 2020. According to management, economic activity has improved on the
ground in the last few months, with customer transactions at 80-85% of pre-covid levels. Customer
interactions have been encouraging from an asset quality standpoint. The management guides for
slippages of ~3.5% in FY21E, and expects to restructure 4.5-5% of loans (mostly from the moratorium
book). However, we have conservatively estimate slippage for FY21 at 4.1% and FY22 at 2.5% and
GNPA/ NNPA at 5.5/2.5% in FY21 and 4.1/1.8% in FY22. Even though the NPA level looks elevated, we
expect minimum risk as 99% of total lending is secured in nature, which helps in the easy recovery.
Historically, the bank’s average LGD has been maintained at ~30% for the last few years.
Strong Liability Franchise: CUB has a granular deposit base, with top 20 deposits constitutes less than
7% and only 11% of the total deposits are above Rs 2 Cr high, resulting in a stable liability profile. Its
deposits also have a higher maturity. Furthermore, the bank has a healthy asset liability management
with 67% of deposits and 51% of advances having a maturity period of one to three years in FY20. The
bank balances its asset-liability by lending to small businesses (classified as retail) through retail term
deposits that help maintain the spread.
Operating efficacy remained intact: CUB has been able to contain its opex growth better than its
peers, which is evident from its cost to income ratio (C/I ratio) at 43% in FY20 compared with 50%-
74% for midcap peers. The bank’s small size and niche positioning generate better pricing power on
the lending front leading to higher spread (above 3% for the last 10 yrs). Furthermore, Bank continued
to upgrade and strengthen its Information Technology framework to ensure smooth and secure
customer friendly Banking. It is this digital strategy traction that has aided in the employees per branch
metric to decline from 10-11 to 8 in the last few years.
Outlook and valuation
CUB has all the right ingredients, which include conservative management, unparalleled lending
franchise, stable margins, superior return ratios across cycles and a well capitalized balance sheet to
deliver steady performance over the years. With ~70% of the branches in rural and semi urban
regions, the bank’s asset quality will have a relatively lower impact of the pandemic. At CMP, the stock
trades at 2.1 times its one-year forward book value, lower than its three-year historical average of
2.8 times and peak valuation of 3.8 times book value. We assign a P/AB (x) of 2.2 to FY23E Adj BVPS
of INR 90 and arrive at a Target Price of Rs 198.
Key Share Data
Market MM Market Cap (Rs.Bn) 117
Market Cap (US$ Mn) 1564
No of o/s shares (Mn) 738 Face Value 1
BSE Code 532210
NSE Code CUB
Bloomberg CUBK:IN
Price performance
% Shareholding Sep-20 Jun-20
FII 18.67 21.65
DII 27.52 30.10
Others 53.81 48.25
Total 100 100
Year NII PPOP PAT ROA ROE Adj. BVPS P/ABVPS
FY20 16752 13414 4763 1.0 9.4 61 2.6
FY21E 18778 15225 3721 0.7 6.8 64 2.5
FY22E 21232 17425 8145 1.4 13.5 76 2.1
FY23E 25298 21045 10728 1.6 15.6 90 1.8

City Union Bank Ltd. November 5, 2020
Page 2
Initiating Coverage @ Dalal & Broacha
Analyst: Avinash Tanawade 022 67141442
Small in size but great on returns…
CUB has a unique business model, which sustained better returns (RoA & RoE above 1.5% & 15% for last 12 yrs except for FY20) across various business cycles.
Bank’s small size and niche positioning provide a better pricing power on the lending front leading to higher returns on its assets as well as equity employed.
Core Business Performance FY17 FY18 FY19 FY20 FY21e FY22e FY23e
NII/ avg. total assets (%) 3.6 3.8 3.8 3.5 3.7 3.8 3.9
Non-interest income/ avg. total assets (%) 1.4 1.4 1.2 1.4 1.4 1.4 1.4
Opex/ avg. total assets (%) 2.1 2.0 2.1 2.1 2.0 2.1 2.1
PPOP/ avg. total assets (%) 3.0 3.2 2.9 2.8 3.0 3.2 3.2
Provisions/ avg. total assets (%) 0.9 1.1 0.7 1.6 2.0 1.1 1.0
Return on Avg. assets (%) 1.5 1.6 1.6 1.0 0.8 1.5 1.7
Leverage (x) 10.1 9.7 9.5 9.4 9.4 9.4 9.5
Return on equity (%) 15.2 15.3 15.2 9.4 7.2 14.4 15.8
(Source: Company, Dalal & Broacha Research)
We believe the bank is capable of maintain higher returns while continuing with its business strategy as a niche banker for s mall companies due to its better
understanding of southern market and high yielding working capital loans oriented business model.
Superior return matrix as compared to its peers
ROE (%) Axis Bk
CUB DCB Bk
HDFC BK ICICI Bk
IndusInd Bk
KVB Kotak Bk RBL Bk
FEDERAL Bk
Karnataka Bk
FY07 21.0 22.0 3.2 19.5 13.4 7.1 16.5 11.4 2.9 21.4 15.1
FY08 17.6 21.8 8.1 17.7 11.7 6.9 18.5 11.4 7.2 13.6 18.5
FY09 19.1 19.9 (15.2) 17.2 7.8 11.7 18.6 7.5 9.2 12.1 18.2
FY10 19.2 20.6 (14.6) 16.3 8.0 19.5 22.6 13.5 5.5 10.3 9.9
FY11 19.3 23.5 3.9 16.7 9.7 19.3 22.3 14.5 1.7 12.0 9.6
FY12 20.3 24.9 8.1 18.7 11.2 19.3 20.8 14.7 5.9 14.4 9.8
FY13 18.5 22.3 11.7 20.3 13.1 17.8 19.0 15.6 6.7 13.9 12.8
FY14 17.4 18.9 14.8 21.3 14.0 17.6 13.5 13.8 5.3 12.6 10.5
FY15 17.8 16.3 14.5 19.4 14.5 19.0 12.1 14.1 10.1 13.7 14.0
FY16 16.8 15.5 11.9 18.3 11.6 16.6 12.9 11.0 11.2 6.0 11.7
FY17 6.8 15.2 10.8 17.9 10.7 15.3 12.6 13.2 12.2 9.8 10.8
FY18 0.5 15.3 10.9 17.9 6.8 16.5 6.1 12.5 11.5 8.3 6.7
FY19 7.2 15.2 12.0 16.5 3.2 13.3 3.3 12.2 12.2 9.8 9.2
FY20 2.1 9.4 11.2 16.4 7.3 14.7 3.6 13.1 5.6 11.1 7.9
(Source: Company, Dalal & Broacha Research)
City Union Bank Ltd. November 5, 2020
Page 3
Initiating Coverage @ Dalal & Broacha
Analyst: Avinash Tanawade 022 67141442
Operating efficiency
CUB is one of the best in terms of operating efficiency. Its C/I ratio stood at 43% in FY20 compared with 50%-74% for midcap peers. The bank’s superior opex
control was supported by its (1) intelligent HR strategy working to keep a young, efficient workforce (2) a contained, focused branch expansion strategy and (3)
strong traction for digital strategy. While the bank is more than 100 years old, it did not shy away from adopting newer technology and landscape. Bank
continued to upgrade and strengthen its IT framework to ensure smooth and secure customer friendly Banking. It is this digita l strategy traction that has aided
in the employees per branch metric to decline from 10-11 to 8 in the last few years. Furthermore, the bank has managed to shift transaction value materially
from branches to non-branch channels. Share of non-branch channels has increased to ~90% from 60% few years back. Besides, bank’s branch expansion
strategy was centered around Tamil Nadu first and then South India. This was helpful from an opex ratio perspective as branch es within catchment areas
where the bank is previously active and has better brand recall tend to break even faster.
Better Operating efficiency - C/I ratio (%)
Peer comparison- C/I ratio (%)
Peer comparison- C/I ratio (%)
(Source: Company, Dalal & Broacha Research)
39.337.5
39.641.7
44.142.8
40.1 40.9
38.5
41.743.0
FY10 FY11 FY12 FY13 FY14 FY15 FY16 FY17 FY18 FY19 FY20
54
42
31
43
66
55
67
3943
55
74
4350 47 50 51
64
52 51
20304050607080
20
40
60
80
3.4
1.9
2.6
2.0
2.8
2.32.6
2.0 2.0 2.1
3.6
2.7 2.6 2.5
3.1
1.9
2.52.1
1.8
0.0
1.0
2.0
3.0
4.0
1
2
3
4

City Union Bank Ltd. November 5, 2020
Page 4
Initiating Coverage @ Dalal & Broacha
Analyst: Avinash Tanawade 022 67141442
Margins maintained across cycles The bank has maintained its NIMs above 3% for over a decade across economic cycles. This was possible due to the bank’s focus on the SME/MSME segment
that is high yielding and wherein re-pricing is possible. Besides, higher churn due to greater proportion of short-term loans (working capital loans) and
extensive knowledge about its market dynamics the bank has been able to manage its yields on advances across business cycles.
Solid Margins across cycles
(Source: Company, Dalal & Broacha Research)
Unlike most banks, which maintain a higher CASA base to control their cost of deposits, CUB is able to maintain high margins on account of the higher
premium it is able to command from its niche market of SME and traders. Right product to right customer enables the bank to charge a premium, which helps
sustain the spread. Besides, ~95% of its loan book is on a floating basis enabling frequent repricing of its book, which helps to maintain NIM above 3%.
Grater control on spread
(Source: Company, Dalal & Broacha Research)
3.2
3.6
3.4 3.43.5 3.4
3.8
4.2
4.44.3
4.0
2.5
3.5
4.5
5.5
FY10 FY11 FY12 FY13 FY14 FY15 FY16 FY17 FY18 FY19 FY20
7.76.9
8.1 8.4 8.4 8.27.6
6.86.3 6.2 6.2
13.012.5
13.6 13.5 13.4 13.2 12.812.1
11.511.0 10.8
4.0
7.0
10.0
13.0
16.0
FY10 FY11 FY12 FY13 FY14 FY15 FY16 FY17 FY18 FY19 FY20
COST OF DEPOSITS YIELD ON ADVANCES

City Union Bank Ltd. November 5, 2020
Page 5
Initiating Coverage @ Dalal & Broacha
Analyst: Avinash Tanawade 022 67141442
Conservative approach towards lending (one mantra “Growth with additional risk say No, No…”)
Over FY06-13, CUBK delivered 29% CAGR in loans maintaining ~60% average lending through working capital and the rest comprised term loa ns. Post that
growth has moderated to 15% CAGR over FY14-FY19 due to slowdown in economic activates, decline in the share of gold loan book (22% in FY13 to 8% in
FY18), drought conditions in parts of South India and disruptions caused by demonetization and roll-out of GST. Bank follows a conservative approach, which
sacrifices balance sheet growth to an extent, but lends comfort as far as underlying asset quality is concerned. Bank has focused on remaining the sole banker
or part of small group of banks (maybe two-three banks); maintaining low ticket sizes and stringent collateralization in these loans. We have factored in a loan
CAGR of 14% over FY20-23E. For the current year, growth would be supported to some extent by the MSME credit guarantee scheme and recapitalization of
interest accumulated during the six-month moratorium ending in August 2020.
Loan growth will pick up…..
(Source: Company, Dalal & Broacha Research)
Most lenders have changed their focus (or strategies) from either the product or the customer or both over the long periods of their history (due to challenges
e.g. corporate). CUB, on the other hand, has sustained a disciplined approach to lending entailing focus on working capital f inance to small manufacturers and
traders. We strongly believe that there is an ample opportunity for the Bank in the years to come to expand its presence across the length & breadth of the
country and become a major player in the National Banking Space.
Products Composition
(Source: Company, Dalal & Broacha Research)
211238
279327 339
366427
50717.2%
13.2%
16.9% 17.3%
3.8%
7.8%
16.7%
18.8%
0%
5%
10%
15%
20%
0
150
300
450
600
FY16 FY17 FY18 FY19 FY20 FY21 FY22 FY23
Loan (Rs Bn) Growth (%)
Bills Purchased & Bills Discounted
1%
Term Loan40%
Cash Credit & Demand Loan59%

City Union Bank Ltd. November 5, 2020
Page 6
Initiating Coverage @ Dalal & Broacha
Analyst: Avinash Tanawade 022 67141442
Granular loan franchise among mid-cap banks;
CUB’s granularity of loans is typified by its share of top 20 borrowers in total loans, which stood at just 5.4% in FY20 compared with 5%-12% for other banks.
The bank’s average MSME ticket is significantly lower than ticket sizes for large private sector banks, which tend to operate at a much larger ticket size range.
At the same time, Small Finance Banks (mostly microfinance lead) do not pose a real threat as they operate at a much lower loan ticket size range. Therefore,
the major competitors for CUB are its key Tamil Nadu-focused mid-sized peers like Karur Vysya Bank, Federal Bank and unlisted Tamilnad Mercantile Bank.
Among its mid-sized peers, we believe CUB is better placed owing to its relatively superior asset quality. Exposures to top 20 Borrowers
(Source: Company, Dalal & Broacha Research)
Well Diversified Loan Book (Sectoral Deployment)
(Source: Company, Dalal & Broacha Research)
Industry Name Amount (in
Rs Cr) % of
Advances
Advances to Major Industries
8149.6 24%
All other advances (Agri,
Trade, Service, Gold Loan, etc.)
26426.6 76%
Advances 34576.2 100%
5.1
%
5.4
%
6.3
%
6.7
%
10
.1%
10
.1%
11
.0%
11
.6%
12
.0%
D C B B K C I T Y U N I O N B K
K A R U R V Y S Y A B K
S O U T H I N D I A N B K
F E D E R A L B K R B L B K I C I C I B K H D F C B K K A R N A T A K A B K
Agriculture16%
MSME31%
Large Industries6%
Wholesale & Retail Traders17%
Commercial Real Estate8%
Housing Loans6%
Others16%
3863888
192356423
576710
5501110
20761643
0 1000 2000 3000
Other Industries
Beverage & Tobacco
Food Processing
Automobiles
Chemicals
Rubber & Plastics
Engineering
Paper & Paper Products
b) Other Metals
a) Iron & Steel
Metals
b) Other Textiles
a) Cotton
Textile
Advances to Major Industries (Rs C)

City Union Bank Ltd. November 5, 2020
Page 7
Initiating Coverage @ Dalal & Broacha
Analyst: Avinash Tanawade 022 67141442
Significant headroom for growth in Tamil Nadu
CUB is not looking to become a pan-India bank overnight, rather it chooses to focus primarily on South India and, within that, on its home state of Tamil Nadu.
Its branch share in Tamil Nadu, which could be regarded as a very rough proxy for market share, is 4.0% as of FY20. We believ e CUB has a lot of headroom in
terms of penetrating in Tamil Nadu as well as in south India. Its understanding of local businesses, relationships and knowledge of the niche busi ness segments
in southern India could support its expansion. Due to personal attention to their needs, access to top management and quick turnaround time, Small
companies usually chose regional banks in their respective home states over other large banks.
Strong foothold in Tamil Nadu, with ~69% of branches, ~80% of deposits and ~62% of loans
Exposures to top 20 Borrowers
(Source: Company, Dalal & Broacha Research)
Tamil Nadu, 485
Karnataka, 41
Andhra Pradesh, 45
Telengana, 33
Maharashtra, 20
Kerala, 18Gujarat, 14
Others, 44
BRANCHES Tamil Nadu80%
Karnataka6%Andhra Pradesh
2%
Telengana3%
Maharashtra2%
Kerala2%
Gujarat1%
Others4%
DEPOSITS
Tamil Nadu62%
Karnataka6%
Andhra Pradesh
8%
Telengana6%
Maharashtra4%
Kerala2%Gujarat
4%Others
8%
ADVANCES
Metro23%
Urban20%Semi
Urban40%
Rural17%
PRESENCE
3.2
3.4 3.4
3.7
3.9
4.0
3.0
3.4
3.8
4.2
FY15 FY16 FY17 FY18 FY19 FY20
City Union Bank Ltd. November 5, 2020
Page 8
Initiating Coverage @ Dalal & Broacha
Analyst: Avinash Tanawade 022 67141442
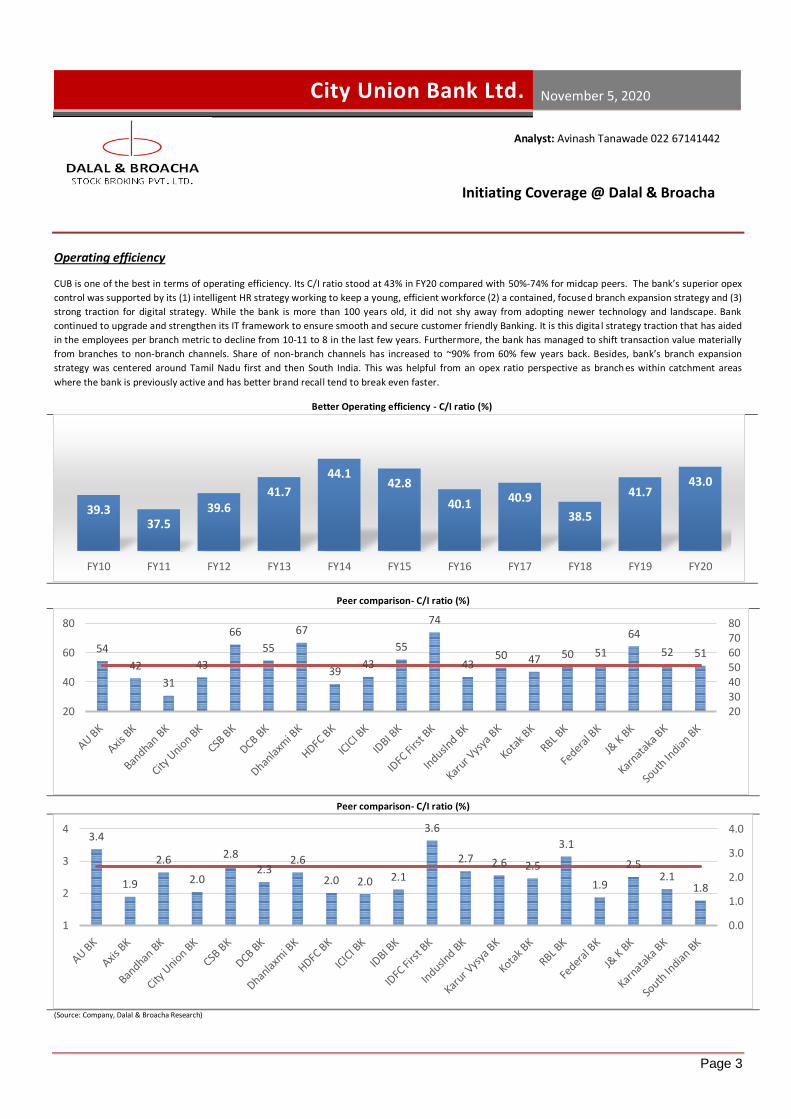
Tamil Nadu’s economy appears to be returning to normal
As far as Tamil Nadu is concerned, it is the second largest state economy after Maharashtra, contributing at least 8% to India’s national GDP. Against the all-
India average GDP growth figure of 4.2% in FY20, the State reported a GSDP growth rate of 8.03%, which was almost double the former. It was for the third
consecutive year, when Tamil Nadu clocked higher economic growth rate than the national average. According to former RBI Governor C Rangarajan, Tamil
Nadu’s economy will revive to pre-Covid-19 level in next two months (by December 2020). With a significant part of the economy resuming, primary indicators
like GST collections, Vehicle registration, collections from petrol, and electricity usage are showing strong signs of improvement.
State wise GST collection for the month of September 2020
(Source: Company, Dalal & Broacha Research)
While Vehicle registration in Tamil Nadu increased by 17.2% YoY in Sep 2020, State’s revenue from stamp duty & registration fees grew by 0.8% YoY at Rs
1,064.62 Cr in Sep 2020. Furthermore, State’s GST collections rose by 15% YoY, which was way higher than the country's GST co llections growth of 4% YoY in
Sep 2020, indicating stronger economic recovery is in sight. Even compared to other developed states such as Maharashtra, Karnataka and Gujarat, Tamil
Nadu’s Sep GST collections were much better.
In order to support economy, state government is looking to take various measures, which includes steps like extending employment guarantee scheme to
urban areas, free distribution of rice to card holders beyond Nov 2020, increase capital expenditure by Rs 10,000 Cr and set up a Rs 3,200 Cr fund to support
construction workers. We believe Tamil Nadu’s economy will recover faster than the county’s overall economy.
13546
6454 6050 6090
4712
2141
-0.2%
14.9%
-4.7%
6.1%
14.6%
7.9%
-10.0%
0.0%
10.0%
20.0%
0
5000
10000
15000
Maharashtra Tamil Nadu Karnataka Gujarat Haryana Andhra Pradesh
GST collection (Rs Cr) Change YoY

City Union Bank Ltd. November 5, 2020
Page 9
Initiating Coverage @ Dalal & Broacha
Analyst: Avinash Tanawade 022 67141442
Asset quality deteriorated but broadly remained stable over past few years
(Business is not science, it's much more an “Art of Economics”) Bank has built its business model on a prudent lending philosophy, which emphasised on granular nature of advances, high level of colla teralization and
greater focus towards working capital facilities (over 2/3 of advances). While small ticket size mitigates concentration risk with no single large account turning
into NPA, secured lending ensures paring of losses in case of default as the bank maintains ~1:1 loan to collateral ratio. Going forward, we believe slippages
will be elevated in the next 2-3 quarters not just for CUB but also for whole banking industry as the asset classification standstill benefit ended on Aug 31,
2020. According to management, economic activity has improved on the ground in last few months, with customer transactions at 80-85% of pre-covid levels.
Bank’s customer interactions have been encouraging from an asset quality/slippage standpoint. Lower exposures to stressed segments like hotels, restaurants
and theatres will reduce the probability of future unexpected surprises.
Asset quality movement
(Source: Company, Dalal & Broacha Research)
During Q2FY21, the bank’s slippages were nil due to standstill levied by the Supreme Court, while pick up in recoveries pushed GNPA/NNPA lower at 3.4/1.8%
vs 3.9/2.1% QoQ. PCR rose to 48.3% (vs 46.8% QoQ). Bank has made an additional COVID-related provisions of Rs 1.15bn during Q2, taking the total stock of
such provisions to ~Rs 3.17bn (~89bps). The bank’s Collection efficiency for the month of Sep stood at 90%, with term loan accounts saw repayments of 86%
and working capital accounts saw repayments of 94%. As of June ’20, 12.45% of the accounts had not serviced even a single EMI . This number has declined
further to 4.09%, indicating improving trends as far as the underlying stress is concerned. We believe that the management commentary, in the past few
months, has been in line with what the numbers have to show. The SMA0, SMA1 and SMA2 accounts amounted to Rs 0.63bn, Rs 2.25bn and Rs 1.09bn as of
October-end, implying a total overdue book then of Rs 3.97bn, which is 111 bps of total advances.
The management guides for slippages of ~3.5% in FY21E, and expects to restructure 4.5-5% of loans (mostly from the moratorium book). However, we have
conservatively estimate slippage for FY21 at 4.1% and FY22 at 2.5% and GNPA/ NNPA at 5.5/2.5% in FY21 and 4.1/1.9% in FY22. Even though NPA level looks
elevated, we expect minimum risk as 99% of total lending are secured in nature which helps in easy recovery. Historically, ba nk’s LGD has been maintained at
<30%. Post GFC, CUB had the highest proportion of loans restructured (10%) and majority of those loans survived (only 2% slipped into NPAs in successive
years). Latest restructuring can be more successful compared to earlier restructuring cycles since the current framew ork is applicable mostly to those
businesses which had been repaying on time pre-covid.
Repayment Status of Accounts – Position as of 30th Sep 2020: Moratorium period along with repayment made in the Sep-20
1 MONTHLY INSTALLMENT
/ INTEREST
2 MONTHLY INSTALLMENT
/ INTEREST
3 MONTHLY INSTALLMENT / INTEREST
4 MONTHLY INSTALLMENT
/ INTEREST
5 MONTHLY INSTALLMENT
/ INTEREST
6 MONTHLY INSTALLMENT
/ INTEREST
FOR THE MONTH OF
SEP-20
LOAN A/CS 87% 75% 66% 61% 56% 51% 86%
CCOD A/CS 99% 95% 94% 94% 93% 91% 94%
TOTAL 90% 82% 78% 76% 73% 68% 90%
2.4%
2.8%3.0% 3.0%
4.1%3.9%
3.4%
1.5% 1.7% 1.7% 1.8% 2.3% 2.1% 1.8%
36%
40%
44%
39%
45%
46.8%48.3%
30%
35%
40%
45%
50%
1%
2%
3%
4%
5%
FY16 FY17 FY18 FY19 FY20 Q1FY21 Q2FY21
GNPA (%) GNPA (%) PCR (%)

City Union Bank Ltd. November 5, 2020
Page 10
Initiating Coverage @ Dalal & Broacha
Analyst: Avinash Tanawade 022 67141442
Focus mainly on retail based term deposit mobilisation….
CUB’s share of retail deposits (retail term deposits + CASA) has been comfortably between 75-85% during the past few years, indicating stability to the bank's
resources profile. The bank’s top 20 deposits constitute less than 7% and only 11% of the total deposits are above Rs 2 Cr. While there has been a pick-up in
CASA after demonetization, this proportion still remains below industry average of 30%. Furthermore, its CASA ratio of ~25%, does not play a major role in
controlling cost of funds. According to management, it is part of their funding model to keep CASA ratio relatively low but, focus on retail deposits (including
TD). Meanwhile, the bank has a healthy asset liability management with 67% of deposits and 51% of advances having maturity period of one to three years in
FY20. The bank balances its asset-liability by lending to small businesses (classified as retail) through retail term deposits that help maintain the spread.
Strong liability franchise
(Source: Company, Dalal & Broacha Research)
30116 32853
3844840832
43839
50781
59949
10.9
9.1
17.0
6.27.4
15.8
18.1
5.0
10.0
15.0
20.0
20000
40000
60000
80000
FY17 FY18 FY19 FY20 FY21 FY22 FY23
Deposits (Rs Cr) Growth (%)
23.4
24.2
25.225.0 25.0 24.9
24.7
21
24
27
FY17 FY18 FY19 FY20 FY21 FY22 FY23
CASA (%)
79.1
84.8 85.0
83.1 83.484.0
84.5
76
80
84
88
FY17 FY18 FY19 FY20 FY21 FY22 FY23
Credit To Deposit ratio (%)

City Union Bank Ltd. November 5, 2020
Page 11
Initiating Coverage @ Dalal & Broacha
Analyst: Avinash Tanawade 022 67141442
Better capitalization to support credit growth
CUB has maintained healthy capitalization levels, with Tier I and CRAR at 15.8% and 16.8% (as % of risk weighted assets) as on Mar 31, 2020. Bank has a strong
track record of maintaining capital adequacy ratio higher than minimum regulatory requirements. Its capital position remains supported by its stable earnings
which provide adequate accruals.
Adequately capitalised
(Source: Company, Dalal & Broacha Research)
Moreover, Bank has demonstrated track record of raising equity capital through rights issue or preferential issue as and when required, to support growth. We
believes that CUB's capitalization will remain adequate over the medium term in the normal course of operations.
15.1
15.4
15.8
15.0
15.8
15.6
15.8
16.2
15.6
16.8
14.0
15.0
16.0
17.0
FY16 FY17 FY18 FY19 FY20
Tier I (%) CRAR (%)

City Union Bank Ltd. November 5, 2020
Page 12
Initiating Coverage @ Dalal & Broacha
Analyst: Avinash Tanawade 022 67141442
Outlook & Valuation
City Union Bank has all the right ingredients, which includes conservative management, unparalleled lending franchise, stable margins, superior return ratios
across cycles and a well capitalized balance sheet to deliver steady performance over the years. Besides, focus on small-ticket sole banker model,
understanding of southern India’s niche business segments, viz MSME, traders and agri loans, and stronger economic recovery will drive higher loan growth.
With ~70% of the branches in rural and semi urban regions, the bank’s asset quality will has a relatively lower impact of the pandemic. We believe the bank’s
profitability will remain under pressure in FY21 due to slower credit offtake & higher provisions. However, we expecting better recovery in FY22 and FY23,
supported by stable margin and higher loan growth. We expect the bank’s RoA/RoE to moderate to 0.7%/7% in FY21 and recover back to 1.5%/14.1% in FY22.
At the current price, the stock trades at 2.0 times its one-year forward book value, lower than its three-year historical average of 2.8 times and peak valuation
of 3.8 times book value. We assign a P/AB (x) of 2.2 to FY23E Adj Book Value per share of INR 90 and arrive at a Target Price of Rs 198.
P/BV 1 yr forward chart
(Source: Dalal & Broacha Research)
0
100
200
300
1-A
pr-
15
1-Ju
n-1
5
1-A
ug-
15
1-O
ct-1
5
1-D
ec-1
5
1-Fe
b-1
6
1-A
pr-
16
1-Ju
n-1
6
1-A
ug-
16
1-O
ct-1
6
1-D
ec-1
6
1-Fe
b-1
7
1-A
pr-
17
1-Ju
n-1
7
1-A
ug-
17
1-O
ct-1
7
1-D
ec-1
7
1-Fe
b-1
8
1-A
pr-
18
1-Ju
n-1
8
1-A
ug-
18
1-O
ct-1
8
1-D
ec-1
8
1-Fe
b-1
9
1-A
pr-
19
1-Ju
n-1
9
1-A
ug-
19
1-O
ct-1
9
1-D
ec-1
9
1-Fe
b-2
0
1-A
pr-
20
1-Ju
n-2
0
1-A
ug-
20
1-O
ct-2
0
CUB 1x 1.5x 2x 2.5x 3x 3.5x
City Union Bank Ltd. November 5, 2020
Page 13
Initiating Coverage @ Dalal & Broacha
Analyst: Avinash Tanawade 022 67141442
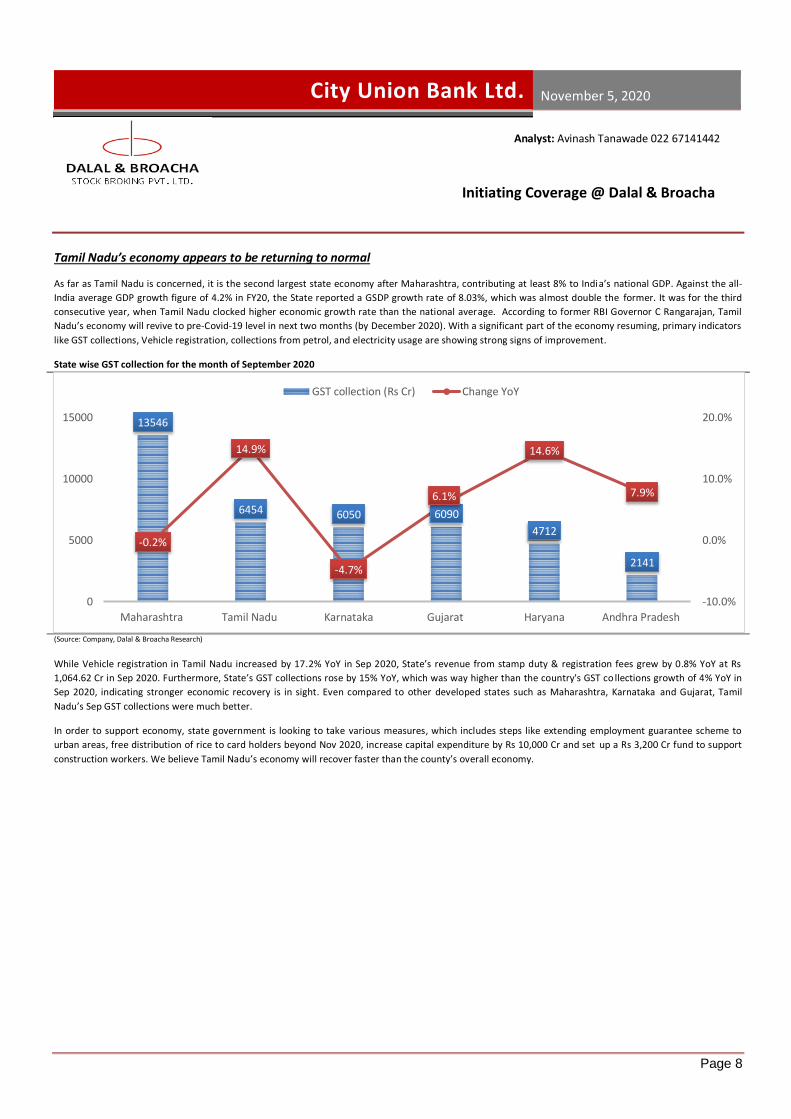
P&L (Rs mn) FY20 FY21 FY22 FY23
Interest Earned 41686 43438 47190 57035
Interest Expended 24934 24660 25958 31736
NII 16752 18778 21232 25298
Other Income 6799 6974 8099 9468
Net Income 23551 25752 29331 34767
Opex 10137 10527 11906 13722
PPOP 13414 15225 17425 21045
Provisions 7551 10251 6536 6703
PBT 5863 4974 10889 14342
Tax 1100 1254 2744 3614
PAT 4763 3721 8145 10728
Ratios (%) FY20 FY21 FY22 FY23
Growth (%)
NII 4.0 12.1 13.1 19.2
Operating profit 8.2 13.5 14.4 20.8
Net profit -30.2 -21.9 118.9 31.7
Advances 3.8 7.8 15.6 18.8
Deposits 6.2 7.4 15.8 18.1
Returns (%)
ROA 1.0 0.7 1.4 1.6
ROE 9.4 6.8 13.5 15.6
Asset quality (%)
GNPA 4.1 5.5 4.1 3.0
NNPA 2.3 2.5 1.9 1.5
PCR 45 56 54 51
Delinquencies 3.3 4.1 2.5 2.2
Credit Cost 2.3 2.9 1.7 1.4
Operating Ratio (%)
NIM 3.7 3.8 3.9 3.9
Cost to Income Ratio 43.0 40.9 40.6 39.5
Opex/ Avg assets 2.1 2.0 2.1 2.1
Other Inc to total Inc 14.0 13.8 14.6 14.2
Business Ratios (%)
Credit to Deposit Ratio 83.1 83.4 83.3 83.8
Investments to Deposit 22.3 22.6 22.41 22.1
CASA 25.0 25.0 24.9 24.7
RWA / Assets 65.3 67.8 68.3 68.8
CAR 16.8 16.1 15.7 15.3
Per share (Rs)
EPS 6 5 11 15
ABVPS 61 64 76 90
P/E 24 31 14 11
P/ABVPS 2.6 2.5 2.1 1.8
BS (Rs mn) FY20 FY21 FY22 FY23
Capital 735 735 735 735
Reserves 52223 55665 63199 73122
Deposits 408325 438385 507810 599493
Borrowings 20324 17885 18779 20094
Other Liabilities 15726 18145 19687 21269
Total 497333 530816 610211 714714
Cash & Bank 47216 45961 52713 57812
Investments 91168 98996 113775 132731
Advances 339274 365763 422761 502093
Fixed Assets 2452 2545 2692 2875
Other Assets 17225 17552 18272 19204
Total 497335 530818 610213 714716
Source: Dalal & Broacha Research)

City Union Bank Ltd. November 5, 2020
Page 14
Initiating Coverage @ Dalal & Broacha
Analyst: Avinash Tanawade 022 67141442
Disclaimer
Dalal&Broacha Stock Broking Pvt Ltd, hereinafter referred to as D&B (CIN_U67120MH1997PTC111186) was established in 1997 and is an integrated
financial services player offering an extensive range of financial solutions and services to a wide spectrum of customers with varied n eeds ranging
from equities to mutual funds to depository services.
D&B is a corporate trading member of Bombay Stock Exchange Limited (BSE), National Stock Exchange of India Limited (NSE). D&B along with its
affiliates offers the most comprehensive avenues for investments and is engaged in the securities businesses including stock broking (Institutional
and retail), depository participant, portfolio management and services rendered in connection with distribution of primary market issues and
financial products like mutual funds, fixed deposits. Details of associates are available on our website i.e. www.dalal-broacha.com
D&B is registered as Research Analyst with SEBI bearing registration Number INH000001246 as per SEBI (Research Analysts) Regulations, 2014.
D&B hereby declares that it has not defaulted with any stock exchange nor its activities were suspended by any stock exchange with whom it is
registered in any time in the past. It has not been debarred from doing business by any Stock Exchange / SEBI or any other authorities; nor has its
certificate of registration been cancelled by SEBI at any point of time.
SEBI and Stock Exchanges have conducted the routine inspection and based on their observations have issued advice letters or levied minor penalty
on D&B for certain operational deviations in routine course of business.
D&B offers research services to clients as well as prospects. The analyst for this report certifies that all of the views expressed in this report accurately
reflect his or her personal views about the subject company or companies and its or their securities, and no part of his or her compensation was, is or
will be, directly or indirectly related to specific recommendations or views expressed in this report.
Other disclosures by D&B (Research Entity) and its Research Analyst under SEBI (Research Analyst) Regulations, 2014 with reference to the subject
company(s) covered in this report-:
D&B or its associates may have financial interest in the subject company.
D&B or its associates do not have any material conflict of interest in the subject company.
The Research Analyst or Research Entity (D&B) has not been engaged in market making activity for the subject company.
D&B or its associates may have actual/beneficial ownership of 1% or more securities of the subject company at the end of the month immediately
preceding the date of publication of Research Report.
Disclosures in respect of Research Analyst:
Whether Research Analyst or his/her relatives have actual/beneficial ownership of 1% or more securities of
the subject company at the end of the month immediately preceding the date of publication of Research
Report:
No
Whether the Research Analyst or his/her relative’s financial interest in the subject company. No
Whether the research Analyst has served as officer, director or employee of the subject company No
Whether the Research Analyst has received any compensation from the subject company in the past twelve
months
No
Whether the Research Analyst has managed or co‐managed public offering of securities for the subject
company in the past twelve months
No
Whether the Research Analyst has received any compensation for investment banking or merchant banking or
brokerage services from the subject company in the past twelve months
No
Whether the Research Analyst has received any compensation for products or services other than investment No
City Union Bank Ltd. November 5, 2020
Page 15
Initiating Coverage @ Dalal & Broacha
Analyst: Avinash Tanawade 022 67141442
banking or merchant banking or brokerage services from the subject company in the past twelve months
Whether the Research Analyst has received any compensation or other benefits from the subject company or
third party in connection with the research report
No
D&B and/or its affiliates may seek investment banking or other business from the company or companies that are the subject of this material. Our
salespeople, traders, and other professionals may provide oral or written market commentary or trading strategies to our clients that reflect opinions
that are contrary to the opinions expressed herein, and our proprietary trading and investing businesses may make investment decisions that may be
inconsistent with the recommendations expressed herein.
In reviewing these materials, you should be aware that any or all of the foregoing, among other things, may give rise to real or potential conflicts of
interest including but not limited to those stated herein. Additionally, other important information regarding our relationships with the company or
companies that are the subject of this material is provided herein. This report is not directed to, or intended for distribution to or use by, any person
or entity who is a citizen or resident of or located in any locality, state, country or other jurisdiction where such distrib ution, publication, availability
or use would be contrary to law or regulation or which would subject D&B or its group companies to any registration or licens ing requirement within
such jurisdiction. Specifically, this document does not constitute an offer to or solicitation to any U.S. person for the purchase or sale of any financial
instrument or as an official confirmation of any transaction to any U.S. person. Unless otherwise stated, this message should not be construed as
official confirmation of any transaction. av No part of this document may be distributed in Canada or used by private customers in United Kingdom. All
material presented in this report, unless specifically indicated otherwise, is under copyright to D&B. None of the material, nor its content, nor any
copy of it, may be altered in any way, transmitted to, copied or distributed to any other party, without the prior express written permission of D&B .
All trademarks, service marks and logos used in this report are trademarks or registered trademarks of D&B or its Group Companies. The information
contained herein is not intended for publication or distribution or circulation in any manner whatsoever and any unauthorized reading,
dissemination, distribution or copying of this communication is prohibited unless otherwise expressly authorized. Please ensure that you have read
“Risk Disclosure Document for Capital Market and Derivatives Segments” as prescribed by Securities and Exchange Board of India before investing in
Indian Securities Market. In so far as this report includes current or historic information, it is believed to be reliable, although its accuracy and
completeness cannot be guaranteed.
Contact Email ID Contact No. Sector
Mr. Kunal Bhatia [email protected] 022 67141442 Auto, Auto Ancillary, FMCG
Mrs.Charulata Gaidhani [email protected] 022 67141446 Pharma /Healthcare
Mr. Mayank Babla mayank.babladalal-broacha.com 022 67141412 I.T/Telecom/Media
Mr. Avinash Tanawade [email protected] 022 67141449 BFSI
Mr. Akshay Ashok [email protected] 022 67141486 BFSI
Mr. Suraj Nandu [email protected] 022 67141438 Associate
Address: - 508, Maker Chambers V, 221 Nariman Point, Mumbai 400 021
Tel: 91-22- 2282 2992, 2287 6173, Fax: 91-22-2287 0092
E-mail: [email protected]