INITIATING COVERAGE - Baroda E-Trade
43
INITIATING COVERAGE BOB Capital Markets Ltd is a wholly owned subsidiary of Bank of Baroda Important disclosures, including any required research certifications, are provided at the end of this report. BUY TP: Rs 5,000 | 21% BAJAJ FINANCE | NBFC | 24 January 2020 BAF 2.0 – Revamped growth engine; initiate with BUY We initiate coverage on Bajaj Finance (BAF) with BUY and a Mar’21 TP of Rs 5,000. Strong traction in consumer finance (~40% of loans) underpins a high- yield, high-churn book that aids faster repricing, while the SME and commercial lending businesses form sustainable scale builders. We estimate a 30% CAGR in NII over FY19-FY22, alongside non-linear fee income growth form a refined cross-sales engine. Higher fixed-rate borrowings and a prudent ALM strategy are expected to sustain spreads at ~9% and fuel a 37% earnings CAGR through FY22. Shubhranshu Mishra Ticker/Price BAF IN/Rs 4,126 Market cap US$ 34.8bn Shares o/s 602mn 3M ADV US$ 66.2mn 52wk high/low Rs 4,253/Rs 3,950 Promoter/FPI/DII 56%/22%/10% Source: NSE STOCK PERFORMANCE Source: NSE Consumer finance, cross-sell to remain key moats: Consumer finance will remain the customer acquisition engine for BAF, driving cross-sales of credit and fee-based products to vetted clients. We expect non-linear fee income growth (~3x over FY19-FY22) from the cross-sell franchise to largely cover for operating cost (~2x). A bulk of NII will thus flow into operating profit which is estimated to log a 33% CAGR through to FY22 vs. a 27% CAGR in AUM. Sustainable scale builders and stable spreads: SME and commercial lending (together 24% of AUM) offer profitable and opportunistic credit plays that mitigate BAF’s concentration in the top-10 cities. We expect a prudent liability mix and rural lending to help sustain spreads at ~9% over FY19-FY22 and model for a 150bps decline in C/I ratio over this period led by technology investments. Well managed asset quality to drive return ratios: The use of technology and data analytics for prudent product positioning and cross-sales has kept credit risk at bay. Credit cost is expected to remain stable at ~200bps over the next three years, thus driving healthy ROE of 22%+. Initiate with BUY: We have a Mar’21 TP of Rs 5,000 for BAF using a residual income model, assuming 12.8% CoE, 7.75% risk-free rate and 5% terminal growth. KEY FINANCIALS Y/E 31 Mar FY18A FY19A FY20E FY21E FY22E Net interest income 69,716 97,252 135,172 171,485 213,464 NII growth (%) 42.2 39.5 39.0 26.9 24.5 Adj. net profit (Rs mn) 24,964 39,950 61,728 82,232 102,432 EPS (Rs) 43.4 69.3 102.6 136.7 170.2 P/E (x) 95.1 59.6 40.2 30.2 24.2 P/BV (x) 15.0 12.1 7.4 6.1 5.0 ROA (%) 3.4 3.8 4.2 4.3 4.4 ROE (%) 20.1 22.5 23.2 22.1 22.6 Source: Company, BOBCAPS Research 880 1,560 2,240 2,920 3,600 4,280 Jan-17 Apr-17 Jul-17 Oct-17 Jan-18 Apr-18 Jul-18 Oct-18 Jan-19 Apr-19 Jul-19 Oct-19 Jan-20 (Rs) BAF [email protected]
-
Upload
khangminh22 -
Category
Documents
-
view
1 -
download
0
Transcript of INITIATING COVERAGE - Baroda E-Trade
INITIATING COVERAGE
BOB Capital Markets Ltd is a wholly owned subsidiary of Bank of Baroda
Important disclosures, including any required research certifications, are provided at the end of this report.
BUY
TP: Rs 5,000 | 21% BAJAJ FINANCE | NBFC | 24 January 2020
BAF 2.0 – Revamped growth engine; initiate with BUY
We initiate coverage on Bajaj Finance (BAF) with BUY and a Mar’21 TP of
Rs 5,000. Strong traction in consumer finance (~40% of loans) underpins a high-
yield, high-churn book that aids faster repricing, while the SME and commercial
lending businesses form sustainable scale builders. We estimate a 30% CAGR in
NII over FY19-FY22, alongside non-linear fee income growth form a refined
cross-sales engine. Higher fixed-rate borrowings and a prudent ALM strategy are
expected to sustain spreads at ~9% and fuel a 37% earnings CAGR through FY22.
Shubhranshu Mishra
Ticker/Price BAF IN/Rs 4,126
Market cap US$ 34.8bn
Shares o/s 602mn
3M ADV US$ 66.2mn
52wk high/low Rs 4,253/Rs 3,950
Promoter/FPI/DII 56%/22%/10%
Source: NSE
STOCK PERFORMANCE
Source: NSE
Consumer finance, cross-sell to remain key moats: Consumer finance will
remain the customer acquisition engine for BAF, driving cross-sales of credit
and fee-based products to vetted clients. We expect non-linear fee income
growth (~3x over FY19-FY22) from the cross-sell franchise to largely cover for
operating cost (~2x). A bulk of NII will thus flow into operating profit which is
estimated to log a 33% CAGR through to FY22 vs. a 27% CAGR in AUM.
Sustainable scale builders and stable spreads: SME and commercial lending
(together 24% of AUM) offer profitable and opportunistic credit plays that
mitigate BAF’s concentration in the top-10 cities. We expect a prudent liability
mix and rural lending to help sustain spreads at ~9% over FY19-FY22 and model
for a 150bps decline in C/I ratio over this period led by technology investments.
Well managed asset quality to drive return ratios: The use of technology and
data analytics for prudent product positioning and cross-sales has kept credit
risk at bay. Credit cost is expected to remain stable at ~200bps over the next
three years, thus driving healthy ROE of 22%+.
Initiate with BUY: We have a Mar’21 TP of Rs 5,000 for BAF using a residual
income model, assuming 12.8% CoE, 7.75% risk-free rate and 5% terminal growth.
KEY FINANCIALS
Y/E 31 Mar FY18A FY19A FY20E FY21E FY22E
Net interest income 69,716 97,252 135,172 171,485 213,464
NII growth (%) 42.2 39.5 39.0 26.9 24.5
Adj. net profit (Rs mn) 24,964 39,950 61,728 82,232 102,432
EPS (Rs) 43.4 69.3 102.6 136.7 170.2
P/E (x) 95.1 59.6 40.2 30.2 24.2
P/BV (x) 15.0 12.1 7.4 6.1 5.0
ROA (%) 3.4 3.8 4.2 4.3 4.4
ROE (%) 20.1 22.5 23.2 22.1 22.6
Source: Company, BOBCAPS Research
880
1,560
2,240
2,920
3,600
4,280
Jan-
17Apr-17
Jul-17
Oct-17
Jan-
18Apr-18
Jul-18
Oct-18
Jan-
19Apr-19
Jul-19
Oct-19
Jan-
20
(Rs) BAF

BAJAJ FINANCE
EQUITY RESEARCH 2 24 January 2020
Contents
Focus charts ................................................................................................. 3
Investment summary ................................................................................... 6
Characteristics of the Bajaj Finance customer ........................................... 7
The 7 consumption desires of Millennials and Gen Z ............................................ 7
Investment rationale .................................................................................... 9
Continued traction in consumer financing ............................................................. 9
Cross-sell franchise to drive fee income .............................................................. 16
SME, commercial loans – sustainable scale builders .......................................... 21
Rural financing to generate higher yields ............................................................ 24
Judicious borrowing approach to support margins ..............................................25
Mortgage business to gain scale in medium term ................................................ 27
Financial review .......................................................................................... 29
Expect 27% AUM CAGR over FY19-FY22 ...................................................... 29
Asset quality to remain healthy ............................................................................ 29
Low opex and credit cost to drive earnings .......................................................... 31
Management profile ................................................................................... 33
Peer comparison ......................................................................................... 34
Valuation methodology .............................................................................. 35
Key risks ..................................................................................................... 36
Annexure .................................................................................................... 37
Retail industry landscape and drivers .................................................................... 37
BAJAJ FINANCE
EQUITY RESEARCH 3 24 January 2020
Focus charts
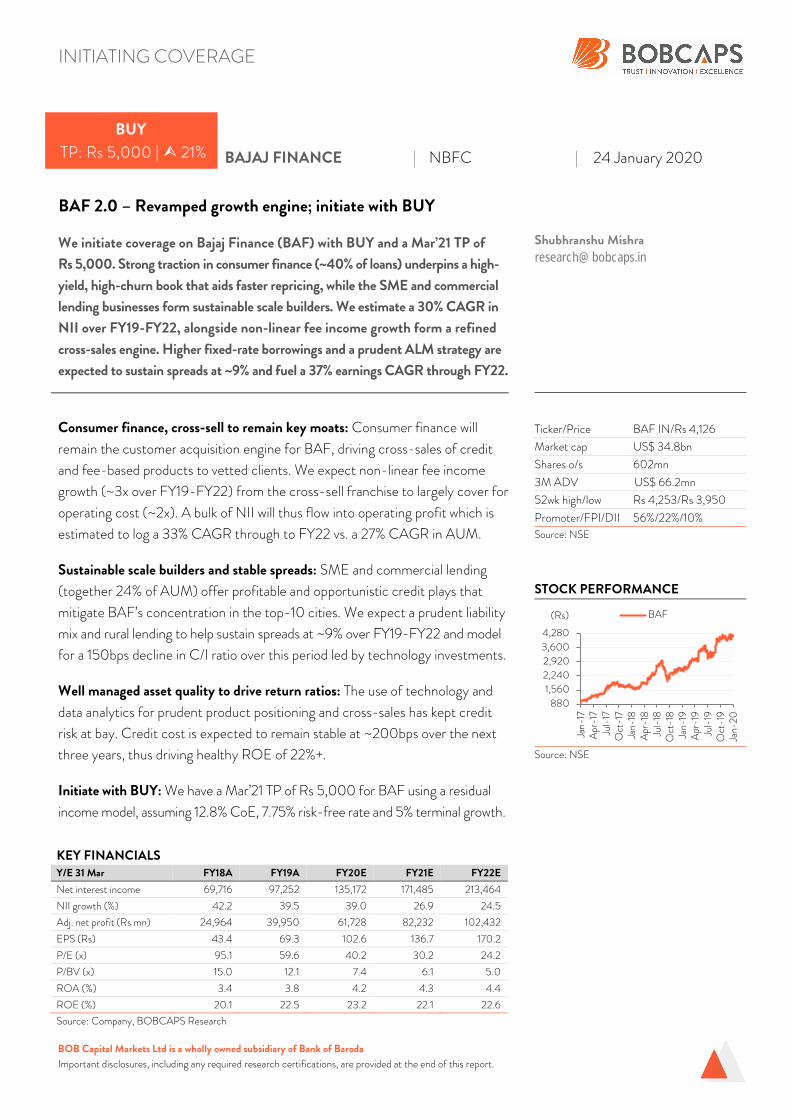
FIG 1 – GROWING MIDDLE CLASS… FIG 2 – …TO DRIVE DISCRETIONARY SPENDING
Source: Burger King RHP, BOBCAPS Research | HH – Households Source: Burger King RHP, BOBCAPS Research
FIG 3 – FINANCE PENETRATION IN CONSUMER
DURABLE PRODUCTS TO INCREASE…
FIG 4 – …DUE TO GROWING INFRASTRUCTURE FOR
DIGITAL PAYMENTS & GEOGRAPHICAL EXPANSION
Source: CRISIL, RBI, BOBCAPS Research Source: CRISIL, RBI, BOBCAPS Research
FIG 5 – BAF’S PERSONAL LOANS OUTSTANDING UP
~46X DURING FY12-FY19
FIG 6 – PERSONAL LOANS PORTFOLIO OF NBFCS
COMPARES WELL TO THAT OF PRIVATE BANKS
Source: Company, BOBCAPS Research Source: Company, BOBCAPS Research
36 60 85 121
15.3
23.6
31.0
41.0
0
5
10
15
20
25
30
35
40
45
0
20
40
60
80
100
120
140
FY09 FY12 FY15 FY18
(%)(mn) HHs with annual earnings Rs 350,000 - Rs 700,000
% of total HHs (R)
11 22 36 86
4.7
8.7
13.1
29.2
0
5
10
15
20
25
30
35
0
20
40
60
80
100
FY09 FY12 FY15 FY18
(%)(mn) HHs with annual earnings Rs 700,000 - Rs 3,500,000
% of total HHs (R)
19
29
38
0 10 20 30 40
FY14
FY19
FY24E
(%)
Finance penetration
1.1 1.1 1.4
2.5
3.1
3.7
0
1
2
3
4
FY14 FY15 FY16 FY17 FY18 FY19
(mn) POS Terminals
2 6 1019
2635
64
87
0
20
40
60
80
100
FY12 FY13 FY14 FY15 FY16 FY17 FY18 FY19
(Rs bn) Personal loans
90.0 82.5
72.5
0
20
40
60
80
100
PSU Banks Pvt. Banks NBFCs
(%) Salaried customer availing of personal loans
BAJAJ FINANCE
EQUITY RESEARCH 4 24 January 2020
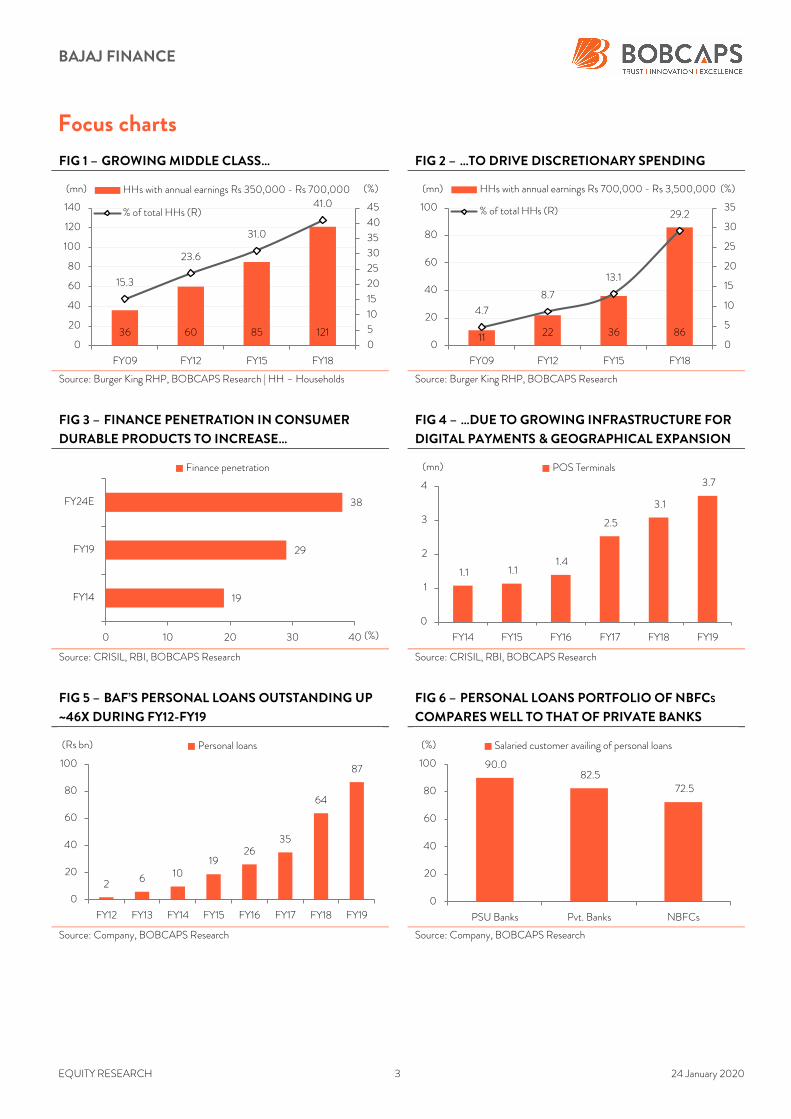
FIG 7 – BAF’S FEE INCOME EVENLY DIVIDED
BETWEEN DISTRIBUTION AND LOAN-RELATED FEES
FIG 8 – BAF TARGETS 75% OF NEW LOAN ORIGINATION
FROM EXISTING CUSTOMERS, LOWERING RISK
Source: Company, BOBCAPS Research Source: Company, BOBCAPS Research
FIG 9 – PRICING OF DEBT THROUGH FY17-FY19 HAS
BEEN LARGELY STABLE…
FIG 10 – …LEADING TO LOWER BORROWING COST
AND HIGHER SPREADS
Source: Company, BOBCAPS Research Source: Company, BOBCAPS Research
FIG 11 – MINISCULE EXPOSURE TO FARMERS IN
RURAL FINANCE PORTFOLIO
FIG 12 – RURAL DELINQUENCIES LOOK BENIGN
Source: Company, BOBCAPS Research Source: Company, BOBCAPS Research
Loan related
fees
45%Distribution
fees
55%
0.33
0.15
0.00
0.10
0.20
0.30
0.40
<18 months on board >18 months on board
(%) Loan loss ratio (existing vs. new customer)
8.7 8.6
8.6
7.4 7.4 7.6
8.9
7.9
8.5
7.0
7.5
8.0
8.5
9.0
FY17 FY18 FY19
(%)NCDs avg. interest rate
CPs avg. interest rate
Bank loans avg. interest rate
9.6 9.7 9.2 8.7 7.9 7.88 8.02
8.7 8.4 8.3 8.7 9.1 9.0 9.1
0
2
4
6
8
10
0
2
4
6
8
10
12
FY14 FY15 FY16 FY17 FY18 FY19 H1FY20
(%)(%) Cost of borrowings Spreads (R)
2.0
0.00.0
0.5
1.0
1.5
2.0
2.5
Rural B2B Rural B2C
(%) Exposure to farmers
1.1
0.8 0.9
0.9
1.3
0.7
0.9
1.1
1.3
1.5
FY16 FY17 FY18 FY19 H1FY20
(%) Rural lending (0+days past due)
BAJAJ FINANCE
EQUITY RESEARCH 5 24 January 2020
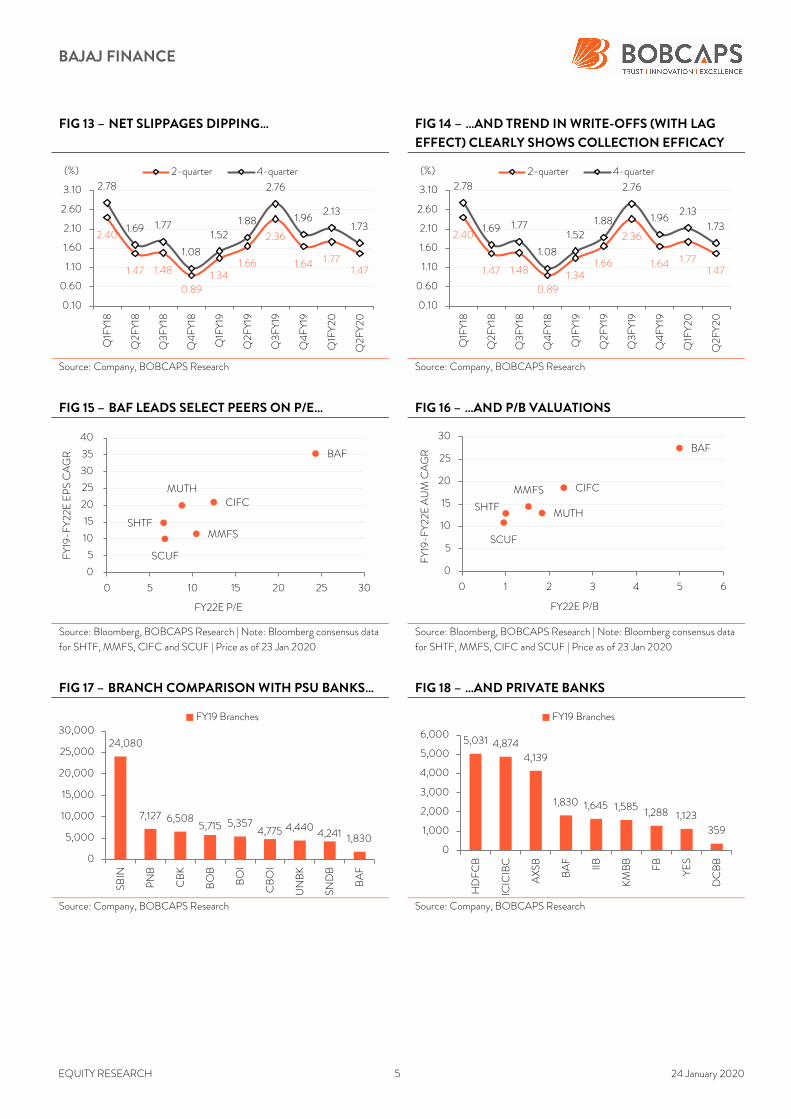
FIG 13 – NET SLIPPAGES DIPPING… FIG 14 – …AND TREND IN WRITE-OFFS (WITH LAG
EFFECT) CLEARLY SHOWS COLLECTION EFFICACY
Source: Company, BOBCAPS Research Source: Company, BOBCAPS Research
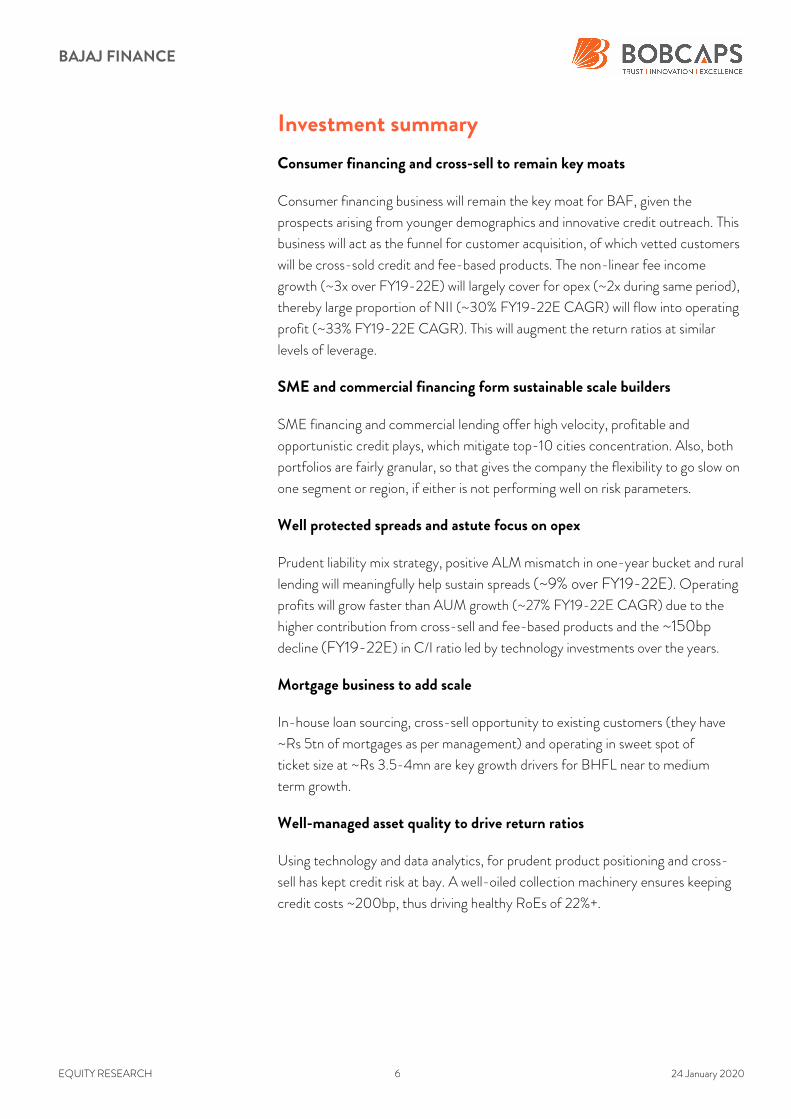
FIG 15 – BAF LEADS SELECT PEERS ON P/E… FIG 16 – …AND P/B VALUATIONS
Source: Bloomberg, BOBCAPS Research | Note: Bloomberg consensus data
for SHTF, MMFS, CIFC and SCUF | Price as of 23 Jan 2020 Source: Bloomberg, BOBCAPS Research | Note: Bloomberg consensus data
for SHTF, MMFS, CIFC and SCUF | Price as of 23 Jan 2020
FIG 17 – BRANCH COMPARISON WITH PSU BANKS… FIG 18 – …AND PRIVATE BANKS
Source: Company, BOBCAPS Research Source: Company, BOBCAPS Research
2.40
1.47 1.48
0.891.34
1.66
2.36
1.64 1.771.47
2.78
1.69 1.77
1.08
1.521.88
2.76
1.962.13
1.73
0.10
0.60
1.10
1.60
2.10
2.60
3.10
Q1F
Y18
Q2F
Y18
Q3FY18
Q4FY18
Q1F
Y19
Q2F
Y19
Q3FY19
Q4FY19
Q1F
Y20
Q2F
Y20
(%) 2-quarter 4-quarter
2.40
1.47 1.48
0.891.34
1.66
2.36
1.64 1.771.47
2.78
1.69 1.77
1.08
1.521.88
2.76
1.962.13
1.73
0.10
0.60
1.10
1.60
2.10
2.60
3.10
Q1F
Y18
Q2F
Y18
Q3FY18
Q4FY18
Q1F
Y19
Q2F
Y19
Q3FY19
Q4FY19
Q1F
Y20
Q2F
Y20
(%) 2-quarter 4-quarter
BAF
SHTFMMFS
CIFC
SCUF
MUTH
0
5
10
15
20
25
30
35
40
0 5 10 15 20 25 30
FY19
-FY22
E EPS C
AGR
FY22E P/E
BAF
SHTF
MMFS CIFC
SCUF
MUTH
0
5
10
15
20
25
30
0 1 2 3 4 5 6
FY19
-FY22
E A
UM
CAGR
FY22E P/B
24,080
7,127 6,5085,715 5,357
4,775 4,4404,241 1,830
0
5,000
10,000
15,000
20,000
25,000
30,000
SBIN
PNB
CBK
BO
B
BO
I
CBO
I
UNBK
SNDB
BAF
FY19 Branches
5,031 4,8744,139
1,830 1,645 1,5851,288 1,123
359
0
1,000
2,000
3,000
4,000
5,000
6,000
HDFCB
ICIC
IBC
AXSB
BAF
IIB
KM
BB
FB
YES
DCBB
FY19 Branches
BAJAJ FINANCE
EQUITY RESEARCH 6 24 January 2020
Investment summary
Consumer financing and cross-sell to remain key moats
Consumer financing business will remain the key moat for BAF, given the
prospects arising from younger demographics and innovative credit outreach. This
business will act as the funnel for customer acquisition, of which vetted customers
will be cross-sold credit and fee-based products. The non-linear fee income
growth (~3x over FY19-22E) will largely cover for opex (~2x during same period),
thereby large proportion of NII (~30% FY19-22E CAGR) will flow into operating
profit (~33% FY19-22E CAGR). This will augment the return ratios at similar
levels of leverage.
SME and commercial financing form sustainable scale builders
SME financing and commercial lending offer high velocity, profitable and
opportunistic credit plays, which mitigate top-10 cities concentration. Also, both
portfolios are fairly granular, so that gives the company the flexibility to go slow on
one segment or region, if either is not performing well on risk parameters.
Well protected spreads and astute focus on opex
Prudent liability mix strategy, positive ALM mismatch in one-year bucket and rural
lending will meaningfully help sustain spreads (~9% over FY19-22E). Operating
profits will grow faster than AUM growth (~27% FY19-22E CAGR) due to the
higher contribution from cross-sell and fee-based products and the ~150bp
decline (FY19-22E) in C/I ratio led by technology investments over the years.
Mortgage business to add scale
In-house loan sourcing, cross-sell opportunity to existing customers (they have
~Rs 5tn of mortgages as per management) and operating in sweet spot of
ticket size at ~Rs 3.5-4mn are key growth drivers for BHFL near to medium
term growth.
Well-managed asset quality to drive return ratios
Using technology and data analytics, for prudent product positioning and cross-
sell has kept credit risk at bay. A well-oiled collection machinery ensures keeping
credit costs ~200bp, thus driving healthy RoEs of 22%+.

BAJAJ FINANCE
EQUITY RESEARCH 7 24 January 2020
Characteristics of the Bajaj Finance customer
BAF’s management has frequently highlighted that it focuses on the mass affluent
segment. We set out to understand who this customer is and how this target
market will shape up in the medium term.
The 7 consumption desires of Millennials and Gen Z
BAF defines mass affluent as incomes above Rs 350,000 in rural areas and
Rs 500,000 in urban areas. With ~440mn millennials and ~390mn Gen Z (born
after 2000) teens and children, the sheer size of India’s youth paves the way for
its consumer story to be one of the world’s most compelling in the next 20 years.
The size of India’s young population is contributing to a decline in dependency
ratio – defined as the ratio of dependent population size to working-age
population size (15 to 64 years of age). The country’s working age population has
increased from 36% in FY00 to 49.8% in FY18.
FIG 19 – DEPENDENCY RATIO DECLINING… FIG 20 – …DUE TO SUSTAINED GROWTH IN YOUNG
POPULATION
Source: MOSPI, Census of 2011, BOBCAPS Research Source: MOSPI, Census of 2011, BOBCAPS Research
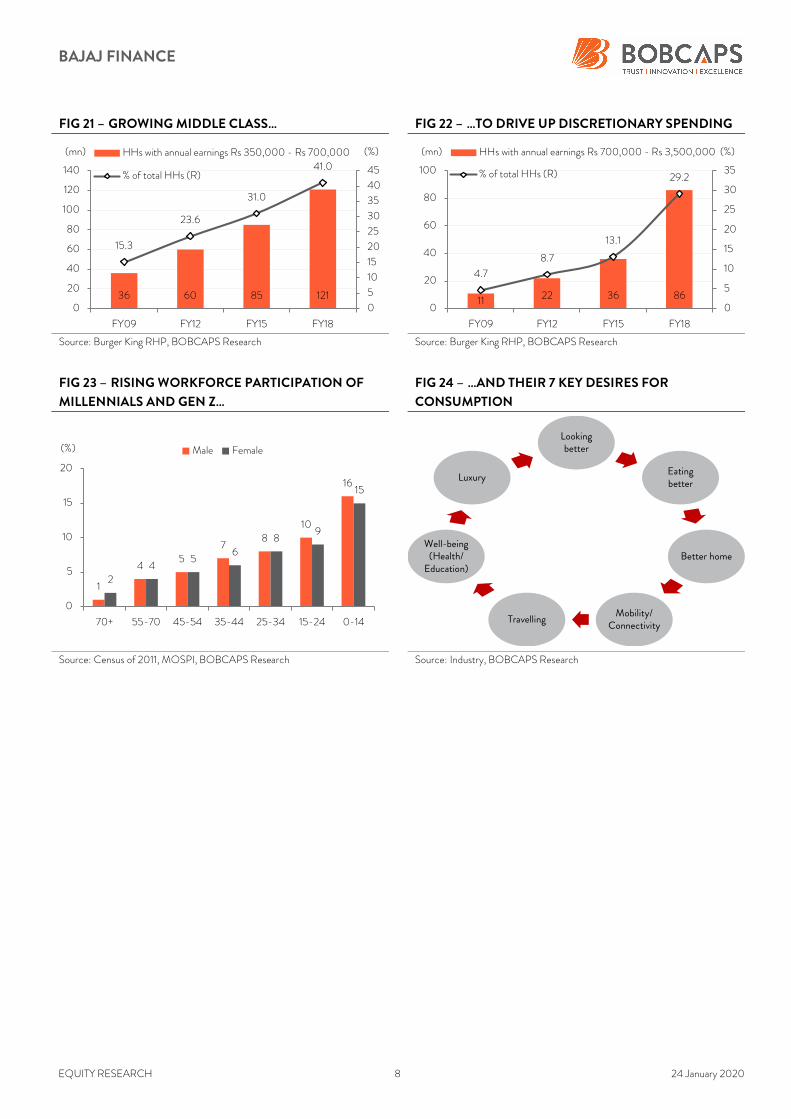
This trend is expected to fuel rising income levels per household as well as higher
levels of discretionary expenditure. Consequently, spends on premium products
will rise, leading to higher expenditure in various categories, including food and
beverages, apparel and accessories, luxury products and consumer durables.
As per industry sources, the seven consumption desires of millennials and Gen Z
Indians can be encapsulated as follows: (1) looking better, (2) eating better,
(3) better home, (4) mobility/connectivity, (5) travelling, (6) wellbeing (health/
education), and (7) luxury.
77 79 75 7264
5952 51 50 50 49
0
20
40
60
80
100
1960
1970
1980
1990
2000
2010
2016
2017
2018
2019
2020
E
(%) Dependency ratio (% of working age population)
32.2
33.533.8
34.8
34.1
32
33
34
35
36
1981 1991 2001 2011 2021E
(%) Growth in population (15-34 yrs.)
BAJAJ FINANCE
EQUITY RESEARCH 8 24 January 2020
FIG 21 – GROWING MIDDLE CLASS… FIG 22 – …TO DRIVE UP DISCRETIONARY SPENDING
Source: Burger King RHP, BOBCAPS Research Source: Burger King RHP, BOBCAPS Research
FIG 23 – RISING WORKFORCE PARTICIPATION OF
MILLENNIALS AND GEN Z…
FIG 24 – …AND THEIR 7 KEY DESIRES FOR
CONSUMPTION
Source: Census of 2011, MOSPI, BOBCAPS Research Source: Industry, BOBCAPS Research
36 60 85 121
15.3
23.6
31.0
41.0
0
5
10
15
20
25
30
35
40
45
0
20
40
60
80
100
120
140
FY09 FY12 FY15 FY18
(%)(mn) HHs with annual earnings Rs 350,000 - Rs 700,000
% of total HHs (R)
11 22 36 86
4.7
8.7
13.1
29.2
0
5
10
15
20
25
30
35
0
20
40
60
80
100
FY09 FY12 FY15 FY18
(%)(mn) HHs with annual earnings Rs 700,000 - Rs 3,500,000
% of total HHs (R)
1
45
78
10
16
24
56
89
15
0
5
10
15
20
70+ 55-70 45-54 35-44 25-34 15-24 0-14
(%) Male FemaleLooking better
Eatingbetter
Better home
Mobility/ Connectivity
Luxury
Well-being (Health/ Education)
Travelling
BAJAJ FINANCE
EQUITY RESEARCH 9 24 January 2020
Investment rationale
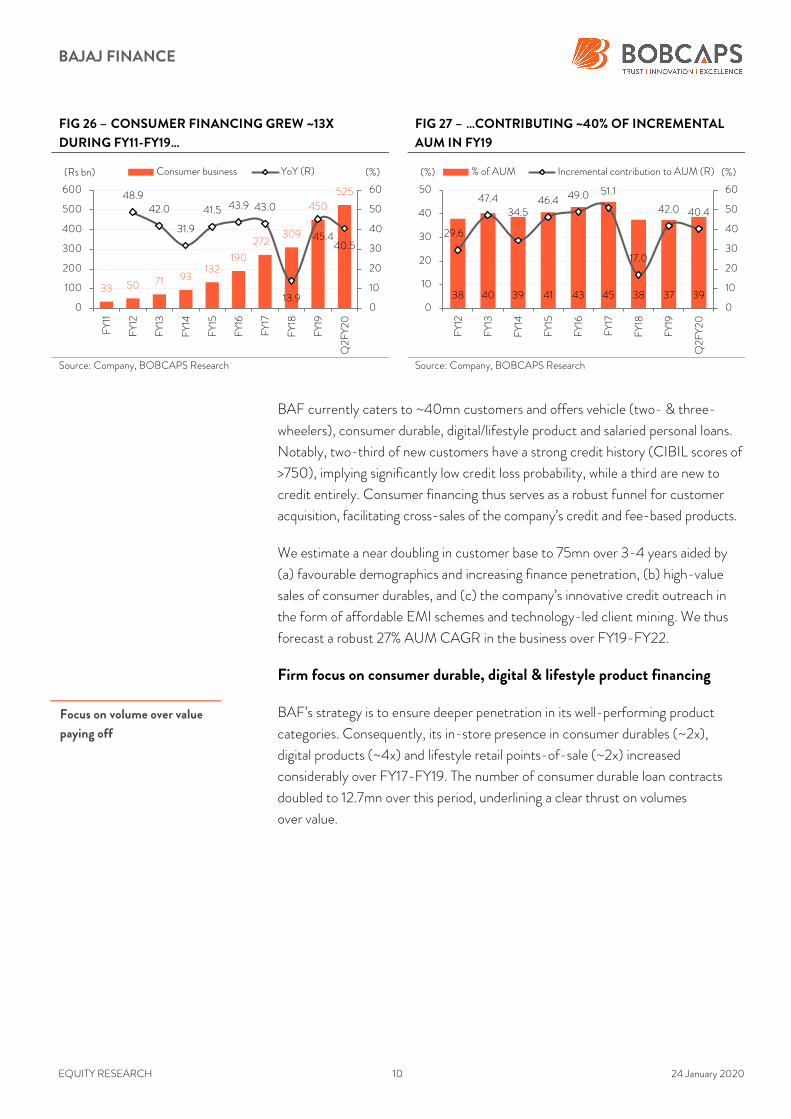
Continued traction in consumer financing
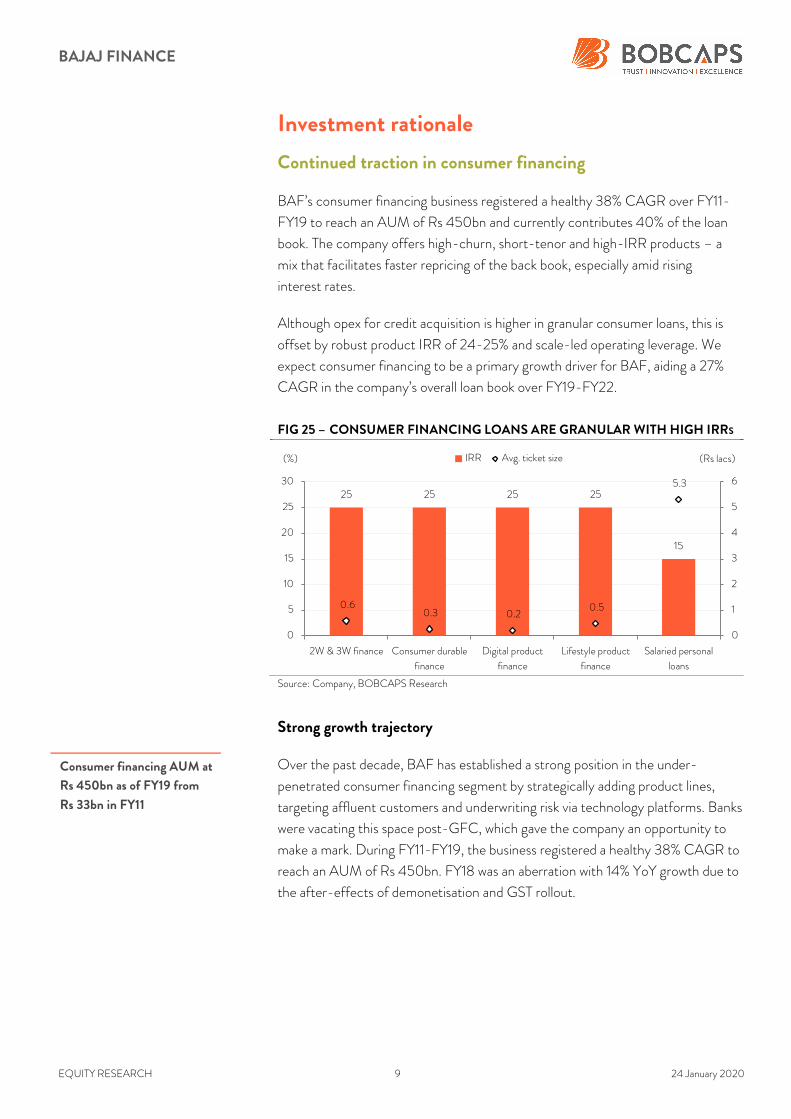
BAF’s consumer financing business registered a healthy 38% CAGR over FY11-
FY19 to reach an AUM of Rs 450bn and currently contributes 40% of the loan
book. The company offers high-churn, short-tenor and high-IRR products – a
mix that facilitates faster repricing of the back book, especially amid rising
interest rates.
Although opex for credit acquisition is higher in granular consumer loans, this is
offset by robust product IRR of 24-25% and scale-led operating leverage. We
expect consumer financing to be a primary growth driver for BAF, aiding a 27%
CAGR in the company’s overall loan book over FY19-FY22.
FIG 25 – CONSUMER FINANCING LOANS ARE GRANULAR WITH HIGH IRRS
Source: Company, BOBCAPS Research
Strong growth trajectory
Over the past decade, BAF has established a strong position in the under-
penetrated consumer financing segment by strategically adding product lines,
targeting affluent customers and underwriting risk via technology platforms. Banks
were vacating this space post-GFC, which gave the company an opportunity to
make a mark. During FY11-FY19, the business registered a healthy 38% CAGR to
reach an AUM of Rs 450bn. FY18 was an aberration with 14% YoY growth due to
the after-effects of demonetisation and GST rollout.
25 25 25 25
15
0.6 0.3 0.2
0.5
5.3
0
1
2
3
4
5
6
0
5
10
15
20
25
30
2W & 3W finance Consumer durable
finance
Digital product
finance
Lifestyle product
finance
Salaried personal
loans
(Rs lacs)(%) IRR Avg. ticket size
Consumer financing AUM at
Rs 450bn as of FY19 from
Rs 33bn in FY11
BAJAJ FINANCE
EQUITY RESEARCH 10 24 January 2020
FIG 26 – CONSUMER FINANCING GREW ~13X
DURING FY11-FY19…
FIG 27 – …CONTRIBUTING ~40% OF INCREMENTAL
AUM IN FY19
Source: Company, BOBCAPS Research Source: Company, BOBCAPS Research
BAF currently caters to ~40mn customers and offers vehicle (two- & three-
wheelers), consumer durable, digital/lifestyle product and salaried personal loans.
Notably, two-third of new customers have a strong credit history (CIBIL scores of
>750), implying significantly low credit loss probability, while a third are new to
credit entirely. Consumer financing thus serves as a robust funnel for customer
acquisition, facilitating cross-sales of the company’s credit and fee-based products.
We estimate a near doubling in customer base to 75mn over 3-4 years aided by
(a) favourable demographics and increasing finance penetration, (b) high-value
sales of consumer durables, and (c) the company’s innovative credit outreach in
the form of affordable EMI schemes and technology-led client mining. We thus
forecast a robust 27% AUM CAGR in the business over FY19-FY22.
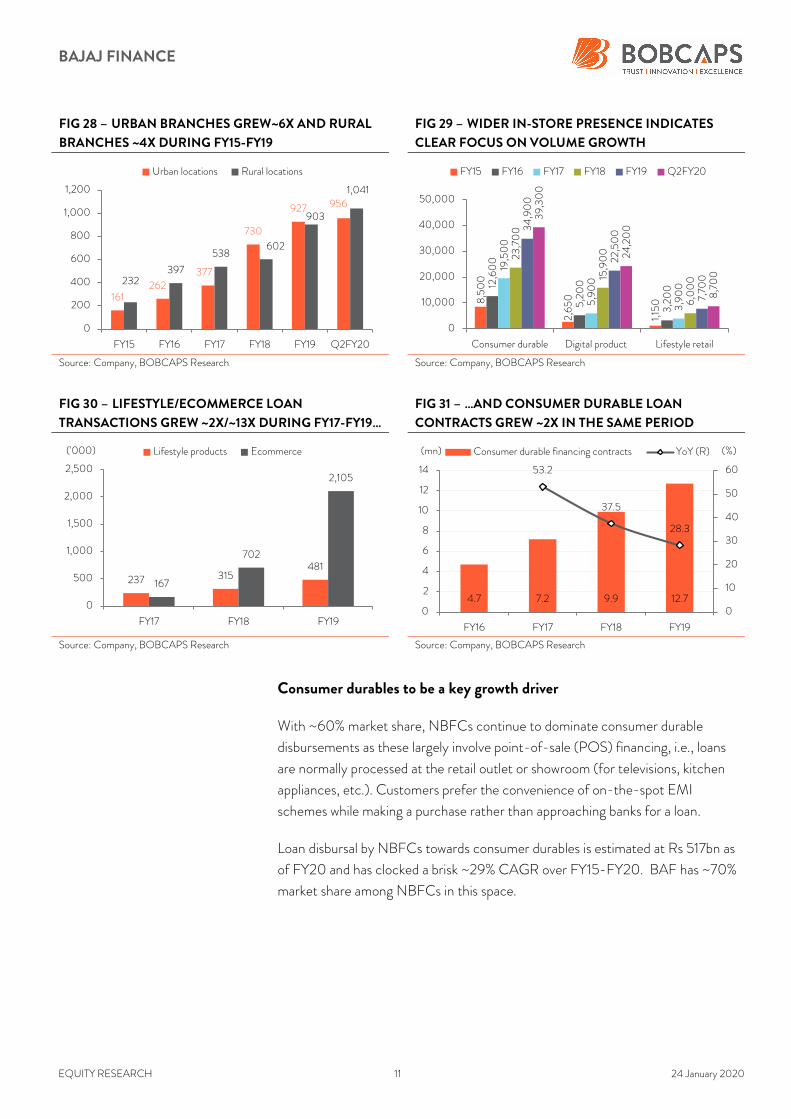
Firm focus on consumer durable, digital & lifestyle product financing
BAF’s strategy is to ensure deeper penetration in its well-performing product
categories. Consequently, its in-store presence in consumer durables (~2x),
digital products (~4x) and lifestyle retail points-of-sale (~2x) increased
considerably over FY17-FY19. The number of consumer durable loan contracts
doubled to 12.7mn over this period, underlining a clear thrust on volumes
over value.
33 50 71 93132
190
272309
450
52548.942.0
31.9
41.5 43.9 43.0
13.9
45.440.5
0
10
20
30
40
50
60
0
100
200
300
400
500
600
FY11
FY12
FY13
FY14
FY15
FY16
FY17
FY18
FY19
Q2F
Y20
(%)(Rs bn) Consumer business YoY (R)
38 40 39 41 43 45 38 37 39
29.6
47.434.5
46.4 49.0 51.1
17.0
42.0 40.4
0
10
20
30
40
50
60
0
10
20
30
40
50
FY12
FY13
FY14
FY15
FY16
FY17
FY18
FY19
Q2F
Y20
(%)(%) % of AUM Incremental contribution to AUM (R)
Focus on volume over value
paying off
BAJAJ FINANCE
EQUITY RESEARCH 11 24 January 2020
FIG 28 – URBAN BRANCHES GREW~6X AND RURAL
BRANCHES ~4X DURING FY15-FY19
FIG 29 – WIDER IN-STORE PRESENCE INDICATES
CLEAR FOCUS ON VOLUME GROWTH
Source: Company, BOBCAPS Research Source: Company, BOBCAPS Research
FIG 30 – LIFESTYLE/ECOMMERCE LOAN
TRANSACTIONS GREW ~2X/~13X DURING FY17-FY19…
FIG 31 – …AND CONSUMER DURABLE LOAN
CONTRACTS GREW ~2X IN THE SAME PERIOD
Source: Company, BOBCAPS Research Source: Company, BOBCAPS Research
Consumer durables to be a key growth driver
With ~60% market share, NBFCs continue to dominate consumer durable
disbursements as these largely involve point-of-sale (POS) financing, i.e., loans
are normally processed at the retail outlet or showroom (for televisions, kitchen
appliances, etc.). Customers prefer the convenience of on-the-spot EMI
schemes while making a purchase rather than approaching banks for a loan.
Loan disbursal by NBFCs towards consumer durables is estimated at Rs 517bn as
of FY20 and has clocked a brisk ~29% CAGR over FY15-FY20. BAF has ~70%
market share among NBFCs in this space.
161262
377
730
927 956
232397
538602
903
1,041
0
200
400
600
800
1,000
1,200
FY15 FY16 FY17 FY18 FY19 Q2FY20
Urban locations Rural locations
8,500
2,650
1,15
0
12,600
5,200
3,200
19,500
5,900
3,900
23,700
15,900
6,0
00
34,900
22,500
7,70
0
39,300
24,200
8,700
0
10,000
20,000
30,000
40,000
50,000
Consumer durable Digital product Lifestyle retail
FY15 FY16 FY17 FY18 FY19 Q2FY20
237 315481
167
702
2,105
0
500
1,000
1,500
2,000
2,500
FY17 FY18 FY19
('000) Lifestyle products Ecommerce
4.7 7.2 9.9 12.7
53.2
37.5
28.3
0
10
20
30
40
50
60
0
2
4
6
8
10
12
14
FY16 FY17 FY18 FY19
(%)(mn) Consumer durable financing contracts YoY (R)
BAJAJ FINANCE
EQUITY RESEARCH 12 24 January 2020
FIG 32 – EASE OF TRANSACTIONS… FIG 33 – …TO HELP NBFCS MAINTAIN MARKET SHARE
IN CONSUMER DURABLE FINANCING
Source: CRISIL, Company, BOBCAPS Research Source: CRISIL, Company, BOBCAPS Research
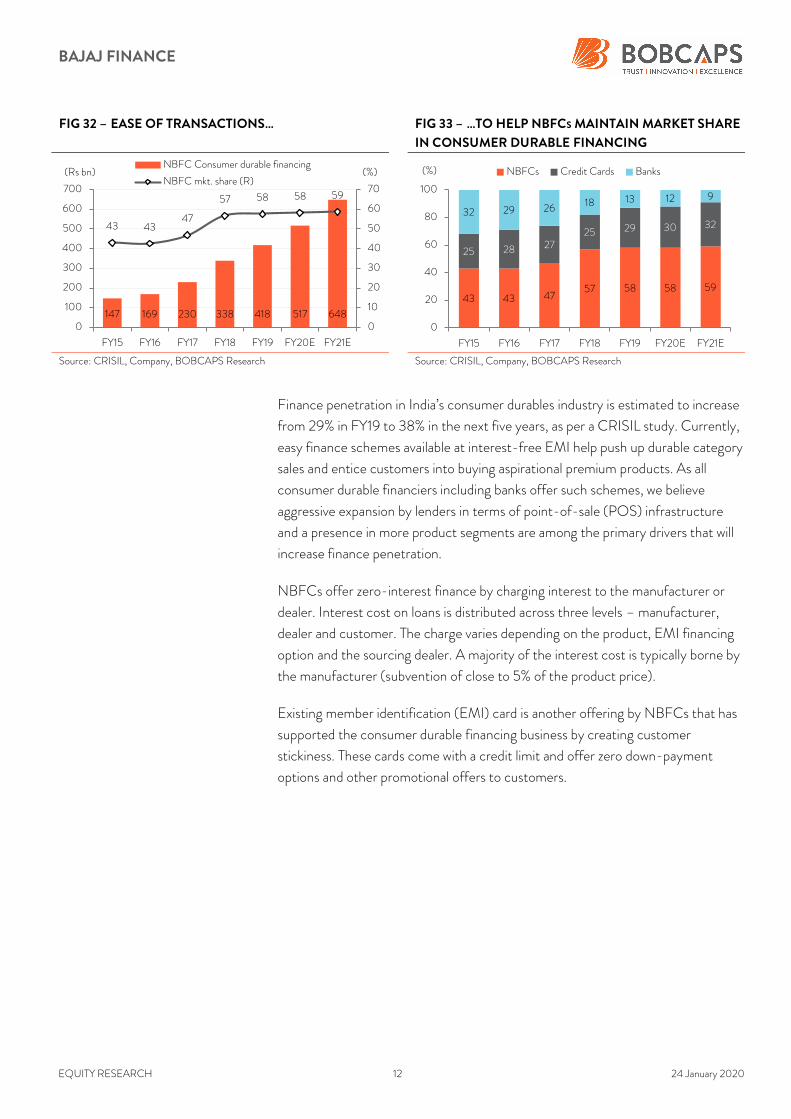
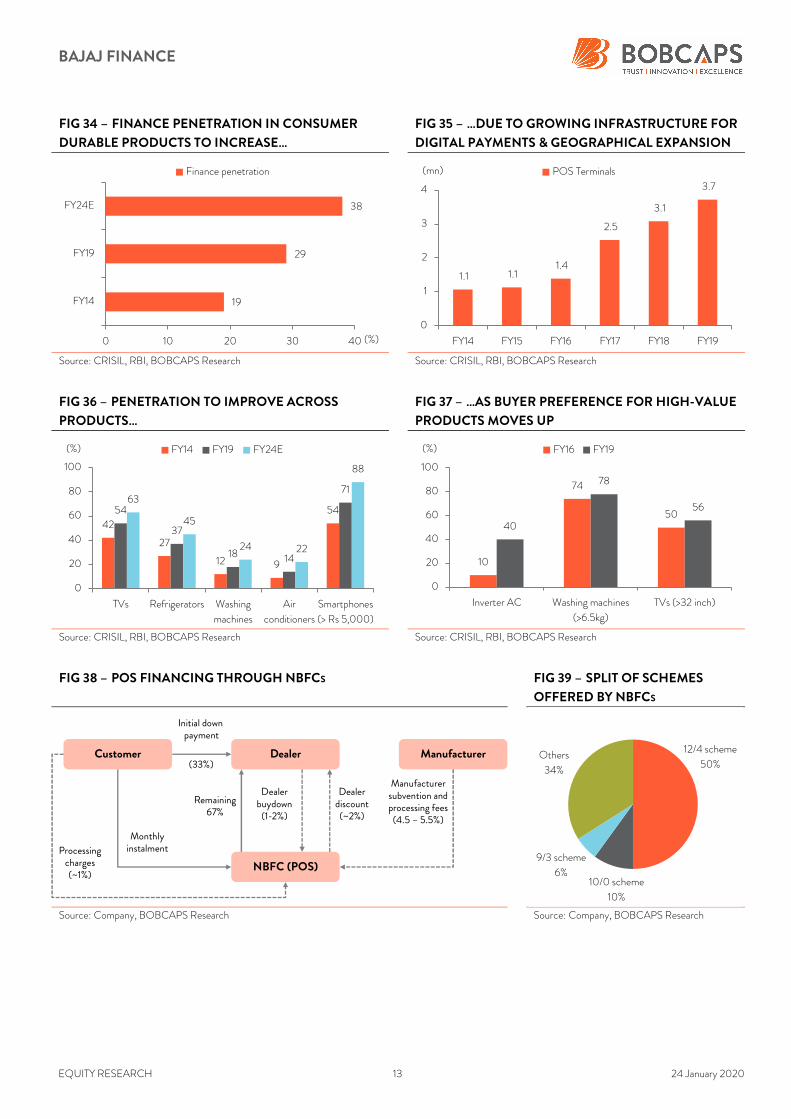
Finance penetration in India’s consumer durables industry is estimated to increase
from 29% in FY19 to 38% in the next five years, as per a CRISIL study. Currently,
easy finance schemes available at interest-free EMI help push up durable category
sales and entice customers into buying aspirational premium products. As all
consumer durable financiers including banks offer such schemes, we believe
aggressive expansion by lenders in terms of point-of-sale (POS) infrastructure
and a presence in more product segments are among the primary drivers that will
increase finance penetration.
NBFCs offer zero-interest finance by charging interest to the manufacturer or
dealer. Interest cost on loans is distributed across three levels – manufacturer,
dealer and customer. The charge varies depending on the product, EMI financing
option and the sourcing dealer. A majority of the interest cost is typically borne by
the manufacturer (subvention of close to 5% of the product price).
Existing member identification (EMI) card is another offering by NBFCs that has
supported the consumer durable financing business by creating customer
stickiness. These cards come with a credit limit and offer zero down-payment
options and other promotional offers to customers.
147 169 230 338 418 517 648
43 4347
57 58 58 59
0
10
20
30
40
50
60
70
0
100
200
300
400
500
600
700
FY15 FY16 FY17 FY18 FY19 FY20E FY21E
(%)(Rs bn)NBFC Consumer durable financing
NBFC mkt. share (R)
43 43 4757 58 58 59
25 28 2725 29 30 32
32 29 26 18 13 12 9
0
20
40
60
80
100
FY15 FY16 FY17 FY18 FY19 FY20E FY21E
(%) NBFCs Credit Cards Banks
BAJAJ FINANCE
EQUITY RESEARCH 13 24 January 2020
FIG 34 – FINANCE PENETRATION IN CONSUMER
DURABLE PRODUCTS TO INCREASE…
FIG 35 – …DUE TO GROWING INFRASTRUCTURE FOR
DIGITAL PAYMENTS & GEOGRAPHICAL EXPANSION
Source: CRISIL, RBI, BOBCAPS Research Source: CRISIL, RBI, BOBCAPS Research
FIG 36 – PENETRATION TO IMPROVE ACROSS
PRODUCTS…
FIG 37 – …AS BUYER PREFERENCE FOR HIGH-VALUE
PRODUCTS MOVES UP
Source: CRISIL, RBI, BOBCAPS Research Source: CRISIL, RBI, BOBCAPS Research
FIG 38 – POS FINANCING THROUGH NBFCS FIG 39 – SPLIT OF SCHEMES
OFFERED BY NBFCS
Source: Company, BOBCAPS Research Source: Company, BOBCAPS Research
19
29
38
0 10 20 30 40
FY14
FY19
FY24E
(%)
Finance penetration
1.1 1.1 1.4
2.5
3.1
3.7
0
1
2
3
4
FY14 FY15 FY16 FY17 FY18 FY19
(mn) POS Terminals
42
27
12 9
5454
37
18 14
7163
45
24 22
88
0
20
40
60
80
100
TVs Refrigerators Washing
machines
Air
conditioners
Smartphones
(> Rs 5,000)
(%) FY14 FY19 FY24E
10
74
5040
78
56
0
20
40
60
80
100
Inverter AC Washing machines
(>6.5kg)
TVs (>32 inch)
(%) FY16 FY19
Initial down payment
(33%)
Remaining67%
Dealerbuydown(1-2%)
Dealerdiscount(~2%)
Manufacturersubvention andprocessing fees(4.5 – 5.5%)
Processing charges(~1%)
Monthly instalment
Customer Dealer Manufacturer
NBFC (POS)
12/4 scheme
50%
10/0 scheme
10%
9/3 scheme
6%
Others
34%

BAJAJ FINANCE
EQUITY RESEARCH 14 24 January 2020
FIG 40 – GEOGRAPHICAL DIVERSIFICATION OF E-
COMMERCE TO FUEL 23-28% CAGR OVER FY19-FY24E
FIG 41 – OEMS CONTINUE TO OFFER SUBVENTION
ON CONSUMER DURABLES TO STAVE OFF RIVALS
Source: CRISIL, Company, BOBCAPS Research Source: Flipkart, BOBCAPS Research
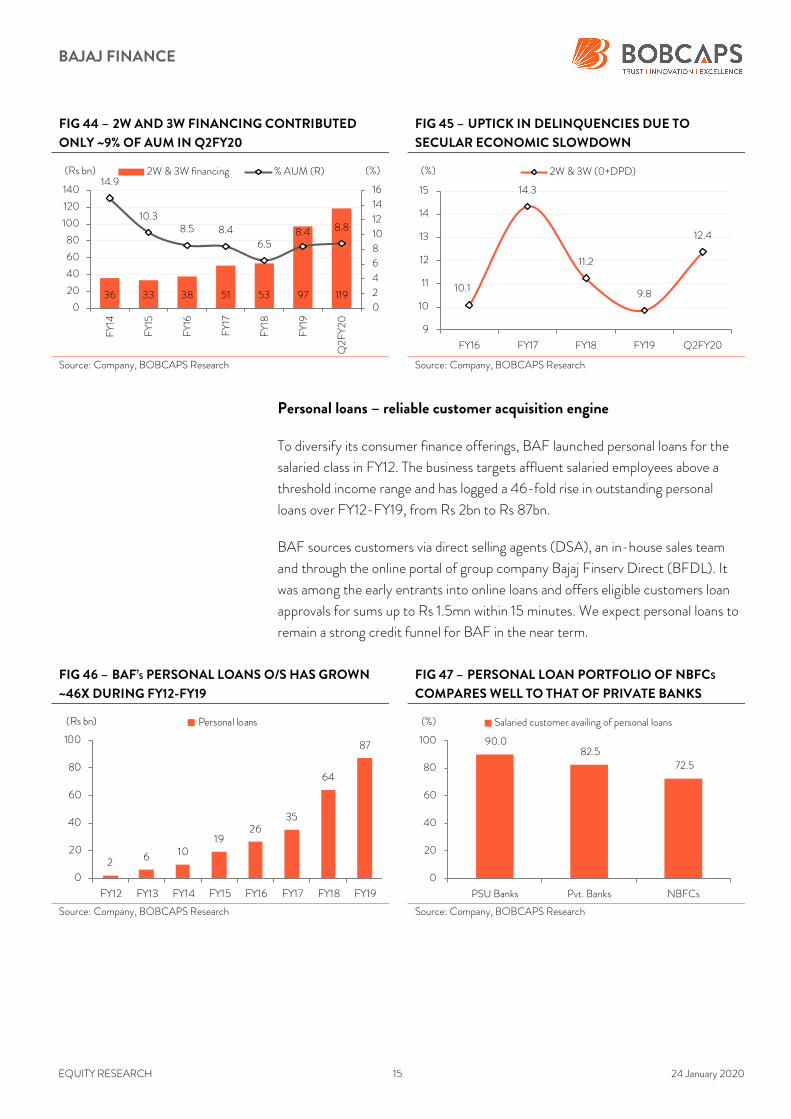
Sensible slowdown in 2W and 3W financing
Though BAF started as a captive auto financier for Bajaj Auto’s (BJAUT) two-
wheelers (2W) and three-wheelers (3W), management deliberately slowed down
channel expansion during FY14-FY17 due to the higher delinquencies during the
period. Thereafter, BAF increased the tally of BJAUT dealer relationships by 60%
to 5,200 in Q2FY20, along with financing 52% of the company’s 2Ws and 46%
of 3Ws, thus gaining market share in the latter’s financing pie. Risk concentration
in 2W and 3W financing has reduced to 9% of AUM in Q2FY20 from 15% in FY14.
FIG 42 – SLOWER GROWTH IN BJAUT DEALERSHIPS… FIG 43 – …BUT MARKET SHARE GAINS IN BJAUT
FINANCING PIE
Source: Company, BOBCAPS Research Source: Company, BOBCAPS Research
713 1,0371,471 1,742
2,2752,905
9,025
0
2,000
4,000
6,000
8,000
10,000
FY14 FY15 FY16 FY17 FY18 FY19 FY24E
(Rs bn) Indian E-Commerce Industry65
1622 24
0
10
20
30
40
50
60
70
TV Refrigerators Air conditioners Washing
machines
No. of OEMs registered on Flipkart
2,6003,000 3,000 3,200
3,900
4,6005,200
0
1,000
2,000
3,000
4,000
5,000
6,000
FY14 FY15 FY16 FY17 FY18 FY19 Q2FY20
BJAUT dealers
30 3128
3733
44
52
27
1215
2328
39
46
0
10
20
30
40
50
60
FY14 FY15 FY16 FY17 FY18 FY19 Q2FY20
(%) BJAUT 2W financing BJAUT 3W financing
Slowed auto loan channel
expansion due to defaults and
risk concentration
BAJAJ FINANCE
EQUITY RESEARCH 15 24 January 2020
FIG 44 – 2W AND 3W FINANCING CONTRIBUTED
ONLY ~9% OF AUM IN Q2FY20
FIG 45 – UPTICK IN DELINQUENCIES DUE TO
SECULAR ECONOMIC SLOWDOWN
Source: Company, BOBCAPS Research Source: Company, BOBCAPS Research
Personal loans – reliable customer acquisition engine
To diversify its consumer finance offerings, BAF launched personal loans for the
salaried class in FY12. The business targets affluent salaried employees above a
threshold income range and has logged a 46-fold rise in outstanding personal
loans over FY12-FY19, from Rs 2bn to Rs 87bn.
BAF sources customers via direct selling agents (DSA), an in-house sales team
and through the online portal of group company Bajaj Finserv Direct (BFDL). It
was among the early entrants into online loans and offers eligible customers loan
approvals for sums up to Rs 1.5mn within 15 minutes. We expect personal loans to
remain a strong credit funnel for BAF in the near term.
FIG 46 – BAF’S PERSONAL LOANS O/S HAS GROWN
~46X DURING FY12-FY19
FIG 47 – PERSONAL LOAN PORTFOLIO OF NBFCS
COMPARES WELL TO THAT OF PRIVATE BANKS
Source: Company, BOBCAPS Research Source: Company, BOBCAPS Research
36 33 38 51 53 97 119
14.9
10.38.5 8.4
6.58.4 8.8
0
2
4
6
8
10
12
14
16
0
20
40
60
80
100
120
140
FY14
FY15
FY16
FY17
FY18
FY19
Q2F
Y20
(%)(Rs bn) 2W & 3W financing % AUM (R)
10.1
14.3
11.2
9.8
12.4
9
10
11
12
13
14
15
FY16 FY17 FY18 FY19 Q2FY20
(%) 2W & 3W (0+DPD)
2 6 1019
2635
64
87
0
20
40
60
80
100
FY12 FY13 FY14 FY15 FY16 FY17 FY18 FY19
(Rs bn) Personal loans
90.0 82.5
72.5
0
20
40
60
80
100
PSU Banks Pvt. Banks NBFCs
(%) Salaried customer availing of personal loans

BAJAJ FINANCE
EQUITY RESEARCH 16 24 January 2020
Cross-sell franchise to drive fee income
BAF has a successful cross-sales franchise that increases customer engagement,
drives high-velocity, small-ticket lending and generates granular fee income. Over
FY16-FY19, the company has seen a three-fold rise in cross-sell customer pool to
~21mn, aiding ~5x fee income growth over this period.
Opex is negligible to sell to existing customers and credit loss is one-third that of
new customers. Management thus expects the fee income-to-PBT ratio to
increase to 38-40% in the near term from 31% at present. This non-linear growth
will largely cover operating costs, allowing a large proportion of NII to flow into
operating profit.
FIG 48 – CORE FEE INCOME GROWTH FIG 49 – MANAGEMENT EXPECTS TO INCREASE FEE
INCOME-TO-PBT RATIO TO ~38% IN NEAR TERM
Source: Company, BOBCAPS Research Source: Company, BOBCAPS Research
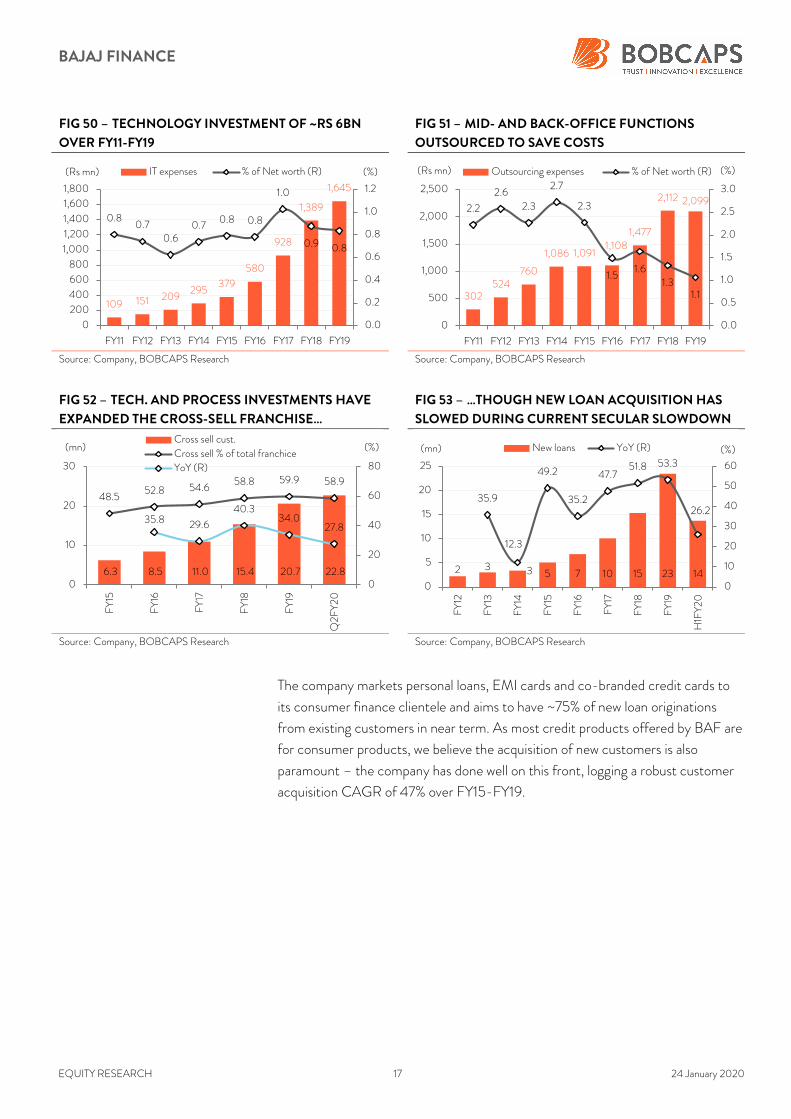
Technology supporting cross-sell franchise
BAF has invested ~Rs 13bn on technology and processes over FY15-FY19.
Domain specialist teams within each business vertical and the use of data analytics
help churn the franchise effectively and deepen engagements with existing
customers. Simultaneously, geographical and product expansion has led to a
tripling of the cross-sell customer pool to ~21mn over FY16-FY19.
37 3542 39 39
27 24
55 60
43
108
55
30 30
0
20
40
60
80
100
120
FY16
FY17
FY18
FY19
FY20
E
FY21
E
FY22
E
(%) NII growth Core fee income growth
32.9
26.4
28.429.9
33.3
36.0
38.4
27.2
30.9 31.4
25
30
35
40FY12
FY13
FY14
FY15
FY16
FY17
FY18
FY19
Q1F
Y20
Q2F
Y20
(%) Fee income to PBT
BAJAJ FINANCE
EQUITY RESEARCH 17 24 January 2020
FIG 50 – TECHNOLOGY INVESTMENT OF ~RS 6BN
OVER FY11-FY19
FIG 51 – MID- AND BACK-OFFICE FUNCTIONS
OUTSOURCED TO SAVE COSTS
Source: Company, BOBCAPS Research Source: Company, BOBCAPS Research
FIG 52 – TECH. AND PROCESS INVESTMENTS HAVE
EXPANDED THE CROSS-SELL FRANCHISE…
FIG 53 – …THOUGH NEW LOAN ACQUISITION HAS
SLOWED DURING CURRENT SECULAR SLOWDOWN
Source: Company, BOBCAPS Research Source: Company, BOBCAPS Research
The company markets personal loans, EMI cards and co-branded credit cards to
its consumer finance clientele and aims to have ~75% of new loan originations
from existing customers in near term. As most credit products offered by BAF are
for consumer products, we believe the acquisition of new customers is also
paramount – the company has done well on this front, logging a robust customer
acquisition CAGR of 47% over FY15-FY19.
109 151 209295
379
580
928
1,389
1,645
0.8 0.7
0.6 0.7
0.8 0.8
1.0
0.9 0.8
0.0
0.2
0.4
0.6
0.8
1.0
1.2
0
200
400
600
800
1,000
1,200
1,400
1,600
1,800
FY11 FY12 FY13 FY14 FY15 FY16 FY17 FY18 FY19
(%)(Rs mn) IT expenses % of Net worth (R)
302524
760
1,086 1,0911,108
1,477
2,112 2,0992.2
2.6 2.3
2.7
2.3
1.5 1.6
1.3 1.1
0.0
0.5
1.0
1.5
2.0
2.5
3.0
0
500
1,000
1,500
2,000
2,500
FY11 FY12 FY13 FY14 FY15 FY16 FY17 FY18 FY19
(%)(Rs mn) Outsourcing expenses % of Net worth (R)
6.3 8.5 11.0 15.4 20.7 22.8
48.552.8 54.6
58.8 59.9 58.9
35.8 29.6
40.334.0
27.8
0
20
40
60
80
0
10
20
30
FY15
FY16
FY17
FY18
FY19
Q2F
Y20
(%)(mn)Cross sell cust.
Cross sell % of total franchiceYoY (R)
2 3 3 5 7 10 15 23 14
35.9
12.3
49.2
35.2
47.751.8 53.3
26.2
0
10
20
30
40
50
60
0
5
10
15
20
25FY12
FY13
FY14
FY15
FY16
FY17
FY18
FY19
H1F
Y20
(%)(mn) New loans YoY (R)
BAJAJ FINANCE
EQUITY RESEARCH 18 24 January 2020
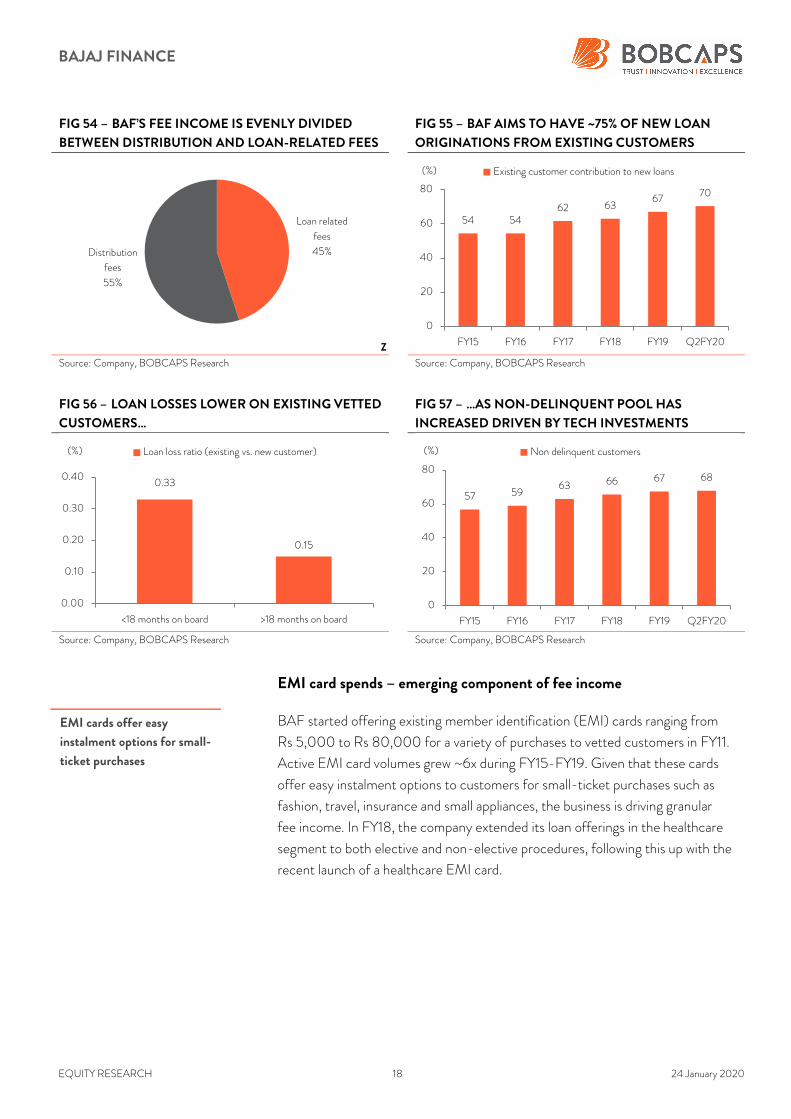
FIG 54 – BAF’S FEE INCOME IS EVENLY DIVIDED
BETWEEN DISTRIBUTION AND LOAN-RELATED FEES
FIG 55 – BAF AIMS TO HAVE ~75% OF NEW LOAN
ORIGINATIONS FROM EXISTING CUSTOMERS
Z
Source: Company, BOBCAPS Research Source: Company, BOBCAPS Research
FIG 56 – LOAN LOSSES LOWER ON EXISTING VETTED
CUSTOMERS…
FIG 57 – …AS NON-DELINQUENT POOL HAS
INCREASED DRIVEN BY TECH INVESTMENTS
Source: Company, BOBCAPS Research Source: Company, BOBCAPS Research
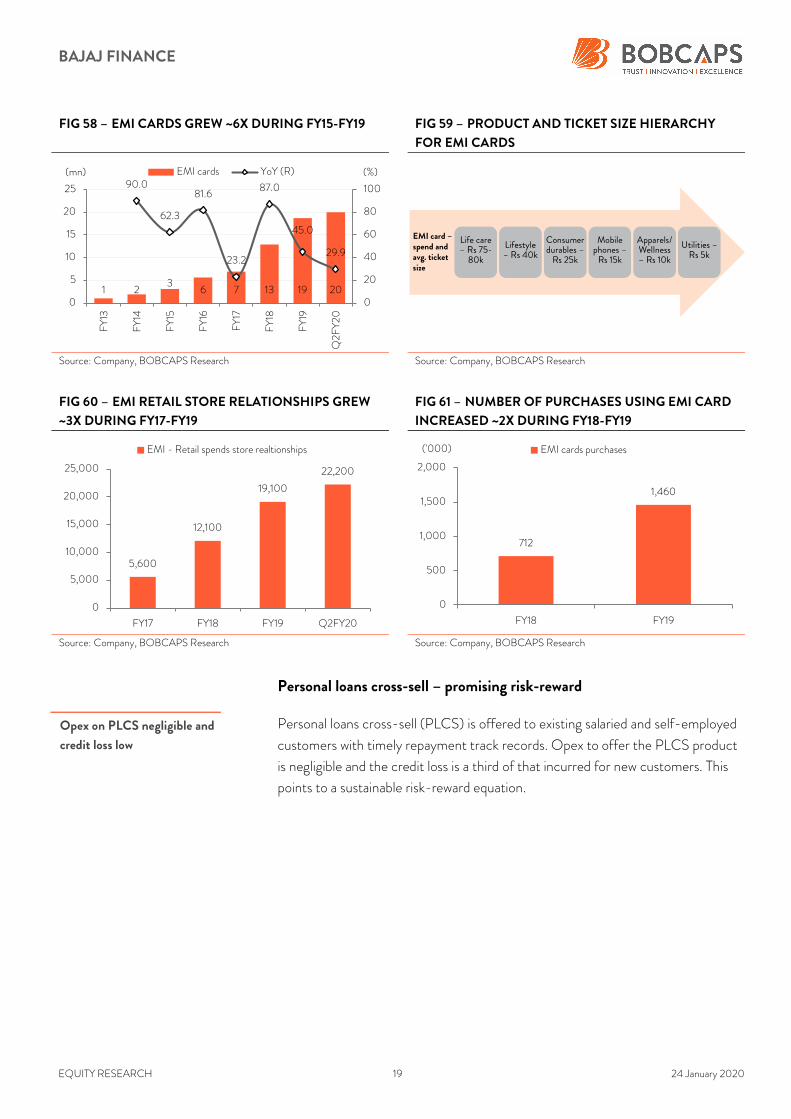
EMI card spends – emerging component of fee income
BAF started offering existing member identification (EMI) cards ranging from
Rs 5,000 to Rs 80,000 for a variety of purchases to vetted customers in FY11.
Active EMI card volumes grew ~6x during FY15-FY19. Given that these cards
offer easy instalment options to customers for small-ticket purchases such as
fashion, travel, insurance and small appliances, the business is driving granular
fee income. In FY18, the company extended its loan offerings in the healthcare
segment to both elective and non-elective procedures, following this up with the
recent launch of a healthcare EMI card.
Loan related
fees
45%Distribution
fees
55%
54 5462 63
6770
0
20
40
60
80
FY15 FY16 FY17 FY18 FY19 Q2FY20
(%) Existing customer contribution to new loans
0.33
0.15
0.00
0.10
0.20
0.30
0.40
<18 months on board >18 months on board
(%) Loan loss ratio (existing vs. new customer)
57 5963 66 67 68
0
20
40
60
80
FY15 FY16 FY17 FY18 FY19 Q2FY20
(%) Non delinquent customers
EMI cards offer easy
instalment options for small-
ticket purchases
BAJAJ FINANCE
EQUITY RESEARCH 19 24 January 2020
FIG 58 – EMI CARDS GREW ~6X DURING FY15-FY19 FIG 59 – PRODUCT AND TICKET SIZE HIERARCHY
FOR EMI CARDS
Source: Company, BOBCAPS Research Source: Company, BOBCAPS Research
FIG 60 – EMI RETAIL STORE RELATIONSHIPS GREW
~3X DURING FY17-FY19
FIG 61 – NUMBER OF PURCHASES USING EMI CARD
INCREASED ~2X DURING FY18-FY19
Source: Company, BOBCAPS Research Source: Company, BOBCAPS Research
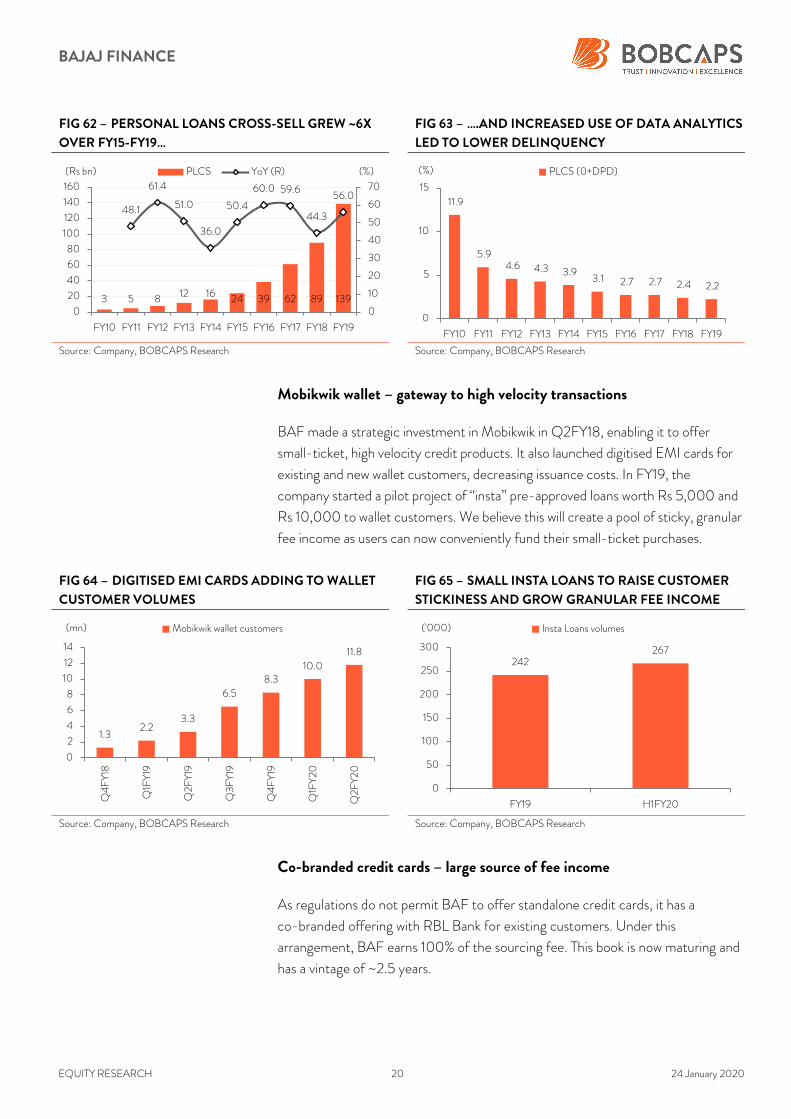
Personal loans cross-sell – promising risk-reward
Personal loans cross-sell (PLCS) is offered to existing salaried and self-employed
customers with timely repayment track records. Opex to offer the PLCS product
is negligible and the credit loss is a third of that incurred for new customers. This
points to a sustainable risk-reward equation.
1 23
6 7 13 19 20
90.0
62.3
81.6
23.2
87.0
45.0
29.9
0
20
40
60
80
100
0
5
10
15
20
25
FY13
FY14
FY15
FY16
FY17
FY18
FY19
Q2F
Y20
(%)(mn) EMI cards YoY (R)
Consumer durables –Rs 25k
Mobile phones –Rs 15k
Apparels/ Wellness – Rs 10k
Utilities –Rs 5k
EMI card –spend and avg. ticket size
Lifestyle – Rs 40k
Life care – Rs 75-80k
5,600
12,100
19,100
22,200
0
5,000
10,000
15,000
20,000
25,000
FY17 FY18 FY19 Q2FY20
EMI - Retail spends store realtionships
712
1,460
0
500
1,000
1,500
2,000
FY18 FY19
('000) EMI cards purchases
Opex on PLCS negligible and
credit loss low
BAJAJ FINANCE
EQUITY RESEARCH 20 24 January 2020
FIG 62 – PERSONAL LOANS CROSS-SELL GREW ~6X
OVER FY15-FY19…
FIG 63 – ….AND INCREASED USE OF DATA ANALYTICS
LED TO LOWER DELINQUENCY
Source: Company, BOBCAPS Research Source: Company, BOBCAPS Research
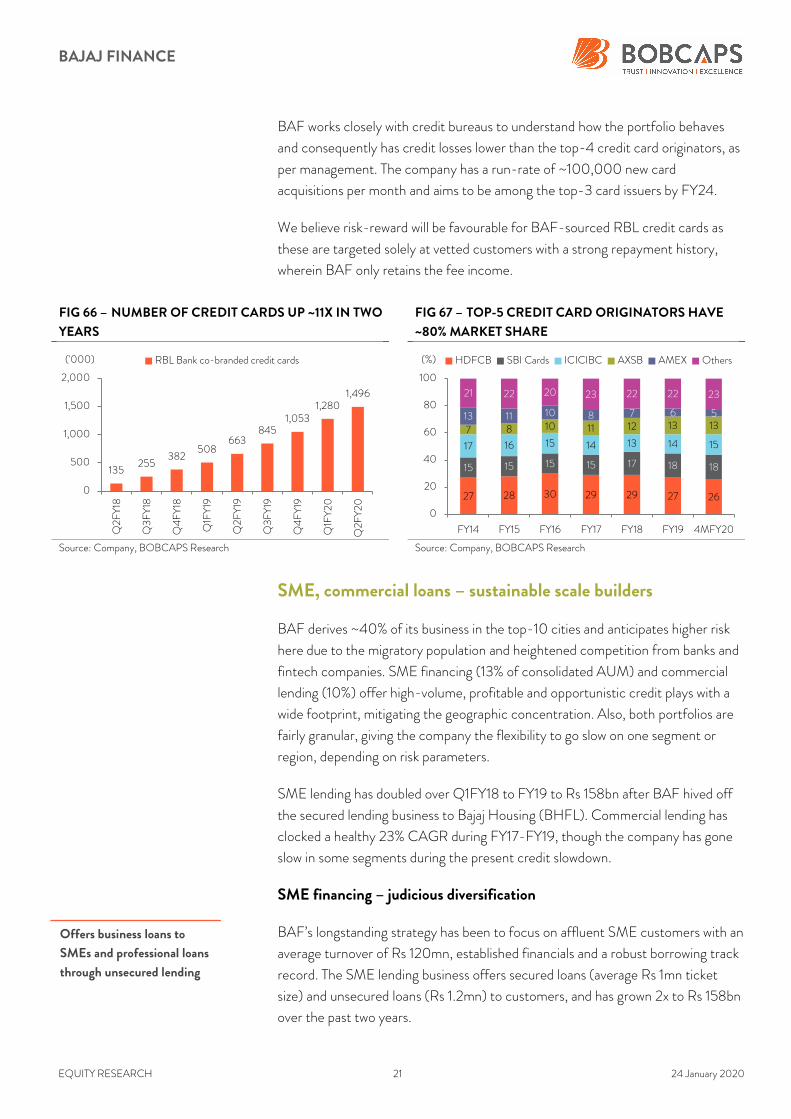
Mobikwik wallet – gateway to high velocity transactions
BAF made a strategic investment in Mobikwik in Q2FY18, enabling it to offer
small-ticket, high velocity credit products. It also launched digitised EMI cards for
existing and new wallet customers, decreasing issuance costs. In FY19, the
company started a pilot project of “insta” pre-approved loans worth Rs 5,000 and
Rs 10,000 to wallet customers. We believe this will create a pool of sticky, granular
fee income as users can now conveniently fund their small-ticket purchases.
FIG 64 – DIGITISED EMI CARDS ADDING TO WALLET
CUSTOMER VOLUMES
FIG 65 – SMALL INSTA LOANS TO RAISE CUSTOMER
STICKINESS AND GROW GRANULAR FEE INCOME
Source: Company, BOBCAPS Research Source: Company, BOBCAPS Research
Co-branded credit cards – large source of fee income
As regulations do not permit BAF to offer standalone credit cards, it has a
co-branded offering with RBL Bank for existing customers. Under this
arrangement, BAF earns 100% of the sourcing fee. This book is now maturing and
has a vintage of ~2.5 years.
3 5 8 12 16 24 39 62 89 139
48.1
61.4
51.0
36.0
50.4
60.0 59.6
44.3
56.0
0
10
20
30
40
50
60
70
0
20
40
60
80
100
120
140
160
FY10 FY11 FY12 FY13 FY14 FY15 FY16 FY17 FY18 FY19
(%)(Rs bn) PLCS YoY (R)
11.9
5.9 4.6 4.3 3.9
3.1 2.7 2.7 2.4 2.2
0
5
10
15
FY10 FY11 FY12 FY13 FY14 FY15 FY16 FY17 FY18 FY19
(%) PLCS (0+DPD)
1.32.2
3.3
6.58.3
10.011.8
0
2
4
6
8
10
12
14
Q4FY18
Q1F
Y19
Q2F
Y19
Q3FY19
Q4FY19
Q1F
Y20
Q2F
Y20
(mn) Mobikwik wallet customers
242267
0
50
100
150
200
250
300
FY19 H1FY20
('000) Insta Loans volumes
BAJAJ FINANCE
EQUITY RESEARCH 21 24 January 2020
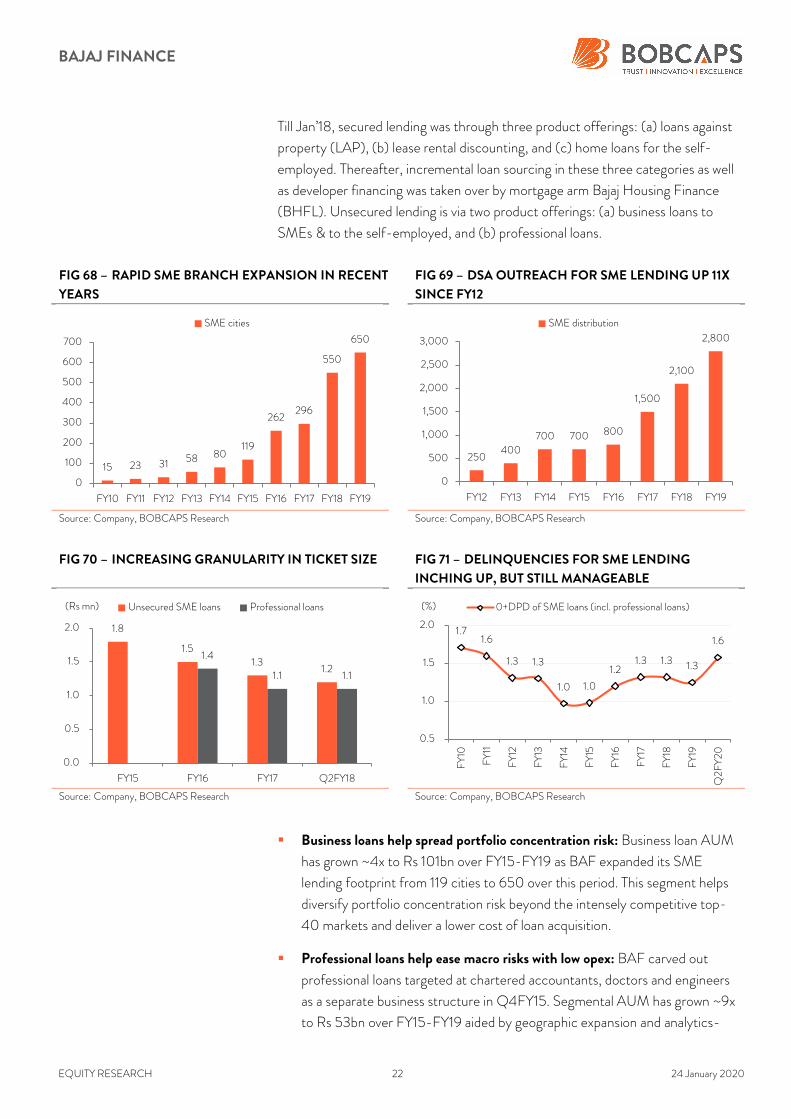
BAF works closely with credit bureaus to understand how the portfolio behaves
and consequently has credit losses lower than the top-4 credit card originators, as
per management. The company has a run-rate of ~100,000 new card
acquisitions per month and aims to be among the top-3 card issuers by FY24.
We believe risk-reward will be favourable for BAF-sourced RBL credit cards as
these are targeted solely at vetted customers with a strong repayment history,
wherein BAF only retains the fee income.
FIG 66 – NUMBER OF CREDIT CARDS UP ~11X IN TWO
YEARS
FIG 67 – TOP-5 CREDIT CARD ORIGINATORS HAVE
~80% MARKET SHARE
Source: Company, BOBCAPS Research Source: Company, BOBCAPS Research
SME, commercial loans – sustainable scale builders
BAF derives ~40% of its business in the top-10 cities and anticipates higher risk
here due to the migratory population and heightened competition from banks and
fintech companies. SME financing (13% of consolidated AUM) and commercial
lending (10%) offer high-volume, profitable and opportunistic credit plays with a
wide footprint, mitigating the geographic concentration. Also, both portfolios are
fairly granular, giving the company the flexibility to go slow on one segment or
region, depending on risk parameters.
SME lending has doubled over Q1FY18 to FY19 to Rs 158bn after BAF hived off
the secured lending business to Bajaj Housing (BHFL). Commercial lending has
clocked a healthy 23% CAGR during FY17-FY19, though the company has gone
slow in some segments during the present credit slowdown.
SME financing – judicious diversification
BAF’s longstanding strategy has been to focus on affluent SME customers with an
average turnover of Rs 120mn, established financials and a robust borrowing track
record. The SME lending business offers secured loans (average Rs 1mn ticket
size) and unsecured loans (Rs 1.2mn) to customers, and has grown 2x to Rs 158bn
over the past two years.
135255
382508
663845
1,0531,280
1,496
0
500
1,000
1,500
2,000
Q2F
Y18
Q3FY18
Q4FY18
Q1F
Y19
Q2F
Y19
Q3F
Y19
Q4FY19
Q1F
Y20
Q2F
Y20
('000) RBL Bank co-branded credit cards
27 28 30 29 29 27 26
15 15 15 15 17 18 18
17 16 15 14 13 14 15
7 8 10 11 12 13 1313 11 10 8 7 6 5
21 22 20 23 22 22 23
0
20
40
60
80
100
FY14 FY15 FY16 FY17 FY18 FY19 4MFY20
(%) HDFCB SBI Cards ICICIBC AXSB AMEX Others
Offers business loans to
SMEs and professional loans
through unsecured lending
BAJAJ FINANCE
EQUITY RESEARCH 22 24 January 2020
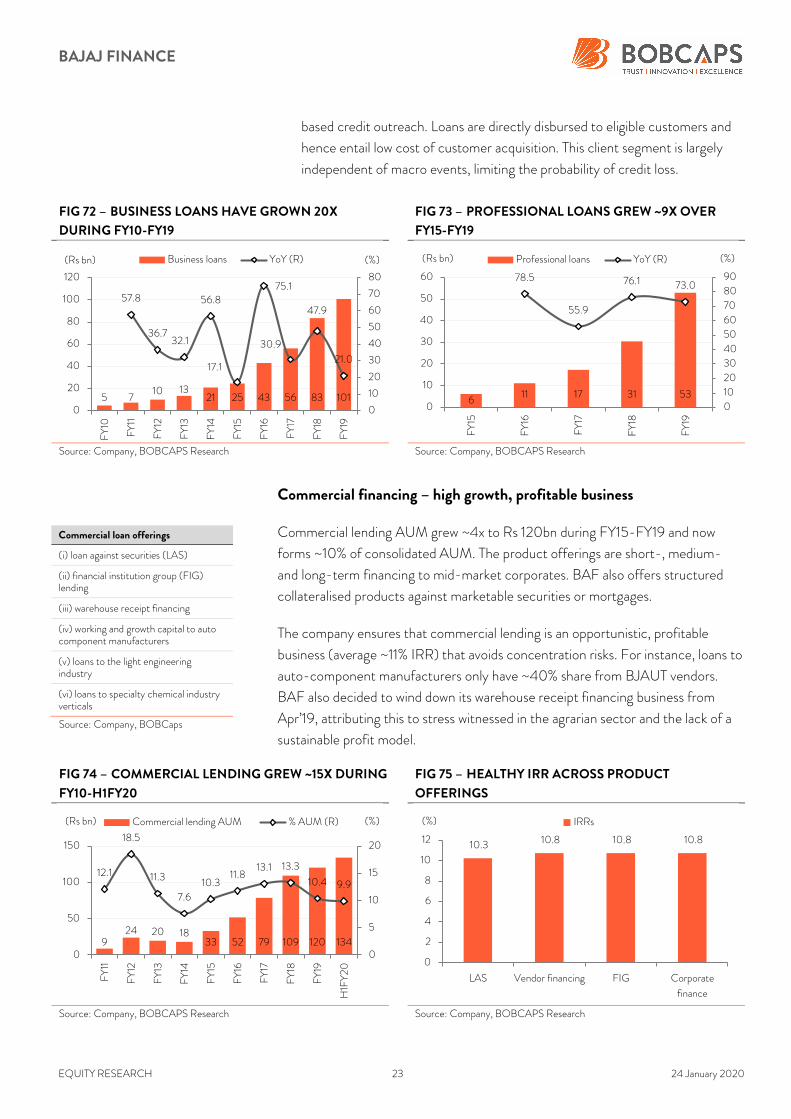
Till Jan’18, secured lending was through three product offerings: (a) loans against
property (LAP), (b) lease rental discounting, and (c) home loans for the self-
employed. Thereafter, incremental loan sourcing in these three categories as well
as developer financing was taken over by mortgage arm Bajaj Housing Finance
(BHFL). Unsecured lending is via two product offerings: (a) business loans to
SMEs & to the self-employed, and (b) professional loans.
FIG 68 – RAPID SME BRANCH EXPANSION IN RECENT
YEARS
FIG 69 – DSA OUTREACH FOR SME LENDING UP 11X
SINCE FY12
Source: Company, BOBCAPS Research Source: Company, BOBCAPS Research
FIG 70 – INCREASING GRANULARITY IN TICKET SIZE FIG 71 – DELINQUENCIES FOR SME LENDING
INCHING UP, BUT STILL MANAGEABLE
Source: Company, BOBCAPS Research Source: Company, BOBCAPS Research
Business loans help spread portfolio concentration risk: Business loan AUM
has grown ~4x to Rs 101bn over FY15-FY19 as BAF expanded its SME
lending footprint from 119 cities to 650 over this period. This segment helps
diversify portfolio concentration risk beyond the intensely competitive top-
40 markets and deliver a lower cost of loan acquisition.
Professional loans help ease macro risks with low opex: BAF carved out
professional loans targeted at chartered accountants, doctors and engineers
as a separate business structure in Q4FY15. Segmental AUM has grown ~9x
to Rs 53bn over FY15-FY19 aided by geographic expansion and analytics-
15 23 31 58 80119
262296
550
650
0
100
200
300
400
500
600
700
FY10 FY11 FY12 FY13 FY14 FY15 FY16 FY17 FY18 FY19
SME cities
250400
700 700 800
1,500
2,100
2,800
0
500
1,000
1,500
2,000
2,500
3,000
FY12 FY13 FY14 FY15 FY16 FY17 FY18 FY19
SME distribution
1.8
1.5 1.3
1.2 1.4
1.1 1.1
0.0
0.5
1.0
1.5
2.0
FY15 FY16 FY17 Q2FY18
(Rs mn) Unsecured SME loans Professional loans
1.7 1.6
1.3 1.3
1.0 1.0
1.2 1.3 1.3 1.3
1.6
0.5
1.0
1.5
2.0
FY10
FY11
FY12
FY13
FY14
FY15
FY16
FY17
FY18
FY19
Q2F
Y20
(%) 0+DPD of SME loans (incl. professional loans)
BAJAJ FINANCE
EQUITY RESEARCH 23 24 January 2020
based credit outreach. Loans are directly disbursed to eligible customers and
hence entail low cost of customer acquisition. This client segment is largely
independent of macro events, limiting the probability of credit loss.
FIG 72 – BUSINESS LOANS HAVE GROWN 20X
DURING FY10-FY19
FIG 73 – PROFESSIONAL LOANS GREW ~9X OVER
FY15-FY19
Source: Company, BOBCAPS Research Source: Company, BOBCAPS Research
Commercial financing – high growth, profitable business
Commercial lending AUM grew ~4x to Rs 120bn during FY15-FY19 and now
forms ~10% of consolidated AUM. The product offerings are short-, medium-
and long-term financing to mid-market corporates. BAF also offers structured
collateralised products against marketable securities or mortgages.
The company ensures that commercial lending is an opportunistic, profitable
business (average ~11% IRR) that avoids concentration risks. For instance, loans to
auto-component manufacturers only have ~40% share from BJAUT vendors.
BAF also decided to wind down its warehouse receipt financing business from
Apr’19, attributing this to stress witnessed in the agrarian sector and the lack of a
sustainable profit model.
FIG 74 – COMMERCIAL LENDING GREW ~15X DURING
FY10-H1FY20
FIG 75 – HEALTHY IRR ACROSS PRODUCT
OFFERINGS
Source: Company, BOBCAPS Research Source: Company, BOBCAPS Research
5 710 13
21 25 43 56 83 101
57.8
36.732.1
56.8
17.1
75.1
30.9
47.9
21.0
0
10
20
30
40
50
60
70
80
0
20
40
60
80
100
120
FY10
FY11
FY12
FY13
FY14
FY15
FY16
FY17
FY18
FY19
(%)(Rs bn) Business loans YoY (R)
611 17 31 53
78.5
55.9
76.1 73.0
0
10
20
30
40
50
60
70
80
90
0
10
20
30
40
50
60
FY15
FY16
FY17
FY18
FY19
(%)(Rs bn) Professional loans YoY (R)
924 20 18
33 52 79 109 120 134
12.1
18.5
11.3
7.6
10.3 11.8
13.1 13.3
10.4 9.9
0
5
10
15
20
0
50
100
150
FY11
FY12
FY13
FY14
FY15
FY16
FY17
FY18
FY19
H1F
Y20
(%)(Rs bn) Commercial lending AUM % AUM (R)
10.3 10.8 10.8 10.8
0
2
4
6
8
10
12
LAS Vendor financing FIG Corporate
finance
(%) IRRs
Commercial loan offerings
(i) loan against securities (LAS)
(ii) financial institution group (FIG) lending
(iii) warehouse receipt financing
(iv) working and growth capital to auto component manufacturers
(v) loans to the light engineering industry
(vi) loans to specialty chemical industry verticals
Source: Company, BOBCaps

BAJAJ FINANCE
EQUITY RESEARCH 24 24 January 2020
Rural financing to generate higher yields
BAF launched the rural lending business in FY14, offering consumer durable,
lifestyle and personal loans, SME and gold loans, and fixed deposits. Rural lending
has grown ~7x during FY16-FY19 to reach an AUM of Rs 92bn and now
contributes 8% of consolidated AUM vs. 3% in FY15. Although consumer durable
ticket sizes are 10% lower than urban branches, the yields are 100-150bps higher.
This offsets the impact of high customer acquisition cost and credit losses.
Expanding hub-and-spoke model
BAF uses a hub-and-spoke model to source customers. As of H1FY20, its rural
business is spread in over 1,000 locations across 13 states and union territories in
India through 16,400+ store relationships. Management expects to increase the
rural presence to 2,500 locations in 4-5 years and extend its distribution reach to
16-17 states in a calibrated manner.
FIG 76 – RAPID GROWTH IN RURAL HUBS (LENDING
BRANCHES) & SPOKES (FRANCHISES)
FIG 77 – RURAL LENDING HAS GROWN ~8X SINCE
FY16
Source: Company, BOBCAPS Research Source: Company, BOBCAPS Research
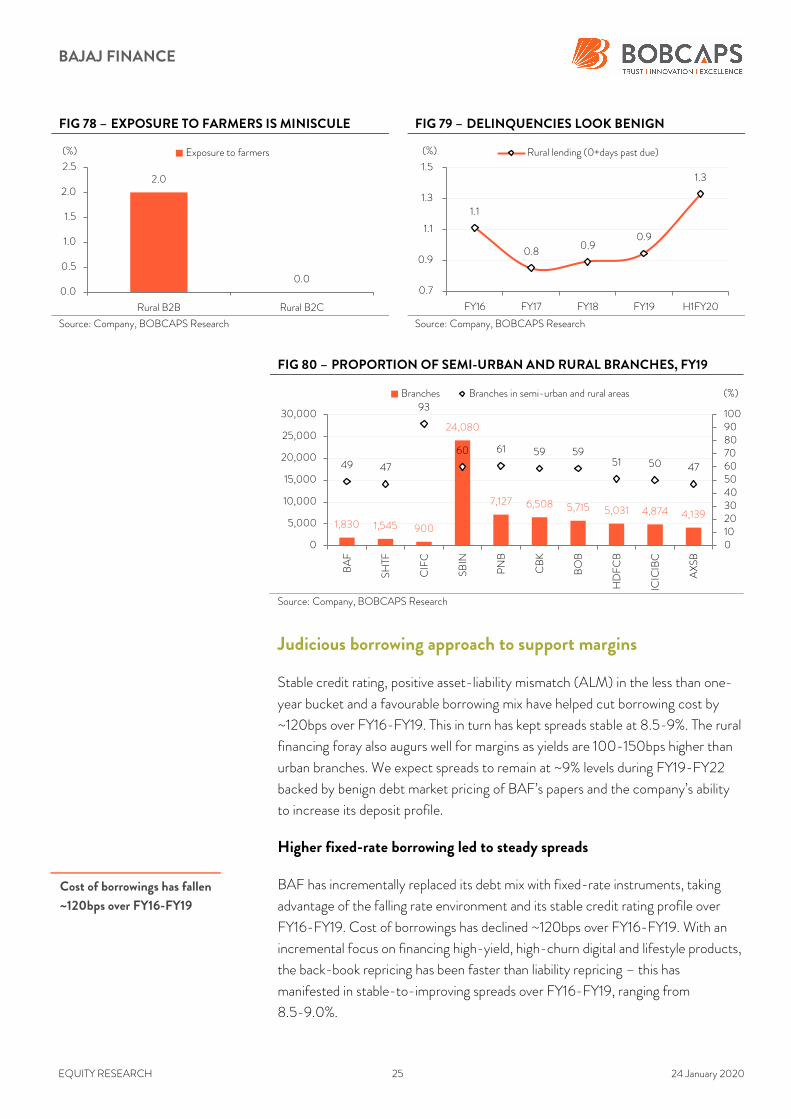
Prudent approach curbs delinquencies
Management has prudently chosen to stay away from farmer loans while
judiciously selecting rural locations to build its presence. Though the EMI bounce
rates are higher, collection efficiency is better than in urban locations – reflected
in benign delinquencies in the rural business (0+dpd 1.3% as of H1FY20).
50105
177219
347
427
182
292361 383
556614
0
100
200
300
400
500
600
700
FY15 FY16 FY17 FY18 FY19 H1FY20
Rural Branches Rural Franchises
1 313
31 55 92 1120.2
1.0
3.0
5.1
6.6
8.0 8.2
0
1
2
3
4
5
6
7
8
9
0
20
40
60
80
100
120
FY14 FY15 FY16 FY17 FY18 FY19 H1FY20
(%)(Rs bn) Rural lending AUM % of consol. AUM (R)
Rural lending forms 8% of
consolidated AUM
BAJAJ FINANCE
EQUITY RESEARCH 25 24 January 2020
FIG 78 – EXPOSURE TO FARMERS IS MINISCULE FIG 79 – DELINQUENCIES LOOK BENIGN
Source: Company, BOBCAPS Research Source: Company, BOBCAPS Research
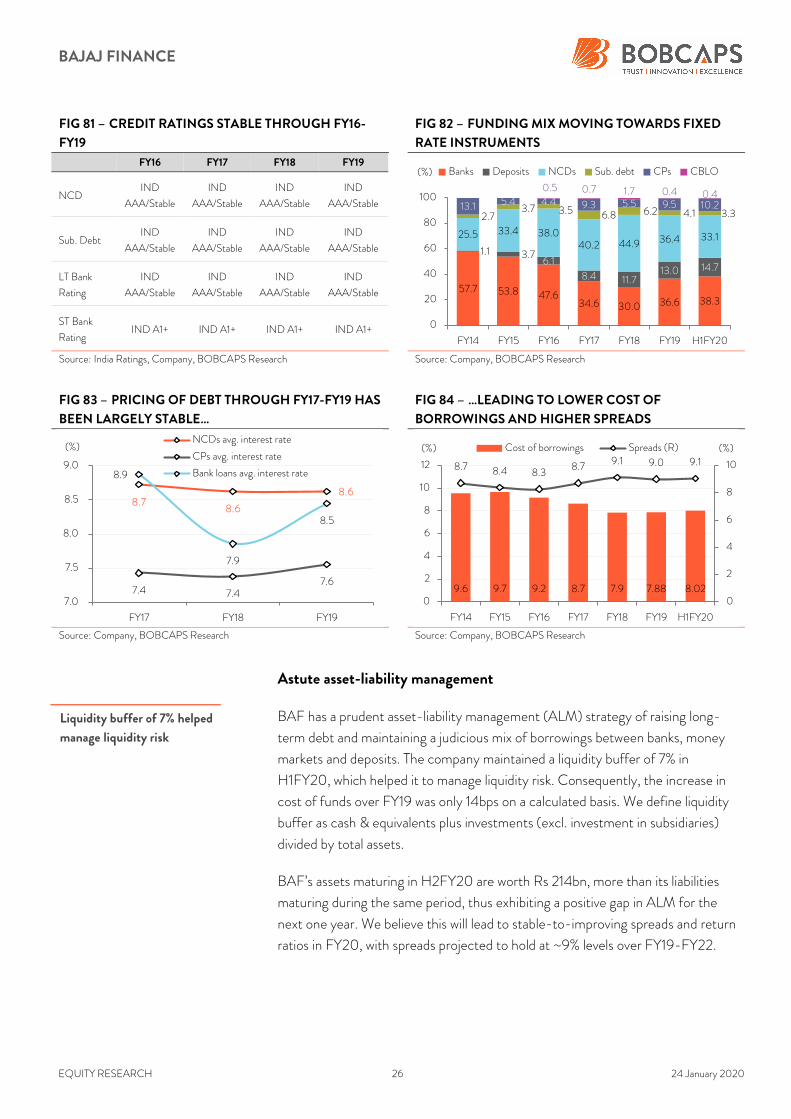
FIG 80 – PROPORTION OF SEMI-URBAN AND RURAL BRANCHES, FY19
Source: Company, BOBCAPS Research
Judicious borrowing approach to support margins
Stable credit rating, positive asset-liability mismatch (ALM) in the less than one-
year bucket and a favourable borrowing mix have helped cut borrowing cost by
~120bps over FY16-FY19. This in turn has kept spreads stable at 8.5-9%. The rural
financing foray also augurs well for margins as yields are 100-150bps higher than
urban branches. We expect spreads to remain at ~9% levels during FY19-FY22
backed by benign debt market pricing of BAF’s papers and the company’s ability
to increase its deposit profile.
Higher fixed-rate borrowing led to steady spreads
BAF has incrementally replaced its debt mix with fixed-rate instruments, taking
advantage of the falling rate environment and its stable credit rating profile over
FY16-FY19. Cost of borrowings has declined ~120bps over FY16-FY19. With an
incremental focus on financing high-yield, high-churn digital and lifestyle products,
the back-book repricing has been faster than liability repricing – this has
manifested in stable-to-improving spreads over FY16-FY19, ranging from
8.5-9.0%.
2.0
0.00.0
0.5
1.0
1.5
2.0
2.5
Rural B2B Rural B2C
(%) Exposure to farmers
1.1
0.8 0.9
0.9
1.3
0.7
0.9
1.1
1.3
1.5
FY16 FY17 FY18 FY19 H1FY20
(%) Rural lending (0+days past due)
1,830 1,545 900
24,080
7,127 6,508 5,715 5,031 4,874 4,139
49 47
93
60 61 59 5951 50 47
0102030405060708090100
0
5,000
10,000
15,000
20,000
25,000
30,000
BAF
SHTF
CIF
C
SBIN
PNB
CBK
BO
B
HDFCB
ICIC
IBC
AXSB
(%)Branches Branches in semi-urban and rural areas
Cost of borrowings has fallen
~120bps over FY16-FY19
BAJAJ FINANCE
EQUITY RESEARCH 26 24 January 2020
FIG 81 – CREDIT RATINGS STABLE THROUGH FY16-
FY19
FIG 82 – FUNDING MIX MOVING TOWARDS FIXED
RATE INSTRUMENTS
FY16 FY17 FY18 FY19
NCD IND
AAA/Stable
IND
AAA/Stable
IND
AAA/Stable
IND
AAA/Stable
Sub. Debt IND
AAA/Stable
IND
AAA/Stable
IND
AAA/Stable
IND
AAA/Stable
LT Bank
Rating
IND
AAA/Stable
IND
AAA/Stable
IND
AAA/Stable
IND
AAA/Stable
ST Bank
Rating IND A1+ IND A1+ IND A1+ IND A1+
Source: India Ratings, Company, BOBCAPS Research Source: Company, BOBCAPS Research
FIG 83 – PRICING OF DEBT THROUGH FY17-FY19 HAS
BEEN LARGELY STABLE…
FIG 84 – …LEADING TO LOWER COST OF
BORROWINGS AND HIGHER SPREADS
Source: Company, BOBCAPS Research Source: Company, BOBCAPS Research
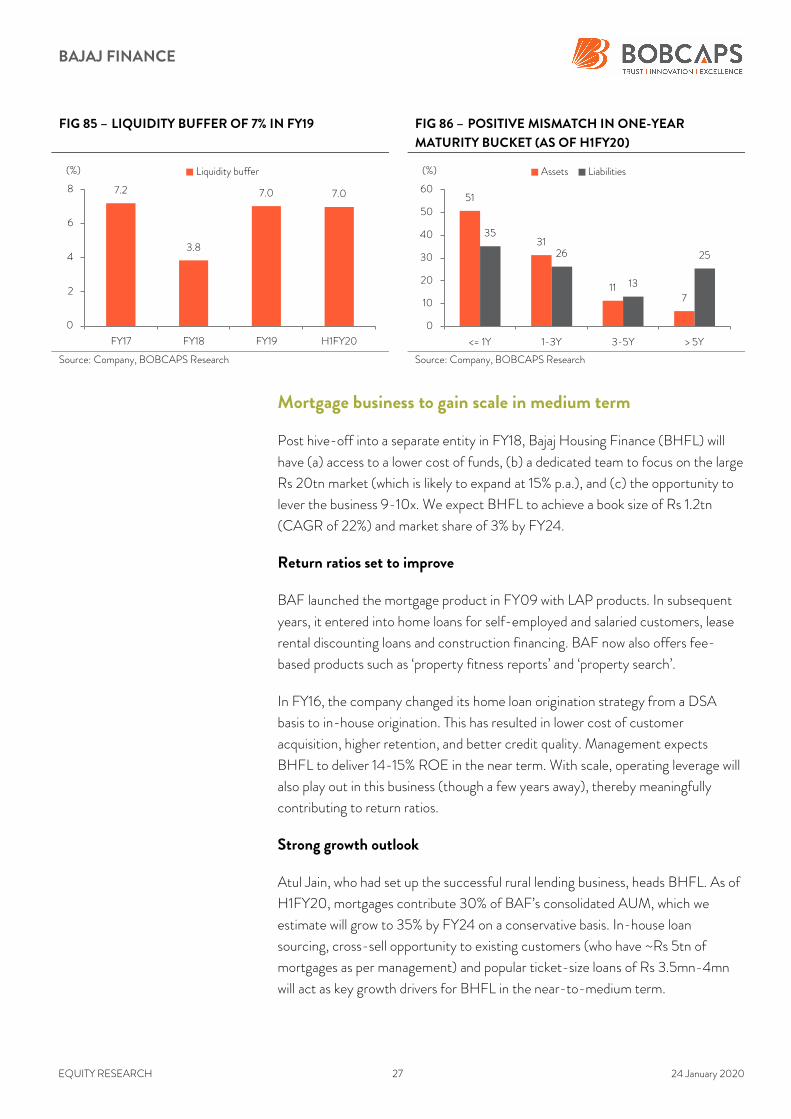
Astute asset-liability management
BAF has a prudent asset-liability management (ALM) strategy of raising long-
term debt and maintaining a judicious mix of borrowings between banks, money
markets and deposits. The company maintained a liquidity buffer of 7% in
H1FY20, which helped it to manage liquidity risk. Consequently, the increase in
cost of funds over FY19 was only 14bps on a calculated basis. We define liquidity
buffer as cash & equivalents plus investments (excl. investment in subsidiaries)
divided by total assets.
BAF’s assets maturing in H2FY20 are worth Rs 214bn, more than its liabilities
maturing during the same period, thus exhibiting a positive gap in ALM for the
next one year. We believe this will lead to stable-to-improving spreads and return
ratios in FY20, with spreads projected to hold at ~9% levels over FY19-FY22.
57.7 53.8 47.634.6 30.0 36.6 38.3
1.1 3.76.1
8.4 11.713.0 14.7
25.5 33.4 38.040.2 44.9 36.4 33.1
2.73.7 3.5 6.8 6.2 4.1 3.3
13.1 5.4 4.4 9.3 5.5 9.5 10.2
0.5 0.7 1.7 0.4 0.4
0
20
40
60
80
100
FY14 FY15 FY16 FY17 FY18 FY19 H1FY20
(%) Banks Deposits NCDs Sub. debt CPs CBLO
8.7 8.6
8.6
7.4 7.4 7.6
8.9
7.9
8.5
7.0
7.5
8.0
8.5
9.0
FY17 FY18 FY19
(%)NCDs avg. interest rate
CPs avg. interest rate
Bank loans avg. interest rate
9.6 9.7 9.2 8.7 7.9 7.88 8.02
8.7 8.4 8.3 8.7 9.1 9.0 9.1
0
2
4
6
8
10
0
2
4
6
8
10
12
FY14 FY15 FY16 FY17 FY18 FY19 H1FY20
(%)(%) Cost of borrowings Spreads (R)
Liquidity buffer of 7% helped
manage liquidity risk
BAJAJ FINANCE
EQUITY RESEARCH 27 24 January 2020
FIG 85 – LIQUIDITY BUFFER OF 7% IN FY19 FIG 86 – POSITIVE MISMATCH IN ONE-YEAR
MATURITY BUCKET (AS OF H1FY20)
Source: Company, BOBCAPS Research Source: Company, BOBCAPS Research
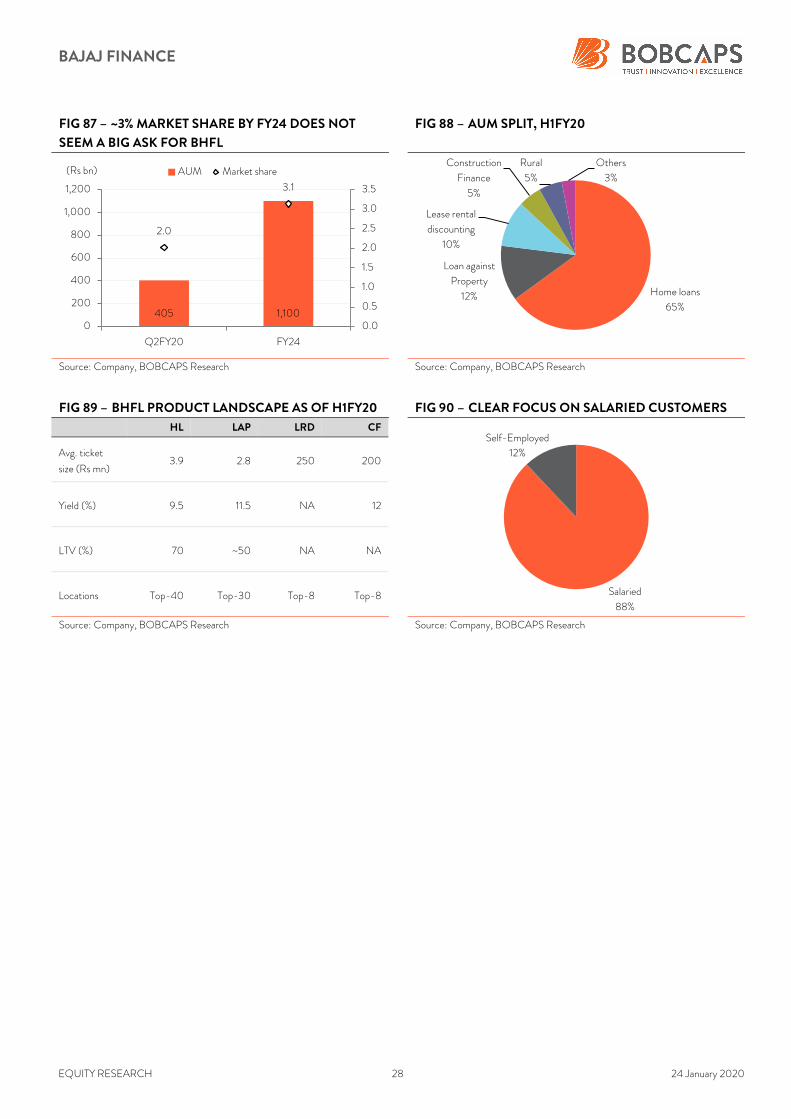
Mortgage business to gain scale in medium term
Post hive-off into a separate entity in FY18, Bajaj Housing Finance (BHFL) will
have (a) access to a lower cost of funds, (b) a dedicated team to focus on the large
Rs 20tn market (which is likely to expand at 15% p.a.), and (c) the opportunity to
lever the business 9-10x. We expect BHFL to achieve a book size of Rs 1.2tn
(CAGR of 22%) and market share of 3% by FY24.
Return ratios set to improve
BAF launched the mortgage product in FY09 with LAP products. In subsequent
years, it entered into home loans for self-employed and salaried customers, lease
rental discounting loans and construction financing. BAF now also offers fee-
based products such as ‘property fitness reports’ and ‘property search’.
In FY16, the company changed its home loan origination strategy from a DSA
basis to in-house origination. This has resulted in lower cost of customer
acquisition, higher retention, and better credit quality. Management expects
BHFL to deliver 14-15% ROE in the near term. With scale, operating leverage will
also play out in this business (though a few years away), thereby meaningfully
contributing to return ratios.
Strong growth outlook
Atul Jain, who had set up the successful rural lending business, heads BHFL. As of
H1FY20, mortgages contribute 30% of BAF’s consolidated AUM, which we
estimate will grow to 35% by FY24 on a conservative basis. In-house loan
sourcing, cross-sell opportunity to existing customers (who have ~Rs 5tn of
mortgages as per management) and popular ticket-size loans of Rs 3.5mn-4mn
will act as key growth drivers for BHFL in the near-to-medium term.
7.2
3.8
7.0 7.0
0
2
4
6
8
FY17 FY18 FY19 H1FY20
(%) Liquidity buffer
51
31
117
35
26
13
25
0
10
20
30
40
50
60
<= 1Y 1-3Y 3-5Y > 5Y
(%) Assets Liabilities
BAJAJ FINANCE
EQUITY RESEARCH 28 24 January 2020
FIG 87 – ~3% MARKET SHARE BY FY24 DOES NOT
SEEM A BIG ASK FOR BHFL
FIG 88 – AUM SPLIT, H1FY20
Source: Company, BOBCAPS Research Source: Company, BOBCAPS Research
FIG 89 – BHFL PRODUCT LANDSCAPE AS OF H1FY20 FIG 90 – CLEAR FOCUS ON SALARIED CUSTOMERS HL LAP LRD CF
Avg. ticket
size (Rs mn) 3.9 2.8 250 200
Yield (%) 9.5 11.5 NA 12
LTV (%) 70 ~50 NA NA
Locations Top-40 Top-30 Top-8 Top-8
Source: Company, BOBCAPS Research Source: Company, BOBCAPS Research
405 1,100
2.0
3.1
0.0
0.5
1.0
1.5
2.0
2.5
3.0
3.5
0
200
400
600
800
1,000
1,200
Q2FY20 FY24
(Rs bn) AUM Market share
Home loans
65%
Loan against
Property
12%
Lease rental
discounting
10%
Construction
Finance
5%
Rural
5%
Others
3%
Salaried
88%
Self-Employed
12%
BAJAJ FINANCE
EQUITY RESEARCH 29 24 January 2020
Financial review
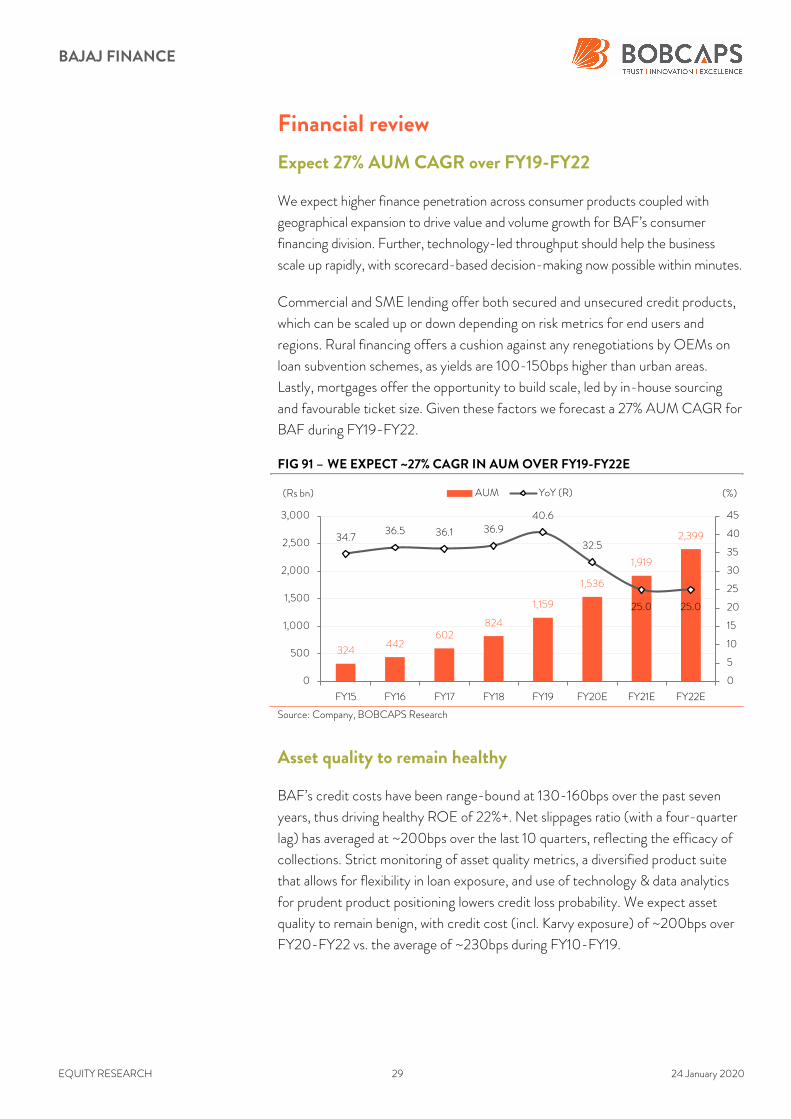
Expect 27% AUM CAGR over FY19-FY22
We expect higher finance penetration across consumer products coupled with
geographical expansion to drive value and volume growth for BAF’s consumer
financing division. Further, technology-led throughput should help the business
scale up rapidly, with scorecard-based decision-making now possible within minutes.
Commercial and SME lending offer both secured and unsecured credit products,
which can be scaled up or down depending on risk metrics for end users and
regions. Rural financing offers a cushion against any renegotiations by OEMs on
loan subvention schemes, as yields are 100-150bps higher than urban areas.
Lastly, mortgages offer the opportunity to build scale, led by in-house sourcing
and favourable ticket size. Given these factors we forecast a 27% AUM CAGR for
BAF during FY19-FY22.
FIG 91 – WE EXPECT ~27% CAGR IN AUM OVER FY19-FY22E
Source: Company, BOBCAPS Research
Asset quality to remain healthy
BAF’s credit costs have been range-bound at 130-160bps over the past seven
years, thus driving healthy ROE of 22%+. Net slippages ratio (with a four-quarter
lag) has averaged at ~200bps over the last 10 quarters, reflecting the efficacy of
collections. Strict monitoring of asset quality metrics, a diversified product suite
that allows for flexibility in loan exposure, and use of technology & data analytics
for prudent product positioning lowers credit loss probability. We expect asset
quality to remain benign, with credit cost (incl. Karvy exposure) of ~200bps over
FY20-FY22 vs. the average of ~230bps during FY10-FY19.
324442
602824
1,159
1,536
1,919
2,39934.736.5 36.1 36.9
40.6
32.5
25.0 25.0
0
5
10
15
20
25
30
35
40
45
0
500
1,000
1,500
2,000
2,500
3,000
FY15 FY16 FY17 FY18 FY19 FY20E FY21E FY22E
(%)(Rs bn) AUM YoY (R)

BAJAJ FINANCE
EQUITY RESEARCH 30 24 January 2020
FIG 92 – DATA ANALYTICS EVIDENT IN BENIGN 0+ DPD ACROSS SEGMENTS
Source: Company, BOBCAPS Research
FIG 93 – NET SLIPPAGES LOW… FIG 94 – …AND LOW WRITE-OFFS (WITH LAG EFFECT)
SHOW THE EFFICACY OF COLLECTIONS
Source: Company, BOBCAPS Research Source: Company, BOBCAPS Research
FIG 95 – WE EXPECT ASSET QUALITY TO REMAIN
BENIGN
FIG 96 – DESPITE BEING CONSERVATIVE ON CREDIT
COST, IT IS STILL BELOW THE 10Y AVERAGE
Source: Company, BOBCAPS Research Source: Company, BOBCAPS Research
1.9
2.2
1.1 1.3
1.5 1.7
2.7
1.3 1.5
2.2
3.1
2.7
1.5 1.7
2.2
0.5 0.5 0.3 0.3
0.4
1.8
0.8
0.8 0.7 1.2
0.0
0.5
1.0
1.5
2.0
2.5
3.0
3.5
FY16 FY17 FY18 FY19 H1FY20
(%) CD loans Lifestyle finance Digital products Salaried PL LAP
2.40
1.47 1.48
0.891.34
1.66
2.36
1.64 1.771.47
2.78
1.69 1.77
1.08
1.521.88
2.76
1.962.13
1.73
0.10
0.60
1.10
1.60
2.10
2.60
3.10
Q1F
Y18
Q2F
Y18
Q3FY18
Q4FY18
Q1F
Y19
Q2F
Y19
Q3FY19
Q4FY19
Q1F
Y20
Q2F
Y20
(%) 2-quarter 4-quarter
1.331.13
0.99 1.03
0.75 0.73
1.251.10
0.71
1.01
1.541.30
1.19 1.25
0.85 0.83
1.461.31
0.86
1.20
0.10
0.60
1.10
1.60
2.10
Q1F
Y18
Q2F
Y18
Q3FY18
Q4FY18
Q1F
Y19
Q2F
Y19
Q3FY19
Q4FY19
Q1F
Y20
Q2F
Y20
(%) 2-quarter 4-quarter
1.2
1.71.4
1.5 1.6
1.92.2
0.30.5 0.4
0.6 0.60.8
0.9
77.2 74.069.6
59.8 60.060.0
60.0
0
10
20
30
40
50
60
70
80
90
0.0
0.5
1.0
1.5
2.0
2.5
FY16 FY17 FY18 FY19 FY20E FY21E FY22E
(%)(%) GNPA NNPA PCR (R)
1.4
1.61.5 1.6
2.0 2.02.1
1.0
1.5
2.0
2.5
FY16 FY17 FY18 FY19 FY20E FY21E FY22E
(%) Credit cost FY10-19 average = 2.3
BAJAJ FINANCE
EQUITY RESEARCH 31 24 January 2020
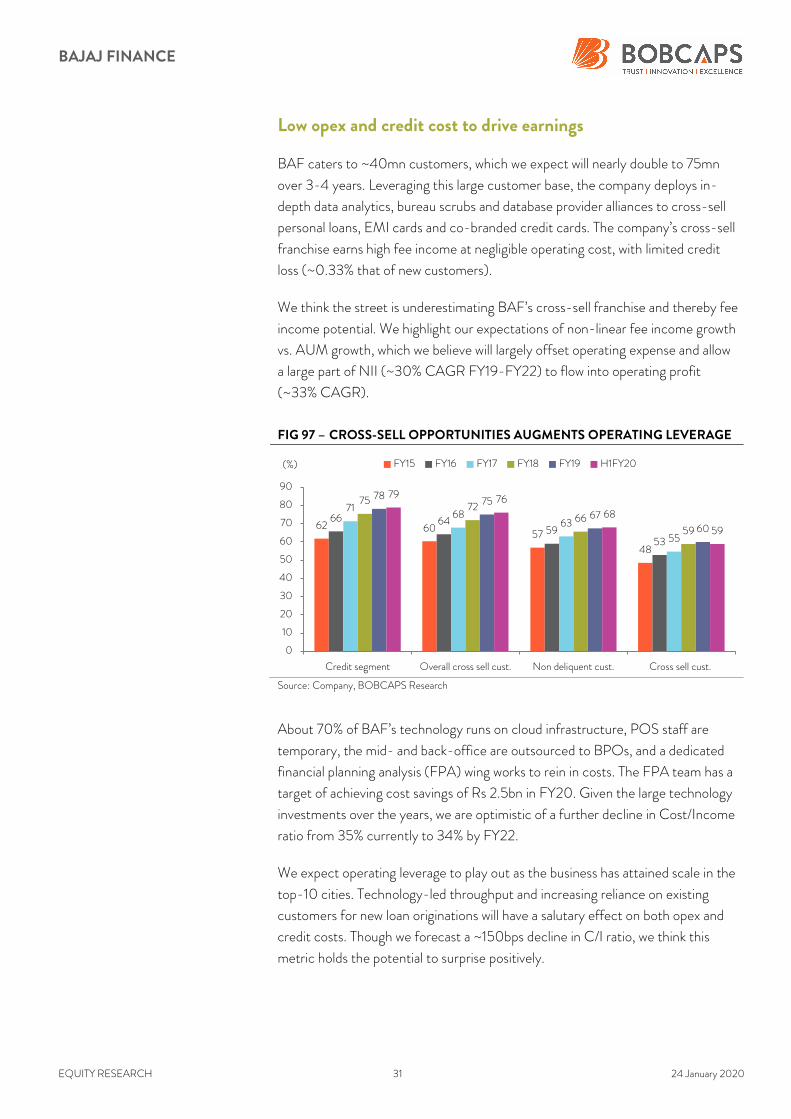
Low opex and credit cost to drive earnings
BAF caters to ~40mn customers, which we expect will nearly double to 75mn
over 3-4 years. Leveraging this large customer base, the company deploys in-
depth data analytics, bureau scrubs and database provider alliances to cross-sell
personal loans, EMI cards and co-branded credit cards. The company’s cross-sell
franchise earns high fee income at negligible operating cost, with limited credit
loss (~0.33% that of new customers).
We think the street is underestimating BAF’s cross-sell franchise and thereby fee
income potential. We highlight our expectations of non-linear fee income growth
vs. AUM growth, which we believe will largely offset operating expense and allow
a large part of NII (~30% CAGR FY19-FY22) to flow into operating profit
(~33% CAGR).
FIG 97 – CROSS-SELL OPPORTUNITIES AUGMENTS OPERATING LEVERAGE
Source: Company, BOBCAPS Research
About 70% of BAF’s technology runs on cloud infrastructure, POS staff are
temporary, the mid- and back-office are outsourced to BPOs, and a dedicated
financial planning analysis (FPA) wing works to rein in costs. The FPA team has a
target of achieving cost savings of Rs 2.5bn in FY20. Given the large technology
investments over the years, we are optimistic of a further decline in Cost/Income
ratio from 35% currently to 34% by FY22.
We expect operating leverage to play out as the business has attained scale in the
top-10 cities. Technology-led throughput and increasing reliance on existing
customers for new loan originations will have a salutary effect on both opex and
credit costs. Though we forecast a ~150bps decline in C/I ratio, we think this
metric holds the potential to surprise positively.
62 6057
48
66 6459
53
7168
63
55
7572
6659
78 7567
60
79 76
68
59
0
10
20
30
40
50
60
70
80
90
Credit segment Overall cross sell cust. Non deliquent cust. Cross sell cust.
(%) FY15 FY16 FY17 FY18 FY19 H1FY20
BAJAJ FINANCE
EQUITY RESEARCH 32 24 January 2020
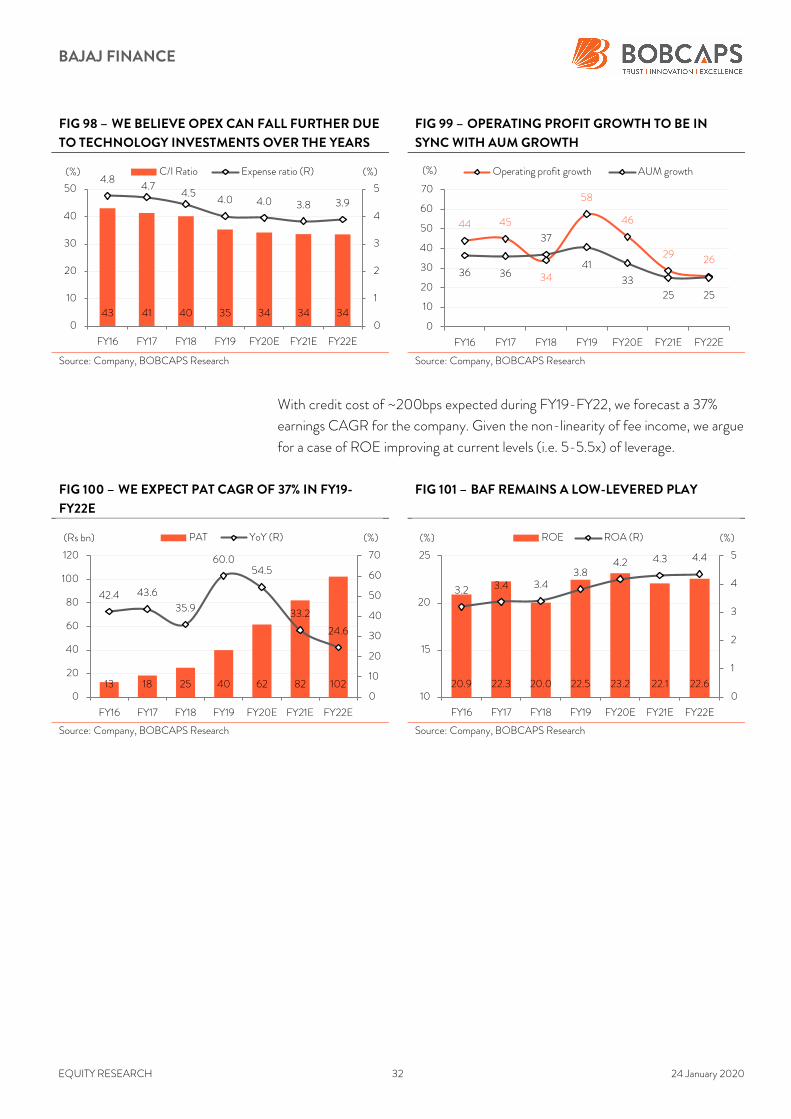
FIG 98 – WE BELIEVE OPEX CAN FALL FURTHER DUE
TO TECHNOLOGY INVESTMENTS OVER THE YEARS
FIG 99 – OPERATING PROFIT GROWTH TO BE IN
SYNC WITH AUM GROWTH
Source: Company, BOBCAPS Research Source: Company, BOBCAPS Research
With credit cost of ~200bps expected during FY19-FY22, we forecast a 37%
earnings CAGR for the company. Given the non-linearity of fee income, we argue
for a case of ROE improving at current levels (i.e. 5-5.5x) of leverage.
FIG 100 – WE EXPECT PAT CAGR OF 37% IN FY19-
FY22E
FIG 101 – BAF REMAINS A LOW-LEVERED PLAY
Source: Company, BOBCAPS Research Source: Company, BOBCAPS Research
43 41 40 35 34 34 34
4.84.7
4.54.0 4.0 3.8 3.9
0
1
2
3
4
5
0
10
20
30
40
50
FY16 FY17 FY18 FY19 FY20E FY21E FY22E
(%)(%) C/I Ratio Expense ratio (R)
44 45
34
58
46
29 2636 36
37
41
33
25 25
0
10
20
30
40
50
60
70
FY16 FY17 FY18 FY19 FY20E FY21E FY22E
(%) Operating profit growth AUM growth
13 18 25 40 62 82 102
42.4 43.6
35.9
60.054.5
33.2
24.6
0
10
20
30
40
50
60
70
0
20
40
60
80
100
120
FY16 FY17 FY18 FY19 FY20E FY21E FY22E
(%)(Rs bn) PAT YoY (R)
20.9 22.3 20.0 22.5 23.2 22.1 22.6
3.2 3.4 3.43.8
4.2 4.3 4.4
0
1
2
3
4
5
10
15
20
25
FY16 FY17 FY18 FY19 FY20E FY21E FY22E
(%)(%) ROE ROA (R)
BAJAJ FINANCE
EQUITY RESEARCH 33 24 January 2020
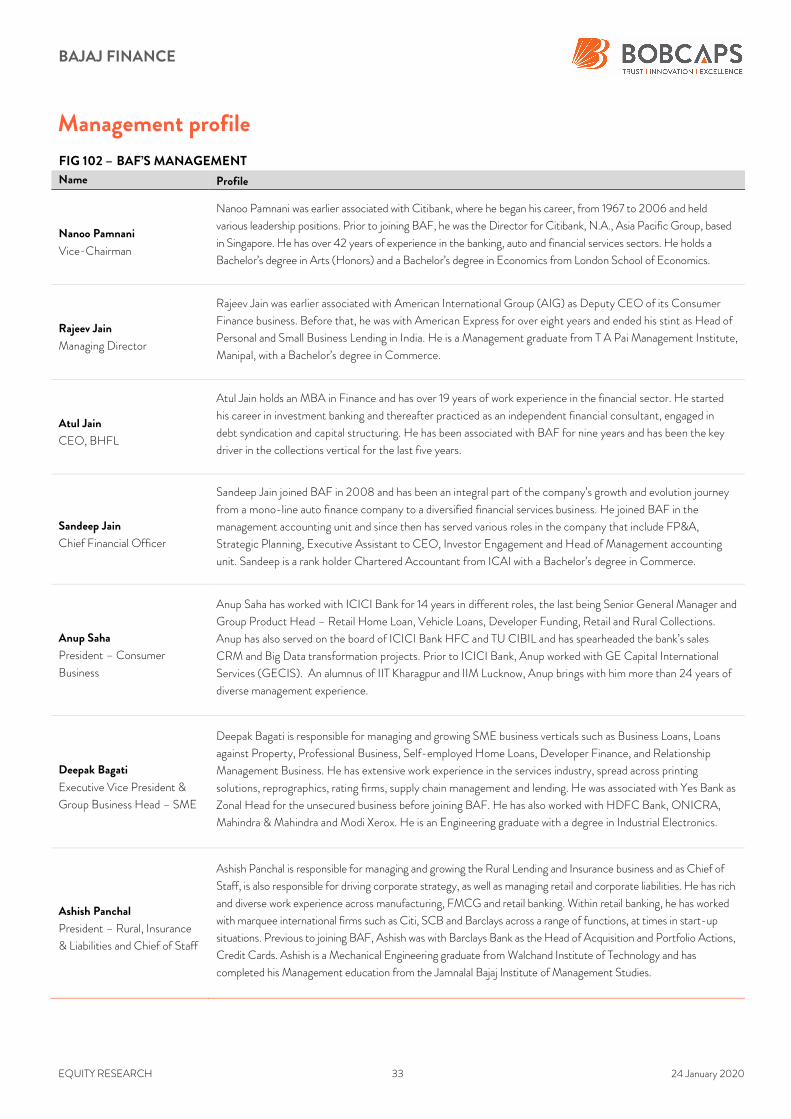
Management profile
FIG 102 – BAF’S MANAGEMENT
Name Profile
Nanoo Pamnani
Vice-Chairman
Nanoo Pamnani was earlier associated with Citibank, where he began his career, from 1967 to 2006 and held
various leadership positions. Prior to joining BAF, he was the Director for Citibank, N.A., Asia Pacific Group, based
in Singapore. He has over 42 years of experience in the banking, auto and financial services sectors. He holds a
Bachelor’s degree in Arts (Honors) and a Bachelor’s degree in Economics from London School of Economics.
Rajeev Jain
Managing Director
Rajeev Jain was earlier associated with American International Group (AIG) as Deputy CEO of its Consumer
Finance business. Before that, he was with American Express for over eight years and ended his stint as Head of
Personal and Small Business Lending in India. He is a Management graduate from T A Pai Management Institute,
Manipal, with a Bachelor’s degree in Commerce.
Atul Jain
CEO, BHFL
Atul Jain holds an MBA in Finance and has over 19 years of work experience in the financial sector. He started
his career in investment banking and thereafter practiced as an independent financial consultant, engaged in
debt syndication and capital structuring. He has been associated with BAF for nine years and has been the key
driver in the collections vertical for the last five years.
Sandeep Jain
Chief Financial Officer
Sandeep Jain joined BAF in 2008 and has been an integral part of the company’s growth and evolution journey
from a mono-line auto finance company to a diversified financial services business. He joined BAF in the
management accounting unit and since then has served various roles in the company that include FP&A,
Strategic Planning, Executive Assistant to CEO, Investor Engagement and Head of Management accounting
unit. Sandeep is a rank holder Chartered Accountant from ICAI with a Bachelor’s degree in Commerce.
Anup Saha
President – Consumer
Business
Anup Saha has worked with ICICI Bank for 14 years in different roles, the last being Senior General Manager and
Group Product Head – Retail Home Loan, Vehicle Loans, Developer Funding, Retail and Rural Collections.
Anup has also served on the board of ICICI Bank HFC and TU CIBIL and has spearheaded the bank’s sales
CRM and Big Data transformation projects. Prior to ICICI Bank, Anup worked with GE Capital International
Services (GECIS). An alumnus of IIT Kharagpur and IIM Lucknow, Anup brings with him more than 24 years of
diverse management experience.
Deepak Bagati
Executive Vice President &
Group Business Head – SME
Deepak Bagati is responsible for managing and growing SME business verticals such as Business Loans, Loans
against Property, Professional Business, Self-employed Home Loans, Developer Finance, and Relationship
Management Business. He has extensive work experience in the services industry, spread across printing
solutions, reprographics, rating firms, supply chain management and lending. He was associated with Yes Bank as
Zonal Head for the unsecured business before joining BAF. He has also worked with HDFC Bank, ONICRA,
Mahindra & Mahindra and Modi Xerox. He is an Engineering graduate with a degree in Industrial Electronics.
Ashish Panchal
President – Rural, Insurance
& Liabilities and Chief of Staff
Ashish Panchal is responsible for managing and growing the Rural Lending and Insurance business and as Chief of
Staff, is also responsible for driving corporate strategy, as well as managing retail and corporate liabilities. He has rich
and diverse work experience across manufacturing, FMCG and retail banking. Within retail banking, he has worked
with marquee international firms such as Citi, SCB and Barclays across a range of functions, at times in start-up
situations. Previous to joining BAF, Ashish was with Barclays Bank as the Head of Acquisition and Portfolio Actions,
Credit Cards. Ashish is a Mechanical Engineering graduate from Walchand Institute of Technology and has
completed his Management education from the Jamnalal Bajaj Institute of Management Studies.
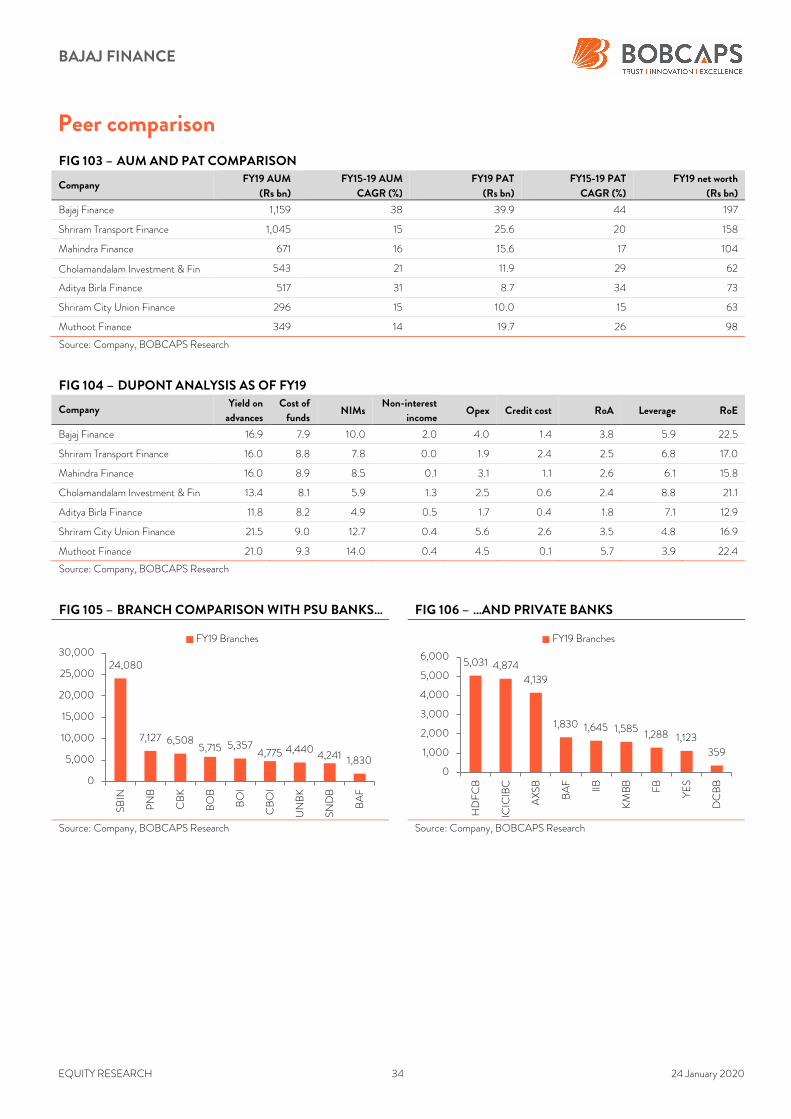
BAJAJ FINANCE
EQUITY RESEARCH 34 24 January 2020
Peer comparison
FIG 103 – AUM AND PAT COMPARISON
Company FY19 AUM
(Rs bn)
FY15-19 AUM
CAGR (%)
FY19 PAT
(Rs bn)
FY15-19 PAT
CAGR (%)
FY19 net worth
(Rs bn)
Bajaj Finance 1,159 38 39.9 44 197
Shriram Transport Finance 1,045 15 25.6 20 158
Mahindra Finance 671 16 15.6 17 104
Cholamandalam Investment & Fin 543 21 11.9 29 62
Aditya Birla Finance 517 31 8.7 34 73
Shriram City Union Finance 296 15 10.0 15 63
Muthoot Finance 349 14 19.7 26 98
Source: Company, BOBCAPS Research
FIG 104 – DUPONT ANALYSIS AS OF FY19
Company Yield on
advances
Cost of
funds NIMs
Non-interest
income Opex Credit cost RoA Leverage RoE
Bajaj Finance 16.9 7.9 10.0 2.0 4.0 1.4 3.8 5.9 22.5
Shriram Transport Finance 16.0 8.8 7.8 0.0 1.9 2.4 2.5 6.8 17.0
Mahindra Finance 16.0 8.9 8.5 0.1 3.1 1.1 2.6 6.1 15.8
Cholamandalam Investment & Fin 13.4 8.1 5.9 1.3 2.5 0.6 2.4 8.8 21.1
Aditya Birla Finance 11.8 8.2 4.9 0.5 1.7 0.4 1.8 7.1 12.9
Shriram City Union Finance 21.5 9.0 12.7 0.4 5.6 2.6 3.5 4.8 16.9
Muthoot Finance 21.0 9.3 14.0 0.4 4.5 0.1 5.7 3.9 22.4
Source: Company, BOBCAPS Research
FIG 105 – BRANCH COMPARISON WITH PSU BANKS… FIG 106 – …AND PRIVATE BANKS
Source: Company, BOBCAPS Research Source: Company, BOBCAPS Research
24,080
7,127 6,5085,715 5,357
4,775 4,4404,241 1,830
0
5,000
10,000
15,000
20,000
25,000
30,000
SBIN
PNB
CBK
BO
B
BO
I
CBO
I
UNBK
SNDB
BAF
FY19 Branches
5,031 4,8744,139
1,830 1,645 1,5851,288 1,123
359
0
1,000
2,000
3,000
4,000
5,000
6,000
HDFCB
ICIC
IBC
AXSB
BAF
IIB
KM
BB
FB
YES
DCBB
FY19 Branches
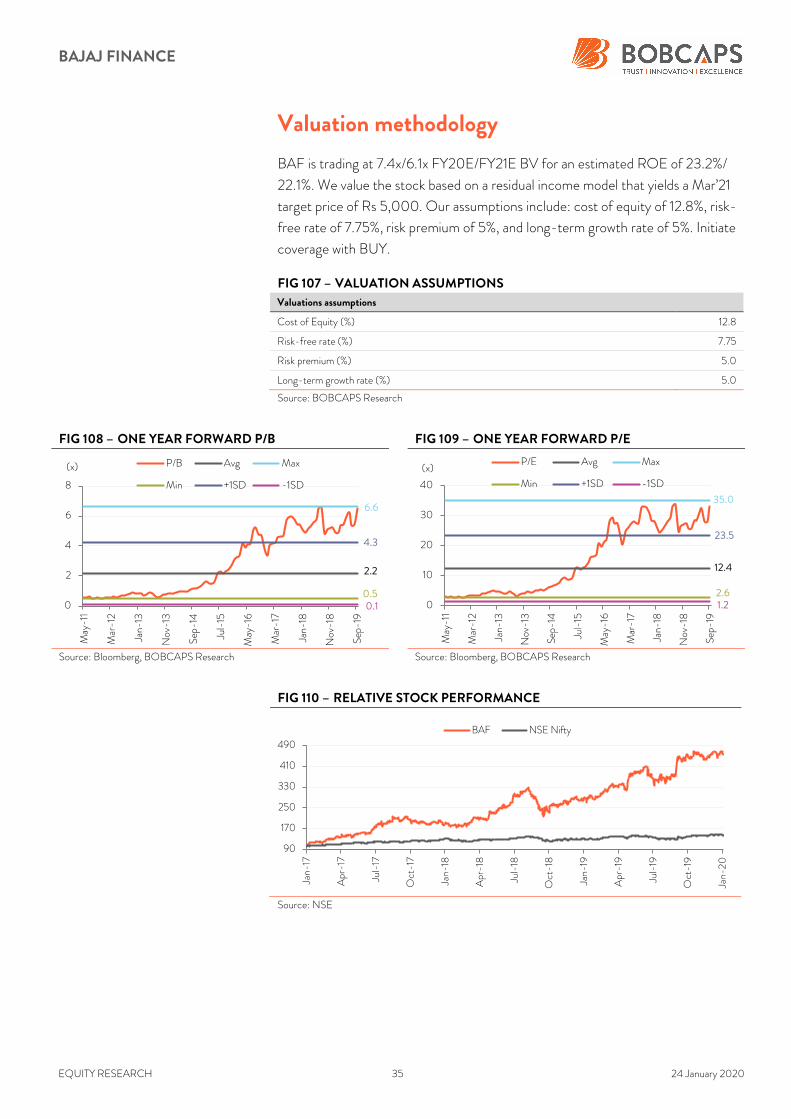
BAJAJ FINANCE
EQUITY RESEARCH 35 24 January 2020
Valuation methodology
BAF is trading at 7.4x/6.1x FY20E/FY21E BV for an estimated ROE of 23.2%/
22.1%. We value the stock based on a residual income model that yields a Mar’21
target price of Rs 5,000. Our assumptions include: cost of equity of 12.8%, risk-
free rate of 7.75%, risk premium of 5%, and long-term growth rate of 5%. Initiate
coverage with BUY.
FIG 107 – VALUATION ASSUMPTIONS
Valuations assumptions
Cost of Equity (%) 12.8
Risk-free rate (%) 7.75
Risk premium (%) 5.0
Long-term growth rate (%) 5.0
Source: BOBCAPS Research
FIG 108 – ONE YEAR FORWARD P/B FIG 109 – ONE YEAR FORWARD P/E
Source: Bloomberg, BOBCAPS Research Source: Bloomberg, BOBCAPS Research
FIG 110 – RELATIVE STOCK PERFORMANCE
Source: NSE
2.2
6.6
0.5
4.3
0.1 0
2
4
6
8
May
-11
Mar-12
Jan-
13
Nov
-13
Sep
-14
Jul-15
May
-16
Mar-17
Jan-
18
Nov
-18
Sep
-19
(x) P/B Avg Max
Min +1SD -1SD
12.4
35.0
2.6
23.5
1.2 0
10
20
30
40
May
-11
Mar-12
Jan-
13
Nov
-13
Sep-
14
Jul-15
May
-16
Mar-17
Jan-
18
Nov
-18
Sep-
19
(x)P/E Avg Max
Min +1SD -1SD
90
170
250
330
410
490
Jan-
17
Apr-17
Jul-17
Oct-17
Jan-
18
Apr-18
Jul-18
Oct-18
Jan-
19
Apr-19
Jul-19
Oct-19
Jan-
20
BAF NSE Nifty
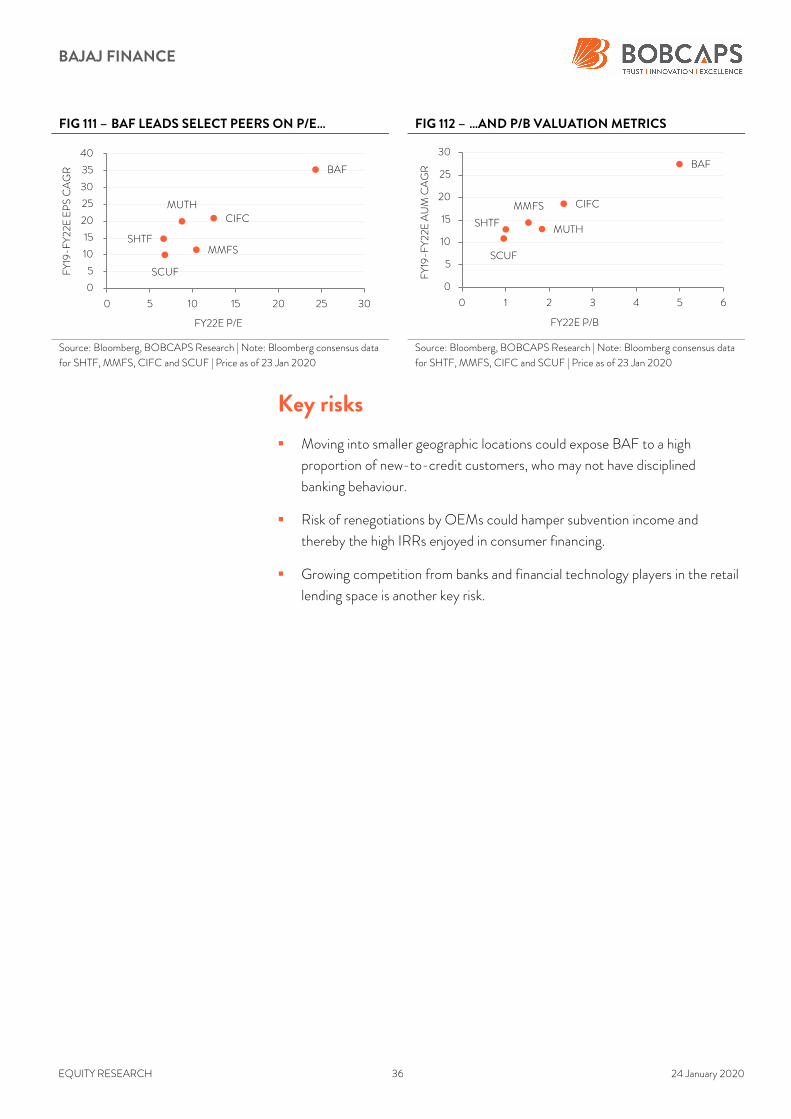
BAJAJ FINANCE
EQUITY RESEARCH 36 24 January 2020
FIG 111 – BAF LEADS SELECT PEERS ON P/E… FIG 112 – …AND P/B VALUATION METRICS
Source: Bloomberg, BOBCAPS Research | Note: Bloomberg consensus data
for SHTF, MMFS, CIFC and SCUF | Price as of 23 Jan 2020 Source: Bloomberg, BOBCAPS Research | Note: Bloomberg consensus data
for SHTF, MMFS, CIFC and SCUF | Price as of 23 Jan 2020
Key risks
Moving into smaller geographic locations could expose BAF to a high
proportion of new-to-credit customers, who may not have disciplined
banking behaviour.
Risk of renegotiations by OEMs could hamper subvention income and
thereby the high IRRs enjoyed in consumer financing.
Growing competition from banks and financial technology players in the retail
lending space is another key risk.
BAF
SHTFMMFS
CIFC
SCUF
MUTH
0
5
10
15
20
25
30
35
40
0 5 10 15 20 25 30
FY19
-FY22
E EPS C
AGR
FY22E P/E
BAF
SHTF
MMFS CIFC
SCUF
MUTH
0
5
10
15
20
25
30
0 1 2 3 4 5 6
FY19
-FY22
E A
UM
CAGR
FY22E P/B
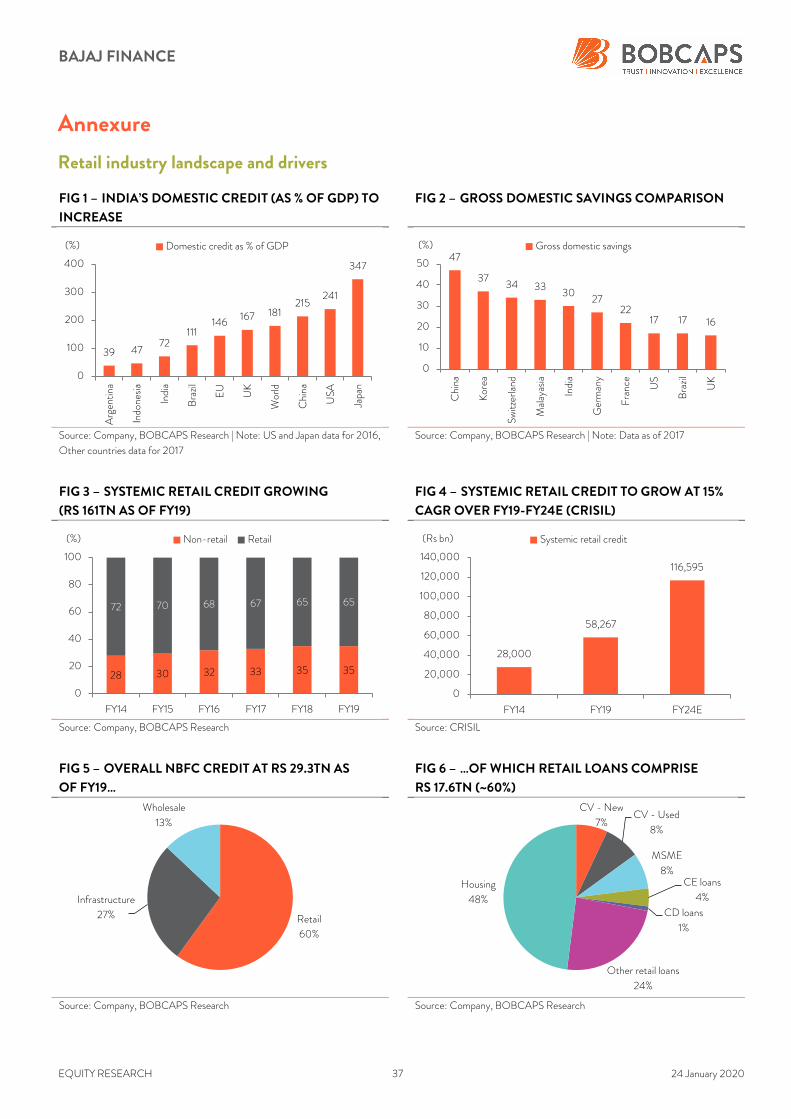
BAJAJ FINANCE
EQUITY RESEARCH 37 24 January 2020
Annexure
Retail industry landscape and drivers
FIG 1 – INDIA’S DOMESTIC CREDIT (AS % OF GDP) TO
INCREASE
FIG 2 – GROSS DOMESTIC SAVINGS COMPARISON
Source: Company, BOBCAPS Research | Note: US and Japan data for 2016,
Other countries data for 2017 Source: Company, BOBCAPS Research | Note: Data as of 2017
FIG 3 – SYSTEMIC RETAIL CREDIT GROWING
(RS 161TN AS OF FY19)
FIG 4 – SYSTEMIC RETAIL CREDIT TO GROW AT 15%
CAGR OVER FY19-FY24E (CRISIL)
Source: Company, BOBCAPS Research Source: CRISIL
FIG 5 – OVERALL NBFC CREDIT AT RS 29.3TN AS
OF FY19…
FIG 6 – …OF WHICH RETAIL LOANS COMPRISE
RS 17.6TN (~60%)
Source: Company, BOBCAPS Research Source: Company, BOBCAPS Research
39 4772
111146
167 181215
241
347
0
100
200
300
400
Argen
tina
Indo
nesia
India
Brazil
EU
UK
World
China
USA
Japa
n
(%) Domestic credit as % of GDP47
3734 33
3027
2217 17 16
0
10
20
30
40
50
China
Kor
ea
Switz
erland
Malay
asia
India
German
y
Franc
e
US
Brazil
UK
(%) Gross domestic savings
28 30 32 33 35 35
72 70 68 67 65 65
0
20
40
60
80
100
FY14 FY15 FY16 FY17 FY18 FY19
(%) Non-retail Retail
28,000
58,267
116,595
0
20,000
40,000
60,000
80,000
100,000
120,000
140,000
FY14 FY19 FY24E
(Rs bn) Systemic retail credit
Retail
60%
Infrastructure
27%
Wholesale
13%
CV - New
7%CV - Used
8%
MSME
8%CE loans
4%
CD loans
1%
Other retail loans
24%
Housing
48%
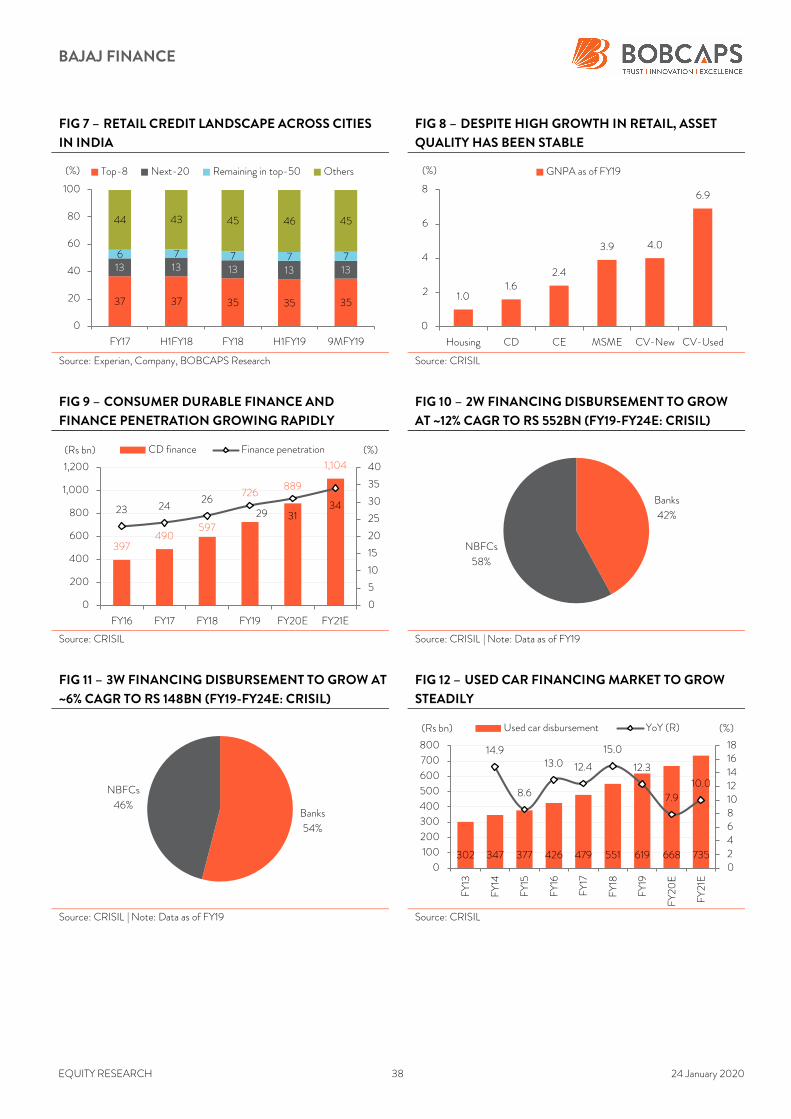
BAJAJ FINANCE
EQUITY RESEARCH 38 24 January 2020
FIG 7 – RETAIL CREDIT LANDSCAPE ACROSS CITIES
IN INDIA
FIG 8 – DESPITE HIGH GROWTH IN RETAIL, ASSET
QUALITY HAS BEEN STABLE
Source: Experian, Company, BOBCAPS Research Source: CRISIL
FIG 9 – CONSUMER DURABLE FINANCE AND
FINANCE PENETRATION GROWING RAPIDLY
FIG 10 – 2W FINANCING DISBURSEMENT TO GROW
AT ~12% CAGR TO RS 552BN (FY19-FY24E: CRISIL)
Source: CRISIL Source: CRISIL | Note: Data as of FY19
FIG 11 – 3W FINANCING DISBURSEMENT TO GROW AT
~6% CAGR TO RS 148BN (FY19-FY24E: CRISIL)
FIG 12 – USED CAR FINANCING MARKET TO GROW
STEADILY
Source: CRISIL | Note: Data as of FY19 Source: CRISIL
37 37 35 35 35
13 13 13 13 13
6 7 7 7 7
44 43 45 46 45
0
20
40
60
80
100
FY17 H1FY18 FY18 H1FY19 9MFY19
(%) Top-8 Next-20 Remaining in top-50 Others
1.0 1.6
2.4
3.9 4.0
6.9
0
2
4
6
8
Housing CD CE MSME CV-New CV-Used
(%) GNPA as of FY19
397490
597
726889
1,104
23 2426
29 3134
0
5
10
15
20
25
30
35
40
0
200
400
600
800
1,000
1,200
FY16 FY17 FY18 FY19 FY20E FY21E
(%)(Rs bn) CD finance Finance penetration
Banks
42%
NBFCs
58%
Banks
54%
NBFCs
46%
302 347 377 426 479 551 619 668 735
14.9
8.6
13.0 12.4
15.0
12.3
7.9
10.0
024681012141618
0
100
200
300
400
500
600
700
800
FY13
FY14
FY15
FY16
FY17
FY18
FY19
FY20
E
FY21
E
(%)(Rs bn) Used car disbursement YoY (R)

BAJAJ FINANCE
EQUITY RESEARCH 39 24 January 2020
FIG 13 – PERSONAL LOAN BOOK TO GROW AT 22%
CAGR TO RS 11.2TN (FY19-FY24E: CRISIL)
FIG 14 – BANKS TO GAIN MARKET SHARE OVER FY19-
FY21E (CRISIL)
Source: CRISIL Source: CRISIL
FIG 15 – NBFC MARKET SHARE INCREASING IN MSME
FINANCING
FIG 16 – LAP MARKET TO GROW AT ~14% CAGR DUE
TO TEPID NBFC PARTICIPATION (FY19-FY21E: CRISIL)
Source: CRISIL Source: CRISIL
FIG 17 – CREDIT CARD SPEND TO GROW AT ~20%
CAGR (FY19-FY24E: CRISIL)
FIG 18 – LOAN AGAINST SHARES (LAS) TO REMAIN
STATIC OVER FY19-FY24E (CRISIL)
Source: CRISIL Source: CRISIL
NBFCs
16%
Banks
84%
11.8 13.8 16.0 18.4 21.0 24.2
37 38 3937
35 34
0
5
10
15
20
25
30
35
40
45
0
5
10
15
20
25
30
FY16 FY17 FY18 FY19 FY20E FY21E
(%)(Rs tn) HL Market size HFCs MS (R)
8.7 17.3
11
21
0
5
10
15
20
25
0
5
10
15
20
FY13 FY19
(%)(Rs tn) MSME systemic credit NBFC market share (R)
1,2891,732
2,2532,902
3,2973,973
4,5365,100
5,900
0
1,000
2,000
3,000
4,000
5,000
6,000
7,000FY13
FY14
FY15
FY16
FY17
FY18
FY19
FY20
E
FY21
E
(Rs bn) LAP market
1,540
5,951
15,123
0
5,000
10,000
15,000
20,000
FY14 FY19 FY24E
(Rs bn) Credit card spend
181214
250
289 276299
0
50
100
150
200
250
300
350
FY15 FY16 FY17 FY18 FY19 FY24E
(Rs bn) LAS
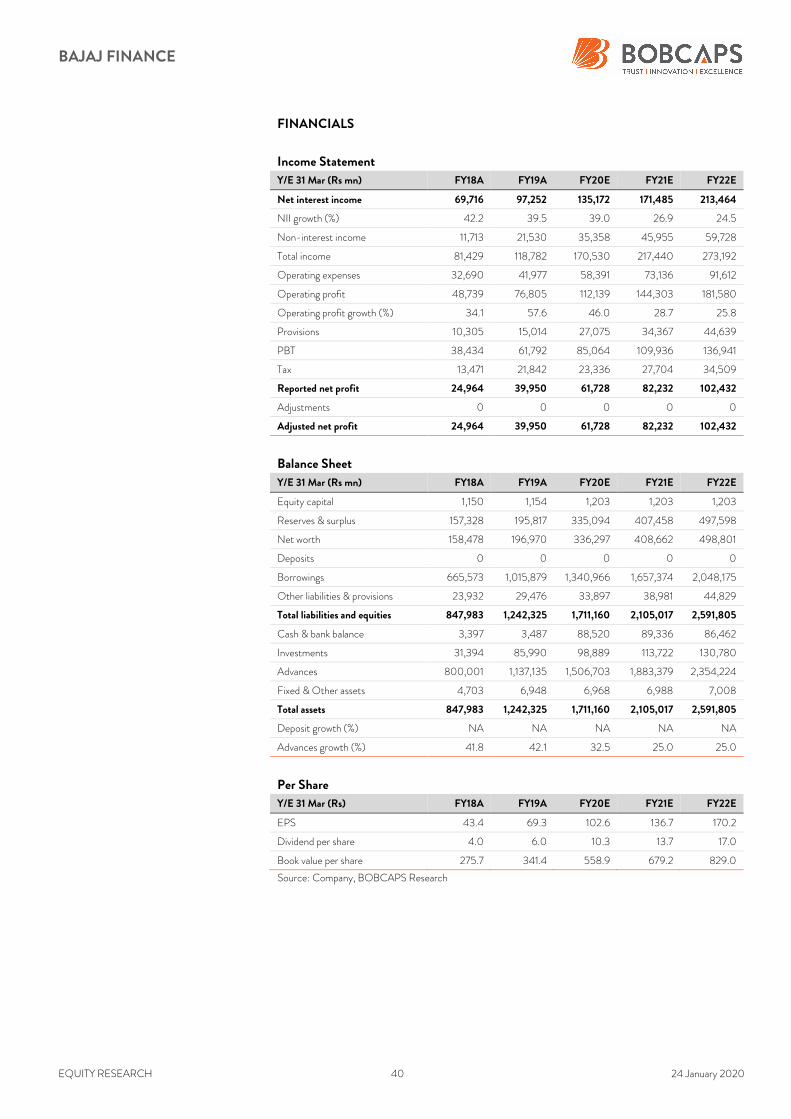
BAJAJ FINANCE
EQUITY RESEARCH 40 24 January 2020
FINANCIALS
Income Statement
Y/E 31 Mar (Rs mn) FY18A FY19A FY20E FY21E FY22E
Net interest income 69,716 97,252 135,172 171,485 213,464
NII growth (%) 42.2 39.5 39.0 26.9 24.5
Non-interest income 11,713 21,530 35,358 45,955 59,728
Total income 81,429 118,782 170,530 217,440 273,192
Operating expenses 32,690 41,977 58,391 73,136 91,612
Operating profit 48,739 76,805 112,139 144,303 181,580
Operating profit growth (%) 34.1 57.6 46.0 28.7 25.8
Provisions 10,305 15,014 27,075 34,367 44,639
PBT 38,434 61,792 85,064 109,936 136,941
Tax 13,471 21,842 23,336 27,704 34,509
Reported net profit 24,964 39,950 61,728 82,232 102,432
Adjustments 0 0 0 0 0
Adjusted net profit 24,964 39,950 61,728 82,232 102,432
Balance Sheet
Y/E 31 Mar (Rs mn) FY18A FY19A FY20E FY21E FY22E
Equity capital 1,150 1,154 1,203 1,203 1,203
Reserves & surplus 157,328 195,817 335,094 407,458 497,598
Net worth 158,478 196,970 336,297 408,662 498,801
Deposits 0 0 0 0 0
Borrowings 665,573 1,015,879 1,340,966 1,657,374 2,048,175
Other liabilities & provisions 23,932 29,476 33,897 38,981 44,829
Total liabilities and equities 847,983 1,242,325 1,711,160 2,105,017 2,591,805
Cash & bank balance 3,397 3,487 88,520 89,336 86,462
Investments 31,394 85,990 98,889 113,722 130,780
Advances 800,001 1,137,135 1,506,703 1,883,379 2,354,224
Fixed & Other assets 4,703 6,948 6,968 6,988 7,008
Total assets 847,983 1,242,325 1,711,160 2,105,017 2,591,805
Deposit growth (%) NA NA NA NA NA
Advances growth (%) 41.8 42.1 32.5 25.0 25.0
Per Share
Y/E 31 Mar (Rs) FY18A FY19A FY20E FY21E FY22E
EPS 43.4 69.3 102.6 136.7 170.2
Dividend per share 4.0 6.0 10.3 13.7 17.0
Book value per share 275.7 341.4 558.9 679.2 829.0
Source: Company, BOBCAPS Research
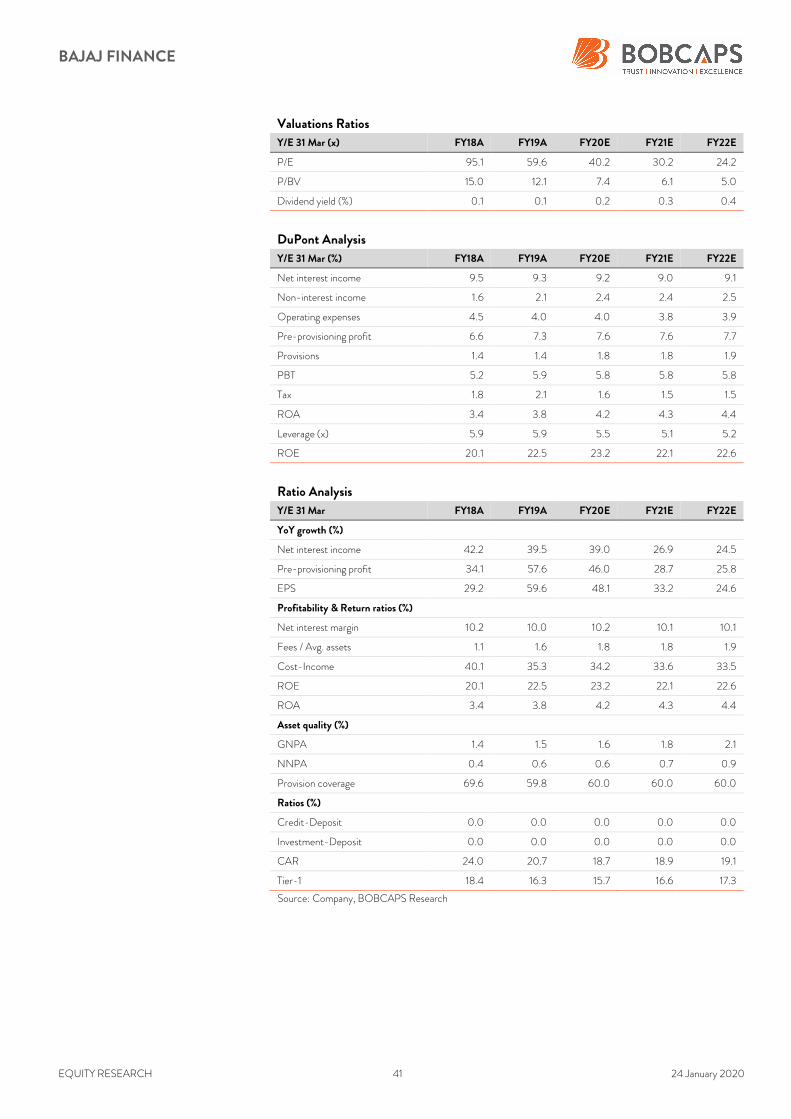
BAJAJ FINANCE
EQUITY RESEARCH 41 24 January 2020
Valuations Ratios
Y/E 31 Mar (x) FY18A FY19A FY20E FY21E FY22E
P/E 95.1 59.6 40.2 30.2 24.2
P/BV 15.0 12.1 7.4 6.1 5.0
Dividend yield (%) 0.1 0.1 0.2 0.3 0.4
DuPont Analysis
Y/E 31 Mar (%) FY18A FY19A FY20E FY21E FY22E
Net interest income 9.5 9.3 9.2 9.0 9.1
Non-interest income 1.6 2.1 2.4 2.4 2.5
Operating expenses 4.5 4.0 4.0 3.8 3.9
Pre-provisioning profit 6.6 7.3 7.6 7.6 7.7
Provisions 1.4 1.4 1.8 1.8 1.9
PBT 5.2 5.9 5.8 5.8 5.8
Tax 1.8 2.1 1.6 1.5 1.5
ROA 3.4 3.8 4.2 4.3 4.4
Leverage (x) 5.9 5.9 5.5 5.1 5.2
ROE 20.1 22.5 23.2 22.1 22.6
Ratio Analysis
Y/E 31 Mar FY18A FY19A FY20E FY21E FY22E
YoY growth (%)
Net interest income 42.2 39.5 39.0 26.9 24.5
Pre-provisioning profit 34.1 57.6 46.0 28.7 25.8
EPS 29.2 59.6 48.1 33.2 24.6
Profitability & Return ratios (%)
Net interest margin 10.2 10.0 10.2 10.1 10.1
Fees / Avg. assets 1.1 1.6 1.8 1.8 1.9
Cost-Income 40.1 35.3 34.2 33.6 33.5
ROE 20.1 22.5 23.2 22.1 22.6
ROA 3.4 3.8 4.2 4.3 4.4
Asset quality (%)
GNPA 1.4 1.5 1.6 1.8 2.1
NNPA 0.4 0.6 0.6 0.7 0.9
Provision coverage 69.6 59.8 60.0 60.0 60.0
Ratios (%)
Credit-Deposit 0.0 0.0 0.0 0.0 0.0
Investment-Deposit 0.0 0.0 0.0 0.0 0.0
CAR 24.0 20.7 18.7 18.9 19.1
Tier-1 18.4 16.3 15.7 16.6 17.3
Source: Company, BOBCAPS Research
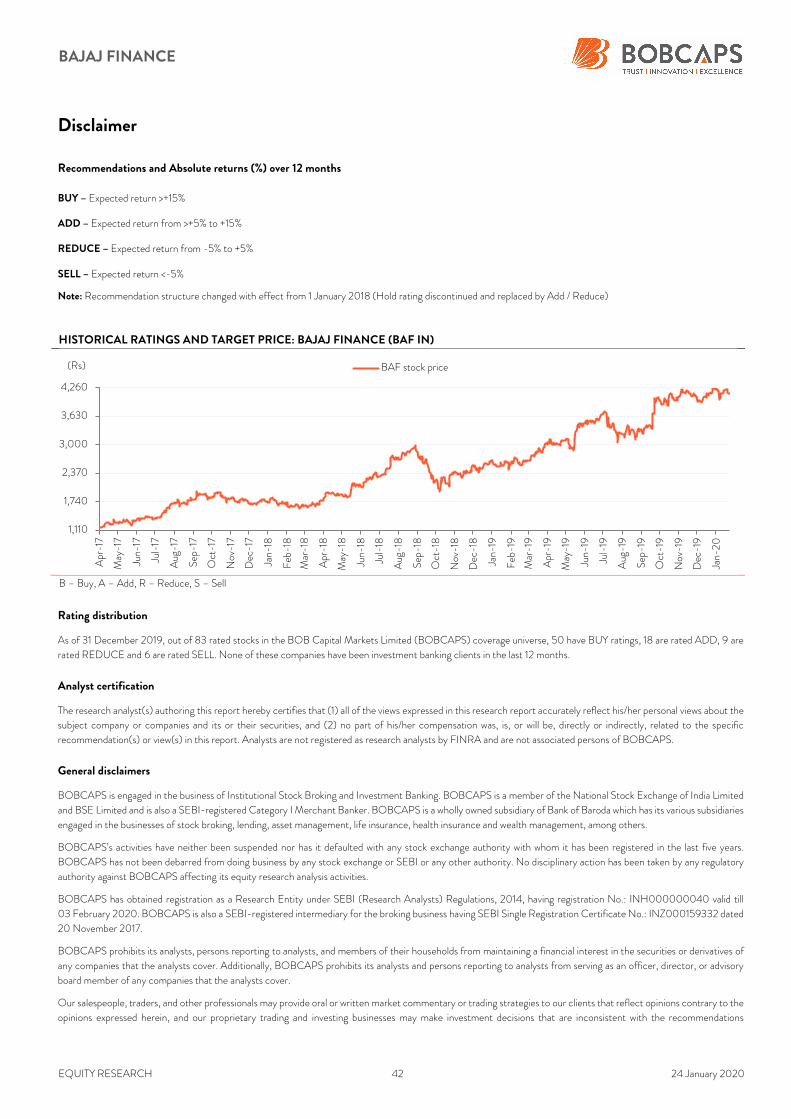
BAJAJ FINANCE
EQUITY RESEARCH 42 24 January 2020
Disclaimer
Recommendations and Absolute returns (%) over 12 months
BUY – Expected return >+15%
ADD – Expected return from >+5% to +15%
REDUCE – Expected return from -5% to +5%
SELL – Expected return <-5%
Note: Recommendation structure changed with effect from 1 January 2018 (Hold rating discontinued and replaced by Add / Reduce)
HISTORICAL RATINGS AND TARGET PRICE: BAJAJ FINANCE (BAF IN)
B – Buy, A – Add, R – Reduce, S – Sell
Rating distribution
As of 31 December 2019, out of 83 rated stocks in the BOB Capital Markets Limited (BOBCAPS) coverage universe, 50 have BUY ratings, 18 are rated ADD, 9 are
rated REDUCE and 6 are rated SELL. None of these companies have been investment banking clients in the last 12 months.
Analyst certification
The research analyst(s) authoring this report hereby certifies that (1) all of the views expressed in this research report accurately reflect his/her personal views about the
subject company or companies and its or their securities, and (2) no part of his/her compensation was, is, or will be, directly or indirectly, related to the specific
recommendation(s) or view(s) in this report. Analysts are not registered as research analysts by FINRA and are not associated persons of BOBCAPS.
General disclaimers
BOBCAPS is engaged in the business of Institutional Stock Broking and Investment Banking. BOBCAPS is a member of the National Stock Exchange of India Limited
and BSE Limited and is also a SEBI-registered Category I Merchant Banker. BOBCAPS is a wholly owned subsidiary of Bank of Baroda which has its various subsidiaries
engaged in the businesses of stock broking, lending, asset management, life insurance, health insurance and wealth management, among others.
BOBCAPS’s activities have neither been suspended nor has it defaulted with any stock exchange authority with whom it has been registered in the last five years.
BOBCAPS has not been debarred from doing business by any stock exchange or SEBI or any other authority. No disciplinary action has been taken by any regulatory
authority against BOBCAPS affecting its equity research analysis activities.
BOBCAPS has obtained registration as a Research Entity under SEBI (Research Analysts) Regulations, 2014, having registration No.: INH000000040 valid till
03 February 2020. BOBCAPS is also a SEBI-registered intermediary for the broking business having SEBI Single Registration Certificate No.: INZ000159332 dated
20 November 2017.
BOBCAPS prohibits its analysts, persons reporting to analysts, and members of their households from maintaining a financial interest in the securities or derivatives of
any companies that the analysts cover. Additionally, BOBCAPS prohibits its analysts and persons reporting to analysts from serving as an officer, director, or advisory
board member of any companies that the analysts cover.
Our salespeople, traders, and other professionals may provide oral or written market commentary or trading strategies to our clients that reflect opinions contrary to the
opinions expressed herein, and our proprietary trading and investing businesses may make investment decisions that are inconsistent with the recommendations
1,110
1,740
2,370
3,000
3,630
4,260
Apr-17
May
-17
Jun-
17
Jul-17
Aug
-17
Sep
-17
Oct-17
Nov
-17
Dec
-17
Jan-
18
Feb
-18
Mar-18
Apr-18
May
-18
Jun-
18
Jul-18
Aug
-18
Sep
-18
Oct-18
Nov
-18
Dec
-18
Jan-
19
Feb
-19
Mar-19
Apr-19
May
-19
Jun-
19
Jul-19
Aug
-19
Sep
-19
Oct-19
Nov
-19
Dec
-19
Jan-
20
(Rs) BAF stock price
BAJAJ FINANCE
EQUITY RESEARCH 43 24 January 2020
expressed herein. In reviewing these materials, you should be aware that any or all of the foregoing, among other things, may give rise to real or potential conflicts of
interest. Additionally, other important information regarding our relationships with the company or companies that are the subject of this material is provided herein.
This material should not be construed as an offer to sell or the solicitation of an offer to buy any security in any jurisdiction where such an offer or solicitation would be
illegal. We are not soliciting any action based on this material. It is for the general information of BOBCAPS’s clients. It does not constitute a personal recommendation
or take into account the particular investment objectives, financial situations, or needs of individual clients. Before acting on any advice or recommendation in this
material, clients should consider whether it is suitable for their particular circumstances and, if necessary, seek professional advice.
The price and value of the investments referred to in this material and the income from them may go down as well as up, and investors may realize losses on any
investments. Past performance is not a guide for future performance, future returns are not guaranteed and a loss of original capital may occur. BOBCAPS does not
provide tax advice to its clients, and all investors are strongly advised to consult with their tax advisers regarding any potential investment in certain transactions —
including those involving futures, options, and other derivatives as well as non-investment-grade securities —that give rise to substantial risk and are not suitable for all
investors. The material is based on information that we consider reliable, but we do not represent that it is accurate or complete, and it should not be relied on as such.
Opinions expressed are our current opinions as of the date appearing on this material only. We endeavour to update on a reasonable basis the information discussed in
this material, but regulatory, compliance, or other reasons may prevent us from doing so.
We and our affiliates, officers, directors, and employees, including persons involved in the preparation or issuance of this material, may from time to time have “long” or
“short” positions in, act as principal in, and buy or sell the securities or derivatives thereof of companies mentioned herein and may from time to time add to or dispose
of any such securities (or investment). We and our affiliates may act as market makers or assume an underwriting commitment in the securities of companies discussed
in this document (or in related investments), may sell them to or buy them from customers on a principal basis, and may also perform or seek to perform investment
banking or advisory services for or relating to these companies and may also be represented in the supervisory board or any other committee of these companies.
For the purpose of calculating whether BOBCAPS and its affiliates hold, beneficially own, or control, including the right to vote for directors, one per cent or more of
the equity shares of the subject company, the holdings of the issuer of the research report is also included.
BOBCAPS and its non-US affiliates may, to the extent permissible under applicable laws, have acted on or used this research to the extent that it relates to non-US
issuers, prior to or immediately following its publication. Foreign currency denominated securities are subject to fluctuations in exchange rates that could have an adverse
effect on the value or price of or income derived from the investment. In addition, investors in securities such as ADRs, the value of which are influenced by foreign
currencies, effectively assume currency risk. In addition, options involve risks and are not suitable for all investors. Please ensure that you have read and understood the
Risk disclosure document before entering into any derivative transactions.
In the US, this material is only for Qualified Institutional Buyers as defined under rule 144(a) of the Securities Act, 1933. No part of this document may be distributed
in Canada or used by private customers in the United Kingdom.
No part of this material may be (1) copied, photocopied, or duplicated in any form by any means or (2) redistributed without BOBCAPS’s prior written consent.
Company-specific disclosures under SEBI (Research Analysts) Regulations, 2014
The research analyst(s) or his/her relatives do not have any material conflict of interest at the time of publication of this research report.
BOBCAPS or its research analyst(s) or his/her relatives do not have any financial interest in the subject company. BOBCAPS or its research analyst(s) or his/her
relatives do not have actual/beneficial ownership of one per cent or more securities in the subject company at the end of the month immediately preceding the date of
publication of this report.
The research analyst(s) has not received any compensation from the subject company in the past 12 months. Compensation of the research analyst(s) is not based on
any specific merchant banking, investment banking or brokerage service transactions.
BOBCAPS or its research analyst(s) is not engaged in any market making activities for the subject company.
The research analyst(s) has not served as an officer, director or employee of the subject company.
BOBCAPS or its associates may have material conflict of interest at the time of publication of this research report.
BOBCAPS’s associates may have financial interest in the subject company. BOBCAPS’s associates may hold actual / beneficial ownership of one per cent or more
securities in the subject company at the end of the month immediately preceding the date of publication of this report.
BOBCAPS or its associates may have managed or co-managed a public offering of securities for the subject company or may have been mandated by the subject
company for any other assignment in the past 12 months.
BOBCAPS may have received compensation from the subject company in the past 12 months. BOBCAPS may from time to time solicit or perform investment banking
services for the subject company. BOBCAPS or its associates may have received compensation from the subject company in the past 12 months for services in respect
of managing or co-managing public offerings, corporate finance, investment banking or merchant banking, brokerage services or other advisory services in a merger or
specific transaction. BOBCAPS or its associates may have received compensation for products or services other than investment banking or merchant banking or
brokerage services from the subject company in the past 12 months.