637583360248109392_HUL Initiating coverage (1).pdf
9
- 1 - Thursday, 03 rd June, 2021 This document is for private circulation, and must be read in conjunction with the disclaimer on the last page. Target: INR 3,185 CMP: INR 2,362 (53.2x FY24 P/E) BUY Index Details Hindustan Unilever Ltd (HUL) is India’s largest FMCG player having ~44 brands spanning 14 distinct categories largely grouped into home care, beauty & personal care, food & refreshments & others. The recent merger of GSK is significantly accretive for HUL as GSK is one of the key players in the foods and refreshment (F&R) category with a wide product portfolio (includes iconic brands such as ‘Horlicks’ and ‘Boost’). The acquired portfolio is complementary to the current offerings of HUL in the F&R category. Combined with HUL’s vast distribution, we believe that HUL can significantly grow its F&R portfolio both in the short as well as in the long run. We initiate coverage on HUL with a BUY for a price target of Rs 3,185 representing a potential upside of 34.8% over the next 24 months (We have used the DCF method to value HUL). Our optimism stems from the following: We expect revenues to grow at a CAGR of 7.8% over FY21-24E to Rs 58,924 crores. 4.7% CAGR in home care revenues to Rs 16,000 cr. 4.3% CAGR in beauty and personal care revenues to Rs 20,484 cr. 15.1% growth in food & refreshment revenues to Rs 20,122 cr. 8.2% growth in other revenues to Rs 2,319 cr. FMCG companies typically do well in an inflationary environment. This combined with a better product mix, increasing e-commerce penetration and higher utilisation should lead to an increase in EBITDA margins by ~100bps to 25.7% by FY24E. This should lead to a faster pace of growth of 9.3% CAGR in EBITDA to Rs 15,161.4 cr and PAT to Rs 10,425.8 crores respectively over the same period. Sensex 52,232 Nifty 15,690 Industry FMCG Scrip Details Mkt Cap (Rs Cr) 5,55,070 O/S Share (Cr) 235 3 M Avg Vol (000) 2,329 52 Wk H/L (Rs) 2504/1955 Div Yield (%) 1.3 FVPS (Rs) 1.0 Shareholding Pattern Shareholder % Promoters 61.90 Institutional 25.63 Public 12.47 Total 100.00 HUL vs. Sensex 20000 30000 40000 50000 60000 0 1000 2000 3000 May-18 Jan-19 Sep-19 May-20 Jan-21 HUL-LHS Sensex-RHS Hindustan Unilever Ltd STOCK POINTER Key Financials (in ₹ crores) Sales EBITDA Net Profit EBITDA (%) Net Profit (%) EPS ₹ BV ₹ RoE (%) RoCE (%) P/E (x) P/BV (x) EV/EBITDA (x) FY20 39,783.0 9,861.0 6,756.0 24.8 17.0 31.3 38.1 82.1 107.7 75.5 62.0 55.8 FY21E 47,028.0 11,626.0 7,995.0 24.7 17.0 34.0 202.9 16.8 22.1 69.4 11.6 47.3 FY22E 50,009.0 12,503.2 8,685.1 25.0 17.4 37.0 204.2 18.1 23.7 63.9 11.6 44.0 FY23E 54,308.4 13,763.8 9,488.5 25.3 17.5 40.4 205.7 19.6 25.7 58.5 11.5 40.0 FY24E 58,924.4 15,161.4 10,425.8 25.7 17.7 44.4 207.3 21.4 28.0 53.2 11.4 36.3
-
Upload
khangminh22 -
Category
Documents
-
view
1 -
download
0
Transcript of 637583360248109392_HUL Initiating coverage (1).pdf

- 1 - Thursday, 03rd June, 2021
This document is for private circulation, and must be read in conjunction with the disclaimer on the last page.
Target: INR 3,185 CMP: INR 2,362 (53.2x FY24 P/E) BUY
Index Details Hindustan Unilever Ltd (HUL) is India’s largest FMCG player having ~44 brands spanning 14 distinct categories largely grouped into home care, beauty & personal care, food & refreshments & others. The recent merger of GSK is significantly accretive for HUL as GSK is one of the key players in the foods and refreshment (F&R) category with a wide product portfolio (includes iconic brands such as ‘Horlicks’ and ‘Boost’). The acquired portfolio is complementary to the current offerings of HUL in the F&R category. Combined with HUL’s vast distribution, we believe that HUL can significantly grow its F&R portfolio both in the short as well as in the long run. We initiate coverage on HUL with a BUY for a price target of Rs 3,185 representing a potential upside of 34.8% over the next 24 months (We have used the DCF method to value HUL). Our optimism stems from the following: We expect revenues to grow at a CAGR of 7.8% over FY21-24E to Rs 58,924 crores.
4.7% CAGR in home care revenues to Rs 16,000 cr. 4.3% CAGR in beauty and personal care revenues to Rs 20,484 cr. 15.1% growth in food & refreshment revenues to Rs 20,122 cr. 8.2% growth in other revenues to Rs 2,319 cr.
FMCG companies typically do well in an inflationary environment. This combined with a better product mix, increasing e-commerce penetration and higher utilisation should lead to an increase in EBITDA margins by ~100bps to 25.7% by FY24E. This should lead to a faster pace of growth of 9.3% CAGR in EBITDA to Rs 15,161.4 cr and PAT to Rs 10,425.8 crores respectively over the same period.
Sensex 52,232
Nifty 15,690
Industry FMCG
Scrip Details
Mkt Cap (Rs Cr) 5,55,070
O/S Share (Cr) 235
3 M Avg Vol (000) 2,329
52 Wk H/L (Rs) 2504/1955
Div Yield (%) 1.3
FVPS (Rs) 1.0
Shareholding Pattern
Shareholder %
Promoters 61.90
Institutional 25.63
Public 12.47
Total 100.00
HUL vs. Sensex
2000030000400005000060000
0
1000
2000
3000
May
-18
Jan-
19
Sep-
19
May
-20
Jan-
21
HUL-LHS Sensex-RHS
Hindustan Unilever Ltd
ST
OC
K P
OIN
TE
R
Key Financials (in ₹ crores)
Sales EBITDA Net Profit EBITDA
(%) Net Profit
(%) EPS
₹ BV ₹
RoE (%)
RoCE (%)
P/E (x)
P/BV (x)
EV/EBITDA (x)
FY20 39,783.0 9,861.0 6,756.0 24.8 17.0 31.3 38.1 82.1 107.7 75.5 62.0 55.8 FY21E 47,028.0 11,626.0 7,995.0 24.7 17.0 34.0 202.9 16.8 22.1 69.4 11.6 47.3 FY22E 50,009.0 12,503.2 8,685.1 25.0 17.4 37.0 204.2 18.1 23.7 63.9 11.6 44.0 FY23E 54,308.4 13,763.8 9,488.5 25.3 17.5 40.4 205.7 19.6 25.7 58.5 11.5 40.0 FY24E 58,924.4 15,161.4 10,425.8 25.7 17.7 44.4 207.3 21.4 28.0 53.2 11.4 36.3
- 2 - Thursday, 03rdJune, 2021
This document is for private circulation, and must be read in conjunction with the disclaimer on the last page.
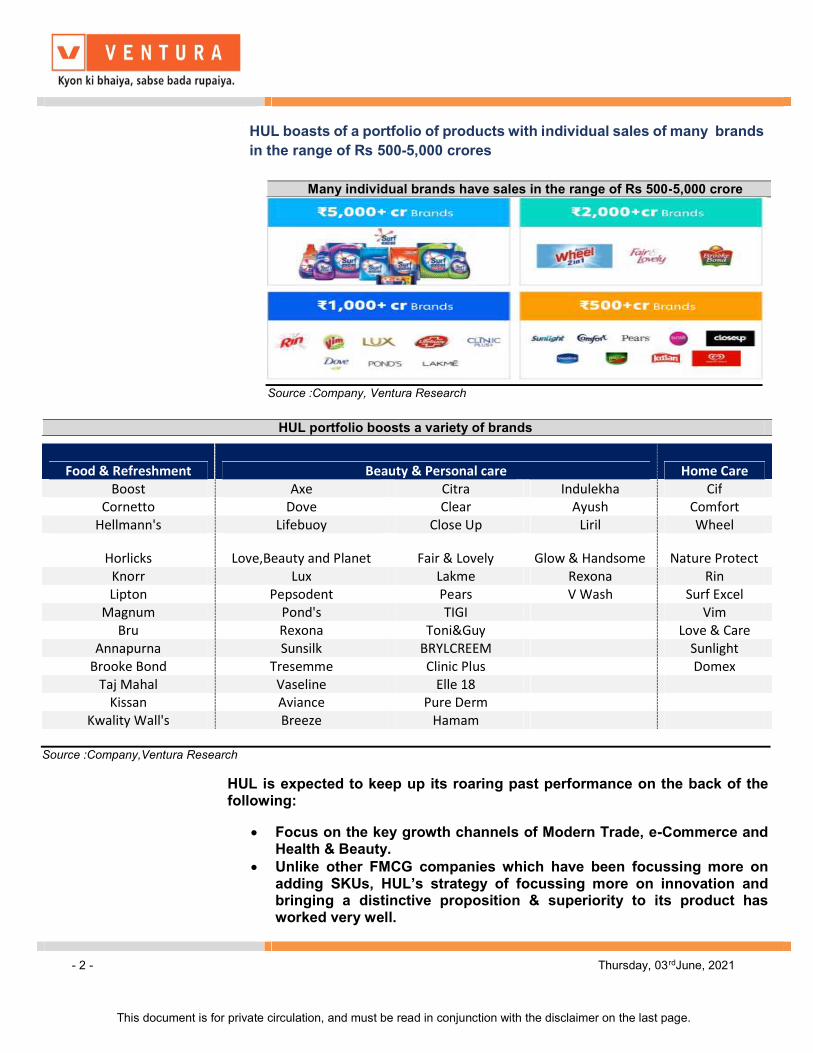
HUL portfolio boosts a variety of brands
Food & Refreshment Beauty & Personal care Home Care Boost Axe Citra Indulekha Cif
Cornetto Dove Clear Ayush Comfort Hellmann's Lifebuoy Close Up Liril Wheel
Horlicks Love,Beauty and Planet Fair & Lovely Glow & Handsome Nature Protect Knorr Lux Lakme Rexona Rin Lipton Pepsodent Pears V Wash Surf Excel
Magnum Pond's TIGI Vim Bru Rexona Toni&Guy Love & Care
Annapurna Sunsilk BRYLCREEM Sunlight Brooke Bond Tresemme Clinic Plus Domex
Taj Mahal Vaseline Elle 18 Kissan Aviance Pure Derm
Kwality Wall's Breeze Hamam Source :Company,Ventura Research
HUL is expected to keep up its roaring past performance on the back of the following:
Focus on the key growth channels of Modern Trade, e-Commerce and Health & Beauty.
Unlike other FMCG companies which have been focussing more on adding SKUs, HUL’s strategy of focussing more on innovation and bringing a distinctive proposition & superiority to its product has worked very well.
HUL boasts of a portfolio of products with individual sales of many brands in the range of Rs 500-5,000 crores
Many individual brands have sales in the range of Rs 500-5,000 crore
Source :Company, Ventura Research

- 3 - Thursday, 03rdJune, 2021
This document is for private circulation, and must be read in conjunction with the disclaimer on the last page.
Learning from COVID, HUL has debottlenecked its production line, making it more flexible to quickly adapt to the changing requirements, should there be a demand first and it has also added new manufacturing partners taking its potential capacity to 1.3x of pre-COVID levels.
Strong cash flow generation on the cards HUL is expected to continue to sustain strong cash flow generation. OCF to EBITDA is expected to be at 82.6% in FY24. FCFE and FCFF is expected to grow at 24.3% and 35.2% CAGR respectively to Rs 22,548.8 cr and Rs 11,256.9 cr in FY24. Dividend payout ratio to remain atleast at 75% Strong return ratios, leadership position, immense size of opportunity and innovation justifies the premium valuations given to the stock Based on the DCF valuation methodology we value HUL at Rs 3,185 representing a potential upside of 34.8% on the CMP of Rs 2,362 over the next 24 months.
DCF Valuation
Source: Company,Ventura Research

- 4 - Thursday, 03rdJune, 2021
This document is for private circulation, and must be read in conjunction with the disclaimer on the last page.
Sensitivity analysis
Source: Company,Ventura Research
Key risk and concern areas
Beauty and Personal care products demand can be affected if WFH becomes more permanent : As per a recent research report, usage of personal care products dropped in UK as people had lesser occasions to use them due to WFH. While we believe that gradually people will return to offices in India but major permanent shift towards WFH can derail the growth prospects for beauty products for HUL.
High valuations : FMCG companies enjoy higher multiples in India than other sectors due to huge growth story for them coupled with a premiumisation opportunity. Better return ratios, corporate governance, delevered balance sheet alongwith market leadership means HUL will always be the leader in the pack and hence enjoy the best multiples within the FMCG sector. However, if there is any structural shift in consumption/savings pattern owing to COVID, it can lead to derating of multiples for the whole FMCG industry.
Source: Company,Ventura Research, Bloomberg
650
1,150
1,650
2,150
2,650
Apr-
15
Jul-1
5
Oct
-15
Jan-
16
Apr-
16
Jul-1
6
Oct
-16
Jan-
17
Apr-
17
Jul-1
7
Oct
-17
Jan-
18
Apr-
18
Jul-1
8
Oct
-18
Jan-
19
Apr-
19
Jul-1
9
Oct
-19
Jan-
20
Apr-
20
Jul-2
0
Oct
-20
Jan-
21
Apr-
21
P/E band chart
Adj Price 49.56x 52.56x 55.56x 58.56x 61.56x
- 5 - Thursday, 03rdJune, 2021
This document is for private circulation, and must be read in conjunction with the disclaimer on the last page.
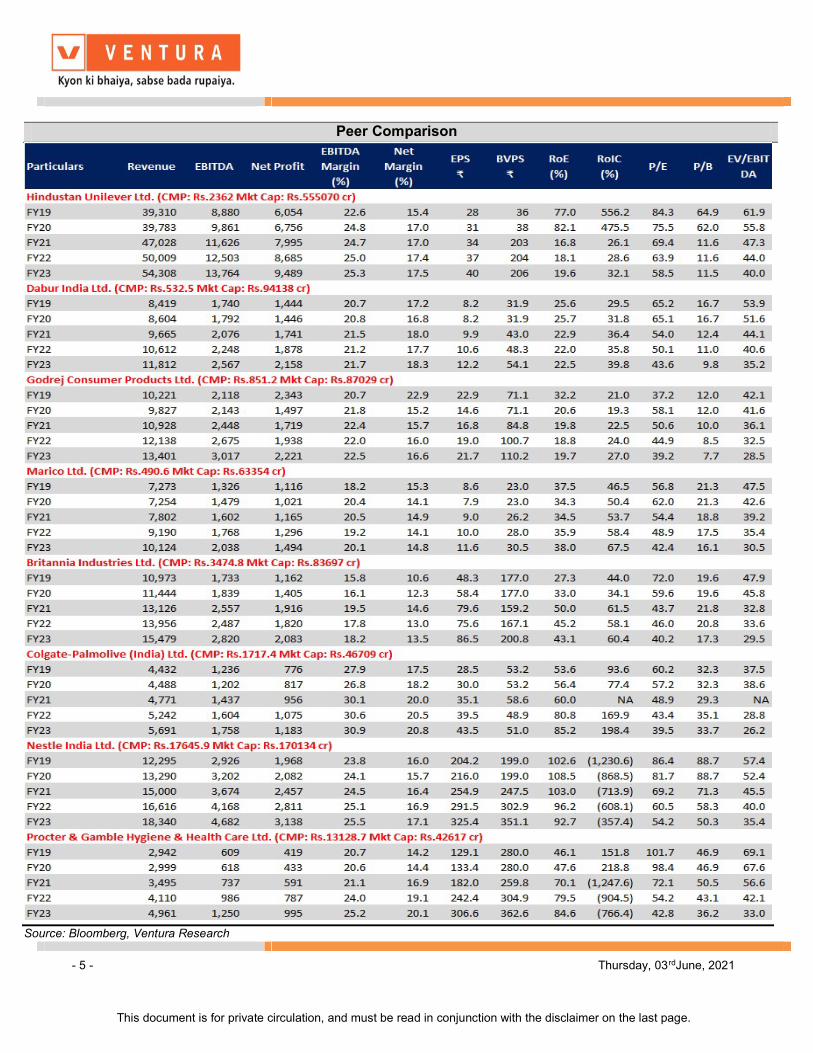
Peer Comparison
Source: Bloomberg, Ventura Research
- 6 - Thursday, 03rdJune, 2021
This document is for private circulation, and must be read in conjunction with the disclaimer on the last page.
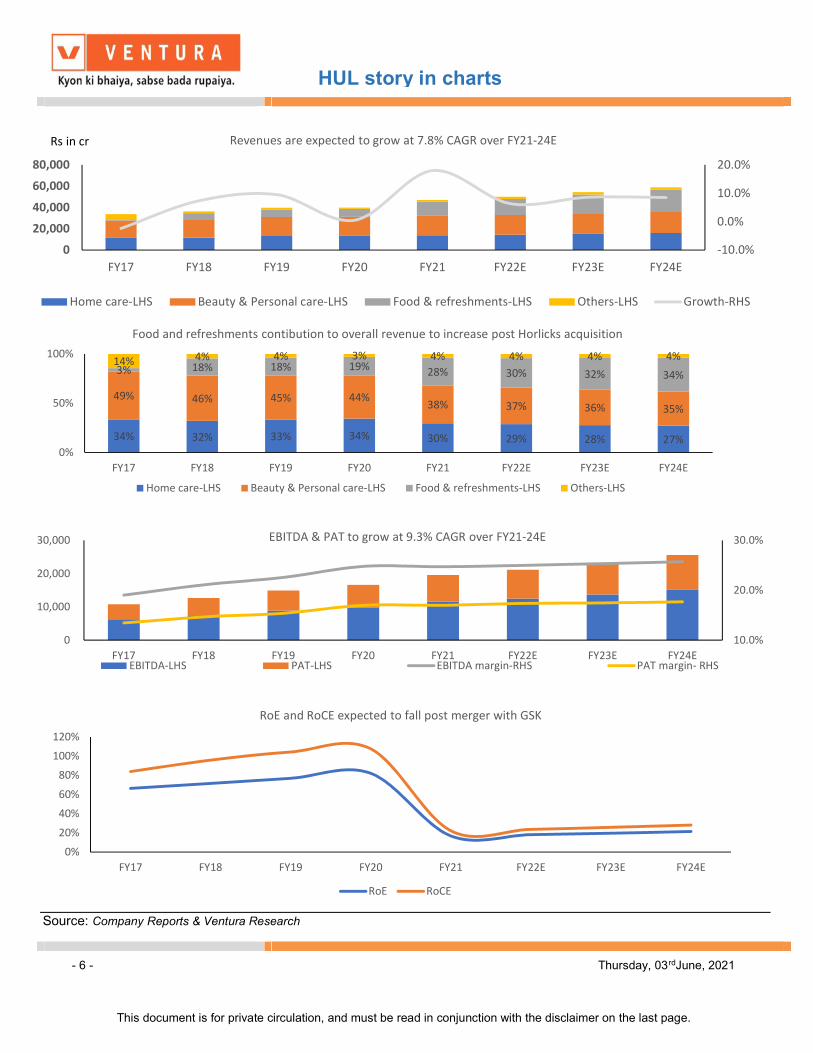
Source: Company Reports & Ventura Research
-10.0%
0.0%
10.0%
20.0%
0
20,000
40,000
60,000
80,000
FY17 FY18 FY19 FY20 FY21 FY22E FY23E FY24E
Revenues are expected to grow at 7.8% CAGR over FY21-24E
Home care-LHS Beauty & Personal care-LHS Food & refreshments-LHS Others-LHS Growth-RHS
Rs in cr
34% 32% 33% 34% 30% 29% 28% 27%
49% 46% 45% 44%38% 37% 36% 35%
3% 18% 18% 19% 28% 30% 32% 34%14% 4% 4% 3% 4% 4% 4% 4%
0%
50%
100%
FY17 FY18 FY19 FY20 FY21 FY22E FY23E FY24E
Food and refreshments contibution to overall revenue to increase post Horlicks acquisition
Home care-LHS Beauty & Personal care-LHS Food & refreshments-LHS Others-LHS
10.0%
20.0%
30.0%
0
10,000
20,000
30,000
FY17 FY18 FY19 FY20 FY21 FY22E FY23E FY24E
EBITDA & PAT to grow at 9.3% CAGR over FY21-24E
EBITDA-LHS PAT-LHS EBITDA margin-RHS PAT margin- RHS
0%
20%
40%
60%
80%
100%
120%
FY17 FY18 FY19 FY20 FY21 FY22E FY23E FY24E
RoE and RoCE expected to fall post merger with GSK
RoE RoCE
HUL story in charts

- 7 - Thursday, 03rdJune, 2021
This document is for private circulation, and must be read in conjunction with the disclaimer on the last page.
Quarterly Financial Performance
Source: Company Reports & Ventura Research

- 8 - Thursday, 03rdJune, 2021
This document is for private circulation, and must be read in conjunction with the disclaimer on the last page.
Financials & Projections
Source: Company Reports & Ventura Research

- 9 - Thursday, 03rdJune, 2021
This document is for private circulation, and must be read in conjunction with the disclaimer on the last page.
Disclosures and Disclaimer
Ventura Securities Limited (VSL) is a SEBI registered intermediary offering broking, depository and portfolio management services to clients. VSL is member of BSE, NSE and MCX-SX. VSL is a depository participant of NSDL. VSL states that no disciplinary action whatsoever has been taken by SEBI against it in last five years except administrative warning issued in connection with technical and venial lapses observed while inspection of books of accounts and records. Ventura Commodities Limited, Ventura Guaranty Limited, Ventura Insurance Brokers Limited and Ventura Allied Services Private Limited are associates of VSL. Research Analyst (RA) involved in the preparation of this research report and VSL disclose that neither RA nor VSL nor its associates (i) have any financial interest in the company which is the subject matter of this research report (ii) holds ownership of one percent or more in the securities of subject company (iii) have any material conflict of interest at the time of publication of this research report (iv) have received any compensation from the subject company in the past twelve months (v) have managed or co-managed public offering of securities for the subject company in past twelve months (vi) have received any compensation for investment banking merchant banking or brokerage services from the subject company in the past twelve months (vii) have received any compensation for product or services from the subject company in the past twelve months (viii) have received any compensation or other benefits from the subject company or third party in connection with the research report. RA involved in the preparation of this research report discloses that he / she has not served as an officer, director or employee of the subject company. RA involved in the preparation of this research report and VSL discloses that they have not been engaged in the market making activity for the subject company. Our sales people, dealers, traders and other professionals may provide oral or written market commentary or trading strategies to our clients that reflect opinions that are contrary to the opinions expressed herein. We may have earlier issued or may issue in future reports on the companies covered herein with recommendations/ information inconsistent or different those made in this report. In reviewing this document, you should be aware that any or all of the foregoing, among other things, may give rise to or potential conflicts of interest. We may rely on information barriers, such as "Chinese Walls" to control the flow of information contained in one or more areas within us, or other areas, units, groups or affiliates of VSL. This report is for information purposes only and this document/material should not be construed as an offer to sell or the solicitation of an offer to buy, purchase or subscribe to any securities, and neither this document nor anything contained herein shall form the basis of or be relied upon in connection with any contract or commitment whatsoever. This document does not solicit any action based on the material contained herein. It is for the general information of the clients / prospective clients of VSL. VSL will not treat recipients as clients by virtue of their receiving this report. It does not constitute a personal recommendation or take into account the particular investment objectives, financial situations, or needs of clients / prospective clients. Similarly, this document does not have regard to the specific investment objectives, financial situation/circumstances and the particular needs of any specific person who may receive this document. The securities discussed in this report may not be suitable for all investors. The appropriateness of a particular investment or strategy will depend on an investor's individual circumstances and objectives. Persons who may receive this document should consider and independently evaluate whether it is suitable for his/ her/their particular circumstances and, if necessary, seek professional/financial advice. And such person shall be responsible for conducting his/her/their own investigation and analysis of the information contained or referred to in this document and of evaluating the merits and risks involved in the securities forming the subject matter of this document. The projections and forecasts described in this report were based upon a number of estimates and assumptions and are inherently subject to significant uncertainties and contingencies. Projections and forecasts are necessarily speculative in nature, and it can be expected that one or more of the estimates on which the projections and forecasts were based will not materialize or will vary significantly from actual results, and such variances will likely increase over time. All projections and forecasts described in this report have been prepared solely by the authors of this report independently of the Company. These projections and forecasts were not prepared with a view toward compliance with published guidelines or generally accepted accounting principles. No independent accountants have expressed an opinion or any other form of assurance on these projections or forecasts. You should not regard the inclusion of the projections and forecasts described herein as a representation or warranty by VSL, its associates, the authors of this report or any other person that these projections or forecasts or their underlying assumptions will be achieved. For these reasons, you should only consider the projections and forecasts described in this report after carefully evaluating all of the information in this report, including the assumptions underlying such projections and forecasts. The price and value of the investments referred to in this document/material and the income from them may go down as well as up, and investors may realize losses on any investments. Past performance is not a guide for future performance. Future returns are not guaranteed and a loss of original capital may occur. Actual results may differ materially from those set forth in projections. Forward-looking statements are not predictions and may be subject to change without notice. We do not provide tax advice to our clients, and all investors are strongly advised to consult regarding any potential investment. VSL, the RA involved in the preparation of this research report and its associates accept no liabilities for any loss or damage of any kind arising out of the use of this report. This report/document has been prepared by VSL, based upon information available to the public and sources, believed to be reliable. No representation or warranty, express or implied is made that it is accurate or complete. VSL has reviewed the report and, in so far as it includes current or historical information, it is believed to be reliable, although its accuracy and completeness cannot be guaranteed. The opinions expressed in this document/material are subject to change without notice and have no obligation to tell you when opinions or information in this report change. This report or recommendations or information contained herein do/does not constitute or purport to constitute investment advice in publicly accessible media and should not be reproduced, transmitted or published by the recipient. The report is for the use and consumption of the recipient only. This publication may not be distributed to the public used by the public media without the express written consent of VSL. This report or any portion hereof may not be printed, sold or distributed without the written consent of VSL. This document does not constitute an offer or invitation to subscribe for or purchase or deal in any securities and neither this document nor anything contained herein shall form the basis of any contract or commitment whatsoever. This document is strictly confidential and is being furnished to you solely for your information, may not be distributed to the press or other media and may not be reproduced or redistributed to any other person. The opinions and projections expressed herein are entirely those of the author and are given as part of the normal research activity of VSL and are given as of this date and are subject to change without notice. Any opinion estimate or projection herein constitutes a view as of the date of this report and there can be no assurance that future results or events will be consistent with any such opinions, estimate or projection. This document has not been prepared by or in conjunction with or on behalf of or at the instigation of, or by arrangement with the company or any of its directors or any other person. Information in this document must not be relied upon as having been authorized or approved by the company or its directors or any other person. Any opinions and projections contained herein are entirely those of the authors. None of the company or its directors or any other person accepts any liability whatsoever for any loss arising from any use of this document or its contents or otherwise arising in connection therewith. The information contained herein is not intended for publication or distribution or circulation in any manner whatsoever and any unauthorized reading, dissemination, distribution or copying of this communication is prohibited unless otherwise expressly authorized. Please ensure that you have read “Risk Disclosure Document for Capital Market and Derivatives Segments” as prescribed by Securities and Exchange Board of India before investing in Securities Market.
Ventura Securities Limited - SEBI Registration No.: INH000001634
Corporate Office: I-Think Techno Campus, 8th Floor, ‘B’ Wing, Off Pokhran Road No 2, Eastern Express Highway, Thane (W) – 400608