Initiating the computer savvy young students into research
10
Allana Management Journal of Research , 2015, Vol V, No 1,pp35-42, ISSN 2231-0290 Initiating the Computer Savvy Young Students into Research : Results of An Experiment with ICT Blended Approach H. S. Acharya , Professor ,AIMS, PUNE Abstract Creating interest in research and initiating the young into research is a real challenge. When research methodologies are part of curriculum , one has to teach a bunch of students with various degrees of research aptitude. This heterogeneity complicates the matter further. However the reality that students now a days are more computer savvy , hence an intelligent use of ICT should help. This research effort identifies six factors , inherent in the target audience in general which need to be properly understood, properly measured and estimated , before the challenge can really be tackled. An experimental approach with planned ICT blended teaching methodology was adopted at Allana Institute of Management over last three years. The methodology is presented , and critically analyzed in this paper. An analysis of the tendency of students to use ICT in conduct of projects, use of analytics and report generation is also discussed . Two Selected graduate projects, one using e_survey, the other using experimental design are briefly discussed as independent case studies . These serve as evidences of effectiveness of the change in teaching methodology. The major limitation of the study is the absence of a control group of students. When the findings are interpreted this aspect must be kept in mind. Key words: ICT, Simulation,
Transcript of Initiating the computer savvy young students into research

Allana Management Journal of Research , 2015, Vol V, No 1,pp35-42, ISSN 2231-0290
Initiating the Computer Savvy Young Students into Research : Results of An Experiment with ICT Blended Approach
H. S. Acharya ,
Professor ,AIMS, PUNE
Abstract
Creating interest in research and initiating the young into research is a real challenge. When research methodologies are part of curriculum , one has to teach a bunch of students with various degrees of research aptitude. This heterogeneity complicates the matter further. However the reality that students now a days are more computer savvy , hence an intelligent use of ICT should help. This research effort identifies six factors , inherent in the target audience in general which need to be properly understood, properly measured and estimated , before the challenge can really be tackled. An experimental approach with planned ICT blended teaching methodology was adopted at Allana Institute of Management over last three years. The methodology is presented , and critically analyzed in this paper. An analysis of the tendency of students to use ICT in conduct of projects, use of analytics and report generation is also discussed . Two Selected graduate projects, one using e_survey, the other using experimental design are briefly discussed as independent case studies . These serve as evidences of effectiveness of the change in teaching methodology. The major limitation of the study is the absence of a control group of students. When the findings are interpreted this aspect must be kept in mind. Key words: ICT, Simulation,

Initiating the Computer Savvy Young Students into Research : Results of An Experiment with ICT Blended Approach
H. S. Acharya ,
Professor ,AIMS, PUNE
1. Introduction
Initiating the young IT graduates into Research , is a challenge. There are factors
which act as inherent deterrents in minds of students of MCA . These need to be countered
while initiating these students into research. The students of MCA are all computer savvy,
which is an aspect that needs to be put to use positively. They can learn things effortlessly if
ICT is brought intelligently into the learning process. ICT can make the approach Student
Centric, and make students learn more on their own,[1, 10] reducing the load teacher quite a bit.
The biggest advantage of such an approach is that students learn by doing and result is a better
understanding of the subject, and are likely to remember processes and concepts for a longer
period . A planned experiment was run for four consecutive years at the Allana Institute of
Management Sciences. Findings of the study are reported in this article.
Literature on how to teach Research methodology is voluminous [3][5][6][8][10][11]. One
of the interesting articles on the web is by An article by Mary Beth Hertz [ 7], where
experience of initiating school children into research is discussed and problems highlighted.
Cristina Leston-Bandeira [4] ,sums up the experiences of teaching Research methodology
quite comprehensively and arrives at ten useful tips for teachers, where emphasis is on use of
ICT happens to be one of the major tips. ResearchReady [1] is an online platform that could be
quite useful to teachers and students alike. The purpose this article is to suggest ways of
bringing in ICT effectively to resolve some of the issues in this connection.
2. The experimental setup and the design of experiment
The research approach was experimental. Four consecutive batches of MCA 3rd
Sem, were
subjected to a investigative plan through a designed experiment as under
Phase I : In the first phase , every batch was submitted to thorough question answer session to
determine their attitude towards research, their beliefs and myths regarding research.
Phase II: In the second phase , the students were exposed to a ICT blended learning plan ,
which is detailed below under the Phase named “ Pedagogy”.

Pedagogy : Face to Face (20%) with 80% blending of ICT
Table 1: The blend of Face-to-Face and ICT in the teaching method implemented.
Component Technolo
gy
% Remarks
Concepts
Explained
Face to
Face
5% Concepts were generally introduced with explanations,
relevance to real life. But were never defined ..
Concepts
defined
Internet 10% Classes were conducted with online facility to connect to
INTERNET. Students were given some time to search
for definitions and examples on each concept
introduced.
Examples ,
Problems (
numerical)
Face to
face
5% Examples and Statistical problems relevant to the
concepts were introduced , context explained, over view
of numerical process were given.
Actual Solution Software 20% Students were asked to fend for themselves, the
formulae, the algorithms and use them
Data creation
for Numerical
examples
Computer
Simulatio
n
20% Generally real data from text books are used in
traditional teaching. With ICT it is possible to generate
data satisfying near to real life conditions. Students were
made to generate data using simulation
Hypothesization Face to
Face
5% Hypothesis were laid wherever necessary with teacher’s
assistance
Inferencing
and
Documentation
Face to
Face
5% This was the most difficult part. Very few students could
do this on their own. Hence teachers Supervision was
necessary
Mini research
projects
Do-It-
Yourself
30% A. Online / Manual Survey OR Designed
Experiments OR Raw data from Internet
B. Followed by complete analytics on Spread Sheet
C. Followed by Report submission (PDF converted)
as soft copy
Total 100
%
The percentages in column three, are all basis of time spent in a class and can be very much the
choice of the teacher. The whole process of teaching was planned in such a way that the
teachers role is to help students in discovering and learning rather than delivering and
teaching.
Phase III : Evaluation
No learning methodology can be complete without an evaluation scheme. Evaluation
plan also included high component of ICT.

Table 2. Evaluation plan with high percentage of ICT.
Item Stage (week) Description Weightage Remarks
Test 1 3rd
/4th
Fully online (Objective + small
computations)
20 Marks Best two out of
three attempts
were considered
to grade the
student
Test 2 7th
/8th
Partly online + Spread Sheet to be
submitted online
20 Marks
Test 3 12th
/13th
Partly online + Spread Sheet to be
submitted online
20 Marks
Project 14th
Own Problem selection + Independent
data collection + Analytics + Inference
+ Report writing
30 Marks Projects were
group projects
Total 70 Marks
All the online tests were conducted using MOODLE. The spread sheet part of the test
contained Problems with inbuilt randomized data creation facility , which ensured that each
student had different data set to deal with.
Target group ( basic experimental units): The experiment was replicated on Four batches
of students with varying batch sizes.
Table 3 Target group ( Students of MT31:Research Methodologies, MCA, 3rd
SEM )
Year/Batch No of students Remarks
2011-12 110 Only direct admissions
2012-13 110 Only direct admissions
2013-14 225 A mix of almost 50% direct and 50% lateral entry into
2nd
year
2014-15 169 A mix of 5% direct and 95% lateral entry into 2nd
year
Reason for large variation in the batch sizes is that , in 2013-14, and 2014-15 sizable no of
students were admitted under the lateral- entry ( direct entry to 3rd
Sem).
Brief Description of Major ICT Components and Processes:
Classes were conducted with provision of individual computer access for 80% of the time ,
and in rest of the classes (20%) a single computer for the whole class. Use of INTERNET
during the class was encouraged. Once a concept was introduced in the class students were
allowed to quickly gather information on the concept using the net for about five minutes.
Through an intensive question answer session the definitions, examples , derivations were
thoroughly discussed for a considerable time. Level of active participation students was very
high since they had access to the learning material on their systems. Every concept was followed
immediately by a few numerical exercises which the students would solve on their own with the
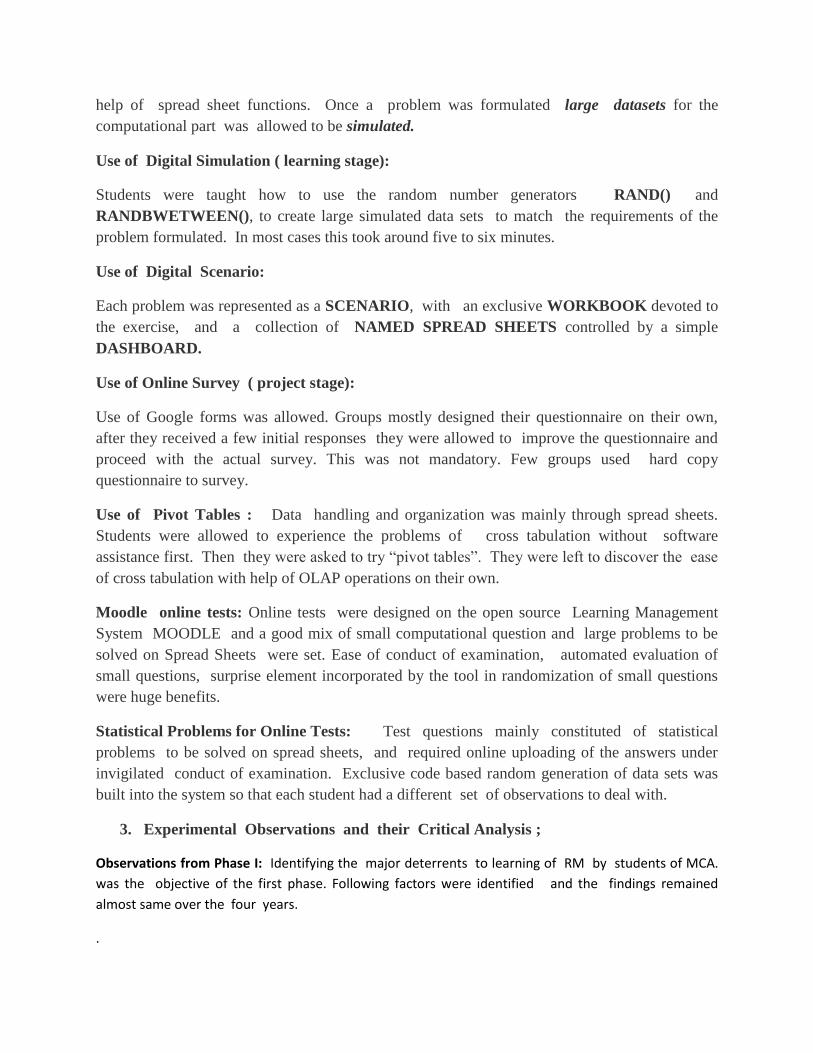
help of spread sheet functions. Once a problem was formulated large datasets for the
computational part was allowed to be simulated.
Use of Digital Simulation ( learning stage):
Students were taught how to use the random number generators RAND() and
RANDBWETWEEN(), to create large simulated data sets to match the requirements of the
problem formulated. In most cases this took around five to six minutes.
Use of Digital Scenario:
Each problem was represented as a SCENARIO, with an exclusive WORKBOOK devoted to
the exercise, and a collection of NAMED SPREAD SHEETS controlled by a simple
DASHBOARD.
Use of Online Survey ( project stage):
Use of Google forms was allowed. Groups mostly designed their questionnaire on their own,
after they received a few initial responses they were allowed to improve the questionnaire and
proceed with the actual survey. This was not mandatory. Few groups used hard copy
questionnaire to survey.
Use of Pivot Tables : Data handling and organization was mainly through spread sheets.
Students were allowed to experience the problems of cross tabulation without software
assistance first. Then they were asked to try “pivot tables”. They were left to discover the ease
of cross tabulation with help of OLAP operations on their own.
Moodle online tests: Online tests were designed on the open source Learning Management
System MOODLE and a good mix of small computational question and large problems to be
solved on Spread Sheets were set. Ease of conduct of examination, automated evaluation of
small questions, surprise element incorporated by the tool in randomization of small questions
were huge benefits.
Statistical Problems for Online Tests: Test questions mainly constituted of statistical
problems to be solved on spread sheets, and required online uploading of the answers under
invigilated conduct of examination. Exclusive code based random generation of data sets was
built into the system so that each student had a different set of observations to deal with.
3. Experimental Observations and their Critical Analysis ;
Observations from Phase I: Identifying the major deterrents to learning of RM by students of MCA.
was the objective of the first phase. Following factors were identified and the findings remained
almost same over the four years.
.
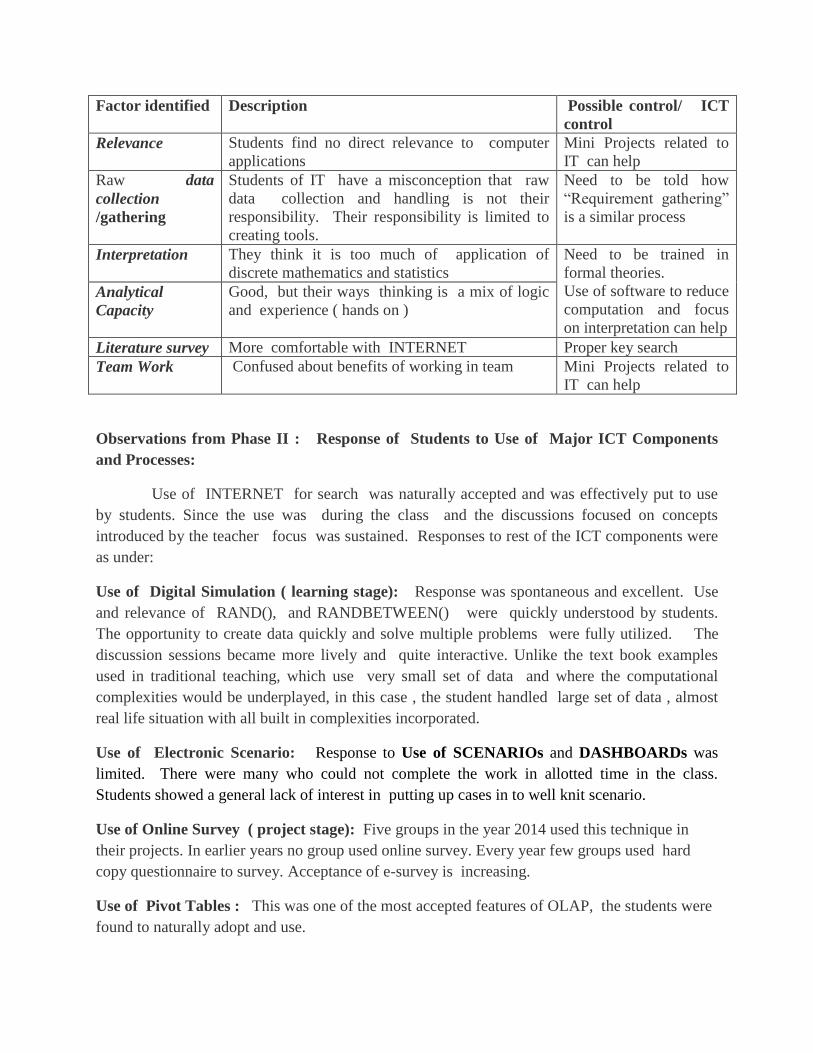
Factor identified Description Possible control/ ICT
control
Relevance Students find no direct relevance to computer
applications
Mini Projects related to
IT can help
Raw data
collection
/gathering
Students of IT have a misconception that raw
data collection and handling is not their
responsibility. Their responsibility is limited to
creating tools.
Need to be told how
“Requirement gathering”
is a similar process
Interpretation They think it is too much of application of
discrete mathematics and statistics
Need to be trained in
formal theories.
Use of software to reduce
computation and focus
on interpretation can help
Analytical
Capacity
Good, but their ways thinking is a mix of logic
and experience ( hands on )
Literature survey More comfortable with INTERNET Proper key search
Team Work Confused about benefits of working in team Mini Projects related to
IT can help
Observations from Phase II : Response of Students to Use of Major ICT Components
and Processes:
Use of INTERNET for search was naturally accepted and was effectively put to use
by students. Since the use was during the class and the discussions focused on concepts
introduced by the teacher focus was sustained. Responses to rest of the ICT components were
as under:
Use of Digital Simulation ( learning stage): Response was spontaneous and excellent. Use
and relevance of RAND(), and RANDBETWEEN() were quickly understood by students.
The opportunity to create data quickly and solve multiple problems were fully utilized. The
discussion sessions became more lively and quite interactive. Unlike the text book examples
used in traditional teaching, which use very small set of data and where the computational
complexities would be underplayed, in this case , the student handled large set of data , almost
real life situation with all built in complexities incorporated.
Use of Electronic Scenario: Response to Use of SCENARIOs and DASHBOARDs was
limited. There were many who could not complete the work in allotted time in the class.
Students showed a general lack of interest in putting up cases in to well knit scenario.
Use of Online Survey ( project stage): Five groups in the year 2014 used this technique in
their projects. In earlier years no group used online survey. Every year few groups used hard
copy questionnaire to survey. Acceptance of e-survey is increasing.
Use of Pivot Tables : This was one of the most accepted features of OLAP, the students were
found to naturally adopt and use.

Moodle online tests: Online tests were designed on Moodle and a good mix of small
computational question and large problems to be solved on Spread Sheets were set. Students
naturally accept this mode of testing. Ease of conduct of examination, automated evaluation of
small questions, surprise element incorporated by the tool in randomization of small questions
were huge benefits. Students have to toggle between spread sheets and the exam application
during the test. With very few exceptions most of the students were comfortable.
Statistical Problems for Online Tests: Students were comfortable and naturally accepted the
process. This was expected.
Observations from Phase III
Student’s response (Table 4-6 ) to Mini Projects are summed up in following tables.
Table 4 : Willingness to work in groups : Frequency distribution of project-group sizes
GroupSize one two Three or Four
Five to eight
> eight Total projects
Total Students
Batch
2014 2 11 10 16 3 43 169
2013 9 36 42 0 0 87 225
2012 2 2 8 0 0 35 110
2011 2 2 8 0 0 34 110
Table 5 : Methodology wise distribution of projects opted by students
Sr No
Year Exlusive e-surveys
Manual Surveys
Internet Data Designed Experiment
Total projects
1 2014 5 6 31 3 45
2 2013 0 37 45 5 87
3 2012 0 11 22 2 35
4 2011 0 11 21 2 34
Table 6 : Domain wise distribution of projects opted by students
Sr No
Year Information technology
Industrial Problems
Social Problems
Sports Business and Trading
Auto Mobiles
Total
1 2014 10 3 7 3 19 3 45
2 2013 27 8 15 10 22 5 87
3 2012 9 2 6 4 11 3 35
4 2011 9 2 5 4 11 3 34

Table7 : Distribution of concepts and tools used by students in their projects.
Sr No
Year OLAP operations
Google Forms
Testing of Hypothesis Chi Square-tests
Testing of Hypothesis T-tests
ANOVA Curve-fitting (regression analysis)
1 2014 45 6 30 12 2 6
2 2013 87 0 62 18 4 10
3 2012 35 0 28 9 2 3
4 2011 34 0 26 9 2 3
In all above tables the numbers indicate the frequency of projects. Simple chi-square tests indicated
that there is no association between the column classifications and the years (rows) at a level of
significance of 0.05. Which essentially means that the patterns observed remained the same across the
years. Which is an indication of consistency of patterns.
4. Sample student projects:
Two selected projects are discussed in brief here as typical cases. One is a designed experiment and
the other is an e-survey.
4.1 Title: “Monitoring of College Wi-Fi Connection” ( [9]) Method: Designed Experiment Metrics : Signal strength, Download speed, Upload speed. Factors considered: Time of the day, Distance from the Access Point Group size : Two students Time spent : 3 days for experimentation , 2 days for tabulation and Analytics Analytical techniques used : Pivot tables ( OLAP), Curve fitting
Abstract: A designed experiment in which the signal strength was measured at various times
and various radial distances from the Wi-Fi Access Point of the IT facility. The experimental
observations were subjected to curve fitting to determine the relationship between the signal
strength and the distance from the Wi-Fi Source.
4.2 Title: “Survey of Future Plans of Students of MBA “ ([2])
Method: E-Survey ( google forms) Total respondents: 149 Survey on :Willingness to take up Independent Business, Current info about family businessand related aspects Group size : Ten students Time spent : 3 days for Google form design , 7 days for actual e-survey,
10 days for tabulation and Analytics, 7 days documentation Analytical techniques used : Pivot tables ( OLAP), Decision Trees, Simple charts, Ch-Square Tests

Abstract: This report examines the findings from a study of 149 respondents who are current
students of MBA in various colleges of Pune. Method used was a google-forms survey.
Decision trees were drawn so that the opinion of students could be properly represented. OLAP
tools as provided in Pivot Table of Spread Sheet were used to determine basic frequencies. Chi-
square tests were used to determine association between student profiles and their opinions.
5. Significant Findings
Response to Digital Simulation of Data was immediate and excellent. Students got
used to handling large set of data. Response to Use of SCENARIOs and DASHBOARDs was
limited. There were many who could not complete the work in allotted time in the class. Once
the problems were solved , students showed a general lack of interest in organizing the
information. Use of Online Survey ( project stage): This aspect was a grand success. Most of
the surveys in 2014 were online and very quick.. Acceptance of e-survey is increasing .
Use of Pivot Tables : This was one of the most accepted features of analytics. Understanding
of Online analytic processing (OLAP) increased and at least to the extent of use of OLAP for
cross table analysis increased.
Moodle online tests: There was tremendous amount of saving of time and better
organization of test. Students naturally accepted these . Statistical Problems for Online Tests:
Students were comfortable and naturally accepted the process. This was expected.
The results show that , computer savvy students adopt to e-surveys naturally. If they
are allowed to use OLAP tools they organize data and perform cross table analysis effortlessly
and they get very easily imitated into analytics. If they are taught simulation of data they get
opportunity to experiment with data and fear of analytics is considerably reduced. Freedom to
choose domain of their interest and do-it-yourself approach helps in building confidence in
them and they start believing that these methods can be used universally and research can be
relevant to any field of specialization.
References
[1] Anonymous, (2014) ResearchReady (http://www.researchready.com)
[2] Altaf Khan, Akshay Chauhan, Chittaranjan Sharma , ZoyebMansuri, Shoaib Shaikh ,
Samdani Shaikh , MaheenSayyed , PradnyaPoojari , TarannumChougle and
NafeesaLangde (2014) , Survey of Future Plans of Students of MBA ,A TECHNICAL
REPORT , Submitted to Dept of MCA, AIMS, Pune , under Course MT31 , Research
Methodologies
[3] Cooper D. R., and Schindler P. S., (2006 ),Business Research Methods, TMH, Ltd

[4] Cristina Leston-Bandeira (2013),Ten tips to develop engaging undergraduate research
methods teaching, (http://www.psa.ac.uk/political-insight/blog/ten-tips-develop-engaging-
undergraduate-research-methods-teaching)on 5 June 2013
[5] Kothari C. R. ( 2011 )Research Methodology, New Age Publication, p 401
[6] Krishnaswamy K. N , Sivakumar A. I. and Mathirajan M ( 2009), Management Research
Methodology, Pub PearsonEducation, India Ltd,
[7] Mary Beth Hertz , ( 2014),(http://www.edutopia.org/blog/elementary-research-mary-beth-
hertz
[8] McBurney, D. H., ( 2006 ) Research Methods, 5th Edition, Thomson Learning, ISBN:81-
315-0047-0
[9] SAYYED MOHD SHOAIB JAFFER and KHAN MUDASSAR ASHFAQUE (2014),
“Monitoring College Wi-Fi Connection” A TECHNICAL REPORT , Submitted to Dept of
MCA, AIMS, Pune , under Course MT31 , Research Methodologies
[10]Tony Bates A.W. Technology, (2005), e-Learning and Distance Education, New York
[11]Zikmund W. G, ( 2003)Business Research Methods , Pub. Thomson South-Western, p748