Cost-Effectiveness of Initiating Dialysis Early: A Randomized Controlled Trial
Upload
khangminh22Category
view
0download
0
Plo�ing A Turnaround
Plo�ing A Turnaround

1 | P a g e
II nnii tt
ii aatt ii
nngg
CCoo
vvee
rr aagg
ee
Magma Fincorp Ltd.
II nn
ii ttii aa
ttii nn
gg CC
oovv
eerraa
ggee
–– 11
44tthh
JJuu
nnee
2200
1177
Recommendation BUY Company Background Magma Fincorp Ltd. (Magma) is pan India NBFC engaged in the business of financing across the assets classes across the various geographies in India. It has a diversified portfolio consisting of cars and utility vehicles (UV), commercial vehicles (CV), construction equipment (CE), tractors (Agri), used vehicles, SME businesses and mortgage finance, Housing Finance and in addition to this Magma is engaged in General Insurance business. Investment Rationale: Earlier during 2012 and 2013, Magma aggressively expanded its
presence both in term of branches and employees. But due to two consecutive weak monsoons and slowdown in rural economy growth momentum could not sustain. However the demand in rural economy is picking up and with expectations of normal rainfalls this year the growth is likely to rebound. In addition to this Magma has changed the business processes internally with the clear focus on growth and quality of book.
Historically Magma has limited exposure to Car, CV and CE financing which was low yielding business. However the company has diversified in last three years to high yield portfolios which contributes 61.6% in FY17 as compared to 42.5% in FY14. This strategic change has led to improved profitability. Magma has implemented better credit monitoring systems and is now doing business under predefined frame work which is leading to minimal credit losses from the new business under this strategy. And by FY18E almost 70-75% of the book will be under this mechanism.
Net Interest Margins for the company are improving steadily over the years led by better mix of high yielding assets and efficient liability profile. We have projected NIMs at 7.5% for FY19E.
Valuation and Recommendation: Going forward, we expect Magma to deliver a healthy operating and financial performance backed by significant restructuring in operating model, multiple and focused product strategy, healthy net interest margins and improving return ratios. Moreover pick up in rural economy will give Magma additional boost as it can capitalize on its extensive reach and pan India presence We expect the company’s RoE to improve from 7.7% in FY17 to reach 10% by FY19E. At CMP of Rs.141, Magma is trading at a P/E of 15.8/13.7x on FY18E/FY19E earnings and 1.43x and 1.31x of its book value respectively. We initiate coverage with a BUY rating on Magma Fincorp Ltd. with target price of Rs. 183 (1.7x FY19E book value) implying an upside of 30% from current levels.
CMP Rs. 141
Target Price Rs. 183
Sector NBFC
Stock Details
BSE Code 524000
NSE Code MAGMA
Bloomberg Code MGMA IN
Market Cap (Rs cr) 3334
Free Float (%) 72.25%
52- wk HI/Lo (Rs) 147/86
Avg. volume (BSE+NSE) (Quarterly)
964220
Face Value (Rs) 2
Dividend (FY 17) 40%
Shares o/s (Crs) 23.69
Relative Performance 1Mth 3Mth 1Yr
Magma 7.7% 34.8% 44.2%
Sensex 1.5% 5.4% 17.8%
Shareholding Pattern March 17
Promoters Holding 27.75%
Institutional (Incl. FII) 49.31%
Corporate Bodies 14.39%
Public & others 8.55%
Anupam Bafna – (+91 22 3926 8186) Research Analyst [email protected]
Year NII
(Rs. cr) Growth
(%) PPB
(Rs. cr) Adj. PAT (Rs. cr)
Growth (%)
Adj. EPS (Rs.)
Adj. PE (x)
BV (Rs.)
P/BV (x)
RoE (%)
FY16 1286 14.65% 681 211 17.0% 8.91 15.80 91 1.55 10.7%
FY17 1220 -5.13% 654 165 -21.7% 6.97 20.18 91 1.54 7.7%
FY18E 1264 3.56% 622 212 28.0% 8.92 15.77 98 1.43 9.4%
FY19E 1400 10.82% 697 245 15.5% 10.30 13.66 108 1.31 10.0%

2 | P a g e
II nnii tt
ii aatt ii
nngg
CCoo
vvee
rr aagg
ee
Magma Fincorp Ltd.
II nn
ii ttii aa
ttii nn
gg CC
oovv
eerraa
ggee
–– 11
44tthh
JJuu
nnee
2200
1177
Company Background
Magma Fincorp Ltd. (Magma) is into multiple financing activities. Magma has a diversified portfolio which is spread across asset financing such as cars and utility vehicles (UV), commercial vehicles (CV), construction equipment (CE), tractors (Agri), used vehicles, SME businesses and mortgage finance, Housing Finance and General Insurance Business. Magma has a total loan book of Rs. 16,101 cr well spread across its portfolio, with cars and UV (25.3%), Agri Financing (19.7%) and Mortgage (18.8%) being the major constituents. The book is well diversified across the geographies mitigating the risk of area concentration. Magma has a network of 284 branches across India and a strong customer engagement with 8,997 employees to serve its customers. Corporate Structure
Some of the reputed institutions like KKR (since March 2012), International Finance
Corporation (since June 2011) and Leapfrog Investments (since May 2015) etc. have stake in
the company and continue to stay invested since long.

3 | P a g e
II nnii tt
ii aatt ii
nngg
CCoo
vvee
rr aagg
ee
Magma Fincorp Ltd.
II nn
ii ttii aa
ttii nn
gg CC
oovv
eerraa
ggee
–– 11
44tthh
JJuu
nnee
2200
1177
Investment Rationale
Turnaround on cards
Earlier during 2012 and 2013, Magma aggressively expanded its presence both in terms of
branches and employees. In just two years it added 103 branches on FY11’s base of 172
branches taking the total number of branches to 275. Between FY12-14, Magma doubled its
head count by adding 4700 employees in 3 years taking the total strength to 9700 at the end
of FY14. However due to two consecutive weak monsoons, lower agriculture produce and
slowdown in rural economy the growth momentum could not sustain and the loan book de-
grew coupled with rise in non-performing assets. During FY16 and FY17 company has taken
various initiatives like cost control, growth in focused segments etc. but in FY17 though the
economic environment in rural area started improving but demonetization impacted the
business substantially and that too in its peak season.
However, we believe now the demand in rural economy is picking up and with expectations
of normal rainfalls this year the growth is likely to rebound. In addition to this Magma has
changed the business processes internally and has also hired some senior executives with the
clear focus on growth and quality of book. We believe, with this changes Magma would see
growth coming back with improvement in asset quality.
Shifting Focus towards high ROA products
Traditionally Magma was into vehicle financing where its majority of the portfolio comprised
of cars and utility vehicles, commercial vehicles, construction equipment Finance. From an
auto financing portfolio, Magma has diversified into other retail loan segments like SME,
Mortgage, Agri and used Assets Financing. Thus, it has focused more on disbursing loans to
SME, Mortgage, Agri, LCV, SCV and used Assets and has witnessed healthy growth in this
segment, whereas car, UV, M&HCV and CE witnessed decelerated growth. Magma has
significantly changed its portfolio towards focus segments with the aim to improve return
ratios along with better credit quality of its traditional portfolio. As on FY14, contribution
from focused segment was 42.5% of the total book which grew and increased to 61.6% as on
FY17. This was driven by strong growth in disbursement in high ROA segments and
decelerated growth in the vehicle financing segment. We expect a similar shift in portfolio to
continue over FY17 - FY19E.
Graph below illustrates shift in the portfolio amongst the product range over the years:

4 | P a g e
II nnii tt
ii aatt ii
nngg
CCoo
vvee
rr aagg
ee
Magma Fincorp Ltd.
II nn
ii ttii aa
ttii nn
gg CC
oovv
eerraa
ggee
–– 11
44tthh
JJuu
nnee
2200
1177
Source: Company data, Nirmal Bang retail Research
Better Credit Monitoring and Implementation of Quality Checks
Learning a lesson from the past, the company has undertaken several steps to closely monitor the portfolio, minimize the credit losses and be assured that the portfolio quality is intact and grows healthy. In this direction following steps the company has taken:
I. Rated the branch’s performance as per their portfolio quality and adopted a
differentiated approach in growing the book in these branches as per grading assigned II. Merger of Sales and 0-90 days Collections team to provide one-point contact with
customer. This will also ensure catch hold of delinquencies early. III. Appointed the credit rating agencies which has done credit rating of complete portfolio
and now the new portfolio is superior to what it was early IV. Implemented CPMI (Continuous Portfolio Monitoring index) and EWI (Early Warning
Indicators), this is an ongoing exercise to evaluate the quality of the portfolio
Magma has now started disbursements under this mechanism and the new book is superior in quality as compared to the previous one. As a result of this gradual shift, by Q1FY18 Magma aims is to make new book more than half of the portfolio. And by FY19E virtually whole book will be driven by focused product. As a result of this exercise we expect the portfolio quality to improve significantly, hence leading to minimum credit losses.

5 | P a g e
II nnii tt
ii aatt ii
nngg
CCoo
vvee
rr aagg
ee
Magma Fincorp Ltd.
II nn
ii ttii aa
ttii nn
gg CC
oovv
eerraa
ggee
–– 11
44tthh
JJuu
nnee
2200
1177
Efficient cost management and Healthy NIMs In the past, Magma has kept its operating expenses under control. In last 8 quarters total operating expenses were capped in the range of ~Rs. 160 Cr per quarter, resulting, improvement in cost to income ratio from 53.1% in Q1FY16 to 47.1% in Q4FY17. This was largely attributable to lower employee expenses as employee strength was reduced. Looking at the past trend we believe Magma is likely to manage the operating costs adequately and keep the cost to income ratio under control leading to healthy profitability. Operating cost for last 8 quarters and it’s YoY Growth:
3.2%0.4%
-7.0%
-24.1%
-5.1% -5.1%
-0.4%
3.6%
-30.0%
-25.0%
-20.0%
-15.0%
-10.0%
-5.0%
0.0%
5.0%
130.0
135.0
140.0
145.0
150.0
155.0
160.0
165.0
170.0
Q1FY16 Q2FY16 Q3FY16 Q4FY16 Q1FY17 Q2FY17 Q3FY17 Q4FY17
Total Operating Cost YoY Growth
Source: Company Data, Nirmal Bang Research
Net interest margins for the company jumped from 3.76% in FY12 to 7.1% FY17 led by a change in product mix, lending in better yielding areas and well managed cost of funds. Additionally, Magma has shifted its focus on to the higher yielding products. The share of vehicle loans (Cars & UV, CV, CE)where the yield is ~14-15% has gone down from 57% as on FY14 to 38% as on FY17 and share of Used Assets, Agri Finance, SME and Mortgage has gone up from 43% in FY14 to 62% in FY17 where the yield is ~18%. Cost of funds which was 11.5% in FY14 has gone down to 10% in FY17. We believe with the growing share of high yielding products and cost of funds going down, net interest margins to remain healthy at ~7.5% levels by FY19E.

6 | P a g e
II nnii tt
ii aatt ii
nngg
CCoo
vvee
rr aagg
ee
Magma Fincorp Ltd.
II nn
ii ttii aa
ttii nn
gg CC
oovv
eerraa
ggee
–– 11
44tthh
JJuu
nnee
2200
1177
3.93%
5.19% 5.39%5.99%
6.81%7.12%
7.56% 7.50%
0.00%
1.00%
2.00%
3.00%
4.00%
5.00%
6.00%
7.00%
8.00%
FY12 FY13 FY14 FY15 FY16 FY17 FY18E FY19E
Net Interest margins
Source: Company Data, Nirmal Bang Research
Asset Quality Peaked and likely to see reverse trend Due to past aggressive practices Magma has faced challenges on the asset quality where it’s GNPA/ NNPA has gone up from 2.7%/2.0% in FY14 (120 day basis) to 9.9% /7.5% in Q3FY17 (120 day basis). This led to increase in credit cost, denting the profitability of the company. To minimize the credit losses, the company has started making fresh disbursements keeping a check on asset quality to keep the portfolio quality intact. Also, new RBI norms of moving to 90 days will lead the faster recognition of stress in the books. Magma Fincorp has sold almost entire NPAs greater than 2 years in Asset Backed Finance business and mortgage NPAs greater than 6 months. Overall, at a consolidated level, it has sold NPAs of Rs. 678 Cr resulting in reduction of Gross NPA ratio by 3.6% and the Net NPA ratio by 2.1% respectively. With this, we believe the asset quality stress for the company will reduce and a healthy portfolio will shape up.
4.9%
8.1%
8.7%9.2%
9.9%
6.7% 6.6% 6.4%
3.9%
6.3%6.9%
7.2%7.5%
5.6% 5.4%5.1%
3.0%
4.0%
5.0%
6.0%
7.0%
8.0%
9.0%
10.0%
11.0%
FY15 FY16 Q1FY17 Q2FY17 Q3FY17 FY17 FY18E FY19E
Gross NPA (%) Net NPA (%)
Source: Company Data, Nirmal Bang Research

7 | P a g e
II nnii tt
ii aatt ii
nngg
CCoo
vvee
rr aagg
ee
Magma Fincorp Ltd.
II nn
ii ttii aa
ttii nn
gg CC
oovv
eerraa
ggee
–– 11
44tthh
JJuu
nnee
2200
1177
Strong Branch Network and Customer centric approach Magma has a geographically diversified strong branch network of 284 branches which is operated through Hub and Spoke Model. Of these over 80% are present in Tier 3, 4, 5, 6 cities (rural and semi urban areas). Magma covers 1900 talukas and 2900 locations across India and has a strong customer engagement with 6500+ field executives. Adoption of high level technology by field officers and supervisors, further aids in improving efficiency and productivity.
Source: Company Data, Nirmal Bang Research
General Insurance business ready to be scaled up The Company had entered into a Joint Venture Agreement in July 2009, with HDI-Gerling Industrie Versicherung AG, for entering into General Insurance Business in India. The JV had received R1 approval on 13th April 2011 and R2 approval on 13th April 2012 from the IRDA. Magma has started General Insurance business from Oct 1, 2012, in addition to its lending operations. Gross written premium for FY16 was Rs. 427.4 Cr and Rs. 422.9 Cr for FY17. It has built a corpus of Rs. 1000 Cr and is planning to double it in next three years. We believe this business has now scaled up and is ready to contribute to the bottom line of the company.
32%
48%
19%
Rural Urban Mix
Rural Semi Urban Urban
35%
19%
21%
25%
Region-wise Mix
North Eaast South West
8 | P a g e
II nnii tt
ii aatt ii
nngg
CCoo
vvee
rr aagg
ee
Magma Fincorp Ltd.
II nn
ii ttii aa
ttii nn
gg CC
oovv
eerraa
ggee
–– 11
44tthh
JJuu
nnee
2200
1177
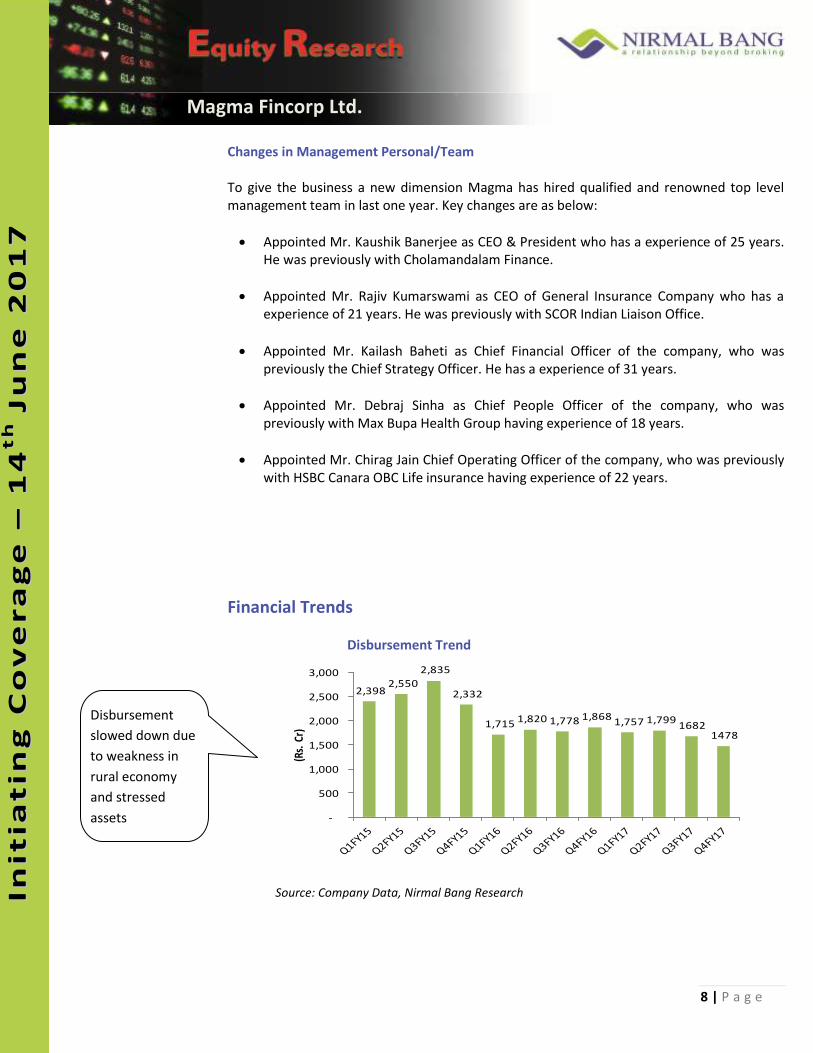
Changes in Management Personal/Team To give the business a new dimension Magma has hired qualified and renowned top level management team in last one year. Key changes are as below:
Appointed Mr. Kaushik Banerjee as CEO & President who has a experience of 25 years. He was previously with Cholamandalam Finance.
Appointed Mr. Rajiv Kumarswami as CEO of General Insurance Company who has a experience of 21 years. He was previously with SCOR Indian Liaison Office.
Appointed Mr. Kailash Baheti as Chief Financial Officer of the company, who was previously the Chief Strategy Officer. He has a experience of 31 years.
Appointed Mr. Debraj Sinha as Chief People Officer of the company, who was previously with Max Bupa Health Group having experience of 18 years.
Appointed Mr. Chirag Jain Chief Operating Officer of the company, who was previously with HSBC Canara OBC Life insurance having experience of 22 years.
Financial Trends
Disbursement Trend
Source: Company Data, Nirmal Bang Research
Disbursement
slowed down due
to weakness in
rural economy
and stressed
assets
2,398 2,550
2,835
2,332
1,715 1,820 1,778 1,868 1,757 1,799
16821478
-
500
1,000
1,500
2,000
2,500
3,000
(Rs.
Cr)

9 | P a g e
II nnii tt
ii aatt ii
nngg
CCoo
vvee
rr aagg
ee
Magma Fincorp Ltd.
II nn
ii ttii aa
ttii nn
gg CC
oovv
eerraa
ggee
–– 11
44tthh
JJuu
nnee
2200
1177
AUM and Borrowing Trend
Source Source: Company Data, Nirmal Bang Research
CAR & Tier I Ratio
Source: Company Data, Nirmal Bang Research
Risk and Concerns
In recent past; despite the healthy growth in NBFC sector and unlike its peers Magma has underperformed and thus its loan book has de-grown.
Magma’s books is highly stressed in the asset quality with one of the highest NPAs.
Increasing competition can lead to Magma witnessing a slowdown in NIMs.
19,567 19,189 18,812 18,521 18,183 17,795 17,600 1734516101
11,714 11,530 11,558 11,922 11,889 11,737 10,807 10789
10096
8,000
10,000
12,000
14,000
16,000
18,000
20,000
22,000
(Rs.
Cr)
AUM Borrowings
18.7% 19.1% 18.7% 18.7%
20.0% 20.0%19.1%
20.4%
14.0% 14.4% 14.6% 14.6%15.4% 15.8%
14.8%15.4%
12.0%
14.0%
16.0%
18.0%
20.0%
CAR Tier I
Weaker
disbursements
led to de-growth
in AUM and
borrowings
Well capitalised
to cater the
upcoming growth

10 | P a g e
II nnii tt
ii aatt ii
nngg
CCoo
vvee
rr aagg
ee
Magma Fincorp Ltd.
II nn
ii ttii aa
ttii nn
gg CC
oovv
eerraa
ggee
–– 11
44tthh
JJuu
nnee
2200
1177
Valuation and Recommendation Going forward, we expect Magma to deliver a healthy operating and financial performance backed by significant restructuring in operating model, multiple and focused product strategy, healthy net interest margins and improving return ratios. Moreover pick up in rural economy will give Magma additional boost as it can capitalize on its extensive reach and pan India presence. Here onwards, we believe that due to management focus on high yielding products and control on portfolio quality will result in a healthy growth, improvement in asset quality. We expect the company’s RoE to improve from 7.7% in FY17 to reach 10% by FY19E.
Peer Comparison
At CMP of Rs.141, Magma is trading at a P/E of 15.8/13.7x on FY18E/FY19E earnings and 1.43x and 1.31x of its book value respectively. We have compared Magma with M&M Financial Services and Shriram City Union Finance which are also in similar type of lending business. The stock looks attractive at current valuations given the future dynamics of the business. We initiate coverage with a BUY rating on Magma Fincorp Ltd. with target price of Rs. 183 (1.7x FY19E book value) implying an upside of 30% from current levels.
Company (FY19E)AUM
(Rs. cr)
Growth
(%)
NII
(Rs. cr)
Growth
(%)
PAT
(Rs. cr)
Growth
(%)
EPS
(Rs.)
PE
(x)
BV
(Rs.)
P/BV
(x)
RoE
(%)M&M Finance 61347 18.36% 4418 17.72% 1176 38.29% 21.10 16.31 141 2.45 15.4%
Shriram City Union Finance32214 17.37% 3858 17.21% 973 30.52% 152.24 15.69 981 2.43 16.5%
Magma 19998 15.44% 1400 10.82% 254 15.47% 10.30 13.66 108 1.31 10.0%
Source: Company data, Nirmal Bang Research, Bloomberg

11 | P a g e
II nnii tt
ii aatt ii
nngg
CCoo
vvee
rr aagg
ee
Magma Fincorp Ltd.
II nn
ii ttii aa
ttii nn
gg CC
oovv
eerraa
ggee
–– 11
44tthh
JJuu
nnee
2200
1177
Quarterly Analysis
Particulars (Rs in cr) FY15 Q1FY16 Q2FY16 Q3FY16 Q4FY16 FY16 Q1FY17 Q2FY17 Q3FY17 Q4FY17 FY17Total Loan Assets 19567 19189 18812 18521 18183 18183 17795 17600 17345 16101 16101YoY Growth 9.5% 4.9% -0.1% -5.0% -7.1% -7.1% -7.3% -6.4% -6.3% -11.5% -11.5%Borrowings 11714 11530 11558 11922 11889 11889 11737 10807 10789 10096 10096YoY Growth 12.9% 4.9% -1.5% 0.0% 1.5% 1.5% 1.8% -6.5% -9.5% -15.1% -15.1%Loans Disbursed 10115 1715 1820 1778 1868 7181 1757 1799 1682 1478 6716YoY Growth 11.4% -28.5% -28.6% -37.3% -19.9% -29.0% 2.4% -1.2% -5.4% -20.9% -6.5%
Interest income 2355 608.4 614.8 622.1 631.1 2476 605.8 598.8 580.3 560.7 2346Interest expense 1233 304.5 295.5 293.7 298.0 1192 306.2 290.2 272.2 256.9 1125Net Interest Income 1121.8 303.9 319.3 328.4 333.1 1284.8 299.7 308.6 308.2 303.8 1220.2YoY Growth 22.0% 21.3% 21.1% 10.4% 7.4% 14.5% -1.4% -3.4% -6.2% -8.8% -5.0%
NIMs 6.2% 6.4% 6.8% 7.2% 7.5% 7.0% 6.9% 7.4% 7.4% 7.6% 7.4%Gain/ (loss ) from Insurance Bus. -1 -2.2 -4.6 -0.7 1.9 -6 -2.1 1.4 0.3 -0.7 -1Other op. income 32 7.9 9.9 7.2 9.2 34 11.7 15.9 13.5 13.9 55Total income 1152.6 309.6 324.6 334.9 344.2 1313.3 309.2 325.8 322.0 317.0 1274.0
Employee costs 362 86.0 81.5 80.3 69.4 317 77.2 72.8 76.9 66.4 293Brokerage & Commission 129 32.2 31.0 29.8 29.5 123 28.5 27.4 26.9 29.0 112Depreciation 35 9.6 10.2 10.7 9.0 39 10.8 11.7 13.7 12.3 49Other expenses 159 36.6 39.9 40.6 36.2 153 39.6 42.3 43.4 41.5 167Total expenses 684.7 164.5 162.5 161.4 144.1 632.6 156.1 154.2 160.9 149.2 620.4Cost to Income Ratio 59.4% 53.1% 50.1% 48.2% 41.9% 48.2% 50.5% 47.3% 50.0% 47.1% 48.7%
Pre prov profit 467.9 145.1 162.1 173.5 200.1 680.8 153.1 171.7 161.1 167.7 653.6YoY Growth 22.5% 44.0% 46.7% 29.9% 62.7% 45.5% 5.6% 5.9% -7.1% -16.2% -4.0%
Provisions 244 87.2 89.0 99.5 98.6 374 87.8 95.1 104.7 319.3 607PBT 223.5 57.8 73.0 74.0 101.5 306.4 65.4 76.6 56.4 -151.5 46.8
Exceptional items 0.0 0.0 0.0 0.0 0 0.0 0.0 0.0 211.5 212Tax expenses 36 10.8 24.3 21.7 35.6 92 17.8 26.0 19.9 -29.6 34Minoirty Interest 7 1.2 0.1 0.1 0.7 2 0.7 0.2 -0.7 -7.9 -8Adj. PAT 180.7 45.8 48.6 52.2 65.3 212.0 46.9 50.4 37.2 31.0 165.5YoY Growth 19.0% 5.6% 18.6% 18.7% 25.0% 17.3% 2.3% 3.7% -28.8% -52.6% -21.9%
Adj. EPS 9.49 2.41 2.05 2.21 2.76 8.93 1.98 2.13 1.57 1.31 7.03
12 | P a g e
II nnii tt
ii aatt ii
nngg
CCoo
vvee
rr aagg
ee
Magma Fincorp Ltd.
II nn
ii ttii aa
ttii nn
gg CC
oovv
eerraa
ggee
–– 11
44tthh
JJuu
nnee
2200
1177
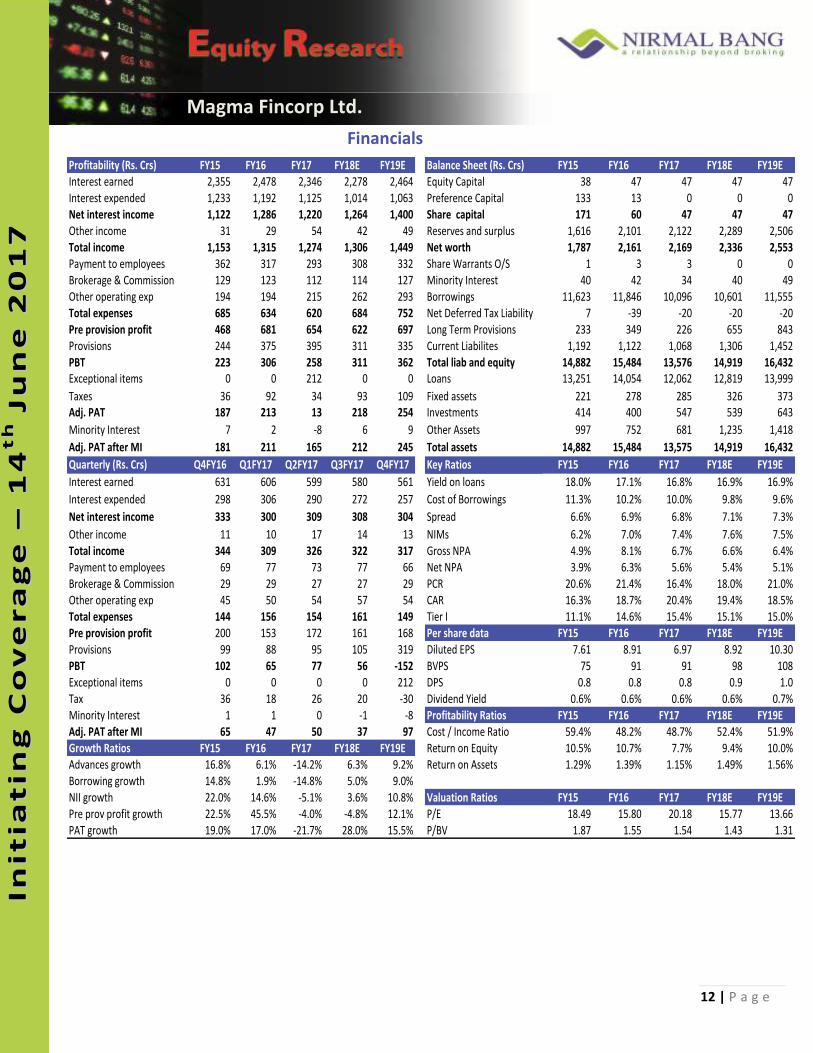
Financials
Profitability (Rs. Crs) FY15 FY16 FY17 FY18E FY19E Balance Sheet (Rs. Crs) FY15 FY16 FY17 FY18E FY19EInterest earned 2,355 2,478 2,346 2,278 2,464 Equity Capital 38 47 47 47 47Interest expended 1,233 1,192 1,125 1,014 1,063 Preference Capital 133 13 0 0 0Net interest income 1,122 1,286 1,220 1,264 1,400 Share capital 171 60 47 47 47Other income 31 29 54 42 49 Reserves and surplus 1,616 2,101 2,122 2,289 2,506Total income 1,153 1,315 1,274 1,306 1,449 Net worth 1,787 2,161 2,169 2,336 2,553Payment to employees 362 317 293 308 332 Share Warrants O/S 1 3 3 0 0Brokerage & Commission 129 123 112 114 127 Minority Interest 40 42 34 40 49Other operating exp 194 194 215 262 293 Borrowings 11,623 11,846 10,096 10,601 11,555Total expenses 685 634 620 684 752 Net Deferred Tax Liability 7 -39 -20 -20 -20Pre provision profit 468 681 654 622 697 Long Term Provisions 233 349 226 655 843Provisions 244 375 395 311 335 Current Liabilites 1,192 1,122 1,068 1,306 1,452PBT 223 306 258 311 362 Total liab and equity 14,882 15,484 13,576 14,919 16,432Exceptional items 0 0 212 0 0 Loans 13,251 14,054 12,062 12,819 13,999
Taxes 36 92 34 93 109 Fixed assets 221 278 285 326 373Adj. PAT 187 213 13 218 254 Investments 414 400 547 539 643
Minority Interest 7 2 -8 6 9 Other Assets 997 752 681 1,235 1,418
Adj. PAT after MI 181 211 165 212 245 Total assets 14,882 15,484 13,575 14,919 16,432
Quarterly (Rs. Crs) Q4FY16 Q1FY17 Q2FY17 Q3FY17 Q4FY17 Key Ratios FY15 FY16 FY17 FY18E FY19E
Interest earned 631 606 599 580 561 Yield on loans 18.0% 17.1% 16.8% 16.9% 16.9%
Interest expended 298 306 290 272 257 Cost of Borrowings 11.3% 10.2% 10.0% 9.8% 9.6%
Net interest income 333 300 309 308 304 Spread 6.6% 6.9% 6.8% 7.1% 7.3%
Other income 11 10 17 14 13 NIMs 6.2% 7.0% 7.4% 7.6% 7.5%Total income 344 309 326 322 317 Gross NPA 4.9% 8.1% 6.7% 6.6% 6.4%Payment to employees 69 77 73 77 66 Net NPA 3.9% 6.3% 5.6% 5.4% 5.1%Brokerage & Commission 29 29 27 27 29 PCR 20.6% 21.4% 16.4% 18.0% 21.0%Other operating exp 45 50 54 57 54 CAR 16.3% 18.7% 20.4% 19.4% 18.5%Total expenses 144 156 154 161 149 Tier I 11.1% 14.6% 15.4% 15.1% 15.0%Pre provision profit 200 153 172 161 168 Per share data FY15 FY16 FY17 FY18E FY19EProvisions 99 88 95 105 319 Diluted EPS 7.61 8.91 6.97 8.92 10.30PBT 102 65 77 56 -152 BVPS 75 91 91 98 108Exceptional items 0 0 0 0 212 DPS 0.8 0.8 0.8 0.9 1.0Tax 36 18 26 20 -30 Dividend Yield 0.6% 0.6% 0.6% 0.6% 0.7%Minority Interest 1 1 0 -1 -8 Profitability Ratios FY15 FY16 FY17 FY18E FY19EAdj. PAT after MI 65 47 50 37 97 Cost / Income Ratio 59.4% 48.2% 48.7% 52.4% 51.9%Growth Ratios FY15 FY16 FY17 FY18E FY19E Return on Equity 10.5% 10.7% 7.7% 9.4% 10.0%Advances growth 16.8% 6.1% -14.2% 6.3% 9.2% Return on Assets 1.29% 1.39% 1.15% 1.49% 1.56%Borrowing growth 14.8% 1.9% -14.8% 5.0% 9.0%NII growth 22.0% 14.6% -5.1% 3.6% 10.8% Valuation Ratios FY15 FY16 FY17 FY18E FY19EPre prov profit growth 22.5% 45.5% -4.0% -4.8% 12.1% P/E 18.49 15.80 20.18 15.77 13.66PAT growth 19.0% 17.0% -21.7% 28.0% 15.5% P/BV 1.87 1.55 1.54 1.43 1.31

13 | P a g e
II nnii tt
ii aatt ii
nngg
CCoo
vvee
rr aagg
ee
Magma Fincorp Ltd.
II nn
ii ttii aa
ttii nn
gg CC
oovv
eerraa
ggee
–– 11
44tthh
JJuu
nnee
2200
1177
Disclaimer:
Nirmal Bang Securities Private Limited (hereinafter referred to as “NBSPL”) is a registered Member of National Stock Exchange of India Limited,
Bombay Stock Exchange Limited and MCX stock Exchange Limited. We have been granted certificate of Registration as a Research Analyst with
SEBI. Registration no. is INH000001766 for the period 23.09.2015 to 22.09.2020 .NBSPL or its associates including its relatives/analyst do not
hold any financial interest/beneficial ownership of more than 1% in the company covered by Analyst (in case any financial interest is held kindly
disclose) NBSPL or its associates/analyst has not received any compensation from the company covered by Analyst during the past twelve
months. NBSPL /analyst has not served as an officer, director or employee of company covered by Analyst and has not been engaged in market
making activity of the company covered by Analyst. The views expressed are based solely on information available publicly and believed to be true.
Investors are advised to independently evaluate the market conditions/risks involved before making any investment decision
.
Nirmal Bang Research (Division of Nirmal Bang Securities Pvt. Ltd.) B-2, 301/302, Marathon Innova, Opp. Peninsula Corporate Park,
Off Ganpatrao Kadam Marg, Lower Parel (W), Mumbai-400013 Board No. : 91 22 3926 8000/8001
Fax. : 022 3926 8010
Copyright © 2022 FDOKUMEN