CEMENT SECTOR - Nirmal Bang
85
IMBALANCE LIKELY TO CONTINUE DEMAND-SUPPLY CEMENT SECTOR
-
Upload
khangminh22 -
Category
Documents
-
view
7 -
download
0
Transcript of CEMENT SECTOR - Nirmal Bang

IMBALANCE LIKELYTO CONTINUE
DEMAND-SUPPLY
CEMENT SECTOR

Institutional Equities
This page has been intentionally left blank

Institutional Equities
Cement Sector
Unfavourable Demand-supply Dynamics; Stretched Valuations The demand-supply balance essentially drives cement pricing, like in any other commodities. However, this (demand-supply relationship) had little to do to drive cement prices in the past five years as supply discipline was the key driving factor for prices, keeping them above the normal price discovery trend. Given that demand-supply gap will continue in the range of ~100mt-140mt for the next two to three years, overall capacity utilisation will hover ~70-75%. This is despite early signs of strong cement demand revival as the contribution in 2HFY18 was largely from the infrastructure segment, although demand lull in real estate segment continued in most parts of India. Hence, we believe that genuine pricing power is unlikely to come back in a hurry. Moreover, cement companies’ ability to maintain/improve operating margin will be tested, which can be attributed to: a) Demand shift towards the infrastructure sector from the remunerative real estate sector. b) Hardening of key raw materials (including inflated cost of limestone and fly-ash). c) Fuel inflation impacting energy cost. Hence, we expect EBITDAM to be flat or under pressure (except in cases of companies undergoing EBITDA correction) and effectively lack of strong earnings growth for large-cap companies. Further, the current premium valuations largely factor in the expected strong demand revival in the initial phase of recovery, leaving limited scope for a further rerating of cement stocks barring a few exceptions. We re-initiate the coverage on the cement sector with our negative view (because of stretched valuation). We have recommended Sell rating on Shree Cement, Dalmia Cement, J K Lakshmi Cement, India Cements and Heidelberg Cement. However we remain positive on select cement stocks such as The Ramco Cements and JK Cement in the mid-cap space, and Sagar Cements in the small-cap space. We believe large-cap companies (ACC, Ambuja and Ultratech) are currently fairly valued and leave little headroom for incremental gains.
Demand growth aided by government-driven infrastructure capex and rural housing: During the past five years, cement demand growth remained subdued because of a) Slow housing demand. b) Limited infrastructure spending (only public spending). c) Weak private sector contribution. Post recovery from the short-term impact of demonetisation and implementation of Goods and Services Tax or GST, we expect cement demand to grow 7%-8% YoY in FY19E/FY20E aided by robust government measures providing a fillip to the infrastructure sector, and rural housing offsetting continuing weakness in commercial/industrial capex and urban housing.
Demand supply gap to continue as supply addition persists: While we expect demand to grow 7%-8% YoY in FY18E-FY20E, we forecast supply CAGR of 3.5% over the same period. However this is on the back of strong 130mt addition in past 5 years (FY12-FY17). Though the pace of supply growth will moderate, demand-supply gap will continue in the range of 100mt-140mt. We expect supply in the range of 460mt-480mt (rated capacity) with effective available supply in the range of 455mt-460mt (based on stabilisation period and available clinker capacity). Given the higher demand-supply gap hovering ~100mt-140mt, we expect no real return of pricing power in the cement sector. We have done sensitivity analysis with expectations of demand swinging faster (~15% YoY) than expected in the next two years as in the previous peak cycle of FY06-FY09. Despite this aggressive assumption the capacity utilization hovers ~ 75% and the demand-supply gap still persists in excess of 100 mt.
Effective capacity utilisation will be sub-optimal: Effective capacity utilisation is likely to be 70%-75% during the next two years, implying that genuine pricing power to cement companies will be still at a fair distance. As cement is a regional play, capacity utilisation in southern region is expected to languish at ~60%-68%, while northern region is likely to show relatively healthier utilisation level (~ 75%-80% in FY19E/FY20E).
Prefer select fundamentally sound companuies in the cement space: At current valuations, we prefer The Ramco Cements (new region expansion, focus on cost control and expected demand revival in strong home market) and JK Cement (better earnings guard from white cement segment) in the mid-cap space, and Sagar Cements (presence in reviving markets like AP/Telangana with timely capacity addition and discounted valuations) in the small-cap space. We believe large-cap cement companies are currently fairly valued and leave limited headroom for gains. We have assigned Sell rating to Shree Cement, Dalmia Bharat, The India Cements, JK Lakshmi Cement and Heidelberg Cement.
View: Negative
Milind Raginwar Research Analyst [email protected] +91-22-6273 8172 Harshit Dhoot Research Associate [email protected] +91-22-6273 8111
Company Rating Market cap.
CMP (Rs)
Target price
(Rs)
Up/ Down
(%)
EV/EBITDA (x) EV/Tonne (mnt) P/E (x)
Rsbn US$mn FY18E FY19E FY20E FY18E FY19E FY20E FY18E FY19E FY20E
ACC Accumulate 2,912 4,485 1,549 1,582 2.1 13.8 12.9 11.4 117 120 117 35.0 28.1 24.0 Acmbuja Cement Accumulate 4,527 6,973 228 227 (0.4) 9.7 9.2 8.2 195 204 199 31.5 26.2 23.4 Dalmia Bharat Sell 2,528 3,894 2,847 2,592 (9.0) 14.5 12.1 11.2 207 206 206 46.0 35.7 31.5 Heidelberg Cement Sell 338 520 149 126 (15.4) 12.2 10.6 9.3 116 116 115 33.2 24.5 20.2 The India Cements Sell 435 669 141 126 (10.6) 9.5 8.6 7.8 68 68 70 39.4 25.4 19.3 JK Cement Buy 709 1,092 1,014 1,179 16.3 10.9 9.3 8.6 130 126 125 21.3 16.0 13.5 JK Lakshmi Cement Sell 523 805 444 389 (12.4) 17.1 14.8 12.4 97 96 95 54.1 36.6 22.7 Sagar Cement Buy 180 276 880 1,058 20.2 13.6 8.4 5.6 72 67 54 76.0 24.3 15.2 Sanghi Industries Accumulate 289 445 115 116 0.9 14.8 12.9 12.2 134 146 161 25.1 20.1 18.3 Shree Cement Sell 5,697 8,774 16,354 15,207 (7.0) 21.7 18.0 15.9 259 259 257 41.2 33.2 28.7 The Ramco Cement Buy 1,743 2,685 736 887 20.5 16.8 14.3 12.3 168 166 167 27.2 21.7 17.6 UltraTech Accumulate 10,770 16,587 3,925 4,302 9.6 21.0 17.3 15.0 207 207 203 46.4 38.6 30.0
Source: Nirmal Bang Institutional Equities Research
26 March 2018

Institutional Equities
4 Cement Sector
Table of Content
Healthy demand from government’s infrastructure capex and rural housing………………………..………….….06
Cement demand expected to grow ~ 7%-8%YoYover the next two years……………………………………….…07
Demand Driver 1: Housing segment’s growth will be aided by rural market, other realty segments to remain weak……………………………………………………………………………………………………………………..….08
Organised urban housing segment will see extended weakness…………………………………………………….10
Commercial property story is no different from organised housing………………………………………………..…11
Demand Driver 2: Government-driven infrastructure creation is a bright spot in an anaemic private capex envirornment……………………………………………………………………………………………………………..…12
Strong government initiatives towards new schemes……………………………………………………………….…14
What do we expect in the next two years?...........................................................................................................16
Incremental supply unabated, demand-supply gap expected to stay in the range of 100mt-140mt……….……..17
Region-wise capacity addition- Focus shifts to eastern region………………………………………………….……18
Key raw materials available in abundance………………………………………………………………….…….….…20
Pricing power remains elusive…………………………………………………………………………………..…….….21
Regional cement prices remain volatile and under pressure…………………………………………………….…...24
Cost inflation is key challenge in the next two years……………………………………………………………….….26
Valuation at a premium………………………………………………………………………………………………...….29
Annexure:…………………………………………………………………………………………………………….…..…32
Companies
ACC ............................................................................................................................................. ……………….37
Ambuja Cements ............................................................................................................................................... 41
Dalmia Bharat ......................................................................................................................................... ………45
HeidelbergCement India ................................................................................................................................... 49
India Cements .................................................................................................................................................... 53
JK Cement ......................................................................................................................................................... 57
JK Lakshmi Cement ........................................................................................................................................... 61
Sagar Cements …………………………………..………..…………………………………………..…..……….…… 65
Sanghi Industries ............................................................................................................................................... 69
Shree Cements .................................................................................................................................................. 73
The Ramco Cements ......................................................................................................................................... 77
UltraTech Cement ................................................................................................................................. 81

Institutional Equities
5 Cement Sector
Key charts and tables
Exhibit 1: P/E and RoE movement in divergent path Exhibit 2:Valuation and EBITDAM moving in opposite direction
Source: Nirmal Bang Institutional Equities Research Source: Nirmal Bang Institutional Equities Research
Exhibit 3: Earnings-focused companies high on valuation Chart
Source: Nirmal Bang Institutional Equities Research
0
7
14
21
28
0
20
40
60
80
FY
08
FY
09
FY
10
FY
11
FY
12
FY
13
FY
14
FY
15
FY
16
FY
17
P/E (LHS) ROE (RHS)
(x) (%)
0
4
8
12
16
0
9
18
27
36
FY
08
FY
09
FY
10
FY
11
FY
12
FY
13
FY
14
FY
15
FY
16
FY
17
Operating Profit Margin (LHS) EV/EBITDA (RHS)
(%) (x)
0
2
4
6
8
10
12
14
16
18
20
0 5 10 15 20 25
EV
/ E
BIT
DA
(x)
RoE (%)
Bubble Size:EBITDA/tn
ACC Ambuja Cements UltraTech Cement Shree Cement
Dalmia Bharat JK Lakhmi India Cement Heidelberg Cement
Sanghi Industries JK Cement Ramco Cement Sagar Cement

Institutional Equities
6 Cement Sector
Healthy demand from government’s infrastructure capex and rural housing
During the past five years, cement demand growth remained subdued because of: a) Slow housing demand. b) Limited infrastructure spending (only public spending). c) Weak industrial capex and private sector contribution. However, reversing the short-term impact of demonetisation and early phase of GST implementation, we expect cement demand to grow 7%-8 YoY in FY19E/FY20E aided by robust government measures providing a fillip to the infrastructure sector, and rural housing offsetting sustained weakness in urban housing and commercial/industrial capex.
Pan-India cement demand under pressure since the past five years
During the past five years, cement demand growth remained subdued, defying the GDP multiplier link (~1.2x in stable market expanding to 1.3x during the economic recovery). However, cement demand picked up during 3QFY18 YoY, recovering from the demonetisation impact and initial phase of GST implementation, growing by a strong 11.1% YoY although on a weak base (versus ~-1%YoY in 3QFY17 and 2.7%YoY in 9MFY18). Strong infrastructure push is the key factor in driving current growth and is expected to continue in the near future barring unforeseen events.
During the past five years, central and eastern region grew faster compared to other regions with a CAGR of 6.6%/3.6% over FY12-FY17 aided by: a) Focus on infrastructure. b) Low-cost housing, while traditionally strong markets such as northern and western regions reported disappointing growth rate of ~2.6%/3.6%, respectively, during the same period. Southern region reported virtually flat growth.
Region-wise demand
Exhibit 4: Demand in southern region disappoints Exhibit 5: Slow demand in weste rn region because of weak urban housing demand
Source: Nirmal Bang Institutional Equities Research, Industry, Crisil Source: Nirmal Bang Institutional Equities Research, Industry, Crisil
Exhibit 6: Northern region weighed down by weak rural and urban demand
Exhibit 7: Central region relatively a bright spot
Source: Nirmal Bang Institutional Equities Research, Industry, Crisil Source: Nirmal Bang Institutional Equities Research, Industry, Crisil
50
53
56
59
62
65
FY12-13 FY13-14 FY14-15 FY15-16 FY16-17
(MT
)
44
48
52
56
60
FY12-13 FY13-14 FY14-15 FY15-16 FY16-17
(MT
)
38
42
46
50
54
FY12-13 FY13-14 FY14-15 FY15-16 FY16-17
(MT
)
0
14
28
42
56
FY12-13 FY13-14 FY14-15 FY15-16 FY16-17
(MT
)

Institutional Equities
7 Cement Sector
Exhibit 8: Eastern region playing catch-up in government-driven low-cost housing & infrastructure space
Source: Nirmal Bang Institutional Equities Research, Industry, Crisil
Cement demand expected to grow ~ 7%-8%YoYover the next two years
According to industry sources, housing accounts for ~60% of total demand whereas infrastructure contributes ~20% and the rest is accounted for by commercial and industrial establishments. However, this is likely to undergo a change with strong infrastructure demand replacing housing demand in early signs of demand revival since 3QFY18. We have analysed the underlying demand sources in detail and tried to forecast demand growth for the sector over FY19-FY20.
Housing accounts for a significant portion (~60%) of total cement domestic demand in India.
Rising urbanisation, an increasing number of households and higher employment are primarily driving the demand for housing, accounting for ~60% of total cement consumption.
Initiatives undertaken by the government are expected to provide an impetus to construction activity in rural and semi-urban areas through large infrastructure and housing development projects, respectively.
The affordable housing segment has been in focus with two major schemes providing a fillip to growth, including Pradhan Mantri Awas Yojana-Urban (PMAY-U) and Pradhan Mantri Awas Yojana-Gramin (PMAY-G).
Exhibit 9: India cement demand – Key constituents (% in total demand, current and estimated)
Source: Industry, Nirmal Bang Institutional Equities Research Source: Industry, Nirmal Bang Institutional Equities Research
0
13
25
38
50
FY12-13 FY13-14 FY14-15 FY15-16 FY16-17
(MT
)
Infrastructure,20%
Commercial / Industrial, 20%
Housing, 60%
Rural Housing (20%)
Urban Housing (Tier 1) (15%)
Urban Housing (Tier 2) (25%)
Infrastructure, 25.0%
Commercial / Industrial,
20.0%
Housing, 55.0%

Institutional Equities
8 Cement Sector
Demand Driver 1: Housing segment’s growth will be aided by rural market, other realty segments to remain weak
Rural housing is likely to gain momentum aided by a good monsoon and PMAY-G
The government, in the President's address to the joint session of Parliament in May 2014, had announced that before the nation celebrates its 75th year of Independence (i.e., 2022), every family should have a pucca house with water connection, toilet facilities and other basic amenities. As part of the Pradhan Mantri Gramin Awas Yojana-Gramin (PMGAY-G) the government is targeting to build 30mn homes by 2022. It has allocated Rs150bn in the FY17 budget and increased the allocation to Rs230bn in FY18 (Rs202bn spent till 9MFY18). The current budget (FY19) had allocated Rs210bn for PMAY-G. Thus, funding for flagship programmes is not a constraint as it will be tied with budgetary support and borrowing from NABARD. As per the Ministry of Rural Development (MoRD), about 1.0mn houses have been constructed in rural areas under PMAY-G till November 2017.
With a normal monsoon forecast for FY18-FY19 (early prediction), rural demand is expected to be strong and outpace urban demand. The India Meteorology Department’s (IMD) monsoon mission climate forecast system (MMCFS) predicts signals of moderate La Nina condition that will be favourable for Indian monsoon. However, even if it weakens, the monsoon will still be normal. .
Exhibit 10: In the past two years gap between sanctioned and completed houses is narrowing
Source: iay.nic.in
Urban housing: Affordable housing is strong while the organised segment continues to see headwinds
Pradhan Mantri Awas Yojana-Urban (PMAY-U) to drive 3.9mn urban homes: PMAY-U aims to provide ‘Housing for All’ by 2022 with the implementation between FY15-FY22 and will provide central assistance to urban local bodies (ULBs) and other implementation agencies through States/Union Territories. Currently, 1.56mn houses are at various stages of construction and ~ 0.41mn houses have been constructed since the launch of PMAY-U, according to the MHUPA (ministry of housing and urban affairs). However, the total number of affordable homes sanctioned under PMAY-U is 3.74mn for the urban poor. The total budgetary allocation by the central government in FY19 for the PMAY (U) is Rs275.0bn (budgetary allocation in the previous year’s FY16/FY17/FY18 was Rs116bn/Rs209.5bn/Rs290bn.
0
500,000
1,000,000
1,500,000
2,000,000
2,500,000
3,000,000
3,500,000
2011-12 2012-13 2013-14 2014-15 2015-16 2016-17
Houses Completed Houses Sanctioned
(Houses)

Institutional Equities
9 Cement Sector
Exhibit 11: Implementation methodology
Source: Ministry of Housing and Urban Poverty Alleviation
The credit-linked subsidy scheme is used as a demand-side intervention to expand institutional credit flow to meet the housing needs of urban poor. India’s urban housing shortage is estimated to be 18.78mn. The shortage is acute across economically weaker sections (EWS) and lower income groups (LIGs), which together constitute 95% of the total housing shortage.
Exhibit 12: Credit-linked subsidy scheme details
Particulars Middle Income
Group 1 Middle Income
Group 2
Annual Income (Rs mn) 0.6 to 1.2 1.2 to 1.8
Interest Subsidy (% p.a.) 4% 3%
Max Loan Tenure( in years) 20 20
Eligible Housing Loan Amount for Interest Subsidy (Rs mn) 0.9 1.2
Dwelling Unit Carpet Area 90 Sq.m 110 Sq.m
Discount Rate for Net Present Value (NPV) calculation of interest subsidy (%) 9% 9%
Source: Ministry of Housing and Urban Poverty Alleviation
Adding to that, the major benefactors of PMAY-U have been states with major cement production which include Madhya Pradesh, Rajasthan, Andhra Pradesh and Telangana which augurs well for the cement industry.
Exhibit 13: Government spending on housing is on the rise
Source: CMIE, Industry, Nirmal Bang Institutional Equities
-4%
-2%
0%
2%
4%
6%
-40%
-20%
0%
20%
40%
60%
19
90
-91
19
91
-92
19
92
-93
19
93
-94
19
94
-95
19
95
-96
19
96
-97
19
97
-98
19
98
-99
19
99
-00
20
00
-01
20
01
-02
20
02
-03
20
03
-04
20
04
-05
20
05
-06
20
06
-07
20
07
-08
20
08
-09
20
09
-10
20
10
-11
20
11
-12
20
12
-13
20
13
-14
20
14
-15
20
15
-16
20
16
-17
20
17
-18
Growth in Central Government's capital expenditure for housing
Capital expenditure for Housing as % of Central Government's total capital expense

Institutional Equities
10 Cement Sector
Organised urban housing segment will see extended weakness
A confluence of high urban real estate prices, lower affordability, sluggish wage growth (particularly in the private sector), and an overall lethargic economic environment have affected demand for real estate in the urban segment. This can be seen from the exhibits below where inventory level continues to remain high and absorption level has declined to FY09 level. Understandably, new housing launches are below the lows witnessed in FY09.
Exhibit 14: Absorption numbers sliding down sharply Exhibit 15: Pan-India inventory level is high
Source: Industry Source: Industry
Exhibit 16: New launches have dried up significantly
Source: Industry
We believe urban housing will see sustained weakness in absorption and new launches in the medium term will be based on the pointers from the data on major cities given below. These are representative of the mood in the organised real estate sector in India as a whole.
Exhibit 17: Lull in residential launch in FY18 continues
Source: Colliers International
0
150
300
450
600
0
120
240
360
480
FY
09
FY
10
FY
11
FY
12
FY
13
FY
14
FY
15
FY
16
FY
17
*
(mn sq ft)('000 no of units)
Units(LHS) Area(RHS) *Till Feb'17
0
4,000
8,000
12,000
16,000
0
2,500
5,000
7,500
10,000
FY
09
FY
10
FY
11
FY
12
FY
13
FY
14
FY
15
FY
16
FY
17
*
(mn sq ft)('000 no of units)
Units(LHS) Area(RHS) *Till Feb'17
0
900
1,800
2,700
3,600
FY
09
FY
10
FY
11
FY
12
FY
13
FY
14
FY
15
FY
16
FY
17
*
(Available Suppy)
*Till Feb'17
-80%
-70%
-60%
-50%
-40%
-30%
-20%
-10%
0%
0
5,000
10,000
15,000
20,000
25,000
NC
R
Ah
me
da
ba
d
Mu
mb
ai
Pu
ne
Be
ng
alu
ru
Hyd
era
ba
d
Ch
en
na
i
Ko
lka
ta
Launch Launch Growth YoY

Institutional Equities
11 Cement Sector
Commercial property story is no different from organised housing
The commercial property segment is also currently undergoing a slowdown in line with the relatively slow economic revival.
All-India medium term trend indicates that the pace of transactions in the commercial property segment has lacked pace. Prompted by the slower pace of transaction, completion of commercial projects has slowed down in the past couple of years. Effectively, with slower completion of projects, the vacancy level declined from ~ 20% in the past couple of years to ~ 15% in 9MFY18.
Exhibit 18: Absorption rate shows a mixed trend in major Indian cities
Source: Colliers International
Exhibit 19: Commercial transactions are flat in top six cities of India
Note: The top six cities are Mumbai, NCR, Bengaluru, Pune, Chennai and Hyderabad
Source: Knight Frank Research, India Real Estate
Exhibit 20: Vacancy trend in major cities hints towards only a marginal change
Source: Colliers International
0123456789101112131415
0123456789
1011121314151617
Bengaluru Chennai Delhi-NCR Hyderabad Kolkata Mumbai Pune
CY2017 CY2018E
12%
15%
17%
20%
22%
0
12
24
36
48
2010 2011 2012 2013 2014 2015 2016 H12017
(mn sq ft)
New Completion Transactions Vacancy
0%
5%
10%
15%
20%
25%
30%
35%
0%
5%
10%
15%
20%
25%
30%
35%
Ben
galu
ru
Che
nnai
Del
hi-N
CR
Hyd
erab
ad
Kol
kata
Mum
bai
Pun
e
CY17 CY18E
Institutional Equities
12 Cement Sector
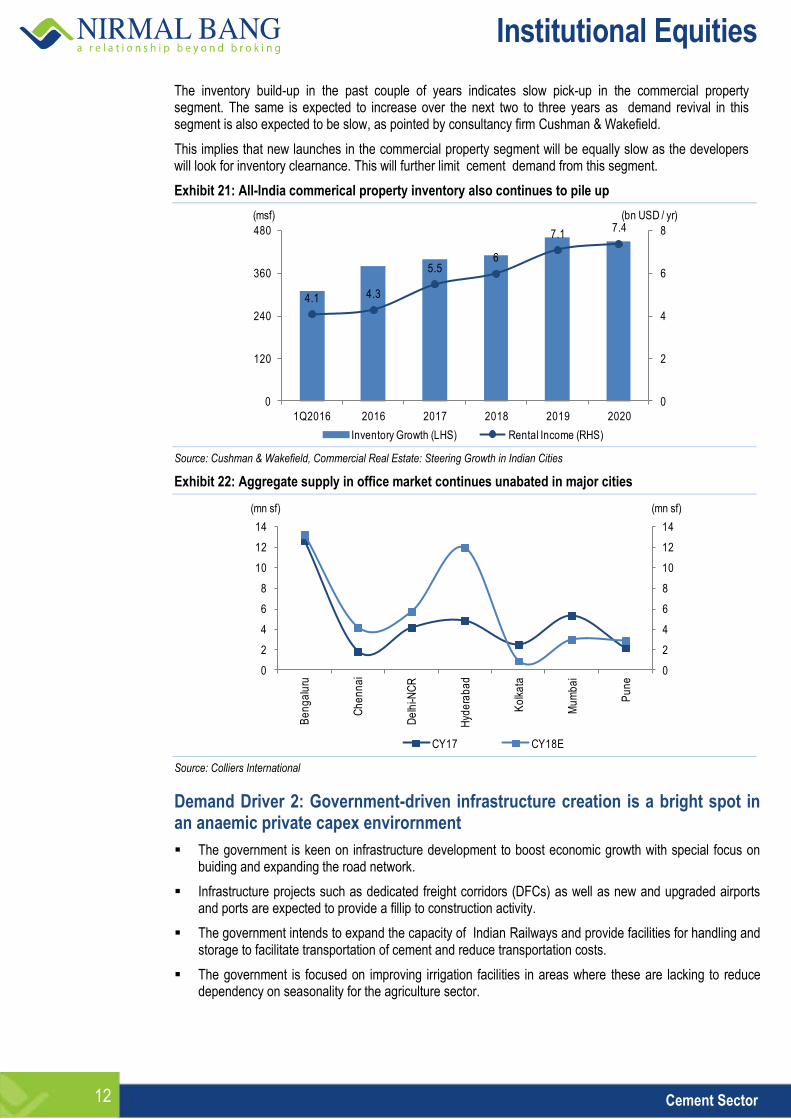
The inventory build-up in the past couple of years indicates slow pick-up in the commercial property segment. The same is expected to increase over the next two to three years as demand revival in this segment is also expected to be slow, as pointed by consultancy firm Cushman & Wakefield.
This implies that new launches in the commercial property segment will be equally slow as the developers will look for inventory clearnance. This will further limit cement demand from this segment.
Exhibit 21: All-India commerical property inventory also continues to pile up
Source: Cushman & Wakefield, Commercial Real Estate: Steering Growth in Indian Cities
Exhibit 22: Aggregate supply in office market continues unabated in major cities
Source: Colliers International
Demand Driver 2: Government-driven infrastructure creation is a bright spot in an anaemic private capex envirornment
The government is keen on infrastructure development to boost economic growth with special focus on buiding and expanding the road network.
Infrastructure projects such as dedicated freight corridors (DFCs) as well as new and upgraded airports and ports are expected to provide a fillip to construction activity.
The government intends to expand the capacity of Indian Railways and provide facilities for handling and storage to facilitate transportation of cement and reduce transportation costs.
The government is focused on improving irrigation facilities in areas where these are lacking to reduce dependency on seasonality for the agriculture sector.
4.1 4.3
5.56
7.17.4
0
2
4
6
8
0
120
240
360
480
1Q2016 2016 2017 2018 2019 2020
(bn USD / yr)(msf)
Inventory Growth (LHS) Rental Income (RHS)
0
2
4
6
8
10
12
14
0
2
4
6
8
10
12
14
Be
ng
alu
ru
Ch
en
na
i
De
lhi-N
CR
Hyd
era
ba
d
Ko
lka
ta
Mu
mb
ai
Pu
ne
CY17 CY18E
(mn sf) (mn sf)

Institutional Equities
13 Cement Sector
Exhibit 23: Central government’s focus on roads and bridges spending is indicates a strong reversal
Source: CMIE, Industry
Exhibit 24: Increased public investment in irrigation
Source: CMIE, Industry
Exhibit 25: NHAI – Total projects under implementation show an improving trend Exhibit
26: Slow pick-up in project recommended by PPPAC*
Source: Department of Economic Affairs Source: Industry ; * PPPAC is public private partnership appraisal committee
-100%
-50%
0%
50%
100%
150%
200%
-10%
-5%
0%
5%
10%
15%
20%
25%
30%
35%
40%
1990
-91
1991
-92
1992
-93
1993
-94
1994
-95
1995
-96
1996
-97
1997
-98
1998
-99
1999
-00
2000
-01
2001
-02
2002
-03
2003
-04
2004
-05
2005
-06
2006
-07
2007
-08
2008
-09
2009
-10
2010
-11
2011
-12
2012
-13
2013
-14
2014
-15
2015
-16
2016
-17
2017
-18
2018
-19
Capital expenditure for roads & bridges as % of Central Government's total capital expense
Growth in Central Government's Capital expenditure for Roads & bridges (%)
0
2,000,000
4,000,000
6,000,000
8,000,000
10,000,000
12,000,000
20
00
-01
20
01
-02
20
02
-03
20
03
-04
20
04
-05
20
05
-06
20
06
-07
20
07
-08
20
08
-09
20
09
-10
20
10
-11
20
11
-12
20
12
-13
20
13
-14
20
14
-15
20
15
-16
20
16
-17
(Rsmn)
Investment Projects Outstanding Investment Projects Under implementation
0
20,000
40,000
60,000
80,000
100,000
120,000
140,000
160,000
180,000
FY
11
FY
12
FY
13
FY
14
FY
15
FY
16
FY
17
1Q
FY
18
(Km)
0
150
300
450
600
20
06
-20
07
20
07
-20
08
20
08
-20
09
20
09
-20
10
20
10
-20
11
20
11
-20
12
20
12
-20
13
20
13
-20
14
20
14
-20
15
20
15
-20
16
20
16
-20
17
20
17
-20
18*
(Rsbn)
*Till 17th May,2017

Institutional Equities
14 Cement Sector
Strong government initiatives towards new schemes
Initiatives by the new government, such as Housing For All, smart cities, Swachh Bharat campaign, infrastructure spending, concrete roads initiative and increase in allocation of funds to states are likely to have a positive impact on the industry in FY19 and FY20.
The government’s recent focus on road projects and increase in state allocations are likely to drive infrastructure and housing demand, thereby drive the demand for cement.
Projects such as smart cities and Atal Mission for Rejuvenation and Urban Transformation (AMRUT) are expected to lead a surge in demand for cement.
The infrastructure segment comprising roads, irrigation and urban infrastructure is expected to witness pointed growth in the next five years which augurs well for the cement sector
Exhibit 27: Increased public investment in irrigation
Source: Industry, Nirmal Bang Institutional Equities
Exhibit 28: The government has fast forwarded the completion of roads under PMGSY in the past three years
Note: Length completed is of new connectivity and upgradation and of both PMGSY-1 and PMGSY-2 schemes
Source: http://omms.nic.in
0%
5%
10%
15%
20%
25%
30%
35%
40%
45%
FY08-FY11 FY13- FY17 FY18 - FY22P
Infrastructure spending
Roads Power Irrigation urban infrastructure Others
0%
50%
100%
150%
200%
15,000
30,000
45,000
60,000
75,000
20
05
-06
20
06
-07
20
07
-08
20
08
-09
20
09
-10
20
10
-11
20
11
-12
20
12
-13
20
13
-14
20
14
-15
20
15
-16
20
16
-17
20
17
-18
*
(Km)
Target length (km) Completed length (km) Completed length as % of target length

Institutional Equities
15 Cement Sector
Development of metro railway, roads, airports
Metro rail projects in Mumbai, Bengaluru and Hyderabad and the expansion phase in Delhi are likely to drive cement demand.
Airport modernisation across major cities is likely to expand the demand for cement industry
The latest development in the Ahmedabad Metro Rail Project has driven cement demand to a large extent.
Demand Driver 3: Private sector revival another key factor for demand pick-up
The private sector’s capital expenditure has been indicating flat growth since the past five to six years. This is because of the lack of proper policy framework (labour and land acquisition still in abeyance), overall dull economic activity and lack of smooth capital avenues (limited liquidity). This segment accounts for~15-%20% of demand in the cement sector. Importantly, the revival in this sector keeps liquidity momentum in the system, thus contributing to consistent new demand for cement. Currently, this segment is going through a lull phase, thereby keeping the demand momentum limited for the cement sector. We expect private sector capital expenditure to gather momentum in the next two to three years following easing liquidity, typically an extended hand from the banking sector, clarity emerging in government policy on business and the overall revival in economic activity.
Exhibit 29: Private sector projects show flat growth in the past five years
Source: CMIE, Industry
0
10,000
20,000
30,000
40,000
50,000
60,000
70,000
80,000
90,000
100,000
1995
-96
1996
-97
1997
-98
1998
-99
1999
-00
2000
-01
2001
-02
2002
-03
2003
-04
2004
-05
2005
-06
2006
-07
2007
-08
2008
-09
2009
-10
2010
-11
2011
-12
2012
-13
2013
-14
2014
-15
2015
-16
2016
-17
(Rsbn)
New investment projects announced Investment projects completed Investment projects dropped (Total)
Investment projects dropped : Abandoned Investment projects dropped:Shelved Investment projects dropped : Stalled
Investment projects dropped : For lack of information Investment projects revived Investment Projects Outstanding : (Total)
Investment Projects Outstanding : Under implementation

Institutional Equities
16 Cement Sector
What do we expect in the next two years?
We expect cement demand to recover healthily from the impact of the government’s demonetisation policy and the early impact of Good and Services Tax (GST) implementation over the next couple of quarters. Rural housing and infrastructure demand is likely to recover strongly and compensate for weak demand from the organised urban housing sector.
We expect cement demand parity to the GDP multiplier (1.2x) to have a lag effect, despite strong initiatives by the government in the infrastructure and housing (low-cost) segment. This is because of the lag in private capital expenditure. This lag is likely to be offset in the medium term and we therefore expect cement demand to grow with a 1.0/1.1x multiplier to GDP growth. We have assumed GDP to grow 7.7%/7.8% in FY19/FY20 (contributed by our economy team), respectively.
We therefore expect cement demand in FY19/FY20 to grow 7%-8% (with an upward bias). The upward bias is to factor in the pent-up demand at the tail-end of 9MFY18 (impacted because of GST implementation and demonetisation) spilling over in FY19 (cement demand is largely deferred, not cancelled). However, we expect demand growth to gain momentum in FY19 because of a relatively steady base and parliamentary elections leading to announcement of new infrastructure projects and the rush for completion of existing projects to showcase them during the elections.
Exhibit 30: Summary of main demand drivers and growth rates
Source: Industry
5-6% 5-6% 10.5-12.5%
Housing 55% Industrial Commercial 20%
Infrastructure 25%

Institutional Equities
17 Cement Sector
Incremental supply unabated, demand-supply gap expected to stay
in the range of 100mt-140mt
Supply addition to continue, southern and eastern regions to lead the pack
Our detailed analysis of demand drivers and supply addition by manufacturers leads us to believe that the pan-India effective utilisation level will continue to hover ~ 70-75% over FY18E-FY20E. While we expect demand to post 8% CAGR over FY18E-FY20E, we forecast supply CAGR of ~3.2% over the same period. It may be noted that supply growth, although it is slow, is on the back of an unprecedented expansion of ~ 240mt (over FY07-FY16). Hence, we expect no real return of pricing power in this sector as the demand-supply gap will continue to be ~ 100mt-140mt in FY20E. As cement is a regional play, the capacity utilisation of players in southern region is expected to be at a lower level of ~65%-70% (improving from a low base) in the next two to three years, while northern region is likely to show relatively healthier utilisation level of ~80%-82% in the same period. We have done sensitivity analysis with expectations of demand swinging faster (~15% YoY) than expected in the next two years as in the previous peak cycle of FY06-FY09. Despite this aggressive assumption the capacity utilization hovers ~ 75% and the demand-supply gap still persists in excess of 100 mt.
In the next two years, we expect capacity addition growth to likely taper off with a CAGR of 3.9% over FY16-FY20E and expect the capacity to top 480mt by FY20E.
The appetite for capacity addition surprises despite the likely lower rate of supply growth during the next two to three years, especially given the fact that capacity utilisation rate hovers in a sub-optimal range (of ~75%). We expect the demand-supply gap to continue for the next two years and the utilisation rate is unlikely to increase substantially, despite the pointers of strong demand in the next two years (relative to the previous trend).
Exhibit 31: All India demand-supply model
FY12 FY13 FY14 FY15 FY16 FY17 FY18E FY19E FY20E
Total Capacity (mt) 313.4 347.5 361.6 392.0 415.8 441.3 454.6 467.3 484.1
Total Effective Capacity (mt) 300.1 329.4 355.5 371.6 403.7 425.5 444.5 457.5 472.5
Total dispatches (mt) 225 248 255.8 270 282.6 272.0 291.0 314.3 339.5
Capacity Utilisation (CU) (%) 71.8 71.4 70.7 68.9 68.0 64.9 64.0 67.3 70.1
Effective CU (%) 74.9 75.3 72.0 72.7 70.0 65.8 65.5 68.7 71.8
Demand growth (%) 7.8 10.3 3.1 5.6 4.7 -1.0 7.0 8.0 8.0
Source: Industry, Nirmal Bang Institutional Equities Research
Exhibit 32: Northern and central regions have better operating ratios which are expected to continue for the next couple of years
Source: Industry, Crisil
0%
25%
50%
75%
100%
North East West South Central Pan -India
Average over last 5 years

Institutional Equities
18 Cement Sector
Region-wise capacity addition- Focus shifts to eastern region
The southern region will continue to add capacity, although the pace of new addition is likely to taper at ~2.4% CAGR over FY16-FY20E. However, with a strong base we expect the demand-supply gap to be significant for any real strong pricing momentum despite the recent strong pick up in the demand. Strong demand revival from the region driven by twin state development of Andhra Pradesh and Telangana since 3QFY18 will keep the demand momentum continuing. However, South India has been maintaining higher prices following the strict supply discipline, defying the demand-supply mechanics.
We like the eastern region as the demand triggers from eastern and north-east regions (given the strong government initiatives) remain robust. However, strong capacity addition by the presence of new cement manufacturers (Emami and Nirma) and cement companies like Shree Cement entering the market, capacity addition is expected to post a CAGR of 8% (FY16-20E) over a high 13% base of FY12-FY16. This is expected to weigh on the capacity utilisation rate.
We expect central region to be the key beneficiary with minimal capacity addition (except for UltraTech Cement) in the next two to three years. With demand gaining momentum, we expect this region to benefit from significant revival in the economy, and consequently provide a fillip to demand. However, post UTCEM’s acquisition of JPA cement assets supply will be unabated from the erstwhile under-utilized capacities in the region.
Exhibit 33: Cement supply
North India cement supply expected to be limited South India continues to add capacity despite DD SS gap of ~70mt
Source: Industry, Crisil, Nirmal Bang Institutional Equities Research Source: Industry, Crisil, Nirmal Bang Institutional Equities Research
East India crowded with supply exerting pressure on prices Limited supply to be added in western region in the next two years
Source: Industry, Crisil, Nirmal Bang Institutional Equities Research Source: Industry, Crisil, Nirmal Bang Institutional Equities Research
0
30
60
90
120
20
11
-12
20
12
-13
20
13
-14
20
14
-15
20
15
-16
20
16
-17
20
17
-18
P
20
18
-19
P
20
19
-20
P
(MT)
0
45
90
135
180
20
11
-12
20
12
-13
20
13
-14
20
14
-15
20
15
-16
20
16
-17
20
17
-18
P
20
18
-19
P
20
19
-20
P
(MT)
0
20
40
60
80
100
20
11
-12
20
12
-13
20
13
-14
20
14
-15
20
15
-16
20
16
-17
20
17
-18
P
20
18
-19
P
20
19
-20
P
(MT)
0
20
40
60
80
20
11
-12
20
12
-13
20
13
-14
20
14
-15
20
15
-16
20
16
-17
20
17
-18
P
20
18
-19
P
20
19
-20
P(MT)

Institutional Equities
19 Cement Sector
Minimal capacity addition in central region likely given the limited resources
Source: Industry, Crisil, Nirmal Bang Institutional Equities Research
0
15
30
45
60
20
11
-12
20
12
-13
20
13
-14
20
14
-15
20
15
-16
20
16
-17
20
17
-18
P
20
18
-19
P
20
19
-20
P
(MT)

Institutional Equities
20 Cement Sector
Key raw materials available in abundance
Our analysis of limestone reserves data published by the Indian Bureau of Mines reveals that barring the central region, limestone reserves are available in abundance in key pockets of northern region (Rajasthan), southern region (Andhra Pradesh & Telangana, Karnataka), and western region (Maharashtra). Cement makers are increasingly setting up capacities in Karnataka and Chhattisgarh, shifting the focus from central region (confirmed through our interaction with cement manufacturers). Karnataka is preferred over the traditional limestone base of Andhra Pradesh because of access to lucrative Maharashtra market. Presence in Chattisgarh (CTG) helps access to the eastern region (backward states) where the central government’s focus is on infrastructure and development. Rajasthan continues to be the hot-spot for cement manufacturers.
Exhibit 34: Limestone resources (proven) skewed towards North and South India
Source: Indian Bureau of Mines
North, 37%
South, 26%
East, 16%
West, 12%
Central, 9%

Institutional Equities
21 Cement Sector
Pricing power remains elusive
Cement demand has indicated green shoots from 2HFY18, as indicated by our industry interactions (notwithstanding the weak base). The push to rural demand and government initiatives undertaken to provide a fillip to the infrastructure sector is likely to compensate for weakness in urban housing demand and will help to continue the momentum. Our estimates indicate FY19/FY20 demand is likely to be in high single digits (~7%-8%), as explained in key demand drivers section. However, supply surplus in key pockets such as South and East India will contain the pricing as incremental demand is likely to undershoot excess supply (we do not subscribe to the theory of demand growth exceeding supply growth). Hence, pricing power is likely to be limited as capacity utilisation is far from reaching ~85% in the next two years.
Cement prices likely to be under pressure
Pan-India, the over-supply situation is expected to continue in FY19/FY20. In South India, the demand-supply gap is expected to stay upwards of at least 70mt-80mt in the next two years. In eastern region, supply outpaced demand in the past and this trend is likely to continue for the next two years. Our estimates indicate that central region will be the key beneficiary in the next two years with limited supply addition and healthy demand pick-up in the Madhya Pradesh/Uttar Pradesh belt.
Though we structurally expect cement demand to overcome weakness of the past five years (2012-17), pushed largely by the central government’s infrastructure initiatives and rural housing (as discussed in cement demand section in detail), we expect demand growth of ~ 7-8%YoY. With the demand-supply gap likely to be maintained at ~100mt-120mt, we expect the capacity utilisation rate to hover ~ 73%-75% in FY18E-FY20E which will keep pricing pressure on cement companies.
Effective capacity utilisation rate likely to remain at ~75%
We expect cement capacity utilisation rate to remain at ~75%, even if the rate tends to vary regionally. We expect the rate to touch ~ 80% in western and central regions, while southern region will continue to lag behind (albeit relatively better than the past five years).
With the utilisation rate remaining in mid-70s, we expect the pricing power to change in certain pockets rather than a structural pan-India change in pricing scenario.
Inter-regional movement to improve with GST
Historically, cement movement has remained robust from surplus regions to scarce regions, thereby keeping in the prices under check. The data last available suggests ~8% movement from southern to western region. This, in turn, is likely to move the stock from western region to central region (Madhya Pradesh) from Vidarbha and northern region (Rajasthan) from Gujarat. Thus, the overall pricing will deviate from the secular uptrend that was observed in the last upcycle.
With the introduction of GST, we believe the inter-regional movement (especially in state clusters like the NCR region) will only improve. However, it is early to measure the change in movement.
Cement prices structurally will thus increase only if pan-India cement utilisation rate moves towards ~85% wherein the gains can be measured across regions which is unlikely in the next two years.
Exhibit 35: Inter-regional movement
% Consumption
Supply North East South West Central Total
North 84.4 0.1 0.0 1.5 14.0 100.0
East 0.1 92.5 0.9 3.5 3.0 100.0
South 0.1 1.4 87.5 11.0 0.0 100.0
West 2.1 2.0 10.9 84.0 1.0 100.0
Central 13.4 4.2 0.0 0.4 82.0 100.0
Source: Industry, Nirmal Bang Institutional Equities Research
Institutional Equities
22 Cement Sector
Indian cement industry continues to be fragmented
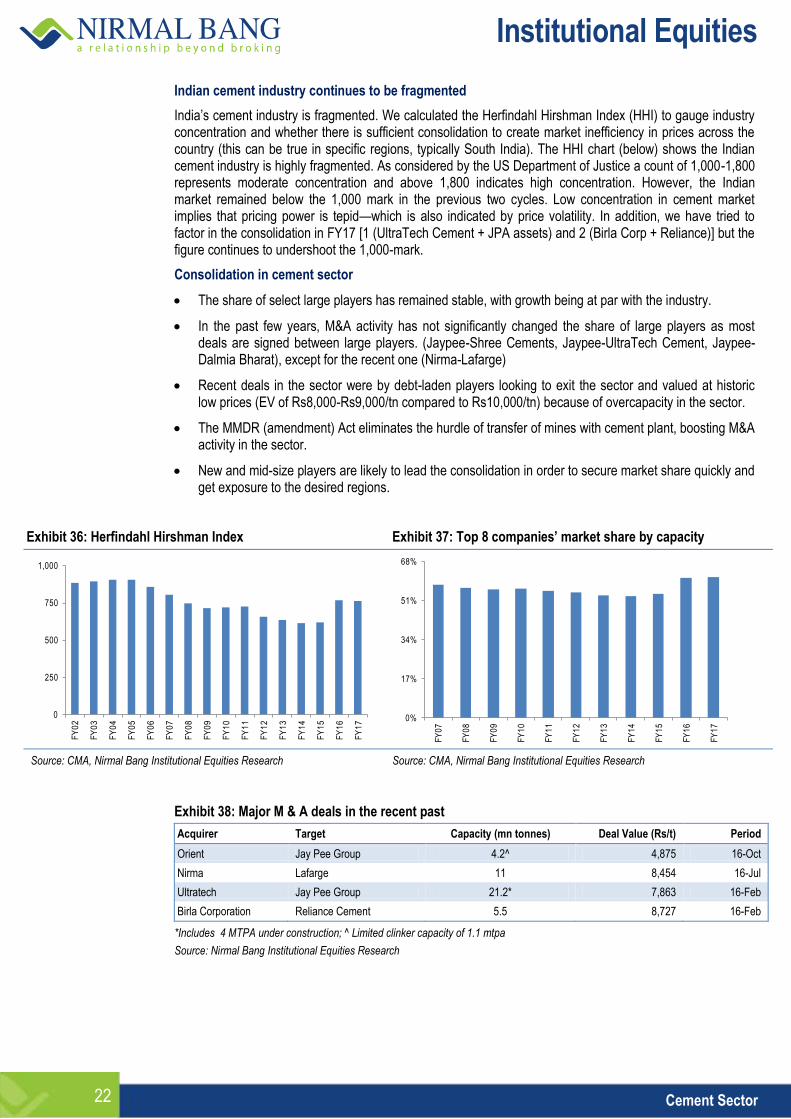
India’s cement industry is fragmented. We calculated the Herfindahl Hirshman Index (HHI) to gauge industry concentration and whether there is sufficient consolidation to create market inefficiency in prices across the country (this can be true in specific regions, typically South India). The HHI chart (below) shows the Indian cement industry is highly fragmented. As considered by the US Department of Justice a count of 1,000-1,800 represents moderate concentration and above 1,800 indicates high concentration. However, the Indian market remained below the 1,000 mark in the previous two cycles. Low concentration in cement market implies that pricing power is tepid—which is also indicated by price volatility. In addition, we have tried to factor in the consolidation in FY17 [1 (UltraTech Cement + JPA assets) and 2 (Birla Corp + Reliance)] but the figure continues to undershoot the 1,000-mark.
Consolidation in cement sector
The share of select large players has remained stable, with growth being at par with the industry.
In the past few years, M&A activity has not significantly changed the share of large players as most deals are signed between large players. (Jaypee-Shree Cements, Jaypee-UltraTech Cement, Jaypee-Dalmia Bharat), except for the recent one (Nirma-Lafarge)
Recent deals in the sector were by debt-laden players looking to exit the sector and valued at historic low prices (EV of Rs8,000-Rs9,000/tn compared to Rs10,000/tn) because of overcapacity in the sector.
The MMDR (amendment) Act eliminates the hurdle of transfer of mines with cement plant, boosting M&A activity in the sector.
New and mid-size players are likely to lead the consolidation in order to secure market share quickly and get exposure to the desired regions.
Exhibit 36: Herfindahl Hirshman Index Exhibit 37: Top 8 companies’ market share by capacity
Source: CMA, Nirmal Bang Institutional Equities Research Source: CMA, Nirmal Bang Institutional Equities Research
Exhibit 38: Major M & A deals in the recent past
Acquirer Target Capacity (mn tonnes) Deal Value (Rs/t) Period
Orient Jay Pee Group 4.2^ 4,875 16-Oct
Nirma Lafarge 11 8,454 16-Jul
Ultratech Jay Pee Group 21.2* 7,863 16-Feb
Birla Corporation Reliance Cement 5.5 8,727 16-Feb
*Includes 4 MTPA under construction; ^ Limited clinker capacity of 1.1 mtpa
Source: Nirmal Bang Institutional Equities Research
0
250
500
750
1,000
FY
02
FY
03
FY
04
FY
05
FY
06
FY
07
FY
08
FY
09
FY
10
FY
11
FY
12
FY
13
FY
14
FY
15
FY
16
FY
17 0%
17%
34%
51%
68%
FY
07
FY
08
FY
09
FY
10
FY
11
FY
12
FY
13
FY
14
FY
15
FY
16
FY
17
Institutional Equities
23 Cement Sector
GST likely to ease inter-regional movement impacting prices
With the introduction of GST, cement movement is likely to be relatively easy across states. Typically, for pan-India cement companies, this is likely to benefit and thus the reach of these companies across states will be higher. Their managements have indicated that the material impact of the benefits will emerge post four to six quarters. The GST rate is 28% which is close to the earlier tax outgo of ~ 28%-30%. Hence, there is no direct impact of GST which replaced the earlier tax regime.
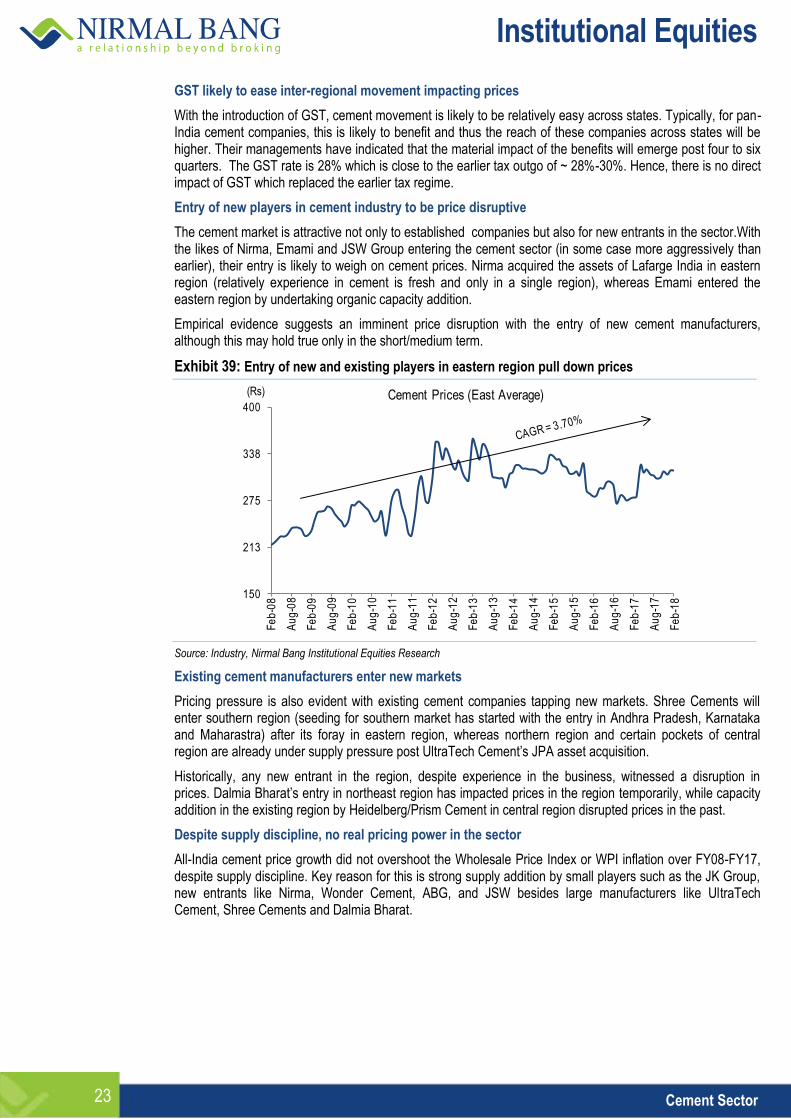
Entry of new players in cement industry to be price disruptive
The cement market is attractive not only to established companies but also for new entrants in the sector.With the likes of Nirma, Emami and JSW Group entering the cement sector (in some case more aggressively than earlier), their entry is likely to weigh on cement prices. Nirma acquired the assets of Lafarge India in eastern region (relatively experience in cement is fresh and only in a single region), whereas Emami entered the eastern region by undertaking organic capacity addition.
Empirical evidence suggests an imminent price disruption with the entry of new cement manufacturers, although this may hold true only in the short/medium term.
Exhibit 39: Entry of new and existing players in eastern region pull down prices
Source: Industry, Nirmal Bang Institutional Equities Research
Existing cement manufacturers enter new markets
Pricing pressure is also evident with existing cement companies tapping new markets. Shree Cements will enter southern region (seeding for southern market has started with the entry in Andhra Pradesh, Karnataka and Maharastra) after its foray in eastern region, whereas northern region and certain pockets of central region are already under supply pressure post UltraTech Cement’s JPA asset acquisition.
Historically, any new entrant in the region, despite experience in the business, witnessed a disruption in prices. Dalmia Bharat’s entry in northeast region has impacted prices in the region temporarily, while capacity addition in the existing region by Heidelberg/Prism Cement in central region disrupted prices in the past.
Despite supply discipline, no real pricing power in the sector
All-India cement price growth did not overshoot the Wholesale Price Index or WPI inflation over FY08-FY17, despite supply discipline. Key reason for this is strong supply addition by small players such as the JK Group, new entrants like Nirma, Wonder Cement, ABG, and JSW besides large manufacturers like UltraTech Cement, Shree Cements and Dalmia Bharat.
150
213
275
338
400
Fe
b-0
8
Au
g-0
8
Fe
b-0
9
Au
g-0
9
Fe
b-1
0
Au
g-1
0
Fe
b-1
1
Au
g-1
1
Fe
b-1
2
Au
g-1
2
Fe
b-1
3
Au
g-1
3
Fe
b-1
4
Au
g-1
4
Fe
b-1
5
Au
g-1
5
Fe
b-1
6
Au
g-1
6
Fe
b-1
7
Au
g-1
7
Fe
b-1
8
(Rs) Cement Prices (East Average)

Institutional Equities
24 Cement Sector
Exhibit 40: Al-India cement price movement vis-à-vis inflation
Source: Nirmal Bang Institutional Equities Research, Industry
Regional cement prices remain volatile and under pressure
Exhibit 41: Fragmented market adds further price volatility in northern region
Exhibit 42: Supply discipline help prices stay elevated amid volatility in southern region
Source: Nirmal Bang Institutional Equities Research, Industry Source: Nirmal Bang Institutional Equities Research, Industry
Exhibit 43: Central region to benefit from demand-supply parity
Exhibit 44: Prices under pressure in western region due to supply pressure from South India
Source: Nirmal Bang Institutional Equities Research, Industry Source: Nirmal Bang Institutional Equities Research, Industry
50
88
125
163
200
Jan
-08
Jun
-08
No
v-0
8
Ap
r-0
9
Se
p-0
9
Fe
b-1
0
Jul-1
0
De
c-1
0
Ma
y-1
1
Oct
-11
Ma
r-1
2
Au
g-1
2
Jan
-13
Jun
-13
No
v-1
3
Ap
r-1
4
Se
p-1
4
Fe
b-1
5
Jul-1
5
De
c-1
5
Ma
y-1
6
Oct
-16
Ma
r-1
7
Au
g-1
7
Jan
-18
(Rs) Cement prices and WPI
India Avg WPI *base 100
150
200
250
300
350
Fe
b-0
8
Au
g-0
8
Fe
b-0
9
Au
g-0
9
Fe
b-1
0
Au
g-1
0
Fe
b-1
1
Au
g-1
1
Fe
b-1
2
Au
g-1
2
Fe
b-1
3
Au
g-1
3
Fe
b-1
4
Au
g-1
4
Fe
b-1
5
Au
g-1
5
Fe
b-1
6
Au
g-1
6
Fe
b-1
7
Au
g-1
7
Fe
b-1
8
(Rs) Cement Prices (North Average)
150
213
275
338
400
Fe
b-0
8
Au
g-0
8
Fe
b-0
9
Au
g-0
9
Fe
b-1
0
Au
g-1
0
Fe
b-1
1
Au
g-1
1
Fe
b-1
2
Au
g-1
2
Fe
b-1
3
Au
g-1
3
Fe
b-1
4
Au
g-1
4
Fe
b-1
5
Au
g-1
5
Fe
b-1
6
Au
g-1
6
Fe
b-1
7
Au
g-1
7
Fe
b-1
8
(Rs) Cement Prices (South Average)
150
200
250
300
350
Fe
b-0
8
Au
g-0
8
Fe
b-0
9
Au
g-0
9
Fe
b-1
0
Au
g-1
0
Fe
b-1
1
Au
g-1
1
Fe
b-1
2
Au
g-1
2
Fe
b-1
3
Au
g-1
3
Fe
b-1
4
Au
g-1
4
Fe
b-1
5
Au
g-1
5
Fe
b-1
6
Au
g-1
6
Fe
b-1
7
Au
g-1
7
Fe
b-1
8
(Rs) Cement Prices (Central Average)
150
200
250
300
350
Fe
b-0
8
Au
g-0
8
Fe
b-0
9
Au
g-0
9
Fe
b-1
0
Au
g-1
0
Fe
b-1
1
Au
g-1
1
Fe
b-1
2
Au
g-1
2
Fe
b-1
3
Au
g-1
3
Fe
b-1
4
Au
g-1
4
Fe
b-1
5
Au
g-1
5
Fe
b-1
6
Au
g-1
6
Fe
b-1
7
Au
g-1
7
Fe
b-1
8
(Rs) Cement Prices (West Average)

Institutional Equities
25 Cement Sector
Exhibit 45: All India cement prices stayed volaltile, is expected to continue the trend
Source: Nirmal Bang Institutional Equities Research, Industry
150
200
250
300
350
Fe
b-0
8
Au
g-0
8
Fe
b-0
9
Au
g-0
9
Fe
b-1
0
Au
g-1
0
Fe
b-1
1
Au
g-1
1
Fe
b-1
2
Au
g-1
2
Fe
b-1
3
Au
g-1
3
Fe
b-1
4
Au
g-1
4
Fe
b-1
5
Au
g-1
5
Fe
b-1
6
Au
g-1
6
Fe
b-1
7
Au
g-1
7
Fe
b-1
8
(Rs) Cement Prices (India Avg)
Institutional Equities
26 Cement Sector
Cost inflation is key challenge in the next two years
Key input prices remain firm
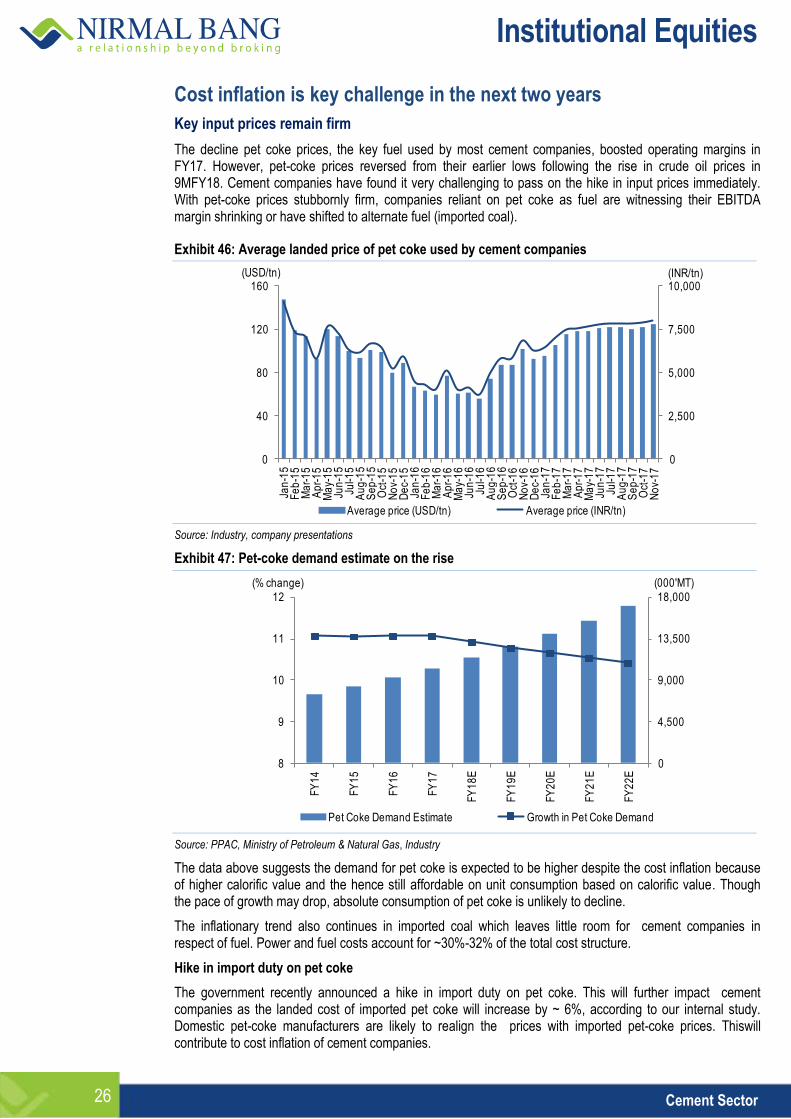
The decline pet coke prices, the key fuel used by most cement companies, boosted operating margins in FY17. However, pet-coke prices reversed from their earlier lows following the rise in crude oil prices in 9MFY18. Cement companies have found it very challenging to pass on the hike in input prices immediately. With pet-coke prices stubbornly firm, companies reliant on pet coke as fuel are witnessing their EBITDA margin shrinking or have shifted to alternate fuel (imported coal).
Exhibit 46: Average landed price of pet coke used by cement companies
Source: Industry, company presentations
Exhibit 47: Pet-coke demand estimate on the rise
Source: PPAC, Ministry of Petroleum & Natural Gas, Industry
The data above suggests the demand for pet coke is expected to be higher despite the cost inflation because of higher calorific value and the hence still affordable on unit consumption based on calorific value. Though the pace of growth may drop, absolute consumption of pet coke is unlikely to decline.
The inflationary trend also continues in imported coal which leaves little room for cement companies in respect of fuel. Power and fuel costs account for ~30%-32% of the total cost structure.
Hike in import duty on pet coke
The government recently announced a hike in import duty on pet coke. This will further impact cement companies as the landed cost of imported pet coke will increase by ~ 6%, according to our internal study. Domestic pet-coke manufacturers are likely to realign the prices with imported pet-coke prices. Thiswill contribute to cost inflation of cement companies.
0
2,500
5,000
7,500
10,000
0
40
80
120
160Ja
n-1
5F
eb
-15
Ma
r-1
5A
pr-
15
Ma
y-1
5Ju
n-1
5Ju
l-15
Au
g-1
5S
ep
-15
Oct
-15
No
v-1
5D
ec-
15
Jan
-16
Fe
b-1
6M
ar-
16
Ap
r-1
6M
ay-
16
Jun
-16
Jul-1
6A
ug
-16
Se
p-1
6O
ct-1
6N
ov-
16
De
c-1
6Ja
n-1
7F
eb
-17
Ma
r-1
7A
pr-
17
Ma
y-1
7Ju
n-1
7Ju
l-17
Au
g-1
7S
ep
-17
Oct
-17
No
v-1
7
(INR/tn)(USD/tn)
Average price (USD/tn) Average price (INR/tn)
0
4,500
9,000
13,500
18,000
8
9
10
11
12
FY
14
FY
15
FY
16
FY
17
FY
18
E
FY
19
E
FY
20
E
FY
21
E
FY
22
E
(000'MT)(% change)
Pet Coke Demand Estimate Growth in Pet Coke Demand

Institutional Equities
27 Cement Sector
Exhibit 48: Impact on pet-coke prices following the hike in import duty
Particulars Earlier, when import
duty was 2.5% Now, when import
duty is 10%
Buyiing price (US$/tn) 95.0 95.0
Import duty 2.4 9.5
Port handling charges (US$/tn) 3.0 3.0
Price at port (US$) 100.4 107.5
Exchange rate 65.0 65.0
Price at port (Rs/tn) 6,524.4 6,987.5
Freight cost (Rs/tn) 1,786.2 1,786.2
Landed cost (Itn) 8,310.6 8,773.7
Increase in pet-coke prices because of the increase in import duty (%)
5.6
Source: Industry
Cost of limestone – a key raw material -- likely to be challenging
The royalty rates for limestone have been reversed and are expected to be addressed on an ongoing basis— likely to bear another costing impact on cement companies. This will weigh on margins under weak demand circumstances.
Further, the recent bidding for limestone reserves indicates aggression by new/existing companies, thereby inflating the cost of limestone, the basic raw material, for cement manufacture. We have provided here a snapshot of the bidding and its impact on raw material cost for the industry.
The working details of limestone bids by the companies and the cost/tn that will be paid by two companies to the government is disclosed below:
Bidding at Nagaur by Emami Cement
Average price for the past 12 months of auction (pan India) as set by the IBM: Rs500/tn
Reserve price (5%*of average price = Rs500): Rs25/tn.
Final bidding for Nagaur limestone mine auction (64.48%* of average price by Emami): Rs322.4/tonne.
*Two blocks at Nagaur received bids at 67.94% and 60.09% and the weighted average rate was @ 64.48%
Royalty to be paid/tn: Rs80
Contribution to National Mineral Exploration Trust: 2% of royalty
District Magistrate Fund: 10% of royalty
Bidding at Chittorgarh by Dalmia Cement:
Average price for the past 12 months of auction (pan-India) as set by IBM: Rs500/tn
Reserve price (14%*of average price = Rs500): Rs70/tn
Final bidding for Chittorgarh limestone mine auction (48.94%* of average price): Rs244.7
Royalty to be paid/t: Rs80/tonne
Contribution to National Mineral Exploration Trust/t: 2% of royalty
DMF: 10% of royalty.

Institutional Equities
28 Cement Sector
Exhibit 49: Total cost/tn for these two companies following the bidding of limestone mines at Nagaur and Chittorgarh
Details Emami Dalmia
Reserve price (Rs/tn) 322.4 244.7
Royalty (Rs/tn) 80.0 80.0
Contribution to National Mineral Exploration Trust (Rs/tn) 1.6 1.6
DMF (Rs/tn) 8.0 8.0
Total (Rs/tn) (limestone cost/t for companies) 412.0 334.3
Source: Department of Mines & Geology, State of Rajasthan

Institutional Equities
29 Cement Sector
Valuation at a premium
We expect continued volatility in earnings of cement companies, given the persistent over-supply situation. We feel genuine pricing power will not return to cement manufacturers in FY19-FY20. This is despite the demand pick-up (from a weak base) expected in the next two years following the government’s thrust on infrastructure and low- cost housing. However, pricing spike with high volatility is likely because of supply discipline followed by cement companies. Strong predatory pricing may also contribute for the price increase, albeit for a short term.
Though the cement sector is likely to benefit from the government’s thrust on infrastructure, we feel the steep valuation premiums have factored in the same, leaving limited head room for surprises.
Industry RoE is under pressure and has eased from its peak. This is despite the fact that earnings are related largely to supply discipline leading to pricing defying demand-supply dynamics. Hence, we feel the valuations (earnings-based or asset-based) are unjustifiably higher.
Exhibit 50: P/E and RoE movement in divergent paths Exhibit 51: Valuation and EBITDAM moving in opposite directions
Source: Industry Source: Industry
With the realistic pricing power still away for the next two to three years, current cement pricing is clearly driven by supply discipline with supply matching demand. This implies that price discovery is far from demand-supply dynamics and driven by external factors (limited supply). However, with limited genuine pricing power, cement pricing will be erratic and non-sustainable as it will lack structural strength.
With limited pricing power and continued input cost pricing pressure, we expect high EBITDAM-based companies to shed margins or at best stay range-bound. Though earnings growth will be contributed by companies with capacity addition, margins will be under pressure (few companies on correction mode and with lower EBITDAM in the past will witness some improvement in margins). Effectively, we feel RoEs in mid/high-teens will be extremely difficult without supply discipline that is currently followed by cement manufacturers, given the demand-supply gap existing in the country.
Hence, we feel the valuations are higher as with capacity utilsiation hovering ~72% and expected to touch ~75% in the next two years, price discovery (pricing power) will continue to be artificial. Therefore, on premium product pricing (artificial), valuing the stocks at a premium will be clearly a double count.
There is no commodity space where commodities following supply discipline have been commanding higher valuations. Hence, we feel the Indian cement sector is in an unique position where:
Existing supply is higher than demand and is expected to remain that way for at least the next two years.
Despite the same, all companies are operating income positive.
Equity valuation of cement companies are at much higher multiples than what the replacement cost justifies.
Expensive from regional considerations too:
The table below points the gap between valuation of Indian companies and their Asian peers widening to double. Fundamentally, its Asian peers are on a better footing in terms of demand-supply fundamentals and valuations.
0
7
14
21
28
0
20
40
60
80
FY
08
FY
09
FY
10
FY
11
FY
12
FY
13
FY
14
FY
15
FY
16
FY
17
P/E (LHS) ROE (RHS)
(x) (%)
0
4
8
12
16
0
9
18
27
36
FY
08
FY
09
FY
10
FY
11
FY
12
FY
13
FY
14
FY
15
FY
16
FY
17
Operating Profit Margin (LHS) EV/EBITDA (RHS)
(%) (x)

Institutional Equities
30 Cement Sector
Exhibit 52: Peer group comparison in Asian region
Mkt. cap. (US$mn)
Share price (LC)
P/E (x) EPS CAGR (%) FY18E-
FY20E
EV/EBITDA(x) EBITDA CAGR (%)
FY18E-FY20E
P/BV(x) FY20E
RoE % FY20E FY19E FY20E FY19E FY20E
China
Anhui Conch Cement 26,978 32.2 9.8 9.2 16.5 6.1 6.0 25.7 1.5 16.3
China Resources Cement 4,711 5.6 8.9 8.9 18.8 6.5 6.6 53.6 1.1 12.7
West China Cement 895 1.3 7.1 6.4 9.6 4.1 4.0 279.5 0.7 10.6
ASEAN
Indocement Tunggal Prakarsa 5,414 20,250.0 29.7 24.4 -0.8 17.5 14.8 -7.6 2.6 10.7
Lafarge Malaysia 1,104 5.1 338.0 51.7 5.9 19.9 13.3 -2.3 1.5 3.2
Holcim Indonesia 459 825.0
49.9 8.4 11.4 8.1 0.0 0.8 1.5
Semen Indonesia Persero 4,567 10,625.0 21.4 17.2 10.2 11.7 10.0 -6.8 1.8 10.9
Taiwan Cement Corp 5,286 36.4 13.9 13.5 6.3 9.8 9.7 9.4 1.2 8.4
Siam Cement 18,598 486.0 10.9 10.4 2.1 9.2 8.8 -0.9 1.6 16.7
Asia Cement Corp (ACC) 3,173 27.6 14.7 14.0 2.8 13.3 13.9 18.3 0.7 4.8
India
UltraTech 17,241 4,110 39.5 30.7 24.4 17.7 15.4 17.0 3.5 11.9
Ambuja Cements 7,194 236 26.6 23.7 15.9 9.4 8.4 9.6 1.6 7.0
Shree Cement 8,588 16,096 33.2 28.6 19.8 17.9 15.9 16.4 4.5 17.2
ACC 4,427 1,545 28.3 24.2 20.9 13.0 11.5 10.3 2.7 12.0
Average - - 31.9 26.8 14.6 14.5 12.8 8.8 3.1 12.0
Source: Bloomberg, Nirnal Bang Institutional Equities Research

Institutional Equities
31 Cement Sector
We continue our negative view on the sector because of premium valuation commanded by cement companies though fundamentals are still far from improving (except for companies with EBITDA/EBITDAM correction, those moving from a lower base). The valuations are already factoring in the demand and the resultant earnings growth for the next two years. We have recommended to avoid companies with high debt, low on governance and premium valuations. We have Sell recommendation on JK Lakshmi Cement, Heidelberg Cement and India Cements sighting continuing margin pressure, higher debt (JKLC and ICEM), lack of cost efficiencies and higher valuations. We feel valuations are far stretched of Shree Cement and Dalmia Cement despite the challenges these companies are likely to counter in the next two years and hence have assigned a Sell rating. However, we prefer companies with cost efficiency, lower debt and better corporate governance. We have assigned a BUY rating on The Ramco Cements and JK Cement. In the small-cap space, we have a Buy recommendation on Sagar Cements. Among the large cap we have assigned ‘ACCUMULATE’ rating on Ultratech Cement. ACC and Ambuja continue to be in our dis-comfort zone due to structural weakness.
Key conclusions about cement sector for the next two years
Cement demand is likely to register high single-digit growth in the next two years (8% in FY19E/FY20E), expecting the current momentum to continue.
Eastern region to lead the growth pack, while revival in southern region will be the key positive. However, central region will be key beneficiary of demand-supply balance.
Demand to accelerate in the medium term till FY20, driven by numerous government-led initiatives.
We expect 30mtpa of capacity to be added till FY20E. However this is following 130mtpa added in the past five years (FY12-FY17). This implies the DD-SS gap to continue in the range of ~100mt-120mt.
Capacity utilisation will continue to remain at ~73%-75% at pan-India level in FY19E-FY20E. This implies the industry’s pricing power will not return in the next two years.
With active inter-regional movement and introduction of GST, the pressure on prices will continue.
Prices are expected to rise marginally by 2%, driven by northern and central regions; but high price volatility is a certainty. Supply discipline in southern region will keep prices elevated, albeit volatility in the region.
Pet coke and coal prices heading northward and will limit margins of cement companies.
Sell-off by debt-ridden players continues to drive deal activity in the sector, but no significant impact on prices likely.

Institutional Equities
32 Cement Sector
Annexure:
India has miles to go in terms of cement consumption
Low per-capita consumption leaves enough headroom for strong demand in India
Although India is the second-largest producer of cement and there is disconnect between GDP growth and cement output in recent years, the country has enough headroom to drive cement demand. This drive needs to be backed by prudent policy formulation and robust spending n by the state.
Exhibit 53: Main cement producers - G20 group
Country 2001 2007 2008 2009 2010 2011 2012 2013 2014 2015
China 661.0 1,361.2 1,388.4 1,644.0 1,881.9 2,063.2 2,137.0 2,359.0 2438.0 2,350.0
India
102.9 170.5 185.0 205.0 220.0 270.0 239.0 272.0 280.0 270.0
European Union e 225.6 269.1 250.8 209.0 192.1 191.6 170.5 157.5 165.8 172.0
USA
88.9 95.5 86.3 63.9 65.2 68.6 74.0 77.2 83.2 83.4
Brazil p 39.4 45.9 51.6 51.7 59.1 63.0 68.0 71.9 72.0 73.0
Turkey
30.0 49.3 51.4 54.0 62.7 63.4 63.8 70.8 72.6 72.8
Russian Federation p 28.7 59.9 53.5 44.3 50.4 56.1 53.0 55.6 68.4 69.0
Japan
79.5 71.4 67.6 59.6 56.6 56.4 59.3 61.7 61.9 59.5
Korea, Rep. of p 52.0 52.2 51.7 50.1 47.4 48.2 46.9 47.3 47.0 49.1
Saudi Arabia p 20.0 30.3 37.4 37.8 42.5 48.0 43.0 48.0 51.8 54.0
Indonesia p 31.1 35.0 38.5 36.9 39.5 45.2 53.5 52.0 54.2 54.4
Mexico p 33.2 38.8 37.1 35.1 34.5 35.4 36.8 37.0 39.4 40.0
Germany e 32.1 33.4 33.6 30.4 29.9 33.5 32.4 31.9 32.5 32.0
Italy
39.8 47.5 43.0 36.3 34.4 33.1 26.2 23.1 21.4 20.8
France 19.1 22.1 21.2 18.1 18.0 19.4 18.0 17.5 16.4 15.6
Canada
12.1 15.1 13.7 11.0 12.4 12.0 12.5 12.1 12.8 12.5
Argentina 5.5 9.6 9.7 9.4 10.4 11.6 10.7 11.9 11.8 12.2
South Africa p 8.4 13.7 13.4 11.8 10.9 11.2 13.8 14.9 13.8 14.0
Australia p 6.8 9.2 9.4 9.2 8.3 8.6 8.8 8.6 9.0 9.1
United Kingdom e 11.9 12.6 10.5 7.8 7.9 8.5 7.9 8.5 9.2 9.6
Notes: p: Preliminary - e: Estimate; Source: Cembureau
Even after seven decades of independence, and nearly two-and-a-half decades of globalisation, India is one of the lowest per capita consumer of cement, which clearly indicates that the space still requires sufficient infrastructure and housing push. Average consumption is just ~200kg/year compared to 1700 kg/year in China and 660kg/year in Vietnam (comparable developing economy). The global average consumption is far ahead at 580kg/year.
This leaves enough headroom for India’s cement demand to shore up on uptick in the economic cycle.
Exhibit 54: World cement production in 2015 by regions and main countries
Exhibit 55: Per capita cement consumption (kg)
Source: Cembureau Source: Cembureau, Company presentations
China , 57%Africa, 5%
USA, 2%
America (Excluding USA),
5%
Europe & Others, 8%
Asia (Excluding China & India),
17%
India , 7%
0
450
900
1,350
1,800
China Turkey Vietnam World Russia Brazil USA India
(Kg)

Institutional Equities
33 Cement Sector
Snapshot of Indian cement industry
With cement production capacity of 441mt in FY17, India is the second-largest cement producer in the world. In 2019, the country’s cement production capacity is expected to increase to 467.3mt, and likely to further increase to 484.1mt by 2020.
Of the total capacity, 98% lies with the private sector and the rest with the public sector, with top 20 companies accounting for ~70% of total production.
Significant concentration of the cement capacities is in southern and western regions largely due to bulk of limestone reserves in these regions.
Out of total 210 large cement plants in India, 77 are situated in Andhra Pradesh, Rajasthan and Tamil Nadu.

Institutional Equities
34 Cement Sector
Exhibit 56: Details of available limestone reserves (industry-wise & state-wise)
Grade/State (In '000 tonnes)
Reserves Remaining resources Total
Proved Probable Total Feasibility Pre-feasibility Measured Indicated Inferred Reconnaissance Total resources
STD111 STD121 STD122 (A) STD211 STD221 STD222 STD331 STD332 STD333 STD334 (B) (A+B)
All India: Total 9,438,939 3,015,917 3,880,897 16,335,753 4,870,440 48,527,013 8,623,172 7,111,337 22,629,060 130,787,772 8,014,504 186,888,998 203,224,752
By Grades
Cement (portland) 8,373,610 1,693,372 3,549,049 13,616,030 4,282,507 3,601,959 6,651,670 5,069,573 13,298,490 88,338,670 6,895,165 128,138,034 141,754,065
Cement (white) 133 23 115 270 4,730 3,054 2,702 117,000 0 2,231 0 129,716 129,986
Cement (Portland & white)
1,776 0 930 2,706 14,125 8,540 13,707 338,670 62,101 506,688 39,000 982,832 985,538
Cement (blendable/ beneficiable)
183,933 51,087 64,749 299,769 165,958 91,508 340,110 42,227 44,217 490,999 0 1,175,019 1,474,788
B.F. & cement mixed
49,731 208 35,456 85,394 1,040 26,623 6,308 3,869 45 89,942 0 127,828 213,222
Others 829,756 1,271,227 230,598 2,331,584 402,080 44,795,329 1,608,675 1,539,998 9,224,207 41,359,242 1,080,339 56,335,569 58,667,153
Source: Indian Bureau of Mines
Exhibit 57: Details of available limestone reserves (State-wise)
Grade/State (In '000 tonnes)
Reserves Remaining resources Total
Proved Probable Total Feasibility Pre-feasibility Measured Indicated Inferred Reconnaissance Total resources
STD111 STD121 STD122 (A) STD211 STD221 STD222 STD331 STD332 STD333 STD334 (B) (A+B)
Andhra Pradesh 1,003,483 19,713 385,133 1,408,329 269,901 53,722 706,890 82,112 268,002 18,666,131 3,466,741 23,513,499 24,921,828
Arunachal Pradesh 0 0 0 0 0 0 0 0 49,220 433,575 1 482,796 482,796
Assam 25,542 152,546 0 178,088 167,902 21,973 4,257 154,644 39,859 901,623 0 1,290,258 1,468,346
Bihar 12,410 0 306 12,715 3,096 2,558 1,405 67,926 38,210 724,118 10,558 847,872 860,588
Chhattisgarh 1,025,180 7,128 145,576 1,177,885 1,071,824 751,825 427,410 1,332,250 485,933 5,558,135 0 9,627,377 10,805,262
Daman & Diu 0 0 0 0 0 0 0 0 0 128,670 0 128,670 128,670
Gujarat 750,236 173,244 76,324 999,804 277,146 159,554 120,210 21,110 906,641 18,772,852 0 20,257,514 21,257,318
Haryana 0 0 0 0 1,425 15,507 3,382 0 2,200 52,163 0 74,677 74,677
Himachal Pradesh 555,180 209,851 69,908 834,938 191,300 327,757 40,840 1,530,937 26,121 3,234,938 37,339 5,389,231 6,224,169
Jammu & Kashmir 443,339 31,917 79,147 554,404 54,863 9,008 20,510 43,611 370 1,752,569 207,283 2,088,214 2,642,618
Jharkhand 88,172 0 29,116 117,288 95,008 13,529 29,265 89,572 13,220 354,319 11,803 606,715 724,003
Karnataka 461,049 2,154 1,113,795 1,576,998 497,136 559,903 1,355,522 1,572,501 13,920,771 34,952,588 0 52,858,420 54,435,419
Kerala 11,472 0 0 11,472 123,106 77 0 21,161 2,888 35,228 0 182,459 193,931
Madhya Pradesh 816,293 1,093,490 545,321 2,455,103 419,938 256,187 498,590 566,011 830,331 4,045,838 269,859 6,886,754 9,341,858
Maharashtra 424,035 143,115 39,905 607,055 583,978 206,162 136,835 28,595 234,518 1,056,168 0 2,246,255 2,853,310
Manipur 0 0 0 0 0 0 0 10,197 2,138 33,718 0 46,053 46,053
Meghalaya 135,836 87,904 1,822 225,562 68,457 39,289 46,200 464,670 2,811,179 14,048,758 0 17,478,553 17,704,116
Nagaland 0 0 0 0 825 0 0 0 1,005,500 745,875 0 1,752,200 1,752,200
Odisha 255,555 77,879 61,007 394,442 173,797 548,527 420,634 139,924 50,397 361,350 32,635 1,727,264 2,121,706
Puducherry 0 0 0 0 0 0 0 4,433 4,333 6,966 0 15,732 15,732
Rajasthan 2,471,143 933,889 863,351 4,268,382 367,799 1,538,090 4,529,048 596,071 761,855 11,365,794 939,808 20,098,465 24,366,847
Sikkim 0 0 0 0 0 0 0 0 0 2,380 0 2,380 2,380
Tamil Nadu 334,445 82,892 56,572 473,909 209,632 99,882 91,350 92,843 33,440 598,942 0 1,126,088 1,599,997
Telangana 625,569 195 400,766 1,026,529 254,912 28,110 92,020 113,416 921,577 11,710,694 3,038,478 16,159,208 17,185,736
Uttar Pradesh 0 0 12,849 12,849 33,360 129,180 38,375 142,763 40,000 31,200 0 414,878 427,727
Uttarakhand 0 0 0 0 5,035 91,872 60,429 29,486 164,879 1,191,059 0 1,542,760 1,542,760
West Bengal 0 0 0 0 0 0 0 7,104 15,482 22,120 0 44,706 44,706
Source: Indian Bureau of Mines

Institutional Equities
35 Cement Sector
This page has been intentionally left blank

Institutional Equities
36 Cement Sector
Company Section

Institutional Equities
Reuters: ACC.NS; Bloomberg: ACC IN
ACC
Initi
atin
g C
over
age
Volume Growth To Drive Performance ACC’s new 2.5mt capacity expansion at Jamul unit will aid volume and revenue traction in the next two years (previous capacity addition in CY11 pushed revenues in CY11/CY12 by 22%/18%, respectively). However, bunching of capacity in eastern region will weigh on realisation gain. In its other markets (particularly northern region) ACC continues to face severe competition and is losing market share (from double-digit to single-digit) to its peers. Steady improvement in operating efficiency will help in mitigating cost inflation. We expect limited traction in realisation because of infrastructure-driven demand and hence limited EBITDA margin traction. We have assigned Accumulate rating to ACC with a target price of Rs1,582/share.
Volume traction with capacity addition in eastern region: ACC’s eastern region expansion (added a clinkerisation unit of 2.0mt and 2.5 grinding capacity) will continue to help it in volume traction following the expected demand revival. This expansion helped ACC to break the volume decline trend (from 24.72mt to 22.99mt) of CY12-CY16 in CY17. We have assumed ~ 6%/7% volume growth for CY18/CY19, respectively, largely aided by expanded capacity.
Supply pressure in eastern region to keep realisation under pressure: Eastern region is expected to add ~20mt of incremental capacity in CY18E/CY19E. With supply from new (Emami) and aggressive manufacturers such as Shree Cements, we expect cement prices to be under pressure in eastern region. This region contributes ~25% to ACC’s revenues, given its strong presence. This, along with a declining market share in other regions (specifically northern region) will limit realisation gain to only 2%-3% in the next two years
Improving efficiency will help to relatively mitigate cost pressure: ACC’s cost/tn witnessed a CAGR of ~6% over CY11-CY16. However, ACC has shown efficiency by way of shift in its fuel mix (pet-coke usage of ~60% in CY17 vs. ~15% in CY15), raw material competency and savings in logistic costs. This will help ACC to relatively mitigate cost inflation. We expect limited margin gain because of restricted realisation gain, despite cost efficiency. We have estimated EBITDAM of 14.2%/14.6% for CY18/CY19, respectively.
Valuation, catalysts and risks: At the CMP of Rs1,549/share, ACC trades at an EV/tn of Rs7.9bn per mt, which we feel is a fair valuation. Despite its large size and strong brand, ACC’s key performance parameters, including cost curtailment and volume gain (market share) remained weak. Further, with the new master supply agreement with Ambuja Cements (ACL), we feel ACC will lose clinker to ACL, thereby further restricting volume traction. At the CMP, the stock trades at EV/EBITDA of 11.8x CY19E EBITDA. We have valued the stock at a replacement cost of Rs8.0bn, translating into an EV/EBITDA of 11.9x CY19E earnings. We reinitiate the coverage with an ACCUMULATE rating with a target price of Rs1,582/share.
ACCUMULATE
Sector: Cement
CMP: Rs1,549
Target Price: Rs1,582
Upside: 2%
Milind Raginwar Research Analyst [email protected] +91-22-6273 8172 Harshit Dhoot Research Associate [email protected] +91 22 6273 8111
Key Data
Current Shares O/S (mn) 187.8
Mkt Cap (Rsbn/US$bn) 291.0/4.5
52 Wk H / L (Rs) 1,870/1,380
Daily Vol. (3M NSE Avg.) 336,645
Share holding (%) 1QFY18 2QFY18 3QFY18
Promoter 54.5 54.5 54.5
Public 45.5 45.5 45.5
Others - - -
One -Year Indexed Stock Performance
Price Performance (%)
1 M 6 M 1 Yr
ACC (5.1) (8.2) 11.8
Nifty 50 Index (2.6) 1.5 12.0
Source: Bloomberg
Y/E December (Rsmn) CY15 CY16 CY17 CY18E CY19E
Net sales 114,328 109,364 129,310 139,480 150,084
EBITDA margin (%) 11.7 12.2 13.8 14.2 14.6
Adjusted net profit 7,447 6,452 8,312 10,364 12,155
vs consensus - - - (9.8) (11.4)
EPS (Rs) 39.6 34.3 44.2 55.1 64.7
Growth (%) (7.3) (13.4) 28.8 24.7 17.3
P/E (x) 39.4 45.5 35.3 28.3 24.2
P/B (x) 3.5 3.4 3.1 2.9 2.7
EV/EBITDA (x) 20.4 20.4 20.4 20.4 20.4
D/E (x) (0.2) (0.3) (0.5) (0.3) (0.4)
RoE (%) 9.2 7.6 9.3 11.1 12.0
RoCE (%) 11.3 10.2 13.7 14.6 15.1
Dividend yield (%) 1.1 1.1 1.2 1.2 1.2
Source: Company, Nirmal Bang Institutional Equities Research
90
100
110
120
130
Mar-17 May-17 Jul-17 Sep-17 Nov-17 Jan-18 Mar-18
ACC LTD Nifty 50
26 March 2018

Institutional Equities
ACC 38
Exhibit 1: Volume growth to be aided by new capacity Exhibit 2: EBITDAM lower than industry average
Source: Company, Nirmal Bang Institutional Equities Research Source: Company, Nirmal Bang Institutional Equities Research
Exhibit 3: Assumption table
CY18E YoY (%) CY19E YoY (%)
Volume (mn tonnes) 28 6.8 29 5.0
Realisation (Rs/tonne) 4,402.2 2.3 4,479.2 1.8
Power & Fuel Cost (per tonne) 1,115.7 8.7 1,192.5 6.9
Logistics Cost (per tonne) 1,201.4 2.0 1,234.4 2.8
Source: Company, Nirmal Bang Institutional Equities Research
Exhibit 4: Valuation charts
EV/EBITDA EV/tn
Source: Company, Nirmal Bang Institutional Equities Research Source: Company, Nirmal Bang Institutional Equities Research
EV/EBITDA EV/tn
Source: Company, Nirmal Bang Institutional Equities Research Source: Company, Nirmal Bang Institutional Equities Research
4,1
87
4,3
48
4,3
85
4,2
42
4,3
05
4,4
02
4,4
79
23.9 24.2 23.6 23.0
26.127.9
29.3
0
5
10
15
20
25
30
35
4,000
4,050
4,100
4,150
4,200
4,250
4,300
4,350
4,400
4,450
4,500
4,550
CY13 CY14 CY15 CY16 CY17 CY18E CY19E
(MT)(Rs/tn)
Realisation Volume
607
573
512
482
608
658
697
13.6
12.311.7 12.2
13.8 14.2 14.6
0
2
4
6
8
10
12
14
16
0
100
200
300
400
500
600
700
800
CY13 CY14 CY15 CY16 CY17 CY18E CY19E
(MT)(Rs/tn)
EBITDA/tn Margin
0
600
1,200
1,800
2,400
Jan
-06
Jul-0
6
Fe
b-0
7
Au
g-0
7
Ma
r-0
8
Oct
-08
Ap
r-0
9
No
v-0
9
Jun
-10
De
c-1
0
Jul-1
1
Fe
b-1
2
Au
g-1
2
Ma
r-1
3
Se
p-1
3
Ap
r-1
4
No
v-1
4
Ma
y-1
5
De
c-1
5
Jul-1
6
Jan
-17
Au
g-1
7
Ma
r-1
8
(Rs)
Price 8 12 14 16
0
600
1,200
1,800
2,400
3,000
Jan
-06
Jul-0
6
Fe
b-0
7
Au
g-0
7
Ma
r-0
8
Oct
-08
Ap
r-0
9
No
v-0
9
Jun
-10
De
c-1
0
Jul-1
1
Fe
b-1
2
Au
g-1
2
Ma
r-1
3
Se
p-1
3
Ap
r-1
4
No
v-1
4
Ma
y-1
5
De
c-1
5
Jul-1
6
Jan
-17
Au
g-1
7
Ma
r-1
8
(Rs)
Price $85 $110 $135 $160 $185
0
5
10
15
20
25
Jan
-06
Jul-0
6
Fe
b-0
7
Au
g-0
7
Ma
r-0
8
Oct
-08
Ap
r-0
9
No
v-0
9
Jun
-10
De
c-1
0
Jul-1
1
Fe
b-1
2
Au
g-1
2
Ma
r-1
3
Se
p-1
3
Ap
r-1
4
No
v-1
4
Ma
y-1
5
De
c-1
5
Jul-1
6
Jan
-17
Au
g-1
7
Ma
r-1
8
EV/EBITDA (X)
EV/EBIDTA Mean +1 SD -1 SD +2 SD -2 SD
0
50
100
150
200
250
300
Jan
-06
Jul-0
6
Fe
b-0
7
Au
g-0
7
Ma
r-0
8
Oct
-08
Ap
r-0
9
No
v-0
9
Jun
-10
De
c-1
0
Jul-1
1
Fe
b-1
2
Au
g-1
2
Ma
r-1
3
Se
p-1
3
Ap
r-1
4
No
v-1
4
Ma
y-1
5
De
c-1
5
Jul-1
6
Jan
-17
Au
g-1
7
Ma
r-1
8
EV/tonne (MT)
EV/tonne Mean +1 SD -1 SD +2 SD -2 SD

Institutional Equities
ACC 39
Financials
Exhibit 5: Income statement
Y/E December (Rsmn) CY15 CY16 CY17 CY18E CY19E
Net sales 114,328 109,364 129,310 139,480 150,084
Growth (%) (0.4) (4.3) 18.2 7.9 7.6
Operating expenses (102,292) (97,413) (113,756) (121,164) (129,763)
EBITDA 13,531 13,511 18,248 20,104 22,186
Growth (%) (5.1) (0.1) 35.1 10.2 10.4
Depreciation &amortisation (6,521) (6,052) (6,401) (6,663) (6,917)
EBIT 10,045 9,246 13,164 15,006 16,695
Other income 3,034 1,786 1,317 1,565 1,426
Interest paid (673) (729) (1,023) (905) (702)
Extraordinary/Exceptional items
PBT 7,840 8,089 12,983 14,100 15,993
Tax (1,924) (2,065) (3,829) (3,737) (3,838)
Effective tax rate (%) (24.5) (25.5) (29.5) (26.5) (24.0)
Net profit 5,916 6,024 9,154 10,364 12,155
Minority interest 0.0 0.0 0.0 0.0 0.0
Reported Net profit 5,916 6,024 9,154 10,364 12,155
Non-recurring items (1,532) (428) 842 0 0
Adjusted Net profit 7,447 6,452 8,312 10,364 12,155
Growth (%) (7.3) (13.4) 28.8 24.7 17.3
Source: Company, Nirmal Bang Institutional Equities Research
Exhibit 7: Balance sheet
Y/E December (Rsmn) CY15 CY16 CY17 CY18E CY19E
Cash & Bank balances 916 2,756 27,043 13,874 14,249
Other Current assets 48,205 52,085 44,517 59,713 71,697
Investments 2,725 2,302 2,302 2,302 2,302
Net fixed assets 75,970 76,606 74,201 78,581 77,464
Goodwill & intangible assets 590 626 826 1,026 1,126
Other non-current assets 0 0 0 0 0
Total assets 128,405 134,375 148,889 155,495 166,838
Current liabilities 38,931 41,679 49,229 49,493 52,411
Borrowings 355 500 592 525 750
Other non-current liabilities 4,692 5,581 5,414 5,414 5,414
Total liabilities 43,978 47,760 55,234 55,431 58,575
Share capital 1,880 1,880 1,880 1,880 1,880
Reserves & surplus 82,550 84,734 91,775 98,183 106,383
Shareholders' funds 84,427 86,614 93,655 100,063 108,263
Minority interest 0 0 0 0 0
Total equity & liabilities 128,404 134,375 148,889 155,495 166,838
Source: Company, Nirmal Bang Institutional Equities Research
Exhibit 6: Cash flow
Y/E December (Rsmn) CY15 CY16 CY17 CY18E CY19E
Pre-tax profit 7,840 8,089 12,983 14,100 15,993
Depreciation 7,151 5,406 6,401 6,663 6,917
Chg in working capital 3,429 3,107 7,378 (9,151) (2,797)
Total tax paid (1,865) (1,536) (3,788) (3,517) (3,608)
Other operating activities 0 0 0 0 0
Operating CF 16,555 15,066 22,974 8,096 16,505
Capital expenditure (8,581) (6,079) (4,197) (11,243) (5,900)
Chg in investments (3,687) (3,456) 7,349 (6,000) (6,500)
Other investing activities 0 0 0 0 0
Investing CF (12,267) (9,535) 3,152 (17,243) (12,400)
FCF 4,288 5,531 26,127 (9,147) 4,105
Equity raised/(repaid) 0 6 (1) 0 0
Debt raised/(repaid) 355 145 92 (67) 225
Dividend (incl. tax) (6,766) (3,842) (3,773) (3,955) (3,955)
Other financing activities (4) 4 1,842 0 0
Financing CF (6,415) (3,687) (1,841) (4,022) (3,730)
Net chg in cash & bank bal. (2,127) 1,844 24,286 (13,169) 375
Closing cash & bank bal 916 2,756 27,043 13,874 14,249
Source: Company, Nirmal Bang Institutional Equities Research
Exhibit 8: Key ratios
Y/E December CY15 CY16 CY17 CY18E CY19E
Profitability and return ratios (%)
EBITDAM 11.7 12.2 13.8 14.2 14.6
EBITM 8.7 8.3 10.0 10.6 11.0
NPM 6.5 5.9 6.4 7.4 8.1
RoE 9.2 7.6 9.3 11.1 12.0
RoCE 11.3 10.2 13.7 14.6 15.1
RoIC 11.0 10.1 15.0 17.3 17.8
Per share data (Rs)
O/s shares 187.9 187.9 187.9 187.9 187.9
EPS 39.6 34.3 44.2 55.1 64.7
FDEPS 39.6 34.3 44.2 55.2 64.7
CEPS 74.3 66.5 78.3 90.6 101.4
BV 449.2 460.7 498.2 532.3 575.9
DPS 17.0 17.0 18.0 18.0 18.0
Valuation ratios (x)
PE 39.4 45.5 35.3 28.3 24.2
P/BV 3.5 3.4 3.1 2.9 2.7
EV/EBITDA 20.4 20.0 13.9 13.0 11.5
EV/Sales 2.4 2.5 2.0 1.9 1.7
Other key ratios
D/E (x) (0.2) (0.3) (0.4) (0.3) (0.4)
DSO (days) 15 16 19 20 21
Du Pont Analysis - RoE
NPM (%) 6.5 5.9 6.4 7.4 8.1
Asset turnover (x) 0.9 0.8 0.9 1.0 1.0
Equity Multiplier (x) 1.5 1.5 1.6 1.6 1.6
RoE (%) 9.2 7.6 9.3 11.1 12.0
Source: Company, Nirmal Bang Institutional Equities Research

Institutional Equities
ACC 40
This page has been intentionally left blank
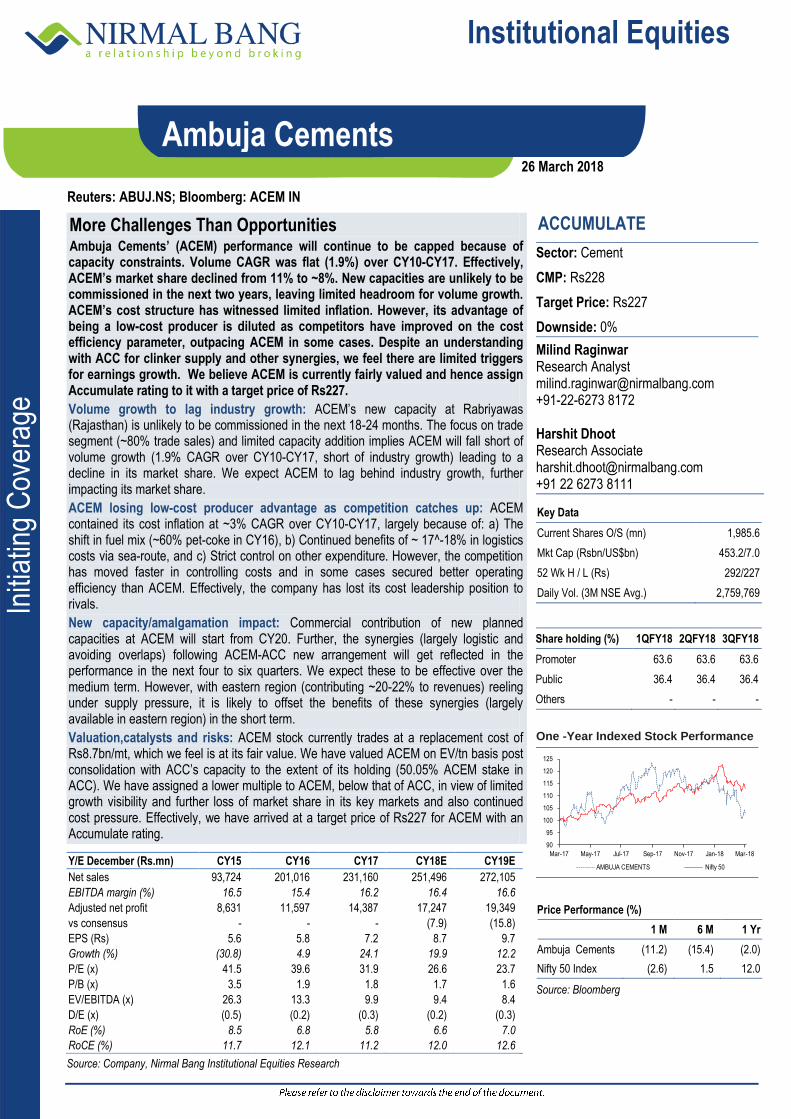
Institutional Equities
Reuters: ABUJ.NS; Bloomberg: ACEM IN
Ambuja Cements
Initi
atin
g C
over
age
More Challenges Than Opportunities Ambuja Cements’ (ACEM) performance will continue to be capped because of capacity constraints. Volume CAGR was flat (1.9%) over CY10-CY17. Effectively, ACEM’s market share declined from 11% to ~8%. New capacities are unlikely to be commissioned in the next two years, leaving limited headroom for volume growth. ACEM’s cost structure has witnessed limited inflation. However, its advantage of being a low-cost producer is diluted as competitors have improved on the cost efficiency parameter, outpacing ACEM in some cases. Despite an understanding with ACC for clinker supply and other synergies, we feel there are limited triggers for earnings growth. We believe ACEM is currently fairly valued and hence assign Accumulate rating to it with a target price of Rs227.
Volume growth to lag industry growth: ACEM’s new capacity at Rabriyawas (Rajasthan) is unlikely to be commissioned in the next 18-24 months. The focus on trade segment (~80% trade sales) and limited capacity addition implies ACEM will fall short of volume growth (1.9% CAGR over CY10-CY17, short of industry growth) leading to a decline in its market share. We expect ACEM to lag behind industry growth, further impacting its market share.
ACEM losing low-cost producer advantage as competition catches up: ACEM contained its cost inflation at ~3% CAGR over CY10-CY17, largely because of: a) The shift in fuel mix (~60% pet-coke in CY16), b) Continued benefits of ~ 17^-18% in logistics costs via sea-route, and c) Strict control on other expenditure. However, the competition has moved faster in controlling costs and in some cases secured better operating efficiency than ACEM. Effectively, the company has lost its cost leadership position to rivals.
New capacity/amalgamation impact: Commercial contribution of new planned capacities at ACEM will start from CY20. Further, the synergies (largely logistic and avoiding overlaps) following ACEM-ACC new arrangement will get reflected in the performance in the next four to six quarters. We expect these to be effective over the medium term. However, with eastern region (contributing ~20-22% to revenues) reeling under supply pressure, it is likely to offset the benefits of these synergies (largely available in eastern region) in the short term.
Valuation,catalysts and risks: ACEM stock currently trades at a replacement cost of Rs8.7bn/mt, which we feel is at its fair value. We have valued ACEM on EV/tn basis post consolidation with ACC’s capacity to the extent of its holding (50.05% ACEM stake in ACC). We have assigned a lower multiple to ACEM, below that of ACC, in view of limited growth visibility and further loss of market share in its key markets and also continued cost pressure. Effectively, we have arrived at a target price of Rs227 for ACEM with an Accumulate rating.
ACCUMULATE
Sector: Cement
CMP: Rs228
Target Price: Rs227
Downside: 0%
Milind Raginwar Research Analyst [email protected] +91-22-6273 8172 Harshit Dhoot Research Associate [email protected] +91 22 6273 8111
Key Data
Current Shares O/S (mn) 1,985.6
Mkt Cap (Rsbn/US$bn) 453.2/7.0
52 Wk H / L (Rs) 292/227
Daily Vol. (3M NSE Avg.) 2,759,769
Share holding (%) 1QFY18 2QFY18 3QFY18
Promoter 63.6 63.6 63.6
Public 36.4 36.4 36.4
Others - - -
One -Year Indexed Stock Performance
Price Performance (%)
1 M 6 M 1 Yr
Ambuja Cements (11.2) (15.4) (2.0)
Nifty 50 Index (2.6) 1.5 12.0
Source: Bloomberg
Y/E December (Rs.mn) CY15 CY16 CY17 CY18E CY19E
Net sales 93,724 201,016 231,160 251,496 272,105
EBITDA margin (%) 16.5 15.4 16.2 16.4 16.6
Adjusted net profit 8,631 11,597 14,387 17,247 19,349
vs consensus - - - (7.9) (15.8)
EPS (Rs) 5.6 5.8 7.2 8.7 9.7
Growth (%) (30.8) 4.9 24.1 19.9 12.2
P/E (x) 41.5 39.6 31.9 26.6 23.7
P/B (x) 3.5 1.9 1.8 1.7 1.6
EV/EBITDA (x) 26.3 13.3 9.9 9.4 8.4
D/E (x) (0.5) (0.2) (0.3) (0.2) (0.3)
RoE (%) 8.5 6.8 5.8 6.6 7.0
RoCE (%) 11.7 12.1 11.2 12.0 12.6
Source: Company, Nirmal Bang Institutional Equities Research
90
95
100
105
110
115
120
125
Mar-17 May-17 Jul-17 Sep-17 Nov-17 Jan-18 Mar-18
AMBUJA CEMENTS Nifty 50
26 March 2018

Institutional Equities
Ambuja Cements 42
Exhibit 1: No volume triggers in the near term for ACL Exhibit 2: Pressure on margins likely to ease as demand picks up
Source: Company, Nirmal Bang Institutional Equities Research Source: Company, Nirmal Bang Institutional Equities Research
Exhibit 3: Assumption table
CY18E YoY (%) CY19E YoY (%)
Volume (mn tonnes) 24 6.1 26 5.0
Realisation (Rs/tonne) 4587 3.8 4759 3.8
Power & Fuel Cost (per tonne) 991 2.0 1039 4.8
Logistics Cost (per tonne) 1216 2.4 1248 2.6
Source: Company, Nirmal Bang Institutional Equities Research
Exhibit 4: ACEM Target Valuations
ACEM Target Valuations (SA) CY15 CY16 CY17 CY18E CY19E
Target Replacement Cost ($) 150 150 150 150 150
Currency Assumption (Rs/$) 65 65 65 65 65
Target Replacement Cost (Rs) 9,750 9,750 9,750 9,750 9,750
Total Capacity (Mn Tonnes) 28.5 29.3 29.3 29.3 29.3
Target EV (Rs mn) 277,388 285,188 285,188 285,188 285,188
Total Net Debt (Rs mn) (49,390) (43,289) (45,887) (48,640) (51,558)
Target M-cap (Rs mn) 227,998 241,898 239,301 236,548 233,629
Total Equity Shares O/S (mn) 1,550 1,552 1,552 1,552 1,552
Target Price 147 156 154 152 151
CY15 CY16 CY17 CY18E CY19E
ACC Target M-cap 253,117 280,921 297,767 290,665 297,549
ACEM Holding in ACC (50.05%) 126,685 140,601 149,033 145,478 148,923
Holding Co discount (20%) 25,337 28,120 29,807 29,096 29,785
Total Equity Shares O/S (mn) 1,550 1,552 1,552 1,552 1,552
ACEM's value in ACC 65.4 72.5 76.8 75.0 76.8
Target Price 212.5 228.4 231.0 227.4 227.3
Source: Company, Nirmal Bang Institutional Equities Research
4,3
39
4,6
28
4,3
51
4,3
36
4,4
21
4,5
87
4,7
59
21.0 21.4 21.5 21.123.0
24.4
25.6
0
5
10
15
20
25
30
4,100
4,200
4,300
4,400
4,500
4,600
4,700
4,800
CY13 CY14 CY15 CY16 CY17 CY18E CY19E
(MT)(Rs/tn)
Realisation Volume
753
868
668
651
734
851
902
18.219.4
16.515.4 16.2 16.4 16.6
0
5
10
15
20
25
0
100
200
300
400
500
600
700
800
900
1,000
CY13 CY14 CY15 CY16 CY17 CY18E CY19E
(MT)(Rs/tn)
EBITDA/tn Margin

Institutional Equities
Ambuja Cements 43
Exhibit 5: Valuation charts
EV/EBITDA EV/tn
Source: Company, Nirmal Bang Institutional Equities Research Source: Company, Nirmal Bang Institutional Equities Research
EV/EBITDA EV/tn
Source: Company, Nirmal Bang Institutional Equities Research Source: Company, Nirmal Bang Institutional Equities Research
0
75
150
225
300
375
450
Jan
-06
Jul-0
6
Fe
b-0
7
Au
g-0
7
Ma
r-0
8
Oct
-08
Ap
r-0
9
No
v-0
9
Jun
-10
De
c-1
0
Jul-1
1
Fe
b-1
2
Au
g-1
2
Ma
r-1
3
Se
p-1
3
Ap
r-1
4
No
v-1
4
Ma
y-1
5
De
c-1
5
Jul-1
6
Jan
-17
Au
g-1
7
Ma
r-1
8
(Rs)
Price 5 9 13 17
0
100
200
300
400
500
Jan
-06
Jul-0
6
Fe
b-0
7
Au
g-0
7
Ma
r-0
8
Oct
-08
Ap
r-0
9
No
v-0
9
Jun
-10
De
c-1
0
Jul-1
1
Fe
b-1
2
Au
g-1
2
Ma
r-1
3
Se
p-1
3
Ap
r-1
4
No
v-1
4
Ma
y-1
5
De
c-1
5
Jul-1
6
Jan
-17
Au
g-1
7
Ma
r-1
8
(Rs)
Price $120 $160 $200 $240 $280
0
5
10
15
20
25
Jan
-06
Jul-0
6
Fe
b-0
7
Au
g-0
7
Ma
r-0
8
Oct
-08
Ap
r-0
9
No
v-0
9
Jun
-10
De
c-1
0
Jul-1
1
Fe
b-1
2
Au
g-1
2
Ma
r-1
3
Se
p-1
3
Ap
r-1
4
No
v-1
4
Ma
y-1
5
De
c-1
5
Jul-1
6
Jan
-17
Au
g-1
7
Ma
r-1
8
(x)
EV/EBIDTA (LHS) Mean +1SD -1SD +2SD -2SD
0
50
100
150
200
250
300
Jan
-06
Jul-0
6
Fe
b-0
7
Au
g-0
7
Ma
r-0
8
Oct
-08
Ap
r-0
9
No
v-0
9
Jun
-10
De
c-1
0
Jul-1
1
Fe
b-1
2
Au
g-1
2
Ma
r-1
3
Se
p-1
3
Ap
r-1
4
No
v-1
4
Ma
y-1
5
De
c-1
5
Jul-1
6
Jan
-17
Au
g-1
7
Ma
r-1
8
(MT)
EV/tonne Mean +1SD -1SD +2SD -2SD

Institutional Equities
Ambuja Cements 44
Financials
Exhibit 6: Income statement
Y/E December (Rsmn) CY15 CY16 CY17 CY18E CY19E
Net sales 93,724 201,016 231,160 251,496 272,105
Growth (%) (5.5) 114.5 15.0 8.8 8.2
Operating expenses (79,082) (172,264) (197,860) (213,650) (230,555)
EBITDA 15,573 31,251 38,124 41,925 45,825
Growth (%) (19.5) 100.7 22.0 10.0 9.3
Depreciation &amortisation (6,257) (14,632) (12,195) (11,975) (12,006)
EBIT 12,640 21,741 28,831 32,670 36,613
Other income 3,323 5,122 2,901 2,720 2,794
Interest paid (918) (1,405) (2,058) (2,085) (1,952)
Extraordinary/Exceptional items - - - - -
PBT 11,166 19,950 27,550 30,585 34,661
Tax (3,091) (5,760) (8,229) (8,284) (9,366)
Effective tax rate (%) (28) (29) (30) (27) (27)
Net profit 8,076 14,190 19,321 22,301 25,295
Minority interest 0 (2,979) (4,158) (5,054) (5,945)
Reported Net profit 8,076 11,211 15,164 17,247 19,349
Non-recurring items (556) (386) 777 0 0
Adjusted Net profit 8,631 11,597 14,387 17,247 19,349
Growth (%) (30.7) 34.4 24.1 19.9 12.2
Source: Company, Nirmal Bang Institutional Equities Research
Exhibit 8: Balance sheet
Y/E December (Rsmn) CY15 CY16 CY17 CY18E CY19E
Cash & Bank balances 28,484 16,962 62,315 44,497 51,328
Other Current assets 47,005 89,208 75,372 100,033 110,003
Investments 1,069 1,305 1,662 1,602 1,612
Net fixed assets 64,389 111,215 109,187 124,833 133,470
Goodwill & intangible assets 678 108,639 106,467 103,275 100,179
Other non-current assets 0 0 0 0 0
Total assets 141,625 327,329 355,004 374,241 396,591
Current liabilities 32,615 77,246 90,479 93,550 96,731
Borrowings 287 318 331 347 364
Other non-current liabilities 5,649 10,534 11,392 11,620 11,853
Total liabilities 38,551 88,097 102,202 105,518 108,949
Share capital 3,104 3,971 3,971 3,971 3,971
Reserves & surplus 99,965 191,483 202,751 213,485 226,321
Shareholders' funds 103,074 239,232 252,801 268,723 287,643
Minority interest 0 43,778 46,080 51,267 57,350
Total equity & liabilities 141,624 327,330 355,004 374,241 396,591
Source: Company, Nirmal Bang Institutional Equities Research
Exhibit 7: Cash flow
Y/E December (Rsmn) CY15 CY16 CY17 CY18E CY19E
Pre-tax profit 11,166 19,950 27,550 30,585 34,661
Depreciation 7,186 101,392 12,195 11,975 12,006
Chg in working capital (509) 1,849 21,891 (20,320) (5,355)
Total tax paid (586) 4,416 (8,948) (7,482) (8,531)
Other operating activities (1,066) 0 0 0 0
Operating CF 16,192 127,607 52,686 14,759 32,780
Capital expenditure (3,080) (256,179) (7,995) (24,429) (17,546)
Chg in investments (534) (5,690) 6,311 (1,938) (2,207)
Other investing activities 0 0 0 0 0
Investing CF (3,614) (261,869) (1,684) (26,367) (19,753)
FCF 12,578 (134,262) 51,002 (11,608) 13,027
Equity raised/(repaid) 346 110,435 0 0 0
Debt raised/(repaid) 4 32 12 17 17
Dividend (incl. tax) (8,939) (6,017) (6,416) (6,351) (6,344)
Other financing activities (85) (22,509) 2,609 (8) (8)
Financing CF (8,675) 122,740 (5,650) (6,210) (6,196)
Net chg in cash & bank bal. 3,903 (11,522) 45,353 (17,818) 6,831
Closing cash & bank bal 28,484 16,962 62,315 44,497 51,328
Source: Company, Nirmal Bang Institutional Equities Research
Exhibit 9: Key ratios
Y/E December CY15 CY16 CY17 CY18E CY19E
Profitability and return ratios (%)
EBITDAM 16.5 15.4 16.2 16.4 16.6
EBITM 13.4 10.7 12.2 12.8 13.2
NPM 9.2 5.8 6.2 6.9 7.1
RoE 8.5 6.8 5.8 6.6 7.0
RoCE 11.7 12.1 11.2 12.0 12.6
RoIC 15.3 10.7 8.7 10.6 11.7
Per share data (Rs)
O/s shares 1,551.9 1,985.7 1,985.7 1,985.7 1,985.7
EPS 5.6 5.8 7.2 8.7 9.7
FDEPS 5.6 5.8 6.3 7.7 9.0
CEPS 9.6 13.2 13.5 14.8 16.0
BV 66.5 120.5 125.8 133.4 142.6
DPS 2.8 2.8 2.8 2.8 2.8
Valuation ratios (x)
PE 41.5 39.6 31.9 26.6 23.7
P/BV 3.5 1.9 1.8 1.7 1.6
EV/EBITDA 26.3 13.3 9.9 9.4 8.4
EV/Sales 4.4 2.1 1.6 1.6 1.4
Other key ratios
D/E (x) -0.5 -0.2 -0.3 -0.2 -0.3
DSO (days) 11 14 14 14 14
Du Pont Analysis - RoE
NPM (%) 9.2 5.8 6.2 6.9 7.1
Asset turnover (x) 0.7 0.9 0.7 0.7 0.7
Equity Multiplier (x) 1.4 1.4 1.4 1.4 1.4
RoE (%) 8.5 6.8 5.8 6.6 7.0
Source: Company, Nirmal Bang Institutional Equities Research

Institutional Equities
Reuters: DALA.NS; Bloomberg: DBEL IN
Dalmia Bharat
Rei
nitia
ting
Cov
erag
e
Valuations far ahead of performance Dalmia Bharat’s (DBEL) revenue performance will continue to be healthy, led by operations in eastern region post merger of OCL. However, the pace will taper on an expanded base in FY19E/FY20E. Realisation gain will be capped with strong supply and demand from the infrastructure segment in markets catered to by DBEL. Revival in southern region (8% market share) will mean earnings growth, although this will also imply a challenge to the current operating efficiency driven by new units (southern region units are relatively aged). Further, DBEL primarily relies on pet-coke and with fuel prices reversing from their bottom and staying stubbornly high, will only add to concerns over maintaining the efficiency. This implies limited EBITDA margin expansion in FY19E/FY20E (hovering ~ 25%). Currently, the stock trades at a replacement cost of Rs13.0bn/mt which is 70% premium to the replacement cost of Rs7.0/bn/mnt far ahead of the earnings growth in the next two years. Hence, we have downgraded the stock from Accumulate to SELL rating to with a target price of Rs2,592/share.
Demand shift, higher supply in key markets: DBEL’s strong presence (~30%-35% dispatches) in eastern region with OCL Cement and its JaiPrakash Associates or JPA assets (40% of the capacity) contributed to its strong performance in 9MFY18. However, higher demand from the infrastructure segment will mean lack of pricing power. Also, capacity addition in the eastern region will further cap realisation gain in the next two years which will restrict top-line growth.
Volume gain in southern region, but pricing gain seen limited: The southern region is expected to gain pace with a strong infrastructure push, typically in Andhra Pradesh/Telangana (5.2% YoY growth in 3QFY18). However, the supply is ~ 2x of the current demand which will ensure limited pricing gain. DBEL’s 50% capacity is in southern region, currently operating at ~60%. Though enough headroom is available for volume gain, pricing gain will be limited in southern region.
Challenges in respect of operating margin expansion: DBEL primarily depends on pet-coke (100% in kilns) and has effectively contained its power costs in the past two years. However, reversing fuel (including pet-coke) prices, cost inflation in key raw material (fly ash and slag) and higher demand from infrastructure segment will imply major challenges to expand EBITDA margins in FY19/FY20. Raw material price inflation spiral (fly-ash/slag) will further add to the worries of the company.
Valuation, catalysts and risks: We feel higher demand from project segment and inflation in raw material and energy cost will imply EBITDAM hovering ~ 25%-26% with limited head room. The stock currently trades at a replacement cost of Rs13.3bn/mt which is 70% premium to the replacement cost of Rs7.0/bn/mnt far ahead of the earnings growth in FY19E/FY20E. The stock also trades at ~20% premium to mean EV/EBITDA valuation at 11.3x FY20E earnings. With limited EBITDA margins gain we feel this valuations ($200/t) are unsustainable. Hence we have Downgraded the stock to SELL from Accumulate rating on DBEL with a revised target price of Rs2,592/share (from Rs2,818 earlier).
SELL
Sector: Cement
CMP: Rs2,847
Target Price: Rs2,592
Downside: 9%
Milind Raginwar Research Analyst [email protected] +91-22-6273 8172 Harshit Dhoot Research Associate [email protected] +91 22 6273 8111
Key Data
Current Shares O/S (mn) 89.2
Mkt Cap (Rsbn/US$bn) 253.8/3.9
52 Wk H / L (Rs) 3,350/1,862
Daily Vol. (3M NSE Avg.) 151,746
Share holding (%) 1QFY18 2QFY18 3QFY18
Promoter 58.0 58.0 58.0
Public 38.8 38.4 38.4
Others 3.2 3.5 3.5
One -Year Indexed Stock Performance
Price Performance (%)
1 M 6 M 1 Yr
Dalmia Bharat 4.0 6.6 50.9
Nifty 50 Index (2.6) 1.5 12.0
Source: Bloomberg
Y/E March (Rsmn) FY16 FY17 FY18E FY19E FY20E
Net sales 64,380 74,044 86,792 98,054 105,762
EBITDA margin (%) 24.5 25.7 23.8 25.1 25.1
Adjusted net profit 1,908 2,937 5,498 7,075 8,031
vs consensus (%) - - - (23.1) (33.3)
EPS (Rs) 21.5 33.1 61.9 79.7 90.4
Growth (%) 1,950.3 53.9 87.2 28.7 13.5
P/E (x) 132.2 85.9 45.9 35.7 31.4
P/B (x) 8.7 7.5 8.9 8.2 7.8
EV/EBITDA (x) 19.6 15.8 14.4 12.1 11.2
D/E(x) 1.1 0.8 0.8 0.8 0.8
RoE (%) 4.0 5.1 9.7 12.8 13.9
RoCE (%) 9.3 10.3 11.8 14.5 15.6
Source: Company, Nirmal Bang Institutional Equities Research
708090
100110120130140150160170180
Mar-17 May-17 Jul-17 Sep-17 Nov-17 Jan-18 Mar-18
DALMIA BHARAT LT Nifty 50
26 March 2018
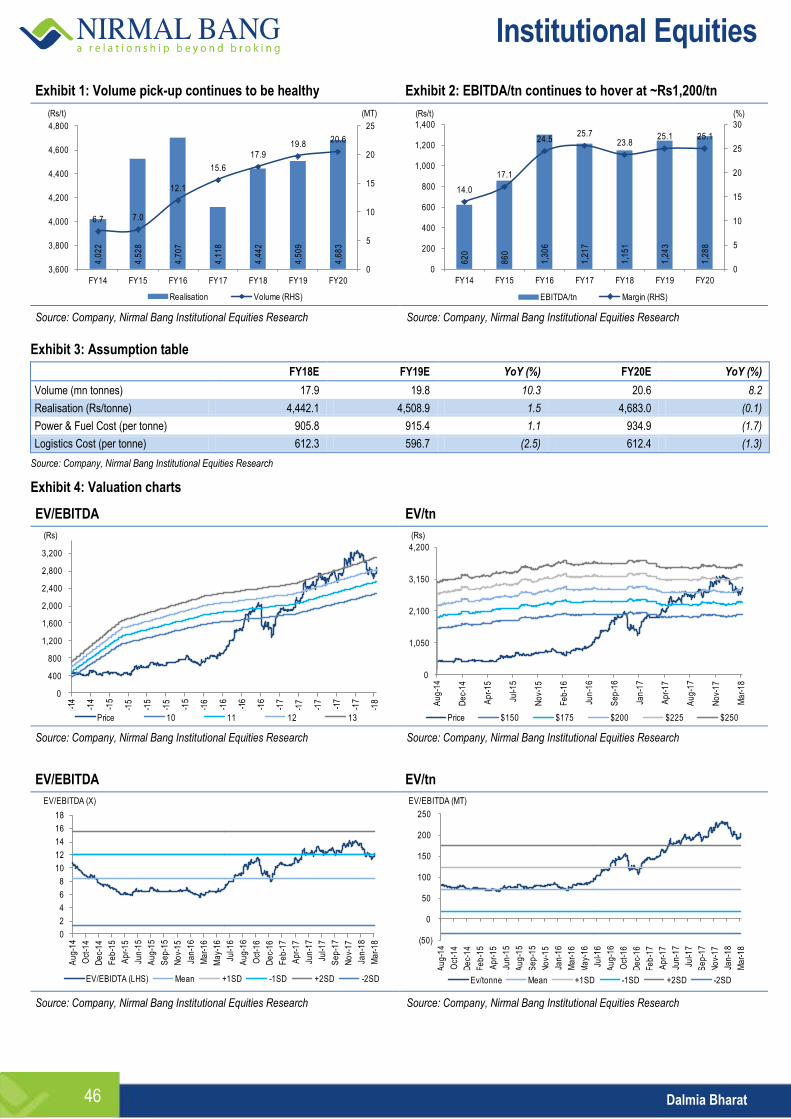
Institutional Equities
Dalmia Bharat 46
Exhibit 1: Volume pick-up continues to be healthy Exhibit 2: EBITDA/tn continues to hover at ~Rs1,200/tn
Source: Company, Nirmal Bang Institutional Equities Research Source: Company, Nirmal Bang Institutional Equities Research
Exhibit 3: Assumption table
FY18E FY19E YoY (%) FY20E YoY (%)
Volume (mn tonnes) 17.9 19.8 10.3 20.6 8.2
Realisation (Rs/tonne) 4,442.1 4,508.9 1.5 4,683.0 (0.1)
Power & Fuel Cost (per tonne) 905.8 915.4 1.1 934.9 (1.7)
Logistics Cost (per tonne) 612.3 596.7 (2.5) 612.4 (1.3)
Source: Company, Nirmal Bang Institutional Equities Research
Exhibit 4: Valuation charts
EV/EBITDA EV/tn
Source: Company, Nirmal Bang Institutional Equities Research Source: Company, Nirmal Bang Institutional Equities Research
EV/EBITDA EV/tn
Source: Company, Nirmal Bang Institutional Equities Research Source: Company, Nirmal Bang Institutional Equities Research
4,0
22
4,5
28
4,7
07
4,1
18
4,4
42
4,5
09
4,6
83
6.7 7.0
12.1
15.6
17.919.8
20.6
0
5
10
15
20
25
3,600
3,800
4,000
4,200
4,400
4,600
4,800
FY14 FY15 FY16 FY17 FY18 FY19 FY20
Realisation Volume (RHS)
(Rs/t) (MT)
62
0
86
0
1,3
06
1,2
17
1,1
51
1,2
43
1,2
88
14.0
17.1
24.525.7
23.825.1 25.1
0
5
10
15
20
25
30
0
200
400
600
800
1,000
1,200
1,400
FY14 FY15 FY16 FY17 FY18 FY19 FY20
EBITDA/tn Margin (RHS)
(Rs/t) (%)
0
400
800
1,200
1,600
2,000
2,400
2,800
3,200
Au
g-1
4
No
v-1
4
Fe
b-1
5
Ap
r-1
5
Jul-1
5
Oct
-15
De
c-1
5
Ma
r-1
6
Jun
-16
Au
g-1
6
No
v-1
6
Jan
-17
Ap
r-1
7
Jul-1
7
Se
p-1
7
De
c-1
7
Ma
r-1
8
(Rs)
Price 10 11 12 13
0
1,050
2,100
3,150
4,200
Au
g-1
4
De
c-1
4
Ap
r-1
5
Jul-1
5
No
v-1
5
Fe
b-1
6
Jun
-16
Se
p-1
6
Jan
-17
Ap
r-1
7
Au
g-1
7
No
v-1
7
Ma
r-1
8
(Rs)
Price $150 $175 $200 $225 $250
0
2
4
6
8
10
12
14
16
18
Au
g-1
4
Oct
-14
De
c-1
4
Fe
b-1
5
Ap
r-1
5
Jun
-15
Au
g-1
5
Se
p-1
5
No
v-1
5
Jan
-16
Ma
r-1
6
Ma
y-1
6
Jul-1
6
Au
g-1
6
Oct
-16
De
c-1
6
Fe
b-1
7
Ap
r-1
7
Jun
-17
Jul-1
7
Se
p-1
7
No
v-1
7
Jan
-18
Ma
r-1
8
EV/EBITDA (X)
EV/EBIDTA (LHS) Mean +1SD -1SD +2SD -2SD
(50)
0
50
100
150
200
250
Au
g-1
4
Oct
-14
De
c-1
4
Fe
b-1
5
Ap
r-1
5
Jun
-15
Au
g-1
5
Se
p-1
5
No
v-1
5
Jan
-16
Ma
r-1
6
Ma
y-1
6
Jul-1
6
Au
g-1
6
Oct
-16
De
c-1
6
Fe
b-1
7
Ap
r-1
7
Jun
-17
Jul-1
7
Se
p-1
7
No
v-1
7
Jan
-18
Ma
r-1
8
EV/EBITDA (MT)
Ev/tonne Mean +1SD -1SD +2SD -2SD

Institutional Equities
Dalmia Bharat 47
Financials
Exhibit 5: Income statement
Year ended March (Rsmn) FY16 FY17 FY18E FY19E FY20E
Net sales 64,380 74,044 86,792 98,054 105,762
Growth (%) 83.2 15.0 17.2 13.0 7.9
Operating expenses (48,593) (55,025) (66,145) (73,458) (79,231)
EBITDA 15,786 19,019 20,647 24,596 26,530
Growth (%) 162.0 20.5 8.6 19.1 7.9
Depreciation & Amortisation (4,528) (6,027) (6,234) (6,173) (6,071)
EBIT 11,259 12,992 14,414 18,424 20,459
Other income 1,642 2,477 2,789 2,389 2,546
Interest paid (7,256) (8,900) (6,805) (7,459) (7,523)
Extraordinary/Exceptional items 0 0 0 0 0
PBT 5,644 6,569 10,398 13,354 15,482
Tax (2,991) (2,762) (3,743) (4,841) (5,922)
Effective tax rate (%) (53.0) (42.0) (36.0) (36.3) (38.3)
Net profit 2,653 3,807 6,655 8,513 9,560
Minority interest (745) (870) (1,157) (1,439) (1,530)
Reported Net profit 1,908 2,937 5,498 7,075 8,031
Non-recurring items 0 0 0 0 0
Adjusted Net profit 1,908 2,937 5,498 7,075 8,031
Growth (%) 1,980.8 53.9 87.2 28.7 13.5
Source: Company, Nirmal Bang Institutional Equities Research
Exhibit 7: Balance sheet
Year ended March (Rsmn) FY16 FY17 FY18E FY19E FY20E
Cash & Bank Balances 2,336 1,750 1,035 1,757 2,135
Other Current assets 49,713 53,922 51,303 54,851 58,419
Investments 1,119 1,020 482 1,524 1,524
Net fixed assets 98,727 94,949 94,434 94,027 95,926
Goodwill & intangible assets 27,801 28,137 28,264 28,391 28,517
Other non-current assets 0 0 0 0 0
Total assets 179,696 179,778 175,519 180,550 186,522
Current liabilities 26,168 31,712 33,200 35,236 37,261
Borrowings 85,630 76,525 73,570 72,770 73,394
Other non-current liabilities 13,055 12,072 14,475 15,839 17,093
Total liabilities 124,852 120,308 121,245 123,845 127,748
Share capital 178 178 178 178 178
Reserves & surplus 49,407 53,163 47,661 49,770 51,500
Shareholders' funds 49,584 53,341 47,838 49,947 51,678
Minority interest 5,259 6,129 6,436 6,758 7,095
Total equity & liabilities 179,696 179,778 175,519 180,550 186,522
Source: Company, Nirmal Bang Institutional Equities Research
Exhibit 6: Cash flow
Year ended March (Rsmn) FY16 FY17 FY18E FY19E FY20E
Pre-tax profit 5,644 6,569 10,398 13,354 15,482
Depreciation (19,635) 6,021 5,612 5,396 5,294
Chg in working capital 6,548 2,201 4,307 (2,512) (653)
Total tax paid 9,749 (3,744) (1,339) (3,477) (4,558)
Other operating activities 0 0 0 0 0
Operating CF 2,306 11,047 18,978 12,761 15,565
Capital expenditure (9,874) (2,579) (5,224) (5,115) (7,320)
Chg in investments (9,616) (768) 337 (42) (1,000)
Other investing activities 0 0 (6,797) 951 0
Investing CF (19,489) (3,347) (11,683) (4,206) (8,320)
FCF (17,183) 7,700 7,294 8,555 7,245
Equity raised/(repaid) 6,191 37 0 0 0
Debt raised/(repaid) 3,603 (9,106) (2,955) (800) 625
Dividend (incl. tax) (269) (190) (190) (190) (190)
Other financing activities 4,714 973 (4,864) (6,844) (7,302)
Financing CF 14,238 (8,286) (8,009) (7,834) (6,867)
Net chg in cash & bank bal. (2,945) (586) (715) 722 378
Closing cash & bank bal. 2,336 1,750 1,035 1,757 2,135
Source: Company, Nirmal Bang Institutional Equities Research
Exhibit 8: Key ratios
Year ended March (Rsmn) FY16 FY17 FY18E FY19E FY20E
Profitability and Return ratios (%)
EBITDAM 24.5 25.7 23.8 25.1 25.1
EBITM 20.0 20.9 19.8 21.2 21.8
NPM 3.0 4.0 6.3 7.2 7.6
RoE 4.0 5.1 9.7 12.8 13.9
RoCE 9.3 10.3 11.8 14.5 15.6
RoIC 6.9 9.3 12.1 14.9 15.5
Per share data (Rs)
O/s shares 88.8 88.8 88.8 88.8 88.8
EPS 21.5 33.1 61.9 79.7 90.4
FDEPS 21.5 33.1 61.9 79.7 90.4
CEPS 72.5 100.9 132.1 149.2 158.8
BV 326.9 379.0 318.8 344.4 366.0
DPS 2.6 1.8 1.8 1.8 1.8
Valuation ratios (x)
PE 132.2 85.9 45.9 35.7 31.4
P/BV 8.7 7.5 8.9 8.2 7.8
EV/EBITDA 19.6 15.8 14.4 12.1 11.2
EV/Sales 4.8 4.1 3.4 3.0 2.8
Other key ratios
D/E (x) 1.1 0.8 0.8 0.8 0.8
DSO (days) 28.9 29.2 29.0 29.0 29.0
Du Pont Analysis - RoE
NPM (%) 3.0 4.0 6.3 7.2 7.6
Asset turnover (x) 0.4 0.4 0.5 0.6 0.6
Equity Multiplier (x) 3.4 3.1 3.1 3.2 3.2
RoE (%) 4.0 5.1 9.7 12.8 13.9
Source: Company, Nirmal Bang Institutional Equities Research

Institutional Equities
Dalmia Bharat 48
This page has been intentionally left blank

Institutional Equities
Reuters: HEID.NS; Bloomberg: HEIM IN
HeidelbergCement India
Rei
nitia
ting
Cov
erag
e
Limited Capacity To Cap Performance HeidelbergCement India or HEIM’s performance in FY19/FY20 will be largely driven by realisation gains in key markets if the economic conditions improve and lead to better demand. However, the shift in demand from housing to infrastructure constrains any healthy gains in realisation. HEIM is largely constrained by capacity (5.3mt capacity, we have factored only HEIM’s own capacity). This is spread across two regions (capacity utilisation was ~84% in FY17). Further, limited cost saving levers because of lack of captive power and benefits of waste heat recovery already reflected in its performance will also be the limiting factors. HEIM has limited headroom for incremental despatches as it moves towards 90% capacity utilisation. Further, aggressive cement manufacturers, like UltraTech Cement or UCL, are expanding in HEIM’s key markets, implying intense competition for HEIM. However, the central region offers better demand-supply dynamics (key HEIM markets are Uttar Pradesh and Madhya Pradesh) that will help margin improvement, albeit only limited. We have assigned 12% discount to the replacement cost to arrive at a fair valuation for HEIM. The stock currently trades at Rs7.42bn/mt EV/tn FY20E capacity which we feel is at a premium. Hence, we initiate coverage on the stock with a Sell rating and a target price of Rs126. At our target price, the stock trades at an EV/EBITDA multiple of 8.0x FY20E earnings.
Capacity constraints limits volume growth: HEIM‘s current capacity utilisation at ~84% (9MFY18) is identical with its FY17 capacity utilisation, indicating that capacity constraints have impacted its performance. We expect HEIM to surpass 90%+ in FY19E/FY20E. The company has not announced any capacity expansion plan yet, implying that capacity addition is unlikely in the next two years (assuming two years for completion of capacity, post announcement). Hence its volume growth will be capped in the next two years. This implies that given our growth assumption of 8%, HEIM will be lacking industry growth. Further, limited clinker capacity (despite assuming limited overshooting of optimum capacity) will impact HEIM’s volume gains. However, we have not factored in any inorganic growth in our estimates.
Higher competitive intensity in its home market: With the acquisition of JaiPrakash Associates’ or JPA’s assets, UltraTech Cement (UCL) entered central India market. Further, UCL intends to set up its greenfield capacity in west Madhya Pradesh. Incremental supply will flow in the market as under-utilised capacities move towards better utilisation. In addition, the combined presence of Birla Corporation and Reliance Cement will add to the competition. This is already being reflected in incremental supply in the region (in 9MFY18) that will keep realisation gains limited.
Limited cost control gains: With the full impact of 12MW waste heat recovery (WHR) plant factored in FY17 earnings and the fuel mix tilting towards pet coke (70%), we expect limited cost levers for HEIM. The captive power plant is not available with HEIM (unlikely to be available by FY20) as it sources power from external sources which is costlier and will keep its costs inflated.
Valuation, catalysts and risks: HEIM currently trades at a replacement cost of Rs7.4bn/mt which is at 20% premium to its mean valuation. We have assigned 12% discount to replacement cost of Rs7.5bn/mt to arrive at a fair value of HEIM at Rs6.5bn/mt. This is to factor in the company’s limited regional presence (despite healthy demand/supply dynamics, capacity constraints and competition post UCL’s acquisition of JPA assets in central India. We initiate coverage on HEIM with a target price of Rs126 and assigned Sell rating to it. At our target price, the stock trades at EV/EBITDA of 8.0x FY20E earnings. Key risks: Faster-than-expected demand growth and any inorganic expansion will be key risks to our rating and target price.
SELL
Sector: Cement
CMP: Rs153
Target Price: Rs126
Downside: 15%
Milind Raginwar Research Analyst [email protected] +91-22-6273 8172 Harshit Dhoot Research Associate [email protected] +91 22 6273 8111
Key Data
Current Shares O/S (mn) 226.6
Mkt Cap (Rsbn/US$mn) 33.8/520.4
52 Wk H / L (Rs) 190/109
Daily Vol. (3M NSE Avg.) 411,114
Share holding (%) 1QFY18 2QFY18 3QFY18
Promoter 69.4 69.4 69.4
Public 30.6 30.6 30.6
Others - - -
One -Year Indexed Stock Performance
Price Performance (%)
1 M 6 M 1 Yr
HeidelbergCement (2.4) 17.0 26.5
Nifty 50 Index (2.6) 1.5 12.0
Source: Bloomberg
Y/E March (Rsmn) FY16 FY17 FY18E FY19E FY20E
Net sales 16,281 16,876 18,465 20,089 21,270
EBITDA margin (%) 14.0 16.2 17.3 18.4 19.8
Adjusted net profit 354 762 1,019 1,372 1,672
vs consensus (%) - - - (26.4) (39.0)
EPS (Rs) 1.6 3.4 4.5 6.1 7.4
Growth (%) n/a 115.3 33.7 34.6 21.9
P/E (x) 96.7 44.9 33.6 24.9 20.5
P/B (x) 3.8 3.5 3.2 2.8 2.5
EV/EBITDA (x) 17.7 14.4 12.4 10.8 9.4
D/E (x) 0.8 0.6 0.6 0.5 0.4
RoE (%) 4.0 8.2 10.0 12.1 13.0
RoCE (%) 9.1 12.9 14.2 15.9 17.2
Dividend yield (%) 0.0 0.0 0.0 0.0 0.0
Source: Company, Nirmal Bang Institutional Equities Research
80
90
100
110
120
130
140
150
Mar-17 May-17 Jul-17 Sep-17 Nov-17 Jan-18 Mar-18
HEIDELBERGCEMENT Nifty 50
26 March 2018
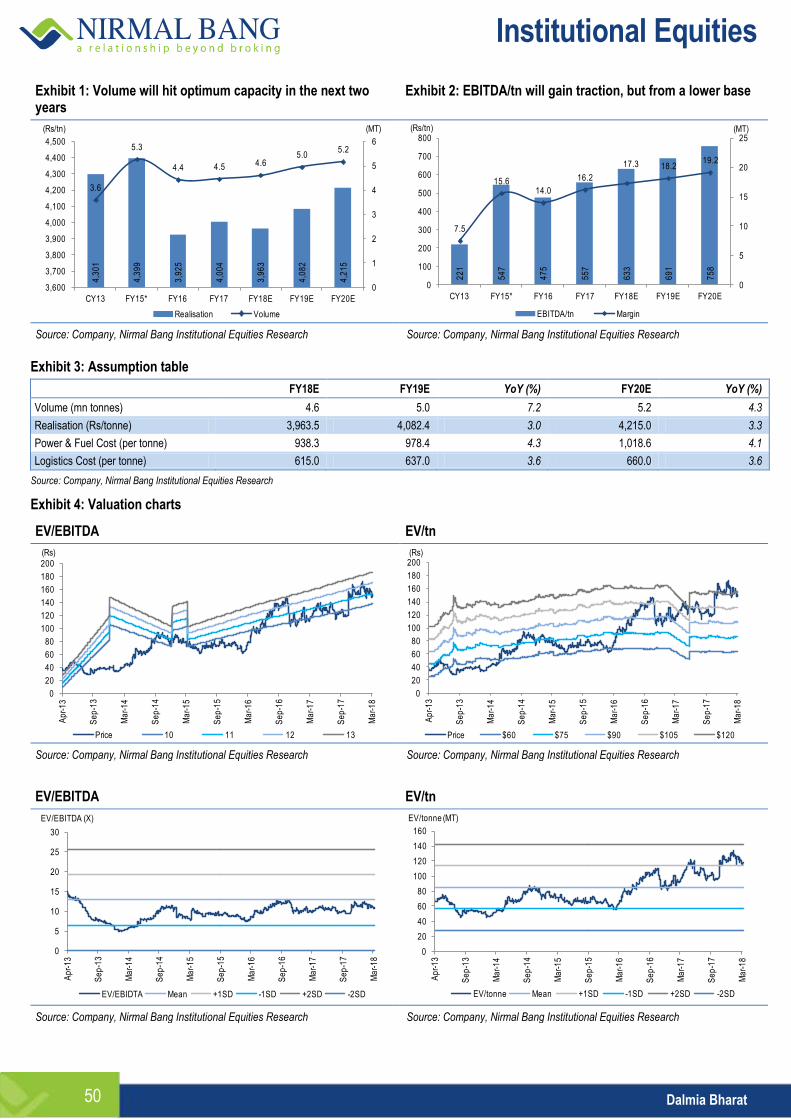
Institutional Equities
Dalmia Bharat 50
Exhibit 1: Volume will hit optimum capacity in the next two years
Exhibit 2: EBITDA/tn will gain traction, but from a lower base
Source: Company, Nirmal Bang Institutional Equities Research Source: Company, Nirmal Bang Institutional Equities Research
Exhibit 3: Assumption table
FY18E FY19E YoY (%) FY20E YoY (%)
Volume (mn tonnes) 4.6 5.0 7.2 5.2 4.3
Realisation (Rs/tonne) 3,963.5 4,082.4 3.0 4,215.0 3.3
Power & Fuel Cost (per tonne) 938.3 978.4 4.3 1,018.6 4.1
Logistics Cost (per tonne) 615.0 637.0 3.6 660.0 3.6
Source: Company, Nirmal Bang Institutional Equities Research
Exhibit 4: Valuation charts
EV/EBITDA EV/tn
Source: Company, Nirmal Bang Institutional Equities Research Source: Company, Nirmal Bang Institutional Equities Research
EV/EBITDA EV/tn
Source: Company, Nirmal Bang Institutional Equities Research Source: Company, Nirmal Bang Institutional Equities Research
4,3
01
4,3
99
3,9
25
4,0
04
3,9
63
4,0
82
4,2
15
3.6
5.3
4.4 4.5 4.65.0
5.2
0
1
2
3
4
5
6
3,600
3,700
3,800
3,900
4,000
4,100
4,200
4,300
4,400
4,500
CY13 FY15* FY16 FY17 FY18E FY19E FY20E
(MT)(Rs/tn)
Realisation Volume
22
1
54
7
47
5
55
7
63
3
69
1
75
8
7.5
15.614.0
16.2
17.3 18.219.2
0
5
10
15
20
25
0
100
200
300
400
500
600
700
800
CY13 FY15* FY16 FY17 FY18E FY19E FY20E
(MT)(Rs/tn)
EBITDA/tn Margin
0
20
40
60
80
100
120
140
160
180
200
Ap
r-1
3
Se
p-1
3
Ma
r-1
4
Se
p-1
4
Ma
r-1
5
Se
p-1
5
Ma
r-1
6
Se
p-1
6
Ma
r-1
7
Se
p-1
7
Ma
r-1
8
(Rs)
Price 10 11 12 13
0
20
40
60
80
100
120
140
160
180
200
Ap
r-1
3
Se
p-1
3
Ma
r-1
4
Se
p-1
4
Ma
r-1
5
Se
p-1
5
Ma
r-1
6
Se
p-1
6
Ma
r-1
7
Se
p-1
7
Ma
r-1
8
(Rs)
Price $60 $75 $90 $105 $120
0
5
10
15
20
25
30
Ap
r-1
3
Se
p-1
3
Ma
r-1
4
Se
p-1
4
Ma
r-1
5
Se
p-1
5
Ma
r-1
6
Se
p-1
6
Ma
r-1
7
Se
p-1
7
Ma
r-1
8
EV/EBITDA (X)
EV/EBIDTA Mean +1SD -1SD +2SD -2SD
0
20
40
60
80
100
120
140
160
Ap
r-1
3
Se
p-1
3
Ma
r-1
4
Se
p-1
4
Ma
r-1
5
Se
p-1
5
Ma
r-1
6
Se
p-1
6
Ma
r-1
7
Se
p-1
7
Ma
r-1
8
EV/tonne (MT)
EV/tonne Mean +1SD -1SD +2SD -2SD

Institutional Equities
Dalmia Bharat 51
Financials
Exhibit 5: Income statement
Year ended March (Rsmn) FY16 FY17 FY18E FY19E FY20E
Net sales 16,281 16,876 18,465 20,089 21,270
Growth (%) 1.2 3.7 9.4 8.8 5.9
Operating expenses (14,172) (14,386) (15,516) (16,646) (17,318)
EBITDA 2,312 2,789 3,256 3,760 4,278
Growth (%) (9.4) 20.6 16.8 15.5 13.8
Depreciation &amortisation (998) (992) (1,035) (1,023) (1,055)
EBIT 1,538 2,034 2,344 2,859 3,331
Other income 224 237 123 123 107
Interest paid (1,085) (898) (812) (804) (816)
Extraordinary/Exceptional items
PBT 454 1,136 1,532 2,055 2,514
Tax (100) (374) (513) (683) (842)
Effective tax rate (%) (22) (33) (34) (33) (34)
Net profit 354 762 1,019 1,372 1,672
Minority interest 0 0 0 0 0
Reported Net profit 354 762 1,019 1,372 1,672
Non-recurring items 0 0 0 0 0
Adjusted Net profit 354 762 1,019 1,372 1,672
Growth (%) n/a 115.3 33.7 34.6 21.9
Source: Company, Nirmal Bang Institutional Equities Research
Exhibit 7: Balance sheet
Year ended March (Rsmn) FY16 FY17 FY18E FY19E FY20E
Cash & Bank balances 78 142 591 259 548
Other Current assets 6,496 5,101 7,865 9,913 11,842
Investments 0 0 0 0 0
Net fixed assets 19,572 18,834 19,275 19,390 19,167
Goodwill & intangible assets 0 0 0 0 0
Other non-current assets (419) (530) (610) (670) (737)
Total assets 25,727 23,546 27,121 28,891 30,820
Current liabilities 9,914 7,797 9,755 10,268 10,735
Borrowings 6,864 6,080 6,678 6,563 6,353
Other non-current liabilities 0 0 0 0 0
Total liabilities 16,777 13,877 16,433 16,831 17,088
Share capital 2,266 2,266 2,266 2,266 2,266
Reserves & surplus 6,683 7,404 8,422 9,794 11,466
Shareholders' funds 8,950 9,670 10,689 12,060 13,732
Minority interest 0 0 0 0 0
Total equity & liabilities 25,727 23,547 27,121 28,891 30,820
Source: Company, Nirmal Bang Institutional Equities Research
Exhibit 6: Cash flow
Year ended March (Rsmn) FY16 FY17 FY18E FY19E FY20E
Pre-tax profit 454 1,136 1,532 2,055 2,514
Depreciation 993 988 1,035 1,023 1,055
Chg in working capital 1,186 (722) (806) (1,536) (1,462)
Total tax paid (152) (264) (434) (622) (775)
Other operating activities (70) (26) 0 0 0
Operating CF 2,411 1,113 1,327 920 1,332
Capital expenditure (1,377) (249) (1,477) (1,137) (832)
Chg in investments 0 0 0 0 0
Other investing activities 0 0 0 0 0
Investing CF (1,377) (249) (1,477) (1,137) (832)
FCF 1,034 864 (149) (217) 500
Equity raised/(repaid) 0 0 0 0 0
Debt raised/(repaid) (2,415) (784) 598 (115) (210)
Dividend (incl. tax) 0 0 0 0 0
Other financing activities (4) (16) 0 0 0
Financing CF (2,419) (800) 598 (115) (210)
Net chg in cash & bank bal. (1,385) 64 449 (332) 290
Closing cash & bank bal 78 142 591 259 548
Source: Company, Nirmal Bang Institutional Equities Research
Exhibit 8: Key ratios
Year ended March (Rsmn) FY16 FY17 FY18E FY19E FY20E
Profitability and return ratios (%)
EBITDAM 14.0 16.2 17.3 18.4 19.8
EBITM 9.3 11.8 12.5 14.0 15.4
NPM 2.2 4.5 5.5 6.8 7.9
RoE 4.0 8.2 10.0 12.1 13.0
RoCE 9.1 12.9 14.2 15.9 17.2
RoIC 7.3 8.5 9.3 10.5 11.3
Per share data (Rs)
O/s shares 226.6 226.6 226.6 226.6 226.6
EPS 1.6 3.4 4.5 6.1 7.4
FDEPS 1.6 3.4 4.5 6.1 7.4
CEPS 6.0 7.7 9.1 10.6 12.0
BV 39.4 42.7 47.2 53.2 60.6
DPS 0.0 0.0 0.0 0.0 0.0
Valuation ratios (x)
PE 96.7 44.9 33.6 24.9 20.5
P/BV 3.8 3.5 3.2 2.8 2.5
EV/EBITDA 17.7 14.4 12.4 10.8 9.4
EV/Sales 2.5 2.4 2.2 2.0 1.9
Other key ratios
D/E (x) 0.8 0.6 0.6 0.5 0.4
DSO (days) 6 3 9 9 9
Du Pont Analysis - RoE
NPM (%) 2.2 4.5 5.5 6.8 7.9
Asset turnover (x) 0.6 0.7 0.7 0.7 0.7
Equity Multipier (x) 3.0 2.6 2.5 2.5 2.3
RoE (%) 4.0 8.2 10.0 12.1 13.0
Source: Company, Nirmal Bang Institutional Equities Research

Institutional Equities
Dalmia Bharat 52
This page has been intentionally left blank
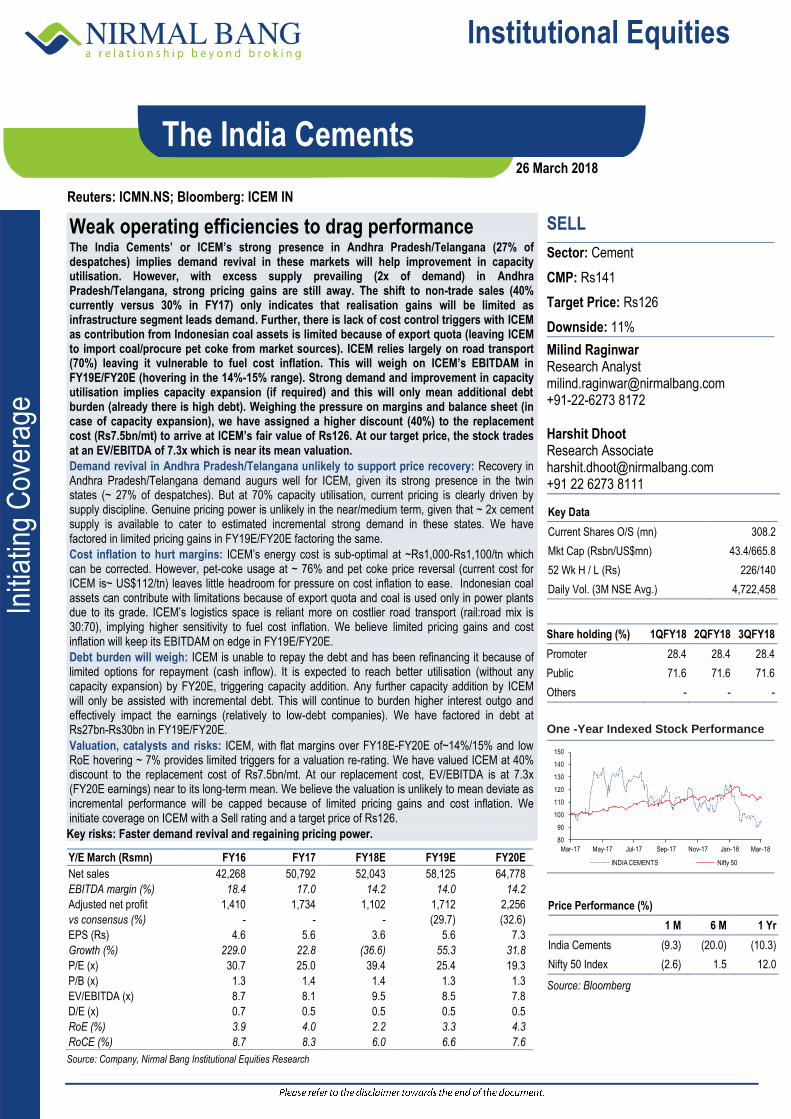
Institutional Equities
Reuters: ICMN.NS; Bloomberg: ICEM IN
The India Cements
Initi
atin
g C
over
age
Weak operating efficiencies to drag performance The India Cements’ or ICEM’s strong presence in Andhra Pradesh/Telangana (27% of despatches) implies demand revival in these markets will help improvement in capacity utilisation. However, with excess supply prevailing (2x of demand) in Andhra Pradesh/Telangana, strong pricing gains are still away. The shift to non-trade sales (40% currently versus 30% in FY17) only indicates that realisation gains will be limited as infrastructure segment leads demand. Further, there is lack of cost control triggers with ICEM as contribution from Indonesian coal assets is limited because of export quota (leaving ICEM to import coal/procure pet coke from market sources). ICEM relies largely on road transport (70%) leaving it vulnerable to fuel cost inflation. This will weigh on ICEM’s EBITDAM in FY19E/FY20E (hovering in the 14%-15% range). Strong demand and improvement in capacity utilisation implies capacity expansion (if required) and this will only mean additional debt burden (already there is high debt). Weighing the pressure on margins and balance sheet (in case of capacity expansion), we have assigned a higher discount (40%) to the replacement cost (Rs7.5bn/mt) to arrive at ICEM’s fair value of Rs126. At our target price, the stock trades at an EV/EBITDA of 7.3x which is near its mean valuation.
Demand revival in Andhra Pradesh/Telangana unlikely to support price recovery: Recovery in Andhra Pradesh/Telangana demand augurs well for ICEM, given its strong presence in the twin states (~ 27% of despatches). But at 70% capacity utilisation, current pricing is clearly driven by supply discipline. Genuine pricing power is unlikely in the near/medium term, given that ~ 2x cement supply is available to cater to estimated incremental strong demand in these states. We have factored in limited pricing gains in FY19E/FY20E factoring the same.
Cost inflation to hurt margins: ICEM’s energy cost is sub-optimal at ~Rs1,000-Rs1,100/tn which can be corrected. However, pet-coke usage at ~ 76% and pet coke price reversal (current cost for ICEM is~ US$112/tn) leaves little headroom for pressure on cost inflation to ease. Indonesian coal assets can contribute with limitations because of export quota and coal is used only in power plants due to its grade. ICEM’s logistics space is reliant more on costlier road transport (rail:road mix is 30:70), implying higher sensitivity to fuel cost inflation. We believe limited pricing gains and cost inflation will keep its EBITDAM on edge in FY19E/FY20E.
Debt burden will weigh: ICEM is unable to repay the debt and has been refinancing it because of limited options for repayment (cash inflow). It is expected to reach better utilisation (without any capacity expansion) by FY20E, triggering capacity addition. Any further capacity addition by ICEM will only be assisted with incremental debt. This will continue to burden higher interest outgo and effectively impact the earnings (relatively to low-debt companies). We have factored in debt at Rs27bn-Rs30bn in FY19E/FY20E.
Valuation, catalysts and risks: ICEM, with flat margins over FY18E-FY20E of~14%/15% and low RoE hovering ~ 7% provides limited triggers for a valuation re-rating. We have valued ICEM at 40% discount to the replacement cost of Rs7.5bn/mt. At our replacement cost, EV/EBITDA is at 7.3x (FY20E earnings) near to its long-term mean. We believe the valuation is unlikely to mean deviate as incremental performance will be capped because of limited pricing gains and cost inflation. We initiate coverage on ICEM with a Sell rating and a target price of Rs126.
Key risks: Faster demand revival and regaining pricing power.
SELL
Sector: Cement
CMP: Rs141
Target Price: Rs126
Downside: 11%
Milind Raginwar Research Analyst [email protected] +91-22-6273 8172 Harshit Dhoot Research Associate [email protected] +91 22 6273 8111
Key Data
Current Shares O/S (mn) 308.2
Mkt Cap (Rsbn/US$mn) 43.4/665.8
52 Wk H / L (Rs) 226/140
Daily Vol. (3M NSE Avg.) 4,722,458
Share holding (%) 1QFY18 2QFY18 3QFY18
Promoter 28.4 28.4 28.4
Public 71.6 71.6 71.6
Others - - -
One -Year Indexed Stock Performance
Price Performance (%)
1 M 6 M 1 Yr
India Cements (9.3) (20.0) (10.3)
Nifty 50 Index (2.6) 1.5 12.0
Source: Bloomberg
Y/E March (Rsmn) FY16 FY17 FY18E FY19E FY20E
Net sales 42,268 50,792 52,043 58,125 64,778
EBITDA margin (%) 18.4 17.0 14.2 14.0 14.2
Adjusted net profit 1,410 1,734 1,102 1,712 2,256
vs consensus (%) - - - (29.7) (32.6)
EPS (Rs) 4.6 5.6 3.6 5.6 7.3
Growth (%) 229.0 22.8 (36.6) 55.3 31.8
P/E (x) 30.7 25.0 39.4 25.4 19.3
P/B (x) 1.3 1.4 1.4 1.3 1.3
EV/EBITDA (x) 8.7 8.1 9.5 8.5 7.8
D/E (x) 0.7 0.5 0.5 0.5 0.5
RoE (%) 3.9 4.0 2.2 3.3 4.3
RoCE (%) 8.7 8.3 6.0 6.6 7.6
Source: Company, Nirmal Bang Institutional Equities Research
80
90
100
110
120
130
140
150
Mar-17 May-17 Jul-17 Sep-17 Nov-17 Jan-18 Mar-18
INDIA CEMENTS Nifty 50
26 March 2018

Institutional Equities
The India Cements 54
Exhibit 1: Volume gains backed by expected demand revival Exhibit 2: Limited margin gains because of stressed operating efficiency
Source: Company, Nirmal Bang Institutional Equities Research Source: Company, Nirmal Bang Institutional Equities Research
Exhibit 3: Assumption table
FY18E FY19E YoY (%) FY20E YoY (%)
Volume (mn tonnes) 10.9 11.9 8.7 12.9 8.7
Realisation (Rs/tonne) 4,622.8 4,756.9 2.9 4,887.7 2.8
Power & Fuel Cost (per tonne) 832.8 856.3 2.8 876.5 2.4
Logistics Cost (per tonne) 1,075.0 1,107.3 3.0 1,140.5 3.0
Source: Company, Nirmal Bang Institutional Equities Research
Exhibit 4: Valuation charts
EV/EBITDA EV/tn
Source: Company, Nirmal Bang Institutional Equities Research Source: Company, Nirmal Bang Institutional Equities Research
EV/EBITDA EV/tn
Source: Company, Nirmal Bang Institutional Equities Research Source: Company, Nirmal Bang Institutional Equities Research
4,1
68
4,5
52
4,7
53
4,6
34
4,6
23
4,7
57
4,8
88
9.8
8.6 8.59.5
10.911.9
12.9
0
2
4
6
8
10
12
14
3,800
4,000
4,200
4,400
4,600
4,800
5,000
FY14 FY15 FY16 FY17 FY18E FY19E FY20E
(MT)(Rs/tn)
Realisation Volume
50
3
74
9
88
7
88
3
65
2
66
4
69
3
12.2
15.6
18.417.0
14.2 14.0 14.2
0
2
4
6
8
10
12
14
16
18
20
0
100
200
300
400
500
600
700
800
900
1,000
FY14 FY15 FY16 FY17 FY18E FY19E FY20E
(MT)(Rs/tn)
EBITDA/tn Margin
0
50
100
150
200
250
300
350
400
Ap
r-0
9
Oct
-09
Ma
y-1
0
De
c-1
0
Jun
-11
Jan
-12
Au
g-1
2
Fe
b-1
3
Se
p-1
3
Ap
r-1
4
No
v-1
4
Ma
y-1
5
De
c-1
5
Jul-1
6
Jan
-17
Au
g-1
7
Ma
r-1
8
(Rs)
Price 7 10 12 14
0
50
100
150
200
250
300
350
Ap
r-0
9
Oct
-09
Ma
y-1
0
De
c-1
0
Jun
-11
Jan
-12
Au
g-1
2
Fe
b-1
3
Se
p-1
3
Ap
r-1
4
No
v-1
4
Ma
y-1
5
De
c-1
5
Jul-1
6
Jan
-17
Au
g-1
7
Ma
r-1
8
(Rs)
Price $45 $60 $75 $90 $105
0
2
4
6
8
10
12
14
16
18
20
Ap
r-0
9
Oct
-09
Ma
y-1
0
De
c-1
0
Jun
-11
Jan
-12
Au
g-1
2
Fe
b-1
3
Se
p-1
3
Ap
r-1
4
No
v-1
4
Ma
y-1
5
De
c-1
5
Jul-1
6
Jan
-17
Au
g-1
7
Ma
r-1
8
EV/EBITDA (X)
EV/EBIDTA Mean +1SD -1SD +2SD -2SD
(50)
0
50
100
150
200
250
Ap
r-0
9
Oct
-09
Ma
y-1
0
De
c-1
0
Jun
-11
Jan
-12
Au
g-1
2
Fe
b-1
3
Se
p-1
3
Ap
r-1
4
No
v-1
4
Ma
y-1
5
De
c-1
5
Jul-1
6
Jan
-17
Au
g-1
7
Ma
r-1
8
EV/Tonne (MT)
EV/tonne Mean +1SD -1SD +2SD -2SD
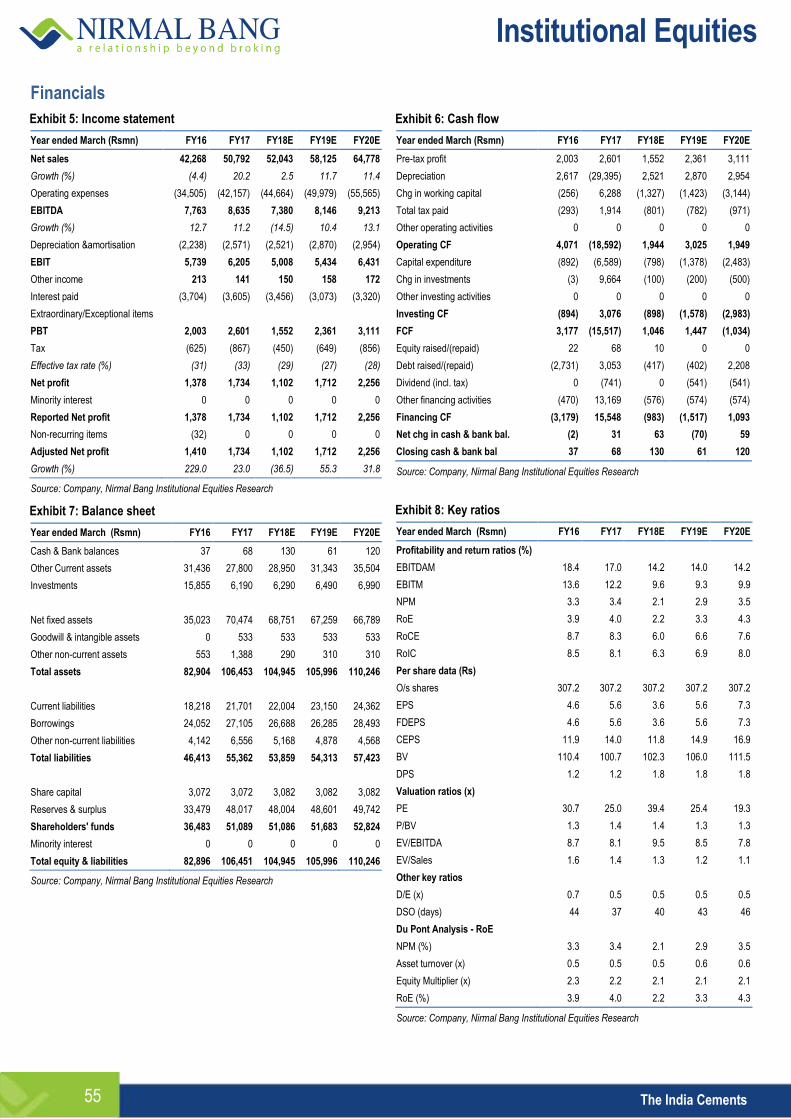
Institutional Equities
The India Cements 55
Financials
Exhibit 5: Income statement
Year ended March (Rsmn) FY16 FY17 FY18E FY19E FY20E
Net sales 42,268 50,792 52,043 58,125 64,778
Growth (%) (4.4) 20.2 2.5 11.7 11.4
Operating expenses (34,505) (42,157) (44,664) (49,979) (55,565)
EBITDA 7,763 8,635 7,380 8,146 9,213
Growth (%) 12.7 11.2 (14.5) 10.4 13.1
Depreciation &amortisation (2,238) (2,571) (2,521) (2,870) (2,954)
EBIT 5,739 6,205 5,008 5,434 6,431
Other income 213 141 150 158 172
Interest paid (3,704) (3,605) (3,456) (3,073) (3,320)
Extraordinary/Exceptional items
PBT 2,003 2,601 1,552 2,361 3,111
Tax (625) (867) (450) (649) (856)
Effective tax rate (%) (31) (33) (29) (27) (28)
Net profit 1,378 1,734 1,102 1,712 2,256
Minority interest 0 0 0 0 0
Reported Net profit 1,378 1,734 1,102 1,712 2,256
Non-recurring items (32) 0 0 0 0
Adjusted Net profit 1,410 1,734 1,102 1,712 2,256
Growth (%) 229.0 23.0 (36.5) 55.3 31.8
Source: Company, Nirmal Bang Institutional Equities Research
Exhibit 7: Balance sheet
Year ended March (Rsmn) FY16 FY17 FY18E FY19E FY20E
Cash & Bank balances 37 68 130 61 120
Other Current assets 31,436 27,800 28,950 31,343 35,504
Investments 15,855 6,190 6,290 6,490 6,990
Net fixed assets 35,023 70,474 68,751 67,259 66,789
Goodwill & intangible assets 0 533 533 533 533
Other non-current assets 553 1,388 290 310 310
Total assets 82,904 106,453 104,945 105,996 110,246
Current liabilities 18,218 21,701 22,004 23,150 24,362
Borrowings 24,052 27,105 26,688 26,285 28,493
Other non-current liabilities 4,142 6,556 5,168 4,878 4,568
Total liabilities 46,413 55,362 53,859 54,313 57,423
Share capital 3,072 3,072 3,082 3,082 3,082
Reserves & surplus 33,479 48,017 48,004 48,601 49,742
Shareholders' funds 36,483 51,089 51,086 51,683 52,824
Minority interest 0 0 0 0 0
Total equity & liabilities 82,896 106,451 104,945 105,996 110,246
Source: Company, Nirmal Bang Institutional Equities Research
Exhibit 6: Cash flow
Year ended March (Rsmn) FY16 FY17 FY18E FY19E FY20E
Pre-tax profit 2,003 2,601 1,552 2,361 3,111
Depreciation 2,617 (29,395) 2,521 2,870 2,954
Chg in working capital (256) 6,288 (1,327) (1,423) (3,144)
Total tax paid (293) 1,914 (801) (782) (971)
Other operating activities 0 0 0 0 0
Operating CF 4,071 (18,592) 1,944 3,025 1,949
Capital expenditure (892) (6,589) (798) (1,378) (2,483)
Chg in investments (3) 9,664 (100) (200) (500)
Other investing activities 0 0 0 0 0
Investing CF (894) 3,076 (898) (1,578) (2,983)
FCF 3,177 (15,517) 1,046 1,447 (1,034)
Equity raised/(repaid) 22 68 10 0 0
Debt raised/(repaid) (2,731) 3,053 (417) (402) 2,208
Dividend (incl. tax) 0 (741) 0 (541) (541)
Other financing activities (470) 13,169 (576) (574) (574)
Financing CF (3,179) 15,548 (983) (1,517) 1,093
Net chg in cash & bank bal. (2) 31 63 (70) 59
Closing cash & bank bal 37 68 130 61 120
Source: Company, Nirmal Bang Institutional Equities Research
Exhibit 8: Key ratios
Year ended March (Rsmn) FY16 FY17 FY18E FY19E FY20E
Profitability and return ratios (%)
EBITDAM 18.4 17.0 14.2 14.0 14.2
EBITM 13.6 12.2 9.6 9.3 9.9
NPM 3.3 3.4 2.1 2.9 3.5
RoE 3.9 4.0 2.2 3.3 4.3
RoCE 8.7 8.3 6.0 6.6 7.6
RoIC 8.5 8.1 6.3 6.9 8.0
Per share data (Rs)
O/s shares 307.2 307.2 307.2 307.2 307.2
EPS 4.6 5.6 3.6 5.6 7.3
FDEPS 4.6 5.6 3.6 5.6 7.3
CEPS 11.9 14.0 11.8 14.9 16.9
BV 110.4 100.7 102.3 106.0 111.5
DPS 1.2 1.2 1.8 1.8 1.8
Valuation ratios (x)
PE 30.7 25.0 39.4 25.4 19.3
P/BV 1.3 1.4 1.4 1.3 1.3
EV/EBITDA 8.7 8.1 9.5 8.5 7.8
EV/Sales 1.6 1.4 1.3 1.2 1.1
Other key ratios
D/E (x) 0.7 0.5 0.5 0.5 0.5
DSO (days) 44 37 40 43 46
Du Pont Analysis - RoE
NPM (%) 3.3 3.4 2.1 2.9 3.5
Asset turnover (x) 0.5 0.5 0.5 0.6 0.6
Equity Multiplier (x) 2.3 2.2 2.1 2.1 2.1
RoE (%) 3.9 4.0 2.2 3.3 4.3
Source: Company, Nirmal Bang Institutional Equities Research

Institutional Equities
The India Cements 56
This page has been intentionally left blank

Institutional Equities
Reuters: JKCE.NS; Bloomberg: JKCE IN
JK Cement
Rei
nitia
ting
Cov
erag
e
Enough Moats To Earnings JK Cement’s (JKCE’s) current capacity utilisation hovers ~74%, leaving enough head room for ramp-up with the expected demand revival. With northern region units operating at 80% of their capacity and southern region facilities operating at lower utilsation of 61%, we have factored in volume growth of 8% for FY19E/FY20E, in line with industry growth. JKCE’s earnings additionally are well guarded by its white cement segment’s performance (currently at 33% of total revenues). Factoring in the above two, we feel JKCE’s earnings are safeguarded. The white cement segment will also help JKCE to relatively mitigate cost inflation. JKCE stock currently trades at a replacement cost of Rs8.0bn/mt We have retained Buy rating on the stock with a revised target price of Rs1,179 (from Rs1,494 earlier) based on FY20E earnings. At our target price, the stock trades at an EV/EBITDA of 9.8x FY20E earnings.
Visibility on volume gain: Current capacity utilisation at ~74% leaves enough headroom for a further ramp-up. Northern region’s capacity utilisation is 80%,while southern region’s facilities are sub-optimal at 61% (9MFY18). With the expected demand revival, we have factored in ~8% grey cement volume growth for JKCE. Further, ramp-up in Karnataka unit’s capacity utilisation will help JKCE tap south Maharashtra market aggressively and leaves upward risk to our volume estimates.
White cement segment to guard earnings: White cement contributes ~33% to total revenues currently. However, this segment accounts for 58% of total earnings. The WC segment has been guarding JKCE’s earnings and we expect the trend to improve in FY19/FY20 with revenue contribution from this segment seen at ~40%/50%. This guards JKCE from cost escalation and safeguards our earnings estimates.
Improvement in balance sheet health: JKCE’s balance sheet has been maintained with a D/E ratio of ~1x. We expect the same to decline ~0.8x/0.6x in FY19/FY20, respectively with limited capital expenditure and steady earnings. With a lean balance sheet, JKCE will be at ease for any incremental capital expenditure. Though the company recently announced new capacity expansion at Mangrol with a capex of Rs20bn, we have not factored in the impact of the same as we expect the capacity to be commissioned post FY20.
Valuation, catalysts and risks: JKCE currently trades at a replacement cost of Rs8.0bn/mt. We have valued the stock at Rs9.2bn/mt FY20E capacity ahead of its replacement cost of Rs8.0bn (factoring in the white segment proportion). This is to take into account the ramp-up in grey cement segment and earnings cushion by way of white cement segment’s performance. This will keep the earnings growth momentum strong with return ratios improving to ~18x from the current 14x-15x range. Benefits of risk mitigation because of geographical diversification (northern and southern regions) as the southern region’s ramped-up capacity is utilised only adds to our comfort. At our target price of Rs1,179/share, the stock trades at EV/EBITDA of 9.8x FY20E earnings. We have retained Buy rating on JKCE.
BUY
Sector: Cement
CMP: Rs1,014
Target Price: Rs1,179
Upside: 16%
Milind Raginwar Research Analyst [email protected] +91-22-6273 8172 Harshit Dhoot Research Associate [email protected] +91 22 6273 8111
Key Data
Current Shares O/S (mn) 69.9
Mkt Cap (Rsbn/US$bn) 71.0/1.1
52 Wk H / L (Rs) 1,196/874
Daily Vol. (3M NSE Avg.) 36,579
Share holding (%) 1QFY18 2QFY18 3QFY18
Promoter 64.2 64.2 64.2
Public 35.8 35.8 35.8
Others - - -
One -Year Indexed Stock Performance
Price Performance (%)
1 M 6 M 1 Yr
JK Cement (0.4) 6.5 14.4
Nifty 50 Index (2.6) 1.5 12.0
Source: Bloomberg
Y/E March (Rsmn) FY16 FY17 FY18E FY19E FY20E
Net revenues 35,212 37,036 43,684 49,428 53,508
EBITDA 4,857 6,414 8,142 9,296 9,874
Adj .PAT 872 2,308 3,331 4,437 5,257
EPS (Rs) 12.5 33.0 47.6 63.5 75.2
EPS growth (%) (44.9) 164.7 44.3 33.2 18.5
EBITDA margin (%) 13.8 17.3 18.6 18.8 18.5
P/E (x) 81.1 30.6 21.2 15.9 13.4
P/BV (x) 4.2 3.7 3.2 2.7 2.3
EV/EBITDA (x) 18.7 14.1 10.9 9.2 8.6
RoCE (%) 8.9 12.0 13.6 15.4 15.7
RoE (%) 5.3 12.8 16.1 18.3 18.3
Source: Company, Nirmal Bang Institutional Equities Research
90
100
110
120
130
140
Mar-17 May-17 Jul-17 Sep-17 Nov-17 Jan-18 Mar-18
JK CEMENTS LTD Nifty 50
26 March 2018

Institutional Equities
JK Cement 58
Exhibit 1: Volume growth will be contributed by southern unit in FY19/FY20
Exhibit 2: EBITDA margin safeguarded by white cement segment
Source: Company, Nirmal Bang Institutional Equities Research Source: Company, Nirmal Bang Institutional Equities Research
Exhibit 3: Assumption table
FY18E FY19E YoY (%) FY20E YoY (%)
Volume (mn tonnes) 7.3 7.8 7.5 8.4 7.5
Realisation (Rs/tonne) 3,775.2 3,879.0 2.8 3,995.4 3.0
Power & Fuel Cost (per tonne) 1,057.6 1,093.3 3.4 992.9 (9.2)
Logistics Cost (per tonne) 1,106.3 1,150.5 4.0 1,185.0 3.0
Source: Company, Nirmal Bang Institutional Equities Research
Exhibit 4: Valuation charts
EV/EBITDA EV/tn
Source: Company, Nirmal Bang Institutional Equities Research Source: Company, Nirmal Bang Institutional Equities Research
EV/EBITDA EV/tn
Source: Company, Nirmal Bang Institutional Equities Research Source: Company, Nirmal Bang Institutional Equities Research
3,5
31
3,7
42
3,1
57
3,6
30
3,7
75
3,8
79
3,9
95
5.4
6.3 6.9 6.8
7.3 7.8
8.4
0
1
2
3
4
5
6
7
8
9
0
500
1,000
1,500
2,000
2,500
3,000
3,500
4,000
4,500
FY14 FY15 FY16 FY17 FY18E FY19E FY20E
(MT)(Rs/tn)
Realisation Volume
61
8
65
8
66
0
87
3
1,0
31
1,1
01
1,0
93
13.0 13.3 13.8
17.318.6 18.8 18.5
0
2
4
6
8
10
12
14
16
18
20
0
200
400
600
800
1,000
1,200
FY14 FY15 FY16 FY17 FY18E FY19E FY20E
(MT)(Rs/tn)
EBITDA/tn Margin
0
350
700
1,050
1,400
1,750
Ap
r-0
7
Oct
-07
Ap
r-0
8
Oct
-08
Ap
r-0
9
No
v-0
9
Ma
y-1
0
No
v-1
0
Ma
y-1
1
De
c-1
1
Jun
-12
De
c-1
2
Jun
-13
Jan
-14
Jul-1
4
Jan
-15
Jul-1
5
Fe
b-1
6
Au
g-1
6
Fe
b-1
7
Au
g-1
7
Ma
r-1
8
(Rs)
Price 6 8 10 12
0
350
700
1,050
1,400
1,750
Ap
r-0
7
Oct
-07
Ap
r-0
8
Oct
-08
Ap
r-0
9
No
v-0
9
Ma
y-1
0
No
v-1
0
Ma
y-1
1
De
c-1
1
Jun
-12
De
c-1
2
Jun
-13
Jan
-14
Jul-1
4
Jan
-15
Jul-1
5
Fe
b-1
6
Au
g-1
6
Fe
b-1
7
Au
g-1
7
Ma
r-1
8
(Rs)
Price $60 $80 $100 $120 $140
0
20
40
60
80
100
120
140
160
Ap
r-0
7
Oct
-07
Ma
y-0
8
De
c-0
8
Jul-0
9
Fe
b-1
0
Se
p-1
0
Ap
r-1
1
No
v-1
1
Jun
-12
De
c-1
2
Jul-1
3
Fe
b-1
4
Se
p-1
4
Ap
r-1
5
No
v-1
5
Jun
-16
Jan
-17
Au
g-1
7
Ma
r-1
8
EV/tonne (x)
EV/tonne Mean +1SD -1SD -2SD
0
20
40
60
80
100
120
140
160
Ap
r-0
7
Oct
-07
Ma
y-0
8
De
c-0
8
Jul-0
9
Fe
b-1
0
Se
p-1
0
Ap
r-1
1
No
v-1
1
Jun
-12
De
c-1
2
Jul-1
3
Fe
b-1
4
Se
p-1
4
Ap
r-1
5
No
v-1
5
Jun
-16
Jan
-17
Au
g-1
7
Ma
r-1
8
EVtonne (MT)
EV/tonne Mean +1SD -1SD -2SD

Institutional Equities
JK Cement 59
Financials
Exhibit 5: Income statement
Y/E March (Rsmn) FY16 FY17 FY18E FY19E FY20E
Net sales 35,212 37,036 43,684 49,428 53,508
Growth (%) 5.5 5.2 18.0 13.2 8.3
Operating expenses (30,355) (30,621) (35,542) (40,132) (43,634)
EBITDA 4,857 6,414 8,142 9,296 9,874
Growth (%) 9.1 32.1 26.9 14.2 6.2
Depreciation &amortisation (1,641) (1,761) (2,091) (2,148) (2,216)
EBIT 3,967 5,613 6,617 7,792 8,372
Other income 752 959 566 644 714
Interest paid (2,707) (2,656) (2,505) (2,176) (1,921)
Extraordinary/Exceptional items - - - - -
PBT 1,260 2,923 4,112 5,617 6,450
Tax (388.1) (648.6) (781.3) (1,179.5) (1,193.3)
Effective tax rate (%) (30.8) (22.2) (19.0) (21.0) (18.5)
Net profit 872 2,275 3,331 4,437 5,257
Minority interest 0 0 0 0 0
Reported Net profit 872 2,275 3,331 4,437 5,257
Non-recurring items 0 (33) 0 0 0
Adjusted Net profit 872 2,308 3,331 4,437 5,257
Growth (%) (44.9) 164.7 44.3 33.2 18.5
Source: Company, Nirmal Bang Institutional Equities Research
Exhibit 7: Balance sheet
Y/E March (Rsmn) FY16 FY17 FY18E FY19E FY20E
Cash & Bank balances 3,684 4,188 2,625 3,489 2,547
Other Current assets 10,837 10,971 10,999 12,610 13,550
Investments 4,366 5,356 6,227 7,843 9,466
Net fixed assets 36,561 37,606 39,701 38,738 40,841
Goodwill & intangible assets 189 243 246 249 252
Other non-current assets (566) (528) 0 0 0
Total assets 55,072 57,837 59,798 62,929 66,656
Current liabilities 9,635 9,885 10,306 11,236 11,968
Borrowings 23,996 23,663 20,316 18,576 16,495
Other non-current liabilities 4,540 5,087 7,000 6,870 7,050
Total liabilities 38,170 38,634 37,623 36,683 35,514
Share capital 699 699 699 699 699
Reserves & surplus 16,203 18,504 21,476 25,547 30,443
Shareholders' funds 16,903 19,203 22,175 26,246 31,142
Minority interest 0 0 0 0 0
Total equity & liabilities 55,072 57,837 59,798 62,929 66,656
Source: Company, Nirmal Bang Institutional Equities Research
Exhibit 6: Cash flow
Y/E March (Rsmn) FY16 FY17 FY18E FY19E FY20E
Pre-tax profit 1,260 2,923 4,112 5,617 6,450
Depreciation 1,614 1,499 2,091 2,148 2,216
Chg in working capital 1,167 650 169 (831) 192
Total tax paid (298) (674) 829 (1,159) (1,413)
Other operating activities 0 0 0 0 0
Operating CF 3,743 4,399 7,201 5,774 7,445
Capital expenditure (3,135) (2,598) (4,189) (1,188) (4,323)
Chg in investments (1,172) (990) (870) (1,617) (1,622)
Other investing activities 0 0 0 0 0
Investing CF (4,307) (3,588) (5,060) (2,804) (5,945)
FCF (564) 811 2,142 2,970 1,500
Equity raised/(repaid) 0 0 0 0 0
Debt raised/(repaid) 557 (333) (3,347) (1,740) (2,081)
Dividend (incl. tax) (337) (654) (368) (368) (368)
Other financing activities 182 680 10 2 7
Financing CF 402 (307) (3,705) (2,106) (2,442)
Net chg in cash & bank bal. (162) 504 (1,563) 864 (942)
Closing cash & bank bal 3,684 4,188 2,625 3,489 2,547
Source: Company, Nirmal Bang Institutional Equities Research
Exhibit 8: Key ratios
Y/E March (Rsmn) FY16 FY17 FY18E FY19E FY20E
Profitability and return ratios (%)
EBITDAM 13.8 17.3 18.6 18.8 18.5
EBITM 11.3 15.2 15.1 15.8 15.6
NPM 2.5 6.2 7.6 9.0 9.8
RoE 5.3 12.8 16.1 18.3 18.3
RoCE 8.9 12.0 13.6 15.4 15.7
RoIC 7.3 11.4 13.5 15.2 16.4
Per share data (Rs)
O/s shares 69.9 69.9 69.9 69.9 69.9
EPS 12.5 33.0 47.6 63.5 75.2
FDEPS 12.5 33.0 47.6 63.5 75.2
CEPS 35.9 58.2 77.5 94.2 106.9
BV 241.5 274.3 316.8 375.1 445.1
DPS 4.0 8.0 4.5 4.5 4.5
Valuation ratios (x)
PE 81.1 30.6 21.2 15.9 13.4
P/BV 4.2 3.7 3.2 2.7 2.3
EV/EBITDA 18.7 14.1 10.9 9.2 8.6
EV/Sales 2.6 2.4 2.0 1.7 1.6
Other key ratios
D/E (x) 1.2 1.0 0.8 0.6 0.4
DSO (days) 17 15 16 17 17
Du Pont Analysis - RoE
NPM (%) 2.5 6.2 7.6 9.0 9.8
Asset turnover (x) 0.7 0.7 0.7 0.8 0.8
Equity multiplier(x) 0.7 0.7 0.7 0.8 0.8
RoE (%) 5.3 12.8 16.1 18.3 18.3
Source: Company, Nirmal Bang Institutional Equities Research

Institutional Equities
JK Cement 60
This page has been intentionally left blank

Institutional Equities
3QF
Y18
Res
ult U
pdat
e
Reuters: JKLC.BO; Bloomberg: JKLC IN
JK Lakshmi Cement
Valuation Overshoots Performance JK Lakshmi Cement’s (JKLC’s) pricing power will be capped because of competition in its key northern region and supply pressure in eastern region (25% revenue contribution). The delay in grinding unit expansion in eastern region implies that JKLC will have limited volume growth in eastern region where healthy demand growth is expected. The pricing power expected in eastern region is expected to be under pressure because of severe competition in this market. The delayed commissioning of power capacities implies higher purchase of costlier power, thereby contributing to cost escalation. Capital expenditure is expected to be higher (Rs3bn) in FY19/FY20. Factoring in the above reasons and its current premium valuation, we have retained or Sell rating on JKLC with a revised target price of Rs389, valuing the stock at 20% discount to replacement cost of Rs7.5bn/mt. Limited pricing power because of competition (northern/western region) and oversupply in eastern region: JKLC’s expansion in eastern region collided with excess supply in the region (~25mt addition during FY16-FY20E). A significant portion of the capacity has been added by new players in the region/industry (Shree Cements/Emami), implying heavy pressure on pricing. JKLC’s northern region volume has been listless so far in FY18 and it faces severe challenge from competitors, keeping the prices under pressure. The price premium expected for JKLC’s products is under pressure and is likely to continue for the next two years, thereby impacting EBITDA margin and earnings. Delayed expansion in eastern region: JKLC’s Odisha grinding unit (best market in eastern region) got delayed and is expected to be on stream only in FY19. Following the delay, JKLC altered the expansion plan and added capacity at its integrated unit in Chhattisgarh (2.7mt) in the over-supply market. Hence, incremental volume will continue in the over-supply market till the new unit at Odisha gets operational. This implies that margins will continue to be under pressure in FY19/FY20. Capital expenditure in excess of Rs3bn over the next two years: JKLC plans to spend ~ Rs3bn in FY19/FY20. This will be largely on the captive power plant at Durg unit, Odisha expansion, 7MW waster heat recovery unit at Durg and maintenance capex. This will keep the debt ~ Rs1.8bn-Rs2.0bn over the next two years, implying an elevated debt/EBITDA of ~3.5x/3.25x in FY19/FY20, respectively. This will keep the balance sheet health under pressure till FY20. Valuation, catalysts and risks: JKLC stock currently trades at a replacement cost of Rs6.6bn/mt FY20E capacity. We have valued the company at Rs6.0bn/mt, 20% discount to the replacement cost factoring in lower EBITDA margin (~12% FY18E-FY20E), challenging business environment and higher valuation based on earnings (stock trades at ~14x FY20E earnings). Though earnings growth is strong, it is from a very weak base and inconsistent over a longer period (flat CAGR over FY12-FY20E). We recommend Sell rating to the stock with a target price of Rs389. At our target price, the stock trades at EV/EBITDA of 11.2x FY20E earnings.
SELL
Sector: Cement
CMP: Rs444
Target Price: Rs389
Downside: 12%
Milind Raginwar Research Analyst [email protected] +91-22-6273 8172 Harshit Dhoot Research Associate [email protected] +91 22 6273 8111
Key Data
Current Shares O/S (mn) 117.7
Mkt Cap (Rsbn/US$mn) 52.1/800.3
52 Wk H / L (Rs) 537/375
Daily Vol. (3M NSE Avg.) 131,672
Share holding (%) 1QFY18 2QFY18 3QFY18
Promoter 45.9 45.9 45.9
Public 54.1 54.1 54.0
Others - - -
One -Year Indexed Stock Performance
Price Performance (%)
1 M 6 M 1 Yr
JK Lakshmi Cement 5.3 9.5 (0.4)
Nifty 50 Index (2.6) 1.5 12.0
Source: Bloomberg
Y/E March (Rsmn) FY16 FY17 FY18E FY19E FY20E
Net sales 26,199 29,104 33,468 37,881 42,724 growth (%) 13.6 11.1 15.0 13.2 12.8 EBITDA margin (%) 10.3 12.6 12.0 12.1 12.7 Adjusted net profit 170 820 965 1,430 2,298 vs consensus - - - (32.5) (30.3) EPS (Rs) 1.4 7.0 8.2 12.1 19.5 growth (%) (84.5) 382.1 17.7 48.1 60.8 P/E (x) 297.5 61.7 52.4 35.4 22.0 P/B (x) 3.8 3.7 3.5 3.3 2.9 EV/EBITDA (x) 25.5 17.8 16.7 14.4 12.1 D/E (x) 1.4 1.1 1.1 1.0 0.9 RoE (%) 1.3 6.0 6.8 9.5 13.9 RoCE (%) 4.8 7.7 8.7 9.9 11.9 Dividend yield (%) 0.1 0.1 0.6 0.6 0.6
Source: Company, Nirmal Bang Institutional Equities Research
80
90
100
110
120
130
Mar-17 May-17 Jul-17 Sep-17 Nov-17 Jan-18 Mar-18
JK LAKSHMI CEMEN Nifty 50
26 March 2018

Institutional Equities
62 JK Lakshmi Cement
Exhibit 1: Volume growth to be aided by new capacity Exhibit 2: EBITDAM lower than industry average
Source: Company, Nirmal Bang Institutional Equities Research Source: Company, Nirmal Bang Institutional Equities Research
Exhibit 3: Assumption table
FY18E FY19E YoY (%) FY20E YoY (%)
Volume (mn tonnes) 8.8 9.9 12.3 11.0 10.7
Realisation (Rs/tonne) 3,780.1 3,855.7 2.0 3,971.4 3.0
Power & Fuel Cost (per tonne) 837.4 888.9 6.2 915.3 3.0
Logistics Cost (per tonne) 995.0 1,014.9 2.0 1,035.2 2.0
Source: Company, Nirmal Bang Institutional Equities Research
Exhibit 4: Valuation charts
EV/EBITDA EV/tn
Source: Company, Nirmal Bang Institutional Equities Research Source: Company, Nirmal Bang Institutional Equities Research
EV/EBITDA EV/tn
Source: Company, Nirmal Bang Institutional Equities Research Source: Company, Nirmal Bang Institutional Equities Research
3,4
61
3,5
78
3,4
31
3,5
00
3,7
80
3,8
56
3,9
71
5.6 6.0
7.3 7.5
8.8
9.9
11.0
0
2
4
6
8
10
12
3,100
3,200
3,300
3,400
3,500
3,600
3,700
3,800
3,900
4,000
4,100
FY14 FY15 FY16 FY17 FY18E FY19E FY20E
(MT)(Rs/tn)
Realisation Volume
47
4
46
9
34
7
46
1
45
4
46
1
49
4
14.7
13.0
10.3
12.612.0 12.1
12.7
0
2
4
6
8
10
12
14
16
0
100
200
300
400
500
600
FY14 FY15 FY16 FY17 FY18E FY19E FY20E
(MT)(Rs/tn)
EBITDA/tn Margin
0
100
200
300
400
500
600
Ap
r-0
5
No
v-0
5
Jun
-06
Jan
-07
Au
g-0
7
Ma
r-0
8
Oct
-08
Ma
y-0
9
De
c-0
9
Jul-1
0
Fe
b-1
1
Se
p-1
1
Ap
r-1
2
No
v-1
2
Jun
-13
Jan
-14
Se
p-1
4
Ap
r-1
5
No
v-1
5
Jun
-16
Jan
-17
Au
g-1
7
Ma
r-1
8
(Rs)
Price 8 11 14 17
0
250
500
750
1,000
Ap
r-0
9
Oct
-09
Ma
y-1
0
De
c-1
0
Jun
-11
Jan
-12
Au
g-1
2
Fe
b-1
3
Se
p-1
3
Ap
r-1
4
No
v-1
4
Ma
y-1
5
De
c-1
5
Jul-1
6
Jan
-17
Au
g-1
7
Ma
r-1
8
(Rs)
Price $50 $80 $110 $140 $170
(10)
(5)
0
5
10
15
20
25
30
Ap
r-0
5
No
v-0
5
Jun
-06
Jan
-07
Au
g-0
7
Ma
r-0
8
Oct
-08
Ma
y-0
9
De
c-0
9
Jul-1
0
Fe
b-1
1
Se
p-1
1
Ap
r-1
2
No
v-1
2
Jun
-13
Jan
-14
Se
p-1
4
Ap
r-1
5
No
v-1
5
Jun
-16
Jan
-17
Au
g-1
7
Ma
r-1
8
EV/EBITDA (X)
EV/EBIDTA Mean +1SD -1SD +2SD -2SD
0
20
40
60
80
100
120
140
Ap
r-0
9
Oct
-09
Ma
y-1
0
De
c-1
0
Jun
-11
Jan
-12
Au
g-1
2
Fe
b-1
3
Se
p-1
3
Ap
r-1
4
No
v-1
4
Ma
y-1
5
De
c-1
5
Jul-1
6
Jan
-17
Au
g-1
7
Ma
r-1
8
EV/tonne (MT)
EV/tonne Mean +1SD -1SD +2SD -2SD

Institutional Equities
63 JK Lakshmi Cement
Financials
Exhibit 5: Income statement
Year Y/E March (Rsmn) FY16 FY17 FY18E FY19E FY20E
Net sales 26,199 29,104 33,468 37,881 42,724
growth (%) 13.6 11.1 15.0 13.2 12.8
Operating expenses (23,497) (25,450) (29,459) (33,306) (37,292)
EBITDA 2,701 3,654 4,008 4,575 5,432
growth (%) (10.0) 35.3 9.7 14.1 18.7
Depreciation &amortisation (1,629) (1,724) (1,634) (1,636) (1,641)
EBIT 1,675 2,629 2,987 3,444 4,304
Other income 603 698 612 505 514
Interest paid (1,923) (1,887) (1,877) (1,791) (1,648)
Extraordinary/Exceptional items - - - - -
PBT (355) 742 1,110 1,653 2,657
Tax 418 78 (144) (223) (359)
Effective tax rate (%) (117.7) 10.5 (13.0) (13.5) (13.5)
Net profit 63 820 965 1,430 2,298
Minority interest - - - - -
Reported Net profit 63 820 965 1,430 2,298
Non-recurring items (107) - - - -
Adjusted Net profit 170 820 965 1,430 2,298
growth (%) (84.5) 382.1 17.7 48.1 60.8
Source: Company, Nirmal Bang Institutional Equities Research
Exhibit 7: Balance sheet
Y/E March (Rsmn) FY16 FY17 FY18E FY19E FY20E
Cash & Bank balances 118 90 337 756 2,264
Other Current assets 9,971 12,335 10,250 10,382 11,685
Investments 1,663 3,095 3,095 3,095 3,095
Net fixed assets 30,601 30,285 30,000 30,084 30,613
Goodwill & intangible assets 67 29 29 29 29
Other non-current assets 0 0 0 0 0
Total assets 42,419 45,834 43,712 44,347 47,686
Current liabilities 7,453 12,354 8,888 9,607 10,343
Borrowings 20,766 19,663 18,837 17,537 18,087
Other non-current liabilities 867 0 1,550 1,680 1,780
Total liabilities 29,085 32,017 29,275 28,824 30,210
Share capital 589 589 589 589 589
Reserves & surplus 12,746 13,228 13,849 14,934 16,887
Shareholders' funds 13,334 13,817 14,438 15,522 17,476
Minority interest 0 0 0 0 0
Total equity & liabilities 42,419 45,834 43,712 44,347 47,686
Source: Company, Nirmal Bang Institutional Equities Research
Exhibit 6: Cash flow
Y/E March (Rsmn) FY16 FY17 FY18E FY19E FY20E
Pre-tax profit (355) 742 1,110 1,653 2,657
Depreciation 1,604 (13,381) 1,634 1,636 1,641
Chg in working capital 248 5,192 (4,079) (262) (1,167)
Total tax paid (0) (789) 1,406 (93) (259)
Other operating activities - - - - -
Operating CF 1,497 (8,236) 71 2,933 2,872
Capital expenditure (2,832) 13,735 (1,349) (1,720) (2,170)
Chg in investments 223 (4,087) 2,697 850 600
Other investing activities - - - - -
Investing CF (2,609) 9,648 1,348 (870) (1,570)
FCF (1,112) 1,412 1,419 2,063 1,302
Equity raised/(repaid) 0 0 (0) (0) (0)
Debt raised/(repaid) 1,112 (1,103) (826) (1,300) 550
Dividend (incl. tax) (29) (35) (294) (294) (294)
Other financing activities (6) (302) (50) (50) (50)
Financing CF 1,077 (1,440) (1,171) (1,645) 205
Net chg in cash & bank bal. (35) (28) 248 419 1,508
Closing cash & bank bal 118 90 337 756 2,264
Source: Company, Nirmal Bang Institutional Equities Research
Exhibit 8: Key ratios
Y/E March (Rsmn) FY16 FY17 FY18E FY19E FY20E
Profitability and return ratios (%)
EBITDAM 10.3 12.6 12.0 12.1 12.7
EBITM 6.4 9.0 8.9 9.1 10.1
NPM 0.6 2.8 2.9 3.8 5.4
RoE 1.3 6.0 6.8 9.5 13.9
RoCE 4.8 7.7 8.7 9.9 11.9
RoIC (1.0) 10.3 9.6 10.2 12.3
Per share data (Rs)
O/s shares 117.7 117.7 117.7 117.7 117.7
EPS 1.4 7.0 8.2 12.1 19.5
FDEPS 1.4 7.0 8.2 12.1 19.5
CEPS 15.3 21.6 22.1 26.0 33.5
BV 113.3 117.4 122.7 131.9 148.5
DPS 0.2 0.3 2.5 2.5 2.5
Valuation ratios (x)
PE 297.5 61.7 52.4 35.4 22.0
P/BV 3.8 3.7 3.5 3.3 2.9
EV/EBITDA 25.5 17.8 16.7 14.4 12.1
EV/Sales 2.6 2.2 2.0 1.7 1.5
Other key ratios
D/E (x) 1.4 1.1 1.1 1.0 0.9
DSO (days) 13 11 13 14 14
Du Pont Analysis - RoE
NPM (%) 0.6 2.8 2.9 3.8 5.4
Asset turnover (x) 0.6 0.7 0.7 0.9 0.9
Leverage factor (x) 3.1 3.3 3.2 2.9 2.8
RoE (%) 1.3 6.0 6.8 9.5 13.9
Source: Company, Nirmal Bang Institutional Equities Research

Institutional Equities
64 JK Lakshmi Cement
This page has been intentionally left blank

Institutional Equities
Reuters: SAGCEM.NS; Bloomberg: SGC IN
Sagar Cements
Initi
atin
g C
over
age
Strong Presence In Andhra/Telangana To Drive Earnings Sagar Cements’ (SGC) caters to the reviving Andhra Pradesh/Telangana market (~51% of total sales volume) where cement demand is bracing up after a long period of lull. To cater aggressively to these markets, SGC is adding grinding capacity in Bayyaram which is expected to be commissioned in 1HFY19. This timely expansion will further boost SGC’s footprint in Andhra Pradesh or AP market. Further, this will also help SGC to increase its market share in Odisha in the eastern region, thereby helping its regional diversification. Also, the expected commissioning of 18MW captive power plant will help SGC to reduce its power cost, thereby mitigating overall fuel cost inflation. Higher volume growth driven by expected demand revival in Telangana/AP, reduced lead distance post new capacities, initiatives to reduce cost and upcoming increase in capacity are the key triggers for SGC. However, EBITDA growth will be steady as AP/Telangana markets are overcrowded and we expect higher supply to exert pricing pressure, thereby restricting realisation gains and keeping EBITDA margin range-bound. We have valued SGC at Rs4.55bn/mt (FY20E capacity), ~40% discount to the replacement cost because of limited capacity (despite expansion) and presence in a crowded market that will limit margin expansion despite revenue growth. We have retained Buy rating on the stock with a revised target price of Rs1,058. At our target price, the stock trades at EV/EBITDA of 10.8x FY20E earnings.
Strong presence in reviving markets of AP/Telangana: The southern region is expected to gain
pace with strong infrastructure-driven demand push in AP/Telangana (5.2% YoY growth in 3QFY18). SGC’s total capacity of 5.5mt (including planned expansion of 1.2mt) is in the AP/Telangana region. SGC has volume contribution of ~51% from the home states of AP/Telangana.
New capacities to facilitate regional diversification: SGC has planned expansion in coastal AP which will also help it to cater to eastern region (Odisha). This will help SGC to expand its footprint in eastern region (currenty ~4%). SGC caters to Maharashtra market (11%), ~12% in Karnataka, and ~19% in Tamil Nadu. With a well diversified regional spread and focus on expanding new markets SGC’s dependence on a single market (AP/Telangana) will decline. This flexibility will be key to guard its earnings in the next two years as its focus on single market reduces.
Focus on cost rationalisation: SGC has focused on cost rationalisation with the commissioning of solar and WHR power plants of ~7MW in FY17. It has planned to set up 18MW captive power unit which will be commissioned in 4QFY19. The cost rationalisation benefits will be reflected in FY19/FY20. SGC’s logistics is driven by road with a lead distance hovering ~350km with the geographical spread across six to seven states. The management is focused on cost reduction, but lack of realisation gains (demand shifting to infrastructure segment and cement-surplus markets) will keep margins on the edge in FY19/FY20, at ~15%.
Valuation, catalysts and risks: SGC stock currently trades at a replacement cost of Rs4.1bn/tn, but we have assigned EV/tn of Rs4.55bn/tn FY20E capacity to arrive at a fair value. SGC’s performance will be steady as it continues to focus on regional diversification and cost rationalisation. The realisation, however, may prevail because of over-supply situation in the market. This, as well as limited capacity are the key reasons for assigning a discount to the replacement cost. We have assigned Buy rating to the stock with a target price of Rs1,058. At our revised target price, the stock trades at EV/EBTIDA of 10.8x FY20E earnings.
BUY
Sector: Cement
CMP: Rs 880
Target Price: Rs 1,058
Upside: 20%
Milind Raginwar Research Analyst [email protected] +91-22-6273 8172 Harshit Dhoot Research Associate [email protected] +91 22 6273 8111
Key Data
Current Shares O/S (mn) 20.4
Mkt Cap (Rsbn/US$mn) 18.0/275.9
52 Wk H / L (Rs) 1,176/721
Daily Vol. (3M NSE Avg.) 34,163
Share holding (%) 1QFY18 2QFY18 3QFY18
Promoter 50.0 50.0 50.0
Public 50.0 50.0 50.0
Others - - -
One -Year Indexed Stock Performance
Price Performance (%)
1 M 6 M 1 Yr
Sagar Cements (7.8) 7.5 20.6
Nifty 50 Index (2.6) 1.5 12.0
Source: Bloomberg
Y/E March (Rsmn) FY16 FY17 FY18E FY19E FY20E
Net sales 7,512 8,082 10,328 12,889 15,410 EBITDA margin (%) 16.1 13.0 14.3 17.2 17.5 Adjusted net profit 443 (39) 236 740 1,180 vs consensus (%) - - - (22.2) (19.9) EPS (Rs) 33.9 (1.9) 11.6 36.3 57.9 Growth (%) n/a (106.6) n/a 213.3 59.5 P/E (x) 25.9 n/a 76.0 24.3 15.2 P/B (x) 2.8 2.3 2.3 2.1 1.8 EV/EBITDA (x) 11.8 17.2 16.6 10.4 7.2 D/E (x) 0.7 0.4 0.3 0.1 (0.3) RoE (%) 14.6 (0.6) 3.0 9.0 12.8 RoCE (%) 14.5 6.1 8.4 13.1 16.8 Dividend yield (%) - - - - -
Source: Company, Nirmal Bang Institutional Equities Research
90
100
110
120
130
140
150
Mar-17 May-17 Jul-17 Sep-17 Nov-17 Jan-18 Mar-18
SAGAR CEMENTS Nifty 50
26 March 2018

Institutional Equities
Sagar Cements 66
Exhibit 1: Volume will gain traction supported by demand revival in key markets
Exhibit 2: EBITDAM will be maintained because of cost-saving initiatives
Source: Company, Nirmal Bang Institutional Equities Research Source: Company, Nirmal Bang Institutional Equities Research
Exhibit 3: Assumption table
FY18E FY19E YoY (%) FY20E YoY (%)
Volume (mn tonnes) 2.6 3.4 30.0 4.1 22.0
Realisation (Rs/tonne) 3,992.9 3,833.1 (4.0) 3,756.5 (2.0)
Power & Fuel Cost (per tonne) 1,347.4 1,135.3 (15.7) 1,044.3 (8.0)
Logistics Cost (per tonne) 731.1 760.4 4.0 798.4 5.0
Source: Company, Nirmal Bang Institutional Equities Research
Exhibit 4: Valuation charts
EV/EBITDA EV/tn
Source: Company, Nirmal Bang Institutional Equities Research Source: Company, Nirmal Bang Institutional Equities Research
EV/EBITDA EV/tn
Source: Company, Nirmal Bang Institutional Equities Research Source: Company, Nirmal Bang Institutional Equities Research
3,9
52
4,2
75
4,5
82
4,2
03
3,9
93
3,8
33
3,7
56
1.4 1.61.8
2.2
2.6
3.4
4.1
0.0
0.5
1.0
1.5
2.0
2.5
3.0
3.5
4.0
4.5
0
500
1,000
1,500
2,000
2,500
3,000
3,500
4,000
4,500
5,000
FY14 FY15 FY16 FY17 FY18E FY19E
(MT)(Rs/tn)
Realisation Volume
9 36
4
66
9
47
8
57
0
65
9
65
60.3
9.8
16.1
13.014.3
17.2 17.5
0
2
4
6
8
10
12
14
16
18
20
0
100
200
300
400
500
600
700
800
FY14 FY15 FY16 FY17 FY18 FY19 FY20
(MT)(Rs/tn)
EBITDA/tn Margin
0
200
400
600
800
1,000
1,200
Ap
r-1
4
Se
p-1
4
Fe
b-1
5
Jul-1
5
Jan
-16
Jun
-16
No
v-1
6
Ap
r-1
7
Oct
-17
Ma
r-1
8
(Rs)
Price 10 11 12 13
0
500
1,000
1,500
2,000
2,500
Ap
r-1
4
Se
p-1
4
Fe
b-1
5
Jul-1
5
Jan
-16
Jun
-16
No
v-1
6
Ap
r-1
7
Oct
-17
Ma
r-1
8
(Rs)
Price $50 $75 $100 $125 $150
(60)
(40)
(20)
0
20
40
60
80
Ap
r-1
4
Se
p-1
4
Fe
b-1
5
Jul-1
5
De
c-1
5
Jun
-16
No
v-1
6
Ap
r-1
7
Se
p-1
7
Ma
r-1
8
(EV/EBITDA (x)
EV/EBIDTA Mean +1SD -1SD +2SD -2SD
0
10
20
30
40
50
60
70
80
90
100
Ap
r-1
4
Se
p-1
4
Fe
b-1
5
Jul-1
5
Jan
-16
Jun
-16
No
v-1
6
Ap
r-1
7
Oct
-17
Ma
r-1
8
EV/tonne (MT)
Ev/tonne Mean +1SD -1SD +2SD -2SD

Institutional Equities
Sagar Cements 67
Financials
Exhibit 5: Income statement
Y/E Mar (Rsmn) FY16 FY17 FY18E FY19E FY20E
Net sales 7,512 8,082 10,328 12,889 15,410
Growth (%) 74.0 (19.3) 27.8 24.8 19.6
Operating expenses (6,303) (7,035) (8,852) (10,673) (12,718)
EBITDA 1,209 1,047 1,475 2,215 2,691
Growth (%) 186.0 (35.1) 40.9 50.1 21.5
Depreciation &amortisation (347) (476) (510) (577) (510)
EBIT 925 663 1,059 1,740 2,291
Other income 63 92 94 102 110
Interest paid (419) (621) (722) (683) (606)
Extraordinary/Exceptional items - - - - -
PBT 506 42 337 1,057 1,686
Tax (64) (81) (101) (317) (506)
Effective tax rate (%) (12.5) (192.9) (30.0) (30.0) (30.0)
Net profit 443 (39) 236 740 1,180
Minority interest 0 0 0 0 0
Reported Net profit 443 (39) 236 740 1,180
Non-recurring items 0 0 0 0 0
Adjusted Net profit 443 (39) 236 740 1,180
Growth (%) (80.1) (106.6) n/a 213.3 59.5
Source: Company, Nirmal Bang Institutional Equities Research
Exhibit 7: Balance sheet
Y/E Mar (Rsmn) FY16 FY17 FY18E FY19E FY20E
Cash & Bank balances 65 1,705 3,037 4,174 7,161
Other Current assets 2,678 2,819 2,974 3,314 3,647
Investments 390 390 390 390 390
Net fixed assets 9,009 9,844 10,333 9,936 7,796
Goodwill & intangible assets 328 328 328 328 328
Other non-current assets 0 0 0 0 0
Total assets 12,470 15,085 17,062 18,141 19,321
Current liabilities 3,046 2,935 4,000 4,739 5,369
Borrowings 3,852 4,456 5,197 4,797 4,166
Other non-current liabilities 18 54 0 0 0
Total liabilities 6,916 7,444 9,196 9,536 9,535
Share capital 174 204 204 204 204
Reserves & surplus 5,317 7,426 7,662 8,402 9,582
Shareholders' funds 5,554 7,642 7,866 8,606 9,786
Minority interest 0 0 0 0 0
Total equity & liabilities 12,470 15,086 17,062 18,141 19,321
Source: Company, Nirmal Bang Institutional Equities Research
Exhibit 6: Cash flow
Y/E Mar (Rsmn) FY16 FY17 FY18E FY19E FY20E
Pre-tax profit 506 42 337 1,057 1,686
Depreciation 454 471 510 577 510
Chg in working capital 1,640 (252) 908 402 297
Total tax paid (620) (45) (155) (317) (506)
Other operating activities 0 0 0 0 0
Operating CF 1,980 216 1,600 1,720 1,988
Capital expenditure (5,334) (1,306) (1,000) (180) 1,630
Chg in investments (390) (0) 0 0 0
Other investing activities 0 0 0 0 0
Investing CF (5,724) (1,306) (1,000) (180) 1,630
FCF (3,744) (1,091) 600 1,540 3,618
Equity raised/(repaid) 63 2,130 (12) 0 0
Debt raised/(repaid) 2,006 604 741 (400) (631)
Dividend (incl. tax) (209) 0 3 (3) 0
Other financing activities (9) (3) 0 0 0
Financing CF 1,851 2,730 732 (403) (631)
Net chg in cash & bank bal. (1,893) 1,640 1,332 1,137 2,987
Closing cash & bank bal 65 1,705 3,037 4,174 7,161
Source: Company, Nirmal Bang Institutional Equities Research
Exhibit 8: Key ratios
Y/E Mar FY16 FY17 FY18E FY19E FY20E
Profitability and return ratios (%)
EBITDAM 16.1 13.0 14.3 17.2 17.5
EBITM 12.3 8.2 10.3 13.5 14.9
NPM 5.9 (0.5) 2.3 5.7 7.7
RoE 14.6 (0.6) 3.0 9.0 12.8
RoCE 14.5 6.1 8.4 13.1 16.8
RoIC 14.8 (6.5) 7.5 13.2 21.1
Per share data (Rs)
O/s shares 17.4 20.4 20.4 20.4 20.4
EPS 33.9 (1.9) 11.6 36.3 57.9
FDEPS 33.9 (1.9) 11.6 36.3 57.9
CEPS 60.6 21.4 36.6 64.6 82.9
BV 319.4 374.6 385.6 421.8 479.7
DPS - - - - -
Valuation ratios (x)
PE 25.9 n/a 76.0 24.3 15.2
P/BV 2.8 2.3 2.3 2.1 1.8
EV/EBITDA 11.8 17.2 16.6 10.4 7.2
EV/Sales 1.9 2.2 2.4 1.8 1.3
Other key ratios
D/E (x) 0.7 0.4 0.3 0.1 (0.3)
DSO (days) 29.5 36.5 35.5 32.4 30.4
Du Pont Analysis - RoE
NPM (%) 5.9 (0.5) 2.3 5.7 7.7
Asset turnover (x) 0.9 0.6 0.6 0.7 0.8
Equity Multiplier (x) 2.7 2.1 2.1 2.1 2.0
RoE (%) 14.6 (0.6) 3.0 9.0 12.8
Source: Company, Nirmal Bang Institutional Equities Research

Institutional Equities
Sagar Cements 68
This page has been intentionally left blank

Institutional Equities
Reuters: SNGI.NS; Bloomberg: SNGI IN
Sanghi Industries
Initi
atin
g C
over
age
Smart Play Unfolds Sanghi Industries’ (SNGI) earnings are expected to post a robust CAGR of 38% over FY15-FY20E, led by strong shift in EBITDA margin from the 18%-19% trajectory to ~23%-24%. The key strengths of SNGI are: a) Its fully utilised capacity will provide the much needed volume delta, b) Margins are expected to enter a higher trajectory, led by flexibility to sell incremental PPC cement. c) It is tapping the niche segment of the lucrative Mumbai market (currently <5%); at competitive cost (savings on logistic costs by tapping the sea route). d) It remains focused on increasing market share by adding capacity and still maintaining balance sheet health (peak net debt/equity ~1x in FY20E). Structurally, the company is placing all its cards in place for a strong foundation. The next phase of expansion will unfold post FY20 (capacity to be on stream by FY20-end) while the valuation seems to be factoring in the same ahead of earnings traction after the expansion. We initiate coverage on the stock with an Accumulate rating and a target price of Rs116, valuing it at a target multiple of Rs7.1bn/mt. This is to factor in the structural shift in earnings with EBITDA margin moving to the higher trajectory, adding new markets in its portfolio (Mumbai market) cost effectively and adding size with expanded capacity to be commissioned by FY20. At our target price, the stock trades at EV/EBITDA of 11.3x FY20E earnings.
Volume delta with optimisation of capacity: SNGI’s augmented capacity (1mt addition) has now stabilised and is likely to provide the much needed volume spurt. We expect sales volume to post a CAGR of 11.0% over FY15-FY20E, beating industry growth and providing strong impetus to volume and revenues. This will further impart the much needed flexibility to produce higher PPC (without losing its OPC clients).
OPC-PPC mix to improve favouring PPC and will improve margins: Currently, the sales mix of OPC:PPC is ~65:35 (earlier 100% OPC). SNGI was earlier selling most of the cement in OPC market. We expect PPC share to advance gradually to 40% in FY18E-FY20E (helped by additional 1mn grinding unit), which will aid EBITDA margin expansion. We expect margins to jump to 22%-24% by FY19E/FY20E from 18%-19% in FY17 (9MFY18 margins are ~22.6%).
Adding the niche Mumbai market cost effectively in its regional portfolio: SNGI is gearing up to cater to the niche coastal Maharashtra market. The jetty at Dharamtar is operational; the jetty, along with the packaging unit (commissioned in1HFY17) and two vessels (available from 2QFY18) to explore the sea route logistics will help SNGI leverage the niche Mumbai market (bulk cement) and further boost its margins. SNGI caters to the RMC/SMC real estate segment in Mumbai market by its presence in the bulk segment.
Eye on market share with timely capacity addition: SNGI is incurring an additional capex of ~Rs12.5bn that is required to add 4mt split over two locations. SNGI has diluted its equity and garnered Rs4bn,tying up for debt of Rs8bn and the remaining amount to be met from internal accruals. The debt repayment starts after three years with a total tenure of 11 years for repayment (3+8 years). The average cost of debt will be ~10.75%. Debt-equity ratio is expected to be ~1x in FY20E. Also, SNGI will replace its high-cost debt of Rs2.65bn at 10.5%, thereby further reducing the interest outgo in FY19E.
Valuation, catalysts and risks: We initiate coverage on SNGI with an Accumulate rating and a target price of Rs116, valuing the stock at a target multiple of Rs7.1bn/mt. This is to factor in the structural shift in earnings with EBITDA margin moving to the higher trajectory, adding new markets in its portfolio (Mumbai market) cost effectively, and adding size with expanded capacity to be commissioned by FY20. At our target price, the stock trades at an EV/EBITDA of 11.3x FY20E earnings. With likely improvement in earnings and clear visibility with respect to doubling of capacity (additional 4.1mt expected in 2HFY20E), we believe SNGI will climb the valuation ladder further.
Key risks: Slow demand recovery and delayed access to Mumbai market/capacity addition.
ACCUMULATE
Sector: Cement
CMP: Rs115
Target Price: Rs116
Downside: 1%
Milind Raginwar Research Analyst [email protected] +91-22-6273 8172 Harshit Dhoot Research Associate [email protected] +91 22 6273 8111
Key Data
Current Shares O/S (mn) 251.0
Mkt Cap (Rsbn/US$mn) 28.8/442.3
52 Wk H / L (Rs) 144/67
Daily Vol. (3M NSE Avg.) 592,941
Share holding (%) 1QFY18 2QFY18 3QFY18
Promoter 75.0 75.0 74.9
Public 25.0 25.0 25.1
Others - - -
One -Year Indexed Stock Performance
Price Performance (%)
1 M 6 M 1 Yr
Sanghi Industries 3.1 21.7 63.4
Nifty 50 Index (2.6) 1.5 12.0
Source: Bloomberg
Y/E March (Rsmn) FY16 FY17 FY18E FY19E FY20E
Net Sales 7,622 9,975 10,538 12,943 14,890 EBITDA Margin (%) 19.8 19.9 22.9 23.3 23.7 Adjusted Net Profit 763.6 631.4 1,008.7 1,435.2 1,573.2 Vs Consensus (%) - - - (12.2) (27.6) EPS (Rs) 4.6 2.9 4.6 5.7 6.3 Growth (%) 233.2 (38.0) 59.8 24.7 9.6 P/E(x) 24.8 40.0 25.0 20.1 18.3 P/B(x) 2.4 2.3 2.0 2.1 1.9 EV/Ebitda (x) 14.8 15.6 13.3 11.7 11.1 D/E 0.4 0.5 0.6 0.7 0.9 RoE (%) 13.0 5.8 8.5 10.9 10.7 RoCE (%) 8.5 7.8 9.9 10.3 9.2 Dividend Yield (%) - - - - -
Source: Company, Nirmal Bang Institutional Equities Research
80
100
120
140
160
180
200
220
Mar-17 May-17 Jul-17 Sep-17 Nov-17 Jan-18 Mar-18
SANGHI INDUS LTD Nifty 50
26 March 2018

Institutional Equities
Sanghi Industries 70
Exhibit 1: Volume to gain traction with new markets in portfolio
Exhibit 2: EBTIDAM to climb in a higher trajectory
Source: Company, Nirmal Bang Institutional Equities Research Source: Company, Nirmal Bang Institutional Equities Research
Exhibit 3: Assumption table
FY18E FY19E YoY (%) FY20E YoY (%)
Volume (mn tonnes) 2.6 3.1 20.5 3.6 15.0
Realisation (Rs/tonne) 4,251.3 4,421.4 4.0 4,587.2 3.8
Power & Fuel Cost (per tonne) 342.4 361.3 5.5 367.2 1.6
Logistics Cost (per tonne) 1,206.3 1,218.4 1.0 1,245.8 2.3
Source: Company, Nirmal Bang Institutional Equities Research
Exhibit 4: Valuation charts
EV/EBITDA EV/tn
Source: Company, Nirmal Bang Institutional Equities Research Source: Company, Nirmal Bang Institutional Equities Research
EV/EBITDA EV/tn
Source: Company, Nirmal Bang Institutional Equities Research Source: Company, Nirmal Bang Institutional Equities Research
5,1
99
4,5
88
4,8
85
4,1
08
4,2
51
4,4
21
4,5
87
2.1 2.1
1.8
2.52.6
3.1
3.6
0.0
0.5
1.0
1.5
2.0
2.5
3.0
3.5
4.0
0
1,000
2,000
3,000
4,000
5,000
6,000
FY14* FY15* FY16 FY17 FY18E FY19E FY20E
(MT)(Rs/tn)
Realisation Volume
69
9
67
2
75
0
66
9
86
3
92
0
99
6
18.8
16.9
19.8 19.9
22.9 23.3 23.7
0
5
10
15
20
25
0
200
400
600
800
1,000
1,200
FY14* FY15* FY16 FY17 FY18E FY19E FY20E
(MT)(Rs/tn)
EBITDA/tn Margin
0
20
40
60
80
100
120
140
160
Ap
r-0
9
Oct
-09
Ma
y-1
0
De
c-1
0
Jun
-11
Jan
-12
Au
g-1
2
Fe
b-1
3
Se
p-1
3
Ap
r-1
4
No
v-1
4
Ma
y-1
5
De
c-1
5
Jul-1
6
Jan
-17
Au
g-1
7
Ma
r-1
8
(Rs)
Price 8 9 10 11
0
20
40
60
80
100
120
140
160
Ap
r-0
9
Oct
-09
Ma
y-1
0
De
c-1
0
Jun
-11
Jan
-12
Au
g-1
2
Fe
b-1
3
Se
p-1
3
Ap
r-1
4
No
v-1
4
Ma
y-1
5
De
c-1
5
Jul-1
6
Jan
-17
Au
g-1
7
Ma
r-1
8
(Rs)
Price $90 $100 $110 $120 $130
0
2
4
6
8
10
12
14
16
18
Ap
r-0
9
Oct
-09
Ma
y-1
0
De
c-1
0
Jun
-11
Jan
-12
Au
g-1
2
Fe
b-1
3
Se
p-1
3
Ap
r-1
4
No
v-1
4
Ma
y-1
5
De
c-1
5
Jul-1
6
Jan
-17
Au
g-1
7
Ma
r-1
8
EV/EBITDA (X)
EV/EBIDTA Mean +1SD -1SD +2SD -2SD
0
20
40
60
80
100
120
140
160
180
Ap
r-0
9
Oct
-09
Ma
y-1
0
De
c-1
0
Jun
-11
Jan
-12
Au
g-1
2
Fe
b-1
3
Se
p-1
3
Ap
r-1
4
No
v-1
4
Ma
y-1
5
De
c-1
5
Jul-1
6
Jan
-17
Au
g-1
7
Ma
r-1
8
EV/tonne (MT)
EV/tonne Mean +1SD -1SD +2SD -2SD

Institutional Equities
Sanghi Industries 71
Financials
Exhibit 5: Income statement
Y/E Mar (Rsmn) FY16 FY17 FY18E FY19E FY20E
Net sales 7,622 9,975 10,538 12,943 14,890
Growth (%) 9.0 (1.8) 5.6 22.8 15.0
Operating expenses (6,110) (7,993) (8,120) (9,929) (11,369)
EBITDA 1,512 1,982 2,418 3,014 3,522
Growth (%) 28.1 (1.7) 22.0 24.7 16.9
Depreciation &amortisation (540) (731) (747) (788) (1,096)
EBIT 989 1,274 1,763 2,307 2,499
Other income 17 22 92 81 73
Interest paid (222) (642) (734) (703) (770)
Extraordinary/Exceptional items
PBT 767 631 1,029 1,604 1,729
Tax (4) 0 (21) (168) (156)
Effective tax rate (%) (1) 0 (2) (11) (9)
Net profit 160 631 1,009 1,435 1,573
Minority interest 0 0 0 0 0
Reported Net profit 160 631 1,009 1,435 1,573
Non-recurring items (604) 0 0 0 0
Adjusted Net profit 764 631 1,009 1,435 1,573
Growth (%) 233.2 (38.0) 59.8 42.3 9.6
Source: Company, Nirmal Bang Institutional Equities Research
Exhibit 7: Balance sheet
Y/E Mar (Rsmn) FY16 FY17 FY18E FY19E FY20E
Cash & Bank balances 830 163 528 2,496 202
Other Current assets 3,182 3,718 3,929 5,134 5,981
Investments 0 0 0 0 0
Net fixed assets 15,607 16,190 18,952 22,915 28,022
Goodwill & intangible assets 0 0 0 0 0
Other non-current assets 0 0 0 0 0
Total assets 19,619 20,071 23,409 30,545 34,206
Current liabilities 3,663 3,522 4,358 4,909 5,446
Borrowings 5,365 5,868 7,468 12,618 14,168
Other non-current liabilities 82 (459) (876) (876) (876)
Total liabilities 9,109 8,931 10,950 16,651 18,739
Share capital 2,200 2,200 2,510 2,510 2,510
Reserves & surplus 8,310 8,940 9,949 11,384 12,957
Shareholders' funds 10,510 11,140 12,459 13,894 15,467
Minority interest 0 0 0 0 0
Total equity & liabilities 19,619 20,071 23,409 30,545 34,206
Source: Company, Nirmal Bang Institutional Equities Research
Exhibit 6: Cash flow
Year ended March (Rsmn) FY16 FY17 FY18E FY19E FY20E
Pre-tax profit 164 631 1,029 1,604 1,729
Depreciation 479 728 747 788 1,096
Chg in working capital (898) (1,153) 560 (655) (309)
Total tax paid (94) (65) (371) (168) (156)
Other operating activities 604 0 0 0 0
Operating CF 254 141 1,964 1,569 2,360
Capital expenditure (467) (1,311) (3,509) (4,751) (6,203)
Chg in investments 0 0 0 0 0
Other investing activities 0 0 0 0 0
Investing CF (467) (1,311) (3,509) (4,751) (6,203)
FCF (213) (1,170) (1,545) (3,182) (3,843)
Equity raised/(repaid) (0) (0) 310 (0) (0)
Debt raised/(repaid) 1,588 504 1,600 5,150 1,550
Dividend (incl. tax) 0 0 0 0 0
Other financing activities (600) 0 0 0 0
Financing CF 988 504 1,910 5,150 1,550
Net chg in cash & bank bal. 775 (666) 365 1,968 (2,293)
Closing cash & bank bal 830 163 528 2,496 202
Source: Company, Nirmal Bang Institutional Equities Research
Exhibit 8: Key ratios
Year ended March (Rsmn) FY16 FY17 FY18E FY19E FY20E
Profitability and return ratios (%)
EBITDAM 19.8 19.9 22.9 23.3 23.7
EBITM 13.0 12.8 16.7 17.8 16.8
NPM 10.0 6.3 9.6 11.1 10.6
RoE 13.0 5.8 8.5 10.9 10.7
RoCE 8.5 7.8 9.9 10.3 9.2
RoIC 8.5 8.1 9.9 9.9 8.8
Per share data (Rs)
O/s shares 220.0 220.0 220.0 220.0 220.0
EPS 4.6 2.9 4.6 5.7 6.3
FDEPS 4.6 2.9 4.6 5.7 6.3
CEPS 7.9 6.2 8.0 8.9 10.6
BV 47.8 50.6 56.6 55.4 61.6
DPS 0.0 0.0 0.0 0.0 0.0
Valuation ratios (x)
PE 24.8 40.0 25.0 20.1 18.3
P/BV 2.4 2.3 2.0 2.1 1.9
EV/EBITDA 14.8 15.6 13.3 11.7 11.1
EV/Sales 2.9 3.1 3.1 2.7 2.6
Other key ratios
D/E (x) 0.4 0.5 0.6 0.7 0.9
DSO (days) 7 9 9 9 9
Du Pont Analysis - RoE
NPM (%) 10.0 6.3 9.6 11.1 10.6
Asset turnover (x) 0.5 0.5 0.5 0.5 0.5
Equity Multiplier (x) 2.5 1.8 1.8 2.0 2.2
RoE (%) 13.0 5.8 8.5 10.9 10.7
Source: Company, Nirmal Bang Institutional Equities Research

Institutional Equities
Sanghi Industries 72
This page has been intentionally left blank

Institutional Equities
Reuters: SHCM.NS; Bloomberg: SRCM IN
Shree Cement
Initi
atin
g C
over
age
Growth Unabated; Stretched Valuation Shree Cement’s (SRCM) regional diversification (southern region 4mt + eastern region 8mt) will help it address the regional concentration risk. However, we believe the company’s entry in eastern region collides with excess supply in the region. Southern region (Karnataka market) is currently facing pricing pressure because of weak demand and crowding out of new/old cement manufacturers. Further, with regional diversification, SRCM will lose its edge over a relatively stronger operating performance in its home state of Rajasthan (benefited by single location, sizeable clinker capacity) and hence we expect OPM weakness. We believe the current softening of valuation has factored in the challenging business environment in the next two years as it enters new excess-supply regions. The stock currently trades at EV/mt of Rs13.8bn FY20E capacity, which we feel is a premium valuation. We have used SOTP valuation to arrive at a fair value of SRCM at Rs15,207. We initiate coverage on the stock with a Sell rating.
Moving away from home market diversification: SRCM’s planned capacity expansion of ~4mt addition in Chhattisgarh was commissioned in 3QFY18 and 4mt addition in Karnataka, including a split grinder in Maharashtra, is planned by 4QFY19. This is besides the expansion of ~4mt capacity in Rajasthan earlier in FY18. The company will be expanding geographically to evade the regional concentration risk. Categorising production, SRCM’s market share is ~23% in northern region and ~ 10% in eastern region while it will enter southern region with Karnataka expansion and also cater to western region. Though this is a healthy long-term plan, in the medium term it will face severe pricing pressure in eastern region and in Karnataka.
Pricing gains to be muted as it enters oversupply markets: SRCM is consolidating in eastern region with fresh capacity expansion. However, eastern region will add capacity at a CAGR of ~8.5% over FY15-FY19E with total capacity in the region expected to touch 78mt by FY19E. Karnataka market is crowded and has recently being tapped by new entrants in the region (Dalmia Cement and Orient Cement), implying heavy pricing pressure. Hence, although SRCM has broadened its base with two additional regions, it will face pricing pressure in new markets before accruing the benefits of diversification. This, along with demand shift from housing to infrastructure segment, implies that pricing pressure will impact margins.
Cost efficiency likely to be under pressure: SRCM relies on pet coke as its key fuel (~90%) while pet-coke prices have reversed from the lows in FY17. Hence, we expect fuel cost inflation will hit the company relatively harder than the industry. Logistics cost is also unlikely to be contained as split grinding units in eastern region are 600km away from the integrated unit in Raipur. This is unlike northern region where split grinders are ~400km away. Hence, we expect SRCM to lose the cost advantage in FY19/FY20.
Valuation, catalysts and risks: We have used SOTP valuation to arrive at fair value for SRCM. We expect the earnings premium to taper off, given the cost inflation impacting earnings and volatile & weak pricing, especially in eastern region. Further, the demand shift from housing to infrastructure segment will only mean price recovery is unlikely although demand will gather strength (realisation of 1.8% over FY14-FY20E). This will lead to revenue traction, but EBITDA margin will reel under pressure. We have valued the company’s cement business at an EV of Rs481bn (EV/mt of Rs12bn FY20Ecapacity) and the power segment with an EV of Rs30.1bn (RoE of 10%) to arrive at a fair value of Rs15,207/share. The stock currently trades at an EV/mt of Rs13.0bn FY20E capacity, which we feel is at premium valuation. We initiate coverage on the stock with SELL rating and a target price of Rs15,207/share.
SELL
Sector: Cement
CMP: Rs16,354
Target Price: Rs15,207
Downside: 7%
Milind Raginwar Research Analyst [email protected] +91-22-6273 8172 Harshit Dhoot Research Associate [email protected] +91 22 6273 8111
Key Data
Current Shares O/S (mn) 34.8
Mkt Cap (Rsbn/US$bn) 569.7/8.7
52 Wk H / L (Rs) 20,560/15,600
Daily Vol. (3M NSE Avg.) 25,294
Share holding (%) 1QFY18 2QFY18 3QFY18
Promoter 64.8 64.8 64.8
Public 35.2 35.2 35.2
Others - - -
One -Year Indexed Stock Performance
Price Performance (%)
1 M 6 M 1 Yr
Shree Cement (2.2) (7.7) 1.8
Nifty 50 Index (2.6) 1.5 12.0
Source: Bloomberg
Y/E March (Rsmn) FY16 FY17 FY18E FY19E FY20E
Net sales 55,647 84,236 100,284 118,572 137,888
Growth (%) 15.0 13.5 19.1 18.2 16.3
EBITDA margin (%) 23.7 28.1 25.5 26.0 25.1
Adjusted net profit 4,549 13,414 13,834 17,141 19,870
vs consensus - - - (7.5) (19.0)
EPS (Rs) 174.1 385.1 397.1 492.0 570.4
Growth (%) 42.3 121.2 3.1 23.9 15.9
P/E (x) 94.3 42.7 41.4 33.4 28.8
P/B (x) 8.4 7.4 6.4 5.4 4.6
EV/EBITDA (x) 31.5 23.3 21.8 18.1 16.0
D/E (x) (0.3) (0.3) (0.2) (0.1) (0.1)
RoE (%) 12.7 18.4 16.6 17.5 17.2
RoCE (%) 9.4 19.1 17.0 18.5 18.5
Dividend yield (%) 0.2 0.7 0.1 0.1 0.1
Source: Company, Nirmal Bang Institutional Equities Research
90
100
110
120
130
Mar-17 May-17 Jul-17 Sep-17 Nov-17 Jan-18 Mar-18
SHREE CEMENT Nifty 50
26 March 2018

Institutional Equities
Shree Cement 74
Exhibit 1: Volume aided by new capacity Exhibit 2: EBITDAM will continue to beat industry average
Source: Company, Nirmal Bang Institutional Equities Research Source: Company, Nirmal Bang Institutional Equities Research
Exhibit 3: Assumption table
CY17 CY18P YoY (%) CY19E YoY (%)
Volume (mn tonnes) 22.3 26.0 17.0 29.9 15.0
Realisation (Rs/tonne) 4,012.2 4,092.4 2.0 4,194.7 2.5
Power & Fuel Cost (per tonne) 872.4 834.6 (4.3) 837.6 0.4
Logistics Cost (per tonne) 627.2 649.2 3.5 668.7 3.0
Source: Company, Nirmal Bang Institutional Equities Research
Exhibit 4: Valuation Table
Particulars Basis EV (Rs mn)
Cement EV/T of Rs12.0bn FY20 capacities 481,000
Power 607 MW @ Rs 50 mn per MW 30,350
Total EV 511,350
Net Debt (18,428)
Market Cap 529,778
No of Shares (mn) 34.8
SOTP Value (Rs) 15,207
Source: Company, Nirmal Bang Institutional Equities Research
3,8
01
3,6
87
3,7
19
3,8
12
4,0
12
4,0
92
4,1
95
14.115.8
13.6
20.122.3
26.0
29.9
0
5
10
15
20
25
30
35
3,400
3,500
3,600
3,700
3,800
3,900
4,000
4,100
4,200
4,300
FY14 FY15 FY16 FY17 FY18E FY19E FY20E
(MT)(Rs/tn)
Realisation Volume
97
7
83
6
69
0
1,0
44
1,0
46
1,0
95
1,0
82
23.6
20.8
23.7
28.1
25.5 26.0 25.1
0
5
10
15
20
25
30
0
200
400
600
800
1,000
1,200
FY14 FY15 FY16 FY17 FY18E FY19E FY20E
(MT)(Rs/tn)
EBITDA/tn Margin

Institutional Equities
Shree Cement 75
Exhibit 5: Valuation charts
EV/EBITDA EV/tn
Source: Company, Nirmal Bang Institutional Equities Research Source: Company, Nirmal Bang Institutional Equities Research
EV/EBITDA EV/tn
Source: Company, Nirmal Bang Institutional Equities Research Source: Company, Nirmal Bang Institutional Equities Research
0
5,000
10,000
15,000
20,000
25,000
Ap
r-0
5
No
v-0
5
Jun
-06
Jan
-07
Au
g-0
7
Ma
r-0
8
Oct
-08
Ma
y-0
9
De
c-0
9
Jul-1
0
Fe
b-1
1
Se
p-1
1
Ap
r-1
2
No
v-1
2
Jun
-13
Jan
-14
Se
p-1
4
Ap
r-1
5
No
v-1
5
Jun
-16
Jan
-17
Au
g-1
7
Ma
r-1
8
(Rs)
Price 10 14 18 22
0
5,000
10,000
15,000
20,000
25,000
Ap
r-0
9
Oct
-09
Ma
y-1
0
De
c-1
0
Jun
-11
Jan
-12
Au
g-1
2
Fe
b-1
3
Se
p-1
3
Ap
r-1
4
No
v-1
4
Ma
y-1
5
De
c-1
5
Jul-1
6
Jan
-17
Au
g-1
7
Ma
r-1
8
(Rs)
Price $150 $200 $250 $300 $350
(10)
(5)
0
5
10
15
20
25
30
35
Ap
r-0
5
No
v-0
5
Jun
-06
Jan
-07
Au
g-0
7
Ma
r-0
8
Oct
-08
Ma
y-0
9
De
c-0
9
Jul-1
0
Fe
b-1
1
Se
p-1
1
Ap
r-1
2
No
v-1
2
Jun
-13
Jan
-14
Se
p-1
4
Ap
r-1
5
No
v-1
5
Jun
-16
Jan
-17
Au
g-1
7
Ma
r-1
8
EV/EBIDTA Mean +1 SD -1 SD +2 SD -2 SD
0
50
100
150
200
250
300
350
Ap
r-0
8
Oct
-08
Jun
-09
De
c-0
9
Au
g-1
0
Ma
r-1
1
Oct
-11
Ma
y-1
2
No
v-1
2
Jul-1
3
Jan
-14
Au
g-1
4
Ap
r-1
5
Oct
-15
Ma
y-1
6
De
c-1
6
Jul-1
7
Ma
r-1
8
EV/tonne Mean +1 SD -1 SD +2 SD -2 SD
EV/tonne (MT)

Institutional Equities
Shree Cement 76
Financials
Exhibit 6: Income statement
Y/E Mar (Rsmn) FY16 FY17 FY18E FY19E FY20E
Net sales 55,647 84,236 100,284 118,572 137,888
Growth (%) 15.0 13.5 19.1 18.2 16.3
Operating expenses (42,445) (60,564) (74,709) (87,740) (103,223)
EBITDA 13,203 23,672 25,575 30,831 34,666
Growth (%) 31.0 34.5 8.0 20.6 12.4
Depreciation &amortisation (9,107) (12,147) (13,848) (15,475) (16,713)
EBIT 5,297 16,602 16,885 20,838 23,990
Other income 1,201 5,077 5,158 5,482 6,037
Interest paid (751) (1,271) (1,227) (1,038) (1,017)
Extraordinary/Exceptional items
PBT 4,545 15,331 15,659 19,800 22,973
Tax 4 (1,917) (1,825) (2,660) (3,103)
Effective tax rate (%) 0.1 (12.5) (11.7) (13.4) (13.5)
Net profit 4,549 13,414 13,834 17,141 19,870
Minority interest - - - - -
Reported Net profit 4,549 13,414 13,834 17,141 19,870
Non-recurring items - - - - -
Adjusted Net profit 4,549 13,414 13,834 17,141 19,870
Growth (%) 42.3 121.2 3.1 23.9 15.9
Source: Company, Nirmal Bang Institutional Equities Research
Exhibit 8: Balance sheet
Y/E Mar (Rsmn) FY16 FY17 FY18E FY19E FY20E
Cash & Bank balances 2,830 3,110 1,337 2,016 4,588
Other Current assets 24,633 29,953 37,906 41,567 48,692
Investments 30,305 40,426 28,494 29,000 28,500
Net fixed assets 31,709 33,096 53,129 67,544 78,936
Goodwill & intangible assets 1,438 (0) (0) (0) (0)
Other non-current assets - - - - -
Total assets 90,915 106,585 120,865 140,126 160,716
Current liabilities 11,056 12,162 16,555 19,359 21,742
Borrowings 15,057 22,454 15,290 15,465 14,660
Other non-current liabilities (3,652) (5,013) (980) (1,024) (1,067)
Total liabilities 22,461 29,603 30,865 33,800 35,335
Share capital 348 348 348 348 348
Reserves & surplus 68,107 76,633 89,652 105,977 125,032
Shareholders' funds 68,455 76,981 90,000 106,326 125,380
Minority interest - - - - -
Total equity & liabilities 90,916 106,584 120,865 140,126 160,716
Source: Company, Nirmal Bang Institutional Equities Research
Exhibit 7: Cash flow
Y/E Mar (Rsmn) FY16 FY17 FY18E FY19E FY20E
Pre-tax profit 4,545 15,331 15,659 19,800 22,973
Depreciation 9,027 (45,117) 13,848 15,475 16,713
Chg in working capital (2,300) (4,202) (6,412) (1,787) (5,226)
Total tax paid (515) (3,290) 4,653 (1,774) (2,663)
Other operating activities 5,495 79 - - -
Operating CF 16,253 (37,198) 27,747 31,715 31,797
Capital expenditure (7,851) 45,167 (33,880) (29,890) (28,105)
Chg in investments (7,984) (10,121) 11,932 (506) 500
Other investing activities - - - - -
Investing CF (15,835) 35,046 (21,948) (30,396) (27,605)
FCF 418 (2,151) 5,799 1,319 4,192
Equity raised/(repaid) (0) (0) (0) (0) (0)
Debt raised/(repaid) (446) 7,397 (7,164) 175 (805)
Dividend (incl. tax) (1,006) (4,864) (408) (815) (815)
Other financing activities 789 (102) - - -
Financing CF (663) 2,432 (7,572) (640) (1,620)
Net chg in cash & bank bal. (245) 280 (1,772) 678 2,572
Closing cash & bank bal 2,830 3,110 1,337 2,016 4,588
Source: Company, Nirmal Bang Institutional Equities Research
Exhibit 9: Key ratios
Y/E Mar (Rsmn) FY16 FY17 FY18E FY19E FY20E
Profitability and return ratios (%)
EBITDAM 23.7 28.1 25.5 26.0 25.1
EBITM 9.5 19.7 16.8 17.6 17.4
NPM 8.2 15.9 13.8 14.5 14.4
RoE 12.7 18.4 16.6 17.5 17.2
RoCE 9.4 19.1 17.0 18.5 18.5
RoIC 15.3 29.8 23.8 22.0 21.2
Per share data (Rs)
O/s shares 34.8 34.8 34.8 34.8 34.8
EPS 174.1 385.1 397.1 492.0 570.4
FDEPS 174.1 385.1 397.1 492.0 570.4
CEPS 522.7 733.7 794.6 936.2 1,050.1
BV 1,682.9 1,965.0 2,209.7 2,583.4 3,052.1
DPS 32.0 116.0 20.0 20.0 20.0
Valuation ratios (x)
PE 93.7 42.4 41.1 33.2 28.6
P/BV 8.3 7.4 6.3 5.3 4.5
EV/EBITDA 31.3 23.1 21.7 17.9 15.9
EV/Sales 7.4 6.5 5.5 4.7 4.0
Other key ratios
D/E (x) (0.3) (0.3) (0.2) (0.1) (0.1)
DSO (days) 16.2 14.5 15.6 14.9 14.5
Du Pont Analysis - RoE
NPM (%) 8.2 15.9 13.8 14.5 14.4
Asset turnover (x) 0.9 0.9 0.9 0.9 0.9
Equity Multiplier (x) 1.8 1.4 1.4 1.3 1.3
RoE (%) 12.7 18.4 16.6 17.5 17.2
Source: Company, Nirmal Bang Institutional Equities Research

Institutional Equities
Reuters: TRCE.NS; Bloomberg: TRCL IN
The Ramco Cements
Rei
nitia
ting
Cov
erag
e
Geared For A Better Show; Upgrade To Buy The Ramco Cements’ (TRCL) strong foothold in its home market (~55% inTamil Nadu and Kerala), diversification in eastern region (22% of revenue contribution) and ~20% of capacity in Andhra Pradesh will help the improvement in earnings. This will also add to better safeguards as the regional diversification will minimise the earnings shocks. TRCL’s new capacity in Vizag will help it to tap the coastal Andhra Pradesh market where it is currently having a minimum presence. TRCL’s planned grinding unit in Odisha (relatively better market for cement pricing in eastern region) will further add to diversifying its revenues (currently ~22% contribution from eastern region and 78% from southern region) and reduce the geographical concentration. It has a sharp focus on earnings improvement by controlling costs that includes use of economical fuel (pet coke despite current inflation in prices) and curtailing raw material cost escalation. We have upgraded our rating on TRCL to Buy from Accumulate earlier, with a target price of Rs887, assigning Rs12.3bn/tn of target replacement costs factoring in its regional diversification that will enhance the quality of earnings, its focus on cost curtailment and improving the quality of the balance sheet. At our target price, the stock trades at EV/EBITDA of 14.8x FY20E earnings. Revival in Andhra Pradesh/Telangana to help TRCL in its home market: TRCL has a strong presence in its key markets (Tamil Nadu + Kerala) with ~55% of the revenue contribution (though this market is currently slow). With revival in Andhra Pradesh/Telangana, we expect less disturbance in the dominant markets of TRCL as volume from Andhra Pradesh-based cement manufacturers will decline, leaving less pricing pressure in Tamil Nadu/Kerala. Besides, TRCL also has ~ 12%-14% presence in Andhra Pradesh/Telangana markets and will benefit from demand recovery in these markets. Additional presence in Andhra Pradesh through incremental capacity: TRCL has timely added a new grinding capacity in Vizag of 1mt (commissioned in mid-2017). This will help TRCL to expand its presence in new areas of coastal Andhra Pradesh. Expected demand recovery in Andhra Pradesh following the state government’s thrust on irrigation projects and affordable housing segment will only help faster ramp-up of new capacity and boost TRCL’s earnings. Besides TRCL is expected to add new capacity in Odisha which will reduce its regional concentration risk (eastern region contributes ~22% of the revenues currently). Reduction in debt to lower interest payment burden: TRCL has strongly focused on reducing debt. It has reduced its debt from ~ Rs25bn to ~ Rs10bn in the past three years. This will help TRCL to reduce its interest burden from Rs1.8bn in FY16 to Rs655mn in FY20E, boosting its earnings. Valuation, catalysts and risks: TRCL currently trades at a replacement cost of Rs10.4bn/tn, but we have assigned EV/tn of Rs12.4mn/tn FY20E capacity to arrive at the fair value (premium to~Rs7.5bn long-term mean EV/tn valuation). TRCL’s healthy performance will continue as realisation improves in its key markets (notwithstanding the short-term jerks), timely capacity expansion in Andhra Pradesh/Telangana and diversification into new eastern region markets. Operating efficiency will continue to spur cost competency aiding the strong performance. Hence, we have aligned higher quality earnings to assign premium valuation and revised our rating on TRCL to Buy from Accumulate earlier with a target price of Rs887/share. At our revised target price, the stock trades at EV/EBTIDA of 14.8x FY20E earnings.
BUY
Sector: Cement
CMP: Rs 736
Target Price: Rs 887
Upside: 21%
Milind Raginwar Research Analyst [email protected] +91-22-6273 8172 Harshit Dhoot Research Associate [email protected] +91 22 6273 8111
Key Data
Current Shares O/S (mn) 235.6
Mkt Cap (Rsbn/US$bn) 173.4/2.7
52 Wk H / L (Rs) 840/625
Daily Vol. (3M NSE Avg.) 309,468
Share holding (%) 1QFY18 2QFY18 3QFY18
Promoter 42.8 42.8 42.7
Public 57.3 57.3 57.3
Others - - -
One -Year Indexed Stock Performance
Price Performance (%)
1 M 6 M 1 Yr
The Ramco Cements 3.1 4.0 12.0
Nifty 50 Index (2.6) 1.5 12.0
Source: Bloomberg
Y/E March (Rsmn) FY16 FY17 FY18E FY19E FY20E
Net sales 35,517 39,302 43,700 51,005 56,878
Growth (%) (1.2) 10.7 11.2 16.7 11.5
EBITDA margin (%) 29.6 29.4 25.2 25.0 26.2
Adjusted net profit 5,422 6,493 6,408 7,973 9,855
vs consensus - - - 5.4 8.7
EPS (Rs) 22.8 27.3 27.1 33.8 41.8
Growth (%) 123.7 19.8 (0.8) 25.1 23.6
P/E (x) 39.0 32.5 32.8 26.2 21.2
P/B (x) 6.8 5.8 5.0 4.2 3.6
EV/EBITDA (x) 21.6 19.1 20.1 17.2 14.8
D/E (x) 0.5 0.3 0.2 0.2 0.2
RoE (%) 18.8 19.2 16.2 17.3 18.2
RoCE (%) 15.4 17.3 15.9 17.7 18.9
Dividend yield (%) 0.5 0.3 0.2 0.3 0.3
Source: Company, Nirmal Bang Institutional Equities Research
90
100
110
120
130
Mar-17 May-17 Jul-17 Sep-17 Nov-17 Jan-18 Mar-18
RAMCO CEMENT Nifty 50
26 March 2018

Institutional Equities
The Ramco Cements 78
Exhibit 1: Volume spurt will help operating cost savings Exhibit 2: Above industry average EBITDAM expected to continue
Source: Company, Nirmal Bang Institutional Equities Research Source: Company, Nirmal Bang Institutional Equities Research
Exhibit 3: Assumption table
FY18E FY19E YoY (%) FY20E YoY (%)
Volume (mn tonnes) 9.1 10.4 14.5 11.3 8.6
Realisation (Rs/tonne) 4,668.6 4,773.7 2.3 4,905.0 2.8
Power & Fuel Cost (per tonne) 805.8 825.8 2.5 834.8 1.1
Logistics Cost (per tonne) 930.0 989.0 6.3 1,008.8 2.0
Source: Company, Nirmal Bang Institutional Equities Research
Exhibit 4: Valuation charts
EV/EBITDA EV/tn
Source: Company, Nirmal Bang Institutional Equities Research Source: Company, Nirmal Bang Institutional Equities Research
EV/EBITDA EV/tn
Source: Company, Nirmal Bang Institutional Equities Research Source: Company, Nirmal Bang Institutional Equities Research
4,7
21
4,5
26
4,8
32
4,5
78
4,6
69
4,7
74
4,9
05
8.6
7.7 7.2
8.3 9.1
10.4
11.3
0
2
4
6
8
10
12
4,300
4,400
4,500
4,600
4,700
4,800
4,900
5,000
FY14 FY15 FY16 FY17 FY18E FY19E FY20E
(MT)(Rs/tn)
Realisation Volume
59
6
86
0
1,4
52
1,3
92
1,2
05
1,2
22
1,3
14
14.1
18.4
29.6 29.4
25.2 25.026.2
0
5
10
15
20
25
30
35
0
200
400
600
800
1,000
1,200
1,400
1,600
FY14 FY15 FY16 FY17 FY18E FY19E FY20E
(MT)(Rs/tn)
EBITDA/tn Margin
0
200
400
600
800
Ap
r-0
5
No
v-0
5
Jun
-06
Jan
-07
Au
g-0
7
Ma
r-0
8
Oct
-08
Ma
y-0
9
De
c-0
9
Jul-1
0
Fe
b-1
1
Se
p-1
1
Ap
r-1
2
No
v-1
2
Jun
-13
Jan
-14
Se
p-1
4
Ap
r-1
5
No
v-1
5
Jun
-16
Jan
-17
Au
g-1
7
Ma
r-1
8
(Rs)
Price 8 10 12 14
(50)
150
350
550
750
Ap
r-0
8
Oct
-08
Jun
-09
De
c-0
9
Au
g-1
0
Ma
r-1
1
Oct
-11
Ma
y-1
2
No
v-1
2
Jul-1
3
Jan
-14
Au
g-1
4
Ap
r-1
5
Oct
-15
Ma
y-1
6
De
c-1
6
Jul-1
7
Ma
r-1
8
(Rs)
Price $80 $100 $120 $140 $160
0
2
4
6
8
10
12
14
16
18
20
Ap
r-0
5
No
v-0
5
Jun
-06
Jan
-07
Au
g-0
7
Ma
r-0
8
Oct
-08
Ma
y-0
9
De
c-0
9
Jul-1
0
Fe
b-1
1
Se
p-1
1
Ap
r-1
2
No
v-1
2
Jun
-13
Jan
-14
Se
p-1
4
Ap
r-1
5
No
v-1
5
Jun
-16
Jan
-17
Au
g-1
7
Ma
r-1
8
EV/EBITDA (X)
EV/EBIDTA Mean +1SD -1SD +2SD -2SD
0
20
40
60
80
100
120
140
160
180
200
Ap
r-0
8
Oct
-08
Ap
r-0
9
Oct
-09
Ma
y-1
0
No
v-1
0
Ma
y-1
1
No
v-1
1
Jun
-12
De
c-1
2
Jun
-13
Jan
-14
Jul-1
4
Jan
-15
Jul-1
5
Fe
b-1
6
Au
g-1
6
Fe
b-1
7
Au
g-1
7
Ma
r-1
8
EV/Tonne (MT)
EV/tonne Mean +1SD -1SD +2SD -2SD
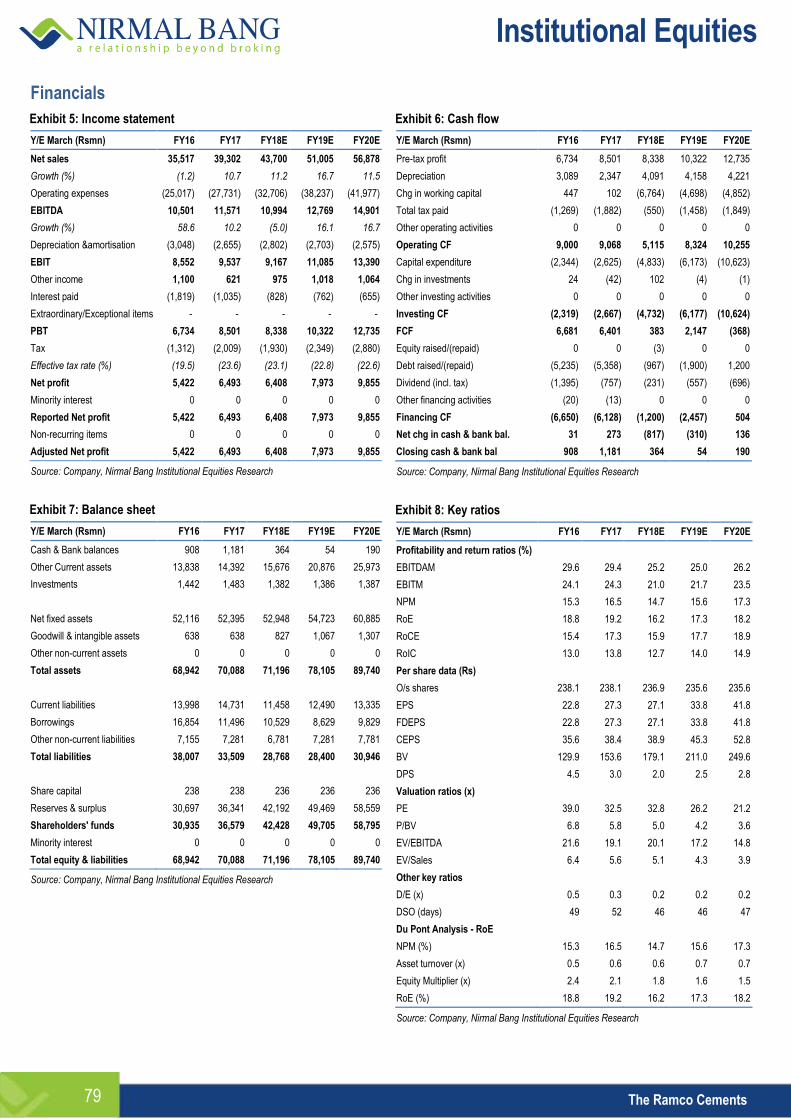
Institutional Equities
The Ramco Cements 79
Financials
Exhibit 5: Income statement
Y/E March (Rsmn) FY16 FY17 FY18E FY19E FY20E
Net sales 35,517 39,302 43,700 51,005 56,878
Growth (%) (1.2) 10.7 11.2 16.7 11.5
Operating expenses (25,017) (27,731) (32,706) (38,237) (41,977)
EBITDA 10,501 11,571 10,994 12,769 14,901
Growth (%) 58.6 10.2 (5.0) 16.1 16.7
Depreciation &amortisation (3,048) (2,655) (2,802) (2,703) (2,575)
EBIT 8,552 9,537 9,167 11,085 13,390
Other income 1,100 621 975 1,018 1,064
Interest paid (1,819) (1,035) (828) (762) (655)
Extraordinary/Exceptional items - - - - -
PBT 6,734 8,501 8,338 10,322 12,735
Tax (1,312) (2,009) (1,930) (2,349) (2,880)
Effective tax rate (%) (19.5) (23.6) (23.1) (22.8) (22.6)
Net profit 5,422 6,493 6,408 7,973 9,855
Minority interest 0 0 0 0 0
Reported Net profit 5,422 6,493 6,408 7,973 9,855
Non-recurring items 0 0 0 0 0
Adjusted Net profit 5,422 6,493 6,408 7,973 9,855
Source: Company, Nirmal Bang Institutional Equities Research
Exhibit 7: Balance sheet
Y/E March (Rsmn) FY16 FY17 FY18E FY19E FY20E
Cash & Bank balances 908 1,181 364 54 190
Other Current assets 13,838 14,392 15,676 20,876 25,973
Investments 1,442 1,483 1,382 1,386 1,387
Net fixed assets 52,116 52,395 52,948 54,723 60,885
Goodwill & intangible assets 638 638 827 1,067 1,307
Other non-current assets 0 0 0 0 0
Total assets 68,942 70,088 71,196 78,105 89,740
Current liabilities 13,998 14,731 11,458 12,490 13,335
Borrowings 16,854 11,496 10,529 8,629 9,829
Other non-current liabilities 7,155 7,281 6,781 7,281 7,781
Total liabilities 38,007 33,509 28,768 28,400 30,946
Share capital 238 238 236 236 236
Reserves & surplus 30,697 36,341 42,192 49,469 58,559
Shareholders' funds 30,935 36,579 42,428 49,705 58,795
Minority interest 0 0 0 0 0
Total equity & liabilities 68,942 70,088 71,196 78,105 89,740
Source: Company, Nirmal Bang Institutional Equities Research
Exhibit 6: Cash flow
Y/E March (Rsmn) FY16 FY17 FY18E FY19E FY20E
Pre-tax profit 6,734 8,501 8,338 10,322 12,735
Depreciation 3,089 2,347 4,091 4,158 4,221
Chg in working capital 447 102 (6,764) (4,698) (4,852)
Total tax paid (1,269) (1,882) (550) (1,458) (1,849)
Other operating activities 0 0 0 0 0
Operating CF 9,000 9,068 5,115 8,324 10,255
Capital expenditure (2,344) (2,625) (4,833) (6,173) (10,623)
Chg in investments 24 (42) 102 (4) (1)
Other investing activities 0 0 0 0 0
Investing CF (2,319) (2,667) (4,732) (6,177) (10,624)
FCF 6,681 6,401 383 2,147 (368)
Equity raised/(repaid) 0 0 (3) 0 0
Debt raised/(repaid) (5,235) (5,358) (967) (1,900) 1,200
Dividend (incl. tax) (1,395) (757) (231) (557) (696)
Other financing activities (20) (13) 0 0 0
Financing CF (6,650) (6,128) (1,200) (2,457) 504
Net chg in cash & bank bal. 31 273 (817) (310) 136
Closing cash & bank bal 908 1,181 364 54 190
Source: Company, Nirmal Bang Institutional Equities Research
Exhibit 8: Key ratios
Y/E March (Rsmn) FY16 FY17 FY18E FY19E FY20E
Profitability and return ratios (%)
EBITDAM 29.6 29.4 25.2 25.0 26.2
EBITM 24.1 24.3 21.0 21.7 23.5
NPM 15.3 16.5 14.7 15.6 17.3
RoE 18.8 19.2 16.2 17.3 18.2
RoCE 15.4 17.3 15.9 17.7 18.9
RoIC 13.0 13.8 12.7 14.0 14.9
Per share data (Rs)
O/s shares 238.1 238.1 236.9 235.6 235.6
EPS 22.8 27.3 27.1 33.8 41.8
FDEPS 22.8 27.3 27.1 33.8 41.8
CEPS 35.6 38.4 38.9 45.3 52.8
BV 129.9 153.6 179.1 211.0 249.6
DPS 4.5 3.0 2.0 2.5 2.8
Valuation ratios (x)
PE 39.0 32.5 32.8 26.2 21.2
P/BV 6.8 5.8 5.0 4.2 3.6
EV/EBITDA 21.6 19.1 20.1 17.2 14.8
EV/Sales 6.4 5.6 5.1 4.3 3.9
Other key ratios
D/E (x) 0.5 0.3 0.2 0.2 0.2
DSO (days) 49 52 46 46 47
Du Pont Analysis - RoE
NPM (%) 15.3 16.5 14.7 15.6 17.3
Asset turnover (x) 0.5 0.6 0.6 0.7 0.7
Equity Multiplier (x) 2.4 2.1 1.8 1.6 1.5
RoE (%) 18.8 19.2 16.2 17.3 18.2
Source: Company, Nirmal Bang Institutional Equities Research

Institutional Equities
The Ramco Cements 80
This page has been intentionally left blank

Institutional Equities
Reuters: ULTC.NS; Bloomberg: UTCEM IN
UltraTech Cement
Initi
atin
g C
over
age
Will Continue Its Leadership Position Ultratech Cement (UTCEM) JPA asset acquisition has helped its entry in central India (11% of capacity, 10% of total despatches) and consolidated its position in northern region (Himachal Pradesh). However, ramping up capacity utilisation of these assets will take some steam out and despite this we expect EBITDAM to register ~21% trajectory. Cost efficiency (largely logistic costs) will benefit and further bolster after the full impact of JPA assets gaining sizeable utilisation likely after FY19, although the fuel cost impact will hit margins of UTCEM. The stock currently trades at ~Rs13.6bn/mt against our fair value of Rs14.0bn/mt. We have assigned Accumulate rating to the stock with a target price of Rs4,302/share. At our target price, the stock trades at EV/EBITDA of 16.2x FY20E earnings.
Inroads in strategic markets through acquisition of JPA assets: UTCEM’s entry in central India cluster through JPA assets is a welcome move. Acquiring JPA assets will mean ~11% of UTCEM’s capacity in central region where UTCEM nearly had no presence earlier. The central region’s demand growth is expected to beat industry growth because of strong state government push for infrastructure (Madhya Pradesh and Uttar Pradesh were erstwhile BIMARU states). The demand-supply gap in this region is narrowest with minimal capacity addition (~2mn over the next three years), implying higher pricing rewards as utilisation rate will range upwards of 80%.
Further consolidation with greenfield capacity addition: UTCEM will add new capacity of ~ 3.5mt (integrated unit) to further consolidate its presence in central India at Dhar in Madhya Pradesh. The plant will help reduce the lead distance (lead distance ~1,000km from Indore to Bela) and cater to the markets of southwest Madhya Pradesh, where it has no presence currently.
Size and well-spread producing centres offer cost moat: UTCEM has effectively used the hub and spoke model through 16 split grinders and seven bulk terminals near markets and logistic efficiency. Additionally, 85% of the power requirement is met through captive sources. With JPA asset acquisition, these benefits will further add to UTCEM although the impact of the same will be reflected post FY19.
Valuation, catalysts and risks: We have estimated our earnings for FY18/FY19/0FY20 at Rs84.5/Rs102/Rs130.9/share respectively, factoring in steady ramp-up of capacity utilisation of JPA assets at ~60%/70% in FY19E/FY20E, respectively. JPA asset acquisition impact will be higher in FY19 that will trigger volume growth. Currently, the stock trades at a replacement cost of Rs13.6bn EV/mtn FY20Ecapacity. We have valued UTCEM at Rs14.0bn EV/mt (30% premium to its mean valuation) to arrive at fair value target price of Rs4,302. The premium is to factor in its strong pan-India presence, continued strong operating performance and healthy balance sheet despite the same not reflecting in RoE because of continued capex to gain size. We believe that though RoCE/RoE are hovering ~12x FY20E earnings, they do not reflect the potential earnings which will be reflected post acquisition of the JPA cement assets. Hence, despite the return ratios hovering ~12x, we have arrived at a premium valuation for UTCEM. We have assigned Accumulate rating to UTCEM, citing huge potential to tap incremental demand that is unlikely to unfold following demand revival. Operating efficiency (despite the size) will reflect fully following the higher capacity utilisation that will further support earnings. At our target price, the stock trades at EV/EBITDA of 16x FY20E earnings.
ACCUMULATE
Sector: Cement
CMP: Rs3,925
Target Price: Rs 4,302
Upside: 9%
Milind Raginwar Research Analyst [email protected] +91-22-6273 8172 Harshit Dhoot Research Associate [email protected] +91 22 6273 8111
Key Data
Current Shares O/S (mn) 274.6
Mkt Cap (Rsbn/US$bn) 899.1/13.5
52 Wk H / L (Rs) 4,600/3,773
Daily Vol. (3M NSE Avg.) 345,051
Share holding (%) 1QFY18 2QFY18 3QFY18
Promoter 62.1 62.1 62.1
Public 38.0 38.0 38.0
Others - - -
One -Year Indexed Stock Performance
Price Performance (%)
1 M 6 M 1 Yr
UltraTech Cement 2.4 12.9 21.0
Nifty 50 Index (2.6) 1.5 12.0
Source: Bloomberg
Y/E March (Rsmn) FY16 FY17 FY18E FY19E FY20E
Net sales 237,088 238,914 298,634 355,191 398,504
EBITDA margin (%) 19.5 20.8 19.4 19.8 19.9
Adjusted net profit 23,702 25,036 23,194 27,934 35,931
vs consensus (%) - - - (21.1) (24.7)
EPS (Rs) 86.4 91.2 84.5 101.8 130.9
Growth (%) 14.6 5.6 (7.4) 20.4 28.6
P/E (x) 46.6 44.1 47.6 39.5 30.7
P/B (x) 5.3 4.6 4.3 3.9 3.5
EV/EBITDA (x) 24.1 21.6 21.5 17.7 15.4
Dividend yield (%) 0.2 0.2 0.2 0.2 0.2
RoE (%) 12.0 11.2 9.3 10.3 11.9
RoCE (%) 12.6 13.3 10.7 10.4 11.8
Source: Company, Nirmal Bang Institutional Equities Research
90
100
110
120
130
Mar-17 May-17 Jul-17 Sep-17 Nov-17 Jan-18 Mar-18
ULTRATECH CEMENT Nifty 50
26 March 2018

Institutional Equities
UltraTech Cement 82
Exhibit 1: Strong capacity headroom will aid volume growth as demand revives
Exhibit 2: EBTIDAM will be line with the industry average
Source: Company, Nirmal Bang Institutional Equities Research Source: Company, Nirmal Bang Institutional Equities Research
Exhibit 3: Assumption table
FY18E FY19E YoY (%) FY20E YoY (%)
Volume (mn tonnes) 55.9 66.2 18.4 72.6 9.8
Realisation (Rs/tonne) 4,381.0 4,512.4 3.0 4,670.3 3.5
Power & Fuel Cost (per tonne) 717.7 720.7 0.4 735.5 2.0
Logistics Cost (per tonne) 925.1 903.7 (2.3) 890.3 (1.5)
Source: Company, Nirmal Bang Institutional Equities Research
Exhibit 4: Valuation charts
EV/EBITDA EV/tn
Source: Company, Nirmal Bang Institutional Equities Research Source: Company, Nirmal Bang Institutional Equities Research
EV/EBITDA EV/tn
Source: Company, Nirmal Bang Institutional Equities Research Source: Company, Nirmal Bang Institutional Equities Research
4,0
27
4,2
24
4,4
04
4,1
72
4,3
81
4,5
12
4,6
70
41.144.1
47.747.6
55.9
66.2
72.6
0
10
20
30
40
50
60
70
80
3,600
3,800
4,000
4,200
4,400
4,600
4,800
FY14 FY15 FY16 FY17 FY18E FY19E FY20E
(MT)(Rs/tn)
Realisation Volume
88
2
90
0
96
8
1,0
38
1,0
15
1,0
43
1,0
61
18.8
18.5
19.5
20.8
19.4
19.819.9
17.0
17.5
18.0
18.5
19.0
19.5
20.0
20.5
21.0
0
200
400
600
800
1,000
1,200
FY14 FY15 FY16 FY17 FY18E FY19E FY20E
(MT)(Rs/tn)
EBITDA/tn Margin
0
1,500
3,000
4,500
6,000
Ap
r-0
5
No
v-0
5
Jun
-06
Jan
-07
Au
g-0
7
Ma
r-0
8
Oct
-08
Ma
y-0
9
De
c-0
9
Jul-1
0
Fe
b-1
1
Se
p-1
1
Ap
r-1
2
No
v-1
2
Jun
-13
Jan
-14
Se
p-1
4
Ap
r-1
5
No
v-1
5
Jun
-16
Jan
-17
Au
g-1
7
Ma
r-1
8
(Rs)
Price 7 11 15 19
0
600
1,200
1,800
2,400
3,000
3,600
4,200
4,800
5,400
Ap
r-0
9
Oct
-09
Ma
y-1
0
De
c-1
0
Jun
-11
Jan
-12
Au
g-1
2
Fe
b-1
3
Se
p-1
3
Ap
r-1
4
No
v-1
4
Ma
y-1
5
De
c-1
5
Jul-1
6
Jan
-17
Au
g-1
7
Ma
r-1
8
(Rs)
Price $110 $150 $190 $230 $270
0
5
10
15
20
25
Ap
r-0
5
No
v-0
5
Jun
-06
Jan
-07
Au
g-0
7
Ma
r-0
8
Oct
-08
Ma
y-0
9
De
c-0
9
Jul-1
0
Fe
b-1
1
Se
p-1
1
Ap
r-1
2
No
v-1
2
Jun
-13
Jan
-14
Se
p-1
4
Ap
r-1
5
No
v-1
5
Jun
-16
Jan
-17
Au
g-1
7
Ma
r-1
8
EV/EBITDA (X)
EV/EBIDTA (LHS) Mean +1 SD -1 SD +2 SD -2 SD
0
50
100
150
200
250
300
350
Ap
r-0
6
No
v-0
6
Jun
-07
Jan
-08
Au
g-0
8
Ma
r-0
9
Oct
-09
Jun
-10
Jan
-11
Au
g-1
1
Ma
r-1
2
Oct
-12
Ma
y-1
3
Jan
-14
Au
g-1
4
Ma
r-1
5
Oct
-15
Ma
y-1
6
De
c-1
6
Au
g-1
7
Ma
r-1
8
EV/EBITDA (MT)
EV/tonne Mean -1 SD -1 SD +2 SD -2 SD

Institutional Equities
UltraTech Cement 83
Financials
Exhibit 5: Income statement
Y/E Mar (Rsmn) FY16 FY17 FY18E FY19E FY20E
Net sales 237,088 238,914 298,634 355,191 398,504
Growth (%) 4.6 0.8 25.0 18.9 12.2
Operating expenses (190,822) (189,225) (240,903) (285,149) (319,344)
EBITDA 46,332 49,743 58,066 70,387 79,511
Growth (%) 9.0 7.4 16.7 21.2 13.0
Depreciation &amortisation (12,970) (12,679) (18,191) (22,507) (22,397)
EBIT 38,102 42,233 45,144 54,606 64,067
Other income 4,741 5,168 5,270 6,726 6,953
Interest paid (5,117) (5,714) (11,862) (16,551) (15,457)
Extraordinary/Exceptional items - - - - -
PBT 32,986 37,760 33,282 38,055 48,610
Tax (9,284) (11,482) (10,089) (10,121) (12,679)
Effective tax rate (%) (28) (30) (30) (27) (26)
Net profit 23,702 26,277 23,194 27,934 35,931
Minority interest - - - - -
Reported Net profit 23,702 26,277 23,194 27,934 35,931
Non-recurring items - 1,241 - - -
Adjusted Net profit 23,702 25,036 23,194 27,934 35,931
Growth (%) 14.6 5.6 (7.4) 20.4 28.6
Source: Company, Nirmal Bang Institutional Equities Research
Exhibit 7: Balance sheet
Y/E Mar (Rsmn) FY16 FY17 FY18E FY19E FY20E
Cash & Bank balances 22,497 22,177 20,998 9,890 8,622
Other Current assets 106,126 114,472 154,993 164,411 205,318
Investments 10,416 15,060 7,385 7,385 7,385
Net fixed assets 238,392 240,611 418,117 425,505 421,204
Goodwill & intangible assets 1,090 484 609 834 984
Other non-current assets 0 0 0 0 0
Total assets 378,520 392,805 602,102 608,026 643,512
Current liabilities 62,279 73,133 79,625 83,113 85,606
Borrowings 76,607 52,532 232,432 207,284 204,357
Other non-current liabilities 31,785 27,736 30,336 33,036 36,236
Total liabilities 170,670 153,401 342,393 323,432 326,199
Share capital 2,744 2,745 2,745 2,745 2,745
Reserves & surplus 205,105 236,660 256,964 281,848 314,569
Shareholders' funds 207,850 239,405 259,709 284,593 317,314
Minority interest 0 0 0 0 0
Total equity & liabilities 378,520 392,805 602,102 608,026 643,512
Source: Company, Nirmal Bang Institutional Equities Research
Exhibit 6: Cash flow
Y/E Mar (Rsmn) FY16 FY17 FY18E FY19E FY20E
Pre-tax profit 32,986 37,760 33,282 38,055 48,610
Depreciation 11,075 (95,918) 18,191 22,507 22,397
Chg in working capital 4,360 26,754 (30,474) (22,091) (16,574)
Total tax paid (7,072) (20,723) (989) (6,421) (9,479)
Other operating activities 0 0 0 0 0
Operating CF 41,349 (52,128) 20,012 32,050 44,954
Capital expenditure (20,346) 94,305 (195,822) (30,120) (18,245)
Chg in investments 1,166 (23,006) (2,825) 15,000 (22,000)
Other investing activities 0 0 0 0 0
Investing CF (19,180) 71,300 (198,648) (15,120) (40,245)
FCF 22,169 19,172 (178,636) 16,930 4,709
Equity raised/(repaid) 942 1 0 0 0
Debt raised/(repaid) 2,451 (24,074) 179,900 (25,148) (2,927)
Dividend (incl. tax) (2,795) (3,803) (2,444) (2,889) (3,050)
Other financing activities (2,410) 8,386 0 0 0
Financing CF (1,811) (19,491) 177,455 (28,038) (5,977)
Net chg in cash & bank bal. 20,358 (319) (1,181) (11,108) (1,268)
Closing cash & bank bal 22,497 22,177 20,998 9,890 8,622
Source: Company, Nirmal Bang Institutional Equities Research
Exhibit 8: Key ratios
Y/E Mar (Rsmn) FY16 FY17 FY18E FY19E FY20E
Profitability and return ratios (%)
EBITDAM 19.5 20.8 19.4 19.8 19.9
EBITM 16.1 17.7 15.1 15.4 16.1
NPM 10.0 10.5 7.8 7.9 9.0
RoE 12.0 11.2 9.3 10.3 11.9
RoCE 12.6 13.3 10.7 10.4 11.8
RoIC 11.4 12.6 9.7 9.1 10.3
Per share data (Rs)
O/s shares 274.4 274.4 274.4 274.4 274.4
EPS 86.4 91.2 84.5 101.8 130.9
FDEPS 86.4 91.2 84.5 101.8 130.9
CEPS 133.6 137.4 150.8 183.8 212.6
BV 757.5 872.5 946.5 1,037.1 1,156.4
DPS 9.1 9.5 9.0 9.5 10.0
Valuation ratios (x)
PE 46.6 44.1 47.6 39.5 30.7
P/BV 5.3 4.6 4.3 3.9 3.5
EV/EBITDA 24.1 21.6 21.5 17.7 15.4
EV/Sales 4.7 4.5 4.2 3.5 3.1
Other key ratios
D/E (x) 0.1 -0.1 0.5 0.5 0.4
DSO (days) 22 19 20 21 22
Du Pont Analysis - RoE
NPM (%) 10.0 10.5 7.8 7.9 9.0
Asset turnover (x) 0.6 0.6 0.6 0.6 0.6
Leverage factor (x) 1.8 1.7 2.0 2.2 2.1
RoE (%) 12.0 11.2 9.3 10.3 11.9
Source: Company, Nirmal Bang Institutional Equities Research

Institutional Equities
84
DISCLOSURES
This Report is published by Nirmal Bang Equities Private Limited (hereinafter referred to as “NBEPL”) for private circulation. NBEPL is a registered Research Analyst under SEBI (Research Analyst) Regulations, 2014 having Registration no. INH000001436. NBEPL is also a registered Stock Broker with National Stock Exchange of India Limited and BSE Limited in cash and derivatives segments. NBEPL has other business divisions with independent research teams separated by Chinese walls, and therefore may, at times, have different or contrary views on stocks and markets. NBEPL or its associates have not been debarred / suspended by SEBI or any other regulatory authority for accessing / dealing in securities Market. NBEPL, its associates or analyst or his relatives do not hold any financial interest in the subject company. NBEPL or its associates or Analyst do not have any conflict or material conflict of interest at the time of publication of the research report with the subject company. NBEPL or its associates or Analyst or his relatives do not hold beneficial ownership of 1% or more in the subject company at the end of the month immediately preceding the date of publication of this research report. NBEPL or its associates / analyst has not received any compensation / managed or co-managed public offering of securities of the company covered by Analyst during the past twelve months. NBEPL or its associates have not received any compensation or other benefits from the company covered by Analyst or third party in connection with the research report. Analyst has not served as an officer, director or employee of Subject Company and NBEPL / analyst has not been engaged in market making activity of the subject company. Analyst Certification: I/We, Mr. Milind Raginwar the research analysts, and Mr. Harshit Dhoot research associates are the authors of this report, hereby certify that the views expressed in this research report accurately reflects my/our personal views about the subject securities, issuers, products, sectors or industries. It is also certified that no part of the compensation of the analyst(s) was, is, or will be directly or indirectly related to the inclusion of specific recommendations or views in this research. The analyst(s) principally responsible for the preparation of this research report and has taken reasonable care to achieve and maintain independence and objectivity in making any recommendations.

Institutional Equities
85
Disclaimer
Stock Ratings Absolute Returns
BUY > 15%
ACCUMULATE -5% to15%
SELL < -5%
This report is for the personal information of the authorized recipient and does not construe to be any investment, legal or taxation advice to you. NBEPL is not soliciting any action based upon it. Nothing in this research shall be construed as a solicitation to buy or sell any security or product, or to engage in or refrain from engaging in any such transaction. In preparing this research, we did not take into account the investment objectives, financial situation and particular needs of the reader.
This research has been prepared for the general use of the clients of NBEPL and must not be copied, either in whole or in part, or distributed or redistributed to any other person in any form. If you are not the intended recipient you must not use or disclose the information in this research in any way. Though disseminated to all the customers simultaneously, not all customers may receive this report at the same time. NBEPL will not treat recipients as customers by virtue of their receiving this report. This report is not directed or intended for distribution to or use by any person or entity resident in a state, country or any jurisdiction, where such distribution, publication, availability or use would be contrary to law, regulation or which would subject NBEPL & its group companies to registration or licensing requirements within such jurisdictions.
The report is based on the information obtained from sources believed to be reliable, but we do not make any representation or warranty that it is accurate, complete or up-to-date and it should not be relied upon as such. We accept no obligation to correct or update the information or opinions in it. NBEPL or any of its affiliates or employees shall not be in any way responsible for any loss or damage that may arise to any person from any inadvertent error in the information contained in this report. NBEPL or any of its affiliates or employees do not provide, at any time, any express or implied warranty of any kind, regarding any matter pertaining to this report, including without limitation the implied warranties of merchantability, fitness for a particular purpose, and non-infringement. The recipients of this report should rely on their own investigations.
This information is subject to change without any prior notice. NBEPL reserves its absolute discretion and right to make or refrain from making modifications and alterations to this statement from time to time. Nevertheless, NBEPL is committed to providing independent and transparent recommendations to its clients, and would be happy to provide information in response to specific client queries.
Before making an investment decision on the basis of this research, the reader needs to consider, with or without the assistance of an adviser, whether the advice is appropriate in light of their particular investment needs, objectives and financial circumstances. There are risks involved in securities trading. The price of securities can and does fluctuate, and an individual security may even become valueless. International investors are reminded of the additional risks inherent in international investments, such as currency fluctuations and international stock market or economic conditions, which may adversely affect the value of the investment. Opinions expressed are subject to change without any notice. Neither the company nor the director or the employees of NBEPL accept any liability whatsoever for any direct, indirect, consequential or other loss arising from any use of this research and/or further communication in relation to this research. Here it may be noted that neither NBEPL, nor its directors, employees, agents or representatives shall be liable for any damages whether direct or indirect, incidental, special or consequential including lost revenue or lost profit that may arise from or in connection with the use of the information contained in this report.
Copyright of this document vests exclusively with NBEPL.
Our reports are also available on our website www.nirmalbang.com
Access all our reports on Bloomberg, Thomson Reuters and Factset.
Team Details:
Name Email Id Direct Line
Rahul Arora CEO [email protected] -
Girish Pai Head of Research [email protected] +91 22 6273 8017 / 18
Dealing
Ravi Jagtiani Dealing Desk [email protected] +91 22 6273 8230, +91 22 6636 8833
Pradeep Kasat Dealing Desk [email protected] +91 22 6273 8100/8101, +91 22 6636 8831
Michael Pillai Dealing Desk [email protected] +91 22 6273 8102/8103, +91 22 6636 8830
Nirmal Bang Equities Pvt. Ltd.
Correspondence Address
B-2, 301/302, Marathon Innova,
Nr. Peninsula Corporate Park,
Lower Parel (W), Mumbai-400013.
Board No. : 91 22 6273 8000/1; Fax. : 022 6273 8010