
Therapeutic antagonists of microRNAs deplete leukemia-initiating cell activity
15
Research article 222 The Journal of Clinical Investigation http://www.jci.org Volume 124 Number 1 January 2014 Therapeutic antagonists of microRNAs deplete leukemia-initiating cell activity Chinavenmeni S. Velu, 1 Aditya Chaubey, 1 James D. Phelan, 1 Shane R. Horman, 1 Mark Wunderlich, 2 Monica L. Guzman, 3 Anil G. Jegga, 4 Nancy J. Zeleznik-Le, 5 Jianjun Chen, 6 James C. Mulloy, 2 Jose A. Cancelas, 2 Craig T. Jordan, 7 Bruce J. Aronow, 4 Guido Marcucci, 8 Balkrishen Bhat, 9 Brian Gebelein, 10 and H. Leighton Grimes 1,2 1 Division of Immunobiology and 2 Division of Experimental Hematology and Cancer Biology, Cincinnati Children’s Hospital Medical Center, Cincinnati, Ohio, USA. 3 Weill Cornell College of Medicine, New York, New York, USA. 4 Division of Biomedical Informatics, Cincinnati Children’s Hospital Medical Center, Cincinnati, Ohio, USA. 5 Loyola University Medical Center, Maywood, Illinois, USA. 6 University of Chicago, Chicago, Illinois, USA. 7 University of Colorado, Aurora, Colorado, USA. 8 The Ohio State University Comprehensive Cancer Center, Columbus, Ohio, USA. 9 Regulus Therapeutics, San Diego, California, USA. 10 Division of Developmental Biology, Cincinnati Children’s Hospital Medical Center, Cincinnati, Ohio, USA. Acute myelogenous leukemia (AML) subtypes that result from oncogenic activation of homeobox (HOX) tran- scription factors are associated with poor prognosis. The HOXA9 transcription activator and growth factor independent 1 (GFI1) transcriptional repressor compete for occupancy at DNA-binding sites for the regula- tion of common target genes. We exploited this HOXA9 versus GFI1 antagonism to identify the genes encoding microRNA-21 and microRNA-196b as transcriptional targets of HOX-based leukemia oncoproteins. Thera- peutic inhibition of microRNA-21 and microRNA-196b inhibited in vitro leukemic colony forming activity and depleted in vivo leukemia-initiating cell activity of HOX-based leukemias, which led to leukemia-free sur- vival in a murine AML model and delayed disease onset in xenograft models. These data establish microRNA as functional effectors of endogenous HOXA9 and HOX-based leukemia oncoproteins, provide a concise in vivo platform to test RNA therapeutics, and suggest therapeutic value for microRNA antagonists in AML. Introduction Although most patients with acute myelogenous leukemia (AML) respond initially to standard chemotherapy (∼70%), 5-year sur- vival rates vary dramatically (15%–70%) depending upon the AML subtype. Cellular heterogeneity is an intrinsic feature of AML. In mouse models and xenografts, engraftment of transplanted AML is mediated by a subpopulation of leukemia-initiating cells (LIC). Broad-spectrum standard therapeutic agents fail to target LIC. The LIC theory postulates that relapse originates from LIC- containing minimal residual disease and the frequency of relapse correlates with the burden of LIC resistant to conventional chemo- therapy. Thus, stem cell–like gene expression signatures are predic- tive of disease outcome (1). Targeted therapies which that LIC and complement current regimens are needed. AML initiated by homeobox-based (HOX-based) leukemia oncoproteins has poor prognosis, highlighting interest in HOX transcription factors. HOXA9 is oncogenically activated by myriad chromosome 11 translocations involving MLL1 or Nup98 (2–5) as well as NPM1 mutations in cytogenetically normal AML (6). Nota- bly, the expression level of HOXA9 may have prognostic value in human AML (7, 8). HOXA9 interacts with homeodomain-con- taining cofactors MEIS1 and PBX1 to form a transcription factor complex that regulates downstream target genes; however, while there has been recent in-depth molecular analysis of endogenous HOXA9 target-gene regulation (9), the evaluation of their require- ment for HOXA9-mediated oncogenesis is limited to Pim1 (10), c-Myb (11), and Flt3 (12, 13). Of these, inhibition of only Pim1 or c-Myb impaired HOXA9 oncogenesis. Thus, the direct transcrip- tional effectors induced by endogenous HOXA9 (and the HOXA9 mechanism of transformation) remain largely unknown. Recently, we showed that Drosophila orthologs of HOXA9 and the growth factor independent 1 (GFI1) transcriptional repres- sor compete for occupancy of a subset of common DNA-binding sites to control embryonic anterior-posterior patterning (14). In mice, GFI1 directly regulates the expression of HoxA9, Pbx1, and Meis1 during the normal transition between common myeloid progenitor (CMP) and granulocytic-monocytic progenitor (GMP) (15). The accumulation of Gfi1 –/– myeloid progenitors is dependent upon HoxA9 gene dosage, and inducible deletion of Gfi1 combined with activation of K-Ras G12D expression induces a potent transplantable AML in vivo in approximately 17 days (15). Given the rapid transition time between normal CMP and GMP, we reasoned that GFI1 may also compete with HOXA9 (in a manner similar to Drosophila orthologs) to transmit an effec- tive antileukemia signal. Here, we show that known GFI1 target genes microRNA-196b (miR-196b) and miR-21 (16) are regulated by endogenous HOXA9, activated by HOX-based leukemia onco- proteins, and control LIC activity as effector/clients of HOX sig- naling. Notably, the in vivo therapeutic potential of microRNAs has not been explored in leukemia. Here, we demonstrate that inhibition of both miR-21 and miR-196b is curative in murine models of HOX-driven AML and substantially improves current therapies in xenograft models. Thus, this work provides a proof of principle to move forward the concept of RNA therapeutic microRNA antagonists in the treatment of AML. We construct a reproducible in vivo platform to test RNA therapeutic efficacy and demonstrate the necessity of specific oligonucleotide modifi- cations to successfully antagonize microRNA in leukemia in vivo. Authorship note: Chinavenmeni S. Velu and Aditya Chaubey contributed equally to this work. Conflict of interest: Balkrishen Bhat is an employee of Regulus Therapeutics, which develops microRNA-targeted therapies. Citation for this article: J Clin Invest. 2014;124(1):222–236. doi:10.1172/JCI66005. Downloaded on January 21, 2014. The Journal of Clinical Investigation. More information at www.jci.org/articles/view/66005
-
Upload
independent -
Category
Documents
-
view
1 -
download
0
Transcript of Therapeutic antagonists of microRNAs deplete leukemia-initiating cell activity

Research article
222 The Journal of Clinical Investigation http://www.jci.org Volume 124 Number 1 January 2014
Therapeutic antagonists of microRNAs deplete leukemia-initiating cell activity
Chinavenmeni S. Velu,1 Aditya Chaubey,1 James D. Phelan,1 Shane R. Horman,1 Mark Wunderlich,2 Monica L. Guzman,3 Anil G. Jegga,4 Nancy J. Zeleznik-Le,5 Jianjun Chen,6 James C. Mulloy,2 Jose A. Cancelas,2 Craig T. Jordan,7 Bruce J. Aronow,4 Guido Marcucci,8 Balkrishen Bhat,9
Brian Gebelein,10 and H. Leighton Grimes1,2
1Division of Immunobiology and 2Division of Experimental Hematology and Cancer Biology, Cincinnati Children’s Hospital Medical Center, Cincinnati, Ohio, USA. 3Weill Cornell College of Medicine, New York, New York, USA. 4Division of Biomedical Informatics,
Cincinnati Children’s Hospital Medical Center, Cincinnati, Ohio, USA. 5Loyola University Medical Center, Maywood, Illinois, USA. 6University of Chicago, Chicago, Illinois, USA. 7University of Colorado, Aurora, Colorado, USA.
8The Ohio State University Comprehensive Cancer Center, Columbus, Ohio, USA. 9Regulus Therapeutics, San Diego, California, USA. 10Division of Developmental Biology, Cincinnati Children’s Hospital Medical Center, Cincinnati, Ohio, USA.
Acute myelogenous leukemia (AML) subtypes that result from oncogenic activation of homeobox (HOX) tran-scription factors are associated with poor prognosis. The HOXA9 transcription activator and growth factor independent 1 (GFI1) transcriptional repressor compete for occupancy at DNA-binding sites for the regula-tion of common target genes. We exploited this HOXA9 versus GFI1 antagonism to identify the genes encoding microRNA-21 and microRNA-196b as transcriptional targets of HOX-based leukemia oncoproteins. Thera-peutic inhibition of microRNA-21 and microRNA-196b inhibited in vitro leukemic colony forming activity and depleted in vivo leukemia-initiating cell activity of HOX-based leukemias, which led to leukemia-free sur-vival in a murine AML model and delayed disease onset in xenograft models. These data establish microRNA as functional effectors of endogenous HOXA9 and HOX-based leukemia oncoproteins, provide a concise in vivo platform to test RNA therapeutics, and suggest therapeutic value for microRNA antagonists in AML.
IntroductionAlthough most patients with acute myelogenous leukemia (AML) respond initially to standard chemotherapy (∼70%), 5-year sur-vival rates vary dramatically (15%–70%) depending upon the AML subtype. Cellular heterogeneity is an intrinsic feature of AML. In mouse models and xenografts, engraftment of transplanted AML is mediated by a subpopulation of leukemia-initiating cells (LIC). Broad-spectrum standard therapeutic agents fail to target LIC. The LIC theory postulates that relapse originates from LIC-containing minimal residual disease and the frequency of relapse correlates with the burden of LIC resistant to conventional chemo-therapy. Thus, stem cell–like gene expression signatures are predic-tive of disease outcome (1). Targeted therapies which that LIC and complement current regimens are needed.
AML initiated by homeobox-based (HOX-based) leukemia oncoproteins has poor prognosis, highlighting interest in HOX transcription factors. HOXA9 is oncogenically activated by myriad chromosome 11 translocations involving MLL1 or Nup98 (2–5) as well as NPM1 mutations in cytogenetically normal AML (6). Nota-bly, the expression level of HOXA9 may have prognostic value in human AML (7, 8). HOXA9 interacts with homeodomain-con-taining cofactors MEIS1 and PBX1 to form a transcription factor complex that regulates downstream target genes; however, while there has been recent in-depth molecular analysis of endogenous HOXA9 target-gene regulation (9), the evaluation of their require-ment for HOXA9-mediated oncogenesis is limited to Pim1 (10),
c-Myb (11), and Flt3 (12, 13). Of these, inhibition of only Pim1 or c-Myb impaired HOXA9 oncogenesis. Thus, the direct transcrip-tional effectors induced by endogenous HOXA9 (and the HOXA9 mechanism of transformation) remain largely unknown.
Recently, we showed that Drosophila orthologs of HOXA9 and the growth factor independent 1 (GFI1) transcriptional repres-sor compete for occupancy of a subset of common DNA-binding sites to control embryonic anterior-posterior patterning (14). In mice, GFI1 directly regulates the expression of HoxA9, Pbx1, and Meis1 during the normal transition between common myeloid progenitor (CMP) and granulocytic-monocytic progenitor (GMP) (15). The accumulation of Gfi1–/– myeloid progenitors is dependent upon HoxA9 gene dosage, and inducible deletion of Gfi1 combined with activation of K-RasG12D expression induces a potent transplantable AML in vivo in approximately 17 days (15). Given the rapid transition time between normal CMP and GMP, we reasoned that GFI1 may also compete with HOXA9 (in a manner similar to Drosophila orthologs) to transmit an effec-tive antileukemia signal. Here, we show that known GFI1 target genes microRNA-196b (miR-196b) and miR-21 (16) are regulated by endogenous HOXA9, activated by HOX-based leukemia onco-proteins, and control LIC activity as effector/clients of HOX sig-naling. Notably, the in vivo therapeutic potential of microRNAs has not been explored in leukemia. Here, we demonstrate that inhibition of both miR-21 and miR-196b is curative in murine models of HOX-driven AML and substantially improves current therapies in xenograft models. Thus, this work provides a proof of principle to move forward the concept of RNA therapeutic microRNA antagonists in the treatment of AML. We construct a reproducible in vivo platform to test RNA therapeutic efficacy and demonstrate the necessity of specific oligonucleotide modifi-cations to successfully antagonize microRNA in leukemia in vivo.
Authorship note: Chinavenmeni S. Velu and Aditya Chaubey contributed equally to this work.
Conflict of interest: Balkrishen Bhat is an employee of Regulus Therapeutics, which develops microRNA-targeted therapies.
Citation for this article: J Clin Invest. 2014;124(1):222–236. doi:10.1172/JCI66005.
Downloaded on January 21, 2014. The Journal of Clinical Investigation. More information at www.jci.org/articles/view/66005

research article
The Journal of Clinical Investigation http://www.jci.org Volume 124 Number 1 January 2014 223
ResultsGFI1 antagonizes HOXA9 in human leukemia and transformation. We previously showed that GFI1 antagonizes HOXA9 during both Drosophila anterior-posterior patterning and normal mammalian myeloid development (14, 15). To determine whether such an antagonistic relationship is detectable in human myeloid leu-kemia, we examined gene expression profile data from 91 AML samples with defined cytogenetic abnormalities (17). Genes with expression signatures similar to either GFI1 or HOXA9 were iden-tified using Pearson correlation analysis, which allowed approxi-mately 200 nearest neighbor probes for each gene, resulting in 365 total probes. Restricting hierarchical clustering analysis to the combined set of HOXA9-like and GFI1-like genes revealed striking reciprocal regulation and a clear division (Figure 1A). The 11q23 (MLL1) translocation leukemias expressed high HOXA9 and low GFI1 signature expression (Figure 1A). In contrast, t(15;17), t(8;21) and inversion 16 leukemias exhibited a reciprocal pattern of high GFI1 and low HOXA9 signature expression (Figure 1A). Concor-dant expression of GFI1-like and HOXA9-like signatures was very rare. Next, we expanded our analysis to a larger data set of 460 adult AML and myelodysplastic syndrome (MDS) patients (18). Similar to pediatric samples, we found reciprocal expression of GFI1-like and HOXA9-like signatures in the adult AML samples. Interestingly, similar to samples with 11q23 translocations, AML with NPM1 mutations showed low GFI1-like and high HOXA9-like signature expression (Supplemental Figure 1; supplemental mate-rial available online with this article; doi:10.1172/JCI66005DS1).
It is possible that the GFI1 and HOXA9 expression patterns either concisely differentiate human myeloid leukemias or reflect alternate abnormal arrested differentiation states. To delineate between these possibilities, we induced overexpression or knockdown of GFI1 in an AML cell line with high GFI1 signature (HL60, Supplemental Figure 2) and analyzed HOXA9 expression. Forced GFI1 expression lowered HOXA9 levels (Supplemental Figure 3A), whereas GFI1 knock-down resulted in an 8- to 10-fold induction of HOXA9 transcript levels (Supplemental Figure 3B). These data suggest that GFI1 and HOXA9 signatures likely represent a dynamic transcriptional pro-gram (instead of a static differentiation state) and that this dynamic relationship may be relevant to leukemogenesis.
Drosophila orthologs of the GFI1 repressor and the HOXA9, PBX, and MEIS activator complex compete for common DNA-binding sites to regulate gene expression (14). To determine whether this mechanism is active in mammalian cells (and relevant to leuke-mogenesis), we coexpressed GFI1 with the NUP98-HOXA9 fusion oncoprotein, which is thought to generate a HOXA9 activator that is significantly less dependent upon PBX and MEIS cofactors (19). Consequently, WT Lin– BM cells were retrovirally transduced with NUP98-HOXA9 marked by EGFP. Transduced cells were expanded for 24 hours and then again retrovirally transduced with GFI1 marked by Discosoma sp. red fluorescent protein (DsRed), or DsRed alone (control). Thirty-six hours later, GFP+DsRed+ cells were sorted and plated in methylcellulose to assess CFU (Figure 1B). As expected, expression of NUP98-HOXA9 led to efficient colony formation upon replating (Figure 1C). The coexpression of GFI1 did not repress the expression of NUP98-HOXA9 or EGFP (Figure 1C; inset), and primary colonies from both GFI1 and vec-tor-control transduced cells were not significantly different from Nup98-HOXA9 alone (Figure 1C). However, replating of NUP98-HOXA9+GFI1 colonies revealed a complete lack of secondary CFU (Figure 1C, P < 0.01). To ensure that this effect was GFI1 specific we
repeated this assay with a variant GFI1 containing a single amino acid substitution (GFI1N382S) that inhibits sequence-specific DNA binding (20). The number of primary and secondary NUP98-HOXA9+GFI1N382S CFU was significantly increased compared with NUP98-HOXA9 alone (Figure 1C, P < 0.05), making it unlikely that the failure of NUP98-HOXA9+GFI1 secondary CFU was due to nonspecific effects of GFI1 overexpression. However, as an additional control, we also limited endogenous Gfi1 alleles and found that NUP98-HOXA9 expression in Gfi1+/–Lin– marrow cells produced more CFU (similar to GFI1N382S) (Figure 1D, P < 0.01). We conclude that it is possible that GFI1 directly antag-onizes HOXA9 signaling at critical transformation-relevant gene targets by competing for DNA binding (in a manner similar to their Drosophila orthologs).
HoxA9-Pbx1-Meis1 binds sequences in Mir21 and Mir196b regula-tory regions. In order to identify the critical genes affected by GFI1-HOXA9 antagonism, we bioinformatically interrogated the genome for evolutionarily conserved regulatory sequences that encode a composite DNA-binding site for both GFI1 (21) and the HOXA9-PBX1-MEIS1 transcription factor complex (22) (CWDTGATTTAYDNS). We identified a putative composite GFI1-HOXA9-PBX1-MEIS1–binding site (Figure 1E) that is conserved throughout mammalian evolution (Supplemental Figure 4) in an established GFI1 target gene, Mir196b (16).
To determine whether GFI1 and the HOXA9-PBX1-MEIS1 com-plex can bind to this sequence in Mir196b, we generated purified proteins and performed EMSA. We found that while GFI1 could bind to the 32P-labeled WT oligonucleotide (Figure 1F, lanes 2 and 3), PBX1-MEIS1 bound weakly (Figure 1F, lane 4) unless HOXA9 was present (Figure 1F, lane 5). Addition of GFI1 appeared to dis-place HOXA9-MEIS1-PBX1 (Figure 1F, lanes 6 and 7). An alter-native explanation is that GFI1 physically interacts with HOXA9-PBX1-MEIS1 protein to inhibit DNA binding. Therefore, we next used an oligonucleotide with a TC→GA mutation (Figure 1E), which abrogates GFI1 DNA binding (Figure 1G, lanes 2 and 3), but does not interfere with HOXA9-PBX1-MEIS1 binding (Fig-ure 1G, lane 5). In agreement with our theory, GFI1 did not affect HOXA9-PBX1-MEIS1 binding to the GFI1-mutant oligonucle-otide (Figure 1G, lanes 6 and 7). Thus, if GFI1 cannot bind the oli-gonucleotide, it cannot displace HOXA9-PBX1-MEIS1. This was further confirmed by preloading the HOXA9-PBX1-MEIS1 pro-tein complex onto the WT or TC→GA mutant oligonucleotide. Addition of purified GFI1 protein rapidly displaced the HOXA9-PBX1-MEIS1 complex from the WT oligonucleotide (Figure 1H; solid line), whereas the complex was not disrupted from the GFI1-mutant oligonucleotide (Figure 1H; dotted line). Moreover, ChIP analyses in a human leukemia cell line revealed that GFI1 and HOXA9 proteins can physically bind to this region in living cells (Figure 1, I and J). Overall, our data suggest that GFI1 competes with HOXA9-PBX1-MEIS1 to occupy a specific DNA-binding site on the Mir196b gene promoter.
Previously, we demonstrated that miR-21 and miR-196b syner-gize to block granulopoiesis and that GFI1 can repress Mir21 and Mir196b (16). Therefore, we examined the Mir21 locus and found 1 conserved HOXA9-PBX1-MEIS1 site in the Mir21 promoter (Fig-ure 1K). EMSA with purified HOXA9, PBX1, and MEIS1 proteins revealed that the proteins formed a complex on the oligonucle-otide (Figure 1L), and ChIP analyses revealed HOXA9 binding in living human cells (Figure 1M). Thus, GFI1 and HOXA9 both physically bind to Mir21 and Mir196b genes.
Downloaded on January 21, 2014. The Journal of Clinical Investigation. More information at www.jci.org/articles/view/66005

research article
224 The Journal of Clinical Investigation http://www.jci.org Volume 124 Number 1 January 2014
Downloaded on January 21, 2014. The Journal of Clinical Investigation. More information at www.jci.org/articles/view/66005

research article
The Journal of Clinical Investigation http://www.jci.org Volume 124 Number 1 January 2014 225
Endogenous and oncogenic HoxA9 regulates the steady state expression of miR-21 and miR-196b. We next wanted to determine whether genetically manipulating endogenous levels of GFI1 and HOXA9 in primary hematopoietic cells affects the expression of miR-21 and miR-196b. Therefore, we quantified the steady state levels of mature miR-21 and miR-196b in RNA from Lin– BM cells of mice with limiting alleles and endogenous expression of Gfi1 and HoxA9 (Supplemental Figure 5). As shown previously (16), Gfi1–/– cells showed increased expression of miR-21 and miR-196b (Figure 2A; P < 0.001, P < 0.01). In agreement with our hypothesis that GFI1 and HOXA9 compete to control these microRNA-encoding genes, the expression of miR-21 and miR-196b are coordinately reduced in HoxA9–/– cells (Figure 2A, P < 0.001), but return to WT levels in HoxA9–/– cells with 1 Gfi1 allele (HoxA9–/–Gfi1+/–; Figure 2A). Next, we examined specificity in 2 ways. First, expression of an unrelated microRNA (miR-224) was not altered by these genetic manipulations (Figure 2A). Second, a putative HOXA9 target gene miR-155 (10) was reduced in HoxA9–/– cells and elevated in Gfi1–/– cells (which overexpress HOXA9); however, unlike miR-21 and miR-196b, the expression level of miR-155 is similar to WT levels in HoxA9–/–Gfi1+/– cells (Figure 2A). Thus, only the HOXA9 target genes miR-21 and miR-196b (which contain compound GFI1-HOX–binding sites) are affected by limiting Gfi1 alleles in a HoxA9-null setting. Together with our published (16) and EMSA data (Figure 1, F, G, and L), the data sets demonstrate antagonistic regulation of miR-21 and miR-196b by endogenous GFI1 and HOXA9.
To determine the relevance of these findings to HOX-based transformation, we first examined primary human AML samples for coexpression of MIR196B and HOXA9. Notably, expression of MIR196B and HOXA9 was significantly correlated in human AML (P = 8.41 × 10⁻⁹; Supplemental Table 1). In agreement with reports that the expression of MIR21 is controlled by multiple signaling pathways and is consistently elevated in multiple AML subtypes
(23, 24), we did not observe a strict correlation between MIR21 and HOXA9. HOXA9, PBX. and MEIS proteins transmit MLL fusion oncoprotein signaling in 11q23 translocation leukemias (25–27), but are not part of the AML-ETO oncoprotein signal in t(8;21) leu-kemias. By analyzing human primary leukemias, we determined that HOXA9, MIR-196, and MIR21 are coordinately upregulated in 11q23 translocation AML, but not in t(8;21) translocation AML (Figure 2B). To delineate the proximity between oncogenic HOX signaling and miR-21 and miR-196b expression, we transduced murine Lin– BM cells with retroviral vectors encoding HOXA9, NUP98-HOXA9, or MLL-AF9, with empty vector and AML-ETO–expressing vector serving as non–HOX-signaling controls. Our results showed significantly elevated expression of miR-21 in cells transduced with HOXA9, NUP98-HOXA9, and MLL-AF9 as compared with vector control or cells transduced with AML-ETO–expressing vectors (Figure 2C, P < 0.01, P < 0.05). We also confirmed our published observation that MLL-AF9 upregu-lates miR-196b (28) and extended this to HOXA9– and NUP98-HOXA9–overexpressing cells (Figure 2D, P < 0.001, P < 0.05). We conclude that both endogenous and oncogenic levels of HOXA9 activate the expression of miR-21 and miR-196b.
Inhibition of miR-21 and miR-196 specifically interferes with Hox-based transformation. Given that miR-21 and miR-196b are increased in cells overexpressing HOX-signaling oncoproteins, we next want-ed to evaluate their importance to HOX-based transformation. Antagomirs are chemically engineered and cholesterol-conjugated oligonucleotides, which efficiently and specifically silence endog-enous microRNAs in vivo (29). We have shown that miR-21– and miR-196b–specific antagomirs modulated primary myeloid devel-opment in vitro (16, 28). Using these antagomir pairs, we exam-ined the impact of miR-21 and miR-196b inhibition upon serial replating in vitro. First, Lin– BM cells were transduced with ret-roviral vectors expressing HOXA9, Nup98-HOXA9, or MLL-AF9, with empty vector and an AML-ETO expressing vector serving as non–HOX-signaling controls. Transduced cells were treated with antagomirs, and 15,000 cells were plated. One week later, CFUs were enumerated; then the cultures were disrupted and 15,000 cells were treated with antagomir again and replated. This cycle was repeated to generate 5 replatings. Antagomirs specific for miR-21 (A21), miR-196b (A196b), both microRNAs, or control antagomirs (4 base pair mutation = CA21, CA196b) did not affect the senesce/differentiation of empty vector–transduced cells (Fig-ure 3A) or the immortalization of AML-ETO–expressing cells (Fig-ure 3B). In contrast, application of miR-21– or miR-196b–specific antagomirs dramatically lowered the number of CFUs for HOXA9-expressing (P < 0.001; Figure 3C), NUP98-HOXA9–expressing (P < 0.001; Figure 3D) and MLL-AF9–expressing (P < 0.001; Fig-ure 3E) cells. Interestingly, there was a precipitous drop in second-ary CFUs (Figure 3F), reminiscent of that engendered by GFI1 antagonism of NUP98-HOXA9 immortalization (Figure 1C). In fact, the number of secondary CFUs for A21, A196b, or combined antagomir-treated HOXA9-, NUP98-HOXA9–, and MLL-AF9-expressing cells was not significantly different from the number of CFUs in empty vector–treated cells (Figure 3F). Thus, the antagomir treatment appears to cancel CFU related to HOX-based oncogenic immortalization, but may not affect normal self-renewal properties.
miR-21 and miR-196 inhibition block established murine MLL fusion protein–induced serially replated leukemic CFU. MLL-AF9 LIC have distinct microenvironmental interactions that set them apart from bulk MLL-AF9 immortalized BM cells (30), indicating that
Figure 1GFI1 antagonizes HOXA9 transformation, and HOXA9-PBX1-MEIS1 directly regulates Mir21 and Mir196b. (A) Hierarchical clustering of gene expression array data from pediatric AML samples (columns) ver-sus 365 class discriminating genes (rows) whose expression is similar to either GFI1 or HOXA9. Color key of AML subtypes. (B) Graphic rep-resentation of experimental scheme. (C) CFU assay of Lin– BM cells cotransduced with retroviral vectors encoding NUP98-HOXA9 and either empty vector control, GFI1 or GFI1N382S (n = 2). (D) CFU assay of either Gfi1+/+ or Gfi1+/– Lin– BM cells transduced with a retroviral vector encoding NUP98-HOXA9 and sorted for GFP (n = 2). *P < 0.05; **P < 0.01 (E) Composite GFI1-HOXA9-PBX1-MEIS1 DNA-binding site on Mir196b promoter. (F) EMSA with purified GFI1 and HOXA9-PBX1-MEIS1 proteins on a synthetic oligonucleotide encoding a DNA sequence in the Mir196b locus. (G) EMSA identical to that shown in part B, except the oligonucleotide encodes a TC→GA mutation in the putative GFI1 binding site. (H) Quantitation of competitive EMSA results from the HOXA9-PBX1-MEIS1 complex bound to either the WT or mutant oligonucleotide, alone or at several time points after addition of purified GFI1 protein. (I and J) ChIP analysis with a GFI1-specific monoclonal antibody (2.5D.17) with isotype control IgG (Con IgG) (I) or HA-epitope tag antibody for HOXA9 (J). (K) Diagram showing the composite HOXA9-PBX1-MEIS1 DNA-binding site on Mir21 promoter. (L) EMSA with purified HOXA9-PBX1-MEIS1 proteins on a synthetic oligonucleotide encoding a DNA sequence in the Mir21 locus. (M) ChIP analysis with an HA-epitope tag specific antibody from cells expressing HA-tagged HOXA9.
Downloaded on January 21, 2014. The Journal of Clinical Investigation. More information at www.jci.org/articles/view/66005

research article
226 The Journal of Clinical Investigation http://www.jci.org Volume 124 Number 1 January 2014
LIC have unique requirements for tumor maintenance. We wanted to preclude the possibility that transformation but not leukemia maintenance, requires miR-21 and miR-196b. Therefore, we treated 2 independent, established MLL-AF9–initiated murine leuke-mias in our serial replating assay. Treatment with A21 or A196b significantly reduced the number of CFUs; however, combined antagomir treatment generated significantly fewer CFUs than either single treatment (P < 0.001 and Supplemental Figure 6; Fig-ure 4A), and effectively lowered miRNA levels in MLL-AF9 leuke-mic splenocytes in vitro (P < 0.001; Figure 4B). We have previously shown that miR-21 and miR-196b overexpression synergize to block G-CSF–induced granulopoiesis (16). Conversely, combined antagonism by miR-21 and miR-196b antagomir treatment (loss of function) was more effective in blocking the MLL-AF9 leukemic CFU replating potential. Therefore, our further analyses focused on the combined miR-21 and miR-196b antagomir treatment.
microRNA antagonism is amenable to in vivo therapeutic interven-tion. To determine the in vivo efficacy of antagomir treatment in AML, we first implanted osmotic pumps to provide 1 month-long treatment (A21+A196b or control antagomir) and then examined
potential toxicity to WT C57BL/6 mice using an established dos-ing regimen (31). We found that pump-administered antagomir treatment was effective in reducing miR-21 and miR-196b levels (Supplemental Figure 7). Antagomir-treated mice did not show alteration in their normal behavior or vital organ function, as evidenced by serum chemistry panels and metabolites (Supple-mental Figure 8). Progenitor and blood cell analysis revealed that antagomir treatment did not affect the numbers or types of nor-mal hematopoietic cells, white blood cells, and lymphocytes (Sup-plemental Table 2, A and B).
We next transplanted 1 million murine CD45.1+CD45.2+ MLL-AF9 leukemic splenocytes into partially conditioned C57BL/6 recipients, allowed 4 days for these cells to home and initiate engraftment, then implanted pumps to deliver antagomirs. Control antagomir-treated mice died of leukemia before the pumps exhausted, and FACS analy-sis of moribund animals showed the presence of CD45.1+CD45.2+ leukemic cells (Figure 4D; inset). In contrast, only 1 A21+A196b-treated mouse died during treatment (Figure 4D, P < 0.01).
Because some targeted therapeutics (such as Gleevec) can be cytostatic, we followed the A21+A196b-treated mice to see if they
Figure 2Expression of miR-21 and miR-196b is regulated by endogenous and oncogen-ic levels of HOXA9. (A) TaqMan analysis of the steady state level of mature miR-21, miR-196b, miR-155 (positive HOXA9 target gene control), and miR-224 (neg-ative control) expression in Lin– BM cells with limiting alleles of Gfi1 and HoxA9 (n = 3). (B) Expression profiling of HOXA9, GFI1, MIR196B, and MIR21 in 7 de novo t(11q; 23) and 5 t(8; 21) AML samples. Expression data were mean centered (relative value scale shown in the bottom right). (C and D) TaqMan analysis of miR-21 (C) and miR-196b (D) expression in Lin– BM cells trans-duced with a retroviral vector encoding the indicated oncoprotein or empty vec-tor (EV) (n = 3). *P < 0.05; **P < 0.01; ***P < 0.001.
Downloaded on January 21, 2014. The Journal of Clinical Investigation. More information at www.jci.org/articles/view/66005

research article
The Journal of Clinical Investigation http://www.jci.org Volume 124 Number 1 January 2014 227
would relapse once the antagomir pumps exhausted. After 165 days, the experiment was terminated and we could not detect the presence of CD45.1+CD45.2+ leukemic cells (P < 0.01; Figure 4D, inset). To address specificity of the treatment, we also trans-planted established AML-ETO9a–initiated murine leukemia and could find no difference in the survival of mice treated with the A21+A196b or control antagomirs (Figure 4E). Thus, it is unlikely that A21+A196b treatment creates a generally hostile environ-ment for transformed cells; it instead appears to specifically tar-get HOX-driven leukemia.
A concise biological platform to test RNAi therapeutics. We next created an in vivo platform to test RNA therapeutics by transplanting 5,000 and 10,000 c-Kit+ MLL-AF9 leukemic splenocytes (Figure 5A), representing a vast excess of LIC (30). The model reproducibly resulted in death at day 20 after transplantation (Figure 5A). Antagomir therapy was curative for an input of either 5,000 (Sup-
plemental Figure 6, P < 0.001) or 10,000 c-Kit+ MLL-AF9 leuke-mic splenocytes (Figure 5B, P < 0.001). In fact, BM biopsy after pump exhaustion (day 70) or upon termination of the experiment (day 150) revealed a lack of leukemic cells in recipients of 5,000 or 10,000 cells (Figure 5B and Supplemental Figure 9; insets). To determine the efficiency of pump-delivered antagomir in this model, 7 days after pump implantation, we performed TaqMan analysis of peripheral white blood cells from transplant recipients. Antagomir treatment resulted in a 60%–80% reduction in miR-21 and miR-196b levels compared with the control antagomir treat-ment (Figure 5C, P < 0.001). Thus, prolonged microRNA antago-nism is sufficient to eliminate MLL-AF9 leukemia in vivo.
Next, we tested 2′-methoxyethyl/2′-fluoro chimeric phosphoro-thioate oligonucleotides (MOE) as microRNA antagonists in this in vivo platform. In contrast to antagomirs, MOE lack a cholester-ol modification. Similar to antagomirs, MOE were functional in
Figure 3Inhibition of miR-21 and miR-196b specifically interferes with HOX-mediated transformation. (A–E) Enumeration of CFU assay with serial replat-ing of the indicated antagomir-treated Lin– WT BM cells transduced with empty retroviral vector (A) or those expressing AML-ETO (B), HOXA9 (C), Nup98-HOXA9 (D), and MLL-AF9 (E), then cultured in methylcellulose. (F) Graphical representation of the number of colonies at second replating for B through E. Control antagomir-21 (CA21), control antagomir-196b (CA196b), antagomir-21 (A21), antagomir-196b (A196b), antagomir-21 and antagomir-196b (A21+A196b) (n = 3). ***P < 0.001.
Downloaded on January 21, 2014. The Journal of Clinical Investigation. More information at www.jci.org/articles/view/66005

research article
228 The Journal of Clinical Investigation http://www.jci.org Volume 124 Number 1 January 2014
Figure 4Inhibition of miR-21 and miR-196b specifically interferes with maintenance of MLL oncoprotein–initiated leukemia. (A and B) Enumeration of methylcellulose CFU assay (A) with serial replating of antagomir-treated MLL-AF9–initiated AML (n = 3, mean ± SD), (B) TaqMan analysis of miR-21 and miR-196b expression in CD45.1+CD45.2+ MLL-AF9 cells treated with either CA21+CA196b or A21+A196b for 72 hours (n = 3). (C) Scheme of experimental strategy showing transplant with MLL-AF9 CD45.1+CD45.2+ leukemic splenocytes and implantation of pumps with treatment groups (n = 6 per group) and flow analysis. (D) Kaplan-Meier survival curve of partially conditioned (500 cGy) C57BL/6 mice (CD45.2+) transplanted with 1 million CD45.1+CD45.2+ MLL-AF9 leukemic splenocytes. Four days later, 6-week osmotic pumps containing A21+A196b or CA21+CA196b (shaded area denotes time of pump activity) were implanted in the mice (n = 6). Treated mice were analyzed by flow cytometry for CD45.1 versus CD45.2 (inset) to identify leukemic cells at time of death (CA21+CA196b) or at the termination of the experiment at 165 days (A21+A196b). (E) Same as C, but with 1 million AML-ETO9a–initiated murine leukemic splenocytes. Antagomir (A21+A196b) or control (CA21+CA196b) *P < 0.05; **P < 0.01; ***P < 0.001.
Downloaded on January 21, 2014. The Journal of Clinical Investigation. More information at www.jci.org/articles/view/66005

research article
The Journal of Clinical Investigation http://www.jci.org Volume 124 Number 1 January 2014 229
Figure 5In vivo platform to test RNA therapeutic treatment for MLL-AF9–initiated leukemia. (A) Scheme of experimental strategy showing transplant with LIC-enriched AML cells, treatment groups (n = 4 recipient mice per group), and flow analysis. (B) Kaplan-Meier survival curve of partially condi-tioned C57BL/6 mice (CD45.2+) transplanted with 10,000 c-Kit+CD45.1+ CD45.2+ MLL-AF9 leukemic splenocytes (n = 4 mice per group). Four days later, 6-week osmotic pumps containing A21+A196b or CA21+CA196b (shaded area denotes time of pump activity) were implanted in the mice, and mice were followed for survival. Insets show flow plots of MLL-AF9 c-Kit+CD45.1+CD45.2+ cells in mice at the indicated time points. (C) TaqMan analysis quantifies the steady state level of mature miR-21 and miR-196b in the peripheral white blood cells of WT mice 10 days after implantation of pumps with the indicated antagomirs. (D and F) MOE is effective in vitro, but ineffective in vivo, at antagonizing microRNA in the MLL-AF9 mouse model of AML. (D) Enumeration of CFU replating after control or MOE (21+196b) treatment of MLL-AF9–transformed cells. (n = 3, mean ± SD). (E) Repeat of transplant as in part B using 10,000 c-Kit+CD45.1+CD45.2+ MLL-AF9 leukemic splenocytes but with MOE (n = 3 mice per group). (F) TaqMan analysis quantifies the steady state levels of mature miR-21 and miR-196b in the peripheral white blood cells of WT mice 10 days after implantation of pumps with the indicated MOE. Note that the MOE lack a cholesterol moiety. ***P < 0.001.
Downloaded on January 21, 2014. The Journal of Clinical Investigation. More information at www.jci.org/articles/view/66005

research article
230 The Journal of Clinical Investigation http://www.jci.org Volume 124 Number 1 January 2014
reducing MLL-AF9 CFU in vitro (Figure 5D, P < 0.001). Therefore, we transplanted 10,000 c-Kit+ MLL-AF9 leukemic splenocytes and implanted pumps to deliver miR-21– and miR-196b–specific MOE or specificity controls (with 4 base pair mutations). However, all mice in the experiments died (Figure 5E). Analysis of white blood cells from the mice 10 days after pump implantation revealed only 20%–30% reduction in target microRNA levels (Figure 5F). While the MOEs can inhibit miRNA activity in vitro and are active in other models, they do not sufficiently inhibit miRNA activity in this in vivo leukemia model so that a biological effect is produced. These data suggest that antagomir cholesterol modification is necessary and that there is a threshold for sufficient prolonged microRNA antagonism to eliminate MLL-AF9 leukemia in vivo.
Targeting miR-21 and miR-196 augments induction chemotherapy of human MLL fusion protein–induced leukemia. To determine wheth-er our murine results could be extended to human leukemias, we treated primary human AML specimens with either t(8;21) (expressing AML-ETO) or 11q23 translocations (MLL fusion) with antagomir (A21+A196b) or control (CA21+CA196b) combi-nations, plated them in methylcellulose, and enumerated CFUs. Neither A21+A196b nor control antagomirs affected the t(8;21) leukemia colony numbers (Figure 6A). In contrast, 2 independent 11q23-translocation leukemias formed significantly fewer CFUs after A21+A196b treatment compared with controls (P < 0.05; Figure 6A). Our transcriptional analysis of adult AML revealed NPM1-mutant AML display GFI1 versus HOXA9 antagonism (Supplemental Figure 1), and we have previously shown HOX and miR-196b expression in NPM1-mutant AML (32). Therefore, we next tested whether AML with NPM1 mutations is sensitive to antagomir treatment. A21+A196b treatment significantly reduced CFU numbers in 3 independent NPM1-mutant AML patient sam-ples (P < 0.05, P < 0.01; Figure 6A) These data suggest that miRNA regulation is a critical downstream event in HOXA9-initiated pro-grams that control leukemic progenitor growth.
AML patients are usually treated with induction chemotherapy consisting of cytarabine (Ara-C) and an anthracycline (such as daunorubicin or idarubicin). Though most patients respond ini-tially (∼70%), 5-year survival rates vary dramatically (15%–70%) depending upon the AML subtype. Consolidation chemotherapy or allogeneic BM transplantation (BMT) is the standard follow-up treatment (33). In general, 11q23-translocation AML is more resistant to chemotherapy than other subtypes (e.g., t]8;21]). To determine whether antagomir therapy would complement current standard treatment for this type of leukemia, we used a humanized in vivo mouse model to determine the effect of antagomirs in com-bination with induction chemotherapy. First, we injected 1 × 10⁶ primary human hematopoietic cells transformed with both MLL-AF9–leukemia fusion protein and oncogenic NRAS (MA9+NRAS) into the tail veins of nonirradiated immunodeficient NOD/SCID/SGM3 (NSS) mice (34). This procedure consistently results in disseminated leukemic disease and rapid lethality (35). On day 25, mice from each group (control or treatment group, n = 4 per group) received either PBS or a regimen mimicking induction che-motherapy (Ara-C and doxorubicin) (ref. 36 and Figure 6B). Nota-bly, we found that chemotherapy treatment significantly extended life span by approximately 12 to 15 days compared with that of the control mice (P < 0.05; Figure 6C). Two days (day 23) before the chemotherapy treatment, additional animals were implanted with 6-week pumps filled with either A21+A196b (n = 8) or the control antagomir combination (n = 7) (Figure 6B). Similar to
the mice treated with chemotherapy alone, all control antagomir-treated mice died of leukemia around 62 days (Figure 6C, P < 0.05). FACS analysis of moribund animals showed the presence of hCD45.1+ leukemic cells (Figure 6C; inset). However, treatment with A21+A196b significantly extended the survival of xenograft-recipient mice up to 80–82 days (P < 0.01; Figure 6C). Together, prolonged inhibition of miR-21 and miR-196b in combination with induction chemotherapy significantly extends life span in a xenograft model of MLL leukemia.
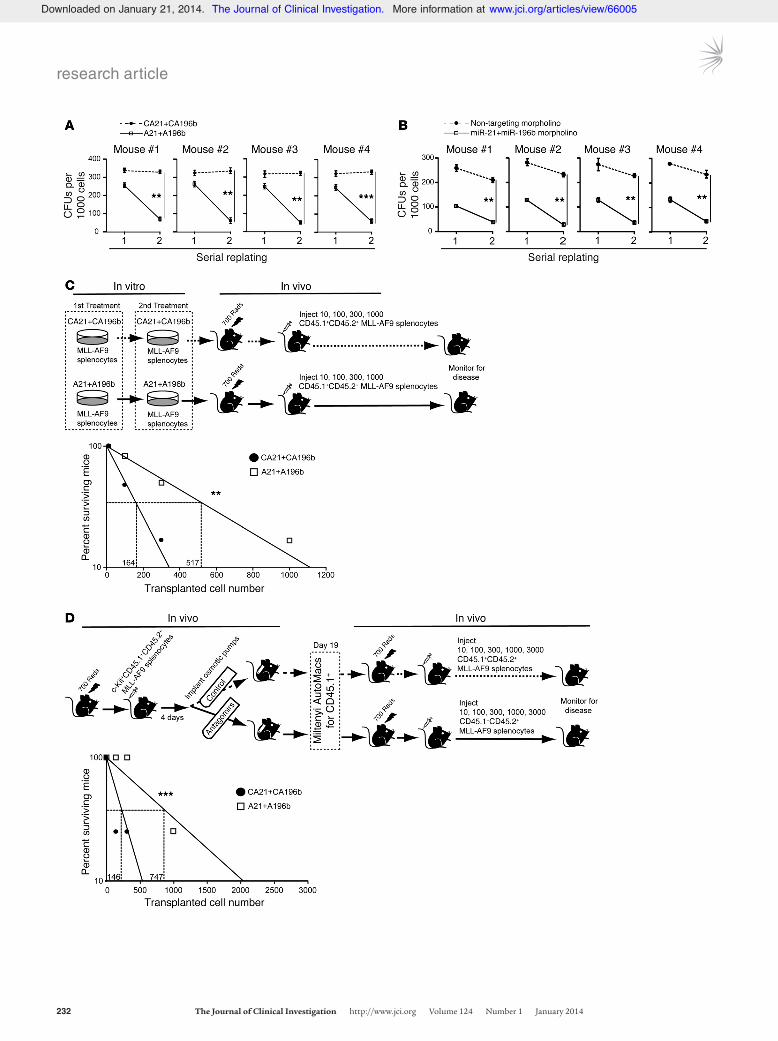
Antagomir-21 and -196b target MLL-AF9 LIC activity. Each colony formed by MLL-AF9 leukemic splenocytes is capable of initiating leukemia in a recipient and thus represents an LIC (30). Antagomir treatment of MLL-AF9 leukemic splenocytes lowered in vitro CFU (Figure 4A), suggesting that antagomir treatment affects LIC. Since MLL-AF9 LIC/CFU are enriched in the c-Kit+ leukemic splenocyte fraction (30), we next examined the effect of antagomirs upon in vitro CFU formation of LIC-enriched c-Kit–selected leukemic sple-nocytes. Antagomir treatment reproducibly lowered the second-ary CFUs from the freshly explanted c-Kit+ MLL-AF9 leukemic splenocytes of 4 independent moribund mice (P < 0.01, P < 0.001; Figure 7A). To assure that the antagomir effects are specific, we uti-lized Vivo-Morpholinos as a different RNA therapeutic platform to block miR-21 and miR-196b. While antagomirs and MOE bind and silence mature microRNA (29), morpholinos are reported to block the nucleolytic processing sites of an immature microRNA to prevent microRNA maturation (37). Vivo-Morpholinos contain an additional octa-guanidine dendrimer that mediates intracellular distribution of the molecule (similar to a TAT-peptide tag) (38). Administration of anti–miR-21 and anti–miR-196b Vivo-Morpho-linos reproducibly lowered the steady state level of mature miR-21 and miR-196b (Supplemental Figure 10, P < 0.001), and signifi-cantly lowered secondary in vitro CFU from the c-Kit+ MLL-AF9 leukemic splenocytes of 4 independent moribund mice (Figure 7B, P < 0.01). These data indicate that downregulation of expression of miR-21 and miR-196b specifically blocks MLL-AF9 CFUs indepen-dently of the RNA therapeutic platform used.
To determine whether antagomir treatment affects the number of LIC, we performed 2 in vitro antagomir treatments on freshly explanted c-Kit+ MLL-AF9 leukemic splenocytes (which are enriched for LIC), then assessed cell cycle/apoptosis and quantified LIC (Figure 7C). A titration of in vitro antagomir-treated cells was injected into partially ablated syngeneic recipients (without fur-ther antagomir treatment). The frequency of control antagomir–treated LIC was 1 in 164, but was reduced 3-fold (1 in 517) by in vitro antagomir treatment (Figure 7C, P < 0.01). Next, we isolated LIC-enriched MLL-AF9 leukemic splenocytes and treated them in vitro with antagomirs, then analyzed cell-cycle parameters. We note that in vitro antagomir-treated cells showed a mild decrease in cells traversing S phase, with an equivalent modest but statis-tically significant gain in cells with a subgenomic DNA content indicative of apoptosis (Supplemental Figure 11, A and B, P < 0.05, P < 0.001). Notably, subtle changes in cell cycle/apoptosis and LIC activity of antagomir-treated leukemia cells in vitro correspond to the biological effect of prolonged microRNA antagonism in vivo.
To incisively confirm the effect of antagomirs on LIC activ-ity, we directly quantified LIC activity after 19 days of in vivo antagomir treatment (Figure 7D). Briefly, we transplanted 10,000 c-Kit+CD45.1+CD45.2+ MLL-AF9 cells into partially ablated CD45.2+ recipients and implanted pumps containing either con-trol or specific antagomirs. Mice were sacrificed after 19 days
Downloaded on January 21, 2014. The Journal of Clinical Investigation. More information at www.jci.org/articles/view/66005

research article
The Journal of Clinical Investigation http://www.jci.org Volume 124 Number 1 January 2014 231
(when control mice were nearly moribund), and flow cytometric analysis of splenocytes showed a 30% reduction in MLL-AF9 leu-kemic splenocytes (CD45.1+CD45.2+) in antagomir-treated mice compared with control mice (P < 0.01, P < 0.001; Supplemental Figure 12); however, the percentage of c-Kit+ MLL-AF9 cells did not differ (data not shown). CD45.1+CD45.2+ MLL-AF9 leukemic splenocytes were isolated (CD45.1 Miltenyi AutoMacs selection), and a titration of cells was injected into partially ablated syngeneic
recipients (without further antagomir treatment). The frequency of control antagomir-treated LIC was similar to the in vitro treat-ment, which was 1 in 146, but was reduced 5-fold (1 in 747) by antagomir treatment (P < 0.001; Figure 7D). Thus, interference with miR-21 and miR-196b quantitatively reduces MLL-AF9 LIC, indicating that miR-21 and miR-196b mediate LIC maintenance and combination in vivo interference with miR-21 and miR-196b results in LIC depletion.
Figure 6Inhibition of miR-21 and miR-196b also interferes with maintenance of human MLL oncoprotein–initiated leukemia and extends life span in a human xenograft model. (A) Enu-meration of methylcellulose CFU assay with primary human AML with t(8;21) (AML-ETO) (patient 1) or 11q23 translocation cytogenet-ics (MLL) (2 independent human samples, patients 2 and 3) and NPM1 mutation (3 independent human samples, patients 4, 5, and 6) (n = 3, mean ± SD). (B) Scheme of experimental strategy show-ing transplant with MA9+NRAS leukemic cells into NSS mice, mouse numbers, and the treat-ment strategy and flow analysis. (C) Kaplan-Meier survival curve of nonirradiated NSS mice (mCD45+) transplanted with 0.5 × 10⁶ hCD45+ MA9+NRAS leukemic cells. On day 25, the control group received PBS and the experimental group received chemotherapeutic agents for 5 days (3 days with Ara-C+Dox and the last 2 day only with Ara-C); mice were followed for survival. Transplanted mice were treated with antagomirs. Twenty-three days after transplantation, 6 week osmot-ic pumps containing A21+A196b or CA21+CA196b were implanted in the mice. On day 25, both groups received chemotherapeutic agents for 5 days (3 days with Ara-C+Dox and the last 2 day only with Ara-C) and they were followed for survival. Insets show flow plots of hCD45+ cells in moribund mice. *P < 0.05; **P < 0.01.
Downloaded on January 21, 2014. The Journal of Clinical Investigation. More information at www.jci.org/articles/view/66005
research article
232 The Journal of Clinical Investigation http://www.jci.org Volume 124 Number 1 January 2014
Downloaded on January 21, 2014. The Journal of Clinical Investigation. More information at www.jci.org/articles/view/66005

research article
The Journal of Clinical Investigation http://www.jci.org Volume 124 Number 1 January 2014 233
chemotherapy regimen. Thus, combining antagomir and chemo-therapy might be a strategy to increase the number of these higher risk AML patients who respond to therapy.
Although microRNAs are thought to play an important role in oncogenesis, movement to convert this information to targeted therapeutics has been slow. However, the combination of anti-microRNA reagents and the knowledge base available to study hematopoiesis creates a unique opportunity for target validation studies. Knowledge gained from such studies in AML is expect-ed to generate principles that will help to clarify the biology and treatment of other tumors. Antagomirs have been successfully used in vivo and have proven to be efficient in silencing endog-enous microRNA in mice (40, 41). Our work demonstrates that the combination of antagomirs targeting miR-21 and miR-196b can be successfully used in vivo with no apparent therapy-limiting toxicity to improve the outcome of MLL-AF9 leukemia. Moreover, our work generated a concise in vivo platform to test RNA thera-peutics, which revealed that oligonucleotides complementary to miR-21 or miR-196, but lacking a cholesterol modification, were ineffective biologically in this in vivo model of leukemia. The effec-tiveness of antagomirs might be explained by the interaction of antagomirs with lipoprotein particles and the expression of lipo-protein receptors on myeloid lineage cells (42). We believe that dif-ferences in the efficacy of antagomir treatment in murine versus human MLL-AF9–initiated AML models centers on a dramatic dif-ference in the incidence of LIC, which is approximately 1 in 150 for the murine model and approximately 40% for the human model (43). Overall, our studies provide a strong rationale to develop microRNA antagonists for clinical use in AML.
MethodsMicroRNA and mRNA expression profiling. Affymetrix microarray CEL file data was downloaded from the St. Jude Children’s Hospital data reposi-tory (17) or Gene Expression Omnibus (GSE6891, ref. 18; GSE35159, ref. 44) and subjected to RMA normalization across the series of 91 pediat-ric AML (17), or 460 adult AML and MDS (18), or human AML cell lines (44). A correlation vector was constructed from GFI1 (Affymetrix probe set 206589_at) or HOXA9, and probe sets of similarly expressed genes were identified using the Pearson distance metric with a correlation cutoff that allowed approximately 200 nearest neighbor probes for GFI1 and HOXA9. The number 200 represents the top approximately 1% of genes/probes spotted on the 22,000 probe set containing Affymetrix microarrays. (Fig-ure 1A and Supplemental Figure 2: Pearson correlation cutoff 0.482-1.0 for HOXA9 and 0.41-1.0 for GFI1, resulting in 365 total probes; Supple-mental Figure 1: 0.381-1.0 for GFI1 and 0.421-1.0 for HOXA9, yielding 417 probes). Notably, in the larger data set of 460 adult AML and MDS patients (Supplemental Figure 1), the Pearson correlations were slightly lower due to the large number of heterogeneous patients included in the data set. These probe sets were pooled and subjected to hierarchical cluster-ing for both gene-gene and sample-sample correlation. The corresponding heat maps show 2 major gene expression patterns consisting of either a high GFI1 or high HOXA9 sample type, except MDS, where an antagonistic relationship is not evident between GFI1 and HOXA9 (possibly due to very low expression values).
A genome-wide microRNA and mRNA expression profiling assay was performed using Exiqon microRNA arrays and Agilent custom-design arrays respectively, in 56 AMLs and 9 normal BM controls. The 56 AMLs comprised 1 (–7), 5 (+8), 1 (+4), 1 t(2;12), 7 inv(16), 5 t(8;21), 8 t(15;17), and 7 t(11q23)/MLL rearrangements and 21 normal karyotypes. All of the patient samples were obtained at the time of diagnosis and were stored
DiscussionEvolutionarily conserved developmental and growth regulatory pathways represent central oncogenic or “gatekeeper” pathways that are pivotal to understanding the process of cellular transfor-mation. GFI1 and HOX transcription factors compete to control both Drosophila anterior-posterior patterning (14) and mamma-lian myeloid progenitor expansion and transformation (15, 16). Here, we have exploited this ancient relationship between com-peting transcription factors to discern client/effectors of HOX-based transformation and LIC activity, namely, GFI1 expression blocks HOX-based transformation and represses expression of miR-21 and miR-196b, and microRNA antagonists can function-ally recapitulate the GFI1 effect. The conservation of GFI1-HOX antagonism underscores the potential importance of this pathway. Antagomir treatment, as a surrogate of GFI1 action, functions to quantitatively block HOX-based LIC maintenance and is more clinically amenable than forced GFI1 expression.
Expression profiling of primary human AML specimens to characterize global miRNA expression has shown that miR-21 is generally upregulated in AML compared with normal CD34+ cells(23, 24), while miR-196b expression is elevated in HOX-based AML (e.g., those with 11q23 or 11p15 translocations or NPM1 mutations) (28, 39). Our data confirm and extend the data to include reciprocal expression of GFI1 and HOXA9 as an underly-ing molecular mechanism. Interestingly, the antagonism between GFI1 and HOXA9 as evidenced by gene expression profiling can be used as a tool to differentiate human leukemias, leaving open the possibility that monitoring miR-21 and miR-196b levels in patients with HOX-based leukemias could be used as biomarkers to identify minimal residual disease. AMLs with 11q23 transloca-tions are historically associated with poor response to therapy (33). Given that antagomir treatment decreases the number of LIC, we hypothesized that antagomir treatment could provide an adjuvant to both increase the efficacy of chemotherapy and reduce minimal residual disease. In fact, our human xenograft model reveals that antagomir therapy doubles the survival time from an induction
Figure 7miR-21 and miR-196b maintain MLL-AF9 LIC. (A) CFU assay with serial replating of antagomir-treated LIC-enriched c-Kit+ MLL-AF9 AML from 4 different mice (n = 3, mean ± SD). (B) CFU assay with serial replating of Vivo-Morpholino–treated LIC-enriched c-Kit+ MLL-AF9 AML from 4 independent mice (n = 3, mean ± SD). (C) Quantitation of MLL-AF9 LIC treated with antagomir in vitro. Sublethally irradiated recipient mice received a cell dose range of 10, 100, 300, and 1000 cells (n = 6 recipient mice for each cell dose) treated twice in vitro with either CA21+CA196b or A21+A196b. The mice were followed for 160 days. LIC frequency was determined using L-Calc software: CA21+CA196b (1 in 164; 95% CI, 1 in 80 to 339) or A21+A196b (1 in 517; 95% CI, 1 in 253 to 1,057). (D) Quantitation of MLL-AF9 LIC treat-ed with antagomir in vivo. Sublethally irradiated recipient mice were transplanted with LIC-enriched population of c-Kit+CD45.1+CD45.2+, and at day 4 the pumps were implanted with CA21+CA196b or A21+A196b. Before the mice became moribund (∼day 19–20), AML cells were isolated from both groups of mice using CD45.1+ Milte-nyi AutoMacs selection, then transplanted into sublethally irradiated recipients at a cell dose range of 10, 100, 300, 1000, or 3000 cells (n = 6 recipient mice for each cell dose). Recipient mice were followed for 160 days. LIC frequency was determined using L-Calc software: CA21+CA196b (1 in 146; 95% CI, 1 in 60 to 355) or A21+A196b (1 in 747; 95% CI, 1 in 489 to 1,140). **P < 0.01; ***P < 0.001.
Downloaded on January 21, 2014. The Journal of Clinical Investigation. More information at www.jci.org/articles/view/66005

research article
234 The Journal of Clinical Investigation http://www.jci.org Volume 124 Number 1 January 2014
Using anti-HA (Sigma-Aldrich), anti-GFI1 (2.5D.17), and control mouse IgG (GNA931V; GE Healthcare), the chromatin-protein complex was immunoprecipitated. After reversing the crosslinks, the chromatin was purified using the PCR Purification Kit (QIAGEN). The following oli-gonucleotides were used for PCR amplification: Mir196b (5′-GAATTGC-CAATCTTGTTTTAAGC-3′ and 5′-ACGCACAGCAGCAATACAAT-3′), Mir21 (5′-CTGGAGTTTCTGTGCAAACTG-3′ and 5′-TGATTAA-CAAAGGAACAAAGAAGG-3′), and Mir196b3-UTR (5′-TCTTCCGTCTCT-GCCAGATT-3′ and 5′-ACCTCTACTTGAGCCGCAGA-3′), Mir21 3-UTR (5′-TGCAAGTGGATGGTTTGGTA-3′ and 5′-ATTCCTCAGCTCTTCG-GTGA-3′). β-ACTIN oligonucleotides (5′-AGCGCGGCTACAGCTTCA-3′ and 5′-CGTAGCACAGCTTCTCCTTAATGTC-3′) were used as an internal control for nonspecific enrichment.
microRNA inhibitors. Antagomirs specific for miR-21 and miR-196b were synthesized by Regulus Therapeutics. One lot of antagomirs synthesized by Dharmacon (described previously; ref. 16) were also utilized to make sure that commercially available material had the same activity. The con-trol (mutant) antagomirs were synthesized by mutating 4 ribonucleo-tides: CA21, 5′-GUCAACUUCAGUCAGAAAAGGUA-3′ and CA196b, 5′-CCCAAGAACAGGUAAGUACGUA-3′ (underlined bases are altered in the control antagomirs). Morpholinos specific for miR-21 and miR-196b were designed and synthesized by a vendor (Gene Tools): miR-21 morpho-lino, 5′-GTCAACATCAGTCTGATAAGCTATC-3′ and miR-196b morpho-lino, 5′-ATCCCAACAACAGGAAACTACCTAA-3′. Nontargeting morpho-lino 5′-CCTCTTACCTCAGTTACAATTTATA-3′ was used as control.
Leukemic cells were treated with 100 nM specific or control antagomirs (incubated on ice for 30 minutes before plating) and then plated for the CFU assay as described previously (20) or placed in culture (IMDM supplemented with 20% FBS and cytokines [IL-3, IL-6, SCF, GM-CSF]) (all from PeproTech). Cells were either treated with combined control antagomirs (CA21+CA196b) or specific antagomirs (A21+A196b) for 72 hours. For serial replating, colonies were pooled and again treated with specific or control antagomirs. For in vivo treatment, either total splenocytes (CD45.1+CD45.2+ cells) or c-Kit+–enriched fractions (c-Kit+CD45.1+CD45.2+ splenocytes) were transplanted into sublethally irradiated mice. At day 4, ALZET Model 2006 (42 day) osmotic pumps (DURECT Corp.) with a pumping rate of 0.15 μl/h were loaded with 240 μl antagomirs according to the manufacture’s protocol, then implanted into mouse to deliver a dose of 80 mg/kg. Control AML-ETO9a–initiated murine leukemia cells were provided by Dong-Er Zhang (UCSD, La Jolla, California, USA). Human AML specimens containing t(8;21) and 11q23 translocations were provided by Martin Carroll (University of Pennsylva-nia, Philadelphia, Pennsylvania, USA). To transplant human MA9+NRAS cells, the tail veins of nonirradiated NOD/SCID background (NOD/LtSz-scid-SGM3, NSS) mice were injected with 0.5 × 10⁶ MA9+NRAS leukemic cells. Mice were either treated with PBS or chemotherapeutic agents (combination of cytarabine [Ara-C] [50 mg/kg) [Sigma-Aldrich] and doxorubicin [Dox] [1.5 mg/kg] [Sigma-Aldrich]), according to a pub-lished regimen (36). Results of limiting dilution transplants after in vitro antagomir therapy were used to calculate LIC frequency using L-Calc software (StemCell Technologies Inc.).
Flow cytometry. Cells were stained with antibodies for FITC-conjugated anti-CD45.2 (clone 104) (Biolegend), PE-conjugated CD45.1 (clone A20), PE-conjugated anti-FcR_II/III (clone A7-R34), Pacific Blue–conjugated anti–IL-7 (eBioscience), APC-conjugated anti–c-Kit (clone 2B8), FITC-conjugated anti-CD34 (clone RAM34), and biotinylated anti–Sca-1 (clone E13-161.7; BD Biosciences — Pharmingen) and subsequently stained with APC-Cy7–conjugated streptavidin (Invitrogen) in PBS with 2% FBS after Fc blocking (2.4G2) and analyzed on an FACS LSRII (BD Biosciences). Human cells were stained with APC-conjugated anti-hCD45 (clone H130;
in liquid nitrogen. The 9 normal controls included 3 CD34+, 2 CD33+ myeloid, and 4 mononuclear (MNC) cell samples. Partek Genomics Suite (Partek Inc.) was utilized for data normalization, including background adjustment, quantile normalization, and log transformation. The resulting data were used to normalize and treat gene expression intensities, median-centering genes for each array and median-centering each gene across all arrays for heat map illustration. After data normalization and filtering microRNA and mRNA, expression profiles for each sample were combined together for correlation analysis. microRNA and mRNA expression data were mean centered for display in heat maps. The complete microarray data set has been reposited in the GEO database (GSE30285).
Cellular selection and viral transduction. BM cells were isolated from C57BL/6 WT mice as described previously (20) and selected on an AUTOMACS magnetic sorter (Miltenyi Biotec) according to the manufacturer’s proto-col. Cells were maintained in DMEM supplemented with cytokines (IL-3, IL-6, SCF) (PeproTech). After 48 hours of cytokine expansion, the cells were transduced with viral vectors encoding Nup98-HOXA9-GFP; 24 hours later they were transduced either with empty vector–DsRed or GFI1-WT-DsRed or GFI1-N382S-DsRed by using a spinfection protocol (20). Both GFP and DsRed double-positive cells were then FACS sorted. Similarly, Lin– cells were transduced with retroviruses encoding MLL-AF9, NUP98-HOXA9, HOXA9, AML-ETO, or empty vector. Cells were plated in methylcellulose medium (M3534; Stem Cell Technologies); colonies were enumerated after 8 days of culture and the average number plotted (± SD). For serial replating, colonies were pooled and replated. Knockdown of GFI1 was performed using shRNA constructs as described previously (16).
RNA extraction and real-time quantitative PCR. Total RNA was extracted using TriZOL reagent (Sigma-Aldrich) and reverse transcribed using a microRNA TaqMan Kit (Applied Biosystems) for miRNA expression and the cDNA High Capacity Archive Kit (Applied Biosystems) for gene expression. Resulting cDNA was used for RT-PCR, and the amplification was performed using specific TaqMan probes on the ABI Prism 7900 amplification system (Applied Biosystems). TaqMan primer/probe sets for miR-21 (002438), miR-196b (002215), miR-155 (000479), miR-224 (4427975), Gfi1 (Mm00515853_m1), HoxA9 (Mm00439364_m1), with Gapdh (Mm99999915_g1), Actin (Hs03023880_g1), Birc5 (Hs00153353_m1), and RNU6B (001093) were used as endogenous internal controls (Applied Biosystems). Relative expression was calculated by using the comparative 2 ΔΔCt method, and results are represented as means ± SD from 3 independent experiments.
Immunoblot. Protein extracts were obtained in Complete-M lysis buffer (Roche). Samples were resolved by 10% SDS-PAGE and electrophoretically transferred to PVDF membrane (Immobilon-P; Millipore). Western blot analysis was performed using the anti-GFI1 (2.5D.17) (45) and anti-β-actin (Sigma-Aldrich) and HRP-conjugated goat anti-mouse or anti-rabbit sec-ondary antibody (GE Healthcare) with the ECL-PLUS Detection Kit (Pierce).
Protein purification and electrophoretic mobility shift assay. Coding regions of human GFI1 (aa 251–423), PBX1 (aa 1–348), MEIS1 (aa 1–391), and HOXA9 (aa 1–273) were amplified and cloned in-frame in the His-tag pET14b (Novagen) bacterial expression vector. All constructs were con-firmed by DNA sequencing. His-tagged constructs were transformed into BL21 bacteria, and protein expression was induced for 2 hours with IPTG (0.5 mM). All proteins were purified under native conditions using Ni-affinity chromatography, then quantified by the Bradford assay, and con-firmed by SDS-PAGE and Coomassie blue analysis. EMSA was performed as described previously (46).
ChIP assays. ChIP analysis was performed as described previously (20). Briefly, HL60 cells were crosslinked with 1% formaldehyde for 10 minutes on ice and terminated with 125 mM glycine. Soluble chromatin was pre-pared by using a Bioruptor to generate a DNA fragment size of 200–800 bp.
Downloaded on January 21, 2014. The Journal of Clinical Investigation. More information at www.jci.org/articles/view/66005

research article
The Journal of Clinical Investigation http://www.jci.org Volume 124 Number 1 January 2014 235
De Fougerolles, Yi Zheng, and Scott Hiebert for scientific advice. Funding was also received from the Children’s Leukemia Research Association, CancerFree KIDS, Alex’s Lemonade Stand, the Leuke-mia Lymphoma Society Translational Research Award, and NIH grants CA105152, and CA159845 (to H.L. Grimes), GM079428 (to B. Gebelein), and HL087188 (to N.J. Zeleznik-Le).
Received for publication July 25, 2012, and accepted in revised form October 10, 2013.
Address correspondence to: H. Leighton Grimes, Division of Immunology, 3333 Burnet Ave., MLC 7038, Cincinnati Children’s Hospital Medical Center, Cincinnati, Ohio 45229, USA. Phone: 513.636.6089; Fax: 513.636.5355; E-mail: [email protected].
James D. Phelan’s present address is: Metabolism Branch, National Cancer Institute, Bethesda, Maryland, USA.
Shane R. Horman’s present address is: Genomics Institute of the Novartis Research Foundation, San Diego, California, USA.
Aditya Chaubey’s present address is: Mazumdar Shaw Center for Translational Research, Bangalore, India.
BioLegend), PE-Cy7–conjugated anti-mCD45 (clone 30-F11; BD Biosci-ences — Pharmingen) and PE-conjugated anti-hCD33 (clone WM53; BD Biosciences — Pharmingen). DNA content and cell cycle were measured by EdU and DNA dye incorporation according to the manufacture’s protocol (Invitrogen). Data were exported and analyzed with FlowJo software.
Statistics. Graph-Pad Prism software was used for all statistical analysis. Log-rank tests were used to analyze Kaplan-Meier curves. Unless otherwise noted, unpaired Student’s t test, 2-tailed, was used to determine the signifi-cance of experimental results between treatment and groups. P < 0.05 was accepted for statistical significance.
Study approval. The animal studies were approved by the Institutional Review Board, Committee on Animal Research, Cincinnati Children’s Hos-pital Medical Center (Cincinnati, Ohio, USA). Surgical techniques were in accord with the Institutional Animal Care and Use Committee of the Cincinnati Children’s Hospital Research Foundation. Patients’ informed consent was obtained in accordance with the Declaration of Helsinki and maintained in respective institution and or hospitals.
AcknowledgmentsWe thank Mi-Ok Kim and Laurie Risner for technical and statis-tical assistance and CCHMC Cores (Comprehensive Mouse and Cancer, Viral Vector, Research Flow Cytometry, and Veterinary Services). We thank Eric Marcusson, Jürgen Soutschek, Tony
1. Eppert K, et al. Stem cell gene expression programs influence clinical outcome in human leukemia. Nat Med. 2011;17(9):1086–1093.
2. Armstrong SA, et al. MLL translocations specify a distinct gene expression profile that distinguishes a unique leukemia. Nat Genet. 2002;30(1):41–47.
3. Ferrando AA, et al. Gene expression signatures in MLL-rearranged T-lineage and B-precursor acute leukemias: dominance of HOX dysregulation. Blood. 2003;102(1):262–268.
4. Grubach L, et al. Gene expression profiling of Poly-comb, Hox Meis genes in patients with acute myeloid leukaemia. Eur J Haematol. 2008;81(2):112–122.
5. Wang GG, Cai L, Pasillas MP, Kamps MP. NUP98-NSD1 links H3K36 methylation to Hox-A gene activation and leukaemogenesis. Nat Cell Biol. 2007;9(7):804–812.
6. Mullighan CG, et al. Pediatric acute myeloid leu-kemia with NPM1 mutations is characterized by a gene expression profile with dysregulated HOX gene expression distinct from MLL-rearranged leu-kemias. Leukemia. 2007;21(9):2000–2009.
7. Drabkin HA, et al. Quantitative HOX expression in chromosomally defined subsets of acute myelog-enous leukemia. Leukemia. 2002;16(2):186–195.
8. Golub TR, et al. Molecular classification of cancer: class discovery and class prediction by gene expres-sion monitoring. Science. 1999;286(5439):531–537.
9. Huang Y, et al. Identification and characteriza-tion of Hoxa9 binding sites in hematopoietic cells. Blood. 2012;119(2):388–398.
10. Hu YL, Passegue E, Fong S, Largman C, Lawrence HJ. Evidence that the Pim1 kinase gene is a direct target of HOXA9. Blood. 2007;109(11):4732–4738.
11. Hess JL, et al. c-Myb is an essential downstream target for homeobox-mediated transformation of hematopoietic cells. Blood. 2006;108(1):297–304.
12. Morgado E, Albouhair S, Lavau C. Flt3 is dispens-able to the Hoxa9/Meis1 leukemogenic coopera-tion. Blood. 2007;109(9):4020–4022.
13. Wang GG, Pasillas MP, Kamps MP. Meis1 pro-grams transcription of FLT3 and cancer stem cell character, using a mechanism that requires inter-action with Pbx and a novel function of the Meis1 C-terminus. Blood. 2005;106(1):254–264.
14. Li-Kroeger D, Witt LM, Grimes HL, Cook TA, Gebelein B. Hox and senseless antagonism functions
as a molecular switch to regulate EGF secretion in the Drosophila PNS. Dev Cell. 2008;15(2):298–308.
15. Horman SR, et al. Gfi1 integrates progenitor versus granulocytic transcriptional programming. Blood. 2009;113(22):5466–5475.
16. Velu CS, Baktula AM, Grimes HL. Gfi1 regulates miR-21 and miR-196b to control myelopoiesis. Blood. 2009;113(19):4720–4728.
17. Ross ME, et al. Gene expression profiling of pedi-atric acute myelogenous leukemia. Blood. 2004; 104(12):3679–3687.
18. Verhaak RG, et al. Prediction of molecular subtypes in acute myeloid leukemia based on gene expres-sion profiling. Haematologica. 2009;94(1):131–134.
19. Calvo KR, Sykes DB, Pasillas MP, Kamps MP. Nup98-HoxA9 immortalizes myeloid progenitors, enforces expression of Hoxa9, Hoxa7 and Meis1, and alters cytokine-specific responses in a manner similar to that induced by retroviral co-expression of Hoxa9 and Meis1. Oncogene. 2002;21(27):4247–4256.
20. Zarebski A, et al. Mutations in growth factor inde-pendent-1 associated with human neutropenia block murine granulopoiesis through colony stim-ulating factor-1. Immunity. 2008;28(3):370–380.
21. Zweidler-Mckay PA, Grimes HL, Flubacher MM, Tsi-chlis PN. Gfi-1 encodes a nuclear zinc finger protein that binds DNA and functions as a transcriptional repressor. Mol Cell Biol. 1996;16(8):4024–4034.
22. Shen WF, et al. AbdB-like Hox proteins stabilize DNA binding by the Meis1 homeodomain pro-teins. Mol Cell Biol. 1997;17(11):6448–6458.
23. Jongen-Lavrencic M, Sun SM, Dijkstra MK, Valk PJ, Lowenberg B. MicroRNA expression profiling in relation to the genetic heterogeneity of acute myeloid leukemia. Blood. 2008;111(10):5078–5085.
24. Wang Y, et al. MicroRNAs expression signatures are associated with lineage and survival in acute leuke-mias. Blood Cells Mol Dis. 2010;44(3):191–197.
25. Ayton PM, Cleary ML. Transformation of myeloid progenitors by MLL oncoproteins is dependent on Hoxa7 and Hoxa9. Genes Dev. 2003;17(18):2298–2307.
26. Wong P, Iwasaki M, Somervaille TC, So CW, Cleary ML. Meis1 is an essential and rate-limiting regula-tor of MLL leukemia stem cell potential. Genes Dev. 2007;21(21):2762–2774.
27. Faber J, et al. HOXA9 is required for survival in human MLL-rearranged acute leukemias. Blood.
2009;113(11):2375–2385. 28. Popovic R, et al. Regulation of mir-196b by MLL
and its overexpression by MLL fusions contributes to immortalization. Blood. 2009;113(14):3314–3322.
29. Krutzfeldt J, et al. Silencing of microRNAs in vivo with ‘antagomirs’. Nature. 2005;438(7068):685–689.
30. Somervaille TC, Cleary ML. Identification and characterization of leukemia stem cells in murine MLL-AF9 acute myeloid leukemia. Cancer Cell. 2006;10(4):257–268.
31. Velu CS, Grimes HL. Utilizing antagomiR (anti-sense microRNA) to knock down microRNA in murine bone marrow cells. Methods Mol Biol. 2012; 928:185–195.
32. Becker H, et al. Favorable prognostic impact of NPM1 mutations in older patients with cytogeneti-cally normal de novo acute myeloid leukemia and associated gene- and microRNA-expression signa-tures: a Cancer and Leukemia Group B study. J Clin Oncol. 2010;28(4):596–604.
33. Dohner H, et al. Diagnosis and management of acute myeloid leukemia in adults: recommendations from an international expert panel, on behalf of the Euro-pean LeukemiaNet. Blood. 2010;115(3):453–474.
34. Feuring-Buske M, Gerhard B, Cashman J, Humphries RK, Eaves CJ, Hogge DE. Improved engraftment of human acute myeloid leukemia progenitor cells in beta 2-microglobulin-deficient NOD/SCID mice and in NOD/SCID mice trans-genic for human growth factors. Leukemia. 2003; 17(4):760–763.
35. Wunderlich M, et al. AML xenograft efficiency is significantly improved in NOD/SCID-IL2RG mice constitutively expressing human SCF, GM-CSF and IL-3. Leukemia. 2010;24(10):1785–1788.
36. Wunderlich M, et al. AML cells are differentially sensitive to chemotherapy treatment in a human xenograft model. Blood. 2013;121(12):e90–e97.
37. Kloosterman WP, Lagendijk AK, Ketting RF, Moulton JD, Plasterk RH. Targeted inhibition of miRNA maturation with morpholinos reveals a role for miR-375 in pancreatic islet development. PLoS Biol. 2007;5(8):e203.
38. Morcos PA, Li Y, Jiang S. Vivo-Morpholinos: a non-peptide transporter delivers Morpholinos into a wide array of mouse tissues. Biotechniques. 2008; 45(6):613–614.
Downloaded on January 21, 2014. The Journal of Clinical Investigation. More information at www.jci.org/articles/view/66005

research article
236 The Journal of Clinical Investigation http://www.jci.org Volume 124 Number 1 January 2014
39. Cammarata G, et al. Differential expression of spe-cific microRNA and their targets in acute myeloid leukemia. Am J Hematol. 2010;85(5):331–339.
40. Care A, et al. MicroRNA-133 controls cardiac hyper-trophy. Nat Med. 2007;13(5):613–618.
41. Ma L, et al. Therapeutic silencing of miR-10b inhib-its metastasis in a mouse mammary tumor model. Nat Biotechnol. 2010;28(4):341–347.
42. Wolfrum C, et al. Mechanisms and optimization of
in vivo delivery of lipophilic siRNAs. Nat Biotechnol. 2007;25(10):1149–1157.
43. Mulloy JC, Wunderlich M, Zheng Y, Wei J. Trans-forming human blood stem and progenitor cells: a new way forward in leukemia modeling. Cell Cycle. 2008;7(21):3314–3319.
44. Saito Y, et al. CD52 as a molecular target for immu-notherapy to treat acute myeloid leukemia with high EVI1 expression. Leukemia. 2011;25(6):921–931.
45. Kazanjian A, et al. Growth factor independence-1 is expressed in primary human neuroendocrine lung carcinomas and mediates the differentiation of murine pulmonary neuroendocrine cells. Cancer Res. 2004;64(19):6874–6882.
46. Gebelein B, Urrutia R. Sequence-specific transcrip-tional repression by KS1, a multiple-zinc-finger-Kruppel-associated box protein. Mol Cell Biol. 2001; 21(3):928–939.
Downloaded on January 21, 2014. The Journal of Clinical Investigation. More information at www.jci.org/articles/view/66005