Cement Sector- Initiating Coverage-10 May 2017.pdf
60
-
Upload
khangminh22 -
Category
Documents
-
view
0 -
download
0
Transcript of Cement Sector- Initiating Coverage-10 May 2017.pdf


Institutional Equities
This page has been intentionally left blank

Institutional Equities
Cement Sector
Initi
atin
g C
over
age
South India – On Course To Realise Its True Potential India’s southern region has some highly developed states with vast potential for cement demand, given the favourable demographics and income levels. During FY06-FY10, cement demand growth in this region had been higher than the all India average on account of higher government spending and robust housing and commercial segments. However, over the past five to six years, demand in the region witnessed considerable contraction as government spending dried up, political scenario worsened and the housing segment across the country weakened. Over the past 12-18 months, we have started witnessing a decent recovery in cement demand driven by higher spending in bifurcated states of Andhra Pradesh and Telangana and central government-sponsored low-cost housing programme in Tamil Nadu and Karnataka. We are quite upbeat about the demand prospects in the southern region and believe that cement prices will also remain elevated despite low capacity utilisation level. The combination of factors like: 1) Higher-than-industry volume growth, 2) Better pricing environment, and 3) Efficient operations will likely result in much better profitability for cement players. We initiate coverage on Dalmia Bharat (DBL) and Sagar Cements (SCL) with a Buy rating and Accumulate rating on The Ramco Cements (TRCL) to play this upcycle in the southern region. We believe these companies, despite the recent run-up in their share prices, still offer significant upside potential. Common investment thesis among these companies is efficient plant operations (resulting in very high EBITDA/mt), massive operating leverage (capacity utilisation less than 60%), higher-than-industry volume growth (FY16-FY19E volume CAGR of 8%-15%) and stable cement prices in its markets (prices in the southern region have been relatively stable at higher levels compared to other regions). The stocks under our coverage provide 10%-20% upside potential and have possibility of further earnings upgrade if demand growth turns out to be better-than-expected, leading to faster realisation of operating leverage. Key risks to our positive call include government intervention in cement prices, lower demand growth leading to increased competition and an adverse political scenario.
Demand is improving at the margin while supply dries up: After years of sluggishness, the southern region showed some green shoots of demand growth in FY17. For the region as a whole, volume growth in FY17 was in excess of 5% whereas some of the listed companies witnessed volume growth in high-teens. This volume growth can be partly attributed to a combination of weak base of the previous year and increased government spending on sectors like irrigation and housing. We believe this demand growth is sustainable as the momentum for key demand drivers of cement has just started and it is likely to continue, given the intention of various state governments to increase spending on capex coupled with growth-oriented schemes driven by the central government. We expect the southern region as a whole to grow at higher-than-all India average for the next couple of years whereas incremental supply in the region will be minimal.
Cement prices stable and costs under control: Cement prices in the southern region have been higher than the all India average for the past two to three years. Despite lower capacity utilisation level of the industry, pricing resilience has been quite remarkable in this region which has helped the industry to survive the excess supply situation. Since the middle of 2014, prices in the southern region have been higher by at least 15% compared to the all India average. Key reasons for higher prices include lower blending, higher input costs compared to players in the northern region and higher lead distance in certain cases.
We have Buy rating on DBL and SCL and Accumulate rating on TRCL: We initiate coverage on three companies with Buy rating on DBL and SCL with up to 18% upside, and Accumulate rating on TRCL.
Mangesh Bhadang Research Analyst [email protected] +91-22-3926 8172
View: POSITIVE Recommendation summary
Company Rating TP (Rs) Upside (%)
DBL Buy 2,806 17%
TRCL Accumulate 775 10%
SCL Buy 951 18%
Source: Nirmal Bang Institutional Equities Research
Market-cap CMP Target Up/ EV/E (x) P/B (x) RoE (%)
Company Rating Rsbn US$mn (Rs) price down(%) FY18E FY19E FY18E FY19E FY18E FY19E
Dalmia Bharat Buy 215 3,311 2,406 2,806 17% 12.2 10.2 4.2 3.5 15.4 17.6
Sagar cement Buy 17 259 806 951 18% 11.5 8.6 1.9 1.7 8.6 12.5
The Ramco Cements Accumulate 169 2,596 706 775 10% 11.9 10.8 3.9 3.3 17.0 17.0
Source: Company, Nirmal Bang Institutional Equities Research
10 May 2017

Institutional Equities
4 Cement Sector
Table of Content
Summary of stock recommendations…………………………………………………...…………..….…05
Demand growth in southern region to be superior compared with the rest of India…….……..…….08
Pricing environment is stable with reduced volatility…………………………………………….………13
Supply outlook………..…………………………………………………………..………...………….……15
Profitability snapshot of southern players……………………………………………….………..……...16
Snapshot of key states with possible demand potential………………………………………………..19
Companies
Dalmia Bharat ……………………………………………………………………….…………..….………27
Sagar cement ………………………………………………………..…………...…….…………………..39
The Ramco Cements……………………………………..……………………...…….…………………..51

Institutional Equities
5 Cement Sector
Summary of stock recommendations
Dalmia Bharat - The best growth story in cement space (Rating: Buy, CMP: Rs2,406, TP: Rs 2,806, Upside: 17%)
DBL, according to us, is probably the best and successful growth story in the cement space in India. From a capacity of mere 1.2mnmt in FY06, DBL has been able to grow 20.0x to a 25mnmt company by FY16, placing it among the top four cement companies in India. Now that a significant scale has been achieved through inorganic and organic routes, we expect the company to report much higher volume growth for the next few years along with increased market share. Apart from this, DBL has been able to achieve growth while focusing on improving efficiency as well. DBL boasts of significantly lower operating costs which help it to generate one of the highest EBITDA/mt among peers. DBL has various firsts to its credit like being the largest slag cement company in India, having one of the lowest electricity consumption patterns in the country, having one of the lowest carbon footprints in the world and a much higher cement-to-clinker ratio among peers. Given the scope for much higher volume growth, presence in regions where cement prices have been favourable and stable and also completion of a major capex programme, DBL is all set to achieve superior earnings growth driven by the excellence exhibited in the past in capex as well as opex. Moreover corporate restructuring - which is on the verge of completion - will create a pure play cement company, unlike a holding company in the past, which will further help shore up its financials and achieve better valuation multiples given its size. We have factored in 12.7%/20.6%/75.6% CAGR in sales, EBITDA and net profit over FY16-FY19E, respectively.
We initiate coverage on DBL with a Buy rating and a target price of Rs2,806. We believe DBL offers huge operating leverage as its plants currently operate at ~55% of their capacity. This operating leverage coupled with cost leadership and a presence in regions where pricing is in favour, like southern and north-east regions, makes DBL an exciting play in the cement space. We have valued the company based on the average of EV/EBITDA and EV/mt multiple. Our target multiple for EV/EBITDA calculation is 12.0x which is in line with the multiples we have assigned to other companies like ACC and Ambuja Cements. Our target price based on this method comes out to Rs2,806, up 17% from the current market price.
Exhibit 1: Earnings-based valuation Exhibit 2: Asset-based valuation
Particulars (Rsmn)
FY19E EBITDA 27,682
Target multiple (x) 12.0
Enterprise value 3,32,180
Net debt 40,685
Equity value 2,91,495
No. of shares (mn) 88.8
Value per share (Rs) 3,283
Particulars (Rsmn)
FY19E capacity (mnmt) 25.0
Target multiple (US$) 150.0
Enterprise value 2,47,500
Net debt 40,685
Equity value 2,06,815
No. of shares (mn) 88.8
Value per share (Rs) 2,329
Source: Company, Nirmal Bang Institutional Equities Research Source: Company, Nirmal Bang Institutional Equities Research
Exhibit 3: Target price of Rs2,806, up 17% from the current market price
Particulars (Rs)
Value based on earnings multiple 3,283
Value based on asset valuation 2,329
Average value per share 2,806
Target price 2,806
CMP (Rs) 2,406
Upside (%) 17%
Source: Company, Nirmal Bang Institutional Equities Research
Institutional Equities
6 Cement Sector
Sagar Cements - Beneficiary of demand reecovery in southern region (Rating: Buy, CMP: Rs806, TP: Rs951, Upside: 18%)
SCL is an Andhra Pradesh-based cement player with current capacity of 4mnmt which is slated to increase to 5.3mnmt by FY19. Despite its small size, SCL is a relevant and significant player in the market following the various initiatives taken by the company in the past like building a strong brand, control over variable costs, judicious capital allocation, upcoming waste heat recovery (WHR) project, introduction of sulfate-resistant cement and its overall understanding of the market. We believe SCL is in a sweet spot as its recent inorganic growth is likely to help in achieving higher volume growth and cement prices in its key markets are also at a high level which helps improve profitability. Recent acquisitions by the company will lead to a substantial reduction in operating costs as we expect the move to reduce lead distance as well as improve the blending ratios. We have not fully factored in the cost reduction on account of acquisitions and expansion in our estimates as we await more clarity on the same. Once the cost reduction benefits are visible, earnings growth will be superior. We have factored in 22%/25%/36% CAGR in sales, EBITDA and net profit for SCL over FY16-FY19E.
We have assigned Buy rating to SCL with a target price of Rs951. We have valued the stock based on our usual method of the average of earnings (EV/EBITDA) and asset-based valuation (EV/mt). We have used target multiples of 7.0x FY19E EV/EBITDA and US$80 EV/mt to value SCL’s business. The target multiples are in line with our assigned multiples for mid-sized regional cement companies, and are at a reasonable discount to our target multiple for UltraTech Cement.
Exhibit 4: Earnings-based valuation Exhibit 5: Asset-based valuation
Particulars (Rsmn)
FY19E EBITDA 2,372
Multiple 7.0
EV 16,605
Net debt 3,633
Equity value 12,972
No. of shares (mn) 20.4
Value per share (Rs) 636
Particulars (Rsmn)
FY19E capacity (mnmt) 5.5
Target EV/mt (US$) 80.0
Enterprise value 29,480
Net debt 3,633
Equity value 25,847
No. of shares (mn) 20.4
Value per share (Rs) 1,267
Source: Company, Nirmal Bang Institutional Equities Research Source: Company, Nirmal Bang Institutional Equities Research
Exhibit 6: Target price of Rs951 is the average of both valuation methodologies
Particulars (Rs)
Value based on earnings multiple 636
Value based on asset valuation 1,267
Average value per share 951
Target price 951
CMP (Rs) 806
Upside (%) 18%
Source: Company, Nirmal Bang Institutional Equities Research

Institutional Equities
7 Cement Sector
The Ramco Cements - Best in class profitability awaiting operating leverage (Rating:Buy, CMP: Rs706, TP:Rs775, Upside: 10%)
We like The Ramco Cements limited (TRCL) as it has several advantages in the southern region like (1) Cost efficiency (100% captive power plant and lower operating costs) and premium product pricing, resulting in superior profitability, (2) beneficiary of demand uptick in the southern region (strong brand image, large market share in Tamil Nadu and Kerala), (3) Completion of major capex, and robust operating cash flow expected to deleverage the balance sheet and improve return ratios, and (4) elevated but justified valuations given the return ratios. TRCL is highly efficient in its operations, as despite running on lower utilizations the company has been able to control its costs well. The company has been reporting higher EBITDA/mt compared to most other cement companies in India for the past few quarters. This best in class profitability is awaiting operating leverage to open up as the current utilization of the company is only 50% which leaves ample scope for further volume growth. We are building in sales/EBITDA/PAT CAGR of 11%/15%/17.5% over FY16-19E respectively. The revenue growth will be driven by 9.6% volume CAGR and a mere 2% pricing CAGR. Lower pricing growth in our assumption corresponds to already higher prices in its key regions. After declining in 9MFY17, we expect operating costs to increase by ~4% in FY18 and FY19. This will translate to higher EBITDA/mt for TRCL compared to other companies. Key downside risks to our call include government intervention in cement pricing, severe draught in Tamil Nadu impacting volumes for the company and increase in input costs.
We have assigned an accumulate rating on TRCL with a target price of Rs775. We have valued the stock based on our usual method of average of earnings based valuation (EV/EBITDA) and asset based valuation (EV/MT). We have used target multiples of 12.0x FY19 EV/EBITDA and US$160 EV/mt to value the business. The target multiples are slightly higher than our assigned multiples for mid-sized cement companies on account of better return profile and huge operating leverage. We believe TRCL is a must have stock in portfolio on account of credible management and best in class profitability.
Exhibit 7: Earnings-based valuation Exhibit 8: Asset-based valuation
Particulars (Rsmn)
FY19E EBIDTA 16,090
Multiple 12.0
EV 1,93,078
Net debt 2,312
Equity value 1,90,766
No. of shares (mn) 238.1
Value per share (Rs) 801
Particulars (Rsmn)
FY19E capacity (mnmt) 16.5
Target EV/mt (US$) 160.0
Enterprise value 1,80,730
Net debt 2,312
Equity value 1,78,418
No. of shares (mn) 238.1
Value per share (Rs) 749
Source: Company, Nirmal Bang Institutional Equities Research Source: Company, Nirmal Bang Institutional Equities Research
Exhibit 9: Target price of Rs775 is the average of both valuation methodologies
Particulars (Rs)
Value based on earnings multiple 801
Value based on asset valuation 749
Average value per share 775
Target price 775
CMP (Rs) 706
Downside 10%
Source: Company, Nirmal Bang Institutional Equities Research

Institutional Equities
8 Cement Sector
Demand growth in southern region to be superior compared with the rest of India
Recent trends suggest that demand is improving at the margin
FY17 was a weak year for the cement sector with demand contraction of 1.3% YoY for the industry. However, amidst this dismal performance from the industry, the southern region stood out with better volume as well as prices. After years of sluggishness, the southern region showed some green shoots of demand growth in FY17. As per the quarterly volume data of four predominant south-based cement companies, volume growth for these companies was in high teens compared to volume contraction reported in the past. Even for the region as a whole, volume growth in FY17 was in excess of 5%. This volume growth can be partly attributed to the combination of weak base of last year and increased government spending on sectors like irrigation and housing. We believe this demand growth is sustainable as the momentum for key demand drivers of cement has just started and it is likely to continue given the intention of various state governments to increase capex coupled with growth-oriented schemes driven by the central government. We expect the southern region as a whole to grow at higher-than-all India average for the next couple of years.
Exhibit 10: Volume growth of south-based companies in high-teens for the past few quarters
Note: Data pertains to 4 south-based companies like India Cements, The Ramco Cements, Orient Cements and Sagar Cements; Source: Company, Nirmal Bang Institutional Equities Research
For the purpose of understanding how cement demand can shape up in this region, we have looked at long-term demand trends. The pattern of demand growth in this region can be classified into three phases.
The first phase is the years FY08-FY10 wherein demand growth was in high single digits. This time period coincides with the booming cement markets in the country where the real estate boom coupled with higher government spending and better rural income post MNREGA was driving demand growth. Moreover, during this period, housing schemes like India Awas Yojna was being implemented in full flow by Andhra Pradesh under its then chief minister, Mr. Y.S.R. Reddy.
Exhibit 11: Three phases of demand growth in the southern region
Source: Cement Manufacturers Association or CMA, Company, Nirmal Bang Institutional Equities Research
-20%
-15%
-10%
-5%
0%
5%
10%
15%
20%
25%
1QF
Y14
2QF
Y14
3QF
Y14
4QF
Y14
1QF
Y15
2QF
Y15
3QF
Y15
4QF
Y15
1QF
Y16
2QF
Y16
3QF
Y16
4QF
Y16
1QF
Y17
2QF
Y17
3QF
Y17
Aggregate volume growth of south based companies (% YoY)
-4%
-2%
0%
2%
4%
6%
8%
10%
12%
FY08
FY09
FY10
FY11
FY12
FY13
FY14
FY15
FY16
FY17
E
FY18
E
FY19
E
Cement Demand Growth in South (% YoY)
High Growth period driven by higher government spending
for housing schemes and
booming real estate markets
Extremely weak period for cement demand with lack of government spending, weak or stagnant real estate market. Andhra Pradesh saw a huge
decline in cement demand during this period (accentuated by state bifurcation) with contraction
in demand for 6 years in a row.
Early signs of demand improvement in place with
recovery in Andhra Pradesh
and Telangana. Karnataka and Tamilnadu demand to revive
soon
Institutional Equities
9 Cement Sector
The next phase of depression lasted for a prolonged period from FY11 to FY16. This time period was characterised by the drop in government expenditure on account of high fiscal deficit and slowdown in property markets across India as the interest rate cycle reversed. Cement demand contracted in four out of six years during this phase. This prolonged demand compression is likely to be followed by volume growth over FY17-FY19E, in our view. We expect the southern region to deliver higher-than-industry demand growth on the back of increased activity in irrigation and housing segments.
Higher spending in irrigation and housing sector to be key drivers
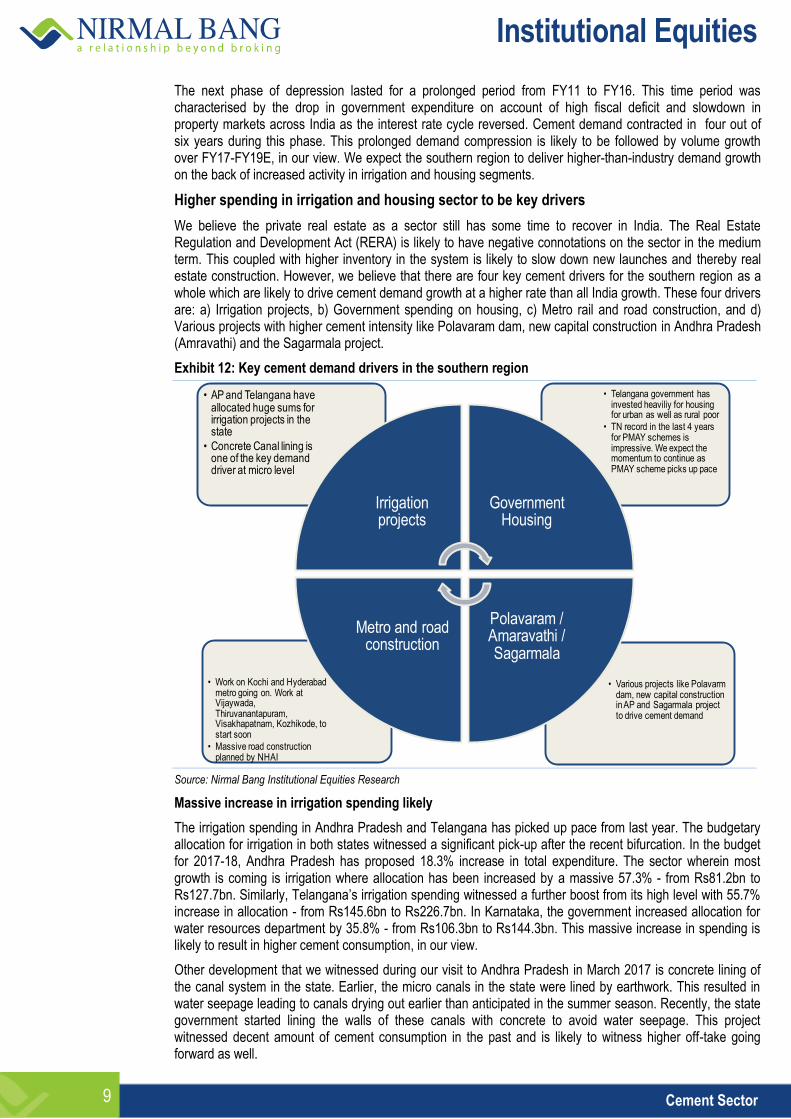
We believe the private real estate as a sector still has some time to recover in India. The Real Estate Regulation and Development Act (RERA) is likely to have negative connotations on the sector in the medium term. This coupled with higher inventory in the system is likely to slow down new launches and thereby real estate construction. However, we believe that there are four key cement drivers for the southern region as a whole which are likely to drive cement demand growth at a higher rate than all India growth. These four drivers are: a) Irrigation projects, b) Government spending on housing, c) Metro rail and road construction, and d) Various projects with higher cement intensity like Polavaram dam, new capital construction in Andhra Pradesh (Amravathi) and the Sagarmala project.
Exhibit 12: Key cement demand drivers in the southern region
Source: Nirmal Bang Institutional Equities Research
Massive increase in irrigation spending likely
The irrigation spending in Andhra Pradesh and Telangana has picked up pace from last year. The budgetary allocation for irrigation in both states witnessed a significant pick-up after the recent bifurcation. In the budget for 2017-18, Andhra Pradesh has proposed 18.3% increase in total expenditure. The sector wherein most growth is coming is irrigation where allocation has been increased by a massive 57.3% - from Rs81.2bn to Rs127.7bn. Similarly, Telangana’s irrigation spending witnessed a further boost from its high level with 55.7% increase in allocation - from Rs145.6bn to Rs226.7bn. In Karnataka, the government increased allocation for water resources department by 35.8% - from Rs106.3bn to Rs144.3bn. This massive increase in spending is likely to result in higher cement consumption, in our view.
Other development that we witnessed during our visit to Andhra Pradesh in March 2017 is concrete lining of the canal system in the state. Earlier, the micro canals in the state were lined by earthwork. This resulted in water seepage leading to canals drying out earlier than anticipated in the summer season. Recently, the state government started lining the walls of these canals with concrete to avoid water seepage. This project witnessed decent amount of cement consumption in the past and is likely to witness higher off-take going forward as well.
• Various projects like Polavarmdam, new capital construction in AP and Sagarmala project to drive cement demand
• Work on Kochi and Hyderabad metro going on. Work at Vijaywada, Thiruvanantapuram, Visakhapatnam, Kozhikode, to start soon
• Massive road construction planned by NHAI
• Telangana government has invested heaviliy for housing for urban as well as rural poor
• TN record in the last 4 years for PMAY schemes is impressive. We expect the momentum to continue as PMAY scheme picks up pace
• AP and Telangana have allocated huge sums for irrigation projects in the state
• Concrete Canal lining is one of the key demand driver at micro level
Irrigation projects
Government Housing
Polavaram / Amaravathi / Sagarmala
Metro and road construction

Institutional Equities
10 Cement Sector
Exhibit 13: Massive increase in budgetary allocation for irrigation in the southern states
State 2015-16 2016-17 2017-18 Growth
Key proposals Actual Revised Budgeted YoY %
Andhra Pradesh
45.5 81.2 127.7 57.3% Polavaram project is estimated to receive Rs72.51bn. This is more than a 100% increase as compared to the revised estimate for 2016-17.
Telangana 95.4 145.6 226.7 55.7% The government aims to provide irrigation to 10mn acres in the state.
Karnataka 81.6 106.3 144.3 35.8% Rs30bn is estimated to be spent on 21 different projects. This includes development of canal in the Cauvery basin.
Source: State budget documents, Nirmal Bang Institutional Equities Research
State-sponsored housing project is another important cement demand driver
Affordable housing segment in India is in vogue these days on account of the government’s ‘Housing For All’ initiative. Under this scheme, the central government provides assistance to individuals in terms of interest subsidy or direct benefit of upto Rs1.5lakh depending on the type of house constructed. Moreover, key highlight of state budgets of southern states was higher expenditure allocated for the housing schemes making use of some the central government’s flagship projects. In the past, schemes like Indira Awas Yojna and Rajiv Awas Yojna were implemented spiritedly in southern states. In fact, data on state-sponsored housing in urban areas indicates that southern states were leaders in the implementation of these schemes. In our recent report on affordable housing, we have mentioned that some of the beneficiaries of this scheme are likely to be southern states like Tamil Nadu, Andhra Pradesh and Karnataka. In the near term, various southern states are likely to up their spending on housing schemes using the incentives provided by the central government.
Tamil Nadu will be an important state to watch out as the government has come up with a slew of measures for the affordable housing segment. The state government has earmarked considerable funds for different programmes to provide housing facilities in rural and urban areas. It has launched a mission for housing the poor last year by dovetailing funds from many schemes to pursue this. It continues to strive for creating ‘hut-free’ villages and ‘slum-free’ cities in Tamil Nadu. Under the Pradhan Mantri Awas Yojana (PMAY), the government in Tamil Nadu will construct 1,76,000 houses in 2017-18 at a unit cost of Rs1,70,000. Of this, the central government’s contribution will be Rs72,000 per house while the state government will contribute Rs98,000. Roughly Rs17.5bn has been budgeted for the same. Apart from this, 20,000 houses will be constructed in 2017-18 under the Chief Minister’s Solar Powered Green House Scheme.
In Telangana, the government is providing two-bedroom houses for the poor. To encourage the implementation of Two-bedroom Housing Scheme, the government is providing sand free of cost. In addition, the government has entered into a pact with 31 cement companies to provide cement at Rs230 per bag as opposed to the market rate of Rs320 per bag. The contractors are slowly taking up the projects and progress has been satisfactory till date.
Update on Polavaram project
Indira Sagar (Polavaram) project is located on Godavari river near Ramayyapet village of Polavaram Mandal in West Godavari district of Andhra Pradesh. The project is multipurpose major terminal reservoir project on Godavari river for development of irrigation, hydropower and drinking water facilities to East Godavari, Vishakhapatnam, West Godavari and Krishna districts of Andhra Pradesh. The project will provide irrigation to 2,91,000 hectares(CCA) and hydropower with installed capacity of 960MW apart from 23.44tmc (663.7mcm) drinking and industrial water supply to Vishakhapatnam township and steel plant and diversion of 80tmc waters to Krishna rriv. The ultimate irrigation potential of the project is 436,800 ha and annual power generation will be 2369.43mn units. In addition, 540 villages will also be provided with drinking water facilities in the command area. The project implements Godavari-Krishna link under interlinking of rivers project. The project envisages transfer of 80tmc of surplus Godavari water to Krishna river which will be shared between Andhra Pradesh (AP), Karnataka and Maharashtra in the proportion of 45tmc by AP and 35tmc by Karnataka and Maharashtra as per the decision of the GWDT Award.
Institutional Equities
11 Cement Sector
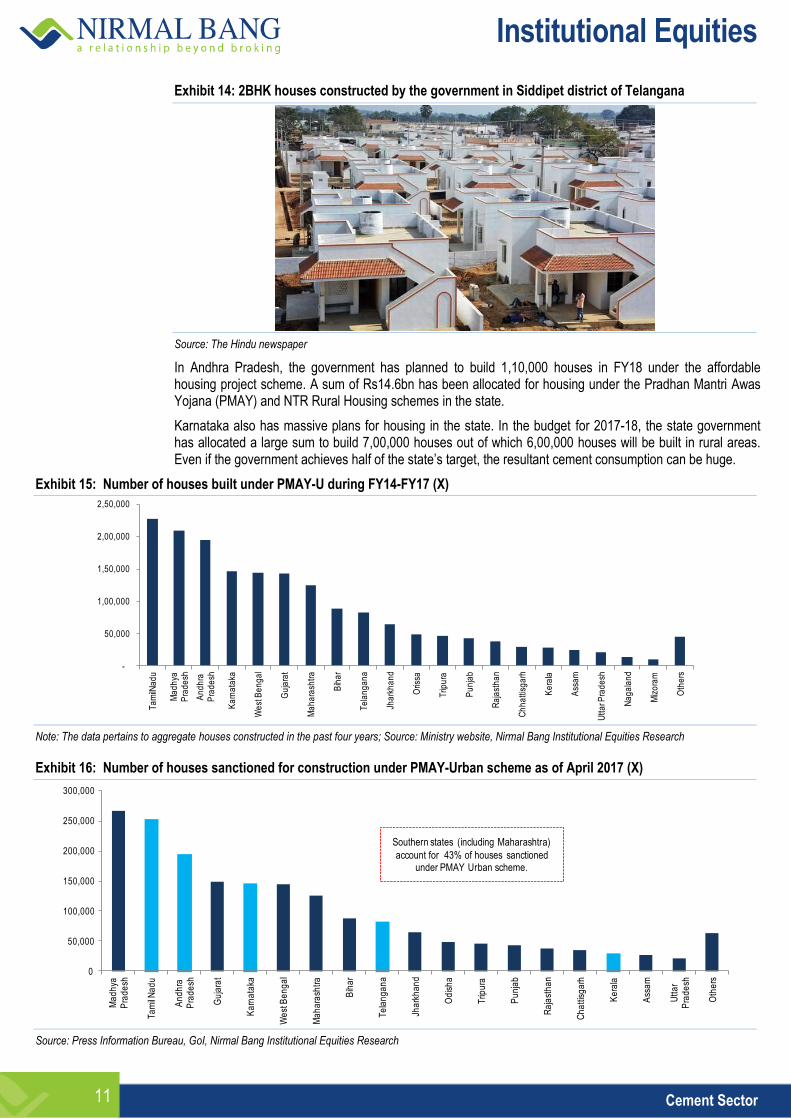
Exhibit 14: 2BHK houses constructed by the government in Siddipet district of Telangana
Source: The Hindu newspaper
In Andhra Pradesh, the government has planned to build 1,10,000 houses in FY18 under the affordable housing project scheme. A sum of Rs14.6bn has been allocated for housing under the Pradhan Mantri Awas Yojana (PMAY) and NTR Rural Housing schemes in the state.
Karnataka also has massive plans for housing in the state. In the budget for 2017-18, the state government has allocated a large sum to build 7,00,000 houses out of which 6,00,000 houses will be built in rural areas. Even if the government achieves half of the state’s target, the resultant cement consumption can be huge.
Exhibit 15: Number of houses built under PMAY-U during FY14-FY17 (X)
Note: The data pertains to aggregate houses constructed in the past four years; Source: Ministry website, Nirmal Bang Institutional Equities Research
Exhibit 16: Number of houses sanctioned for construction under PMAY-Urban scheme as of April 2017 (X)
Source: Press Information Bureau, GoI, Nirmal Bang Institutional Equities Research
-
50,000
1,00,000
1,50,000
2,00,000
2,50,000
Ta
milN
ad
u
Ma
dh
ya
Pra
de
sh
An
dh
ra
Pra
de
sh
Ka
rna
taka
We
st B
en
ga
l
Gu
jara
t
Ma
ha
rash
tra
Bih
ar
Te
lan
ga
na
Jha
rkh
an
d
Oris
sa
Trip
ura
Pu
nja
b
Ra
jast
ha
n
Ch
ha
ttis
ga
rh
Ke
rala
Ass
am
Utt
ar P
rad
esh
Na
ga
lan
d
Miz
ora
m
Oth
ers
0
50,000
100,000
150,000
200,000
250,000
300,000
Ma
dh
ya
Pra
de
sh
Ta
mil
Na
du
An
dh
ra
Pra
de
sh
Gu
jara
t
Ka
rna
taka
We
st B
en
ga
l
Ma
ha
rash
tra
Bih
ar
Te
lan
ga
na
Jha
rkh
an
d
Od
ish
a
Trip
ura
Pu
nja
b
Ra
jast
ha
n
Ch
att
isg
arh
Ke
rala
Ass
am
Utt
ar
Pra
de
sh
Oth
ers
Southern states (including Maharashtra)
account for 43% of houses sanctioned under PMAY Urban scheme.

Institutional Equities
12 Cement Sector
Possibility of higher cement despatches from the southern region to other regions
On account of the presence of limestone clusters in the southern region, this region has generally been a net exporter of cement to nearby regions. States like Maharashtra, Odisha and West Bengal are the recipients of cement on account of either scarcity of limestone in these states or easy logistics because of proximity. While the eastern region witnessed good demand growth in the past, Maharashtra, which is a key state for volume growth of companies in the southern region, has witnessed subdued demand in the past year or so. With the uptick in urban infrastructure, metro rail-related work, increased road construction and railway station redevelopment, we expect cement demand in the state to improve which may increase the inter-state export of cement between Andhra Pradesh and Maharashtra.
Moreover, the government in its report on ‘Sagarmala’ had conducted origin-destination analysis for various classes of goods. For cement, the report indicated possible opportunity of 9mnmt-10mnmt of cement being moved through the coastal route by 2025. Out of that, roughly 5.5mnmt-6.0mnmt cement is expected to be despatched from Andhra Pradesh. With better development of coastal infrastructure, we expect higher amount of cement being despatched from states like Andhra and Karnataka, thereby improving the utilisation of existing capacities. Exhibit 17: Huge opportunity for coastal movement of cement in the southern region
Source: Sagarmala report by the Ministry of Shipping
Exhibit 18: Current inter-state flow of cement in India
Source: Nirmal Bang Institutional Equities Research
Institutional Equities
13 Cement Sector
Pricing environment is stable with reduced volatility
Prices in the southern region have been higher than all India average for the past few years
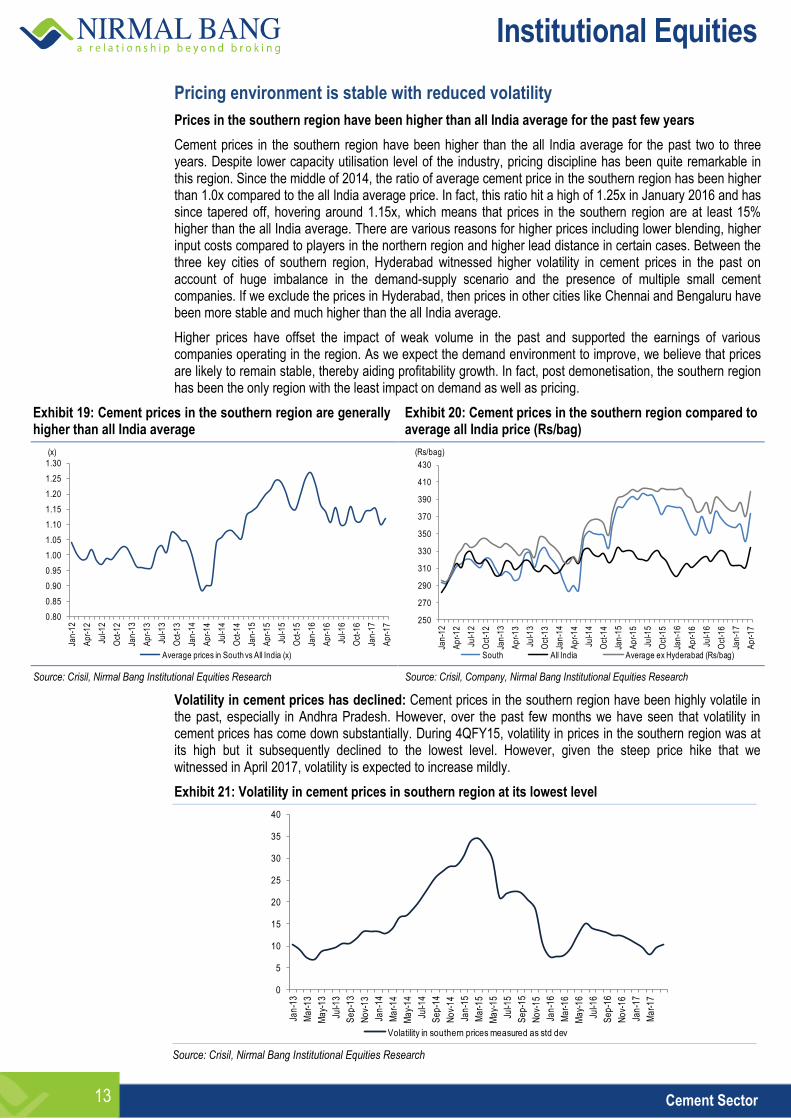
Cement prices in the southern region have been higher than the all India average for the past two to three years. Despite lower capacity utilisation level of the industry, pricing discipline has been quite remarkable in this region. Since the middle of 2014, the ratio of average cement price in the southern region has been higher than 1.0x compared to the all India average price. In fact, this ratio hit a high of 1.25x in January 2016 and has since tapered off, hovering around 1.15x, which means that prices in the southern region are at least 15% higher than the all India average. There are various reasons for higher prices including lower blending, higher input costs compared to players in the northern region and higher lead distance in certain cases. Between the three key cities of southern region, Hyderabad witnessed higher volatility in cement prices in the past on account of huge imbalance in the demand-supply scenario and the presence of multiple small cement companies. If we exclude the prices in Hyderabad, then prices in other cities like Chennai and Bengaluru have been more stable and much higher than the all India average.
Higher prices have offset the impact of weak volume in the past and supported the earnings of various companies operating in the region. As we expect the demand environment to improve, we believe that prices are likely to remain stable, thereby aiding profitability growth. In fact, post demonetisation, the southern region has been the only region with the least impact on demand as well as pricing.
Exhibit 19: Cement prices in the southern region are generally higher than all India average
Exhibit 20: Cement prices in the southern region compared to average all India price (Rs/bag)
Source: Crisil, Nirmal Bang Institutional Equities Research Source: Crisil, Company, Nirmal Bang Institutional Equities Research
Volatility in cement prices has declined: Cement prices in the southern region have been highly volatile in the past, especially in Andhra Pradesh. However, over the past few months we have seen that volatility in cement prices has come down substantially. During 4QFY15, volatility in prices in the southern region was at its high but it subsequently declined to the lowest level. However, given the steep price hike that we witnessed in April 2017, volatility is expected to increase mildly.
Exhibit 21: Volatility in cement prices in southern region at its lowest level
Source: Crisil, Nirmal Bang Institutional Equities Research
0.80
0.85
0.90
0.95
1.00
1.05
1.10
1.15
1.20
1.25
1.30
Jan
-12
Ap
r-1
2
Jul-1
2
Oct
-12
Jan
-13
Ap
r-1
3
Jul-1
3
Oct
-13
Jan
-14
Ap
r-1
4
Jul-1
4
Oct
-14
Jan
-15
Ap
r-1
5
Jul-1
5
Oct
-15
Jan
-16
Ap
r-1
6
Jul-1
6
Oct
-16
Jan
-17
Ap
r-1
7
Average prices in South vs All India (x)
(x)
250
270
290
310
330
350
370
390
410
430
Jan
-12
Ap
r-1
2
Jul-1
2
Oct
-12
Jan
-13
Ap
r-1
3
Jul-1
3
Oct
-13
Jan
-14
Ap
r-1
4
Jul-1
4
Oct
-14
Jan
-15
Ap
r-1
5
Jul-1
5
Oct
-15
Jan
-16
Ap
r-1
6
Jul-1
6
Oct
-16
Jan
-17
Ap
r-1
7
South All India Average ex Hyderabad (Rs/bag)
(Rs/bag)
0
5
10
15
20
25
30
35
40
Jan
-13
Ma
r-1
3
Ma
y-1
3
Jul-1
3
Se
p-1
3
No
v-1
3
Jan
-14
Ma
r-1
4
Ma
y-1
4
Jul-1
4
Se
p-1
4
No
v-1
4
Jan
-15
Ma
r-1
5
Ma
y-1
5
Jul-1
5
Se
p-1
5
No
v-1
5
Jan
-16
Ma
r-1
6
Ma
y-1
6
Jul-1
6
Se
p-1
6
No
v-1
6
Jan
-17
Ma
r-1
7
Volatility in southern prices measured as std dev

Institutional Equities
14 Cement Sector
Southern region witnessed strong MoM price hike in April 2017 after weakness for a couple of months
Cement prices in the southern region witnessed a big MoM advance after relatively weak prices for the past two months. Dealers in Chennai stated that the price hike was notified to them at short notice. Prices in Chennai rose by around Rs20-Rs30 per bag while Hyderabad showed an uptick of Rs35-Rs40 per bag. However, the sharpest rise in this region was witnessed in Bengaluru where prices rose by Rs40-Rs50 per bag. Dealers indicated a fall in demand from the beginning of the current month, but were not sure whether it could be attributed to the hike. Dealers expect the demand to improve slightly, but remain unsure about future price prospects and whether the hiked prices can sustain. Some dealers also indicated that uncertainty coupled with lack of construction activity during the monsoon season will make it very tough to sustain the hiked prices. Some regions also saw follow-on pricing hikes in the second week of April 2017 as well.
Protest from CREDAI on higher cement prices
The Confederation of Real Estate Developers’ Association of India (CREDAI), which is an apex body of real estate developers in India, has protested against this massive price hike undertaken by cement companies. This body has been vocal in the past with respect to arbitrary cement price hikes undertaken by companies. In fact, on various occasions its members have even boycotted buying cement of premium brands to protest against the price hike.
CREDAI stated it has received numerous complaints and protest mails from its members across India about cement companies hugely jacking up prices of cement, thus negatively affecting the deliverability of affordable housing projects. Cement prices have witnessed a sudden jump of 20% to 40% in a short span of two months across India, while there are reports that cost of production of cement has not changed much. While the government laid emphasis on the housing industry and recognised its need, especially the affordable housing segment, by awarding it infrastructure status, this unjust price rise may increase construction costs which will have to be passed on to the consumers. CREDAI has regularly requested the central government for its swift intervention to put an end to the collusive practices in the industry and rein in price hikes so that it may contribute to the government’s goal of ‘Housing for All’ by 2022.
Here is the verbatim account of what the CREDAI president stated:
“We are pained by the complaints of unjustifiable and collusive jacking up of cement prices by cement manufacturers across India which have a potential to create unnecessary roadblocks and impediments in achieving the goals of Housing For All by 2022 envisioned by our Prime Minister. On earlier occasions too the Competition Commision of India has pulled up cement manufacturers for collusive pricing and imposed hefty fines on them. It is estimated that Rs100 rise in cement per bag results in increase in construction cost by at least Rs50 per square foot in the entire project. We are in talks with other affected parties like Builder’s Association of India as well as National Highway Builder’s Federation for possible joint action against this artificial price rise.”
Where do we think cement prices can go from here?
While the comments made by the property developer’s body are a threat to higher cement prices, we believe that historical instances like this have not yielded much result in favour of developers. We expect some correction in cement prices in the near term as the hike in April 2017 has been too steep. However, we believe that cement prices in the southern region will be resilient and that cement companies will pass on the increased cost burden to consumers by way of higher prices. We do not have pricing estimates for individual cities, but for companies in our coverage we have factored in 3%-6% increase in realisation from a low base.
More recently, a group of ministers (GOM) constituted by the Andhra Pradesh government, held talks with the cement companies to look into the steep price hike taken by the companies in the month of April. The construction industry already reeling under the pressure of low demand has alleged that the cement companies have created artificial scarcity in the market by deliberately stopping production intermittently. We expect the pricing in the southern region to be stable in the near-medium term as we expect some uncertainty on back of GST implementation etc.
Institutional Equities
15 Cement Sector
Supply outlook
No significant capacity addition planned
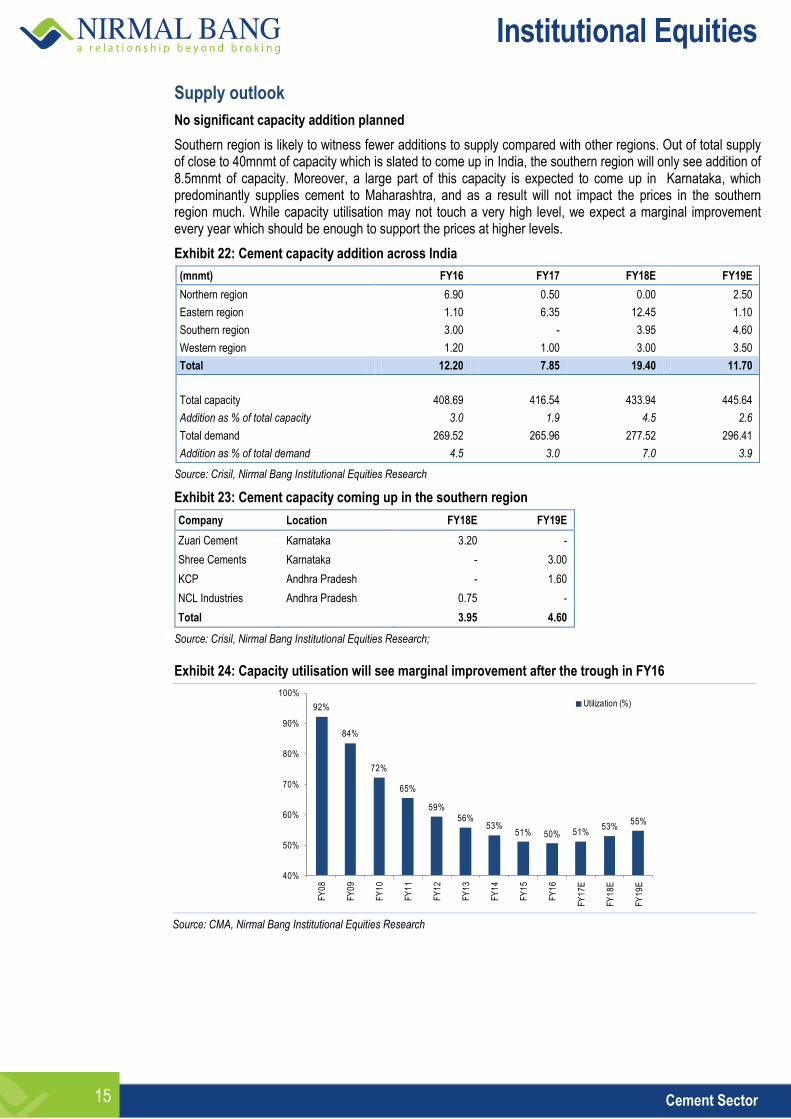
Southern region is likely to witness fewer additions to supply compared with other regions. Out of total supply of close to 40mnmt of capacity which is slated to come up in India, the southern region will only see addition of 8.5mnmt of capacity. Moreover, a large part of this capacity is expected to come up in Karnataka, which predominantly supplies cement to Maharashtra, and as a result will not impact the prices in the southern region much. While capacity utilisation may not touch a very high level, we expect a marginal improvement every year which should be enough to support the prices at higher levels.
Exhibit 22: Cement capacity addition across India
(mnmt) FY16 FY17 FY18E FY19E
Northern region 6.90 0.50 0.00 2.50
Eastern region 1.10 6.35 12.45 1.10
Southern region 3.00 - 3.95 4.60
Western region 1.20 1.00 3.00 3.50
Total 12.20 7.85 19.40 11.70
Total capacity 408.69 416.54 433.94 445.64
Addition as % of total capacity 3.0 1.9 4.5 2.6
Total demand 269.52 265.96 277.52 296.41
Addition as % of total demand 4.5 3.0 7.0 3.9
Source: Crisil, Nirmal Bang Institutional Equities Research
Exhibit 23: Cement capacity coming up in the southern region
Company Location FY18E FY19E
Zuari Cement Karnataka 3.20 -
Shree Cements Karnataka - 3.00
KCP Andhra Pradesh - 1.60
NCL Industries Andhra Pradesh 0.75 -
Total
3.95 4.60
Source: Crisil, Nirmal Bang Institutional Equities Research; Exhibit 24: Capacity utilisation will see marginal improvement after the trough in FY16
Source: CMA, Nirmal Bang Institutional Equities Research
92%
84%
72%
65%
59%56%
53%51% 50% 51%
53%55%
40%
50%
60%
70%
80%
90%
100%
FY
08
FY
09
FY
10
FY
11
FY
12
FY
13
FY
14
FY
15
FY
16
FY
17
E
FY
18
E
FY
19
E
Utilization (%)

Institutional Equities
16 Cement Sector
Profitability snapshot of southern players
Exhibit 25: Financial and valuation snapshot
Market-cap CMP Target Up/ EV/E (x) P/B (x) RoE (%)
Company Rating Rsbn US$mn (Rs) price down(%) FY18E FY19E FY18E FY19E FY18E FY19E
Dalmia Bharat Buy 215 3,311 2,406 2,806 17% 12.2 10.2 4.2 3.5 15.4 17.6
Sagar cement Buy 17 259 806 951 18% 11.5 8.6 1.9 1.7 8.6 12.5
The Ramco Cements Accumulate 169 2,596 705 775 10% 11.9 10.8 3.9 3.3 17.0 17.0
Source: State budget documents; PRS India, Nirmal Bang Institutional Equities Research
Exhibit 26: EBITDA/mt of southern players has been generally higher in recent quarters . . .
Source: Company, Nirmal Bang Institutional Equities Research
Exhibit 27: . . . so has been the volume growth
Source: Company, Nirmal Bang Institutional Equities Research;
0
200
400
600
800
1,000
1,200
1,400
TRCL DBEL SRCM UTCEM JKCE ICEM ACEM HEIM SGC ACC JKLC PRSC MGC
Southern players exhibited higher
EBITDA/mt in 3QFY17 on account of better
(EBITDA/mt (Rs))
22.1 21.6 20.0 20.0
5.9 4.6 4.0
0.5
(1.6) (1.7)(3.7) (4.5)
(8.8) (9.2)(11.1)
-15
-10
-5
0
5
10
15
20
25
TR
CL
ICE
M
OR
CM
NT
DB
EL
MG
C
SR
CM
JKL
C
SG
C
PR
SC
UT
CE
M
HE
IM
JKC
E
AC
EM
AC
C
BC
OR
P
Volume growth (y-y %)
(YoY %)

Institutional Equities
17 Cement Sector
Exhibit 28: Lower RoE for southern companies is a result of lower capacity utilisation
Source: Bloomberg, Nirmal Bang Institutional Equities Research
Exhibit 29: ROE expected to shoot up in the coming years Exhibit 30: With a favourable demand scenario, operating profit margins to go up
Source: Crisil, Nirmal Bang Institutional Equities Research Source: Crisil, Company, Nirmal Bang Institutional Equities Research
Exhibit 31: Snapshot of the EBITDA growth Exhibit 32: Free cash flow profile looks promising for Ramco
and Dalmia
Source: Crisil, Nirmal Bang Institutional Equities Research Source: Crisil, Company, Nirmal Bang Institutional Equities Research
0
5
10
15
20
25
Shr
ee C
emen
t
Ram
co C
cem
ent
Ultr
atec
h
JK C
emen
t
JK L
aksh
mi
Cem
ent
Hei
delb
erg
Cem
ent
AC
C
Dal
mia
Cem
ent
San
ghi C
emen
t
Man
gala
m C
emen
t
KC
P L
td
Orie
nt C
emen
t
Birl
a C
orp
Am
buja
Sag
ar C
emen
t
Indi
a C
emen
t
Lower utilization levels have resulted in lower ROE for the south based companies with the exception of Ramco which has a superior EBITDA despite weak utilisations
(%)
0%
2%
4%
6%
8%
10%
12%
14%
16%
18%
20%
TRCL DBEL SGC
ROE %
FY17E FY18E FY19E
0%
5%
10%
15%
20%
25%
30%
35%
TRCL DBEL SGC
OPM%
FY17E FY18E FY19E
0%
5%
10%
15%
20%
25%
30%
35%
40%
45%
TRCL DBEL SGC
EBITDA growth %
FY17E FY18E FY19E (2,000)
0
2,000
4,000
6,000
8,000
10,000
12,000
TRCL DBEL SGC
FCF
FY17E FY18E FY19E

Institutional Equities
18 Cement Sector
Exhibit 33: Our estimate vs consensus
(Rsmn) Our estimates Consensus estimates Deviation (%)
TRCL FY18E FY19E FY18E FY19E FY18E FY19E
Sales 45,517 50,178 44,618 49,566 2.0 1.2
EBITDA 15,045 16,090 13,015 14,548 15.6 10.6
PAT 8,045 9,064 7,542 8,811 6.7 2.9
DBL FY18E FY19E FY18E FY19E FY18E FY19E
Sales 82,829 92,052 84,383 96,138 (1.8) (4.3)
EBITDA 23,519 27,682 21,283 25,106 10.5 10.3
PAT 7,141 10,327 5,341 8,204 33.7 25.9
SCL FY18E FY19E FY18E FY19E FY18E FY19E
Sales 12,041 14,539 10,790 14,173 11.6 2.6
EBITDA 1,729 2,372 1,907 2,666 (9.3) (11.0)
PAT 709 1,149 642 1,133 10.5 1.4
Source: Bloomberg, Nirmal Bang Institutional Equities Research

Institutional Equities
19 Cement Sector
Snapshot of key states with possible demand potential
Andhra Pradesh - Largest producer of cement in India
Andhra Pradesh (AP) is the eighth-largest state in India covering an area of about 1,63,000sqkm. On its formation in 2014, Telangana became the newest state in India, making it the 12th-largest state in the country. The states of AP and Telangana account for the country’s largest reserves of limestone. The states together are home to about 40 cement plants out of the total 209 in the country. The AP-Telangana region is also home to Nalgonda cluster- one of the seven cement clusters in India. The states have an installed capacity of 60.2mnmt (15% of India’s total cement capacity) and demand of 16.7mnmt. As a result of this, Andhra Pradesh and Telangana are cement-surplus states exporting it to other states and surrounding markets. Major urban demand within these states comes from cities like Hyderabad, Warangal, Vizag and Vijaywada.
Exhibit 34: Consistently high growth in GSDP post 2013
Source: Government websites, Nirmal Bang Institutional Equities Research
Government spending
The common theme between the budgets of these two states has been increased spending on irrigation, which augurs well for increased cement consumption. Budgetary allocation for irrigation in Andhra Pradesh has been increased by 57% from the revised estimate of 2015-16 whereas the same in case of Telangana has been increased by a massive 169%. Spending on rural development is also higher, which will help rural income and in turn boost rural demand for cement.
The gross state domestic product (GSDP) of Andhra Pradesh for 2016-17 is estimated at Rs6.03trn, which is 13.2% higher than the estimate for 2015-16. Total expenditure for 2017-18 is estimated at Rs1,570bn, a 18.3% increase over the revised estimate of 2016-17. Departments of rural development, irrigation and health welfare witnessed increase in allocation for 2016-17. On the other hand, the department of municipal administration witnessed a 21.8% decrease in allocation for 2016-17. Irrigation allocation to the department of major and minor irrigation increased 57.3% for 2017-18, over the budget estimate of 2016-17. We expect these measures to positively contribute to higher cement demand.
The GSDP of Telangana for 2016-17 is estimated at Rs5.83trn, which is 15% higher than the revised estimate for 2015-16. Total expenditure for 2016-17 is estimated at Rs1,304bn, a 30.3% increase over the revised estimate of 2015-16. A sum of Rs241.3bn is expected to be spent on irrigation in the state, which is a massive increase of 169% over 2015-16. Moreover, 0.2mn two bed-room houses are budgeted to be built for eligible poor people. Mission Bhagirath scheme to provide drinking water supply to all houses in the state has also been allocated a significant sum. All these measures are expected to prop up cement demand in the state.
Exhibit 35: Andhra Pradesh state budget highlights
Andhra Pradesh (Rsbn)
2016-17 budgeted
2016-17 revised
Change (%)
2017-18 budgeted
Change (%)
Total expenditure 1356.0 1327.0 (2.2) 1569.0 18.3
Revenue deficit (48.7) (46.0) - (4.2) -
Fiscal deficit (205.0) (191.6) - (230.5) -
Primary deficit (82.4) (69.6) - (82.7) -
Source: State budget documents; PRS India, Nirmal Bang Institutional Equities Research
0%
2%
4%
6%
8%
10%
12%
14%
16%
0
1,000
2,000
3,000
4,000
5,000
6,000
FY06 FY07 FY08 FY09 FY10 FY11 FY12 FY13 FY14 FY15 FY16
Nominal GSDP (INR mn) (LHS) GSDP growth (RHS)
(Rsmn)

Institutional Equities
20 Cement Sector
Exhibit 36: Telangana state budget highlights
Telangana (Rsbn)
2016-17 budgeted
2016-17 revised
Change (%)
2017-18 budgeted
Change (%)
Total expenditure 1304.0 1121.0 (14.0) 1496.0 33.4
Revenue deficit 37.2 2.0 - 45.7 -
as a % of GSDP 0.6 0.0 - 0.6 -
Fiscal deficit (234.7) (218.9) - (261.0) -
as a % of GSDP (3.5) (3.4) - 3.5 -
Primary deficit (157.6) (141.9) - (149.6) -
as a % of GSDP (2.3) (2.2) - (2.0) -
Source: State budget documents; PRS India, Nirmal Bang Institutional Equities Research
Exhibit 37: Andhra Pradesh expenditure details
Andhra Pradesh (Rsbn)
2016-17 budgeted
2016-17 revised
Change (%)
2017-18 budgeted
Change (%)
Capital expenditure 215.2 204.6 (4.9) 310.9 52.0
Revenue expenditure 1141.7 1123.1 (1.6) 1259.1 12.1
Total expenditure 1356.9 1327.6 (2.2) 1570.0 18.3
Debt + interest 178.1 177.6 (0.3) 227.9 28.3
Source: State budget documents; PRS India, Nirmal Bang Institutional Equities Research
Exhibit 38: Telangana expenditure details
Telangana (Rsbn)
2016-17 budgeted
2016-17 revised
Change (%)
2017-18 budgeted
Change (%)
Capital expenditure 332.1 253.2 (23.8) 411.3 62.5
Revenue expenditure 972.1 868.7 (10.6) 1085.1 24.9
Total expenditure 1304.2 1121.9 (14.0) 1496.5 (33.4)
Debt + interest 108.6 108.6 0.0 158.0 45.5
Source: State budget documents; PRS India, Nirmal Bang Institutional Equities Research
Exhibit 39: Increased allocation for irrigation, panchayat raj and rural development
Andhra Pradesh (Rsbn) Department
2016-17 budgeted
2016-17 revised
Change (%)
Comments
Rural development 114.72 145.31 26.7 Under National RURBAN Mission, six clusters (Alur, Nandalur, Cheepurupalli, Sompet, Nujendla and Chendarlapadu) have been selected. Rs5.02bn has been allocated under Pradhan Mantri Gram Sadak Yojana.
Water resources (Irrigation)
81.2 127.7 57.3 Polavaram project is estimated to receive Rs72.51bn. This is more than a 100% increase as compared to the revised estimate in 2016-17. Under the scheme NTR Jala Sri, 120,000 new bore wells have been sanctioned. Rs440mn has been allocated in this regard.
Panchayat raj 56.96 66.1 16 Rs65.62bn has been allocated for MGNREGS.
Urban development 66.61 52.07 (21.8) Rs10.61bn has been allocated for capital development operations.
Source: State budget documents; PRS India, Nirmal Bang Institutional Equities Research
Exhibit 40: Substantial increase in spending on irrigation in Telangana
Telangana (Rsbn) Department
2016-17 revised
2017-18 budgeted
Change (%)
Comments
Irrigation 145.6 226.7 55.7 The government aims to provide irrigation to 10mn people in the state. Manair River Front Project will be implemented at an estimated cost of Rs 5.06bn. A provision of Rs1.93bn has been proposed for the project in the budget.
Social welfare 68.9 103.8 50.6
It is proposed to procure and distribute 8.4mn sheep to 4,00,000 Yadava community families in the state over the next two years. Under the scheme, it is proposed to distribute 20 female and one male sheep to each eligible family enrolled under a Sheep Development Cooperative Society at 75% subsidy.
Rural development 63.5 74.4 17.3 Rs30bn is budgeted to be spent under MNREGA.
Panchayat raj 39.91 72.8 82.4 Current projects to convert WBM roads to BT roads, and maintenance of BT roads will be continued.
Source: State budget documents; PRS India, Nirmal Bang Institutional Equities Research

Institutional Equities
21 Cement Sector
Demand-supply scenario
Andhra Pradesh and Telangana together have been the largest producers of cement in India. With the abundance of limestone, AP and Telangana have been cement-surplus states for a long time. Over the past15 years, cement capacity in these states has gone up from 6.8mnmt in 2000 to 37.8mnmt in 2016. However, capacity utilisation in the southern region as a whole has been languishing at 55.4% since FY15. We expect no major capex in Andhra Pradesh in the next three years.
Exhibit 41: AP-Telangana region is a cement-surplus region due to the presence of Nalgonda cluster
Source: CMA, Nirmal Bang Institutional Equities Research
Exhibit 42: Cement demand growth has fallen behind GDSP growth for some time now
Source: CMA, Government websites, Nirmal Bang Institutional Equities Research
Exhibit 43: Per capita cement consumption has started to pick up once again
Source: Government websites,, Nirmal Bang Institutional Equities Research
0
10
20
30
40
50
60
70
FY
00
FY
01
FY
02
FY
03
FY
04
FY
05
FY
06
FY
07
FY
08
FY
09
FY
10
FY
11
FY
12
FY
13
FY
14
FY
15
FY
16
FY
17
E
Capacity Demand
(million metric ton)
-15%
-10%
-5%
0%
5%
10%
15%
20%
25%
FY06 FY07 FY08 FY09 FY10 FY11 FY12 FY13 FY14 FY15 FY16
Cement demand growth Nominal GSDP growth
0
50
100
150
200
250
300
65,000,000
70,000,000
75,000,000
80,000,000
85,000,000
90,000,000
95,000,000
FY01
FY02
FY03
FY04
FY05
FY06
FY07
FY08
FY09
FY10
FY11
FY12
FY13
FY14
FY15
FY16
FY17
E
Population (LHS) Per capita cement (in kg) (RHS)
(kg)

Institutional Equities
22 Cement Sector
Exhibit 44: Major cement brands
Installed capacity (mt) Brand
India Cements 7.09 Coromandel King-Sankar Sakthi- Raasi Gold
Penna Cement 6.5 Penna Power, Penna Premium
UltraTech Cement 5.6 UltraTech
Jaiprakash 5 Jaypee Cement
Source: Nirmal Bang Institutional Equities Research
Tamil Nadu- Large number of players in a competitive market
In the 2017-18 budget, Tamil Nadu government has formulated five priority missions - namely, water resource management, poverty reduction, housing for poor, skill building and clean Tamil Nadu. The budget has laid down a strong foundation for cement demand in the coming financial year. The government has decided to rejuvenate Kudiramamath, a programme to maintain and manage water bodies within the state. As Tamil Nadu is a water-deficit state, the government has increased the allocation to Rs3bn in 2017-18. The government has also proposed to take over irrigation, ground water recharge and other drinking supply projects in the state through an approval of Rs2.5bn. The total allocation for the water resources department is Rs48bn, up 41% from the revised estimate of 2016-17. Under the highways department, the state has allocated a total of Rs100bn. In addition to this, the government has allotted Rs37bn for the Chennai metro rail project.
Exhibit 45: GSDP has grown consistently at a CAGR of 9% since FY06
Source: Government websites, Nirmal Bang Institutional Equities Research
Exhibit 46: Cement capacity has far exceeded the state’s demand since FY09
Source: CMA, Nirmal Bang Institutional Equities Research
0%
2%
4%
6%
8%
10%
12%
14%
16%
18%
0
2,000
4,000
6,000
8,000
10,000
12,000
FY06 FY07 FY08 FY09 FY10 FY11 FY12 FY13 FY14 FY15 FY16
Nominal GSDP (Rsmn) (LHS) GSDP growth (RHS)
(Rsmn)
0
5
10
15
20
25
30
35
40
FY
00
FY
01
FY
02
FY
03
FY
04
FY
05
FY
06
FY
07
FY
08
FY
09
FY
10
FY
11
FY
12
FY
13
FY
14
FY
15
FY
16
FY
17
E
Capacity Demand
(million metric ton)
Institutional Equities
23 Cement Sector
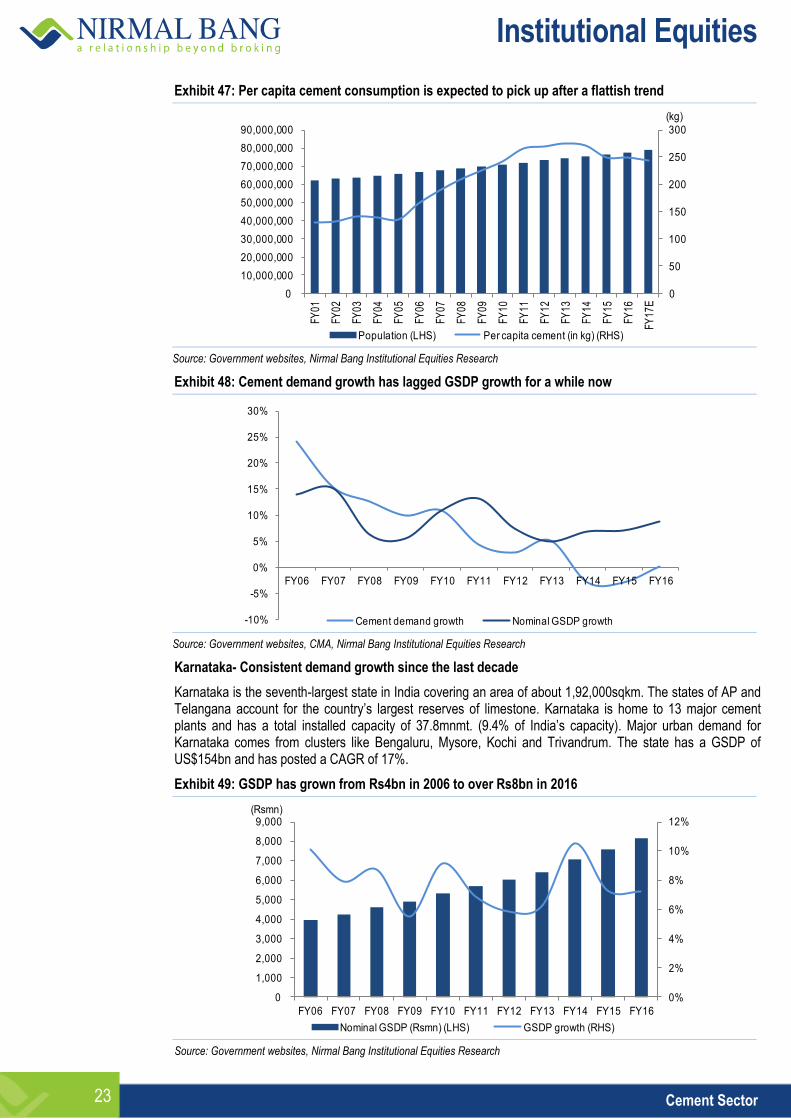
Exhibit 47: Per capita cement consumption is expected to pick up after a flattish trend
Source: Government websites, Nirmal Bang Institutional Equities Research
Exhibit 48: Cement demand growth has lagged GSDP growth for a while now
Source: Government websites, CMA, Nirmal Bang Institutional Equities Research
Karnataka- Consistent demand growth since the last decade
Karnataka is the seventh-largest state in India covering an area of about 1,92,000sqkm. The states of AP and Telangana account for the country’s largest reserves of limestone. Karnataka is home to 13 major cement plants and has a total installed capacity of 37.8mnmt. (9.4% of India’s capacity). Major urban demand for Karnataka comes from clusters like Bengaluru, Mysore, Kochi and Trivandrum. The state has a GSDP of US$154bn and has posted a CAGR of 17%.
Exhibit 49: GSDP has grown from Rs4bn in 2006 to over Rs8bn in 2016
Source: Government websites, Nirmal Bang Institutional Equities Research
0
50
100
150
200
250
300
0
10,000,000
20,000,000
30,000,000
40,000,000
50,000,000
60,000,000
70,000,000
80,000,000
90,000,000
FY01
FY02
FY03
FY04
FY05
FY06
FY07
FY08
FY09
FY10
FY11
FY12
FY13
FY14
FY15
FY16
FY17
E
Population (LHS) Per capita cement (in kg) (RHS)
(kg)
-10%
-5%
0%
5%
10%
15%
20%
25%
30%
FY06 FY07 FY08 FY09 FY10 FY11 FY12 FY13 FY14 FY15 FY16
Cement demand growth Nominal GSDP growth
0%
2%
4%
6%
8%
10%
12%
0
1,000
2,000
3,000
4,000
5,000
6,000
7,000
8,000
9,000
FY06 FY07 FY08 FY09 FY10 FY11 FY12 FY13 FY14 FY15 FY16
Nominal GSDP (Rsmn) (LHS) GSDP growth (RHS)
(Rsmn)

Institutional Equities
24 Cement Sector
Government spending
Exhibit 50: Karnataka state budget highlights
Karnataka (Rsbn)
2016-17 budgeted
2016-17 revised
Change (%)
2017-18 budgeted
Change (%)
Total expenditure 1,634.0 1,644.0 0.6 1,865.0 13.4
Revenue deficit 5.2 10.6 - 1.4 -
as a % of GSDP 0.1 0.1 - 0.0 -
Fiscal deficit (256.6) (241.5) - (333.6) -
as a % of GSDP (2.3) (2.2) - (2.6) -
Primary deficit (129.9) (118.6) - (192.0) -
as a % of GSDP 1.2 (1.1) - (1.5) -
Source: State budget documents, PRS India, Nirmal Bang Institutional Equities Research
Exhibit 51: Karnataka expenditure details
Karnataka (Rsbn)
2016-17 budgeted
2016-17 revised
Change (%)
2017-18 budgeted
Change (%)
Capital expenditure 331.8 326.7 (1.5) 418.1 27.9
Revenue expenditure 1302.4 1318.1 1.2 1447.6 9.8
Total expenditure 1634.2 1644.8 0.6 1865.6 13.4
Debt + interest 200.5 200.8 0.2 226.9 13.0
Source: State budget documents, PRS India, Nirmal Bang Institutional Equities Research
Exhibit 52: Increased allocation for irrigation, urban & rural development and social welfare
Karnataka (Rsbn) Department
2016-17 budgeted
2016-17 revised
Change (%)
Comments
Irrigation 113.89 106.32 -6.6 Rs30bn is estimated to be spent on 21 different projects. This includes development of canal in the Cauvery basin at a cost of Rs5.1bn.
Urban development 110.29 105.62 -4.2 Bengaluru metro rail work for the line between Silk Board to K. R. Puram will be commenced at a cost of Rs42bn.
Rural development 127.61 127.44 -0.1 Rs22bn has been allocated for the Rural Water Supply Scheme. Rs 15.85bn will be provided for ensuring rural sanitation and creating an open defecation-free state.
Social welfare 91.1 92.58 1.6 Rs3bn has been allocated to distribute buffalo-cow or sheep/goat to 100,000 SC/ST families. Rs1bn has been allocated for LPG connections to SC/ST families living below the poverty line.
Source: State budget documents, PRS India, Nirmal Bang Institutional Equities Research
Exhibit 53: FY10 saw a spurt in capacity which is expected to be above demand for years to come
Source: State budget documents, PRS India, Nirmal Bang Institutional Equities Research
0
5
10
15
20
25
30
35
40
FY
00
FY
01
FY
02
FY
03
FY
04
FY
05
FY
06
FY
07
FY
08
FY
09
FY
10
FY
11
FY
12
FY
13
FY
14
FY
15
FY
16
FY
17
E
Capacity Demand
(million metric ton)
Institutional Equities
25 Cement Sector
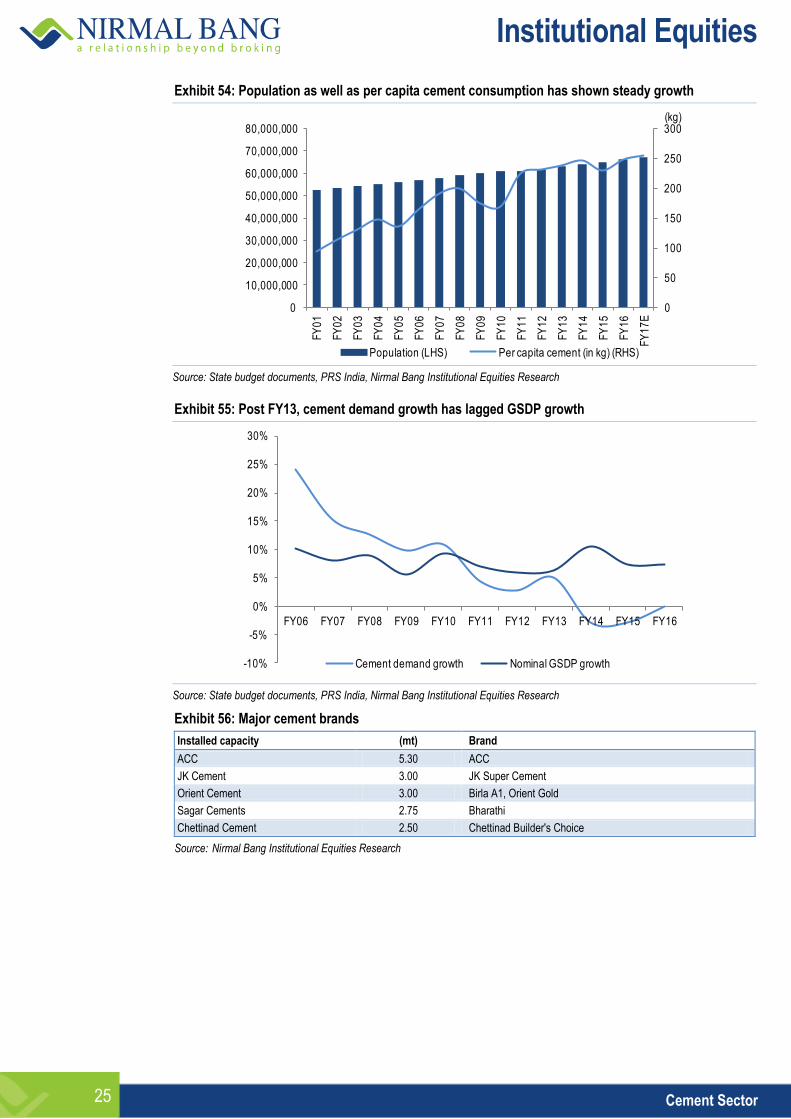
Exhibit 54: Population as well as per capita cement consumption has shown steady growth
Source: State budget documents, PRS India, Nirmal Bang Institutional Equities Research
Exhibit 55: Post FY13, cement demand growth has lagged GSDP growth
Source: State budget documents, PRS India, Nirmal Bang Institutional Equities Research
Exhibit 56: Major cement brands
Installed capacity (mt) Brand
ACC 5.30 ACC
JK Cement 3.00 JK Super Cement
Orient Cement 3.00 Birla A1, Orient Gold
Sagar Cements 2.75 Bharathi
Chettinad Cement 2.50 Chettinad Builder's Choice
Source: Nirmal Bang Institutional Equities Research
0
50
100
150
200
250
300
0
10,000,000
20,000,000
30,000,000
40,000,000
50,000,000
60,000,000
70,000,000
80,000,000
FY
01
FY
02
FY
03
FY
04
FY
05
FY
06
FY
07
FY
08
FY
09
FY
10
FY
11
FY
12
FY
13
FY
14
FY
15
FY
16
FY
17
E
Population (LHS) Per capita cement (in kg) (RHS)
(kg)
-10%
-5%
0%
5%
10%
15%
20%
25%
30%
FY06 FY07 FY08 FY09 FY10 FY11 FY12 FY13 FY14 FY15 FY16
Cement demand growth Nominal GSDP growth

Institutional Equities
26 Cement Sector
This page has been intentionally left blank

Institutional Equities
Initi
atin
g C
over
age
Reuters: DALA.BO; Bloomberg: DBEL IN
Dalmia Bharat
The Best Growth Story In Cement Space We initiate coverage on Dalmia Bharat (DBL) with a Buy rating and a target price of Rs2,806,up 17% from the current market price. DBL, according to us, is probably the best and successful growth story in the cement space in India. From a capacity of merely 1.2mnmt in FY06, DBL has been able to grow to a 25mnmt company by FY16, placing it among the top four cement companies in India. Now that a significant scale has been achieved through inorganic and organic routes, we expect the company to report much higher volume growth for the next few years along with increased market share. Apart from this, DBL has been able to achieve growth while focusing on improving efficiency as well. DBL boasts of significantly lower operating costs which help it to generate one of the highest EBITDA/mt among peers. DBL has various firsts to its credit like being the largest slag cement company in India, having one of the lowest electricity consumption patterns in the country, having one of the lowest carbon footprints in the world and a much higher cement-to-clinker ratio among peers. Given the scope for much higher volume growth, presence in regions where cement prices have been favourable and stable and completion of a major capex programme, DBL is all set to achieve superior earnings growth driven by the excellence exhibited in the past in capex as well as opex. Moreover corporate restructuring - which is on the verge of completion - will create a pure play cement company unlike a holding company in the past, which will further help shore up its financials and achieve better valuation multiples given its size. We have factored in 12.7%/20.6%/75.6% CAGR in sales, EBITDA and net profit over FY16-FY19E, respectively. We have valued DBL stock based on our usual method of the average of earnings and asset-based valuation. Our target multiples for DBL at 12.0x FY19E EV/EBITDA and US$150 FY19E EV/mt are higher than that of some pan-India players like ACC and Ambuja Cements but lower compared with UltraTech Cement. We believe that given the vast earnings potential and aggressive management approach, the higher multiples are justified. Our target price on the DBL stock is Rs2,806, up 17% from the current market price. Key risks to our call include demand slowdown in DBL’s key markets affecting the pricing and aggressive acquisition in future leading to strain on its balance sheet. Excellence in opex and capex to generate best return ratios in the industry: DBL has reduced its operating costs by 24% over the past few years on account of higher blending, increased usage of alternate fuel and higher production from its new and modern plants. The cost at which DBL has acquired capacity or has grown organically averages close to US$90/mt compared to much higher replacement cost. This trait of excellence in opex as well as capex is likely to generate much higher return ratios for DBL as its assets start operating close to their optimum capacity. Restructuring complete, pure play cement company to have much higher multiples: As DBL has grown its cement business through acquisitions right from 2006, the erstwhile corporate structure of the company had its cement business under various subsidiaries and associate companies along with other businesses not related to cement. Over the years and through a series of measures, DBL developed a much leaner structure and is now a large pure play cement company with huge operating leverage.
BUY
Sector: Cement
CMP: Rs2,406
Target Price: Rs2,806
Upside: 17%
Mangesh Bhadang Research Analyst [email protected] +91-22-3926 8172
Key Data
Current Shares O/S (mn) 89.0
Mkt Cap (Rsbn/US$mn) 214.1/3.3
52 Wk H / L (Rs) 2,422/813
Daily Vol. (3M NSE Avg.) 311,413
Share holding (%) 2QFY17 3QFY17 4QFY17
Promoter 57.4 57.3 57.8
DII+FII 13.3 13.8 13.4
Others 29.3 28.9 28.8
One -Year Indexed Stock Performance
Price Performance (%)
1 M 6 M 1 Yr
Dalmia Bharat 11.3 20.7 186.6
Nifty Index 1.3 10.5 18.4
Source: Bloomberg
Y/E March (Rsmn) FY14 FY15 FY16 FY17E FY18E FY19E
Revenues 30,158 35,141 64,380 73,140 82,829 92,052
YoY (%) 8.1 16.5 83.2 13.6 13.2 11.1
EBITDA 4,640 5,999 15,773 19,511 23,519 27,682
EBITDA (%) (26.5) 29.3 162.9 23.7 20.5 17.7
Adj. PAT (84) 30 1,908 3,800 7,141 10,327
YoY (%) - - - 99.2 87.9 44.6
EPS (Rs) (1) 0 21 43 80 116
RoE (%) 0 0 5 9 15 18
EV/EBITDA 13.73 19.3 10.9 13.9 11.2 9.2
EV/mt (US$) 53.41 73.9 105.3 167.0 162.5 156.5
P/E (x) - - 57.3 56.2 29.9 20.6
Source: Company, Nirmal Bang Institutional Equities Research
7090
110130150170190210230250270290310
May-16 Jul-16 Sep-16 Nov-16 Jan-17 Mar-17 May-17
DALMIA BHARAT LT Nifty 50
10 May 2017
Institutional Equities
28 Dalmia Bharat
The best growth story in the cement space
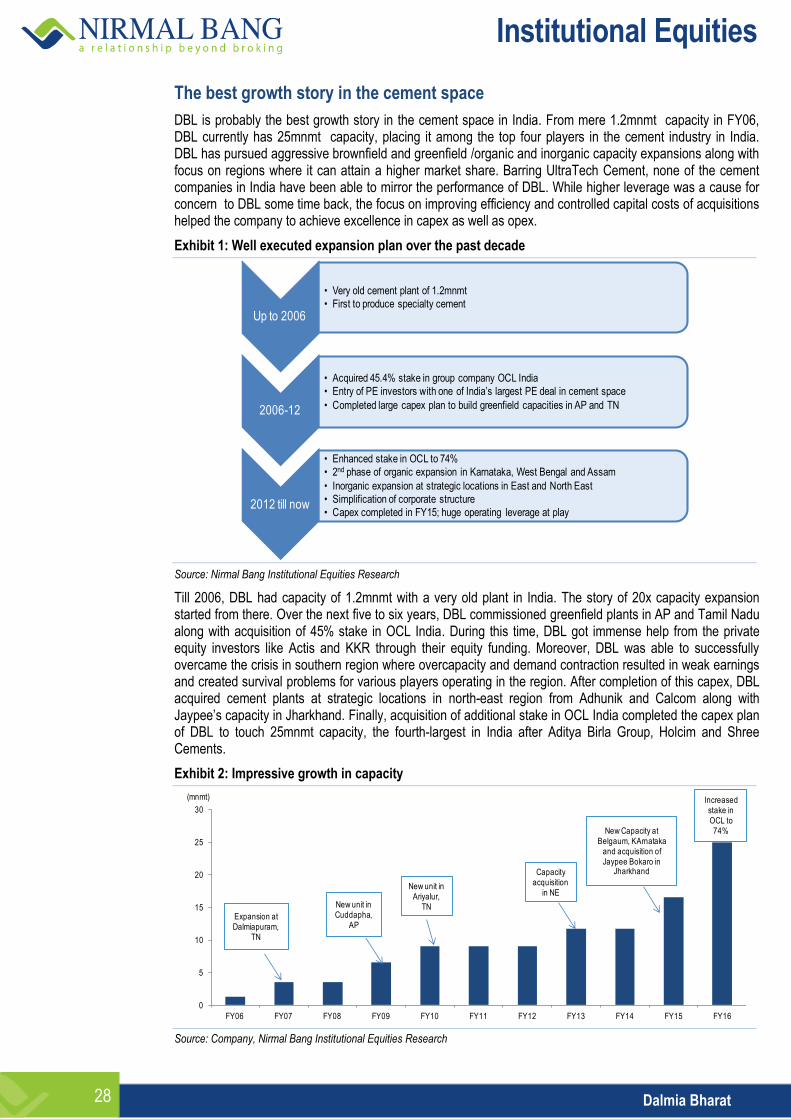
DBL is probably the best growth story in the cement space in India. From mere 1.2mnmt capacity in FY06, DBL currently has 25mnmt capacity, placing it among the top four players in the cement industry in India. DBL has pursued aggressive brownfield and greenfield /organic and inorganic capacity expansions along with focus on regions where it can attain a higher market share. Barring UltraTech Cement, none of the cement companies in India have been able to mirror the performance of DBL. While higher leverage was a cause for concern to DBL some time back, the focus on improving efficiency and controlled capital costs of acquisitions helped the company to achieve excellence in capex as well as opex.
Exhibit 1: Well executed expansion plan over the past decade
Source: Nirmal Bang Institutional Equities Research
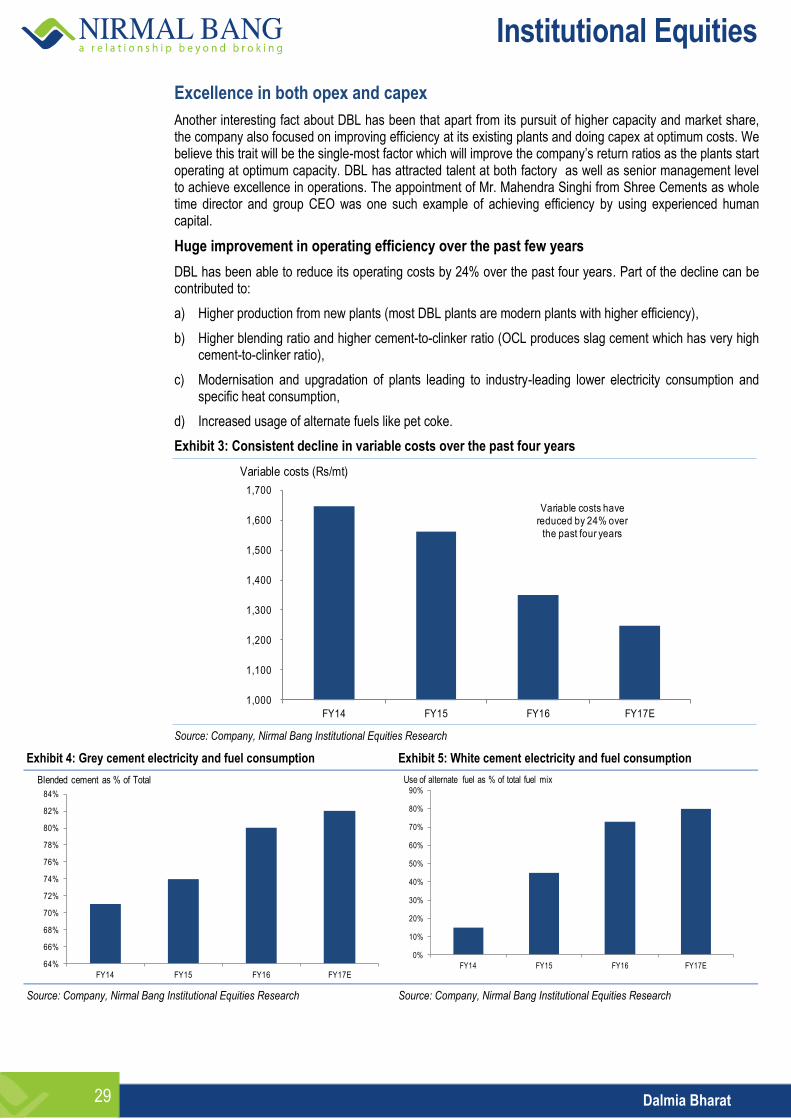
Till 2006, DBL had capacity of 1.2mnmt with a very old plant in India. The story of 20x capacity expansion started from there. Over the next five to six years, DBL commissioned greenfield plants in AP and Tamil Nadu along with acquisition of 45% stake in OCL India. During this time, DBL got immense help from the private equity investors like Actis and KKR through their equity funding. Moreover, DBL was able to successfully overcame the crisis in southern region where overcapacity and demand contraction resulted in weak earnings and created survival problems for various players operating in the region. After completion of this capex, DBL acquired cement plants at strategic locations in north-east region from Adhunik and Calcom along with Jaypee’s capacity in Jharkhand. Finally, acquisition of additional stake in OCL India completed the capex plan of DBL to touch 25mnmt capacity, the fourth-largest in India after Aditya Birla Group, Holcim and Shree Cements.
Exhibit 2: Impressive growth in capacity
Source: Company, Nirmal Bang Institutional Equities Research
Up to 2006
• Very old cement plant of 1.2mnmt
• First to produce specialty cement
2006-12
• Acquired 45.4% stake in group company OCL India
• Entry of PE investors with one of India’s largest PE deal in cement space
• Completed large capex plan to build greenfield capacities in AP and TN
2012 till now
• Enhanced stake in OCL to 74%
• 2nd phase of organic expansion in Karnataka, West Bengal and Assam
• Inorganic expansion at strategic locations in East and North East
• Simplification of corporate structure
• Capex completed in FY15; huge operating leverage at play
0
5
10
15
20
25
30
FY06 FY07 FY08 FY09 FY10 FY11 FY12 FY13 FY14 FY15 FY16
Expansion at Dalmiapuram,
TN
New unit in Cuddapha,
AP
New unit in Ariyalur,
TN
Capacity acquisition
in NE
New Capacity atBelgaum, KArnataka
and acquisition of Jaypee Bokaro in
Jharkhand
Increased stake in OCL to74%
(mnmt)
Institutional Equities
29 Dalmia Bharat
Excellence in both opex and capex
Another interesting fact about DBL has been that apart from its pursuit of higher capacity and market share, the company also focused on improving efficiency at its existing plants and doing capex at optimum costs. We believe this trait will be the single-most factor which will improve the company’s return ratios as the plants start operating at optimum capacity. DBL has attracted talent at both factory as well as senior management level to achieve excellence in operations. The appointment of Mr. Mahendra Singhi from Shree Cements as whole time director and group CEO was one such example of achieving efficiency by using experienced human capital.
Huge improvement in operating efficiency over the past few years
DBL has been able to reduce its operating costs by 24% over the past four years. Part of the decline can be contributed to:
a) Higher production from new plants (most DBL plants are modern plants with higher efficiency),
b) Higher blending ratio and higher cement-to-clinker ratio (OCL produces slag cement which has very high cement-to-clinker ratio),
c) Modernisation and upgradation of plants leading to industry-leading lower electricity consumption and specific heat consumption,
d) Increased usage of alternate fuels like pet coke.
Exhibit 3: Consistent decline in variable costs over the past four years
Source: Company, Nirmal Bang Institutional Equities Research
Exhibit 4: Grey cement electricity and fuel consumption Exhibit 5: White cement electricity and fuel consumption
Source: Company, Nirmal Bang Institutional Equities Research Source: Company, Nirmal Bang Institutional Equities Research
1,000
1,100
1,200
1,300
1,400
1,500
1,600
1,700
FY14 FY15 FY16 FY17E
Variable costs (Rs/mt)
Variable costs have reduced by 24% over
the past four years
64%
66%
68%
70%
72%
74%
76%
78%
80%
82%
84%
FY14 FY15 FY16 FY17E
Blended cement as % of Total
0%
10%
20%
30%
40%
50%
60%
70%
80%
90%
FY14 FY15 FY16 FY17E
Use of alternate fuel as % of total fuel mix

Institutional Equities
30 Dalmia Bharat
DBL increased the proportion of blended cement in its overall product mix from 71% in FY14 to 82% in FY17. Blended cement is not only more environment friendly over the usual cement varieties, but it also improves operating costs as the clinker factor in total output reduces. Moreover, blended cement uses waste products like fly ash and slag which are considered environmental hazards. Slag is the waste produced by steel plants and its use in cement has been as a cost-effective additive which helps in conservation of limestone reserves. Fly ash is the waste produced by coal-based power plants; its increasing use in cement manufacture has helped in doing away with environmental problems in its disposal. DBL enhanced the use of fly ash and slag in cement substantially as compared to its historical benchmarks. DBL also moderated the consumption of power in the manufacture of cement. DBL reduced power consumption per tonne of cement manufactured from 74 units in FY14 to 67 units in FY16, establishing a new benchmark in Indian cement industry. While the use of pet coke instead of coal was driven by lower pet coke costs, the plants of DBL are equipped with multi fuel inputs making them flexible when it comes to using different fuels, depending on their price. The usage of alternate fuels including pet coke and other things like municipal waste, carbon black and saw dust increased from 15% in FY14 to 80% in FY17. Also, the company’s plants in southern region have already achieved 100% pet coke and other alternate fuel usage in their fuel mix. All these measures coupled with the focus on keeping lead distance below 300km resulted in lower operating costs for DBL.
Organic and inorganic acquisitions realised with efficient deployment of capital
DBL has followed a zonal approach in creating capacity and acquiring companies. Current footprint of the company is largely based in eastern and southern regions. While a large part of capacity in souther region has grown organically, most of the capacity in eastern region came up through the inorganic route. Around 50% of existing capacity of DBL was created through acquisitions. The average cost of acquisition and capex for a new plant of DBL has been around US$91/mt compared to replacement cost of around US$130-US$140/mt. This efficient deployment of capital will help generate higher return ratios for the company over the long run.
Exhibit 6: Cost of organic and inorganic acquisitions for DBL
Source: Company, Nirmal Bang Institutional Equities Research
Below we have looked at the timeline of past key acquisitions and capacity creation by DBL.
Acquisition of equity stake in OCL India: DBL acquired 21.7% stake in OCL India in October 2007. The company progressively increased its stake to 45.4% in 2010 to 48% in FY14 and 74.6% in FY15 (owning the entire promoter shareholding). In November 2016, DBL announced the amalgamation of OCL India with DBL. After this amalgamation and restructuring exercise is complete, DBL will be a single cement entity of the group with a very simplified structure. This move will not only help consolidate and use the cash flow efficiently, but will also lower administrative costs, in our view. In FY15, OCL India launched its premium Konark DSP-Dhalai special brand of cement, which currently accounts for 16% of its total sales. This launch helped improve average realisation of operations in the eastern region. As the share of Konark DSP in the company’s total sales mix improves, a further improvement in realisation is expected.
Acquisition of Calcom Cement (North East): DBL acquired 50% stake in Assam-based Calcom Cement in January 2012, increasing its stake to 75.6% in November 2012. At the time of the acquisition, Calcom’s grinding and clinker capacity was 1.3mnmt and 0.3mnmt, respectively, which was subsequently expanded to 2.1mnmt of grinding and 1.3mnmt of clinker capacity.

Institutional Equities
31 Dalmia Bharat
Acquisition of Adhunik Cement (North East): DBL acquired Meghalaya-based Adhunik Cement (1.5mnmt capacity) in September 2012.
Acquisition of Dalmia Cement East (erstwhile Bokaro Jaypee Cement): DBL acquired 100% stake (in two stages) in Bokaro Jaypee Cement (2.1mt split grinding unit) from Jaiprakash Associates in 2014 (with a 30-year slag and clinker supply agreement). The acquisition enabled the company to enter new and growing markets of Bihar and Jharkhand. Following the acquisition, DBL replaced its erstwhile brand with Dalmia brand in the premium category.
Strong brands and market presence
DBL, over the years, created successful brands in cement, helping the company achieve higher market share and realise beter prices. DBL’s brand portfolio comprises Dalmia DSP, Dalmia, Dalmia Ultra, Dalmia Super Roof, Vajram, Konark and Konark DSP. These brands are positioned as premium brands across all its existing markets. Focus on branding of cement has helped in increasing the recall value of the brands. Moreover, higher capacity in existing markets coupled with brand visibility helped the company to gain market share. The company has also launched various specialty cement products which are used in lining of oil wells, railway sleepers and air strips among other downstream applications. The strategy of the company is to create a mother brand named Dalmia and sell other sub-brands under the main brand. This strategy helped the company to successfully replace its erstwhile brand to Dalmia brand and even charge a premium. Exhibit 7: Brand portfolio of DBL
Source: Company
Market share of ~11% in key markets
Along with scale, the focus of the company is to improve market share in its existing markets. We have classified DBL’s geographic reach in three segments - South, East and North East. Market share of the company in all these regions has improved over the past two to three years. In southern region, where fragmentation is very high, DBL has close to 7.5% market share with 12mnmt capacity. In eastern region, the company has 15% market share with 9.3mnmt capacity and in north-east region it has 21% market share with 3.6mnmt capacity.
Exhibit 8: Region-wise gain in market share over nine-month period Exhibit 9: Consistent improvement in market share
Region 9MFY16 9MFY17 3QFY16 3QFY17
South 6.7% 7.4% 6.5% 7.7%
East 15.1% 15.1% 15.2% 15.0%
North-East 16.7% 20.6% 18.9% 20.6%
Average 10.4% 10.8% 10.7% 11.0%
Source: Company, Nirmal Bang Institutional Equities Research Source: Company, Nirmal Bang Institutional Equities Research
8.1%
9.0%
10.5%
11.0%
6%
7%
8%
9%
10%
11%
12%
FY14 FY15 FY16 FY17E
Market share in operating markets (%)

Institutional Equities
32 Dalmia Bharat
Restructuring in last leg; pure play cement company with simplified structure now
As DBL has grown its cement business through acquisitions right from 2006, the erstwhile corporate structure of the company had its cement business under various subsidiaries and associate companies along with other businesses not related to cement. DBL had given an assurance of creating a pure play cement company and simplifying the existing structure. In 2010, the company was known as Dalmia Cement (Bharat) with operations in cement, sugar and power businesses. In March 2010, the company’s board decided to hive off the sugar and cement businesses. As a result, Dalmia Bharat Enterprises (DBEL) was created with cement, power and refractory assets. The cement and thermal power business was housed under DBEL as two wholly-owned subsidiaries — Avnija Properties and DCB Power Ventures.
In FY16, DBL acquired KKR’s 15% stake in Dalmia Cement (Bharat) or DCBL through a preferential issue of 75,00,000 equity shares and a part cash consideration. Subsequently, DBL acquired a 100% ownership in Dalmia Cement (Bharat) and KKR became the largest institutional shareholder in DBL. This restructuring helped DBL simplify its corporate structure while extending its successful partnership with KKR.
DBL also announced the amalgamation of OCL India (OCL) and Dalmia Cement East Bokaro) with Odisha Cement , a 100%-subsidiary of OCL. Adhunik Cement (DBL’s subsidiary) was amalgamated with Dalmia Cement (Bharat) following a transfer of 99MW power assets from Dalmia Cement Bharat Power Ventures to DCBL. This restructuring provided a single cement company with 75% stake in OCL and 76% stake in Calcom. Rest of the cement assets were part of DCBL, an operating company of DBL.
In November 2016, this structure was further simplified with OCL being amalgamated with DBL. This resulted in a more simplified structure with now only Calcom remaining as a 76%-owned subsidiary.
Exhibit 10: Simplified corporate structure to be achieved in the next few months
Source: Company
Final stage transaction overview – OCL India amalgamating with DBL
Amalgamation of Dalmia Bharat (DBL) and OCL India (OCL)
OCL India to be renamed as DBL
Transfer of business undertakings of OCL India to Dalmia Cement (Bharat) (DCBL)
DBL shareholders to receive two shares of OCL India for every share held in DBL
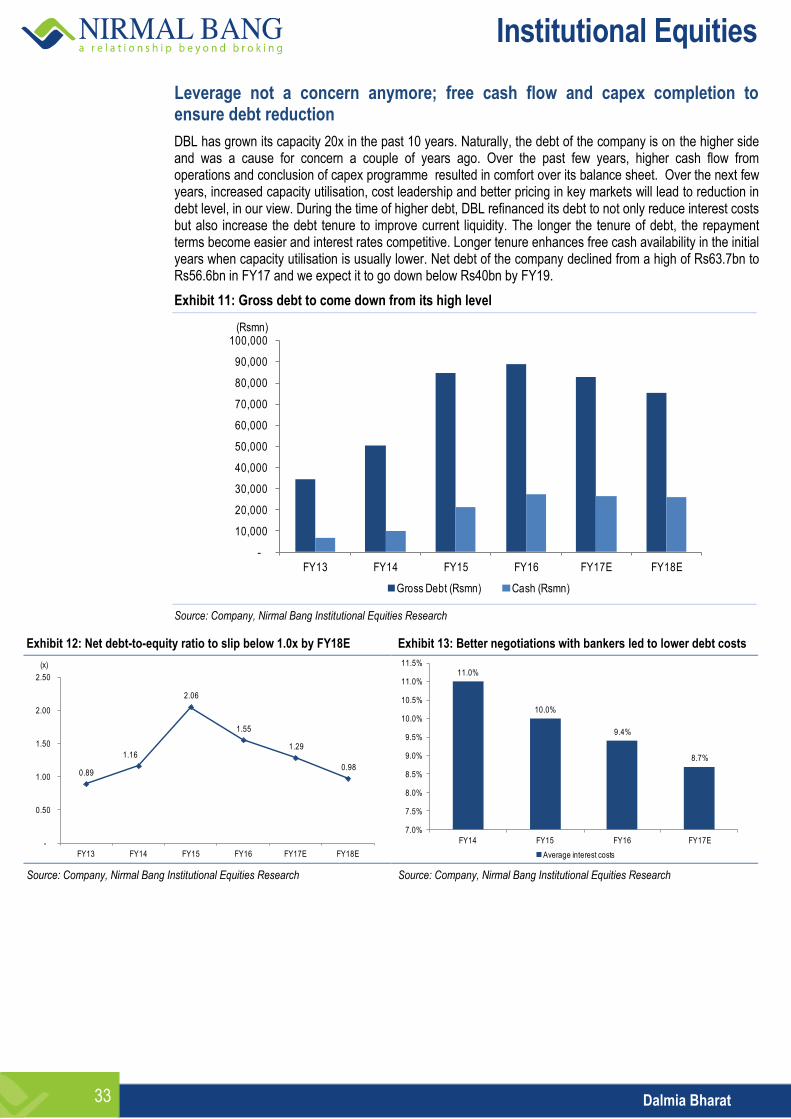
Institutional Equities
33 Dalmia Bharat
Leverage not a concern anymore; free cash flow and capex completion to ensure debt reduction
DBL has grown its capacity 20x in the past 10 years. Naturally, the debt of the company is on the higher side and was a cause for concern a couple of years ago. Over the past few years, higher cash flow from operations and conclusion of capex programme resulted in comfort over its balance sheet. Over the next few years, increased capacity utilisation, cost leadership and better pricing in key markets will lead to reduction in debt level, in our view. During the time of higher debt, DBL refinanced its debt to not only reduce interest costs but also increase the debt tenure to improve current liquidity. The longer the tenure of debt, the repayment terms become easier and interest rates competitive. Longer tenure enhances free cash availability in the initial years when capacity utilisation is usually lower. Net debt of the company declined from a high of Rs63.7bn to Rs56.6bn in FY17 and we expect it to go down below Rs40bn by FY19.
Exhibit 11: Gross debt to come down from its high level
Source: Company, Nirmal Bang Institutional Equities Research
Exhibit 12: Net debt-to-equity ratio to slip below 1.0x by FY18E Exhibit 13: Better negotiations with bankers led to lower debt costs
Source: Company, Nirmal Bang Institutional Equities Research Source: Company, Nirmal Bang Institutional Equities Research
-
10,000
20,000
30,000
40,000
50,000
60,000
70,000
80,000
90,000
100,000
FY13 FY14 FY15 FY16 FY17E FY18E
Gross Debt (Rsmn) Cash (Rsmn)
(Rsmn)
0.89
1.16
2.06
1.55
1.29
0.98
-
0.50
1.00
1.50
2.00
2.50
FY13 FY14 FY15 FY16 FY17E FY18E
(x)11.0%
10.0%
9.4%
8.7%
7.0%
7.5%
8.0%
8.5%
9.0%
9.5%
10.0%
10.5%
11.0%
11.5%
FY14 FY15 FY16 FY17E
Average interest costs

Institutional Equities
34 Dalmia Bharat
Valuation
We initiate coverage on DBL with a Buy rating and a target price of Rs2,806. We believe DBL offers huge operating leverage as its plants are currently operating at ~55% of their capacity. This operating leverage coupled with cost leadership and presence in regions where pricing is in favour like southern and north-east makes DBL an exciting play in the cement space. We have valued the company based on the average of EV/EBITDA and EV/mt multiple. Our target multiple for EV/EBITDA calculation is 12.0x which is in line with the multiples we have assigned to other companies like ACC and Ambuja Cements but lower when compared with The Ramco Cements. Our target price based on this method comes out to Rs2,806, up 17% from the current market price.
Exhibit 14: Earnings-based valuation Exhibit 15: Asset-based valuation
Particulars (Rsmn)
FY19E EBITDA 27,682
Target multiple (x) 12.0
Enterprise value 332,180
Net debt 40,685
Equity value 291,495
No of shares (mn) 88.8
Value per share (Rs) 3,283
Particulars (Rsmn)
FY19E capacity (mnmt) 25.0
Target multiple (US$) 150.0
Enterprise value 247,500
Net debt 40,685
Equity value 206,815
No. of shares (mn) 88.8
Value per share (Rs) 2,329
Source: Company, Nirmal Bang Institutional Equities Research Source: Company, Nirmal Bang Institutional Equities Research
Exhibit 16: Target price of Rs2,806, up 17% from the current market price
Particulars (Rs)
Value based on earnings multiple 3,283
Value based on asset valuation 2,329
Average value per share 2,806
Target price 2,806
CMP (Rs) 2,406
Upside (%) 17%
Source: Company, Nirmal Bang Institutional Equities Research
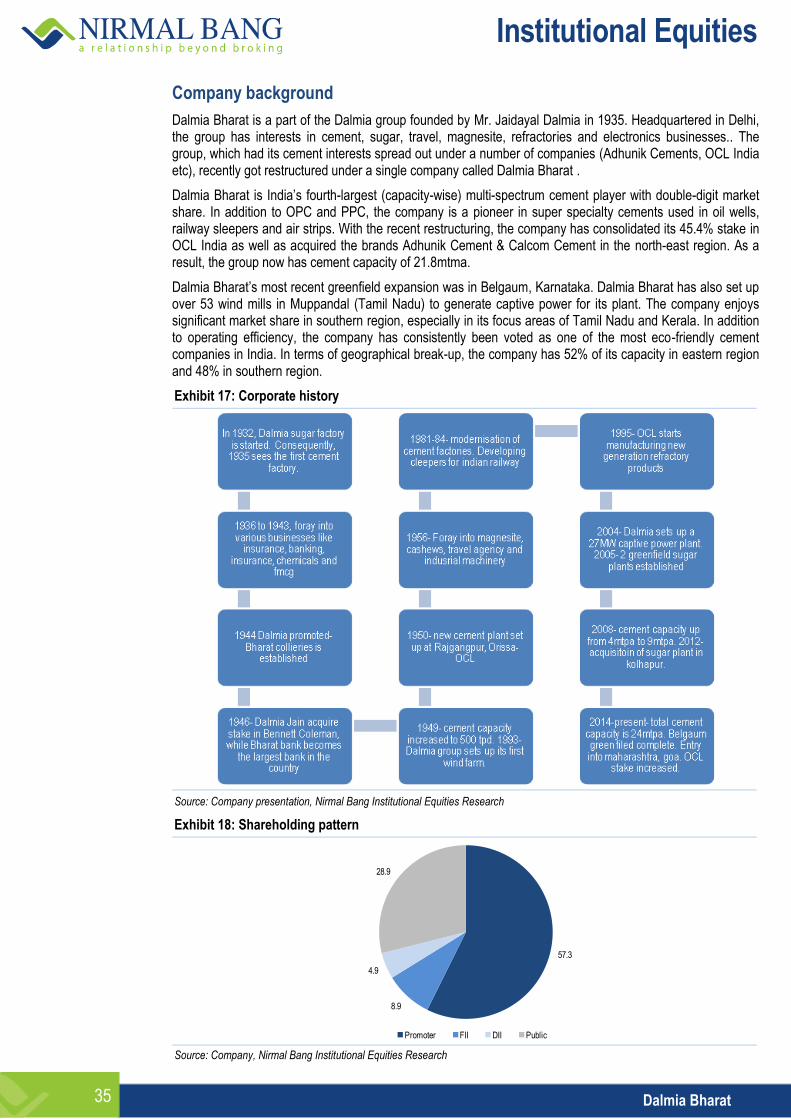
Institutional Equities
35 Dalmia Bharat
Company background
Dalmia Bharat is a part of the Dalmia group founded by Mr. Jaidayal Dalmia in 1935. Headquartered in Delhi, the group has interests in cement, sugar, travel, magnesite, refractories and electronics businesses.. The group, which had its cement interests spread out under a number of companies (Adhunik Cements, OCL India etc), recently got restructured under a single company called Dalmia Bharat .
Dalmia Bharat is India’s fourth-largest (capacity-wise) multi-spectrum cement player with double-digit market share. In addition to OPC and PPC, the company is a pioneer in super specialty cements used in oil wells, railway sleepers and air strips. With the recent restructuring, the company has consolidated its 45.4% stake in OCL India as well as acquired the brands Adhunik Cement & Calcom Cement in the north-east region. As a result, the group now has cement capacity of 21.8mtma.
Dalmia Bharat’s most recent greenfield expansion was in Belgaum, Karnataka. Dalmia Bharat has also set up over 53 wind mills in Muppandal (Tamil Nadu) to generate captive power for its plant. The company enjoys significant market share in southern region, especially in its focus areas of Tamil Nadu and Kerala. In addition to operating efficiency, the company has consistently been voted as one of the most eco-friendly cement companies in India. In terms of geographical break-up, the company has 52% of its capacity in eastern region and 48% in southern region.
Exhibit 17: Corporate history
Source: Company presentation, Nirmal Bang Institutional Equities Research
Exhibit 18: Shareholding pattern
Source: Company, Nirmal Bang Institutional Equities Research
57.3
8.9
4.9
28.9
Promoter FII DII Public

Institutional Equities
36 Dalmia Bharat
Exhibit 19: Key shareholders (%)
Promoter 57.34
KKR (strategic partner) 16.86
Morgan Stanley Asia 1.4
Birla Sunlife Asset Management 1.17
DSP Blackrock Investment Managers 0.81
Goldman Sachs Group 0.78
Vanguard Group 0.66
Source: Company, Nirmal Bang Institutional Equities Research
Exhibit 20: Board members and management team
Name of the director Designation Experience
Mr. Pradip Khaitan chairman, non- executive, non- independent director
He holds LLB degree from the University of Calcutta. A partner in Khaitan & Co., solicitors and advocates, he has legal and commercial experience. Mr. Khaitan serves as director in several public limited companies such as CESC,, Electrosteel Castings, Graphite India Hindustan Motors, India Glycols OCL India, Pilani Investment & Industries Corporation, TCPL Packaging etc.
Mr. Jai Dalmia Executive director
He holds a BE degree in electrical engineering from Jadavpur University and a master’s degree in electrical engineering from the University of Illinois, Urbana, Champagne. He was co-opted as a director of the company in February 2011 and elevated to the post of managing director in April 2011. Mr. Dalmia has more than 40 years of experience across industries; with special focus on refractory, sugar and cement sectors.
Mr. Y. H. Dalmia Executive director
He holds a B.Com (Hons.) degree from the University of Delhi and is a fellow of the Institute of Chartered Accountants of India. He was co-opted as a director and later elevated to the post of managing director of the company in February 2011. He holds about 39 years of experience in the cement industry. Mr. Dalmia has served as president of the Cement Manufacturers Association.
Mr. N. Gopalaswamy Non-executive director
He holds a B.Sc. degree in chemistry from Madras University and a B.E. degree in chemical engineering from Annamalai University. He is a member of the Institute of Industrial Engineers, USA, Indian Institution of Industrial Engineering, Indian Institute of Chemical Engineering, and the Institution of Engineers (India). He is a council member of the Tiruchirapalli Productivity Council and has over 44 years of experience in the cement industry.
Mr. Gautam Dalmia Non-executive director
He has 19 years of experience in cement and sugar industries. Mr. Dalmia was co-opted as a director of the company in February 2011. As managing director of group companies, Dalmia Cement (Bharat) and Dalmia Bharat Sugar and Industries, he is directly responsible for managing the operations of the cement and sugar businesses and leads execution of projects. He also provides leadership to the commercial functions of the group.
Mr. V. S. Jain Non-executive director
He is a fellow of the Institute of Chartered Accountants of India and Institute of Cost and Works Accountant of India. He graduated from Shri Ram College of Commerce, University of Delhi. Mr. Jain began his professional career with Indian Oil Corporation and was engaged over 26 years in various capacities. He was responsible for financial strategies and implementation and financial appraisal of projects. As executive director, his responsibilities include international negotiations for procurement of crude oil and petroleum products. He later served as the chairman of Steel Authority of India until July 2006.
Mr. Jayesh Doshi Executive director Mr Doshi is a fellow of the Institute of Chartered Accountants of India. He holds the position of Group CFO,
Mrs. Sudha Pillai Non-executive, non-independent director
-
Source: Company, Nirmal Bang Institutional Equities Research
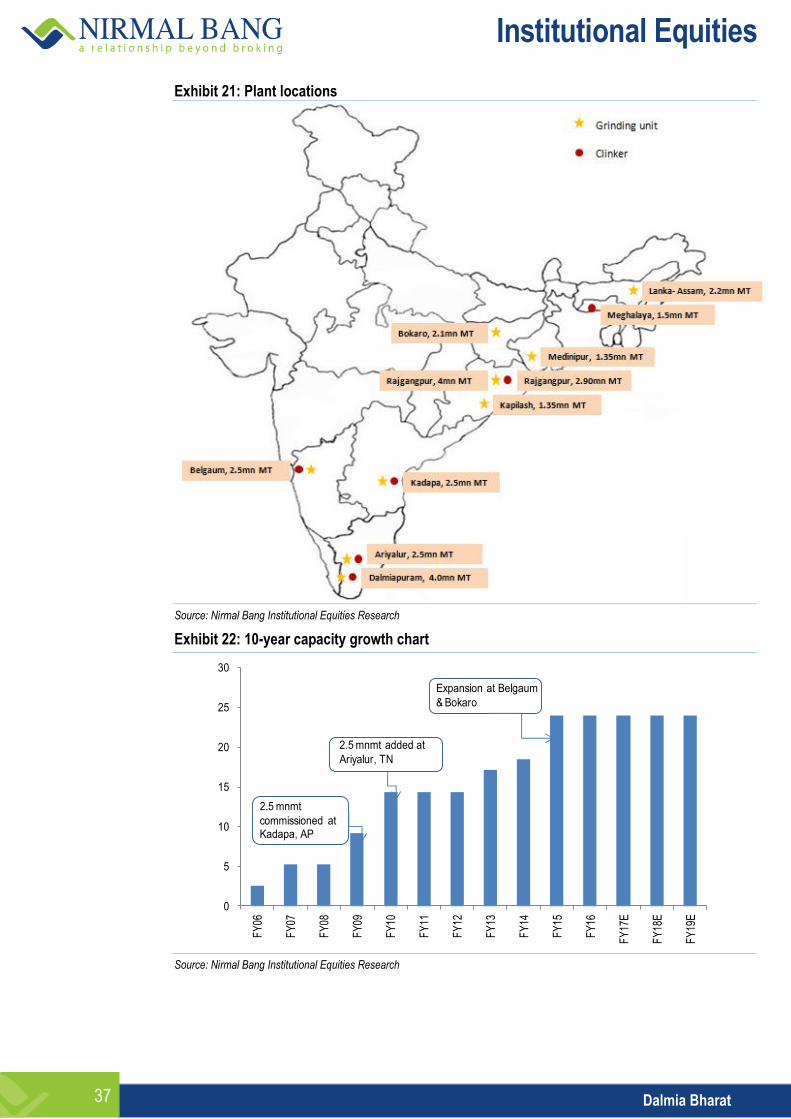
Institutional Equities
37 Dalmia Bharat
Exhibit 21: Plant locations
Source: Nirmal Bang Institutional Equities Research
Exhibit 22: 10-year capacity growth chart
Source: Nirmal Bang Institutional Equities Research
0
5
10
15
20
25
30
FY
06
FY
07
FY
08
FY
09
FY
10
FY
11
FY
12
FY
13
FY
14
FY
15
FY
16
FY
17E
FY
18E
FY
19E
2.5 mnmt
commissioned at Kadapa, AP
2.5 mnmt added at
Ariyalur, TN
Expansion at Belgaum
& Bokaro

Institutional Equities
38 Dalmia Bharat
Financials
Exhibit 23: Income statement
Y/E March (Rsmn) FY15 FY16 FY17E FY18E FY19E
Net Sales 35,141 64,380 73,140 82,829 92,052
Raw Material Costs 5,365 11,165 12,022 13,378 14,609
Employee Costs 2,774 5,065 5,903 6,632 7,311
Freight costs 8,101 13,100 14,250 15,705 16,985
Power and Fuel 7,087 8,829 9,016 10,226 11,059
Other Exp 4,757 8,998 10,861 11,614 12,489
Total Exp 29,143 48,607 53,629 59,310 64,370
Operating profit 5,999 15,773 19,511 23,519 27,682
OPM (%) 17 25 27 28 30
Other Income 960 1,655 1,076 1,130 1,186
Interest 4,344 7,256 8,710 7,640 6,857
Depreciation 2,716 4,528 5,191 5,362 5,524
PBT (101) 5,644 6,686 11,646 16,487
Tax 469 2,991 2,006 3,494 4,946
Tax rate - 53% 30% 30% 30%
Adjusted Profit 30 1,908 3,800 7,141 10,327
EPS (Rs) 0 21 43 80 116
Source: Company, Nirmal Bang Institutional Equities Research
Exhibit 25: Balance sheet
Y/E March (Rsmn) FY15 FY16 FY17E FY18E FY19E
Equity Capital 169 185 185 185 185
Reserves and Surplus 30,800 39,521 42,653 48,959 58,243
Networth 30,982 39,739 42,871 49,177 58,461
Minority interest 7,470 3,569 3,747 3,747 3,747
Total Debt 84,797 88,925 83,925 76,925 67,425
Deferred tax liability 4,006 5,674 5,674 5,674 5,674
Total liabilities 129,918 140,870 139,418 138,980 139,040
GB 84,124 106,420 110,013 112,585 115,587
Acc. Depr. 25,891 30,303 35,494 40,856 46,380
NB 58,233 76,117 74,518 71,729 69,207
CWIP 19,142 2,702 1,750 1,750 1,750
Investment 16,870 25,752 25,752 25,752 25,752
NWC-Cash 5,595 (401) (57) 303 706
Cash 5,281 2,483 1,527 1,722 2,014
Total Assets 129,918 140,870 139,418 138,980 139,040
Source: Company, Nirmal Bang Institutional Equities Research
Exhibit 24: Cash flow
Y/E March (Rsmn) FY15 FY16 FY17E FY18E FY19E
Profit after tax 30 1,908 3,800 7,141 10,327
Add : Depreciation 2,716 4,528 5,191 5,362 5,524
Net change in WC (2,875) 4,115 (695) (729) (792)
Net cash from operations (128) 10,551 8,296 11,774 15,060
Capital expenditure (40,072) (13,509) (4,000) (4,000) (4,500)
Sale of investments (4,534) (8,883) - - -
Net cash from investing (44,605) (22,392) (4,000) (4,000) (4,500)
Issue of shares 13 36 - - -
Increase in debt 42,063 4,129 (5,000) (7,000) (9,500)
change in DTL 2,334 9,016 - - -
Dividends paid incl. tax (209) (534) (668) (835) (1,044)
Net cash from financing 49,170 9,044 (5,252) (7,579) (10,267)
Net Cash 4,437 (2,798) (956) 195 293
Opening Cash 844 5,281 2,483 1,527 1,722
Closing Cash 5,281 2,483 1,527 1,722 2,014
Source: Company, Nirmal Bang Institutional Equities Research
Exhibit 26: Key ratios
Y/E March (Rsmn) FY15 FY16 FY17E FY18E FY19E
Growth (%)
Sales 17 83 14 13 11
Operating profit 14 67 10 11 9
Net profit (136) - 99 88 45
Leverage (x)
Debt:equity 2.74 2.24 1.96 1.56 1.15
Net debt:equity 2.06 1.55 1.35 1.03 0.70
Profitability (%)
OPM 17 25 27 28 30
NPM 0 3 5 9 11
RoE 0 5 9 15 18
RoCE 7 15 18 21 25
Valuation (x)
P/E - 57.4 56.2 29.9 20.7
P/BV 1.7 2.8 5.0 4.3 3.7
EV/EBITDA 19.3 10.9 13.9 11.2 9.2
EV/mt (US$) 73.9 105.3 167.0 162.5 156.5
Source: Company, Nirmal Bang Institutional Equities Research
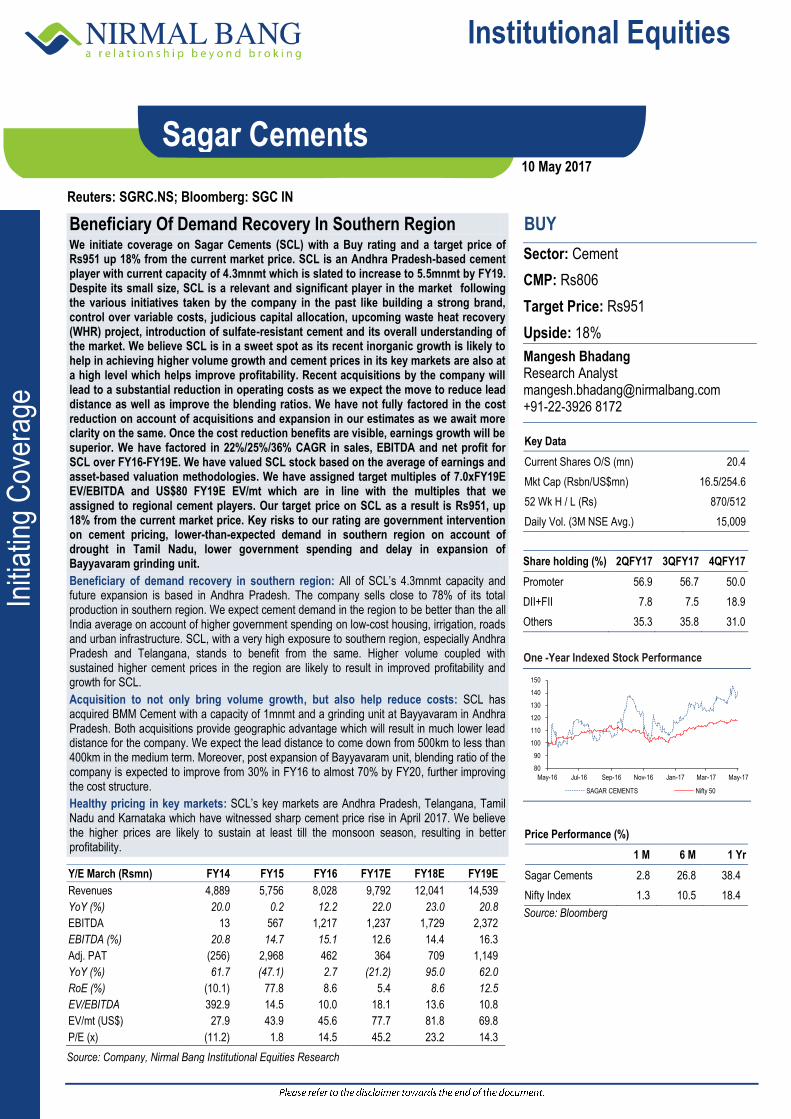
Institutional Equities
Initi
atin
g C
over
age
Reuters: SGRC.NS; Bloomberg: SGC IN
Sagar Cements
Beneficiary Of Demand Recovery In Southern Region We initiate coverage on Sagar Cements (SCL) with a Buy rating and a target price of Rs951 up 18% from the current market price. SCL is an Andhra Pradesh-based cement player with current capacity of 4.3mnmt which is slated to increase to 5.5mnmt by FY19. Despite its small size, SCL is a relevant and significant player in the market following the various initiatives taken by the company in the past like building a strong brand, control over variable costs, judicious capital allocation, upcoming waste heat recovery (WHR) project, introduction of sulfate-resistant cement and its overall understanding of the market. We believe SCL is in a sweet spot as its recent inorganic growth is likely to help in achieving higher volume growth and cement prices in its key markets are also at a high level which helps improve profitability. Recent acquisitions by the company will lead to a substantial reduction in operating costs as we expect the move to reduce lead distance as well as improve the blending ratios. We have not fully factored in the cost reduction on account of acquisitions and expansion in our estimates as we await more clarity on the same. Once the cost reduction benefits are visible, earnings growth will be superior. We have factored in 22%/25%/36% CAGR in sales, EBITDA and net profit for SCL over FY16-FY19E. We have valued SCL stock based on the average of earnings and asset-based valuation methodologies. We have assigned target multiples of 7.0xFY19E EV/EBITDA and US$80 FY19E EV/mt which are in line with the multiples that we assigned to regional cement players. Our target price on SCL as a result is Rs951, up 18% from the current market price. Key risks to our rating are government intervention on cement pricing, lower-than-expected demand in southern region on account of drought in Tamil Nadu, lower government spending and delay in expansion of Bayyavaram grinding unit.
Beneficiary of demand recovery in southern region: All of SCL’s 4.3mnmt capacity and future expansion is based in Andhra Pradesh. The company sells close to 78% of its total production in southern region. We expect cement demand in the region to be better than the all India average on account of higher government spending on low-cost housing, irrigation, roads and urban infrastructure. SCL, with a very high exposure to southern region, especially Andhra Pradesh and Telangana, stands to benefit from the same. Higher volume coupled with sustained higher cement prices in the region are likely to result in improved profitability and growth for SCL.
Acquisition to not only bring volume growth, but also help reduce costs: SCL has acquired BMM Cement with a capacity of 1mnmt and a grinding unit at Bayyavaram in Andhra Pradesh. Both acquisitions provide geographic advantage which will result in much lower lead distance for the company. We expect the lead distance to come down from 500km to less than 400km in the medium term. Moreover, post expansion of Bayyavaram unit, blending ratio of the company is expected to improve from 30% in FY16 to almost 70% by FY20, further improving the cost structure.
Healthy pricing in key markets: SCL’s key markets are Andhra Pradesh, Telangana, Tamil Nadu and Karnataka which have witnessed sharp cement price rise in April 2017. We believe the higher prices are likely to sustain at least till the monsoon season, resulting in better profitability.
BUY
Sector: Cement
CMP: Rs806
Target Price: Rs951
Upside: 18%
Mangesh Bhadang Research Analyst [email protected] +91-22-3926 8172
Key Data
Current Shares O/S (mn) 20.4
Mkt Cap (Rsbn/US$mn) 16.5/254.6
52 Wk H / L (Rs) 870/512
Daily Vol. (3M NSE Avg.) 15,009
Share holding (%) 2QFY17 3QFY17 4QFY17
Promoter 56.9 56.7 50.0
DII+FII 7.8 7.5 18.9
Others 35.3 35.8 31.0
One -Year Indexed Stock Performance
Price Performance (%)
1 M 6 M 1 Yr
Sagar Cements 2.8 26.8 38.4
Nifty Index 1.3 10.5 18.4
Source: Bloomberg
Y/E March (Rsmn) FY14 FY15 FY16 FY17E FY18E FY19E
Revenues 4,889 5,756 8,028 9,792 12,041 14,539
YoY (%) 20.0 0.2 12.2 22.0 23.0 20.8
EBITDA 13 567 1,217 1,237 1,729 2,372
EBITDA (%) 20.8 14.7 15.1 12.6 14.4 16.3
Adj. PAT (256) 2,968 462 364 709 1,149
YoY (%) 61.7 (47.1) 2.7 (21.2) 95.0 62.0
RoE (%) (10.1) 77.8 8.6 5.4 8.6 12.5
EV/EBITDA 392.9 14.5 10.0 18.1 13.6 10.8
EV/mt (US$) 27.9 43.9 45.6 77.7 81.8 69.8
P/E (x) (11.2) 1.8 14.5 45.2 23.2 14.3
Source: Company, Nirmal Bang Institutional Equities Research
80
90
100
110
120
130
140
150
May-16 Jul-16 Sep-16 Nov-16 Jan-17 Mar-17 May-17
SAGAR CEMENTS Nifty 50
10 May 2017
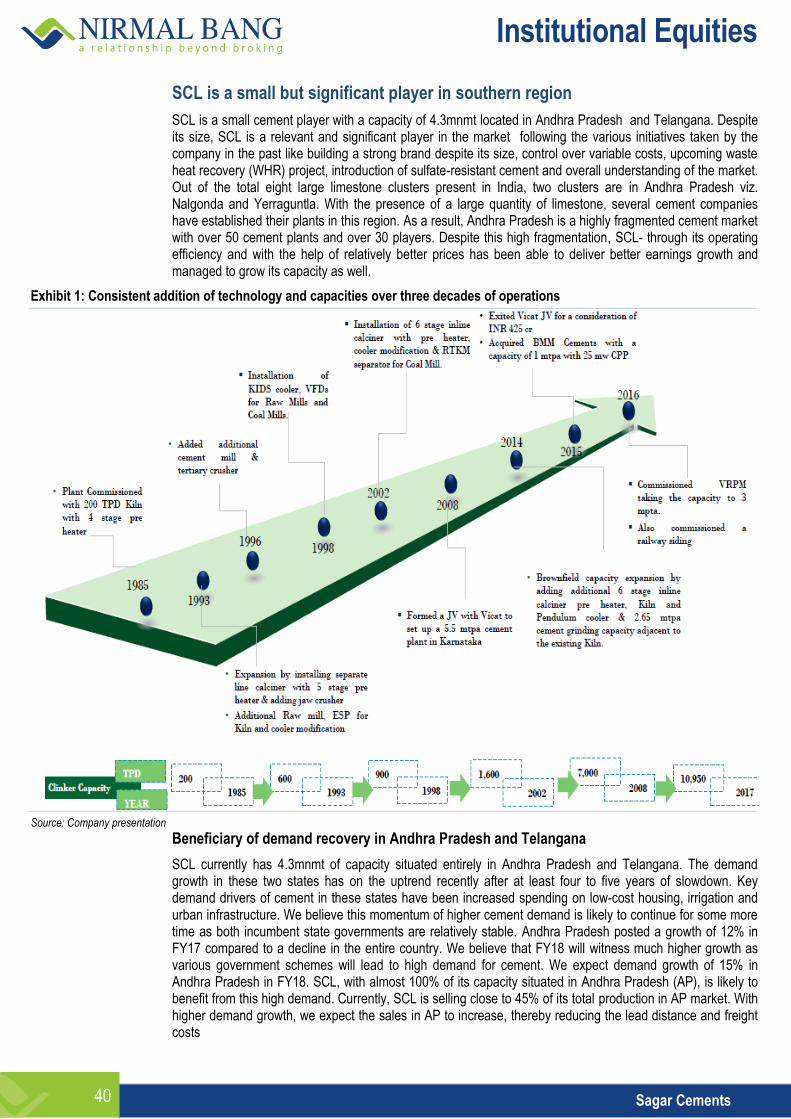
Institutional Equities
40 Sagar Cements
SCL is a small but significant player in southern region
SCL is a small cement player with a capacity of 4.3mnmt located in Andhra Pradesh and Telangana. Despite its size, SCL is a relevant and significant player in the market following the various initiatives taken by the company in the past like building a strong brand despite its size, control over variable costs, upcoming waste heat recovery (WHR) project, introduction of sulfate-resistant cement and overall understanding of the market. Out of the total eight large limestone clusters present in India, two clusters are in Andhra Pradesh viz. Nalgonda and Yerraguntla. With the presence of a large quantity of limestone, several cement companies have established their plants in this region. As a result, Andhra Pradesh is a highly fragmented cement market with over 50 cement plants and over 30 players. Despite this high fragmentation, SCL- through its operating efficiency and with the help of relatively better prices has been able to deliver better earnings growth and managed to grow its capacity as well.
Exhibit 1: Consistent addition of technology and capacities over three decades of operations
Source: Company presentation
Beneficiary of demand recovery in Andhra Pradesh and Telangana
SCL currently has 4.3mnmt of capacity situated entirely in Andhra Pradesh and Telangana. The demand growth in these two states has on the uptrend recently after at least four to five years of slowdown. Key demand drivers of cement in these states have been increased spending on low-cost housing, irrigation and urban infrastructure. We believe this momentum of higher cement demand is likely to continue for some more time as both incumbent state governments are relatively stable. Andhra Pradesh posted a growth of 12% in FY17 compared to a decline in the entire country. We believe that FY18 will witness much higher growth as various government schemes will lead to high demand for cement. We expect demand growth of 15% in Andhra Pradesh in FY18. SCL, with almost 100% of its capacity situated in Andhra Pradesh (AP), is likely to benefit from this high demand. Currently, SCL is selling close to 45% of its total production in AP market. With higher demand growth, we expect the sales in AP to increase, thereby reducing the lead distance and freight costs

Institutional Equities
41 Sagar Cements
Exhibit 2: Cement demand in AP has started picking up
Source: Industry,Company,Nirmal Bang Institutional Equities Research
Acquisitions and expansion to ensure higher volume growth
SCL has increased its capacity substantially over the past few years. After the expansion in FY08-09, the company did not add capacity as the weak markets did not support expansion. Now that the greenshoots of better demand are in place, SCL is all geared up to benefit from this demand uptick. The company first acquired BMM cements with a capacity of 1mnmt in FY16. Later the company bought a smaller grinding unit at Bayyavaram with capacity of 0.2mnmt and further enhanced to 0.3 mnmt. The company has then raised QIP to increase the capacity of Bayyavaram unit to 1.5mnmt. The addition of grinding capacities will be ably supported by SCL’s clinker capacity at its mother unit in Mattampally. The acquisition took total cement capacity of the company from 3 mnmt to 4.3 mnmt which will eventually go up to 5.5mnmt post expansion at Bayyavaram. As a result, we are estimating 14% volume CAGR for the company over FY16-19.
Exhibit 3: Expect 15% volume CAGR for SCL over FY16-FY19E
Source: Company, Nirmal Bang Institutional Equities Research
Acquisitions to reduce operating costs through lower lead distance and higher blending
SCL has acquired two units which are situated almost equidistant from its existing facility in opposite directions. This will ensure significant reduction in lead distance as the distant markets of Tamil Nadu, Kerala and Karnataka will now be serviced through BMM Cement whereas markets in Odisha and coastal Andhra Pradesh will be serviced through Bayyavaram grinding unit. The existing facility at Nalgonda will now service nearby markets like AP,Telangana and Maharashtra. The current lead distance of SCL is close to 500km. We believe these acquisitions will help SCL to achieve lower lead distance of less than 400km in the medium term and less than 350km over a slightly longer period. Moreover, additional grinding units will also increase the blending ratio of SCL as the Bayyavaram unit will produce only slag cement. We expect the blending ratio of SCL to move up from 30% in FY16 to 70% over the next three to four years which will help reduce operating costs for the company significantly. We have not factored in the benefits of higher blending as well as lower lead distance in our estimates fully as we await some confirmation of the same.
12%13%
17%
-3% -3%-2%
-5%
-12%
-7%
2%
12%
15%
-15%
-10%
-5%
0%
5%
10%
15%
20%
FY07 FY08 FY09 FY10 FY11 FY12 FY13 FY14 FY15 FY16 FY17 FY18E
Cement demand growth in
AP and Telangana recovering after years of
slowdown
1.58
1.41 1.56
1.89
2.15
2.50
2.87
(15)
(10)
(5)
0
5
10
15
20
25
1.00
1.20
1.40
1.60
1.80
2.00
2.20
2.40
2.60
2.80
3.00
FY13 FY14 FY15 FY16 FY17E FY18E FY19E
Volumes (mnmt) Growth (% YoY)
(mnmt) (%)

Institutional Equities
42 Sagar Cements
Exhibit 4: Acquisitions will help reduce lead distance
Source: Company’s QIP document
Exhibit 5: Significant change in blending ratios to drive costs lower
Source: Company,Nirmal Bang Institutional Equities Research
Gaining further control on costs through new waste heat recovery plant and captive power plant
SCL is on the verge of commissioning the 6MW waste heat recovery plant at its unit in Matampally. Secondly, the company plans to use the funds from the QIP to build a 18MW coal-based captive power plant at the same unit. This will ensure greater control over power and fuel costs for SCL as it currenty sources more than 70% of its electricity requirement from the grid and 10% from an energy exchange. The BMM plant already has a 25MW power unit. As the utilisation of BMM plant is on lower side, SCL is currently selling power from this plant through the energy exchange.
Exhibit 6: Moderate growth in operating costs likely
Source: Company, Nirmal Bang Institutional Equities Research
OPC, 70%
PPC, 30%
PSC, 0%
FY2016
OPC, 30%
PPC, 25%
PSC, 45%
FY2020E
3,448
3,326
3,604
3,971
4,126
4,233
-6%
-4%
-2%
0%
2%
4%
6%
8%
10%
12%
3,000
3,200
3,400
3,600
3,800
4,000
4,200
4,400
FY14 FY15 FY16 FY17E FY18E FY19E
Operating costs/mt (Rs) Growth (YoY)

Institutional Equities
43 Sagar Cements
The past several quarters have witnessed the share of AP-Telangana in SCL’s total cement sales drop to as low as 29%. This was because of weak demand in these states following political uncertainty, bad monsoon and a muted real estate market. This has affected the lead distance as well, thereby leading to overall cost escalation. A break-up of the total tonnage through roads and rakes is given in the chart below. With rake rates slashed in the previous quarter, there could be substantial cost savings in the coming quarters. In addition to this, as demand stages a comeback in AP and Telangana, SCL will enjoy a huge advantage in its selling and distribution costs as the lead distance reduces. As cement is a bulky commodity, reduction in lead distance will translate into huge savings in total expenses. We expect cement demand from AP and Telangana to be higher than southern region’s overall demand.
Exhibit 7: Road transportation continues to dominate freight costs Exhibit 8: Share of AP and Telangana in total cement sales expected to pick up
Source: Company, Nirmal Bang Institutional Equities Research Source: Company, Nirmal Bang Institutional Equities Research
Pricing in key markets in a sweet spot
We believe the cement business of SCL is in a sweet spot with strategic locations, better demand growth and strong prices. SCL is currently operating at 53% of its cement capacity, offering huge operating leverage. Despite lower capacity utilisation, the industry in southern region has survived because of better prices. We believe cement prices in AP will remain stable which will result in significantly better return ratios for SCL. Over the past few weeks, cement prices in southern region have risen sharply and we expect this price rise to sustain till the monsoon. This will ensure better profitability going forward. Exhibit 9: Cement prices in southern region have moved up recently and are likely to remain stable
Source: Crisil, Company data, Nirmal Bang Institutional Equities Research
(5,000)
0
5,000
10,000
15,000
20,000
25,000
0
100
200
300
400
500
600
700
1QFY16 2QFY16 3QFY16 4QFY16 1QFY17 2QFY17 3QFY17
By road (thousand tonnes)- LHS By rake (tonnes)- RHS
(000's tonnes) ( tonnes)
5142 43
54 53
36 3729 33 36
4552
4537
44
4958 57
46 47
64 6371 67 64
5548
5563
56
0%
10%
20%
30%
40%
50%
60%
70%
80%
90%
100%
1QF
Y14
2QF
Y14
3QF
Y14
4QF
Y14
1QF
Y15
2QF
Y15
3QF
Y15
4QF
Y15
1QF
Y16
2QF
Y16
3QF
Y16
4QF
Y16
1QF
Y17
2QF
Y17
3QF
Y17
Within AP & Telangana Outside AP & Telangana
200
250
300
350
400
Ma
r-1
4
Ma
y-1
4
Jul-1
4
Se
p-1
4
No
v-1
4
Jan
-15
Ma
r-1
5
Ma
y-1
5
Jul-1
5
Se
p-1
5
No
v-1
5
Jan
-16
Ma
r-1
6
Ma
y-1
6
Jul-1
6
Se
p-1
6
No
v-1
6
Jan
-17
Ma
r-1
7
Bangalore Chennai Hyderabad
(Rs/50 Kg bag)
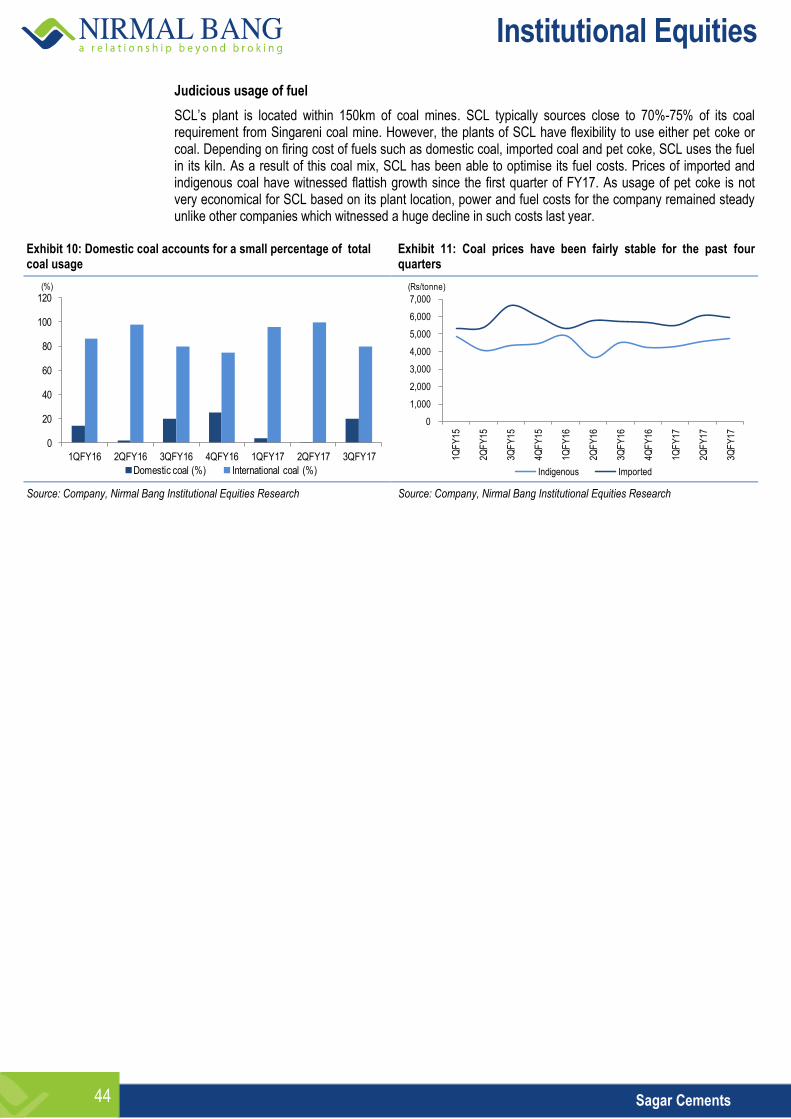
Institutional Equities
44 Sagar Cements
Judicious usage of fuel
SCL’s plant is located within 150km of coal mines. SCL typically sources close to 70%-75% of its coal requirement from Singareni coal mine. However, the plants of SCL have flexibility to use either pet coke or coal. Depending on firing cost of fuels such as domestic coal, imported coal and pet coke, SCL uses the fuel in its kiln. As a result of this coal mix, SCL has been able to optimise its fuel costs. Prices of imported and indigenous coal have witnessed flattish growth since the first quarter of FY17. As usage of pet coke is not very economical for SCL based on its plant location, power and fuel costs for the company remained steady unlike other companies which witnessed a huge decline in such costs last year.
Exhibit 10: Domestic coal accounts for a small percentage of total coal usage
Exhibit 11: Coal prices have been fairly stable for the past four quarters
Source: Company, Nirmal Bang Institutional Equities Research Source: Company, Nirmal Bang Institutional Equities Research
0
20
40
60
80
100
120
1QFY16 2QFY16 3QFY16 4QFY16 1QFY17 2QFY17 3QFY17
Domestic coal (%) International coal (%)
(%)
0
1,000
2,000
3,000
4,000
5,000
6,000
7,000
1QF
Y15
2QF
Y15
3QF
Y15
4QF
Y15
1QF
Y16
2QF
Y16
3QF
Y16
4QF
Y16
1QF
Y17
2QF
Y17
3QF
Y17
Indigenous Imported
(Rs/tonne)

Institutional Equities
45 Sagar Cements
Financials - Expect 25% EBITDA CAGR over FY16-FY19E
We expect 22% sales CAGR over FY16-FY19E. This is a result of sales volume assumed to have a conservative growth of 15% over three years and realisation growing at 6% CAGR over the same period. Our pricing growth assumption is only slightly higher than our cost assumption, which means we expect SCL to just pass on the increased cost burden and maintain or marginally improve its EBITDA/mt. During the same period, we have factored in cost escalation of 21% CAGR on absolute basis and 5.5% CAGR on per mt basis. We expect the RoE of SCL to improve to 12.5% by FY19E.
Exhibit 12: Operating profit to post a CAGR of 25% Exhibit 13: PAT to go up 2.5x times to Rs1,149mn
Source: Company, Nirmal Bang Institutional Equities Research Source: Company, Nirmal Bang Institutional Equities Research
Assign Buy rating to SCL with a target price of Rs951
We have assigned Buy rating to SCL with a target price of Rs951. We have valued the stock based on our usual method of the average of earnings (EV/EBITDA) and asset-based valuation (EV/mt). We have used target multiples of 7.0x FY19E EV/EBITDA and US$80 EV/mt to value SCL’s business. The target multiples are in line with our assigned multiples for mid-sized regional cement companies, and are at a reasonable discount to our target multiple for UltraTech Cement.
Exhibit 14: Earnings-based valuation Exhibit 15: Asset-based valuation
Particulars (Rsmn)
FY19E EBITDA 2,372
Multiple 7.0
EV 16,605
Net debt 3,633
Equity value 12,972
No. of shares (mn) 20.4
Value per share (Rs) 636
Particulars (Rsmn)
FY19E capacity (mnmt) 5.5
Target EV/mt (US$) 80.0
Enterprise value 29,480
Net debt 3,633
Equity value 25,847
No. of shares (mn) 20.4
Value per share (Rs) 1,267
Source: Company, Nirmal Bang Institutional Equities Research Source: Company, Nirmal Bang Institutional Equities Research
Exhibit 16: Target price of Rs951 is the average of both valuation methodologies
Particulars (Rs)
Value based on earnings multiple 636
Value based on asset valuation 1,267
Average value per share 951
Target price 951
CMP (Rs) 806
Upside (%) 18%
Source: Company, Nirmal Bang Institutional Equities Research
1,217 1,237
1,729
2,372
0%
20%
40%
60%
80%
100%
120%
140%
-
500
1,000
1,500
2,000
2,500
FY16 FY17E FY18E FY19E
EBITDA (Rsmn) YoY growth (%)
(Rsmn)
462 364
709
1,149
-100%
-80%
-60%
-40%
-20%
0%
20%
40%
60%
80%
100%
120%
-
200
400
600
800
1,000
1,200
1,400
FY16 FY17E FY18E FY19E
PAT (Rsmn) YoY growth (%)
(Rsmn)
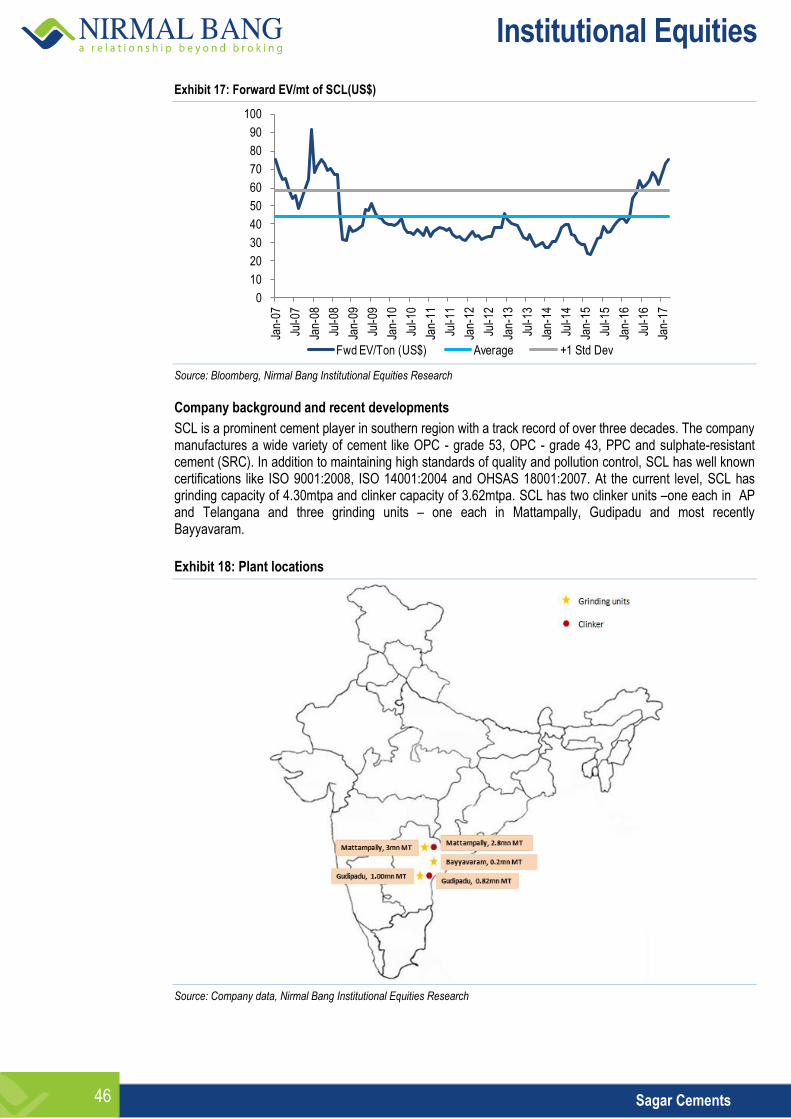
Institutional Equities
46 Sagar Cements
Exhibit 17: Forward EV/mt of SCL(US$)
Source: Bloomberg, Nirmal Bang Institutional Equities Research
Company background and recent developments
SCL is a prominent cement player in southern region with a track record of over three decades. The company manufactures a wide variety of cement like OPC - grade 53, OPC - grade 43, PPC and sulphate-resistant cement (SRC). In addition to maintaining high standards of quality and pollution control, SCL has well known certifications like ISO 9001:2008, ISO 14001:2004 and OHSAS 18001:2007. At the current level, SCL has grinding capacity of 4.30mtpa and clinker capacity of 3.62mtpa. SCL has two clinker units –one each in AP and Telangana and three grinding units – one each in Mattampally, Gudipadu and most recently Bayyavaram.
Exhibit 18: Plant locations
Source: Company data, Nirmal Bang Institutional Equities Research
0
10
20
30
40
50
60
70
80
90
100
Jan-
07
Jul-0
7
Jan-
08
Jul-0
8
Jan-
09
Jul-0
9
Jan-
10
Jul-1
0
Jan-
11
Jul-1
1
Jan-
12
Jul-1
2
Jan-
13
Jul-1
3
Jan-
14
Jul-1
4
Jan-
15
Jul-1
5
Jan-
16
Jul-1
6
Jan-
17
Fwd EV/Ton (US$) Average +1 Std Dev

Institutional Equities
47 Sagar Cements
Acquisition of BMM Cements completed in 3QFY16
SCL has signed a share purchase agreement to acquire 1mt cement plant and captive 25MW power plant in Gudipadu from BMM Cements. The acquisition took place at an enterprise value of Rs 5.4bn or US$87/tn. BMM Cements has limestone reserves of about 155mt. The acquisition of BMM Cements came at an opportune time wherein the demand environment and pricing in the region of its operations look encouraging. Post acquisition, SCL is likely to benefit from freight and power cost savings because of shorter lead distance and captive power plant, respectively.
Vicat joint venture
In 2008, SCL had formed a joint venture or JV with a French cement company, Vicat, to set up 5.5mtpa capacity in Karnataka along with 50MW captive power plant. While SCL had 47% stake in the JV, Vicat had the remaining 53%. Out of total investment of Rs5 bn, SCL’s contribution was Rs900mn while Vicat invested around Rs4.1bn.The lower equity infusion by SCL was because of the local expertise it brought to the table and the premium paid by Vicat to make its entry into India, one of the biggest cement markets in the world. In July 2014, SCL sold its entire 47% stake to Vicat for Rs4.5bn. This deal helped SCL to curtail debt and further fund its capex.
Recent fund raising through the QIP route
SCL recently raised close to Rs2bn by way of QIP and preferential allotment of shares to promoters. While the QIP happened at Rs720/share, the preferential allotment to promoters happened at Rs800/share. The proceeds of the QIP will be used to fund the expansion of Bayyavaram unit and set up a18MW power plant at Matampally unit. The QIP resulted in 17% dilution in pre-money equity base.
Exhibit 19: Recent developments in SCL
Source: Nirmal Bang Institutional Equities Research
Exhibit 20: Progress in clinker capacity over the past 10 years (mtma)
Source: Company data, Nirmal Bang Institutional Equities Research
0
0.5
1
1.5
2
2.5
3
3.5
FY
06
FY
07
FY
08
FY
09
FY
10
FY
11
FY
12
FY
13
FY
14
FY
15
FY
16
FY
17E
FY
18E
FY
19E
Addition of line 2 at Nalgonda
Post acquisition of BMM
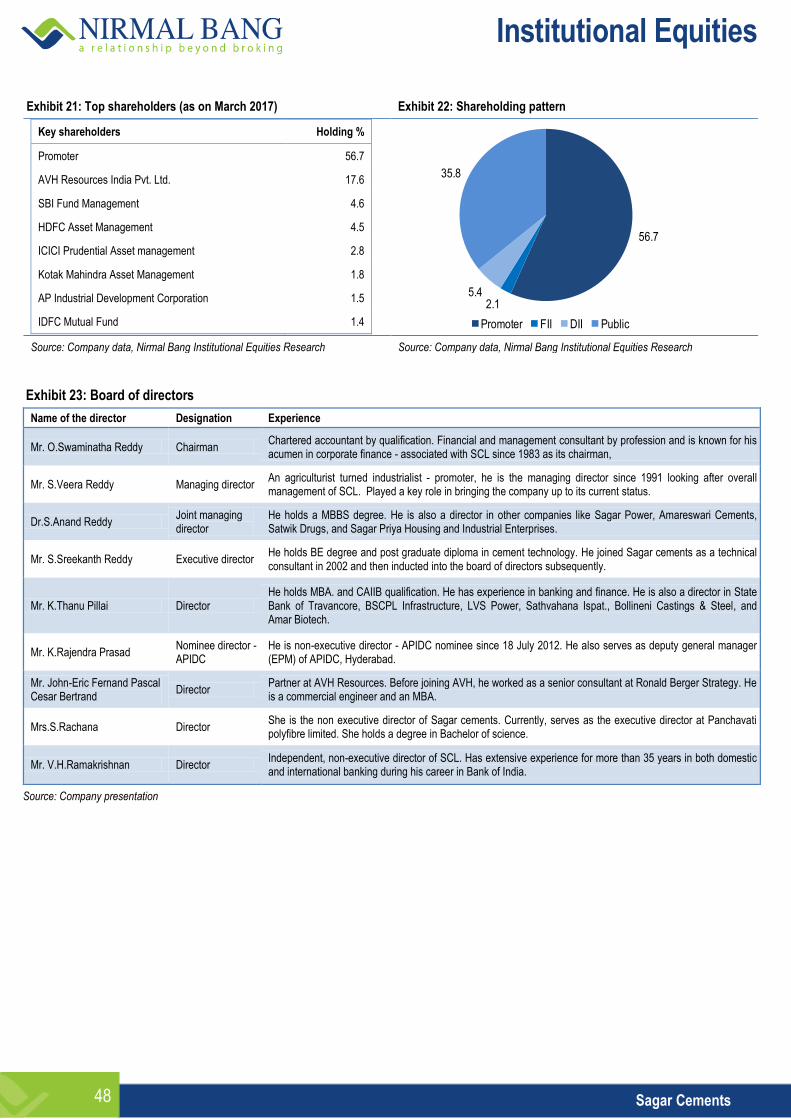
Institutional Equities
48 Sagar Cements
Exhibit 21: Top shareholders (as on March 2017) Exhibit 22: Shareholding pattern
Key shareholders Holding %
Promoter 56.7
AVH Resources India Pvt. Ltd. 17.6
SBI Fund Management 4.6
HDFC Asset Management 4.5
ICICI Prudential Asset management 2.8
Kotak Mahindra Asset Management 1.8
AP Industrial Development Corporation 1.5
IDFC Mutual Fund 1.4 Source: Company data, Nirmal Bang Institutional Equities Research Source: Company data, Nirmal Bang Institutional Equities Research
Exhibit 23: Board of directors
Name of the director Designation Experience
Mr. O.Swaminatha Reddy Chairman Chartered accountant by qualification. Financial and management consultant by profession and is known for his acumen in corporate finance - associated with SCL since 1983 as its chairman,
Mr. S.Veera Reddy Managing director An agriculturist turned industrialist - promoter, he is the managing director since 1991 looking after overall management of SCL. Played a key role in bringing the company up to its current status.
Dr.S.Anand Reddy Joint managing director
He holds a MBBS degree. He is also a director in other companies like Sagar Power, Amareswari Cements, Satwik Drugs, and Sagar Priya Housing and Industrial Enterprises.
Mr. S.Sreekanth Reddy Executive director He holds BE degree and post graduate diploma in cement technology. He joined Sagar cements as a technical consultant in 2002 and then inducted into the board of directors subsequently.
Mr. K.Thanu Pillai Director He holds MBA. and CAIIB qualification. He has experience in banking and finance. He is also a director in State Bank of Travancore, BSCPL Infrastructure, LVS Power, Sathvahana Ispat., Bollineni Castings & Steel, and Amar Biotech.
Mr. K.Rajendra Prasad Nominee director - APIDC
He is non-executive director - APIDC nominee since 18 July 2012. He also serves as deputy general manager (EPM) of APIDC, Hyderabad.
Mr. John-Eric Fernand Pascal Cesar Bertrand
Director Partner at AVH Resources. Before joining AVH, he worked as a senior consultant at Ronald Berger Strategy. He is a commercial engineer and an MBA.
Mrs.S.Rachana Director She is the non executive director of Sagar cements. Currently, serves as the executive director at Panchavati polyfibre limited. She holds a degree in Bachelor of science.
Mr. V.H.Ramakrishnan Director Independent, non-executive director of SCL. Has extensive experience for more than 35 years in both domestic and international banking during his career in Bank of India.
Source: Company presentation
56.7
2.15.4
35.8
Promoter FII DII Public

Institutional Equities
49 Sagar Cements
Financial summary Exhibit 24: Income statement
Y/E March (Rsmn) FY15 FY16 FY17E FY18E FY19E
Net Sales 5,756 8,028 9,792 12,041 14,539
Raw material costs 678 1,685 1,882 2,271 2,768
Employee costs 334 410 500 615 750
Freight costs 1,541 1,899 2,555 3,052 3,370
Power and fuel expenses 2,102 2,204 2,814 3,395 4,099
Other expenses 358 613 783 953 1,151
Total expenses 5,189 6,811 8,555 10,311 12,167
Operating profit 567 1,217 1,237 1,729 2,372
OPM 9.8 15.2 12.6 14.4 16.3
Other income 3,661 65 300 300 300
Interest costs 231 418 566 530 475
Depreciation 215 336 451 486 556
PBT before extraordinary items
3,782 528 520 1,013 1,641
PBT 3,782 528 520 1,013 1,641
Tax 814 66 156 304 492
Tax rate 21.5 12.5 30.0 30.0 30.0
PAT 2,968 462 364 709 1,149
EPS (Rs) 171 27 18 35 56
Source: Company, Nirmal Bang Institutional Equities Research
Exhibit 26: Balance sheet
Y/E March (Rsmn) FY13 FY14 FY15 FY16E FY17E
Equity capital 174 174 204 204 204
Reserves and surplus 5,046 5,403 8,181 9,286 10,657
Net worth 5,220 5,577 8,385 9,490 10,861
Total debt 2,454 4,370 5,070 4,570 4,070
Deferred tax liability 475 263 263 263 263
Total liabilities 8,149 10,210 13,286 13,446 14,044
Gross block 5,548 12,030 12,882 13,882 15,882
Acc. Depr. 2,210 2,546 2,997 3,483 4,039
Net block 3,338 9,485 9,886 10,400 11,844
CWIP 1,122 152 300 300 300
Investment 572 227 300 300 300
NWC-cash 1,347 281 783 963 1,163
Cash 2,193 65 2,017 1,483 437
Total assets 8,572 10,210 13,286 13,446 14,044
Source: Company, Nirmal Bang Institutional Equities Research
Exhibit 25: Cash flow
Y/E March (Rsmn) FY15 FY16 FY17E FY18E FY19E
PAT 2,968 462 364 709 1,149
Add: Depreciation 215 336 451 486 556
Less:
Chg. in NWC (996) 1,066 (502) (180) (200)
Cash flow from operations 2,187 1,864 312 1,015 1,505
Capex (923) (5,512) (1,000) (1,000) (2,000)
Chg in Investment 288 345 (73) - -
Cash flow from inv. (635) (5,168) (1,073) (1,000) (2,000)
Issue of shares - - 2,118 - -
Inc in debt 176 1,916 700 (500) (500)
inc in DTL 153 (212) - - -
Dividend paid (157) (105) (105) (50) (50)
Cash flow from financing 172 1,599 2,713 (550) (550)
Net cash flow 1,724 (1,705) 1,952 (535) (1,045)
Opening cash balance 46 1,770 65 2,017 1,483
Closing cash balance 1,770 65 2,017 1,483 437
Source: Company, Nirmal Bang Institutional Equities Research
Exhibit 27: Key ratios
Y/E March (Rsmn) FY15 FY16 FY17E FY18E FY19E
Growth (%)
Sales 17.7 39.5 22.0 23.0 20.8
Operating profit - 114.8 1.6 39.8 37.2
Net profit NA (84.4) (21.2) 95.0 62.0
Leverage (x)
Debt:equity 0.5 0.8 0.6 0.5 0.4
Net debt:equity 0.1 0.8 0.4 0.4 0.4
Profitability (%)
OPM 9.8 15.2 12.6 14.4 16.3
NPM 51.6 5.8 3.7 5.9 7.9
RoE 77.8 8.6 5.4 8.6 12.5
RoCE 4.3 8.6 5.9 9.2 12.9
Valuation (x)
P/E 1.8 14.5 45.2 23.2 14.3
P/B 1.0 1.2 2.1 1.9 1.7
EV/EBITDA 14.5 10.0 18.1 13.6 10.8
EV/MT ($) 43.9 45.6 77.7 81.8 69.8
Source: Company, Nirmal Bang Institutional Equities Research
Institutional Equities
50 Sagar Cements
This page has been intentionally left blank

Institutional Equities
Initi
atin
g C
over
age
Reuters: TRCE.BO; Bloomberg: TRCL IN
The Ramco Cements
Best In Class Profitability Awaits Operating Leverage We like The Ramco Cements (TRCL) in the cement sector as it has several advantages in the southern region like: (1) Cost efficiency (100% captive power plant and lower operating costs) and premium product pricing, resulting in superior profitability. (2) Beneficiary of demand uptick in the southern region (strong brand image, large market share in Tamil Nadu and Kerala). (3) Completion of major capex, and robust operating cash flow expected to deleverage the balance sheet and improve return ratios. TRCL is highly efficient in its operations, as despite lower capacity utilisation the company has been able to control its costs well. TRCL has been reporting higher EBITDA/mt compared to most other cement companies in India for the past few quarters. This best-in-class profitability awaits operating leverage to open up as the current capacity utilisation of the company is only 50%, leaving ample scope for further volume growth. We have factored in sales/EBITDA/PAT CAGR of 11%/15%/17.5%, respectively, over FY16-FY19E. Revenue growth will be driven by 9.6% volume CAGR and a mere 2% pricing CAGR. Lower growth in prices in our estimates corresponds to already higher prices in key regions. After declining in 9MFY17, we expect operating costs to increase ~4% in FY18 and FY19. This will translate to higher EBITDA/mt for TRCL compared to other companies. We have valued TRCL based on the average of 12.0x FY19E EV/EBITDA and FY19E EV/mt of US$160 to arrive at our target price of Rs775. We have assigned Accumulate rating to the stock as the upside is only around 10% from the current market price. Key downside risks to our call include government intervention in cement pricing, severe drought in Tamil Nadu impacting volume and increase in input costs. Myriad factors supporting best-in-class profitability: Multiple factors have supported higher profitability of TRCL over the years including lower costs and premium pricing. Operating costs of TRCL have posted only a 1% CAGR over the past five years (FY12-FY17E). In fact, over the past two years, operating costs actually declined by 7% CAGR. A large part of this decline can be attributed to the fall in fuel costs (coal and pet coke) while measures to reduce costs and improve efficiency have also played their part in reducing overall operating costs. Demand uptick in the southern region is positive for TRCL: We expect cement demand in the southern region to be higher than the all-India level on account of increased state government spending on various infrastructure projects such as irrigation, ports, roads and low-cost housing. TRCL, with ~90% exposure to the southern region, is well placed to capture this growth. We have factored in 7%-8% demand CAGR for the southern region and for TRCL we expect 9.6% volume CAGR over FY16-FY19E. Financials and valuation: We have factored in 15% EBITDA CAGR for TRCL on top of its already high base. EBITDA growth will largely be driven by higher volume as cement prices in the region are already high. However, if the recent price hikes undertaken in most states in the southern region sustain, there may be upside risk to our estimates. We have valued TRCL based on the average of earnings and asset-based valuations to arrive at our target price of Rs775, up 10% from the current market price.
ACCUMULATE
Sector: Cement
CMP: Rs706
Target Price: Rs775
Upside: 10%
Mangesh Bhadang Research Analyst [email protected] +91-22-3926 8172
Key Data
Current Shares O/S (mn) 238.1
Mkt Cap (Rsbn/US$bn) 167.9/2.6
52 Wk H / L (Rs) 728/473
Daily Vol. (3M NSE Avg.) 230,619
Share holding (%) 2QFY17 3QFY17 4QFY17
Promoter 42.3 42.3 42.3
DII+FII 43.5 43.1 36.8
Others 14.2 14.6 20.9
One -Year Indexed Stock Performance
Price Performance (%)
1 M 6 M 1 Yr
The Ramco Cements 4.2 14.4 40.9
Nifty Index 1.3 10.5 18.4
Source: Bloomberg
Y/E March (Rsmn) FY14 FY15 FY16E FY17E FY18E FY19E
Revenues 36,835 36,449 35,958 40,524 45,517 50,178
YoY (%) (3.8) (1.0) (1.3) 12.7 12.3 10.2
EBITDA 5,630 7,133 10,590 13,105 15,045 16,090
EBITDA (%) 15.3 19.6 29.5 32.3 33.1 32.1
Adj. PAT 1,377 2,424 5,583 6,557 8,045 9,064
YoY (%) (65.9) 76.0 130.3 17.5 22.7 12.7
FDEPS (Rs) 6 10 23 28 34 38
RoE (%) 5.5 9.2 18.1 17.0 17.0 17.0
EV/EBITDA 8.4 14.2 14.0 11.0 13.4 11.3
EV/mt (US$) 83.1 79.2 93.4 108.6 163.7 159.0
P/E (x) 14.3 37.2 30.4 17.1 24.3 19.8
Source: Company, Nirmal Bang Institutional Equities Research
70
80
90
100
110
120
130
Oct-14 Dec-14 Feb-15 Apr-15 Jun-15 Aug-15 Oct-15
JK LAKSHMI CEMENT NSE CNX NIFTY INDEX
10 May 2017
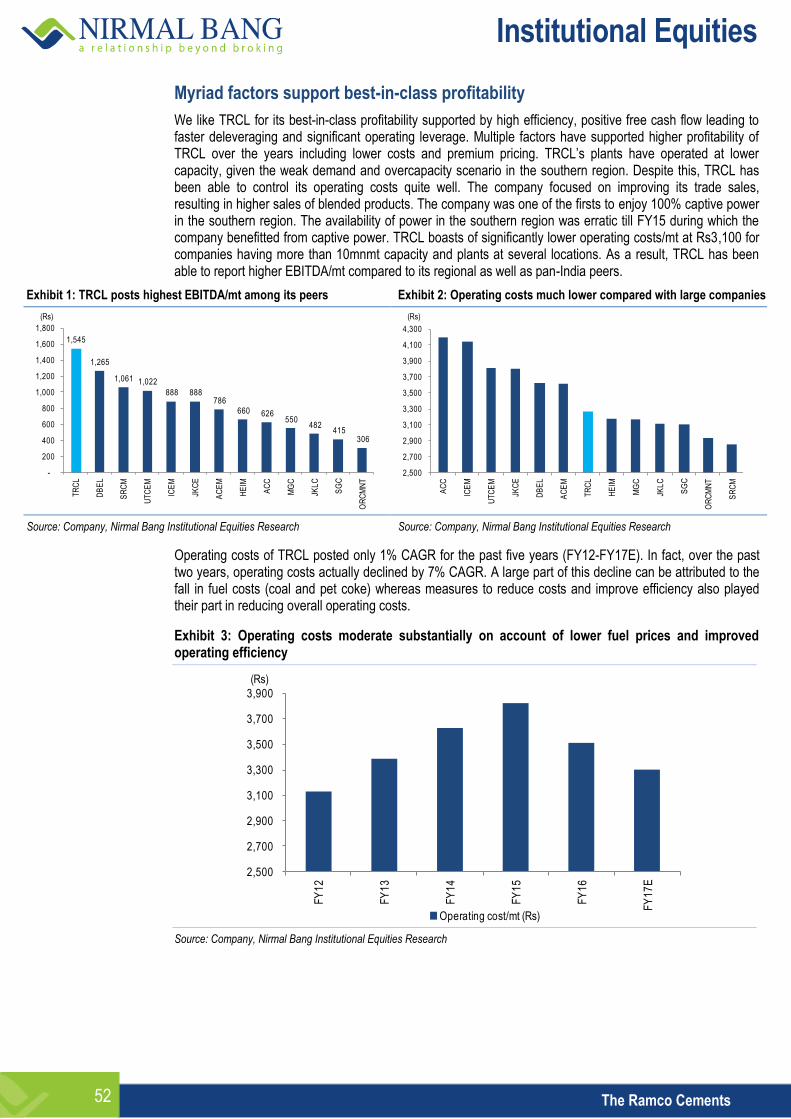
Institutional Equities
52 The Ramco Cements
Myriad factors support best-in-class profitability
We like TRCL for its best-in-class profitability supported by high efficiency, positive free cash flow leading to faster deleveraging and significant operating leverage. Multiple factors have supported higher profitability of TRCL over the years including lower costs and premium pricing. TRCL’s plants have operated at lower capacity, given the weak demand and overcapacity scenario in the southern region. Despite this, TRCL has been able to control its operating costs quite well. The company focused on improving its trade sales, resulting in higher sales of blended products. The company was one of the firsts to enjoy 100% captive power in the southern region. The availability of power in the southern region was erratic till FY15 during which the company benefitted from captive power. TRCL boasts of significantly lower operating costs/mt at Rs3,100 for companies having more than 10mnmt capacity and plants at several locations. As a result, TRCL has been able to report higher EBITDA/mt compared to its regional as well as pan-India peers.
Exhibit 1: TRCL posts highest EBITDA/mt among its peers Exhibit 2: Operating costs much lower compared with large companies
Source: Company, Nirmal Bang Institutional Equities Research Source: Company, Nirmal Bang Institutional Equities Research
Operating costs of TRCL posted only 1% CAGR for the past five years (FY12-FY17E). In fact, over the past two years, operating costs actually declined by 7% CAGR. A large part of this decline can be attributed to the fall in fuel costs (coal and pet coke) whereas measures to reduce costs and improve efficiency also played their part in reducing overall operating costs.
Exhibit 3: Operating costs moderate substantially on account of lower fuel prices and improved operating efficiency
Source: Company, Nirmal Bang Institutional Equities Research
1,545
1,265
1,061 1,022
888 888 786
660 626 550
482 415
306
-
200
400
600
800
1,000
1,200
1,400
1,600
1,800
TR
CL
DB
EL
SR
CM
UT
CE
M
ICE
M
JKC
E
AC
EM
HE
IM
AC
C
MG
C
JKL
C
SG
C
OR
CM
NT
(Rs)
2,500
2,700
2,900
3,100
3,300
3,500
3,700
3,900
4,100
4,300
AC
C
ICE
M
UT
CE
M
JKC
E
DB
EL
AC
EM
TR
CL
HE
IM
MG
C
JKL
C
SG
C
OR
CM
NT
SR
CM
(Rs)
2,500
2,700
2,900
3,100
3,300
3,500
3,700
3,900
FY
12
FY
13
FY
14
FY
15
FY
16
FY
17
E
Operating cost/mt (Rs)
(Rs)
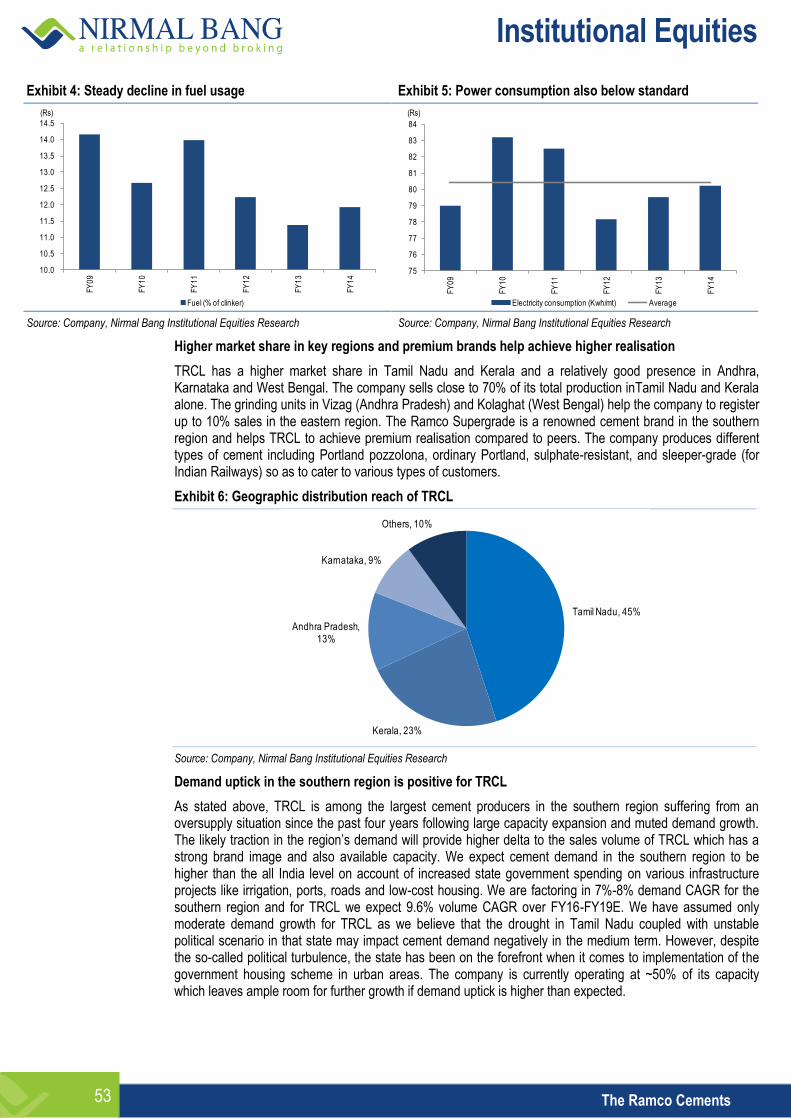
Institutional Equities
53 The Ramco Cements
Exhibit 4: Steady decline in fuel usage Exhibit 5: Power consumption also below standard
Source: Company, Nirmal Bang Institutional Equities Research Source: Company, Nirmal Bang Institutional Equities Research
Higher market share in key regions and premium brands help achieve higher realisation
TRCL has a higher market share in Tamil Nadu and Kerala and a relatively good presence in Andhra, Karnataka and West Bengal. The company sells close to 70% of its total production inTamil Nadu and Kerala alone. The grinding units in Vizag (Andhra Pradesh) and Kolaghat (West Bengal) help the company to register up to 10% sales in the eastern region. The Ramco Supergrade is a renowned cement brand in the southern region and helps TRCL to achieve premium realisation compared to peers. The company produces different types of cement including Portland pozzolona, ordinary Portland, sulphate-resistant, and sleeper-grade (for Indian Railways) so as to cater to various types of customers.
Exhibit 6: Geographic distribution reach of TRCL
Source: Company, Nirmal Bang Institutional Equities Research
Demand uptick in the southern region is positive for TRCL
As stated above, TRCL is among the largest cement producers in the southern region suffering from an oversupply situation since the past four years following large capacity expansion and muted demand growth. The likely traction in the region’s demand will provide higher delta to the sales volume of TRCL which has a strong brand image and also available capacity. We expect cement demand in the southern region to be higher than the all India level on account of increased state government spending on various infrastructure projects like irrigation, ports, roads and low-cost housing. We are factoring in 7%-8% demand CAGR for the southern region and for TRCL we expect 9.6% volume CAGR over FY16-FY19E. We have assumed only moderate demand growth for TRCL as we believe that the drought in Tamil Nadu coupled with unstable political scenario in that state may impact cement demand negatively in the medium term. However, despite the so-called political turbulence, the state has been on the forefront when it comes to implementation of the government housing scheme in urban areas. The company is currently operating at ~50% of its capacity which leaves ample room for further growth if demand uptick is higher than expected.
10.0
10.5
11.0
11.5
12.0
12.5
13.0
13.5
14.0
14.5
FY
09
FY
10
FY
11
FY
12
FY
13
FY
14
Fuel (% of clinker)
(Rs)
75
76
77
78
79
80
81
82
83
84
FY
09
FY
10
FY
11
FY
12
FY
13
FY
14
Electricity consumption (Kwh/mt) Average
(Rs)
Tamil Nadu, 45%
Kerala, 23%
Andhra Pradesh, 13%
Karnataka, 9%
Others, 10%

Institutional Equities
54 The Ramco Cements
Exhibit 7: Demand drivers in key states
State Snapshot Demand drivers
Tamil Nadu
1. Installed capacity of ~40mt (~11% of total installed capacity) and 20mt of consumption (~8% of total consumption).
2. Major urban demand from Chennai, Madurai, Coimbatore and Trichy.
1. Recently the state government started announcing infrastructure projects and improved policy framework.
2. Good monsoon and low base of the previous year to drive agriculture-based economy.
3. Low-budget housing programme. 4. Ban on sand mining impacts demand, but a solution
expected soon.
Karnataka & Kerala
1. Installed capacity of ~27mt (~7% of total installed capacity).
2. Major urban demand from Bengaluru, Mysore, Kochi and Trivandrum.
1. Focus on state roads.
2. Strong housing and commercial markets in Bengaluru.
Andhra Pradesh
1. Huge demand because of state-sponsored housing schemes.
2. New state creation-related construction activities.
1. Telangana statehood and new capital creation.
2. Strong monsoon to create further rural demand
3. Cyclone-related construction work.
4. Traction in low-cost housing.
5. Irrigation projects.
Source: Nirmal Bang Institutional Equities Research
Exhibit 8: Volume growth expected to be higher
Source: Company, Nirmal Bang Institutional Equities Research
Exhibit 9: Lower capacity utilisation leaves ample room for volume growth
Source: Company, Nirmal Bang Institutional Equities Research
7.4
8.3 8.6
7.7
7.2
8.3
9.0
9.5
-15
-10
-5
0
5
10
15
20
6
7
7
8
8
9
9
10
10
FY
12
FY
13
FY
14
FY
15
FY
16
FY
17
E
FY
18
E
FY
19
E
Volumes (mnmt) Growth (% YoY)
(mnmt) (%)
64.5%
57.1%
59.5% 59.6%
55.3%
47.8%
43.8%
50.4%
54.5%
57.7%
40%
45%
50%
55%
60%
65%
70%
FY
10
FY
11
FY
12
FY
13
FY
14
FY
15
FY
16
FY
17
E
FY
18
E
FY
19
E
Capacity utilisation

Institutional Equities
55 The Ramco Cements
Robust operating cash flow to deleverage balance sheet
TRCL has completed major capex in the past five years (integrated capacity at 12.5mt, satellite grinding capacity of 4mt) which led to a rise in its debt from Rs7.0bn in FY07 to Rs 26.6bn in FY13. The company has no major capex plan for the near future and is expected to generate free cash flow (post capex) of Rs5bn-Rs7bn which will be used to repay debt. The deleveraging has already started and the company has repaid debt of Rs5bn in FY16 and about Rs5.3bn in FY17.
We are factoring in sales/EBITDA/PAT CAGR of 11%/15%/17.5%, respectively, over FY16-FY19E. Revenue growth will be driven by 9.6% volume CAGR and a mere 2% pricing CAGR. Lower pricing growth in our assumption corresponds to already higher prices in key regions. As with any other company, higher-than-expected price hikes poses a key upside risk to our estimates. After declining in 9MFY17, we expect operating costs to increase by ~4% each in FY18 and FY19.
Exhibit 10: FCF growth to remain high in the absence of capex
Source: Company, Nirmal Bang Institutional Equities Research
Exhibit 11: Debt-equity ratio to fall substantially
Source: Company, Nirmal Bang Institutional Equities Research
0.1
1.5
(1.6)
3.1
4.1
6.0
5.1
7.0
(3)
(2)
(1)
0
1
2
3
4
5
6
7
8
FY
12
FY
13
FY
14
FY
15
FY
16
FY
17
E
FY
18
E
FY
19
E
Free cash flow generation (Rsbn)
(Rsbn)
1.61
1.32
1.12 1.18
1.03
0.71
0.46
0.27 0.13
-
0.2
0.4
0.6
0.8
1.0
1.2
1.4
1.6
1.8
FY
11
FY
12
FY
13
FY
14
FY
15
FY
16
FY
17
E
FY
18
E
FY
19
E
Total debt to equity (x)
(x)

Institutional Equities
56 The Ramco Cements
Assign Accumulate rating to TRCL with a target price of Rs775
We have assigned Accumulate rating to TRCL with a target price of Rs775. We have valued the stock based on our usual method of the average of earnings-based valuation (EV/EBITDA) and asset-based valuation (EV/mt). We have used target multiples of 12.0x FY19E EV/EBITDA and US$160 EV/mt to value the business. The target multiples are slightly higher than our assigned multiples for mid-sized cement companies on account of better return profile and huge operating leverage. We believe TRCL is a must-have stock in one’s portfolio on account of credible management and best-in-class profitability.
Exhibit 12: Earnings-based valuation Exhibit 13: Asset-based valuation
Particulars (Rsmn)
FY19E EBITDA 16,090
Multiple 12.0
EV 1,93,078
Net debt 2,312
Equity value 1,90,766
No. of shares (mn) 238.1
Value per share (Rs) 801
Particulars (Rsmn)
FY19E capacity (mnmt) 16.5
Target EV/mt (US$) 160.0
Enterprise value 1,80,730
Net debt 2,312
Equity value 1,78,418
No. of shares (mn) 238.1
Value per share (Rs) 749
Source: Company, Nirmal Bang Institutional Equities Research Source: Company, Nirmal Bang Institutional Equities Research
Exhibit 14: Target price of Rs775 is the average of both valuation methodologies
Particulars (Rs)
Value based on earnings multiple 801
Value based on asset valuation 749
Average value per share 775
Target price 775
CMP (Rs) 706
Upside 10%
Source: Company, Nirmal Bang Institutional Equities Research
Exhibit 15: 12-month forward rolling EV/mt (US$) Exhibit 16: 12-month forward rolling EV/EBITDA
Source: Bloomberg, Company, Nirmal Bang Institutional Equities Research Source: Bloomberg, Company, Nirmal Bang Institutional Equities Research
0
30
60
90
120
150
180
Ma
r-1
1
Jul-1
1
Oct
-11
Jan
-12
Ma
y-1
2
Au
g-1
2
De
c-1
2
Ma
r-1
3
Jun
-13
Oct
-13
Jan
-14
Ap
r-1
4
Au
g-1
4
No
v-1
4
Fe
b-1
5
Jun
-15
Se
p-1
5
De
c-1
5
Ap
r-1
6
Jul-1
6
Oct
-16
Fe
b-1
7
Ma
y-1
7
Fwd EV/mt (US$) Average Fwd EV/mt (US$) +1 Std Dev
0
5
10
15
20
Ma
r-1
1
Jul-1
1
Oct
-11
Fe
b-1
2
Ma
y-1
2
Se
p-1
2
De
c-1
2
Ap
r-1
3
Jul-1
3
Oct
-13
Fe
b-1
4
Ma
y-1
4
Se
p-1
4
De
c-1
4
Ap
r-1
5
Jul-1
5
No
v-1
5
Fe
b-1
6
Jun
-16
Se
p-1
6
De
c-1
6
Ap
r-1
7
Fwd EV/EBIDTA (x) Average Fwd EV/EBITDA +1 Std Dev

Institutional Equities
57 The Ramco Cements
Company background
TRCL is a South India-based cement company headquartered in Chennai and is the flagship company of the Ramco Group. The company is the fifth largest cement producer in India with a total production capacity of 16.45mtpa. TRCL also produces ready-mix concrete and dry mortar products, and operates one of the largest wind farms in India.
Exhibit 17: Shareholding pattern (%)
Source: Company, Nirmal Bang Institutional Equities Research
Exhibit 18: Major shareholders (%)
Promoter 42.3
Government of Tamil Nadu 3.4
SBI Funds Management 3.3
Aberdeen Asset Management 3.0
Kotak Mahindra Asset Management 2.3
Reliance capital Asset Management 1.8
Sundaram Asset management 1.8
Source: Company, Nirmal Bang Institutional Equities Research
Exhibit 19: Board members and the management team
Name of the director Designation Experience
Mr. P.R.Ramasubrahmaneya Rajha
Chairman & Managing Director
Mr. Rajha is the patriarch of the Ramco Group and has been responsible for sustainable growth and profits.
Mr. P.R.Venketrama Raja
Non-Executive Director
He has a bachelor’s degree in chemical engineering from University of Madras and masters in business administration from University of Michigan, USA. He has been on the board of TRCL since 1985.
Mr. R.S.Agarwal Non-Executive Independent Director
He started his career in 1965 and after serving in various capacities with a paper mill in North India for 9 years and with Industrial Development Bank of India (IDBI) for 28 years. Retired as executive director of IDBI.
Mr. M.B.N.Rao Non-Executive Independent Director
A graduate in agriculture, he holds a diploma in computer studies from University of Cambridge and National Computing Centre, London, and a certificate in industrial finance.
Mr. M.M.Venkatachalam Non-Executive Independent Director
Justice Mrs. Chitra Venkataraman (Retd.)
Additional Independent Director
She serves as additional independent director of TRCL. She is a graduate in economics from Ethiraj College, Chennai, and a graduate from Law College, Chennai. She started her practice at Madras High Court specialising in direct and indirect tax laws.
Source: Company, Nirmal Bang Institutional Equities Research
42.3
14.5
22.3
20.9
Promoter FII DII Public

Institutional Equities
58 The Ramco Cements
Exhibit 20: Plant locations
Source: Nirmal Bang Institutional Equities Research
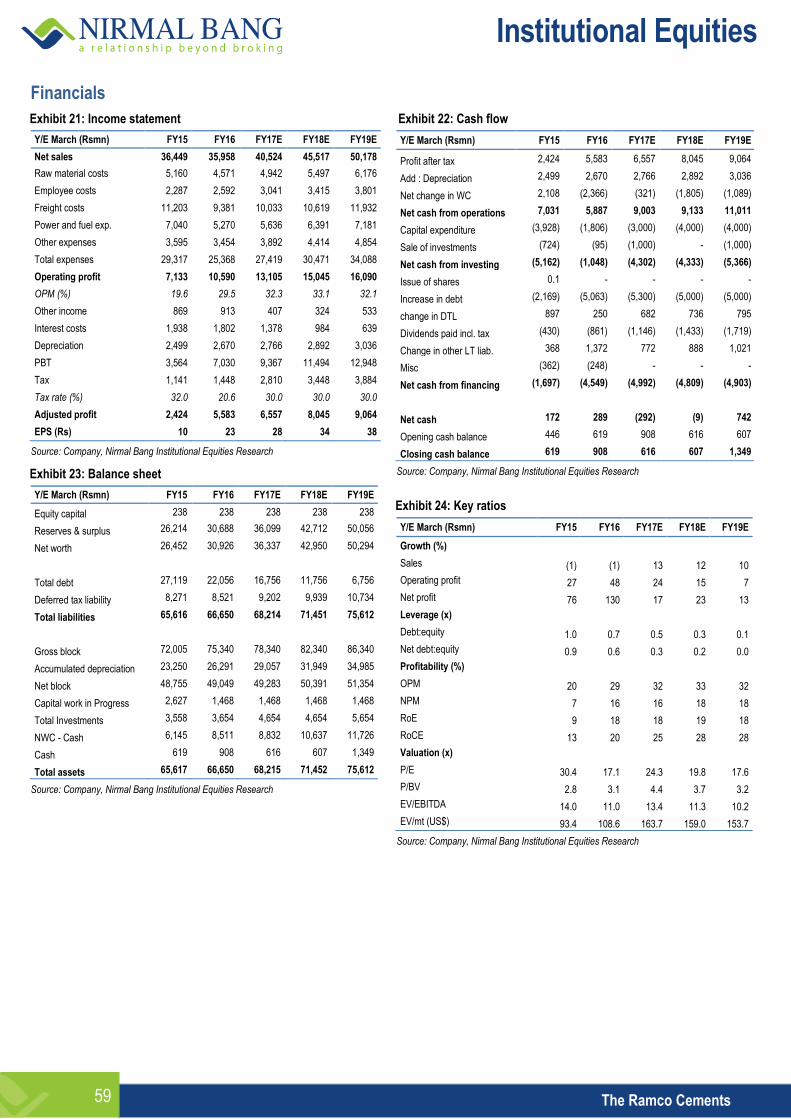
Institutional Equities
59 The Ramco Cements
Financials
Exhibit 21: Income statement
Y/E March (Rsmn) FY15 FY16 FY17E FY18E FY19E
Net sales 36,449 35,958 40,524 45,517 50,178
Raw material costs 5,160 4,571 4,942 5,497 6,176
Employee costs 2,287 2,592 3,041 3,415 3,801
Freight costs 11,203 9,381 10,033 10,619 11,932
Power and fuel exp. 7,040 5,270 5,636 6,391 7,181
Other expenses 3,595 3,454 3,892 4,414 4,854
Total expenses 29,317 25,368 27,419 30,471 34,088
Operating profit 7,133 10,590 13,105 15,045 16,090
OPM (%) 19.6 29.5 32.3 33.1 32.1
Other income 869 913 407 324 533
Interest costs 1,938 1,802 1,378 984 639
Depreciation 2,499 2,670 2,766 2,892 3,036
PBT 3,564 7,030 9,367 11,494 12,948
Tax 1,141 1,448 2,810 3,448 3,884
Tax rate (%) 32.0 20.6 30.0 30.0 30.0
Adjusted profit 2,424 5,583 6,557 8,045 9,064
EPS (Rs) 10 23 28 34 38
Source: Company, Nirmal Bang Institutional Equities Research
Exhibit 23: Balance sheet
Y/E March (Rsmn) FY15 FY16 FY17E FY18E FY19E
Equity capital 238 238 238 238 238
Reserves & surplus 26,214 30,688 36,099 42,712 50,056
Net worth 26,452 30,926 36,337 42,950 50,294
Total debt 27,119 22,056 16,756 11,756 6,756
Deferred tax liability 8,271 8,521 9,202 9,939 10,734
Total liabilities 65,616 66,650 68,214 71,451 75,612
Gross block 72,005 75,340 78,340 82,340 86,340
Accumulated depreciation 23,250 26,291 29,057 31,949 34,985
Net block 48,755 49,049 49,283 50,391 51,354
Capital work in Progress 2,627 1,468 1,468 1,468 1,468
Total Investments 3,558 3,654 4,654 4,654 5,654
NWC - Cash 6,145 8,511 8,832 10,637 11,726
Cash 619 908 616 607 1,349
Total assets 65,617 66,650 68,215 71,452 75,612
Source: Company, Nirmal Bang Institutional Equities Research
Exhibit 22: Cash flow
Y/E March (Rsmn) FY15 FY16 FY17E FY18E FY19E
Profit after tax 2,424 5,583 6,557 8,045 9,064
Add : Depreciation 2,499 2,670 2,766 2,892 3,036
Net change in WC 2,108 (2,366) (321) (1,805) (1,089)
Net cash from operations 7,031 5,887 9,003 9,133 11,011
Capital expenditure (3,928) (1,806) (3,000) (4,000) (4,000)
Sale of investments (724) (95) (1,000) - (1,000)
Net cash from investing (5,162) (1,048) (4,302) (4,333) (5,366)
Issue of shares 0.1 - - - -
Increase in debt (2,169) (5,063) (5,300) (5,000) (5,000)
change in DTL 897 250 682 736 795
Dividends paid incl. tax (430) (861) (1,146) (1,433) (1,719)
Change in other LT liab. 368 1,372 772 888 1,021
Misc (362) (248) - - -
Net cash from financing (1,697) (4,549) (4,992) (4,809) (4,903)
Net cash 172 289 (292) (9) 742
Opening cash balance 446 619 908 616 607
Closing cash balance 619 908 616 607 1,349
Source: Company, Nirmal Bang Institutional Equities Research
Exhibit 24: Key ratios
Y/E March (Rsmn) FY15 FY16 FY17E FY18E FY19E
Growth (%)
Sales (1) (1) 13 12 10
Operating profit 27 48 24 15 7
Net profit 76 130 17 23 13
Leverage (x)
Debt:equity 1.0 0.7 0.5 0.3 0.1
Net debt:equity 0.9 0.6 0.3 0.2 0.0
Profitability (%)
OPM 20 29 32 33 32
NPM 7 16 16 18 18
RoE 9 18 18 19 18
RoCE 13 20 25 28 28
Valuation (x)
P/E 30.4 17.1 24.3 19.8 17.6
P/BV 2.8 3.1 4.4 3.7 3.2
EV/EBITDA 14.0 11.0 13.4 11.3 10.2
EV/mt (US$) 93.4 108.6 163.7 159.0 153.7
Source: Company, Nirmal Bang Institutional Equities Research

Institutional Equities
60
Disclaimer
Stock Ratings Absolute Returns
BUY > 15%
ACCUMULATE -5% to15%
SELL < -5%
This report is published by Nirmal Bang’s Institutional Equities Research desk. Nirmal Bang group has other business units with independent research teams separated by Chinese walls, and therefore may, at times, have different or contrary views on stocks and markets. Reports based on technical and derivative analysis may not match with reports based on a company's fundamental analysis. This report is for the personal information of the authorised recipient and is not for public distribution. This should not be reproduced or redistributed to any other person or in any form. This report is for the general information for the clients of Nirmal Bang Equities Pvt. Ltd., a division of Nirmal Bang, and should not be construed as an offer or solicitation of an offer to buy/sell any securities.
We have exercised due diligence in checking the correctness and authenticity of the information contained herein, so far as it relates to current and historical information, but do not guarantee its accuracy or completeness. The opinions expressed are our current opinions as of the date appearing in the material and may be subject to change from time to time without notice.
Nirmal Bang or any persons connected with it do not accept any liability arising from the use of this document or the information contained therein. The recipients of this material should rely on their own judgment and take their own professional advice before acting on this information. Nirmal Bang or any of its connected persons including its directors or subsidiaries or associates or employees or agents shall not be in any way responsible for any loss or damage that may arise to any person/s from any inadvertent error in the information contained, views and opinions expressed in this publication.
Nirmal Bang Equities Private Limited (hereinafter referred to as “NBEPL”) is a registered Member of National Stock Exchange of India Limited, Bombay Stock Exchange Limited. NBEPL has registered with SEBI as a Research Entity in terms of SEBI (Research Analyst) Regulations, 2014. (Registration No: INH000001436 -19.08.2015 to 18.08.2020).
NBEPL or its associates including its relatives/analyst do not hold any financial interest/beneficial ownership of more than 1% in the company covered by Analyst.
NBEPL or its associates/analyst has not received any compensation from the company covered by Analyst during the past twelve months. NBEPL /analyst has not served as an officer, director or employee of company covered by Analyst and has not been engaged in market-making activity of the company covered by Analyst.
The views expressed are based solely on information available publicly and believed to be true. Investors are advised to independently evaluate the market conditions/risks involved before making any investment decision.
Access all our reports on Bloomberg, Thomson Reuters and Factset.
Team Details:
Name Email Id Direct Line
Rahul Arora CEO [email protected] -
Girish Pai Head of Research [email protected] +91 22 3926 8017 / 18
Dealing
Ravi Jagtiani Dealing Desk [email protected] +91 22 3926 8230, +91 22 6636 8833
Pradeep Kasat Dealing Desk [email protected] +91 22 3926 8100/8101, +91 22 6636 8831
Michael Pillai Dealing Desk [email protected] +91 22 3926 8102/8103, +91 22 6636 8830
Nirmal Bang Equities Pvt. Ltd.
Correspondence Address
B-2, 301/302, Marathon Innova,
Nr. Peninsula Corporate Park,
Lower Parel (W), Mumbai-400013.
Board No. : 91 22 3926 8000/1; Fax. : 022 3926 8010