Tracking universal health coverage
103
Tracking universal health coverage 2021 Global Monitoring Report CONFERENCE EDITION
-
Upload
khangminh22 -
Category
Documents
-
view
1 -
download
0
Transcript of Tracking universal health coverage
Tracking universal health coverage2021 Global Monitoring Report
CONFERENCE EDITION

World Health Organization and the International Bank for Reconstruction and Development / The World Bank 2021 – All rights reserved.This is an advance copy distributed to the participants of the launch of the Tracking Universal Health Coverage 2021 Global Monitoring Report. The document may not be reviewed, abstracted, quoted, reproduced, transmitted, distributed, translated or adapted, in part or in whole, in any form or by any means without the permission of the World Health Organization and the World Bank.

Tracking universal health coverage2021 Global Monitoring Report
CONFERENCE EDITION

ContentsForeword iJoint statement iiAcknowledgements iiiAbbreviations ivExecutive summary vIntroduction 1
1. Monitoring SDG indicator 3.8.1: coverage of essential health services 41.1 Trends in UHC service coverage index 41.2 Primary data availability for indicators used to build UHC service coverage index 101.3 Inequalities in service coverage and unmet health care needs 121.4 Limitations of and future developments in the current measure of SDG indicator 3.8.1 12
2. Monitoring SDG indicator 3.8.2 and SDG- related indicators of financial hardship 222.1 Financial hardship is a key consequence of the lack of financial protection 222.2 Data availability to track financial hardship 232.3 Levels of and trends in catastrophic and impoverishing out of pocket health spending 242.4 Age profile of people incurring catastrophic health spending and impoverishment due to out of pocket payments 282.5 Discussion 30
3. Joint progress in SDG indicator 3.8.1 on service coverage and SDG indicator 3.8.2 on catastrophic health spending 343.1 Joint progress at global level - Continuous service coverage expansion at a major cost to individual and families 343.2 Joint progress at regional level - huge variation in service coverage expansion across regions but a consistent pattern in worsening of catastrophic health spending 363.3 Joint progress at country level – within all regions, some countries have been successful at expanding service coverage without increasing catastrophic health spending 37
4. Accelerating progress towards UHC SDG 3.8 targets in the COVID-19 pandemic era 464.1 Disruptions of essential health services due to COVID-19 464.2 COVID-19 and financial protection 524.3 Strengthening health systems based on primary health care: accelerating progress towards UHC and health security 54
References 58Statistical annexes 62
FiguresFigure ES.1 Progress in service coverage (SDG indicator 3.8.1) and catastrophic health spending (SDG indicator 3.8.2,
10% threshold), 2000–2017 vFigure ES.2 Level of and change in UHC SCI (in index points) by country, 2000–2019 viFigure ES.3 Average percentage of countries reporting disruptions in essential health services across integrated service
delivery channels (n=112), January–March 2021 vii
Figure ES.4 Main reason reported by household for not accessing health care when needed, multi-country evidence ixFigure 1.1 UHC SCI by country, 2019 4Figure 1.2 Change in UHC SCI (in index points), 2000–2019 5Figure 1.3 Number of countries by UHC SCI group, 2000–2019 5Figure 1.4 Trends in UHC SCI by WHO region, 2000–2019 6Figure 1.5 Percentage of countries by UHC SCI group in 2019 and change in UHC SCI (index points) over 2000–2019,
by WHO region 6Figure 1.6 Correlation between gross national income per capita and UHC SCI, by World Bank income group, 2019 7Figure 1.7 Trend in UHC SCI by World Bank income group, 2000–2019 7Figure 1.8 Percentage of countries by UHC SCI group in 2019 and change in UHC SCI (index points) over 2000–2019, by World
Bank income group 8

Figure 1.9 Trends in UHC SCI by subcomponent, 2000–2019 8Figure 1.10 Percentage of countries by UHC SCI group in 2019 and change in UHC SCI (index points) over 2000–2019, for each component 9Figure 1.11 Relationship between UHC SCI and life expectancy at birth, by World Bank income group, 2019 10Figure 1.12 Trends in UHC SCI and life expectancy at birth, by World Bank income group, 2000–2019 10Figure 1.13 Percentage of UHC SCI sub-indicators for which primary data were available over the period 2015–2019 11Figure 1.14 Percentage of UHC SCI sub-indicators for which primary data were available over the period 2015–2019,
by subcomponent and World Bank income group 11Figure 1.15 RMNCH composite coverage index by multiple dimensions of inequality: latest situation (2010–2019) globally
and by World Bank country income group 12Figure 1.16 RMNCH composite coverage index by economic status and World Bank income group, change over time
(2000–2009 and 2010–2019) globally and by World Bank country income group 13Figure 1.17 Inequalities in unmet health care needs among those reporting a health need in the WHO Region of the Americas,
by country and income quintile, 2011–2019 14Figure 1.18 Inequalities in unmet health care needs among those reporting a health need in the WHO Region of the Americas,
by type of access barrier and income quintile, 2011–2019 14Figure 1.19 Inequalities in unmet health care needs among older adults reporting a health need in the WHO European Region,
by country and income quintile, latest year available (2020) 15Figure 1.20 Trends in prevalence of hypertension, proportion of diagnosed, treated, and controlled hypertension among
all hypertension, 2000–2019 17Figure 1.21 Relationship between prevalence of hypertension and proportion of controlled hypertension among
all hypertension, 2019 17Figure 1.22 Proposed standardized cascade for measuring effective coverage 18Figure 2.1 Financial hardship due to out of pocket health spending and lack of financial protection 22Figure 2.2 Trends in the incidence of catastrophic health spending as tracked by SDG indicator 3.8.2,10% threshold 25Figure 2.3 Average percentage point change in the incidence of catastrophic health spending, as tracked
by SDG indicator 3.8.2 25Figure 2.4 Average percentage point change in concentration of those further impoverished by out of pocket health spending among those living in
extreme poverty (below PPP $1.90) across countries in the United Nations African Region 27Figure 2.5 Composition of the population incurring financial hardship across a sample of 141 countries or territories 28Figure 2.6 Median proportion of the population spending more than 10% of household budget on health out of pocket across people living in households
with different age structures and country income groups and United Nations regions 29Figure 2.7 Median proportion of the population further impoverished into relative poverty across people living in households
with different age structures and across country income groups (most recent year available) 30Figure 3.1 Progress in service coverage (SDG indicator 3.8.1) and catastrophic health spending (SDG indicator 3.8.2,10%
threshold), 2000–2017 34Figure 3.2 Projected world population shortfall in reaching WHO triple billion targets over 2018–2025, based on pre-pandemic progress observed over 2000–2019 35Figure 3.3 Trends in UHC service coverage index (SDG indicator 3.8.1) and incidence of catastrophic health spending
(SDG indicator 3.8.2,10% threshold) by WHO region, 2000–2017 37Figure 3.4 Trends in UHC service coverage index (SDG indicator 3.8.1) and incidence of catastrophic health spending
(SDG indicator 3.8.2,10% threshold) for selected countries in the WHO Region of the Americas, 2000–2017 38Figure 3.5 Most recent UHC service coverage index score (SDG indicator 3.8.1) and incidence of catastrophic health spending
(SDG indicator 3.8.2,10% threshold) for countries in fragile and conflict-affected situations in the WHO Eastern Mediterranean Region, 2000–2017 39Figure 3.6 Trends in UHC service coverage index (SDG indicator 3.8.1) and the incidence of catastrophic health spending
(SDG indicator 3.8.2,10% threshold) for selected countries in the WHO Western Pacific Region, 2000–2017 40Figure 3.7 Trends in UHC service coverage index (SDG indicator 3.8.1) and incidence of catastrophic health spending
(SDG indicator 3.8.2,10% threshold) for selected countries in the WHO South-East Asia Region, 2000–2017 41Figure 4.1 UHC service coverage index, 2000–2019 and 2020 preliminary estimate 41Figure 4.2 Average percentage of countries reporting disruptions in essential health services across integrated service
delivery channels (n=112), January–March 2021 47Figure 4.3 Average percentage of countries reporting disruptions in essential health services across service areas,
January–March 2021 47

6
Figure 4.4 Average percentage of countries reporting disruptions across tracer service areas by WHO region, January– March 2021 48
Figure 4.5 Average percentage of countries reporting disruptions across tracer service areas by World Bank income group, January–March 2021 48
Figure 4.6 Average percentage of countries reporting disruptions in essential health services across service areas in the African Region, January–March 2021 49
Figure 4.7 Reasons for service disruptions in essential health services, January–March 2021 50Figure 4.8 Percentage of households who experienced decrease in income, multi-country evidence 53Figure 4.9 Main reason reported by household for not accessing health care when needed, multi-country evidence 54Figure 4.10 Primary health care (PHC) theory of change 56Figure A1.1 Calculation of UHC service coverage index 63
TablesTable ES.1 SDG and SDG-related indicators of financial hardship (millions of people), 2000–2017 viiTable 2.1 SDG-related indicators of impoverishing health spending, % of global population 26
BoxesBox 1.1 UHC service coverage index and life expectancy at birth 10Box 1.2 Understanding unmet needs and barriers to health care in the WHO Region of the Americas 14Box 1.3 Unmet health care needs among older persons in the WHO European Region 15Box 1.4 From hypertension prevalence to control: a pooled analysis of 1201 population-representative studies with 104 million participants 17Box 1.5 One example to address long-standing challenges in measuring effective coverage 18Box 2.1 Out of pocket health spending: definition 23Box 3.1 Projected progress towards reaching the UHC target of the WHO Thirteenth General Programme of Work 35Box 3.2 Making progress towards UHC in Thailand, Timor-Leste and Bangladesh 42Box 3.3 Making progress towards UHC in Eritrea 43Box 4.1 Maintaining quality essential health services during the COVID-19 pandemic in the WHO African Region 49Box 4.2 Maintaining essential health services in North Macedonia 51
Global Monitoring Report on Universal Health Coverage 2021 (as of 12 December, 2021)

i
Foreword
The right to health is well established in principle but not yet in practice.
The COVID-19 pandemic is the most disruptive event in a century with significant health, social and economic consequences, including shortening healthy life expectancy. It has also demonstrated that investing in universal health coverage (UHC) is the foundation of social, economic, and political stability and global health security.
This report is yet another reminder that our world is way off track to reach the Sustainable Development Goal target on UHC. In 2018, the World Health Assembly adopted the “triple billion” targets, including the target to see 1 billion more people benefiting from UHC by 2023. Even before the pandemic, the world was still 730 million people short of that target; now we estimate that shortfall to be between 800 and 840 million.
Only with a significant increase in ambition will we be able to change the trajectory to progress towards UHC in every country, built on the foundation of primary health care.
UHC is a political choice. At the United Nations General Assembly in September 2019, just a few months before the pandemic struck, all countries made that choice by endorsing the Political Declaration on Universal Health Coverage. The pandemic has only illustrated why that commitment is so important, and why, as the world responds to and recovers from the pandemic, we must all pursue it with more determination, innovation and collaboration.
COVID-19 is a devastating reminder that when health is at risk, everything is at risk, and that health is not a luxury, but a human right; not a cost, but an investment in sustainable development.
Dr Tedros Adhanom Ghebreyesus
Director-GeneralWorld Health Organization

ii
Joint statement
Global Monitoring Report on Universal Health Coverage 2021 (as of 12th December 2021)
Health is a fundamental human right, and universal health coverage (UHC) is critical for achieving that right. UHC represents the aspiration that good quality health services should be received by everyone, when and where needed, without incurring financial hardship. This ambition was clearly stated as a target in the United Nations Agenda 2030 for Sustainable Development and reaffirmed when world leaders endorsed the Political Declaration of the United Nations High-level Meeting on Universal Health Coverage in September 2019, the most comprehensive international health agreement in history. Beyond health and wellbeing, UHC also contributes to social inclusion, gender equality, poverty eradication, economic growth and human dignity.
This report reveals that pre-pandemic, gains in service coverage were substantial and driven by a massive scaling up of interventions to tackle communicable diseases, such as HIV, tuberculosis and malaria. And while impoverishing health spending has decreased in recent years, the number of people impoverished or further impoverished by out of pocket health spending has remained unacceptably high. These trends are exacerbated by substantial and persistent inequalities between and within countries.
The COVID-19 pandemic has subsequently led to significant disruptions in the delivery of essential health services. Rising poverty and shrinking incomes resulting from the global economic recession are likely to increase financial barriers to accessing care and financial hardship owing to out of pocket health spending for those seeking care, particularly among disadvantaged populations. The pre-COVID challenges, combined with additional difficulties arising from the pandemic, brings an even greater urgency to the quest for UHC.
Strengthening health systems based on strong primary health care (PHC) is crucial to building back better and accelerating progress towards UHC and health security. Effective implementation of PHC-oriented health systems enables greater equity and resilience, with greater potential to deliver high-quality, safe, comprehensive, integrated, accessible, available and affordable health care to everyone, everywhere, but most especially the most vulnerable. Substantial financial investments in PHC-oriented building blocks of health systems, particularly in the areas of greatest expenditure (health and care workforces, health infrastructure, medicines and other health products) should be supported, carefully planned and informed by health system performance data to address critical gaps, particularly in low-income and lower-middle income countries.
There is also an urgent need to remove remaining barriers in order to enable access to health care for all. Key barriers to UHC progress include poor infrastructure, with limited availability of basic amenities, weaknesses in the design of coverage policies to limit the harmful effects of out of pocket payments particularly for the poor and those with chronic health service needs, shortages and inefficient distribution of qualified health workers, prohibitively expensive good quality medicines and medical products, and lack of access to digital health and innovative technologies.
Maintaining progress towards UHC is likely to be challenging. UHC is first and foremost a political choice. It is also a moral imperative to guarantee the right to health for all. More than ever before, strong political commitment from world leaders and partners organizations is the essential ingredient for overcoming barriers
Tedros Adhanom GhebreyesusDirector-GeneralWorld Health Organization
Mamta MurthiVice President for Human DevelopmentWorld Bank Group
Mathias CormannSecretary-GeneralOrganisation for Economic Co-operation and Development

iii
The report was undertaken under the overall joint leadership of Samira Asma (Assistant Director-General for Data, Analytics and Delivery) and Zsuzsanna Jakab (Acting Assistant Director-General for Universal Health Coverage / Life Course). The production of the report was coordinated by Stephen Mac Feely (Department of Data and Analytics) and Joseph Kutzin (Department of Health Governance and Financing). Technical coordination and development of this report was led by Nelly Biondi, Gabriela Flores and Tessa Tan-Torres Edejer.
The following principal contributors made substantial contribution in the writing of the report: • Chapter 1. Nelly Biondi, Bochen Cao, Pierre-Antoine Dugue, Ahmadreza Hosseinpoor, Natalia Houghton, Katherine Kirkby,
Megumi Rosenberg and Anne Schlotheuber (WHO)• Chapter 2. Gabriela Flores, Tessa Tan-Torres Edejer and Joe Kutzin (WHO); Patrick Hoang-Vu Eozenou, Marc-François Smitz
(the World Bank)• Chapter 3. Nelly Biondi, Pierre-Antoine Dugue, Gabriela Flores, Humphrey Cyprian Karamagi, Rakesh Mani Rastogi (WHO)• Chapter 4. Ammar Aftab, Shannon Barkley, Melanie Bertram, Nelly Biondi, Abril Paola Campos, Pierre-Antoine Dugue, Gabriela Flores,
Rouselle Lavado, Rakesh Mani Rastogi, Susan Sparkes, Regina Titi-Ofei, Ardita Tahirukaj (WHO ; Sven Neelsen, Jewelwayne Salcedo, Ajay Tandon (the World Bank)
The extended team, external contributors and peer reviewers to the financial protection discussions are listed in the thematic report on financial protection released at the same time as this report. Their substantial involvement contributed to improving the quality and content of Chapter 2 and Chapter 4. The World Bank would like to thank Juan Pablo Uribe, Feng Zhao, Christoph Kurowski, Magnus Lindelow and Toomas Palu for their oversight and suggestions on financial protection leading to improvements in Chapter 2 and related parts of Chapter 4.
WHO wishes to thank the following WHO technical staff and consultants at headquarters and regional offices who reviewed and provided inputs into the development of this report and provided support during the country consultation process on SDG 3.8 indicators: Deena Alasfoor, Jotheeswaran Amuthavalli Thiyagarajan, Sarah Louise Barber, Michel Beusenberg, Mathieu Boniol, Joseph Cabore, Jorge Castro, Somnath Chatterji, Camilo Cid, A’isha Alison Louise Commar, Melanie Cowan, Peter Cowley, Adrienne Cox, Stephania Davia, Amalia Del Riego, Valeria De Oliveira Cruz, Theresa Diaz, Henry Doctor, Benson Droti, Tarun Dua, Pierre-Antoine Dugue, Laure Dumolard, Sall Farba Lamine, Diana Estevez Fernandez, Marta Gacic-Dobo, Jun Gao, Sebastian Garcia Saiso, Philippe Glaziou, Ann-Lise Guisset, Jessica Chi Ying Ho, Dirk Horemans, Natalia Houghton, Raymond Hutubessy, Richard Paul Johnston, Hyppolite Kalambay Ntembwa, Muhammad Kanji, Humphrey Cyprian Karamagi, Gael Kernen, Faraz Khalid, Katherine Kirkby, Kathleen Krupinski, Mark Landry, Daniel Lins Menucci, Wahyu Retno Mahanani, Lindiwe Makubalo, Rakesh Mani Rastogi, Awad Mataria, Ann-Beth Moller, William Msemburi, Sheraz Muhammad, Diane Muhongerwa Karenzi, Juliet Nabyonga, Tapas Sadasivan Nair, Benjamin Nganda, Abdisalan Noor, Thomas O’Connell, Kathryn O’Neill, Seydiou Ouaritio Coulibaly, Rushita Rajbhandary, Arash Rashidian, Bastien Renault, Teri Renolds, Leanne Margaret Riley, Briana Rivas-Morello, Alice Robson, Megumi Rosenberg, Ravi Santhana Gopala Krishnan, Lale Say, Anne Schlotheuber, Gerard Schmets, Patricia Soliz, Kathleen Louise Strong, Yuka Sumi, Ardita Tahirukaj, Tova Tampe, Sarah Thomson, Hazim Timimi, Regina Titi-Ofei, Kavitha Viswanathan, Hui Wang, Ding Wang and Tomas Zapata.
In addition, WHO thanks the following external partners and peer reviewers: Francesca Colombo, Chris James, Caroline Berchet (OECD); Juliana Daher, Mary Mahy (UNAIDS); Jennifer Requejo, Liliana Carjaval (UNICEF); Vladimira Kantorova, Mark Wheldon, Philipp Ueffing, Joseph Molitoris (UN DESA).
WHO also would like to thank all ministry of health and national statistical office focal points for reviewing figures and providing feedback during the country consultation process on SDG 3.8 indicators.
Overall project management was done by Nelly Biondi with support from Diana Estevez Fernandez.
Acknowledgements

iv
Global Monitoring Report on Universal Health Coverage 2021 (as of 12th December 2021)
GBD Global Burden of Diseases, Injuries and Risk Factors StudyGDP gross domestic productIHME Institute for Health Metrics and EvaluationILO International Labour OrganizationHIV human immunodeficiency virusOECD Organisation for Economic Co-operation and DevelopmentRMNCH reproductive, maternal, newborn and child healthSCI service coverage indexSDG Sustainable Development GoalUHC universal health coverageUNICEF United Nations Children’s FundUSAID United States Agency for International DevelopmentWHO World Health Organization
Abbreviations

v
Universal health coverage (UHC) means that everyone receives quality health services, when and where they need them, without incurring financial hardship.
Before COVID-19 struck, the world was far short of reaching the Sustainable Goal (SDG) 3.8 targets and the goal of 1 billion more people benefiting from UHC by 2023.
Since 2000, service coverage has increased as average income has grown, but at an undue cost to many people (Figure ES.1). Trajectories on the path to UHC, as tracked by related SDG indicators on service coverage and financial hardship, vary substantially across WHO regions and countries. Country-level analysis of coverage policy is needed to identify gaps in health coverage, understand their causes and develop appropriate policy responses.
2000
2005
2010
2017
2015
8
9
10
11
12
13
14
15
16
30 40 50 60 70 80 90 100
Cata
stro
phic
out-o
f-poc
ket
heal
th s
pend
ing
(SDG
3.8
.2, 1
0%
thre
shol
d)
UHC service coverage index (SDG 3.8.1)
An increase in service coverage is better
Less
peo
ple
wit
h ca
tast
roph
ic h
ealt
h sp
endi
ng is
bet
ter
Figure ES.1 Progress in service coverage (SDG indicator 3.8.1) and catastrophic health spending (SDG indicator 3.8.2,10% threshold), 2000–2017
Executive summary
Note: The vertical axis corresponds to the global incidence rate of catastrophic health spending defined as the population-weighted proportion of the population with household out of pocket health expenditure exceeding 10% of household budget (13.2% in 2017). The horizontal axis corresponds to the global population-weighted average UHC service coverage index (65) in 2017. Source: SDG indicator 3.8.1: WHO global service coverage database, 2021 update; SDG indicator 3.8.2: WHO and World Bank global financial protection database, 2021 update.
Without accounting for the impact of the COVID-19 pandemic, at current rates of progress for both service coverage and financial hardship, only about an additional 270 million people were projected to be covered by essential health services and not experiencing catastrophic out of pocket health spending by 2023 – that is, a shortfall of about 730 million people.
Service coverage was improving but not fast enough.
SDG indicator 3.8.1 on service coverage, as measured by the UHC service coverage index (SCI), improved globally from a population-weighted average of 45 in 2000 to 68 in 2019. The infectious disease sub-index improved the fastest with a pronounced acceleration around 2005, followed by the reproductive, maternal, newborn and child health (RMNCH) sub-index. Conversely, the noncommunicable diseases and the service capacity and access sub-indexes experienced slower gains. However, the progress observed over the period 2000–2019 was not sufficient to achieve a minimum of 80 by 2030.

vi
Global Monitoring Report on Universal Health Coverage 2021
Less than 2020–3940–5960–7980 or moreData not availableNot applicable
Less than 1010–1920–2930 or moreData not availableNot applicable
Figure ES.2 Level of and change in UHC SCI (in index points) by country, 2000–2019
a. UHC SCI, 2019
b. Change in UHC SCI (in index points), 2000–2019
Source: WHO global service coverage database, 2021.
Average UHC SCI values were highest in the WHO Western Pacific Region (80), European Region (79) and Region of the Americas (77), and lowest in the African Region (46) (Figure ES.2a). Trends in the UHC SCI between 2000 and 2019 showed improvements across all WHO regions, with the South-East Asia Region and Western Pacific Region recording the largest gains (over 30 index points) (Figure ES.2b).
The strong positive relationship between UHC SCI and gross national income per capita (current US$) suggests that service coverage might be driven by income growth. Low-income countries had lower average index scores compared to high-income countries (42 versus 83) in 2019, though the pace of progress was faster. In other words, service use increases when people have more money and face less severe financial barriers to seek care.
vii
Note:The relative poverty line is defined as 60% of the median per capita consumption or income in each country. Source: WHO and World Bank, 2021: Global monitoring report on financial protection in health 2021.
The expansion of service coverage, along with other factors, has accompanied the significant health gains made over the last two decades. UHC SCI increased from 45 in 2000 to 68 in 2019, while the global average life expectancy at birth increased from 66.8 years to 73.3 years over the same period. Between 2000 and 2019, the African Region had the fastest growth in both measures with an increase of 22 index points in the UHC SCI and a gain of 11.7 years of life expectancy.
Trends in catastrophic health spending were already worsening pre-pandemic.
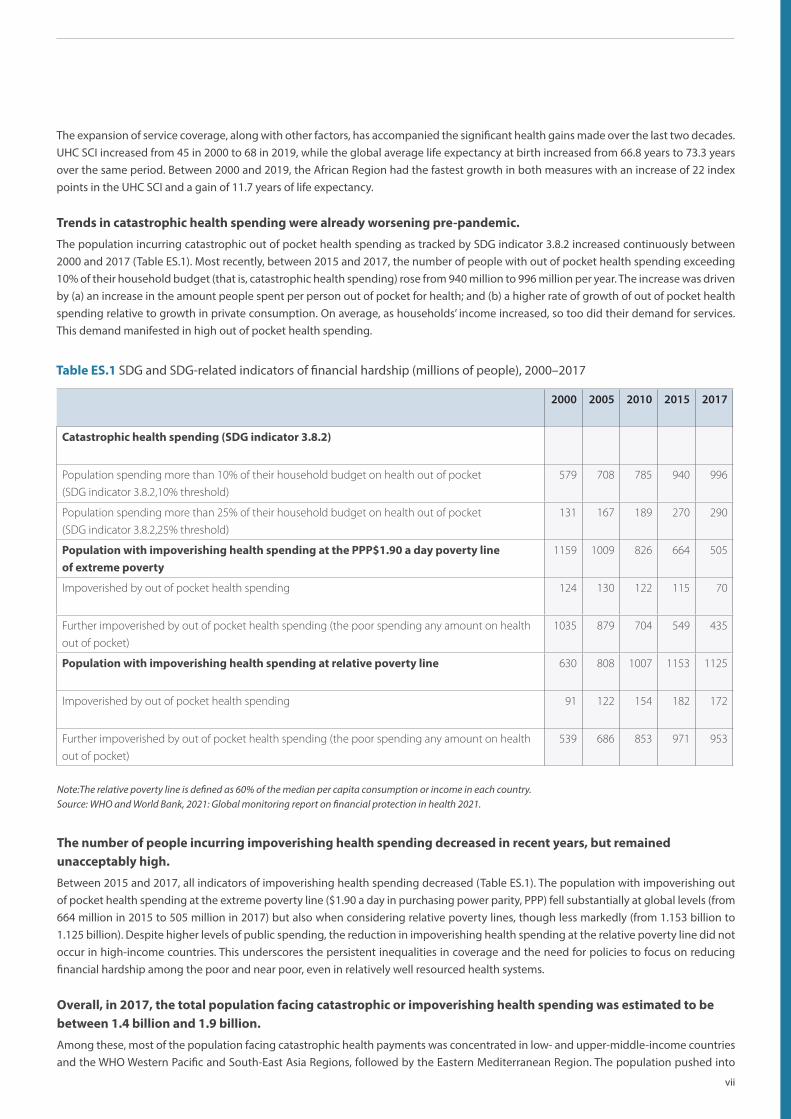
The population incurring catastrophic out of pocket health spending as tracked by SDG indicator 3.8.2 increased continuously between 2000 and 2017 (Table ES.1). Most recently, between 2015 and 2017, the number of people with out of pocket health spending exceeding 10% of their household budget (that is, catastrophic health spending) rose from 940 million to 996 million per year. The increase was driven by (a) an increase in the amount people spent per person out of pocket for health; and (b) a higher rate of growth of out of pocket health spending relative to growth in private consumption. On average, as households’ income increased, so too did their demand for services. This demand manifested in high out of pocket health spending.
Table ES.1 SDG and SDG-related indicators of financial hardship (millions of people), 2000–2017
The number of people incurring impoverishing health spending decreased in recent years, but remained unacceptably high.
Between 2015 and 2017, all indicators of impoverishing health spending decreased (Table ES.1). The population with impoverishing out of pocket health spending at the extreme poverty line ($1.90 a day in purchasing power parity, PPP) fell substantially at global levels (from 664 million in 2015 to 505 million in 2017) but also when considering relative poverty lines, though less markedly (from 1.153 billion to 1.125 billion). Despite higher levels of public spending, the reduction in impoverishing health spending at the relative poverty line did not occur in high-income countries. This underscores the persistent inequalities in coverage and the need for policies to focus on reducing financial hardship among the poor and near poor, even in relatively well resourced health systems.
Overall, in 2017, the total population facing catastrophic or impoverishing health spending was estimated to be between 1.4 billion and 1.9 billion.
Among these, most of the population facing catastrophic health payments was concentrated in low- and upper-middle-income countries and the WHO Western Pacific and South-East Asia Regions, followed by the Eastern Mediterranean Region. The population pushed into
2000 2005 2010 2015 2017
Catastrophic health spending (SDG indicator 3.8.2)
Population spending more than 10% of their household budget on health out of pocket
(SDG indicator 3.8.2,10% threshold)
579 708 785 940 996
Population spending more than 25% of their household budget on health out of pocket
(SDG indicator 3.8.2,25% threshold)
131 167 189 270 290
Population with impoverishing health spending at the PPP$1.90 a day poverty line of extreme poverty
1159 1009 826 664 505
Impoverished by out of pocket health spending 124 130 122 115 70
Further impoverished by out of pocket health spending (the poor spending any amount on health
out of pocket)
1035 879 704 549 435
Population with impoverishing health spending at relative poverty line 630 808 1007 1153 1125
Impoverished by out of pocket health spending 91 122 154 182 172
Further impoverished by out of pocket health spending (the poor spending any amount on health
out of pocket)
539 686 853 971 953

viii
Global Monitoring Report on Universal Health Coverage 2021
Source: WHO, Second round of national pulse survey on continuity of essential health services during the COVID-19 pandemic.
Figure ES.3 Average percentage of countries reporting disruptions in essential health services across integrated service delivery channels (n=112), January–March 2021
22%
29%
14%
24%
19%
9%
13%
4%
9%
6%
5%
6%
3%
8%
3%
36%
48%
21%
41%
28%
0% 10% 20% 30% 40% 50% 60% 70% 80% 90% 100%
AVERAGE DISRUPTION
Primary care
Emergency, critical and operative care
Rehabilitative, palliative and long-term care
Auxiliary services
Percentage of countries
5–5% disrupted 26–50% disrupted More than 50% disrupted
extreme poverty (at $1.90) was concentrated in low- and lower-middle-income countries and the African, Western Pacific and South-East Asia Regions. Based on a relative poverty line definition, however, impoverishing health expenditure was more concentrated in upper-middle-income countries and in the Western Pacific, African and Eastern Mediterranean Regions. Across regions, financial hardship was also increasing. Between 2000 and 2017, the incidence of catastrophic health spending was on the rise (except in the Region of the Americas since 2005) and so was the proportion of the population impoverished and further impoverished into relative poverty by out of pocket health spending.
Persistent inequalities in service coverage and financial hardship existed across households within countries.
For instance, coverage of RMNCH interventions tended to be highest among more advantaged groups, such as the richest, the most educated, and those living in urban areas, especially in low-income countries. People living in poor households and in households with older members (those aged 60 and older) were more likely to face financial hardship as a result of paying out of pocket for health care.Monitoring health inequalities is essential to identify and track disadvantaged populations in order to provide decision-makers with an evidence base to formulate more equity-oriented policies, programmes and practices. For example, in order to improve the lives of older people, their families and communities, making progress towards UHC will require extension and improved targeting of benefits to reduce financial hardship and to meet the health needs of people living in older or multigenerational households. To substantially reduce financial hardship, it is critical to protect poor people, and those with chronic health care needs, from out of pocket health spending, such as through the effective implementation of exemption mechanisms and related pro-poor health financing measures.
The COVID-19 pandemic is likely to halt the progress made towards UHC over the past 20 years.
Health systems are facing challenges to ensure the continuity of essential health services.
Additional patient load caused by the COVID-19 pandemic has strained health systems and threatened their ability to provide all essential health services. During the first quarter of 2021, disruptions to essential health services were still widespread across the globe and reported across all service delivery channels and programme-specific areas. Primary care as well as rehabilitative, palliative and long-term care service delivery channels were most affected (Figure ES.3). High-income countries reported fewer service disruptions compared with countries in other income groups. The magnitude and extent of those disruptions decreased in the first quarter of 2021, with countries reporting that, on average, only one third of services were disrupted compared with just over half in the second semester of 2020. Despite a reduction in the magnitude, the continuing disruption may be much more prolonged than the major initial shock, and therefore leading to a stagnation or even a decrease in service coverage.

ix
Figure ES.4 Main reason reported by household for not accessing health care when needed, multi-country evidence
Note: upper-middle-income countries n=1 to 13; lower-middle-income countries n=2 to 17; lower-income countries n=3 to 12.. Data collected between April and August 2020.Source: Author’s calculations using data from the World Bank High Frequency Survey (2021). Data collected between April 2020 and August 2020.
65.6
30.6
17.4
31.4
8
30.4
27.2
25.4
19.1
20.9
21.9
21
8.1
18.3
33.3
22.3
0% 10% 20% 30% 40% 50% 60% 70% 80% 90% 100%
Low income
Lower middle income
Upper middle income
All
Share of households not able to access needed health care
Coun
try in
com
e gr
oup
Financial reasons COVID-19 reasons Supply reasons Other reasons
Strengthening health systems based on primary health care-oriented systems is crucial to build back better and accelerate progress towards UHC and health security.
Effective PHC-oriented systems are the bedrock of equitable and resilient health systems that deliver high-quality, safe, comprehensive, integrated, accessible, available and affordable health care to everyone, everywhere, especially the most vulnerable. Building such health systems is the most practical, efficient and effective first step for countries working to deliver UHC.
Primary health care must feature in health system efforts to build back better, including through (a) action on all components of multisectoral policy and action to address the determinants of health, integrated health services emphasizing primary care and essential public health functions, and empowered people and communities; and (b) critical investments in the health and care workforce, physical infrastructure, and medicine and other health products. Investments in these areas should be supported and carefully planned, informed by health system performance information to address critical gaps, particularly in low-income and lower-middle-income countries.The bulk of the required investments and implementation will come from domestic public resources. The degree to which those resources leads to an effective PHC-oriented health system depends on policy design and implementation. International assistance flows, including global health initiatives, will continue to contribute. To advance the related objectives of health system strengthening (based on PHC) and global health security, initiatives addressing both must be genuinely linked. This need is particularly acute in conflict-affected and fragile settings where numerous external partners play a larger role – requiring renewed commitment to coordinated responses aligned behind the national health sector policies, strategies and plans.
People are struggling to access care due to financial constraints, and financial hardship is likely to worsen further among those seeking care as poverty grows and income falls.
Lack of data currently precludes a detailed and comprehensive assessment of the impact of COVID-19 on financial protection; nevertheless, the combined macroecononomic, fiscal, and health impacts of COVID-19 point towards the strong likelihood of a significant worsening of financial protection globally – higher rates of foregone care due to financial barriers as poverty grows (Figure ES.4), and, for those seeking care, a higher incidence of catastrophic health spending and worsening impoverishment due to out of pocket health spending – resulting from the pandemic, in particular among lower-income households in all countries. This worsening of financial protection will probably be sustained in the medium term unless proactive policy efforts are made, for example, pro-poor focused increases in public spending to reduce out of pocket spending on health, enhanced social protection support, removal of co-payments and other fees at the time and place of seeking care, cash transfer payments to enable poor and vulnerable households to meet their basic needs (including for health services), expansion in coverage and strengthening of primary health care – not just to recover but also to accelerate progress towards UHC.

x
Global Monitoring Report on Universal Health Coverage 2021
Good-quality, timely and disaggregated data to track progress towards UHC, and the policies that support it, require investment and political commitment to enhance country health information systems.
COVID-19 has underscored the need to develop rapid data collection approaches, track barriers to access, disaggregate health data and complement traditional household surveys with nimbler forms of monitoring using other modalities such as mobile phone and social media surveys to track both service coverage and financial hardship. It is also critical to monitor policies introduced to safeguard access to quality health services and their implementation, particularly those related to COVID-19.
1
The goal of universal health coverage (UHC) is to ensure that all people receive the health services they need, including services designed to promote better health, prevent illness, and provide treatment, rehabilitation and palliative care of sufficient quality to be effective, while at the same time ensuring that the use of those services does not expose the user to financial hardship.
Monitoring trends and patterns in UHC across countries is critical to ensure equitable, affordable access to effective health services that leave no one behind. The global health agenda calls for all stakeholders, including international agencies and civil society groups, to better coordinate and support country progress towards the 2030 Sustainable Development Goal (SDG) health targets.
This monitoring report analyses progress towards and impediments to achieving UHC. The framework used in this report builds on two SDG UHC indicators.• 3.8.1 captures the population service coverage dimension of UHC (that everyone – irrespective of their living standards – should
receive the health services they need). • 3.8.2 captures the financial protection dimension of UHC through measurement of financial hardship due to out of pocket health
payments made when using health services.
In early 2021, the World Health Organization WHO collated data to calculate both SDG indicator 3.8.1 and indicator 3.8.2. A formal country consultation was conducted between mid-March and the end of June 2021 with nominated focal points from national governments and national statistical offices to review inputs and the calculation of indicators.
Tracking both indicators jointly is a minimum requirement to track progress towards UHC.
Chapter 1 provides an updated analysis of SDG indicator 3.8.1 as measured by the UHC service coverage index (SCI). As co-custodians, Chapter 2 is co-authored by WHO and the World Bank and draws on a global thematic report on financial protection prepared jointly by the two agencies and published at the same time as the present report (1). It reports on level of and trends in SDG-related indicators of financial protection – specifically the SDG indicator 3.8.2 and other indicators of impoverishing health spending. Chapter 3 examines the joint progress in service coverage and financial hardship at global, regional and country levels. Chapter 4 describes the extent and magnitude of disruptions to essential health services and the potential worsening of financial protection that has resulted from the COVID-19 pandemic. This chapter further highlights that strong resilient health systems based on primary health care are critical to make progress towards UHC and effectively respond to COVID-19 or similar threats.
Introduction

2
Global Monitoring Report on Universal Health Coverage 2021

3
Monitoring SDG indicator 3.8.1: coverage of essential health services
1

4
Global Monitoring Report on Universal Health Coverage 2021
1 – Monitoring SDG indicator 3.8.1: coverage of essential health services
The goal of the service coverage dimension of universal health coverage (UHC) is that people in need of promotive, preventive, curative, rehabilitative or palliative health services receive them, and that the services received are of sufficient quality to achieve potential health gains. Resource constraints mean that countries cannot provide all health services, but all countries should be able to ensure coverage of essential health services. This chapter presents the results for an index that aims to summarize the coverage of essential health services with a single number, provides more detailed analyses of levels and trends in a subset of service coverage indicators by key dimensions of inequality, and finally summarizes limitations and discusses future developments in the current measures of Sustainable Development Goal (SDG) indicator 3.8.1.
1.1 Trends in UHC service coverage index
The construction of the UHC service coverage index (SCI) to monitor SDG indicator 3.8.1 is based on 14 indicators extracted from various sources and organized into four broad categories of service coverage, namely reproductive, maternal, newborn and child health (RMNCH), infectious diseases, noncommunicable diseases, and service capacity and access. These indicators are meant to be indicative of service coverage and should not be interpreted as a complete or exhaustive list of the health services or interventions that are required to achieve UHC (2) (Annex 1).
In 2019, the UHC SCI ranged from 27 to 89 across the 194 World Health Organization (WHO) Member States (Figure 1.1 and Annex 3). Of these, 31 had very high service coverage (index of 80 and above), 93 had high coverage (index between 60 and 79), 54 had medium coverage (index between 40 and 59) and 16 had low coverage (index between 20 and 39). No country had very low coverage (index below 20).
Less than 2020-3940-5960-7980 or moreData not availableNot applicable
Figure 1.1 UHC SCI by country, 2019
Source: WHO global service coverage database, 2021.

5
Over the past two decades, substantial progress has been made worldwide in the UHC SCI, especially in Asia and Africa (Figure 1.2 and Annex 4). In 2000, 16 countries were in the very low service coverage group but from 2010 no country was in the lowest group. On the other side of the scale, only one country had an index greater than 80 in 2000 compared to 31 in 2019 (Figure 1.2 and Figure 1.3).
16 5
5556
3622 18 16
7257
6257 56 54
5066
7689 91 93
1 10 20 26 29 31
2000 2005 2010 2015 2017 2019
Num
ber
of co
untri
es
Below 20 20–39 40–59 60–79 80 or more
Less than 1010–1920–2930 or moreData not availableNot applicable
Figure 1.3 Number of countries by UHC SCI group, 2000–2019
Figure 1.2 Change in UHC SCI (in index points), 2000–2019
Source: WHO global service coverage database, 2021.
Source: WHO global service coverage database, 2021.

6
Global Monitoring Report on Universal Health Coverage 2021
0
20
40
60
80
100
2000 2005 2010 2015 2017 2019
UHC
SCI
Africa AmericasSouth-East Asia EuropeEastern Mediterranean Western Pacific
Figure 1.4 Trends in UHC SCI by WHO region, 2000–2019
Note: The dark bold trend line corresponds to the global index. Source: WHO global service coverage database, 2021.
The global population-weighted UHC SCI (3) was 68 in 2019, up from 45 in 2000 (Figure 1.4, Annex 5 and Annex 6). SCI average values were highest in the Western Pacific Region, European Region and Region of the Americas (80, 79 and 77 respectively) and lowest in the African Region (46). SCI trends between 2000 and 2019 show improvements across all WHO regions, although to varying degrees. The South-East Asia Region and Western Pacific Region recorded the largest absolute gains with an increase of about 30 points between 2000 to 2019, driven by increases in the UHC SCI in countries with large populations such as China, India and Indonesia. During the same period, the Region of the Americas and the European Region recorded the lowest absolute gains of 12 and 16 points respectively. A likely explanation is that as service coverage scales up, slower SCI growth is inevitable and greater efforts are required in order to reduce inequalities in accessing and using essential health services. The progress observed globally and across all regions over the period 2000–2019 was not sufficient to achieve a minimum UHC SCI of 80 by 2030.
Analyses at country level indicate that regional performances in 2019 and progress over 2000–2019 mask considerable variations across countries within the same region. For example, while the Western Pacific Region had an overall index of about 80, more than half of the countries in that region (14 countries out of 27) had an index value lower than 60; these were mainly Pacific island States (Figure 1.5). Similarly, while the Region of the Americas as a whole only recorded an increase of 12 index points compared with 2000, more than 60% of countries (22 countries out of 35) enjoyed an increase in their index values in excess of 20 index points.
Figure 1.5 Percentage of countries by UHC SCI group in 2019 and change in UHC SCI (index points) over 2000–2019, by WHO region
Africa
Americas
South-East Asia
Europe
Eastern Mediterranean
Western Pacific
9%
36%
29%
22%
30%
29%
9%
40%
33%
41%
64%
51%
45%
23%
33%
26%
6%
11%
45%
2%
5%
11%
0% 20% 40% 60% 80% 100%
Less than 10 10–19 20–29 30 or more
28%
10%
4%
57%
6%
36%
38%
48%
15%
86%
55%
60%
52%
26%
9%
9%
40%
22%
0%20%40%60%80%100%
20–39 40–59 60–79 80 or more
Source: WHO global service coverage database, 2021.
a. UHC SCI, 2019 b. change in UHC SCI (in index points), 2000-2019

7
20
30
40
50
60
70
80
90
100
2 3 4 5
UHC
SCI
Log gross national income per capita (current US$)
High Upper-middle Lower-middle Low
Note: Gross national income per capita is calculated using the Atlas method (current US$).Source: WHO global service coverage database, 2021.
Figure 1.6 Correlation between gross national income per capita and UHC SCI, by World Bank income group, 2019
The strong correlation between UHC SCI and gross national income per capita (current US$) in log scale (r = 0.8) suggests there is a close relationship between income and the coverage of essential health services (Figure 1.6). Disaggregation of UHC SCI by World Bank income groups shows UHC SCI average scores for each income group ranked in order of income level grouping (Figure 1.7 and Annex 6). The average score observed in low-income countries (approximately 40) was half that of the average score observed in high-income countries (approximately 80). Improved index values were observed since 2000 across all groups, although the reclassification of Indonesia and India from low to lower-middle income in 2003 and 2007 respectively, and the reclassification of China from lower-middle to upper-middle income in 2010, resulted in some recalibrations to the index between 2000 and 2010. The high-income group saw its average index value increased by only 9 index points between 2000 to 2019, but this group generally had the highest initial value of UHC SCI in 2000 (more than 70) and thus had less room for significant additional progress. On the other hand, the low-income group experienced the fastest progress during this period, with an absolute gain of 15 index points.
Note: The dark bold trend line corresponds to the global index. Source: WHO global service coverage database, 2021.
0
10
20
30
40
50
60
70
80
90
100
2000 2005 2010 2015 2017 2019
UHC
SCI
High Upper-middle Lower-middle Low
Figure 1.7 Trend in UHC SCI by World Bank income group, 2000–2019

8
Global Monitoring Report on Universal Health Coverage 2021
Figure 1.9 Trends in UHC SCI by subcomponent, 2000–2019
High income
Upper-middle income
Lower-middle income
Lower income
45%
27%
11%
37%
41%
26%
31%
16%
30%
47%
58%
3%
3%
15%
11%
0% 20% 40% 60% 80% 100%
Less than 10 10-19 20-29 30 or more
2%
23%
3%
14%
26%
50%
26%
84%
66%
27%
71%
3%
6%
0%20%40%60%80%100%
20-39 40-59 60-79 80 or more
Source: WHO global service coverage database, 2021.
Note: The dark bold trend line corresponds to the overall index.Source: WHO global service coverage database, 2021.
Although the low-income group reported the lowest average score, more than 20% of countries classified within this group (17 countries out of 64) reached an index value in excess of 60 by 2019 (Figure 1.8). Similarly, although the high-income group recorded the lowest absolute gain since 2000, approximately 20% of countries in this group (seven countries out of 38) recorded increases in their UHC SCI of more than 20 index points.
Figure 1.8 Percentage of countries by UHC SCI group in 2019 and change in UHC SCI (index points) over 2000–2019, by World Bank income group
a. UHC SCI, 2019 b. Change in UHC SCI over 2000–2019
Looking at the four UHC SCI subcomponents, the infectious diseases sub-index improved the fastest between 2000 and 2019 (from 22 to 70) with a pronounced acceleration around 2005 due to the rapid scale-up of HIV, tuberculosis and malaria services (4–7) (Figure 1.9). The RMNCH sub-index also witnessed significant progress, increasing from 68 to 76 over the same period (8, 9). Conversely, noncommunicable diseases and service capacity and access components showed slower gains.
0
10
20
30
40
50
60
70
80
90
100
2000 2005 2010 2015 2017 2019
UHC
SCI
RMNCH Infectious diseasesNoncommunicable diseases Service capacity and access

9
RMNCH
Infectious diseases
Noncommunicable diseases
Service capacity and access
66%
2%
84%
91%
24%
7%
15%
8%
6%
15%
2%
1%
4%
76%
0% 20% 40% 60% 80% 100%
Less than 10 10–19 20–29 30 or more
1%
1%
9%
2%
9%
4%
18%
15%
21%
45%
11%
37%
40%
49%
22%
46%
30%
1%
40%
0%20%40%60%80%100%
Below 20 20–39 40–59 60–79 80 or more
Source: WHO global service coverage database, 2021.
Figure 1.10 Percentage of countries by UHC SCI group in 2019 and change in UHC SCI (index points) over 2000–2019, for each component
a. UHC SCI, 2019 b. Change in UHC SCI over 2000–2019
Sub-indices for infectious diseases and RMNCH reached index values in excess of 60 for most countries by 2019. Countries with an index lower than 60 were mainly low- and lower-middle-income countries located in the African, South-East Asia and Eastern Mediterranean Regions (Figure 1.10). The noncommunicable diseases sub-index, which currently includes prevalence-based proxy indicators for the treatment of hypertension and diabetes and non-use of tobacco (Box 1.1), ranged mainly between 40 and 79 and was evenly distributed across income groups and regions (10, 11). The service capacity and access sub-index aggregated to the global level masks wide disparities at country level. About 40% of all countries (53 countries) had a sub-index value lower than 60, and 9% had values lower than 20 (18 countries). With the exception of the infectious diseases sub-index, which increased in most countries by more than 30 index points, few countries saw any of their sub-indices increase by more than 10 index points.

10
Global Monitoring Report on Universal Health Coverage 2021
Box 1.1 UHC service coverage index and life expectancy at birth
The UHC SCI is highly correlated with life expectancy at birth (r = 0.9), reflecting the potential impact of high coverage of essential health services, among many other factors, on major health outcomes. High-income countries tend to have much higher UHC SCI and life expectancy at birth than lower-income countries. A difference in life expectancy of approximately 20 years is evident when comparing countries in the top 10% of UHC SCI (median UHC SCI: 86, median life expectancy at birth: 82.4 years) with those in the bottom 10% (median UHC SCI: 38, median life expectancy at birth: 62.9 years) for the year 2019 (Figure 1.11).
Significant health gains accompanied improvements in worldwide service coverage over the last two decades. Global average life expectancy at birth increased from 66.8 years in 2000 to 73.3 years in 2019 (12). The UHC SCI increased from 45 to 68 over the same period. Between 2000 and 2019, the African Region had the fastest growth in both measures with an increase of 22 index points in the UHC SCI and a gain of 11.7 years of life expectancy (Figure 1.12).
Figure 1.11 Relationship between UHC SCI and life expectancy at birth, by World Bank income group, 2019
505560657075808590
0 10 20 30 40 50 60 70 80 90 100Life
exp
ecta
ncy
at b
irth
(in y
ears
)
High Upper-middle Lower-middle Low
Source: WHO global service coverage database, 2021, and WHO global health estimates, 2020.
Figure 1.12 Trends in UHC SCI and life expectancy at birth, by World Bank income group, 2000–2019
50
55
60
65
70
75
80
0 10 20 30 40 50 60 70 80 90
Life
exp
ecta
ncy
at b
irth
(in ye
ars)
UHC SCI
Africa AmericasSouth-East Asia EuropeEastern Mediterranean Western Pacific
Source: WHO global service coverage database, 2021, and WHO global health estimates, 2020.
These results suggest that improving UHC could reduce inequalities in life expectancy, although mortality often results from a combination of factors, many of which lie outside the scope of the health system. Comprehensive coverage of essential health care, especially in low-resource settings where socioeconomic factors lag behind those of wealthier nations, could play a key role in achieving improved global health outcomes.
1.2 Primary data availability for indicators used to build UHC service coverage index The values of the indicators used to compile the UHC SCI for monitoring SDG indicator 3.8.1 are derived from existing WHO and United Nations agency modelled estimates, country reported data, and published results from household surveys. The availability of primary data was assessed for each country and all UHC SCI sub-indicators. For more details on the primary data sources used and the availability for each indicator, see Annex 2.
Countries had at least one primary data point over the period 2015–2019 for an average of 67% of all UHC SCI sub-indicators (Figure 1.13). Primary data availability varied across countries but was generally high at around 65–67%, except for the South-East Asia and African Regions, where availability was generally higher, at around 78% and 70% respectively, and the Western Pacific Region, where this percentage was lower at 63%. This result can be explained by the fact that the UHC SCI is primarily based on indicators that are measured in internationally funded household survey programmes such as the United States Agency for International Development (USAID) Demographic and Health Surveys or the United Nations Children’s Fund (UNICEF) Multiple Indicator Cluster Surveys. Twenty-nine countries had primary data for less than 50% of indicators, of which many were small island developing States, micro States or conflict-affected countries (13).

11
Figure 1.13 Percentage of UHC SCI sub-indicators for which primary data were available over the period 2015–2019
Less than 4040–5960–7980 or moreData not availableNot applicable
Source: WHO global service coverage database, 2021.
The lack of recent primary data on noncommunicable disease indicators is a major obstacle in increasing the overall availability of primary data used to calculate the index. Primary data were available for only 42% of noncommunicable disease indicators at the global level compared with the other subcomponents (Figure 1.14). Whereas primary data availability for noncommunicable diseases and service capacity and access indicators was lower in low-income countries compared with high-income countries, the opposite was observed for RMNCH and infectious disease indicators. RMNCH indicators, such as demand for family planning satisfied by modern methods, antenatal care coverage (four or more visits), or care-seeking behaviour for suspected pneumonia, are not typically measured in high-income countries with well established health care systems, whereas these data are more closely monitored in low-income countries through national surveys, censuses and household surveys such as Demographic and Health Surveys or Multiple Indicator Cluster Surveys.
Figure 1.14 Percentage of UHC SCI sub-indicators for which primary data were available over the period 2015–2019, by subcomponent and World Bank income group
0102030405060708090
100
RMNCH Infectious diseases Noncommunicablediseases
Service capacity andaccess
High Upper-middle Lower-middle Low
Source: WHO global service coverage database, 2021.

12
Global Monitoring Report on Universal Health Coverage 2021
Figure 1.15 RMNCH composite coverage index by multiple dimensions of inequality: latest situation (2010–2019) globally and by World Bank country income group
Note: Circles indicate median values across countries – one circle for each subgroup. Source: WHO Health Equity Monitor database, 2021.
The use of WHO and United Nations agency modelled estimates as well as data imputation methods is required to fill data gaps (Annex 1 and Annex 2), overcome measurement challenges and ensure sufficient temporal and cross-country comparability in reporting.
1.3 Inequalities in service coverage and unmet health care needs
1.3.1 Inequalities in the coverage of reproductive, maternal, newborn and child health services using the RMNCH composite index
The purpose of UHC is to ensure that all people have accessible, affordable and quality health provision, regardless of their wealth, gender or other circumstances. However, persistent inequalities in UHC exist both between and within countries, meaning that certain population subgroups have poorer access to services and interventions or have systematically worse health outcomes. A major challenge to measuring within-country inequalities in UHC SCI is the lack of disaggregated data for many indicators (14). However, inequalities across population subgroups can be monitored for a subset of low- and middle-income countries using the RMNCH composite coverage index (15, 16). This index is calculated as the weighted average of eight indicators in four stages along the continuum of care: reproductive health (demand for family planning satisfied with modern methods); maternal health (antenatal care coverage at least one visit and skilled attendance at birth); child immunization (BCG, measles and DTP3 immunization coverage); and management of childhood illnesses (oral rehydration therapy for diarrhoea and care seeking for suspected pneumonia). This composite index should not be compared with the RMNCH component of the UHC SCI as it summarizes the level of coverage across a larger spectrum of RMNCH interventions and is based on primary data from Demographic and Health Surveys or Multiple Indicator Cluster Surveys.
The coverage of RMNCH interventions varies substantially both within and across countries. Within countries, coverage tends to be higher among more advantaged groups such as the richest, most educated, or those living in urban areas. For instance, data from 79 low- and middle-income countries indicate a median coverage of 74% among the richest population quintile, compared with a median coverage of 61% among the poorest quintile (Figure 1.15). However, these inequalities are twice as large in low-income countries as in middle-income countries. There is a 24 percentage points difference in coverage between the richest and poorest across 21 low-income countries, while the comparable gap is 12 and 10 among lower-middle and upper-middle-income countries, respectively. There are similar patterns for inequalities related to education level and place of residence.
13
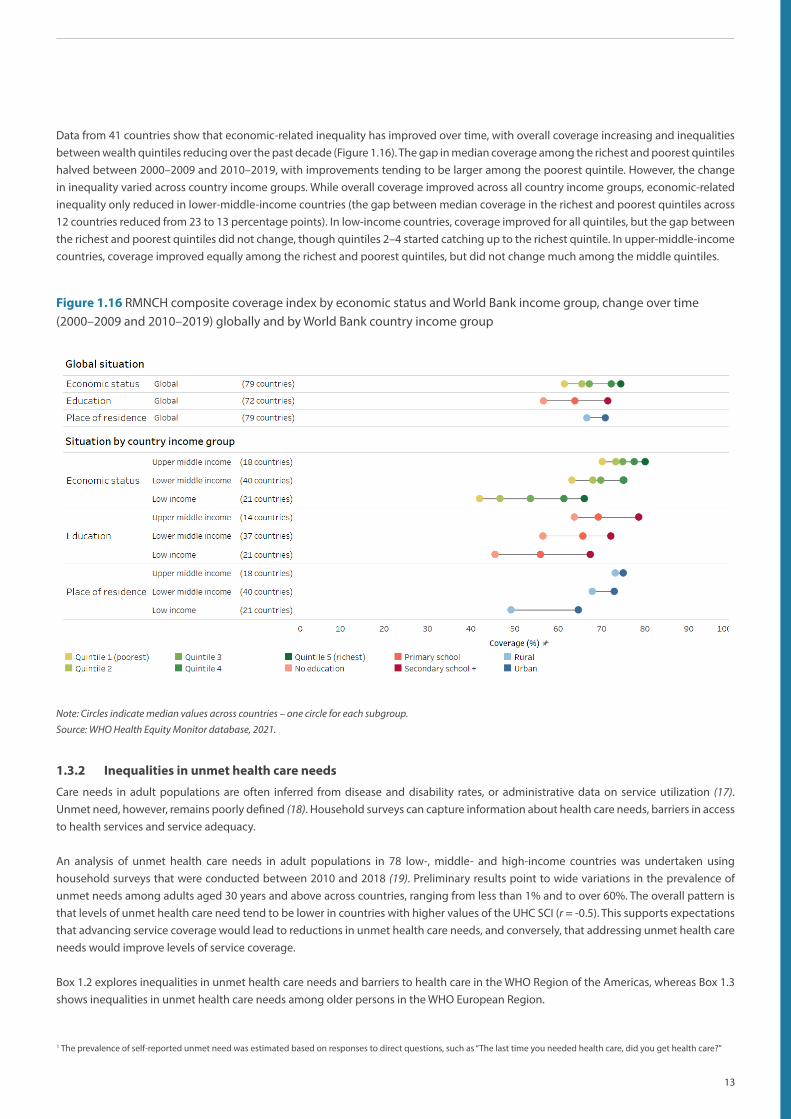
Figure 1.16 RMNCH composite coverage index by economic status and World Bank income group, change over time (2000–2009 and 2010–2019) globally and by World Bank country income group
Note: Circles indicate median values across countries – one circle for each subgroup. Source: WHO Health Equity Monitor database, 2021.
Data from 41 countries show that economic-related inequality has improved over time, with overall coverage increasing and inequalities between wealth quintiles reducing over the past decade (Figure 1.16). The gap in median coverage among the richest and poorest quintiles halved between 2000–2009 and 2010–2019, with improvements tending to be larger among the poorest quintile. However, the change in inequality varied across country income groups. While overall coverage improved across all country income groups, economic-related inequality only reduced in lower-middle-income countries (the gap between median coverage in the richest and poorest quintiles across 12 countries reduced from 23 to 13 percentage points). In low-income countries, coverage improved for all quintiles, but the gap between the richest and poorest quintiles did not change, though quintiles 2–4 started catching up to the richest quintile. In upper-middle-income countries, coverage improved equally among the richest and poorest quintiles, but did not change much among the middle quintiles.
1.3.2 Inequalities in unmet health care needs
Care needs in adult populations are often inferred from disease and disability rates, or administrative data on service utilization (17). Unmet need, however, remains poorly defined (18). Household surveys can capture information about health care needs, barriers in access to health services and service adequacy.
An analysis of unmet health care needs in adult populations in 78 low-, middle- and high-income countries was undertaken using household surveys that were conducted between 2010 and 2018 (19). Preliminary results point to wide variations in the prevalence of unmet needs among adults aged 30 years and above across countries, ranging from less than 1% and to over 60%. The overall pattern is that levels of unmet health care need tend to be lower in countries with higher values of the UHC SCI (r = -0.5). This supports expectations that advancing service coverage would lead to reductions in unmet health care needs, and conversely, that addressing unmet health care needs would improve levels of service coverage.
Box 1.2 explores inequalities in unmet health care needs and barriers to health care in the WHO Region of the Americas, whereas Box 1.3 shows inequalities in unmet health care needs among older persons in the WHO European Region.
1 The prevalence of self-reported unmet need was estimated based on responses to direct questions, such as “The last time you needed health care, did you get health care?”

14
Global Monitoring Report on Universal Health Coverage 2021
Box 1.2 Understanding unmet needs and barriers to health care in the WHO Region of the Americas
To ensure an equitable path to UHC, it is crucial to understand and address the full range of factors that act as demand-side and supply-side barriers (20). Unmet health care needs can result for various and complex reasons, each of which may require a specific policy approach (21, 22). An analysis of demand-side reasons for unmet health care needs was conducted in 2021, based on household surveys in 17 countries in the WHO Region of the Americas (23). The results show that about one third of the population (34.4%) experienced unmet needs due to multiple access barriers. On average, the percentage of unmet needs was higher among individuals in the poorest income quintile than the richest quintile (Figure 1.17).
Of those who reported a health care need, availability barriers were the most common reason for unmet care needs, followed by financial barriers and administrative barriers (Figure 1.18). Overall, people in the poorest income quintile were those most likely to experience barriers related to acceptability issues, financial and geographical access, or availability of resources.
Figure 1.17 Inequalities in unmet health care needs among those reporting a health need in the WHO Region of the Americas, by country and income quintile, 2011–2019
Source: Pan American Health Organization, 2021.
Figure 1.18 Inequalities in unmet health care needs among those reporting a health need in the WHO Region of the Americas, by type of access barrier and income quintile, 2011–2019
Source: Pan American Health Organization, 2021.
The results support the notion that advancing UHC requires integrated and multisectoral approaches aimed at reducing multiple deterrents to optimal health care seeking, such as high cost, insurance problems, lack of time, inadequate availability of resources, and low willingness to seek care due to cultural and linguistic reasons. To have a better understanding of unmet needs, new ways to collect quality data on access barriers need to be developed, including strengthening national health information systems to obtain disaggregated data on access barriers and triangulate qualitative information on the experiences of users and providers into national and local monitoring efforts.
2 Questions on unmet health care needs are included in country household surveys based on the Living Standards Measurement Study model. People are asked whether they
had a medical problem but did not seek appropriate care, or not at all, and reasons behind their decision. Access barriers are classified according to the dimensions of access
defined as follows. Acceptability: the person does not trust the provider, is mistreated by health workers, prefers to use home remedies, or gender, language, and culture
norms inhibit people from seeking care. Administrative (or Accommodation): long wait times, lack of time, or cumbersome administrative requirements. Availability: there are
no doctors, medicines, or services at the health centre. Financial: the person does not have money or insurance to cover the cost of the service. Geographical: the person lives
far away or does not have transportation.

15
Box 1.3 Unmet health care needs among older persons in the WHO European Region
UHC presents a critical opportunity to reorient health and care systems to meet the needs of increasing numbers of older people with a higher prevalence of chronic conditions and complex health and long-term care needs. An analysis of unmet health care needs among older persons aged 60 years or over in 27 countries in the WHO European Region was conducted using cross-national surveys (the Survey of Health, Ageing and Retirement in Europe wave 8 2019 – 2020). The results show that around one in 10 older persons (12%) experienced unmet need due to either affordability barriers.
Unmet need for health care due to health care costs or unavailability differs widely between European countries. Nearly one third of older persons in Greece declared unmet health care needs, followed by Bulgaria, Estonia and Romania with nearly one in five. On average, the percentage of unmet needs was higher among older persons in the poorest income quintile than in the richest quintile (Figure 1.19). The difference between rich and poor in unmet health care needs ranged from less than 2% in Poland, Slovenia, Croatia and Switzerland to more than 20% in Romania, Greece and Belgium. The unmet needs also varied by age, sex and education. However, these variations were not uniform across all European countries.
Figure 1.19 Inequalities in unmet health care needs among older adults reporting a health need in the WHO Region of the Europe, by country and income quintile, latest year available (2020)
AustriaBelgiumBulgariaCroatiaCyprus
Czech RepublicDenmark
EstoniaFinlandFrance
GermanyGreece
HungaryIsrael
ItalyLatvia
LithuaniaLuxembourg
MaltaNetherlands
PolandRomaniaSlovakiaSlovenia
SpainSweden
Switzerland
0 10 20 30 40 50 Percentage
5th (richest) quintile 1st (poorest) quintile
Source: Survey of Health, Ageing and Retirement in Europe wave 8 2019 – 2020.
Making progress toward UHC will require extension and improved targeting of benefit packages and financial protection to meet the health and long-term care needs of older adults, and especially the poorest and most vulnerable segments of ageing populations.
3 Unmet health care needs were estimated from response to the following question: During the last twelve months, which of the following types of care did you forgo because
of the costs you would have to pay or services unavailable? These services include care from a general practitioner, care from a specialist physician, drugs, dental care, optical
care, and other health care services.

16
Global Monitoring Report on Universal Health Coverage 2021
1.4 Limitations of and future developments in the current measure of SDG indicator 3.8.1
The inclusionary nature of UHC and its emphasis on providing health services (promotive, preventive, curative, rehabilitative and palliative) to those in need across the life-course and of sufficient quality to be effective while leaving no one behind poses unique challenges for monitoring UHC service coverage in policy-relevant ways. No index can fully summarize all of the health services required across all levels of care to achieve UHC, especially considering the absence of routine data systems that simultaneously capture intervention need, access, use and effectiveness of these services (24). Given this fact, the current UHC SCI uses a selection of key indicators to track overall coverage of essential health services. These indicators should not be interpreted as a recommended set of services. The current UHC SCI is compiled using a relatively simple methodology and wherever possible uses SDG indicators to reduce the reporting burden on countries, thereby facilitating country uptake in a similar or modified format. It is envisaged that the UHC SCI will be redesigned in the coming years to address a number of shortcomings (25, 26).
1.4.1 Indicator selection
Selecting an appropriate set of core indicators for global monitoring highly depends on the availability of data across enough countries and years to ensure temporal and cross-country comparability in reporting. The current UHC SCI covers only preventive and curative health services, mainly at primary health care level. No coverage indicators were selected for several important health areas – for example, few data are currently available in most countries on the coverage of interventions for noncommunicable diseases, mental health, injuries and emergencies. Furthermore, existing indicators do not distinguish between interventions for newborns, adolescents or older adults. Future work should support countries and regions to adapt the global index to national purposes by selecting indicators according to national data availability and health priorities. In particular, the UHC SCI is not especially relevant for high-income countries, where only a subset of indicators, mainly from the noncommunicable disease categories, can be used to distinguish levels of coverage of essential health services.
1.4.2 Use of proxy indicators
To overcome the global paucity of data on direct measures of different types of health services, risk factor indicators (for example, prevalence of tobacco use, mean fasting blood glucose and prevalence of raised blood pressure) and health system input indicators (for example, density of health workers and hospital beds) are used as proxy indicators for service coverage measurement. With noncommunicable diseases accounting for at least 60% of early death and disability worldwide, the omission of noncommunicable disease indicators beyond risk factor prevalence proxies is at odds with the reality of many countries’ populations and health systems. While the use of proxy measures is necessary where data on direct measures of service coverage are lacking, it is important to continually revisit how well such proxy indicators directly reflect levels and trends in health service coverage across settings (Box 1.4).

17
Box 1.4 From hypertension prevalence to control: a pooled analysis of 1201 population-representative studies with 104 million participants
A recent study that measured the prevalence of hypertension and progress in its detection, treatment, and control from 1990 to 2019 across 200 countries and territories showed that the global age-standardized prevalence of hypertension remained stable in 2019 compared with 2000, at around 33% (10). While the prevalence of hypertension remained stable between 2000 and 2019, diagnostic, treatment and control rates increased substantially over the same period (Figure 1.20). Data show a relatively weak inverse correlation between prevalence of hypertension and control rates (r = –0.3) (Figure 1.21).
Figure 1.20 Trends in prevalence of hypertension, proportion of diagnosed, treated, and controlled hypertension among all hypertension, 2000–2019
0%
10%
20%
30%
40%
50%
60%
2000
2001
2002
2003
2004
2005
2006
2007
2008
2009
2010
2011
2012
2013
2014
2015
2016
2017
2018
2019
Prevalence Diagnostic Treatment Control
Note: Total was calculated as a crude average of estimates for men and women.Source: NCD Risk Factor Collaboration, 2021.
Figure 1.21 Relationship between prevalence of hypertension and proportion of controlled hypertension among all hypertension, 2019
0%
10%
20%
30%
40%
50%
60%
70%
20% 30% 40% 50% 60%
Prop
ortio
n of
cont
rolle
d hy
pert
ensio
n am
ong
all h
yper
tens
ion
Prevalence of hypertension
Note: Total was calculated as a crude average of estimates for men and women.Source: NCD Risk Factor Collaboration, 2021.
This lack of direct relationship between hypertension prevalence and service coverage, as well as differences in how these measures have evolved over time, have implications not only for how well the noncommunicable disease component of the UHC SCI captures country performance on noncommunicable disease service coverage, but also for how well progress on the overall UHC SCI is monitored. While the use of proxy measures is necessary, it is important to continually reassess how well proxy indicators actually capture progress on health service coverage with a view to proposing a more refined index that includes better indicators for the 2025 comprehensive review of SDG indicators.
1.4.3 Data sources, completeness and disaggregation by key dimensions of inequality
Indicators used in the index heavily rely on household surveys rather than routine data systems. In most countries and particularly in low-income countries, when routine data are used, they are only available from the public sector, despite the important role played by the private health sector. Data scarcity is even more problematic for ensuring no one is left behind as more investments are made in health systems. Currently, comparable data on coverage of essential services that can be disaggregated by key dimensions of inequality are mostly available for RMNCH indicators in countries that have conducted Demographic and Health Surveys or Multiple Indicator Cluster Surveys. Investment and political commitment are vital to enhancing country health information systems, so that disaggregated data across multiple inequality dimensions and for all health sectors can be generated using a variety of data sources, including population-based surveys, routine health facility data, administrative data and civil registration and vital statistics. Only then can countries monitor health inequalities and use this information to inform the policies they are implementing to improve health equity.
1.4.4 Calculation methodology
Care should always be taken when comparing countries with similar index values, given the uncertainty around estimates of each individual sub-indicator. Multiple data sources and various methods can be used for constructing health-related indices, including indicator conversion and rescaling, weighting schemes and averaging methods (14). Indicators are also mostly based on household surveys. Given
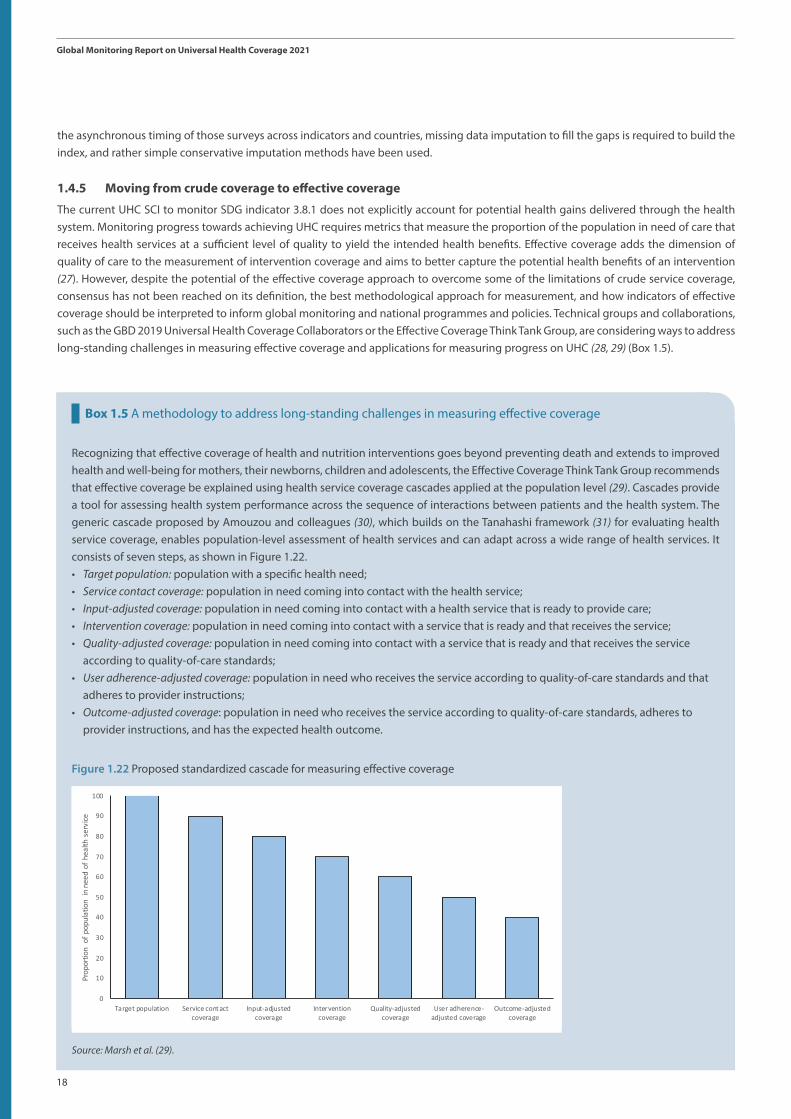
18
Global Monitoring Report on Universal Health Coverage 2021
Box 1.5 A methodology to address long-standing challenges in measuring effective coverage
Recognizing that effective coverage of health and nutrition interventions goes beyond preventing death and extends to improved health and well-being for mothers, their newborns, children and adolescents, the Effective Coverage Think Tank Group recommends that effective coverage be explained using health service coverage cascades applied at the population level (29). Cascades provide a tool for assessing health system performance across the sequence of interactions between patients and the health system. The generic cascade proposed by Amouzou and colleagues (30), which builds on the Tanahashi framework (31) for evaluating health service coverage, enables population-level assessment of health services and can adapt across a wide range of health services. It consists of seven steps, as shown in Figure 1.22.• Target population: population with a specific health need; • Service contact coverage: population in need coming into contact with the health service; • Input-adjusted coverage: population in need coming into contact with a health service that is ready to provide care;• Intervention coverage: population in need coming into contact with a service that is ready and that receives the service; • Quality-adjusted coverage: population in need coming into contact with a service that is ready and that receives the service
according to quality-of-care standards; • User adherence-adjusted coverage: population in need who receives the service according to quality-of-care standards and that
adheres to provider instructions; • Outcome-adjusted coverage: population in need who receives the service according to quality-of-care standards, adheres to
provider instructions, and has the expected health outcome.
Figure 1.22 Proposed standardized cascade for measuring effective coverage2
2
0
10
20
30
40
50
60
70
80
90
100
Target population Service contactcoverage
Input-adjustedcoverage
Interventioncoverage
Quality-adjustedcoverage
User adherence-adjusted coverage
Outcome-adjustedcoverage
Prop
ortio
n of
pop
ulat
ion
in n
eed
of h
ealth
ser
vice
Source: Marsh et al. (29).
the asynchronous timing of those surveys across indicators and countries, missing data imputation to fill the gaps is required to build the index, and rather simple conservative imputation methods have been used.
1.4.5 Moving from crude coverage to effective coverage
The current UHC SCI to monitor SDG indicator 3.8.1 does not explicitly account for potential health gains delivered through the health system. Monitoring progress towards achieving UHC requires metrics that measure the proportion of the population in need of care that receives health services at a sufficient level of quality to yield the intended health benefits. Effective coverage adds the dimension of quality of care to the measurement of intervention coverage and aims to better capture the potential health benefits of an intervention (27). However, despite the potential of the effective coverage approach to overcome some of the limitations of crude service coverage, consensus has not been reached on its definition, the best methodological approach for measurement, and how indicators of effective coverage should be interpreted to inform global monitoring and national programmes and policies. Technical groups and collaborations, such as the GBD 2019 Universal Health Coverage Collaborators or the Effective Coverage Think Tank Group, are considering ways to address long-standing challenges in measuring effective coverage and applications for measuring progress on UHC (28, 29) (Box 1.5).

19
Global Monitoring Report on Universal Health Coverage 2021 (as of November 2nd, 2021)
Looking forward to 2030, moving from measures of service coverage to an overarching measure of effective coverage that captures interventions across a range of services (promotive, preventive, curative, rehabilitative and palliative) and levels of care (primary, secondary and tertiary), as well as ensuring that those services address health needs across the life-course, is an important next step for monitoring UHC at both national and global levels. To truly deliver on the promise of UHC – to improve health outcomes across the life-course – tracking the full cascade of care from population need, to service provision, to effectiveness must be prioritized. Health systems would then be able to track where changes are needed, identify bottlenecks, implement solutions and measure progress regularly. It is important to understand whether interventions that the health system delivers have their desired effect of improving the health of the population.
Monitoring the health-related SDGs is a country-led process. Thus, at a time of increasingly sophisticated model-based estimates in health indicators, more effort must be made to ensure methods are understandable, replicable, and adaptable for use by technical experts in countries. The SDGs explicitly call for investment and strengthening of national data systems that directly support UHC monitoring and can thus foster greater accountability and action for improving service coverage in an equitable way (32). Comprehensive review proposals for SDG indicators can be submitted every five years to the United Nations Statistical Commission. The next comprehensive review will be in 2025, when a new index of service coverage will be proposed.

20
Global Monitoring Report on Universal Health Coverage 2021

21
Global Monitoring Report on Universal Health Coverage 2021 (as of November 2nd, 2021)
Monitoring SDG indicator 3.8.2 and SDG-related indicators of financial hardship
2

22
Global Monitoring Report on Universal Health Coverage 2021
Financial protection is at the core of universal health coverage (UHC) and, together with service coverage, is one of the health system’s goals. Financial protection in health is achieved when (a) there are no financial barriers to access; and (b) direct payments required to obtain health services (out of pocket health spending) are not a source of financial hardship. Since 2015, WHO and the World Bank have been reporting progress in reducing financial hardship. This chapter draws on a joint global thematic report on financial protection prepared by WHO and the World Bank and published at the same time as the present report (1). The main contributions of the new joint report are at least four: (a) it clarifies the distinction between financial hardship and financial protection; (b) it sheds light on financial hardship experienced by the poor spending any amount on health out of pocket and across people living in households with different age compositions; (c) it links financial hardship with the type of household out of pocket health spending, public health spending and forgone care; and (d) it unpacks and discusses in further detail potential pathways through which financial protection will probably be worsened due to COVID-19. Points (a) and (b) are summarized here; point (d) is summarized in Chapter 4 of this report.
2.1 Financial hardship is a key consequence of the lack of financial protection
The starting point to clarify the distinction between financial hardship and the lack of financial protection is to consider all the population in need of health care services or health products, rather than a specific subgroup with a particular health care need or in need of a particular intervention (Figure 2.1). Some of the people seeking care face barriers to access related to financial constraints, acceptability issues, unavailability of services, or accessibility, to quote a few of the most frequent dimensions (31, 33) considered in assessment of barriers (22, 34–36). All such barriers contribute to delaying and preventing people from using services, hereafter simply referred to as forgone care. Even when contact is established access to care can be a source of financial hardship if direct payments or out of pocket health spending are large in relation to a household’s welfare (Figure 2.1, Box 2.1). If they are not, then access to care does not result in financial hardship.
2 – Monitoring SDG indicator 3.8.2 and SDG- related indicators of financial hardship
Figure 1
non-financial barriers
Financial barriers
Non-financial barriers
→ Foregone care Financial barriers → Foregone care
Utilization
Out-of-pocket spending
No out-of-pocket payment
No financial hardship due to out-of-pocket
spendingFinancial hardship due to out-of-pocket spending
Lack of financial protection
Neither catastrophic, nor
impoverishingCatastrophic
paymentsImpoverishing
OOP
All people in need of health care goods and services
Notes: Catastrophic and impoverishing out-of-pocket health spending are metrics used to identify in which cases out-of-pocket health payments are a source of financial hardship (see Box 2). Catastrophic out-of-pocket metrics include SDG 3.8.2, capacity to pay approaches, etc. (see annex A2). Impoverishing out-of-pocket metrics include indicators to identify both people impoverished and further impoverished by out-of-pocket health spending, using various poverty lines (e.g. the global extreme poverty line, a relative poverty line).
Figure 2.1 Financial hardship due to out of pocket health spending and lack of financial protection
Note: Catastrophic and impoverishing out of pocket health spending are metrics used to identify in which cases out of pocket health payments are a source of financial hardship. Catastrophic out of pocket metrics include SDG indicator 3.8.2 and capacity to pay approaches (see Annex 8). Impoverishing out of pocket spending includes indicators to identify both people impoverished and further impoverished by out of pocket health spending, using various poverty lines (e.g. the global extreme poverty line, a relative poverty line).Source: WHO and World Bank (1).

23
Box 2.1 Out of pocket health spending: definition
Out of pocket health spending is defined as any spending incurred by a household when any member uses a health good or service to receive any type of care (preventive, curative, rehabilitative or long-term care); provided by any type of provider; for any type of disease, illness or health condition; in any type of setting (outpatient, inpatient, at home). It includes formal and informal expenses directly related to the cost of seeking care as mapped in division 06 (health) of the United Nations classification of individual consumption according to purpose (COICOP 2018), that is, on medicines and health products (06.1); outpatient care services, including dental care (06.2); inpatient care services, including inpatient dental care (06.3); diagnostic imaging services and medical laboratory services (06.4.1); and patient emergency transportation services and emergency rescue (06.4.2) (37). It excludes prepayment (for example, taxes, contributions or premiums) and reimbursement of the household by a third party such as the government, a health insurance fund or a private insurance company. It also excludes indirect expenses (for example, non-emergency transportation cost) and the opportunity cost of seeking care (for example, lost income) (38). COICOP was revised in 2018 to provide more information on important components of household care consumption.
Catastrophic health spending represents a sufficient but not a necessary condition for financial hardship to occur (Figure 2.1 and Annex 7). The definition of catastrophic health spending used in relation to SDG indicator 3.8.2 is focused on relatively large out of pocket health spending; in effect, it includes those exceeding 10% and 25% of the household’s total consumption or income (budget) (39). Recognizing that for poor and near poor people it is the absolute level of out of pocket health spending that is crucial, even if it represents less than 10% of a household budget, indicators of impoverishing health spending are also used to track financial hardship. Impoverishing out of pocket health spending occurs when a household is forced by an adverse health event to divert spending from non-medical budget items such as food, shelter or clothing to such an extent that its spending on such items is reduced to below or further below the level indicated by a poverty line. The total number of people incurring impoverishing health spending includes those impoverished and those further impoverished. For those impoverished, out of pocket health spending exceeds the shortfall between the poverty line and their total consumption. Those further impoverished are poor people spending any amount on health out of pocket. Indeed, for the poor in particular, out of pocket health spending most often represents spending on regrettable necessities (40) incurred to compensate a loss in welfare triggered by an illness, injury or adverse health event. Such spending can both increase welfare and also diminish it, if it displaces spending on other basic needs. The poverty lines used in this chapter are chosen to assess to what extent out of pocket health spending deters efforts to end poverty (SDG 1). The link with SDG target 1.1 (elimination of extreme poverty) is made by using the poverty line of extreme poverty (PPP $1.90 a day per person). To link with SDG target 1.2 (reduction of poverty everywhere), a country-specific relative poverty line, defined as 60% of the median per capita consumption or income, is used in this report.
Applying these definitions of catastrophic health spending and impoverishing health spending used for global monitoring, when out of pocket health spending represents less than 10% of the household budget and is not impoverishing, then access to care does not result in financial hardship. In all other cases, it does. The degree of overlap between catastrophic and impoverishing health spending depends on their definition. Figure 2.1 suggests that the intersection is small, as the current definitions used at global level are not interrelated. Other definitions with a greater degree of overlap exist (Annex 8) and are used at regional levels (see Annex 9 for those used in the WHO European Region).
Finally, Figure 2.1 clearly shows that tracking financial hardship is not sufficient to assess the degree of financial protection. When households must either forego care because of financial barriers, or when access to health services results in financial hardship, then the population in need of health care lacks financial protection.
2.2 Data availability to track financial hardship
Financial hardship monitoring relies on household budget surveys, household income and expenditure surveys, household living standard surveys or socioeconomic surveys that are collected on average every four years, with some variation in frequency across country income groups and regions (often annual in upper-middle-income and high-income countries or in the WHO European Region). Availability of estimates to produce global and regional aggregates may not align with availability of data at the national and regional levels.
SDG and SDG-related financial hardship estimates in this chapter are based on data available to WHO and the World Bank by the end of September 2021. Specifically, they are based on 903 estimates for 161 countries or territories on catastrophic payments (compared to 739 data points in 2019), and on 816 estimates for 149 countries or territories for people impoverished (compared to 719 data points in

24
Global Monitoring Report on Universal Health Coverage 2021
2019). Altogether, the countries for which validated estimates on financial hardship are available represent more than 90% of the world population, and half of the data points have been collected after 2008.
All indicators of financial hardship were included in a country consultation conducted by WHO and the World Bank between March 2021 and July 2021. A total of 28 countries or territories produced the estimates for SDG indicator 3.8.2 that are used in this report; 18 of them also produced the indicators of impoverishing health spending. Over 95% of the countries or territories were consulted on these estimates as focal points were nominated and could be contacted. The 33 WHO Member States without any estimate available on financial hardship were informed about the methods and data needed to produce them going forward.
Since more data are available for more countries and for more years, methods used in previous analyses are used to recalculate global and regional estimates for 2000, 2005, 2010 and 2015. The most recent reference year is 2017, which is the year for which there is sufficient population coverage to produce a new global estimate. There are 111 countries with at least one survey-based estimate on catastrophic health spending between 2014 and 2020, representing about 87% of the world population. There are also 99 countries with at least one point for impoverishing spending between 2014 and 2020, representing 65% of the world population in 2017. For more information on methods to construct global and regional aggregates and data availability, see Annexes 1 and 3 of the 2021 Global monitoring report on financial protection in health (1). Producing more recent global and regional estimates than for 2017 would lack the support of a sufficient number of survey-based estimates to be reliable.
A sample of 709 surveys covering 141 countries was used to look at the joint distribution of catastrophic payments (at the 10% threshold) and impoverishing health expenditure (both for the population pushed into poverty and for the population further pushed into poverty) at a PPP $1.90 poverty line, and at a relative poverty line definition.
Estimates of catastrophic and impoverishing health spending across households with different age compositions were produced for 92 countries or territories accounting for 53% of the global population in 2017; population coverage is higher across all country income groups except lower-middle-income countries (43% due to the exclusion of India) and high-income ones (21%).
2.3 Levels of and trends in catastrophic and impoverishing out of pocket health spending
Before the COVID-19 pandemic, the world was off track to reduce financial hardship. Trends in catastrophic health spending were going in the wrong direction and the number of people incurring financial hardship remained unacceptably high. The incidence of catastrophic spending increased continuously between 2000 and 2017. More recently, between 2015 and 2017 it rose from 12.7% of the world population spending more than 10% of their household income on health out of pocket (940 million) to 13.2% (996 million). The population spending more than 25% of its household budget on health out of pocket also increased from 270 million people to 290 million. Overall, the increase was driven by (a) an increase in the amount people spent out of pocket on health; and (b) a higher rate of growth of out of pocket spending relative to growth in private consumption, resulting in an increase in the aggregate health share (Figure 2.2). The rate of increase in the incidence of catastrophic health spending between 2015 and 2017 was similar to the pace of change over the previous 15 years (on average, by 0.2 percentage points per year). In high-income countries the increase accelerated; and for the first time it increased in low-income countries.

25
Perc
enta
ge o
f pop
ulat
ion
with
out
-of-
pock
etex
ceed
ing
10%
of h
ouse
hold
bud
get
Aver
age
aggr
egat
e sh
are
of o
ut-o
f-po
cket
ove
r con
sum
ptio
n (%
)
20.0
19.0
18.0
17.0
16.0
15.0
14.0
13.0
12.0
11.0
10.0
9.0
8.0
20002001
20022003
20042005
20062007
20082009
20102011
20122013
20142015
20162017
3.3
3.2
3.1
3
2.9
2.8
Out-of-pocket share (%) (left axis) Catastrophic health spending (SDG 3.8.2, 10% threshold) (right axis)
Figure 2.2 Trends in the incidence of catastrophic health spending as tracked by SDG indicator 3.8.2,10% threshold
Source: WHO and World Bank (1).
Within all regions, some countries did manage to reduce the incidence of catastrophic health spending. Among the 137 countries or territories with at least two estimates available for SDG indicator 3.8.2,the proportion of the population spending more than 10% of their household budget on health out of pocket decreased on average by more than 0.1 percentage points per year, pointing to little or no change in 44 countries or territories (Figure 2.3.a); in 33 countries or territories, the change ranged on average between –0.1 and +0.1 percentage points per year, and in 60 countries or territories it increased by more than 0.1 percentage points per year. In 89% of the countries facing increases in the proportion of the population spending more than 10% of their household budget on health out of pocket, there is also a significant increase in the proportion of the population spending more than a quarter of their household budget on health out of pocket (Figure 2.3.a versus Figure 2.3.b). In 82% of the countries with reductions in the incidence of catastrophic health spending at the 10% threshold, it also decreased at the 25% threshold.
Figure 2.3 Average percentage point change in the incidence of catastrophic health spending, as tracked by SDG indicator 3.8.2
Source: WHO and World Bank (1).
>0.1 percentage point a year (p.p.)[-0.1 p.p; 0.1 p.p]<-0.1 p.p.No data availableNot applicable
>0.01 p.p.[-0.01 p.p; 0.01 p.p]<-0.1 p.p.No data availableNot applicable
a) At the 10% threshold b) At the 25% thresholda. At the 10% thresholdb. At the 25% threshold

26
Global Monitoring Report on Universal Health Coverage 2021
Source: WHO and World Bank (1).
Table 2.1 SDG-related indicators of impoverishing health spending, % of global population
2000 2005 2010 2015 2017
Population with impoverishing health spending at the PPP $1.90 a day line of extreme poverty 19.0 15.5 12.0 9.1 6.7
Impoverished by out of pocket health spending 2.0 2.0 1.8 1.6 0.9
Further impoverished by out of pocket health spending 17.0 13.5 10.2 7.5 5.8
Population with impoverishing health spending at relative poverty line of 60% of median per capita consumption or income
10.3 12.5 14.6 15.8 15.0
Impoverished by out of pocket health spending 1.5 1.9 2.2 2.5 2.3
Further impoverished by out of pocket health spending 8.8 10.6 12.4 13.3 12.7
The number of people incurring impoverishing health spending decreased substantially and continuously at global levels – from 19% in 2000 to 6.7% in 2017, based on the extreme poverty line (Table 2.1). This substantial reduction was due to a lower percentage of the population impoverished and further impoverished into extreme poverty in both the total population and among those living in extreme poverty. However, the concentration of those incurring impoverishing health spending among the global extreme poor remained very high (72%, not shown in the table). Across regions, the reduction in the population further pushed into extreme poverty because of out of pocket health spending accelerated markedly between 2015 and 2017 in lower-income and lower-middle-income countries and in Africa, exceeding –1.3 percentage points per year. For 24 of the 43 countries in Africa with survey-based estimates available for more than one year, on average the incidence of impoverishing health spending among those living in extreme poverty decreased by –1.2 percentage points per year (Figure 2.4).

27
Figure 2.4 Average percentage point change in concentration of those further impoverished by out of pocket health spending among those living in extreme poverty (below PPP $1.90) across countries in the United Nations African RegionFigure 12
Aver
age
annu
al p
erce
ntag
e po
int c
hang
e
Seyc
helle
s
Tuni
sia
Cam
eroo
n
Beni
n
Stat
e of
Pal
estin
e
Swaz
iland
Nam
ibia
6
2
-2
4
0
-4
-6
Gam
bia
Djib
outi
Chad
Sene
gal
Keny
a
Guin
ea
Ethi
opia
Mad
agas
car
Dem
ocra
tic R
epub
lic o
f the
Con
go
Ugan
da
Sao
Tom
e an
d Pr
inci
pe
Rwan
da
Sout
h Af
rica
Mor
occo
Ghan
a
Cabo
Ver
de
Buru
ndi
Egyp
t
Mal
i
Mal
awi
Sier
ra L
eone
Guin
ea-B
issa
u
Libe
ria
Mau
ritan
ia
Mau
ritiu
s
Moz
ambi
que
Bots
wan
a
Côte
d’Iv
oire
Som
alia
Nig
er
Burk
ina
Faso
Togo
Gabo
n
Ango
la
Nig
eria
3065 HGF Figure 301121_2.indd 123065 HGF Figure 301121_2.indd 12 10.12.21 23:2510.12.21 23:25
Note: Number of countries: 43. Average percentage point changes are computed as mean annualized absolute change over time. The median most recent year is 2015. Source: WHO and World Bank (1).
Impoverishing health spending at the relative poverty line only started to decrease in 2015 but less markedly (from 15.8% to 15%) in 2017 (Table 2.1). The reduction in impoverishing health spending at the relative poverty line occurred in all country income groups except for the high-income (Annex 10). Overall, the number of people incurring impoverishing health spending remained extremely high (505 million people at the extreme poverty line and 1125 million people at the relative poverty line).
Most poor people spending on health out of pocket and the majority of those impoverished spend less than 10% of their household budget on health. Based on the relative poverty line, those incurring only impoverishing out of pocket health spending without incurring catastrophic health spending represent on average 53% of the whole population incurring financial hardship (based on a sample of 141 countries) (Figure 2.5.a). The rate is slightly lower in low-income countries (46%) and slightly higher in high-income countries (63%). Based on the poverty line of extreme poverty, on average 55% of the whole population incurring financial hardship only suffer impoverishing health spending; in low-income countries their share is higher (66%). Within the group of people incurring only impoverishing health spending, the poor spending any amount on health out of pocket represent the lion’s share (92% with both poverty lines). To substantially reduce financial hardship, in addition to limiting relatively large out of pocket health spending, poor people need to be exempted from paying out of pocket when seeking care.

28
Global Monitoring Report on Universal Health Coverage 2021
The overlap between those incurring catastrophic health spending and those incurring impoverishing health spending was small – 9% based on the relative poverty line and 11% based on the poverty line of extreme poverty estimated on the sample of 141 countries (Figure 2.5.b). Applying these estimates to the global number of people suffering catastrophic and impoverishing out of pocket health spending, while avoiding double counting, suggests that between 1.366 billion and 1.888 billion people incurred financial hardship in 2017, depending on the poverty line used to identify impoverishing health spending (the poverty line of extreme poverty or relative poverty, respectively). The relatively low overlap between catastrophic health spending and impoverishing health spending confirms the need to track financial hardship with both types of indicator at global levels. Catastrophic health spending and impoverishing health spending definitions can be interrelated (Annex 8). Adopting such an approach, the incidence of catastrophic health spending is highly concentrated in the lowest consumption quintile of the population in the WHO European Region (41) (Annex 9).
Figure 2.5 Composition of the population incurring financial hardship across a sample of 141 countries or territories
Note: In both figures 2.5.a and 2.5.b, catastrophic health spending is defined as out of pocket health spending exceeding 10% of household budget. However, in figure 2.5.a, impoverishing health spending is identified using the relative poverty line of 60% of median per capita consumption, while in figure 2.5.b, the extreme poverty line of PPP $1.90 a day is used. Source: WHO and World Bank (1).
2.4 Age profile of people incurring catastrophic health spending and impoverishment due to out of pocket payments
The COVID-19 pandemic has affected households with all types of age composition through the health and economic shocks they have been exposed to. Evidence from before the pandemic shows that older people face greater cost and higher out of pocket health spending, but every age group comes with specific health needs (42), and in a household economic resources are pooled to cover the cost of the care of all its members. This is a fundamental assumption behind measures of catastrophic and impoverishing health spending for which the unit of analysis is the household. Therefore, a life-cycle approach (42) is used to compare the incidence of catastrophic and impoverishing health spending prior to the pandemic across people living in households with different age structures. Specifically, (a) multigenerational households include adults (aged 20 to 59 years) living with both older and younger people; (b) older households include at least one older person (aged 60 years or above) and no one aged below 20 years, including also households composed of only older people; (c) younger households include at least one person aged below 20 years and none aged above 59 years; and (d) other households include only adults aged between 20 and 59 years.
People living in older households face the highest incidence of catastrophic health spending, as tracked by SDG indicator 3.8.2 at the 10% threshold across all income groups and United Nations regions (Figure 2.6). Across country income groups, the median proportion of the population spending more than 10% of a household budget on health out of pocket is the highest among households with older members in upper-middle-income countries (38.3%). In high-income countries and lower-middle-income countries, the median
0
10
20
30
40
50
60
70
80
90
100
a. SDG indicator 3.8.2, 10% threshold and therelative poverty line
b. SDG indicator 3.8.2, 10% threshold andPPP $1.90 a day poverty line
% o
f tho
se in
curr
ing
finan
cial
har
dshi
p
Pushed further by out of pocket <=10% Pushed by out of pocket<=10%Pushed further by out of pocket>10% Pushed further by out of pocket>10%Only catastrophic

29
incidence of catastrophic health spending for older households is half that of upper-middle-income countries. Within country income groups, the life-cycle approach shows that for people living in older households the median proportion of the population with out of pocket health spending exceeding 10% of their household budget is 4.5 higher than the median rate among those living in younger ones in lower-middle-income countries versus only twice as much in low-income countries. Across United Nations regions, the proportion of the population spending more than 10% of a household budget on health out of pocket is the highest among households with older members in Asia and the lowest in Latin America and the Caribbean. Within United Nations regions, in Europe the median incidence of catastrophic health spending is 5.9 higher among people living in older households than among those living in younger ones; in all other United Nations regions the relative difference in medians ranges between 2.3 and 2.4. Latin America and the Caribbean is the only region where the median incidence of catastrophic health spending in older households is almost equal to the median rate of people living in multigenerational households. The median incidence rates of both catastrophic and further impoverishment due to out of pocket health spending tends to be lowest among younger households and households with only adults. Using a different approach to compare incidence rates of catastrophic health spending across people living in households with different age structures but controlling for other possible confounders (such as socioeconomic status), a recent study (43) confirms the large differences in financial hardship between younger and older households across countries, with people living in households with higher old-age dependency ratios facing the highest incidence of catastrophic health spending. Most importantly, the study shows that differences in incidence of catastrophic health spending between those living in older households and those living in younger ones are greatest within the poorest quintile of a country (43).
Reducing impoverishing out of pocket health spending is important to reduce financial hardship among people living in multigenerational households. In multigenerational households, the concentration of members in critical age groups (42) (children and adolescents, women of reproductive age, older people) is likely to increase health care needs compared to households with other age compositions. At the same time, multigenerational households tend to be poorer than younger and older households. As such, median rates of impoverishing health spending are highest for people living in multigenerational households (Figure 2.7). The difference compared to the median incidence rates among people living in younger households is strongest in upper-middle-income countries (1.7 times higher), which is driven by Asia, and lowest in lower-middle-income countries (1.1 times higher).
Figure 15
Bars indicate median incidence rates across countries (%)
Low Medium High
Low-income
Lower middle-income
Africa
Upper middle-income
Asia
High-income
Europe
Latin America and Caribbean
Adults only Younger households Multigenerational Older households
3.6 4.5 6.7 8.6
6.7 4.4 9.3 20.3
14.0 15.9 23.2 38.3
7.9 7.0 10.3 21.0
8.1 4.5 8.5 12.9
14.0 2.6 23.2 38.3
4.9 2.6 6.9 15.3
3.6 3.7 8.8 8.6
Figures 1,8,10,12,15,16.indd 5Figures 1,8,10,12,15,16.indd 5 10.12.21 23:5210.12.21 23:52
Figure 2.6 Median proportion of the population spending more than 10% of household budget on health out of pocket across people living in households with different age structures and country income groups and United Nations regions
Note: The figure shows the median population-weighted proportion of the population spending more than 10% of their household budget on health.Source: WHO and World Bank (1).

30
Global Monitoring Report on Universal Health Coverage 2021
Figure 2.7 Median proportion of the population further impoverished into relative poverty across people living in households with different age structures and across country income groups (most recent year available)
Figure 16
Low Medium High
Low-income
Lower middle-income
Africa
Upper middle-income
Asia
High-income
Europe
Latin America and Caribbean
Adults only Younger households Multigenerational Older households
1.6 10.3 11.8
3.3 13.8 18.7 13.2
13.3 23.4 39.9 16.9
4.5 15.3 22.8 3.0
2.3 13.9 18.6 13.2
13.3 23.4 39.9 16.9
4.7 15.3 23.3 4.1
2.3 11.7 17.1 6.1
Bars indicate median incidence rates across countries (%)
Figures 1,8,10,12,15,16.indd 6Figures 1,8,10,12,15,16.indd 6 10.12.21 23:5210.12.21 23:52
Note: The figure shows the median population-weighted proportion of the population further pushed into relative poverty. The relative poverty line is defined as 60% of median consumption.Source: WHO and World Bank (1).
2.5 Discussion
This chapter shows that even before COVID-19 struck, the world was off track to reduce financial hardship because trends in catastrophic health spending were going in the wrong direction and the number of people incurring financial hardship remained unacceptably high. Most of the people incurring financial hardship are poor people spending less than 10% of their household budget on health out of pocket, and most of those are spending any amount on health out of pocket (that is, further impoverished people). Further insights from the thematic global report on financial protection (1) show that financial hardship tends to be lower in countries with greater reliance on public spending. At the same time, increases in public spending per se are insufficient to ensure a reduction in financial hardship. Country-level analysis shows that population coverage, co-payment policies, targeting, and the comprehensiveness of the benefit package are essential to translate increases in public spending into improvements in financial protection (1, 41). In many regions, medicines are the main driver of out of pocket health spending and financial hardship (1, 41, 44), underscoring the need to reduce gaps in coverage of outpatient medicines.
The overall impact of out of pocket health spending on people’s living standards and ability to spend on other basic needs is certainly underestimated, as this chapter focuses only on direct payments for health. The chapter focuses particularly on direct payments at the time of seeking care, as these types of payment pose serious challenges from a health financing system perspective, with negative consequences for equity and efficiency. From the health system perspective, direct contributions are being collected in a very inefficient way; facilities and providers cannot count on those funds, as they are received only when people decide and find the means to seek care. They are also collected from people who are sick, who at that moment are probably unable to work properly and as such may not be earning any money, contributing to an increase in inequality in health care access. Co-payments, while often used with the objective of reducing unnecessary consumption of health care goods and services, are not good instruments for rationing or for directing people to use health services more efficiently and are likely to lead to adverse health outcomes among poor people, older people and people with chronic conditions (41). While indirect costs (such as cost of transportation) and the opportunity cost of seeking care (for example, income loss) are not factored into the analysis presented in this chapter, these other costs can only add to the negative economic consequences

31
people have to cope with when seeking care. For many, those indirect costs, in addition to direct costs, are a major barrier to accessing care, and it is important to track financial barriers to access in addition to financial hardship to monitor the lack of financial protection. Evidence from a systematic review shows that even before the pandemic one of the most reported reasons keeping people from accessing health care was affordability, irrespective of age (1).
Timely monitoring of financial hardship was problematic even before the pandemic. The current average lag of four years in indicators of catastrophic and impoverishing health spending will not shorten and might even increase, leading to a gap in knowledge regarding the level of financial hardship experienced during the pandemic, unless immediate actions are taken to start improving the timeliness and frequency of data on household out of pocket health spending.
Very few estimates were available for 2020 at the time of producing this report. Most results to date do not show a different pattern in 2020 compared to previous years (1). When more data become available a clear understanding of the circumstances under which the data were collected (method of capture, recall period of the health expenditure items, survey period), in addition to in-depth analysis of indicators of access to care, unmet needs, and barriers to access, will be needed to understand the patterns during the peak of the pandemic.
Overall, with financial hardship increasing over time, financial protection was going in the wrong direction to reach the objective of UHC. This trend contrasts with the continuous positive trend in service coverage at global and regional levels, as further discussed in the next chapter. However, as discussed in Chapter 4, the pandemic is likely to halt the progress made in service coverage expansion over the past 20 years, increase forgone care (especially for financial reasons), and worsen financial hardship due to out of pocket health spending for those seeking care, especially among those living in poor households and with older members. Overall, during the pandemic financial protection is likely to decrease unless proactive policy efforts are made.

32
Global Monitoring Report on Universal Health Coverage 2021

33
Joint progress in SDG indicator 3.8.1 on service coverage and SDG indicator 3.8.2 on catastrophic health spending
3

34
Global Monitoring Report on Universal Health Coverage 2021
3 – Joint progress in SDG indicator 3.8.1 on service coverage and SDG indicator 3.8.2 on catastrophic health spending
The 2030 Sustainable Development Goals (SDGs) emphasize that all people should receive the quality health services they need without financial hardship (target 3.8). Critical to attaining universal health coverage (UHC) is monitoring to assess progress. This chapter explores the joint progress in both UHC dimensions (service coverage and financial hardship) at global, regional and country levels over the period of time for which data are available for both UHC SDG-related indicators.
3.1 Joint progress at global level - Continuous service coverage expansion at a major cost to individual and families
This report confirms alarming pre-COVID-19 diverging trends in SDG UHC indicators, with UHC SCI (indicator 3.8.1) improving and catastrophic health spending (indicator 3.8.2) worsening (26) between 2000 and 2017, the reference years for which global values were available for both indicators (Figure 3.1). While service coverage increased from a population-weighted average of 45 in 2000 to 65 in 2017 (at an average 1.2 index points per year), the share of the global population spending more than 10% of their household budget on health out of pocket rose from 9.4% in 2000 to 13.2% in 2017 (at an average annual 0.2 percentage points).
Box 3.1 shows projected progress towards reaching the UHC target of the WHO Thirteenth General Programme of Work – progress that has been severely hampered by the advent of the COVID-19 pandemic.
Figure 3.1 Progress in service coverage (SDG indicator 3.8.1) and catastrophic health spending (SDG indicator 3.8.2,10% threshold), 2000–2017
2000
20052010
20172015
8
9
10
11
12
13
14
15
16
30 40 90 100
Cata
stro
phic
out-o
f-poc
ket h
ealth
spen
ding
(SD
G in
dica
tor 3
.8.2
, 10%
thre
shol
d)
UHC service coverage index (SDG indicator 3.8.1) 50 60 70 80
An increase in service coverage is better
Less
peo
ple
wit
h ca
tast
roph
ic h
ealt
h sp
endi
ng is
bet
ter
Note: The vertical axis corresponds to the 2017 global incidence rate of catastrophic health spending, defined as the proportion of the population-weighted population with household out of pocket health expenditure exceeding 10% of household budget (13.2% in 2017). The horizontal axis corresponds to the 2017 global population-weighted average UHC SCI (65) in 2017. Source: SDG indicator 3.8.1: WHO global service coverage database, 2021 update; SDG indicator 3.8.2: WHO and World Bank global financial protection database, 2021 update.

35
Box 3.1 Projected progress towards reaching the UHC target of the WHO Thirteenth General Programme of Work
The WHO Thirteenth General Programme of Work defines WHO’s strategy for the period 2019–2023. It focuses on the “triple billion” targets to achieve measurable impacts on people’s health at the country level (45, 46). Those targets are a shared vision among WHO and Member States, helping countries to accelerate the delivery of the SDGs. They aim to improve the health of billions of people by 2023 by achieving (a) 1 billion more people enjoying better health and well-being; (b) 1 billion more people benefiting from UHC; and (c) 1 billion more people being better protected from health emergencies. The “billions” are calculated using three composite indices based on SDG indicators and serve as both a measurement tool and a policy roadmap to accelerate progress towards health-related SDGs.
Current progress towards each of the targets is shown in Figure 3.2. Readers should note that these estimates do not account for the full impact of the COVID-19 pandemic. The 1 billion for UHC is calculated as the number of additional people covered by essential health services without experiencing catastrophic health spending due to out of pocket costs (more than 10% of household spending) between 2018 and 2023. Projections indicate that even without accounting for the impact of COVID-19, the world is not expected to meet the UHC 1 billion target by 2023. The pre-pandemic trajectory based on data up to and including 2019 projected that 269 million more people would be covered by essential health services without experiencing financial hardship by 2023 compared with 2018 – leaving a sizeable shortfall of 731 million.
Figure 3.2 Projected world population shortfall in reaching WHO triple billion targets over 2018–2025, based on pre-pandemic progress observed over 2000–2019
1
+1billion
+800million
+600million
+400million
+200million
Universal health coverage
0
Gap to reaching the triple billion targets by 2023
269 million more people by 2023
902 million more people by 2023
924 million more people by 2023Health emergency protection
Healthier populations Shortfall: 98 million
Shortfall: 731 million
Shortfall: 76 million
Projected additional people (millions)
Source: WHO triple billion dashboard (47).
The pandemic has underscored the importance and interconnections of the triple billion targets. It has shown that healthier, more resilient societies can respond more effectively to health emergencies and that essential health services must be available to all. It has also highlighted the need for a broader, whole-of-society approach and global solidarity to achieve a better response to COVID-19 and future health emergencies.

36
Global Monitoring Report on Universal Health Coverage 2021
3.2 Joint progress at regional level
Starting points and trajectories on the path to UHC as tracked by related SDG indicators varied substantially across WHO regions over the period 2000–2017 (Figure 3.3).
• Quadrant I includes regions with relatively high levels of service coverage and low levels of catastrophic health spending. Regions that successfully manage to increase service coverage while simultaneously reducing catastrophic health spending are progressing towards the top right corner of this quadrant. In 2017, only the Region of the Americas and the European Region were in quadrant I, with the former almost there already in 2000 and the latter joining in 2005. Service coverage has increased over time in both but neither saw a consistent reduction in incidence rates of catastrophic health spending. The two regions have had somewhat opposite trends. In the Region of the Americas, trends in catastrophic health spending were encouraging after 2005, with the proportion of the population spending more than 10% of their household budget on health out of pocket falling from 8.1% in 2005 to 7.1% in 2017. Conversely, in the European Region, trends in catastrophic health spending went in the wrong direction, increasing from 6.3% in 2005 to 6.9% in 2017.
• Quadrant II includes regions with relatively high service coverage but at a major cost to individuals and their families (that is, with relatively high levels of catastrophic health spending). In 2017, the WHO Western Pacific Region was in this quadrant. Although this region experienced the fastest improvements in service coverage from 2000 (from an index of 51 to 78), it also recorded the fastest increases in catastrophic health spending (from 10.3% to 20.2%).
• South-East Asia was in quadrant III in 2017, meaning it experienced relatively low service coverage and relatively high rates of catastrophic health spending. Progress in service coverage from 2000 was impressive (from an index of 30 to 57), and for a decade was achieved with only small increases in catastrophic health spending. Large increases in catastrophic health spending, however, became evident, from 12.6% in 2010 to 15.2% in 2017, pulling the region towards quadrant II.
• Quadrant IV comprises regions with relatively low service coverage and low levels of catastrophic health spending. The African Region and the Eastern Mediterranean Region are both in this quadrant but both had distinct trajectories. The African Region managed to increase service coverage without any major increases in catastrophic health spending over the period 2000 to 2017. Catastrophic health spending in the Eastern Mediterranean Region, however, increased from 7.3% to 12.5%.
The levels and trends of global and regional population-weighted averages that were previously discussed can be largely driven by populous countries. This effect is particularly strong in the Western Pacific and South-East Asia Regions, where single countries account for more than two thirds of the regional population (75% for China and 68% for India, respectively). Similarly, countries with very small populations, such as small island developing States and micro States, have virtually no contribution to the trends of their respective regions. This is particularly true in the Western Pacific Region and the Region of the Americas. More in-depth analysis of the joint progress in service coverage and catastrophic health spending at the country level is therefore needed; this is further discussed in the next section.

37
Figure 3.3 Trends in UHC service coverage index (SDG indicator 3.8.1) and incidence of catastrophic health spending (SDG indicator 3.8.2,10% threshold) by WHO region, 2000–2017
Note: The vertical axis corresponds to the 2017 global incidence rate of catastrophic health spending defined as the proportion of the population-weighted population with household out of pocket health expenditure exceeding 10% of household budget (13.2% in 2017). The horizontal axis corresponds to the 2017 global population-weighted average UHC SCI (65) in 2017. Source: SDG indicator 3.8.1: WHO global service coverage database, 2021 update; SDG indicator 3.8.2: WHO and World Bank global financial protection database, 2021 update.
3.3 Joint progress at country level
In the Region of the Americas (Figure 3.4), most of the countries with available data were in quadrant I in 2017 (relatively high levels of service coverage and relatively low levels of catastrophic health spending), with variable individual country trajectories (47). Chile and Colombia made sustained progress in service coverage over the period 2006–2016. However, while catastrophic health spending decreased substantially in Colombia (from 20% in 2008 to 8% in 2016), this indicator worsened in Chile (from 9% in 2006 to 14% in 2016). Service coverage improvements have been strong in several countries, particularly those that had very low levels in 2000, such as Peru, Bolivia and Nicaragua, but additional efforts are required to further increase service coverage, especially in Bolivia and Nicaragua. The incidence of catastrophic health spending has decreased in Bolivia and Peru in recent years, in contrast to Nicaragua, which experienced a dramatic increase in 2014 (reaching 25% incidence). For some countries given as examples, it is possible to relate progress in both dimensions with the efforts to strengthen health systems in countries (44). For example, Bolivia tripled public spending on health in a decade, increasing public expenditure on primary health care to 37%, compared to a regional average of less than 15%, and it is one of the three Latin American countries close to reaching the regional goal of allocating 6% of gross domestic product (GDP) towards public health.
20002017
2000
2017
2000
2017
2000
20172000
2017
2000
2017
0
5
10
15
20
25
0 10 20 30 40 50 60 70 80 90 100UHC service coverage index (SDG indicator 3.8.1)
Africa Americas South-East Asia Europe Eastern Mediterranean Western Pacific
Quadrant IV Quadrant I
Quadrant III Quadrant II
An increase in service coverage is better
Less
peop
le w
ith
cata
stro
phic
hea
lth
spen
ding
is be
tter
Cata
strop
hic ou
t of p
ocke
t hea
lth sp
endin
g (SD
G ind
icato
r 3.8.
2, 10
% th
resh
old)

38
Global Monitoring Report on Universal Health Coverage 2021
Note: The vertical axis corresponds to the 2017 global incidence rate of catastrophic health spending defined as the proportion of the population-weighted population with household out of pocket health expenditure exceeding 10% of household budget (13.2% in 2017). The horizontal axis corresponds to the 2017 global population-weighted average UHC SCI (65) in 2017. Trajectories are shown for selected countries, for all others the dots in beige show the most recent score in service coverage and incidence rate of catastrophic health spending (SDG indicator 3.8.2,10% threshold). Source: SDG indicator 3.8.1: WHO global service coverage database, 2021 update; SDG indicator 3.8.2: WHO and World Bank global financial protection database, 2021 update.
Regarding the European Region, in-depth analysis of trends has shown that unmet needs and financial hardship are linked to weaknesses in policy design in all three dimensions of health coverage. For example, gaps in population coverage are more common in countries where the basis for entitlement is linked to employment or payment of contributions; the benefits package is narrow or not adequately supported by public spending on health; and there are user charges (co-payments) in place without protection mechanisms, such as co-payment exemptions for poor households or a cap on co-payments (41). Weaknesses in coverage policy undermine equity and efficiency by creating financial barriers to access, shifting the financial burden of paying for health care onto those who can least afford it – poor people and regular users of health services – and encouraging inefficient patterns of use. In Europe, the poorest households are most likely to incur catastrophic health spending, defined as out of pocket payments exceeding 40% of household capacity to pay (1, 26, 41).
In the Eastern Mediterranean Region, there are insufficient data to track SDG UHC indicators in fragile and conflict-affected situations (13), and available data are often outdated (Figure 3.5). For years where data are available, service coverage levels are often significantly below regional values for the same year, while incidence rates of catastrophic health spending range from being very low in some cases (for example, Somalia) to much higher in others (for example, Afghanistan). As discussed in Chapter 2, the financial hardship experienced by people spending less than 10% of their household budget on health is captured by indicators of impoverishing health spending. In the case of Somalia, 25% of the population in 2017 was pushed or further pushed below the extreme poverty line by out of pocket health spending. Hence, in a country such as Somalia with very low levels of service coverage and low levels of catastrophic health spending but
Figure 3.4 Trends in UHC service coverage index (SDG indicator 3.8.1) and incidence of catastrophic health spending (SDG indicator 3.8.2,10% threshold) for selected countries in the WHO Region of the Americas, 2000–2017
2001
2019
2008
2017
2006
2016
2008
2016
2001
2014
2000
2019
0
5
10
15
20
25
30
0 70 80 90 100
UHC service coverage index10 20 30 40 50 60
Region of the Americas Bolivia Brazil ChileColombia Nicaragua Peru Other countr ies
Quadrant IV Quadrant I
Quadrant IIQuadrant III
An increase in service coverage is better
Less
peo
ple
wit
h ca
tast
roph
ic h
ealt
h sp
endi
ng is
bet
ter
Cata
strop
hic ou
t of p
ocke
t hea
lth sp
endin
g (SD
G ind
icato
r 3.8.
2, 10
% th
resh
old)

39
Note: The vertical axis corresponds to the 2017 global incidence rate of catastrophic health spending defined as the proportion of the population-weighted population with household out of pocket health expenditure exceeding 10% of household budget (13.2% in 2017). The horizontal axis corresponds to the 2017 global population-weighted average UHC SCI (65) in 2017.Source: SDG indicator 3.8.1: WHO global service coverage database, 2021 update; SDG indicator 3.8.2: WHO and World Bank global financial protection database, 2021 update.
high levels of impoverishment or further impoverishment due to out of pocket health spending, the foundations of the health system need to be built. It is noteworthy that the impressive regional improvements in service coverage were driven, in most cases, by countries that are not in fragile and conflict-affected situations. However, the high number of refugees and migrants makes it hard to estimate both service coverage and catastrophic health spending in some of these countries, as they have limited access to (quality) health care services and financial protection.
Figure 3.5 Most recent UHC service coverage index score (SDG indicator 3.8.1) and incidence of catastrophic health spending (SDG indicator 3.8.2,10% threshold) for countries in fragile and conflict-affected situations in the WHO Eastern Mediterranean Region, 2000–2017
In the Western Pacific Region, service coverage has improved (to varying degrees) in all countries shown in Figure 3.6. However, only Australia, Malaysia and Viet Nam did not experience large increases in catastrophic health spending. The worsening regional trend in catastrophic health spending does not apply to small island developing States or micro States, for which primary estimates are not available. In all other countries with available data, catastrophic health spending generally increased quite strongly, including in high-income countries, such as the Republic of Korea (from 8% to 12%) and to some extent Japan (from 9% to 11%). Service coverage has increased substantially in Viet Nam, which was ranked last in the region at the start of the period but has now reached quadrant I, thanks to a simultaneous reduction in catastrophic health spending (10% in 2018). Trends in service coverage in Mongolia seems to have stalled between 2014 and 2018 while the incidence of catastrophic health spending has increased steeply. China, which has transitioned from lower-middle to upper-middle-income status, has experienced the largest increase in service coverage between 2002 and 2016 but has also the largest increase in catastrophic health spending. In these two countries, however, the proportion of the poor spending on health out of pocket has decreased since 2013/2014, suggesting that the increase in financial hardship did not affect the poorest segment of the population as much as in the richest. rends in the SDG UHC indicator suggest that with the rapid improvement in service coverage, most countries in the region face challenges to mitigate the rise of financial hardship due to health out of pocket spending, although some
20002005
2010
2015
2017
Afghanistan (2016)
Somalia (2017)
Syrian Arab Rep. (2007)
Yemen (2014)
Iraq (2012)
Sudan (2009)
0
5
10
15
20
25
30
0 70 80 90 100
UHC service coverage index10 20 30 40 50 60
Quadrant IV
Quadrant III Quadrant II
Quadrant I
An increase in service coverage is better
Less
peo
ple
wit
h ca
tast
roph
ic h
ealt
h sp
endi
ng is
bet
ter
Cata
strop
hic ou
t of p
ocke
t hea
lth sp
endin
g (SD
G ind
icato
r 3.8.
2, 10
% th
resh
old)
Eastern Mediterranean RegionMedium-intensity conflict
High-density conflictHigh institutional and social fragility

40
Global Monitoring Report on Universal Health Coverage 2021
Figure 3.6 Trends in UHC service coverage index (SDG indicator 3.8.1) and the incidence of catastrophic health spending (SDG indicator 3.8.2,10% threshold) for selected countries in the WHO Western Pacific Region, 2000–2017
Note: The vertical axis corresponds to the 2017 global incidence rate of catastrophic health spending defined as the proportion of the population-weighted population with household out of pocket health expenditure exceeding 10% of household budget (13.2% in 2017). The horizontal axis corresponds to the 2017 global population-weighted average UHC SCI (65) in 2017.Source: SDG indicator 3.8.1: WHO global service coverage database, 2021 update; SDG indicator 3.8.2: WHO and World Bank global financial protection database, 2021 update.
indicators point to a relative protection of the poorest segments and the richest segment of the population occurring over the most recent years. Because the Western Pacific Region is diverse in terms of countries ‘development stages and health systems, individual countries’ development analysis is critical to understand and reduce inequalities in service coverage and financial hardship and to identify policy gaps that may arise as countries reform their systems (48).
2000
20052010
20152017
20092015
2002
2016
20102019
2003
2018
2002
2018
2013 2019
2000
2015
20022018
0
5
10
15
20
25
30
0 10 20 30 40 50 60 70 80 90 100UHC service coverage index
Quadrant III Quadrant II
Quadrant IQuadrant IV
An increase in service coverage is better
Less
peo
ple
wit
h ca
tast
roph
ic h
ealt
h sp
endi
ng is
bet
ter
Cata
strop
hic ou
t of p
ocke
t hea
lth sp
endin
g (SD
G ind
icato
r 3.8.
2, 10
% th
resh
old)
Western Pacific Region
Japan
Australia
Republic of Korea
China
Mongolia

41
Although South-East Asia joined quadrant III in 2015, favourable trends are observed in several countries (Figure 3.7). As detailed in Box 3.2, Thailand joined quadrant I in 2007 and has continued to improve both indicators since then. Other countries will probably join quadrant I in the short term, in particular Indonesia, Sri Lanka and Bhutan. The former two managed to maintain stable catastrophic health spending at around 5% while continuously improving their service coverage. Although Indonesia has experienced a steady increase in SDG indicator 3.8.2,it remains below 5%. Timor-Leste and Nepal are making progress despite economic and health challenges. Though service coverage is still too low in these countries, they have managed to maintain their proportions of catastrophic health spending below the global average, especially Timor-Leste at around 2.5% (Box 3.2). India and Bangladesh are in quadrant III. Despite increases in service coverage, until 2017 those two countries were experiencing difficulties in preventing increases in catastrophic health spending (Box 3.2).
Note: The vertical axis corresponds to the 2017 global incidence rate of catastrophic health spending defined as the proportion of the population-weighted population with household out of pocket health expenditure exceeding 10% of household budget (13.2% in 2017). The horizontal axis corresponds to the 2017 global population-weighted average UHC SCI (65) in 2017.Source: SDG indicator 3.8.1: WHO global service coverage database, 2021 update; SDG indicator 3.8.2: WHO and World Bank global financial protection database, 2021 update.
Figure 3.7 Trends in UHC service coverage index (SDG indicator 3.8.1) and incidence of catastrophic health spending (SDG indicator 3.8.2,10% threshold) for selected countries in the WHO South-East Asia Region, 2000–2017
2000 20052010
2015 20172000
2016
2000
2017
2000
2017
2001
2017
2004
2016
20152017
20032016
20052016
2000
2019
20012014
0
5
10
15
20
25
30
0 10 20 30 70 80 90 100
UHC service coverage index 40 50 60
Quadrant III
Quadrant IV Quadrant I
Quadrant II
Less
peo
ple
wit
h ca
tast
roph
ic h
ealt
h sp
endi
ng is
bet
ter
An increase in service coverage is better
Cata
strop
hic ou
t of p
ocke
t hea
lth sp
endin
g (SD
G ind
icato
r 3.8.
2, 10
% th
resh
old)
South-East Asia RegionIndonesiaSri Lanka
BangladeshMaldivesThailand
BhutanMyanmarTimor-Leste
IndiaNepal

42
Global Monitoring Report on Universal Health Coverage 2021
Box 3.2 Making progress towards UHC in Thailand, Timor-Leste and Bangladesh
Thailand
Thailand’s implementation of its policy on UHC has made good progress since its inception in 2002 (49). Every Thai citizen is now entitled to essential preventive, curative and palliative health services at all life stages, with a relatively high level of financial risk protection. Like its counterparts elsewhere, however, the policy faces challenges. A predominantly tax-financed system in a nation with a high proportion of people living in poverty will always strive to contain rising costs. Disparities exist among the different health insurance schemes that provide coverage for Thai citizens. The burden of national health expenditure is chiefly borne by the government, primarily to reduce financial barriers to access for the poor. The population is ageing, and the disease profiles of the population are changing in parallel with the modernization of Thai people’s lifestyles. Thailand is now aiming to enhance and sustain its UHC policy. Developing the existing primary care system in Thailand has the greatest potential to provide more self-sustaining, efficient, equitable and effective UHC. Primary care needs to move from its traditional role of providing basic disease-based care to being the first point of contact in an integrated, coordinated, community-oriented and person-focused care system, for which the national health budget should be prioritized.
Timor-Leste
Timor-Leste is strongly committed to achieving UHC. Recently, the health status of its citizens has improved, with more health services available and better financial protection for its population. However, service coverage is still low. For example, about 73.5% of children are fully vaccinated by the end of their first year and only 57% of births are attended by skilled personnel. The government faces challenges in maintaining current levels of health funding and securing additional funds for new emerging health challenges, such as the rise of noncommunicable diseases. Also, there are variations in access to health services between urban and rural, rich and poor, and educated and uneducated populations. The distribution of resources such as personnel, funds, and drugs is closely linked to the distribution of health facilities and not to the population or use of services. These are not small challenges to overcome, but Timor-Leste is determined to apply a thoughtful and focused approach. Timor-Leste’s National Health Sector Strategic Plan 2011–2030 is progressing well and orients the country’s health sector in the direction of UHC through better access to health services and financial protection. The plan aims to rebuild health facilities, expand community-based health services, increase the number of medical graduates and launch the health financing strategy and family health service delivery model (50).
Bangladesh
The health system of Bangladesh is experiencing a double burden: low service coverage, and a lack of efficient financial risk protection mechanisms. Bangladesh has a pluralistic health care system, making it highly unregulated. With great inequality in service delivery and low financial security, essential service coverage is unsatisfactory. The government is trying to increase health service coverage among people below the poverty line through a pilot health-financing scheme, Shasthyo Suroksha Karmasuchi (SSK), in three upazilas (Kalihati, Ghatail and Madhupur) of Tangail district. Even with this progress, Bangladesh would not achieve UHC 2030 goals unless it intervenes primarily in maternal, newborn and child health and stabilizes out of pocket expenditure (51).
In the African Region, most countries were in quadrant IV (low level of service coverage and catastrophic health spending), except Nigeria, Uganda, Sierra Leone, Angola, South Sudan and Togo, which are in quadrant III (low level of service coverage and high level of catastrophic health spending). In those countries, the incidence of catastrophic health spending has decreased over time except in Angola and South Sudan, where the situation has worsened. Protecting people against the impoverishing effect of health payments, as well as effectively harnessing the public and private sectors, are of critical importance in making progress towards UHC in many countries in Africa. Box 3.3 presents the example of Eritrea.

43
Box 3.3 Making progress towards UHC in Eritrea
Eritrea is highly committed to global health targets, being one of the few countries in the WHO African Region that attained all its health Millennium Development Goal targets. Since 2015, the country has put in place several initiatives to accelerate movement towards UHC.
On making its commitment to UHC, the country hosted a WHO Regional Office for Africa UHC scoping mission, the focus of which was on identifying critical actions in the country that if addressed would accelerate the movement towards UHC. The UHC roadmap that arose from these deliberations has formed the backbone of the actions the country has prioritized.At the health governance level, efforts have been made to define a comprehensive cohort-based set of essential interventions to be provided at each level of the system. The country has remodelled its service delivery approach, with devolution of health management to newly created districts, expansion of clinical capacity in zobas or regions (which are currently providing emergency and critical care, including neonatal and paediatric intensive care unit services), and establishment of functional outreach to villages across the whole country, which provide essential services (including for noncommunicable diseases) in addition to traditional outreach services.
The country has a strong technical accountability process, with high-level annual sector reviews conducted at each subnational unit involving the entire Ministry of Health management led by the Minister of Health, which aim to identify and overcome operational challenges faced by the subnational units. Additionally, the country health sector benefits from consistent independently assessed strategic reviews and evaluations, which have allowed independent review and guidance to be integrated into its priorities, which it fully owns and implements.
Finally, the overall governance structure is such that the government is in effective control of the health agenda, with partner support complementary to, not substituting, the stewardship.
SDG-related indicators on service coverage and catastrophic health spending are obtained from different data sources and cannot be used to determine within a given country who benefits from service coverage without financial hardship. Catastrophic health spending as defined in SDG indicator 3.8.2 is focused on those spending more than 10% of their household budget on health regardless of their poverty status. Indicators of impoverishing health spending complement this measure and focus on the financial hardship experience of the near poor and the poor, including those spending any amount on health out of pocket. Both types of indicator are needed to capture financial hardship across the whole population with global metrics. For an accurate picture of the number of households and persons who benefit from service coverage without incurring financial hardship, data on service coverage components, household out of pocket health spending, total consumption and spending on necessities need to be collected with the same survey or for similar population groups. Data on forgone care, barriers to access and utilization are also needed to clarify and understand trends in service coverage and financial hardship, especially during the COVID-19 pandemic, as discussed in the next chapter.

44
Global Monitoring Report on Universal Health Coverage 2021

45
Accelerating progress towards UHC SDG 3.8 targets in the COVID-19 pandemic era
4

46
Global Monitoring Report on Universal Health Coverage 2021
Globally, since the advent of the COVID-19 pandemic in early 2020 and as of the end of November 2021, there have been around 260 million confirmed cases of COVID-19, including over 5 million deaths, reported to WHO (52). The pandemic has laid bare long-ignored risks, including inadequate health systems, gaps in social protection and structural inequalities. It has also brought home the importance of basic public health and strong health system and emergency preparedness, as well as the resilience of a population in the face of a new virus or pandemic, lending ever greater urgency to the quest for universal health coverage (UHC). This chapter discusses the extent and magnitude of disruptions to essential health services and considers various indications that are pointing towards a worsening of financial protection resulting from the pandemic. Overall, the emerging evidence is clear: the COVID-19 pandemic is likely to halt the continuous progress made in service coverage expansion over the past 20 years and exacerbate financial hardship due to out of pocket health spending for those seeking care, especially among those living in poor households. The chapter concludes that strong health systems based on primary health care are the foundation of an effective response to COVID-19 and the basis for progress towards UHC.
4.1 Disruptions of essential health services due to COVID-19
Data for 2020 are only available for nine out of the 14 UHC SCI sub-indicators, precluding a comprehensive assessment of the impact of COVID-19 on the coverage of essential health services. Nevertheless, preliminary analyses suggest that the UHC SCI decreased slightly in 2020 compared with 2019 (Figure 4.1). While it might be possible that this preliminary 2020 UHC SCI value is an overestimation, it suggests that progress has stopped and may even have reversed.
4 – Accelerating progress towards UHC SDG 3.8 targets in the COVID-19 pandemic era
Source: WHO global service coverage database, 2021.
To better understand the extent of disruptions to essential health services caused by COVID-19 globally, WHO and other agencies have been tracking the rapidly evolving situation (53–55). In 2020, WHO published results from the first national pulse survey on the continuity of essential health services during the COVID-19 pandemic (56), as well as results from specific pulse surveys on noncommunicable disease resources and services (57), mental, neurological and substance use services (58), and immunization (59). Those surveys were followed, in early 2021, by the second round of the national pulse survey on the continuity of essential health services (60).
40
45
50
55
60
65
70
75
2000
2005
2010
2015
2017
2019202
0
Figure 4.1 UHC service coverage index, 2000–2019 and 2020 preliminary estimate
UHC S
CI
Pre-COVID-19 projection Estimated data Historical data

47
Figure 4.2 Average percentage of countries reporting disruptions in essential health services across integrated service delivery channels (n=112), January–March 2021
Figure 4.3 Average percentage of countries reporting disruptions in essential health services across service areas, January–March 2021
Findings from this second round of the pulse survey demonstrated that substantial disruptions persisted after the first year of the pandemic; 94% of 135 participating countries, territories and areas reported one or more disruptions to services in January–March 2021, only a fractional improvement on the findings from quarters 3 and 4 of 2020. Moreover, countries reported disruptions across all service delivery channels, with the highest proportion of disruptions reported in primary care and rehabilitative, palliative and long-term care (Figure 4.2), and across all tracer service areas, including mental, neurological and substance abuse disorders, neglected tropical diseases, noncommunicable diseases, immunization, communicable diseases, and sexual, reproductive, maternal, newborn, child and adolescent health (SRMNCAH) and nutrition (Figure 4.3).
Source: WHO (60).
Source: WHO (60).
22%
29%
14%
24%
19%
9%
13%
4%
9%
6%
5%
6%
3%
8%
3%
35%
48%
22%
41%
27%
0% 10% 20% 30% 40% 50% 60% 70% 80% 90% 100%Percentage of countries
5–25% disrupted 26–50% disrupted More than 50% disrupted
Average disruption
Primary care
Emergency, critical and operative care
Rehabilitative, palliative and long-term care
Auxiliary services
21%
23%
15%
19%
23%
22%
24%
9%
13%
11%
8%
8%
7%
9%
9%
10%
19%
9%
5%
8%
3%
39%
45%
44%
37%
37%
36%
35%
0% 10% 20% 30% 40% 50% 60% 70% 80% 90% 100%
Percentage of countries
5–25% disrupted 26–50% disrupted More than 50% disrupted
Average disruption of programme specific areas
Mental, neurological and substance abuse disorders (n=121)
Neglected tropical diseases (n=109)
Noncommunicable diseases (n=109)
Immunization (n=112)
Communicable diseases (n=128)
SRMNCAH and nutrition (n=121)

48
Global Monitoring Report on Universal Health Coverage 2021
Source: WHO (60).
Source: WHO (60).
On average, countries in the Americas and Africa reported greater disruptions across tracer service areas compared to other regions (Figure 4.4 and Box 4.1). Care should be taken interpreting these preliminary findings, however, as there were important variations in response rates across regions. High-income countries reported fewer service disruptions compared with countries in other income groups (Figure 4.5).
Figure 4.4 Average percentage of countries reporting disruptions across tracer service areas by WHO region, January–March 2021
22%
26%
26%
18%
18%
16%
22%
9%
11%
13%
6%
6%
7%
6%
7%
7%
10%
6%
5%
4%
8%
38%
44%
49%
30%
29%
26%
35%
0% 10% 20% 30% 40% 50% 60% 70% 80% 90% 100%
Percentage of countries
5–25% disrupted 26–50% disrupted More than 50% disrupted
Global (n=135)
African Region (n=40)
Region of the Americas (n=29)
South-East Asia Region (n=9)
European Region (n=23)
Eastern Mediterranean Region (n=21)
Western Pacific Region (n=13)
Figure 4.5 Average percentage of countries reporting disruptions across tracer service areas by World Bank income group, January–March 2021
22%
15%
28%
24%
23%
9%
5%
11%
11%
8%
7%
6%
9%
8%
5%
38%
26%
48%
42%
36%
0% 10% 20% 30% 40% 50% 60% 70% 80% 90% 100%
Percentage of countries
5–25% disrupted 26–50% disrupted More than 50% disrupted
Global (n=135)
High income (n=35)
Upper-middle income (n=37)
Lower-middle income (n=37)
Lower-middle income (n=37)

49
Disruptions are occurring due to both supply-side and demand-side factors. On the supply side, the two largest contributors are insufficient staff availability and decreases in inpatient volume due to cancellations of elective surgery, and on the demand side, the disruptions are driven by changes in care-seeking behaviours (Figure 4.7).
Box 4.1 Maintaining quality essential health services during the COVID-19 pandemic in the WHO African Region
Gaps in capacity to provide essential services coupled with low resilience of health systems in many countries in the African Region have challenged the provision of essential services during the COVID-19 pandemic. Outbreaks have not only led to disability and death, they have also diverted human, infrastructure and financial resources away from other services towards COVID-19-related services (or measures to combat other threats) (61).
Multiple measures were implemented early in the pandemic to mitigate the impact of COVID-19 on service provision. The WHO Regional Office for Africa has also provided up-to-date information on the status of provision of essential services. More timely monitoring of indicators at facilities was put in place to rapidly identify drops in service capacity or utilization, together with national pulse surveys to evaluate the extent and magnitude of disruptions across various essential health services. Most disruptions were felt at the beginning of the pandemic, largely as a result of administrative and logistical issues. Subsequent disruptions were service and location specific, primarily driven by users’ perceptions of risk rather than provision deficiency. By the end of the first quarter of 2021 (after one year of the pandemic), only a few services were still reporting severe and widespread disruptions in the African Region. Primary care services were mostly affected compared to other integrated service delivery channels; the most affected service area was mental, neurological and substance abuse disorders (Figure 4.6).
Figure 4.6 Average percentage of countries reporting disruptions in essential health services across service areas in the African Region, January–March 2021
25%
20%
31%
19%
25%
29%
23%
10%
18%
10%
4%
12%
9%
6%
10%
14%
7%
23%
6%
2%
7%
44%
53%
48%
46%
43%
40%
36%
0% 20% 40% 60% 80% 100%
Percentage of countries
Source: WHO (60).
However, 95% of African countries still reported some service disruptions and the pandemic has highlighted the need for the region to enhance the resilience of countries’ health systems (62). Adaptive capacity is currently lacking in the region but is critical to build resilience through rapid recovery of health systems and their reconfiguration in line with evolving norms and threats. Focusing on health system resilience will minimize short- and long-term risks of major health service disruptions to essential health services arising from outbreaks.
5–25% disrupted 26–50% disrupted More than 50% disrupted
Average disruption of programme-specific areas)
Mental, neurological and substance abuse disorders (n=37)
Immunization (n=33)
Neglected tropical diseases (n=33)
Noncommunicable diseases (n=38)
SRMNCAH and nutrition (n=38)
Communicable diseases (n=36)

50
Global Monitoring Report on Universal Health Coverage 2021
66%
47%
35%
26%
22%
19%
16%
14%
12%
57%
57%
43%
36%
0% 20% 40% 60% 80% 100%
Figure 4.7 Reasons for service disruptions in essential health services, January–March 2021
Source: WHO (60).
The magnitude and extent of disruptions within countries has decreased, with an average of about one third of services disrupted in reporting countries in 2021 compared with just over half in 2020. This progress may be, in part, a result of intentional service delivery modifications and the intensified efforts of countries to respond to challenges, bottlenecks and barriers in their health systems brought on by the pandemic (Box 4.2).
Supply side facor Demand side factorPercentage of countries
Insufficient staff availability (due to employment to provide COVID-19 relief or other) (n=112)
Community fear/mistrust in seeking health care (n=112)
Decrease in outpatient volume due to patients not presenting (n=111)
Decrease in inpatient volume due to cancellation of elective care (n=112)
Financial difficulties during outbreak/lockdown (n=112)
Travel restrictions hindering access to the health facilities (n=112)
Changes in treatment policies for care-seeking behaviour (n=111)
Insufficient personal protective equipment available (n=111)
Unavailability/stock-out of essential medicines (n=111)
Inpatient services/hospital beds not available (n=111)
Closure of outpatient clinics (n=112)
Closure of population-level screening programmes (n=111)
Closure of outpatient services as per government directive (n=112)

51
Box 4.2 Maintaining essential health services in North Macedonia
To mitigate the impact of COVID-19 on service coverage, North Macedonia’s Ministry of Health has taken a comprehensive approach, consisting of four key steps (63, 64): 1. rapid assessment and situation analysis on the impact of COVID-19 on essential health services; 2. action plan development; 3. action plan implementation;4. ongoing monitoring and evaluation of and modifications to the action plan.
In June 2020, North Macedonia’s Ministry of Health, in close cooperation with the WHO country and regional offices, completed a rapid assessment and situation analysis that revealed that a wide range of services had been disrupted. Among the most affected services were elective surgeries, non-specialist and non-urgent outpatient and inpatient care, noncommunicable disease diagnosis, routine immunization, and psychiatric group therapy. Disruptions were due to both supply-side factors (such as population screening programme suspensions and elective care cancellations) and demand-side factors (such as patients not presenting or facing barriers to care due to government lockdowns or fear of infection).
In response to these findings, a Ministry of Health technical working group developed and widely disseminated an action plan identifying key priority actions, including: • strengthening coordination and governance mechanisms;• appointing dedicated coordinators to organize the work of health care facilities;• strengthening health facility capacities;• using telemedicine to deliver services;• strengthening health worker capacities and addressing their health needs;• documenting and sharing learning.
Through implementation of this plan, including through digital health interventions, access to safe care in the current context is recovering. The interventions have enabled clinicians to provide safe routine consultations remotely while supporting continuity of care, particularly to vulnerable groups, such as the elderly or patients with comorbidities. To respond to the rapidly changing COVID-19 situation, the action plan will be revised and reimplemented according to new needs and priorities identified through ongoing monitoring and evaluation efforts.
Throughout 2021, countries have been completing rapid facility assessments using modules from the suite of health service capacity assessments in the context of the COVID-19 pandemic (65). In the seven countries for which data are available, about a quarter of facilities reported reductions in service volumes for at least some outpatient services, with RMNCH and communicable disease services reporting decreases in the largest proportion of facilities. Conversely, certain services have also experienced disruptions due to increased demand for services, for example in primary care services for undifferentiated symptoms (such as headache, pain, fever), with reporting countries noting increases in about two thirds of facilities.
Even small levels of disruption can have substantial negative impacts on health outcomes and are especially concerning in settings where UHC was already challenged. For example, the disruption of vaccination campaigns in low- and middle-income countries can have important negative consequences for child health outcomes and the spread of vaccine-preventable diseases. Ensuring continued availability of and access to high-quality services and addressing the main barriers to care (health workforce availability, supply chain disruptions, community fear and mistrust, financial hardship caused by lockdowns) will be critical to mitigate the immediate and long-term consequences of the ongoing pandemic.

52
Global Monitoring Report on Universal Health Coverage 2021
Throughout 2021, countries have been completing rapid facility assessments using modules from the suite of health service capacity assessments in the context of the COVID-19 pandemic (65). In the seven countries for which data are available, about a quarter of facilities reported reductions in service volumes for at least some outpatient services, with RMNCH and communicable disease services reporting decreases in the largest proportion of facilities. Conversely, certain services have also experienced disruptions due to increased demand for services, for example in primary care services for undifferentiated symptoms (such as headache, pain, fever), with reporting countries noting increases in about two thirds of facilities.
Even small levels of disruption can have substantial negative impacts on health outcomes and are especially concerning in settings where UHC was already challenged. For example, the disruption of vaccination campaigns in low- and middle-income countries can have important negative consequences for child health outcomes and the spread of vaccine-preventable diseases. Ensuring continued availability of and access to high-quality services and addressing the main barriers to care (health workforce availability, supply chain disruptions, community fear and mistrust, financial hardship caused by lockdowns) will be critical to mitigate the immediate and long-term consequences of the ongoing pandemic.
4.2 COVID-19 and financial protection
COVID-19 is likely to significantly worsen financial protection globally. Lack of data currently precludes a detailed and comprehensive assessment of the impact of COVID-19 on financial protection; nevertheless, the combined economic and health impacts of COVID-19 point towards the strong likelihood of a significant worsening of financial protection globally – higher incidence of catastrophic spending, worsening impoverishment, and higher rates of foregone care due to financial barriers – resulting from the pandemic, in particular among low- and middle-income countries and lower-income households. There are a number of pathways through which financial protection will be impacted.
First, over and above the health effects, COVID-19 has pushed the global economy into recession in 2020 on a scale not witnessed since the 1930s, with most countries experiencing negative economic growth. Declining incomes and mobility restrictions contributed to a rapid decline in private consumption, which was followed by declining investment in most countries (66–68).
The impact of COVID-19 on aggregate income and private consumption is reverberating at the household level, although to a lower extent in high-income countries (69). Household incomes and employment have been severely hurt. The International Labour Organization (ILO) has estimated that the equivalent of 255 million full-time jobs were lost in 2020 (70). The World Bank’s high-frequency surveys confirm the magnitude of the employment shock. More than half of all households surveyed across a multitude of countries reported income losses resulting from the economic effects of the pandemic. About 36% of those who worked prior to COVID-19 had to stop working from April to July 2020 and 62% of households reported reduction in total income (71). Furthermore, the World Bank estimated in 2021 that around 120 million additional people had been pushed into extreme poverty owing to COVID-19, bringing the total to around 735 million (72).
These poor and more vulnerable populations emerging due to unemployment, decreased savings and lack of social protections are bearing the economic brunt of the pandemic, with evidence of growing inequalities across households. Global estimates indicate that, in 2020, income losses averaged around 5% among the richest global quintile and 6% among the poorest quintile; 2021 projections, on the other hand, indicate that most income losses were recovered among the richest quintile but that the poorest quintile continued to suffer income losses (73) (Figure 4.8).
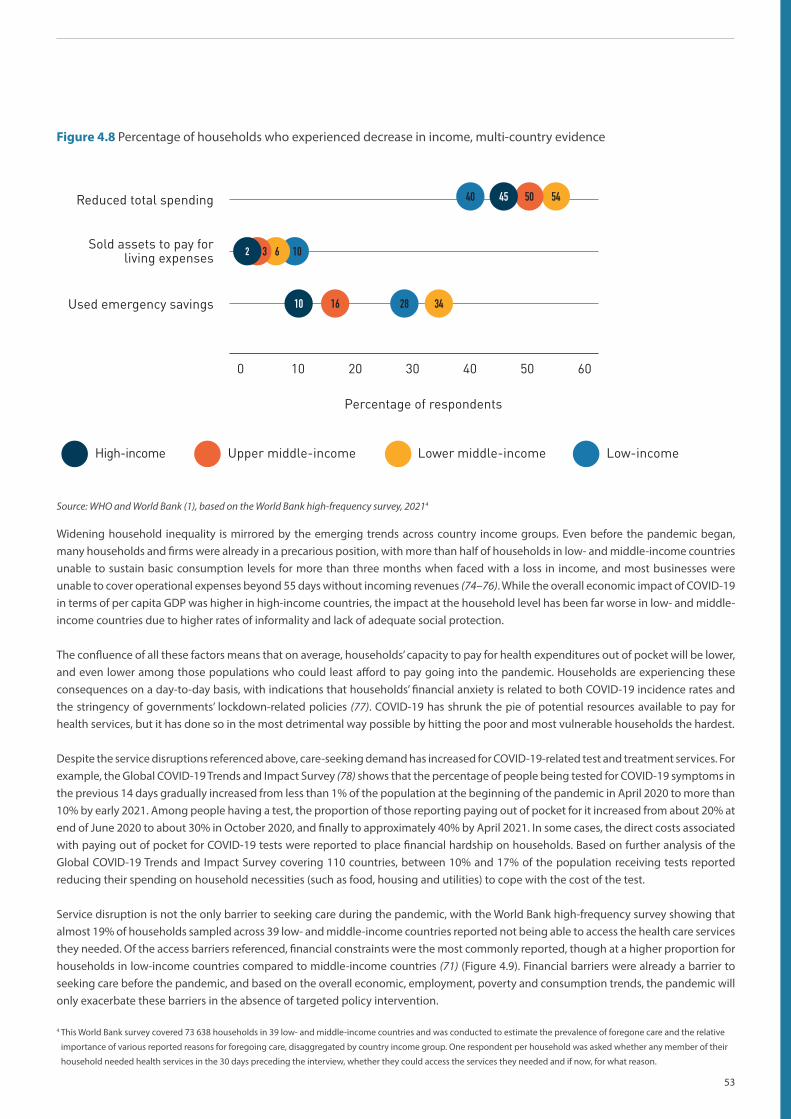
53
Figure 4.8 Percentage of households who experienced decrease in income, multi-country evidenceFigure 26
100 20 30 40 50 60
40 45 50 54
2 3 6 10
10 16 28 34
Sold assets to pay for living expenses
Used emergency savings
Reduced total spending
Percentage of respondents
Low-incomeLower middle-incomeUpper middle-incomeHigh-income
fig 26.indd 1fig 26.indd 1 09.12.21 19:2209.12.21 19:22
Source: WHO and World Bank (1), based on the World Bank high-frequency survey, 20214
4 This World Bank survey covered 73 638 households in 39 low- and middle-income countries and was conducted to estimate the prevalence of foregone care and the relative
importance of various reported reasons for foregoing care, disaggregated by country income group. One respondent per household was asked whether any member of their
household needed health services in the 30 days preceding the interview, whether they could access the services they needed and if now, for what reason.
Widening household inequality is mirrored by the emerging trends across country income groups. Even before the pandemic began, many households and firms were already in a precarious position, with more than half of households in low- and middle-income countries unable to sustain basic consumption levels for more than three months when faced with a loss in income, and most businesses were unable to cover operational expenses beyond 55 days without incoming revenues (74–76). While the overall economic impact of COVID-19 in terms of per capita GDP was higher in high-income countries, the impact at the household level has been far worse in low- and middle-income countries due to higher rates of informality and lack of adequate social protection.
The confluence of all these factors means that on average, households’ capacity to pay for health expenditures out of pocket will be lower, and even lower among those populations who could least afford to pay going into the pandemic. Households are experiencing these consequences on a day-to-day basis, with indications that households’ financial anxiety is related to both COVID-19 incidence rates and the stringency of governments’ lockdown-related policies (77). COVID-19 has shrunk the pie of potential resources available to pay for health services, but it has done so in the most detrimental way possible by hitting the poor and most vulnerable households the hardest.
Despite the service disruptions referenced above, care-seeking demand has increased for COVID-19-related test and treatment services. For example, the Global COVID-19 Trends and Impact Survey (78) shows that the percentage of people being tested for COVID-19 symptoms in the previous 14 days gradually increased from less than 1% of the population at the beginning of the pandemic in April 2020 to more than 10% by early 2021. Among people having a test, the proportion of those reporting paying out of pocket for it increased from about 20% at end of June 2020 to about 30% in October 2020, and finally to approximately 40% by April 2021. In some cases, the direct costs associated with paying out of pocket for COVID-19 tests were reported to place financial hardship on households. Based on further analysis of the Global COVID-19 Trends and Impact Survey covering 110 countries, between 10% and 17% of the population receiving tests reported reducing their spending on household necessities (such as food, housing and utilities) to cope with the cost of the test.
Service disruption is not the only barrier to seeking care during the pandemic, with the World Bank high-frequency survey showing that almost 19% of households sampled across 39 low- and middle-income countries reported not being able to access the health care services they needed. Of the access barriers referenced, financial constraints were the most commonly reported, though at a higher proportion for households in low-income countries compared to middle-income countries (71) (Figure 4.9). Financial barriers were already a barrier to seeking care before the pandemic, and based on the overall economic, employment, poverty and consumption trends, the pandemic will only exacerbate these barriers in the absence of targeted policy intervention.

54
Global Monitoring Report on Universal Health Coverage 2021
Figure 4.9 Main reason reported by household for not accessing health care when needed, multi-country evidence
65.6
30.6
17.4
31.4
8
30.4
27.2
25.4
19.1
20.9
21.9
21
8.1
18.3
33.3
22.3
0% 10% 20% 30% 40% 50% 60% 70% 80% 90% 100%
Low income
Lower-middle income
Upper-middle income
All
Share of households not able to access needed health care
Coun
try in
com
e gr
oup
Financial reasons COVID-19 reasons Supply reasons Other reasons
Note: upper-middle-income countries n=1 to 13; lower-middle-income countries n=2 to 17; ower-income countries n=3 to 12. Data collected between April and August, 2020.Source: Author’s calculations using data from the World Bank High Frequency Survey (2021).
Increasing self-medication during the pandemic will also contribute to increased out of pocket health spending, as self-medication expenditures are typically paid for out of pocket, even in countries with high rates of coverage of health services (79). This pattern of self-medication not only raises financial protection concerns, but also has potential negative externalities for health, in particular antimicrobial resistance (80). High demand, panic buying, and hoarding of medicines and medical goods have resulted in higher prices. Supply-side constraints due to travel restrictions and interruptions in supply chains during the beginning of the pandemic also led to sharp increases in prices of drugs, vaccines and other commodities (81).
Governments around the world worked to protect households and the overall economy throughout 2020, resulting in large increases in overall government expenditure. However, these expenditures were matched with large declines in government revenues, with tax revenues declining by an average of 1.5 percentage points of GDP in 2020 (66). Higher government spending combined with lower government revenues implied higher levels of deficit financing and a jump in levels of public debt across most countries, which will have long-term effects on debit servicing payments, placing additional pressure on constrained fiscal envelopes.
This worsening of financial protection will probably be sustained in the medium term unless proactive policy efforts are made – for example, pro-poor focused increases in public spending to crowd out out of pocket spending for health, enhanced social protection support, removal of co-payments and other fees at the time and place of seeking care, cash transfer payments to enable poor and vulnerable households to meet their basic needs (including for health services), expansion in coverage and strengthening of primary health care – not just to recover but also to accelerate progress towards UHC. To develop and target these policy interventions and to understand trends in financial protection, it will be critical to adapt data collection tools and relevant metrics to closely monitor household out of pocket health spending, total consumption spending, and forgone care. Regional and country-level analysis will also be needed to identify gaps in coverage, understand their causes and develop appropriate policy responses (41, 44, 48, 82).
4.3 Strengthening health systems based on primary health care: accelerating progress towards UHC and health security
The global political commitment to primary health care was codified in the 2018 Declaration of Astana and reiterated in the Political Declaration of the 2019 United Nations High-level Meeting on Universal Health Coverage. Primary health care is the cornerstone of a strong, resilient health system and is key to accelerating progress towards UHC and the SDGs (83, 84). Primary health care implementation has evolved over time to address demographic, economic and social challenges as well as shifting disease burdens. Evidence demonstrates that a primary health care approach is the most equitable, effective and efficient way to improve the health of populations (85–87). As such, primary health care must feature in health system efforts to build back better.

55
The response to the COVID-19 pandemic has revealed the missed opportunities for advancing health for all through primary health care. Gaps in primary health care implementation have weakened countries’ abilities to detect and respond to the outbreak, and to maintain delivery of essential health services – echoing the unlearned lessons of the Ebola virus disease outbreak in 2013–2016, when discussions highlighted the importance of trust, community leadership, and resilient, primary health care-oriented health systems.
As a result, gaps persist. Evidence-based, multisectoral policies and actions that are proven to address the determinants of health and promote health and health equity have not been legislated or implemented in many countries. People and communities still lack information and opportunities for participation in policy formulation and planning, health services management, co-creation of health and self-management, thereby missing opportunities to ensure that health systems are people centred, responding to the needs and preferences of people and communities. Health services remain fragmented, with gaps in quality in all channels of service delivery, including primary care, outpatient referral care, inpatient hospital care, intensive care, emergency care and long-term care (88). Investment in primary care – the hub of integrated service delivery – and in preventive and promotive services remains woefully inadequate. For example, across the OECD, primary care receives US$ 1 of every US$ 7 spent on health, and general practitioners make up only 23% of the physician workforce (86). As such, primary care is not enabled to substantively contribute to outbreak surveillance, prevention, or response, or to undertake community-based care with confidence in infection prevention and control and effective referral mechanisms.
Even before the COVID-19 pandemic, the global UHC SCI was 68 (2019). Current trends observed over the period 2000–2019 demonstrate that progress has not been fast enough to reach the SDG indicator 3.8.1 target of a minimum of 80% coverage of essential health services by 2030 (Chapter 1). The COVID-19 pandemic has further impacted the delivery of essential health services. Disruptions were reported across all service delivery channels, with the highest proportion of disruptions reported in primary care (48% of countries), and across all service areas. The primary cause of these disruptions, as reported by 66% of countries, was insufficient staff to provide both routine services and the emergency response (60). The COVID-19 pandemic has also disproportionately hit some vulnerable population groups – people with low socioeconomic status have a higher risk of catching and dying from COVID-19, and face higher indirect health impact (such as disruption of routine care).
Primary health care offers us an approach to build back better after the crisis, addressing persistent challenges around health equity and the quality of health services while also enabling our health systems to be more resilient for future emergencies. This necessitates adopting an all-hazards risk management approach; strengthening governance; maintaining essential public health functions; and ensuring equitable access to quality, people centred integrated health services. Yet, in many settings, progress is hampered by a lack of political will, insufficient leadership and inadequate funding (86, 88, 89).
It was estimated (before COVID-19) that US$ 200 billion to 328 billion per annum investment is needed to strengthen primary health care to reach the SDGs in 67 low-income and lower-middle-income countries, saving 60 million lives by 2030 (90, 91). Further estimates demonstrate that the additional investment needed to improve emergency preparedness ranges from less than US$ 1 per person per year in low- and middle-income countries to between US$ 1 and US$ 5 per person per year (92, 93).
The largest portions of these investments are required for physical infrastructure (27%), medicines and other health products (27%), and the health and care workforce (31%) (90). These three areas for investment are among the key levers for primary health care implementation (Figure 4.10). The levers expand on the health system building blocks, identifying key elements of the health system to be strengthened and oriented towards primary health care to accelerate progress towards the health-related SDGs (including healthier populations, UHC and health security) (94).

56
Global Monitoring Report on Universal Health Coverage 2021
Figure 4.10 Primary health care (PHC) theory of change
Source: Adapted from WHO and UNICEF (94).
While not all levers require large financial investment, action on all levers is needed to advance primary health care. Investments in the three most costly levers should be guided and supported by critical actions and interventions on the other levers. Actions must be carefully planned to address gaps in each context, guided by accurate health system performance information.
• Health and care workforce. Even before the COVID-19 pandemic, there was a projected shortage of 18 million health workers by 2030 (95). The surge required for the COVID-19 response further aggravated the situation. An additional challenge was presented by the direct effects of COVID-19 on the health workforce, including between 80 000 and 180 000 deaths from COVID-19 among health and care workers between January 2020 and May 2021, as well as the mental health and labour disruptions impacts (96, 97). The health workforce will be further stretched (in both primary care and referral care) with the additional need for rolling out COVID-19 vaccination to achieve 70% vaccination globally by mid-2022 and the diagnostic and curative services to respond to fluctuating needs, which can exceed health system capacity during case load peaks (98). These factors impact the ability to ensure adequate and sustainable numbers, competency levels and equitable distribution of a committed, multidisciplinary health workforce that includes facility-, outreach- and community-based health workers. Publicly funded investments are required to support both pre-service education of new health workers and their employment with decent working conditions.
• Physical infrastructure. The physical infrastructure of health facilities impacts both the ability of health care providers to do their jobs and patient satisfaction, which in turn affects the use of health services. Investment is needed in safe, secure and accessible health facilities (including primary care facilities) to provide high-quality services with reliable water, sanitation, waste disposal and recycling, diagnostic facilities and laboratories, telecommunications connectivity and power supply, and transport systems that can connect patients with other care providers.
• Medicines and other health products. Access to health products, including medicines, vaccines, medical devices, in vitro diagnostics, protective equipment, vector control tools, and assistive devices, is an essential element of health services. These must be of assured safety, efficacy, performance and quality. In addition, they must be appropriate, available and affordable. Ensuring that appropriate health products are available and affordable depends upon several policy decisions and integrated processes related to the

57
assessment, selection, pricing, procurement, supply chain management, maintenance (in the case of medical devices), prescribing and dispensing (in the case of medicines), and safe and appropriate use of all health products. It also requires careful attention to coverage policy: access to medicines should not depend on health insurance status; the range of medicines covered should meet population health needs; and any co-payment in place should be carefully designed – for example, using low, fixed co-payments instead of percentage co-payments, exempting poor households and people with chronic conditions, and applying an annual cap on all co- payments (41).
While the bulk of the required investments and implementation will come from domestic resources, international assistance flows, including global health initiatives, will continue to contribute. To advance the related objectives of health system strengthening (based on primary health care) and global health security, initiatives addressing both must be genuinely linked. This need is particularly acute in conflict and fragile settings where numerous external partners play a larger role – requiring renewed commitment to coordinated responses aligned behind the national health sector policies, strategies and plans. In this respect, there are worrying signs of further parallel initiatives, as often occurs in response to crises. Yet, the opportunity remains for the global community to propose financial and political solutions that firmly place primary health care-oriented health system strengthening at the heart of achieving UHC and global health security (99,100).
Reflections around primary health care following the Astana Declaration, the SDGs, and the COVID-19 pandemic offer the opportunity for the global community to consider efforts beyond funding to support primary health care implementation at country level. Such support involves refining national health plans and strategies with a focus on the three components of primary health care: providing contextualized technical assistance, including support for the development of tools and guidance, knowledge sharing, and innovations in primary health care; high-level advocacy for implementing a primary health care strategy; and aligning country-level primary health care efforts and coordination among multilateral agencies and partners through the Global Action Plan for Healthy Lives and Well-being for All (SDG 3 Global Action Plan) (101).
To help drive primary health care improvement at country level, while also allowing tracking of a subset of indicators at regional and global levels, WHO and UNICEF, supported by a broad range of partners, have developed the primary health care monitoring framework and indicators (publication pending).
The main objectives of the primary health care monitoring framework and indicators are to: support Member States to assess, monitor and improve primary health care performance within the context of national and
subnational policy and planning processes. Indicators relevant to each lever are included and can be selected based on country context, performance gaps and priorities; and
enable global tracking of the progress of WHO Member States in strengthening primary health care on the road to UHC and the SDGs. Country implementation of this framework will be supported by WHO, UNICEF and a broad network of partners, including those in the SDG 3 Global Action Plan and the Primary Health Care Performance Initiative.
Data for global indicators will be included in the WHO Global Health Observatory and the World Health Data Hub. WHO will use this information to report on global progress on primary health care to Member States at the World Health Assembly as part of UHC progress reporting, as well as in the global report on primary health care in 2022.

58
Global Monitoring Report on Universal Health Coverage 2021
1. Global monitoring report on financial protection in health 2021. Geneva: World Health Organization and World Bank; 2021.2. SDG indicators: metadata repository. New York: United Nations Department of Economic and Social Affairs, Statistics Division
(https://unstats.un.org/sdgs/metadata/, accessed 18 November 2021).3. World population prospects 2019. New York: United Nations Department of Economic and Social Affairs, Population Division; 2019
(https://population.un.org/wpp/, accessed 18 November 2021).4. Global tuberculosis report 2021. Geneva: World Health Organization; 2021. 5. Global progress report on HIV, viral hepatitis and sexually transmitted infections, 2021. Accountability for the global health sector
strategies 2016–2021: actions for impact. Geneva: World Health Organization; 2021. 6. World malaria report 2021. Geneva: World Health Organization; 2021. 7. Progress on household drinking water, sanitation and hygiene 2000–2020: five years into the SDGs. Geneva: World Health
Organization and United Nations Children’s Fund; 2021. 8. World family planning 2020 highlights: accelerating action to ensure universal access to family planning. New York: United Nations
Department of Economic and Social Affairs, Population Division; 2020.9. Every woman every child. Protect the progress: rise, refocus, recover. New York: United Nations Children’s Fund; 2020. 10. NCD Risk Factor Collaboration (NCD-RisC). Worldwide trends in hypertension prevalence and progress in treatment and
control from 1990 to 2019: a pooled analysis of 1201 population-representative studies with 104 million participants. Lancet. 2021;398(10304):957–80.
11. WHO report on the global tobacco epidemic 2021: addressing new and emerging products. Geneva: World Health Organization; 2021.
12. Global health estimates 2019: deaths by cause, age, sex, by country and by region, 2000–2019. Geneva: World Health Organization; 2020.
13. Classification of fragile and conflict-affected situations. The World Bank (https://www.worldbank.org/en/topic/fragilityconflictviolence/brief/harmonized-list-of-fragile-situations, accessed 23 November 2021)
14. Hogan DR, Stevens GA, Hosseinpoor AR, Boerma T. Monitoring universal health coverage within the Sustainable Development Goals: development and baseline data for an index of essential health services. Lancet Glob Health. 2018;6(2):e152–e168.
15. Countdown 2008 Equity Analysis Group. Mind the gap: equity and trends in coverage of maternal, newborn, and child health services in 54 Countdown countries. Lancet. 2008;371(9620):1259–67.
16. Wehrmeister FC, Barros AJD, Hosseinpoor AR, Boerma T, Victora CG. Measuring universal health coverage in reproductive, maternal, newborn and child health: an update of the composite coverage index. PLoS One. 2020;15(4):e0232350.
17. Kingston A, Comas-Herrera A, Jagger C. Forecasting the care needs of the older population in England over the next 20 years: estimates from the Population Ageing and Care Simulation (PACSim) modelling study. Lancet Public Health. 2018;3(9):e447-e55.
18. Vreman RA, Heikkinen I, Schuurman A, Sapede C, Garcia JL, Hedberg N et al. Unmet medical need: an introduction to definitions and stakeholder perceptions. Value in Health. 2019;22(11):1275–82.
19. Multi-country cross sectional and longitudinal studies to quantify unmet needs for health and social care among older people. Kobe: World Health Organization Centre for Health Development (https://extranet.who.int/kobe_centre/en/project-details/unmet_needs, accessed 30 November 2021).
20. Strategy for universal access to health and universal health coverage. 53rd Directing Council, 29 September–3 October 2014. Washington (DC): Pan American Health Organization; 2014 (http://iris.paho.org/xmlui/handle/123456789/7652, accessed 20 November 2021).
21. Levesque J-F, Harris M, Russell G. Patient-centred access to health care: conceptualising access at the interface of health systems and populations. Int J Equity Health. 2013;12:18.
22. Houghton N, Bascolo E, del Riego A. Monitoring access barriers to health services in the Americas: a mapping of household surveys. Rev Panam Salud Publica. 2020;44:e96.
23. Báscolo E, Houghton N, Del Riego A. Leveraging household survey data to measure barriers to health services access in the Americas. Rev Panam Salud Publica. 2020;44:e100.
24. Boerma T, Eozenou P, Evans D, Evans T, Kieny M-P, Wagstaff A. Monitoring progress towards universal health coverage at country and global levels. PLoS Med. 2014;11(9):e1001731.
25. Tracking universal health coverage: 2017 global monitoring report. Geneva and Washington (DC): World Health Organization and World Bank; 2017.
26. Primary health care on the road to universal health coverage: 2019 monitoring report. Executive summary. Geneva: World Health Organization; 2019.
References

59
27. Shengelia B, Tandon A, Adams OB, Murray CJ. Access, utilization, quality, and effective coverage: an integrated conceptual framework and measurement strategy. Soc Sci Med. 2005;61(1):97–109.
28. GBD 2019 Universal Health Coverage Collaborators. Measuring universal health coverage based on an index of effective coverage of health services in 204 countries and territories, 1990–2019: a systematic analysis for the Global Burden of Disease Study 2019. Lancet. 2020;396(10258):1250–84.
29. Marsh AD, Muzigaba M, Diaz T, Requejo J, Jackson D, Chou D et al., on behalf of the Effective Coverage Think Tank Group. Effective coverage measurement in maternal, newborn, child, and adolescent health and nutrition: progress, future prospects, and implications for quality health systems. Lancet Glob Health. 2020;8(5):e730–e736.
30. Amouzou A, Leslie HH, Ram M, Fox M, Jiwani SS, Requejo J et al. Advances in the measurement of coverage for RMNCH and nutrition: from contact to effective coverage. BMJ Glob Health. 2019;4e001297.
31. Tanahashi T. Health service coverage and its evaluation. Bull World Health Organ. 1978;56:295–303. 32. Transforming our world: the 2030 Agenda for Sustainable Development. New York: United Nations; 2015. 33. Levesque, J, Pineault R, Hamel M, Roberge D, Kapetanakis C, Simard B et al. Emerging organisational models of primary healthcare
and unmet needs for care: insights from a population-based survey in Quebec province. BMC Fam Pract. 2012;13:66. 34. Handbook for conducting an adolescent health services barriers assessment (AHSBA) with a focus on disadvantaged adolescents.
Geneva: World Health Organization; 2012.35. Assessment of barriers to accessing health services for disadvantaged adolescents in Tanzania. Brazzaville: World Health
Organization Regional Office for Africa; 2019.36. Barriers and facilitating factors in access to health services in the Republic of Moldova. Copenhagen: World Health Organization
Regional Office for Europe; 2012.37. Classification of individual consumption according to purpose (COICOP) 2018. New York: United Nations Statistics Division; 2017. 38. A system of health accounts: 2011 edition. Organisation for Economic Co-operation and Development, European Union and World
Health Organization; 2011.39. SDG indicator 3.8.2 metadata. New York: United Nations Statistical Commission (https://unstats.un.org/sdgs/metadata, accessed 21
November 2021).40. Deaton A, Zaidi S. Guidelines for constructing consumption aggregates for welfare analysis. LSMS Working Paper No. 135.
Washington (DC): World Bank; 2002. 41. Can people afford to pay for health care? New evidence on financial protection in Europe. Copenhagen: World Health Organization
Regional Office for Europe; 2019.42. Diaz T, Strong KL, Cao B, Guthold R, Moran AC, Moller A-B et al. A call for standardised age-disaggregated health data. Lancet
Healthy Longevity. 2021;2(7):e436–e443. 43. Eozenou P, Neelsen S, Smizt M. Financial protection in health among the elderly: a global stocktake. Health Syst Reform.
2021;7(2):e1911067.44. Cid C, Flores G, Del Riego A, Fitzgerald J. Objetivos de desarrollo sostenible: impacto de la falta de protección financiera en salud en
países de América Latina y el Caribe. Rev Panam Salud Publica. 2021;45:e95.45. Thirteenth General Programme of Work 2019–2023: promote health, keep the world safe, serve the vulnerable. Geneva: World
Health Organization; 2019.46. Thirteenth General Programme of Work (GPW13): methods for impact measurement. Geneva: World Health Organization; 2020. 47. Triple billion dashboard [online database]. Geneva: World Health Organization; 2021 (https://portal.who.int/triplebillions, accessed 5
November 2021). 48. Chu A, Kwon S, Cowley P. Health financing reforms for moving towards universal health coverage in the Western Pacific Region.
Health Syst Reform. 2019;5(1):32–47. 49. Sumriddetchkajorn K, Shimazaki K, Ono T, Kusaba T, Sato K, Kobayashi N. Universal health coverage and primary care, Thailand. Bull
World Health Organ. 2019;97(6):415–22.50. Timor-Leste: building a strong finance system for UHC. Geneva: World Health Organization (https://extranet.who.int/
countryplanningcycles/sites/default/files/planning_cycle_repository/timor-leste/stories_from_the_field_issue3_timor-leste.pdf, accessed 22 November 2021).
51. Joarder T, Chaudhury TZ, Mannan I. Universal health coverage in Bangladesh: activities, challenges, and suggestions. Advances in Public Health. 2019;4954095.
52. WHO Coronavirus (COVID-19) Dashboard. Geneva: World Health Organization; 2021 (https://covid19.who.int, accessed 25 November 2021).
53. Health at a glance 2021: OECD indicators. Paris: Organisation for Economic Co-operation and Development; 2021.

60
Global Monitoring Report on Universal Health Coverage 2021
54. Tackling the mental health impact of the COVID-19 crisis: an integrated, whole-of-society response. OECD Policy Responses to Coronavirus (COVID-19). Paris: Organisation for Economic Co-operation and Development; 2021.
55. Supporting young people’s mental health through the COVID-19 crisis. OECD Policy Responses to Coronavirus (COVID-19). Paris: Organisation for Economic Co-operation and Development; 2021.
56. Pulse survey on continuity of essential health services during the COVID-19 pandemic. Geneva: World Health Organization; 2020. 57. The impact of the COVID-19 pandemic on noncommunicable disease resources and services: results of a rapid assessment. Geneva:
World Health Organization; 2020. 58. The impact of COVID-19 on mental, neurological and substance use services: results of a rapid assessment. Geneva: World Health
Organization; 2020. 59. Danovaro C, Gurung S, Ho LL, Lindstrand A. Understanding the disruption to programmes through rapid polling. Geneva: World
Health Organization; 2020 (https://www.who.int/immunization/GIN_March-April_2020.pdf?ua=1, accessed 22 November 2021) . 60 Second round of the national pulse survey on continuity of essential health services during the COVID-19 pandemic: January–March
2021: interim report, 22 April 2021. Geneva: World Health Organization; 2021 (https://apps.who.int/iris/handle/10665/340937, accessed 22 November 2021).
61. Wilhelm JA, Helleringer S. Utilization of non-Ebola health care services during Ebola outbreaks: a systematic review and meta-analysis. J Glob Health. 2019;9(1):010406.
62. Karamagi HC, Tumusiime P, Titi-Ofei R, Droti B, Kipruto H, Nabyonga-Orem J et al. Towards universal health coverage in the WHO African Region: assessing health system functionality, incorporating lessons from COVID-19. BMJ Glob Health. 2021;6(3):e004618.
63. Maintaining essential health services in North Macedonia. Geneva: WHO Health Services Learning Hub (https://hlh.who.int/ab-detail/action-brief-north-macedonia---deep-dive, accessed 23 November 2021).
64. North Macedonia: accelerating access to essential health services during COVID-19 response. Geneva: World Health Organization (https://www.who.int/about/accountability/results/who-results-report-2020-mtr/country-story/2020/accelerating-access-to-essential-health-services-during-covid-19-response, accessed 23 November 2021).
65. Continuity of essential health services modules. Geneva: World Health Organization (https://www.who.int/teams/integrated-health-services/monitoring-health-services/monitoring-frontline-service-readiness-capacities-during-the-covid-19-pandemic, accessed 23 November 2021).
66. World economic outlook: recovery during a pandemic. Washington (DC): International Monetary Fund; 2021.67. Impact of the COVID-19 pandemic on trade and development: situation as at 31 March 2021. Geneva: United Nations Conference on
Trade and Development; 2021 (https://unctad.org/programme/covid-19-response/impact-on-trade-and-development-2021#data, accessed 23 November 2021).
68. OECD economic outlook, interim report September 2021: keeping the recovery on track.. Paris: Organisation for Economic Co- operation and Development; 2021
69. Adaptive health financing: budgetary and health system responses to combat COVID-19. and Development; 202170. ILO monitor: COVID-19 and the world of work, 7th edition. Geneva: International Labour Organization; 2021 (https://www.ilo.org/
global/topics/coronavirus/impacts-and-responses/WCMS_767028/lang--en/index.htm, accessed 23 November 2021).71. High frequency phone survey on COVID-19. Washington (DC): World Bank; 2021.72. Gerszon Mahler D, Yonzan N, Lakner C, Castaneda Aguilar A, Wu H. Updated estimates of the impact of COVID-19 on global poverty:
turning the corner on the pandemic in 2021? Washington (DC): World Bank; 2021. 73. Yonzan N, Lakner C, Gerszon Mahler D. Is COVID-19 increasing global inequality? Washington (DC): World Bank; 2021.74. Financial crises, poverty, and income distribution. Washington (DC): International Monetary Fund; 2021.75. Ravallion R, Chen S. The impact of the global financial crisis on the world’s poorest. Vox, 30 April 2009.76. Furceri D, Zdzienicka A. How costly are debt crises? J Int Money Finance. 2021;31(4):726–42. 77. Kreuter K, Kim E, LaRocca S, Morris K, Kern C, Garcia A. Data on economic anxiety offer new opportunities for insights on the global
effects of the COVID-19 pandemic. Social Data Science Center; 2020 (https://socialdatascience.umd.edu/data-on-economic-anxiety-offer-new-opportunities-for-insights-on-the-global-effects-of-the-covid-19-pandemic/, accessed 23 November 2021).
78. Global COVID-19 Trends and Impact Survey, in partnership with Facebook. Baltimore, Maryland: University of Maryland; 2021.79. Baird K. The incidence of high medical expenses by health status in seven developed countries. Health Policy. 2016;120(1):26–34. 80. Alsan M, Schoemaker L, Eggleston K, Kammili N, Kolli P, Bhattacharya J. Out of pocket health expenditures and antimicrobial
resistance in low-income and middle-income countries: an economic analysis. Lancet Infectious Diseases. 2015;15(10):1203–10.

61
81. Ebrahimy E, Igan D, Martinez Peria S. The impact of COVID-19 on inflation: potential drivers and dynamics. Washington (DC): International Monetary Fund; 2020.
82. Wang H, Vinals Torresa L, Travisa P. Catastrophic health expenditure and financial protection in eight countries in the WHO South-East Asia Region. Bulletin of the World Health Organization. 2018;96(9):610–620E.
83. Declaration of Astana: Global Conference on Primary Health Care, Astana, Kazakhstan, 25 and 26 October 2018. Geneva: World Health Organization; 2018.
84. Political Declaration of the High-level Meeting on Universal Health Coverage. Universal health coverage: moving together to build a healthier world. New York: United Nations; 2019.
85. A vision for primary health care in the 21st century: towards universal health coverage and the Sustainable Development Goals. Geneva: World Health Organization and United Nations Children’s Fund; 2018 (https://www.who.int/docs/default-source/primary-health/vision.pdf, accessed 23 November 2021).
86. Realising the potential of primary health care. OECD Health Policy Studies. Paris: Organisation for Economic Co-operation and Development; 2020.
87. Strengthening the frontline: how primary health care helps health systems adapt during the COVID 19 pandemic. OECD Policy Responses to Coronavirus (COVID-19). Paris: Organisation for Economic Co-operation and Development; 2021.
88. Barkley S, Marten R, Reynolds T, Kelley E, Dalil S, Swaminathan S et al. Primary health care: realizing the vision. Bull World Health Organ. 2020;98(11):727–727A.
89. Walking the talk: reimagining primary health care after COVID-19. Washington: World Bank, 2021.90. Stenberg K, Hanssen O, Bertram M, Brindley C, Meshreky A, Barkley S et al. Guide posts for investment in primary health
care and projected resource needs in 67 low-income and middle-income countries: a modelling study. Lancet Glob Health. 2019;7(11):e1500–e1510.
91. Rasanathan K, Evans TG. Primary health care, the Declaration of Astana and COVID-19. Bull World Health Organ. 2020;98(11):801–8. 92. From panic and neglect to investing in health security: financing pandemic preparedness at a national level. Washington (DC):
World Bank, International Working Group on Financing Preparedness; 2017. 93. Peters DH, Hanssen O, Gutierrez J, Abrahams J, Nyenswah T. Financing common goods for health: core government functions in
health emergency and disaster risk management. Health Syst Reform. 2019;5(4):307–21.94. Operational framework for primary health care: transforming vision into action. Geneva: World Health Organization and United
Nations Children’s Fund; 2020.95. Global strategy on human resources for health: Workforce 2030. Geneva: World Health Organization; 2020. 96. COVID-19 weekly epidemiological update: data as received by WHO from national authorities, as of 28 March 2021. Geneva: World
Health Organization; 2021. 97. The impact of COVID-19 on health and care workers: a closer look at deaths. Geneva: World Health Organization; 2021.98. Strategy to achieve global COVID-19 vaccination by mid-2022. Geneva: World Health Organization; 2021. 99. Primary health care and health emergencies. Geneva: World Health Organization; 2018. 100. Building health systems resilience for universal health coverage and health security during the COVID-19 pandemic and beyond:
WHO position paper. Geneva: World Health Organization; 2021.101. Edelman A, Marten R, Montenegro H, Sheikh K, Barkley S, Ghaffar A et al. Modified scoping review of the enablers and barriers to
implementing primary health care in the COVID-19 context. Health Policy Plan. 2021;36(7):1163–86.

62
Global Monitoring Report on Universal Health Coverage 2021
Statistical annexes
Annex 1. Methods for constructing SDG indicator 3.8.1 UHC service coverage index
The construction of the UHC service coverage index (SCI) to monitor SDG indicator 3.8.1 is based on an original set of 14 indicators extracted from various sources and organized by four broad categories of service coverage, namely reproductive, maternal, newborn and child health (RMNCH), infectious diseases, noncommunicable diseases, and service capacity and access. These tracer indicators are only meant to be indicative of service coverage and should not be interpreted as a complete or exhaustive list of health services and interventions that are required to reach universal health coverage. The 14 tracer indicators were selected because they are well established, with available data widely reported by countries. Metadata for each tracer indicator, as well as detailed methodology for constructing the index, can be found here: https://unstats.un.org/sdgs/metadata/files/Metadata-03-08-01.pdf. In all, the analysis includes 194 Member States. SCI scores range between 0 and 100 and are computed following the four steps detailed below.
1. Imputation of missing data
In the absence of data for each Member State, for each calendar year and for each indicator, the imputation of data for missing values is necessary. To impute missing values in the SCI analysis, a twofold approach is pursued. First, data are extended for missing years; and second, data are extended in instances where no data are available. In the first step, the missing data are inferred by way of simple interpolation between observed values and constant extrapolation outside the range of observed values. That is, if a country has data for 2013 and 2016, linear interpolation is used to fill missing values for years 2014 and 2015 and constant extrapolation is used to fill missing values before 2013 using the 2013 value and after 2016 using the 2016 value. In the second step, for every Member State that does not have data for a given indicator and when estimates do not already exist, a regional median is calculated for each calendar year based on World Bank geographic regions, with a separate grouping of traditional high-income countries. This imputation rule for countries with no data, however, does not apply to care seeking for suspected pneumonia, as this indicator is not typically measured in higher-income countries with well established health systems. For countries without observed data, coverage was estimated from a regression that predicts coverage of care seeking for symptoms of pneumonia (on the logit scale) as a function of the log of the estimated under-5 pneumonia mortality rate from WHO Maternal and Child Epidemiology Estimation (WHO-MCEE) group (2021 revision).
2. Conversion and rescaling
To build an index, all tracer indicators need to be placed on the same scale, with 0 being the lowest value and 100 being the optimal value. For most indicators, this scale is the natural scale of measurement (for example, antenatal care coverage, four or more visits). However, for a few indicators, conversion and/or rescaling are required to obtain appropriate values on a scale from 0 to 100.
ConversionBoth prevalence of raised blood pressure and prevalence of tobacco use are converted into prevalence of non-raised blood pressure and prevalence of tobacco non-use respectively, so that an increase means an improvement.
Rescaling• Rescaling based on a non-zero minimum to obtain finer resolution. Prevalence of non-raised blood pressure and tobacco non-use are
both capped at minimum thresholds, corresponding to the maximum observed across all Member States. - Prevalence of non-raised blood pressure: rescaled value = (X–40)/(100–40)*100 - Prevalence of tobacco non-use: rescaled value = (X–30)/(100–30)*100
• Rescaling for a continuous measure. Mean fasting plasma glucose, which is a continuous measure (units of mmol/L), is converted to a scale of 0 to 100 using the minimum theoretical biological risk (5.1 mmol/L) and observed maximum across countries (7.4 mmol/L). - Mean FPG: rescaled value = (7.4 – original value)/(7.4–5.1)*100
• Maximum thresholds for rate indicators. Hospital bed density and health workforce density are both capped at maximum thresholds, and values above this threshold are held constant at 100. These thresholds are based on minimum values observed across OECD countries. - hospital beds per 10,000: rescaled value = minimum(100, original value / 18*100) - physicians per 1,000: rescaled value = minimum(100, original value / 0.9*100) - psychiatrists per 100,000: rescaled value = minimum(100, original value / 1*100) - surgeons per 100,000: rescaled value = minimum(100, original value / 14*100)

63
Reproductive, maternal, newborn and child health (RMNCH) 1. Family planning (FP) 2. Antenatal care, 4+ visits (ANC) 3. DTP3 immunization (DTP3) 4. Care seeking for suspected pneumonia (Pneumonia)Infectious diseases (ID) 1. TB treatment (TB) 2. HIV therapy (ART) 3. Insecticide-treated nets (ITN) 4. Basic sanitation (WASH)Noncommunicable diseases (NCD) 1. Non-elevated blood pressure (BP) 2. Mean fasting plasma glucose (FPG) 3. Tobacco non-use (Tobacco)Service capacity and access (Capacité) 1. Hospital bed density (Hospital) 2. Health worker density (HWF) 3. IHR core capacity index (IHR)
𝑅𝑅𝑅𝑅𝑅𝑅𝑅𝑅𝑅𝑅 = (𝐹𝐹𝐹𝐹 ∗ 𝐴𝐴𝑅𝑅𝑅𝑅 ∗ 𝐷𝐷𝐷𝐷𝐹𝐹𝐷 ∗ 𝐹𝐹𝑃𝑃𝑃𝑃𝑃𝑃𝑃𝑃𝑃𝑃𝑃𝑃𝑃𝑃𝑃𝑃)!/#
𝐼𝐼𝐷𝐷 = (𝐷𝐷𝑇𝑇 ∗𝐴𝐴𝑅𝑅𝐷𝐷 ∗ 𝐼𝐼𝐷𝐷𝑅𝑅 ∗𝑊𝑊𝐴𝐴𝑊𝑊𝑅𝑅)!/#if high malaria risk
𝐼𝐼𝐷𝐷 = (𝐷𝐷𝑇𝑇 ∗𝐴𝐴𝑅𝑅𝐷𝐷 ∗ 𝑊𝑊𝐴𝐴𝑊𝑊𝑅𝑅)!/$if low malaria risk
𝑅𝑅𝑅𝑅𝐷𝐷 = (𝑇𝑇𝐹𝐹 ∗ 𝐹𝐹𝐹𝐹𝐹𝐹 ∗ 𝐷𝐷𝑃𝑃𝑇𝑇𝑃𝑃𝑇𝑇𝑇𝑇𝑃𝑃)!/$
𝑅𝑅𝑃𝑃𝐶𝐶𝑃𝑃𝑇𝑇𝑃𝑃𝐶𝐶𝐶𝐶 = (𝑅𝑅𝑃𝑃𝐻𝐻𝐶𝐶𝑃𝑃𝐶𝐶𝑃𝑃𝐻𝐻 ∗ 𝑅𝑅𝑊𝑊𝐹𝐹 ∗ 𝐼𝐼𝑅𝑅𝑅𝑅)!/$
𝑈𝑈𝑅𝑅𝑅𝑅𝑊𝑊𝑃𝑃𝑆𝑆𝑆𝑆𝑃𝑃𝑇𝑇𝑃𝑃𝑅𝑅𝑃𝑃𝑆𝑆𝑃𝑃𝑆𝑆𝑃𝑃𝐶𝐶𝑃𝑃𝐼𝐼𝑃𝑃𝐼𝐼𝑃𝑃𝐼𝐼 = (𝑅𝑅𝑅𝑅𝑅𝑅𝑅𝑅𝑅𝑅 ∗ 𝐼𝐼𝐷𝐷 ∗𝑅𝑅𝑅𝑅𝐷𝐷 ∗ 𝑅𝑅𝑃𝑃𝐶𝐶𝑃𝑃𝑇𝑇𝑃𝑃𝐶𝐶𝐶𝐶)!/#
Figure A1.1 Calculation of UHC service coverage index
3. Computation of the index
Once all tracer indicator values are on a scale of 0 to 100, geometric means are computed within each of the four health services areas, and then a geometric mean is taken of those four values (Figure A1.1). The health worker density indicator is calculated as the geometric mean of rescaled values for physicians, psychiatrists and surgeons.
Because a geometric mean cannot be computed from zero values, a minimum value of 1is used instead (out of 100). The choice of using the geometric mean rather than the arithmetic mean is justified by the theoretical framework underlying service coverage, in which a balanced mix of inputs is necessary to reach UHC.
4. Global and regional aggregates
Regional and global aggregates use United Nations population estimates at the country level to compute a weighted average of country values for the index. This is justified because UHC is a property of countries, and the index of essential services is a summary measure of access to essential services for each country’s population. United Nations population estimates at country level are used to ensure consistency and comparability of estimates within countries and between countries over time.

6564
Global Monitoring Report on Universal Health Coverage 2021
Tracer area Tracer indicator Population Type Primary data sources Countries with primary data over 2015–2019
Data source used to build SDG indicator 3.8.1
Reproductive, maternal, newborn and child health
Family planning Demand satisfied with modern methods Married women aged 15–49 Service coverage Household survey 83/194 United Nations DESA, Population Division. Estimates and Projections of Family Planning Indicators, 2021 revision
Pregnancy and delivery care ANC, 4+ visits Women with a live birth in past xx years Service coverage Household survey 113/194 WHO SRH global database
Child immunization DTP3 immunization 1-year-old children Service coverage Administrative system and household survey 194/194 WHO/UNICEF Estimates of National Immunization Coverage (WUENIC), 2021 revision
Child treatment CSB for suspected pneumonia Children < 5 Service coverage Household survey 70/194 UNICEF global database
Infectious diseases
Tuberculosis treatment TB treatment coverage TB incident cases Service coverage Administrative system 193/194 WHO estimates, 2021 edition
HIV therapy HIV ART coverage People living with HIV Service coverage Administrative system, household survey and surveillance system
134/194 UNAIDS/WHO estimates, 2021 edition
Malaria prevention ITN use Population living in malaria-endemic areas Service coverage Household survey 40/40 WHO/MAP estimates, 2021 revision
Water and sanitation Population with access to at least basic sanitation
All Service coverage Household survey 153/194 WHO/UNICEF Joint Monitoring Programme for Water Supply, Sanitation and Hygiene (JMP) estimates, 2021 revision
Noncommunicable disease
Prevention of CVDs Prevalence of raised blood pressure Adults aged 30+ Proxy Household survey 99/194 WHO/NCD RisC Group estimates, 2021 revision
Management of diabetes Mean FPG Adults aged 18+ Proxy Household survey Outdated WHO/NCD RisC Group estimates, 2016 revision
Tobacco control Tobacco use Adults aged 15+ Proxy Household survey 143/194 WHO estimates, 2021 revision
Service capacity and access
Hospital access Hospital beds density – Proxy Facility data 152/194 WHO
Health workforce Health worker density: comprising physicians, psychiatrists and surgeons
– Proxy Administrative system (167;154;116)/194 WHO NHWA database
Health security IHR core capacity index – Proxy Key informant 194/194 Electronic State Parties Self-Assessment Annual Reporting Tool (e-SPAR), 2021 revision
Annex 2. Characteristics and primary data availability of the 14 tracer indicators included in UHC SCI, 2015–2019

6766
Global Monitoring Report on Universal Health Coverage 2021
Country Fam
ily p
lann
ing
dem
and
satis
fied
with
mod
ern
met
hods
1
Ante
nata
l car
e, 4
+ vi
sits 2
Child
imm
uniza
tion
(DTP
3)
Care
seek
ing
beha
viou
r for
child
pn
eum
onia
Tube
rcul
osis
trea
tmen
t
HIV
anti-
retr
ovira
l the
rapy
Inse
ctici
de-tr
eate
d ne
ts u
se 3
Acce
ss to
at l
east
bas
ic sa
nita
tion
Non-
elev
ated
blo
od p
ress
ure
+ *
Mea
n fa
stin
g pl
asm
a gl
ucos
e + *
Toba
cco
non-
use
+ *
Hosp
ital b
ed d
ensit
y + *
Heal
th w
orke
r den
sity
5+*
Afghanistan 44 21 72 68 10 73 49 33 ≥80 65 21 13Albania 7 78 ≥80 ≥80 44 ≥80 ≥80 31 ≥80 67 ≥80 71Algeria 77 70 ≥80 47 ≥80 ≥80 ≥80 40 ≥80 70 ≥80 ≥80Andorra 67 ≥80 ≥80 ≥80 ≥80 ≥80 ≥80 49 ≥80 52 ≥80 ≥80Angola 27 61 57 49 28 66 24 51 36 78 ≥80 44 3Antigua and Barbuda 79 ≥80 ≥80 ≥80 54 ≥80 ≥80 29 67 ≥80 ≥80 73Argentina ≥80 ≥80 ≥80 ≥80 65 ≥80 ≥80 20 ≥80 64 ≥80 ≥80Armenia 42 ≥80 ≥80 ≥80 48 ≥80 ≥80 21 71 61 ≥80 ≥80Australia ≥80 ≥80 ≥80 ≥80 ≥80 ≥80 ≥80 51 ≥80 80 ≥80 ≥80Austria ≥80 ≥80 ≥80 ≥80 ≥80 ≥80 ≥80 44 ≥80 61 ≥80 ≥80Azerbaijan 30 76 ≥80 33 52 ≥80 ≥80 32 61 65 ≥80 ≥80Bahamas ≥80 ≥80 ≥80 ≥80 64 ≥80 ≥80 26 66 ≥80 ≥80 49Bahrain 57 ≥80 ≥80 ≥80 37 ≥80 ≥80 39 57 78 ≥80 71Bangladesh 73 37 ≥80 46 23 ≥80 53 52 69 49 50 25Barbados 77 ≥80 ≥80 ≥80 53 ≥80 ≥80 31 71 ≥80 ≥80 77Belarus 75 ≥80 ≥80 ≥80 64 ≥80 ≥80 18 ≥80 62 ≥80 ≥80Belgium ≥80 ≥80 ≥80 ≥80 ≥80 ≥80 ≥80 50 ≥80 66 ≥80 ≥80Belize 70 ≥80 ≥80 67 41 ≥80 ≥80 37 ≥80 ≥80 57 77Benin 27 52 76 29 65 65 26 17 49 ≥80 ≥80 24 7Bhutan 79 ≥80 ≥80 74 42 ≥80 75 28 62 61 ≥80 39Bolivia (Plurinational State of) 57 ≥80 75 62 69 61 64 53 ≥80 ≥80 72 43Bosnia and Herzegovina 30 ≥80 73 ≥80 79 65 ≥80 27 ≥80 47 ≥80 ≥80Botswana ≥80 73 ≥80 14 ≥80 53 80 28 73 71 ≥80 24Brazil ≥80 ≥80 70 50 68 ≥80 ≥80 25 ≥80 ≥80 ≥80 ≥80Brunei Darussalam 76 ≥80 ≥80 ≥80 71 ≥80 ≥80 23 68 76 ≥80 ≥80Bulgaria 64 ≥80 ≥80 ≥80 45 ≥80 ≥80 25 ≥80 43 ≥80 ≥80Burkina Faso 53 47 ≥80 56 69 51 58 21 50 ≥80 78 22 5Burundi 43 49 ≥80 59 ≥80 55 44 46 43 ≥80 ≥80 42 2Cabo Verde 76 ≥80 ≥80 78 ≥80 ≥80 77 28 61 ≥80 ≥80 52
RMNCH Infectious diseases Noncommunicable diseases
Service capacity and access
Inte
rnat
iona
l Hea
lth R
egul
atio
ns
core
capa
city
inde
x*
RMNC
H
Infe
ctio
us d
iseas
es
NCDs
Serv
ice ca
pacit
y an
d ac
cess
43 46 32 57 23 37 Legend62 46 72 59 76 62 Very high coverage (>80)
≥80 69 ≥80 61 ≥80 75 High coverage (60-79)40 ≥80 ≥80 62 74 77 Medium coverage (40-59)63 47 39 61 20 39 Low coverage (20-39)69 ≥80 74 54 79 72 Very low coverage (<20)61 ≥80 ≥80 48 ≥80 73
≥80 76 71 45 ≥80 69 Not applicable≥80 ≥80 ≥80 73 ≥80 ≥8067 ≥80 ≥80 64 ≥80 ≥80
≥80 51 74 50 ≥80 6562 ≥80 ≥80 52 67 70
≥80 ≥80 69 56 ≥80 7167 59 46 56 44 5169 ≥80 77 58 ≥80 7468 ≥80 80 46 ≥80 74≥80 ≥80 ≥80 67 ≥80 ≥8041 ≥80 68 66 56 6735 42 37 76 18 3859 ≥80 63 47 61 6269 69 65 74 60 6735 63 79 50 70 6530 54 71 53 41 54
≥80 73 ≥80 56 ≥80 75≥80 ≥80 ≥80 49 ≥80 7772 ≥80 70 46 ≥80 7044 60 46 73 17 4347 58 55 71 17 4448 ≥80 ≥80 52 63 69
UHC
Serv
ice C
over
age
Inde
x
Service capacity and access
SCI components
Annex 3 UHC service coverage index, its four components and tracer indicators by country, 2019
Cambodia 61 76 ≥80 69 ≥80 63 66 57 ≥80 68 50 21Cameroon 37 65 67 30 62 53 60 44 39 69 ≥80 72 5Canada ≥80 ≥80 ≥80 ≥80 75 ≥80 ≥80 63 ≥80 ≥80 ≥80 ≥80Central African Republic 33 41 42 35 53 47 65 14 32 59 ≥80 56 3Chad 21 31 50 26 62 60 16 12 37 ≥80 ≥80 25 2Chile ≥80 ≥80 ≥80 ≥80 69 ≥80 ≥80 40 ≥80 57 ≥80 ≥80China ≥80 77 ≥80 ≥80 75 ≥80 ≥80 55 72 63 ≥80 ≥80Colombia ≥80 ≥80 ≥80 64 51 ≥80 ≥80 49 ≥80 ≥80 ≥80 ≥80Comoros 36 49 ≥80 38 57 42 42 36 45 ≥80 70 ≥80 6Congo 40 79 79 28 24 59 63 20 34 77 79 ≥80 5Cook Islands 64 77 ≥80 ≥80 50 43 ≥80 28 27 64 ≥80 16Costa Rica ≥80 ≥80 ≥80 ≥80 64 ≥80 ≥80 37 ≥80 ≥80 61 ≥80Côte d'Ivoire 40 51 ≥80 44 70 60 52 34 38 ≥80 ≥80 22 12Croatia 55 ≥80 ≥80 ≥80 73 ≥80 ≥80 19 ≥80 47 ≥80 ≥80Cuba ≥80 79 ≥80 ≥80 77 ≥80 ≥80 34 ≥80 73 ≥80 ≥80Cyprus 55 ≥80 ≥80 ≥80 65 ≥80 ≥80 48 ≥80 49 ≥80 ≥80Czechia ≥80 ≥80 ≥80 ≥80 76 ≥80 ≥80 31 ≥80 56 ≥80 ≥80Democratic People's Republic of Korea ≥80 ≥80 ≥80 ≥80 26 73 ≥80 55 ≥80 74 ≥80 28Democratic Republic of the Congo 26 52 57 34 63 64 56 16 43 ≥80 ≥80 44 4Denmark ≥80 ≥80 ≥80 ≥80 ≥80 ≥80 ≥80 40 79 74 ≥80 ≥80Djibouti 47 26 ≥80 ≥80 27 ≥80 18 67 43 ≥80 ≥80 78 16Dominica ≥80 ≥80 ≥80 65 54 ≥80 ≥80 20 55 ≥80 ≥80 59Dominican Republic ≥80 ≥80 ≥80 73 47 80 ≥80 18 ≥80 ≥80 ≥80 49Ecuador ≥80 80 ≥80 79 70 ≥80 ≥80 55 ≥80 ≥80 77 ≥80Egypt ≥80 ≥80 ≥80 68 40 69 ≥80 37 ≥80 65 71 79El Salvador ≥80 ≥80 ≥80 80 54 ≥80 ≥80 46 ≥80 ≥80 56 ≥80Equatorial Guinea 27 67 53 54 35 39 39 66 36 61 ≥80 ≥80 12Eritrea 28 57 ≥80 45 69 61 47 12 61 ≥80 ≥80 56 19Estonia 75 ≥80 ≥80 ≥80 65 ≥80 ≥80 34 ≥80 56 ≥80 ≥80Eswatini ≥80 76 ≥80 60 ≥80 69 64 30 80 ≥80 ≥80 10Ethiopia 63 43 68 30 75 71 22 9 55 ≥80 ≥80 18 4Fiji 65 ≥80 ≥80 70 38 ≥80 ≥80 36 26 65 ≥80 47Finland ≥80 ≥80 ≥80 ≥80 73 ≥80 ≥80 40 ≥80 67 ≥80 ≥80France ≥80 ≥80 ≥80 ≥80 ≥80 ≥80 ≥80 51 ≥80 52 ≥80 ≥80Gabon 41 78 70 68 56 48 14 50 38 67 ≥80 72 36Gambia 38 77 ≥80 59 31 71 56 47 38 ≥80 ≥80 56 9Georgia 50 ≥80 ≥80 74 65 73 ≥80 26 45 54 ≥80 ≥80Germany ≥80 ≥80 ≥80 ≥80 ≥80 ≥80 ≥80 51 ≥80 68 ≥80 ≥80Ghana 47 ≥80 ≥80 56 45 34 68 23 44 ≥80 ≥80 40 5Greece 60 ≥80 ≥80 ≥80 67 ≥80 ≥80 48 ≥80 50 ≥80 ≥80
50 74 70 73 37 6142 47 54 62 24 44≥80 ≥80 ≥80 80 ≥80 ≥8017 38 39 54 14 3230 30 29 67 11 2876 ≥80 ≥80 58 ≥80 80≥80 ≥80 ≥80 63 ≥80 ≥8069 ≥80 72 72 ≥80 7827 50 43 68 25 4433 52 37 59 24 4068 80 60 37 48 5477 ≥80 79 69 78 7844 52 52 69 23 4578 ≥80 ≥80 44 ≥80 7378 ≥80 ≥80 58 ≥80 8074 ≥80 ≥80 62 ≥80 7968 ≥80 ≥80 53 ≥80 7869 ≥80 54 74 58 6835 40 44 70 18 39≥80 ≥80 ≥80 62 ≥80 ≥8032 56 40 71 34 4871 ≥80 72 45 75 6755 ≥80 69 52 62 6677 ≥80 80 76 ≥80 ≥80≥80 ≥80 65 58 77 70≥80 ≥80 71 72 79 7622 48 43 57 30 4349 51 39 ≥80 38 5074 ≥80 ≥80 55 ≥80 7840 76 75 59 34 5863 48 32 80 17 3861 ≥80 67 39 66 61≥80 ≥80 ≥80 62 ≥80 ≥80≥80 ≥80 ≥80 64 ≥80 ≥8027 62 37 59 41 4938 62 49 64 27 4858 73 74 40 ≥80 65≥80 ≥80 ≥80 68 ≥80 ≥8049 68 39 75 21 4557 ≥80 ≥80 62 83 78

6968
Global Monitoring Report on Universal Health Coverage 2021
Country Fam
ily p
lann
ing
dem
and
satis
fied
with
mod
ern
met
hods
1
Ante
nata
l car
e, 4
+ vi
sits 2
Child
imm
uniza
tion
(DTP
3)
Care
seek
ing
beha
viou
r for
child
pn
eum
onia
Tube
rcul
osis
trea
tmen
t
HIV
anti-
retr
ovira
l the
rapy
Inse
ctici
de-tr
eate
d ne
ts u
se 3
Acce
ss to
at l
east
bas
ic sa
nita
tion
Non-
elev
ated
blo
od p
ress
ure
+ *
Mea
n fa
stin
g pl
asm
a gl
ucos
e + *
Toba
cco
non-
use
+ *
Hosp
ital b
ed d
ensit
y + *
Heal
th w
orke
r den
sity
5+*
Afghanistan 44 21 72 68 10 73 49 33 ≥80 65 21 13Albania 7 78 ≥80 ≥80 44 ≥80 ≥80 31 ≥80 67 ≥80 71Algeria 77 70 ≥80 47 ≥80 ≥80 ≥80 40 ≥80 70 ≥80 ≥80Andorra 67 ≥80 ≥80 ≥80 ≥80 ≥80 ≥80 49 ≥80 52 ≥80 ≥80Angola 27 61 57 49 28 66 24 51 36 78 ≥80 44 3Antigua and Barbuda 79 ≥80 ≥80 ≥80 54 ≥80 ≥80 29 67 ≥80 ≥80 73Argentina ≥80 ≥80 ≥80 ≥80 65 ≥80 ≥80 20 ≥80 64 ≥80 ≥80Armenia 42 ≥80 ≥80 ≥80 48 ≥80 ≥80 21 71 61 ≥80 ≥80Australia ≥80 ≥80 ≥80 ≥80 ≥80 ≥80 ≥80 51 ≥80 80 ≥80 ≥80Austria ≥80 ≥80 ≥80 ≥80 ≥80 ≥80 ≥80 44 ≥80 61 ≥80 ≥80Azerbaijan 30 76 ≥80 33 52 ≥80 ≥80 32 61 65 ≥80 ≥80Bahamas ≥80 ≥80 ≥80 ≥80 64 ≥80 ≥80 26 66 ≥80 ≥80 49Bahrain 57 ≥80 ≥80 ≥80 37 ≥80 ≥80 39 57 78 ≥80 71Bangladesh 73 37 ≥80 46 23 ≥80 53 52 69 49 50 25Barbados 77 ≥80 ≥80 ≥80 53 ≥80 ≥80 31 71 ≥80 ≥80 77Belarus 75 ≥80 ≥80 ≥80 64 ≥80 ≥80 18 ≥80 62 ≥80 ≥80Belgium ≥80 ≥80 ≥80 ≥80 ≥80 ≥80 ≥80 50 ≥80 66 ≥80 ≥80Belize 70 ≥80 ≥80 67 41 ≥80 ≥80 37 ≥80 ≥80 57 77Benin 27 52 76 29 65 65 26 17 49 ≥80 ≥80 24 7Bhutan 79 ≥80 ≥80 74 42 ≥80 75 28 62 61 ≥80 39Bolivia (Plurinational State of) 57 ≥80 75 62 69 61 64 53 ≥80 ≥80 72 43Bosnia and Herzegovina 30 ≥80 73 ≥80 79 65 ≥80 27 ≥80 47 ≥80 ≥80Botswana ≥80 73 ≥80 14 ≥80 53 80 28 73 71 ≥80 24Brazil ≥80 ≥80 70 50 68 ≥80 ≥80 25 ≥80 ≥80 ≥80 ≥80Brunei Darussalam 76 ≥80 ≥80 ≥80 71 ≥80 ≥80 23 68 76 ≥80 ≥80Bulgaria 64 ≥80 ≥80 ≥80 45 ≥80 ≥80 25 ≥80 43 ≥80 ≥80Burkina Faso 53 47 ≥80 56 69 51 58 21 50 ≥80 78 22 5Burundi 43 49 ≥80 59 ≥80 55 44 46 43 ≥80 ≥80 42 2Cabo Verde 76 ≥80 ≥80 78 ≥80 ≥80 77 28 61 ≥80 ≥80 52
RMNCH Infectious diseases Noncommunicable diseases
Service capacity and access
Inte
rnat
iona
l Hea
lth R
egul
atio
ns
core
capa
city
inde
x*
RMNC
H
Infe
ctio
us d
iseas
es
NCDs
Serv
ice ca
pacit
y an
d ac
cess
43 46 32 57 23 37 Legend62 46 72 59 76 62 Very high coverage (>80)
≥80 69 ≥80 61 ≥80 75 High coverage (60-79)40 ≥80 ≥80 62 74 77 Medium coverage (40-59)63 47 39 61 20 39 Low coverage (20-39)69 ≥80 74 54 79 72 Very low coverage (<20)61 ≥80 ≥80 48 ≥80 73
≥80 76 71 45 ≥80 69 Not applicable≥80 ≥80 ≥80 73 ≥80 ≥8067 ≥80 ≥80 64 ≥80 ≥80
≥80 51 74 50 ≥80 6562 ≥80 ≥80 52 67 70
≥80 ≥80 69 56 ≥80 7167 59 46 56 44 5169 ≥80 77 58 ≥80 7468 ≥80 80 46 ≥80 74≥80 ≥80 ≥80 67 ≥80 ≥8041 ≥80 68 66 56 6735 42 37 76 18 3859 ≥80 63 47 61 6269 69 65 74 60 6735 63 79 50 70 6530 54 71 53 41 54
≥80 73 ≥80 56 ≥80 75≥80 ≥80 ≥80 49 ≥80 7772 ≥80 70 46 ≥80 7044 60 46 73 17 4347 58 55 71 17 4448 ≥80 ≥80 52 63 69
UHC
Serv
ice C
over
age
Inde
x
Service capacity and access
SCI components
Annex 3 UHC service coverage index, its four components and tracer indicators by country, 2019
Grenada 77 73 ≥80 76 54 ≥80 ≥80 22 77 ≥80 ≥80 64Guatemala 69 ≥80 ≥80 52 63 ≥80 68 47 79 ≥80 27 22Guinea 32 35 47 69 53 73 60 28 34 ≥80 ≥80 17 3Guinea-Bissau 49 ≥80 78 48 45 35 35 17 37 ≥80 ≥80 56 2Guyana 61 ≥80 ≥80 ≥80 67 ≥80 ≥80 34 77 ≥80 ≥80 61Haiti 46 67 51 37 73 68 37 29 ≥80 ≥80 38 13Honduras 79 ≥80 ≥80 64 53 ≥80 ≥80 44 ≥80 78 29 39Hungary 78 ≥80 ≥80 ≥80 55 ≥80 ≥80 19 ≥80 53 ≥80 ≥80Iceland ≥80 ≥80 ≥80 ≥80 ≥80 ≥80 ≥80 54 ≥80 ≥80 ≥80 ≥80India 73 51 ≥80 78 63 ≥80 68 48 ≥80 60 29 38Indonesia ≥80 ≥80 ≥80 75 24 66 ≥80 33 ≥80 46 65 31Iran (Islamic Republic of) 76 ≥80 ≥80 76 27 ≥80 ≥80 56 ≥80 80 ≥80 ≥80Iraq 56 68 ≥80 44 19 60 ≥80 20 ≥80 72 73 59Ireland ≥80 ≥80 ≥80 ≥80 ≥80 ≥80 ≥80 46 ≥80 69 ≥80 ≥80Israel 68 ≥80 ≥80 ≥80 71 ≥80 ≥80 51 ≥80 69 ≥80 ≥80Italy 66 ≥80 ≥80 ≥80 ≥80 ≥80 ≥80 43 ≥80 67 ≥80 ≥80Jamaica ≥80 ≥80 ≥80 ≥80 44 ≥80 ≥80 23 80 ≥80 ≥80 56Japan 57 ≥80 ≥80 ≥80 ≥80 ≥80 ≥80 48 ≥80 70 ≥80 ≥80Jordan 56 ≥80 ≥80 61 37 ≥80 ≥80 37 67 50 80 42Kazakhstan 74 ≥80 ≥80 ≥80 55 ≥80 ≥80 31 64 66 ≥80 ≥80Kenya 76 63 ≥80 66 ≥80 60 51 33 45 ≥80 ≥80 74 14Kiribati 46 67 ≥80 ≥80 50 ≥80 45 30 30 39 ≥80 23Kuwait 66 ≥80 ≥80 ≥80 63 ≥80 ≥80 36 53 71 ≥80 43Kyrgyzstan 65 ≥80 ≥80 60 47 ≥80 ≥80 33 ≥80 63 ≥80 ≥80Lao People's Democratic Republic 70 62 ≥80 40 50 61 79 53 ≥80 53 43 11Latvia 76 ≥80 ≥80 ≥80 41 ≥80 ≥80 27 ≥80 46 ≥80 ≥80Lebanon 61 ≥80 ≥80 74 65 ≥80 ≥80 36 72 44 ≥80 ≥80Lesotho ≥80 77 ≥80 58 77 51 48 35 ≥80 65 72 5Liberia 42 ≥80 70 57 44 54 53 18 34 64 ≥80 44 5Libya 36 ≥80 73 ≥80 54 56 ≥80 29 61 69 ≥80 42Lithuania 70 ≥80 ≥80 ≥80 36 ≥80 ≥80 20 79 53 ≥80 ≥80Luxembourg ≥80 ≥80 ≥80 ≥80 ≥80 ≥80 ≥80 50 ≥80 69 ≥80 ≥80Madagascar 65 51 70 40 13 59 59 12 39 ≥80 59 18 7Malawi 78 48 ≥80 77 ≥80 62 62 26 52 ≥80 ≥80 72 2Malaysia 55 ≥80 ≥80 ≥80 50 ≥80 ≥80 32 76 67 ≥80 ≥80Maldives 31 ≥80 ≥80 74 39 ≥80 ≥80 43 ≥80 63 ≥80 ≥80Mali 41 43 77 35 48 67 64 44 43 ≥80 ≥80 15 6Malta 73 ≥80 ≥80 ≥80 72 ≥80 ≥80 51 ≥80 65 ≥80 ≥80Marshall Islands 72 68 79 66 50 ≥80 ≥80 47 27 59 ≥80 71Mauritania 36 63 ≥80 34 38 62 10 49 37 ≥80 ≥80 22 13
69 79 76 52 76 7053 72 70 68 32 5744 44 51 67 13 3725 62 31 69 14 37≥80 ≥80 77 59 80 7440 49 57 64 27 4760 79 71 69 41 6368 ≥80 78 46 ≥80 73≥80 ≥80 ≥80 73 ≥80 ≥8078 72 71 63 44 6173 ≥80 51 53 53 59≥80 ≥80 58 72 ≥80 7758 61 49 49 63 5564 ≥80 ≥80 68 ≥80 ≥80≥80 ≥80 ≥80 71 ≥80 ≥80≥80 ≥80 ≥80 66 ≥80 ≥80≥80 ≥80 67 54 76 70≥80 ≥80 ≥80 69 ≥80 ≥8043 73 66 50 52 60≥80 ≥80 ≥80 51 ≥80 7641 73 53 72 35 5661 71 57 33 52 5176 ≥80 ≥80 52 69 7047 77 74 56 78 7035 61 62 65 26 5077 ≥80 69 47 ≥80 7273 75 ≥80 49 ≥80 7225 74 57 61 20 4846 62 39 58 22 4254 65 65 49 61 60≥80 ≥80 66 44 ≥80 70≥80 ≥80 ≥80 68 ≥80 ≥8029 55 27 61 16 3535 72 54 76 18 48≥80 ≥80 76 55 ≥80 7651 65 68 65 80 6948 47 55 72 16 4260 ≥80 ≥80 69 ≥80 ≥8049 71 70 42 70 6235 50 33 68 22 40
Cambodia 61 76 ≥80 69 ≥80 63 66 57 ≥80 68 50 21Cameroon 37 65 67 30 62 53 60 44 39 69 ≥80 72 5Canada ≥80 ≥80 ≥80 ≥80 75 ≥80 ≥80 63 ≥80 ≥80 ≥80 ≥80Central African Republic 33 41 42 35 53 47 65 14 32 59 ≥80 56 3Chad 21 31 50 26 62 60 16 12 37 ≥80 ≥80 25 2Chile ≥80 ≥80 ≥80 ≥80 69 ≥80 ≥80 40 ≥80 57 ≥80 ≥80China ≥80 77 ≥80 ≥80 75 ≥80 ≥80 55 72 63 ≥80 ≥80Colombia ≥80 ≥80 ≥80 64 51 ≥80 ≥80 49 ≥80 ≥80 ≥80 ≥80Comoros 36 49 ≥80 38 57 42 42 36 45 ≥80 70 ≥80 6Congo 40 79 79 28 24 59 63 20 34 77 79 ≥80 5Cook Islands 64 77 ≥80 ≥80 50 43 ≥80 28 27 64 ≥80 16Costa Rica ≥80 ≥80 ≥80 ≥80 64 ≥80 ≥80 37 ≥80 ≥80 61 ≥80Côte d'Ivoire 40 51 ≥80 44 70 60 52 34 38 ≥80 ≥80 22 12Croatia 55 ≥80 ≥80 ≥80 73 ≥80 ≥80 19 ≥80 47 ≥80 ≥80Cuba ≥80 79 ≥80 ≥80 77 ≥80 ≥80 34 ≥80 73 ≥80 ≥80Cyprus 55 ≥80 ≥80 ≥80 65 ≥80 ≥80 48 ≥80 49 ≥80 ≥80Czechia ≥80 ≥80 ≥80 ≥80 76 ≥80 ≥80 31 ≥80 56 ≥80 ≥80Democratic People's Republic of Korea ≥80 ≥80 ≥80 ≥80 26 73 ≥80 55 ≥80 74 ≥80 28Democratic Republic of the Congo 26 52 57 34 63 64 56 16 43 ≥80 ≥80 44 4Denmark ≥80 ≥80 ≥80 ≥80 ≥80 ≥80 ≥80 40 79 74 ≥80 ≥80Djibouti 47 26 ≥80 ≥80 27 ≥80 18 67 43 ≥80 ≥80 78 16Dominica ≥80 ≥80 ≥80 65 54 ≥80 ≥80 20 55 ≥80 ≥80 59Dominican Republic ≥80 ≥80 ≥80 73 47 80 ≥80 18 ≥80 ≥80 ≥80 49Ecuador ≥80 80 ≥80 79 70 ≥80 ≥80 55 ≥80 ≥80 77 ≥80Egypt ≥80 ≥80 ≥80 68 40 69 ≥80 37 ≥80 65 71 79El Salvador ≥80 ≥80 ≥80 80 54 ≥80 ≥80 46 ≥80 ≥80 56 ≥80Equatorial Guinea 27 67 53 54 35 39 39 66 36 61 ≥80 ≥80 12Eritrea 28 57 ≥80 45 69 61 47 12 61 ≥80 ≥80 56 19Estonia 75 ≥80 ≥80 ≥80 65 ≥80 ≥80 34 ≥80 56 ≥80 ≥80Eswatini ≥80 76 ≥80 60 ≥80 69 64 30 80 ≥80 ≥80 10Ethiopia 63 43 68 30 75 71 22 9 55 ≥80 ≥80 18 4Fiji 65 ≥80 ≥80 70 38 ≥80 ≥80 36 26 65 ≥80 47Finland ≥80 ≥80 ≥80 ≥80 73 ≥80 ≥80 40 ≥80 67 ≥80 ≥80France ≥80 ≥80 ≥80 ≥80 ≥80 ≥80 ≥80 51 ≥80 52 ≥80 ≥80Gabon 41 78 70 68 56 48 14 50 38 67 ≥80 72 36Gambia 38 77 ≥80 59 31 71 56 47 38 ≥80 ≥80 56 9Georgia 50 ≥80 ≥80 74 65 73 ≥80 26 45 54 ≥80 ≥80Germany ≥80 ≥80 ≥80 ≥80 ≥80 ≥80 ≥80 51 ≥80 68 ≥80 ≥80Ghana 47 ≥80 ≥80 56 45 34 68 23 44 ≥80 ≥80 40 5Greece 60 ≥80 ≥80 ≥80 67 ≥80 ≥80 48 ≥80 50 ≥80 ≥80
50 74 70 73 37 6142 47 54 62 24 44≥80 ≥80 ≥80 80 ≥80 ≥8017 38 39 54 14 3230 30 29 67 11 2876 ≥80 ≥80 58 ≥80 80≥80 ≥80 ≥80 63 ≥80 ≥8069 ≥80 72 72 ≥80 7827 50 43 68 25 4433 52 37 59 24 4068 80 60 37 48 5477 ≥80 79 69 78 7844 52 52 69 23 4578 ≥80 ≥80 44 ≥80 7378 ≥80 ≥80 58 ≥80 8074 ≥80 ≥80 62 ≥80 7968 ≥80 ≥80 53 ≥80 7869 ≥80 54 74 58 6835 40 44 70 18 39≥80 ≥80 ≥80 62 ≥80 ≥8032 56 40 71 34 4871 ≥80 72 45 75 6755 ≥80 69 52 62 6677 ≥80 80 76 ≥80 ≥80≥80 ≥80 65 58 77 70≥80 ≥80 71 72 79 7622 48 43 57 30 4349 51 39 ≥80 38 5074 ≥80 ≥80 55 ≥80 7840 76 75 59 34 5863 48 32 80 17 3861 ≥80 67 39 66 61≥80 ≥80 ≥80 62 ≥80 ≥80≥80 ≥80 ≥80 64 ≥80 ≥8027 62 37 59 41 4938 62 49 64 27 4858 73 74 40 ≥80 65≥80 ≥80 ≥80 68 ≥80 ≥8049 68 39 75 21 4557 ≥80 ≥80 62 83 78

7170
Global Monitoring Report on Universal Health Coverage 2021
Country Fam
ily p
lann
ing
dem
and
satis
fied
with
mod
ern
met
hods
1
Ante
nata
l car
e, 4
+ vi
sits 2
Child
imm
uniza
tion
(DTP
3)
Care
seek
ing
beha
viou
r for
child
pn
eum
onia
Tube
rcul
osis
trea
tmen
t
HIV
anti-
retr
ovira
l the
rapy
Inse
ctici
de-tr
eate
d ne
ts u
se 3
Acce
ss to
at l
east
bas
ic sa
nita
tion
Non-
elev
ated
blo
od p
ress
ure
+ *
Mea
n fa
stin
g pl
asm
a gl
ucos
e + *
Toba
cco
non-
use
+ *
Hosp
ital b
ed d
ensit
y + *
Heal
th w
orke
r den
sity
5+*
Afghanistan 44 21 72 68 10 73 49 33 ≥80 65 21 13Albania 7 78 ≥80 ≥80 44 ≥80 ≥80 31 ≥80 67 ≥80 71Algeria 77 70 ≥80 47 ≥80 ≥80 ≥80 40 ≥80 70 ≥80 ≥80Andorra 67 ≥80 ≥80 ≥80 ≥80 ≥80 ≥80 49 ≥80 52 ≥80 ≥80Angola 27 61 57 49 28 66 24 51 36 78 ≥80 44 3Antigua and Barbuda 79 ≥80 ≥80 ≥80 54 ≥80 ≥80 29 67 ≥80 ≥80 73Argentina ≥80 ≥80 ≥80 ≥80 65 ≥80 ≥80 20 ≥80 64 ≥80 ≥80Armenia 42 ≥80 ≥80 ≥80 48 ≥80 ≥80 21 71 61 ≥80 ≥80Australia ≥80 ≥80 ≥80 ≥80 ≥80 ≥80 ≥80 51 ≥80 80 ≥80 ≥80Austria ≥80 ≥80 ≥80 ≥80 ≥80 ≥80 ≥80 44 ≥80 61 ≥80 ≥80Azerbaijan 30 76 ≥80 33 52 ≥80 ≥80 32 61 65 ≥80 ≥80Bahamas ≥80 ≥80 ≥80 ≥80 64 ≥80 ≥80 26 66 ≥80 ≥80 49Bahrain 57 ≥80 ≥80 ≥80 37 ≥80 ≥80 39 57 78 ≥80 71Bangladesh 73 37 ≥80 46 23 ≥80 53 52 69 49 50 25Barbados 77 ≥80 ≥80 ≥80 53 ≥80 ≥80 31 71 ≥80 ≥80 77Belarus 75 ≥80 ≥80 ≥80 64 ≥80 ≥80 18 ≥80 62 ≥80 ≥80Belgium ≥80 ≥80 ≥80 ≥80 ≥80 ≥80 ≥80 50 ≥80 66 ≥80 ≥80Belize 70 ≥80 ≥80 67 41 ≥80 ≥80 37 ≥80 ≥80 57 77Benin 27 52 76 29 65 65 26 17 49 ≥80 ≥80 24 7Bhutan 79 ≥80 ≥80 74 42 ≥80 75 28 62 61 ≥80 39Bolivia (Plurinational State of) 57 ≥80 75 62 69 61 64 53 ≥80 ≥80 72 43Bosnia and Herzegovina 30 ≥80 73 ≥80 79 65 ≥80 27 ≥80 47 ≥80 ≥80Botswana ≥80 73 ≥80 14 ≥80 53 80 28 73 71 ≥80 24Brazil ≥80 ≥80 70 50 68 ≥80 ≥80 25 ≥80 ≥80 ≥80 ≥80Brunei Darussalam 76 ≥80 ≥80 ≥80 71 ≥80 ≥80 23 68 76 ≥80 ≥80Bulgaria 64 ≥80 ≥80 ≥80 45 ≥80 ≥80 25 ≥80 43 ≥80 ≥80Burkina Faso 53 47 ≥80 56 69 51 58 21 50 ≥80 78 22 5Burundi 43 49 ≥80 59 ≥80 55 44 46 43 ≥80 ≥80 42 2Cabo Verde 76 ≥80 ≥80 78 ≥80 ≥80 77 28 61 ≥80 ≥80 52
RMNCH Infectious diseases Noncommunicable diseases
Service capacity and access
Inte
rnat
iona
l Hea
lth R
egul
atio
ns
core
capa
city
inde
x*
RMNC
H
Infe
ctio
us d
iseas
es
NCDs
Serv
ice ca
pacit
y an
d ac
cess
43 46 32 57 23 37 Legend62 46 72 59 76 62 Very high coverage (>80)
≥80 69 ≥80 61 ≥80 75 High coverage (60-79)40 ≥80 ≥80 62 74 77 Medium coverage (40-59)63 47 39 61 20 39 Low coverage (20-39)69 ≥80 74 54 79 72 Very low coverage (<20)61 ≥80 ≥80 48 ≥80 73
≥80 76 71 45 ≥80 69 Not applicable≥80 ≥80 ≥80 73 ≥80 ≥8067 ≥80 ≥80 64 ≥80 ≥80
≥80 51 74 50 ≥80 6562 ≥80 ≥80 52 67 70
≥80 ≥80 69 56 ≥80 7167 59 46 56 44 5169 ≥80 77 58 ≥80 7468 ≥80 80 46 ≥80 74≥80 ≥80 ≥80 67 ≥80 ≥8041 ≥80 68 66 56 6735 42 37 76 18 3859 ≥80 63 47 61 6269 69 65 74 60 6735 63 79 50 70 6530 54 71 53 41 54
≥80 73 ≥80 56 ≥80 75≥80 ≥80 ≥80 49 ≥80 7772 ≥80 70 46 ≥80 7044 60 46 73 17 4347 58 55 71 17 4448 ≥80 ≥80 52 63 69
UHC
Serv
ice C
over
age
Inde
x
Service capacity and access
SCI components
Annex 3 UHC service coverage index, its four components and tracer indicators by country, 2019
Grenada 77 73 ≥80 76 54 ≥80 ≥80 22 77 ≥80 ≥80 64Guatemala 69 ≥80 ≥80 52 63 ≥80 68 47 79 ≥80 27 22Guinea 32 35 47 69 53 73 60 28 34 ≥80 ≥80 17 3Guinea-Bissau 49 ≥80 78 48 45 35 35 17 37 ≥80 ≥80 56 2Guyana 61 ≥80 ≥80 ≥80 67 ≥80 ≥80 34 77 ≥80 ≥80 61Haiti 46 67 51 37 73 68 37 29 ≥80 ≥80 38 13Honduras 79 ≥80 ≥80 64 53 ≥80 ≥80 44 ≥80 78 29 39Hungary 78 ≥80 ≥80 ≥80 55 ≥80 ≥80 19 ≥80 53 ≥80 ≥80Iceland ≥80 ≥80 ≥80 ≥80 ≥80 ≥80 ≥80 54 ≥80 ≥80 ≥80 ≥80India 73 51 ≥80 78 63 ≥80 68 48 ≥80 60 29 38Indonesia ≥80 ≥80 ≥80 75 24 66 ≥80 33 ≥80 46 65 31Iran (Islamic Republic of) 76 ≥80 ≥80 76 27 ≥80 ≥80 56 ≥80 80 ≥80 ≥80Iraq 56 68 ≥80 44 19 60 ≥80 20 ≥80 72 73 59Ireland ≥80 ≥80 ≥80 ≥80 ≥80 ≥80 ≥80 46 ≥80 69 ≥80 ≥80Israel 68 ≥80 ≥80 ≥80 71 ≥80 ≥80 51 ≥80 69 ≥80 ≥80Italy 66 ≥80 ≥80 ≥80 ≥80 ≥80 ≥80 43 ≥80 67 ≥80 ≥80Jamaica ≥80 ≥80 ≥80 ≥80 44 ≥80 ≥80 23 80 ≥80 ≥80 56Japan 57 ≥80 ≥80 ≥80 ≥80 ≥80 ≥80 48 ≥80 70 ≥80 ≥80Jordan 56 ≥80 ≥80 61 37 ≥80 ≥80 37 67 50 80 42Kazakhstan 74 ≥80 ≥80 ≥80 55 ≥80 ≥80 31 64 66 ≥80 ≥80Kenya 76 63 ≥80 66 ≥80 60 51 33 45 ≥80 ≥80 74 14Kiribati 46 67 ≥80 ≥80 50 ≥80 45 30 30 39 ≥80 23Kuwait 66 ≥80 ≥80 ≥80 63 ≥80 ≥80 36 53 71 ≥80 43Kyrgyzstan 65 ≥80 ≥80 60 47 ≥80 ≥80 33 ≥80 63 ≥80 ≥80Lao People's Democratic Republic 70 62 ≥80 40 50 61 79 53 ≥80 53 43 11Latvia 76 ≥80 ≥80 ≥80 41 ≥80 ≥80 27 ≥80 46 ≥80 ≥80Lebanon 61 ≥80 ≥80 74 65 ≥80 ≥80 36 72 44 ≥80 ≥80Lesotho ≥80 77 ≥80 58 77 51 48 35 ≥80 65 72 5Liberia 42 ≥80 70 57 44 54 53 18 34 64 ≥80 44 5Libya 36 ≥80 73 ≥80 54 56 ≥80 29 61 69 ≥80 42Lithuania 70 ≥80 ≥80 ≥80 36 ≥80 ≥80 20 79 53 ≥80 ≥80Luxembourg ≥80 ≥80 ≥80 ≥80 ≥80 ≥80 ≥80 50 ≥80 69 ≥80 ≥80Madagascar 65 51 70 40 13 59 59 12 39 ≥80 59 18 7Malawi 78 48 ≥80 77 ≥80 62 62 26 52 ≥80 ≥80 72 2Malaysia 55 ≥80 ≥80 ≥80 50 ≥80 ≥80 32 76 67 ≥80 ≥80Maldives 31 ≥80 ≥80 74 39 ≥80 ≥80 43 ≥80 63 ≥80 ≥80Mali 41 43 77 35 48 67 64 44 43 ≥80 ≥80 15 6Malta 73 ≥80 ≥80 ≥80 72 ≥80 ≥80 51 ≥80 65 ≥80 ≥80Marshall Islands 72 68 79 66 50 ≥80 ≥80 47 27 59 ≥80 71Mauritania 36 63 ≥80 34 38 62 10 49 37 ≥80 ≥80 22 13
69 79 76 52 76 7053 72 70 68 32 5744 44 51 67 13 3725 62 31 69 14 37≥80 ≥80 77 59 80 7440 49 57 64 27 4760 79 71 69 41 6368 ≥80 78 46 ≥80 73≥80 ≥80 ≥80 73 ≥80 ≥8078 72 71 63 44 6173 ≥80 51 53 53 59≥80 ≥80 58 72 ≥80 7758 61 49 49 63 5564 ≥80 ≥80 68 ≥80 ≥80≥80 ≥80 ≥80 71 ≥80 ≥80≥80 ≥80 ≥80 66 ≥80 ≥80≥80 ≥80 67 54 76 70≥80 ≥80 ≥80 69 ≥80 ≥8043 73 66 50 52 60≥80 ≥80 ≥80 51 ≥80 7641 73 53 72 35 5661 71 57 33 52 5176 ≥80 ≥80 52 69 7047 77 74 56 78 7035 61 62 65 26 5077 ≥80 69 47 ≥80 7273 75 ≥80 49 ≥80 7225 74 57 61 20 4846 62 39 58 22 4254 65 65 49 61 60≥80 ≥80 66 44 ≥80 70≥80 ≥80 ≥80 68 ≥80 ≥8029 55 27 61 16 3535 72 54 76 18 48≥80 ≥80 76 55 ≥80 7651 65 68 65 80 6948 47 55 72 16 4260 ≥80 ≥80 69 ≥80 ≥8049 71 70 42 70 6235 50 33 68 22 40
Mauritius 55 78 ≥80 77 21 ≥80 ≥80 45 54 70 ≥80 74Mexico ≥80 ≥80 ≥80 73 52 ≥80 ≥80 47 76 ≥80 54 ≥80Micronesia (Federated States of) 63 77 78 68 50 ≥80 ≥80 45 3 60 ≥80 52Monaco ≥80 ≥80 ≥80 ≥80 ≥80 ≥80 ≥80 48 ≥80 66 ≥80 ≥80Mongolia 70 ≥80 ≥80 76 32 31 67 29 ≥80 57 ≥80 ≥80Montenegro 31 75 ≥80 ≥80 49 ≥80 ≥80 25 ≥80 54 ≥80 ≥80Morocco 74 61 ≥80 70 70 ≥80 ≥80 41 ≥80 78 56 ≥80Mozambique 52 51 ≥80 57 67 ≥80 46 36 37 ≥80 78 40 4Myanmar 77 59 ≥80 58 ≥80 77 73 38 ≥80 35 57 33Namibia 78 63 ≥80 68 ≥80 64 35 27 79 78 ≥80 40Nauru 50 40 ≥80 69 50 ≥80 66 31 ≥80 29 ≥80 19Nepal 61 78 ≥80 ≥80 63 46 73 38 ≥80 55 16 46Netherlands ≥80 ≥80 ≥80 ≥80 ≥80 ≥80 ≥80 49 ≥80 68 ≥80 ≥80New Zealand ≥80 ≥80 ≥80 ≥80 ≥80 ≥80 ≥80 48 ≥80 80 ≥80 ≥80Nicaragua ≥80 63 ≥80 58 51 ≥80 73 41 ≥80 78 52 ≥80Niger 47 39 ≥80 59 65 59 66 14 31 ≥80 ≥80 16 3Nigeria 35 57 57 40 67 27 42 42 40 ≥80 ≥80 28 17Niue 36 77 ≥80 77 50 ≥80 ≥80 34 39 60 44 22North Macedonia 25 ≥80 ≥80 ≥80 58 ≥80 ≥80 25 ≥80 51 ≥80 ≥80Norway ≥80 ≥80 ≥80 ≥80 78 ≥80 ≥80 50 80 76 ≥80 ≥80Oman 38 74 ≥80 56 52 ≥80 ≥80 31 74 ≥80 56 ≥80Pakistan 50 52 ≥80 71 12 58 67 28 68 70 35 25Palau 58 ≥80 ≥80 75 50 ≥80 ≥80 28 20 74 ≥80 34Panama 72 ≥80 ≥80 ≥80 53 ≥80 ≥80 40 79 ≥80 ≥80 ≥80Papua New Guinea 49 49 35 63 61 ≥80 19 54 56 42 10 7Paraguay ≥80 75 ≥80 ≥80 52 ≥80 ≥80 6 ≥80 ≥80 46 77Peru 67 ≥80 ≥80 61 77 ≥80 78 66 ≥80 ≥80 ≥80 ≥80Philippines 57 ≥80 77 66 43 68 ≥80 44 ≥80 66 56 12Poland 69 79 ≥80 ≥80 73 ≥80 ≥80 18 ≥80 65 ≥80 ≥80Portugal 77 ≥80 ≥80 ≥80 ≥80 ≥80 ≥80 46 ≥80 64 ≥80 ≥80Qatar 63 ≥80 ≥80 ≥80 ≥80 ≥80 ≥80 36 57 ≥80 68 62Republic of Korea ≥80 ≥80 ≥80 ≥80 75 ≥80 ≥80 56 ≥80 69 ≥80 ≥80Republic of Moldova 63 ≥80 ≥80 79 46 ≥80 78 20 74 59 ≥80 ≥80Romania 71 76 ≥80 ≥80 67 ≥80 ≥80 20 ≥80 57 ≥80 ≥80Russian Federation 73 ≥80 ≥80 ≥80 48 ≥80 ≥80 26 79 59 ≥80 ≥80Rwanda 69 47 ≥80 54 ≥80 ≥80 32 69 51 ≥80 79 41 7Saint Kitts and Nevis 75 ≥80 ≥80 77 54 ≥80 ≥80 25 74 ≥80 ≥80 ≥80Saint Lucia 75 ≥80 ≥80 72 54 ≥80 ≥80 34 76 ≥80 71 ≥80Saint Vincent and the Grenadines ≥80 70 97 78 54 ≥80 ≥80 34 ≥80 ≥80 ≥80 ≥80Samoa 27 77 58 73 50 ≥80 ≥80 36 31 62 55 33
64 75 54 55 78 65≥80 ≥80 72 66 76 7432 71 71 19 55 48≥80 ≥80 ≥80 66 ≥80 ≥80≥80 ≥80 40 51 ≥80 6356 65 75 51 ≥80 6775 75 ≥80 64 72 7360 60 56 66 22 4764 70 77 51 49 6159 73 58 55 62 6261 60 66 43 49 5434 77 60 58 30 53≥80 ≥80 ≥80 69 ≥80 ≥80≥80 ≥80 ≥80 69 ≥80 ≥8078 75 67 68 70 7039 54 44 65 13 3751 46 42 70 29 4467 68 78 43 40 5560 68 77 50 ≥80 68≥80 ≥80 ≥80 67 ≥80 ≥80≥80 63 77 59 79 6949 63 36 51 35 4563 76 76 35 60 5976 ≥80 71 66 ≥80 7721 48 46 50 11 3365 ≥80 75 37 61 6148 77 79 ≥80 74 7851 71 62 66 32 5566 ≥80 ≥80 48 ≥80 74≥80 ≥80 ≥80 66 ≥80 ≥80≥80 ≥80 ≥80 55 74 74≥80 ≥80 ≥80 70 ≥80 ≥8060 ≥80 68 44 ≥80 6767 80 80 47 ≥80 71≥80 ≥80 75 50 ≥80 7571 65 63 74 28 5451 ≥80 77 53 78 7269 ≥80 73 59 74 7249 ≥80 74 61 77 7361 55 75 41 48 53

7372
Global Monitoring Report on Universal Health Coverage 2021
Country Fam
ily p
lann
ing
dem
and
satis
fied
with
mod
ern
met
hods
1
Ante
nata
l car
e, 4
+ vi
sits 2
Child
imm
uniza
tion
(DTP
3)
Care
seek
ing
beha
viou
r for
child
pn
eum
onia
Tube
rcul
osis
trea
tmen
t
HIV
anti-
retr
ovira
l the
rapy
Inse
ctici
de-tr
eate
d ne
ts u
se 3
Acce
ss to
at l
east
bas
ic sa
nita
tion
Non-
elev
ated
blo
od p
ress
ure
+ *
Mea
n fa
stin
g pl
asm
a gl
ucos
e + *
Toba
cco
non-
use
+ *
Hosp
ital b
ed d
ensit
y + *
Heal
th w
orke
r den
sity
5+*
Afghanistan 44 21 72 68 10 73 49 33 ≥80 65 21 13Albania 7 78 ≥80 ≥80 44 ≥80 ≥80 31 ≥80 67 ≥80 71Algeria 77 70 ≥80 47 ≥80 ≥80 ≥80 40 ≥80 70 ≥80 ≥80Andorra 67 ≥80 ≥80 ≥80 ≥80 ≥80 ≥80 49 ≥80 52 ≥80 ≥80Angola 27 61 57 49 28 66 24 51 36 78 ≥80 44 3Antigua and Barbuda 79 ≥80 ≥80 ≥80 54 ≥80 ≥80 29 67 ≥80 ≥80 73Argentina ≥80 ≥80 ≥80 ≥80 65 ≥80 ≥80 20 ≥80 64 ≥80 ≥80Armenia 42 ≥80 ≥80 ≥80 48 ≥80 ≥80 21 71 61 ≥80 ≥80Australia ≥80 ≥80 ≥80 ≥80 ≥80 ≥80 ≥80 51 ≥80 80 ≥80 ≥80Austria ≥80 ≥80 ≥80 ≥80 ≥80 ≥80 ≥80 44 ≥80 61 ≥80 ≥80Azerbaijan 30 76 ≥80 33 52 ≥80 ≥80 32 61 65 ≥80 ≥80Bahamas ≥80 ≥80 ≥80 ≥80 64 ≥80 ≥80 26 66 ≥80 ≥80 49Bahrain 57 ≥80 ≥80 ≥80 37 ≥80 ≥80 39 57 78 ≥80 71Bangladesh 73 37 ≥80 46 23 ≥80 53 52 69 49 50 25Barbados 77 ≥80 ≥80 ≥80 53 ≥80 ≥80 31 71 ≥80 ≥80 77Belarus 75 ≥80 ≥80 ≥80 64 ≥80 ≥80 18 ≥80 62 ≥80 ≥80Belgium ≥80 ≥80 ≥80 ≥80 ≥80 ≥80 ≥80 50 ≥80 66 ≥80 ≥80Belize 70 ≥80 ≥80 67 41 ≥80 ≥80 37 ≥80 ≥80 57 77Benin 27 52 76 29 65 65 26 17 49 ≥80 ≥80 24 7Bhutan 79 ≥80 ≥80 74 42 ≥80 75 28 62 61 ≥80 39Bolivia (Plurinational State of) 57 ≥80 75 62 69 61 64 53 ≥80 ≥80 72 43Bosnia and Herzegovina 30 ≥80 73 ≥80 79 65 ≥80 27 ≥80 47 ≥80 ≥80Botswana ≥80 73 ≥80 14 ≥80 53 80 28 73 71 ≥80 24Brazil ≥80 ≥80 70 50 68 ≥80 ≥80 25 ≥80 ≥80 ≥80 ≥80Brunei Darussalam 76 ≥80 ≥80 ≥80 71 ≥80 ≥80 23 68 76 ≥80 ≥80Bulgaria 64 ≥80 ≥80 ≥80 45 ≥80 ≥80 25 ≥80 43 ≥80 ≥80Burkina Faso 53 47 ≥80 56 69 51 58 21 50 ≥80 78 22 5Burundi 43 49 ≥80 59 ≥80 55 44 46 43 ≥80 ≥80 42 2Cabo Verde 76 ≥80 ≥80 78 ≥80 ≥80 77 28 61 ≥80 ≥80 52
RMNCH Infectious diseases Noncommunicable diseases
Service capacity and access
Inte
rnat
iona
l Hea
lth R
egul
atio
ns
core
capa
city
inde
x*
RMNC
H
Infe
ctio
us d
iseas
es
NCDs
Serv
ice ca
pacit
y an
d ac
cess
43 46 32 57 23 37 Legend62 46 72 59 76 62 Very high coverage (>80)
≥80 69 ≥80 61 ≥80 75 High coverage (60-79)40 ≥80 ≥80 62 74 77 Medium coverage (40-59)63 47 39 61 20 39 Low coverage (20-39)69 ≥80 74 54 79 72 Very low coverage (<20)61 ≥80 ≥80 48 ≥80 73
≥80 76 71 45 ≥80 69 Not applicable≥80 ≥80 ≥80 73 ≥80 ≥8067 ≥80 ≥80 64 ≥80 ≥80
≥80 51 74 50 ≥80 6562 ≥80 ≥80 52 67 70
≥80 ≥80 69 56 ≥80 7167 59 46 56 44 5169 ≥80 77 58 ≥80 7468 ≥80 80 46 ≥80 74≥80 ≥80 ≥80 67 ≥80 ≥8041 ≥80 68 66 56 6735 42 37 76 18 3859 ≥80 63 47 61 6269 69 65 74 60 6735 63 79 50 70 6530 54 71 53 41 54
≥80 73 ≥80 56 ≥80 75≥80 ≥80 ≥80 49 ≥80 7772 ≥80 70 46 ≥80 7044 60 46 73 17 4347 58 55 71 17 4448 ≥80 ≥80 52 63 69
UHC
Serv
ice C
over
age
Inde
x
Service capacity and access
SCI components
Annex 3 UHC service coverage index, its four components and tracer indicators by country, 2019
Mauritius 55 78 ≥80 77 21 ≥80 ≥80 45 54 70 ≥80 74Mexico ≥80 ≥80 ≥80 73 52 ≥80 ≥80 47 76 ≥80 54 ≥80Micronesia (Federated States of) 63 77 78 68 50 ≥80 ≥80 45 3 60 ≥80 52Monaco ≥80 ≥80 ≥80 ≥80 ≥80 ≥80 ≥80 48 ≥80 66 ≥80 ≥80Mongolia 70 ≥80 ≥80 76 32 31 67 29 ≥80 57 ≥80 ≥80Montenegro 31 75 ≥80 ≥80 49 ≥80 ≥80 25 ≥80 54 ≥80 ≥80Morocco 74 61 ≥80 70 70 ≥80 ≥80 41 ≥80 78 56 ≥80Mozambique 52 51 ≥80 57 67 ≥80 46 36 37 ≥80 78 40 4Myanmar 77 59 ≥80 58 ≥80 77 73 38 ≥80 35 57 33Namibia 78 63 ≥80 68 ≥80 64 35 27 79 78 ≥80 40Nauru 50 40 ≥80 69 50 ≥80 66 31 ≥80 29 ≥80 19Nepal 61 78 ≥80 ≥80 63 46 73 38 ≥80 55 16 46Netherlands ≥80 ≥80 ≥80 ≥80 ≥80 ≥80 ≥80 49 ≥80 68 ≥80 ≥80New Zealand ≥80 ≥80 ≥80 ≥80 ≥80 ≥80 ≥80 48 ≥80 80 ≥80 ≥80Nicaragua ≥80 63 ≥80 58 51 ≥80 73 41 ≥80 78 52 ≥80Niger 47 39 ≥80 59 65 59 66 14 31 ≥80 ≥80 16 3Nigeria 35 57 57 40 67 27 42 42 40 ≥80 ≥80 28 17Niue 36 77 ≥80 77 50 ≥80 ≥80 34 39 60 44 22North Macedonia 25 ≥80 ≥80 ≥80 58 ≥80 ≥80 25 ≥80 51 ≥80 ≥80Norway ≥80 ≥80 ≥80 ≥80 78 ≥80 ≥80 50 80 76 ≥80 ≥80Oman 38 74 ≥80 56 52 ≥80 ≥80 31 74 ≥80 56 ≥80Pakistan 50 52 ≥80 71 12 58 67 28 68 70 35 25Palau 58 ≥80 ≥80 75 50 ≥80 ≥80 28 20 74 ≥80 34Panama 72 ≥80 ≥80 ≥80 53 ≥80 ≥80 40 79 ≥80 ≥80 ≥80Papua New Guinea 49 49 35 63 61 ≥80 19 54 56 42 10 7Paraguay ≥80 75 ≥80 ≥80 52 ≥80 ≥80 6 ≥80 ≥80 46 77Peru 67 ≥80 ≥80 61 77 ≥80 78 66 ≥80 ≥80 ≥80 ≥80Philippines 57 ≥80 77 66 43 68 ≥80 44 ≥80 66 56 12Poland 69 79 ≥80 ≥80 73 ≥80 ≥80 18 ≥80 65 ≥80 ≥80Portugal 77 ≥80 ≥80 ≥80 ≥80 ≥80 ≥80 46 ≥80 64 ≥80 ≥80Qatar 63 ≥80 ≥80 ≥80 ≥80 ≥80 ≥80 36 57 ≥80 68 62Republic of Korea ≥80 ≥80 ≥80 ≥80 75 ≥80 ≥80 56 ≥80 69 ≥80 ≥80Republic of Moldova 63 ≥80 ≥80 79 46 ≥80 78 20 74 59 ≥80 ≥80Romania 71 76 ≥80 ≥80 67 ≥80 ≥80 20 ≥80 57 ≥80 ≥80Russian Federation 73 ≥80 ≥80 ≥80 48 ≥80 ≥80 26 79 59 ≥80 ≥80Rwanda 69 47 ≥80 54 ≥80 ≥80 32 69 51 ≥80 79 41 7Saint Kitts and Nevis 75 ≥80 ≥80 77 54 ≥80 ≥80 25 74 ≥80 ≥80 ≥80Saint Lucia 75 ≥80 ≥80 72 54 ≥80 ≥80 34 76 ≥80 71 ≥80Saint Vincent and the Grenadines ≥80 70 97 78 54 ≥80 ≥80 34 ≥80 ≥80 ≥80 ≥80Samoa 27 77 58 73 50 ≥80 ≥80 36 31 62 55 33
64 75 54 55 78 65≥80 ≥80 72 66 76 7432 71 71 19 55 48≥80 ≥80 ≥80 66 ≥80 ≥80≥80 ≥80 40 51 ≥80 6356 65 75 51 ≥80 6775 75 ≥80 64 72 7360 60 56 66 22 4764 70 77 51 49 6159 73 58 55 62 6261 60 66 43 49 5434 77 60 58 30 53≥80 ≥80 ≥80 69 ≥80 ≥80≥80 ≥80 ≥80 69 ≥80 ≥8078 75 67 68 70 7039 54 44 65 13 3751 46 42 70 29 4467 68 78 43 40 5560 68 77 50 ≥80 68≥80 ≥80 ≥80 67 ≥80 ≥80≥80 63 77 59 79 6949 63 36 51 35 4563 76 76 35 60 5976 ≥80 71 66 ≥80 7721 48 46 50 11 3365 ≥80 75 37 61 6148 77 79 ≥80 74 7851 71 62 66 32 5566 ≥80 ≥80 48 ≥80 74≥80 ≥80 ≥80 66 ≥80 ≥80≥80 ≥80 ≥80 55 74 74≥80 ≥80 ≥80 70 ≥80 ≥8060 ≥80 68 44 ≥80 6767 80 80 47 ≥80 71≥80 ≥80 75 50 ≥80 7571 65 63 74 28 5451 ≥80 77 53 78 7269 ≥80 73 59 74 7249 ≥80 74 61 77 7361 55 75 41 48 53
San Marino 67 ≥80 ≥80 ≥80 ≥80 ≥80 ≥80 48 ≥80 51 ≥80 ≥80Sao Tome and Principe 59 ≥80 ≥80 ≥80 ≥80 57 46 25 ≥80 ≥80 ≥80 26Saudi Arabia 42 ≥80 ≥80 ≥80 67 ≥80 ≥80 46 35 79 ≥80 ≥80Senegal 53 56 ≥80 48 73 70 64 56 34 ≥80 ≥80 17 13Serbia 36 ≥80 ≥80 ≥80 66 ≥80 ≥80 24 ≥80 42 ≥80 ≥80Seychelles 52 ≥80 ≥80 79 65 ≥80 ≥80 27 48 70 ≥80 ≥80Sierra Leone 47 79 ≥80 76 42 77 43 16 32 ≥80 79 22 3Singapore 77 ≥80 ≥80 ≥80 76 ≥80 ≥80 48 ≥80 76 ≥80 ≥80Slovakia 77 ≥80 ≥80 ≥80 70 ≥80 ≥80 29 ≥80 54 ≥80 ≥80Slovenia 77 ≥80 ≥80 ≥80 ≥80 ≥80 ≥80 25 ≥80 68 ≥80 ≥80Solomon Islands 53 68 ≥80 79 50 ≥80 34 51 51 46 71 15Somalia 3 24 42 23 39 42 16 38 40 ≥80 ≥80 48 2South Africa 79 76 ≥80 66 68 58 78 27 68 71 ≥80 74South Sudan 17 17 49 48 20 65 31 16 43 ≥80 ≥80 44 4Spain ≥80 ≥80 ≥80 ≥80 ≥80 ≥80 ≥80 55 ≥80 60 ≥80 ≥80Sri Lanka 73 ≥80 ≥80 52 50 61 ≥80 41 ≥80 68 ≥80 47Sudan 32 51 ≥80 48 22 69 51 37 32 ≥80 69 37 11Suriname 66 68 77 ≥80 55 ≥80 ≥80 29 79 78 ≥80 50Sweden ≥80 ≥80 ≥80 ≥80 ≥80 ≥80 ≥80 50 ≥80 64 ≥80 ≥80Switzerland ≥80 ≥80 ≥80 ≥80 ≥80 ≥80 ≥80 63 ≥80 63 ≥80 ≥80Syrian Arab Republic 61 64 54 77 32 ≥80 ≥80 32 ≥80 73 70 23Tajikistan 53 64 ≥80 69 51 74 ≥80 22 77 57 ≥80 ≥80Thailand ≥80 ≥80 ≥80 80 75 ≥80 ≥80 52 ≥80 68 ≥80 ≥80Timor-Leste 49 77 ≥80 70 44 63 56 41 ≥80 42 ≥80 13Togo 40 55 ≥80 39 68 ≥80 57 18 40 ≥80 ≥80 33 7Tonga 48 ≥80 ≥80 76 50 ≥80 ≥80 28 11 55 ≥80 50Trinidad and Tobago 64 ≥80 ≥80 74 74 ≥80 ≥80 29 65 ≥80 ≥80 ≥80Tunisia 70 ≥80 ≥80 ≥80 30 ≥80 ≥80 42 77 64 ≥80 63Turkey 60 ≥80 ≥80 ≥80 70 ≥80 ≥80 46 ≥80 56 ≥80 ≥80Turkmenistan 76 ≥80 ≥80 51 52 ≥80 ≥80 35 48 ≥80 ≥80 ≥80Tuvalu 44 67 ≥80 72 50 ≥80 ≥80 17 43 47 ≥80 18Uganda 55 57 ≥80 71 ≥80 75 53 20 46 ≥80 ≥80 28 9Ukraine 70 ≥80 ≥80 ≥80 55 75 ≥80 28 ≥80 62 ≥80 ≥80United Arab Emirates 59 ≥80 ≥80 ≥80 48 ≥80 ≥80 38 68 ≥80 ≥80 ≥80United Kingdom of Great Britain and Northern Ireland ≥80 ≥80 ≥80 ≥80 ≥80 ≥80 ≥80 56 ≥80 77 ≥80 ≥80United Republic of Tanzania 58 62 ≥80 55 74 59 47 32 45 ≥80 ≥80 35 4United States of America ≥80 ≥80 ≥80 ≥80 80 ≥80 ≥80 47 73 66 ≥80 ≥80Uruguay ≥80 ≥80 ≥80 ≥80 78 ≥80 ≥80 29 75 68 ≥80 ≥80Uzbekistan ≥80 ≥80 96 68 48 73 ≥80 24 77 74 ≥80 ≥80Vanuatu 60 52 ≥80 72 50 75 53 34 32 73 ≥80 20
≥80 ≥80 ≥80 61 ≥80 ≥8032 79 64 60 44 6075 74 ≥80 50 ≥80 7354 60 65 65 23 4969 74 ≥80 46 ≥80 7151 79 ≥80 45 80 7040 72 39 63 13 39≥80 ≥80 ≥80 71 ≥80 ≥8073 ≥80 ≥80 51 ≥80 77≥80 ≥80 ≥80 53 ≥80 8041 72 52 49 35 5044 16 32 70 15 2770 76 68 50 ≥80 6734 29 28 72 18 32≥80 ≥80 ≥80 68 ≥80 ≥8054 77 66 62 63 6757 52 41 60 29 4457 74 73 56 66 67≥80 ≥80 ≥80 68 ≥80 ≥80≥80 ≥80 ≥80 69 ≥80 ≥8048 63 62 58 43 5662 69 72 46 ≥80 66≥80 ≥80 ≥80 70 ≥80 ≥8037 70 54 56 36 5339 52 50 71 21 4461 75 74 26 67 5653 ≥80 ≥80 54 78 7371 ≥80 62 59 76 7077 ≥80 ≥80 61 ≥80 7969 78 74 54 ≥80 7351 67 71 33 45 5266 67 51 74 26 5066 ≥80 74 54 ≥80 73≥80 ≥80 74 60 ≥80 78≥80 ≥80 ≥80 72 ≥80 ≥8051 65 51 73 19 46≥80 ≥80 ≥80 61 ≥80 ≥80≥80 ≥80 ≥80 53 ≥80 7957 ≥80 71 51 ≥80 7145 67 58 43 44 52

7574
Global Monitoring Report on Universal Health Coverage 2021
Country Fam
ily p
lann
ing
dem
and
satis
fied
with
mod
ern
met
hods
1
Ante
nata
l car
e, 4
+ vi
sits 2
Child
imm
uniza
tion
(DTP
3)
Care
seek
ing
beha
viou
r for
child
pn
eum
onia
Tube
rcul
osis
trea
tmen
t
HIV
anti-
retr
ovira
l the
rapy
Inse
ctici
de-tr
eate
d ne
ts u
se 3
Acce
ss to
at l
east
bas
ic sa
nita
tion
Non-
elev
ated
blo
od p
ress
ure
+ *
Mea
n fa
stin
g pl
asm
a gl
ucos
e + *
Toba
cco
non-
use
+ *
Hosp
ital b
ed d
ensit
y + *
Heal
th w
orke
r den
sity
5+*
Afghanistan 44 21 72 68 10 73 49 33 ≥80 65 21 13Albania 7 78 ≥80 ≥80 44 ≥80 ≥80 31 ≥80 67 ≥80 71Algeria 77 70 ≥80 47 ≥80 ≥80 ≥80 40 ≥80 70 ≥80 ≥80Andorra 67 ≥80 ≥80 ≥80 ≥80 ≥80 ≥80 49 ≥80 52 ≥80 ≥80Angola 27 61 57 49 28 66 24 51 36 78 ≥80 44 3Antigua and Barbuda 79 ≥80 ≥80 ≥80 54 ≥80 ≥80 29 67 ≥80 ≥80 73Argentina ≥80 ≥80 ≥80 ≥80 65 ≥80 ≥80 20 ≥80 64 ≥80 ≥80Armenia 42 ≥80 ≥80 ≥80 48 ≥80 ≥80 21 71 61 ≥80 ≥80Australia ≥80 ≥80 ≥80 ≥80 ≥80 ≥80 ≥80 51 ≥80 80 ≥80 ≥80Austria ≥80 ≥80 ≥80 ≥80 ≥80 ≥80 ≥80 44 ≥80 61 ≥80 ≥80Azerbaijan 30 76 ≥80 33 52 ≥80 ≥80 32 61 65 ≥80 ≥80Bahamas ≥80 ≥80 ≥80 ≥80 64 ≥80 ≥80 26 66 ≥80 ≥80 49Bahrain 57 ≥80 ≥80 ≥80 37 ≥80 ≥80 39 57 78 ≥80 71Bangladesh 73 37 ≥80 46 23 ≥80 53 52 69 49 50 25Barbados 77 ≥80 ≥80 ≥80 53 ≥80 ≥80 31 71 ≥80 ≥80 77Belarus 75 ≥80 ≥80 ≥80 64 ≥80 ≥80 18 ≥80 62 ≥80 ≥80Belgium ≥80 ≥80 ≥80 ≥80 ≥80 ≥80 ≥80 50 ≥80 66 ≥80 ≥80Belize 70 ≥80 ≥80 67 41 ≥80 ≥80 37 ≥80 ≥80 57 77Benin 27 52 76 29 65 65 26 17 49 ≥80 ≥80 24 7Bhutan 79 ≥80 ≥80 74 42 ≥80 75 28 62 61 ≥80 39Bolivia (Plurinational State of) 57 ≥80 75 62 69 61 64 53 ≥80 ≥80 72 43Bosnia and Herzegovina 30 ≥80 73 ≥80 79 65 ≥80 27 ≥80 47 ≥80 ≥80Botswana ≥80 73 ≥80 14 ≥80 53 80 28 73 71 ≥80 24Brazil ≥80 ≥80 70 50 68 ≥80 ≥80 25 ≥80 ≥80 ≥80 ≥80Brunei Darussalam 76 ≥80 ≥80 ≥80 71 ≥80 ≥80 23 68 76 ≥80 ≥80Bulgaria 64 ≥80 ≥80 ≥80 45 ≥80 ≥80 25 ≥80 43 ≥80 ≥80Burkina Faso 53 47 ≥80 56 69 51 58 21 50 ≥80 78 22 5Burundi 43 49 ≥80 59 ≥80 55 44 46 43 ≥80 ≥80 42 2Cabo Verde 76 ≥80 ≥80 78 ≥80 ≥80 77 28 61 ≥80 ≥80 52
RMNCH Infectious diseases Noncommunicable diseases
Service capacity and access
Inte
rnat
iona
l Hea
lth R
egul
atio
ns
core
capa
city
inde
x*
RMNC
H
Infe
ctio
us d
iseas
es
NCDs
Serv
ice ca
pacit
y an
d ac
cess
43 46 32 57 23 37 Legend62 46 72 59 76 62 Very high coverage (>80)
≥80 69 ≥80 61 ≥80 75 High coverage (60-79)40 ≥80 ≥80 62 74 77 Medium coverage (40-59)63 47 39 61 20 39 Low coverage (20-39)69 ≥80 74 54 79 72 Very low coverage (<20)61 ≥80 ≥80 48 ≥80 73
≥80 76 71 45 ≥80 69 Not applicable≥80 ≥80 ≥80 73 ≥80 ≥8067 ≥80 ≥80 64 ≥80 ≥80
≥80 51 74 50 ≥80 6562 ≥80 ≥80 52 67 70
≥80 ≥80 69 56 ≥80 7167 59 46 56 44 5169 ≥80 77 58 ≥80 7468 ≥80 80 46 ≥80 74≥80 ≥80 ≥80 67 ≥80 ≥8041 ≥80 68 66 56 6735 42 37 76 18 3859 ≥80 63 47 61 6269 69 65 74 60 6735 63 79 50 70 6530 54 71 53 41 54
≥80 73 ≥80 56 ≥80 75≥80 ≥80 ≥80 49 ≥80 7772 ≥80 70 46 ≥80 7044 60 46 73 17 4347 58 55 71 17 4448 ≥80 ≥80 52 63 69
UHC
Serv
ice C
over
age
Inde
x
Service capacity and access
SCI components
Annex 3 UHC service coverage index, its four components and tracer indicators by country, 2019
San Marino 67 ≥80 ≥80 ≥80 ≥80 ≥80 ≥80 48 ≥80 51 ≥80 ≥80Sao Tome and Principe 59 ≥80 ≥80 ≥80 ≥80 57 46 25 ≥80 ≥80 ≥80 26Saudi Arabia 42 ≥80 ≥80 ≥80 67 ≥80 ≥80 46 35 79 ≥80 ≥80Senegal 53 56 ≥80 48 73 70 64 56 34 ≥80 ≥80 17 13Serbia 36 ≥80 ≥80 ≥80 66 ≥80 ≥80 24 ≥80 42 ≥80 ≥80Seychelles 52 ≥80 ≥80 79 65 ≥80 ≥80 27 48 70 ≥80 ≥80Sierra Leone 47 79 ≥80 76 42 77 43 16 32 ≥80 79 22 3Singapore 77 ≥80 ≥80 ≥80 76 ≥80 ≥80 48 ≥80 76 ≥80 ≥80Slovakia 77 ≥80 ≥80 ≥80 70 ≥80 ≥80 29 ≥80 54 ≥80 ≥80Slovenia 77 ≥80 ≥80 ≥80 ≥80 ≥80 ≥80 25 ≥80 68 ≥80 ≥80Solomon Islands 53 68 ≥80 79 50 ≥80 34 51 51 46 71 15Somalia 3 24 42 23 39 42 16 38 40 ≥80 ≥80 48 2South Africa 79 76 ≥80 66 68 58 78 27 68 71 ≥80 74South Sudan 17 17 49 48 20 65 31 16 43 ≥80 ≥80 44 4Spain ≥80 ≥80 ≥80 ≥80 ≥80 ≥80 ≥80 55 ≥80 60 ≥80 ≥80Sri Lanka 73 ≥80 ≥80 52 50 61 ≥80 41 ≥80 68 ≥80 47Sudan 32 51 ≥80 48 22 69 51 37 32 ≥80 69 37 11Suriname 66 68 77 ≥80 55 ≥80 ≥80 29 79 78 ≥80 50Sweden ≥80 ≥80 ≥80 ≥80 ≥80 ≥80 ≥80 50 ≥80 64 ≥80 ≥80Switzerland ≥80 ≥80 ≥80 ≥80 ≥80 ≥80 ≥80 63 ≥80 63 ≥80 ≥80Syrian Arab Republic 61 64 54 77 32 ≥80 ≥80 32 ≥80 73 70 23Tajikistan 53 64 ≥80 69 51 74 ≥80 22 77 57 ≥80 ≥80Thailand ≥80 ≥80 ≥80 80 75 ≥80 ≥80 52 ≥80 68 ≥80 ≥80Timor-Leste 49 77 ≥80 70 44 63 56 41 ≥80 42 ≥80 13Togo 40 55 ≥80 39 68 ≥80 57 18 40 ≥80 ≥80 33 7Tonga 48 ≥80 ≥80 76 50 ≥80 ≥80 28 11 55 ≥80 50Trinidad and Tobago 64 ≥80 ≥80 74 74 ≥80 ≥80 29 65 ≥80 ≥80 ≥80Tunisia 70 ≥80 ≥80 ≥80 30 ≥80 ≥80 42 77 64 ≥80 63Turkey 60 ≥80 ≥80 ≥80 70 ≥80 ≥80 46 ≥80 56 ≥80 ≥80Turkmenistan 76 ≥80 ≥80 51 52 ≥80 ≥80 35 48 ≥80 ≥80 ≥80Tuvalu 44 67 ≥80 72 50 ≥80 ≥80 17 43 47 ≥80 18Uganda 55 57 ≥80 71 ≥80 75 53 20 46 ≥80 ≥80 28 9Ukraine 70 ≥80 ≥80 ≥80 55 75 ≥80 28 ≥80 62 ≥80 ≥80United Arab Emirates 59 ≥80 ≥80 ≥80 48 ≥80 ≥80 38 68 ≥80 ≥80 ≥80United Kingdom of Great Britain and Northern Ireland ≥80 ≥80 ≥80 ≥80 ≥80 ≥80 ≥80 56 ≥80 77 ≥80 ≥80United Republic of Tanzania 58 62 ≥80 55 74 59 47 32 45 ≥80 ≥80 35 4United States of America ≥80 ≥80 ≥80 ≥80 80 ≥80 ≥80 47 73 66 ≥80 ≥80Uruguay ≥80 ≥80 ≥80 ≥80 78 ≥80 ≥80 29 75 68 ≥80 ≥80Uzbekistan ≥80 ≥80 96 68 48 73 ≥80 24 77 74 ≥80 ≥80Vanuatu 60 52 ≥80 72 50 75 53 34 32 73 ≥80 20
≥80 ≥80 ≥80 61 ≥80 ≥8032 79 64 60 44 6075 74 ≥80 50 ≥80 7354 60 65 65 23 4969 74 ≥80 46 ≥80 7151 79 ≥80 45 80 7040 72 39 63 13 39≥80 ≥80 ≥80 71 ≥80 ≥8073 ≥80 ≥80 51 ≥80 77≥80 ≥80 ≥80 53 ≥80 8041 72 52 49 35 5044 16 32 70 15 2770 76 68 50 ≥80 6734 29 28 72 18 32≥80 ≥80 ≥80 68 ≥80 ≥8054 77 66 62 63 6757 52 41 60 29 4457 74 73 56 66 67≥80 ≥80 ≥80 68 ≥80 ≥80≥80 ≥80 ≥80 69 ≥80 ≥8048 63 62 58 43 5662 69 72 46 ≥80 66≥80 ≥80 ≥80 70 ≥80 ≥8037 70 54 56 36 5339 52 50 71 21 4461 75 74 26 67 5653 ≥80 ≥80 54 78 7371 ≥80 62 59 76 7077 ≥80 ≥80 61 ≥80 7969 78 74 54 ≥80 7351 67 71 33 45 5266 67 51 74 26 5066 ≥80 74 54 ≥80 73≥80 ≥80 74 60 ≥80 78≥80 ≥80 ≥80 72 ≥80 ≥8051 65 51 73 19 46≥80 ≥80 ≥80 61 ≥80 ≥80≥80 ≥80 ≥80 53 ≥80 7957 ≥80 71 51 ≥80 7145 67 58 43 44 52
Inte
rnat
iona
l Hea
lth R
egul
atio
ns
core
capa
city
inde
x*
RMNC
H
Infe
ctio
us d
iseas
es
NCDs
Serv
ice ca
pacit
y an
d ac
cess
43 46 32 57 23 37 Legend62 46 72 59 76 62 Very high coverage (>80)
≥80 69 ≥80 61 ≥80 75 High coverage (60-79)40 ≥80 ≥80 62 74 77 Medium coverage (40-59)63 47 39 61 20 39 Low coverage (20-39)69 ≥80 74 54 79 72 Very low coverage (<20)61 ≥80 ≥80 48 ≥80 73
≥80 76 71 45 ≥80 69 Not applicable≥80 ≥80 ≥80 73 ≥80 ≥8067 ≥80 ≥80 64 ≥80 ≥80
≥80 51 74 50 ≥80 6562 ≥80 ≥80 52 67 70
≥80 ≥80 69 56 ≥80 7167 59 46 56 44 5169 ≥80 77 58 ≥80 7468 ≥80 80 46 ≥80 74≥80 ≥80 ≥80 67 ≥80 ≥8041 ≥80 68 66 56 6735 42 37 76 18 3859 ≥80 63 47 61 6269 69 65 74 60 6735 63 79 50 70 6530 54 71 53 41 54
≥80 73 ≥80 56 ≥80 75≥80 ≥80 ≥80 49 ≥80 7772 ≥80 70 46 ≥80 7044 60 46 73 17 4347 58 55 71 17 4448 ≥80 ≥80 52 63 69
UHC
Serv
ice C
over
age
Inde
x
Service capacity and access
SCI components
Venezuela (Bolivarian Republic of) ≥80 ≥80 64 72 43 ≥80 ≥80 34 ≥80 78 53 ≥80Viet Nam 79 74 ≥80 ≥80 65 60 ≥80 51 ≥80 64 ≥80 34Yemen 46 25 73 34 27 73 54 51 ≥80 68 32 15Zambia 69 64 ≥80 75 75 61 42 31 47 ≥80 79 ≥80 7Zimbabwe ≥80 72 ≥80 48 ≥80 72 32 36 32 ≥80 ≥80 ≥80 11
Values in italic correspond to imputed values.
1 Data refer to married women or in a union to enable comparable estimates across member states.2 The reference year is not the year in which the survey was conducted but the middle year of the data coverage period.3 Pertains only to countries with highly endemic malaria in sub-Saharan Africa.5 Geometric mean of the rescaled values for medical dotors, psychiatrists and surgeons.* Proxy indicators. + Values have been rescaled for incorporation into the index calulations.
Country index values of 80 and over are reported as ≥80 for presentation purposes and to avoid comparisons that are not meaningful given the inability of the index to adequately distinguish between countries with high level of service coverage provision.
Note: The statistics shown in this table are based on the evidence available in end-August 2021. They have been compiled primarily using publications and databases produced and maintained by WHO or the United Nations groups. Wherever possible, estimates have been computed using standardized categories and methods in order to enhance cross-national comparability. This approach may result, in some cases, in differences between the estimates presented here and the official national statistics prepared and endorsed by individual countries. It is important to stress that these estimates are also subject to uncertainty, especially for countries with weak statistical and health information systems where the quality of underlying empirical data is limited. More details on the indicators and estimates presented here are available at the WHO UHC data portal: https://www.who.int/data/monitoring-universal-health-coverage. Due to the update of the entire underlying data series, the values of UHC SCI and its tracer indicators should not be compared to those reported in the previous editions of UHC Global monitoring report.
70 75 69 65 70 7066 ≥80 70 69 61 7052 41 47 68 29 4460 73 50 72 34 5550 72 52 64 37 55
Country index values of 80 and over are reported as ≥80 for presentation purposes and to avoid comparisons that are not meaningful given the inability of the index to adequately distinguish between countries with high level of service coverage provision.
Note: The statistics shown in this table are based on the evidence available in end-August 2021. They have been compiled primarily using publications and databases produced and maintained by WHO or the United Nations groups. Wherever possible, estimates have been computed using standardized categories and methods in order to enhance cross-national comparability. This approach may result, in some cases, in differences between the estimates presented here and the official national statistics prepared and endorsed by individual countries. It is important to stress that these estimates are also subject to uncertainty, especially for countries with weak statistical and health information systems where the quality of underlying empirical data is limited. More details on the indicators and estimates presented here are available at the WHO UHC data portal: https://www.who.int/data/monitoring-universal-health-coverage. Due to the update of the entire underlying data series, the values of UHC SCI and its tracer indicators should not be compared to those reported in the previous editions of UHC Global monitoring report.
Values in italic correspond to imputed values. Country index values of 80 and over are reported as ≥80 for presentation purposes and to avoid comparisons that are not meaningful given the inability of the index to adequately distinguish between countries with high level of service coverage provision.1 Data refer to married women or in a union to enable comparable estimates across member states.2 The reference year is not the year in which the survey was conducted but the middle year of the data coverage period.3 Pertains only to countries with highly endemic malaria in sub-Saharan Africa.5 Geometric mean of the rescaled values for medical dotors, psychiatrists and surgeons.* Proxy indicators.+ Values have been rescaled for incorporation into the index calulations.
Note: The statistics shown in this table are based on the evidence available in end-August 2021. They have been compiled primarily using publications and databases produced and maintained by WHO or the United Nations groups. Wherever possible, estimates have been computed using standardized categories and methods in order to enhance cross-national comparability. This approach may result, in some cases, in differences between the estimates presented here and the official national statistics prepared and endorsed by individual countries. It is important to stress that these estimates are also subject to uncertainty, especially for countries with weak statistical and health information systems where the quality of underlying empirical data is limited. More details on the indicators and estimates presented here are available at the WHO UHC data portal: https://www.who.int/data/monitoring-universal-health-coverage. Due to the update of the entire underlying data series, the values of UHC SCI and its tracer indicators should not be compared to those reported in the previous editions of UHC Global monitoring report.

7776
Global Monitoring Report on Universal Health Coverage 2021
Annex 3 UHC service coverage index, its four components and tracer indicators by country, 2019 Annex 3 UHC service coverage index, its four components and tracer indicators by country, 2019
Country 2000 2005 2010 2015 2017 2019Afghanistan 21 26 28 32 36 37Albania 45 55 59 62 62 62Algeria 61 65 70 75 75 75Andorra 66 71 73 75 76 77Andorra 22 23 32 37 39 39Antigua and Barbuda 43 65 69 72 72 72Argentina 68 72 73 74 74 73Armenia 46 46 57 65 68 69Australia 80 ≥80 ≥80 ≥80 ≥80 ≥80Austria 66 72 76 79 ≥80 ≥80Azerbaijan 44 39 53 61 63 65Bahamas 50 64 64 67 69 70Bahrain 64 66 69 72 72 71Bangladesh 24 26 37 45 48 51Barbados 41 68 70 73 74 74Belarus 50 55 65 69 71 74Belgium 76 79 ≥80 ≥80 ≥80 ≥80Belize 46 59 64 64 65 67Benin 23 24 35 37 38 38Bhutan 40 38 49 57 60 62Bolivia (Plurinational State of) 43 49 57 65 65 67Bosnia and Herzegovina 43 59 59 62 65 65Botswana 32 46 51 53 54 54Brazil 68 72 74 75 75 75Brunei Darussalam 55 67 73 73 78 77Bulgaria 67 63 63 66 67 70Burkina Faso 19 26 33 39 41 43Burundi 17 25 36 40 42 44Cabo Verde 35 54 62 67 68 69Cambodia 19 41 53 58 60 61Cameroon 20 30 34 41 43 44Canada 76 ≥80 ≥80 ≥80 ≥80 ≥80Central African Republic 15 20 27 30 30 32Chad 16 16 24 28 29 28Chile 63 71 73 77 78 80China 50 59 68 77 80 ≥80Colombia 51 64 69 76 77 78Comoros 26 31 38 41 42 44Congo 21 29 34 40 39 40Cook Islands 45 48 58 62 63 54Costa Rica 65 69 73 74 77 78Côte d'Ivoire 19 27 35 43 45 45Croatia 67 69 70 71 72 73Cuba 57 72 77 ≥80 ≥80 80Cyprus 53 68 72 77 79 79Czechia 72 71 73 76 78 78Democratic People's Republic of Korea 43 45 48 39 68 68Democratic Republic of the Congo 22 25 31 35 37 39Denmark 77 78 ≥80 ≥80 ≥80 ≥80Djibouti 27 32 40 44 49 48Dominica 41 60 64 66 66 67Dominican Republic 45 49 60 63 64 66Ecuador 56 62 73 76 78 ≥80Egypt 42 46 59 62 65 70El Salvador 50 63 69 73 74 76Equatorial Guinea 27 30 37 40 43 43Eritrea 29 36 44 46 48 50Estonia 60 61 71 75 77 78Eswatini 34 46 52 54 57 58Ethiopia 16 20 31 37 37 38
Country 2000 2005 2010 2015 2017 2019Afghanistan 21 26 28 32 36 37Albania 45 55 59 62 62 62Algeria 61 65 70 75 75 75Andorra 66 71 73 75 76 77Andorra 22 23 32 37 39 39Antigua and Barbuda 43 65 69 72 72 72Argentina 68 72 73 74 74 73Armenia 46 46 57 65 68 69Australia 80 ≥80 ≥80 ≥80 ≥80 ≥80Austria 66 72 76 79 ≥80 ≥80Azerbaijan 44 39 53 61 63 65Bahamas 50 64 64 67 69 70Bahrain 64 66 69 72 72 71Bangladesh 24 26 37 45 48 51Barbados 41 68 70 73 74 74Belarus 50 55 65 69 71 74Belgium 76 79 ≥80 ≥80 ≥80 ≥80Belize 46 59 64 64 65 67Benin 23 24 35 37 38 38Bhutan 40 38 49 57 60 62Bolivia (Plurinational State of) 43 49 57 65 65 67Bosnia and Herzegovina 43 59 59 62 65 65Botswana 32 46 51 53 54 54Brazil 68 72 74 75 75 75Brunei Darussalam 55 67 73 73 78 77Bulgaria 67 63 63 66 67 70Burkina Faso 19 26 33 39 41 43Burundi 17 25 36 40 42 44Cabo Verde 35 54 62 67 68 69Cambodia 19 41 53 58 60 61Cameroon 20 30 34 41 43 44Canada 76 ≥80 ≥80 ≥80 ≥80 ≥80Central African Republic 15 20 27 30 30 32Chad 16 16 24 28 29 28Chile 63 71 73 77 78 80China 50 59 68 77 80 ≥80Colombia 51 64 69 76 77 78Comoros 26 31 38 41 42 44Congo 21 29 34 40 39 40Cook Islands 45 48 58 62 63 54Costa Rica 65 69 73 74 77 78Côte d'Ivoire 19 27 35 43 45 45Croatia 67 69 70 71 72 73Cuba 57 72 77 ≥80 ≥80 80Cyprus 53 68 72 77 79 79Czechia 72 71 73 76 78 78Democratic People's Republic of Korea 43 45 48 39 68 68Democratic Republic of the Congo 22 25 31 35 37 39Denmark 77 78 ≥80 ≥80 ≥80 ≥80Djibouti 27 32 40 44 49 48Dominica 41 60 64 66 66 67Dominican Republic 45 49 60 63 64 66Ecuador 56 62 73 76 78 ≥80Egypt 42 46 59 62 65 70El Salvador 50 63 69 73 74 76Equatorial Guinea 27 30 37 40 43 43Eritrea 29 36 44 46 48 50Estonia 60 61 71 75 77 78Eswatini 34 46 52 54 57 58Ethiopia 16 20 31 37 37 38
Fiji 45 53 56 58 59 61Finland 75 ≥80 ≥80 ≥80 ≥80 ≥80France ≥80 ≥80 ≥80 ≥80 ≥80 ≥80Gabon 30 39 46 51 51 49Gambia 31 37 41 45 46 48Georgia 45 57 63 65 65 65Germany 76 80 ≥80 ≥80 ≥80 ≥80Ghana 24 25 34 41 42 45Greece 66 70 72 75 77 78Grenada 41 61 65 67 69 70Guatemala 44 53 59 57 56 57Guinea 16 22 29 33 35 37Guinea-Bissau 17 22 30 38 38 37Guyana 49 63 69 72 73 74Haiti 23 33 42 44 46 47Honduras 42 52 57 60 60 63Hungary 67 67 67 70 71 73Iceland 77 ≥80 ≥80 ≥80 ≥80 ≥80India 31 33 48 55 57 61Indonesia 22 33 45 51 55 59Iran (Islamic Republic of) 37 49 57 69 74 77Iraq 43 46 47 49 53 55Ireland 75 78 79 ≥80 ≥80 ≥80Israel 77 80 ≥80 ≥80 ≥80 ≥80Italy 70 76 79 ≥80 ≥80 ≥80Jamaica 37 61 66 68 69 70Japan 70 77 80 ≥80 ≥80 ≥80Jordan 57 59 61 60 61 60Kazakhstan 39 57 64 71 73 76Kenya 30 37 47 52 54 56Kiribati 30 35 44 48 50 51Kuwait 67 68 66 67 68 70Kyrgyzstan 52 57 61 69 71 70Lao People's Democratic Republic 26 34 39 45 48 50Latvia 51 56 63 66 70 72Lebanon 54 62 66 68 69 72Lesotho 27 33 43 46 48 48Liberia 22 24 35 38 39 42Libya 53 55 58 57 60 60Lithuania 47 53 58 65 67 70Luxembourg 77 79 ≥80 ≥80 ≥80 ≥80Madagascar 19 23 28 31 31 35Malawi 25 31 40 43 47 48Malaysia 48 64 68 73 75 76Maldives 46 49 62 68 71 69Mali 21 25 36 38 39 42Malta 72 72 74 79 80 ≥80Marshall Islands 42 45 56 60 61 62Mauritania 18 26 33 34 41 40Mauritius 43 52 57 63 64 65Mexico 60 65 70 73 73 74Micronesia (Federated States of) 41 43 49 46 47 48Monaco 75 79 ≥80 ≥80 ≥80 ≥80Mongolia 44 43 54 62 63 63Montenegro 63 64 65 67Morocco 45 55 63 70 71 73Mozambique 23 27 35 43 46 47Myanmar 27 34 45 54 56 61Namibia 38 47 54 59 59 62Nauru 32 37 47 51 52 54Nepal 20 24 37 45 48 53
Country 2000 2005 2010 2015 2017 2019Afghanistan 21 26 28 32 36 37Albania 45 55 59 62 62 62Algeria 61 65 70 75 75 75Andorra 66 71 73 75 76 77Andorra 22 23 32 37 39 39Antigua and Barbuda 43 65 69 72 72 72Argentina 68 72 73 74 74 73Armenia 46 46 57 65 68 69Australia 80 ≥80 ≥80 ≥80 ≥80 ≥80Austria 66 72 76 79 ≥80 ≥80Azerbaijan 44 39 53 61 63 65Bahamas 50 64 64 67 69 70Bahrain 64 66 69 72 72 71Bangladesh 24 26 37 45 48 51Barbados 41 68 70 73 74 74Belarus 50 55 65 69 71 74Belgium 76 79 ≥80 ≥80 ≥80 ≥80Belize 46 59 64 64 65 67Benin 23 24 35 37 38 38Bhutan 40 38 49 57 60 62Bolivia (Plurinational State of) 43 49 57 65 65 67Bosnia and Herzegovina 43 59 59 62 65 65Botswana 32 46 51 53 54 54Brazil 68 72 74 75 75 75Brunei Darussalam 55 67 73 73 78 77Bulgaria 67 63 63 66 67 70Burkina Faso 19 26 33 39 41 43Burundi 17 25 36 40 42 44Cabo Verde 35 54 62 67 68 69Cambodia 19 41 53 58 60 61Cameroon 20 30 34 41 43 44Canada 76 ≥80 ≥80 ≥80 ≥80 ≥80Central African Republic 15 20 27 30 30 32Chad 16 16 24 28 29 28Chile 63 71 73 77 78 80China 50 59 68 77 80 ≥80Colombia 51 64 69 76 77 78Comoros 26 31 38 41 42 44Congo 21 29 34 40 39 40Cook Islands 45 48 58 62 63 54Costa Rica 65 69 73 74 77 78Côte d'Ivoire 19 27 35 43 45 45Croatia 67 69 70 71 72 73Cuba 57 72 77 ≥80 ≥80 80Cyprus 53 68 72 77 79 79Czechia 72 71 73 76 78 78Democratic People's Republic of Korea 43 45 48 39 68 68Democratic Republic of the Congo 22 25 31 35 37 39Denmark 77 78 ≥80 ≥80 ≥80 ≥80Djibouti 27 32 40 44 49 48Dominica 41 60 64 66 66 67Dominican Republic 45 49 60 63 64 66Ecuador 56 62 73 76 78 ≥80Egypt 42 46 59 62 65 70El Salvador 50 63 69 73 74 76Equatorial Guinea 27 30 37 40 43 43Eritrea 29 36 44 46 48 50Estonia 60 61 71 75 77 78Eswatini 34 46 52 54 57 58Ethiopia 16 20 31 37 37 38

7978
Global Monitoring Report on Universal Health Coverage 2021
Annex 4 UHC service coverage index by country, 2000–2019
Country 2000 2005 2010 2015 2017 2019Afghanistan 21 26 28 32 36 37Albania 45 55 59 62 62 62Algeria 61 65 70 75 75 75Andorra 66 71 73 75 76 77Andorra 22 23 32 37 39 39Antigua and Barbuda 43 65 69 72 72 72Argentina 68 72 73 74 74 73Armenia 46 46 57 65 68 69Australia 80 ≥80 ≥80 ≥80 ≥80 ≥80Austria 66 72 76 79 ≥80 ≥80Azerbaijan 44 39 53 61 63 65Bahamas 50 64 64 67 69 70Bahrain 64 66 69 72 72 71Bangladesh 24 26 37 45 48 51Barbados 41 68 70 73 74 74Belarus 50 55 65 69 71 74Belgium 76 79 ≥80 ≥80 ≥80 ≥80Belize 46 59 64 64 65 67Benin 23 24 35 37 38 38Bhutan 40 38 49 57 60 62Bolivia (Plurinational State of) 43 49 57 65 65 67Bosnia and Herzegovina 43 59 59 62 65 65Botswana 32 46 51 53 54 54Brazil 68 72 74 75 75 75Brunei Darussalam 55 67 73 73 78 77Bulgaria 67 63 63 66 67 70Burkina Faso 19 26 33 39 41 43Burundi 17 25 36 40 42 44Cabo Verde 35 54 62 67 68 69Cambodia 19 41 53 58 60 61Cameroon 20 30 34 41 43 44Canada 76 ≥80 ≥80 ≥80 ≥80 ≥80Central African Republic 15 20 27 30 30 32Chad 16 16 24 28 29 28Chile 63 71 73 77 78 80China 50 59 68 77 80 ≥80Colombia 51 64 69 76 77 78Comoros 26 31 38 41 42 44Congo 21 29 34 40 39 40Cook Islands 45 48 58 62 63 54Costa Rica 65 69 73 74 77 78Côte d'Ivoire 19 27 35 43 45 45Croatia 67 69 70 71 72 73Cuba 57 72 77 ≥80 ≥80 80Cyprus 53 68 72 77 79 79Czechia 72 71 73 76 78 78Democratic People's Republic of Korea 43 45 48 39 68 68Democratic Republic of the Congo 22 25 31 35 37 39Denmark 77 78 ≥80 ≥80 ≥80 ≥80Djibouti 27 32 40 44 49 48Dominica 41 60 64 66 66 67Dominican Republic 45 49 60 63 64 66Ecuador 56 62 73 76 78 ≥80Egypt 42 46 59 62 65 70El Salvador 50 63 69 73 74 76Equatorial Guinea 27 30 37 40 43 43Eritrea 29 36 44 46 48 50Estonia 60 61 71 75 77 78Eswatini 34 46 52 54 57 58Ethiopia 16 20 31 37 37 38
Netherlands 79 ≥80 ≥80 ≥80 ≥80 ≥80New Zealand 77 ≥80 ≥80 ≥80 ≥80 ≥80Nicaragua 47 52 63 68 68 70Niger 17 21 32 34 34 37Nigeria 20 28 38 40 41 44Niue 41 42 50 53 54 55North Macedonia 57 57 62 66 67 68Norway 74 80 ≥80 ≥80 ≥80 ≥80Oman 63 64 66 67 69 69Pakistan 23 32 36 41 43 45Palau 44 45 52 56 58 59Panama 64 68 72 73 76 77Papua New Guinea 27 29 36 38 36 33Paraguay 43 49 55 59 60 61Peru 40 60 72 76 77 78Philippines 35 37 43 49 53 55Poland 63 68 70 73 74 74Portugal 71 76 80 ≥80 ≥80 ≥80Qatar 51 52 50 66 72 74Republic of Korea 75 ≥80 ≥80 ≥80 ≥80 ≥80Republic of Moldova 49 49 58 64 66 67Romania 67 69 69 71 71 71Russian Federation 51 45 66 71 74 75Rwanda 23 31 45 53 55 54Saint Kitts and Nevis 42 63 68 70 71 72Saint Lucia 42 64 69 71 70 72Saint Vincent and the Grenadines 42 63 68 71 72 73Samoa 43 40 50 53 54 53San Marino 73 76 78 80 ≥80 ≥80Sao Tome and Principe 36 42 52 58 60 60Saudi Arabia 73 73 73 71 72 73Senegal 21 27 42 46 47 49Serbia 49 68 68 69 70 71Seychelles 46 50 60 66 68 70Sierra Leone 17 19 30 35 38 39Singapore 62 68 78 ≥80 ≥80 ≥80Slovakia 62 71 72 75 76 77Slovenia 71 71 75 77 79 80Solomon Islands 35 36 45 48 49 50Somalia 14 14 20 24 27 27South Africa 36 47 58 ≥80 ≥80 ≥80South Sudan 28 31 32Spain 74 78 ≥80 ≥80 ≥80 ≥80Sri Lanka 45 48 55 60 64 67Sudan 27 29 37 42 44 44Suriname 41 57 63 67 68 67Sweden 75 78 ≥80 ≥80 ≥80 ≥80Switzerland 77 ≥80 ≥80 ≥80 ≥80 ≥80Syrian Arab Republic 44 51 55 54 56 56Tajikistan 41 44 55 62 65 66Thailand 41 63 70 75 ≥80 ≥80Timor-Leste 32 46 49 50 53Togo 23 30 35 40 42 44Tonga 46 47 54 54 55 56Trinidad and Tobago 43 64 69 72 72 73Tunisia 47 57 63 66 68 70Turkey 61 65 66 77 77 79Turkmenistan 54 60 66 69 71 73Tuvalu 37 39 47 50 52 52Uganda 22 31 40 45 48 50Ukraine 48 51 59 63 70 73
Netherlands 79 ≥80 ≥80 ≥80 ≥80 ≥80New Zealand 77 ≥80 ≥80 ≥80 ≥80 ≥80Nicaragua 47 52 63 68 68 70Niger 17 21 32 34 34 37Nigeria 20 28 38 40 41 44Niue 41 42 50 53 54 55North Macedonia 57 57 62 66 67 68Norway 74 80 ≥80 ≥80 ≥80 ≥80Oman 63 64 66 67 69 69Pakistan 23 32 36 41 43 45Palau 44 45 52 56 58 59Panama 64 68 72 73 76 77Papua New Guinea 27 29 36 38 36 33Paraguay 43 49 55 59 60 61Peru 40 60 72 76 77 78Philippines 35 37 43 49 53 55Poland 63 68 70 73 74 74Portugal 71 76 80 ≥80 ≥80 ≥80Qatar 51 52 50 66 72 74Republic of Korea 75 ≥80 ≥80 ≥80 ≥80 ≥80Republic of Moldova 49 49 58 64 66 67Romania 67 69 69 71 71 71Russian Federation 51 45 66 71 74 75Rwanda 23 31 45 53 55 54Saint Kitts and Nevis 42 63 68 70 71 72Saint Lucia 42 64 69 71 70 72Saint Vincent and the Grenadines 42 63 68 71 72 73Samoa 43 40 50 53 54 53San Marino 73 76 78 80 ≥80 ≥80Sao Tome and Principe 36 42 52 58 60 60Saudi Arabia 73 73 73 71 72 73Senegal 21 27 42 46 47 49Serbia 49 68 68 69 70 71Seychelles 46 50 60 66 68 70Sierra Leone 17 19 30 35 38 39Singapore 62 68 78 ≥80 ≥80 ≥80Slovakia 62 71 72 75 76 77Slovenia 71 71 75 77 79 80Solomon Islands 35 36 45 48 49 50Somalia 14 14 20 24 27 27South Africa 36 47 58 ≥80 ≥80 ≥80South Sudan 28 31 32Spain 74 78 ≥80 ≥80 ≥80 ≥80Sri Lanka 45 48 55 60 64 67Sudan 27 29 37 42 44 44Suriname 41 57 63 67 68 67Sweden 75 78 ≥80 ≥80 ≥80 ≥80Switzerland 77 ≥80 ≥80 ≥80 ≥80 ≥80Syrian Arab Republic 44 51 55 54 56 56Tajikistan 41 44 55 62 65 66Thailand 41 63 70 75 ≥80 ≥80Timor-Leste 32 46 49 50 53Togo 23 30 35 40 42 44Tonga 46 47 54 54 55 56Trinidad and Tobago 43 64 69 72 72 73Tunisia 47 57 63 66 68 70Turkey 61 65 66 77 77 79Turkmenistan 54 60 66 69 71 73Tuvalu 37 39 47 50 52 52Uganda 22 31 40 45 48 50Ukraine 48 51 59 63 70 73United Arab Emirates 51 76 74 79 77 78United Kingdom of Great Britain and Northern Ireland 74 ≥80 ≥80 ≥80 ≥80 ≥80United Republic of Tanzania 19 27 37 41 43 46United States of America 76 79 ≥80 ≥80 ≥80 ≥80Uruguay 65 68 74 78 78 79Uzbekistan 52 52 63 67 69 71Vanuatu 40 39 48 49 50 52Venezuela (Bolivarian Republic of) 52 61 66 71 69 70Viet Nam 40 44 59 66 68 70Yemen 31 32 41 43 44 44Zambia 30 35 45 50 52 55Zimbabwe 32 33 47 55 56 55
Note: The statistics shown in this table are based on the evidence available in end-August 2021. They have been compiled primarily using publications and databases produced and maintained by WHO or the United Nations groups. Wherever possible, estimates have been computed using standardized categories and methods in order to enhance cross-national comparability. This approach may result, in some cases, in differences between the estimates presented here and the official national statistics prepared and endorsed by individual countries. It is important to stress that these estimates are also subject to uncertainty, especially for countries with weak statistical and health information systems where the quality of underlying empirical data is limited. More details on the indicators and estimates presented here are available at the WHO UHC data portal: https://www.who.int/data/monitoring-universal-health-coverage. Due to the update of the entire underlying data series, the values of UHC SCI and its tracer indicators should not be compared to those reported in the previous editions of UHC Global monitoring report.
Country index values of 80 and over are reported as ≥80 for presentation purposes and to avoid comparisons that are not meaningful given the inability of the index to adequately distinguish between countries with high level of service coverage provision.
Country index values of 80 and over are reported as ≥80 for presentation purposes and to avoid comparisons that are not meaningful given the inability of the index to adequately distinguish between countries with high level of service coverage provision.
Note: The statistics shown in this table are based on the evidence available in end-August 2021. They have been compiled primarily using publications and databases produced and maintained by WHO or the United Nations groups. Wherever possible, estimates have been computed using standardized categories and methods in order to enhance cross-national comparability. This approach may result, in some cases, in differences between the estimates presented here and the official national statistics prepared and endorsed by individual countries. It is important to stress that these estimates are also subject to uncertainty, especially for countries with weak statistical and health information systems where the quality of underlying empirical data is limited. More details on the indicators and estimates presented here are available at the WHO UHC data portal: https://www.who.int/data/monitoring-universal-health-coverage. Due to the update of the entire underlying data series, the values of UHC SCI and its tracer indicators should not be compared to those reported in the previous editions of UHC Global monitoring report.
Inte
rnat
iona
l Hea
lth R
egul
atio
ns
core
capa
city
inde
x*
RMNC
H
Infe
ctio
us d
iseas
es
NCDs
Serv
ice ca
pacit
y an
d ac
cess
43 46 32 57 23 37 Legend62 46 72 59 76 62 Very high coverage (>80)
≥80 69 ≥80 61 ≥80 75 High coverage (60-79)40 ≥80 ≥80 62 74 77 Medium coverage (40-59)63 47 39 61 20 39 Low coverage (20-39)69 ≥80 74 54 79 72 Very low coverage (<20)61 ≥80 ≥80 48 ≥80 73
≥80 76 71 45 ≥80 69 Not applicable≥80 ≥80 ≥80 73 ≥80 ≥8067 ≥80 ≥80 64 ≥80 ≥80
≥80 51 74 50 ≥80 6562 ≥80 ≥80 52 67 70
≥80 ≥80 69 56 ≥80 7167 59 46 56 44 5169 ≥80 77 58 ≥80 7468 ≥80 80 46 ≥80 74≥80 ≥80 ≥80 67 ≥80 ≥8041 ≥80 68 66 56 6735 42 37 76 18 3859 ≥80 63 47 61 6269 69 65 74 60 6735 63 79 50 70 6530 54 71 53 41 54
≥80 73 ≥80 56 ≥80 75≥80 ≥80 ≥80 49 ≥80 7772 ≥80 70 46 ≥80 7044 60 46 73 17 4347 58 55 71 17 4448 ≥80 ≥80 52 63 69
UHC
Serv
ice C
over
age
Inde
x
Service capacity and access
SCI components
Annex 3 UHC service coverage index, its four components and tracer indicators by country, 2019
Country 2000 2005 2010 2015 2017 2019Afghanistan 21 26 28 32 36 37Albania 45 55 59 62 62 62Algeria 61 65 70 75 75 75Andorra 66 71 73 75 76 77Andorra 22 23 32 37 39 39Antigua and Barbuda 43 65 69 72 72 72Argentina 68 72 73 74 74 73Armenia 46 46 57 65 68 69Australia 80 ≥80 ≥80 ≥80 ≥80 ≥80Austria 66 72 76 79 ≥80 ≥80Azerbaijan 44 39 53 61 63 65Bahamas 50 64 64 67 69 70Bahrain 64 66 69 72 72 71Bangladesh 24 26 37 45 48 51Barbados 41 68 70 73 74 74Belarus 50 55 65 69 71 74Belgium 76 79 ≥80 ≥80 ≥80 ≥80Belize 46 59 64 64 65 67Benin 23 24 35 37 38 38Bhutan 40 38 49 57 60 62Bolivia (Plurinational State of) 43 49 57 65 65 67Bosnia and Herzegovina 43 59 59 62 65 65Botswana 32 46 51 53 54 54Brazil 68 72 74 75 75 75Brunei Darussalam 55 67 73 73 78 77Bulgaria 67 63 63 66 67 70Burkina Faso 19 26 33 39 41 43Burundi 17 25 36 40 42 44Cabo Verde 35 54 62 67 68 69Cambodia 19 41 53 58 60 61Cameroon 20 30 34 41 43 44Canada 76 ≥80 ≥80 ≥80 ≥80 ≥80Central African Republic 15 20 27 30 30 32Chad 16 16 24 28 29 28Chile 63 71 73 77 78 80China 50 59 68 77 80 ≥80Colombia 51 64 69 76 77 78Comoros 26 31 38 41 42 44Congo 21 29 34 40 39 40Cook Islands 45 48 58 62 63 54Costa Rica 65 69 73 74 77 78Côte d'Ivoire 19 27 35 43 45 45Croatia 67 69 70 71 72 73Cuba 57 72 77 ≥80 ≥80 80Cyprus 53 68 72 77 79 79Czechia 72 71 73 76 78 78Democratic People's Republic of Korea 43 45 48 39 68 68Democratic Republic of the Congo 22 25 31 35 37 39Denmark 77 78 ≥80 ≥80 ≥80 ≥80Djibouti 27 32 40 44 49 48Dominica 41 60 64 66 66 67Dominican Republic 45 49 60 63 64 66Ecuador 56 62 73 76 78 ≥80Egypt 42 46 59 62 65 70El Salvador 50 63 69 73 74 76Equatorial Guinea 27 30 37 40 43 43Eritrea 29 36 44 46 48 50Estonia 60 61 71 75 77 78Eswatini 34 46 52 54 57 58Ethiopia 16 20 31 37 37 38

8180
Global Monitoring Report on Universal Health Coverage 2021
Annex 5 UHC service coverage index and its four components by WHO region, UN SDG regions and World Bank income groups, 2019 Annex 6 UHC service coverage index by WHO region, United Nations SDG regions and World Bank income groups, 2000–2019
Grouping UHC Service Coverage Index
RMNCH Infectious diseases
NCDs Service capacity and access
Global 67 76 70 62 67
WHO Region
African Region 46 55 47 69 29
Region of the Americas 77 ≥80 ≥80 62 ≥80
Eastern Mediterranean Region 57 67 52 58 56
European Region 79 ≥80 ≥80 59 ≥80
South-East Asian Region 61 73 66 61 47
Western Pacific Region 80 ≥80 ≥80 64 ≥80
World Bank income group
High income ≥80 ≥80 ≥80 64 ≥80
Upper and middle income 77 ≥80 77 60 ≥80
Lower and middle income 58 68 62 62 44
Low income 42 52 43 69 23
Country index values of 80 and over are reported as ≥80 for presentation purposes and to avoid comparisons that are not meaningful given the inability of the index to adequately distinguish between countries with high level of service coverage provision.
Note: The statistics shown in this table are based on the evidence available in end-August 2021. They have been compiled primarily using publications and databases produced and maintained by WHO or the United Nations groups. Wherever possible, estimates have been computed using standardized categories and methods in order to enhance cross-national comparability. This approach may result, in some cases, in differences between the estimates presented here and the official national statistics prepared and endorsed by individual countries. It is important to stress that these estimates are also subject to uncertainty, especially for countries with weak statistical and health information systems where the quality of underlying empirical data is limited. More details on the indicators and estimates presented here are available at the WHO UHC data portal: https://www.who.int/data/monitoring-universal-health-coverage. Due to the update of the entire underlying data series, the values of UHC SCI and its tracer indicators should not be compared to those reported in the previous editions of UHC Global monitoring report.
Country 2000 2005 2010 2015 2017 2019
Global 45 50 58 64 65 67
WHO Region
African Region 24 30 39 43 44 46
Region of the Americas 65 71 74 76 77 77
Eastern Mediterranean Region 35 42 48 52 55 57
European Region 64 66 73 77 78 79
South-East Asian Region 30 34 47 54 57 61
Western Pacific Region 51 60 68 75 78 80
World Bank income group
High income 74 78 80 ≥80 ≥80 ≥80
Upper and middle income 62 59 68 74 77 77
Lower and middle income 49 55 47 52 55 58
Low income 28 32 37 38 42 42
Note: The statistics shown in this table are based on the evidence available in end-August 2021. They have been compiled primarily using publications and databases produced and maintained by WHO or the United Nations groups. Wherever possible, estimates have been computed using standardized categories and methods in order to enhance cross-national comparability. This approach may result, in some cases, in differences between the estimates presented here and the official national statistics prepared and endorsed by individual countries. It is important to stress that these estimates are also subject to uncertainty, especially for countries with weak statistical and health information systems where the quality of underlying empirical data is limited. More details on the indicators and estimates presented here are available at the WHO UHC data portal: https://www.who.int/data/monitoring-universal-health-coverage. Due to the update of the entire underlying data series, the values of UHC SCI and its tracer indicators should not be compared to those reported in the previous editions of UHC Global monitoring report.
Country index values of 80 and over are reported as ≥80 for presentation purposes and to avoid comparisons that are not meaningful given the inability of the index to adequately distinguish between countries with high level of service coverage provision.
Very high coverage (>80)
High coverage (60-79)
Medium coverage (40-59)
Low coverage (20-39)
Very low coverage (<20)
Very high coverage (>80)
High coverage (60-79)
Medium coverage (40-59)
Low coverage (20-39)
Very low coverage (<20)

82
Global Monitoring Report on Universal Health Coverage 2021
Annex 7 Different measures to understand financial hardship due to out of pocket health spending
Out of pocket health spending is a source of financial hardship. Whether that happens is assessed by comparing either a household’s out of pocket health spending to its ability to pay (metrics based on this approach are used to identify catastrophic health spending) or its consumption levels gross and net of such spending relative to a poverty line. Metrics based on this approach are used to identify impoverishing health spending.
For some people the relative level of out of pocket health spending is a source of financial hardship (incidence of catastrophic health spending, see also Annex 8)
Within the SDG monitoring framework, the incidence of catastrophic health spending is measured as the proportion of the population with out of pocket health spending exceeding 10% or 25% of the household’s total consumption or income (budget) (1). There are other indicators of catastrophic health spending used at regional levels which are more sensitive to financial hardship among poorer households and do count households who spend less than 10% (Annex 8), see Annex 9 for those used in the WHO European Region (2). For global monitoring, those spending on health out of pocket less than 10% of their household budget who are impoverished or further impoverished are identified in indicators of impoverishing health spending.
For others the absolute level of out of pocket health spending matters (population impoverished or pushed into poverty)For some people it is the absolute level of out of pocket health spending that matters. These are people with consumption levels above a poverty line only because of out of pocket health spending, while consumption on necessities (such as food, housing and utilities) might lie below minimum living standards. The proportion of the population impoverished by out of pocket health spending (pushed into poverty) is an estimate of their number as a percentage of the population. It is measured as the change in the poverty headcount ratio resulting from the exclusion of out of pocket health spending from the indicator of household welfare (3–5). To ensure cross-country comparability and because consumption is the preferred welfare measure (6), Chapter 2 uses consumption gross of out of pocket health spending as the measure of household welfare; income is used only where WHO and the World Bank do not have access to consumption data for global monitoring.
For the poor any amount spent on health out of pocket is a source of financial hardship (population further impoverished or pushed further into poverty)Some people have consumption levels below a poverty line even when out of pocket health spending is included in their total consumption (that is, they are already living below the poverty line). Out of pocket health spending deepens their poverty levels, but they are not counted in the incidence of impoverishment just presented. In previous global reports. The increase in the poverty gap due to out of pocket health spending was used to take into account the effect of out of pocket health spending on people both impoverished and further impoverished into poverty (3, 7, 8). In Chapter 2 the poor spending any amount on health out of pocket are counted. By adding this indicator, it is possible to monitor financial hardship across the whole population: those incurring relatively large out of pocket health payments regardless of their poverty status (SDG indicator 3.8.2); those for which the absolute level of out of pocket health spending is sufficient to impoverish them; and the poor who are further impoverished by any amount spent on health out of pocket. The total number of people incurring impoverishing health spending includes both those impoverished and those further impoverished. These two groups are always mutually exclusive.
Poverty linesFor global monitoring, three two poverty lines are used to demonstrate the interdependence between the eradication of poverty and UHC: an absolute poverty line of extreme poverty, defined as living on $1.90 a day (in 2011 PPP terms ), which corresponds to the median national poverty line of low-income countries (9) and links directly the financial protection objective of UHC to the SDG goal 1.1 of eradication of extreme poverty (1); a relative poverty line of 60% of median daily per capita consumption or income, which captures the impact of out of pocket health spending on poverty across all countries, at all income group levels; The third one is a higher poverty line of $3.20 a day (in 2011 PPP terms), which corresponds to the typical standard used to assess national poverty levels by lower-middle-income countries (10). The latter is included in the thematic report (3) and is available from WHO and World Bank databases (11–13) but not discussed here.

83
References: Annex 7
1. SDG indicators: metadata repository. New York: United Nations Department of Economic and Social Affairs, Statistics Division (https://unstats.un.org/sdgs/metadata/, accessed 18 November 2021).
2. Can people afford to pay for health care? New evidence on financial protection in Europe. Copenhagen: World Health Organization Regional Office for Europe; 2019.
3. Global monitoring report on financial protection in health 2021. Geneva: World Health Organization and World Bank; 2021.4. Wagstaff A, Flores G, Smitz M-F, Hsu J, Chepynoga K, Eozenou P. Progress on impoverishing health spending: results for 122 countries:
a retrospective observational study. Lancet Global Health. 2017;6(2):E180–E192.5. Foster JE, Greer J, Thorbecke E. A class of decomposable poverty measures. Econometrica. 1984;3(52):761–6.6. Deaton A, Zaidi S. Guidelines for constructing consumption aggregates for welfare analysis. LSMS Working Paper No. 135.
Washington (DC): World Bank; 2002. 7. Tracking universal health coverage: 2017 global monitoring report. Geneva and Washington (DC): World Health Organization and
World Bank; 2017. 8. tracking universal health coverage: first global monitoring report. Geneva and Washington (DC): World Health Organization and
World Bank; 2015.9. Jolliffe D, Prydz EB. Estimating international poverty lines from comparable national thresholds. Journal of Economic Inequality.
2016;14(2):185–98. 10. Poverty and shared prosperity 2020: reversals of fortune. Washington (DC): World Bank; 2020.11. Global Health Observatory data repository: financial protection indicators. Geneva: World Health Organization (https://apps.who.int/
gho/data/node.main.UHCFINANCIALPROTECTION?lang=en, accessed 23 November 2021).12. Global Health Observatory. Financial protection: what is UHC? Geneva: World Health Organization (https://www.who.int/data/gho/
data/themes/topics/financial-protection, accessed 23 November 2021).13. Universal health coverage data. Washington (DC): World Bank (https://datatopics.worldbank.org/universal-health-coverage/,
accessed 23 November 2021).
Annex 8. Different ways to monitor catastrophic health spending
There are alternative ways to monitor catastrophic health spending. Some studies define out of pocket health spending as catastrophic when it exceeds a given percentage (for example, 10% or 25%) of consumption or income. This so-called “budget share” approach is adopted in SDG indicator 3.8.2 (1). Empirically, catastrophic spending is usually less concentrated among “poor people” (or more concentrated among “rich people”) when the budget share approach is used. Some households may appear to be richer than they are because they have borrowed money to finance spending on health (or other items), but it can be safely assumed that households in the poorest quintile are genuinely poor.
Other studies relate health spending to consumption or income less a deduction for necessities rather than to total consumption or income. The argument is that everyone needs to spend at least some minimum amount on basic needs such as food and housing, and these absorb a larger share of a poor household’s consumption or income than of a rich household. As a result, a poor household may not be able to spend much, if anything, on health care. By contrast, a rich household may spend 10% or 25% of its budget on health care and still have enough resources left over to meet its basic needs.
There are different approaches to deducting expenditures for basic needs (2, 3). Some studies deduct all of a household’s actual spending on food (4), while other studies deduct a standard amount from a household’s total resources to represent basic spending on food, to address the role of preferences in food spending (5). These two approaches differ only for households whose actual food expenditure exceeds the standard amount. For all other households, actual food spending is deducted instead of the higher, standard amount. Both approaches therefore treat households whose actual food spending is below the standard amount in the same way. Nevertheless, with the standard food approach, catastrophic spending may be less concentrated among rich households than with the actual food spending approach.
Still other studies deduct the prevailing poverty line, essentially an allowance for all basic needs (6). Depending on the poverty line used, this third approach is likely to result in greater concentration of catastrophic spending among poor households than among rich ones, compared with the budget share approach. It also links catastrophic health spending and impoverishment: those with a negative capacity to pay start off below the poverty line, even before paying for health care, and are pushed even further into poverty by any health spending. By contrast, those with out of pocket health spending exceeding the gap between the poverty line and their household total consumption are pushed into poverty by their health spending.

84
Global Monitoring Report on Universal Health Coverage 2021
6 Both international poverty lines of $1.90 and $3.20 a day are expressed in 2011 PPP terms. In the rest of Chapter 2 dollars always refer to international dollars in 2011 PPP terms.
Building on the second and third approaches, in the WHO European Region an amount representing spending on three basic needs (food, housing [rent] and utilities) is deducted consistently for all households (7). As a result, catastrophic expenditure is more likely to be concentrated among poor households with this approach than with the budget share approach. It also links catastrophic health spending and impoverishment.
In this report, global definitions of catastrophic health spending and impoverishing health spending are not interrelated. The effect of out of pocket health spending across the whole population is captured using three different indicators.References: Annex 81. SDG indicators: metadata repository. New York: United Nations Department of Economic and Social Affairs, Statistics Division (https://
unstats.un.org/sdgs/metadata/, accessed 18 November 2021).2. Wagstaff A. Measuring catastrophic medical expenditures: reflections on three issues. Health Economics. 2019;28:765–81. 3. Cylus J, Thomson S, Evetovits T. Catastrophic health spending in Europe: equity and policy implications of different calculation
methods. Bull World Health Organization. 2018;96:589–664. 4. Wagstaff A, van Doorslaer E. Catastrophe and impoverishment in paying for health care: with applications to Vietnam 1993–1998.
Health Econ. 2003;12:921–34. 5. Xu K, Evans D, Kawabata K, Zeramdini R, Klavus J, Murray C. Household catastrophic health expenditure: a multicountry analysis.
Lancet. 2003;362:111–7. 6. Wagstaff A, Eozenou P. CATA meets IMPOV: a unified approach to measuring financial protection in health. Policy Research Working
Paper No. 6861. Washington (DC): World Bank; 2014.7. Can people afford to pay for health care? New evidence on financial protection in Europe. Copenhagen: World Health Organization
Regional Office for Europe; 2019.

85
Annex 9. World Health Organization European Region indicators of catastrophic and impoverishing health spending
Country Latest year Proportion of households with out of pocket payments greater than 40% of capacity to paya
Proportion of households at risk of impoverishmentafter out of pocket payments
Further impoverished
Impoverished At risk of impoverishment
Not at risk of impoverishment
No out-of-pocket payments
Albania 2015 12,5 6,7 1,5 6,7 51,4 33,7
Austria 2014/2015 3,2 0,8 0,2 1,0 77,9 20,9
Belgiumc 2018 3,82 0,64 0,22 0,77 65,54 32,83
Bulgariac 2018 19,23 4,34 3,62 8,10 78,28 5,65
Croatia 2014 4,0 2,0 0,5 3,3 73,8 20,4
Cyprus 2015 5,0 1,3 0,5 1,9 88,4 8,0
Czechia 2012 1,1 0,4 0,1 1,4 97,6 0,6
Estoniad 2016 8,1 1,5 1,3 2,1 54,7 40,4
Finlandc 2016 3,82 0,56 0,60 2,18 83,27 13,39
Francee 2017 2,07 1,34 0,15 1,47 81,33 15,71
Georgiae 2018 17,39 3,90 2,92 3,72 64,74 24,72
Germanye 2018 2,43 0,83 0,17 0,5 88,3 10,3
Greecee 2019 8,86 1,63 0,93 3,21 79,66 14,56
Hungary 2015 11,6 3,8 2,1 5,7 76,0 12,3
Ireland 2015/2016 1,2 0,8 0,1 0,9 64,5 33,8
Italye 2019 9,44 2,82 1,36 2,1 71,7 22,0
Kyrgyzstan 2014 12,8 2,2 1,5 6,7 71,2 18,5
Latviae 2016 12,9 2,20 2,01 4,12 62,76 28,91
Lithuania 2016 15,2 2,2 3,4 4,2 52,3 37,8
Luxembourgc 2017 2,35 1,11 0,27 0,5 89,8 8,3
Maltac 2015 6,85 1,04 1,13 2,15 80,11 15,58
North
Macedoniac
2018 6,51 2,22 1,71 2,84 39,38 53,85
Republic of
Moldova
2016 17,1 3,2 3,5 8,9 56,5 27,9
Poland 2014 8,6 2,6 1,1 4,3 75,3 16,7
Portugald 2015 10,64 2,20 1,55 2,83 84,33 9,09
Romaniac 2015 12,52 3,72 1,92 5,17 51,51 37,68
Slovakiae 2015 5,09 2,64 0,64 3,14 88,83 4,75
Sloveniae 2018 0,82 0,14 0,08 0,33 80,60 18,85
Spaine 2019 1,59 0,71 0,09 0,70 71,45 27,05
Sweden 2012 1,8 0,9 0,2 0,6 50,5 47,8
Turkeye 2018 4,26 2,30 0,35 1,95 52,78 42,62
Ukrainee 2019 16,68 8,38 2,41 8,45 76,35 4,41
United
Kingdom
2014 1,4 0,8 0,0 0,7 51,4 47,1
Note: Catastrophic health spending defined as out of pocket payments exceeding 40% of capacity to pay using the food, housing, and utilities approach (see Annex 8); b. Proportion of households at risk of impoverishment after out of pocket payments using a relative poverty line reflecting basic needs on food, housing, and utilities (Annex 8); c. New estimate; d. Estimate amended; e. Estimate updated.

86
Global Monitoring Report on Universal Health Coverage 2021
Annex 10. Population suffering financial hardship (SDG and SDG related indicators) by country income group (%)
Country income groupsSDG indicator 3.8.2,10% threshold SDG indicator 3.8.2,25% threshold
2000 2005 2010 2015 2017 2000 2005 2010 2015 2017
Global 9.4 10.8 11.3 12.7 13.2 2.1 2.6 2.7 3.7 3.8
Low income 11.2 12.6 7.9 7.1 7.6 2.7 3.1 1.9 1.5 1.5
Lower-middle income 9.7 12.7 12.3 13.9 14.2 2.4 3.2 2.8 4 4.5
Upper-middle income 7.5 5.4 13.6 15.5 16.7 1.1 0.9 3.6 4.9 5
High income 14.9 15.1 14.2 15.4 15.8 2.6 2.4 2.2 2.4 2.5
Pushed below a poverty line Further pushed below a poverty line
PPP$1.90 a day 2000 2005 2010 2015 2017 2000 2005 2010 2015 2017
Global 2 2 1.8 1.6 0.9 17 13.5 10.2 7.5 5.8
Low income 3.6 3.3 1.7 1.4 1 28.5 24.1 25.9 27.8 22.6
Lower-middle income 1.5 1.9 2.8 2.8 1.2 13.7 10.9 14.2 10.4 7.6
Upper-middle income 0.6 0.2 1.5 1 1 5 2.4 5.3 2.5 1.7
High income 0.1 0.1 0.1 0 0 1.2 1.2 0.3 0.2 0.3
60% of median per capita consumption 2000 2005 2010 2015 2017 2000 2005 2010 2015 2017
Global 1.5 1.9 2.2 2.5 2.3 8.8 10.6 12.4 13.3 12.7
Low income 1.9 2.1 1.7 1.6 1.5 8.1 9.4 11.5 13.4 12.8
Lower-middle income 1.2 2.1 2.4 2.9 2.3 8 10.8 10 11.1 10.6
Upper-middle income 1.3 1.1 2.6 2.8 2.9 12.5 13.9 16.1 17.3 16.3
High income 1.3 1.3 1.4 1.3 1.4 9.8 10.6 10 9.8 10.2
Note: All aggregates were produced jointly by WHO and the World Bank. WHO and World Bank estimated values are based on standard definitions and methods to ensure cross-country comparability, which may not correspond to the methods used at regional or national level to monitor catastrophic spending on health. These estimates are based on a data availability for global monitoring, which may not necessarily align with the availability of data at national or regional levels.Source: Global database on financial protection assembled by WHO and the World Bank, 2021 update

87
Annex 11. Population suffering financial hardship (SDG and SDG related indicators) by country income group (Millions)
Country income groups SDG indicator 3.8.2,10% threshold SDG indicator 3.8.2,25% threshold
2000 2005 2010 2015 2017 2000 2005 2010 2015 2017
Global 579 708 785 940 996 131 167 189 270 290
Low income 275 298 62 45 55 66 73 15 10 11
Lower-middle income 197 313 313 408 423 48 79 72 119 135
Upper-middle income 46 31 339 408 434 7 5 90 129 130
High income 60 67 72 79 85 11 11 11 12 13
Pushed below a poverty line Further pushed below a poverty line
PPP$1.90 a day 2000 2005 2010 2015 2017 2000 2005 2010 2015 2017
Global 124 130 122 115 70 1035 879 704 549 435
Low income 89 80 14 9 7 705 575 206 174 161
Lower-middle income 30 47 70 81 37 280 271 358 304 224
Upper-middle income 4 1 36 25 25 33 15 130 66 43
High income 1 1 1 1 1 11 12 3 2 3
PPP$3.20 a day 2000 2005 2010 2015 2017 2000 2005 2010 2015 2017
Global 111 133 146 164 118 2053 1936 1775 1535 1260
Low income 58 70 14 8 8 1341 1154 351 291 290
Lower-middle income 46 58 77 102 57 593 692 1012 993 789
Upper-middle income 6 3 52 52 52 79 44 386 232 157
High income 1 2 1 1 2 30 33 14 11 16
60% of median per capita consumption 2000 2005 2010 2015 2017 2000 2005 2010 2015 2017
Global 91 122 154 182 172 539 686 853 971 953
Low income 46 50 14 10 11 201 225 92 84 91
Lower-middle income 25 51 60 85 69 165 268 250 322 314
Upper-middle income 8 7 64 72 75 82 83 396 448 419
High income 11 13 16 15 17 86 105 111 114 125
Note: All aggregates were produced jointly by WHO and the World Bank. WHO and World Bank estimated values are based on standard definitions and methods to ensure cross-country comparability, which may not correspond to the methods used at regional or national level to monitor catastrophic spending on health. These estimates are based on a data availability for global monitoring, which may not necessarily align with the availability of data at national or regional levels.
Source: Global database on financial protection assembled by WHO and the World Bank, 2021 update
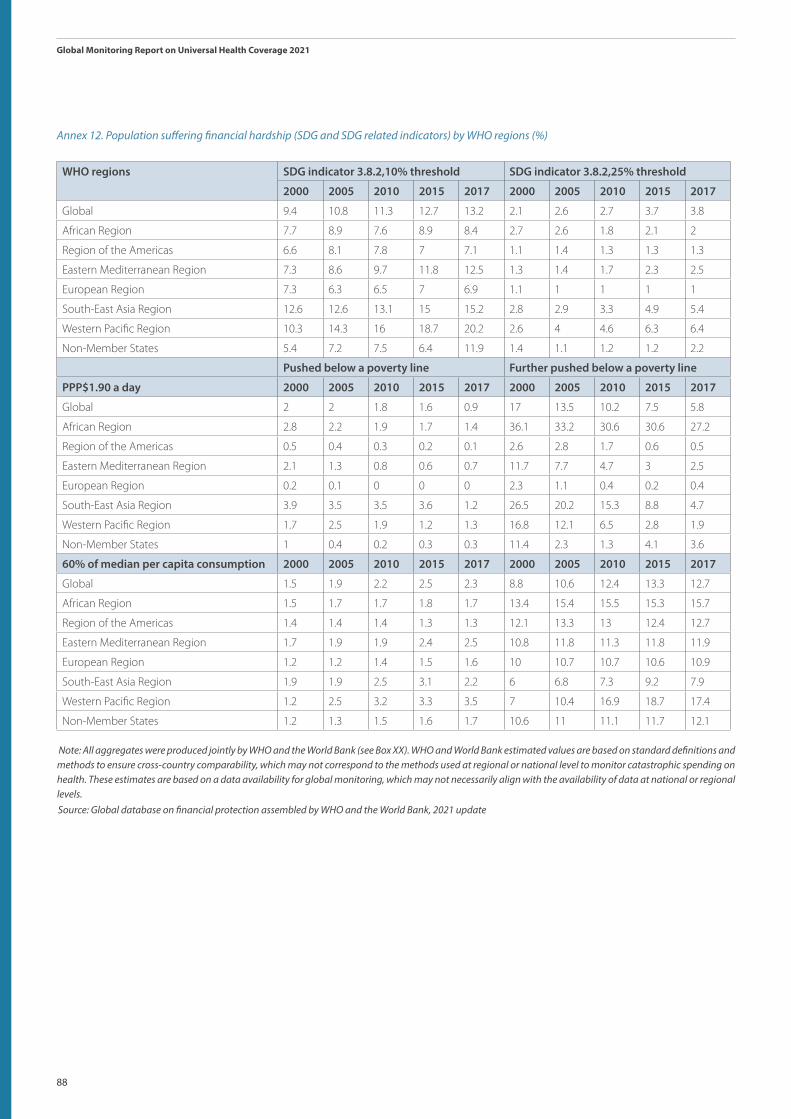
88
Global Monitoring Report on Universal Health Coverage 2021
Annex 12. Population suffering financial hardship (SDG and SDG related indicators) by WHO regions (%)
WHO regions SDG indicator 3.8.2,10% threshold SDG indicator 3.8.2,25% threshold
2000 2005 2010 2015 2017 2000 2005 2010 2015 2017
Global 9.4 10.8 11.3 12.7 13.2 2.1 2.6 2.7 3.7 3.8
African Region 7.7 8.9 7.6 8.9 8.4 2.7 2.6 1.8 2.1 2
Region of the Americas 6.6 8.1 7.8 7 7.1 1.1 1.4 1.3 1.3 1.3
Eastern Mediterranean Region 7.3 8.6 9.7 11.8 12.5 1.3 1.4 1.7 2.3 2.5
European Region 7.3 6.3 6.5 7 6.9 1.1 1 1 1 1
South-East Asia Region 12.6 12.6 13.1 15 15.2 2.8 2.9 3.3 4.9 5.4
Western Pacific Region 10.3 14.3 16 18.7 20.2 2.6 4 4.6 6.3 6.4
Non-Member States 5.4 7.2 7.5 6.4 11.9 1.4 1.1 1.2 1.2 2.2
Pushed below a poverty line Further pushed below a poverty line
PPP$1.90 a day 2000 2005 2010 2015 2017 2000 2005 2010 2015 2017
Global 2 2 1.8 1.6 0.9 17 13.5 10.2 7.5 5.8
African Region 2.8 2.2 1.9 1.7 1.4 36.1 33.2 30.6 30.6 27.2
Region of the Americas 0.5 0.4 0.3 0.2 0.1 2.6 2.8 1.7 0.6 0.5
Eastern Mediterranean Region 2.1 1.3 0.8 0.6 0.7 11.7 7.7 4.7 3 2.5
European Region 0.2 0.1 0 0 0 2.3 1.1 0.4 0.2 0.4
South-East Asia Region 3.9 3.5 3.5 3.6 1.2 26.5 20.2 15.3 8.8 4.7
Western Pacific Region 1.7 2.5 1.9 1.2 1.3 16.8 12.1 6.5 2.8 1.9
Non-Member States 1 0.4 0.2 0.3 0.3 11.4 2.3 1.3 4.1 3.6
60% of median per capita consumption 2000 2005 2010 2015 2017 2000 2005 2010 2015 2017
Global 1.5 1.9 2.2 2.5 2.3 8.8 10.6 12.4 13.3 12.7
African Region 1.5 1.7 1.7 1.8 1.7 13.4 15.4 15.5 15.3 15.7
Region of the Americas 1.4 1.4 1.4 1.3 1.3 12.1 13.3 13 12.4 12.7
Eastern Mediterranean Region 1.7 1.9 1.9 2.4 2.5 10.8 11.8 11.3 11.8 11.9
European Region 1.2 1.2 1.4 1.5 1.6 10 10.7 10.7 10.6 10.9
South-East Asia Region 1.9 1.9 2.5 3.1 2.2 6 6.8 7.3 9.2 7.9
Western Pacific Region 1.2 2.5 3.2 3.3 3.5 7 10.4 16.9 18.7 17.4
Non-Member States 1.2 1.3 1.5 1.6 1.7 10.6 11 11.1 11.7 12.1
Note: All aggregates were produced jointly by WHO and the World Bank (see Box XX). WHO and World Bank estimated values are based on standard definitions and methods to ensure cross-country comparability, which may not correspond to the methods used at regional or national level to monitor catastrophic spending on health. These estimates are based on a data availability for global monitoring, which may not necessarily align with the availability of data at national or regional levels.Source: Global database on financial protection assembled by WHO and the World Bank, 2021 update

89
Annex 13. Population suffering financial hardship (SDG and SDG related indicators) by WHO regions (Millions)
WHO regions SDG indicator 3.8.2,10% threshold SDG indicator 3.8.2,25% threshold
2000 2005 2010 2015 2017 2000 2005 2010 2015 2017
Global 579 708 785 940 996 131 167 189 270 290
African Region 51 67 65 87 87 18 20 15 21 21
Region of the Americas 55 71 72 68 70 9 12 12 13 13
Eastern Mediterranean Region 35 46 57 78 86 6 7 10 15 17
European Region 63 56 58 64 63 10 9 9 9 9
South-East Asia Region 198 214 238 288 299 43 49 59 93 107
Western Pacific Region 175 252 292 352 385 45 71 83 118 123
Non-Member States 2 3 3 3 5 1 0 0 0 1
Pushed below a poverty line Further pushed below a poverty line
PPP$1.90 a day 2000 2005 2010 2015 2017 2000 2005 2010 2015 2017
Global 124 130 122 115 70 1035 879 704 549 435
African Region 18 16 16 17 15 238 249 263 300 281
Region of the Americas 4 3 3 2 1 21 25 16 5 5
Eastern Mediterranean Region 10 7 5 4 5 56 41 28 20 17
European Region 2 1 0 0 0 20 10 4 2 3
South-East Asia Region 62 60 63 70 24 417 344 277 169 93
Western Pacific Region 29 43 34 22 25 281 210 117 52 36
Non-Member States 0 0 0 0 0 2 0 0 1 1
60% of median per capita consumption 2000 2005 2010 2015 2017 2000 2005 2010 2015 2017
Global 91 122 154 182 172 539 686 853 971 953
African Region 10 13 14 18 18 88 116 133 150 163
Region of the Americas 11 13 13 13 13 101 117 121 121 126
Eastern Mediterranean Region 8 10 12 16 17 51 62 67 78 82
European Region 11 11 12 14 15 87 94 95 97 100
South-East Asia Region 30 32 45 60 43 94 115 133 177 155
Western Pacific Region 21 43 58 61 65 117 180 303 345 324
Non-Member States 0 0 0 0 0 2 2 2 2 2
Note: All aggregates were produced jointly by WHO and the World Bank (see Box XX). WHO and World Bank estimated values are based on standard definitions and methods to ensure cross-country comparability, which may not correspond to the methods used at regional or national level to monitor catastrophic spending on health. These estimates are based on a data availability for global monitoring, which may not necessarily align with the availability of data at national or regional levels.

90
Global Monitoring Report on Universal Health Coverage 2021
Annex 14. SDG indicators of Universal health coverage by country, most recent year available
Country
SDG UHC indicator 3.8.1: UHC Service Coverage Index, 2019
SDG UHC indicator 3.8.2: Incidence of catastrophic health spending (%), latest year
Most recent year available
At 10% of household total consumption or income
At 25% of household total consumption or income
Afghanistan 37 2020 - -
Albania 62 2012 16,7 4,9
Algeria 75 - - -
Andorra 77 - - -
Angola 39 2018 35,5 12,5
Antigua and Barbuda 72 - - -
Argentina* 73 2017 9,6 2,5
Armenia 69 2017 21,0 7,1
Australia ≥ 80 2015 2,5 0,4
Austria ≥ 80 1999 4,3 0,7
Azerbaijan 65 2005 8,1 1,1
Bahamas 70 - - -
Bahrain* 71 2015 4,9 1,4
Bangladesh 51 2016 24,4 8,4
Barbados 74 2016 16,4 3,8
Belarus 74 2020 13,5 0,6
Belgium ≥ 80 2009 11,4 1,4
Belize 67 2018 6,2 3,1
Benin 38 2015 5,5 1,0
Bhutan 62 2017 4,0 1,8
Bolivia (Plurinational State of ) 67 2019 4,6 0,8
Bosnia and Herzegovina 65 2015 8,2 1,4
Botswana 54 2009 1,0 0,2
Brazil 75 2017 11,8 1,9
Brunei Darussalam 77 - - -
Bulgaria 70 2018 21,3 3,1
Burkina Faso 43 2014 3,1 0,4
Burundi 44 2013 3,3 0,4
Cabo Verde 69 2007 2,0 0,0
Cambodia 61 2019 - -
Cameroon 44 2014 10,7 1,8
Canada* ≥ 80 2019 3,5 0,8
Central African Republic 32 2008 6,7 1,2
Chad 28 2011 8,7 1,6
Chile ≥ 80 2016 14,6 2,1
China ≥ 80 2016 24,0 9,2
Colombia 78 2016 8,2 2,2
Comoros 44 2014 8,8 1,6
Congo 40 2011 4,6 0,7
Cook Islands 54 - - -
Costa Rica 78 2018 7,4 1,1
Côte d’Ivoire 45 2014 12,4 3,4
Croatia 73 2010 2,8 0,3
Cuba ≥ 80 - - -
Cyprus 79 2015 14,7 1,6
Czechia 78 2010 2,2 0,1
Democratic People’s Republic of Korea 68 - - -
Democratic Republic of the Congo 39 2012 4,8 0,6
Denmark ≥ 80 2010 2,9 0,5
Djibouti 48 2017 1,5 0,3
Dominica 67 - - -
Dominican Republic 66 2018 8,2 0,9
Ecuador ≥ 80 2013 10,3 2,4
Egypt 70 2017 31,1 6,1
El Salvador 76 2014 1,7 0,3
Equatorial Guinea 43 - - -
Eritrea 50 - - -
Estonia 78 2010 8,8 1,2
Eswatini 58 2016 5,0 1,3
Ethiopia 38 2015 2,1 0,3
Fiji 61 2008 0,8 0,1
Finland ≥ 80 2016 6,7 0,7
France ≥ 80 - - -
Gabon 49 2017 3,8 0,7
Gambia 48 2015 0,2 0,0
Georgia 65 2017 31,2 9,7
Germany ≥ 80 2010 1,5 0,1
Ghana 45 2016 1,3 0,1
Greece 78 2016 16,9 1,6
Grenada 70 - - -
Guatemala 57 2014 11,5 3,8
Guinea 37 2012 7,0 1,3
Guinea-Bissau 37 2010 6,3 1,0
Guyana 74 - - -
Haiti 47 2013 11,5 4,0
Honduras 63 2004 1,1 0,1
Hungary 73 2010 7,4 0,3
Iceland ≥ 80 1995 7,0 0,9
India 61 2017 17,3 6,5
Indonesia 59 2017 4,5 0,9
Iran (Islamic Republic of ) 77 2019 15,3 3,5
Iraq 55 2012 3,7 0,9
Ireland ≥ 80 2009 5,6 0,5
Israel ≥ 80 2012 10,6 1,8
Italy ≥ 80 2010 9,3 1,1
Jamaica 70 2004 10,2 2,9
Japan* ≥ 80 2019 10,5 1,9
Jordan 60 2008 1,7 0,3
Kazakhstan 76 2015 2,5 0,1
Kenya 56 2015 5,1 1,3
Kiribati 51 2006 0,0 0,0
Kuwait 70 - - -
Kyrgyzstan 70 2016 3,5 0,7
Lao People’s Democratic Republic 50 2007 3,0 0,3
Latvia 72 2016 21,4 5,7
Lebanon 72 2012 26,6 6,3
Lesotho 48 2010 4,5 1,4
Liberia 42 2016 6,7 1,1
Libya 60 - - -
Lithuania 70 2008 12,9 2,7
Luxembourg ≥ 80 2016 3,5 0,3
Madagascar 35 2012 2,9 0,6
Malawi 48 2016 4,4 1,0
Malaysia* 76 2019 1,5 0,1
Maldives 69 2016 10,3 4,1
Mali 42 2018 2,1 0,1
Malta ≥ 80 2015 15,9 2,7
Marshall Islands 62 - - -
Mauritania 40 2014 11,7 2,9
Mauritius 65 2017 8,2 1,9
Mexico 74 2016 1,6 0,2
Micronesia (Federated States of ) 48 - - -
Monaco ≥ 80 - - -
Mongolia 63 2018 7,2 1,3
Montenegro 67 2015 10,3 0,8
Morocco 73 2013 20,5 6,4
Mozambique 47 2014 1,6 0,4
Myanmar 61 2017 12,7 3,5
Namibia 62 2015 1,5 0,3
Nauru 54 - - -
Nepal 53 2016 10,7 2,1
Netherlands ≥ 80 - - -
New Zealand ≥ 80 - - -
Nicaragua 70 2014 24,7 9,1
Niger 37 2018 6,5 0,9
Nigeria 44 2018 15,8 4,1
Niue 55 - - -
North Macedonia 68 - - -
Norway ≥ 80 1998 5,1 0,5
Oman 69 1999 0,6 0,1
Pakistan 45 2018 - -
Palau 59 - - -
Panama 77 2017 6,2 0,7
Papua New Guinea 33 - - -
Paraguay 61 2014 7,1 1,9
Peru 78 2019 8,4 1,1
Philippines 55 2015 6,3 1,4
Poland 74 2016 14,1 1,3
Portugal ≥ 80 2011 18,4 3,3
Qatar 74 - - -
Republic of Korea* ≥ 80 2018 12,0 2,9
Republic of Moldova 67 2016 18,7 3,6
Romania 71 2016 13,4 2,2
Russian Federation* 75 2020 7,7 0,9
Rwanda 54 2016 1,2 0,1
Saint Kitts and Nevis 72 - - -
Saint Lucia 72 2016 6,6 1,9
Saint Vincent and the Grenadines 73 - - -
Samoa 53 - - -
San Marino ≥ 80 - - -
Sao Tome and Principe 60 2017 4,8 1,2
Saudi Arabia* 73 2018 1,3 0,6
Senegal 49 2011 3,3 0,2
Serbia 71 2015 8,0 0,5
Seychelles 70 2013 2,6 1,3
Sierra Leone 39 2018 16,4 3,0
Singapore ≥ 80 - - -
Slovakia 77 2015 2,7 0,0
Slovenia ≥ 80 2018 3,7 0,3
Solomon Islands 50 - - -
Somalia 27 2017 0,1 0,0
South Africa 67 2014 1,0 0,1
South Sudan 32 2017 13,4 4,0
Spain ≥ 80 2019 7,9 1,1
Sri Lanka 67 2016 5,4 0,9
Sudan 44 2009 18,4 3,3
Suriname 67 2016 4,9 1,4
Sweden ≥ 80 1996 5,5 0,7
Switzerland ≥ 80 - - -
Syrian Arab Republic 56 2007 6,9 1,4
Tajikistan 66 2018 10,3 2,2
Thailand ≥ 80 2019 1,9 0,3
Timor-Leste 53 2014 2,6 0,5
Togo 44 2018 13,4 2,4
Tonga 56 - - -
Trinidad and Tobago 73 2014 3,9 1,9
Tunisia 70 2015 16,7 2,4
Turkey 79 2016 3,2 0,4
Turkmenistan 73 - - -
Tuvalu 52 - - -
Uganda 50 2016 15,3 3,8
Ukraine 73 2019 8,3 1,2
United Arab Emirates* 78 2019 0,4 -
United Kingdom of Great Britain and Northern Ireland ≥ 80 2018 2,3 0,4
United Republic of Tanzania 46 2018 4,3 0,8
United States of America ≥ 80 2019 4,3 0,8
Uruguay 79 2016 2,3 0,2
Uzbekistan 71 2003 6,7 1,8
Vanuatu 52 - - -
Venezuela (Bolivarian Republic of ) 70 - - -
Viet Nam* 70 2020 8,5 1,7
Yemen 44 2014 15,8 4,2
Zambia 55 2010 0,3 0,0
Zimbabwe 55 2017 11,8 7,0

91
Annex 14. SDG indicators of Universal health coverage by country, most recent year available
Country
SDG UHC indicator 3.8.1: UHC Service Coverage Index, 2019
SDG UHC indicator 3.8.2: Incidence of catastrophic health spending (%), latest year
Most recent year available
At 10% of household total consumption or income
At 25% of household total consumption or income
Congo 40 2011 4,6 0,7
Cook Islands 54 - - -
Costa Rica 78 2018 7,4 1,1
Côte d’Ivoire 45 2014 12,4 3,4
Croatia 73 2010 2,8 0,3
Cuba ≥ 80 - - -
Cyprus 79 2015 14,7 1,6
Czechia 78 2010 2,2 0,1
Democratic People’s Republic of Korea 68 - - -
Democratic Republic of the Congo 39 2012 4,8 0,6
Denmark ≥ 80 2010 2,9 0,5
Djibouti 48 2017 1,5 0,3
Dominica 67 - - -
Dominican Republic 66 2018 8,2 0,9
Ecuador ≥ 80 2013 10,3 2,4
Egypt 70 2017 31,1 6,1
El Salvador 76 2014 1,7 0,3
Equatorial Guinea 43 - - -
Eritrea 50 - - -
Estonia 78 2010 8,8 1,2
Eswatini 58 2016 5,0 1,3
Ethiopia 38 2015 2,1 0,3
Fiji 61 2008 0,8 0,1
Finland ≥ 80 2016 6,7 0,7
France ≥ 80 - - -
Gabon 49 2017 3,8 0,7
Gambia 48 2015 0,2 0,0
Georgia 65 2017 31,2 9,7
Germany ≥ 80 2010 1,5 0,1
Ghana 45 2016 1,3 0,1
Greece 78 2016 16,9 1,6
Grenada 70 - - -
Guatemala 57 2014 11,5 3,8
Guinea 37 2012 7,0 1,3
Guinea-Bissau 37 2010 6,3 1,0
Guyana 74 - - -
Haiti 47 2013 11,5 4,0
Honduras 63 2004 1,1 0,1
Hungary 73 2010 7,4 0,3
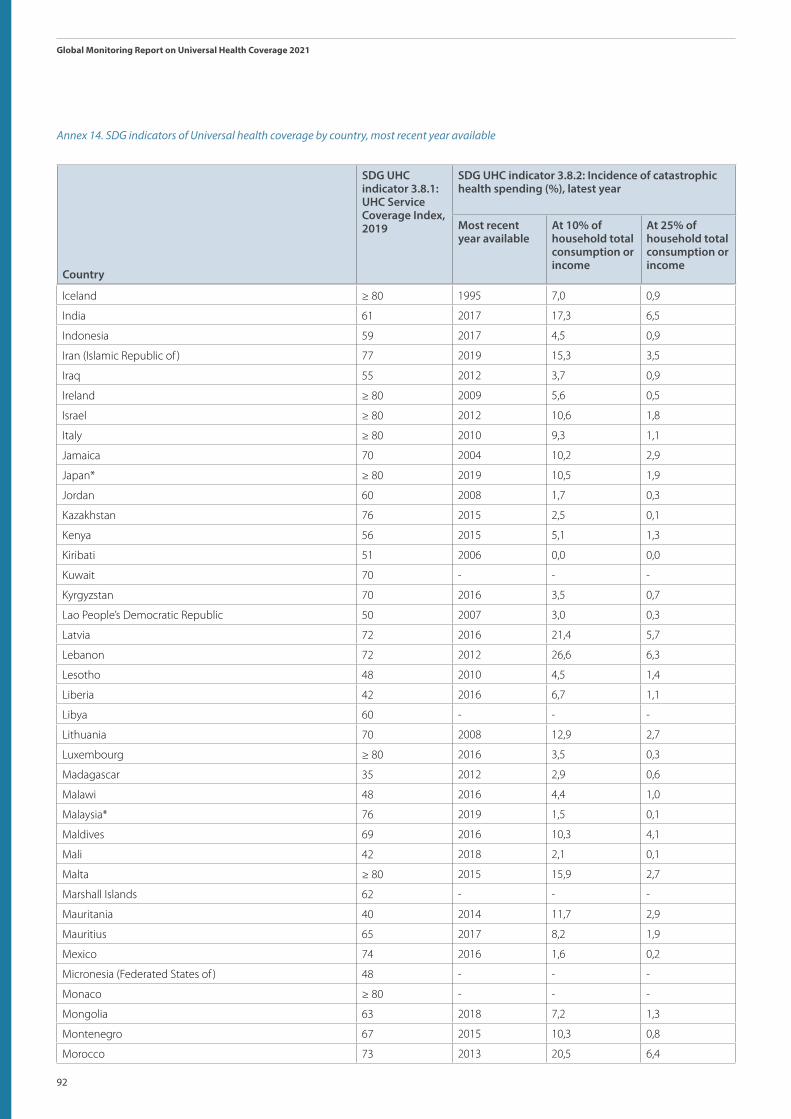
92
Global Monitoring Report on Universal Health Coverage 2021
Country
SDG UHC indicator 3.8.1: UHC Service Coverage Index, 2019
SDG UHC indicator 3.8.2: Incidence of catastrophic health spending (%), latest year
Most recent year available
At 10% of household total consumption or income
At 25% of household total consumption or income
Iceland ≥ 80 1995 7,0 0,9
India 61 2017 17,3 6,5
Indonesia 59 2017 4,5 0,9
Iran (Islamic Republic of ) 77 2019 15,3 3,5
Iraq 55 2012 3,7 0,9
Ireland ≥ 80 2009 5,6 0,5
Israel ≥ 80 2012 10,6 1,8
Italy ≥ 80 2010 9,3 1,1
Jamaica 70 2004 10,2 2,9
Japan* ≥ 80 2019 10,5 1,9
Jordan 60 2008 1,7 0,3
Kazakhstan 76 2015 2,5 0,1
Kenya 56 2015 5,1 1,3
Kiribati 51 2006 0,0 0,0
Kuwait 70 - - -
Kyrgyzstan 70 2016 3,5 0,7
Lao People’s Democratic Republic 50 2007 3,0 0,3
Latvia 72 2016 21,4 5,7
Lebanon 72 2012 26,6 6,3
Lesotho 48 2010 4,5 1,4
Liberia 42 2016 6,7 1,1
Libya 60 - - -
Lithuania 70 2008 12,9 2,7
Luxembourg ≥ 80 2016 3,5 0,3
Madagascar 35 2012 2,9 0,6
Malawi 48 2016 4,4 1,0
Malaysia* 76 2019 1,5 0,1
Maldives 69 2016 10,3 4,1
Mali 42 2018 2,1 0,1
Malta ≥ 80 2015 15,9 2,7
Marshall Islands 62 - - -
Mauritania 40 2014 11,7 2,9
Mauritius 65 2017 8,2 1,9
Mexico 74 2016 1,6 0,2
Micronesia (Federated States of ) 48 - - -
Monaco ≥ 80 - - -
Mongolia 63 2018 7,2 1,3
Montenegro 67 2015 10,3 0,8
Morocco 73 2013 20,5 6,4
Annex 14. SDG indicators of Universal health coverage by country, most recent year available
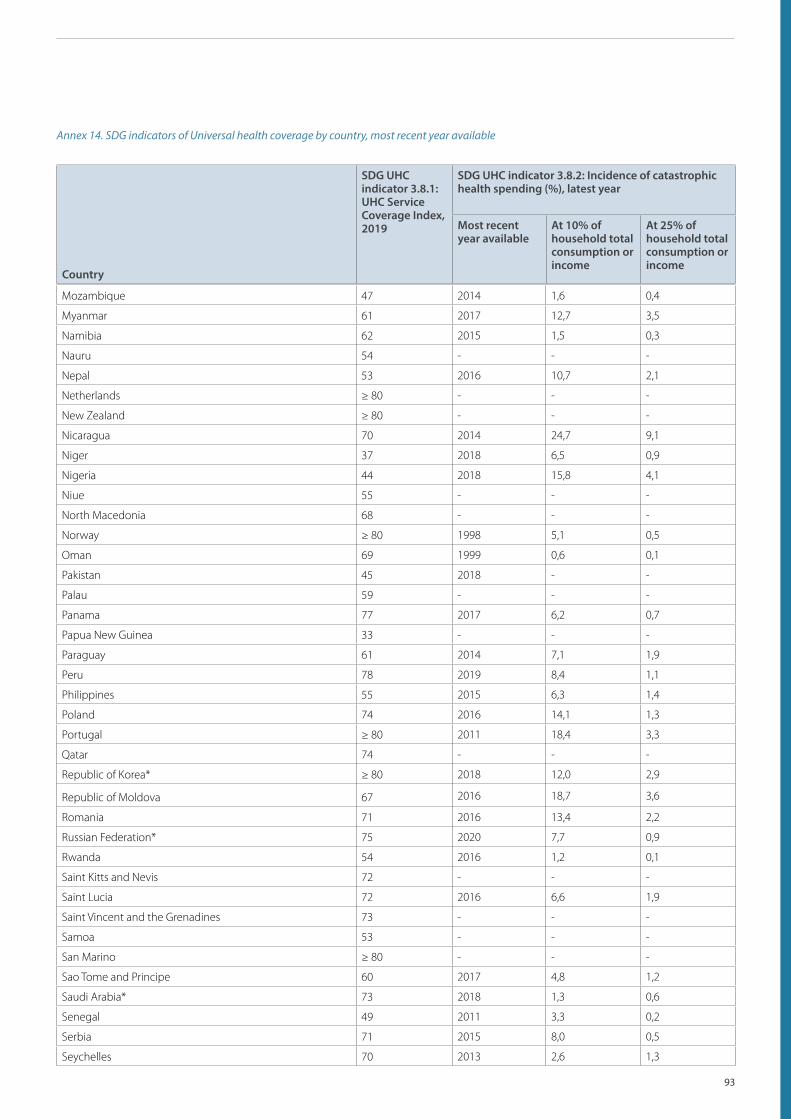
93
Country
SDG UHC indicator 3.8.1: UHC Service Coverage Index, 2019
SDG UHC indicator 3.8.2: Incidence of catastrophic health spending (%), latest year
Most recent year available
At 10% of household total consumption or income
At 25% of household total consumption or income
Mozambique 47 2014 1,6 0,4
Myanmar 61 2017 12,7 3,5
Namibia 62 2015 1,5 0,3
Nauru 54 - - -
Nepal 53 2016 10,7 2,1
Netherlands ≥ 80 - - -
New Zealand ≥ 80 - - -
Nicaragua 70 2014 24,7 9,1
Niger 37 2018 6,5 0,9
Nigeria 44 2018 15,8 4,1
Niue 55 - - -
North Macedonia 68 - - -
Norway ≥ 80 1998 5,1 0,5
Oman 69 1999 0,6 0,1
Pakistan 45 2018 - -
Palau 59 - - -
Panama 77 2017 6,2 0,7
Papua New Guinea 33 - - -
Paraguay 61 2014 7,1 1,9
Peru 78 2019 8,4 1,1
Philippines 55 2015 6,3 1,4
Poland 74 2016 14,1 1,3
Portugal ≥ 80 2011 18,4 3,3
Qatar 74 - - -
Republic of Korea* ≥ 80 2018 12,0 2,9
Republic of Moldova 67 2016 18,7 3,6
Romania 71 2016 13,4 2,2
Russian Federation* 75 2020 7,7 0,9
Rwanda 54 2016 1,2 0,1
Saint Kitts and Nevis 72 - - -
Saint Lucia 72 2016 6,6 1,9
Saint Vincent and the Grenadines 73 - - -
Samoa 53 - - -
San Marino ≥ 80 - - -
Sao Tome and Principe 60 2017 4,8 1,2
Saudi Arabia* 73 2018 1,3 0,6
Senegal 49 2011 3,3 0,2
Serbia 71 2015 8,0 0,5
Seychelles 70 2013 2,6 1,3
Annex 14. SDG indicators of Universal health coverage by country, most recent year available

94
Global Monitoring Report on Universal Health Coverage 2021
Country
SDG UHC indicator 3.8.1: UHC Service Coverage Index, 2019
SDG UHC indicator 3.8.2: Incidence of catastrophic health spending (%), latest year
Most recent year available
At 10% of household total consumption or income
At 25% of household total consumption or income
Sierra Leone 39 2018 16,4 3,0
Singapore ≥ 80 - - -
Slovakia 77 2015 2,7 0,0
Slovenia ≥ 80 2018 3,7 0,3
Solomon Islands 50 - - -
Somalia 27 2017 0,1 0,0
South Africa 67 2014 1,0 0,1
South Sudan 32 2017 13,4 4,0
Spain ≥ 80 2019 7,9 1,1
Sri Lanka 67 2016 5,4 0,9
Sudan 44 2009 18,4 3,3
Suriname 67 2016 4,9 1,4
Sweden ≥ 80 1996 5,5 0,7
Switzerland ≥ 80 - - -
Syrian Arab Republic 56 2007 6,9 1,4
Tajikistan 66 2018 10,3 2,2
Thailand ≥ 80 2019 1,9 0,3
Timor-Leste 53 2014 2,6 0,5
Togo 44 2018 13,4 2,4
Tonga 56 - - -
Trinidad and Tobago 73 2014 3,9 1,9
Tunisia 70 2015 16,7 2,4
Turkey 79 2016 3,2 0,4
Turkmenistan 73 - - -
Tuvalu 52 - - -
Uganda 50 2016 15,3 3,8
Ukraine 73 2019 8,3 1,2
United Arab Emirates* 78 2019 0,4 -
United Kingdom of Great Britain and Northern Ireland ≥ 80 2018 2,3 0,4
United Republic of Tanzania 46 2018 4,3 0,8
United States of America ≥ 80 2019 4,3 0,8
Uruguay 79 2016 2,3 0,2
Uzbekistan 71 2003 6,7 1,8
Vanuatu 52 - - -
Venezuela (Bolivarian Republic of ) 70 - - -
Viet Nam* 70 2020 8,5 1,7
Yemen 44 2014 15,8 4,2
Zambia 55 2010 0,3 0,0
Zimbabwe 55 2017 11,8 7,0
Annex 14. SDG indicators of Universal health coverage by country, most recent year available

95
- Not applicable.
Country index values of 80 and over are reported as ≥80 for presentation purposes and to avoid comparisons that are not meaningful given the inability of the index to adequately distinguish between countries with high level of service coverage provision.
Note: *Produced by member state. Catastrophic health spending is defined as out of pocket expenditures exceeding 10% and 25% of household total consumption or income. This definition with these two thresholds corresponds to SDG indicator 3.8.2,defined as “the proportion of population with large household expenditures on health as a share of total household expenditure or income”. WHO and World Bank estimated values are based on standard definitions and methods to ensure cross-country comparability, which may not correspond to the methods used at regional and/or national level to monitor catastrophic spending on health. These estimates are based on a data availability for global monitoring which may not necessarily align with availability of data at national or regional levels. Source: Global database on financial protection assembled by WHO and the World Bank, 2021 update.

96
Global Monitoring Report on Universal Health Coverage 2021
ContactWorld Health Organization20, Avenue AppiaCH-1211 Geneva 27Switzerlandwww.who.int/data/monitoring-universal-health-coverage