Initial Coverage Research - Euro Cosmetic
38
Initial Coverage Research THIS DOCUMENT MAY NOT BE DISTRIBUTED IN THE U.S., AUSTRALIA, CANADA OR JAPAN Euro Cosmetic: everyone's beauty routine Januay 21, 2021, at 19:00 The perfect industrial partner in the Personal Care industry Euro Cosmetic is the perfect industrial partner for all private labels, multinational brands and pharmaceutical companies that seek to project and manufacture on an industrial scale any kind of personal care product, except for the make-up. The long list of Euro Cosmetic’s products includes toothpastes, detergents, sanitizing gels, creams and perfumes, among others, for which the Company offers the wide range of services, starting from engineering and formulating active ingredients to the delivery of final product. This high range of both products and services offered has allowed the Company to ensure high flexibility to all its clients and therefore to constantly expand its customer portfolio. The Company stands out for its quality and innovation: quality is guaranteed by several national and international certifications – such as Cosmos Organic and the Italian PMC, among others, –, while innovation is reflected in its 4.0 production plants as well as in its R&D and product development activities. A solid Company with a resilient business model In 2007-2019 Euro Cosmetic’s Value of Production grew at a 14% CAGR, experiencing strong growth rates even during the 2008-2009 financial crisis, thanks to the resilient and defensive nature of its reference industry and to the wide range of first necessity products that Euro Cosmetic produces. A big chunk of Euro Cosmetic's growth is attributable to the current ownership of the Company, which took office in 2011, when Daniela Maffoni, the current CEO, and Carlo Ravasio, the current Chairman, acquired 76.8% of the Company's shares; since then, the VoP has increased by 75% to €22.6mln in 2019, thanks to both the capture of new customers and the successful investments made in the expansion of the production plant. A quick look at the year just ended and at the current one The economic consequences of the crisis triggered by Covid-19 has had very limited impact on the Company’s business, mainly thanks to its ability to take up opportunities from increasing demand for sanitizing products. For the FY2020, according to the freshly released Company’s guidance, VoP is forecast to reach €27.4mln, +21% yoy, and EBITDA margin is expected to improve from 12% to about 17.5%, while for the current fiscal year VoP is estimated at €29.0mln (+5.8% yoy) with EBITDA margin at 17.6%. Strategic development and our 2021E-2023E estimates FY2021 Company’s guidance is based on a strategic plan consisting of the following four pillars: i) extending the production plant by 5,000 square meters, to reach a total surface of 21,500 sqm, ii) launching a niche skincare line products to be sold online, and intended for the retail market, iii) expanding the product range thanks to continuous investments in R&D, and iv) acquiring new customers thanks to the increase in production capacity. In addition to financing the aforementioned expansion of the production site (estimated investment of €4.6mln) and launch of the new line of skin care products (estimated expenses of €0.7mln), the net IPO proceeds, worth €7.2mln, are going to be used to finance M&A opportunities aimed at strengthening the market positioning within the pharmaceutical sector. According to our stand-alone 2021E-2023E estimates, VoP is expected to increase at a 2019-2023E CAGR of 9% to over €32mln in 2023, while the EBITDA is estimated just below €6mln in 2023, with margin improving from 12% in 2019 to 18% in 2023. We project cumulated 2021E-2023E FCFs at €7.6mln or a yearly average of €1.9mln, including €3.9mln of cumulated capex and €2.6mln of NOWC needs. The main risks to our estimates are linked to i) the concentration of revenue per customer (in 2019, 27% of revenue was generated only from one customer) and ii) a potential unexpected decline in demand. Valuation: 12-month Target Price at €10.7; BUY We initiate our coverage with a BUY recommendation and a target price of €10.7 as the average of DCF and relative market multiple valuations, implying a significant potential upside on current stock price. Through cumulated cash flows of €7.6mln and a Terminal Value FCF of €2.5mln, we get to an Enterprise Value of €46.4mln and to an Equity Value of €52.2mln, which led us to a Fair Value of €11.0/share. Our relative valuation based on the average 2021E-2022E EV/EBITDA multiple (10.8x), led to an Equity Value of €49.9mln or €10.5/share, already including a 15% liquidity discount. Target Price (€) 10.7 Recommendation BUY Price as of January 21, 2021 6.4 Number of shares (mln) 4.8 Market capitalization (€, mln) 30.5 Performance from IPO Absolute +2% Max / Min 7.0/5.8 Average daily volumes 9,472 (€mln) 2019 2020E 2021E 2022E Value of Production 22.6 27.4 28.9 30.6 yoy change (%) 17% 21% 6% 6% EBITDA 2.8 4.8 4.9 5.4 margin (%) 12% 17% 17% 18% EBIT 1.4 3.4 3.5 3.7 margin (%) 6% 13% 12% 12% Net income 1.0 2.5 2.9 2.6 margin (%) 4% 9% 10% 9% Net Debt/(cash) 3.7 (5.7) (6.3) (8.4) Shareholders' Equity 6.4 15.8 18.1 20.2 Capex 1.2 0.9 2.0 1.0 Free Cash Flow 2.8 2.4 1.5 2.7 Source: Banca Profilo estimates and elaborations, Company data. Francesca Sabatini Head of Equity Research [email protected] +39 02 58408 461 Benedetta Sorge Equity Research Analyst [email protected] +39 02 58408 570 Sales Desk +39 02 58408 478
-
Upload
khangminh22 -
Category
Documents
-
view
0 -
download
0
Transcript of Initial Coverage Research - Euro Cosmetic

Initial Coverage Research
THIS DOCUMENT MAY NOT BE DISTRIBUTED IN THE U.S., AUSTRALIA, CANADA OR JAPAN
Euro Cosmetic: everyone's beauty routine
Januay 21, 2021, at 19:00
The perfect industrial partner in the Personal Care industry Euro Cosmetic is the perfect industrial partner for all private labels, multinational brands and pharmaceutical companies that seek to project and manufacture on an industrial scale any kind of personal care product, except for the make-up. The long list of Euro Cosmetic’s products includes toothpastes, detergents, sanitizing gels, creams and perfumes, among others, for which the Company offers the wide range of services, starting from engineering and formulating active ingredients to the delivery of final product. This high range of both products and services offered has allowed the Company to ensure high flexibility to all its clients and therefore to constantly expand its customer portfolio. The Company stands out for its quality and innovation: quality is guaranteed by several national and international certifications – such as Cosmos Organic and the Italian PMC, among others, –, while innovation is reflected in its 4.0 production plants as well as in its R&D and product development activities. A solid Company with a resilient business model In 2007-2019 Euro Cosmetic’s Value of Production grew at a 14% CAGR, experiencing strong growth rates even during the 2008-2009 financial crisis, thanks to the resilient and defensive nature of its reference industry and to the wide range of first necessity products that Euro Cosmetic produces. A big chunk of Euro Cosmetic's growth is attributable to the current ownership of the Company, which took office in 2011, when Daniela Maffoni, the current CEO, and Carlo Ravasio, the current Chairman, acquired 76.8% of the Company's shares; since then, the VoP has increased by 75% to €22.6mln in 2019, thanks to both the capture of new customers and the successful investments made in the expansion of the production plant. A quick look at the year just ended and at the current one The economic consequences of the crisis triggered by Covid-19 has had very limited impact on the Company’s business, mainly thanks to its ability to take up opportunities from increasing demand for sanitizing products. For the FY2020, according to the freshly released Company’s guidance, VoP is forecast to reach €27.4mln, +21% yoy, and EBITDA margin is expected to improve from 12% to about 17.5%, while for the current fiscal year VoP is estimated at €29.0mln (+5.8% yoy) with EBITDA margin at 17.6%. Strategic development and our 2021E-2023E estimates FY2021 Company’s guidance is based on a strategic plan consisting of the following four pillars: i) extending the production plant by 5,000 square meters, to reach a total surface of 21,500 sqm, ii) launching a niche skincare line products to be sold online, and intended for the retail market, iii) expanding the product range thanks to continuous investments in R&D, and iv) acquiring new customers thanks to the increase in production capacity. In addition to financing the aforementioned expansion of the production site (estimated investment of €4.6mln) and launch of the new line of skin care products (estimated expenses of €0.7mln), the net IPO proceeds, worth €7.2mln, are going to be used to finance M&A opportunities aimed at strengthening the market positioning within the pharmaceutical sector. According to our stand-alone 2021E-2023E estimates, VoP is expected to increase at a 2019-2023E CAGR of 9% to over €32mln in 2023, while the EBITDA is estimated just below €6mln in 2023, with margin improving from 12% in 2019 to 18% in 2023. We project cumulated 2021E-2023E FCFs at €7.6mln or a yearly average of €1.9mln, including €3.9mln of cumulated capex and €2.6mln of NOWC needs. The main risks to our estimates are linked to i) the concentration of revenue per customer (in 2019, 27% of revenue was generated only from one customer) and ii) a potential unexpected decline in demand. Valuation: 12-month Target Price at €10.7; BUY We initiate our coverage with a BUY recommendation and a target price of €10.7 as the average of DCF and relative market multiple valuations, implying a significant potential upside on current stock price. Through cumulated cash flows of €7.6mln and a Terminal Value FCF of €2.5mln, we get to an Enterprise Value of €46.4mln and to an Equity Value of €52.2mln, which led us to a Fair Value of €11.0/share. Our relative valuation based on the average 2021E-2022E EV/EBITDA multiple (10.8x), led to an Equity Value of €49.9mln or €10.5/share, already including a 15% liquidity discount.
Target Price (€) 10.7
Recommendation BUY
Price as of January 21, 2021 6.4
Number of shares (mln) 4.8
Market capitalization (€, mln) 30.5
Performance from IPO
Absolute +2%
Max / Min 7.0/5.8
Average daily volumes 9,472
(€mln) 2019 2020E 2021E 2022E
Value of Production 22.6 27.4 28.9 30.6
yoy change (%) 17% 21% 6% 6%
EBITDA 2.8 4.8 4.9 5.4
margin (%) 12% 17% 17% 18%
EBIT 1.4 3.4 3.5 3.7
margin (%) 6% 13% 12% 12%
Net income 1.0 2.5 2.9 2.6
margin (%) 4% 9% 10% 9%
Net Debt/(cash) 3.7 (5.7) (6.3) (8.4)
Shareholders' Equity 6.4 15.8 18.1 20.2
Capex 1.2 0.9 2.0 1.0
Free Cash Flow 2.8 2.4 1.5 2.7
Source: Banca Profilo estimates and elaborations, Company data.
Francesca Sabatini
Head of Equity Research
+39 02 58408 461
Benedetta Sorge
Equity Research Analyst
+39 02 58408 570
Sales Desk
+39 02 58408 478

Equity Research
THIS DOCUMENT MAY NOT BE DISTRIBUTED IN THE U.S., AUSTRALIA, CANADA OR JAPAN
Contents
Executive summary ............................................................................................... 3
Euro Cosmetic in a nutshell ...................................................................................................................... 3
Main Financial data and estimates (2021E-2023E) ............................................................................... 4
Valuation: DCF and market multiples approach .................................................................................... 5
Key risks ................................................................................................................................................... 5
SWOT analysis ...................................................................................................... 6
The reference market ............................................................................................. 7
The Global Beauty & Personal Care market ............................................................................................. 7
Euro Cosmetic competitive arena: strategic positioning ....................................................................... 10
Euro Cosmetic competitive arena: benchmarking analysis .................................................................. 12
Euro Cosmetic overview and business model ....................................................... 14
Euro Cosmetic’s history and activities .................................................................................................... 14
Ownership structure ............................................................................................................................... 17
Management ............................................................................................................................................ 17
Historical operating and financial performance ................................................... 19
Main operating and financial data ........................................................................................................ 19
2020 expected closing ............................................................................................................................ 24
Strategy and estimates ......................................................................................... 25
Company’s strategy and guidance ........................................................................................................ 25
Our 2021E-2023E estimates .................................................................................................................. 25
Key risks .................................................................................................................................................. 31
Valuation .............................................................................................................33
DCF Valuation ........................................................................................................................................ 33
Relative market multiples valuation ..................................................................................................... 34
DISCLAIMER ...................................................................................................... 38

Equity Research_.
3 THIS DOCUMENT MAY NOT BE DISTRIBUTED IN THE U.S., AUSTRALIA, CANADA OR JAPAN
Executive summary
Euro Cosmetic in a nutshell
From Trenzano to Palazzo Mezzanotte
Euro Cosmetic was founded in Tortona in 2002 and then relocated to Trenzano (Brescia)
in 2007; in 2011, the current CEO, Daniela Maffoni, and Chairman, Carlo Ravasio,
acquired 76.8% of the Company's shares, becoming major shareholders; since then, the
Value of Production has increased by 75%, from €12.6mln to €22.6mln in 2019, and the
factory has been expanded by 13,500 square meters, to reach the current surface of
16,500 sqm. In 2017, Mrs. Maffoni and Mr. Ravasio took over the remaining shares of
the Company and in 2020 started the IPO process on the AIM Italia market, to enhance
Euro Cosmetic’s business and its brand, and to take the Company to the next level.
Euro Cosmetic’s wide product range: from
cleansers to skin care products
Euro Cosmetic brands itself as the ideal industrial partner which, on behalf of third
parties, projects, develops and industrializes a wide range of beauty & personal care
products, with the only exception of make-up. Euro Cosmetic’s products fall into four
main categories:
▪ cleansers and detergents (~39% of FY19 revenue), including shower gels, soaps,
hand sanitizers and shampoos;
▪ oral hygiene products (~35%), like toothpastes and mouthwashes;
▪ fragrancies (~15%), such as eau de parfum, after-shaves and deodorants;
▪ skin care products (~10%), like lotions, toners, creams, and sunscreens.
Production flexibility
which allows the Company to satisfy different customers’ needs
Thanks to its high flexible production system, Euro Cosmetic offers the wide range of
services for each of its product category, starting from engineering and formulating active
ingredients, to mixing, filling and labeling, to the delivery of the final products. The
Company is thus able to satisfy different customers’ needs, such as:
▪ private labels of large retail store chains (~43% of FY19 revenue);
▪ industrial companies, both large multinational and small and medium-sized
companies with their own brands (~28%);
▪ cosmetic companies specializing in high quality products intended for beauty
salons, hair salons and hotels (~25%);
▪ pharmaceutical companies (~4%).
A consolidated, resilient
and quality business The diversification both by product category and by type of client is a main competitive
advantage of the Company, and other strengths can be added to this: a proven business
model, long-lasting relationship with its customers, and a resilient business which can
guarantee stability even during periods of economic crisis, thanks to the wide range of
the first necessity products offered. Moreover, Euro Cosmetic is characterized by quality
and innovation, the first being guaranteed by several national and international
certifications, while the second is reflected in a 4.0 production plants as well as in R&D
investments and product development activities.
R&D is key to product innovation
R&D activities are at the basis of the Beauty & Personal Care industry, as they are
essential to match or anticipate new consumer needs, who requires every time more
quality products. To be always in line with new market trends and new industry
regulations, Euro Cosmetic’s R&D activities are based on two cornerstones:
▪ the implementation of the most up-to-date European and international
legislations, even soft law rules;
▪ a non-stop research and development, which allows the Company to have a
range of already tested and ready-to-use formulas.

Equity Research_.
4 THIS DOCUMENT MAY NOT BE DISTRIBUTED IN THE U.S., AUSTRALIA, CANADA OR JAPAN
Main Financial data and estimates (2021E-2023E)
14% VoP CAGR in 2007-2019
Since the relocation to Trenzano (2007), Euro Cosmetic’s Value of Production has grown
at a 14% CAGR, to reach €22.6mln in 2019, experiencing strong growth rates even
during the 2008-2009 financial crisis. The historical double-digit growth rate is
attributable to three main growth drivers: i) the constant capture of new customers,
including major multinationals and large retailers with their own private labels, ii) the
scale up of production capacity following the expansion of the production plant in 2015,
and iii) the penetration into new markets.
2019, the year of redemption:
- VoP at €22.6mln, +17% yoy
- EBITDA margin up 180bps to 12.4%
After two years of stalemate, Euro Cosmetic returned to growth in 2019, due to the
strengthening of its competitive positioning both on the pharmaceutical sector and in
quality products intended for hotels and beauty salons; the Value of Production reached
€22.7mln in 2019, which made an increase of 17% yoy, and the EBITDA margin on VoP
improved by 180 basis points to 12.4%, thanks to: i) optimization of raw materials
purchases, ii) increase in minimum batches for skincare products, and iii) higher focus
on high margins products and sectors.
FY2020 guidance:
- VoP at €27.4mln, +21% yoy
- EBITDA margin up more than 500bps to 17.5%
The consequences of the crisis triggered by Covid-19 has had a little to none impact on
Euro Cosmetic's business, not only thanks to the essentiality of its daily care products,
but also thanks to the Company's ability to take on opportunities generated by the
sudden change in consumers’ habits: the need to frequently wash or sanitize hands has
generated a strong demand in sanitizers and cleansers, an opportunity that Euro
Cosmetic has seized by formulating a hand sanitizer that sold more than 4.5mln pieces
between February and June, with 6M20 related revenues of about €3.6mln. After having
recorded 9M finished products revenue of €20.9mln, +26.7% yoy, according to the
guidance published on January 14, the Company expects FY20 revenue from finished
products of €26.8mln, +22% yoy, and VoP of €27.4mln, +21% yoy, with EBITDA
margin on VoP improving from 12.4% in 2019 to about 17.5%.
IPO Proceeds (€7.2mln) are going to
be used to:
- enlarge the production plant
- enter the BTC
market - finance potential
M&As.
For the next years, Euro Cosmetic is set to expand its business further, through both
organic and external growth. As for organic growth, the Company’s development and
growth plan is based on the following four pillars:
i) enlargement of the production plant by 5,000 square meters, to reach a total
surface of 21,500 sqm (estimated investment of about €4.6mln, of which €900k
will be invested in 2021 and the rest will be spread over a period of twelve
years);
ii) launch of a niche skincare line products to be sold online, directly to the final
customer (estimated total expenses of €0.7mln, to be invested over the next
two years, including an advertising partnership for the launch of the product
with The Blonde Salad agency);
iii) expansion of the product range thanks to continuous investments in R&D and
the freshly obtained PMC certification (the certification of the Italian “Presidio
Medico Chirurgico”, a specific category of medical devices such as disinfectants,
insecticides and insect repellents);
iv) capture of new customers, thanks both to the increase in production capacity
and the strengthening of Euro Cosmetic brand following the IPO.
Based on this growth plan, the Company has given the following guidance for the
FY2021: finished products revenue of €28.7mln, +7.1% yoy, VoP of €29.0mln, +5.8%
yoy, EBITDA margin on VoP of 17.6%, EBIT margin of 12.4%, and capex of about
€2mln. Moreover, the Company intends to grow also by external lines, and some of the
net IPO proceeds, worth €7.2mln, are going to be used to finance M&A opportunities
aimed at strengthening its market share on the pharmaceutical sector. According to our
stand-alone 2021E-2023E estimates, VoP is expected to continue increasing, at a 9%
2019-2023E CAGR to over €32mln in 2023, while the EBITDA is expected just below
€6mln in 2023, with margin on VoP improving from 12.4% in 2019 to about 18% in
2023. Excluding the 2020 revenue surge, we believe sustainable growth is to be about
6% over the next three years.

Equity Research_.
5 THIS DOCUMENT MAY NOT BE DISTRIBUTED IN THE U.S., AUSTRALIA, CANADA OR JAPAN
Valuation: DCF and market multiples approach DCF assumptions: - €7.6mln of
cumulated FCFs - €2.5mln as
Terminal Value cash flow
- 7.1% WACC
Given Euro Cosmetic’s cash generating business model, a DCF method well adapts as a
valuation approach. To run a DCF model, we used our projections of FCF for the 2021E-
23E explicit period: cumulated cash flows of €7.6mln, a Terminal Value FCF of €2.5mln,
a perpetual growth rate of 2% and a WACC of 7.1%. In order to get to the Equity
Valuation we considered the estimated Net Financial Position as of the end of 2019,
equal to -€5.7mln (cash). The DCF method leads us to an Enterprise Value of €46.4mln
and an Equity Value of €52.2mln, equal to a Fair Value of €11.0 per share.
Relative market multiples approach:
EV/EBITDA 2021E-2022E of 10.8x
In order to assess a relative valuation of Euro Cosmetic through the market multiples
approach, we selected a sample of listed international companies specialized in the
production and distribution of cosmetic products: Sarantis, L'Occitane, PZ Cussons,
Colgate-Palmolive, Beiersdorf, Johnson & Johnson and L'Oreal. Among these, we have
narrowed the sample to the fist three, as it they better comparable to Euro Cosmetic in
terms of business, dimension and product comparability. Our best sample shows an
average 2021E-2022E EV/EBITDA of 10.8x, which led to an Equity Value of €49.9mln,
equal to €10.5 per share.
12-month TP equal to €10.7; BUY
We then set our Target Price at €10.7/share, computed as a simple average between
the Fair Value from DCF and the result of the relative valuation, implying a potential
upside higher than 60% as of market close on January 21. We initiate our coverage
with a BUY recommendation.
Key risks Main identified risks: The main risks to our estimates are linked to: i) the concentration of revenue per
customer, ii) a potential decline in demand, iii) a potential loss of competitiveness, iv) a
potential products’ defects, v) a potential loss of qualified personnel essential for the
success of the business; vi) a potential appreciation of raw materials and vii) the family-
oriented ownership model.
Risk related to the concentration of revenue per customer: - medium-low
likelihood
- high impact
The risk we have evaluated to have the highest potential impact on Euro Cosmetic’s
business and financials, is the one related to the concentration of revenue per customer.
In 2019, 27% of revenue was generated only from one customer, while the top 10
clients represented more than 90% of total revenue. This risk is partially offset by the
strong stability and duration that the Company has historically been showing in customer
relations. Moreover, one of the main growth strategies of the Company is the expansion
of the customer portfolio and consequently the reduction in the dependence of revenues
on individual customers. We evaluate this risk with a medium-low likelihood of that
occurring but with a high potential impact on the business.
Risk related to the decline in demand: - medium-low
likelihood - medium impact
The business of Euro Cosmetic, like any other company, is exposed to the potential risk
of contraction in demand deriving from: a reduction in the activity of the main
customers, worsening of macroeconomic conditions, or a potential exogenous event.
This risk is partially offset by the essential nature of Euro Cosmetic’s business, thanks
to the wide range of first necessity products offered. With regard to the potential impact
on our 2021E-2023E estimates, the major risk is associated to a possible overestimation
of revenue coming from the "professional" sector, which, in case of new strict lockdown
measures, could be one of most affected sectors. We evaluate this risk with a medium-
low likelihood of that occurring and a medium potential impact on the business.

Equity Research_.
6 THIS DOCUMENT MAY NOT BE DISTRIBUTED IN THE U.S., AUSTRALIA, CANADA OR JAPAN
SWOT analysis
STRENGTHS WEAKNESSES
• Long-lasting client relationship
• Resilience of Euro Cosmetic’s reference industry and
business
• Product certification and 4.0 production plant as
barriers to entry
• Production flexibility in terms of quantity, timing and
customization
• R&D activities releasing a consistent range of already
tested and ready to use formulas
• Net working capital cash absorption
• High revenue concentration by client company
OPPORTUNITIES THREATS
• Expansion in the B2C market through the launch of
a proprietary branded skincare line products
• Increasing demand for cleansers and sanitizing
products after Covid-19 outbreak
• Market positioning strengthening within the
pharmaceutical sector thanks to the freshly obtained
PMC certification
• Diversification of the product range and increase in
turnover through potential M&A
• High level of competition and market saturation in the
Personal Care industry
• Risk of cannibalization of a product line by the giants
of the sector

Equity Research_.
7 THIS DOCUMENT MAY NOT BE DISTRIBUTED IN THE U.S., AUSTRALIA, CANADA OR JAPAN
The reference market The Global Beauty & Personal Care market Main types of beauty & personal care products
Global Beauty & Personal Care is Euro Cosmetic’s main reference market. Personal care
products are consumer goods used to enhance the appearance or odor of the human
body, such as skin care products, hair care products, deodorants, makeup, fragrances
and oral care products. Euro Cosmetic’s revenues by product, at the end of 2019, were
broken down as follows:
▪ 39% in cleansers and detergents (shampoo, soap, shower gel, sanitizers,
intimate wash, etc.),
▪ 35% in oral care products (toothpaste, mouthwash, breath spray),
▪ 15% in fragrances (scented waters, perfumes, deodorants, etc.), and
▪ 10% in skincare & lotions (body lotions, sun creams, toners, scrubs, etc.).
Global Beauty &
Personal Care market: over $505bn in 2019
In 2019, Global Beauty & Personal Care market was worth $505bn and, thanks to its
resilience and defensive nature, it is expected to decrease by 4% only in 2020, to
$497bn, to then grow at a 5% CAGR from 2020 to 2023. Regarding the geographical
breakdown, the most valuable market is the United States, with 2019 estimated
revenues at $80bn, but, from a regional point of view, Asia Pacific occupies the largest
share of the market, with only China and Japan together having a market share of around
$95bn. Europe was worth €79bn at retail sales price in 2019, with Italy, Euro Cosmetic’s
main reference market, accounting for about €12bn. Regarding distribution channels,
cosmetics are sold through various networks, from luxury spas and saloons to online and
television shopping; however, main distribution channels are supermarkets, specialty
stores, perfumeries, pharmacies and exclusive brand outlets, with online channels also
gaining popularity among consumers.
Figure 1: Beauty & Personal Care market’s main segmentations
Source: Allied Market Research
Beauty & Personal Care value-chain
The Beauty & Personal Care Industry value chain comprises:
1. Raw materials suppliers to cosmetic and personal care manufacturers, which
procure products ranging from active ingredients to packaging,
2. Manufacturers, which industrialize product formulations,
3. Distribution, wholesale and logistics companies that deal with transport and
warehousing,
4. Beauty retailers, such as salons, department stores, online stores and
pharmacies, and
5. Consumers, those who represent the final link in the value chain.
Euro Cosmetic, being a manufacturing company covering all stages of the production
cycle, from R&D activities to the delivery of the final product, belongs to the second
phase of the value chain and, partially, to the third one.
Beauty & Personal Care
market
By Category
- Sun care & skin
care
- Hair care
- Body care
- Make up and
colour cosmetics
- Frangrances
- Oral care products
- Others
By Distribution Channel
- Retail Sales
1. Supermarkets
2. Pharmacies
3. Brand stores
4. Specialty
stores
- Online Sales
By Geographical Area
- North America
- Europe
- Asia Pacific
- LAMEA
By Gender
- Female
- Male

Equity Research_.
8 THIS DOCUMENT MAY NOT BE DISTRIBUTED IN THE U.S., AUSTRALIA, CANADA OR JAPAN
R&D is key to product
innovation The constant research for product innovation stands among the key feature of this
sector, therefore, expenses in research and development are typically relevant. On
average, cosmetic companies spend about 3.5% of their annual turnover on R&D, a
figure that, on the total value of the market’s value in 2019, would be equal to $18bn.
R&D is also a key driver for Euro Cosmetic which invests on average between 1% and
2% of its turnover to develop a wide set of formulas that can be used both to create new
products and to renew existing ones. R&D expenses include the cost of related
specialized personnel, the costs for chemical-physical and microbiological tests and the
cost of product certifications, among others.
Figure 2: Beauty & Personal Care market’s revenue, 2012-2023E ($, bn)
Source: Statista
2020E-2025E: global
revenue at €616bn in 2025, +5% CAGR
Revenue in the Beauty & Personal Care market are expected to decrease by 4% only in
2020, to then grow at a 5% CAGR thereafter (2020E-2025E), thanks to different
structural growth drivers. People have been using cosmetics for thousands of years, but,
over the years, the usage frequency has increased considerably and it is expected to
continue to do so, as people increasingly use this type of products to protect their health,
enhance their well-being and boost their self-esteem. In addition to the standard of living
improvement and the surge in health awareness and beauty concerns, the launch of
innovative products and the increasing use of digital channels have been creating new
opportunities. In particular, main market trends are expected to be: i) a greater
consumer attention to natural or organic products, and ii) the use, by manufacturers and
retailers, of new communication channels to create new marketing strategies for
customers engagement, especially among younger consumers.
The persisting search
for BIO Within the Beauty & Personal Care market, consumers are increasingly focused on
product effectiveness and ingredients rather than on price, and a win in the fight over
product superiority comes from the marketing use of the words “natural” and “organic”.
Fear over chemicals potential damages to skin and the environment has fueled the
consumers’ switch to organic and natural alternatives, but since the EU and FDA still
have no legal definition of natural for beauty products, brands can greenwash with little
regulation. However, thanks to several national and international standards and
certifications, the attention that consumers place in reading the labels and understanding
the ingredients is growing over time, and this raises the opportunities for manufacturing
companies to create innovative products that are increasingly in line with the new
standards required by consumers. Turning to numbers, the global natural cosmetics
market size is expected to reach a value of $48bn by 2025, growing at a CAGR of 5%
from 2019 to 2025. On this aspect, Euro Cosmetic has integrated various disciplines
related to the organic world into its production standards and has obtained two of the
409 422 435 447 460 474 489 505483
511541
572594
616
0
100
200
300
400
500
600
700
Make up Skincare Personal Care Fragrance
Equity Research_.
9 THIS DOCUMENT MAY NOT BE DISTRIBUTED IN THE U.S., AUSTRALIA, CANADA OR JAPAN
most important international certifications that certify the product as organic and BIO,
Cosmos Organic and Cosmos Natural.
The power of social media marketing
Social media marketing across Instagram, YouTube, Snapchat and Facebook represent
the new way to introduce new products to younger generations. What used to be walking
through malls with associates applying makeup samples for free, is now replaced by
bloggers and influencers doing social media tutorials that demonstrate the use of the
product, the final yield, and what they think about it. An example that perfectly explains
the powerful of these instruments is the business case of Kylie Cosmetics: Kylie Jenner,
by posting YouTube videos of her makeup routines and sharing her looks on social media,
had positioned herself as a leading voice in the beauty world: so, when she founded the
Kylie Cosmetics line, the lip-kits sold out in less than a minute, and the company was
valued at $1.2bn at the time Coty acquired 51% of the shares (estimated EV/Sales of
about 6x). The growth in popularity and effectiveness of influence marketing has gone
hand in hand with a growth in online sales, and has reached its peak during the
pandemic. On the heels, Euro Cosmetic is almost ready to launch its brand new niche
skincare line products, to be sold directly to the final consumer through online channel;
thanks to this new line of products, the Company will officially enter the B2C market,
with its own brand and its own e-commerce platform. To promote the product launch,
Euro Cosmetic has signed a partnership with The Blonde Salad, the digital publishing
and marketing Company founded and directed by Chiara Ferragni.
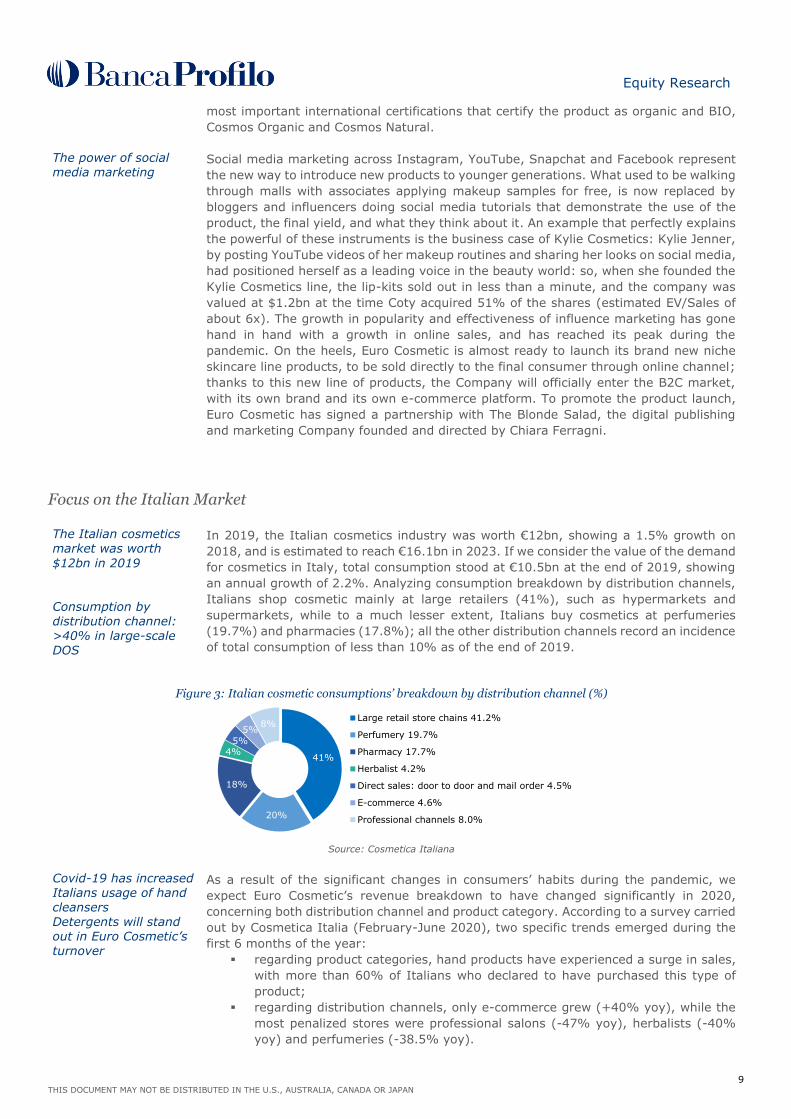
Focus on the Italian Market The Italian cosmetics market was worth
$12bn in 2019 Consumption by
distribution channel: >40% in large-scale DOS
In 2019, the Italian cosmetics industry was worth €12bn, showing a 1.5% growth on
2018, and is estimated to reach €16.1bn in 2023. If we consider the value of the demand
for cosmetics in Italy, total consumption stood at €10.5bn at the end of 2019, showing
an annual growth of 2.2%. Analyzing consumption breakdown by distribution channels,
Italians shop cosmetic mainly at large retailers (41%), such as hypermarkets and
supermarkets, while to a much lesser extent, Italians buy cosmetics at perfumeries
(19.7%) and pharmacies (17.8%); all the other distribution channels record an incidence
of total consumption of less than 10% as of the end of 2019.
Figure 3: Italian cosmetic consumptions’ breakdown by distribution channel (%)
Source: Cosmetica Italiana
Covid-19 has increased Italians usage of hand cleansers Detergents will stand out in Euro Cosmetic’s turnover
As a result of the significant changes in consumers’ habits during the pandemic, we
expect Euro Cosmetic’s revenue breakdown to have changed significantly in 2020,
concerning both distribution channel and product category. According to a survey carried
out by Cosmetica Italia (February-June 2020), two specific trends emerged during the
first 6 months of the year:
▪ regarding product categories, hand products have experienced a surge in sales,
with more than 60% of Italians who declared to have purchased this type of
product;
▪ regarding distribution channels, only e-commerce grew (+40% yoy), while the
most penalized stores were professional salons (-47% yoy), herbalists (-40%
yoy) and perfumeries (-38.5% yoy).
41%
20%
18%
4%5%
5%8%
Large retail store chains 41.2%
Perfumery 19.7%
Pharmacy 17.7%
Herbalist 4.2%
Direct sales: door to door and mail order 4.5%
E-commerce 4.6%
Professional channels 8.0%

Equity Research_.
10 THIS DOCUMENT MAY NOT BE DISTRIBUTED IN THE U.S., AUSTRALIA, CANADA OR JAPAN
Consequently, we expect that the impact on Euro Cosmetic's total turnover will undergo
significant changes during 2020, for which we expect detergency products to stand out,
as well as revenues from the pharmaceutical sector.
Figure 4: The most purchased products by Italians from February to June
Source: Cosmetica Italiana
Note: Percentage values on multiple answers (participants could select up to four options)
Euro Cosmetic competitive arena: strategic positioning Euro Cosmetic’s
selected competitors: Sarantis, L'Occitane, PZ Cussons, Colgate-Palmolive, Beiersdorf, Johnson & Johnson and L'Oreal.
There are not listed companies that can be considered as “perfectly comparable” to Euro
Cosmetic, mainly due to relevant differences concerning the business model and the
dimension of the company. Starting from a wide list of Personal Care listed companies,
we conducted a comparative analysis based on four main macro-categories: business
model, product categories, competitiveness of the brand in Italy and dimension of the
company; based on the results obtained, we selected the following seven listed
companies as “comparables”: Sarantis, L'Occitane, PZ Cussons, Colgate-Palmolive,
Beiersdorf, Johnson & Johnson and L'Oreal.
Figure 5: Euro Cosmetic’s competitive arena
Source: Banca Profilo elaborations on Company data
Note: Data are at the end of 2019 and, if not available, at the end of 2018.
The “X” means “comparability indicator equal to or higher than 50%”.
Sarantis (GR), FY19
€348mln revenue
13% EBITDA margin
Sarantis (Greece) is a manufacturer and distributor of consumer products, mainly
fragrances and cosmetics. The company produces aftershave lotions and deodorants (for brands such as Adidas and C-THRU); household products, like food packaging, cleaning and shoe care products (under the brands Sanitas and Camel) and health and care products, which mainly comprise vitamins and food supplements. The company has also set up joint-ventures and strategic alliances with international companies in the cosmetics, health and beauty sectors, such as Estee Lauder, Kolastyna, Domet,
Topstar and Clinique, for exclusive distribution of their products in Greece and Eastern Europe.
0% 10% 20% 30% 40% 50% 60% 70%
Hand hygiene products
Body hygiene products
Hair products
Facial products
Body products
Eye makeup products
Face makeup products
Alcoholic perfumery
Mouth hygiene products
Cosmetic products for male
Lip products
Make-up kits
Gift packages
Competitive Arena
# Score Company
# of times Euro
Cosmetic's
revenue
Country Business modelProduct
categories
Competitiveness
of the brand in
Italy
Dimension
1 75% Sarantis SA 17 Greece x x x
2 66% L'Occitane International SA 65 Luxembourg x x
3 62% PZ Cussons PLC 31 UK x x x
4 54% Colgate-Palmolive Co 638 US x x
5 49% Beiersdorf AG 348 Germany x x
6 47% Johnson & Johnson 3336 US x x
7 44% L'Oreal SA 1360 France x x
Field of analysis

Equity Research_.
11 THIS DOCUMENT MAY NOT BE DISTRIBUTED IN THE U.S., AUSTRALIA, CANADA OR JAPAN
L'Occitane
International (FR), FY19 €1.4bn revenue 15% EBITDA margin
L'Occitane International (Switzerland) is active in the production and sale of
cosmetics and well-being products based on natural and organic ingredients sourced principally from or near Provence. The Company operates through three segments: i) Sell-out segment, which sells directly to final customers through a retail distribution and
on-line, ii) Sell-in segment, which sells to intermediates, including distributors, wholesalers, television show channels and travel retailers, and iii) Business to Business segment, which sells its products to airline companies and hotels which provide the products as free amenities to final customers. Its brands include L’Occitane en Provence, Melvita, Le Couvent des Minimes, Erborian and L’Occitane en Bresil.
PZ Cussons (UK), FY19 £774mln revenue
14% EBITDA margin
PZ Cussons (UK) is a consumer products company focused on the manufacturing and distribution of soaps, detergents, toiletries, beauty products, pharmaceuticals, edible oils, fats and spreads, and nutritional products. Its oral and personal care products are
sold under the following brands: Carex, Charles Worthington, Cussons Baby, Fudge, Fudge Urban, Imperial Leather, Premier, Mum & Me, Original Source, Sanctuary Spa, St. Tropez and Robb. While the company sells some internationally recognized brands, the majority of its products are branded and marketed for the numerous local markets it serves.
Colgate-Palmolive (US), FY19 $15.7bn revenue
27% EBITDA margin
Colgate-Palmolive (US) is a consumer products company which operates in two product segments: Oral, Personal and Home Care, and Pet Nutrition. Within the first division, company's products include toothpaste, toothbrushes, shampoos, deodorants,
bar and liquid soaps, dishwashing liquid, marketed unders several brands among which Colgate Total, Palmolive, Protex and Softsoap. The Company also manufactures and markets a range of pet nutrition products for dogs and cats through its Hill's Pet Nutrition segment. The company operates and sells on a global scale.
Beiersdorf (DE), FY19 €7.2bn revenue
18% EBITDA margin
Beiersdorf (Germany) is a manufacturer of chemical consumer goods, with a focus on personal products and cosmetics. The company operates through two business segments: Consumer and Tesa. The Consumer business segment provides skin and beauty care products, such as all-purpose skin creams, face, body and hand creams, lip
care sticks, deodorants, soaps, shampoos, adhesive and other bandages, among others. The brand portfolio includes NIVEA, Eucerin and La Prairie, which constitute the company’s core brands, as well as regional and local brands, such as Hansaplast, Labello, Florena and Hidrofugal, among others. The Tesa business segment is involved
in developing, manufacturing and marketing self-adhesive products. The company has a worldwide presence with over 150 subsidiaries.
Johnson & Johnson
(US), FY19 $81.4bn revenue 37% EBITDA margin
Johnson & Johnson (USA) researches, develops, manufactures and sales a range of
products in the healthcare field. It operates through three business units: Consumer, Pharmaceutical and Medical Devices. Its primary focus is products related to human health and well-being, such as baby care, oral care, skin care and over-the-counter pharmaceutical products. Pharmaceutical is focused on five therapeutic areas and Medical Devices includes a range of products used in the orthopaedic, surgery, cardiovascular, diabetes care and vision care fields.
L'Oreal (FR), FY19 $26.7bn revenue
23% EBITDA margin
L'Oreal (France) is the world's largest manufacturer of beauty and hair products. It operates through the following segments: Professional Products, Consumer Products,
L'Oréal Luxe, and Active Cosmetics. The Professional Products segment includes products which are used and sold in hair salons; the Consumer Products offers beauty and care products which are sold in mass market retail channels; the L'Oréal Luxe
segment markets high-end skin care and beauty products which are sold in selective retail outlets such as department stores, perfumeries, and travel retail; and the Active Cosmetics segment offers dermo cosmetic skincare products which are sold in pharmacies and specialist sections of drugstores. The revenue breakdown shows: 35%
of sales in skincare and sun protection; 26% in Makeup; 15% in Haircare; 10% in Hair colouring; 9% in Fragrances and 5% in other categories.

Equity Research_.
12 THIS DOCUMENT MAY NOT BE DISTRIBUTED IN THE U.S., AUSTRALIA, CANADA OR JAPAN
Euro Cosmetic competitive arena: benchmarking analysis Benchmarking analysis We conducted a benchmarking analysis considering two different samples: the listed
global companies selected as “comparables”, and the unlisted Italian companies operating as Personal Care manufacturers on behalf of third parties (Ondaline, C.D.B Cosmetici Dermo-Biologici e Areaderma). The analysis was conducted by averaging 2018 and 2019 data.
Euro Cosmetic margins above the average but still room for improvement
As regards to revenue growth and margins, Euro Cosmetic stands between the two samples. The first sample includes large multinationals selling directly to consumers, while the second one consists of manufacturers and fillers on behalf of third parties which, having a B2B business model, have a limited markup and consequently a more
compressed marginality. Euro Cosmetic stands out in terms of margins if compared to other B2B producers; yet if we consider the Company's 2020 guidance and forward strategy, Euro Cosmetic can head to even higher margins.
Figure 6: Benchmarking analysis on growth and marginality
Source: Banca Profilo elaborations on Company data, FactSet, Cerved
Sustainable debt level but working capital management to be improved
Euro Cosmetic’s net debt is considerable as sustainable, with an average Net Debt/EBITDA 2018-2019 of 2.2x, but with a clear improvement trend from 2018 (3.0x) to 2019 (1.3x). The incidence of working capital on turnover is halfway between the two samples. In terms of average days of management, Euro Cosmetic does worse than its
competitors, as there is a marked disproportion in terms of DSO only partially offset by a greater delay in payment times: however, if we incorporate the positive effect of factoring operations in 2019 (with which 32% of total trade receivables have been assigned), Days Sales Outstanding decrease by 24 days, with a Cash Conversion Cycle in line with the sample of Italian B2B companies. Factoring was concluded at a cost of less than 1% and therefore we believe the Company will carry it out on a recurring basis.
4.9%
18.8%
5.5%
11.7%11.2%
6.3%
0%
2%
4%
6%
8%
10%
12%
14%
16%
18%
20%
Revenue growth EBITDA Margin
Listed comparables Euro Cosmetic Unlisted Italian B2B

Equity Research_.
13 THIS DOCUMENT MAY NOT BE DISTRIBUTED IN THE U.S., AUSTRALIA, CANADA OR JAPAN
Figure 7: Benchmarking analysis on and debt level and working capital management
Source: Banca Profilo elaborations on Company data, FactSet, Cerved
Figure 8: Cash Conversion Cycle breakdown
Source: Banca Profilo elaborations on Company data, FactSet, Cerved
0.1
2.2
4.4
0.0
1.0
2.0
3.0
4.0
5.0
Net Debt/EBITDA
Listed comparables Euro Cosmetic Unlisted Italian B2B
13%
18%
24%
0%
5%
10%
15%
20%
25%
NOWC on revenue
13296 96
48
55 11389
89
-117 -130 -130
-83
0
10
20
30
40
50
60
70
80
90
-150
-100
-50
0
50
100
150
200
250
Listed comparables Euro Cosmetic Euro Cosmetic
w/factoring
Unlisted Italian
B2B
Days Inventory Outstanding Days Sales Outstanding
Days Payables Outstanding Cash Conversion Cycle (r.s.)

Equity Research_.
14 THIS DOCUMENT MAY NOT BE DISTRIBUTED IN THE U.S., AUSTRALIA, CANADA OR JAPAN
Euro Cosmetic overview and business model Euro Cosmetic’s history and activities From Trenzano to Palazzo Mezzanotte
Euro Cosmetic is a Company active in the Beauty & Personal Care industry through the
formulation and manufacturing of products for personal hygiene, well-being and
perfuming, intended for private label operators, large multinationals, small and medium-
sized companies with their own brands, and pharmaceutical companies The Company
was founded in Tortona (Alessandria) in 2002, but in 2007 it was relocated to Trenzano
(Brescia), in a new building of 3k square meters. In 2011, current CEO, Daniela Maffoni,
and Chairman, Carlo Ravasio, acquired 76.8% of the Company's shares, starting a period
of strong expansion for Euro Cosmetic; since then, the VoP has increased by 75% to
€22.6mln in 2019, thanks to both the capture of new customers and the successful
investments made in the expansion of the production plant. In 2017, Mrs. Maffoni and
Mr. Ravasio took over the remaining shares of the Company and in 2020 started the IPO
process on the AIM Italia market, to enhance Euro Cosmetic’s business and its brand,
and to take the Company to the next level.
Figure 9: Euro Cosmetic’s main milestones
Source: Banca Profilo elaborations on Company data
Euro Cosmetic: R&D, production and B2B sale of Personal
Care
Euro Cosmetic develops and produces a wide variety of cosmetic products on behalf of third parties, with a focus on four categories:
1. detergents (~39% of FY19 revenue), such as hand sanitizers, shower gels,
intimate wash, liquid soaps, shampoos, conditioners, and hair waxes; 2. oral hygiene (~35% of FY19 revenue), such as toothpaste and gel toothpaste,
alcoholic and alcohol-free mouthwashes and specific products for breath; 3. fragrancies (~15% of FY19 revenue), such as scented water for body, eau de
parfum, after-shave and roll-on, stick or spray deodorants; 4. skin care & lotions (~10% of FY19 revenue) with products such as lotions and
toners, scrub products, creams, oils and lotions, sunscreens and after sun creams.
Four different sales formats
The products are sold in four different formats: 1. bulk, loose product not yet bottled and labelled, 2. final product with customer brand, complete with packaging and labelling, ready
to be put on the market, 3. private label products, entirely formulated and manufactured by Euro Cosmetic
and sold at supermarkets or at other retail chains with their own private label, 4. products with brands registered by Euro Cosmetic that represent product tests
which, if successful, are re-presented on the market under private label brands.
In 2011, the current CEO, Daniela Maffoni, and Chairman, Carlo
Ravasio, acquired 76.8% of the
company's shares
In 2015, the production plant was expanded from 3,000 square meters to 16,500 square meters
On November 6, 2020, Euro Cosmetic went public on the AIM
Italia market
In 2017, Mrs. Maffoniand Mr. Ravasio took over the remaining
shares
2002 2007 2011 2015 2017 2020
In 2007, the Company was relocated to Trenzano
(Brescia)
4.6 12.9 19.9 20.6 22.6 27.4
2007 2011 2015 2017 2019 2020E
FY VoP timeline (€, mln)
Euro Cosmetic was founded in Tortona
(Alessandria) in 2002

Equity Research_.
15 THIS DOCUMENT MAY NOT BE DISTRIBUTED IN THE U.S., AUSTRALIA, CANADA OR JAPAN
Euro Cosmetic’s
customer base: long duration of commercial partnerships; yet high
concentration of revenues per customer
With a highly flexible production system, Euro Cosmetic offers different production
services, both in terms of product type and packaging, and in terms of production time. The Company is thus able to satisfy different customers’ needs, fpr:
▪ large retail store chains, with their own private labels,
▪ industrial companies, both large multinational and small and medium-sized companies with their own brands,
▪ cosmetic companies specialized in products intended for hotels ad beauty salons,
▪ pharmaceutical companies. At the end of 2019, Euro Cosmetic's total customers amounted to 35, rising to 47 at the end of June 2020, due to the numerous partnerships on sanitizing gels. The customer
base is both Euro Cosmetic’s strength and weakness: the 10 most important customers have a duration of 8.5 years indicating a high client retention and long lasting client loyalty, but, at the end of 2019, the same top 10 customers represented more than 90% of turnover, indicating a client concentration risk.
Business model and corporate structure The perfect partner in the Personal Care industry
Euro Cosmetic brands itself as an industrial partner in the Personal Care industry with a highly flexible production capacity that allows the Company to quickly respond to different customers’ needs. Thanks to a partner like Euro Cosmetic, client companies, whether they are beauty multinationals or large retail store chains, are able to quickly bring a wide range of new products of different nature to the market or to renew already existing ones, for example by using a new formulation or a new packaging.
A flexible production system
Euro Cosmetic’s activities cover all stages of the production process, ranging from the definition of the marketing strategy to the delivery of the final product, passing through research, development and production. The production process, however, is not standardized for all product lines: client companies can decide whether to entrust the entire production process to Euro Cosmetic or whether to outsource only some phases. In Euro Cosmetic there are six different production lines, based on the order
management method (two different types) and on the type of work required by the client (three different types), and each client can choose among the six different
combinations.
Order management: order-based production and stock-
based offering
As for the type of order management, Euro Cosmetic offers: ▪ an order-based production, in case of punctual and specific orders in terms of
quantity and timing
▪ a warehouse-based production, in case of a long-term contract requiring recurring production and stock availability;
Types of processing: from all-inclusive to customized processing
As for the type of required manufacturing process, the Company operates through three different production regimes:
▪ The "full service" (about ~80% of the total) which provides for a 360° collaboration between Euro Cosmetic and the client company, starting from the
project idea to the product delivery, passing through formulas research, development and testing, packaging selection and other production phases, including filling. A typical “full service” client is the large-scale private label distributor, which is not involved in the production process.
▪ The “partial full service” (~10%), a production regime that starts from a
commercial need already defined by the client company, as well as from certain
inputs already provided, such as formulas or packaging. Based on the inputs received, Euro Cosmetic carries out tests on the bulk and on its compatibility with the chosen packaging (R&D), to then deal with the entire production process. A typical “partial full service” client is a multinational company, which is already active in the sector and needs an industrial partner with high production capacities capable of industrializing a product on a large scale.
▪ Finally, there are some highly customized processes based on the needs of the
client company (~10%) that can also coincide with a single phase of the production process, such as the formulation, the product test phase, or the filling one. This method is preferred by customers that need to outsource part of their production process, either due to the need for specific know-how, or for periods with peak demand.

Equity Research_.
16 THIS DOCUMENT MAY NOT BE DISTRIBUTED IN THE U.S., AUSTRALIA, CANADA OR JAPAN
Figure 10: Euro Cosmetic’s production process
Source: Banca Profilo elaborations on Company data
R&D is key to product innovation
R&D activities stand among the key feature of the Beauty & Personal Care sector as they are necessary for the design of products in line with new consumption trends, which require ever more quality, efficiency and innovation. The R&D phase is extremely delicate both in terms of creating formulas and active ingredients, and in testing them. With the aim of always being in line with new market trends but without running the
risk of excessively lengthening the time for creating a product, the definition of R&D activities in Euro Cosmetic is based on two cornerstones: the continuing search of new formulas, which allows the Company to have a range of already tested formulations, and the implementation of the most up-to-date European legislation and international
certifications, even soft law rules. Among the most recent ones: in 2019 the Company obtained the IFS-HPC certification regarding the safety standards for products marketed by European large-scale retailers; in 2020 it obtained the Cosmos Bio and Cosmos
Organic certifications from ICEA, attesting the product as natural or BIO, while in September 2020, the Company obtained the PMC certification (Presidio Medico Chirurgico), a certification that will allow Euro Cosmetic to produce a new category of products compared to those already in production, such as disinfectants, germicides and bactericides, repellents and insecticides, among others. Euro Cosmetic spends on average between 1% and 2% of turnover on R&D costs compared to an average of 2%
of comparables – excluding Johnson & Johnson (13%) as present also in the pharmaceutical sector –.
Figure 11: Latest renewals and new certifications
Source: Banca Profilo elaborations on Company data
The main stages of R&D
In Euro Cosmetic, R&D is divided mainly into three groups of activities leading to the production of the bulk:
▪ Development of active ingredients and formulas and consequent definition of characteristics related to performance, chemical-physical and micro-biological structures;
Marketing R&D Production Storage Delivery
▪ definition of the commercial need by the client company
▪ commercial analysis on the reference market and on raw materials
▪ development of active ingredients and new formulations
▪ definition of the organoleptic, chemical-physical and micro-biological
characteristics▪ creation of
prototypes▪ analysis of the
product
performance
▪ procurement of the raw materials
▪ mixing of raw materials and
product manufacturing (cream, oil, soap, etc.)
▪ filling of the
packaging with the product
▪ package labeling or sleevering
▪ final packing
▪ the product is picked up waiting to be delivered to the customer, or
directly withdrawn from it
▪ storage of the finished product
Full Service
Partial Full Service
Customized subcontracts
renewal
Feb. 2019
July2018
Sept.2020
April2019
Oct.2019
Feb.2020
renewal new!new! new!

Equity Research_.
17 THIS DOCUMENT MAY NOT BE DISTRIBUTED IN THE U.S., AUSTRALIA, CANADA OR JAPAN
▪ Testing phase, which involves the analysis of prototypes in a pilot environment,
the analysis of the chemical-physical and microbiology stability of the formulation, and the analysis of the product performance (activity partially outsourced to specialized centers);
▪ Final control concerning the legal aspects, regarding the certifications, the documentation and the legislation in force, and the safety aspects for the consumer.
A valuable production plant
The second key fulcrum of Euro Cosmetic is its production plant, currently at 65% of its capacity:
• 12 machines for the bulk production with a capacity ranging from 20,000kgs to
300,000 kgs for a total daily production capacity of 100,000 kgs and 28,000 tons annually;
• 12 filling lines ranging from tubes fillers to bottle and vase fillers with a daily production capacity of 350,000 units and 80mln units per year.
The production plant represents a strength of Euro Cosmetic as it is expensive to replicate, being composed by numerous machinery related to industry 4.0, and allows
the Company to produce and fill any type of existing personal care product, from
toothpaste to deodorant roll-on, passing through hand sanitizers and Marseille soap.
Ownership structure A family-oriented
company Euro Cosmetic is a family-owned company, currently controlled by the Ravasio family
through MD Srl and Findea’s Srl. MD, the company holding 39% of the share capital of
Euro Cosmetic, is wholly owned by Daniela Maffoni, CEO of Euro Cosmetic, while
Findea’s, the company holding 34% of Euro Cosmetic share capital, is 74% owned by
Carlo Ravasio, Chairman of Euro Cosmetic. Free float stands at 27%.
Figure 12: Ownership structure
Source: Banca Profilo elaborations on Company data
Management Euro Cosmetic corporate governance, a family-oriented company
Both Euro Cosmetic’s Board of Directors and the Board of Statutory Auditors are made
up of five members appointed up to the approval of the financial statements at 31
December 2022. Since 2007, Euro Cosmetic has been a family-oriented company and
to date two out of the five BoD’s members belong to the Ravasio family.
Figure 13: Composition of the Board of Directors
Source: Banca Profilo elaborations on Company data
39%
34%
27%
MD S.r.l. Findea's S.r.l Free float
Board of Directors Position Executive Independent Minority Birth year Gender Nationality
Daniela Maffoni CEO x 1973 F Italian
Carlo Ravasio Chairman 1945 M Italian
Riccardo Alloisio Director 1968 M Italian
Alessandro Celli Director 1966 M Italian
Massimo Vannini Director x 1953 M Italian

Equity Research_.
18 THIS DOCUMENT MAY NOT BE DISTRIBUTED IN THE U.S., AUSTRALIA, CANADA OR JAPAN
Carlo Ravasio Carlo Ravasio, Chairman of the Company, boasts numerous experiences in the
entrepreneurial field. In 1970 he founded a cleaning and personal care company, which
was successfully sold to a Private Equity fund in 2006, after having achieved a turnover
of over €80mln. In 2011 he entered in the capital of Euro Cosmetic and became
Chairman of the Board of Directors.
Daniela Maffoni Daniela Maffoni, CEO of Euro Cosmetic, graduated from the University of Bergamo in
foreign languages and literatures with a managerial economic orientation; subsequently she attended a management course at SDA Bocconi, School of
Management. Before entering into Euro Cosmetic’s capital in 2011, she gained
experience in the home care and personal care sector, covering the role of director in
Klaifer SpA and in the Emmegi Detergens Group.
Riccardo Alloisio Riccardo Alloisio, director, graduated in Business Administration in 1992 from Bocconi
University, and enrolled in the register of Chartered Accountants of Brescia in 1995
and in 1999 in the Register of Statutory Auditors. From 1993 to 1996 he held the role
of auditor at Ernst & Young and from 1997 to 2011 he worked as a Partner at Pernigotto
& Associati. Since 2011 he has been carrying out his professional activity at the Alloisio
& Associati studio.
Alessandro Celli Alessandro Celli, managing director, qualified as a geometer, is a consultant in the field
of fire prevention, accident prevention and health and hygiene regulations. He has
acquired several experiences at various municipal and provincial bodies of Brescia and
Milan.
Massimo Vannini Massimo Vannini, independent director, qualified as an accountant, has valuable
experiences in numerous Italian banks, including Banca Popolare di Novara and Credito
Emiliano. During his experience at Credito Emiliano he held various managerial roles
up to becoming the head of Rolofinance, contributing to the realization of various
acquisitions including Champion, Snaidero, Concorde and Kartogroup. Since 2014 he
has worked at Cariparma, where he currently holds the role of sales manager for Italy,
for the corporate division.
Figure 14: Other important roles
Source: Banca Profilo elaborations on Company data
Other important roles Position Birth year Gender Nationality
Silvia Tosin Investor Relator F Italian
Fabio Piga Plant manager 1960 M Italian
Cinzia Benigni Technical manager 1961 F Italian
Patrizia Loda Administrative manager 1971 F Italian

Equity Research_.
19 THIS DOCUMENT MAY NOT BE DISTRIBUTED IN THE U.S., AUSTRALIA, CANADA OR JAPAN
Historical operating and financial performance Main operating and financial data Since 2007, VoP has grown at a 14% CAGR
From 2007 to 2019, Euro Cosmetic's Value of Production has grown at a 14% CAGR,
reaching €22.6mln in 2019, with strong growth rates even during the 2008-2009
financial crisis, an evidence of the resilience of the Company’s business. A big chunk of
Euro Cosmetic's growth is attributable to the current ownership of the Company, which
took office in 2011; since then, the VoP has increased by 75%, thanks to both the
acquisition of new customers and the successful investments made in expanding the
factory plant.
Figure 15: VoP evolution over 2007 – 2019 (€, mln)
Source: Banca Profilo elaborations on Company data
2019 Revenue breakdown
Looking at revenue breakdown by type of client, in 2019, 43% of revenues came from
large retail store chains, 28% from multinational personal care companies, 25% from
cosmetic companies specializing in high quality products for beauty salons, hair salons
and hotels, and remaining 4% from pharmaceutical companies. We expect however this
breakdown to have changed significantly in 2020, due to both the decline in revenue
from quality products intended for beauty professional companies and the surge in
demand for hand sanitizers, which boosted sales in the pharmaceutical sector.
Figure 16: Euro Cosmetic’s 2019 revenue breakdown by type of client and by product type (%)
Source: Banca Profilo elaborations on Company data
4.65.5
8.4
12.6 12.9
14.8 14.6
19.4 19.9
22.7
20.619.3
22.6
14.5
0
5
10
15
20
25
2007 2008 2009 2010 2011 2012 2013 2014 2015 2016 2017 2018 2019 1H20
43%
28%
25%
4%
Retailers (Private labels) - 43% (↓ in 2020E)
Industrial personal care companies - 28% (↑ in 2020E)
Beauty professional companies - 25% (↓↓ in 2020E)
Pharmaceutical companies - 4% (↑↑ in 2020E)
39%
35%
15%
10%
Cleansers and detergents - 39% (↑↑ in 2020E)
Oral Care products - 35% (↓ in 2020E)
Fragrancies - 15% (≈ in 2020E)
Skincare & Lotion products - 10% (↓ in 2020E)
Expected 2020 variation
↑ = slight increase↑↑ = marked increase↓ = slight decrease↓↓ = marked decrease≈ = broadly unchanged

Equity Research_.
20 THIS DOCUMENT MAY NOT BE DISTRIBUTED IN THE U.S., AUSTRALIA, CANADA OR JAPAN
Cost of goods sold
breakdown: 60% raw materials (ingredients and packaging)
In 2019, cost of goods sold stood at €19.8mln, with an incidence on revenue equal to
90%, broadly in line with 2018 (89%). The breakdown into single voices was the
following:
▪ raw materials (60% on revenue, 67% on total COGS), mainly ingredients used
in the production and mixing phase (about 65% of the total), and packaging
material used in the filling and labelling phase (about 35%);
▪ services (11% and 13%), mainly related to outsourced product assembly
services and freight transport logistics and services;
▪ labour cost (18% and 20%), divided between structure administrative staff and
production staff;
• other costs (1% and 1%), including costs for the use of third-party assets.
Figure 17: 2019 cost structure (€, mln)
Source: Banca Profilo elaborations on Company data
Average 2018-2019
EBITDA margin at 12%
In 2019, EBITDA margin on revenue improved by 215 basis points to 13%, thanks to:
i) the optimization of raw materials purchases, ii) the increase in minimum batches for
skincare products, and iii) the production mix shifting towards high margins products,
mainly detergents and skincare products.
Net income margin at 5% in 2019
Finally, 2019 Net Income stood at €1mln, up €0.7mln, with margin on Revenue
improving from 2% in 2018 to 5% in 2019. This increase was mainly due to the
reduction of tax rate from 46% to about 25%, thanks tax benefits on super-
amortization.

Equity Research_.
21 THIS DOCUMENT MAY NOT BE DISTRIBUTED IN THE U.S., AUSTRALIA, CANADA OR JAPAN
Table 1: Euro Cosmetic Profit & Loss 2018-2019 (€, mln)
Source: Banca Profilo elaborations on Company data
A production plant
worth €8.8mln
On the Balance Sheet side, at the end of 2019, Euro Cosmetic had €8.8mln of fixed
assets, broadly in line with 2018 (€9.0mln), of which approximately 97% was
represented by tangible fixed assets, mainly plants, machineries, lands and buildings.
2018 2019
Revenue 19.3 22.0
yoy 14%
Changes in unfinished & finished goods (0.1) 0.2
Other Revenues 0.1 0.4
Value of Production 19.3 22.6
yoy 17%
Cost of raw materials & changes in inventories (11.6) (13.2)
% on revenue 60% 60%
Cost of purchased services (2.0) (2.5)
% on revenue 10% 11%
Costs for the use of third-party assets (0.0) (0.0)
% on revenue 0% 0%
Labour cost (3.5) (4.0)
% on revenue 18% 18%
# employees - 90
Other operating costs (0.2) (0.2)
% on revenue 1% 1%
Cost of goods sold (17.3) (19.8)
EBITDA 2.1 2.8
EBITDA margin on revenue 11% 13%
yoy 37%
D&A (1.4) (1.3)
% on revenue 7% 6%
Write-downs - (0)
EBIT 0.7 1.5
EBIT margin on revenue 4% 7%
yoy 107%
Net financial income (expenses) (0.1) (0.1)
% on revenue 1% 0%
EBT 0.6 1.3
EBT margin on revenue 3% 6%
Income Tax Expense (0.3) (0.3)
Tax rate 45% 24%
Net Income 0.3 1.0
Net Income margin on revenue 2% 5%
yoy 223%
Profit & Loss (€ mln)

Equity Research_.
22 THIS DOCUMENT MAY NOT BE DISTRIBUTED IN THE U.S., AUSTRALIA, CANADA OR JAPAN
NOWC stood at
€2.9mln in 2019, with a 13% incidence on Revenue
Net Operating Working Capital stood at €2.9mln in 2019 (13% of Revenue), down
€1.4mln from 2018 thanks to a non-recourse factoring operation on some 40% of total
trade receivables, which generated a flow of immediate cash equal to approximately
€2.9mln; the cost of the transaction was lower than 1%. Without factoring, Net
Operating Working Capital would have been equal to €5.7mln (26% of Revenue).
Figure 18: Net Operating Working Capital breakdown, 2018-2019 (€, mln)
Source: Banca Profilo elaborations on Company data.
NFP equal to 1.3x the EBITDA at the end of
2019
Net Financial Position was equal to €3.7mln at the end of 2019 (1.3x the EBITDA and
0.6x the Shareholders’ Equity), down by €2.4mln due to the decrease in trade
receivables, following the factoring operation, as well as the termination of some leasing
debts come to maturity. In the first half of 2020, NFP worsened by €3mln mainly due to
the deferral of the factoring transaction to the end of September; at the end of the nine
months, following a new factoring transaction worth €3.5mln, the NFP stood at €3.3mln.
Figure 19: 2019 Net Financial Position (€, mln)
Source: Banca Profilo elaborations on Company data.
Shareholders' equity:
€6.4mln in 2019 Shareholders' equity amounted to €6.4mln in 2019 compared to €5.8mln in 2018, a
change mainly attributable to the increase in net income, from €0.3mln in 2018 to €1mln
in 2019.
5.84.1
7.0
3.8
3.9
3.9
-5.3 -5.1 -5.1
-8
-6
-4
-2
0
2
4
6
8
10
12
2018 2019 2019 without factoring
Trade Receivable Inventories
Trade Payable Net Operating Working Capital
22% 13% 26%
Incidence of NOWC on Revenue

Equity Research_.
23 THIS DOCUMENT MAY NOT BE DISTRIBUTED IN THE U.S., AUSTRALIA, CANADA OR JAPAN
Table 2: Euro Cosmetic Balance Sheet 2018 – 2019 (€, mln)
Source: Banca Profilo elaborations on Company data
2018 2019 1H 2020
Intangible Assets 0.2 0.2 0.2
Tangible Assets 8.8 8.6 8.5
PP&E 4.3 4.5 4.3
Lands and buildings 4.5 4.2 4.2
Financial Assets - - -
Fixed Assets 9.0 8.9 8.7
Trade Receivable 5.8 4.1 10.0
Inventories 3.8 3.9 5.4
Trade Payable (5.3) (5.1) (6.8)
Net Operating Working Capital 4.3 2.9 8.6
NOWC % on revenue 22% 13% 59%
trade receivables (% on revenue) 30% 19% 69%
inventories (% on revenue) 20% 18% 38%
trade paybles (% on COGS) 31% 25% 58%
Other current assets 0.6 0.9 0.8
Other current liabilities (0.8) (1.1) (1.9)
Non current assets 0.0 0.0 0.0
Non current liabilities (1.1) (1.3) (1.4)
Of which Funds (0.9) (1.1) (1.2)
Invested Capital 12.0 10.2 14.7
Capex 0.6 1.0 0.6
Intangible 0.2 0.0 0.1
Tangible 0.4 1.0 0.5
% on revenue 3% 5% 4%
Share capital 1.2 1.2 1.2
Reserves and Retained Earnings 4.6 5.3 6.8
Shareholders' equity 5.8 6.4 7.9
Net debt (cash) 6.2 3.7 6.8
Cash and cash equivalents (2.5) (2.5) (2.1)
Debts to banks 5.6 2.8 5.9
Leasing debts 3.0 2.7 2.6
Other debts 0.0 0.7 0.3
Balance Sheet (€ mln)

Equity Research_.
24 THIS DOCUMENT MAY NOT BE DISTRIBUTED IN THE U.S., AUSTRALIA, CANADA OR JAPAN
Free Cash Flow was
positive for €2.8mln in 2019
In 2019, Euro Cosmetic’s Free Cash Flow was positive for €2.8mln, including Net
Operating Working Capital cash generation for €1.4mln and €1.2mln of capex.
Table 3: Euro Cosmetic’s Cash Flow 2018-2019 (€, mln)
Source: Banca Profilo estimates and elaborations on Company data
2020 expected closing FY2020 Company’s
guidance: - +21% yoy in VoP - EBITDA margin at
about 17.5%
The consequences of the crisis triggered by Covid-19 has had a very limited impact on
Euro Cosmetic's business; actually, it has created a business opportunity, thanks to the
high demand in its hand sanitizers and its exponential growth in the pharmaceutical
sector. This has allowed the Company to more than offset the decline in revenue from
the “professional segment” (beauty salons, hairdressers and hotels) affected by the
forced closure during lockdowns. According to the Company’s guidance, released on
January 14, FY2020 VoP is forecast at €27.4mln, +21% yoy, the EBITDA margin on VoP
is expected to improve from 12.4% to about 17.5%, while the EBIT margin from 6.3%
to 12.4%. The net improvement in margins is due to a greater incidence, on the product
mix, of high-margin products, as well as to the strengthening of the market positioning
in the pharmaceutical sector.
Our 2020 revenue
breakdown estimate As for revenue breakdown by type of client, we estimate: i) a consolidation of revenue
from large retail chains, ii) a double-digit growth in revenue from industrial companies,
iii) a triple-digit growth in the pharmaceutical sector due to the surge in demand for
hand sanitizers, and iv) a decline of about 30% in revenue from specialized cosmetic
companies, whose business has been affected by the forced closure of hotels, beauty
salons and hairdressers during lockdowns.
Estimated net income
margin at 9% According to our Income Statement estimates, the Company is expected to close the
full year with a net profit equal to €2.4mln, with a margin of 9%. As for dividends, we
have assumed a payout ratio of 20% of net profit, for an absolute value equal to about
€500k.
Our Balance Sheet
estimates According to our Balance Sheet estimates:
▪ as regards fixed assets, no significant changes are expected;
▪ NOWC is estimated to have increased by €700k, in line with the growth in
turnover;
▪ capex should have been equal to about €950k, mainly in tangible assets aimed
at renewing the production plant;
▪ total debts are expected to be about €8.8mln at the end of 2020 from €6.2mln
in 2019, due to new loans of approximately €3.5mln signed in the first half of
2020;
Finally, the Company is expected to have ended the fiscal year with a net financial
position of -€5.7mln (cash), already including €7.2mln of IPO Proceeds.
2018 2019
EBIT 0.7 1.5
Tax rate 45% 24%
NOPAT 0.4 1.1
D&A 1.4 1.3
Operating Cash Flow 1.7 2.4
Changes in Funds 0.1 0.2
Changes in Operating NWC 0.6 1.4
Capex (0.7) (1.2)
Free Cash Flow 1.6 2.8
Cash Flows (€ mln)

Equity Research_.
25 THIS DOCUMENT MAY NOT BE DISTRIBUTED IN THE U.S., AUSTRALIA, CANADA OR JAPAN
Strategy and estimates Company’s strategy and guidance IPO Proceeds (€7.2mln) are going to be used to:
- enlarge the production plant
- enter the BTC market
- finance potential M&As.
FY2021 guidance:
- +7.1% yoy in VoP - EBITDA margin at
about 17.6% - capex of about
€2mln
For the next years, Euro Cosmetic is set to expand its business further, through both
organic and external growth. As for organic growth, the Company’s strategic plan is
based on the following four pillars:
i) enlargement of the production plant by about 5,000 square meters, to reach a
total surface of 21,500 sqm (estimated investment of about €4.6mln, of which
€900k will be invested in 2021 while the remaining part will be spread over a
period of twelve years).
ii) launch of a niche skincare line products, to be sold directly to the final consumer
through online channels (estimated total expenses of €0.7mln, to be spread
over 2021 and 2022): thanks to this new line of products, the Company will
officially enter the B2C market, with its own brand and its own e-commerce
platform. To promote the product launch, Euro Cosmetic has signed a
partnership with The Blonde Salad, the digital publishing and marketing
Company founded and directed by Chiara Ferragni.
iii) expansion of the product range thanks to continuous investments in R&D and
the freshly obtained PMC certification (the certification of the Italian “Presidio
Medico Chirurgico”, a specific category of medical devices such as disinfectants,
insecticides and insect repellents);
iv) capture of new customers, thanks to both the increase in production capacity
and the strengthening of Euro Cosmetic brand following the IPO.
Based on this strategic plan, the Company has given the following guidance for the
FY2021: revenue from finished products of €28.7mln, +7.1% yoy, VoP of €29.0mln,
+5.8% yoy, EBITDA margin on VoP of 17.6%, EBIT margin of 12.4%, and capex of
about €2mln. Moreover, the Company intends to grow also by external lines, and some
of the net IPO proceeds, worth €7.2mln, are going to be used to finance M&A
opportunities aimed at strengthening the market positioning within the pharmaceutical
sector.
Our 2021E-2023E estimates VoP is estimated to grow at a CAGR of 9% over 2019-2023E
Our 2021E-2023E estimates are on Euro Cosmetic as is, stand alone, and are based on both macroeconomic and sectoral assumptions, as well as on estimates related to specific Company projects. We expect:
i) a constant consolidation of revenue from large retail chains, given the already high number of partnerships Euro Cosmetic has with Private Labels;
ii) a double-digit growth of revenue from the industrial sector in 2021, followed by a period of consolidation. The growth will be driven by both capture of new
customers and consolidation of the relationship with actual clients, thanks to: 1) the strengthening of Euro Cosmetic brand after the IPO, 2) the increased production capacity following the enlargement of the production plant, and 3) the expansion of the product range, with: PMC products, products based on new certifications, and already existing products that can be renewed in their formulas by including new active ingredients;
iii) a physiological slowdown in revenue from the pharmaceutical sector, in both
2021 and 2022, followed by a growth in line with the market in 2023: we expect the product range expansion, mainly thanks to PMC products, will only partially offset the physiological decline in the demand for hand sanitizers, after the revenue surge in 2020;
iv) a return to growth in revenues from professional products, thanks to the gradual reopening of the economic activities concerned (hotels, hairdressers and beauty
salons), after the forced closures of 2020; according to our estimates, with this type of customer, Euro Cosmetic will return to 2019 levels only in 2022;
v) approximately €2.8mln of cumulative revenue between 2021 and 2023 generated by the entry into the BTC market.

Equity Research_.
26 THIS DOCUMENT MAY NOT BE DISTRIBUTED IN THE U.S., AUSTRALIA, CANADA OR JAPAN
We estimate sustainable growth about 6% over the next three years
According to our stand-alone 2021E-2023E estimates, VoP is estimated to grow at a
2019-2023E CAGR of 9%, to over €32mln in 2023; excluding the 2020 revenue surge, we believe sustainable growth will be about 6% over the next three years.
Figure 20: Euro Cosmetic finished products revenue’s trend over 2018-2023E (€, mln)
Source: Banca Profilo elaborations and estimates
Cost assumptions: 2021E-2023E incidence of COGS on revenue is estimated to decrease to 84%
The incidence of cost of goods sold on finished products revenue is expected to decrease
from 90% in 2019 to an average 84% over the 2021-2023 period, in line with 2020,
due to a decrease in the incidence of raw materials and labour cost, allowing a net
improvement in margins.
▪ Cost of materials: due to the change in the product mix towards higher margins
products and to an estimated increase in bargaining power, we forecast the
incidence of cost of raw materials on revenue to have been dropped from 60%
in 2019 to about 54% from 2020 onwards. In addition, any appreciation of the
cost of raw materials exceeding 3% has been contractually negotiated with
client companies, guaranteeing an upward revision of final sales prices.
▪ Cost of purchased services: in 2020 we expect the incidence on revenue up by
125bps at about 13%, due to the strong rise in external processing services
needed for the production of sanitizers; we expect only a small decrease in its
incidence from 2021 onwards, as cost savings from expansion of the logistics
area will partially be offset by the increase in marketing expenses.
▪ Labour costs: in line with Company's recruitment plan, we have assumed 20
hires between 2020 and 2021, and 10 hires between 2022 and 2023; with a
broadly unchanged average cost per employee (estimated at 44k), such
assumptions lead to a 2020E-2023E average incidence on revenue equal to
about 17% (18% in both 2018 and 2019).
▪ Other operating costs: we assume for the all period under analysis an incidence
on revenue in line with the 2018-2019 average, equal to 1%.
EBITDA: - 2019-2023E CAGR
of 19% - 2023 margin at
about 18%
Based on our revenue and cost assumptions, EBITDA is estimated to grow at a 2019-
2023E CAGR of 19%, to just below €6mln in 2023, with margin on Value of Production
improving from 12.4% to about 18% in 2023. Excluding the 2020 EBITDA surge, we
believe sustainable growth will be about 6% over the next three years, thanks to
increasing selling volumes and focusing on high-margin products.
8.6 9.3 10.6 11.0 11.5 11.6
6.4 6.0
8.610.0
10.8 11.3
0.8 0.9
3.72.3
1.3 1.4
3.35.5
3.84.8 5.5
5.80.3
1.01.5
19.021.8
26.828.4
30.231.7
0
5
10
15
20
25
30
35
2018 2019 2020E 2021E 2022E 2023E
Retailers (Private labels) Industrial companies
Pharmaceutical companies Beauty professional companies
BTC

Equity Research_.
27 THIS DOCUMENT MAY NOT BE DISTRIBUTED IN THE U.S., AUSTRALIA, CANADA OR JAPAN
Figure 21: EBITDA (€, mln) and EBITDA margin (%) 2018-2023E trend
Source: Banca Profilo elaborations and estimates
D&A has to reflect a 2021-2023 estimated cumulated capex plan of €3.9mln
D&A is expected to have slightly fallen in 2020 due to an estimated 22% decline in
investments, with 2020 capex at about 950k from €1.2mln in 2019. From 2021
onwards, D&A should increase on average by 10% per year due to an estimated
investment plan equal to total capex in the three-year period 2021-2023 of €3.9mln.
On average, D&A refers for more than 90% to tangible assets.
Tax rate as little as 25% given the super-amortization; 13% in 2021 due to
IPO-related tax credit
We estimate a tax rate of 25% until 2023, in line with the 2019 figure, except for 2021.
In general, the tax relief is guaranteed by the investments both already made and
planned in 4.0 machineries, which guarantee a reduction in the tax base thanks to the
super-amortization. In 2021, the Company will have a tax credit of approximately 400k,
relating to IPO costs (approximately half of the total costs incurred), with a consequent
lowering of the tax rate to approximately 13%.
9% Net Income margin
is to be considered sustainable; 20% payout ratio
Net income is estimated to grow at a 2019-2023E CAGR of 29% to just below €3mln in
2023. On average, net income margin is expected to be sustainable at 9%. As for
dividends, we have assumed a payout ratio of 20% of net profit, for an absolute value
equal on average to €500k.
2.12.8
4.8 4.95.4 5.7
11%
12%
17%17% 18% 18%
0%
4%
8%
12%
16%
20%
24%
0
1
2
3
4
5
6
2018 2019 2020E 2021E 2022E 2023E
EBITDA EBITDA margin on VoP

Equity Research_.
28 THIS DOCUMENT MAY NOT BE DISTRIBUTED IN THE U.S., AUSTRALIA, CANADA OR JAPAN
Table 4: Euro Cosmetic Profit & Loss 2018-2023E (€, mln)
Source: Banca Profilo elaborations and estimates
2018 2019 2020E 2021E 2022E 2023E
Revenue from finished products 19.3 22.0 26.8 28.4 30.2 31.7
yoy 14% 22% 6% 6% 5%
Changes in unfinished & finished goods (0.1) 0.2 0.2 0.2 0.2 0.1
Other Revenues 0.1 0.4 0.3 0.3 0.3 0.3
Value of Production 19.3 22.6 27.4 28.9 30.6 32.1
yoy 17% 21% 6% 6% 5%
Cost of raw materials & changes in inventories (11.6) (13.2) (14.6) (15.5) (16.3) (17.1)
% on revenue 60% 60% 54% 54% 54% 54%
Cost of purchased services (2.0) (2.5) (3.4) (3.4) (3.6) (3.8)
% on revenue 10% 11% 13% 12% 12% 12%
Costs for the use of third-party assets (0.0) (0.0) (0.0) (0.0) (0.0) (0.0)
% on revenue 0% 0% 0% 0% 0% 0%
Labour cost (3.5) (4.0) (4.4) (4.9) (5.1) (5.3)
% on revenue 18% 18% 17% 17% 17% 17%
Other operating costs (0.2) (0.2) (0.2) (0.2) (0.2) (0.2)
% on revenue 1% 1% 1% 1% 1% 1%
Cost of goods sold (17.3) (19.8) (22.6) (23.9) (25.2) (26.4)
EBITDA 2.1 2.8 4.8 4.9 5.4 5.7
EBITDA margin on revenue 11% 13% 18% 17% 18% 18%
EBIT margin on VoP 11% 12% 17% 17% 18% 18%
yoy 37% 70% 3% 9% 6%
D&A (1.4) (1.4) (1.3) (1.5) (1.7) (1.8)
% on revenue 7% 6% 5% 5% 6% 6%
Write-downs - (0) (0) - - -
EBIT 0.7 1.4 3.4 3.5 3.7 3.9
EBIT margin on revenue 4% 7% 13% 12% 12% 12%
EBITDA margin on VoP 4% 6% 13% 12% 12% 12%
yoy 104% 141% 0% 7% 6%
Net financial income (expenses) (0.1) (0.1) (0.2) (0.2) (0.2) (0.2)
% on revenue 1% 0% 1% 1% 1% 1%
EBT 0.6 1.3 3.3 3.3 3.5 3.7
EBT margin on revenue 3% 6% 12% 12% 12% 12%
Income Tax Expense (0.3) (0.3) (0.8) (0.4) (0.9) (0.9)
Tax rate 45% 25% 25% 13% 25% 25%
Net Income 0.3 1.0 2.5 2.9 2.6 2.8
Net Income margin on revenue 2% 5% 9% 10% 9% 9%
Net Income margin on VoP 2% 4% 9% 10% 9% 9%
yoy 217% 148% 16% -8% 6%
Dividends 0.4 0.3 0.5 0.6 0.5 0.6
Payout ratio 127% 30% 20% 20% 20% 20%
Profit & Loss (€ mln)

Equity Research_.
29 THIS DOCUMENT MAY NOT BE DISTRIBUTED IN THE U.S., AUSTRALIA, CANADA OR JAPAN
Balance Sheet
projections
Capex 2021-2023: €3.9mln
NOWC absorption of €2.7mln from 2021 to 2023
Regarding our Balance Sheet projections:
▪ as for fixed assets, we estimate a significant increase in 2021E, due to the rise
in right of use which are related to the €900k increase in the lease;
▪ capex should total €3.9mln over the 2021-2023 period, with an annual average
of €1.3mln. Investments will mainly be made in tangible assets, aimed at
expanding and renewing the production plant;
▪ NOWC is estimated to increase by €2.6mln over 2021-2023 (€3.3mln over
2020-2023), with the incidence on revenue expected to be on average equal to
18%, already including the positive effect coming from factoring operations,
estimated to be done on a recurring basis, given Euro Cosmetic’s high rating
profile and the consequent low cost of the transaction.
▪ as for debts, we have estimated a total recourse to debt equal to approximately
€2.5mln, already including the lease for the expansion of the production plant,
of which €900k in 2021 and the remaining part (approximately €3.7mln) spread
over a period of twelve years;
Consequently, the NFP is forecast to decline progressively, until reaching -€11.0mln in
2023, thanks to Euro Cosmetic cash generative business.
Figure 22: Net working capital composition and dynamics over 2018-2023E (€, mln)
Source: Banca Profilo elaborations and estimates
5.84.1 4.4 5.2 5.9 6.4
3.83.9
5.45.9
6.5 6.8
(5.3) (5.1) (6.2) (6.5) (6.8) (7.1)
-10
-5
0
5
10
15
2018 2019 2020E 2021E 2022E 2023E
Trade Receivable Inventories Trade Payable

Equity Research_.
30 THIS DOCUMENT MAY NOT BE DISTRIBUTED IN THE U.S., AUSTRALIA, CANADA OR JAPAN
Table 5: Euro Cosmetic Balance Sheet 2018-2023E (€, mln)
Source: Banca Profilo elaborations and estimates
Free Cash Flow of €7.6mln from 2021 to 2023
According to our Profit & Loss and Balance Sheet estimates, we estimate €7.6mln of
cumulated Free Cash Flow in three years, net of comprehensive of €3.9mln of capex
and €2.6mln of NOWC needs.
2018 2019 2020E 2021E 2022E 2023E
Intangible Assets 0.2 0.2 0.3 0.4 0.5 0.5
Tangible Assets 8.8 8.6 8.3 8.8 8.1 7.4
PP&E 4.3 4.5 4.5 4.5 4.2 3.7
Right of use 4.5 4.2 3.8 4.2 4.0 3.7
Financial Assets - - - - - -
Fixed Assets 9.0 8.9 8.6 9.2 8.6 7.9
Trade Receivable 5.8 4.1 4.4 5.2 5.9 6.4
Inventories 3.8 3.9 5.4 5.9 6.5 6.8
Trade Payable (5.3) (5.1) (6.2) (6.5) (6.8) (7.1)
Net Operating Working Capital 4.3 2.9 3.5 4.7 5.6 6.2
NOWC % on revenue 22% 13% 13% 17% 19% 19%
trade receivables (% on revenue) 30% 19% 17% 18% 20% 20%
inventories (% on revenue) 20% 18% 20% 21% 21% 22%
trade paybles (% on COGS) 31% 25% 28% 27% 27% 27%
Other current assets 0.6 0.9 0.9 0.9 1.0 1.0
Other current liabilities (0.8) (1.1) (1.3) (1.3) (1.4) (1.5)
Non current assets 0.0 0.0 0.0 0.0 0.0 0.0
Non current liabilities (1.1) (1.3) (1.7) (1.6) (2.0) (2.2)
Of which Funds (0.9) (1.1) (1.3) (1.4) (1.6) (1.7)
Invested Capital 12.0 10.2 10.0 11.9 11.8 11.4
Capex 0.7 1.2 0.9 2.0 1.0 1.0
Intangible 0.2 0.0 0.1 0.1 0.1 0.1
Tangible 0.5 1.2 0.9 1.8 0.9 0.9
% on revenue 4% 6% 4% 7% 3% 3%
Share capital 1.2 1.2 1.6 1.6 1.6 1.6
Reserves and Retained Earnings 4.6 5.3 14.2 16.5 18.6 20.9
Shareholders' equity 5.8 6.4 15.8 18.1 20.2 22.5
Net debt (cash) 6.2 3.7 (5.7) (6.3) (8.4) (11.0)
Cash and cash equivalents (2.5) (2.5) (14.5) (16.1) (18.8) (21.7)
Of which net IPO Proceeds (7.2) (7.2) (7.2) (7.2)
Debts to banks 5.6 2.8 5.7 5.9 6.3 6.3
Leasing debts 3.0 2.7 2.7 3.5 3.7 4.0
Other debts 0.0 0.7 0.4 0.4 0.4 0.4
Balance Sheet (€ mln)

Equity Research_.
31 THIS DOCUMENT MAY NOT BE DISTRIBUTED IN THE U.S., AUSTRALIA, CANADA OR JAPAN
Table 6: Euro Cosmetic Free Cash Flow 2018-2023E (€, mln)
Source: Banca Profilo elaborations and estimates
Key risks Estimates execution risks
Main risks to our projections are linked to: i) the concentration of revenue per customer,
ii) a potential drop in demand, iii) the loss of products' competitiveness, iv) product
liability, v) the loss of qualified personnel; vi) the appreciation of raw materials and vii)
the family-oriented model.
Risk related to the concentration of revenue per customer: - medium-low likelihood
- high impact
Euro Cosmetic shows a high concentration of revenue per customer, with the top 10 client companies representing more than 90% of total revenue at the end of 2019, and the first customer about 27%. This concentration represents a strong risk in the moment in which one or more commercial relationships with client companies should be
interrupted. This risk is partially offset by the high stability, duration and consolidation that the Company has been showing both in historical and current commercial relations with customers. We evaluate this risk with a medium-low likelihood of that occurring and a high potential impact on the business.
Risk related to the
decline in demand: - medium-low likelihood - medium impact
The business of Euro Cosmetic, like any other company, is exposed to the potential risk
of contraction in demand deriving from a reduction in the activity of the main customers, from the worsening of macroeconomic conditions, or from potential exogenous events. This risk is partially offset by the defensive nature of Euro Cosmetic’s reference industry and business. We evaluate this risk with a medium-low likelihood of that occurring and a medium potential impact on the business.
Risk of losing products'
competitiveness: - medium-low likelihood - medium impact
Euro Cosmetic's success partially depends on the ability to keep offering innovative
products that meet customer needs and anticipate competing products on new market trends. It cannot be excluded that the Company makes evaluation or technical errors in the design, production and marketing of new products, but we believe that the current management, as demonstrated in recent years, will largely mitigate this risk through: i) the constant monitoring of reference markets, ii) the careful business administration and management and iii) a precise business expansion strategy. We evaluate this risk with a medium-low likelihood of that occurring and a medium potential impact on the
business.
Risk related to product
liability: - low likelihood - medium impact
Euro Cosmetic operates in a sector where the use of products by the final consumer
could have side or undesirable effects on health conditions. Although the Company adopts high quality standards and is equipped with systems dedicated solely to quality control, this eventuality would expose the Company to potential legal actions by third
parties who were able to demonstrate the causal link between the damage suffered and the activity of the Company. For this reason, Euro Cosmetic has taken out insurance policies to protect itself against this risk. We evaluate this risk with a low likelihood of that occurring and a medium potential impact on the business.
Risk of losing qualified personnel:
- low likelihood - medium-low impact
The results of Euro Cosmetic depend to a significant extent on its management and on some key figures. The Company, should there be an interruption of the professional
collaboration relationships with some key figures, could be exposed to a deterioration of its competitiveness, with repercussions on both demand and economic results. We evaluate this risk with a low likelihood of that occurring and a medium potential impact on the business.
2018 2019 2020E 2021E 2022E 2023E
EBIT 0.7 1.4 3.4 3.5 3.7 3.9
Tax rate 45% 25% 25% 13% 25% 25%
NOPAT 0.4 1.1 2.6 3.0 2.8 2.9
D&A 1.4 1.4 1.3 1.5 1.7 1.8
Operating Cash Flow 1.7 2.4 3.9 4.5 4.4 4.7
Changes in Funds 0.1 0.2 0.1 0.2 0.2 0.2
Changes in Operating NWC 0.6 1.4 (0.7) (1.2) (0.9) (0.5)
Capex (0.7) (1.2) (0.9) (2.0) (1.0) (1.0)
Free Cash Flow 1.6 2.8 2.4 1.5 2.7 3.3
Cash Flows (€ mln)

Equity Research_.
32 THIS DOCUMENT MAY NOT BE DISTRIBUTED IN THE U.S., AUSTRALIA, CANADA OR JAPAN
Risk related to the
appreciation of raw materials: - medium likelihood
- medium-low impact
Euro Cosmetic’s incidence of raw materials cost on turnover is over 50% and therefore
the Company is exposed to its price fluctuations. However, the Company sets the price with suppliers about 6/7 months in advance, and any appreciation of raw materials cost exceeding 3% is by contract turned to final prices and therefore to client companies. We
evaluate this risk with a medium likelihood of that occurring and a medium-low potential impact on the business.
Risk associated with the family-oriented model: - low likelihood - medium-low impact
Over the years, the family-oriented governance has ensured business stability and medium-long term corporate policies that have led Euro Cosmetic to expand the business. However, the overlap between ownership and management of the Company, and the will of perpetuating the business in the hands of next generations, indicates a
risk of potential conflicts of interest and it cannot be excluded that management decisions may be influenced by the consideration of owners’ personal interests. We evaluate this risk with a low likelihood of that occurring and a medium-low potential impact on the business.
Table 7: Risk matrix
Im
pact
Very high
High Concentration of
revenue per customer
Medium
Product liability;
Loss of qualified personnel
Contraction of demand;
Loss of products' competitiveness
Medium-Low Family-oriented
model
Appreciation of raw materials
Low
Potential impact VS
likelihood
Low Medium-Low Medium High Very high
Likelihood
Source: Banca Profilo elaborations on Company data

Equity Research_.
33 THIS DOCUMENT MAY NOT BE DISTRIBUTED IN THE U.S., AUSTRALIA, CANADA OR JAPAN
Valuation DCF method and market multiples
A DCF method well adapts as a valuation approach, as allows us to better capture the
value of Euro Cosmetic’s expansion capex plan and its cash generating business model.
Furthermore, we have selected a sample of listed international companies
"comparables" to Euro Cosmetic, in order to suggest an appropriate sample for the
relative valuation through market multiples.
DCF Valuation DCF assumptions: - €7.6mln of
cumulated FCFs
- €2.5mln as
Terminal Value cash flow
- 7.1% WACC
To run a DCF model, we would use our projections of FCF for the 2021E-23E explicit
period: cumulated cash flows for €7.6mln or €1.9mln as yearly average.
In order to assess the Terminal Value, we factor in:
▪ an annual FCF generation of €2.5mln
▪ perpetual growth rate of 2%.
We would use a WACC of 7.1%, derived from:
▪ risk free rate equal to 3.0%, as implicitly expected by consensus on the 30Y
Italian BTP yield curve (moving average of the last 100 days) with an estimated
increase in interest rates;
▪ market risk premium equal to 5.5%;
▪ beta of 1.0, coming from the average of chosen listed peers;
▪ target debt to equity structure, with 80% weight of Equity
In order to get to the Equity Valuation we would consider our estimate for the Net
Financial Position as of December 31, 2020, equal to -€5.7mln, in order to include both
the IPO Proceeds and the effect on NWC of the factoring operations made.
Table 8: WACC calculation
Source: Banca Profilo estimates and elaborations
DCF Fair Value: €11.0/share
The DCF method leads us to an Enterprise Value of €46.4mln and an Equity Value of
€52.2mln or €11.0/share.
Perpetual growth rate 2.0%
WACC 7.1%
Risk free rate (30Y) 3.0%
Equity Risk Premium 5.5%
Beta 1.0
Cost of Equity 8.5%
Cost of Debt (before tax) 1.6%
Tax rate 25.0%
WACC Calculation

Equity Research_.
34 THIS DOCUMENT MAY NOT BE DISTRIBUTED IN THE U.S., AUSTRALIA, CANADA OR JAPAN
Table 9: DCF valuation
Source: Banca Profilo estimates and elaborations
Relative market multiples valuation EV/EBITDA the multiple to be used
In order to assess a relative valuation of Euro Cosmetic through the market multiples
approach, we selected a sample of listed international companies specialized in the
production and distribution of cosmetic products: Sarantis, L'Occitane, PZ Cussons,
Colgate-Palmolive, Beiersdorf, Johnson & Johnson and L'Oreal. To implement the
analysis, we divided the sample into two subgroups, with the first one consisting of
those companies most similar to Euro Cosmetic by business model, dimension and
margins, in accordance with our analysis on comparables.
Table 10: Sample benchmarking on revenue growth and EBITDA margin
Source: Banca Profilo estimates and elaborations on Factset (as of January 20, 2021)
EV/EBITDA 2021E-2022E of 10.8x
Considering the first sample of closer to Euro Cosmetic’s activity peers, the average
EV/EBITDA 2021E and 2022E are equal to 11.5x and 10.1x respectively (as of January
20), with a simple average of 10.8x; we derived an average Equity Value of €49.9mln,
equal to a per share value of €10.5, already including a 15% liquidity discount given
Euro Cosmetic’s low level of turnover velocity ratio.
Free Cash Flow (FCF) 1.5 2.7 3.3 2.5
Years 1.0 2.0 3.0
Discount factor 0.9 0.9 0.8
NPV Cash flows 1.4 2.3 2.7
Sum of NPVs 1.4 3.8 6.5
Terminal Value 49.1
NPV Terminal Value 39.9
Enterprise Value 46.4
Net Financial Position 2020E (5.7)
Minorities
Equity Value (€, mln) 52.2
Current outstanding shares 4.8
Equity Value per share (€) 11.0
2021E 2022E Over2023EDCF Valuation
(€ mln, except for the target price)
Company CurrencyMarket Cap
(Mln)EV
2018 2019 2020E 2021E 2022E 2018 2019 2020E 2021E 2022E
Sarantis SA EUR 630 654 15% 8% 7% 7% 7% 14% 15% 16% 16% 16%
L'Occitane International SA EUR 2,902 3,709 6% 13% -1% 9% 8% 15% 16% 14% 16% 19%
PZ Cussons PLC GBp 1,003 1,092 0% -13% -4% 3% 3% 14% 15% 15% 15% 16%
Beiersdorf AG EUR 23,093 18,854 3% 6% -8% 6% 4% 17% 17% 16% 17% 17%
Colgate-Palmolive Co USD 68,745 76,763 1% 1% 4% 4% 3% 27% 27% 27% 27% 28%
Johnson & Johnson USD 427,472 436,866 7% 1% 0% 9% 5% 33% 33% 34% 35% 35%
L'Oreal SA EUR 164,375 161,959 4% 11% -7% 9% 7% 22% 24% 23% 24% 24%
Average Best Peers 7% 3% 1% 6% 6% 14% 15% 15% 16% 17%
Median Best Peers 6% 8% -1% 7% 7% 14% 15% 15% 16% 16%
Average 5% 4% -1% 7% 5% 20% 21% 21% 22% 22%
Median 4% 6% -1% 7% 5% 17% 17% 16% 17% 19%
Euro Cosmetic -3% 14% 22% 6% 6% 11% 13% 17% 17% 18%
Sales growth EBITDA margin
20/01/2021

Equity Research_.
35 THIS DOCUMENT MAY NOT BE DISTRIBUTED IN THE U.S., AUSTRALIA, CANADA OR JAPAN
Table 11: Sample market multiples
Source: Banca Profilo estimates and elaborations, Factset (as of January 20, 2021)
Table 12: EV/EBITDA market multiple
Source: Banca Profilo estimates and elaborations on Factset (as of January 20, 2021)
12-month Target Price
at €10.7/share BUY recommendation
We set our target price at €10.7/share as the average of the DCF Fair Value and the
result from the relative valuations, implying a potential upside higher than 60% as of
market close on January 21, 2020. We initiate our coverage with a BUY
recommendation.
Company
20/01/2021 2020E 2021E 2022E 2020E 2021E 2022E 2020E 2021E 2022E
Sarantis SA 1.6x 1.5x 1.4x 10.3x 9.6x 9.0x 15.5x 14.2x 13.0x
L'Occitane International SA 2.4x 2.2x 2.0x 17.3x 13.3x 10.5x 29.2x 22.0x 17.7x
PZ Cussons PLC 1.8x 1.8x 1.7x 12.1x 11.5x 10.8x
Beiersdorf AG 2.7x 2.5x 2.4x 17.0x 15.0x 13.8x 33.9x 28.8x 26.3x
Colgate-Palmolive Co 4.7x 4.5x 4.4x 17.5x 16.5x 15.8x 26.2x 24.6x 23.1x
Johnson & Johnson 5.3x 4.9x 4.7x 15.8x 14.1x 13.3x 20.4x 18.0x 16.6x
L'Oreal SA 5.8x 5.3x 5.0x 25.1x 22.2x 21.0x 41.0x 36.6x 33.8x
Average Best Peers 1.9x 1.8x 1.7x 13.2x 11.5x 10.1x 22.3x 18.1x 15.4x
Median Best Peers 1.8x 1.8x 1.7x 12.1x 11.5x 10.5x 22.3x 18.1x 15.4x
Average 3.1x 2.9x 2.8x 15.0x 13.3x 12.2x 25.0x 21.6x 19.3x
Median 2.7x 2.5x 2.4x 17.0x 14.1x 13.3x 27.7x 23.3x 20.4x
Euro Cosmetic 0.9x 0.9x 0.8x 5.4x 5.1x 4.7x 12.9x 10.8x 11.7x
EV / Sales EV / EBITDA P / E
20/01/2021 2021 2022
Average EV/EBITDA Best Peers 11.5x 10.1x
Euro Cosmetic EBITDA 4.9 5.4
Enterprise Value 56.7 54.1
Net Financial Position 2020E
Liquidity Discount
Current Minorities
Equity Value 53.9 45.9
Average Equity Value
Current outstanding shares
Price per share (€)
4.8
10.5
0.0
Valuation on EV/EBITDA market multiple (€, mln)
(5.7)
15%
49.9

Equity Research_.
36 THIS DOCUMENT MAY NOT BE DISTRIBUTED IN THE U.S., AUSTRALIA, CANADA OR JAPAN
n Resilience of Euro Cosmetic’s reference industry and business n Net working capital cash absorption
n Products certification and 4.0 production plant as entry barriers n High revenue concentration by client company
n Production flexibility in terms of quantity, timing and
customization
n Long-lasting client relationship
n R&D investment releasing a consistent range of tested
formulations and active ingredients
n Expansion in the B2C channel through the launch of an n High level of competition in the Personal Care industry
e-commerce platform for the marketing of niche n Risk of cannibalization of a product line by the giants
products Euro Cosmetic branded of the sector
n Change in post-pandemic consumers’ habits on hand
and body hygiene
n Growth in the pharmaceutical channel, based on
Euro Cosmetic certification for the production of
medical-surgical devices (Italian “PMC”)
n Diversification of the product range and increase in
turnover through potential M&A
Market positioning strengthening in the pharmaceutical sector thanks to the freshly obtained PMC certification
Product range expansion as regards to both cosmetics and surgical medical devices
Launch of a B2C e-commerce platform for the sale and marketing of high-quality niche skincare product
Risk associated with customer concentration and the relative dependence of revenues on a few important customers
Euro Cosmetic
"ID Card"Recommendation Target Price Upside
BUY 10.7 66%
SWOT Analysis
Company Overview
Euro Cosmetic brands itself as the ideal industrial partner that, on behalf of third parties, projects, develops and produces a wide
range of beauty & personal care products, with the only exception of make-up. Euro Cosmetic products fall into four main categories: i)
cleansers and detergents (~39% of FY19 revenue), including shower gels and shampoos; ii) oral hygiene products (~35%), like
toothpastes and mouthwashes; iii) fragrancies (~15%), such as eau de parfum, after-shaves and deodorants; and iv) skin care
products (~10%), such as lotions, toners, creams, oils and sunscreens. Thanks to its highly flexible production system, Euro Cosmetic
offers the wide range of services for each of its product category, starting from engineering and formulating active ingredients, to
mixing, filling and labeling, to the delivery of the final products. The Company is thus able to satisfy different customers’ needs,
mainly intended for: i) private labels of large retail store chains (~43% of FY19 revenue); ii) industrial companies, both large
multinational and small and medium-sized companies with their own brands (~28%); iii) cosmetic companies specializing in high
quality products intended for beauty salons, hair salons and hotels (~25%), and iv) pharmaceutical companies (~4%). The Company
was founded in Tortona in 2002, but the current ownership entered in the Company’s capital in 2011; since then, the Value of
Production has increased by 75%, from €12.6mln to €22.6mln in 2019, and the factory has been expanded by 13,500 square meters, to
reach the current surface of 16,500 sqm. As for 2020, after having recorded 9M finished products revenue of €20.9mln, +26.7% yoy,
according to the guidance published on January 14, the Company expects FY20 VoP to be €27.4mln, +21% yoy, with EBITDA margin
improving from 12.4% in 2019 to about 17.5%.
Strengths Weaknesses
Opportunities Threats
Main catalysts
Main risks

Equity Research_.
37 THIS DOCUMENT MAY NOT BE DISTRIBUTED IN THE U.S., AUSTRALIA, CANADA OR JAPAN
Main Financials Company Description
(€ mln) 2018 2019 2020E 2021E 2022E Company Sector Personal Care
Price (€) 6.40
19.3 22.6 27.4 28.9 30.6 Number of shares (mln) 4.76
yoy change 17% 21% 6% 6% Market Cap (€ mln) 30.47
Reference Index FTSE AIM ITALIA
EBITDA 2.1 2.8 4.8 4.9 5.4 Main Shareholders MD Srl; Findea's Srl
yoy change 37% 70% 3% 9% Main Shareholder stake 39%; 34%
EBITDA margin (%) 11% 12% 17% 17% 18% Free Float 27%
Daily Average Volumes ('000)
EBIT 0.7 1.4 3.4 3.5 3.7 Sample of best comparables
EBIT margin (%) 4% 6% 13% 12% 12%
Other selected comparables
EBT 0.6 1.3 3.3 3.3 3.5
EBT Margin (%) 3% 6% 12% 11% 11%
Net income 0.3 1.0 2.5 2.9 2.6
Net Income margin (%) 2% 4% 9% 10% 9%
Net debt (cash) 6.2 3.7 (5.7) (6.3) (8.4)
Shareholders Equity 5.8 6.4 15.8 18.1 20.2
Changes in NOWC 0.6 1.4 (0.7) (1.2) (0.9)
Capex (0.7) (1.2) (0.9) (2.0) (1.0)
Free Cash Flow 1.6 2.8 2.4 1.5 2.7
Breakdown by business unit Data of best peers
(€ mln) 2018 2019 2020E 2021E 2022E 2020E 2021E 2022E
Detergents 6.1 8.6 12.9 13.4 13.7 Revenue Growth (yoy) 1% 6% 6%
Oral Care 6.7 7.7 8.3 8.4 8.8 EBITDA Margin 15% 16% 17%
Skincare & Lotion 2.7 2.3 2.0 2.8 3.7
Fragrancies 3.5 3.3 3.5 3.8 3.9 Average data
Revenues from finished products 19.1 21.8 26.8 28.4 30.2
Solvibility Ratios Multiples of best peers
2018 2019 2020E 2021E 2022E 2021E 2022E
Net Debt (cash)/Equity 1.1x 0.6x -0.4x -0.3x -0.4x Average EV/EBITDA 11.4x 9.9x
Net Debt (cash)/EBITDA 3.0x 1.3x -1.2x -1.3x -1.6x Median EV/EBITDA 10.0x 9.4x
EBIT Interest Coverage Ratio 4.7x 10.3x 18.7x 16.7x 16.8x
Financial and Operative ratios
2018 2019 2020E 2021E 2022E
Tax rate 25% 25% 25% 13% 25%
ROE 5% 16% 16% 16% 13%
ROIC 3% 11% 26% 25% 24%
Capex/VoP 4% 5% 3% 7% 3%
D&A/Capex 184% 109% 138% 75% 168%
Source: FactSet, Banca Profilo estimates and elaborations
Euro Cosmetic
"ID Card"Recommendation Target Price Upside
BUY 10.7
Value of Production
Sarantis, L'Occitane, PZ
Cussons
Beiersdorf, L'Oreal,
Johnson & Johnson and
Colgate-Palmolive.
66%January 21 -19:00
9,472.0

Equity Research_.
38 THIS DOCUMENT MAY NOT BE DISTRIBUTED IN THE U.S., AUSTRALIA, CANADA OR JAPAN
DISCLAIMER
ANALYST’S AND BANK’S INFORMATION
THIS DOCUMENT CONCERNING NEODECORTECH S.P.A, (THE “ISSUER” OR THE “COMPANY”) HAS BEEN DRAFTED BY FRANCESCA SABATINI WHO IS EMPLOYED BY BANCA
PROFILO S.P.A. (“THE BANK”) AS FINANCIAL ANALYST; FRANCESCA SABATINI IS RESPONSIBLE FOR THE DRAFTING OF THE DOCUMENT.
BANCA PROFILO S.P.A. IS A BANK AUTHORISED TO PERFORM BANKING AND INVESTMENT SERVICES; IT IS PART OF BANCA PROFILO BANKING GROUP (THE “GROUP”)
AND IT IS SUBJECT TO THE MANAGEMENT AND CO-ORDINATION OF AREPO BP S.P.A. (THE “PARENT COMPANY”). SATOR PRIVATE EQUITY FUND “A” LP (THE “PARENT
ENTITY”) HOLDS INDIRECT CONTROL PARTICIPATION INTERESTS IN BANCA PROFILO.
THE BANK IS REGISTERED WITH THE ITALIAN BANKING ASSOCIATION CODE NO. 3025 AND IS SUBJECT TO THE REGULATION AND SURVEILLANCE OF THE BANK OF ITALY AND OF CONSOB (COMMISSIONE NAZIONALE PER LE SOCIETÀ E LE BORSA). THE BANK HAS PREPARED THIS DOCUMENT FOR ITS PROFESSIONAL CLIENTS ONLY,
PURSUANT TO DIRECTIVE 2004/39/EC AND ANNEX 3 OF THE CONSOB REGULATION ON INTERMEDIARIES (RESOLUTION N. 16190). THIS DOCUMENT IS BEING
DISTRIBUTED AS OF JANUARY 22, 2021.
THE ANALYST FRANCESCA SABATINI WHO HAS DRAFTED THIS DOCUMENT HAS SIGNIFICANT EXPERIENCE IN BANCA PROFILO S.P.A. AND OTHER INVESTMENT
COMPANIES. THE ANALYST AND ITS RELATIVES DO NOT OWN FINANCIAL INSTRUMENTS ISSUED BY THE ISSUER AND SHE DOES NOT ACT AS SENIOR MANAGER, DIRECTOR OR ADVISOR FOR THE ISSUER. THE ANALYST DOES NOT RECEIVE BONUSES, INCOME OR ANY OTHER REMUNERATION CORRELATING, DIRECTLY OR
INDIRECTLY, TO THE SUCCESS OF THE INVESTMENT BANKING OPERATIONS OF BANCA PROFILO S.P.A.
A REDACTED VERSION OF THIS REPORT HAS BEEN DISCLOSED TO THE ISSUER TO PERMIT TO IT TO REVIEW AND COMMENT ON FACTUAL INFORMATION RELATING TO
THE ISSUER AND THIS REPORT HAS BEEN AMENDED FOLLOWING SUCH DISCLOSURE PRIOR TO ITS FINAL DISSEMINATION.
THIS DOCUMENT IS BASED UPON INFORMATION THAT WE CONSIDER RELIABLE, BUT THE BANK HAS NOT INDEPENDENTLY VERIFIED THE CONTENTS HEREOF. THE
OPINIONS, ESTIMATES AND PROJECTIONS EXPRESSED IN IT ARE AS OF THE DATE HEREOF AND ARE SUBJECT TO CHANGE WITHOUT NOTICE TO THE RECIPIENT. PAST
PERFOMANCE IS NOT GUARANTEE OF FUTURE RESULTS.
THIS REPORT HAS BEEN PREPARED BY ITS AUTHORS INDEPENDENTLY OF THE COMPANY AND ITS SHAREHOLDERS, SUBSIDIARIES AND AFFILIATES. THE BANK HAS NO AUTHORITY WHATSOEVER TO GIVE ANY INFORMATION OR MAKE ANY REPRESENTATION OR WARRANTY ON BEHALF OF THE COMPANY, ANY OTHER PERSON IN
CONNECTION THEREWITH. IN PARTICULAR, THE OPINIONS, ESTIMATES AND PROJECTIONS EXPRESSED IN IT ARE ENTIRELY THOSE OF THE AUTHOR HEREOF.
NO REPRESENTATION OR WARRANTY, EXPRESS OR IMPLIED, IS MADE AS TO AND NO RELIANCE SHOULD BE PLACED ON THE FAIRNESS, ACCURACY, COMPLETENESS OR
REASONABLENESS OF THE INFORMATION, OPINIONS AND PROJECTIONS CONTAINED IN THIS DOCUMENT, AND NONE OF THE BANK, THE COMPANY, NOR ANY OTHER
PERSON ACCEPTS ANY LIABILITY WHATSOEVER FOR ANY LOSS HOWSOEVER ARISING FROM ANY USE OF THIS DOCUMENT OR ITS CONTENTS OR OTHERWISE ARISING
IN CONNECTION THEREWITH.
NO DUPLICATION
NO PART OF THE CONTENT OF THE DOCUMENT MAY BE COPIED, FORWARDED OR DUPLICATED IN ANY FORM OR BY ANY MEANS WITHOUT THE PRIOR CONSENT OF THE
BANK. BY ACCEPTING THIS REPORT, YOU AGREE TO BE BOUND BY THE FOREGOING LIMITATIONS.
NO OFFER OR SOLICITAION
THIS DOCUMENT DOES NOT CONSTITUTE AN OFFER OR INVITATION OR FORM PART OF AN OFFER, SOLICITATION OR INVITATION TO PURCHASE ANY SECURITIES, AND
NEITHER THIS DOCUMENT NOR ANYTHING CONTAINED HEREIN SHALL FORM THE BASIS OF ANY CONTRACT OR COMMITMENT WHATSOEVER.
RECIPIENTS
THIS DOCUMENT IS GIVEN TO YOU SOLELY FOR YOUR INFORMATION ON A CONFIDENTIAL BASIS AND MAY NOT BE REPRODUCED OR REDISTRIBUTED, IN WHOLE OR IN PART, TO ANY OTHER PERSON. IN PARTICULAR, NEITHER THIS DOCUMENT NOR ANY COPY HEREOF MAY BE TAKEN OR TRANSMITTED IN OR INTO THE UNITED STATES
(THE “U.S.”), AUSTRALIA, CANADA OR JAPAN OR REDISTRIBUTED, DIRECTLY OR INDIRECTLY, IN THE U.S., AUSTRALIA, CANADA OR JAPAN. ANY FAILURE TO COMPLY
WITH THIS RESTRICTION MAY CONSTITUTE A VIOLATION OF U.S., AUSTRALIAN, CANADIAN OR JAPANESE SECURITIES LAWS.
THIS DOCUMENT IS BEING DISTRIBUTED ONLY TO, AND IS DIRECTED ONLY AT, PERSONS WHO ARE QUALIFIED INVESTORS WITHIN THE MEANING OF ARTICLE 2(1) (E) OF THE PROSPECTUS DIRECTIVE (DIRECTIVE 2003/71/EC) (ALL SUCH PERSONS BEING REFERRED TO AS “RELEVANT PERSONS”). THIS DOCUMENT MUST NOT BE ACTED
ON OR RELIED ON BY PERSONS WHO ARE NOT RELEVANT PERSONS. ANY INVESTMENT OR INVESTMENT ACTIVITY TO WHICH THIS COMMUNICATION RELATES IS
AVAILABLE ONLY TO RELEVANT PERSONS AND WILL BE ENGAGED IN ONLY WITH RELEVANT PERSONS.
IN CASE THAT THIS DOCUMENT IS DISTRIBUTED IN ITALY IT SHALL BE DIRECTED ONLY AT QUALIFIED INVESTORS WITHIN THE MEANING OF ARTICLE 100(1) (A) OF
LEGISLATIVE DECREE NO. 58 OF FEBRUARY 24, 1998, AS AMENDED, AND ARTICLE 34-TER, PARA. 1, LETT B), OF CONSOB REGULATION NO. 11971 OF 1999, AS AMENDED. THIS DOCUMENT IS NOT ADDRESSED TO ANY MEMBER OF THE GENERAL PUBLIC IN ITALY. IN NO CIRCUMSTANCES SHOULD THIS DOCUMENT CIRCULATE AMONG OR BE
DISTRIBUTED TO (I) A MEMBER OF THE GENERAL PUBLIC, (II) INDIVIDUALS OR ENTITIES FALLING OUTSIDE THE DEFINITION OF “QUALIFIED INVESTORS” AS SPECIFIED
ABOVE OR (III) TO DISTRIBUTION CHANNELS THROUGH WHICH INFORMATION IS OR IS LIKELY TO BECOME AVAILABLE TO A LARGE NUMBER OF PERSONS.
THE DISTRIBUTION OF THIS DOCUMENT IN OTHER JURISDICTIONS MAY BE RESTRICTED BY LAW AND PERSONS INTO WHOSE POSSESSION THIS DOCUMENT COMES SHOULD INFORM THEMSELVES ABOUT, AND OBSERVE, ANY SUCH RESTRICTION. ANY FAILURE TO COMPLY WITH THESE RESTRICTIONS MAY CONSTITUTE A VIOLATION
OF THE LAWS OF ANY SUCH OTHER JURISDICTION.
CONFLICTS OF INTEREST
THE BANK MAY, FROM TIME TO TIME, DEAL IN, HOLD OR ACT AS MARKET MAKER OR ADVISER, BROKER OR BANKER IN RELATION TO THE FINANCIAL INSTRUMENTS, OR DERIVATIVES THEREOF, OF PERSONS, FIRMS OR ENTITIES MENTIONED IN THIS DOCUMENT, OR BE REPRESENTED IN THE GOVERNING BODIES OF THE COMPANY. IN
FACT, THE BANK ACTED AS GLOBAL COORDINATOR IN THE IPO OF THE ISSUER, THE BANK IS PRESENTLY NOMAD, CORPORATE BROKER, LIQUIDITY PROVIDER AND
SPECIALIST OF THE ISSUER.
BANCA PROFILO S.P.A. HAS ADOPTED INTERNAL PROCEDURES FOR THE PREVENTION AND AVOIDANCE OF CONFLICTS OF INTEREST WITH RESPECT TO THE
RECOMMENDATIONS, WHICH CAN BE CONSULTED ON THE RELEVANT SECTION OF ITS WEBSITE (WWW.BANCAPROFILO.IT, IN THE SECTION “CLIENTI AZIENDALI E
ISTITUZIONALI/ANALISI E RICERCA).
EQUITY RESEARCH PUBLICATIONS IN LAST 12M
THE BANK PUBLISHES ON ITS WEBSITE WWW.BANCAPROFILO.IT, ON A QUARTERLY BASIS, THE PROPORTION OF ALL RECOMMENDATIONS THAT ARE ‘BUY’, ‘HOLD’, ‘SELL’
OR EQUIVALENT TERMS OVER THE PREVIOUS 12 MONTHS, AND THE PROPORTION OF ISSUERS CORRESPONDING TO EACH OF THOSE CATEGORIES TO WHICH SUCH PERSON HAS SUPPLIED MATERIAL SERVICES OF INVESTMENT FIRMS SET OUT IN SECTIONS A AND B OF ANNEX I TO DIRECTIVE 2014/65/EU OVER THE PREVIOUS 12
MONTHS.
ADDITIONAL INFORMATION
THE BANK PROVIDES ALL OTHER ADDITIONAL INFORMATION, ACCORDING TO ARTICLE 114, PARAGRAPH 8 OF LEGISLATIVE DECREE 58/98 (“FINANCIAL DECREE”) AND
COMMISSION DELEGATED REGULATION (EU) 2016/958 AS OF 9 MARCH 2016 (THE “COMMISSION REGULATION”) ON THE RELEVANT SECTION OF ITS WEBSITE (WWW.BANCAPROFILO.IT, IN THE SECTION “CLIENTI AZIENDALI E ISTITUZIONALI/ANALISI E RICERCA”).