Euro Credit Pilot - UniCredit Research
110
03 2016 March 2016 Euro Credit Pilot Economics & FI/FX Research Credit Research Equity Research Cross Asset Research “ Banks take “central” stage ” EUROMONEY CREDIT RESEARCH POLL: Please participate. Click on http://www.euromoney.com/FixedIncome2016 to take part in the online survey.
-
Upload
khangminh22 -
Category
Documents
-
view
3 -
download
0
Transcript of Euro Credit Pilot - UniCredit Research

03
2016
March 2016
Euro Credit Pilot
Economics & FI/FX Research
Credit Research Equity Research Cross Asset Research
“Banks take “central” stage”
EUROMONEY CREDIT RESEARCH POLL: Please participate. Click on http://www.euromoney.com/FixedIncome2016
to take part in the online survey.

March 2016 Credit Research
Euro Credit Pilot
UniCredit Research page 2 See last pages for disclaimer.
Contents 4 Top Story: credit fears return to banks due to excessive regulation
6 Credit Drivers
6 Macro: central banks to set the tone
7 Micro fundamentals: banks’ asset quality and profitability not as bad as premiums indicate
8 Debt-equity linkage: a preference for AT1
10 Credit quality trend: banks’ capitalization and asset quality holding up well
12 Corporate Hybrids: Muted new issuance activity and somewhat increased investor uncertainty
15 Valuation & Timing
16 Spread Forecast Table
17 Other Credit Markets
17 Credit Derivatives: Senior underperformance explained
19 High yield: premiums exceed inherent fundamental risk
21 Securitization: Reviving Italian NPL ABS
23 Sector allocation
24 Fundamental Credit Views
24 Telecommunications (Marketweight)
30 Media (Marketweight)
34 Technology (Marketweight)
37 Automobiles & Parts (Overweight)
43 Utilities (Overweight)
56 Oil & Gas (Overweight)
61 Industrial Goods & Services (Core) (Underweight)
65 Industrial Transportation (Marketweight)
68 Basic Resources (Overweight)
70 Chemicals (Underweight)
75 Construction & Materials (Marketweight)
77 Health Care (Marketweight)
80 Personal & Household Goods (Marketweight)
83 Food & Beverage (Marketweight)
86 Travel & Leisure (Marketweight)
87 Retail (Marketweight)
89 Banks (Overweight)
97 Financial Services (Overweight)
99 Insurance (Overweight)
Published on 4 March 2016
Cover picture © Andrey Kuzmin - fotolia.com

March 2016 Credit Research
Euro Credit Pilot
UniCredit Research page 3 See last pages for disclaimer.
In February, credit crisis fears were back with a vengeance, and this time the fears directly concerned systemic issues, namely banks. In January, the iTraxx Financials Senior index was still trading at around the 90bp area. This was already high compared to the 70bp in early December, but still around the same level as in October. However, in February, the index blew out to almost 140bp, a high not seen since 2013. This blowout in senior financials spreads was remarkable, because it takes a drastic scenario to cause a shift of such magnitude. Prior to the subprime crisis, bank credit spreads were known to be less cyclical and remained relatively calm, even in a recession. This is due to the fact that banks need to be fundamentally resilient to recession risk: otherwise, if a mild slowdown can cause a panic in bank debt, the entire financial system would be rather unstable. So what is behind this development? Are we really entering into a new financial crisis similar to that experienced after the subprime era or during the European sovereign debt crisis? In our view no, because the driver of the current development is completely different. In the present edition of the ECP, we will elaborate on these issues and will show that banks’ capitalization and asset quality are holding up well. In any case, our general recommendation remains that the sell-off is fundamentally overblown and has created a lot of attractive buying opportunities.
■ Macro Outlook: The upcoming ECB and the Fed policy decisions are likely to set the tone in markets in the coming weeks. The Bank of Japan’s decision to cut its rates deeper into negative territory at the end of January reduced expectations of a rate hike by the Fed and raised expectations of another ECB rate cut.
■ Micro Fundamentals: Elevated concerns about banks counterintuitive to higher capital and less risk exposure.
■ Debt-Equity Linkage: The February rout in AT1 (CoCo) bonds resulted in an average decline of 15%, partly reflecting market aversion in risky assets and partly mirroring regulatory factors and risks inherent in the relatively new instruments. We believe that the sell-off was overblown, and thus recommend increasing exposure to CoCo bonds, which are still trading at attractive yields.
■ Credit-Quality Trend: Concern about weak earnings, capital adequacy and credit quality have weighed heavily on European banks as of late. However, our analysis shows that European banks have become more resilient, with capital requirements on target and asset quality much improved. Many European banks currently show stable rating outlooks.
■ Corporate Hybrids: Muted new issuance activity and somewhat increased investor uncertainty
■ Valuation & Timing: We recommend positioning for a retightening in credit spreads over the coming months
■ Other Credit Markets: Credit Derivatives – Senior underperformance explained. High Yield – premiums exceed inherent fundamental risk. Securitization – Reviving Italian NPL ABS
■ Allocation: We keep our sector recommendations unchanged and overweight Automobiles, Utilities, Oil & Gas and Basic Resources.
Dr. Philip Gisdakis (UniCredit Bank) +49 89 378-13228 [email protected]
Dr. Christian Weber, CFA (UniCredit Bank) +49 89 378-12250 [email protected]
Dr. Tim Brunne (UniCredit Bank)
+49 89 378-13521 [email protected]
Holger Kapitza (UniCredit Bank) +49 89 378-28745 [email protected]
Dr. Stefan Kolek (UniCredit Bank)
+49 89 378-12495 [email protected]
Manuel Trojovsky (UniCredit Bank) +49 89 378-14145 [email protected]

March 2016 Credit Research
Euro Credit Pilot
UniCredit Research page 4 See last pages for disclaimer.
Top Story: credit fears return to banks due to excessive regulation
Remarkable blowout in financials spreads…
In February, credit crisis fears were back with a vengeance, and this time the fears directly concerned systemic issues, namely banks. In January, the iTraxx Financials Senior index was still trading at around the 90bp area. This was already high compared to the 70bp in early December, but still around the same level as in October. However, in February, the index blew out to almost 140bp, a high not seen since 2013. This blowout in senior financials spreads was remarkable, because it takes a drastic scenario to cause a shift of such magnitude. Prior to the subprime crisis, bank credit spreads were known to be less cyclical and remained relatively calm, even in a recession. This is due to the fact that banks need to be fundamentally resilient to recession risk: otherwise, if a mild slowdown can cause a panic in bank debt, the entire financial system would be rather unstable. So what is behind this development? Are we really entering into a new financial crisis similar to that experienced after the subprime era or during the European sovereign debt crisis? In our view no, because the driver of the current development is completely different. In the present edition of the ECP, we will elaborate on these issues and will show that banks’ capitalization and asset quality are holding up well. In any case, our general recommendation remains that the sell-off is fundamentally overblown and has created a lot of attractive buying opportunities.
CREDIT SPREAD DYNAMICS
iTraxx Financials Senior spread Spreads vs. stocks (in relative terms): DB, Barclays and overall
Source: iBoxx, Bloomberg, UniCredit Research
…but this time is different Looking into the rear mirror helps to put the current situation into perspective. During the subprime and the sovereign debt crises, bank asset quality was in focus, but not to a normal extent. The affected assets (mortgage debt and government bonds) usually make up a significant proportion of bank assets, and the anticipated loss severity was so high that fears emerged that several banks could collapse. This is completely different in the current environment – the concerns vary greatly from bank to bank. Some are related to potential losses from the commodity crisis. (We think that these remain limited, though). Other institutions are in focus because their business profiles are currently being restructured, which will involve considerable costs. Separately, the Italian banking system is in the spotlight because of NPL concerns and the associated strategy of the government to establish a bank asset-guarantee scheme. Of course, there are also more general concerns regarding an economic slowdown ahead, but as mentioned above, a normal cyclical downturn should not affect bank debt to the extent that we witnessed in February.
0
50
100
150
200
250
300
350
400
2010 2011 2012 2013 2014 2015 2016
iTraxx FinSen
0%
50%
100%
150%
200%
250%
300%
350%
400%
40% 50% 60% 70% 80% 90% 100% 110%
5Y C
DS
spr
ead
(inde
xed
to 1
00 fo
r 1-N
ov-2
015)
Stock price (indexed to 100 for 1-Nov-2015)
Deutsche Bank Overall Barclays

March 2016 Credit Research
Euro Credit Pilot
UniCredit Research page 5 See last pages for disclaimer.
Regulatory initiatives designed to stabilize the system can have side effects
That said, there is one common theme behind all these various issues. Although the costs involved should not threaten to bring down an institution, they may be substantial. However, with the current regulatory and market environment (negative interest rates and the overall low-yield environment), the question arises as to who should provide the funds. Due to the prevailing environment, bank profitability is low, so organic financing of new capital requirements (whatever the reason) appears to be out of the question at the moment. But, given investor expectations of persistently low profitability, the willingness to invest in bank equity and provide the necessary funds is also very limited. However, given tight capital requirements and strict rules governing how to wind down banks that cannot meet these thresholds, any larger capital requirements could escalate into credit fears quickly because of bail-in regulation. So what we are currently witnessing in the market is how regulatory initiatives that were designed to stabilize the banking system can actually destabilize it when banks get into the kind of trouble that would be otherwise be manageable.
Capital concerns can quickly translate into credit fears
The way in which equity concerns affected the debt aspect of banks’ capital structure is demonstrated in the right chart above. It shows a scatter plot of changes in 5Y CDS spreads of Deutsche Bank, Barclays and the iTraxx FinSen relative to changes in the corresponding stocks (stocks on the x-axis and spreads on the y-axis with data points indexed to 100% at 1 November 2015; the stock index is the STOXX Europe 600 Banks). Initially, the sensitivity on the spread side towards the plunge in stock prices was quite low. Stock prices dropped 25% without causing a substantial spread movement. At the beginning, it was mostly an equity story. However, once the stock price retreats beyond a certain level, spreads start to react strongly, as fears regarding potentially unsatisfiable capital requirements translate into wind-down fears.
Authorities will not push the financial system over a cliff
While we share the view that excessive regulation could trigger a banking crisis, we do not believe that the authorities will push the financial system over a cliff, causing another credit crisis. Hence, we think that the spread blowout is not justified and we recommend positioning for a retightening. Recently, ECB vice president Vitor Constâncio said that any monetary easing (if the ECB decides to take this route) must be conducted in conjunction with measures to mitigate any negative effect it will have on banks. In our economists’ view, this could result in a two-tier deposit-rate, like in Japan, among other countries. Furthermore, authorities signaled that the post-crisis trend of rising capital requirements will come to an end. ECB officials pointed out recently that they plan to reduce the central bank’s Pillar 2 requirements on individual lenders as the capital conservation buffer grows, allowing the sum of the two to remain broadly steady. The ECB expects banks to ensure they have common equity capital equivalent to about 10%, on average, of risk-weighted assets. To emphasize this, the ECB’s Daniele Nouy and Mario Draghi said that capital requirements had reached a “steady state”. In addition, authorities signaled that there may be a review in regulation that might limit banks’ ability to service coupons on AT1 bonds.
With an average yield of 10%, CoCos/AT1 appear to be the sweet spot in the capital structure at the moment
However, the sell-off not only affected senior bonds of financials, but CoCo/AT1 were also hit hard. The average price of CoCo bonds has dropped about 15 points to an average price of around 85, currently trading at around 90 on average. Moreover, the gap between dividend yields in stocks and bond yields for CoCos has opened up significantly (dividend yields rose from 4% at the start of the year to 6%, while yields of AT1s rose to 10% from 6%). Moreover, as dividend cuts further down the road are not unlikely, CoCo bonds appear to be more attractive than equity in the capital structure of banks. Moreover, in the event that banks approach the conversion point, equities are likely to underperform because of the potential dilution from a CoCo conversion. Given that the average CET1 ratio of European banks is in the area of 10-11% (for national champions even higher), the conversion triggers are fairly distant at the moment. Hence, the crucial risk factor driving markets currently is the coupon payments. If banks continue to service coupon payments, and we believe that this is the case as fundamental challenges are not that high (the above-mentioned rethinking of potential restrictions by authorities supports this view), investors will earn an attractive return.

March 2016 Credit Research
Euro Credit Pilot
UniCredit Research page 6 See last pages for disclaimer.
Credit Drivers Macro: central banks to set the tone
The upcoming ECB and the Fed policy decisions are likely to set the tone in markets in the coming weeks. The Bank of Japan’s decision to cut its rates deeper into negative territory at the end of January reduced expectations of a rate hike by the Fed and raised expectations of another ECB rate cut (see left chart). The reaction by markets to this highlighted, however, their sensitivity to negative interest rates. Reactions among Financials were notable: the iTraxx Fin Sen index surged to levels not seen since 2013. Negative interest rates – which are currently being applied by the BoJ; the ECB and the central banks of Denmark, Sweden and Switzerland – have led to flatter interest-rate curves, and coupled with regulatory overhaul, have reduced banks’ profitability in traditional (lending) margin business. The ECB and the Fed’s policy decisions will occur at a time when the global economy is witnessing weaker growth momentum, which has led to growth forecasts being lowered. At the same time, currency-regime shifts have increased volatility in foreign-exchange markets, and commodity prices have been struggling to find momentum.
Expect a package of easing measures from the ECB in March
On 9 and 10 March, the ECB is expected to implement further measures intended to boost inflation. Our economists expect the central bank to introduce a package of easing measures – which is likely to include a deposit-rate cut, probably by 10bp (as priced in by Eonia forwards) but with the risk that the cut will be larger – together with an expansion and extension of its asset purchase program. The likelihood of further easing rose after the ECB’s February CPI estimate declined to -0.2% yoy. The ECB’s ability to limit the impact of its negative rates on banks will be key for credits. Our economists estimate the direct costs of excess liquidity for banks will be EUR 5bn p.a. To put this into perspective, this represents 3% of eurozone banks’ total profits for 2014 and 5% of banks’ 2015 profits reported thus far. This amount is not negligible in the current growth environment. Thus, measures to alleviate this impact on banks’ profitability – e.g. the introduction of a two-tiered rate or the granting of larger exemptions for minimum reserves, which are strategies used, for example, by the SNB – will be important for credit spreads’ trajectories.
Expect up to three rate hikes from the Fed this year
Regarding the Fed, which decides on 16 March, comments from various FOMC members over the past few weeks suggest that they want to see evidence that the recent headwinds from the weaker global economy will not affect the US economy. Solid economic data should be supportive of global appetite for risk. The implied market probability of a rate hike in March has declined from 50% in December to below 10%. Our economists expect up to three rate hikes from the Fed this year.
FINANCIALS CREDIT SPREADS START FEELING THE IMPACT OF NEGATIVE RATES
Market implied probabilities of central banks’ actions in March 2016 iTraxx FinSen vs. 2Y Bunds
Source: Bloomberg, UniCredit Research
0
10
20
30
40
50
60
70
80
90
100
Jan-
15
Feb-
15
Mar
-15
Apr
-15
May
-15
Jun-
15
Jul-1
5
Jul-1
5
Aug
-15
Sep
-15
Oct
-15
Nov
-15
Dec
-15
Jan-
16
Feb-
16
Mar
ket i
mpl
ied
prob
abilit
y (%
)
Fed ECB
-0.8
-0.6
-0.4
-0.2
0
0.2
0.450
100
150
200
250
300
350
Jan-
12
Apr
-12
Jul-1
2
Oct
-12
Jan-
13
Apr
-13
Jul-1
3
Oct
-13
Jan-
14
Apr
-14
Jul-1
4
Oct
-14
Jan-
15
Apr
-15
Jul-1
5
Oct
-15
Jan-
16
%bp
iTraxx FinSen (reversed LS)
2Y Bunds yield (RS)

March 2016 Credit Research
Euro Credit Pilot
UniCredit Research page 7 See last pages for disclaimer.
Micro fundamentals: banks’ asset quality and profitability not as bad as premiums indicate
Elevated concerns about banks counterintuitive to higher capital and less risk exposure. Plunging stock prices and accelerating risk premiums despite fewer risk-weighted assets and more capital
Banks have been under increased pressure since the start of the year, with bank spreads 28bp wider (iBoxx Banks) and senior spreads (+20bp to 76bp) also fully reflecting rising risk aversion. As bank stocks sold off significantly (16%), valuation measures have slipped back to levels not seen since the height of the eurozone debt crisis or the financial crisis. The question is whether the current price-to-book ratio of just over 0.5x (for STOXX 600 Europe Banks, red line in the left chart) is once again the result of concerns about a potential deterioration of asset quality. During the eurozone sovereign-debt crisis, balance sheets were scrutinized because of their exposure to sovereign debt and investors were concerned whether single banks could fail along with their respective home nation’s ability to repay its public debt. In the financial crisis, the issue of asset quality was coupled with profitability as banks accumulated losses from fire sales, write-off’s and capital market turbulence. Currently, asset quality does not appear to be nearly as much at risk since banks have significantly lowered their risk-weighted assets in recent years, while at the same time increasing their capital buffers (the median Tier-1 ratio has soared from 8% to nearly 14% since 2007, black line in the left chart). With the ECB still eager to lower rates on deposits, investor concerns seem to linger on profitability rather than asset quality. Margins in the STOXX 600 Europe Banks have slipped back to late-2014 levels (4.1%, red line in the right chart), but are still positive and well above the levels seen in 2008 and 2012. Low (positive) profitability is a concern for equity investors, but less so for debtholders.
Debtholder sweet spot? Hence, concerns appear to be exaggerated, even for coupons of the debt instruments most exposed to swings in profits – CoCo notes. This is especially true with the ECB signaling it may adjust its opinion on CoCo coupon payments and ask for a change to EU banking law. The proposed change would allow supervisors the option of permitting banks to make discretionary payments to investors and staff even when a lender loses money in a given year and breaches regulatory buffers. As standing rules prohibit payments of dividends, bonuses or coupons on CoCo bonds in such a case, banks could be forced into an unpleasant situation. While not aiming to allow broad-based payments during times of stress, the ECB’s comments suggest a bank should be able to decide how to cut payouts in accordance with the firm’s business plan. The change would likely only support the implementation of a plan to conserve capital within the company, but the fact that authorities are considering such a move indicates that they do not intend to allow regulation to precipitate a crisis.
BANK EQUITY VALUATION, CAPITAL LEVEL AND PROFITABILITY
Bank’s price/book ratio vs. median T1 ratio STOXX 600 Europe Banks: profit margin and EPS (blended est.)
Source: Bloomberg, Markit, UniCredit Research
0
2
4
6
8
10
12
14
0
0.5
1
1.5
2
2.5
2001 2003 2005 2007 2009 2011 2013 2015
Med
ian
T1 R
atio
Pric
e/B
ook
Rat
io
Stoxx Europe 600 Banks (Price/Book) Median T1 Ratio
-30
-20
-10
0
10
20
30
Oct
-08
Feb-
09Ju
n-09
Oct
-09
Feb-
10Ju
n-10
Oct
-10
Feb-
11Ju
n-11
Oct
-11
Feb-
12Ju
n-12
Oct
-12
Feb-
13Ju
n-13
Oct
-13
Feb-
14Ju
n-14
Oct
-14
Feb-
15Ju
n-15
Oct
-15
Feb-
16
PROF_MARGINBEST_EPS

March 2016 Credit Research
Euro Credit Pilot
UniCredit Research page 8 See last pages for disclaimer.
Debt-equity linkage: a preference for AT1 The February rout in AT1 (CoCo) bonds resulted in an average decline of 15%, partly
reflecting market aversion in risky assets and partly mirroring regulatory factors and risks inherent in the relatively new instruments. We believe that the sell-off was overblown, and thus recommend increasing exposure to CoCo bonds, which are still trading at attractive yields. We think that CoCo bonds, rather than equities, are the sweet spot in banks’ capital structure at the moment. The sharp and broad-based drop in AT1 prices was in part triggered by the simultaneous sell-off in bank stocks and the ensuing sharp blowout in CDS spreads, which in turn was triggered by concerns about banks’ credit fundamentals. We view these concerns as unfounded, with fundamentals and credit profiles not having materially changed, but instead continuing to improve (with the usual exceptions). While the underperformance in bank shares could continue for a while given ongoing dividend cuts and limited earnings growth, the prospect for AT1s is not as negative as recent underperformance would suggest. Given attractive valuations with appealing yields of more than 10% for the universe, and more clarity regarding the likelihood of coupon payments in AT1s, we prefer these instruments to bank stocks.
Potential AT1 repricing triggers
In general, AT1s are a cheaper form of going-concern capital and can help banks buffer losses at times of stress through conversion to equity or writedown (temporary or permanent). Moreover, the fully discretionary nature of coupon payments also provides banks with financial flexibility. The negative sentiment surrounding bank fundamentals undoubtedly took its toll on AT1s. However, we also believe that part of the sell-off was technical, with few buyers willing or able to step in, creating a vicious circle in AT1 that feeds on itself. In terms of investors, the market has been in a bit of a quandary as of late: equity investors and other specialized funds were eschewing bonds – despite promising returns – due to their illiquid nature, traditional credit funds were steering clear of them due to their complexity and regulatory constraints, and many hedge funds and distressed funds have avoided them since the bonds were not cheap enough. Furthermore, there has also been substantial tiering among individual AT1 issues, particularly due to fears of potentially skipped coupon payments and concerns about insufficient available distributable items (ADI), which would also lead to coupon restrictions. Whatever the reason, AT1s dropped about 15% to an average price of around 85 points, and is currently trading at an average of around 90 points after a moderate rebound. In our opinion the sector still looks cheap, but is unlikely to cheapen further.
AT1 BONDS CONTINUE TO LOOK ATTRACTIVE AGAINST EUROPEAN BANK EQUITIES
AT1 total returns vs. STOXX Europe 600 banks and overall returns AT1 and bank equity yields
Source: iBoxx, Bloomberg, UniCredit Research
60
70
80
90
100
110
120
130
140
Dec
-13
Mar
-14
Jun-
14
Sep
-14
Dec
-14
Mar
-15
Jun-
15
Sep
-15
Dec
-15
Mar
-16
STOXX Europe 600 Banks return STOXX Europe 600 returnAT1 total return
indexed to 100 on 1 January 2014
0
2
4
6
8
10
12
Dec-14 Mar-15 Jun-15 Sep-15 Dec-15 Mar-16
Yiel
d (%
)
Yield differentialCoCo (AT1) EURDividend yield (STOXX Europe 600 Banks)
March 2016 Credit Research
Euro Credit Pilot
UniCredit Research page 9 See last pages for disclaimer.
Bank equity weakness is broad-based
On the equities side, European Bank shares are by far the largest underperformer in 2016 YTD, with the STOXX Europe 600 subindex returning -16.0% against -6.7% for the overall index. While many bank stocks have rebounded quickly, paring some of the losses suffered by mid-February, others have failed to stage a comeback, the reasons for which we outline below. A look at the index members reveals that the underperformance is broad-based, with 32 out of 47 banks having registered double-digit declines YTD. The worst-performing group with YTD returns of -20% or higher includes banks from across Europe including Germany, Greece, France, Italy, Portugal, Spain, Switzerland and the UK. This reflects the extent to which profit warnings, dividend cuts to boost capital buffers, recapitalization measures, and restructuring and litigation costs, are weighing on performance across jurisdictions. Interestingly, looking at underperformers in bank stocks, there is a substantial degree of correlation between the performance of equities and the AT1 securities of the banks in question. However, we note that recent AT1 performance also reflects factors specifically related to individual AT1s, such as the low headroom for coupon risk and strained ADIs, which vary materially among banks. A major issue potentially leading to a mandatory coupon restriction for AT1 securities is the lack of ADIs, although rating agency opinions suggest that banks have sufficient ADIs to pay their AT1 coupons. The remaining names (i.e. the outperformers) include Nordic and some Dutch and UK banks. It is no coincidence that AT1 bonds issued by these banks have fared considerably better given their higher dividends, healthier capitalization and lower AT1 coupons. Among the best performing AT1s in 2016 YTD are those issued by Swedish banks.
Dividend yields and AT1 yields As highlighted in the right chart above, the gap between dividend yields in stocks and AT1 yields diverged significantly, with the yield differential briefly hitting 500bp. However, this could reverse anytime soon. Given that dividend cuts down the road are not unlikely, AT1 bonds appear to be the more attractive spot in banks’ capital structure, as opposed to equity. If banks were to approach the conversion point, equities would likely underperform, given the dilution from a potential CoCo conversion. Perhaps equally important, while potential rights issues would not contribute to ADIs, they would weigh on banks’ equity performance to a similar extent.
Positioning for a re-tightening We continue to recommend positioning for a compression in bank senior spreads. With AT1s, we believe that a similar strategy can be implemented at a lower level of the capital structure, while avoiding the – in our view – higher risks in bank equity. Given that the average CET1 ratio of European banks is in the area of 12% (for national champions even higher), the conversion triggers are currently fairly remote. Hence the crucial risk factor driving markets at the moment is coupon restrictions. Our base case is that banks continue to honor their coupon payments, allowing investors to earn an attractive return.

March 2016 Credit Research
Euro Credit Pilot
UniCredit Research page 10 See last pages for disclaimer.
Credit quality trend: banks’ capitalization and asset quality holding up well
Concern about weak earnings, capital adequacy and credit quality have weighed heavily on European banks as of late. However, our analysis shows that European banks have become more resilient, with capital requirements on target and asset quality much improved. Many European banks currently show stable rating outlooks. However, the amount of non-performing loans (NPL) needs to be closely monitored and will likely weigh on bank’s profitability, albeit at manageable level.
Concerns about weak earnings, capital adequacy and credit quality weigh heavily on European banks
In recent weeks, investors in European banks have been worried about sluggish earnings due to weak economic growth, a prolonged period of negative interest rates and concerns about capital adequacy at some major lenders. This has put shares of banks under pressure. However, hybrid instruments like CoCos have been most heavily hit and bank credit spreads in Europe have been widening as well. For this reason, we take a closer look at banks’ capitalization and the quality of assets.
The ECB says European banks are much more resilient today, with capital requirements at target, while still-high levels of NPLs will likely be manageable
Following up on ECB’s president Mario Draghi’s hearing before the European Parliament’s Economic and Monetary Affairs committee in mid-February, at which he stated that past market turmoil appears to be more related to general factors concerning weakening economic activity, Danièle Nouy, Chair of the Supervisory Board of the ECB, also noted that the “situation in the euro area banking sector today is very different from what it was in 2012. The banking sector is much more resilient”. She continued that the quality of capital has also been substantially improved and that the sector is much more able to absorb unexpected financial or economic headwinds than a few years ago. Banks have made huge progress in meeting the fully loaded capital requirements (CRR/CRD IV) that will be in effect from 2019 onwards, she said, and the vast majority of banks meet these requirements already today. She added that there was still a subset of banks with elevated levels of NPLs but that these NPLs have been now identified, due to a harmonized definition within SREP and adequate reserves have been built, which will allow the sector to gradually lower the NPLs over the next few years.
EBA says that EU banks have continued to strengthen their capital positions and were able to improve asset quality, while NPLs will likely weigh on profitability
A recent study by the EBA (link) of 105 banks in 21 countries shows improvements in the resilience of the EU banking sector. In general, EU banks have continued to strengthen their capital positions, mainly through raising additional capital and retaining earnings. Since December 2011, the aggregate CET1 ratio has increased by 280bp to 12.6% following the efforts of banks, supervisors, and regulators to increase banks’ capital in the aftermath of the financial crisis. The improvement has been achieved more through increases in capital than reductions in RWAs. The EBA said that, between December 2013 and June 2015, lending increased, as shown by a modest increase in RWAs (the denominator of the capital ratio) by 1.3%. On a country level, CET1 ratios (fully loaded) for all banks are comfortably above the minimum, with the highest values in the Nordics (up to 22.3%), followed by the UK (12.8%), Germany (12.6%), Italy (11.1%), Spain (10%), and Portugal (9.6%). The quality of assets has also improved, albeit from a low base. Nonetheless, EU banks will need to continue addressing NPL levels, which will likely continue to weigh on banks’ profitability. Aggregate EU NPLs (of total loans), defined as 90-plus-days overdue and/or “debtor is unlikely to pay”, decreased by 50bp to 5.6% in 1H15 vs. 4Q14, while the NPL coverage ratio in EU was unchanged at 43%. As highlighted in the left chart, the ratio of NPLs not yet provisioned for (uncovered) is between 1% and 4.5%. When considering the weighted average by total assets, the ratio is about 1.9%. However, the increased level of banks’ capital and the value of collateral should be taken into account when assessing the level of additional provisions, even in the periphery, where, as a result of economic stress, NPL levels are higher. However, incentives for banks differ and banks that suffer from a high level of impaired loans coupled with a low coverage ratio may struggle to clean up their balance sheets. Low coverage ratios may result in a reluctance to resolve NPLs by disposing of them, due to material differences between the potential price and net book value, leading to losses. In contrast, high coverage ratios mean that a large share of losses has already been recognized in banks’ financial

March 2016 Credit Research
Euro Credit Pilot
UniCredit Research page 11 See last pages for disclaimer.
statements, which may encourage banks to dispose of their NPLs and achieve lower NPL ratios. The data show that smaller banks in particular report higher NPL ratios for loans, at about 18%, compared to 9% for medium-sized banks and 4% for larger banks, while smaller banks reported the lowest level of NPL coverage at 40% (compared to 40% in medium and 44% in large banks). This suggest that smaller banks may face strong market pressure to maintain their NPL coverage ratio and stick to highly provisioned loans, rather than disposing.
Basel Committee: large internationally active banks well above Basel III capital requirements
The results of the EBA study are in line with the latest Basel III monitoring exercise, published by the Basel Committee on 2 March 2016 (link). Data have been provided for a total of 230 banks, comprising 101 large internationally active banks, defined as Group 1 banks that have a Tier-1 capital of more than EUR 3bn, and 129 Group 2 banks (other). The data as of 30 June 2015, assuming full phasing-in of the Basel III requirements in 2015, show that all Group 1 banks would meet the minimum CET1 of 4.5% and the CET1 target level of 7.0% (including the capital conservation buffer) as of 2019.
European financial senior rating drift shows balanced rating actions, while a large share of European banks show stable rating outlooks
A look at rating trends in the European financial seniors universe reveals that upgrades/ downgrades are balanced amid improved capitalization and risk profile in the sector. As highlighted in the right chart, which shows rating changes in the iBoxx financial seniors universe within one year based on rating actions by Fitch, Moody’s and S&P, the pace and the severity of downgrades has moderately slowed down, while upgrades are holding up well. On 2 December 2015, S&P affirmed the ratings of most European banks after a review that followed the national introduction of bank resolution frameworks (BRRD), which requires systemic banks to have significant buffers of bail-in-able instruments for recapitalization, and the lower likelihood of extraordinary government support. In general, S&P affirmed ratings on those banks for which the removal of systemic support had been offset by better intrinsic creditworthiness and/or potential support to senior creditors from material buffers of additional loss-absorbing capacity (ALAC), and lowered ratings on those banks for which the loss of support outweighed mitigating factors.
Conclusion In conclusion, we think the recent market turmoil can be explained more by earnings-related concerns than by banks’ capitalization and asset quality. However, a prolonged environment of negative interest rates could potentially encourage some banks to try to overcome low profitability more rapidly by making loans that are more risky. Any increased competition in lending at lower credit standards may in turn subsequently trigger adverse consequences for the banking sector.
EUROPEAN BANKS HOLD UP WELL IN TERMS OF CAPITAL AND ASSET QUALITY, RESULTING IN BALANCED RATING DRIFT
Key credit metrics at a glance – major national banks iBoxx FinSen composite rating drift**
Source: Bankscope, Bloomberg*, UniCredit Research Source: rating Agencies, UniCredit Research **The left scale shows the index’s average rating actions at a given month compared to the previous year. Hence, it also takes into account the severity of the rating action. That is, a level of -1 would indicate an average deterioration of one notch per rating composite. However, we caution that since drift is limited to the IG universe, it is therefore subject to a negative bias given that it only considers bonds initially rated BBB- or higher, thus excluding rising stars while at the same time still including falling angels for at least twelve months.
DeutscheBank
BNP Paribas*
Crédit Agricole*
BPCE Group
ING Bank
HSBC
Barclays
RBSLloyds
UniCredit*
Intesa Sanpaolo*
BancoSantander BBVA
Bank of Ireland
Danske
DnBASA
Nordea
10.0
12.0
14.0
16.0
18.0
20.0
22.0
24.0
26.0
28.0
-1.0 0.0 1.0 2.0 3.0 4.0 5.0 6.0
Tota
l cap
ital r
atio
in %
Uncovered NPL ratio = Gross NPL ratio x (1 - NPL coverage) in %
- Bubble size reflects total assets
0
0.1
0.2
0.3
0.4
0.5
0.6
0.7
0.8
0.9
1
-1
-0.8
-0.6
-0.4
-0.2
0
0.2
0.4
0.6
0.8
1
Jan-06 Jan-07 Jan-08 Jan-09 Jan-10 Jan-11 Jan-12 Jan-13 Jan-14 Jan-15
Upgrades (LS) Downgrades (LS) Action Rate (RS)

March 2016 Credit Research
Euro Credit Pilot
UniCredit Research page 12 See last pages for disclaimer.
Corporate Hybrids: Muted new issuance activity and somewhat increased investor uncertainty
General comment Contrary to the message the headline might convey, in a less volatile market environment, investor demand for corporate hybrids should continue to remain healthy. This has been driven by the persisting low-interest-rate environment (compared to long-term averages) on the one hand and by fair valuations of corporate hybrids relative to senior bonds on the other. Evidence of still-healthy investor demand for hybrid paper was provided by the heavily oversubscribed order books of the latest hybrid new issues from BHP, Solvay and OMV in October and November 2015. While we acknowledge that market participants have become more cautious since then, current new issue premiums would compensate investors for increased volatility. Also, when looking at overall credit quality, in terms of issue-rating distribution, we acknowledge that overall issuance quality has improved. In 2015, 77% of all issued hybrids carried an investment-grade issue rating, as opposed to 73% in 2013 and 67% in 2014.
Recap of special events in 2015 In addition to increased market volatility in the second half of 2015, corporate hybrid investors were confronted with two different potential early call events:
■ In the first half of 2015, holders of hybrids from German issuers were hit by concerns surrounding potential early calls. These concerns were triggered by a proposed change in the tax deductibility of hybrid coupons. Germany was rumored to be drafting a bill that would ban the tax deductibility of coupons of hybrid paper. While the original draft bill did not pass, Germany established a working group to assess the findings of an OECD report (published in October) and to draft a new bill that would avoid double non-taxation. We expect Germany to align a new draft bill with the final OECD report, i.e. it should not target third-party corporate hybrid paper. However, a translation into local law (also from other European countries) is still pending. According to prevalent hybrid documentation, if hybrid issuers are no longer able to claim a tax deduction on the interest paid by the notes, or if this deduction is reduced, a “tax event” will occur. This will allow the hybrid issuer to exercise an exceptional and early call right (mostly at 101).
■ In October, S&P changed its opinion regarding certain types of language describing an early call as a result of a rating event. All affected hybrids lost their equity content at S&P, and in theory, issuers would have had the right to call the bonds early due to a rating event (also mostly at 101). A few days after S&P's announcement, the first issuers unconditionally and irrevocably waived the right to call their hybrid bonds in such an event. As a result, S&P again increased the equity content on these hybrids to intermediate (50%).
■ In both cases, outstanding hybrids with cash prices trading far above their early call price dropped by several points. Although concerns of an early call proved unfounded – as issuers’ response was investor friendly – we think the two events will likely lead to different investor behavior in the medium term: In our view, investors will try to shy away from secondary market issues that are trading at cash prices far above par. Instead, they will tend to prefer hybrids with lower cash prices or switch between issues of the same issuer, where possible.
Investment performance In terms of total return, corporate hybrids started to underperform senior bonds in September 2015. Since January 2015, the total return of the iBoxx Non-financial sub index has been -6.2%, while the total return of the iBoxx Non-Fin Senior has been -0.5% (see chart below). The mixed performance of corporate hybrids, especially since the end of September, has been driven by a combination of overall-weaker market sentiment (economic growth concerns of BRIC countries, weak commodities, etc.), but also by idiosyncratic headlines. Single names that have been particularly in focus were Volkswagen, due to its emissions scandal and German utilities, driven by discussions regarding insufficient nuclear provisions. Hybrid valuations of these issuers lost several points in cash-price terms without seeing any significant investor-buying support. Later in 2015, and in early 2016, the main underperformers were commodity-related issuers like Repsol and OMV. Since January 2016, the general risk-off mode, above-average volatility and falling stock markets have negatively affected hybrid bond performance.
March 2016 Credit Research
Euro Credit Pilot
UniCredit Research page 13 See last pages for disclaimer.
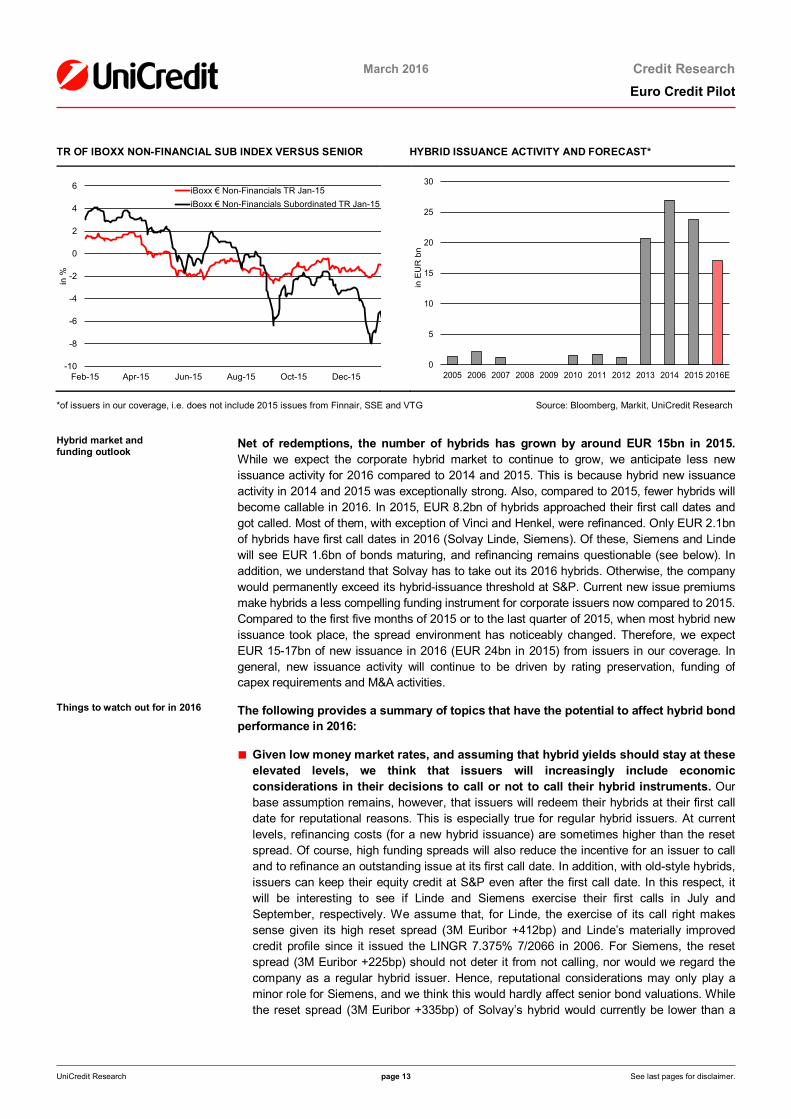
TR OF IBOXX NON-FINANCIAL SUB INDEX VERSUS SENIOR HYBRID ISSUANCE ACTIVITY AND FORECAST*
*of issuers in our coverage, i.e. does not include 2015 issues from Finnair, SSE and VTG Source: Bloomberg, Markit, UniCredit Research
Hybrid market and funding outlook
Net of redemptions, the number of hybrids has grown by around EUR 15bn in 2015. While we expect the corporate hybrid market to continue to grow, we anticipate less new issuance activity for 2016 compared to 2014 and 2015. This is because hybrid new issuance activity in 2014 and 2015 was exceptionally strong. Also, compared to 2015, fewer hybrids will become callable in 2016. In 2015, EUR 8.2bn of hybrids approached their first call dates and got called. Most of them, with exception of Vinci and Henkel, were refinanced. Only EUR 2.1bn of hybrids have first call dates in 2016 (Solvay Linde, Siemens). Of these, Siemens and Linde will see EUR 1.6bn of bonds maturing, and refinancing remains questionable (see below). In addition, we understand that Solvay has to take out its 2016 hybrids. Otherwise, the company would permanently exceed its hybrid-issuance threshold at S&P. Current new issue premiums make hybrids a less compelling funding instrument for corporate issuers now compared to 2015. Compared to the first five months of 2015 or to the last quarter of 2015, when most hybrid new issuance took place, the spread environment has noticeably changed. Therefore, we expect EUR 15-17bn of new issuance in 2016 (EUR 24bn in 2015) from issuers in our coverage. In general, new issuance activity will continue to be driven by rating preservation, funding of capex requirements and M&A activities.
Things to watch out for in 2016 The following provides a summary of topics that have the potential to affect hybrid bond performance in 2016:
■ Given low money market rates, and assuming that hybrid yields should stay at these elevated levels, we think that issuers will increasingly include economic considerations in their decisions to call or not to call their hybrid instruments. Our base assumption remains, however, that issuers will redeem their hybrids at their first call date for reputational reasons. This is especially true for regular hybrid issuers. At current levels, refinancing costs (for a new hybrid issuance) are sometimes higher than the reset spread. Of course, high funding spreads will also reduce the incentive for an issuer to call and to refinance an outstanding issue at its first call date. In addition, with old-style hybrids, issuers can keep their equity credit at S&P even after the first call date. In this respect, it will be interesting to see if Linde and Siemens exercise their first calls in July and September, respectively. We assume that, for Linde, the exercise of its call right makes sense given its high reset spread (3M Euribor +412bp) and Linde’s materially improved credit profile since it issued the LINGR 7.375% 7/2066 in 2006. For Siemens, the reset spread (3M Euribor +225bp) should not deter it from not calling, nor would we regard the company as a regular hybrid issuer. Hence, reputational considerations may only play a minor role for Siemens, and we think this would hardly affect senior bond valuations. While the reset spread (3M Euribor +335bp) of Solvay’s hybrid would currently be lower than a
-10
-8
-6
-4
-2
0
2
4
6
Feb-15 Apr-15 Jun-15 Aug-15 Oct-15 Dec-15
in %
iBoxx € Non-Financials TR Jan-15iBoxx € Non-Financials Subordinated TR Jan-15
0
5
10
15
20
25
30
2005 2006 2007 2008 2009 2010 2011 2012 2013 2014 2015 2016E
in E
UR
bn

March 2016 Credit Research
Euro Credit Pilot
UniCredit Research page 14 See last pages for disclaimer.
potential new issuance spread, we regard Solvay as a regular hybrid issuer (and more likely to call). In addition, we understand that the SOLBBB 6.375% 6/04 has to be redeemed, given that, otherwise, Solvay would permanently exceed its hybrid issuance threshold (≤15% of capitalization) at S&P. If one of these issuers were to consider keeping its hybrids outstanding, we would regard this as negative for the hybrid market and for sentiment in this asset class.
■ Besides the extension risk described above, we regard special event risk and, especially, methodology changes by rating agencies as key risks for corporate hybrid spreads. Unfortunately, these types of events are hardly predictable. During the course of 2015, investors faced the two special events described above and the resulting underperformance of affected hybrids. We expect the different double-non taxation initiatives from the OECD and the EU Commission to be translated into local law in 2016. We expect Germany’s draft bill to be aligned with the final results of the OECD report, i.e. not targeting third-party corporate hybrid paper. However, any EU country’s draft bill that is not aligned with the OECD report would be negative for hybrids in their respective jurisdiction. Hybrids carrying a high coupon and/or trading at a cash price significantly above their early redemption price would be particularly affected. Additionally, in the last few years, only minor methodology adjustments have been made by credit-rating agencies. In April 2013, S&P tightened its methodology in assigning 100% equity credit. In July 2013, Moody’s changed its methodology with regard to equity content for issuers downgraded to non-investment grade. Both changes led to early calls or exchange offers associated with lower bond valuations.
■ Long periods of exceptionally low interest rates, low volatility and more standardized hybrid documentation have increased investor demand for this product class. As a result, the hybrid bond market has continuously grown since 2013. Hence, we think that hybrids remain a crowded trade, as many investors are already heavily invested in corporate hybrid paper. Sometimes, investors show a preference for 1. hybrids of an issuer over its senior bonds or 2. a preference for hybrid bonds over the senior bonds of other issuers in the same rating category. In our view, this could intensify underperformance. This preference shown by investors intensified the significant underperformance of corporate hybrids, compared to seniors, at the end of September 2015. More specifically, the considerable drop in the valuation of VW hybrid paper in September (as a result of the “Dieselgate” scandal) showed that there is a lack of investor support in a sell-off – even for robust and well known credits like Volkswagen, as investors were reluctant to add additional risk. One should bear this in mind during times of increased market volatility.

March 2016 Credit Research
Euro Credit Pilot
UniCredit Research page 15 See last pages for disclaimer.
Valuation & Timing The new year kicked off with remarkable downward pressure, as global growth concerns and
plunging commodity prices kept investors nervous. However, these concerns have started to abate recently, and pressure on risky assets has receded. Equities have rebounded strongly and posted double-digit gains since mid-February (STOXX 600 Europe) as oil prices stabilized above USD 33/bbl. Although the OECD trimmed its global growth expectations (3% after 3.3%, now flat to 2015), the overall economic picture remains resilient and the expected level of growth in the eurozone over the next 12M is commensurate with spread levels that are still significantly tighter, suggesting that the upside from current levels remains appealing.
Given the substantial spread blowout that we regard as fundamentally unjustified – in Non-financials, but particularly in Financials – we recommend positioning for a retightening in credit spreads over the coming months (i.e. relatively near-term). In Non-financials, the average spread amounts to 120bp. That is only 10bp below the recent peak, which still leaves some additional short-term tightening potential, as this level compares with about 100bp at the end of last year and about 80bp prior to the VW crisis. In synthetics, spread volatility has been even higher (iTraxx Main: 80bp at the end of last year; recent peak at 125bp, current level 95bp), with additional spread tightening potential lower than in cash bonds due to the pronounced snapback in recent days. For investors wanting to place an even more aggressive bullish bet, AT1/CoCos might offer some attractive opportunities due to the recent blowout.

March 2016 Credit Research
Euro Credit Pilot
UniCredit Research page 16 See last pages for disclaimer.
Spread Forecast Table SPREAD FORECAST 2016 (BP)
Index 1-3M 3-6M A iBoxx universe + +
BBB iBoxx universe ++ +
Telecoms iBoxx universe + +
Automobiles iBoxx universe + +
Industrials iBoxx universe + +
Utilities iBoxx universe + +
Hybrids iBoxx universe ++ +
Financials Sub iBoxx universe ++ +
Financials Sub iTraxx universe ++ +
HY cash BB (ML) ++ +
HY cash B (ML) ++ +
– = negative outlook, o = neutral, + = positive outlook, ++ = very positive outlook
Source: Bloomberg, UniCredit Research
0
25
50
75
100
125
150
0
25
50
75
100
125
150
Dec-14 Jun-15 Dec-15 Jun-16 Dec-16
bp
iBoxx NFI iTraxx Mainactual forecast
0
25
50
75
100
125
150
0
25
50
75
100
125
150
Dec-14 Jun-15 Dec-15 Jun-16 Dec-16
bp
iBoxx FinSen iTraxx FinSenactual forecast
0
100
200
300
400
500
600
0
100
200
300
400
500
600
Dec-14 Jun-15 Dec-15 Jun-16 Dec-16
bp
iBoxx HY iTraxx Xoveractual forecast
March 2016 Credit Research
Euro Credit Pilot
UniCredit Research page 17 See last pages for disclaimer.
Other Credit Markets Credit Derivatives: Senior underperformance explained
Spread widening of iTraxx European spreads in the first two months of the year was accompanied by large moves in the positioning of non-dealers. We argue that demand for a cheap hedge against a systemic financial crisis has driven the sharp underperformance of the iTraxx Senior vs. the Main. This also pulled financial single-name CDS wider until mid-February.
Bank single-name spreads in the spotlight in February
Investors observed single-name CDS of financial sector entities explode in the first half of February. We think that this development was at least partly driven by investors pushing the headline spread of the iTraxx Financial Senior wider as they sought a cheap hedge against a systemic financial crisis that included buying protection on the index. While single-name stories hit the screens regarding challenges of individual banks in the first weeks of the year, these were not universally affecting the whole sector, which would be a characteristic of a systemic crisis. The surging index spread pulled single-name CDS wider across the board.
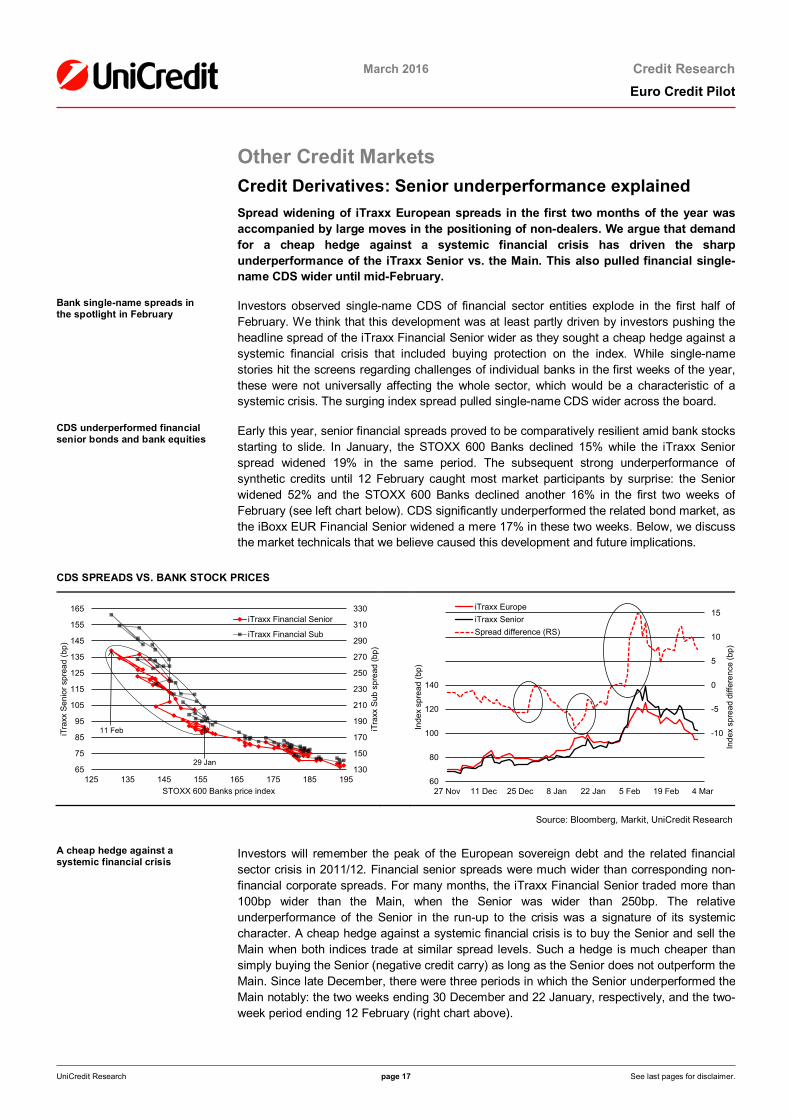
CDS underperformed financial senior bonds and bank equities
Early this year, senior financial spreads proved to be comparatively resilient amid bank stocks starting to slide. In January, the STOXX 600 Banks declined 15% while the iTraxx Senior spread widened 19% in the same period. The subsequent strong underperformance of synthetic credits until 12 February caught most market participants by surprise: the Senior widened 52% and the STOXX 600 Banks declined another 16% in the first two weeks of February (see left chart below). CDS significantly underperformed the related bond market, as the iBoxx EUR Financial Senior widened a mere 17% in these two weeks. Below, we discuss the market technicals that we believe caused this development and future implications.
CDS SPREADS VS. BANK STOCK PRICES
Source: Bloomberg, Markit, UniCredit Research
A cheap hedge against a systemic financial crisis
Investors will remember the peak of the European sovereign debt and the related financial sector crisis in 2011/12. Financial senior spreads were much wider than corresponding non-financial corporate spreads. For many months, the iTraxx Financial Senior traded more than 100bp wider than the Main, when the Senior was wider than 250bp. The relative underperformance of the Senior in the run-up to the crisis was a signature of its systemic character. A cheap hedge against a systemic financial crisis is to buy the Senior and sell the Main when both indices trade at similar spread levels. Such a hedge is much cheaper than simply buying the Senior (negative credit carry) as long as the Senior does not outperform the Main. Since late December, there were three periods in which the Senior underperformed the Main notably: the two weeks ending 30 December and 22 January, respectively, and the two-week period ending 12 February (right chart above).
130
150
170
190
210
230
250
270
290
310
330
65
75
85
95
105
115
125
135
145
155
165
125 135 145 155 165 175 185 195
iTra
xx S
ub s
prea
d (b
p)
iTra
xx S
enio
r spr
ead
(bp)
STOXX 600 Banks price index
iTraxx Financial Senior
iTraxx Financial Sub
29 Jan
11 Feb
-20
-15
-10
-5
0
5
10
15
60
80
100
120
140
160
180
200
27 Nov 11 Dec 25 Dec 8 Jan 22 Jan 5 Feb 19 Feb 4 Mar
Inde
x sp
read
diff
eren
ce (b
p)
Inde
x sp
read
(bp)
iTraxx EuropeiTraxx SeniorSpread difference (RS)
March 2016 Credit Research
Euro Credit Pilot
UniCredit Research page 18 See last pages for disclaimer.
Demand for cheap hedges underpins market fears of systemic financial crisis
In January and February, there was unusually strong demand for the cheap hedge mentioned above. We disagree that this demand was fundamentally justified, albeit the hedge was cheap to enter and rather popular. The stark demand for the trade explains the underperformance of iTraxx Senior spreads vs. the Main since mid-January. Admittedly, some investors who entered the hedge early and closed it in mid-February made a decent profit.
Positioning in iTraxx indices: client risk-taking explained
A global trade information warehouse (TIW) of US service provider DTCC provides gross notional volumes of all outstanding iTraxx index trades. DTCC’s volumes are split into two components, one number for trades in which non-dealers (i.e. clients) sold protection and another number for trades in which non-dealers bought protection. We calculate the difference between the gross volume sold and the gross volume bought by clients and call it “client risk-taking” (measured in EUR bn; available on a weekly basis). If client risk-taking is positive, then clients as a whole are long default risk of the underlying index. Correspondingly, a negative value for client risk-taking represents a hedge.
Comparison of index spreads to client risk-taking measure reveals the market dynamics
The two charts below show our client risk-taking measure (black line; data for Series 24) and related index spreads (red line, corresponding to right axis with reversed scale) have recently moved in tandem again, both for the Main index (left chart) and the Financial Senior index (right chart). Spread widening is typically accompanied by a more defensive positioning of non-dealers. A strong move to a more defensive positioning was seen in February both for the Main (due to a reduction of the long-risk position of clients) and the Senior (surging volume hedges).
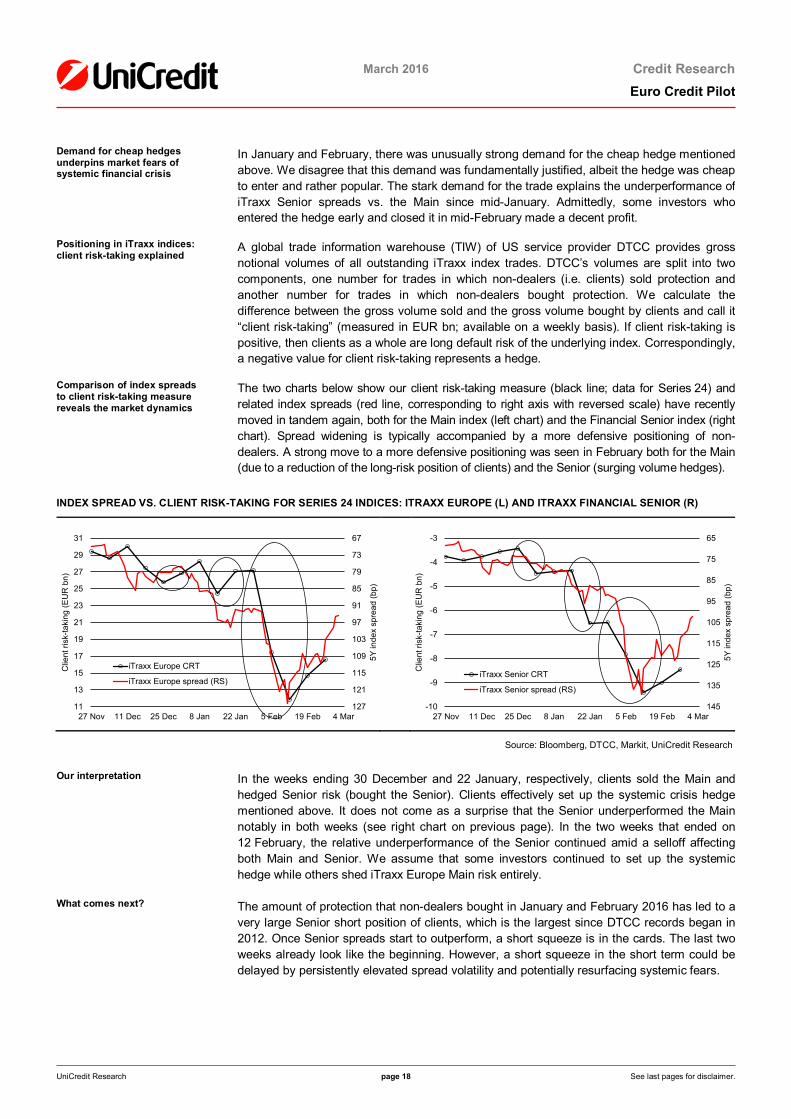
INDEX SPREAD VS. CLIENT RISK-TAKING FOR SERIES 24 INDICES: ITRAXX EUROPE (L) AND ITRAXX FINANCIAL SENIOR (R)
Source: Bloomberg, DTCC, Markit, UniCredit Research
Our interpretation In the weeks ending 30 December and 22 January, respectively, clients sold the Main and hedged Senior risk (bought the Senior). Clients effectively set up the systemic crisis hedge mentioned above. It does not come as a surprise that the Senior underperformed the Main notably in both weeks (see right chart on previous page). In the two weeks that ended on 12 February, the relative underperformance of the Senior continued amid a selloff affecting both Main and Senior. We assume that some investors continued to set up the systemic hedge while others shed iTraxx Europe Main risk entirely.
What comes next? The amount of protection that non-dealers bought in January and February 2016 has led to a very large Senior short position of clients, which is the largest since DTCC records began in 2012. Once Senior spreads start to outperform, a short squeeze is in the cards. The last two weeks already look like the beginning. However, a short squeeze in the short term could be delayed by persistently elevated spread volatility and potentially resurfacing systemic fears.
67
73
79
85
91
97
103
109
115
121
12711
13
15
17
19
21
23
25
27
29
31
27 Nov 11 Dec 25 Dec 8 Jan 22 Jan 5 Feb 19 Feb 4 Mar
5Y in
dex
spre
ad (b
p)
Clie
nt ri
sk-ta
king
(EU
R b
n)
iTraxx Europe CRT
iTraxx Europe spread (RS)
65
75
85
95
105
115
125
135
145-10
-9
-8
-7
-6
-5
-4
-3
27 Nov 11 Dec 25 Dec 8 Jan 22 Jan 5 Feb 19 Feb 4 Mar5Y
inde
x sp
read
(bp)
Clie
nt ri
sk-ta
king
(EU
R b
n)
iTraxx Senior CRT
iTraxx Senior spread (RS)

March 2016 Credit Research
Euro Credit Pilot
UniCredit Research page 19 See last pages for disclaimer.
High yield: premiums exceed inherent fundamental risk Heightened growth concerns at the start of the year have resulted in a volatile
environment for risky assets. While the widening pressure in high-yield spreads has eased somewhat, spread-implied default rates are still overshooting credit fundamentals. As companies in the most battered sectors increase creditor-friendly measures, pronounced improvement in risk premiums has become more likely.
High-yield spreads imply a surge in default rates
Credit spreads have witnessed substantial increases in the first weeks of the year. Experiencing a setback similar to other risky assets, high-yield returns have dipped into negative territory (iBoxx EUR HY -2% YTD). The rise in non-financial high-yield spreads (iBoxx EUR HY NFI +83bp to 542bp) has been fueled by a number of concerns, particularly global growth. In the past decade, risk premiums traded significantly wider than current levels only during the financial crisis and the eurozone crisis. Spreads imply that default rates (assuming a 40% recovery rate and 2Y government yield levels of -0.5% in EUR and 0.75% in USD) could surge as high as 9% in Europe (from 3.3% in January) and 11.5% in the US (from 3.1% in January). While neither consensus growth expectations nor our economists indicate a pronounced negative turnaround in economic activity on either side of the Atlantic, there are additional reasons to assume a less drastic increase in defaults.
A spike in defaults is difficult to justify from the fundamentals side
From a micro perspective, credit fundamentals are still on a solid footing in Europe. While industrial companies exposed to demand from commodity-related sectors reported declining revenues in 4Q15, profitability across many other industrial sectors (e.g. paper, packaging, cement, toll roads) generally improved, reflecting the favorable economic path and tailwind from positive FX effects. Overall, adj. EBITDA margins for issuers in the iBoxx HY NFI have steadily climbed over the past year, reaching the highest level (17%) since 2006. While steelmakers and miners are reporting severe sales and margin declines, they have responded to rising spreads by intensifying creditor-supportive measures: e.g. ArcelorMittal with a EUR 3bn capital increase, Anglo American announcing a tender of a series of short-dated EUR and USD notes, and Glencore securing a significant credit facility. Rating agencies are taking a similar view in assuming that default rates will increase, but much more gradually and to levels well below crisis levels (12M Moody’s baseline forecast 3.4% in Europe and 4.7% in the US, left chart below). This appears reasonable as the development of leverage (net debt/EBITDA) has been very stable in European HY (median at 4x from 3.9x, black line in the right chart below).
MODERATE DEFAULT RATE INCREASE EXPECTATIONS AND HIGH RISK COMPENSATION IN EURO NON-FINANCIAL HY
US and European default rate and baseline forecast by Moody’s Leverage (net-debt [adj.] / EBITDA [adj.]) in iBoxx EUR HY NFI
Source: iBoxx, Moody’s, UniCredit Research
0%
2%
4%
6%
8%
10%
12%
14%
16%
18%
Jan-
99O
ct-9
9Ju
l-00
Apr
-01
Jan-
02O
ct-0
2Ju
l-03
Apr
-04
Jan-
05O
ct-0
5Ju
l-06
Apr
-07
Jan-
08O
ct-0
8Ju
l-09
Apr
-10
Jan-
11O
ct-1
1Ju
l-12
Apr
-13
Jan-
14O
ct-1
4Ju
l-15
Apr
-16
Jan-
17
US actual Europe_ActualEurope_Baseline US_Baseline_Forecast
1.5
2
2.5
3
3.5
4
4.5
5
5.5
6
6.5
Jan-
09A
pr-0
9Ju
l-09
Oct
-09
Jan-
10A
pr-1
0Ju
l-10
Oct
-10
Jan-
11A
pr-1
1Ju
l-11
Oct
-11
Jan-
12A
pr-1
2Ju
l-12
Oct
-12
Jan-
13A
pr-1
3Ju
l-13
Oct
-13
Jan-
14A
pr-1
4Ju
l-14
Oct
-14
Jan-
15A
pr-1
5Ju
l-15
Oct
-15
Jan-
16
25% Percentile Net debt adj. / EBITDA adj. (median) 75% Percentile

March 2016 Credit Research
Euro Credit Pilot
UniCredit Research page 20 See last pages for disclaimer.
Risk compensation at elevated levels
Risk compensation has increased significantly due to spreads increasing while leverage has trended broadly sideways: the premium paid for a single unit of leverage for bonds in the iBoxx EUR HY NFI has risen to 135bp, exceeding the 10Y average (130bp) and the median (116bp). The average in 2014 was 90bp and last year 102bp. The all-time low was reached in May 2007, at 62bp, for one turn of leverage, indicating that there have clearly been worse times to add risk. Before the spread-per-unit-of-leverage ratio moves back to just the upper range of the 3Y-10Y median risk compensation band (116bp, light red shaded area in the left chart), spreads in the iBoxx EUR HY NFI could improve by 85bp, assuming stable leverage going forward. A tightening of 120bp from current levels would push risk compensation merely to the lower range of the red shaded area.
Widening pattern indicates fewer underlying growth concerns than it seems at first glance
The way the recent weakness has unfolded has added to our conviction that the excessive spread widening has been partly fueled by scarce liquidity in secondary markets. Spread performance across rating categories does not appear to reflect deeper growth concerns among credit investors. When growth is expected to dip and potentially cause trouble for weaker companies, these tend to underperform. The widening in the market turmoil has been more or less proportional, however. The ratio of BBB to A spreads in the iBoxx EUR NFI has remained stable (1.9x) and is in line with the longer-term median level (2x). Within HY, spreads across rating categories have even compressed sharply, leaving BB notes the major underperformers YTD in spread terms: spread (ASW) ratios of both CCC over BB (2.4x) and B over BB (1.5) have compressed and dipped well below their long-term median levels (2.7x and 1.8x, respectively). Interestingly, the spread ratio of BB to BBB has remained broadly stable (2.7x), and virtually flat to its long-term median (2.6x), suggesting that the widening push has been felt strongest within the more-liquid investment-grade-rated bonds. This indicates that risk aversion has risen temporarily, and that growth is still considered fairly resilient.
SOLID RISK COMPENSATION IN HIGH YIELD WITH SELL-OFF PATTERN LIQUIDITY-DRIVEN
Risk compensation iBoxx EUR HY NFI (ASW per net debt/EBITDA) iBoxx EUR HY NFI rating category spread ratios
Source: iBoxx, Bloomberg, UniCredit Research
2.5
3
3.5
4
4.5
5
5.5
0
50
100
150
200
250
300
Feb-
06
Aug
-06
Feb-
07
Aug
-07
Feb-
08
Aug
-08
Feb-
09
Aug
-09
Feb-
10
Aug
-10
Feb-
11
Aug
-11
Feb-
12
Aug
-12
Feb-
13
Aug
-13
Feb-
14
Aug
-14
Feb-
15
Aug
-15
Spread (ASW) / leverage in bp 10Y median spread/lev.3Y median spread / lev. Median net debt adj. / EBITDA (adj)
1
1.5
2
2.5
3
3.5
4
4.5
Jan-
11M
ar-1
1M
ay-1
1Ju
l-11
Sep
-11
Nov
-11
Jan-
12M
ar-1
2M
ay-1
2Ju
l-12
Sep
-12
Nov
-12
Jan-
13M
ar-1
3M
ay-1
3Ju
l-13
Sep
-13
Nov
-13
Jan-
14M
ar-1
4M
ay-1
4Ju
l-14
Sep
-14
Nov
-14
Jan-
15M
ar-1
5M
ay-1
5Ju
l-15
Sep
-15
Nov
-15
Jan-
16
CCC vs. B median CCC/BB vs. BB median B/BBCCC vs. BB median CCC/BB

March 2016 Credit Research
Euro Credit Pilot
UniCredit Research page 21 See last pages for disclaimer.
Securitization: Reviving Italian NPL ABS In a recent agreement between Italy and the EC on the way in which Italian banks might
reduce their vast stock of non-performing loans (NPLs) such that it would not be considered state aid, securitizations involving government guarantees were proposed as a solution. The plan targets the EUR 200bn of severely delinquent debt, often referred to as bad loans. The Italian government devised a guarantee mechanism that allows banks to securitize their NPLs, subject to a number of conditions. It is as yet unclear whether NPL ABS will be eligible under the ECB repo window. A number or smaller Italian banks are reportedly already exploring such deals. Despite the many concerns, caveats and complexities, we believe that the plan is a positive for Italian securitization, if only in signaling that securitization remains a viable solution. On the other hand, we do not expect the measure to materially boost investor-placed Italian securitization issuance.
Bad loans are a drag on bank balance sheets and lending capabilities
Italy’s prolonged recession and slow growth have clearly left their mark in terms of bad loans. The amount of NPLs (also referred to as “sofferenze”) potentially eligible for future securitization under the plan increased to more than EUR 200bn (about 13% of GDP) at the end of 2015, up from EUR 60bn in 2009. The elevated and growing amount of NPLs in Italy continues to weigh on the balance sheets of banks, while constraining their capital and ability to lend. As shown in the left chart below, since the onset of the financial crisis in 2008, Italian NPLs have more than tripled to 18.2% (December 2015) of total gross loans, from just 10% in 2011 and around 5% in 2007, reflecting the challenging macroeconomic backdrop and the ensuing rise in severe delinquencies. Another major roadblock for the NPL resolution has been the slow pace of write-offs resulting from the limited incentive for lenders to incur losses. Moreover, in the absence of a stronger economic recovery and without a significant pickup in write-offs and loan sales (the 2015 rate was about 8%), the bad debt ratio in Italian banks is likely to remain very high for several decades, according to IMF estimates.
NPL guarantee scheme technicalities
Under the proposed GACS mechanism, the senior tranches securitizations in question would be backed by an Italian government guarantee. The guarantee scheme specifies that senior-most ABS notes must be of IG credit quality prior to the application of the guarantee, that is, without accounting for the guarantee as such. To qualify, at least 50% of the junior and mezzanine notes (if included in the deal structure), would be placed, with the remaining junior notes being retained by the originator. Regarding the guarantee for the most senior tranche, Italy would provide it at a bank’s request, on the condition that the tranche is rated at least IG by one of the recognized credit rating agencies (please refer to our recent note for details). Importantly, the guarantee would be priced based on the average CDS spread of the previous six months for a basket of Italian issuers. Excluding the recent spread blowout in European bank senior CDS, we estimate the cost of such a guarantee to amount to 80-120bp.
ITALIAN BAD LOAN STOCKS (“SOFFERENZE”) AND LACK OF GRANULARITY IN ITALIAN NPL EXPOSURE
Banks’ NPL ratio increased to 18.2% in December 2015 Less than 25% of the bad-loan stock is of loans of EUR <250,000
Source: Bank of Italy, Bloomberg, Moody’s UniCredit Research
0
4
8
12
16
20
0
50
100
150
200
250
Dec-00 Dec-03 Dec-06 Dec-09 Dec-12 Dec-15
%EU
R b
n
Other Financial Inst. HouseholdsNFI corporations/SMEs NPL to total gross loans (RS)
0
10
20
30
40
50
60
70
0
5
10
15
20
25
30
35
Bel
ow 3
0
30 to
75
75 to
125
125
to 2
50
250
to 5
00
500
to 1
000
1000
to 2
500
2500
to 5
000
5000
to 2
5000
>250
00
# of
def
aulte
d bo
rrow
ers
(%)
Bad
loan
s (%
)
Defaulted amount buckets (EUR, thousands)
Defaulted amount (LS) Defaulted borrowers (RS)
granular "securitizable" exposure
March 2016 Credit Research
Euro Credit Pilot
UniCredit Research page 22 See last pages for disclaimer.
Breakthrough or blip? The agreement could pave the way for the re-emergence of the NPL ABS sector in Europe, which has been largely dormant since 2007. In the run-up to the financial crisis, the European ABS market saw at least 34 Italian NPL securitizations backed by assets ranging from unsecured consumer loans to residential and commercial mortgages. The introduction of a new securitization law supporting NPL transactions quickly boosted issuance in 2000. Primary activity of Italian NPL securitizations peaked in 2001, with Italian lenders making extensive use of ABS to dispose of their NPLs from past recessions. Unlike many of the granular securitizations backed by performing consumer loans and statistically predictable cash flows, NPL transactions have unique credit profiles because they mainly derive their cash flows from recoveries on distressed debt.
NPLs – from nascent to niche market
Relative to the enormous amount of Italian non-performing assets, the market for distressed debt remains fairly small so far. Data on NPL transactions remain scarce due to the private nature of deals. Overall, buyers of Italian NPLs are mostly UK or US hedge funds and private equity funds. Major sellers have been large Italian and foreign-owned banks. Despite some recent increases, the number of NPL loan sales remains insignificant, with the portfolios involved in these transactions being largely made up of higher-quality and highly provisioned assets, or consumer-financing-related loans, which banks tend to write down almost completely once they are in default and therefore can sell at substantial discounts. Given the large difference between the book value of these NPLs and the price at which market participants are willing to acquire them, lenders are often reluctant to part with their NPL holdings. Whether the bad loans are sold to private investors or to an SPV that has been set up for NPL securitizations, the existing price gap between the current value and the market price would force potential NPL originators to book losses. Regarding potential volumes under the GACS plan, we believe that only a quarter of the NPL stock (roughly EUR 50bn) is potentially securitizable if granular portfolios similar to current Italian ABS are assumed (see right chart above). Given these considerations, as well as banks’ underlying reasons for not disposing of their bad loan portfolios, we remain skeptical as to whether the GACS mechanism will be a breakthrough for NPL-backed securitization. Another disincentive would be the envisaged reduction in the foreclosure period which, by definition, would benefit the valuation of NPLs at the bank balance sheet level.
Why the GACS mechanism is no panacea
At first glance, the GACS mechanism is straightforward and provides a viable solution to deal with banks’ protracted NPL burdens. The benefits of securitization within this context are beyond question, particularly regarding the underlying assets’ illiquid nature. Moreover, NPL volumes could benefit the ailing Italian securitization sector, as specialized investors are already familiar with the risk characteristics of such granular portfolios with high levels of arrears. In theory, the Italian government’s NPL plan would facilitate the disposal of the large NPL overhang in Italy’s banking system, which, in turn, should help stabilize asset quality. Yet, the mechanism is no panacea. Its success is dependent on the participation of larger investors willing to venture into both senior and subordinated tranches. While the reduced funding costs for the guaranteed senior tranches could be attractive for smaller lenders lacking cheaper funding alternatives such as covered bonds, the extent to which a guarantee makes sense for larger banks is still unclear. As outlined above, many potential Italian NPL ABS originators have an incentive to hold on to highly provisioned loans rather than to dispose of them to boost their overall provisioning coverage ratios, defined as the ratio of cash provisions to gross loans, which is typically used to asses credit risk.
Benefits for investors For investors, the fact that banks need to shrink their balance sheets creates opportunities for non-bank accounts willing to venture into NPL securitizations. We caution, however, that the GACS mechanism’s success cannot be taken for granted and the emergence of guaranteed senior tranches will not meaningfully improve the Italian ABS sector’s liquidity. Still, given the guarantee, they would become more attractive for investors, especially due to their likely eligibility under the Eurosystem repo facility. The guaranteed senior tranches, which should obtain the same rating as the Italian sovereign, will offer a substantial pickup to Italian BTPs, given their lower liquidity, lack of standardization and limited investor base.

March 2016 Credit Research
Euro Credit Pilot
UniCredit Research page 23 See last pages for disclaimer.
Sector allocation Although economic data did not show a significant deterioration, the intense volatility at the
start of the year proved a somewhat more defensive stance right. The negative trajectory of the first six weeks has broadened the availability of opportunities although the weakening has not altered the group of the most interesting sectors. Hence, we leave our recommendations unchanged. Basic Resources (-176bp, of which 75bp is attributable to Anglo American moving to HY in March) is the best-performing sector YTD and continues to be one of our favorites after debtholder-friendly measures have been intensified in response to the decline in commodity prices. Automobiles are enjoying a short-duration profile and should continue to benefit from the ongoing improvement in eurozone growth, particularly as the periphery is catching up. Oil & Gas will benefit from a stabilization in oil prices.
CREDIT ALLOCATION TABLE
As of 2 March 2016
Current recommendation
iBoxx weight YTD spread change
Current spread level
Macro allocation Sovereigns AAA UW 17.3% -1.1 -31.7 Sovereigns ex-AAA OW 49.2% 15.5 40.9 Sub-Sovereigns MW 14.2% 5.0 6.2 Covered Bonds MW 1.9% 7.4 23.9 Financials OW 7.2% 27.4 128.6 Non-Financials MW 10.2% 11.0 120.5 Sector allocation NFI Telecommunications TEL MW 12.9% 19.8 121.5 Media MDI MW 2.5% 12.2 119.7 Technology THE MW 2.7% 11.7 70.0 Automobiles & Parts ATO OW 9.5% 17.1 127.2 Utilities UTI OW 22.2% 27.2 135.6 Oil & Gas OIG OW 9.6% 23.0 157.3 Industrial Goods & Services (Core) IGS UW 6.7% 15.2 96.6 Industrial Transportation ITR MW 5.5% 11.5 90.9 Basic Resources BAS OW 2.2% -179.8 305.6 Chemicals CHE UW 3.3% -0.7 77.7 Construction & Materials CNS MW 2.4% 19.4 120.5 Health Care HCA MW 5.7% 10.3 87.5 Personal & Household Goods PHG MW 4.1% 6.4 74.0 Food & Beverage FOB MW 6.4% 7.3 74.6 Travel & Leisure TAL MW 1.3% 20.8 142.2 Retail RET MW 3.0% 27.8 143.1 Quality allocation NFI AAA UW 0.7% 7.2 47.5 AA UW 10.0% 5.6 59.5 A MW 36.7% 11.8 86.5 BBB MW 52.6% 12.0 156.7
Source: iBoxx, UniCredit Research

March 2016 Credit Research
Euro Credit Pilot
UniCredit Research page 24 See last pages for disclaimer.
Fundamental Credit Views
Telecommunications (Marketweight) Sector key figures Sector Wrap-Up Weight in iBoxx NFI: Current ASW spread: change mom/YTD: EURO STOXX TEL YTD:
12.9% 121.5bp -0.0/+19.8 -4.5%
Sector drivers: We keep our marketweight recommendation for the telecoms sector. The iBoxx EUR (IG) Telecoms index has outperformed the iBoxx EUR (IG) Non-Financials index, particularly since the beginning of December. Telecoms bonds were much less impacted by declining oil and commodity prices amid global growth concerns than other sectors. However, as our economists and strategists stick to their view that the concerns about China and negative spillover effects to the rest of the world are overdone, we expect outperformance of the iBoxx EUR (IG) Telecoms index to run out of steam. Telecoms could even trail the market once volatility subsides and an overall reduction in spreads benefits higher-beta sectors to a greater extent. The overall improving operating performance in the telecoms sector is not expected to become a major spread driver at current valuations, as it should only support telecoms operators in stabilizing their credit profiles. We still expect lively M&A activity, but it is difficult to estimate whether it will exceed the already very high level of the last two years. Apart from some exceptions, we assume that consolidation should not lead to higher leverage and rating pressure, similar to many transactions in the past (Telefonica-GVT, BT-EE, Orange-Jazztel, Telenet-Base, Wind-3 Italia). The positive effects of consolidation on competition are expected to be (partially) offset by remedies. EU regulation is largely expected to be credit-neutral (some negative impact from roaming regulation, but regulation has started to welcome network investments over further competition increases). We currently do not expect bigger spectrum auctions in 2016 to play an important role, except for the upcoming one in the US. New issuance is not expected to be a major spread driver in the telecoms sector, albeit we expect new issuance to increase significantly yoy. The weakness in emerging markets will likely have a negative impact on some credits and might need to be offset by balance-sheet measures. Hence, despite an overall improving operating environment and stable sector rating outlooks from all three major rating agencies, we recommend to remain selective in the telecoms sector. Market recap: Since the beginning of November, the EUR iBoxx IG Telecoms average spread has widened by 19bp to 121bp, and the EUR iBoxx NFI average spread has widened by 22bp to 126bp. There was no clear outperforming company, as shorter-dated bonds outperformed longer-dated bonds in general. The main underperformers were perpetual bonds (AMXLMM and ORAFP). In addition, T and VOD bonds underperformed. Sector composition: Orange (14.6%), Telefonica (12.8%), AT&T (11.5%), Vodafone (9.4%), Deutsche Telekom (6.8%), TeliaSonera (6.3%), America Movil (6.3%), Telstra (5.2%), Verizon Communications (5.1%), Telenor (3.9%), KPN (3.4%), Emirates Telecommunications (2.2%), TDC (1.9%), Bharti Airtel (1.6%), Telekom Austria (1.5%), Swisscom (1.4%), Vivendi (1.4%), Proximus (1.0%), Telefonica Deutschland (1.0%), BT (0.9%), Singapore Telecom (0.7%), EverythingEverywhere (0.6%), TDF Infrastructure (0.5%)
Current Ratings (Moody's/S&P/Fitch)
Credit Profile
Name (Ticker): Recommendation Weight in iBoxx Comment Telecommunications sector
A2s/A-s/As Weakening America Movil (AMXLMM): Underweight 6.3% America Movil (AMX) released weaker-than-expected 4Q15 results in terms of EBITDA. In 4Q15, revenues increased by 0.6% yoy versus +1.2% in 3Q15, 0.1% in 2Q15 and 3.1% in 1Q15 (-0.6% at constant exchange rates, versus -0.6% in 3Q15, -0.5% in 2Q15 and +1.0% in 1Q15) to MXN 230.6bn (above consensus estimate of MXN 228.1bn), mainly driven by still strongly increasing equipment sales (+13.2% yoy), while services revenues decreased by 1.5% yoy (-1.0% in 3Q15). In 4Q15, EBITDA decreased yoy by 5.1% versus -8.2% in 3Q15, -5.0% in 2Q15 and -3.1% in 1Q15 (at constant currencies, -2.9% in 4Q15 versus -2.5% in 3Q15, -3.1% in 2Q15 and -2.1% yoy in 1Q15) to MXN 63.9bn (below the consensus estimate of MXN 67.7bn). The EBITDA margin remained under pressure and decreased yoy to 27.7% in 4Q15 (29.8% in 3Q15, 31.1% in 2Q15 and 31.0% in 1Q15, 29.4% in 4Q14). In 4Q15, the operating performance was relatively weak in Mexico, as revenues (around 30% of group total) declined yoy by 0.5% (service revenues -6.9% yoy), but EBITDA was down by 14.2% yoy (-9.5% in 3Q15, 7.3% in 2Q15). The weaker results in Mexico were not able to be offset by (surprisingly still) good results in Brazil (revenues in local currency -1.2% yoy, EBITDA +6.7% yoy), partly because of the weak Brazilian real and clearly weaker development qoq. Net debt declined qoq from around MXN 600bn to MXN 585bn at YE15, mainly due to the Telesites spin-off, which reduced group debt by MXN 21bn. However, leverage remained relatively high qoq at 1.8x, which continues to exceed the company's own threshold of "below 1.5x". AMX proposed a dividend increase from MXN 0.26 to MXN 0.28 to be paid as usual in two installments, plus a share buyback program of MXN 12bn. We have an underweight recommendation on the euro-denominated AMXLMM senior notes, which trade relatively tight considering the inherent emerging-market risks and the regulatory pressure in the company’s domestic markets. In the past, AMX’s CEO has stated that the group can live with the “preponderance status” in Mexico (and regulatory pressure) and therefore does not intend to sell assets to reduce its dominant market positions in Mexico. It remains to be seen how the regulator/competition authorities will react to this strategy going forward. However, AMXLMM’s hybrids trade relatively more attractively than its senior bonds, versus peers. (1Q16 results: 21 April).
Baa1n/BBB+s/A-s Weakening AT&T (T): Underweight 11.5% We have an underweight recommendation for AT&T bonds. We think AT&T might experience further rating pressure if it cannot deleverage quickly enough. 4Q15 results indicated that competition in the domestic mobile business led to a significant revenue decline and mobile subscriber growth looked quite depressed, maybe driven by T-Mobile's success. We think that, at some point, AT&T might become more aggressive in terms of subscriber acquisition, which would lead to EBITDA margin pressure. We note that S&P has a negative outlook on the US telecoms market. The US wireless industry will suffer from maturing industry conditions, increased price competition, elevated capital expenditures and the potential for incremental spending for spectrum licenses in the broadcast incentive auctions, according to S&P. Moreover, AT&T still appears more willing to get involved in acquisitions than Verizon, in our view. (1Q16 results: 26 April)
Baa3s/BBB-s/BBB-s – Bharti Airtel (BHARTI): No recommendation 1.6%

March 2016 Credit Research
Euro Credit Pilot
UniCredit Research page 25 See last pages for disclaimer.
Current Ratings (Moody's/S&P/Fitch)
Credit Profile
Name (Ticker): Recommendation Weight in iBoxx Comment Telecommunications sector
Baa2/BBBp/BBBs Improving BT Group (BRITEL): Overweight 0.9% (member of the iTraxx NFI) BT Group (BT) reported 3Q15/16 results that were roughly in line with consensus expectations. Adjusted revenues increased 3% yoy to GBP 4.59bn (consensus of GBP 4.6bn; underlying revenue growth excluding transit was even up 4.7% yoy compared to 2% in the last quarter), resulting in BT’s best underlying top-line growth in seven years, significantly supported by an outstanding quarter in BT Consumer. Adjusted EBITDA increased by 3% yoy (underlying 4%) to GBP 1.61bn (consensus GBP 1.60bn). Normalized free cash flow was an inflow of GBP 904mn, broadly in line with last year. Net debt decreased qoq from GBP 5.92bn to GBP 5.02bn. For FY15/16, BT’s outlook remained largely unchanged. BT continues to expect growth in underlying revenue, excluding transit in 2015/16, with modest growth in adjusted EBITDA. BT expects underlying revenue excluding transit to grow by 1% to 2% for the full year. While underlying revenue excluding transit grew 2.3% in the first nine months, the revenue trend in the fourth quarter will be negatively impacted by the "ladder pricing revenue". BT continues to expect modest growth in adjusted EBITDA, with normalized free cash flow to be around GBP 2.8bn. We continue to have an overweight recommendation for BRITEL bonds. (4Q15/16 results: 5 May)
Baa1s/BBB+s/BBB+s Stable Deutsche Telekom (DT): Marketweight 6.8% (member of the iTraxx NFI) Deutsche Telekom (DT) released better-than-expected 4Q15 results, as revenues were in line with consensus expectations and EBITDA and FCF were above consensus. DT provided a positive growth outlook for FY16. In terms of revenues (reported up by 5.0% yoy and organically down 0.3% versus +2.2% in 3Q15), DT Group again generated strong yoy growth in the US (+15.5%), supported by growth at T-Systems (+3.4% yoy) and a moderate top-line decline in Germany (-1.0% yoy) and Europe (-2.4%). Regarding adjusted group EBITDA (reported up by 15.7% yoy and organically up 11%), the US again showed strong yoy growth, while Germany (+4.3% yoy) and T-Systems (+8.0%) also showed healthy growth. The group adjusted EBITDA margin was up yoy to 28.8% from 26.1% in 4Q14. FCF (before dividends) was broadly stable yoy at EUR 998mn (consensus of EUR 912mn). Net debt decreased by roughly EUR 0.3bn qoq to EUR 47.6bn. The reported net debt/adj. EBITDA ratio declined qoq from 2.5x to 2.4x (own-company threshold is 2.5x). For full-year 2015, DT achieved its targets: 1. group top line of FY14 (EUR 62.7bn) was expected to increase (FY15: EUR 69.2bn; +10.5% yoy); 2. adjusted EBITDA was expected to grow by around 4% yoy to EUR 18.3bn at constant currencies (1.33 EUR-USD exchange rate), which transforms into a target of EUR 19.4bn at last year’s EUR-USD exchange rate of 1.11 (the company achieved currency-adjusted growth of 6.2% yoy to EUR 19.9bn in FY15). FCF (company defined) was expected to increase moderately from EUR 4.1bn in FY14 to EUR 4.3bn (not impacted by exchange-rate changes) and ended at EUR 4.5bn. For FY16, DT expects ongoing revenue growth (no concrete guidance) and adjusted EBITDA growth of 6.5% yoy to around EUR 21.2bn. Capex should slightly increase to EUR 11.2bn (up from EUR 10.8bn in FY15) and FCF should increase to EUR 4.9bn from EUR 4.5bn in FY15. We keep our marketweight recommendation for DT bonds. The company’s reported leverage of 2.4x is still high for current ratings and therefore a concern, especially at relatively tight spread levels. This is mitigated by DT’s (group revenue and) EBITDA growth (mainly in the US). Given that DT recently stated that it is not planning to dispose of its (mobile) operations in the Netherlands, we may get further information concerning how the leverage is expected to develop in light of the upcoming US spectrum auction. (1Q16 results: 4 May)
Aa3s/AA-s/A+s – Emirates Telecommunications (ETISLT): No recommendation 2.2% The Emirates Telecommunications Corporation (Etisalat) joined the IG Telecoms iBoxx index after its inaugural EUR-denominated bond issue in June. Etisalat is the incumbent integrated telecommunication service provider in the United Arab Emirates. Following market liberalization, the company acquired stakes in telecommunication companies throughout the Middle East, Africa and Asia. The most recent acquisition was the 53% Maroc Telecom stake of Vivendi. In FY13, Etisalat generated AED 38.9bn of revenues (USD 9.3bn) and EBITDA of AED 18.9bn. The federal government of the UAE owns 60% indirectly through the Emirates Investment Authority. The remaining shares are held by Emirati nationals as stipulated by law.
Baa2p/BBB/-- Improving Everything Everywhere (EVEVRV): Overweight 0.6% After the UK Competition and Markets Authority’s (CMA) announced its final decision to approve BT’s GBP 12.5bn acquisition of Everything Everywhere Ltd. (EE) unconditionally and without remedies, EE is covered as part of BT. BT/EE will be the only fully integrated (fixed and mobile) network operator in the UK and will thereby have a competitive advantage in the development of convergence products. Furthermore, BT expects opex and capex synergies (NPV of GBP 3.0bn) and revenue synergies (NPV GBP 1.6bn). See our comments on BT for further information.
Baa3s/BBB-s/BBB-p Stable KPN NV (KPN): Overweight 3.4% (member of the iTraxx NFI) KPN released weaker-than-expected 4Q15 results, below analyst consensus (as collected by KPN). In 4Q15, adjusted (for the impact of incidentals) revenues were down yoy by 8.1% (versus -2.6% in 3Q15, -3.8% in 2Q15) to EUR 1.745bn (compared to consensus of EUR 1.789bn). This was mainly driven by a still relatively strong decline in the group’s Business segment (-8.3% yoy in 4Q15 versus -7.2% in 3Q15 and -8.9% in 2Q15). This decline could not be offset by growth in Consumer Residential. Without the tax settlement benefit (EUR 44m) in 4Q14, adjusted group revenues would have been down only 5.9% yoy. Adjusted (for the impact of incidentals and restructuring costs), EBITDA declined by 7.6% yoy (versus +4.6% in 3Q15 and +1.5% in 2Q15) to EUR 582mn in 4Q15 (versus consensus of EUR 590mn). Without the tax settlement benefit (EUR 44mn) in 4Q14, adjusted EBITDA would have been down only 0.7% yoy. Customer base growth and the positive impact of cost savings were offset by the impact of declining revenues in Business as well as by higher subscriber acquisition costs in Consumer Mobile. Reported free cash flow generation in 4Q15 was still strong at EUR 223mn (consensus estimate of EUR 172mn) versus minus EUR 179mn in 4Q14, partly driven by lower interest payments. However, reported net debt decreased qoq by around EUR 1bn to EUR 6.5bn, mainly driven by EUR 805mn proceeds from the sale of 150 million shares in Telefónica Deutschland and free cash flow generation. The net debt/EBITDA ratio was lower at 2.5x at the end of 4Q15 (versus 2.8x at the end of 3Q15). KPN expects to distribute approximately 70% of the proceeds from the sale of approximately 5% Telefónica Deutschland shares to its shareholders in June 2016. KPN has additional financial flexibility via the remaining 15.5% stake in Telefónica Deutschland and expected cash proceeds related to the sale of BASE Company in 2016. For FY16, KPN expects adjusted EBITDA to be in line with FY15 and capex of EUR 1.2bn (versus EUR 1.3bn in FY15). FCF (excluding the Telefónica Deutschland dividend) should exceed EUR 650mn in FY16 (EUR 552mn in FY15), according to KPN. We have an overweight recommendation on KPN’s senior bonds. We expect that KPN will be able to stabilize its operating performance in 2016, expressed by the company’s stable EBITDA forecast. We like the KPN 3.75% 09/20 and the KPN 3.25% 02/21, but see particularly good value in the KPN 6.125% hybrid bond. Upside potential could be triggered if Moody’s and S&P start to follow Fitch’s rating outlook change to positive. (1Q16 results: 29 April)

March 2016 Credit Research
Euro Credit Pilot
UniCredit Research page 26 See last pages for disclaimer.
Current Ratings (Moody's/S&P/Fitch)
Credit Profile
Name (Ticker): Recommendation Weight in iBoxx Comment Telecommunications sector
Baa1s/BBB+s/BBB+s Stable Orange (ORAFP): Overweight 14.6% (member of the iTraxx NFI) Orange released better-than-expected FY15 results and provided a decent outlook for FY16. Group revenues decreased 0.1% yoy to EUR 40.24bn on a comparable basis (cb), exceeding the consensus estimate of EUR 40.1bn. This demonstrated an ongoing improving trend compared to declines of -3.8% in 1Q14, -3.4% in 2Q14, -2.3% in 3Q14, -0.6% in 4Q14, -0.9% in 1Q15, +0.2% in 2Q15, +0.5% in 3Q15 and +0.5% in 4Q15. Restated EBITDA continued to benefit from ongoing operating cost reductions and rose by 0.1% yoy (on a cb) to EUR 12.43bn (exceeding the consensus of EUR 12.3bn). It also improved compared to declines of -3.8% in 1Q14, -3.1% in 2Q14, -2.3% in 3Q14, -0.7% in 4Q14, -1.9% in 1Q15, +0.4% in 2Q15, +1.1% in 3Q15. The restated ratio of net financial debt to EBITDA was 2.01x at 31 December 2015, versus 2.09x at 31 December 2014, and in line with the objective of a ratio of around 2x in the medium term. For 2016, Orange aims for a restated EBITDA that is higher than in 2015 on a comparable basis. This objective will be supported by continued efforts to reduce the cost structure. The group maintains its objective of a ratio of net debt to EBITDA of around 2x in the medium term to preserve Orange’s financial strength and investment capacity. Within this framework, the group is pursuing a policy of selective acquisitions by concentrating on markets in which it is already present. The group confirmed the payment of a dividend of EUR 0.60 per share for 2015. The group expects to propose a stable dividend of EUR 0.60 per share for 2016. In addition, Orange reiterated that discussions with the Bouygues Group are ongoing with the aim of a business combination with Bouygues Telecom. These discussions will take at least several weeks before any decision is taken. We do not expect that the acquisition of Bouygues’ telecom unit will have a negative impact on Orange’s credit profile, while Orange could lose its one notch rating uplift regarding its government-related issuer status with Moody’s. We have an overweight recommendation for ORAFP bonds. (1Q16 results: 26 April)
A1s/As/-- Stable Proximus (previously Belgacom) (PROXBB): Marketweight 1.0% Proximus released solid 4Q15 results that were broadly in line with consensus expectations (collected by Proximus). It also revised its FY15 EBITDA outlook upwards. In 4Q15, total underlying revenues decreased by 0.3% yoy (2.2% in FY15) to EUR 1,502mn (consensus of EUR 1.521bn), driven by core revenue growth of +0.5% in Fixed Internet, TV and ICT as well as mobile services. These were offset by a decline of the BICS business (-2.7% yoy, driven by negative volatility in the voice business). Group underlying EBITDA increased by 8.4% (4.9% in FY15) to EUR 414mn, which was above consensus expectations of EUR 408mn. The main driver of EBITDA growth was further-improving underlying core EBITDA (+8.7% yoy), which itself was driven by solid direct margin growth and by lower HR and non-HR costs. Reported F(O)CF was negative, at EUR 114mn in 4Q15, versus a positive EUR 81mn in 4Q14. In 4Q15, group free cash flow was impacted by the payment of the litigation settlement with BASE, Mobistar and KPN for EUR 120mn. Furthermore, the fourth quarter of 2015 included the impact of higher income-tax payments and higher cash used for the acquisition of non-controlling interests, and this was partly offset by growth in underlying EBITDA compared to 2014. For FY15, FCF fell by 43% yoy to EUR 408mn. Net debt decreased qoq from EUR 1,644mn to EUR 1,919mn (EUR 1,800mn at FYE 2014), mainly due to FCF generation. The reported net debt/(underlying) EBITDA ratio (before non-recurring items) was up qoq from 1.0x to 1.1x. In FY16, Proximus will continue its Fit-for-Growth strategy, in which the company aims to generate “slight growth” of core underlying revenues and EBITDA, despite BICS’ high comparable base in 2015. FY16 is expected to bring some additional challenges. Regulation will have an adverse impact on financials; the EU roaming regulation will especially have a negative impact on EBITDA of Proximus’s domestic business as it will result in a more competitive environment (acquisition of BASE by Telenet). To sustain long-term growth, the company raised investments in its fixed-line network, with special focus on Fiber-to-the-Business. Therefore, capex is expected to be around EUR 950mn (vs. FY15: EUR 926mn). Proximus aims to pay a total gross dividend per share of EUR 1.50, in line with its previously announced three-year commitment. We have a marketweight recommendation on PROXBB bonds. They are currently trading in line with SCMNVX bonds. Given the company’s outlook and unchanged shareholder remuneration policy, we expect a relatively stable credit-profile development. Some uncertainty stems from the competitive environment, in combination with the EU roaming regulation. The acquisition of BASE by Telenet will likely improve Telenet’s competitive position, and competition may increase thereafter for a limited time. However, consolidation should eventually lead to a more-stable price environment going forward, in our view. (1Q16 results: 4 May)
Aa3s/A+s/A+s – Singapore Telecom (STSP): No recommendation 0.7% Singapore Telecommunications Ltd is the leading provider of telecommunications services in Singapore. It is majority-owned (52%) by the Singapore state holding company Temasek. Outside its home market, the group fully owns Optus, a diversified and integrated telecommunications operator in Australia. The company also has significant strategic minority stakes in several large and growing mobile service operators in Asia.
A2s/As/-- Stable Swisscom (SCMNVX): Marketweight 1.4% Swisscom released FY15 results broadly in line with expectations. In FY15, revenues fall by 0.2% (like-for-like +0.7) to CHF 11.68bn (AWP consensus of CHF 11.65bn). In FY15, reported EBITDA decreased yoy by 7.1% (lfl +2.3%) to CHF 4.10bn (AWP consensus of CHF 4.16bn). The company noted that currency effects and more intense competition with stronger price dynamics characterized the business in FY15. Net debt decreased qoq from CHF 8.3bn to CHF 8.0bn due to FCF generation. The ratio of reported net debt to EBITDA remained almost unchanged at 2.0x. Swisscom targets a net debt/EBITDA ratio of 2.1x as the maximum threshold. For 2016, the company expects to generate revenue in excess of CHF 11.6bn, EBITDA of around CHF 4.2bn and capital expenditure of over CHF 2.3bn (versus CHF 2.4bn in FY15). The cost base is planned to be reduced by over CHF 300mn by 2020, as the company mentioned more intense competition (leading to pricing pressure). We have a marketweight recommendation for Swisscom bonds. The company has demonstrated a solid and relatively stable operating performance in the past and dominates the competition through a high-quality network and high market shares, which offer better economies of scale compared to competitors. The company’s financial policy is conservative and event risk (mainly M&A) is low. The Swiss government has been highly interventionist regarding Swisscom’s M&A activities, which has prevented the company from potential acquisitions in the past. Current valuations are a good reflection of Swisscom’s low credit risk. We reiterate our marketweight recommendation on SCMNVX bonds; (1Q16 results: 3 May)
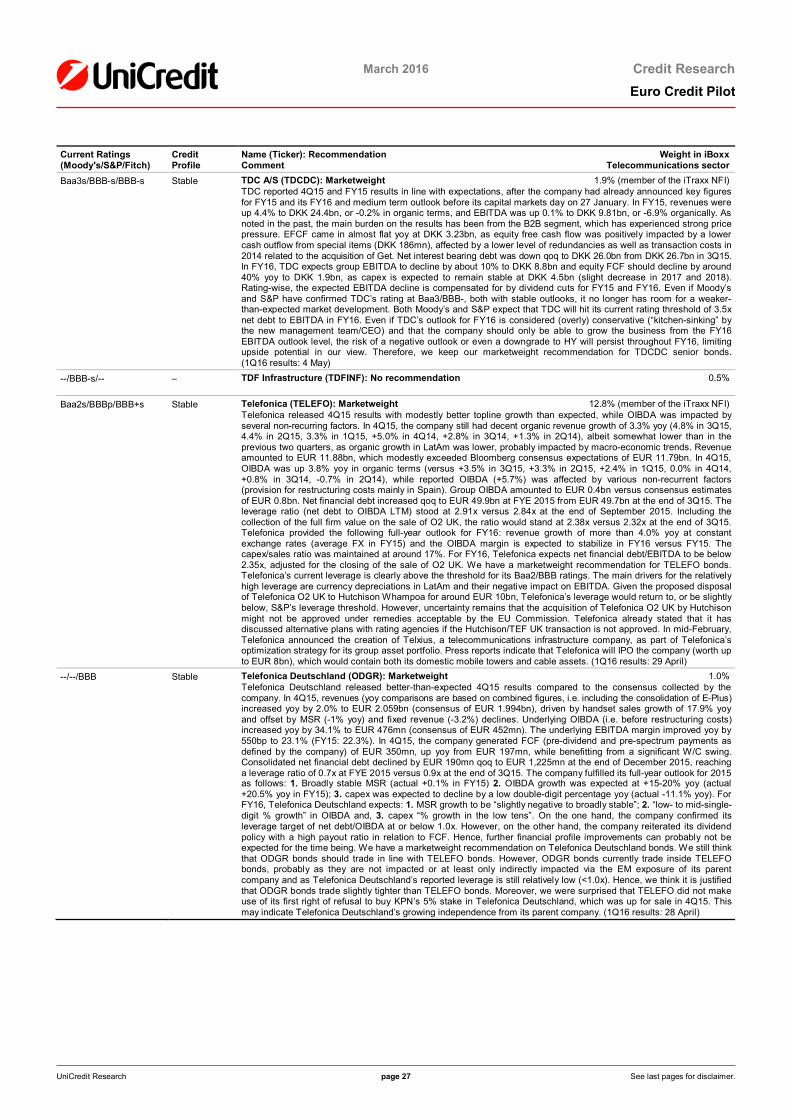
March 2016 Credit Research
Euro Credit Pilot
UniCredit Research page 27 See last pages for disclaimer.
Current Ratings (Moody's/S&P/Fitch)
Credit Profile
Name (Ticker): Recommendation Weight in iBoxx Comment Telecommunications sector
Baa3s/BBB-s/BBB-s Stable TDC A/S (TDCDC): Marketweight 1.9% (member of the iTraxx NFI) TDC reported 4Q15 and FY15 results in line with expectations, after the company had already announced key figures for FY15 and its FY16 and medium term outlook before its capital markets day on 27 January. In FY15, revenues were up 4.4% to DKK 24.4bn, or -0.2% in organic terms, and EBITDA was up 0.1% to DKK 9.81bn, or -6.9% organically. As noted in the past, the main burden on the results has been from the B2B segment, which has experienced strong price pressure. EFCF came in almost flat yoy at DKK 3.23bn, as equity free cash flow was positively impacted by a lower cash outflow from special items (DKK 186mn), affected by a lower level of redundancies as well as transaction costs in 2014 related to the acquisition of Get. Net interest bearing debt was down qoq to DKK 26.0bn from DKK 26.7bn in 3Q15. In FY16, TDC expects group EBITDA to decline by about 10% to DKK 8.8bn and equity FCF should decline by around 40% yoy to DKK 1.9bn, as capex is expected to remain stable at DKK 4.5bn (slight decrease in 2017 and 2018). Rating-wise, the expected EBITDA decline is compensated for by dividend cuts for FY15 and FY16. Even if Moody’s and S&P have confirmed TDC’s rating at Baa3/BBB-, both with stable outlooks, it no longer has room for a weaker-than-expected market development. Both Moody’s and S&P expect that TDC will hit its current rating threshold of 3.5x net debt to EBITDA in FY16. Even if TDC’s outlook for FY16 is considered (overly) conservative (“kitchen-sinking” by the new management team/CEO) and that the company should only be able to grow the business from the FY16 EBITDA outlook level, the risk of a negative outlook or even a downgrade to HY will persist throughout FY16, limiting upside potential in our view. Therefore, we keep our marketweight recommendation for TDCDC senior bonds. (1Q16 results: 4 May)
--/BBB-s/-- – TDF Infrastructure (TDFINF): No recommendation 0.5%
Baa2s/BBBp/BBB+s Stable Telefonica (TELEFO): Marketweight 12.8% (member of the iTraxx NFI) Telefonica released 4Q15 results with modestly better topline growth than expected, while OIBDA was impacted by several non-recurring factors. In 4Q15, the company still had decent organic revenue growth of 3.3% yoy (4.8% in 3Q15, 4.4% in 2Q15, 3.3% in 1Q15, +5.0% in 4Q14, +2.8% in 3Q14, +1.3% in 2Q14), albeit somewhat lower than in the previous two quarters, as organic growth in LatAm was lower, probably impacted by macro-economic trends. Revenue amounted to EUR 11.88bn, which modestly exceeded Bloomberg consensus expectations of EUR 11.79bn. In 4Q15, OIBDA was up 3.8% yoy in organic terms (versus +3.5% in 3Q15, +3.3% in 2Q15, +2.4% in 1Q15, 0.0% in 4Q14, +0.8% in 3Q14, -0.7% in 2Q14), while reported OIBDA (+5.7%) was affected by various non-recurrent factors (provision for restructuring costs mainly in Spain). Group OIBDA amounted to EUR 0.4bn versus consensus estimates of EUR 0.8bn. Net financial debt increased qoq to EUR 49.9bn at FYE 2015 from EUR 49.7bn at the end of 3Q15. The leverage ratio (net debt to OIBDA LTM) stood at 2.91x versus 2.84x at the end of September 2015. Including the collection of the full firm value on the sale of O2 UK, the ratio would stand at 2.38x versus 2.32x at the end of 3Q15. Telefonica provided the following full-year outlook for FY16: revenue growth of more than 4.0% yoy at constant exchange rates (average FX in FY15) and the OIBDA margin is expected to stabilize in FY16 versus FY15. The capex/sales ratio was maintained at around 17%. For FY16, Telefonica expects net financial debt/EBITDA to be below 2.35x, adjusted for the closing of the sale of O2 UK. We have a marketweight recommendation for TELEFO bonds. Telefonica’s current leverage is clearly above the threshold for its Baa2/BBB ratings. The main drivers for the relatively high leverage are currency depreciations in LatAm and their negative impact on EBITDA. Given the proposed disposal of Telefonica O2 UK to Hutchison Whampoa for around EUR 10bn, Telefonica’s leverage would return to, or be slightly below, S&P’s leverage threshold. However, uncertainty remains that the acquisition of Telefonica O2 UK by Hutchison might not be approved under remedies acceptable by the EU Commission. Telefonica already stated that it has discussed alternative plans with rating agencies if the Hutchison/TEF UK transaction is not approved. In mid-February, Telefonica announced the creation of Telxius, a telecommunications infrastructure company, as part of Telefonica’s optimization strategy for its group asset portfolio. Press reports indicate that Telefonica will IPO the company (worth up to EUR 8bn), which would contain both its domestic mobile towers and cable assets. (1Q16 results: 29 April)
--/--/BBB Stable Telefonica Deutschland (ODGR): Marketweight 1.0% Telefonica Deutschland released better-than-expected 4Q15 results compared to the consensus collected by the company. In 4Q15, revenues (yoy comparisons are based on combined figures, i.e. including the consolidation of E-Plus) increased yoy by 2.0% to EUR 2.059bn (consensus of EUR 1.994bn), driven by handset sales growth of 17.9% yoy and offset by MSR (-1% yoy) and fixed revenue (-3.2%) declines. Underlying OIBDA (i.e. before restructuring costs) increased yoy by 34.1% to EUR 476mn (consensus of EUR 452mn). The underlying EBITDA margin improved yoy by 550bp to 23.1% (FY15: 22.3%). In 4Q15, the company generated FCF (pre-dividend and pre-spectrum payments as defined by the company) of EUR 350mn, up yoy from EUR 197mn, while benefitting from a significant W/C swing. Consolidated net financial debt declined by EUR 190mn qoq to EUR 1,225mn at the end of December 2015, reaching a leverage ratio of 0.7x at FYE 2015 versus 0.9x at the end of 3Q15. The company fulfilled its full-year outlook for 2015 as follows: 1. Broadly stable MSR (actual +0.1% in FY15) 2. OIBDA growth was expected at +15-20% yoy (actual +20.5% yoy in FY15); 3. capex was expected to decline by a low double-digit percentage yoy (actual -11.1% yoy). For FY16, Telefonica Deutschland expects: 1. MSR growth to be “slightly negative to broadly stable”; 2. “low- to mid-single-digit % growth” in OIBDA and, 3. capex “% growth in the low tens”. On the one hand, the company confirmed its leverage target of net debt/OIBDA at or below 1.0x. However, on the other hand, the company reiterated its dividend policy with a high payout ratio in relation to FCF. Hence, further financial profile improvements can probably not be expected for the time being. We have a marketweight recommendation on Telefonica Deutschland bonds. We still think that ODGR bonds should trade in line with TELEFO bonds. However, ODGR bonds currently trade inside TELEFO bonds, probably as they are not impacted or at least only indirectly impacted via the EM exposure of its parent company and as Telefonica Deutschland’s reported leverage is still relatively low (<1.0x). Hence, we think it is justified that ODGR bonds trade slightly tighter than TELEFO bonds. Moreover, we were surprised that TELEFO did not make use of its first right of refusal to buy KPN’s 5% stake in Telefonica Deutschland, which was up for sale in 4Q15. This may indicate Telefonica Deutschland’s growing independence from its parent company. (1Q16 results: 28 April)

March 2016 Credit Research
Euro Credit Pilot
UniCredit Research page 28 See last pages for disclaimer.
Current Ratings (Moody's/S&P/Fitch)
Credit Profile
Name (Ticker): Recommendation Weight in iBoxx Comment Telecommunications sector
Baa2s/BBBs/-- Stable Telekom Austria (TKAAV): Marketweight 1.5% (member of the iTraxx NFI) Telekom Austria (TA) released better-than-expected 4Q15 results (positively impacted by extraordinary effects and the first-time consolidation of acquisitions). The company provided a FY16 outlook in line with consensus expectations. In 4Q15, group revenues increased by 4.5% yoy (-3.5% in 3Q15, +2.1% in 2Q15, -2.0% in 1Q15, +2.4% in 4Q14) to EUR 1,076mn (consensus estimate as compiled by TA: EUR 1,041mn; FY15: +0.2% yoy). Excluding extraordinary and FX effects, revenues grew by 4.3% yoy on a clean basis in 4Q15. Revenues in the Austrian segment increased by 2.2% yoy, mostly driven by higher revenues from wholesale as well as higher equipment revenues. The Bulgarian segment posted an increase in revenues of 8.4% yoy and profited from the acquisition of Blizoo although competition remained fierce, especially in the mobile business segment. Comparable group EBITDA decreased by 6.8% yoy (-6.8% in 3Q15, +9.1% yoy in 2Q15, +5.8% 1Q15, -3.9% in 4Q14) to EUR 321mn (consensus estimate: EUR 282.5mn; FY15: +6.7% yoy). Excluding extraordinary and FX effects, comparable group EBITDA grew by 7.7% in 4Q15. FOCF was slightly negative at EUR 11mn in 4Q15, but full-year FOCF amounted to EUR 355mn in FY15 versus EUR 156mn in FY14. TA's reported net debt increased qoq from EUR 2,573mn to EUR 2,676mn, mainly due to acquisition payments. However, reported leverage (net debt/EBITDA) was down qoq to 1.9x from 2.0x due the strong EBITDA increase yoy in 4Q15. In 2015, Telekom Austria Group managed to stabilize its revenues and to grow EBITDA. For FY16, TA aims to offset the negative revenue impact of the abolition of retail roaming fees and to achieve modest growth (+1% yoy) in group revenues (versus revenues of EUR 4,026mn in FY15; FY16 consensus estimate: EUR 4,028mn). Capex before spectrum investments and acquisitions will increase moderately to approximately EUR 750mn in 2016 (versus EUR 703mn excluding spectrum and EUR 780mn including spectrum purchases in FY15). The intended dividend is expected to remain stable at EUR 0.05 per share. In order to ensure its financial flexibility, Telekom Austria Group remains committed to maintaining its Baa2/BBB ratings. The outlook is based on constant exchange rates, with the exception of the Belarusian ruble (devaluation of 20% versus EUR in 2016 expected). With regard to frequencies, the governments of Croatia, Serbia and Macedonia are expected to sell spectrum in 2016: in the 900-MHz spectrum in Serbia and Macedonia and in the 2100-MHz spectrum in Croatia. This will lead to higher capex than in FY15, reducing FOCF generation. We have a marketweight recommendation for TKAAV bonds. Telekom Austria continues to operate in a challenging market environment, particularly in Bulgaria, Croatia and Belarus. However, thanks to the improving development in the Austrian telecoms market, underlying group EBITDA is stabilizing and FOCF improving, which we regard as necessary going forward to keep current ratings. TKAAV bond spreads already reflect a stable rating development, and also that potential prolonged operating underperformance would be mitigated by America Movil and potential shareholder support by ÖIAG. (1Q16 results: 22 April)
A3s/As/-- Stable Telenor (TELNO): Underweight 3.9% (member of the iTraxx NFI) Telenor reported solid 4Q15 results in line with expectations and provided a decent outlook for FY16, which, however, reflects growing EBITDA margin pressure in key markets such as Thailand and Malaysia. Revenues increased yoy by 15% (organically +2% in 4Q15, +4.5% in 3Q15 and +5.7% in 2Q15) to NOK 33.5bn (right in line with consensus of NOK 33.5bn), driven by positive currency effects and a significant contribution from Myanmar. Again, a positive revenue development in most business units more than compensated for tougher market conditions in Thailand, Denmark and Malaysia. EBITDA (before other income and expenses) increased by 15% (organically +6% in 3Q15 vs. +5% in 2Q15) to NOK 10.86bn (consensus estimate of NOK 11bn). The EBITDA margin increased yoy to 32.4% (30.6% in 4Q14), mainly driven by Myanmar, India, Pakistan and Bangladesh. In 4Q15, FOCF (OCF minus CF from investing activities) improved to NOK 1.5bn yoy from breakeven. However, net debt increased from NOK 46.6bn only to NOK 54.1bn qoq, due to dividend payments (NOK 5.5bn) and currency effects. The reported net debt to EBITDA ratio increased modestly to 1.2x at the end of December from 1.1x at the end of September 2015. For 2016, Telenor provided the following full-year outlook: 1. Organic revenue growth of 2-4% (FY15: 4.7% yoy); 2. EBITDA margin before other income and expenses at 33-34% (FY15: 34.5%); and 3. capex-to-sales ratio, excluding licenses, spectrum and the broadcasting satellite, of 17-19% (FY15: 18.4%). Telenor pointed out that fierce competition and headwinds in key markets like Thailand and Malaysia are putting pressure on EBITDA margin expectations. We keep our underweight recommendation for TELNO bonds, as current spread levels are already tight and reflect the company’s solid operating performance, while we are concerned about potential event risk. On the one hand, Telenor could be involved in potential acquisitions. On the other hand, Telenor could suffer from problems similar to those of TeliaSonera, given its high emerging market exposure. On 30 October, Svein Aaser resigned as chairman of the board, with immediate effect. It is reported that Mr. Aaser and the minister of trade and industry had “different views on the handling of the VimpelCom issue”. We note that VimpelCom has been under investigation for several years (regarding potential corruption in Uzbekistan, for which VimpelCom has set aside provisions of USD 900mn for potential claims – although recently VIP reached a settlement agreement with US and Dutch authorities for USD 795mn) and that Telenor has decided to divest its stake in VimpelCom. A similar story led to bond-spread volatility for TLSNSS bonds. (1Q16 results: 27 April)

March 2016 Credit Research
Euro Credit Pilot
UniCredit Research page 29 See last pages for disclaimer.
Current Ratings (Moody's/S&P/Fitch)
Credit Profile
Name (Ticker): Recommendation Weight in iBoxx Comment Telecommunications sector
A3wn/A-s/A-s Weakening TeliaSonera (TLSNSS): Overweight 6.3% (member of the iTraxx NFI) TeliaSonera released better-than-expected 4Q15 results and provided a “stable” outlook for FY16. We note that the company reports the Eurasian region as discontinued operations for the first time, i.e. deconsolidated from revenues and EBITDA. In 4Q15, reported net sales increased by 5.9% yoy to SEK 22.66bn (up 2.9% yoy organically versus 2.4% in 3Q15, which included Eurasia), which is above the consensus estimate of SEK 22.2bn. Hereby, the core regions of Sweden (+2.3% yoy) and Europe (+5.1%) showed good organic net sales growth. Reported 3Q15 EBITDA (excl. non-recurring items) of SEK 6.56bn increased 11.1% yoy (increasing 9.0% yoy organically versus falling 0.9% in 3Q15, including Eurasia), which was clearly above the consensus estimate of SEK 6.31bn. In Sweden, yoy EBITDA growth was particularly strong with 10% (Europe 2.1% yoy). Eurasia remained affected by macroeconomic pressure and high competition in parts of the footprint. Regarding the potential disposal of the assets in the Eurasian region, TeliaSonera provided no additional news. In December, it announced the first divestment of its Nepalese operation to Axiata (Ncell). The process to leave other Eurasian markets continues. Reported net debt decreased qoq from SEK 61.5bn at 30 September 2015 to SEK 55.7bn as of 31 December 2015, mainly due to FCF generation including the dividend from Megafon and an early payment of the last tranche from AT Telecom. Hence, the reported net debt/EBITDA ratio was down qoq to 1.53x from 1.70x at the end of 3Q15. The company provided a relatively stable outlook for 2016. It continues to target a solid investment grade long-term credit rating (A- to BBB+). The company targets a leverage corresponding to net debt/EBITDA of 2x plus/minus 0.5x. With this, the company is widening its financial flexibility, as previously the aim was to keep the ratio below 2x. Therefore, Moody’s placed TeliaSonera’s A3 rating on review for potential downgrade, as the new leverage target of between 1.5x and 2.5x is equivalent to a Moody's-gross-adjusted debt/EBITDA of between 3.3x and 4.3x. We have an overweight recommendation for TLSNSS bonds, which trade significantly wider than ORAFP and DT bonds and thereby almost at the level of KPN bonds. Even if one factors in a one-notch downgrade to high BBB, due to the disposal of its Eurasia business, potential regulatory fines from the DoJ and/or a broaden financial policy, TLSNSS bonds still look attractive for this lower rating level, in our view. (1Q16 results: 20 April)
A2s/As/A Stable Telstra (TLSAU): Underweight 5.2% Telstra released solid 1H15/16 results (ending 31 December 2015) that were slightly below expectations at the EBITDA level. In 1H15/16, “total income” increased by 9.1% to AUD 14.2bn, while group reported revenues increased yoy by 7.6% to AUD 13.7bn. EBITDA increased by 1.7% to AUD 5.4bn (compared to consensus estimate of AUD 5.5bn, up around 4% yoy). On a guidance basis and excluding Pacnet operating results, total income (excluding finance income) increased by 7.3% and EBITDA increased by 1.4%. Net debt rose yoy from AUD 13.6bn at the end of June 2015 to AUD 14.3bn as of 31 December 2015 (from AUD 13.1bn at the end of December 2014). The reported net debt/EBITDA ratio remained stable at 1.3x, which is the lower end of the company’s target range of 1.3-1.8x. For FY15/16, the company confirmed that it is on track to meet its full year guidance: it still expects “mid-single-digit” total group revenue growth (9.2% in 1H15/16) and “low-single-digit” EBITDA growth (2.1% in 1H15/16). The company’s capex-to-sales ratio is expected to increase from 13.9% in FY14/15 to around 15% in FY15/16 (15.2% in 1H15/16) and F(O)CF is expected to be AUD 4.6-5.1bn (AUD 1.9bn in 1H15/16 up from AUD 0.3bn in 1H14/15) compared to AUD 5.0bn in FY14/15. Fundamentally, despite increasing competition, we see a relatively low risk of Telstra’s ratings coming under pressure, provided management balances its shareholder remuneration and M&A policy with its F(O)CF generation. However, at current tight valuations, we see little reason to invest in EUR-denominated TLSAU bonds, and therefore we have an underweight recommendation on the name. (FY15/16 results: 15 August)
Baa1s/BBB+s/A-s Improving Verizon Communications (VZ): Marketweight 5.1% We keep our marketweight recommendation for Verizon Communications bonds. In contrast to AT&T, Verizon reiterated – during an investor update on 21 January – its commitment to reducing leverage and returning to single-A credit ratings at Moody's and S&P by 2018/19. The company’s outlook for FY15 indicates a stable operating development with strong FOCF generation. The upcoming spectrum auction in the US will probably prevent both Verizon and AT&T from meaningful deleveraging in 2016. (1Q16 results: 21 April)
Baa2s/BBBs/BBBs Weakening Vivendi (VIVFP): Underweight 1.4% (member of the iTraxx NFI) Vivendi reported 4Q15 results that showed a stagnant to weakening performance in the main business lines. Revenues in 4Q15 were up 1.4% organically yoy to EUR 10.762bn (consensus: EUR 10.6bn), but EBITDA was down 10.0% to EUR 1.333bn. The main weakness was in Canal+, which Vivendi called its "one challenge to address." Revenues at Canal+ were up by 0.2% organically to EUR 5.513bn, but EBITDA was down 13.4% to EUR 735mn. Vivendi explained that subscriber losses were weighing on revenues and that there is a weaker value perception for the product as a whole. Vivendi announced a “transformation plan” for Canal+ to invest more in premium content and original programming. Universal Music Group (UMG) reported a fairly stable performance yoy with revenues of EUR 5.108bn (+2.7% organically) and EBITDA down 1.5% to EUR 711mn. Vivendi also announced a (hostile) takeover offer for Gameloft, in which it has acquired a 30% stake. Vivendi’s offer of EUR 6 per share amounts to a 9.5% premium on the company’s closing stock price (market capitalization: EUR 468mn). In its outlook, Vivendi stated that it would attempt to prevent a "significant decline” in operating results at Canal+ in 2016 via its transformation plan, with the goal of reaching breakeven in 2018 and profitability similar to the European leaders in the medium term. The outlook for UMG was more positive with the expectation of ongoing growth in streaming and subscription revenues largely able to offset the decline of downloads and physical sales, leading to the expectation of a “reasonable increase” in sales in 2016 and “enhanced results” from 2017. The company’s net cash position declined to EUR 6.4bn as of FYE 15 compared to EUR 8.0bn as of 3Q15, due mainly to EUR 0.9bn in acquisitions and EUR 0.7bn in share repurchases in the quarter. The company has announced EUR 4.0bn in dividends for 2015, EUR 3.0bn of which will be paid in 2016 in addition to a previously announced plan to pay EUR 1.4bn in dividends in 2017. Therefore, Vivendi’s sizeable net cash position (which had previously been its main strength) should decline significantly in the near term. In the meantime, we do not see that Vivendi’s acquisition spending has successfully transformed its operating business into an international media conglomerate as targeted. We believe other recent acquisitions (Telecom Italia stake and potentially Gameloft) have an unclear role in the company’s evolving strategy. Gameloft’s opposition to Vivendi’s bid and Vivendi’s own track record in gaming do not give us confidence that this strategy will turn around the company’s operating performance. We do not believe that current spread levels reflect these risks relative to peers and we therefore have an underweight recommendation on the name.

March 2016 Credit Research
Euro Credit Pilot
UniCredit Research page 30 See last pages for disclaimer.
Current Ratings (Moody's/S&P/Fitch)
Credit Profile
Name (Ticker): Recommendation Weight in iBoxx Comment Telecommunications sector
Baa1s/BBB+s/BBB+s Weakening Vodafone (VOD): Underweight 9.4% (member of the iTraxx NFI) Vodafone released its 3Q15/16 trading update in line with expectations. Reported group revenues decreased by 5.5% to GBP 10.3bn (negatively impacted by FX rate movements), with group organic growth of 2.6% (slightly lower than the 2.8% in 1H15/16). Group service revenues increased organically (excluding the impact of MTR cuts) yoy by 1.4% in 3Q15/16 (bang in line with the consensus). While Europe had still negative organic growth of 0.6%, this was more than offset by 6.5% growth in AMAP, in particular with a strong performance in South Africa. Moreover, the group benefitted from gradual improvements in Germany and Italy. The performance of the Group remained in line with management’s expectations and the company confirmed its full year outlook for FY15/16 (EBITDA is expected to be in a range of GBP 11.7-12.0 bn, and free cash flow to be positive after all capex, and before the impact of M&A, spectrum purchases and restructuring costs; total capex is expected to be between GBP 8.5-9.0bn). Using EBITDA at the mid-point of Vodafone’s guidance range, the reported leverage would be at around 2.5x. The fully-adjusted leverage might end up at slightly below 3x at FYE 2015/16, thus not offering much leeway for potential acquisitions under current ratings. In mid-February, Vodafone announced that it intends to raise approximately GBP 2.9bn from mandatory convertible bonds. Vodafone intends to hedge its exposure under the mandatory convertible bonds to any future movements in its share price by an option strategy. A mandatory convertible bond receives normally 100% equity credit under rating agency methodologies. We have the impression that the mandatory convertible bond may act as a “safety back”. For the time being, it will receive 100% equity credit and will improve financial credit metrics. It also shows the company’s commitment to remain IG rated. If in the next 18-36 months Vodafone really needs the “safety back”, it will increase equity. If it is no longer needed to stabilize the rating, Vodafone can avoid the equity dilution. In addition, to the GBP 2.9bn of mandatory convertible debt, Vodafone also placed EUR 6bn of senior bonds in the market. Thus, Vodafone reduced its dependence on short-dated CP refinancing. For the time being, we continue to have an underweight recommendation for VOD bonds, given relatively high M&A related event risks.(4Q15/16 results: 17 May)
Stephan Haber, CFA (UniCredit Bank) +49 89 378-15192 [email protected]
Media (Marketweight) Sector key figures Sector Wrap-Up Weight in iBoxx NFI: Current ASW spread: change mom/YTD: EURO STOXX MDI YTD:
2.5% 119.7bp +0.0/+12.2 -0.7%
Sector drivers: The media sector is driven by a close link between ad-spending and GDP growth. Hence, the outlook for companies in the media sector is moderately positive, as a continued cyclical recovery in advertising expenditure, consumer confidence and corporate expenditure is expected in FY16. Cash-flow generation has remained solid (with a seasonally stronger 2H) and, as anticipated, shareholder-friendly policies remain common, especially when cash generation is strong. As a result, we expect only modest improvements in most companies' credit profiles in the coming quarters. M&A activity has continued at a steady pace, with a series of small-to-medium-sized bolt-on acquisitions. Bertelsmann, WPP and Publicis are more cyclical. Pearson, Wolters Kluwer, Reed Elsevier, SES, Eutelsat and Sky are less cyclical. Market recap: The media sector outperformed the index from November through the end of February, with spreads widening by 11bp to 115bp, compared to the iBoxx EUR Non-Financials, where spreads widened by 20bp to 120bp. The trends were quite mixed, with weak performances from PSON, SKYLN, DISCA and TWX and stronger performances from SESGFP and WKLNA. Sector composition: Sky (17.9%), Eutelsat (12.6%), WPP (12.6%), Bertelsmann (11.1%), SES (9.3%), Wolters Kluwer (7.4%), Publicis (6.0%), RELX Group (5.4%), Pearson (4.5%), Time Warner (3.3%), ITV (2.8%), DIRECTV (2.5%), JCDecaux (2.3%), Discovery Communications (2.3%)
Current Ratings (Moody's/S&P/Fitch)
Credit Profile
Name (Ticker): Recommendation Weight in iBoxx Comment Media sector

March 2016 Credit Research
Euro Credit Pilot
UniCredit Research page 31 See last pages for disclaimer.
Current Ratings (Moody's/S&P/Fitch)
Credit Profile
Name (Ticker): Recommendation Weight in iBoxx Comment Media sector
Baa1s/BBB+s/BBB+s Stable Bertelsmann (BERTEL): Underweight 11.1% (member of the iTraxx NFI) Bertelsmann's 3Q15 trading statement showed some improving trends in operating performance qoq. Revenues in 3Q15 were up 3.6%, to EUR 4.1bn, showing improved momentum relative to 2.5% through 1H15. EBITDA was up to EUR 532mn in 3Q15, an increase of 13.9%, which was also up on 4.4% growth through 1H15. Although the company did not provide a segment breakdown with the trading statement, RTL reported solid 3Q15 results as well, with 7.5% revenue growth in the quarter (4.1% on an underlying basis) and with reported EBITDA up 4.9% to EUR 216mn. RTL slightly increased its revenue guidance for 2015 and now expects to “grow moderately” (previously “grow slightly”) and confirmed its expectation for EBITA to be in line with 2014. Penguin Random House is also expected to show strengthening operating performance in 2016, as confirmed by Pearson. Economic debt (including pensions and operating leasing) was up to EUR 5,937mn from EUR 5,867mn as of 1H15. A 1.2% increase qoq points to some deleveraging in the quarter considering the stronger growth in 3Q15 EBITDA. Bertelsmann also announced that it would waive the right to call its hybrid bonds issued in April 2015. With this step, Bertelsmann is hoping to receive 50% equity credit for the bonds again after the recent change in S&P’s hybrid-bond criteria removed this credit and counted the full amount toward the company’s debt. Despite positive signs of improving operating performance in the quarter, we remain somewhat cautious about Bertelsmann in the near term as the company seems to be stepping up acquisitions, including recent announcements of a USD 105mn investment in Udacity and USD 230mn in HotChalk, which should impact the 4Q15 results. We believe that the company will need to see a sustained improvement in EBITDA growth and may need to moderate the pace of acquisitions if it intends to keep its 2.5x leverage target in the future. We therefore believe that Bertelsmann faces some difficult decisions in 2016, with leverage already at the high end of its target range. We have an underweight recommendation on BERTEL as spreads are trading tight relative to their peer group and we see better value in WKLNA. Bertelsmann will report 4Q15 results on 22 March.
Baa3p/BBBs/-- Stable Eutelsat (ETLFP): Marketweight 12.6% Eutelsat reported 1H15/16 results that were in line with expectations. Revenues of EUR 774mn in 1H15/16 were up 1.5% on a like for like basis (+7.1% reported), which compares to consensus of EUR 772mn. However, this was below the company’s guidance for revenue growth of 2-3% in FY15/16. EBITDA of EUR 600mn compares to consensus of EUR 595mn and represented a margin of 77.5%, which was in line with the margin in 1H14/15 of 77.4%. EBITDA was up 7.3% on a reported basis. Reported revenues and EBITDA continue to get a boost from the high share of revenues booked in USD, with currency effects adding 5.6pp to 1H15/16 revenue growth. The company’s backlog stands at EUR 5.8bn, or 3.9 years of revenue. This is down slightly from EUR 6.0bn, or 4.1 years of revenue in 1Q15/16, but still represents a very healthy figure. Net leverage was down to 3.2x from 3.4x in FYE 14/15 and is thus in the company’s target range of below 3.3x mainly due to the increase in EBITDA. Eutelsat confirmed its guidance of organic revenue growth of 2-3% with an EBITDA margin above 76.5%, although the company said that it expects revenue growth to come in at the lower end of the range. In 2H15/16, Eutelsat expects to benefit from new capacity with the ramp-up of new satellites in service (Eutelsat 8 West B, Eutelsat 115 West B, Eutelsat 36C, Eutelsat 9B) and new launches (Eutelsat 65 West A in March 2016, Eutelsat 117 West B in 2Q16). However, this will be partially offset by the termination of a contract for HTS capacity on Eutelsat 3B. Eutelsat’s 1H15/16 report was solid, with sustained revenue growth at high margins and further deleveraging. The fact that Eutelsat confirmed its revenue guidance at the lower end of guidance was a slight disappointment, considering the ambitious launch schedule planned in 2016. However, we believe that this target should be easy to reach and there could be some upside, particularly if the US increases defense spending. Deleveraging is being boosted by positive currency effects, due to the strengthening USD, and the company’s scrip dividend, which has preserved cash. Eutelsat said that 61% of rights had opted in favor of the scrip dividend. We therefore expect a further solid performance by Eutelsat in the coming quarters with further deleveraging by the end of its FY 15/16. We reiterate our marketweight recommendation on ETLFP. We continue to prefer SESGFP currently, which is better positioned in a similar rating category and also has managed sustained deleveraging, but trades at equal (SESGFP 4.625% 3/20) to wider (SESGFP4.75% 3/21) spreads relative to ETLFP issues.
Baa2s/BBB+n/-- Weakening Pearson (PSON): Marketweight 4.5% (member of the iTraxx NFI) Pearson reported FY15 results that were in line with its revised guidance from January. Revenues came in at GBP 4.468bn (-2% underlying) and adjusted operating profit was at GBP 723mn (-2% underlying). However, including one-off items, such as a GBP 849mn impairment charge, unadjusted operating profit was at GBP -404mn. Adjusted EPS was at GBP 70.3 (guidance: GBP 69-70). Pearson confirmed its previous outlook that operating profit is expected to be between GBP 580mn and GBP 620mn and EPS at GBP 50-55 in 2016. The company is expected to incur restructuring costs of GBP 320mn in 2016 with annualized savings of GBP 350mn, of which GBP 250mn are to occur in 2016. Following the disposals of the FT Group, The Economist Group and Powerschool, net leverage declined to 0.8x from 1.9x as of FYE 2014. The company said that it expects net debt to rise in 2016 due to the restructuring expenses planned and the unchanged dividend payment. Since the key figures and guidance were known before, the most interesting aspect of the results release was the strategy presented for 2016-18. Pearson is expecting another tough year in 2016 as restructuring expense will burden operating results again. In addition, some of the cyclical and policy burdens the company is facing will only begin to ease gradually in the coming years. Pearson was adamant that these factors are temporary only and not structural. Pearson also emphasized during the conference call that it would be very cautious about M&A in the near term. This is because one of its key strategic goals in 2016 is to simplify the organization, which further acquisitions would only complicate. Pearson also said that it is committed to a Baa1/BBB+ rating. However, considering the recent downgrade from Moody’s and S&P, the company is not sure that it will be able to achieve this before its restructuring in 2016 begins to bear fruit, which could last until 2018. Pearson was able to deleverage impressively in 2015, as expected, thanks to the major asset sales during the year. However, it appears that 2016 will be a difficult year for the company. Operating profitability should decline due to cyclical pressures and restructuring. At the same time, net debt is expected to rise, leading to an increase in leverage from the current low level. Although the goal of simplifying the organization makes sense before beginning any new M&A, one problem is that Pearson will be increasingly reliant on the highly policy-driven business model with considerable seasonal swings in cash flow generation. However, following S&P’s downgrade we think that most of the negative factors from the restructuring program and guidance revision have now been priced in. We still think that there is a chance that Pearson’s problems could actually be structural rather than cyclical, contrary to the company’s claims. If this turns out to be the case, there could be further downside for PSON bonds in the future, but we think the company will be given some time to restructure in 2016 before this becomes evident. We therefore expect spreads to stabilize at current levels and changed our recommendation to marketweight from underweight.

March 2016 Credit Research
Euro Credit Pilot
UniCredit Research page 32 See last pages for disclaimer.
Current Ratings (Moody's/S&P/Fitch)
Credit Profile
Name (Ticker): Recommendation Weight in iBoxx Comment Media sector
Baa2s/BBB+s/-- Stable Publicis (PUBFP): Marketweight 6.0% (member of the iTraxx NFI) Publicis reported 4Q15 results that were in line with consensus estimates but that showed a clear acceleration in top-line growth sequentially. In 4Q15, the company generated EUR 2.7bn in revenues (consensus: EUR 2.7bn), which represents growth of 2.8%. This compares favorably to the 0.7% figure in 3Q15 and brings the annual figure to 1.5%, exceeding the company’s guidance target of 1% for the year. The company reported an operating profit before depreciation and amortization of EUR 1.7bn in FY15 for a margin of 17.3%. This is only slightly below the 18% recorded in FY14. A decline was expected because Sapient generates lower margins than Publicis. Net income came to EUR 901mn, compared to consensus of EUR 884mn. The company said that it expects “modest organic growth” in 2016 and that it would be able to “fire on all cylinders in 2017”. Within the regions, Europe showed weakness with organic revenue growth of -1.7% (+1.4% through 9M15), North America regained momentum with +6.3% (9M15: 0.9%), Asia Pacific was at +5.1% (9M15: 3.5%), Latin America was -3.7% (9M15: -6%) and Middle East and Africa -4.4% (9M15: +2.2%). Net debt came to EUR 1.872bn after net financial debt stood at EUR 3.1bn as of 3Q15, due to significant year-end working inflows. Average net debt was EUR 2.429bn throughout 2015. The 4Q15 figures from Publicis give some hope that the unexpected weakness seen in 3Q15 is not entrenched. Particularly North America was a concern because Sapient was expected to reignite growth already in 2015, but the integration proved to be more difficult than management originally expected. Based on the outlook statement, the company will not have an easy year in 2016 and is also planning a major reorganization, with the expectation that 2017 will be much better. Furthermore, the fact that the margin has remained well supported even with the integration of Sapient is a positive factor going into 2016. We therefore expect Publicis to have its challenges in 2016, but it appears that the situation is manageable. Despite weak results in 2015, especially compared to WPPLN, PUBFP bonds trade in line with key peers. We expect the 2015 results to stabilize spreads and alleviate greater concerns about Publicis’s future. We therefore reiterate out marketweight recommendation on the name.
--/BBB+s/BBB+s Stable RELX Group (REEDLN): Marketweight 5.4% (member of the iTraxx NFI) RELX Group reported FY15 results that were basically in line with consensus expectations. Revenues of GBP 5.971bn compared with consensus of GBP 6.05bn. This amounts to a 3% underlying growth rate for the year, which is in line with the organic growth generated in FY14. Operating profit of GBP 1.822bn compared with consensus of GBP 1.85bn and represents 5% organic growth. Leverage was largely unchanged yoy at 2.2x pension and lease adjusted (FY14: 2.3x) and 1.8x unadjusted (FY: 1.7x). The company announced a 14% increase in the dividend at RELX PLC and 5% at RELX NV. EPS growth came to 7% and 20%, respectively. Therefore, the disparity is a result of the end of dividend tax credits in the UK, so the final 2015 dividends are being equalized without the UK tax credit gross-up. In FY15, RELX also announced that it would increase the amount of its share buybacks from GBP 500mn in FY15 to GBP 700mn in 2016. The company’s outlook for 2016 was characteristically vague, calling for another year of underlying revenue, profit and earnings growth. Trends so far in 2016 are, reportedly, consistent with those of 2015, so it does not appear that the company’s business has been hit by the market volatility at the start of the year. Trends within the segments were remarkably consistent yoy with Scientific, Technical & Medical showing 2% underlying revenue growth and 3% operating profit growth (FY14: 2% revenues and 3% operating profit), Risk & Business Analytics with 7% revenue and 7% operating profit growth (FY14: 6% revenues and 6% operating profit), Legal with 1% revenue growth and 7% operating profit growth (FY14: 1% revenues and 6% operating profit) and Exhibitions with 5% revenue growth and 2% operating profit growth (FY14: 7% revenues and 9% operating profit). RELX’s FY15 report was in line with expectations and shows an ongoing solid business performance with good organic growth trends and stable leverage. However, shareholder remuneration is clearly rising, which could lead to an increase in leverage in the coming fiscal year. In addition, we think that shareholders may put increasing pressure on the company to use the company’s balance sheet to increase either top-line growth or further increases in shareholder remuneration in the future. However, in the meantime, trends look broadly stable and FY16 is shaping up to be another solid year. We reiterate our marketweight recommendation on REEDLN.
Baa2s/BBBp/BBBs Stable SES (SESGFP): Overweight 9.3% SES reported FY15 results that were in line with consensus and the company’s own revised guidance for 2015. Revenues of EUR 2.015bn (consensus: EUR 2.01bn; guidance: -3% at constant currencies (CC)) were up 5% on an absolute basis but down 3.2% at constant currencies. EBITDA of EUR 1.494bn (consensus: EUR 1.49bn; guidance -3.5% at CC) was up 4.6%, but down 3.6% at constant currencies. This resulted in another strong margin of 74.2%, compared to 74.4% in 2014. Net operating cash flow (company definition) was up 17% to EUR 1.451bn. The company’s backlog increased to EUR 7.4bn from EUR 7.3bn in the prior-year period. Leverage was down again to 2.54x from 2.77x as of FYE 2014 due to the ongoing increase in EBITDA and sustained FCF growth. SES also announced the acquisition of RR Media for USD 242mn and an EV/EBITDA of 9.5x. SES expects to finance this out of cash on hand. SES also now has a 49% interest in O3b after the recent USD 460mn financing round. Therefore, if SES were to acquire more of the company, O3b would be consolidated at SES. SES’s guidance calls for FY16 revenue of between EUR 2.01bn and EUR 2.05bn, which is basically flat yoy. This is a bit of a disappointment and is slightly behind current consensus of EUR 2.07bn. The EBITDA margin is expected to be between 73.5% and 74%, which is in line with the margin level of recent years. However, growth is expected to get a boost in 2017, considering the 2016 launch schedule. The biggest unknown is what the company’s plans are for O3b. If SES were to exceed the 50% threshold of ownership and consolidate the company, this would have an uncertain impact on the balance sheet since investors have not seen detailed financials on O3b. On the other hand, consolidating O3b should boost top-line growth. Considering SES's recent FCF generation, we expect the acquisition of RR Media to slow SES's deleveraging trend but not to reverse it. In addition, we think SES already meets S&P’s current conditions for a rating upgrade, so we do not believe that this acquisition will reverse the positive ratings pressure that has already been building. A further positive surprise is possible in the government segment in 2016 if the US government increases defense spending. Slow growth in 2016 should give way to stronger results in 2017. Spreads look attractive relative to ETLFP currently, as SESGFP bonds tend to trade in line with ETLFP or slightly wider. This is despite the fact that both companies are exposed to similar macro trends and that SESGFP has shown a more consistent recent deleveraging trend, positioning it more strongly in a similar rating category.

March 2016 Credit Research
Euro Credit Pilot
UniCredit Research page 33 See last pages for disclaimer.
Current Ratings (Moody's/S&P/Fitch)
Credit Profile
Name (Ticker): Recommendation Weight in iBoxx Comment Media sector
Baa2s/BBBs/BBB-s Improving Sky (SKYLN): Marketweight 17.9% (member of the iTraxx NFI) Sky reported 1H15/16 numbers that were in line with consensus estimates on the revenue and EBITDA lines. Revenue of GBP 5,718mn was up 5% organically (1Q15/16: +6%), while EBITDA of GBP 1,049mn was up 8% (1Q15/16: +7%). Within the regions, revenue (adjusted for currency effects) was +6% yoy in the UK and Ireland (1Q15/16: +7%), +10% in Germany and Austria (1Q15/16: +11%) and -3% in Italy (1Q15/16: -4%). These are still solid growth rates, but growth slowed somewhat after a strong 1Q15/16. Revenue was mainly driven by retail customer growth (+4.5% in UK and Ireland, +9.0% in Germany and Austria, and flat in Italy yoy), as ARPU trends were flat in all regions. The UK and Ireland delivered a further increase in unadjusted EBITDA of 13% to GBP 950mn and therefore remains by far the most important contributor to group EBITDA. Germany and Austria made a positive contribution of GBP 7mn through 1H15/16, although this was down from GBP 29mn in 1H14/15. We expect that this decline is due to some currency effects as well as rising marketing expenses to drive revenue growth. In Italy, EBITDA declined again, to GBP 92mn from GBP 125mn in 1H14/15 due to the more difficult environment there. Net debt as of 1H15/16 was at GBP 5.7bn, compared to GBP 6.3bn as of 1H14/15, amounting to leverage of 2.6x (company calculation). This compares with 2.8x as of 1Q15/16 and 3.2x as of 1H14/15 and continues Sky’s deleveraging trend. However, a significant amount of the yoy deleveraging was driven by the GBP 561mn inflow for the disposal of Sky Bet (March 2015). The company proposed increasing its interim dividend by 2%, which is lower than the increase in EPS of 10% yoy. Sky has set a deleveraging target of 2.0x before considering a new share repurchase program or major acquisitions. We therefore believe that deleveraging remains a priority in the coming quarters, especially leading up to the increased expenses for the Premier League rights in FY16/17 of around GBP 600mn per year. However, we believe Sky will need to generate further ARPU increases as well as a higher EBITDA contribution outside the UK to achieve this. SKYLN bonds currently trade at the widest spreads in the high-grade media sector. However, these spread differentials are in line with average spread levels throughout 2015. We expect SKYLN to trade at somewhat wider spreads than its high-grade media peers in the near term due to the ongoing execution risk associated with the integration of Sky Deutschland and Sky Italia as well as the company’s need generate further ARPU gains to offset the increased expense for the English Premier League rights. A further risk remains the potential introduction of a “no single buyer rule” for the German Bundesliga rights, similar to the bidding system in the UK. Although this appears to be a longer-term risk that could impact 2017, at the earliest, it is still something that could affect the company’s future growth plans in Germany. We therefore confirm our marketweight recommendation on SKYLN bonds.
Baa1s/BBB+s/-- Improving Wolters Kluwer (WKLNA): Overweight 7.4% (member of the iTraxx NFI) Wolters Kluwer reported strong FY15 results that showed a continuation of the trends in 9M15. FY15 organic revenue growth came to 3% compared to 2% in FY14 and 3% through 9M15. This is despite a tough comparable base in 4Q15. Operating profit was also up 3% organically for a margin of 21.4%, compared to no growth and a margin of 21% in FY14. In its outlook statement for 2016, the company raised most of the targets it had set for 2015. The adjusted operating margin target is 21.5-22.0% (FY14: 21-21.5%), adjusted FCF (company definition) is at EUR 600-625mn (FY14: EUR 500-525mn), ROIC is to be above 9% (FY14: above 8%) and diluted adjusted EPS is forecast to increase by a mid-single-digit amount (unchanged). Net leverage was down to 1.7x compared to 2.1x as of FYE 14 and 2.0x as of 3Q15, following seasonal working capital inflows in 4Q15. As a result of this strong performance, Wolters Kluwer raised its share repurchase target to EUR 600mn over three years, compared to last year’s target of EUR 140mn and raised its dividend 6%, basically in line with EPS growth of 5%. The company also said that restructuring costs are expected to return to normal levels of around EUR 15-25mn in 2016 compared to EUR 46mn in 2015. Wolters Kluwer also gave guidance for the individual segments in 2016. Health is expected to see another year of “good organic growth” due to strong growth in Clinical Solutions (FY15: revenues +5%). Margins are expected to improve slightly. Tax & Accounting is expected to improve slightly in 2016 (FY15: +3%) with an ongoing shift toward software products. Growth and margins are expected to be weaker in 1H16, but return to 2015 levels by 2H16. Governance, Risk & Compliance (FY15: +5%) is expected to see slower organic growth but a slight improvement in margins in 2016. Legal and Regulatory (FY15: -2%) is to see another organic revenue decline due to weak legal markets and a sustained decline in print products, with digital products still unable to offset this decline. However, margins are to improve due to lower restructuring expense and efficiency savings. Wolters Kluwer reiterated its long-term leverage target of 2.5x but noted that the actual result may deviate from that target from time to time. The timing of the share repurchase program is to be executed over three years but is expected to average around EUR 200mn per year. We believe that leverage should stabilize at current levels or increase slightly depending on the timing of share repurchases and acquisitions. However, considering that the company’s operating results are strengthening and its success with deleveraging in recent years, we see this increase in shareholder remuneration as basically in line with expectations. We reiterate our overweight recommendation on Wolters Kluwer considering that WKLNA bonds are still trading wider than those of comparable peers despite Wolters Kluwer’s deleveraging success and better recent relative operating performance.
Baa2/BBBs/BBB+s Stable WPP (WPPLN): Marketweight 12.6% (member of the iTraxx NFI) WPP's 3Q15 trading statement showed ongoing steady sales growth despite a difficult advertising-market environment. Net sales on a like-for-like basis were up 3.3%, which is an improvement on the 2.6% mark through 9M15. This shows that the company did not suffer as much from some of the difficulties in the quarter as Publicis did. WPP noted that it saw revenue growth in all main regions, with strong growth in North America and the UK as well as in emerging markets. In fact, growth in most regions seemed to strengthen in the third quarter relative to the beginning of the year with net sales growth up to 3.7% in North America (3.1% lfl through 9M15) and to 2.4% in emerging markets (2.3% through 9M15). This is somewhat surprising considering the volatility in emerging markets in the period and indicates that WPP continues to perform strongly and has likely gained market share in the period. The company said that it was reviewing its forecast for the end of the year, reflecting the “characteristic caution in the fourth quarter forecast”, but reiterated its expectation for 3% net sales growth and a 0.3pp net sales margin improvement in constant currency in 2015. Net debt was up GBP 403mn to GBP 3.436bn, due to increased acquisition activity and ongoing share buybacks. However, leverage should still be considerably below the company’s target range. We therefore expect the company to continue to look for further opportunities to raise leverage through share buybacks and acquisitions and we reiterate our marketweight recommendation on the name. WPP will report FY15 results on 4 March.
Jonathan Schroer, CFA (UniCredit Bank) +49 89 378-13212 [email protected]

March 2016 Credit Research
Euro Credit Pilot
UniCredit Research page 34 See last pages for disclaimer.
Technology (Marketweight) Sector key figures Sector Wrap-Up Weight in iBoxx NFI: Current ASW spread: change mom/YTD: EURO STOXX THE YTD:
2.7% 70.0bp +1.3/+11.7 -6.8%
Sector drivers: We have a marketweight recommendation for the technology sector. The expected improvement in the global economic climate should positively drive global technology spending and thereby support technology sector growth. We expect M&A activity to remain lively in the sector in 2016. However, we expect investment-grade-rated technology companies, given their strong liquidity, to achieve their growth and strategic M&A goals, while keeping credit quality largely intact. Market recap: Sector composition: Apple (20.6%), IBM (19.9%), Microsoft (19.3%), SAP (11.2%), Cap Gemini (9.8%), Oracle (9.3%), ASML (3.5%), Ericsson (2.2%), Amadeus IT (2.1%), Infineon (2.1%).
Current Ratings (Moody's/S&P/Fitch)
Credit Profile
Name (Ticker): Recommendation Weight in iBoxx Comment Technology sector
Baa2s/BBBs/-- Stable Amadeus IT (AMSSM): Overweight 2.1% Amadeus IT Holding (Amadeus), a leading transaction processor and provider of advanced technology solutions for the global travel and tourism industry, released solid FY15 results that were slightly better than Bloomberg consensus expectations. In FY15, revenues and EBITDA grew yoy by 14.5% (FY14: 10.1%) and 12.2% (FY14: 9.9%) to EUR 3,913mn (Bloomberg consensus: EUR 3.87bn) and EUR 1,465mn (Bloomberg consensus: EUR 1.44bn), respectively. The results were driven by increased market share, the successful migration of clients and acquisitions and by a positive FX impact. Free cash flow – which is defined by the company as “EBITDA less capex, plus change in working capital, less tax cash, less interest and financial fees” – grew by 10.5% yoy to EUR 659mn in FY15. Net debt decreased from EUR 1.74bn at FYE 2014 to EUR 1.61bn. Leverage was down from 1.32x to 1.09x. For FY16, the company expects low-double-digit revenue growth, while the EBITDA margin should remain broadly stable (leading to low-double-digit EBITDA growth), driven by the acquisition of Navitaire. After capex of 12-15% of revenues, FCF (company defined) is expected to be in the area of EUR 700-750mn in FY16. The net-debt-to-EBITDA ratio is expected to be in the range of 1.0-1.5x in FY16. At the beginning of July, Amadeus announced that it had agreed to acquire Navitaire, a wholly owned subsidiary of Accenture, for USD 830mn. Navitaire provides technology and business solutions to the airline industry. The acquisition was completed on 26 January 2016. The acquisition was fully debt-financed, and pro forma for the transaction, leverage should show an increase to 1.56x as of FYE 2015. As such, Amadeus’s leverage would be at the top end of its self-imposed leverage target of net debt/EBITDA of between 1.0x and 1.5x. Therefore, the fully debt-funded acquisition of Navitaire reduced Amadeus’s flexibility under current ratings. We have an overweight recommendation on Amadeus. We expect the company to focus on integrating Navitaire in 2016 and thereby to deleverage, which would be in line with its behavior following past acquisitions. (1Q16 results: 6 May)
Aa1s/AA+s/-- – Apple (AAPL): No recommendation 20.6% Apple is the largest US-based provider of mobile devices, personal computers and related products and services. Apple has been an industry leader in the growth of, and market shift to, internet-connected mobile devices, which include smartphones and tablets. Apple generates the majority of its revenues in highly competitive markets that are characterized by rapid technology evolution and short product life cycles. However, given the company’s strong brand and its importance to the industry in terms of product innovation capabilities, these risks appear mitigated. For years, Apple has been able to differentiate itself via innovation, product quality and quality user experience versus significantly more price-aggressive Asian competitors. Apple's reported revenues for FY14/15 (ended 26 September 2015) amounted to USD 234bn, up about 28% over the prior year. Revenues and earnings came mainly from iPhone and iPad sales (70% of revenues). EBITDA grew by 36.5% yoy to USD 82.5bn, reflecting an EBITDA margin of around 35%. S&P regards Apple’s profitability as "above average" for the technology hardware sector and considers its profitability volatility to be "low". (2Q15/16 results: 25 April)
Baa1s/--/BBB+s Stable ASML (ASML): Marketweight 3.5% ASML released 4Q15 results that exceeded Bloomberg consensus estimates, but the company’s 1Q16 outlook was below consensus expectations. In 4Q15, sales decreased 4% yoy (-7% qoq) to EUR 1.43bn (broadly in line with consensus of EUR 1.41bn and company guidance of EUR 1.4bn), driven by continued strong memory-segment sales, as well as by strong service and field option sales. The gross margin increased yoy to 46.0% from 44.0% and increased qoq from 45.4% (consensus 45.0%, company guidance 45%). FOCF (net cash from operating activities minus investments in capex) was very strong and amounted to EUR 864mn in 4Q15, up from EUR 281mn in 4Q14 and EUR 333mn in 3Q15. For 1Q16, ASML expects net sales of approximately EUR 1.3bn (consensus estimate of EUR 1.38bn) and a gross margin of around 42%. Moreover, ASML expects 2Q16 sales to increase significantly from their first-quarter level. In line with its strong FCF generation, ASML announced that it plans to increase its dividend by 50% yoy. Moreover, ASML announced a new share-buyback program, to be executed within the 2016-17 time frame. As part of this program, ASML intends to purchase up to EUR 1.5bn of its shares, which includes approximately EUR 500mn of planned purchases remaining from the prior program, which was announced on 21 January 2015. This buyback program will start on 21 January 2016. We keep our marketweight recommendation on ASML bonds. (1Q16 results: 20 April)

March 2016 Credit Research
Euro Credit Pilot
UniCredit Research page 35 See last pages for disclaimer.
Current Ratings (Moody's/S&P/Fitch)
Credit Profile
Name (Ticker): Recommendation Weight in iBoxx Comment Technology sector
--/BBBs/-- Improving Cap Gemini (CAPFP): Overweight 9.8% France-based Cap Gemini, which offers a broad and balanced range of IT consulting and services, released solid FY15 results. In FY15, Cap Gemini, which, since 1 July 2015, includes IGATE consolidated, generated revenues of EUR 11.9bn (reported growth of 12.7% yoy; organic +1.0%; in line with consensus estimate of EUR 11.9bn). Reported figures were positively impacted by FX effects and by the IGATE acquisition. The operating margin increased yoy by 140bp, to 10.6%, and operating profit increased by 8.6% yoy to EUR 1.02bn. In FY15, “organic FCF” (similar to FOCF) improved yoy, from minus EUR 668mn to minus EUR 815mn. These results exceeded the company’s own forecast for FY15, which had foreseen revenue growth of 12%, an operating margin rate of 10.3% and organic free cash flow exceeding EUR 600mn. The consolidated net cash position of EUR 1,464mn as of 30 June 2015 turned into a net debt position of EUR 1.77bn as of FYE 2015 due the acquisition of IGATE for EUR 4.1bn, which was partially offset by a EUR 500mn capital increase. For FY16, the company forecasts revenue growth at constant exchange rates of 7.5-9.5%, an operating margin of between 11.1% to 11.3% and organic FCF generation in excess of EUR 850mn. The company estimates the negative impact of FX fluctuations on revenues to be -2%, primarily due to the appreciation of EUR-GBP and EUR-BRL. Cap Gemini’s board of directors recommended that it pay a dividend of EUR 1.35 per share in 2016 (up 15% yoy), which amounts to EUR 232mn. In addition, the company aims to use EUR 150mmn for share buybacks in FY16, from a total share-buyback program of EUR 600mn (over a multi-year period). Hence, the company would have more than EUR 470mn of FCF – after shareholder remuneration measures have been implemented – available for debt reduction. Net (gross) debt to EBITDA was around 1.2x (2.6x) as of YE15. This should decline below 2.3x at FYE 2016, driven by a mixture of EBITDA growth and net-debt reduction via FCF generation. We have an overweight recommendation on CAFP bonds. We expect the company to continue to improve its financial credit profile, which suffered from the IGATE acquisition. (1Q16 revenues: 27 April)
Baa1s/BBB+s/BBB+s Stable Ericsson (ERICB): Underweight 2.2% (member of the iTraxx NFI) Ericsson reported 4Q15 results that were below consensus expectations. Net sales increased 8% yoy (-1% at constant currency) to SEK 73.6bn (versus consensus estimate of SEK 74.2bn). The underperformance versus consensus was mainly driven by markets such as Russia, Brazil and parts of the Middle East, which continued to be weak, mainly due to macroeconomic developments. However, Networks experienced a recovery in 4Q15 and saw 4G deployments in Mainland China (after a weak 3Q15). The gross margin declined yoy to 36.3% from 36.6% (seasonally up qoq from 33.9%) and came in significantly below the consensus estimate of 37.6%, despite higher IPR licensing revenues and lower restructuring charges. Lower mobile broadband software sales and strong sales in mobile broadband hardware had a negative impact on Ericsson's gross margin. Its operating margin increased to 15.0% in 4Q15 (versus 9.3% in 4Q14) with improvements in all segments. Operating profit was up strongly, to SEK 11.0bn (versus SEK 6.3bn in 4Q14). The major contributors to the profit improvement were higher IPR-licensing revenues and lower operating expenses, mainly in Networks. Cash flow from operating activities increased strongly yoy to SEK 21.9bn in 4Q15, from SEK 8.6bn in 4Q14, due to significantly improved W/C (inflow of SEK 10.9bn versus SEK 0.3bn in 4Q14), which reflected cash conversion of 85% (the company’s target was 70%). The company’s net debt position of SEK 0.2bn changed to a net cash position of SEK 18.5bn qoq (versus SEK 27.6bn in 4Q14). The weaker-than-expected 4Q15 results are not a concern in the short term, as cash flow generation improved and the company returned to a net cash position. Given that the LMETEL 5.375% 6/27/2017 bond is relatively illiquid and has a short maturity, we expect little spread impact on the bond. We keep our underweight recommendation on the name, as outperformance for this tightly trading bond with a short maturity seems unlikely. (1Q16 results: 21 April)
Aa3/AA-s/A+s – IBM Corp (IBM): Restricted 19.9%
Aaas/AAAs/AA+s – Microsoft (MSFT): No recommendation 19.3% Microsoft Corporation is the world's largest software manufacturer. It licenses and supports a wide range of software products, including the Windows operating system, which runs on approximately 90% of the world's personal computers. At around 0.5x, its leverage is low.
A1s/AA-s/A+s – Oracle Corp (ORCL): No recommendation 9.3% Based in California, Oracle is by far the largest provider of database software in the world, with an estimated market share in the high-40% range, which is more than twice the size of No. 2-ranked IBM and No. 3-ranked Microsoft. In the enterprise-applications market, Oracle is the strong No. 2 overall provider after SAP. Oracle is also a strong competitor in the middleware software market (software that links separate applications). Its leverage is around 1x. The company is known to be an aggressive consolidator, mainly in the enterprise-software market.

March 2016 Credit Research
Euro Credit Pilot
UniCredit Research page 36 See last pages for disclaimer.
A2s/As/-- Stable SAP (SAPGR): Marketweight 11.2% SAP (A2s/As/--) announced more-detailed preliminary 4Q15 results and lifted its mid-term outlook, as 4Q15 were strong. As SAP's 4Q15 results and FY16 outlook were released on 12 January, its announcement was focused more on the company's updated mid-term outlook. SAP raised its 2017 ambition to reflect the current exchange-rate environment and strong business momentum. Assuming a stable exchange-rate environment going forward, SAP now expects non-IFRS cloud subscriptions and support revenue to fall within a range of EUR 3.8-4.0bn in 2017 (FY16 target: EUR 2.95-3.05bn; growth rate of 33% at constant currency). The upper end of the 2017 range represents a 2015-to-2017 CAGR of 32%. Non-IFRS total revenue is now expected to be within a range of EUR 23.0-23.5bn in 2017 (versus its previous target, which was announced along with its 4Q14 results: EUR 21-22bn in 2017). The company now expects its 2017 non-IFRS operating profit to be within a range of EUR 6.7-7.0bn (FY16 target: EUR 6.4-6.7bn versus EUR 6.35bn in 2015; its previous non-IFRS operating profit target [announced with 4Q14 results] was EUR 6.3-7.0bn). Hence, even in the mid-term, operating profitability is expected to grow only slowly, given ongoing investments into the cloud business. However, SAP continues to expect that revenue generated by its rapidly growing cloud subscriptions and support will, by 2017, be close to that generated by software licensing, and the former is expected to exceed software licensing revenue in 2018. At that time, SAP expects that it will have achieved a scale in its cloud business that will clear the way for accelerated operating profit expansion. We note that SAP did not adjust its long term 2020 ambition (EUR 7.5-8.0bn non-IFRS cloud subscriptions and support revenue; EUR 8.0-9.0bn total non-IFRS operating profit). We welcome SAP’s updated mid-term outlook, which indicates that the company is moving towards its long-term target – at current operating-profit growth rates, this still looks ambitious. Although operating-profit growth is not expected to accelerate before 2018 – and therefore will not be a major driver of deleveraging – the company’s strong FCF generation (EUR 3.0bn in FY15 versus EUR 2.8bn in FY14) remains a major argument for strong deleveraging (net debt declined to EUR 5.6bn at FYE 2015, from EUR 7.7bn at FYE 2014). Leverage (net debt to EBITDA) was at 1.01x at FYE 2015 versus 1.44x at FYE 2014. We have a marketweight recommendation on SAPGR bonds, which already trade tight compared to their US peers. We do not expect that SAP's mid-term outlook update will significantly move spreads at current valuations. (1Q16 results: 20 April)
Stephan Haber, CFA (UniCredit Bank) +49 89 378-15192 [email protected]

March 2016 Credit Research
Euro Credit Pilot
UniCredit Research page 37 See last pages for disclaimer.
Automobiles & Parts (Overweight) Sector key figures Sector Wrap-Up Weight in iBoxx NFI: Current ASW spread: change mom/YTD: EURO STOXX ATO YTD:
9.5% 127.2bp -5.4/+17.1 -14.3%
Sector drivers: The European car market is currently recovering more strongly than expected. The North American economy is still growing rapidly, but is assumed to be close to its peak level. The car markets in Russia, Brazil and Japan continue to decline. China's economy has recently declined, but the government has introduced incentives (reducing purchase tax by 50% for cars with engines less than 1.6l capacity from 1 October 2015 to end of 2016). Negative cost drivers are overcapacity in southern Europe, as well as increased R&D costs and capex, which, among other things, is necessary to meet EU emission targets and to increase the number of electric automobiles on the road. German car groups BMW and Daimler enjoy excellent credit metrics, broad regional diversification (with strong footholds in the Chinese mass-market and premium-car segment) and high liquidity positions. VW emission-scandal headlines continue to add volatility to the sector. Ratings of captive finance subsidiaries are closely linked to their carmaker parents' ratings. French carmakers have the French state as a shareholder. Japanese manufacturers have high exposure to the JPY given that their production is largely domestic. Market recap: In the last quarter, the spread of the iBoxx Automobiles & Parts sector tightened by 4bp. The main underperformers were VW hybrids and FCE Bank bonds. Renault and FCACAP bonds outperformed. Sector composition: Volkswagen (26.8%), BMW (18.3%), Daimler (13.7%), Renault (8.6%), Toyota Motor Corp (6.8%), FCE Bank (5.8%), FCA Bank (5.1%), Continental (3.5%), Robert Bosch (3.4%), Honda (1.8%), GM Financial (1.4%), Valeo (1.0%), Delphi Automotive (0.8%), Magna (0.7%), Hella (0.6%), Dongfeng Motor Hong Kong (0.6%), BorgWarner (0.6%), Beijing Automotive Group (0.6%).
Current Ratings (Moody's/S&P/Fitch)
Credit Profile
Name (Ticker): Recommendation Weight in iBoxx Comment Automobiles & Parts sector
A2p/A+s/-- Stable BMW AG (BMW): Marketweight 18.3% (member of the iTraxx NFI) With its 3Q15 results, BMW Group again affirmed its FY15 targets: 1. group: EBT solid increase (FY14: EUR 8.7bn); 2. Automotive: solid sales-volume increase (FY14: 2.117mn), slight decrease in fleet emissions (FY14: 130g), significant increase in revenues, EBIT margin between 8-10% (9M15: 9.0%; FY14: 9.6%); 3. Motorcycles: solid increase in sales volume (FY14: 123.4k); 4. Financial Services: ROE ≥18%. The number of deliveries to customers in China was up by 1.0% (+1.9%) yoy, which represented 21% of automobile deliveries in 9M15. Based on projections of slower growth, BMW Group proactively adjusted production in, and for, China. BMW is also helping Chinese dealers respond to more-intense competition through training and other sales-enhancing measures. The recently introduced revised 3 Series models did not affect 3Q15 sales in the Chinese market. However, BMW expects to see an effect from this from 4Q15 onwards, which should also be supported by the launch of the 7 Series. Product momentum is expected to improve further in 2016, for instance, supported by the new BMW X1. BMW expects Automotive FCF (company definition, adj. for net investment in marketable securities, before dividends) in FY15 and in FY16 to exceed EUR 3bn (9M15: EUR 3,376mn; FY14: EUR 3.4bn). BMW expects, however, that FCF will be lower in 4Q15 due to the high level of costs and investment, as well as due to the resulting payments to suppliers. The company also said that a disproportionately large share of project costs for FY14 will be posted in 4Q15. BMW’s dividend payment in FY15 was EUR 1.9bn (vs. EUR 1.7bn yoy), and it targets a payout ratio 0f 30-40%. BMW’s group liquidity (company definition, includes cash and equivalents and securities) stood at EUR 10.9bn (i.e. 12.8% of LTM revenues excluding financial services) vs. EUR 11.3bn qoq. BMW’s credit-loss ratio was 0.35% in 9M15 vs. 0.5% in FY14. BMW’s cash curve trades slightly wider than Daimler’s (A3p/A-s/A-s), even though it is rated slightly better. Despite the recent joint acquisition of Nokia’s HERE for EUR 0.85bn (completion expected by 1Q16), we view the 2015 guidance affirmation as positive. We also see BMW as on its way towards an upgrade to A1 at Moody’s, where it was also rated before November 2008. We keep a marketweight recommendation on BMW’s retail-sized bonds in the iBoxx Auto sector index, where it represents 20% of the volume. (4Q15 results: 16 March)
Baa1s/BBBp/BBBp Stable Continental AG (CONGR): Marketweight 3.5% (member of the iTraxx NFI) Continental published FY15 results that were in line with its key figures published in January, while management affirmed organic growth outlook for FY16. As already reported in January, and as commented on in our Daily Credit Briefing of 12 January, the company’s sales increased by 14% to EUR 39.2bn while organic growth was 4% (excl. FX changes and sales contributions from acquisitions). EBITDA grew by 17%yoy to EUR 6.0bn while the margin increased by 40bp yoy to 15.3%. EBIT grew by 23% yoy to EUR 2.7bn with the margin up by 80bp to 10.5%. Division-wise, the strongest contributor was the Automotive Group with EBITDA up by 25% to EUR 3.0bn (50% of FY15 EBITDA, margin up by 110bp to 12.6%). EBITDA in the Rubber Group increased by 12% yoy to EUR 3.2bn, while the margin dropped by 50bp to 20.3%. Continental’s reported FCF (before M&A) was EUR 2.7bn in 2015. However, reported net debt rose by slightly more than EUR 700mn to EUR 3.5bn mainly due to acquisitions of EUR 2.3bn, dividends of EUR 650mn and pension funding of EUR 341mn. Gearing increased to 26.8% vs. 25.6% in the prior year. Regarding its outlook, management expects a growth rate similar to that achieved in FY15. In FY16, organic profitable sales growth of around 5% (around 4% in FY15) to approx. EUR 41bn is expected. EBIT margin of over 10.5% is expected in FY16. The company aims to grow faster than the market with its innovative electronics, sensor and software solutions as well as industrial products and tires. Continental anticipates a moderate rise in global vehicle production of 1.5% to just under 90mn units. Growth in European and Chinese vehicle markets is expected to offset Russian and Brazilian markets. Furthermore, Continental raised the dividend by 15% yoy to EUR 3.75 for FY15. We continue to have a marketweight recommendation on Continental’s (retail-sized) bonds.

March 2016 Credit Research
Euro Credit Pilot
UniCredit Research page 38 See last pages for disclaimer.
Current Ratings (Moody's/S&P/Fitch)
Credit Profile
Name (Ticker): Recommendation Weight in iBoxx Comment Automobiles & Parts sector
A3p/A-s/A-s Stable Daimler (DAIGR): Marketweight 13.7% (member of the iTraxx NFI) Daimler stated that for FY16, further growth is expected in revenue and EBIT from the ongoing business. Daimler expects to achieve further significant growth in total unit sales once again in 2016. However, the rate of growth is likely to be somewhat lower than in 2015, which featured exceptional dynamism. Daimler also assumes that group revenue will grow slightly in 2016. From a regional perspective, Mercedes-Benz Cars expects the Asian markets to be particularly strong drivers of growth in unit sales in 2016. FY15 was the first year in which China was the biggest sales market for Mercedes-Benz. Following growth of 41% in FY15, further expansion is planned in 2016, particularly with the models produced locally. However, the growth rate in China will be more moderate this year according to the company. Last year, the dealer network expanded to approximately 500 dealerships and local production capacities were also expanded. In addition to the C and E-Class, production of two SUV models (the GLA and the GLC) started in 2015. Further growth is planned, with new models also in North America, and Mercedes-Benz Cars intends to profit to an above-average degree from the ongoing revival of demand expected in Western Europe. For the individual divisions, the following targets for EBIT from the ongoing business have been set for FY16: Mercedes-Benz Cars – slightly above the prior-year level; Daimler Trucks – at the prior-year level; Mercedes-Benz Vans – slightly above the prior-year level; Daimler Buses – slightly above the prior-year level; and Daimler Financial Services – slightly above the prior-year level. Daimler said that the anticipated development of earnings in the automotive divisions will continue to have a positive impact on the industrial FCF in FY16. As the investment offensive in products and technologies is continued and intensified, the industrial FCF adjusted for special items should be significantly lower in 2016 than the comparable amount of EUR 5.9bn in FY15. Daimler assumes, however, that it will be significantly higher than the dividend distribution in FY16. Daimler will increase its dividend payment in FY16 to EUR 3,477mn from EUR 2,621mn yoy. Given Daimler’s current positive momentum, the senior cash curves of better-rated BMW (A2p/A+s) and Daimler trade in line with each other. VW’s senior cash curve trades around 100bp wider. Despite the high likelihood of an upgrade at Moody’s, Daimler still has a weaker average rating than BMW, given its cyclical truck business. Despite the recent outperformance of single-A rated Daimler bonds compared to the iBoxx Autos HG EUR IG index, we continue to have a marketweight recommendation for Daimler. (1Q16 results: 22 April)
Baa3/BBBs/BBBs Stable Delphi Automotive (DLPH): Marketweight 0.8% After share repurchases and dividends of USD 1.4bn, the acquisition of HellermannTyton Group PLC (completed 21 December 2015) and the disposal of the reception systems business (completion 30 September), the company had short term debt of USD 52mn at the end of 4Q15 and a cash position of USD 536mn. According to our calculations, debt/EBITDA in FY15 rose to 2.2x from 1.5x yoy. Moody’s Baa3 hurdle ratio is debt leverage of 2-2.5x. For 1Q16, the company expects adjusted organic growth of 5-8%, an operating income margin of 12.3-12.7% and an EPS of USD 1.28-1.38 at a tax rate of 17%. The 2016 guidance is for: 1. revenues of USD 16.6-17bn (organic growth 8-10%, adjusted for FX, commodities, HellermannTyton acquisition and the E&S divestiture; FY15: USD 15,165mn); 2. adjusted operating income of USD 2.2-2.3bn (operating margin 13.3-13.6%; FY15: 13.0%); 3. adjusted EPS of USD 5.8-6.1 per share (FY15: USD 5.22); 4. USD 2bn in cash flow from operations (FY15: USD 1,667mn) and USD 1.2bn in cash flow before financing; 5. an adjusted effective tax rate of 17%. The company’s guidance is based on the following assumptions: global market growth of 2% (North America +3%, Europe +2%, China +4%, South America -10%), EUR-USD at 1.1, and share repurchases of USD 400mn. Delphi announced it would increase its annual dividend payout from USD 1.00 to USD 1.16, which will represent around 15% of its 2016 operating cash flow. After some underperformance, we upgrade our recommendation on the DLPH 3/25 to marketweight from underweight. In spread-to-duration terms, the bond now trades in line with VW’s senior cash curve (A3n/BBB+n/BBB+n) and the extrapolated curves of GM Financial (Ba1s/BBB-s/BBB-s) and Renault (Ba1p/BBB-s/BBB-s). Nevertheless, we do not expect any rating upgrades given the company’s capital deployment strategy. Delphi’s capital allocation strategy for its operating cash flow remains unchanged: 45-55% M&A and share repurchases, 10-15% dividends and 35-40% capex. (1Q15 results: 28 April)
Baa2s/BB+/BBB Stable FCA Bank (FCACAP): Overweight 5.1% FCA Bank provides retail financing (to private customers via dealerships), dealer financing (OEM dealer networks) and rental financing (to corporate customers via dealerships/direct) in Europe to the brands of Fiat Chrysler Automobiles (Alfa Romeo, Chrysler, Fiat, Fiat Professional, Jeep, Lancia, Abarth, Maserati) and to Jaguar and Land Rover. The company signed new cooperation agreements with Ferrari and Hymer (motor caravans and caravans). In 1H15, FCA Bank's average managed loan portfolio increased by 6.8% yoy to EUR 15.7bn, EBT was up by 45.3% yoy to EUR 184.3mn, credit losses were down to 52bp vs. 57bp in FY14 and net income was up by 45.1% yoy to EUR 131.3mn yoy. The company paid EUR 91.5mn in dividends to its shareholders in 1H15. YTD to August 2015, FCA's unit sales increased in Europe by 13.2% yoy (1H15: 12.6%). In 1H15, FCA Bank entered into new partnerships with Ferrari and Hymer. FCA's 2018 business plan has significant growth targets, which will also lead to an increase in FCA Bank's assets. In line with the autos IG EUR index, FCACAP bond spreads widened by around 50bp but outperformed the index, as VW's bonds have the highest weight in the sector. We keep an overweight recommendation on FCACAP bonds in the iBoxx IG autos sector given their spread premium to similarly rated GM Financial and Renault bonds. FCACAP's bonds trade with a slight premium to those of GM Financial (Ba1s/BBB-s/BBB-s) and Renault (Ba1p/BBB-s/BBB-s). We believe that the good sales momentum in Italian and western European car sales and in FCA Bank's financed brands and the new cooperation with Ferrari and Hymer are positive. To support the growth of its loan portfolio, FCA Bank would be able to issue more benchmark bonds; it has another EUR 1.6bn of headroom for bond issuance in its EUR 6bn Euro Medium-Term Note (EMTN) program. FCA Bank does not face any bond maturities in 2015 and 2016. (FY15 results Fiat Chrysler Automobiles: 26 April)

March 2016 Credit Research
Euro Credit Pilot
UniCredit Research page 39 See last pages for disclaimer.
Current Ratings (Moody's/S&P/Fitch)
Credit Profile
Name (Ticker): Recommendation Weight in iBoxx Comment Automobiles & Parts sector
Baa2s/BBBs/BBB-p Stable FCE Bank Plc (F): Marketweight 5.8% FCE Bank’s rating is equal to that of Ford (Baa3s/BBB-s/BBB-p) at Moody’s and Fitch. At S&P, FCE Bank is rated one notch better than Ford given its regulated status, its bbb SACP and its demonstrated ability to access funding independently of its immediate parent, Ford Motor Credit. In the business units, Ford expects North America to sustain its strong performance in 2016, with an operating margin of greater than or equal to 9.5% and EBT about equal to that of 2015. It expects Europe, Middle East & Africa and Asia Pacific to all be profitable in 2016, with Europe and Asia Pacific results improving over 2015 and Middle East & Africa results about equal to or higher than those of last year. The loss in South America is expected to be higher than in 2015. Ford Credit’s EBT is expected to be equal to or higher than that of 2015. Ford aims for its Automotive revenue and operating margin in 2016 to be equal to or higher than that of 2015, but with lower Automotive operating-related cash flow compared to 2015. Ford expects its 2016 EBT (excluding special items) to be equal to or higher than that of 2015. In its 2020 vision (released Sep 2014), Ford projects an Automotive operating margin of about 8% by 2020, with a long-term target of 8-9%, and Automotive EBT to be more balanced between North America and other regions. Ford’s 2018 target for Automotive debt is about USD 10bn (4Q15: USD 12.8bn), and its long-term target for total Automobile liquidity is USD 30bn (4Q15: USD 34.5bn), with USD 20bn in gross cash and a USD 10bn RCF. Given that Ford has already achieved its 2018 Automotive debt and liquidity targets, any further rating upgrade can only occur through an increase in automotive EBITDA (in particular outside of North America) and/or a reduction in the adjustment of pension liabilities. The outlook for 2016 indicates stable or slightly improving automotive credit metrics. We particularly like Ford’s stable outlook for its most important segment, North America, but also the projected improvement in its international segments, which is another prerequisite for a rating upgrade. We believe that Ford’s sales momentum at products like SUV, Van and Pickup (39% of Ford Group’s 2015 production according to LMC Automotive data) was also supported by the low oil price, which declined by 35.8% in 2H15. FCE Bank’s ratings at Moody’s and Fitch are fully linked to Ford’s. At S&P, FCE Bank’s rating has a one-notch difference to that of Ford. For FCE’s credit profile, see our Credit Flash of 27 Nov. We keep our marketweight recommendation on FCE Bank bonds in the iBoxx EUR IG Auto sector. FCE Bank’s cash curve trades tighter than RCI Banque’s (Baa1s/BBBn) and GM Financial’s (Ba1s/BBB-s/BBB-s). (1Q16 results Ford Motor Company: 28 April)
Ba1p/BBB-s/BBB-s Stable GM Financial (GMFIN): Overweight 1.4% GM Financial (GMF) is committed to keeping a rating that is equal to that of its parent, GM (Ba1s/BBB-s/BBB-s), which, in turn, remains committed to maintaining its IG rating. On 4 September 2014, GMF entered into a support agreement with GM that provides increased support to GMF's credit profile. The agreement covers an initial 5Y term with automatic annual 1Y extensions, beginning in September 2015, and requires 100% ownership of GMF by GM as long as GMF has unsecured debt securities outstanding. The agreement provides for leverage limits and liquidity support to GMF. For 2016, GM expects improved consolidated adjusted EBIT, an improved EBIT-adjusted margin and improved automotive adjusted FCF and a similar earnings seasonality to recent years; 1Q weaker, 2Q and 3Q stronger, and 4Q about average. GM aims to achieve sustained strong margins in North America and China and to break even in Europe. Adj. Auto FCF was USD 4bn p.a. in 2010-15 and GM sees the potential for USD 6-7bn p.a. in 2016-18. GM’s target is to reinvest in the business to drive growth and +20% ROIC, and to maintain USD 20bn in cash. GM has authorized a USD 4bn increase to its existing common stock repurchase program, bringing the total to USD 9bn, while extending the program through 2017. The board also authorized an increase to the regular quarterly common stock dividend of 6%, beginning in 1Q16. GM said that its US breakeven declined to 10-11mn units compared to around 16mn in 2007. The company said that continued execution of its plan should keep it on track to achieve 9-10% EBIT-adjusted margin by early next decade. GM continues to expect capex of 5-5.5% of revenues in the near-term (around USD 9bn in 2016). We calculate GM’s adjusted automotive gross leverage in LTM 9M15 at 2.1x, which already indicates a one-notch upgrade to mid-BBB. Nevertheless, for an upgrade to occur, GMNA’s performance must continue to show the current profitability level and Europe has to break even. GM still has some way to go until it reaches its adjusted 9-10% group EBIT margin target (FY15: 7.1%), as all other segments outside of GMNA generate, in total, USD -0.8bn in adjusted EBIT. Although GM’s results continued to improve in FY15, Moody’s hurdle ratios have not yet been reached and we therefore do not expect an upgrade to IG at the agency yet. Although US car sales seem to have peaked, GM says that many growth drivers for the light vehicle market (fuel price, interest rates, disposal income, unemployment, etc.) remain stable or positive. Despite the recent underperformance of high-beta names, we keep our overweight recommendation on GMF bonds in the iBoxx EUR IG Auto sector given the spread premium to FCE Bank (Baa3s/BBBs/BBB-p). GMF bonds trade roughly comparable to VW senior (A3n/BBB+n/BBB+n) and Renault (Ba1p/BBB-s/BBB-s) bonds. GMF has USD 1bn in maturities in 2016. We expect GMF to continue to increase the share of unsecured and EUR-denominated debt. (4Q15 results: 3 February)
Baa2s/--/-- Stable Hella (HELLA): Marketweight 0.6% We calculate unchanged gross debt/EBITDA (adj. for restructuring costs and the cost of supplier default) in of 1.9x qoq 1H15/16, but up to 1.2x vs. 1.0x on a net basis. Moody’s (2/15) said that it would consider upgrading Hella's ratings if the group were to sustainably achieve an EBIT margin in the high single digits and a debt/EBITDA ratio well below 2.0 (LTM1Q15/16: 2.18x). Moreover, an upgrade would require material positive FCF generation and an RCF/net debt ratio greater than 40% (LTM1Q: 125.1%) on a sustainable basis. Negative pressure on Moody’s rating would arise if 1. Hella's profitability came under pressure, resulting in the EBIT margin falling sustainably below 5% (LTM1Q: 6.5%) or material negative FCF; and 2. retained cash flow coverage in terms of RCF/net debt were to fall notably below 30% or if its leverage ratio, measured by debt/EBITDA, were to remain consistently above 2.5x. Likewise, an increase in net debt/EBITDA above 2.0x could have a negative rating impact, Moody’s added. On 17 December, Hella CEO Rolf Breidenbach said in an interview with Reuters, that Hella is looking for acquisition targets and has its eye on companies with sales of EUR 100mn, but maybe also larger. The CEO added that Hella is looking for purchases in the areas of electronics and special applications. Hella is also investing its recent IPO proceeds in, for example, the fields of LED technology and energy management. Hella’s cash & equivalents and financial assets were EUR 924mn in total vs. EUR 987mn yoy. In one of its most recent conference calls, the company said that its minimum liquidity is EUR 250-300mn, but that it currently aims to keep its current high strategic liquidity. For details on Hella’s credit profile, please refer to our Credit Flash from 30 March. We keep our marketweight recommendation on the retail-sized HELLA 2.375% 1/20 bond, which is more or less fairly valued given its scarcity value, as it is the company’s only iBoxx bond. The bond trades quite fair against RCI Banque’s (Baa1s/BBBn) bonds and slightly below the bonds of FCE Bank (Baa3s/BBBs/BBB-p) and GM Financial (Ba1s/BBB-s/BBB-s) in the BBB auto index. In addition, we do not expect any rating changes for the time being given Hella’s comfortable headroom in the current rating, but also its margin development and growth strategy (organic, network strategy, smaller acquisitions). The next larger debt maturities are a EUR 150mn EIB loan in 2015 and Hella’s EUR 300mn 1.25% 9/17 bond. (3Q15/16 results: 13 April)

March 2016 Credit Research
Euro Credit Pilot
UniCredit Research page 40 See last pages for disclaimer.
Current Ratings (Moody's/S&P/Fitch)
Credit Profile
Name (Ticker): Recommendation Weight in iBoxx Comment Automobiles & Parts sector
A1s/A+s/As Stable Honda (HNDA): Underweight 1.8% With its 3Q15/16 results, Honda updated its forecast for FY15/16 (ending 31 March 2016): sales revenue up by 9.2% (previous: +9.5%) yoy, operating margin down to 4.7% vs. 5.0% yoy (unchanged), capex up to JPY 670bn vs. JPY 653.8bn yoy (unchanged), depreciation and amortization up by 50.8% yoy and R&D expenses up by 64.6% (+49.6%) yoy. We calculate LTM 1Q15/16 gross adjusted automotive debt/EBITDA to be more or less unchanged, at a low 0.9x qoq. Although Honda's credit-profile momentum is stable, we keep our underweight recommendation on the company’s bonds in our HG iBoxx auto portfolio, as they trade rather tightly and offers little tightening potential. (4Q15/16: 28 April)
Stable Mahle (MAHLGR): Hold 0.0% With its 1H15 results in November, Mahle said that it was well on track to achieving its FY15 sales guidance of EUR 11.4-11.6bn (FY14: EUR 9,942mn) due to Delphi Thermal and Kokusan Denki contributing to 2H15 sales and the high likelihood that Delphi Thermal’s JV partner in China will acquire the local Delphi Thermal business, but no positive FX effects are expected in 2H15. The earnings development in 2H15 will suffer from weakening markets in China and Brazil and higher depreciation (PPA Delphi). Regarding the VW headlines, the company said that after the Delphi Thermal acquisition, no customer accounts for more than 10% of sales, that there would be no significant light vehicle diesel exposure in global sales and that the diesel engine is still a technology with crucial advantages in terms of range and achieving compliance with the strict CO2 regulations in Europe. We calculate net debt/EBITDA (UniCredit adjusted) of 1.9x in LTM1H15 vs. 1.4x in FY14. Pro forma for 12 months of Delphi Thermal EBITDA (FY13: EUR 389mn), leverage would be unchanged at 1.4x. Mahle’s net leverage (co. definition) of 1.2x is well below its 2x target. Nevertheless, we note that the company needs to maintain some leverage headroom given potential payments for antitrust fines and for the potential exercise of its call option for further stakes in 50.7%-owned Mahle Behr. Mahle’s 70%-owned Brazilian subsidiary Mahle Metal Leve SA, however, is listed and reports quarterly results (in BRL). For FY15, for Mahle Metal Leve SA, Bloomberg consensus expects a decline in EBITDA to EUR 102mn vs. EUR 123.8mn yoy. For a credit profile overview, please refer to our Issuer Profile dated 26 June. For details regarding MAHLE’s put/call options structure for the remaining stake in 50.7%-owned Mahle Behr GmbH & Co. KG, its dividend strategy and its financial targets (unadjusted net debt/EBITDA of 2.0x and an equity ratio of >33%), please refer to the company’s investor presentation. In May 2015, Mahle issued an unrated retail-sized EUR 500mn 5/22 bond and has another EUR 300mn 5/21 bond outstanding. We keep a hold recommendation on the bonds. (FY15 results: 25 April)
A3s/A-s/BBB+p Positive Michelin (MLFP): Hold 0.0% Michelin stated that demand for passenger car, light truck and truck tires is expected to continue rising in 2016 in mature markets and remain in line with 2015 trends in new markets. Demand for specialty tires is expected to continue to be affected by mining company inventory drawdowns. In this environment, Michelin's objectives for 2016 are volume growth at least in line with global trends in its operating markets (passenger car up 2-3%, truck: up 0-2%, specialty down 2-5%), an increase in operating income before non-recurring items at constant FX, and structural FCF of at least EUR 800mn (FY15: EUR 965mn). The group set ambitious targets for 2016-2020 in terms of operating margins before non-recurring items, between 11-15% (previously 10-12%) in the passenger car and light truck tire segment, 9-13% (previously 7-9%) in the truck tire segment and 17-24% (previously 20.24%) in the specialty segment. In January 2016, the company launched a new EUR 150mn tranche of its EUR 750mn share buyback plan and has committed EUR 20mn in 2016 to date, following on from the 2015 buyback and cancellation of EUR 451mn in Michelin shares, representing 2.7% of issued capital. Michelin plans to increase its dividend per share to EUR 2.85 (from EUR 2.5 yoy), representing a payout ratio of 37%. Although the company’s credit metrics momentum is expected to continue to be positive in 2016 and might lead to some more positive rating actions, results were also supported by lower rubber and oil prices, just like at Continental. We keep our hold recommendation on non-benchmark-sized Michelin bonds, given the fair spread levels for a low-A credit. Apart from its convertible bond maturing in January 2017, Michelin has four smaller bonds outstanding that are not part of the iBoxx. (1Q16 sales: 20 April)
Stable RCI Banque (RCIBK): Marketweight 0.0% Moody's (7/15) stated that RCI's monoline business model and its captive status inherently limit any upwards movement on the baseline credit assessment that could develop following 1. a material reduction in the reliance on wholesale funding or 2. any other material improvement in the bank's credit fundamentals. Under its advanced loss-given default analysis, RCI's long-term and short-term deposit and senior unsecured debt ratings could be positively affected by significant issuance of subordinated instruments. A downgrade of RCI's ratings could materialise if 1. its parent's credit profile weakens or 2. if the bank's credit fundamentals deteriorate. S&P (5/15) said that it could lower its ratings of RCI by year-end 2015 if it believes there is a greater likelihood that senior unsecured creditors may incur losses if the bank fails. Specifically, S&P may lower its long-term counterparty credit rating by one notch if it considers that extraordinary government support to be less predictable under the EU Bank Recovery and Resolution Directive. S&P could also revise its view of RCI Banque's systemic importance in France to "low" from "moderate" if support from the French government in times of need became weaker than it currently factors into the rating. In addition to potential changes in RCI Banque's government support, it would review other relevant rating factors before taking any rating actions. These might include any steps RCI Banque might take to mitigate bail-in risks to senior unsecured creditors. At this stage, S&P does not foresee an upward revision of the bank's SACP given its almost exclusive focus on car finance and auto leasing and its mainly wholesale-funded business model. We keep a marketweight recommendation on RCI's bonds given the positive momentum of its parent's rating. (1H16 Renault results: 28 July)

March 2016 Credit Research
Euro Credit Pilot
UniCredit Research page 41 See last pages for disclaimer.
Current Ratings (Moody's/S&P/Fitch)
Credit Profile
Name (Ticker): Recommendation Weight in iBoxx Comment Automobiles & Parts sector
Baa1s/BBBn/-- Stable Renault (RENAUL): Overweight 8.6% (member of the iTraxx XOVER) For 2016, Renault expects the global market to record growth of 1-2% yoy (Europe +2%, France +2%, Brazil -6%, Russia -12%, China +4-5%, India +8%). Against this backdrop, and with a particularly full product plan this year, Renault expects acceleration in sales growth worldwide, a strengthening of the Renault brand in Europe and an increase in each of its five regions. Renault (at constant scope of consolidation) is aiming to increase group revenues (at constant exchange rates), improve group operating margin and generate a positive Automotive operational FCF. The company’s 2017 target is for a group operating margin of >5% and group revenues of EUR 50bn. Renault-Nissan alliance synergies in 2016 are expected to be more than EUR 4.3bn (FY15E: EUR 4.1bn). Renault group has entered into discussions with the other shareholders of the AvtoVAZ controlling holding company, ARA BV, with the intention of recapitalizing the company. This could lead to consolidation in Renault’s accounts, and AvtoVAZ’s loan and receivables (Bloomberg FY15E: EBITDA of EUR 219mn, net debt EUR 1.0bn) would be capitalized and constitute part of the net equity investment on 31 December 2015. Adjusted automotive gross debt/EBITDA in FY15E (UniCredit Research) improved to 3.4x vs. 4.6x yoy. Renault plans to present steps to improve the emissions performance of current diesel cars. For our comment on the Renault emission-fraud probe, please refer to our Daily Credit Briefing of 20 January. For the shareholder agreement between Renault, Nissan and the French government please refer to our comment on 14 December. Our latest Credit Flash on Renault is from 17 November. Following Renault’s re-entry into IG indices in 2015, investors were positive on the name and expected more rating upgrades. With the current diesel-emission headlines and the foreseeable consolidation of leveraged AvtoVAZ, however, the rating upgrade potential of Renault has disappeared, in our view. Renault bonds trade roughly 25bp wider than RCI Banque. We have a marketweight recommendation on Renault bonds as rating upgrade potential is now limited. (1H16 results: 28 July)
--/AA-s/-- Stable Robert Bosch (RBOSGR): Underweight 3.4% Robert Bosch GmbH (--/AA-s/--) released preliminary key figures for FY15, with organic sales revenue up by 9.9% yoy (excl. FX: +4%) to EUR 70.6bn and its adjusted EBIT margin up to 6.5% vs. 5.8% yoy. According to Bloomberg, Bosch CEO, Volkmar Denner, said at a press briefing that Bosch is fully cooperating with the authorities and that it had begun an internal investigation as soon as VW’s emissions cheating came to light. Bosch has submitted information beyond that which has been requested by the authorities to help technical understanding. Mr. Denner added that manufacturers are responsible for vehicle emissions, not suppliers that contribute a component or piece of software to drivetrains. He said that allegations that all diesel cars pollute the environment are “factually wrong”. Bosch’s CFO, Stefan Asenkerschbaumer, added that there has, so far, been no decline in demand for diesel technology. He also said that larger transactions would be possible given that Bosch has EUR 14.5bn in net liquidity. Bosch did not submit an offer for GE Appliances, and stated that a decision on whether to sell its starter-motors and generator business (6,500 employees, 13 manufacturing sites), amid tough competition and cost pressure, is still pending. In mid-December, Bloomberg reported that the business unit may fetch between EUR 600mn and EUR 800mn and that the sale process would begin in 1Q16. For 2016, Bosch forecasts only moderate growth of 2.8% for the global economy but aims to grow faster than its various markets. Despite the fact that it plans to undertake enormous investment to secure its long-term viability, results and EBIT from operations are expected to further improve. (FY15 annual report: April 2016)
Stable Sixt (SIXT): Hold 0.0% After reporting preliminary 3Q15 (9M15) results at the end of October, Sixt (not rated) has now presented its final 3Q15 results and upped its EBT guidance for FY15. Following 3Q15 business performance that was above the company’s internal expectations, and given the previous experience of 4Q business development, the company now projects consolidated EBT for FY15 to reach at least EUR 180mn, which would be significantly higher than the previous year's total of EUR 157.0mn. The guidance so far has been “EBT to increase slightly”. With regard to 2015 consolidated operating revenue, expectations remain unchanged and foresee a substantial increase on the previous year's figure. Revenue of the vehicle rental business unit was up by 20.0% (+17.9%) yoy, leasing business unit revenue was up by 0.5% (+2.1%) and the EBITDA margin was slightly down to 33.7% (30.5%) vs. 33.9% (31.9%) yoy. Compared to FYE 2014, total assets were up by 32.5% to EUR 3,733.9mn, rental vehicles were up by 43.1% to EUR 1,805.2mn and lease assets were up by 5.2% to EUR 948.9mn. Nevertheless, the equity ratio was still up to 27.8% vs. 26.3% at FYE 2014. As of 3Q15, the number of Sixt rental stations worldwide (company offices and franchisees) totaled 2,185 (FYE 2014: 2,177 stations). The number of stations in the Sixt corporate countries increased by 60 to 1,114 (FYE 2014: 1,054). This growth is due to the continuous expansion in the US, but also thanks to the new openings in various European countries. The number of stations in the US as of the reporting date, 3Q15, was 66 (31 December 2014: 50). The network of stations within Germany at the end of 3Q15 consisted of 515 offices, an increase of 32 (FYE 2014: 483). Due to reorganizations in a number of markets, the changes in the international franchise network saw the number of stations drop by 52 to 1,071 stations. In LTM9M15, we calculate slightly increased net debt/EBITDA (adj., UniCredit Research) of 3.1x vs. 3.0x qoq and 2.9x yoy. We note, however, that following the IPO of Sixt Leasing AG in 2Q15 (trading commenced on 7 May 2015), Sixt SE holds a 41.9%, interest in the company and, for the time being, Sixt Leasing AG continues to be fully consolidated. Sixt stated that the IPO would create financial scope for further growth whilst leaving the equity ratio of the expanding Vehicle Rental Business Unit untouched. The profit-and-loss transfer agreement between Sixt SE and Sixt Leasing AG was terminated as of 30 April 2015. We keep a hold recommendation on Sixt bonds. Sixt has three unrated retail-sized bonds outstanding of EUR 250mn each. (FY15 results: 15 March)

March 2016 Credit Research
Euro Credit Pilot
UniCredit Research page 42 See last pages for disclaimer.
Current Ratings (Moody's/S&P/Fitch)
Credit Profile
Name (Ticker): Recommendation Weight in iBoxx Comment Automobiles & Parts sector
Aa3s/AA-s/As Stable Toyota (TOYOTA): Underweight 6.8% With its 3Q15/16 results, Toyota released its FY15/16 guidance: a 2.5% decline (previous: flat) in consolidated vehicle sales development to 8.75mn vs. 8.972mn yoy, and retail vehicle sales (including Daihatsu and Hino brands) of 10.05mn units (previous: 10.0mn units) vs. 10.168mn units yoy. Net revenues are expected to be JPY 27.5bn (unchanged) vs. JPY 27.2bn yoy, and the operating income margin unchanged, at 10.2% vs. 10.1% yoy. Adjusted automotive gross leverage was a low 0.6x yoy in FY14/15, and the company does not report enough data to calculate interim automotive leverage ratios. Toyota's automotive credit metrics and performance are significantly dependent on the value of the JPY against the USD and EUR. On 29 January, the company announced that it would buy out 51.19%-owned Daihatsu with a stock swap. Toyota also has a share repurchase program of a maximum JPY 150bn, running from 8 February-24 March. In January, Toyota’s US auto sales fell 4.7%. Moody’s said that because the company’s Aa3 rating is higher than the ratings of its potential support providers, the rating on Toyota does not include any uplift from potential support from either the government (A1s/A+s/As) or its main banks (which would generally be factored into Japanese corporate ratings). Moody’s hurdle ratios for the current rating are adjusted EBITA margins of at least 8% and an adjusted debt/EBITDA of between 0.5x and 1.75x. S&P said that it might lower its rating on Toyota Motor if the company's competitive position deteriorated in key global vehicle markets, significantly constraining and destabilizing profitability. For instance, S&P might consider a downgrade if the company's EBITDA margin fell and remained below 10.0% for a protracted period. S&P might also downgrade Toyota Motor if it believed the company’s financial policy was becoming much less conservative. Toyota’s bonds trade at comparatively tight spread levels and offer low carry compared to that of many of its sector peers. Therefore, despite the typical outperformance of better-rated names in a volatile spread environment, we keep our underweight recommendation on Toyota bonds, as we see no rating upside potential or spread tightening potential for the name. (4Q15/16 results: 6 May)
Baa2s/BBBs/-- Stable Valeo (FRFP): Marketweight 1.0% (member of the iTraxx NFI) Net debt (co. definition) at FYE 2015 was down to EUR 124mn vs. EUR 377mn yoy. Net debt/EBITDA (co. definition) was 0.07x (0.43x pro-forma the acquisition of Peiker & Spherols). The company had total available liquidity of EUR 2.9bn, consisting of EUR 1,725mn in cash and EUR 1.2bn in confirmed bank credit lines with an average maturity of four years. The bank lines have covenants stipulating that Valeo's net debt/EBITDA ratio must not exceed 3.25x. At FYE 2015, the ratio calculated over 12 months was less than 0.1x. Valeo also has a short-term CP financing program for a maximum amount of EUR 1.2bn. However, given Valeo’s debt rating, the regulations applicable to monetary funds currently restrict its access to this market. 47% of the company’s 2015 OEM sales were from Europe, 22% from North America, 16% from China and 13% from Asia excl. China. 2015 order intake was 46% from Europe, 20% from China, 25% from North America and 8% from Asia (excl. China). The company said that the market’s global production in 2015 was up by 2% (Europe +5%, North America +3%, South America -19%, China +4% and Asia [excl. China] down by -1% [2H15: +4%]). The company’s 2016 outlook is based on the following assumptions: an increase in global automotive production of around 2.5%, including around 2% in Europe, around 5% in China, around 2% in North America; and raw material prices and FX rates in line with current levels. Valeo has set the following objectives for 2016: strong sales growth; outperforming the market in its main production regions, including China; and a slight increase in the operating margin, despite the increase in net R&D expenditure required for the group's future growth engines of CO2 emissions reduction and intuitive driving. Valeo plans to pay out EUR 3.0bn in dividends, up from EUR 2.2bn yoy. We keep our marketweight recommendation on the FRFP 3.25% 1/24 bond in our iBoxx Autos sector model portfolio. The bond trades roughly in line with similar-rated bonds such as HELLA 20, MGCN 15 and the extrapolated VLVY curve. (1H16 results: 21 July).
A3n/BBB+n/BBB+n Stable Volkswagen (VW): Overweight 26.8% (member of the iTraxx NFI) Automotive FCF (after capex and dividends and before exceptionals) in 9M15 increased to EUR 6,047mn, compared to EUR 3,190mn yoy. Automotive net liquidity (company definition) was strongly up to EUR 27.8bn vs. EUR 20.8bn qoq. Volkswagen expects another cash inflow of around EUR 2.2bn for the disposal of its LeasePlan stake (completion expected by FYE 2015). The EUR 0.85bn payment for the joint Nokia HERE acquisition is expected to be completed by end-March 2016. In LTM 9M15, Automotive gross debt/EBITDA (adjusted, excluding special items of EUR 6,855mn) was more or less unchanged, at 1.9x vs. 2.0x qoq, and net debt/EBITDA improved to 0.5x vs. 0.8x qoq. The ratios do not include VW’s JVs in China, which are accounted for using the equity method and which recorded (proportionate) operating profit in 9M15 of EUR 3,777mn vs. EUR 3,920mn yoy (FY14: EUR 5.2bn). In 3Q15, this profit declined by 20% yoy and, in 2Q15, by 17% yoy. VW's 2015 guidance was maintained at “flat deliveries” vs. 2014 and for group revenue growth of up to 4%. Due to charges related to the irregularities in the software used for certain diesel engines, VW now expects 2015 operating profit for both its Group and Passenger Cars segments to be down significantly yoy. In terms of EBIT before special items, however, VW’s guidance remains unchanged at group operating profit margin of 5.5-6.5% (FY14: 6.3%). VW will step up its cost and investment management and the continuous optimization of its processes. The monthly sales performance in the US, China and Europe will certainly be of importance for investors. From 1 October 2015 on, we expect VW to profit from the incentives introduced in the Chinese car market. We keep our overweight recommendation on VW bonds in the iBoxx EUR IG auto sector. This is based on our current base case that VW will remain a high-BBB rated credit (on average), however, trading levels are already closer to the low-BBB area. VW senior bonds trade very close to those of Renault (Ba1p/BBB-s/BBB-s) and GM Financial (Ba1s/BBB-s/BBBs) bonds, and some 20bp wider than RCI Banque (Baa1s/BBBn) bonds. They are 80bp wider than BMW (A2p/A+s) and Daimler (A3p/A-s/A-s). Nevertheless, VW’s bonds traditionally trade somewhat wider given the sheer size of the firm’s benchmark volume. In 2022-24 seniors, we still prefer VW Leasing GmbH bonds to those of VW Financial Services GmbH, given the 20bp spread differential at the same rating, the debt issuance program and guarantee structure. As there is still some downgrade risk left at the agencies, the hybrid bonds might be less attractive for more conservative IG benchmark investors. (FY15 results: April 2016)
Dr. Sven Kreitmair, CFA (UniCredit Bank) +49 89 378-13246 [email protected]

March 2016 Credit Research
Euro Credit Pilot
UniCredit Research page 43 See last pages for disclaimer.
Utilities (Overweight) Sector key figures Sector Wrap-Up Weight in iBoxx NFI: Current ASW spread: change mom/YTD: EURO STOXX UTI YTD:
22.2% 135.6bp -1.2/+27.2 -7.3%
Sector drivers: The first utilities in our coverage have already released full-year 2015 results. Unsurprisingly, the results are still affected by declining electricity and lower commodity prices, resulting in a drop in generation income and the recognition of impairments (mainly for conventional power generation assets). For 2016, integrated utilities such as EDF (A1wn/A+n/As) and RWE (Baa2wn/BBBn/BBB+wn) have provided guidance for lower EBITDA, mostly driven by the bleak outlook for their generation businesses. Hence, we would expect to see most of the 2015 topics repeating themselves, i.e. rating preservation, capex reduction and the launch of new efficiency programs to contain operating costs. In the first two months, rating agencies already started to assess the impact of the market environment on utilities' balance sheets. In January, Fitch downgraded Vattenfall by one notch, citing pressure on cash flows coming from declining achieved power prices in the next few years. In mid-February, and following a review of the European utility companies' exposure to a weakening commodity and power price environment, Moody’s took rating actions on 30 unregulated utilities (22 within UniCredit coverage), and placed 10 companies on review for downgrade. However, we expect the rating migration trend in the utility sector to come to an end during 2016. While we still see peripheral names in particular profiting from their geographic diversification and diversified business models, they are more exposed to exchange rate risks and political uncertainties (Brazil, Russia, Turkey), which might become more of an issue for 2016. We take note of the increasing rise of European CO2 allowance prices in 2015. However, we do not expect a huge increase in CO2 costs and the price development of CO2 allowances to play a more important role in 2016. In the medium term (i.e. after 2019), CO2 costs should impact wholesale power prices, especially in countries with above-average carbon intensity (e.g. Germany, CEE). Staying with prices, we note that since last summer, the significant decline in natural gas prices (dropping faster than electricity prices) has led to a recovery in spark spreads. If sustainable, this is positive for utilities with gas-fired power plants in Spain, Italy and also France. Lastly, we expect that political regulation and intervention will continue through 2016, but political environment to become more supportive going forward. Vattenfall announced that it is considering more early shut-downs of nuclear power plants, already raising concerns of stable future electricity supply. Stock performance of several integrated utilities affected by political intervention was weak, eroding value for its public shareholders. In addition, we think that the announcement of reduced or scrip dividend payments as a wake-up call. Lastly, we see the favorable environment for TSOs to continue. Lower regulatory returns (form lower interest rates), should be offset by growth of the regulatory asset base (need for more efficient, connected infrastructure in Europe) and lower refinancing cost. Market recap: Last quarter, the average iBoxx Utilities sector spread widened by 37bp, with corporate hybrid paper strongly underperforming. The EDF 4.25% PERP (first call in Jan 2020), EDF 4.125% PERP (Jan 2022), DONGAS 4.875% 7/13, EDF 5% PERP and EDF 5.375% PERP widened by 283bp, 250bp, 199bp, 196bp and 190bp, respectively. Valuations of EDF hybrids were driven by a set of negative headlines, i.e. potentially insufficient nuclear provisions, the acquisition of struggling Areva NP and the construction of nuclear power plant in the UK (Hinkley Point 3). The weak performance of Dong's hybrids was commodity-price-related and partly due to the decision to keep its E&P business. Also, the ENBW 7.375% 4/72 lost 170bp, and EDP's (weakness of Portugal and Brazil) senior bonds closed between 80bp to 120bp wider on a three-month horizon. Sector composition: EDF (16.0%), Engie (8.0%), Enel (6.7%), Gas Natural (4.7%), Snam (4.7%), Iberdrola (4.3%), RWE (3.0%), Suez Environnement (2.8%), Terna (2.6%), EnBW (2.5%), EDP (2.3%), E.ON (2.3%), Veolia Environnement (2.1%), Vattenfall (2.1%), National Grid (2.1%), Tennet (2.0%), Dong (1.9%), CEZ (1.7%), Scottish & Southern (1.6%), Statkraft (1.5%), Hera (1.3%), Fortum Oyi (1.3%), Vier Gas Transport (1.3%), Eandis (1.2%), A2A (1.0%), 2i Rete Gas (1.0%), Nederlandse Gas (1.0%), Eurogrid (1.0%), Acea (1.0%), Origin Energy (0.9%), Red Electrica (0.9%), EWE (0.9%), Elia (0.9%), TVO (0.8%), Enagas (0.7%), Suez Alliance (0.7%), Verbund (0.7%), Eustream (0.6%), TIGF (0.6%), Electricity Supply Board (0.6%), AusNet Services (0.5%), Enexis (0.5%), CDP Reti (0.4%), Redexis Gas (0.4%), State Grid (0.4%), Edison (0.3%), Centrica (0.3%), United Utilities Water (0.3%), Madrilena Red de Gas (0.3%), Elenia (0.3%), Bord Gais Eireann (0.3%), Korea Gas (0.3%), Energa (0.3%), Iren (0.3%), SPP-Distribucia (0.3%), Alliander (Nuon) (0.3%), PGE (0.3%), SGSP (0.3%), Viesgo (0.3%), Beijing Enterprises (0.3%), Canal de Isabel II Gestion (0.2%), ENECO (0.2%).
Current Ratings (Moody's/S&P/Fitch)
Credit Profile
Name (Ticker): Recommendation Weight in iBoxx Comment Utilities sector
Baa2s/BBBs/-- Stable 2i Rete Gas (FIREIT): Underweight 1.0% 2i Rete Gas currently has three bonds outstanding, and these are part of the iBoxx utilities index. While 2iR’s business profile benefits from a higher-than-average proportion of regulated activities, we regard the company’s credit metrics as weaker than those of its peers A2A (Baa3s/BBBs/--), Hera (Baa1s/BBBs/--), IREN (--/--/BBB-) and Snam (Baa1s/BBBs/BBB-s). Given that most of its peers are majority-owned by municipalities, we also consider its shareholder base to be weaker. We note recent rumors regarding a potential merger of 2iR and Italgas (Snam), while not imminent, are driven by their common shareholder Cassa Depositi e Prestiti. In the event of a successful merger, this would offer around 20bp tightening potential for FIREIT bonds at current levels. 2iR is Italy’s second largest operator in the gas distribution sector, with a market share of approximately 17% in terms of volume of gas distributed in Italy (2013). In addition to its gas activities, 2iR manages a small portfolio of water activities in 11 municipalities. The company’s business profile benefits from the fact that almost 100% of its revenues come from regulated activities, with no exposure to volume risk. It is somewhat constrained by its high leverage (1H15: 5.2x), limited ability to generate free cash flow (after capex and dividends) and concession-renewal risk for its gas network in the coming years. In addition to a potential rearrangement of its currently granular gas concession network, 2iR may continue to play an active role in the consolidation of the fragmented Italian gas distribution market in the future. The company will report full-year 2015 results on 29 April.

March 2016 Credit Research
Euro Credit Pilot
UniCredit Research page 44 See last pages for disclaimer.
Current Ratings (Moody's/S&P/Fitch)
Credit Profile
Name (Ticker): Recommendation Weight in iBoxx Comment Utilities sector
Baa3s/BBBs/-- Improving A2A (AEMSPA): Marketweight (from Restricted) 1.0% A2A released solid 9M15 results, with net debt declining compared to FYE 2014 levels. Results were marked by excellent performance achieved by the thermoelectric plants and a positive contribution from operational efficiency measures, counteracting the still weak economic situation in the electricity sector and the lower margins of the hydroelectric sector. 9M15 revenues came in broadly stable yoy at EUR 3,638mn, while EBITDA improved by 4% to EUR 814mn from EUR 783mn.Net income was positively affected by the lower tax load starting from 2015 following the abolition of the “Robin Hood Tax” and improved by 49% yoy to EUR 237mn. Operating cash flow (co. definition) declined to EUR 536mn from EUR 724mn yoy, mainly due to weaker working capital generation, mainly attributable to the reduction of trade payables. Reported 9M15 capex came in broadly stable at EUR 206mn yoy, while dividend payments were up by EUR 11mn to EUR 113mn. LTM 9M15 reported net financial debt declined to EUR 3,138mn from EUR 3,363mn at FYE 2014, translating into an improved reported LTM 9M15 net debt/EBITDA of 3.0x from 3.3x at FYE 2014. We regard the latest results as marginally spread positive and think that A2A is on track to strengthen its credit profile. In addition, we like the company’s positive earnings momentum and its commitment to deleveraging. In its business plan, A2A stressed its commitment to a debt-risk profile that is consistent with a sold investment-grade rating. We see some implementation risks connected with the new business plan and note that some of A2A’s growth targets look ambitious, especially assuming that there will be a delay until the planned investments reap benefits. Hence, we keep our marketweight recommendation on the name. In February, A2A made a few comments with regard to the company’s 2015-19 strategic plan. More specifically, A2A’s 2015-19 industrial plan includes: 1. a significant capex increase to EUR 2.1bn in the period (a 40% increase compared to the previous five-year period); 2. 32% EBITDA growth to EUR 1.35bn by 2019 (5.7% CAGR); 3. a reduction of net debt to around EUR 2.5bn (FY14: EUR 3.4bn), which would translate into net debt/EBITDA of 1.9x (FY14: 3.3x); and 4. a doubling of the dividend payout by 2019. After A2A’s excellent 9M15 results, the company’s guidance is for a 2.5% increase in FY15 EBITDA versus the original guidance of around EUR 1,035mn (FY14: EUR 1.024mn). A2A has agreed with Linea Group Holding (--/--/BBB-) to extend the exclusivity period to 29 February with the aim of finalizing negotiations over partnership agreements with the shareholders of Linea Group.
Baa2s/BBB-s/BBB+s Improving Acea (ACEIM): Overweight 1.0% Acea has released slightly better-than-expected 1H15 results, with revenues down by 4.6% yoy to EUR 1,411mn, but consolidated EBITDA up by 6.7% yoy to EUR 353mn. This was achieved by a solid performance across all business areas and Acea’s focus on regulated businesses and operational efficiency. Acea’s investments increased yoy to EUR 168mn versus EUR 142mn in 1H14. Reported net debt increased marginally to EUR 2,129mn, from EUR 2,089mn at FYE 2014, reflecting higher capex requirements, partly offset by the positive performance of working capital, related to accelerated billings in Energy and Water. The reported 1H15 net debt/EBITDA ratio thus remained stable at 2.9x (FYE 2014: 2.9x). Acea confirmed its strong commitment to rationalizing and streamlining its operating processes across all areas of business and corporate activities. The company will also intensify its focus on improvements to the billing process in order to contain any increase in working capital and to help reduce group indebtedness. Acea’s new 2015-19 business plan targets 20% EBITDA growth over the five-year period, from EUR 718mn in FY14 to EUR 864mn in 2019 (4% CAGR). In 2019, net debt/EBITDA ratio guidance is 2.6x (FYE 2014: 2.9x). Acea confirmed its existing growth strategies, which are focused on driving organic growth, above all in its regulated business, which will likely continue to contribute around 75% of consolidated EBITDA. Acea noted that further upside to the business plan may derive from the process of consolidation in Italy’s local utilities sector, which the government aims to encourage through the 2015 Stability Law and its public administration reforms. Acea stated that it is ready to take advantage of the opportunities that will arise from this. The 2014 reported capex number (EUR 319mn) is a good proxy for the capex level in the next couple of years. Moody’s notes that if Acea achieves its 2.6x leverage target by 2019, it would put upward pressure on the rating in the medium term. Other pre-conditions for an upgrade would include a continued improvement of Acea's financial profile to a level of FFO interest coverage above 4.5x (LTM1Q15: 5.3x), an FFO/net debt ratio sustainably around 20% (LTM1Q15: 20%), and an RCF/net debt ratio in the upper-teens, (LTM1Q15: 18%) as well as further improvement in the domestic macroeconomic environment. We have an overweight recommendation on ACEA. We like the name for its high proportion of regulated EBITDA (75% from water, networks), a low proportion of which comes from generation and its commitment to further reducing net debt.
Aa2s/AA-s/-- Stable Alliander Finance BV (ALLRNV): Marketweight 0.3% Alliander released a solid set of FY13 results. Revenues were up to EUR 1,744mn (FY12: EUR 1,674mn) largely due to higher tariffs. Total operating expenses remained effectively unchanged yoy. Comparable operating profit increased by 14% yoy to EUR 468mn (FY12: EUR 409mn). Operating cash flow was EUR 683mn (FY12: EUR 545mn). Thanks to positive free cash flow after capex (EUR 570mn, of which 85% was invested in the electricity and gas network) and dividends, net debt (company definition and treating the hybrid as 50% debt) was down to EUR 1,718mn (FY12: EUR 1,785mn). However, from 2014 on, tariffs in the new regulatory period will face a significant fall, which primarily reflects a decline in the cost-of-debt assumption. Moody's estimates that, once implemented, Alliander's allowed revenue will decline by 7-10% but that FFO is likely to fall even more. The company has therefore announced that it intends to achieve efficiency improvements over the coming years. For 2014, its guidance is for lower operating profit yoy and gross capex of around EUR 500mn. In addition, the company reiterated its commitment to a solid A rating profile on a stand-alone basis. The minimum FFO/net debt target of 20% (FY13: 38.7%) was also reiterated, as was a minimum FFO interest cover of 3.5x and net debt/capitalization of a maximum of 60%. Despite that some pressure will arise from the tariff reduction, we expect Alliander to be able to keep credit metrics in line with current ratings, which should also be supported by offsetting measures, such as efficiency improvements. We keep our marketweight recommendation on the name.
A3s/A-s/A-s – AusNet Services (ANVAU): No recommendation 0.5% AusNet Services (formerly SP Ausnet) is a diversified energy infrastructure business that owns and operates the primary regulated Victorian electricity transmission network, as well as an electricity distribution network in eastern Victoria and a gas distribution network in western Victoria.

March 2016 Credit Research
Euro Credit Pilot
UniCredit Research page 45 See last pages for disclaimer.
Current Ratings (Moody's/S&P/Fitch)
Credit Profile
Name (Ticker): Recommendation Weight in iBoxx Comment Utilities sector
Baa1s/--/-- Stable Bord Gáis Éireann (BOGAEI): No recommendation from Marketweight 0.3% Bord Gáis released strong FY13 results despite a difficult economic environment. Total revenue was up 11% on 2012 results to EUR 505mn, while EBITDA stood at EUR 346mn vs. EUR 300mn as of FYE 2012, supported by higher capacity bookings, colder weather and a mid-year tariff increase. Net debt stood at EUR 1,730mn vs. EUR 1,929mn as of FYE 2012. S&P recently changed its outlook on the Bord Gais rating to positive, following the revision of Bord Gais's SACP to "BBB+" after the sale of its unregulated business, Bord Gais Energy, to a consortium led by Centrica Plc. As a result, Bord Gais’s business model shifted to being an almost fully regulated gas and water network operator. Following the disposal, Bord Gais retains the strategically important monopoly transmission and distribution networks and the nationwide Irish Water business. In line with the methodology on government-related entities, S&P could factor one notch into its ratings on Bord Gais for state support if it raised the sovereign credit rating on Ireland to A. We have terminated our coverage (from marketweight).
Baa2s/--/BBB+s – Canal de Isabel II Gestion (CNGEST): No recommendation 0.2% Canal de Isabel II Gestion provides water, sanitation and other waste-related services to the Comunidad Autonoma de Madrid. The company was established by the public entity Canal des Isabel II, a government-related body founded in 1851 and legally responsible for the provision of integrated water services to the population of Madrid since 1984. The company also provides small-scale electricity-generation services (biogas and sludge treatment) and telecommunications and IT services.
Baa3s/--/BBBs – CDP Reti (CDPRTI): No recommendation 0.4%
Baa1wn/BBB+n/A-s – Centrica (CNALN): No recommendation 0.3% (member of the iTraxx NFI)
A3wn/A-s/A-s Stable CEZ (CEZCP): Marketweight 1.7% CEZ released 9M15 results that were below analyst’s estimates and affected by the continuing decline in electricity selling prices and outages at the Temelín and Dukovany nuclear power plants. CEZ also reduced its 2015 EBITDA guidance. 9M15 revenues increased to CZK 150.6bn from CZK 147.0bn yoy, while EBITDA decreased to CZK 48.4bn from CZK 54.7bn yoy; this was mainly attributable to the continued decline in electricity selling prices due to the ongoing crisis in European energy markets. EBITDA was negatively affected by a CZK 6.7bn-yoy-lower contribution from Power Production and Trading CE (CZK 23.8bn), which was mainly due to lower prices and was partly offset by a cut in fixed operating costs. Despite a positive CZK 7.9bn swing in working capital (mainly related to a decrease in inventories), reported operating cash flow dropped to CZK 49.8bn, compared to CZK 59.1bn the year before. Reported 9M15 capex came in lower, at EUR 20.2bn from CZK 21.7bn yoy, and dividend payments were CZK 21.3bn. Consequently, reported LTM9M15 net debt declined to CZK 140.3bn from CZK 155.2bn in 9M14 and CZK 147.2bn at FYE 2014. Its LTM9M15 net debt/EBITDA ratio (company definition) increased to 2.1x from 2.0x at FYE 2014. Together with its 9M15 results, CEZ reduced its 2015 EBITDA outlook to CZK 64bn (1H15: CZK 68bn, FY14: CZK 72.5bn), while adjusted net income is still expected to be CZK 27bn (FY14: CZK 29.5bn). According to CEZ, the main reasons for the reduced EBITDA target are the unplanned outages at Dukovany, which are related to the comprehensive inspection of welds; outages at Temelin and the postponed completion of coal-fired plant renovations and construction in the Czech Republic. CEZ further stated that it is interested in Vattenfall’s (A3n/BBB+n/A-n) German lignite assets, which are up for sale. With its 1Q15 figures, CEZ announced a new dividend policy of a 60-80% payout ratio of CEZ’s consolidated adjusted net income, from 50-60% previously. While we regard CEZ’s latest results and reduced full-year EBITDA guidance as somewhat spread-negative, we keep our marketweight recommendation on CEZ. We still like the company’s strong credit metrics and competitive low-cost generation fleet.
Baa1wn/BBB+s/BBB+s Stable DONG Energy (DONGAS): Marketweight 1.9% Dong released solid FY15 results that were mainly driven by higher production from offshore wind and higher levels of activity from construction contracts, which were partly offset by lower power, oil and gas prices. FY15 revenues increased by 6% to DKK 70,843mn yoy, while EBITDA rose by 13% to DKK 18,484mn yoy. In 2015, EBITDA was positively affected by a total of DKK 1.7bn from a gain on the sale of Oil & Gas's license interests, insurance compensation and a settled dispute from 2005 and 2006 concerning CO2 emission allowances. Reported cash from operations declined to DKK 13,571mn from DKK 14,958mn yoy due to weaker working-capital generation (DKK 2.8bn) and higher tax payments (DKK 1.2bn) in Norway. Reported gross investments rose to DKK 18,693mn from DKK 15,359mn; these were mainly related to offshore wind activities (DKK 10bn) and oil and gas fields (DKK 6bn). Reported (adjusted) net debt increased to DKK 9,193mn (DKK 31,070mn) from DKK 3,978mn (DKK 23,813mn) at FYE 2014 due to the high level of investment and negative FX effects from loans in GBP (DKK 1,083mn). In total, this resulted in an improved FYE 2015 FFO/adj. net debt (company definition) of 40.4% versus 36.1% at FYE 2014. For 2016, EBITDA is expected to total DKK 20-23bn. Wind Power and D&C should make significantly higher contributions to EBITDA, while guidance at Oil & Gas is expected to be significantly lower. Gross investments should amount to DKK 20-23bn, mostly related to wind farms. Towards 2020, Dong expects offshore wind and bioenergy to account for >80% of investment. Dong’s long-term FFO/adj. net debt target remains around 30%, while the dividend policy (40-60%) is subject to change in connection with the expected IPO. In January, Dong decided to keep its Oil & Gas business as part of the planned IPO and to use its cash flows to partly fund investments in renewable energy. Ratings at Moody's will be at risk should the significant and prolonged reduction in oil and gas prices not be adequately mitigated. S&P expects increasing operating cash flow from new wind power and oil and gas assets to offset the negative effect of significant ongoing capital expenditure. Ratings could be downgraded in the event of delays in new assets coming on stream, lower-than-expected production or if FFO/debt ratios are consistently below 25%. We regard Dong’s underlying FY15 results as solid but do not expect any spread impact. While we expect net financial debt to continue to grow, we continue to take comfort from Dong’s solid earnings momentum and its commitment to maintaining a robust and stable financial profile, with a minimum rating of Baa1/BBB+. We do not anticipate rating pressure and therefore reiterate our marketweight recommendation on the name.

March 2016 Credit Research
Euro Credit Pilot
UniCredit Research page 46 See last pages for disclaimer.
Current Ratings (Moody's/S&P/Fitch)
Credit Profile
Name (Ticker): Recommendation Weight in iBoxx Comment Utilities sector
Baa1wn/BBB+wn/BBB+s Weakening E.ON (EOANGR): Marketweight 2.3% (member of the iTraxx NFI) E.ON released 9M15 results that were broadly in line with analysts' expectations in terms of adjusted EBITDA and underlying net income. It also confirmed its full-year forecast. Nine month revenues increased by 5% yoy to EUR 84,301mn, while 9M15 EBITDA (adj. for extraordinary items) declined by 18% yoy to EUR 5,361mn from EUR 6,528mn. The decline in EBITDA was related to lower earnings due to the decommissioning of generation capacity in Germany, the disposal of operations in Italy and Spain, lower wholesale prices and lower oil prices on the output of the fields in the North Sea (E&P). This was only partly offset by a weather-driven increase in gas sales in Germany and generally higher earnings in Other EU Countries. In 3Q15, E.ON booked EUR 8,177mn in impairments (including EUR 400mn in reversals), which were driven by E.ON’s expectations regarding long-term development of electricity and fuel prices, by the political and regulatory environment and by its implications for E.ON's anticipated profitability. Reported cash from operating activities dropped to EUR 5,741mn, compared to EUR 7,439mn the year before, primarily reflecting the provisional nuclear-fuel tax refund recorded in the prior-year period. In sum, economic net debt declined to EUR 28,123mn (1H15: EUR 29,344mn) from EUR 33,394mn at FYE 2014 due to high positive operating cash flow, and the proceeds from divestments exceeded investment expenditures (reduced by 6% to EUR 2,659mn) and E.ON SE’s dividend payments (EUR 822mn). Another positive factor was a decrease in provisions for pensions, which declined by EUR 1.0bn to EUR 4.6bn, mainly because of an increase in interest rates. The latest net debt figure translates into a slightly improved LTM1H15 net debt/EBITDA figure of 3.9x (FY14: 4.0x, LTM1H15: 3.8x). E.ON stated that it is well on track to deliver its key milestones in the spin-off process. The full-year 2015 outlook was confirmed in terms of the ranges given for EBITDA (EUR 7-7.6bn) and net income (EUR 1.4-1.8bn). With regard to the Uniper spin-off, E.ON stated that its goal is still is for both companies to be operationally independent by 1 January. E.ON expects to record the proceeds from the sale of its oil and gas production business in Norway to DEA Deutsche Erdoel in 4Q15. Despite the huge impairment charges, we regard the latest results as credit neutral. We have a marketweight recommendation on E.ON, which will report full-year 2015 results on 9 March.
A1n/--/-- – Eandis Cvba (GEDISC): No recommendation 1.2% Eandis is a Belgian utility company. It was established in March 2006 via the merger of GeDis, ENV and Indexis (Flanders). Eandis is owned by seven Flemish distribution-system operators.
A1wn/A+wn/As Stable EDF (EDF): Underweight 16.0% (member of the iTraxx NFI) EDF released slightly better-than-expected FY15 results on an EBITDA and adj.-net-income level. Full-year sales improved by 2.2% yoy to EUR 75,005mn, driven by good operating performance (increased nuclear output). EBITDA rose by 1.9% to EUR 17,601mn (-0.6% organically). In organic terms, EBITDA in France was stable (EUR 11,515mn). In the UK, EBITDA grew 5% yoy (EUR 2,242mn) and, in Italy, EBITDA rose 52% (EUR 1,345mn) thanks to Edison’s (Baa3s/BBB+n/) successful arbitration on the Libyan gas contract. Operating cash flow increased by 16% to EUR 13,502mn from higher EBITDA and lower tax payments, and free cash flow improved to a negative EUR 2,064mn from EUR -4,007mn in FY14. This resulted in increased reported net financial debt of EUR 37.4bn versus EUR 34.2bn yoy and a higher net financial debt/EBITDA of 2.1x (FY14: 2.0x). For 2016, EDF targets EBITDA in the range of EUR 16.3-16.8bn. Its guidance of net financial debt/EBITDA of between 2-2.5x and a payout ratio of net income (excluding non-recurring items) of between 55-65% remains unchanged. EDF also reiterated its ambition for a positive cash flow (after dividends) by 2018. For 2018, EDF targets a maximum amount of net investments at EUR 10.5bn, while new developments will be financed by proceeds from assets disposals. Ratings at Moody's could be downgraded if 1. the HPC project and/or the acquisition of AREVA NP were to go ahead without their risks being adequately mitigated or 2. if EDF fails to offset the impact of lower prices using mitigating measures. S&P would consider a downgrade should EDF decide to go ahead with the Hinkley Point C nuclear project. Spread drivers for EDF are the recently announced higher valuation for Areva NP, which adds to EDF’s significant project pipeline (Hinkley Point C, Grand Carénage), difficulties at the Flamanville reactor vessel and increasing exposure to unregulated wholesale electricity prices from 2016. We further take note of a Bloomberg article that cited French newspaper Le Figaro, saying that EDF may need a EUR 5bn capital increase and that EDF, together with the French state, is working on ways to avoid this. We think that these strong headwinds can only be partially offset by disposals and improved opex. We do not see EDF’s senior bond valuations as compensating investors sufficiently for these issues. While EDF’s hybrids already discount one to two notches of downgrade, we see an increased likelihood that the company will need to fund the higher nuclear provisions with additional hybrid issuance, which will negatively impact valuations of secondary hybrid issues. Hence, we reiterate our underweight recommendation.
Baa3wn/BBB+wn/-- – Edison (EDFFP): No recommendation 0.3% Edison is the second-largest energy company in Italy and a leading European operator with operations in the supply, production and sale of electric power and hydrocarbons (natural gas and crude oil). Edison reported LTM9M14 EBITDA of EUR 845mn and net debt of EUR 2,145mn. For FY13, S&P calculated FFO/net debt of 15.3% and net debt/EBITDA of 4.0x. The company is fully controlled by EDF Group through its interest held in Transalpine di Energia.
Baa3s/BB+p/BBB-s Improving EDP (EDPPL): Overweight 2.3% (member of the iTraxx XOVER) EDP released 9M15 results that were below analyst expectations in terms of net income, with EBITDA increasing by 10% to EUR 2,991mn from EUR 2,708mn, or 5% excluding special items. Results were affected by adverse conditions for hydro and wind production, with EDP’s Portuguese hydro resources falling to levels of 22% below the long-term average, while the drought situation in Brazil deteriorated (EUR -89mn). Reported FFO improved to EUR 2,020mn from EUR 1,712mn yoy, mainly due to higher EBITDA being offset by higher income taxes and higher interest payments. Lower working-capital generation resulted in a slightly lower operating cash flow (company definition) of EUR 2,400mn, compared to EUR 2,441mn in 9M14. Capex increased by EUR 128mn to EUR 1,218mn yoy, of which, EUR 852mn was dedicated to expansion projects (mainly in hydro and wind), while maintenance capex declined by EUR 47mn to EUR 366mn yoy, mostly for regulated networks in Iberia and Brazil. After dividends of EUR 741mn (9M14: EUR 731mn), LTM 9M15 net debt rose to EUR 17,321mn from EUR 17,042mn at FYE 2014, reflecting the acquisition and full control of Pecém (EUR 700mn), which was largely mitigated by the disposal of gas assets to Redexis (EUR 240mn) and by the 50% equity content of the issued hybrid (EUR 375mn). Reported net debt/EBITDA stood at 4.4x, compared to 4.7x at FYE 2014 (1H15: 4.7x). Adjusted for EUR 2,446mn in regulatory receivables (which will ease by 2020), the ratio was 3.8x (FYE 2014: 4.0x). For FY15, EDP targets an EBITDA contribution of EUR >3.6bn, net profit of EUR >900mn and net debt below EUR 17bn. On 14 October, S&P affirmed EDP’s ratings. Its decision was based on the economic recovery in Portugal and improving economic and capital-market conditions in Spain, which strengthen EDP's credit fundamentals. S&P expects that EDP’s credit metrics will strengthen markedly to result in FFO/net debt that is slightly >15% by FYE 2016. Ratings could be upgraded if S&P becomes more confident that EDP can achieve FFO/net debt of about 16% (FY14: 12.5%) on a sustainable basis. While we like the company for its good geographical diversification, we regard the latest set of results as rather weak. Through its hydro-generation assets, the company remains exposed to sufficient water-supply levels, which are currently one of the reasons for weaker earnings. That said, we keep our overweight recommendation on the name for relative-value reasons.

March 2016 Credit Research
Euro Credit Pilot
UniCredit Research page 47 See last pages for disclaimer.
Current Ratings (Moody's/S&P/Fitch)
Credit Profile
Name (Ticker): Recommendation Weight in iBoxx Comment Utilities sector
Baa1s/A-s/BBB+s – Electricity Supply Board (ESBIRE): No recommendation 0.6% With a leading market position, ESB is an integrated utility company that operates predominantly in Ireland and Northern Ireland. ESB's activities include power generation, the transmission and distribution of electricity and power supply.
--/BBB/-- – Elenia (ELENIA): No recommendation 0.3% The Elenia Group consists of Elenia Oy, a regulated electricity distribution business, and Elenia Lampo, a district heating business. Elenia Finance is the group's finance subsidiary. In addition to supporting Elenia Finance's obligations under the debt program, Elenia Oy and Elenia Lampo's operating cash flows finance the group's operations, bank debt at Elenia Oy and potential private placements by Elenia Finance.
--/A-n/-- – Elia (ELIASO): No recommendation 0.9% Elia reported a solid set of 1H14 results. Revenues were up by 0.8% yoy to EUR 406mn, while EBITDA increased by 12.5% yoy to EUR 213mn. The increase in EBITDA was driven by a strong performance from 50Hertz in Germany, which posted a 28.7% increase in EBITDA yoy and a 44% increase in EBIT yoy (however, note that 50Hertz is now accounted for using the equity method). However, the increase was largely due to one-off effects (EUR 37.1mn). At the end of 2Q, the company received an official decision from the German Federal Network Agency (BNetzA) regarding the previous regulatory period. This upheld the costs passed on in the past, allowing 50Hertz to release the recognized regulatory provisions. Furthermore, a provision related to a court case was cancelled following the court's positive decision. Excluding these one-off effects, EBIT at 50Hertz increased by EUR 8.4mn (or 7.8%), primarily as a result of increased investments. In Belgium, EBITDA rose 3.2% to EUR 153.3mn on the back of a rise in depreciation to be passed on and changes in provisions, whereas EBIT dropped 3.2%, with a decrease in the fair remuneration due to a drop in the average OLO (down from 2.20% to 2.08%) and lower cost savings, which were only partially compensated for by an increase in the offsetting in tariffs of the decommissioning of fixed assets. Net debt stood at EUR 2,604mn (FYE 2013: EUR 2,628mn). We do not expect these results to have a spread impact. According to S&P, rating downside pressure could emerge if Elia's operating and financial performance weakens unexpectedly, which could result from higher investment levels, increased funding needs or a large acquisition. A sustained decline in Elia's FFO/debt <10% (FY13: 12.1%, 2014E: 13-14%) could trigger a downgrade. We have ceased our coverage of Elia.
Baa2p/A-s/A-s Stable Enagas (ENGSM): Marketweight from Underweight 0.7% Enagas's FY15 results were slightly below analyst expectations in terms of EBITDA and were negatively impacted by the reform of the Spanish natural gas sector in August 2014. However, the results were supported by international activities and growth in national gas demand. Domestic gas volumes increased by 4.5% yoy, predominantly driven by higher yoy demand from the electricity sector. Regulated revenue dropped by 2.2% to EUR 1,160mn yoy, mainly as a result of the impact of regulatory reform (EUR -60mn). EBITDA fell by 4.2% in 2015 to EUR 901mn due to a 13% increase in operating expenses and the effects of regulatory reform. Reported FY15 net cash flows from operating activities rose to EUR 674mn from EUR 590mn due to improved working-capital generation. Reported net investments declined by 21% to EUR 530mn from EUR 670mn yoy, with EUR 206mn invested in Spain and EUR 324mn internationally. Enagas’s reported FY15 free cash flow stood at EUR 144mn (FY14: EUR -80mn). Reported net financial debt rose to EUR 4,237mn vs. EUR 4,059mn at FYE 2014, which translates into a still-comfortable adjusted FY15 net debt/EBITDA ratio of 4.5x (FY14: 4.2x). FFO/net debt was broadly unchanged at 16.4% yoy. With regard to the period 2016-20, Enagas expects demand for natural gas to increase by 3-4%. The company’s guidance is for an average 0.7% decline in regulated revenues but annual average net profit growth of 2% over the period (0.5% growth for FY16) from operational-efficiency measures, lifetime extensions and a better financial result. International activities will provide 13% of net profits by 2017, increasing to ≥25% by 2020. Up to 2020, Enagas plans to invest EUR 400mn p.a. (EUR 250mn abroad). Net debt should stay broadly at 2015's levels (2020E: EUR 4.3bn), and FFO/net debt should remain above 15%. Enagas remains committed to its current credit ratings. While Enagas’s credit metrics have weakened somewhat in the last 12 months, it remains one of the strongest TSOs in the sector. We expect the company to focus on attractive shareholder remuneration (5% of annual dividend growth) and international growth through potential further M&A. However, based on the financial targets in its 2020 plan, we expect a stable credit-profile trend on average. In this respect, we see Enagas’s senior bonds as being currently fairly priced. Its bonds trade flat to those of Red Electrica (--/A-s/A-p) and around 10bp tighter than the bonds of lower-rated Italian TSOs, such as Snam (Baa1s/BBBs/BBB+s) and Terna (Baa1s/BBBs/BBB+s), which benefit from inclusion in the ECB’s public sector purchase program. Based on our credit-trend assumptions and fair valuations, we changed our recommendation to marketweight from underweight.
A3n/A-wn/A-s Stable EnBW (ENBW): Marketweight 2.5% (member of the iTraxx NFI) EnBW's 9M15 results were affected by ongoing pressure on electricity wholesale market prices, negative extraordinary items in Grids and higher, weather-related gas sales. 9M15 revenues declined by 1% yoy to EUR 15,315mn, while adjusted EBITDA rose marginally by 0.2% to EUR 1,636mn. Renewables improved by 7% to EUR 156mn as a result of the full commissioning of EnBW's offshore wind farm, Baltic 2, and the moderate expansion of onshore wind power plants. This over compensated for weaker performance at run-of-river power plants, which was due to lower electricity prices. Due to tax refunds and lower tax payments, reported FFO improved by 29% yoy to EUR 1,526mn, while 9M15 reported cash from operating activities declined to EUR 1,174mn from EUR 1,467mn yoy, driven by negative EUR 323mn in W/C generation. This was partly offset by a strong 33%-yoy decline in 9M15 capex to EUR 866mn, as major projects (including Baltic 2) were completed. Compared to EnBW's results at FYE 2014, adjusted net debt (company definition and including the hybrids at 50%) fell to EUR 7,870mn from EUR 7,983mn. The decrease was primarily due to lower pension provisions as a result of an increase in the discount rate and positive FCF. Consequently, LTM9M15 net debt/adj. EBITDA improved to 3.6x from 3.7x at FYE 2014. For 2015-17, EnBW plans EUR 4.0bn in investments, of which EUR 2.7bn will be dedicated to growth projects that are partly financed by EUR1.9bn in disposals. EnBW stated that, following a two-year construction period, the offshore wind farm EnBW Baltic 2 has been placed into operation. EnBW will acquire 74.2% in Verbundnetz Gas Aktiengesellschaft, which is held by EWE (Baa1s/--/--). In return, EWE and the EWE-Verband will each acquire 10% of EWE's shares. In addition, EnBW will provide EWE and EWE-Verband with a total cash settlement of EUR 125mn. EnBW announced that, as part of the preparations of its FY15 financial statements, the company has identified a need to recognize impairment losses of around EUR 700mn in Generation and Trading. The impairment tests mainly affect the power plants. In addition, provisions for onerous procurement contracts were increased by another EUR 35mn to EUR 250mn. EnBW stated that the main reason for the EUR 950mn in extraordinary expenses was the worsening expectations regarding short, medium and long-term electricity prices. We keep our marketweight recommendation on ENBW. EnBW will publish FY15 results on 21 March.
--/A-s/-- – ENECO (ENECO): No recommendation 0.2% Eneco is a Dutch utility that is active in electricity and gas distribution. The company is the monopoly owner and operator of the Netherlands' third-largest regional electricity and gas-distribution network.

March 2016 Credit Research
Euro Credit Pilot
UniCredit Research page 48 See last pages for disclaimer.
Current Ratings (Moody's/S&P/Fitch)
Credit Profile
Name (Ticker): Recommendation Weight in iBoxx Comment Utilities sector
Baa2s/BBBs/BBB+s Stable Enel (ENELIM): Marketweight from Overweight 6.7% (member of the iTraxx NFI) Enel released better-than-expected FY15 results on a revenue and EBITDA level, driven by resilient performance in Italy and Iberia and by efficiency gains that offset negative FX impacts from the LatAm and Russian operations (EUR 0.9bn). Full-year 2015 revenues remained broadly flat, at EUR 75.7bn yoy. This was largely attributable to a decrease in sales of electricity, which was partly offset by an increase in revenues from the sale of fuels and gas in the same period. FY15 reported and ordinary EBITDA (excluding non-recurring items) decreased by 3% to EUR 15.3bn and EUR 15.0bn yoy respectively. FY15 net financial debt rose only slightly to EUR 37.5bn from EUR 37.4bn at FYE 2014. This translates into an almost-unchanged reported net financial debt/EBITDA ratio of 2.45x (versus 2.4x at FYE 2014). In mid-December, Enel announced that it would sign a contract for the sale of part of its 66% stake in Slovenské elektrárne (SE) to Czech energy group Energetický a průmyslový holding a.s. (EPH). In November, Enel announced the acquisition of the remaining 31.7% stake in Enel Green Power (EGP) for EUR 3.2bn. Enel will fund the transaction by issuing approximately 771mn new shares to EGP minority shareholders and expects to close the deal by the end of 1Q16. The deal is consistent with Enel’s recently updated 2016-19 strategic plan, to dedicate 53% of its EUR 17bn in capex to renewable energy, only 9% to conventional thermal generation and 34% to networks. As a result, renewable energy’s share of generation capacity will increase to 52% in FY19 from 38% in FY14. We regard the latest FY15 results as marginally spread-positive and like Enel’s strong business profile; good earnings momentum and its medium-term commitment to deleveraging, which is also reflected in its 2016-19 strategic plan (targeted leverage of 2.1x; FY15: 2.45x). Furthermore, we like the fact that the share of its revenue from conventional generation is lower than average. Nevertheless, for relative-value reasons, we changed our recommendation from overweight to marketweight. While Enel’s senior bonds should continue to be technically supported by their inclusion in the ECB’s public sector purchase program, we think they look expensive, with limited further tightening potential. Enel hybrids could benefit from Enel's being upgraded to BBB+ by S&P in the next 12 months, as its hybrids would then be assigned an average BBB- rating, qualifying them for inclusion in iBoxx IG indices.
Baa1s/--/BBB Stable Energa (ENEASA): Marketweight from Overweight 0.3% Energa released somewhat weak 2Q15 results that were below consensus estimates, affected by difficult market conditions and affected by lower electricity production from renewables. 1H15 revenues increased to PLN 5,425mn from PLN 5,287mn, while EBITDA declined to PLN 1,216mn from PLN 1,281mn. The main contributors to this EBITDA reduction were the Generation Segment, which declined to PLN 228mn from PLN 373mn, and the Sales Segment, which fell to PLN 67mn from PLN 107mn yoy. The negative result of the Generation segment came from a decline in the prices of green property rights, declining wholesale prices, partly offset by lower fuel costs. The decline in 1H15 EBITDA was partly offset by the Distribution Segment, which increased to PLN 964mn from PLN 794mn yoy, contributing roughly 79% to Energa’s 2Q15 EBITDA (72% in 1Q15). Capex in 1H15 climbed to PLN 743mn from PLN 575mn and dividend payouts amounted to PLN 596mn compared to PLN 405mn in the previous period. Net debt (company definition) increased to PLN 4,252mn from PLN 3,817mn at FYE 2014, translating into a reported net debt/EBITDA ratio of 1.9x compared to 1.7x at FYE 2014. Moody’s expects Energa to manage its credit profile in line with guidance, with FFO/interest cover above 5.0x (LTM1Q15: 7.6x) and FFO/net debt in the thirties (LTM1Q15: 60%). The agency would consider an upgrade if FFO/net debt remained in the 40% area on a sustainable basis. In addition, Moody’s ratings of Polish utilities seem to be constrained by the uncertainty they face given an absence of strategic direction for the state-controlled energy sector, and the utilities' potential role in a planned restructuring of the Polish coal mining industry. At the end of September, we changed our recommendation on Energa to marketweight from overweight, given the potential (and politically driven) financial involvement in Poland’s loss-making coal mines.
Aa3s/A+s/-- – Enexis (ENEXIS): No recommendation 0.5% Enexis manages the electricity and gas-distribution grid in the northern, eastern and southern parts of the Netherlands.
A1wn/Awn/-- Stable Engie (ENGIFP): Marketweight 8.0% (member of the iTraxx NFI) Engie released mixed FY15 results, which were impacted by a still-difficult European market price environment. This was partially offset by good performance in fast-growing markets and by cost discipline. Due to the deteriorated market environment, Engie had to book EUR 8.7bn in impairments, mainly on exploration and production and liquefied natural gas-supply-and-sales assets. For the full year, revenues were down by 6.4% yoy on a gross basis, or -8.8% organically, to EUR 69.9bn. This decrease is mainly attributable to lower commodity prices, the decline in LNG activities, the unavailability of the Doel 3 and Tihange 2 nuclear plants and Doel 1 being offline in Belgium. However, the decrease was partially offset by the appreciation of the USD and favorable weather in France. EBITDA declined by 7.2% on a gross basis, and by -9.1% organically, to EUR 11.3bn, compared to FY14. EBITDA was impacted by the above effects. This was partly compensated for by the commissioning of new assets and performance on costs. Reported operating cash flow improved to EUR 9.8bn from EUR 7.9bn. This was mainly related to improved working-capital generation. Capex increased to EUR 6.5nn versus EUR 5.8bn yoy and included a EUR 0.5bn negative FX impact. FY15 net debt (company definition) increased marginally to EUR 27.7bn, compared to EUR 27.5bn at FYE 2014 (LTM1H15: EUR 26.8bn). This translates into weaker FY15 reported net debt/EBITDA of 2.5x versus 2.3x FYE 2014. For 2016, Engie targets EBITDA of EUR 10.8-11.4bn (FY14: EUR 11.3bn) and net recurring income of between EUR 2.4-2.7bn (FY14: EUR 2.6bn). For FY15 and FY16, the company has confirmed that it will pay dividends of EUR 1 per share in cash and EUR 0.70 for FY17 and FY18. As part of its three-year strategic plan, Engie will focus its new developments on low CO2 activities, on integrated customer solutions and on activities that are not exposed to commodity prices. The transformation targets EUR 22bn in capex; a EUR 15bn portfolio-rotation program, with nearly one-third signed already, and EUR 1bn in opex savings. Upon completion of this plan, the contribution to EBITDA from contracted/regulated activities will be more than 85%. For the period 2016-18, Engie expects to maintain net debt/EBITDA at 2.5x or below and to maintain an A credit rating. Despite Engie's highly diversified business model and large portion of regulated activities (60% of EBITDA), the latest results demonstrate that the company is not completely immune to prolonged persistently weak commodity and electricity prices. On the positive side, Engie remains committed to its credit rating, by trying to offset headwinds in some of its markets with a strong focus on capex discipline, asset-rotation programs and cost-reduction measures. We therefore keep our marketweight recommendation on the name.
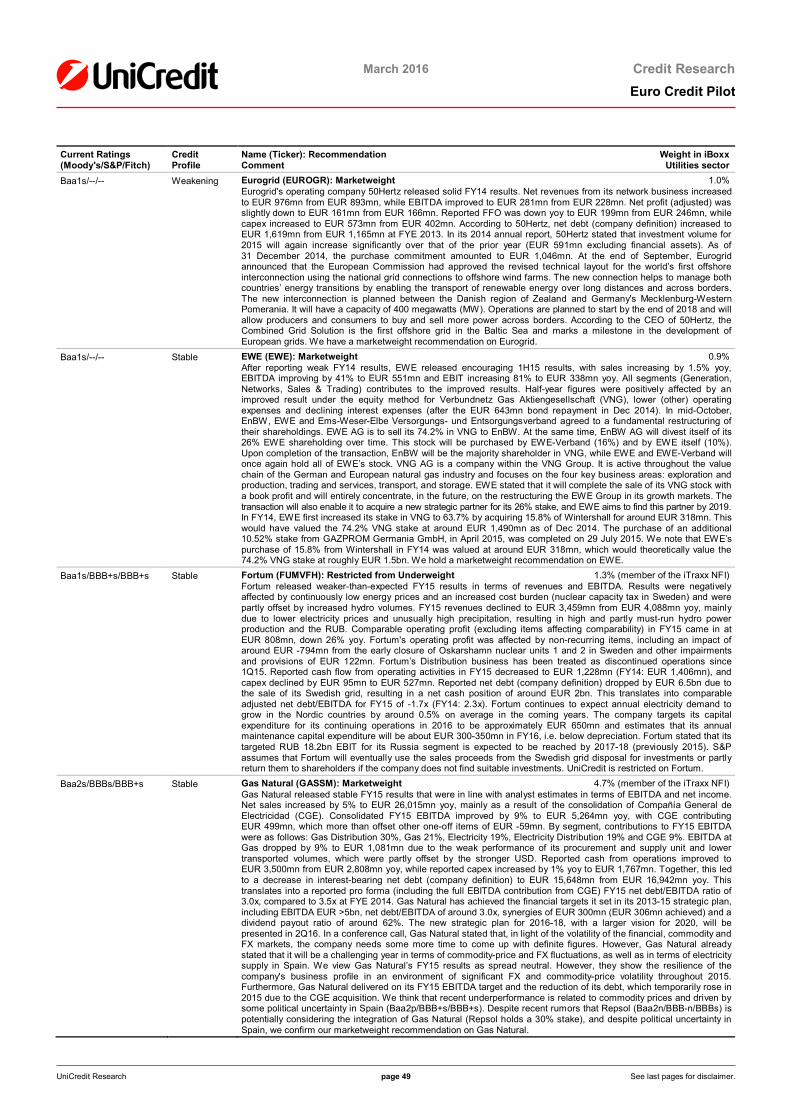
March 2016 Credit Research
Euro Credit Pilot
UniCredit Research page 49 See last pages for disclaimer.
Current Ratings (Moody's/S&P/Fitch)
Credit Profile
Name (Ticker): Recommendation Weight in iBoxx Comment Utilities sector
Baa1s/--/-- Weakening Eurogrid (EUROGR): Marketweight 1.0% Eurogrid's operating company 50Hertz released solid FY14 results. Net revenues from its network business increased to EUR 976mn from EUR 893mn, while EBITDA improved to EUR 281mn from EUR 228mn. Net profit (adjusted) was slightly down to EUR 161mn from EUR 166mn. Reported FFO was down yoy to EUR 199mn from EUR 246mn, while capex increased to EUR 573mn from EUR 402mn. According to 50Hertz, net debt (company definition) increased to EUR 1,619mn from EUR 1,165mn at FYE 2013. In its 2014 annual report, 50Hertz stated that investment volume for 2015 will again increase significantly over that of the prior year (EUR 591mn excluding financial assets). As of 31 December 2014, the purchase commitment amounted to EUR 1,046mn. At the end of September, Eurogrid announced that the European Commission had approved the revised technical layout for the world’s first offshore interconnection using the national grid connections to offshore wind farms. The new connection helps to manage both countries’ energy transitions by enabling the transport of renewable energy over long distances and across borders. The new interconnection is planned between the Danish region of Zealand and Germany's Mecklenburg-Western Pomerania. It will have a capacity of 400 megawatts (MW). Operations are planned to start by the end of 2018 and will allow producers and consumers to buy and sell more power across borders. According to the CEO of 50Hertz, the Combined Grid Solution is the first offshore grid in the Baltic Sea and marks a milestone in the development of European grids. We have a marketweight recommendation on Eurogrid.
Baa1s/--/-- Stable EWE (EWE): Marketweight 0.9% After reporting weak FY14 results, EWE released encouraging 1H15 results, with sales increasing by 1.5% yoy, EBITDA improving by 41% to EUR 551mn and EBIT increasing 81% to EUR 338mn yoy. All segments (Generation, Networks, Sales & Trading) contributes to the improved results. Half-year figures were positively affected by an improved result under the equity method for Verbundnetz Gas Aktiengesellschaft (VNG), lower (other) operating expenses and declining interest expenses (after the EUR 643mn bond repayment in Dec 2014). In mid-October, EnBW, EWE and Ems-Weser-Elbe Versorgungs- und Entsorgungsverband agreed to a fundamental restructuring of their shareholdings. EWE AG is to sell its 74.2% in VNG to EnBW. At the same time, EnBW AG will divest itself of its 26% EWE shareholding over time. This stock will be purchased by EWE-Verband (16%) and by EWE itself (10%). Upon completion of the transaction, EnBW will be the majority shareholder in VNG, while EWE and EWE-Verband will once again hold all of EWE’s stock. VNG AG is a company within the VNG Group. It is active throughout the value chain of the German and European natural gas industry and focuses on the four key business areas: exploration and production, trading and services, transport, and storage. EWE stated that it will complete the sale of its VNG stock with a book profit and will entirely concentrate, in the future, on the restructuring the EWE Group in its growth markets. The transaction will also enable it to acquire a new strategic partner for its 26% stake, and EWE aims to find this partner by 2019. In FY14, EWE first increased its stake in VNG to 63.7% by acquiring 15.8% of Wintershall for around EUR 318mn. This would have valued the 74.2% VNG stake at around EUR 1,490mn as of Dec 2014. The purchase of an additional 10.52% stake from GAZPROM Germania GmbH, in April 2015, was completed on 29 July 2015. We note that EWE’s purchase of 15.8% from Wintershall in FY14 was valued at around EUR 318mn, which would theoretically value the 74.2% VNG stake at roughly EUR 1.5bn. We hold a marketweight recommendation on EWE.
Baa1s/BBB+s/BBB+s Stable Fortum (FUMVFH): Restricted from Underweight 1.3% (member of the iTraxx NFI) Fortum released weaker-than-expected FY15 results in terms of revenues and EBITDA. Results were negatively affected by continuously low energy prices and an increased cost burden (nuclear capacity tax in Sweden) and were partly offset by increased hydro volumes. FY15 revenues declined to EUR 3,459mn from EUR 4,088mn yoy, mainly due to lower electricity prices and unusually high precipitation, resulting in high and partly must-run hydro power production and the RUB. Comparable operating profit (excluding items affecting comparability) in FY15 came in at EUR 808mn, down 26% yoy. Fortum's operating profit was affected by non-recurring items, including an impact of around EUR -794mn from the early closure of Oskarshamn nuclear units 1 and 2 in Sweden and other impairments and provisions of EUR 122mn. Fortum’s Distribution business has been treated as discontinued operations since 1Q15. Reported cash flow from operating activities in FY15 decreased to EUR 1,228mn (FY14: EUR 1,406mn), and capex declined by EUR 95mn to EUR 527mn. Reported net debt (company definition) dropped by EUR 6.5bn due to the sale of its Swedish grid, resulting in a net cash position of around EUR 2bn. This translates into comparable adjusted net debt/EBITDA for FY15 of -1.7x (FY14: 2.3x). Fortum continues to expect annual electricity demand to grow in the Nordic countries by around 0.5% on average in the coming years. The company targets its capital expenditure for its continuing operations in 2016 to be approximately EUR 650mn and estimates that its annual maintenance capital expenditure will be about EUR 300-350mn in FY16, i.e. below depreciation. Fortum stated that its targeted RUB 18.2bn EBIT for its Russia segment is expected to be reached by 2017-18 (previously 2015). S&P assumes that Fortum will eventually use the sales proceeds from the Swedish grid disposal for investments or partly return them to shareholders if the company does not find suitable investments. UniCredit is restricted on Fortum.
Baa2s/BBBs/BBB+s Stable Gas Natural (GASSM): Marketweight 4.7% (member of the iTraxx NFI) Gas Natural released stable FY15 results that were in line with analyst estimates in terms of EBITDA and net income. Net sales increased by 5% to EUR 26,015mn yoy, mainly as a result of the consolidation of Compañía General de Electricidad (CGE). Consolidated FY15 EBITDA improved by 9% to EUR 5,264mn yoy, with CGE contributing EUR 499mn, which more than offset other one-off items of EUR -59mn. By segment, contributions to FY15 EBITDA were as follows: Gas Distribution 30%, Gas 21%, Electricity 19%, Electricity Distribution 19% and CGE 9%. EBITDA at Gas dropped by 9% to EUR 1,081mn due to the weak performance of its procurement and supply unit and lower transported volumes, which were partly offset by the stronger USD. Reported cash from operations improved to EUR 3,500mn from EUR 2,808mn yoy, while reported capex increased by 1% yoy to EUR 1,767mn. Together, this led to a decrease in interest-bearing net debt (company definition) to EUR 15,648mn from EUR 16,942mn yoy. This translates into a reported pro forma (including the full EBITDA contribution from CGE) FY15 net debt/EBITDA ratio of 3.0x, compared to 3.5x at FYE 2014. Gas Natural has achieved the financial targets it set in its 2013-15 strategic plan, including EBITDA EUR >5bn, net debt/EBITDA of around 3.0x, synergies of EUR 300mn (EUR 306mn achieved) and a dividend payout ratio of around 62%. The new strategic plan for 2016-18, with a larger vision for 2020, will be presented in 2Q16. In a conference call, Gas Natural stated that, in light of the volatility of the financial, commodity and FX markets, the company needs some more time to come up with definite figures. However, Gas Natural already stated that it will be a challenging year in terms of commodity-price and FX fluctuations, as well as in terms of electricity supply in Spain. We view Gas Natural’s FY15 results as spread neutral. However, they show the resilience of the company's business profile in an environment of significant FX and commodity-price volatility throughout 2015. Furthermore, Gas Natural delivered on its FY15 EBITDA target and the reduction of its debt, which temporarily rose in 2015 due to the CGE acquisition. We think that recent underperformance is related to commodity prices and driven by some political uncertainty in Spain (Baa2p/BBB+s/BBB+s). Despite recent rumors that Repsol (Baa2n/BBB-n/BBBs) is potentially considering the integration of Gas Natural (Repsol holds a 30% stake), and despite political uncertainty in Spain, we confirm our marketweight recommendation on Gas Natural.

March 2016 Credit Research
Euro Credit Pilot
UniCredit Research page 50 See last pages for disclaimer.
Current Ratings (Moody's/S&P/Fitch)
Credit Profile
Name (Ticker): Recommendation Weight in iBoxx Comment Utilities sector
A1wn/Awn/-- – GDF SUEZ Alliance and Belgelec Finance S.A., which are guaranteed by GDF SUEZ (SZEFP): 0.7% No recommendation
Baa1s/BBBs/-- Improving Hera (HERIM): Marketweight 1.3% Hera released resilient 1H15 results with revenues up by 6.1% yoy to EUR 2,213mn from EUR 2,087mn, mainly due to the change in the scope of consolidation (integration of Amga Udine since 1 July 2014). EBITDA improved by 2.5% to EUR 459mn from EUR 448mn in 1H14, due to the resilience of Hera’s balanced multi-utility portfolio and mainly driven by the good performance in Gas and Water. Hera stated that the operating environment in Italy is still challenging, marked by weak GDP growth and overcapacities in the energy sector weighing on wholesale electricity margins. That said, Hera’s Gas business benefitted from a strong expansion in sold volumes (+34% yoy) due to lower winter temperatures in 2015 compared to the previous year, albeit still above long-term average temperatures. Net profit rose by 11.4% to EUR 107mn due to reduced fiscal burden from the Robin Hood tax cancellation and a lower average cost of debt. Reported free cash flow before dividends (EUR 133mn) and acquisitions (EUR 32mn) improved to EUR 138mn from EUR 3mn in 1H14. Reported 1H15 net debt rose only slightly to EUR 2,656mn compared to EUR 2,640mn at FYE 2014, resulting in a broadly unchanged net debt/EBITDA figure (company definition) of 3.0x. On 29 May, Moody’s changed the outlook on Hera’s ratings to stable from negative. The decision was primarily driven by the improvement of the company’s credit metrics to a level commensurate with its Baa1 rating after positive results in FY14 and 1Q15. Moody’s assumes that, under Hera’s 2014-18 industrial plan, FFO/net debt should consolidate in the upper teens (FY14: 18%) and RCF/net debt in the low teens (FY14: 14%). The rating factors in Hera’s credit-friendly external growth model, aimed at small-scale acquisitions through stock-for-stock, synergy-generating mergers. We expect Hera to be able to stabilize its credit metrics in line with the requirements for its current ratings, supported by good momentum in Gas, Water and Waste (excluding the maintenance issues above). We continue to like the company due to its strong and diversified business model with a high share of regulated activities (48% at FYE 2014). Hence, we keep our marketweight recommendation on the name.
Baa1s/BBBp/BBB+s Stable Iberdrola (IBESM): Marketweight 4.3% (member of the iTraxx NFI) Iberdrola released solid FY15 results, which beat earnings estimates in terms of net profit. However, EBITDA was below analyst’s estimates. Results were affected by an improved macroeconomic environment and positive FX effects (the appreciation of the USD and GBP), which were partly offset by the depreciation of the Brazilian Real. In Spain, Iberdrola benefitted from 1.8% growth in electricity demand. In its domestic market, FY15 was marked by 27.6% lower hydroelectric production yoy, given that 2014 was a year of extraordinary rainfall. Full-year revenues increased to EUR 31,419mn (+4.6%) from EUR 30,032mn yoy, and EBITDA improved to EUR 7,306mn (+4.9%) from EUR 6,965mn yoy. FFO (company definition) improved by 8.2% to EUR 5,907mn yoy, while net investments also rose by 13.2% to EUR 3,223mn, mainly (87%) focused on networks, renewables and Mexico. Reported net financial debt (company definition) increased to EUR 28,067mn versus EUR 25,619mn at FYE 2014. The FY15 reported-net-debt figure includes incremental debt originating from UIL of EUR 2,406mn (merger effective since 16 December). For FY15, and already including UIL, Iberdrola calculates FFO/net debt of 21% (FYE 2014: 21.3%), net debt/EBITDA of 3.8x (FYE 2014: 3.7x) and RCF/net debt of 18.7% (FY14: 18.6%). All of Iberdrola’s segments are expected to deliver solid net profit growth in 2016. We regard a near-term upgrade by as S&P as likely but assume no positive spread impact as this would simply align the agency’s rating with those of Moody’s and Fitch. While we note that Iberdrola’s growing hydro and wind-production assets will continue to increase earnings volatility and that the company is looking for more growth, we like Iberdrola’s focus on renewables, demonstrated in below-average carbon intensity (of around 225 kg CO2/MWh) and its high proportion of regulated or quasi-regulated income (75% of FY15 EBITDA). The share of regulated income will increase further when the UIL merger is finally approved. Taking into consideration the already tight valuations, we keep our marketweight recommendation on the name.
--/--/BBB-s – IREN (IREIM): No recommendation 0.3%
Aa2s/A+s/AA-s – Korea Gas (KORGAS): No recommendation 0.3% Korea Gas Corporation is Korea's only fully integrated natural gas company. It has an effective monopoly on importing, transmitting and wholeselling natural gas in Korea. Since its founding, it has grown to become the world's largest LNG importer. Korea Gas currently operates three liquefied natural gas terminals and a nationwide pipeline network that spans 3,562km. It produces and supplies natural gas; purifies and sells gas-related by-products; builds and operates production facilities and a distribution network and explores, imports and exports natural gas for domestic and overseas markets. Listed on the Korea Stock Exchange, Korgas is 61%-owned by the Korean government directly – and indirectly through Korea Electric Power Corp and local governments.
--/BBB/BBB – Madrileña Red de Gas (MRDGF): No recommendation 0.3% Madrileña Red de Gas is a Spanish gas distribution grid operator. The company was created in 2010 following Gas Natural's divestment of some gas distribution assets as required by Spain's competition authorities. It manages the gas distribution network for nearly 60 municipalities in the region of Madrid. With more than 835,000 customers, it is the third-largest gas distribution company in Spain.
Baa1s/A-s/BBBs Stable National Grid Plc (NGGLN): Marketweight 2.1% (member of the iTraxx NFI) National Grid released stable 1H15/16 results, driven by good performance of the UK regulated business and progress in managing its cost base in the US. Adjusted operating profit increased by 14% yoy to GBP 1,836mn (13% on constant FX), and profit before tax improved by 21% yoy to GBP 1,371mn. Reported operating cash flow (before exceptional items) stood at GBP 2,681mn, a GBP 114mn-yoy improvement, driven in part by increased regulated income in the US business, higher interconnector revenues and the absence of US system stabilization costs. Investments rose by 17% in the period to GBP 1,919mn, primarily reflecting increased investment in US and UK Gas Distribution. Reported net debt (including GBP 400mn in negative FX effects) increased to GBP 24.6bn from GBP 23.9bn at FY14/15. National Grid announced that will begin a process of rebalancing its portfolio through the potential sale of a majority stake in UK Gas Distribution in 2H15/16. According to the company, a sale of a majority stake will realize some of the value and support a higher asset-growth profile for the remaining businesses, given the maturity of its business. In the UK, there are eight regional distribution networks, four of which are owned by National Grid. National Grid is the sole owner and operator of its UK distribution networks, which deliver gas to around 10.9 million customers. As of LTM1H15/16, the business generated GBP 826mn (i.e. 20%) of National Grid’s adjusted operating profit. According to Bloomberg, which cited those involved, the business could be worth as much as GBP 10bn. In terms of outlook, National Grid expects FY15/16 investments to reach GBP 3.7bn, which should translate into 4% to 5% asset growth over the next few years, while the sale of a majority stake in UK Gas Distribution is expected to increase this growth rate towards the upper end of this range. We regard the latest results as spread neutral and keep our marketweight recommendation on the name.

March 2016 Credit Research
Euro Credit Pilot
UniCredit Research page 51 See last pages for disclaimer.
Current Ratings (Moody's/S&P/Fitch)
Credit Profile
Name (Ticker): Recommendation Weight in iBoxx Comment Utilities sector
A2s/AA-s/-- – Nederlandse Gas (NEGANV): No recommendation from Underweight 1.0% Nederlandse Gasunie released solid 1H14 results. Revenues increased to EUR 876mn (1H13: EUR 874mn, and EUR 763mn adjusted for the tariff settlement repayment), while EBITDA was up to EUR 662mn (1H13: EUR 493mn). On a normalized basis, EBITDA was EUR 662mn (1H13: EUR 604mn). Operating cash flow was EUR 534mn, while investment expenses in 2013 amounted to EUR 239mn. Net debt (company definition) was up to EUR 4,278mn (FY13: EUR 4,248mn). S&P expects the company to be able to sustain its adjusted FFO/net debt above 13%, all else being equal. In the credit rating agency's base-case scenario, Gasunie's adjusted FFO-to-debt ratio will be between 16.5% and 17% in 2014 and will strengthen to 17.5-18% in 2015 before moving to 17-17.5% in 2016 (vs. 16% in 2013). We have terminated our coverage (from underweight).
Baa3wn/BBB-s/BBBs – Origin Energy (ORGAU): No recommendation 0.9% Origin is Australia's leading integrated energy company. Thus, Origin has diverse operations across the energy supply chain, from gas exploration and production to power generation and energy retailing.
Baa1s/--/BBB+s Weakening PGE (PGEPW): Marketweight 0.3% PGE released solid FY15 results, with sales revenues increasing by 1% yoy to PLN 28,542mn and recurring EBITDA (excluding one-offs) up by 18% to PLN 7,511mn yoy. In 2015, the main contributors to recurring EBITDA were Distribution (+6%) and Supply (+148%). While net generation volumes went up by 1%, EBITDA at Conventional Generation dropped by 6%. EBITDA at Renewables, where available capacity went up by 70% to 529MW, came in flat. PGE noted that, while its existing wind farms benefitted from a secured support scheme, there is still uncertainty related to renewable-energy support in 2016. The results were affected by lower prices of green certificates and the lower price of electricity sold. For 2015, PGE booked fixed asset impairments of around PLN 9bn. In 2015, capex increased by 49% to PLN 3,613mn due to acceleration at Conventional Generation construction sites and the expansion of wind capacities. At December 2015, net debt (company definition) stood at PLN 2,637mn (FY14: net cash of PLN 1,018mn). This yields a reported FY15 net debt/EBITDA figure of 0.3x. With regard to EBITDA in 2016, PGE projects a substantially lower contribution from Generation, a significantly lower contribution from Supply, a higher contribution from Renewables and a lower contribution from Distribution. For 2016, PGE expects slightly lower capex compared to 2015. At Renewables, capex will mostly likely be limited to modernizations. While we expect PGE’s credit metrics to weaken over time, we do not see any rating pressure due to sufficient rating headroom. We regard the latest full-year results as spread neutral but note that news regarding PGE has become more negative recently (more political uncertainty, NKW coal mine, etc.). We think that the recently announced management change has added to already negative sentiment on Polish utilities, which has been driven by potential financial involvement in struggling coal mine NKW and depressed power price forecasts. PGE also needs funds for plant refurbishments in order to reduce the CO2 intensity of the company’s coal-fired generation fleet. In this respect, we take note of a recent comment by PGE CEO Marek Woszczyk (Bloomberg) that “more and more foreign financial institutions are not interested in financing coal-based investments in generation, which marks a challenge for large power firms”. That said, PGE currently has sufficient headroom under its ratings. Taking into account PGE’s current 0.3x FY15 net leverage (company definition) and current bond valuations, we reiterate our marketweight recommendation on PGE.
Baa2p/A-s/A-p Stable Red Eléctrica (REESM): Overweight 0.9% Red Electrica released solid FY15 results, which were marginally below analyst estimates in terms of EBITDA and net income, as growth lost some of its momentum in 4Q15. Full-year revenue increased by 5% to EUR 1,939mn, and EBITDA improved by 5.3% to EUR 1,458mn. The company’s telecommunications activity accounted for over half of the growth in EBITDA, while its traditional activities contributed the remainder (i.e. growth in transmission revenue in Spain from the facilities started up in 2014). Operating cash flow (company definition) increased to EUR 1,135mn from EUR 1,009mn yoy. Working-capital generation was positive (EUR 197mn), largely due to the recovery of value-added tax, i.e. a reversal of last year's negative number. Investments were down by 53% to EUR 448mn yoy, as 2014 numbers included the acquisition of Administrador de Infraestructuras Ferroviarias's fiber network (EUR 434mn). Dividend payments rose by 18% to EUR 405mn. In sum, this resulted in a decline in reported net financial debt to EUR 4,906mn from EUR 5,409mn at FYE 2014. This translates into a reported FY15 net debt/EBITDA of 3.4x, compared to 3.9x at FYE 2014, and is broadly in line with the company’s 2014-19 leverage guidance of 3.5x. Red Electrica’s 2014-19 strategy plan includes at least a 200bp improvement in the EBITDA margin, EUR 3.1bn of investment in the Spanish transmission network (EUR 430mn in FY15) and average net debt/EBITDA of 3.5x in this period. In December, Red Electrica announced the acquisition of 50% of Transmisora Electrica del Norte (TEN) for around EUR 200mn. This will allow it to participate in the construction and operation of a 600km electricity transmission line in Chile, which is currently being undertaken by TEN. Moody’s regards the deal as consistent with Red Electrica’s strategic plan, which in addition to expenditure of EUR 3.1bn on the Spanish transmission grid, dedicates up to EUR 1bn to new activities, including international expansion. The company remains one of the European TSOs with the lowest leverage in the sector. Thanks to its public shareholder (20% ownership), Red Electrica bonds could benefit from inclusion in the ECB’s public sector purchase program if this program is extended to include Spanish corporates in the future. Hence, we keep our overweight recommendation on Red Electrica.
Baa3s/--/BBB – Redexis Gas (REDEXS): No recommendation 0.4% Redexis is the second-largest gas transmission company and fourth-largest distribution company in Spain.

March 2016 Credit Research
Euro Credit Pilot
UniCredit Research page 52 See last pages for disclaimer.
Current Ratings (Moody's/S&P/Fitch)
Credit Profile
Name (Ticker): Recommendation Weight in iBoxx Comment Utilities sector
Baa2wn/BBBwn/BBB+wn
Weakening RWE (RWE): Marketweight 3.0% (member of the iTraxx NFI) On 17 February, RWE announced that it has achieved its earnings goals for 2015 and that it has decided to suspend dividend payments for 2015. Due to special items, EBITDA came in at EUR 7.0bn and exceeded original guidance of EUR 6.1-6.4bn. A further worsening of the prospects for conventional power led to an impairment of EUR 2.1bn, and a write-down of EUR 900mn in deferred taxes had to be recognized. Thanks to the sale of RWE Dea in March 2015, reported net debt dropped to EUR 25.1bn from EUR 31.0bn, and reported net debt/EBITDA improved to 3.6x from 4.1x yoy. Due to recent dramatic deterioration in the earnings prospects of conventional power-generation and political risks, RWE has decided to propose a suspension of FY15 dividend payments to holders of common shares. RWE plans to increase the share capital of its NewCo (renewables, grids, supply) by about 10% by the end of 2016. The proceeds will be earmarked to finance further growth in forward-looking markets. RWE will also step up its efficiency program (EUR 2.5bn in savings by 2018, EUR 1.6bn already achieved in 2015). For 2016, RWE expects EBITDA of EUR 5.2-5.5bn and that net debt is unlikely to change significantly yoy. We calculate a 2016E net debt/EBITDA ratio of 4.7x and FFO/net debt of 16% (2015E: 17%). Moody’s placed RWE’s ratings on review for downgrade, reflecting the company's exposure to a weakening power-price environment, which will likely further reduce its operating cash flow. Moody’s projects FFO/net debt in the upper teens (LTM9M15: 16%) and RCF/net debt in the low teens (LTM9M15: 12%). Ratings could be downgraded (limited to one notch) if the adverse effects are not mitigated by other measures. We regard RWE as weakly positioned against Moody’s guidance, but even RWE’s lower 2016 guidance does currently not justify more than a one-notch downgrade. An announced suspension of dividend payments and the stepping-up of efficiency measures might even be sufficient to avoid a Moody’s downgrade. While reduced dividend payments may have been expected, a suspension (for common shareholders) was an unexpected move and interpreted as a negative read-across for future hybrid coupon payments. We would not completely exclude the risk of hybrid coupon deferrals but regard the risk as very remote. We think a coupon deferral would send a very negative signal to the market, in return for temporarily preserving only a small amount of cash (EUR 38.5mn). We regard efforts to stabilize its credit metrics and its announcement of a 10% increase of the NewCo capital as positive. The latter enables RWE to speed up investments in renewables. We have a marketweight recommendation on RWE.
A3n/A-n/BBB+s – Scottish & Southern Energy (SSELN): No recommendation 1.6% Scottish & Southern Energy released its trading statement on 26 January. SSE reported satisfactory results from operations in 9M14/15 and confirmed its expected financial results for FY14/15, which will be in line with the financial outlook given in the interim result statement. The company confirmed its target to increase the full-year dividend for FY15/16 so that it at least equals Retail Prices Index inflation. Furthermore, SSE expects gross capex to amount to GBP 1.55bn in FY14/15 and to total around GBP 5.5bn (net of disposals) over four years to March 2018. The company estimates that its adj. net debt and hybrid capital will total around GBP 7.8bn in March 2015, compared to GBP 7.6bn yoy. In addition, the company provided further info on its value program, which is on course to achieve its objectives: 1. to complete transactions to dispose of assets with a total value of GBP 440mn; 2. 90% of the GBP 100mn target annual savings in overheads being realized to date; 3. the process to dispose of onshore wind farm assets, which is now under way. Despite the company’s vertically integrated business model, with a sizeable share of regulated network activities (which S&P expects to contribute approximately 40% of operating profit through the business cycle), we have terminated our coverage (from underweight).
A3s/BBB+s/-- – SGSP Australia (SPIAUA): No recommendation 0.3% SGSP (Australia) Assets Pty Ltd (SGSPAA, formerly SPI [Australia] Assets Pty Ltd) owns electricity and gas infrastructure assets.
Baa1s/BBBs/BBB+s – Snam (SRGIM): Marketweight 4.7% Snam released stable and improved 9M15 results, with revenue above analyst estimates and EBITDA in line with consensus. 9M15 revenues increased by 3.8% yoy to EUR 2,748mn, while EBITDA came in broadly stable, at EUR 2,108mn. EBIT declined by 3.7% to EUR 1,472mn. The increase in revenues was mainly attributable to the transportation and natural-gas-distribution segments and partly from the contribution of newly consolidated companies. On the EBIT level, higher revenues were partially offset by increased operating costs (EUR 79mn) and an increase in depreciation and amortization (EUR 53mn). In 9M15, Snam generated net cash flow from operating activities of EUR 1,666mn (9M14: EUR 1,095mn), mainly attributable to lower taxes and improved working-capital generation. While capex declined to EUR 750mn from EUR 823mn yoy, dividend payments rose to EUR 875mn from EUR 505mn, resulting in negative reported free cash flow of EUR 46mn. Consequently, reported LTM9M15 net financial debt increased to EUR 13,709mn, compared to EUR 13,652mn at FYE 2014, which translates into unchanged LTM9M15 net financial debt/EBITDA (company definition) of 4.9x from FYE 2014. For 2015, based on current information, Snam expects seasonally adjusted demand for natural gas in the Italian market to be slightly higher (from flat) than in 2014. As part of Snam’s 2015-18 strategic plan, the company is planning to invest EUR 5.1bn to increase the flexibility of its gas system and to enhance its interconnection with European networks. The investments will be split into Transport and Regasification (EUR 3.1bn), Distribution (EUR 1.5bn) and Storage (EUR 0.5bn). The company expects an average annual regulatory-asset-base increase of around 1%. Moody’s expects Snam’s FFO/interest coverage to remain between 3x and 4x (LTM1H15: 6.3x), FFO/net debt of 10% to low teens (LTM1H15: 13.5%) and RCF/net debt of 6% to the high single digits (LTM1H15: 7.4%), as well as net debt/fixed assets that are ≤70% (LTM1H15: 92%). Snam’s ratings at Moody’s are capped at one notch above that of Italy. At S&P, Snam’s ratings are constrained by the ratings of Italy (Baa2s/BBB-s/BBB+s), a downgrade of which would most likely trigger a similar downgrade of Snam. S&P would also consider a downgrade if Snam’s SACP (a-) weakened by more than two notches. Current S&P ratings reflect the expectation of FFO/net debt of around 12% (LTM1H15: 14.3%). We are currently restricted on Snam.
Baa2s/--/As Stable SPP – distribúcia (SPPDIS): Marketweight 0.3% On 22 May, Moody's downgraded SPP distribúcia to Baa2 from Baa1. The rating action reflects Moody's re-assessment of the business risk profile of the SPP-Infrastructure group SPP distribúcia's parent company) due to the weakening of the credit quality of Eustream's counterparty portfolio and continued geopolitical risk surrounding Ukraine and Russia. While the SPP Infrastructure group as a whole benefits from the diversity of its operations and fully-regulated gas distribution activities, these are not sufficient to fully offset the negative impact of the recent developments at Eustream. While ultimately, SPP-distribúcia is a subsidiary of the SPP Infrastructure group, risks for the name are more skewed towards regulatory and political risks in Slovakia than towards geopolitical risks between Europe and Russia. Hence, we have a marketweight recommendation on the name.

March 2016 Credit Research
Euro Credit Pilot
UniCredit Research page 53 See last pages for disclaimer.
Current Ratings (Moody's/S&P/Fitch)
Credit Profile
Name (Ticker): Recommendation Weight in iBoxx Comment Utilities sector
Baa2s/--/A- Stable SPP Infrastructure Financing (SPPEUS): Underweight 0.6% SPP Infrastructure Financing's bond is fully guaranteed by Eustream, which is the operating entity. Eustream is solely active in the gas transmission business in Slovakia. On 22 May, Moody's downgraded SPP distribucia to Baa2 from Baa1. The rating action reflects Moody's re-assessment of the business risk profile of the SPP Infrastructure group its parent company) due to the weakening of the credit quality of Eustream's counterparty portfolio and continued geopolitical risk surrounding Ukraine and Russia. While the SPP Infrastructure group as a whole benefits from the diversity of its operations and the presence of fully regulated gas distribution activities, these are not sufficient to fully offset the negative impact of recent developments at Eustream. Moody's notes that Eustream's cash flows are still reliant on its long-term contract with a Russian client for gas transit from east to west. While the medium-term reverse flow contract for the exit capacity in the Ukrainian direction is a source of additional cash flows, it exposes Eustream to relatively higher counterparty risk given the destination of the gas and the weak credit quality of certain shippers. The Baa2 rating of the notes issued by SPP Infrastructure Financing B.V. is a result of the unconditional and irrevocable guarantee provided by Eustream and, as such, reflects the credit quality of the guarantor. The current shareholder agreement stipulates a leverage cap for Eustream of 2.5x. Additionally, Moody’s is concerned about the high concentration of Eustream's contract portfolio with a Russian shipper (around 55-60% of the total capacity revenues in FY14). Tensions between Ukraine and Russia and the finite life of the gas transit contract in Ukrainian territory pose risks for longer-term survivability in its current form. We have limited visibility on how the geopolitical situation surrounding Ukraine will evolve. We have an underweight recommendation on the name.
Aa3s/AA-s/A+s – State Grid (CHGRID): No recommendation 0.4% S&P considers State Grid’s business risk as strong, reflecting the company’s strong competitive position as the world’s largest public utility company by revenue, with robust cash-flow generation and stable profitability. Its core business is the construction and operation of power grids. Its other businesses include power technology, research and development, power equipment manufacturing, overseas investments and financial services. With its monopoly position in power transmission and distribution in its service area and sizable and diversified power networks, State Grid’s industry risk can be considered very low. Although State Grid benefits from government policy, tariff-setting lacks transparency and predictability. Therefore, the country risk is seen as moderately high. Because of highly stable operating cash flow in the transmission and distribution of power, the company is expected to maintain its strong cash flow generation and profitability over the next two years. As a consequence of expected high power sales in tandem with China’s real GDP growth, sizable capex will be essential and resulting negative free operating cash flow is likely. With State Grid’s ownership, robust cash flows and solid market position, the company has excellent access to banking facilities and a strong standing in domestic capital markets. S&P considers State Grid’s liquidity to be “adequate”.
Baa1s/A-n/BBB+s Stable Statkraft (STATK): Underweight from Marketweight 1.5% In an environment of significantly declining energy prices, Statkraft released weak FY15 results. Average Nordic power prices in 4Q15 declined by 29% to EUR 22/MWh (3Q15: EUR 13/MWh) from EUR 31/MWh yoy. Net operating revenue in FY15 improved by 4.6% to NOK 50,578mn, while underlying EBITDA (excluding non-recurring items) declined by 16% to NOK 10,169mn. The lower yoy EBITDA was primarily related to the lower Nordic power prices; the deconsolidation of UK wind farms and a lower contribution from market operations, which was somewhat offset by higher contributions from acquisitions in Chile and Brazil and new production capacity. The security situation in southeast Turkey has resulted in increased risk related to the Cetin project. Statkraft has therefore decided to suspend the majority of the construction works, resulting in impairments and related costs of NOK 2,086mn. Cash from operations improved to NOK 8,639mn from NOK 6,898mn yoy, mainly related to changes in working capital. Net investment for 2015 increased to NOK 9,834mn from NOK 5,449mn yoy. Net interest-bearing debt (company definition) increased to NOK 35,036mn from NOK 23,638mn at FYE 2014. This increase was primarily related to new investment and payment of dividends and debt in the acquired companies in Chile and Brazil. Based on reported numbers, this translates into a higher FY15 net debt/underlying EBITDA of 3.4x versus 1.9x at FYE 2014 (LTM1H15: 2.3x). Statkraft stated that, as a result of a change in the owner’s dividend policy (DCB 25 November), the company has adjusted the investment plan to account for its reduced investment capacity. Hence, Statkraft will no longer invest in new offshore wind projects and will postpone some international hydropower projects. We note Statkraft’s sizeable investment plan and pressure from continuously weak wholesale prices but still expect the company to manage capex in line with requirements under its current ratings. Despite Statkraft’s large reservoir capacity (which supports more-flexible production) and long-term contracts, the latest results, especially in 3Q15, show that its Nordic Hydropower segment is not immune from sustained low electricity prices. While Nordic power price futures have stabilized at low levels, they reflect the market’s expectation of a continued high hydrological balance. Thus, we expect Statkraft’s generation business to continue to come under pressure from low production margins in the Nordic market. Statkraft bonds trade 20bp tighter than those of Dong (Baa1s/BBB+s/BBB+s) and some 30bp below similar-rated Vattenfall (A3n/BBB+n/BBB+s) and Fortum (Baa1s/BBB+s/BBB+s) issues, which we regard as unjustified. Hence, we change our recommendation on Statkraft to underweight from marketweight.
A3s/--/-- Stable Suez Environnement (SEVFP): Underweight 2.8% Suez Environnement released solid FY15 figures, largely thanks to positive currency effects (stronger USD and GBP) and good momentum in the International and Water Europe divisions. For the full year, Suez generated revenues of EUR 15,135mn, up by 5.7% on a reported basis and 2.7% on constant scope and exchange rates. FY15 EBITDA improved by 4.1% to EUR 2,751mn, including the EUR 131mn positive impact from the capital gain on the revaluation of the interest in Chongqing Water Group. Performance at Recycling Europe is still suffering from negative price effects on secondary raw materials (mainly metals). Reported cash flow from operating activities stood broadly flat, at EUR 1,992mn yoy, while cash flow from investing activities increased to EUR 1,350mn from EUR 860mn in FY14. Net debt (company definition) rose to EUR 8,083mn (1H15: EUR 8.0bn) from EUR 7.2bn at FYE 2014. This translated into reported FY15 net debt/EBITDA of 2.9x compared to 2.7x at FYE 2014. For 2016, the company targets organic revenue growth of at least 2%, with organic EBIT greater than organic revenue growth, free cash flow of around EUR 1bn and net financial debt/EBITDA of around 3.0x. Suez reiterated its ambition to reach EUR 3bn in EBITDA in 2017. Due to the company’s acquisition strategy, its appetite for M&A and its 3.0x leverage target, its credit metrics will likely remain at the lower end of guidance for Moody’s rating. Moody’s does not, therefore, see any upgrade potential. While we like the company’s strong business profile and geographic diversification, we also note its acquisition strategy (partly into politically more-unstable countries), which exposes Suez Environnement to some execution risk and FX risk and might increase financial pressure. In the event of a one-notch downgrade, the SEVFP 3% perpetual bond would still be rated IG. However, the perpetuals are exposed to higher extension risk than other hybrids in the utilities universe. We continue to regard current senior and hybrid valuations as unattractive and therefore keep our underweight recommendation on the name.
A3wn/BBB+wn/-- – Talent Yield Euro (BEIENT): No recommendation 0.3%

March 2016 Credit Research
Euro Credit Pilot
UniCredit Research page 54 See last pages for disclaimer.
Current Ratings (Moody's/S&P/Fitch)
Credit Profile
Name (Ticker): Recommendation Weight in iBoxx Comment Utilities sector
A3s/A-s/-- Stable TenneT Holding B.V. (TENN): Marketweight 2.0% TenneT released strong 1H14 results. On an underlying basis (involving the recognition of regulatory receivables and payables in connection with TenneT's regulated activities), EBIT rose to EUR 368mn (up EUR 131mn yoy). Revenue in the Netherlands showed a slight increase, resulting from additional revenue in connection with last year's completed investment in the Randstad 380kv project in Germany, and TenneT's offshore investments and activities had a positive influence (this includes the impact of the reimbursement of offshore expenses which was introduced last year). Net interest-bearing debt (net of EEG balances and cash) stood at EUR 3,212mn (FY13: EUR 3,147mn). TenneT expects its 10-year investment program to amount to EUR 16bn, of which EUR 5bn is forecast for the Netherlands and EUR 11bn for Germany. According to TenneT's annual report in 2013, the financing of investments is expected to be realized primarily through additional debt issuance and equity (if needed to preserve the credit rating). Regarding offshore projects, however, the company continues to look at minority equity investors. We still think that TenneT is facing a challenging investment plan over the next decade, which is likely to weigh on credit metrics. However, with more regulatory visibility having emerged over recent years, particularly regarding offshore in Germany, some uncertainty regarding the future development of TenneT's credit profile should have vanished by now. We keep our marketweight recommendation on the name.
--/BBB-n/BBBs – Teollisuuden Voima Oyi (TVOYFH): No recommendation 0.8% TVO is a Finnish nuclear operator, which generates electricity at cost for its shareholders. The company's largest shareholders are PVO and Fortum, with a 58% and 26% stake respectively. PVO itself is a power generator and is owned by a consortium of Finnish industrial companies, municipal utilities and Fortum.
Baa1s/BBBs/BBB+s Stable Terna (TRNIM): Marketweight 2.6% Terna reported solid preliminary FY15 results and presented an updated strategic plan for 2016-19. FY15 revenues increased to EUR 2,070mn from EUR 1,996mn yoy. Full-year EBITDA improved to EUR 1,530mn from EUR 1,491mn. In FY15, investments remained broadly stable, at EUR 1,100mn. As a result of the investments carried out and the acquisition of the Italian high-voltage grid, net financial debt (company definition) increased to EUR 8,000mn, compared to EUR 6,966mn at FYE 2014, and reported net debt/EBITDA increased to 5.2x from 4.7x at FYE 2014. For 2016, Terna targets revenue and EBITDA of around EUR 2.09bn and EUR 1.52bn respectively, while investments will total approximately EUR 900mn. Terna’s updated 2016-19 (2015-19) strategic plan includes an increase in its tariff regulatory asset base (RAB), which is to grow at a CAGR of 4.6% (3%) to EUR 14.7bn (EUR 13.4bn). The plan is for cumulative capex of EUR 3.3bn, as opposed to EUR 3.2bn previously for 2015-19 (EUR 1.1bn was already spent in FY15). The company aims to continue developing its grid network, to pursue new investment opportunities in Italy and abroad and to integrate the grid acquired from Italian Railways. Furthermore, Terna expects to generate cumulative FCF of around (above) EUR 2.0bn in 2016-19. The company stated that its financial ratios will improve while the plan is being implemented. The ratio of net debt to RAB will remain below 60%, with a gradual reduction in net debt starting in 2018-19 (2017-18). Ratings at Moody's and S&P are capped at one notch above that of Italy (Baa2s/BBB-s/BBB+s). We regard the preliminary results as spread-neutral and the new objectives under the 2016-19 plan as marginally negative for the credit. That said, we reiterate our marketweight recommendation on the name. Terna will present its FY15 results on 21 March.
Baa2s/--/-- Improving Transport et Infrastructures Gaz France (TTLINF): Underweight 0.6% TIGF is the No. 2 French operator of natural gas transmission (14% of the French network) and underground storage (24% of total French capacity); both are located in the southwest of France. In addition, the company is the sole gas operator in the southwest of France. TIGF was created as a 100% subsidiary of the Total Group in 2005, resulting from the merger-absorption of Total Stockage Gaz France (TSGF) and Total Transport Gaz France (TTGF). In July 2013, the company was acquired by a consortium of long-term investors, including SNAM, the Singaporean sovereign fund GIC and EDF. In 1Q15, Crédit Agricole Assurances acquired a 10% stake in TIGF Holding (the parent company of TIGF), following a capital increase in the company. As a result, Snam, GIC, and EDF Invest, together with Crédit Agricole Assurances, indirectly hold 40.5%, 31.5%, 18.0% and 10.0% respectively of the share capital of TIGF. The gas transmission business involves the transmission of gas to end-users, such as industries and public distribution networks in the southwest of France, and providing connections to other networks in France, Spain and the rest of Europe. TIGF owns and operates about 5,000km of pipelines and transports about 16% of all gas volumes transported in France. The company also owns and operates two underground gas storage facilities, with a combined useful storage capacity of 6.5bcm, representing roughly 24% of France's underground natural gas storage capacity. As of FYE 2014, the group had 570 employees. In FY14, the company reported a 14% increase in revenue to EUR 419mn. Transmission operations generated around 58% of the company's EUR 275mn EBITDA in FY14 (EUR 230mn in FY13), with the remainder coming from its storage activities. AT FYE 2014, TGIF reported net debt/EBITDA of 3.0x (FYE 2013: 3.4x).
A3s/BBB+p/BBB+s Stable United Utilities Water PLC (UU): Marketweight 0.3% (member of the iTraxx NFI) United Utilities Water Plc (UU) released a solid set of 1H14/15 results. Revenues were up by GBP 13.7mn to GBP 859.4mn (1.6% yoy), which is lower than the allowed regulated price increase for 2014/15 of 3.8% nominal (1.2% real price increase, plus 2.6% RPI inflation) and mainly reflected a previously announced special customer discount, which has been applied to this year’s bills. This follows real price decreases of 4.3% in 2010/11 and 2011/12 and allowed real price increases of 0.6% in 2012/13 and 1.0% in 2013/14. The increase in underlying operating profit by GBP 3.3mn to GBP 343.1mn, which was reflected in the revenue increase, was partly offset by the expected increase in depreciation and other cost pressure, including bad debt. Capex was GBP 419mn, representing an increase of GBP 12mn compared with the prior year and reflecting the continued good progress made by the capital investment program. Gearing stood at 57%, well in line with Ofwat’s assumed range of 55-65%. UU said that it was encouraged by the operational and customer-service-performance improvements and that it believes that it can improve further. Improved capital delivery performance, with continued substantial investment in assets, should deliver further benefits for its customers and the environment. UU says that it is ahead of schedule regarding, and remains confident that it can deliver on, its 2010-15 regulatory outperformance targets. The company intends to continue with a dividend policy of 2% p. a. growth above the rate of Retail Prices Index inflation through to 2015. This is to be underpinned by a robust capital structure. We have a marketweight recommendation on its outstanding EUR 500mn iBoxx bond.

March 2016 Credit Research
Euro Credit Pilot
UniCredit Research page 55 See last pages for disclaimer.
Current Ratings (Moody's/S&P/Fitch)
Credit Profile
Name (Ticker): Recommendation Weight in iBoxx Comment Utilities sector
A3wn/BBB+wn/BBB+s Weakening Vattenfall (VATFAL): Underweight 2.1% (member of the iTraxx NFI) Vattenfall released mixed FY15 results, which were impacted by lower electricity prices and only partly offset by lower operating costs (-30% vs. FY10). The company stated that market conditions remain challenging due to a combination of low electricity prices and new requirements. FY15 net sales declined to SEK 164.5bn from SEK 165.9bn yoy. 2015 underlying operating profit (before impairments and provisions) declined to SEK 20.5bn from SEK 24.1bn yoy, despite an improved cost structure. Operating profit for FY15, i.e. EBIT after items affecting comparability, decreased to SEK -23.0bn from SEK -2.2bn yoy due to SEK 36.8bn in impairment losses (FY14: SEK 23.8bn) and SEK 6.0bn in provisions (FY14: SEK 5.7bn). These were mainly for nuclear power and mining operations in Germany and for environment-related provisions for hydro power in Germany. Reported FFO dropped to SEK 29.0bn from SEK 32.1bn yoy, while capex decreased by SEK 0.3bn to SEK 28.7bn (of which, growth of SEK 12.8bn was primarily in wind). Compared to FYE 2014, reported net debt declined to SEK 64.2bn from SEK 79.5bn, mainly thanks to positive cash flow after investments, while adjusted net debt declined to SEK 137.6bn from SEK 158.3bn at FYE 2014. 2015 adjusted net debt/reported EBITDA stood at 4.2x versus 3.9x at FYE 2014. Reported FFO/adj. net debt improved to 21.1% (LTM9M15: 22.5%) versus 20.3% at FYE 2014. In its 2016-17 investment plan, SEK 23.8bn and SEK 23.6bn are to be spent in 2016 and 2017 respectively. 36% of the investment volume will be allocated to growth investments, of which 93% (SEK 14.4bn) will go to wind power. With regard to the sale of its German lignite operations, Vattenfall stated that it still expects to reach an agreement in 1H16. For the time being, the results of Vattenfall and its peers continue to be negatively affected by lower wholesale electricity prices and to demonstrate the structural difficulties faced by the company and energy producers in general. While Vattenfall’s senior bonds seem to be fairly priced compared to those of its peers, the VATFAL 3% 3/77 (Baa2n/BB+n/--) hybrid still looks expensive to us, especially compared to German utility hybrids. In addition, we think that, despite Vattenfall’s focus on maintaining a solid financial profile, it remains vulnerable with regard to a potential downgrade by Moody’s and/or S&P. Hence, we keep our underweight recommendation.
Baa1s/BBBs/BBBs Improving Veolia Environnement (VIEFP): Marketweight 2.1% (member of the iTraxx NFI) Veolia Environnement released solid FY15 results, which were positively affected by continued cost cutting and benefitted from the integration of Dalkia International and from favorable FX impacts. Revenues increased by 4.5% to EUR 24,965mn (1.4% at constant FX), or -0.6% on pro forma numbers (i.e. Dalkia International already fully consolidated for FY14). FY15 EBITDA grew by 11.3% yoy to EUR 2,997mn (8.1% at constant FX), which was strongly up by 18.6% on pro forma numbers. Cost-cutting initiatives had a total impact of EUR 223mn. Gross capex in the period declined to EUR 1,484mn from EUR 1,568mn yoy. Reported net free cash flow in FY15 improved to EUR 856mn from EUR 314mn due to growth in EBITDA and strong year-end cash receipts. FY15 net financial debt stood at EUR 8,170mn, compared to EUR 8,311mn as of FYE 2014. Veolia stated that an increase of EUR 445mn in reported net financial debt versus FYE 2014 came from a negative FX impact. The numbers translate into improved FY15 net debt/EBITDA of 2.7x, compared to 3.0x at FYE 2014. For 2016, Veolia aims to achieve growth in revenues and EBITDA, net free cash flow of at least EUR 650mn and current net income of at least EUR 600mn. At its investor day, Veolia Environnement presented its 2016-18 strategic plan, which is based on the following two main drivers: revenue growth via an improved balance between municipal and industrial client activities, including stronger growth outside of Europe, and continued improvement in operational efficiency. By 2018, Veolia aims to achieve revenues of more than EUR 27bn and EBITDA of around EUR 3.5bn. This should allow the company to achieve current net income of more than EUR 800mn and net free cash flow of around EUR 1bn. With regard to the company’s 2018 plan, we note that it calls for a greater proportion of revenue to come from industrial clients, with a lower contribution from (more-stable) municipality activities in the future. We note Veolia’s continued focus on improving efficiency and like the company’s geographical diversification. We continue to have a marketweight recommendation on Veolia.
Baa1wn/BBB+wn/-- Improving VERBUND-International Finance BV (VERAV): Marketweight 0.7% Verbund released good 1H15 results. They were affected by a still-challenging price environment in the electricity market, but this was offset by better water supply levels (improved yoy hydro coefficient of 1.03 vs. 0.93). Revenues declined by 0.8% to EUR 1,405mn, while adj. EBITDA improved by 5.0% to EUR 442mn. 1H15 results were positively impacted by non-recurring effects from the reversal of provisions due to the legal settlements expected in Grid, additional cost reductions and effects in the electricity/grid sector, and better water supply levels; these were offset by the additional decrease in average achieved contract prices, due to the difficult operating environment. Water supply was 3% higher, compared to the long-term average, and improved by 10% compared to 1H14. On the other hand, Verbund stated that the average achieved contract price for 2015 was EUR 4.2 below the 2014 average contract prices. Net debt declined further to EUR 3.8bn from EUR 4.1bn at FYE 2014. Based on reported figures, this translates into an improved reported LTM1H15 net debt/EBITDA of 4.1x from 5.0x at FYE 2014. On 9 July 2015, Verbund raised its earnings forecast for FY15. Verbund is expecting EBITDA of around EUR 850mn (previous guidance: EUR 770mn, FY14: EUR 809mn) and a group result of around EUR 240m (previously: EUR 180mn). The planned dividend continues to be based on a payout ratio of approximately 50% of the adjusted EUR 240mn group result. Verbund’s 2015 revised guidance also includes savings of around EUR 165mn by the end of 2015, coming from its 2013-15 cost-cutting program, which is EUR 35mn more than originally envisaged. Net debt is set to fall, mainly as a result of higher free cash flow and reduced capex, and net debt/EBITDA at FYE 2015 should reach around 3.7x (under the previous EUR 770mn EBITDA forecast). Verbund confirmed its capex plans of EUR 870mn for the 2015–17 period, with a focus on expanding Austria’s regulated high-voltage grid. Verbund’s good earnings momentum and improved full-year outlook support our expectation that, after the company’s weak FY14 results, the situation for Verbund is improving. The company is making good progress with regard to restructuring its asset base and cost containment, which is currently supported by good momentum for its (more-volatile) hydro-generation assets. However, we note that Verbund is exposed to a still-challenging power-price environment. Verbund should be able to generate stable, positive free cash flow, helped by efficiency gains and reduced capex spending. We therefore keep our marketweight recommendation on the name.

March 2016 Credit Research
Euro Credit Pilot
UniCredit Research page 56 See last pages for disclaimer.
Current Ratings (Moody's/S&P/Fitch)
Credit Profile
Name (Ticker): Recommendation Weight in iBoxx Comment Utilities sector
--/A-s/-- Stable Vier Gas Transport (VGASDE): Marketweight 1.3% Vier Gas Transport GmbH is the holding company of the gas transmission system operator Open Grid Europe GmbH (OGE). OGE, which was previously part of the E.ON, is the largest gas transmission operator in Germany, with a grid length of around 12,000km. OGE's revenues are determined by the German regulator via a revenue cap mechanism. The current five-year regulatory period started in 2013 and should provide for a relatively high degree of cash-flow visibility for the next few years. In particular, the company is only temporarily exposed to changes in demand (volume deviations are listed in a regulatory account and will be recovered in the subsequent regulatory period; deviations exceeding 5% will be compensated for by a two-year time lag). In 1H14, the company generated solid results, which were, however, lower yoy: sales declined significantly to EUR 483.7mn (1H13: EUR 523.2mn; on a mild winter leading to lower transport revenues, while 2013 was characterized by excess revenues), and EBITDA stood at EUR 236.5mn (1H13: EUR 257mn). Net income was up marginally yoy to EUR 94.9mn (1H13: EUR 92.2mn). FFO was EUR 221.1mn vs. EUR 217mn in 1H13. Net debt increased slightly to EUR 2,351mn vs. EUR 2,310mn as of FYE 2013. For 2014, the company expects EBITDA to be above EUR 400mn. S&P could lower its ratings if FFO/debt declines <12% (FY13: 17%), which could occur if OGE were unable to control costs due to poor operating performance – if unforeseen expenses were not able to be passed on to customers. Ratings could also be lowered if business risk deteriorates, which is dependent on regulatory changes and changes in the business mix (more risky industries and countries). We expect credit metrics to remain in line with current ratings in 2014/2015. We keep our marketweight recommendation on the name.
--/BBB-/-- – Viesgo (VIESGO): No recommendation 0.3% Michael Gerstner (UniCredit Bank) +49 89 378-15449 [email protected]
Oil & Gas (Overweight) Sector key figures Sector Wrap-Up Weight in iBoxx NFI: Current ASW spread: change mom/YTD: EURO STOXX OIG YTD:
9.6% 157.3bp -14.8/+23.0 +0.4%
Sector drivers: In line with the previous quarters in 2015, oil majors reported a strong 4Q15 contribution from downstream operations on the back of strong refining margins, while upstream divisions suffered from the weak-oil-price environment. We understand from statements by oil and gas majors that further significant capex cuts and a significant increase in asset disposals from 2015 is limited, as the most of the capex is already committed, while an increase in asset disposals and capex cuts could have a negative effect on the reserves bases going forward. We expect the whole sector to report a negative FCF (after dividend) at current oil price levels, although the sector currently benefits from lower opex, while refining margins remain strong (although below 9M15 levels). Regarding rating actions, rating agencies placed the majority of the names in our coverage on credit watch negative after lowering their oil price decks, following a shift in the Brent forward curve. Some of the credit-watch negative statuses have already been resolved, while we expect the majority of the remaining names to be downgraded in the near term. We expect limited new issuance from Oil & Gas majors in 2016, unless the operational environment improves, as oil names have strong cash levels, on balance, as well as strong credit lines, while the short term bond redemption for the coming two years is limited. Market recap: During the last three months, the iBoxx Oil & Gas index has widened by around 55bp, while the iBoxx Non-Financials index widened by around 23bp. Our top picks remain Total and Repsol, while we favor Total hybrids, in particular. Sector composition: Total (18.5%), ENI (15.9%), Shell (13.0%), BP (12.3%), OMV (7.4%), Statoil (7.3%), Repsol (6.0%), Pemex (5.8%), BG Energy (4.8%), Sinopec (2.4%), APT Pipelines (1.4%), Schlumberger (1.3%), Kinder Morgan (1.3%), SAGESS (0.7%), CNOOC (0.6%), ONGC Videsh (0.6%), PKN Orlen (0.6%).
Current Ratings (Moody's/S&P/Fitch)
Credit Profile
Name (Ticker): Recommendation Weight in iBoxx Comment Oil & Gas sector
A2wp/A+wn/A+n Stable BG Energy Holdings (BGGRP): Marketweight 4.8% BG Energy released 4Q15 results that exceed Bloomberg consensus estimates on a quarterly EBITDA level. The company’s production increased by 16% yoy to 704kboe/d, driven by ramp ups in both Australia and Brazil. BG’s EBITDA declined by 22% yoy in 4Q15 to USD 1.4bn due to the low oil price environment. BG’s reported EBITDA was ahead of Bloomberg consensus estimates of USD 1.2bn. EBITDA in Upstream dropped by 12% to USD 1.1bn, in LNG Shipping & Marketing EBITDA dropped by 51% to USD 272mn. The drop in EBITDA reflects the lower oil price environment, which was partly offset by the increased contribution from liquefaction following the start-up of QCLNG operations. We calculate FCF of around USD 1.7bn, including OCF of USD 4.3bn, disposals of USD 5.2bn, capex of USD 5.6bn (down by 34% yoy) and dividends of USD 1bn. The company’s net debt declined by USD 2bn to USD 10bn as a result of the QCLNG pipeline disposal, and gearing fell to 25.3% vs. 29.2%, reflecting the reduction in net debt. We view BG’s rating as the most stable in the A category due to its merger with better-rated Shell. BG’s bonds trade around 10bp tighter than its rating peer BP and around 10-15bp wider than Shell. We keep our marketweight recommendation on BG.

March 2016 Credit Research
Euro Credit Pilot
UniCredit Research page 57 See last pages for disclaimer.
Current Ratings (Moody's/S&P/Fitch)
Credit Profile
Name (Ticker): Recommendation Weight in iBoxx Comment Oil & Gas sector
A2wn/A-s/As Weakening BP (BPLN): Overweight 12.3% (member of the iTraxx NFI) BP released 4Q15 results that missed Bloomberg consensus estimates on a quarterly underlying RC (replacement cost) profit basis. The company’s quarterly RC profit (profit adjusted for one-off items and inventory charges) was USD 196mn vs. USD 2.2bn in 4Q14 and vs. USD 815mn Bloomberg consensus estimates. Underlying RC profit before interest and tax in Upstream was USD -728mn vs. USD 2.2bn in 4Q14 (USD 823mn in 3Q15). Production (excl. Rosneft) was 2,369kboe/d, which was1.7% higher qoq. The increase in RC profit was mainly driven by lower oil prices and lower gas marketing and trading results. Downstream reported USD 1,218mn vs. USD 1,213mn in 4Q14 and USD 2,302mn in 3Q15. The changes are in line with the average refining marker margin of USD 13.2/bbl in 4Q15, USD 13/bbl in 4Q14 and USD 20/bbl in 3Q15. Rosneft reported Underlying RC profit before interest and tax of USD 235mn vs. USD 470mn in 4Q14, mainly affected by lower oil prices and FX effects. BP reported negative FCF of roughly USD 5bn, consisting of USD 19bn in OCF, capex of USD 18.6bn and dividends of USD 6.7bn. BP’s net debt increased to USD 27.2bn in FY15 from USD 22.6bn in the previous year, while the net debt ratio (co. definition) was 21.6% vs. 16.7% in the prior year. BP aims to keep this ratio at around 20% with some flexibility. The company expects to keep its production broadly in line with 2015, i.e. 2,258kboe/d, while it expects production in 1Q16 to be largely similar to 4Q15. Regarding refining margins, the company expects 1Q16 to be lower than 4Q15. Regarding capex, the company’s guidance was for the lower end of the range of USD 17-19bn for 2016. During the conference call, management said that there is still some headroom for capex deferral if needed due to sustained low oil prices. Regarding asset sales, management reiterated that it expects USD 3-5mn in 2016, while it has completed the USD 10bn announced in October. Regarding the company’s rating, management said that the average cost of borrowing is just over 2%, which means that a downgrade would increase the cost of the debt portfolio by around 10-15bp. However, BP is carrying high cash balances and management does not expect to renew its debt on a roll-forward basis. We note that that this in line with our assumption of subdued new issuance in the oil-and-gas sector, which we underlined in our 2016 oil & gas credit outlook. Overall, we understand from management statements that a downgrade would not have a significant impact on the financial framework perspective. We keep our overweight recommendation on BP as we view the name as among the most stable in the A rated category, due to the company’s scale, capital discipline and the removal of the liquidity pressure following the oil spill settlement
A3wn/A-wn/As – Eni (ENIIM): Restricted 15.9% (member of the iTraxx NFI) In its 4Q15 results, Eni reduced the target oil price, under which full-year capex is funded by operating cash flow, to USD 50/bbl in 2015 vs. its previous guidance of USD 63/bbl for the period 2015-16. Going forward, management expects that capex will be 100% funded by OCF under a USD 50/bbl scenario, while operating cost per boe is expected to be reduced by 11% yoy. ENI’s 4Q15 standalone adjusted operating profit from continuing operations was EUR 0.86bn, which was down by 64% from 4Q14 levels. The drop in adjusted operating profit reflects the lower contribution form the E&P segment driven by the impact of sharply lower oil prices, partly offset by production growth, cost efficiencies and the depreciation of the euro against the dollar in 4Q14. The Gas & Power and Refining & Marketing segments reported positive adjusted operating profit, albeit lower than in 4Q14 (down by EUR 0.2bn overall) due to the negative oil price environment and, in the case of Gas & Power, the unfavorable outcome of commercial arbitration. On 18 March, the company is hosting a strategy presentation to outline the strategy and targets for its 2016-19 plan, as well as the current economic and financial outlook. UniCredit is restricted on Eni.
Stable Galp Energia (GALPPL): Buy 0.0% Galp Energia released 4Q15 results that were broadly in line with estimates on a quarterly EBITDA basis. EBITDA (replacement cost adjusted) dropped by 23% yoy (+19% yoy for FY15) to EUR 309mn in 4Q15 (EUR 1.6bn in FY15), with Exploration & Production down by 48% (-20%) to EUR 53mn (EUR 356mn), Refining & Marketing down by 13% (+94.3%) to EUR 166mn (EUR 800mn) and Gas & Power down by 13% (-13%) to EUR 88mn (EUR 382mn). The drop in EBITDA was mainly due to the decrease in the price of oil, natural gas and oil products. The company reported FCF (change in net debt) of EUR 98mn in FY15, consisting of EUR 1.6bn in OCF, EUR 1.2bn in capex and EUR 318mn in dividends. The company’s net debt (excluding a cash loan to Sinopec) decreased to EUR 2.4bn from EUR 2.5bn. Galp’s net debt/EBITDA declined to 1.5x from 1.9x in 2014. Based on the reported figures, we calculate an adjusted FFO/net debt of 32%. We note that Galp surpassed its own guidance in terms of EBITDA generation and production with EUR 1.6bn vs EUR 1.1-1.3bn in EBITDA and production growth of 50% (working interest) vs. 30-35% (45.8kboe/d vs. 30.5kboe/d). Furthermore, capex was at the lower end of guidance at EUR 1.3bn vs. EUR 1.3-1.5bn. During the conference call, management did not provide a lot of guidance as it intends to give more detail during the capital markets day (CMD) on 15 March. We keep our buy recommendation on Galp given its relatively strong credit metrics, good project pipeline and further increasing production. We like the strong execution of Galp’s production projects. However, the major threat to the company’s growing business will be Petrobras’ (Ba3wn/BBn/BB+n) announced 25% cut to its previous capex forecast. The company said in its 2015-19 management plan that it intends to cut capex to USD 98bn. We note that more than 80% of Galp’s entitlement production is based in Brazil, where Petrobras is the operator. However, we understand from management statements, that projects where Galp is involved in Brazil are top priority for Petrobras.
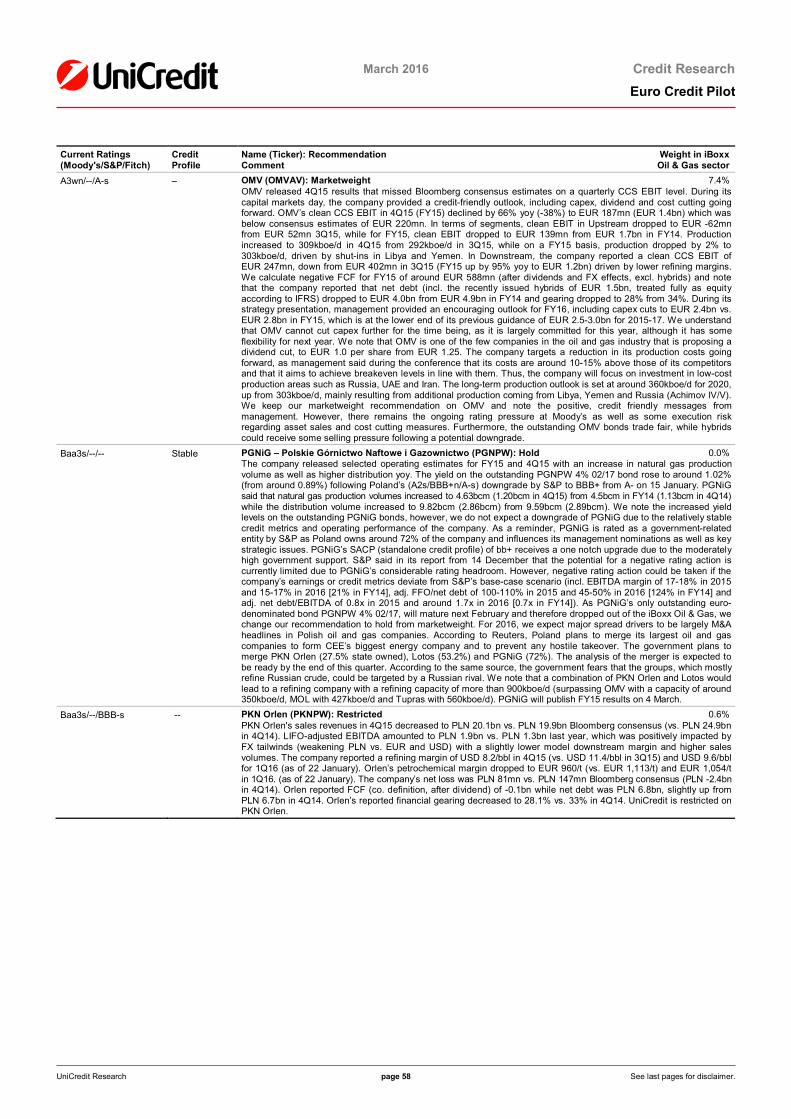
March 2016 Credit Research
Euro Credit Pilot
UniCredit Research page 58 See last pages for disclaimer.
Current Ratings (Moody's/S&P/Fitch)
Credit Profile
Name (Ticker): Recommendation Weight in iBoxx Comment Oil & Gas sector
A3wn/--/A-s – OMV (OMVAV): Marketweight 7.4% OMV released 4Q15 results that missed Bloomberg consensus estimates on a quarterly CCS EBIT level. During its capital markets day, the company provided a credit-friendly outlook, including capex, dividend and cost cutting going forward. OMV’s clean CCS EBIT in 4Q15 (FY15) declined by 66% yoy (-38%) to EUR 187mn (EUR 1.4bn) which was below consensus estimates of EUR 220mn. In terms of segments, clean EBIT in Upstream dropped to EUR -62mn from EUR 52mn 3Q15, while for FY15, clean EBIT dropped to EUR 139mn from EUR 1.7bn in FY14. Production increased to 309kboe/d in 4Q15 from 292kboe/d in 3Q15, while on a FY15 basis, production dropped by 2% to 303kboe/d, driven by shut-ins in Libya and Yemen. In Downstream, the company reported a clean CCS EBIT of EUR 247mn, down from EUR 402mn in 3Q15 (FY15 up by 95% yoy to EUR 1.2bn) driven by lower refining margins. We calculate negative FCF for FY15 of around EUR 588mn (after dividends and FX effects, excl. hybrids) and note that the company reported that net debt (incl. the recently issued hybrids of EUR 1.5bn, treated fully as equity according to IFRS) dropped to EUR 4.0bn from EUR 4.9bn in FY14 and gearing dropped to 28% from 34%. During its strategy presentation, management provided an encouraging outlook for FY16, including capex cuts to EUR 2.4bn vs. EUR 2.8bn in FY15, which is at the lower end of its previous guidance of EUR 2.5-3.0bn for 2015-17. We understand that OMV cannot cut capex further for the time being, as it is largely committed for this year, although it has some flexibility for next year. We note that OMV is one of the few companies in the oil and gas industry that is proposing a dividend cut, to EUR 1.0 per share from EUR 1.25. The company targets a reduction in its production costs going forward, as management said during the conference that its costs are around 10-15% above those of its competitors and that it aims to achieve breakeven levels in line with them. Thus, the company will focus on investment in low-cost production areas such as Russia, UAE and Iran. The long-term production outlook is set at around 360kboe/d for 2020, up from 303kboe/d, mainly resulting from additional production coming from Libya, Yemen and Russia (Achimov IV/V). We keep our marketweight recommendation on OMV and note the positive, credit friendly messages from management. However, there remains the ongoing rating pressure at Moody’s as well as some execution risk regarding asset sales and cost cutting measures. Furthermore, the outstanding OMV bonds trade fair, while hybrids could receive some selling pressure following a potential downgrade.
Baa3s/--/-- Stable PGNiG – Polskie Górnictwo Naftowe i Gazownictwo (PGNPW): Hold 0.0% The company released selected operating estimates for FY15 and 4Q15 with an increase in natural gas production volume as well as higher distribution yoy. The yield on the outstanding PGNPW 4% 02/17 bond rose to around 1.02% (from around 0.89%) following Poland’s (A2s/BBB+n/A-s) downgrade by S&P to BBB+ from A- on 15 January. PGNiG said that natural gas production volumes increased to 4.63bcm (1.20bcm in 4Q15) from 4.5bcm in FY14 (1.13bcm in 4Q14) while the distribution volume increased to 9.82bcm (2.86bcm) from 9.59bcm (2.89bcm). We note the increased yield levels on the outstanding PGNiG bonds, however, we do not expect a downgrade of PGNiG due to the relatively stable credit metrics and operating performance of the company. As a reminder, PGNiG is rated as a government-related entity by S&P as Poland owns around 72% of the company and influences its management nominations as well as key strategic issues. PGNiG’s SACP (standalone credit profile) of bb+ receives a one notch upgrade due to the moderately high government support. S&P said in its report from 14 December that the potential for a negative rating action is currently limited due to PGNiG’s considerable rating headroom. However, negative rating action could be taken if the company’s earnings or credit metrics deviate from S&P’s base-case scenario (incl. EBITDA margin of 17-18% in 2015 and 15-17% in 2016 [21% in FY14], adj. FFO/net debt of 100-110% in 2015 and 45-50% in 2016 [124% in FY14] and adj. net debt/EBITDA of 0.8x in 2015 and around 1.7x in 2016 [0.7x in FY14]). As PGNiG’s only outstanding euro-denominated bond PGNPW 4% 02/17, will mature next February and therefore dropped out of the iBoxx Oil & Gas, we change our recommendation to hold from marketweight. For 2016, we expect major spread drivers to be largely M&A headlines in Polish oil and gas companies. According to Reuters, Poland plans to merge its largest oil and gas companies to form CEE’s biggest energy company and to prevent any hostile takeover. The government plans to merge PKN Orlen (27.5% state owned), Lotos (53.2%) and PGNiG (72%). The analysis of the merger is expected to be ready by the end of this quarter. According to the same source, the government fears that the groups, which mostly refine Russian crude, could be targeted by a Russian rival. We note that a combination of PKN Orlen and Lotos would lead to a refining company with a refining capacity of more than 900kboe/d (surpassing OMV with a capacity of around 350kboe/d, MOL with 427kboe/d and Tupras with 560kboe/d). PGNiG will publish FY15 results on 4 March.
Baa3s/--/BBB-s -- PKN Orlen (PKNPW): Restricted 0.6% PKN Orlen's sales revenues in 4Q15 decreased to PLN 20.1bn vs. PLN 19.9bn Bloomberg consensus (vs. PLN 24.9bn in 4Q14). LIFO-adjusted EBITDA amounted to PLN 1.9bn vs. PLN 1.3bn last year, which was positively impacted by FX tailwinds (weakening PLN vs. EUR and USD) with a slightly lower model downstream margin and higher sales volumes. The company reported a refining margin of USD 8.2/bbl in 4Q15 (vs. USD 11.4/bbl in 3Q15) and USD 9.6/bbl for 1Q16 (as of 22 January). Orlen’s petrochemical margin dropped to EUR 960/t (vs. EUR 1,113/t) and EUR 1,054/t in 1Q16. (as of 22 January). The company’s net loss was PLN 81mn vs. PLN 147mn Bloomberg consensus (PLN -2.4bn in 4Q14). Orlen reported FCF (co. definition, after dividend) of -0.1bn while net debt was PLN 6.8bn, slightly up from PLN 6.7bn in 4Q14. Orlen’s reported financial gearing decreased to 28.1% vs. 33% in 4Q14. UniCredit is restricted on PKN Orlen.

March 2016 Credit Research
Euro Credit Pilot
UniCredit Research page 59 See last pages for disclaimer.
Current Ratings (Moody's/S&P/Fitch)
Credit Profile
Name (Ticker): Recommendation Weight in iBoxx Comment Oil & Gas sector
Baa2wn/BBB-wn/BBBs Stable Repsol (REPSM): Overweight 6.0% (member of the iTraxx NFI) Repsol released 4Q15 results that were slightly below estimates on a quarterly EBITDA level. The company will cut the proposed dividend to EUR 0.30/share from EUR 0.50/share, and we note that management provided further credit-friendly measures in order to keep its current rating. 4Q15 EBITDA amounted to EUR 923mn, slightly below the 3Q15 level of EUR 1.0bn. CCS-adjusted (current cost of supplies) EBITDA dropped to EUR 1.1bn from EUR 1.4bn in 3Q15. In segment terms, EBITDA in Upstream dropped to EUR 275mn from EUR 334mn in the previous quarter, while in Downstream, CCS-adjusted EBITDA declined to EUR 891mn from EUR 1.2bn. Repsol’s refining margin indicator dropped by around 17% qoq to USD 7.3/bbl, which is below the 25-30% decrease in refining margins across the oil and gas industry. Repsol reduced its net debt (co. definition, assigning the outstanding perpetual hybrid REPSM 3.875% NC21 100% equity credit, and debt mainly adjusted for intragroup loans) by EUR 1.2bn to EUR 12bn. Regarding its ratings, we note Repsol will publish its 1Q16 results in May, the agencies will have some more time to check the track record of asset disposals and downstream performance as well as their oil price deck assumptions by then. The company’s ratings are under review for downgrade at Moody’s, but we expect the agency’s downgrade to be limited to one notch, on the back of recent credit-friendly measures announced by management. Regarding Fitch, we note that the agency affirmed its rating at BBBs on 25 January, but the agency could place the rating on watch negative following the downward adjustment of its oil and natural gas price assumptions on 24 January. S&P said in a note on 1 February that it expects to resolve the credit watch by mid-March. Taking the rating agency statements into account, we expect Repsol senior bonds to stay in the iBoxx Oil & Gas index, as we view it as likely that the company will retain its average IG rating. We keep our overweight recommendation, which is based on management’s strong commitment to its IG rating and our expectation that the company will likely stay investment grade on average unless oil prices drop further and rating agencies lower their oil price assumptions further. We understand from management statements that it will not issue another EUR 3bn in hybrids, which is in line with our expectations, while we expect S&P to reinstate equity credit on the outstanding hybrids once Repsol changes the language in the hybrid documents. Therefore, our overweight recommendation is based on the senior and hybrid bonds; we expect further volatility in the price of the hybrids, mainly as a result of the oil price.
Aa1wn/A+wn/AA-n Weakening Royal Dutch Shell (RDSALN): Marketweight 13.0% (member of the iTraxx NFI) Shell reported 4Q15 results that were in line with Bloomberg consensus estimates in terms of its quarterly current-cost-of-supplies (CCS) earnings (excluding identified items). The company’s CCS earnings were USD 1.8bn, which was flat qoq (USD 3.2bn in 4Q14) and in line with consensus. Upstream reported CCS of USD 493mn, down from USD 1.7bn last year. Production declined to 3,039kboe/d, down from 3,213kboe/d last year. In Downstream, the company reported CCS earnings (excluding identified items) of USD 1.5bn (flat yoy), which is a drop of 42% qoq and driven by a drop in refining margins. We calculate negative FCF of USD 4.7bn, driven by OCF of USD 29.8bn, capex of USD 26.1bn and USD 9bn in dividends. The company’s net debt increased to USD 26.6bn vs. USD 23.9bn in FY14, while gearing increased to 14% vs. 12.2%. During a conference call, management reiterated the guidance from its shareholder prospectus, which was published in December. Shell’s guidance included asset sales of USD 30bn in 2016-18 (more back-end loaded and including more downstream and midstream assets, which are not so sensitive to the oil price) and capex of USD 33bn in 2016. While we understand that asset sales for the combined Shell-BG will be less than USD 10bn in 2016, we have some doubts regarding the execution of capex cuts, given previous statements regarding the flexibility of capex and the project portfolio. However, current cost deflation in the industry and the company’s ability to defer projects could make these capex cuts achievable. Shell’s management said that the company’s credit rating is important in terms of its access to capital markets and its trading partners, and that its A+ rating makes this achievable. Gearing is expected to show an increase to the low-20% area following the Shell-BG combination (from Shell’s current stand-alone gearing of 14% in FY15). Following the release of Shell’s figures, we calculate adj. FFO/net debt of around 34% for FY15, which is significantly below last year’s 54% – S&P assumes this ratio will remain at about 30-35% in 2016/17 before edging up to approximately 45% in 2018. We keep our marketweight recommendation on the name for the following reasons: 1. we view a downgrade to the mid-A rating area as fully discounted in spread levels, although we think the base case is a downgrade to the high-A rating area, on average; 2. we view the rating agencies’ oil price assumptions of around USD 40/bbl on average for 2016 as reasonable; and 3. management’s more shareholder-friendly measures, as management is strongly committed to maintaining its dividend and reserve bases, while the financial profile, as well as projects, are managed through the cycle. Therefore, we view further capex cuts and asset sales as limited. The merger with BG Group was closed on 15 February.
--/AA-s/-- Weakening Schlumberger (SLB): Underweight 1.3% The company released 4Q15 (FY15) results in line with Bloomberg consensus estimates on a quarterly revenue level, while capex was below estimates. The company reported quarterly revenue of USD 7.7bn, down by 39% yoy vs. USD 7.8bn Bloomberg consensus (USD 35.5bn for FY15 vs. USD 48.6bn in FY14). Pretax operating income dropped by 54% yoy to USD 1.3bn (USD 6.5bn in FY15, down by 38% yoy) and the margin dropped to 16.6% (18.4% for FY15) from 22% (21.8% for FY14). The company’s operating margin dropped significantly in North America (by 1250bp yoy vs. 220bp International). Schlumberger says that the activity in North America land fell by 45%, which is the sharpest drop seen since 1986, as capex spending by North American customers declined by more than 40%. Activity in North American offshore was down by 17%. The company’s FCF (co. definition, i.e. before stock repurchases, dividends, proceeds from employee stock plans and M&A) for 4Q15 was USD 798mn (incl. USD 205mn for severance payments) while this amount was USD 4.96bn (incl. USD 810mn severance payments) in FY15. The company’s net debt increased by USD 343mn in 4Q15 (USD 160mn in FY15) to USD 5.5bn. As Schlumberger expects extended weakness in activity for 1H16, the company reduced its workforce by 10,000, while it streamlined its overheads, infrastructure and asset base, which led to the company recognizing USD 530mn in pretax restructuring costs in 4Q15. Capex (excl. multi-client and SPM investments) is expected to be USD 2.4bn for FY16 (vs. USD 2.4bn in FY15). However, the company continues with its share repurchase program. In 4Q15 the company purchased USD 398mn worth of shares. In addition, Schlumberger confirmed another USD 10bn share repurchase program. However the company does not aim to increase dividends this year. We keep our underweight recommendation on Schlumberger due to current spread levels, the company’s weakening environment and its commitment to share repurchases.

March 2016 Credit Research
Euro Credit Pilot
UniCredit Research page 60 See last pages for disclaimer.
Current Ratings (Moody's/S&P/Fitch)
Credit Profile
Name (Ticker): Recommendation Weight in iBoxx Comment Oil & Gas sector
Aa2wn/A+s/-- Weakening Statoil (STLNO): Marketweight 7.3% (member of the iTraxx NFI) Statoil reported 4Q15 results, which were above Bloomberg consensus estimates on the 4Q15 adjusted earnings level. Adjusted earnings in 4Q15 were NOK 15.2bn, down 44% yoy mainly due to lower oil prices. However, Statoil beat Bloomberg consensus estimates of NOK 13.6bn. In Development and Production Norway, production decreased by 2% yoy to 1,309kboe/d in 4Q15. The decrease was mainly due to an expected natural decline in mature fields, lower gas sales and redetermination. In Development and Production International, production declined by 5% yoy to 737kboe/d. We calculate negative FCF of around NOK 21bn, driven by OCF of NOK 109bn, capex of NOK 125bn and dividends of NOK 23bn. Statoil’s net interest bearing debt adj. (company definition) increased to NOK 130bn from NOK 115bn in 3Q15, while net debt to capital employed adjusted (company definition) increased to 26.8% from 24.3% in 3Q15. Statoil said that more than 80% of its projects with a planned start-up by 2022 will have a breakeven oil price below USD 50/bbl. The company is introducing a two-year scrip dividend program starting from 4Q15. The Norwegian government will match subscription of shares by minority shareholders, and thereby maintain its ownership at 67% throughout the program. Going forward, company capex for 2016 is estimated at around USD 13bn, while Statoil expects efficiency improvements with pre-tax cash flow effects of around USD 2.5bn from 2016 onwards. For the period 2014-17, organic growth is expected to be around 1% from a rebased equity production level. Furthermore, from 1Q16 on, the company will change its presentation currency to USD. Following the changes in Statoil spreads in recent weeks, we now believe that Statoil bonds are fairly priced in the AA rated oil and gas segment. Therefore, we changed our recommendation to marketweight from underweight on 4 February.
Aa1wn/A+n/AAs Stable Total (TOTAL): Overweight 18.5% (member of the iTraxx NFI) Total's 4Q15 results beat Bloomberg consensus estimates on a net income and production basis. Management confirmed the outlook for 2016 and subsequent years that it released at its capital markets day in September. Adjusted net operating income dropped by 18% yoy to USD 2.3bn due to the weak oil price environment. In Upstream, earnings dropped by 53% yoy to USD 748mn, Refining & Chemicals picked up by 5% to USD 1bn, while Marketing & Services more than doubled to USD 530mn. Adjusted net income dropped by 18% yoy to USD 2.1bn, which was higher than Bloomberg consensus estimates of USD 1.8bn. Total’s results were driven by the low-oil-price environment, partially offset by lower costs, high refining margins, and stronger sales in Marketing & Services due to good performance and strong growth in Africa. Production grew by 9% yoy to 2,347kboe/d, while management expects production to grow further by 4% this year. Overall the company delivered negative FCF of around USD 5bn, consisting of USD 20bn in OCF, capex of around USD 25bn, disposal proceeds of around USD 5bn and dividend payments of around USD 2.9bn. The company’s net debt (co. definition, adding net current financial assets and hedging instruments to cash) declined to USD 26.6bn from USD 28.7bn, while the net-debt-to-equity ratio declined to 28% from 31%. Following Total’s figure, we calculate adj. FFO/net debt of around 37%, down from 57% in FY14. Overall, management confirmed its outlook for 2016 with organic capex down to USD 19bn, which is a reduction of more than 15% compared to 2015, while capex levels of USD 17-19bn from 2017 onwards were also confirmed. Opex savings of USD 2.4bn are expected in 2016 and more than USD 3bn in 2017. USD 4bn of asset sales are expected in 2016, i.e. the same level as in 2015. In Upstream, the growth target of 5% on average per year for 2014-19 was confirmed. In Downstream, European refining capacity will be cut by 20% by the end of 2016. Regarding cash-flow breakeven, In 2016, Total expects to be FCF neutral (before dividends) at around USD 45/bbl and a European refining margin indicator of USD 35/t, in the case of net asset sales of USD 2bn, which is conservative. according to management, given net asset sales of USD 2.7bn in 2015. At a Brent price of USD 50 per barrel in 2016, the company expects to generate USD 1bn of FCF, while negative FCF of USD 1bn is expected for a Brent price of USD 40/bbl. We note that Total bonds are no longer as attractive as we stated in our Sector Report Oil & Gas (21 Jan), as Total spreads have not widened as much as those of AA rated peers Shell, Statoil and Schlumberger. However, taking into account Total’s strong execution of cost savings, capex cutbacks and asset sales, it remains our favorite oil and gas major. Therefore, we keep our overweight recommendation on the name and note that a one-notch downgrade (which we expect in the near term from Moody's) is already priced into current spread levels.
Mehmet Dere (UniCredit Bank) +49 89 378-11294 [email protected]

March 2016 Credit Research
Euro Credit Pilot
UniCredit Research page 61 See last pages for disclaimer.
Industrial Goods & Services (Core) (Underweight) Sector key figures Sector Wrap-Up Weight in iBoxx NFI: Current ASW spread: change mom/YTD: EURO STOXX IGS YTD:
6.7% 96.6bp -0.7/+15.2 -4.2%
Sector drivers: As this sector includes names that are active across various industries, it is highly diverse. Consequently, the businesses of most companies covered are highly dependent on cyclical economic developments. The specific drivers of the sector's performance in the past few months have been the softer development of the Chinese economy, in particular the construction market, the drop in the prices of oil and of other commodities, which is closely linked to the Chinese economy, and FX effects. While the strong USD boosted EUR-denominated revenues and supported competitive advantage of most European industrial companies, the low oil price caused reluctance regarding discretionary spending on capex in Oil & Gas. Oil is the largest industrial equipment end-market. Supportive FX base-effects will barely be noticeable from now on, notwithstanding the future EUR-USD exchange rate. The development in China should be the most unpredictable threat to the sector's performance. The ability of the country's leaders to encounter and reverse slowing GDP growth despite the shift from an industry-based to a more service-based economy is yet to be seen. Market recap: Industrials' spreads (excluding Industrial Transportation, 11.8bp) have not widened as much as those of the broader iBoxx NFI (20.6bp) in the last three months. Regarding our coverage, ATCOA bonds performed weakest, while WURTH showed good development. Also SUFP and SIEGR bonds performed well. Sector composition: Hutchison Whampoa (9.2%), Siemens (9.2%), Schneider Electric (9.0%), Honeywell (5.1%), General Electric (4.5%), 3M Company (4.4%), Danaher (4.0%), Airbus Group (3.8%), United Technologies (3.8%), ITW (3.5%), Urenco (3.0%), ISS (2.9%), Volvo (2.9%), Würth (2.7%), ABB (2.3%), SKF (2.2%), G4S (2.0%), Atlas Copco (1.9%), Brambles (1.8%), Adecco (1.8%), Edenred (1.6%), Rolls-Royce (1.3%), MAN (1.3%), Alstom (1.2%), Amcor (1.1%), Ecolab (1.0%), Shanghai Electric (1.0%), Experian (1.0%), Smiths Group (1.0%), Babcock International (1.0%), Rentokil (0.9%), Tyco Electronics (0.9%), Prosegur (0.9%), Thales (0.9%), Pentair (0.9%), DS Smith (0.9%), CSSC (0.9%), Alfa Laval (0.9%), Tyco International (0.8%), Flowserve (0.8%).
Current Ratings (Moody's/S&P/Fitch)
Credit Profile
Name (Ticker): Recommendation Weight in iBoxx Comment Industrial Goods & Services (Core) sector
A2s/As/A-s Weakening ABB (ABBNVX): Underweight 2.3% ABB reported 4Q15 results largely in line with expectations. New orders were down 2% organically to USD 8.3bn. Revenues for the quarter came in at USD 9.2bn (-1% yoy) vs. estimates of USD 9.3bn. Operational EBITA reached USD 1.1bn, thereby rising 1%. The main drags on the quarter’s performance were the ongoing macro uncertainties, weak Chinese industrial production and low capex investments in process industries. On a divisional basis, order intake was weak in Discrete Automation & Motion (-9%), as demand from process industries in the US and China remained subdued. A positive development became visible in Power Systems as a result of the “step change” efforts, now entering the division’s targeted operating EBITA corridor of 7-11% (at 7.5% vs. 4Q14: 1.3%). The group EBITA margin rose 60bp to 11.7%, thanks to the turnaround in Power Systems and ongoing group-wide productivity and cost savings measures. Cash-flow generation for the quarter was again strong, benefitting from working capital management, with cash flow from operating activities amounting to USD 2.0bn, up 18% at constant currencies (4Q14: USD 1.8bn). Net debt decreased to USD 1.2bn (9M15: USD 2.3bn). ABB confirmed its short-term outlook, expecting a positive development in the US, growth in China at a slower pace than in 2015 and modest growth in Europe. Also oil prices and FX effects should continue to impact the company’s results. The strategic review of the division Power Grids remains on track to be completed in 2016. Given the subdued environment, we keep our underweight recommendation on the company.
Baa1s/BBB+s/-- Improving Adecco (ADENVX): Marketweight 1.8% Adecco announced long-term targets for 2016-20 at its investor day in January. The targets were little changed from previous years. The company said it is targeting an EBITA margin of 4-5-5.0% on average through the cycle, excluding one-offs, and revenue growth at least in line with its main peers. Adecco revised down its margin target for 2015 to 5.2% from 5.5%, meaning that last year was expected to be above the average of what the company is targeting over the long term. Other targets include OCF conversion above 90% through the cycle and a dividend payout ratio of 40-50% (unchanged from the previously stated range). Adecco reiterated its commitment to an investment-grade credit rating, but said that, starting in 2016, it “will consider buy-and-build M&A opportunities” and that excess cash will be returned to shareholders at the end of the year. The company also provided an update on current trading. In October and November 2015, revenues were up 5% organically and the company expects a similar performance for December. This compares with 4% growth in 3Q15 and 2% in 4Q14. Adecco noted that growth improved particularly in France during the last quarter of the year. Therefore, it appears that market turbulence at the end of 2015 did not have a negative impact on the company’s revenue performance. However, the EBITA margin is expected to be around 5.2%, which is below the target of 5.5%. ADENVX currently trades tight, but in line with comparable high-grade business services peers. We therefore reiterate our marketweight recommendation on the name. (FY15 results: 9 March).
A2s/Ap/A-s Improving Airbus Group (AIRFP): Marketweight 3.8% (member of the iTraxx NFI) Airbus Group released overall good FY15 results, especially on the cash-generation side. After an exceptional year regarding new orders in FY14, group order intake was EUR 159bn (FY14: EUR 166bn) with 1,080 (FY14: 1,456) net Commercial Aircraft (CA) orders, resulting in an order book of EUR 1,006bn (FY14: EUR 858bn). Group sales for the year were up 6% to EUR 64.5bn, backed by the strong USD and higher deliveries in CA. EBIT before one-offs increased 1.6% to EUR 4.1bn, thanks to the A380 breakeven, a favorable mix at the Helicopters business and progress on the Helicopters as well as Defence and Space transformation plan. Pre-delivery payment inflows and improved control of working capital led to FCF before M&A of EUR 1.18bn (FY14: EUR 1.11bn), clearly surpassing the company’s guidance of breakeven, accounting for the ramp-up phases for the A320neo, A350 and the A400M. The net cash position, as reported by the company, increased to EUR 10.0bn (FY14: EUR 9.1bn; 9M15: EUR 7.8bn) after a dividend payment of EUR 945mn and EUR 264mn of the EUR 1bn share buyback program, to be completed by end-June 2016. For FY16, the company expects 650 aircraft deliveries and an increased commercial order book again. Before M&A, it further guides for stable EBIT before one-offs and stable EPS before one-offs yoy. Also, FCF before M&A is expected to remain stable. We have a marketweight recommendation on AIRFP bonds.

March 2016 Credit Research
Euro Credit Pilot
UniCredit Research page 62 See last pages for disclaimer.
Current Ratings (Moody's/S&P/Fitch)
Credit Profile
Name (Ticker): Recommendation Weight in iBoxx Comment Industrial Goods & Services (Core) sector
Baa3p/BBB-n/-- Stable Alstom (ALOTFP): Marketweight (from restricted) 1.2% Alstom reported solid 3Q15/16 sales and new orders numbers and confirmed its medium-term outlook. New orders for the quarter were up 46% yoy to EUR 2.4bn. The development is mainly due to orders from Europe, India and Panama. The 9M15/16 order intake number is lower organically by 23% yoy vs. the prior year's inflated number. Quarterly sales came in at EUR 1.6bn, increasing by 7% yoy (9M15/16: +3% yoy). At end-December, the order backlog amounted to EUR 28.7bn (1H15/16: EUR 27.7bn), covering over four years of sales. The medium-term targets of 5% organic sales growth with a gradually improving operating margin within the 5-7% range were maintained. Also the company continues to expect FCF to be in line with net income. Regarding the EUR 875mn outcome of the bond buyback program (vs. an official target at its announcement of EUR 500mn), we calculate a FY16E debt/EBITDA ratio of ca. 2.3x based on S&P's assumptions and in line with the company's guidance. We take the higher-than-officially-planned amount of the debt reduction as supportive of our assumption that Alstom will target an IG rating going forward. S&P's decision on the issue will probably be made only after the company's analysts day scheduled for 30 March. While the resolution of the agency's negative outlook will strongly depend on the statements issued by the company by then, for the time being, we expect S&P to lift its outlook to stable from negative, while maintaining the BBB- rating. Hence, we change our recommendation on ALOTFP bonds back to marketweight from restricted.
A2s/As/As Stable Atlas Copco (ATCOA): Marketweight 1.9% Atlas Copco released solid results for 4Q15 and FY15 in a tough environment, also benefitting from FX effects. Quarterly revenues came in right in line with consensus expectations (Bloomberg) at SEK 25.6bn, equaling a 2% organic decline yoy. Orders declined 5% to SEK 23.8bn. Operating profit came in at SEK 4.8bn, below expectations of SEK 5bn, resulting in a margin of 18.9% (4Q14: 18.8%). Profit for the quarter was impacted by a SEK 2.8bn tax provision as a result of the EC's decision on Belgian tax rulings. Cash generation was good again, albeit weaker than last year, with FOCF (after capex) of SEK 4.6bn (4Q14: SEK 5.2bn), also thanks to a working capital release of SEK 1.4bn (4Q14: SEK 1.2bn) due to a decrease in inventories. Net debt receded somewhat and leverage remained unchanged qoq, with numbers as adjusted by UniCredit. In 4Q15, the division's Compressor Technique service business grew, but order intake on compressors was lower due to soft demand for industrial compressors in China and Brazil and global weak demand for gas and process compressors on the back of the oil price slump. Demand for Mining and Rock Excavation Technique equipment remained weak. Low commodity prices continued to weigh on demand from Brazil, Australia and the US. Segment orders were lower 7% yoy. Construction Technique suffered most, with orders organically down 13% and revenues 6% lower yoy. For FY16, the company expects overall demand to remain at the current level. The gross debt/EBITDA ratio stands at a comfortable 1.1x (FYE 2014: 1.4x, numbers as adjusted by UniCredit). A dividend of SEK 6.30 per share has been proposed (FY14: SEK 6.00), to be paid out in two installments. Thanks to its cash generation, proven resilience and sufficient headroom under current ratings, we think ATCOA bonds have good relative value, particularly compared to SUFP bonds, which are rated one notch lower. Hence, while we have a negative view on the sector as a whole, we confirm our marketweight recommendation on Atlas Copco.
--/BBBs/-- Improving Babcock International (BABLN): Overweight 1.0% Babcock International's 1H15 results showed sustained revenue growth and a further deleveraging trend. Revenues through 1H15/16 came to GBP 2,349mn, up 12% yoy, or +10% organically (consensus: GBP 2,259mn). Operating profit was up 6% to GBP 253mn, or +8% organically. The company’s order book of GBP 20.0bn was stable qoq and up 8% yoy, giving the group excellent revenue visibility, with 92% of revenue for FY15/16 in place and 60% for FY 16/17. The company reiterated its previous (vague) guidance that it is on track to deliver growth in revenue and EPS in line with that of previous years. Babcock International managed to deleverage further, to 2.1x, due to continued, strong cash flow generation. The company maintains its target of deleveraging to 1.9x by the end of its fiscal year from 2.2x as of FY14/15. Within the segments, Marine and Technology delivered 11% revenue and operating profit growth and continues to be supported by its work with the UK ministry of defense, with whom it maintains long-term framework agreements. The segment Defense and Security showed revenues down 3%, but operating profit up 4%. The revenue decline was expected and was attributable to the completion of Regional Prime contracts in January 2015 and to the planned phasing of aircraft deliveries. Revenues in Support Services were up 30%, due to the performance of the Cavendish Nuclear decommissioning projects. We see BABLN as trading at attractive spreads relative to its peers in the high-grade business services peer group considering the company’s ongoing operating growth and solid deleveraging potential. We therefore reiterate our overweight recommendation on the name.
--/BBB-s/-- Stable G4S (GFSLN): Marketweight 2.0% G4S reported solid underlying 1H15 results (at constant exchange rates) with lower-than-expected revenue growth but improving profitability and better cash generation. In 1H15, revenues from continuing operations came in at GBP 3.285bn (up +2.8% versus +3.9% in FY14; compared to G4S-collected consensus of GBP 3.4bn). However, if the three large contracts that were completed in 1Q14 are excluded, growth in 1H15 would have been 4.2%, which is in line with growth in the previous year. In 1H15, G4S won several new contracts, with an annual contract value of over GBP 680mn (2014: GBP 600mn) and a total contract value of GBP 1.4bn (2014: GBP 1.2bn); contract-retention rates remained at approximately 90%. The sales pipeline stood at an annual contract value of GBP 6bn (GBP 5.5bn at FYE 2014). Underlying PBITA increased by 4.9% to GBP 193mn, in line with the consensus estimates of GBP 194mn. Operating cash flow came to GBP 195mn (before tax and interest expenses), which was up 5% on 2014's GBP 185mn and showed that the company’s increased focus on cash management is paying off. Net debt stabilized yoy at GBP 1,677mn (GBP 1,578mn as of FYE 2014; the increase since FYE 2014 has been largely driven by dividend payments), compared to GBP 1,680mn as of 30 June 2014, and the net leverage ratio came to 3.0x versus 3.1x as of 30 June 2014 (2.8x as of FYE 2014). As usual, G4S’s outlook was very vague. Regarding this, the company stated the following: “Sales, new contract mobilization and ongoing productivity programs provided increasingly good momentum through the first half and this is expected to deliver further improvements in the group’s performance in the second half". The company made good progress with its plans and there remains significant opportunity to realize the full potential of its strategy. We reiterate our marketweight recommendation on G4S as we expect the company to continue to make incremental improvements to profitability in 2015. However, we also see no major trigger for outperformance by G4S in the foreseeable future and expect its credit profile to remain largely stable in 2015. (FY15 results: 9 March).

March 2016 Credit Research
Euro Credit Pilot
UniCredit Research page 63 See last pages for disclaimer.
Current Ratings (Moody's/S&P/Fitch)
Credit Profile
Name (Ticker): Recommendation Weight in iBoxx Comment Industrial Goods & Services (Core) sector
Baa2/BBB-p/-- Improving ISS (ISSDC): Overweight 2.9% ISS (Baa2s/BBB-p/--) released good FY15/4Q15 results, broadly meeting expectations. FY15 revenues grew organically by 4.4% yoy (4Q15: +4.8%), in line with the company’s guidance of 4.0-4.5%, while at the upper end of the range. The operating margin of 5.7% for the full year (4Q15: 6.6%) came in just in line with both expectations and guidance. Also, cash conversion reached a good 99% ratio (4Q15: 98%). As ISS already fulfills S&P’s requirements for a BBB rating and has been assigned a positive rating outlook for almost one year at S&P, while the agency merely needs ISS to establish a track record of disciplined financial policy, we expect the results to support a positive rating action in the near term. For FY16, the company expects an organic revenue growth rate of 2-4%, an operating margin above 5.7% and cash conversion above 90%. The company further announced that its board of directors has decided to initiate a share buyback program of up to DKK 150mn with the sole purpose of hedging obligations arising from ISS’s share-based incentive scheme. The company will report on any buybacks on a weekly basis. All in all, ISS continued to show strengthening operating performance in a tough competitive environment and the share repurchase program means no shift to a more shareholder-friendly financial policy. Hence, we confirm our overweight recommendation.
A3n/--/-- – MAN (MANGR): No recommendation 1.3% Due to the control and profit-and-loss transfer agreement, Moody's has fully aligned MAN's rating with that of VW.
A3s/A-s/-- Weakening Schneider Electric (SUFP): Underweight 9.0% Schneider published FY15 results that were in line with expectations. On an organic basis, revenues were down 1% yoy to EUR 26.6bn. The adjusted EBITA margin was 13.7% (FY14: 13.9%), despite support from positive FX effects. The main drags on the performance were, as expected, the increasingly sluggish Chinese economy and the demand slump in the North American Oil & Gas sector, but also overall weakness in the US industry markets. 4Q15 revenues were down 0.6% organically, with Industry (-4.3%) and IT (-3.5%) down yoy. Mainly thanks to a positive contribution from changes in trade working capital, FCF was higher than in the prior year, at EUR 2.0bn (FY14: EUR 1.7bn). As dividends of EUR 1.2bn partly offset FCF, net debt was down EUR 0.4bn to EUR 4.6bn at FYE 2015. This decline helped the net debt/adjusted EBITDA ratio, as defined by the company, to decrease from 1.2x to 1.0x yoy. Furthermore, Schneider upgraded its target for the share buyback program, valid in 2015 and 2016, to EUR 1.5bn from EUR 1.0-1.5bn. The targets for FY16 are flat-to-low single-digit declining organic revenue growth and a 20-60bp improvement in the adjusted EBITA margin excluding FX effects, which are estimated to have a negative impact of 40-50bp. We keep our underweight recommendation on the name, as SUFO bonds trade too tight, in our view.
A1s/A+s/As Stable Siemens (SIEGR): Marketweight 9.2% (member of the iTraxx NFI) Siemens reported somewhat stronger-than-expected 1Q15/16 numbers, with revenues of EUR 18.9bn (+1% yoy organically) and Industrial Business profit of EUR 1.99bn (+10% yoy), raising the profit margin by 20bp yoy to 10.4%, mainly as a result of positive currency effects. Consensus expected a sales number of EUR 18.6bn and Industrial Business profit of EUR 1.87bn. Orders came in at EUR 22.8bn, like-for-like (lfl) up 19% yoy, resulting in a book-to-bill ratio of 1.2x and raising the Industrial orders backlog to EUR 114bn (FYE 2014/15: EUR 110bn). Order intake was strong in Europe and weak in the Americas. The performance of individual divisions was mixed. Power and Gas, Wind Power and Renewables, Energy Management and Process Industries and Drives fell short of targeted profit margins, while Mobility slightly exceeded its target. The large gas turbine business, industrial deceleration, particularly in China, declining revenues in Oil & Gas and weak demand in commodity-related industries continued to be a drag on the results, as well as the integration of Dresser-Rand. Cash generation of Industrial Business significantly receded to EUR 68mn after EUR 588mn in the prior year, due to effects from the timing of payments in large Mobility projects. The company reported an industrial net debt to EBITDA ratio of 0.8x (FYE 2014/15: 0.6x). Siemens upgraded its full-year outlook, now forecasting EPS between EUR 6.00 and EUR 6.40 (from EUR 5.90-6.20) due to its “strong start into the fiscal year”. The remainder of the outlook was affirmed: a book-to-bill ratio clearly above 1.0x, moderate revenue growth net of FX effects and an Industrial Profit margin between 10% and 11%. While the 1Q15/16 number beat estimates, the good performance was in large part driven by positive currency effects, as reflected by the fact that only (reported) EPS is set to come in higher, while both organic revenue growth and industrial profit margin were left untouched. Only order intake showed a significant improvement, while cash generation disappointed. We confirm our marketweight recommendation.
Baa2s/BBBn/A- – SKF (SKFBSS): No recommendation 2.2% SKF is the leading global supplier of products, solutions and services in rolling bearings, seals, mechatronics, services and lubrication systems. The company benefits from its large share of more-stable service and aftermarket sales, which help offset cyclical demand swings (particularly from the auto industry, which accounts for about one third of sales).
A2s/BBB+s/-- Stable Thales (HOFP): Marketweight 0.9% Thales released good numbers for FY15, even slightly better than expected. Order intake advanced 28% yoy on an organic basis to EUR 18.9bn (book-to-bill of 1.34x), as the Ambition Boost plan has delivered in all business lines. From a geographical perspective, orders for FY15 were up 22% organically in mature markets (Europe +19%) and 40% in emerging markets (Middle East +88%). The order book now stands at EUR 32.3bn (9M15: EUR 28.6bn), equaling 2.3 years of sales. The organic revenue increase was 4.5% yoy to EUR 14.1bn (FY15 target: low single-digit growth). Despite execution difficulties on a number of projects, Transport sales were 4.1% higher, mainly thanks to urban rail signaling projects. Also profitability improved with EBIT up 23% to EUR 1,216mn (FY15 target: EUR 1.13-1.15bn), notably driven by the segment Defence and Space. Following an in-depth review and additional charges in 1H15, Transport reported a negative EBIT of EUR 37mn (FY14: positive EUR 32mn), while break-even was reached in 2H15. Also for FY16, break-even is targeted with a gradual return to profitability afterwards. Free operating cash flow for FY15 more than doubled to EUR 1.1bn (FY14: EUR 0.5bn) thanks to the higher EBIT and a release of working capital (mainly advance payments received on orders). Change in net cash for the year was a positive EUR 971mn, with net cash now amounting to EUR 1,978mn (1H15: EUR 614mn). FY16 orders are expected to reach 2013-2014 levels (average: EUR 13.6bn). Sales are expected to grow organically at a mid-single-digit rate and EBIT should be EUR 1.30-1.33bn, equaling an EBIT margin of around 9%. The medium-term target of an EBIT margin of 9.5-10% for 2017 and 2018 has been maintained. Revenues are forecast to grow at a mid-single-digit rate in the same time frame. The closing of the EUR 400mn Vormetric acquisition is expected in 1H16. The order book is large enough to compensate for a book-to-bill ratio below 1.0x in 2016. While we see value in the Vormetric acquisition over the longer term, for FY16 it should burden credit metrics somewhat. We further caution about the high importance of oil-dependent customers in the Middle East (20% share of order intake in FY15). Therefore, we keep our marketweight recommendation on the name.

March 2016 Credit Research
Euro Credit Pilot
UniCredit Research page 64 See last pages for disclaimer.
Current Ratings (Moody's/S&P/Fitch)
Credit Profile
Name (Ticker): Recommendation Weight in iBoxx Comment Industrial Goods & Services (Core) sector
Baa2s/BBBs/BBBs Stable Volvo (VLVY): Underweight 2.9% (member of the iTraxx NFI) Volvo’s 2016 market forecast for heavy-duty trucks was increased by 5,000 units in EU 30, by +30,000 for China and was reduced for North America by 20,000 units and for Brazil by 5,000 units. The market guidance is as follows: North America 260,000 units (-13.8% yoy), EU 30 280,000 (-2.7% yoy), Brazil 35,000 (-15.9% yoy), China 555,000 (+0.1% yoy), India 245,000 (+16.7% yoy) and Japan flat. In Construction equipment, Volvo’s market expectation is for Europe: -5% to +5%, North America -10% to 0%, South America -10% to 0%, Asia excl. China -10% to 0% and China -20% to -10%. The company increased its credit reserves in customer finance in FY15 to 1.41% from 1.33% yoy. Net order intake in trucks was down by 19.8% (-9.9%) yoy and in machines by 18.3% (-25.5%) yoy. Volvo said its restructuring program is close to being completed at the end of 2015 and that it has delivered the expected results with the number of employees down by around 5,000 for the full year. As a result, 2016 is expected to have an SEK 10bn lower structural cost level compared with 2012, when measured in local currencies. Volvo had SEK 3.3bn assets and SEK 573mn in liabilities classified as held for sale. This mainly pertains to the planned divestment of the North American used truck business, Arrow Truck Sales. The assets and liabilities held for sale also include the planned divestment of the external IT business and outsourcing of Volvo Group’s own IT infrastructure, which is planned to be divested during 2Q16. Volvo’s industrial FCF (after dividends, before special items) rose significantly to SEK 11.9bn vs. SEK - 0.4bn yoy and industrial net debt declined to SEK 11.3bn vs. SEK 17.1bn yoy. The company again proposed an unchanged dividend payment. We estimate industrial gross debt/EBITDA improved to 1.2x vs. 2.6x yoy and therefore it offers significant rating headroom for a cyclical decline and a difficult 2016, as indicated by Volvo’s order intake and market guidance. As VLVY’s 17 and 19 senior bonds trade quite tight, just 15bp wider than Continental (Baa1s/BBBp/BBBp) bonds and close to FCE Bank’s (Baa3s/BBBs/BBB-p) shorter maturities, we keep our underweight recommendation. (1Q16 results: 22 April)
--/A/-- Stable Würth (WURTH): Marketweight 2.7% Würth is set to post good FY15 numbers. The company released a preliminary sales figure of EUR 11.05bn, a 9.0% increase compared to FY14, including positive FX effects amounting to 2.5%. In Southern and Eastern Europe as well as North America, above-average growth rates could be achieved. According to the company, investments in future growth and increasing price pressure prevented a parallel development of profits, which are expected to remain flat compared to the prior year (FY14: EUR 515mn). While revenue growth comes in at the top of the guidance given the 1H15 numbers (single-digit growth), profits fall short of expectations, as Würth had anticipated a development in line with revenue growth. The company continues to build its large workforce of sales representatives, with an additional 1,000 hired in FY15. For FY16, Würth plans to hire 1,500 more sales representatives. Further targets are an improvement in profitability and the generation of reasonable sales growth. While the company shows resilience in a troubled environment, we regard WURTH bond prices as fair. Thus, we keep our marketweight recommendation.
Christian Aust, CFA (UniCredit Bank) +49 89 378-12806 [email protected] Stephan Haber, CFA (UniCredit Bank) +49 89 378-15192 [email protected] Dr. Sven Kreitmair, CFA (UniCredit Bank) +49 89 378-13246 [email protected] Jonathan Schroer, CFA (UniCredit Bank) +49 89 378-13212 [email protected]

March 2016 Credit Research
Euro Credit Pilot
UniCredit Research page 65 See last pages for disclaimer.
Industrial Transportation (Marketweight) Sector key figures Sector Wrap-Up Weight in iBoxx NFI: Current ASW spread: change mom/YTD: EURO STOXX IGS YTD:
5.5% 90.9bp -3.1/+11.5 -4.2%
Sector drivers: The iBoxx Industrial Transportation index is a sub-segment of the iBoxx Industrial Goods & Services sector. The sub-index includes toll-road operators, airport operators and logistics companies. The main drivers for the concession operators are traffic volumes and tariff reviews. Traffic volumes (road and air) are correlated with GDP growth and are also impacted by weather conditions (particularly for road traffic). Toll-road tariffs include adjustment mechanisms that protect revenues from certain risks (e.g. inflation, unplanned investments). FY16 outlook: Road traffic levels in Europe should continue to grow (1-2% in France, Italy and 2-4% in Spain/Portugal) in FY16, supported by GDP growth and lower oil prices. However, based on the tariff formulas included in the concession contracts, the low-inflation environment in Europe will weigh on revenue growth. On the other hand, the concession framework continues to provide strong visibility in earnings and cash-flow development, and lower financing costs could support this. Despite a mature European road network, we see risk of higher capex levels in the short term, given government initiatives in France and Italy, for example. Regulatory risks have increased somewhat due to growing political pressure on toll-road operators in France, Italy and Spain. We see continued event risk in the sector due to M&A, driven by further geographic/business diversification and new concession tenders. Market recap: The iBoxx EUR ITR has performed slightly better than the iBoxx NFI since the beginning of 2016, with outperformance mainly driven by the French names ARRFP, ADPFP, DGFP; shorter-dated bonds of Spanish and Italian operators also performed well. Longer-date bonds of ATLIM, ABESM and SISIM underperformed the sector in the first two months. Sector composition: Vinci (16.5%), Atlantia (14.3%), Abertis (8.0%), APRR (7.5%), Deutsche Post DHL (6.7%), HIT (6.3%), Paris Airport (6.0%), BAA (4.4%), Maersk (4.0%), Ryanair (3.6%), Transurban (3.4%), SIAS (2.4%), Beijing Infrastructure Investment (2.3%), Ferrovial (2.2%), Sydney Airport (1.5%), UPS (1.5%), Aeroporti di Roma (1.4%), DAA (Dublin Airport) (1.3%), Australia Pacific Airports (1.3%), SANEF (1.3%), PostNL (1.1%), Brussels Airport (1.1%), Royal Mail (1.1%), Aurizon (0.9%).
Current Ratings (Moody's/S&P/Fitch)
Credit Profile
Name (Ticker): Recommendation Weight in iBoxx Comment Industrial Transportation sector
--/BBBp/BBB+s Stable Abertis Infraestructuras S.A. (ABESM): Marketweight 8.0% Abertis (--/BBB+p/BBB+s) provided an outlook for stronger growth in 2016, after the group reported FY15 results slightly below market expectations. Following like-for-like sales and comparable EBITDA growth of 5% in FY15, management expects sales of EUR 4.7bn in FY16 (+7%) and disproportionate EBITDA growth of 10% yoy to EUR 3.1bn this year. We note that Abertis’ 2015-17 strategy calls for EBITDA expansion to around EUR 4bn in the period. Besides further growth in toll-road revenues, cost savings on the back of Abertis’s efficiency program (incremental EUR 0.2bn p.a.) are expected to drive stronger EBITDA growth this year, as well as an increase in recurring discretionary cash flow (FY15: around EUR 1.0bn before shareholder remuneration, growth capex and disposals). However, including capex and dividends, Abertis expects reported net debt to increase to about EUR 14bn at FYE 2016, up by around EUR 1.5bn yoy. This implies broadly stable reported net leverage of 4.5x at FYE 2016 when compared to FYE 2015 and when using comparable 2015 EBITDA (vs. reported net leverage of 4.7x at FYE 2015). We keep our marketweight recommendation on Abertis at this stage.
Baa2p/BBB+s/BBB+s Improving Aeroporti di Roma (ADRIT): Overweight 1.4% Atlantia cancelled the planned sale of a 30% minority stake in 96%-controlled Aeroporti die Roma (ADR; Baa2p/BBB+s/BBB+s). The talks with international investors (several sovereign wealth funds, according to earlier speculation) were stopped as, while Atlantia’s management did receive offers in line with its expectations, it decided to “retain full control of governance and operations, which remain a prerogative of the management”. While funds generated from a potential minority stake sale of ADR were earmarked for additional (airport) concession investments, we can only speculate that 1. Atlantia will use other sources of funding to make the targeted investments (e.g. Nice, London City airports have been rumored in the past) or 2. will concentrate on ADR’s expansion. Although we would have welcomed financially strong minority investors in the ADR concession, our overweight recommendation on ADR is founded on 1. ADR’s continued strong passenger growth and operating improvements (following a stable concession agreement); 2. implicit support by Atlantia given ADR’s growing importance and EBITDA share within the group; and 3. the ADRIT bond still trading with a pick-up to ATLIM bonds.
Baa1s/BBB+s/A-s Improving Atlantia (ATLIM): Marketweight 14.3% (member of the iTraxx NFI) Atlantia (Baa1s/BBB+s/A-s) reported 3Q15 traffic growth for its Italian concessions under Autostrade per l’Italia (ASPI, Baa1s/BBB+s/A-s). Traffic on ASPI’s network improved by 3.8% yoy during 3Q15, which brought growth in 9M15 to 2.6% yoy, driven by light vehicles (+2.4%) as well as heavy vehicles (+3.4%).
Baa1s/A-s/-- Stable Autoroutes du Sud de la France (ASFFP): Marketweight 0.0% Vinci reported slightly better-than-expected FY15 results. Comparable revenues were down 4.3% to EUR 38.5bn (consensus: EUR 38.3bn), as Contracting was down 6.2% on the back of weak market conditions in France and a more uncertain global operating environment. Order intake in Contracting grew 3.0% to EUR 31.4bn, while a 9% increase outside of France more than offset a 2% domestic decline (despite some recovery of the French residential property market in 2015). Progress at Vinci Autoroutes (+4.0% yoy), Vinci Airports (+20.2%) and Vinci Energies (+6.1%) pushed group EBITDA to EUR 5.7bn for the year, up 3.6% excluding Vinci Park, more than offsetting a 14.2% decrease in Vinci Construction. Therefore, the EBITDA margin also advanced 50bp yoy to 14.7%. A sharp rise in FCF (company-defined, before acquisitions/disposals) in the Contracting business from EUR 0.4bn in FY14 to EUR 1.1bn supported group FCF, which increased to EUR 3.0bn (FY14: EUR 2.2bn). Therefore, net financial debt was down to EUR 12.4bn, compared to EUR 13.3bn at FYE 2014, corresponding to an unadjusted net leverage of 2.2x (FYE 2014: 2.4x). Although Vinci expects weaker traffic growth, revenue at Vinci Autoroutes is expected to grow at a similar rate to 2015, as new tariff arrangements are applicable from 1 February 2016. Growth at Vinci Airports is forecast to continue, albeit at a slower pace due to the higher comparison base. Eurovia and Vinci Construction revenues are likely to continue their decline, while Vinci Energies are expected to book stable revenues. Management indicated that Vinci will bid for stakes in Nice and Lyon airports, which are planned to be privatized. The results once more prove that the complementary business models of Vinci’s Concessions and Contracting businesses enable the company to offset the impact of challenges in individual areas. We keep our marketweight recommendation on Vinci.

March 2016 Credit Research
Euro Credit Pilot
UniCredit Research page 66 See last pages for disclaimer.
Current Ratings (Moody's/S&P/Fitch)
Credit Profile
Name (Ticker): Recommendation Weight in iBoxx Comment Industrial Transportation sector
Baa2s/BBB+s/BBB+s – Autoroutes Paris-Rhin-Rhône (ARRFP): Marketweight 7.5% APRR (Baa2s/BBB+s/BBB+s) released solid traffic and toll revenue figures. On the back of continued light vehicle traffic (+2.7%) and heavy-duty traffic growth (+4.1%) on APRR’s network in 4Q15, full-year 2015 traffic activity improved 2.7% yoy to 22.2mn kilometers (9M15: +2.6%). Consequently, FY15 revenues from tolls increased a solid 3.1% yoy to EUR 2.15bn, while revenues from retail facilities, telcos and others remained broadly flat yoy (EUR 68mn). Excluding IFRIC 12 construction revenues (EUR 165mn), APRR’s revenues improved 3% yoy to EUR 2.21bn, which is slightly higher than expected at the beginning of 2015, despite the government-imposed tariff freeze last year (will be recovered from 2016). Solid top-line performance in 2H15 continued to support APRR’s EBITDA growth in FY15. The slightly improved FCF generation last year vs. FY14 (EUR 0.5bn) did not cover the EUR 1.1bn of up-streamed dividends in 1H15 to Eiffarie Holding. Overall, we expect APRR (incl. Eiffarie holding) to have limited incentive for further deleveraging following the refinancing last year (incl. two new benchmark issues in 4Q15 and an extension of APRR/Eiffarie bank facilities to 2021). We have a marketweight recommendation on APRR for relative-value reasons.
Baa1s/A-s/BBB+s Stable Cofiroute (DGFP): Marketweight 16.5% (member of the iTraxx NFI) Vinci reported slightly better-than-expected FY15 results. Comparable revenues were down 4.3% to EUR 38.5bn (consensus: EUR 38.3bn), as Contracting was down 6.2% on the back of weak market conditions in France and a more uncertain global operating environment. Order intake in Contracting grew 3.0% to EUR 31.4bn, while a 9% increase outside of France more than offset a 2% domestic decline (despite some recovery of the French residential property market in 2015). Progress at Vinci Autoroutes (+4.0% yoy), Vinci Airports (+20.2%) and Vinci Energies (+6.1%) pushed group EBITDA to EUR 5.7bn for the year, up 3.6% excluding Vinci Park, more than offsetting a 14.2% decrease in Vinci Construction. Therefore, the EBITDA margin also advanced 50bp yoy to 14.7%. A sharp rise in FCF (company-defined, before acquisitions/disposals) in the Contracting business from EUR 0.4bn in FY14 to EUR 1.1bn supported group FCF, which increased to EUR 3.0bn (FY14: EUR 2.2bn). Therefore, net financial debt was down to EUR 12.4bn, compared to EUR 13.3bn at FYE 2014, corresponding to an unadjusted net leverage of 2.2x (FYE 2014: 2.4x). Although Vinci expects weaker traffic growth, revenue at Vinci Autoroutes is expected to grow at a similar rate to 2015, as new tariff arrangements are applicable from 1 February 2016. Growth at Vinci Airports is forecast to continue, albeit at a slower pace due to the higher comparison base. Eurovia and Vinci Construction revenues are likely to continue their decline, while Vinci Energies are expected to book stable revenues. Management indicated that Vinci will bid for stakes in Nice and Lyon airports, which are planned to be privatized. The results once more prove that the complementary business models of Vinci’s Concessions and Contracting businesses enable the company to offset the impact of challenges in individual areas. We keep our marketweight recommendation on Vinci.
A3s/--/BBB+s Stable Deutsche Post DHL (DPWGR): Marketweight 6.7% The German postal regulator (Bundesnetzagentur) approved a postage increase for Deutsche Post DHL for 2016-18. Postage for standard letter sizes was increased by 12.9%, to EUR 0.70, and large sizes (Maxibrief) were increased by 8.3% to EUR 2.60. Postage on international standard letters was increased by 12.5% to EUR 0.90 and on large international items (Grossbrief) by 7.2% to EUR 3.70. The price increase became valid on 1 January 2016, but the regulator also said that Deutsche Post will not be eligible to increase prices further before 2019. According to the company, the overall impact on Deutsche Post’s revenues will be a 7.5% increase on the EUR 3.0bn regulated part of PeP’s revenue base, i.e. around EUR 225mn (FY14: EUR 15.5bn in total segment revenue; EUR 56.6mn at the group level). We would expect the EBIT margin in PeP (FY14: 8.3%) to see only a slight benefit as the company will also need to increase salaries through 2017 based on the recent wage agreement that ended the strike earlier in 2015 and as the company’s expansion of its parcel business outside Germany will also increase expenses. In addition, Deutsche Post has already factored in some price increases into its forecast for a 3% EBIT increase in PeP from 2013-20. We see the decision to increase postage prices as modestly positive for Deutsche Post and think this should help to stem some of the recent negative sentiment after a troubled 2015. However, the announcement is largely in line with previous expectations and should not affect the company’s own guidance. DPWGR bonds are trading tight but have performed resiliently in recent months despite the difficulties from the strike, the guidance revision for 2015 and the announced write-downs on the NFE project in the Global Forwarding, Freight segment. We therefore reiterate our marketweight recommendation on the name. Deutsche Post DHL will report FY15 results on 9 March.
Baa3s/--/-- – Holding d'Infrastructures de Transport (HITTFP): No recommendation 6.3% See Abertis, Abertis owns 56% of HIT.
Baa1s/BBB+n/-- Weakening Maersk (MAERSK): Marketweight 4.0% Maersk's FY15 results were in line with estimates on an annual-revenue basis. Its management has a subdued outlook, as underlying profit for FY16 is expected to be significantly below FY15's USD 3.1bn. The breakeven for Maersk Oil was reached when oil prices were in the range of USD 45-55/bbl. At USD 3.1bn, Maersk's underlying profit was slightly below its guidance of USD 3.4bn for FY15. Maersk reported sales of USD 40bn, which was in line with Bloomberg consensus estimates. In segment terms, Maersk Line reported underlying profit of USD 1.3bn vs. USD 2.2bn last year, on the back of poor market conditions, which led to significantly lower freight rates, mainly in the second half of the year. Maersk Oil reported underlying profit of USD 435mn vs. USD 1bn due to the weak-oil-price environment. Maersk Drilling reported underlying profit of USD 732mn vs. USD 471mn last year on the back of good contract coverage, fleet growth and cost savings. In APM Shipping Services, Maersk reported underlying profit of USD 404mn vs. USD 185mn. Maersk's net debt remained broadly stable over the year (up by USD 0.1bn) at USD 7.8bn, driven by EBITDA of USD 9.1bn, capex of USD 7.2bn, divestments of USD 5.8bn and dividends of USD 6.2bn. In terms of ratings, note that S&P changed its outlook to negative in February, due to weak market conditions. The credit-rating agency said that Maersk faces difficult market conditions for all its main business areas and that it expects Maersk's credit ratios to weaken substantially over 2016. The negative outlook reflects the risk that Maersk could by downgraded by one notch if market conditions do not improve. All in all, we confirm our marketweight recommendation on Maersk as we think that Maersk bonds are fairly priced.

March 2016 Credit Research
Euro Credit Pilot
UniCredit Research page 67 See last pages for disclaimer.
Current Ratings (Moody's/S&P/Fitch)
Credit Profile
Name (Ticker): Recommendation Weight in iBoxx Comment Industrial Transportation sector
Baa3p/BBB-p/-- Weakening PostNL (PNLNA): Underweight 1.1% (member of the iTraxx NFI) PostNL reported 4Q15 results that were in line with expectations on the revenue line, with an improvement in underlying cash operating income. FY15 revenues were EUR 3.46bn compared to consensus of EUR 3.47bn, while cash operating income of EUR 303mn was up 6% on the prior-year's figure. In 4Q15, this performance accelerated, with cash underlying income up 21% to EUR 147mn, despite a rise in revenues of only 1%. Net debt was down to EUR 580mn from EUR 730mn due to good cash-flow generation in 4Q15. The company will again not pay a dividend for the financial year, as the consolidated equity position is still negative, at EUR 223mn. The company confirmed its previous outlook for 2016, calling for a significant decline in underlying cash operating income to EUR 220-260mn (excluding the German operations). This decline is attributable to regulatory measures and the adjusted market approach (EUR 35mn), implementation of the sustainable delivery model (EUR 10mn) and higher cash-out for restructuring than cost-savings achieved (EUR 10mn). The strategic review of the German operations is still continuing, although PostNL said that it has made “good progress” with restructuring this business. For 2016, the company’s focus will be on implementing its restructuring plans and navigating a regulatory environment that the company expects “to remain challenging” and will require “significant management attention.” On the segment level, underlying cash operating income stabilized in most segments in 4Q15, with the core Mail in NL segment up slightly to EUR 117mn from EUR 113mn in 4Q14. International improved the most, at EUR 11mn vs. 4mn in 4Q14. However, a major concern is that underlying cash operating income in Mail in NL was down to EUR 204mn for the full year, from EUR 230mn in FY14. Despite some signs of stabilization in 4Q15, PostNL confirmed that 2016 is expected to be a difficult year, largely due to increasing regulatory burdens, which are expected to drag down results by EUR 30-50mn over three to four years. The government’s attempt to stimulate competition in the Netherlands could also put pressure on the company’s tariff structure. The increasing regulatory burdens were a major reason why the company revised its guidance down for FY16 with its strategy update in November. Although we expect the sale of PostNL’s stake in TNT to be approved by regulators, we believe that this, as well as a rating upgrade of one notch, has already been priced in at current levels relative to other high-grade business services and logistics peers. Considering the near-term operating challenges the company faces – as well as the unknown outcome of the ongoing review of German operations – we confirm our underweight recommendation on PNLNA for now.
Baa1s/--/-- SANEF (SANEFP): 1.3% Sanef is the French toll road concession owned by HIT, which is 56%-owned by Aberits, see Abertis
Baa3n/--/BBBs Stable Società Iniziative Autostradali e Servizi (SISIM): Overweight 2.4% SIAS (Baa2n/–/BBBs) reported solid 3Q15 results in November, broadly in line with expectations. On the back of strong traffic growth of 3.3% yoy (9M15: +2.7% yoy) on SIAS’s concessions – carried by light vehicle as well as heavy duty traffic – and the 1.5% tariff increase this year, reported motorway revenues increased 4.6% yoy to EUR 284mn. Reported adj. gross operating margin (adj. EBITDA) of EUR 197.7mn (+3.0% yoy) met the consensus estimate (EUR 198mn). Given the seasonal positive FCF generation over the summer (holiday) period (EUR 123mn vs. EUR -55mn in 1H15), reported net debt improved sequentially to EUR 1.54bn at end-September 2015 from EUR 1.64bn at FYE 2014. Given the earnings growth and FCF generation, reported adj. EBITDA/net debt improved to 2.4x in LTM 9M15 from 2.7x at FYE 2014. SIAS also continues to expect a consolidation (i.e. improvement) in the group’s results for full-year 2015 due to improved traffic as well as the 1.5% tariff increase (only inflation compensation, as agreed with the Italian MIT). Pending the approval of either the updated stand-alone 2014-18 financial plans for several SIAS concessions (incl. recovery of 2015 tariff increase) or the concession combination and extension plan (as previously agreed with the MIT), we continue to expect SIAS to use its low leverage and solid liquidity (EUR 1.1bn in cash plus committed and uncommitted lines) to make further investments in the extension of the average remaining lifetime of its portfolio (as well as to pay the interim dividend in November 2015). In December 2015, SIAS, together with its majority shareholder ASTM, announced the takeover of an indirect 41% stake of the Brazilian 1,860km-tollroad operator Ecorodovias (Brazilian NewCo will acquire 61% stake in Ecorodovias together with CR Almeida). Sias will acquire a 40% stake in the Italian NewCo (which will hold a 64.1% stake in the Brazilian NewCo) for a total contribution of EUR 208.2mn (Italian NewCo capital increase and acquisition of Italian NewCo shares from ASTM). The current Italian NewCo shareholder agreement between SIAS and ASTM covers five years, while the shareholder agreement at the Brazilian NewCo runs 10 years. We have an overweight recommendation on SIAS.
Christian Aust, CFA (UniCredit Bank) +49 89 378-12806 [email protected] Jonathan Schroer, CFA (UniCredit Bank) +49 89 378-13212 [email protected] Mehmet Dere (UniCredit Bank) +49 89 378-11294 [email protected]

March 2016 Credit Research
Euro Credit Pilot
UniCredit Research page 68 See last pages for disclaimer.
Basic Resources (Overweight) Sector key figures Sector Wrap-Up Weight in iBoxx NFI: Current ASW spread: change mom/YTD: EURO STOXX BAS YTD:
2.2% 305.6bp -268.1/-179.8 -4.2%
Sector drivers: China remains the main driving force behind commodity demand, accounting for about 50% of metal demand globally. Hence, the country's slowing economic growth and the shift towards a more consumption-driven economy are expected to weigh on metals demand. China's GDP is still growing at around 6-7% and overall global GDP growth remains intact (although the outlook has certainly moderated during 2015/ early 2016). The pricing outlook for some commodities remains uncertain at this stage, given lower growth and oversupply for many metals and bulk commodities, in particular iron ore, aluminum, nickel and copper (short-term). Overall, the pricing environment is expected to remain volatile amid ongoing macroeconomic, fiscal and geopolitical worries. Profitability is generally expected to suffer further during 2016 from lower prices. In order to support weakening cash generation, capex and dividend cuts and other credit-protective measures like disposals (and equity issuance) continue in the industry in 2016. Market recap: Following a sharp drop in oil at the beginning of 2016, followed by a quick rebound in February 2016 (while e.g. copper remained flat YTD), the iBoxx EUR Basic Resources tightened 64bp in the first two months of 2016 (before the exclusions of AALLN bonds). This was also driven by Mining company's announcements of additional measures to protect their balance sheets. Best performers in Jan/Feb were GLENLN and AALLN while BHP and RIOLN widened since the start of the year. Sector composition: BHP Billiton (42.4%), Glencore (36.5%), Rio Tinto (6.7%), Vale (6.3%), Mondi (5.5%), Baosteel (2.5%).
Current Ratings (Moody's/S&P/Fitch)
Credit Profile
Name (Ticker): Recommendation Weight in iBoxx Comment Basic Resources sector
Ba3n/BBs/BB+n Weakening Anglo American (AALLN): Hold 0.0% We moved to hold (from underweight) on Anglo American, following Moody’s slightly-worse-than-expected three-notch downgrade to Ba3/negative and Anglo’s dismal but still better-than-expected FY15 results and strategic update in February. Anglo’s composite rating settled at the mid-BB area for the time being and, thus, left the iBoxx EUR Basic Resources index in March 2016. With AALLN’s EUR cash curve already trading with a significant pick-up to BB rated (basic resources) peers, we believe risks of a continuously volatile commodity price environment, execution risks for Anglo’s targeted debt reduction as well as further rating downgrades are now already reflected in current spreads. Although it is now too late to prevent a downgrade to high-yield, we gain some comfort from Anglo’s further increased efforts to reduce net debt over the coming year(s). Pro forma for the non-core disposals – which ultimately include everything except De Beers (diamonds), Platinum and Copper – and cautiously applying only USD 0.5bn of the USD 1.2bn in expected incremental earnings improvements this year, we would arrive at broadly stable adj. net leverage of 3.3x in FY16 (although we would expect gross debt/EBITDA to move further up to slightly above 5x in this scenario). A successful execution of disposals should also support Anglo’s still solid liquidity which was used for around USD 1.5bn of bond buybacks in Feb/March 2016. Cash and cash equivalents amounted to USD 6.9bn at FYE 2015, of which ca. USD 2bn is tied to the operating business according to Anglo, which should include the USD 1.4bn cash balance in South Africa. Additionally, Anglo has access to USD 7.9bn in undrawn, committed facilities, with the main USD 5.0bn 2020 RCF and an additional USD 0.4bn of facilities (announced last year) not subject to financial covenants or a MAC clause. In the medium term, Anglo targets a return to a solid IG rating.
A1wn/An/A+n Stable BHP Billiton Ltd. (BHP): Marketweight 42.4% BHP Billiton (A1wn/Awn/A+n) released 1H15/16 results below expectations, but delivered capex cuts and an altered dividend policy. Revenues declined 37% yoy to USD 15.7bn (lower end of consensus expectations), while underlying EBITDA of USD 6.0bn (40% underlying margin) was less than half the USD 13.1bn reported for 1H14/15. Reported net debt of USD 25.9bn at end-December 2015 increased from USD 24.4bn at FYE 2014/15 and USD 24.9bn in December 2014. The gearing ratio increased to 29.7% and reported net debt/LTM underlying EBITDA increased to 1.75x (from 1.11x in June 2015). For FY16 and FY17, BHP further reduced its capex guidance by USD 3.5bn and now expects to spend USD 7.0bn this year (i.e. USD 3.4bn in 2H15/16) and USD 5.0bn in FY17 (previous: USD 7.0bn). Additionally, BHP delivered a deeper-than-expected cut to dividends and proposed an interim dividend of USD 0.16 per share (-74% yoy, whereas the market was expecting only a 50% cut). Furthermore, and in line with S&P’s requirement, BHP altered its dividend policy from a progressive payout to a “minimum 50% payout of underlying attributable profit at every reporting period”. For 1H15/16, BHP will distribute the minimum dividend of USD 0.04 per share plus USD 0.12/share to reflect differences between underlying attributable profit (USD 0.4bn) and free cash flow before dividends (USD 1.2bn). Stronger-than-expected cuts in capex and dividends stabilized BHP’s A rating at S&P and A+ at Fitch. We confirm our marketweight recommendation on BHP with a preference for BHP perps.
Baa3s/BBB-s/-- Stable Glencore (GLENLN): Overweight 36.5% (member of the iTraxx NFI) We keep our overweight recommendation on Glencore following the release of its FY15 results, which were broadly in line with the December 2015 investor update and given the further stepping-up of efforts to reduce debt in 2016 and 2017. The GLENLN EUR 17s, in particular, have benefitted from the recent renewal of the 1Y RCF and continued commitment from banks. The current stabilization of copper prices (trading flat YTD at USD 2.14/lb) and the halt of the negative ratings trajectory (which stopped at Baa3/BBB-) have led to a 20-point recovery for the longer-dated GLENLN bonds from their mid-January lows. However, we see potential for further (relative) outperformance due to the targeted strong deleveraging in 2016/17 on the back of increased FCF generation and disposals. Given improved liquidity at FYE 2015 (USD 15.2bn of cash and available RCF) and USD 4.5-5.5bn from disposals targeted this year – as well as GELNLN bonds currently still trading at or below par – we even see some room for debt buybacks. The main focus is on the outlook and Glencore continues to deliver: Based on commodity spot prices as of end-February and an additional USD 0.4bn in cost savings this year, management increased its FY16 EBITDA outlook to USD 8.1bn (previously: USD 7.7bn). The outlook includes a USD 2.75bn contribution from the marketing business, which is the mid-point of the confirmed USD 2.4-2.7bn 2016 EBIT guidance for the segment plus USD 0.2bn in depreciation. Also, the 2016 outlook for industrial capex has been cut further to USD 3.5bn and the target for group FCF (before changes in working capital) has been increased to USD 3.0bn this year (previously: USD 2.0bn). Besides the already announced intention to sell a minority stake in the Agricultural business by end-1H16, Glencore seeks additional disposals this year, particularly of non-core precious-metals streams and logistics infrastructure, which should be easier to execute than the sale of mining assets, in our view. On the other hand, Glencore has lowered its target for the further release of net working capital this year, with RMI expected to remain at around USD 15bn going forward (2016/17). Taking the announced measures together, Glencore targets reported net debt of USD 17-18bn at end-2016 (previously: USD 18-19bn) and a further reduction to USD 15bn in FY17. Hence, management reiterated its commitment to an IG rating and targets achievement of a strong Baa/BBB rating in the medium term.

March 2016 Credit Research
Euro Credit Pilot
UniCredit Research page 69 See last pages for disclaimer.
Current Ratings (Moody's/S&P/Fitch)
Credit Profile
Name (Ticker): Recommendation Weight in iBoxx Comment Basic Resources sector
Baa2s/--/-- Stable Mondi (MNDILN): Marketweight 5.5% Mondi (Baa2s/BBBs/--) released solid FY15 results and announced the disposal of Neusiedler. The uncoated fine paper operations in Austria is being sold to its 51% held subsidiary Mondi SCP a.s., valuing the enterprise at EUR 115mn. 2H15 group revenues grew 3% to EUR 3.4bn (FY15: +7%, at constant scope: +3.9%), impacted by favorable FX effects, higher selling prices and volume growth in Containerboard, Corrugated Paper and Consumer Packaging. The stronger USD and generally lower input costs contributed to a 14% rise in reported underlying EBITDA in the second half (FY15: +18%). All divisions reported operating improvements compared to FY14, and also compared to 2H14 (except Fibre Packaging, which reported 2H15 underlying EBITDA down 2% yoy). Cash generated from operations was 24% higher for FY15. Net debt came in EUR 115mn lower yoy at EUR 1.5bn, resulting in a reported net debt/EBITDA ratio of 1.1x. Dividend per share is proposed to be EUR 0.52 (FY14: EUR 0.42). For FY16 the company provided a somewhat positive outlook. Currently, Mondi sees some softness in some of its packaging paper grades, but also firmer prices in the European uncoated fine paper markets following recent industry capacity rationalization. Lower energy prices and related input costs, weaker emerging markets currencies, as well as incremental contributions from recently completed major capital projects, are expected to benefit the group’s performance in the near term. We hold a marketweight recommendation on the company.
Baa1n/A-n/A-n – Rio Tinto (RIOLN): No recommendation 6.7% Rio Tinto is one of the world's largest, globally-diversified mining groups. The group combines separately-listed companies, Rio Tinto Plc (incorporated in the UK) and Rio Tinto Ltd. (incorporated in Australia), in a dual-company structure. Rio Tinto is mainly active in four product groups: iron ore, copper, energy and aluminum. The group's business strategy focuses on organic growth through the development of large, long-life, low-cost ore deposits. Shares in Rio Tinto are widely held.
Ba3n/BBB-n/BBBwn – Vale (VALEBZ): No recommendation 6.3% Vale is the world's largest producer of iron ore and iron ore pellets. It is the second-largest producer of nickel. The company derives the majority of its revenues from its Brazilian operations but also has mining assets in Canada, Australia, Indonesia and Mozambique. Vale benefits from low-cost operations, which partly mitigates its lower product diversification compared to its peers (strong focus on iron ore).
Christian Aust, CFA (UniCredit Bank) +49 89 378-12806 [email protected]

March 2016 Credit Research
Euro Credit Pilot
UniCredit Research page 70 See last pages for disclaimer.
Chemicals (Underweight) Sector key figures Sector Wrap-Up Weight in iBoxx NFI: Current ASW spread: change mom/YTD: EURO STOXX CHE YTD:
3.3% 77.7bp -1.4/-0.7 -5.1%
Sector drivers: In its 2016 outlook, Cefic (the European Chemical Industry Council) forecasts slightly higher output growth of 1% yoy in 2016 (vs. +0.5% expected in FY15). According to Cefic, European chemicals production in 2016 should be supported by stable GDP growth in the region next year (which is slightly more cautious than our economists’ expectation of a moderate acceleration in European real GDP growth to +1.7% in 2016, after +1.5% expected for 2015). Softer growth in demand for chemicals from the European manufacturing industry in 2016 (particularly from Automotive after two years of recovery) is expected to be more than offset by stronger growth in demand for chemicals from other industries, including through higher consumer demand, as well as by chemicals export volumes on the back of an improved demand outlook from the global manufacturing industry this year (and still supported by favorable exchange rates and lower oil prices). However, despite the forecast slight acceleration in European chemicals output growth in 2016, the sector should show underlying growth below the EU GDP trend next year. Additionally, chemicals pricing will likely to remain negative overall this year, particularly given the ongoing decline in oil-based raw materials (Jan-Aug 2015 chemical producer prices: -4.5% yoy, according to the latest available Cefic data). While lower prices support the volume outlook, EU chemicals sales (adj. for FX effects) should show a further decline in 2016 (Jan-July 2015: -3% yoy). With the outlook for another year of slow growth in the European chemicals industry in 2016, we also expect more companies to use existing balance-sheet flexibility for inorganic growth initiatives. This leaves the sector with low underlying growth trends (though individual performance should clearly differ, depending on end-industry exposure) and relatively high M&A risk. Market recap: The iBoxx EUR Chemicals index has tightened 4bp since end-2015, whereas the iBoxx NFI has widened by around 20bp. However, excluding the technical tightening following the exclusion of the old SOLBBB hybrids at the beginning of 2016, which were downgraded to a composite HY rating in December 2015, the sector slightly underperformed the broader NFI in the first two months of this year. This was driven by the AKEFP perp and SYNNVX (received a takeover offer from ChemChina) as well as BASGR bonds suffering from weak results. SDFGR and AIFP bonds outperformed in January/February this year. Sector composition: Linde (16.9%), BASF (15.5%), Air Liquide (9.3%), DSM (8.2%), Akzo Nobel (7.7%), Solvay (6.3%), Praxair (5.9%), K+S (5.7%), Evonik Industries (4.4%), Arkema (4.2%), PPG Industries (4.0%), Lanxess (3.7%), Syngenta (3.2%), SABIC (2.7%), Albemarle (2.3%).
Current Ratings (Moody's/S&P/Fitch)
Credit Profile
Name (Ticker): Recommendation Weight in iBoxx Comment Chemicals sector
--/A+wn/-- Stable Air Liquide (AIFP): Marketweight 9.3% Air Liquide released FY15 results that were broadly in line with expectations. For FY16, the company continues to expect another year of net profit growth, excluding the impact of the Airgas acquisition and financing. Air Liquide reported FY15 revenues of EUR 16.4bn, up 3.3% yoy organically. The operating margin increased 50bp to 17.6% and net profit came in at EUR 1.76bn, 5.5% higher than last year on a reported basis. Gas & Services sales rose 3.8% organically to EUR 14.75bn, while growth increased from quarter to quarter, with the strongest growth in 4Q15 at 4.8%. The group operating margin benefitted from efficiency gains of EUR 298mn and lower energy prices. Net cash flow from operating activities (after working capital) was unchanged at EUR 2.8bn, offset mainly by dividends of EUR 1.0bn and capex of EUR 2.3bn, resulting in an increase in net debt of EUR 0.9bn to EUR 7.2bn. We keep our marketweight recommendation.
Baa1s/BBB+s/BBB+s Stable AkzoNobel (AKZANA): Marketweight 7.7% (member of the iTraxx NFI) Akzo Nobel (Baa1s/BBB+s/BBB+s) reported solid 4Q15 results, marginally below expectations. Revenues were up 4% yoy (EUR 14.9bn vs. consensus of EUR 14.8bn), as 6% of positive FX effects offset -1% in volume and -1% in scope. On a regional basis, positive volume development in Asia was more than offset by a flat development in Europe and negative in Latin America. The company delivered on its financial targets, with a return on sales of 10.6% (vs. target of 9%), a return on investment of 15% (vs. 14%) and a net debt/EBITDA ratio of 0.6x (vs. not more than 2.0x). EBITDA came in at EUR 2.1bn, up 24% yoy, right in line with expectations for the full year, while 4Q15 EBITDA was EUR 426mn vs. consensus expectation of EUR 438mn. Group FCF (from operations) was EUR 448mn (FY14: EUR 199mn) and mainly benefitted from the increased EBITDA. Hence, net debt could be reduced to EUR 1.23bn (FYE 2014: EUR 1.61bn). As announced in October 2015 at its CMD, Akzo Nobel will continue to “focus on operational excellence, organic growth, innovation and sustainability”, according to the statement and aims to grow in line with, or faster than, its relevant markets (we note that the market is only growing around 0-3%). Only a few days later, Akzo Nobel confirmed the purchase of BASF’s coil-coatings business for EUR 475mn. While a EUR 475mn deal is easily digestible for Akzo Nobel, we nevertheless highlight the shift in Akzo’s strategy to (also inorganic) growth, as it represents the company’s largest transaction since 2008. For 2016-18, return on sales (RoS) is expected to range between 9% and 11% (vs. 10.6% in FY15) and return on investments (RoI) between 13% and 16.5% (all based on EUR-USD of 1.10 and an oil price around USD 60/bbl). While the company’s guidance is for a challenging FY16, expecting difficult market conditions in Brazil, China and Russia, no significant improvement in Europe and deflationary pressures to continue, the financial outlook was confirmed. We keep our marketweight recommendation on the company.

March 2016 Credit Research
Euro Credit Pilot
UniCredit Research page 71 See last pages for disclaimer.
Current Ratings (Moody's/S&P/Fitch)
Credit Profile
Name (Ticker): Recommendation Weight in iBoxx Comment Chemicals sector
Baa2n/BBBn/-- Improving Arkema (AKEFP): Overweight 4.2% Arkema (Baa2n/BBBn/--) released 4Q15 results somewhat better than expected, as EBITDA slightly exceeded and revenue fell slightly short of expectations. The company expects to increase EBITDA in FY16. Revenue for the quarter amounted to EUR 1.76bn (vs. company collected consensus: EUR 1.83bn), equivalent to a 23% increase yoy, including a 24.4% contribution from scope effects (mainly Bostik), while it decreased organically 6.4% (volumes +2.1%, prices -8.5%). EBITDA for the quarter came in 29% higher yoy at EUR 214mn (vs. EUR 192mn), and resulting in an EBITDA margin of 12.2% (4Q14: 11.3%). The High Performance Materials segment reported 72% yoy higher EBITDA thanks to first synergies from the Bostik integration, developments in fluorinated polymers and a good development of the filtration and absorption business. The 13.6% EBITDA margin for the segment was mechanically diluted by the Bostik integration. The thiochemicals platform in Malaysia supported EBITDA growth (+10.7% yoy) in the Industrial Specialties segment (EBITDA margin of 15.6% vs. 13.3% in 4Q14). Coating Solutions was impacted by low-cycle conditions (EBITDA -28% yoy, EBITDA margin of 6.1% vs. 7.3% in 4Q14). For the full year, revenue rose 29% to EUR 7.68bn (organic: -4.5%; FY14: 5.95bn) and EBITDA was EUR 1,057mn, therefore exceeding the target range of EUR 1,020-1,040mn (FY14: EUR 784mn). The FY15 EBITDA margin reached 13.8% (FY14: 13.2%). Arkema reports FCF of EUR 442mn for the full year (FY14: EUR 21mn), thanks to lower capex and a working capital release (partially driven by lower raw material costs). Net debt stood at EUR 1.38bn at FYE 2015 compared to EUR 1.63bn at end-September, resulting in a net debt/EBITDA ratio of 1.6x, as reported by the company (including 50% of hybrid debt). The company’s outlook for 2016 includes capex of EUR 470mn and EBITDA growth. Arkema expects moderate worldwide growth, with divergent dynamics by region. In FY15, EUR 30mn of the targeted cumulative EUR 100mn in savings over 2015 to 2017 in operational excellence were achieved. As, following the Bostik acquisition, the company continues to be on track to deleverage to credit metrics commensurate with its Baa2/BBB rating (stable outlooks potentially towards year-end 2016), we confirm our overweight recommendation on the name. We prefer the AKEFP 4.75% 10/49 perpetual, trading at YTC 5.3%.
A1s/A+n/A+s Weakening BASF (BASGR): Underweight 15.5% (member of the iTraxx NFI) BASF (A1s/A+n/A+s) released 4Q/FY15 results in line with the preliminary numbers of its profit warning issued at the end of January. For FY16, the company guides for a considerable sales decline and a slight decline in EBIT before special items. 4Q15 revenues amounted to EUR 13.9bn (down 23% yoy). This was primarily driven by the asset swap of its natural gas trading and storage activities with Gazprom (total scope -19%), while support came from the strong USD (+3%). Volumes and prices deducted another 7% from 4Q15 sales. EBIT before special items for the quarter (down 30%yoy) suffered from the performance of the oil & gas and the chemicals segments, more than offsetting positive FX effects. In the chemicals segment, the petrochemicals division took the hardest hit due to lower margins. 4Q15 EBITDA was down 34% to EUR 1.89bn. For the full year, sales were 5.2% lower than in the prior year, EBITDA -3.6% and EBIT before special items -8.4%. Sales prices fell in almost all divisions (-9%), while volumes were up 3% mainly due to the oil & gas segment. A working capital release boosted FY15 FCF to EUR 3.6bn, up EUR 2bn compared to the prior year. Dividends amounted to EUR 2.8bn, resulting in a net debt decrease of EUR 710mn yoy. Net debt now stands at EUR 13bn. For 2016, BASF expects global chemical production to grow 3.4% (2015: 3.6%), based on an oil price of USD 40/bbl (Brent). The company guides for many uncertainties for its outlook for 2016. As a result, sales are expected to decrease considerably (>5%), also on the back of the divestiture of the natural gas trading and storage activities. Both EBIT and EBIT before special items are anticipated to decline slightly (≤10%). Still, in the challenging macroeconomic environment, the company regards its targets as “extremely difficult” to achieve. Regarding capex, BASF expects investments of EUR 4.2bn (FY15: EUR 5.2bn). We note that the company last year guided for capex amounting to EUR 4.0bn. Although BASGR bond spreads have widened remarkably compared to peers over the last quarter, we keep our underweight recommendation on the company, as the continuously low oil price continues to squeeze profitability and growth. Also, the capex target was exceeded by more than 25% in FY15. Furthermore, for the time being, management has not communicated a strategy as to how it plans to counter the worsened trend in its business. As a result, we see an increased incentive for inorganic growth.

March 2016 Credit Research
Euro Credit Pilot
UniCredit Research page 72 See last pages for disclaimer.
Current Ratings (Moody's/S&P/Fitch)
Credit Profile
Name (Ticker): Recommendation Weight in iBoxx Comment Chemicals sector
Baa3s/BBBs/-- Stable Brenntag (BNRGR): Overweight 0.0% Brenntag will report its FY15 results on 16 March. We keep our overweight recommendation on Brenntag despite its weaker-than-expected 3Q15 results (reported in November 2015), its lower full-year 2015 outlook (to be released on 16 March) and the USD 440mn in acquisitions in the US. While this might sound counterintuitive – as the current operating performance shows the impact from weaker demand in the oil and gas industry in North America as well as the impact from economic slowdown in emerging markets – we note that relevant credit metrics further improved in LTM 9M15 on the back of strong cash-flow generation, which was supported by improved working-capital management. Constant-currency, top-line growth slowed to 0.8% in 3Q15 (EUR 2.61bn), as a stable result in Europe did not offset the double-digit decline in North America (NA) (-11%) and lower sales in LatAm (-1.5%) and Asia Pacific (-9%). Although 3Q15 group EBITDA of EUR 204mn (-2% at constant FX; +8% yoy on reported basis) suffered from a weaker contribution from NA (-9%) and came in approximately 5% below market expectations, EBITDA continued to improve in all other major sales regions (also adj. for positive FX effects). However, FCF generation was boosted by a EUR 12mn working-capital-related inflow in 3Q15 (vs. a EUR 28mn charge in 3Q14). Both gross debt and net debt were further reduced in 3Q15. Hence, fully adj. net leverage (UniCredit definition) declined to 1.9x in LTM 9M15 (from 2.2x at FYE 2014 and 2.3x in 9M14), with adj. FFO/net debt improving to 33%. Given the current headwinds from NA and emerging markets, Brenntag reduced its full-year 2015 EBITDA outlook to EUR 790-810mn from its previous EUR 830-855mn (vs. EUR 727mn reported in FY14). Management still expects higher contributions from Europe (also adj. for FX) and a significant EBITDA improvement in LatAm as well as in Asia Pacific. In the short term, the weaker NA market environment (and EBITDA contribution) will be partly mitigated by active cost management. Additionally, Brenntag aims to reduce its dependency on the oil and gas industry in NA via the announced acquisitions of two distributors of lubricants to a broad range of end-markets in the US for a combined EV of USD 440mn (approximately EUR 400mn). While its US acquisitions should improve Brenntag’s business profile in the region (higher industry diversification; reduced earnings volatility), management’s response to the changed market environment in US oil and gas also implies a (temporary) deviation of Brenntag’s annual M&A budget of EUR 200-250mn p.a., which we now expect to move to around EUR 550-600mn this year, including recent acquisitions in Turkey, the Netherlands, Dubai and Singapore (not yet reflected in 9M15 results). Assuming fully debt-financed acquisitions, this implies an increase in pro forma net leverage to around 2.3-2.4x and in the adj. debt/EBITDA ratio to around 2.8-2.9x (fully adj.), which is above S&P’s base-case for the BBB rating of net leverage between 1.9-2.1x in 2015/16 but still in line with Moody’s expectation (for the Baa3 rating) of adj. debt/EBITDA at around 3.0x or below. While this could imply a negative outlook at S&P, we believe Brenntag is able to improve credit metrics over a two-year horizon towards net debt/EBITDA of 2.1x (assuming 2% EBITDA growth, pro forma for the contribution from announced acquisitions, and at least EUR 100mn FCF generation after dividends p.a.). Both agencies stressed that they expect no change in Brenntag’s financial policies for their stable outlooks. This leaves some risk that Moody’s might also take (outlook) action, despite its upgrade to IG in March 2015. We see the risk of Brenntag returning to HY as very moderate at this stage and mitigated by Brenntag’s improvement in underlying cash generation.
A3n/A-s/A-s Stable DSM (DSM): Overweight 8.2% (member of the iTraxx NFI) DSM reported 4Q15/FY15 results in line with expectations. Still supported by FX effects, as well as by 3% higher volumes (offsetting 2% lower prices), revenues increased 6% yoy to EUR 1.93bn. Reported 4Q15 EBITDA improved 3% yoy to EUR 261mn, driven by still double-digit growth in Performance Materials (though lower input prices feed through to customers) and 3% higher EBITDA in Nutrition (pricing remained flat in 4Q15/FY15), which was partly offset by higher corporate costs, likely due to upfront costs for the targeted adjustment of DSM’s global organizational and operating model. As previously stated, the reshuffling of the support & service functions is expected to result in annual savings of EUR 100-125mn in FY18 (EUR 25mn achieved in 2015), while the additional EUR 130-150mn efficiency program for Nutrition was just launched with the CMD in November 2015. Hence, DSM confirmed the targets of its 2015-18 strategy and expects to deliver increased EBITDA in FY16 (we note that the 2018 Driving Profitable Growth strategy calls for annual EBITDA growth in the high-single-digit area). DSM finished 2015 with a EUR 0.1bn lower reported net debt position of EUR 2.32bn (reported net leverage of 2.2x; -0.1x yoy), given improved cash generation and lower investments in working capital and capex. Following solid FY15 results and confirmation of its strategy, we reiterate our overweight recommendation on DSM.
Baa2p/BBB+s/-- Stable Evonik Industries (EVKGR): Marketweight 4.4% Evonik Industries (Baa2p/BBB+s/--) reported weaker-than-expected 4Q15 results and expects lower EBITDA in FY16. Despite solid volume growth (+3%), revenues declined 1% organically in 4Q15 to EUR 3.20bn (reported -1% yoy), driven by 4% lower prices in the quarter (oil-price effect in Performance Materials). However, group EBITDA of EUR 501mn (+12% yoy) met the consensus estimate, supported by continued cost savings and a release of provisions in 4Q15. For the full-year 2015, Evonik reported 5% higher revenues (+1% organic) and an adj. EBITDA of EUR 2.47bn (+31% yoy). Capex in 4Q15 was lower yoy (EUR 293mn vs. EUR 370mn) and reported FCF of EUR 378mn improved clearly from the EUR 113mn reported in 4Q14. Consequently, and despite a EUR 200mn contribution to pensions, Evonik’s net cash position at year-end 2015 improved to EUR 1.1bn. Pension provisions decreased by EUR 0.5bn qoq to EUR 3.3bn, which resulted in adj. net leverage (incl. pensions) of 0.9x at FYE 2015 (vs. 1.9x at FYE 2014). Given Evonik’s expectation of a weaker global growth dynamic this year, the group forecasts “slightly lower” sales this year (FY15: EUR 13.51bn). We note that this reduced dynamic is in line with the view of the VCI (German Chemical Industry Association), which lowered its FY16 outlook for German chemicals sales growth to 0.5% (previously: +1.5%) mainly due to a 0.5% decline in prices this year (previously: stable) and only 1% higher production (previously: +1.5%). With the expected top-line decline, Evonik sees adj. EBITDA, despite continued contributions from cost savings programs, to decline to a range of EUR 2.0-2.2bn (vs. EUR 2.47bn in FY15 and a pre-results consensus estimate of EUR 2.4bn). Capex should remain “around the level of 2015” (EUR 0.9bn) and Evonik also expects to continue generating positive FCF in FY16 as it aims to remain disciplined with regard to M&A. Evonik confirmed its medium-term (2018) targets of EUR 18bn in revenues and an adj. EBITDA of more than EUR 3bn. We think the strong FCF generation and deleveraging in FY15 could justify an upgrade to Baa1 at Moody’s to bring the ratings in line with those of S&P. However, FCF is likely to weaken given the expected strong decline in EBITDA this year and stable capex. We continue to believe that Evonik would also pursue a larger transaction if it found a suitable candidate. However, in the absence of any large, debt-financed M&A, we believe ratings will remain at the upper Baa/BBB level. Given that EVKGR bonds trade in line with AKZANA and with a pick-up to better-rated DSM bonds, we confirm our marketweight recommendation on Evonik.

March 2016 Credit Research
Euro Credit Pilot
UniCredit Research page 73 See last pages for disclaimer.
Current Ratings (Moody's/S&P/Fitch)
Credit Profile
Name (Ticker): Recommendation Weight in iBoxx Comment Chemicals sector
Ba1s/BBBn/-- Weakening K+S (SDFGR): Marketweight 5.7% K+S will release its FY15 results on 10 March. K+S reported 3Q15 results slightly below expectations in November 2015 and, as expected, narrowed its 2015 full-year earnings outlook ranges. Based on yoy lower Potash and Magnesium volumes but higher average prices (potash prices were stable qoq) and the continued volume and price increases in Salt, K+S reported 8% higher yoy revenues of EUR 891mn for 3Q15. Also reported EBITDA was up 7% yoy to EUR 199mn (+7% yoy), supported by positive FX effects. However, earnings (EBITDA, EBIT I) came in below expectations, mainly due to lower potash volumes (due to production constraints i.e. maintenance, according to K+S) and increased depreciation in the quarter. Though operating cash flow remained resilient after 9M15 (+1.1% yoy) given the strong turnaround in 3Q15 (+78% yoy), reported adj. FCF of minus EUR 171mn in 3Q15 (vs. minus EUR 176mn in 3Q14) remains affected by higher capex for the Legacy mine. Hence, reported net debt continued to move upwards to EUR 2.22bn at end-September 2015 (vs. EUR 2.02bn in 1H15 and EUR 1.68bn at FYE 2014). Despite the significant investments in the Legacy project, reported net debt/EBITDA increased only to 2.1x in LTM 9M15 – up 0.1x qoq and 0.2x vs. FYE 2014 – and hence, it remains in line with K+S’s guidance during the capex period. While K+S expects a slight decline in potash volumes in 2015 (previous: “slightly higher”), salt volumes are still expected to remain stable yoy in 2015. Hence, K+S largely confirmed its full-year 2015 guidance but tweaked its FY15 revenues forecast to EUR 4.3-4.5bn (previous: EUR 4.35-4.55bn), with yoy growth driven by still-higher average pricing in Potash (vs. FY14) and higher prices/volumes in Salt. The FY15 earnings guidance was also confirmed, though management, as indicated in October 2015, expects to achieve only the lower end of the respective outlook ranges. Consequently, the forecast was updated to FY15 EBITDA between EUR 1.06bn and EUR 1.11bn (previous: EUR 1.06-1.14bn) and EBIT I of EUR 780-830mn (previous: EUR 780-860mn) as FX effects (based on EUR/USD 1.11) as well as the fit-for-future program should further contribute to the results (EUR 500mn in cost savings targeted by 2016 of which more than EUR 120mn in FY15, which represents a slight incremental positive vs. FY14). This should more than offset the positive one-offs in FY14 as well as the incremental opex for the Legacy project. K+S confirmed that the Legacy project remains on track, in time and on budget and confirmed the FY15 capex guidance of EUR 1.3bn. Continued execution of the Legacy project in line with the schedule still implies significantly negative adj. FCF in FY15 and FY16 (vs. minus EUR 0.3bn reported in FY14) but remains key to any rating improvement at Moody’s. K+S also confirmed its 2020 outlook (introduced with 2Q15) of an EBITDA increase to EUR 1.6bn (CAGR 2014-2020: 10%), mainly driven by the Legacy project and the “Salt 2020” program. We expect 3Q15 results, reported below company-collected consensus expectations (likely outdated) as well as the narrowed full-year outlook ranges (was indicated by management before) to weigh only marginally on SDFGR spreads, as potash peers (e.g. Potash Corp., Mosaic) have already indicated a more challenging market environment in Potash from 3Q15. Hence, we confirm our marketweight recommendation on K+S.
Baa3s/BBB-p/-- Improving Lanxess AG (LXSGR): Marketweight 3.7% (member of the iTraxx NFI) Lanxess will report FY15 results on 17 March. Lanxess reported 3Q15 results above expectations and raised its FY15 outlook in November 2015. While 3Q15 revenues (EUR 1.95bn, -4% yoy) remained below expectations due to lower prices, reported EBITDA before exceptionals increased more strongly than expected, by 12% yoy to EUR 235mn, due to FX and faster realization of cost savings. All three segments contributed to the earnings increase, and the EBITDA margin climbed to 12%. Despite higher working capital (NWC/sales at 22%), net financial debt was slightly lower yoy at EUR 1.32bn at end-September 2015 (vs. EUR 1.34bn in 3Q14), while pensions remained broadly stable at EUR 1.3bn yoy. Given the solid performance in 3Q15 and the already-achieved EUR 150mn cost savings this year due to phase I of the Lanxess restructuring program (one year ahead of schedule), Lanxess again raised its FY15 outlook for EBITDA pre-exceptionals to EUR 860-900mn (previously: EUR 840-880mn). Additionally, Lanxess anticipates a further EUR 150mn in cost savings by 2019 from the optimization of its global plant network (phase II). We also expect the execution of phases II (plant optimization) and III (see recently announced JV with Saudi Aramco in synthetic rubber) of Lanxess’ restructuring to be the main focus during the upcoming quarters. With short-term downgrade risks clearly reduced this year on the back of the faster-than-expected progress on the “Let’s Lanxess again” program, we raised our recommendation from underweight to marketweight following the 3Q15 results and CMD in early November. While we continue to regard LXSGR spread levels as tight vs. those of better-rated peers, we also see no triggers for a significant underperformance of the bonds at the moment.
A2s/A+s/-- Weakening Linde (LINGR): Underweight 16.9% (member of the iTraxx NFI) Linde will report its FY15 results on 10 March. Linde (A2s/A+s/–) published mixed 9M15 results. The FY15 guidance was maintained. Revenues increased 7.7% to EUR 13.6bn (9M14: EUR 12.6bn) driven by exchange rate effects – at constant currency there was a decline of 0.9%. Also group operating profit (EBITDA incl. profit/losses from associates and JVs) rose 8.2% to EUR 3.1bn (9M14: EUR 2.9bn), while, excluding currency effects, it was down 0.7%. The operating margin thereby improved slightly to 23.1% (9M14: 23.0%). Mainly on the back of an adjustment for additional funding for pension plans made in the prior-year period, operating cash flow rose 26.6% to EUR 2.4bn (9M14: EUR 1.9bn), while adjusted for this effect, the increase was 9.2%, supported by the higher operating profit. Net financial debt declined somewhat qoq to EUR 8.2bn (1H15: EUR 8.5bn). The net debt/EBITDA ratio as calculated by the company remained at 2.0x (FYE 2014: 2.1x, 1H15: 2.0x). The Gases division posted a revenue increase of 1.5% organically, benefitting from positive trends in the fast-growing Healthcare business (+7.6% at constant currencies), especially in the US. All regions reported growth, while on an organic basis, the EMEA region was down 1.6% due to the expiry of a hydrogen supply contract in Italy. Also, operating profit was up for all regions. The Engineering division continues to suffer. Owing to the low oil price and limited discretionary spending, the order backlog remained at EUR 3.8bn, a significantly lower level than last year with an order intake of EUR 1.1bn (9M14: EUR 2.7bn). Revenues for the division were down 10.1% to EUR 2.0bn (9M14: EUR 2.2bn), with operating profit declining by 21.8% to EUR 169mn (9M14: EUR 216mn), resulting in an operating margin of 8.4%. Linde continues to expect group revenues of EUR 17.9-18.5bn and an operating profit of EUR 4.1-4.3bn. For the Gases division, the company anticipates revenues of EUR 15.1-15.5bn and an operating profit of EUR 4.1-4.3bn, while for the Engineering division revenues are forecast to amount to EUR 2.5-2.7bn at an operating profit margin of 8%. Also, the medium-term outlook was confirmed. The company regards the macroeconomic environment as challenging. We keep our underweight recommendation on the name for relative value reasons.

March 2016 Credit Research
Euro Credit Pilot
UniCredit Research page 74 See last pages for disclaimer.
Current Ratings (Moody's/S&P/Fitch)
Credit Profile
Name (Ticker): Recommendation Weight in iBoxx Comment Chemicals sector
Baa2n/BBB-s/BBBn Stable Solvay (SOLBBB): Marketweight 6.3% (member of the iTraxx NFI) Solvay announced 4Q15/FY15 results in line with expectations. With Cytec contributing only from FY16, Solvay’s net sales of EUR 2.54bn in 4Q15 declined 1% (organic: -5%) as lower volumes and mix in oil-market-related Advanced Formulations (-16%) as well as lower prices in Functional Polymers (-9%) were not fully offset by a stable performance in Performance Chemicals (+2%) and mainly FX-related growth in Advanced Materials (+13%). For the full-year 2015, group sales were up 4% yoy (organic: -2%) to EUR 10.58bn. In line with the company-collected consensus, group recurring EBITDA (REBITDA) in 4Q15 improved 4% yoy to EUR 429mn, driven by continued improvement in all segments, except Advanced Formulations. Supported by Solvay’s Excellence cost savings program, the REBITDA margin improved by 100bp to 18% in FY15. Reported FCF (before acquisitions) declined to EUR 376mn in 4Q15 (-31% yoy), mainly due to a lower seasonal working capital-related inflow. Given the strong seasonality, reported full-year FCF (excl. M&A) came in 41% lower yoy at EUR 387mn, also due to a contribution from discontinued operations. Including Cytec, pro-forma FCF would have amounted to EUR 492mn. However, as the Cytec acquisition (completed at year-end 2015) and refinancing was already recognized in cash-flow and balance sheet, net debt incl. hybrids increased to EUR 6.6bn at end-December 2015 from EUR 2.0bn incl. hybrids at FYE 2014, which results in a gearing ratio of 88% and a pro-forma net leverage incl. hybrids and REBITDA contribution of Cytec of 2.8x (and pro-forma net leverage of 1.9x excl. hybrids). In FY16, Solvay will focus on the integration of Cytec and continued execution of the Excellence program, which is expected to deliver another approx. EUR 200mn in cost savings by FYE 2016 (vs. around EUR 600mn achieved in 2013-15). Hence, Solvay expects REBITDA growth (from the EUR 2.34bn pro-forma level) in the high single-digits this year, assuming no further market deterioration and oil at USD 30/bbl. While this is slightly higher than the pre-results consensus expectation of 3-4% REBITDA growth this year, Solvay noted that 2016 growth will likely be back-end-loaded, but achieved in all four segments. Earnings growth and disciplined capex should also lead to a sharp increase in FCF generation and Solvay forecasts EUR 650mn in FY16 (+32% on FY15 pro-forma level). The target for cost synergies with Cytec exceeding EUR 100mn by 2018 has also been confirmed (EUR 20mn already achieved). Management remains committed to maintaining an IG rating and we note that the group’s 2016 targets, including the slightly higher proposed dividend of EUR 3.30/share for FY15, imply a deleveraging of around EUR 300mn this year or around 0.3x towards 2.5x at FYE 2016 (incl. hybrids). While execution and delivery of the deleveraging remains critical and we will have a close look at its progress, we think there should be no additional short-term pressure on ratings following the FY15 results (despite the currently negative outlook at Moody’s and Fitch, which still have a one-notch higher rating compared to S&P). Consequently, we keep our marketweight recommendation on Solvay, but expect the SOLBBB hybrids (currently trading at attractive levels following their recent underperformance), in particular, to benefit from the results announcement and management's commitment to IG. We also note that the EUR 500mn SOLBBB perp that will become callable this year is likely to be called but unlikely to be refinanced with another perp, which should somewhat ease pressure regarding a potential new hybrid issue.
A2wn/A+wn/-- Weakening Syngenta (SYNNVX): Underweight 3.2% ChemChina confirmed its offer of USD 465 per share in cash for all Syngenta shares (USD 43.2bn) and will allow the distribution of a dividend of up to CHF 16 per share by Syngenta (USD 1.5bn). Syngenta’s board supports the offer and the minimum acceptance level was set at 67% (if a 90% acceptance level is reached, ChemChina aims to take Syngenta private). Further, the offer remains subject to ChemChina obtaining all regulatory approvals (incl. approval by the US committee on foreign investments) without major remedies (i.e. without major mandatory divestures or loss of influence by ChemChina). The break-up fee was set at USD 3bn for ChemChina and USD 1.5bn to be paid by Syngenta if management withdraws its support of the offer. The USD 1.5bn dividend payout will be financed from Syngenta’s FCF (FY15: USD 0.8bn before acquisitions, forecast to rise to over USD 1.0bn in FY16). We believe there is a high probability that the minimum acceptance level will be achieved, as the offer is all-cash and antitrust issues should be fewer than for a Monsanto/Syngenta merger. However, political issues will certainly arise as ChemChina is effectively 100% controlled by the People’s Republic of China. According to management statements, Syngenta has agreed, with ChemChina, to keep an IG rating. ChemChina chairman Ren Jianxin stated that there are plenty of potential (co-)investors (funds and banks incl. equity investors) that will have the possibility to “either invest in ChemChina or into the [Syngenta] transaction” [i.e. the acquisition SPV] but that a consortium has not yet been selected. We have an underweight recommendation on Syngenta.
Christian Aust, CFA (UniCredit Bank) +49 89 378-12806 [email protected]

March 2016 Credit Research
Euro Credit Pilot
UniCredit Research page 75 See last pages for disclaimer.
Construction & Materials (Marketweight) Sector key figures Sector Wrap-Up Weight in iBoxx NFI: Current ASW spread: change mom/YTD: EURO STOXX CNS YTD:
2.4% 120.5bp +3.1/+19.4 -11.7%
Sector drivers: Volumes are expected to moderately increase in 2016. Construction is largely a regional play, and prospects differ by region. For Europe, construction activity is expected to grow by 2%+, led by eastern European countries, with France, for example, forecast to show moderate recovery. Prospects remain favorable for the US, mainly on continued positive momentum for residential and some improvement in non-residential and infrastructure investments. Cost inflation is expected to ease for energy, which should help offset ongoing inflationary pressure and deteriorating economic environment in emerging markets. Profitability is expected to further benefit from price increases (in cement in some markets), higher volumes and benefits from cost-cutting programs. Market recap: The iBoxx EUR Construction & Materials index has widened by around 20bp since the start of the year. Performance was mainly impacted by VOTORA and LHVNX bonds, while short-dated ENFP and CRHID issues outperformed the sector in the past two months. Sector composition: Saint-Gobain (24.3%), Bouygues (21.7%), CRH (16.4%), Lafarge (12.7%), LafargeHolcim (5.1%), Imerys (5.0%), Vinci (4.0%), Voto-Votorantim (3.8%), Geberit (2.4%), Danfoss (2.4%), Mohawk Industries (2.4%).
Current Ratings (Moody's/S&P/Fitch)
Credit Profile
Name (Ticker): Recommendation Weight in iBoxx Comment Construction & Materials sector
Baa1s/BBBs/-- Stable Bouygues (ENFP): Marketweight 21.7% (member of the iTraxx NFI) Bouygues reported FY15 results roughly in line with expectations. The company reported revenues of EUR 32.4bn in FY15 (versus consensus estimates of 32.5bn), a decline of 2% yoy (-5% lfl at constant exchange rates), but group EBITDA remained basically flat yoy at EUR 2,411mn. The latter was mainly driven by TF1 and Bouygues Telecom, which offset the EBITDA decline in Construction. Despite weaker EBITDA development in Construction, Bouygues claimed that the current operating margin of this business field remained stable at 3.2% in 2015 and that the order book was up 5% yoy to EUR 29bn at FYE 2015. In the telecom unit, EBITDA rose by 8% to EUR 752mn, thanks to a mobile ARPU stabilization. The telecom EBITDA margin improved yoy by 180bp to 19.7% in FY15. Net debt came to EUR 2.6bn at FYE 2015, down EUR 0.7bn yoy. Hence, reported net leverage was low at 1.1x. We note that the mentioned net-debt figure did not include the proceeds of the Alstom public share buyback offer (EUR 996mn received in late January 2016). For 2016, Bouygues’ management expects an ongoing profitability improvement. In Construction, it will continue to target growth in international markets and to broaden its portfolio of offers with innovative products and services in both its existing markets and new market segments. Profitability is, hence, expected to start improving in 2016. For Bouygues Telecom, management confirmed its standalone targets: EBITDA margin target of 25% for 2017 and planned cost savings of at least EUR 400mn in 2016 compared to end-2013. Capex is expected to reach EUR 750-800mn in 2016. However, the main driver for the Bouygues’ credit profile remains the merger discussions between Bouygues Telecom and Orange, which would bolster its long-term presence in the telecoms sector. The acquisition of Bouygues’ telecoms unit by Orange will likely face significant regulatory hurdles – even if both parties can agree on a transaction. If such a transaction is closed, the impact on Bouygues’ credit profile depends heavily on the conditions of the transaction. So far, we assume (based on newspaper speculation) that Bouygues would receive a stake of around 15% in Orange plus a cash payment of around EUR 2bn for its telecoms unit. If the latter were used for debt reduction, it would largely offset the lost EBITDA from the telecom unit. ENFP bonds could benefit from a potential bond buyback. Given that ENFP bonds already trade tight for their ratings and compared to peers, as well as the uncertainty of such a transaction, we keep our marketweight recommendation on the name.
Baa2s/BBB+n/BBBn Improving CRH (CRHID): Overweight 16.4% CRH (Baa2s/BBB+n/BBBn) reported FY15 results that exceeded consensus expectations (Bloomberg), surpassing its EBITDA guidance of EUR 2.08bn with EUR 2.22bn (+35% yoy). For FY16, the company expects “a year of continued growth”. Revenues for FY15 amounted to EUR 23.6bn (vs. Bloomberg consensus of EUR 23.1bn), up 25% yoy. During FY15, the markets showed a positive development in the Americas and a mixed picture in Europe. The assets acquired from Lafarge/Holcim made a strong contribution and post-acquisition sales and EBITDA were above expectations. Cash inflow from operations reached EUR 1.3bn, up 47%. Net debt amounted to EUR 6.6bn (9M15: EUR 8bn), in light of the acquisition of the Lafarge/Holcim assets. Dividends per share will be maintained at EUR 0.625. For FY16, the company expects continued growth in US housing construction and that non-residential construction will also show gains. The backdrop in Europe is expected to be broadly stable in 2016, with regional variations. For Asia, the company anticipates continued good growth in the Philippines. As the year-end debt metrics were above its target, CRH is confident that it will be able to restore the metrics to normalized levels during 2016. Hence, we confirm our overweight recommendation.
Baa2s/BBBs/BBBs Stable LafargeHolcim (LHNVX): Marketweight 5.1% (member of the iTraxx NFI) LafargeHolcim, reported combined results for the first time with its 3Q15 figures. Reported net sales of CHF 7.83bn (-8.7% yoy; -1.1% like-for-like) came in below already-cautious market expectations (CHF 7.92bn), particularly impacted by weaker Aggregates (-1.7%) and Ready Mix (-0.4%) volumes while Cement volumes were slightly up in the quarter (+0.2%). Regionally, markets remained slow in Middle East Africa (-5.1%), Asia (-2.3%) and Europe (-1.8%). Reported cash flow from operations declined to CHF 0.3mn in 3Q15, which, despite EUR 0.6bn of maintenance and expansion capex and incl. CHF 6.1bn in disposal proceeds, resulted in the combined LafargeHolcim starting with net financial debt of CHF 18.3bn at end-September 2015. LafargeHolcim also used the release of combined 3Q15 results to announce a new 2016-18 strategic plan. The targets, which assume 2% annual market growth, include CHF 10bn of FCF generation over the coming three years. Cumulative capex of CHF 3.5bn in 2016 and 2017 should be covered by CHF 3.5bn of additional divestments planned (in 2016). Despite remaining committed to a “solid IG rating”, management reiterates its target of a progressive dividend policy with a payout ratio of 50% over the cycle (proposed 2015 dividend was increased from CHF 1.30 to CHF 1.50). LafargeHolcim has, so far, confirmed the CHF 1.1bn synergies target, but now expects this to already be achieved by FYE 2017 (previously: 2018). LafargeHolcim expects markets in China, Brazil, France, India and Switzerland to remain challenging for the remainder of this year, while positive trends in the US, UK and Philippines should continue. The target of CHF 100mn in synergies this year as well as a maximum of CHF 1.4bn in capex in 2H15 was confirmed. However, the combined FYE 2015 net debt target was increased to CHF 17.5bn, which corresponds to CHF 15.5bn (previously CHF 15.0bn) before the Lafarge squeeze-out and fair-value adjustment of LGFP bonds. We continue to have a marketweight recommendation on LafargeHolcim. While the short-term situation (2H15) is weaker than expected (particularly the higher year-end net debt target), the outlook for strong FCF generation in 2016-18 is supportive. However, we would wait for more details on how expected FCF is applied to debt reduction and shareholder remuneration.

March 2016 Credit Research
Euro Credit Pilot
UniCredit Research page 76 See last pages for disclaimer.
Current Ratings (Moody's/S&P/Fitch)
Credit Profile
Name (Ticker): Recommendation Weight in iBoxx Comment Construction & Materials sector
Baa2s/BBBs/BBBwn Stable Saint-Gobain (SGOFP): Underweight 24.3% (member of the iTraxx NFI) Saint-Gobain (Baa2s/BBBs/BBBwn) released FY15 results in line with expectations and set up a new cost savings program to support its FY16 outlook for further like-for-like (lfl) earnings growth. Following slightly better performance in 4Q15, Saint-Gobain reported 2% lfl growth in operating income (EUR 2.64bn) after the group lowered its FY15 target to “yoy stable operating income” with its 9M15 results in October 2015. Driven by Flat Glass and Interior Solutions, like-for-like revenue growth slightly accelerated in 4Q15 to 0.4% (EUR 9.80bn) from 0.2% in 3Q15. Thus, Saint-Gobain reported 0.4% lfl higher revenues (EUR 39.62bn; reported +3.3%) for full-year 2015. EBITDA increased by 0.8% lfl to EUR 3.84bn in FY15, supported by revenue growth and by achieving the targeted EUR 360mn of cost savings last year (in particular, enhancing margins in Flat Glass). As FY15 capex remained in line with guidance at EUR 1.35bn (+10% yoy) and due to EUR 2.5bn in disposal proceeds from the Verallia sale collected in 4Q15, reported net debt declined strongly to EUR 4.80bn at year-end 2015 (FYE 2014: EUR 7.22bn). Excluding the Verallia sale, net debt declined by EUR 0.7bn in 2H15, which points to yoy improved operating cash-flow generation in the second half. We note, however, that Saint-Gobain continues to pursue the EUR 2.3bn acquisition of a controlling stake in Swiss Sika (likely won’t be completed before summer 2016, however). For 2016, management sees “more vibrant trading in Western Europe, with France stabilizing” and continued “slight growth” in NA construction markets (though the outlook for NA industrial markets has become more uncertain). Additionally Saint-Gobain announced a new EUR 800mn cost savings program for the period 2016-18 (of which EUR 250mn is expected to be achieved in FY16), targeting purchasing and operational excellence. Combined with a focus on protecting prices, Saint-Gobain forecast a further like-for-like improvement in operating income this year. As FY16 capex is expected to remain at around EUR 1.4bn (mainly targeting growth outside Western Europe), the group keeps a “priority focus on high FCF generation”. The dividend proposal of EUR 1.24/share for FY15 remained stable yoy. Given that SGOFP bonds continue to trade tight vs. mid-BBB rated peers and that we expect no significant improvement in credit metrics or ratings in 2016, we keep an underweight recommendation on Saint-Gobain.
Baa1s/A-s/BBB+s Stable Vinci (DGFP): Marketweight 4.0% Vinci reported slightly better-than-expected FY15 results. Comparable revenues were down 4.3% to EUR 38.5bn (consensus: EUR 38.3bn), as Contracting was down 6.2% on the back of weak market conditions in France and a more uncertain global operating environment. Order intake in Contracting grew 3.0% to EUR 31.4bn, while a 9% increase outside of France more than offset a 2% domestic decline (despite some recovery of the French residential property market in 2015). Progress at Vinci Autoroutes (+4.0% yoy), Vinci Airports (+20.2%) and Vinci Energies (+6.1%) pushed group EBITDA to EUR 5.7bn for the year, up 3.6% excluding Vinci Park, more than offsetting a 14.2% decrease in Vinci Construction. Therefore, the EBITDA margin also advanced 50bp yoy to 14.7%. A sharp rise in FCF (company-defined, before acquisitions/disposals) in the Contracting business from EUR 0.4bn in FY14 to EUR 1.1bn supported group FCF, which increased to EUR 3.0bn (FY14: EUR 2.2bn). Therefore, net financial debt was down to EUR 12.4bn, compared to EUR 13.3bn at FYE 2014, corresponding to an unadjusted net leverage of 2.2x (FYE 2014: 2.4x). Although Vinci expects weaker traffic growth, revenue at Vinci Autoroutes is expected to grow at a similar rate to 2015, as new tariff arrangements are applicable from 1 February 2016. Growth at Vinci Airports is forecast to continue, albeit at a slower pace due to the higher comparison base. Eurovia and Vinci Construction revenues are likely to continue their decline, while Vinci Energies are expected to book stable revenues. Management indicated that Vinci will bid for stakes in Nice and Lyon airports, which are planned to be privatized. The results once more prove that the complementary business models of Vinci’s Concessions and Contracting businesses enable the company to offset the impact of challenges in individual areas. We keep our marketweight recommendation on Vinci.
Christian Aust, CFA (UniCredit Bank) +49 89 378-12806 [email protected]

March 2016 Credit Research
Euro Credit Pilot
UniCredit Research page 77 See last pages for disclaimer.
Health Care (Marketweight) Sector key figures Sector Wrap-Up Weight in iBoxx NFI: Current ASW spread: change mom/YTD: EURO STOXX HCA YTD:
5.7% 87.5bp -3.6/+10.3 -3.8%
Sector drivers: For 2016, we expect slightly improved (M&A activity) credit metrics yoy and a further increase in the medium term due to the higher quality of drugs in the current pipeline, fewer patent expirations, more approvals by the US Food and Drug Administration and the positive impact of recent M&A activity (e.g. asset swap between Novartis and GSK, acquisition of Merck's OTC business by Bayer, Sigma-Aldrich by Merck KGaA, Teva's acquisition of Allergan Generics). In our view, large M&A deals will not be in focus in 2016 in a volatile market environment. We assume that asset swaps, partnerships and bolt-on acquisitions will improve the portfolio of pharmaceutical companies. The need for large acquisitions to drive organic growth has been lessened by recent positive trends in drug-development pipelines, by new-product commercialization and by moderating patent-expiration risk, in our view. With an expected annual organic growth rate that is twice the global GDP rate, top-line momentum in the pharmaceutical industry is expected to remain strong. From a regional perspective, IMS Research Institute estimates, for 2014-18, global pharma growth of 4-7%, growth in developed markets of 3-6% and in emerging pharmaceutical markets (often referred to as "pharmerging markets") of 8-11%. The OECD expects that most countries will experience an increase in pharmaceutical spending per capita by 2018. US pharmaceutical spending is expected to increase further. Healthcare spending in the US was the highest in the OECD as a percentage of GDP in 2014 (17.7%), a result of its having also the highest prices and margins. Market recap: Last quarter, the iBoxx Health Care index widened slightly. MRKGR 1.375% 9/22, ROSW 0.875% 2/25, MRKGR 4.5% 3/20 senior issues outperformed the index. TEVA senior issues underperformed the index Sector composition: Sanofi-Aventis (15.7%), Bayer (13.3%), GlaxoSmithKline (9.8%), Merck KGaA (8.9%), Roche (8.9%), Pfizer (7.0%), Amgen (6.7%), Teva (5.9%), Merck & Co. (5.3%), Eli Lilly (4.4%), Novartis (2.5%), Johnson & Johnson (2.4%), Thermo Fisher (2.3%), Bristol-Myers Squibb (2.3%), Molnlycke (2.0%), AstraZeneca (1.5%), Essilor (1.1%).
Current Ratings (Moody's/S&P/Fitch)
Credit Profile
Name (Ticker): Recommendation Weight in iBoxx Comment Health Care sector
Baa1s/As/BBBs Improving Amgen (AMGN): Overweight 6.7% Amgen reported strong 4Q15 results and increased its guidance for 2016. In 4Q15, total sales increased by 3% to USD 5,536mn. Product sales growth was driven by Enbrel, Sensipar, Prolia, Kyprolis and XGEVA. Adj. operating income grew by 16% to USD 2,366mn. In FY15, total revenues increased by 8% to USD 21,662mn with 8% product sales growth. In FY15, adj. operating income grew by 19% to USD 10,052mn. Operating cash flow (co. def.) improved by USD 0.5bn yoy to USD 9.1bn and free cash flow came (co. def.) to USD 8.5bn compared to USD 7.8bn in FY14, driven by higher revenues and higher operating income. In FY15, the company repurchased 12mn shares of common stock at a total cost of USD 1.85bn. At 31 December 2015, Amgen had USD 4.9bn remaining under its stock repurchase authorization. Outstanding total debt stood at USD 31.6bn (FY14: USD 30.7bn). Amgen increased its guidance for 2016 with total revenues in the range of USD 22bn to USD 22.5bn, up from November 2015 guidance of USD 21.7bn to USD 22.3bn. FY16 EPS (excluding one-time items) will be USD 10.60 to USD 11 (previous guidance: USD 10.35 to USD 10.75). According to our calculations, credit metrics improved in FY15. All three rating agencies share a stable outlook on Amgen. We anticipate no rating action or outlook revision in the short term.
Improving Amplifon (AMPIM): Buy 0.0% Amplifon reported strong FY15 results with both revenue (at current exchange rates) and EBITDA up by more than 16% each. For FY15, net revenue improved by 11.3% yoy at constant exchange rates to EUR 1,034mn. This was driven by solid organic growth (+8.2%), acquisitions (+3.1%) and, for the remaining 4.7%, by a positive foreign-exchange effect. In FY15, reported EBITDA (net of non-recurring items) improved by 20% yoy to EUR 167.4mn and the EBITDA margin to 16.2% (+70bp yoy). EBITDA was negatively impacted by EUR 2.2mn in extraordinary items (one-off costs of EUR 6.8mn related to the transition in Amplifon’s leadership and restructuring costs of EUR 0.9mn in the Netherlands, partially offset by non-recurring income of EUR 3.0mn in the United States and EUR 2.5mn in India). All regions contributed to the EBITDA increase (EMEA: +15.1%; Americas: +32.2%; Asia-Pacific: + 17%). At 31 Dec 2015, net financial debt (co. def.) amounted to EUR 204.9mn (30 Sep 2015: EUR 252.5mn; 31 Dec 2014: EUR 248.4mn). At 31 Dec 2015, the net debt/EBITDA ratio (co. def.) fell from 1.77x (31 Dec 2014) to 1.21x. For 2016, management indicated a continuation of the revenue and profitability growth trend driven by organic growth and continuous network expansion. On a regional perspective, Amplifon anticipates sales and profitability improvement in Europe due to continued store expansion (France, Germany) and new openings. Revenues in the Americas should benefit from new marketing initiatives. In Asia-Pacific, management expects stable organic growth above the market growth rate. For FY16, we anticipate further slight improvement in credit metrics due to the indicated improvement in revenue and operating result. We confirm our buy recommendation on Amplifon.
A3s/A-s/As Weakening AstraZeneca (AZN): Underweight 1.5% (member of the iTraxx NFI) AstraZeneca’s 4Q15 and FY15 key results were mixed and the outlook for 2016 disappointing. In FY15, total revenue decreased by 7% yoy to USD 24,708mn and +1% yoy at constant exchange rates. The “Growth Platform” improved by 11% yoy to USD 14bn. Key drug sales missed Bloomberg market estimates in 4Q15: Brilinta (USD 174mn, +43% yoy versus consensus of USD 180mn, indication: heart attack), Onglyza (USD 192mn versus consensus of USD 198mn, indication: diabetes) and Bydureon (USD 155mn versus consensus of USD 176.3mn, indication: diabetes). In FY15, AstraZeneca’s core gross profit increased by 2% to USD 20,589mn and core EPS by 7% to USD 4.26. The outlook for 2016 is disappointing. AstraZeneca has issued a warning to expect lower revenues and earnings in 2016. Both key figures are likely to decline in the mid-single-digit percentage range, according to the company. During the conference call following its last deal in 4Q15, management pledged to only pursue acquisitions that immediately add to the bottom line. In November 2015, AstraZeneca agreed to buy ZS Pharma for USD 2.7bn in cash, mainly for a potential blockbuster for hyperkalemia. In December 2015, it announced that it was buying a 55% stake in Acerta Pharma BV for USD 4bn, gaining access to a potential blockbuster medicine for blood cancer. The same month, the company announced two more transactions to bolster its respiratory and biologics development, as well as expand operations in China and Japan. (1Q16 results: 29 April 2016)

March 2016 Credit Research
Euro Credit Pilot
UniCredit Research page 78 See last pages for disclaimer.
Current Ratings (Moody's/S&P/Fitch)
Credit Profile
Name (Ticker): Recommendation Weight in iBoxx Comment Health Care sector
A3s/A-s/An Improving Bayer (BAYNGR): Marketweight 13.3% (member of the iTraxx NFI) Bayer reported 4Q15 results with sales roughly in line with and earnings falling short of expectations. The earnings shortfall was mainly related to Healthcare (higher marketing and R&D expenses) and CropScience (currency devaluation of the Brazilian real). EBITDA before special items improved by 4% to EUR 1,865mn (HealthCare: +7.2%, CropScience: -9.5%, Covestro: +18.4%). For 2016, Bayer expects sales of more than EUR 47bn (low-single-digit percentage increase at constant currency and portfolio adjusted), including Covestro, which is below current market expectations of EUR 48.1bn. Note, only 69% of Covestro will be reflected in 2016. Bayer intends to increase EBITDA before special items as well as core EPS by a mid-single-digit percentage (in line with current consensus). The new organizational structure of the divisions has come into effect. Bayer will report by business units that include Pharmaceuticals, Consumer Health, CropScience and Animal Health. In 2016, total Life Science (excluding Covestro) should deliver sales of EUR 35bn and EBITDA before special items increase by a mid-single digit percentage. In CropScience, Bayer expects sales to be at the previous year’s level and EBITDA to increase by a low-single-digit percentage. For 2016, Bayer also anticipates capex of approx. EUR 2.5bn and net financial debt of less than EUR 16bn. Credit metrics improved in 2015. We assume further improvement in 2016. (1Q16 results: 26 April)
A2n/A+s/A+n Stable GlaxoSmithKline (GSK): Underweight 9.8% GlaxoSmithKline’s 4Q15 and FY15 results came in slightly above market expectations. In 2015, group sales grew on a reported basis (+4%) and at constant currency (CER, +6%). The 2015 results include ten months of the former Novartis Vaccines and Consumer Healthcare products and exclude sales of the former GSK Oncology business from 2 March. Pharmaceuticals turnover was down 7% on a reported basis, primarily reflecting the disposal of the Oncology business. Vaccines sales grew 19% (USA +24%, Europe 23%, International +12%). Core operating profit was GBP 5,729mn (-9%) and core operating margin 4.1% lower on a CER basis, reflecting a negative currency impact and the impact of the Novartis transaction. In 4Q15, Glaxo showed a loss of GBP 254mn due to costs associated with the Novartis transaction and the Pharmaceuticals restructuring program. At 31 December 2015, net debt stood at GBP 10.7bn (FY14: GBP 14.4bn). The decrease primarily reflected the impact of the Novartis transaction, in which GSK sold its Oncology business for net cash proceeds of GBP 10bn and paid GBP 3.3bn to purchase Novartis Vaccines business. The company now expects sales of new products to meet its target of GBP 6bn annual revenue up to two years earlier than previously stated (2018 versus 2020). (1Q16 results: 6 May)
A1s/AAs/As Improving Merck & Co (MRK): Marketweight 5.3% Merck & Co reported mixed results for 4Q15, and its guidance for 2016 seems conservative, in our view. Worldwide sales were USD 10.2bn for 4Q15 (-3% yoy, including a 7% negative impact from foreign exchange and a 3% net positive impact, primarily from the acquisition of Cubist Pharmaceuticals), which came in slightly below market expectations (Bloomberg). From a drug perspective, Januvia sales (diabetes drug) of USD 921mn came in 13-15% weaker than expected. During the conference call, management highlighted that it was driven by an expected customer purchase pattern. The Keytruda (immunotherapy) launch has been going well and has exceeded market expectations by 5-7% (sales: USD 214mn in 4Q15). Full-year 2015 worldwide sales were USD 39.5bn, a decrease of 6% yoy (including a 6% negative impact from foreign exchange and a 3% net negative impact resulting from the divestiture of Consumer Care). Merck’s FY16 full-year EPS guidance is USD 1.96-2.23. At mid-January 2016 exchange rates, Merck estimates FY16 revenues will be between USD 38.7bn and USD 40.2bn (consensus: USD 40.25bn), including an approximately 3% negative impact from FX, which is slightly below market expectations (USD 40bn). (1Q16 results: 26 April)
Baa1n/An/-- Weakening Merck KGaA (MRKGR): Marketweight 8.9% S&P confirmed Merck KGaA’s senior debt rating of A and its BBB+ rating on the Merck KGaA’s hybrids (Baa3/BBB+/--). S&P also revised the equity credit of Merck’s hybrid capital (EUR 1.5bn) to “intermediate” from “minimal” and regards the hybrid securities as 50% equity when calculating its credit metrics. This reaction follows Merck’s announcement that it has waived a certain call option right in its hybrid security documentation and finalized the acquisition of US company Sigma Aldrich. The call option that was waived by Merck KGaA gave the company the right to call the hybrid if “equity content” were lowered. S&P noted that Merck’s waiver of the call option sufficiently mitigates the risks of call. S&P now regards the hybrid as 50% equity when calculating credit ratios. Note, several other issuers, including Alliander (Aa2s/AA-s/--), Bertelsmann (Baa1s/BBB+s/BBB+s), Dong (Baa1s/BBB+s/BBB+s) and Vattenfall (A3n/BBB+n/A-n) already announced they would unconditionally and irrevocably waive the right to call their hybrid bonds in the event of a loss of equity content following a rating downgrade. S&P and Moody’s share a negative outlook on the name. After the Sigma Aldrich acquisition, we assume that adj. leverage will temporarily peak in FY16, so rating headroom will be limited. However, management has lifted its forecast for full-year 2015 (including Sigma Aldrich for only 43 days). Merck assumes net sales will be between EUR 12.6bn and EUR 12.8bn for 2015 (of which Sigma to account for EUR 300mn) and EBITDA before exceptionals of between EUR 3,580mn and EUR 3,650mn. (FY15 results: 8 March)
Aa3s/AA-s/AAs Weakening Novartis (NOVNVX): Marketweight 2.5% Novartis reported 4Q15 results slightly below market expectations. In 4Q15, Novartis reported sales from continuing operations up by 4% (USD 12.52bn) at constant exchange rates (CER). The strong performance of Pharmaceuticals was offset by weak Alcon results. Core operating income was USD 3.1bn (-5% reported base, +9% constant currency [CC]), below the Bloomberg estimate of USD 3.19bn. Core operating income margin in CC increased 1.1%, mainly due to the strong performance of Pharmaceuticals. Net income was USD 1.1bn (-57%, -34% CC), impacted by a prior-year exceptional pre-tax gain of USD 0.4bn from the sale of shares in LTS Lohmann Therapie-Systeme AG, as well as exceptional charges of USD 0.3bn related to Venezuelan subsidiaries in 4Q15. Free cash flow in 4Q15 was USD 2.9bn (-26%), a decrease of USD 1.0bn yoy, primarily due to the negative currency impact on operations, lower hedging gains and higher investments in intangible assets (mainly for the remaining ofatumumab rights). As of 31 December 2015, net debt (co. def.) stood at USD 16.5bn, compared to USD 6.5bnn at 31 December 2014. The USD 10.0bn increase was driven by outflows of USD 16.0bn related to the acquisition of oncology assets from GSK, the dividend payment of USD 6.6bn, share repurchases of USD 6.1bn, divestment-related payments of USD 1.0bn and other net cash outflow items of USD 0.8bn. This was partially compensated for by free cash flow of USD 9.0bn, net divestment proceeds of USD 9.9bn, related to portfolio-transformation transactions, and proceeds of USD 1.6bn from exercising options. In 2015, credit metrics deteriorated yoy as a result of the closing of the GSK transaction and the sale of Animal Health, which led to a net cash outflow of USD 6.1bn. For 2016, management sees net sales and core operating income broadly in line with the previous year. We assume stable credit metrics for 2016. (1Q16 results: 21 April)

March 2016 Credit Research
Euro Credit Pilot
UniCredit Research page 79 See last pages for disclaimer.
Current Ratings (Moody's/S&P/Fitch)
Credit Profile
Name (Ticker): Recommendation Weight in iBoxx Comment Health Care sector
A1s/AAwn/A+wn Weakening Pfizer (PFE): Underweight 7.0% Pfizer reported 4Q15 and FY15 results that beat expectations, but the outlook for 2016 disappointed. On 3 February, Moody's updated Pfizer's key credit factors. Moody’s highlighted the company’s position as one of the world’s largest pharmaceutical companies, the strong cash flow (assumption of annual operating cash flow of approx. USD 20bn before the Allergan acquisition and over USD 24bn afterwards) and the strong diversification. The pending Allergan acquisition will improve the business profile and tax efficiency, Moody’s added. However, a number of Pfizer’s products are no longer patent-protected and there are declines in most markets, despite growth in emerging markets. Moody’s assumes that adjusted debt/EBITDA will rise to about 2.6x including the Allegan acquisition, but the agency anticipates deleveraging to approximately 2.0x within two years of the deal closing. The outlook is stable, assuming Pfizer will again reach adjusted debt/EBITDA of approx. 2.0x within two years of closing the Allergan acquisition. In Moody’s view, the pending Allergan acquisition pushes back the point at which Pfizer will consider splitting its pharmaceutical business, with a split unlikely to occur before 2019. The rating agency highlighted the continuing possibility of a split, however, as this overhangs the credit profile because the individual businesses would likely have weaker credit quality than the whole. (1Q16 results: 26 April)
A1s/AAs/AAs – Roche (ROSW): Restricted 8.9% Roche’s 2015 key figures were in line with market expectations (Bloomberg). In 2015, group sales increased by 5% at constant currency (CC; 1% in CHF) to CHF 47.5bn, in line with Bloomberg consensus of CHF 47.9bn. Sales in Pharmaceuticals rose by 5% yoy to CHF 37.3bn, mainly driven by oncology medicines Herceptin, Avastin and Perjeta, as well as Esbriet. In Diagnostics, sales increased by 6% to CHF 10.8bn at CC (+6% in CHF) driven by immunodiagnostic products. However, group core operating profit decreased by 1% yoy to CHF 17.5bn (+5% at CC) in FY15, in line with market expectations of CHF 17.6bn. Excluding the one-time benefit of CHF 428mn before tax, related to the divestment of filgrastim rights in 2014, operating profit improved by 2% (+7% at CC). In FY15, operating free cash flow (reported) was CHF 14.8bn (FY14: CHF 15.9bn). The growth in operating profit was offset by higher capex and a lower increase in accounts payable. Net debt (co. def.) remained more or less stable yoy at CHF 14.1bn as the free cash flow was largely absorbed by acquisitions. The net pension liability decreased by CHF 0.6bn, with the main driver being the translation of the EUR-denominated unfunded plans in Germany into CHF on consolidation. Total dividends paid in 2015 were CHF 7.0bn, an increase of CHF 0.2bn compared to 2014, reflecting the 3% increase of the Roche Group annual dividend.
A1s/AAs/AA-s Stable Sanofi (SANFP): Marketweight 15.7% (member of the iTraxx NFI) Sanofi-Aventis reported mixed key results for 4Q15 and FY15. In FY15, operating cash flow increased by 12.2% to EUR 8,132mn after capex of EUR 1,464mn and a EUR 1,048mn decrease in working capital. This free operating cash flow contributed to financing share repurchases (EUR 1,784mn), partially offset by proceeds from the issuance of new shares (EUR 573mn), the dividend paid by Sanofi (EUR 3,694mn), acquisitions and partnerships net of disposals (EUR 1,716mn) and restructuring costs (EUR 682mn). As a consequence, net debt increased from EUR 7,171mn at 31 December 2014 to EUR 7,254mn at the end of December 2015. Management assumes broadly stable EPS at constant exchange rates (CER) for 2016. The medium-term guidance for the Diabetes business (23% of sales, 25% of earnings) was already reduced at the end of October 2015. Sanofi expects global Diabetes sales to decline at an average annualized rate of 4-8% at CER in 2015-18. Half of this revision is linked to Lantus, and the other half to reduced expectations for Afrezza, Lyxumia and BGM. Management also published its 2015-20 roadmap on 6 November, with expected sales CAGR of 3-4% over 2015-20. From a business perspective, the company’s assumptions over the medium term are: 1. Diabetes & Cardiovascular sales in 2020 broadly in line with 2015 sales, 2. Sales in General Medicines & Emerging Markets to grow in the low single digit CAGR range, 3. sales CAGR of Sanofi Genzyme (Specialty Care) in the double-digit range, and 4. high-single-digit sales CAGR at Sanofi Pasteur (Vaccines) and Merial (Animal Health). Business EPS is expected to grow faster than sales beginning in 2018. In the middle of December, Sanofi announced it was in exclusive negotiations with Boehringer Ingelheim (not rated) to swap assets.
Stable STADA (SAZGR): Hold 0.0% STADA (not rated) reported preliminary results for FY15, which came in below market expectations (Bloomberg consensus), and provided rough guidance for 2016. While sales were in line with market expectations (Bloomberg), EBITDA came in below consensus. In FY15, sales rose by 3% to EUR 2,115mn (Bloomberg consensus: EUR 2,105mn). Reported EBITDA decreased by 10% to EUR 377.1mn and adj. EBITDA (co. def.) by 10% to EUR 389.4mn (consensus: EUR 409mn). There were one-offs of EUR 63.1mn (before taxes, EUR 55.4mn after taxes). Due to lower impairment losses on intangible assets in comparison to FY14, adjusted net income decreased by 11% to EUR 165.8mn (consensus: EUR 172.1mn). At 31 December 2015, net debt (co. def.) came in at EUR 1,215.7mn (FY14: EUR 1,327.5mn). The net debt/EBITDA ratio (co. def.) remained stable yoy at 3.1x (FY14: 3.1x). Cash flow from operations increased to EUR 311.7mn (FY14: EUR 223.8mn) and free cash flow to EUR 133.5mn (FY14: EUR -38.2mn). STADA provided only rough guidance for 2016, expecting slight growth in group sales adjusted for currency and portfolio effects and adjusted EBITDA (co. def.). Bloomberg consensus anticipates 4% sales growth and 10% EBITDA improvement. For 9H15, we calculate more or less stable credit metrics versus FYE 2014 and yoy. For 9M15, we calculate adjusted net leverage of 3.2x (FY14: 2.6x, 9M14: 3.0x) and adjusted FFO/net debt of 26% (FY14: 23%, 9M14: 23%). STADA will publish its final results for FY15, including its forecast for FY16, on 23 March.

March 2016 Credit Research
Euro Credit Pilot
UniCredit Research page 80 See last pages for disclaimer.
A3/BBB+wn/BBB+ Weakening Teva (TEVA): Marketweight 5.9% Teva reported solid FY15 and 4Q15 key results. Reported revenue in FY15 decreased by 3% yoy to USD 19.7bn (+ 4% constant currency). In FY15, Generic Medicines went down by 3% to USD 9.5bn. In Specialty Medicine, Copaxone sales decreased by 6%, Azilect by 5% and Nuvigil by 10%. Gross profit (co. def.) was up 1% to USD 12.2bn and gross profit margin improved to 62.2% (+30bp yoy). In FY15, EBITDA (co. def.) improved by 6% yoy to USD 6.6bn. In FY15, cash flow from operations (co. def.) increased by 8% yoy to USD 5.5bn and free operating cash flow by 15% to USD 4.9bn. In FY15, net debt (co. def.) decreased by USD 8.1bn and adj. net debt/EBITDA to 1.51x (FY14: 1.65x). Management highlighted, pending the closing of the Allergan generics acquisition (for around USD 40bn), that it is providing revenue and non-GAAP EPS guidance for 1Q16 only. For 1Q16, the company anticipates revenue in the range of USD 4.7bn to USD 4.9bn (1Q15: USD 4.98bn), cash flow from operations in the range of USD 1.2bn to USD 1.3bn (1Q15: USD 1.35mn) and non-GAAP EPS in the range of USD 1.16 to USD 1.20 (1Q15: USD 1.36). The guidance for FY16 will be provided shortly after the closing of the Actavis generic deal. Management remains confident that the Allergan generics transaction will close by early April. Previously, “Teva new” outlook for 2015-18 included sales CAGR of +12.5%, EBITDA, CFO and FCF CAGR of +20%. All three rating agencies have a watch negative outlook on Teva in light of the pending acquisition of Allergan generics.
Dr. Silke Stegemann, CEFA (UniCredit Bank) +49 89 378-18202 [email protected]
Personal & Household Goods (Marketweight) Sector key figures Sector Wrap-Up Weight in iBoxx NFI: Current ASW spread: change mom/YTD: EURO STOXX PHG YTD:
4.1% 74.0bp -5.9/+6.4 -7.0%
Sector drivers: Companies in this sector, particularly luxury product makers, are highly dependent on GDP growth and consumer sentiment. Demand in the high-end luxury business is fairly price inelastic and is not very sensitive to economic cycles. Stagnation in Europe and the slowdown in Chinese demand have directed the focus of luxury companies even more to quality and to being "up to date". In our view, the luxury sector should continue to grow, but at a slower pace. According to Bain & Co, growth in the global luxury goods market will increase by 4-7% per year between FY14 and FY17. The situation for the tobacco industry as a whole remains challenging, in our view. The global tobacco industry’s key topics for 2016 are innovation, M&A and regulation (revised European Tobacco Products Directive, TPD). Falling worldwide tobacco consumption, especially in highly profitable regions such as the US and Europe, have driven producers to innovation. The global vapor product market (e-cigarettes) may have reached USD 9.8bn in 2015 (+52% yoy) and may surpass USD 23bn in 2019 (Euromonitor). M&A activity has picked up significantly since 2013. Imperial Tobacco remains the most obvious takeover target. At the end of 2015, the Daily Mail, the FT and Bloomberg highlighted that BAT, Japan Tobacco or China National Tobacco Corporation could be interested in Imperial. Market recap: In the last three months, the iBoxx PHG (including Tobacco) index has widened slightly. BAT senior issues have underperformed the sector. Spreads of PG, MCFP and KERFP issues have tightened slightly and outperformed the index. Sector composition: BAT (25.3%), Philip Morris (18.5%), Procter & Gamble (17.8%), Imperial Tobacco (9.9%), Kering (8.7%), LVMH (6.8%), Jimmy Choo (5.6%), Luxottica (3.1%), SCA (1.5%), BSH (1.5%), Whirlpool (1.4%).
Current Ratings (Moody's/S&P/Fitch)
Credit Profile
Name (Ticker): Recommendation Weight in iBoxx Comment Personal & Household Goods sector
--/--/-- Improving adidas (ADSGR): Buy 0.0% adidas’ key preliminary figures exceeded sales and earnings targets in 2015 and the company increased its guidance for 2016. In 2015, group sales (at constant currency) increased by 10% and on a reported basis by 16% to EUR 16.90bn (FY14: EUR 14.5bn). Topline momentum was driven by double-digit sales growth in Western Europe, Greater China and Latin America as well as the MEAA region. The adidas and Reebok brands performed better than market expectations. In FY15, net income from continuing operations grew by 12% yoy to EUR 720mn (despite a higher tax rate of 32.9%). adidas group net income for 2015 was impacted by non-operational goodwill impairment losses totaling EUR 34mn, mainly related to the company’s Russia/CIS and Latin America cash-generating units. The impairment losses were non-cash in nature and do not affect adidas’ group liquidity. adidas will release its full-year results 2015 on 3 March and hold a conference call the same day.
A3s/A-s/A-n Stable BAT (BATSLN): Marketweight 25.3% (member of the iTraxx NFI) BAT released strong FY15 sales results despite a tough environment. In FY15, revenue increased by 5.4% yoy at constant currency to GBP 14,720 but declined on a reported basis by 6.2% to GBP 13.104bn. Adjusted profit from operations increased by 4% at constant currency, to GBP 5,620mn (and decreased by 7.6% to GBP 4,992mn on a reported basis). Group cigarette volume fell by 0.5% to GBP 663bn, which was better than the overall industry decline of 2.3%. At 31 December 2015, net debt was up, to GBP 14,794mn (an increase of GBP 4,6629mn vs. 31 December 2014) due to investment activities. This was principally due to the investment in RAI as a result of RAI’s acquisition of Lorillard in June 2015 to allow BAT to maintain its 42% stake in the enlarged business, the buyout of minorities (24.7% shares) in Souza Cruz and the acquisition of TDR in Croatia. Management only provided rough guidance for 2016, indicating the trading environment would remain challenging, but that BAT’s resilient business model has shown that it is ready to face future challenges. BAT highlighted that it expects to meet its target of high-single-digit earnings growth in 2016 as it has already introduced the bulk of its planned price increases for the year. BAT says that it aims to grow its operating margin by 50-100bp a year. Management warned that a strong USD and GBP could weigh on profit growth this year (expected profit down 8% based on current exchange rates). As expected, BAT’s credit metrics weakened in 2015 due to M&A activity. In FY15, we calculate adj. net leverage of 3.1x (FY14: 2.0x) and adj. FFO/net debt of 29% (FY14: 31%). In FY15, net leverage (reported) was 2.8x, slightly higher than the company’s long-term corridor for net debt/EBITDA of 1.5-2.5x. We think that BAT’s strong cash generation will enable it to gradually reduce its debt and strengthen its credit metrics from 2016 on

March 2016 Credit Research
Euro Credit Pilot
UniCredit Research page 81 See last pages for disclaimer.
Current Ratings (Moody's/S&P/Fitch)
Credit Profile
Name (Ticker): Recommendation Weight in iBoxx Comment Personal & Household Goods sector
Baa3n/BBBs/BBBs Stable Imperial Tobacco (IMTLN): Overweight 9.9% Imperial Tobacco’s 1Q15/16 (ending 31 Dec 2015) trading update was in line with guidance for FY15/16. In 1Q15/16, Tobacco net revenue increased by 10% (reported basis, +16.6% at constant currency) to GBP 1,634mn, driven by ITG Brands in the US. Tobacco net revenue in Growth Markets declined by 2.5% but grew by 7.2% excluding Iraq and Syria. Organic net revenue was 2.0% (+4.3% excluding Iraq and Syria). Total tobacco volume declined by 3.0%. Imperial Tobacco Growth Brands maintained good momentum. Growth Brand volumes were up 0.4% (excluding Iraq and Syria +7.3%) supported by investment in consumer initiatives and the continued success of the company’s migration program. During the conference call, management stuck to its target of delivering incremental savings of GBP 55mn in FY15/16. This is part of its program to reduce complexity through a range of initiatives (savings potential: GBP 300mn by September 2018). (1H15/16 results: 4 May)
--/BBBs/-- Stable Kering (formerly PPR) (KERFP): Overweight 8.7% (member of the iTraxx NFI) Kering (--/BBBs/--) reported FY15 and 4Q15 results on the operating level in line with consensus estimates. In FY15, reported revenue increased by 15.4% to EUR 11.58bn (Bloomberg consensus: EUR 11.4bn; FY14: +4% yoy) supported by positive FX tailwinds. Group revenue on a like-for-like (comparable) basis improved by 4.6% yoy (FY14: +4.5%). Revenue growth in mature markets was 7.3% on a comparable basis, driven by dynamic performance in Western Europe and Japan. Revenue generated outside the eurozone accounted for 78.8% of the consolidated total in 2015. In 2015, Kering's Luxury activities delivered revenue of EUR 7,865mn, up 16.4% as reported and 4.1% on a comparable basis. Gucci saw a return to growth in 2015 (revenue: +11.5% on a reported basis, +0.4% at constant currency), with an increase in sales on a comparable basis driven by directly operated stores in mature and emerging markets. Sport & Lifestyle activities reported revenue of EUR 3.68bn in 2015, up by 13.5% as reported and by 5.9% at comparable exchange rates. In FY15, Kering's recurring operating income amounted to EUR 1.65bn (-1%, consensus: EUR 1.66bn). Luxury activities recurring operating income totaled EUR 1.71bn (consensus: EUR 1.71bn) in 2015, up 2.5%, with a more pronounced increase in 2H15. In FY15, EBITDA increased by 3.3% yoy to EUR 2.1bn (EBITDA margin: 17.8%). At 31 December 2015, net debt had increased by EUR 287mn yoy to EUR 4,679mn and the net debt/EBITDA ratio had weakened slightly to 2.28x yoy (FY14: 2.21x).
--/A-s/-- Improving Luxottica (LUXIM): Overweight 3.1% Luxottica reported FY15 and 4Q15 preliminary sales. In 2015, sales increased to EUR 8.8bn, reflecting strong adjusted organic growth of 17% (FY15: +5.5%; 4Q15: 2.7% at constant exchange rates). In 2015, both divisions performed well: the Wholesale division increased sales by 12.5% and Retail by 20.3% (6.9% and 4.5%, respectively, at constant exchange rates). Luxottica increased sales in e-commerce by +50% and showed growth at the Wholesale business (+12.5%, 6.9% at constant currency) in all geographies and notable performance from its top retail chains (+20.3%, constant currency: +4.5%). Sunglass Hut confirmed it remains a leader in the sun category worldwide with double-digit growth in total sales for the fifth consecutive year: +24.6% (+10% at constant exchange rates), with Australia, Continental Europe, Brazil and Mexico the leading performers. LensCrafters in North America made a strong contribution with comparable store sales up by 4.3%. On a regional perspective, Europe improved sales by 7.8% (6.8% at constant exchange rates), emerging markets by 14.5% (13.3%), and North America by 22.9% (3.7%). Luxottica also announced that Adil Khan, CEO of Markets and board member, resigned, to be replaced by founder Leonardo Del Vecchio, as the board of directors approved a simplification of the company structure. We calculate slightly weaker credit metrics for 2015, but we expect at least stable credit metrics in 2016. Management highlighted that Luxury activities will focus on achieving same-store revenue growth, with a targeted and selective expansion strategy for the store network, which will lead to a slower pace of net store openings. At Gucci, the changes in place since 2015 should improve results. With regard to Sport & Lifestyle activities, Puma expects to capitalize on its successful repositioning and achieve further revenue growth and an increase in recurring operating income. (1Q16: 29 April)
--/A+s/-- Stable LVMH (MCFP): Marketweight 6.8% (member of the iTraxx NFI) LVMH reported strong FY15 key results slightly above market expectations. The organic growth rate in FY15 was 6% yoy (FY14: 5%; FY13: 8% yoy). Sales on a reported basis increased by 16% to EUR 35.66bn. From a business perspective, revenue in all business units increased on a reported basis in the mid-double-digit range (Wines & Spirits: +16%; Fashion & Leather Goods: +14%; Perfumes & Cosmetics: +15%; Watches & Jewelry: +19%; Selective Retailing: +18%). Organic growth rates were also up in all business units (Wines & Spirits: +6%; Fashion & Leather Goods: 4%; Perfumes & Cosmetics: +7%; Watches & Jewelry: +8%; Selective Retailing: +5%). Wines & Spirits showed strong growth in the US and Japan and continued destocking in China. In Fashion & Leather Goods, Louis Vuitton showed momentum. Perfumes & Cosmetics gained market share and benefitted from successful innovations. Profit from recurring operations (co. def.) of EUR 6.61bn (+16% yoy) slightly exceeded market expectations of EUR 6.5bn. All business units improved their operating result in the double-digit range (Wines & Spirits: +19%; Fashion & Leather Goods: 10%; Perfumes & Cosmetics: +26%; Watches & Jewelry: +53%; Selective Retailing +6%). At FYE 2015, free cash flow improved by 30% yoy to EUR 3.679mn and net financial debt decreased by 12% to EUR 4.235bn. FY15 credit metrics improved yoy. Management sounds confident for 2016 and assumes growth momentum across all business groups. We assume continued demand for luxury goods in North America, Europe and Japan and a still-volatile environment in China.
A2s/As/An Stable Philip Morris International Inc. (PM): Marketweight 18.5% Philip Morris reported mixed FY15 and 4Q15 key results. In FY15, reported net revenues, excluding excise taxes, were down by 10% to USD 26.8bn and operating profit decreased to USD 11bn. On an organic basis, operating income improved by 10.8%. In 4Q15, operating income was down by 23.6% (excluding unfavorable currency movements and the impact of acquisitions). Cigarette shipment volumes in 2015 were down by 1% (FY14: -2.8%, FY13: -5.1%) to 847.3bn units (excluding acquisitions). Cigarette shipment volume in EEMA was slightly positive (+0.4%, all other regions showed a decline). Marlboro shipped 285bn units, a 0.9% improvement. The increase in Marlboro cigarette shipments reflected growth in the EU, notably in France, Germany and Spain, which was partly offset by Italy and the UK. Marlboro shipment volumes decreased in Latin America & Canada, mainly due to Argentina, Brazil and Mexico, but partly offset by Colombia. Cigarette shipment volume of Bond Street was essentially flat, with growth notably driven by Australia, Russia and Serbia, largely offset by declines in the EU, Kazakhstan and Ukraine. Moody’s highlighted that Philip Morris’ pricing environment in 2016 remains strong, but that foreign exchange volatility will continue. The expected 6% price increases will more than offset volumes falling between 1% and 3% and cost increases of around 1%. Excluding foreign exchange effects, the rating agency assumes a decline in leverage to 2.0x in 2016 (FY15: 2.6x, FY14: 2.4x). Although PM’s cash flow generation remains strong, the company will be negatively impacted by adverse currency movement. While currency movements had a negative impact of 17.9% on operating profit in 2015 (FY14: 10.8%), cash flow generation was in line with 2014 thanks to working capital improvement. (1Q16: 19 April)

March 2016 Credit Research
Euro Credit Pilot
UniCredit Research page 82 See last pages for disclaimer.
Current Ratings (Moody's/S&P/Fitch)
Credit Profile
Name (Ticker): Recommendation Weight in iBoxx Comment Personal & Household Goods sector
Stable Prada (PRADA): Hold 0.0% Prada (not rated) reported preliminary sales figures for FY15/16 (ended 31 January) that were more or less stable yoy and broadly in line with Bloomberg consensus. From a regional perspective (in Retail), Europe (+6% at current exchange rates, 5% at constant exchange rates) and Japan (4% at current exchange rates, 11% at constant rates) showed growth. The situation in the Chinese market remains tough but showed some improvement in 4Q15/16. Asia/Pacific recorded a 4% revenue decrease at constant currency and 16% at constant exchange rates. For FY15/16, group sales amounted to EUR 3,545mn (flat yoy). In line with Prada’s strategy of the past few years to prioritize retail channel development, sales in the wholesale channel decreased in FY15/16 by EUR 88mn to EUR 444mn (FY14/15: -4% at constant currency). In FY15/16, sales in Retail improved by EUR 76mn (+2.4% at constant exchange rate) to EUR 3,057mn from 618 directly operated stores (FY14/15: 594 directly operated stores). From a brand perspective, the Prada brand increased sales by 1% to EUR 2,486mn. Miu Miu brand showed growth at current exchange rates (+10%) and constant exchange rates (+1%). Church brand also showed growth (14% at current exchange rates, +7% at constant exchange rates). Prada’s credit profile benefits from the strong brand portfolio, strong diversification and high margins, reflected in positive FCF over the last few years. For FY15/16, we assume slightly weaker credit metrics yoy. For 1H15/16, we calculate adj. net debt/EBITDA of 1.8x (FY14/15: 1.3x) and adj. FFO/net debt of 42% vs. 58% (FY14/15).
Baa1s/A-s/-- Stable Svenska Cellulosa AB (SCA) (SCABSS): Overweight 1.5% SCA reported 4Q15 results in line with Bloomberg consensus. The outlook for 2016 is confident. 4Q15 net sales increased by 6% to SEK 29.04bn (FY15: +11%) with continued growth in Personal Care & Tissue. Organic sales growth was 4% (FY15: 5%), of which volume accounted for 3% (3%) and price/mix for 1% (2%). Organic sales growth was 2% in mature markets and 11% in emerging markets. Emerging markets accounted for 32% of sales. Operating profit (excluding special items) rose by 6% yoy to SEK 3,454mn (FY15: 10%; FY14: 14%) and by 5% excluding exchange-rate effects. Profit was favorably affected by a better price/mix, higher volumes and cost savings. Raw material costs increased by SEK 529mn. The operating margin of 11.9% in 4Q15 was flat yoy despite pulp cost headwinds. In FY15, operating cash flow improved to SEK 9,890mn (FY14: SEK 8,149mn). At 31 December 2015, reported net debt had declined by SEK 6,489mn to SEK 29.5bn (FY14: SEK 35.9bn). The company is currently operating a number of restructuring initiatives and strategic moves that are credit positive in our view: investing in emerging markets, optimizing the hygiene supply chain and the acquisition of Wausau Paper (14 Oct). Moody’s and S&P share a stable outlook on SCA. We do not anticipate rating action after the FY15 results. S&P affirmed its A rating and stable outlook after the announcement of the Wausau acquisition. (1Q16: 28 April)
Dr. Silke Stegemann, CEFA (UniCredit Bank) +49 89 378-18202 [email protected]

March 2016 Credit Research
Euro Credit Pilot
UniCredit Research page 83 See last pages for disclaimer.
Food & Beverage (Marketweight) Sector key figures Sector Wrap-Up Weight in iBoxx NFI: Current ASW spread: change mom/YTD: EURO STOXX FOB YTD:
6.4% 74.6bp -3.9/+7.3 +0.6%
Sector drivers: Food & Beverage is one of the least cyclical sectors in the iBoxx Non-Financials index. The main drivers of the sector are commodity prices, GDP growth and, to a lesser extent, consumer sentiment. In the current macroeconomic environment, the main concerns for the sector are 1. high price elasticity, as consumers remain cautious; 2. focus on prices and promotions to address growing consumer sensitivity to low prices in developed markets; 3. emerging market growth slowing. However, S&P stated that consumer products' credit quality will likely be modestly negative in 2016. Subdued demand globally reflects a cautious consumer, decelerating growth in emerging markets, and changing consumer tastes for certain products. Companies will protect/grow market share by investing in their brands, through product innovation and by repositioning their portfolios. Market recap: Over the last three months, spreads in the iBoxx Food & Beverage sector index have widened slightly. Brewery senior issues of ABIBB and CARLB have tightened and outperformed the index. MDLZ issues were the worst performers. Sector composition: Anheuser-Busch InBev (16.8%), Coca-Cola (11.6%), Danone (10.6%), Heineken (7.9%), Mondelez (6.9%), Carlsberg (6.6%), Nestlé (6.3%), Pernod Ricard (5.6%), Diageo (5.1%), Unilever (3.7%), Cargill Inc (2.8%), Kellogg (2.0%), PepsiCo (2.0%), SABMiller (1.9%), General Mills (1.8%), Coca Cola HBC (1.5%), Kerry Group (1.4%), Kraft Heinz Company (1.4%), Bacardi (1.3%), Archer-Daniels-Midland (1.1%), Coca-Cola Enterprises (0.8%), BRF (0.8%).
Current Ratings (Moody's/S&P/Fitch)
Credit Profile
Name (Ticker): Recommendation Weight in iBoxx Comment Food & Beverage sector
A2wn/A-s/Awn Weakening Anheuser-Busch InBev (ABIBB): Marketweight 16.8% (member of the iTraxx NFI) The pending acquisition of SABMiller (A3wn/A-s/A-wn) by the world’s largest beer company, Anheuser Busch (ABI), for USD 107.5bn, will have a substantial impact on the beer industry. The deal will give Anheuser Busch a significant presence in almost every major market and control over a third of the world’s beer production. On 11 November 2015, the boards of AB InBev and SABMiller announced that they had reached agreement on the acquisition of SABMiller for USD 107.9bn (GBP 71bn) funded with a USD 37.7bn equity component (partial share alternative) and USD 70.2bn in debt. ABI lined up a two-year USD 15bn bridge loan and a USD 15bn one-year bridge loan with a one-year extension option as part of a larger USD 75bn financing package to complete the deal (28 October 2015: “2015 Senior Facilities Agreement”). On 14 January, ABI issued USD 46bn in bonds (the second-largest issue in history). On 20 January 2016, ABI announced the pricing of USD 1.47bn notes due in 2046. ABI has already agreed on the disposal of the MillerCoors stake for USD 12bn (USD 7.5bn after-tax). SABMiller, which is being taken over by Anheuser-Busch, is divesting assets in Europe. On 10 February, ABI received a binding offer of USD 2.85bn for the European beer brands Grolsch and Peroni. ABI reported robust 2015 performance, however 4Q15 EBITDA came in below market expectations. In 2015, cash flow from operating activities and net debt (co. def.) remained nearly stable yoy at USD 14,121mn (2014: USD 14,144mn) and USD 42.2bn (FY14: USD 42.1bn). In 2015, we calculate nearly stable credit metrics yoy with adj. net leverage of 2.7x (FY14: 2.5x) and adj. FFO/net debt of 27% (FY14: 28%).
Baa2n/--/BBBs Stable Carlsberg (CARLB): Marketweight 6.6% (member of the iTraxx NFI) Fitch and Moody’s provided encouraging comments on Carlsberg’s FY15 results. Fitch highlighted Carlsberg’s credit metrics will likely return to a level more commensurate with the requirements of its BBB issuer rating, following Carlsberg’s better-than-expected FY15 results. Net debt/EBITDA (co. def.) of 2.3x in FY15 (FY14: 2.7x) is slightly better than the company's earlier guidance of 2.5x. Fitch estimates that Carlsberg's FFO-adjusted net leverage returned to below 3.5x in 2015 from 4.0x in 2014 (Fitch's calculation). Fitch assumes that Carlsberg will maintain its credit metrics despite the ongoing macroeconomic issues in Eastern Europe and the challenging operating environment in some of its key markets. The rating agency highlighted as credit positive that free cash flow in 2015 returned to 2012 levels (DKK >4bn), as well as Carlsberg’s commitment to further deleveraging. In line with our thoughts (DCB of 11 February), Fitch believes that an upcoming merger of the two global industry leaders, Anheuser Busch InBev (ABI, [A2wn/As/Awn]) and SABMiller plc (A3wn/A-s/A-wn), is unlikely to materially impact the competitive landscape for Carlsberg in Europe, at least not immediately, given that the enlarged ABI/SABMiller entity will be focusing on integration and paying down debt. Moody’s underlined that Carlsberg’s rating remains weakly positioned within the rating category owning to its pressured operating performance. The pressure arises from the ongoing challenging macroeconomic environment in Russia and the weak RUB. Based on preliminary results, Moody’s anticipates 2015 credit metrics will be broadly in line or possibly slightly better yoy. The rating agency calculates adj. gross debt/EBITDA of 3.4x (FY14: 3.4x) and adj. RCF/net debt of 17.7% (FY14: 17.5%). These ratios remain weaker than required (adj. RCF/net debt >20%, adj. debt/EBITDA <3.0x) to maintain Moody’s Baa2 rating.
Baa1/BBB+s/-- Improving Coca-Cola Hellenic (CCHLN): Overweight 1.5% Coca Cola HBC reported strong FY15 results and remains confident regarding 2016. In FY15, Coca-Cola HBC’s reported volume growth of 2.6% (FY14: -2.8%) was supported by good performance from Sparkling and Water.Comparable EBIT (co. def.) was EUR 473.2mn (+11.4% yoy) supported by favorable input costs (EU sugar costs declined, PET resin costs decreased), increased volume and positive effects from its growth initiatives. Comparable EBIT margin improved by 100bp yoy to 7.5%. Free operating cash flow (co. def.) came in at EUR 412mn (FY14: EUR 333mn) mainly due to increased profits and further improvement in working capital. As of 31 December, net debt (co. def.) declined by EUR 251mn to EUR 1,217mn (31 Dec 2014: EUR 1,469mn). For FY15, we calculate an improvement in credit metrics with adj. FFO/net debt of 43% (FY14: 35%) and adj. net debt/EBITDA of 1.9x (FY14: 2.2x). The USD 400mn debt maturity in September 2015 was repaid using the available cash, which will result in a permanent reduction of total debt. During its latest conference call, management sounded confident that 2016 will be another year of sustainable volume growth and progress in margin improvement supported by: 1. Volume growth in all segments. 2. Substantial improvement in FX-neutral net sales revenue per case, in line with the performance prior to 2015. 3. Limitation of the increase in overall input costs per case to low single digits on an FX-neutral basis. Coca-Cola HBC has already hedged a majority of its sugar requirements for 2016. It assumes to offset rising sugar price by decreasing PET costs. 4. Adverse FX impact of EUR 135mn. 5. Capex/sales ratio in the range of 5.5-6.5%. In 2016, the ratio should be at the lower end due to volatility in some of the emerging markets. 6. Coca Cola HBC expects incremental restructuring costs of EUR 35mn in FY16 and EUR 25mn annualized benefits from 2017 onwards. For 2016, we assume an improvement in credit metrics based on the indicated growth factors for 2016. (1Q16 trading update: 12 May)
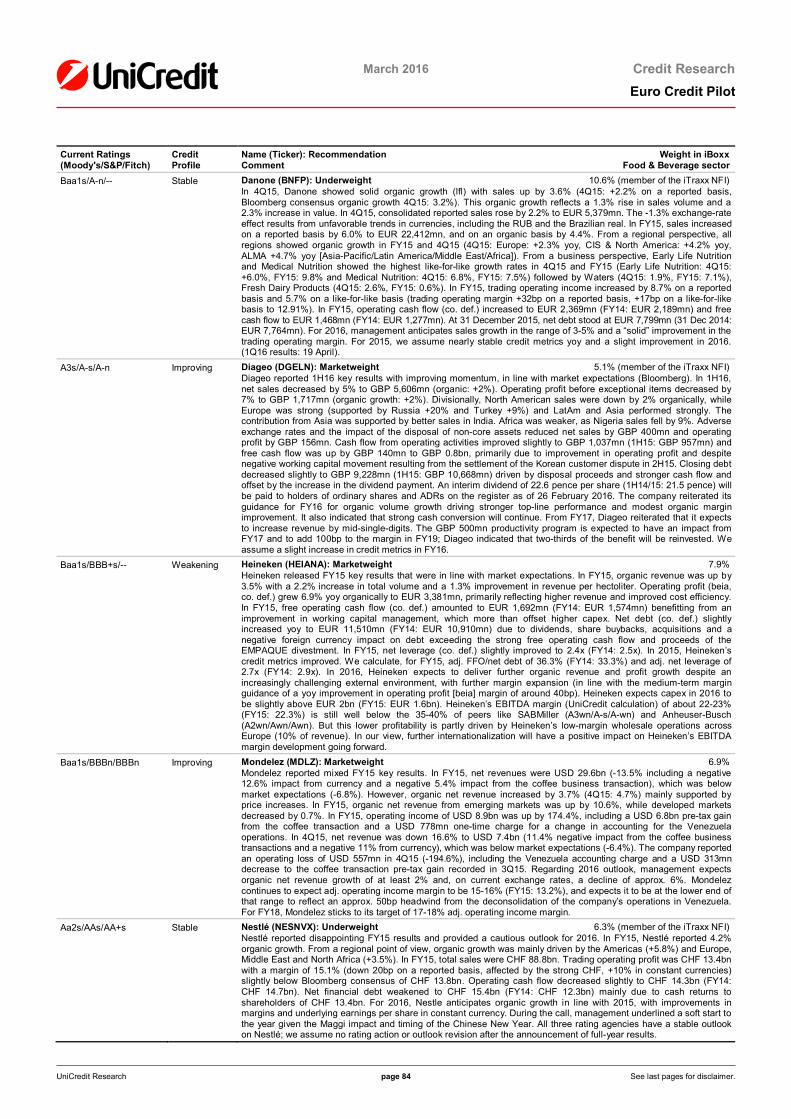
March 2016 Credit Research
Euro Credit Pilot
UniCredit Research page 84 See last pages for disclaimer.
Current Ratings (Moody's/S&P/Fitch)
Credit Profile
Name (Ticker): Recommendation Weight in iBoxx Comment Food & Beverage sector
Baa1s/A-n/-- Stable Danone (BNFP): Underweight 10.6% (member of the iTraxx NFI) In 4Q15, Danone showed solid organic growth (lfl) with sales up by 3.6% (4Q15: +2.2% on a reported basis, Bloomberg consensus organic growth 4Q15: 3.2%). This organic growth reflects a 1.3% rise in sales volume and a 2.3% increase in value. In 4Q15, consolidated reported sales rose by 2.2% to EUR 5,379mn. The -1.3% exchange-rate effect results from unfavorable trends in currencies, including the RUB and the Brazilian real. In FY15, sales increased on a reported basis by 6.0% to EUR 22,412mn, and on an organic basis by 4.4%. From a regional perspective, all regions showed organic growth in FY15 and 4Q15 (4Q15: Europe: +2.3% yoy, CIS & North America: +4.2% yoy, ALMA +4.7% yoy [Asia-Pacific/Latin America/Middle East/Africa]). From a business perspective, Early Life Nutrition and Medical Nutrition showed the highest like-for-like growth rates in 4Q15 and FY15 (Early Life Nutrition: 4Q15: +6.0%, FY15: 9.8% and Medical Nutrition: 4Q15: 6.8%, FY15: 7.5%) followed by Waters (4Q15: 1.9%, FY15: 7.1%), Fresh Dairy Products (4Q15: 2.6%, FY15: 0.6%). In FY15, trading operating income increased by 8.7% on a reported basis and 5.7% on a like-for-like basis (trading operating margin +32bp on a reported basis, +17bp on a like-for-like basis to 12.91%). In FY15, operating cash flow (co. def.) increased to EUR 2,369mn (FY14: EUR 2,189mn) and free cash flow to EUR 1,468mn (FY14: EUR 1,277mn). At 31 December 2015, net debt stood at EUR 7,799mn (31 Dec 2014: EUR 7,764mn). For 2016, management anticipates sales growth in the range of 3-5% and a “solid” improvement in the trading operating margin. For 2015, we assume nearly stable credit metrics yoy and a slight improvement in 2016. (1Q16 results: 19 April).
A3s/A-s/A-n Improving Diageo (DGELN): Marketweight 5.1% (member of the iTraxx NFI) Diageo reported 1H16 key results with improving momentum, in line with market expectations (Bloomberg). In 1H16, net sales decreased by 5% to GBP 5,606mn (organic: +2%). Operating profit before exceptional items decreased by 7% to GBP 1,717mn (organic growth: +2%). Divisionally, North American sales were down by 2% organically, while Europe was strong (supported by Russia +20% and Turkey +9%) and LatAm and Asia performed strongly. The contribution from Asia was supported by better sales in India. Africa was weaker, as Nigeria sales fell by 9%. Adverse exchange rates and the impact of the disposal of non-core assets reduced net sales by GBP 400mn and operating profit by GBP 156mn. Cash flow from operating activities improved slightly to GBP 1,037mn (1H15: GBP 957mn) and free cash flow was up by GBP 140mn to GBP 0.8bn, primarily due to improvement in operating profit and despite negative working capital movement resulting from the settlement of the Korean customer dispute in 2H15. Closing debt decreased slightly to GBP 9,228mn (1H15: GBP 10,668mn) driven by disposal proceeds and stronger cash flow and offset by the increase in the dividend payment. An interim dividend of 22.6 pence per share (1H14/15: 21.5 pence) will be paid to holders of ordinary shares and ADRs on the register as of 26 February 2016. The company reiterated its guidance for FY16 for organic volume growth driving stronger top-line performance and modest organic margin improvement. It also indicated that strong cash conversion will continue. From FY17, Diageo reiterated that it expects to increase revenue by mid-single-digits. The GBP 500mn productivity program is expected to have an impact from FY17 and to add 100bp to the margin in FY19; Diageo indicated that two-thirds of the benefit will be reinvested. We assume a slight increase in credit metrics in FY16.
Baa1s/BBB+s/-- Weakening Heineken (HEIANA): Marketweight 7.9% Heineken released FY15 key results that were in line with market expectations. In FY15, organic revenue was up by 3.5% with a 2.2% increase in total volume and a 1.3% improvement in revenue per hectoliter. Operating profit (beia, co. def.) grew 6.9% yoy organically to EUR 3,381mn, primarily reflecting higher revenue and improved cost efficiency. In FY15, free operating cash flow (co. def.) amounted to EUR 1,692mn (FY14: EUR 1,574mn) benefitting from an improvement in working capital management, which more than offset higher capex. Net debt (co. def.) slightly increased yoy to EUR 11,510mn (FY14: EUR 10,910mn) due to dividends, share buybacks, acquisitions and a negative foreign currency impact on debt exceeding the strong free operating cash flow and proceeds of the EMPAQUE divestment. In FY15, net leverage (co. def.) slightly improved to 2.4x (FY14: 2.5x). In 2015, Heineken’s credit metrics improved. We calculate, for FY15, adj. FFO/net debt of 36.3% (FY14: 33.3%) and adj. net leverage of 2.7x (FY14: 2.9x). In 2016, Heineken expects to deliver further organic revenue and profit growth despite an increasingly challenging external environment, with further margin expansion (in line with the medium-term margin guidance of a yoy improvement in operating profit [beia] margin of around 40bp). Heineken expects capex in 2016 to be slightly above EUR 2bn (FY15: EUR 1.6bn). Heineken’s EBITDA margin (UniCredit calculation) of about 22-23% (FY15: 22.3%) is still well below the 35-40% of peers like SABMiller (A3wn/A-s/A-wn) and Anheuser-Busch (A2wn/Awn/Awn). But this lower profitability is partly driven by Heineken’s low-margin wholesale operations across Europe (10% of revenue). In our view, further internationalization will have a positive impact on Heineken’s EBITDA margin development going forward.
Baa1s/BBBn/BBBn Improving Mondelez (MDLZ): Marketweight 6.9% Mondelez reported mixed FY15 key results. In FY15, net revenues were USD 29.6bn (-13.5% including a negative 12.6% impact from currency and a negative 5.4% impact from the coffee business transaction), which was below market expectations (-6.8%). However, organic net revenue increased by 3.7% (4Q15: 4.7%) mainly supported by price increases. In FY15, organic net revenue from emerging markets was up by 10.6%, while developed markets decreased by 0.7%. In FY15, operating income of USD 8.9bn was up by 174.4%, including a USD 6.8bn pre-tax gain from the coffee transaction and a USD 778mn one-time charge for a change in accounting for the Venezuela operations. In 4Q15, net revenue was down 16.6% to USD 7.4bn (11.4% negative impact from the coffee business transactions and a negative 11% from currency), which was below market expectations (-6.4%). The company reported an operating loss of USD 557mn in 4Q15 (-194.6%), including the Venezuela accounting charge and a USD 313mn decrease to the coffee transaction pre-tax gain recorded in 3Q15. Regarding 2016 outlook, management expects organic net revenue growth of at least 2% and, on current exchange rates, a decline of approx. 6%. Mondelez continues to expect adj. operating income margin to be 15-16% (FY15: 13.2%), and expects it to be at the lower end of that range to reflect an approx. 50bp headwind from the deconsolidation of the company’s operations in Venezuela. For FY18, Mondelez sticks to its target of 17-18% adj. operating income margin.
Aa2s/AAs/AA+s Stable Nestlé (NESNVX): Underweight 6.3% (member of the iTraxx NFI) Nestlé reported disappointing FY15 results and provided a cautious outlook for 2016. In FY15, Nestlé reported 4.2% organic growth. From a regional point of view, organic growth was mainly driven by the Americas (+5.8%) and Europe, Middle East and North Africa (+3.5%). In FY15, total sales were CHF 88.8bn. Trading operating profit was CHF 13.4bn with a margin of 15.1% (down 20bp on a reported basis, affected by the strong CHF, +10% in constant currencies) slightly below Bloomberg consensus of CHF 13.8bn. Operating cash flow decreased slightly to CHF 14.3bn (FY14: CHF 14.7bn). Net financial debt weakened to CHF 15.4bn (FY14: CHF 12.3bn) mainly due to cash returns to shareholders of CHF 13.4bn. For 2016, Nestle anticipates organic growth in line with 2015, with improvements in margins and underlying earnings per share in constant currency. During the call, management underlined a soft start to the year given the Maggi impact and timing of the Chinese New Year. All three rating agencies have a stable outlook on Nestlé; we assume no rating action or outlook revision after the announcement of full-year results.

March 2016 Credit Research
Euro Credit Pilot
UniCredit Research page 85 See last pages for disclaimer.
Current Ratings (Moody's/S&P/Fitch)
Credit Profile
Name (Ticker): Recommendation Weight in iBoxx Comment Food & Beverage sector
Baa3p/BBB-s/BBB-s Improving Pernod Ricard (RIFP): Overweight 5.6% (member of the iTraxx NFI) Moody’s highlighted that Pernod Ricard’s steady improvement in operating result supports its positive outlook. In 1H15/16, Pernod Ricard improved organic revenue and operating profit by 3%, supported by improved trading conditions in the US. Pernod Ricards’ US division reported a 3% increase in organic sales, compared to a flat result in FY14/15. Moody’s added that Pernod Richard was successful in compensating for challenging marketing conditions in China, where organic sales declined by 2%, and in South Korea, with solid performance in India (+14%) and other Asian countries. Moody’s noted that the gradual improvement in Pernod Richard’s operating performance supports the positive rating pressure on its Baa3 rating over the next 12 months. Moody’s current rating and outlook factor in continued improvement in 2H15/16, and assume that the company will continue to focus on reducing its financial leverage. However, a rating upgrade could be prompted by the company’s ability to manage foreign-currency volatility and a slowdown in emerging markets over the next 12 months. Pernod Ricard reported only key figures for 1H15/16. We assume a slight improvement in credit metrics in 1H15/16 yoy and FY15/16 (UniCredit assumption: adj. net leverage of 3.8x in FY15/16) and 3.7x in FY16/17). Management confirmed its vague outlook for FY15/16, including improving its business performance yoy and delivering organic growth in profit from recurring operations, in line with guidance of 1% to 3%.
A3w/A-s/A-wn Weakening SABMiller (SABLN): Marketweight 1.9% (member of the iTraxx NFI) Fitch maintained its watch negative rating on SABMiller pending completion of the merger with Anheuser-Busch (A2wn/A-s/Awn). If the merger goes through as planned, it will probably downgrade the combined company to BBB+. Fitch underlined that the merger will create a global player with combined revenue of close to USD 65bn, EBITDA of USD 22bn and FCF around USD 12bn. The rating agency assumes adj. FFO adjusted gross leverage to peak at 5.7x (FY14/15: 2.4x), before declining to around 4.0x by 2019 due to FCF generation. Fitch expects to downgrade SABM’s rating to the same level as Anheuser Busch upon completion of the transaction. Should SABMiller’s current debt be structurally subordinated to ABI’s existing or acquisition debt, its ratings would be further notched down.
Baa2n/BBB-s/-- Stable Südzucker (SZUGR): Hold 0.0% (member of the iTraxx NFI) 3Q15/16 key results in January 2016 exceeded 3Q14/15 results. In 3Q15/16, the operating result jumped to EUR 64mn (>100% yoy, 3Q14/15: EUR 27mn). Südzucker confirmed its outlook for FY15/16 from 19 November (ad-hoc release). For FY15/16, management expects group revenue of EUR 6.3-6.5bn (reported FY14/15: EUR 6.8bn). In FY15/16, guidance for operating profit is in the range of EUR 200-240mn (FY14/15: EUR 181mn). For the sugar segment, Südzucker expects the operating result to decline significantly to a range of EUR -80mn to EUR -60mn (FY14/15: EUR 7mn). For special products, Südzucker assumes an operating profit of over EUR 145mn (FY14/15: EUR 120mn). For the fruit segment, Südzucker expects an operating result of below EUR 65mn, which corresponds to the level in FY14/15 (EUR 65mn). Within the CropScience segment, Südzucker now expects the operating result to come in between EUR 70mn and EUR 90mn (FY14/15: EUR -11mn). Management also expects EBITDA (co. def.) to increase to EUR 480-520mn (FY14/15: EUR 453mn). Investments in fixed assets of around EUR 400mn should be around the FY14/15 level (EUR 386mn). The company also highlighted net financial debt of EUR 650-750mn for FY15/16 (FY14/15: EUR 593mn). In FY15/16, cash flow (co. def.) should be above EUR 450mn (FY14/15: EUR 389mn). Cash flow/revenues should be above EUR 6% in FY15/16 (FY14/15: EUR 5.7%). During the last conference call, management indicated for FY16/17 that a "decline in ethanol profit could be compensated for by higher earnings in sugar". Südzucker assumes the sugar segment would reach breakeven in the next financial year if sugar prices did not change, as the improvement would mainly come from cost savings and higher sugar production volumes.
A1s/A+s/A+s Stable Unilever (UNANA): Underweight 3.7% (member of the iTraxx NFI) Unilever reported 4Q15 key results with underlying sales growth beating market expectations and operating profit in line with consensus estimates (Bloomberg). In 4Q15, underlying sales growth was up by 4.9% (consensus: +4.0%) driven by Personal Care (+4.1%, 38% of group sales), Home Care (+8.0%, 19% of group sales) and Refreshment (+8.8%, 19% of group sales). Underlying pricing growth was up to 2.9% (consensus: +1.6%), mainly supported by strong growth in Refreshment. From a regional perspective, the Americas surprised positively, with Latin America growing +12% in 4Q15, mainly due to price increases. On a full-year basis, FY15 underlying sales growth was 4.1% (volume +2.1%, price: +1.9%) and turnover increased by 10% to EUR 53.3bn (positive currency impact of 5.9%). In the emerging markets, underlying sales growth was 7.1% (volume: +2.7%, price: +4.3%). In FY15, core operating profit increased by 12% to EUR 7.9bn and operating margin was up by 30bp to 14.8% (in line with market expectations). The margin was down in Foods and up in all other segments. In FY15, free operating cash flow (co. def.) improved by 54% yoy to EUR 4.8bn due to the increase in core operating profit and working capital improvement. However, net debt (co. def.) increased to EUR 11.5bn (FY14: EUR 9.9bn) due to bolt-on acquisitions.
Dr. Silke Stegemann, CEFA (UniCredit Bank) +49 89 378-18202 [email protected]

March 2016 Credit Research
Euro Credit Pilot
UniCredit Research page 86 See last pages for disclaimer.
Travel & Leisure (Marketweight) Sector key figures Sector Wrap-Up Weight in iBoxx NFI: Current ASW spread: change mom/YTD: EURO STOXX TAL YTD:
1.3% 142.2bp -3.4/+20.8 -4.9%
Sector drivers: Regarding its 2016 outlook, S&P said discretionary spending in the global leisure industry will likely improve modestly this year. The credit-rating agency expects operating strength in the lodging and theme park segments, continued recovery in the cruise segment and modest revenue gains in most US-based gaming markets in 2016. Regarding hotels in Europe, the weak euro should support hotel demand. However, perceived security risks could temporarily discourage some inbound travel to Europe following the Paris attacks. All in all, mid-single-digit revenue-per-available-room (RevPAR) growth is expected in Europe in 2016. Furthermore, we note that the 2016 UEFA European Championship could boost demand for French hotels this summer. Market recap: During the last three months, the iBoxx Travel & Leisure index has widened by around 27bp. We note that CPGLN and SWFP bonds have remained relatively stable, while ACFP and MCD bonds have widened but still outperformed the index. The outstanding ACFP 4.125% perp has widened by more than 230bp during the last three months, which, however, is based on market technicals rather than on fundamentals, in our view. Sector composition: Priceline (23.1%), McDonald's (17.3%), Carnival (15.6%), Accor (13.0%), Sodexo (10.5%), Compass Group (10.5%), Expedia (5.5%), easyJet (4.5%).
Current Ratings (Moody's/S&P/Fitch)
Credit Profile
Name (Ticker): Recommendation Weight in iBoxx Comment Travel & Leisure sector
--/BBB-s/BBB-s Stable Accor (ACFP): Marketweight 13.0% (member of the iTraxx NFI) Accor's FY15 results showed that sales were below market expectations and that operating profit was in line with estimates (Bloomberg). In FY15, revenue increased by 2.9% yoy on a lfl basis (+2.3% yoy reported) to EUR 5.58bn, which was below consensus (+3.5%). The increase resulted from growth in most of the company’s key markets: Mediterranean, Middle East, Africa (MMEA, +7.9%); Asia-Pacific (+5.4%); and Northern, Central and Eastern Europe (NCEE, +5.0%). Revenue in France was down by 0.5% in 2015, reflecting a sharp decline in 4Q15 (-6.6%) due to the terrorists attacks in Paris on 13 November. Revenue in the Americas was down by 3.7% due to continued deterioration in economic activity in Brazil (4Q15: -7.5%), where business has slowed across the country, notably affecting seminar and meeting activity in hotels. In FY15, HotelServices showed growth of 6.2%, and HotelInvest showed growth of 1.9%. EBIT was up by 10.6% yoy to EUR 665mn (lfl basis: +3.5%), in line with consensus of EUR 663mn. The EBIT margin improved to 11.9% (+0.9%). Adjusted for operating expenses related to Accor's digital plan, its operating margin was 12.6%. At 31 December 2015, funds from operations (company definition) was EUR 816mn (FYE 2014: EUR 768mn). Recurring cash flow amounted to EUR 341mn, and net debt (company definition) decreased to EUR -194mn, an improvement of EUR 354mn over the year (excluding cash payments of USD 840mn for the FRHI acquisition). Management provided only rough guidance for 2016: it plans to “continue to significantly improve the operational and financial performance”. Note that Accor announced the acquisition if FRHI, which includes the brands Fairmont, Raffles and Swissotel, for USD 2.9bn. The non-debt-funded acquisition will consist of USD 840mn in cash and the issuance of 46.7mn Accor shares. S&P said the transaction will strengthen Accor's position in the luxury and upscale segments and will boost its presence in the key North American market. The acquisition's impact on Accor's financial risk profile should be limited, since the part-cash consideration should be absorbed by improved headroom in the company's metrics. The acquisition is subject to shareholder approval, and according to Bloomberg, the extraordinary shareholders meeting will take place on 3 April. We like Accor’s stable business profile and note that the FRHI acquisition is slightly positive. We keep our marketweight recommendation. Over the last three months, Accor's senior bonds have broadly outperformed the iBoxx Travel & Leisure index, while its outstanding ACFP 4.125% perp has widened by more than 230bp. However, this is based on market technicals rather than on fundamentals, in our view.
Baa1p/As/A-s Stable Compass Group (CPGLN): Marketweight 10.5% (member of the iTraxx NFI) Compass's 1Q16 trading figures revealed organic growth of 5.9%. Compass said it is partly reinvesting in growth opportunities, while its restructuring program in Offshore & Remote and in some emerging markets is progressing well. On a regional basis, revenues at North America grew by 7.9% and at Europe by 3.6%, while organic revenue growth at Rest of World was 3.6%. Currency movements had a negative yoy-translation impact on revenues and profit in the quarter: of GBP 116mn and GBP 7mn respectively. Management said its outlook for 2016 remains positive, with strong growth in North America and improving growth in Europe. Compass's Baa1 rating at Moody's is supported by 1. the company's scale within the contract food-service industry; 2. its diversified business mix, with Compass providing food and soft support services to customers in various sectors, including the less-cyclical healthcare and education sectors; 3. its limited customer concentration; 4. its robust FCF generation and 5. a solid liquidity profile. We note Compass's strong margins in recent years and its outlook for flattish margins going forward. We keep our marketweight recommendation on the name.
Baa1s/BBB+s/BBB+n Weakening McDonald's (MCD): Marketweight 17.3% McDonald’s 4Q15 results featured an increase in global sales (at constant FX) that beat consensus estimates. Sales increased by 5% yoy (at constant FX) vs. Bloomberg consensus estimates of 3.2%. The company benefitted from strong sales in the US (up by 5.7% yoy), which were boosted by the October launch of the “All Day Breakfast” and, to a lesser extent, by unseasonably mild weather. International Lead sales (at constant FX) rose by 4.2%, led by strong performance in the UK, Canada and Australia. In high-growth markets, sales increased by 3% in 4Q15, reflecting positive performance in Russia and China. In Foundational Markets, sales rose by 5.9%, driven by strength in Asia and Europe. The company’s consolidated operating income rose by 7% (16% at constant FX) to USD 1.9bn. In FY16, the company expects general and administrative expenses to decrease by about 1-2% at constant FX, with fluctuations expected to occur between quarters – these will include sponsorship of the 2016 Summer Olympics in 3Q16. Based on current interest and FX rates, the company’s interest expense for FY16 is expected to increase by about 40-45% vs. that of FY15 due to higher average debt balances (its interest expense in FY15 was USD 638mn). We keep our marketweight recommendation following McDonald’s' good 4Q15 results and expect to see some spread tightening. However, as a result of McDonald's suffering a few weak quarters, we will monitor whether the company’s improving sales are sustainable, as it benefitted from its “All Day Breakfast” campaign in 4Q15.

March 2016 Credit Research
Euro Credit Pilot
UniCredit Research page 87 See last pages for disclaimer.
Current Ratings (Moody's/S&P/Fitch)
Credit Profile
Name (Ticker): Recommendation Weight in iBoxx Comment Travel & Leisure sector
--/A-s/BBB+s Stable Sodexo (SWFP): Marketweight 10.5% Sodexo's 1Q16 sales results beat Bloomberg consensus estimates on a quarterly organic sales-growth level. Organic sales grew by 4.7% yoy to EUR 5.6bn in 1Q16, which was above Bloomberg consensus estimates of 3.9%. Regarding On-site Services, which organically grew by 4.7% yoy to EUR 5.4bn, we note that the Rugby World Cup accounted for half of 1Q16 organic growth, while Sodexo reported an acceleration of growth in Health Care and Seniors in North America. The good momentum in integrated services contracts won by Corporate Services in 2015 was partly offset by a sharp slowdown in the oil and mining sectors. In the Benefits and Rewards Services segment, the company grew organically by 5.3% yoy to EUR 186mn. The sustained performance reflected solid sales development, and growth occurred despite the economic slowdown in Latin America, particularly in Brazil. In terms of ratings, we note that S&P recently raised Sodexo's short-term rating to A-1, while it affirmed is long-term rating and outlook. S&P expects the company to generate good cash flow and maintain low debt and conservative financial policies over the next one to two years. In our opinion, Sodexo has one of the least-cyclical business models (long average length of contracts resulting in stable, visible revenues and CF) in Travel & Leisure. We note that Sodexo bonds currently trade with a slight pickup of around 5-10bp vs. its closest peer, Compass. We keep our marketweight recommendation on the name.
Mehmet Dere (UniCredit Bank) +49 89 378-11294 [email protected]
Retail (Marketweight) Sector key figures Sector Wrap-Up Weight in iBoxx NFI: Current ASW spread: change mom/YTD: EURO STOXX RET YTD:
3.0% 143.1bp -14.4/+27.8 +0.4%
Sector drivers: Within the iBoxx Retail index, the main spread driver during the last three months was the imminent rating pressure for Casino bonds, while for the remaining issuers, mainly the maturities 2021 and 2025 widened relatively stronger than the remaining bonds. While we note that food retailer 4Q15 were broadly healthy, we expect for 2016 a challenging year for operations in Emerging Markets and stable to slightly improving results in their domestic business. We note the increasing pressure from hard discounters in the UK and France and the ongoing price war, which has a negative impact mainly on UK margins. Further pressure on UK food retail margins are a result of the persisting food price deflation in the market. In the short term, we view a downgrade for Casino bonds as likely on the back of the ongoing pressure from its Latin American business and challenging margin outlook for its French business. Therefore we expect Casino bonds to drop out of the iBoxx in the coming months. Market recap: During the last three months, the iBoxx Retail index widened by around 50bp, mainly as a result of the imminent rating pressure on Casino. While we expect some volatility on Casino bonds and a downgrade in the coming months to High Yield. Overall we have a marketweight recommendation on the sector. Sector composition: Groupe Casino (23.7%), Carrefour (23.6%), Auchan (15.9%), Walmart (11.7%), METRO (8.2%), Wesfarmers (5.0%), Vinci Park (4.5%), Safeway (2.7%), Walgreens Boots Alliance (2.7%), DIA (1.9%).
Current Ratings (Moody's/S&P/Fitch)
Credit Profile
Name (Ticker): Recommendation Weight in iBoxx Comment Retail sector
--/A-n/-- Weakening Auchan (AUCHAN): Marketweight 15.9% (member of the iTraxx NFI) Auchan has released 1H15 results, which were marked by weak European operations. The company’s reported revenues (excluding taxes and at constant FX) increased by 2.6% yoy to EUR 26.9bn, while, on a lfl basis, revenues declined by 0.7% yoy. Auchan reported a decline in sales in all regions except for Asia (France -2.9% yoy, Eurozone -4.4%, CEE -6.4%). In Asia, revenues increased by 28.6% (+7.0% at constant FX) as Sun Art maintained its ranking among the leading food retailers in China. Furthermore, Auchan continued its expansion and development of e-commerce with Feiniu and the acquisition of Fields, which is a specialist in online food retailing in China. In 1H15, EBITDA grew by 2.0% yoy to EUR 1.1bn, driven by growth in Asia and by positive FX tailwinds from CEE, which were impacted by the weak RUB. The company’s OCF declined to EUR -457mn vs. EUR -246mn in 1H15 mainly due to higher W/C requirements, while net debt increased to EUR 3.6bn from EUR 1.8bn in FY14 (1H14: EUR 4.2bn) on the back of capex of EUR 1.1bn (vs. EUR 1bn in 1H14) and dividends of EUR 182mn (vs. EUR 362mn in 1H14). Going forward, management stated that 2H15 should bring many challenges. The group announced exclusive negotiations with Système U to enhance the purchasing partnership that was signed in September 2014. Furthermore, in June, Auchan announced the sale of Grosbil to Mutares, which was approved by antitrust authorities on 30 July and is expected to be finalized in 2H15. With regard to ratings, we note that S&P revised Auchan’s rating outlook to negative, due to weaker profitability, while it affirmed its A rating on 30 April. The rating agency stated that, if the group is not able to restore its profitability in the region while maintaining sound operating performance and maintaining profitability in emerging markets over the next 24 months, S&P’s view of its business-risk profile could fall to the lower end of its "strong" category. The negative outlook reflects S&P’s stance that Auchan may find it difficult to quickly restore positive lfl revenues and sound profitability in Western Europe, which could lead S&P to consider Auchan's business-risk profile as having deteriorated. Ratings could be lowered if Auchan fails to restore persistent revenue growth and strong EBITDA growth in Western Europe over the next 24 months. We keep our marketweight recommendation on Auchan, as we believe that the company still has a strong market position in the solid French market – mainly through its hypermarkets and supermarkets, while we note that management sees a return to growth in Spain. Auchan will publish its FY15 report on 14 March.
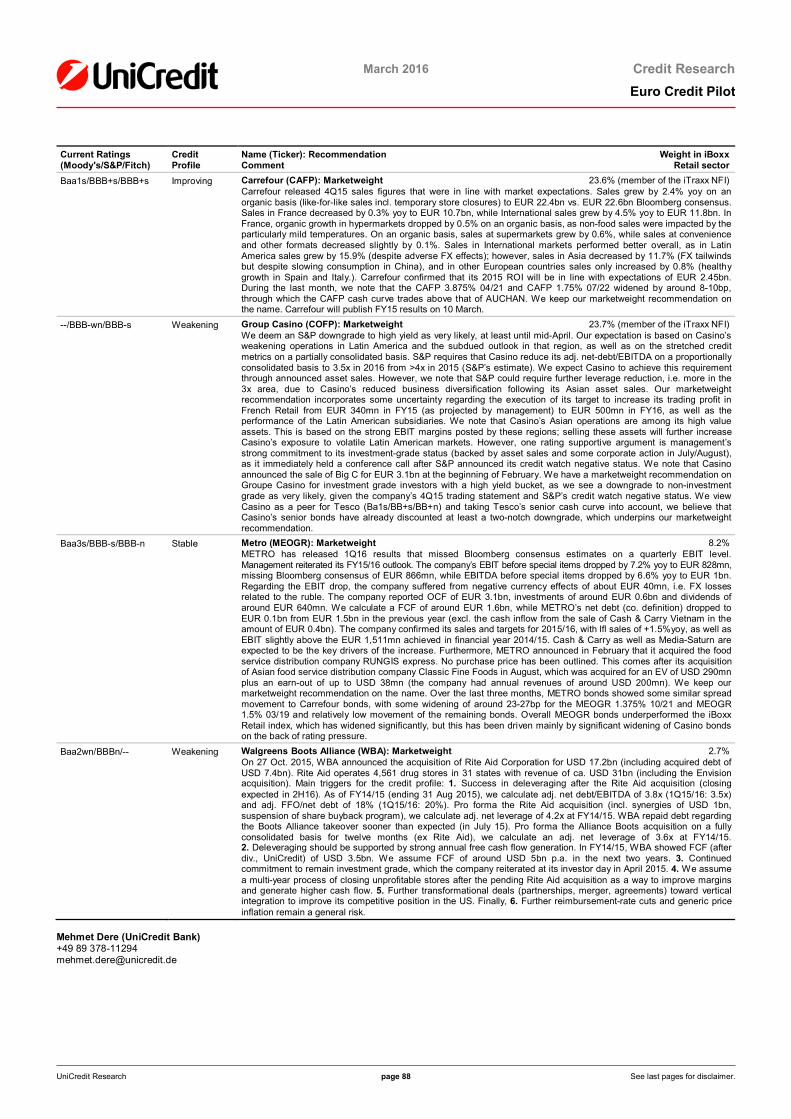
March 2016 Credit Research
Euro Credit Pilot
UniCredit Research page 88 See last pages for disclaimer.
Current Ratings (Moody's/S&P/Fitch)
Credit Profile
Name (Ticker): Recommendation Weight in iBoxx Comment Retail sector
Baa1s/BBB+s/BBB+s Improving Carrefour (CAFP): Marketweight 23.6% (member of the iTraxx NFI) Carrefour released 4Q15 sales figures that were in line with market expectations. Sales grew by 2.4% yoy on an organic basis (like-for-like sales incl. temporary store closures) to EUR 22.4bn vs. EUR 22.6bn Bloomberg consensus. Sales in France decreased by 0.3% yoy to EUR 10.7bn, while International sales grew by 4.5% yoy to EUR 11.8bn. In France, organic growth in hypermarkets dropped by 0.5% on an organic basis, as non-food sales were impacted by the particularly mild temperatures. On an organic basis, sales at supermarkets grew by 0.6%, while sales at convenience and other formats decreased slightly by 0.1%. Sales in International markets performed better overall, as in Latin America sales grew by 15.9% (despite adverse FX effects); however, sales in Asia decreased by 11.7% (FX tailwinds but despite slowing consumption in China), and in other European countries sales only increased by 0.8% (healthy growth in Spain and Italy.). Carrefour confirmed that its 2015 ROI will be in line with expectations of EUR 2.45bn. During the last month, we note that the CAFP 3.875% 04/21 and CAFP 1.75% 07/22 widened by around 8-10bp, through which the CAFP cash curve trades above that of AUCHAN. We keep our marketweight recommendation on the name. Carrefour will publish FY15 results on 10 March.
--/BBB-wn/BBB-s Weakening Group Casino (COFP): Marketweight 23.7% (member of the iTraxx NFI) We deem an S&P downgrade to high yield as very likely, at least until mid-April. Our expectation is based on Casino’s weakening operations in Latin America and the subdued outlook in that region, as well as on the stretched credit metrics on a partially consolidated basis. S&P requires that Casino reduce its adj. net-debt/EBITDA on a proportionally consolidated basis to 3.5x in 2016 from >4x in 2015 (S&P’s estimate). We expect Casino to achieve this requirement through announced asset sales. However, we note that S&P could require further leverage reduction, i.e. more in the 3x area, due to Casino’s reduced business diversification following its Asian asset sales. Our marketweight recommendation incorporates some uncertainty regarding the execution of its target to increase its trading profit in French Retail from EUR 340mn in FY15 (as projected by management) to EUR 500mn in FY16, as well as the performance of the Latin American subsidiaries. We note that Casino’s Asian operations are among its high value assets. This is based on the strong EBIT margins posted by these regions; selling these assets will further increase Casino’s exposure to volatile Latin American markets. However, one rating supportive argument is management’s strong commitment to its investment-grade status (backed by asset sales and some corporate action in July/August), as it immediately held a conference call after S&P announced its credit watch negative status. We note that Casino announced the sale of Big C for EUR 3.1bn at the beginning of February. We have a marketweight recommendation on Groupe Casino for investment grade investors with a high yield bucket, as we see a downgrade to non-investment grade as very likely, given the company’s 4Q15 trading statement and S&P’s credit watch negative status. We view Casino as a peer for Tesco (Ba1s/BB+s/BB+n) and taking Tesco’s senior cash curve into account, we believe that Casino’s senior bonds have already discounted at least a two-notch downgrade, which underpins our marketweight recommendation.
Baa3s/BBB-s/BBB-n Stable Metro (MEOGR): Marketweight 8.2% METRO has released 1Q16 results that missed Bloomberg consensus estimates on a quarterly EBIT level. Management reiterated its FY15/16 outlook. The company’s EBIT before special items dropped by 7.2% yoy to EUR 828mn, missing Bloomberg consensus of EUR 866mn, while EBITDA before special items dropped by 6.6% yoy to EUR 1bn. Regarding the EBIT drop, the company suffered from negative currency effects of about EUR 40mn, i.e. FX losses related to the ruble. The company reported OCF of EUR 3.1bn, investments of around EUR 0.6bn and dividends of around EUR 640mn. We calculate a FCF of around EUR 1.6bn, while METRO’s net debt (co. definition) dropped to EUR 0.1bn from EUR 1.5bn in the previous year (excl. the cash inflow from the sale of Cash & Carry Vietnam in the amount of EUR 0.4bn). The company confirmed its sales and targets for 2015/16, with lfl sales of +1.5%yoy, as well as EBIT slightly above the EUR 1,511mn achieved in financial year 2014/15. Cash & Carry as well as Media-Saturn are expected to be the key drivers of the increase. Furthermore, METRO announced in February that it acquired the food service distribution company RUNGIS express. No purchase price has been outlined. This comes after its acquisition of Asian food service distribution company Classic Fine Foods in August, which was acquired for an EV of USD 290mn plus an earn-out of up to USD 38mn (the company had annual revenues of around USD 200mn). We keep our marketweight recommendation on the name. Over the last three months, METRO bonds showed some similar spread movement to Carrefour bonds, with some widening of around 23-27bp for the MEOGR 1.375% 10/21 and MEOGR 1.5% 03/19 and relatively low movement of the remaining bonds. Overall MEOGR bonds underperformed the iBoxx Retail index, which has widened significantly, but this has been driven mainly by significant widening of Casino bonds on the back of rating pressure.
Baa2wn/BBBn/-- Weakening Walgreens Boots Alliance (WBA): Marketweight 2.7% On 27 Oct. 2015, WBA announced the acquisition of Rite Aid Corporation for USD 17.2bn (including acquired debt of USD 7.4bn). Rite Aid operates 4,561 drug stores in 31 states with revenue of ca. USD 31bn (including the Envision acquisition). Main triggers for the credit profile: 1. Success in deleveraging after the Rite Aid acquisition (closing expected in 2H16). As of FY14/15 (ending 31 Aug 2015), we calculate adj. net debt/EBITDA of 3.8x (1Q15/16: 3.5x) and adj. FFO/net debt of 18% (1Q15/16: 20%). Pro forma the Rite Aid acquisition (incl. synergies of USD 1bn, suspension of share buyback program), we calculate adj. net leverage of 4.2x at FY14/15. WBA repaid debt regarding the Boots Alliance takeover sooner than expected (in July 15). Pro forma the Alliance Boots acquisition on a fully consolidated basis for twelve months (ex Rite Aid), we calculate an adj. net leverage of 3.6x at FY14/15. 2. Deleveraging should be supported by strong annual free cash flow generation. In FY14/15, WBA showed FCF (after div., UniCredit) of USD 3.5bn. We assume FCF of around USD 5bn p.a. in the next two years. 3. Continued commitment to remain investment grade, which the company reiterated at its investor day in April 2015. 4. We assume a multi-year process of closing unprofitable stores after the pending Rite Aid acquisition as a way to improve margins and generate higher cash flow. 5. Further transformational deals (partnerships, merger, agreements) toward vertical integration to improve its competitive position in the US. Finally, 6. Further reimbursement-rate cuts and generic price inflation remain a general risk.
Mehmet Dere (UniCredit Bank) +49 89 378-11294 [email protected]

March 2016 Credit Research
Euro Credit Pilot
UniCredit Research page 89 See last pages for disclaimer.
Banks (Overweight) Sector key figures Sector Wrap-Up Weight in iBoxx FIN: Current ASW spread: change mom/YTD: EURO STOXX BAK YTD:
81.3% SEN: 79.0bp LT2: 219.9bp UT2: 0.0bp T1: 393.4bp -2.2%
Sector drivers: As stated in our last Euro Credit Pilot edition, after the significant spread widening since May (Greece, China and other geopolitical and macro topics), we see room for spread tightening in 2016, especially as we think that banks will be influenced more by improving macro developments in their home markets rather than by global or regional headlines. However, we might well see prolonged volatility along the way, and this is what characterized early 2016. While banks’ fundamentals have largely improved, and rating agencies have rediscovered their ability to upgrade banks again, challenges remain: economic growth and other macro topics (a continuation of 2015?); litigation risk; regulatory challenges/uncertainties regarding capital and funding requirements (total loss-absorbing capacity, minimum requirement for own funds and eligible liabilities, supervisory review and evaluation process) and associated restructuring and reorganization activities of banks, likely meaning de-risking and deleveraging (look at the significant strategy overhauls at Deutsche Bank and Credit Suisse, also affecting capitalization). Also, low or negative rates are important drivers for some countries, such as the UK (where mortgages with variable rates prevail) and the Nordics, in particular. Nevertheless, we remain constructive on financial credit, assuming 2016 is marked by further progress on the sovereign side, the ongoing hunt for yield, cheap targeted-longer-term-refinancing-operation funding and the potential inclusion of bank bonds in the ECB’s corporate bond purchase program. What has become clear in early 2016 is that banks' business models and their ability to generate adequate and sustainable profitability has come under increased scrutiny, especially given ever-increasing regulatory restrictions on profitable business, as this often coincides with higher risks. Market recap: The tone in markets has become more concerning again as macro risks have resurfaced (China and other geopolitical and macro topics). Investors then used the sell-off as a buying opportunity, supported by central banks and 3Q15 figures from a number of institutions, which, overall, have proven unable to materially improve the general mood. Early 2016 saw material market turmoil as doubts about banks' business models, new bail-in laws and exposure to resource industries surfaced – to name but a few drivers. Sector composition: Rabobank (7.0%), BNP Paribas (5.3%), Crédit Agricole (3.9%), Crédit Mutuel (3.8%), ING (3.2%), Credit Suisse (3.1%), BPCE (3.1%), Goldman Sachs (3.0%), HSBC (2.9%), Intesa Sanpaolo (2.9%), Deutsche Bank (2.8%), JPMorgan Chase (2.8%), ABN Amro Bank (2.7%), Nordea (2.7%), Société Générale (2.6%), Banco Santander (2.5%), Bank of America (2.5%), Citigroup (2.3%), Wells Fargo & Co (2.3%), Morgan Stanley (2.2%), Barclays (2.0%), Lloyds Banking Group (2.0%), Svenska Handelsbanken (1.9%), Standard Chartered (1.6%), SEB (1.5%), UBS (1.5%), Abbey National (1.4%), UniCredit (1.4%), National Australia Bank (1.4%), Pohjola Bank (1.3%), DNB (1.2%), Nationwide (1.2%), Commerzbank (1.2%), Commonwealth Bank of Australia (1.1%), BBVA (1.0%), RBS (1.0%), Swedbank (0.7%), Sumitomo Mitsui (0.6%), SpareBank 1 (0.6%), Mediobanca (0.5%), Berlin-Hannoversche Hyp. (0.5%), Westpac (0.5%), LBBW (0.5%), La Banque Postale (0.5%), Danske Bank (0.5%), Deutsche Pfandbriefbank (0.5%), Nomura (0.5%), Bank of Ireland (0.5%), Aust. & NZ. Banking Group (0.4%), CaixaBank (0.4%), Credit Mutuel Arkea (0.4%), La Caixa (0.4%), KBC (0.4%), UBI Banca (0.4%), Nord/LB (0.4%), Erste Bank (0.3%), Macquarie (0.3%), KBC GROEP NV (0.3%), Yorkshire Building Society (0.3%), Fortis (0.3%), UniCredit Bank Austria (0.3%), Bank of New Zealand (0.3%), Raiffeisen Bank Int. (0.3%), Coventry Building Society (0.2%), Belfius Bank (0.2%), SpareBank 1 SMN (0.2%), Leeds Building Society (0.2%), BRE Finance France (0.2%), Nykredit (0.2%), MUFG (0.1%), Landesbank Berlin (0.1%), Van Lanschot (0.1%), Emirates NBD (0.1%), IBK (0.1%), Bankinter (0.1%), PKO Bank (0.1%), NIBC Bank NV (0.1%), China Construction Bank (0.1%), Turkiye Garanti Bankasi (0.1%), Vakifbank (0.1%), Saastopankkien Keskuspankki Suomi (0.1%), HYPO NOE (0.1%).
Current Ratings (Moody's/S&P/Fitch)
Credit Profile
Name (Ticker): Recommendation Weight in iBoxx Comment Banks sector
A2s/As/As Stable ABN Amro (ABNANV): Marketweight 2.7% ABN AMRO Group reported FY15 net attributable profit of EUR 1.9bn in FY15 (+69% yoy) and a 4Q15 net attributable profit of EUR 272mn (vs. EUR 400 in 4Q14), compared to market estimates (Bloomberg) of EUR 320mn and driven by EUR 190mn of net regulatory levies. 4Q15 figures also included provisions for SMEs with potential derivative-related matters and legal issues. Total revenues rose by 5% thanks to a re-priced loan portfolio and 8% higher fee income. Operating costs rose 8%, driven by increased regulatory levies and project and pension costs. Loan impairments fell by 57% to EUR 505mn. Despite volatile oil and commodity prices, the ECT’s cost of risk was 52bp. ABN AMRO said that it is “still on track”, with a ROE of 12% (compared to a goal of 10-13%) and a cost-income ratio of 61.8% (compared to its goal of reaching 56-60% by FY17). ABN AMRO intends to raise its FY15 dividend-payout ratio to 40% from 35%. Regarding outlook, ABN said that low interest rates, more competition in the mortgage market, uncertain and higher regulatory costs and uncertain economic conditions will drive FY16. ABN also stated that it uses hedges to stabilize net interest income against volatile interest rates. Since 2H15, ABN has reported more competition from insurance, pension funds and new entrants for mortgages with a long-dated interest period.

March 2016 Credit Research
Euro Credit Pilot
UniCredit Research page 90 See last pages for disclaimer.
Current Ratings (Moody's/S&P/Fitch)
Credit Profile
Name (Ticker): Recommendation Weight in iBoxx Comment Banks sector
Ba1p/BB+p/BB+p Improving Allied Irish Banks (AIB): Marketweight 0.0% Allied Irish Banks released its 3Q15 interim management statement (unaudited) and an update on its capital reorganization. 9M15 NIM (excluding Eligible Liabilities Guarantee) was 1.94% thanks to reduced funding costs, more new lending and restructuring of impaired loans. However, AIB expects lower mortgage rates since October to impact the rate of the 4Q15 NIM rise. Fees and commissions rose 6% yoy thanks to more customer business. The 9M15 cost-income ratio (including additional gains) stood at 50% due to more income and stable costs. 2H15 costs are anticipated to be flat hoh, impacted by a 2% salary raise. Impaired loans fell EUR 2bn qoq, driven by restructuring, a better economy and continued redemptions in all loan sectors. Specific provision coverage was flat, at 48%. 9M15 Irish mortgage arrears fell 19% (new arrears fell and more exiting of arrears). Total accounts in arrears regarding owner-occupiers and buy-to-let fell 20% and 18% respectively YTD. AIB forecasts lower provision write-backs in 2H15 hoh but improving (although more slowly) collateral values and customer cash flows. Regarding capital reorganization, on 6 November, AIB announced that the SSM approved AIB’s proposed capital reorganization, mainly to simplify the capital structure, in line with regulation, and to prepare the initial repayment of state aid. AIB plans a partial redemption of the 2009 preference shares (repayment of EUR 1.7bn to the state), with the complete redemption being conditional upon the following: 1. Conversion of all 2009 preference shares into ordinary shares (EUR +1.8bn net in fully loaded CET1), 2. Issuance of EUR ≥750mn of Tier- 2 capital and 3. the issuance of EUR ≥500mn of AT1 capital. Moreover, the planned maturity of the contingent capital notes (CCNs) is predicted to lead to a reimbursement of another EUR 1.6bn to the state in July 2016. AIB also expects its 2009 preference shares to convert into ordinary shares, valuing AIB’s ordinary shares at some EUR 11.7bn. Details are expected to be finalized in the next few days and may include additional measures such as 1. the redemption of the EBS promissory note issued in 2010 at carrying value on the EBS balance sheet at the date of redemption (corresponding to around EUR 220mn on 31 October); 2. the potential issue of warrants to Ireland at the time of re-admission of AIB’s ordinary shares to a regulated market, with Ireland being allowed to subscribe up to 9.99% of AIB’s ordinary shares at ≥200% of the re-admission price and within 10 years; 3. an ordinary share consolidation (1-for-250 basis) to reduce the number of ordinary shares, reducing the ordinary shares after conversion to around 2.7 billion ordinary shares. Regarding capitalization, after the proposed capital reorganization, and on a transitional basis, (including 2009 preference shares), the CET1 ratio is expected to fall to 15.4% from 18.2%, and the total capital ratio to 18.7% from 19.4%. However, based on CRD IV fully loaded capital (excluding 2009 preference shares), and after the proposed capital reorganization, the CET1 ratio is expected to rise from 9.2% to 12.2%, the total capital ratio to 15.1% from 9.9% and the leverage ratio to 7.3% from 5.2%.
Ba3s/--/BBs Stable Banco Popolare Scarl (BPIM): Marketweight 0.0% The Banco Popolare Group reported a FY15 net attributable income of EUR 430mn (vs. EUR -1.9bn in FY14) and EUR 80.2mn in 4Q15 (vs. EUR -1.8bn in 4Q14) compared to market estimates (Bloomberg) of EUR 108.5mn. FY15 results were driven by 9% lower top-line results yoy and, in particular, by 77%-yoy-lower loan adjustments. Net interest income was down 0.4% yoy, and fees and commissions rose 3%. Also, unlike last year, there were no equity/goodwill adjustments. Regarding asset quality, net non-performing exposures (NPE, which are bad, unlikely-to-be-paid and past-due loans) declined by EUR 200mn yoy to EUR 14.1bn thanks to falling new NPL net inflows (EUR 1.4bn vs. EUR 4bn in FY14). The NPE coverage ratio (including written-off bad loans) fell to 43.7% from 44.6% yoy thanks to the disposal of unsecured bad loans, which raised the share of secured NPLs with lower coverage. The CET1 ratio, including profits, rose 130bp yoy to 13.2%, and the Tier-1 ratio 90bp to 13.2%. The total capital ratio rose 130bp yoy to 15.9%. The reported leverage ratio was 5% (and 4.7% fully loaded). The LCR (fully-loaded) was >180%, and the NSFR (according to the latest Quantitative Impact Study) was around 97%.
A3s/A-s/A-s Improving Banco Santander (SANTAN): Marketweight 2.5% (member of the iTraxx FIN) Banco Santander reported FY15 attributable net profit of EUR 6.6bn (+12.9% yoy) and EUR 25mn for 4Q15, compared market estimates of EUR 1.41bn for 4Q15 (Bloomberg). FY15-recorded total revenues rose 6%, with commercial revenues (net interest income and fees) up some 8% but gains on financial transactions down 16%. FY15 saw record net interest income of EUR 32.2bn (+8.9%). Commercial revenues rose 0.2% more than costs, excluding exchange rates, or stayed flat in euros. Costs were up 7% to EUR 21.6bn (stable without inflation), helped by the bank’s efficiency plan. The cost-income ratio was 47.6%. FY15 loan-loss provisions fell 4% to EUR 10.1bn. Moreover, there were provisions of EUR 1.1bn in non-recurrent results: EUR 835mn regarding the reversal of tax provisions in Brazil and EUR 283mn from Banco Internacional do Funchal (Banif). Also, a EUR 600mn fund was set up for potential claims regarding the commercialization of payment-protection insurance (PPI) in the UK. Without non-recurring items, underlying FY15 profit rose 13% to EUR 6.6bn, with Europe representing 56% of the profit and the Americas 44%. In the United Kingdom, FY15 attributable profit rose 14% yoy to GBP 1.4bn (excluding PPI) and fell 21% yoy to GBP 989mn (including PPI). Revenue rose thanks to volumes, with stable banking NIM and 5%-higher net interest income. Also, there was a provision charge of GBP 450mn to the corporate center (response to the FCA consultation).
Baa1s/BBB+s/As Improving Bank of America (BAC): Marketweight 2.5% Bank of America reported 4Q15 net attributable profit of USD 3bn, up 9.8% yoy, as fixed-income trading revenue increased and expenses shrank. This equals an adjusted EPS of USD 0.29 per share, beating the EPS of USD 0.27 per share expected by the market (Bloomberg). Total revenues increased 4.3% yoy to USD 19.5bn on the back of an increase in trading income (up 455.1% to USD 1.4bn) and in net interest income (up 1.7% yoy to USD 9.8bn) – while income from commissions and fees declined by 6.1% yoy to 8.2bn. According to Bank of America, fixed-income gains reflected higher volumes and improvements across most products, and in rates and credit-related products in particular. Operating expenses declined 2.3% yoy to USD 13.9bn and, excluding litigation non-interest expenses, were down 3% yoy to USD 13.4bn. The company’s CEO, Brian Moynihan, has been trimming expenses while facing headwinds from low interest rates and volatile markets. Revenue from equity trading declined 3% yoy to USD 882mn, while USD 964mn was expected by the company. The company’s CFO, Paul Donofrio, said that Bank of America’s total energy-related exposure is USD 21.3bn, or 2% of outstanding loans. Total write-offs increased to USD 1.1bn (from USD 200mn in 3Q15) on the back of non-accrual energy loans. Overall, the NPL ratio declined 32bn yoy (and -6bp qoq) to 1.05%.

March 2016 Credit Research
Euro Credit Pilot
UniCredit Research page 91 See last pages for disclaimer.
Current Ratings (Moody's/S&P/Fitch)
Credit Profile
Name (Ticker): Recommendation Weight in iBoxx Comment Banks sector
Baa2p/BBB-p/BBB-p Improving Bank of Ireland (BKIR): Marketweight 0.5% Bank of Ireland reported FY15 attributable net income of EUR 947mn, up 20.5% yoy. Total income net of insurance was EUR 3.3bn, compared to EUR 2.97bn in FY14. The increase in total income reflected higher net interest income (+5.3% yoy) and higher trading revenues (of EUR 58mn compared to minus EUR 42mn in FY14), which was more than sufficient to offset the negative impact of lower fee income (-7.3% yoy). The net interest margin increased by 8bp to 2.19% due to the positive impacts of lower funding costs and new lending, and was partially offset by lower liquid-asset yields and general challenges posed by the low interest-rate environment. Asset quality continued to improve. Loan-loss provisions declined by 37.3% yoy to EUR 296mn. NPLs were further reduced by EUR 3.8bn in FY15, with reductions across all asset classes reflecting the company’s ongoing progress with resolution strategies that include appropriate and sustainable support to viable customers who are in financial difficulty, the improving economic environment and the ongoing recovery in collateral values. Further reductions in NPLs in FY16 and beyond are planned. The group’s loan-to-deposit ratio declined by 4pp to 106% in FY15, and its net-stable-funding ratio was 120%. Its liquidity coverage ratio increased by 10pp yoy to 108%. The company’s liquidity position is stable, with customer deposits funding more than 90% of customer loans (these deposits are predominantly retail oriented). Operating expenses increased by 6.9% to EUR 1.8bn. The cost-income ratio declined to around 53%, but this was not enough to reach the group’s target cost-income ratio of below 50%. Regulatory charges, including the costs associated with the Irish bank levy, amounted to EUR 75mn in FY15, and the company expects these regulatory costs and levies may increase by EUR 40-45mn in FY16. The acquisitions of performing business banking portfolios of around EUR 400mn from Danske Bank and Lloyds Bank were completed in FY15.
B1s/BBp/BBB-s Stable Bankia (BKIASM): Marketweight 0.0% Bankia reported net attributable profit of EUR 1bn in FY15 (+39% yoy) and EUR 185mn in 4Q15 (despite EUR 184mn in net provisions related to its IPO), compared to market estimates of EUR 134.2mn (Bloomberg). Net interest income declined by 6% yoy to EUR 2.7bn. Commissions and fees fell 1% yoy to EUR 938mn. Trading income rose 29% yoy to EUR 281mn. Operating expenses continued to decline to EUR 1.7bn (-5% yoy). Regarding asset quality, loan-loss provisions declined by 39% yoy to EUR 538mn. The NPL ratio declined by 210bp yoy to 10.8%, while the coverage ratio increased by 240bp yoy to 60%. Capitalization increased further: the CET ratio increased by 161bp yoy to 13.9% phased-in and by 166bp qoq fully loaded to 12.3%. Phased-in, the total capital ratio rose by 134bp yoy to 15.2%.
A2s/A-s/As Stable Barclays (BACR): Marketweight 2.0% (member of the iTraxx FIN) Barclays reported GBP -49mn in FY15 net attributable income (vs. GBP 76mn in FY14). 4Q15 adjusted pretax profit (PBT) was GBP 247mn excluding restructuring from GBP 563mn yoy and compared to market estimates of GBP 519mn (Bloomberg). Group adjusted total income net of insurance claims fell 5% to GBP 24.5bn and Core total income was roughly flat yoy at GBP 24.7bn. Total adjusted operating costs fell 6% to GBP 17bn. Core business profit before tax rose 3% to GBP 6.9bn, driven by all Core operating businesses, including Africa Banking, at constant currency. There were positive cost-income jaws across all Core operating businesses. The faster rundown of non-Core led to 2% lower group adjusted profit before tax to of GBP 5.4bn, driven by a 24% higher non-Core loss before tax of GBP 1.5bn. The non-Core wind down led to RWAs falling GBP 29bn to GBP 47bn. Significant adjustments were, among other things, another GBP 1.5bn in PPI provisions (slower-than-expected fall in claims and FCA proposals), GBP -261mn in 4Q15 for the announced sale of the Italian retail banking branch network (total disposal losses relating to the Spanish, Portuguese and Italian businesses in FY15 were GBP 580mn) and GBP 167mn in 4Q15 provisions for investigations and litigation including foreign exchange. Strategy update: Barclays said that it intends to simplify the group along two core divisions (Barclays UK and Barclays Corporate & International), to “sell down” Barclays Africa Group to deconsolidation over the next 2-3 years and to have a one-off increase of non-Core by transferring some GBP 8bn in risk-weighted assets and to speed up the run-down especially in FY16 (guidance of some GBP 20bn RFIAs for Non-Core by FY17). Barclays also gave a FY16 cost target of GBP 2.8bn for new Core, excluding Barclays Africa Group, and new group financial targets focused on RoE, CET1 and the cost-income ratio as follows: CET1 of >100-150bp compared to regulatory requirements and a cost-income ratio of below 60%.
A2s/--/A-s Stable Bayern LB (BYLAN): Marketweight 0.0% BayernLB reported 9M15 net attributable profit of EUR 426mn (vs. EUR -561mn in 9M14). While pre-tax income rose 2% yoy to EUR 574mn, profit after taxes was driven by last year’s disposal of Hungarian bank MKB. Net interest income fell 10% yoy to EUR 1.1bn, net fees and commissions by 0.6% to EUR 167mn, and trading revenues amounted to EUR -84mn (vs. EUR 135mn in 9M14). 9M15 results were impacted by the new EUR 99mn bank levy and the EUR 47mn payment to the new deposit guarantee scheme, compared to a combined figure of EUR 2mn in 9M14. In terms of segments (9M15), in Corporates & Mittelstand, pre-tax profit rose by EUR 69mn to EUR 232mn; in DKB- Deutsche Kreditbank, core earnings rose to EUR 238mn from EUR 114mn in 9M14, mainly thanks to higher net interest income of EUR 588mn; in Real Estate & Savings Banks/Association, pre-tax profit amounted to EUR 160mn vs. EUR 193mn, driven by low interest rates. Financial Markets reported a pre-tax profit of EUR 123mn vs. EUR -13mn in 9M14, driven by gains on securities and lower fair-value adjustments on derivatives transactions. Capitalization is as follows: Phased-in, the CET1 ratio fell 20bp yoy to 13.8%; fully-loaded, the ratio fell 170bp yoy to 11.1%. The total capital ratio rose 50bp yoy to 16.2%. Heta: BayernLB stated that Bavaria and Austria reached a settlement on 11 November and that Austria paid a settlement amount of EUR 1.23bn after approval by BayernLB, which ends all of the group’s legal matters with Austria and Kärntner Landesholding. However, to have legal clarity, BayernLB and HETA have agreed to continue the Munich suit over the Austrian Act on Substitute Capital (EKEG). Regarding its outlook for 2015, Bayern LB stated that, in light of the sound operating businesses, BYLAN expects to report FY15 pre-tax profit in the mid-triple-digit-million-EUR range as long as the macroeconomic conditions remain unchanged.

March 2016 Credit Research
Euro Credit Pilot
UniCredit Research page 92 See last pages for disclaimer.
Current Ratings (Moody's/S&P/Fitch)
Credit Profile
Name (Ticker): Recommendation Weight in iBoxx Comment Banks sector
Baa1s/BBB+s/A-s Improving BBVA (BBVASM): Marketweight 1.0% (member of the iTraxx FIN) BBVA reported net attributable FY15 income of EUR 2.6bn (+1%) and EUR 940mn in 4Q15 (vs. EUR 689mn in 4Q14), compared to an estimated EUR 824.9mn (Bloomberg). Results were driven by low interest rates (especially USD and EUR), a better risk premium (1.06%) and reduced loan-loss and real estate provisions in Spain. FY15 net interest income increased by 9% to EUR 16.4bn (+21.5% at constant exchange rates) despite low interest rates. FY15 record gross income rose 10.9% to EUR 23.7bn (+15.7% before currency impacts). 4Q15 contributions to the Spanish Deposit Guarantee Fund and the Resolution Fund were EUR 291mn, and there were no dividends from CNCB or results from CIFH. Costs rose 12.5% or 15.8% at constant exchange rates, largely due to “corporate operations”, including efficiency measures. The cost-income ratio rose 74bp yoy to 52%. FY15 operating income rose 9% to EUR 11.4bn, or 16% at constant exchange rates. Excluding the above-mentioned “corporate operations”, net attributable profit from ongoing operations was +43% yoy at EUR 3.8bn. Among other things, “corporate operations” included the disposals of the whole investment in CIFH and of 6.34% of CNCB, the bad will due to the integration of Catalunya Banc and pricing the initial 25.01% stake in Garanti at fair value after the acquisition of another 14.89% in the bank. The NPL ratio fell 40bp yoy to 5.4%, and NPL coverage rose 10pp yoy to 74%. Including unrealized capital gains from the sovereign portfolio, available for sale, the phased-in CET1 ratio was up 20bp yoy to 12.1%, and the CET1 ratio (fully loaded) stood at 10.3%. The fully loaded leverage ratio was 6.0%.
A1s/A+wn/A+s Stable BNP Paribas (BNP): Marketweight 5.3% BNP Paribas reported net attributable profit of EUR 6.7bn in FY15 (+4164%) and EUR 665mn in 4Q15 (vs. EUR 1.4bn in 4Q14), compared to market estimates of EUR 864mn (Bloomberg). FY15 revenues rose 10% to EUR 42.9bn, including EUR +314mn in 4Q15 own credit adjustment and own credit risk in derivatives (DVA). Revenues rose for all operating divisions: Domestic Markets up 1.6%, International Financial Services up 14.5% and CIB up 13.2%. Results profited from last year’s acquisitions and from foreign exchange impacts (+3.5% at constant scope and exchange rates). Operating costs rose 10% to EUR 29.3bn, including EUR 793mn for the Simple & Efficient transformation costs and acquisitions’ restructuring costs (vs. EUR 757mn in FY14) and EUR 69mn to a fund for the resolution of four Italian banks. Operating costs at the operating divisions rose 9.3%: +3.1% for Domestic Markets, +15% for International Financial Services and +11.5% for CIB. At constant scope and exchange rates, these were up 3%, driven by new regulations, compliance and business-development plans, but were somewhat mitigated by the Simple & Efficient plan. Cost of risk was flat, at 54bp (-3bp yoy). BNP reported a further one-off provision of EUR 100mn, which was related to its remediation plan. Regarding CIB's 2016-19 Transformation Plan, BNP announced a CIB "transformation" plan that aims for a 8% RoE by 2019 (to be updated in the 2017-20 plan) and is grounded in “three levers” across regions and businesses: 1.“Focus” intends to free up capital by “rightsizing” businesses, countries and portfolios and aims for market growth via a gross cut in RWAs of EUR 20bn (EUR 10bn net of reinvestments). 2. “Improve” is to generate EUR 1bn in cost cuts. 3. “Grow” intends to develop growth initiatives with less capital and to produce fees, based on derivatives, digital platforms and geographical actions. CIB wants to strengthen growth at its European business and to profit from Asia-Pacific growth, in particular. Overall, CIB aims for average revenue growth of 4% p.a. in 2015-19, an improvement of the cost-income ratio by 8pp and EUR 1.6bn of further pre-tax income vs. FY15.
Baa1s/BBB+s/As Improving Citigroup (C): Marketweight 2.3% Citigroup reported 4Q15 net attributable income of USD 3.3bn, or USD 1.02 per diluted share. This compares to attributable net income of USD 344mn in 4Q14, which was mainly due to lower legal and regulatory costs – these hammered the company in 4Q14. In 4Q14, Citi incurred USD 3.5bn in legal costs, which were tied to settling several high-profile investigations, including allegations of currency-trading and interest-rate manipulation. On top of that, higher revenues contributed to increasing profit when they increased 3.1% yoy to USD 18.5bn. This was driven by a 61% increase to USD 2.91bn at the holding company – after accounting adjustments were included. The company completed sales of businesses, such as subprime lender OneMain Financial and a credit-card unit in Japan. In FY15, the company generated USD 17.2bn in net income, the highest since 2006. Citigroup’s effective tax rate was 29% in 4Q15, down from 74% in 4Q14. This was impacted by elevated non-tax-deductible legal and related expenses. Operating expenses decreased 22.8% yoy to USD 11.1bn, mainly driven by lower legal and related expenses and repositioning costs. Legal and related expenses stood at USD 411mn in 4Q15, compared to USD 2.9bn in 4Q14, and repositioning charges halved to USD 313mn. The cost of credit in 4Q15 was USD 2.5bn, up 25% yoy. Loan-loss provisions increased by 24.9% yoy to USD 2.5bn, primarily at Institutional Clients Group.
Baa1s/BBB+n/BBBp Stable Commerzbank (CMZB): Marketweight 1.2% (member of the iTraxx FIN) Commerzbank reported net attributable profit of EUR 1.1bn (+299%) in FY15 and of EUR 187mn in 4Q15 (vs. EUR -280mn in 4Q14), compared to the EUR 156.1mn expected (Bloomberg). Net interest income rose 6% yoy to EUR 6.3bn. Net commission income improved by 5% yoy to EUR 3.4mn. Regarding asset quality, LLPs fell 40% yoy to EUR 696mn. In terms of segments, FY15 operating profit at Private Customer rose 65% yoy to EUR 751mn, including a one-off of some net EUR 80mn in 3Q15. Operating profit at Mittelstandsbank fell to EUR 1.1bn from EUR 1.2bn. Central & Eastern Europe, driven by solid business at M Bank, reported lower operating profit of EUR 346mn, down from EUR 364mn. Operating profit at Corporates & Markets fell to EUR 610mn from EUR 675mn, driven by doubts over global growth in 2H15. Non-Core Assets reported better revenues, loan-loss provisions and costs, and operating profit was EUR -401mn vs. EUR -815mn. Capitalization looks more comfortable now: fully loaded, the CET1 ratio was 12%, up 270bp yoy, and the CET1 phase-in ratio was 13.8%, up 210bp yoy. Regarding its outlook, Commerzbank stated that FY16 is expected to be “challenging”, driven by geopolitical and macroeconomic conditions, but that it will stick to its strategy. It intends to raise market share for its core bank and to keep costs stable, excluding “additional external noninfluenceable burdens”. The bank also anticipates a “moderate” rise in loan-loss provisions, driven by lower recoveries and a “slight” rise in net profit yoy.

March 2016 Credit Research
Euro Credit Pilot
UniCredit Research page 93 See last pages for disclaimer.
Current Ratings (Moody's/S&P/Fitch)
Credit Profile
Name (Ticker): Recommendation Weight in iBoxx Comment Banks sector
A2p/As/Ap Improving Credit Agricole (CASA) (ACAFP): Marketweight 3.9% Crédit Agricole S.A. reported net attributable profit of EUR 3.5bn (+50% yoy) in FY15 and EUR 882mn (+28% yoy) in 4Q15, compared to market estimates of EUR 707mn for 4Q15 (Bloomberg). Crédit Agricole Group (CAG) reported net attributable profit of EUR 6bn (+23% yoy) in FY15. CAG’s FY15 results were in line with the 2014-16 medium-term plan, with revenues up 5% yoy; 3% higher costs; 3% higher loan-loss provisions, including for legal matters, and EUR 475mn from equity-accounted entities. Results were driven by all business lines thanks to solid lending, deposits or more assets under management, and CIB net income rose 12% yoy to EUR 739mn. Regarding its simplification plans, Crédit Agricole announced that it plans to simplify the group structure and strengthen capitalization for Crédit Agricole S.A. via an intragroup transfer of the cooperative investment certificates and cooperative associate certificates (CCI/CCAs) issued by regional banks and held by Crédit Agricole S.A. These certificates would be transferred to SACAM Mutualisation. The certificates are to be 100%-owned by the regional banks and are intended to pool part of their earnings. They correspond with a transaction value of EUR 18bn, and the attributable proportion of the certificates corresponds to 17.2x the regional banks' contribution to FY15 net income. Among other things, this would entail 1. unwinding Switch 1 while maintaining Switch 2 (covering the value of the equity-accounted insurance activities); 2. reaching CASA’s pro forma January fully-loaded CET1 target of 11% before the planned end-FY16 (150bp ≥Pillar 2); 3. deleveraging CASA’s corporate center by financial management of the balance sheet; 4. a recurring increase of EUR 0.3bn in CASA’s annual cash flow and 5. While “viewed positively” by the ECB, the deal is contingent on the Autorité des Marchés Financiers' decision, that there is no requirement for a public offer to withdraw shares and staff representatives. The deal could be finalized in 3Q16.
Baa3s/BBB+s/As Weakening Credit Suisse (CS): Marketweight 3.1% (member of the iTraxx FIN) Credit Suisse reported FY15 net income of CHF -2.9bn – vs. CHF 1.9bn in FY14 and CHF -5.83bn for 4Q15 (vs. CHF 691mn in 4Q14) – compared to an estimate of CHF -4.3bn (Bloomberg). The group's FY15 pre-tax loss was CHF 2.4bn and CHF 6.4bn for 4Q15, driven by the following one-off impacts: goodwill impairment of CHF 3.8bn, restructuring costs of CHF 355mn, litigation items of CHF 821mn, Strategic Resolution Unit losses of CHF 2.5bn and a fair-value-of-own-debt gain of CHF 298mn. Core pre-tax income was CHF 88mn vs. CHF 7.2bn in FY14 and an adjusted core pre-tax income of CHF 4.2bn vs. CHF 6.3bn in FY14. Adjusted pre-tax income rose 27% for APAC, 6% for Private Banking in IWM and 4% for the Swiss Universal Bank. However, adjusted pretax income in GM fell to CHF 1.1bn from CHF 2.7bn, largely due to market conditions and credit spreads on legacy fixed income. IBCM net revenues fell 17% due to reduced debt and equity underwriting revenues. However, this decrease was somewhat mitigated by better advisory fees. Moreover, CS has sped up its restructuring efforts, cutting some 4,000 staff. Regarding its outlook, CS stated that, by relying on wealth management and investment banking, it intends to implement its strategy until end-2018. It plans to implement its plan despite the fact that its environment has been weakened since 4Q15 by uncertain Chinese growth; lower oil prices; industry mutual fund redemptions; “asynchronous policies” by central banks; lower liquidity and a strong CHF, which is driving reduced client business, lower issuance and volatility in some asset classes. CS expects markets to remain volatile in 1Q16. Despite this, it plans to advance its restructuring efforts. Cost savings are expected to be CHF 1.2bn p.a., or 34% of 2018's cost-cutting target of CHF 3.5bn.
Baa1n/BBB+s/A-s Weakening Deutsche Bank (DB): Marketweight 2.8% (member of the iTraxx FIN) Deutsche Bank reported an FY15 net loss of EUR 6.8bn vs. EUR 1.7bn in FY14. FY15 revenues rose 5% to EUR 33.5bn. Revenues also rose slightly at constant exchange rates and excluding the EUR 0.7bn impact from the Hua Xia Bank transaction, which included an impairment of the 19.99% investment and other transaction-related effects. FY15 non-interest costs rose 40% to EUR 38.7bn due to the following non-recurrent drivers of EUR 12bn: EUR 5.8bn in impairments of goodwill and other intangible assets, litigation charges of EUR 5.2bn vs. EUR 2bn in FY14 and restructuring and severance costs of EUR 1bn vs. EUR 0.4bn in FY14. Adjusted costs rose somewhat to EUR 26.5bn. At constant exchange rates, and due to lower costs in NCOU (thanks to deleveraging and cost savings) adjusted costs were somewhat lower and impacted by regulatory costs. Segment-wise, 4Q15 revenues fell 30% yoy to EUR 2.1bn in CB&S (pre-tax income of EUR -2bn vs. EUR +2.2bn in FY14) due to valuation adjustments in Debt Sales & Trading, difficult trading conditions and reduced client business. In PBC, 4Q15 revenues fell 7% yoy to EUR 2.2bn (pre-tax income of EUR -3.3bn vs. EUR +1.2bn in FY14) due to valuation and transaction-related impacts from the stake in Hua Xia Bank and low interest rates – somewhat mitigated by revenue growth in credit offerings. 4Q15 GTB revenues rose 13% yoy to EUR 1.2bn in difficult conditions and due to solid business in Trade Finance & Cash Management for Corporates and in Institutional Cash & Securities Services, and a positive exchange-rate impact. 4Q15 Deutsche AWM net revenues rose 14% to EUR 1.4bn due to cumulative net money inflows; more business activity in Active, Passive and Alternative Products and the positive impact of exchange rates. The fully loaded CET1 ratio fell 40bp qoq to 11.1%, driven by the net loss. The disposal of the 19.99% stake in Hua Xia Bank would have led to a ca. 50-60bp higher pro forma fully loaded CET 1 ratio. The leverage ratio fell 10bp qoq to 3.5%, driven by the 4Q15 loss, and the stake sale in Hua Xia Bank would have led to a ca. 10bp increase (pro forma). RWA fell EUR 11bn qoq to EUR 397bn due to lower market risk, credit risk and credit valuation adjustments offsetting higher RWAs for operational risk and exchange rate movements, with decreases mainly in CB&S and NCOU.
A1/A+/-- Stable DNB (DNBNO): Marketweight 1.2% DNB reported net attributable income in FY15 of NOK 24.8bn (+20%) and in 4Q15 of NOK 6.8bn vs. NOK 5bn in 4Q14, compared to market estimates of NOK 6.81bn (Bloomberg). FY15 profit, adjusted for basis swaps, rose by NOK 2.5bn and was driven by higher net interest income, other net operating income and lower costs. FY15 net interest income rose 9% yoy, benefitting from higher volumes and better deposit spreads (lending spreads -18bp and deposit spreads +23bp). Loan losses rose 39%, driven by shipping and offshore and mitigated by personal customers due to the NPL portfolio disposal to Lindorff in 3Q15. However, collective impairments were up NOK 597mn due to large corporate exposure and economic conditions in some industries, and the lack of the FY14 reversal of NOK 341mn. The Pillar 2 requirement for DNB is at 1.5%, and the total CET1 requirement will thus be 15% at end-FY16. DNB intends to comply with this through retained earnings and efficiency actions.

March 2016 Credit Research
Euro Credit Pilot
UniCredit Research page 94 See last pages for disclaimer.
Current Ratings (Moody's/S&P/Fitch)
Credit Profile
Name (Ticker): Recommendation Weight in iBoxx Comment Banks sector
Baa2p/BBB+n/BBB+s Stable Erste Bank (ERSTBK): Marketweight 0.3% Erste Group Bank reported FY15 net attributable profit of EUR 968mn (vs. EUR -1.4bn in FY14), and for 4Q15 of EUR 204mn vs. EUR 42mn in 4Q14 and compared to market estimates for 4Q15 of EUR 155mn (Bloomberg). Results were driven by volume growth in CEE, improving risk costs and lower one-off impacts. Regarding asset quality, the net impairment loss on non-fair-value financial assets again declined significantly yoy (-65%). The NPL ratio again improved, to 7.1%, down 140bp yoy. The NPL coverage ratio fell 440bp to 64.5%. The Basel III CET1 ratio phased-in rose 170bp yoy to 12.3%, and the total capital ratio rose 220bp yoy to 17.9%. Regarding its outlook, among other things, Erste Group expects its operating environment to support credit expansion. The bank expects 2016 real GDP growth to be 1.5-3.8% in Austria (and in all major CEE markets) due to domestic demand. FY16 ROTE is forecast to be some 10-11% thanks to loan growth, better asset quality and the sale of a stake in VISA (approximately EUR 127mn before tax) – this is somewhat offset by low interest rates and lower operating results in Hungary, due to reduced volumes, and in Romania, due to asset re-pricing. Banking levies are expected to be some EUR 360mn pre-tax.
A3s/BBB+s/As Stable Goldman Sachs (GS): Marketweight 3.0% Goldman Sachs reported 4Q15 net attributable profit of USD 574mn, down 71.8% yoy and 56.8% qoq after a legal settlement was reached. During 4Q15, the bank recorded provisions for the legal settlement of USD 1.8bn (USD 1.54bn after-tax) with the Residential Mortgage-Backed Securities Working Group of the US Financial Fraud Enforcement Task Force, which reduced diluted earnings-per-common-share by USD 3.41 and annualized ROE by 8.1pp to 3.0%. Diluted earnings-per-common-share were at USD 1.27, which was better than the USD 0.75 expected by the market (Bloomberg). Total revenues declined by 5.4% yoy in 4Q15 to USD 7.27bn due to a strong decline in commissions and fees (lower by 78.5% yoy to USD 818mn, reflecting lower volumes) and falling net interest income (down 27.2% yoy to USD 700mn). These results were partially offset by significantly higher net revenues in securities services, primarily reflecting improved securities lending spreads. Trading revenues increased by 96.7% to USD 5.76bn. Revenue from trading in fixed-income, currency and commodities markets rose 1.2% yoy to USD 1.18 bn, excluding accounting adjustments, while equity-trading revenue fell 7.1% yoy to USD 1.77bn. Operating expenses, at USD 6.2bn, were 38.5% higher than in 4Q14, due to the increase in other expenses (up 120.5% to USD 5.7bn) on the back of litigation costs. Goldman Sachs’s M&A activity peaked in 2015, when the bank advised on completed transactions valued at more than USD 1 trillion. The ratio of compensation and benefits to net revenues slightly declined to 31% (from 39% in 3Q15), and total staff declined 0.3% during 4Q15. On 19 January 2016, the board of directors of The Goldman Sachs Group, Inc. declared a dividend of USD 0.65 per common share, to be paid on 30 March 2016 to common shareholders. Capitalization declined slightly; the Basel III CET-1 ratio was down slightly, by 30bp qoq to 12.4%.
A1s/As/AA-s Weakening HSBC (HSBC): Marketweight 2.9% (member of the iTraxx FIN) HSBC Holding Plc reported net attributable profit of USD 13.5bn in FY15, down 1.2% yoy as growth in China slowed. 4Q15 showed a loss of USD 1.3bn (down 125.3% qoq and 359.3% yoy), which was due to restructuring costs and provisions for legal and regulatory matters, including USD 370mn for potential settlements and USD 337mn to compensate customers in Britain. Loan impairment charges and provisions for credit risk of USD 1.64bn also had a negative impact. On an adjusted basis, profit before tax declined by 7% yoy to USD 20.4bn. FY15 trading revenues increased by 29% yoy to USD 8.7bn, and loan-loss provisions declined by 3.4% yoy. Earnings per share declined slightly to USD 0.65, compared with USD 0.69 in FY14. Risk-weighted assets (RWAs) declined by 9.6% yoy to USD 1.1bn in FY15, nearly halfway towards the group’s target, which is to be achieved by end-2017. The main part of the reduction in RWAs came from Global Banking and Markets. Further RWA reduction is expected for FY16, in addition to a decrease of around USD 33bn from the sale of the company’s business in Brazil. In February, HSBC’s board of directors decided unanimously to remain headquartered in the UK. It also approved a 4Q15 dividend of USD 0.21 per ordinary share. Dividends per ordinary share in FY15 thus totaled USD 0.51 (USD 0.01 higher than those of FY14), i.e. USD 10.0bn in total (USD +0.4bn than in FY14). However, the board noted that prospective dividend growth remained dependent on the long-term overall profitability of the HSBC group and on further progress regarding efficiently deploying capital. HSBC’s CET 1 ratio increased by 80bp yoy to 11.9% in FY15 on the back of accelerated run-off of legacy books and its shrinking its balance sheet in areas that can no longer support the expanded capital requirements in force.
Baa3/--/BBB-n Stable HSH Nordbank (HSHN): Underweight 0.0% HSH Nordbank reported net attributable income of EUR 23mn in 9M15, compared to EUR 332mn in the prior year. 9M15 net income before taxes was EUR 110mn, down from EUR 460mn in 9M14, driven by the lack of last year’s larger debt waiver of EUR 668mn (vs. EUR 289mn in 9M15) from guarantors. Results were also impacted by EUR 54mn for the European bank levy and the deposit-guarantee system of the German Savings Banks Finance Group. 9M15 loan-loss provisions were impacted by the additional premium of EUR 311mn, with the base premium being EUR 355mn. Together, these guarantee fees of EUR 666mn were larger than the EUR 660mn compensation and debt waiver. The Core Bank reported total income of EUR 598mn, up from EUR 563mn in 9M14, due to 12%-higher net interest income. HSH Nordbank’s loan-loss provisioning was driven by “heavy allocations” for the shipping portfolio due to difficult markets and restructuring activities. However, there were net reversals for corporate and real estate client portfolios thanks to repayments and lower risk. Adjusted for guarantee compensation effects, net loan-loss provisioning fell to a positive EUR 43mn, from EUR 387mn due to the smaller debt waiver. Regarding capitalization, in 9M15, phased-in, the CET 1 ratio rose 40bp qoq to 12.8%. Fully loaded, the CET ratio increased 50bp qoq to 12.0%. Both CET ratios included the additional premium buffers due to the capital protection clause. In terms of its outlook, HSH Nordbank said that the agreement, in principle, between the European Commission, Hamburg and Schleswig-Holstein in October will become more detailed in the next few months. It also said that EUR ≤6.2bn of NPLs is to be transferred to the above-mentioned majority shareholders and that another EUR 2bn is to be sold on the market in parallel to the run-off portfolio. Furthermore, the bank added that losses from this will fall under the second-loss guarantee. HSH Nordbank’s operating company will pay much lower guarantee fees under the new structure, and the final conclusion of the state aid proceedings is forecast for 1H16, according to the bank. HSH Nordbank also stated that 4Q15 will largely be driven by the agreement, in principle, that the latter will impact FY15 results, and that it still views positive FY15 net income before taxes to be possible “as a whole”.

March 2016 Credit Research
Euro Credit Pilot
UniCredit Research page 95 See last pages for disclaimer.
Current Ratings (Moody's/S&P/Fitch)
Credit Profile
Name (Ticker): Recommendation Weight in iBoxx Comment Banks sector
Baa1s/A-s/As Improving ING Groep (INTNED): Marketweight 3.2% (member of the iTraxx FIN) ING Group reported FY15 net profit of EUR 4bn, including the net result of the legacy Insurance businesses (+221% yoy) and a 4Q15 net profit of EUR 819mn, compared to market estimates (Bloomberg) of EUR 789mn. Total revenues rose by 8% yoy, driven by 2% higher net interest income, 1% higher commissions and 257% higher other income. However, investment income was 37% lower. While costs rose 3%, the gross result before tax was up 16%, and loan-loss provisions fell 16%, leading to a 26% higher underlying results before tax. Regarding ING Bank, its FY15 net result was up 74%, and underlying net profit rose 23% yoy to EUR 4.2bn in spite of higher regulatory costs and thanks to higher net interest income and reduced cost of risk. Asset quality improved: the NPL ratio fell by 50bp yoy to 2.5%, and NPL coverage rose by 300bp yoy to 38.5%. ING Bank's fully loaded CET1 ratios rose 20bp yoy to 11.6%. ING Group sold Voya and materially cut its stake in NN Group.
Baa1s/BBB-s/BBB+s Stable Intesa Sanpaolo (ISPIM): Marketweight 2.9% (member of the iTraxx FIN) Intesa Sanpaolo reported EUR 2.7bn in net attributable profit in FY15 (-28% yoy) and EUR 13mn in net attributable profit in 4Q15 (vs. EUR 48mn in 4Q14), compared to market estimates of EUR 78mn (Bloomberg). On a yoy comparison, FY15 results were driven by 2%-yoy-higher total income of EUR 17.1bn (due to 7%-yoy-lower net interest income, 41%-yoy-higher trading income and an 11% increase in fee and commission income) and 28%-yoy-lower loan-loss provisions of EUR 3.3bn. Also, operating expenses rose by 2%. Intesa reported positive and higher net income yoy from all business units. In terms of segments, 1. Corporate and Investment Banking EUR 1.3bn vs. EUR 1.2bn; 2. Banca dei Territori EUR 1.2bn vs. EUR 0.9bn; 3. International Subsidiary Banks EUR 418mn vs. EUR 376mn; 4. Private Banking EUR 663mn vs. EUR 499mn;. 5. Asset management EUR 466mn vs. EUR 270mn and 6. Insurance EUR 630mn vs. EUR 501mn. Regarding asset quality, Intesa said that its 1H15 NPL inflow from performing loans was at its lowest level since 2007 (as it was already in 3Q15) and that net inflow was down 33% yoy. Gross inflow fell 29% yoy. In terms of its outlook, for FY16, Intesa anticipates better operating income thanks to net fees and commissions and anticipates a better operating margin and income before taxes from continuing operations, with a lower cost of risk. Intesa also intends to pay a EUR 3bn cash dividend for FY16.
A3s/A-s/A+s Stable JPMorgan Chase (JPM): Marketweight 2.8% JPMorgan Chase reported 4Q15 net attributable income of USD 5.4bn, which is an increase of 10.2% yoy on the back of lower expenses. Earnings per share, excluding litigation costs, accounting adjustments and a tax benefit, were USD 1.34, beating the average market estimate (Bloomberg) of USD 1.27. Expenses, which helped banks counter low interest rates and volatile markets in 4Q15, declined 7.4% yoy to USD 14.3bn, driven by lower Corporate & Investment Banking expenses, which reflected lower legal costs and lower compensation. At the same time, revenues increased slightly, by 0.8% yoy to USD 23.7bn, driven by higher revenue in Corporate and Consumer & Community Banking, largely offset by lower revenue in Corporate & Investment Banking and Asset Management. Trading income increased by 19.1% yoy but declined compared to that of the previous quarter (-32.3% qoq). Income from commissions and fees declined (-10% yoy), while net interest income increased slightly (1.5% yoy). JPMorgan also reported that regulatory changes will have a smaller impact on capital requirements than previously estimated. In July, US regulators said that JPMorgan would have to pay USD 166mn. According to JPMorgan, its surcharge for G-SIBs fell to 3.5% (from up to the 5% estimated a year earlier) after the company cut client deposits and reduced derivatives. This decline has a positive impact on the company's passing a future Fed stress test while keeping the return of capital to shareholders.
--/An/A-s Stable KBC (KBC): Marketweight 0.4% KBC reported very solid results, with 4Q15 net attributable profit of EUR 862mn, up 86% yoy (and 44% qoq). Profit was boosted by the liquidation of KBC Financial Holding Inc. but tempered by impairments on goodwill. The goodwill impairment on the banking unit in Slovakia and on the bank and insurance subsidiaries in Bulgaria added up to EUR 344mn. The previously announced liquidation of KBC Financial Holding Inc. resulted in a positive income-tax figure and a negative net result from financial instruments, at fair value, of EUR 765nn. Excluding these two items, the net result came to EUR 441mn in 4Q15. FY15 came to EUR 2.64bn, 50% more than in FY14 (and EUR 2.22bn excluding the two items). Both the banking and insurance franchises in the group’s core markets and core activities prospered. All countries generated a profit. Net interest income (of EUR 1.07bn in 4Q15) was slightly higher despite the low-interest-rate environment and some pressure on lending margins. KBC’s net interest margin narrowed from 1.99% to 1.95%. Sales of non-life insurance products across all markets increased yoy, and the non-life combined ratio stood at a solid 91% for FY15. Aggregate sales of life products increased, particularly in the Czech Republic. The cost/income ratio stood at 55% in FY15. The cost of credit in FY15 amounted to 0.23% of KBC’s loan portfolio.
Baa1p/BBB+s/A+s Improving Lloyds Banking Group (LLOYDS): Marketweight 2.0% (member of the iTraxx FIN) Lloyds Banking Group reported statutory net profit of GBP 860mn in FY15 (-39% yoy) and adjusted FY15 profit of GBP 8.11bn (or +10% excluding TSB), excluding PPI charges and restructuring, in line with market estimates (Bloomberg). The results were impacted by the loss on the TSB disposal and PPI provisions. The latter rose by GBP 2.1bn in 4Q15 due to a time bar proposed by the FCA and the consequences of the Plevin case. Lloyds assumes this amount to be sufficient until mid-2018, based on current FCA proposals and some 10,000 complaints per week (up from some 8,000). The pro forma CET1 ratio is 13.9% before dividends and 13.0% after. Regarding its outlook, Lloyds gives 2016 guidance of NIM of some 2.70% and an asset quality ratio of some 20bp. It also reiterated its RoE and cost-income-ratio goals but for a later point in time. Regarding CET1 generation, Lloyds now expects to create some 200bp p.a. pre-dividend, up from 150-200bp. Its medium-term effective tax rate is forecast to be 27%.

March 2016 Credit Research
Euro Credit Pilot
UniCredit Research page 96 See last pages for disclaimer.
Current Ratings (Moody's/S&P/Fitch)
Credit Profile
Name (Ticker): Recommendation Weight in iBoxx Comment Banks sector
A3s/BBB+s/As Stable Morgan Stanley (MS): Marketweight 2.2% Morgan Stanley reported 4Q15 net attributable income of USD 753mn, up 143% yoy and down 19.8% qoq. This translates into an adjusted EPS of USD 0.43. Thus, it beat the average market EPS estimate of USD 0.32. While total revenue remained stable, after accounting changes are excluded, total revenue increased 5.3% yoy to USD 7.9bn. Operating costs declined 41% yoy to USD 6.3bn. However, during the previous year the company had to face USD 3.1bn in litigation charges. Equity-trading revenue increased to USD 1.8bn (from USD 1.6bn), driven by revenues from cash equities and prime brokerage. Advisory revenue increased 5.7% yoy to USD 516mn due to higher M&A activity. Income at the wealth management division increased 4.3% yoy to USD 768mn, as compensation costs declined. The bank’s CEO, James Gorman, emphasized the further need for cost-cutting as MS remains below its profitability targets. Mr. Gorman stated that difficult market conditions in 2H15 were responsible for worse trading activity, while in 4Q15, the bank “took an action to meaningfully restructure the fixed-income business on a capital and expense basis”. MS’s target is to achieve a 9-11% return on equity by 2017. Excluding one-off items, fixed-income trading revenue fell 8.2% yoy to USD 550mn in 4Q15, its second-lowest level since the financial crisis. Excluding DVA, return on average common equity stood at 7.8% at the end of 2015 (4.9% in 4Q15 excluding DVA), compared to 4.1% at the end of 2014. Further cost cutting and increased efficiency should support MS’s progress towards its target. The company announced a new efficiency plan, Project Streamline, which should reduce at least USD 1bn in costs by 2017, assuming flat revenue stays flat. MS wants to consolidate processes and real estate and rely more on outsourcing. It will continue to focus on managing expenses.
Aa3s/AA-n/AA-s Stable Nordea (NDASS): Marketweight 2.7% Nordea reported FY15 net attributable income of EUR 3.7bn (+9.9% yoy). Reported total recurrent income rose 3% yoy. Non-recurrent items included a 4Q15 restructuring charge of EUR 263mn, as Nordea makes the transition to becoming a digital bank. Other non-recurrent items included a 2Q14 restructuring charge of EUR 190mn, a 3Q14 gain of EUR 378mn from the sale of Nets, an impairment of EUR 344m on intangible assets and a 4Q15 gain of EUR 176m before tax from the disposal of Nordea’s Merchant Acquiring business to Nets. FY15 net interest income was impacted by lower interest rates, which were mitigated by savings operations as a growth driver. Reported recurrent FY15 costs were in line with Nordea’s target of EUR 4.7bn, leading to a recurrent cost-income ratio of -220bp at 47.1%. For FY16, the bank anticipates underlying stable costs thanks to cost savings of some EUR 200mn but some 3% higher total costs due to IT and compliance costs in local currencies. FY15 net loan losses were 14bp, compared to a 10-year average of 16bp (4Q15 net loan losses were 17bp, largely due to commodity markets). Impaired loans rose 9% (of which 8pp were driven by the technical impact of the new collective provisioning model in 4Q15). Nordea expects stable credit quality over the next few quarters. Its CET1 ratio rose 20bp qoq to 16.5%, and Nordea intends to keep a management buffer of 50-150bp above the capital requirement. As previously announced, Nordea is simplifying its legal structure to change its Norwegian, Danish and Finnish subsidiary banks into branches of its Swedish parent company via cross-border mergers.
Ba1p/BBB-p/BBB+s Stable RBS (RBS): Marketweight 1.0% (member of the iTraxx FIN) RBS Group Plc reported FY15 statutory net attributable income of GBP -1.979bn (vs. GBP -3.470bn in FY14), including restructuring costs of GBP 2.9bn (due to faster restructuring, especially in CIB) and litigation and conduct costs of GBP 3.6bn. RBS also stated that it booked a goodwill impairment of GBP 498mn for Private Banking, GBP -263mn for the redemption of own debt and GBP +1.1bn related to Citizens (mainly due to a reclassification of foreign exchange reserves). Adjusted operating profit fell to GBP 4.4bn from GBP 6.1bn, driven by income erosion and Capital Resolution. Somewhat counterbalanced by a loss and faster recognition of contributions regarding the RBS group pension fund due to accounting changes, the CET1 ratio rose to 15.5% (both fully loaded and transitional) thanks to 32%-lower RWAs (driven by selling Citizens Financial Group and the faster run-down of Capital Resolution). Regarding outlook, RBS stated the following: RBS expects core PBB and CPB income to stabilize in FY16 thanks to solid planned volume growth, especially regarding mortgages but also core commercial lending, while CIB may see “modest” income falls. FY16 cost savings are expected to be some GBP 800mn. Due to the winding-down of most legacy credit portfolios, no “considerable recoveries” are to be repeated, and there may even be some net impairment charges. However, impairments for core portfolios are expected to remain “low”, with a “modest overall net impairment charge” for FY16. Nevertheless, RBS also stated that the risk of larger single-name events has risen. Referring to earlier guidance of restructuring costs of some GBP 5bn and disposal losses of some GBP 1.5bn in 2015-19, RBS expects FY16 restructuring costs to be GBP >1bn and most remaining “signaled” disposal losses to take place in FY16. RBS expects Capital Resolution to cut RWAs to some GBP 30bn by end-FY16.
Aa3s/A+s/A+p Stable Skandinaviska Enskilda Banken AB (SEB): Marketweight 1.5% Skandinaviska Enskilda Banken AB (SEB) reported FY15 net attributable income of SEK 16.6bn (+14% yoy) and of SEK 4.6bn in 4Q15 (-19% yoy), compared to market estimates of SEK 3.81bn (Bloomberg). FY15 total revenues fell 6% to SEK 44.1bn, with 5% lower net interest income due to repo rates being down some 70bp. Net fee and commission income rose 4% to SEK 16.9bn, impacted by generally reduced 3Q15 corporate-event-driven business. Lending fees fell yoy as customer activity was down. Asset management performance and transaction fees rose by SEK 220mn to SEK 679mn thanks to solid fund results. Payment and card fees fell, driven by the disposal of Euroline AB. Total operating costs fell 1%, with higher staff and pension costs being offset by reduced consultancy and premises expenses. Net credit losses fell 33% to SEK 883mn, with the loan-loss ratio down to 6bp from 9bp. The NPL ratio improved to 0.6%, and NPL coverage improved by 290bp yoy to 61.8%. The CET1 ratio stood at 18.8%, compared to SEB's estimate of 16% for the full Pillar 1 and 2 (the latter according to the methodology of the Swedish Financial Supervisory Authority) CET1 requirements. Regarding its outlook, SEB reiterated its long-term financial goals: 1. a yearly dividend payout ratio of ≥40%, 2. a CET1 ratio of some 150bp above that required by the Swedish Financial Supervisory Authority and 3. RoE of 15%.
A2s/As/As Stable Société Générale (SOCGEN): Marketweight 2.6% (member of the iTraxx FIN) Société Générale reported group net attributable income of EUR 4.1bn (+49%) in FY15 and of 656mn in 4Q15 (vs. EUR 549mn in 4Q14), compared to market estimates of EUR 944mn (Bloomberg). Excluding non-economic items, FY15 net income rose 27.4%. Net banking income rose 9% (4% excluding noneconomic items) to EUR 25.6bn, due to solid results across businesses. Operating costs rose 5% and were dragged down by fiscal, regulatory/legal and restructuring costs due to the bank's cost-savings plan. Adjusted for this, operating costs rose 1.4%. The cost of risk fell 9bp yoy to 52bp. The net cost of risk rose 3% to EUR 3.1bn, driven by a further provision of EUR 400mn in 4Q15 for litigation matters (the total is now at EUR 1.7bn). Regarding its capitalization, the group’s fully loaded CET1 ratio rose 80bp yoy to 10.9% (buffer target of 100-150bp above the regulatory minimum), and its fully loaded leverage ratio rose 20p yoy to 4%; both ratios are end-FY16 goals. The fully loaded total capital ratio rose 200bp yoy to 16.3% (goal of >18% for end-FY17).

March 2016 Credit Research
Euro Credit Pilot
UniCredit Research page 97 See last pages for disclaimer.
Current Ratings (Moody's/S&P/Fitch)
Credit Profile
Name (Ticker): Recommendation Weight in iBoxx Comment Banks sector
Aa2s/AA-n/AA-s Stable Svenska Handelsbanken (SHBASS): Marketweight 1.9% Svenska Handelsbanken reported FY15 net attributable profit of SEK 16.3bn (+8% yoy) and 4Q15 net attributable profit of SEK 4.5bn (+35% yoy, +20% qoq), compared to the estimated SEK 4.6bn (Bloomberg). FY15 net interest income rose 2% yoy to SEK 27.7bn. Net fee and commission income rose 9% to SEK 9.3bn. Net gains on financial transactions rose 47% to SEK 2.6bn, with a capital-gain impact from the sale of shares in SCA of SEK 1.2bn and flat yoy excluding the capital gains and nonrecurring items. Other income fell to SEK 668mn from SEK 737mn. Loan losses fell 10% yoy to SEK 1.6bn. Capitalization remains strong. The bank aims for a CET1 ratio (under normal circumstances) that is within 1-3pp above the Swedish Financial Supervisory Authority‘s CET1 requirement. The Swedish Financial Supervisory Authority’s 2015 3Q15 CET1 requirement was 18.6%, and the bank reported a CET1 ratio of 21.2% using the proposed dividend. Given that the countercyclical buffer will be higher in 2016, the capital requirement is expected to rise by 30bp.
Dr. Tilo Höpker (UniCredit Bank) +49 89 378-12960 [email protected] Dr. Martina von Terzi (UniCredit Bank) +49 89 378-14245 [email protected]
Financial Services (Overweight) Sector key figures Sector Wrap-Up Weight in iBoxx FIN: Current ASW spread: change mom/YTD: EURO STOXX FSV YTD:
7.0% SEN: 85.2bp T1: 181.6bp -18.4%
Sector drivers: Following many dropouts in 2008, the iBoxx FSV is now an even smaller sector. It includes a strange mix of single names that do not have much in common, except for being, in some way, related to financials and not fitting into other sectors (according to the iBoxx committee members; we have a different view in some cases). Given this composition, we have stopped providing a sector view, as this simply does not make any sense. Moreover, we have focused our commentary on the most-important issuer in this sector by far. Market recap: Sector composition: General Electric (37.8%), DVB Bank (9.5%), Wendel (6.8%), Achmea (5.7%), Deutsche Börse (5.6%), Motability (4.0%), Investor AB (3.7%), SBAB (3.7%), MasterCard (3.6%), Exor (3.2%), LeasePlan (2.4%), ALD International (2.4%), CDP (2.0%), BlackRock (1.6%), 3CIF (1.6%), NASDAQ OMX (1.6%), Credit Logement SA (1.4%), BRFkredit (1.2%), Moody's (1.1%), Jefferies (1.1%).
Current Ratings (Moody's/S&P/Fitch)
Credit Profile
Name (Ticker): Recommendation Weight in iBoxx Comment Financial Services sector
A3s/A-s/-- Improving Deutsche Wohnen (DWNIGY): Marketweight 0.0% Deutsche Wohnen will report its FY15 results on 18 March. On 2 February, the majority of shareholders of Deutsche Wohnen declined a takeover offer by Vonovia, which is credit-neutral to positive for Deutsche Wohnen. Deutsche Wohnen will release its FY15 results on 18 March 2016. According to the latest (9M15) results, Deutsche Wohnen’s funds from operations (FFO1) increased 38% yoy to EUR 228.7mn, exceeding market expectations (Bloomberg). Profit after taxes increased 260% yoy to EUR 521.7mn, mainly due to the profit from the revaluation of the company’s investment properties. The company’s operating result increased 7% yoy to EUR 376.5mn, benefitting from the consistently positive market environment. Residential earnings increased 2% yoy to EUR 393mn, and earnings from disposals grew by 57% yoy to EUR 60.8bn. Declining corporate expenses (-18% yoy to EUR 54.8mn) and lower interest expenses also contributed to an increase in adjusted earnings before taxes. Transaction and one-off financing costs increased to EUR 75.2mn in 9M15 (from EUR 5.1mn previous year), also including expenses incurred within the context of the takeover offer for Immobilien Invest SE and LEG Immobilien AG. The property portfolio of Deutsche Wohnen consisted of approximately 149,000 residential and commercial units at 30 September, with the Berlin region representing about 73% of the portfolio. The average rent of the residential properties increased by 3.2% yoy to EUR 5.83 per square meter, with an average vacancy rate of 2.1% (from 2.4% in the previous year). In 2015, Deutsche Wohnen’s capital increased when it issued over 42mn new shares, which were priced at EUR 21.50 per share. Gross proceeds from the capital increase amounted to around EUR 907mn. The new shares carry full dividend rights from FY15. Deutsche Wohnen’s loan-to-value ratio declined to 41.4%. Outlook: for FY15, the company expects an FFO1 of between EUR 285mn and EUR 290mn. The outlook assumes rents will increase by around 3.5% in 2015, on average, and by around 4% in Berlin.

March 2016 Credit Research
Euro Credit Pilot
UniCredit Research page 98 See last pages for disclaimer.
Current Ratings (Moody's/S&P/Fitch)
Credit Profile
Name (Ticker): Recommendation Weight in iBoxx Comment Financial Services sector
--/BBB+n/-- Stable EXOR (EXOIM): Marketweight 3.2% On 10 February, EXOR announced it is investing EUR 103.3mn to acquire 13% of Welltec, the global leader in well intervention services for the oil and gas industry. In 4Q15, EXOR increased its shareholding in The Economist Group from 4.7% to 43.4% for a total consideration of EUR 392mn, sold treasury shares for a gross amount of EUR 511.2mn and received approval from PartnerRe shareholders for the merger, valuing PartnerRe at USD 6.9bn, with the deal expected to be closed in 1Q16. It also divested its shareholding Banijay for net proceeds of EUR 60.1mn. The company placed EUR 250mn in 2025 notes and EUR 750mn in 2022 notes in 4Q15. We note that since the separation from FCA on 3 January 2016, EXOR holds a 23.5%-stake (33.4% in voting rights) in Ferrari. EXOR said that the total funds needed to complete the PartnerRe merger transaction will be approximately USD 6.1bn, funded by a combination of cash available on hand and a loan dated 11 May 2015 for an aggregate principal amount of up to USD 4.75bn, also containing financial covenants. The available loan amount was reduced by the proceeds from the Cushman & Wakefield disposal in September 2015, the disposal of treasury shares in November and the EUR 1bn bond issuance in 4Q15; we estimate it is now down to around USD 1.9bn. S&P (on 3 November) said it would lower EXOR’s ratings if it concluded that the company's LTV would remain above 20% for a sustained period of time, without management taking action to lower it. This would likely happen if EXOR were unable to finance a significant part of the PartnerRe acquisition through asset disposals. S&P would also lower the ratings if EXOR's equity values declined markedly, or if its listed assets were below 60% of total assets for a sustained period of time. EXOR’s bond curve trades 50-100bp tighter than Wendel’s (--/BBB-s), which is rated two notches weaker, but already 50bp wider than equally rated JABHOL. Nevertheless, should the decline in equity values of its major listed assets remain or continue in 2016, there is some risk for a one-notch downgrade. We would also expect more bond supply from the remainder of the acquisition loan. (FY15 results: 14 April)
--/BBB+s/-- Improving Vonovia (ANNGR): Marketweight 0.0% Vonovia more than doubled its earnings in FY15. Germany's leading residential real estate company, listed on the DAX in September 2015, reported that its FFO1 funds from operations excluding sales (a measure of a real estate company’s ability to generate cash) increased by 112% yoy to EUR 608mn in FY15, slightly above the company’s 2015 FFO1 forecast of EUR 600mn. FFO per share increased at a slower pace to EUR 1.30 from EUR 1.0 in FY14. The vacancy rate reduced further to 2.7% amid a moderate rent increase of 2.9% (like-for-like) to EUR 5.78 in FY15. Due to the company's acquisitions, rental income increased considerably during FY15, by 79% yoy to EUR 1.4bn. The loan-to-value ratio declined to 47%, below the 50 % target threshold for the end of 2015. An increase in the value of the company’s real estate portfolio due to positive real estate market developments (especially in Germany), active portfolio optimization measures and extensive modernization of the company’s properties contributed to a positive result in FY15 after the previous year, when the value of Vonovia's real estate portfolio almost doubled to EUR 24.2bn due to acquisitions and organic growth. The strategic plan for a further integration of GAGFAH and SÜDEWO was developed. The dividend proposal increased by 27% to EUR 0.94 per share. Outlook for FY16: The FFO1 forecast for 2016 of between EUR 690mn and EUR 710mn was confirmed. To achieve further improvements in the quality of its housing stocks, investment in in modernization is planned to increase considerably, by 31% yoy to between EUR 430mn and EUR 500mn. Vonovia is also planning to invest around EUR 330mn in maintenance. Overall, this corresponds to an investment of up to EUR 830mn, or up to EUR 38 per square meter in FY16.
Dr. Martina von Terzi (UniCredit Bank) +49 89 378-14245 [email protected]

March 2016 Credit Research
Euro Credit Pilot
UniCredit Research page 99 See last pages for disclaimer.
Insurance (Overweight) Sector key figures Sector Wrap-Up Weight in iBoxx FIN: Current ASW spread: EURO STOXX INN YTD:
11.8% SEN: 112.8bp T1: 373.7bp -11.4%
Sector drivers: The overall macroeconomic environment remains challenging for the European insurance sector. Going forward, continued easing monetary policy, sustained expectations of low inflation and moderate growth are moving already compressed yields further down and driving expectations that the low-yield environment will remain. Longer-than-expected low interest rates are the key risk factor to the insurance sector. Life insurance companies face considerable interest-rate risk given their investments in fixed-income securities and their unique liabilities; their assets and liabilities are heavily exposed to interest-rate movements. Non-life insurers with short-termed liabilities can be expected to have lower interest-rate sensitivity than insurers with longer-term risks, whose claims would be paid further into the future. Overall, non-life insurers have a smaller negative duration gap; therefore, they would be less affected by a drop in interest rates than life insurers. In non-life reinsurance, low interest rates create pressure on prices through competition from other asset classes and cost-cutting pressure based on economies of scale of reinsured portfolios. The price-cutting pressures might lead to underwriting losses, which, in combination with lower investment returns, could lead to falling profitability in the sector. Another key factor for insurance sector in 2016 is Solvency II, the EU directive on the taking-up and pursuit of insurance and reinsurance, which took effect on 1 January 2016. Solvency II is a very important regulatory change and it should lead to the strengthening of capital positions. Since the Solvency II models seem, so far, to deliver higher capital ratios than the previous models (due to lower required capital), we expect little need for new bond issuance to cover for missing capital. On the other hand, more clarity on Solvency II might result in slightly increased issuance activity among European issuers on the back of improved financing conditions. At a minimum, we expect the called and expired bonds to be replaced by new issuance. We do not foresee the higher demand for funding in the insurance universe being driven by fundamental issues. Solvency II figures reported so far with FY15 results do not, overall, provide any concerns for the European insurance sector. Market recap: Most insurance companies reported their FY15 earnings in February and the remainder will follow in March. In FY15, insurance continued its overall positive trend, and most of the earnings reported so far have been credit-positive. Most companies are in line with their FY15 profit outlook and Solvency II capitalization levels. Sector composition: Allianz (18.5%), Assicurazioni Generali (13.2%), AXA (6.2%), Metropolitan Life (5.2%), Munich Re (5.1%), CNP Assurances (4.4%), Berkshire Hathaway (3.8%), Aviva (3.7%), NN Group (3.5%), ZFS (2.9%), Talanx (2.7%), Achmea (2.7%), Hannover Re (2.3%), Crédit Agricole (2.2%), Swiss Life (1.8%), Swiss Re (1.8%), Intesa Sanpaolo Vita (1.7%), Aegon (1.6%), Delta Lloyd (1.6%), Sampo (1.4%), ASR Nederland (1.3%), BNP Paribas (1.3%), PZU (1.2%), Poste Italiane (1.1%), Sogecap (1.0%), La Mondiale (1.0%), Mapfre (1.0%), Kommunal Landspensjonskasse (0.8%), SCOR (0.8%), Great-West Lifeco (0.7%), Vienna Insurance Group (0.7%), AON (0.7%), Danica (0.7%), UNIQA (0.7%), SACE (0.6%).
Current Ratings (Moody's/S&P/Fitch)
Credit Profile
Name (Ticker): Recommendation Weight in iBoxx Comment Insurance sector
Aaa/A-n/A- Stable Achmea (ACHMEA): Marketweight 2.7% Achmea is the largest insurance provider in the Netherlands. Its main segments are non-life, health and income-protection insurance. Internationally, Achmea group is active in Turkey, Greece, Slovakia, Ireland and with partner Rabobank in Australia. In FY15, Achmea reported net attributable profit of EUR 383mn, up from EUR 14mn in FY14 on the back of lower expenses. Total costs declined by 14.8% yoy to EUR 22.8bn, driven by lower benefits and claims. Gross premium revenues stood at EUR 19.9bn (down by 0.4% yoy). Pension & Life, Banking and International also contributed positively. The FY15 results were strongly influenced by a EUR 481mn allocation to mitigate the premium increase of the company's health insurance policies. Compensation for storm damage was high in FY15, reducing the company's profit by more than EUR 120mn. Premiums remained stable, at around EUR 20bn. Positive developments in Achmea's pension and life activities, banking and international activities and higher investment results compensated for higher storm damage, additions to provisions for injury loss and lower profits at healthcare. Achmea remained well capitalized, with a Solvency II ratio of 210% in FY15 (Achmea uses a partial internal model for non-life insurance under Solvency II).
A3s/A-s/A-s Stable Aegon (AEGON): Marketweight 1.6% (member of the iTraxx FIN) Aegon is a large Dutch life insurer with significant operations in the US (where the company is known as Transamerica), the UK and the Netherlands. The company reported 4Q15 net income of EUR 478mn, up by 19.8% yoy. Underlying earnings before tax amount to EUR 486mn, down by 13.5% yoy due to lower earnings in the US (impacted by one-offs and lower retirement-plan earnings). Aegon’s net income increased to EUR 478mn, driven by net recoveries and lower fair value losses. Deposits in asset management deposits increased, while new sales in life insurance declined by 16% yoy to EUR 440mn. On 13 January 2016, Aegon announced and started its EUR 400mn share-buyback program to neutralize the dilutive effect of the cancellation of the preferred shares in 2013. At the Investor Conference in January, Aegon provided the market with a strategy update and FY18 financial targets and measures to improve operational performance. The group return on equity is targeted for 10% by 2018. This target should be supported by the following: 1. a reduction of annual operating expenses by EUR 200mn by end-2018, 2. additional investments in digital capabilities and expertise of EUR 50mn per annum above the current level. Capital and cash-flow (CF) targets for the 2016-18 period are as follows: 1. group Solvency II ratio as per FY15 of around 160% (fulfilled); 2. regulatory approval to use the partial internal model to calculate Solvency II capital (in progress); 3. cumulative free CF after holding expenses of EUR 3.3bn until 2018 – Aegon's Dutch and UK operations are expected to resume dividend payments in 2016 and 2017 respectively and 4. capital returns to shareholders of over EUR 2bn in the period 2016-18 (consisting of a dividend payout ratio of 50% of free CF; EUR 400mn share buyback [on track] and a proposal to increase the 2015 final dividend per share to EUR 0.13 – bringing the total 2015 dividend per share to EUR 0.25 [on track, to be proposed at AGM]). The results are credit neutral. 4Q15 earnings were weaker than expected. Targets are on track, and the group remains relatively well capitalized, although its Solvency I ratio (to be discontinued in 1Q16) declined by 12pp yoy to 220% in 4Q15, mainly due to asset-adequacy-reserve increases in the US as a result of lower interest rates. The Solvency II ratio is estimated to be around 160% in FY15. The gross leverage ratio improved to 27% in 4Q15, driven by the redemption of the USD 500mn 4.625% senior bond in December and 4Q15 earnings.

March 2016 Credit Research
Euro Credit Pilot
UniCredit Research page 100 See last pages for disclaimer.
Current Ratings (Moody's/S&P/Fitch)
Credit Profile
Name (Ticker): Recommendation Weight in iBoxx Comment Insurance sector
Baa1s/A-n/BBB+s Stable AIG (AIG): Marketweight 0.0% American International Group, Inc. (AIG) provides Property&Casualty and life insurance in more than 100 countries and is a leading provider of life insurance and retirement services in the US. AIG reported a 4Q15 after-tax operating loss of USD 1.3bn, compared to a net after-tax operating profit of USD 1.4bn in 4Q14. FY15 after-tax operating income was USD 2.9bn (down from USD 6.6bn in FY14). The negative results were primarily driven by adverse prior-year loss-reserve development and lower returns on alternative investments. Property&Casualty reported a pre-tax operating loss of USD 2.3bn. Adjusted loss ratio increased by 2.1pp due to higher severe losses and accident losses in the US commercial automobile liability. Consumer insurance pre-tax operating income decreased 18% yoy to USD 753mn, reflecting lower net investment income, driven by lower returns on alternative investments in hedge funds, primarily in retirement, and a decline in underwriting income in personal insurance (mainly due to less favorable net prior-year loss-reserve development). Life's pre-tax operating income increased, although this was primarily due to one-off effects in 4Q14. Personal insurance reported a pre-tax operating loss of USD 32mn, because of a decline in underwriting results and a decrease in net investment income. The combined ratio, above 100%, increased due to increases in the loss ratio and acquisition ratio, partially offset by a decrease in the general-operating-expense ratio. Net investment income decreased, driven by lower interest income and lower returns of alternative investments in hedge funds. The results are credit negative. While we like AIG's continued restructuring story, 4Q15 results were weak. Underwriting profitability remains weak, with a combined ratio that is above 100%. On 11 February, AIG’s board of directors authorized the repurchase of additional shares of AIG common stock – which with an aggregate purchase price of up to USD 5bn, brings AIG’s remaining share-repurchase authorization to around USD 5.8bn – and declared a 14% increase in its quarterly dividend, to USD 0.32 per share.
Aa3s/AAs/AA-s Stable Allianz Group (ALVGR): Marketweight 18.5% (member of the iTraxx FIN) Allianz, Europe’s biggest insurer, reported 4Q15 net attributable income of EUR 1.42bn, which was up by 13.7% yoy (+4.1% qoq) and missed average analyst estimates of EUR 1.56bn (Bloomberg). Operating profit increased 14.5% yoy to EUR 2.6bn in 4Q15 and had a strong positive impact on FY15's figures. In FY15, operating profit totaled EUR 10.7bn, up 3.2% yoy and near the upper end of Allianz’s target range. In the Property&Casualty insurance, both gross premiums written and operating profit increased; the latter rose by 8.5% yoy to EUR 1.2bn in 4Q15 despite a larger impact from natural catastrophes compared to 4Q14. This was primarily due to storms and flooding in the UK and floods in France, the US and India and was offset by a larger run-off contribution. The combined ratio improved by 0.2pp to 96.2% in 4Q15. Growth continued in core markets and in emerging markets, leading to the highest annual premium growth in the last ten years. In the life/health insurance segment, operating profit increased strongly to EUR 1.1bn despite a slight reduction in revenues due to a strategic shift in the company’s product mix – shifting towards unit-linked and capital-efficient products. In Asset Management, third-party net outflows continued to decrease over the year, and operating profit increased by 8.3% yoy to EUR 637mn. In FY15, operating profit declined by 11.8% yoy to EUR 2.3bn, mainly reflecting an impact from an overall lower asset base that resulted from continued, albeit declining, third-party net outflows at PIMCO and, to a lesser extent, due to a decrease in margin on third-party assets under management. Allianz Global Investors performed well, recording its highest operating profit since the implementation of a new structure at Asset Management in FY12. Its cost-income ratio rose by 5.3pp yoy to 64.5%. The board of management proposed a dividend of EUR 7.30 per share for FY15, up by 6.6% compared to FY14. Shareholders’ equity rose by 3.9% yoy to EUR 63.1bn in FY15. Outlook: Allianz’s board of management remains confident for FY16 and expects operating profit to reach EUR 10.5bn, with a target range of plus/minus EUR 500mn. The results are credit positive. FY15 operating profit was close to the top of the group’s target earnings range. The group’s business is well diversified, and the company has delivered strong results in challenging operating conditions. In Life/Health, the strategic shift in the company’s product mix – towards unit-linked and capital-efficient products – is positive. Capitalization remains strong, with the Solvency II ratio increasing by 9pp yoy to 200% in FY15. In November 2015, the company’s internal model was approved by the German supervisory authority.
Baa2s/--/A-s Improving Assicurazioni Generali (ASSGEN): Marketweight 13.2% (member of the iTraxx FIN) Assicurazioni Generali, Italy’s biggest insurer, will publish its FY15 results on 18 March. With its 3Q15 results, the company reported net attributable profit of EUR 420mn, down 18.1% yoy and below market estimates of EUR 555mn (Bloomberg). The drop in profit was caused mainly by a worsening situation in Life. The consolidated operating result stood at EUR 1.06bn in 3Q15, down 9.3% yoy. Operating profit in Life declined by 15.2% yoy (and by almost 30% qoq) to EUR 625mn. Non-Life business declined in comparison with the previous quarter, but increased by 10.8% yoy to EUR 501mn. Gross written premiums increased by 0.9% yoy to EUR, mainly due to growth in Non-Life (+2.6% yoy), while Life stagnated yoy and declined 13% qoq. Generali’s CEO Mario Greco plans to expand in Europe by adding fee-generating products and commercial partnerships as part of a four-year plan to boost cash flow. Since taking over in 2012, Mr. Greco has sold assets to raise funds, including a US reinsurer and Swiss private bank BSI Group. He expects good profits in 4Q15 and is confident of closing FY15 with a significantly higher net profit than in FY14. The combined ratio in the Non-Life segment improved further to 92.7% (down 70bp yoy), despite the higher impact of natural catastrophe claims. The expense ratio in Life fell 50bp to 10.6%. The pro forma internal model Economic Solvency ratio stood at 196% (+10pp against FY14), mainly driven by the contribution of the normalized operating earnings of the period. The group applied to the College of Supervisors to use their own internal model for the calculation of the capital requirements according to the Solvency II regime. The application outcome is expected by March 2016. The Group Solvency I ratio achieved 166% (+2pp vs. FY14). The required solvency capital amounts to EUR 18.1bn, while the available solvency capital is at EUR 30bn. The resulting surplus therefore grew to EUR 11.9bn (from EUR 10.4bn at 31 December 2014). The results are credit positive. 3Q15 results were worse than expected, because of the company’s Life performance. Generali, however, continues to make progress on its restructuring at a formidable pace and the cost-containment measures are also taking effect. The group is well capitalized.

March 2016 Credit Research
Euro Credit Pilot
UniCredit Research page 101 See last pages for disclaimer.
Current Ratings (Moody's/S&P/Fitch)
Credit Profile
Name (Ticker): Recommendation Weight in iBoxx Comment Insurance sector
A2s/A-s/-- Stable Aviva (AVLN): Marketweight 3.7% (member of the iTraxx FIN) Aviva will publish its FY15 results on 10 March. In 9M15, net asset value increased 2% to 387p per share (HY15: 380p). Underlying operational momentum has continued across the business. Life Insurance’s value of new business (VNB) increased 25% yoy to GBP 823mn. This was the VNB’s eleventh consecutive quarter of growth. At General Insurance, the combined operating ratio improved in 9M15 to 94% (from 95.9% in 9M14). However, 9M15 numbers include Friends Life from 10 April 2015 (the acquisition completion date), while 9M14 results are for Aviva as a standalone company. Integration of Friend Life has been successful and ahead of schedule so far. It may deliver more than the market expects. GBP 3bn of Friends Life assets are due to be transferred from AXA Investment Managers in November. UK Life VNB grew 36% to GBP 404mn, up 13% excluding the Friends Life contribution. Europe VNB grew 11% to GBP 284mn with particularly strong growth in Italy (up 55% to GBP 57mn). Asia VNB increased 21% to GBP 115mn. With GBP 1.9bn under management, Asset Management’s AIMS Target Return fund achieved a return of 6.6% over the past 12 months. Solvency II: Throughout recent market volatility, Aviva’s economic solvency appeared resilient, and the company managed to maintain a good capital position: It posted an economic capital surplus of GBP 10.1bn (HY15: GBP 10.8bn) and a coverage ratio of 172% (HY15: 176%), performing in line with its published sensitivities. The company expects to have its internal Solvency II model approved in December 2015. Aviva’s Solvency II numbers will be reported for the first time with its FY15 results in March 2016, including target capital range, sensitivities and roadmap for capital going forward. Recently, S&P revised upwards the financial-risk profile of the group to strong, and S&P’s leverage ratio remains stable at 27% (HY15: 27%). Outlook: Aviva’s near-term priorities are to stay focused on delivering the benefits from the Friends Life integration and from the transition to Solvency II. According to the company, there is significant upside to be had from better capital allocation. Focus will remain on improvement in the company’s key metrics. The results are credit positive.
A2s/A-p/A-s Improving AXA (AXASA): Marketweight 6.2% (member of the iTraxx FIN) AXA is an international insurer with a very strong market position. It reported FY15 net income of EUR 5.6bn, up by 12% yoy on the back of higher life insurance sales in Europe and Asia. This was an all-time high above the average market estimate (Bloomberg) of EUR 5.39bn. Operating profit rose by 10% to EUR 5.57bn. Total revenues increased by 7% to EUR 98.5bn, benefiting from an increase in revenues in all segments. Revenues at Life & Savings increased by 7% yoy to EUR 59.2bn (benefitting from the company’s business mix), Property&Casualty revenues were up by 6% yoy to EUR 31.3bn (mainly driven by 2.8% in tariff increases, on average, but partly offset by lower volumes), asset management increased by 15% yoy to EUR 3.8bn (driven by higher management fees) and international insurance was up by 10% yoy to EUR 5.6bn (supported by revenues from AXA Assistance, mainly with third-party clients). In Life & Savings, the investment margin was kept at 34% despite the low-rate environment. Life annual premium equivalent sales increased by 5% on a comparable basis (by 14% yoy on a reported basis, benefiting from a positive FX effect), mainly driven by unit-linked products and higher sales of health-protection policies. Despite the economic slowdown in China, AXA’s Chinese business continues to perform “very well”, as stated by the company’s CFO Gerald Harlin. Shareholder equity increased by 5% yoy to EUR 68.5bn in FY15, driven by a rise in net income and favorable FX movements, but this was partly offset by a dividend payment and a decrease of unrealized capital gains, which were attributable to higher interest rates and corporate spread widening. The gearing and solvency ratios remained well within the company’s target range. A dividend of EUR 1.10 per share (up 16% yoy) will be proposed at the shareholders’ annual general meeting on 27 April. The results are credit positive. AXA reported improving capital ratios, with the Solvency II ratio increasing by 4pp to 205% as of 31 December 2015, driven mainly by a strong operating return contribution and only partly offset by financial market impacts.
--/As/-- Improving CNP (CNPFP): Marketweight 4.4% CNP Assurances, France’s largest life insurer, reported FY15 net profit of EUR 1.13bn, up by 4.6% yoy and beating consensus expectations of EUR 1.10bn (Bloomberg). Premium income increased by 2.5% yoy to EUR 31.6bn in FY15. Net insurance revenue stood at around EUR 2.5bn, up 0.4% yoy. The group's new business margin stood at 14.5% in FY15, benefitting from product mix improvements in France and a consolidation of CNP Santander Insurance. Premium income in France amounted to EUR 24.8bn in FY15, up 1.1% yoy. New business value (NBV) was up by EUR 15mn, and new business margin by 0.3 points. Growth was led by a 21.4% increase in unit-linked sales, which accounted for 15.6% of total savings/pensions premiums vs. 13.1% in 2014. Life and pensions developed particularly well in France, with EUR 2bn net inflow to unit-linked savings/pensions contracts and a EUR 0.2 billion net inflow to traditional savings/pension products. In December, CNP Assurances signed a partnership framework contract with AG2R LA MONDIALE in the field of retirement savings. In Latin America, growth momentum was maintained across all business segments despite a difficult economic environment. CNP’s business model underwent rapid changes in FY15, leading to an improvement in the company’s product mix, led by 34.8% yoy growth in unit-linked sales and a 149.1% yoy rise in personal risk/protection premiums, which reflected the contribution of newly acquired CNP Santander Insurance. Unit-linked contracts and personal risk/protection business accounted for over 70% of premium income generated in the region in FY15 (compared to 48% in FY14). CNP announced a cash dividend of EUR 0.77 per share at the annual general meeting to be held on 28 April. The results are credit positive. The Solvency II coverage ratio improved significantly and stood at 192% at 31 December 2015 (compared to 160% in end-FY14). Development in the French life/pension business and the increased importance of unit-linked contracts in CNP’s product mix is encouraging and shows the company’s ability to reduce its interest-risk exposure.
--/AA-s/A+s Improving Hannover Re (HANRUE): Marketweight 2.3% (member of the iTraxx FIN) Hannover Re will report FY15 earnings on 10 March. Its latest released 3Q15 net income stood at EUR 254.1mn, up 1.2% yoy and strongly above market expectations of EUR 238mn (Bloomberg). On 4 February, Hannover Re confirmed its FY16 profit target after January renewals in Property&Casualty reinsurance. Despite declining considerably in some markets, amid fierce competition, the company’s broad, diversified portfolio helped it reach a satisfactory level of profitability in highly competitive insurance markets. The company’s 2016 profit targets should, therefore, remain reachable. Its outlook for 2016 is as follows: Despite the overall soft market conditions in Property&Casualty reinsurance, Hannover Re expects to achieve its profit targets for 2016. Hannover Re continues to target a combined ratio of less than 96%. The company expects the premium volume in Property&Casualty reinsurance to decline slightly in response to company’s more-selective underwriting policy. The company confirmed its 2016 major-loss budget of EUR 825mn and sees its return on investment at about 2.9% and dividend pay-out ratio at 35-40% in 2016. Group net income is expected to total around EUR 950mn in FY16. The company’s confirmation that its 2016 profit target is on track is credit positive. Despite highly competitive insurance markets, Hannover Re benefits from its good positioning in the reinsurance market and the high quality of its loss reserves, both of which suggest the company will generate good underwriting results again in FY15 on 10 March.

March 2016 Credit Research
Euro Credit Pilot
UniCredit Research page 102 See last pages for disclaimer.
Current Ratings (Moody's/S&P/Fitch)
Credit Profile
Name (Ticker): Recommendation Weight in iBoxx Comment Insurance sector
A3s/As/A+s Stable Legal & General (LGEN): Marketweight 0.0% Legal & General will report its FY15 results on 15 March. In 9M15, the company provided an update on its business development and reported operational cash generation of GBP 936mn. This compares to GBP 844mn in 9M14, resulting in solid 11% growth yoy. The new business surplus of GBP 7mn (9M14: minus GBP 17mn) primarily reflects improved efficiency and increasing scale in UK Protection and Savings, as well as the implementation of the capital lite strategy for new UK pension risk transfer business. As a result, net cash generation is up 14% yoy at GBP 943mn (from 9M14 GBP 827mn). Total annuity assets have increased by 8% yoy to GBP 43.1bn and annuity sales were GBP 1.5bn. In 9M14, the annuity sales accounted for GBP 3.9bn, with a one-off benefit from the GBP 3bn buy-in transaction with ICI pension fund. In September, Legal & General announced an agreement to manage GBP 13bn of assets for the National Grid UK Pension Scheme, starting in November. LGIM total assets under management increased 8% yoy to GBP 717bn, reflecting external net inflows of GBP 21.7bn (compared to 9M14 GBP 8.3bn) across all major asset classes. LGIM’s property business continues to receive high demand from retail clients, UK pension funds and international clients, with net external inflows of GBP 0.6bn in 9M15. Total international AUM increased by 63% yoy to GBP 117.8bn, with a strong contribution in 3Q15 stemming from the US and Japanese markets. The company is ahead of its original group-wide target to deliver GBP 80mn of operating cost savings this year, reducing costs from the GBP 1.25bn seen in 2014. Legal & General expects to incur around GBP 40mn of restructuring costs in 2015 in order to deliver these savings. Solvency II: the company applied to the Prudential Regulatory Authority (PRA) to use its internal model to calculate the Solvency Capital Requirement, matching adjustments and deduction and aggregation for Legal & General America. Legal & General will report its Solvency II capital position for the first time as part of its FY15 results in March 2016. The results are credit positive. Operating profit increased and cost cutting continues in line with the company’s plan.
--/BBB+s/BBBs Weakening Mapfre (MAPSM): Marketweight 1.0% Mapfre, the leading insurance company in Spain, reported that FY15 revenues increased by 4.1% yoy to over EUR 26.7bn, while premiums amounted to over EUR 22.3bn. Net earnings declined by 16.1% yoy to EUR 709mn due to the fall in Non-Life underwriting results (mainly as a consequence of the impact of the snowstorms in the US), which was less than offset by claims and a higher tax rate in some countries. The combined ratio stood at 98.6% at end-FY15, representing an increase of 2.8pp (of which 1.3pp were from extraordinary losses as a result of the snowstorms in the US). The company approved its strategic plan for the 2016-18 period, which focuses on profitable growth, customer orientation and digital transformation; the international launch of the VERTI brand for this business, as of 2017, was deployed in Germany and Italy. Mapfre also reached an agreement with the British company Admiral on the creation of a 50/50 joint venture called Preminen, which will offer online services for comparing insurance rates in several countries. The group’s key strategic objectives for 2016 are as follows: 1. achieving a combined ratio below 96% percent, 2. an expense ratio of 28% and 3. maintaining a pay-out ratio of over 50%. Mapfre has taken steps to protect its US earnings from large weather losses, which were driven by concentrated exposure to Massachusetts. Price hikes and higher deductibles may reflect previously inadequate pricing for the risks the insurer has taken. The company increased quota-share reinsurance cover in FY15 to help mitigate weather risk. The strong USD supported investment income, a key contributor to US earnings. For FY15, the results are credit negative, as weaker investment returns failed to offset significant underwriting losses and the combined ratio increased strongly.
A2s/AA-s/AA-s Stable Munich Re (MUNRE): Marketweight 5.1% (member of the iTraxx FIN) Munich Re reported preliminary FY15 figures and announced profits of EUR 3.1bn in FY15 (slightly lower than the EUR 3.2bn in FY14). According to provisional calculations, in 4Q15, the group posted a profit of EUR 0.7bn (the same as in 4Q14). Net income was about EUR 700mn, which is in line with market estimates (Bloomberg). The company profited from the low impact from major losses in FY15 and high releases of reserves for basic losses from prior years. At the same time, the currently difficult market environment of continuously low interest rates (which had a negative impact on the company’s investment income) and the increasing volatility in financial markets (with its negative impact on asset-management income) had a negative impact in FY15. The devaluation of the EUR also had a negative impact on Munich Re's business operations. As in previous years, the consolidated results for the group were marked by various opposing effects, such as changes in the value of derivative financial instruments and a goodwill impairment in ERGO’s business. This contrasted with good results in Property&Casualty reinsurance. A comparatively low tax charge – due to adjustments for the prior year – was also positive for the group’s results. The reinsurance business contributed a solid EUR 3.3bn (up from EUR 2.9bn) to the consolidated result, with the operating result up by EUR 0.9bn to EUR 4.1bn. Gross premiums written climbed to EUR 28.2bn (from EUR 26.8bn). FX changes had a significant impact on premium growth (+5.4%). Property&Casualty reinsurance contributed strongly to the consolidated result for FY15. The combined ratio for FY15 amounted to 89.7% (down from the previous 92.7%) of net earned premiums and, in 4Q15, totaled only 78.6% (down from 91.2% in 4Q14). Life reinsurance contributed EUR 0.3bn to the consolidated result, below the company’s target of EUR 0.4bn (impacted by two large mortality claims). In the US and Australia, business largely developed as expected in 2015 after negative effects had impacted the results in the previous year. Total major-loss expenditure for FY15 amounted to EUR 1.0bn (down from EUR 1.2bn), of which EUR 0.2bn was attributable to 4Q15. Reserve strengthening was somewhat lower than run-off profits for major losses from previous years. In relation to net earned premiums, the major-loss burden of 6.2% (7.2%) for FY15 was below the average expected figure of 12%. The results are credit positive.
Baa2s/A-s/-- Stable NN Group (NNGRNV): Marketweight 3.5% NN Group reported 4Q15 net attributable profit of EUR 360mn, up by 83% yoy, mainly due to positive results at its Japan unit and cost savings in the Netherlands. The operating result of NN’s Japan Life unit increased to EUR 27mn in 4Q15 (+125% yoy). Cost savings in the Netherlands amounted to EUR 15mn. In FY15, net attributable profit increased strongly (+166.2% yoy) to EUR 1.57bn. The 4Q15 operating result from ongoing business fell by 3.2% yoy to EUR 250mn, mainly due to worsening results in Netherlands Non-life and in the Asset Management. In FY15, the operating profit from ongoing business increased by 32.2% yoy to around EUR 1.44mn, with almost all segments reporting improved results. Assets under management at Asset Management stood at EUR 187bn, down 1.5% qoq and impacted by a challenging market environment. The company plans to focus strategically on its asset management business, for which it took a restructuring provision of EUR 13mn in 4Q15. CEO Lard Friese stated that NN Group is “taking measures to improve the results of the Non-life business through better underwriting performance and a further reduction of expenses”. Holding company cash capital increased to EUR 1.95bn, reflecting free cash flow at the holding company for FY15 of EUR 1.37bn, and EUR 849mn was returned to shareholders in the form of dividends and share buybacks The results are credit positive. The NN Group has made good progress on restructuring and cost cutting. Cost savings in the Netherlands already added up to EUR 15mn in 4Q15, bringing the expense base down to EUR 803mn. We expect this development to continue. The group reported a strong capital position. After the proposed final 2015 dividend of EUR 341mn is deducted, the Solvency II ratio stood at 239% at 4Q15 and is based on the company’s Partial Internal Model.

March 2016 Credit Research
Euro Credit Pilot
UniCredit Research page 103 See last pages for disclaimer.
Current Ratings (Moody's/S&P/Fitch)
Credit Profile
Name (Ticker): Recommendation Weight in iBoxx Comment Insurance sector
Baa3n/--/BBBs Stable Old Mutual (OLDMUT): Marketweight 0.0% Old Mutual will publish FY15 results on 11 March. 3Q15 trading update showed strong operational performance despite a volatile macroeconomic backdrop. Gross sales increased 31% yoy to GBP 8.1bn, mainly due to excellent 3Q15 activity at Old Mutual Wealth. Gross sales at Old Mutual Wealth increased 45% yoy to a record GBP 5.5bn as it benefited from its integrated strategy of owning distribution, an investment platform, discretionary fund and asset management as well as the recent changes to the UK pension regime. While the acquisition of Intrinsic Financial Services helped to increase UK pension sales, the acquisition of Quilter Cheviot enabled the insurer to expand wealth management. Excluding corporate activity from the purchase of Quilter Cheviot and the sale of France and Switzerland, FUM were up 2% YTD with positive net client cash flow offsetting adverse market movements over August and September. Old Mutual South Africa recorded strong sales growth of 28% yoy despite weaker economic conditions in South Africa. The Rest of Africa business grew sales by 32% yoy due to strong asset management flows in Kenya and Malawi, increased sales advisers and strong credit life sales in Zimbabwe, and positive foreign exchange impacts. In Property & Casualty, gross written premiums in South Africa were up 14% yoy. Asset Management performed relatively well in a difficult 3Q15 for equity markets. Gross inflows totaled USD 6.2bn (3Q14: USD 8.9bn), of which USD 1.8bn came from new client accounts during the quarter. Gross outflows totaled USD 8.7bn (3Q14: USD 5.8bn), largely in US equities and some global/non-US equity products. Solvency II: The group’s regulatory capital surplus, calculated under the EU Financial Groups Directive, was GBP 1.5bn at 30 September 2015, representing a stable statutory cover ratio of 149%. The group is progressing on its implementation of Solvency II and SAM in line with its plan. Old Mutual expects to receive formal PRA approval of its Solvency II applications by the end of this year. The results are credit positive given the solid operating performance and despite a challenging outlook for Old Mutual’s South Africa market.
A2s/A+s/As Weakening Prudential (PRUFIN): Marketweight 0.0% Prudential will report its FY15 results on 9 March. In 3Q15 new business profit increased by 16% yoy to GBP 574mn, based on strong growth in Asian and UK life operations and continued new business discipline in the US. Asia contributed GBP 312mn (+11% yoy), US counted for GBP 186mn (+21%), and UK GBP 76mn (+25% yoy), the latter reflecting Prudential’s proactive response to the changes brought by UK pension reforms. In the retail business, annual premium equivalent (APE) sales were 18% yoy higher, driven by Prudential’s market-leading with-profits proposition. Total net outflows in 9M15 of GBP 5bn, contributed to a decline M&G third party funds under management by 5% yoy to 127.3bn YTD, reflecting retail net outflows. The company remain optimistic about the outlook across the Group and in Asia in particular. In the US and UK, Prudential continues to focus on providing products that meet the investment needs of our customers while prioritizing earnings and cash. The company showed ability of the business to adapt to changing pensions and savings landscapes is a reflection of the Group’s long track record in providing customers with evolving and appropriate product propositions. Prudential’s CEO Mike Wells said he expects to see more outflows at M&G after retail clients pulled GBP 7.3bn from its funds this year as sentiment toward fixed income assets waned.
--/AA-s/A+s Improving SCOR (SCOR): Marketweight 0.8% SCOR's 4Q15 net income stood at EUR 150mn, which beat the EUR 132.3mn estimated by the market (Bloomberg). FY15 net income added up to EUR 642mn (up 25% yoy). Gross written premiums (GWPs) reached EUR 13.4bn in FY15, up strongly at 18.6% yoy at current FX rates (and 6.4% yoy at constant FX rates). The total rise in GWPs was driven by SCOR Global Property & Casualty GWPs (+16% yoy at current FX rates), which rose by EUR 5.7bn and by SCOR Global Life GWPs (+20.6% yoy), which rose by EUR 7.7bn. With a net combined ratio of 91.1% in FY15, SCOR Global Property&Casualty recorded strong technical profitability in an environment of low natural catastrophe losses but with an unusually high frequency of large man-made losses. SCOR Global Life reported a technical margin of 7.2% in FY15, above the company's assumption of 7.0% in its “Optimal Dynamics” strategic plan. SCOR Global Investments achieved a solid 3.1% return on invested assets, while maintaining prudent portfolio management. The group's cost ratio remained stable in FY15 at 5% of premiums. Group net income reached EUR 642mn in FY15 (+25.4% yoy). The annualized return on equity stood at 10.6% (or 1,055bp above the risk-free rate). Shareholders’ equity increased by 11.1% yoy to EUR 6.4bn at 31 December 2015 after a dividend of EUR 260mn was paid in May 2015. At its annual general meeting, SCOR plans to propose an increased dividend of EUR 1.50 per share for FY15, which is up from EUR 1.40 for FY14 and represents a payout ratio of 43%. SCOR’s financial leverage stood at 27.5% as of 31 December 2015. This is temporarily above the range indicated in “Optimal Dynamics”. A contribution of EUR 250mn from the following added to financial leverage: dated subordinated debt issued in June 2015 and dated subordinated debt of EUR 600mn, which was issued to refinance undated subordinated debt of CHF 650mn (callable in August 2016). In addition, SCOR called two debts in FY15, due in 2029 and 2020 for EUR 10mn and EUR 93mn, both at par-value. Adjusted for the intended calls of the two debts (callable in 3Q16), financial leverage would stand at 20.6%, which is within the optimal range indicated in the company's plan. SCOR’s Solvency II ratio, adjusted for the two debts (which are likely callable in 3Q16), stood at 211% (up from 202% in FY14), which is within the optimal solvency range of 185-220% as defined in the “Optimal Dynamics” plan. The reinsurer targets non-life premium organic growth of 5% in FY16 and a combined ratio of 94%, based on a 6% lower natural-loss rate.
Baa1s/--/-- Stable Standard Life (SLLN): Marketweight 0.0% Standard Life, Scotland’s largest insurer, provided an update to its FY15 sales and flow figures. Group operating profit increased by 9% yoy to GBP 665mn after an expected GBP38mn reduction in spread/risk margin, which was due to lower annuity sales and a reduced benefit from asset liability management. This was more than offset by fee-based revenue of GBP 1.6bn (+10% yoy). Driven by net inflows of GBP 6.3bn (up from GBP 1.0bn in FY14), assets under administration increased by 4% yoy to GBP 307.4bn, despite volatile markets. Institutional and Wholesale saw net inflows more than double to GBP 12.6bn (from GBP 6bn in FY14), with 67% of net inflows coming from outside the UK as the company continued to expand globally. Third-party investment performance beat its benchmark. Workplace and Retail continued to develop well, with net inflows up 14% yoy to GBP 5.8bn and adding over 250,000 new customers through auto enrolment, which contributed to a 9% increase in regular contributions to workplace pensions of GBP 2.9bn. Fee-based revenue increased by 10% yoy to GBP 1.6bn (representing 94% of underlying income). The company's CEO, Keith Skeoch, expected investment solutions to drive the company's long-term growth and to allow it to deliver on its progressive dividend policy. Standard Life proposed a final dividend of 12.34p, which will raise the FY15 dividend to 18.36p (up 7.8% yoy). Its reported Solvency II capital surplus was GBP 2.1bn, which is equal to a Solvency II ratio of 162%.

March 2016 Credit Research
Euro Credit Pilot
UniCredit Research page 104 See last pages for disclaimer.
Current Ratings (Moody's/S&P/Fitch)
Credit Profile
Name (Ticker): Recommendation Weight in iBoxx Comment Insurance sector
--/BBB+s/-- Stable Swiss Life (SLHNVX): Marketweight 1.8% Swiss Life reported adjusted profit from operations of CHF 1.3bn (up 17% yoy) in FY15. All units contributed to this growth. Net profit increased by 7% yoy to CHF 878mn, driven by income from fees, which increased by 36% yoy to CHF 342mn. Premium income totaled CHF 18.9bn (up 5% yoy when measured in local currencies and a 1% yoy decline when adjusted for FX movements). Profit at Swiss Life Asset Managers continued to grow, with net new assets from its third-party business at CHF 7.2bn (compared to CHF 4.5bn as of FY14). Despite the low-interest-rate environment, the company posted a robust net investment return of 3.7% (similar to its 3.8% in FY14). Despite low interest rates, the company’s new-business margin stood at 1.7%, down 1pp from FY14 but above the company’s target of 1.5%. The value of new business was up 5% yoy to CHF 268mn. The increase in the company’s profit supported the CHF 1.2bn growth of its insurance reserves. Swiss Life Switzerland increased its profit by 10% yoy to CHF 734mn in FY15, driven by savings of CHF 499mn (which increased by 19% yoy), while fees were slightly negative due to investments in growth initiatives. In France, Swiss Life saw a profit increase of 20% yoy to EUR 219mn. In addition to savings of EUR 163mn (up by 12% yoy), the risk result of EUR 82mn (+18% yoy) and fees of EUR 43mn (+38% yoy) also contributed to this increase. Profits at the Germany segment increased by 51% yoy to EUR 121mn, based on savings of EUR 86mn (+33% yoy) and, in particular, on income from fees of EUR 37mn (+159%). The risk result contributed EUR 26mn (+8% yoy). Swiss Life International saw a 26%-yoy increase to EUR 38mn, mainly due to fees of EUR 29mn (+61% yoy). Shareholders' equity declined by 5% yoy to CHF 12.2bn, particularly due to lower unrealized gains on bonds and negative currency-translation effects. Swiss Life generated an adjusted return on equity of 9.7% in 2015, which is slightly lower than the 9.6% in FY14 but at the upper end of its target band of 8-10%. The board of directors proposed an increase in the dividend from CHF 6.50 to CHF 8.50 at its annual general meeting. Efficiency ratios improved for the group by 2bp to 0.60%. The value of new business rose from CHF 255mn in 2014 to CHF 268mn (plus 5%). Swiss Life generated an adjusted return on equity of 9.7% in 2015 (2014: 9.6%) and thus once again attained the upper end of its target band of 8-10%. Shareholders' equity amounted to CHF 12.2 billion (minus 5%, particularly due to lower unrealized gains on bonds and negative currency-translation effects). Swiss Life expects its SST ratio to be around 140% as of 1 January 2016 (based on the internal model).
Aa3s/AA-s/A+s Stable Swiss Re (SRENVX): Marketweight 1.8% (member of the iTraxx FIN) Swiss Re, the world’s second largest reinsurer, reported FY15 net income of USD 4.6bn, up by 31% yoy. The results reflected, in particular, continued solid underwriting performance, supported by benign natural catastrophe experience and net reserve releases from the previous year. 4Q15 contributed strongly, with net profit of USD 938mn (up from USD 245mn in 4Q14, when earnings were hit by one-off charges), beating market average estimates of USD 916mn (Bloomberg). L&H Re contributed particularly strongly to the result, reporting FY15 net income of USD 393mn, which reflected a strong operating result, lower interest charges and net realized gains. This compared to a loss of USD 462mn in FY14, which was mainly due to management action taken to address the pre-2004 US individual life business. In FY15, premiums earned and fee income decreased by 2.7% yoy to USD 11.0bn due to FX effects, while benefiting from new longevity deals in Europe and large transactions in Australia. Property&Casualty Re saw net income falling 16% yoy to USD 2.98bn in FY15), following price softening, a large man-made loss burden and lower realized investment gains. The combined ratio declined by 230bp to 86.0%. Net premiums earned declined slightly, driven mainly by FX movements. Excluding this, premiums-earned increased by USD 497mn due to higher premiums in US casualty and higher earnings from previous contracts in the EMEA region. Corporate Solutions delivered net income of USD 340mn in FY15 (up 7% yoy), reflecting continued profitable business performance across most lines of business and increased investment income. Admin Re reported a strong increase in net income to USD 422mn in FY15 (from USD 34mn in FY14 – impacted by the USD 203mn loss on the sale of Aurora National Life Assurance Company). This was mainly driven by higher realized gains from sales of assets as part of the preparation for Solvency II and tax credits in the UK in FY15. Swiss Re delivered on its return-on-equity and earnings-per-share targets for FY15. The company continued its strong ROI of 3.5% in the current low-interest-rate environment. Swiss Re continues to focus on profitability and economic growth using ROE and economic-worth-per-share as its key measures. Total ROE jumped 320bp to 13.7% in FY15. Swiss Re's board of directors will propose raising its regular dividend to CHF 4.60 per share and the authorisation of a new public share-buyback program of up to CHF 1.0bn in a move to deploy its excess capital.
--/A+s/-- Stable TALANX (TALANX): Marketweight 2.7% Talanx will report its FY15 earnings on 21 March, when it will report its official Solvency II ratio (according to its internal capital model, which was approved by the national regulator on 23 November). As of December 2014, its regulatory Solvency II ratio was 182%, and its economic solvency ratio amounted to 271%. The Talanx group had improved its operating business as of 30 September 2015. Gross written premiums increased by 12.1% yoy to EUR 24.4bn. FX fluctuations had an overall-positive effect on premium performance. Adjusted for FX effects, gross written premiums increased by 6.5% yoy. Operating profit (EBIT) grew by 4.4% yoy to EUR 1.5bn. Excluding the full goodwill impairment in the German life insurance business in 2Q15, group net income stood at EUR 643mn. The combined ratio improved across the group to 96.9% (from 97.7% in 9M14) thanks to a decline in the expense ratio. The underwriting result continued to be shaped by the German life insurers. Outlook for the group net income for FY15 of EUR 600mn to EUR 650mn was confirmed. For FY16, a group net income of more than EUR 700mn is expected.
Baa3s/BBB-s/-- Stable Unipol (USIMIT): Marketweight 0.0% Unipol's consolidated net profit increased to EUR 579mn in FY15 (from EUR 505mn in FY14), despite a negative one-off factor of EUR 159mn related to the recalculation of deferred taxes (due to the recent decrease of the corporate income tax rate from 27.5% to 24%). Direct insurance income gross of outwards reinsurance declined by 7.9% yoy to around EUR 16.5bn (down by 4.2% yoy on a comparable basis net of the effect of the sale of the business unit to Allianz). Pre-tax profit declined by 2.6% yoy to EUR 1.25bn. Non-Life business contributed to this with profit of EUR 907mn (similar to that of EUR 1bn in FY14), and Life contributed profit of EUR 343mn (up from EUR 274mn in FY14). Direct premium income of the group amounted to EUR 7.9bn (down by 12.1% yoy and 4.9% on a comparable basis). The group's combined ratio declined to 93.5% (93.9% net of reinsurance) as of 31 December 2015, from 94.7% recorded in 2014 (94% net of reinsurance). In Life, direct income amounted to EUR 8.6bn as of 31 December 2015, down by 3.6% yoy. With regard to the main companies within Life, UnipolSai recorded income of EUR 3.4bn (-7.5% yoy); Popolare Vita Group reported income of EUR 3bn (-17% yoy) and the Arca Vita Group reported income that had increased significantly, amounting to EUR 1.9bn (+46.2% yoy). The banking business recorded positive gross income of EUR 6mn as of 31 December 2015. The coverage ratio of non-performing loans continued to grow, reaching 57.3%. The CET1 ratio of the Unipol Banking Group as of 31 December 2015 was 17.8%. Its Solvency I margin in FY15 increased by 1pp yoy to 170%. Its Solvency II figure was not published, but the company has been authorized by the Italian Insurance Supervisory Authority to use specific parameters to quantify its solvency capital requirement for technical insurance risks for Non-Life and Health. The authorization to apply the internal model is pending. The individual accounting results of Unipol Gruppo Finanziario S.p.A are still preliminary, given an estimated profit as of 31 December 2015 of EUR 166mn. The dividend for FY15 is expected to be EUR 0.18 per ordinary share.

March 2016 Credit Research
Euro Credit Pilot
UniCredit Research page 105 See last pages for disclaimer.
Current Ratings (Moody's/S&P/Fitch)
Credit Profile
Name (Ticker): Recommendation Weight in iBoxx Comment Insurance sector
A1s/AA-s/A+s Weakening Zurich Insurance Group (ZURNVX): Marketweight 2.9% (member of the iTraxx FIN) Zurich Insurance Group, Switzerland’s biggest insurance company, reported disappointing FY15 results. Net attributable income declined by 53% yoy to USD 1.84bn. The main negative factor was general insurance, where business operating profit (bop) declined by 71% yoy to USD 864mn, as the business recorded an operating loss of USD 120mn in 4Q15. The combined ratio deteriorated by 680bp to 103.6%, which was partly due to large losses and natural-catastrophe claims (including severe flooding in the UK and Ireland in December) and USD 275mn related to the explosions in the port of Tianjin in August 2015. Targeted measures are conducted to reduce earnings volatility and at renewed underwriting or exiting under-performing portfolios. Gross written premiums and policy fees fell by 6% yoy to USD 34bn (but were up 3% yoy on a local-currency basis). This reflected organic growth, an increase in new business through captives in North America Commercial and an increase in premiums in Latin America due to inflation and a new distribution agreement in Brazil. The company reported that actions to restore profitability, including new underwritings or exiting unprofitable portfolios, increasing cost efficiency and further simplifying the organization, are ongoing. Global Life and Farmers is performing better and continuing to make progress in strategic execution. The bop of the global life sector increased by 2% yoy to USD 1.3bn, while farmers' bop declined by 10% yoy to USD 1.42bp. Chairman and CEO ad interim Tom de Swaan said that "given the challenges within General Insurance, it is unlikely that the group will achieve its target of a business operating profit after tax return on equity of 12-14% in FY16". Zurich is on track to achieve its other targets for 2014-16. Its economic capital model ratio stood at 114% at the end of September, and this is within the company's target range. The group expects to deliver cash remittances in excess of USD 10bn for the period, which is above its target. FY15 cash remittances of USD 3.9bn and the company's solid capital position underpin its board's proposal for an unchanged dividend of CHF 17 per share. However, additional capital will not be returned to investors at this time to maintain the group's capital strength and flexibility in the current circumstances. On 7 March 2016, Mario Greco will become the company's new CEO.
Dr. Martina von Terzi (UniCredit Bank) +49 89 378-14245 [email protected]

March 2016 Credit Research
Euro Credit Pilot
UniCredit Research page 106 See last pages for disclaimer.
Notes

March 2016 Credit Research
Euro Credit Pilot
UniCredit Research page 107
Disclaimer Our recommendations are based on information obtained from, or are based upon public information sources that we consider to be reliable but for the completeness and accuracy of which we assume no liability. All estimates and opinions included in the report represent the independent judgment of the analysts as of the date of the issue. This report may contain links to websites of third parties, the content of which is not controlled by UniCredit Bank. No liability is assumed for the content of these third-party websites. We reserve the right to modify the views expressed herein at any time without notice. Moreover, we reserve the right not to update this information or to discontinue it altogether without notice. This analysis is for information purposes only and (i) does not constitute or form part of any offer for sale or subscription of or solicitation of any offer to buy or subscribe for any financial, money market or investment instrument or any security, (ii) is neither intended as such an offer for sale or subscription of or solicitation of an offer to buy or subscribe for any financial, money market or investment instrument or any security nor (iii) as an advertisement thereof. The investment possibilities discussed in this report may not be suitable for certain investors depending on their specific investment objectives and time horizon or in the context of their overall financial situation. The investments discussed may fluctuate in price or value. Investors may get back less than they invested. Changes in rates of exchange may have an adverse effect on the value of investments. Furthermore, past performance is not necessarily indicative of future results. In particular, the risks associated with an investment in the financial, money market or investment instrument or security under discussion are not explained in their entirety. This information is given without any warranty on an "as is" basis and should not be regarded as a substitute for obtaining individual advice. Investors must make their own determination of the appropriateness of an investment in any instruments referred to herein based on the merits and risks involved, their own investment strategy and their legal, fiscal and financial position. As this document does not qualify as an investment recommendation or as a direct investment recommendation, neither this document nor any part of it shall form the basis of, or be relied on in connection with or act as an inducement to enter into, any contract or commitment whatsoever. Investors are urged to contact their bank's investment advisor for individual explanations and advice. Neither UniCredit Bank nor any of their respective directors, officers or employees nor any other person accepts any liability whatsoever (in negligence or otherwise) for any loss howsoever arising from any use of this document or its contents or otherwise arising in connection therewith. This analysis is being distributed by electronic and ordinary mail to professional investors, who are expected to make their own investment decisions without undue reliance on this publication, and may not be redistributed, reproduced or published in whole or in part for any purpose. Responsibility for the content of this publication lies with: UniCredit Group and its subsidiaries are subject to regulation by the European Central Bank a) UniCredit Bank AG (UniCredit Bank), Am Tucherpark 16, 80538 Munich, Germany, (also responsible for the distribution pursuant to §34b WpHG). The company belongs to UniCredit Group. Regulatory authority: “BaFin“ – Bundesanstalt für Finanzdienstleistungsaufsicht, Lurgiallee 12, 60439 Frankfurt, Germany. b) UniCredit Bank AG London Branch (UniCredit Bank London), Moor House, 120 London Wall, London EC2Y 5ET, United Kingdom. Regulatory authority: “BaFin“ – Bundesanstalt für Finanzdienstleistungsaufsicht, Lurgiallee 12, 60439 Frankfurt, Germany and subject to limited regulation by the Financial Conduct Authority, 25 The North Colonnade, Canary Wharf, London E14 5HS, United Kingdom and Prudential Regulation Authority 20 Moorgate, London, EC2R 6DA, United Kingdom. Further details regarding our regulatory status are available on request. c) UniCredit Bank AG Hong Kong Branch (UniCredit Bank Hong Kong), 25/F Man Yee Building, 68 Des Voeux Road Central, Hong Kong. Regulatory authority: Hong Kong Monetary Authority, 55th Floor, Two International Financial Centre, 8 Finance Street, Central, Hong Kong d) UniCredit Bank AG Singapore Branch (UniCredit Bank Singapore), Prudential Tower, 30 Cecil Street, #25-01, Singapore 049712 Regulatory authority: Monetary Authority of Singapore, 10 Shenton Way MAS Building, Singapore 079117 e) UniCredit Bank AG Tokyo Branch (UniCredit Tokyo), Otemachi 1st Square East Tower 18/F, 1-5-1 Otemachi, Chiyoda-ku, 100-0004 Tokyo, Japan Regulatory authority: Financial Services Agency, The Japanese Government, 3-2-1 Kasumigaseki Chiyoda-ku Tokyo, 100-8967 Japan, The Central Common Government Offices No. 7.
POTENTIAL CONFLICTS OF INTERESTS A2A 3; ABN Amro Bank 3; Accor 3; Acea 3; Airbus Group 3; Akzo Nobel 3; Allianz 1b; Allied Irish Banks 3; Amgen 3; Assicurazioni Generali 3; AT&T 3; Atlantia 3; AXA 3; Banco Popolare Scarl 3; Bank of America 3; Barclays 3; Bayer 3; BBVA 3; BMW 3; Bouygues 3; Cap Gemini 3; Citigroup 3; Continental 3; Credit Suisse 2; Daimler 3; Deutsche Wohnen 2; DNB 3; E.ON 3; EDF 3; Edison 3; EDP 3; Enel 3; Engie 3; ENI 3; EWE 3; Exor 3; FCA Bank 3; FCE Bank 3; General Electric 3; Goldman Sachs 3; Hera 3; HSBC 3; Iberdrola 3; Intesa Sanpaolo 3; Iren 3; Kering 3; KPN 3; Lloyds Banking Group 3; Luxottica 3; LVMH 3; Morgan Stanley 3; Nordea 3; Novartis 3; OMV 3; Orange 3; Pfizer 3; PGNiG 3; PKN Orlen 3; RBS 3; Repsol 3; Saint-Gobain 3; Sanofi-Aventis 3; SAP 3; SEB 3; Siemens 3; Sixt 3; Snam 3; Société Générale 3; Suez Alliance 3; Svenska Handelsbanken 3; Telefonica 2; Telekom Austria 3; Terna 3; Unilever 3; Verbund 3; Vivendi 3; Vodafone 3; Volkswagen 3; Vonovia 2; Key 1a: UniCredit Bank AG and/or any related legal person owns at least 2% of the capital stock of the analyzed company. Key 1b: The analyzed company owns at least 2% of the capital stock of UniCredit Bank AG and/or any related legal person. Key 2: UniCredit Bank AG and/or any related legal person has been lead manager or co-lead manager over the previous 12 months of any publicly disclosed offer of financial instruments of the analyzed company, or in any related derivatives. Key 3: UniCredit Bank AG and/or any related legal person administers the securities issued by the analyzed company on the stock exchange or on the market by quoting bid and ask prices (i.e. acts as a market maker or liquidity provider in the securities of the analyzed company or in any related derivatives). Key 5: The analyzed company and UniCredit Bank AG and/or any related legal person have concluded an agreement on the preparation of analyses. Key 6a: Employees or members of the Board of Directors of UniCredit Bank AG and/or any other employee that works for UniCredit Research (i.e. the joint research department of the UniCredit Group) and/or members of the Group Board (pursuant to relevant domestic law) are members of the Board of Directors of the analyzed company. Members of the Board of Directors of the analyzed company hold office in the Board of Directors of UniCredit Bank AG (pursuant to relevant domestic law). The application of this Key 6a is limited to persons who, although not involved in the preparation of the analysis, had or could reasonably be expected to have access to the analysis prior to its dissemination to customers or the public. Key 6b: The analyst is on the Supervisory Board/Board of Directors of the company they cover.
RECOMMENDATIONS, RATINGS AND EVALUATION METHODOLOGY Company Date Rec. Company Date Rec. Company Date Rec. AALLN 16/02/2016 Hold EDPPL 05/03/2015 Overweight PSON 30/10/2015 Marketweight ABESM 02/04/2015 Marketweight EDPPL 05/03/2015 Marketweight PUBFP 14/01/2016 Marketweight ABIBB 29/01/2016 Marketweight ELIASO 17/08/2015 no rec. RCIBK 15/01/2016 Overweight ACAFP 02/04/2015 Marketweight ELIASO 14/08/2015 Underweight RCIBK 24/06/2015 Marketweight ACAFP 10/03/2015 Restricted ELIASO 10/08/2015 no rec. RCIBK 27/05/2015 Restricted ACEIM 13/11/2015 Overweight ENEASA 01/10/2015 Marketweight REEDLN 23/07/2015 Marketweight ADSGR 06/11/2015 Buy ENELIM 10/02/2016 Marketweight REEDLN 05/03/2015 Underweight ADSGR 11/03/2015 Hold ENELIM 29/06/2015 Overweight REESM 29/10/2015 Overweight AEMSPA 02/04/2015 Marketweight ENGSM 17/02/2016 Marketweight REPSM 08/05/2015 Overweight AIFP 30/07/2015 Marketweight ENIIM 28/10/2015 Restricted REPSM 18/03/2015 Restricted AKEFP 31/07/2015 Overweight ENIIM 06/10/2015 Marketweight ROSW 18/02/2016 Restricted ALOTFP 09/02/2016 Restricted ENIIM 02/09/2015 Overweight ROSW 02/04/2015 Marketweight AMSSM 29/02/2016 Overweight ENIIM 23/04/2015 Marketweight SABLN 15/10/2015 Marketweight AMSSM 05/10/2015 Restricted EOANGR 12/08/2015 Marketweight SANFP 30/10/2015 Marketweight ANNGR 10/02/2016 no rec. EOANGR 11/03/2015 Underweight SANFP 14/09/2015 Restricted ANNGR 09/12/2015 Restricted EVKGR 04/08/2015 Marketweight SAPGR 22/04/2015 Marketweight ANNGR 03/11/2015 Marketweight EVKGR 27/03/2015 Underweight SAPGR 25/03/2015 Restricted ANNGR 23/03/2015 Restricted EXOIM 12/02/2016 Marketweight SCMNVX 06/11/2015 Marketweight ARRFP 25/01/2016 Marketweight EXOIM 20/11/2015 Restricted SCMNVX 09/09/2015 Restricted ARRFP 10/11/2015 Restricted EXOIM 12/11/2015 Marketweight SDFGR 03/07/2015 Marketweight ASML 16/04/2015 Marketweight EXOIM 05/05/2015 Buy SIEGR 30/06/2015 Marketweight ASSGEN 31/07/2015 Marketweight F 04/02/2016 Restricted SIEGR 19/05/2015 Restricted ATLIM 12/11/2015 Marketweight F 05/03/2015 Marketweight SKYLN 29/01/2016 Marketweight ATLIM 29/10/2015 Restricted FIREIT 12/02/2016 Underweight SKYLN 09/11/2015 Restricted

March 2016 Credit Research
Euro Credit Pilot
UniCredit Research page 108
Company Date Rec. Company Date Rec. Company Date Rec. ATLIM 11/05/2015 Marketweight FRFP 12/11/2015 Marketweight SKYLN 30/09/2015 Overweight BASGR 27/10/2015 Underweight FUMVFH 08/01/2016 Restricted SLB 19/10/2015 Underweight BATSLN 02/04/2015 Marketweight FUMVFH 22/10/2015 Underweight SPPDIS 05/03/2015 Marketweight BATSLN 10/03/2015 Restricted GALPPL 14/10/2015 Buy SPPEUS 20/04/2015 Underweight BERTEL 29/01/2016 Underweight GMFIN 22/06/2015 Overweight SPPEUS 05/03/2015 Marketweight BERTEL 09/04/2015 Marketweight HEIANA 09/09/2015 Marketweight SRGIM 07/12/2015 Marketweight BGGRP 09/04/2015 Marketweight HELLA 30/03/2015 Marketweight SRGIM 03/11/2015 Restricted BGGRP 27/03/2015 Underweight HERIM 12/11/2015 Marketweight SRGIM 15/05/2015 Marketweight BGGRP 06/03/2015 Restricted HERIM 26/10/2015 Restricted SSELN 05/06/2015 no rec. BNP 30/10/2015 Marketweight HSHN 31/03/2015 Underweight STATK 05/02/2016 Underweight BNP 12/08/2015 Restricted IBESM 05/03/2015 Marketweight STATK 29/10/2015 Marketweight BNRGR 25/11/2015 Restricted IBM 29/02/2016 Restricted STATK 14/09/2015 Restricted BNRGR 26/03/2015 Overweight INTNED 05/08/2015 Marketweight STLNO 04/02/2016 Marketweight BOGAEI 28/07/2015 no rec. INTNED 03/06/2015 Restricted SUFP 21/01/2016 Underweight BPLN 21/01/2016 Overweight IREIM 28/01/2016 Overweight SWFP 08/07/2015 Marketweight BPLN 29/07/2015 Marketweight ISSDC 12/03/2015 Overweight SYNNVX 03/02/2016 Underweight BPLN 03/07/2015 Overweight ISSDC 05/03/2015 Marketweight SYNNVX 13/11/2015 Marketweight CAFP 05/03/2015 Marketweight KPN 29/01/2016 Overweight SYNNVX 08/05/2015 Underweight CAPFP 14/08/2015 Overweight LHNVX 12/11/2015 Marketweight SZUGR 20/11/2015 Hold CARLB 20/08/2015 Marketweight LHNVX 18/09/2015 Restricted SZUGR 13/04/2015 Sell CMZB 02/11/2015 Marketweight LINGR 29/07/2015 Underweight T 29/01/2016 Underweight CMZB 14/09/2015 Restricted LUXIM 01/02/2016 Overweight TDCDC 28/01/2016 Marketweight COFP 18/01/2016 Marketweight LUXIM 02/12/2015 Buy TDCDC 10/08/2015 Overweight COFP 16/12/2015 Overweight LUXIM 07/08/2015 Overweight TELEFO 28/10/2015 Marketweight CONGR 12/01/2016 Marketweight LXSGR 05/11/2015 Marketweight TELEFO 07/09/2015 Restricted CONGR 12/11/2015 Restricted MAHLGR 04/06/2015 Hold TELEFO 14/08/2015 Marketweight CPGLN 25/11/2015 Marketweight MANGR 04/03/2015 no rec. TELEFO 06/05/2015 Overweight CS 04/02/2016 Marketweight MCD 14/08/2015 Marketweight TELEFO 26/03/2015 Restricted CS 19/11/2015 Restricted MCD 18/05/2015 Restricted TEVA 27/07/2015 Marketweight DAIGR 04/02/2016 Marketweight MDLZ 05/05/2015 Marketweight TLSNSS 29/01/2016 Overweight DAIGR 29/10/2015 Restricted MEOGR 15/06/2015 Marketweight TLSNSS 19/10/2015 Marketweight DB 31/07/2015 Marketweight NEGANV 28/07/2015 no rec. TOTAL 12/02/2016 Overweight DB 27/04/2015 Underweight NGGLN 05/03/2015 Marketweight TOTAL 02/02/2016 Marketweight DGELN 13/10/2015 Marketweight NNGRNV 05/08/2015 Marketweight TOTAL 30/07/2015 Overweight DLPH 05/02/2016 Marketweight ODGR 05/11/2015 Marketweight TRNIM 18/02/2016 Marketweight DLPH 30/10/2015 Underweight OMVAV 21/01/2016 Marketweight TRNIM 10/12/2015 Restricted DLPH 31/07/2015 Marketweight OMVAV 15/09/2015 Restricted TRNIM 05/03/2015 Marketweight DLPH 05/03/2015 Overweight ORAFP 29/01/2016 Overweight TTLINF 28/08/2015 Underweight DONGAS 29/04/2015 Marketweight PKNPW 19/11/2015 Restricted VIVFP 19/02/2016 Underweight DWNIGY 10/11/2015 Marketweight PKNPW 29/06/2015 Marketweight VLVY 05/02/2016 Underweight EDF 19/01/2016 Underweight PNLNA 05/10/2015 Underweight VW 28/10/2015 Overweight EDF 05/11/2015 Marketweight PRADA 17/12/2015 Hold WBA 11/01/2016 Marketweight EDF 07/10/2015 Restricted PROXBB 30/10/2015 Marketweight WKLNA 29/07/2015 Overweight EDF 09/03/2015 Marketweight PSON 21/01/2016 Underweight Overview of our ratings You will find the history of rating regarding recommendation changes as well as an overview of the breakdown in absolute and relative terms of our investment ratings on our website www.disclaimer.unicreditmib.eu/credit-research-rd/Recommendations_CR_e.pdf. Note on the evaluation basis for interest-bearing securities: Recommendations relative to an index: For high grade names the recommendations are relative to the "iBoxx EUR Benchmark" index family, for sub investment grade names the recommendations are relative to the "iBoxx EUR High Yield" index family. Marketweight: We recommend having the same portfolio exposure in the name as the respective iBoxx index. We expect that the average total return of the instruments of the issuer is equal to the total return of the index. Overweight: We recommend having a higher portfolio exposure in the name as the respective iBoxx index. We expect that the average total return of the instruments of the issuer is greater than the total return of the index. Underweight: We recommend having a lower portfolio exposure in the name as the respective iBoxx index. We expect that the average total return of the instruments of the issuer is less than the total return of the index. Outright recommendations: Hold: We recommend holding the respective instrument for investors who already have exposure. We expect that the total return of the instruments of the issuer is equal to the yield. Buy: We recommend buying the respective instrument for investors who already have exposure. We expect that the total return of the instruments of the issuer is greater than the yield. Sell: We recommend selling the respective instrument for investors who already have exposure. We expect that the total return of the instruments of the issuer is less than the yield. We employ three further categorizations for interest-bearing securities in our coverage: Restricted: A recommendation and/or financial forecast is not disclosed owing to compliance or other regulatory considerations such as a blackout period or a conflict of interest. Coverage in transition: Due to changes in the research team, the disclosure of a recommendation and/or financial information are temporarily suspended. The interest-bearing security remains in the research universe and disclosures of relevant information will be resumed in due course. Not rated: Suspension of coverage. Trading recommendations for fixed-interest securities mostly focus on the credit spread (yield difference between the fixed-interest security and the relevant government bond or swap rate) and on the rating views and methodologies of recognized agencies (S&P, Moody’s, Fitch). Depending on the type of investor, investment ratings may refer to a short period or to a 6 to 9-month horizon. Please note that the provision of securities services may be subject to restrictions in certain jurisdictions. You are required to acquaint yourself with local laws and restrictions on the usage and the availability of any services described herein. The information is not intended for distribution to or use by any person or entity in any jurisdiction where such distribution would be contrary to the applicable law or provisions. If not otherwise stated daily price data refers to pre-day closing levels and iBoxx bond index characteristics refer to the previous month-end index characteristics. Coverage Policy A list of the companies covered by UniCredit Bank is available upon request. Frequency of reports and updates It is intended that each of these companies be covered at least once a year, in the event of key operations and/or changes in the recommendation.
SIGNIFICANT FINANCIAL INTEREST UniCredit Bank AG and/or other related legal persons with them regularly trade shares of the analyzed company. UniCredit Bank AG and/or other related legal persons may hold significant open derivative positions on the stocks of the company which are not delta-neutral. UniCredit Bank AG and/or other related legal persons have a significant financial interest relating to the analyzed company or may have such at any future point of time. Due to the fact that UniCredit Bank AG and/or any related legal person are entitled, subject to applicable law, to perform such actions at any future point in time which may lead to the existence of a

March 2016 Credit Research
Euro Credit Pilot
UniCredit Research page 109
significant financial interest, it should be assumed for the purposes of this information that UniCredit Bank AG and/or any related legal person will in fact perform such actions which may lead to the existence of a significant financial interest relating to the analyzed company. Analyses may refer to one or several companies and to the securities issued by them. In some cases, the analyzed companies have actively supplied information for this analysis.
INVESTMENT BANKING TRANSACTIONS The analyzed company and UniCredit Bank AG and/or any related legal person concluded an agreement on services in connection with investment banking transactions in the previous 12 months, in return for which the Bank and/or such related legal person received a consideration or promise of consideration or intends to do so. Due to the fact that UniCredit Bank AG and/or any related legal person are entitled to conclude, subject to applicable law, an agreement on services in connection with investment banking transactions with the analyzed company at any future point in time and may receive a consideration or promise of consideration, it should be assumed for the purposes of this information that UniCredit Bank AG and/or any related legal person will in fact conclude such agreements and will in fact receive such consideration or promise of consideration.
ANALYST DECLARATION The author’s remuneration has not been, and will not be, geared to the recommendations or views expressed in this study, neither directly nor indirectly.
ORGANIZATIONAL AND ADMINISTRATIVE ARRANGEMENTS TO AVOID AND PREVENT CONFLICTS OF INTEREST To prevent or remedy conflicts of interest, UniCredit Bank has established the organizational arrangements required from a legal and supervisory aspect, adherence to which is monitored by its compliance department. Conflicts of interest arising are managed by legal and physical and non-physical barriers (collectively referred to as “Chinese Walls”) designed to restrict the flow of information between one area/department of UniCredit Bank and another. In particular, Investment Banking units, including corporate finance, capital market activities, financial advisory and other capital raising activities, are segregated by physical and non-physical boundaries from Markets Units, as well as the research department. Disclosure of publicly available conflicts of interest and other material interests is made in the research. Analysts are supervised and managed on a day-to-day basis by line managers who do not have responsibility for Investment Banking activities, including corporate finance activities, or other activities other than the sale of securities to clients.
ADDITIONAL REQUIRED DISCLOSURES UNDER THE LAWS AND REGULATIONS OF JURISDICTIONS INDICATED You will find a list of further additional required disclosures under the laws and regulations of the jurisdictions indicated on our website www.cib-unicredit.com/research-disclaimer. Notice to Austrian investors: This analysis is only for distribution to professional clients (Professionelle Kunden) as defined in article 58 of the Securities Supervision Act. Notice to investors in Bosnia and Herzegovina: This report is intended only for clients of UniCredit in Bosnia and Herzegovina who are institutional investors (Institucionalni investitori) in accordance with Article 2 of the Law on Securities Market of the Federation of Bosnia and Herzegovina and Article 2 of the Law on Securities Markets of the Republic of Srpska, respectively, and may not be used by or distributed to any other person. This document does not constitute or form part of any offer for sale or subscription for or solicitation of any offer to buy or subscribe for any securities and neither this document nor any part of it shall form the basis of, or be relied on in connection with or act as an inducement to enter into, any contract or commitment whatsoever. Notice to Brazilian investors: The individual analyst(s) responsible for issuing this report represent(s) that: (a) the recommendations herein reflect exclusively the personal views of the analysts and have been prepared in an independent manner, including in relation to UniCredit Group; and (b) except for the potential conflicts of interest listed under the heading “Potential Conflicts of Interest” above, the analysts are not in a position that may impact on the impartiality of this report or that may constitute a conflict of interest, including but not limited to the following: (i) the analysts do not have a relationship of any nature with any person who works for any of the companies that are the object of this report; (ii) the analysts and their respective spouses or partners do not hold, either directly or indirectly, on their behalf or for the account of third parties, securities issued by any of the companies that are the object of this report; (iii) the analysts and their respective spouses or partners are not involved, directly or indirectly, in the acquisition, sale and/or trading in the market of the securities issued by any of the companies that are the object of this report; (iv) the analysts and their respective spouses or partners do not have any financial interest in the companies that are the object of this report; and (v) the compensation of the analysts is not, directly or indirectly, affected by UniCredit’s revenues arising out of its businesses and financial transactions. UniCredit represents that: except for the potential conflicts of interest listed under the heading “Potential Conflicts of Interest” above, UniCredit, its controlled companies, controlling companies or companies under common control (the “UniCredit Group”) are not in a condition that may impact on the impartiality of this report or that may constitute a conflict of interest, including but not limited to the following: (i) the UniCredit Group does not hold material equity interests in the companies that are the object of this report; (ii) the companies that are the object of this report do not hold material equity interests in the UniCredit Group; (iii) the UniCredit Group does not have material financial or commercial interests in the companies or the securities that are the object of this report; (iv) the UniCredit Group is not involved in the acquisition, sale and/or trading of the securities that are the object of this report; and (v) the UniCredit Group does not receive compensation for services rendered to the companies that are the object of this report or to any related parties of such companies. Notice to Canadian investors: This communication has been prepared by UniCredit Bank AG, which does not have a registered business presence in Canada. This communication is a general discussion of the merits and risks of a security or securities only, and is not in any way meant to be tailored to the needs and circumstances of any recipient. The contents of this communication are for information purposes only, therefore should not be construed as advice and do not constitute an offer to sell, nor a solicitation to buy any securities. Notice to Cyprus investors: This document is directed only at clients of UniCredit Bank who are persons falling within the Second Appendix (Section 2, Professional Clients) of the law for the Provision of Investment Services, the Exercise of Investment Activities, the Operation of Regulated Markets and other Related Matters, Law 144(I)/2007 and persons to whom it may otherwise lawfully be communicated who possess the experience, knowledge and expertise to make their own investment decisions and properly assess the risks that they incur (all such persons together being referred to as “relevant persons”). This document must not be acted on or relied on by persons who are not relevant persons or relevant persons who have requested to be treated as retail clients. Any investment or investment activity to which this communication related is available only to relevant persons and will be engaged in only with relevant persons. This document does not constitute an offer or solicitation to any person to whom it is unlawful to make such an offer or solicitation. Notice to investors in Ivory Coast: The information contained in the present report have been obtained by Unicredit Bank AG from sources believed to be reliable, however, no express or implied representation or warranty is made by Unicredit Bank AG or any other person as to the completeness or accuracy of such information. All opinions and estimates contained in the present report constitute a judgement of Unicredit Bank AG as of the date of the present report and are subject to change without notice. They are provided in good faith but without assuming legal responsibility. This report is not an offer to sell or solicitation of an offer to buy or invest in securities. Past performance is not an indicator of future performance and future returns cannot be guaranteed, and there is a risk of loss of the initial capital invested. No matter contained in this document may be reproduced or copied by any means without the prior consent of Unicredit Bank AG. Notice to New Zealand investors: This report is intended for distribution only to persons who are “wholesale clients” within the meaning of the Financial Advisers Act 2008 (“FAA”) and by receiving this report you represent and agree that (i) you are a “wholesale client” under the FAA (ii) you will not distribute this report to any other person, including (in particular) any person who is not a “wholesale client” under the FAA. This report does not constitute or form part of, in relation to any of the securities or products covered by this report, either (i) an offer of securities for subscription or sale under the Securities Act 1978 or (ii) an offer of financial products for issue or sale under the Financial Markets Conduct Act 2013. Notice to Omani investors: This communication has been prepared by UniCredit Bank AG. UniCredit Bank AG does not have a registered business presence in Oman and does not undertake banking business or provide financial services in Oman and no advice in relation to, or subscription for, any securities, products or financial services may or will be consummated within Oman. The contents of this communication are for the information purposes of sophisticated clients, who are aware of the risks associated with investments in foreign securities and neither constitutes an offer of securities in Oman as contemplated by the Commercial Companies Law of Oman (Royal Decree 4/74) or the Capital Market Law of Oman (Royal Decree 80/98), nor does it constitute an offer to sell, or the solicitation of any offer to buy non-Omani securities in Oman as contemplated by Article 139 of the Executive Regulations to the Capital Market Law (issued vide CMA Decision 1/2009). This communication has not been approved by and UniCredit Bank AG is not regulated by either the Central Bank of Oman or Oman’s Capital Market Authority. Notice to Pakistani investors: Investment information, comments and recommendations stated herein are not within the scope of investment advisory activities as defined in sub-section I, Section 2 of the Securities and Exchange Ordinance, 1969 of Pakistan. Investment advisory services are provided in accordance with a contract of engagement on investment advisory services concluded with brokerage houses, portfolio management companies, non-deposit banks and the clients. The distribution of this report is intended only for informational purposes for the use of professional investors and the information and opinions contained herein, or any part of it shall not form the basis of, or be relied on in connection with or act as an inducement to enter into, any contract or commitment whatsoever. Notice to Polish Investors: This document is intended solely for professional clients as defined in Art. 3.39b of the Trading in Financial Instruments Act of 29 July 2005 (as amended). The publisher and distributor of the document certifies that it has acted with due care and diligence in preparing it, however, assumes no liability for its completeness and accuracy. This document is not an advertisement. It should not be used in substitution for the exercise of independent judgment. Notice to Serbian investors: This analysis is only for distribution to professional clients (profesionalni klijenti) as defined in article 172 of the Law on Capital Markets. Notice to UK investors: This communication is directed only at clients of UniCredit Bank who (i) have professional experience in matters relating to investments or (ii) are persons falling within Article 49(2)(a) to (d) (“high net worth companies, unincorporated associations, etc.”) of the United Kingdom Financial Services and Markets Act 2000 (Financial Promotion) Order 2005 or (iii) to whom it may otherwise lawfully be communicated (all such persons together being referred to as “relevant persons”). This communication must not be acted on or relied on by persons who are not relevant persons. Any investment or investment activity to which this communication relates is available only to relevant persons and will be engaged in only with relevant persons. CR e 8

March 2016 Credit Research
Euro Credit Pilot
UniCredit Research page 110
UniCredit Research* Erik F. Nielsen Group Chief Economist Global Head of CIB Research +44 207 826-1765 [email protected]
Dr. Ingo Heimig Head of Research Operations +49 89 378-13952 [email protected]
Credit Research
Luis Maglanoc, CFA, Head +49 89 378-12708 [email protected]
Credit Strategy & Structured Credit Research
Dr. Philip Gisdakis, Head Credit Strategy +49 89 378-13228 [email protected]
Dr. Christian Weber, CFA, Deputy Head Credit Strategy +49 89 378-12250 [email protected]
Dr. Tim Brunne Quantitative Credit Strategy +49 89 378-13521 [email protected]
Holger Kapitza Credit Strategy & Structured Credit +49 89 378-28745 [email protected]
Dr. Stefan Kolek EEMEA Corporate Credits & Strategy +49 89 378-12495 [email protected]
Manuel Trojovsky Credit Strategy & Structured Credit +49 89 378-14145 [email protected]
Financials Credit Research
Franz Rudolf, CEFA, Head Covered Bonds +49 89 378-12449 [email protected]
Dr. Tilo Höpker Banks +49 89 378-12960 [email protected]
Luis Maglanoc, CFA Regulatory & Accounting Service +49 89 378-12708 [email protected]
Natalie Tehrani Monfared Regulatory & Accounting Service +49 89 378-12242 [email protected]
Emanuel Teuber Covered Bonds +49 89 378-12961 [email protected]
Robert Vielhaber Sub-Sovereigns & Agencies, Green Bonds +49 89 378-12004 [email protected]
Dr. Martina von Terzi Banks, Financial Services, Insurance +49 89 378-14245 [email protected]
Corporate Credit Research
Stephan Haber, CFA, Co-Head Telecoms, Technology +49 89 378-15192 [email protected]
Dr. Sven Kreitmair, CFA, Co-Head Automotive & Mobility +49 89 378-13246 [email protected]
Christian Aust, CFA Industrials +49 89 378-12806 [email protected]
David Bertholdt Capital Goods & Services +49 89 378-13211 [email protected]
Mehmet Dere Retail, Travel & Leisure, Oil & Gas +49 89 378-11294 [email protected]
Michael Gerstner Utilities, Hybrids +49 89 378-15449 [email protected]
Alexander Rozhetskin EEMEA (Banks, Oil & Gas, Basic Resources, Telecoms) +44 207 826-7953 [email protected]
Jonathan Schroer, CFA Media/Cable, Logistics, Business Services +49 89 378-13212 [email protected]
Dr. Silke Stegemann, CEFA Health Care & Pharma, Food & Beverage, Personal & Household Goods +49 89 378-18202 [email protected]
Publication Address
UniCredit Research Corporate & Investment Banking UniCredit Bank AG Arabellastrasse 12 D-81925 Munich [email protected]
Bloomberg UCCR Internet www.research.unicredit.eu
*UniCredit Research is the joint research department of UniCredit Bank AG (UniCredit Bank), UniCredit Bank AG London Branch (UniCredit Bank London), UniCredit Bank AG Milan Branch (UniCredit Bank Milan), UniCredit Bank New York (UniCredit Bank NY), UniCredit Bulbank, Zagrebačka banka d.d., UniCredit Bank Czech Republic and Slovakia, Bank Pekao, ZAO UniCredit Bank Russia (UniCredit Russia), UniCredit Bank Romania. CR 21