Credit Derivatives Update - UniCredit Research
14
5 February 2016 Credit Research Credit Derivatives Update UniCredit Research page 1 See last pages for disclaimer. Europe index skew looks attractive ■ Why is the magnitude of Europe and IG index skew currently so large? We call the difference between the fair-value spread of an index and its traded spread the index “skew”. Hence, the skew is negative if the fair-value spread is wider than the index spread. This is what we have seen over recent months for the Europe as well as the IG. In January, the fair-value spreads of the IG and Europe (as implied by single-name CDS spreads for the index constituents) were temporarily 20bp and 12bp wider than the traded spread. These are multi-year peak levels for both indices and pose an arbitrage opportunity. Our charts (below and on page 2) show that the index skew of the Europe and IG has been both positive and negative and, during the last ten years, the skew has only been more extreme for a few months in late-2008 and early-2009. Typically, index spread moves more rapidly than the single-name spreads, which lets the skew fluctuate as index arbitrage is not feasible for small skew levels. However, the skew development for the Europe and the IG of the past few months cannot be understood by such reasoning. Instead, we think that there has been, and still is, strong demand for single-name CDS protection – due to single-name and sector idiosyncrasies – which has pushed the spread of a small subset of index names wider. Presumably, investors continue to be merely interested in purchasing default protection on particular reference entities, without shorting systemic spread widening risk. This is implemented by buying single-name CDS and selling an index. In this publication, we therefore present an analysis of the spread dispersion among index constituents. Our analysis suggests the following: 1. that the mentioned type of hedge trade has indeed driven the skew to current extreme levels, 2. that the magnitude of the skew should decline again if index arbitrage kicks in or if hedging demand for idiosyncratic single-name or sector risks abates. ■ Risk and reward of an index arbitrage trade. Buying the Europe and selling single-name protection on all Europe index constituents is an index arbitrage trade that currently pays ca. 40bp upfront (see chart below). (continued overleaf) ITRAXX EUROPE INDEX SKEW; PREMIUM OF THE SKEW TRADE* *The skew trade means buying (protection on) the Europe and selling single-name CDS protection on all constituents of the index, such that the investor is perfectly hedged regarding default risk. The investor receives the package premium. Source: Markit, UniCredit Research Contents Europe index skew looks attractive ______________ 1 iTraxx option event calendar __________________ 7 iTraxx option market overview ________________ 8 Recent Credit Derivatives Update publications Sell a December Main strangle, 10 July 2015 Crossover spread and implied volatility, 17 July 2015 iTraxx client positioning analyzed, 30 July 2015 Summer options, 7 August 2015 Series 24 preview, 21 August 2015 Series 24 roll spreads, 18 September 2015 Smooth transition of implied volatilities, 28 September 2015 Analyzing Senior outperformance, 9 October 2015 Spreads and skews, 16 October 2015 Buy hedges when they are cheap, 23 October 2015 Carry and roll-down for Europe and IG, 30 October 2015 Exploring BIS CDS statistics, 13 November 2015 Hedging with a Europe payer spread, 20 November 2015 iTraxx Europe chartbook, 1 December 2015 Taking a look at skew dynamics, 4 December 2015 IG and Europe compared, 11 December 2015 Top 100 single-name CDS in 2H15, 8 January 2016 Earnings seasons’ impact on spreads, 22 January 2016 Recent Credit Derivatives Analytics publications Index client positioning, 3 February 2016 Author Dr. Tim Brunne (UniCredit Bank) +49 89 378-13521 [email protected] Bloomberg UCCR10 and UCCR15 (Credit Research) HVIT (iTraxx Europe Trading) Internet www.research.unicredit.eu -60 -50 -40 -30 -20 -10 0 10 -0.5 0 0.5 1 1.5 2 2.5 3 1-Jan-06 1-Jan-08 1-Jan-10 1-Jan-12 1-Jan-14 1-Jan-16 Index spread skew (bp) Skew package premium (%) Package upfront premium Index skew (right scale)
-
Upload
khangminh22 -
Category
Documents
-
view
3 -
download
0
Transcript of Credit Derivatives Update - UniCredit Research

5 February 2016 Credit Research
Credit Derivatives Update
UniCredit Research page 1 See last pages for disclaimer.
Europe index skew looks attractive ■ Why is the magnitude of Europe and IG index skew currently so
large? We call the difference between the fair-value spread of an index and its traded spread the index “skew”. Hence, the skew is negative if the fair-value spread is wider than the index spread. This is what we have seen over recent months for the Europe as well as the IG. In January, the fair-value spreads of the IG and Europe (as implied by single-name CDS spreads for the index constituents) were temporarily 20bp and 12bp wider than the traded spread. These are multi-year peak levels for both indices and pose an arbitrage opportunity. Our charts (below and on page 2) show that the index skew of the Europe and IG has been both positive and negative and, during the last ten years, the skew has only been more extreme for a few months in late-2008 and early-2009. Typically, index spread moves more rapidly than the single-name spreads, which lets the skew fluctuate as index arbitrage is not feasible for small skew levels. However, the skew development for the Europe and the IG of the past few months cannot be understood by such reasoning. Instead, we think that there has been, and still is, strong demand for single-name CDS protection – due to single-name and sector idiosyncrasies – which has pushed the spread of a small subset of index names wider. Presumably, investors continue to be merely interested in purchasing default protection on particular reference entities, without shorting systemic spread widening risk. This is implemented by buying single-name CDS and selling an index. In this publication, we therefore present an analysis of the spread dispersion among index constituents. Our analysis suggests the following: 1. that the mentioned type of hedge trade has indeed driven the skew to current extreme levels, 2. that the magnitude of the skew should decline again if index arbitrage kicks in or if hedging demand for idiosyncratic single-name or sector risks abates.
■ Risk and reward of an index arbitrage trade. Buying the Europe and selling single-name protection on all Europe index constituents is an index arbitrage trade that currently pays ca. 40bp upfront (see chart below). (continued overleaf)
ITRAXX EUROPE INDEX SKEW; PREMIUM OF THE SKEW TRADE*
*The skew trade means buying (protection on) the Europe and selling single-name CDS protection on all constituents of the index, such that the investor is perfectly hedged regarding default risk. The investor receives the package premium. Source: Markit, UniCredit Research
Contents Europe index skew looks attractive ______________ 1
iTraxx option event calendar __________________ 7 iTraxx option market overview ________________ 8
Recent Credit Derivatives Update publications
Sell a December Main strangle, 10 July 2015
Crossover spread and implied volatility, 17 July 2015
iTraxx client positioning analyzed, 30 July 2015
Summer options, 7 August 2015
Series 24 preview, 21 August 2015
Series 24 roll spreads, 18 September 2015
Smooth transition of implied volatilities, 28 September 2015
Analyzing Senior outperformance, 9 October 2015
Spreads and skews, 16 October 2015
Buy hedges when they are cheap, 23 October 2015
Carry and roll-down for Europe and IG, 30 October 2015
Exploring BIS CDS statistics, 13 November 2015
Hedging with a Europe payer spread, 20 November 2015
iTraxx Europe chartbook, 1 December 2015
Taking a look at skew dynamics, 4 December 2015
IG and Europe compared, 11 December 2015
Top 100 single-name CDS in 2H15, 8 January 2016
Earnings seasons’ impact on spreads, 22 January 2016
Recent Credit Derivatives Analytics publications
Index client positioning, 3 February 2016
Author Dr. Tim Brunne (UniCredit Bank) +49 89 378-13521 [email protected]
Bloomberg UCCR10 and UCCR15 (Credit Research) HVIT (iTraxx Europe Trading)
Internet www.research.unicredit.eu
-60
-50
-40
-30
-20
-10
0
10
-0.5
0
0.5
1
1.5
2
2.5
3
1-Jan-06 1-Jan-08 1-Jan-10 1-Jan-12 1-Jan-14 1-Jan-16
Inde
x sp
read
ske
w (b
p)
Ske
w p
acka
ge p
rem
ium
(%)
Package upfront premium
Index skew (right scale)

5 February 2016 Credit Research
Credit Derivatives Update
UniCredit Research page 2 See last pages for disclaimer.
(continued from front page) Entering into such a trade does not expose the investor to credit event risk, if the notional amount of single-name protection sold reflects the notional amount implicitly hedged by means of the index. The investor assumes a pure mark-to-market risk, which translates into the necessity to provide cash collateral (margin calls for cleared derivatives). If, for example, the trade were structured as a note, with a notional amount of EUR 20mn in cash collateral and with a skew package notional of EUR 625mn, the premium received would be EUR 2.5mn. If this premium were distributed over five years, then the “annual coupon” would be ca. 2.5% of the invested cash of EUR 20mn. The risk for an investor is that the skew premium increases to previously unseen levels . If it increases from 40bp to more than around 3% in the short term, then the cash collateral would no longer suffice and a unwinding trigger would usually be reached. In this case, in which the index skew falls to less than about -60bp which would be more extreme than in 2008/2009, either more cash collateral would have to be provided or the note would be unwound at market levels, meaning a large loss for the investor. However, as time goes by, the sensitivity of the skew package to the index skew declines and the critical index skew for unwinding becomes larger and larger. We therefore think that in the current yield environment, this looks like an attractive investment, as there is absolutely no credit event risk for the investor. Clearly, such a trade would also be feasible for the IG, with an even better rate of return currently.
5Y INDEX SKEW TIME SERIES FOR THE LAST DECADE: EUROPE (L) AND IG (R)
Source: UniCredit Research
■ First observation: the current magnitude of the index skew is extreme, but remains below 2008/09 peak levels. 5Y on-the-run spreads for the Europe (left) and IG (right) are shown above for the last ten years as well as the related index skew. The shown index skew is the difference between the traded (on-the-run series) index spread and the corresponding fair-value spread, which is negative if the former is tighter than the latter. In January, the 5Y IG skew almost reached -20bp and the Europe skew peaked at around -12bp. For almost three months, between late-November 2008 and early-February 2009, the 5Y skew of both indices was almost continuously less than -20bp, even declining to below -50bp towards year-end 2008. However, these extremes occurred amid index spreads twice as wide as current levels. Clearly, this situation raises the question as to whether current skew levels should be regarded as an investment opportunity? As the risk of “selling the skew” is currently in further decline, the question could be rephrased as follows: what would potentially drive the skew back to zero?
-60
-48
-36
-24
-12
0
12
0
50
100
150
200
250
300
1-Jan-06 1-Jan-08 1-Jan-10 1-Jan-12 1-Jan-14 1-Jan-16
Inde
x sk
ew (b
p)
On-
the-
run
inde
x sp
read
(bp)
Index skew (quoted - fair value spread; RS)Index spread (on-the-run series)
-60
-48
-36
-24
-12
0
12
0
50
100
150
200
250
300
1-Jan-06 1-Jan-08 1-Jan-10 1-Jan-12 1-Jan-14 1-Jan-16
Inde
x sk
ew (b
p)
On-
the-
run
inde
x sp
read
(bp)
Index skew (quoted - fair value spread; RS)Index spread (on-the-run series)

5 February 2016 Credit Research
Credit Derivatives Update
UniCredit Research page 3 See last pages for disclaimer.
5Y INDEX SKEW TIME SERIES SINCE MID-2015: EUROPE (L) AND IG (R)
Source: Markit, UniCredit Research
Since mid-20015, the index skews (of the Europe and the IG) have become increasingly negative. As we have highlighted in previous research publications, in the past a rapid widening of the index would frequently squeeze the magnitude of the skew and push it into positive territory (e.g. 1 October and 14 December in left chart above). However, reality has bent this rule; for the IG at least since mid-2015 and for the Europe since the start of 2016: the spread widening trend has been accompanied by a declining skew.
CURRENT SINGLE-NAME SPREAD DISTRIBUTION FOR THE CONSTITUENTS OF THE EUROPE (L) AND THE IG (R) *
*5Y par spreads, 4 February 2016 Source: Markit, UniCredit Research
■ Second observation: spread dispersion reached multi-year peak levels in January. The spread histograms above have a logarithmic spread scale, and hence index constituents that trade much wider than the index can be included in the chart. Current spread distributions are characterized by the existence of such “spread outliers” among the index members. While the IG spread dispersion is clearly much larger than the corresponding one for the Europe, in historical terms spread dispersion is currently relatively large for both indices. The two charts below, showing (kernel-smoothed) distribution densities of log-spreads (i.e. the natural logarithms of single-name spreads in bp) illustrate this fact. Back in July 2015, single-name spreads were less dispersed than they are currently.
-15
-10
-5
0
5
10
15
55
65
75
85
95
105
115
25 Jun 23 Jul 20 Aug 17 Sep 15 Oct 12 Nov 10 Dec 7 Jan 4 Feb5Y
inde
x sk
ew (b
p)
5Y in
dex
spre
ad (b
p)
Index skew (right scale)EUROPES24V1EUROPES23V1On-the-run fair value
-25
-20
-15
-10
-5
0
5
10
65
75
85
95
105
115
125
135
25 Jun 23 Jul 20 Aug 17 Sep 15 Oct 12 Nov 10 Dec 7 Jan 4 Feb
5Y in
dex
skew
(bp)
5Y in
dex
spre
ad (b
p)
Index skew (right scale)IGS25V1IGS24V1On-the-run fair value
0
10
20
30
40
50
60
70
<20 <40 <80 <160 <320 <640 <1280 <2560
Num
ber o
f ind
ex m
embe
rs
CDS par spread interval (upper bound in bp)
Insurance (9)Banks (21)Telecom, Media, Technology (20)Energy, Utilities (20)Consumers (25)Autos, Industrials, Pharma (30)
0
5
10
15
20
25
30
35
<20 <40 <80 <160 <320 <640 <1280 <2560
Num
ber o
f ind
ex m
embe
rs
CDS par spread interval (upper bound in bp)
Insurance (9)Financial Services (10)Telecom, Media, Technology (19)Energy, Utilities (19)Consumers, Autos, Pharma (44)Industrials (24)

5 February 2016 Credit Research
Credit Derivatives Update
UniCredit Research page 4 See last pages for disclaimer.
DISTRIBUTION DENSITY FOR LOG-SPREADS: 1 JULY 2015 (L) AND 4 FEBRUARY 2016 (R); IG AND EUROPE*
*We show densities obtained from kernel-smoothing of logarithms of the 125 single-name spreads of each index. For this exercise, we took the conventional single-name spreads corresponding to a 100bp running coupon for each index member. Source: Markit, UniCredit Research
NORMALIZED CROSS-SECTIONAL SPREAD-DISPERSION (L) AND THE STANDARD DEVIATION OF LOG-SPREADS
Source: Markit, UniCredit Research
There are several ways to measure a distribution’s width. For the single-name spread distributions considered in this publication, we show the “normalized cross-sectional spread dispersion” in the left chart above. This is defined as the standard deviation of constituent spreads on a particular date divided by the related average (see for example “Credit Derivative Strategies: New Thinking on Managing Risk and Return” by R. Douglas (editor), Wiley, 2007). This measure is highly sensitive to the existence of very wide spreads, which drive this dispersion measure up. Therefore, our preferred measure of index spread dispersion is a similar but alternative gauge, i.e. the standard deviation of log-spreads (right chart). As the logarithm pulls large spreads closer to the mean of the respective ensemble, the second measure is less susceptible to large spread outliers. Hence, it better measures the width of the distribution of index constituent spreads ex outliers. Undoubtedly, the dispersion of IG constituent spreads recently reached multi-year extreme levels. Since mid-2015, the dispersion of the Europe also markedly increased, after declining for more than two years from mid-2012 (ECB president Mario Draghi’s “whatever it takes” words), before only marginally increasing in late-2014 and early-2015. We doubt that it is pure coincidence that spread dispersion and the magnitude of the index skew surged in lockstep (cf. charts above and top charts on page 2). Hence, we stick to our hypothesis that this simultaneous development was driven by single-name default hedges, the cost of which was partly offset by selling systemic spread widening risk.
0
0.2
0.4
0.6
0.8
1
1.2
1 2 3 4 5 6 7 8
Dis
tribu
tion
dens
ity
log(single-name CDS conventionsl spread (bp))
Europe IG
0
0.2
0.4
0.6
0.8
1
1.2
1 2 3 4 5 6 7 8
Dis
tribu
tion
dens
ity
log(single-name CDS conventional spread (bp))
Europe IG
0.2
0.7
1.2
1.7
2.2
2.7
1-Jan-12 1-Jan-13 1-Jan-14 1-Jan-15 1-Jan-16
Nor
mal
ized
spr
ead
disp
ersi
on
Europe (on-the-run)
IG (on-the-run)
0.3
0.4
0.5
0.6
0.7
0.8
0.9
1
1.1
1.2
1-Jan-12 1-Jan-13 1-Jan-14 1-Jan-15 1-Jan-16
Sta
ndar
d de
viat
ion
of lo
g-sp
read
s
Europe (on-the-run)
IG (on-the-run)
5 February 2016 Credit Research
Credit Derivatives Update
UniCredit Research page 5 See last pages for disclaimer.
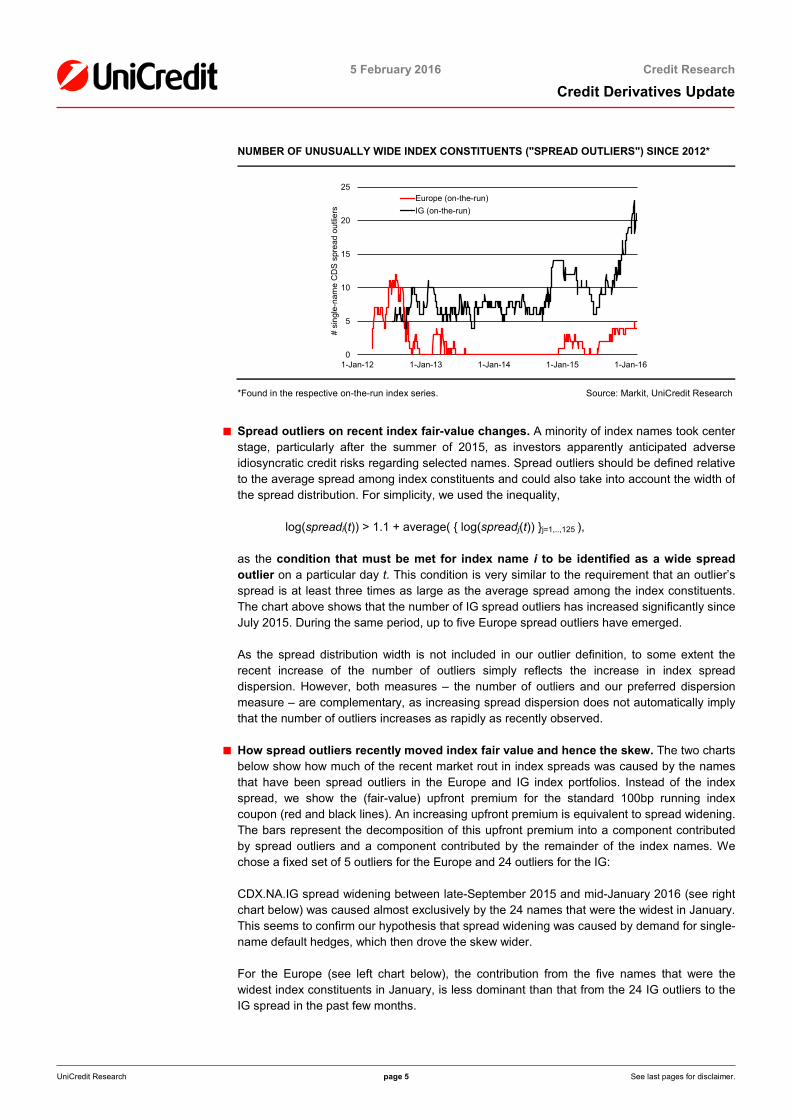
NUMBER OF UNUSUALLY WIDE INDEX CONSTITUENTS ("SPREAD OUTLIERS") SINCE 2012*
*Found in the respective on-the-run index series. Source: Markit, UniCredit Research
■ Spread outliers on recent index fair-value changes. A minority of index names took center stage, particularly after the summer of 2015, as investors apparently anticipated adverse idiosyncratic credit risks regarding selected names. Spread outliers should be defined relative to the average spread among index constituents and could also take into account the width of the spread distribution. For simplicity, we used the inequality,
log(spreadi(t)) > 1.1 + average( { log(spreadj(t)) }j=1,..,125 ),
as the condition that must be met for index name i to be identified as a wide spread outlier on a particular day t. This condition is very similar to the requirement that an outlier’s spread is at least three times as large as the average spread among the index constituents. The chart above shows that the number of IG spread outliers has increased significantly since July 2015. During the same period, up to five Europe spread outliers have emerged.
As the spread distribution width is not included in our outlier definition, to some extent the recent increase of the number of outliers simply reflects the increase in index spread dispersion. However, both measures – the number of outliers and our preferred dispersion measure – are complementary, as increasing spread dispersion does not automatically imply that the number of outliers increases as rapidly as recently observed.
■ How spread outliers recently moved index fair value and hence the skew. The two charts below show how much of the recent market rout in index spreads was caused by the names that have been spread outliers in the Europe and IG index portfolios. Instead of the index spread, we show the (fair-value) upfront premium for the standard 100bp running index coupon (red and black lines). An increasing upfront premium is equivalent to spread widening. The bars represent the decomposition of this upfront premium into a component contributed by spread outliers and a component contributed by the remainder of the index names. We chose a fixed set of 5 outliers for the Europe and 24 outliers for the IG:
CDX.NA.IG spread widening between late-September 2015 and mid-January 2016 (see right chart below) was caused almost exclusively by the 24 names that were the widest in January. This seems to confirm our hypothesis that spread widening was caused by demand for single-name default hedges, which then drove the skew wider.
For the Europe (see left chart below), the contribution from the five names that were the widest index constituents in January, is less dominant than that from the 24 IG outliers to the IG spread in the past few months.
0
5
10
15
20
25
1-Jan-12 1-Jan-13 1-Jan-14 1-Jan-15 1-Jan-16
# si
ngle
-nam
e C
DS
spr
ead
outli
ers
Europe (on-the-run)IG (on-the-run)

5 February 2016 Credit Research
Credit Derivatives Update
UniCredit Research page 6 See last pages for disclaimer.
This comes as no great surprise, as the relative index weight of the 5 Europe outliers is much smaller than the relative weight of the 24 IG outliers. However, it also shows that single-name default hedging is a weaker driver of the Europe spread and skew than it is for the IG. This interpretation is in line with the fact that the Europe skew is still notably smaller than the IG skew.
EUROPE SERIES 24 UPFRONT PREMIUM (FAIR-VALUE; 5Y) IG SERIES 24 UPFRONT PREMIUM (FAIR-VALUE; 5Y)
Source: Markit, UniCredit Research
-2
-1.5
-1
-0.5
0
0.5
1
1.5
21-Sep-15 19-Oct-15 16-Nov-15 14-Dec-15 11-Jan-16
fair-
valu
e in
dex
upfro
n pr
emiu
m (%
)
upfront contribution of remaining names
upfront contribution of outliers
FV index upfront premium
-2.5
-1.5
-0.5
0.5
1.5
2.5
21-Sep-15 19-Oct-15 16-Nov-15 14-Dec-15 11-Jan-16
fair-
valu
e in
dex
upfro
n pr
emiu
m (%
)
upfront contribution of remaining names
upfront contribution of outliers
FV index upfront premium

5 February 2016 Credit Research
Credit Derivatives Update
UniCredit Research page 7 See last pages for disclaimer.
iTraxx option event calendar ACTIVE TRADING PERIODS* FOR ITRAXX OPTIONS (MAIN)
*We regard as “active trading periods” in the past (black lines) those periods for which composite prices are available from Markit for the respective option maturities. Our expectations for “active trading periods” in the future (grey lines) derive from the application of patterns observed in the past to the future. The chart above (iTraxx Europe Main) also comprises standard option contracts that are not yet part of Markit’s daily index option data but which should start to be actively quoted in the next few months. Source: Markit, UniCredit Research
MAJOR MACRO DATA RELEASES, EVENTS AND OPTION EXPIRATION DATES*
*Vertical lines indicate business weeks. Source: Bloomberg, UniCredit Research
3M5 Feb rollrollroll15 Apr 15 (Main S23)
20 May 15 (Main S23)17 Jun 15 (Main S23)
15 Jul 15 (Main S23)19 Aug 15 (Main S23)
16 Sep 15 (Main S23)21 Oct 15 (Main S23)
18 Nov 15 (Main S23)16 Dec 15 (Main S23)
21 Oct 15 (Main S24)18 Nov 15 (Main S24)
16 Dec 15 (Main S24)20 Jan 16 (Main S24)
17 Feb 16 (Main S24)16 Mar 16 (Main S24)
20 Apr 16 (Main S24)18 May 16 (Main S24)
15 Jun 16 (Main S24)20 Apr 16 (Main S25)
18 May 16 (Main S25)15 Jun 16 (Main S25)
20 Jul 16 (Main S25)
24 Mar 15 23 Jun 15 22 Sep 15 22 Dec 15 22 Mar 16 21 Jun 16 20 Sep 16
Germany GDP (12 Feb)Eurozone GDP (12 Feb)
ITRX 24 opt. (17 Feb)Ifo index (23 Feb)
ECB M3 growth (25 Feb)Eurozone CPI (25 Feb)
ISM man. (1 Mar)UK s PMI (3 Mar)ISM non-man. (3 Mar)
US payrolls (4 Mar)ECB meeting (10 Mar)
ITRX 24 opt. (16 Mar)FOMC meeting (16 Mar)Eurozone CPI (17 Mar)BoE meeting (17 Mar)
ITRX roll (S25) (21 Mar)Ifo index (22 Mar)
ECB M3 growth (29 Mar)US payrolls (1 Apr)ISM man. (1 Apr)
UK s PMI (5 Apr)ISM non-man. (5 Apr)
Eurozone CPI (14 Apr)BoE meeting (14 Apr)
IMF eco. outlook (15 Apr)ITRX 24-25 opt. (20 Apr)ECB meeting (21 Apr)
Ifo index (25 Apr)ECB M3 growth (27 Apr)UK GDP (27 Apr)
0.51.52.53.54.55.56.57.58.59.5
10.511.512.513.514.515.516.517.518.519.520.521.522.523.524.525.526.527.528.529.530.5
10 Feb 24 Feb 9 Mar 23 Mar 6 Apr 20 Apr 4 May
iTraxx annual earnings release season
5 February 2016 Credit Research
Credit Derivatives Update
UniCredit Research page 8 See last pages for disclaimer.
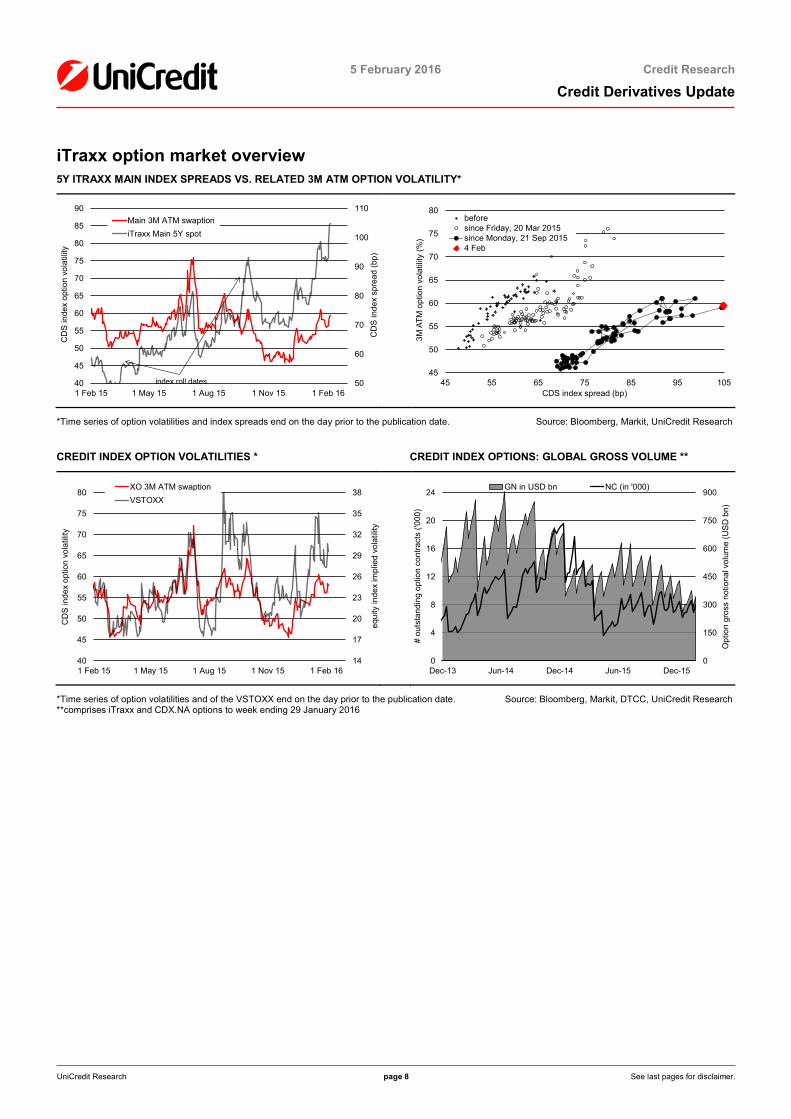
iTraxx option market overview 5Y ITRAXX MAIN INDEX SPREADS VS. RELATED 3M ATM OPTION VOLATILITY*
*Time series of option volatilities and index spreads end on the day prior to the publication date. Source: Bloomberg, Markit, UniCredit Research
CREDIT INDEX OPTION VOLATILITIES * CREDIT INDEX OPTIONS: GLOBAL GROSS VOLUME **
*Time series of option volatilities and of the VSTOXX end on the day prior to the publication date. Source: Bloomberg, Markit, DTCC, UniCredit Research **comprises iTraxx and CDX.NA options to week ending 29 January 2016
50
60
70
80
90
100
110
40
45
50
55
60
65
70
75
80
85
90
1 Feb 15 1 May 15 1 Aug 15 1 Nov 15 1 Feb 16
CD
S in
dex
spre
ad (b
p)
CD
S in
dex
optio
n vo
latil
ity
Main 3M ATM swaptioniTraxx Main 5Y spot
index roll dates45
50
55
60
65
70
75
80
45 55 65 75 85 95 105
3M A
TM o
ptio
n vo
latil
ity (%
)
CDS index spread (bp)
beforesince Friday, 20 Mar 2015since Monday, 21 Sep 20154 Feb
14
17
20
23
26
29
32
35
38
40
45
50
55
60
65
70
75
80
1 Feb 15 1 May 15 1 Aug 15 1 Nov 15 1 Feb 16
equi
ty in
dex
impl
ied
vola
tility
CD
S in
dex
optio
n vo
latil
ity
XO 3M ATM swaptionVSTOXX
0
150
300
450
600
750
900
0
4
8
12
16
20
24
Dec-13 Jun-14 Dec-14 Jun-15 Dec-15
Opt
ion
gros
s no
tiona
l vol
ume
(US
D b
n)
# ou
tsta
ndin
g op
tion
cont
ract
s ('0
00)
GN in USD bn NC (in '000)

5 February 2016 Credit Research
Credit Derivatives Update
UniCredit Research page 9
Disclaimer Our recommendations are based on information obtained from, or are based upon public information sources that we consider to be reliable but for the completeness and accuracy of which we assume no liability. All estimates and opinions included in the report represent the independent judgment of the analysts as of the date of the issue. This report may contain links to websites of third parties, the content of which is not controlled by UniCredit Bank. No liability is assumed for the content of these third-party websites. We reserve the right to modify the views expressed herein at any time without notice. Moreover, we reserve the right not to update this information or to discontinue it altogether without notice. This analysis is for information purposes only and (i) does not constitute or form part of any offer for sale or subscription of or solicitation of any offer to buy or subscribe for any financial, money market or investment instrument or any security, (ii) is neither intended as such an offer for sale or subscription of or solicitation of an offer to buy or subscribe for any financial, money market or investment instrument or any security nor (iii) as an advertisement thereof. The investment possibilities discussed in this report may not be suitable for certain investors depending on their specific investment objectives and time horizon or in the context of their overall financial situation. The investments discussed may fluctuate in price or value. Investors may get back less than they invested. Changes in rates of exchange may have an adverse effect on the value of investments. Furthermore, past performance is not necessarily indicative of future results. In particular, the risks associated with an investment in the financial, money market or investment instrument or security under discussion are not explained in their entirety. This information is given without any warranty on an "as is" basis and should not be regarded as a substitute for obtaining individual advice. Investors must make their own determination of the appropriateness of an investment in any instruments referred to herein based on the merits and risks involved, their own investment strategy and their legal, fiscal and financial position. As this document does not qualify as an investment recommendation or as a direct investment recommendation, neither this document nor any part of it shall form the basis of, or be relied on in connection with or act as an inducement to enter into, any contract or commitment whatsoever. Investors are urged to contact their bank's investment advisor for individual explanations and advice. Neither UniCredit Bank nor any of their respective directors, officers or employees nor any other person accepts any liability whatsoever (in negligence or otherwise) for any loss howsoever arising from any use of this document or its contents or otherwise arising in connection therewith. This analysis is being distributed by electronic and ordinary mail to professional investors, who are expected to make their own investment decisions without undue reliance on this publication, and may not be redistributed, reproduced or published in whole or in part for any purpose. Responsibility for the content of this publication lies with: UniCredit Group and its subsidiaries are subject to regulation by the European Central Bank a) UniCredit Bank AG (UniCredit Bank), Am Tucherpark 16, 80538 Munich, Germany, (also responsible for the distribution pursuant to §34b WpHG). The company belongs to UniCredit Group. Regulatory authority: “BaFin“ – Bundesanstalt für Finanzdienstleistungsaufsicht, Lurgiallee 12, 60439 Frankfurt, Germany. b) UniCredit Bank AG London Branch (UniCredit Bank London), Moor House, 120 London Wall, London EC2Y 5ET, United Kingdom. Regulatory authority: “BaFin“ – Bundesanstalt für Finanzdienstleistungsaufsicht, Lurgiallee 12, 60439 Frankfurt, Germany and subject to limited regulation by the Financial Conduct Authority, 25 The North Colonnade, Canary Wharf, London E14 5HS, United Kingdom and Prudential Regulation Authority 20 Moorgate, London, EC2R 6DA, United Kingdom. Further details regarding our regulatory status are available on request. c) UniCredit Bank AG Hong Kong Branch (UniCredit Bank Hong Kong), 25/F Man Yee Building, 68 Des Voeux Road Central, Hong Kong. Regulatory authority: Hong Kong Monetary Authority, 55th Floor, Two International Financial Centre, 8 Finance Street, Central, Hong Kong d) UniCredit Bank AG Singapore Branch (UniCredit Bank Singapore), Prudential Tower, 30 Cecil Street, #25-01, Singapore 049712 Regulatory authority: Monetary Authority of Singapore, 10 Shenton Way MAS Building, Singapore 079117 e) UniCredit Bank AG Tokyo Branch (UniCredit Tokyo), Otemachi 1st Square East Tower 18/F, 1-5-1 Otemachi, Chiyoda-ku, 100-0004 Tokyo, Japan Regulatory authority: Financial Services Agency, The Japanese Government, 3-2-1 Kasumigaseki Chiyoda-ku Tokyo, 100-8967 Japan, The Central Common Government Offices No. 7.
POTENTIAL CONFLICTS OF INTERESTS A2A 3; Aareal Bank 3; ABN Amro Bank 3; Accor 3; Acea 3; Airbus Group 3; Akzo Nobel 3; Allianz 1b; Allied Irish Banks 3; Amgen 3; ArcelorMittal 3; Assicurazioni Generali 3; Astaldi 3; AT&T 3; Atlantia 3; Autostrada B. V. V. P. 3; AXA 3; Banca Carige 2, 3; Banca P. Emilia Romagna 3; Banca Pop. di Vicenza 3; Banca Popolare di Milano 3; Banco de Sabadell 3; Banco Popolare Scarl 3; Banco Popular Espanol 3; Bank für Tirol und Vorarlberg 1a, 6a; Bank of America 3; Bank of Montreal 3; Bankinter 3; Banque PSA 3; Barclays 3; Bayer 3; BBVA 3; BCP 3; BKS Bank 1a, 6a; BMW 3; Bouygues 3; Buzzi Unicem 3; CA Immo 3, 6a; Cap Gemini 3; Cassa Depositi e Prestiti 3; Citigroup 3; Continental 3; Credit Suisse 2; Daimler 3; Danske Bank 3; Deutsche Bank 3; Deutsche Postbank 3; Deutsche Wohnen 2; DNB 3; DZ Bank 3; E.ON 3; EDF 3; Edison 3; EDP 3; Eika BoligKreditt 3; Enel 3; Engie 3; ENI 3; European Investment Bank 3; European Union 3; EVN 3; EWE 3; Exor 3; FCA 3; FCA Bank 3; Finmeccanica 3; FMS-WM 3; Freistaat Bayern 3; Gazprom 3; General Electric 3; Goldman Sachs 3; Hapag-Lloyd 2; Hera 3; HSBC 3; HypoVereinsbank 3; Iberdrola 3; IGT 3; IKB 3; Intesa Sanpaolo 3; IPIC 1b; Iren 3; Kering 3; KPN 3; Kreditanstalt für Wiederaufbau 3; Land Baden-Württemberg 3; Land Berlin 3; Land Hessen 3; Land Nordrhein-Westfalen 3; Landesbank Berlin 3; Landwirtschaftliche Rentenbank 3; LBBW 3; Lloyds Banking Group 3; Luxottica 3; LVMH 3; Mediobanca 1a, 3, 6a; Morgan Stanley 3; Münchener Hypothekenbank 3; Nokia 3; Nord/LB 3; Nordea 3; Norilsk Nickel 3; Novartis 3; Oberbank 1a, 6a; OMV 3; Orange 3; Peugeot 3; Pfizer 3; PGNiG 3; Piaggio 3; PKN Orlen 3; PKO Bank 3; Poste Vita 3; Procter & Gamble 3; Prysmian 3; PZU 3; Raiffeisen Bank Int. 3; Renault 3; Repsol 3; Royal Bank of Canada 3; Saarland 3; Saint-Gobain 3; Salini Impregilo 3; Sanofi-Aventis 3; SAP 3; SEB 3; Severstal 3; Siemens 3; Sixt 3; Snam 3; Société Générale 3; Suez Alliance 3; Svenska Handelsbanken 3; Swedbank 3; Telecom Italia 3; Telefonica 2; Telekom Austria 3; Terna 3; ThyssenKrupp 3; Time Warner 3; UBI Banca 3; UBS 3; UniCredit 2, 3; UniCredit Bank Austria 3; Unilever 3; Unipol 3; Veneto Banca 3; Verbund 3; Vestas 3; Vivendi 3; Vodafone 3; Volkswagen 3; Vonovia 2; Wells Fargo & Co 3; Wienerberger 3; Wind 3 Key 1a: UniCredit Bank AG and/or any related legal person owns at least 2% of the capital stock of the analyzed company. Key 1b: The analyzed company owns at least 2% of the capital stock of UniCredit Bank AG and/or any related legal person. Key 2: UniCredit Bank AG and/or any related legal person has been lead manager or co-lead manager over the previous 12 months of any publicly disclosed offer of financial instruments of the analyzed company, or in any related derivatives. Key 3: UniCredit Bank AG and/or any related legal person administers the securities issued by the analyzed company on the stock exchange or on the market by quoting bid and ask prices (i.e. acts as a market maker or liquidity provider in the securities of the analyzed company or in any related derivatives). Key 5: The analyzed company and UniCredit Bank AG and/or any related legal person have concluded an agreement on the preparation of analyses. Key 6a: Employees or members of the Board of Directors of UniCredit Bank AG and/or any other employee that works for UniCredit Research (i.e. the joint research department of the UniCredit Group) and/or members of the Group Board (pursuant to relevant domestic law) are members of the Board of Directors of the analyzed company. Members of the Board of Directors of the analyzed company hold office in the Board of Directors of UniCredit Bank AG (pursuant to relevant domestic law). The application of this Key 6a is limited to persons who, although not involved in the preparation of the analysis, had or could reasonably be expected to have access to the analysis prior to its dissemination to customers or the public. Key 6b: The analyst is on the Supervisory Board/Board of Directors of the company they cover.
RECOMMENDATIONS, RATINGS AND EVALUATION METHODOLOGY Company Date Rec. Company Date Rec. Company Date Rec. AAFFP 01/12/2015 Hold EVKGR 27/03/2015 Underweight RHIGIM 14/09/2015 Hold AAFFP 24/07/2015 Buy EVRAZ 25/01/2016 Sell RHMGR 06/08/2015 Hold ABESM 02/04/2015 Marketweight EVRAZ 04/12/2015 Restricted ROSW 02/04/2015 Marketweight ABESM 02/03/2015 Restricted EVRAZ 15/04/2015 Buy ROSW 18/02/2015 Restricted ABIBB 29/01/2016 Marketweight EXCRTU 18/12/2015 Hold RTE 07/10/2015 Restricted ACAFP 02/04/2015 Marketweight EXOIM 20/11/2015 Restricted RTE 05/02/2015 Marketweight ACAFP 10/03/2015 Restricted EXOIM 12/11/2015 Marketweight RURAIL 02/04/2015 Hold ACEIM 13/11/2015 Overweight EXOIM 05/05/2015 Buy RZB 10/11/2015 Coverage in
transition ADSGR 06/11/2015 Buy EXOIM 26/02/2015 Hold SAARLB 10/11/2015 Coverage in
transition ADSGR 11/03/2015 Hold F 04/02/2016 Restricted SABLN 15/10/2015 Marketweight AEMSPA 02/04/2015 Marketweight F 05/03/2015 Marketweight SANFP 30/10/2015 Marketweight

5 February 2016 Credit Research
Credit Derivatives Update
UniCredit Research page 10
Company Date Rec. Company Date Rec. Company Date Rec. AEMSPA 18/02/2015 Restricted FNCIM 30/09/2015 Restricted SANFP 14/09/2015 Restricted AIFP 30/07/2015 Marketweight FNCIM 10/08/2015 Buy SAPGR 22/04/2015 Marketweight AKBNK 18/12/2015 Buy FRFP 12/11/2015 Marketweight SAPGR 25/03/2015 Restricted AKBNK 10/11/2015 Coverage in
transition FUMVFH 08/01/2016 Restricted SAPSJ 24/04/2015 Buy
AKEFP 01/02/2016 Marketweight FUMVFH 22/10/2015 Underweight SAPSJ 10/03/2015 Restricted AKEFP 31/07/2015 Overweight GALPPL 14/10/2015 Buy SBERRU 29/05/2015 Hold ALBALN 08/09/2015 Buy GAMENT 16/12/2015 Buy SCMNVX 06/11/2015 Marketweight ALBALN 17/04/2015 Hold GAMENT 30/04/2015 Hold SCMNVX 09/09/2015 Restricted ALRSRU 24/03/2015 Buy GAMENT 18/02/2015 Sell SDFGR 03/07/2015 Marketweight ALTICE 17/02/2015 Buy GARAN 18/12/2015 Hold SHAEFF 18/12/2015 Hold ALUFP 29/01/2016 no
recommendation GASSM 05/02/2015 Marketweight SHAEFF 21/09/2015 Buy
AMSSM 05/10/2015 Restricted GAZPRU 25/01/2016 Overweight SHAEFF 14/09/2015 Hold ANNGR 09/12/2015 Restricted GAZPRU 29/09/2015 Restricted SHAEFF 23/04/2015 Buy ANNGR 03/11/2015 Marketweight GBFGR 29/06/2015 Sell SHAEFF 26/03/2015 Restricted ANNGR 23/03/2015 Restricted GLENLN 03/03/2015 Overweight SIBUR 02/04/2015 Hold ANTOLN 29/07/2015 Buy GLENLN 02/03/2015 Buy SIEGR 30/06/2015 Marketweight ANTOLN 09/06/2015 Hold GMFIN 22/06/2015 Overweight SIEGR 19/05/2015 Restricted ANTOLN 21/04/2015 Sell GMKNRM 25/01/2016 Hold SKYLN 29/01/2016 Marketweight ANZ 10/11/2015 Coverage in
transition GMKNRM 06/10/2015 Restricted SKYLN 09/11/2015 Restricted
ANZNZ 10/11/2015 Coverage in transition
GMKNRM 02/04/2015 Hold SKYLN 30/09/2015 Overweight
ARRFP 25/01/2016 Marketweight GT 16/12/2015 Buy SKYLN 16/02/2015 Marketweight ARRFP 10/11/2015 Restricted HALKBK 18/12/2015 Hold SLB 19/10/2015 Underweight ASBBNK 10/11/2015 Coverage in
transition HEIANA 09/09/2015 Marketweight SNAIM 16/12/2015 Hold
ASML 16/04/2015 Marketweight HEIGR 29/07/2015 Hold SNAIM 18/09/2015 Sell ASSGEN 31/07/2015 Marketweight HELLA 30/03/2015 Marketweight SNAIM 20/07/2015 Restricted ASTIM 15/05/2015 Restricted HERIM 12/11/2015 Marketweight SNSSNS 10/11/2015 Coverage in
transition ATLIM 12/11/2015 Marketweight HERIM 26/10/2015 Restricted SPPDIS 05/03/2015 Marketweight ATLIM 29/10/2015 Restricted HOLNVX 11/08/2015 no
recommendation SPPEUS 20/04/2015 Underweight
ATLIM 11/05/2015 Marketweight HPLGR 28/09/2015 Restricted SPPEUS 05/03/2015 Marketweight ATLIM 13/02/2015 Restricted HPLGR 18/09/2015 Buy SPPEUS 05/02/2015 Restricted AUSTVB 10/11/2015 Coverage in
transition HPLGR 30/03/2015 Hold SRGIM 07/12/2015 Marketweight
BACARD 19/05/2015 no recommendation
HSHN 31/03/2015 Underweight SRGIM 03/11/2015 Restricted
BASGR 27/10/2015 Underweight HTOGA 24/04/2015 Hold SRGIM 15/05/2015 Marketweight BATSLN 02/04/2015 Marketweight HTZ 10/11/2015 Sell SSELN 05/06/2015 no
recommendation BATSLN 10/03/2015 Restricted HTZ 21/07/2015 Hold STANLN 10/11/2015 Coverage in
transition BCPPL 10/11/2015 Coverage in
transition IBESM 05/03/2015 Marketweight STATK 05/02/2016 Underweight
BERTEL 29/01/2016 Underweight IGT 12/08/2015 Buy STATK 29/10/2015 Marketweight BERTEL 09/04/2015 Marketweight IGT 10/03/2015 Hold STATK 14/09/2015 Restricted BFASM 10/11/2015 Coverage in
transition IKB 10/11/2015 Coverage in
transition STERV 12/10/2015 Hold
BFCM 10/11/2015 Coverage in transition
INTNED 05/08/2015 Marketweight STLNO 04/02/2016 Marketweight
BGGRP 09/04/2015 Marketweight INTNED 03/06/2015 Restricted SUFP 21/01/2016 Underweight BGGRP 27/03/2015 Underweight INTNED 05/02/2015 Marketweight SUNCOM 19/05/2015 Hold BGGRP 06/03/2015 Restricted IREIM 29/01/2016 Overweight SUNCOM 06/02/2015 Restricted BMW 05/02/2015 Marketweight ISCTR 18/12/2015 Buy SWEDA 02/02/2016 Marketweight BMY 21/01/2016 no
recommendation ISCTR 10/11/2015 Coverage in
transition SWEDA 10/11/2015 Coverage in
transition BMY 14/08/2015 Marketweight ISSDC 12/03/2015 Overweight SWFP 08/07/2015 Marketweight BNP 30/10/2015 Marketweight ISSDC 05/03/2015 Marketweight SYNNVX 03/02/2016 Underweight BNP 12/08/2015 Restricted ITCIT 29/07/2015 Buy SYNNVX 13/11/2015 Marketweight BNRGR 25/11/2015 Restricted ITCIT 06/03/2015 Hold SYNNVX 08/05/2015 Underweight BNRGR 26/03/2015 Overweight JAGLN 30/09/2015 Hold SZUGR 20/11/2015 Hold BOGAEI 28/07/2015 no
recommendation JAGLN 09/02/2015 Buy SZUGR 13/04/2015 Sell
BORMIO 17/04/2015 Hold JNJ 15/07/2015 no recommendation
T 29/01/2016 Underweight
BPCEGP 10/11/2015 Coverage in transition
KNFP 10/11/2015 Coverage in transition
TCGLN 18/09/2015 Hold
BPIPL 10/11/2015 Coverage in transition
KPN 29/01/2016 Overweight TCGLN 30/07/2015 Buy
BPLN 21/01/2016 Overweight LBBER 10/11/2015 Coverage in transition
TCGLN 10/07/2015 Hold
BPLN 29/07/2015 Marketweight LGFP 18/09/2015 Restricted TCGLN 24/04/2015 Buy BPLN 03/07/2015 Overweight LGFP 07/08/2015 Overweight TDCDC 28/01/2016 Marketweight BREMLB 10/11/2015 Coverage in
transition LHAGR 29/10/2015 Hold TDCDC 10/08/2015 Overweight
BZLNZ 10/11/2015 Coverage in transition
LHAGR 13/03/2015 Sell TDCDC 20/02/2015 Marketweight
CABBCO 27/11/2015 Hold LHNVX 12/11/2015 Marketweight TELEFO 28/10/2015 Marketweight CAFP 05/03/2015 Marketweight LHNVX 18/09/2015 Restricted TELEFO 07/09/2015 Restricted CAFP 05/02/2015 no
recommendation LINGR 29/07/2015 Underweight TELEFO 14/08/2015 Marketweight
CAIAV 03/02/2016 Marketweight LUXIM 01/02/2016 Overweight TELEFO 06/05/2015 Overweight CAIXAB 07/10/2015 no LUXIM 02/12/2015 Buy TELEFO 26/03/2015 Restricted

5 February 2016 Credit Research
Credit Derivatives Update
UniCredit Research page 11
Company Date Rec. Company Date Rec. Company Date Rec. recommendation
CAPFP 14/08/2015 Overweight LUXIM 07/08/2015 Overweight TEVA 27/07/2015 Marketweight CARLB 20/08/2015 Marketweight LXSGR 05/11/2015 Marketweight TITANL 29/05/2015 Hold CBAAU 10/11/2015 Coverage in
transition MAHLGR 04/06/2015 Hold TITIM 13/01/2016 Restricted
CBLCSY 29/01/2016 Buy MANGR 04/03/2015 no recommendation
TITIM 06/08/2015 Marketweight
CBLCSY 04/05/2015 Hold MANTEN 17/11/2015 Hold TITIM 06/08/2015 Hold CEIFP 02/11/2015 Hold MANTEN 28/05/2015 Buy TITIM 24/04/2015 Hold CEIFP 04/03/2015 Sell MANTEN 19/05/2015 Hold TITIM 19/03/2015 Restricted CHMFRU 25/01/2016 Buy MATTER 24/04/2015 Sell TKAGR 20/04/2015 Hold CHMFRU 02/04/2015 Hold MCD 14/08/2015 Marketweight TKAGR 18/02/2015 Restricted CIRSA 10/09/2015 Buy MCD 18/05/2015 Restricted TLSNSS 29/01/2016 Overweight CLNVX 18/02/2015 Marketweight MDLZ 05/05/2015 Marketweight TLSNSS 19/10/2015 Marketweight CMCRAV 18/06/2015 Buy MEOGR 15/06/2015 Marketweight TMFG 18/09/2015 Hold CMZB 02/11/2015 Marketweight METINR 02/04/2015 Hold TMFG 24/04/2015 Buy CMZB 14/09/2015 Restricted MOLHB 21/01/2016 Buy TOTAL 30/07/2015 Overweight CNHI 04/09/2015 Sell MONTE 19/10/2015 Restricted TRNIM 10/12/2015 Restricted COFP 18/01/2016 Marketweight MRKGR 05/02/2015 Marketweight TRNIM 05/03/2015 Marketweight COFP 16/12/2015 Overweight MTNA 19/10/2015 Hold TRNIM 05/02/2015 Restricted COFP 18/02/2015 Marketweight NAB 10/11/2015 Coverage in
transition TTLINF 28/08/2015 Underweight
CONGR 12/01/2016 Marketweight NDB 27/11/2015 Marketweight UBS 13/10/2015 Marketweight CONGR 12/11/2015 Restricted NDB 15/09/2015 Restricted UBS 31/07/2015 Restricted CPGLN 25/11/2015 Marketweight NEGANV 28/07/2015 no
recommendation UNIIM 06/11/2015 Marketweight
CRH 18/11/2015 Restricted NGGLN 05/03/2015 Marketweight UOBSP 10/11/2015 Coverage in transition
CS 04/02/2016 Marketweight NLMKRU 22/05/2015 Buy UOBSP 07/08/2015 Marketweight CS 19/11/2015 Restricted NNGRNV 05/08/2015 Marketweight URKARM 28/04/2015 Sell CVALIM 10/11/2015 Coverage in
transition NOKIA 20/04/2015 Hold VAKBN 18/12/2015 Sell
DAA 10/11/2015 Coverage in transition
NOKIA 14/04/2015 Sell VEBBNK 26/11/2015 Hold
DAIGR 04/02/2016 Marketweight NOVO 20/01/2016 Restricted VEBBNK 05/02/2015 Buy DAIGR 29/10/2015 Restricted NOVO 18/01/2016 Hold VICEN 12/03/2015 Restricted DANBNK 10/11/2015 Coverage in
transition NOVO 05/10/2015 Buy VIP 25/01/2016 Buy
DB 31/07/2015 Marketweight NOVO 22/07/2015 Hold VIP 10/11/2015 Hold DB 27/04/2015 Underweight NSINO 17/04/2015 no
recommendation VIVFP 02/03/2015 Marketweight
DBSSP 07/08/2015 Marketweight NUMFP 29/06/2015 Buy VLVY 05/02/2016 Underweight DEKA 10/11/2015 Coverage in
transition NUMFP 17/02/2015 Hold VMED 16/06/2015 Buy
DEXBBB 10/11/2015 Coverage in transition
NYKRE 10/11/2015 Coverage in transition
VOITGR 08/09/2015 Hold
DGELN 13/10/2015 Marketweight OCBCSP 10/11/2015 Coverage in transition
VW 28/10/2015 Overweight
DLNA 12/08/2015 Marketweight OCBCSP 07/08/2015 Marketweight VWSDC 05/11/2015 Hold DLPH 05/02/2016 Marketweight ODGR 05/11/2015 Marketweight VWSDC 20/08/2015 Buy DLPH 30/10/2015 Underweight OMVAV 21/01/2016 Marketweight WBA 11/01/2016 Marketweight DLPH 31/07/2015 Marketweight OMVAV 15/09/2015 Restricted WFC 14/08/2015 Marketweight DLPH 05/03/2015 Overweight ONTEX 05/11/2015 Hold WFC 26/05/2015 Restricted DONGAS 29/04/2015 Marketweight ONTEX 05/03/2015 Buy WGZ 10/11/2015 Coverage in
transition DOUGR 06/08/2015 Hold ORAFP 29/01/2016 Overweight WIEAV 18/02/2015 Hold DPB 10/11/2015 Coverage in
transition PBBGR 19/01/2016 Restricted WINDIM 07/08/2015 Buy
DSM 11/02/2015 Overweight PBBGR 10/03/2015 Marketweight WKLNA 29/07/2015 Overweight DWNIGY 10/11/2015 Marketweight PELHOL 26/11/2015 Hold WSTP 10/11/2015 Coverage in
transition DZBK 10/11/2015 Coverage in
transition PETBRA 09/06/2015 no
recommendation WSTPNZ 10/11/2015 Coverage in
transition EDF 19/01/2016 Underweight PETBRA 03/03/2015 Hold XELLA 30/11/2015 Hold EDF 05/11/2015 Marketweight PEUGOT 24/02/2015 Hold XELLA 22/09/2015 Restricted EDF 07/10/2015 Restricted PEUGOT 19/02/2015 Marketweight ZFFNGR 08/05/2015 Buy EDF 09/03/2015 Marketweight PG 07/07/2015 no
recommendation
EDPPL 05/03/2015 Overweight PG 17/06/2015 Marketweight EDPPL 05/03/2015 Marketweight PIAGIM 14/09/2015 Sell EITIM 29/07/2015 Hold PIAGIM 02/03/2015 Hold ELIASO 17/08/2015 no
recommendation PKNPW 19/11/2015 Restricted
ELIASO 14/08/2015 Underweight PKNPW 29/06/2015 Marketweight ELIASO 10/08/2015 no
recommendation PMIIM 10/11/2015 Coverage in
transition
ENEASA 01/10/2015 Marketweight PNLNA 05/10/2015 Underweight ENELIM 29/06/2015 Overweight POPSM 10/11/2015 Coverage in
transition
ENELIM 05/02/2015 Restricted PRADA 17/12/2015 Hold ENGSM 25/02/2015 Underweight PROXBB 30/10/2015 Marketweight ENIIM 28/10/2015 Restricted PSON 21/01/2016 Underweight ENIIM 06/10/2015 Marketweight PSON 30/10/2015 Marketweight ENIIM 02/09/2015 Overweight PUBFP 14/01/2016 Marketweight ENIIM 23/04/2015 Marketweight RABOBK 10/11/2015 Coverage in
transition
ENIIM 19/02/2015 Overweight RBIAV 10/11/2015 Coverage in

5 February 2016 Credit Research
Credit Derivatives Update
UniCredit Research page 12
Company Date Rec. Company Date Rec. Company Date Rec. transition
ENIIM 05/02/2015 no recommendation
RCIBK 15/01/2016 Overweight
EOANGR 12/08/2015 Marketweight RCIBK 24/06/2015 Marketweight EOANGR 11/03/2015 Underweight RCIBK 27/05/2015 Restricted EOFP 18/12/2015 Hold REEDLN 23/07/2015 Marketweight EOFP 17/03/2015 Buy REEDLN 05/03/2015 Underweight EPERGY 04/02/2016 Hold REEDLN 26/02/2015 Marketweight ESTONE 03/08/2015 Sell REESM 29/10/2015 Overweight EUROCA 08/07/2015 Hold RENAUL 15/01/2016 Marketweight EUROCA 16/06/2015 Buy RENAUL 23/04/2015 Overweight EUROCA 24/04/2015 Hold REPSM 08/05/2015 Overweight EVKGR 04/08/2015 Marketweight REPSM 18/03/2015 Restricted Overview of our ratings You will find the history of rating regarding recommendation changes as well as an overview of the breakdown in absolute and relative terms of our investment ratings on our website www.disclaimer.unicreditmib.eu/credit-research-rd/Recommendations_CR_e.pdf. Note on the evaluation basis for interest-bearing securities: Recommendations relative to an index: For high grade names the recommendations are relative to the "iBoxx EUR Benchmark" index family, for sub investment grade names the recommendations are relative to the "iBoxx EUR High Yield" index family. Marketweight: We recommend having the same portfolio exposure in the name as the respective iBoxx index. We expect that the average total return of the instruments of the issuer is equal to the total return of the index. Overweight: We recommend having a higher portfolio exposure in the name as the respective iBoxx index. We expect that the average total return of the instruments of the issuer is greater than the total return of the index. Underweight: We recommend having a lower portfolio exposure in the name as the respective iBoxx index. We expect that the average total return of the instruments of the issuer is less than the total return of the index. Outright recommendations: Hold: We recommend holding the respective instrument for investors who already have exposure. We expect that the total return of the instruments of the issuer is equal to the yield. Buy: We recommend buying the respective instrument for investors who already have exposure. We expect that the total return of the instruments of the issuer is greater than the yield. Sell: We recommend selling the respective instrument for investors who already have exposure. We expect that the total return of the instruments of the issuer is less than the yield. We employ three further categorizations for interest-bearing securities in our coverage: Restricted: A recommendation and/or financial forecast is not disclosed owing to compliance or other regulatory considerations such as a blackout period or a conflict of interest. Coverage in transition: Due to changes in the research team, the disclosure of a recommendation and/or financial information are temporarily suspended. The interest-bearing security remains in the research universe and disclosures of relevant information will be resumed in due course. Not rated: Suspension of coverage. Trading recommendations for fixed-interest securities mostly focus on the credit spread (yield difference between the fixed-interest security and the relevant government bond or swap rate) and on the rating views and methodologies of recognized agencies (S&P, Moody’s, Fitch). Depending on the type of investor, investment ratings may refer to a short period or to a 6 to 9-month horizon. Please note that the provision of securities services may be subject to restrictions in certain jurisdictions. You are required to acquaint yourself with local laws and restrictions on the usage and the availability of any services described herein. The information is not intended for distribution to or use by any person or entity in any jurisdiction where such distribution would be contrary to the applicable law or provisions. If not otherwise stated daily price data refers to pre-day closing levels and iBoxx bond index characteristics refer to the previous month-end index characteristics. Coverage Policy A list of the companies covered by UniCredit Bank is available upon request. Frequency of reports and updates It is intended that each of these companies be covered at least once a year, in the event of key operations and/or changes in the recommendation.
SIGNIFICANT FINANCIAL INTEREST UniCredit Bank AG and/or other related legal persons with them regularly trade shares of the analyzed company. UniCredit Bank AG and/or other related legal persons may hold significant open derivative positions on the stocks of the company which are not delta-neutral. UniCredit Bank AG and/or other related legal persons have a significant financial interest relating to the analyzed company or may have such at any future point of time. Due to the fact that UniCredit Bank AG and/or any related legal person are entitled, subject to applicable law, to perform such actions at any future point in time which may lead to the existence of a significant financial interest, it should be assumed for the purposes of this information that UniCredit Bank AG and/or any related legal person will in fact perform such actions which may lead to the existence of a significant financial interest relating to the analyzed company. Analyses may refer to one or several companies and to the securities issued by them. In some cases, the analyzed companies have actively supplied information for this analysis.
INVESTMENT BANKING TRANSACTIONS The analyzed company and UniCredit Bank AG and/or any related legal person concluded an agreement on services in connection with investment banking transactions in the previous 12 months, in return for which the Bank and/or such related legal person received a consideration or promise of consideration or intends to do so. Due to the fact that UniCredit Bank AG and/or any related legal person are entitled to conclude, subject to applicable law, an agreement on services in connection with investment banking transactions with the analyzed company at any future point in time and may receive a consideration or promise of consideration, it should be assumed for the purposes of this information that UniCredit Bank AG and/or any related legal person will in fact conclude such agreements and will in fact receive such consideration or promise of consideration.
ANALYST DECLARATION The author’s remuneration has not been, and will not be, geared to the recommendations or views expressed in this study, neither directly nor indirectly.
ORGANIZATIONAL AND ADMINISTRATIVE ARRANGEMENTS TO AVOID AND PREVENT CONFLICTS OF INTEREST To prevent or remedy conflicts of interest, UniCredit Bank has established the organizational arrangements required from a legal and supervisory aspect, adherence to which is monitored by its compliance department. Conflicts of interest arising are managed by legal and physical and non-physical barriers (collectively referred to as “Chinese Walls”) designed to restrict the flow of information between one area/department of UniCredit Bank and another. In particular, Investment Banking units, including corporate finance, capital market activities, financial advisory and other capital raising activities, are segregated by physical and non-physical boundaries from Markets Units, as well as the research department. Disclosure of publicly available conflicts of interest and other material interests is made in the research. Analysts are supervised and managed on a day-to-day basis by line managers who do not have responsibility for Investment Banking activities, including corporate finance activities, or other activities other than the sale of securities to clients.
ADDITIONAL REQUIRED DISCLOSURES UNDER THE LAWS AND REGULATIONS OF JURISDICTIONS INDICATED You will find a list of further additional required disclosures under the laws and regulations of the jurisdictions indicated on our website www.cib-unicredit.com/research-disclaimer. Notice to Austrian investors: This analysis is only for distribution to professional clients (Professionelle Kunden) as defined in article 58 of the Securities Supervision Act.

5 February 2016 Credit Research
Credit Derivatives Update
UniCredit Research page 13
Notice to investors in Bosnia and Herzegovina: This report is intended only for clients of UniCredit in Bosnia and Herzegovina who are institutional investors (Institucionalni investitori) in accordance with Article 2 of the Law on Securities Market of the Federation of Bosnia and Herzegovina and Article 2 of the Law on Securities Markets of the Republic of Srpska, respectively, and may not be used by or distributed to any other person. This document does not constitute or form part of any offer for sale or subscription for or solicitation of any offer to buy or subscribe for any securities and neither this document nor any part of it shall form the basis of, or be relied on in connection with or act as an inducement to enter into, any contract or commitment whatsoever. Notice to Brazilian investors: The individual analyst(s) responsible for issuing this report represent(s) that: (a) the recommendations herein reflect exclusively the personal views of the analysts and have been prepared in an independent manner, including in relation to UniCredit Group; and (b) except for the potential conflicts of interest listed under the heading “Potential Conflicts of Interest” above, the analysts are not in a position that may impact on the impartiality of this report or that may constitute a conflict of interest, including but not limited to the following: (i) the analysts do not have a relationship of any nature with any person who works for any of the companies that are the object of this report; (ii) the analysts and their respective spouses or partners do not hold, either directly or indirectly, on their behalf or for the account of third parties, securities issued by any of the companies that are the object of this report; (iii) the analysts and their respective spouses or partners are not involved, directly or indirectly, in the acquisition, sale and/or trading in the market of the securities issued by any of the companies that are the object of this report; (iv) the analysts and their respective spouses or partners do not have any financial interest in the companies that are the object of this report; and (v) the compensation of the analysts is not, directly or indirectly, affected by UniCredit’s revenues arising out of its businesses and financial transactions. UniCredit represents that: except for the potential conflicts of interest listed under the heading “Potential Conflicts of Interest” above, UniCredit, its controlled companies, controlling companies or companies under common control (the “UniCredit Group”) are not in a condition that may impact on the impartiality of this report or that may constitute a conflict of interest, including but not limited to the following: (i) the UniCredit Group does not hold material equity interests in the companies that are the object of this report; (ii) the companies that are the object of this report do not hold material equity interests in the UniCredit Group; (iii) the UniCredit Group does not have material financial or commercial interests in the companies or the securities that are the object of this report; (iv) the UniCredit Group is not involved in the acquisition, sale and/or trading of the securities that are the object of this report; and (v) the UniCredit Group does not receive compensation for services rendered to the companies that are the object of this report or to any related parties of such companies. Notice to Canadian investors: This communication has been prepared by UniCredit Bank AG, which does not have a registered business presence in Canada. This communication is a general discussion of the merits and risks of a security or securities only, and is not in any way meant to be tailored to the needs and circumstances of any recipient. The contents of this communication are for information purposes only, therefore should not be construed as advice and do not constitute an offer to sell, nor a solicitation to buy any securities. Notice to Cyprus investors: This document is directed only at clients of UniCredit Bank who are persons falling within the Second Appendix (Section 2, Professional Clients) of the law for the Provision of Investment Services, the Exercise of Investment Activities, the Operation of Regulated Markets and other Related Matters, Law 144(I)/2007 and persons to whom it may otherwise lawfully be communicated who possess the experience, knowledge and expertise to make their own investment decisions and properly assess the risks that they incur (all such persons together being referred to as “relevant persons”). This document must not be acted on or relied on by persons who are not relevant persons or relevant persons who have requested to be treated as retail clients. Any investment or investment activity to which this communication related is available only to relevant persons and will be engaged in only with relevant persons. This document does not constitute an offer or solicitation to any person to whom it is unlawful to make such an offer or solicitation. Notice to investors in Ivory Coast: The information contained in the present report have been obtained by Unicredit Bank AG from sources believed to be reliable, however, no express or implied representation or warranty is made by Unicredit Bank AG or any other person as to the completeness or accuracy of such information. All opinions and estimates contained in the present report constitute a judgement of Unicredit Bank AG as of the date of the present report and are subject to change without notice. They are provided in good faith but without assuming legal responsibility. This report is not an offer to sell or solicitation of an offer to buy or invest in securities. Past performance is not an indicator of future performance and future returns cannot be guaranteed, and there is a risk of loss of the initial capital invested. No matter contained in this document may be reproduced or copied by any means without the prior consent of Unicredit Bank AG. Notice to New Zealand investors: This report is intended for distribution only to persons who are “wholesale clients” within the meaning of the Financial Advisers Act 2008 (“FAA”) and by receiving this report you represent and agree that (i) you are a “wholesale client” under the FAA (ii) you will not distribute this report to any other person, including (in particular) any person who is not a “wholesale client” under the FAA. This report does not constitute or form part of, in relation to any of the securities or products covered by this report, either (i) an offer of securities for subscription or sale under the Securities Act 1978 or (ii) an offer of financial products for issue or sale under the Financial Markets Conduct Act 2013. Notice to Omani investors: This communication has been prepared by UniCredit Bank AG. UniCredit Bank AG does not have a registered business presence in Oman and does not undertake banking business or provide financial services in Oman and no advice in relation to, or subscription for, any securities, products or financial services may or will be consummated within Oman. The contents of this communication are for the information purposes of sophisticated clients, who are aware of the risks associated with investments in foreign securities and neither constitutes an offer of securities in Oman as contemplated by the Commercial Companies Law of Oman (Royal Decree 4/74) or the Capital Market Law of Oman (Royal Decree 80/98), nor does it constitute an offer to sell, or the solicitation of any offer to buy non-Omani securities in Oman as contemplated by Article 139 of the Executive Regulations to the Capital Market Law (issued vide CMA Decision 1/2009). This communication has not been approved by and UniCredit Bank AG is not regulated by either the Central Bank of Oman or Oman’s Capital Market Authority. Notice to Pakistani investors: Investment information, comments and recommendations stated herein are not within the scope of investment advisory activities as defined in sub-section I, Section 2 of the Securities and Exchange Ordinance, 1969 of Pakistan. Investment advisory services are provided in accordance with a contract of engagement on investment advisory services concluded with brokerage houses, portfolio management companies, non-deposit banks and the clients. The distribution of this report is intended only for informational purposes for the use of professional investors and the information and opinions contained herein, or any part of it shall not form the basis of, or be relied on in connection with or act as an inducement to enter into, any contract or commitment whatsoever. Notice to Polish Investors: This document is intended solely for professional clients as defined in Art. 3.39b of the Trading in Financial Instruments Act of 29 July 2005 (as amended). The publisher and distributor of the document certifies that it has acted with due care and diligence in preparing it, however, assumes no liability for its completeness and accuracy. This document is not an advertisement. It should not be used in substitution for the exercise of independent judgment. Notice to Serbian investors: This analysis is only for distribution to professional clients (profesionalni klijenti) as defined in article 172 of the Law on Capital Markets. Notice to UK investors: This communication is directed only at clients of UniCredit Bank who (i) have professional experience in matters relating to investments or (ii) are persons falling within Article 49(2)(a) to (d) (“high net worth companies, unincorporated associations, etc.”) of the United Kingdom Financial Services and Markets Act 2000 (Financial Promotion) Order 2005 or (iii) to whom it may otherwise lawfully be communicated (all such persons together being referred to as “relevant persons”). This communication must not be acted on or relied on by persons who are not relevant persons. Any investment or investment activity to which this communication relates is available only to relevant persons and will be engaged in only with relevant persons. CR e 8

5 February 2016 Credit Research
Credit Derivatives Update
UniCredit Research page 14
UniCredit Research* Erik F. Nielsen Group Chief Economist Global Head of CIB Research +44 207 826-1765 [email protected]
Dr. Ingo Heimig Head of Research Operations +49 89 378-13952 [email protected]
Credit Research
Luis Maglanoc, CFA, Head +49 89 378-12708 [email protected]
Credit Strategy & Structured Credit Research
Dr. Philip Gisdakis, Head Credit Strategy +49 89 378-13228 [email protected]
Dr. Christian Weber, CFA, Deputy Head Credit Strategy +49 89 378-12250 [email protected]
Dr. Tim Brunne Quantitative Credit Strategy +49 89 378-13521 [email protected]
Holger Kapitza Credit Strategy & Structured Credit +49 89 378-28745 [email protected]
Dr. Stefan Kolek EEMEA Corporate Credits & Strategy +49 89 378-12495 [email protected]
Manuel Trojovsky Credit Strategy & Structured Credit +49 89 378-14145 [email protected]
Financials Credit Research
Franz Rudolf, CEFA, Head Covered Bonds +49 89 378-12449 [email protected]
Dr. Tilo Höpker Banks +49 89 378-12960 [email protected]
Luis Maglanoc, CFA Regulatory & Accounting Service +49 89 378-12708 [email protected]
Natalie Tehrani Monfared Regulatory & Accounting Service +49 89 378-12242 [email protected]
Emanuel Teuber Covered Bonds +49 89 378-12961 [email protected]
Robert Vielhaber Sub-Sovereigns & Agencies, Green Bonds +49 89 378-12004 [email protected]
Dr. Martina von Terzi Banks, Financial Services, Insurance +49 89 378-14245 [email protected]
Corporate Credit Research
Stephan Haber, CFA, Co-Head Telecoms, Technology +49 89 378-15192 [email protected]
Dr. Sven Kreitmair, CFA, Co-Head Automotive & Mobility +49 89 378-13246 [email protected]
Christian Aust, CFA Industrials +49 89 378-12806 [email protected]
David Bertholdt Capital Goods & Services +49 89 378-13211 [email protected]
Mehmet Dere Retail, Travel & Leisure, Oil & Gas +49 89 378-11294 [email protected]
Michael Gerstner Utilities, Hybrids +49 89 378-15449 [email protected]
Alexander Rozhetskin EEMEA (Banks, Oil & Gas, Basic Resources, Telecoms) +44 207 826-7953 [email protected]
Jonathan Schroer, CFA Media/Cable, Logistics, Business Services +49 89 378-13212 [email protected]
Dr. Silke Stegemann, CEFA Health Care & Pharma, Food & Beverage, Personal & Household Goods +49 89 378-18202 [email protected]
Publication Address
UniCredit Research Corporate & Investment Banking UniCredit Bank AG Arabellastrasse 12 D-81925 Munich [email protected]
Bloomberg UCCR Internet www.research.unicredit.eu
iTraxx Europe trading (index and options) Matthias Beck (UniCredit Bank) +49 89 378-14119 [email protected] Dirk Metzger (UniCredit Bank) +49 89 378-13678
*UniCredit Research is the joint research department of UniCredit Bank AG (UniCredit Bank), UniCredit Bank AG London Branch (UniCredit Bank London), UniCredit Bank AG Milan Branch (UniCredit Bank Milan), UniCredit Bank New York (UniCredit Bank NY), UniCredit Bulbank, Zagrebačka banka d.d., UniCredit Bank Czech Republic and Slovakia, Bank Pekao, ZAO UniCredit Bank Russia (UniCredit Russia), UniCredit Bank Romania. CR 21