Effectiveness Review: Raising Poor and Marginalised Women’s Voices, Liberia
Upload
khangminh22Category
view
0download
0
1
LIBERIA AGRICULTURE PILOT SURVEY
FINAL REPORT
MINISTRY OF AGRICULTURE APRIL,2019

2
Contents………………………………………………………………………………………………..1 FOREWORD .................................................................................................... Error! Bookmark not defined.
ACKNOWLEDGEMENT ................................................................................................................................... 7
List of Acronyms .......................................................................................................................................... 10
Executive Summary ..................................................................................................................................... 11
CHAPTER 1: INTRODUCTION ................................................................................................................... 17
1.1 Background ................................................................................................................................. 17
1.2 Objectives.................................................................................................................................... 18
1.3 Scope and Coverage .................................................................................................................... 18
1.4 Sample Design ............................................................................................................................. 19
1.5 Sample Size and Sample Selection .............................................................................................. 19
1.6 Data Capture ............................................................................................................................... 19
1.7 Funding ....................................................................................................................................... 20
1.8 Presentation of Results ............................................................................................................... 20
CHAPTER 2: AGRICULTURAL HOUSEHOLDS DEMOGRAPHIC CHARACTERISTICS .................................... 21
2.1: Size of population in agriculture households by sex and County, 2019 ........................................... 21
2.2: Distribution of population in agriculture households by number of holders, type of holding and
county...................................................................................................................................................... 22
2.3 Distribution of agriculture population by County and household size and average size of holding 23
2.4: Distribution of population in the agriculture households by sex and age group ............................. 24
2.5 Relationship of agricultural household members to head of household .......................................... 25
2.6 Educational attainment .................................................................................................................... 25
2.6A. Agriculture population size by sex, literacy status and county ..................................................... 26
2.7 Main Activity ..................................................................................................................................... 26
2.9 Secondary Activity, Sex and Counties ................................................................................................ 26
2.10 Marital Status of the households .................................................................................................... 27
CHAPTER 3: VULNERABILITY AND DISABILITY ............................................................................................. 28
3.1 Children not going to School ............................................................................................................. 28
3.2 Biological Parents of Children ........................................................................................................... 29
3.3 Disability ............................................................................................................................................ 30
CHAPTER 4: CROPS AND LAND USE............................................................................................................. 31
4.1 Means of Acquisition of farms/parcels and Plots ............................................................................. 31

3
4.2: Land Use Type .................................................................................................................................. 31
4.3: Distribution of Farms Parcels by Gender of the Farm Manager ...................................................... 31
4.4: Rice and Cassava production within the survey areas ..................................................................... 32
CHAPTER 5: EXTENSION SERVICES AND AGRICULTURE INFORMATION ..................................................... 34
5.1: Agriculture households that received extension service ................................................................. 34
5.2 Source of Extension Information ...................................................................................................... 35
5.3: Main Source of Extension Service .................................................................................................... 35
5.4: Number of Agriculture households who are satisfied with services received by source of service
............................................................................................................................................................ 36
CHAPTER 6: ACCESS TO FACILITIES ............................................................................................................. 37
6.1 Agriculture households by Type of Facility ....................................................................................... 37
6.2 Agriculture households’ main source of water. ................................................................................ 37
6.3: Households by Toilet Type ............................................................................................................... 37
CHAPTER 7: MEANS OF TRANSPORT ........................................................................................................... 39
7.1: Main Source of Access ..................................................................................................................... 39
CHAPTER 8: STORAGE FACILITIES ............................................................................................................... 40
8.1 Households who own storage facility ............................................................................................... 40
CHAPTER 9: ACCESS TO LOAN/ CREDIT ...................................................................................................... 41
9.1 Number of households who applied for agricultural loan ................................................................ 41
9.2 Purpose of Loan ................................................................................................................................ 41
9.3: Source of Loan and Payment Period ................................................................................................ 42
9.4: Source of Loan and type of collateral for the last five years ........................................................... 43
CHAPTER 10: FARM MANAGEMENT PRACTICES ......................................................................................... 44
10.1 House who use Fertilizers ............................................................................................................... 44
10.2 Holders who use seed inputs and type ......................................................................................... 44
10.3 Holders who use Pesticides by Type .............................................................................................. 45
10.4: Holders by inputs and education status ........................................................................................ 45
10.5: Holders who did not use improved inputs..................................................................................... 46
CHAPTER 11: FOOD SECURITY..................................................................................................................... 48
11.1: Food insecurity experience ............................................................................................................ 48
11.9 : Presence of food shortage ............................................................................................................ 53
11.: Reason for food shortage ................................................................................................................ 53
11.12: Household immediate Response to the food shortage by sex .................................................... 54

4
11.13: Steps taken to alleviate food shortage ........................................................................................ 55
11.15: Households reported to likely experience food shortages .......................................................... 56
11.16: Natural and Man-made Disasters ................................................................................................ 57
CHAPTER 12: LABOUR INPUT ...................................................................................................................... 59
12.1: Agricultural household members by status of employment ......................................................... 59
12.2: Paid employees .............................................................................................................................. 60
12.3: The Kuu System .............................................................................................................................. 61
12.4: Agriculture households who used KUU in the past 12 months .................................................... 61
CHAPTER 13: EQUIPMENT .......................................................................................................................... 63
13.1: Households who reported used of agriculture equipment ........................................................... 63
13.2: Agriculture equipment owned by type .......................................................................................... 63
13.3: Agriculture households equipment type, and years owned .......................................................... 63
13.4: Distribution of agriculture household’s equipment ..................................................................... 64
CHAPTER 14: LIVESTOCK ............................................................................................................................. 66
14.1: Livestock ownership ....................................................................................................................... 66
14.2: Type of Cattle ................................................................................................................................. 66
14.3: Goats and Sheep ............................................................................................................................ 67
14.4: Other domestic animals by type .................................................................................................... 67
14.5: Distribution of livestock intake by type ......................................................................................... 67
14.6: Distribution of Livestock off-take by type .................................................................................... 68
14.7: Distribution of livestock losses by type ........................................................................................ 69
14.8: Poultry Type ................................................................................................................................... 70
CHAPTER 15: CHALLENGES AND LESSONS LEARNT .................................................................................... 73
• Listing and Field Exercise................................................................................................................ 73
APPENDIX .................................................................................................................................................... 74
A. Glossary of Terms ............................................................................................................................... 74
B. Weighting and Response Rates ......................................................................................................... 81
C. Estimates of Sampling Errors…………………………………………………………………………………………………..82
Table

5
Table 2.1: Size of population in agriculture households by sex and County, 2019 ............................ 22
Table 2.2 Distribution of population in Agricultural households by number of holders, type of holding
and county .......................................................................................................................................... 22
Table 2.4. Distribution of population in the agriculture households by sex and age group ............... 25
Table 2.6A: Agriculture population size by sex, literacy status and County ....................................... 26
Table 2.10: Agriculture household population aged 12 years and over by sex, age group, marital status
............................................................................................................................................................ 27
Table 3.1: Proportion of Children aged 4-17 not currently in school and reasons for not being in school
by county ............................................................................................................................................. 29
Table 3.2: Population of children age 4-17 years with biological mother alive by county ................. 30
Table 3.3: Percentage distribution of household with disability, type of disability by sex and county
............................................................................................................................................................ 30
Table 4.1: Number and distribution of means of acquiring the farm/parcels by location and period
acquired .............................................................................................................................................. 88
Table 4.2: Estimate area of land used by land type and County ........................................................ 91
Table 4.3: Number of distribution of farm/parcels by gender of the farm manager, location and
County ................................................................................................................................................. 32
Table 4.4: Estimate of area under crop production, yield by type of crop and County ..................... 33
Table 5.1: Number of agriculture households that received Extension Services by Extension service
type and County .................................................................................................................................. 34
Table 5.2: Number of agriculture households that received Information by information type, source of
information and County .............................................................................................................................. 92
Table 5.3: Number of agriculture households received extension service by main source of extension
service and County………………………………………………………………………………………………………………………. 35Table
5.4: Number of agriculture households who are satisfied with the service received by source of
service………………………………………………………………………………………………………………………………………………….36
Table 6.1: Number of agriculture households by type of facility, average distance in minutes and
County…………………………………………………………………………………………………………………………………………………..96
Table 6.2: Number of agriculture households by water source type and average distance to source in
minutes………………………………………………………………………………………………………………………………………… 101
Table 6.3: Number of agriculture households by Toilet Type..................................................................... 38
Table 7.1: Number of households by means of transport used, source of access and number owned
............................................................................................................................................................ 39
Table 8.1: Number of households who own storage facility by type and average capacity (Mt) ...... 40
Table 9.1: Number of agriculture households who applied for loan during the last 5 years by County
............................................................................................................................................................ 41

6
Table 9.2: Number of agriculture households who received loan during the last 5 years by
reason/purpose of the loan ................................................................................................................ 41
Table 9.3: Number of agriculture households who received loan during the last 5 years by source of
loan received and loan period ............................................................................................................ 42
Table 9.4: Number agriculture households who received loan during the last 5 years by source of
loan, type of collateral and County ................................................................................................... 103
Table 10.1: Number of Holders who use fertilizer by type of fertilizer .............................................. 44
Table 10.2: Number of Holders who use seed inputs by type of seed and County ......................... 45
Table 10.3: Number of Holders who use pesticides by type of pesticides applied ............................ 45
Table 10.4: Number of Holders by Inputs/farm practice and Educational Status .............................. 46
Table 10.5: Number of holders who did not use improved inputs by reason by sex ......................... 47
Table 11.1: Number of agriculture households worried they would not have enough food to eat
because of a lack of money or other resources during the last 12 months by County ...................... 49
Table 11.2: Number of agriculture households unable to eat healthy and nutritious food because of
a lack of money or other resources during the last 12 months by County ........................................ 49
Table 11. 3: Number of agriculture households who ate only a few kinds of foods because of a lack
of money or other resources during the last 12 months by County .................................................. 50
Table 11.4: Number of agriculture households who had to skip a meal because there was not enough
money or other resources to get food during the last 12 months by County .................................... 50
Table 11.5: Number of agriculture households who ate less because of a lack of money or other
resources during the last 12 months by County ................................................................................. 51
Table 11.6: Number of agriculture households who ran out of food because of a lack of money or
other resources during the last 12 months by County ....................................................................... 51
Table 11.7: Number of agriculture households hungry but did not eat because there was not enough
money or other resources for food during the last 12 months by County ......................................... 52
Table 11.8: Number of agriculture households who went without eating for a whole day because of
a lack of money or other resources during the last 12 months by County ........................................ 52
Table 11.9: Agriculture households who experienced food shortage during the last 12 months by
County ................................................................................................................................................. 53
Table 11.11: Main reason for food shortage by Sex in last 12 months .............................................. 54
Table11.12: Immediate response taken by agriculture households who experience food shortage by
sex and age group ............................................................................................................................... 55
Table 11.13: Steps taken to alleviate food shortage by agriculture households who experience food
shortage by sex and age group ........................................................................................................... 56
Table 11.15: Number of agriculture households reported to likely experience food shortages in next
12 months by County .......................................................................................................................... 56

7
Table 11.16: Number of agriculture households who experienced natural and man-made disaster by
severity of disaster .............................................................................................................................. 58
Table 12.1: Number of agriculture households members engaged in agricultural activity in past 12
months by work status, sex, age group and County ........................................................................... 59
Table 12.2: Number and distribution of agriculture households who reported having paid employees
by Sex and County ............................................................................................................................... 60
Table 12.3: Number agriculture households who used Cooperative (Kuu) system by county in past 12
months ................................................................................................................................................ 61
Table 12.4: Number of Agriculture Households Who Use KUU In the Past 12 Months by Type of
farming ................................................................................................................................................ 62
Table 13.1: Number of agriculture households who reported use of agriculture equipment by type,
ownership status and County in past 12 months ............................................................................. 106
Table 13.2: Number of agriculture equipment owned by type; average number owned per agriculture
households by County in past 12 months ......................................................................................... 107
Table 13.3: Number of agriculture households by type of equipment owned, years acquired of
equipment and County in past 12 months ......................................................................................... 64
Table 13.4: Number and distribution of agriculture households by type of equipment owned and
usage in the past twelve months ........................................................................................................ 65
Table 14.1: Number and distribution of agriculture households who have livestock by County in past
12 months ........................................................................................................................................... 66
Table 14.3: Number and distribution of Goats and Sheep by type, Sex, and County .................... 110
Table14.4: Number and distribution of other domestic animals by type and County ..................... 112
Table 14.5: Number and distribution of livestock intake by Type and County during the last 12 months
............................................................................................................................................................ 68
Table 14.6: Numbers and distribution of livestock off-take by type and County during the last 12
months ................................................................................................................................................ 69
Table 14.7: Number and distribution of livestock losses by type of livestock, reason for loss and
County during the Reference Period .................................................................................................. 70
Table 14.8: Number and distribution of poultry by type, and County ............................................... 71
FOREWORD

8
The agriculture sector in Liberia is arguably the principal engine of growth and economic transformation.
For that growth to be planned and executed effectively, data on what pertains in the sector is crucial for
decision-making.
The Government of Liberia through the Ministry of Agriculture therefore requested the Food and
Agriculture Organization of the United Nations (UNFAO) to rehabilitate the Agricultural Statistical
System under the Technical Cooperation Program (TCP/3602). Since the appropriate
methodologies for annual agricultural surveys do exist, and trained staff are present in the
Ministry of Agriculture, this Liberia Agriculture Pilot Survey (2019) was commissioned. It has been
prepared by the Statistics Division of the Department of Planning and Development of the
Ministry of Agriculture in collaboration with the Liberia Institute of Geo-information Service
(LISGIS) and with technical support from FAO-Liberia.
The Liberia Agriculture Pilot survey was conducted in four out of the fifteen counties of Liberia.
It seeks to serve as a quick reference for various category of users, by providing salient features
of Liberian agriculture in figures, with focus on crops such as rice and cassava, livestock, and
fisheries.
With this first effort completed, the Ministry of Agriculture intends to continue and expand agriculture and crop surveys throughout the country and for all agricultural value chains. This report, and others to follow, will provide quality, consistent, and timely information of the agriculture sector for the formulation of sound development policies and plans to improve the efficiency of crop production in Liberia. I am therefore please to deliver this maiden edition of the Liberia Agriculture {Pilot} Survey for 2019 and hope that it will provide practitioners with the tools and references needed to guide planning for the full realization of President George Manneh Weah’s Pro-Poor Agenda for Prosperity and Development.
Jeannie Milly Cooper MINISTER OF AGRICULTURE R.L. Monrovia, Liberia
ACKNOWLEDGEMENT

9
The Ministry of Agriculture (MOA) through its Division of Statistics conducted 2019 Agriculture
Pilot Survey under the TCP/3602 Project with the primary objective of providing relevant
statistics for agricultural development planning. A pilot agriculture survey of this type requires a
great deal of efforts, cooperation, a high level of commitment and technical as well as
administrative support. Many individuals have made some contributions from the planning stage,
data collection and towards publication of the results. Accordingly, we wish to sincerely extend
our thanks and appreciations to those who have contributed in making the 2019 Agricultural pilot
survey a very successful one. We are particularly grateful to the former Minister of Agriculture,
Dr. Mogana S. Flomo, Jr. and Madam Mariatou Njie, FAO Country Representative who exerted
some efforts in mobilizing resources, which enabled the survey team to accomplish the first pilot
crop survey. We are very fortunate to have worked with people who recognized the usefulness
of statistics. Thus, we owe a great deal to Hon. Jeannie Milly Cooper, the current Minister of
Agriculture and Hon. Robert K. Fagans Sr., Deputy Minister for Planning and Development for
their administrative and moral support. Special mention is due to Hon Francis F Wreh , Director-
General for Liberia Institute of Statistics and Geo-Information Services (LISGIS) for his technical
advice and administrative guidance during the data collection and summarization as well as
analytical process of the survey results. Special mention is made of Mr. Lamin Janneh,
International consultant for data processing and Mr. Kofi Agyeman-Duah, international
statistician hired by FAO as our mentor to make this survey a successful one. Gratitude is
expressed to the staff in the statistics division and LISGIS Agriculture section for their level of hard
works and cooperation in the field. We are indebted to the Local Government Authorities who
assisted our field personnel in the form of interpreting, logging, escorting and introducing them
to the farmers. Principal contributors were the selected farmers who have cooperated, opened
to dialogue about their agricultural as well as basic socio-economic activities. They deserve credit.
Gratitude is expressed to the field personnel of the Ministry of Agriculture (MOA) whose
dedication and sacrifices have made the field activities of the 2019 Agricultural Survey possible
despite of several constraints. So many people have contributed to this report, and it is difficult
and impossible to thank them individually. However, we extend thanks and appreciation to those
individuals and Institutions, time does not permit us to mention one by one.
Mr. Aagon Nyanqgbeanquoi Yoko DIRECTOR, STATISTICS DIVISION MINISTRY OF AGRICULTURE
10
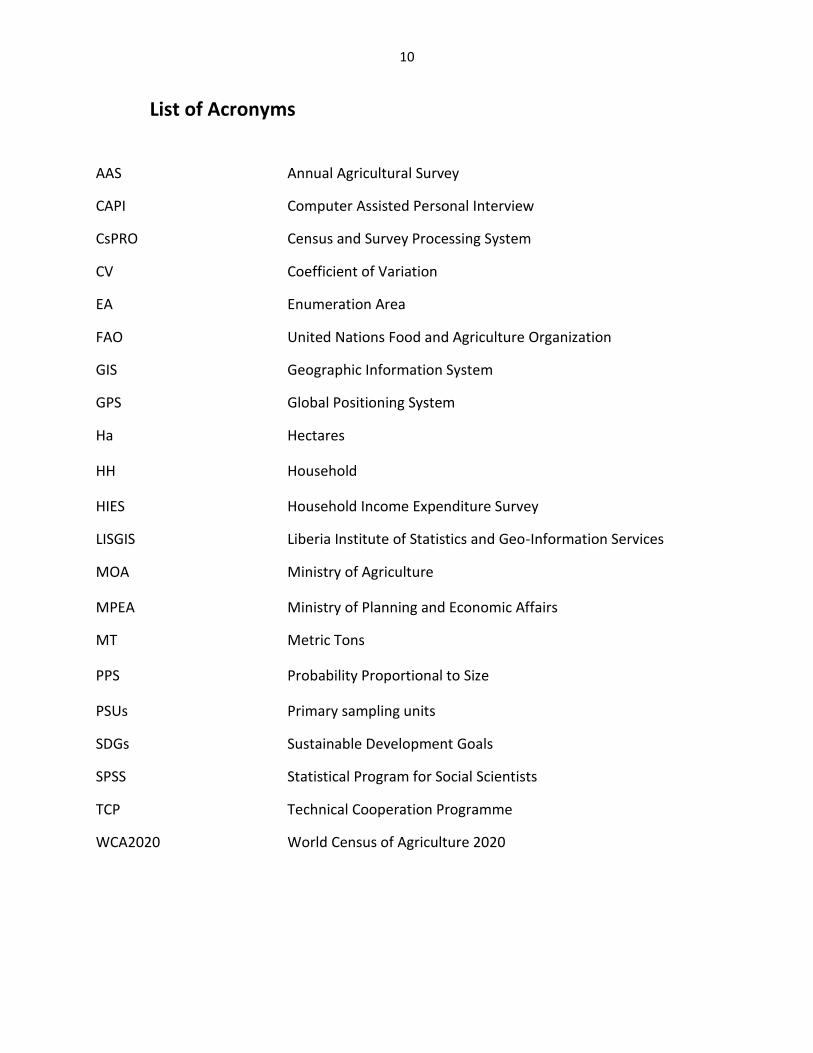
List of Acronyms
AAS Annual Agricultural Survey
CAPI Computer Assisted Personal Interview
CsPRO Census and Survey Processing System
CV Coefficient of Variation
EA Enumeration Area
FAO United Nations Food and Agriculture Organization
GIS Geographic Information System
GPS Global Positioning System
Ha Hectares
HH Household
HIES Household Income Expenditure Survey
LISGIS Liberia Institute of Statistics and Geo-Information Services
MOA Ministry of Agriculture
MPEA Ministry of Planning and Economic Affairs
MT Metric Tons
PPS Probability Proportional to Size
PSUs Primary sampling units
SDGs Sustainable Development Goals
SPSS Statistical Program for Social Scientists
TCP Technical Cooperation Programme
WCA2020 World Census of Agriculture 2020
11
Executive Summary
Introduction
The 2019 crops pilot was undertaken in four counties in Liberia: - three from the food basket
counties namely, Bong, Lofa and Nimba and one county from the least food producing counties
(Bomi). The main objectives of the Pilot Survey are to:
• Collect timely, reliable, and accurate agricultural statistics on major food crops and
livestock.
• Provide gender-disaggregated agricultural statistics on key agricultural activities.
• Provide indicators for the MoA to lead and monitor trends in food security status and
vulnerability assessment.
• Provide indicators for monitoring the sustainable development goals (SDGs);
• Ensure that a user-friendly agricultural database is developed to enhance the availability
and accessibility of crop production statistics, crop forecasting and market price statistics.
• Ensure that agriculture and food security web-based database is set-up to assemble,
verify, integrate, validate and disseminate all available data in the sector and allowing
smooth access and utilization by all stakeholders using FAO Country Stat Platform; and
• Above all, to test the survey instruments including the use of the CAPI technology.
A probability sample design in which each sampling unit in the target population has a known,
non-zero probability of being included in the sample was adopted. A three-stage stratified cluster
sample design was used. At the first stage, 42 EAs were selected from a frame provided by LISGIS.
At the second stage, 420 agriculture households were systematically selected from a list of
agriculture households within the sampled EAs. At the third stage, two sample farms were
selected randomly from each of the two crops (rice and cassava) from the list of farms prepared
separately for the EA.
At the end of the survey, 405 agriculture households and 42 EAs were successfully covered.
The Computer Assisted Personal Interview (CAPI) technology was used by the enumerators to
collect information from the respondents. The questionnaire was designed in CSPro 7.0 and CAPI
application was employed in the data capture. The SPSS software and Cspro 7.0 were used for
data editing and data cleaning; and SPSS and Excel were used for the tables.

12
Demographic characteristics of agricultural households (Chapter 2)
The total agricultural households’ population in the four counties was reported at 717,668. Out
of this, 48.2% were males and 51.8% females. Nimba County has the highest agriculture
population of 275,048 and Bomi County with the least 42,010.
The total number of holders was reported at 218,729 and out of this, Nimba County has the total
of 96,882 holders and Bomi County has the least of 8,054 holders. The survey reported the
number of agriculture households head at 160,613 and the average household size as four (4.0).
For all ages, Nimba county recorded 275,048 followed by Bong with the total of 210,615, Lofa
189,994 and Bomi accounting for 42,010. The survey report revealed that under 18 years in the
agriculture household, Nimba reported at 130,327 followed by Bong with the total of 103,992
The agriculture population between 25 to 34 years were reported at 100,888 with female’s
population accounting for 62,032 compared to male population with 38,856. Those who age
65+year in the agriculture household were reported at 13,659, and out of this, 8,488 were
females and 5,171 males.
Vulnerability (Chapter 3)
As many as 62,140 children between the ages 4-17 years were not going to school at the time of
the survey. out of this estimate, 30,306(48.8%) were not going to school because the household
found schooling expensive or had no money to send the child to school. Another (6,485) 10.42
percent cited the distance to school being too far as the reason for the child not going to school.
Other reason worth mentioning are child not interested in school was reported at 2,510(4.04%)
and child too young to go to school 8,284(13.33%).
The disability status of all household members was collected. The total number of people living
with disability was 5,733 and out of this, Bong County recorded 3,329 people with disability. A
detailed analysis of the disability data shows that the most common form of disability is physical
with the total of 2,073 females compared to males with 1,292 members.
Land Use (Chapter 4)
The total number of holders acquired land within the enumeration area (EA) by various means.
Nimba county reported 69,029 compared to Lofa with the total of 48,227. Out of this,66,797
holders inherited the land in Nimba and 48,753 in Lofa followed by Bong with a total of 37,179
and Bomi with the total of 5,596 holders. The number of holders that purchased land in Bong
was reported at 4,156 compared to Lofa with a total of 1,889 followed by Nimba 1,569 and Bomi

13
with the least of 33 holders. 1,666 holders used community land in Lofa followed by Bong 569,
Nimba 366 and Bomi 351. The holders that borrowed land in Bomi was reported at 5,295
compared to Bong with the total of 1,592 followed by Nimba 267 and Lofa with the total of 179.
The Survey results indicate that 557,668 ha of land was used by the agriculture households in the
four counties in 2019. About 61.9 percent (345,319 ha) of the land area was utilized for
temporary crops like cereals and vegetables. Approximately, 26.4 percent (146,978 ha) of the
land is under permanent crops (cocoa, oil palm, or rubber) and 11.4% (63,704 ha) under
temporary fallow.
A total of 190,098 metric tons of rice (upland) was reported to have been produced by the four
counties. Nimba County (68,567Mt) was the highest producer of rice followed by Lofa (63,543
Mt) and Bong (49,510 Mt) while Bomi recorded only 8,466 Mt.
The combined cassava production of the four counties was reported at 334,339 metric tons with
a yield of 5.4 metric tons per hectare. Nimba recorded the highest production of 147,827 Mt
followed by Bong (98,155 Mt), Lofa (74,296 mt) and Bomi (16,061Mt)
Extension Service (Chapter 5)
Extension services were provided by the government and other partners to farmers through
various sources. The total agricultural households were reported at 717,668. Out of this, the
number of households that received extension information through radio were reported at
26,246 farmers,17,644 received information on new agriculture practices,7,373 received
information on crop varieties. 6778 received information through farmer-to-farmer interaction,
150 received through farmer association and 149 through other source of information. 300
farmers received information on credit facilities and 72 households receiving farm machinery
information. Plant Disease and Pest information was provided to 6,986 households/ Agriculture
marketing is one of the key important aspects as relate to agriculture commodity. The results
only show that 1,012 households received marketing information.
Access of Facilities (Chapter 6)
Facilities on education, food storage, health, information, etc. were used as an indicator to
determine the traveling distance for agriculture households. 109,437 agriculture households
walked up to 30 minutes to primary school. Out of this, 50,081 (45.8%) in Nimba followed by
35,492(32.4%) in Lofa, 20,142 (18.4%) in Bong and 3,722 (3.4%) in Bomi. The total of 57,831
households walked 30 minutes to food storages facilities. Of this number, 25,817 in Nimba; Lofa

14
25,674, Bong 5,292 and Bomi 1,048 compared to 21,709 and 21,476 that covered one hour for
primary school and food storage facilities, respectively.
Means of Transport (Chapter 7).
The households in the agriculture sector normally used transportation to transfer their goods
from one location to another. The number of households involved in renting or hiring transport
facilities were reported at 67,732 members.
Out of this estimate, 45,577 (67.3%) rent motorbike and 1,119 (1.9%) owned motorbike. The
number of households that rent or hired pick-up were reported at 9,255(13.7%) compared to
3,696(5.5%) households that rent or hired tricycle.
Storage Facilities (Chapter 8)
The agriculture households that owned and stored their harvest under shelter/outside/kitchen
was reported at 113,089 with storage capacity of 2.6 metric tons which was less than 71,931
households that owned bags with storage capacity of 5.3 metric tons. This result mean those who
used bags have more storage capacity than under shelter/outside kitchen.
The agriculture households that used sealed containers was reported at 4,525 with storage
capacity of 2.6 metric tons as compared to specific house room and drum (1.9 metric ton).
However, none of the households’ own silo for storage purpose but cold storage, underground
and other specify were reported less than (0.1 to 0.3) metric tons
Access to Loan (Chapter 9)
The total of 20,565 holders applied for loan in the last five years and out of this,16,658 holders
were in Nimba County compared to Bong county with the total of 1,391 holders followed by Bomi
with 1,364 and 1,152 holders in Lofa county. Usually, loans are applied for various reasons like
purchasing seeds, fertilizer, agro- chemicals, de-busing (clearing of land) and hiring of labour.
Regardless of the county, the loans received were largely 19,911 total applicants.
Out of this estimate, the number of holders that received loan for agriculture labour were
reported at 17,693 (89%). For purchasing of seed about 612(3.1%) holders received loan which
was less than De-bushing (clearing of land) with the total of 703.
Farm Management Practices (Chapter 10)
The number of agriculture households that applied fertilizer in the survey areas was reported at
9,260. Out of this, 5,646 (61.0%) households used or applied mineral fertilizers (inorganic)

15
compared to 3,047(32.9%) household that used organic fertilizer. Moreover, 6.1 percent (567)
households applied manure to their crops in the study areas.
The number of holders in study areas were reported at 164,160, and out of this, 160,074 (97.5%)
used local seeds compared to 3,878 (2.4%) holders that used improved seeds This mean the total
production in the four counties were low because 97.5 percent holders used local seeds.
This result mean that Central Agriculture Research Institute (CARI) and extension division at the
ministry of agriculture need to double their work for local farmers to use improve variety.The
two types of pesticide used were insecticide and rodenticides. The number of agriculture holders
that applied pesticide were reported at 4,296.(100%) while (3,468) (80.7%) holder applied
insecticide and 19.3 % applied rodenticides
Food Security (Chapter 11)
The total of 139,637(19.5%) households had to worry that they would not have enough food to
eat because of lack of money or other resources in the 12 months preceding the survey. Out of
this, Nimba county accounted for 60,865 follows by Bong with a total of 38,840, Lofa 32021 and
Bomi 7,912.
The second food insecurity issue is whether households were unable to eat healthy and nutritious
food. The total of 141,177(19.6%) households were unable to eat healthy and nutritious during
the period. Households in Bomi (100%), Nimba (97%), Bong (97%) and Lofa 66% had challenges
eating healthy and nutritious food. Another important indicator of the FIES is “households eating
a few kinds of food” which was measured. Predictably, households in Bomi (100%), Bong (97%)
and Nimba (92%) and Lofa 67% had this problem
Labor Inputs (chapter 12)
There were 743,234 household members engaged in permanent agricultural activities compared
to 834,088 agriculture household members involved in temporary agricultural activities. Adult
males constituted 38.7%. Adult females 38.8%, boys 11.3% and girls 11.2%. Except for Lofa
county where adult females were reported at 148,576 compared to adult males 127,839. Both
adult males and boys were reported at 50.01% compared to 49.98% adult females and girls in
the three other counties.

16
Equipment (Chapter 13)
The total number of hoes reported in the survey areas were 155,799 compared to 129,849 axes.
Out of this, 138,690 hoes were owned solely by the holders while 11,699 were owned by the
holding jointly with other holders and 4,799 were borrowed.
The total of 110,382 axes were owned by the holders while 13, 437 were owned by the holding
jointly with other holdings and 5,111 axes were borrowed. Although, 307 were provided by other
private holders.
Livestock (Chapter 14)
A total of 40,175 agriculture households reported having livestock (cattle, goats, sheep, poultry
etc. 42.0 percent of households in Nimba County reported of having livestock followed by Bong
with 16.0 percent. Both Lofa and Bomi recorded about 14.0 percent and 2.0 percent, respectively.
The number of cattle owned by households in Lofa and Nimba was recorded at 8,619 herds. Of
this number females owned 5,011 (58.14%) male ownership constitutes 41.9%. Indigenous cattle
(beef) constituted 4,137 (82.6%) and crossbreed (beef) were 874 (17.4%).
Conclusion Despite the challenges encountered, the results generally show that the survey instruments
(questionnaires) can help address most of the food security and vulnerability issues in Liberia and
the CAPI technology is very effective and efficient in collecting agriculture data.
However, it must be stressed that the data from the Pilot Survey covered only four (4) out of the
15 counties in Liberia and cannot substitute for data from the annual agriculture survey since the
TCP was primarily put in place for the FAO to assist the MoA to undertake a pilot agriculture
survey based on the CAPI technology. Therefore, the MoA Management should endeavor to
ensure that resources are mobilized from the Government of Liberia and other development
partners to undertake the main survey as soon as possible

17
CHAPTER 1: INTRODUCTION
1.1 Background
Data is needed for planning processes, such as the design of agricultural programs, investment
in agriculture or the evaluation of existing agricultural policies and its impact on farmer outputs,
Agricultural surveys are one way to obtain such data. Research on agricultural activities of
households seeks to collect and analyze the entire value chain of agriculture, both subsistence
and non-subsistence farming. Results of such research can help to evaluate policies for
addressing needs in the agricultural sector of Liberia.
The first Annual Agriculture Production Survey in Liberia was conducted in 1974 by the Ministry
of Planning and Economic Affairs (MPEA) after the first Agricultural Census of Liberia was
conducted in 1971. It was mainly designed to facilitate the availability of agricultural statistics in
Liberia. The responsibility was later transferred to the Ministry of Agriculture (MOA) in 1976.
Annual Production Surveys continued to be supported for the major crops in Liberia until 1989
except for two years in 1979 and 1980, due to financial constraints.
Conflict and capacity constraints resulted in limited socio-economic, geo-information and
statistical gaps in Liberia after 1989. Most data and major censuses were lost during the civil war,
thus rendering historical statistics unavailable. The existing National Statistical and Geo-

18
Information System lack capacity in data collection and compilation and institutional memory.
These obstacles adversely affect the production of timely, reliable, comprehensive, and
coordinated national socio-economic statistical and spatial information. As a result, evidence-
based policy decision-making is limited in Liberia.
However, soon after the war, in 2004, the government established an autonomous agency, the
Liberia Institute of Statistics and Geo-Information Services (LISGIS). The agency is responsible for
the production of reliable statistical and spatial data, including data acquisition, analysis, geo-
information, and communication to meet the demands of domestic and international clients.
To bridge the data gap created as a result, in 2014/15 the Crop Cutting Survey was made an
integral part of the Household Income Expenditure Survey (HIES) undertaken by LISGIS. The
Survey provided production estimates for the two key staple crops in Liberia - Rice and Cassava.
In 2018, the Ministry of Agriculture under the FAO Technical Cooperation Programme
TCP/LIR/3602 decided to re-activate the Annual Agriculture Survey by conducting the 2019 Pilot
Survey in accordance with the UN WCA2020 taking into consideration the Sustainable
Development Goals (SDG2).
1.2 Objectives
The immediate objectives of the Pilot Survey are to:
• Collect timely, reliable, and accurate agricultural statistics on major food crops and livestock.
• Provide gender-disaggregated agricultural statistics on key agricultural activities.
• Provide indicators for the MoA to lead and monitor trends in food security status and vulnerability assessment.
• Provide indicators for monitoring the sustainable development goals (SDGs).
• Ensure that a user-friendly agricultural database is developed to enhance the availability and accessibility of crop production statistics, crop forecasting and market price statistics.
• Ensure that agriculture and food security web-based database is set-up to assemble, verify, integrate, validate and disseminate all available data in the sector and allowing smooth access and utilization by all stakeholders using FAO Country Stat Platform; and
• Above all, to test the survey instruments including the use of the CAPI technology.
1.3 Scope and Coverage
The target population or the universe for the pilot Agriculture Survey 2019 is defined as all the
agricultural households engaged in crop cultivation and/or livestock farming in the four selected

19
counties. However, the survey population consisted of all rural areas in the selected EAs. Also
undeveloped parts within the settlements of the urban areas with rural characteristics were
included in the universe.
1.4 Sample Design
Some counties in Liberia are the bread baskets of the country whilst others are known to be the
least when it comes to food production. Thus for the pilot survey whose main purpose among
others, is to test the survey instruments and the CAPI technology, four counties – three from the
food basket counties namely; Bong, Lofa and Nimba and one county from the least food
producing counties - Bomi were considered.
Having initially settled on these four counties, a probability sample design in which each sampling
unit in the target population has a known, non-zero probability of being included in the sample
was adopted. A three-stage stratified cluster sample design was used for the Pilot Survey where
the first stage units are the Primary Sampling Units (PSUs) simply the enumeration areas (EAs) or
clusters selected from a 2011 National Sample Frame (EA frame) provided by LISGIS. The second
stage units are the agriculture households systematically selected from a current list of
agriculture households within the sampled EAs. The third sample frame consisted of a list of all
the farms under the same crop within all the sampled agricultural households in each sample EA.
Two separate lists were prepared for rice and cassava. Each of these lists served as the sampling
frame for the selection of farms for the crop cutting experiments. Three rice and one cassava
sample farms were then selected randomly from each of the two crops from the list of farms
prepared for the EA. The crop cutting exercise provided the data for the computation of the
production and yield estimates.
1.5 Sample Size and Sample Selection
A total of 420 agricultural households in 42 sample EAs were targeted but in the end 405
agricultural households and 42 EAs were successfully covered. At the first stage, 42 EAs were
selected systematically. At the second stage, after a complete household listing by the field team,
10 agricultural households were selected systematically from each EA visited. Finally, at the third
stage, four sample farms were selected randomly from each of the two crops from the list of
farms prepared for the EA.
1.6 Data Capture
The Computer Assisted Personal Interview (CAPI) technology was used by the enumerators to
collect information from the respondents. This appreciably ensured data quality by minimising
inconsistencies in data and error during the data capture and processing. Specifically:

20
• The questionnaire was designed in CSPro 7.0 and CAPI application was employed in the
data capture.
• The SPSS software and Cspro 7.0 were used for Data editing and data cleaning.; and
• SPSS and Excel were used for the tables.
• The TCP/3602 project ended in October 2019,
1.7 Funding
Technical assistance and funding of the Pilot Liberia Pilot Agriculture Survey were mainly
provided by the FAO through the Technical Cooperation Programme TCP/LIR/3602.
1.8 Presentation of Results
The report covers fourteen (14) out of the 18 major topics studied in the survey. These are:
1. Introduction/Background 2. Demographic Characteristics
3. Vulnerability and Disability 4. Crops and Land Use 5. Extension Service and Agriculture Information 6. Access to Facilities 7. Means of Transport 8. Storage Facilities 9. Access to loan/credit 10. Farm Management Practices 11. Food Security 12. Labor Inputs. 13. Equipment and 14. Livestock.
Where possible, figures are compared with those obtained in the 2011 Liberia Annual
Agriculture Survey since the frame used for the Pilot Survey emanated from the 2011
population projections supplied by LISGIS.

21
CHAPTER 2: AGRICULTURAL HOUSEHOLDS DEMOGRAPHIC CHARACTERISTICS
CHAPTER 3:
This section discusses the demographic characteristics of the agriculture households surveyed
in the four counties of Liberia.
2.1: Size of population in agriculture households by sex and County, 2019
The total agricultural household population in the four counties was recorded to be 717,668. Out
of this 48.2% were males and 51.8% were females (Table 2.1 and Figure 2.1). Nimba County has
the highest agriculture population of 275,048 and Bomi County with the least 42,010. The
estimates obtained from the Pilot Survey compares favorably with figures obtained by the LISGIS
Agriculture Survey conducted in 2011 for the four counties as well as LISGIS 2017 projected
population figures (Appendix D1).

22
3.1.1 Table 2.1: Size of population in agriculture households by sex and
County, 2019
County Male % of Tot Female % of Tot Total % of Tot
Bomi 18,926 45.1 23,083 54.9 42,010 100
Bong 105,727 50.2 104,888 49.8 210,615 100
Lofa 85,702 45.1 104,292 54.9 189,994 100
Nimba 135,116 49.1 139,932 50.9 275,048 100
Total 345,472 48.1 372,196 51.9 717,668 100
2.2: Distribution of population in agriculture households by number of holders, type of
holding and county Table 2.2 show the population in the agriculture households as well as the agriculture holders.
The total number of holders was assessed to be 218,727, of which Nimba County obtained 96,882
(35%) holders and Bomi County has the least of 8,054(19%) holders. However, the total type of
holdings mainly crop production was reported at 216,689 compared to mixed crop and livestock
with the total of 2,038 holding.
Table 2.2 Distribution of population in Agricultural households by number of holders, type of holding
and county
Description Total Holders Type of holding

23
Total pop in Agri. Hh
Number % Mainly Crop production
% Mainly
Livestock production
% Mixed (Crop
and livestock)
%
Total 717,668 218,727 30 216,689 99 0 0 2038 1
Bomi 42,010 8,054 19 8,054 100 0 0 0 0
Bong 210,615 57,943 28 57,871 99.8 0 0 72 0.1
Lofa 189,994 55,848 29 55,597 99.5 0 0 251 0.5
Nimba 275,048 96,882 35 95,167 98.2 0 0 1715 0.8
2.3 Distribution of agriculture population by County and household size and average
size of holding The average household size is one of the important indicators which influence the wellbeing of
the house given their resources. So, the interest is not only in the size of the population but also
the average household size. The number of agriculture households head was reported at 160,613
with the average household size as four (4.0). Bomi and Bong each has the average size of five
(5.0) while the average household sizes range from one (1) to over 10. The households with 4-5
members were 59,309. One-member household were 3,131 and households with 10 or more
were 2,427. Noticeably, while Lofa did not have any single household with 10 or more members
(Table 2.3).
Table 2.3: Distribution of agriculture population by County and household size and average size of holding
County Total Agricultural Household Size Average Hh Size Agriculture
Population Agriculture Household
% One (2 - 3) (4 - 5) (6 - 9) 10 +
Bomi 42,010 7,912 19 186 1984 1662 4047 33 5
Bong 210,615 40,917 19 1462 10529 10897 16368 1661 5
Lofa 189,994 48,879 26 1033 20643 19065 8138 0 4
Nimba 275,048 62,905 23 451 20670 27686 13366 733 4
Total 717668 160,613 22 3131 53826 59309 41919 2427 5

24
2.4: Distribution of population in the agriculture households by sex and age group
Table 2.4 shows the population in the agriculture households in the four counties. For all ages,
the female population in the agriculture households was reported at 372,195 compared to male
population of 345,473. Household population under 18 years was reported at 167,269 females
and males 171,017
For all ages, Nimba county recorded 275,048 followed by Bong with the total of 210,615, Lofa
189,994 and Bomi accounting for 42,010. The survey report revealed that under 18 years in the
agriculture household, Nimba reported at 130,327 followed by Bong with the total of 103,992.
The agriculture population between 25 to 34 years was reported at 100,888 with female’s
population accounting for 62,032 compared to 38,857male population. The total agriculture
household’s population between the ages of 45 to 54 years were reported at 58,732 in the four
counties. Nimba constituted about 27,719 (47.2%) with the total male population of 19,526
compared to female with a total of 8,193. The total agriculture household in Lofa was reported
at 16,043(27.3%) and out of this number, the female population in the agriculture households
was 8,739 and male 7,304. Ages 65+ in the agriculture household were reported at 13,659, of
which 8,488 were females and 5,171 males.

25
Table 2.4. Distribution of population in the agriculture households by sex and age
group
2.5 Relationship of agricultural household members to head of household
Table 2.5 show the population in the agriculture households as well as the agriculture holders in
the four counties. The total male and female headed agriculture households was reported at
160,613 and out of this, the female headed households was 27.9% compared to male headed
household 72.1%. In terms of agriculture holders, 48.07% (345,049) were males and 51.92%
(372,620) were females in the survey areas.
Out of this total, Nimba county male headed was reported at 52,591 compared to female headed
10,314. Bong with a total of 32,555 male headed and female headed households 8,362. Lofa male
headed households was reported at 27,145 and female headed households was reported at
21,735 and Bomi haven the least of 4,357 male headed households compared to female 3,183 in
Table 2.5(Appendix D).
2.6 Educational attainment
This section looks at the educational attainment of the number of holders in the survey areas.
The number of holders that has never been to school were reported at 147,049 in the four
counties. Out of this, Bong county recorded 36,254 followed by Lofa with 33,834, Nimba, 27463
and Bomi with only 4,490. For those who had been to school but had not gone beyond primary
school was reported at 61,070. Again, only 54,041 people have attained either junior high, senior
high school, vocational or degree (Table 2.6 appendix D).
Under 18 18 - 24 25 - 34 35 - 44 45 - 54 55 - 64 65 +
Bomi
Male 11,313 2,338 1,500 1,452 924 969 430 18,926
Female 11,839 2,685 2,345 3,131 1,329 1,245 510 23,084
Total 23,152 5,023 3,845 4,583 2,253 2,214 940 42,010
Bong
Male 55,254 13,677 9,980 13,620 5,608 5,643 1,946 105,728
Female 53,738 16,261 11,251 9,741 7,109 4,713 2,074 104,887
Total 108,992 29,938 21,231 23,361 12,717 10,356 4,020 210,615
Lofa
Male 43,274 10,532 10,200 11,502 7,304 2,531 359 85,702
Female 38,001 10,994 25,682 16,002 8,739 1,962 2,912 104,292
Total 81,275 21,526 35,882 27,504 16,043 4,493 3,271 189,994
Nimba
Male 61,136 14,350 17,177 14,362 19,526 6,129 2,436 135,116
Female 69,191 19,628 22,753 14,751 8,193 2,424 2,992 139,932
Total 130,327 33,978 39,930 29,113 27,719 8,553 5,428 275,048

26
2.6A. Agriculture population size by sex, literacy status and county
One need not to have formal education to be able to read or write. However, modern day
agriculture requires literate farmers to be effective and efficient to use improved and adopt
modern methods of agriculture. Hence, the literacy status of the agriculture household members
15 years and older were solicited from respondents. Table 2.6A shows that 46.71 percent
(263,350) of households could not read or write.
Table 2.6A: Agriculture population size by sex, literacy status and County
Number of agriculture household member
COUNTY Read or write
Don’t read or write TOTAL Percent illiterate
Bomi 18,594 13,599
32,193 42.24%
Bong 77,132 90,253
167,385 53.92%
Lofa 76,567 83,893
160,460 52.28%
Nimba 128,161 75,605
203,766 37.10%
Total 300,454 263,350
563,804 46.71%
2.7 Main Activity
The household members main activities were solicited in Table 2.7 appendix D. The total number
of male & female involve in economic activities of survey areas were as followed: 319,676
households practiced crop production the four counties, 489 households in livestock activity and
5,144 households in trading. For the economically inactive, students were found to be in the
majority (169,649) followed by 38,191 who were involved in household work. No activity, not
looking for job were reported at 1,676.
2.9 Secondary Activity, Sex and Counties
The total secondary activities were presented in table 2.9 appendix D. The total male and female
involved in crop production as a secondary activity were reported at 174,674 in the four counties,
83,346 households were trader, 2,514 households involved in livestock activity and 918 males
were involved in fishing only in Lofa County. For the economically inactive, those who engages in
household work were reported at 121,458 followed by students with the total of 112,653. Only
Bomi county practiced aquaculture with the total member of 33 and those who involved in
artisan were reported at 3,143 in Bomi and Bong Counties.

27
2.10 Marital Status of the households
Table 2.10 shows the marital status of the households 12 years and over. Thirty nine percent
(183,670) out of the 466,411 were found to be never married. Out of the never married, the male
accounted for 101,476 and females with the total of 87,194. On the contrary, 131,814 females
were married compared to 99,549 males. The survey report shows that 3,156 females were
divorced compared to 789 males. The total of 7,651 females were widowed in comparison to 492
males
Table 2.10: Agriculture household population aged 12 years and over by sex, age
group, marital status
50+ year Total %
Male 47,504 42,258 10,408 1,306 101,476 0.218
Female 40,617 31,329 6,608 3,640 82,194 0.176
Total 88,121 73,587 17,016 4,946 183,670 0.39
Male - 13,288 56,767 29,494 99,549 0.213
Female 389 47,191 67,689 16,545 131,814 0.283
Total 389 60,479 124,456 46,039 231,363 0.50
Male 0 4,951 11,540 2,105 18,596 0.040
Female 0 6,299 6,662 194 13,155 0.028
Total 0 11,250 18,202 2,299 31,751 0.068
Male - - 789 - 789 0.00
Female - 194 2,219 743 3,156 0.007
Total 194 3,008 743 3,945 0.01
Male - - 5 487 492 0.001
Female - - 1,252 6,399 7,651 0.016
Total 1,257 6,886 8,143 0.02
Male - - 476 622 1,098 0.002
Female - 9 900 1,081 1,990 0.0043
Total 9 1,376 1,703 3,088 0.01
Male 833 - - - 833 0.00
Female 2,994 624 - 3,618 0.01
Total 3,827 624 4,451 0.01
92,337 146,134 165,315 62,616 466,411 1.00
Don't Know
General Total
Marital Status
Married
Living Together
Divorced
Widowed
Seperated
Never married
Age Group
12 to 17 years 18 to 29 years 30 to 49 years

28
CHAPTER 3: VULNERABILITY AND DISABILITY
3.1 Children not going to School
Schooling is the starting point to the total development of the child. However, as many as 62,140
children between the ages 4-17 years were found not going to school at the time of the survey
(Table 3.1). Several reasons were assigned for the children not being in school. The total of
30,306(48.8%) were not going to school because the household found schooling expensive or
had no money to send the child to school. Another 10.42 percent (6,485) cited the distance to
school being too far as the reason for the child not going to school. Other reason worth
mentioning are child not interested in school was reported at 2,510(4.04%) and child too young
to go to school 8,284(13.33%).
There were county variations. Cost of schooling and households not having money permeated
through all the counties. As far as distance to school as a hindrance is concerned, 4,478 (7.21%)
children in Bong and 1,813 (2.92%) children in Lofa were affected. “Children work for money or
food” was also another factor which affected 1,249 (16.5%) children in Nimba and Bong Counties.
In Bomi for instance, 4,116 (6.62%) percent of the children were not going to school because of
the cost of schooling or household had no money. In Nimba and Bong County, the survey report
shows that 1,452(2.34%) children were found not going to school because they were pregnant.
The total of 3,471 (5.59%) children in Bong, Lofa and Nimba were not in school because they had
to help with household work.
29
Table 3.1: Proportion of Children aged 4-17 not currently in school and reasons for not
being in school by county
3.2 Biological Parents of Children
Children usually become very vulnerable when they lose their biological parents or when their
biological parents are alive but for some reason, they do not stay with them the same household.
Table 3.2 depicts that the biological mothers of 22,274 children were not alive. Children in Nimba
(35%) and Lofa (34%) were the most affected. For those children, whose mothers were alive,
234,978 of them were not staying with their mother.
As far as biological father is concerned, 32,588 number of the children had lost them. Here also
children in Lofa 16,102(49%) and Nimba 9,885(30%) were more vulnerable. Again, 221,982
children did not stay with their biological fathers with Nimba County recording 79,915 (36%)
children and Bong 75,868(34%) children
Reason Total
Male Female Male Female Male Female Male Female
illness - - - - 291 - - 194 485
work for food or money - - 833 - - - 416 - 1,249
help with household work - - 1,661 1,391 107 - 312 - 3,471
care for ill or disabled household member,- - - - - - - -
care for younger sibling - - - - 369 - - - 369
not interested in school 33 79 208 1,107 222 369 - 492 2,510
distance to school too far - - 2,343 2,135 740 1,073 - 194 6,485
no food at home, - - - - - - - -
expensive or no money 2,728 1,388 6,307 4,117 3,440 3,465 5,740 3,121 30,306
child considered too young 51 - - 1,520 1,671 - 374 4,668 8,284
pregnancy/marriage, - - - 828 - - - 624 1,452
expelled from school, - - - - - - - -
failure e.g. of exams, - - - - - - - -
completed High School - - - - - - - -
disability, - - - - - - - -
other, - - 326 - 489 549 395 2,149 3,908
NA - - 1,174 562 - - 789 1,095 3,620
Total 2,812 1,467 12,853 11,660 7,329 5,456 8,026 12,537 62,140
Bomi Bong Lofa Nimba

30
Table 3.2: Population of children age 4-17 years with biological mother alive by county
3.3 Disability
The disability status of all household members was collected. The total number of people living
with disability was 5,733 and the highest number of people with disability was recorded in Bong
County (3,329).
A detailed analysis of the disability data shows that the most common form of disability is physical
with the total of 2,073 females compared to males with 1,292 members. Bong County with a total
of 1,946 people who are physically challenged. Sight affects 716 females in Bomi and Nimba
County and hearing affect 612 females and 208 males in Bong and 251 in Lofa counties (Table
3.3).
Table 3.3: Percentage distribution of household with disability, type of disability by
sex and county
COUNTY
Biological
Mother
Alive %
Biological
Mother in
agriculture
household
s %
Biological
Mother
not in
agricultur
e
househol
ds %
Biological
Father
Alive
Biological
Father in
agricultur
e
househol
ds
Biological
Father
not in
agricultur
e
househol
ds
DK
Bomi 16,100 0.07 15,173 0.07 927 0.04 11,689 0.05 9,448 0.05 2,241 0.07 0
Bong 82,440 0.35 76,562 0.36 5,878 0.26 75,868 0.34 71,508 0.38 4,360 0.13 0
Lofa 60,774 0.26 53,107 0.25 7,667 0.34 54,510 0.25 37,859 0.20 16,102 0.49 549
Nimba 75,664 0.32 67,862 0.32 7,802 0.35 79,915 0.36 70,031 0.37 9,885 0.30 0
Total 234,978 1.00 212,704 1.00 22,274 1.00 221,982 1.00 188,845 1.00 32,588 549
Type of Disability
Male Female Male Female Male Female Male Female Male Female
Sight - 300 - - - - - 416 - 716
Hearing - - 208 612 251 - - - 459 612
Speech - - - - - - - - - -
Physical - 300 1,041 905 251 - - 867 1,292 2,073
Intellect - - - - - - - - - -
Emotional - - - - - - - - - -
Other (specify) - - - 562 - - 29 29 29 592
Total - 600 1,249 2,080 502 - 29 1,312 1,781 3,992
Bomi Bong Lofa Nimba Total

31
CHAPTER 4: CROPS AND LAND USE
4.1 Means of Acquisition of farms/parcels and Plots
Table 4.1 appendix D revealed the total number of holders that acquired land within the
enumeration area (EA) by various means were reported at 160,031. Out of this, Nimba county
constituted 69,029 followed by Lofa with the total of 48,227, Bong 37,179 and Bomi 5,596.
The total of 41,486 holders operate outside the enumeration areas but within the district. Out of
this, Nimba constituted 25,074 followed by Bong with the total of 8,019, Lofa 5,101 and 3,392
in Bomi. However, the total of 836 holders operate in outside the district, of which 361 in Bong
and 475 in Bomi counties.
The holders that purchased land in the four counties were reported at 7,647. Out of this, 4,156
in Bong, 1889 in Lofa, 1569 in Nimba and 33 in Bomi counties.
The total of 7,612 holders used community land in the survey areas, of which 1,666 holders in
Lofa, 5,229 in Bong, 366 in Nimba and 351 Bomi. The holders that borrowed land in the four
counties were reported at 2,605. Out of this, Bong accounted for1,592 followed by Bomi with the
total of 569, Nimba 265 and 179 in Lofa counties.
The total of 139,372 holders inherited land within the EA, and 37,165 inherited land outside the EA but
within the district, however, 803 inherited land outside the district.
4.2: Land Use Type
Table 4.2 appendix D indicate that 557,668 ha of land was used by the agriculture households in
the four counties in 2019. About 61.9 percent (345,319 ha) of the land area was utilized for
temporary crops like cereals and vegetables. Approximately, 26.4 percent (146,978 ha) of the
land is under permanent crops (cocoa, oil palm, or rubber) and 11.4% (63,704 ha) under
temporary fallow.
4.3: Distribution of Farms Parcels by Gender of the Farm Manager
Table 4.3 show the total distribution of farm parcels by gender of the farm manager was reported
at 166,045 with males accounting for 68.4% compared to female with 31.6%. The total gender
within the EA were reported at 132,066 and of this, 67.7% were male compared to 32.3% female.
Outside EA but within the District were reported at 33,509. Out of this, 23,892 males were
reported compared to 9,617 females.

32
Table 4.3: Number of distribution of farm/parcels by gender of the farm manager,
location and County
4.4: Rice and Cassava production within the survey areas
The Sustainable Development Goal 2.3 stipulates among other things that, by 2030 countries
should double the agricultural productivity. For this reason, the Survey tried to measure the
production and yield of the two most important crops in Liberia.
A total of 190,098 metric tons of rice (upland) was reported to have been produced by the four
counties. Nimba County (68,567Mt) highest producer of rice followed by Lofa (63,543 Mt) and
Bong (49,510 Mt) while Bomi recorded only 8,466 Mt (Table 4.4). In terms of total production,
the figures are higher than what was achieved in 2011. In 2011, the production levels for Bong
(47,210Mt), Lofa (51,440Mt), Nimba (61,630Mt) and Bomi (7,390Mt)1. However, the yield of 1.14
metric tons per hectare invariably, shows that Liberia has not been able to improve the yield per
hectare over the years
The combined cassava production of the four counties was reported at 334,339 metric tons with
a yield of 5.4 metric tons per hectare. Nimba recorded the highest production of 147,827 Mt
followed by Bong (98,155 Mt), Lofa (74,296 mt) and Bomi (16,061Mt)
Male Female Total
Within EA 89,376 42,690 132,066
Outside EA but within District 23,892 9,617 33,509
Outside District 365 105 470
Total 113,633 52,412 166,045

33
Table 4.4: Estimate of area under crop production, yield by type of crop and County
Estimates of Rice production 2019
Rice Production
Description
Number of
Agriculture
household
Average farm
Area per
household
(Ha)
Average
Yield per
Ha
Average
Yield per
Household
Production (MT)
Total 160,613 1.16 1.14 1.17 190,086
Bomi 7,912 0.85 1.26 1.07 8,466
Bong 40,917 1.2 1.31 1.21 49,510
Lofa 48,879 1.3 1.33 1.30 63,543
Nimba 62,905 1.2 1.35 1.09 68,567
Estimates of Cassava production 2019
Cassava
Descriptio
n
Number of Agriculture
household
Average farm
Area per
household
(Ha)
Average
Yield
per Ha
Average
Yield per
househol
d
Production (MT)
Total 160,613 0.4
6
5.
4
2.0
6
334,339
Bomi 7,912 0.41 4.6 2.03 16,061
Bong 40,917 0.47 5.6 2.32 96,155
Lofa 48,879 0.49 5.7 1.52 74,296
Nimba 62,905 0.48 5.7 2.35 147,827

34
CHAPTER 5: EXTENSION SERVICES AND AGRICULTURE INFORMATION
5.1: Agriculture households that received extension service
Extension services were provided by the government and other partners to farmers. The total
agricultural household’s population reported were 717,668. Those who received extension
services by various type was estimate at 12,112 and out of this, 3,273 (27%) farmers received
MOA extension service. Bomi received 69 percent amongst the four counties. Local and
International Non-governmental Organization (NGOs) provided extension service to 6,491 (54%)
farmers in the four counties. EPA provided extension service to 416 farmers in Nimba county.
The Cooperative Development Agency (CDA) only provided extension service to 46 farmers in
Bomi county and MOA veterinary staff provided extension services to 72 farmers in Bong County
and other constituted 834, (Table 5.1)
Table 5.1: Number of agriculture households that received Extension Services by
Extension service type and County
Bomi Bong Lofa Nimba Total
A. MoA veterinary staff -
72
-
-
72
B. MoA agricultural extension officer
2,259
144
251
619
3,273
C. Farmers' unions 186
612
-
-
798
D. CDA (Cooperative Devt. Agency)
46
-
-
-
46
E. Local/INGO 2,040
1,704
2,038
709
6,491
F. Fisheries -
-
-
-
-
G. Forestry -
-
-
-
-
H. Private sector Dealers -
-
-
180
180
I. EPA -
-
-
416
416
X. Other 346
72
-
416
834
Total 4,877
2,605
2,290
2,340
12,112

35
5.2 Source of Extension Information
Extension services were provided by the government and other partners to farmers through
various sources such as: radio, television, internet, newspaper, agriculture bulletin, extension
officer, farmer to farmers, and farmers association. The total agricultural households reported
were 160,613. Out of this, the number of households that received extension information
through radio were 26,246 farmers, 17,644 received information on new agriculture
practices,7,373 received information on crop varieties. 300 farmers received information on
credit facilities, 72 households receiving farm machinery information. 6,986 households received
plant disease and pest information and 1,012 households received agriculture marketing
information in Table 5.2 appendix D
5.3: Main Source of Extension Service
Table 5.3 shows the total agriculture households that received main source of extension service
was reported at 8,865. Out of this, (54%) received extension service in Bomi county compared to
Lofa with the total of (23%) followed by Bong with (13%) household. Nimba County received least
information amongst the four counties with the total of 11.2% households.
Table 5.3: Number of agriculture households received extension service by main source
of extension service and County
COUNTY
Bomi Bong Lofa Nimba Total
A. MoA veterinary staff - 72 - - 72
B. MoA agricultural extension officer 2,226 144 251 - 2,621
C. Farmers' unions 186 612 - - 798
D. CDA (Cooperative Devt. Agency) - - - - -
E. Local/INGO 2,040 216 1,747 403 4,406
F. Fisheries - - - - -
G. Forestry - - - - -
H. Private sector Dealers - - - 180 180
I. EPA - - - 416 416
X. Other 300 72 - - 372
-
Total 4,752
1,116
1,998 999 8,865

36
5.4: Number of Agriculture households who are satisfied with services received by source of
service
Table 5.4 recorded 11,114 total number of households that satisfied with the various extension
services in survey areas. Out of this estimate, 4,883 (44 percent) were satisfied with MOA
extension officers compared to NGOs with an estimation of 3,925(35 percent) households. The
total of 612 and 326 household in Bong counties were satisfied with farmers union and fisheries
extension services.
The reports revealed that 4,183 households in Bomi were satisfied with various extension
services followed by Bong with 2,859 households, Nimba County 2034 households and 2,038
households’ in Lofa County.
Table 5.4: Number of agriculture households who are satisfied with the service received
by source of service
COUNTY
Bomi Bong Lofa Nimba Total
A. None - 72 - 416 488
B. MoA veterinary staff - - - - -
C. MoA agricultural extension officer
2,259
908
1,098 619 4,883
D. Farmers' unions - 612 - - 612
E. CDA (Cooperative Devt. Agency) - - - - -
F. Local/INGO 1,532
869
941 583 3,925
G. Fisheries - 326 - - 326
H. Forestry - - - - -
I. Private sector Dealers - - - - -
J. EPA - - - 416 416
X. Other 392
72 - - 464
Total 4,183
2,859
2,038
2,034 11,114

37
CHAPTER 6: ACCESS TO FACILITIES
6.1 Agriculture households by Type of Facility
Facilities on education, food storage, health, information, etc were used as an indicator to
determine the traveling distance for agriculture households. Those who walked up to 30 minutes
to primary school were reported at 109,563 households, 57,831 to food storage, 48,281 to health
facility, 72,621 to radio or mobile phone, 11,333 households used public transport.
The survey reported that the total of 109,563 households who walked for 30 minutes to a primary
school in the four counties and out of this, Nimba reported 50,081 (45.7%) , Lofa 35,618(32.5%)
, Bong 20,142 (18.4%) and Bomi 3,722 (3.4%).
The households walked 30 minutes to food storages facilities in the four counties reported were
25,817 households in Nimba; 25,674 households in Lofa, 5,295 household in Bong and 1,048 Bomi
compared to 21,709 and 21,476 that covered one-hour distance for both primary school and food
storage facilities.
However, the total households that covered 30 minutes to credit facility in the study areas were
estimated at 6,092, 3,857 household covered a distance for one hour and 251 households walked
a distance for two hours (Table 6.1 appendix D).
6.2 Agriculture households’ main source of water.
There are nine (9) main sources of water determined during the survey period and it include the
following: piped water inside house, piped water outside but in yard, public stand post/water
point, community borehole, rive/stream/pond, protected well, unprotected well, protected
spring, unprotected spring and other. The households who walked for 30 minutes in the four
counties were reported for the following indicator. Protected well 38,671; community borehole
36,031and public stand post 27,647.
Moreover, those who used unprotected well and unprotected spring by covering 30 minutes
distance were reported at 6,107and 1,929 households. A total of 25,740 households walked 30
minutes distance to used river/stream/pond and 1,450 walked for 30 to 60 minutes. The survey
discovered that none of the households use pipe water inside the house. Table 6.2 main source
of water in appendix D
6.3: Households by Toilet Type
Table 6.3 revealed the number of agriculture households that used different type of toilet were
reported at 160,613. Out of this,66,545 used bush (NO TOILET) and 53,846 used pit latrines.
Moreover, the number of agriculture households that used dry sanitation toilet (VIP) outside yard
38
were reported at 13,043 and those that used river or bush were reported at 10,158. Most
importantly, 1,199 households used flush/pour toilet inside the house while those that shared by
houses were reported at 943.
Table 6.3: Number of agriculture households by Toilet Type
Type of Toilet Number of agriculture Households
Flush/pour toilet inside house 1,199
Flush/pour toilet shared by houses 943
Dry sanitation toilet (VIP) outside yard 13,043
Dry sanitation toilet (VIP) shared by houses 2,774
Pit latrine 53,846
Public pit latrine 12,105
No toilet (use bush) 66,545
River/beach 10,158
Total 160,613

39
CHAPTER 7: MEANS OF TRANSPORT
7.1: Main Source of Access
The households in the agriculture sector normally used transportation as a main to transfer their
goods from one location to another. Table 7.1 show the number of households that used 10
main transport facilities during the survey. They include pick-up, buses, tractor, tricycle,
motorbike, boats, wheelbarrow, truck, canoes, and other. Accordingly, the number of
households involved in renting or hiring these facilities were reported at 67,371 households. Out
of this estimate, 45,577 (67.3%) rent motorbike and 1,119 (1.9%) owned motorbike.
The number of households that rent or hired pick-up were reported at 9,255(13.7%) compared
to 3,696(5.5%) households that used tricycle. However, the number of households that owned
transport facility were reported at 12,266 compared to 828 households rent tractor. The number
of households that owned wheelbarrow were reported 3,445 and those that borrow accounted
for 5,641.
Table 7.1: Number of households by means of transport used, source of access and
number owned
Main transport facility used
Main source of access
Number of transport facility owned Owns Borrow Rent/hire Head loading/porter
-
-
- -
Car/Pick up -
-
9,255 -
Buses/Lorry -
-
3,624 -
Tractor -
-
828 -
Tricycle -
-
3,696 -
Motorbike 1,119
-
45,577 1,119
Boats/Ferry -
-
2,007 -
Wheelbarrow 3,445
5,641
1,062 11,147
Trailers /Truck -
-
489 -
Canoes -
-
833 -

40
CHAPTER 8: STORAGE FACILITIES
8.1 Households who own storage facility
The agriculture households that owned and stored their harvest under shelter/outside/kitchen
was reported at 113,089 with storage capacity of 2.6 metric tons. A total of 71,931 households
owned and used bags with storage capacity of 5.3 metric tons. This result mean those who used
bags have more storage capacity than under shelter/outside kitchen.
The agriculture households that used sealed containers was reported at 4,525 with storage
capacity of 2.6 metric tons compared to specific house room and drum (1.9 metric ton).
However, none of the households’ own silo for storage purpose but cold storage, underground
and other specify were reported less than (0.1 to 0.3) metric tons
Table 8.1: Number of households who own storage facility by type and average
capacity (Mt)
Type of storage facility Number of agriculture
household’s own storage facility Average Capacity (Mt)
Granary/barn 17,211 1.5
In the house 32,457 1.6
Specific house/room 26,861 1.9
Under shelter/outside/kitchen 113,089 2.6
Sealed containers 4,525 2.1
Bags 71,931 5.3
Drums 752 1.9
Silo - -
Cold storage 72 0.3
Under ground 194 0.1
Other (specify) 1,932 0.1

41
CHAPTER 9: ACCESS TO LOAN/ CREDIT
9.1 Number of households who applied for agricultural loan
Table 9.1 revealed a total of 20,565 holders applied for loan in the last five years and out of
this,16,658 holders were in Nimba County, 1,391 holders in Bong, 1,364 holders in Bomi and
1,152 holders in Lofa county.
Table 9.1: Number of agriculture households who applied for loan during the last 5
years by County
COUNTY Number of agriculture Households who applied for loan
Bomi 1,364
Bong 1,391
Lofa 1,152
Nimba 16,658
Total 20,565
9.2 Purpose of Loan
Usually, loans are applied for various reasons like purchasing seeds, fertilizer, agro chemicals, de-
busing (clearing of land) and hiring of labour. The results in Table 9.2 show that regardless of the
county, the loans received were largely 19,911 total applicants. Out of this estimate, the number
of holders that received loan for agriculture labour were reported at 17,693 (89%). For
purchasing of seed 612(3.1%) holders received loan which was less than De-bushing (clearing of
land) with the total of 703.
Table 9.2: Number of agriculture households who received loan during the last 5 years
by reason/purpose of the loan
Purpose of loan Number of agriculture households who
received loan
Agriculture labour 17,693
Seeds 612
Farm implements and machinery 194
De-bushing (clearing of land) 703
Other agricultural purpose 709
Total 19,911

42
9.3: Source of Loan and Payment Period
Table 9.3 exposed the source of loan received and payment period during the last five
years and it were reported at 19,911. Out of this, cooperative credit society give loan to
7,955 holders; 6,949 holders received loan from self-help group, 3,623 holders received
loan from money landers; 1,106 holders received loan from family and friends, and
277holders received loan from Micro-finance institution.
Those who loan payment period less than one year were reported at 14,686(74%)
compared to 4,366(22%) holder who payment was more than three years. A total of 4,366
holders paid their loan for more than 3 years while less than one year was reported at
2,582. There was no commercial bank to give loan to the holders, but Micro-finance
Institutions provided loan to 277 holders within the survey areas.
Table 9.3: Number of agriculture households who received loan during the last 5 years
by source of loan received and loan period
SOURCE of LOAN Less than 1
Year Between 1 and
3 years More than 3
years
Others Total
Liberia Bank for Development and Investment
- - - - -
Commercial Banks - - - - -
Micro finances institutions
97
180 - - 277
Cooperative credit society
7,704
251 - -
7,955
Money lenders 3,372 - -
251
3,623
Self-help group 2,582 -
4,366 -
6,949
Government - - - - -
Family and friends 931
175 - -
1,106
NGO - - - - -
Total 14,686
607
4,366
251
19,911
43
9.4: Source of Loan and type of collateral for the last five years
Table 9.4 appendix D shows that 18,827 holders gave collateral to various institutions for
loan during the last five years. Out of this estimate, 11,194 holders used crops as collateral
to various source of credit institutions. 6,333 used thirty party in the study areas.
Moreover, 1,646 holders did not used collateral in all the four counties. 88 holders use
livestock and salary as collateral.

44
CHAPTER 10: FARM MANAGEMENT PRACTICES
10.1 House who use Fertilizers
Agronomic practices required farmers to use fertilizer as a mean for plant to grow and to obtain
better yields. Table 10.1 indicates the number of holders that applied fertilizer in the survey areas
was reported at 9,260. Out of this, 5,646 (61.0%) holders used or applied mineral
fertilizers(inorganic) compared to 3,047(32.9%) holders that used organic fertilizer. Moreover,
6.1 percent (567) households applied manure to their crops in the study areas.
Table 10.1: Number of Holders who use fertilizer by type of fertilizer
Type of Fertilizer applied Number of households
apply fertilizer Percent
A. Mineral fertilizers (Inorganic fertiliser)
5,646 61.0%
C. Organic fertilizer
3,047 32.9%
E. Manure
567 6.1%
Total
9,260 100.0%
10.2 Holders who use seed inputs and type One of the methods used to be self sufficient in food production is to use improve seeds for
better yields. Table 10.2 show the number of holders in study areas were reported at 164,160.
Out of this, 160,074 (97.5%) used local seeds compared to 3,878 (2.4%) holders that used
improved seeds
This mean the total production in the four counties were low because 97.5 percent holders
used local seeds. This result show that the Central Agriculture Research Institute (CARI) and
Extension Division at the Ministry of Agriculture need to double their work for local farmers
to use improve variety.

45
Table 10.2: Number of Holders who use seed inputs by type of seed and County
Name of Seed Input Number of Holders Percent
A. Local Seeds
160,074 97.5%
B. Improved Seeds
3,878 2.4% D. Genetically Modified (GM) seeds
208 0.1%
Total
164,160 100.0%
10.3 Holders who use Pesticides by Type
The two types of pesticide used were insecticide and rodenticides. The number of agriculture
holders that applied pesticide and insecticide were reported at 4,296.(100%). Out of this, 3,468
(80.7%) holder applied insecticide and 828(19.3 % applied rodenticides(Table 10.3)
Table 10.3: Number of Holders who use pesticides by type of pesticides applied
Type of Pesticide Number of Holders Percent
A. Insecticide
3,468 80.7%
D. Rodenticides
828 19.3%
Total 4296 100.0%
10.4: Holders by inputs and education status
The total number of holders by inputs and education status were reported at 218,728, out of this
estimate, those who never been to school was reported at 102,045(46.7%). About 1,335
agriculture holders’ practices improved seeds and out of this,218 holders were in junior high and
828 in senior high school. The number of holders that practices mineral fertilizer(inorganic) were
reported at 4,818 and out of this,3,096 did not go to school while 1,154 were in senior high, those
who practices organic fertilizer was 3,047 holders. Moreover, in the study areas 2,060 practices
irrigation and out of this, 1,198 did go to school; 858 holders in senior high school and 5persons
obtained college degree (Table 10.4).

46
Table 10.4: Number of Holders by Inputs/farm practice and Educational Status
Education
al Statu
s of Hold
ers
Total number of
Holders
A. Local
Seeds
B. Impro
ved Seeds
D. Geneti
cally Modifi
ed (GM) seeds
A.Mineral
fertilizers
(Inorganic
fertiliser)
C. Orga
nic fertili
ser
E. Man
ure
A. Insect
icide D.Rodenticides
Irrigation
None
102,045 64,893
291
208
3,096
828
-
1,440
-
1,198
Pre-primary
12,978
6,658
-
-
-
1,656
562
828
- .
Primary
48,092
18,938
-
-
562
562
-
562
- .
Junior High
29,020
17,839
216
-
-
-
-
307
- .
Senior High
22,884
18,268
828
-
1,154
-
-
326
828
858
Vocational
2,136
300
-
-
-
-
-
-
- .
Degree
1,574
745
-
-
5
-
5
5
-
5
DK . -
-
-
-
-
-
-
- .
Total
218,728
127,643
1,335
208
4,818
3,047
567
3,468
828
2,060
10.5: Holders who did not use improved inputs
The total number of holders that did not used improved inputs in the four counties were reported
at 149,904. Out of this, 105,399 were male (70 percent) and 44,505(30 percent) females. A total
of 66,041 holders expressed that the improved inputs were not available, 43,833 holders said the
improved inputs were too expensive,17,813 holders said they do not see the usefulness.
Moreover, 21,711 holders pointed out NO Knowledge about improved inputs in table 10.5.

47
Table 10.5: Number of holders who did not use improved inputs by reason by sex
Reasons Number of holders
Male Female Total
No knowledge
17,129 4,582 21,711
Too expensive
29,598 14,235 43,833
Not available
47,254 18,787 66,041
Do not see usefulness
10,985 6,829 17,813
Other
433 72 505
Total
105,399 44,505 149,904

48
CHAPTER 11: FOOD SECURITY
The United Nations SDG2: recommends that countries should try as much as possible to “End
hunger, achieve food security and improved nutrition and promote sustainable agriculture” by
2030. Therefore, countries should periodically assess the food security situation to know if there
are on track or not. However, measuring the food security of countries especially in developing
countries has not been that easy over the years. Hence, in the WCA 2020, the FAO has:
“introduced an innovative approach in its census supplementary theme on food security to
access valid information on the severity of food insecurity as experienced by individuals in the
population.
The approach … known as the Food Insecurity Experience Scale (FIES), aims to measure
household food security through experience-based food insecurity. This is based on the premise
that the severity of the food insecurity situation of an individual or a household can be inferred
from observing typical behaviors and experiences associated with food insecurity. These include,
for example, the condition of being worried about not being able to procure food, having to
compromise on the variety and quality of foods consumed, and being forced to cut portions or
to skip meals”2.
11.1: Food insecurity experience
Eight recommended questions of the FIES were used in the Pilot Survey and the results are
presented in Table 11.1. Two -third of the households had had to worry that they would not have
enough food to eat because of lack of money or other resources in the 12 months preceding the
survey. The total of 139,637 households worried not having enough food to eat. Out of this,
Nimba county accounted for 60,865 follows by Bong with a total of 38,840, Lofa 32021 and Bomi
7,912.
.

49
Table 11.1: Number of agriculture households worried they would not have enough
food to eat because of a lack of money or other resources during the last 12 months
by County
COUNTY Total number of
agriculture households
Agriculture households worried not having enough
food to eat Percent of
the total
Bomi 7,912 7,912 100
Bong 40,917 38,840 95
Lofa 48,879 32,021 66
Nimba 62,905 60,865 97
Total 160,613 139,637 87
FAO (2015): World Programme for the census of Agriculture 2020: Volume 1, Programme,
Concepts and Definitions. Rome
Table 11.2 indicates the number of agriculture households unable to eat health and nutritious
food were reported at 141,177. Of this number, 61,195 (97%) in Nimba, 39,601 (97%) in Bong,
32,469 (66%) in Lofa and 7,912 (100%) in Bomi counties
Table 11.2: Number of agriculture households unable to eat healthy and nutritious food
because of a lack of money or other resources during the last 12 months by County
COUNTY Total number of agriculture households
Agriculture households unable to eat healthy and
nutritious food Percent of
the total
Bomi 7,912 7,912 100
Bong 40,917 39,601 97
Lofa 48,879 32,469 66
Nimba 62,905 61,195 97
Total 160,613 141,177 88
The number of agriculture households who ate only a few kinds of foods because of lack of money
or other resources during the past 12 months in 2019 were reported at 138,000. Out of this, 92%
in Nimba. 97% in Bong, 67% in Lofa and 100% in Bomi counties in table 11.3

50
Table 11.3: Number of agriculture households who ate only a few kinds of foods
because of a lack of money or other resources during the last 12 months by County
COUNTY Total number of agriculture households
Agriculture households who ate
only a few kinds of foods
Percent of the total
Bomi 7,912 7,912 100
Bong 40,917 39,673 97
Lofa 48,879 32,587 67
Nimba 62,905 57,828 92
160,613 138,000 85
Table 11.4 of the agriculture households had to skip a meal because there was not enough money
or other resources to get food during the past 12 months were reported at 137,555. Out of this,
58,789 households in Nimba, 37,951 households in Bong, 32,957 households in Lofa and 7,878
households in Bomi counties.
Table 11.4: Number of agriculture households who had to skip a meal because there
was not enough money or other resources to get food during the last 12 months by
County
County Total number of agriculture
households
Agriculture households who had
to skip a meal Percent of
the total
Bomi 7,912 7,878 100
Bong 40,917 37,951 93
Lofa 48,879 32,957 67
Nimba 62,905 58,769 93
Total 160,613 137,555 86

51
The number of agriculture households who ate less because of a lack of money or other
resources during the past 12 months were reported at 140,590, of which Nimba
constituted 97% followed by Bong with a total of 95%, Lofa with 67% and 100% in Bomi
respectively in table 11.5
Table 11.5: Number of agriculture households who ate less because of a lack of
money or other resources during the last 12 months by County
County Total number of agriculture
households
Agriculture households who ate
less Percent of
the total
Bomi 7,912 7,912 100
Bong 40,917 38,785 95
Lofa 48,879 32,878 67
Nimba 62,905 61,015 97
Total 160,613 140,590 88
The number of agriculture households who ran out of food because of a lack of money
or other resources were estimated at 140,120 in table 11.5. out of this, 97 % of the
households in ran out of food in Nimba compared to 95% household in Bong, 66 %
household in Lofa and 100 % of the households in Bomi in table 11.6
Table 11.6: Number of agriculture households who ran out of food because of a lack
of money or other resources during the last 12 months by County
County Total number of agriculture households
Agriculture households who ran out of food
Percent of the total
Bomi 7,912 7,912 100
Bong 40,917 38,768 95
Lofa 48,879 32,113 66
Nimba 62,905 61,328 97
Total 160,613 140,120 87
Table 11.7 shows the number of agriculture’s households hungry but did not eat because there
was not enough money or other resources for food were reported at 135,904 (84.6%). The
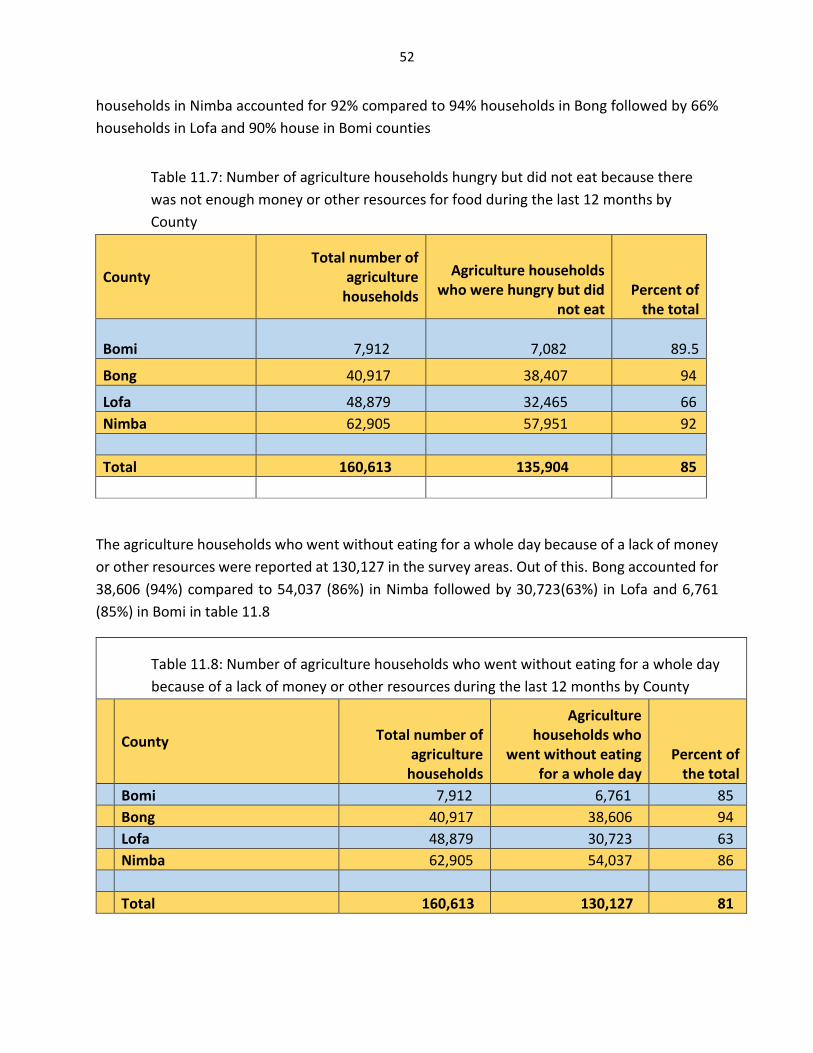
52
households in Nimba accounted for 92% compared to 94% households in Bong followed by 66%
households in Lofa and 90% house in Bomi counties
Table 11.7: Number of agriculture households hungry but did not eat because there
was not enough money or other resources for food during the last 12 months by
County
County Total number of
agriculture households
Agriculture households who were hungry but did
not eat Percent of
the total
Bomi 7,912 7,082
89.5
Bong 40,917 38,407 94
Lofa 48,879 32,465 66
Nimba 62,905 57,951 92
Total 160,613 135,904 85
The agriculture households who went without eating for a whole day because of a lack of money
or other resources were reported at 130,127 in the survey areas. Out of this. Bong accounted for
38,606 (94%) compared to 54,037 (86%) in Nimba followed by 30,723(63%) in Lofa and 6,761
(85%) in Bomi in table 11.8
Table 11.8: Number of agriculture households who went without eating for a whole day
because of a lack of money or other resources during the last 12 months by County
County Total number of agriculture
households
Agriculture households who
went without eating for a whole day
Percent of the total
Bomi 7,912 6,761 85
Bong 40,917 38,606 94
Lofa 48,879 30,723 63
Nimba 62,905 54,037 86
Total 160,613 130,127 81

53
11.9 : Presence of food shortage
Table 11.9 shows the total number of agriculture households experiencing food shortage during
the last 12 months in study areas were reported at 19,236. Out of this, Lofa county accounted
for 33% follow by Bong 4%, Nimba 2% and Bomi 1%.
Table 11.9: Agriculture households who experienced food shortage during the last 12
months by County
County Total number of
agriculture households
Number of agriculture
households experiencing food
shortage Percent of the
total
Bomi 7,912 51 0.65
Bong 40,917 1,806 4.6
Lofa 48,879 16,211 33
Nimba 62,905 1,168 2
Total 160,613 19,236 12
11.: Reason for food shortage
Several reasons were adduced by the households as contributing to the food shortages (Table
11.11). The total number of agriculture households that food shortage affected were reported at
175,233 of which males accounted for 86,923(49.6 %) and females.88,310 (50.4%).
The major reasons identified for food shortages include the following: loss of crops/insufficient
production affected 107,138 of the households, Lack of adequate capital affected 40,323
households, family size too big affected 18,558 households, lack of adequate labour affected
3,255 households, Inability to work because of illness or injury affected 2,380 households, lack of jobs
affected 1,895 and other affected 1,382. More importantly, disable or old people, loss of livestock
and over selling produce were considered zero.

54
Table 11.11: Main reason for food shortage by Sex in last 12 months
Main Reasons for food shortage
Number of agriculture households
Male Female Total
Loss of crops/Insufficient production 53,404 53,734 107,138
Lack of jobs 1,125 770 1,895
Inability to work because of illness or injury 1,190 1,190 2,380
Disabled, old age - - -
Lack of adequate land - 302 302
Lack of adequate capital 19,697 20,626 40,323
Family too big 9,279 9,279 18,558
Lack of adequate labour 1,537 1,718 3,255
Over selling produce - - -
Loss of livestock - - -
environmental or political crises - - -
Others 691 691 1,382
Total 86,923 88,310 175,233
11.12: Household immediate Response to the food shortage by sex
Households who experience food shortages usually adopt various strategies to cope with the
situation. The results depicted in table 11.12 indicate that overall, 286,318 number of agriculture
households experience food shortage during the survey and out of this, the male adult account
for 86,923(36.8%) and female adult 88,310 (37.4%). Those who reduced the size of their meals
to allow the other household members to eat bigger portion was estimated at 252,771 and out
of this, female adult account for (29.1%), male adult(28.5%) then the boys (21.0%). Similarly, 21.4
percent of the girls also reduced their meals. Eating less preferred food affected 33,567 number
of agriculture household and out of this, male adult account for 44.4% compared to 43.9 percent
of the adult females. The same applied to the boys (6.4%) ate less preferred food in comparison
to the girls (5.2%).
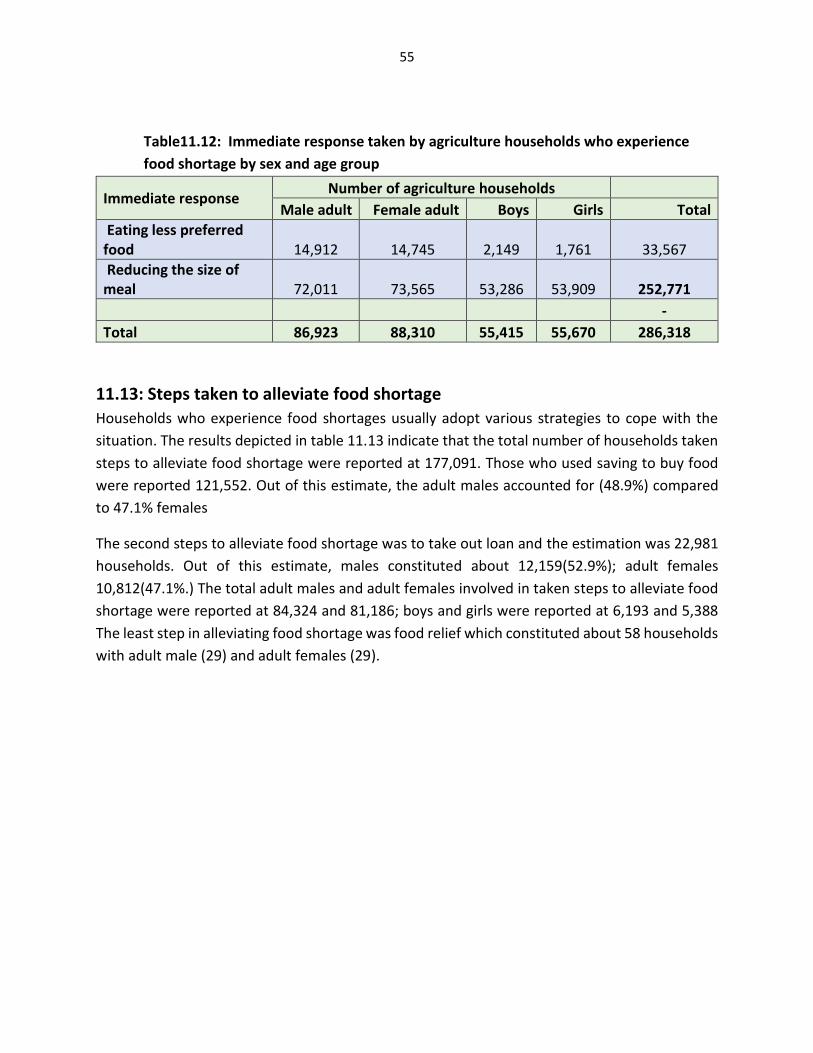
55
Table11.12: Immediate response taken by agriculture households who experience
food shortage by sex and age group
Immediate response Number of agriculture households
Male adult Female adult Boys Girls Total
Eating less preferred food 14,912 14,745 2,149 1,761 33,567
Reducing the size of meal 72,011 73,565 53,286 53,909 252,771
-
Total 86,923 88,310 55,415 55,670 286,318
11.13: Steps taken to alleviate food shortage
Households who experience food shortages usually adopt various strategies to cope with the
situation. The results depicted in table 11.13 indicate that the total number of households taken
steps to alleviate food shortage were reported at 177,091. Those who used saving to buy food
were reported 121,552. Out of this estimate, the adult males accounted for (48.9%) compared
to 47.1% females
The second steps to alleviate food shortage was to take out loan and the estimation was 22,981
households. Out of this estimate, males constituted about 12,159(52.9%); adult females
10,812(47.1%.) The total adult males and adult females involved in taken steps to alleviate food
shortage were reported at 84,324 and 81,186; boys and girls were reported at 6,193 and 5,388
The least step in alleviating food shortage was food relief which constituted about 58 households
with adult male (29) and adult females (29).

56
Table 11.13: Steps taken to alleviate food shortage by agriculture households who
experience food shortage by sex and age group
Steps taken to alleviate food shortage
Number of agriculture households
Adult Male Adult Female Boys Girls Total
Use savings to buy food
59,395 57,268
2,299
2,590 121,552
Take out a loan 12,169 10,812 - - 22,981
Sold land - - - - -
Sold livestock 2,074 1,388 - - 3,462
Get another job 3,902 3,908 924
312 9,046
Social grand - - - - -
Food relief 29 29 - - 58
Help from charities 2,142 2,898 - - 5,040
Other (Specify) 4,611 4,881 2,970
2,486 14,948
Total 84,324 81,186
6,193
5,388 177,091
11.15: Households reported to likely experience food shortages
This section looks at households which likely experience food shortage in the next 12 months.
Table 11.15 shows that food shortages affected 67,803 households and 59 percent of 24,328
households in Bong experienced food shortage. Similarly, food shortage was encountered by
most households in Bomi (46%) and Lofa (40%). Just 33 percent of households experienced food
shortage in Nimba
Table 11.15: Number of agriculture households reported to likely experience food
shortages in next 12 months by County
County Total
agriculture households
Agriculture households reported likely to experience food shortage
during the next 12 months Percent of the
total
Bomi 7,912 3,616 46
Bong 40,917 24,328 59
Lofa 48,879 19,340 40
Nimba 62,905 20,519 33
Total 160,613 67,803 42

57
11.16: Natural and Man-made Disasters
Natural and man-made disasters when they occur have direct consequences on food security.
Therefore, attempt was made to ascertain whether households in the four counties encountered
any natural or man-made disaster in the 12 months before the survey. The results are captured
in Table 11.16. Floods affected about 112,845 households in all the four counties. Out of this
estimate, no damages done to 100,958 households, 7,683 were slightly affected and 3,683
moderately affected and 521 severely affected.
Drought also affected agriculture households in the study areas. 112,845 households were in all
the four counties. NO damage was reported at 107,773, 3,177 were slightly affected, 1,895
moderately affected.
Another natural disaster which caused the households was pests/diseases. It affected 112,844
agriculture households in all the counties. 20,885 households were slightly affected, 7,814
moderately affected and 696 severely affected, and there was no damage done to 81,806
households in the four counties.
Erratic rains – that is, rains falling when they are not expected and failing to fall when they are
expected disrupt agricultural activities. 160,613 agriculture households in the four counties
suffered from erratic rains, and out of this, about 135,601 households were not affected, while
13,531were slightly affected, 11,174 were moderately affected, 307 were severely affected.
Man-made disasters such as insecurity and setting fire to farms affected some of the households.
Again, the four counties suffered from insecurity were reported at 160,613 households. Out of
this estimate, no damages done to 140,281 household, while 6,130 were slightly affected and
14,202 were moderately affected. Finally, wildfires caused by man affected 160,613 households
in all the four counties while 2794 were slightly affected and 2780 were moderately affected

58
Table 11.16: Number of agriculture households who experienced natural and man-
made disaster by severity of disaster
Type of disaster Number of agriculture households reporting
No damage Slight
Moderate Severe Total
Natural
Floods and tidal waves 100,958 7,683 3,683
521
112,845
Drought 107,773 3,177 1,895
112,845
Typhoons or hurricanes/ Hailstorms 111,204
383 709
549
112,845
Pests/diseases 81,806 20,885 7,814
2,339
112,844
Erratic rains 135,601 13,531 11,174
307
160,613
Wild fires 152,268 828 6,688
828
160,612
Other 144,292 10,264 6,056
160,612
Man made
Insecurity 140,281 6,130 14,202
160,613
Wild fires 155,039 2,794 2,780
160,613

59
CHAPTER 12: LABOUR INPUT
12.1: Agricultural household members by status of employment
There were 743,234 household members engaged in permanent agricultural activities compared
to 834,088 agriculture household members involved in temporary agricultural activities. Adult
males constituted 38.7% (287,501), adult females 38.8% (288,027), boys 11.3% (84,231) and girls
11.2% (83,475). Except for Lofa County where adult females (148,576) were more than adult
males (127,839), both adult males and boys were 371,732 (50.01%) more than 371,502(49.98%)
adult females and girls in the three other counties (Table 12.1)
In Lofa, the adult females (146,217) involve in temporary agricultural activities were more than
adult males (120,660) and in Nimba, there were 151,579 adult males compared to 78432 adult
females. For boys and girls, the girls in Lofa (48,914) were more than 5,743 girls in Nimba while
the boys in Lofa (54,422) were also more than the (10,075) boys in Nimba in comparison, 834,088
temporary agriculture activities were more than 784,234 permanent agriculture activities
Table 12.1: Number of agriculture households members engaged in agricultural
activity in past 12 months by work status, sex, age group and County
Work Status
COUNTY
Number of households members who worked as Permanent agric. activities
Number of household’s members who worked as Temporary agric. activities
Adults male
Adult female Boys Girls Total
Adults male
Adult female Boys Girls Total
Bomi 8,056
8,225
1,290
1,030
18,601
39,774
13,217
2,335
2,261
57,587
Bong 63,404
61,505
33,936
42,819
201,664
48,714
53,170
27,167
31,307
160,358
Lofa
127,839
148,576
47,622
39,298
363,335
120,660
146,217
54,422
48,914
370,213
Nimba
88,202
69,720
1,383
328
159,633
151,679
78,432
10,075
5,743
245,929
Total
287,501
288,027
84,231
83,475
743,234
360,827
291,036
94,000
88,225
834,088

60
12.2: Paid employees
There were 339,528 adult males from 15 years and above households which reported having paid
employees. Lofa reported the highest number of households with paid employees of 186,993
(53.3%) followed by Nimba County with 88,755 (26.1%) (Table 12.2). There were 291,470 adult
females from 15 years and above households which reported having paid employees. Again, Lofa
county reported the highest number of households with paid employees of 192,584 (66.1%)
followed by Nimba county with 61,283(21.0%), while the least was Bong County 37,602 (12.9%).
In comparison, the survey report indicates that the adult males from 15 years above involved in
temporary paid employees were reported at 596,387 higher than 339,528 permanent adult male
employees. In addition, the adult females from 15 years and above involved in temporary paid
employees were reported at 482,785 higher compared to 291,470 adult females’ permanent
employees.
Table 12.2: Number and distribution of agriculture households who reported having
paid employees by Sex and County
Agricultural Households reporting paid employees
COUNTY Total agricultu
re househo
lds
Number of permanently paid employees during the past 12 months
Number of temporary paid employees during the past 12 months
ADULT MALES 15 years and above
ADULT FEMALES 15 years and above
CHILDREN BOYS less than 15 years
CHILDREN GIRLS 15 years below
ADULT MALES 15 years and above
ADULT FEMALES 15 years and above
CHILDREN BOYS less than 15 years
CHILDREN GIRLS less than 15 years
Bomi 7,912
132 - - -
35,153
7,109 - -
Bong 40,917
63,647
37,602 4,499
18,435
68,979
34,704
8,435
6,452
Lofa 48,879
186,993
192,584 53,649
49,410
195,556
207,747
52,393
49,410
Nimba 62,905
88,755
61,283 1,196
8,535
295,700
233,225
21,325
11,416
Total 160,613
339,528
291,470 59,344
76,379
595,387
482,785
82,153
67,278
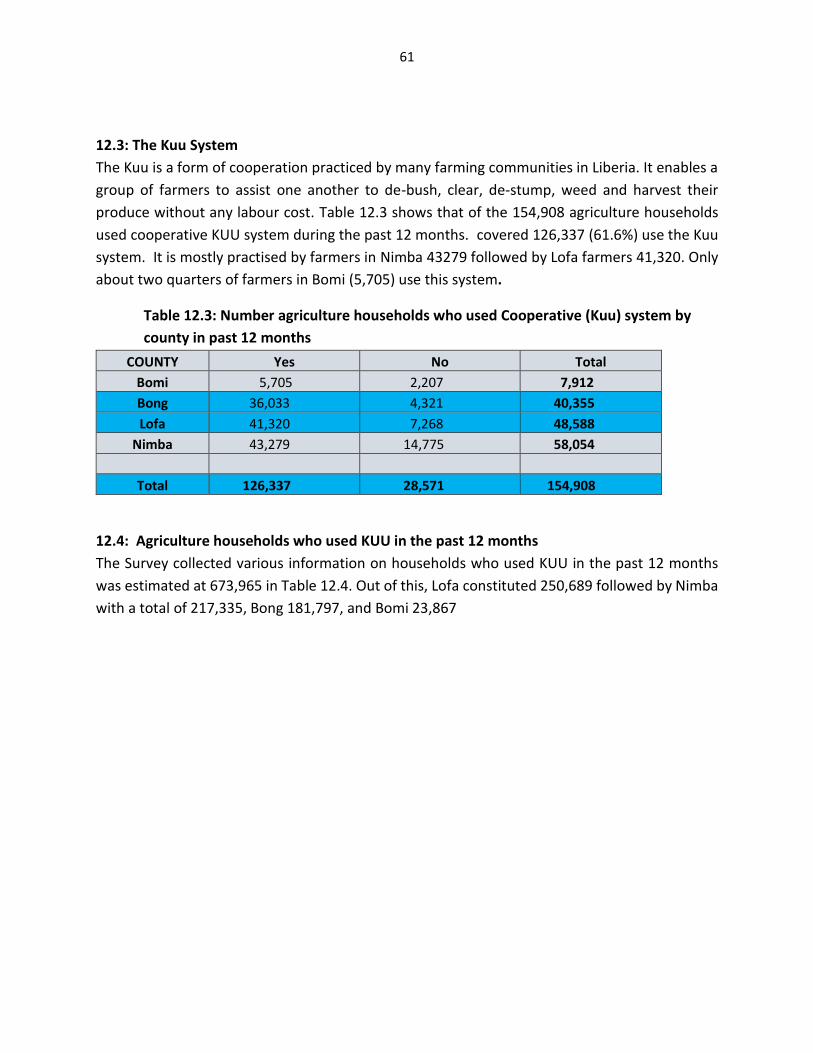
61
12.3: The Kuu System
The Kuu is a form of cooperation practiced by many farming communities in Liberia. It enables a
group of farmers to assist one another to de-bush, clear, de-stump, weed and harvest their
produce without any labour cost. Table 12.3 shows that of the 154,908 agriculture households
used cooperative KUU system during the past 12 months. covered 126,337 (61.6%) use the Kuu
system. It is mostly practised by farmers in Nimba 43279 followed by Lofa farmers 41,320. Only
about two quarters of farmers in Bomi (5,705) use this system.
Table 12.3: Number agriculture households who used Cooperative (Kuu) system by
county in past 12 months
COUNTY Yes No Total
Bomi 5,705 2,207 7,912
Bong 36,033 4,321 40,355
Lofa 41,320 7,268 48,588
Nimba 43,279 14,775 58,054
Total 126,337 28,571 154,908
12.4: Agriculture households who used KUU in the past 12 months
The Survey collected various information on households who used KUU in the past 12 months
was estimated at 673,965 in Table 12.4. Out of this, Lofa constituted 250,689 followed by Nimba
with a total of 217,335, Bong 181,797, and Bomi 23,867

62
Table 12.4: Number of Agriculture Households Who Use KUU In the Past 12 Months by
Type of farming
Type of Farming Activity Kuu are deployed to do
COUNTY
Number of Households
Bomi Bong Lofa Nimba Total
A. Brushing 5,705 35,342 40,301
42,809 124,156
B. Felling 5,705 28,614 35,860
30,091 100,269
C. Clearing 3,824 24,959 37,028
36,273 102,084
D. Planting 4,959 27,847 36,749
37,987 107,543
E. Weeding 1,961 22,224 35,853
25,313 85,351
F. Harvesting 1,580 24,815 36,263
34,344 97,001
G. Fencing 33 17,996 28,815
10,518 57,361
Total: 23,767 181,797 250,869
217,335 673,765

63
CHAPTER 13: EQUIPMENT
13.1: Households who reported used of agriculture equipment
Table 13.1 in appendix D show the type of agriculture equipment used and owned during the
past 12 months. The total number of hoes reported in the survey areas were 155,799. Out of this,
138,690 were owned solely by the holders while 11,699 were owned by the holding jointly with
other holders and 4,799 were borrowed.
The second total type of equipment reported were 129,849 Axes. Out of this estimate, 110,382
axes were owned by the holders while 13, 437 were owned by the holding jointly with other
holdings and 5,111 axes were borrowed. Although, 307 were provided by other private holders.
The total type of equipment used during the survey were reported at 513,697, out of this,
445,523 were owned solely by the holders, 48,258 were jointly owned by the holdings with other
holders, borrowed 15,912 while 2,664 were provided by landlord. Most importantly, 828 tractors
were rented but none was owned by the holders.
13.2: Agriculture equipment owned by type
The total number of agriculture equipment owned by type and average were collected during
the survey. The results are presented in table 13.2 appendix D. About 155,709 households
reported that they owned 646,959 hoes with the average of 4 per household.
The second type of equipment were axes and 129,849 households reported that they owned
368,531 axes with total average of 3 per household in the four counties, while 83,267 total
number of households reported owned 430,873 pangas/machete with 5 on average per
household compared to 12,998 households who reported that the owned 34,372 pruning knives
with the average of 3 per household in the four counties. In all the four counties, it was reported
that 513,697 agriculture households stated that they owned 1,810,200 equipment with the total
average of 4 per household.
13.3: Agriculture households equipment type, and years owned
In Table 13.3 about 513,697 agriculture households reported they owned 281,590 equipment for
less than 1 years ago, 224,956 equipment from 1 to 4 years ago and 3,867 equipment for 5 to 9
years ago. According to the table, 155709 agriculture households stated they owned 80,025 hoes
for the period less than one year, while 72966 hoes for 1 to 4 years compared to 1,153 hoes for
5 to 9 years. 129,849 agriculture households acquired 54,248 axes for less than 1 year compared
to 72,586 for 1 to 4 years while 1,793 for 5 to 9 years. Most importantly, the 828 agriculture
households acquired the 823 tractors for less than 1 year.

64
Table 13.3: Number of agriculture households by type of equipment owned, years
acquired of equipment and County in past 12 months
13.4: Distribution of agriculture household’s equipment
The number and distribution of agriculture households by type of equipment owned and usage
in the past 12 months was presented in table 13.4. The results show that 153,776 hoes followed
by 128,034 axes, 82,010 pangas/machete were in good condition. About 12,747 pruning knives,
26,446 pail, 72,212 file/sharping stones were all in good working condition during the survey
period. Most importantly, the total number of equipment owned and in good working condition
by agriculture households were reported at 506,729
Type of Equipment
No. of agriculture households
reporting equipment
Less than 1 year
ago 1-4 years ago
5 -9
Years
ago
10 years
and Over
Hoes 155,709 80,625 72,966 1,153 965
Axes 129,849 54,248 72,586 1,793 1,222
Slashers 5,594 2,417 2,628 - 549
Pangas/Machete 83,267 47,418 34,381 920 549
Watering cans 2,812 1,715 1,097 - -
Wheelbarrows 5,855 2,183 3,672 - -
Pruning knives 12,998 8,924 4,075 - -
Pruning saws 833 833 - - -
Chain/Handsaw - - - - -
Sheller spade - - - - -
Fork hoe 4,459 - 4,459 - -
Tractor 828 828 - - -
Plough mechanical - - - - -
Ox-plough - - - - -
Trailer - - - - -
Harrow/Cultivator - - - - -
Weeder - - - - -
Planter - - - - -
Sprayer 29 29 - - -
Pail 26,446 24,588 1,858 - -
Milk can 194 97 97 - -
Hand Mill (Manual Hammer) 1,156 583 573 - -
Hammer Mill (Engine Driven) - - - - -
Ox Cart 5,610 2,298 3,312 - -
File/sharpening stone 78,056 54,804 23,252 - -
Other, specify - - - - -
Total 513,697 281,590 224,956 3,867 3,284
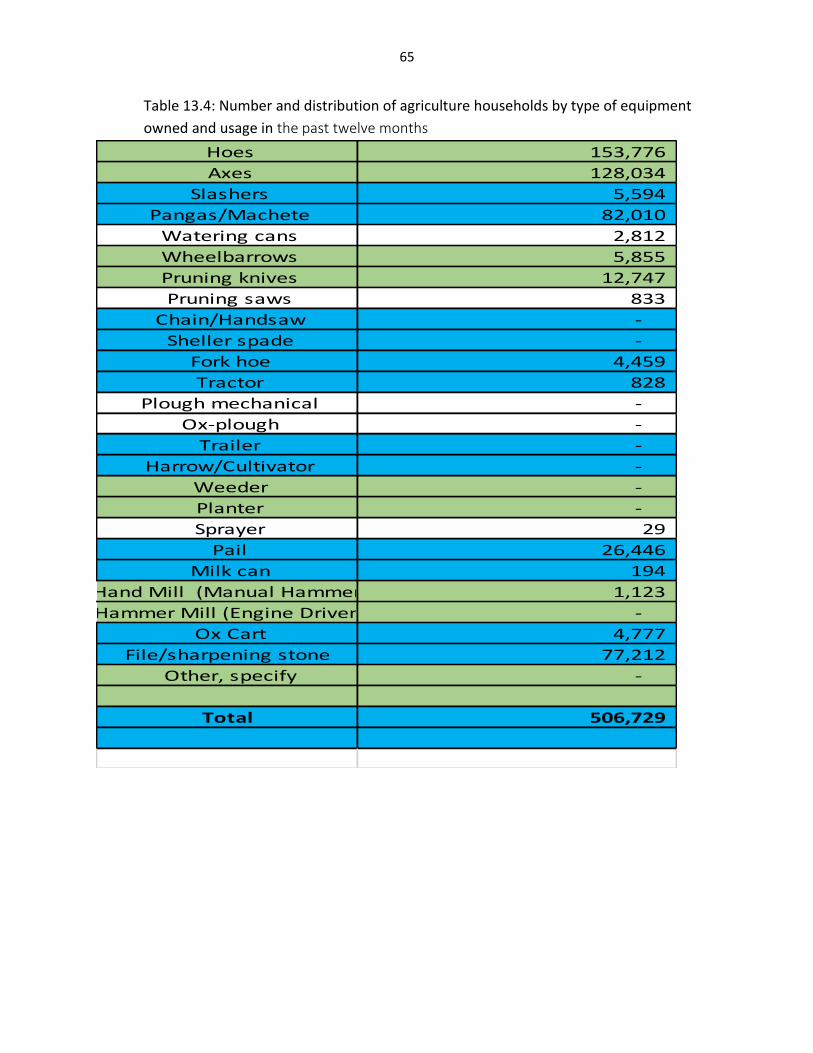
65
Table 13.4: Number and distribution of agriculture households by type of equipment
owned and usage in the past twelve months
Hoes 153,776
Axes 128,034
Slashers 5,594
Pangas/Machete 82,010
Watering cans 2,812
Wheelbarrows 5,855
Pruning knives 12,747
Pruning saws 833
Chain/Handsaw -
Sheller spade -
Fork hoe 4,459
Tractor 828
Plough mechanical -
Ox-plough -
Trailer -
Harrow/Cultivator -
Weeder -
Planter -
Sprayer 29
Pail 26,446
Milk can 194
Hand Mill (Manual Hammer) 1,123
Hammer Mill (Engine Driven) -
Ox Cart 4,777
File/sharpening stone 77,212
Other, specify -
Total 506,729

66
CHAPTER 14: LIVESTOCK
14.1: Livestock ownership
According to the 2011 Liberia Annual Agriculture Survey3, a concerted effort was made by
international and local organizations to restocking the livestock looted during the civil conflict.
The effort seems to be paying off. The Pilot Survey data shows a total of 40,175 (25%) agriculture
households reported of having livestock (cattle, goats, sheep, poultry etc.). A 42.0 percent of
households in Nimba County reported of having livestock followed by Bong with 16.0 percent.
Both Lofa and Bomi recorded about 14.0% and 2.0 % respectively.
Table 14.1: Number and distribution of agriculture households who have livestock by
County in past 12 months
COUNTY Total Agriculture
Households Agriculture households who reported livestock Percent of the total
Bomi 7,912 186 2
Bong 40,917 6,516 16
Lofa 48,879 7,040 14
Nimba 62,905 26,434 42
Total: 160,613 40,175 25
14.2: Type of Cattle
This section examines the number of cattle owned by both males and females in Lofa and Nimba
and the results show that there were about 8,619 herds of cattle owned by the households with
females accounting for 5,011(58.14%. The indigenous cattle (beef) constituted 4,137(82.6%) and
crossbreed (beef) were 874 (17.4%) compared to the number of cattle owned by males’
household’s member with the total indigenous cattle of 3,608 (41.9%) in Appendix D
3 Source: LIGIS; 2011 Liberia Annual Agriculture Survey
67
14.3: Goats and Sheep
Table 14.3 depicts the number of goats and sheep owned by the households in three out of the
four counties. The survey report indicates that Bomi, Lofa and Nimba recorded 48,375 number
of goats. Male household members owned 48.3 percent (23,373) compared to 51.7 percent
(25,002) owned by females. The total female goats/doe were 15,634 as against 12,396 male
goats/buck. Similarly, the number of female goats less than one year old (13,688) was more than
the number of male goats (6,657) less than one year old. This indeed portend well for the goat
growth of the goat industry.
Table 14.3 in appendix D also shows that the number of sheep was 16,917 with male household
members owning 5,656 (33.4%) while the female household members owed 11,261 (66.6%).
Unlike goats, the rams (9,911) were about twice the number ewes (3,867). Likewise rams of less
than one year were 2,557 compared to 582 ewes of less than one ye
14.4: Other domestic animals by type
Data was collected on other domestic animals like pigs, horses, dogs, and cats. The findings show
that 11,541 pigs, 20,852 dogs, 3,164 cats and 26,084 others are in table 14.4 appendix D. There
was no horse in any of the four counties surveyed (Table 14.4). For the pigs, male household
members owned 1,823 (15.8%) and females owned 9,718 (84.2%).
14.5: Distribution of livestock intake by type
The number of distribution of livestock intake found in Bong and Nimba counties were reported
at 1,082 cattle, 17,565 goats, 13,135 sheep, and 3,443 pig. Out of this estimate, 7,143 goats,
3,064 sheep, 1,335 pig and 721 cattle heads of livestock were alive in the farm during the past 12
months compared to 10,422 goats, 10,071 sheep, 2,109 pig and 361 cattle heads of livestock
bought or received from other in Table 18.5

68
Table 14.5: Number and distribution of livestock intake by Type and County during the
last 12 months
Bong
Type of livestock Number of livestock
bought or received from others
How many head of livestock were born alive in the farm
during the last 12 months Total livestock intake
Cattle -
-
-
Goat 2,607
-
2,607
Sheep 8,962
1,330
10,292
Pig -
326
326
Nimba
Type of livestock Number of livestock
bought or received from others
How many head of livestock were born alive in the farm
during the last 12 months Total livestock intake
Cattle 361
721
1,082
Goat 7,815
7,143
14,958
Sheep 1,109
1,734
2,843
Pig 2,109
1,009
3,117
14.6: Distribution of Livestock off-take by type
Table 14.6 show the number of distribution of livestock off-take by type during the past 12
months in Nimba county were reported at 4,731 cattle, 8,064 goat, 582 sheep and 1,275 pig.
Out of this, 1,077 cattle,7,391 goat,194 sheep and 420 pig were consumed compared to 2,827
cattle, 673 goats, 388 sheep and 855 pigs were sold.
69
Table 14.6: Numbers and distribution of livestock off-take by type and County during the
last 12 months
Nimba
Type of livestock
Number consumed Number sold Number given away/gifts
Total livestock off-take
Cattle 1,077
2,827
827 4,731
Goat 7,391
673
- 8,064
Sheep 194
388
- 582
Pig 420
855
- 1,275
14.7: Distribution of livestock losses by type
The survey highlighted the number of livestock that lost during the reference period. In table
14.7 indicates 1,032 goats, 6,626 sheep, and 416 pig lost in the Bong and Nimba counties. About
725 goats died due to disease and 307 died due to other reasons. About 6,625 sheep died due
to starvation and 416 died due to disease.

70
Table 14.7: Number and distribution of livestock losses by type of livestock, reason for loss and
County during the Reference Period
Bong
Type of livestock Deaths due to disease Stolen or lost
Lost to predators
Dead due to starvation
Loss due to other reasons
Total livestock losses
Cattle -
-
- -
-
-
Goat -
-
- -
-
-
Sheep -
-
- 6,626
-
6,626
Pig -
-
- -
-
-
Nimba
Type of livestock Deaths due to disease
Stolen or lost Lost to
predators Dead due to starvation
Loss due to other reasons
Total livestock losses
Cattle -
-
- -
-
-
Goat 725
-
- -
307
1,032
Sheep -
-
- -
-
-
Pig 416
-
- -
-
416
14.8: Poultry Type
A total of 600,260 poultry of different kinds were documented. Out of this, Lofa account for
208,297 indigenous chicken where female owned 159,796 and male account for the least 48,501
followed by Nimba county accounting for 190,673 poultry of different kinds. In Nimba the total
indigenous chicken account for 198,322 where female owned 135,530 higher than male with
53,792. The results clearly show that poultry rearing is the preserve of the female household
member accounting for close to 70.3 percent of the total whereas, male households constituted
29.7% in the study areas. At the county level, the number of indigenous chickens were 507,691,

71
Guinea fowl 1,014, exotic chicken/ broiler 33, and other1,522. Moreover, the number of
indigenous chickens owned by females were reported at 421,114 and males 176,577 while
females owned 1,014 Guinea fowl and 33 exotic chickens in Table 8.5.
Table 14.8: Number and distribution of poultry by type, and County
Bomi
Type of Poultry Number of Poultry
Number of Poultry owned by female household members
Number of Poultry owned by male households’ members
Indigenous Chicken 26,314 25,348 966
Exotic Chicken (layers) - - -
Exotic Chicken (broilers) 33 33 -
Others, specify 175 - 175
Total 26,523 25,381 1,142
Bong
Type of Poultry Number of Poultry
Number of Poultry owned by female household members
Number of Poultry owned by male households’ members
Indigenous Chicken 173,757 100,440 73,317
Guinea Fowl 1,010 1,010 -
Pigeons - - -
Others, specify - - -
Total 174767 101,450 73,317
Lofa
Type of Poultry
Number of Poultry
Number of Poultry owned by female household members
Number of Poultry owned by male households’ members
Indigenous Chicken 208,297
159,796 48,501
Exotic Chicken (layers) -
- -
Others, specify - - -
Total 208297 159,796 48,501

72
Nimba
Type of Poultry Number of Poultry
Number of Poultry owned by female household members
Number of Poultry owned by male households’ members
Indigenous Chicken 189,322 135,530 53,792
Guinea Fowl 5 5 -
Pigeons - - -
Others, specify 1,346 - 1,346
Total 190673 135,535 55,138

73
CHAPTER 15: CHALLENGES AND LESSONS LEARNT
• Listing and Field Exercise
➢ Bad road network.
➢ Lack of internet connectivity/communication.
➢ Language barrier
➢ Transportation was inadequate for enumerators
➢ The time used for training the field teams was too short. Many enumerators including
their supervisors could not fully understand the concepts and definitions of terms in the
short period.
➢ MOA / FAO were unable to provide support to technical team for data analysis and
report writing, for example, lack of laptops, lack of internet service, No DSA and
transportation to do the analysis
• Recommendations
Field work should be planned to coincide with the major harvest period to ensure that the crop
cutting exercise could be used to properly estimate crop production and crop yield. Any time an
annual agriculture survey is to be undertaken, statisticians and data processing personnel should
be recruited at same time and work through the instruments (questionnaires, manuals and survey
design) together.
Enough time should be given for field training during which time consultants (statistics and data
processing) should be around. Again, provision should always be made for the staff of the
Secretariat to monitor closely the field exercise. Support should be given to technical team to do
the work on time. The final tables which will be delivered by the TCDC Data Processing
Consultant should be treated as statistical abstracts.
• Conclusion Despite the challenges encountered, the results generally show that the survey instruments
(questionnaires) can help address most of the food security and vulnerability issues in Liberia and
the CAPI technology is very effective and efficient in collecting agriculture data.
However, it must be stressed that the data from the Pilot Survey covered only four (4) out of the
15 counties in Liberia and cannot substitute for data from the annual agriculture survey since the
TCP was primarily put in place for the FAO to assist the MoA to undertake a pilot agriculture
survey based on the CAPI technology. Therefore, the MoA Management should endeavor to
ensure that resources are mobilized from the Government of Liberia and other development
partners to undertake the main survey as soon as possible.

74
APPENDIX
A. Glossary of Terms
Agricultural holding: An agricultural holding is an economic unit of agricultural production under single management comprising all livestock kept and all land used wholly or partly for agricultural production purposes, without regard to title, legal form, or size.
Agricultural holder: The agricultural holder is defined as the civil or juridical person who makes the major decisions regarding resource use and exercises management control over the agricultural holding operation.
Area of holding according to land use types: Land use refers to activities – such as growing crops, raising livestock or cultivating fish – carried out on the land making up the holding with the intention of obtaining products and/or benefits.
Agricultural census reference period: The reference period for agricultural census items varies according to the type of data. The reference periods are usually the day of enumeration (for inventory items) or a twelve-month reference period (for continuing activities).
Agricultural Extension Services: refers to the provision of agricultural advice and information.
Locality: A locality is any place with one or more dwellings, either a compact settlement or to crop and livestock producers etc. Extension services may be provided by Government scattered houses.
Agricultural Equipment: refers to machinery, implements and other facilities
Area harvested: Area harvested refers to the total area from which the crop is gathered.
Arable land: Arable land is land that is used in most years for growing temporary crops. It includes land used for growing temporary crops in twelve months reference period, as well as land that would normally be so used but is lying fallow or has not been sown due to unforeseen circumstances.
Agricultural land: Agricultural land is the total of cropland and permanent meadows and pastures.
Agricultural Season: The main/first agricultural season normally refers to the growing cycle of temporary crops that are planted and harvested in the first half of the year, occasionally extending up to the end of June.

75
Agro-forestry: farm management system involving growing trees in conjunction with crops and livestock production.
Aquaculture: farming of aquatic organisms including fish, crustaceans, mollusks, and aquatic plants.
Apiary: is the maintenance of honeybee colonies, commonly in hives, by humans.
Collateral is defined as assets pledged as security for a loan of money, which means that if the borrower defaults on the terms of the loan, the collateral may be sold, and the proceeds used to pay off the loan. For the purpose of the agricultural census, collateral is used in a wider sense to also cover guarantee provided for the purchase of goods and services.
Cropland: Cropland is the total of arable land and land under permanent crops.
Drainage: removal of excess water to improve agricultural productivity.
Drip irrigation: A drip irrigation system delivers water directly to the root zone of a plant, where it seeps slowly into the soil one drop at a time. Almost no water is lost through surface runoff or evaporation, and soil particles have plenty of opportunity to absorb and hold water for plants
Economic activity status: a classification describing a person as employed, unemployed or not economically active.
Economically active: a person who is either employed or unemployed.
Economic Production Activities: Other economic production activities are economic production activities undertaken by the household enterprise, other than agricultural production on the holding.
Educational attainment: highest level of education achieved by a person.
Employed: a person with paid work or in self-employment.
Employee: a person in paid employment.
Enumeration area (EA): small geographic unit defined for census enumeration purposes.
Enterprise: an economic unit under single management consisting of one or more than one establishment.
Exotic: Refers to livestock introduced in the country from abroad.

76
Extension workers: These are individuals employed by the government or non-governmental organizations who work as an agricultural development agent for contacting and demonstrating improved farming methods to farmers. They are responsible for organizing, disseminating, guiding and introducing technical methods in agricultural production directly to farmers and for facilitating farmers coming into contact with cultivation methods to promote agricultural production.
Extension Services: refers to personal contact with extension personnel or direct participation in extension activities such as a farm demonstration.
Environmental conservation: refers to practice of protecting the environment, on individual, organizational or governmental level, for the benefit of the natural environment.
Freehold farms: The permanent ownership of land or buildings which can be legally passed on to heirs
Fertilizers: substances that supply plants with nutrients or enhance plant growth, containing at least 5% of the three primary nutrients.
Forest: land with trees of height 5 meters or more with crown cover of more than 10%.
Frame: the basis used for identifying all the statistical units to be enumerated in a statistical collection.
Field: A field is a piece of land in a parcel separated from the rest of the parcel by easily recognizable demarcation lines, such as parts, cadastral boundaries and/or hedges.
A field may consist of one or more plots, where a plot is a part or whole of a field on which a specific crop or crop mixture is cultivated.
Farm management practices refers to the different activities practiced on the farm, such as use of irrigation, application of fertilizers, use of improved seed, use of pesticides, etc.
Feeder road: is a minor or small road used to bring the traffic to a major road.
Granary: is a special storage house which has been constructed in such a way that e.g., rodents will not easily access the granary.
Household: A household consists of one or more persons related or unrelated who live informal grass-roots organizations, and others, together in one or part of one or more than one housing unit/dwelling unit and have common catering arrangements.

77
Household food security: the situation where all members of a household always are consuming enough safe and nutritious food.
Household membership: Household size is the number of members of the holder's household. holding solely or partly for agricultural production during reference period. This can be obtained either by listing all household members or asking a direct question on the number of household members.
Head of household: The Head of the household is a person of either sex who is a member of the household and generally runs the affairs of the household and is looked upon by the other members of the household as the main decision maker.
Hired labour: Is labour input supplied by other persons other than the holding members and who are paid for their work either in cash or kind or both. The persons are hired for doing agricultural work on the holding; they can be permanent or temporary.
Irrigation: Irrigation refers to purposely providing land with water, other than rain, for improving pastures or crop production.
Improved/cross refers to livestock which are crosses of exotic and indigenous breed.
Indigenous cattle: refers to livestock of local types e.g. the long-horned cattle.
Joint holder: is a person making the major decisions regarding resource use and exercising management control over the agricultural holding operations, in conjunction with another person.
Legal status: Legal status refers to the juridical aspects under which the agricultural holding is operated. It also refers to other aspects about the type of holding. From the juridical point of view, a holding may be operated by a single individual, jointly by several individuals with or without contractual agreement belonging to the same or to different households.
Land tenure: Land tenure refers to the current status of the land operated by the holding. The collection of data should relate specifically to that land. Land rented out to others should be excluded. The reference period for land tenure data is usually the day of enumeration.
Land temporarily fallow: Land temporarily fallow is arable land at prolonged rest before re-cultivation. This may be part of the holding’s crop rotation system or because the normal crop cannot be planted because of flood damage, lack of water, unavailability of inputs, or other reasons.

78
Land under temporary crops: Land under temporary crops includes all land used for crops with a less than one-year growing cycle; that is, they must be newly sown or planted for further production after the harvest.
Land under permanent crops: Land under permanent crops refers to: land cultivated with long-term crops which do not have to be replanted for several years; land under trees and shrubs producing flowers, such as roses and jasmine; and nurseries (except those for forest trees, which should be classified under “forest or other wooded land”). Permanent meadows and pastures are excluded from land under permanent crops.
Land under temporary pastures is the land temporarily cultivated with pastures.
Land under permanent pastures means land used permanently (i.e. for five years or more), seeded and cared for or grown naturally (grazing land). Permanent pastures on which trees and shrubs are grown should be classified under this category only if the growing of grass (naturally growing grass) is the most important use of the area.
Land use: classification of land according to the activity undertaken on the land.
Legal status of holder: juridical aspects under which an agricultural holding is operated.
Livestock: animals (including birds and insects) kept or reared in captivity mainly for agricultural purposes.
Loan/Credit: Loan for agricultural purposes refers to any type of credit received for purposes related to the operations of the agricultural holding.
Local produce market: refers to farmers who buy produce at your local farmer market. Farmer’s markets feature local farmers who sell their products once or twice a week at stands located in public use areas.
Miller: refers to a person who operates a mill, a machine to grind a cereal crop to make floor.
Mixed or Associated Cropping: Mixed cropping, also called associated and inter-planted cropping, refers to the situation when two or more different temporary or permanent crops are grown simultaneously on the same field or plot.
Mixed stand: This describes different crops simultaneously grown on the same plot.
Module: a separate component of the agricultural census –a modular approach is used for the agricultural census, with core and supplementary modules.

79
Nurseries refer: to a place where young plants are grown and cared for. E.g. some nurseries sell plants to the general public.
Number of years since cleared (for each parcel): The purpose of this item is to better understand the extent of recent land clearances, especially where shifting cultivation is present or where deforestation is a concern. Usually, it will only be necessary to collect data in broad ranges, such as: in the last one year; 1–3 years ago; 4 or more years ago.
Organic fertilizers: fertilizers prepared from processed plant and animal material other wooded land: land with tree/shrub/bush cover less than that required to be classified as a forest.
Own-account agricultural production: a household characteristic, indicating that the household contains one or more agricultural holdings.
Other wooded land: land with trees/shrub/bush cover less than that required to be classified as a forest.
Parcel: A parcel is any piece of land, of one land tenure type, entirely surrounded by other land, water, road, forest or other features not forming part of the holding or forming part of the holding under a different land tenure type.
Pesticide: substances intended to repel, mitigate, control or destroy diseases and pests in plants or animals and to prevent any harm to agricultural commodity during production, storage, transport, processing and marketing etc.
Permanent crops: Permanent crops are crops with a more than one year growing cycle. Permanent crops may be grown in a compact plantation or as scattered trees/plants and both should be included.
Plot: A plot is defined as a piece of land within the holding on which a specific crop or a crop mixture is grown. A parcel may be made up of one or more plots.
Pure stand: This is a crop cultivated in a crop plot. A pure stand can either be permanent or temporary.
Primary Sampling Unit (PSU): The Primary Sampling Units (PSUs) are the areas where the Survey was conducted.
Period of loan or credit refers to the period over which the loan or credit is to be paid off, as agreed at the time the loan was received.

80
Range land Management is the carefully use of land management of rangeland resources (plants, animals, soil and water) to meet the needs and desires of society.
Respondent: The respondent is the person from whom data are collected about the agricultural unit.
Random sampling: sampling method used for sample surveys, in which each unit within the scope of the survey has a fixed, but not necessarily the same, probability of selection in the sample.
Reference period: the time period to which a given data item collected in a census or survey refers – for example, an agricultural year for crops; the day of enumeration for livestock.
Soil degradation: Soil degradation is the decline in soil quality caused by natural processes or, more commonly, improper use by humans. Its consequences include loss of organic matter; decline in soil fertility; decline in structural condition; erosion; adverse changes in salinity, acidity or alkalinity; and the effects of toxic chemicals, pollutants or excessive flooding.
Soil erosion: Soil erosion is the displacement of soil material by running water, rainfall, wind or other factors, resulting in a decline of arable layers
Sub-holding: A sub-holding is defined as a single agricultural activity or group of activities managed by a particular person or group of persons in the holder’s household on behalf of the agricultural holder.
Sub-holder: A sub-holder is a person responsible for managing a sub-holding on the holder’s behalf.
Sampling frame: the means by which all in-scope units are identified for a sample survey.
Sampling error: the error in statistics obtained from a sample survey because data are collected from only a sample of unit
Sector: the institutional category (such as household, corporation, cooperative, government) to which the holding belongs.
Soil degradation: decline in soil quality caused by natural processes or improper use by humans.
Source of Loan refers to who provided the credit.
Specific house/room; refers to a house or room used purely/solely for storage of agricultural produce.
Scope: the geographical area or types of units covered by a statistical collection
Temporary crops: Temporary crops are those with a less than one-year growing cycle.

81
Total area of holding: Total area of holding is the area of all the land making up the agricultural
holding. It includes all land operated by the holding without regard to title or legal form. Thus,
land owned by members of a household but rented to others should not be included in the area
of the holding.
Under shelter/outside; meaning that there are some shelters for storage, but not a house with complete walls.
Unemployment: a situation where a person of working age is without work, available for work and seeking work. Wood or Forest land: includes wood lots or tracts of timber, natural or planted, which have or will have value as wood, timber or other forest products
B. Weighting and Response Rates
Computation of Weights
Weights were computed to take care of the different probabilities of selection in order to obtain the true contribution of each selected EA in the sample based on the first and second stage probabilities of selection.
Let Mhi = Number of 2011 Liberia Population households in the ith selected EA (PSU) in
the hth stratum or county
Mhi* = Number of households listed in the ith selected EA in the hth stratum (county by
UR)
ΣMhi = Total number of households in the ith stratum (i.e. number of households in
either an urban or rural area in a county)
ah = Number of samples EAs allocated to the hth stratum (county by UR)
e.g. a1 = 4 for urban area in Lofa County
and a12 = 10 for a rural area in Lofa County
b = 10 (number of selected households per EA in each stratum)
Then the first and second stage probabilities of selection are:
Pa M
Mhi
h hi
hi
1 =
and *2
hi
hiM
bP =

82
Where,
P1 hi is the probability of selecting the ith EA in the hth stratum, and P2 hi is the probability of selecting a household in the ith EA of the hth stratum. The overall probability of selection of a household in the ith selected EA of the hth stratum is given by:
Fhi = P1 hi * P2 hi
**hi
hi
hi
h
M
M
M
ba
=
The weighting factor (or expansion factor), Whi, for a household in the ith selected EA in the hth stratum is the reciprocal (inverse) of the overall probability of selecting that household.
That is, WF
hi
hi
=1
hi
hi
h
hi
M
M
ba
M *
*=
To cater for non-response the number of households successfully interviewed in each EA was used in the computation. Therefore,
The final weight for the sample households in the j-th cluster within the i-th sample PSU in stratum h is given by:
"
'
*'
b
bhihi WW =
,
Where:
='b The number of interviews plus the number of no interviews in the sample cluster
="b Total number of interviewed sample households selected in the j-th sample PSU within the i-th sample stratum h.
C. Estimates of Sampling Errors
The SPSS Software Complex Samples (CSPlan) module was used for estimating the sampling errors, the coefficient of variation (CV), the confidence limits, the design effect and the square root of the design effect. A CV exceeding 20% is considered very low and signifies that the sample size is too small.

83
D. Appendix D. Tables
Table 2.5: Distribution of population in the agriculture households and holder by sex, age group and
relation to household head by County
County Sex Agriculture Households Population Agriculture Holder Non
Holder Total Male Female Male Female
Bomi
Head 7,912 4,729 3,183 4,357 3,183 371
Spouse 5,719 - 5,719 - 463 5,048
Son/Daughter 23,485 12,592 10,893 51 - 2,660
Son/Daug. in Law 33 - 33 - - 33
Parent 826 175 651 - - 826
Grand Child 1019 411 608
84
Relative 2294 834 1459
1,058
Non-Relative 722 186 536
722
Total 42,010 18,927 23,082 4,408 3,646 10,802
Bong
Head 40,917 32,555 8,362 32,555 8,362 -
Spouse 22,120 - 22,120 - 9,742 11,766
Son/Daughter 128,651 65,648 63,003 2,709 978 24,575
Son/Daug. in Law 2,363 1,391 972 - 828 144
Parent 691 - 691 - - 691
Grand Child 2883 1477 1405 0 0 72
Relative 12090 4656 7433 0 2769 5,530
Non Relative 900 0 900 0 0 900
Total 210,615 105,727 104,886 35,264 22,679 43,678
Head 48,879 27,145 21,735 27,145 21,735 -
Spouse 32,457 - 32,457 - 3,612 28,446
Son/Daughter 94,443 50,108 44,335 - 1,073 21,013
Son/Daug. in Law 1,444 1,060 383 769 107 251
Parent 586 335 251 335
251

84
Lofa
Grand Child 3869 2144 1725
-
Relative 5441 2861 2581 0
1,817
Non Relative 2075 2050 25 1073
291
Domestic Worker 800
800
800
Total 189,994 85,703 104,292 29,322 26,527 52,869
Nimba
Head 62,905 52,591 10,314 51,712 10,314 879
Spouse 50,119 - 50,119 - 30,307 19,812
Son/Daughter 130,582 69,393 61,189 566 - 21,290
Son/Daug. in Law 8,257 2,287 5,970 - - 455
Parent 9,937 8,259 1,678 3,567 - 3,109
Grand Child 9149 2145 7004 0 0 -
Relative 3690 420 3270 416 0 1,900
Non Relative 406 21 384 0 0 395
Domestic Worker 5 0 5 0 0 -
Total 275,048 135,116 139,933 56,261 40,621 47,840

85
Table 2.7: Size of population in the agriculture households, by type of MAIN activity and sex
and County
Main Activi
ty
Bomi Bong Lofa Nimba
Total
Male
Female Total
Male
Female Total
Male
Female Total
Male
Femal
e
Grand
Total
Crop production
15,206
5,668
9,538
82,799
41,980
40,819
100,307
37,373
62,934
121,364
62,989
58,375
319,676

86
Livestock
-
-
-
-
-
-
489
489
-
-
-
-
489
Fisheries
-
-
-
-
-
-
-
-
-
-
-
-
Forestry
-
-
-
-
-
-
-
-
-
88
88
- 88
Aquaculture
-
-
-
-
-
-
-
-
-
-
-
-
Trader
1,458
809
649
1,470
72
1,398
1,098
264
834
1,118
150
968
5,144
Artisan
-
-
-
-
-
-
-
-
-
-
-
-
Agricultural paid job outside holding
-
-
-
-
-
-
-
-
-
161
150
11
161
Non agriculture paid job
219
219
-
1,669
1,525
144
-
-
-
288
258
29
2,176
No activity- looking for work
-
-
-
562
-
562
990
-
990
11
11
-
1,001
No activity - not looking for work
509
33
476
208
-
208
107
-
107
852
150
703
1,676

87
Student
12,069
6,081
5,988
57,901
29,775
28,126
46,498
28,124
18,374
53,181
30,840
22,341
169,649
Household work
941
400
542
15,466
7,021
8,446
3,610
1,285
2,325
18,174
3,808
14,366
38,191
Too young
-
-
-
4,246
860
3,385
2,395
740
1,656
1,720
624
1,095
8,361
Total
30,401
13,210
17,191
164,321
81,233
83,089
155,493
68,274
87,218
196,956
99,067
97,889
547,171
Table 2.9: Size of population in agriculture households, by type of Secondary activity, sex and County
Number of populations in agriculture Households
Bomi Bong Lofa Nimba
Secondary activity Total
Male Female Total
Male
Female Total Male
Female
Total
Male
Female
Crop production
6,023
3,958
2,065
27,194
12,350
14,844
89,580
37,442
52,138
51,877
31,305
20,572
Livestock
-
-
-
534
534
-
-
-
-
1,980
1,560
420
Fisheries
-
-
-
-
-
-
918
918
-
-
-
-
Forestry
-
-
-
-
-
-
-
-
-
-
-
-
Aquaculture
33
33
-
-
-
-
-
-
-
-
-
-
Trader
8,483
2,856
5,627
20,946
12,118
8,828
5,329
2,009
3,320
48,588
24,460
24,128
Artisan 79
46
33
3,064
2,380
684
-
-
-
-
-
-

88
Agricultural paid job outside holding
-
-
-
1,728
1,520
208
251
251
-
1,895
1,895
-
Non agriculture paid job
1,828
1,449
379
5,291
3,846
1,445
-
-
-
4,014
2,409
1,606
No activity- looking for work
1,395
1,298
97
5,589
2,013
3,575
10,310
4,358
5,952
906
858
48
No activity - not looking for work
1,284
33
1,251
11,115
4,633
6,482
3,910
157
3,753
22,533
11,787
10,746
Student
746
700
46
30,618
16,260
14,358
39,727
23,628
16,100
41,561
21,241
20,320
Household work
12,865
3,537
9,328
61,704
27,534
34,171
12,993
4,755
8,237
33,895
11,223
22,673
Too young
9,274
5,017
4,257
42,833
22,540
20,293
26,975
12,183
14,792
67,799
28,379
39,420
Total
42,010
18,926
23,083
210,615
105,727
104,888
189,994
85,702
104,292
275,049
135,116
139,932
Table 4.1: Number and distribution of means of acquiring the farm/parcels by location and period acquired
COUNTY: BOMI
Location Length of period
Means of acquiring the plot Within EA
Outside EA but within District
Outside District
Under a year ago
1-3 years ago
4 or more years ago
Inherited
4,642
1,912
442 -
671
6,326
89
Purchased
33 -
-
- -
33
Cleared -
-
-
- -
-
Community land
351
1,447 -
- -
1,798
Use right from Local Authority
-
-
33
-
33
-
Sharecropping -
-
-
- -
-
Borrowed
569
33 -
- -
602
Rented -
-
-
- -
-
Other -
-
-
- -
-
Total
5,596
3,392
475 -
704
8,759
COUNTY: BONG
Location Length of period
Means of acquiring the plot
Within EA Outside EA but within District
Outside District
Under a year ago
1-3 years ago
4 or more years ago
Inherited 24,180
7,693
361
4,303
8,784
19,146
Purchased 4,156
-
-
-
1,667
2,490
Cleared -
-
-
- -
-
Community land 5,295
-
-
889
1,159
3,247
Use right from Local Authority
-
-
-
- -
-
Sharecropping -
-
-
- -
-
Borrowed 1,592
326
-
1,154
72
691
Rented 1,344
-
-
-
1,018
326
Other 612
-
-
- -
612

90
Total 37,179
8,019
361
6,346
12,699
26,513
COUNTY: Lofa
Location Length of period
Means of acquiring the plot
Within EA Outside EA but within District
Outside District
Under a year ago
1-3 years ago
4 or more years ago
Inherited 43,753
2,742
-
5,119
13,730
27,646
Purchased 1,889
2,039
-
2,039
966
923
Cleared -
-
-
- -
-
Community land 1,666
154
-
502 -
1,317
Use right from Local Authority
251
-
-
- -
251
Sharecropping -
-
-
- -
-
Borrowed 179
13
-
38 -
154
Rented -
154
-
-
154
-
Other 489
-
-
- -
489
Total 48,227
5,101
-
7,699
14,849
30,779
COUNTY: Nimba
Location Length of period
Means of acquiring the plot
Within EA Outside EA but within District
Outside District
Under a year ago
1-3 years ago
4 or more years ago
Inherited 66,797
24,780
-
13,677
14,059
63,840
Purchased 1,569
20
-
1,514
45
31
Cleared -
-
-
-
-
-
Community land 366
-
-
-
-
366
Use right from Local Authority
29
29
-
-
29
29
Sharecropping -
-
-
-
-
-

91
Borrowed 267
62
-
109
70
150
Rented -
154
-
150
5
-
Other -
29
-
29
-
-
Total 69,029
25,074
-
15,480
14,208
64,416
Table 4.2: Estimate area of land used by land type and County
Bomi
Type of land use Number of agriculture households
Area (ha)
% of the total holding
Land under temporary crops 7,540 26,827 100
Land under temporary meadows and pastures . .
Land temporary fallow . .
Land under permanent crops . .
Land under permanent meadows and pastures . .
Land under farm buildings and farmyards . .
Forest and other wooded land . .
Area used for aquaculture ( including inland and coastal waters if part of the holding) . .
Other area not elsewhere classified . .
Total 7,540 26,827 100
Bong
Type of land use Number of agriculture households
Area (ha)
% of the total holding
Land under temporary crops 37,860 101,524 85.3
Land under temporary meadows and pastures 833 1,667 1.4
Land temporary fallow . .
Land under permanent crops 1,661 15,761 13.2
Land under permanent meadows and pastures . .
Land under farm buildings and farmyards . .
Forest and other wooded land . .
Area used for aquaculture ( including inland and coastal waters if part of the holding) . .
Other area not elsewhere classified . .

92
Total 40,355 118,952 100.0
Lofa
Type of land use Number of agriculture households
Area (ha)
% of the total holding
Land under temporary crops 34,088 112,009 63.6
Land under temporary meadows and pastures . .
Land temporary fallow 14,500 63,397 36.0
Land under permanent crops . 582 0.3
Land under permanent meadows and pastures . .
Land under farm buildings and farmyards . .
Forest and other wooded land . .
Area used for aquaculture ( including inland and coastal waters if part of the holding) . .
Other area not elsewhere classified . .
Total 48,588 175,988 100.0
Nimba
Type of land use Number of agriculture households
Area (ha)
% of the total holding
Land under temporary crops 51,461 104,959 44.5
Land under temporary meadows and pastures . .
Land temporary fallow 307 307 0.1
Land under permanent crops 5,540 130,635 55.4
Land under permanent meadows and pastures . .
Land under farm buildings and farmyards . .
Forest and other wooded land . .
Area used for aquaculture ( including inland and coastal waters if part of the holding) . .
Other area not elsewhere classified . .
Total 57,308 235,901 100.0
Grand Total 153,791 557,668 100
Table 5.2: Number of agriculture households that received Information by information
type, source of information and County
Type of information
County:
Bomi
Radio
Televisio
n
Internet
Newspape
r
Agric. Magazines/Bulletin
s
Extension
Farmer to
Farmers'
associ
Othe
r Tota
l

93
officers
farmer
ations
A. weather -
-
-
-
-
186
300
-
-
486
B. Crop Varieties 758
-
-
-
-
79
707
-
-
1,544
C. New Agric practices
2,216
-
-
-
-
264
407
-
-
2,887
D. Farm machinery
-
-
-
-
-
-
-
-
-
-
E. Credit Facilities
300
-
-
-
-
-
-
-
-
300
F. Plant Diseases and Pests
2,216
-
-
-
-
186
-
-
-
2,401
G. Marketing 712
-
-
-
-
-
-
-
300
1,012
H. Livestock husbandry &
Diseases -
-
-
-
-
-
-
-
300
300
I. Agronomic practices
1,740
-
-
-
-
-
-
-
-
1,740
J. Water & Irrigation
300
-
-
-
-
-
-
-
-
300
K. Fish farming -
-
-
-
-
-
-
-
-
-
L. HIV/AIDS -
-
-
-
-
-
-
-
-
-
X. Other -
-
-
-
-
-
-
-
-
-
Total 8,242
-
-
-
-
714
1,414
-
600
10,970
Type of information
County: Bong
Radio
Televisio
n
Internet
Newspape
r
Agric. Magazines/Bulletin
s
Extension
Farmer to
Farmers'
associ
Othe
r Tota
l

94
officers
farmer
ations
A. weather -
-
-
-
-
828
72
-
-
900
B. Crop Varieties -
-
-
-
-
828
684
-
-
1,512
C. New Agric practices
216
-
-
-
-
828
72
-
72
1,189
D. Farm machinery
-
-
-
-
-
-
-
-
-
-
E. Credit Facilities
-
-
-
-
-
-
-
-
-
-
F. Plant Diseases and Pests
216
-
-
-
-
828
-
-
72
1,117
G. Marketing -
-
-
-
-
-
-
-
-
-
H. Livestock husbandry &
Diseases -
-
-
-
-
-
-
-
-
-
I. Agronomic practices
216
-
-
-
-
-
-
-
-
216
J. Water & Irrigation
-
-
-
-
-
828
-
-
-
828
K. Fish farming -
-
-
-
-
-
-
-
-
-
L. HIV/AIDS -
-
-
-
-
-
-
-
-
-
X. Other -
-
-
-
-
-
-
-
-
-
Total 649
-
-
-
-
4,141
828
-
144
5,762
Type of information
County: Lofa
Radio
Televisio
n
Internet
Newspape
r
Agric. Magazines/Bulletin
s
Extension
officers
Farmer to farm
er
Farmers'
association
s
Othe
r Tota
l

95
A. weather 107
-
-
-
-
-
-
-
-
107
B. Crop Varieties -
-
-
-
-
-
-
-
-
-
C. New Agric practices
1,389
-
-
-
-
251
-
-
-
1,640
D. Farm machinery
-
-
-
-
-
-
-
-
-
-
E. Credit Facilities
-
-
-
-
-
-
-
-
-
-
F. Plant Diseases and Pests
-
-
-
-
-
251
-
-
-
251
G. Marketing -
-
-
-
-
-
-
-
-
-
H. Livestock husbandry &
Diseases -
-
-
-
-
-
-
-
-
-
I. Agronomic practices
291
-
-
-
-
-
-
-
-
291
J. Water & Irrigation
-
-
-
-
-
-
-
-
-
-
K. Fish farming -
-
-
-
-
-
-
-
-
-
L. HIV/AIDS -
-
-
-
-
-
-
-
-
-
X. Other -
-
-
-
-
-
-
-
-
-
Total 1,787
-
-
-
-
502
-
-
-
2,289
Type of information
County: Nimba
Radio
Televisio
n
Internet
Newspape
r
Agric. Magazines/Bulletin
s
Extension
officers
Farmer to farm
er
Farmers'
association
s
Othe
r Tota
l
A. weather 504
-
-
-
-
312
420
-
-
1,237

96
B. Crop Varieties 4,061
-
-
-
-
307
9
-
-
4,377
C. New Agric practices
7,742
-
-
-
-
-
4,106
150
5
12,459
D. Farm machinery
-
-
-
-
-
-
-
-
-
-
E. Credit Facilities
-
-
-
-
-
-
-
-
-
-
F. Plant Diseases and Pests
3,260
-
-
-
-
29
-
-
-
3,290
G. Marketing -
-
-
-
-
-
-
-
-
-
H. Livestock husbandry &
Diseases -
-
-
-
-
-
-
-
-
-
I. Agronomic practices
-
-
-
-
-
-
-
-
-
-
J. Water & Irrigation
-
-
-
-
-
59
-
-
-
59
K. Fish farming -
-
-
-
-
-
-
-
-
-
L. HIV/AIDS -
-
-
-
-
-
-
-
-
-
X. Other -
-
-
-
-
-
-
-
-
-
Total
15,568
-
-
-
-
707
4,536
150
5
21,422
Grand Total
26,246
6,064
6,778
150
149
40,443
Table 6.1: Number of agriculture households by type of facility, average distance in
minutes and County
Bomi
Type of facility Up to 30
minutes
More than
30-60
More than 60-
120 minutes
More than 2 hours

97
minutes
Fertilizer dealer -
-
125
175
Pesticides dealer -
-
46
46
Seed dealer 870
711
1,626
1,761
Credit institution 2,326
-
-
227
Irrigation facilities -
-
-
-
Area equipped for irrigation -
-
-
-
Veterinary services -
-
-
-
A periodic or permanent agricultural produce market -
445
954
1,320
Agricultural produce collection network 175
-
-
-
Food storage facilities 1,048
1,707
175
186
Agricultural processing facilities -
-
-
-
Facilities for maintaining agricultural machinery 300
-
-
-
Farmers? associations, cooperatives 300
46
-
-
Agricultural extension service 635
1,766
46
-
Electricity 826
175
-
-
Primary school 3,722
943
517
205
Health facility 1,912
460
979
2,080
Radio, telephone (including mobile phone coverage) and Internet services
6,151
300
46
-
Public transport (bus, train, boat) -
-
-
51
Bong

98
Type of facility Up to 30
minutes
More than
30-60 minute
s
More than 60-
120 minutes
More than 2 hours
Fertilizer dealer 1,717
1,440
828
2,485
Pesticides dealer 961
612
828
3,096
Seed dealer 4,915
1,800
900
691
Credit institution 1,535
-
-
-
Irrigation facilities 828
-
-
-
Area equipped for irrigation -
-
-
-
Veterinary services -
-
-
-
A periodic or permanent agricultural produce market 5,508
1,923
3,801
2,618
Agricultural produce collection network -
-
-
-
Food storage facilities 5,292
144
-
-
Agricultural processing facilities 1,734
-
-
-
Facilities for maintaining agricultural machinery -
828
-
-
Farmers? associations, cooperatives 4,265
5,565
899
833
Agricultural extension service 216
-
-
-
Electricity 144
-
-
-
Primary school 20,142
3,833
2,282
1,383
Health facility 9,960
3,037
3,810
4,522
Radio, telephone (including mobile phone coverage) and Internet services
17,540
3,554
2,066
612
Public transport (bus, train, boat) 7,155
900
-
-
Lofa

99
Type of facility Up to 30
minutes
More than
30-60 minute
s
More than 60-
120 minutes
More than 2 hours
Fertilizer dealer 251
-
-
-
Pesticides dealer -
-
-
-
Seed dealer 780
369
251
794
Credit institution -
-
251
251
Irrigation facilities -
-
-
-
Area equipped for irrigation -
-
-
-
Veterinary services 549
-
-
-
A periodic or permanent agricultural produce market 1,601
1,539
2,632
2,440
Agricultural produce collection network 1,608
1,509
1,347
846
Food storage facilities 25,674
13,871
2,103
1,270
Agricultural processing facilities 1,548
369
883
1,335
Facilities for maintaining agricultural machinery 1,131
-
-
-
Farmers? associations, cooperatives 291
251
-
-
Agricultural extension service 825
-
-
107
Electricity 1,073
-
-
-
Primary school 35,618
6,699
3,329
1,230
Health facility 20,492
6,625
3,292
8,051
Radio, telephone (including mobile phone coverage) and Internet services
33,357
1,550
-
154
Public transport (bus, train, boat) 107
-
-
-
Nimba
100
Type of facility Up to 30
minutes
More than
30-60 minute
s
More than 60-
120 minutes
More than 2 hours
Fertilizer dealer 98
1,445
29
420
Pesticides dealer 93
1,357
29
5
Seed dealer 3,056
2,713
188
159
Credit institution 2,231
3,857
-
-
Irrigation facilities 5
-
-
-
Area equipped for irrigation 5
-
-
-
Veterinary services 828
-
-
-
A periodic or permanent agricultural produce market 4,057
2,344
223
307
Agricultural produce collection network 3,676
-
3,260
416
Food storage facilities 25,817
5,754
4,563
-
Agricultural processing facilities 550
1,098
29
-
Facilities for maintaining agricultural machinery 29
703
29
-
Farmers? associations, cooperatives 460
179
29
416
Agricultural extension service 34
11
29
307
Electricity 511
-
-
-
Primary school 50,081
10,234
180
-
Health facility 15,917
10,612
7,091
4,285
Radio, telephone (including mobile phone coverage) and Internet services
15,573
312
-
416
Public transport (bus, train, boat) 4,071
336
-
-

101
Table 6.2: Number of agriculture households by water source type and average distance
to source in minutes
Bomi
Main Source of Water (Drinking and Cooking)
Up to 30 minutes
More than 30-60 minutes
More than 60-120 minutes
More than 2 hours
Piped water inside house -
-
-
-
Piped water outside house but in yard
-
-
-
-
Public stand post/water point 481
-
-
-
Community borehole 4,020
-
-
-
River/stream/pond 1,047
-
-
-
Protected well -
-
-
-
Unprotected well 659
186
-
-
Protected Spring -
-
-
-
Unprotected Spring 1,518
-
-
-
Other -
-
-
-
Bong
Main Source of Water (Drinking and Cooking)
Up to 30 minutes
More than 30-60 minutes
More than 60-120 minutes
More than 2 hours
Piped water inside house -
-
-
-
Piped water outside house but in yard
398
-
-
-
Public stand post/water point 9,098
833
-
-
Community borehole 9,201
828
326
-
River/stream/pond 13,009
1,382
612
-
Protected well 3,975
-
-
-
Unprotected well 562
-
-
-
Protected Spring -
-
-
-

102
Unprotected Spring 691
-
-
-
Other -
-
-
-
Lofa
Main Source of Water (Drinking and Cooking)
Up to 30 minutes
More than 30-60 minutes
More than 60-120 minutes
More than 2 hours
Piped water inside house -
-
-
-
Piped water outside house but in yard
6,017
-
-
-
Public stand post/water point 10,660
1,050
-
-
Community borehole 21,249
545
-
-
River/stream/pond 8,946
214
197
-
Protected well -
-
-
-
Unprotected well -
-
-
-
Protected Spring -
-
-
-
Unprotected Spring -
-
-
-
Other -
-
-
-
Nimba
Main Source of Water (Drinking and Cooking)
Up to 30 minutes
More than 30-60 minutes
More than 60-120 minutes
More than 2 hours
Piped water inside house -
-
-
-
Piped water outside house but in yard
9,033
-
-
-
Public stand post/water point 7,408
416
-
-
Community borehole 1,561
-
-
-
River/stream/pond 2,738
624
-
-
Protected well 34,696
-
-
-
Unprotected well 4,880
-
-
-

103
Protected Spring -
-
-
-
Unprotected Spring 1,238
312
-
-
Other -
-
-
-
Table 9.4: Number agriculture households who received loan during the last 5 years by
source of loan, type of collateral and County
County: Bomi
Number of agriculture households
Type of collateral
Source of loan No
collateral Land
title Crops
Livestock
Salar
y Third Party
Oth
er Tota
l
Liberia Bank for Development and Investment
-
-
-
-
-
-
-
-
Commercial Banks -
-
-
-
-
-
-
-
Micro finances institutions
-
-
-
-
-
-
-
-
Cooperative credit society
300
-
-
-
-
403
-
703
Input supplier -
-
-
-
-
-
-
-
Money lenders -
-
-
-
-
-
-
-
Self-help group -
-
-
-
-
-
-
-
Government -
-
-
-
-
-
-
-
NGO -
-
-
-
-
-
-
-
Family and friends 361
-
-
-
-
300
-
661
Other -
-
-
-
-
-
-
-
Total 661
-
-
-
-
703
-
1,364
County: Bong
Number of agriculture households

104
Type of collateral
Source of loan No
collateral Land
title Crops
Livestock
Salar
y Third Party
Oth
er Tota
l
Liberia Bank for Development and Investment
-
-
-
-
-
-
-
-
Commercial Banks -
-
-
-
-
-
-
-
Micro finances institutions
-
-
-
-
-
-
-
-
Cooperative credit society
-
-
-
-
-
-
-
-
Input supplier -
-
-
-
-
-
-
-
Money lenders -
-
-
-
-
-
-
-
Self-help group -
-
-
-
-
828
562
1,391
Government -
-
-
-
-
-
-
-
NGO -
-
-
-
-
-
-
-
Family and friends -
-
-
-
-
-
-
-
Other -
-
-
-
-
-
-
-
Total -
-
-
-
-
828
562
1,391
County: Lofa
Number of agriculture households
Type of collateral
Source of loan No
collateral Land
title Crops
Livestock
Salar
y Third Party
Oth
er Tota
l
Liberia Bank for Development and Investment
-
-
-
-
-
-
-
-
Commercial Banks -
-
-
-
-
-
-
-
Micro finances institutions
-
-
-
-
-
-
-
-

105
Cooperative credit society
251
-
-
-
-
-
-
251
Input supplier -
-
-
-
-
-
-
-
Money lenders 358
-
-
-
-
-
-
358
Self-help group -
-
-
-
-
-
-
-
Government -
-
-
-
-
-
-
-
NGO -
-
-
-
-
-
-
-
Family and friends -
-
-
-
-
251
-
251
Other -
-
-
-
-
-
-
-
Total 610
-
-
-
-
251
-
861
County: Nimba
Number of agriculture households
Type of collateral
Source of loan No
collateral Land
title Crops
Livestock
Salar
y Third Party
Oth
er Tota
l
Liberia Bank for Development and Investment
-
-
-
-
-
-
-
-
Commercial Banks -
-
-
-
-
-
-
-
Micro finances institutions
180
-
-
-
88
9
-
277
Cooperative credit society
-
-
6,521
88
-
392
-
7,001
Input supplier -
-
-
-
-
-
-
-
Money lenders -
-
-
-
-
3,265
-
3,265
Self-help group -
-
4,673
-
-
885
562
5,558
Government -
-
-
-
-
-
-
-

106
NGO -
-
-
-
-
-
-
-
Family and friends 194
-
-
-
-
-
-
194
Other -
-
-
-
-
-
-
-
Total 374
-
11,194
88
88
4,551
562
16,857
Table 13.1: Number of agriculture households who reported use of agriculture
equipment by type, ownership status and County in past 12 months
Type of Equipmen
t
Total no. of
equipment
Owned solely by the holder or members of the holder?s household
Owned by the holding jointly with other holdings
Provided by the landlord
Provided by other private holders (excluding cooperatives)
Provided by a cooperative
Provided by a private agricultural service establishment
Provided by a government agency
Rented
Borrowed
other
Hoes 155,709
138,690
11,609
612
5
-
-
-
-
4,793
-
Axes
129,849
110,382
13,437
612
307
-
-
-
-
5,111
-
Slashers
5,594 5,565
-
-
-
-
-
-
-
29
-
Pangas/M
achete
83,267 67,823
12,298
-
150
-
-
-
-
2,996
-
Watering cans
2,812
2,812
-
-
-
-
-
-
-
-
-

107
Wheelbarr
ows
5,855 4,658
1,151
-
-
-
-
-
-
46
-
Pruning knives
12,998
12,998
-
-
-
-
-
-
-
-
-
Pruning saws
833
833
-
-
-
-
-
-
-
-
-
Fork hoe
4,459 420
4,039
-
-
-
-
-
-
-
-
Tractor
828 -
-
-
-
-
-
-
828
-
-
Sprayer
29 29
-
-
-
-
-
-
-
-
-
Pail
26,446 26,446
-
-
-
-
-
-
-
-
-
Milk can
194 97
-
-
-
-
-
-
-
97
-
Hand Mill (Manual
Hammer)
1,156 573
-
-
-
-
-
-
-
583
-
Ox Cart
5,610 5,610
-
-
-
-
-
-
-
-
-
File/sharpening stone
78,056
68,635
5,723
1,440
-
-
-
-
-
2,257
-
Total
513,697
445,573
48,258
2,664
461
-
-
-
828
15,912
-
Table 13.2: Number of agriculture equipment owned by type; average number
owned per agriculture households by County in past 12 months
Type of equipment Total Number of agriculture
households reporting Number of
equipment owned
Average number of equipment per
households
Hoes
155,709 646,959
4
Axes
129,849 368,531
3
Slashers
5,594 8,165
1

108
Pangas/Machete
83,267 430,873
5
Watering cans
2,812 4,560
2
Wheelbarrows
5,855 16,220
3
Pruning knives
12,998 34,372
3
Pruning saws
833 1,667
2
Chain/Handsaw - .
-
Sheller spade - .
-
Fork hoe
4,459 19,660
4
Tractor -
-
Plough mechanical - .
-
Ox-plough - .
-
Trailer - .
-
Harrow/Cultivator - .
-
Weeder - .
-
Planter - .
-
Sprayer
29 29
1
Pail
26,446 51,703
2
Milk can
194 189
1
Hand Mill (Manual Hammer)
1,156
665
1
Hammer Mill (Engine Driven)
- .
-
Ox Cart
5,610 8,053
1
File/sharpening stone
78,056 218,553
3
Other, specify - .
-

109
Total
513,697 1,810,200
4
Table 14.2: Number and distribution of Cattle by type, age and County
Lofa & Nimba Counties
Lofa
Type of Cattle Total Number of
Cattle Number of Cattle owned by
female households’ members
Number of Cattle owned by male
households’ members
Indigenous cattle (beef)
-
-
-
Exotic (beef) -
-
-
Crossbreed (beef) 874
874
-
Dairy cattle -
-
-
Bulls -
-
-
Cows -
-
-
Heifers -
-
-
Female calves < 1 year -
-
-
Male calves < 1 year -
-
-
Tollies 1-3 yrs -
-
-
Oxen -
-
-
Total Cattle 874
874
-
NIMBA
Type of Cattle Total Number of
Cattle Number of Cattle owned by
female households’ members
Number of Cattle owned by male
households’ members

110
Indigenous cattle (beef)
7,745
4,137
3,608
Exotic (beef) -
-
-
Crossbreed (beef) -
-
-
Dairy cattle -
-
-
Bulls -
-
-
Cows -
-
-
Heifers -
-
-
Female calves < 1 year -
-
-
Male calves < 1 year -
-
-
Tollies 1-3 yrs -
-
-
Oxen -
-
-
Total Cattle 7,745
4,137
3,608
Table 14.3: Number and distribution of Goats and Sheep by type, Sex, and County
Bomi, Lofa and Nimba
BOMI
Goat and Sheep Number of Goats and Sheep
Number of Goats and Sheep owned by female households’ members
Number of Goats and Sheep owned by male households’ members
Goat (Female) /doe 3,883
3,883
-
Goat (Male)/buck 4,557
612
3,945
Goats (Female) < 1 year 612
-
612
Goat (Male) < 1 year -
-
-

111
Total Goat 9,052
4,495
4,557
-
Sheep (Male)/ ram 5,880
2,074
3,806
Sheep (Female)/ewe 1,888
-
1,888
Sheep (Male)/ ram < 1 year 1,383
-
1,383
Sheep (Female)/ewe < 1 year
-
-
-
Total Sheep 9,151
2,074
7,077
LOFA
Goat and Sheep Number of Goats and Sheep
Number of Goats and Sheep owned by female households members
Number of Goats and Sheep owned by male households members
Goat (Female) /doe 2,515
1,456
1,059
Goat (Male)/buck 3,173
291
2,882
Goats (Female) < 1 year 4,200
1,456
2,744
Goat (Male) < 1 year 291
291
-
Total Goat 10,179
3,494
6,685
Sheep (Male)/ ram 1,541
582
959
Sheep (Female)/ewe 690
690
-
Sheep (Male)/ ram < 1 year 633
633
-
Sheep (Female)/ewe < 1 year
582
582
-
Total Sheep 3,446
2,487
959

112
NIMBA
Goat and Sheep Number of Goats and Sheep
Number of Goats and Sheep owned by female households’ members
Number of Goats and Sheep owned by male households’ members
Goat (Female) /doe 9,236
6,574
2,662
Goat (Male)/buck 4,666
3,882
784
Goats (Female) < 1 year 8,876
2,982
5,894
Goat (Male) < 1 year 6,365
1,946
4,419
Total Goat 29,143
15,384
13,759
Sheep (Male)/ ram 2,490
374
2,116
Sheep (Female)/ewe 1,290
361
929
Sheep (Male)/ ram < 1 year 541
361
180
Sheep (Female)/ewe < 1 year
-
-
-
Total Sheep 4,321
1,096
3,225
Table14.4: Number and distribution of other domestic animals by type and County
County:
Bomi
Domestic animals Number of domestic animals
Number of domestic animals owned by female households’ members
Number of domestic animals owned by male households’ members
Pigs -
-
-
Horses -
-
-
Dogs 252
-
252

113
Cats 186
186
-
Other specify -
-
-
Bong
Domestic animals Number of domestic animals
Number of domestic animals owned by female households members
Number of domestic animals owned by male households members
Pigs 4,982
534
4,448
Horses -
-
-
Dogs 1,018
1,018
-
Cats -
-
-
Other specify -
-
-
Lofa
Domestic animals Number of domestic animals
Number of domestic animals owned by female households’ members
Number of domestic animals owned by male households’ members
Pigs 489
-
489
Horses -
-
-
Dogs 2,634
1,364
1,270
Cats 3,008
2,855
153
Other specify -
-
-
Nimba
Domestic animals Number of domestic animals
Number of domestic animals owned by female households members
Number of domestic animals owned by male households members

114
Pigs 6,070
1,289
4,781
Horses -
-
-
Dogs 16,948
16,397
551
Cats -
-
-
Other specify 26,084
26,084
-

67
Liberia Pilot Agricultural Survey 2019
Identification and general characteristics4
Identification: County name CCode District name dCode Clan name ClCode
EFEA Code (10 Digits)
Urban/Rural
S/ No. EA (2 Digits)
Structure Number HH NO.
Location of EA Latitude Longitude
Name of Respondent Contact number of respondents
4 Ensure that Information from the Selected EA/Listing Excel files (heighted blue) are transferred onto the Cover Page before interview

Name of Household head

Section 02: Demographic Characteristics
Ho
useh
old
mem
ber ID
S2q1
List the names of the Household members (START FROM THE HEAD)
S2q2 Relationship of (Name) to Head of Household 1= Head 2= Spouse 3= Son/Daughter 4= Son/Daughter in Law 5= Parent 6= Grand child 7= Relative 8= Non-relative 9= Domestic Worker
S2q3 What is (Name) Sex 1= Male 2= Female
S2q4 What is (Name) Age (in completed years i.e. age at last birthday) 00= less than 1 year 98= If 98 or more 99= Don't know
S2q5 What is (Name) Marital Status (12 YEARS OR OLDER) 1= Never married 2= Married 3= Living together 4= Divorced 5= Widowed 6=Separated 99=Don't know
S2q6 What is (Name) Educational attainment (FOR PERSONS 5 YEARS AND OLDER) 0=None 1=Pre-primary 2=Primary 3=Junior high 4=Senior High 5=Vocational 6=Degree 99=DK
S2q7 LITERACY (6 YEARS OR OLDER) Can (Name) Read or Write in any Language? 1= Yes 2= No
FOR MEMBERS AGED 5 TO 17 YEARS
S2q8 Is [name] currently going to school? 1= Yes (Go To S2q10) 2 = No
S2q9 If No, why is [name] not going to school (SEE CODES)
S2q10 Is [name’s] biological Mother alive? 1 = Yes 2=No, GO TO S2q12 8 =DK, GO TO S2q12
S2q11 If alive does [name’s] biological Mother live in this household? 1 = Yes 2=No 8 =DK
S2q12 Is [name’s] biological Father alive? 1 = Yes 2=No, GO TO S2q14 8 =DK, GO TO S2q14
S2q13 If alive does (name's) biological Father live in this household? 1 = Yes 2=No 8 =DK
01
02
03
04
05
06

Section 02: Demographic Characteristics Cont’d
Ho
useh
old
mem
ber ID
DISABILITY
S2q16 What is (Name) Main Activity (8 YEARS AND ABOVE)? (REFER TO CODES)
S2q17 What is (Name) Status in employment of Main Job activity (REFER TO CODES)
S2q18 What is (Name) Secondary Activity (REFER TO CODES)
S2q19 What is (Name) Status in employment of Secondary Job activity (REFER TO CODES)
S2q20 Does (Name) Manage a farm (field/plot) 1= Yes 2= No
S2q21 Is (Name) a Holder? 1= Yes 2= No (If S2q16 or S2q18 =1,2,3,4, 5 and S2q20=1) If "1" then member is a holder. Copy the ID of member to Section 3 and applicable Sections If "2" end interview for member
S2q22 What is the Main agricultural activity? 1= Mainly crop production 2= Mainly livestock production 3= Mixed (crop and livestock
CODES FOR MAIN AND SECONDARY ACTIVITIES 1=Crop production 2= Livestock 3= Fisheries 4= Forestry 5=Aquaculture 6=Trader 7= Artisan 8= Agricultural paid job outside holding 9 = Non agriculture paid job 10= No activity- looking for work 11= No activity - not looking for work 12 = Student 13 = Household work 14 = Too young CODES FOR STATUS OF MAIN AND SECONDARY ACTIVITY CODES 1= Employee

S2q14 Does (NAME) have any serious disability that limits his/her full participation in life activities (such as mobility, work, social life, etc.)
Yes..........1
No...........2
IF NO, GO TO S2q16
S2q15 What type of disability does (NAME) have? 1=Sight 2=Hearing 3=Speech 4=Physical 5=Intellect 6=Emotional 8=Other (specify)
2= Employer 3 = Own-account worker 4= Contributing family worker 5= Member of producers’ cooperative 11= Other (specify) CODES FOR REASON WHY NOT GOING TO SCHOOL (s2q9) 1 = illness 2 = work for food or money 3 = help with household work 4 = care for ill or disabled household member, 5 = care for younger sibling 6 = not interested in school 7= distance to school too far 8 = no food at home, 9 = expensive or no money 10= child considered too young 11= pregnancy/marriage, 12 = expelled from school 13 = failure e.g. of exams, 14 = completed High School 15= disability, 21=other, 99=NA
01
02
03
04
05
06

CHAPTER 1: Section 03: Land Use H
ou
seh
old
mem
ber
ID
S3
q1
ID o
f H
old
er (
fro
m S
ecti
on
02
, s2
q21
)
S3
q1
Farm /Parcel No. S3q2
S3q3
List of Crop Name (If Mixed Crops List Each crop in a Row with similar Farm/Field/Plot Number)
S3q4
Crop Code
(SEE
CROP CODES)
S3q5
Land
use
Code
(LU)
S3q6 Location of farm/field/plot 1= Within EA 2= Outside EA but within District 3= Outside District
S3q7 How did Holder acquire use of farm/field/plot? 1= Inherited 2= Purchased 3= Cleared 4=Community land 5= Use right from Local Authority 6= Sharecropping 7= Borrowed 8= Rented 9= Other
S3q8
Period in years since land Acquired 1= Under a year ago 2= 1-3 years ago 3 = 4 or more years ago
S3q9
Holder Area
Estimate
S3q10
Number of Trees for
Permanent Crops
S3q11
Number of
Trees
planted
other than
trees for
permanent
crops
LAND USE CODES (LU)
1= Land under temporary crops 2= Land under temporary meadows and pastures 3= Land temporary fallow 4. Land under permanent crops 5= Land under permanent meadows and pastures 6= Land under farm buildings and farmyards 7= Forest and other wooded land 8= Area used for aquaculture ( including inland and coastal waters if part of the holding) 13= Other area not elsewhere classified

CODES FOR CROPS Crop Group Crop Name Crop Code New Code 3. Oil seed crops Crop Name Crop Code
9. Tree Crop Crop Name Crop Code
1. Cereals Wheat 1.01 11
Soya Beans 40 31
Lemon and Limes 90 91
Maize 1.02 12
Ground Nuts 41 32
Mangos 91 92
Rice 1.03 13
Caster Beans 42 33
Oranges 92 93
Sorghum 1.04 14
Linseed 43 34
Other fruits and nut 93 94
Barley 1.05 15
Mustard 44 35
Paw-paws 94 95
Oats 1.7 16
Simsim 45 36
Naartjie 95 96
Millets 1.8 17
Sunflower 46 39
Marula Maroela 96 97
Mixed Cereals 1.14 18
Eembe 97 98
Other 1.9 19
Enyandi 98 99
5. Roots/Tubers Iris Potatoes 55 51
Grapes 99 910
Sweet potatoes 56 52
Guava 100 911
2. Vegetables and Melon Asparagus 15 21
Cassava 57 53
Palm/eendunga 101 912
Cabbages 16 22
Yams 58 54
Omauni 102 913
Cauliflowers & Broccoli 17 23
Other roots and tubers 59 59
Lettuce 18 24
Spinanch 19 25
Chicory 20 26 7. Leguminous crops Beans 70 71 10. Forest trees and plantations
Cucumber 21 27
Broad Beans 72 72
Natural forest trees 110 101
Egg plant 22 28
Chick Peas 73 73
Other forest trees 111 102
Tomotoes 23 29
Cow Peas 74 74
77= Plantation trees 112 103
Water melons 24 230
Lentils 75 75
Pumpkin 25 231
Peas 76 76
Carrots 26 232
Pigeon Peas 77 77 11. OTHER LAND USES
Turnips 27 233
Leguminous crops 78 78
fallow land 115 111
Garlic 28 234
grazing land 116 112

Onion 29 235 8. Sugar Crops Sugar Cane 85 81
homestead 117 113
Mushroom 30 236
Sweet sorghum 86 82
other land 118 119
other Vegetables 31 239
other sugar crops 87 89
CHAPTER 2: Section 04: Extension visits/ services and Agriculture Information
H
old
ers
ID
S4q1
Was this holding/farm ever visited by any Extension service provider during the past 12 months?
Yes ....................1 No.......................2 (IF NO, Go To s4q6)
S4q2
How many times was this holding/farm visited by any extension service providers?
S4q3 Which of the following extension service providers visited you? (SELECT ALL THAT APPLY)
A. MoA veterinary staff B. MoA agricultural extension officer C. Farmers' unions D. CDA (Cooperative Devt. Agency) E. Local/INGO F. Fisheries G. Forestry H. Private sector Dealers I. EPA X. Other …………
S4q4
Which of the following extension services did you receive (SELECT ALL THAT APPLY) A. Farm management B. Selection of crop C. Input use D. Credit E. Farm mechanization F. Livestock husbandry G. Plant protection H. Environmental conservation I. Marketing J. Water irrigation and drainage X. Other
S4q5 Which of the following extension service providers’ best satisfy your need?
(SELECT ALL THAT APPLY) A. None B. MoA veterinary staff C. MoA agricultural extension officer D. Farmers' unions E. CDA (Cooperative Devt. Agency) F. Local/INGO G. Fisheries H. Forestry I. Private sector Dealers J. EPA X. Other …………
S4q6
Did the holding/farm receive any agricultural related information?
Yes =1 No = 2
IF NO, GO TO SECTION 5
Which of the following agricultural related information were received by this holding?
S4q7 Information Topic (SELECT ALL THAT APPLY) A. Weather B Crop varieties C. New agricultural practices D. Farm machinery E. Credit facilities F. Plant diseases and pests G. Marketing H. Livestock husbandry & diseases I. Agronomic practices J. Water & Irrigation K. Fish farming L. HIV/AIDS X. Other
S4q8 MAIN information source 01= Radio 02= Television 03= Internet 04= Newspaper 05= Agric. Magazines/Bulletins 06= Extension officers 07= Farmer to farmer 08= Farmers' associations 09= Agric show/exhibitions 10= Neighbour 15= Other
01
02
03

CHAPTER 3: Section 05: Access to Facilities
Faci
lity
No
.
Fac
ility
No
.
SECTION 5a: Facility
S5q1
Does the household have access to any of the following facilities?
S5q2 Travelling time to nearest facility (To and Fro)
SECTION 5b: Main source of Water
SECTION 5c: Toilet
Yes = 1
No = 2
IF NO, GO
TO S5q3
1=Up to 30 minutes 2=More than 30-60 minutes 3=More than 60-120 minutes 4=More than 2 hours
S5q3 What is the Household's MAIN source of water (drinking & cooking) 1=Piped water inside house 2=Piped water outside house but in yard 3=Public stand post/water point 4=Community borehole 5=River/stream/pond 6=Protected well 7= Unprotected well 8=Protected Spring 9= Unprotected Spring 14=Other (specify)
S5q4 Travelling
time to nearest water
source 0=Facility in dwelling 1=Up to 30 minutes 2=More than 30-60 minutes 3=More than 60-120 minutes 4=More than 2 hours
S5q5 Type of MAIN Toilet facility 1=Flush/pour toilet inside house 2=Flush/pour toilet shared by other households 3=Dry sanitation toilet (VIP) outside yard 4=Dry sanitation toilet (VIP) shared by houses 5=Pit latrine 6=Public pit latrine 7=No toilet (use bush) 8=River/beach 13=Other, specify
01
Fertilizer dealer
02
Pesticides dealer
03
Seed dealer
04
Credit institution

05
Irrigation facilities
06
Area equipped for
irrigation
07
Veterinary services
08
A periodic or permanent
agricultural produce
market
09
Agricultural produce
collection network
10
Food storage facilities
11
Agricultural processing
facilities
12
Facilities for maintaining
agricultural machinery
13
Farmers’ associations,
cooperatives
14
Agricultural extension
service
15
Electricity
16
Primary school
17
Health facility
18
Radio, telephone
(including mobile phone
coverage) and Internet
services
19
Public transport (bus,
train, boat)

CHAPTER 4: Section 06: Means of Transportation
Faci
lity
No
.
Fac
ility
No
.
Means of transport used
S6q1
Did the household use any of the following means of transport?
S6q2 Source of Main access
S6q3 If Owned , how many NOTE: QUESTION IS APPLICABLE IF AND ONLY IF s6q2 = 1
Yes = 1 No = 2 IF NO, NEXT TRANSPORT ITEM
1= Owns 2= Borrow 3= Rent/hire 8= Others
Note: if s6q1 is Head loading/porter, then 1 and 2 is N/A If S6q1=2, S6q2 is blank
01
Head loading/porter
02
Car/Pick up
03
Buses/Lorry
04
Tractor
05
Bicycle
06
Tricycle
07
Motorbike
08
Boats/Ferry

09
Wheelbarrow
10
Trailers /Truck
11
Canoes
16
Others (Specify)
CHAPTER 5: Section 07: Storage facility
Sto
rage
/ Fa
cilit
y N
o.
Storage facility
S7q1 Does the
household use any of this type
of storage facility?
S7q2 Type of unit used to fill the storage facility
S7q3 Number of units used
S7q4
Weight in Kg.
(FOR OFFICE USE
ONLY) (S7q2*S7q3)
Yes = 1 No = 2 IF NO, NEXT FACILITY
1=25kg 2= Bags (50kg) 3= bags (100kg) 4=4 corner Tin (12.5kg) 5=Round Tin (15 kg) 10=Other (specify)
01 Granary/barn
02 In the house
03 Specific house/room

CHAPTER 6: Section 08: Access to Loan/Credit
Ho
lder ID
D
S8q1
Did this
holding
apply for
a Loan
for
agricultur
al
purposes
S8q2 Was the loan
granted?
1= Yes
2 = No, Go to
s8q7
S8q3 MAIN Source of Loan received during last 5 years (MOST RECENT LOAN) 01= Liberia Bank for Development and Investment 02= Commercial Banks
S8q4 Loan Period 1= Less than 1 Year 2= Between 1 and 3 years 3= More than 3 years 8= Others
S8q5 What was the MAIN reason for the Loan? 01= Agriculture labour 02= Seeds 03= Fertilizer 04= Agro chemicals 05= Farm implements and machinery 06= Irrigation structures 07= Livestock 08= Aquaculture (marine resources and fisheries)
S8q6 MAIN Type collateral security 0= No collateral 1= Land title 2= Crops 3= Livestock 4= Salary 5= Third party
S8q7 If it was not granted, why not? (MAIN) 1= Lack collateral security 2= Not profitable 3= Income too low 4= Previous debt problems 5=Could not get a guarantor
04 Under
shelter/outside/kitchen
05 Sealed containers
06 Bags
07 Drums
08 Silo
09 Cold storage
10 Under ground
15 Other (specify)

in the last
5 years?
1= Yes
2 = NO,
NEXT
HOLDER
03= Micro finances institutions 04= Cooperative credit society 05=Input supplier 06= Money lenders 07= Self-help group 08= Government 09= NGO 10= Family and friends 15= Other
09= Trading agricultural produce 10= Tractor 11= Borehole 12= De-bushing (clearing of land) 13= Threshing 18= Other agricultural purpose
11= Other 6= Amount applied for too high 7=Inappropriate purpose of loan 12=Other
01
02
03

CHAPTER 7: S
ection 09: Irrigation/Farm management Practices (ONLY FOR CROP FIELDS)
09a: Irrigation
ID o
f H
old
er (
fro
m S
ecti
on
02
)
Farm
/Par
cel N
o.
Use of irrigation on the holding
S9q1
Did you
use any
type of
irrigation
during
the last
12
months
1= Yes 2= No IF NO GO TO S9q7
S9q2 Which irrigation method was used on the irrigated area?
1= Surface irrigation
2 = Sprinklers 3 =Localized irrigation (Drip irrigation)
S9q3
What was the source of irrigation water? 1= Surface water (River /Lake/Pond/Mountain (by gravity)) (go to s9q7) 2= Surface water (River /Lake/Pond (by pumping)) (go to s9q7) 3= Ground water (Deep Well/Tube well) 4= Ground water (Shallow well) 5=Mixed surface water and groundwater 6= Municipal/Town Council Water supply 7= Harvested 8 = Borehole 9 = Treated Waste water/semi purified
S9q4 Did the holder pay for irrigation 1 = Yes
2 = No Skip to s9q7
S9q5 Payment terms for irrigation water
1= water fee per area irrigated (acres)
2 = water fee per volume of water 3 = other
S9q6
What was the frequency of
water payment for irrigation
1= Monthly
2 = Quarterly
3= Annually 4= Others

10 = Rural Water Supply 15= Other Canal
CHAPTER 8: 0
9b: Farm management
ID o
f H
old
er (
fro
m S
ecti
on
02)
Farm
/Par
cel N
o.
Farm management practices (ONLY FOR CROP FIELDS)
S9q7
Seed Inputs
(SELECT ALL THAT
APPLY)
A. Local
seeds
B.
Improved
seeds
S9q8 MAIN source of supply of seed inputs 1=Own 2=Exchanges within community 3=Local markets 4=Seed company 5=Donation 6=Cooperatives
S9q9 Did you use any type of fertilizer in the past 12 months? 1=Yes 2=No (Go to S9q12
S9q10 Type of fertilizer 1= Mineral fertilizers (Inorganic fertiliser) 2=Organo-mineral fertilizers 3= Organic fertiliser 4=Biofertilizers
S9q11 MAIN source of supply of fertilizer inputs 1=own 2=markets 3=cooperatives 4=government 5=NGOs
S9q12 Did you
use any
type of
Pesticid
e in the
past 12
months
?
1=Yes
S9q13 Type of Pesticides A. Insecticides B. Herbicides C. Fungicides D.Rodenticides X. Other pesticides
CHAPTER 9:
S9q14 MAIN source of supply of pesticides inputs 1=own 2=markets 3=cooperatives 4=government 5=NGOs
S9q15
(If the response in s9q1 is ONLY “A”
reason for not using
improved input
1= no knowledge 2 = too expensive

C. Hybrid
seeds
D.
Geneticall
y
Modified
(GM)
seeds
7=Government 8=NGOs
5=Manure 10=Other organic materials to enhance plant growth
2=No
(GoTO
S9q15)
3 = not available 4 = do not see usefulness 9= other
CHAPTER 10: Section 10: Aquaculture (Fish Farming)
Ho
lder ID
S10q1
Was Fish Farming
S10q2 What type of aquaculture do you have?
S10q3 Size of type used in m2
S10q4 Source of fingerlings
Number of stocked Fingerlings
S10q9 Number of fish Harvested
S10q10
Total Weight (Kg) of Fish Harvested during the last 12 months

carried out by this holding during the past 12 months? 1= Yes,
2 = No
IF NO,
NEXT
HOLDER
1 = Still water culture (Pond) 2 = Running water culture 3 = Water recycling system 4 = Pens, cages and hapas (Cage culture/ Dam) 5=Rice-cum-fish culture 6=Floating rafts, lines, ropes, bags and stakes 7=Tanks and race ways
1 = Government 2 = NGO/Project 3 = Private trader 8 = Other
S10q5
Tilapia
S10q6
Catfish (Clarias)
S10q7
Carp
S10q8
Other Specify
01
02
03
Section 10: Aquaculture (Fish Farming) Cont’d
Ho
lder ID
S10q11
Was partial
harvest from
fish farming
carried out on
this farm during
the past 12
months?
1 = Yes
S10q12 What was the reason for partial harvest? 1= Own Consumption 2= Marketing 3 = Other
S10q13
For how many years did the farmer practice aquaculture? 1 = The last three years 2= The last five years 3 = The last ten years 4 = Over ten years
S10q14 What is the water type used? 1= Freshwater 2 = Brackish water 5 = Other
S10q15 What is the water source used? 1 = Rain-fed 2 = Groundwater//borehole 3 = Rivers/canals 4 = Lakes/reservoirs 5 = Dams
S10q16
How do you manage the site? (Type of Activity) 1 = Feeding 2 = Water monitoring 3 = Cleaning 4 = Feeding & Water monitoring 5 = Feeding & Cleaning 6 = Harvesting/fishing 7= Watering & Cleaning 8 = All of the above
Management of Site
S10q17
Number of male workers
S10q18
Number of female workers

2 = No, GO TO
s10q14
01
02
03
CHAPTER 11: Section 13: Food Security
Ho
use
ho
ld ID
D
S13q1
[During the last
12 MONTHS, was
there a time
when] you [or
any other adult in
your household]
were worried you
would not have
enough food to
eat because of a
lack of money or
other resources?
Yes = 1
No = 2
S13q2 [During the last 12 MONTHS, was there a time when] you [or any other adult in your household] were unable to eat healthy and nutritious food because of a lack of money or other resources?
S13q3
[During the last 12 MONTHS, was there a time when] you [or any other adult in your household] ate only a few kinds of foods because of a lack of money or other resources? Yes = 1 No = 2
S13q4 [During the last 12 MONTHS, was there a time when] you [or any other adult in your household] had to skip a meal because there was not enough money or other resources to get food? Yes = 1 No = 2
S13q5 [During the last 12 MONTHS, was there a time when] you [or any other adult in your household] ate less than you [he/she] thought you [he/she] should because of a lack of money or other resources?
S13q6
[During the last 12 MONTHS, was there a time when] your household ran out of food because of a lack of money or other resources? Yes = 1 No = 2
S13q7
[During the last 12 MONTHS, was there a time when] you [or any other adult in your household] were hungry but did not eat because there was not enough money or other resources for food? Yes = 1 No = 2
S13q8
[During the last 12 MONTHS, was there a time when] you [or any other adult in your household] went without eating for a whole day because of a lack of money or other resources? Yes = 1 No = 2

Yes = 1 No = 2
Yes = 1 No = 2
Section 13: Food Security Cont’d
Ho
use
ho
ld ID
D
S13q9
Did the
household
experience any
Food shortages
during the past
12 months?
S13q10
Main Reasons Food Shortage
(SEE CODES)
Codes for s13q10
01= Loss of crops/Insufficient production 02= Lack of jobs 03= Inability to work because of illness or injury
S13q11
What was the
households'
immediate
By which HH member
S13q12
Adult
Male
S13q13
Adult
Female
S13q14
Boys
S13q15
Girls

Yes = 1
No = 2 GO TO
S13q21
04= Disabled, old age 05= Lack of adequate land 06= Lack of adequate capital 07= Family too big 08= Lack of adequate labour 09= Over selling produce 10= Loss of livestock 11= environmental or political crises 15= Others
response to food
shortage?
IMMEDIATE
RESPONSE(CHAN
GE IN EATING
PATTERN)
1= Skipping
meals
2= Eating less
preferred food
3= Reducing the
size of meal
1 = Yes 2 = No
1 = Yes 2 = No
1 = Yes 2 = No
1 = Yes 2 = No
Section 13: The Food Security Cont’d
Ho
use
ho
ld ID
D
S13q16
What steps were taken to
alleviate food shortage?
1= Use savings to buy food 2= Take out a loan 3= Sold land 4= Sold livestock 5= Get another job 6= Social grant 7= Food relief
By which HH member
S13q21
Is the household likely to experience food shortage during the next 12 months?
S13q17
Adult Male
S13q18
Adult
Female
S13q19
Boys
S13q20
Girls
1 = Yes 2 = No

8= Help from charities 13=Other (Specify)
1 = Yes 2 = No
1 = Yes 2 = No
1 = Yes 2 = No
1 = Yes 2 = No
Section 13: The Food Security Cont’d (Natural and manmade disasters)
Ho
use
ho
ld ID
D
Which of the following natural disasters did the household experience in the last 12 months? EXTENT OF DAMAGE 0 = No damage 1 = Slight 2 = Moderate 3 = Severe
Which of the following man-made disasters did the
household experience in the last 12 months?
EXTENT OF DAMAGE 0 = No damage 1 = Slight 2 = Moderate 3 = Severe
S13q22
Floods
and
tidal
waves
S13q23
Drought
S13q24
Typhoons or
hurricanes/
Hailstorms
S13q25
Pests/diseases
S13q26
Erratic
rains
S13q27
Wild fires
S13q28
Other
S13q29
Insecurity
S13q30
Wild fires

CHAPTER 12: Section 14: Other Economic Activity
Ho
lder ID
D S14q1
Is Holder engaged in any of the following Other
Economic Activities?
1 = Yes 2 = No go to Section 15
CODES FOR OTHER ECONOMIC ACTIVITIES
S14q2 What are your other sources of income?
A. No other income source B. Income derived from economic production activities other than agricultural production C. Income from paid employment D. Investment income E. Remittances - Internal (within Liberia) F. Remittances - External (outside Liberia) G. Veteran social grant H. Social grant
I. Disability pension
J. Old age pension grant
01
A. Support agriculture and post-harvest crop activities
02
B. Hunting, trapping, game propagation and related service activities
03
C. Forestry and logging
04
D. Fishing and aquaculture
05
E. Processing of agricultural products (agro-processing) Handicrafts
06
F. Wholesale and retail trade
G. Repair of motor vehicles and motor cycles
H. Hotels and restaurants (excluding agrotourism)
I. Agrotourism
X. Other

CHAPTER 13: Section 15: Labour Inputs
Ho
lder ID
D
Number of household members who worked permanently on holding/farm during the past 12
months
Number of household members who worked temporary on holding/farm during the past 12
months
S15q1
ADULT MALES
15 years and above
S15q2
ADULT FEMALES
15 years and above
S15q3
CHILDREN BOYS
less than 15
years
S15q4
CHILDREN GIRLS less than
15 years
S15q5
ADULT MALES
15 years and
above
S15q6
ADULT FEMALES 15 years
and above
S15q7
CHILDREN BOYS less than
15 years
S15q8
CHILDREN GIRLS less
than 15 years
Section 15: Labour Inputs Cont’d
Ho
useh
old
ID
S15q9
Did you have any
paid employees
during the past 12
months?
1= Yes
2= No GO TO
S15q18
Number of permanently paid employees during
the past 12 months
Number of temporary paid employees during
the past 12 months
Kuu System
S15q10
ADULT
MALES
15
years
S15q11
ADULT
FEMALES
15 years
and
above
S15q12
CHILDREN
BOYS less
than 15
years
S15q13
CHILDREN
GIRLS 15
years
below
S15q14
ADULT
MALES
15
years
S15q15
ADULT
FEMALES
15 years
and
above
S15q16
CHILDREN
BOYS less
than 15
years
S15q17
CHILDREN
GIRLS less
than 15
years
S15q18 Did you use
the Kuu
system during
the past 12
months?
S15q19
Which of
the
following
activities
did you use
S15q20 ADULT MALES 15 years and above
S15q21
ADULT
FEMALES
15 years and
above

and
above
and
above
1=Yes 2=No, GO TO NEXT SECTION
the Kuu
for?
(RECORD
ALL THAT
APPLY)
A. Brushing B. Felling C. Clearing D. Planting E. Weeding F. Harvesting
G. Fencing

CHAPTER 14: Section 16: Equipment H
ou
seh
old
ID
D
Type of Equipment
S16q1
Did your
household use
(Name of
Equipment)
during the past
12 months?
Yes = 1
No = 2
IF NO, NEXT
ITEM
S16q2 Type of ownership
Codes for Ownership (s16q2) 1 = Owned solely by the holder or members of the holder’s household 2=Owned by the household jointly with other households 3=Provided by the landlord 4=Provided by other private holders (excluding cooperatives) 5=Provided by a cooperative 6=Provided by a private agricultural service establishment 7=Provided by a government agency 8 = Rented 9 =Borrowed 14 = other (specify) IF 3 TO 14 GO TO NEXT ITEM
S16q3 Enter the number of the agricultural equipment owned by the household If s16q2 = 1 or 2
If used during past 12 months
S16q4
If the equipment used was
owned, when was it
acquired?
1= Less than 1 year ago
2= 1-4 years ago
3=5-9
3= 10 years and over
S16q5
How many of the
equipment are in
working conditions?
01= Hoes
02= Axes
03= Slashers
4= Pangas/Machete
05= Watering cans
06= Wheelbarrows
07= Pruning knives
08= Pruning saws
09= Chain/Handsaw

10= Sheller spade
11= Fork hoe
12= Tractor
13= Plough mechanical
14= Ox-plough
15= Trailer
16= Harrow/Cultivator
17= Weeder
18= Planter
19= Sprayer
20= Pail
21= Milk can
22= Hand Mill (Manual
Hammer)
23= Hammer Mill (Engine
Driven)
24= Ox Cart
25=File/sharpening stone
30= Other, specify


CHAPTER 15: Section 17: Production and disposition of crop products (All Holders)
Ho
lder ID
S17q1
Crop
Name
S17q2
Crop
Code
( REFER
TO
SECTION
03)
What is the quantity harvested and in what
conditions/ state?
Codes for Condition
If Rice or Cassava
1= Fresh
Maize:
2= Green harvested: with shell/cob and stalk
3= Green harvested: with shell/cob and without stalk
4= Green harvested: in the shell/cob
5= Fresh/raw harvested: with shell/cob and with stalk
6= Fresh/raw harvested: with shell/cob without stalk
7= Fresh/raw harvested: in the shell/cob
8= Dry at harvest
What is the quantity sold and to whom was it sold?
S17q3
Unit of
measurement
(refer to the
codes
provided in
manual)
S17q4
Number
of Units
harvested
S17q5
Condition/State
(refer to list of
codes provided)
S17q6 Cost per unit of measurement L$
S17q7 Quantities sold (For Rice i.e. Paddy)
S17q8 Total value of production sold in L$
S17q9 Mostly sold to: 1= Govt. organizations 2= Private trader local market village 3= Private trader district market 4= Consumer at market 5= Neighbour/Relative 11= Other, specify
01
02
03
Section 17: Production and disposition of crop products Cont’d

CHAPTER 16: Section 18a: Livestock (All Households)
Ho
lder ID
D
Crop
Name
Crop
Code
( REFER
TO
SECTION
03)
Fill in quantities which were used for other purpose
Where most losses happen
S17q10
Processed
for sale
S17q11
Processed for
animal feed
S17q12
Given to
A.land lord / proprietor B.For labour C.Friends/relatives D.Exchange for other goods X.Others (specify)
S17q13
Consumed by
Household
(including that
before harvest)
S17q14
Used for seed
S17q15
Quantities
stored/Currently in
storage
S17q16 Portion lost after harvest (%)
S17q17 Where did most losses occur? 1= on the field 2= during the storage 3 = during the transport 4=Loss at Processing 5=Loss at Packaging 6=Loss at Sales 8 = others
01
02
03
Ho
us
ehold
ID
Livestock (excluding poultry)

Serial No. of Livestock S18q1
Did any member of the household raise
or own any livestock during reference
period (past 12 months)?
1=Yes
2=No, Go To Poultry S18q18
S18q2
How many head of livestock did the holding raise or
own?
S18q3
How many owned by female Household members?
01= Indigenous cattle (beef)
02= Exotic (beef)
03= Crossbreed (beef)
04= Dairy cattle
05= Bulls (male)
06= Cows (female)
07= Heifers (young Female cow)
08= Female calves < 1 year
09= Male calves < 1 year
10= Tollies 1-3 yrs
11= Oxen
Total Cattle
12= Goat (Female) /doe
13= Goat (Male)/buck
Section 18a: Livestock Cont’d
HH ID
S18q4 Livesto
ck Serial No.
Livestock
Type
Livestock Intake 2018/2019 (during the last 12 months)
Livestock Off-take 2018/2019
Livestock Losses (2018/2019)
S18q5 Number of livestock bought or
S18q6 How many head of livestock were born alive in the
S18q7 Total livestock intake
S18q8
Number
consumed
S18q9
Number
sold/trade
d, or
S18q10
Number
given
away
S18q11 S18q12 Number of deaths
S18q13 How many of livestock were
S18q14 How many of livestock were
S18q15 How many of livestock died due
S18q16 Number of losses due to other reasons
S18q17 Total livestock Losses
14= Goats (Female) < 1 year
15= Goat (Male) < 1 year
Total Goat
16= Sheep (Male)/ ram
17= Sheep (Female)/ewe
Sheep (Male)/ ram < 1 year
19= Sheep (Female)/ewe < 1 year
Total Sheep
20=Pigs
21=Horses
22=Dogs
23=Cats
28=Other specify

received from others
farm during the last 12 months
by the
Household
otherwise
disposed
of for
slaughter
(gifts,
traditiona
l fines)
Total
livestock
off-take
due to disease
stolen or lost?
lost to predator?
to starvation?
(Specify) e.g. drowning, accidents)
1 Cattle
2 Goat
3 Sheep
4 Pig
Section 18b: Poultry
Ho
useh
old
ID
D Poultry
Serial No. of Poultry Type S18q18
Did any member of the household raise or own any poultry during reference period?
1=Yes
2=No go to next section
S18q19 Total number
S18q20 How many owned by female Household members?
1=Indigenous Chicken
2=Exotic Chicken (layers)
3=Exotic Chicken (broilers)
4=Ducks
5=Geese
6=Turkeys

CHAPTER 17: Section 19: LIST OF FARMS FOR CROP-CUTTING PLOT SELECTION
CHAPTER 18: Section 20: Farm Area Measurement
Note 2: Only consider fields more than 0.001 Ha for measurements
7=Guinea Fowl
8=Pigeons
13=Others, specify
Household ID
(From s3q1) Holder ID (From s3q2)
Farm/Parcel No. (From s3q3)
Crop Name (Rice) (From s3q4
Crop Code (Rice) (From s3q5)
Is Rice Farm selected for Crop cutting? 1=Yes COPY HH ID; FARM NO.; CROP CODE TO SECTION20 2=No
Crop Name (Cassava) (From s3q4)
Crop Code (Cassava) (From s3q5)
Is Cassava Farm selected for Crop cutting? 1=Yes COPY HH ID; FARM NO. CROP CODE TO SECTION20 2=No
S19q1 S19q1 S19q2 S19q3 S19q4 S19q5 S19q6 S19q7 S19q8

Household ID (From s19q1)
Location COORDINATES
Farm/ Parcel No. (From s19q3)
Crop Code (From s19q5/8)
Area in Ha measured with GPS (Clockwise)
Area in Ha measured with GPS (Anti-clockwise)
Latitude Longitude
S20q1 S20q1 S20q2 S20q3 S20q4 S20q5 S20q6 S20q7
CHAPTER 19: Section 21: CROP-CUTTING RESULTS
S21q1 S21q1 S21q2 S21q3 S21q4 S21q5 S21q6 S21q7
Household ID (From s20q1)
Farm/Parcel No. (From s20q5)
Crop Name
Crop Code (From s20q6)
Crop –cutting Fresh Weight of the
harvest Dry Weight Dry Weight
Day Month Kilograms
Day Month Kilograms
Copyright © 2022 FDOKUMEN