Agriculture and Forestry
252
-
Upload
khangminh22 -
Category
Documents
-
view
1 -
download
0
Transcript of Agriculture and Forestry

Agriculture and Forestry, Volume 66. Issue 3: 1-252, Podgorica, 2020 2
Agriculture and Forestry - Poljoprivreda i šumarstvo PUBLISHER - IZDAVAČ
University of Montenegro – Univerzitet Crne Gore
Biotechnical faculty (BTF), Podgorica - Biotehnički fakultet, Podgorica
Bul. M. Lalića 1, 81000 Podgorica, Crna Gora (Montenegro), P.Box 97,
Tel.: +382 20 268434; +382 20 268437; Fax: +382 20 268432
Web: www.agricultforest.ac.me; E-mail: [email protected]
EDITORIAL BOARD - REDAKCIJA
Milić ČUROVIĆ, Editor in chief - glavni i odgovorni urednik (BTF),
Miomir JOVANOVIĆ, Co-Editor, Secretary General - sekretar redakcije (BTF),
Igor PAJOVIĆ, Co-Editor, Technical editor - tehički urednik (BTF),
Juan Antonio Ballesteros Canovas (CH), Joachim Müller (GER),
Hubert Hasenauer (AUT), Che Fauziah ISHAK (MYS), Renzo MOTTA (ITA),
Sead Šabanadžović (USA), Guangyu Sun (CHN), Dušan Petrić (SRB),
Gordan Karaman (MNE), Paraskevi Londra (GRE), Peter Dovč (SLO),
Reinhard Eder (AUT), Jelena Latinović (BTF), Emil Erjavec (SLO),
Božidarka Marković (BTF), Aleksandra Despotović (BTF), Franc Bavec (SLO),
Svetislav Popović (MNE), Vojislav Trkulja (BIH), Milan Medarević (SRB),
Shkelqim Karaj (GER), Ana Topalović (BTF), Radmila Pajović (BTF),
Nataša Mirecki (BTF), Vjekoslav Tanaskovik (MKD), Goran Barović (MNE),
Paolo Billi (JPN), Drago Cvijanović (SRB), Siniša Berjan (BIH),
Naser Sabaghnia (IRI), Elazar Fallik (ISR), Vlatka Vajs (SRB),
Paul Sestras (ROU), Slavko Mijović (BTF), Momčilo Radulović (BTF)
Luka FILPOVIĆ, Technical editor - tehički urednik (CIS, UCG),
Technical design: Jovana Zvizdić
Indexed in (by alphabethical order): AGRICOLA, AGRIS, CAB Abstracts, CAB Direct, CABI full
text, COBISS, CrossRef, DOI, DOAJ, EBSCO (currently included in EDS EBSCO Discovery Service),
Elektronische Zeitschriftenbibliothek EZB (Electronic Journals Library), Genamics JournalSeek, Global
impact factor (GIF), Google Scholar, HathiTrustt, Index Copernicus, International Scientific Indexing
(ISI), Israel Union List of Electronic Journals (ULE), JournalRate (Academic journal search tool),
Journals Impact factor (JIF) by Global Society for Scientific Research (GSSR), KoBSON, MALMAD,
National Agricultural Library – USA, Open Academic Journals Index (OAJI), ProQuest, Research bible,
RoMEO, Regional Information Center for Science and Technology (RICeST) – Iran, Rubriq database,
SCOPUS, The Open University Library, The Rudjer Bošković Institute Library, Ulrichsweb, Universal
Impact Factor, WorldCat, XML, Zeitschriftendatenbank (ZDB), Zoological Record of the Clarivate
Analitics Master Jouurnal List, ...
The journal “Agriculture and Forestry” is funded by the Biotechnical faculty, Co-funded by the
Ministry of Science & the Ministry of Agriculture and Rural Development of Montenegro
CIP – Каталогизација у публикацији
Централна народна библиотека Црне Горе, Цетиње
ISSN 0554-5579
COBIS.CG-ID 3758082
Agriculture and Forestry, Volume 66. Issue 3: 1-252, Podgorica, 2020 3
CONTENT Zvonko ANTUNOVIĆ, Đuro SENČIĆ, Željka KLIR, Krunoslav ZMAIĆ, Danijela SAMAC and Josip NOVOSELEC ORGANIC LIVESTOCK FARMING IN REPUBLIC OF CROATIA - STATE AND PERSPECTIVE DEVELOPMENT ................................................... 007-013 Milena ĐOKIĆ, Božidarka MARKOVIĆ, Vesna GANTNER, Milan MARKOVIĆ ASSOCIATION OF GENETIC VARIANTS OF β-LACTOGLOBULIN GENE WITH MILK TRAITS OF JEZEROPIVSKA SHEEP BREED ................... 015-023 Zvonimir STEINER , Ivana PRAKATUR, Josip NOVOSELEC, Danijela SAMAC, Željka KLIR, Boris ANTUNOVIĆ, Stipo BENAK, Vesna GANTNER, Mario RONTA INFLUENCE OF PUMPKIN SEED CAKE ON PRODUCTION AND SLAUGHTER INDICATORS FOR BROILER CHICKENS ........................ 025-031 Branislav DUDIĆ , Zdenka DUDIĆ, Radovan PEJANOVIĆ, Goran ŠKATARIĆ, Darina SAXUNOVA, Tomáš PERÁČEK THE RURAL POLICY OF SLOVAKIA AFTER JOINING THE EU .................... 033-051 Razak WAHAB, Norashikin MOHD FAUZI, Nasihah MOKHTAR, Mohamad Saiful SULAIMAN, Ros Syazmini MOHD GHANI, Taharah EDIN ENHANCING MECHANICAL PROPERTIES OF RHIZOPHORA APICULATA THROUGH ENGINEERED LAMINATED BOARDS ................... 053-064 Tanja MAKSIMOVIĆ, Nina JANJIĆ, Biljana LUBARDA EFFECT OF DIFFERENT CONCENTRATIONS OF MANNITOL ON GERMINATION OF PEA SEEDS (Pisum sativum L.) ........................................... 065-072
Agriculture and Forestry, Volume 66. Issue 3: 1-252, Podgorica, 2020 4 Aleksandra GOVEDARICA-LUČIĆ, Goran PERKOVIĆ, Alma RAHIMIĆ, Ivana BOŠKOVIĆ, Sanid PAŠIĆ INFLUENCE OF FERTILIZATION ON GROWTH AND QUALITY OF LETTUCE ............................................................................. 073-080 Yasuhiro MORI, Akinobu TANAKA, Toshinori NAKAGAWA, Yhiya AMEN, Yasumitsu KUWANO, Yufu TANIZAKI, Shota TOMOKIYO, Kuniyoshi SHIMIZU ISOLATION AND QUANTIFICATION OF THE PLANT GROWTH REGULATOR 1-TRIACONTANOL FROM MOSO BAMBOO (Phyllostachys pubescens) SHOOT SKIN AND ITS COMPOST .......................... 081-093 Mile VAJKIĆ, Biljana VRANJEŠ, Evica STOJILJKOVIĆ, Marko ĐAPAN OCCUPATIONAL INJURY ANALYSIS IN THE FORESTRY OF THE REPUBLIC OF SRPSKA-BOSNIA AND HERZEGOVINA .................. 095-104 Vasyl SAVOSKO, Natalia TOVSTOLYAK, Yuryi LYKHOLAT, Ivan GRYGORYUK STRUCTURE AND DIVERSITY OF URBAN PARK STANDS AT KRYVYI RIH ORE-MINING & METALLURGICAL DISTRICT, CENTRAL UKRAINE ............................................................................................ 105-126 Vera RAJIČIĆ, Dragan TERZIĆ, Vesna PERIŠIĆ, Marijana DUGALIĆ, Goran DUGALIĆ, Milomirka MADIĆ, Nataša LJUBIČIĆ IMPACT OF LONG-TERM FERTILIZATION ON YIELD IN WHEAT GROWN ON SOIL TYPE VERTISOL .............................................. 127-138 Kyriakos GIANNOULIS , Ilias PLATIS, Nikolaos GOUGOULIAS, Eleni WOGIATZI INFLUENCE OF Trichoderma harzianum AND Glomus mycorrhiza ON BIOMASS AND ESSENTIAL OIL YIELD OF ORGANIC Ocimum basilicum CULTIVATION ....................................................................... 139-154 Ryszard HAITLINGER, Miloje ŠUNDIĆ COOREMANIA KIETAENSIS SP. NOV. (ASTIGMATA: CANESTRINIIDAE) FROM BOUGAINVILLE ISLAND, PAPUA NEW GUINEA .............................. 155-168
Agriculture and Forestry, Volume 66. Issue 3: 1-252, Podgorica, 2020 5 Huseyin ONEN, Nihat AKYOL, Shahid FAROOQ, Cumali OZASLAN SEED DORMANCY DIFFERENCES AMONG COMMON RAGWEED (AMBROSIA ARTEMISIIFOLIA L.) POPULATIONS DISTRIBUTED IN DIFFERENT CLIMATIC REGIONS OF TURKEY .......................................... 169-182 Yannawut UTTARUK, Teerawong LAOSUWAN METHODS OF ESTIMATION FOR ABOVE GROUND CARBON STOCK IN NONGBUA-NONMEE COMMUNITY FOREST, MAHA SARAKHAM PROVINCE, THAILAND................................................... 183-195 Hamid EL BILALI, Imaël Henri Nestor BASSOLE, Lawali DAMBO, Sinisa BERJAN CLIMATE CHANGE AND FOOD SECURITY ..................................................... 197-210 Midheta BAŠIĆ, Lejla BEGANOVIĆ, Jasna HUREMOVIĆ, Sabina ŽERO ASSESSMENT OF METALS AND THEIR ESTIMATED DAILY INTAKES IN VARIOUS NUTS ................................................................ 211-219 Zoran MALIČEVIĆ, Željko LAKIĆ, Milan JUGOVIĆ, Dragoljub MITROVIĆ THE SIGNIFICANCE OF TRANSVERSAL DISTRIBUTION DURING THE APPLICATION OF PLANT PROTECTION BY BOOM SPRAYER ........... 221-230 Ranko KOPRIVICA, Biljana VELJKOVIĆ, Dušan RADIVOJEVIĆ, Tatjana DEDIĆ, Zoran MILEUSNIĆ, Dragoslav ĐOKIĆ EQUIPMENT OF FAMILY FARMS WITH AGRICULTURAL MECHANIZATION IN NORTHWEST OF MONTENEGRO ............................... 231-239 Tatjana POPOVIĆ, Saša MATIJAŠEVIĆ, Danijela RAIČEVIĆ, Slavko MIJOVIĆ INFLUENCE OF VINE LOADS WITH FERTILE BUDS ON GRAPE YIELD AND QUALITY OF VARIETY ŽIŽAK IN PODGORICA VINEYARD AREA .................................................................... 241-250 INSTRUCTIONS TO AUTHORS ........................................................................... 251-252

Agriculture & Forestry, Vol. 66 Issue 3: 7-13, 2020, Podgorica 7
Antunović, Z., Senčić, Đ., Klir, Ž., Zmaić, K., Samac, D., Novoselec, J. (2020): Organic livestock farming in
Republic of Croatia- state and perspective development. Agriculture and Forestry, 66 (3): 7-13.
DOI: 10.17707/AgricultForest.66.3.01
Zvonko ANTUNOVIĆ, Đuro SENČIĆ, Željka KLIR,
Krunoslav ZMAIĆ, Danijela SAMAC and Josip NOVOSELEC 1
ORGANIC LIVESTOCK FARMING IN REPUBLIC OF CROATIA-
STATE AND PERSPECTIVE DEVELOPMENT
SUMMARY
Recently, in the Republic of Croatia an increase in organic farming was
observed. The aim of this paper is to present the state and perspectives of organic
livestock farming development in Croatia during recent five years. There has
been an increase in the number of organic farmers by 114% and the number of
organic processors by 52.28%. The used agricultural land decreased by 1.54%,
while the land under organic production in total used agricultural land increased,
which is 6.94%. Areas sown with crops important for organic livestock feeding
increased the most for rapeseed and green forage from arable land and gardens
and a decrease was observed in oats. The largest increase regarding livestock was
in the number of Equidae and sheep and goats, while the only decrease was
observed in poultry. The largest increase was also found for sheep meat, beef and
pork, while in dairy production the largest increase was in goat milk, as well as
production of cheese. Expansion of organic production is observed in the recent
five years in Croatia. This contributes to the growing interest in organic
production, as indicated by increases in the analyzed indicators in the organic
livestock sector.
Keywords: organic livestock farming; the Republic of Croatia; state and
perspectives of development.
INTRODUCTION
Organic agriculture in the world has been the fastest growing branch of
agricultural production in recent years. The Republic of Croatia has recorded
significant increase in organic agriculture with the same trend in organic livestock
farming. The reasons for the abovementioned can be seen through Croatia's
outstanding natural resources as well as their conservation and the development
of organic agriculture, which all contribute to the development of a country based
on natural and ethical principles, without which no development is complete
1Zvonko Antunović, (corresponding author: [email protected]), Đuro Senčić, Ţeljka Klir,
Krunoslav Zmaić, Danijela Samac, Josip Novoselec, Faculty of Agrobiotechnical Sciences Osijek,
J. J. Strossmayer University of Osijek, V. Preloga 1, 31000 Osijek, CROATIA
Paper presented at the GEA (Geo Eco-Eco Agro) International Conference 2020, Podgorica.
Notes: The authors declare that they have no conflicts of interest. Authorship Form signed online.
Received:28/05/2020 Accepted:23/06/2020
Antunović et al. 8
(Senčić et al., 2011). Favorable climatic conditions, the possibility of producing
cheap and good quality food, large quantities of floorcloth, smaller financial
investments and the possession of certified organic land areas are very good
prerequisites for the spread of organic livestock farming in the Republic of
Croatia (Antunović, 2011; Gugić et al., 2017). The aim of organic livestock
farming is to obtain high-quality food for human consumption, but also to ensure
animal welfare and environmental protection (Senčić et al., 2011). Organic
livestock production encourages the use of natural sources in a particular
breeding area, grazing, open barns and canopies, which ensures better adaptation
of animals to environmental conditions (Antunović, 2011). In the common
market of the European Union, the advantages of the Republic of Croatia are,
among other things, reflected in the possibility of developing organic agriculture,
including organic livestock farming, and through the integration with tourism, as
well as the protection of native plant and animal genetic resources and the
conservation of biodiversity. According to the data of the Croatian Chamber of
Economy, cited in the Ministry of Agriculture's Annual Report on the State of
Agriculture in year 2018, it was pointed out that the annual value of the Croatian
market of organic products is around 100 million EUR, which is certainly not
negligible, while the share of consumption of organic products in total
consumption is 2.2%. Thus, the aim of this paper is to present the state and
perspectives of the development of organic livestock farming in the Republic of
Croatia, by analyzing the period of the recent five years.
STATE AND PERSPECTIVES OF DEVELOPMENT OF ORGANIC
LIVESTOCK FARMING IN THE REPUBLIC OF CROATIA
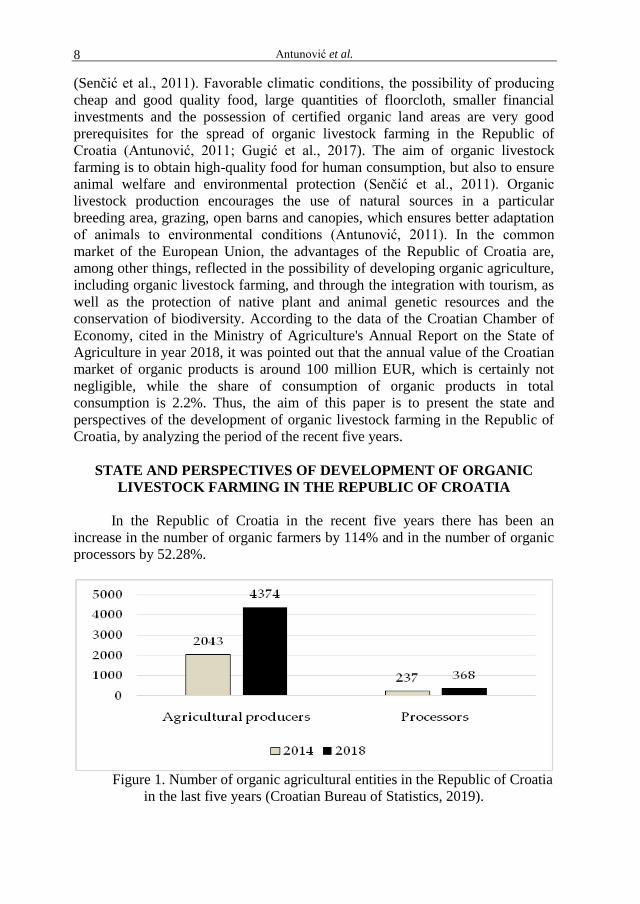
In the Republic of Croatia in the recent five years there has been an
increase in the number of organic farmers by 114% and in the number of organic
processors by 52.28%.
Figure 1. Number of organic agricultural entities in the Republic of Croatia
in the last five years (Croatian Bureau of Statistics, 2019).

Organic livestock farming in Republic of Croatia- state and perspective development 9
During the recent five years, the first five entities in the processing and
preserving of meat and its products have been registered in the Republic of
Croatia. Likewise, the number of registered producers of plant and animal oils
and fats were also increased significantly by 121.62%, as well as the number of
dairy producers by 37.50%.
Figure 2. Number of processors of organic livestock products (Croatian
Bureau of Statistics, 2019).
Table 1. The area of utilized agricultural land and area under organic production
in the last five years in the Republic of Croatia (Croatian Bureau of Statistics,
2019).
Year Agricultural
land used,
(ha)
Areas under
organic
production,
(ha)
Share of areas under
organic production in
total utilized
agricultural area,%
2014 1 508 885 50 054 3.32
2015 1 537 629 75 883 4.94
2016 1 546 019 93 814 6.07
2017 1 496 663 96 6185 6.46
2018 1 485 645 103 166 6.94
Difference (2014-2018), % - 1.54 + 51.48
The area of utilized agricultural land in the Republic of Croatia has
decreased by 1.54% in the recent five years, while the area under organic
production has increased significantly from 50.054 ha to 103.166 ha, which is an
increase of 51.48% (Table 1). In the recent five years there has also been an
increase in the share of areas under organic production in total utilized
agricultural area from 3.32% in 2014 to 6.94% in 2018. Although significant
Antunović et al. 10
increase of areas under organic production in total utilized agricultural area in the
Republic of Croatia has been identified in the recent five years, although
anticipated increase from the Action Plan of the Ministry of Agriculture has not
yet been fully realized, where an increase of 8% is expected by 2016. The
Ministry of Agriculture of the Republic of Croatia in the year 2011 adopted an
Action plan of development of organic agriculture with the objective to accelerate
the development of organic livestock farming, and to ensure supply primarily the
Croatian market, and also ensure the placement of organic products abroad.
According to Antunović et al. (2016) limiting factors in the development of
organic agriculture are depopulation of rural areas, unfavorable educational
structure, insufficient education of farmers and consumers of organic products,
problems with unresolved land ownership along with numerous cropped and
scattered land areas as well as mined areas.
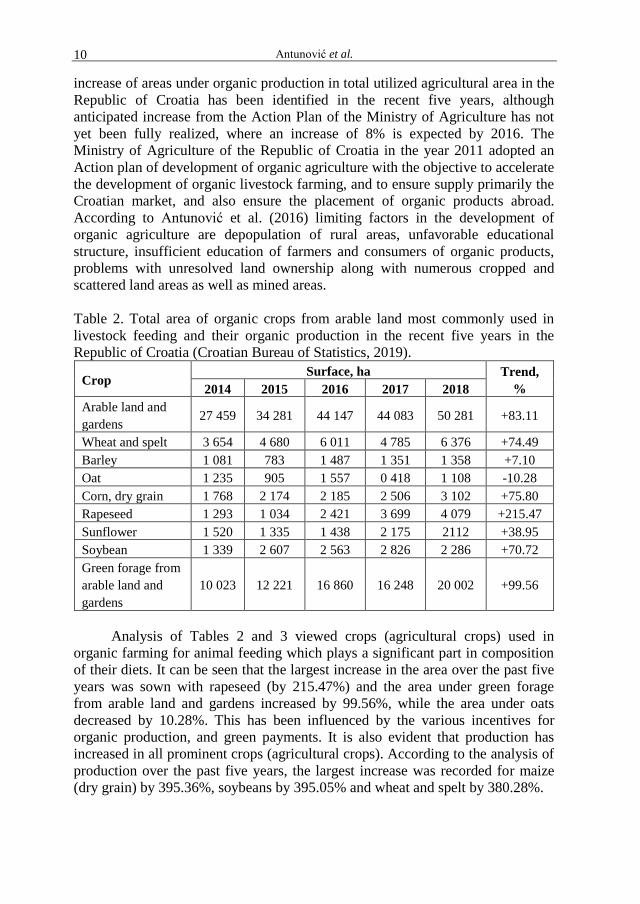
Table 2. Total area of organic crops from arable land most commonly used in
livestock feeding and their organic production in the recent five years in the
Republic of Croatia (Croatian Bureau of Statistics, 2019).
Crop Surface, ha Trend,
% 2014 2015 2016 2017 2018
Arable land and
gardens 27 459 34 281 44 147 44 083 50 281 +83.11
Wheat and spelt 3 654 4 680 6 011 4 785 6 376 +74.49
Barley 1 081 783 1 487 1 351 1 358 +7.10
Oat 1 235 905 1 557 0 418 1 108 -10.28
Corn, dry grain 1 768 2 174 2 185 2 506 3 102 +75.80
Rapeseed 1 293 1 034 2 421 3 699 4 079 +215.47
Sunflower 1 520 1 335 1 438 2 175 2112 +38.95
Soybean 1 339 2 607 2 563 2 826 2 286 +70.72
Green forage from
arable land and
gardens
10 023 12 221 16 860 16 248 20 002 +99.56
Analysis of Tables 2 and 3 viewed crops (agricultural crops) used in
organic farming for animal feeding which plays a significant part in composition
of their diets. It can be seen that the largest increase in the area over the past five
years was sown with rapeseed (by 215.47%) and the area under green forage
from arable land and gardens increased by 99.56%, while the area under oats
decreased by 10.28%. This has been influenced by the various incentives for
organic production, and green payments. It is also evident that production has
increased in all prominent crops (agricultural crops). According to the analysis of
production over the past five years, the largest increase was recorded for maize
(dry grain) by 395.36%, soybeans by 395.05% and wheat and spelt by 380.28%.
Organic livestock farming in Republic of Croatia- state and perspective development 11
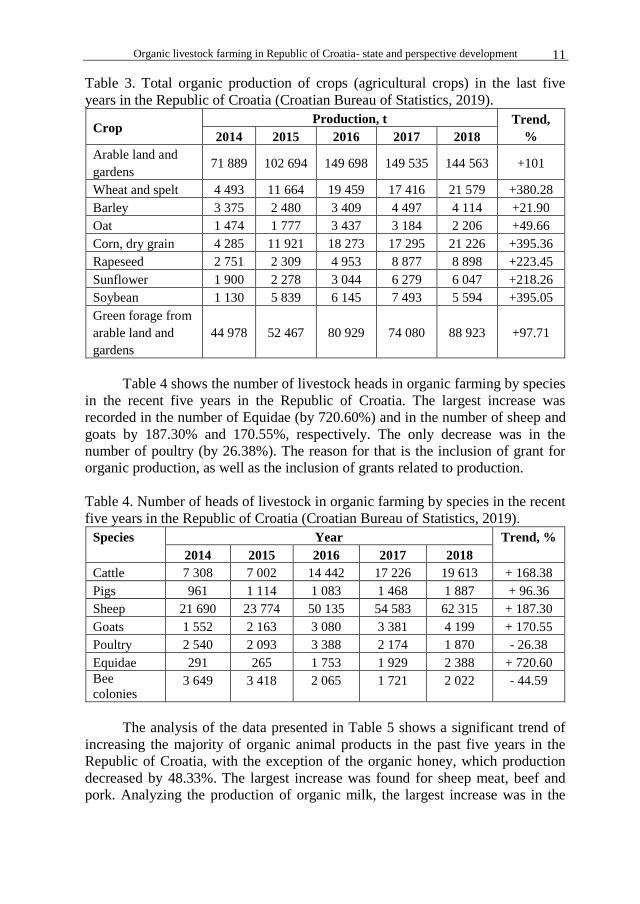
Table 3. Total organic production of crops (agricultural crops) in the last five
years in the Republic of Croatia (Croatian Bureau of Statistics, 2019).
Crop Production, t Trend,
% 2014 2015 2016 2017 2018
Arable land and
gardens 71 889 102 694 149 698 149 535 144 563 +101
Wheat and spelt 4 493 11 664 19 459 17 416 21 579 +380.28
Barley 3 375 2 480 3 409 4 497 4 114 +21.90
Oat 1 474 1 777 3 437 3 184 2 206 +49.66
Corn, dry grain 4 285 11 921 18 273 17 295 21 226 +395.36
Rapeseed 2 751 2 309 4 953 8 877 8 898 +223.45
Sunflower 1 900 2 278 3 044 6 279 6 047 +218.26
Soybean 1 130 5 839 6 145 7 493 5 594 +395.05
Green forage from
arable land and
gardens
44 978 52 467 80 929 74 080 88 923 +97.71
Table 4 shows the number of livestock heads in organic farming by species
in the recent five years in the Republic of Croatia. The largest increase was
recorded in the number of Equidae (by 720.60%) and in the number of sheep and
goats by 187.30% and 170.55%, respectively. The only decrease was in the
number of poultry (by 26.38%). The reason for that is the inclusion of grant for
organic production, as well as the inclusion of grants related to production.
Table 4. Number of heads of livestock in organic farming by species in the recent
five years in the Republic of Croatia (Croatian Bureau of Statistics, 2019).
Species Year Trend, %
2014 2015 2016 2017 2018
Cattle 7 308 7 002 14 442 17 226 19 613 + 168.38
Pigs 961 1 114 1 083 1 468 1 887 + 96.36
Sheep 21 690 23 774 50 135 54 583 62 315 + 187.30
Goats 1 552 2 163 3 080 3 381 4 199 + 170.55
Poultry 2 540 2 093 3 388 2 174 1 870 - 26.38
Equidae 291 265 1 753 1 929 2 388 + 720.60
Bee
colonies 3 649 3 418 2 065 1 721 2 022 - 44.59
The analysis of the data presented in Table 5 shows a significant trend of
increasing the majority of organic animal products in the past five years in the
Republic of Croatia, with the exception of the organic honey, which production
decreased by 48.33%. The largest increase was found for sheep meat, beef and
pork. Analyzing the production of organic milk, the largest increase was in the
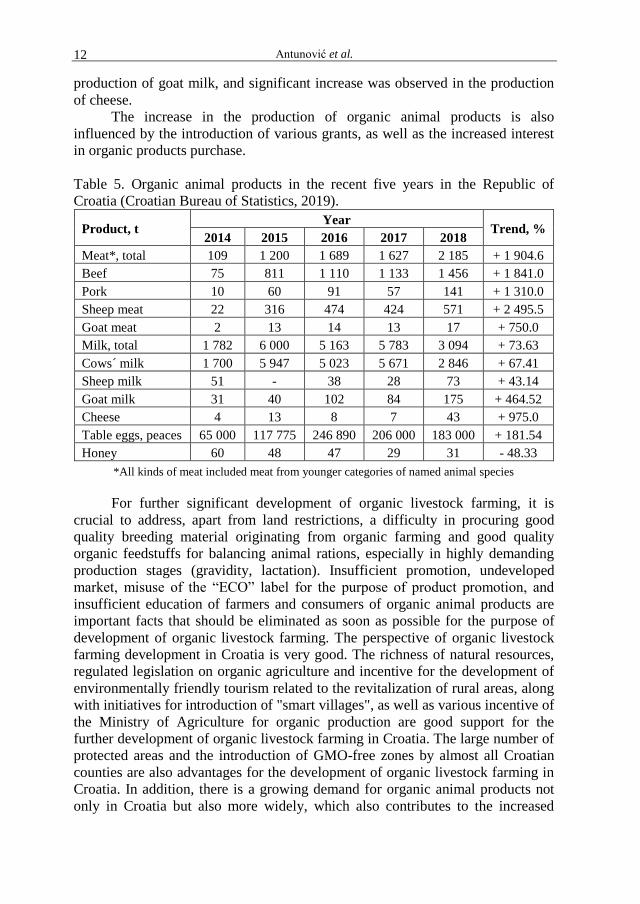
Antunović et al. 12
production of goat milk, and significant increase was observed in the production
of cheese.
The increase in the production of organic animal products is also
influenced by the introduction of various grants, as well as the increased interest
in organic products purchase.
Table 5. Organic animal products in the recent five years in the Republic of
Croatia (Croatian Bureau of Statistics, 2019).
Product, t Year
Trend, % 2014 2015 2016 2017 2018
Meat*, total 109 1 200 1 689 1 627 2 185 + 1 904.6
Beef 75 811 1 110 1 133 1 456 + 1 841.0
Pork 10 60 91 57 141 + 1 310.0
Sheep meat 22 316 474 424 571 + 2 495.5
Goat meat 2 13 14 13 17 + 750.0
Milk, total 1 782 6 000 5 163 5 783 3 094 + 73.63
Cows´ milk 1 700 5 947 5 023 5 671 2 846 + 67.41
Sheep milk 51 - 38 28 73 + 43.14
Goat milk 31 40 102 84 175 + 464.52
Cheese 4 13 8 7 43 + 975.0
Table eggs, peaces 65 000 117 775 246 890 206 000 183 000 + 181.54
Honey 60 48 47 29 31 - 48.33
*All kinds of meat included meat from younger categories of named animal species
For further significant development of organic livestock farming, it is
crucial to address, apart from land restrictions, a difficulty in procuring good
quality breeding material originating from organic farming and good quality
organic feedstuffs for balancing animal rations, especially in highly demanding
production stages (gravidity, lactation). Insufficient promotion, undeveloped
market, misuse of the “ECO” label for the purpose of product promotion, and
insufficient education of farmers and consumers of organic animal products are
important facts that should be eliminated as soon as possible for the purpose of
development of organic livestock farming. The perspective of organic livestock
farming development in Croatia is very good. The richness of natural resources,
regulated legislation on organic agriculture and incentive for the development of
environmentally friendly tourism related to the revitalization of rural areas, along
with initiatives for introduction of "smart villages", as well as various incentive of
the Ministry of Agriculture for organic production are good support for the
further development of organic livestock farming in Croatia. The large number of
protected areas and the introduction of GMO-free zones by almost all Croatian
counties are also advantages for the development of organic livestock farming in
Croatia. In addition, there is a growing demand for organic animal products not
only in Croatia but also more widely, which also contributes to the increased

Organic livestock farming in Republic of Croatia- state and perspective development 13
interest in this production and contributes to its higher quality perspective for
development.
CONCLUSIONS
An analysis of organic livestock farming in the recent five years in the
Republic of Croatia shows the expansion of this production, some difficulties,
and significant advantages that contribute to its overall positive image. This has
also contributed to the growing interest of this production, which is indicated by
significant increase of analyzed indicators, not only by farmers but also by
consumers of organic animal products, as well as by those users whose perception
of environmental protection and biodiversity are especially emphasized.
CONFLICTS OF INTEREST
The authors declare no conflict of interest.
REFERENCES Antunović, Z. (2011). Organic farming of sheep and goats. In Đ. Senčić, eds. Organic
zootechnique, Faculty of Agriculture in Osijek, pp. 92-122.
Antunović, Z., Novoselec, J., Klir,. Ţ. (2016): Organic sheep and goat farming in the
Republic of Croatia - state and development perspectives. Proceeding of the 51st
croatian and 11th international symposium of agriculture, 15-18 February, Opatija,
Croatia, pp. 306-310.
European Union (2007): Council Regulation (EC) No. 834/2007. on organic production
and labeling of organic products with regard to organic production, labeling and
control. Official Journal of the European Union [Online] (Available on-line with
updates http://32007R0834) (verified 2nd
30 August 2017).
Gugić, J., Grgić, I., Dorbić, B., Šuste, M., Dţepina, M., Zrakić, M. (2017): Status
overview and development prospect of organic agriculture in Croatia. Glasnik zaštite
bilja, 60: 1, 20-30.
Ministry of Agriculture (2019): Annual report. Sheep, goats, and small animals. Kriţevci,
p. 88.
Senčić, Đ., Antunović, Z., Mijić, P., Baban, M., Puškadija, Z. (2011): Organic
zootechnique. Faculty of Agriculture in Osijek, p. 239.
Annual Report on the state of agriculture in year 2018. Ministry of Agriculture, Zagreb
(available at
https://poljoprivreda.gov.hr/UserDocsImages/dokumenti/poljoprivredna_politika/zel
eno_izvjesce/2019_11_13_Zeleno%20izvjesce2018.pdf
Action plan for the development of organic agriculture in the Republic of Croatia for the
period 2011-2016 (2011): Ministry of Agriculture. Zagreb p. 37.
Ministry of Agriculture of the Republic of Croatia ( available at www.mp.hr)
Bureau of Statistics (available at www.dzs.hr)


Agriculture & Forestry, Vol. 66 Issue 3: 15-23, 2020, Podgorica 15
Đokić, M., Marković, B., Gantner, V., Marković, M. (2020): Association of genetic variants of β-lactoglobulin
gene with milk traits of Jezeropivska sheep breed. Agriculture and Forestry, 66 (3): 15-23.
DOI: 10.17707/AgricultForest.66.3.02
Milena ĐOKIĆ1, Božidarka MARKOVIĆ
1,
Vesna GANTNER 2, Milan MARKOVIĆ
1
ASSOCIATION OF GENETIC VARIANTS OF β-LACTOGLOBULIN
GENE WITH MILK TRAITS OF JEZEROPIVSKA SHEEP BREED
SUMMARY
Association of genetic variants of β-lactoglobulin (β-Lg) on milk traits of
Montenegrin autochthonous sheep breed - Jezeropivska sheep was studied.
Polymorphisms within ovine β-Lg genes were detected using PCR-RFLP method
by RsaI restriction endonuclease. Milk yield and milk composition parameters
during lactation were determined by using the standard ICAR procedures.
The obtained results showed a prevalence of A allele (0.625) compared to
B allele (0.375), while the frequencies of genotypes were: 0.364 (AA), 0.523
(AB) and 0.113 (BB). No statistically significant differences in duration of
lactation and total milk yield between these three genotypes were found.
Daily milk yield was the highest (0.70 kg) in ewes with BB genotype β-
lactoglobulin then AB genotype follows (0.60 kg) and AA (0.54 kg) genotype.
Genotype AA of Jezeropivska breed was linked with the higher protein content
(5.86%). The protein content in the milk of AB and BB genotype was the same
(5.64%). Significant association between AB genotype of β-lactoglobulin gene
with higher lactose content (4.67%) was found.
The results presented in this study could be useful in improvement of the
concept of conservation and sustainable use of this autochthonous sheep breed,
while gene of β-Lg as a potential marker in improving milk traits of sheep.
Keywords: Jezeropivska sheep, milk yield, milk composition, β-
lactoglobulin, genotype.
INTRODUCTION
Milk and dairy products from sheep represent a significant part of the
agricultural economy worldwide, especially in marginal areas (Selvaggi et al.,
2015). There is a strong association between milk protein polymorphisms and its
yield, composition and technological aspects. Hence, in-depth research of genetic
1Milena Đokić, (corresponding author: [email protected]), Božidarka Marković, Milan
Marković, University of Montenegro, Biotechnical Faculty Podgorica, MONTENEGRO. 2Vesna Gantner, Faculty of Agrobiotechnical Sciences Osijek, University of Josip Juraj
Strossmayer in Osijek, CROATIA.
Paper presented at the GEA (Geo Eco-Eco Agro) International Conference 2020, Podgorica
Notes: The authors declare that they have no conflicts of interest. Authorship Form signed online.
Received:15/06/2020 Accepted:04/09/2020
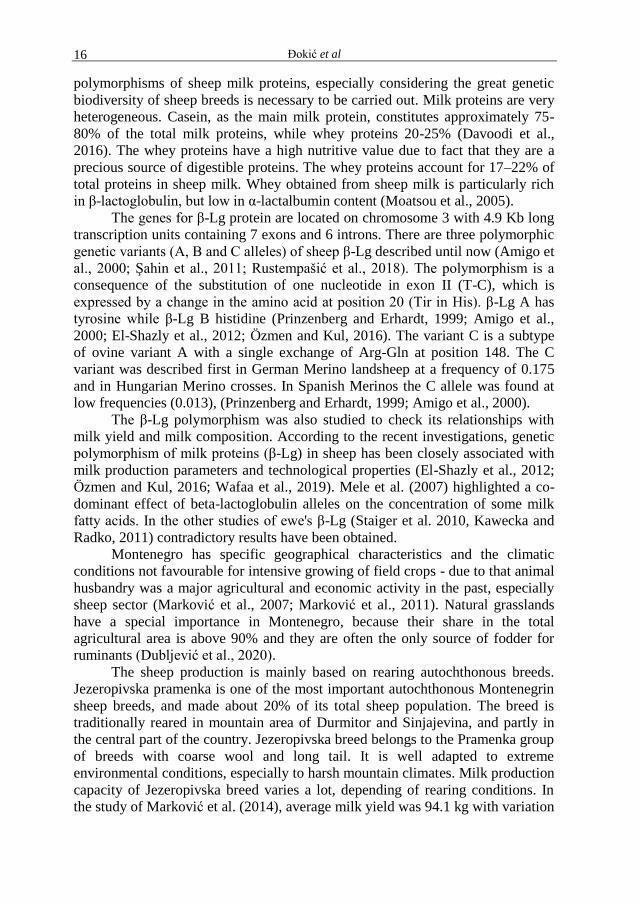
Đokić et al 16
polymorphisms of sheep milk proteins, especially considering the great genetic
biodiversity of sheep breeds is necessary to be carried out. Milk proteins are very
heterogeneous. Casein, as the main milk protein, constitutes approximately 75-
80% of the total milk proteins, while whey proteins 20-25% (Davoodi et al.,
2016). The whey proteins have a high nutritive value due to fact that they are a
precious source of digestible proteins. The whey proteins account for 17–22% of
total proteins in sheep milk. Whey obtained from sheep milk is particularly rich
in β-lactoglobulin, but low in α-lactalbumin content (Moatsou et al., 2005). The genes for β-Lg protein are located on chromosome 3 with 4.9 Kb long
transcription units containing 7 exons and 6 introns. There are three polymorphic
genetic variants (A, B and C alleles) of sheep β-Lg described until now (Amigo et
al., 2000; Şahin et al., 2011; Rustempašić et al., 2018). The polymorphism is a
consequence of the substitution of one nucleotide in exon II (T-C), which is
expressed by a change in the amino acid at position 20 (Tir in His). β-Lg A has
tyrosine while β-Lg B histidine (Prinzenberg and Erhardt, 1999; Amigo et al.,
2000; El-Shazly et al., 2012; Özmen and Kul, 2016). The variant C is a subtype
of ovine variant A with a single exchange of Arg-Gln at position 148. The C
variant was described first in German Merino landsheep at a frequency of 0.175
and in Hungarian Merino crosses. In Spanish Merinos the C allele was found at
low frequencies (0.013), (Prinzenberg and Erhardt, 1999; Amigo et al., 2000).
The β-Lg polymorphism was also studied to check its relationships with
milk yield and milk composition. According to the recent investigations, genetic
polymorphism of milk proteins (β-Lg) in sheep has been closely associated with
milk production parameters and technological properties (El-Shazly et al., 2012;
Özmen and Kul, 2016; Wafaa et al., 2019). Mele et al. (2007) highlighted a co-
dominant effect of beta-lactoglobulin alleles on the concentration of some milk
fatty acids. In the other studies of ewe's β-Lg (Staiger et al. 2010, Kawecka and
Radko, 2011) contradictory results have been obtained.
Montenegro has specific geographical characteristics and the climatic
conditions not favourable for intensive growing of field crops - due to that animal
husbandry was a major agricultural and economic activity in the past, especially
sheep sector (Marković et al., 2007; Marković et al., 2011). Natural grasslands
have a special importance in Montenegro, because their share in the total
agricultural area is above 90% and they are often the only source of fodder for
ruminants (Dubljević et al., 2020).
The sheep production is mainly based on rearing autochthonous breeds.
Jezeropivska pramenka is one of the most important autochthonous Montenegrin
sheep breeds, and made about 20% of its total sheep population. The breed is
traditionally reared in mountain area of Durmitor and Sinjajevina, and partly in
the central part of the country. Jezeropivska breed belongs to the Pramenka group
of breeds with coarse wool and long tail. It is well adapted to extreme
environmental conditions, especially to harsh mountain climates. Milk production
capacity of Jezeropivska breed varies a lot, depending of rearing conditions. In
the study of Marković et al. (2014), average milk yield was 94.1 kg with variation
Association of genetic variants of β-lactoglobulin gene with milk traits ... 17
from 50 kg to 200 kg, while average duration of lactation was 178.5 days. In the
same study, the percentages of the main milk components were: 5.71% of fat,
5.57% of protein, 4.47% of lactose and 11.04% of solid non-fat. Similar to the
other Montenegrin sheep breeds (Bardoka, Ljaba, Sora, Sjenička and Žuja)
Jezeropivska pramenka is three-purpose breed, with meat and milk as the main
products, while wool is low value by-product. In Montenegro sheep milk is
generally used for manufacture of different traditional local product (cheeses,
yogurt, kaymak - skorup, jardum etc.). Sheep’s milk has high values of chemical
components, and it is the best raw material for the production of cheese, because
it gives twice higher randman than cow’s milk (Jandrić and Savić, 2019). Sheep
milk products are of excellent quality and high nutritional value, and therefore
they are highly valued on the market (Marković et al., 2016).
Having in mind the importance of autochthonous breeds in generally, the
aim of this research was to do genetic characterization of polymorphic forms of
β-Lg genes in Jezeropivska pramenka sheep breed. Also, for obtaining complete
data, it is important to investigate milk production traits (duration of lactation,
milk yield and milk composition) and to analyse the effect of β-Lg genotypes on
the milk properties of this autochthonous Montenegrin sheep breed what would
be in line with similar research on other sheep breeds in Europe and in the world.
The obtained data of polymorphism of milk protein gene can be used as an
important selection tool in the sheep breeding programs. Effective selection on
favourable genotypes of milk proteins can increase the frequency of alleles with a
positive effect on milk properties and milk quality.
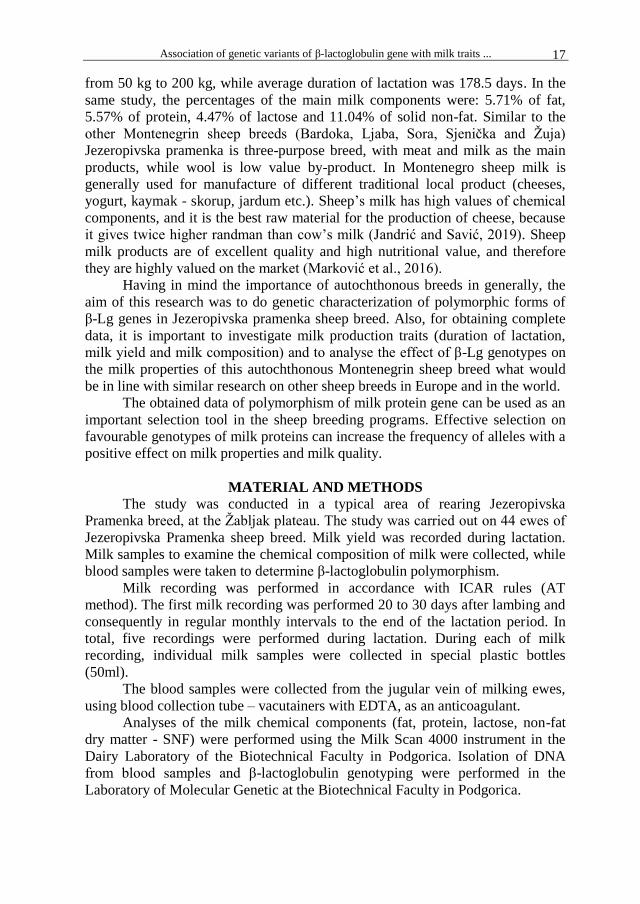
MATERIAL AND METHODS The study was conducted in a typical area of rearing Jezeropivska
Pramenka breed, at the Žabljak plateau. The study was carried out on 44 ewes of
Jezeropivska Pramenka sheep breed. Milk yield was recorded during lactation.
Milk samples to examine the chemical composition of milk were collected, while
blood samples were taken to determine β-lactoglobulin polymorphism.
Milk recording was performed in accordance with ICAR rules (AT
method). The first milk recording was performed 20 to 30 days after lambing and
consequently in regular monthly intervals to the end of the lactation period. In
total, five recordings were performed during lactation. During each of milk
recording, individual milk samples were collected in special plastic bottles
(50ml).
The blood samples were collected from the jugular vein of milking ewes,
using blood collection tube – vacutainers with EDTA, as an anticoagulant.
Analyses of the milk chemical components (fat, protein, lactose, non-fat
dry matter - SNF) were performed using the Milk Scan 4000 instrument in the
Dairy Laboratory of the Biotechnical Faculty in Podgorica. Isolation of DNA
from blood samples and β-lactoglobulin genotyping were performed in the
Laboratory of Molecular Genetic at the Biotechnical Faculty in Podgorica.
Đokić et al 18
DNA extraction: Genomic DNA was isolated from the blood samples using
phenol-chloroform method (Ivanković and Dovč, 2004). The quality of DNA was
checked by spectrophotometry and good quality DNA samples were used in
genotyping.
PCR - RFLP of β-lg gene: β-Lactoglobulin genotypes were identified using
procedure described by Ivanković and Dovč (2004) and Şahin et al. (2011). The
amplification of a part genome DNA - genes for the synthesis of milk protein β-
lactoglobulin (120 bp) was performed using a programmed Thermal Cycler
(Eppendorf Mastercycler). The PCR amplifications were performed in reaction
mixtures of 20 µL containing 10 µL of PCR Master Mix, 1,1 µL of each primer,
5,8 µL H2O and 2 µL genomic DNA. Thermal Cycler was programmed for an
initial denaturation at 95°C for 3 min, followed by 35 cycles each with denaturing
at 93°C for 15 s, annealing at 58°C for 15 s, extension at 72°C for 2 s, and a final
extension at 72°C for 2 min. The restriction fragments were directly analyzed by
electrophoresis in 1% agarose gels in 1×TAE buffer, stained with ethidium
bromide and visualized under UV light. The genotypes of the analyzed
individuals at the β-lactoglobulin locus were determined using the restriction
fragments observed in the gel.
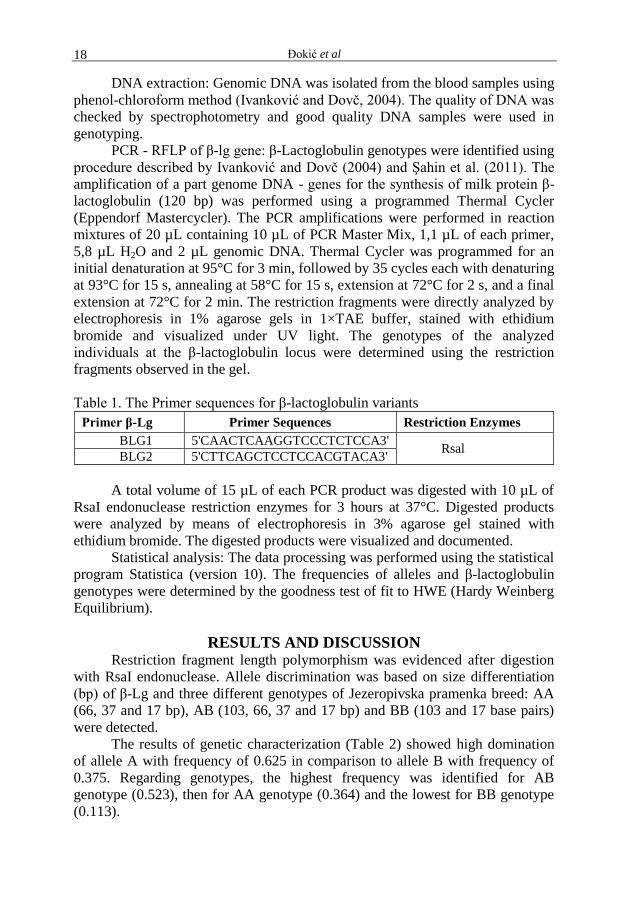
Table 1. The Primer sequences for β-lactoglobulin variants
Primer β-Lg Primer Sequences Restriction Enzymes
BLG1 5'CAACTCAAGGTCCCTCTCCA3' Rsal
BLG2 5'CTTCAGCTCCTCCACGTACA3'
A total volume of 15 µL of each PCR product was digested with 10 µL of
RsaI endonuclease restriction enzymes for 3 hours at 37°C. Digested products
were analyzed by means of electrophoresis in 3% agarose gel stained with
ethidium bromide. The digested products were visualized and documented.
Statistical analysis: The data processing was performed using the statistical
program Statistica (version 10). The frequencies of alleles and β-lactoglobulin
genotypes were determined by the goodness test of fit to HWE (Hardy Weinberg
Equilibrium).
RESULTS AND DISCUSSION
Restriction fragment length polymorphism was evidenced after digestion
with RsaI endonuclease. Allele discrimination was based on size differentiation
(bp) of β-Lg and three different genotypes of Jezeropivska pramenka breed: AA
(66, 37 and 17 bp), AB (103, 66, 37 and 17 bp) and BB (103 and 17 base pairs)
were detected.
The results of genetic characterization (Table 2) showed high domination
of allele A with frequency of 0.625 in comparison to allele B with frequency of
0.375. Regarding genotypes, the highest frequency was identified for AB
genotype (0.523), then for AA genotype (0.364) and the lowest for BB genotype
(0.113).
Association of genetic variants of β-lactoglobulin gene with milk traits ... 19
The occurrence of β-Lg variants in this study is similar to the other sheep
breeds studied so far. According to the research of Ivanković and Dovč (2004),
Kusza et al. (2014), El-Shazly et al. (2012) and Marković et al. (2015) A and B
alleles of β-Lg were widely reported in almost all examined sheep breeds. Similar
to our results for Jezeropivska pramenka breed, the higher frequencies of allele A
of β-Lg were reported by Amigo et al. (2000) for Barbaresca-Siciliana, Lacaune,
Tsigaja and Massese breeds, Wafaa et al. (2019) for Awassi breed, as well as
Amigo et al. (2000) for many West European sheep breeds (Blackfaced, Border
Leicester Merino, Cheviot, Dorset Horn, Delle Langhe, East Friesian, Finnish
Landrace, Manchega, Massese, Merino, Merinoland, Segurena, Suffolk, Welsh).
The highest frequency of allele A in Turkish sheep breeds was detected in Tuj
breed as 0.7188 (Şahin et al., 2011).
Table 2. Frequency of genes and genotypes for β-lactoglobulin of Jezeropivska
pramenka (n=44)
β-lactoglobulin Ho He Frequency
Alleles A 55 55.01 0.625
B 33 33.21 0.375
Genotype
AA 16 17,19 0.364
AB 23 20.63 0.523
BB 5 6.29 0.113
The allele and genotypes frequencies of β-lactoglobulin in Pramenka breed
sheep in Bosnia and Herzegovina, which belong to the same group as
Jezeropivska breed (group of Pramenka breeds) are very similar to ours.
Rustempašić et al. (2018) reported that allele frequency was 0.547 and 0.453, A
and B respectively, while genotype frequencies were: AA (0.325), AB (0.445),
and BB (0.229). However, the results of Masala et al. (2020) for Dupska
Pramenka breed in Bosnia and Herzegovina were shown higher frequency of B
genetic variation (0.52) than A (0.48), while the most common genotype was the
AB determined in 68% of the examined population.
The opposite to our results, Amigo et al. (2000) reported domination of
allele B for Carranzana, Chios, Lacha, Sarda, Tajik, Valle del Belice breeds, as
well as El-Shazly et al. (2012) for Noemi and Sawakni breeds.
The higher frequency of AB genotype, similar to ours, was obtained for many
autochthonous breeds: Croatian Pag breed ewes (Čubrić-Čurik et al. 2002); Greek
Chios breeds (Triantaphyllopoulos et al. 2017); native Turkish fat-tailed sheep
breeds - Akkaraman, Awassi, Tuj, Karakaş, Norduz, Güney Karaman and Kangal
(Şahin et al. 2011) and in three Hungarian sheep breeds - Cokanski, Rusty Tsigai
and Zomborski Tsigai (Kusza et al. 2014).
The average values with standard deviation of milk production traits
(lactation duration, total milk yield, daily milk yield) for the three β-Lg genotype
are presented in Table 3.
Đokić et al 20
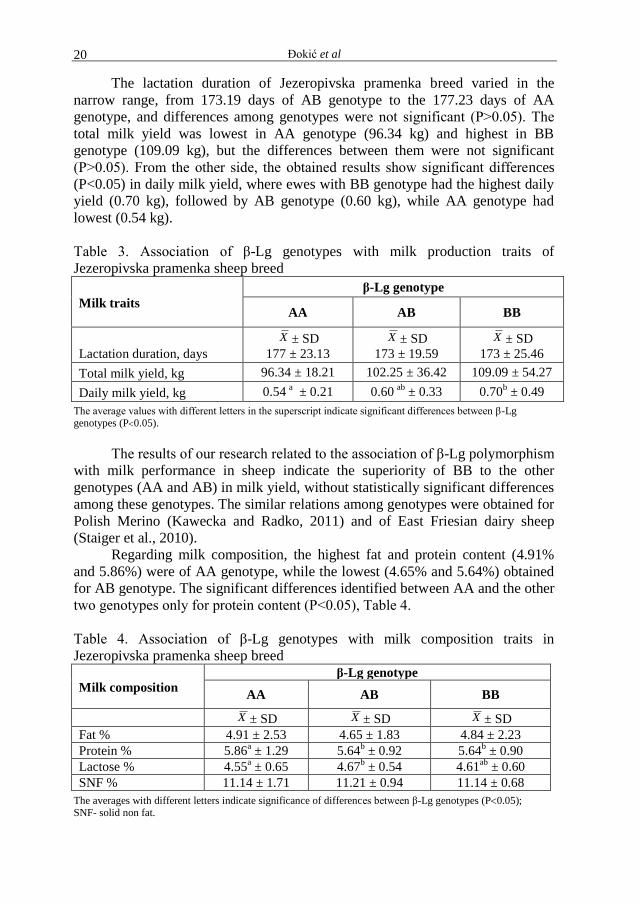
The lactation duration of Jezeropivska pramenka breed varied in the
narrow range, from 173.19 days of AB genotype to the 177.23 days of AA
genotype, and differences among genotypes were not significant (P˃0.05). The
total milk yield was lowest in AA genotype (96.34 kg) and highest in BB
genotype (109.09 kg), but the differences between them were not significant
(P˃0.05). From the other side, the obtained results show significant differences
(P<0.05) in daily milk yield, where ewes with BB genotype had the highest daily
yield (0.70 kg), followed by AB genotype (0.60 kg), while AA genotype had
lowest (0.54 kg).
Table 3. Association of β-Lg genotypes with milk production traits of
Jezeropivska pramenka sheep breed
Milk traits
β-Lg genotype
AA AB BB
Lactation duration, days
X ± SD
177 ± 23.13
X ± SD
173 ± 19.59
X ± SD
173 ± 25.46
Total milk yield, kg 96.34 ± 18.21 102.25 ± 36.42 109.09 ± 54.27
Daily milk yield, kg 0.54 a ± 0.21 0.60
ab ± 0.33 0.70
b ± 0.49
The average values with different letters in the superscript indicate significant differences between β-Lg genotypes (P0.05).
The results of our research related to the association of β-Lg polymorphism
with milk performance in sheep indicate the superiority of BB to the other
genotypes (AA and AB) in milk yield, without statistically significant differences
among these genotypes. The similar relations among genotypes were obtained for
Polish Merino (Kawecka and Radko, 2011) and of East Friesian dairy sheep
(Staiger et al., 2010).
Regarding milk composition, the highest fat and protein content (4.91%
and 5.86%) were of AA genotype, while the lowest (4.65% and 5.64%) obtained
for AB genotype. The significant differences identified between AA and the other
two genotypes only for protein content (P˂0.05), Table 4.
Table 4. Association of β-Lg genotypes with milk composition traits in
Jezeropivska pramenka sheep breed
Milk composition
β-Lg genotype
AA AB BB
X ± SD X ± SD X ± SD
Fat % 4.91 ± 2.53 4.65 ± 1.83 4.84 ± 2.23
Protein % 5.86a ± 1.29 5.64
b ± 0.92 5.64
b ± 0.90
Lactose % 4.55a ± 0.65 4.67
b ± 0.54 4.61
ab ± 0.60
SNF % 11.14 ± 1.71 11.21 ± 0.94 11.14 ± 0.68
The averages with different letters indicate significance of differences between β-Lg genotypes (P0.05); SNF- solid non fat.
Association of genetic variants of β-lactoglobulin gene with milk traits ... 21
No statistically significant differences were found in milk fat content
between genotypes in the studied sheep. The opposite to the fat and protein
results, the lactose content was significantly lower in AA genotype (4.55%) than
in AB genotype (4.67%), while content of lactose in BB genotype was in the
middle (4.61%). Regarding SNF content, there were no significant differences
between genotypes, the results ranged from 11.14% in AA and BB genotype to
11.21% in AB genotype.
Our results of association of β-Lg genotypes and protein and lactose content
in milk are in accordance with results of Kusza et al. (2014) revealed for different
dairy breeds, but not fully with the results reported by Triantaphyllopoulos et al.
(2017), who found that AA genotype of β-Lg gene of Chios and Karagouniko
breeds was associated with the highest fat, protein percentage, while greater
lactose percentage observed in genotype AB - 5,42% compared to genotype AA -
4.96% and to genotype BB - 5.32%.
The results of investigation of Özmen and Kul (2016) on allele and genotype
effects on milk production traits Sakiz and Awassi breeds are fully in accordance
with our results. They obtained that ewes of AB genotype had a greater milk yield
than those with AA genotype, while homozygous AA ewes had higher milk
protein and fat percentage when compared with other two genotypes.
CONCLUSIONS
This study shows that Jezeropivska sheep breed has a genetic variability in
the β-lactoglobulin locus. A significant association of β-Lg genotypes and daily
milk yield and milk quality was revealed. Although, the results showed that milk
yield did not have a clear relationship with β-LG genotype, protein and lactose
content were statistical significant. More investigation of the effect of β-Lg
polymorphism and milk composition is needed. It was determined that milk
protein polymorphism can be considered as a potential tool in the breeding
program of Jezeropivska sheep breed, especially regarding selection of genotypes
associated with better milk composition. This research is also the important
contribution for creation of long-term conservation strategy of the autochthonous
sheep breeds in Montenegro.
REFERENCES
Amigo, L., Recio, I., Ramos, M. (2000): Genetic polymorphism of ovine milk proteins:
its influence on technological properties of milk- a review. International Dairy
Journal 10, 135-149.
Čubrić-Čurik, V., Feligini, M., Lukac-Havranek, J., Curik, I., Guiseppe, E. (2002):
Genetic polymorphism of β-lactoglobulin in native sheep from the Island of Pag.
Food Technol Biotechnol. 40: 75-78.
Davoodi, S. H., Shahbazi, R., Esmaeili, S., Sohrabvandi, S., Mortazavian, A.M., Jazayeri,
S. and Davoodi, A.T. (2016): “Health-Related Aspects of Milk Proteins.” Iranian
journal of pharmaceutical research : IJPR vol. 15,3 (2016): 573-591.
Đokić et al 22
Dubljević, R., Radonjić, D., Marković, M. (2020): Production traits of major types of
grasslands in the Durmitor area. Agriculture and Forestry, 66 (2): 229-236
El-Shazly, S.A., Mahfouz, M.E., Al-Otaibi, S.A., and Ahmed, M.M. (2012): Genetic
polymorphism in β-lactoglobulin gene of some sheep breeds in the Kingdom of
Saudi Arabia (KSA) and its influence on milk composition. African Journal of
Biotechnology Vol. 11(19), 4330-4337.
Ivanković, A. and Dovč, P. (2004): Polimorfizem genov za β-laktoglobulin in αs1-kazein
paske ovce, Acta agriculturae slovenica, 842, 121- 130.
Jandrić, M., Savić, Z. (2019): Influence of milk on the content and changes of milk fat
during production of sjenički white cheese. Agriculture and Forestry, 65 (4): 175-
182. DOI:10.17707/AgricultForest.65.4.15
Kawecka, A and Radko, A. (2011): Genetic polymorphism of β-lactoglobulin in sheep
raised for milk production. Journal of Applied Animal Research, Vol. 39, No. 1.,
68-71.
Kusza, S., Sziszkosz, N., Nagy, K., Masala, A., Kukovics, S. and András, J. (2014):
Preliminary result of a genetic polymorphism of β-lactoglobulin gene and the
phylogenetic study of ten balkan and central european indigenous sheep breeds.
Biohimica polonica. Vol. 62, No 1/2015, 109-112.
Marković, B., Đokić, M., Kostić, S., Marković, M. (2016): Stanje i trendovi ovčarske
proizvodnja na durmitorskom području, CANU, Podgorica.
Marković, B., Ivanković, A., Mirecki, S, Marković, M. (2015): Genetic polymorphism of
beta – lactoglobulin in the three sheep breeds in Montenegro. International
symposium on Animal Science, Novi Sad, Serbia. 159-164.
Marković, B., Marković, M., Adzić, N. (2007): The farm animal genetic resources of
Montenegro, Biotechnology in Animal Husbandry 23 (3-4) ISSN 1450-9156,
Institute for Animal Husbandry, Belgrade-Zemun, 1-9.
Marković, B., Marković, M., Mirecki, S., Radonjić D., (2014): Variation of milk yield
and milk composition of Pivska pramenka sheep breed through lactation,
Proceedings of the International Symposium on Animal Science, Beograd-
Zemun, 167-173.
Marković, B., Marković, M., Radonjić, D., Veljić, M. (2011): Sustainable sheep and goat
production based on the local breeds in Montenegro. 8th Global Conference on
Consevation on Animal Genetic Resources. Tekirdag Turkiye. 414-420.
Masala, A., Alilović, I., Ohran, H., Kusza, S., Goletic, T., Hrkovic-Porobija, A.,
HodzicGenetic, A. (2020): Polymorphism β-Lactoglobulin Gene in Dubska
Pramenka Sheep Breed. CMBEBIH 2019 , 641-645.
Mele, M., Conte, G., Serra, A., Buccioni, A., Secchiari, P. (2007): Relationship between
beta-lactoglobulin polymorphism and milk fatty acid composition in milk of
Massese dairy ewes. Small Ruminant Research 73, 37–44.
Moatsou, G., Hatzinaki, A., Samolada, M., Anifantakis, E. (2005). Major whey proteins
in ovine and caprine acid wheys from indigenous Greek breeds. Int. Dairy J. 15:
123–131.
Özmen, O., Kul, S. (2016): Investigating the genetic polymorphism in the exon 2 region
of ovine beta-lactoglobulin gene and its association with some milk traits. Ankara
Üniv Vet Fak Derg, 63, 323-328.
Prinzenberg, M. and Erhardt, G. (1999): Molecular genetic characterization of ovine b-
lactoglobulin C allele and detection by PCR-RFLP. J. Anim. Breed. Genet. 116,
9–14.
Association of genetic variants of β-lactoglobulin gene with milk traits ... 23
Rustempašić, A., Dokso, A., Zečević, E., Hodžić, A., Hrković-Porobija, A., Sarić, Z.,
Miskoska–Milevska, E., Popovski, Z. and Brka, M. (2018): Polymorphism of β-
lactoglobulin in Pramenka sheep breed in Bosnia and Herzegovina.
Şahin, E., Karsli, T., Elmaci, C., Balcioğlu, M.S. (2011): Beta-Lactoglobulin Gene Types
in Turkish Fat-Tailed Sheep Breeds. Short communication. Kafkas Univ Vet Fak
Derg 17 (6): 1031-1033.
Selvaggi, M., Laudadio, V., Dario, C., Tufarelli, V. (2015): β-lactoglobulin gene
polymorphisms in sheep and effects on milk production traits: A review. Adv.
Anim. Vet. Sci. 3(9): 478-484.
Staiger, E. A., Thonney, M. L., Buchanan, J. W., Rogers, E. R., Oltenacu, P. A. and
Mateescu, R.G. (2010): Effect of prolactin, β-lactoglobulin, and κ-casein
genotype on milk yield in East Friesian sheep. American Dairy Science
Association. J. Dairy Sci. 93, 1736–1742.
Triantaphyllopoulos, K.A., Koutsouli, P., Kandris, A., Papachristou, D., Markopoulou,
K.E., Mataragka, A., Massouras, T., Bizelis, I. (2017): Effect of βlactoglobulin
gene polymorphism, lactation stage and breed on milk traits in Chios and
Karagouniko sheep breeds, Annals of Animal Science, DOI: 10.1515/aoas-2016-
0058.
Wafaa, I. I., Hassooni, H. A. and Alkhazraji, W. J. (2019): Association of β-lactoglobulin
gene polymorphism with milk production and composition in local Awassi sheep.
Plant Archives Vol. 19, Supplement 2, ISSN:0972-521

Agriculture & Forestry, Vol. 66 Issue 3: 25-31, 2020, Podgorica 25
Steiner, Z., Prakatur, I., Novoselec, J., Samac, D., Klir, Ž., Antunović, B., Benak, S., Gantner, V., Ronta, M.
(2020): Influence of pumpkin seed cake on production and slaughter indicators for broiler chickens.
Agriculture and Forestry, 66 (3): 25-31.
DOI: 10.17707/AgricultForest.66.3.03
Zvonimir STEINER1, Ivana PRAKATUR
1, Josip NOVOSELEC
1,
Danijela SAMAC1, Željka KLIR
1, Boris ANTUNOVIĆ
1,
Stipo BENAK2, Vesna GANTNER
1, Mario RONTA
1
INFLUENCE OF PUMPKIN SEED CAKE ON PRODUCTION AND
SLAUGHTER INDICATORS FOR BROILER CHICKENS
SUMMARY
The aim of the research was to determine the possibility of adding pumpkin
seed cake (PSC) in feed mixtures for broiler chickens, as well as its influence on
production and slaughter indicators. The experiment consisted of control and two
experimental groups of broiler chickens fed for 6 weeks with feed mixtures
containing different rates of PSC (0%, 7% and 14%, respectively). Statistically
significantly higher body mass was determined in the E1 group compared to the
E2 group (P<0.01) and in the E1 group compared to the C group (P<0.05).
Regarding the percentage shares of different body parts in body weight, the C and
E1 groups had statistically very significantly (P <0.01) higher values of wing
shares compared to the E2 group. Regarding the skin color, L value was statically
significantly (P<0.05) higher in the C group, compared to the E1 group. From all
of the above, it is to conclude that PSC in the rate of 7% in fodder mixtures can
be recommended for feeding broilers in the period from the 1st until the 42nd day
of age, with a potential to improve production and slaughter indicators.
Keywords: PSC, feeding, broilers, slaughtering indicators.
INTRODUCTION
According to the data of the Croatian Bureau of Statistics, the total number
of farming poultry heads in the Republic of Croatia in the period from 2012 until
2016 was in average 10 million. Nutritional needs of broiler chickens are very
high. In average, feed mixtures contain amino acid ratio and high crude protein
level, ranging from 37% to 48%. As the price of feed participates within the total
production cost in the rate of 70%, it is in the interest of farmers to lower this
cost. Furthermore, the price of conventional fodders is often unfavourable for
producers, so alternative fodders are being sought (Steiner et al., 2015).
1Mario Ronta, (corresponding author: [email protected]), Zvonimir Steiner, Ivana Prakatur, Josip
Novoselec, Danijela Samac, Željka Klir, Boris Antunović, Vesna Gantner, Faculty of
Agrobiotehnical Sciences Osijek 1, CROATIA. 2Stipo Benak, Belje plus d.o.o. CROATIA
Paper presented at the GEA (Geo Eco-Eco Agro) International Conference 2020, Podgorica.
Notes: The authors declare that they have no conflicts of interest. Authorship Form signed online.
Received:29/05/2020 Accepted:30/07/2020
Steiner et al 26
Alternative fodders intended for broiler production are divided to those rich in
crude proteins and those rich in energy. PSC is an alternative fodder that has a
potential to be a source of protein in poultry due to high levels of crude proteins
(Wafar et al., 2017). Pumpkin seed cake (PSC) contains up to 500 g/kg of crude
proteins and 70 g/kg of raw fibre. For the purpose of preparation of meals for
monogastric animals, only the pellets and cakes from shelled seeds are being used
(Domaćinović 2006).
Fodder produced from shelled seed can be used in feeding swine and older
poultry, but despite of large amount of protein, due to the lysine deficiency, it is
being used in addition to other protein fodders (Dumovski and Milas, 2004). PSC
is a high-quality by-product rich in proteins, derived from pumpkin oil production
(Antunović, 2015). Zdunczyk et al. (1999) studied chemical composition and
nutritive value of PSC from Cucurbita pepo compared to soybean meal. The
content of crude protein and ether extract was higher in PSC compared to
soybean meal (598.0 vs. 474.2 g/kg and 124.6 vs. 28.3 g/kg, respectively).
The main fatty acids found in PSC were oleic acid (50.4%) and linoleic
acid (29.9%). The proteins found in PSC contained significant amounts of
tryptophan (1.54 g/16 g N). In contrast, lysine content (3.21 g/16 g N) and
isoleucine content (3.83 g/16 g N) were low. Furthermore, small amounts of
phenolic compounds (2.61 g/kg), low activity of trypsin inhibitor (1.33 TUI/mg)
and small amounts of α-galactoside (19.9 g/kg) were found in PSC. Among the
anti-nutritive compounds, only the content of inositol phosphate in PSC (40.5
mg/g) was higher than in soybean seed (10.8 mg/g). The simultaneous coefficient
of digestibility (TD) of PSC protein was similar (83.1% vs. 83.5%), but the
protein efficiency ratio (PER) was lower compared to the soybean meal (1.01 vs.
1.50). Kreft et al. (2002) point out that PSC represents better source than
pumpkin seed or pumpkin oil. Also, PSC is a high quality source of high quality
fatty acids, proteins, herbal sterols and vitamins.
MATERIAL AND METHODS The study included 135 one-day-old broilers of Ross 308 chickens divided
into three groups; Control group (C), Experimental group 1 (E1), and
Experimental group 2 (E2). The C group fed feed mixtures with no PSC added.
The E1 and E2 groups of broilers fed fodder mixtures containing 7% and 14% of
PSC, respectively.
The feeding itself took place in two phases; the initial – “starter” phase,
which lasted for the first 21 days of broiler chickens’ life and the final –
“finisher” phase, which lasted from 22nd until 42nd day of broiler chickens’ life.
Feeding and watering of chickens was ad libitum. In order to examine the
influence of PSC on production and slaughter indicators of broiler chickens, the
recipes presented in Table 1 were prepared.
Influence of pumpkin seed cake on production and slaughter indicators for broiler chickens 27
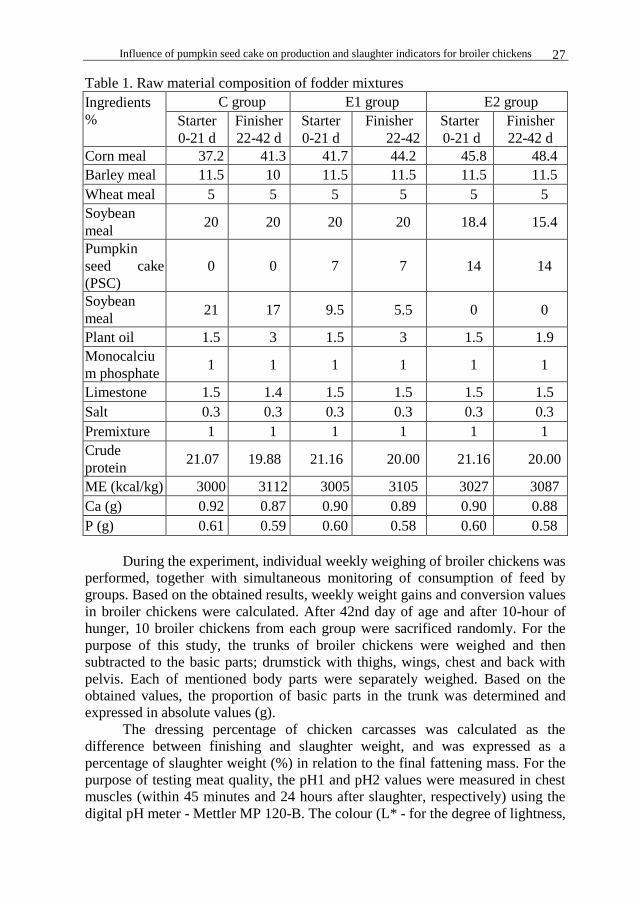
Table 1. Raw material composition of fodder mixtures
Ingredients
%
C group E1 group E2 group
Starter
0-21 d
Finisher
22-42 d
Starter
0-21 d
Finisher
22-42
Starter
0-21 d
Finisher
22-42 d
Corn meal 37.2 41.3 41.7 44.2 45.8 48.4
Barley meal 11.5 10 11.5 11.5 11.5 11.5
Wheat meal 5 5 5 5 5 5
Soybean
meal 20 20 20 20 18.4 15.4
Pumpkin
seed cake
(PSC)
0 0 7 7 14 14
Soybean
meal 21 17 9.5 5.5 0 0
Plant oil 1.5 3 1.5 3 1.5 1.9
Monocalciu
m phosphate 1 1 1 1 1 1
Limestone 1.5 1.4 1.5 1.5 1.5 1.5
Salt 0.3 0.3 0.3 0.3 0.3 0.3
Premixture 1 1 1 1 1 1
Crude
protein 21.07 19.88 21.16 20.00 21.16 20.00
ME (kcal/kg) 3000 3112 3005 3105 3027 3087
Ca (g) 0.92 0.87 0.90 0.89 0.90 0.88
P (g) 0.61 0.59 0.60 0.58 0.60 0.58
During the experiment, individual weekly weighing of broiler chickens was
performed, together with simultaneous monitoring of consumption of feed by
groups. Based on the obtained results, weekly weight gains and conversion values
in broiler chickens were calculated. After 42nd day of age and after 10-hour of
hunger, 10 broiler chickens from each group were sacrificed randomly. For the
purpose of this study, the trunks of broiler chickens were weighed and then
subtracted to the basic parts; drumstick with thighs, wings, chest and back with
pelvis. Each of mentioned body parts were separately weighed. Based on the
obtained values, the proportion of basic parts in the trunk was determined and
expressed in absolute values (g).
The dressing percentage of chicken carcasses was calculated as the
difference between finishing and slaughter weight, and was expressed as a
percentage of slaughter weight (%) in relation to the final fattening mass. For the
purpose of testing meat quality, the pH1 and pH2 values were measured in chest
muscles (within 45 minutes and 24 hours after slaughter, respectively) using the
digital pH meter - Mettler MP 120-B. The colour (L* - for the degree of lightness,
Steiner et al 28
a* - for the degree of redness and b* - for the degree of yellowness) of meat and
skin of chickens was determined with Minolta Chromametar CR-410.
The results of the research were analysed by the usage of computer
program Statistica 12 (2013). The differences between mean values were tested
by GLM (General Linear Model) variance analysis (ANOVA) at significance
levels P <0.05 and P <0.01.
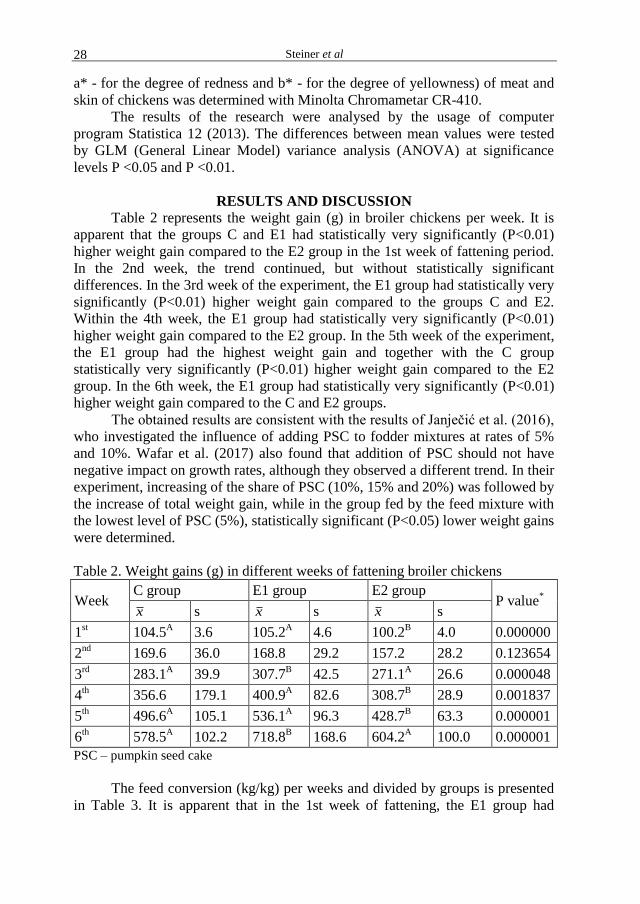
RESULTS AND DISCUSSION
Table 2 represents the weight gain (g) in broiler chickens per week. It is
apparent that the groups C and E1 had statistically very significantly (P<0.01)
higher weight gain compared to the E2 group in the 1st week of fattening period.
In the 2nd week, the trend continued, but without statistically significant
differences. In the 3rd week of the experiment, the E1 group had statistically very
significantly (P<0.01) higher weight gain compared to the groups C and E2.
Within the 4th week, the E1 group had statistically very significantly (P<0.01)
higher weight gain compared to the E2 group. In the 5th week of the experiment,
the E1 group had the highest weight gain and together with the C group
statistically very significantly (P<0.01) higher weight gain compared to the E2
group. In the 6th week, the E1 group had statistically very significantly (P<0.01)
higher weight gain compared to the C and E2 groups.
The obtained results are consistent with the results of Janječić et al. (2016),
who investigated the influence of adding PSC to fodder mixtures at rates of 5%
and 10%. Wafar et al. (2017) also found that addition of PSC should not have
negative impact on growth rates, although they observed a different trend. In their
experiment, increasing of the share of PSC (10%, 15% and 20%) was followed by
the increase of total weight gain, while in the group fed by the feed mixture with
the lowest level of PSC (5%), statistically significant (P<0.05) lower weight gains
were determined.
Table 2. Weight gains (g) in different weeks of fattening broiler chickens
Week C group E1 group E2 group
P value*
x s x s x s
1st 104.5
A 3.6 105.2
A 4.6 100.2
B 4.0 0.000000
2nd
169.6 36.0 168.8 29.2 157.2 28.2 0.123654
3rd
283.1A
39.9 307.7B
42.5 271.1A
26.6 0.000048
4th 356.6 179.1 400.9
A 82.6 308.7
B 28.9 0.001837
5th 496.6
A 105.1 536.1
A 96.3 428.7
B 63.3 0.000001
6th 578.5
A 102.2 718.8
B 168.6 604.2
A 100.0 0.000001
PSC – pumpkin seed cake
The feed conversion (kg/kg) per weeks and divided by groups is presented
in Table 3. It is apparent that in the 1st week of fattening, the E1 group had
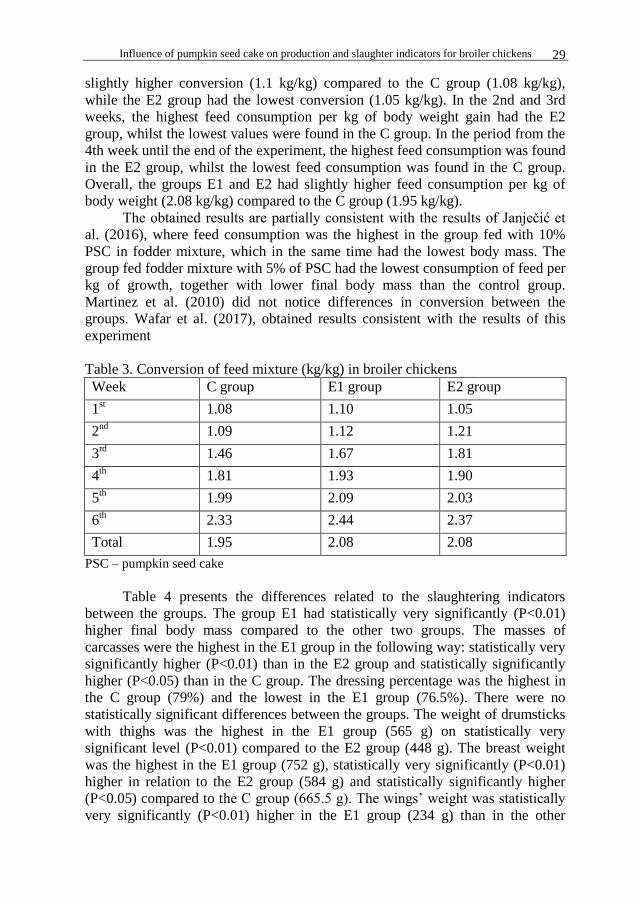
Influence of pumpkin seed cake on production and slaughter indicators for broiler chickens 29
slightly higher conversion (1.1 kg/kg) compared to the C group (1.08 kg/kg),
while the E2 group had the lowest conversion (1.05 kg/kg). In the 2nd and 3rd
weeks, the highest feed consumption per kg of body weight gain had the E2
group, whilst the lowest values were found in the C group. In the period from the
4th week until the end of the experiment, the highest feed consumption was found
in the E2 group, whilst the lowest feed consumption was found in the C group.
Overall, the groups E1 and E2 had slightly higher feed consumption per kg of
body weight (2.08 kg/kg) compared to the C group (1.95 kg/kg).
The obtained results are partially consistent with the results of Janječić et
al. (2016), where feed consumption was the highest in the group fed with 10%
PSC in fodder mixture, which in the same time had the lowest body mass. The
group fed fodder mixture with 5% of PSC had the lowest consumption of feed per
kg of growth, together with lower final body mass than the control group.
Martinez et al. (2010) did not notice differences in conversion between the
groups. Wafar et al. (2017), obtained results consistent with the results of this
experiment
Table 3. Conversion of feed mixture (kg/kg) in broiler chickens
Week C group E1 group E2 group
1st 1.08 1.10 1.05
2nd
1.09 1.12 1.21
3rd
1.46 1.67 1.81
4th 1.81 1.93 1.90
5th 1.99 2.09 2.03
6th 2.33 2.44 2.37
Total 1.95 2.08 2.08
PSC – pumpkin seed cake
Table 4 presents the differences related to the slaughtering indicators
between the groups. The group E1 had statistically very significantly (P<0.01)
higher final body mass compared to the other two groups. The masses of
carcasses were the highest in the E1 group in the following way: statistically very
significantly higher (P<0.01) than in the E2 group and statistically significantly
higher (P<0.05) than in the C group. The dressing percentage was the highest in
the C group (79%) and the lowest in the E1 group (76.5%). There were no
statistically significant differences between the groups. The weight of drumsticks
with thighs was the highest in the E1 group (565 g) on statistically very
significant level (P<0.01) compared to the E2 group (448 g). The breast weight
was the highest in the E1 group (752 g), statistically very significantly (P<0.01)
higher in relation to the E2 group (584 g) and statistically significantly higher
(P<0.05) compared to the C group (665.5 g). The wings’ weight was statistically
very significantly (P<0.01) higher in the E1 group (234 g) than in the other
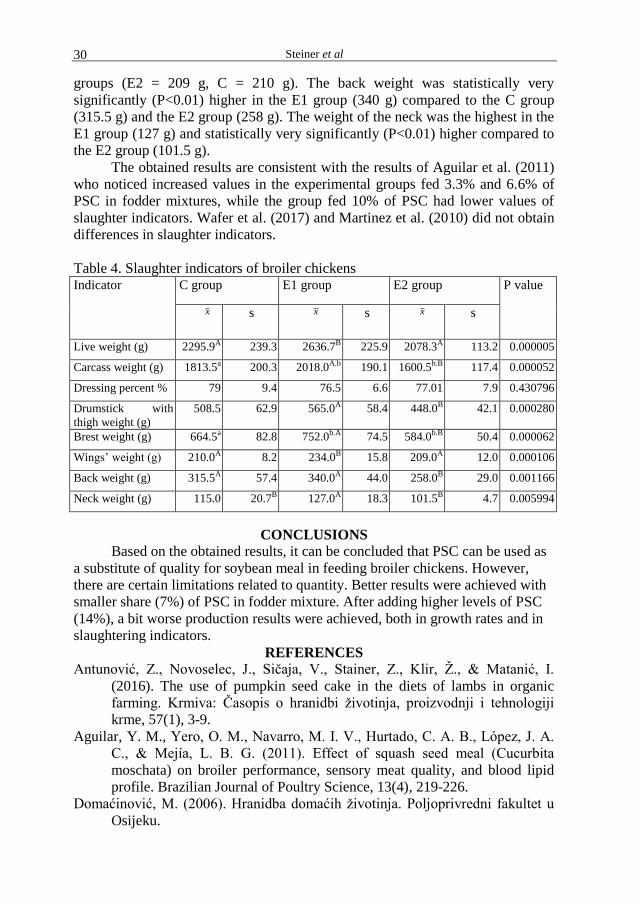
Steiner et al 30
groups (E2 = 209 g, C = 210 g). The back weight was statistically very
significantly (P<0.01) higher in the E1 group (340 g) compared to the C group
(315.5 g) and the E2 group (258 g). The weight of the neck was the highest in the
E1 group (127 g) and statistically very significantly (P<0.01) higher compared to
the E2 group (101.5 g).
The obtained results are consistent with the results of Aguilar et al. (2011)
who noticed increased values in the experimental groups fed 3.3% and 6.6% of
PSC in fodder mixtures, while the group fed 10% of PSC had lower values of
slaughter indicators. Wafer et al. (2017) and Martinez et al. (2010) did not obtain
differences in slaughter indicators.
Table 4. Slaughter indicators of broiler chickens Indicator
C group E1 group E2 group P value
x s x s x s
Live weight (g) 2295.9A 239.3 2636.7B 225.9 2078.3A 113.2 0.000005
Carcass weight (g) 1813.5a 200.3 2018.0A.b 190.1 1600.5b.B 117.4 0.000052
Dressing percent % 79 9.4 76.5 6.6 77.01 7.9 0.430796
Drumstick with
thigh weight (g)
508.5 62.9 565.0A 58.4 448.0B 42.1 0.000280
Brest weight (g) 664.5a 82.8 752.0b.A 74.5 584.0b.B 50.4 0.000062
Wings’ weight (g) 210.0A 8.2 234.0B 15.8 209.0A 12.0 0.000106
Back weight (g) 315.5A 57.4 340.0A 44.0 258.0B 29.0 0.001166
Neck weight (g) 115.0 20.7B 127.0A 18.3 101.5B 4.7 0.005994
CONCLUSIONS
Based on the obtained results, it can be concluded that PSC can be used as
a substitute of quality for soybean meal in feeding broiler chickens. However,
there are certain limitations related to quantity. Better results were achieved with
smaller share (7%) of PSC in fodder mixture. After adding higher levels of PSC
(14%), a bit worse production results were achieved, both in growth rates and in
slaughtering indicators.
REFERENCES
Antunović, Z., Novoselec, J., Sičaja, V., Stainer, Z., Klir, Ž., & Matanić, I.
(2016). The use of pumpkin seed cake in the diets of lambs in organic
farming. Krmiva: Časopis o hranidbi životinja, proizvodnji i tehnologiji
krme, 57(1), 3-9.
Aguilar, Y. M., Yero, O. M., Navarro, M. I. V., Hurtado, C. A. B., López, J. A.
C., & Mejía, L. B. G. (2011). Effect of squash seed meal (Cucurbita
moschata) on broiler performance, sensory meat quality, and blood lipid
profile. Brazilian Journal of Poultry Science, 13(4), 219-226.
Domaćinović, M. (2006). Hranidba domaćih životinja. Poljoprivredni fakultet u
Osijeku.
Influence of pumpkin seed cake on production and slaughter indicators for broiler chickens 31
Dumovski, F., Milas, Z, (2004). Priručnik o proizvodnji i upotrebi stočne hrane –
krme. Hrvatsko agronomsko društvo, Zagreb.
Državni zavod za statistiku https://www.dzs.hr/ 13. 04. 2018
Janječić, Z.,Bedeković, D., Pintarić, J., Babić-Alagić, J. (2016): Upotreba pogače
sjemenki bundeve u hranidbi brojlera. Zbornik sažetaka 23. međunarodnog
savjetovanja Krmiva 2016. 1-2 lipnja., Opatija, Hrvatska, str 80.
Kreft, I., Stibilj, V., & Trkov, Z. (2002). Iodine and selenium contents in
pumpkin (Cucurbita pepo L.) oil and oil-cake. European Food Research
and Technology, 215(4), 279-281.
Martínez, Y., Valdivié, M., Martínez, O., Estarrón, M., & Córdova, J. (2010).
Utilization of pumpkin (Cucurbita moschata) seed in broiler chicken diets.
Cuban Journal of Agricultural Science, 44(4), 387-392.
Statisitica-Stat Soft, Inc. Version 12, 2013, www.statsoft.com
Steiner, Z., Domaćinović, M., Klarić, I., Ronta, M., Bertić, V., Steiner, N., &
Šerić, V. (2015). Procjena upotrebe ddgs-a u krmnim smjesama tovnih
pilića. Krmiva: Časopis o hranidbi životinja, proizvodnji i tehnologiji
krme, 56(4), 163-167.
Wafar, R. J., Hannison, M. I., Abdullahi, U., & Makinta, A. (2017). Effect of
Pumpkin (Cucurbita pepo L.) Seed Meal on the Performance and Carcass
Charac teristics of Broiler Chickens. Asian Journal of Advan ces in
Agricultural Research, 2(3), 1-7.
Zdunczyk, Z., Minakowski, D., Frejnagel, S., & Flis, M. (1999). Comparative
study of the chemical composition and nutritional value of pumpkin seed
cake, soybean meal and casein. Food/Nahrung, 43(6), 392-395.


Agriculture & Forestry, Vol. 66 Issue 3: 33-51, 2020, Podgorica 33
Dudić, B., Dudić, Z., Pejanović, R., Škatarić G., Saxunová D., Peráček T. (2020): The rural policy of Slovakia after joining the EU. Agriculture and Forestry, 66 (3): 33-51.
DOI: 10.17707/AgricultForest.66.3.04
Branislav DUDIĆ1, Zdenka DUDIĆ2, Radovan PEJANOVIĆ3, Goran ŠKATARIĆ4, Darina SAXUNOVÁ5, Tomáš PERÁČEK5
THE RURAL POLICY OF SLOVAKIA AFTER JOINING THE EU
SUMMARY The main players in rural development are for instance, factors as impact
of technologies, development of domestic and foreign markets, benefits in communication and transport and population migration. The research object of the study is the rural policy and its tools such a financial subsidy contributing to rural economic development in Slovak conditions. The objective of the scientific study is to examine the development of rural policy in Slovakia since 2004 and its tools for augmentation of economic development sustaining ecologically clean environment and agricultural production. As a member state of the European Union, the Slovak Republic has the possibility to use the supporting policy instruments for the development of rural areas, agriculture and society as such. The instrument for this goal is the Rural Development Program 2014-2020. The program belongs to documents of national nature and represents a rural development strategy through various measures. Measures are grouped in line with the axes such as: increasing the competitiveness of the agricultural and forestry sector, improving the environment, the quality of life in rural areas and the diversification of the rural economy to which it is directed assistance exclusively from the European Agricultural Fund for Rural Development.
Keywords: rural development, agriculture, subsidy, common rural policy.
INTRODUCTION The total budget for agriculture and rural development represents about
46% of EU spending per year. Agriculture and rural development has become again a central issue and a major determinant of EU development. Agricultural
1Branislav Dudić, (corresponding author: [email protected]), Comenius University, Faculty of Management, Bratislava, SLOVAK REPUBLIC; University Business Academy, Faculty of Economics and Engineering Management, NOVI SAD, SERBIA. 2Zdenka Dudić, University Business Academy, Faculty of Economics and Engineering Management, NOVI SAD, SERBIA. 3Radovan Pejanović, University of Novi Sad, SERBIA. 4 Goran Škatarić, National parks of Montenegro, Podgorica, MONTENEGRO; 5 Darina Saxunova, Tomáš Peráček, Comenius University, Faculty of Management, Bratislava, SLOVAK REPUBLIC; Paper presented at the GEA (Geo Eco-Eco Agro) International Conference 2020, Podgorica. Notes: The authors declare that they have no conflicts of interest. Authorship Form signed online. Received:20/05/2020 Accepted:07/08/2020
Dudić et al 34
and rural development policies play a vital role in the territorial, economic and social cohesion of the European Union and in the protection of the environment. Forms of agricultural entities where the agricultural production is conducted varies. Cooperative farming is frequently observed especially in small countries or as a complement in larger countries. „Cooperative is a group of people that allow several people or legal entity working together on a basic of voluntary held a job to improve the lives of its members (Sagimun, 2005; Amelia & Ronald, 2018). In the past there were cooperative farms in Slovakia, nowadays it is a mix of farming enterprising entities, cooperatives and micro, small and medium entrepreneurs as producers in agriculture. As a member state of the European Union, the Slovak Republic has the possibility to use supporting policy instruments for the development of rural areas, agriculture and society as such. The population exceeds 5.4 million and consists of mostly of Slovaks and the biggest Hungarian nationality in the southern territories of Slovakia. Slovakia's territory spans about 49,054 square kilometers (19,000 sq mi) and is mostly mountainous. The capital and largest city is Bratislava and the second largest city is Košice.
In the period of fifteen years from 2004-2018, Slovakia, as a member of the EU, benefitted from around 35 billion euros of EU funding. Slovakia will have €12 billion available in period between 2021 and 2027. Slovakia’s contribution to the EU budget is the amount of €646 million. Slovakia is a recipient of €2.66 billion in EU funding. Financial resources obtained for financing from the EU are invested into the following areas: Agriculture (21.27%), Regional policy - cohesion and structural funds (74.72%), Research and development (3.21%), Citizenship - freedom, security and justice (0.40%), Administration (0.40%).
Slovakia is divided into 8 regions, such as Bratislava, Trnava, Nitra, Trenčín, Banská Bystrica, Žilina, Prešov and Košice region. Of the total area of Slovakia, according to the individual types of regions, the largest share of 59% spreads also in the prevailing rural areas, with the transitio-nal regions having a 36.8% share, predominantly the smallest 4.2% share being urban regions.
METHODOLOGY Rural areas represent about 92% of the territory in the EU-28. These
regions produce around 45% of gross value added (HPH) in the EU-28 and represent more than half of jobs. Rural development must be able to meet market requirements and ensure adequate food quality and protection as well as the protection of environmental policy. The research object is the rural policy of the Slovakia from historical perspective in the period after Slovakia’s accession to the EU so are rural policy tools such a financial subsidy contributing to rural economic development in Slovak conditions. The objective of the scientific study is to examine the development of rural policy in Slovakia since 2004. The research approach applied when examining research phenomena was a combined approach by mixing several classical research methods (synthesis, deduction,

The rural policy of Slovakia after joining the EU 35
analysis, comparison) and empirical results obtained by processing secondary data from database of the Ministry of Agriculture of the Slovak Republic, European Commission etc. Results of the research is systemization of the rural development process and compilation of the existing organizations focusing on supporting and managing the process of rural development. Their role is to bring benefits for augmenting the quality of the life in rural areas, highlighting the ecological and environmental friendly activities (Spalevic et al, 2017a) leading to competitive food products and health improvement. These are attractive features to attract people again for living in the countryside and work as farmers. To assist to perform this old profession could result in reviving rural areas economically and in sociable, cultural and generational aspects. CURRENT STATE OF THE KNOWLEDGE IN THE LITERATURE Agriculture represents an indispensable production process that is beneficial substantially to every society and economy (Johnston and Mellor, 1961; Melovic et al., 2020a; Sinabell, 2009) and remains an essential driver of the rural areas of the European Union (Bournaris et al., 2016). The enterprise value of an agricultural operation is the present value of expected future cash inflows reduced by present cash outflows or future returns plus the value of future investment opportunities. A farm that maintains the flexibility to alter production in the future will be worth more than an identical farm that cannot (Dixit & Pindyck, 1994; Carey & Zilberman, 2002). The transitional years during which an agricultural producer waits for newly grafted or planted agricultural products to mature cannot be reversed. Forgone revenue cannot be recovered. The farmer as a producer has a choice to make a decision about the change in the future point. The level of a grower's perception of uncertainty about future price premiums will largely dictate the duration of the delay of an investment (West, 2019; Melovic et al., 2020b).
In big agricultural countries, an example is from in Indonesia, Muftiadi (2018) made a research in food crops market. The market is very large, he highlighted its slow growth, and pointed out that contribution to economy indicated a negative trend in rice production, the results showed a very sharp decrease during 1971-2008, the efficiency of other food crops subsector production (beans, corn, vegetables and fruits and other food crops) shows an increase in efficiency. Both subsectors tend to be more inefficient in the future, if no fundamental government policy to support the sector is accepted. It is an eternal problem that agriculture industry is underfinanced, since the prices of the product cannot fly up, as it is the essential commodity for the people’s life. Many examples prove that farmers survive in business only with the support of subsidies. (Loizou et.al., 2019) stressed that the impact of the financial crisis, being spread globally, again strengthened its effect on agriculture in Europe. Especially in south European countries where agriculture plays a more important role than in the north European countries. They point out that „the role of agriculture particularly within the reformed Common Agricultural Policy (CAP)
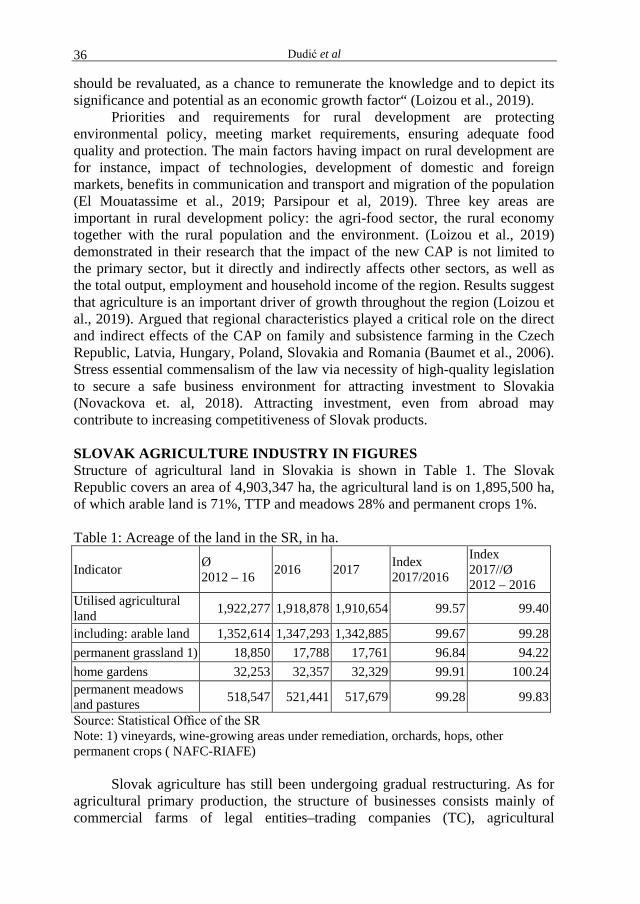
Dudić et al 36
should be revaluated, as a chance to remunerate the knowledge and to depict its significance and potential as an economic growth factor“ (Loizou et al., 2019).
Priorities and requirements for rural development are protecting environmental policy, meeting market requirements, ensuring adequate food quality and protection. The main factors having impact on rural development are for instance, impact of technologies, development of domestic and foreign markets, benefits in communication and transport and migration of the population (El Mouatassime et al., 2019; Parsipour et al, 2019). Three key areas are important in rural development policy: the agri-food sector, the rural economy together with the rural population and the environment. (Loizou et al., 2019) demonstrated in their research that the impact of the new CAP is not limited to the primary sector, but it directly and indirectly affects other sectors, as well as the total output, employment and household income of the region. Results suggest that agriculture is an important driver of growth throughout the region (Loizou et al., 2019). Argued that regional characteristics played a critical role on the direct and indirect effects of the CAP on family and subsistence farming in the Czech Republic, Latvia, Hungary, Poland, Slovakia and Romania (Baumet et al., 2006). Stress essential commensalism of the law via necessity of high-quality legislation to secure a safe business environment for attracting investment to Slovakia (Novackova et. al, 2018). Attracting investment, even from abroad may contribute to increasing competitiveness of Slovak products. SLOVAK AGRICULTURE INDUSTRY IN FIGURES Structure of agricultural land in Slovakia is shown in Table 1. The Slovak Republic covers an area of 4,903,347 ha, the agricultural land is on 1,895,500 ha, of which arable land is 71%, TTP and meadows 28% and permanent crops 1%. Table 1: Acreage of the land in the SR, in ha.
Indicator Ø 2012 – 16 2016 2017 Index
2017/2016
Index 2017//Ø 2012 – 2016
Utilised agricultural land 1,922,277 1,918,878 1,910,654 99.57 99.40
including: arable land 1,352,614 1,347,293 1,342,885 99.67 99.28 permanent grassland 1) 18,850 17,788 17,761 96.84 94.22 home gardens 32,253 32,357 32,329 99.91 100.24 permanent meadows and pastures 518,547 521,441 517,679 99.28 99.83
Source: Statistical Office of the SR Note: 1) vineyards, wine-growing areas under remediation, orchards, hops, other permanent crops ( NAFC-RIAFE)
Slovak agriculture has still been undergoing gradual restructuring. As for agricultural primary production, the structure of businesses consists mainly of commercial farms of legal entities–trading companies (TC), agricultural

The rural policy of Slovakia after joining the EU 37
cooperatives (AC) and physical entities (PE)–especially self-employed farmers (SEF), sole proprietors – who also work as SEF and free business on a marginal basis. In the case of Slovak legal entities, an average farming area is approximately 500 ha, in the case of small farmers it is 21 ha. In Slovakia the small-size private properties represent less than one third of the private forests (Bouriaud et al., 2013). In Slovakia, there are many sole-proprietors with a very small area of land, which, however, are not significant from a societal point of view, but they supply local markets (representing more shadow economy). Table 2: Agricultural land
Agricultural land Legal entities Individuals Total Hectares (ha) 1,529,083 366,417 1,895,500 in percent (%) 80.7 19.3 100.0
Source: Green report, 2017 Table 3: Interval of agricultural land Interval of agricultural land
Number of enterprises
Profit/Loss (revenues-expenses)
Profit/Loss (revenues-expenses-personal income)
Income costs
2016 2017 2016 2017 Index 2016 2017 2016 2017 in € per ha up to 50 340 267 67.5 120.1 177.9 −263.6 −276.2 97.6 95.2 50 – 100 267 228 59.7 63.0 105.5 −56.4 −58.0 93.9 94.3 101 – 500 401 404 49.5 37.2 75.2 8.4 −5.6 95.9 96.8 above 500 41 45 57.6 48.6 84.4 47.7 37.5 95.6 96.8 Total 1049 944 53.9 46.6 86.5 −7.1 −12.2 95.9 96.4 Source: NAFC-RIAFE Economic outturn and the number of SEF enterprises divided into intervals showing agricultural land intervals in € per ha of agricultural land, index in %. (Information sheets of the MARD SR, CD of NAFC-RIAFE).
Majority of the banks offer credit products for the agricultural sector and its enterprises can use: -short-term bridging loans for the financing of operating needs up to the amount of eligible direct payments from the Agricultural Paying Agency (APA), -short-term bridging loans for the financing of a project before a subsidy is granted from the EU structural funds, -investment loan for the purchase of land in the territory of the Slovak Republic intended for agricultural production, -investment mid-term and long-term loan for the procurement of tangible and intangible assets, the construction of operational premises, the reconstruction of real estate or the purchase of technologies, machines and equipment,
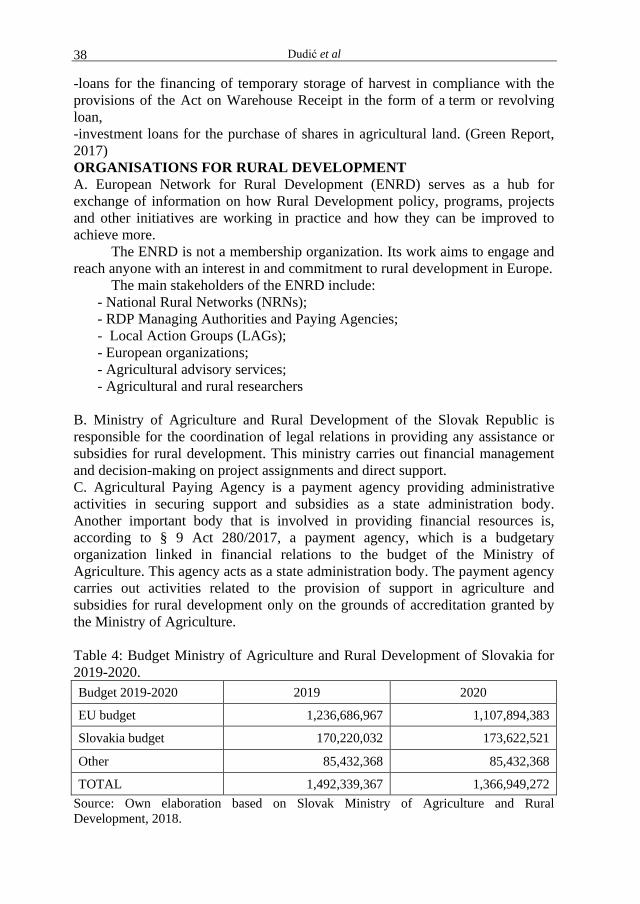
Dudić et al 38
-loans for the financing of temporary storage of harvest in compliance with the provisions of the Act on Warehouse Receipt in the form of a term or revolving loan, -investment loans for the purchase of shares in agricultural land. (Green Report, 2017) ORGANISATIONS FOR RURAL DEVELOPMENT A. European Network for Rural Development (ENRD) serves as a hub for exchange of information on how Rural Development policy, programs, projects and other initiatives are working in practice and how they can be improved to achieve more.
The ENRD is not a membership organization. Its work aims to engage and reach anyone with an interest in and commitment to rural development in Europe.
The main stakeholders of the ENRD include: - National Rural Networks (NRNs); - RDP Managing Authorities and Paying Agencies; - Local Action Groups (LAGs); - European organizations; - Agricultural advisory services; - Agricultural and rural researchers
B. Ministry of Agriculture and Rural Development of the Slovak Republic is responsible for the coordination of legal relations in providing any assistance or subsidies for rural development. This ministry carries out financial management and decision-making on project assignments and direct support. C. Agricultural Paying Agency is a payment agency providing administrative activities in securing support and subsidies as a state administration body. Another important body that is involved in providing financial resources is, according to § 9 Act 280/2017, a payment agency, which is a budgetary organization linked in financial relations to the budget of the Ministry of Agriculture. This agency acts as a state administration body. The payment agency carries out activities related to the provision of support in agriculture and subsidies for rural development only on the grounds of accreditation granted by the Ministry of Agriculture. Table 4: Budget Ministry of Agriculture and Rural Development of Slovakia for 2019-2020. Budget 2019-2020 2019 2020
EU budget 1,236,686,967 1,107,894,383
Slovakia budget 170,220,032 173,622,521
Other 85,432,368 85,432,368
TOTAL 1,492,339,367 1,366,949,272 Source: Own elaboration based on Slovak Ministry of Agriculture and Rural Development, 2018.
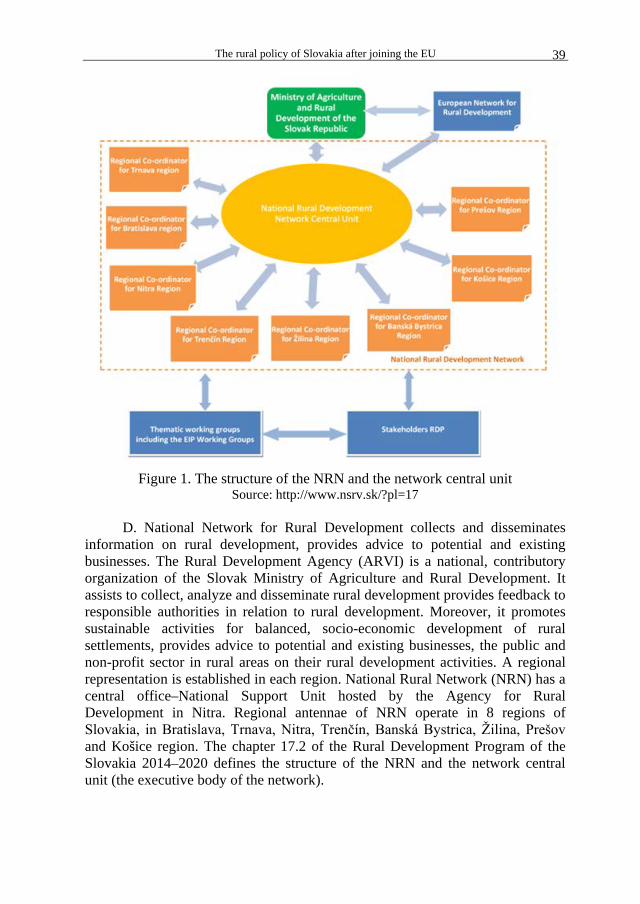
The rural policy of Slovakia after joining the EU 39
Figure 1. The structure of the NRN and the network central unit
Source: http://www.nsrv.sk/?pl=17
D. National Network for Rural Development collects and disseminates information on rural development, provides advice to potential and existing businesses. The Rural Development Agency (ARVI) is a national, contributory organization of the Slovak Ministry of Agriculture and Rural Development. It assists to collect, analyze and disseminate rural development provides feedback to responsible authorities in relation to rural development. Moreover, it promotes sustainable activities for balanced, socio-economic development of rural settlements, provides advice to potential and existing businesses, the public and non-profit sector in rural areas on their rural development activities. A regional representation is established in each region. National Rural Network (NRN) has a central office–National Support Unit hosted by the Agency for Rural Development in Nitra. Regional antennae of NRN operate in 8 regions of Slovakia, in Bratislava, Trnava, Nitra, Trenčín, Banská Bystrica, Žilina, Prešov and Košice region. The chapter 17.2 of the Rural Development Program of the Slovakia 2014–2020 defines the structure of the NRN and the network central unit (the executive body of the network).
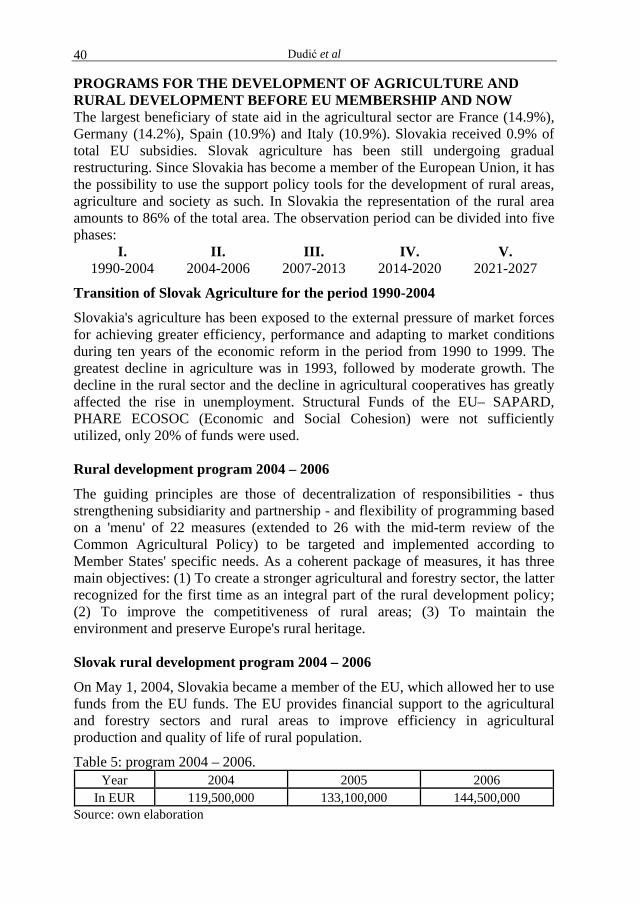
Dudić et al 40
PROGRAMS FOR THE DEVELOPMENT OF AGRICULTURE AND RURAL DEVELOPMENT BEFORE EU MEMBERSHIP AND NOW The largest beneficiary of state aid in the agricultural sector are France (14.9%), Germany (14.2%), Spain (10.9%) and Italy (10.9%). Slovakia received 0.9% of total EU subsidies. Slovak agriculture has been still undergoing gradual restructuring. Since Slovakia has become a member of the European Union, it has the possibility to use the support policy tools for the development of rural areas, agriculture and society as such. In Slovakia the representation of the rural area amounts to 86% of the total area. The observation period can be divided into five phases:
I. 1990-2004
II. 2004-2006
III. 2007-2013
IV. 2014-2020
V. 2021-2027
Transition of Slovak Agriculture for the period 1990-2004
Slovakia's agriculture has been exposed to the external pressure of market forces for achieving greater efficiency, performance and adapting to market conditions during ten years of the economic reform in the period from 1990 to 1999. The greatest decline in agriculture was in 1993, followed by moderate growth. The decline in the rural sector and the decline in agricultural cooperatives has greatly affected the rise in unemployment. Structural Funds of the EU– SAPARD, PHARE ECOSOC (Economic and Social Cohesion) were not sufficiently utilized, only 20% of funds were used. Rural development program 2004 – 2006
The guiding principles are those of decentralization of responsibilities - thus strengthening subsidiarity and partnership - and flexibility of programming based on a 'menu' of 22 measures (extended to 26 with the mid-term review of the Common Agricultural Policy) to be targeted and implemented according to Member States' specific needs. As a coherent package of measures, it has three main objectives: (1) To create a stronger agricultural and forestry sector, the latter recognized for the first time as an integral part of the rural development policy; (2) To improve the competitiveness of rural areas; (3) To maintain the environment and preserve Europe's rural heritage. Slovak rural development program 2004 – 2006
On May 1, 2004, Slovakia became a member of the EU, which allowed her to use funds from the EU funds. The EU provides financial support to the agricultural and forestry sectors and rural areas to improve efficiency in agricultural production and quality of life of rural population.
Table 5: program 2004 – 2006. Year 2004 2005 2006
In EUR 119,500,000 133,100,000 144,500,000 Source: own elaboration
The rural policy of Slovakia after joining the EU 41
"EU Quality Policy" or "Quality brand SK" The aim of this project is to attract Slovak consumers to quality domestic products. Any Slovak producer may obtain the Slovak certificate of the quality- Slovak brand if its products are made from domestic raw materials in accordance with the declared technological procedure, parameters of quality and safety of food. It is also necessary to register raw materials in order that the total consumption of raw materials may be at least 75% of the consumption of domestic raw materials. The stages of the production process must be carried out in the territory of the Slovak Republic and products that have had excellent quality properties before will receive the Slovak certificate of quality it for a period of three years and for seasonal products for a period of one year. All criteria must be in accordance with national legislation of the SC, as well as EU legislation.
Rural development program 2007 – 2013
In the framework of the EU rural development program, Member States received €96 billion. The aims of the policy have been simplified and clarified around three clearly defined economic, environmental and territorial objectives, namely: (1) improving the competitiveness of agriculture and forestry; (2) improving the environment and the countryside; and (3) improving the quality of life in rural areas and encouraging diversification of economic activity. Slovak rural development program 2007 – 2013
PRV 2007-2013 was approved by the European Commission decision C (2007) 6164 of December 4th, 2007 by the European Commission in Brussels (the EC assessed the program as harmoniously balanced and uniform for the whole of Slovakia). The main focus in the program, besides investing in primary
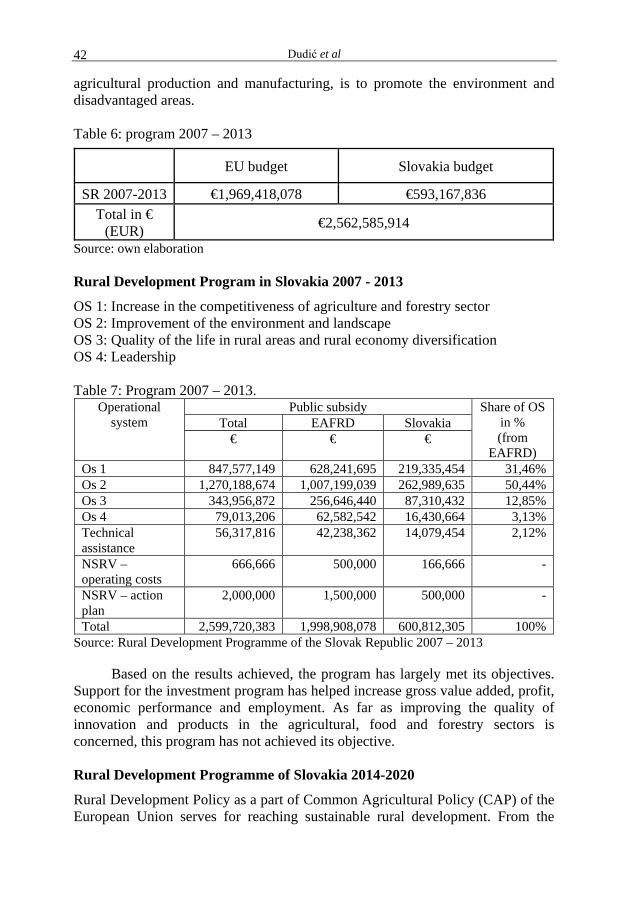
Dudić et al 42
agricultural production and manufacturing, is to promote the environment and disadvantaged areas. Table 6: program 2007 – 2013
Source: own elaboration Rural Development Program in Slovakia 2007 - 2013
OS 1: Increase in the competitiveness of agriculture and forestry sector OS 2: Improvement of the environment and landscape OS 3: Quality of the life in rural areas and rural economy diversification OS 4: Leadership Table 7: Program 2007 – 2013.
Operational system
Public subsidy Share of OS in % (from
EAFRD)
Total EAFRD Slovakia € € €
Os 1 847,577,149 628,241,695 219,335,454 31,46% Os 2 1,270,188,674 1,007,199,039 262,989,635 50,44% Os 3 343,956,872 256,646,440 87,310,432 12,85% Os 4 79,013,206 62,582,542 16,430,664 3,13% Technical assistance
56,317,816 42,238,362 14,079,454 2,12%
NSRV –operating costs
666,666 500,000 166,666 -
NSRV – action plan
2,000,000 1,500,000 500,000 -
Total 2,599,720,383 1,998,908,078 600,812,305 100% Source: Rural Development Programme of the Slovak Republic 2007 – 2013
Based on the results achieved, the program has largely met its objectives. Support for the investment program has helped increase gross value added, profit, economic performance and employment. As far as improving the quality of innovation and products in the agricultural, food and forestry sectors is concerned, this program has not achieved its objective. Rural Development Programme of Slovakia 2014-2020
Rural Development Policy as a part of Common Agricultural Policy (CAP) of the European Union serves for reaching sustainable rural development. From the
EU budget Slovakia budget
SR 2007-2013 €1,969,418,078 €593,167,836 Total in €
(EUR) €2,562,585,914
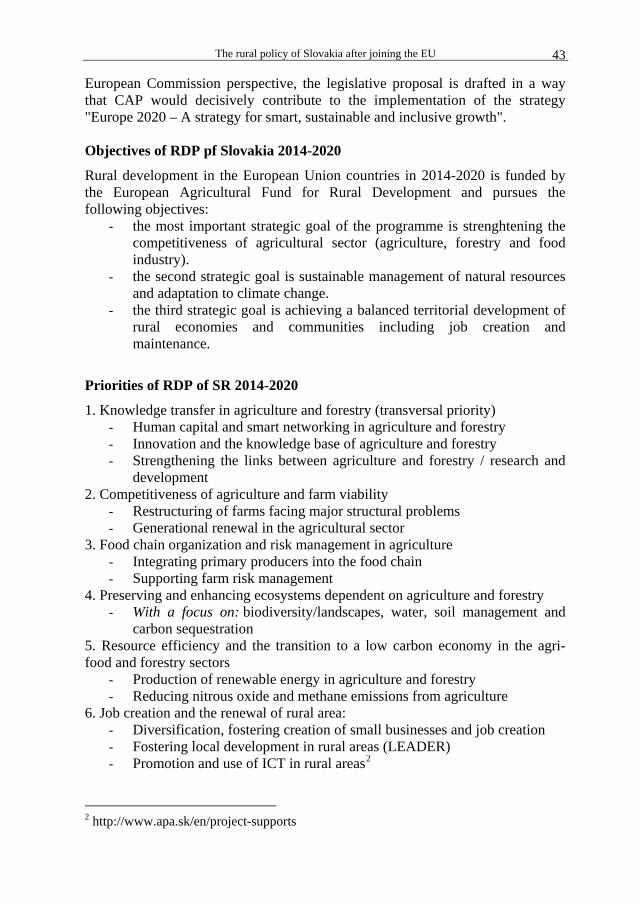
The rural policy of Slovakia after joining the EU 43
European Commission perspective, the legislative proposal is drafted in a way that CAP would decisively contribute to the implementation of the strategy "Europe 2020 – A strategy for smart, sustainable and inclusive growth".
Objectives of RDP pf Slovakia 2014-2020
Rural development in the European Union countries in 2014-2020 is funded by the European Agricultural Fund for Rural Development and pursues the following objectives:
- the most important strategic goal of the programme is strenghtening the competitiveness of agricultural sector (agriculture, forestry and food industry).
- the second strategic goal is sustainable management of natural resources and adaptation to climate change.
- the third strategic goal is achieving a balanced territorial development of rural economies and communities including job creation and maintenance.
Priorities of RDP of SR 2014-2020
1. Knowledge transfer in agriculture and forestry (transversal priority) - Human capital and smart networking in agriculture and forestry - Innovation and the knowledge base of agriculture and forestry - Strengthening the links between agriculture and forestry / research and
development 2. Competitiveness of agriculture and farm viability
- Restructuring of farms facing major structural problems - Generational renewal in the agricultural sector
3. Food chain organization and risk management in agriculture - Integrating primary producers into the food chain - Supporting farm risk management
4. Preserving and enhancing ecosystems dependent on agriculture and forestry - With a focus on: biodiversity/landscapes, water, soil management and
carbon sequestration 5. Resource efficiency and the transition to a low carbon economy in the agri-food and forestry sectors
- Production of renewable energy in agriculture and forestry - Reducing nitrous oxide and methane emissions from agriculture
6. Job creation and the renewal of rural area: - Diversification, fostering creation of small businesses and job creation - Fostering local development in rural areas (LEADER) - Promotion and use of ICT in rural areas2
2 http://www.apa.sk/en/project-supports

Dudić et al 44
Slovak rural development program 2014-2020
The Rural Development Program of the Slovak Republic 2014 - 2020 (hereinafter referred to as the "RDP") is a program document of the Slovak Republic for the use of assistance from the European Agricultural Fund for Rural Development (hereinafter "EAFRD") in the area of achieving sustainable development of the Slovak Republic, which creates conditions for strengthening the competitiveness of agricultural and the balanced territorial development of rural economies and communities, including sustainability of job creation. Table 8: program 2014 – 2020
EU budget Slovakia budget Total
SR 2014-2020 1 574 569 461,50 524 630 234,50 2 099 199 696,00 Source: own elaboration
CAP (COMMON AGRICULTURAL POLICY) 2021 – 20273 The European Union shapes its budget for a pragmatic, modern, and long-term planning for the 2021-27 period to deliver on issues that matter to Europeans. The Commission proposes that funding for the CAP is moderately reduced – by around 5% – due to less contribution, with a future union of 27 members. Based on nine objectives, the future CAP will continue to ensure access to high-quality food and strong support for the unique European farming model.
Nine objectives comprise relevant areas for farmers, which are the tasks and challenges, such as: a) ensuring fair income for farmers due to the significance of the agricultural production and sustainability of the sector and sustainability of jobs in agricultural industry, b) increasing competitiveness of agricultural products will help to achieve higher quality of these products, c) rebalancing power in food chain, securing an appropriate share of all components in agricultural production, d) encouraging climate change action, e) enhancing environmental care, f) preserving landscapes and biodiversity – all mentioned tasks will lead to healthier products and also, they will motivate farmer to ecological production in farming (Spalevic et al, 2017b), g) supporting generational renewal with the objective of attracting young generation to start business in this industry, that will result in h) enhancing vibrant rural areas, i) finally striving to protect food and health quality. The new way of working will also entail:
3 https://ec.europa.eu/info/food-farming-fisheries/key-policies/common-agricultural-policy/future-cap_en

The rural policy of Slovakia after joining the EU 45
1. streamlining administrative processes: countries shall submit only one strategic plan covering direct payments, rural development and sectorial strategies, 2. making environmental protection easier: through a set of standards and objectives at EU level, each country shall adapt environmental and climate actions to the reality on the ground, 3. simplifying support to young farmers: a single strategic plan will enable a consistent action for generational renewal covering both direct payments and rural development. Moreover, young farmers will have easier access to complementary income and installation support as EU eligibility criteria will be reduced.
Figure 2. Nine (9) goals for high-quality food & strong support for the European farming model. Source: https://ec.europa.eu/info/food-farming-fisheries/key-policies/common-agricultural-policy/future-cap_en
As shown in Table 9. France would remain the largest Common Agricultural Policy recipient (17.5%), followed by Spain (12.3%). Germany (11.5%), Italy (10.2%) and Poland (8.5%).

Dudić et al 46
Table 9: CAP allocation per Member State in millions (in constant 2018 prices).
Member State EAGF – Direct
payments
EAGF – Market
interventions
EAFRD – Rural
Development
Total amount allocated
%
Austria - AT 4,135.6 91.0 2,988.8 7,215.5 2.3% Belgium - BE 3,020.8 2.6 417.9 3,441.3 1,1% Bulgaria - BG 4,930.2 172.8 1,752.4 6,855.4 2.2% Croatia - HR 2,207.7 76.7 1,750.1 4,034.5 1.3% Czech Rep - CZ 5,218.2 44.0 1,609.7 6,871.9 2.2% Cyprus - CY 290.8. 28.8 99.5 419.1 0.1% Denmark - DK 5,263.5 1.8 471.6 5,736.9 1.8% Estonia - EE 1,102.4 0.9 546.6 1,650.0 0.5% Finland - FI 3,169.0 1.2 1,816.6 4,986.8 1.6% France - FR 44,464.1 3,385.1 7,522.4 55,371.6 17.5% Germany - DE 30,003.0 263.5 6,185.0 36,424.5 11.5% Greece - EL 12,668.8 391.0 3,170.0 16,229.8 5.1% Hungary - HU 7,587.8 200.6 2,589.1 10,377.4 3.3% Ireland - IE 7,240.5 0.4 1,646.4 8,887.3 2.8% Italy - IT 22,146.8 2,262.1 7,902.2 32,311.1 10.2% Latvia - LV 1,967.4 2.0 729.7 2,699.2 0.8% Lithuania - LT 3,343.9 3.7 1,214.2 4,561.7 1.4% Luxemburg - LU 199.9 0.2 76.5 276.5 0.1% Malta - MT 28.0 0.1 75.9 104.1 0.1% Netherlands- NL 4,378.5 1.8 455.0 4,835.4 1.5% Poland - PL 18,859.5 31.3 8,198.2 27,088.9 8.6% Portugal - PT 3,741.0 1,038.6 3,068.1 7,847.7 2.5% Romania - RO 11,869.7 323.0 6,006.1 18,198.8 5.8% Slovenia - SI 802.8 34.2 636.1 1,473.1 0.5% Slovakia - SK 2,444.5 36.6 1,416.3 3,897.5 1.2% Spain - ES 29,750.3 2,921.7 6,228.2 38,900.2 12.3% Sweden - S 4,187.7 3.7 1,316.0 5,507.4 1.7% TOTAL MS 235,022.2 11,319.4 69,861.7 316,203.3 100% % expenditure allocated 74.3% 3.6% 22.1% 100% --
Source: Towards the Common Agricultural Policy beyond 2020: comparing the reform package with the current regulations.
RESULTS AND DISCUSSION Public funding in 2016 subsidized the forest sector by €27,263,000 from
various public sources (state budget, EU funds, etc.). In 2015, public sources allocated to the sector €58,009,000. The decrease in funding was caused by lower funding from the Rural Development Program of the Slovak Republic (RDP SR) 2014-2020 which represented the main source of public funding in forestry in
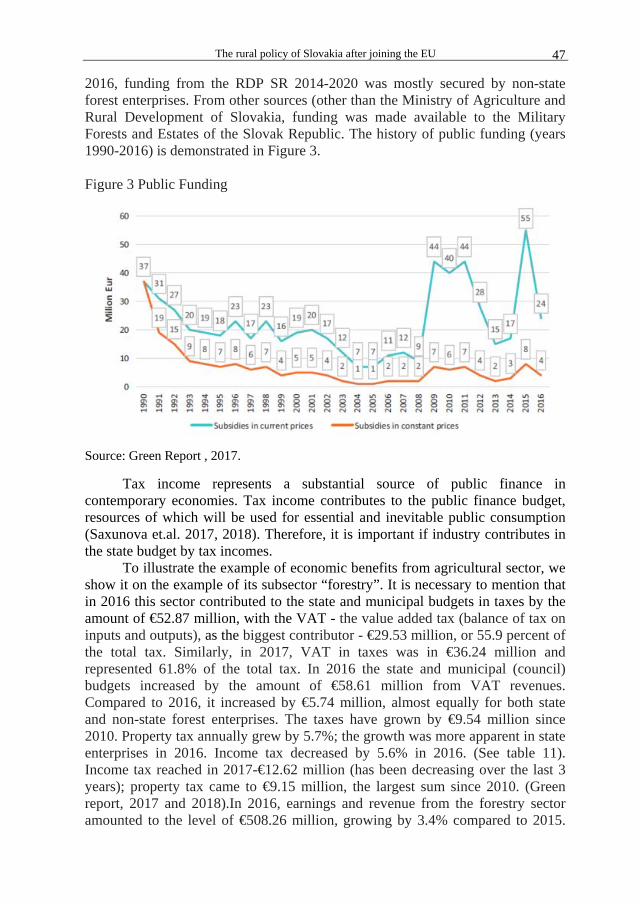
The rural policy of Slovakia after joining the EU 47
2016, funding from the RDP SR 2014-2020 was mostly secured by non-state forest enterprises. From other sources (other than the Ministry of Agriculture and Rural Development of Slovakia, funding was made available to the Military Forests and Estates of the Slovak Republic. The history of public funding (years 1990-2016) is demonstrated in Figure 3. Figure 3 Public Funding
Source: Green Report , 2017.
Tax income represents a substantial source of public finance in contemporary economies. Tax income contributes to the public finance budget, resources of which will be used for essential and inevitable public consumption (Saxunova et.al. 2017, 2018). Therefore, it is important if industry contributes in the state budget by tax incomes.
To illustrate the example of economic benefits from agricultural sector, we show it on the example of its subsector “forestry”. It is necessary to mention that in 2016 this sector contributed to the state and municipal budgets in taxes by the amount of €52.87 million, with the VAT - the value added tax (balance of tax on inputs and outputs), as the biggest contributor - €29.53 million, or 55.9 percent of the total tax. Similarly, in 2017, VAT in taxes was in €36.24 million and represented 61.8% of the total tax. In 2016 the state and municipal (council) budgets increased by the amount of €58.61 million from VAT revenues. Compared to 2016, it increased by €5.74 million, almost equally for both state and non-state forest enterprises. The taxes have grown by €9.54 million since 2010. Property tax annually grew by 5.7%; the growth was more apparent in state enterprises in 2016. Income tax decreased by 5.6% in 2016. (See table 11). Income tax reached in 2017-€12.62 million (has been decreasing over the last 3 years); property tax came to €9.15 million, the largest sum since 2010. (Green report, 2017 and 2018).In 2016, earnings and revenue from the forestry sector amounted to the level of €508.26 million, growing by 3.4% compared to 2015.
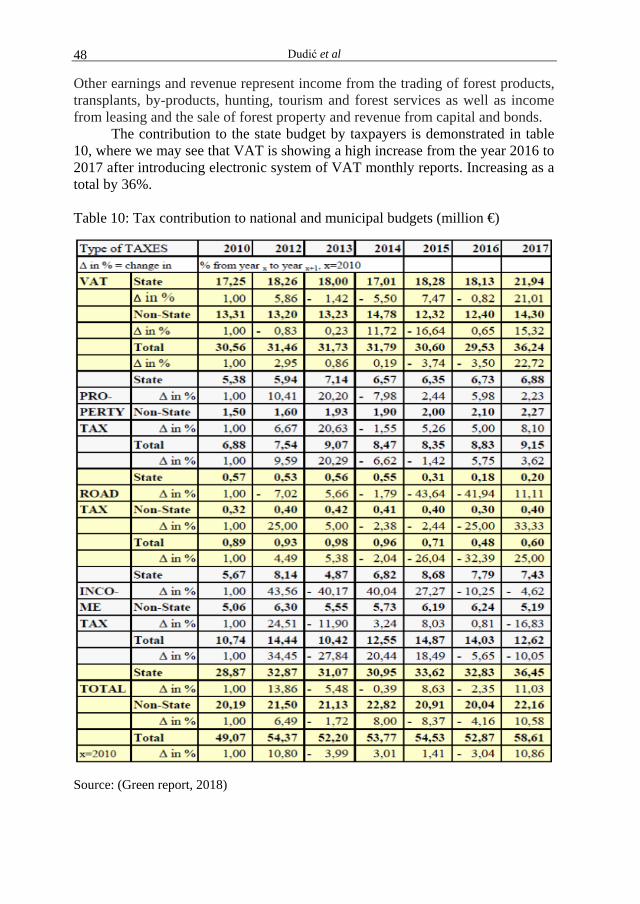
Dudić et al 48
Other earnings and revenue represent income from the trading of forest products, transplants, by-products, hunting, tourism and forest services as well as income from leasing and the sale of forest property and revenue from capital and bonds.
The contribution to the state budget by taxpayers is demonstrated in table 10, where we may see that VAT is showing a high increase from the year 2016 to 2017 after introducing electronic system of VAT monthly reports. Increasing as a total by 36%.
Table 10: Tax contribution to national and municipal budgets (million €)
Source: (Green report, 2018)
The rural policy of Slovakia after joining the EU 49
CONCLUSIONS The preparation of the Slovak Republic for its accession to the European
Union: the strategy of agricultural policy had begun to converge with the tasks and objectives of the agro-policy within the EU. The European Union has sought to help farmers be self-sufficient in the EU, to increase the share of investment in agricultural production and augment efficiency. The strategic interest of the European Union is the food safety and food self-sufficiency.
Support for rural development in Slovakia is based primarily on its ability to provide a range of public services that go beyond food production alone and on the ability of the rural economy to generate new sources of income and employment while preserving the culture, environment and heritage of rural areas. Rural development is implemented through EU financial instruments and through operational programs where the emphasis is on eliminating regional disparities and on using natural resources to develop entrepreneurship in rural areas. Great emphasis is placed on the development of rural tourism and on the use of land, forests and pastures for business. There is a room for establishing social enterprises, which are not-for-profit private organizations providing goods and services directly related to their explicit aim to benefit the community from economical and social area (Saxunova, Schurmann, 2015; Melovic et al, 2019; Nacka et al, 2019).
REFERENCES Agricultural Paying Agency. (2018). [Online]. [Retrieved September 20. 2018].
http://www.apa.sk/en/project supports Amelia. N.. & Ronald. N. (2018). Efforts to enhance active cooperatives in Indonesia
based on macroeconomic variables. International Journal of Economic Policy in Emerging Economies. 11(4). 411.
Baumert J., Kunter M., Blum W., Brunner M. (2006). Teachers' Mathematical Knowledge, Cognitive Activation in the Classroom, and Student Progress. American Educational Research Journal. 47. 1.
Bouriaud, L., Nichiforel, L., Weiss, G., Bajraktari, A., Čurović, M., Dobsinska, Z., Glavonjic, P., Jarský, V., Sarvasova, Z., Teder, M. (2013): Governance of private forests in Eastern and Central Europe: An analysis of forest harvesting and management rights; Annals of forest research, 56(1) pp: 199-215
Bournaris, T.,Moulogianni, C.,Arampatzis, S.,Kiomourtzi, F.,Wascher, D., & Manos, B. (2016). A knowledge brokerage approach for assessing the impacts of the setting up young farmers policy measure in Greece. Environmental Impact Assessment Review, 57, 159-166. doi:10.1016/j.eiar.2015.12.004 .
Carey. J. M.. & Zilberman. D. (2002). A Model of Investment under Uncertainty: Modern Irrigation Technology and Emerging Markets in Water. American Journal of Agricultural Economics. 84(1). 171-183. doi:10.1111/1467-8276.00251
Dixit. A. K.. & Pindyck. R. S. (1994). Investment under uncertainty. Princeton (New Jersey): Princeton University Press.
El Mouatassime, S., Boukdir, A., Karaoui, I., Skataric, G., Nacka, M., Khaledi Darvishan, A., Sestras, P., Spalevic, V. (2019). Modelling of soil erosion processes and runoff for sustainable watershed management: Case study Oued el Abid Watershed, Morocco. Agriculture and Forestry, 65 (4), 241-250.
Dudić et al 50
European Commission. (2018). [Online]. [Retrieved November 20. 2018]. http://europa.eu/rapid/press-release
European Commission. 2018. Strategy for the Western Balkans [online]. In ec.europa.eu. [cited 2018 – 03 - 25]. Available from Internet: https://ec.europa.eu/commission/news/strategy-western-balkans-2018-feb-06_sk
European Network for Rural Development. (2018). [Online]. [Retrieved November 20. 2018]. https://enrd.ec.europa.eu/about/brief_en
Green Report (report on agriculture and food sector in the Slovak Republic 2016). (2017), (2018). [Online]. [Retrieved September 20. 2018]. http://www.mpsr.sk/index.php?navID=122?start
Johnston B., Mellor J. (1961). The American Economic Review. American Economic Association. 51. 4. https://www.jstor.org/stable/i331432
Loizou E., Karelakis Ch., Galanopoulos K., Konstadinos Mattas K. (2019). The role of agriculture as a development tool for a regional economy. Agricultural Systems. 173. 482-490.
Melovic, B., Cirovic, D., Dudic, B., Vulic, T. B., & Gregus, M. (2020b). The Analysis of Marketing Factors Influencing Consumers’ Preferences and Acceptance of Organic Food Products—Recommendations for the Optimization of the Offer in a Developing Market. Foods, 9(3), 259.
Melovic, B., Dabic, M., Rogic, S., Durisic, V., & Prorok, V. (2020a). Food for thought: Identifying the influential factors that affect consumption of organic produce in today's youth. British Food Journal, 122(4), 1130-1155.
Melovic, B., Milovic, N., Backovic-Vulic, T., Dudic, B., & Bajzik, P. (2019). Attitudes and Perceptions of Employees toward Corporate Social Responsibility in Western Balkan Countries: Importance and Relevance for Sustainable Development. Sustainability, 11(23), 6763.
Muftiadi. A. (2018). Food crops production efficiency analysis in Indonesia in 1971-2008. International Journal of Economic Policy in Emerging Economies. 11(3). 282. doi:10.1504/ijepee.2018.093952
Nacka, M., Simonovska, A., Skataric, G., Dudic, B. (2019): Opportunities to profit under competitive market conditions. Agriculture and Forestry, 65 (4): 161-174.
Novácková. D.. Paškrtová. L.. & Saxunová. D. (2018). Investment aid as a catholicon for regional development in Slovakia? International Journal of Economic Policy in Emerging Economies. 11(3). 209.
Parsipour, H., Popovic, S., Behzadfar, M., Skataric, G., Spalevic, V. (2019): Cities expansion and land use changes of agricultural and garden lands in peri-urban villages (case study: Bojnurd). Agriculture and Forestry, 65(3): 173-187
Saxunova D.. Novackova D.. and Kajanova J.. 2018. "International Tax Competition Complying with Laws: Who are its Beneficiaries? ". Journal of Eastern Europe Research in Business and Economics. Vol. 2018. Article ID 145385. DOI: 10.5171/2018.145385
Saxunová D.. Nováčková D.. Kajanova J. 2017. International tax competition and tax exemption as an economic investment stimulus - The case of Slovakia. 1. ed. ISBN 978-0-9860419-7-6. - Norristown : International business information management association. 2017. - S. 2636-2648 [USB-key]
Saxunová, D., Schurman,, H., The potencial of social services. In: FAIMA Business & Management Journal. - Vol. 3, Iss. 3 (2015), s. 60-71. - ISSN 2344-4088
Sinabell F. (2009). A spatial econometric analysis of the regional growth and volatility in Europe. Austrian Economic Association. 36. 2. 193-207.
The rural policy of Slovakia after joining the EU 51
Spalevic, V., Lakicevic, M., Radanovic, D., Billi, P., Barovic, G., Vujacic, D., Sestras, P., & Khaledi Darvishan, A. (2017a). Ecological-Economic (Eco-Eco) Modelling in the River Basins of Mountainous Regions: Impact of Land Cover Changes on Sediment Yield in the Velicka Rijeka, Montenegro. Notulae Botanicae Horti Agrobotanici Cluj-Napoca, 45(2), 602-610.
Spalevic, V., Radanovic, D., Skataric, G., Billi. P., Barovic, G., Curovic, M., Sestras, P., and Khaledi Darvishan A. (2017b): Ecological-economic (eco-eco) modelling in the mountainous river basins: Impact of land cover changes on soil erosion. Agriculture and Forestry, 63 (4): 9-25.
West. J. (2019). Multi-criteria evolutionary algorithm optimization for horticulture crop management. Agricultural Systems. 173. 469-481. doi:10.1016/j.agsy.2019.03.016
World Customs Organization. 2018. What is the Harmonized System (HS)? [online]. In wcoomd.org. [cited 2018 – 03 - 20]. Available from Internet: http://www.wcoomd.org/en/topics/nomenclature/overview/what-is-the-harmonized-system.aspx

Agriculture & Forestry, Vol. 66 Issue 3: 53-64, 2020, Podgorica 53
Wahab, R., Fauzi, M. N., Mokhtar, N., Sulaiman, S. M., Ghani, M. S. R., Edin, T. (2020): Enhancing mechanical
properties of Rhizophora apiculata through engineered laminated boards. Agriculture and Forestry, 66 (3): 53-
64.
DOI: 10.17707/AgricultForest.66.3.05
Razak WAHAB1*, Norashikin MOHD FAUZI
2,
Nasihah MOKHTAR2, Mohamad Saiful SULAIMAN
1,
Ros Syazmini MOHD GHANI1, Taharah EDIN
1
ENHANCING MECHANICAL PROPERTIES OF RHIZOPHORA
APICULATA THROUGH ENGINEERED LAMINATED BOARDS
SUMMARY
A study in enhancing the strength properties of Rhizophora apiculata by
turning the solid wood into an engineered laminated board was executed. The
matured Rhizophora species was selected from peat swamp forest in Sibu,
Sarawak. The trunk was segregated into three parts, namely the bottom, middle
and top portion and subsequently sawn into wooden planks. The laminated boards
were cut into specific thicknesses and immediately bonded with an adhesive by
pressed drying. Preparation for solid and laminated boards testing samples
followed the ISO and ASTM standards. Properties such as the moisture content,
density, basic density, static bending (MOR and MOE) and compression were
determined. The results show an improvement in properties from the solid to
laminated board. The values in density, MOR, and MOE increased in the range of
2-6%, 29-42%, and 13-36%, respectively. However, the values of the moisture
content, basic density, and compression, indicated a vice versa trend ranging from
1-2%, 2-6%, and 8-24%, respectively. The bottom portion was more durable and
robust compared to the other portions.
Keywords: Rhizophora apiculata, solid wood, engineered laminated
boards, physical and strength properties.
INTRODUCTION
Peat swamp mangrove forests inhabited the coastal and riverine shores of
the tropics and sub-tropics (Zhang et al., 2015; González 2012; Chandra et al.,
2011) and constituted a dominant coastal vegetation community in tropical Asia
where Malaysia-Indonesia is the centre of distribution (Abdullah et al., 2018).
Seventy species of mangrove plants distributed worldwide and divided into 20
genera (Spalding et al., 2010). According to Duke (2006), Rhizophora apiculata
1Razak Wahab, (corresponding author: [email protected]), Mohamad Saiful Sulaiman,
Ros Syazmini Mohd Ghani, Taharah Edin, 1University College of Technology Sarawak (UCTS),
96000 Sibu, Sarawak, MALAYSIA 2 Norashikin Mohd Fauzi, Nasihah Mokhtar, Universiti Malaysia Kelantan, 17699 Jeli Campus,
Jeli, Kelantan, MALAYSIA
Notes: The authors declare that they have no conflicts of interest. Authorship Form signed online.
Recieved:31/03/2020 Accepted:01/06/2020
Wahab et al 54
is a species of plant in the Rhizophoraceae family. The main agroforestry uses
from this species are soil stabilization, coastal protection, wildlife/marine habitat
for marine fauna and also as timber products which are fuelwood, charcoal, dyes,
and traditional medicines (Alongi 2008; Mazda et al., 2007). Nowadays,
mangrove species can be further enhanced in constructions of dwellings, making
furniture, rafts, boats, fences and even as a dying agent from the extracted tannin
(Nabihah 2015).
Economically the mangroves forests consist of both monetary and non-
monetary such as forest industry, fisheries industry, wildlife conservation,
tourism and environment protection (Chandra et al., 2011; Bennet and Reynold
1993). The most typical representatives’ species in the mangrove forest are the
Rhizophora apiculata, Rhizophora mucronata and Rhizophora mangle (Halim et
al., (2013). The mangrove trees is a complex combination of roots, trunk,
branches and leaves (Zhang et al., (2015), the trees can grow up to 30 metres in
height with trunk diameters up to 0.5 metres in width, elliptic-shaped leaves
stained dark green with simple green in the middle and reddish-brown at the base
of the leaves, bisexual flowers, round-shaped fruit up to pearl-shaped and brown,
18-38 cm long and 1-2 cm wide (Sugiarto 2019). On properties perception, wood
density is a critical characteristic defining the mechanical properties of the wood
and its performance with high wood density has been found to decrease vessel
implosion by reducing the mechanical stresses associated with the negative
pressure in the water column during drought (Santini et al., 2013). Greenwood of
the mangrove R. apiculata trunk possesses higher density than water, but dry
mangrove wood with a lower density floats in seawater and resistance to the
marine deterioration (Zhang et al., (2015).
Wood and modified wood-based materials have long been used in many
applications due to their excellent features in aesthetic appearance, reasonable
cost, ease of use, low density, high mechanical strength, etc. (Percin et al., 2015).
Excellent mechanical properties enable them to be utilized in a broad range of
products especially after undergoing modification in the production of layered
(laminated) wood with better strength or bending properties (Gáborík et al.,
2016). Wood laminating materials are obtained by bonding two or more layers
with adhesive and joining the fibre directions of the layers parallel or
perpendicular to each other (Cibo et al., 2018). Laminating is a technique that
improves the value of the wood material while enabling changes in the wood’s
properties and can be altered via in various ways which comprise multiple layers
of wood, most frequently in the form of veneers (thin slices), glued and pressed
together (Gáborík et al., 2016). The established laminated products which are
oriented strand board (OSB), laminated veneer board (LVL), Strand-based
composites include parallel strand board (PSL), laminated strand board (LSL) and
oriented strand board (OSL), and also Glue-laminated timber (GLULAM)
(Shmulsky and Jones 2019; Wiegner et al., 2009; Ong 2015). The focal point of
this study was to determine the strength of physical and mechanical properties via
solid wood and laminated wood. The differences properties between portions
Enhancing mechanical properties of Rhizophora apiculata through engineered laminated boards 55
(bottom, middle, and top) were also investigated. Previous studies related to
cross-laminated bamboo, concentrated on the mechanical properties such as
compressive, tensile, shear, and bending resistance no experimental procedure
proposed for mangrove species, Rhizophora apiculata. More studies on mangrove
species are needed by virtue of this study fills the identified research gap by
focusing on its mechanical property’s enhancement through engineered laminated
boards.
MATERIAL AND METHODS Sample Preparation
The Rhizophora apiculata used in this study was harvested from a
mangrove forest in Sibu, Sarawak. The mangrove tree with an average height of
15 m and a diameter of 20 cm at dbh was selected. The tree was removed from
the soil and cut into three (3) parts namely, the bottom, middle and top portion.
The bottom, middle and top parts were part was cut 50%, 30% and 20% of the
total length of the respectively. Subsequently, the samples was cut into the
measurable sizes for physical and mechanical testing. The samples were divided
into two groups namely solid-wood and laminated wood. The samples were cut
by using a band saw into specific sizes and thickness. In group 2 (laminated), the
samples with specific thickness were bonded together to perform as laminated
wood. PVC glue branded, Pye Bond was used for the process. Samples were
conditioning for 48 hours using clamping jig to maintain the position and
imposed the pressure. The procedure followed the International Organization for
Standardization, ISO 3131-1975 (Sulaiman et al., 2018; Wahab et al., 2017a) and
the American Standard Testing Method, ASTM D 143 for mechanical testing
(Ghani et al., 2018). The test was conducted according to the standard
specification, International Organization for Standardization, Wood-
determination of Density of Physical Test, ISO 3131-1975 (Sulaiman et al., 2018;
Wahab et al., 2017a). The physical tests was carried out to determine the moisture
content, density and basic density.
Moisture Content
The method that was used to determine the moisture content was based on
oven-dry weight. In this study, the samples were cut into the following
measurement of 25 mm x 25 mm x 25 mm with weight approximately 1–8g. All
test was carried out according to the International Organization for
Standardization which is ISO/TR 22157 (Wahab et al., 2018a; ISO / TR 22157
(2004).
Determination of Density and Basic Density
Density defined as the mass per unit volume, which is the moisture content
of sample, at 12%. Basic density is defined as the mass per unit volume in oven-
dry condition (Sulaiman et al., 2018; Wahab et al., 2018a). Samples of size 10
mm x 30mm x 30 mm were taken and oven-dried for 48 hours at 105±2°C to
attain a constant weight. The samples were then weighed to obtain the oven-dried
weight. To determine the green volume, the samples were placed into water under
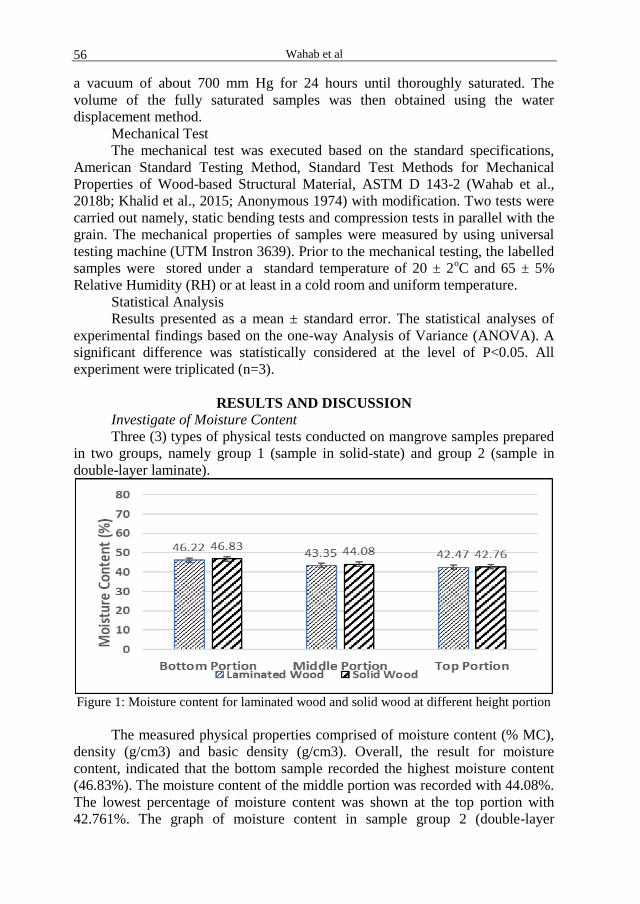
Wahab et al 56
a vacuum of about 700 mm Hg for 24 hours until thoroughly saturated. The
volume of the fully saturated samples was then obtained using the water
displacement method.
Mechanical Test
The mechanical test was executed based on the standard specifications,
American Standard Testing Method, Standard Test Methods for Mechanical
Properties of Wood-based Structural Material, ASTM D 143-2 (Wahab et al.,
2018b; Khalid et al., 2015; Anonymous 1974) with modification. Two tests were
carried out namely, static bending tests and compression tests in parallel with the
grain. The mechanical properties of samples were measured by using universal
testing machine (UTM Instron 3639). Prior to the mechanical testing, the labelled
samples were stored under a standard temperature of 20 ± 2oC and 65 ± 5%
Relative Humidity (RH) or at least in a cold room and uniform temperature.
Statistical Analysis
Results presented as a mean ± standard error. The statistical analyses of
experimental findings based on the one-way Analysis of Variance (ANOVA). A
significant difference was statistically considered at the level of P<0.05. All
experiment were triplicated (n=3).
RESULTS AND DISCUSSION
Investigate of Moisture Content
Three (3) types of physical tests conducted on mangrove samples prepared
in two groups, namely group 1 (sample in solid-state) and group 2 (sample in
double-layer laminate).
Figure 1: Moisture content for laminated wood and solid wood at different height portion
The measured physical properties comprised of moisture content (% MC),
density (g/cm3) and basic density (g/cm3). Overall, the result for moisture
content, indicated that the bottom sample recorded the highest moisture content
(46.83%). The moisture content of the middle portion was recorded with 44.08%.
The lowest percentage of moisture content was shown at the top portion with
42.761%. The graph of moisture content in sample group 2 (double-layer
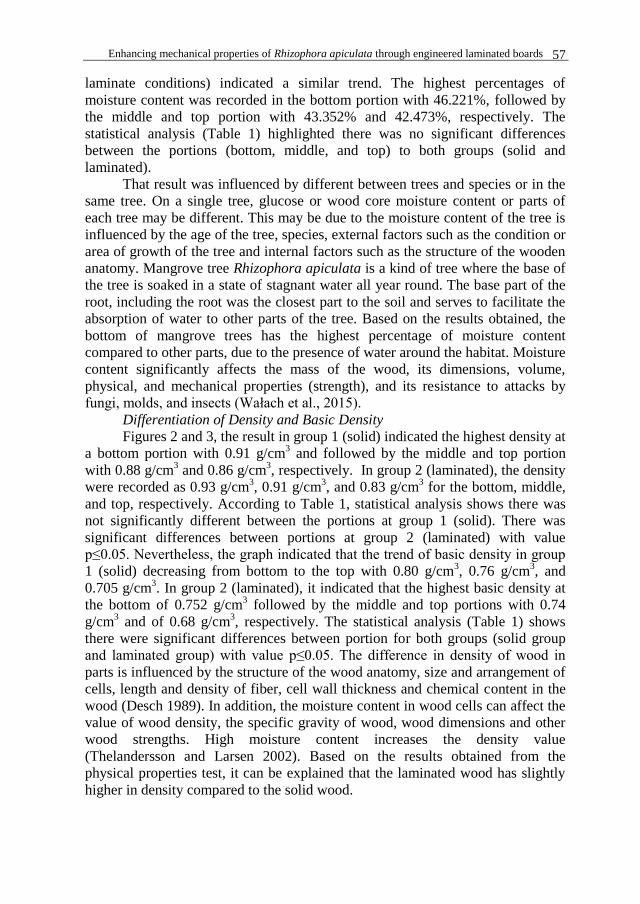
Enhancing mechanical properties of Rhizophora apiculata through engineered laminated boards 57
laminate conditions) indicated a similar trend. The highest percentages of
moisture content was recorded in the bottom portion with 46.221%, followed by
the middle and top portion with 43.352% and 42.473%, respectively. The
statistical analysis (Table 1) highlighted there was no significant differences
between the portions (bottom, middle, and top) to both groups (solid and
laminated).
That result was influenced by different between trees and species or in the
same tree. On a single tree, glucose or wood core moisture content or parts of
each tree may be different. This may be due to the moisture content of the tree is
influenced by the age of the tree, species, external factors such as the condition or
area of growth of the tree and internal factors such as the structure of the wooden
anatomy. Mangrove tree Rhizophora apiculata is a kind of tree where the base of
the tree is soaked in a state of stagnant water all year round. The base part of the
root, including the root was the closest part to the soil and serves to facilitate the
absorption of water to other parts of the tree. Based on the results obtained, the
bottom of mangrove trees has the highest percentage of moisture content
compared to other parts, due to the presence of water around the habitat. Moisture
content significantly affects the mass of the wood, its dimensions, volume,
physical, and mechanical properties (strength), and its resistance to attacks by
fungi, molds, and insects (Wałach et al., 2015).
Differentiation of Density and Basic Density
Figures 2 and 3, the result in group 1 (solid) indicated the highest density at
a bottom portion with 0.91 g/cm3 and followed by the middle and top portion
with 0.88 g/cm3 and 0.86 g/cm
3, respectively. In group 2 (laminated), the density
were recorded as 0.93 g/cm3, 0.91 g/cm
3, and 0.83 g/cm
3 for the bottom, middle,
and top, respectively. According to Table 1, statistical analysis shows there was
not significantly different between the portions at group 1 (solid). There was
significant differences between portions at group 2 (laminated) with value
p≤0.05. Nevertheless, the graph indicated that the trend of basic density in group
1 (solid) decreasing from bottom to the top with 0.80 g/cm3, 0.76 g/cm
3, and
0.705 g/cm3. In group 2 (laminated), it indicated that the highest basic density at
the bottom of 0.752 g/cm3 followed by the middle and top portions with 0.74
g/cm3 and of 0.68 g/cm
3, respectively. The statistical analysis (Table 1) shows
there were significant differences between portion for both groups (solid group
and laminated group) with value p≤0.05. The difference in density of wood in
parts is influenced by the structure of the wood anatomy, size and arrangement of
cells, length and density of fiber, cell wall thickness and chemical content in the
wood (Desch 1989). In addition, the moisture content in wood cells can affect the
value of wood density, the specific gravity of wood, wood dimensions and other
wood strengths. High moisture content increases the density value
(Thelandersson and Larsen 2002). Based on the results obtained from the
physical properties test, it can be explained that the laminated wood has slightly
higher in density compared to the solid wood.
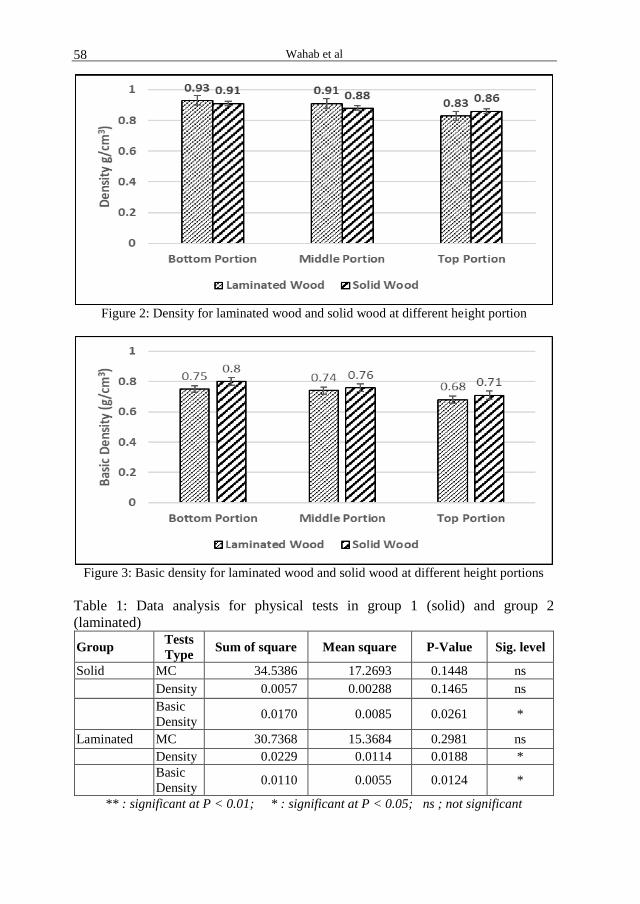
Wahab et al 58
Figure 2: Density for laminated wood and solid wood at different height portion
Figure 3: Basic density for laminated wood and solid wood at different height portions
Table 1: Data analysis for physical tests in group 1 (solid) and group 2
(laminated)
Group Tests
Type Sum of square Mean square P-Value Sig. level
Solid MC 34.5386 17.2693 0.1448 ns
Density 0.0057 0.00288 0.1465 ns
Basic
Density 0.0170 0.0085 0.0261 *
Laminated MC 30.7368 15.3684 0.2981 ns
Density 0.0229 0.0114 0.0188 *
Basic
Density 0.0110 0.0055 0.0124 *
** : significant at P < 0.01; * : significant at P < 0.05; ns ; not significant

Enhancing mechanical properties of Rhizophora apiculata through engineered laminated boards 59
Figure 4: MOR for static bending test on laminated wood and solid wood solid at
different height portions.
Figure 5: MOE for static bending of laminated wood and solid wood at different height
portions.
The results supported by Percin et al., (2015), highlighted that density of
the laminated wood materials has more superior values than the solid wood
materials which were representing their kinds. The increase was assumed to be
due to glue usage and layered structure.Determination of Modulus of Rupture
(MOR) and Modulus of Elasticity (MOE) on Static Bending Test.
The result (Figure 4) in group 1 (solid) indicated that bottom portion has the
highest MOR value with 168.200 N/mm2 and followed by the top and middle
portions which were167.875 N/mm2 and 165.275 N/mm
2, respectively. Whereas
in group 2 (laminated), it indicated the trend of MOR value decreasing from
bottom to the top, with the value of 284.825 N/mm2, 256.850 N/mm
2 and 237.350
N/mm2, respectively. There was no significant difference between portions in
group 1 (solid) (see Table 2). Notwithstanding, there was a significant difference
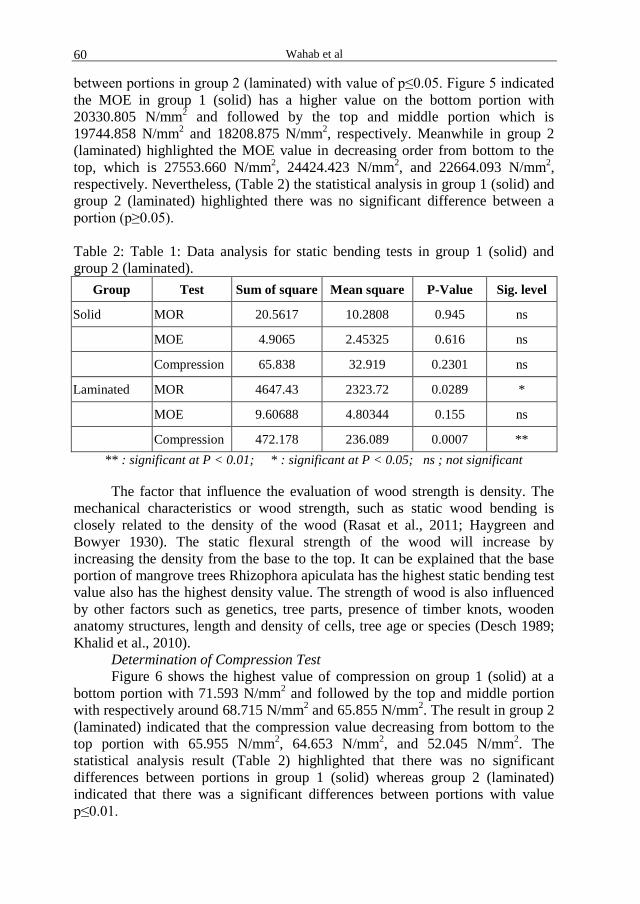
Wahab et al 60
between portions in group 2 (laminated) with value of p≤0.05. Figure 5 indicated
the MOE in group 1 (solid) has a higher value on the bottom portion with
20330.805 N/mm2 and followed by the top and middle portion which is
19744.858 N/mm2 and 18208.875 N/mm
2, respectively. Meanwhile in group 2
(laminated) highlighted the MOE value in decreasing order from bottom to the
top, which is 27553.660 N/mm2, 24424.423 N/mm
2, and 22664.093 N/mm
2,
respectively. Nevertheless, (Table 2) the statistical analysis in group 1 (solid) and
group 2 (laminated) highlighted there was no significant difference between a
portion (p≥0.05).
Table 2: Table 1: Data analysis for static bending tests in group 1 (solid) and
group 2 (laminated).
Group Test Sum of square Mean square P-Value Sig. level
Solid MOR 20.5617 10.2808 0.945 ns
MOE 4.9065 2.45325 0.616 ns
Compression 65.838 32.919 0.2301 ns
Laminated MOR 4647.43 2323.72 0.0289 *
MOE 9.60688 4.80344 0.155 ns
Compression 472.178 236.089 0.0007 **
** : significant at P < 0.01; * : significant at P < 0.05; ns ; not significant
The factor that influence the evaluation of wood strength is density. The
mechanical characteristics or wood strength, such as static wood bending is
closely related to the density of the wood (Rasat et al., 2011; Haygreen and
Bowyer 1930). The static flexural strength of the wood will increase by
increasing the density from the base to the top. It can be explained that the base
portion of mangrove trees Rhizophora apiculata has the highest static bending test
value also has the highest density value. The strength of wood is also influenced
by other factors such as genetics, tree parts, presence of timber knots, wooden
anatomy structures, length and density of cells, tree age or species (Desch 1989;
Khalid et al., 2010).
Determination of Compression Test
Figure 6 shows the highest value of compression on group 1 (solid) at a
bottom portion with 71.593 N/mm2 and followed by the top and middle portion
with respectively around 68.715 N/mm2 and 65.855 N/mm
2. The result in group 2
(laminated) indicated that the compression value decreasing from bottom to the
top portion with 65.955 N/mm2, 64.653 N/mm
2, and 52.045 N/mm
2. The
statistical analysis result (Table 2) highlighted that there was no significant
differences between portions in group 1 (solid) whereas group 2 (laminated)
indicated that there was a significant differences between portions with value
p≤0.01.
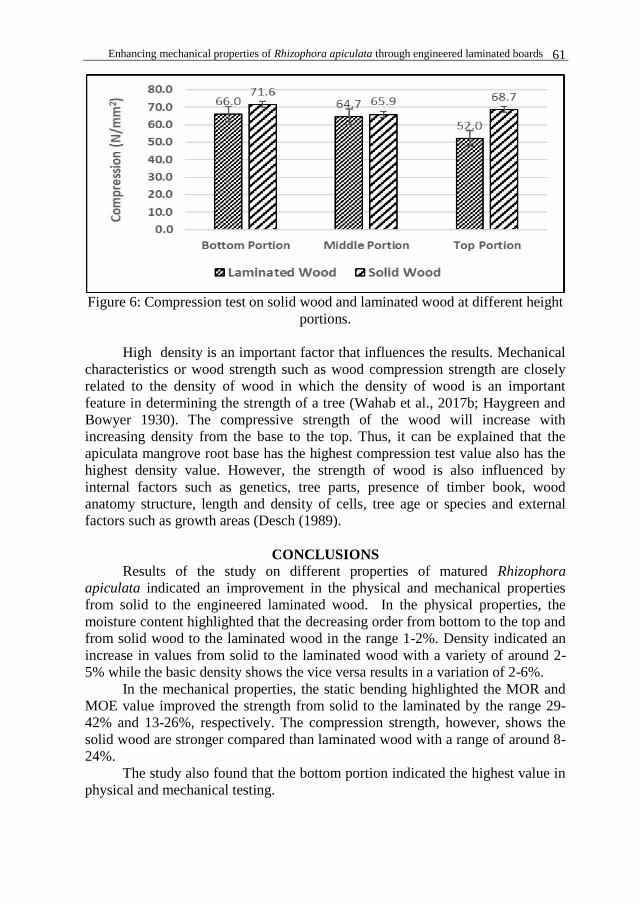
Enhancing mechanical properties of Rhizophora apiculata through engineered laminated boards 61
Figure 6: Compression test on solid wood and laminated wood at different height
portions.
High density is an important factor that influences the results. Mechanical
characteristics or wood strength such as wood compression strength are closely
related to the density of wood in which the density of wood is an important
feature in determining the strength of a tree (Wahab et al., 2017b; Haygreen and
Bowyer 1930). The compressive strength of the wood will increase with
increasing density from the base to the top. Thus, it can be explained that the
apiculata mangrove root base has the highest compression test value also has the
highest density value. However, the strength of wood is also influenced by
internal factors such as genetics, tree parts, presence of timber book, wood
anatomy structure, length and density of cells, tree age or species and external
factors such as growth areas (Desch (1989).
CONCLUSIONS
Results of the study on different properties of matured Rhizophora
apiculata indicated an improvement in the physical and mechanical properties
from solid to the engineered laminated wood. In the physical properties, the
moisture content highlighted that the decreasing order from bottom to the top and
from solid wood to the laminated wood in the range 1-2%. Density indicated an
increase in values from solid to the laminated wood with a variety of around 2-
5% while the basic density shows the vice versa results in a variation of 2-6%.
In the mechanical properties, the static bending highlighted the MOR and
MOE value improved the strength from solid to the laminated by the range 29-
42% and 13-26%, respectively. The compression strength, however, shows the
solid wood are stronger compared than laminated wood with a range of around 8-
24%.
The study also found that the bottom portion indicated the highest value in
physical and mechanical testing.
Wahab et al 62
The factor that influenced the results may be due to the natural
morphological in R. apiculata with content, high fibre strength and also complex
microstructure at the bottom portion.
ACKNOWLEDGEMENTS
This study was financed by the University College of Technology Sarawak
Grant (UCTS/RESEARCH /4/2017/01). The authors expressed their gratitude to
University College of Technology Sarawak (UCTS) and Forest Research Institute
Malaysia (FRIM) for permission on using their laboratory and workshop
equipment in the preparation and analysis parts of the study.
REFERENCES
Abdullah F, Shaari H, Satyanarayana B, Khalik WMAWM, Jaafar MZM (2018). Macro,
Micro, and Non-Essential Elements in Different Parts of Rhizophora Apiculate.
Malaysian Journal of Analytical Sciences, 22(4): 570 – 578. DOI: 10.17576/mjas-
2018-2204-01.
Alongi DM (2008). Mangrove forests: resilience, protection from tsunamis, and responses
to global climate change. Estuarine, Coastal and Shelf Science, 76(1), 1-13.
Anonymous (1974). The Strength Properties of Timber. MTP Construction. England:
Medical and Technical Publishing Co. Ltd.
Bennet EL and Reynold CJ (1993).The value of a mangrove area in sarawak. Biodiversity
Conservation, 2: 359-375. DOI:10.1007/BF00114040.
Chandra IA, Seca G, and Abu Hena MK (2011). Aboveground Biomass Production of
Rhizophora apiculate Blume in Sarawak Mangrove Forest. American Journal of
Agricultural and Biological Sciences 6 (4): 469-474.
Cibo C, Altay C, Özçifçi A, Baysal E, Toker H (2018). Determination of Some
Mechanical Properties of Laminated Wood Material Reinforced with Carbon Fiber
(CFRP). Mesleki Bilimler Dergisi (MBD), 7 (2): 123 – 132.
Desch HE (1989). Struktur, Sifat dan Penggunaan. Terjermah oleh Mohd. Zin Jusoh and
Mohd. Hamami Sahri. Edisi ke enam. United Kingdom: The Macmillan Press.
Duke NC (2006). Rhizophora apiculata, R. mucronata, R. stylosa, R. X Annamalai, R. X
lamarckii (Indo-West Pacific stilt mangrove).
Gáborík J, Gaff M, Ruman D, Záborský V, Kašíčková V, Sikora A (2016). Adhesive as a
Factor Affecting the Properties of Laminated Wood. Adhesive and lamination,
BioResources 11(4), 10565-10574. DOI: 10.15376/biores.11.4.10565-10574.
Ghani RSM, Wahab R, Azmi SNB, Wi KM, Mokhtar N, Sulaiman MS (2018a).
Comparison of Properties between Solid and Laminated Mahang Wood. Advanced
Journal of Technical and Vocational Education, 2(2): 24-28.
González NSS (2012). Structure and function of wood in mangroves. Thesis in Doctor of
Philosophy at the University of Queensland.
Halim NHA, Abidin NAZ, Me R (2013). A Study of Chemical Compounds in
Rhizophora apiculata. The Open Conference Proceedings Journal, 2013(4),
(Suppl-2, M24) 108-110.
Haygreen JG, Bowyer JL (1930). Introduction to Forest Product and Wood Science,
Subtitled by Suhaimi Muhammed and Sheikh Abdul Karim Yamani Zakaria.
Ampang Press Sdn. Bhd., Kuala Lumpur.
ISO / TR 22157 (2004). Bamboo: Determination of Physical and Mechanical Properties.
Enhancing mechanical properties of Rhizophora apiculata through engineered laminated boards 63
Khalid I, Sulaiman O, Hashim R, Wahab R, Jumhuri N, Rasat MSM (2015). Evaluation
on Layering Effects and Adhesive Rates of Laminated Compressed Composite
Panels made from Oil Palm (Elaeis guineesis). Journal of Materials and Design.
68: 24-28. DOI:10.1016 / j.matdes. 2014.12.007, Elsevier Science Direct UK.
Khalid I, Wahab R, Mahmud S, Othman S, Affendy H, Hanim RA & Andy RM (2010).
Chemical Changes in 15-year-old Cultivated Acacia hybrid Oil-Heat Treated at
180, 200 and 220°C. International Journal of Chemistry 2 (1). Pp. 97-107. Feb.
2010. ISSN: 1916-9701. Canadian Center of Science and Education.
Mazda Y, Wolanski E, Ridd PV (2007). The Role of Physical Processes in Mangrove
Environments: Manual for the Preservation and Utilization of Mangrove
Ecosystems. Terrapub, Tokyo, 598 pp.
Nabihah A (2015). Bioactivities of Methanol Extracts from Rhizophora apiculata Blume
and Rhizophora mucronata Lam. Barks. BSc. Thesis. Universiti Malaysia Sarawak
(UNIMAS).
Ong CB (2015). Glue-laminated timber (Glulam). In Wood Composites (pp. 123-140).
Woodhead Publishing.
Percin O, Sofuoglu SD, Altunok M (2015). Effect of Heat Treatment on Some Physical
and Mechanical Properties of Laminated Wood. The XXVII International
Conference Research for Furniture Industry, Ankara, Turkey.
Rasat MSM, Wahab R, Sulaiman O, Janshah M, Aminuddin M, Tamer AT, Izyan K
(2011). Properties of bio-composite board from oil palm frond agricultural waste.
Bioresources Journal 6(4): 4389-4403. Sep. 2011.
Santini NS, Schmitz N, Bennion V, Lovelock CE (2013).The anatomical basis of the link
between density and mechanical strength in mangrove branches. Functional Plant
Biology, 2013, 40, 400–408. doi.org/10.1071/FP12204.
Shmulsky R, Jones PD (2019). Forest products and wood science: an introduction. John
Wiley & Sons.
Spalding M, Kainuma M, Collins L (2010). World atlas of mangroves. Earthscan,
London.
Sugiarto A (2019). Supplemental materials for preprint: Pertumbuhan Akar Propagul
Rhizophora apiculate Blume Pada Medium Air Tawar. Retrieved from osf.io/krpa.
Sulaiman MS, Ramle SFM, Hashim R, Sulaiman O, Amini MHM, Geng BJ (2018). The
classical mechanics engineered of Bambusa vulgaris and Schizostachyum
brachycladum. Journal of Tropical Resources and Sustainable Science 6:57-61.
Thelandersson S, Larsen HJ (2002). Timber Engineering. John Wiley & Sons, Ltd.
Wahab R, Ghani RSM, Samsi HW & Rasat MSM (2017b). Changes in the Features of Oil
Heat Treated 18-Years Old Acacia mangium. Research Journal of Pharmaceutical,
Biological and Chemical Sciences 8 (2): 2093-2106. ISSN: 0975-8585.
Wahab R, Mokhtar N, Ghani RSM, Sulaiman MS, Samsi HW (2018a). Changes in
Strength Characteristics and Durability on 4-Year-Old Tropical Bamboo
Gigantochloa Scortechinii through Heat Treatment. Asian Journal of Science and
Technology, 9(5):8227-8233.
Wahab R, Rasat MSM, Samsi HW, Mustafa MT, Don SMM
(2017a). Assessing the
suitability of Agro-Waste from Oil Palm Empty Fruit Bunches as Quality Eco-
Composite Boards. Journal of Agricultural Science 9 (8): 237-247. ISSN 1916-
9752 E-ISSN 1916-9760. Doi: 10.5539/jas. v9n6p251. Published by Canadian
Center of Science and Education.
Wahab R, Sulaiman MS, Mokhtar N, Ghani RSM, Samsi HW, Yusuf M (2018b).
Properties of Hibiscus cannabinus and Elaeis guineesis fronds fibers Eco-

Wahab et al 64
Composites boards. International Journal of Current Research 10 (5): 69770-
69775. ISSN: 0975-833X.
Wałach D, Jaskowska-Lemańska J, Dybeł P (2015). The impact of the moisture content
of wood on the results of non-destructive tests. Forestry and Wood Technology №
92: 448-454.
Wiegner K, Wilke O, Jann O, Brödner D, Scheffer H, Kalus S, Till C (2009). Study on
VOC-emissions from oriented strand boards (OSB). In Proceedings of the 9th
International conference Healthy Buildings.
Zhang X, Chua VP, Cheong HT (2015). Hydrodynamics in mangrove prop roots and their
physical properties. Journal of hydro-environment research. 9(2):281-294.
DOI: 10.1016/j.jher. 2014.07.010.
Agriculture & Forestry, Vol. 66 Issue 3: 65-72, 2020, Podgorica 65
Maksimović, T., Janjić, N., Lubarda, B. (2020): Effect of different concentrations of mannitol on germination of
pea seeds (Pisum sativum L.). Agriculture and Forestry, 66 (3): 65-72.
DOI: 10.17707/AgricultForest.66.3.06
Tanja MAKSIMOVIĆ, Nina JANJIĆ, Biljana LUBARDA 1
EFFECT OF DIFFERENT CONCENTRATIONS OF MANNITOL ON
GERMINATION OF PEA SEEDS (Pisum sativum L.)
SUMMARY
During the life cycle, plants are exposed to various abiotic and biotic stress
factors that adversely affect their growth, development and productivity. Drought
is one of the stress factors affecting the decline in plant growth and productivity
worldwide. In this study, the effect of water deficiency caused by different
concentrations of mannitol (5%, 10%, and 20%) on the germination of seeds of
two varieties of peas (Petit Provencal and Joff) was studied. The results of the
study showed that the germination percentage and germination potential of both
pea varieties decreased with increasing mannitol concentration compared to the
control. The Petit Provencal variety had a higher percentage of germination,
germination potential and vigor index of drought resistance and this variety was
considered more tolerant to drought stress.
Keywords: drought, mannitol, seed, germination, Pisum sativum L.
INTRODUCTION
In the past few years, drought has been one of the most common factors
damaging plant growth and development, and is becoming an increasingly serious
problem in many regions around the world. Extreme water shortages cause
considerable physiological, metabolic and morphological changes in plants which
in turn reduce the yield and quality of the crop (Al-Jebory, 2012; Duan et al.,
2017; Chaves and Oliveira, 2004).
Pea (Pisum sativum) is a very important agricultural crop from the legume
(Fabaceae) family that plays a large role in human nutrition. It is of particular
importance primarily because of its high nutritional value, intensive production
and its short cultivation period (Kumar and Choundhary, 2014). Since peas are
grown in climatically different regions under different production conditions, pea
seeds are inevitably susceptible to various stress conditions. Stressful conditions
inhibit seed germination, resulting in poor crops, reduced biomass, and
ultimately, reduced yield and quality (Machado Neto et al., 2004;
1Tanja Maksimović, (corresponding author: [email protected]), Nina Janjić, Biljana
Lubarda, Department of Biology, Faculty of Natural Sciences and Mathematics, University of
Banja Luka, Mladena Stojanovića 2, 78 000 Banja Luka, Republic of Srpska, BOSNIA AND
HERZEGOVINA
Notes: The authors declare that they have no conflicts of interest. Authorship Form signed online.
Received:02/06/2020 Accepted:08/07/2020
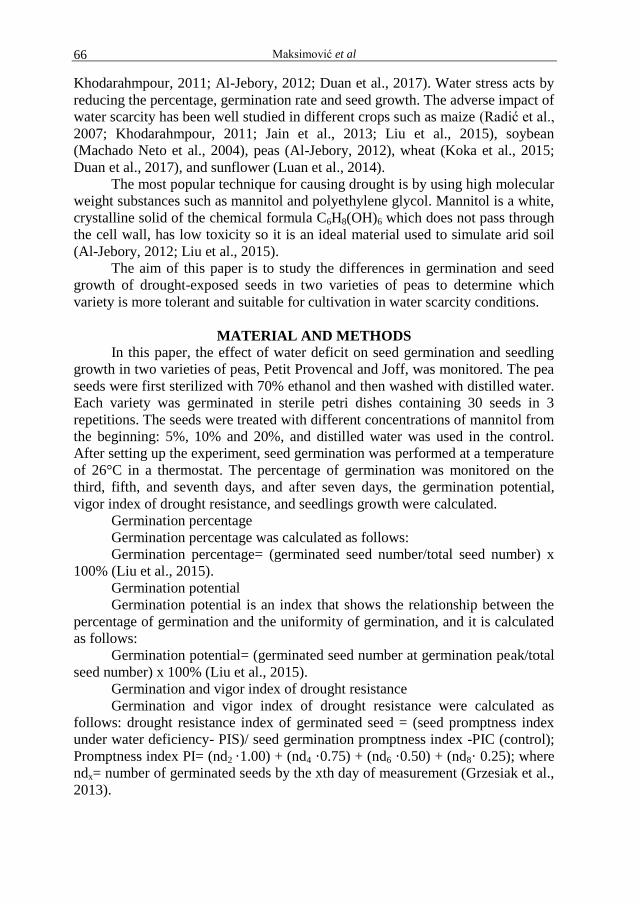
Maksimović et al 66
Khodarahmpour, 2011; Al-Jebory, 2012; Duan et al., 2017). Water stress acts by
reducing the percentage, germination rate and seed growth. The adverse impact of
water scarcity has been well studied in different crops such as maize (Radić et al.,
2007; Khodarahmpour, 2011; Jain et al., 2013; Liu et al., 2015), soybean
(Machado Neto et al., 2004), peas (Al-Jebory, 2012), wheat (Koka et al., 2015;
Duan et al., 2017), and sunflower (Luan et al., 2014).
The most popular technique for causing drought is by using high molecular
weight substances such as mannitol and polyethylene glycol. Mannitol is a white,
crystalline solid of the chemical formula C6H8(OH)6 which does not pass through
the cell wall, has low toxicity so it is an ideal material used to simulate arid soil
(Al-Jebory, 2012; Liu et al., 2015).
The aim of this paper is to study the differences in germination and seed
growth of drought-exposed seeds in two varieties of peas to determine which
variety is more tolerant and suitable for cultivation in water scarcity conditions.
MATERIAL AND METHODS In this paper, the effect of water deficit on seed germination and seedling
growth in two varieties of peas, Petit Provencal and Joff, was monitored. The pea
seeds were first sterilized with 70% ethanol and then washed with distilled water.
Each variety was germinated in sterile petri dishes containing 30 seeds in 3
repetitions. The seeds were treated with different concentrations of mannitol from
the beginning: 5%, 10% and 20%, and distilled water was used in the control.
After setting up the experiment, seed germination was performed at a temperature
of 26°C in a thermostat. The percentage of germination was monitored on the
third, fifth, and seventh days, and after seven days, the germination potential,
vigor index of drought resistance, and seedlings growth were calculated.
Germination percentage
Germination percentage was calculated as follows:
Germination percentage= (germinated seed number/total seed number) x
100% (Liu et al., 2015).
Germination potential
Germination potential is an index that shows the relationship between the
percentage of germination and the uniformity of germination, and it is calculated
as follows:
Germination potential= (germinated seed number at germination peak/total
seed number) x 100% (Liu et al., 2015).
Germination and vigor index of drought resistance
Germination and vigor index of drought resistance were calculated as
follows: drought resistance index of germinated seed = (seed promptness index
under water deficiency- PIS)/ seed germination promptness index -PIC (control);
Promptness index PI= (nd2 ·1.00) + (nd4 ·0.75) + (nd6 ·0.50) + (nd8· 0.25); where
ndx= number of germinated seeds by the xth day of measurement (Grzesiak et al.,
2013).
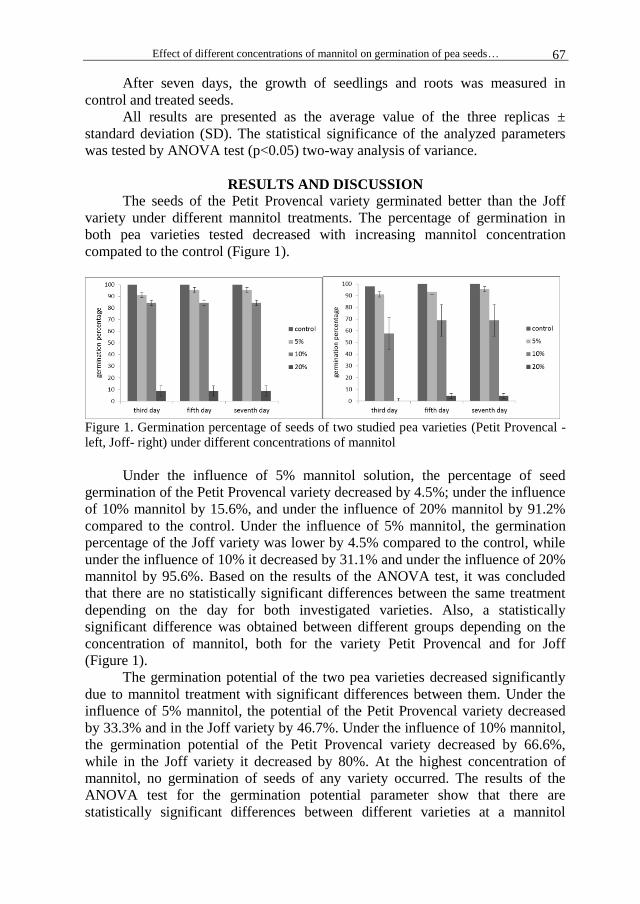
Effect of different concentrations of mannitol on germination of pea seeds… 67
After seven days, the growth of seedlings and roots was measured in
control and treated seeds.
All results are presented as the average value of the three replicas ±
standard deviation (SD). The statistical significance of the analyzed parameters
was tested by ANOVA test (p<0.05) two-way analysis of variance.
RESULTS AND DISCUSSION
The seeds of the Petit Provencal variety germinated better than the Joff
variety under different mannitol treatments. The percentage of germination in
both pea varieties tested decreased with increasing mannitol concentration
compated to the control (Figure 1).
Figure 1. Germination percentage of seeds of two studied pea varieties (Petit Provencal -
left, Joff- right) under different concentrations of mannitol
Under the influence of 5% mannitol solution, the percentage of seed
germination of the Petit Provencal variety decreased by 4.5%; under the influence
of 10% mannitol by 15.6%, and under the influence of 20% mannitol by 91.2%
compared to the control. Under the influence of 5% mannitol, the germination
percentage of the Joff variety was lower by 4.5% compared to the control, while
under the influence of 10% it decreased by 31.1% and under the influence of 20%
mannitol by 95.6%. Based on the results of the ANOVA test, it was concluded
that there are no statistically significant differences between the same treatment
depending on the day for both investigated varieties. Also, a statistically
significant difference was obtained between different groups depending on the
concentration of mannitol, both for the variety Petit Provencal and for Joff
(Figure 1).
The germination potential of the two pea varieties decreased significantly
due to mannitol treatment with significant differences between them. Under the
influence of 5% mannitol, the potential of the Petit Provencal variety decreased
by 33.3% and in the Joff variety by 46.7%. Under the influence of 10% mannitol,
the germination potential of the Petit Provencal variety decreased by 66.6%,
while in the Joff variety it decreased by 80%. At the highest concentration of
mannitol, no germination of seeds of any variety occurred. The results of the
ANOVA test for the germination potential parameter show that there are
statistically significant differences between different varieties at a mannitol
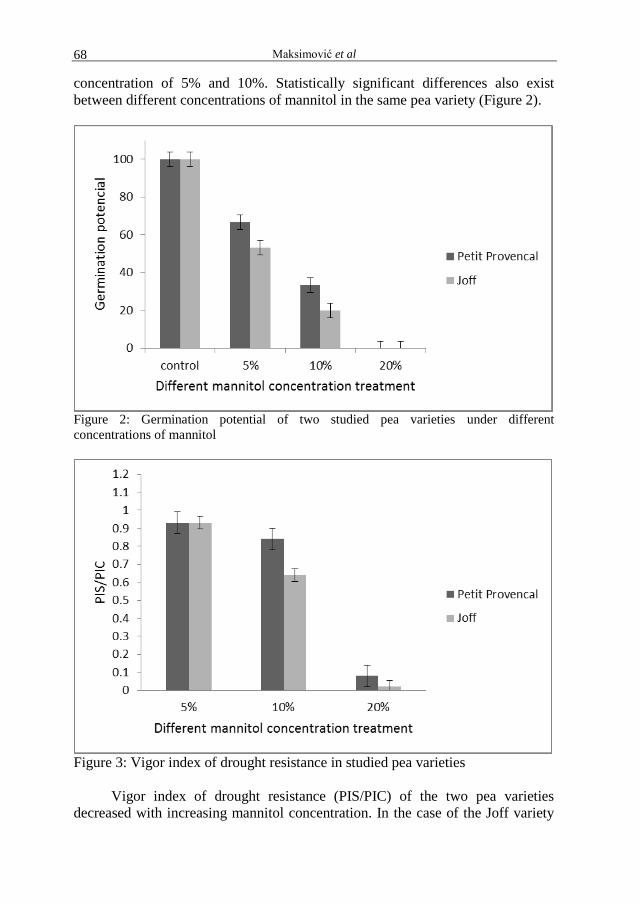
Maksimović et al 68
concentration of 5% and 10%. Statistically significant differences also exist
between different concentrations of mannitol in the same pea variety (Figure 2).
Figure 2: Germination potential of two studied pea varieties under different
concentrations of mannitol
Figure 3: Vigor index of drought resistance in studied pea varieties
Vigor index of drought resistance (PIS/PIC) of the two pea varieties
decreased with increasing mannitol concentration. In the case of the Joff variety
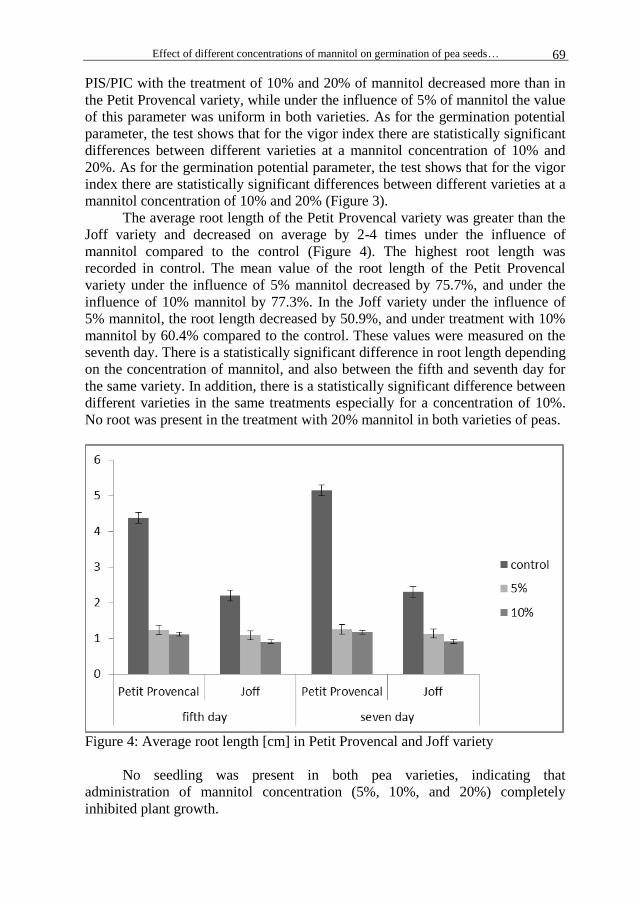
Effect of different concentrations of mannitol on germination of pea seeds… 69
PIS/PIC with the treatment of 10% and 20% of mannitol decreased more than in
the Petit Provencal variety, while under the influence of 5% of mannitol the value
of this parameter was uniform in both varieties. As for the germination potential
parameter, the test shows that for the vigor index there are statistically significant
differences between different varieties at a mannitol concentration of 10% and
20%. As for the germination potential parameter, the test shows that for the vigor
index there are statistically significant differences between different varieties at a
mannitol concentration of 10% and 20% (Figure 3).
The average root length of the Petit Provencal variety was greater than the
Joff variety and decreased on average by 2-4 times under the influence of
mannitol compared to the control (Figure 4). The highest root length was
recorded in control. The mean value of the root length of the Petit Provencal
variety under the influence of 5% mannitol decreased by 75.7%, and under the
influence of 10% mannitol by 77.3%. In the Joff variety under the influence of
5% mannitol, the root length decreased by 50.9%, and under treatment with 10%
mannitol by 60.4% compared to the control. These values were measured on the
seventh day. There is a statistically significant difference in root length depending
on the concentration of mannitol, and also between the fifth and seventh day for
the same variety. In addition, there is a statistically significant difference between
different varieties in the same treatments especially for a concentration of 10%.
No root was present in the treatment with 20% mannitol in both varieties of peas.
Figure 4: Average root length [cm] in Petit Provencal and Joff variety
No seedling was present in both pea varieties, indicating that
administration of mannitol concentration (5%, 10%, and 20%) completely
inhibited plant growth.
Maksimović et al 70
Plants are exposed to various stress factors throughout their life cycle that
greatly affect their growth, development and productivity. Drought is among the
first abiotic stressors, which limit the normal functioning of the plant (Machado
Neto et al., 2004; Radić et al., 2007; Khodarahmpour, 2011; Al-Jebory, 2012;
Jain et al., 2013; Luan et al. al., 2014; Liu et al., 2015; Koka et al., 2015; Duan et
al., 2017). The effect of drought, on the level of the whole pea plant is multiple,
and is reflected in the reduced ability to germinate and sprout seeds, poorer root
development and above-ground part of the plant, reduced ability to create and
accumulate dry matter, as well as a negative impact on flower formation, pollen
formation, pollination, grain formation and quality (Al-Jebory, 2012; Elkoca,
2014).
In this paper, drought resistance of two varieties of peas under simulated
mannitol-induced conditions was monitored. The percentage of germination of
both varieties of peas declined under the influence of drought. By comparison of
the tested varieties it was found that the percentage of germination was higher in
the Petit Provencal variety compared to Joff. Treatment with the highest
concentration of mannitol (20%) caused a 91.2% decrease in germination rates
for the Petit Provencal variety and 96.5% for the Joff variety, indicating that the
Petit Provencal variety exhibited higher drought resistance (Figures 1). These
results agree with those of Machado Neto et al. (2004) for soybean and with Koka
et al. (2015) for the oat.
According to Elkoca (2014) water uptake is directly related to the osmotic
potential of the applied polyethylene glycol and mannitol in the experiment. More
specifically, when treating seeds with these substances, the promptness and
percentage of seed germination are reduced.
Similar studies were carried out by Machado Neto et al. (2004) on certain
soybean varieties, whereby they found that the percentage of germination
decreased depending on the concentrations of mannitol applied, which may be
related to the results of our studies.
Germination potential is a parameter that shows the degree of germination
and evenness of seed germination (Liu et al., 2015). In this paper, it was shown
that the germination potential of both pea varieties declined under the influence
of drought, but that it decreased more in the Joff variety than in the Petit
Provencal variety (Figure 2), indicating that the Petit Provencal seed germinated
faster than the Joff variety seed, showing at the same time stronger drought
resistance. Water stress not only affects seed germination but also extends the
period required for germination (Khodarahmpour, 2011; Liu et al., 2015), as we
have noted in this paper.
The drought resistance index is a parameter that better and more accurately
indicates to us the drought resistance and germination characteristics (Grzesiak et
al., 2012; 2013). The resistance index for both tested pea varieties decreased with
increasing mannitol concentration, but for the Petit Provencal variety decreased
less than for Joff, which tells us that the Little Provencal variety showed greater
resistance to drought (Figure 3). Liu et al. (2015) in their study on two maize
Effect of different concentrations of mannitol on germination of pea seeds… 71
varieties also found a decrease in drought resistance index with increasing
mannitol concentration.
From the obtained results, it was found that the Petit Provencal variety had
longer roots under the influence of drought (Figure 4), implying that this variety
had a more developed root system and therefore showed higher resistance than
the Joff variety. Reduced root growth in 4 mannitol-induced soybean cultivars
was reported by Machado Neto et al. (2004) as well as Koka et al. (2015) on the
oat. Duan et al. (2017) reported in their study on wheat that inhibitions of root
growth under the influence of polyethylene glycol-induced drought occur, and
this may be related to the results obtained in this work. Khodarahmpour (2011)
by studying 7 maize hybrids under drought stress conditions showed that root
length decreased by up to 60% compared to the control.
The Petit Provencal cultivar had a higher percentage of germination and
higher promptness, root length, indicating that this variety was more drought
tolerant than the Joff variety.
CONCLUSIONS
The growth of plants in arid and semi-arid conditions depends on the
susceptibility of the plants to drought and the ability of the seed to achieve
optimal germination in adverse conditions. It is therefore of great importance to
determine the tolerance of varieties to drought in the initial stages of growth.
Taking all the characteristics into account, in this paper the Petit Provencal
variety germinated faster and had a higher percentage and potential of
germination than the Joff variety. Also, the cultivar Little Provencal had a better
root system, which indicates a better ability for osmotic adaptation, which allows
cultivation of the tested variety in dry conditions. This type of research shows
that monitoring seed germination index can be used to determine the tolerance
and sensitivity of a variety to the stress caused by drought in the initial stages of
growth.
ACKNOWLEDGEMENTS
The authors acknowledge financial support of the Ministry of Education,
Science and Technological Development of the Republic of Serbia (Grant No.
451-03-68/2020-14/ 200358; 200032) and DRAGON GA 810775 (Data Driven
Precision Agriculture Services and Skill Acquisition), H2020-WIDESPREAD-
05-2017-Twinning; and bilateral project (MNO & Serbia; 2019-2020):
Alternative cereals and oil crops as a source of healthcare food and an important
raw material for the production of biofuel; FAO Project (2019-2022):
Redesigning the exploitation of small grains genetic resources towards increased
sustainability of grain-value chain and improved farmers’ livelihoods in Serbia
and Bulgaria – GRAINeFIT.
REFERENCES Al-Jebory E I. 2012. Effect of water stress on carbohydrate metabolism during Pisum
sativum seedlings growth. Euphrates Journal of Agriculture Science, 4 (4); 1-12.
Maksimović et al 72
Chaves M M, Oliveira M M. 2004. Mechanisms underlying plant resilience to water
deficits: prospects for water-saving agriculture. J. Exp. Bot., 55; 2365–2384.
Duan H, Zhu Y, Li J, Wang H, Zhou Y. 2017. Effects of Drought on Growth and
Development of Wheat Seedlings. International Journal of Agriculture & Biology.
19(5);1119-1124. doi:10.17957/IJAB/15.0 393.
Elkoca, E. 2014: Osmo- and hydropriming enhance germination rate and reduce thermal
time requirement of pea (Pisum sativum L. cv. Winner) seeds. Akademik Ziraat
Dergisi, 3(1);1-12.
Grzesiak M T, Marcinska I, Janowiak F, Rzepka A, Hura T. 2012. The relationship
between seedling growth and grain yield under drought conditions in maize and
triticale genotypes. Acta Physiol Plantarum, 34; 1757-1764.
Grzesiak M T, Waligorski P, Janowiak F, Marcinska I, Hura K, Szczyrek P, Głab T.
2013. The relations between drought susceptibility index based on grain yield
(DSIGY) and key physiological seedling traits in maize and triticale genotypes.
Acta Physiol Plant, 35; 549-565. http://dx.doi.org/10.1007/s11738-012-1097-5.
Jain M, Mittal M, Gadre R. 2013. Effect of PEG-6000 Imposed Water Deficit on
Chlorophyll Metabolism in Maize Leaves. Journal of Stress Physiology. 9(3): 262-
271.
Khodarahmpour, Z. 2011. Effect of drought stress induced by polyethylene glycol (PEG)
on germination indices in corn (Zea mays L.). African Journal of Biotehnolog, 10
(79); 18222-18227.
Koka J A, Wani A H, Agarwal R M, Parveen S, Wani F A. 2015. Effect of Polyethylene
glycol 6000, mannitol, sodium and potassium salts on the growth and biochemical
characteristics of oat (Avena sativa L.). European Academic Research, 3 (1); 303-314.
Kumar,A, Choundhary A K. 2014. Scientific Cultivation of Vegetable Pea (Pisum
sativum L.). In book: Advances in Vegetable Agronomy. Publisher: Indian
Agricultural Research Institute.
Liu, M, Li M, Liu K, Sui N. 2015. Effect of Drought Stress on Seed Germination and
Seedling Growth of Different Maize Varieties. Journal of Agricultural Science, 7 (5);
231-240.
Luan Z, Xiao M, Daowei D, Zhang H, Tian Y, Wu Yi, Guan B, Song Y. 2014. Effects of
salinity, temperature, and polyethylene glycol on the seed germination of sunflower
(Helianthus annuus L.). The Scientific World Journal, 2014; 1-9.
Machado Neto B N, Saturnino S M, Bomfim D C, Custódio C C. 2004. Water Stress
Induced by Mannitol and Sosium Chloride in Soybean Cultivars. Brazilian Archives
of Biology and Technology, 47 (4); 521-529.
Radić V, Beatović D, Mrđa J. 2007. Salt tolerance of corn genotypes (Zea mays L.)
during germination and later growth. Journal of Agricultural Sciences, 52 (2); 115-
120.

Agriculture & Forestry, Vol. 66 Issue 3: 73-80, 2020, Podgorica 73
Govedarica-Lučić, A., Perković, G., Rahimić, A., Bošković, I., Pašić, S. (2020): Influence of fertilization on
growth and qualty of lettuce. Agriculture and Forestry, 66 (3): 73-80
DOI: 10.17707/AgricultForest.66.3.07
Aleksandra GOVEDARICA-LUČIĆ, Goran PERKOVIĆ1,
Alma RAHIMIĆ2, Ivana BOŠKOVIĆ
1, Sanid PAŠIĆ
3
INFLUENCE OF FERTILIZATION ON GROWTH
AND QUALTY OF LETTUCE
SUMMARY
The biological characteristics of lettuce and its specific growth and
development are the basis for establishing the optimal method of cultivation. In
order to achieve appropriate high yields, producers various organic, mineral and
microbial fertilizers.
The aim of the study was to determine the effect of fertilization on the
growth and quality of different varieties of lettuce. A two-factor experiment
(fertilization and variety) was set up on a random block system in a greenhouse
without heating, on the territory of East Sarajevo. A non-fertilized control variant
was included in the trial.
During the research, the effect of fertilizers (Slavol and Fitofert humisuper)
on two varieties of lettuce (Santoro RZ and Kiribati RZ) was examined.
The highest mass of lettuce was recorded on the variant with application of
Slavol (309,19 g).The highest percentage of dry matter was achieved by
fertilization with Slavol in the Kiribati RZ variety – 6,46%, while the lowest
percentage was achieved on the control variant in the Santoro RZ variety - 5.10%.
Keywords: fertilization, lettuce, yield, quality.
INTRODUCTION
Vegetable crops have high nutrient requirements. Proper growth and
development of plants requires a ratio of nutrients found in the soil. Nutrition of
plants, ie. the addition of the necessary nutrients to the plant is done by applying
fertilizer. Today, organic and mineral fertilizers are used to feed the plants
(Rašević, 2017). Organic fertilizers play a major role in the growth and
development of plants. They contain the necessary macro and micro elements and
1Aleksandra Govedarica-Lučić, (corresponding author: [email protected]), Goran
Perković, Ivana Bošković, Faculty of Agriculture, University of East Sarajevo, BOSNIA AND
HERZEGOVINA. 2Alma Rahimić, Agromediterranean Faculty, University of “Džemal Bijedić”, Mostar, BOSNIA
AND HERZEGOVINA. 3Sanid Pašić, Federal Institute of Agriculture, Butmirska 18, BOSNIA AND HERZEGOVINA.
Notes: The authors declare that they have no conflicts of interest. Authorship Form signed online.
Received:08/04/2020 Accepted:03/07/2020

Govedarica-Lučić et al 74
improve the physical and chemical properties of the soil (Chaterjee et al.,2005;
Chaterjee et al.,2014; Čabilovski et al., 2010).
However, according to many researchers, fertilizing the soil with organic
fertilizer for vegetable nutrition alone does not produce good results in achieving
high and stable yields. Therefore, various types of organic fertilizers should be
applied in combination with mineral fertilizers (Ogbonna, 2008; Ndaeyo et al.,
2005; Makinde et al., 2007; Dauda et al., 2008). Mineral fertilizers are products
containing nutrients essential for the normal growth and development of
plants.As for the production of lettuce, it has been proven that organic fertilizers
are more suitable than inorganic fertilizer (Masarirambi et al. 2010). Also,
mineral fertilizers can have a detrimental effect on plant quality, declining dry
matter content, increasing soil acidity, increases the nitrate concentration in the
lettuce cultivar ,degeneration of physical properties, increasing erosion and
instability of soil aggregates (Adeoluwa and Adeogun, 2010; Olowoake and
Adeoye, 2010; Premuzic et al. 2001).
The application of microbiological fertilizers has economic and
environmental justification. Fertilizers and lately bio stimulants have increasingly
been used as a tool with the potential to enable a more sustainable agriculture
production (Bulgari et al. 2015). Improvement of plant production goes towards
significant use of microbial inoculants in the production of non-leguminous
plants, including the most important crop and vegetable species. Because the aim
of this study was to examine the effects of Slavol bio stimulant and the Fitofert
fertilizer on production of the lettuce and draw a conclusion about the
effectiveness of their action.
MATERIAL AND METHODS The impact of different fertilization variants on the growth and quality of
two lettuce varieties was investigated during one growing season in 2019. A two-
factor experiment was set up in a greenhouse without heating. The experiment
was set up according to a random block system, in three repetitions with the size
of a test plot of 2 m² (1x2 m).
Within the first tested factor fertilization (A) were variants:a1) control (no
fertilization), a2) Slavol, and a3) Fitofert humisuper plus.
Slavol is a universal certified fertilizer and can be used in organic and
traditional agricultural production. Slavol is a preparation containing bacteria
(nitrogen fixers and phosphomineralizers), plant growth stimulants that produce
auxins (indole-3 acetic acid) in the fermentation process in the range of 0.01 to
0.1 mg/l. It affects cell division, stem and coleoptile growth, development of
adventitious and lateral roots, flowering and pollination, and fruit quality.
Fitofert hemisuper plus organic-inorganic NPK fertilizer is used for all
plant species, and exclusively for leafy vegetables grown on different soils in the
field and substrates.
Second tested factor (B) includes the following variants: b1) Santoro RZ,
and b2) Kiribati RZ.

Influence of fertilization on growth and quality of lettuce 75
In the stage of tenological maturity of lettuce we analyzed:
weight of lettuce (g),
vitamin C content in fresh leaf (mg100g-1
),
dry matter content in the leaf (%).
The dry matter content in the leaf was determined by drying in an oven at
105°C. Based on the difference between the initial mass of the sample and after
drying, the percentage of dry matter was calculated.
Vitamin C was determined by titration method. The significance of the
differences of the environments was tested by the two-factorial variance analysis
(ANOVA) method using SPSS 4.5 software.
Soil characteristics of the experimental field
Chemical analysis of the soil showed that the soil is an alkaline reaction,
low in carbonate and belonging to the group of poorly lime soils, rich in humus,
rich in nitrogen, very rich in readily available phosphorus and very rich in readily
available potassium.
Table 1. Chemical properties of soil
pH
H2O
pH
KCl
CaCO3
%
Humus
%
N
%
P2O5
mg100g-1
K2O
mg100g-1
8,01 7,42 <1% 7,24 0,47 >40 65,41
RESULTS AND DISCUSSION
Weight of lettuce (g)
From the analysis of variance it can be concluded that the fertilization
factor had a significant effect on the tested characteristic.
Table 2. Effect of fertilization and variety on the weight of lettuce (g)
Fertilization Variety Average for
fertilization
b1 b2
a1 169,49 135,09 152,29
a2 268,90 349,48 309,19**
a3 222,98 181,13 202,06
Average for
variety 220,46
221,90
221,18
LSD A B AxB
0,05 85,36 69,70 120,73
0,01 121,34 99,09 171,62
The highest weight of lettuce was recorded on variant a2 (309.19 g) and
compared with the control (152.29 g) and a3 variant (202.06 g) the difference was
statistically significant. Željkovic et al. (2013) confirmed the positive impact of
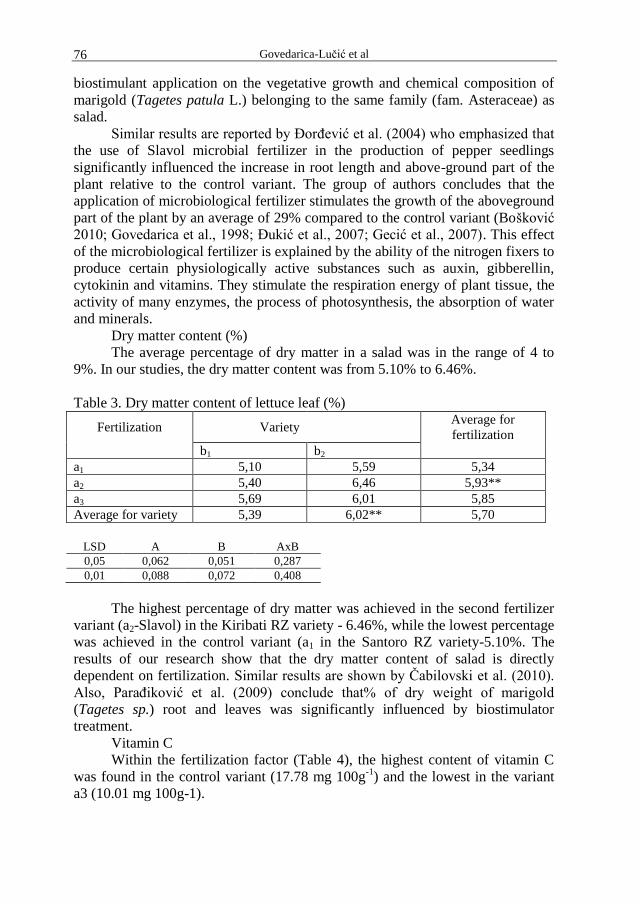
Govedarica-Lučić et al 76
biostimulant application on the vegetative growth and chemical composition of
marigold (Tagetes patula L.) belonging to the same family (fam. Asteraceae) as
salad.
Similar results are reported by ĐorĎević et al. (2004) who emphasized that
the use of Slavol microbial fertilizer in the production of pepper seedlings
significantly influenced the increase in root length and above-ground part of the
plant relative to the control variant. The group of authors concludes that the
application of microbiological fertilizer stimulates the growth of the aboveground
part of the plant by an average of 29% compared to the control variant (Bošković
2010; Govedarica et al., 1998; Đukić et al., 2007; Gecić et al., 2007). This effect
of the microbiological fertilizer is explained by the ability of the nitrogen fixers to
produce certain physiologically active substances such as auxin, gibberellin,
cytokinin and vitamins. They stimulate the respiration energy of plant tissue, the
activity of many enzymes, the process of photosynthesis, the absorption of water
and minerals.
Dry matter content (%)
The average percentage of dry matter in a salad was in the range of 4 to
9%. In our studies, the dry matter content was from 5.10% to 6.46%.
Table 3. Dry matter content of lettuce leaf (%)
Fertilization Variety Average for
fertilization
b1 b2
a1 5,10 5,59 5,34
a2 5,40 6,46 5,93**
a3 5,69 6,01 5,85
Average for variety 5,39 6,02** 5,70
LSD A B AxB
0,05 0,062 0,051 0,287
0,01 0,088 0,072 0,408
The highest percentage of dry matter was achieved in the second fertilizer
variant (a2-Slavol) in the Kiribati RZ variety - 6.46%, while the lowest percentage
was achieved in the control variant (a1 in the Santoro RZ variety-5.10%. The
results of our research show that the dry matter content of salad is directly
dependent on fertilization. Similar results are shown by Čabilovski et al. (2010).
Also, ParaĎiković et al. (2009) conclude that% of dry weight of marigold
(Tagetes sp.) root and leaves was significantly influenced by biostimulator
treatment.
Vitamin C
Within the fertilization factor (Table 4), the highest content of vitamin C
was found in the control variant (17.78 mg 100g-1
) and the lowest in the variant
a3 (10.01 mg 100g-1).
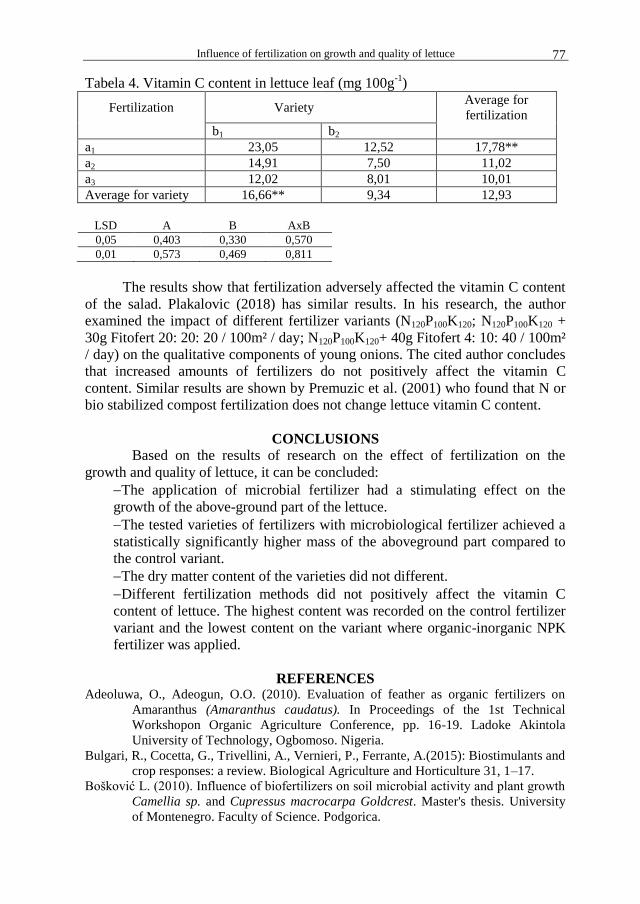
Influence of fertilization on growth and quality of lettuce 77
Tabela 4. Vitamin C content in lettuce leaf (mg 100g-1
)
Fertilization Variety Average for
fertilization
b1 b2
a1 23,05 12,52 17,78**
a2 14,91 7,50 11,02
a3 12,02 8,01 10,01
Average for variety 16,66** 9,34 12,93
LSD A B AxB
0,05 0,403 0,330 0,570
0,01 0,573 0,469 0,811
The results show that fertilization adversely affected the vitamin C content
of the salad. Plakalovic (2018) has similar results. In his research, the author
examined the impact of different fertilizer variants (N120P100K120; N120P100K120 +
30g Fitofert 20: 20: 20 / 100m² / day; N120P100K120+ 40g Fitofert 4: 10: 40 / 100m²
/ day) on the qualitative components of young onions. The cited author concludes
that increased amounts of fertilizers do not positively affect the vitamin C
content. Similar results are shown by Premuzic et al. (2001) who found that N or
bio stabilized compost fertilization does not change lettuce vitamin C content.
CONCLUSIONS
Based on the results of research on the effect of fertilization on the
growth and quality of lettuce, it can be concluded:
The application of microbial fertilizer had a stimulating effect on the
growth of the above-ground part of the lettuce.
The tested varieties of fertilizers with microbiological fertilizer achieved a
statistically significantly higher mass of the aboveground part compared to
the control variant.
The dry matter content of the varieties did not different.
Different fertilization methods did not positively affect the vitamin C
content of lettuce. The highest content was recorded on the control fertilizer
variant and the lowest content on the variant where organic-inorganic NPK
fertilizer was applied.
REFERENCES Adeoluwa, O., Adeogun, O.O. (2010). Evaluation of feather as organic fertilizers on
Amaranthus (Amaranthus caudatus). In Proceedings of the 1st Technical
Workshopon Organic Agriculture Conference, pp. 16-19. Ladoke Akintola
University of Technology, Ogbomoso. Nigeria.
Bulgari, R., Cocetta, G., Trivellini, A., Vernieri, P., Ferrante, A.(2015): Biostimulants and
crop responses: a review. Biological Agriculture and Horticulture 31, 1–17.
Bošković L. (2010). Influence of biofertilizers on soil microbial activity and plant growth
Camellia sp. and Cupressus macrocarpa Goldcrest. Master's thesis. University
of Montenegro. Faculty of Science. Podgorica.
Govedarica-Lučić et al 78
Chaterjee, B., Ghanti, P., Thapa, U. and Tripathy, P. (2005). Effect of organic nutrition
in sprouting broccoli (Brassica oleracea L. var. italica Plenck). Vegetable
Science 33 (1): pp 51-54.
Chatterjee, R., Bandhopadhyay, S. and Jana, J.C. (2014).Organic amendments
influencing growth, head yield and nitrogen use efficiency in cabbage
(Brassica Oleracea Var.Capitata L.) American International Journal of Research
In Formal, Applied & Natural Sciences 5 (1):90-95
Čabilovski, R., Manojlovic, M., Bogdanovic, D. (2010). Monitoring of mineral nitrogen
dynamics in soil and adoption by lettuce crop after application of organic
fertilizers. Yearbook of scientific papers of the Faculty of Agriculture in Novi
Sad. Year 34, no. 1. 46-52
Dauda, S.N., Ajayi, F.A. and Ndor, E. (2008). Growth and yield of water melon (Citrullus
lanatus) as affected by poultry manure application Journal of Agriculture and
Social Science, 4: 121 - 124
Đordjević, S., Jakovljevic, M., Santric, L. (2004). Effects of bacterialisation of pepper by
the fertilizer "Slavol" in seedling production, Proceedings of the Scientific
Papers, Vol.10, no. 1, 115-120
Đukić D.A., Jemcev V.T., Kuzmanova J. (2007). Soil biotechnology "Future", Novi Sad,
p.529
Govedarica, M., Milosevic, N., Djukic, D.A., Mandic, L.G. (1998). Effect of Azotobacter
chroocroccum and Azospirillum lipoferum strains on sugar beet yield and soil
microbial activity, Actra Agriculturae Serbica, Vol.III, num. 5,pp 29-37.
Gecic, J., Mrkovacki, N., Cacic, N. (2007). Application of different types of sugar beet
inoculation with Azotobacter chroocroccum, Annual of scientific papers,
Volume 31, No. 1, 47-54
Makinde, E.A., Ayoola,O.T. and Akande, M.O. (2007). Effects of organic-mineral
fertilizer application on the growth and yield of “egusi” melon (Citrullus
vulgaris L.). Australian Journal of Basic and applied sciences, 1(1): 15 – 19
Masarirambi, M. T., Hlawe, M. M., Oseni, O. T., Sibiya, T. E. (2010): Effects of organic
fertilizers on growth, yield, quality and sensory evaluation of red lettuce
(Lactuca sativa L.) „Veneza Roxa‟. Agriculture and Biology Journal of North
America 1, 1319–1324.
Ndaeyo, N.U., Ukpong, E.S. and John, N.M. (2005). Performances of okra as affected by
organic and inorganic fertilizers on an ultisol. Proceedings of the 39th
Conference of the Agricultural Society of Nigeria October 9 – 13, p. 206 - 209.
Ogbonna P.E. (2008). Effectof combined application of organic and inorganic fertilizers
on fruit yield of egg plant (Solanum melongena). Pro. 42nd Annual conf.
Agricultural Society of Nigeria (ASN) October 19-23 p. 236-250
Olowoake A.A., Adeoye G.O. (2010). Comparative eficacy of NPK fertilizer and
composted organic residues on growth, nutrient apsorption and dry matter
accumulation in maize. International Journal of Organic Agriculture Research
and Development, vol. 2, pp. 43-53
ParaĎiković, N., Zeljković, S., Đurić. G., Vinković, T., Mustapić-Karlić, J., Kanižai, G.,
Iljkić, D. (2009). Growth and development of velvet (Tagetes erecta L.) under
the influence of substrate volume and biostimulator treatment. In Proceedings of
the 44th Croatian and 4th International Symposium of Agronomists, Lončarić,
Z., Marić, S. (ed.), 786-790, Osijek, Croatia, Faculty of Agriculture in Osijek.
Plakalovic, J. (2018). Influence of agro-technical measures on the vulnerability and yield
of young onions. Master thesis. University of East Sarajevo. Agricultural faculty.
Influence of fertilization on growth and quality of lettuce 79
Premuzic, Z., Garate, A., Bonilla, I. (2001): Yield and quality of greenhouse lettuce as
affected by form of N fertiliser and light supply. In: Horst, W. J., Schenk, M. K.,
Bürkert, A., Claassen, N., Flessa, H., Frommer, W. B., Goldbach, H., Olfs, H.
W.,Römheld, V., Sattelmacher, B., Schmidhalter, U., Schubert, S.,von Wirén,
N., Wittenmayer, L. (eds.), Plant nutrition: food security and sustainability of
agro-ecosystems through basic and applied research, 300–301. Kluwer
Academic Publishers,Springer Netherlands.
Raševic, I. (2017). Effect of increasing doses of nitrogen on the chemical composition of
carrots. Master thesis.Faculty of Agriculture, University of East Sarajevo.
Željković, S., ParaĎiković, N., Vinković, T., Tkalec, M., Maksimović, I., Haramija, J.
(2013). Nutrient status, growth and proline concentration of French marigold
(Tagetes patula L.) as affected by biostimulant treatment. Journal of Food,
Agriculture & EnvironmentJFAE, WFL Publisher, Helsinki, Finland, 11(3&4),
2324-2327

Agriculture & Forestry, Vol. 66 Issue 3: 81-93, 2020, Podgorica 81
Mori, Y., Tanaka, A., Nakagawa, T., Amen, Y., Kuwano, Y., Tanizaki, Y., Tomokiyo, S., Shimizu, K. (2020): Isolation and quantification of the plant growth regulator 1-triacontanol from Moso bamboo (Phyllostachys pubescens) shoot skin and its compost. Agriculture and Forestry, 66 (3): 81-93.
DOI: 10.17707/AgricultForest.66.3.08
Yasuhiro MORI1, Akinobu TANAKA2, Toshinori NAKAGAWA2,3, Yhiya AMEN2,4, Yasumitsu KUWANO1, Yufu TANIZAKI1, Shota TOMOKIYO1, Kuniyoshi SHIMIZU2
ISOLATION AND QUANTIFICATION OF THE PLANT GROWTH
REGULATOR 1-TRIACONTANOL FROM MOSO BAMBOO (Phyllostachys pubescens) SHOOT SKIN AND ITS COMPOST
SUMMARY
To investigate chemical uses of Moso bamboo (Phyllostachys pubescens) shoot skin, we identified the main component of non-polar solvent extracts. To this end, a white precipitate from n-hexane extracts was evaluated using silica-gel column chromatography. The fraction with the highest recovery showed a single spot in silica-gel thin-layer chromatography (TLC) analyses. In subsequent nuclear magnetic resonance (NMR) and electron impact-mass spectrometry (EI-MS) analyses, we identified the compound in the fraction as 1-triacontanol, which is a known regulator of plant growth. In addition, gas chromatography-mass spectrometry (GC-MS) experiments showed 1-triacontanol concentrations of 13.3 and 41.7 ppm in fresh and boiled skins, respectively. In boiled skins, 1-triacontanol concentrations reached a maximum of 71.3 ppm after 2 weeks of composting. Although concentrations gradually decreased thereafter, they remained at 19.7 ppm after compost maturation for 6 months. In a further experiment, seeds of Welsh onion were sown on absorbent cotton impregnated with authentic 1-triacontanol solutions, significant increase in hypocotyl length was observed. Due to the presence of 1-triacontanol, Moso bamboo shoot skin has potential as functional compost that promotes plant growth for agricultural uses.
Keywords: 1-triacontanol, compost, Moso bamboo shoot skin, non-polar solvent extract, Phyllostachys pubescens.
1Yasuhiro Mori, (corresponding author: [email protected]), Department of Biomass Utilization, Institute of Agricultural and Forest Resources, Fukuoka Agriculture and Forestry Research Center, 1438-2, Toyoda Yamamoto-machi, Kurume, Fukuoka 839-0827, JAPAN. 2Division of Sustainable Bioresources Science, Department of Agro-Environmental Sciences, Faculty of Agriculture, Graduate School of Kyushu University, Fukuoka, JAPAN. 3Department of Biological Resources Management, The University of Shiga Prefecture, Hikone, JAPAN. 4Department of Pharmacognosy, Faculty of Pharmacy, Mansoura University, Mansoura, EGYPT. Notes: The authors declare that they have no conflicts of interest. Authorship Form signed online. Received:26/06/2020 Accepted:23/07/2020
Mori et al 82
INTRODUCTION Bamboo shoots are a popular delicacy with a crunchy texture and pleasant
taste, and are known as the King of Forest Vegetables (Chongtham et al., 2011). Annual consumption of bamboo shoots has been maintained at approximately 200,000 t for the past forty years in Japan (Forestry Agency, Ministry of Agriculture, Forestry and Fisheries, Japan, 2020). Moso bamboo (Phyllostachys pubescens) is the highest yield species of bamboo shoots in Japan (Torii and Isagi, 1997). Moso bamboo shoots are mainly available in fresh and canned forms. When harvested during winter (off-season), Moso bamboo shoots are marketed as the fresh form without peeling. Spring (peak season) harvests, however, are often processed by boiling and canning for long term storage. Boiled shoots are generally peeled prior to canning, leading to the accumulation of numerous shoot skins at canning factories during the peak season. Because they generate an unpleasant odor with decay, their disposal demands significant time and cost.
In our previous studies of Moso bamboo shoot skins, components from fresh skins were roughly divided into polar and non-polar compounds by extracting with n-hexane and then extracting the insoluble fractions with methanol and dichloromethane (Tanaka et al., 2011, 2013). We then examined the functions of polar solvent-extracts and isolated the compounds stigmasterol and dihydrobrassicasterol from dichloromethane-soluble fractions of methanol extracts. These compounds had antibacterial activity against Staphylococcus aureus (Tanaka et al., 2011, 2013).
Moreover, in an in vitro immunization system (Iwamoto et al., 2013), these methanol extracts suppressed immunoglobulin E production following stimulation by the cedar pollen antigen (Cry j 1) in human peripheral blood mononuclear cells (Tanaka, 2013). Antioxidant activities of methanol extracts were also described in oxygen radical absorption capacity assays and inhibition of melanin biosynthesis was demonstrated in cultured B-16 melanoma cells (Tanaka, 2013).
These studies collectively indicate that Moso bamboo shoot skins have functional ingredients with promise in cosmetics and other health-related products following extraction with polar solvents, such as methanol. Compounds that were extracted with the non-polar solvent n-hexane had limited antibacterial, antiallergic, antioxidant, and antimelanoma activities (Tanaka, 2013).
In this study, we further investigated functions of non-polar solvent extracts from Moso bamboo shoot skins by isolating major components of n-hexane extracts and identified the plant growth regulator 1-triacontanol (Ries et al., 1977b; Naeem et al., 2012). We also determined 1-triacontanol concentrations in composted boiled (hot water-extracted) shoot skins. Finally, we report the effects of 1-triacontanol treatments on seed germination and hypocotyl lengths of a plant species.

Isolation and quantification of the plant growth regulator 1-triacontanol from Moso… 83
MATERIAL AND METHODS Moso bamboo shoot skin and composting Moso bamboo (P. pubescens) shoots were harvested in Miyako or Yame,
Fukuoka prefecture, Japan, and non-boiled or boiled skins were provided by Life Design Co., Ltd. (Fukuoka, Japan) or Kazue Bussan Inc. (Fukuoka, Japan). Boiled skins (about 1 m3) were composted in a pile on a composting platform at Fukuoka Agriculture and Forestry Research Center. The pile was turned manually every 2 weeks to maintain aerobic conditions and was watered when necessary. Samples were taken before boiling (fresh) and after 0, 1, and 2 weeks, and 2, 3, and 6 months after composting. Samples were roughly crushed into small pieces and were lyophilized after storage at −30°C.
Isolation and identification of the main components in n-hexane extracts
from Moso bamboo shoot skin Non-boiled (fresh) skins of Moso bamboo shoots were dried at room
temperature and were then ground to powder. The powder (17.8 kg) was extracted with 72.5 l of n-hexane for 48 h. The n-hexane solution was then evaporated, yielding 40.1 g (dry weight) of extract. A 39 g sample of the extract was dissolved in 500 ml of n-hexane by sonicating and heating. The resulting solution was stored overnight at −20°C and was then decanted and the precipitated solute was purified to a yellowish crude powder.
The dissolving and decanting process was repeated until the solute was bleached and 5 g of white precipitate was finally obtained. Subsequently, 4 g of crude precipitate was applied to silica-gel column chromatography (column, φ 8.0 × 32.0 cm) with 800 g of Wakogel C-200 and was eluted with 2000 ml of n-hexane:ethyl acetate mixtures at ratios of 10:0, 9:1, 8:2, 7:3, 6:4, 5:5, 2.5:7.5, and 0:10, and then with methanol (2000 ml). For each elution stage, 500 ml fractions were collected, leading to a total of 36 fractions (fl–f36). Fractions were combined to form 12 fractions as follows: F1 (f1–f4, 8.1 mg), F2 (f5–f8, 7.2 mg), F3 (f9–f11, 473.7 mg), F4 (f12–f13, 641.9 mg), F5 (f14–f16, 325.0 mg), F6 (f17–f19, 290.1 mg), F7 (f20–f21, 32.2 mg), F8 (f22–f24, 63.8 mg), F9 (f25–f28, 50.2 mg), F10 (f29–f32, 22.1 mg), F11 (f33–f34, 2.4 mg), and F12 (f35–f36, 106.1 mg). These fractions were analyzed using silica-gel thin-layer chromatography (TLC) on silica-gel 60 F254 plates (Merck Co., Darmstadt, Germany) with n-hexane:ethyl acetate:acetic acid at 9:1:0.1 (F1–F3), 7:3:0.1 (F4–F8), or 6:4:0.1 (F9–F12). Spots were made visible by spraying with 10% sulfuric acid/methanol and then heating on a hot plate to 140°C. Among fractions, F4 was recovered with the highest quantity and contained a pure compound that formed a single spot in TLC analyses.
The chemical structure of the compound was analyzed using nuclear magnetic resonance (NMR) and electron impact-mass spectrometry (EI-MS). 1H and 13C-NMR spectra were generated on a Bruker DRX 400 NMR spectrometer (Bruker Daltonics Inc., MA, USA) using tetramethylsilane (TMS) as an internal standard for chemical shifts. Chemical shifts (δ) were expressed in ppm with
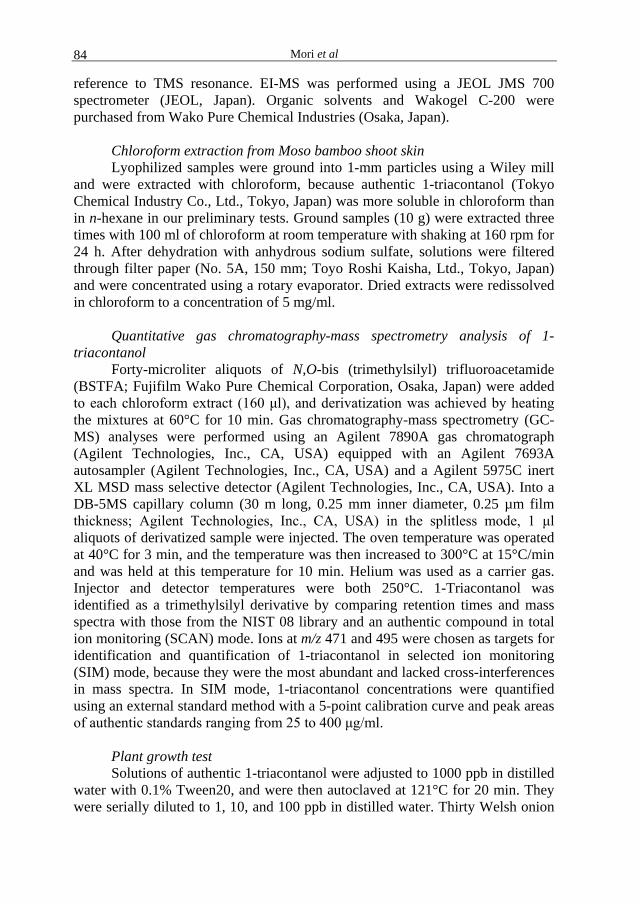
Mori et al 84
reference to TMS resonance. EI-MS was performed using a JEOL JMS 700 spectrometer (JEOL, Japan). Organic solvents and Wakogel C-200 were purchased from Wako Pure Chemical Industries (Osaka, Japan).
Chloroform extraction from Moso bamboo shoot skin Lyophilized samples were ground into 1-mm particles using a Wiley mill
and were extracted with chloroform, because authentic 1-triacontanol (Tokyo Chemical Industry Co., Ltd., Tokyo, Japan) was more soluble in chloroform than in n-hexane in our preliminary tests. Ground samples (10 g) were extracted three times with 100 ml of chloroform at room temperature with shaking at 160 rpm for 24 h. After dehydration with anhydrous sodium sulfate, solutions were filtered through filter paper (No. 5A, 150 mm; Toyo Roshi Kaisha, Ltd., Tokyo, Japan) and were concentrated using a rotary evaporator. Dried extracts were redissolved in chloroform to a concentration of 5 mg/ml.
Quantitative gas chromatography-mass spectrometry analysis of 1-
triacontanol Forty-microliter aliquots of N,O-bis (trimethylsilyl) trifluoroacetamide
(BSTFA; Fujifilm Wako Pure Chemical Corporation, Osaka, Japan) were added to each chloroform extract (160 μl), and derivatization was achieved by heating the mixtures at 60°C for 10 min. Gas chromatography-mass spectrometry (GC-MS) analyses were performed using an Agilent 7890A gas chromatograph (Agilent Technologies, Inc., CA, USA) equipped with an Agilent 7693A autosampler (Agilent Technologies, Inc., CA, USA) and a Agilent 5975C inert XL MSD mass selective detector (Agilent Technologies, Inc., CA, USA). Into a DB-5MS capillary column (30 m long, 0.25 mm inner diameter, 0.25 µm film thickness; Agilent Technologies, Inc., CA, USA) in the splitless mode, 1 μl aliquots of derivatized sample were injected. The oven temperature was operated at 40°C for 3 min, and the temperature was then increased to 300°C at 15°C/min and was held at this temperature for 10 min. Helium was used as a carrier gas. Injector and detector temperatures were both 250°C. 1-Triacontanol was identified as a trimethylsilyl derivative by comparing retention times and mass spectra with those from the NIST 08 library and an authentic compound in total ion monitoring (SCAN) mode. Ions at m/z 471 and 495 were chosen as targets for identification and quantification of 1-triacontanol in selected ion monitoring (SIM) mode, because they were the most abundant and lacked cross-interferences in mass spectra. In SIM mode, 1-triacontanol concentrations were quantified using an external standard method with a 5-point calibration curve and peak areas of authentic standards ranging from 25 to 400 μg/ml.
Plant growth test Solutions of authentic 1-triacontanol were adjusted to 1000 ppb in distilled
water with 0.1% Tween20, and were then autoclaved at 121°C for 20 min. They were serially diluted to 1, 10, and 100 ppb in distilled water. Thirty Welsh onion
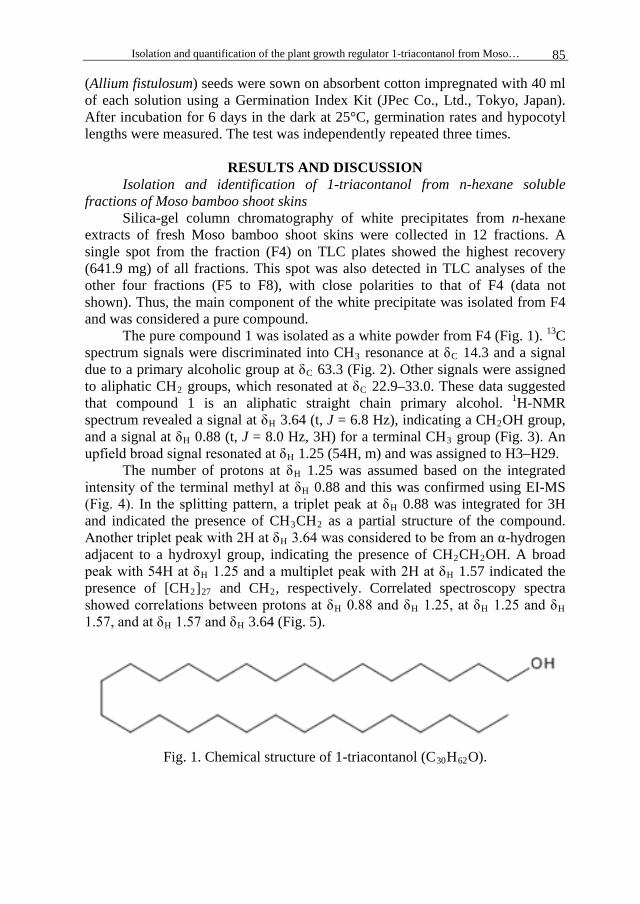
Isolation and quantification of the plant growth regulator 1-triacontanol from Moso… 85
(Allium fistulosum) seeds were sown on absorbent cotton impregnated with 40 ml of each solution using a Germination Index Kit (JPec Co., Ltd., Tokyo, Japan). After incubation for 6 days in the dark at 25°C, germination rates and hypocotyl lengths were measured. The test was independently repeated three times.
RESULTS AND DISCUSSION Isolation and identification of 1-triacontanol from n-hexane soluble
fractions of Moso bamboo shoot skins Silica-gel column chromatography of white precipitates from n-hexane
extracts of fresh Moso bamboo shoot skins were collected in 12 fractions. A single spot from the fraction (F4) on TLC plates showed the highest recovery (641.9 mg) of all fractions. This spot was also detected in TLC analyses of the other four fractions (F5 to F8), with close polarities to that of F4 (data not shown). Thus, the main component of the white precipitate was isolated from F4 and was considered a pure compound.
The pure compound 1 was isolated as a white powder from F4 (Fig. 1). 13C spectrum signals were discriminated into CH3 resonance at δC 14.3 and a signal due to a primary alcoholic group at δC 63.3 (Fig. 2). Other signals were assigned to aliphatic CH2 groups, which resonated at δC 22.9–33.0. These data suggested that compound 1 is an aliphatic straight chain primary alcohol. 1H-NMR spectrum revealed a signal at δH 3.64 (t, J = 6.8 Hz), indicating a CH2OH group, and a signal at δH 0.88 (t, J = 8.0 Hz, 3H) for a terminal CH3 group (Fig. 3). An upfield broad signal resonated at δH 1.25 (54H, m) and was assigned to H3–H29.
The number of protons at δH 1.25 was assumed based on the integrated intensity of the terminal methyl at δH 0.88 and this was confirmed using EI-MS (Fig. 4). In the splitting pattern, a triplet peak at δH 0.88 was integrated for 3H and indicated the presence of CH3CH2 as a partial structure of the compound. Another triplet peak with 2H at δH 3.64 was considered to be from an α-hydrogen adjacent to a hydroxyl group, indicating the presence of CH2CH2OH. A broad peak with 54H at δH 1.25 and a multiplet peak with 2H at δH 1.57 indicated the presence of [CH2]27 and CH2, respectively. Correlated spectroscopy spectra showed correlations between protons at δH 0.88 and δH 1.25, at δH 1.25 and δH 1.57, and at δH 1.57 and δH 3.64 (Fig. 5).
Fig. 1. Chemical structure of 1-triacontanol (C30H62O).
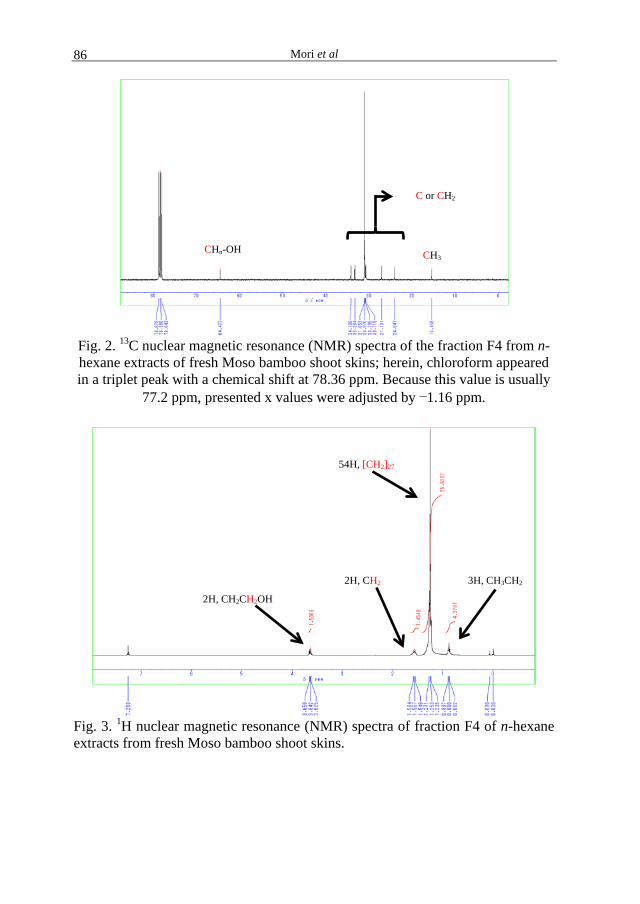
Mori et al 86
Fig. 2. 13C nuclear magnetic resonance (NMR) spectra of the fraction F4 from n-hexane extracts of fresh Moso bamboo shoot skins; herein, chloroform appeared in a triplet peak with a chemical shift at 78.36 ppm. Because this value is usually
77.2 ppm, presented x values were adjusted by −1.16 ppm.
Fig. 3. 1H nuclear magnetic resonance (NMR) spectra of fraction F4 of n-hexane extracts from fresh Moso bamboo shoot skins.
2H, CH2CH2OH
2H, CH2 3H, CH3CH2
54H, [CH2]27
CHn-OH CH3
C or CH2
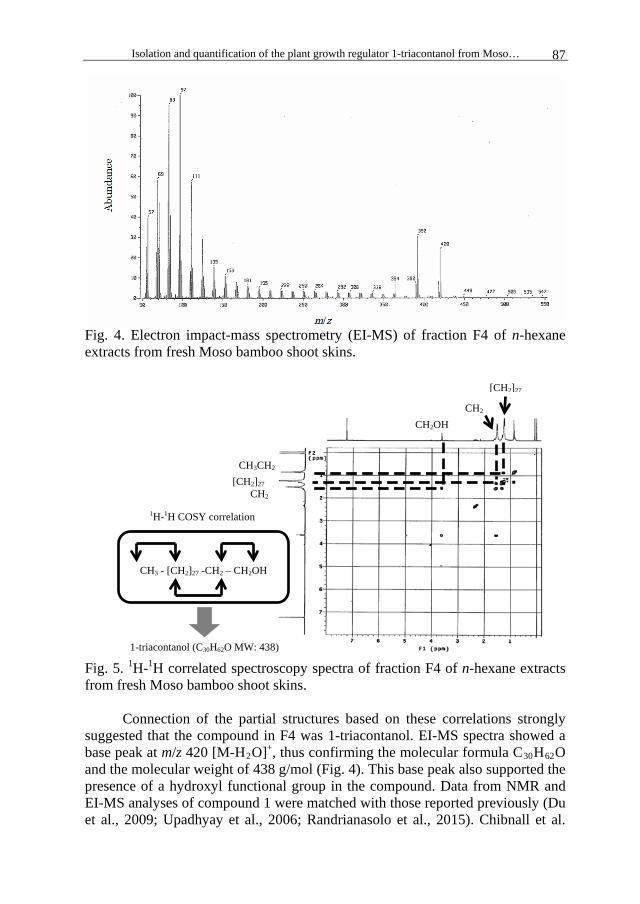
Isolation and quantification of the plant growth regulator 1-triacontanol from Moso… 87
Fig. 4. Electron impact-mass spectrometry (EI-MS) of fraction F4 of n-hexane extracts from fresh Moso bamboo shoot skins.
Fig. 5. 1H-1H correlated spectroscopy spectra of fraction F4 of n-hexane extracts from fresh Moso bamboo shoot skins.
Connection of the partial structures based on these correlations strongly suggested that the compound in F4 was 1-triacontanol. EI-MS spectra showed a base peak at m/z 420 [M-H2O]+, thus confirming the molecular formula C30H62O and the molecular weight of 438 g/mol (Fig. 4). This base peak also supported the presence of a hydroxyl functional group in the compound. Data from NMR and EI-MS analyses of compound 1 were matched with those reported previously (Du et al., 2009; Upadhyay et al., 2006; Randrianasolo et al., 2015). Chibnall et al.
CH3CH2
CH2OH
[CH2]27
CH2
CH3 - [CH2]27 -CH2 – CH2OH
1H-1H COSY correlation
1-triacontanol (C30H62O MW: 438)
[CH2]27 CH2
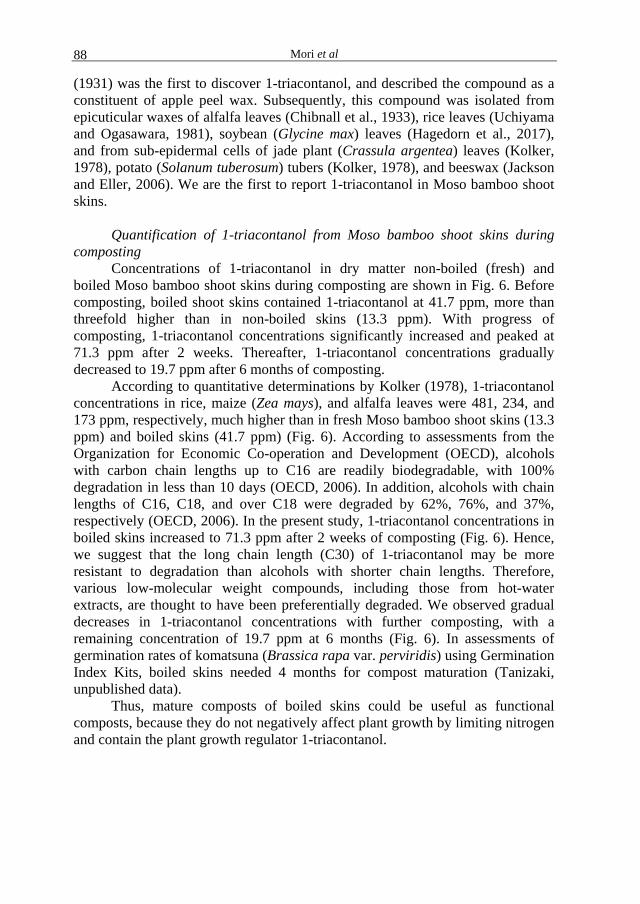
Mori et al 88
(1931) was the first to discover 1-triacontanol, and described the compound as a constituent of apple peel wax. Subsequently, this compound was isolated from epicuticular waxes of alfalfa leaves (Chibnall et al., 1933), rice leaves (Uchiyama and Ogasawara, 1981), soybean (Glycine max) leaves (Hagedorn et al., 2017), and from sub-epidermal cells of jade plant (Crassula argentea) leaves (Kolker, 1978), potato (Solanum tuberosum) tubers (Kolker, 1978), and beeswax (Jackson and Eller, 2006). We are the first to report 1-triacontanol in Moso bamboo shoot skins.
Quantification of 1-triacontanol from Moso bamboo shoot skins during
composting Concentrations of 1-triacontanol in dry matter non-boiled (fresh) and
boiled Moso bamboo shoot skins during composting are shown in Fig. 6. Before composting, boiled shoot skins contained 1-triacontanol at 41.7 ppm, more than threefold higher than in non-boiled skins (13.3 ppm). With progress of composting, 1-triacontanol concentrations significantly increased and peaked at 71.3 ppm after 2 weeks. Thereafter, 1-triacontanol concentrations gradually decreased to 19.7 ppm after 6 months of composting.
According to quantitative determinations by Kolker (1978), 1-triacontanol concentrations in rice, maize (Zea mays), and alfalfa leaves were 481, 234, and 173 ppm, respectively, much higher than in fresh Moso bamboo shoot skins (13.3 ppm) and boiled skins (41.7 ppm) (Fig. 6). According to assessments from the Organization for Economic Co-operation and Development (OECD), alcohols with carbon chain lengths up to C16 are readily biodegradable, with 100% degradation in less than 10 days (OECD, 2006). In addition, alcohols with chain lengths of C16, C18, and over C18 were degraded by 62%, 76%, and 37%, respectively (OECD, 2006). In the present study, 1-triacontanol concentrations in boiled skins increased to 71.3 ppm after 2 weeks of composting (Fig. 6). Hence, we suggest that the long chain length (C30) of 1-triacontanol may be more resistant to degradation than alcohols with shorter chain lengths. Therefore, various low-molecular weight compounds, including those from hot-water extracts, are thought to have been preferentially degraded. We observed gradual decreases in 1-triacontanol concentrations with further composting, with a remaining concentration of 19.7 ppm at 6 months (Fig. 6). In assessments of germination rates of komatsuna (Brassica rapa var. perviridis) using Germination Index Kits, boiled skins needed 4 months for compost maturation (Tanizaki, unpublished data).
Thus, mature composts of boiled skins could be useful as functional composts, because they do not negatively affect plant growth by limiting nitrogen and contain the plant growth regulator 1-triacontanol.

Isolation and quantification of the plant growth regulator 1-triacontanol from Moso… 89
Fig. 6. Concentrations of 1-triacontanol in Moso bamboo shoot skins; bars indicate mean concentrations of 1-triacontanol per dry weight of skins (mean ± SE, n=3). Different lower-case letters indicate significant differences in concentrations (p < 0.05), as indicated by Tukey’s tests.
Effects of 1-triacontanol treatments on plant growth In this study, we monitored germination rate and hypocotyl length of
Welsh onion after treatments with authentic 1-triacontanol solutions (Table 1). Germination rates of Welsh onion were over 90% in all of these treatment conditions except in the presence of 10 ppb 1-triacontanol. Yet hypocotyl lengths of Welsh onions were significantly greater (1.25 times) in 1000 ppb 1-triacontanol solution than in controls. No significant effects of 1-triacontanol treatments on Welsh onions were observed at lower concentrations.
Table 1. Germination rate and hypocotyl length of Welsh onion after
treatment with authentic 1-triacontanol solutions at different concentrations
Different lower-case letters indicate significant differences in germination rates or hypocotyl lengths (p
< 0.05) from Tukey’s tests.
mean SE mean SE
0ppb 96.7 ± 0.0 ab 18.3 ± 1.0 a
1ppb 98.9 ± 1.1 a 20.1 ± 0.9 ab
10ppb 88.9 ± 2.9 b 17.8 ± 1.2 a
100ppb 95.6 ± 2.2 ab 20.3 ± 0.9 ab
1000ppb 98.9 ± 1.1 a 22.9 ± 0.8 b
1-triacontanol concentrationGermination rate (%) Hypocotyl length (mm)
Mori et al 90
1-Triacontanol was originally isolated from chloroform extracts of alfalfa (Medicago sativa) as a plant growth regulator that promoted water uptake and dry weight of rice (Oryza sativa, Ries et al., 1977b). According to a review article (Naeem et al., 2012), 1-triacontanol enhances growth, yield, photosynthesis, and chlorophyll contents of various plant species. When applied to shoots of rice plants, 1-triacontanol rapidly elicited biosynthesis of 9-β-L(+)-adenosine in the roots (Ries, 1991; Naeem et al., 2012) as a probable source, adenosine monophosphate from adenosine diphosphate and adenosine triphosphate (Olsson and Pearson, 1990; Naeem et al., 2012). Subsequently, apoplastic ion concentrations increased in plant tissues (Ries et al., 1993; Naeem et al., 2012). In published suppression subtractive hybridization and Northern blotting analyses, 1-triacontanol upregulated photosynthetic and photorespiratory genes and downregulated abscisic acid and stress- and wound-related genes (Chen et al., 2002). These events are thought to trigger various metabolic activities, including photosynthesis, nutrient uptake, and enzyme activity, likely leading to accelerated plant growth.
In this study, 1-triacontanol significantly promoted hypocotyl lengths of Welsh onion, but did not affect germination at the tested concentrations (Table 1). When micro propagated balm (Melissa officinalis) was planted in medium supplemented with 1-triacontanol at 2–10 ppb, shoot lengths increased significantly (Tantos et al., 1999). Significantly enhanced shoot growth was also observed in herbal plants, including coriander (Coriandrum sativum, Idrees et al., 2010), sweet basil (Ocimum basilicum, Hashmi et al., 2011), and Artemisia annua (Aftab et al., 2010) following treatments with foliar spray containing 1-triacontanol at 439, 4.39, 43.9, and 1.5 ppm, respectively. In another study, seed germination of maize, paddy, and sunflower was significantly promoted by soaking in solution containing 1–10 ppm 1-triacontanol (Niranjana et al., 1999). In contrast, however, germination rates of seeds from 15 species, including soybean, lettuce (Lactuca sativa), and purslane (Portulaca oleracea), were not significantly enhanced when sown on absorbent paper in petri dishes containing 1-triacontanol at 4.39 ppm (Hoagland, 1980).
Thus, the plant growth promotion effect of 1-triacontanol likely depends on concentration, treatment mode, and species. In this study, we demonstrated that boiled skins of Moso bamboo shoot hold sufficient concentrations of 1-triacontanol to promote hypocotyl lengths of Welsh onion even after compost maturation. Further studies are required to determine volumes of Moso bamboo skins that are required to improve soils and promote growth or improve yields of agricultural plants such as Welsh onion.
More evidence is required to confirm that 1-triacontanol was responsible for increased growth of the present plants. Increased yields of vegetable or crop plants following application of boiled Moso bamboo skins will set a precedent, as shown with alfalfa plants (Ries et al., 1977a). Discarded biomass from bamboo shoot production in a village could be converted to local compost contributing to agricultural production within the same village.
Isolation and quantification of the plant growth regulator 1-triacontanol from Moso… 91
CONCLUSIONS We isolated the main component of n-hexane extracts from fresh Moso
bamboo shoot skins using silica-gel column chromatography and identified the plant growth regulator 1-triacontanol in NMR and EI-MS analyses. In our GC-MS analyses, 1-triacontanol concentrations remained 19.7 ppm even after boiled skins were composted for 6 months. Our laboratory experiments show that 1-triacontanol significantly promotes hypocotyl length of germinated Welsh onion. Thus, Moso bamboo shoot skins may provide functional compost that contains a plant growth regulator.
ACKNOWLEDGEMENTS We thank Shojiro Oda (Life Design Co., Ltd., Fukuoka, Japan) and
Takahiro Kazue (Kazue Bussan Inc., Fukuoka, Japan) for providing Moso bamboo shoot skins. The assistance of Akira Shima, Akihiro Tsutsumi, Michiyo Yamamoto, Mayumi Ikeda, Kuniko Okubo, and Yuri Uchida (Institute of Agricultural and Forest Resources, Fukuoka Agriculture and Forestry Research Center) in extracting from Moso bamboo shoot skins is greatly appreciated. We would like to thank Enago (www.enago.jp) for the English language review. Finally, the anonymous reviewers are gratefully acknowledged for valuable comments and suggestions.
REFERENCES Aftab T, Khan MMA, Idrees M, Naeem M, Singh M, and Ram M. 2010.
Stimulation of crop productivity, photosynthesis and artemisinin production in Artemisia annua L. by triacontanol and gibberellic acid application. Journal of Plant Interactions, 5:273–281.
Chen X, Yuan H, Chen R, Zhu L, Du B, Weng Q, and Heet G. 2002. Isolation and characterization of triacontanol-regulated genes in rice (Oryza sativa L.): Possible role of triacontanol as a plant growth stimulator. Plant and Cell Physiology, 43:869–876.
Chibnall AC, Piper SH, Pollard A, Smith JAB, and Williams EF. 1931. The wax constituents of the apple cuticle. Biochem Journal, 25:2095–2110.
Chibnall AC, Williams EF, Latner AL, and Piper SH. 1933. The isolation of n-triacontanol from lucerne wax. Biochem Journal, 27:1885–1888.
Chongtham N, Bisht MS, and Haorongbam S. 2011. Nutritional properties of bamboo shoots: Potential and prospects for utilization as a health food. Comprehensive Reviews in Food Science and Food Safety, 10:153–168.
Du S, Wang M, Zhu W, and Qin Z. 2009. A new fungicidal lactone from Xylocarpus granatum (Meliaceae). Natural Product Research, 23:1316–1321.
Forestry Agency, Ministry of Agriculture, Forestry and Fisheries, Japan 2020. A summary for demand and supply of main non-wood forest products in Japan fiscal year 2018. https://www.e-stat.go.jp/dbview?sid=0001784441. (accessed June 05, 2020) (In Japanese).
Mori et al 92
Hagedorn O, Fleute-Schlachter I, Mainx HG, Zeisler-Diehl V, and Koch K. 2017. Surfactant-induced enhancement of droplet adhesion in superhydrophobic soybean (Glycine max L.) leaves. Beilstein Journal of Nanotechnology, 8:2345–2356.
Hashmi N, Khan MMA, Naeem M, Idrees M, Aftab T, and Moinuddin 2011. Ameliorative effect of triacontanol on the growth, photosynthetic pigments, enzyme activities and active constituents of essential oil of Ocimum basilicum L. Medicinal and Aromatic Plant Science Biotechnology, 5:20–24.
Hoagland RE. 1980 Effects of triacontanol on seed germination and early growth. International Journal of Plant Sciences, 141:53–55.
Idrees M, Khan MMA, Aftab T, and Naeem M. 2010. Synergistic effects of gibberellic acid and triacontanol on growth, physiology, enzyme activities and essential oil content of Coriandrum sativum L. The Asian and Australasian Journal of Plant Science and Biotechnology, 4:24–29.
Iwamoto A, Mitsuda K, Inoue A, Kato T, Inoue Y, and Kawahara H. 2013. Purification and identification of an IgE suppressor from strawberry in an in vitro immunization system. Cytotechnology, 64:309–314.
Jackson MA, Eller FJ. 2006. Isolation of long-chain aliphatic alcohols from beeswax using lipase-catalyzed methanolysis in supercritical carbon dioxide. The Journal of Supercritical Fluids, 37:173–177.
Kolker LS. 1978. Analytical procedures for 1-triacontanol and its presence in plants and the environment. Dissertation, Michigan State University
Naeem M, Khan MMA, and Moinuddin 2012. Triacontanol: a potent plant growth regulator in agriculture. Journal of Plant Interactions,7:129–142.
Niranjana SR, Pandit A, Prakash HS, and Shetty HS. 1999. Effect of triacontanol on seed quality of maize, paddy and sunflower. Seed Science and Technology, 27: 1007–1013.
Olsson RA, Pearson JD. 1990. Cardiovascular purinoceptors. Physiological Reviews, 70:761–845.
Organization for Economic Co-operation and Development (OECD) 2006. Long chain alcohols (C6-22 primary aliphatic alcohols). SIDS (Screening Information Data Set) initial assessment report for SIAM (SIDS Initial Assessment Meeting) 22. Paris, France. 18–21 April.
Randrianasolo R, Krebs HC, Rakotoarimanga JV, Raharisolololao A, and Rakotondramanga M. 2015. Secondary metabolites of Phellolophium madagascariensis. Journal of Pharmacognosy and Phytochemistry, 4:55–56.
Ries SK, Bittenbender H, Hangarter R, Kolker L, Morris G, and Wert V. 1977a. Improved growth and yield of crops from organic supplements. In: Lockeretz W (ed) Agriculture and Energy. Academic Press, New York, pp 377–384.
Ries SK, Wert V, Sweeley CC, and Leavitt RA. 1977b. Triacontanol: A new naturally occurring plant growth regulator. Science, 195:1339–1341.
Isolation and quantification of the plant growth regulator 1-triacontanol from Moso… 93
Ries SK. 1991. Triacontanol and its second messenger 9-β-L(+)- adenosine as plant growth substances. Plant Physiology, 95:986–989.
Ries S, SavithiryS, Wert V, and Widders I. 1993. Rapid induction of ion pulses in tomato, cucumber, and maize plants following a foliar application of L(+)-adenosine. Plant Physiology, 101:49–55.
Tanaka A, Kim HJ, Oda S, Shimizu K, and Kondo R. 2011. Antibacterial activity of moso bamboo shoot skin (Phyllostachys pubescens) against Staphylococcus aureus. Journal of Wood Science, 57:544–542.
Tanaka A. 2013. A search of bioactive substances from Moso bamboo. Master thesis, Kyushu University (in Japanese).
Tanaka A, Shimizu K, and Kondo R. 2013. Antibacterial compounds from shoot skins of moso bamboo (Phyllostachys pubescens). Journal of Wood Science, 59:155–159.
Tantos Á, Mészáros A, Kissimon J, Horváth G, and Farkas T. 1999. The effect of triacontanol on micropropagation of balm, Melissa officinalis L. Plant Cell Reports, 19:88–91.
Torii A, Isagi Y. 1997. Range expansion of bamboo species in southern areas of Kyoto prefecture, Japan. Japanese Journal of Ecology, 47:31–41. (in Japanese with English abstract)
Uchiyama T, Ogasawara N. 1981. Constituents of plant leaf waxes contained in rice callus tissues. Agricultural and Biological Chemistry, 45:1261–1263.
Upadhyay RK, Rohatgi L, Chaubey,MK, and Jain SC. 2006. Ovipositional responses of the pulse beetle, Bruchus chinensis (Coleoptera: Bruchidae) to extracts and compounds of Capparis decidua. Journal of Agricultural and Food Chemistry, 54:9747–9751.


Agriculture & Forestry, Vol. 66 Issue 3: 95-104, 2020, Podgorica 95
Vajkić, M., Vrnješ, B., Stojiljković, E., Đapan, M. (2020): Occupational injury analysis in the forestry of the
Republic of Srpska-Bosnia and Herzegovina. Agriculture and Forestry, 66 (3): 95-104
DOI: 10.17707/AgricultForest.66.3.09
Mile VAJKIĆ1, Biljana VRANJEŠ
2,
Evica STOJILJKOVIĆ3, Marko ĐAPAN
4
OCCUPATIONAL INJURY ANALYSIS IN THE FORESTRY OF THE
REPUBLIC OF SRPSKA-BOSNIA AND HERZEGOVINA
SUMMARY
Forestry in the Republic of Srpska (BIH) is an important branch in
industry, with the majority of activities in the field of forestry being conducted by
the Public Forest Enterprise "Forests of the Republic of Srpska". From the aspect
of occupational safety and health, forestry is a high-risk economic activity in
which a large number of occupational injuries occur, often with fatalities. The
basic task of occupational safety and health is to provide the best working
conditions for all employees by designing occupational safety measures. To fulfil
this task, the occupational injury analysis provides the opportunity to properly
select preventive measures of protection and indicates the importance and
magnitude of the problems related to occupational safety in the organization.
Also, the analysis of certain etiological specificities of injury enables more
accurate actions within the organization, with the aim of defining instructions for
improving the risk management process in the organization. In this paper,
occupational injury analysis in forestry was carried out in for the period 2011-
2019., and obtained research results shows that 76% of injuries occur during
woodcutting, and that about 60% of those injuries are related to the occupation of
a cutter. Also, research see that the cause of injuries in 49% is the worker’s
negligence.
Keywords: forestry, occupational injury, risk management, occupational
safety and health.
INTRODUCTION
Forestry, due to a large number of potential hazards and harms to the health
and safety of workers, as well as the probability of accidents, is a challenge for
occupational safety and health engineers to prevent occupational injuries and
occupational deceases. Forest work is considered to be one of the most dangerous
1Mile Vajkić, (corresponding author: [email protected]), High School of mechanical
engineering, Prijedor, Republika Srpska, BOSNIA AND HERZEGOVINA. 2Biljana Vranješ, University of Banja Luka, Faculty of Mechanical engineering, Banja Luka,
Republika Srpska, BOSNIA AND HERZEGOVINA. 3Evica Stoiljković, University of Niš, Faculty of Occupational Safety, Niš, SERBIA. 4Marko Đapan, University of Kragujevac, Faculty of Engineering, Kragujevac, SERBIA.
Notes: The authors declare that they have no conflicts of interest. Authorship Form signed online.
Received:04/05/2020 Accepted:05/08/2020
Vajkić et al 96
occupations in the world (Lilley et al., 2002; Klun and Medved, 2007). Forest
workers can still be found not wearing the compulsory safety equipment and
ignoring safety rules and thus, accident rates are fairly high. Neither do most
forest workers use personal protective equipment, although it is recommended in
order to avoid serious and fatal accidents (Yoshimura and Acar, 2004).
Application of safety equipment, such as safety trousers, decreases the number of
accidents with chain saw, but on the other hand it in-creases the number of
injuries of other unprotected body parts (Sullman et al. 1999). Europe-wide, the
number of fatal occupational accidents in the agricultural, hunting and forestry
sectors is higher than in any other (Kogler et al., 2015).An occupational injury is
a change occurred in the work environment affecting one’s integrity (physical,
psychological and social), it occurred as a consequence of the sudden and
immediate inconsistency between the behaviour of the person in the performance
of work activity and the elements of the work environment (Krstić I., Anđelković
B., 2013). Felling, cross-cutting, extraction and skidding operations are the most
common operations that result in fatal forestry accidents. Each of the harvesting
methods also has its specific features that depend on natural and production
conditions, the technology used, and the share of manual operations in the overall
process (Gerasimov and Sokolov, 2014). Exposure to the harms, which are
largely present in the forestry, causes the onset of occupational diseases.
Occupational diseases are those diseases which are caused by harms at the
workplace that are caused by the longer direct influence of the work process and
workplace conditions (Krstić I., Anđelković B., 2013). The large number of
injuries which often have a fatal outcome, as well as the occurrence of
occupational diseases due to exposure to numerous harms, classify forestry as a
high-risk industry. In the world, the number of occupational injuries in forestry
exceeds 170 000 per year, while the number of fatal injuries ranges from 80 to
100 (Garland, J. J., 2018). Taking into account the facts, experiences and
previous research in the field of occupational safety in forestry and collected data
on accidents in The Public Forestry Enterprise "Forests of the Republic of
Srpska", we decided to conduct this study to indicate the most important factors
of accidents in forest operations. The aim of this analysis is to present the most
common causes and sources of injuries at work in forestry in the Republic of
Srpska (BIH) and to indicate the jobs where injuries most often occur. The results
of this analysis contribute to a better organization of safety at work in forestry
and enable more precise action in order to reduce risks in the workplace.
MATERIAL AND METHODS Occupational injury analysis in forestry was carried out in The Public
Forestry Enterprise "Forests of Republic of Srpska" for the period 2011-2019.
The analysis was conducted on the basis of data obtained by the occupational
safety service in The Public Forestry Company "Forests of Republika Srpska".
Any injury (minor, severe, or fatal) in forest operations is recorded using special
documents (report of injury). Report of injury contains information on the age
Occupational injury analysis in the forestry of the Republic of Srpska-B&H 97
and qualification of the person involved in the accident, time and place of the
accident, activities and phase of work at the time of the accident, form and
distribution of injuries, severity of the accident, source and cause of the injury.
In the period 2011-2019, this company managed 77% of forest resources in
Republika Srpska (BIH) and employs an average of 4,500 workers. The main
harvesting technology was motor-manual processing with a chainsaw. In addition
to felling and pruning wood, actions were carried out in order to protect forests,
maintain roads and watercourses and afforestation. Tractors, loading machinery
and trucks were used for transport. An injury risk assessment was performed for
all workplaces and all forest workers had standard protective equipment. In this
paper for the period 2011-2019. the following analyzes were performed:
- injuries by type of employment,
- injuries by gender of the injured worker,
- injuries by educational degree of the injured,
- injuries by the place of occurrence of the injury,
- injuries by the season when they occurred,
- injuries by the day of the week in which the injury occurred,
- injuries according to the job classification,
- sources and causes of occupational injuries.
RESULTS AND DISCUSSION
Fatal accident statistics are generally the most accurate of all accident
statistics in that they are not reported by the injured person and must be published
in official records (Thelin, 2002; Lindroos and Burstrom, 2010). According to
occupational accident reports gathered from a number of selected International
Labour Office member states, the average estimated fatal occupational accident
frequency rate in forestry, logging and related services was 14/100,000 workers.
(Enez et al.,2014). The EU collects data on occupational injuries from the
Member States. It is considered that the number of occupational injuries with
fatal outcome is reliable, although there are also different ways of statistical
observation.
In the legislation of the Republic of Srpska (BIH), categorization of
injuries by severity is: light, serious and fatal injuries. In the analyzed period
(2011-2019), the RS forestry recorded 1265 minor injuries, 96 serious injuries
and 8 fatal injuries. The smallest number of injuries was 133 in 2011, and the
highest of 171 injuries at work was in 2017. For the period 2011-2019, the annual
average number of injuries at work in RS is 1236, therefore occupational injuries
in forestry with an average annual number of 152 make up 12% of total injuries
in the Republic of Srpska. Figure 1. shows the number of injuries, classified by
severity, in the Republic of Srpska forestry.
From Figure 1 we can conclude that in the Republic of Srpska forestry,
there is a trend of the increase in the total number of injuries at work, while in the
case of fatal injuries there is a trend of slight downward, Figure 1.
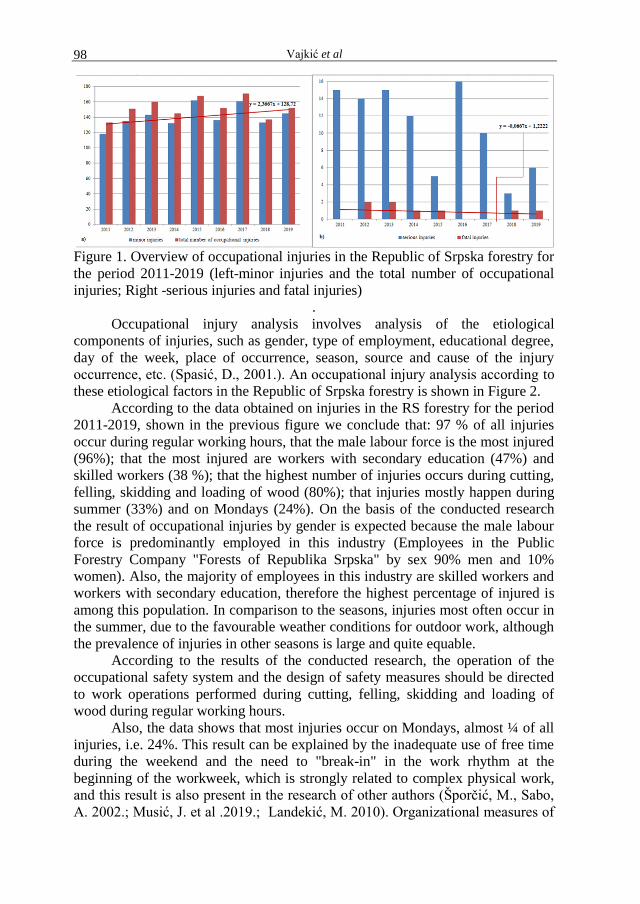
Vajkić et al 98
Figure 1. Overview of occupational injuries in the Republic of Srpska forestry for
the period 2011-2019 (left-minor injuries and the total number of occupational
injuries; Right -serious injuries and fatal injuries)
.
Occupational injury analysis involves analysis of the etiological
components of injuries, such as gender, type of employment, educational degree,
day of the week, place of occurrence, season, source and cause of the injury
occurrence, etc. (Spasić, D., 2001.). An occupational injury analysis according to
these etiological factors in the Republic of Srpska forestry is shown in Figure 2.
According to the data obtained on injuries in the RS forestry for the period
2011-2019, shown in the previous figure we conclude that: 97 % of all injuries
occur during regular working hours, that the male labour force is the most injured
(96%); that the most injured are workers with secondary education (47%) and
skilled workers (38 %); that the highest number of injuries occurs during cutting,
felling, skidding and loading of wood (80%); that injuries mostly happen during
summer (33%) and on Mondays (24%). On the basis of the conducted research
the result of occupational injuries by gender is expected because the male labour
force is predominantly employed in this industry (Employees in the Public
Forestry Company "Forests of Republika Srpska" by sex 90% men and 10%
women). Also, the majority of employees in this industry are skilled workers and
workers with secondary education, therefore the highest percentage of injured is
among this population. In comparison to the seasons, injuries most often occur in
the summer, due to the favourable weather conditions for outdoor work, although
the prevalence of injuries in other seasons is large and quite equable.
According to the results of the conducted research, the operation of the
occupational safety system and the design of safety measures should be directed
to work operations performed during cutting, felling, skidding and loading of
wood during regular working hours.
Also, the data shows that most injuries occur on Mondays, almost ¼ of all
injuries, i.e. 24%. This result can be explained by the inadequate use of free time
during the weekend and the need to "break-in" in the work rhythm at the
beginning of the workweek, which is strongly related to complex physical work,
and this result is also present in the research of other authors (Šporčić, M., Sabo,
A. 2002.; Musić, J. et al .2019.; Landekić, M. 2010). Organizational measures of
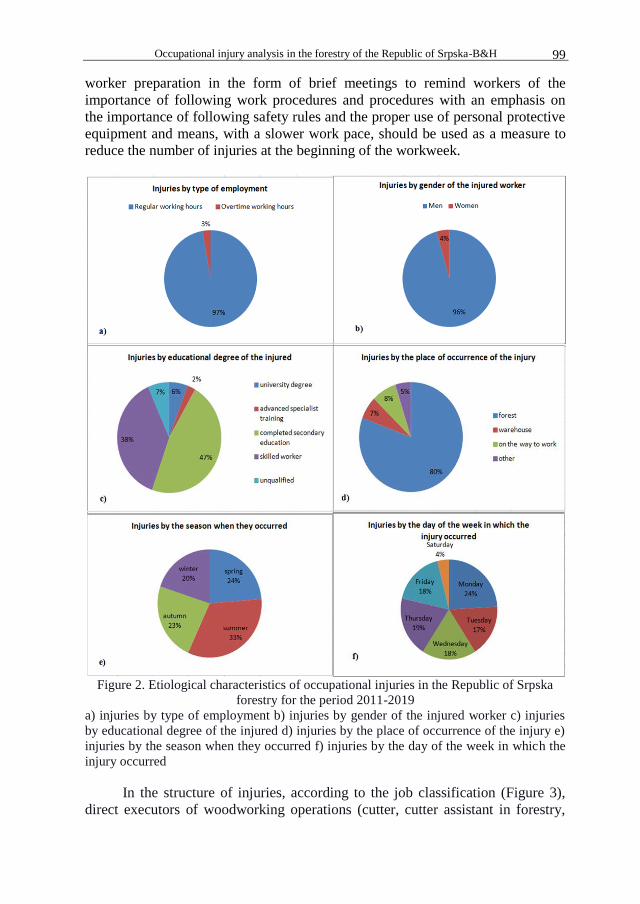
Occupational injury analysis in the forestry of the Republic of Srpska-B&H 99
worker preparation in the form of brief meetings to remind workers of the
importance of following work procedures and procedures with an emphasis on
the importance of following safety rules and the proper use of personal protective
equipment and means, with a slower work pace, should be used as a measure to
reduce the number of injuries at the beginning of the workweek.
Figure 2. Etiological characteristics of occupational injuries in the Republic of Srpska
forestry for the period 2011-2019
a) injuries by type of employment b) injuries by gender of the injured worker c) injuries
by educational degree of the injured d) injuries by the place of occurrence of the injury e)
injuries by the season when they occurred f) injuries by the day of the week in which the
injury occurred
In the structure of injuries, according to the job classification (Figure 3),
direct executors of woodworking operations (cutter, cutter assistant in forestry,
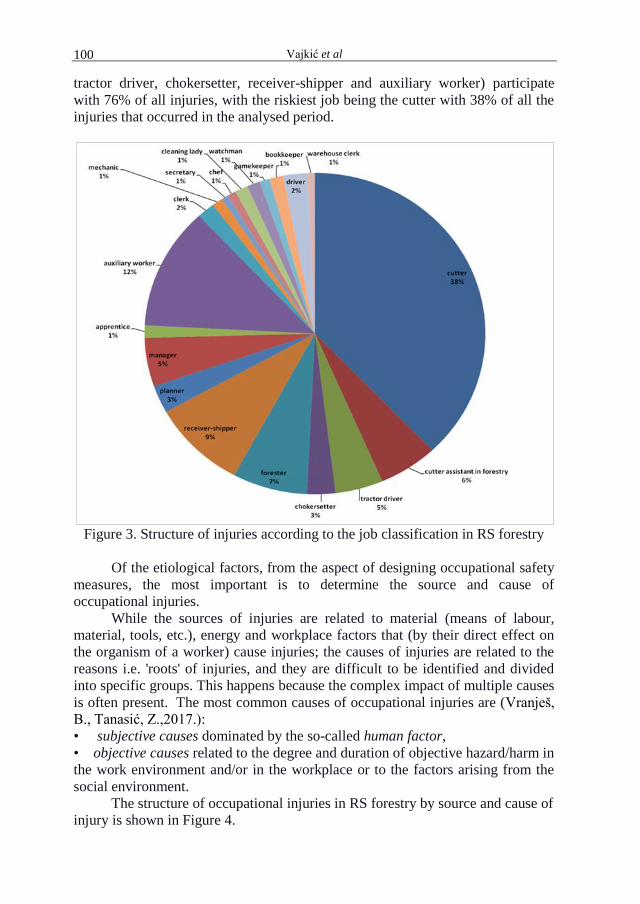
Vajkić et al 100
tractor driver, chokersetter, receiver-shipper and auxiliary worker) participate
with 76% of all injuries, with the riskiest job being the cutter with 38% of all the
injuries that occurred in the analysed period.
Figure 3. Structure of injuries according to the job classification in RS forestry
Of the etiological factors, from the aspect of designing occupational safety
measures, the most important is to determine the source and cause of
occupational injuries.
While the sources of injuries are related to material (means of labour,
material, tools, etc.), energy and workplace factors that (by their direct effect on
the organism of a worker) cause injuries; the causes of injuries are related to the
reasons i.e. 'roots' of injuries, and they are difficult to be identified and divided
into specific groups. This happens because the complex impact of multiple causes
is often present. The most common causes of occupational injuries are (Vranješ,
B., Tanasić, Z.,2017.):
• subjective causes dominated by the so-called human factor,
• objective causes related to the degree and duration of objective hazard/harm in
the work environment and/or in the workplace or to the factors arising from the
social environment.
The structure of occupational injuries in RS forestry by source and cause of
injury is shown in Figure 4.

Occupational injury analysis in the forestry of the Republic of Srpska-B&H 101
Based on the results of the research, we can conclude that in 1/3 of all
injuries the source of the injury is the object of work-tree, and in more than 50%
the sources are the object and means of work. Also, the source of injury in 19%
of cases is the substrate, so more attention should be paid to the selection and
purchase of adequate work shoes adapted to field working conditions.
The largest number of fatal injuries occurs in tree felling. Tree felling
should be carried out professionally following the safety measures for all workers
in the forest. All workers who conduct tree felling should be at an adequate
distance and out of the area of risk of a falling tree.
Injuries at work mostly occur when:
• the tree falls in the wrong direction;
• the constitution of the tree causes change in the direction of the fall;
• a falling tree knocks down other trees or knocks down branches from
other trees;
• there are broken branches on the felling tree, which fall off during felling
and pose a threat to the worker.
Figure 4. Sources and causes of occupational injuries in the Republic of Srpska
forestry for the period 2011-2019.
While working in the forest, very dangerous operations are clearing broken
trees, windthrow, damage caused by snow or sanation of the fire because of the
unnatural position of trees etc. Applying technical measures for the protection of
work means, safety procedures and rules for conducting work operations and
training measures for workers are a good way of reducing the impact of these
sources.
Theoretical sources and research data of other authors (Šporčić, M., Sabo,
A. 2002). State that the most common cause of all occupational injuries is a
person i.e. human error. Human error is a failure to perform a specific task, which
may result in interruption of planned operations, damaging the equipment and
property.

Vajkić et al 102
Figure 5. Pareto diagram
This error can occur due to numerous reasons: lack of precision, improper
handling, lapses in recognition, cognitive and memory lapses, lapses in attention
(fatigue, lack of alertness), etc. So, these are unwanted actions or activities that
result in deviations from expected standard behaviours or norms, with people,
equipment and system at risk (Stojiljković, E. 2020). The following figure shows
the causes of occupational injuries in the Republic of Srpska forestry for the
period 2011-2019 using the Pareto diagram. Based on the data obtained, we can
conclude that negligence, not following safety rules, underestimation of danger,
not using or misusing of personal protective equipment, etc. are the most
common causes of injuries at work in forestry (e.g. in 49% of cases the cause of
occupational injuries is workers’ negligence). Also, according to the results
obtained, we can clearly and accurately define measures of occupational safety
and health at work, i.e. in what direction should we act in order to continuously
reduce the risk in the workplace.
The cumulative curve of the Pareto diagram (Fig. 5) leads to the conclusion
that in the system of occupational safety and health at work in forestry new forms
of training and continuous education of employees for safe and healthy work and
reduction of human errors should be defined, with emphasize on the significance
and importance of following occupational safety measures. Considering that in
11% of all injuries that occurred the causes are the means of work, we can
conclude that even technical measures for protection at work in forestry are not at
an enviable level. Proper use of work means, regular inspection and maintenance
of it, use of safety devices on work means, adequate use and maintenance of
means and personal protective equipment etc. are some of the measures that can
reduce the risk of injury at work in Republic of Srpska (BIH) forestry.
Conducting the research we found no data on occupational disease cases in
this economic industry.
Occupational injury analysis in the forestry of the Republic of Srpska-B&H 103
CONCLUSIONS
Every occupational injury causes minor or major disruption to the work
processes in every industry, including forestry. For this reason and due to the fact
that only a healthy, satisfied and motivated employee can express his full work
potential, special attention should be paid to occupational injury analysis in every
working organization.
Etiological analysis of occupational injuries in RS-BIH forestry for the
period 2011-2019 shows that 76% of injuries occur during woodcutting, and that
about 60% of those injuries are related to the occupation of a cutter. Also, we can
see that the cause of injuries in 49% is the worker’s negligence. In order to reduce
the overall risk in the workplace of the company "Forests of the Republic of
Srpska", it is necessary to act specifically in the area of cutting wood. It is
imposed that the basic guideline for risk reduction is continuous education on
safety and health at work, as well as an urgent modernization of the cutting
process, that is, the automation of a cutter and auxiliary worker workplaces. By
reducing the proportion of manual labour and increasing awareness about
occupational safety and health, there would be a clear reduction in the number of
occupational injuries. In forestry, an economic industry where workers are
exposed to numerous dangers, lack of data about occupational diseases (from the
aspect of occupational safety and health), is not acceptable.
Even if the occupational injury analysis shows that the by-laws do not
directly affect the number and cause of injuries, it would be good to better define
the measures of occupational safety and health in forestry. Also, outdated by-laws
should be harmonized with other RS-BIH legislation and with modern guidelines
on safety and health at work. More detailed regulation of safety and health at
work of forestry workers would enable better and safer work in the field of
forestry.
REFERENCES
Enez, K., Topbas, M., Acar, H.H., 2014. An evaluation of the occupational
accidents among logging workers within the boundaries of Trabzon
Forestry Directorate, Turkey. Int. J. Ind. Ergon. 44, 621–628.
Evropska komisija (2015). Zaštita zdravlja i sigurnosti radnika u poljoprivredi,
stočarstvu,hortikulturi i šumarstvu. Luxembourg: Ured za publikacije
Europske unije
Garland, J. J. (2018). Accident reporting and analysis in forestry: guidance on
increasing the safety of forest work. In: Proceedings of the Forest
Engineering Conference, vol. 17. Rotorua, New Zealand,.
Gerasimov, Y., Sokolov, A., 2014. Ergonomic evaluation and comparison of
wood harvesting systems in Northwest Russia. Appl. Ergon. 45, 318–338.
ILO (1998). Safety and healthin forestry work. Geneva: International Labour
Office.
Klun, J., Medved, M., 2007. Fatal accidents in forestry in some European
countries. Croatian J. For. Eng. 28, 55–63.
Vajkić et al 104
Kogler, R., Quendler, E., Boxberger, J., 2015. Analysis of occupational accidents
with agricultural machinery in the period 2008–2010 in Austria. Saf. Sci.
72, 319–328.
Krstić I., Anđelković B. (2013). Profesionalni rizik. Niš: Univerzitet u Nišu,
Fakultet zaštite na radu u Nišu.
Landekić, M. (2010). Organizacijska kultura i sigurnost pri radu u Hrvatskom
šumarskom sektoru, Šumarski list br. 11–12, CXXXIV (2010), str. 613-622
Lilley, R., Feyer, A.M., Kirk, P., Gander, P., 2002. A survey of forest workers in
New Zealand – Do hours of work, rest, and recovery play a role in
accidents and injury? J. Saf. Res. 33, 53–71.
Lindroos, O., Burstrom, L., 2010. Accident rates and types among self-employed
private forest owners. Accid. Anal. Prev. 42, 1729–1735.
Milijić, V. (2013). Zaštita na radu u šumi. Majdanpek: Resurs centar Majdanpek
Musić, J., Halilović, V., Lojo, A., Šporčić, M., Đonlagić, A. (2019). Analiza
sigurnosti pri radu u šumarstvu Federacije BiH studija slučaja. Nova
mehanizacija šumarstva: časopis za teoriju i praksu šumarskoga
inženjerstva, 40 (2019), Zagreb, https://doi.org/10.5552/nms.2019.4
Spasić, D .(2001). Ekonomika zaštite na radu. Niš: Grafičko preduzeće SVEN.
Stojiljković, E. (2020). Procena ljudske pouzdanosti. Monografija nacionalnog
značaja. Niš: Univerzitet u Nišu, Fakultet zaštite na radu u Nišu.
Sullman M. J. M, P M. Kirk, R. Parker, J. E. Gaskin . 1999 , New Zealand
Logging Industry Accident Reporting Scheme: Focus for a Human Factors
Research Programme
Šporčić, M., Sabo, A. (2002). Ozlijeđivanje radnika u hrvatskom šumarstvu
tijekom razdoblja 1991-2000, Šumarski list br. 5–6, CXXVI (2002), str.
261-271
Thelin, A., 2002. Fatal accidents in Swedish farming and forestry, 1988–1997.
Saf. Sci. 40, 501–517.
Vranješ, B., Tanasić, Z. (2017). The application of the Ishikawa method for
determining the cause of accidents at work, 13th International Conference
on Accomplishments in Mechanical and Industrial Engineering DEMI
2017, Banja Luka 26th - 27
th May
2017, pp. 827-834.
Yoshimura, T., Acar, H.H., 2004. Occupational safety and health conditions of
forestry workers in Turkey. J. For. Res. 9, 225–232.
Agriculture & Forestry, Vol. 66 Issue 3: 105-126, 2020, Podgorica 105
Savosko, V., Tovstolyak, N., Lykholat, Y., Grygoryuk, I. (2020): Structure and diversity of urban park stands at
Kryvyi Rih ore-mining & metallurgical district, central Ukraine. Agriculture and Forestry, 66 (3): 105-126.
DOI: 10.17707/AgricultForest.66.3.10
Vasyl SAVOSKO, Natalia TOVSTOLYAK,
Yuryi LYKHOLAT, Ivan GRYGORYUK 1
STRUCTURE AND DIVERSITY OF URBAN PARK STANDS AT
KRYVYI RIH ORE-MINING & METALLURGICAL DISTRICT,
CENTRAL UKRAINE
SUMMARY
The present study examines the relationships between structure (floristic
composition, dendrometric parameters), diversity (diversity and evenness
indexes) of urban forest park stands and the ecological (soil fertility, soil
moisture), environmental factors (air pollution). The study is based on the forest
park stands inventory data, performed from 2012 to 2017 in Kryvyi Rih City,
Central Ukraine. The floristic compositions of the urban forest park stands are
poor. There are only 23 species that belong to 14 families and 12 genera. More
families were represented by at least more than 2% of taxon diversity. While
Ulmaceae (2 genera, 4 species–17,39 %), Fabaceae (3 genera, 2 species–17,39
%), Aсеrасеае (1 genera, 4 species–17,39 %) were the most representative
families. It was established that at forest park the values of stand density varied
from 490 to 660 trees*ha-1
, stem heights were from 26 to 31 m, stem diameters
were from 13 to 17 cm, stand basal area were from 32 to 49 m2*ha
-1, stand
volume were from 200 to 415 m3*ha
-1. the values of relative stem heights were
from 0,63 to 0,82 m*year-1
, relative stem diameters were from 0,31 to 0,43
cm*year-1
, relative stand basal area were from 0,80 to 1,19 m2*ha
-1*year
-1,
relative stand volume were from 5,45 to 10,28 m3*ha
-1*year
-1. The varied values
of the forest park stands index (Shannon-Wiener diversity index from 0,75 to
1,61, Pielou‟s evenness index from 0,53 to 0,86, Simpson‟s diversity from 0,24 to
0,60, Margalef‟s diversity index from 0,87 to 6,97) indicate the ecological
instability of these woody plant communities. Current state of the urban forest
park stands determined by the combined influence of ecological (soil fertility, soil
moisture) and environmental factors (air pollution).
Keywords: Floristic Composition, Dendrometric Parameters, Stand Basal
Area, Stand Volume, Diversity and Evenness Index.
1Vasyl Savosko (corresponding author: [email protected]), Natalia Tovstolyak, Kryvyi Rih
State Pedagogical University, Kryvyi Rih, UKRAINE; Yuryi Lykholat, Oles Honchar Dnipro
National University, Dnipro, UKRAINE; Ivan Grygoryuk, National University of Life and
Environmental Sciences of Ukraine, Kyiv, UKRAINE
Notes: The authors declare that they have no conflicts of interest. Authorship Form signed online.
Received:25/02/2020 Accepted:20/07/2020
Savosko et al 106
INTRODUCTION
Unfortunately, exploding human populations, 6 billion people are
degrading the environment at an accelerating rate, especially in developing and
undeveloped countries (Janhäll, 2015; Kim, 2016; Verma and Raghubanshi,
2018). Besides, anthropogenic activities have triggered unprecedented
environmental changes on a global and on a local scale. Especially anthropogenic
activities strictly available in metallurgical and mining areas (Carvalho, 2017;
Urošević et al 2018) such as Kryvyi Rih basin (Bielyk et al 2020; Savosko et al.,
2019a; Savosko et al., 2020).
It should also be noted that, due to increasing congested cities all over the
world, people‟s well-being and people‟s health are at stake. That's why, over the
past few decades, there have been intensive efforts to “green cities”, reflected in a
surge of interest in innovations such as “green walls” (Janhäll S., 2015; Nowak et
al, 2018; Rode et al, 2016). Therefore, it is so important to ensure the sustainable
existence of the urban forest park stands.
As known urban forest park stands have a great importance in terms of
nature and landscape protection. They represent a natural habitat for a wide range
of other organisms, serve public welfare, and contribute to popularization,
planting and maintenance of plants. Besides, they play an important role in
improving various environmental factors in urban areas, such as: temperature,
humidity, and dust/pollution content. They also provide sustainable development
of the city, either through local climate regulation, carbon sequestration or
reduction of stormwater runoff (Anguluri and Narayana, 2017; Rode et al, 2016).
Generally, urban forest park stands which are integral to human health represent a
complex and necessary feature of the urban landscape, as well as areas provide
ecosystem services.
In recent decades, ecosystem services is widely used among scientists and
policy makers to highlight the importance of the environment in sustaining
human livelihoods in industrial areas (Olander et al, 2018; Rode et al, 2016),
especially in metallurgical and mining basins such as Kryvyi Rih City, Central
Ukraine (Savosko and Tovstolyak, 2017; Savosko et al, 2019a).
Ecosystem services are generally defined as goods and services that are of
value to people, provided wholly or in part by ecosystems services including and
urban forest park stands (Lykholat et al, 2016a; Song et al 2018). These three
attributes are as well defining ecosystems services of the urban forest park stands:
1) floristic composition, 2) dendrometric characteristics, 3) diversity and
evenness indices (Booth 2018; Ebrahimigajoti et al, 2013; Kolbe et al, 2016;
Lykholat et al, 2016b; Liquete et al 2016). Floral composition is the oldest and
most common way of assessing the structure of the forest stands. The
dendrometric characteristics of trees at stands are usually evaluated using a set of
variables such as diameter at breast height, tree height, crown projection area,
crown length and height of the crown base. Species and biological diversity have
always been some of the most frequently used evaluation measures for forest
Structure and diversity of urban park stands at Kryvyi Rih ore-mining & metallurgical district… 107
communities in the general forestical monitoring work (Chivulescu et al, 2018;
Solomou and Skoufogianni, 2016).
Numerous studies have analyzed the modern state of the urban forest park
stands (Verma and Raghubanshi, 2018; Voigt et al, 2014). Nevertheless, these
studies are limited by the lack of research on one attribute (or floristic
composition, ore dendrometric characteristics, ore diversity and evenness
indices). Moreover, the estimates of forest park stands in urban environments
mainly rely upon methodologies developed for trees in traditional forests. More
exact quantification of urban forest park stands may depend on development of
comprehensive research especially at different habitats.
It is widely accepted that understanding conservation targets and
sustainable development of the urban forest park stands, including a full
description of woody species floristic composition, dendrometric parameters and
diversity and evenness indexes (Martins and Pereira, 2018). Furthermore,
description and analysis of urban forest park stands through floristic and
dendrometric, diversity and evenness characterization provide means to analyse
the relation between woody vegetation and edaphic, topographic and human
factors (Dan et al, 2016; Lykholat et al 2019a; Lykholat et al 2019b).
The main objectives of this work were to (i) analyze of urban forest park
stands floristic composition in the Kryvyi Rih City (Central Ukraine), (ii)
estimate their dendrometric parameters and (iii) assess their diversity and
evenness indexes. As no detailed ecological information is available on the urban
forest park stands, it was not possible to set ecological hypotheses. However,
assuming that the pattern of woody species and stands types results from different
stochastical events, it was hypothesized that current state of the urban forest park
stands determined by the combined influence of ecological (soil fertility, soil
moisture) and environmental factors (air pollution).
MATERIALS AND METHODS
Study area.
This study was conducted in the forest park woodlands, which is located in
the Kryvyi Rih City (Ore-mining and metallurgical basin, Central Ukraine). The
study area is located between 47°53'54" and 48°8'52" north latitude and
33°19'52" and 33°33'38" west longitude (Figure 1). The climate of the study area
is characterized by a short spring, dry summer, little snowy cold winters. The air
temperatures average–3,5 and 21,8°C in January and July, respectively.
Precipitation falls primarily as rain averaging 400-450 mm year–1
.
Research design and data collection.
During 2012-2017 we performed a comprehensive study of Kryvyi Rih
District parks: 1) studied the history of parks, 2) analyzed the evolution of parks
(their progress / regress), 3) studied the ecological conditions in parks, 4) studied
the floristic composition of all plant trees in parks, 5) identified treys plantations
similar to forest (woody stands, park stands), 6) studied of the structure and
diversity of urban park stands.
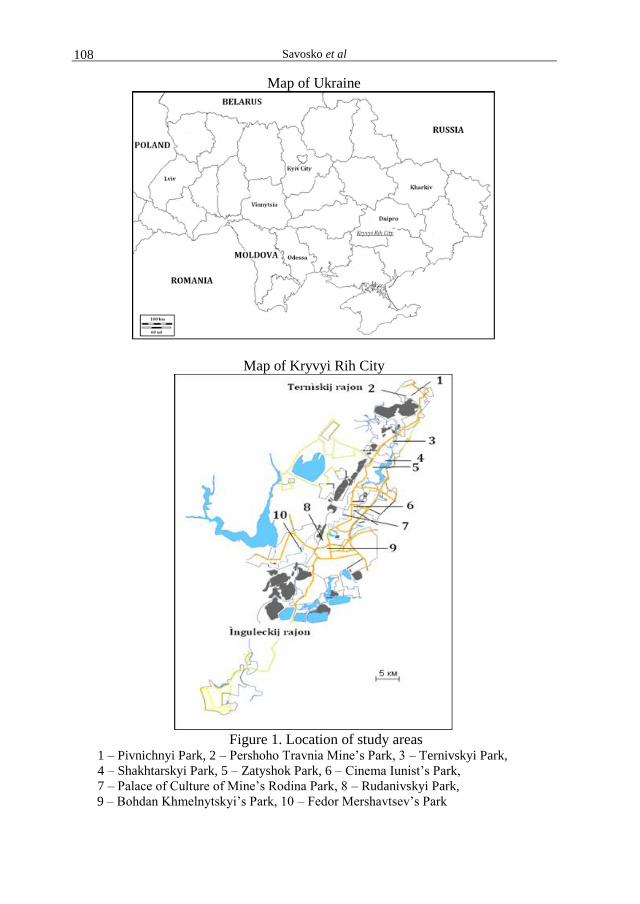
Savosko et al 108
Map of Ukraine
Map of Kryvyi Rih City
Figure 1. Location of study areas
1 – Pivnichnyi Park, 2 – Pershoho Travnia Mine‟s Park, 3 – Ternivskyi Park,
4 – Shakhtarskyi Park, 5 – Zatyshok Park, 6 – Cinema Iunist‟s Park,
7 – Palace of Culture of Mine‟s Rodina Park, 8 – Rudanivskyi Park,
9 – Bohdan Khmelnytskyi‟s Park, 10 – Fedor Mershavtsev‟s Park
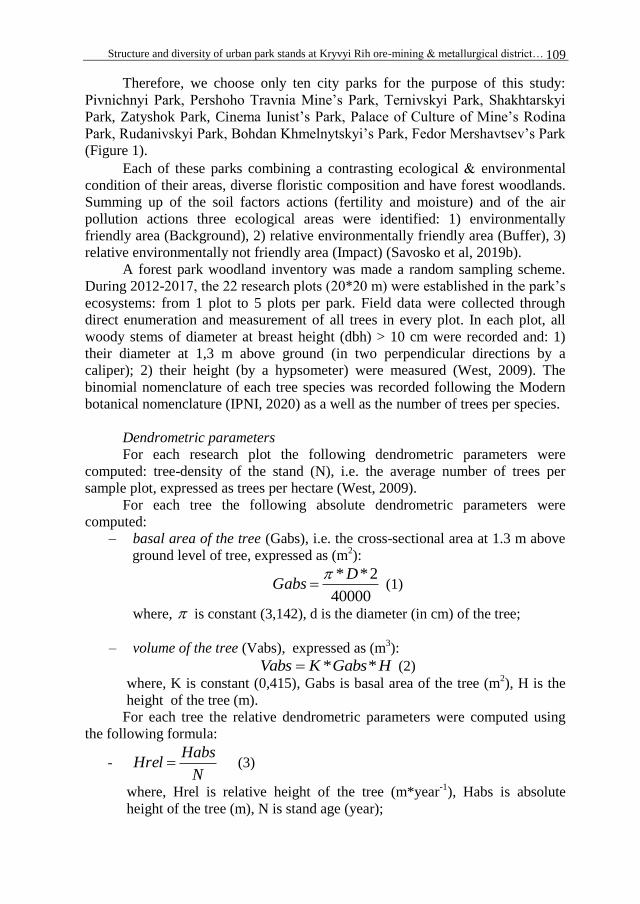
Structure and diversity of urban park stands at Kryvyi Rih ore-mining & metallurgical district… 109
Therefore, we choose only ten city parks for the purpose of this study:
Pivnichnyi Park, Pershoho Travnia Mine‟s Park, Ternivskyi Park, Shakhtarskyi
Park, Zatyshok Park, Cinema Iunist‟s Park, Palace of Culture of Mine‟s Rodina
Park, Rudanivskyi Park, Bohdan Khmelnytskyi‟s Park, Fedor Mershavtsev‟s Park
(Figure 1).
Each of these parks combining a contrasting ecological environmental
condition of their areas, diverse floristic composition and have forest woodlands.
Summing up of the soil factors actions (fertility and moisture) and of the air
pollution actions three ecological areas were identified: 1) environmentally
friendly area (Background), 2) relative environmentally friendly area (Buffer), 3)
relative environmentally not friendly area (Impact) (Savosko et al, 2019b).
A forest park woodland inventory was made a random sampling scheme.
During 2012-2017, the 22 research plots (20*20 m) were established in the park‟s
ecosystems: from 1 plot to 5 plots per park. Field data were collected through
direct enumeration and measurement of all trees in every plot. In each plot, all
woody stems of diameter at breast height (dbh) > 10 cm were recorded and: 1)
their diameter at 1,3 m above ground (in two perpendicular directions by a
caliper); 2) their height (by a hypsometer) were measured (West, 2009). The
binomial nomenclature of each tree species was recorded following the Modern
botanical nomenclature (IPNI, 2020) as a well as the number of trees per species.
Dendrometric parameters
For each research plot the following dendrometric parameters were
computed: tree-density of the stand (N), i.e. the average number of trees per
sample plot, expressed as trees per hectare (West, 2009).
For each tree the following absolute dendrometric parameters were
computed:
– basal area of the tree (Gabs), i.e. the cross-sectional area at 1.3 m above
ground level of tree, expressed as (m2):
40000
2** DGabs
(1)
where, is constant (3,142), d is the diameter (in cm) of the tree;
– volume of the tree (Vabs), expressed as (m3):
HGabsKVabs ** (2)
where, K is constant (0,415), Gabs is basal area of the tree (m2), H is the
height of the tree (m).
For each tree the relative dendrometric parameters were computed using
the following formula:
- N
HabsHrel (3)
where, Hrel is relative height of the tree (m*year-1
), Habs is absolute
height of the tree (m), N is stand age (year);
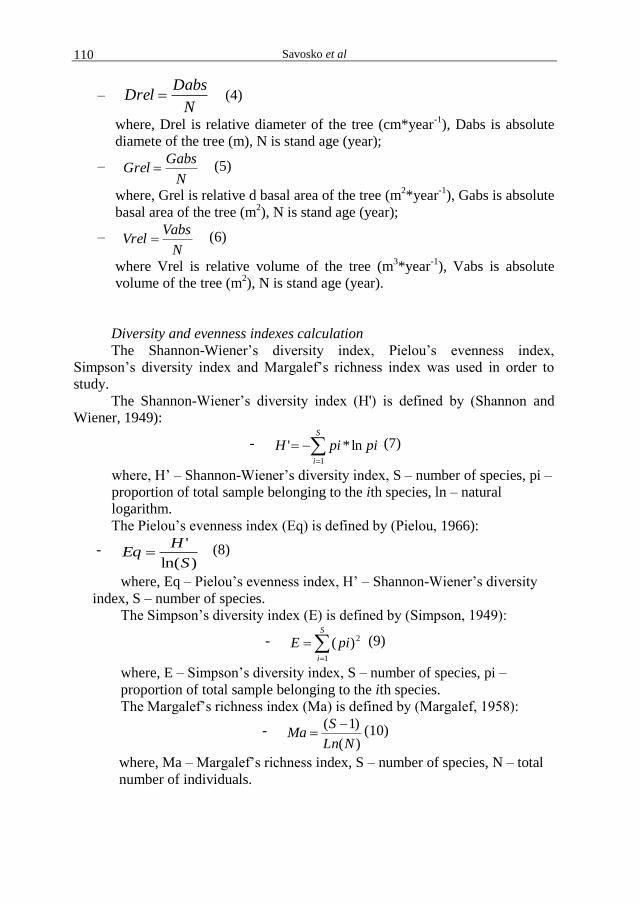
Savosko et al 110
– N
DabsDrel (4)
where, Drel is relative diameter of the tree (cm*year-1
), Dabs is absolute
diamete of the tree (m), N is stand age (year);
– N
GabsGrel (5)
where, Grel is relative d basal area of the tree (m2*year
-1), Gabs is absolute
basal area of the tree (m2), N is stand age (year);
– N
VabsVrel (6)
where Vrel is relative volume of the tree (m3*year
-1), Vabs is absolute
volume of the tree (m2), N is stand age (year).
Diversity and evenness indexes calculation
The Shannon-Wiener‟s diversity index, Pielou‟s evenness index,
Simpson‟s diversity index and Margalef‟s richness index was used in order to
study.
The Shannon-Wiener‟s diversity index (H') is defined by (Shannon and
Wiener, 1949):
-
S
i
pipiH1
ln*' (7)
where, H‟ – Shannon-Wiener‟s diversity index, S – number of species, pi –
proportion of total sample belonging to the ith species, ln – natural
logarithm.
The Pielou‟s evenness index (Eq) is defined by (Pielou, 1966):
- )ln(
'
S
HEq (8)
where, Eq – Pielou‟s evenness index, H‟ – Shannon-Wiener‟s diversity
index, S – number of species.
The Simpson‟s diversity index (E) is defined by (Simpson, 1949):
-
S
i
piE1
2)( (9)
where, E – Simpson‟s diversity index, S – number of species, pi –
proportion of total sample belonging to the ith species.
The Margalef‟s richness index (Ma) is defined by (Margalef, 1958):
- )(
)1(
NLn
SMa
(10)
where, Ma – Margalef‟s richness index, S – number of species, N – total
number of individuals.
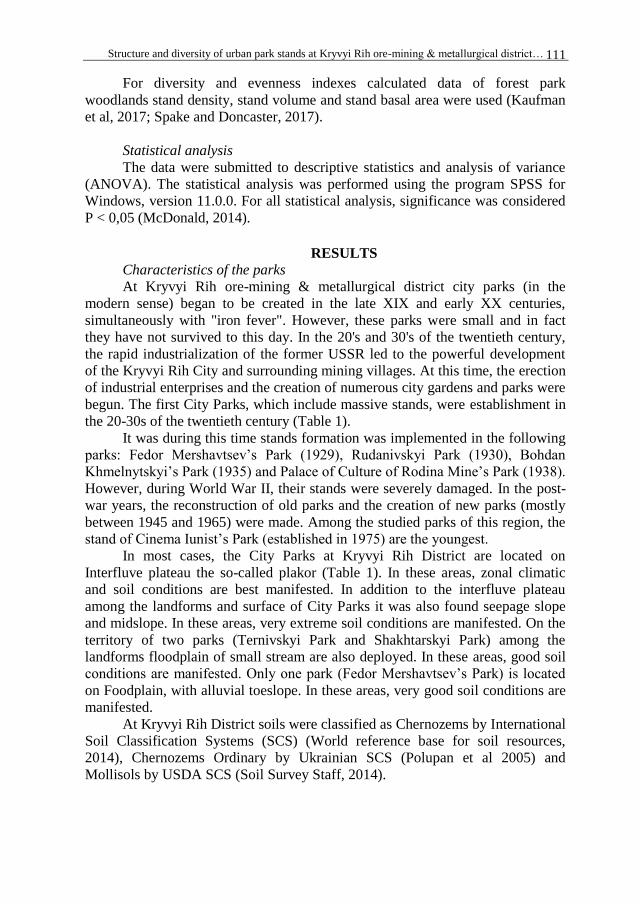
Structure and diversity of urban park stands at Kryvyi Rih ore-mining & metallurgical district… 111
For diversity and evenness indexes calculated data of forest park
woodlands stand density, stand volume and stand basal area were used (Kaufman
et al, 2017; Spake and Doncaster, 2017).
Statistical analysis
The data were submitted to descriptive statistics and analysis of variance
(ANOVA). The statistical analysis was performed using the program SPSS for
Windows, version 11.0.0. For all statistical analysis, significance was considered
P < 0,05 (McDonald, 2014).
RESULTS
Characteristics of the parks
At Kryvyi Rih ore-mining & metallurgical district city parks (in the
modern sense) began to be created in the late XIX and early XX centuries,
simultaneously with "iron fever". However, these parks were small and in fact
they have not survived to this day. In the 20's and 30's of the twentieth century,
the rapid industrialization of the former USSR led to the powerful development
of the Kryvyi Rih City and surrounding mining villages. At this time, the erection
of industrial enterprises and the creation of numerous city gardens and parks were
begun. The first City Parks, which include massive stands, were establishment in
the 20-30s of the twentieth century (Table 1).
It was during this time stands formation was implemented in the following
parks: Fedor Mershavtsev‟s Park (1929), Rudanivskyi Park (1930), Bohdan
Khmelnytskyi‟s Park (1935) and Palace of Culture of Rodina Mine‟s Park (1938).
However, during World War II, their stands were severely damaged. In the post-
war years, the reconstruction of old parks and the creation of new parks (mostly
between 1945 and 1965) were made. Among the studied parks of this region, the
stand of Cinema Iunist‟s Park (established in 1975) are the youngest.
In most cases, the City Parks at Kryvyi Rih District are located on
Interfluve plateau the so-called plakor (Table 1). In these areas, zonal climatic
and soil conditions are best manifested. In addition to the interfluve plateau
among the landforms and surface of City Parks it was also found seepage slope
and midslope. In these areas, very extreme soil conditions are manifested. On the
territory of two parks (Ternivskyi Park and Shakhtarskyi Park) among the
landforms floodplain of small stream are also deployed. In these areas, good soil
conditions are manifested. Only one park (Fedor Mershavtsev‟s Park) is located
on Foodplain, with alluvial toeslope. In these areas, very good soil conditions are
manifested.
At Kryvyi Rih District soils were classified as Chernozems by International
Soil Classification Systems (SCS) (World reference base for soil resources,
2014), Chernozems Ordinary by Ukrainian SCS (Polupan et al 2005) and
Mollisols by USDA SCS (Soil Survey Staff, 2014).

Savosko et al 112
Table 1. The main characteristics of the parks at Kryvyi Rih District
Park Year of
establishment
Area,
ha
Ecological factors Environ-
mental
factors,
levels
of the air
pollution
Landforms
and surface
Soil
Texture Moisture Fertility
Pivnichnyi Park 1963 27,0
Interfluve
plateau,
seepage
slope,
midslope
Clay
loam
Dry,
slightly
moist,
moist
Good
fertility Moderate
Pershoho
Travnia Mine‟s
Park
1949 8,0
Interfluve
plateau,
seepage
slope
Clay
loam
Dry,
slightly
moist
Good
fertility Moderate
Ternivskyi Park 1963 7,7
Interfluve
plateau,
seepage
slope,
midslope,
floodplain
of small
stream
Clay
loam
Dry,
slightly
moist,
moist
Good
fertility Low
Shakhtarskyi
Park 1950 42,8
Interfluve
plateau,
seepage
slope,
midslope,
floodplain of
small stream
Clay
loam
Dry,
slightly
moist,
moist
Good
fertility Low
Zatyshok Park 1962 3,6 Interfluve
plateau
Clay
loam
Dry,
slightly
moist
Good
fertility Low
Cinema Iunist‟s
Park 1975 3,5
Interfluve
plateau,
Clay
loam
Dry,
slightly
moist
Good
fertility Low
Palace of Culture
of Rodina Mine‟s
Park
1938 4,9 Interfluve
plateau
Clay
loam
Dry,
slightly
moist
Good
fertility Moderate
Rudanivskyi
Park 1930 14,0
Midslope,
colluvial
footslope
Clay
loam
Slightly
moist
Good
fertility Moderate
Bohdan
Khmelnytskyi‟s
Park
1935 42,0
Seepage
slope,
midslope
Clay
loam
Dry,
slightly
moist
Good
fertility High
Fedor
Mershavtsev‟s
Park
1929 36,0
Foodplain,
alluvial
toeslope
Sandy
clay
loam
Moist
Very
good
fertility
Very low
Structure and diversity of urban park stands at Kryvyi Rih ore-mining & metallurgical district… 113
Soil texture (such as loam, sandy loam or clay) as known, refers to the
proportion of sand, silt and clay sized particles that make up the mineral fraction
of the soil. In its turn, soil texture significantly effects on soil fertility and on the
growth / development of woody plant species. The results of our research showed
that in City Park at Kryvyi Rih District, the soil texture was represented by the
following classes. The first class, the clay loam soil, was found in most parks.
The second class, sandy clay loam soil was found in only one park (Fedor
Mershavtsev‟s Park). Generally, soil texture in City Parks at Kryvyi Rih District
is favorable for woody plants. As we noted earlier, Kryvyi Rih District is located
in arid areas. Therefore, moisture status of soil is very relevant for our research of
the City Parks. We found that in most cases soil moisture can be estimated as dry-
slightly moist. In some cases (Ternivskyi Park and Shakhtarskyi Park), soil
moisture can be estimated as slightly moist-moist. Only in one case soil moisture
can be estimated as Slightly-moist (Rudanivskyi Park) and moist (Fedor
Mershavtsev‟s Park). Generally, soil moisture in City Parks at Kryvyi Rih District
is a few and a slightly favorable for woody plants. Therefore, in the future it is
very important to reconstruct old irrigation systems and create new irrigation
systems. The soils of the Kryvyi Rih District (Chernozems by Internutional SCS
and Mollisols by USDA SCS) are some of the most fertile soils in the World.
That is why the soil fertility of City parks can only be assessed as “Good fertility”
(in most cases) and “Very good fertility” (Fedor Mershavtsev‟s Park).
At Kryvyi Rih District, the presence of a significant number of powerful
mining and metallurgical enterprises causes significant air pollution, which
worsens the ecological conditions for the growth of tree species. According to the
common classification scheme, there are the following levels of air pollution: 1)
very low, 2) low, 3) moderate and 4) high. For very low level of air pollution the
following concentrations are available: Carbon monoxide (CO) from 0,600
mg*m3 to 1,500 mg*m
3; Nitrogen dioxide (NO2) from 0,008 mg*m
3 to 0,020
mg*m3; Sulfur dioxide (SO2) from 0,010 mg*m
3 to 0,025 mg*m
3; Dust from
0,030 mg*m3 to 0,075 mg*m
3. For low level of air pollution the following
concentrations are available: Carbon monoxide (CO) from 1,500 mg*m3 to 3,000
mg*m3; Nitrogen dioxide (NO2) from 0,020 mg*m
3 to 0,040 mg*m
3; Sulfur
dioxide (SO2) from 0,025 mg*m3 to 0,050 mg*m
3; Dust from 0,075 mg*m
3 to
0,150 mg*m3. For moderate level of air pollution the following concentrations are
available: Carbon monoxide (CO) from 3,000 mg*m3 to 6,000 mg*m
3; Nitrogen
dioxide (NO2) from 0,040 mg*m3 to 0,080 mg*m
3; Sulfur dioxide (SO2) from
0,050 mg*m3 to 0,100 mg*m
3; Dust from 0,150 mg*m
3 to 0,300 mg*m
3. For
moderate level of air pollution the following concentrations are available: Carbon
monoxide (CO) from 6,000 mg*m3 to 12,000 mg*m
3; Nitrogen dioxide (NO2)
from 0,080 mg*m3 to 0,160 mg*m
3; Sulfur dioxide (SO2) from 0,100 mg*m
3 to
0,200 mg*m3; Dust from 0,300 mg*m
3 to 0,600 mg*m
3. Generally, the very low
level of air pollution is typical for the area of one City Park, the low level of air
pollution is typical for the area of for City Parks, the moderate level of air
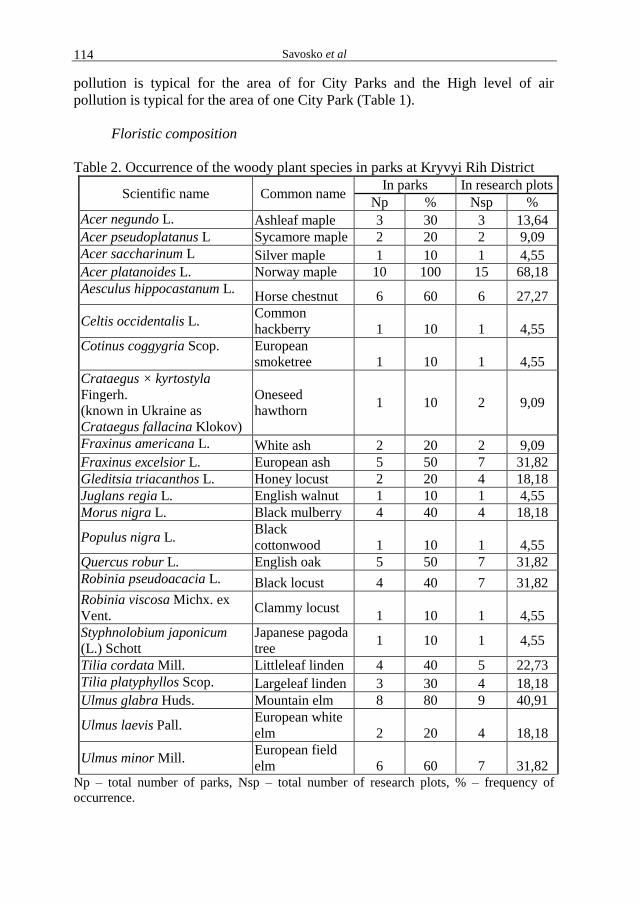
Savosko et al 114
pollution is typical for the area of for City Parks and the High level of air
pollution is typical for the area of one City Park (Table 1).
Floristic composition
Table 2. Occurrence of the woody plant species in parks at Kryvyi Rih District
Scientific name Common name In parks In research plots
Np % Nsp %
Acer negundo L. Ashleaf maple 3 30 3 13,64
Acer pseudoplatanus L Sycamore maple 2 20 2 9,09
Acer saccharinum L Silver maple 1 10 1 4,55
Acer platanoides L. Norway maple 10 100 15 68,18
Aesculus hippocastanum L. Horse chestnut 6 60 6 27,27
Celtis occidentalis L. Common
hackberry 1 10 1 4,55
Cotinus coggygria Scop. European
smoketree 1 10 1 4,55
Crataegus × kyrtostyla
Fingerh.
(known in Ukraine as
Crataegus fallacina Klokov)
Oneseed
hawthorn 1 10 2 9,09
Fraxinus americana L. White ash 2 20 2 9,09
Fraxinus excelsior L. European ash 5 50 7 31,82
Gleditsia triacanthos L. Honey locust 2 20 4 18,18
Juglans regia L. English walnut 1 10 1 4,55
Morus nigra L. Black mulberry 4 40 4 18,18
Populus nigra L. Black
cottonwood 1 10 1 4,55
Quercus robur L. English oak 5 50 7 31,82
Robinia pseudoacacia L. Black locust 4 40 7 31,82
Robinia viscosa Michx. ex
Vent. Clammy locust
1 10 1 4,55
Styphnolobium japonicum (L.) Schott
Japanese pagoda
tree 1 10 1 4,55
Tilia cordata Mill. Littleleaf linden 4 40 5 22,73
Tilia platyphyllos Scop. Largeleaf linden 3 30 4 18,18
Ulmus glabra Huds. Mountain elm 8 80 9 40,91
Ulmus laevis Pall. European white
elm 2 20 4 18,18
Ulmus minor Mill. European field
elm 6 60 7 31,82
Np – total number of parks, Nsp – total number of research plots, % – frequency of
occurrence.
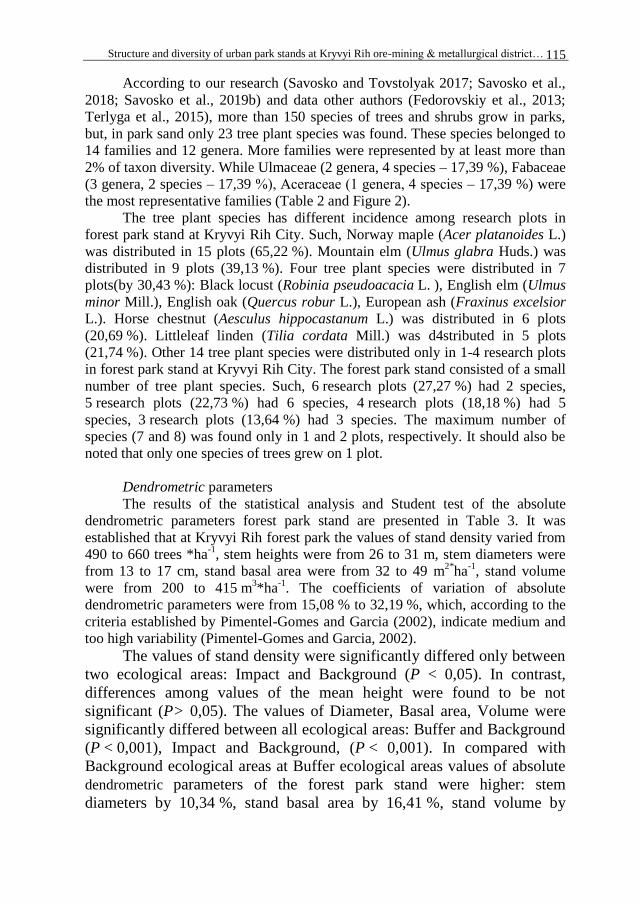
Structure and diversity of urban park stands at Kryvyi Rih ore-mining & metallurgical district… 115
According to our research (Savosko and Tovstolyak 2017; Savosko et al.,
2018; Savosko et al., 2019b) and data other authors (Fedorovskiy et al., 2013;
Terlyga et al., 2015), more than 150 species of trees and shrubs grow in parks,
but, in park sand only 23 tree plant species was found. These species belonged to
14 families and 12 genera. More families were represented by at least more than
2% of taxon diversity. While Ulmaceae (2 genera, 4 species – 17,39 %), Fabaceae
(3 genera, 2 species – 17,39 %), Aсеrасеае (1 genera, 4 species – 17,39 %) were
the most representative families (Table 2 and Figure 2).
The tree plant species has different incidence among research plots in
forest park stand at Kryvyi Rih City. Such, Norway maple (Acer platanoides L.)
was distributed in 15 plots (65,22 %). Mountain elm (Ulmus glabra Huds.) was
distributed in 9 plots (39,13 %). Four tree plant species were distributed in 7
plots(by 30,43 %): Black locust (Robinia pseudoacacia L. ), English elm (Ulmus
minor Mill.), English oak (Quercus robur L.), European ash (Fraxinus excelsior
L.). Horse chestnut (Aesculus hippocastanum L.) was distributed in 6 plots
(20,69 %). Littleleaf linden (Tilia cordata Mill.) was d4stributed in 5 plots
(21,74 %). Other 14 tree plant species were distributed only in 1-4 research plots
in forest park stand at Kryvyi Rih City. The forest park stand consisted of a small
number of tree plant species. Such, 6 research plots (27,27 %) had 2 species,
5 research plots (22,73 %) had 6 species, 4 research plots (18,18 %) had 5
species, 3 research plots (13,64 %) had 3 species. The maximum number of
species (7 and 8) was found only in 1 and 2 plots, respectively. It should also be
noted that only one species of trees grew on 1 plot.
Dendrometric parameters
The results of the statistical analysis and Student test of the absolute
dendrometric parameters forest park stand are presented in Table 3. It was
established that at Kryvyi Rih forest park the values of stand density varied from
490 to 660 trees *ha-1
, stem heights were from 26 to 31 m, stem diameters were
from 13 to 17 cm, stand basal area were from 32 to 49 m2*
ha-1
, stand volume
were from 200 to 415 m3*ha
-1. The coefficients of variation of absolute
dendrometric parameters were from 15,08 % to 32,19 %, which, according to the
criteria established by Pimentel-Gomes and Garcia (2002), indicate medium and
too high variability (Pimentel-Gomes and Garcia, 2002).
The values of stand density were significantly differed only between
two ecological areas: Impact and Background (P < 0,05). In contrast,
differences among values of the mean height were found to be not
significant (P> 0,05). The values of Diameter, Basal area, Volume were
significantly differed between all ecological areas: Buffer and Background
(P < 0,001), Impact and Background, (P < 0,001). In compared with
Background ecological areas at Buffer ecological areas values of absolute
dendrometric parameters of the forest park stand were higher: stem
diameters by 10,34 %, stand basal area by 16,41 %, stand volume by
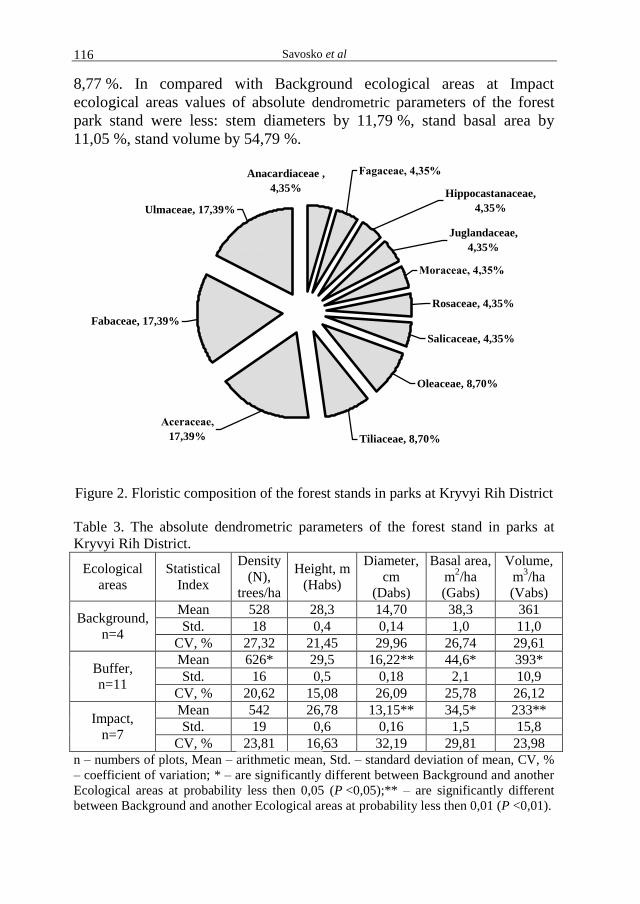
Savosko et al 116
8,77 %. In compared with Background ecological areas at Impact
ecological areas values of absolute dendrometric parameters of the forest
park stand were less: stem diameters by 11,79 %, stand basal area by
11,05 %, stand volume by 54,79 %.
Mоrасеае, 4,35%
Rosaceae, 4,35%
Salicaceae, 4,35%
Oleaceae, 8,70%
Tiliaceae, 8,70%
Aсеrасеае,
17,39%
Fabaceae, 17,39%
Juglandaceae,
4,35%
Hippocastanaceae,
4,35%Ulmaceae, 17,39%
Fagaсеае, 4,35%Anacardiaceae ,
4,35%
Figure 2. Floristic composition of the forest stands in parks at Kryvyi Rih District
Table 3. The absolute dendrometric parameters of the forest stand in parks at
Kryvyi Rih District.
Ecological
areas
Statistical
Index
Density
(N),
trees/ha
Height, m
(Habs)
Diameter,
cm
(Dabs)
Basal area,
m2/ha
(Gabs)
Volume,
m3/ha
(Vabs)
Background,
n=4
Mean 528 28,3 14,70 38,3 361
Std. 18 0,4 0,14 1,0 11,0
CV, % 27,32 21,45 29,96 26,74 29,61
Buffer,
n=11
Mean 626* 29,5 16,22** 44,6* 393*
Std. 16 0,5 0,18 2,1 10,9
CV, % 20,62 15,08 26,09 25,78 26,12
Impact,
n=7
Mean 542 26,78 13,15** 34,5* 233**
Std. 19 0,6 0,16 1,5 15,8
CV, % 23,81 16,63 32,19 29,81 23,98
n – numbers of plots, Mean – arithmetic mean, Std. – standard deviation of mean, CV, %
– coefficient of variation; * – are significantly different between Background and another
Ecological areas at probability less then 0,05 (P <0,05);** – are significantly different
between Background and another Ecological areas at probability less then 0,01 (P <0,01).
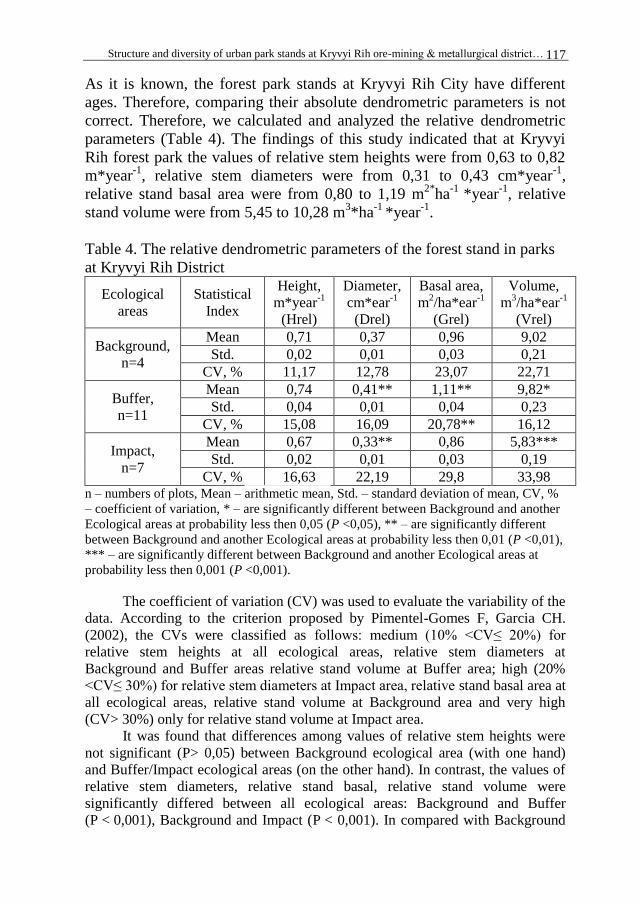
Structure and diversity of urban park stands at Kryvyi Rih ore-mining & metallurgical district… 117
As it is known, the forest park stands at Kryvyi Rih City have different
ages. Therefore, comparing their absolute dendrometric parameters is not
correct. Therefore, we calculated and analyzed the relative dendrometric
parameters (Table 4). The findings of this study indicated that at Kryvyi
Rih forest park the values of relative stem heights were from 0,63 to 0,82
m*year-1
, relative stem diameters were from 0,31 to 0,43 cm*year-1
,
relative stand basal area were from 0,80 to 1,19 m2*
ha-1
*year-1
, relative
stand volume were from 5,45 to 10,28 m3*ha
-1 *year
-1.
Table 4. The relative dendrometric parameters of the forest stand in parks
at Kryvyi Rih District
Ecological
areas
Statistical
Index
Height,
m*year-1
(Hrel)
Diameter,
cm*ear-1
(Drel)
Basal area,
m2/ha*ear
-1
(Grel)
Volume,
m3/ha*ear
-1
(Vrel)
Background,
n=4
Mean 0,71 0,37 0,96 9,02
Std. 0,02 0,01 0,03 0,21
CV, % 11,17 12,78 23,07 22,71
Buffer,
n=11
Mean 0,74 0,41** 1,11** 9,82*
Std. 0,04 0,01 0,04 0,23
CV, % 15,08 16,09 20,78** 16,12
Impact,
n=7
Mean 0,67 0,33** 0,86 5,83***
Std. 0,02 0,01 0,03 0,19
CV, % 16,63 22,19 29,8 33,98 n – numbers of plots, Mean – arithmetic mean, Std. – standard deviation of mean, CV, %
– coefficient of variation, * – are significantly different between Background and another
Ecological areas at probability less then 0,05 (P <0,05), ** – are significantly different
between Background and another Ecological areas at probability less then 0,01 (P <0,01),
*** – are significantly different between Background and another Ecological areas at
probability less then 0,001 (P <0,001).
The coefficient of variation (CV) was used to evaluate the variability of the
data. According to the criterion proposed by Pimentel-Gomes F, Garcia CH.
(2002), the CVs were classified as follows: medium (10% <CV≤ 20%) for
relative stem heights at all ecological areas, relative stem diameters at
Background and Buffer areas relative stand volume at Buffer area; high (20%
<CV≤ 30%) for relative stem diameters at Impact area, relative stand basal area at
all ecological areas, relative stand volume at Background area and very high
(CV> 30%) only for relative stand volume at Impact area.
It was found that differences among values of relative stem heights were
not significant (P> 0,05) between Background ecological area (with one hand)
and Buffer/Impact ecological areas (on the other hand). In contrast, the values of
relative stem diameters, relative stand basal, relative stand volume were
significantly differed between all ecological areas: Background and Buffer
(P < 0,001), Background and Impact (P < 0,001). In compared with Background
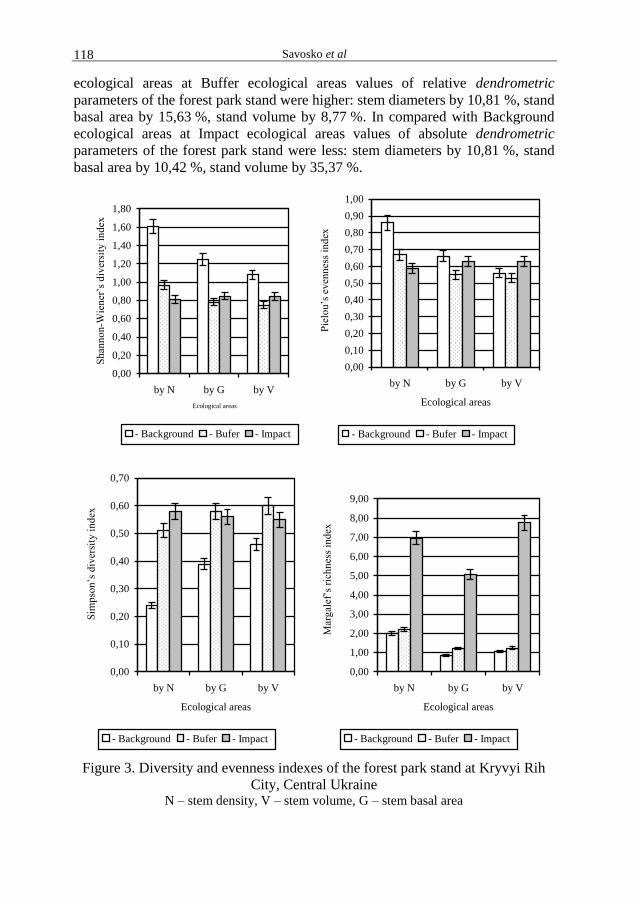
Savosko et al 118
ecological areas at Buffer ecological areas values of relative dendrometric
parameters of the forest park stand were higher: stem diameters by 10,81 %, stand
basal area by 15,63 %, stand volume by 8,77 %. In compared with Background
ecological areas at Impact ecological areas values of absolute dendrometric
parameters of the forest park stand were less: stem diameters by 10,81 %, stand
basal area by 10,42 %, stand volume by 35,37 %.
0,00
0,20
0,40
0,60
0,80
1,00
1,20
1,40
1,60
1,80
by N by G by V
Ecological areas
Sh
ann
on
-Wie
ner
’s d
iver
sity
in
dex
- Background - Bufer - Impact
0,00
0,10
0,20
0,30
0,40
0,50
0,60
0,70
0,80
0,90
1,00
by N by G by V
Ecological areas
Pie
lou
’s e
ven
nes
s in
dex
- Background - Bufer - Impact
0,00
0,10
0,20
0,30
0,40
0,50
0,60
0,70
by N by G by V
Ecological areas
Sim
pso
n’s
div
ersi
ty i
nd
ex
- Background - Bufer - Impact
0,00
1,00
2,00
3,00
4,00
5,00
6,00
7,00
8,00
9,00
by N by G by V
Ecological areas
Mar
gal
ef’s
ric
hn
ess
ind
ex
- Background - Bufer - Impact
Figure 3. Diversity and evenness indexes of the forest park stand at Kryvyi Rih
City, Central Ukraine N – stem density, V – stem volume, G – stem basal area
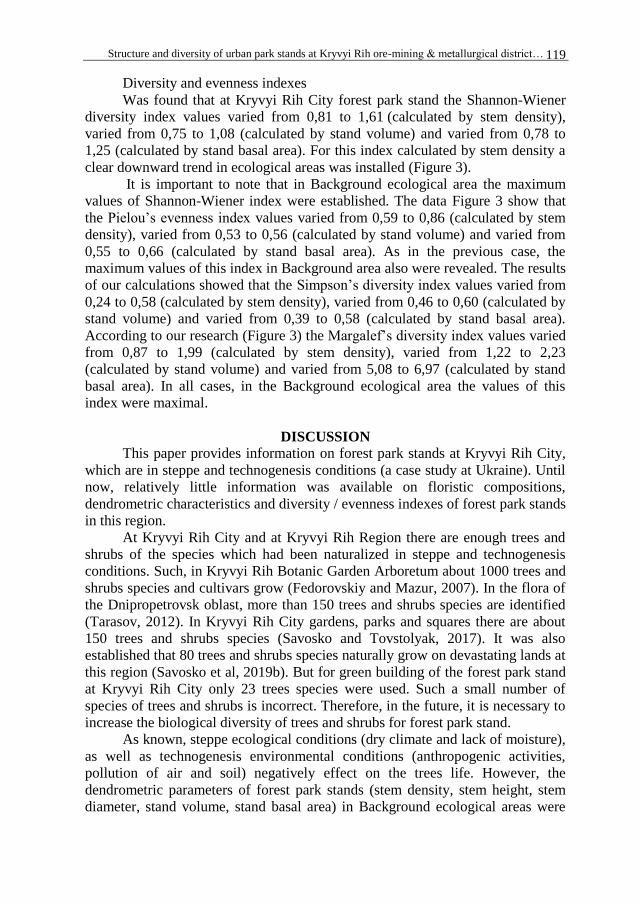
Structure and diversity of urban park stands at Kryvyi Rih ore-mining & metallurgical district… 119
Diversity and evenness indexes
Was found that at Kryvyi Rih City forest park stand the Shannon-Wiener
diversity index values varied from 0,81 to 1,61 (calculated by stem density),
varied from 0,75 to 1,08 (calculated by stand volume) and varied from 0,78 to
1,25 (calculated by stand basal area). For this index calculated by stem density a
clear downward trend in ecological areas was installed (Figure 3).
It is important to note that in Background ecological area the maximum
values of Shannon-Wiener index were established. The data Figure 3 show that
the Pielou‟s evenness index values varied from 0,59 to 0,86 (calculated by stem
density), varied from 0,53 to 0,56 (calculated by stand volume) and varied from
0,55 to 0,66 (calculated by stand basal area). As in the previous case, the
maximum values of this index in Background area also were revealed. The results
of our calculations showed that the Simpson‟s diversity index values varied from
0,24 to 0,58 (calculated by stem density), varied from 0,46 to 0,60 (calculated by
stand volume) and varied from 0,39 to 0,58 (calculated by stand basal area).
According to our research (Figure 3) the Margalef‟s diversity index values varied
from 0,87 to 1,99 (calculated by stem density), varied from 1,22 to 2,23
(calculated by stand volume) and varied from 5,08 to 6,97 (calculated by stand
basal area). In all cases, in the Background ecological area the values of this
index were maximal.
DISCUSSION
This paper provides information on forest park stands at Kryvyi Rih City,
which are in steppe and technogenesis conditions (a case study at Ukraine). Until
now, relatively little information was available on floristic compositions,
dendrometric characteristics and diversity / evenness indexes of forest park stands
in this region.
At Kryvyi Rih City and at Kryvyi Rih Region there are enough trees and
shrubs of the species which had been naturalized in steppe and technogenesis
conditions. Such, in Kryvyi Rih Botanic Garden Arboretum about 1000 trees and
shrubs species and cultivars grow (Fedorovskiy and Mazur, 2007). In the flora of
the Dnipropetrovsk oblast, more than 150 trees and shrubs species are identified
(Tarasov, 2012). In Kryvyi Rih City gardens, parks and squares there are about
150 trees and shrubs species (Savosko and Tovstolyak, 2017). It was also
established that 80 trees and shrubs species naturally grow on devastating lands at
this region (Savosko et al, 2019b). But for green building of the forest park stand
at Kryvyi Rih City only 23 trees species were used. Such a small number of
species of trees and shrubs is incorrect. Therefore, in the future, it is necessary to
increase the biological diversity of trees and shrubs for forest park stand.
As known, steppe ecological conditions (dry climate and lack of moisture),
as well as technogenesis environmental conditions (anthropogenic activities,
pollution of air and soil) negatively effect on the trees life. However, the
dendrometric parameters of forest park stands (stem density, stem height, stem
diameter, stand volume, stand basal area) in Background ecological areas were
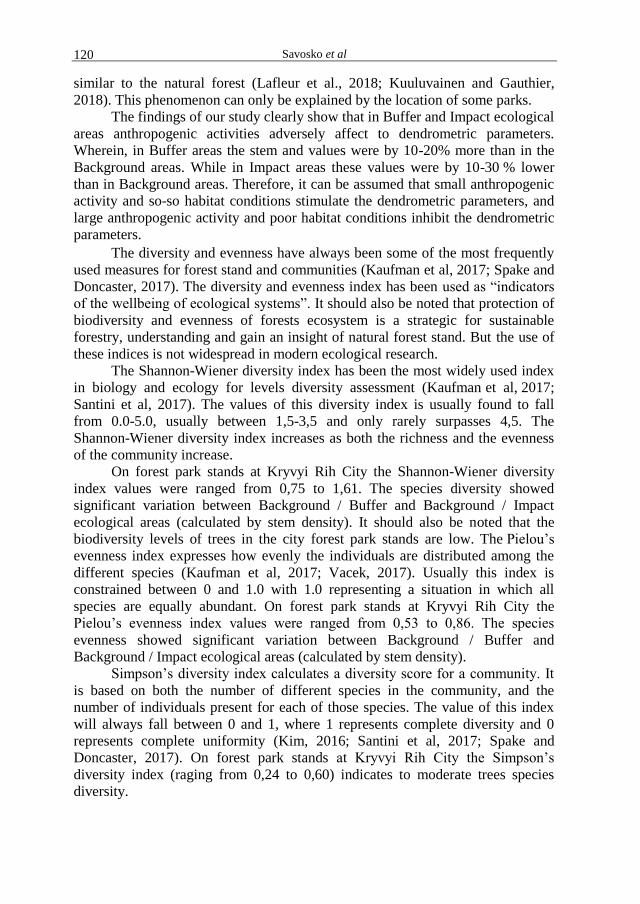
Savosko et al 120
similar to the natural forest (Lafleur et al., 2018; Kuuluvainen and Gauthier,
2018). This phenomenon can only be explained by the location of some parks.
The findings of our study clearly show that in Buffer and Impact ecological
areas anthropogenic activities adversely affect to dendrometric parameters.
Wherein, in Buffer areas the stem and values were by 10-20% more than in the
Background areas. While in Impact areas these values were by 10-30 % lower
than in Background areas. Therefore, it can be assumed that small anthropogenic
activity and so-so habitat conditions stimulate the dendrometric parameters, and
large anthropogenic activity and poor habitat conditions inhibit the dendrometric
parameters.
The diversity and evenness have always been some of the most frequently
used measures for forest stand and communities (Kaufman et al, 2017; Spake and
Doncaster, 2017). The diversity and evenness index has been used as “indicators
of the wellbeing of ecological systems”. It should also be noted that protection of
biodiversity and evenness of forests ecosystem is a strategic for sustainable
forestry, understanding and gain an insight of natural forest stand. But the use of
these indices is not widespread in modern ecological research.
The Shannon-Wiener diversity index has been the most widely used index
in biology and ecology for levels diversity assessment (Kaufman et al, 2017;
Santini et al, 2017). The values of this diversity index is usually found to fall
from 0.0-5.0, usually between 1,5-3,5 and only rarely surpasses 4,5. The
Shannon-Wiener diversity index increases as both the richness and the evenness
of the community increase.
On forest park stands at Kryvyi Rih City the Shannon-Wiener diversity
index values were ranged from 0,75 to 1,61. The species diversity showed
significant variation between Background / Buffer and Background / Impact
ecological areas (calculated by stem density). It should also be noted that the
biodiversity levels of trees in the city forest park stands are low. The Pielou‟s
evenness index expresses how evenly the individuals are distributed among the
different species (Kaufman et al, 2017; Vacek, 2017). Usually this index is
constrained between 0 and 1.0 with 1.0 representing a situation in which all
species are equally abundant. On forest park stands at Kryvyi Rih City the
Pielou‟s evenness index values were ranged from 0,53 to 0,86. The species
evenness showed significant variation between Background / Buffer and
Background / Impact ecological areas (calculated by stem density).
Simpson‟s diversity index calculates a diversity score for a community. It
is based on both the number of different species in the community, and the
number of individuals present for each of those species. The value of this index
will always fall between 0 and 1, where 1 represents complete diversity and 0
represents complete uniformity (Kim, 2016; Santini et al, 2017; Spake and
Doncaster, 2017). On forest park stands at Kryvyi Rih City the Simpson‟s
diversity index (raging from 0,24 to 0,60) indicates to moderate trees species
diversity.
Structure and diversity of urban park stands at Kryvyi Rih ore-mining & metallurgical district… 121
Margalef‟s diversity index is a little popular in the current biological and
ecological research. But this index measures species richness and it is highly
sensitive to sample size and it is a very simple index to apply (Gamito, 2010;
Konijnendijk, 2018). On forest park stands at Kryvyi Rih City the Margalef‟s
diversity index values were ranged from 0,87 to 7,77. The species evenness
showed significant variation between Background / Impact ecological areas
(calculated by all stem density, stand volume and stand basal area).
In generally, compound indices, including variations of all diversity and
evenness index, are assumed to intelligibly integrate species richness and
evenness into forest park stands. The results of our research (floristic
composition, dendrometric parameters, diversity and evenness indexes) differ
significantly with the data that were obtained in boreal forest (Darabi et al, 2014;
Rapanoela et al, 2016), but they are comparable with the data obtained in the
forest park stands (Miller et al, 2015; Ostoić et al, 2018). Our results also show
that differences in floristic composition, dendrometric parameters, diversity and
evenness indexes are greater between urban land uses than ecological conditions.
This fact, as wel as other results support our hypothesis that current state of the
urban forest park stands determined by the combined influence of ecological (soil
fertility, soil moisture) and environmental factors (air pollution).
CONCLUSIONS
The floristic compositions of Kryvyi Rih City urban forest park stands
(Central Ukraine) are poor. There are only 24 species that belong to 14 families
and 12 genera. The absolute and relative dendrometric parameters of the woody
plants comparable to forest stand at the boreal zone. Ecological and
environmental conditions statistically significant affect these characteristics. At
low impact levels, there are stimulations of dendrometric parameters. At high
impact levels, there are inhibitions of dendrometric parameters. The Kryvyi Rih
City urban forest park stands characterized nasty of diversity and evenness
indexes. This indicates the ecological instability of these woody plant
communities. Current state of the urban forest park stands determined by the
combined influence of ecological (soil fertility, soil moisture) and environmental
factors (air pollution).
REFERENCES
Anguluri R., Narayana P. (2017): Role of green space in urban planning: outlook
towards smart cities. Urban Forestry and Urban Greening, 25: 58-65. DOI:
10.1016/j.ufug.2017.04.007
Bielyk Y., Savosko V., Lykholat Y., Heilmeier H., Grygoryuk I. (2020):
Macronutrients and heavy metals contents in the leaves of trees from the
devastated lands at Kryvyi Rih District (Central Ukraine). E3S Web of
Conferences, 166: 01011. https://doi.org/10.1051/e3sconf/202016601011
Savosko et al 122
Booth T. H. (2018): Species distribution modelling tools and databases to assist
managing forests under climate change. Forest Ecology and Management,
430: 196-203. DOI: 10.1016/j.foreco.2018.08.019
Carvalho F. P. (2017): Mining industry and sustainable development: time for
change. Food and Energy Security, 6 (2): 61–77. DOI: 10.1002/fes3.109
Chivulescu S., Leca, S., Silaghi D., Cristea V. (2018): Structural biodiversity and
dead wood in virgin forests from Eastern Carpathians. Agriculture and
Forestry, 64 (1): 177-188. DOI: 10.17707/AgricultForest.64.1.20
Dan Z., Haifeng Z., Xingyuan H., Zhibin R., Chang Z., Xingyang Y., Zhixia M.,
Peijiang W. (2016): Effects of forest type and urbanization on species
composition and diversity of urban forest in Changchun, Northeast China.
Urban Ecosystems, 19 (1): 455-473. DOI: 10.1007/s11252-015-0473-5
Darabi S. M., Kooch Y., Hosseini S. M. (2014): Dynamic of Plant Composition
and Regeneration following Windthrow in a Temperate Beech Forest.
International Scholarly Research Notices, 2014: 421457. DOI:
10.1155/2014/421457
Ebrahimigajoti T., Nosrati H., Razbanhaghighi A., Khanbabai M. (2013).
Studying biodiversity of plant associations in Sutan-Chay Basin in
Arasbaran, northwest of Iran. Agriculture and Forestry, 59 (1): 85-98.
Fedorovskiy V. D., Tеrlyga N. S., Yukhimenko Yu. S., Danilchuk O. V.,
Danilchuk N. M., Lapteva O. V. (2013): Specific composition and vital
state of arboreal-shrub vegetation of parks and public gardens of Kryvyi
Rih. Plant Introduction, 3: 73-79. (in Ukrainian)
Fedorovskiy V. D., Mazur A. E. (2007): Woody plants of Kryvorozhsky
botanical garden. Prospect, Ukraine. [in Russian]
Gamito S. (2010): Caution is needed when applying Margalef diversity index.
Ecological Indicators, 10: 550-551. DOI: 10.1016/j.ecolind.2009.07.006
IPNI (2020): The International Plant Names Index, http://www.ipni.org.
Janhäll S. (2015): Review on urban vegetation and particle air pollution –
deposition and dispersion. Atmospheric Environment, 105: 130-137. DOI:
10.1016/j.atmosenv.2015.01.052
Kaufman S., Hauck M. Leuschner Ch. (2017): Comparing the plant diversity of
paired beech primeval and production forests: Management reduces
cryptogam, but not vascular plant species richness. Forest Ecology and
Management, 400 (15): 58-67. DOI: 10.1016/j.foreco.2017.05.043
Kim G. (2016): Assessing urban forest structure, ecosystem services, and
economic benefits on Vacant Land. Sustainability, 8: 679. DOI:
10.3390/su8070679
Kolbe S. E., Miller A. I., Cameron G. N. Culley T. M. (2016): Effects of natural
and anthropogenic environmental influences on tree community
composition and structure in forests along an urban-wildland gradient in
southwestern Ohio. Urban Ecosystems, 19 (2): 915-938. DOI:
10.1007/s11252-016-0531-7

Structure and diversity of urban park stands at Kryvyi Rih ore-mining & metallurgical district… 123
Konijnendijk C. C. (2018): A Forest of diversity. In: The Forest and the City.
Future City, 9. 185-194. Springer, Cham. DOI: 10.1007/978-3-319-75076-
7_13
Kuuluvainen T., Gauthier S. (2018): Young and old forest in the boreal: critical
stages of ecosystem dynamics and management under global change.
Forest Ecosystems, 5: 26. DOI: 10.1186/s40663-018-0142-2
Lafleur B., Fenton N. J., Simard M., Leduc A., Paré D., Valeria O., Bergeron Y.
(2018): Ecosystem management in paludified boreal forests: enhancing
wood production, biodiversity, and carbon sequestration at the landscape
level. Forest Ecosystems, 5: 27. DOI: 10.1186/s40663-018-0145-z
Liquete C., Cid N., Lanzanova D., Grizzetti B., Reynaud A. (2016): Perspectives
on the link between ecosystem services and biodiversity: the assessment of
the nursery function. Ecological Indicators, 63: 249-257. DOI:
10.1016/j.ecolind.2015.11.058
Lykholat Y., Khromyk N., Ivanko I., Kovalenko I., Shupranova L., harytonov M.
(2016a): Metabolic responses of steppe forest trees to altirude associated
local environmental changes. Agriculture and Forestry, 62 (2): 163-171
Lykholat Y., Alekseeva A., Khromykh N., Ivanko I., Kharytonov M., Kovalenko
I. (2016b): Assessment and prediction of viability and metabolic activity of
Tilia platyphyllos in arid steppe climate of Ukraine. Agriculture and
Forestry, 62 (3): 65-71.
Lykholat Y. V., Khromykh N. O., Lykholat T. Y., Didur O. O., Lykholat O. A.,
Legostaeva T. V., Kabar A. M., Sklyar T. V., Savosko V. M., Kovalenko I.
M., Davydov V. R., Bielyk Yu. V., Volyanik K. O., Onopa A. V., Dudkina
K. A., Grygoryuk I. P. (2019a): Industrial characteristics and consumer
properties of Chaenomeles Lindl. hruits. Ukrainian Journal of Ecology, 9
(3): 132-137.
Lykholat Y. V., Khromykh N. O., Lykholat T. Y., Bobrova O. M., Didur O. O.,
Lykholat O. A., Sudak V. M., Legostaeva T. V., Gtytzaj Z. V., Kabar A.
M., Savosko V. M., Kovalenko I. M., Davydov V. R., Suvorova K. M.,
Dudkina K. A., Kolinko O. M., Grygoryuk I. P. (2019b): Introduction
success of less common species from the genus Berberis L. Ukrainian
Journal of Ecology, 9 (4): 634-640. DOI: 10.15421/2019_801
Margalef R. (1958): Temporal succession and spatial heterogeneity in
phytoplankton. Perspectives in Marine biology, Buzzati-Traverso (ed.).
University of California Press, Berkeley, 323-347.
Martins B., Pereira A. N. (2018): Index for evaluation of public parks and
gardens proximity based on the mobility network: A case study of Braga,
Braganza and Viana do Castelo (Portugal) and Lugo and Pontevedra
(Spain). Urban Forestry and Urban Greening, 34: 134-140. DOI:
10.1016/j.ufug.2018.06.014
McDonald J. H. (2014): Handbook of biolological statistics. Sparky house
publishing, USA.
Savosko et al 124
Miller R. W., Hauer R. J., Werner L. P. (2015): Urban forestry: Planning and
managing urban greenspaces. Waveland Press, USA.
Nowak D. J., Hirabayashi S., Doyle M., McGovern M., Pasher J. (2018): Air
pollution removal by urban forests in Canada and its effect on air quality
and human health. Urban Forestry and Urban Greening, 29: 40-48. DOI:
10.1016/j.ufug.2017.10.019
Olander L. P., Johnston R. J., Tallis H., Kagan J., Maguire L. A., Polasky S.,
Urban D., Boyd J., Wainger L., Palmer M. (2018): Benefit relevant
indicators: ecosystem services measures that link ecological and social
outcomes. Ecological Indicators, 85: 1262-1272. DOI:
10.1016/j.ecolind.2017.12.001
Ostoić S. K., Fabio S. S., Borelli A. V. (2018): Urban forest research in the
Mediterranean: a systematic review. Urban Forestry and Urban Greening,
31: 185-196. DOI: 10.1016/j.ufug.2018.03.005
Pielou E. C. (1966): The measurement of diversity in different types of biological
collections. Journal of Theoretical Biology, 13: 131-144.
Pimentel-Gomes F., Garcia C. H. (2002). Statistics applied to agronomic
experiments and forest: Exposure with examples and guidelines for
application use. FEALQ, Piracicaba, 309.
Polupan М. І., Solovej V. B., Velichko V. A. (2005): Classification of soils at
Ukraine. Agrarian Science, Kyiv. (in Ukrainian)
Rapanoela R., Raulier F., Gauthier S. (2016): Regional instability in the
abundance of open stands in the boreal forest of Eastern Canada. Forests,
7: 103. DOI:10.3390/f7050103
Rode J., Wittmer H., Emerton L., Schröter-Schlaack C. (2016): „Ecosystem
service opportunities‟: a practice-oriented framework for identifying
economic instruments to enhance biodiversity and human livelihoods.
Journal for Nature Conservation, 33: 35-47. DOI:
10.1016/j.jnc.2016.07.001
Santini S. L., Belmaker J., Costello M. J., Pereira H. M., Rossberg A. G.,
Schipper A. M., Ceausu S., Dornelas M., Hilbers J. P., Hortal J., Huijbregts
M. A. J., Navarro L. M., Schiffers K. H., Visconti P., Rondinini C. (2017):
Assessing the suitability of diversity metrics to detect biodiversity change.
Biological Conservation, 213: 341-350. DOI:
10.1016/j.biocon.2016.08.024
Savosko V. M., Tovstolyak N. V. (2017): Ecological conditions of garden and
park territories of former iron mines (Kryvyi Rih Basin, Ukraine).
Ukrainian Journal of Ecology, 7 (4): 12–17. [in Ukrainian]
Savosko V., Lykholat Y., Domshyna K., Lykholat, T. (2018): Ecological and
geological determination of trees and shrubs‟ dispersal on the devastated
lands at Kryvorizhya. Journal of Geology, Geography and Geoecology, 27
(1): 116-130. DOI: 10.15421/111837 [in Ukrainian]
Structure and diversity of urban park stands at Kryvyi Rih ore-mining & metallurgical district… 125
Savosko V. M., Lykholat Y. V., Bielyk Yu. V., Lykholat T. Y. (2019a):
Ecological and geological determination of the initial pedogenesis on
devastated lands in the Kryvyi Rih Iron Mining & Metallurgical District
(Ukraine). Journal of Geology, Geography and Geoecology, 28 (4): 738-
746. DOI: https://doi.org/10.15421/111969
Savosko V. M., Tovstolyak N. V., Lykholat Yu. V., Grygoryuk I. P. (2019b):
Variability of botanical and ecological indicators of woodlands in gardens
& parks cultivated plant communities at Kryvyi Rih District. Biological
Systems: Theory and Innovation, 10 (3): 13-26. [in Ukrainian]
Savosko, V., Podolyak, A., Komarova, I., Karpenko, A (2020): Modern
environmental technologies of healthy soils contaminated by heavy metals
and radionuclides. E3S Web of Conferences, 166: 01007. DOI:
https://doi.org/10.1051/e3sconf/202016601007
Shannon C. E., Wiener W. (1949): The mathematical theory of communication.
University of Illinois Press: USA.
Simpson E. H. (1949): Measurement of diversity. Nature, 163: 688.
Soil Survey Staff (2014): Keys to Soil Taxonomy, 12th Edition. USDA-Natural
Resources Conservation Service, Washington DC.
Solomou A., Skoufogianni E. (2016): Alpha and Beta plant diversity in
multispecies agroecosystems of central Greece. Agriculture and Forestry,
62 (4): 19-25. DOI: 10.17707/AgricultForest.62.4.03
Song X. P., Tan P. Y., Edwards P., Richards D. (2018): The economic benefits
and costs of trees in urban forest stewardship: a systematic review. Urban
Forestry and Urban Greening, 29: 162-170. DOI:
10.1016/j.ufug.2017.11.017
Spake R., Doncaster P. (2017): Use of meta-analysis in forest biodiversity
research: key challenges and considerations. Forest Ecology and
Management, 400 (15): 429-437. DOI: 10.1016/j.foreco.2017.05.059
Tarasov V. V. (2012): Flora of Dnipropetrovsk and Zaporozhye regions. Lyra,
Ukraine. [in Ukrainian]
Terlyga N. S., Danylchuk O. V., Yukhimenko Yu. S., Fedorovskiy V. D.,
Danylchuk N. M. (2015): Cultivated dendroflora of parks and parks of
Kryvyi Rih: historical aspects of formation and modern state. Bulletin of
Kharkiv National Agrarian University: a series of biology, 2 (35): 93-101.
(in Ukrainian)
Urošević S., Vuković M., Pejčić B., Štrbac N. (2018): Mining-metallurgical
sources of pollution in eastern Serbia and environmental consciousness.
Revista internacional de contaminación ambiental, 34 (1): 103-115. DOI:
10.20937/RICA.2018.34.01.09
Vacek Z. (2017): Structure and dynamics of spruce-beech-fir forests in Nature
Reserves of the Orlické hory Mts. in relation to ungulate game. Central
European Forestry Journal, 63: 23–34. DOI: 10.1515/forj-2017-0006

Savosko et al 126
Verma P., Raghubanshi A. S. (2018): Urban sustainability indicators: challenges
and opportunities. Ecological Indicators, 93: 282-291. DOI:
10.1016/j.ecolind.2018.05.007
Voigt A., Kabisch N., Wurster D., Dagmar H., Breuste J. (2014): Structural
diversity: a multi-dimensional approach to assess recreational services in
urban parks. AMBIO, 43: 480-491. DOI: 10.1007/s13280-014-0508-9
West P. W. (2009): Tree and Forest Measurement. Springer-Verlag, Germany.
World reference base for soil resources (2014): International soil classification
system for naming soils and creating legends for soil maps. Food and
Agriculture Organization of the United Nations, Rome.
Agriculture & Forestry, Vol. 66 Issue 3: 127-138, 2020, Podgorica 127
Rajičić, V., Terzić, D., Perišić, V., Dugalić, M., Madić, M., Dugalić, G., Ljubičić, N. (2020): Impact of long-
term fertilization on yield in wheat grown on soil type vertisol. Agriculture and Forestry, 66 (3): 127-138.
DOI: 10.17707/AgricultForest.66.3.11
Vera RAJIČIĆ, Dragan TERZIĆ, Vesna PERIŠIĆ, Marijana DUGALIĆ,
Goran DUGALIĆ 2, Milomirka MADIĆ
3, Nataša LJUBIČIĆ
1
IMPACT OF LONG-TERM FERTILIZATION ON YIELD IN WHEAT
GROWN ON SOIL TYPE VERTISOL
SUMMARY
Experiments were carried out at stationary in Kragujevac, in Serbia, during
the three growing seasons. The primary aim of the research was perceiving of the
influence of long-term usage of the same amounts and rates of nitrogen,
phosphorus and potassium on the yield and grain quality of winter wheat variety
„Kruna“. Uptake NPK uptake by wheat ranged from 120 kg ha-1
nitrogen, from
60 to 100 kg ha-1
phosphorus and 60 kg ha-1
potassium, respectively, depending
on treatments type. The grain yield of the wheat was significantly lower in
control (treatment without fertilizer). The three-year grain yield of winter wheat
was the highest in the NP1K and NP2K (4.367 and 4.531 t ha-1
) treatments. In
terms of investigated traits, particularly grain yield and test weight fertilizer
expressed more efficiency in the 2014/2015. Variance analysis showed
statistically very significant differences for grain yield, 1.000-grain weight and
test weight between the vegetation seasons and very significant differences for
grain yield and 1000-grain weight between the variants of fertilization. Variance
analysis showed very significant differences for 1000-grain weight between the
interaction of the vegetation seasons and variants of fertilization.
It could be concluded that the grain yield in all treatments in the 2014/2015
growing season was significantly greater than in the other examined years, mostly
as the result of highly favorable weather conditions at major stages of plant
development wheat.
Keywords: fertilization, mineral nutrition, yield, wheat, correlation.
INTRODUCTION
In the last few decades, large experimental material about mineral nutrition
and fertilizing of wheat was gathered. However, taking into account the dominant
influence of the mineral nutrition in the synthesis of primary production of the
1Vera Rajičić, (corresponding author: [email protected]), Dragan Terzić, Vesna Perišić,
Marijana Dugalić, University of Niš, Faculty of Agriculture, Kosančićeva 4, Kruševac, SERBIA. 2Nataša Ljubičić, BioSense Institute, Zorana ĐinĎića 1, Novi Sad, SERBIA. 3Goran Dugalić, Milomirka Madić, University of Kragujevac, Faculty of Agronomy, Cara Dušana
34, Čačak, SERBIA.
Notes: The authors declare that they have no conflicts of interest. Authorship Form signed online.
Received:19/05/2020 Accepted:26/06/2020
Rajičić et al 128
organic matter and yield forming, this problem, intensively researched until now,
will stay in the focal point of researchers and practitioners as long as plants
cultivated (Kneţević et al., 2015). A constant advance in the selection and
creation of new varieties represents the strong impetus to research of different
problems of the mineral nutrition of wheat (Perišić et al., 2016; Khan et al., 2017;
Djuric et al., 2018; Jordanovska et al., 2018; Terzić et al., 2018a; Rajičić et al.,
2019). With the appearance of the new wheat variety (essentially distinguished in
a number of useful traits, a higher yield potential on the first place), it turned out
their demands are more pronounced according to mineral nutrition (Kneţević et
al., 2007; Jelić et al., 2016; Khan and Mohammad, 2016; Đekić et al., 2017a;
Tmušić et al., 2018).
Winter wheat use relatively large amounts of mineral elements during
vegetation and have high demands according to soil fertility (Jelić et al., 2014;
Đekić et al., 2017b). From the numerous macroelements from the soil, wheat use
nitrogen the most, something less potassium, even less phosphorus and the least
sulfur, magnesium, and calcium (Milivojević et al., 2018). Amounts of nutritional
elements from the soil used by wheat during vegetation mostly depend on the
grain yield level and the vegetative mass. In Serbia, the most often amounts of
nitrogen needed to be applied for high yield are ranged between 80-120 kg ha-1
depending on agrochemical properties of the soil (Malešević et al., 2010; Popović
et al., 2011; Đekić et al., 2014; Jelic et al., 2015; Terzic et al., 2018b; Rajičić et
al., 2019).
From the numerous macroelements, nitrogen, phosphorus, and potassium
are the most important for wheat growth and development and in certain
quantities and rates must be incorporated in almost all soil types, regardless it
represents direct nutrient usage or usage in preceding cultivated species (Popović
et al., 2011). Between the elements of mineral nutrition, the nitrogen has the
greatest role in yield increases of cultivated species (Kneţević et al., 2007; Đekić
et al., 2014; Terzic et al., 2018b; Madić et al., 2019), especially in wheat (Jelic et
al., 2015; Khan and Mohammad, 2016; Đekić et al., 2017a; Rajičić et al., 2020).
Nitrogen is showing the greatest effect through the joint usage with phosphorus
and potassium (Popović et al., 2011; Đekić et al., 2014; Jelić et al., 2014; Khan et
al., 2017; Terzic et al., 2018b; Kneţević et al., 2019; Rajičić et al., 2019).
The primary aim of the research was perceiving of the influence of long-
term usage of the same amounts and rates of nitrogen, phosphorus and potassium
on the yield and grain quality of winter wheat variety „Kruna“, during the three
growing seasons (2012/13, 2013/14 and 2014/15) on location Kragujevac in
Republic of Serbia.
MATERIAL AND METHODS
Experimental design
Effects of mineral nutrition efficiency of wheat have been studied at the
stationary field trial of the Small Grains Research Centre at Kragujevac location,
(44° 22′ N, 20° 56′ E, 173-220 m a. s. l.) of Šumadija district in Republic of

Impact of long-term fertilization on yield in wheat grown on soil type vertisol 129
Serbia, for three years period from 2013 to 2015. The winter wheat cultivar used
in the experiment was Kruna, the dominant cultivar in the production region of
Šumadija in Republic of Serbia. Fertilization was regular and followed a long-
time scheme. Wheat sowing was done on two separated stationary fields (A and
B) with corn rotation system.
Because of appearance of new demanded cultivars at permanent changes in
soil fertility level and environmental conditions, still exist need to researches
mineral nutrition of wheat, as well as determine optimal rates and balanced
nutrition ratios in concrete agro ecological conditions. The rates of nitrogen
application were 120 kg ha-1
N and they were applied either individually or in
combination with two phosphorus rates and a potassium fertilizer. A non-
fertilized variant served as a control. Eight variants of mineral nutrition N (120 kg
ha-1
N), P1 (60 kg ha-1
P2O5), P2 (100 kg ha-1
P2O5), NP1 (120 kg ha-1
N and 60 kg
ha-1
P2O5 ), NP2 (120 kg ha-1
N and 100 kg ha-1
P2O5), NP1K (120 kg ha-1
N, 60
kg ha-1
P2O5 and 60 kg ha-1
K2O), NP2K (120 kg ha-1
N, 100 kg ha-1
P2O5 and 60
kg ha-1
K2O) and untreated control were tested in the experiment. The fertilizers
applied were complex NPK fertilizers (15:15:15), superphosphate (17% P2O5)
and CAN (calcium ammonium nitrate) as a nitrogen fertilizer containing 27% N.
Total amounts of phosphorus and potassium fertilizers and half the nitrogen rate
are regularly applied during pre-sowing cultivation of soil.
Sowing in all three analyzed years was carried out in the second half of
October, at spacing between rows with of 12 cm, with a seed density of 500
germinating grains per m2. The trial was designed in a randomized block with
five replications. The crops were harvested at full maturity using (dates of
harvesting 17.07.2012, 15.07.2013 and 04.07.2014). Three parameters, namely
grain yield (t ha-1
), 1000-grain weight (g) and test weight (kg hl-1
) were analyzed.
Grain yield was harvested and reported at 14% moisture. The 1000-grain weight
was determined using an automatic seed counter. Test weight is the weight of a
measured volume of grain expressed in kilograms per hectoliter.
Soil analysis
The trial was set up on a vertisol soil in a process of degradation, with
heavy texture and very coarse and unstable structure (humus 2.2%, nitrogen
0.13%, phosphorus 2.0 mg 100 g-1
soil, potassium 20.0 mg K2O 100 g-1
soil and
pH in H2O 5.19).
Statistical analysis
The results were analyzed by the method of analyzing the variance of a
single-factorial trial (ANOVA) using the statistics module Analyst Program
SAS/STAT (SAS Institute, 2000). The significance of differences in mean values
of the treatments was tested by the LSD test. Relative dependence was defined
through correlation analysis (Pearson's correlation coefficient), and the
coefficients that were obtained were tested at the 5% and 1% levels of
significance.
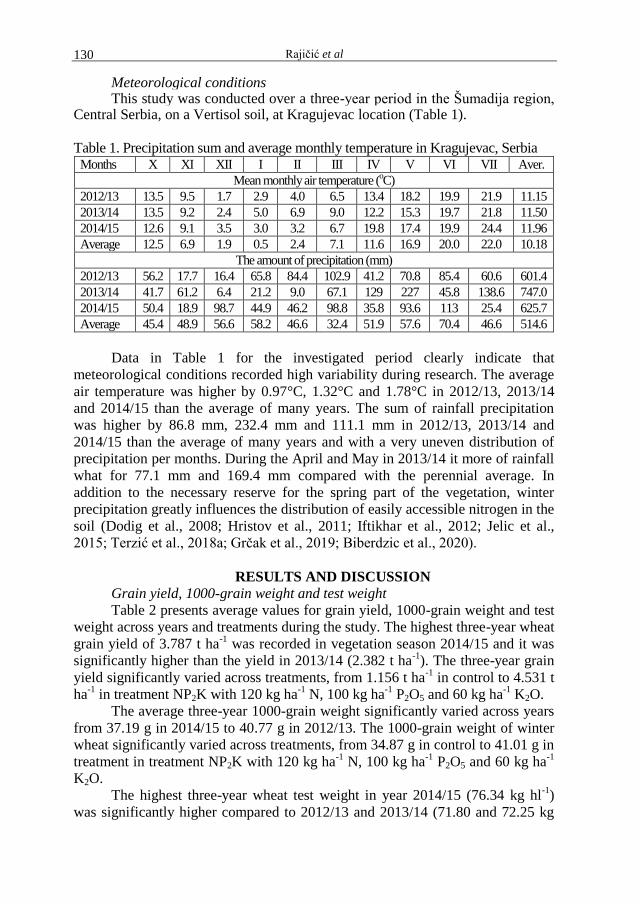
Rajičić et al 130
Meteorological conditions This study was conducted over a three-year period in the Šumadija region,
Central Serbia, on a Vertisol soil, at Kragujevac location (Table 1).
Table 1. Precipitation sum and average monthly temperature in Kragujevac, Serbia Months X XI XII I II III IV V VI VII Aver.
Mean monthly air temperature (oC)
2012/13 13.5 9.5 1.7 2.9 4.0 6.5 13.4 18.2 19.9 21.9 11.15
2013/14 13.5 9.2 2.4 5.0 6.9 9.0 12.2 15.3 19.7 21.8 11.50
2014/15 12.6 9.1 3.5 3.0 3.2 6.7 19.8 17.4 19.9 24.4 11.96
Average 12.5 6.9 1.9 0.5 2.4 7.1 11.6 16.9 20.0 22.0 10.18
The amount of precipitation (mm)
2012/13 56.2 17.7 16.4 65.8 84.4 102.9 41.2 70.8 85.4 60.6 601.4
2013/14 41.7 61.2 6.4 21.2 9.0 67.1 129 227 45.8 138.6 747.0
2014/15 50.4 18.9 98.7 44.9 46.2 98.8 35.8 93.6 113 25.4 625.7
Average 45.4 48.9 56.6 58.2 46.6 32.4 51.9 57.6 70.4 46.6 514.6
Data in Table 1 for the investigated period clearly indicate that
meteorological conditions recorded high variability during research. The average
air temperature was higher by 0.97°C, 1.32°C and 1.78°C in 2012/13, 2013/14
and 2014/15 than the average of many years. The sum of rainfall precipitation
was higher by 86.8 mm, 232.4 mm and 111.1 mm in 2012/13, 2013/14 and
2014/15 than the average of many years and with a very uneven distribution of
precipitation per months. During the April and May in 2013/14 it more of rainfall
what for 77.1 mm and 169.4 mm compared with the perennial average. In
addition to the necessary reserve for the spring part of the vegetation, winter
precipitation greatly influences the distribution of easily accessible nitrogen in the
soil (Dodig et al., 2008; Hristov et al., 2011; Iftikhar et al., 2012; Jelic et al.,
2015; Terzić et al., 2018a; Grčak et al., 2019; Biberdzic et al., 2020).
RESULTS AND DISCUSSION
Grain yield, 1000-grain weight and test weight
Table 2 presents average values for grain yield, 1000-grain weight and test
weight across years and treatments during the study. The highest three-year wheat
grain yield of 3.787 t ha-1
was recorded in vegetation season 2014/15 and it was
significantly higher than the yield in 2013/14 (2.382 t ha-1
). The three-year grain
yield significantly varied across treatments, from 1.156 t ha-1
in control to 4.531 t
ha-1
in treatment NP2K with 120 kg ha-1
N, 100 kg ha-1
P2O5 and 60 kg ha-1
K2O.
The average three-year 1000-grain weight significantly varied across years
from 37.19 g in 2014/15 to 40.77 g in 2012/13. The 1000-grain weight of winter
wheat significantly varied across treatments, from 34.87 g in control to 41.01 g in
treatment in treatment NP2K with 120 kg ha-1
N, 100 kg ha-1
P2O5 and 60 kg ha-1
K2O.
The highest three-year wheat test weight in year 2014/15 (76.34 kg hl-1
)
was significantly higher compared to 2012/13 and 2013/14 (71.80 and 72.25 kg
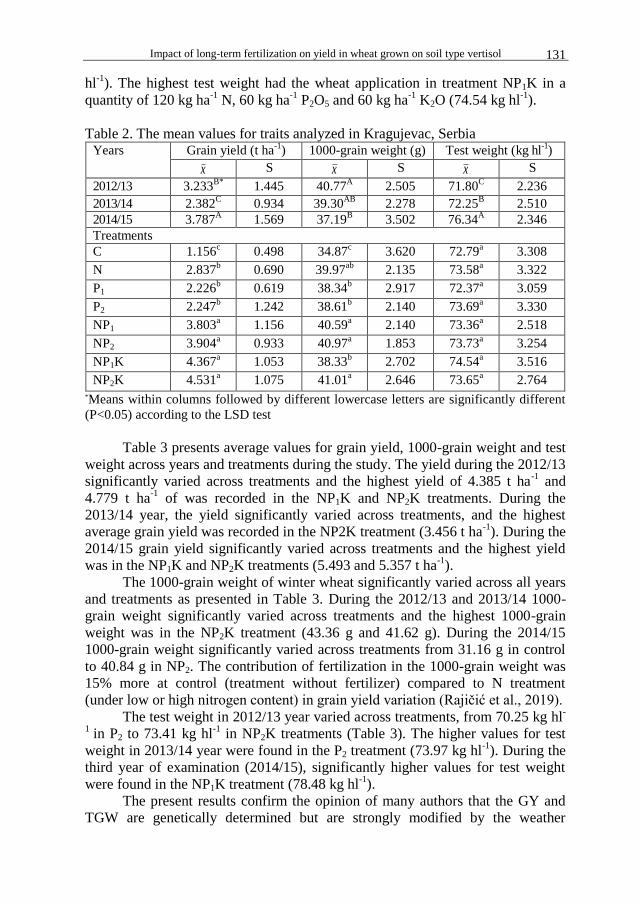
Impact of long-term fertilization on yield in wheat grown on soil type vertisol 131
hl-1
). The highest test weight had the wheat application in treatment NP1K in a
quantity of 120 kg ha-1
N, 60 kg ha-1
P2O5 and 60 kg ha-1
K2O (74.54 kg hl-1
).
Table 2. The mean values for traits analyzed in Kragujevac, Serbia Years Grain yield (t ha
-1) 1000-grain weight (g) Test weight (kg hl
-1)
x S x S x S
2012/13 3.233B*
1.445 40.77A
2.505 71.80C
2.236
2013/14 2.382C
0.934 39.30AB
2.278 72.25B
2.510
2014/15 3.787A 1.569 37.19
B 3.502 76.34
A 2.346
Treatments
C 1.156c
0.498 34.87c
3.620 72.79a
3.308
N 2.837b
0.690 39.97ab
2.135 73.58a
3.322
P1 2.226b
0.619 38.34b
2.917 72.37a
3.059
P2 2.247b
1.242 38.61b
2.140 73.69a
3.330
NP1 3.803a
1.156 40.59a
2.140 73.36a
2.518
NP2 3.904a
0.933 40.97a
1.853 73.73a
3.254
NP1K 4.367a
1.053 38.33b
2.702 74.54a
3.516
NP2K 4.531a
1.075 41.01a
2.646 73.65a
2.764 *Means within columns followed by different lowercase letters are significantly different
(P<0.05) according to the LSD test
Table 3 presents average values for grain yield, 1000-grain weight and test
weight across years and treatments during the study. The yield during the 2012/13
significantly varied across treatments and the highest yield of 4.385 t ha-1
and
4.779 t ha-1
of was recorded in the NP1K and NP2K treatments. During the
2013/14 year, the yield significantly varied across treatments, and the highest
average grain yield was recorded in the NP2K treatment (3.456 t ha-1
). During the
2014/15 grain yield significantly varied across treatments and the highest yield
was in the NP1K and NP2K treatments (5.493 and 5.357 t ha-1
).
The 1000-grain weight of winter wheat significantly varied across all years
and treatments as presented in Table 3. During the 2012/13 and 2013/14 1000-
grain weight significantly varied across treatments and the highest 1000-grain
weight was in the NP2K treatment (43.36 g and 41.62 g). During the 2014/15
1000-grain weight significantly varied across treatments from 31.16 g in control
to 40.84 g in NP2. The contribution of fertilization in the 1000-grain weight was
15% more at control (treatment without fertilizer) compared to N treatment
(under low or high nitrogen content) in grain yield variation (Rajičić et al., 2019).
The test weight in 2012/13 year varied across treatments, from 70.25 kg hl-
1 in P2 to 73.41 kg hl
-1 in NP2K treatments (Table 3). The higher values for test
weight in 2013/14 year were found in the P2 treatment (73.97 kg hl-1
). During the
third year of examination (2014/15), significantly higher values for test weight
were found in the NP1K treatment (78.48 kg hl-1
).
The present results confirm the opinion of many authors that the GY and
TGW are genetically determined but are strongly modified by the weather
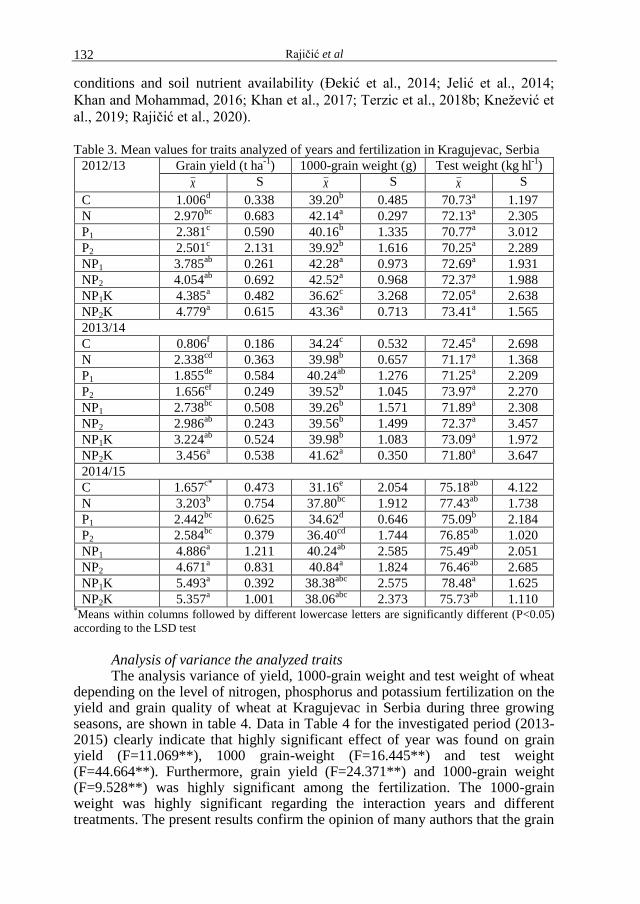
Rajičić et al 132
conditions and soil nutrient availability (Đekić et al., 2014; Jelić et al., 2014;
Khan and Mohammad, 2016; Khan et al., 2017; Terzic et al., 2018b; Kneţević et
al., 2019; Rajičić et al., 2020).
Table 3. Mean values for traits analyzed of years and fertilization in Kragujevac, Serbia
2012/13 Grain yield (t ha-1
) 1000-grain weight (g) Test weight (kg hl-1)
x S x S x S
C 1.006d
0.338 39.20b
0.485 70.73a
1.197
N 2.970bc
0.683 42.14a
0.297 72.13a
2.305
P1 2.381c
0.590 40.16b
1.335 70.77a
3.012
P2 2.501c
2.131 39.92b
1.616 70.25a
2.289
NP1 3.785ab
0.261 42.28a
0.973 72.69a
1.931
NP2 4.054ab
0.692 42.52a
0.968 72.37a
1.988
NP1K 4.385a
0.482 36.62c
3.268 72.05a
2.638
NP2K 4.779a
0.615 43.36a
0.713 73.41a
1.565
2013/14
C 0.806f
0.186 34.24c
0.532 72.45a
2.698
N 2.338cd
0.363 39.98b
0.657 71.17a
1.368
P1 1.855de
0.584 40.24ab
1.276 71.25a
2.209
P2 1.656ef
0.249 39.52b
1.045 73.97a
2.270
NP1 2.738bc
0.508 39.26b
1.571 71.89a
2.308
NP2 2.986ab
0.243 39.56b
1.499 72.37a
3.457
NP1K 3.224ab
0.524 39.98b
1.083 73.09a
1.972
NP2K 3.456a
0.538 41.62a
0.350 71.80a
3.647
2014/15
C 1.657c*
0.473 31.16e
2.054 75.18ab
4.122
N 3.203b
0.754 37.80bc
1.912 77.43ab
1.738
P1 2.442bc
0.625 34.62d
0.646 75.09b
2.184
P2 2.584bc
0.379 36.40cd
1.744 76.85ab
1.020
NP1 4.886a
1.211 40.24ab
2.585 75.49ab
2.051
NP2 4.671a
0.831 40.84a
1.824 76.46ab
2.685
NP1K 5.493a
0.392 38.38abc
2.575 78.48a
1.625
NP2K 5.357a
1.001 38.06abc
2.373 75.73ab
1.110 *Means within columns followed by different lowercase letters are significantly different (P<0.05)
according to the LSD test
Analysis of variance the analyzed traits The analysis variance of yield, 1000-grain weight and test weight of wheat
depending on the level of nitrogen, phosphorus and potassium fertilization on the yield and grain quality of wheat at Kragujevac in Serbia during three growing seasons, are shown in table 4. Data in Table 4 for the investigated period (2013-2015) clearly indicate that highly significant effect of year was found on grain yield (F=11.069**), 1000 grain-weight (F=16.445**) and test weight (F=44.664**). Furthermore, grain yield (F=24.371**) and 1000-grain weight (F=9.528**) was highly significant among the fertilization. The 1000-grain weight was highly significant regarding the interaction years and different treatments. The present results confirm the opinion of many authors that the grain

Impact of long-term fertilization on yield in wheat grown on soil type vertisol 133
yield and 1000-grain weight are genetically determined but are strongly modified by the weather conditions and soil nutrient availability (Đekić et al. 2014, 2017a; Jelic et al., 2014, 2015; Khan et al., 2017; Milivojević et al., 2018; Popovic et. al., 2017; Terzić et al., 2018a; Tmušić et al., 2018; Rajičić et. al., 2019). Application of mineral fertilizers has a significant impact on 1000-grain weight which is significantly higher in more intensively fertilized variants as observed by Đekić et al. (2014), Terzić et al. (2018a) and Rajičić et al. (2020).
Table 4. The analysis of variance for the tested parameters in Kragujevac, Serbia
Effect df Mean sqr
Effect
Mean sqr
Error F p-level
The analysis of variance for grain yield
Year, (Y) 2. 117 20.014 1.808 11.069**
0.000
Fertilization, (F) 7. 112 21.695 0.890 24.371**
0.000
Year x Fertilization, (YxF) 14. 96 0.629 0.530 1.188 0.297
The analysis of variance for 1000-grain weight
Year, (Y) 2. 117 130.056 7.908 16.445**
0.000
Fertilization, (F) 7. 112 63.204 6.634 9.528**
0.000
Year x Fertilization, (YxF) 14. 96 17.105 2.535 6.747**
0.008
The analysis of variance for test weight
Year, (Y) 2. 117 250.198 5.602 44.664**
0.000
Fertilization, (F) 7. 112 6.417 9.919 0.647 0.716
Year x Fertilization, (YxF) 14. 96 5.631 5.538 1.017 0.444 nsnon significant; *significant at 0.05; **significant at 0.01;
Table 5. Correlations between for traits analyzed by vegetation seasons Correlations between the traits analyzed in 2012/13
Traits Grain yield (t ha-1
) 1000-grain weight (g) Test weight (kg hl-1)
Grain yield (t ha-1
) 1.00 0.219ns
0.374*
1000-grain weight (g)
1.00 0.170ns
Test weight (kg hl-1)
1.00
Correlations between the traits analyzed in 2013/14
Grain yield (t ha-1
) 1.00 0.683**
-0.022ns
1000-grain weight (g)
1.00 -0.143ns
Test weight (kg hl-1)
1.00
Correlations between the traits analyzed in 2014/15
Grain yield (t ha-1
) 1.00 0.733**
0.094ns
1000-grain weight (g)
1.00 0.565ns
Test weight (kg hl-1)
1.00
nsnon significant; *significant at 0.05; **significant at 0.01;
Correlations between the analyzed traits Table 5 presents the correlation coefficients between the years and
examined traits. Positive and significant correlation coefficients, in 2012/13, were found between grain yield and test weight (r=0.374*). Highly significant and positive correlation coefficients, in 2013/14, as presented in Table 5, were found
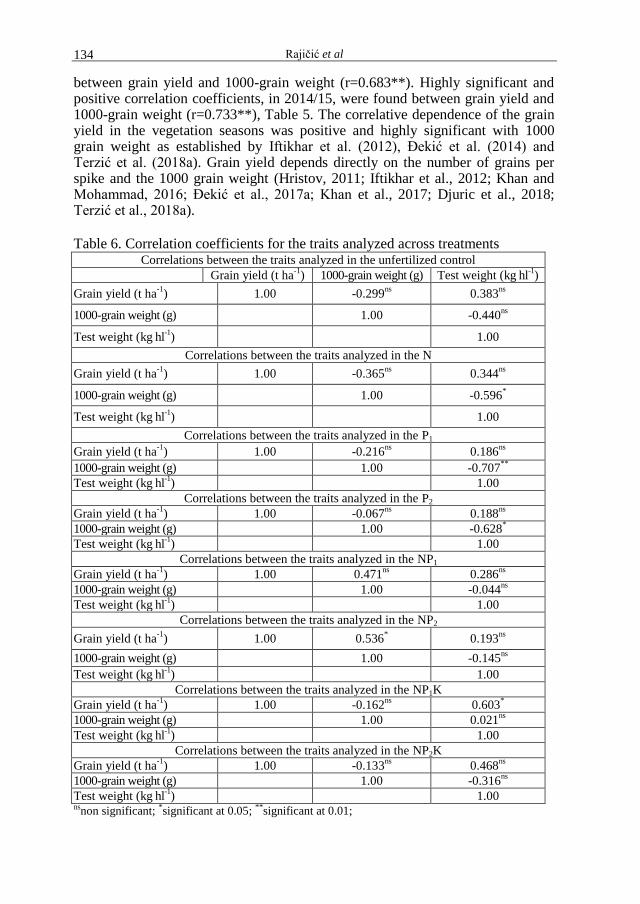
Rajičić et al 134
between grain yield and 1000-grain weight (r=0.683**). Highly significant and positive correlation coefficients, in 2014/15, were found between grain yield and 1000-grain weight (r=0.733**), Table 5. The correlative dependence of the grain yield in the vegetation seasons was positive and highly significant with 1000 grain weight as established by Iftikhar et al. (2012), Đekić et al. (2014) and Terzić et al. (2018a). Grain yield depends directly on the number of grains per spike and the 1000 grain weight (Hristov, 2011; Iftikhar et al., 2012; Khan and Mohammad, 2016; Đekić et al., 2017a; Khan et al., 2017; Djuric et al., 2018; Terzić et al., 2018a).
Table 6. Correlation coefficients for the traits analyzed across treatments Correlations between the traits analyzed in the unfertilized control
Grain yield (t ha-1
) 1000-grain weight (g) Test weight (kg hl-1)
Grain yield (t ha-1
) 1.00 -0.299ns
0.383ns
1000-grain weight (g)
1.00 -0.440ns
Test weight (kg hl-1)
1.00
Correlations between the traits analyzed in the N
Grain yield (t ha-1
) 1.00 -0.365ns
0.344ns
1000-grain weight (g)
1.00 -0.596*
Test weight (kg hl-1)
1.00
Correlations between the traits analyzed in the P1
Grain yield (t ha-1
) 1.00 -0.216ns
0.186ns
1000-grain weight (g)
1.00 -0.707**
Test weight (kg hl-1)
1.00
Correlations between the traits analyzed in the P2
Grain yield (t ha-1
) 1.00 -0.067ns
0.188ns
1000-grain weight (g)
1.00 -0.628*
Test weight (kg hl-1)
1.00
Correlations between the traits analyzed in the NP1
Grain yield (t ha-1
) 1.00 0.471ns
0.286ns
1000-grain weight (g)
1.00 -0.044ns
Test weight (kg hl-1)
1.00
Correlations between the traits analyzed in the NP2
Grain yield (t ha-1
) 1.00 0.536*
0.193ns
1000-grain weight (g)
1.00 -0.145ns
Test weight (kg hl-1)
1.00
Correlations between the traits analyzed in the NP1K
Grain yield (t ha-1
) 1.00 -0.162ns
0.603*
1000-grain weight (g)
1.00 0.021ns
Test weight (kg hl-1)
1.00
Correlations between the traits analyzed in the NP2K
Grain yield (t ha-1
) 1.00 -0.133ns
0.468ns
1000-grain weight (g)
1.00 -0.316ns
Test weight (kg hl-1)
1.00
nsnon significant; *significant at 0.05; **significant at 0.01;
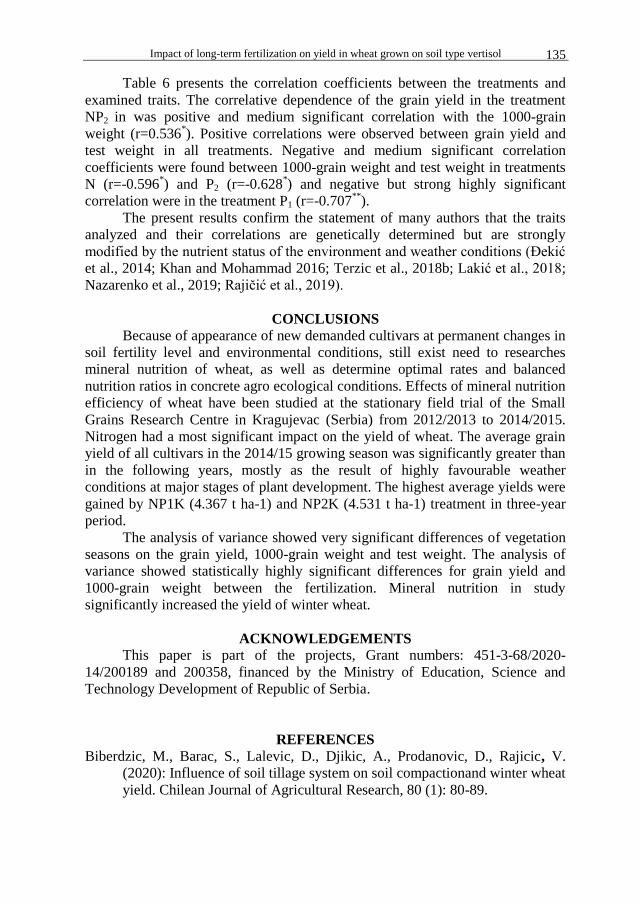
Impact of long-term fertilization on yield in wheat grown on soil type vertisol 135
Table 6 presents the correlation coefficients between the treatments and
examined traits. The correlative dependence of the grain yield in the treatment
NP2 in was positive and medium significant correlation with the 1000-grain
weight (r=0.536*). Positive correlations were observed between grain yield and
test weight in all treatments. Negative and medium significant correlation
coefficients were found between 1000-grain weight and test weight in treatments
N (r=-0.596*) and P2 (r=-0.628
*) and negative but strong highly significant
correlation were in the treatment P1 (r=-0.707**
).
The present results confirm the statement of many authors that the traits
analyzed and their correlations are genetically determined but are strongly
modified by the nutrient status of the environment and weather conditions (Đekić
et al., 2014; Khan and Mohammad 2016; Terzic et al., 2018b; Lakić et al., 2018;
Nazarenko et al., 2019; Rajičić et al., 2019).
CONCLUSIONS
Because of appearance of new demanded cultivars at permanent changes in
soil fertility level and environmental conditions, still exist need to researches
mineral nutrition of wheat, as well as determine optimal rates and balanced
nutrition ratios in concrete agro ecological conditions. Effects of mineral nutrition
efficiency of wheat have been studied at the stationary field trial of the Small
Grains Research Centre in Kragujevac (Serbia) from 2012/2013 to 2014/2015.
Nitrogen had a most significant impact on the yield of wheat. The average grain
yield of all cultivars in the 2014/15 growing season was significantly greater than
in the following years, mostly as the result of highly favourable weather
conditions at major stages of plant development. The highest average yields were
gained by NP1K (4.367 t ha-1) and NP2K (4.531 t ha-1) treatment in three-year
period.
The analysis of variance showed very significant differences of vegetation
seasons on the grain yield, 1000-grain weight and test weight. The analysis of
variance showed statistically highly significant differences for grain yield and
1000-grain weight between the fertilization. Mineral nutrition in study
significantly increased the yield of winter wheat.
ACKNOWLEDGEMENTS
This paper is part of the projects, Grant numbers: 451-3-68/2020-
14/200189 and 200358, financed by the Ministry of Education, Science and
Technology Development of Republic of Serbia.
REFERENCES
Biberdzic, M., Barac, S., Lalevic, D., Djikic, A., Prodanovic, D., Rajicic, V.
(2020): Influence of soil tillage system on soil compactionand winter wheat
yield. Chilean Journal of Agricultural Research, 80 (1): 80-89.
Rajičić et al 136
Dodig D., Zorić M., Kneţević D., King S., Šurlan-Momirović G. (2008):
Genotype x environment interaction for wheat yield in different drought
stress conditions and agronomic traits suitable for selection. Aust. J. Agr.
Res., 59: 536-545.
Đekić V., Milovanović M., Popović V., Milivojević J., Staletić M., Jelić M.,
Perišić, V. (2014): Effects of fertilization on yield and grain quality in
winter triticale. Rom. Agric. Res., 31: 175-183.
Đekić V., Jelić M., Milivojević J., Popović V., Branković S., Staletić M., Terzić
D. (2017a): Winter wheat yield and yield components depending on the
level of nitrogen, phosphorus and potassium fertilization. Proceedings, VIII
International Scientific Agriculture Symposium "Agrosym 2017", 05-08
October, Jahorina, 650-657.
Đekić V., Milivojević J., Jelić M., Popović V., Branković S., Biberdţić M.,
Terzić D. (2017b): Effects of fertilization on production traits of
Takovčanka cultivar of winter wheat. Proceedings, 2nd International and
14th National Congress of Soil Science Society of Serbia “Solutions and
Projections for Sustainable Soil Management”. NSoil 2017, 25-28th
September 2017, Novi Sad, Serbia, 49-54.
Djuric N., Prodanovic S., Brankovic G., Djekic V., Cvijanovic G., Zilic S.,
Dragicevic V., Zecevic V., Dozet G. (2018): Correlation-Regression
Analysis of Morphological-Production Traits of Wheat Varieties. Rom.
Biotech. Lett. 23 (2): 13457-13465.
Grčak M., Grčak D., Grčak D., Aksić M., Gudţić S., Nikolić K., Rajičić V.
(2019): Phosphorus, potassium and nitrogen abundance in soil of Doljevac
municipalit. Proceedings, X International Scientific Agriculture
Symposium "Agrosym 2019", Jahorina, October 03-06, 2019, 1169-1173.
Hristov N., Мladenov N., Кondić-Špika А. (2011): Effect of environmental and
genetic factors on the correlation and stability of grain yield components in
wheat. Genetika, 43 (1): 141-152.
Iftikhar R., Khaliq I., Ijaz M., Rahman A.M. (2012): Association analysis of grain
yield and its components in spring wheat (Triticum aestivum L.). Amer.
Euras. J. Agric. Envir. Sci., 12 (3): 289-392.
Jelić M., Milivojević J., Đekić V., Paunović A., Tmušić N. (2014): Impact of
liming and fertilization on grain yield and utilization of nitrogen and
phosphorus in wheat plant grown on soil type pseudogley. Proceedings of
research papers PKB Agroekonomik, Belgarde, 20 (1-4): 49-56.
Jelic M., Milivojevic J., Nikolic O., Djekic V., Stamenkovic S. (2015): Effect of
long-term fertilization and soil amendments on yield, grain quality and
nutrition optimization in winter wheat on an acidic pseudogley. Rom.
Agric. Res., 32: 165-174.
Jelić M., Milivojević J., Paunović A., Madić M., Đekić V. (2016): Adaptation of
winter wheat genotypes to low ph and high mobile al content in the soil.
Proceedings, VII International Scientific Sympozium "Agrosym Jahorina
2016", AGROSYM, 06-09. October, Jahorina, 762-767.
Impact of long-term fertilization on yield in wheat grown on soil type vertisol 137
Jordanovska S., Jovović Z., Dolijanović Ţ., Dragičević V., Branković G., Đekić
V. (2018): Nutritional properties of Macedonian landraces of small grain
cereals as a source of new genetic variability. Genetika, 50 (3): 863-883.
doi: 10.2298/GENSR1803863J
Knezevic D., Paunovic A., Madic M., Djukic N. (2007): Genetic analysis of
nitrogen accumulation in four wheat cultivars and their hybrids. Cereal
Res. Commun., 35 (2): 633-336.
Kneţević D., Radosavac A., Zelenika M. (2015): Variability of grain weight per
spike of wheat grown in different ecological conditions. Acta Agriculturae
Serbica, 20 (39): 85-95.
Kneţević D., Paunović A., Kondić D., Radosavac A., Laze A., Kovačević V.,
Mićanović D. (2019): Variability in seed germination of barley cultivars
(Hordeum vulgare L.) grown under different nitrogen application rates.
Acta Agriculturae Serbica, 24 (47): 61-69. doi: 10.5937/AASer1947061K
Khan F.U. and F. Mohammad (2016): Application of stress selection indices for
assessment of nitrogen tolerance in wheat (Triticum aestivum L.). The J.
Anim. Plant Sci., 26 (1): 201-210.
Khan F.U., Mohammad F., Raziuddin. Z., Shah M., Ahmad M., Shah Z. (2017):
Genotypic differences and genotype × nitrogen interactions for yield traits
in bread wheat. The J. Anim. Plant Sci., 27 (4): 1264-1268.
Lakić Ţ., Glamočlija Đ., Kondić D., Popović V., Pavlović S. (2018): Krmne
biljke i ţita u funkciji zaštite zemljišta od degradacije. Monografija.
Poljoprivredni fakultet Banja Luka. ISBN 978-99938-93-47, p. 1 - 405.
Madić, M., Kneţević, D., Đurović, D., Paunović, A., Stevović, V., Tomić, D.,
Đekić V. (2019): Assessment of the correlation between grain yield and its
components in spring barley on an acidic soil. Acta agriculturae Serbica,
24 (47): 41-49. doi: 10.5937/AASer1947041M
Malešević M., Glamočlija Đ., Prţulj N., Popović V., Stanković S., Ţivanović T.,
Tapanarova A. (2010): Production characteristics of different malting
barley genotypes in intensive nitrogen fertilization. Genetika, Belgrade,
42(2): 323-330.
Milivojević J., Bošković-Rakočević Lj., Đekić V., Luković K., Simić Z. (2018):
Cultivar-specific accumulation of iron, manganese, zinc and copper in
winter wheat grain (Triticum aestivum L.). J. Centr. Eur. Agric., 19 (2):
423-436. doi: 10.5513/JCEA01/19.2.2051
Nazarenko, M., Mykolenko, S., Chernysky, V. (2019): Modern Ukrainian winter
wheat varieties grain productivity and quality at ecological exam.
Agriculture and Forestry, 65 (1): 127-136.
DOI:10.17707/AgricultForest.65.1.13
Perišić V., Perišić V., Ţivanović T., Milovanović M., Đekić V., Staletić M.,
Luković K. (2016): Comparative stability analysis of yield components of
wheat genotypes. Proceedings, XX International Eco-Conference® 2016,
9th Eco-Conference® on Safe Food, 28-30. September 2016, Novi Sad,
Serbia, 63-72.
Rajičić et al 138
Popović, V., M. Tatić, V. Spalević, V. Rajičić, V. Filipović, LJ. Šarčević-
Todosijević and P. Stevanović (2017): Effect of nitrogen fertilization on
soybean plant height in arid year. Proceedings, 2nd International and 14th
National Congress of Soil Science Society of Serbia “Solutions and
Projections for Sustainable Soil Management”. 25-28th September 2017,
Novi Sad, Serbia, 65-73.
Rajičić V., Milivojević J., Popović V., Branković S., Đurić N., Perišić V., Terzić
D. (2019): Winter wheat yield and quality depending on the level of
nitrogen, phosphorus and potassium fertilization. Agriculture and Forestry,
65 (2): 79-88. DOI: 10.17707/AgricultForest.65.2.06
Rajičić, V., Popović, V., Perišić, V., Biberdţić, M., Jovović, Z., Gudţić, N.,
Mihailović, V., Čolić, V., Đurić, N., Terzić, D. (2020): Impact of Nitrogen
and Phosphorus on Grain Yield in Winter Triticale Grown on Degraded
Vertisol. Agronomy, 2020, 10 (6): 757.
SAS/STAT (2000): User's Guide, Version 9.1.3. SAS Institute Inc.
Terzić D., Đekić V., Milivojević J., Branković S., Perišić V., Perišić V., Đokić D.
(2018a): Yield components and yield of winter wheat in different years of
research. Biologica Nyssana, 9 (2): 119-131. doi: 10.5281/zenodo.2538604
Terzic D., Đekić V., Jevtic S., Popovic V., Jevtic A., Mijajlovic J., Jevtic A.
(2018b): Effect of longterm fertilization on grain yield and yield
components in winter triticale. The J. Anim Plant Sci. 28(3): 830-836.
Tmušić N., Kneţević J., Đekić V., Nikolić K. (2018): The influence of weather
conditions and fertilizing method on plant height at different cultivars of
winter wheat. Proceedings, IX International Scientific Agriculture
Symposium "Agrosym 2018", Jahorina, October 04-06, 2018; 385-389.
Agriculture & Forestry, Vol. 66 Issue 3: 139-154, 2020, Podgorica 139
Giannoulis, K., Platis, I., Gougoulias, N., Wogiatzi, E. (2020): Influence of Trichoderma harzianum and Glomus
mycorrhiza on biomass and essential oil yield of organic Ocimum basilicum cultivation. Agriculture and
Forestry, 66 (3): 139-154
DOI: 10.17707/AgricultForest.66.3.12
Kyriakos GIANNOULIS1, Ilias PLATIS
2,
Nikolaos GOUGOULIAS2, Eleni WOGIATZI
2
INFLUENCE OF Trichoderma harzianum AND Glomus mycorrhiza ON
BIOMASS AND ESSENTIAL OIL YIELD OF ORGANIC
Ocimum basilicum CULTIVATION
SUMMARY
The growing interest in dealing with the cultivation of aromatic –
medicinal plants requires the study of factors related to the production process,
which includes the development of plants in field, as well as their processing and
the receipt of essential oils. The aim of this study was to investigate the effect of
two organic formulations, Trichoderma harzianum (T22), and Glomus
mycorrhiza (G), in the cultivation of seedlings of Ocimum basilicum variety
"Genovese" fresh and dry weight, as well as essential oil content and its quality
characteristics. For the purposes of the study a field experiment was conducted in
2018 and 2019, using a factorial experimental design, with two factors: a) control,
b) Trichoderma harzianum (T22) and c) Mycorizas Glomus (G) under four
replicates. There was found statistically significantly difference between the two
harvests occurred in each year on fresh and dry weight while no significant
difference was recorded through the tested treatments. Furthermore, there was
recorded a decrease in the essential oil yield between the cultivating years
(approximately 14%), and also between annual cuts.
Finally, the most remarkable finding was that although the different
treatments did not show significant differences in the quantitative characteristics
of sweet basil in the case of quality characteristics with mycorrhiza treatments
essential oil having 40 identified ingredients instead of 21 that identified in
control. Therefore, the use of these organic formulations is suggested to be used
only in case of essential oil production where a predetermined quality of essential
oil will be known.
Keywords: aromatic-medicinal plants, Ocimum basilicum, organic plant
production, yield, essential oil
1Giannoulis Kyriakos, (corresponding author: [email protected]), University of
Thessaly, Dept of Agriculture, Crop Production and Rural Environment, Laboratory of Agronomy
and Applied Crop Physiology, Fytokoy Str., 38446 Volos, GREECE. 2Platis Ilias, Gougoulias Nikolaos, Wogiatzi Eleni, University of Thessaly, Department of
Agrotechnology, 41110, Larissa, GREECE.
Notes: The authors declare that they have no conflicts of interest. Authorship Form signed online.
Received:03/07/2020 Accepted:05/08/2020
Giannoulis et al 140
INTRODUCTION
Ocimum basilicum is a herbaceous plant of Lamiaceae family (Grayer et
al., 1996) with annual and perennial species. It is one of the most popular
aromatic plants and is widely used in cooking (Chalchat and Ozcan, 2008),
pharmaceutical (Ahmed et al., 2014), confectionery and perfumery (Nguyen et
al., 2010). Basil (Ocimum basilicum L.) in the science of medicine is called Herba
Basilici and it is the most economically important species (Bravo et al., 2008).
It is considered to be native to the tropical and subtropical zones of Africa
and Asia. It was firstly spread to India and other regions of Asia (Klimánková et
al., 2008) and later on to Greece and the Mediterranean basin (Marotti et al. 1996;
Sanda et al. 1998; Martins et al. 1999). It appeared in North America around 1620
through the first European settlers.
Ocimum genus includes more than 50 species. Ocimum basilicum is an
economically and industrially important plant. It is a versatile plant with many
different morphological characteristics, such as the size, the color and the texture
of the leaves, the color of the inflorescence, but also the chemical composition of
the essential oil. Basil has a smooth or slightly fluffy shoot, multi-branched with a
height ranging up to 1 m (Blank et al., 2004). Its growth in width is almost the
same as in height.
It is cultivated in areas with temperate climates, mild and short winters and
cool summers. Basil requires high growth temperatures, with an excellent of
25°C. At temperatures below 7°C, especially in the early growing stages, the
damage is irreversible. It is cultivated in rich and light soils, with a pH that can
range from 4.5-8.2 (with an excellent value of 6.4), warmly sunny, irrigated and
well drained. It has high water requirements, especially on hot summer days, but
it needs attention to excessive watering.
Transplanting takes place in April-May at distances of 30-40 x 40-50 cm,
by hand or with automatic transplanting machines in properly prepared soil.
Before transplanting the plants are pruned at a height of 15 cm to encourage the
growth of lateral branches. The broadleaf basil does not stop growing even at
flowering stage.
The essential oil is stored in glandular trichomes of leaves (Sangwan et al.,
2001) and it is used in fungicides or insecticides and in various pharmaceutical
and industrial products (Grayer et al., 1996). The global production of basil
essential oil varies from 50 to 100 tones (Lubbe and Verpoorte, 2011), while it is
reported that Indian basil essential oil yield varies from 132.0 to 162.5 kg ha−1
(Singh et al., 2010). Basil essential oil contains antifungal anti-bacterial
properties and it is used as aromatic agents in food, perfumery and
pharmaceutical industries (Varban et al., 2010; Wannissorn et al., 2005). The
qualitative and quantitative improvement of essential oil production represents an
area of high commercial interest (Copetta et al., 2006).
Nowadays, there is a high interest for organic products. In literature is
reported investigation on different bio-fertilizers and/or symbiosis with fungi
(Augé, 2001; Xavier and Boyetchko, 2002; Lee et al., 2013; Bharti et al., 2016) in
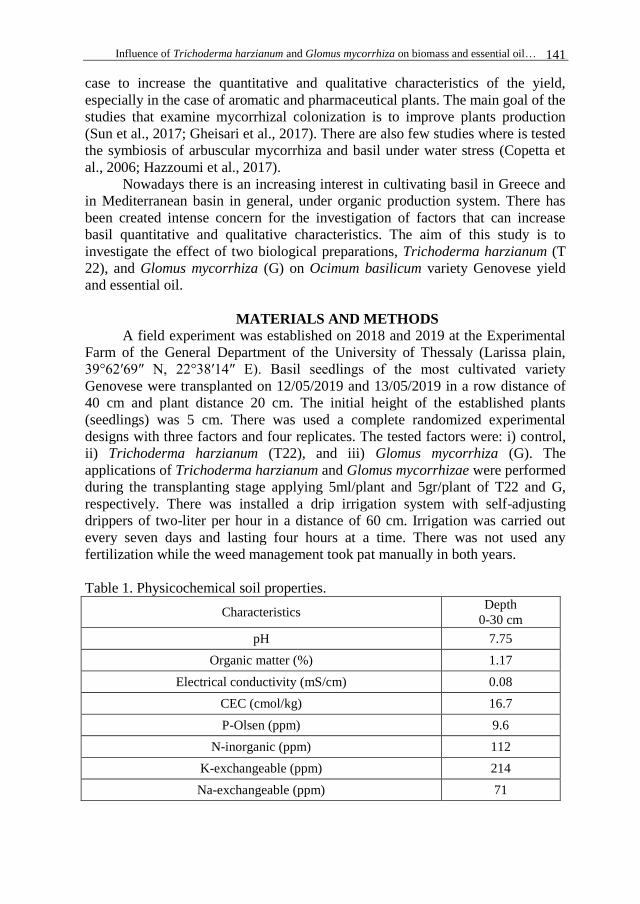
Influence of Trichoderma harzianum and Glomus mycorrhiza on biomass and essential oil… 141
case to increase the quantitative and qualitative characteristics of the yield,
especially in the case of aromatic and pharmaceutical plants. The main goal of the
studies that examine mycorrhizal colonization is to improve plants production
(Sun et al., 2017; Gheisari et al., 2017). There are also few studies where is tested
the symbiosis of arbuscular mycorrhiza and basil under water stress (Copetta et
al., 2006; Hazzoumi et al., 2017).
Nowadays there is an increasing interest in cultivating basil in Greece and
in Mediterranean basin in general, under organic production system. There has
been created intense concern for the investigation of factors that can increase
basil quantitative and qualitative characteristics. The aim of this study is to
investigate the effect of two biological preparations, Trichoderma harzianum (T
22), and Glomus mycorrhiza (G) on Ocimum basilicum variety Genovese yield
and essential oil.
MATERIALS AND METHODS
A field experiment was established on 2018 and 2019 at the Experimental
Farm of the General Department of the University of Thessaly (Larissa plain,
39°62′69″ N, 22°38′14″ E). Basil seedlings of the most cultivated variety
Genovese were transplanted on 12/05/2019 and 13/05/2019 in a row distance of
40 cm and plant distance 20 cm. The initial height of the established plants
(seedlings) was 5 cm. There was used a complete randomized experimental
designs with three factors and four replicates. The tested factors were: i) control,
ii) Trichoderma harzianum (T22), and iii) Glomus mycorrhiza (G). The
applications of Trichoderma harzianum and Glomus mycorrhizae were performed
during the transplanting stage applying 5ml/plant and 5gr/plant of T22 and G,
respectively. There was installed a drip irrigation system with self-adjusting
drippers of two-liter per hour in a distance of 60 cm. Irrigation was carried out
every seven days and lasting four hours at a time. There was not used any
fertilization while the weed management took pat manually in both years.
Table 1. Physicochemical soil properties.
Characteristics Depth
0-30 cm
pH 7.75
Organic matter (%) 1.17
Electrical conductivity (mS/cm) 0.08
CEC (cmol/kg) 16.7
P-Olsen (ppm) 9.6
N-inorganic (ppm) 112
K-exchangeable (ppm) 214
Na-exchangeable (ppm) 71

Giannoulis et al 142
Before seedling establishment on 2018 a soil sampling up to a depth of 30
cm for further analysis carried out and the soil physicochemical characteristics
are presented in Table 1.
Sampling carried out with two cuts on 06/07/20018 and on 05/09/2018 for
the first experimental year and on 04/07/2019 and on 04/09/2019 for the second.
Sampling took place at flowering stage and the plants were cut 4 cm above
ground. In order to avoid any border effect, samplings were done from the 1 m2
of the inner rows of the plot of each replication. The plot size was 20 m2 (4 m
width x 5 m length). The fresh weight was measured at the field and then the
samples were transported to the laboratory for air drying and further analysis.
Twelve and a half grammars of basil dry leaves were subjected to 250 ml
of water in a Clevenger-type distillation apparatus in case to determine the
essential oil content. The hydro distillation lasted 105 minutes. The procedure
was repeated three times for each sample and the essential oil content was
estimated on the basis of DW plant material (ml 100 g−1
). A further analysis of
the distilled essential oil analysis was done using a GC-MS on a fused silica DB-
5 column and a Gas chromatograph interfaced with a mass spectrometer. The
relative content of each compound was calculated as a percentage (%) of the total
chromatographic area and the results are expressed as the mean percentage (%) of
three replicates (Sarrou et al., 2017; Tsivelika et al., 2018).
The climatic data were recorded by an automatic meteorological station
that was located near the experimental field. Finally all data were analyzed using
GenStat (7th Edition) package and the LSD.05 was used as the test criterion for
assessing differences between means (Steel and Torrie, 1982).
RESULTS AND DISCUSSION
Weather conditions
The study area is characterized by a typical Mediterranean climate with
cold humid winters and hot-dry summers.
Figure 1. Average temperature and precipitation occurred in the study site during
the growing periods of Ocimum basilicum (2018 and 2019).
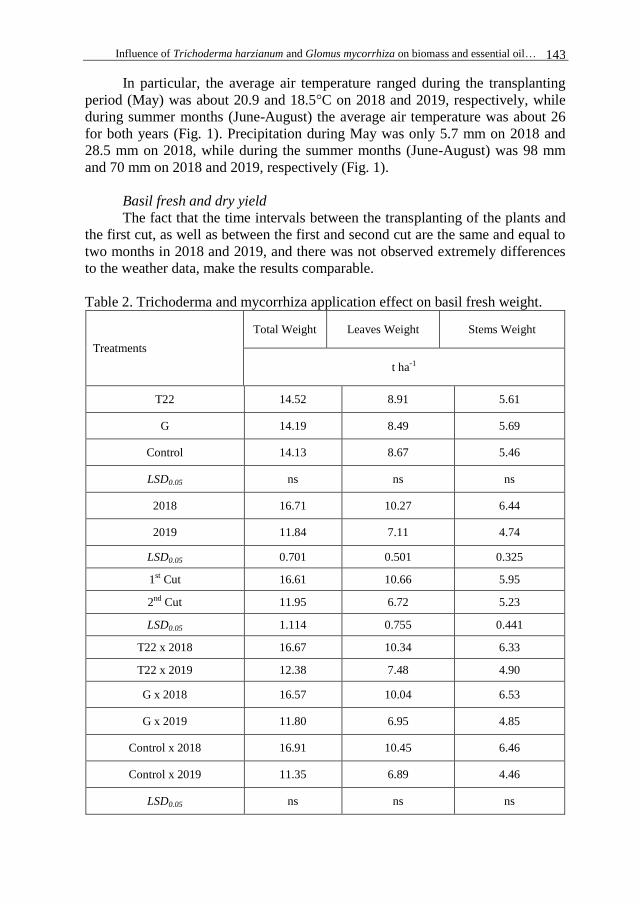
Influence of Trichoderma harzianum and Glomus mycorrhiza on biomass and essential oil… 143
In particular, the average air temperature ranged during the transplanting
period (May) was about 20.9 and 18.5°C on 2018 and 2019, respectively, while
during summer months (June-August) the average air temperature was about 26
for both years (Fig. 1). Precipitation during May was only 5.7 mm on 2018 and
28.5 mm on 2018, while during the summer months (June-August) was 98 mm
and 70 mm on 2018 and 2019, respectively (Fig. 1).
Basil fresh and dry yield
The fact that the time intervals between the transplanting of the plants and
the first cut, as well as between the first and second cut are the same and equal to
two months in 2018 and 2019, and there was not observed extremely differences
to the weather data, make the results comparable.
Table 2. Trichoderma and mycorrhiza application effect on basil fresh weight.
Treatments
Total Weight Leaves Weight Stems Weight
t ha-1
T22 14.52 8.91 5.61
G 14.19 8.49 5.69
Control 14.13 8.67 5.46
LSD0.05 ns ns ns
2018 16.71 10.27 6.44
2019 11.84 7.11 4.74
LSD0.05 0.701 0.501 0.325
1st Cut 16.61 10.66 5.95
2nd Cut 11.95 6.72 5.23
LSD0.05 1.114 0.755 0.441
T22 x 2018 16.67 10.34 6.33
T22 x 2019 12.38 7.48 4.90
G x 2018 16.57 10.04 6.53
G x 2019 11.80 6.95 4.85
Control x 2018 16.91 10.45 6.46
Control x 2019 11.35 6.89 4.46
LSD0.05 ns ns ns
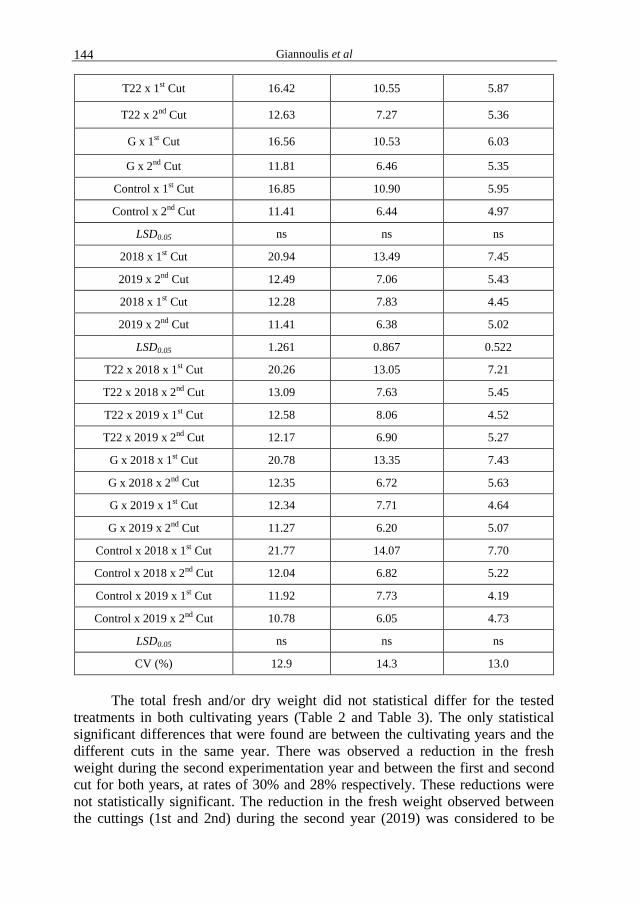
Giannoulis et al 144
T22 x 1st Cut 16.42 10.55 5.87
T22 x 2nd Cut 12.63 7.27 5.36
G x 1st Cut 16.56 10.53 6.03
G x 2nd Cut 11.81 6.46 5.35
Control x 1st Cut 16.85 10.90 5.95
Control x 2nd Cut 11.41 6.44 4.97
LSD0.05 ns ns ns
2018 x 1st Cut 20.94 13.49 7.45
2019 x 2nd Cut 12.49 7.06 5.43
2018 x 1st Cut 12.28 7.83 4.45
2019 x 2nd Cut 11.41 6.38 5.02
LSD0.05 1.261 0.867 0.522
T22 x 2018 x 1st Cut 20.26 13.05 7.21
T22 x 2018 x 2nd Cut 13.09 7.63 5.45
T22 x 2019 x 1st Cut 12.58 8.06 4.52
T22 x 2019 x 2nd Cut 12.17 6.90 5.27
G x 2018 x 1st Cut 20.78 13.35 7.43
G x 2018 x 2nd Cut 12.35 6.72 5.63
G x 2019 x 1st Cut 12.34 7.71 4.64
G x 2019 x 2nd Cut 11.27 6.20 5.07
Control x 2018 x 1st Cut 21.77 14.07 7.70
Control x 2018 x 2nd Cut 12.04 6.82 5.22
Control x 2019 x 1st Cut 11.92 7.73 4.19
Control x 2019 x 2nd Cut 10.78 6.05 4.73
LSD0.05 ns ns ns
CV (%) 12.9 14.3 13.0
The total fresh and/or dry weight did not statistical differ for the tested
treatments in both cultivating years (Table 2 and Table 3). The only statistical
significant differences that were found are between the cultivating years and the
different cuts in the same year. There was observed a reduction in the fresh
weight during the second experimentation year and between the first and second
cut for both years, at rates of 30% and 28% respectively. These reductions were
not statistically significant. The reduction in the fresh weight observed between
the cuttings (1st and 2nd) during the second year (2019) was considered to be
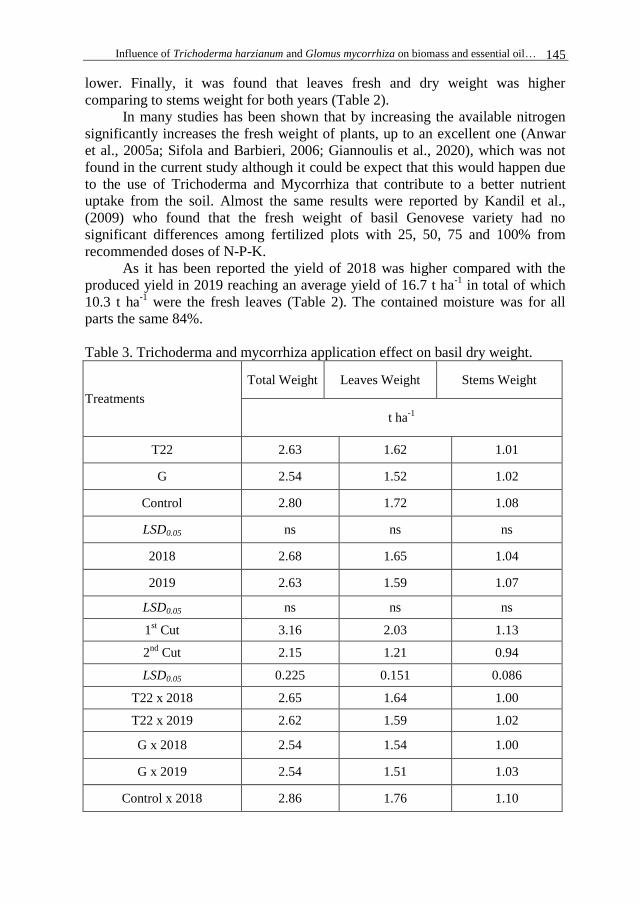
Influence of Trichoderma harzianum and Glomus mycorrhiza on biomass and essential oil… 145
lower. Finally, it was found that leaves fresh and dry weight was higher
comparing to stems weight for both years (Table 2).
In many studies has been shown that by increasing the available nitrogen
significantly increases the fresh weight of plants, up to an excellent one (Anwar
et al., 2005a; Sifola and Barbieri, 2006; Giannoulis et al., 2020), which was not
found in the current study although it could be expect that this would happen due
to the use of Trichoderma and Mycorrhiza that contribute to a better nutrient
uptake from the soil. Almost the same results were reported by Kandil et al.,
(2009) who found that the fresh weight of basil Genovese variety had no
significant differences among fertilized plots with 25, 50, 75 and 100% from
recommended doses of N-P-K.
As it has been reported the yield of 2018 was higher compared with the
produced yield in 2019 reaching an average yield of 16.7 t ha-1
in total of which
10.3 t ha-1
were the fresh leaves (Table 2). The contained moisture was for all
parts the same 84%.
Table 3. Trichoderma and mycorrhiza application effect on basil dry weight.
Treatments
Total Weight Leaves Weight Stems Weight
t ha-1
T22 2.63 1.62 1.01
G 2.54 1.52 1.02
Control 2.80 1.72 1.08
LSD0.05 ns ns ns
2018 2.68 1.65 1.04
2019 2.63 1.59 1.07
LSD0.05 ns ns ns
1st Cut 3.16 2.03 1.13
2nd
Cut 2.15 1.21 0.94
LSD0.05 0.225 0.151 0.086
T22 x 2018 2.65 1.64 1.00
T22 x 2019 2.62 1.59 1.02
G x 2018 2.54 1.54 1.00
G x 2019 2.54 1.51 1.03
Control x 2018 2.86 1.76 1.10
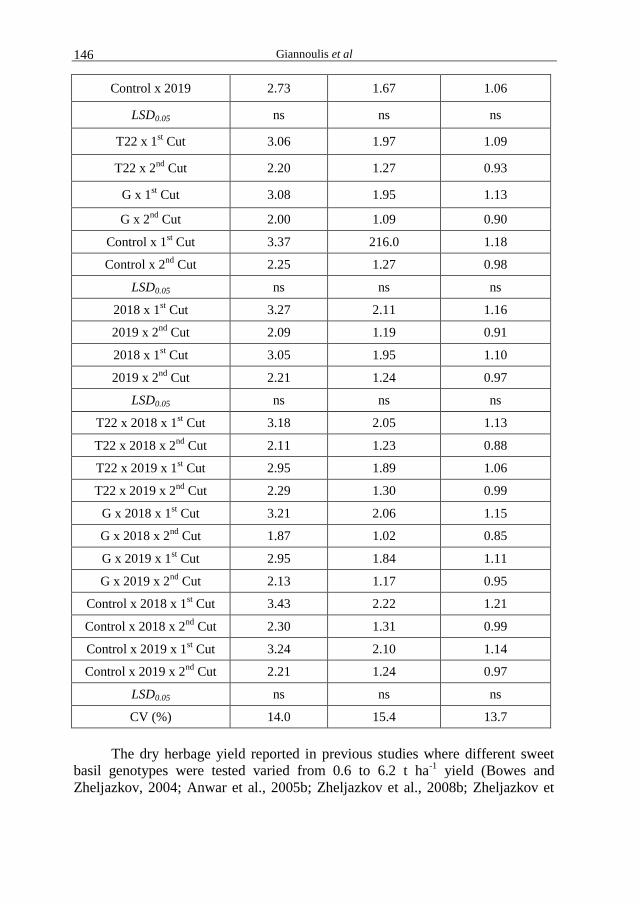
Giannoulis et al 146
Control x 2019 2.73 1.67 1.06
LSD0.05 ns ns ns
T22 x 1st Cut 3.06 1.97 1.09
T22 x 2nd
Cut 2.20 1.27 0.93
G x 1st Cut 3.08 1.95 1.13
G x 2nd
Cut 2.00 1.09 0.90
Control x 1st Cut 3.37 216.0 1.18
Control x 2nd
Cut 2.25 1.27 0.98
LSD0.05 ns ns ns
2018 x 1st Cut 3.27 2.11 1.16
2019 x 2nd
Cut 2.09 1.19 0.91
2018 x 1st Cut 3.05 1.95 1.10
2019 x 2nd
Cut 2.21 1.24 0.97
LSD0.05 ns ns ns
T22 x 2018 x 1st Cut 3.18 2.05 1.13
T22 x 2018 x 2nd
Cut 2.11 1.23 0.88
T22 x 2019 x 1st Cut 2.95 1.89 1.06
T22 x 2019 x 2nd
Cut 2.29 1.30 0.99
G x 2018 x 1st Cut 3.21 2.06 1.15
G x 2018 x 2nd
Cut 1.87 1.02 0.85
G x 2019 x 1st Cut 2.95 1.84 1.11
G x 2019 x 2nd
Cut 2.13 1.17 0.95
Control x 2018 x 1st Cut 3.43 2.22 1.21
Control x 2018 x 2nd
Cut 2.30 1.31 0.99
Control x 2019 x 1st Cut 3.24 2.10 1.14
Control x 2019 x 2nd
Cut 2.21 1.24 0.97
LSD0.05 ns ns ns
CV (%) 14.0 15.4 13.7
The dry herbage yield reported in previous studies where different sweet
basil genotypes were tested varied from 0.6 to 6.2 t ha-1
yield (Bowes and
Zheljazkov, 2004; Anwar et al., 2005b; Zheljazkov et al., 2008b; Zheljazkov et
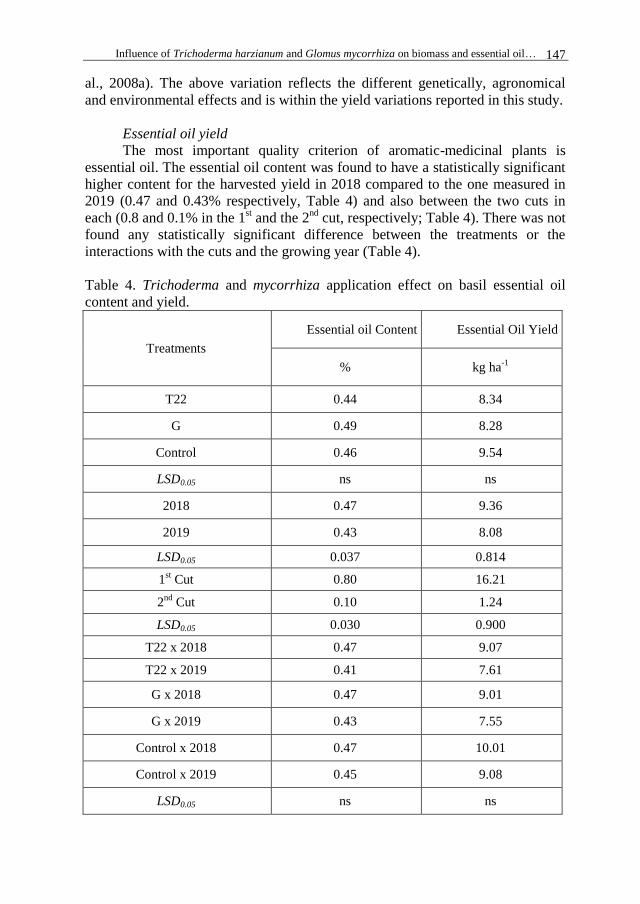
Influence of Trichoderma harzianum and Glomus mycorrhiza on biomass and essential oil… 147
al., 2008a). The above variation reflects the different genetically, agronomical
and environmental effects and is within the yield variations reported in this study.
Essential oil yield
The most important quality criterion of aromatic-medicinal plants is
essential oil. The essential oil content was found to have a statistically significant
higher content for the harvested yield in 2018 compared to the one measured in
2019 (0.47 and 0.43% respectively, Table 4) and also between the two cuts in
each (0.8 and 0.1% in the 1st and the 2
nd cut, respectively; Table 4). There was not
found any statistically significant difference between the treatments or the
interactions with the cuts and the growing year (Table 4).
Table 4. Trichoderma and mycorrhiza application effect on basil essential oil
content and yield.
Treatments
Essential oil Content Essential Oil Yield
% kg ha-1
T22 0.44 8.34
G 0.49 8.28
Control 0.46 9.54
LSD0.05 ns ns
2018 0.47 9.36
2019 0.43 8.08
LSD0.05 0.037 0.814
1st Cut 0.80 16.21
2nd
Cut 0.10 1.24
LSD0.05 0.030 0.900
T22 x 2018 0.47 9.07
T22 x 2019 0.41 7.61
G x 2018 0.47 9.01
G x 2019 0.43 7.55
Control x 2018 0.47 10.01
Control x 2019 0.45 9.08
LSD0.05 ns ns
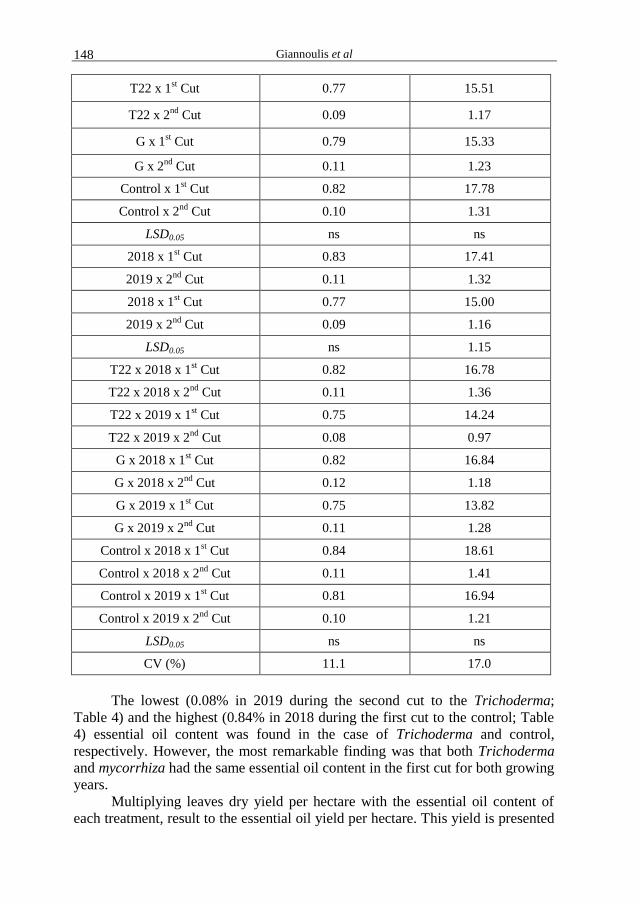
Giannoulis et al 148
T22 x 1st Cut 0.77 15.51
T22 x 2nd
Cut 0.09 1.17
G x 1st Cut 0.79 15.33
G x 2nd
Cut 0.11 1.23
Control x 1st Cut 0.82 17.78
Control x 2nd
Cut 0.10 1.31
LSD0.05 ns ns
2018 x 1st Cut 0.83 17.41
2019 x 2nd
Cut 0.11 1.32
2018 x 1st Cut 0.77 15.00
2019 x 2nd
Cut 0.09 1.16
LSD0.05 ns 1.15
T22 x 2018 x 1st Cut 0.82 16.78
T22 x 2018 x 2nd
Cut 0.11 1.36
T22 x 2019 x 1st Cut 0.75 14.24
T22 x 2019 x 2nd
Cut 0.08 0.97
G x 2018 x 1st Cut 0.82 16.84
G x 2018 x 2nd
Cut 0.12 1.18
G x 2019 x 1st Cut 0.75 13.82
G x 2019 x 2nd
Cut 0.11 1.28
Control x 2018 x 1st Cut 0.84 18.61
Control x 2018 x 2nd
Cut 0.11 1.41
Control x 2019 x 1st Cut 0.81 16.94
Control x 2019 x 2nd
Cut 0.10 1.21
LSD0.05 ns ns
CV (%) 11.1 17.0
The lowest (0.08% in 2019 during the second cut to the Trichoderma;
Table 4) and the highest (0.84% in 2018 during the first cut to the control; Table
4) essential oil content was found in the case of Trichoderma and control,
respectively. However, the most remarkable finding was that both Trichoderma
and mycorrhiza had the same essential oil content in the first cut for both growing
years.
Multiplying leaves dry yield per hectare with the essential oil content of
each treatment, result to the essential oil yield per hectare. This yield is presented
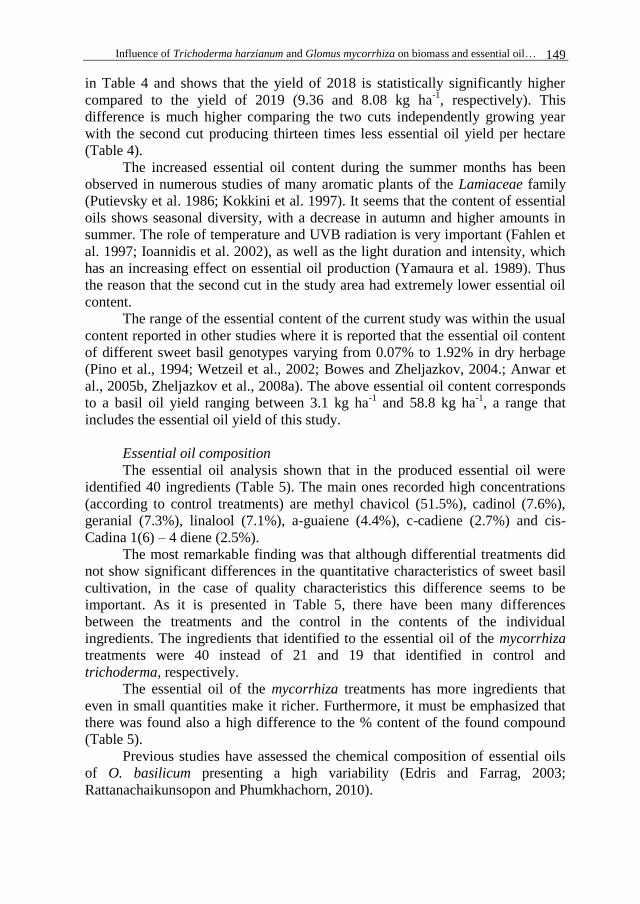
Influence of Trichoderma harzianum and Glomus mycorrhiza on biomass and essential oil… 149
in Table 4 and shows that the yield of 2018 is statistically significantly higher
compared to the yield of 2019 (9.36 and 8.08 kg ha-1
, respectively). This
difference is much higher comparing the two cuts independently growing year
with the second cut producing thirteen times less essential oil yield per hectare
(Table 4).
The increased essential oil content during the summer months has been
observed in numerous studies of many aromatic plants of the Lamiaceae family
(Putievsky et al. 1986; Kokkini et al. 1997). It seems that the content of essential
oils shows seasonal diversity, with a decrease in autumn and higher amounts in
summer. The role of temperature and UVB radiation is very important (Fahlen et
al. 1997; Ioannidis et al. 2002), as well as the light duration and intensity, which
has an increasing effect on essential oil production (Yamaura et al. 1989). Thus
the reason that the second cut in the study area had extremely lower essential oil
content.
The range of the essential content of the current study was within the usual
content reported in other studies where it is reported that the essential oil content
of different sweet basil genotypes varying from 0.07% to 1.92% in dry herbage
(Pino et al., 1994; Wetzeil et al., 2002; Bowes and Zheljazkov, 2004.; Anwar et
al., 2005b, Zheljazkov et al., 2008a). The above essential oil content corresponds
to a basil oil yield ranging between 3.1 kg ha-1
and 58.8 kg ha-1
, a range that
includes the essential oil yield of this study.
Essential oil composition
The essential oil analysis shown that in the produced essential oil were
identified 40 ingredients (Table 5). The main ones recorded high concentrations
(according to control treatments) are methyl chavicol (51.5%), cadinol (7.6%),
geranial (7.3%), linalool (7.1%), a-guaiene (4.4%), c-cadiene (2.7%) and cis-
Cadina 1(6) – 4 diene (2.5%).
The most remarkable finding was that although differential treatments did
not show significant differences in the quantitative characteristics of sweet basil
cultivation, in the case of quality characteristics this difference seems to be
important. As it is presented in Table 5, there have been many differences
between the treatments and the control in the contents of the individual
ingredients. The ingredients that identified to the essential oil of the mycorrhiza
treatments were 40 instead of 21 and 19 that identified in control and
trichoderma, respectively.
The essential oil of the mycorrhiza treatments has more ingredients that
even in small quantities make it richer. Furthermore, it must be emphasized that
there was found also a high difference to the % content of the found compound
(Table 5).
Previous studies have assessed the chemical composition of essential oils
of O. basilicum presenting a high variability (Edris and Farrag, 2003;
Rattanachaikunsopon and Phumkhachorn, 2010).
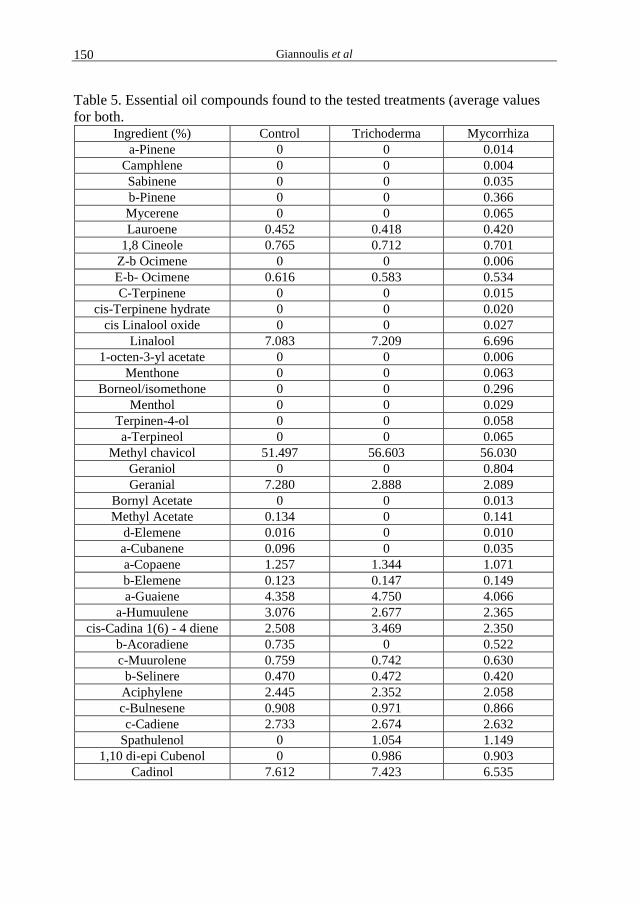
Giannoulis et al 150
Table 5. Essential oil compounds found to the tested treatments (average values
for both. Ingredient (%) Control Trichoderma Mycorrhiza
a-Pinene 0 0 0.014
Camphlene 0 0 0.004
Sabinene 0 0 0.035
b-Pinene 0 0 0.366
Mycerene 0 0 0.065
Lauroene 0.452 0.418 0.420
1,8 Cineole 0.765 0.712 0.701
Z-b Ocimene 0 0 0.006
E-b- Ocimene 0.616 0.583 0.534
C-Terpinene 0 0 0.015
cis-Terpinene hydrate 0 0 0.020
cis Linalool oxide 0 0 0.027
Linalool 7.083 7.209 6.696
1-octen-3-yl acetate 0 0 0.006
Menthone 0 0 0.063
Borneol/isomethone 0 0 0.296
Menthol 0 0 0.029
Terpinen-4-ol 0 0 0.058
a-Terpineol 0 0 0.065
Methyl chavicol 51.497 56.603 56.030
Geraniol 0 0 0.804
Geranial 7.280 2.888 2.089
Bornyl Acetate 0 0 0.013
Methyl Acetate 0.134 0 0.141
d-Elemene 0.016 0 0.010
a-Cubanene 0.096 0 0.035
a-Copaene 1.257 1.344 1.071
b-Elemene 0.123 0.147 0.149
a-Guaiene 4.358 4.750 4.066
a-Humuulene 3.076 2.677 2.365
cis-Cadina 1(6) - 4 diene 2.508 3.469 2.350
b-Acoradiene 0.735 0 0.522
c-Muurolene 0.759 0.742 0.630
b-Selinere 0.470 0.472 0.420
Aciphylene 2.445 2.352 2.058
c-Bulnesene 0.908 0.971 0.866
c-Cadiene 2.733 2.674 2.632
Spathulenol 0 1.054 1.149
1,10 di-epi Cubenol 0 0.986 0.903
Cadinol 7.612 7.423 6.535
Influence of Trichoderma harzianum and Glomus mycorrhiza on biomass and essential oil… 151
According to the different genotype of O. basilicum, there were found
different compounds content to linalool (Hussain et al., 2008; Pozzatti et al.,
2008; Rao et al., 2011), eugenol (Nardoni et al., 2015), geraniol (Cardoso et al.,
2016) and methyl chavicol (Opalchenova and Obreshkova, 2003).
Finally in previous studies was reported essential oil of O. basilicium with
high amounts of methyl chavicol 45–86% (Bozin et al., 2006; Hossain et al.,
2010; Shirazi et al., 2014; Císarová et al., 2016; Avetisyan et al., 2017), which is
in line with the findings of the current study.
CONCLUSIONS
This study was conducted during 2018 and 2019 seasons, at the General
Department of the University of Thessaly, to study the effect of two biological
preparations, Trichoderma harzianum (T 22), and Glomus mycorrhiza (G) on
Ocimum basilicum variety Genovese yield and essential oil. The results indicated
that the above treatments did not affect the quantitative characteristics but only
the qualitative ones. Moreover, sweet basil yield was different between the cuts
with the first one producing the major yield. Therefore, an overall conclusion
could be that sweet basil could be a promising annual aromatic-medicinal crop
and different essential oil quality could be produced depending on the use of or
not of mycorrhiza or trichoderma according to market requirements for its use.
ACKNOWLEDGMENTS
This work was supported by the General Department, University of
Thessaly, Greece.
REFERENCES Ahmed EA, Hassan EA, Tobgy KM, Ramadan EM. 2014. Evaluation of rhizobacteria of
some medicinal plants for plant growth promotion and biological control. Ann.
Agric. Sci. 59(2):273–280.
Anwar F, Ashraf M, Bhanger MI. 2005a. Interprovenance variation in the composition of
Moringa oleifera oil seeds from Pakistan. J Am. Oil Chem. Soc. 82:45–51.
Anwar M, Patra DD, Chand S, Kumar A, Naqvi AA, Khanuja SPS. 2005b. Effect of
organic manures and inorganic fertilizer on growth, herb and oil yield, nutrient
accumulation, and oil quality of French basil. Commun. Soil Sci. Plant Anal.
36:1737–1746.
Augé RM. 2001. Water relations, drought and vesicular-arbuscular mycorrhizal
symbiosis. Mycorrhiza 11:3–42.
Avetisyan A, Markosian A, Petrosyan M, Sahakyan N, Babayan A, Aloyan S, Trchounian
A, 2017. Chemical composition and some biological activities of the essential oils
from basil Ocimum different cultivars. BMC Complement. Altern. Med. 17:60.
Bharti N, Barnawal D, Wasnik K, Tewari SK, Kalra A. 2016. Co-inoculation of Dietzia
natronolimnaea and Glomus intraradices with vermicompost positively influences
Ocimum basilicum L. growth and resident microbial community structure in salt
affected low fertility soils. Appl. Soil Ecol. 100:211–225.
Blank AF, Carvalho Filho JLS, Santos Neto AL, Alves PB, Arrigoni-Blank MF, Silva-
Mann R, MendoncΈa MC. 2004. Caracterizacão morfológica e agronômica de
acessos de manjericão e alfavaca. Hortic. Bras. 22:113–116.

Giannoulis et al 152
Bowes K, Zheljazkov V.D. 2004. Ocimum sanctum L. and Ocimum basilicum L. grown in
Nova Scotia, Canada show potential as essential oil crops. J. Amer. Soc. Hort. Sci.
129:789–794.
Bozin B, Mimca-Dukic N, Simin N, Anackov G. 2006. Characterization of the volatile
composition of essential oils of some Lamiaceae spices and the antimicrobial and
antioxidant activities of the entire oils. J. Agric. Food Chem. 54:1822–1828.
Bravo E, Amrani S, Aziz M, Harnafi H, Napolitano M. 2008. Ocimum basilicum
ethanolic extract decreases cholesterol synthesis and lipid accumulatio in human
macrophages. Fitoterapia 79:515–523.
Cardoso NNR, Alviano CS, Blank AF, Romanos MTV, Fonseca BB, Rozental S,
Rodrigues IA, Alviano DS. 2016. Synergism effect of the essential oil from
Ocimum basilicum var. Maria Bonita and its major components with fluconazole
and its influence on ergosterol biosynthesis. Evid. Based. Complement. Alternat.
Med. 2016:5647182.
Chalchat JC, Ozcan MM. 2008. Comparative essential oil composition of flowers, leaves
and stems of basil (Ocimum basilicum L.) used as herb. Food Chem. 110:501–503.
Císarová M, Tančinová D, Medo J, Kačániová M. 2016. The in vitro effect of selected
essential oils on the growth and mycotoxin production of Aspergillus species. J.
Environ. Sci. Heal. Part B. 51:668–674.
Copetta A, Lingua G, Berta G. 2006. Effects of three AM fungi on growth, distribution of
glandular hairs, and essential oil production in Ocimum basilicum L. var.
Genovese. Mycorrhiza 16:485–494.
Edris AE, Farrag ES. 2003. Antifungal activity of peppermint and sweet basil essential
oils and their major aroma constituents on some plant pathogenic fungi from the
vapor phase. Nahrung–Food. 47:117–121.
Fahlen A, Welander M, Wennersten R. 1997. Effects of light-temperature regimes on
plant growth and essential oil yield of selected aromatic plants. J. Sci. Food Agric.
73:111–119.
Gheisari S, Movahhedi M, Salehi A, Gholamhoseini M. 2017. Responses of field grown
fennel (Foeniculum vulgare Mill.) to different mycorrhiza species under varying
intensities of drought stress. J. Appl. Res. Med. Aromatic Plants, 5:16–25.
Giannoulis KD, Kamvoukou CA, Gougoulias N, Wogiatzi E. 2020. Irrigation and
nitrogen application affect Greek oregano (Origanum vulgare ssp. hirtum) dry
biomass, essential oil yield and composition. Ind. Crops Prod. 150:112392.
Grayer RG, Kite GC, Goldstone FJ, Bryan SE, Paton A, Putievsky E. 1996. Infraspecific
taxonomy and essential oil chemotypes in basil, Ocimum basilicum.
Phytochemistry 43:1033–1039.
Hazzoumi Z, Moustakime Y, Elharchli E, Joutei K. 2017. Effect of arbuscular
mycorrhizal fungi (AMF) and water stress on growth, phenolic compounds,
glandular hairs, and yield of essential oil in basil (Ocimum gratissimum L.). Chem.
Biol. Technol. Agric. 2:10.
Hossain MA, Kabir MJ, Salehuddin SM, Rahman SMM, Das AK, Singha SK, Alam MK,
Rahman A. 2010. Antibacterial properties of essential oils and methanol extracts
of sweet basil Ocimum basilicum occurring in Bangladesh. Pharm. Biol. 48:504–
511.
Hussain AI, Anwar F, Hussain Sherazi ST, Przybylski R. 2008. Chemical composition,
antioxidant and antimicrobial activities of basil (Ocimum basilicum) essential oils
depends on seasonal variations. Food Chem. 108:986–995.

Influence of Trichoderma harzianum and Glomus mycorrhiza on biomass and essential oil… 153
Ioannidis D, Bonner L, Johnson CB. 2002. UN-B is required for normal development of
oil glands in Ocimum basilicum L. (sweet basil). Ann. Bot. 90:453-460.
Kandil MAM, Khatab ME, Ahmed SS, Schnug E. 2009. Herbal and essential oil yield of
Genovese basil (Ocimum basilicum L.) grown with mineral and organic fertilizer
sources in Egypt. Journal FϋR Kulturpflanzen, 61(12):443–449.
Klimánková E, Holadová K, Hajšlová J, Cájka T, Poustka J, Koudela M. 2008. Aroma
profiles of five basil (Ocimum basilicum L.) cultivars grown under conventional
and organic conditions. Food Chem. 107:464–472.
Kokkini S, Karousou R, Dardioti A, Krigas N, Lanaras T. 1997. Autumn essential oils of
Greek oregano. Phytochemistry, 44:883-886.
Lee EH, Eo JK, Ka KH, Eom AH. 2013. Diversity of arbuscular mycorrhizal fungi and
their roles in ecosystems. Mycobiology 41(3):121–125.
Lubbe A, Verpoorte R. 2011. Cultivation of medicinal and aromatic plants for specialty
industrial materials. Ind. Crops Prod. 34(10):785-801.
Marotti M, Piccaglia R, Giovanelli E. 1996. Differences in essential oil composition of
basil (Ocimum basilicum L.) Italian cultivars related to morphological
characteristics. J. Agr. Food Chem., 14:3926–3929.
Martins AP, Salgueiro LR, Vila R, Tomi F, Canigueral S, Casanova J, Proença da Cunha
A, Adzet T. 1999. Composition of the essential oils of Ocimum canum, O.
gratissimum and O. minimum. Planta Med. 65:187–189.
Nardoni S, Giovanelli S, Pistelli L, Mugnaini L, Profili G, Pisseri F, Mancianti F. 2015.
In vitro activity of twenty commercially available, plant-derived essential oils
against selected dermatophyte species. Nat. Prod. Commun. 10:1473–1478.
Nguyen PM, Kwee EM, Niemeyer ED. 2010. Potassium rate alters the antioxidant
capacity and phenolic concentration of basil (Ocimum basilicum L.) leaves. Food
Chem. 123:1235–1241.
Opalchenova G, Obreshkova D. 2003. Comparative studies on the activity of basil - an
essential oil from Ocimum basilicum L. - against multidrug resistant clinical
isolates of the genera Staphylococcus, Enterococcus and Pseudomonas by using
different test methods. J. Microbiol. Methods 54:105–110.
Pino JA, Roncal E, Rosado A, Goire I. 1994. The essential oil of Ocimum basilicum L.
from Cuba. J. Essent. Oil Res. 6:89–90.
Pozzatti P, Scheid LA, Spader TB, Atayde ML, Santurio JM, Alves SH. 2008. In vitro
activity of essential oils extracted from plants used as spices against
fluconazoleresistant and fluconazole-susceptible Candida spp. Can. J. Microbiol.
54:950–956.
Putievsky E, Ravid U, Duda N. 1986. The essential oil and yield components from
various plant parts of Salvia fruticosa. J. Nat. Prod. 49(6):1015-1017.
Rao BRR, Kotharia SK, Rajput DK, Patel RP, Darokar MP. 2011. Chemical and
biological diversity in fourteen selections of four Ocimum species. Nat. Prod.
Commun. 6:1705–1710.
Rattanachaikunsopon P, Phumkhachorn P. 2010. Antimicrobial activity of basil (Ocimum
basilicum) oil against salmonella enteritidis in vitro and in food. Biosci.
Biotechnol. Biochem. 74:1200–1204.
Sanda K, Koba K, Nambo P, Gaset A. 1998. Chemical investigation of Ocimum species
growing in Togo. Flavour Fragr. J., 13:226–232.
Sangwan NS, Farooqi AHA, Shabih F, Sangwan RS. 2001. Regulation of essential oil
production in plants. Plant Growth Regul. 34:3–21.

Giannoulis et al 154
Sarrou E, Tsivelika N, Chatzopoulou P, Tsakalidis G, Menexes G, Mavromatis A. 2017.
Conventional breeding of Greek oregano (Origanum vulgare ssp. hirtum) and
development of improved cultivars for yield potential and essential oil quality.
Euphytica. 213:104.
Shirazi MT, Gholami H, Kavoosi G, Rowshan V, Tafsiry A. 2014. Chemical
composition, antioxidant, antimicrobial and cytotoxic activities of Tagetes minuta
and Ocimum basilicum essential oils. Food Sci. Nutr. 2:146–155.
Sifola MI, Barbieri G. 2006. Growth, yield and essential oil content of three cultivars of
basil grown under different levels of nitrogen in the field. Sci. Hort. 108:408–413.
Singh S, Singh M, Singh AK, Kalra A, Yadav A, Patra D.D. 2010. Enhancing
productivity of Indian basil (Ocimum basilicum L.) through harvest management
under rainfed conditions of subtropical north Indian plains. Ind. Crops Prod.
32:601–606.
Snoussi M, Dehmani A, Noumi E, Flamini G, Papetti A. 2016. Chemical composition and
antibiofilm activity of Petroselinum crispum and Ocimum basilicum essential oils
against Vibrio spp. strains. Microb. Pathog. 90:13–21.
Steel RGD, Torrie JH. 1982. Principles and procedures of statistics. A Biometrical
Approach, 2nd
ed. McGraw-Hill, Inc. pp. 633.
Sun X, Shi J, Ding G. 2017. Combined effects of arbuscular mycorrhiza and drought
stress on plant growth and mortality of forage sorghum. Appl. Soil Ecol. 119:384–
391.
Tsivelika N, Sarrou E, Gusheva K, Pankou C, Koutsos T, Chatzopoulou P, Mavromatis
A. 2018. Phenotypic variation of wild Chamomile (Matricaria chamomilla L.)
populations and their evaluation for medicinally important essential oil. Biochem.
Syst. Ecol. 80:21-28.
Varban DL, Duda MM, Varban R. 2010. The study of the Ocimum basilicum L. specie
cultivated in organic system. Pro Environ. 3:284–288.
Wannissorn B, Jarikasem S, Siriwangchai T, Thubthimthed S. 2005. Antibacterial
properties of essential oils from Thai medicinal plants. Fitoterapia 76:233–236.
Wetzeil SB, Kruger H, Hammer K, Bachmann K. 2002. Investigations on morphological
and molecular variability of Ocimum L. species. J. Herbs, Spices Med. Plants
9:8183–8187.
Xavier LJC, Boyetchko SM. 2002. Arbuscular mycorrhizal fungi as biostimulants and
bioprotectants of crops. Appl. Mycol. Biotechnol. 2:311–340.
Yamaura T, Tanaka S, Tabata M. 1989. Light dependent formation of glandular
trichomes and monoterpenes in thyme seedlings. Phytochemistry, 28:741-744.
Zheljazkov VD, Callahan A, Cantrell CL. 2008a. Yield and Oil Composition of 38 Basil
(Ocimum basilicum L.) Accessions Grown in Mississippi. J. Agric. Food Chem.
56:241–245
Zheljazkov VD, Cantrell CL, Evans WB, Ebelhar MW, Coker C. 2008b. Yield and
composition of Ocimum basilicum L. and Ocimum sanctum L. grown at four
locations. HortScience. 43:737–741.
Agriculture & Forestry, Vol. 66 Issue 3: 155-168, 2020, Podgorica 155
Haitlinger, R., Šundić, M. (2020): Cooremania kietaensis sp. nov. (Astigmata: Canestriniidae) from
Bougainville Island, Papua New Guinea. Agriculture and Forestry, 66 (3): 155-168
DOI: 10.17707/AgricultForest.66.3.13
Ryszard HAITLINGER 1, Miloje ŠUNDIĆ
2
COOREMANIA KIETAENSIS SP. NOV. (ASTIGMATA:
CANESTRINIIDAE) FROM BOUGAINVILLE ISLAND, PAPUA NEW
GUINEA
SUMMARY
Cooremania kietaensis sp. nov. from Papua New Guinea is described and
illustrated, based on males, females and protonymphs. All specimens were
obtained from undetermined Lucanidae (Coleoptera). All canestriniids known
from Papua New Guinea are listed.
Keywords: Acari, taxonomy, new species, Lucanidae, Coleoptera, Papua
New Guinea canestriniids.
INTRODUCTION
Insects constitute the most diverse form of animal life in terrestrial
ecosystems (Bolu, 2016). The family Lucanidae (Coleoptera) includes about 1200
species in the world fauna which occurring mainly in subtropical regions. The
canestriniid mites were found only on 47 lucaniid species and some undetermined
species, 17 canestriniid species found on Lucanidae [without determined to the
genus for example mentioned by Okabe and Goka (2008)] belonging to 9 genera:
Amboniophela Haitlinger, 1993, Canestrinia Berlese, 1881, Cooremania Nesbitt,
1976, Haitlingeria Kim, Lee, Choi, Sim and Kim, 2006, Noemiphela Haitlinger,
1991, Rugoniphela Haitlinger, 1991, Sandrophela Haitlinger, 1990, Uriophela
Haitlinger, 1991 and Vereoxia Haitlinger, 1995 (Berlese, 1881, Nesbitt, 1976,
Haitlinger, 1990a, 1991, 1993, 1995, Kim et al., 2006).
One species of Coleopterophagus (Kishida, 1924) found on Lucanidae not
belongs to this genus. Canestriniid mites were found on Lucanidae only in Asia,
Europe and Papua New Guinea (Berlese, 1881, Kishida, 1924, Nesbitt, 1976,
Haitlinger, 1989a, b, 1990a, 1993, 1995, Kim et al., 2006, Okabe and Goka
2008). From Papua New Guinea were known only two species associated with
Lucanidae: Cooremania wauensis Nesbitt, 1976 and Amboinophela bernae
Haitlinger, 1993 (Nesbitt, 1976, Haitlinger, 1993). Moreover, in Papua New
1Ryszard Haitlinger, (corresponding author: [email protected]), Institute of Biology,
Invertebrate Systematics and Ecology, Wroclaw University of Environmental and Life Sciences,
Kozuchowska 5B, 51-631 Wroclaw, POLAND. 2Miloje Šundić, ([email protected]) Department of Biology, Faculty of Sciences,
University of Montenegro, Cetinjski put b. b. 80 000 Podgorica, MONTENEGRO.
Notes: The authors declare that they have no conflicts of interest. Authorship Form signed online.
Received:24/06/2020 Accepted:02/08/2020
Haitlinger and Šundić 156
Guinea were found 20 other species: Albinorattia igori Haitlinger, 1989
associated with Cetoniinae (Scarabaeidae), Sandrophela kokodaica Haitlinger,
1990 associated with Passandridae, Athogavia arrybasi Haitlinger, 1989,
Aurilossongia bolanica Haitlinger, 1989, A. guarana Haitlinger, 1989, A. norae
Haitlinger, 1989, Mossongia bissaina Haitlinger, 1989, M. savina Haitlinger,
1989 associated with Dynastinae (Scarabaeidae), Apalotacarus cidaris Summers
& Schuster, 1981, A. fusulus Summers & Schuster, 1981, A. petilus Summers &
Schuster, 1981, A. rigescens Summers & Schuster, 1981, Arraphosoma ninax
Summers & Schuster, 1981, Jullongia izae Haitlinger, 1990, Lidiophela pecki
(Nesbitt, 1976), Passalophagus georlei Nesbitt, 1976, Phaleratus fentoni Nesbitt,
1976, Photia howdeni Nesbitt, 1976 and Sajanophela alfredae Haitlinger, 1989
associated with Passalidae (Nesbitt, 1976, Summers & Schuster, 1981a, b,
Haitlinger, 1989a, b, 1990a, b).
The genus Cooremania Nesbitt, 1976 is known only from one species
found in Papua New Guinea and differing from all other genera by the presence
of peg-like setae on ventral part of idiosoma and legs I-III (in all instars). In this
paper we describe a new species Cooremania kietaensis from Bougainville
Island, Papua New Guinea. It is second species of the genus Cooremania.
MATERIALS AND METHODS
Three males, two females and three protonymphs of the new species were
obtained from the Lucanidae collection of the Museum of Natural History,
Wrocław University. All specimens were preserved in 75% ethanol. Mite
specimens were cleared in Nesbitt’s solution and mounted in Berlese’s medium.
Figures were drawn using a Carl Zeiss Axioscope A1 compound microscope.
Measurements were made using a NIKON Eclipse 50i compound microscope. All
measurements are given in micrometers. The terminology and abbreviations
follow Grandjean (1939), Griffiths et al., (1990), Norton (1998), Trach and
Khaustov (2011) and Haitlinger and Šundić (2016).
RESULTS
Canestriniidae Berlese, 1884
Cooremania Nesbitt, 1976
Type species: Cooremania wauensis Nesbitt, 1976, by original designation.
Diagnosis. Propodosomal and sejugal structure absent. The presence of
peg-like setae on the ventral surface of all stages. Part of setae on legs I-III peg-
like. Males with well developed adanal suckers.
Cooremania kietaensis sp. nov.
(Figs. 1-20)
Diagnosis. Setae 2a, c3, 3a, 4b, ad2 and g peg-like. Setae p1, p2, p3 and h3
tubercle-like in males, peg-like in females, setae vF I, vF II and nG peg-like.
Description. Male (holotype) (n = 3) – Idiosoma with ornamentation on
propodosoma and anterior part of hysterosoma; Propodosoma with setae vi, si
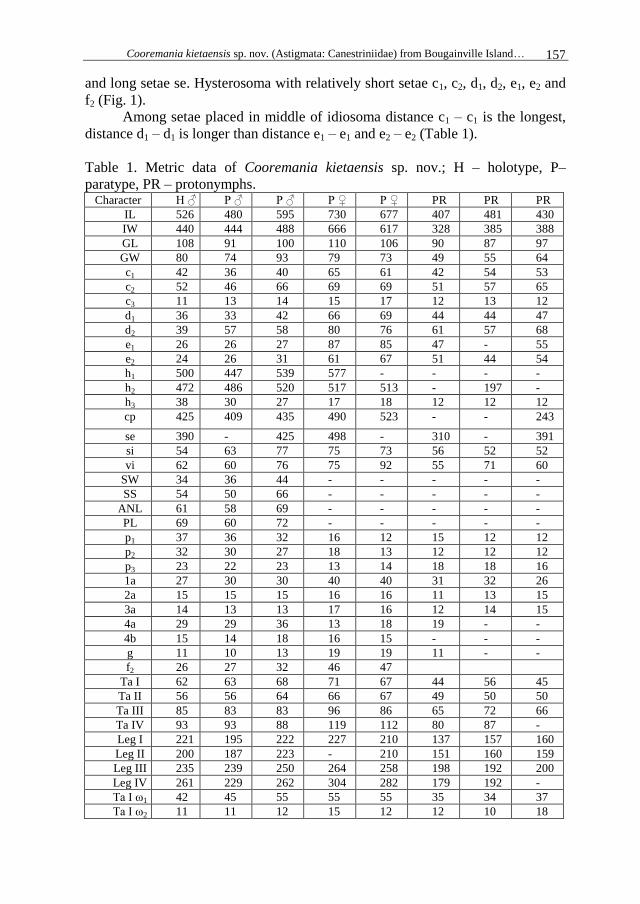
Cooremania kietaensis sp. nov. (Astigmata: Canestriniidae) from Bougainville Island… 157
and long setae se. Hysterosoma with relatively short setae c1, c2, d1, d2, e1, e2 and
f2 (Fig. 1).
Among setae placed in middle of idiosoma distance c1 – c1 is the longest,
distance d1 – d1 is longer than distance e1 – e1 and e2 – e2 (Table 1).
Table 1. Metric data of Cooremania kietaensis sp. nov.; H – holotype, P–
paratype, PR – protonymphs. Character H ♂ P ♂ P ♂ P ♀ P ♀ PR PR PR
IL 526 480 595 730 677 407 481 430
IW 440 444 488 666 617 328 385 388
GL 108 91 100 110 106 90 87 97
GW 80 74 93 79 73 49 55 64
c1 42 36 40 65 61 42 54 53
c2 52 46 66 69 69 51 57 65
c3 11 13 14 15 17 12 13 12
d1 36 33 42 66 69 44 44 47
d2 39 57 58 80 76 61 57 68
e1 26 26 27 87 85 47 - 55
e2 24 26 31 61 67 51 44 54
h1 500 447 539 577 - - - -
h2 472 486 520 517 513 - 197 -
h3 38 30 27 17 18 12 12 12
cp 425 409 435 490 523 - - 243
se 390 - 425 498 - 310 - 391
si 54 63 77 75 73 56 52 52
vi 62 60 76 75 92 55 71 60
SW 34 36 44 - - - - -
SS 54 50 66 - - - - -
ANL 61 58 69 - - - - -
PL 69 60 72 - - - - -
p1 37 36 32 16 12 15 12 12
p2 32 30 27 18 13 12 12 12
p3 23 22 23 13 14 18 18 16
1a 27 30 30 40 40 31 32 26
2a 15 15 15 16 16 11 13 15
3a 14 13 13 17 16 12 14 15
4a 29 29 36 13 18 19 - -
4b 15 14 18 16 15 - - -
g 11 10 13 19 19 11 - -
f2 26 27 32 46 47
Ta I 62 63 68 71 67 44 56 45
Ta II 56 56 64 66 67 49 50 50
Ta III 85 83 83 96 86 65 72 66
Ta IV 93 93 88 119 112 80 87 -
Leg I 221 195 222 227 210 137 157 160
Leg II 200 187 223 - 210 151 160 159
Leg III 235 239 250 264 258 198 192 200
Leg IV 261 229 262 304 282 179 192 -
Ta I ω1 42 45 55 55 55 35 34 37
Ta I ω2 11 11 12 15 12 12 10 18

Haitlinger and Šundić 158
Ta I ω3 78 66 83 71 82 50 59 60
Ta I d 95 81 100 92 100 79 88 71
Ta I e 40 45 46 46 40 33 35 32
Ta I wa 40 43 29 47 32 33 27 29
Ta I p 20 20 20 30 23 16 20 26
Ta I q 21 - 27 44 17 25 27 22
Ta I la 15 17 22 22 15 16 16 18
Ti I φ 151 152 - 172 171 120 - 126
Ge I σ 49 45 51 53 54 40 34 41
Ge I mG 26 25 33 31 26 18 24 20
Ge I cG 31 34 38 39 36 31 40 35
Fe I vF 7 9 8 9 11 11 9 11
Tr I vTr 35 43 37 22 24 32 33 31
Ta II ω 65 59 56 63 67 51 51 52
Ta II d 72 98 124 115 105 70 76 66
Ta II e 36 48 54 55 49 36 29 31
Ta II wa 29 44 46 39 35 28 23 28
Ta II ra 28 45 38 - 44 37 38 21
Ta II la 16 20 18 18 20 - - -
Ti II φ 73 70 83 79 82 55 61 69
Ge II σ 36 33 39 36 37 30 29 -
Ge II mG 33 25 37 37 32 18 20 22
Ge II cG 23 20 20 23 24 24 15 18
Fe II vF 10 14 10 12 10 8 10 12
Tr II vTr 35 27 20 30 36 29 - -
Ta III d 48 67 57 127 117 84 73 -
Ta III e 45 62 47 72 70 33 44 48
Ta III w 25 30 28 54 48 34 28 31
Ti III φ 69 64 83 81 76 44 45 -
Ge III nG 12 12 12 16 13 12 10 11
Tr III vTr 12 12 - 10 13 13 10 13
Ta IV d 121 111 - 142 134 78 90 -
Ta IV w 41 38 41 58 40 34 36 -
Ta IV e 55 60 - 75 73 31 34 -
Ti IV φ 102 - 121 71 68 33 36 -
Tr IV vTr 48 49 - 15 13 - - -
c1-c1 214 200 - 258 222 158 186 198
d1-d1 100 101 116 128 121 85 82 108
e1-e1 126 116 129 132 151 103 - 101
e2-e2 107 70 106 90 127 75 - 58
ad1 24 22 23 54 57 - - -
ad2 11 10 11 48 55 - - -
Ventral side of idiosoma with long setae cp, h1, h2, thin setae 1a, 4a, peg-
like setae 2a, c3, 3a, 4b, ad2 and g and tubercle-like setae p1, p2, p3 and h3.
Apodemes I joint medially to form Y – shaped structure, other apodemes as in
Fig. 2. Aedagus short. The adanal suckers well developed (Fig. 2).
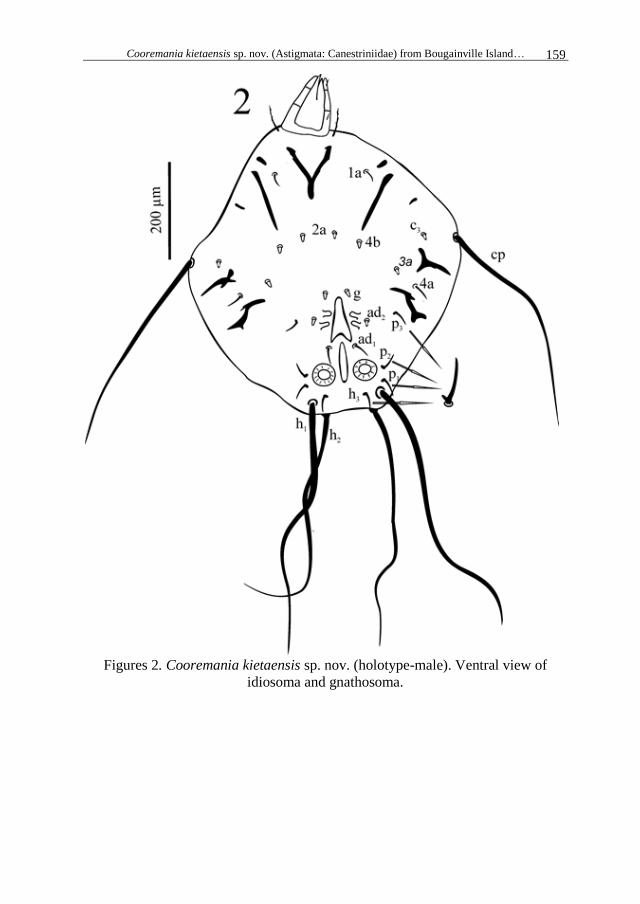
Cooremania kietaensis sp. nov. (Astigmata: Canestriniidae) from Bougainville Island… 159
Figures 2. Cooremania kietaensis sp. nov. (holotype-male). Ventral view of
idiosoma and gnathosoma.

Haitlinger and Šundić 160
Gnathosoma partly covered by idiosoma, subcapitulum with 2 pairs of
nude setae, palps with placed terminally solenidion ω and two pairs of short setae
(Fig. 3). Chelicerae with denticles (Fig. 4).
Figures 3-4. Cooremania kietaensis sp. nov. (holotype-male). 3. Gnathosoma, 4.
Chelicerae.
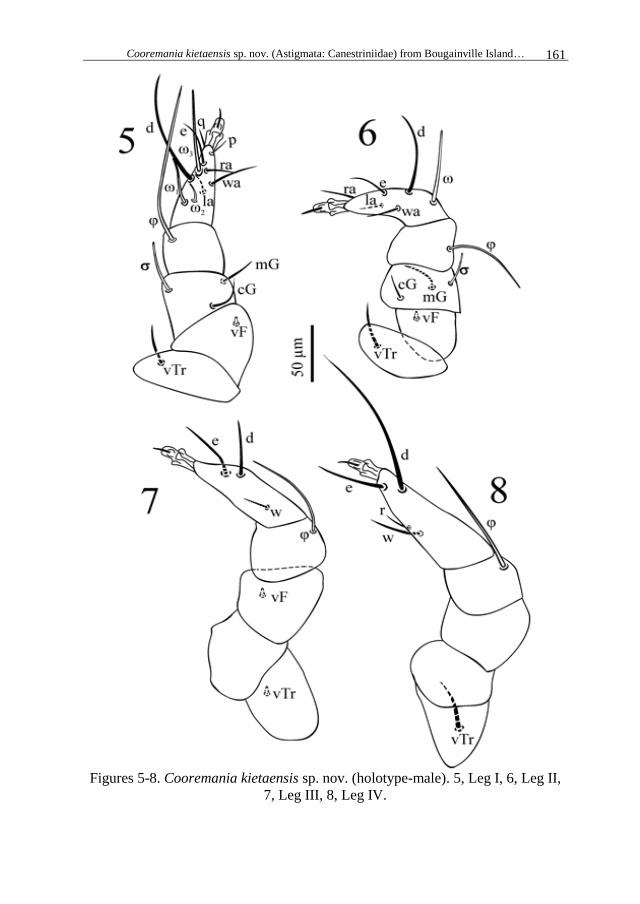
Cooremania kietaensis sp. nov. (Astigmata: Canestriniidae) from Bougainville Island… 161
Figures 5-8. Cooremania kietaensis sp. nov. (holotype-male). 5, Leg I, 6, Leg II,
7, Leg III, 8, Leg IV.

Haitlinger and Šundić 162
Leg setal formula: Leg I: Ta – ω1, ω2, ω3, d, e, q, p, la, ra, wa, s; Ti – φ, Ge
σ, cG, mG; Fe – vF; Tr – vTr (Fig. 5, Table 1). Leg II: Ta – ω, d, e, ra, la, wa, s;
Ti – φ, Ge – σ, mG, cG; Fe – vF; Tr – vTr (Fig. 6). Leg III: Ta – d, e, w, s; Ti – φ;
Ge – nG; Tr – vTr (Fig. 7). Leg IV: Ta – d, e, w, s; Ti – φ; Tr – vTr (Fig. 8). Leg
I: seta d is the longest on Ta, φ is two times longer than φ on Ti II and III and
distinctly longer than φ on Ti IV, seta vF is peg-like. Setae vF on Fe II, seta nG
on Ge III and Tr III are peg-like.
Figures 9-10. Cooremania kietaensis sp. nov. (female). 9, Dorsal view of
idiosoma and gnathosoma, 10, Ventral view of idiosoma and gnathosoma.
Female (n = 2). The females have longer idiosoma than males, the dorsal
setal pattern is identical as in males but all setae are longer, excluding setae h3
and h2 (one male has this seta longer) (Fig. 9, Table 1).
The whole dorsum is ornamented. Ventral side of idiosoma differs from
males in shape of setae in anal and genital region: setae p1, p2, p3 and h3 are peg-
like, in males tubercle-like (Fig. 10). Gnathosoma as in male, partly covered by
idiosoma.
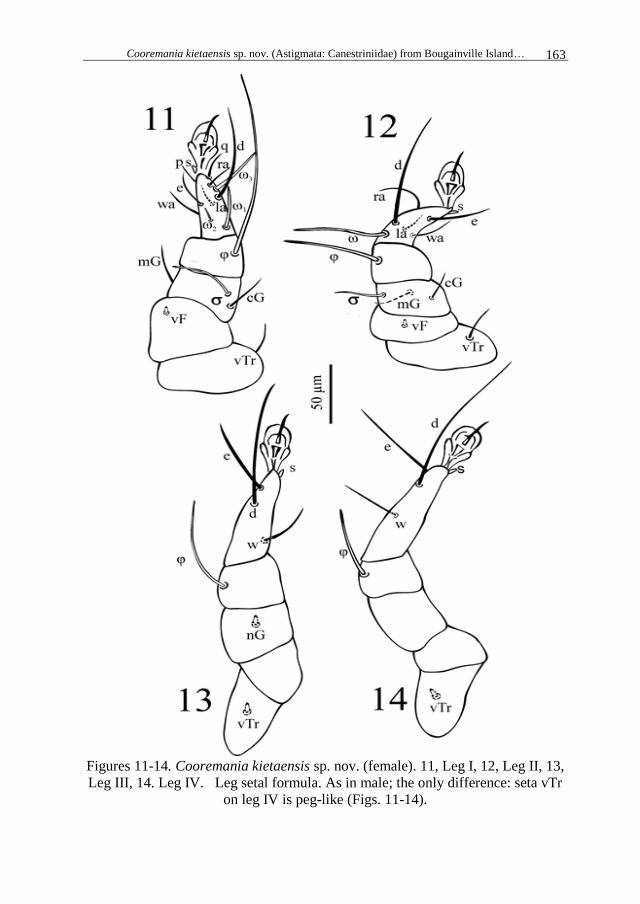
Cooremania kietaensis sp. nov. (Astigmata: Canestriniidae) from Bougainville Island… 163
Figures 11-14. Cooremania kietaensis sp. nov. (female). 11, Leg I, 12, Leg II, 13,
Leg III, 14. Leg IV. Leg setal formula. As in male; the only difference: seta vTr
on leg IV is peg-like (Figs. 11-14).
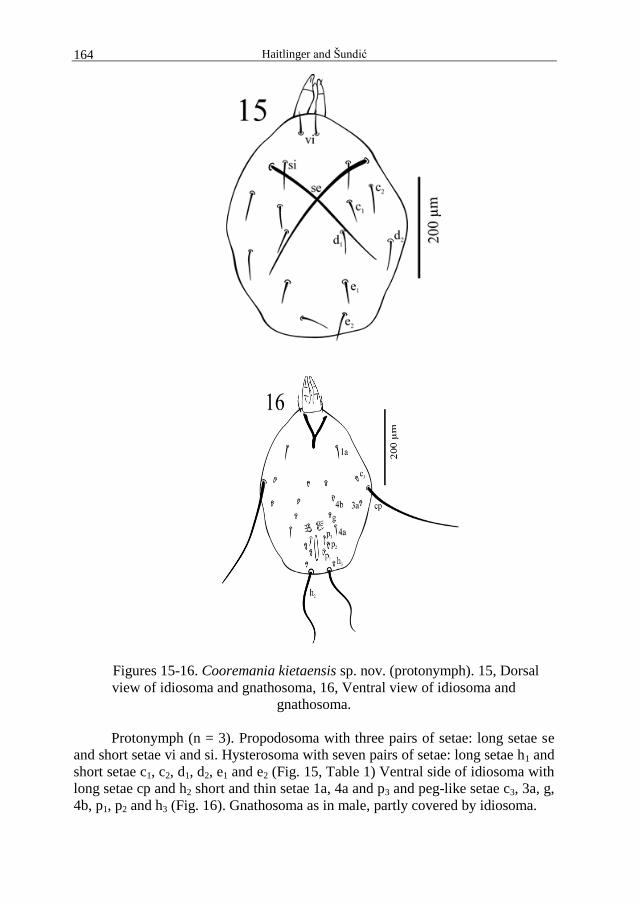
Haitlinger and Šundić 164
Figures 15-16. Cooremania kietaensis sp. nov. (protonymph). 15, Dorsal
view of idiosoma and gnathosoma, 16, Ventral view of idiosoma and
gnathosoma.
Protonymph (n = 3). Propodosoma with three pairs of setae: long setae se
and short setae vi and si. Hysterosoma with seven pairs of setae: long setae h1 and
short setae c1, c2, d1, d2, e1 and e2 (Fig. 15, Table 1) Ventral side of idiosoma with
long setae cp and h2 short and thin setae 1a, 4a and p3 and peg-like setae c3, 3a, g,
4b, p1, p2 and h3 (Fig. 16). Gnathosoma as in male, partly covered by idiosoma.
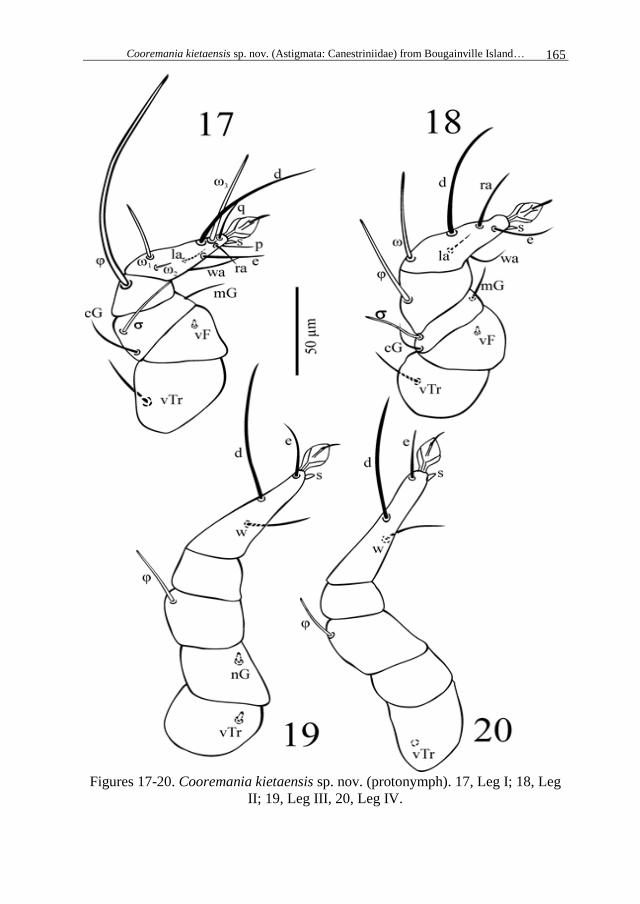
Cooremania kietaensis sp. nov. (Astigmata: Canestriniidae) from Bougainville Island… 165
Figures 17-20. Cooremania kietaensis sp. nov. (protonymph). 17, Leg I; 18, Leg
II; 19, Leg III, 20, Leg IV.
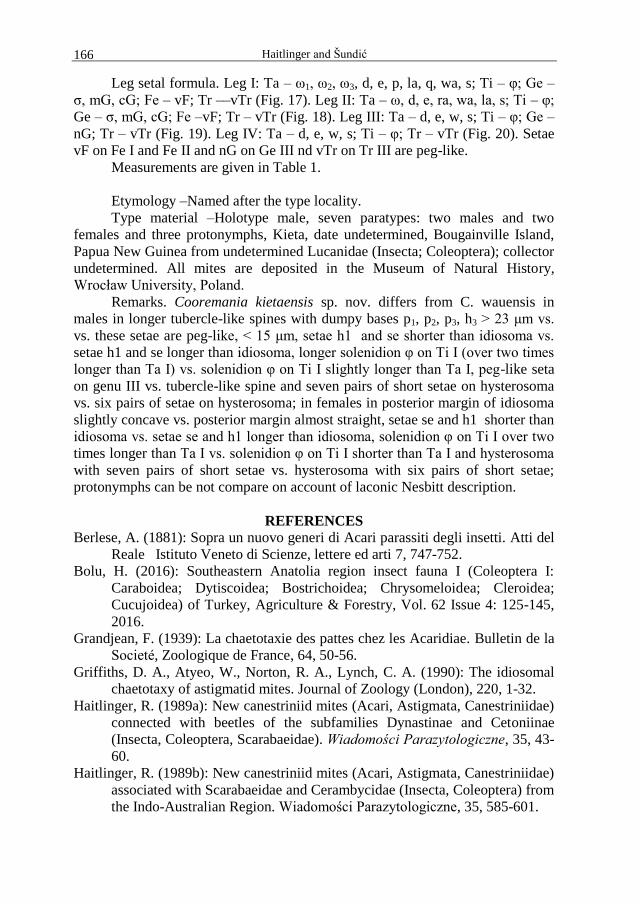
Haitlinger and Šundić 166
Leg setal formula. Leg I: Ta – ω1, ω2, ω3, d, e, p, la, q, wa, s; Ti – φ; Ge –
σ, mG, cG; Fe – vF; Tr ––vTr (Fig. 17). Leg II: Ta – ω, d, e, ra, wa, la, s; Ti – φ;
Ge – σ, mG, cG; Fe –vF; Tr – vTr (Fig. 18). Leg III: Ta – d, e, w, s; Ti – φ; Ge –
nG; Tr – vTr (Fig. 19). Leg IV: Ta – d, e, w, s; Ti – φ; Tr – vTr (Fig. 20). Setae
vF on Fe I and Fe II and nG on Ge III nd vTr on Tr III are peg-like.
Measurements are given in Table 1.
Etymology –Named after the type locality.
Type material –Holotype male, seven paratypes: two males and two
females and three protonymphs, Kieta, date undetermined, Bougainville Island,
Papua New Guinea from undetermined Lucanidae (Insecta; Coleoptera); collector
undetermined. All mites are deposited in the Museum of Natural History,
Wrocław University, Poland.
Remarks. Cooremania kietaensis sp. nov. differs from C. wauensis in
males in longer tubercle-like spines with dumpy bases p1, p2, p3, h3 > 23 μm vs.
vs. these setae are peg-like, < 15 μm, setae h1 and se shorter than idiosoma vs.
setae h1 and se longer than idiosoma, longer solenidion φ on Ti I (over two times
longer than Ta I) vs. solenidion φ on Ti I slightly longer than Ta I, peg-like seta
on genu III vs. tubercle-like spine and seven pairs of short setae on hysterosoma
vs. six pairs of setae on hysterosoma; in females in posterior margin of idiosoma
slightly concave vs. posterior margin almost straight, setae se and h1 shorter than
idiosoma vs. setae se and h1 longer than idiosoma, solenidion φ on Ti I over two
times longer than Ta I vs. solenidion φ on Ti I shorter than Ta I and hysterosoma
with seven pairs of short setae vs. hysterosoma with six pairs of short setae;
protonymphs can be not compare on account of laconic Nesbitt description.
REFERENCES
Berlese, A. (1881): Sopra un nuovo generi di Acari parassiti degli insetti. Atti del
Reale Istituto Veneto di Scienze, lettere ed arti 7, 747-752.
Bolu, H. (2016): Southeastern Anatolia region insect fauna I (Coleoptera I:
Caraboidea; Dytiscoidea; Bostrichoidea; Chrysomeloidea; Cleroidea;
Cucujoidea) of Turkey, Agriculture & Forestry, Vol. 62 Issue 4: 125-145,
2016.
Grandjean, F. (1939): La chaetotaxie des pattes chez les Acaridiae. Bulletin de la
Societé, Zoologique de France, 64, 50-56.
Griffiths, D. A., Atyeo, W., Norton, R. A., Lynch, C. A. (1990): The idiosomal
chaetotaxy of astigmatid mites. Journal of Zoology (London), 220, 1-32.
Haitlinger, R. (1989a): New canestriniid mites (Acari, Astigmata, Canestriniidae)
connected with beetles of the subfamilies Dynastinae and Cetoniinae
(Insecta, Coleoptera, Scarabaeidae). Wiadomości Parazytologiczne, 35, 43-
60.
Haitlinger, R. (1989b): New canestriniid mites (Acari, Astigmata, Canestriniidae)
associated with Scarabaeidae and Cerambycidae (Insecta, Coleoptera) from
the Indo-Australian Region. Wiadomości Parazytologiczne, 35, 585-601.
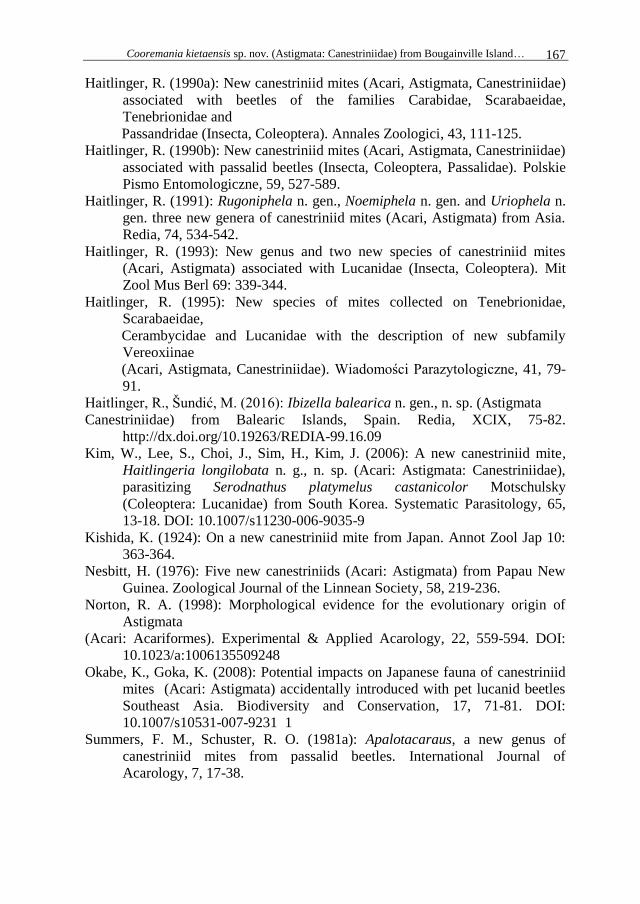
Cooremania kietaensis sp. nov. (Astigmata: Canestriniidae) from Bougainville Island… 167
Haitlinger, R. (1990a): New canestriniid mites (Acari, Astigmata, Canestriniidae)
associated with beetles of the families Carabidae, Scarabaeidae,
Tenebrionidae and
Passandridae (Insecta, Coleoptera). Annales Zoologici, 43, 111-125.
Haitlinger, R. (1990b): New canestriniid mites (Acari, Astigmata, Canestriniidae)
associated with passalid beetles (Insecta, Coleoptera, Passalidae). Polskie
Pismo Entomologiczne, 59, 527-589.
Haitlinger, R. (1991): Rugoniphela n. gen., Noemiphela n. gen. and Uriophela n.
gen. three new genera of canestriniid mites (Acari, Astigmata) from Asia.
Redia, 74, 534-542.
Haitlinger, R. (1993): New genus and two new species of canestriniid mites
(Acari, Astigmata) associated with Lucanidae (Insecta, Coleoptera). Mit
Zool Mus Berl 69: 339-344.
Haitlinger, R. (1995): New species of mites collected on Tenebrionidae,
Scarabaeidae,
Cerambycidae and Lucanidae with the description of new subfamily
Vereoxiinae
(Acari, Astigmata, Canestriniidae). Wiadomości Parazytologiczne, 41, 79-
91.
Haitlinger, R., Šundić, M. (2016): Ibizella balearica n. gen., n. sp. (Astigmata
Canestriniidae) from Balearic Islands, Spain. Redia, XCIX, 75-82.
http://dx.doi.org/10.19263/REDIA-99.16.09
Kim, W., Lee, S., Choi, J., Sim, H., Kim, J. (2006): A new canestriniid mite,
Haitlingeria longilobata n. g., n. sp. (Acari: Astigmata: Canestriniidae),
parasitizing Serodnathus platymelus castanicolor Motschulsky
(Coleoptera: Lucanidae) from South Korea. Systematic Parasitology, 65,
13-18. DOI: 10.1007/s11230-006-9035-9
Kishida, K. (1924): On a new canestriniid mite from Japan. Annot Zool Jap 10:
363-364.
Nesbitt, H. (1976): Five new canestriniids (Acari: Astigmata) from Papau New
Guinea. Zoological Journal of the Linnean Society, 58, 219-236.
Norton, R. A. (1998): Morphological evidence for the evolutionary origin of
Astigmata
(Acari: Acariformes). Experimental & Applied Acarology, 22, 559-594. DOI:
10.1023/a:1006135509248
Okabe, K., Goka, K. (2008): Potential impacts on Japanese fauna of canestriniid
mites (Acari: Astigmata) accidentally introduced with pet lucanid beetles
Southeast Asia. Biodiversity and Conservation, 17, 71-81. DOI:
10.1007/s10531-007-9231 1
Summers, F. M., Schuster, R. O. (1981a): Apalotacaraus, a new genus of
canestriniid mites from passalid beetles. International Journal of
Acarology, 7, 17-38.

Haitlinger and Šundić 168
Summers, F. M., Schuster, R. O. (1981b): Three new genera of canestriniid mites
associated with passalid beetles. International Journal of Acarology, 7, 39-
46.
Trach, V. A., Khaustov, A. A. (2011) A review of the genus Coleopterophagus
Berlese, 1882 (Acari: Astigmata: Canestriniidae) of Ukraine. Acarina, 19,
213-230.
Agriculture & Forestry, Vol. 66 Issue 3: 169-182, 2020, Podgorica 169
Onen, H., Farooq, S., Akyol, N., Ozaslan, C. (2020): Seed dormancy differences among common ragweed
(Ambrosia artemisiifolia L.) populations distributed in different climatic regions of Turkey. Agriculture and
Forestry, 66 (3): 169-182.
DOI: 10.17707/AgricultForest.66.3.14
Huseyin ONEN, Nihat AKYOL 1,
Shahid FAROOQ 2, Cumali OZASLAN
3
SEED DORMANCY DIFFERENCES AMONG COMMON RAGWEED
(AMBROSIA ARTEMISIIFOLIA L.) POPULATIONS DISTRIBUTED IN
DIFFERENT CLIMATIC REGIONS OF TURKEY
SUMMARY
Common ragweed (Ambrosia artemisiifolia L.) is an allergenic invasive
weed rapidly expanding its distribution range throughout Europe. Seed dormancy
is among the most important seed adaptation traits, helping colonizing plants to
avoid adverse environmental conditions. Furthermore, knowledge of seed
dormancy enables to predict the seed germination timing of species and enforce
specific management practices at suitable times. This study was aimed at
determining the seed dormancy differences among different common ragweed
populations distributed in two distinct regions of Turkey (i.e., eastern and western
parts of the country). The seeds of all populations were extremely dormant
(80.50-96.71% dormancy). The populations distributed in western part of the
country were more dormant than eastern populations.
Mechanical scarification and cold-wet stratification at 4°C for 2, 3 and 4
weeks were tested to infer their potential in releasing seed dormancy. Cold-wet
stratification proved effective in releasing seed dormancy; however, populations
differed in the stratification time required for seed dormancy release. Overall,
eastern populations became non-dormant with lesser stratification time (i.e., 2
weeks), while western populations took longer stratification time to become
completely non-dormant. Mechanical scarification with sandpaper also released
seed dormancy and all populations behaved similar for this technique. This
knowledge can be used to predict the germination timing of different populations
distributed in two distinct regions of the country. Furthermore, the results can
also be utilized in implementing effective management strategies at the proper
time.
Keywords: Common ragweed, Seed dormancy, Populations, Cold-wet
stratification, Mechanical scarification.
1Huseyin Onen, (corresponding author: [email protected]), Nihat Akyol, Gaziosmanpasa
University, Tokat, TURKEY. 2Shahid Farooq, Department of Plant Protection, Harran University, Sanlıurfa, TURKEY. 3Cumali Ozaslan, Department of Plant Protection, Faculty of Agriculture, Dicle University,
Diyarbakır, TURKEY.
Notes: The authors declare that they have no conflicts of interest. Authorship Form signed online.
Received:27/06/2020 Accepted:05/08/2020
Onen et al 170
INTRODUCTION
Common ragweed (Ambrosia artemisiifolia L.) is a notorious invasive
plant species readily becoming naturalized throughout Europe. The species has
successfully colonized almost all of temperate Europe, while its distribution is
limited in areas having relatively high temperatures at the start of common
ragweed (ragweed hereafter) growing season (Essl et al., 2015). Ragweed
negatively affects biodiversity and its pollens are one of the major sources of
seasonal allergies for people (Zemmer et al., 2012; Essl et al., 2015; Ozaslan et
al., 2016). Moreover, it is also a noxious weed of different arable crops like
sunflower, soybean, maize etc. in several regions of the world (Fumanal et al.,
2008; Essl et al., 2015; Ozaslan et al., 2016; Önen, 2015). Therefore, ragweed has
been considered among the 100 worst invasive species of Europe (DAISIE,
2016). The extensive distribution of the species along roadsides, non-agricultural
areas and ruderal habitats is also observed throughout its invasion range (Fumanal
et al., 2008; Essl et al., 2015; Ozaslan et al., 2016). Ragweed produces enormous
amounts of seeds, which result in rapid range expansion soon after introduction to
new geographic regions. Seeds germinate in late spring and germination is
stopped with rise in soil temperature (Essl et al., 2015).
Seed dormancy is an important adaptive trait helping plant species to avoid
adverse environmental conditions and promotes persistence in the soil seed bank
(Willemsen and Rice, 1972). The dispersion of invasive plant species over time
can be maximized by seed dormancy (Mandak and Pysek, 2001; Richardson and
Kluge, 2008). The persistence of ragweed in soil seed bank requires a dormant
period immediately after seed dispersal (Dinelli et al., 2013). Dormant period
helps the plant species to avoid adverse environmental conditions and ensures
germination in the next growing season if dormancy is broken. It has been well
documented that ragweed seeds exhibit both primary and secondary dormancy
(Bazzaz, 1970; Willemsen and Rice, 1972; Baskin and Baskin, 1980; Essl et al.,
2015). Primary dormancy can be broken by cold-wet stratification at 4°C for 2
weeks (Pickett and Baskin, 1973; Baskin and Baskin, 1980; Fumanal et al.,
2006). However, different regional findings suggest the existence of huge
variation in ragweed seeds for dormancy and germination among different
populations or even within the same population (Willemsen and Rice, 1972;
DiTommaso, 2004; Essl et al., 2015). These variations allow invasive plant
species like ragweed to persist under a wide range of environmental conditions
(Li and Feng, 2009; Eslami, 2011). Seed dormancy helps the colonizing and
colonized populations to persist under a specific set of environmental conditions
with varying seasonality across different regions. Seed dormancy also excludes
the extinction risks and provides opportunities for adaptive divergence.
Different biotic or abiotic factors (external or internal to the seed coat)
induce seed dormancy in plant species (Battla and Benech-Arnold, 2007). The
seed dormancy status of the seeds continuously fluctuates and reaches to
maximum or minimum at different times (Battla et al., 2004). The fluctuations in
seed dormancy status hamper the management efforts implemented against
Seed dormancy differences among common ragweed (Ambrosia artemisiifolia L.) … 171
weedy and invasive species through unusual patterns of seedling emergence
(Battla and Benech-Arnold, 2007). Hence seed dormancy knowledge is of prime
importance for understanding biology and ecology of the species as well as for
predicting seedling emergence (Battla and Benech-Arnold, 2007; Gioria and
Pyšek, 2017). The development of management strategies against invasive or
weedy plant species requires sound knowledge of seed dormancy (Brownsey et
al., 2013).
Ragweed is distributed in three distinct regions in Turkey (i.e., Black Sea,
Marmara and Inner Anatolia), which have different climates (Onen et al., 2014,
2015, 2016; Ozaslan et al., 2016). The species has started to incur losses to crop
production (Onen et al., 2016; Ozaslan et al., 2016) and recently pollens of the
species have been observed in various regions of the country (Farooq et al., 2016;
Celenk and Malyer, 2017). Moreover, it has been reported that species is tolerant
to various abiotic stresses and invasion will be accelerated in the country in the
future (Onen et al., 2017). Hence understanding differences among seed
dormancy of different populations distributed in distinct regions is essential for
development and enforcing site-specific/region-specific management practices.
Although exhaustive work has been done to understand the seed dormancy
in ragweed across different geographic regions of the world, variations among
different populations have merely been explored at regional scales. Moreover, the
studies have largely focused on the cold-wet stratification for 2 weeks only, while
different timings have rarely been explored for different populations. Moreover,
seed dormancy in ragweed is due to weak embryo and resistance offered by the
hard seed coat; however, mechanical scarification has never been explored. This
study was therefore designed to explore the seed dormancy differences among
ragweed populations distributed in Marmara (Western part) and Black Sea
(Eastern part) regions of Turkey. The results will help to understand the biology
and ecology of different populations, predict seedling emergence and
enforcement of management options at correct/suitable timings for effective
management of the species.
MATERIAL AND METHODS
Study area
The study area lies in Turkey, which is a diverse country situated between
25°40' to 44°48'E, and 35°51' to 42°06'N. The total area of the country is 814,578
km2. Out of the total area, 97 and 3% is located in Asia and Europe, respectively.
The country is divided into seven distinct geographical regions namely: Black
Sea, Eastern Anatolia, South Eastern Anatolia, Mediterranean, Aegean, Marmara
and Inner Anatolia. The ragweed populations included in the study were
distributed in Black Sea and Marmara regions of the country. Black Sea region
shares a border with Georgia, while Marmara region shares border with Greece
and Bulgaria. The travel, transport and trade activities with these countries could
transport alien species to the country (Wilson et al., 2016). The country has huge
diversity in climate, which makes it suitable for the invasion of non-native
Onen et al 172
species. Marmara region lies in western side of the country and has a moderate
climate with average winter and summer temperature of 4°C and 27°C,
respectively. Black Sea region is situated in eastern part of the country and has a
wet, warm and humid climate with average winter and summer temperature of
7°C and 23°C, respectively (Sensoy, 2014).
Seed Collection
Ragweed achenes (hereafter seeds) were collected from four different
locations, two from Black Sea region (i.e., Samsun and Beşikduzu districts) and
two from Marmara region (Keşan and Çorlu districts), which were highly infested
with ragweed. Mature seeds were collected from 40-50 mother plants. The seeds
spent 3 weeks in the laboratory, then were separated from the trash (leaves,
inflorescence etc.) and stored in glass jars. The experiments were conducted
immediately after the seed collection to avoid the effects of after-ripening on seed
dormancy. The information on climatic features and geographic locations of the
populations are presented in Table 1. Similarly, the climatic conditions prevailing
at the seed collection sites of ragweed populations during ragweed growth season
are provided in Table 2.
Table 1: Geographic information and climatic conditions prevailing at the
collection sites of different common ragweed populations in two distinct regions
in Turkey
Habitat Agriculture Ruderal Roadside Agriculture and
Roadside
Location Beşikduzu Samsun Keşan Çorlu
Latitude 41.05 41.38 41.09 41.14
Longitude 39.21 36.21 26.64 27.87
Region Black Sea Black Sea Marmara Marmara
Aridity
Index 1.11 0.89 0.68 0.67
PET (mm) 779.30 813.58 901.24 839.18
Annual
rainfall
(mm)
865.42 723.60 614.66 563.81
Aridity
Class*
Humid - No
risk of
desertification
Semi humid
may be
vulnerable to
desertification
Semi humid -
open to
desertification
Semi humid-
open to
desertification
* Aridity class adopted from Camci et al. (2007), PET= potential evapotranspiration.
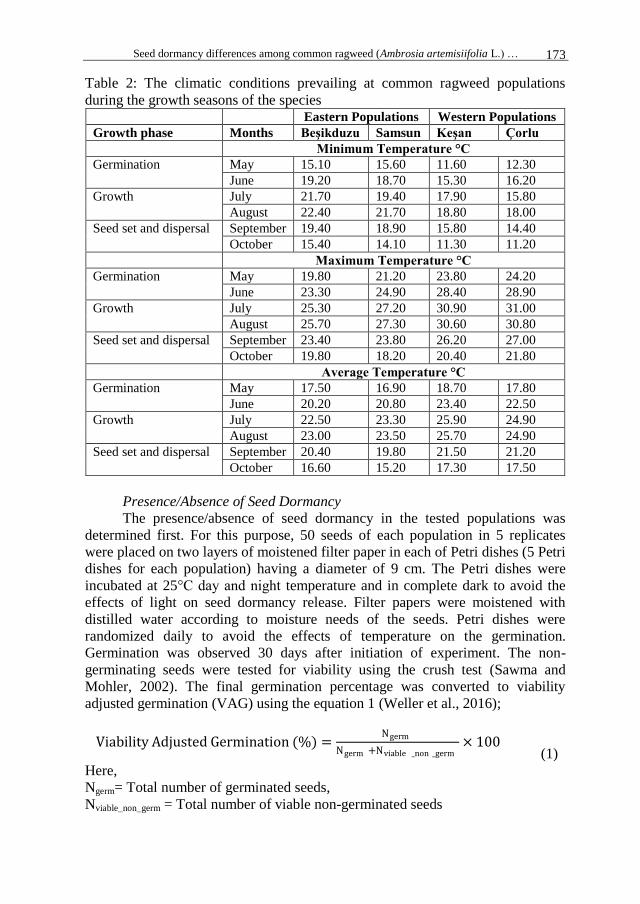
Seed dormancy differences among common ragweed (Ambrosia artemisiifolia L.) … 173
Table 2: The climatic conditions prevailing at common ragweed populations
during the growth seasons of the species Eastern Populations Western Populations
Growth phase Months Beşikduzu Samsun Keşan Çorlu
Minimum Temperature °C
Germination May 15.10 15.60 11.60 12.30
June 19.20 18.70 15.30 16.20
Growth July 21.70 19.40 17.90 15.80
August 22.40 21.70 18.80 18.00
Seed set and dispersal September 19.40 18.90 15.80 14.40
October 15.40 14.10 11.30 11.20
Maximum Temperature °C
Germination May 19.80 21.20 23.80 24.20
June 23.30 24.90 28.40 28.90
Growth July 25.30 27.20 30.90 31.00
August 25.70 27.30 30.60 30.80
Seed set and dispersal September 23.40 23.80 26.20 27.00
October 19.80 18.20 20.40 21.80
Average Temperature °C
Germination May 17.50 16.90 18.70 17.80
June 20.20 20.80 23.40 22.50
Growth July 22.50 23.30 25.90 24.90
August 23.00 23.50 25.70 24.90
Seed set and dispersal September 20.40 19.80 21.50 21.20
October 16.60 15.20 17.30 17.50
Presence/Absence of Seed Dormancy
The presence/absence of seed dormancy in the tested populations was
determined first. For this purpose, 50 seeds of each population in 5 replicates
were placed on two layers of moistened filter paper in each of Petri dishes (5 Petri
dishes for each population) having a diameter of 9 cm. The Petri dishes were
incubated at 25°C day and night temperature and in complete dark to avoid the
effects of light on seed dormancy release. Filter papers were moistened with
distilled water according to moisture needs of the seeds. Petri dishes were
randomized daily to avoid the effects of temperature on the germination.
Germination was observed 30 days after initiation of experiment. The non-
germinating seeds were tested for viability using the crush test (Sawma and
Mohler, 2002). The final germination percentage was converted to viability
adjusted germination (VAG) using the equation 1 (Weller et al., 2016);
Viability Adjusted Germination (%) =Ngerm
Ngerm +Nviable _non _germ× 100
(1)
Here,
Ngerm= Total number of germinated seeds,
Nviable_non_germ = Total number of viable non-germinated seeds
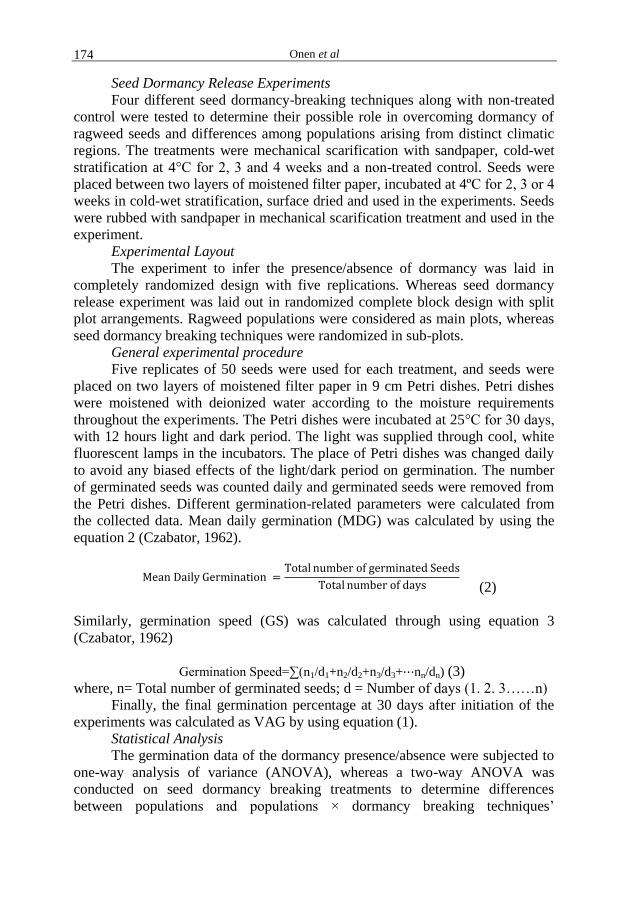
Onen et al 174
Seed Dormancy Release Experiments
Four different seed dormancy-breaking techniques along with non-treated
control were tested to determine their possible role in overcoming dormancy of
ragweed seeds and differences among populations arising from distinct climatic
regions. The treatments were mechanical scarification with sandpaper, cold-wet
stratification at 4°C for 2, 3 and 4 weeks and a non-treated control. Seeds were
placed between two layers of moistened filter paper, incubated at 4ºC for 2, 3 or 4
weeks in cold-wet stratification, surface dried and used in the experiments. Seeds
were rubbed with sandpaper in mechanical scarification treatment and used in the
experiment.
Experimental Layout
The experiment to infer the presence/absence of dormancy was laid in
completely randomized design with five replications. Whereas seed dormancy
release experiment was laid out in randomized complete block design with split
plot arrangements. Ragweed populations were considered as main plots, whereas
seed dormancy breaking techniques were randomized in sub-plots.
General experimental procedure
Five replicates of 50 seeds were used for each treatment, and seeds were
placed on two layers of moistened filter paper in 9 cm Petri dishes. Petri dishes
were moistened with deionized water according to the moisture requirements
throughout the experiments. The Petri dishes were incubated at 25°C for 30 days,
with 12 hours light and dark period. The light was supplied through cool, white
fluorescent lamps in the incubators. The place of Petri dishes was changed daily
to avoid any biased effects of the light/dark period on germination. The number
of germinated seeds was counted daily and germinated seeds were removed from
the Petri dishes. Different germination-related parameters were calculated from
the collected data. Mean daily germination (MDG) was calculated by using the
equation 2 (Czabator, 1962).
Mean Daily Germination =Total number of germinated Seeds
Total number of days
(2)
Similarly, germination speed (GS) was calculated through using equation 3
(Czabator, 1962)
Germination Speed=∑(n1/d1+n2/d2+n3/d3+⋯nn/dn) (3)
where, n= Total number of germinated seeds; d = Number of days (1. 2. 3……n)
Finally, the final germination percentage at 30 days after initiation of the
experiments was calculated as VAG by using equation (1).
Statistical Analysis
The germination data of the dormancy presence/absence were subjected to
one-way analysis of variance (ANOVA), whereas a two-way ANOVA was
conducted on seed dormancy breaking treatments to determine differences
between populations and populations × dormancy breaking techniques’
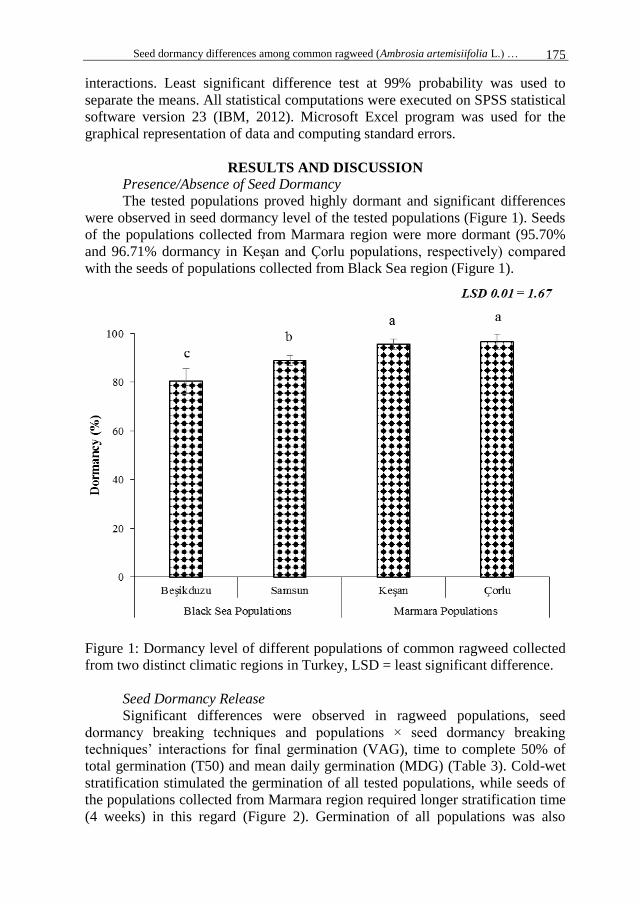
Seed dormancy differences among common ragweed (Ambrosia artemisiifolia L.) … 175
interactions. Least significant difference test at 99% probability was used to
separate the means. All statistical computations were executed on SPSS statistical
software version 23 (IBM, 2012). Microsoft Excel program was used for the
graphical representation of data and computing standard errors.
RESULTS AND DISCUSSION
Presence/Absence of Seed Dormancy
The tested populations proved highly dormant and significant differences
were observed in seed dormancy level of the tested populations (Figure 1). Seeds
of the populations collected from Marmara region were more dormant (95.70%
and 96.71% dormancy in Keşan and Çorlu populations, respectively) compared
with the seeds of populations collected from Black Sea region (Figure 1).
Figure 1: Dormancy level of different populations of common ragweed collected
from two distinct climatic regions in Turkey, LSD = least significant difference.
Seed Dormancy Release
Significant differences were observed in ragweed populations, seed
dormancy breaking techniques and populations × seed dormancy breaking
techniques’ interactions for final germination (VAG), time to complete 50% of
total germination (T50) and mean daily germination (MDG) (Table 3). Cold-wet
stratification stimulated the germination of all tested populations, while seeds of
the populations collected from Marmara region required longer stratification time
(4 weeks) in this regard (Figure 2). Germination of all populations was also
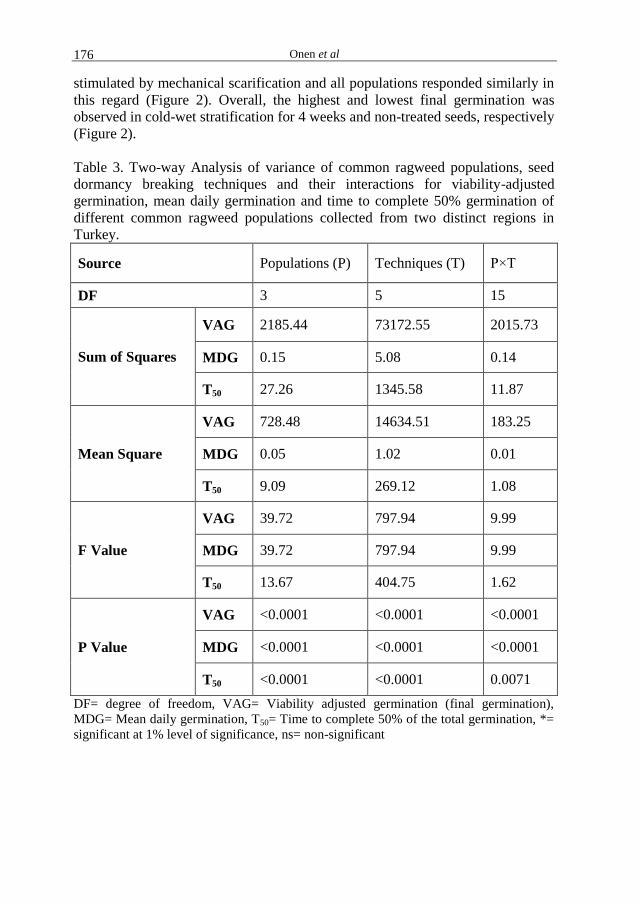
Onen et al 176
stimulated by mechanical scarification and all populations responded similarly in
this regard (Figure 2). Overall, the highest and lowest final germination was
observed in cold-wet stratification for 4 weeks and non-treated seeds, respectively
(Figure 2).
Table 3. Two-way Analysis of variance of common ragweed populations, seed
dormancy breaking techniques and their interactions for viability-adjusted
germination, mean daily germination and time to complete 50% germination of
different common ragweed populations collected from two distinct regions in
Turkey.
Source Populations (P) Techniques (T) P×T
DF 3 5 15
Sum of Squares
VAG 2185.44 73172.55 2015.73
MDG 0.15 5.08 0.14
T50 27.26 1345.58 11.87
Mean Square
VAG 728.48 14634.51 183.25
MDG 0.05 1.02 0.01
T50 9.09 269.12 1.08
F Value
VAG 39.72 797.94 9.99
MDG 39.72 797.94 9.99
T50 13.67 404.75 1.62
P Value
VAG <0.0001 <0.0001 <0.0001
MDG <0.0001 <0.0001 <0.0001
T50 <0.0001 <0.0001 0.0071
DF= degree of freedom, VAG= Viability adjusted germination (final germination),
MDG= Mean daily germination, T50= Time to complete 50% of the total germination, *=
significant at 1% level of significance, ns= non-significant
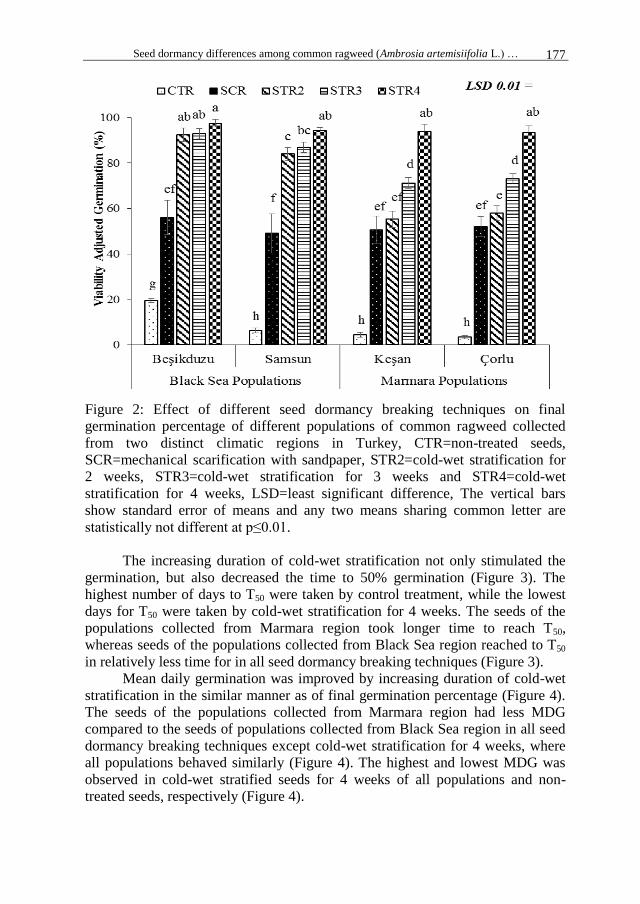
Seed dormancy differences among common ragweed (Ambrosia artemisiifolia L.) … 177
Figure 2: Effect of different seed dormancy breaking techniques on final
germination percentage of different populations of common ragweed collected
from two distinct climatic regions in Turkey, CTR=non-treated seeds,
SCR=mechanical scarification with sandpaper, STR2=cold-wet stratification for
2 weeks, STR3=cold-wet stratification for 3 weeks and STR4=cold-wet
stratification for 4 weeks, LSD=least significant difference, The vertical bars
show standard error of means and any two means sharing common letter are
statistically not different at p≤0.01.
The increasing duration of cold-wet stratification not only stimulated the
germination, but also decreased the time to 50% germination (Figure 3). The
highest number of days to T50 were taken by control treatment, while the lowest
days for T50 were taken by cold-wet stratification for 4 weeks. The seeds of the
populations collected from Marmara region took longer time to reach T50,
whereas seeds of the populations collected from Black Sea region reached to T50
in relatively less time for in all seed dormancy breaking techniques (Figure 3).
Mean daily germination was improved by increasing duration of cold-wet
stratification in the similar manner as of final germination percentage (Figure 4).
The seeds of the populations collected from Marmara region had less MDG
compared to the seeds of populations collected from Black Sea region in all seed
dormancy breaking techniques except cold-wet stratification for 4 weeks, where
all populations behaved similarly (Figure 4). The highest and lowest MDG was
observed in cold-wet stratified seeds for 4 weeks of all populations and non-
treated seeds, respectively (Figure 4).
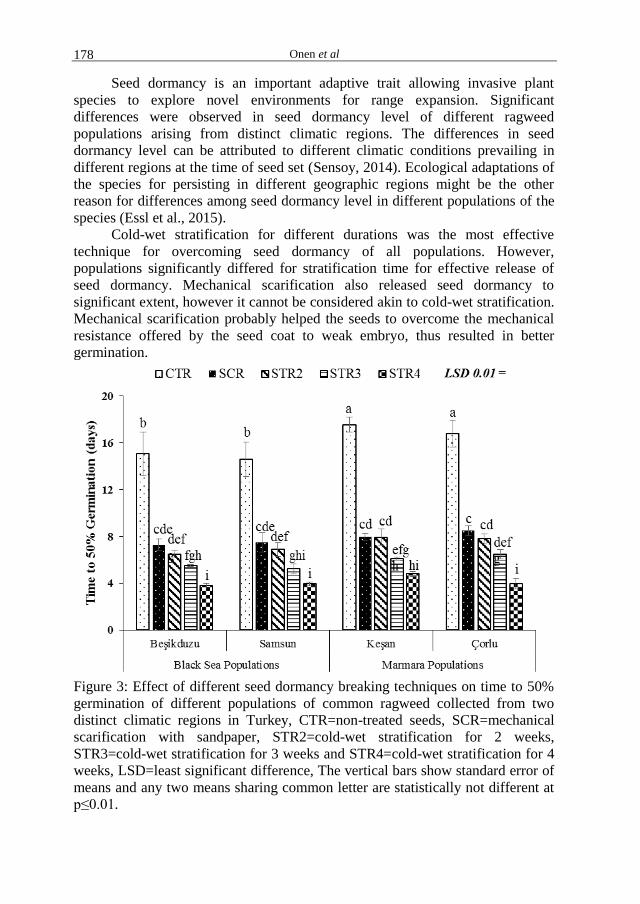
Onen et al 178
Seed dormancy is an important adaptive trait allowing invasive plant
species to explore novel environments for range expansion. Significant
differences were observed in seed dormancy level of different ragweed
populations arising from distinct climatic regions. The differences in seed
dormancy level can be attributed to different climatic conditions prevailing in
different regions at the time of seed set (Sensoy, 2014). Ecological adaptations of
the species for persisting in different geographic regions might be the other
reason for differences among seed dormancy level in different populations of the
species (Essl et al., 2015).
Cold-wet stratification for different durations was the most effective
technique for overcoming seed dormancy of all populations. However,
populations significantly differed for stratification time for effective release of
seed dormancy. Mechanical scarification also released seed dormancy to
significant extent, however it cannot be considered akin to cold-wet stratification.
Mechanical scarification probably helped the seeds to overcome the mechanical
resistance offered by the seed coat to weak embryo, thus resulted in better
germination.
Figure 3: Effect of different seed dormancy breaking techniques on time to 50%
germination of different populations of common ragweed collected from two
distinct climatic regions in Turkey, CTR=non-treated seeds, SCR=mechanical
scarification with sandpaper, STR2=cold-wet stratification for 2 weeks,
STR3=cold-wet stratification for 3 weeks and STR4=cold-wet stratification for 4
weeks, LSD=least significant difference, The vertical bars show standard error of
means and any two means sharing common letter are statistically not different at
p≤0.01.
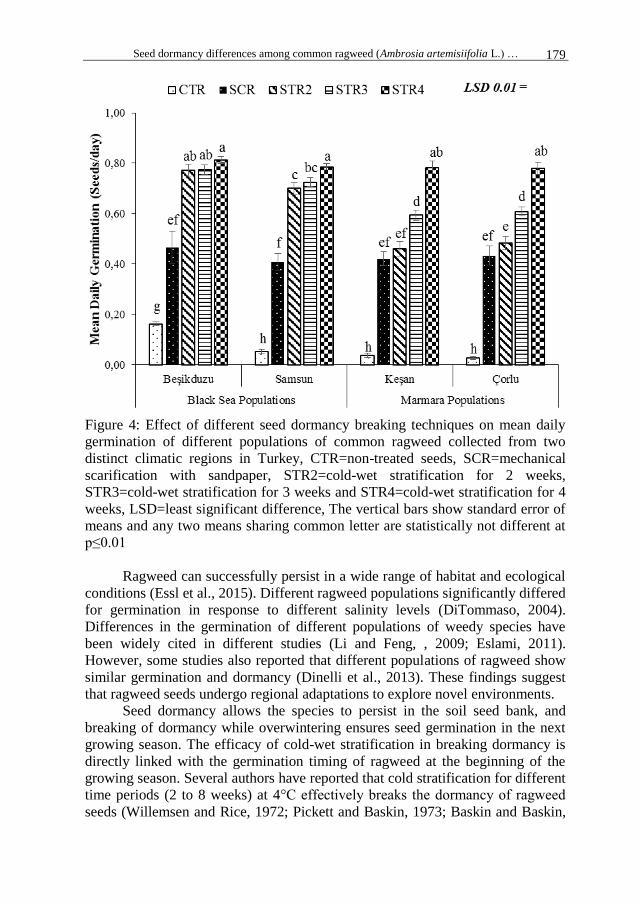
Seed dormancy differences among common ragweed (Ambrosia artemisiifolia L.) … 179
Figure 4: Effect of different seed dormancy breaking techniques on mean daily
germination of different populations of common ragweed collected from two
distinct climatic regions in Turkey, CTR=non-treated seeds, SCR=mechanical
scarification with sandpaper, STR2=cold-wet stratification for 2 weeks,
STR3=cold-wet stratification for 3 weeks and STR4=cold-wet stratification for 4
weeks, LSD=least significant difference, The vertical bars show standard error of
means and any two means sharing common letter are statistically not different at
p≤0.01
Ragweed can successfully persist in a wide range of habitat and ecological
conditions (Essl et al., 2015). Different ragweed populations significantly differed
for germination in response to different salinity levels (DiTommaso, 2004).
Differences in the germination of different populations of weedy species have
been widely cited in different studies (Li and Feng, , 2009; Eslami, 2011).
However, some studies also reported that different populations of ragweed show
similar germination and dormancy (Dinelli et al., 2013). These findings suggest
that ragweed seeds undergo regional adaptations to explore novel environments.
Seed dormancy allows the species to persist in the soil seed bank, and
breaking of dormancy while overwintering ensures seed germination in the next
growing season. The efficacy of cold-wet stratification in breaking dormancy is
directly linked with the germination timing of ragweed at the beginning of the
growing season. Several authors have reported that cold stratification for different
time periods (2 to 8 weeks) at 4°C effectively breaks the dormancy of ragweed
seeds (Willemsen and Rice, 1972; Pickett and Baskin, 1973; Baskin and Baskin,
Onen et al 180
1980; Fumanal et al., 2006; Essl et al., 2015). Cold-wet scarification
requirements for breaking seed dormancy of ragweed correspond well to its
distribution range in Turkey as well as across the whole Europe (Essl et al., 2015;
Ozaslan et al., 2016). The results also reveal that ragweed requires a specific set
of environmental conditions for germination; however, cold-wet stratification for
2 weeks, even did not completely (100% germination) overcome the dormancy
and populations required more than 2 weeks of cold-wet stratification for
complete release of seed dormancy. The possible reasons of population
differences might be the maturity time of the seeds and environmental conditions
prevailing at the time of seed maturation. Earlier studies have confirmed that seed
collected from different populations of same weeds at different times exhibit
significant differences for dormancy (Steadman et al., 2004). Since seeds were
collected at same time, the population differences could not be attributed to seed
maturation timing.
Ragweed flowers and matures at different times in different geographic
regions in Turkey (Author’s observation). The species germinates and matures
earlier in the Marmara region compared with Black Sea region. Climatic
conditions of these regions can be considered as the sole driver of these
differences. The differences in the stratification time requirement could be
attributed to different maturation timings and ecological adaptations of the
species in distinct geographic regions. Stratification requirements could be used
to predict the germination timing in different regions and could aid in
implementation of management practices.
CONCLUSIONS
The current study concludes that different ragweed populations collected
from different climatic regions exhibit significant differences for seed dormancy.
Cold-wet scarification successfully overcomes the dormancy, while populations
from different climatic regions require different cold-wet stratification duration
for complete seed dormancy release. The results of the current study add valuable
information on the understanding of ecology of different populations distributed
in distinct climatic regions of the country. Moreover, biological changes in the
seeds and embryo growth after mechanical scarification need to be explored for
better understanding of the phenomenon of dormancy release by mechanical
scarification. Nonetheless, a thorough understanding of the germination biology
of regional populations is necessary for successful management of ragweed at
regional scales.
ACKNOWLEDGEMENTS
The current study was funded by the Scientific and Technological Council
of Turkey (TUBITAK) with a Grant Number 113 O 790 as a part of the COST
Action (TD 1209 - European Information System for Alien Species).
Seed dormancy differences among common ragweed (Ambrosia artemisiifolia L.) … 181
REFERENCES Baskin JM, Baskin CC. 1980. Ecophysiology of secondary dormancy in seeds of
Ambrosia artemisiifolia. Ecology, 61: 475‒480.
Batlla D, Benech-Arnold RL. 2007. Predicting changes in dormancy level in weed seed
soil banks: implications for weed management. Crop Protection, 26(3): 189‒197.
Batlla D, Kruk BC and Benech-Arnold RL. 2004. Modelling changes in dormancy in
weed soil seed banks: implications for the prediction of weed emergence. In:
Benech-Arnold R.L., Sánchez R.A. (eds.): Handbook of seed physiology.
Applications to agriculture. New York: Haworth Press Inc: 245‒264.
Bazzaz F. 1970. Secondary dormancy in the seeds of the common ragweed Ambrosia
artemisiifolia. Bulletin of the Torrey Botanical Club, 302‒305.
Brownsey RN, Kyser GB and DiTomaso JM. 2013. Seed and germination biology of
Dittrichia graveolens (Stinkwort). Invasive Plant Science and Management, 6(3):
371‒380.
Camci CS, Karaca A, Haktanır K and Yildiz H. 2007. Global attention to Turkey due to
desertification. Environmental Monitoring and Assessment, 128: 489‒493.
Celenk S, Malyer H. 2017. The occurrence of Ambrosia pollen in the atmosphere of
Northwest Turkey: investigation of possible source regions. International Journal
of Biometeorology, 1‒12.
Czabator FJ. 1962. Germination value: an index combining speed and completeness of
pine seed germination. Forest Science, 8: 386‒396.
Delivering Alien Invasive Species Inventories for Europe – DAISIE. 2016. 100 of the
Worst: http:// www.europe-aliens.org/speciesTheWorst.do (accessed 3.7.3017).
Dinelli G, Marotti I, Catizone P, Bosi S, Tanveer A, Abbas R and Pavlovic D. 2013.
Germination ecology of Ambrosia artemisiifolia L. and Ambrosia trifida L.
biotypes suspected of glyphosate resistance. Open Life Sciences, 8: 286‒296.
DiTommaso, A. 2004. Germination behavior of common ragweed (Ambrosia
artemisiifolia) populations across a range of salinities. Weed Science, 52:
1002‒1009.
Ellis R, Roberts E. 1981. The quantification of ageing and survival in orthodox seeds.
Seed Science and Technology, 9: 373‒409.
Eslami, S. 2011. Comparative germination and emergence ecology of two populations of
common lambsquarters (Chenopodium album) from Iran and Denmark. Weed
science, 59: 90‒97.
Essl F, Biró K, Brandes D, Broennimann O, Bullock JM, Chapman DS, Chauvel B,
Dullinger S, Fumanal B and Guisan A. 2015. Biological flora of the British Isles:
Ambrosia artemisiifolia. Journal of Ecology, 103: 1069‒1098.
Farooq S, Lommen STE, Hallmann CA and Onen H. 2016. Seed and pollen production
variations among Ragweed populations in Black Sea region. In: Book of Abstracts.
Turkey 6th
Plant Protection Congress with International Participation, Konya,
Turkey, September 5‒8, 2016.
Fumanal B, Girod C, Fried G, Bretagnolle F and Chauvel B. 2008. Can the large
ecological amplitude of Ambrosia artemisiifolia explain its invasive success in
France? Weed Research, 48: 349‒359.
Fumanal B, Plenchette C, Chauvel B and Bretagnolle F. 2006. Which role can arbuscular
mycorrhizal fungi play in the facilitation of Ambrosia artemisiifolia L. invasion in
France? Mycorrhiza, 17: 25‒35.
Gioria M, Pyšek P. 2017. Early bird catches the worm: germination as a critical step in
plant invasion. Bioogical Invasions, 19(4): 1055‒1080.
Onen et al 182
IBM Corporation. (2012): IBM SPSS statistics for Windows, version 21.0. IBM
Corporation Armonk, NY.
Li YP, Feng YL. 2009. Differences in seed morphometric and germination traits of
crofton weed (Eupatorium adenophorum) from different elevations. Weed
Science, 57: 26‒30.
Mandak B, Pyšek P. 2001. Fruit dispersal and seed banks in Atriplex sagittata: the role of
heterocarpy. Journal of Ecology, 89: 159‒165.
Onen H, 2015. Invasive plants catalogue of Turkey. Ankara, Turkey: Ministry of Food,
Agriculture and Livestock. Ankara Turkey. ISBN: 978-605-9175-05-0. In Turkish.
Onen H, Gunal H and Ozcan S. 2014. The Black Sea highway: the route of common
ragweed (Ambrosia artemisiifolia L.) invasion in Turkey. In: Book of Abstracts:
8th
International Conference on Biological Invasions from understanding to action,
Antalya, Turkey, November 3‒8, 2014.
Onen H, Ozaslan C and Akyol N 2015. Ambrosia artemisiifolia L. In: Onen H. (eds):
Invasive Plants Catalogue of Turkey. ISBN: 978-605-9175-05-0. In Turkish.
Onen H, Farooq S, Gunal H and Ozaslan C. 2016. Common ragweed invasion in Turkey:
What we have learnt so far? In: Book of Abstracts. Turkey 6th
Plant Protection
Congress with International Participation, Konya, Turkey, September 5‒8, 2016.
Onen H, Farooq S, Gunal H, Ozaslan C and Erdem H. 2017. Higher tolerance to abiotic
stresses and soil types may accelerate common ragweed (Ambrosia artemisiifolia)
Invasion. Weed Science, 65(1): 115‒127.
Ozaslan C, Onen H, Farooq S, Gunal H and Akyol N. 2016. Common ragweed: An
emerging threat for sunflower production and human health in Turkey. Weed
Biology and Management, 1: 42‒55.
Pickett ST, Baskin JM. 1973. The role of temperature and light in the germination
behavior of Ambrosia artemisiifolia. Bulletin of the Torrey Botanical Club, 100:
165‒170.
Richardson DM, Kluge RL. 2008. Seed banks of invasive Australian Acacia species in
South Africa: role in invasiveness and options for management. Perspectives in
Plant Ecology, Evolution and Systematics, 10: 161‒177.
Sawma JT, Mohler CL. 2002. Evaluating seed viability by an unimbibed seed crush test
in comparison with the tetrazolium test 1. Weed Technology, 16: 781‒786.
Sensoy, S. 2014. Climate of Turkey: http://topraksuenerji.org/Climate_of_turkey.pdf
(accessed 3.7.2017).
Steadman KJ, Ellery AJ, Chapman R, Moore A and Turner NC. 2004. Maturation
temperature and rainfall influence seed dormancy characteristics of annual
ryegrass (Lolium rigidum). Crop and Pasture Science, 55: 1047‒1057.
Weller S, Florentine S, Sillitoe J, Grech C and McLaren D. 2016. An investigation of the
effects of stage of ensilage on Nassella neesiana seeds, for reducing seed viability
and injury to livestock. Scientific reports, 6. doi:10.1038/srep22345.
Willemsen RW, Rice EL. 1972. Mechanism of seed dormancy in Ambrosia artemisiifolia.
American Journal of Botany, 59(3): 248‒257.
Wilson JRU, García-Díaz P, Cassey P, Richardson DM, Pyšek P and Blackburn TM.
2016. Biological invasions and natural colonisations are different: the need for
invasion science. NeoBiota, 31: 87–98.
Zemmer F, Karaca F and Ozkaragoz F. 2012. Ragweed pollen observed in Turkey:
detection of sources using back trajectory models. Science of the Total
Environment, 430, 101–108.
Agriculture & Forestry, Vol. 66 Issue 3: 183-195, 2020, Podgorica 183
Uttaruk, Y., Laosuwan, T. (2020): Methods of estımatıon for above ground carbon stock ın Nongbua-nonmee
communıty forest, Maha Sarakham Provınce, Thaıland. Agriculture and Forestry, 66 (3): 183-195
DOI: 10.17707/AgricultForest.66.3.15
Yannawut UTTARUK1, Teerawong LAOSUWAN
2
METHODS OF ESTIMATION FOR ABOVE GROUND CARBON STOCK
IN NONGBUA-NONMEE COMMUNITY FOREST, MAHA SARAKHAM
PROVINCE, THAILAND
SUMMARY
The climate of the world today has changed greatly. This is mainly due to
human activity causing large emissions of carbon dioxide (CO2) from the reserve
into the atmosphere, which is the main cause of global warming. This research
methodology comprised of training for people in the community and local
government sector, so they acquired knowledge and understanding of the causes
and consequences of global warming. The people will also learn the adjustment
toward weather atmosphere, the method in relieving global warming issues with
the potential of the community forest as well as tree measurement techniques.
The research method was based from the analysis of the carbon stock from the
community forest from 3 different methods; which are 1) method of tree
measurement by farmers in the community 2) Measurement, Reporting and
Verification (MRV) online method, and 3) the application of Geoinformatics
Technology (GIT). The research results found that 50 participants in the training
session possessed over 80 percent of understanding toward causes and
consequences from global warming, adjustment toward the change of weather
atmosphere, and way to relieve the severity of global warming issue with a
potential of community forest. Participants were also able to learn tree
measurement techniques as well as able to record results. The results from the
data analysis from the field survey, MRV online tool, and Geoinformatics
Technology found that the community forest can complete the process of carbon
stock that is equivalent to 5,256.66 tCO2e, 5,061.32 tCO2e, 5,058.01 tCO2e
respectively.
Keywords: Community forest, Carbon stock, Ecological structure, Remote
Sensing, Geoinformatics technology, MRV.
1Yannawut Uttaruk, (corresponding author: [email protected]) Department of Biology, Faculty
of Science, Mahasarakham University, Khamrieng, Katarawichai, Maha Sarakham, 44150,
THAILAND. 2Teerawong Laosuwan, Department of Physics, Faculty of Science, Mahasarakham University,
Khamrieng, Katarawichai, Maha Sarakham, 44150, THAILAND.
Notes: The authors declare that they have no conflicts of interest. Authorship Form signed online.
Recieved:16/05/2020 Accepted:30/08/2020

Uttaruk and Laosuwan 184
INTRODUCTION
When radiations from the sun pierce through the atmosphere to the earth
surface, it will enter the earth crust where the atmosphere will reflect some parts
to space. The Greenhouse Gas (GHG) will act as an absorbent of the heat
radiation, so the weather on the earth surface is warm and suitable for the
existence of the living organisms. Thus, without these types of gases, the average
temperature of the earth surface will decrease down to 0°F (approximately -
17.78°C). These GHGs in an appropriate amount will help average the heat on the
earth surface to around 59°F (about 15
°C) (Gore, 2007). Thus, the high amount of
Greenhouse Gases (GHG) that derived from human actions will increase the
severity of the greenhouse effect, which results in the average temperature of the
earth to increase drastically. This will lead to a tremendous change in the weather
atmosphere. Significant GHGs are including Carbon dioxide (CO2), Methane
(CH4), Nitrous oxide (N2O), Hydrofluorocarbons (HFC), Perfluorinated
compounds (PFC), and Nitrogen trifluoride (NF3) (Uttaruk and Laosuwan, 2016).
The CO2 is a GHG that we give importance the most as it has up to 80 percent
ratio of GHG that was released from human activities. Examples of human
activities were fuel combustion from factories, deforestation to build resident or
for agricultural purposes. The deforestation takes up almost 20 percent for the
CO2 emission to the atmosphere (Uttaruk and Laosuwan, 2018). This was
because trees and forests have excellent quality in the absorbent of CO2
(Senpaseuth et al., 2009). Therefore, the decreased number of forest area will
result in an increasing amount of CO2 (Spracklen et al., 2015; Ounkerd et al.,
2015; Bradford and Bell, 2017). At present; CO2 sequestration can be done in two
methods which are 1) direct storage which is a method to prevent the diffusion of
CO2 to the atmosphere, and 2) the indirect storage. This method is considered the
best method for the carbon stock, which was to store it in trees and forests as trees
and forests are the best sources for the carbon stock (IPCC, 2018).
Therefore, forest pays an essential role in the sequestration and emission of
CO2. The sequestration or absorption of CO2 through the process of
photosynthesis will be completed when tree brings about CO2 to use in absorbing
foods, production, and creation of biomass (Cairns et al., 1997; Mekuria et al.,
2015; Sisay et al., 2017). The forest had three significant effects on global
warming; which are, 1) forest can absorb CO2 from the atmosphere and help to
maintain and stabilize the earth’s temperature. The second effect was the forest
help release vapor into the atmosphere and increase moist. The third effect was
that the forest covered the entire area of land from the sun, which also helps to
reduce the heat in the earth surface (Laosuwan and Uttaruk, 2016a; Rotjanakusol
and Laosuwan, 2018). Thus, international scientific research that was published
in “National Science Foundation Report” from the United States stated that
growing of trees, increase numbers of forest area, sustainable agriculture, and
conservation of wetlands as well as a better management of soil all can help
effectively reduce the severity of the global warming. Growing of forests will
help reduce up to 37 percent of 11.3 billion tons of CO2 emission by 2030 or
Methods of estımatıon for above ground carbon stock ın Nongbua-nonmee … 185
equal to the fuel combustion. This would be enough to maintain the earth surface
not to exceed 2°C (The Nature Conservancy, 2019). For Thailand, in 1973 the
area of the forest was about 221,707 km2 or approximately 43.21% of the area in
Thailand. However, in 2017, the forestry area has tremendously reduced to about
163,981.28 km2 or equivalent to 31.68 % (Royal Forest Department Thailand,
2019). The number of forest intrusion increased drastically every year. This was
due to the significant change in the economic structures from agricultural to
industrial; this resulted in the deterioration of forest and a drastic reduction in the
number of forest (Royal Forest Department Thailand, 2016).
The management of the community forest is another trend that people in
the community pay attention to more than ever before (Laosuwan et al., 2016b).
The people also began hosting activities for the conservation and preservation of
the forest (Poungngamchuen, 2013). Thus, each local area tends to have format
and method on the management of the community forest differently, but less
likely to succeed. This was because it was done only done through the
participation of the people (Dyer et al., 2014; Samek et al., 2014). There was no
cooperation from the government sector as much as needed. Therefore, the
involvement from the people and the cooperation from government sectors as
well as educational institutes are significant to the management of the community
forest (Samek et al., 2011; Husseini et al., 2016; Tadesse et al., 2017). The
objective of this research project was to development methods of estimation for
above ground carbon stock in Nongbua-nonmee community forest, Bua Kho Sub-
district, Mueang District, Maha Sarakham province, Thailand. Thus to raise
awareness within the community on the causes and consequences from the global
warming, adjustment toward the changes of weather atmosphere, and method to
relieve the severity of global warming issues with potential of the community
forest.
MATERIAL AND METHODS To make it concise and easy to understand, this research illustrated
operational methods into steps as follow:
Transfer of Knowledge
The research transferred the knowledge through lecturer from the
researcher on topics of 1) causes and consequences from global warming 2) the
adjustment toward the change of the weather atmosphere and 3) method on
relieving the severity of global warming from the community forest. Thus, the
researcher has evaluated the results of participants in the training on the three
topics above with questionnaires.
Operational Training
The researcher hosted an operational training on the carbon stock
measurement techniques in biomass from trees within the study area through the
placement of sample permanent plot in a size of 20x20 m2 for the total of 15 plot
(Figure 1). Thus, participants acquired knowledge and understanding on 1)
survey planning process 2) tree measurement techniques based on the theory as
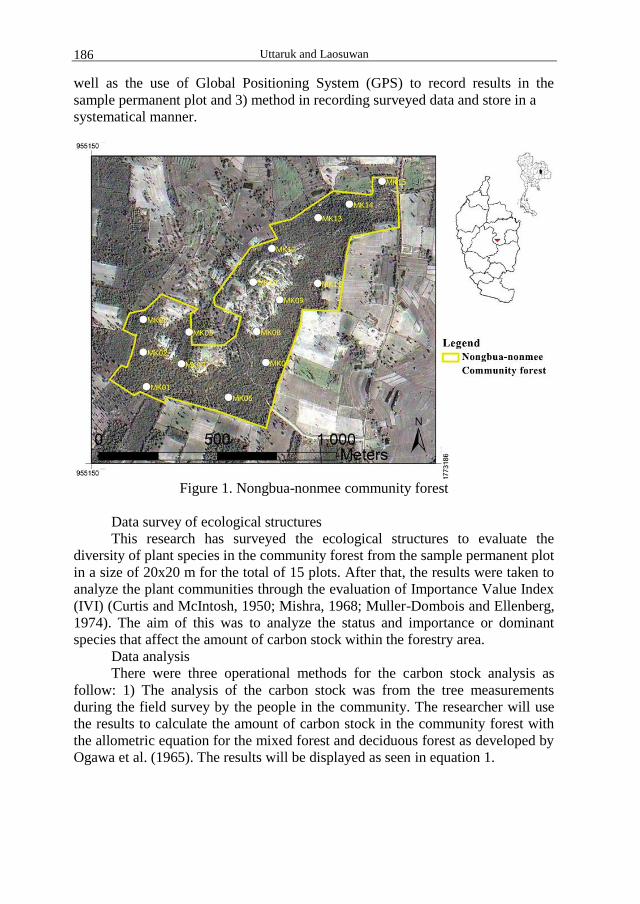
Uttaruk and Laosuwan 186
well as the use of Global Positioning System (GPS) to record results in the
sample permanent plot and 3) method in recording surveyed data and store in a
systematical manner.
Figure 1. Nongbua-nonmee community forest
Data survey of ecological structures
This research has surveyed the ecological structures to evaluate the
diversity of plant species in the community forest from the sample permanent plot
in a size of 20x20 m for the total of 15 plots. After that, the results were taken to
analyze the plant communities through the evaluation of Importance Value Index
(IVI) (Curtis and McIntosh, 1950; Mishra, 1968; Muller-Dombois and Ellenberg,
1974). The aim of this was to analyze the status and importance or dominant
species that affect the amount of carbon stock within the forestry area.
Data analysis
There were three operational methods for the carbon stock analysis as
follow: 1) The analysis of the carbon stock was from the tree measurements
during the field survey by the people in the community. The researcher will use
the results to calculate the amount of carbon stock in the community forest with
the allometric equation for the mixed forest and deciduous forest as developed by
Ogawa et al. (1965). The results will be displayed as seen in equation 1.
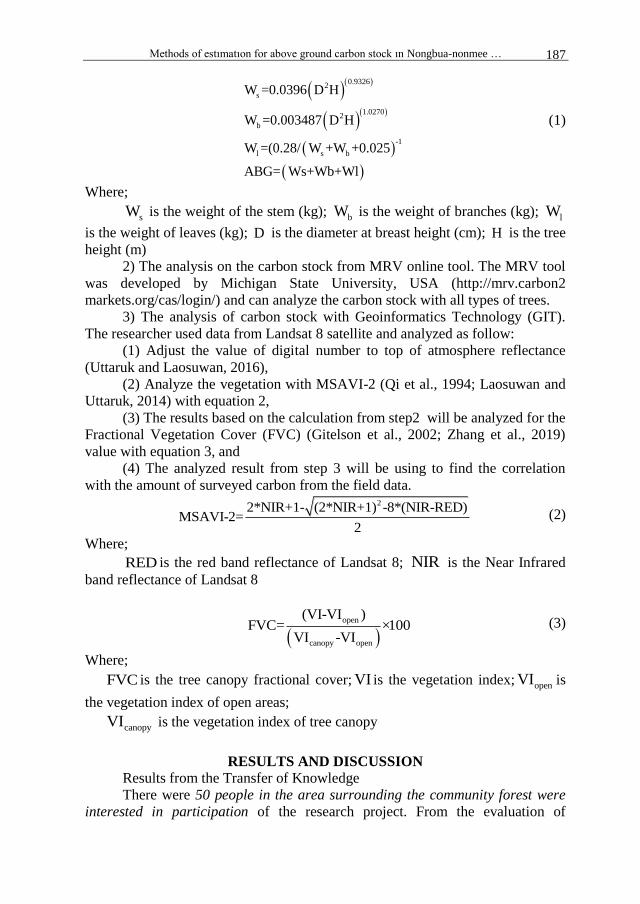
Methods of estımatıon for above ground carbon stock ın Nongbua-nonmee … 187
0.9326 2
s
1.0270 2
b
-1
s bl
W 0.0396 D H
W =0.003487 D H
0.28/ W +W +0.025
W
=
W =
s+W
(
ABG= b+Wl
(1)
Where;
sW is the weight of the stem (kg); bW is the weight of branches (kg); lW
is the weight of leaves (kg); D is the diameter at breast height (cm); H is the tree
height (m)
2) The analysis on the carbon stock from MRV online tool. The MRV tool
was developed by Michigan State University, USA (http://mrv.carbon2
markets.org/cas/login/) and can analyze the carbon stock with all types of trees.
3) The analysis of carbon stock with Geoinformatics Technology (GIT).
The researcher used data from Landsat 8 satellite and analyzed as follow:
(1) Adjust the value of digital number to top of atmosphere reflectance
(Uttaruk and Laosuwan, 2016),
(2) Analyze the vegetation with MSAVI-2 (Qi et al., 1994; Laosuwan and
Uttaruk, 2014) with equation 2,
(3) The results based on the calculation from step2 will be analyzed for the
Fractional Vegetation Cover (FVC) (Gitelson et al., 2002; Zhang et al., 2019)
value with equation 3, and
(4) The analyzed result from step 3 will be using to find the correlation
with the amount of surveyed carbon from the field data. 22*NIR+1- (2*NIR+1) -8*(NIR-RED)
MSAVI-2=2
(2)
Where;
RED is the red band reflectance of Landsat 8; NIR is the Near Infrared
band reflectance of Landsat 8
open
canopy open
(VI-VI )FVC= ×100
VI -VI (3)
Where;
FVC is the tree canopy fractional cover; VI is the vegetation index; openVI is
the vegetation index of open areas;
canopyVI is the vegetation index of tree canopy
RESULTS AND DISCUSSION
Results from the Transfer of Knowledge
There were 50 people in the area surrounding the community forest were
interested in participation of the research project. From the evaluation of

Uttaruk and Laosuwan 188
questionnaire, it found that participants acquired understandings of topic (1), (2),
and (3) for 81 percent. About 8 percent understand certain topics and another 11
percent did not provide opinions in the questionnaire. Regarding the
acknowledgment of changes toward the weather atmosphere – In general, the
people will receive the news on the changes in weather atmosphere from a
different form of media. However, the people still lack awareness on knowledge
and consequences of the moves toward weather atmosphere. From the project, it
was found that the group that was engaged in the transfer of knowledge tended to
respond and become aware of the consequences than those who never receive
knowledge transfer. This was because the people still lack the basic
understanding on the carbon cycle in daily life. Results from the Operational Training
The results for the evaluation of knowledge and ability for the tree
measurement in 50 participants found that those that received operational training
were able to measure the growth (diameter) and height of the tree. Participants
were also able to record measured data into the record form. After the
categorization, it was found that 37 percent of training participants were able to
measure tree growth with tools. Additionally, 50 percent of participants were able
to use estimation method; the rest of 13 percent did not provide any opinions. For
the height measurement of tree, it was found that 24 percent of training
participants used tools to measure, 68 percent used estimation, and the rest of 8
percent did not provide any opinions.
Results from the Data Survey of the Ecological Structures
The results from data survey of the ecological structure to estimate the
diversification of species in the community forest found 33 different plant species
from 23 families. Five plant species that were mostly found including:
1) Dipterocarpus tuberculatus Roxb. DIPTEROCARPA CEAE,
2) Shorea obtusa Wall. ex Blume: DIPTEROCARPACEAE,
3) Xylia xylocarpa (Roxb.) Taub. var. kerrii (Craib & Hutch.) I.C. Nielsen :
LEGUMINOSAE-MIMOSOIDEAE,
4) Dipterocarpus obtusifolius Teijsm ex Miq.: DIPTEROCARPACEAE,
5) Catunaregam tomentosa (Blume ex DC.) Tirveng.: RUBIACEAE.
After an analysis of the plant communities through the Importance Value
Index (IVI) evaluation (Table 1) which consisted of Relative Density (RD),
Relative Frequency (RF), and Relative Dominance (RDo), it was found that five
dominant species were
1) Dipterocarpus tuberculatus Roxb.
2) Shorea obtusa Wall. ex Blume
3) Xylia xylocarpa (Roxb.) Taub. var. kerrii (Craib & Hutch.) I.C. Nielsen
4) Dipterocarpus obtusifolius Teijsm ex Miq.
5) Catunaregam tomentosa (Blume ex DC.) Tirveng
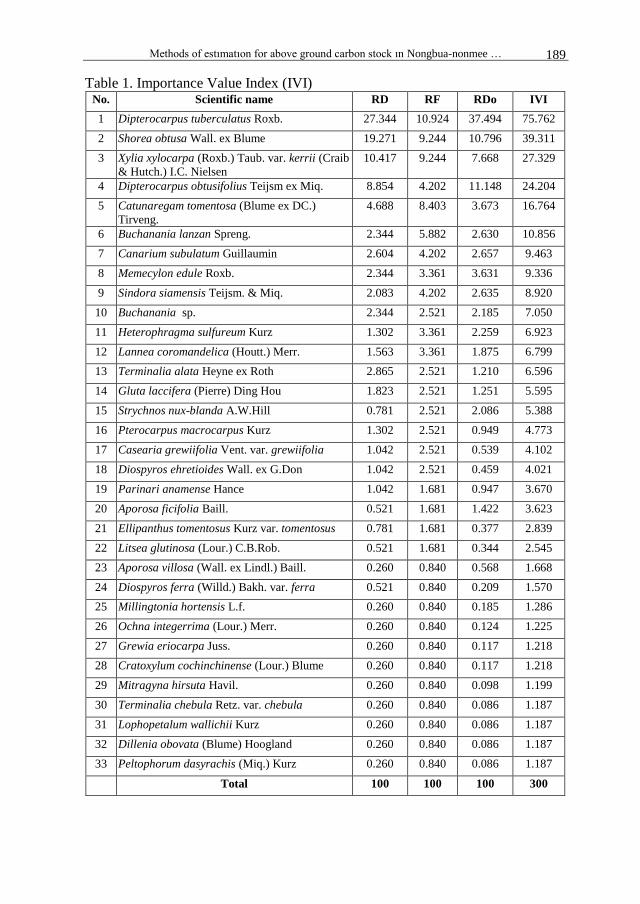
Methods of estımatıon for above ground carbon stock ın Nongbua-nonmee … 189
Table 1. Importance Value Index (IVI) No. Scientific name RD RF RDo IVI
1 Dipterocarpus tuberculatus Roxb. 27.344 10.924 37.494 75.762
2 Shorea obtusa Wall. ex Blume 19.271 9.244 10.796 39.311
3 Xylia xylocarpa (Roxb.) Taub. var. kerrii (Craib
& Hutch.) I.C. Nielsen
10.417 9.244 7.668 27.329
4 Dipterocarpus obtusifolius Teijsm ex Miq. 8.854 4.202 11.148 24.204
5 Catunaregam tomentosa (Blume ex DC.)
Tirveng.
4.688 8.403 3.673 16.764
6 Buchanania lanzan Spreng. 2.344 5.882 2.630 10.856
7 Canarium subulatum Guillaumin 2.604 4.202 2.657 9.463
8 Memecylon edule Roxb. 2.344 3.361 3.631 9.336
9 Sindora siamensis Teijsm. & Miq. 2.083 4.202 2.635 8.920
10 Buchanania sp. 2.344 2.521 2.185 7.050
11 Heterophragma sulfureum Kurz 1.302 3.361 2.259 6.923
12 Lannea coromandelica (Houtt.) Merr. 1.563 3.361 1.875 6.799
13 Terminalia alata Heyne ex Roth 2.865 2.521 1.210 6.596
14 Gluta laccifera (Pierre) Ding Hou 1.823 2.521 1.251 5.595
15 Strychnos nux-blanda A.W.Hill 0.781 2.521 2.086 5.388
16 Pterocarpus macrocarpus Kurz 1.302 2.521 0.949 4.773
17 Casearia grewiifolia Vent. var. grewiifolia 1.042 2.521 0.539 4.102
18 Diospyros ehretioides Wall. ex G.Don 1.042 2.521 0.459 4.021
19 Parinari anamense Hance 1.042 1.681 0.947 3.670
20 Aporosa ficifolia Baill. 0.521 1.681 1.422 3.623
21 Ellipanthus tomentosus Kurz var. tomentosus 0.781 1.681 0.377 2.839
22 Litsea glutinosa (Lour.) C.B.Rob. 0.521 1.681 0.344 2.545
23 Aporosa villosa (Wall. ex Lindl.) Baill. 0.260 0.840 0.568 1.668
24 Diospyros ferra (Willd.) Bakh. var. ferra 0.521 0.840 0.209 1.570
25 Millingtonia hortensis L.f. 0.260 0.840 0.185 1.286
26 Ochna integerrima (Lour.) Merr. 0.260 0.840 0.124 1.225
27 Grewia eriocarpa Juss. 0.260 0.840 0.117 1.218
28 Cratoxylum cochinchinense (Lour.) Blume 0.260 0.840 0.117 1.218
29 Mitragyna hirsuta Havil. 0.260 0.840 0.098 1.199
30 Terminalia chebula Retz. var. chebula 0.260 0.840 0.086 1.187
31 Lophopetalum wallichii Kurz 0.260 0.840 0.086 1.187
32 Dillenia obovata (Blume) Hoogland 0.260 0.840 0.086 1.187
33 Peltophorum dasyrachis (Miq.) Kurz 0.260 0.840 0.086 1.187
Total 100 100 100 300
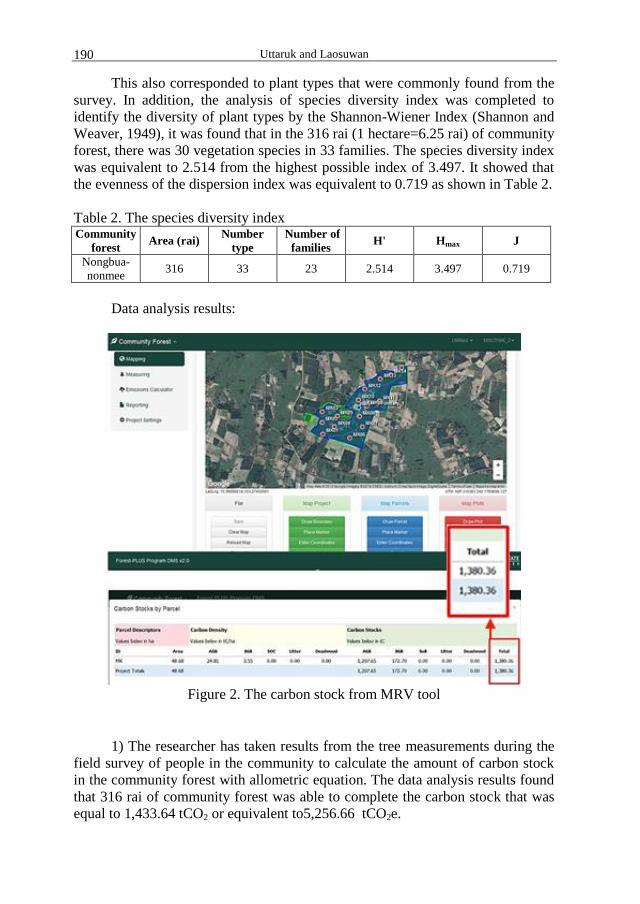
Uttaruk and Laosuwan 190
This also corresponded to plant types that were commonly found from the
survey. In addition, the analysis of species diversity index was completed to
identify the diversity of plant types by the Shannon-Wiener Index (Shannon and
Weaver, 1949), it was found that in the 316 rai (1 hectare=6.25 rai) of community
forest, there was 30 vegetation species in 33 families. The species diversity index
was equivalent to 2.514 from the highest possible index of 3.497. It showed that
the evenness of the dispersion index was equivalent to 0.719 as shown in Table 2.
Table 2. The species diversity index Community
forest Area (rai)
Number
type
Number of
families H' Hmax J
Nongbua-
nonmee 316 33 23 2.514 3.497 0.719
Data analysis results:
Figure 2. The carbon stock from MRV tool
1) The researcher has taken results from the tree measurements during the
field survey of people in the community to calculate the amount of carbon stock
in the community forest with allometric equation. The data analysis results found
that 316 rai of community forest was able to complete the carbon stock that was
equal to 1,433.64 tCO2 or equivalent to5,256.66 tCO2e.
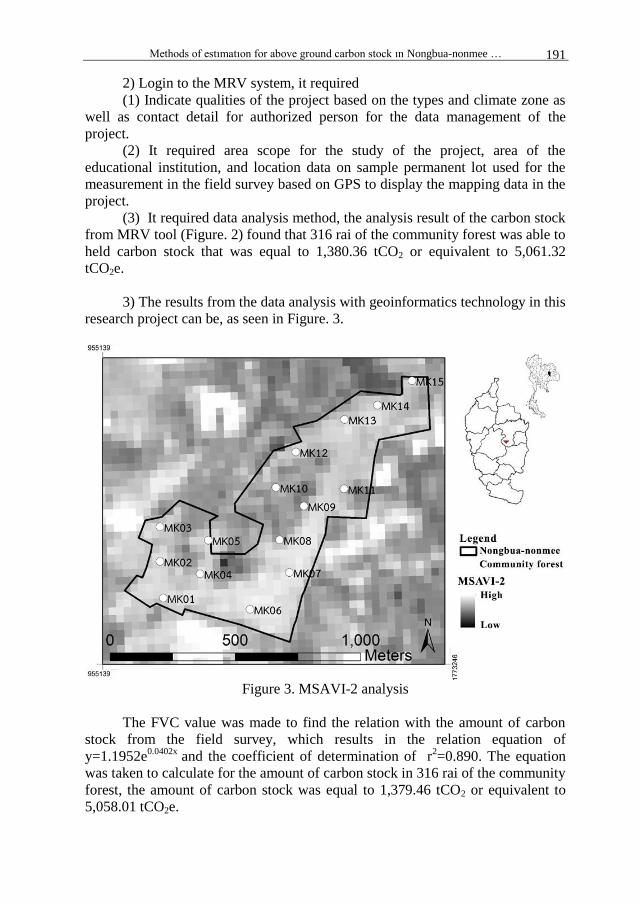
Methods of estımatıon for above ground carbon stock ın Nongbua-nonmee … 191
2) Login to the MRV system, it required
(1) Indicate qualities of the project based on the types and climate zone as
well as contact detail for authorized person for the data management of the
project.
(2) It required area scope for the study of the project, area of the
educational institution, and location data on sample permanent lot used for the
measurement in the field survey based on GPS to display the mapping data in the
project.
(3) It required data analysis method, the analysis result of the carbon stock
from MRV tool (Figure. 2) found that 316 rai of the community forest was able to
held carbon stock that was equal to 1,380.36 tCO2 or equivalent to 5,061.32
tCO2e.
3) The results from the data analysis with geoinformatics technology in this
research project can be, as seen in Figure. 3.
Figure 3. MSAVI-2 analysis
The FVC value was made to find the relation with the amount of carbon
stock from the field survey, which results in the relation equation of
y=1.1952e0.0402x
and the coefficient of determination of r2=0.890. The equation
was taken to calculate for the amount of carbon stock in 316 rai of the community
forest, the amount of carbon stock was equal to 1,379.46 tCO2 or equivalent to
5,058.01 tCO2e.
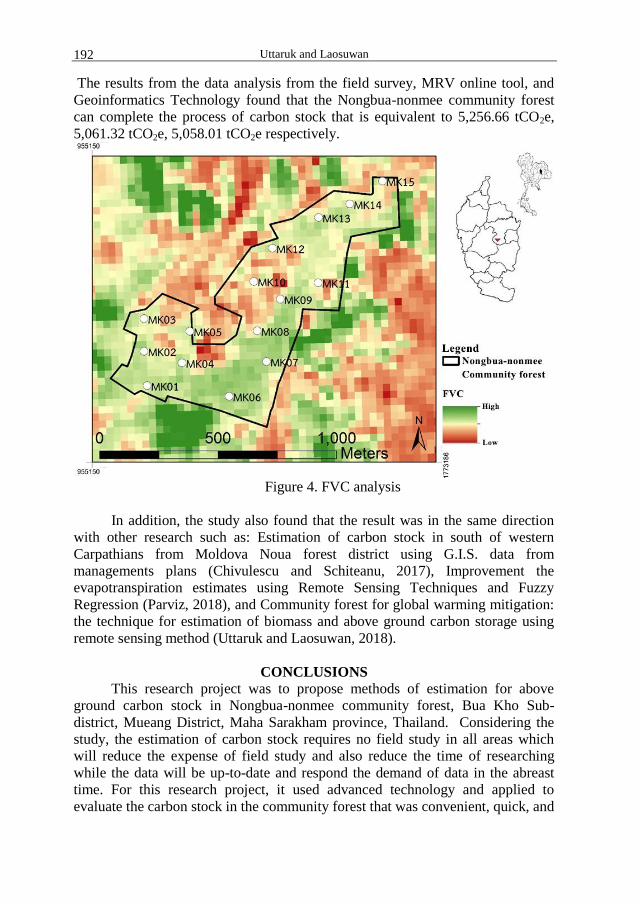
Uttaruk and Laosuwan 192
The results from the data analysis from the field survey, MRV online tool, and
Geoinformatics Technology found that the Nongbua-nonmee community forest
can complete the process of carbon stock that is equivalent to 5,256.66 tCO2e,
5,061.32 tCO2e, 5,058.01 tCO2e respectively.
Figure 4. FVC analysis
In addition, the study also found that the result was in the same direction
with other research such as: Estimation of carbon stock in south of western
Carpathians from Moldova Noua forest district using G.I.S. data from
managements plans (Chivulescu and Schiteanu, 2017), Improvement the
evapotranspiration estimates using Remote Sensing Techniques and Fuzzy
Regression (Parviz, 2018), and Community forest for global warming mitigation:
the technique for estimation of biomass and above ground carbon storage using
remote sensing method (Uttaruk and Laosuwan, 2018).
CONCLUSIONS
This research project was to propose methods of estimation for above
ground carbon stock in Nongbua-nonmee community forest, Bua Kho Sub-
district, Mueang District, Maha Sarakham province, Thailand. Considering the
study, the estimation of carbon stock requires no field study in all areas which
will reduce the expense of field study and also reduce the time of researching
while the data will be up-to-date and respond the demand of data in the abreast
time. For this research project, it used advanced technology and applied to
evaluate the carbon stock in the community forest that was convenient, quick, and

Methods of estımatıon for above ground carbon stock ın Nongbua-nonmee … 193
reliable. The project used MRV online tool and Geoinformatics technology. Thus,
the estimated result of the carbon stock was taken to test for the accuracy with
Pair Sample T-test, it was found that all three methods have a statistically
significant of 95%. Each of the methods can be chosen to evaluate the carbon
stock for the community forest.
ACKNOWLEDGEMENTS
This research was financially supported by National Research Council of
Thailand (NRCT).
REFERENCES Bradford, J.B., and Bell D.M. 2017. A window of opportunity for climate-change
adaptation: easing tree mortality by reducing forest basal area. Frontiers in
Ecology and the Environment, 15(1), 11-17.
Cairns, M.A., Winjum, J.K., Phillips, D.L., Kolchugina, T.P., and Vinson, T.S. 1997.
Terrestrial carbon dynamics: Case studies in the former Soviet Union, the
conterminous United States, Mexico and Brazil. Mitigation and Adaptation
Strategies for Global Change, 1(4), 363-383.
Chivulescu S., Schiteanu I., (2017) Estimation of carbon stock in south of western
Carpathians from Moldova Noua forest district using G.I.S. data from
managements plans, Agriculture and Forestry, 63 (3): 39-46.
Curtis, J.T., and McIntosh, R. P. 1950.The interrelations of certain analytic and
synthetic of phytosociological characters. Ecology, 31(3), 434–455.
Dyer, J., Stringer, L.C., Dougill, A.J., Leventon, J., Nshimbi, M., Chama, F.,
Kafwifwi, A., Muledi, J.I., Kaumbu, J.-M.K., Falcao, M., Muhorro, S.,
Munyemba, F., Kalaba, G.M., Syampungani. S. 2014. Assessing participatory
practices in community-based natural resource management: Experiences in
community engagement from southern Africa. Journal of Environmental
Management, 137, 137-145.
Gitelson, A.A., Kaufman, Y.J., Stark, R., Rundquist, D. 2002. Novel algorithms for
remote estimation of vegetation fraction. Remote Sensing of Environment, 80
(1), 76–87.
Gore, Al. 2007. An Inconvenient Truth: The Crisis of Global Warming. Penguin
Books USA, New York, 192 p.
Husseini, R., Kendie, S.B., and Agbesinyale, P. 2016. Community participation in
the management of forest reserves in the Northern Region of Ghana.
International Journal of Sustainable Development & World Ecology, 23(3),
245-256.
IPCC. 2018. Global warming of 1.5°C. https://report.ipcc. ch/sr15/pdf/sr15_spm_
final.pdf (Accessed: 15 November 2019).
Laosuwan, T., Uttaruk, Y. 2014. Estimating Tree Biomass via Remote Sensing,
MSAVI 2, and Fractional Cover Model. IETE Technical Review, 31(5), 362-
368.
Laosuwan, T., Uttaruk, Y. 2016a. Application of Geo-informatics and Vegetation
Indices to Estimate Above-ground Carbon stock. Studia Universitatis Vasile
Goldis Arad, Seria Stiintele Vietii, 26(4), 449-454.
Uttaruk and Laosuwan 194
Laosuwan, T., Uttaruk, Y., Rotjanakusol, T., Laosuwan, N., Dumrongsukit, S., and
Pattaaumpan., K. 2016b. Public Participation in the Management of
Community Forests: A Case Study on Community Forests at Koke Kralong
Pong Dang, Nong Reua, Na Chuak, Maha Sarakham. Hatyai Academic
Journal, 14(2), 149-169.
Mekuria, W., Langan, S., Johnston, R., Belay, B., Amare, D., Gashaw, T., Desta, G.,
Noble, A., and Wale, A. 2015. Restoring aboveground carbon and
biodiversity: a case study from the Nile basin, Ethiopia. Forest Science and
Technology, 11(2), 86-96.
Mishra, R. 1968., Ecology Work Book. Oxford and IBH Publishing Co, Calcutta, 244
p.
Muller-Dombois, D., Ellenberg, H. 1974. Aims and Methods of Vegetation
Ecology. John Wiley & Sons. New York, 547 p.
Ogawa, H., Yoda, K., Ogino, K., and Kira, T. 1965. Comparative ecological study on
three main types of forest vegetation in Thailand. II. Plant biomass. Nature and
Life in Southeast Asia, 4, 49-80.
Ounkerd, K., Sunthornhao, P., and Puangchit, L. 2015. Valuation of Carbon Stock in
Trees at Khao Wong Community Forest, Chaiyaphum Province. Thai Journal
of Forestry, 34 (1), 29-38.
Parviz, L. (2018): Improvement the evapotranspiration estimates using Remote
Sensing techniques and Fuzzy Regression. Agriculture and Forestry, 64 (2):
121-136.
Poungngamchuen, J., Supa-udomlerk Trirat, S., and Rungkawat, N. 2013.
Participatory Development of the People in Community Forest Management
Model: A Case Study of Baan Tha Pha Pao, Tha Pra Duk Sub-district, Maetha
District, Lampun Province. KMUTT Research and Development Journal,
36(2), 215-234.
Qi, J., Chehbouni, A., Huete, A.R., Kerr, Y.H. 1994. Modified Soil Adjusted
Vegetation Index (MSAVI). Remote Sensing of Environment, 48(2), 119-126.
Rotjanakusol T., Laosuwan T. 2018. Remote Sensing Based Drought Monitoring in
The Middle-Part of Northeast Region of Thailand. Studia Universitatis Vasile
Goldis Arad, Seria Stiintele Vietii, 28(1), 14-21.
Royal Forest Department Thailand. 2016. Forest Department Strategy 2016-2021.
http://forestinfo.forest.go.th/Content/file/forest%20strategy%2059_64. pdf.
(Accessed: 11 December 2016).
Royal Forest Department Thailand. 2019. Forest Information. http://forestinfo.
forest.go.th/Content.aspx?id=72/ (Accessed: 02 October 2019).
Samek, J. H., Skole, D. L., Klinhom, U., Butthep. C., Navanugraha, C., Uttaruk, P.,
and Laosuwan, T. 2011. Inpang Carbon Bank in Northeast Thailand: A
community effort in carbon trading from agroforestry projects. In Carbon
stock Potential of Agroforestry Systems, 8, 263-280.
Samek, J. H., Skole, D. L., Klinhom, U., Laosuwan, T., Uttaruk, P., Butthep. C. 2014.
Smallholders in Thailand and REDD+ and FLEGT linkages. ETFRN news 55:
Linking FLEGT and REDD+ to Improve Forest Governance, 55, 134-144.
Methods of estımatıon for above ground carbon stock ın Nongbua-nonmee … 195
Senpaseuth, P., Navanugraha, C., and Pattanakiat, S. 2009. The Estimation of
Carbon Storage in Dry Evergreen and Dry Dipterocarp Forests in Sang Khom
District, Nong Khai Province, Thailand. Environment and Natural Resources
Journal, 7(2), 1-11.
Shannon, C. E., and Weaver, W. The Mathematical Theory of Communication.
Urbana, IL, The University of Illinois Press, 1949,132 p.
Sisay, K., Thurnher, C., Belay, B., Lindner, G., Hasenauer, H. (2017). Volume and
Carbon Estimates for the Forest Area of the Amhara Region in Northwestern
Ethiopia. Forests, 8 (4), 122.
Spracklen, B.D., Kalamandeen, M., Galbraith, D., Gloor, E., and Spracklen, D.V.
2015. A Global Analysis of Deforestation in Moist Tropical Forest Protected
Areas. PLoS ONE, 10(12), e0143886.
Tadesse, S., Woldetsadik, M., Senbeta, F. 2017. Forest users’ level of participation in
a participatory forest management program in southwestern Ethiopia. Forest
Science and Technology, 13(4), 164-173.
The Nature Conservancy. 2019. Nature’s Make or Break Potential for Climate
Change.https://www.nature.org/en-us/what-we-do/our-insights/perspectivets/
natures-make-or-break-potential-for-climate-change/(Accessed: 15 Feb 2019).
Uttaruk, Y., and Laosuwan, T. 2016. Remote sensing based vegetation indices for
estimating above ground carbon stock in orchards. Agriculture and Forestry,
62 (4), 193-201.
Uttaruk, Y., and Laosuwan, T. 2018. Community forest for global warming
mitigation: the technique for estimation of biomass and above ground carbon
storage using remote sensing method. Agriculture and Forestry, 64(3), 47-57.
Zhang, S., Chen, H., Fu, Y., Niu, H., Yang, Y., Zhang, B. 2019. Fractional
Vegetation Cover Estimation of Different Vegetation Types in the Qaidam
Basin”, Sustainability, 11(3), 864.

Agriculture & Forestry, Vol. 66 Issue 3: 197-210, 2020, Podgorica 197
El Bılalı, H., Bassole, I. H. N., Dambo, L., Berjan, S. (2020): Climate change and food security. Agriculture and
Forestry, 66 (3): 197-210.
DOI: 10.17707/AgricultForest.66.3.16
Hamid EL BILALI1*, Imaël Henri Nestor BASSOLE
2,
Lawali DAMBO3, Sinisa BERJAN
4
CLIMATE CHANGE AND FOOD SECURITY
SUMMARY
Climate change is one of the most pressing challenges facing humanity in
the Anthropocene era. It is widely admitted that climate change will have far-
reaching impacts including on food security. Therefore, this review paper
analyses the multifaceted relations between climate change and food security. In
particular, the paper explores the impacts of climate change on the four
dimensions of food security (i.e. food availability, food access, food utilization,
stability). It draws upon a review of scholarly literature indexed in the Web of
Science. The analysis of the literature shows that there is a dual relationship
between climate change and food security; on the one hand, climate change
affects all the dimensions of food security and, on the other hand, the quest for
food security has implications in terms of climate change. As for food availability
and supply, climate change is widely believed to reduce crop yields and livestock
productivity especially in the countries of the Global South. Effects on food
production and availability as well as the impacts of extreme climate events affect
both food physical and economic accessibility. The changes in production
systems induced by climate change may induce changes in dietary patterns and
food utilization. Climate change will also affect the stability and resilience of
food systems with consequences in terms of long-term food security. Moreover,
the quest for food security, through agricultural intensification and agricultural
land expansion, increases greenhouse gas emissions from deforestation and land
use changes. The intricate relation between climate change and food security
makes the case for integrated policies that maximise co-benefits while addressing
trade-offs. That is fundamental to make sure that ‘climate action’ will not
jeopardize the achievement of ‘zero hunger’ and vice-versa.
Keywords: Climate change, food security, food availability, food access,
food utilisation, food system, agriculture.
1Hamid El Bilali, (corresponding author: [email protected]), International Centre for Advanced
Mediterranean Agronomic Studies (CIHEAM-Bari), Valenzano (Bari), ITALY. 2Imaël Henri Nestor Bassole, Joseph KI Zerbo University of Ouagadougou, Ouagadougou,
BURKINA FASO. 3Lawali Dambo, Abdou Moumouni University of Niamey, Niamey, NIGER. 4Sinisa Berjan, Faculty of Agriculture, University of East Sarajevo, East Sarajevo, BOSNIA AND
HERZEGOVINA.
Notes: The authors declare that they have no conflicts of interest. Authorship Form signed online.
Received:20/06/2020 Accepted:01/09/2020
El Bilali et al 198
INTRODUCTION
According to the Food and Agriculture Organisation of the United Nations
(FAO, 2009), “Food security exists when all people, at all times, have physical,
social and economic access to sufficient, safe and nutritious food to meet their
dietary needs and food preferences for an active and healthy life”. Food security
is built on four pillars (Committee on World Food Security, 2012; Ericksen,
2008; FAO et al., 2013; United Nations System High Level Task Force on Global
Food Security, 2011): food availability (i.e. sufficient quantities of food produced
and supplied on a consistent basis); food access (i.e. physical access and
affordability); food utilisation (i.e. proper use of food based on basic nutrition
knowledge); and stability in food availability, access and utilization. The concept
of food security (FS) has been central in the discussion on sustainable
development. Indeed, the first Millennium Development Goal (MDG) aimed to
“Eradicate extreme poverty and hunger” (United Nations, 2015a). More recently,
from 2016 on, the second Sustainable Development Goal (SDG) “Zero Hunger”
aims to “End hunger, achieve food security and improved nutrition and promote
sustainable agriculture” (United Nations, 2015b). However, despite efforts made
over the last decades, food insecurity is still a pressing issue in many countries,
especially developing ones. In fact, the report on the State of Food Security and
Nutrition in the World 2019 (FAO et al., 2019) shows that more than 820 million
people were hungry in 2018, especially in Africa, Latin America and Asia.
Nevertheless, it was estimated that over 2 billion people do not have a good FS
status, including 8% of the population of developed countries (e.g. North
America and Europe), when also considering people affected by moderate levels
of food insecurity (FAO et al., 2019).
Food insecurity is a symptom of the dysfunction of the global food system
(Capone et al., 2016; Capone et al., 2018; El Bilali et al., 2018; El Bilali, 2018; El
Bilali, 2019), which is under the unprecedented confluence of various pressures
(FAO, 2014) such as climate change (FAO, 2016). Indeed, FAO (2016) puts that
“Through its impacts on agriculture, climate change will have negative effects on
food security in all of its dimensions […] While food security will be affected
through other channels – for example, by extreme weather events that reduce
urban dwellers’ incomes and thus access to food – agriculture is a key channel
through which climate change affects food security” (p. 8). Climate change
affects the natural resources (e.g. water, land) used in agricultural production
(Cadro et al., 2019; Čustović et al. 2012; Simunic et al., 2019). Beyond its
impacts on agriculture and food security, climate change (CC) is one of the most
pressing challenges facing humanity (Intergovernmental Panel on Climate
Change, 2012; Steffen et al., 2015; United Nations, 2015b). It is central in the
ongoing debate on sustainable development. Indeed, the SDG 13 “Climate
action” aims to “Take urgent action to combat climate change and its impacts”
(United Nations, 2015b). Furthermore, CC represents a threat towards the
achievement of different SDGs such as SDG2 “Zero hunger” (Mugambiwa &
Tirivangasi, 2017). In this context, the present paper aims to analyse the

Climate change and food security 199
multifaceted relations between CC and food security. In particular, it explores the
impacts of CC on the four dimensions of food security. The paper draws upon a
review of all documents indexed in the Web of Science viz. Science Citation
Index Expanded (SCIE), Social Sciences Citation Index (SSCI), Arts &
Humanities Citation Index (A&HCI), Conference Proceedings Citation Index -
Science (CPCI), and Emerging Sources Citation Index (ESCI). A search was
performed in June 2020 using the Title-Abs-Key search query {climate change}
AND {food security}.
EFFECTS OF CLIMATE CHANGE ON FOOD SECURITY DIMENSIONS Climate change and food availability
Climate change affects food availability through its adverse impacts on
crop yields, and fish and livestock productivity, especially in Sub-Saharan Africa
(SSA) and South Asia, where most of the food insecure people live. Indeed,
Zougmoré et al. (2018) suggest that “[…] without appropriate interventions,
climate change and variability will affect agricultural yields, food security and
add to the presently unacceptable levels of poverty in sub-Saharan Africa”. The
effects of CC will be particularly severe in regions where agriculture is
predominantly rain-fed such as in SSA, which makes it highly vulnerable to
climate fluctuations and droughts (Adhikari et al., 2015; Cooper et al., 2008;
Muchuru & Nhamo, 2019). Webersik and Wilson (2009) put that “African
economies are closely linked to natural resources and rely heavily on agriculture,
largely rain fed […]. It is predicted that Africa will be particularly vulnerable to
climate change and climate variability associated with biodiversity loss, food
insecurity, water scarcity and an increase in drought frequency” (p. 400). CC will
reduce the yields and productions of the main staple crops such as rice (Akinbile
et al., 2015; van Oort & Zwart, 2018), wheat (Trnka et al., 2019) and maize
(Davenport et al., 2018; Freduah et al., 2019; Murray-Tortarolo et al., 2018;
Waha et al., 2013), CC is also predicted to affect livestock productivity (Godber
& Wall, 2014; Mare et al., 2018; Naah & Braun, 2019). Ramasamy (2010) put
that “Rising temperatures, more intense droughts, floods, and greater weather
variability all mean productivity losses to crops and livestock” (p. 185). Some
studies also report an increase in the incidence of animal diseases that is
attributed to CC (Hussain et al., 2016). Furthermore, the impacts of CC on crops
and livestock are strongly linked; for instance, the decrease in the growth of
forages reduce livestock weight gains (Butt et al., 2005). Further studies also
analyse the potential adverse effects of CC on fisheries (Ding et al., 2017; Lam et
al., 2012; Lauria et al., 2018). Referring to the Ganges-Brahmaputra-Meghna
(Bangladesh/India) and the Volta (Ghana) deltas, Lauria et al. (2018) suggest that
“changes in temperature and primary production could reduce fish productivity
and fisheries income especially in the Volta and Bangladesh deltas” (p. 1566).
The impacts of CC on fisheries, and consequently fish-based economies, are
expected to be particularly high in Small Island Developing States (SIDS) (Dey et
al., 2016; Moustache, 2017).

El Bilali et al 200
Most of the scholarly literature focuses on CC damages on agriculture thus
food availability; nevertheless, Hasegawa et al. (2018) point out that stringent CC
mitigation measures can also increase the risk of food insecurity in SSA. Hence,
the challenge ahead is how to balance socio-economic development (including
food security) and environmental conservation (e.g. CC mitigation) (Rudi et al.,
2012). Moreover, some scholars assume that the so-called ‘carbon fertilisation’
may offset somehow the impact of CC on crop yields. In fact, Roudier et al.
(2011) highlight “the pivotal role that the carbon fertilization effect may have on
the sign and amplitude of change in crop yields” (p. 1073). Likewise, Sultan and
Gaetani (2016) point out that “a robust evidence of yield loss in West Africa
emerges. This yield loss is mainly driven by increased mean temperature while
potential wetter or drier conditions as well as elevated CO2 concentrations can
modulate this effect”. Moreover, global warming could expand both the
agricultural area and growing season in some northern countries such as Russia
(Kiselev et al., 2013), with positive effects on agriculture production.
Yields and productivity declines can have serious implications also for the
other FS dimensions, especially food access and food utilisation. For instance,
Solaymani (2018) shows a “negative impact of rainfall-temperature variability
[…] on food availability and access to food due to a reduction in the supply of
agricultural products, a commodity inflation pressure and a reduction in
household income” (p. 1575) in Malaysia. Wheeler and von Braun (2013) argue
that “food access and utilization will be affected indirectly via collateral effects
on household and individual incomes, and food utilization could be impaired by
loss of access to drinking water and damage to health” (p. 508).
Climate change and food access
Climate change will reduce food access through negative impacts on both
food prices and rural livelihoods. Food supply shortfalls, due to negative impacts
of CC on yields and production, would increase food prices. Increases in food
prices would affect millions of low-income people that live in areas that are
already affected by high rates of hunger and poverty, such as South Asia
(Bandara & Cai, 2014) and SSA (Tamako & Thamaga-Chitja, 2017). Tamako
and Thamaga-Chitja (2017) suggest that “Sub-Saharan Africa is faced with a
range of climate risks, which include rapid and uncertain changes in rainfall and
temperature patterns that threaten food production, and could lead to an increase
in food prices and food insecurity” (p. 16). Poor urban and rural people, most of
whom are net food buyers and already spend a high share of their income on
food, would find it more difficult to meet their dietary needs, which increase the
risk of food insecurity and hunger. The situation is particularly alarming for
populations that depend on agriculture for their livelihoods and income,
especially small-scale farmers in the Global South (Descheemaeker et al., 2016;
García de Jalón et al., 2018; Williams et al., 2018; Wood et al., 2014). In this
regard, Williams et al. (2018) put that “The impacts of changing climate on
agriculture have consequences on livelihoods and food security. Smallholder
Climate change and food security 201
farmers, who have heterogeneous farming systems and limited resources,
compounded with multiple risks, are greatly affected”. Akinseye et al. (2020)
argue that “Climate variability and change will have far reaching consequences
for smallholder farmers in sub-Saharan Africa, the majority of whom depend on
agriculture for their livelihoods”. Indeed, rural populations will suffer from the
increase of food prices as well as the negative impacts of CC on their sources of
income and livelihoods strategies relating to agriculture. Indeed, agricultural
production loss implies the loss of income for farmers and of revenues for
countries (Sultan et al., 2019) as agriculture is an important source of income and
livelihoods in rural areas and a significant contributor to the national gross
domestic product in developing countries (Diao et al., 2007). Decrease of
production will be often combined with the loss of livelihoods assets due to the
increase of the intensity and frequency of climate-related disasters (Habiba et al.,
2016; Poudel et al., 2017). Indeed, severe droughts or floods can dramatically
reduce incomes and cause asset losses thus eroding income earning capacity.
Poor rural people (e.g. smallholders, agricultural workers) are particularly
vulnerable to disaster impacts.
The impacts of CC will be also high on food importing countries as food
exports might be reduced or banned in case of extreme climate events. For
instance, Qureshi et al. (2013) show that CC will reduce Australian food exports
and put that “Despite its relatively small contribution to total global food supply,
Australia's contribution to international trade in wheat, meat and dairy products is
substantial and could affect global food prices” (136), especially in South and
South-East Asia, which already suffer from food insecurity. While most of the
focus is on the impacts of CC on economic accessibility (i.e. affordability), CC
will also impact food physical accessibility in remote regions. For instance,
referring to the Himalayan region, Hussain et al. (2016) report that “After
hazards, households face transitory food insecurity owing to damage to their local
food systems and livelihood sources, and constrained food supply from other
areas” (p. 921). Gregory et al. (2005) highlight the diversity of pathways through
which CC affects FS and argue that “Climate change may affect food systems in
several ways ranging from direct effects on crop production (e.g. changes in
rainfall leading to drought or flooding, or warmer or cooler temperatures leading
to changes in the length of growing season), to changes in markets, food prices
and supply chain infrastructure” (p. 2139).
Climate change and food utilisation
Climate variability will change food utilisation with impacts on the
nutrition status of the populations, especially poor and vulnerable people. For
instance, higher temperatures can favour the development of pathogens, while
water scarcity (induced by droughts) affects water quality and hygiene habits,
especially in arid and semi-arid areas, which could increase the burden of
diseases (e.g. diarrhoea) (FAO, 2016), especially among the poor children.
Indeed, the impacts of malnutrition caused by global warming might be

El Bilali et al 202
particularly severe among vulnerable groups such as children (Belesova et al.,
2019; Sorgho et al., 2016) and women (Bryan et al., 2018). Also the dietary
patterns of indigenous communities will be particularly affected (Smith et al.,
2019; Wesche & Chan, 2010); referring to the Inuit in the Canadian Arctic,
Wesche and Chan (2010) argue that “Changing access to, availability of, quality
of, and ability to use traditional food resources has implications for quality of
diet. Nutritional implications of lower traditional food use include likely
reductions in iron, zinc, protein, vitamin D, and omega-3 fatty acids, among
others” (p. 361). CC will also affect food utilisation in other ways such as
reducing the nutrient content of staple crops and increasing the risk of food
contamination (Lake et al., 2012; Medina et al., 2017). Indeed, CC will have
notable impacts on food utilisation, including nutrition and food safety (Lake et
al., 2012). Lake et al. (2012) highlight the relation between food access and food
utilisation dimensions of FS in the context of changing climate and suggest that
“Increasing food prices may lower the nutritional quality of dietary intakes,
exacerbate obesity, and amplify health inequalities. Altered conditions for food
production may result in […] altered use of pesticides and veterinary medicines,
and affect the main transfer mechanisms through which contaminants move from
the environment into food. All these have implications for food safety and the
nutritional content of food” (p. 1520). Moreover, the literature points to some
potential links between CC and diet-related non-communicable diseases (NCDs)
(Savage et al., 2020). Other scholars analyse the linkage between CC and food
utilisation the other way round and point out to the need to move towards dietary
patterns that have lower GHG emissions to mitigate CC (Lake et al., 2012).
Esham et al. (2018) point out that little attention is paid to the impacts of CC on
access and utilization dimensions of FS and highlight that “achieving food
security necessitates action beyond building climate resilient food production
systems to a holistic approach that is able to ensure climate resilience of the entire
food system while addressing nutritional concerns arising from impacts of
climate change” (p. 1017). This implies expanding the narrow focus from the
impacts of the changing climate on crop yield and productivity to include the
impact on the nutritional value of crops (Leisner, 2020) and, consequently, diets.
Climate change and food system stability
Climate variability and the increasingly frequent and intensive extreme
climate events will affect the stability of food availability, access and use. This
will likely happen through changes in seasonality, fluctuations in ecosystem
productivity, increased risks and reduced predictability of food supply (FAO,
2016). This will be a major problem especially for SIDS and landlocked
countries, which are more vulnerable to both food supply and trade disruptions.
Referring to the islands of the South Pacific, Barnett (2011) shows that “climate
change will adversely affect food systems in the region, including the supply of
food from agriculture and fisheries, the ability of countries to import food,
systems for the distribution of food, and the ability of households to purchase and

Climate change and food security 203
utilize food” (p. 229). CC will affect all the elements of and activities within the
food system (HLPE, 2014) with cascading effects and far-reaching implications
in terms of FS at global, national and local levels (Myers et al., 2017; Schnitter &
Berry, 2019). The short-term effects of temperature increase and rainfall
variability on crop yields can have long-term effects on global food system
stability. In this regard, Wheeler and von Braun (2013) put that “A robust and
coherent global pattern is discernible of the impacts of climate change on crop
productivity that could have consequences for food availability. The stability of
whole food systems may be at risk under climate change because of short-term
variability in supply” (p. 508). Climate variability would also increase price
volatility (Baldos & Hertel, 2015; Takle et al., 2013). The recognition of the
impacts of CC on food availability, access and utilisation and their stability over
time implies the need of adopting a food system approach. In this respect, Keller
et al. (2018) point out that “Efficient responses require an understanding of the
full spectrum of potential climate impacts on food utilization, access and
availability, as well as on the underlying natural, built and governance systems”
(p. 742).
FOOD SECURITY AND CLIMATE CHANGE MITIGATION
The relation between CC and FS is dual but much more attention is paid in
the literature to the impacts of CC on food security. In this respect, Islam and
Wong (2017) argue that “it seems that research on climate change and food
in/security has often been one-sided; with climate change being identified as the
cause of food insecurity and not how the systems in place to ensure food security
have exacerbated the issue of climate change”. Agriculture is a main contributor
to CC, through GHG emissions, and one of the most affected sectors by CC
(FAO, 2016; HLPE, 2012). Agriculture, forestry and other land uses (AFOLU)
account for about a fifth of GHG emissions worldwide (FAO, 2016). Indeed,
Torquebiau (2017) suggests that “Agriculture is probably the most climate-
dependent human activity and is both victim and responsible for climate change,
while it can also be a solution to the climate change crisis”. In this context,
sustainable intensification is presented as a win-win strategy to combine FS and
CC mitigation (Ayantunde et al., 2020; Descheemaeker et al., 2016; van Loon et
al., 2019). However, referring to cereal cropping in SSA, van Loon et al. (2019)
conclude that while “intensification scenarios are clearly superior to expansion
scenarios in terms of climate change mitigation” (p. 3720), “Intensification will
come, depending on the nutrient use efficiency achieved, with large increases in
nutrient inputs and associated GHG emissions” (p. 3720). Many scholars
highlighted the benefits of climate-smart agriculture (CSA) (Abegunde et al.,
2019; García de Jalón et al., 2017) both for CC mitigation and adaptation.
Loboguerrero et al. (2019) argue that “Climate-smart agriculture can help foster
synergies between productivity, adaptation, and mitigation”. In this context, FAO
(2016) suggests that “Food and agriculture must be central to global efforts to
adapt to climate change, through policies and actions that address vulnerabilities
El Bilali et al 204
and risks and promote agricultural systems that are resilient and sustainable […]
Delaying the transformation of the agricultural sectors will force poorer countries
to fight poverty, hunger and climate change at the same time”.
CONCLUSIONS
This paper presents a comprehensive review on the multifaceted
relationships between CC and food security. It shows an increasing academic
interest in the nexus between CC and the different dimensions of food security.
However, most of the articles deal with the effects of CC on food availability and
agriculture (especially crop production) while analyses regarding the remaining
dimensions of FS are rather scarce. The effects of CC on food security, that are
expected to intensify over time, vary across countries and world regions. Indeed,
effects are expected to be higher in developing countries whose economies are
very dependent on the performance of rain-fed agriculture. Furthermore, the
review shows that there is a dual relationship between climate change and food
security. Both strategies for CC mitigation and adaptation have an impact on food
security. The multifaceted and multidimensional relations between CC and FS
call for adopting reflexive governance arrangements and integrated policies that
maximise co-benefits while addressing trade-offs between climate and FS (e.g.
agriculture) policies. This is of paramount importance to make sure that strategies
for CC mitigation and/or adaptation do not jeopardize efforts for ending hunger
and eradicating all forms of malnutrition in the framework of the implementation
of the 2030 Agenda for Sustainable Development. In this respect, further efforts
are needed in science, policy and practice to foster transition towards low
emissions and climate resilient agriculture and food systems to achieve the long-
term climate neutrality and food security objectives. Likewise, it is necessary to
promote approaches that deliver mitigation, adaptation and development co-
benefits, especially in the Global South.
ACKNOWLEDGEMENTS This work was carried out within the project SUSTLIVES (SUSTaining
and improving local crop patrimony in Burkina Faso and Niger for better LIVes
and EcoSystems) of the DeSIRA initiative (Development Smart Innovation
through Research in Agriculture) financed by the European Union.
REFERENCES Abegunde V. O., Sibanda M., Obi A. (2019). The Dynamics of Climate Change
Adaptation in Sub-Saharan Africa: A Review of Climate-Smart Agriculture among
Small-Scale Farmers. Climate, 7(11), 132. https://doi.org/10.3390/cli7110132
Adhikari U., Nejadhashemi A. P., Woznicki S. A. (2015). Climate change and eastern
Africa: a review of impact on major crops. Food and Energy Security, 4(2), 110–
132.
Akinbile C. O., Akinlade G. M., Abolude A. T. (2015). Trend analysis in climatic
variables and impacts on rice yield in Nigeria. Journal of Water and Climate
Change, 6(3), 534–543.
Climate change and food security 205
Akinseye F. M., Ajeigbe H. A., Traore P. C. S., Agele S. O., Zemadim B., Whitbread, A.
(2020). Improving sorghum productivity under changing climatic conditions: A
modelling approach. Field Crops Research, 246, 107685.
https://doi.org/10.1016/j.fcr.2019.107685
Ayantunde A. A., Oluwatosin B. O., Yameogo V., van Wijk M. (2020). Perceived
benefits, constraints and determinants of sustainable intensification of mixed crop
and livestock systems in the Sahelian zone of Burkina Faso. International Journal
of Agricultural Sustainability, 18(1), 84–98.
https://doi.org/10.1080/14735903.2019.1698494
Baldos U. L. C. & Hertel T. W. (2015). The role of international trade in managing food
security risks from climate change. Food Security, 7(2), 275–290.
Bandara J. S. & Cai Y. (2014). The impact of climate change on food crop productivity,
food prices and food security in South Asia. Economic Analysis and Policy, 44(4),
451–465.
Barnett J. (2011). Dangerous climate change in the Pacific Islands: food production and
food security. Regional Environmental Change, 11(S1), 229–237.
Belesova K., Gornott C., Milner J., Sié A., Sauerborn R., Wilkinson P. (2019). Mortality
impact of low annual crop yields in a subsistence farming population of Burkina
Faso under the current and a 1.5 °C warmer climate in 2100. Science of The Total
Environment 691, 538–548. https://doi.org/10.1016/j.scitotenv.2019.07.027
Bryan E., Bernier Q., Espinal M., Ringler C. (2018). Making climate change adaptation
programmes in sub-Saharan Africa more gender responsive: insights from
implementing organizations on the barriers and opportunities. Climate and
Development 10(5), 417–431.
Butt T. A., McCarl B. A., Angerer J., Dyke P. T., Stuth J. W. (2005). The economic and
food security implications of climate change in Mali. Climatic Change, 68(3), 355–
378.
Capone R., Bottalico F., Ottomano Palmisano G., El Bilali H., Dernini S. (2018). Food
systems sustainability, food security and nutrition in the Mediterranean region: The
contribution of the Mediterranean diet. In, Encyclopedia of Food Security and
Sustainability, Volume 2. Elsevier, Amsterdam. pp. 176-180.
https://doi.org/10.1016/B978-0-08-100596-5.21977-X
Capone R., El Bilali H., Debs Ph., Bottalico F. (2016). Relations between food and
nutrition security, diets and food systems. Agriculture and Forestry 62(1): 49-58.
DOI: 10.17707/AgricultForest.62.1.05.
Cadro, S., Uzunović, M., Cherni-Cadro, S., Zurovec, J. (2019). Changes in the water
balance of Bosnia and Herzegovina as a result of climate change. Agriculture and
Forestry, 65 (3): 19-33
Committee on World Food Security. (2012). Coming to terms with terminology: Food
security, Nutrition security, Food security and nutrition, Food and nutrition
security. Rome.
Cooper P. J. M., Dimes J., Rao K. P. C., Shapiro B., Shiferaw B., Twomlow S. (2008).
Coping better with current climatic variability in the rain-fed farming systems of
sub-Saharan Africa: An essential first step in adapting to future climate change?
Agriculture, Ecosystems & Environment, 126(1–2), 24–35.
https://doi.org/10.1016/j.agee.2008.01.007
Čustović H., Đikić M., Ljuša M., Žurovec O. (2012). Effect of Climate Changes on
Agriculture of the Western Balkan Countries and Adaptation Policies. Agriculture
& Forestry, 58 (2): 127-141.
El Bilali et al 206
Davenport F., Funk C., Galu G. (2018). How will East African maize yields respond to climate change and can agricultural development mitigate this response? Climatic Change, 147(3–4), 491–506. https://doi.org/10.1007/s10584-018-2149-7
Descheemaeker K., Oosting S. J., Homann-Kee Tui S., Masikati P., Falconnier G. N., Giller, K. E. (2016). Climate change adaptation and mitigation in smallholder crop–livestock systems in sub-Saharan Africa: a call for integrated impact assessments. Regional Environmental Change, 16(8), 2331–2343.
Dey M. M., Gosh K., Valmonte-Santos R., Rosegrant M. W., Chen O. L. (2016). Economic impact of climate change and climate change adaptation strategies for fisheries sector in Solomon Islands: Implication for food security. Marine Policy, 67, 171–178.
Diao X., Hazell P., Resnick D., Thurlow J. (2007). The Role of Agriculture in Development: Implications for Sub-Saharan Africa. Washington D.C.: International Food Policy Research Institute. https://doi.org/10.2499/9780896291614RR153
Ding Q., Chen X., Hilborn R., Chen Y. (2017). Vulnerability to impacts of climate change on marine fisheries and food security. Marine Policy, 83, 55–61.
El Bilali H. (2019). Research on agro-food sustainability transitions: where are food security and nutrition? Food Security 11(3):559-577. DOI: https://doi.org/10.1007/s12571-019-00922-1
El Bilali H., Callenius C., Strassner C., Probst L. (2018). Food and nutrition security and sustainability transitions in food systems. Food and Energy Security; e00154. https://doi.org/10.1002/fes3.154
El Bilali H. (2018). Relation between innovation and sustainability in the agro-food system. Italian Journal of Food Science 30: 200-225. https://doi.org/10.14674/IJFS-1096
Ericksen P. J. (2008). Conceptualizing food systems for global environmental change research. Global Environmental Change, 18(1), 234–245.
Esham M., Jacobs B., Rosairo H.S.R., Siddighi B.B. (2018). Climate change and food security: A Sri Lankan perspective. Environment, Development and Sustainability 20(3): 1017–1036. https://doi.org/10.1007/s10668-017-9945-5
FAO (2009). Declaration of the World Food Summit on Food Security. Rome. FAO (2014). Building a common vision for sustainable food and agriculture - Principles
and Approaches. Rome. FAO (2016). The State of Food and Agriculture: Climate Change, Agriculture and Food
Security. Rome. FAO, IFAD, UNICEF, WFP & WHO (2019). The State of Food Security and Nutrition in
the World 2019 - Safeguarding against economic slowdowns and downturns. Rome. FAO, WFP & IFAD (2013). The State of Food Insecurity in the World 2013: The
Multiple Dimensions of Food Security. Rome. Freduah B., MacCarthy D., Adam M., Ly M., Ruane A., Timpong-Jones E., … Adiku S.
(2019). Sensitivity of Maize Yield in Smallholder Systems to Climate Scenarios in Semi-Arid Regions of West Africa: Accounting for Variability in Farm Management Practices. Agronomy, 9(10), 639. https://doi.org/10.3390/agronomy9100639
García de Jalón S., Iglesias A., Neumann M. B. (2018). Responses of sub-Saharan smallholders to climate change: Strategies and drivers of adaptation. Environmental Science & Policy, 90, 38–45. https://doi.org/10.1016/j.envsci.2018.09.013
García de Jalón S., Silvestri S., Barnes A. P. (2017). The potential for adoption of climate smart agricultural practices in Sub-Saharan livestock systems. Regional Environmental Change, 17(2), 399–410. https://doi.org/10.1007/s10113-016-1026-z
Climate change and food security 207
Godber O. F., Wall R. (2014). Livestock and food security: vulnerability to population growth and climate change. Global Change Biology, 20(10), 3092–3102.
Gregory P., Ingram J.S., Brklacich M. (2005). Climate change and food security. Philosophical Transactions of the Royal Society B: Biological Sciences, 360(1463), 2139–2148.
Habiba U., Abedin M. A., Shaw R. (2016). Food Security, Climate Change Adaptation, and Disaster Risk. In J. Uitto & R. Shaw (Eds.), Sustainable Development and Disaster Risk Reduction (pp. 87–101). Tokyo: Springer.
Hasegawa T., Fujimori S., Havlík P., Valin H., Bodirsky B. L., Doelman J. C., … Witzke P. (2018). Risk of increased food insecurity under stringent global climate change mitigation policy. Nature Climate Change, 8(8), 699–703.
HLPE (2012). Food security and climate change. A report by the High Level Panel of Experts on food security and nutrition of the Committee on World Food Security. Rome.
HLPE (2014). Note on Critical and Emerging Issues for Food Security and Nutrition. Rome.
Hussain A., Rasul G., Mahapatra B., Tuladhar S. (2016). Household food security in the face of climate change in the Hindu-Kush Himalayan region. Food Security, 8(5), 921–937.
Intergovernmental Panel on Climate Change (2012). Sustainable Development and mitigation. In Climate Change 2007 (pp. 691–744). Cambridge: Cambridge University Press.
Islam M. & Wong A. (2017). Climate Change and Food In/Security: A Critical Nexus. Environments, 4(2), 38. https://doi.org/10.3390/environments4020038
Keller M., Zamudio A. N., Bizikova L., Sosa A. R., Gough A. M. (2018). Food security and climate change from a systems perspective: community case studies from Honduras. Climate and Development, 10(8), 742–754.
Kiselev S., Romashkin R., Nelson G. C., Mason-D’Croz D., Palazzo A. (2013). Russia’s Food Security and Climate Change: Looking into the Future. Economics, 7(2013–39), 1. https://doi.org/10.5018/economics-ejournal.ja.2013-39
Lake I. R., Hooper L., Abdelhamid A., Bentham G., Boxall A. B. A., Draper A., … Waldron K. W. (2012). Climate Change and Food Security: Health Impacts in Developed Countries. Environmental Health Perspectives, 120(11), 1520–1526.
Lam V., Cheung W., Swartz W., Sumaila U. (2012). Climate change impacts on fisheries in West Africa: implications for economic, food and nutritional security. African Journal of Marine Science, 34(1), 103–117. https://doi.org/10.2989/1814232X.2012.673294
Lauria V., Das I., Hazra S., Cazcarro I., Arto I., Kay S., … Fernandes J. A. (2018). Importance of fisheries for food security across three climate change vulnerable deltas. Science of The Total Environment, 640–641, 1566–1577.
Leisner C. P. (2020). Review: Climate change impacts on food security- focus on perennial cropping systems and nutritional value. Plant Science, 293, 110412.
Loboguerrero A. M., Campbell B., Cooper P., Hansen J., Rosenstock T., Wollenberg E. (2019). Food and Earth Systems: Priorities for Climate Change Adaptation and Mitigation for Agriculture and Food Systems. Sustainability, 11(5), 1372.
Mare F., Bahta Y. T., Van Niekerk W. (2018). The impact of drought on commercial livestock farmers in South Africa. Development in Practice, 28(7), 884–898.
Medina A., Akbar A., Baazeem A., Rodriguez A., Magan, N. (2017). Climate change, food security and mycotoxins: Do we know enough? Fungal Biology Reviews, 31(3), 143–154.
El Bilali et al 208
Moustache A. M. (2017). Adaptation to Impacts of Climate Change on the Food and
Nutrition Security Status of a Small Island Developing State. In Natural Resources
Management (pp. 919–944). Hersey (PA, USA): IGI Global.
Muchuru S. & Nhamo G. (2019). A review of climate change adaptation measures in the
African crop sector. Climate and Development, 11(10), 873–885.
Mugambiwa S. S. & Tirivangasi H. M. (2017). Climate change: A threat towards
achieving ‘Sustainable Development Goal number two’ (end hunger, achieve food
security and improved nutrition and promote sustainable agriculture) in South
Africa. Jàmbá: Journal of Disaster Risk Studies, 9(1).
https://doi.org/10.4102/jamba.v9i1.350
Murray-Tortarolo G. N., Jaramillo V. J., Larsen J. (2018). Food security and climate
change: the case of rainfed maize production in Mexico. Agricultural and Forest
Meteorology, 253–254, 124–131. https://doi.org/10.1016/j.agrformet.2018.02.011
Myers S. S., Smith M. R., Guth S., Golden C. D., Vaitla B., Mueller N. D., … Huybers P.
(2017). Climate Change and Global Food Systems: Potential Impacts on Food
Security and Undernutrition. Annual Review of Public Health, 38(1), 259–277.
Naah J.-B. & Braun B. (2019). Local agro-pastoralists’ perspectives on forage species
diversity, habitat distributions, abundance trends and ecological drivers for
sustainable livestock production in West Africa. Scientific Reports, 9(1), 1707.
Poudel S., Funakawa S., Shinjo H. (2017). Household Perceptions about the Impacts of
Climate Change on Food Security in the Mountainous Region of Nepal.
Sustainability, 9(4), 641.
Qureshi M., Hanjra M. A., Ward J. (2013). Impact of water scarcity in Australia on global
food security in an era of climate change. Food Policy, 38, 136–145.
Ramasamy S. (2010). World Food Security: The Challenges of Climate Change and
Bioenergy. In R. Lal, M. Sivakumar, S. Faiz, A. Rahman, & K. Islam (Eds.),
Climate Change and Food Security in South Asia (pp. 183–213). Dordrecht:
Springer.
Roudier P., Sultan B., Quirion P., Berg A. (2011). The impact of future climate change on
West African crop yields: What does the recent literature say? Global
Environmental Change, 21(3), 1073–1083.
https://doi.org/10.1016/j.gloenvcha.2011.04.007
Rudi L.-M., Azadi H., Witlox F. (2012). Reconcilability of Socio-Economic Development
and Environmental Conservation in Sub-Saharan Africa. Global and Planetary
Change, 86–87, 1–10.
Savage A., McIver L., Schubert L. (2020). Review: the nexus of climate change, food and
nutrition security and diet-related non-communicable diseases in Pacific Island
Countries and Territories. Climate and Development, 12(2), 120–133.
Schnitter R. & Berry P. (2019). The Climate Change, Food Security and Human Health
Nexus in Canada: A Framework to Protect Population Health. International Journal
of Environmental Research and Public Health, 16(14), 2531.
Simunic, I., Likso, T., Miseckaite, O., Orlović-Leko, P., Ciglenečki, I., Spalević, V.
(2019). Climate changes and soil water regime. Agriculture and Forestry, 65(3):
05-18. DOI: 10.17707/AgricultForest.65.3.01
Smith E., Ahmed S., Dupuis V., Running Crane M., Eggers M., Pierre M., … Byker
Shanks C. (2019). Contribution of Wild Foods to Diet, Food Security, and Cultural
Values Amidst Climate Change. Journal of Agri., Food Syst. and Com. Dev., 9, 1–
24.
Climate change and food security 209
Solaymani, S. (2018). Impacts of climate change on food security and agriculture sector
in Malaysia. Environment, Development and Sustainability, 20(4), 1575–1596.
Sorgho R., Franke J., Simboro S., Phalkey R., Saeurborn R. (2016). NUTRItion and
CLIMate (NUTRICLIM): investigating the relationship between climate variables
and childhood malnutrition through agriculture, an exploratory study in Burkina
Faso. Public Health Reviews, 37(1), 16. https://doi.org/10.1186/s40985-016-0031-6
Steffen W., Richardson K., Rockstrom J., Cornell S. E., Fetzer I., Bennett E. M., …
Sorlin S. (2015). Planetary boundaries: Guiding human development on a changing
planet. Science, 347(6223), 1259855–1259855.
https://doi.org/10.1126/science.1259855
Sultan B., Defrance D., Iizumi T. (2019). Evidence of crop production losses in West
Africa due to historical global warming in two crop models. Scientific Reports, 9(1),
12834.
Sultan B. & Gaetani M. (2016). Agriculture in West Africa in the Twenty-First Century:
Climate Change and Impacts Scenarios, and Potential for Adaptation. Frontiers in
Plant Science, 7. https://doi.org/10.3389/fpls.2016.01262
Takle E. S., Gustafson D., Beachy R., Nelson G. C., Mason-D’Croz D., Palazzo A.
(2013). US Food Security and Climate Change: Agricultural Futures. Economics
7(2013–34), 1. https://doi.org/10.5018/economics-ejournal.ja.2013-34
Tamako N. & Thamaga-Chitja J. M. (2017). Does social capital play a role in climate
change adaptation among smallholder farmers for improving food security and
livelihoods? Food and Nutrition Challenges in Southern Africa, 16–27.
Torquebiau E. (2017). Le changement climatique, un défi pour la recherche : l’exemple
de l’initiative « 4 ‰ ». OCL, 24(1), 108. https://doi.org/10.1051/ocl/2016054
Trnka M., Feng S., Semenov M. A., Olesen J. E., Kersebaum K. C., Rötter R. P., …
Büntgen U. (2019). Mitigation efforts will not fully alleviate the increase in water
scarcity occurrence probability in wheat-producing areas. Science Advances, 5(9),
e2406.
United Nations (2015a). The Millennium Development Goals Report 2015. New York.
United Nations (2015b). Transforming Our World: The 2030 Agenda for Sustainable
Development. Resolution adopted by the General Assembly on 25 September 2015.
New York.
United Nations System High Level Task Force on Global Food Security (2011). Food
and Nutrition Security: Comprehensive Framework for Action. Summary of the
Updated Comprehensive Framework for Action (UCFA). Rome.
van Loon M. P., Hijbeek R., Berge H. F. M., De Sy V., Broeke G. A., Solomon D.,
Ittersum M. K. (2019). Impacts of intensifying or expanding cereal cropping in sub-
Saharan Africa on greenhouse gas emissions and food security. Global Change
Biology 25(11), 3720–3730. https://doi.org/10.1111/gcb.14783
van Oort P. A. J. & Zwart S. J. (2018). Impacts of climate change on rice production in
Africa and causes of simulated yield changes. Global Change Biology, 24(3), 1029–
1045.
Waha K., Müller C., Rolinski S. (2013). Separate and combined effects of temperature
and precipitation change on maize yields in sub-Saharan Africa for mid- to late-21st
century. Global and Planetary Change, 106, 1–12.
Webersik C. & Wilson C. (2009). Achieving environmental sustainability and growth in
Africa: the role of science, technology and innovation. Sustainable Development,
17(6), 400–413. https://doi.org/10.1002/sd.411
El Bilali et al 210
Wesche S. D. & Chan H. M. (2010). Adapting to the Impacts of Climate Change on Food
Security among Inuit in the Western Canadian Arctic. EcoHealth, 7(3), 361–373.
Wheeler T. & von Braun J. (2013). Climate Change Impacts on Global Food Security.
Science, 341(6145), 508–513. https://doi.org/10.1126/science.1239402
Williams P. A., Crespo O., Abu M., Simpson N. P. (2018). A systematic review of how
vulnerability of smallholder agricultural systems to changing climate is assessed in
Africa. Environmental Research Letters, 13(10), 103004.
Wood S. A., Jina A. S., Jain M., Kristjanson P., DeFries R. S. (2014). Smallholder farmer
cropping decisions related to climate variability across multiple regions. Global
Environmental Change, 25, 163–172.
https://doi.org/10.1016/j.gloenvcha.2013.12.011 Zougmoré R. B., Partey S. T., Ouédraogo M., Torquebiau E., Campbell B. M. (2018).
Facing climate variability in sub-Saharan Africa: analysis of climate-smart agriculture opportunities to manage climate-related risks. Cahiers Agricultures, 27(3), 34001.
Agriculture & Forestry, Vol. 66 Issue 3: 211-219, 2020, Podgorica 211
Bašić, M., Beganović, L., Huremović, J., Žero, S. (2020): Assessment of metals and their estimated daily intakes
in various nuts. Agriculture and Forestry, 66 (3): 211-219.
DOI: 10.17707/AgricultForest.66.3.17
Midheta BAŠIĆ, Lejla BEGANOVIĆ, Jasna HUREMOVIĆ1, Sabina ŽERO
ASSESSMENT OF METALS AND THEIR ESTIMATED DAILY
INTAKES IN VARIOUS NUTS
SUMMARY
Nuts have received increased public attention in recent years as important
sources of essential elements. Information on the levels of elements in edible nuts
is useful to consumers. Content of metals was analysed in various types of nuts
from Sarajevo markets, Bosnia and Herzegovina. The samples included almond,
walnuts, Brazil walnuts, Indian walnuts, Macadamia, hazelnuts and pistachios.
Metals cadmium, chromium, iron, manganese, lead and zinc (Cd, Cr, Fe, Mn, Pb
and Zn) were determined by flame atomic absorption spectrometry (FAAS).
Moreover, estimated daily intake of all analysed metals and carcinogenic risk
over a lifetime exposure to Pb has been calculated.
The metal levels in nuts ranged as follows: 1.53-6.95 mgCd/kg, 1.97-7.92
mgCr/kg, 32.03-97.70 mgFe/kg, 6.48-30.58 mgMn/kg, 0.42-1.38 mgPb/kg,
31.30-50.23 mgZn/kg. By concentrations in nuts, in most cases, the metals were
arranged as the following diminishing series: Fe > Pb > Zn >Mn > Cr > Cd.
Estimated daily intakes for Cd, Cr, Fe, Mn, Pb and Zn were calculated and varied
from 0.0002 mg/kg/day for Pb to 0.0489 mg/kg/day for Fe. Carcinogenic risk for
Pb was lower than 10−6
indicating the risk of cancer due to exposure to Pb
through nuts consumption is in an acceptable range. The results provide
important information on the nutritional values of nut samples at the Sarajevo
market. In most cases, the content of metal was in accordance with the contents
given in the previously published papers.
Keywords: Nuts, Metals, Contamination, Daily Intake, Carcinogenic Risk.
INTRODUCTION
Food crops like fruits, vegetables and nuts cultivated in contaminated lands
can accumulate toxic heavy metals. Human exposure to toxic metals goes through
ingestion of contaminated food and water and by inhalation of air pollutants or
contaminated soil particles (Davarynejad et al. 2013; Onyedikachi et al. 2018). In
the past years, the increasing demand of food safety has stimulated research
regarding the risk associated with consumption of contaminated foodstuffs by
1Jasna Huremović (corresponding author: [email protected]), Midheta Bašić, Lejla
Beganović, Sabina Žero, University of Sarajevo, Faculty of Science, Department of Chemistry,
Zmaja od Bosne 33-35, 71000 Sarajevo, BOSNIA AND HERZEGOVINA.
Notes: The authors declare that they have no conflicts of interest. Authorship Form signed online.
Recieved:15/07/2020 Accepted:16/09/2020

Bašić et al 212
heavy metals and pesticides or toxins (D’Mello 2003). Nuts are widely used in
the food industry such as baking, confectionery, candy and chocolate products,
ice-cream and dairy (Özkutlu et al. 2013). Nuts have received increased public
attention in recent years as important sources of essential elements, and
information on the levels of elements in edible nuts is useful to consumers (Yin et
al. 2015). Bioactive compounds, such as essential fatty acids, essential amino
acids, antioxidants, essential mineral and vitamins are present in high
concentrations in nuts. Thus, health benefits which we have by consuming nuts
are blood pressure and body weight control, reduction of blood cholesterol and
triglycerides, as well as prevention of coronary heart disease (Moreda-Piñeiro et
al. 2016). Determination of some elements in nuts is not only necessary in
evaluating the dietary intake of the essential elements, but also useful in detecting
heavy metal contamination in food (Cabrera et al. 2003; Chung et al. 2013; Yin et
al. 2015).
Nuts are rich in micronutrients such as niacin and folic acid, vitamins (E
and B6) and minerals (Ca, Cr, Mg, Mn, Cu, Fe, Zn, Se, P and K) (Kafaoglu et al.
2016). Fe, Cu, Cr and Zn are essential micronutrients for human health. They
play an important role in human metabolism, and interest in essential
micronutrients is increasing together with reports of relationships between trace
element status and oxidative diseases (Cabrera et al. 2003). Some heavy metals, if
present even in very low concentrations in food products, can cause human health
problems. Information about the dietary intake of such metals is very important to
assess risks to consumers (Lanre-Iyanda and Adekunle 2012). Also, the
determination of trace elements and minerals in foodstuffs is an important part of
toxicological and nutritional analyses (Cabrera et al. 2003). Biotoxic effects of
heavy metals depend upon the oxidation states and concentrations of heavy
metals, mode of deposition and kind of sources (Bukvić et al. 2013).
The aim of this study was to analyse the metals cadmium, chromium, iron,
manganese, lead and zinc (Cd, Cr, Fe, Mn, Pb, Zn) concentrations in different
types of nuts marketed in Sarajevo: almond, walnuts, Brazil walnuts, Indian
walnuts, Macadamia, hazelnuts and pistachios. Metals were analysed by flame
atomic absorption spectrometry (FAAS). In addition, estimated daily intakes of
metals from nuts samples and estimated carcinogenic risk over a lifetime
exposure to Pb were also calculated.
MATERIAL AND METHODS Sample collection and analysis
Nuts samples were collected from different Sarajevo (Bosnia and
Herzegovina) markets. Samples of nuts were collected randomly in sufficient
quantities to provide a representative samples. Samples were cut to small pieces
and dried at 105ºC, then powdered and stored in plastic bags for metals analysis.
Metals in nuts samples were extracted following the acid digestion procedure: a
total of about 1 g (± 0.1 mg) of dry nuts was weight directly in Teflon digestion
vessels. Following the addition of 30 mL 65% (v/v) HNO3, after the evaporation
Assessment of metals and their estimated daily intakes in various nuts 213
of nitrogen oxides, the vessel was sealed and allowed to react at 50ºC for 12 h.
The digest was transferred to a volumetric flask and filled up with Milli-Q water
to 50 mL. Metals content of commonly consumed nuts were determined by
FAAS using an atomic absorption spectrometer model AA240FS, Varian
(Australia). All samples and blanks were prepared in triplicate and measurement
for each replicate was repeated thrice. All the chemicals and reagents were of
analytical grade and were purchased from Merck (Germany). Standard solutions
of metals were also provided by Merck (Germany). Milli-Q water was used
throughout the whole experiment. All of the volumetric glassware used were
soaked in 10% (v/v) HNO3 overnight and rinsed with Milli-Q water before use.
The sample analyses were performed in triplicate and the standard deviation was
calculated. The method detection limits (LOD) were calculated as three times the
standard deviation of the blank signal. The LOD values were: Cr (0.006 mg/L),
Mn (0.002 mg/L), Fe (0.006 mg/L), Pb (0.01 mg/L), Ni (0.01 mg/L), Cd (0.002
mg/L), Zn (0.001 mg/L). Spiked samples were used to test the methods at varying
concentrations of analyte and the percent recovery was calculated. The acceptable
recoveries of known additions ranged between 89-108%. Metal concentrations
are expressed as the mean value (mg/kg) ± standard deviation (SD) of three
subsamples collected from the same source.
Estimated daily intake of metals (EDI)
A recommended dietary intake (RDI), sometimes referred to as
recommended daily intake, is the average daily intake level of a particular
nutrient that is likely to meet the nutrient requirements of 97-98% of healthy
individuals in a particular life stage or gender group. Estimated daily intake
(mg/kg/day) is calculated based on the assumptions that: a) body weight is 60 kg
and b) daily intake of nuts is 30 g. Estimated daily intake were calculated using
(mg/kg/day) = metal concentrations in nuts × 30/1000/60 (Ozbas et al. 2013).
Carcinogenic risk (CR)
Carcinogenic risk (CR) shows the probability of developing cancer over a
lifetime due to exposure to a potential carcinogen for an individual. The United
States Environmental Protection Agency (USEPA 2010) provided a cancer slope
factor (CSF) for the calculation of the cancer risk over a lifetime exposure to Pb.
The estimation of the cancer risk is calculated using the Equation 1 given by
USEPA: CR = CSF × ED /1/
where, CSF is the carcinogenic slope factor of 0.0085 (mg/kg/day) for Pb
set by USEPA (2010). Acceptable risk levels for carcinogens range from 10−4
(risk of developing cancer over a human lifetime is 1 in 10000) to 10−6
(risk of
developing cancer over a human lifetime is 1 in 1000000).
RESULTS AND DISCUSSION
Nuts are known to be a concentrated food for major elements and they are
an interesting food for trace elements for the human diet. A small number of
published data are available on the metal contamination in nuts on different
market sites.
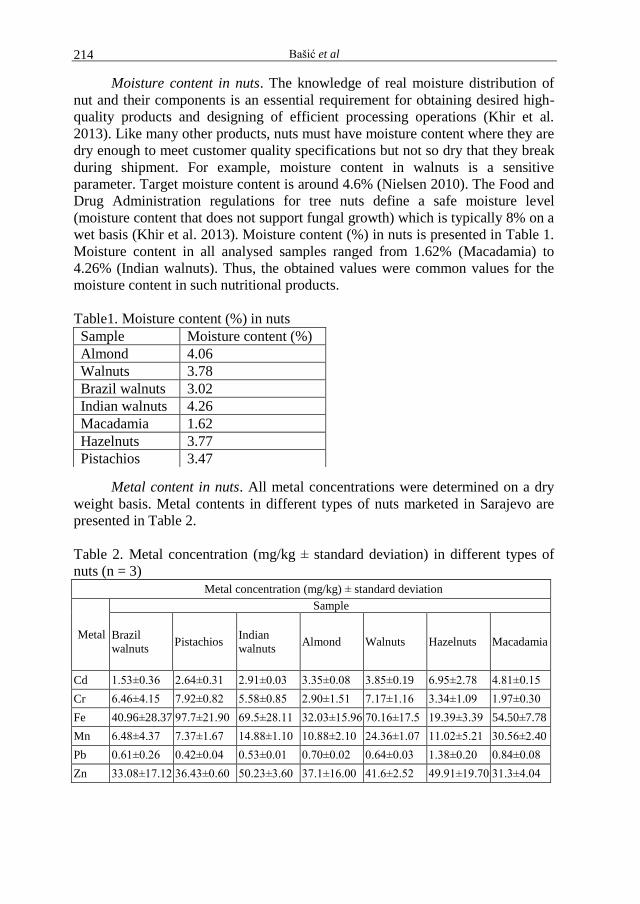
Bašić et al 214
Moisture content in nuts. The knowledge of real moisture distribution of
nut and their components is an essential requirement for obtaining desired high-
quality products and designing of efficient processing operations (Khir et al.
2013). Like many other products, nuts must have moisture content where they are
dry enough to meet customer quality specifications but not so dry that they break
during shipment. For example, moisture content in walnuts is a sensitive
parameter. Target moisture content is around 4.6% (Nielsen 2010). The Food and
Drug Administration regulations for tree nuts define a safe moisture level
(moisture content that does not support fungal growth) which is typically 8% on a
wet basis (Khir et al. 2013). Moisture content (%) in nuts is presented in Table 1.
Moisture content in all analysed samples ranged from 1.62% (Macadamia) to
4.26% (Indian walnuts). Thus, the obtained values were common values for the
moisture content in such nutritional products.
Table1. Moisture content (%) in nuts
Metal content in nuts. All metal concentrations were determined on a dry
weight basis. Metal contents in different types of nuts marketed in Sarajevo are
presented in Table 2.
Table 2. Metal concentration (mg/kg ± standard deviation) in different types of
nuts (n = 3)
Metal concentration (mg/kg) ± standard deviation
Metal
Sample
Brazil
walnuts Pistachios
Indian
walnuts Almond Walnuts Hazelnuts Macadamia
Cd 1.53±0.36 2.64±0.31 2.91±0.03 3.35±0.08 3.85±0.19 6.95±2.78 4.81±0.15
Cr 6.46±4.15 7.92±0.82 5.58±0.85 2.90±1.51 7.17±1.16 3.34±1.09 1.97±0.30
Fe 40.96±28.37 97.7±21.90 69.5±28.11 32.03±15.96 70.16±17.5 19.39±3.39 54.50±7.78
Mn 6.48±4.37 7.37±1.67 14.88±1.10 10.88±2.10 24.36±1.07 11.02±5.21 30.56±2.40
Pb 0.61±0.26 0.42±0.04 0.53±0.01 0.70±0.02 0.64±0.03 1.38±0.20 0.84±0.08
Zn 33.08±17.12 36.43±0.60 50.23±3.60 37.1±16.00 41.6±2.52 49.91±19.70 31.3±4.04
Sample Moisture content (%)
Almond 4.06
Walnuts 3.78
Brazil walnuts 3.02
Indian walnuts 4.26
Macadamia 1.62
Hazelnuts 3.77
Pistachios 3.47
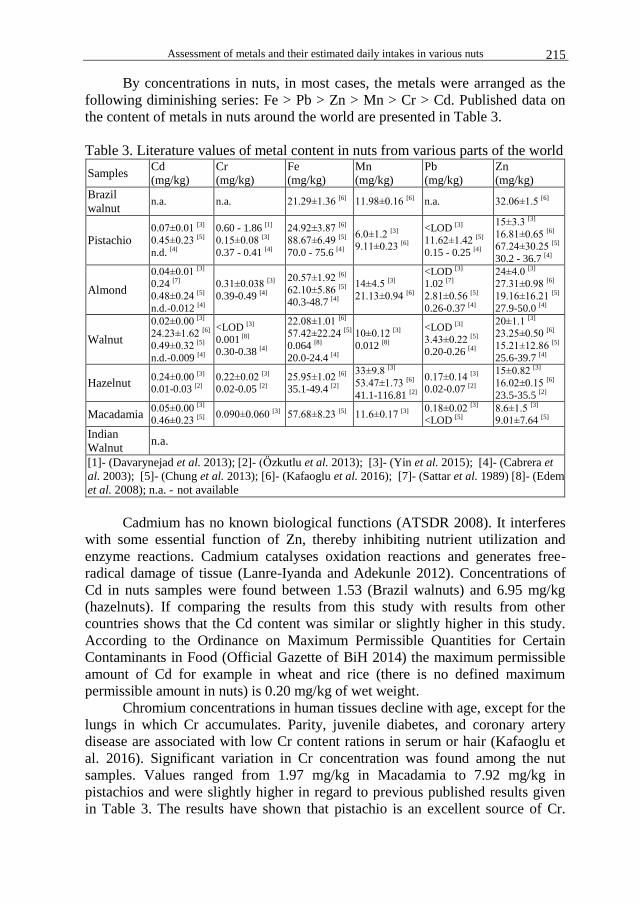
Assessment of metals and their estimated daily intakes in various nuts 215
By concentrations in nuts, in most cases, the metals were arranged as the
following diminishing series: Fe > Pb > Zn > Mn > Cr > Cd. Published data on
the content of metals in nuts around the world are presented in Table 3.
Table 3. Literature values of metal content in nuts from various parts of the world
Samples Cd
(mg/kg)
Cr
(mg/kg)
Fe
(mg/kg)
Mn
(mg/kg)
Pb
(mg/kg)
Zn
(mg/kg)
Brazil
walnut n.a. n.a. 21.29±1.36 [6] 11.98±0.16 [6] n.a. 32.06±1.5 [6]
Pistachio 0.07±0.01 [3]
0.45±0.23 [5]
n.d. [4]
0.60 - 1.86 [1]
0.15±0.08 [3]
0.37 - 0.41 [4]
24.92±3.87 [6]
88.67±6.49 [5]
70.0 - 75.6 [4]
6.0±1.2 [3] 9.11±0.23 [6]
<LOD [3]
11.62±1.42 [5]
0.15 - 0.25 [4]
15±3.3 [3]
16.81±0.65 [6] 67.24±30.25 [5]
30.2 - 36.7 [4]
Almond
0.04±0.01 [3] 0.24 [7]
0.48±0.24 [5]
n.d.-0.012 [4]
0.31±0.038 [3]
0.39-0.49 [4]
20.57±1.92 [6]
62.10±5.86 [5] 40.3-48.7 [4]
14±4.5 [3]
21.13±0.94 [6]
<LOD [3] 1.02 [7]
2.81±0.56 [5]
0.26-0.37 [4]
24±4.0 [3] 27.31±0.98 [6]
19.16±16.21 [5]
27.9-50.0 [4]
Walnut
0.02±0.00 [3] 24.23±1.62 [6]
0.49±0.32 [5]
n.d.-0.009 [4]
<LOD [3]
0.001 [8] 0.30-0.38 [4]
22.08±1.01 [6] 57.42±22.24 [5]
0.064 [8]
20.0-24.4 [4]
10±0.12 [3]
0.012 [8]
<LOD [3]
3.43±0.22 [5] 0.20-0.26 [4]
20±1.1 [3] 23.25±0.50 [6]
15.21±12.86 [5]
25.6-39.7 [4]
Hazelnut 0.24±0.00 [3] 0.01-0.03 [2]
0.22±0.02 [3] 0.02-0.05 [2]
25.95±1.02 [6] 35.1-49.4 [2]
33±9.8 [3]
53.47±1.73 [6]
41.1-116.81 [2]
0.17±0.14 [3] 0.02-0.07 [2]
15±0.82 [3]
16.02±0.15 [6]
23.5-35.5 [2]
Macadamia 0.05±0.00 [3] 0.46±0.23 [5]
0.090±0.060 [3] 57.68±8.23 [5] 11.6±0.17 [3] 0.18±0.02 [3] <LOD [5]
8.6±1.5 [3] 9.01±7.64 [5]
Indian
Walnut n.a.
[1]- (Davarynejad et al. 2013); [2]- (Özkutlu et al. 2013); [3]- (Yin et al. 2015); [4]- (Cabrera et
al. 2003); [5]- (Chung et al. 2013); [6]- (Kafaoglu et al. 2016); [7]- (Sattar et al. 1989) [8]- ( Edem
et al. 2008); n.a. - not available
Cadmium has no known biological functions (ATSDR 2008). It interferes
with some essential function of Zn, thereby inhibiting nutrient utilization and
enzyme reactions. Cadmium catalyses oxidation reactions and generates free-
radical damage of tissue (Lanre-Iyanda and Adekunle 2012). Concentrations of
Cd in nuts samples were found between 1.53 (Brazil walnuts) and 6.95 mg/kg
(hazelnuts). If comparing the results from this study with results from other
countries shows that the Cd content was similar or slightly higher in this study.
According to the Ordinance on Maximum Permissible Quantities for Certain
Contaminants in Food (Official Gazette of BiH 2014) the maximum permissible
amount of Cd for example in wheat and rice (there is no defined maximum
permissible amount in nuts) is 0.20 mg/kg of wet weight.
Chromium concentrations in human tissues decline with age, except for the
lungs in which Cr accumulates. Parity, juvenile diabetes, and coronary artery
disease are associated with low Cr content rations in serum or hair (Kafaoglu et
al. 2016). Significant variation in Cr concentration was found among the nut
samples. Values ranged from 1.97 mg/kg in Macadamia to 7.92 mg/kg in
pistachios and were slightly higher in regard to previous published results given
in Table 3. The results have shown that pistachio is an excellent source of Cr.
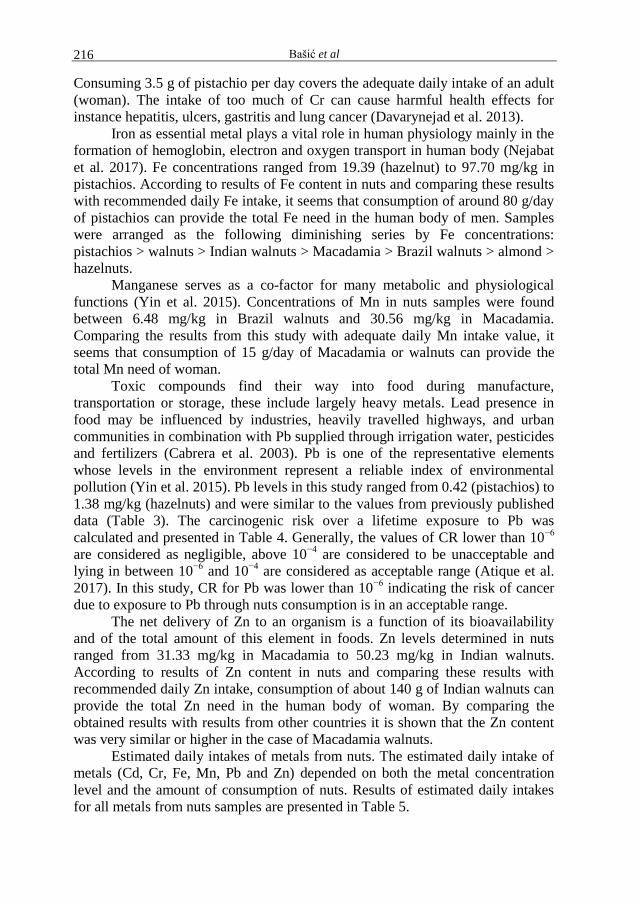
Bašić et al 216
Consuming 3.5 g of pistachio per day covers the adequate daily intake of an adult
(woman). The intake of too much of Cr can cause harmful health effects for
instance hepatitis, ulcers, gastritis and lung cancer (Davarynejad et al. 2013).
Iron as essential metal plays a vital role in human physiology mainly in the
formation of hemoglobin, electron and oxygen transport in human body (Nejabat
et al. 2017). Fe concentrations ranged from 19.39 (hazelnut) to 97.70 mg/kg in
pistachios. According to results of Fe content in nuts and comparing these results
with recommended daily Fe intake, it seems that consumption of around 80 g/day
of pistachios can provide the total Fe need in the human body of men. Samples
were arranged as the following diminishing series by Fe concentrations:
pistachios > walnuts > Indian walnuts > Macadamia > Brazil walnuts > almond >
hazelnuts.
Manganese serves as a co-factor for many metabolic and physiological
functions (Yin et al. 2015). Concentrations of Mn in nuts samples were found
between 6.48 mg/kg in Brazil walnuts and 30.56 mg/kg in Macadamia.
Comparing the results from this study with adequate daily Mn intake value, it
seems that consumption of 15 g/day of Macadamia or walnuts can provide the
total Mn need of woman.
Toxic compounds find their way into food during manufacture,
transportation or storage, these include largely heavy metals. Lead presence in
food may be influenced by industries, heavily travelled highways, and urban
communities in combination with Pb supplied through irrigation water, pesticides
and fertilizers (Cabrera et al. 2003). Pb is one of the representative elements
whose levels in the environment represent a reliable index of environmental
pollution (Yin et al. 2015). Pb levels in this study ranged from 0.42 (pistachios) to
1.38 mg/kg (hazelnuts) and were similar to the values from previously published
data (Table 3). The carcinogenic risk over a lifetime exposure to Pb was
calculated and presented in Table 4. Generally, the values of CR lower than 10−6
are considered as negligible, above 10−4
are considered to be unacceptable and
lying in between 10−6
and 10−4
are considered as acceptable range (Atique et al.
2017). In this study, CR for Pb was lower than 10−6
indicating the risk of cancer
due to exposure to Pb through nuts consumption is in an acceptable range.
The net delivery of Zn to an organism is a function of its bioavailability
and of the total amount of this element in foods. Zn levels determined in nuts
ranged from 31.33 mg/kg in Macadamia to 50.23 mg/kg in Indian walnuts.
According to results of Zn content in nuts and comparing these results with
recommended daily Zn intake, consumption of about 140 g of Indian walnuts can
provide the total Zn need in the human body of woman. By comparing the
obtained results with results from other countries it is shown that the Zn content
was very similar or higher in the case of Macadamia walnuts.
Estimated daily intakes of metals from nuts. The estimated daily intake of
metals (Cd, Cr, Fe, Mn, Pb and Zn) depended on both the metal concentration
level and the amount of consumption of nuts. Results of estimated daily intakes
for all metals from nuts samples are presented in Table 5.
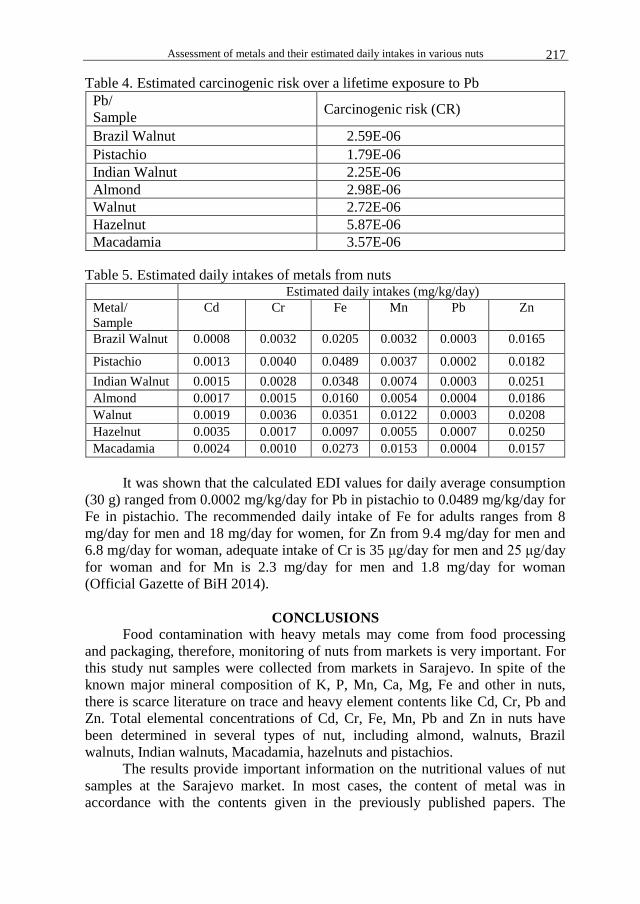
Assessment of metals and their estimated daily intakes in various nuts 217
Table 4. Estimated carcinogenic risk over a lifetime exposure to Pb
Pb/
Sample Carcinogenic risk (CR)
Brazil Walnut 2.59E-06
Pistachio 1.79E-06
Indian Walnut 2.25E-06
Almond 2.98E-06
Walnut 2.72E-06
Hazelnut 5.87E-06
Macadamia 3.57E-06
Table 5. Estimated daily intakes of metals from nuts Estimated daily intakes (mg/kg/day)
Metal/
Sample
Cd Cr Fe Mn Pb Zn
Brazil Walnut 0.0008 0.0032 0.0205 0.0032 0.0003 0.0165
Pistachio 0.0013 0.0040 0.0489 0.0037 0.0002 0.0182
Indian Walnut 0.0015 0.0028 0.0348 0.0074 0.0003 0.0251
Almond 0.0017 0.0015 0.0160 0.0054 0.0004 0.0186
Walnut 0.0019 0.0036 0.0351 0.0122 0.0003 0.0208
Hazelnut 0.0035 0.0017 0.0097 0.0055 0.0007 0.0250
Macadamia 0.0024 0.0010 0.0273 0.0153 0.0004 0.0157
It was shown that the calculated EDI values for daily average consumption
(30 g) ranged from 0.0002 mg/kg/day for Pb in pistachio to 0.0489 mg/kg/day for
Fe in pistachio. The recommended daily intake of Fe for adults ranges from 8
mg/day for men and 18 mg/day for women, for Zn from 9.4 mg/day for men and
6.8 mg/day for woman, adequate intake of Cr is 35 μg/day for men and 25 μg/day
for woman and for Mn is 2.3 mg/day for men and 1.8 mg/day for woman
(Official Gazette of BiH 2014).
CONCLUSIONS
Food contamination with heavy metals may come from food processing
and packaging, therefore, monitoring of nuts from markets is very important. For
this study nut samples were collected from markets in Sarajevo. In spite of the
known major mineral composition of K, P, Mn, Ca, Mg, Fe and other in nuts,
there is scarce literature on trace and heavy element contents like Cd, Cr, Pb and
Zn. Total elemental concentrations of Cd, Cr, Fe, Mn, Pb and Zn in nuts have
been determined in several types of nut, including almond, walnuts, Brazil
walnuts, Indian walnuts, Macadamia, hazelnuts and pistachios.
The results provide important information on the nutritional values of nut
samples at the Sarajevo market. In most cases, the content of metal was in
accordance with the contents given in the previously published papers. The
Bašić et al 218
calculated carcinogenic risk for Pb is indicating that the risk of cancer due to
exposure to Pb through nuts consumption is in an acceptable range.
REFERENCES
Atique Ullah, A.K.M., Maksud, M.A., Khan, S.R., Lutfa, L.N., Quraishi, S.B.
(2017): Dietary intake of heavy metals from eight highly consumed species
of cultured fish and possible human health risk implications in Bangladesh.
Toxicol Rep., 4: 574–579. https://doi.org/10.1016/j.toxrep.2017.10.002
ATSDR (2008): Case Studies in Environmental Medicine (CSEM), Cadmium
Toxicity. Agency for Toxic Substances and Disease Registry (availabele at
https://www.atsdr.cdc.gov/csem/cadmium/docs/cadmium.pdf)
Bukvić, E., Huremović, J., Memić, M., Gojak-Salimović, S. (2013): Heavy
metals in fruits and vegetables from markets in Sarajevo, Bosnia and
Herzegovina. Technol Acta., 6(2): 29-36.
Cabrera, C., Loris, F., Gimenez, R., Olalla, M., López, M.C. (2003): Mineral
content in legumes and nuts: contribution to the Spanish dietary intake. Sci
Total Environ., 308: 1–14. https://doi.org/10.1016/S0048-9697(02)0061-3
Chung, K.H., Shin, K.O., Hwang, H.J., Choi, K.S. (2013): Chemical composition
of nuts and seeds sold in Korea. Nutr Res Pract., 7(2): 82–88.
https://doi.org/10.4162/nrp.2013.7.2.82
D’Mello, J.P.F. (2003): Food safety: contaminants and toxins. Wallingford,
Oxon, UK, Cambridge, MA, CABI Publishing.
Davarynejad, G., Zarei, M., Nagy, P.T. (2013): Identification and quantification
of heavy metals concentrations in pistacia. Not Sci Biol., 5(4): 438-444.
https://doi.org/10.15835/nsb549115
Edem, C.A., Dosumu, M.I., Bassey, F.I. (2008): Determination of proximate
composition, ascorbic acid and heavy metal content of African walnut
(Tetra carpidium conophorum). Afr J Environ Pollut Health., 6(1): 59-60.
http://dx.doi.org/10.3923/pjn.2009.225.226
Kafaoglu, B., Fisher, A., Hill, S., Karaa, D.J. (2016): Determination and
Evaluation of Metal Bioaccessibility in Some Nuts and Seeds by in Vitro
Gastro-Intestinal Method. J Food Composit Anal., 45: 58-65.
https://doi.org/10.1016/j.jfca.2015.09.011
Khir, R., Pan, Z., Atungulu, G.G., Thompson, J.F., Shao, D. (2013): Size and
Moisture Distribution Characteristics of Walnuts and Their Components.
Food Bioproc Tech., 6(3): 771–782. https://doi.org/10.1007/s11947-011-
0717-1
Lanre-Iyanda, T.Y. & Adekunle, I.M. (2012): Assessment of heavy metals and
their estimated daily intakes from two commonly consumed foods (kulikuli
and robo) found in Nigeria. Afr J Food Agric Nutr Dev., 12(3): 6156.
Moreda-Piñeiro, J., Herbello-Hermelo, P., Domínguez-González, R., Bermejo-
Barrera, P., Moreda-Piñeiro, A. (2016): Bioavailability assessment of
essential and toxic metals in edible nuts and seeds. Food Chem., 205:146-
154. https://doi.org/10.1016/j.foodchem.2016.03.006
Assessment of metals and their estimated daily intakes in various nuts 219
Nejabat, M., Kahe, H., Shirani, K., Ghorbannejad, P., Hadizadeh, F., Karimi, G.
(2017): Health risk assessment of heavy metals via dietary intake of wheat
in Golestan Province, Iran. Hum Ecol Risk Assess., 23(5): 1193-1201.
https://doi.org/10.1080/10807039.2017.1309265
Nielsen, S.S. (2010): Food analysis, 4th edn., West Lafayette, IN, USA, Purdue
University.
Official Gazette of BiH (2014): Ordinance on Maximum Permissible Quantities
for Certain Contaminants in Food, No. 68/14 of the Food Act (available at
http://www.sluzbenilist.ba/page/akt/zUp8Jgztz5k76kjn45hB4GvE=)
Onyedikachi, U.B., Belonwy, DC, Wegwu, MO. (2018): Human health risk
assessment of heavy metals in soils and commonly consumed food crops
from quarry sites located at Isiagwu, Ebonyi State. Ovidius Univ Ann
Chem., 29(1): 8-24. https://doi.org/10.2478/auoc-2018-0002
Ozbas, E.E., Okten, H.E., Ozcan, H.K., Demir, G. (2013): Selected Essential and
Non-Essential Elements Content of Turkish Hazelnuts. Environ Pollut.,
2(1): 81-87. http://dx.doi.org/10.5539/ep.v2n1p81
Özkutlu, F., Doğru, Y.Z., Özenç, N., Yazici, G., Turan, M., Akçay, F. (2013):
The importance of Turkish hazelnut trace and heavy metal contents for
human nutrition. S Afr J Plant Soil., 1(3): 37-44.
Sattar, A., Wahid, M., Durrani, S.K. (1989): Concentration of selected heavy
metals in spices, dry fruits and plant nuts. Plant Food Hum Nutr., 39(3):
279-286. https://doi.org/10.1007/BF01091938
USEPA (2010): Risk-based Concentration Table. United States Environmental
Protection Agency (available at https://www.epa.gov/risk/regional-
screening-levels-rsls-generic-tables)
Yin, L.L., Qing, T., Zhang, S.X,. Yin, K.X., Qin, J.I.Q. (2015): Determination of
Trace Elements in Edible Nuts in the Beijing Market by ICP-MS. Biomed
Environ Sci., 28(6): 449-454. https://doi.org/10.3967/bes2015.063


Agriculture & Forestry, Vol. 66 Issue 3: 221-230, 2020, Podgorica 221
Maličević, Z., Lakić, Ž., Jugović, M., Mitrović, D. (2020): The significance of transversal distribution during the application of plant protection by boom sprayer. Agriculture and Forestry, 66 (3): 221-230.
DOI: 10.17707/AgricultForest.66.3.18 Zoran MALIČEVIĆ 1, Željko LAKIĆ 2, Milan JUGOVIĆ 3, Dragoljub MITROVIĆ 4
THE SIGNIFICANCE OF TRANSVERSAL DISTRIBUTION DURING THE APPLICATION OF PLANT PROTECTION BY BOOM SPRAYER
SUMMARY The capacity of nozzles changes during the exploitation, i.e. it produces
deviation from normal values. The consumption has an effect on the increase of the capacity of the nozzle, or the fraying and abrasion of the cartridge itself, which has a consequence of increased flow of the substance. On the other hand, decrease of the capacity occurs as a consequence of impurities which come with water which is used as a carrier of substances.
The aim of the study is to point to the significance of regular control of the nozzle capacity, since it affect on the quality of the application, all of which affect the deviation from the mean value of the transverse distribution.
Measured deviations of the nozzles according to the positions had significant deviations (5- decrease 83,33%, or 13- increase of the capacity for 61,11%), and the consumption of the substance according to the surface (ha) fit perfectly. During designing and monitoring of the treatment standard, most of the producers monitor consumption (l/ha), and this paper points to frequent occurrences in practice (deviations) that can significantly affect the quality of the application, as shown by water-sensitive papers. The coverage of water-sensitive papers ranged from 5.60 to 57.40%.
Keywords: nozzles, transversal distribution, boom sprayer, controlled application.
INTRODUCTION
In practice, it is often the case that manufacturers adjust the operating parameters (device capacity, operating speed) to achieve the desired norm in terms of consumption of the agent according to the treated area. Quality treatment, i.e. good transverse distribution implies uniform spray capacity as well
1Zoran Maličević (corresponding author: [email protected]), Faculty of Agriculture, University of Banja Luka, Republic of Srpska, BOSNIA AND HERZEGOVINA. 2Željko Lakić, Institute for Agriculture Banja Luka, Republic of Srpska, BOSNIA AND HERZEGOVINA. 3Milan Jugović, University of East Sarajevo, Faculty of Agriculture, Republic of Srpska, BOSNIA AND HERZEGOVINA. 4Dragoljub Mitrović, Biotechnical Faculty, University of Montenegro, MONTENEGRO. Notes: The authors declare that they have no conflicts of interest. Authorship Form signed online. Recieved:19/06/2020 Accepted:20/09/2020
Maličević et al 222
as good jet overlap. Change of the stated parameters occurs due to deviations from the nominal values of the capacity of individual sprayers on grains sprayers. Due to the deviation from the nominal values of the capacity, the quality application is disturbed through the uneven transverse distribution.
The mean value of the transverse distribution represents the mean volume value of the distributed liquid per treated area. A greater or lesser deviation from this mean represents the coefficient of variation. The coefficient of variation represents the numerical value of the distribution of fluid over the surface and allows the comparison of different results (Visacki, 2014).
The result of the treatment with damaged sprinklers is an uneven transverse distribution, and it reflects on the quality of the application despite the circumstances in terms of an ideal match of the tank consumption according to the treated surface. The cause of this phenomenon is the deviation of the sprayer from the nominal capacity. The result of increasing or decreasing the capacity of certain sprinklers is stated.
In order to achieve the most precise application of pesticides and complete crop protection, it is not enough that the sprayers have only a modern construction, but it is necessary that they have adequate exploitation potential (Djukic, 2008).
The exploitation potential of the sprayer represents the possibility for reliable execution of the set tasks, when applying pesticides. Exploitation potential implies quantitative and qualitative parameters.
Quantitative parameters include: pump capacity, sprayer capacity, hydraulic mixing device capacity, mutual harmonization of the stated capacities, gear ratio, tank volume, etc.
Qualitative parameters are: precision of dosing and capacity, uniformity of transverse distribution of pesticides, uniformity of droplets in the jet.
The precondition for a quality application is not the possession of a sprayer of a modern concept, but a well-adjusted sprayer that will provide a controlled application of pesticides, and thus the production of health-safe agricultural products. All of the above has influenced the fact that in the previous period, the control of the correctness of the sprayers became a regular obligation in most European countries (Sedlar, 2006). Inspections of sprayers are carried out in accordance with EN 13790. Belgium, Germany and the Netherlands are among the countries that were among the first to introduce mandatory inspections in accordance with this standard. In the area of northern Belgium in the period from September 1995 to December 1998, 17,466 sprayers were tested. Of the tested number of sprayers, 2,802 or 16% of sprayers did not pass the inspection, and therefore their exploitation potential was not satisfactory. Of the 2,802 sprayers, 2,409 (86%) did not receive a quality certificate, due to worn nozzles or a faulty manometer (Langenakens and Pieters, 1999). Inspections of sprayers in Germany have shown that the cause of their malfunction in 19% of cases are worn nozzles, then a faulty manometer and wing valves in 13% and 10% of cases, respectively (Rietz, 1998). At the second European symposium dedicated to the
The significance of transversal distribution during the application of plant protection by... 223
standardization of sprayer control procedures in Europe, held in Germany, a large number of authors point out the special importance of nozzles. Nozzles as the final elements of the sprayer determine the size of the droplets, the shape and angle of the outlet jet, the amount of liquid and the quality of coverage of the treated surface (Djukic, 2001).
The conducted inspections in the territory of Republika Srpska and Bosnia and Herzegovina also indicate the fact that the malfunction and poor exploitation potential are mostly affected by nozzles and faulty manometers (Malicevic, 2012). In BiH a significant problem is the practice of agricultural producers to buy parts of uncertain quality whose only advantage is the low price. A special risk is the choice of nozzles of questionable quality. Especially in such a situation, the positive effect of correctness control comes to the fore, and the aim of this paper is to point out the importance of quality control of nozzles, which are the most common cause of deviations in application. The use of water-sensitive papers (WSP) is a fast and reliable method for assessing the quality of applications, which is the ultimate goal of the research.
MATERIAL AND METHODS There are 60 different requirements that every plant protection machine
must meet regarding inspections of sprayers in accordance with current standards and regulations. However, the most important thing is: pump operation control, manometer correctness control, mixer operation control and nozzle operation control.
Nozzles as key elements, i.e. their condition directly affect the quality of pesticide applications, i.e. the transverse distribution is in direct relation with the condition of the sprayers (Fig. 1). One of the basic parts is the nozzle cartridge that because of the high pressure exposure has its own lifespan, and is being withdrawn from service when it is worn out.
The service life of the sprayer depends on: the material of construction, the height of the pressure used, the condition of the filter and the maintenance.
The most efficient way to determine the condition of the sprayer is to permanently inspection, monitoring and comparing the flow rate of the old sprayer with the new one (same type and size).
Sprayer quality control involves control of the sprayer capacity and control of the transverse distribution of the sprayer (Sedlar, 2005). The "Laboratory for Testing and Calibration of Plant Protection Machines" has a sprayer capacity meter (Fig. 2), which was used in the research. It consists of an adapter for all types of sprinklers and a memory unit for storing 1000 data of measured capacities.
An Agromehanika AGS 440 mounted sprayer, aggregated with an IMT 539 tractor, was used in the experiment. The volume of the sprayer tank is 440 liters, and the working reach is 8 m. Low pressure pump BM 65 from the same manufacturer, piston-membrane type (2 pistons) with a capacity of 65 l/min on 540 t/min, serving 16 nozzles, with quality mixing. Nozzle carriers are
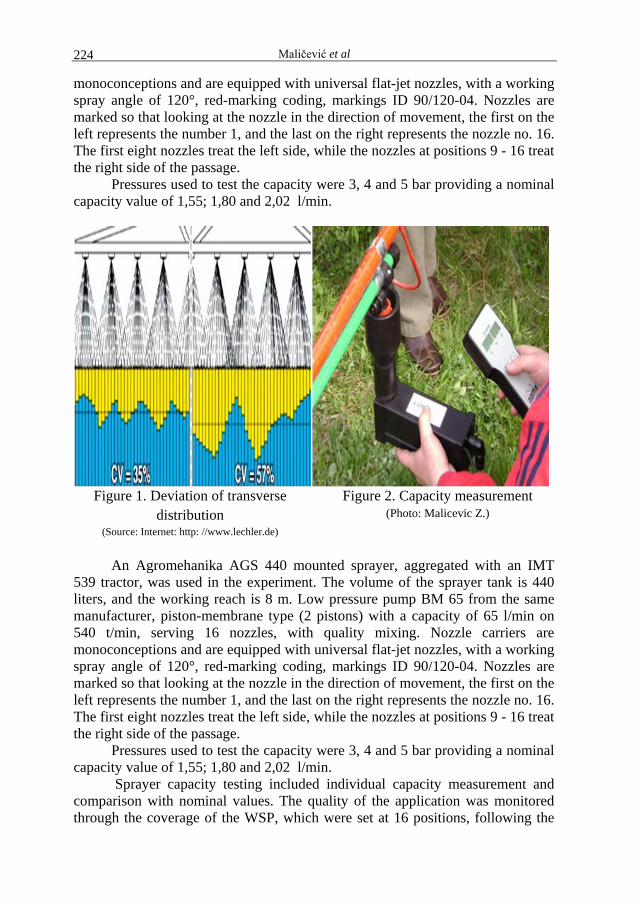
Maličević et al 224
monoconceptions and are equipped with universal flat-jet nozzles, with a working spray angle of 120°, red-marking coding, markings ID 90/120-04. Nozzles are marked so that looking at the nozzle in the direction of movement, the first on the left represents the number 1, and the last on the right represents the nozzle no. 16. The first eight nozzles treat the left side, while the nozzles at positions 9 - 16 treat the right side of the passage.
Pressures used to test the capacity were 3, 4 and 5 bar providing a nominal capacity value of 1,55; 1,80 and 2,02 l/min.
Figure 1. Deviation of transverse
distribution (Source: Internet: http: //www.lechler.de)
Figure 2. Capacity measurement (Photo: Malicevic Z.)
An Agromehanika AGS 440 mounted sprayer, aggregated with an IMT
539 tractor, was used in the experiment. The volume of the sprayer tank is 440 liters, and the working reach is 8 m. Low pressure pump BM 65 from the same manufacturer, piston-membrane type (2 pistons) with a capacity of 65 l/min on 540 t/min, serving 16 nozzles, with quality mixing. Nozzle carriers are monoconceptions and are equipped with universal flat-jet nozzles, with a working spray angle of 120°, red-marking coding, markings ID 90/120-04. Nozzles are marked so that looking at the nozzle in the direction of movement, the first on the left represents the number 1, and the last on the right represents the nozzle no. 16. The first eight nozzles treat the left side, while the nozzles at positions 9 - 16 treat the right side of the passage.
Pressures used to test the capacity were 3, 4 and 5 bar providing a nominal capacity value of 1,55; 1,80 and 2,02 l/min.
Sprayer capacity testing included individual capacity measurement and comparison with nominal values. The quality of the application was monitored through the coverage of the WSP, which were set at 16 positions, following the
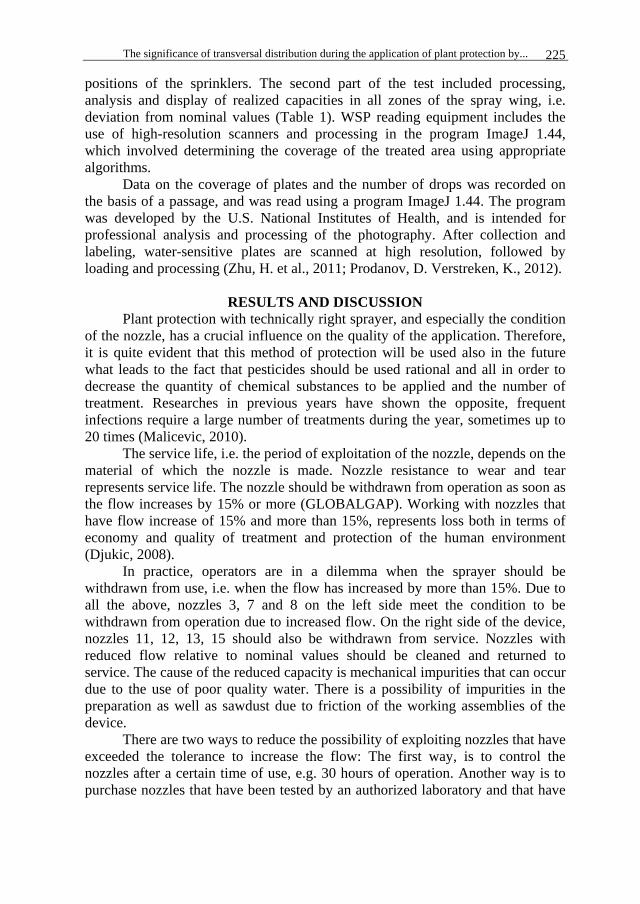
The significance of transversal distribution during the application of plant protection by... 225
positions of the sprinklers. The second part of the test included processing, analysis and display of realized capacities in all zones of the spray wing, i.e. deviation from nominal values (Table 1). WSP reading equipment includes the use of high-resolution scanners and processing in the program ImageJ 1.44, which involved determining the coverage of the treated area using appropriate algorithms.
Data on the coverage of plates and the number of drops was recorded on the basis of a passage, and was read using a program ImageJ 1.44. The program was developed by the U.S. National Institutes of Health, and is intended for professional analysis and processing of the photography. After collection and labeling, water-sensitive plates are scanned at high resolution, followed by loading and processing (Zhu, H. et al., 2011; Prodanov, D. Verstreken, K., 2012).
RESULTS AND DISCUSSION
Plant protection with technically right sprayer, and especially the condition of the nozzle, has a crucial influence on the quality of the application. Therefore, it is quite evident that this method of protection will be used also in the future what leads to the fact that pesticides should be used rational and all in order to decrease the quantity of chemical substances to be applied and the number of treatment. Researches in previous years have shown the opposite, frequent infections require a large number of treatments during the year, sometimes up to 20 times (Malicevic, 2010).
The service life, i.e. the period of exploitation of the nozzle, depends on the material of which the nozzle is made. Nozzle resistance to wear and tear represents service life. The nozzle should be withdrawn from operation as soon as the flow increases by 15% or more (GLOBALGAP). Working with nozzles that have flow increase of 15% and more than 15%, represents loss both in terms of economy and quality of treatment and protection of the human environment (Djukic, 2008).
In practice, operators are in a dilemma when the sprayer should be withdrawn from use, i.e. when the flow has increased by more than 15%. Due to all the above, nozzles 3, 7 and 8 on the left side meet the condition to be withdrawn from operation due to increased flow. On the right side of the device, nozzles 11, 12, 13, 15 should also be withdrawn from service. Nozzles with reduced flow relative to nominal values should be cleaned and returned to service. The cause of the reduced capacity is mechanical impurities that can occur due to the use of poor quality water. There is a possibility of impurities in the preparation as well as sawdust due to friction of the working assemblies of the device.
There are two ways to reduce the possibility of exploiting nozzles that have exceeded the tolerance to increase the flow: The first way, is to control the nozzles after a certain time of use, e.g. 30 hours of operation. Another way is to purchase nozzles that have been tested by an authorized laboratory and that have
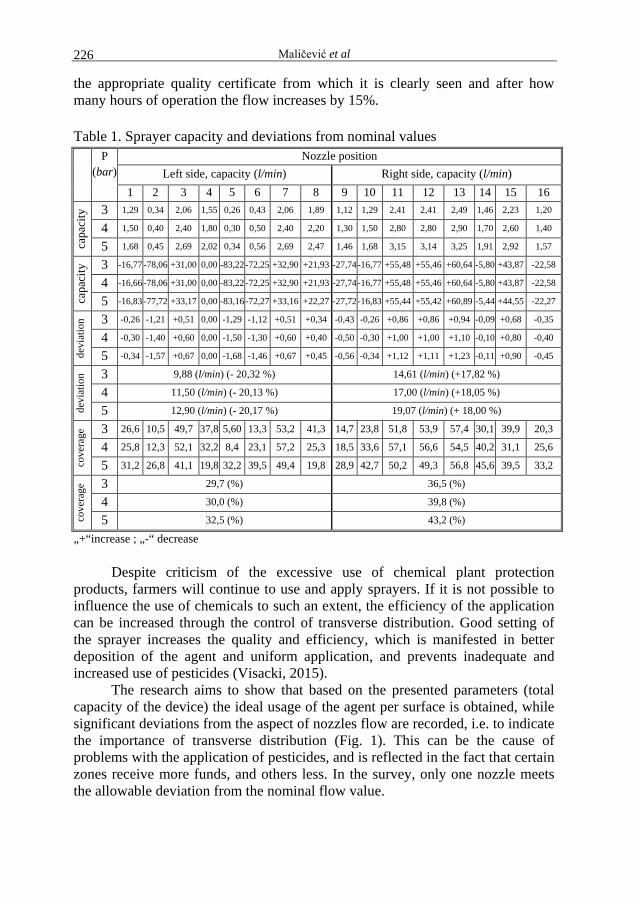
Maličević et al 226
the appropriate quality certificate from which it is clearly seen and after how many hours of operation the flow increases by 15%. Table 1. Sprayer capacity and deviations from nominal values P
(bar)
Nozzle position Left side, capacity (l/min) Right side, capacity (l/min)
1 2 3 4 5 6 7 8 9 10 11 12 13 14 15 16
capa
city
3 1,29 0,34 2,06 1,55 0,26 0,43 2,06 1,89 1,12 1,29 2,41 2,41 2,49 1,46 2,23 1,20
4 1,50 0,40 2,40 1,80 0,30 0,50 2,40 2,20 1,30 1,50 2,80 2,80 2,90 1,70 2,60 1,40
5 1,68 0,45 2,69 2,02 0,34 0,56 2,69 2,47 1,46 1,68 3,15 3,14 3,25 1,91 2,92 1,57
capa
city
3 -16,77 -78,06 +31,00 0,00 -83,22 -72,25 +32,90 +21,93 -27,74 -16,77 +55,48 +55,46 +60,64 -5,80 +43,87 -22,58
4 -16,66 -78,06 +31,00 0,00 -83,22 -72,25 +32,90 +21,93 -27,74 -16,77 +55,48 +55,46 +60,64 -5,80 +43,87 -22,58
5 -16,83 -77,72 +33,17 0,00 -83,16 -72,27 +33,16 +22,27 -27,72 -16,83 +55,44 +55,42 +60,89 -5,44 +44,55 -22,27
devi
atio
n 3 -0,26 -1,21 +0,51 0,00 -1,29 -1,12 +0,51 +0,34 -0,43 -0,26 +0,86 +0,86 +0,94 -0,09 +0,68 -0,35
4 -0,30 -1,40 +0,60 0,00 -1,50 -1,30 +0,60 +0,40 -0,50 -0,30 +1,00 +1,00 +1,10 -0,10 +0,80 -0,40
5 -0,34 -1,57 +0,67 0,00 -1,68 -1,46 +0,67 +0,45 -0,56 -0,34 +1,12 +1,11 +1,23 -0,11 +0,90 -0,45
devi
atio
n 3 9,88 (l/min) (- 20,32 %) 14,61 (l/min) (+17,82 %)
4 11,50 (l/min) (- 20,13 %) 17,00 (l/min) (+18,05 %) 5 12,90 (l/min) (- 20,17 %) 19,07 (l/min) (+ 18,00 %)
cove
rage
3 26,6 10,5 49,7 37,8 5,60 13,3 53,2 41,3 14,7 23,8 51,8 53,9 57,4 30,1 39,9 20,3
4 25,8 12,3 52,1 32,2 8,4 23,1 57,2 25,3 18,5 33,6 57,1 56,6 54,5 40,2 31,1 25,6
5 31,2 26,8 41,1 19,8 32,2 39,5 49,4 19,8 28,9 42,7 50,2 49,3 56,8 45,6 39,5 33,2
cove
rage
3 29,7 (%) 36,5 (%)
4 30,0 (%) 39,8 (%)
5 32,5 (%) 43,2 (%)
„+“increase ; „-“ decrease
Despite criticism of the excessive use of chemical plant protection products, farmers will continue to use and apply sprayers. If it is not possible to influence the use of chemicals to such an extent, the efficiency of the application can be increased through the control of transverse distribution. Good setting of the sprayer increases the quality and efficiency, which is manifested in better deposition of the agent and uniform application, and prevents inadequate and increased use of pesticides (Visacki, 2015).
The research aims to show that based on the presented parameters (total capacity of the device) the ideal usage of the agent per surface is obtained, while significant deviations from the aspect of nozzles flow are recorded, i.e. to indicate the importance of transverse distribution (Fig. 1). This can be the cause of problems with the application of pesticides, and is reflected in the fact that certain zones receive more funds, and others less. In the survey, only one nozzle meets the allowable deviation from the nominal flow value.

The significance of transversal distribution during the application of plant protection by... 227
Measured values of the sprayer capacity expressed in liters per minute are shown in table 1. Values of measured capacities (3, 4 and 5 bar) show significant deviations, both in the form of increase and decrease from the nominal value of capacity. In accordance with the current standards that regulate this area, which require withdrawal from operation in case of capacity increase by 15% and more, it is clear that seven nozzles do not meet the requirements of the standard. The table shows the quantities (l/min) as well as percentage deviations of the sprayer according to the positions, as well as deviations of the device capacity towards the sides. Positions of nozzles whose capacity exceeds the allowed deviation are: 3, 7, 8, 11, 12, 13 and 15. Nozzles 3, 7 and 8 they are on the left side of the device while the others are on the right side of the device. The largest deviation of 60.89% in terms of capacity increase was recorded at the position of the nozzle number 13, which is located on the right side of the device. Nozzles at positions 11 and 12 also have an increased capacity of 55.46%, which is high above the allowable deviation limit. The smallest deviation of 22.27% in terms of capacity increase was recorded at position 8. The coefficient of variation is particularly high and ranged from 48,31% (p=4 bar) to 48,74 % (p=5 bar), which can be considered very bad.
By concentrations in nuts, in most cases, the metals were arranged as the following diminishing series: Fe > Pb > Zn > Mn > Cr > Cd. Published data on the content of metals in nuts around the world are presented in Table 3.
The analysis of the obtained values of the tests shows a large deviation according to individual positions. In practice, this is a serious and common problem due to the fact that according to the form for calculating the standard, the average deviation is only 1.11%, and the individual deviation by position is over 60%. The analysis of the data from Table 1 measured the deviation towards the sides, which ranges from 17.82% in the form of an increase in capacity on the right, or a decrease in capacity of 20.32% on the left side of the device.
This is a common problem in which a large number of agricultural producers are found, i.e. as an indicator of the adjustment of operating parameters, they monitor the consumption of liquid according to the treated area, i.e. the consumption of preparations according to the sprayer tank. Deviation in the capacity of the nozzle is the cause of poor pesticide application, i.e. reflected in the uneven coverage of the treated area (fig. 3).
The average coverage at p=3 bar was 33,10%, at p=4 bar was 34,91% and 37,83% at pressure of p=5 bar, which is the best result in research.
The coefficient of variation is also extremely high, and the best result can be considered 29.26% at a pressure of 5 bar, while at the other two pressures they are significantly worse.
Overcoming this problem lies in the fact that the control of the nozzle capacity eliminates the possibility of poor transverse distribution, reduces the coefficient of variation, and that the consumption according to the treated area fits perfectly.

Maličević et al 228
Graph 1. Capacity of inspected nozzles (p=4 bara)
Figure 3. Coverage of water-sensitive papers (p=4 bar)
(Photo: Malicevic Z.)
The control of the nozzle capacity provides a precondition for the controlled application of plant protection products, and the possibility of deviations in terms of capacity according to the positions of the nozzle is excluded.
CONCLUSIONS
The quality of application from the aspect of pesticide application devices cannot be characterized as satisfactory. A major problem in practice is the untrainedness of the operator of the application devices and the lack of basic knowledge in terms of adjusting the operating parameters that provide the norm of treatment.
The significance of transversal distribution during the application of plant protection by... 229
Treatment with inspected sprayer has multiple advantages over uncontrolled, and is reflected in: better uniformity in terms of transverse distribution, more uniform and better coverage of plant parts, lower usage of pesticides, increased performance of human and machine labor and lower cost of protection.
Inspection of the device, and especially the capacity of the nozzle, provides a model of controlled application of pesticides, which not only provides optimal consumption of pesticides but also improves the effect of transverse distribution. The tested capacity of the nozzle as well as the speed of movement enable the reduction of the norm and the dose of treatment, increases the precision of the device itself, and thus significantly increases the degree of protection of the human environment.
Nozzle capacity control is a reliable indicator of the quality of transverse distribution, and at the same time prevents the possibility of inaccurate application, with optimal consumption of the product according to the surface.
The conducted research and analysis indicate the necessity of regular control of the nozzle capacity, because the quality of the application largely depends on their condition.
Not enough attention is paid to the control of transverse distribution; however, these tests have shown that it is perhaps the most important segment in the quality and precise application of pesticides. Quality application implies control of transverse distribution, which is certainly a step towards optimizing the use of pesticides.
REFERENCES
Djukic, N., Sedlar, A., Bugarin, R. (2008): Defining a mathematical model of nozzle consuption and its significance for domestic production. Modern agricultural technology, 34, 1-2, 63-71.
Djukic, N., Sedlar, A. (2001): Good sprayer, effective protection. Review of agronomic knowledge, 6, 48-50.
Langenakens, J., Pieters M. (1999): Organization and Results of The Compulsory Inspection of Sprayers in Belgium. 7th International Congress on Agrcultural, Adana-Turkiye, 50-53.
Malicevic Z, Railic B, Mitric S, Babic M, Marceta I,. Improvement measures of the sprayers efficiency in order to apply small and medium norms by spraying orchards, Agroznanje, Banja Luka (2010), vol.11, br. 4., 135 – 140.
Malicevic, Z., Railic, B. Mitric, S., Mihajlovic, D., Babic, M. (2012): "Techniques for pesticide application in order to obtain GlobalGAP standards in the Republic of Srpska", Agroknowledge, vol. 13., br. 3., 421-430 str., Conference of agronomists of Republika Srpska.
Prodanov, D., Verstreken, K. (2012): Automated Segmentation and Morphometric of Cell and Tissue Structures. Selected Algorithms in ImageJ, In tech open sciens/open minds, Molecular Imaging, March 16th, 183 – 208.
Maličević et al 230
Rietz, S., Gamzlemeier, H. (1998): Inspection of plant protection equipment in Europe, AgEng, Oslo, 98-A-023.
Sedlar, A. (2006): Analysis of sprayer testing methods, Master's thesis, Novi Sad. Sedlar, A., Djukic, N., Bugarin, R. (2005): The importance of regular sprayer inspection;
Journal of Agronomic Knowledge, Novi Sad, br. 4 Visacki, V., Sedlar, A., Turan, J., Bugarin, R., Burg, P. (2014): Uniformity of pesticide
application at the most common exploitation parameters. Modern agricultural technology, 40, No. 3, 125-134.
Visacki, V., Lazic, S., Sunjka, D., Sedlar, A., Bugarin, R., Turan, J., Burg, P. (2015): Determining the quality of application of field sprayer in corn, 41, No. 1, 57-66.
Zhu, H., Salyani, M., Fox, R.D. (2011): A portable scanning system for evaluation of spray deposit distribution, Computers and Electronics in Agriculture, 76: 38–43.

Agriculture & Forestry, Vol. 66 Issue 3: 231-239, 2020, Podgorica 231
Koprivica, R., Veljković, B., Radivojević, D., Dedić, T., Mileusnić, Z., Đokić, D. (2020): Equipment of family
farms with agricultural mechanization in Northwest of Montenegro. Agriculture and Forestry, 66 (3): 231-239.
DOI: 10.17707/AgricultForest.66.3.19
Ranko KOPRIVICA, Biljana VELJKOVIĆ 1, Dušan RADIVOJEVIĆ
2,
Tatjana DEDIĆ 3, Zoran MILEUSNIĆ
2, Dragoslav ĐOKIĆ
4
EQUIPMENT OF FAMILY FARMS WITH AGRICULTURAL
MECHANIZATION IN NORTHWEST OF MONTENEGRO
SUMMARY
The paper presents the results of testing equipment at family farms with
agricultural machinery in Northwest Montenegro in municipalities Pljevlja,
Ţabljak, Kolašin and Mojkovac. In the mentioned municipalities, 123 agricultural
farms in 65 villages were surveyed. The total area of available land on farms is
1612.08 ha, of which only 8.27% are cultivated and the rest meadows and
pastures. The average area of family farms is 13.11 ha of used agricultural land,
which is three times more than the average in Montenegro. Single-axle tractors
with an engine power of 5-10 kW are represented by 16% of the total number of
tractors. Family farms are not sufficiently equipped with two-axle tractors,
because every other one has a tractor (0.51 tractors per farm). The tractors are
average power of 30.12 kW. Energy equipments in the surveyed area, expressed
through the nominal engine power of two-axle tractors per unit area, in averages
at 1.18 kW / ha.
There’s a shortage of tractors with engine power over 50 kW with rear and
front wheel drive (double traction). Family farms are insufficiently equipped with
attached machines (1.28 machines / farm). Ratios per one two-axle tractor are
2.49 attachments and 10.27 ha of used land. There is a lack of machines for
vertical tillage and combined machines for pre-sowing soil preparation (chisel
plows, seed drills, rotary harrows), as well a seeder for small grains and corn. In
addition, there is a lack of machines for the preparation of silage and haylage in
silage facilities (self-loading trailers and combines), as well roll presses, wrappers
and catchers wrapped in foil.
Keywords: size, equipment, farms, tractors, attachments, energy
equipment.
1Ranko Koprivica, Biljana Veljković *(corresponding author: [email protected]), University of
Kragujevac, Faculty of Agronomy in Čačak, Cara Dušan 34, 32000 Čačak, SERBIA. 2Dušan Radivojević, Zoran Mileusnić, University of Belgrade, Faculty of Agriculture, Nemanjina 6,
11080 Belgrade Zemun, SERBIA. 3Tatjana Dedić, FAO-Regional Office for Europe and Central Asia, Budapest, HUNGARY. 4Dragoslav Đokić, Institute for forage crops, Globoder 37251 Kruševac, SERBIA.
Notes: The authors declare that they have no conflicts of interest. Authorship Form signed online.
Recieved:17/06/2020 Accepted:24/09/2020
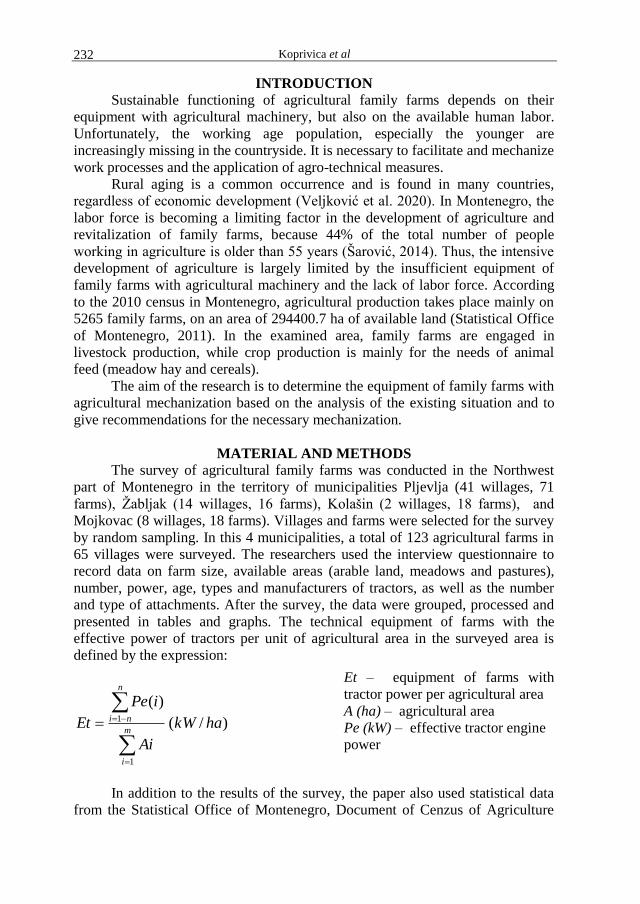
Koprivica et al 232
INTRODUCTION
Sustainable functioning of agricultural family farms depends on their
equipment with agricultural machinery, but also on the available human labor.
Unfortunately, the working age population, especially the younger are
increasingly missing in the countryside. It is necessary to facilitate and mechanize
work processes and the application of agro-technical measures.
Rural aging is a common occurrence and is found in many countries,
regardless of economic development (Veljković et al. 2020). In Montenegro, the
labor force is becoming a limiting factor in the development of agriculture and
revitalization of family farms, because 44% of the total number of people
working in agriculture is older than 55 years (Šarović, 2014). Thus, the intensive
development of agriculture is largely limited by the insufficient equipment of
family farms with agricultural machinery and the lack of labor force. According
to the 2010 census in Montenegro, agricultural production takes place mainly on
5265 family farms, on an area of 294400.7 ha of available land (Statistical Office
of Montenegro, 2011). In the examined area, family farms are engaged in
livestock production, while crop production is mainly for the needs of animal
feed (meadow hay and cereals).
The aim of the research is to determine the equipment of family farms with
agricultural mechanization based on the analysis of the existing situation and to
give recommendations for the necessary mechanization.
MATERIAL AND METHODS The survey of agricultural family farms was conducted in the Northwest
part of Montenegro in the territory of municipalities Pljevlja (41 willages, 71
farms), Ţabljak (14 willages, 16 farms), Kolašin (2 willages, 18 farms), and
Mojkovac (8 willages, 18 farms). Villages and farms were selected for the survey
by random sampling. In this 4 municipalities, a total of 123 agricultural farms in
65 villages were surveyed. The researchers used the interview questionnaire to
record data on farm size, available areas (arable land, meadows and pastures),
number, power, age, types and manufacturers of tractors, as well as the number
and type of attachments. After the survey, the data were grouped, processed and
presented in tables and graphs. The technical equipment of farms with the
effective power of tractors per unit of agricultural area in the surveyed area is
defined by the expression:
)/(
)(
1
1 hakW
Ai
iPe
Etm
i
n
ni
In addition to the results of the survey, the paper also used statistical data
from the Statistical Office of Montenegro, Document of Cenzus of Agriculture
Et – equipment of farms with
tractor power per agricultural area
A (ha) – agricultural area
Pe (kW) – effective tractor engine
power
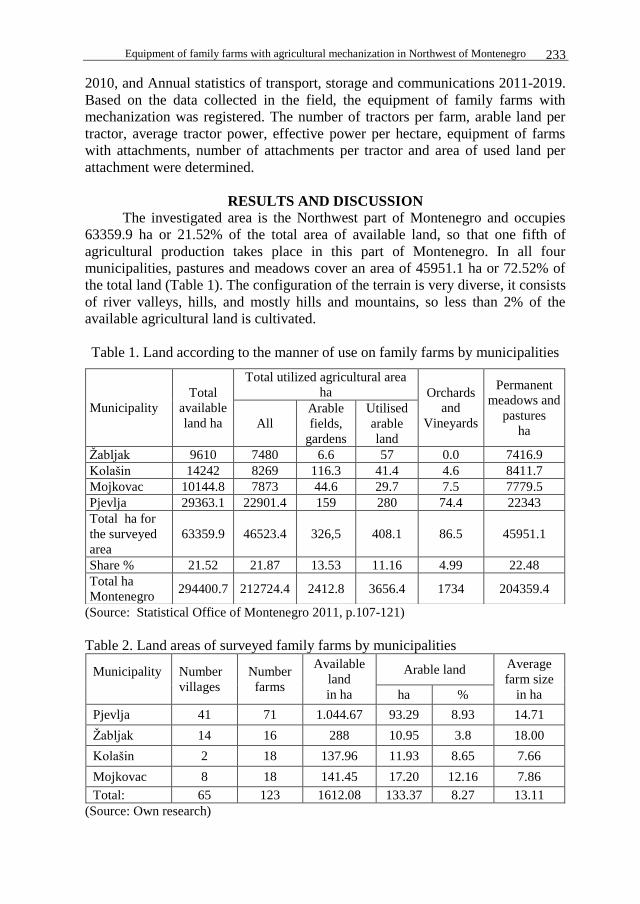
Equipment of family farms with agricultural mechanization in Northwest of Montenegro 233
2010, and Annual statistics of transport, storage and communications 2011-2019.
Based on the data collected in the field, the equipment of family farms with
mechanization was registered. The number of tractors per farm, arable land per
tractor, average tractor power, effective power per hectare, equipment of farms
with attachments, number of attachments per tractor and area of used land per
attachment were determined.
RESULTS AND DISCUSSION
The investigated area is the Northwest part of Montenegro and occupies
63359.9 ha or 21.52% of the total area of available land, so that one fifth of
agricultural production takes place in this part of Montenegro. In all four
municipalities, pastures and meadows cover an area of 45951.1 ha or 72.52% of
the total land (Table 1). The configuration of the terrain is very diverse, it consists
of river valleys, hills, and mostly hills and mountains, so less than 2% of the
available agricultural land is cultivated.
Table 1. Land according to the manner of use on family farms by municipalities
(Source: Statistical Office of Montenegro 2011, p.107-121)
Table 2. Land areas of surveyed family farms by municipalities
Municipality
Number
villages
Number
farms
Available
land
in ha
Arable land Average
farm size
in ha ha %
Pjevlja 41 71 1.044.67 93.29 8.93 14.71
Ţabljak 14 16 288 10.95 3.8 18.00
Kolašin 2 18 137.96 11.93 8.65 7.66
Mojkovac 8 18 141.45 17.20 12.16 7.86
Total: 65 123 1612.08 133.37 8.27 13.11
(Source: Own research)
Municipality
Total
available
land ha
Total utilized agricultural area
ha Orchards
and
Vineyards
Permanent
meadows and
pastures
ha All
Arable
fields,
gardens
Utilised
arable
land
Ţabljak 9610 7480 6.6 57 0.0 7416.9
Kolašin 14242 8269 116.3 41.4 4.6 8411.7
Mojkovac 10144.8 7873 44.6 29.7 7.5 7779.5
Pjevlja 29363.1 22901.4 159 280 74.4 22343
Total ha for
the surveyed
area
63359.9 46523.4 326,5 408.1 86.5 45951.1
Share % 21.52 21.87 13.53 11.16 4.99 22.48
Total ha
Montenegro 294400.7 212724.4 2412.8 3656.4 1734 204359.4
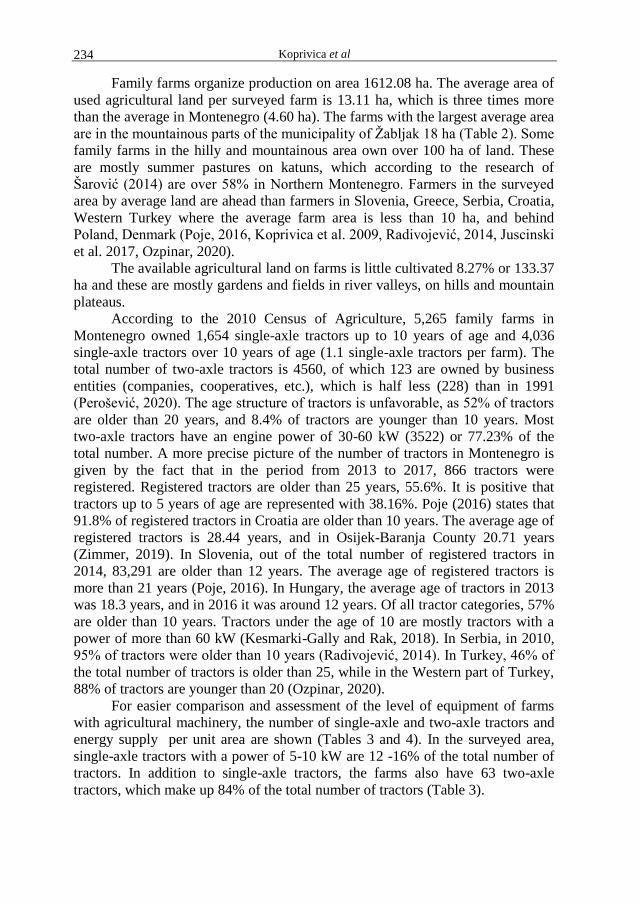
Koprivica et al 234
Family farms organize production on area 1612.08 ha. The average area of
used agricultural land per surveyed farm is 13.11 ha, which is three times more
than the average in Montenegro (4.60 ha). The farms with the largest average area
are in the mountainous parts of the municipality of Ţabljak 18 ha (Table 2). Some
family farms in the hilly and mountainous area own over 100 ha of land. These
are mostly summer pastures on katuns, which according to the research of
Šarović (2014) are over 58% in Northern Montenegro. Farmers in the surveyed
area by average land are ahead than farmers in Slovenia, Greece, Serbia, Croatia,
Western Turkey where the average farm area is less than 10 ha, and behind
Poland, Denmark (Poje, 2016, Koprivica et al. 2009, Radivojević, 2014, Juscinski
et al. 2017, Ozpinar, 2020).
The available agricultural land on farms is little cultivated 8.27% or 133.37
ha and these are mostly gardens and fields in river valleys, on hills and mountain
plateaus.
According to the 2010 Census of Agriculture, 5,265 family farms in
Montenegro owned 1,654 single-axle tractors up to 10 years of age and 4,036
single-axle tractors over 10 years of age (1.1 single-axle tractors per farm). The
total number of two-axle tractors is 4560, of which 123 are owned by business
entities (companies, cooperatives, etc.), which is half less (228) than in 1991
(Perošević, 2020). The age structure of tractors is unfavorable, as 52% of tractors
are older than 20 years, and 8.4% of tractors are younger than 10 years. Most
two-axle tractors have an engine power of 30-60 kW (3522) or 77.23% of the
total number. A more precise picture of the number of tractors in Montenegro is
given by the fact that in the period from 2013 to 2017, 866 tractors were
registered. Registered tractors are older than 25 years, 55.6%. It is positive that
tractors up to 5 years of age are represented with 38.16%. Poje (2016) states that
91.8% of registered tractors in Croatia are older than 10 years. The average age of
registered tractors is 28.44 years, and in Osijek-Baranja County 20.71 years
(Zimmer, 2019). In Slovenia, out of the total number of registered tractors in
2014, 83,291 are older than 12 years. The average age of registered tractors is
more than 21 years (Poje, 2016). In Hungary, the average age of tractors in 2013
was 18.3 years, and in 2016 it was around 12 years. Of all tractor categories, 57%
are older than 10 years. Tractors under the age of 10 are mostly tractors with a
power of more than 60 kW (Kesmarki-Gally and Rak, 2018). In Serbia, in 2010,
95% of tractors were older than 10 years (Radivojević, 2014). In Turkey, 46% of
the total number of tractors is older than 25, while in the Western part of Turkey,
88% of tractors are younger than 20 (Ozpinar, 2020).
For easier comparison and assessment of the level of equipment of farms
with agricultural machinery, the number of single-axle and two-axle tractors and
energy supply per unit area are shown (Tables 3 and 4). In the surveyed area,
single-axle tractors with a power of 5-10 kW are 12 -16% of the total number of
tractors. In addition to single-axle tractors, the farms also have 63 two-axle
tractors, which make up 84% of the total number of tractors (Table 3).
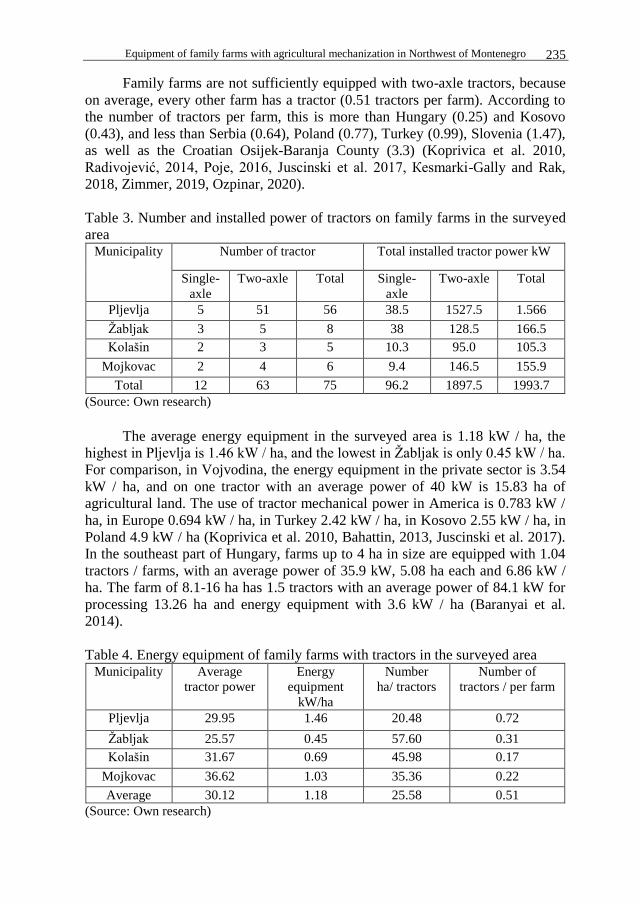
Equipment of family farms with agricultural mechanization in Northwest of Montenegro 235
Family farms are not sufficiently equipped with two-axle tractors, because
on average, every other farm has a tractor (0.51 tractors per farm). According to
the number of tractors per farm, this is more than Hungary (0.25) and Kosovo
(0.43), and less than Serbia (0.64), Poland (0.77), Turkey (0.99), Slovenia (1.47),
as well as the Croatian Osijek-Baranja County (3.3) (Koprivica et al. 2010,
Radivojević, 2014, Poje, 2016, Juscinski et al. 2017, Кesmarki-Gally and Rak,
2018, Zimmer, 2019, Ozpinar, 2020).
Table 3. Number and installed power of tractors on family farms in the surveyed
area Municipality Number of tractor Total installed tractor power kW
Single-
axle
Two-axle Total Single-
axle
Two-axle Total
Pljevlja 5 51 56 38.5 1527.5 1.566
Ţabljak 3 5 8 38 128.5 166.5
Kolašin 2 3 5 10.3 95.0 105.3
Mojkovac 2 4 6 9.4 146.5 155.9
Total 12 63 75 96.2 1897.5 1993.7
(Source: Own research)
The average energy equipment in the surveyed area is 1.18 kW / ha, the
highest in Pljevlja is 1.46 kW / ha, and the lowest in Ţabljak is only 0.45 kW / ha.
For comparison, in Vojvodina, the energy equipment in the private sector is 3.54
kW / ha, and on one tractor with an average power of 40 kW is 15.83 ha of
agricultural land. The use of tractor mechanical power in America is 0.783 kW /
ha, in Europe 0.694 kW / ha, in Turkey 2.42 kW / ha, in Kosovo 2.55 kW / ha, in
Poland 4.9 kW / ha (Koprivica et al. 2010, Bahattin, 2013, Juscinski et al. 2017).
In the southeast part of Hungary, farms up to 4 ha in size are equipped with 1.04
tractors / farms, with an average power of 35.9 kW, 5.08 ha each and 6.86 kW /
ha. The farm of 8.1-16 ha has 1.5 tractors with an average power of 84.1 kW for
processing 13.26 ha and energy equipment with 3.6 kW / ha (Baranyai et al.
2014).
Table 4. Energy equipment of family farms with tractors in the surveyed area Municipality Average
tractor power
Energy
equipment
kW/ha
Number
ha/ tractors
Number of
tractors / per farm
Pljevlja 29.95 1.46 20.48 0.72
Ţabljak 25.57 0.45 57.60 0.31
Kolašin 31.67 0.69 45.98 0.17
Mojkovac 36.62 1.03 35.36 0.22
Average 30.12 1.18 25.58 0.51
(Source: Own research)
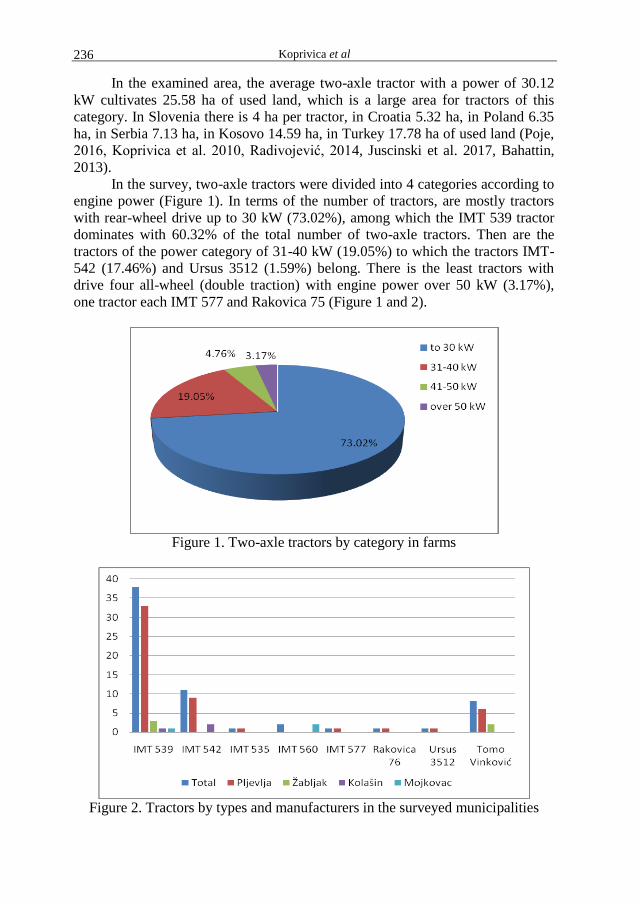
Koprivica et al 236
In the examined area, the average two-axle tractor with a power of 30.12
kW cultivates 25.58 ha of used land, which is a large area for tractors of this
category. In Slovenia there is 4 ha per tractor, in Croatia 5.32 ha, in Poland 6.35
ha, in Serbia 7.13 ha, in Kosovo 14.59 ha, in Turkey 17.78 ha of used land (Poje,
2016, Koprivica et al. 2010, Radivojević, 2014, Juscinski et al. 2017, Bahattin,
2013).
In the survey, two-axle tractors were divided into 4 categories according to
engine power (Figure 1). In terms of the number of tractors, are mostly tractors
with rear-wheel drive up to 30 kW (73.02%), among which the IMT 539 tractor
dominates with 60.32% of the total number of two-axle tractors. Then are the
tractors of the power category of 31-40 kW (19.05%) to which the tractors IMT-
542 (17.46%) and Ursus 3512 (1.59%) belong. There is the least tractors with
drive four all-wheel (double traction) with engine power over 50 kW (3.17%),
one tractor each IMT 577 and Rakovica 75 (Figure 1 and 2).
Figure 1. Two-axle tractors by category in farms
Figure 2. Tractors by types and manufacturers in the surveyed municipalities
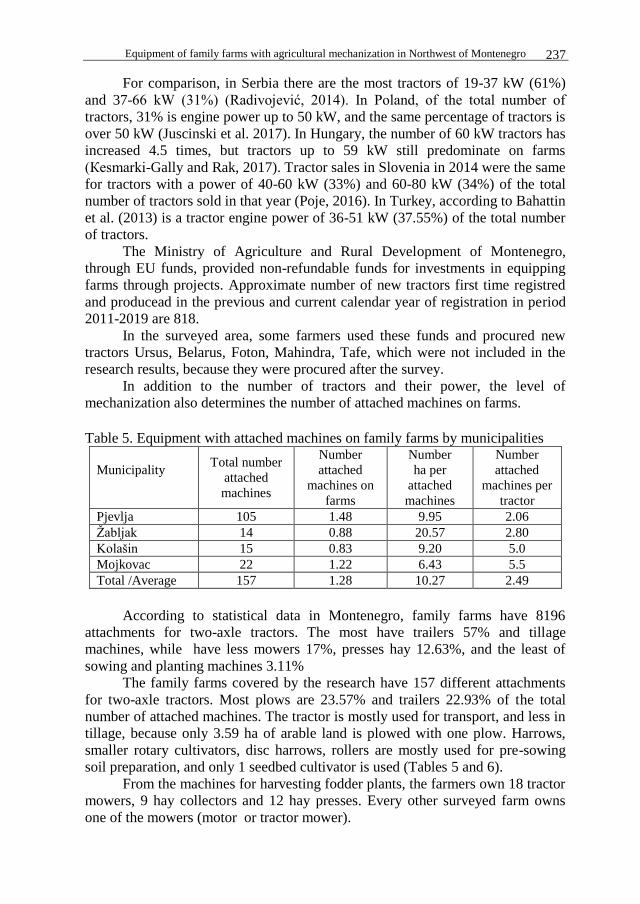
Equipment of family farms with agricultural mechanization in Northwest of Montenegro 237
For comparison, in Serbia there are the most tractors of 19-37 kW (61%)
and 37-66 kW (31%) (Radivojević, 2014). In Poland, of the total number of
tractors, 31% is engine power up to 50 kW, and the same percentage of tractors is
over 50 kW (Juscinski et al. 2017). In Hungary, the number of 60 kW tractors has
increased 4.5 times, but tractors up to 59 kW still predominate on farms
(Кesmarki-Gally and Rak, 2017). Tractor sales in Slovenia in 2014 were the same
for tractors with a power of 40-60 kW (33%) and 60-80 kW (34%) of the total
number of tractors sold in that year (Poje, 2016). In Turkey, according to Bahattin
et al. (2013) is a tractor engine power of 36-51 kW (37.55%) of the total number
of tractors.
The Ministry of Agriculture and Rural Development of Montenegro,
through EU funds, provided non-refundable funds for investments in equipping
farms through projects. Approximate number of new tractors first time registred
and producead in the previous and current calendar year of registration in period
2011-2019 are 818.
In the surveyed area, some farmers used these funds and procured new
tractors Ursus, Belarus, Foton, Mahindra, Tafe, which were not included in the
research results, because they were procured after the survey.
In addition to the number of tractors and their power, the level of
mechanization also determines the number of attached machines on farms. Table 5. Equipment with attached machines on family farms by municipalities
Municipality
Total number
attached
machines
Number
attached
machines on
farms
Number
ha per
attached
machines
Number
attached
machines per
tractor
Pjevlja 105 1.48 9.95 2.06
Ţabljak 14 0.88 20.57 2.80
Kolašin 15 0.83 9.20 5.0
Mojkovac 22 1.22 6.43 5.5
Total /Average 157 1.28 10.27 2.49
According to statistical data in Montenegro, family farms have 8196
attachments for two-axle tractors. The most have trailers 57% and tillage
machines, while have less mowers 17%, presses hay 12.63%, and the least of
sowing and planting machines 3.11%
The family farms covered by the research have 157 different attachments
for two-axle tractors. Most plows are 23.57% and trailers 22.93% of the total
number of attached machines. The tractor is mostly used for transport, and less in
tillage, because only 3.59 ha of arable land is plowed with one plow. Harrows,
smaller rotary cultivators, disc harrows, rollers are mostly used for pre-sowing
soil preparation, and only 1 seedbed cultivator is used (Tables 5 and 6).
From the machines for harvesting fodder plants, the farmers own 18 tractor
mowers, 9 hay collectors and 12 hay presses. Every other surveyed farm owns
one of the mowers (motor or tractor mower).
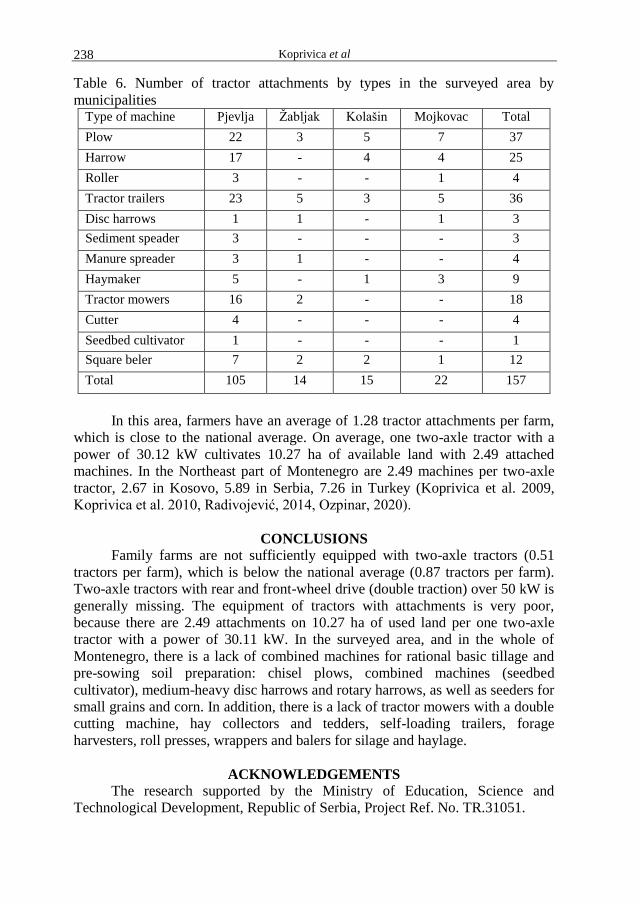
Koprivica et al 238
Table 6. Number of tractor attachments by types in the surveyed area by
municipalities Type of machine Pjevlja Ţabljak Kolašin Mojkovac Total
Plow 22 3 5 7 37
Harrow 17 - 4 4 25
Roller 3 - - 1 4
Tractor trailers 23 5 3 5 36
Disc harrows 1 1 - 1 3
Sediment speader 3 - - - 3
Manure spreader 3 1 - - 4
Haymaker 5 - 1 3 9
Tractor mowers 16 2 - - 18
Cutter 4 - - - 4
Seedbed cultivator 1 - - - 1
Square beler 7 2 2 1 12
Total 105 14 15 22 157
In this area, farmers have an average of 1.28 tractor attachments per farm,
which is close to the national average. On average, one two-axle tractor with a
power of 30.12 kW cultivates 10.27 ha of available land with 2.49 attached
machines. In the Northeast part of Montenegro are 2.49 machines per two-axle
tractor, 2.67 in Kosovo, 5.89 in Serbia, 7.26 in Turkey (Koprivica et al. 2009,
Koprivica et al. 2010, Radivojević, 2014, Ozpinar, 2020).
CONCLUSIONS
Family farms are not sufficiently equipped with two-axle tractors (0.51
tractors per farm), which is below the national average (0.87 tractors per farm).
Two-axle tractors with rear and front-wheel drive (double traction) over 50 kW is
generally missing. The equipment of tractors with attachments is very poor,
because there are 2.49 attachments on 10.27 ha of used land per one two-axle
tractor with a power of 30.11 kW. In the surveyed area, and in the whole of
Montenegro, there is a lack of combined machines for rational basic tillage and
pre-sowing soil preparation: chisel plows, combined machines (seedbed
cultivator), medium-heavy disc harrows and rotary harrows, as well as seeders for
small grains and corn. In addition, there is a lack of tractor mowers with a double
cutting machine, hay collectors and tedders, self-loading trailers, forage
harvesters, roll presses, wrappers and balers for silage and haylage.
ACKNOWLEDGEMENTS
The research supported by the Ministry of Education, Science and
Technological Development, Republic of Serbia, Project Ref. No. TR.31051.
Equipment of family farms with agricultural mechanization in Northwest of Montenegro 239
REFERENCES Bahattin A. (2013): Agricultural mechanization in Turkey. IERI Procedia 5 (1)41-44.
Baranyai Z., Szabo G., Vasary M. (2014): Analysis of machine use in Hungarian
agriculture - Is there any future for machinery sharing arrangements. Roczniki
(Annals), Polish Association of Agricultural Economists and Agribusiness.
Stowarzyszenie Ekonomistow Rolnictwa e Agrobiznesu (SERiA) vol. XVI (3) p.
24-29
Juscinski S., Piekarski W., Chomik Z. (2017): Analysis of Power Equipment Level on
the Example of Farm Tractors in Selected Farms of Przeworsk Province.
Agricultural engineering, Vol. 21, No.3, pp. 17-27.
Кesmarki-Gally S. E., Rak R. (2018): Challenges for the development of agricultural
power machines and their operating costs in Hungary. Roczniki Naukowe SERiA
XX (5) p. 81-86.
Koprivica R., Veljković B., Thaqi A., Sharku A. (2010): Opremljenost porodičnih farmi
poljoprivrednom mehanizacijom na području Šar Planine. Traktori i pogonske
mašine, Vol. 15 No 4, p. 51-58. Novi Sad.
Koprivica, R., Veljković B., Dedić T., Martinov, S. (2009.): Analiza obezbeĎenosti
traktorima na porodičnim gazdinstvima u području Severoistočne Crne Gore.
Traktori i pogonske mašine, Vol. 14, No 5, p. 23-28, Novi Sad.
Ozpınar, S. (2020): Mechanization and agricultural farm structure in the agricultural area
of the Dardanelles region. Int. J. Agric. Environ. Food Sci., 4(1), 39-56.
Perošević, N. (2020): Agriculture development in the Municipality of Nikšić (1945-
1991). Agriculture and Forestry, 66 (1): 83-94.
Poje T. (2016): Stanje traktorske tehnike na Slovenskim obiteljskim gospodarstvima.
51.Hrvatski i 11. meĎunarodni simpozij agronoma, 15.-18. veljače 2016. godine,
Opatija, Hrvatska, Zbornik radova 2016 pp.498-501.
Radivojević D. (2014). Poljoprivredna mehanizacija oprema i objekti, ISBN 978-86-
6161-111-7, COBISS.SR-ID 206984204 CIP 631.3 (497.11) “2012” (083.41),
Zavod za statistiku Republike Srbije, Posebna publikacija - Monografska studija
p.p. 1-154.
Statistical Office of Montenegro (2011): Structure of agricultural holdings Agricultural
census 2010. Podgorica
Statistical Office of Montenegro (2019): Annual statistics of transport, storage and
communications
https://www.monstat.org/userfiles/file/saobracaj/2019/PUBLIKACIJA-
%20GODISNJA%20STATISTIKA%20SAOBRACAJA%202019-cg(1).pdf
Šarović R. (2014): Agricultural family farm in Montenegro. Agriculture & Forestry, Vol.
60. Issue 1: 145-156.
Veljković B., Koprivica R., Milošević T., Radivojević D., Broćić Z. (2020): Udruţivanje
u funkciji odrţivog ruralnog razvoja. Agroekonomika godina 49 br. 86 p. 1-11.
Zimmer D. (2019): Optimalno opremanje poljoprivrednih gospodarstava sredstvima
poljoprivredne mehanizacije. Doktorska disertacija. Fakultet agrobiotehničkih
znanosti Osijek Sveučilište Josipa Jurja Strossmayera u Osijeku.


Agriculture & Forestry, Vol. 66 Issue 3: 241-250, 2020, Podgorica 241
Popović, T., Matijašević, S., Raičević, D., Mijović, S. (2020): Influence of vine loads with fertile buds on grape
yield and quality of variety Žižak in Podgorica vineyard area. Agriculture and Forestry, 66 (3): 241-250.
DOI: 10.17707/AgricultForest.66.3.20
Tatjana POPOVIĆ1, Saša MATIJAŠEVIĆ
2,
Danijela RAIČEVIĆ, Slavko MIJOVIĆ1
INFLUENCE OF VINE LOADS WITH FERTILE BUDS ON GRAPE
YIELD AND QUALITY OF VARIETY ŽIŽAK
IN PODGORICA VINEYARD AREA
SUMMARY
Results of a two - year study of the influence of different vine loads with
fertile buds on elements of grape yield and quality of Žižak grape variety are
presented in this paper. The research was conducted in the Podgorica sub region,
at the Lješkopolje site. Four different vine loads with fertile buds were applied:
14 buds, 18 buds, 20 and 24 buds per vine. The results of this research show that
the applied loads significantly influence the examined parameters of the
autochthonous variety Žižak. The highest percentage of developed and fertile
shoots, as well as the average number of flowers per bud, had a variant with load
of 14 buds. The relative coefficient of yielding in all examined load variants had
mean values. In terms of the number of flowers per fertile shoot in the two-year
average, variants with a load of 18 and 14 buds (1.44 and 1.39) stood out. The
highest yield of grapes in the two-year average had the variant with a load of 24
buds - 3.60 kg/vine, while the highest bunch weight had the variant V1-185 g.
The quality of grapes also varied significantly under the influence of the vine load
with fertile buds. The highest sugar content in must had variant with a load of 18
buds (22.32%), while the highest acid content (6.27g/l) was recorded in the
variant with 24 buds per vine.
Keywords: Žižak, load, fertility, yield, bunch weight, grape quality
INTRODUCTION
Pruning is an ampelotechnical measure that should enable the achievement
of maximum yields of grapes, without reflecting on the weakening of the
vegetative power of the vine and deterioration of quality of grapes (Cindrić et al.,
2000). This ampelotechnical measure seeks to ensure balance between vegetative
strength and condition of vine and the quality of grape yield, in a manner that
does not jeopardize productive capacity of the vine during decades of vineyard
exploitation (Mijatović et al., 2018). Pruning maintains the cultivation form of the
1Tatjana Popović (corresponding author: [email protected]), Danijela Raičević, Slavko
Mijović, Biotechnical faculty Podgorica, MONTENEGRO. 2Saša Matijašević, Faculty of Agriculture Belgrade, SERBIA .
Notes: The authors declare that they have no conflicts of interest. Authorship Form signed online.
Recieved:24/08/2020 Accepted:28/09/2020
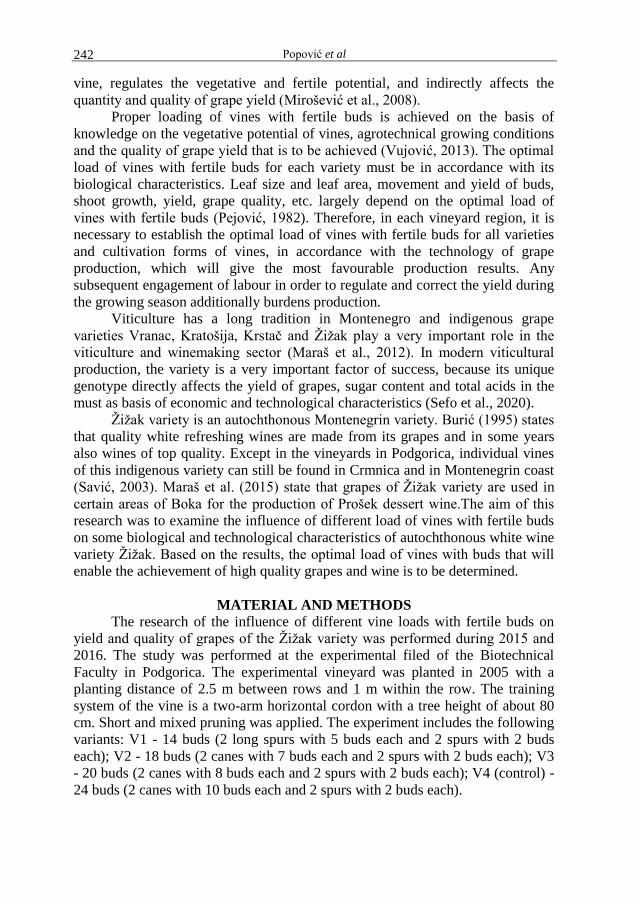
Popović et al 242
vine, regulates the vegetative and fertile potential, and indirectly affects the
quantity and quality of grape yield (Mirošević et al., 2008).
Proper loading of vines with fertile buds is achieved on the basis of
knowledge on the vegetative potential of vines, agrotechnical growing conditions
and the quality of grape yield that is to be achieved (Vujović, 2013). The optimal
load of vines with fertile buds for each variety must be in accordance with its
biological characteristics. Leaf size and leaf area, movement and yield of buds,
shoot growth, yield, grape quality, etc. largely depend on the optimal load of
vines with fertile buds (Pejović, 1982). Therefore, in each vineyard region, it is
necessary to establish the optimal load of vines with fertile buds for all varieties
and cultivation forms of vines, in accordance with the technology of grape
production, which will give the most favourable production results. Any
subsequent engagement of labour in order to regulate and correct the yield during
the growing season additionally burdens production.
Viticulture has a long tradition in Montenegro and indigenous grape
varieties Vranac, Kratošija, Krstač and Žižak play a very important role in the
viticulture and winemaking sector (Maraš et al., 2012). In modern viticultural
production, the variety is a very important factor of success, because its unique
genotype directly affects the yield of grapes, sugar content and total acids in the
must as basis of economic and technological characteristics (Sefo et al., 2020).
Žižak variety is an autochthonous Montenegrin variety. Burić (1995) states
that quality white refreshing wines are made from its grapes and in some years
also wines of top quality. Except in the vineyards in Podgorica, individual vines
of this indigenous variety can still be found in Crmnica and in Montenegrin coast
(Savić, 2003). Maraš et al. (2015) state that grapes of Žižak variety are used in
certain areas of Boka for the production of Prošek dessert wine.The aim of this
research was to examine the influence of different load of vines with fertile buds
on some biological and technological characteristics of autochthonous white wine
variety Žižak. Based on the results, the optimal load of vines with buds that will
enable the achievement of high quality grapes and wine is to be determined.
MATERIAL AND METHODS The research of the influence of different vine loads with fertile buds on
yield and quality of grapes of the Žižak variety was performed during 2015 and
2016. The study was performed at the experimental filed of the Biotechnical
Faculty in Podgorica. The experimental vineyard was planted in 2005 with a
planting distance of 2.5 m between rows and 1 m within the row. The training
system of the vine is a two-arm horizontal cordon with a tree height of about 80
cm. Short and mixed pruning was applied. The experiment includes the following
variants: V1 - 14 buds (2 long spurs with 5 buds each and 2 spurs with 2 buds
each); V2 - 18 buds (2 canes with 7 buds each and 2 spurs with 2 buds each); V3
- 20 buds (2 canes with 8 buds each and 2 spurs with 2 buds each); V4 (control) -
24 buds (2 canes with 10 buds each and 2 spurs with 2 buds each).
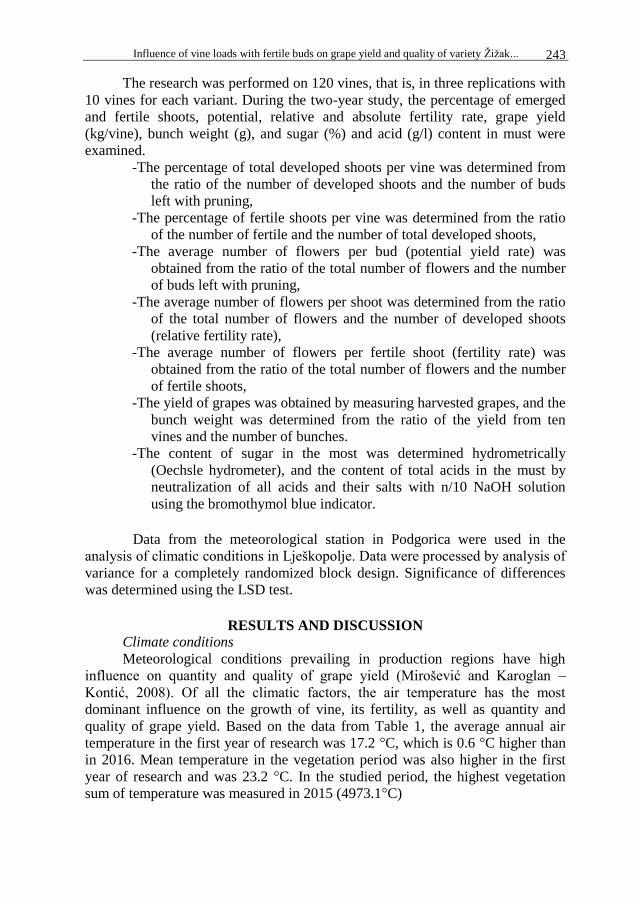
Influence of vine loads with fertile buds on grape yield and quality of variety Žižak... 243
The research was performed on 120 vines, that is, in three replications with
10 vines for each variant. During the two-year study, the percentage of emerged
and fertile shoots, potential, relative and absolute fertility rate, grape yield
(kg/vine), bunch weight (g), and sugar (%) and acid (g/l) content in must were
examined.
-The percentage of total developed shoots per vine was determined from
the ratio of the number of developed shoots and the number of buds
left with pruning,
-The percentage of fertile shoots per vine was determined from the ratio
of the number of fertile and the number of total developed shoots,
-The average number of flowers per bud (potential yield rate) was
obtained from the ratio of the total number of flowers and the number
of buds left with pruning,
-The average number of flowers per shoot was determined from the ratio
of the total number of flowers and the number of developed shoots
(relative fertility rate),
-The average number of flowers per fertile shoot (fertility rate) was
obtained from the ratio of the total number of flowers and the number
of fertile shoots,
-The yield of grapes was obtained by measuring harvested grapes, and the
bunch weight was determined from the ratio of the yield from ten
vines and the number of bunches.
-The content of sugar in the most was determined hydrometrically
(Oechsle hydrometer), and the content of total acids in the must by
neutralization of all acids and their salts with n/10 NaOH solution
using the bromothymol blue indicator.
Data from the meteorological station in Podgorica were used in the
analysis of climatic conditions in Lješkopolje. Data were processed by analysis of
variance for a completely randomized block design. Significance of differences
was determined using the LSD test.
RESULTS AND DISCUSSION
Climate conditions
Meteorological conditions prevailing in production regions have high
influence on quantity and quality of grape yield (Mirošević and Karoglan –
Kontić, 2008). Of all the climatic factors, the air temperature has the most
dominant influence on the growth of vine, its fertility, as well as quantity and
quality of grape yield. Based on the data from Table 1, the average annual air
temperature in the first year of research was 17.2 °C, which is 0.6 °C higher than
in 2016. Mean temperature in the vegetation period was also higher in the first
year of research and was 23.2 °C. In the studied period, the highest vegetation
sum of temperature was measured in 2015 (4973.1°C)
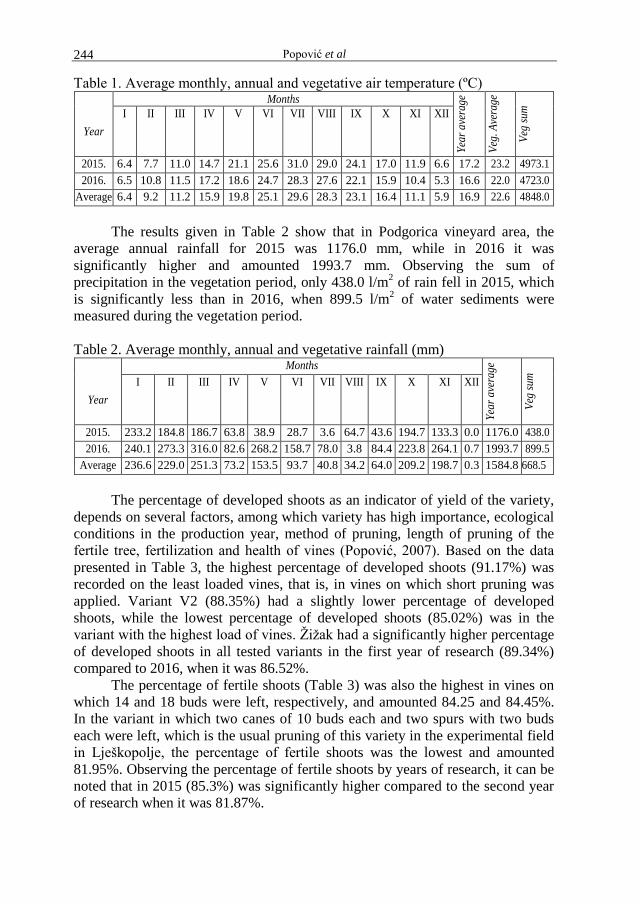
Popović et al 244
Table 1. Average monthly, annual and vegetative air temperature (ºC)
Year
Months
Yea
r av
erag
e
Veg
. Ave
rage
Veg
sum
I II III IV V VI VII VIII IX X XI XII
2015. 6.4 7.7 11.0 14.7 21.1 25.6 31.0 29.0 24.1 17.0 11.9 6.6 17.2 23.2 4973.1
2016. 6.5 10.8 11.5 17.2 18.6 24.7 28.3 27.6 22.1 15.9 10.4 5.3 16.6 22.0 4723.0
Average 6.4 9.2 11.2 15.9 19.8 25.1 29.6 28.3 23.1 16.4 11.1 5.9 16.9 22.6 4848.0
The results given in Table 2 show that in Podgorica vineyard area, the
average annual rainfall for 2015 was 1176.0 mm, while in 2016 it was
significantly higher and amounted 1993.7 mm. Observing the sum of
precipitation in the vegetation period, only 438.0 l/m2 of rain fell in 2015, which
is significantly less than in 2016, when 899.5 l/m2 of water sediments were
measured during the vegetation period.
Table 2. Average monthly, annual and vegetative rainfall (mm)
Year
Months
Yea
r av
erag
e
Veg
sum
I II III IV V VI VII VIII IX X XI XII
2015. 233.2 184.8 186.7 63.8 38.9 28.7 3.6 64.7 43.6 194.7 133.3 0.0 1176.0 438.0
2016. 240.1 273.3 316.0 82.6 268.2 158.7 78.0 3.8 84.4 223.8 264.1 0.7 1993.7 899.5
Average 236.6 229.0 251.3 73.2 153.5 93.7 40.8 34.2 64.0 209.2 198.7 0.3 1584.8 668.5
The percentage of developed shoots as an indicator of yield of the variety,
depends on several factors, among which variety has high importance, ecological
conditions in the production year, method of pruning, length of pruning of the
fertile tree, fertilization and health of vines (Popović, 2007). Based on the data
presented in Table 3, the highest percentage of developed shoots (91.17%) was
recorded on the least loaded vines, that is, in vines on which short pruning was
applied. Variant V2 (88.35%) had a slightly lower percentage of developed
shoots, while the lowest percentage of developed shoots (85.02%) was in the
variant with the highest load of vines. Žižak had a significantly higher percentage
of developed shoots in all tested variants in the first year of research (89.34%)
compared to 2016, when it was 86.52%.
The percentage of fertile shoots (Table 3) was also the highest in vines on
which 14 and 18 buds were left, respectively, and amounted 84.25 and 84.45%.
In the variant in which two canes of 10 buds each and two spurs with two buds
each were left, which is the usual pruning of this variety in the experimental field
in Lješkopolje, the percentage of fertile shoots was the lowest and amounted
81.95%. Observing the percentage of fertile shoots by years of research, it can be
noted that in 2015 (85.3%) was significantly higher compared to the second year
of research when it was 81.87%.
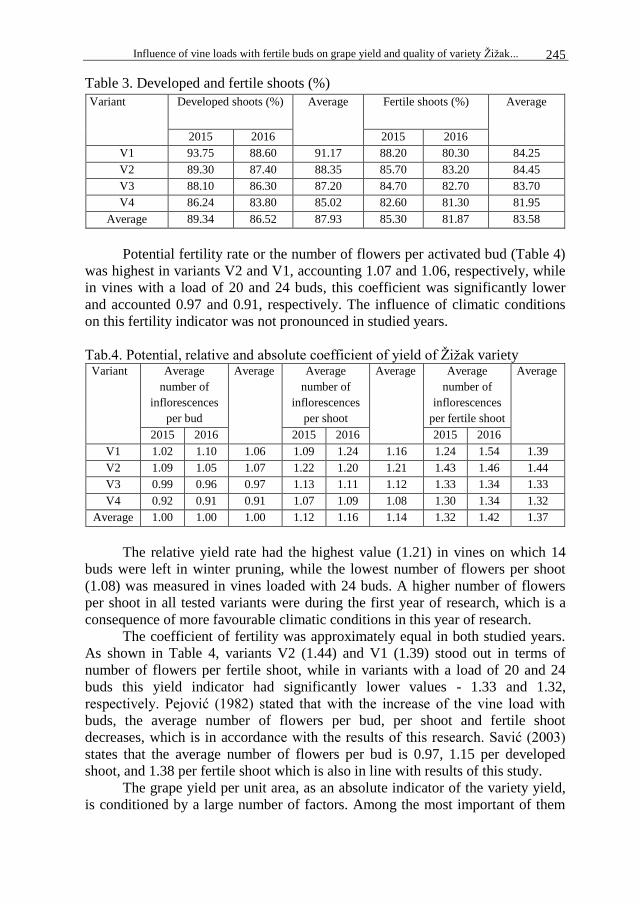
Influence of vine loads with fertile buds on grape yield and quality of variety Žižak... 245
Table 3. Developed and fertile shoots (%)
Variant Developed shoots (%) Average Fertile shoots (%) Average
2015 2016 2015 2016
V1 93.75 88.60 91.17 88.20 80.30 84.25
V2 89.30 87.40 88.35 85.70 83.20 84.45
V3 88.10 86.30 87.20 84.70 82.70 83.70
V4 86.24 83.80 85.02 82.60 81.30 81.95
Average 89.34 86.52 87.93 85.30 81.87 83.58
Potential fertility rate or the number of flowers per activated bud (Table 4)
was highest in variants V2 and V1, accounting 1.07 and 1.06, respectively, while
in vines with a load of 20 and 24 buds, this coefficient was significantly lower
and accounted 0.97 and 0.91, respectively. The influence of climatic conditions
on this fertility indicator was not pronounced in studied years.
Tab.4. Potential, relative and absolute coefficient of yield of Žižak variety Variant Average
number of
inflorescences
per bud
Average Average
number of
inflorescences
per shoot
Average Average
number of
inflorescences
per fertile shoot
Average
2015 2016 2015 2016 2015 2016
V1 1.02 1.10 1.06 1.09 1.24 1.16 1.24 1.54 1.39
V2 1.09 1.05 1.07 1.22 1.20 1.21 1.43 1.46 1.44
V3 0.99 0.96 0.97 1.13 1.11 1.12 1.33 1.34 1.33
V4 0.92 0.91 0.91 1.07 1.09 1.08 1.30 1.34 1.32
Average 1.00 1.00 1.00 1.12 1.16 1.14 1.32 1.42 1.37
The relative yield rate had the highest value (1.21) in vines on which 14
buds were left in winter pruning, while the lowest number of flowers per shoot
(1.08) was measured in vines loaded with 24 buds. A higher number of flowers
per shoot in all tested variants were during the first year of research, which is a
consequence of more favourable climatic conditions in this year of research.
The coefficient of fertility was approximately equal in both studied years.
As shown in Table 4, variants V2 (1.44) and V1 (1.39) stood out in terms of
number of flowers per fertile shoot, while in variants with a load of 20 and 24
buds this yield indicator had significantly lower values - 1.33 and 1.32,
respectively. Pejović (1982) stated that with the increase of the vine load with
buds, the average number of flowers per bud, per shoot and fertile shoot
decreases, which is in accordance with the results of this research. Savić (2003)
states that the average number of flowers per bud is 0.97, 1.15 per developed
shoot, and 1.38 per fertile shoot which is also in line with results of this study.
The grape yield per unit area, as an absolute indicator of the variety yield,
is conditioned by a large number of factors. Among the most important of them
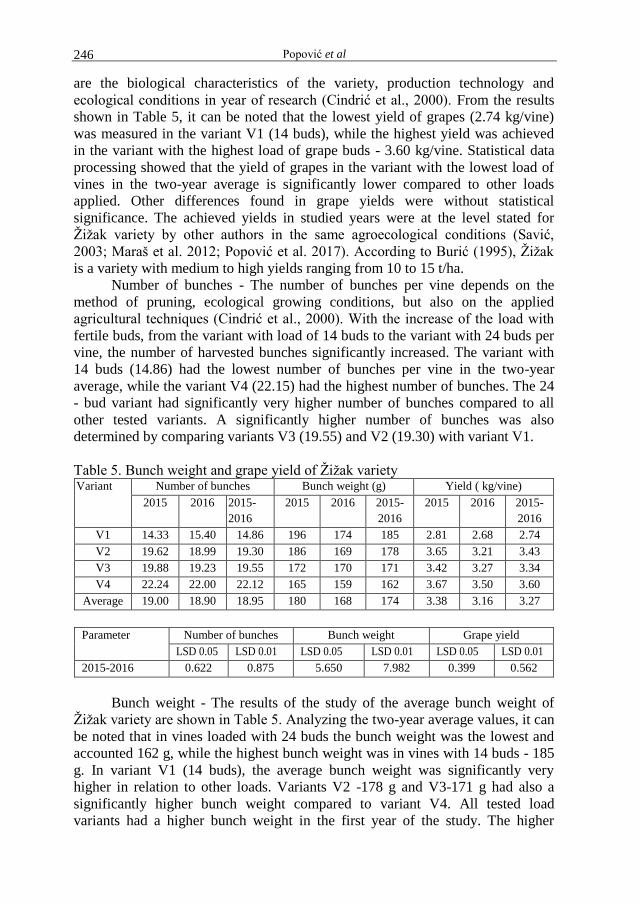
Popović et al 246
are the biological characteristics of the variety, production technology and
ecological conditions in year of research (Cindrić et al., 2000). From the results
shown in Table 5, it can be noted that the lowest yield of grapes (2.74 kg/vine)
was measured in the variant V1 (14 buds), while the highest yield was achieved
in the variant with the highest load of grape buds - 3.60 kg/vine. Statistical data
processing showed that the yield of grapes in the variant with the lowest load of
vines in the two-year average is significantly lower compared to other loads
applied. Other differences found in grape yields were without statistical
significance. The achieved yields in studied years were at the level stated for
Žižak variety by other authors in the same agroecological conditions (Savić,
2003; Maraš et al. 2012; Popović et al. 2017). According to Burić (1995), Žižak
is a variety with medium to high yields ranging from 10 to 15 t/ha.
Number of bunches - The number of bunches per vine depends on the
method of pruning, ecological growing conditions, but also on the applied
agricultural techniques (Cindrić et al., 2000). With the increase of the load with
fertile buds, from the variant with load of 14 buds to the variant with 24 buds per
vine, the number of harvested bunches significantly increased. The variant with
14 buds (14.86) had the lowest number of bunches per vine in the two-year
average, while the variant V4 (22.15) had the highest number of bunches. The 24
- bud variant had significantly very higher number of bunches compared to all
other tested variants. A significantly higher number of bunches was also
determined by comparing variants V3 (19.55) and V2 (19.30) with variant V1.
Table 5. Bunch weight and grape yield of Žižak variety Variant Number of bunches Bunch weight (g) Yield ( kg/vine)
2015 2016 2015-
2016
2015 2016 2015-
2016
2015 2016 2015-
2016
V1 14.33 15.40 14.86 196 174 185 2.81 2.68 2.74
V2 19.62 18.99 19.30 186 169 178 3.65 3.21 3.43
V3 19.88 19.23 19.55 172 170 171 3.42 3.27 3.34
V4 22.24 22.00 22.12 165 159 162 3.67 3.50 3.60
Average 19.00 18.90 18.95 180 168 174 3.38 3.16 3.27
Parameter Number of bunches Bunch weight Grape yield
LSD 0.05 LSD 0.01 LSD 0.05 LSD 0.01 LSD 0.05 LSD 0.01
2015-2016 0.622 0.875 5.650 7.982 0.399 0.562
Bunch weight - The results of the study of the average bunch weight of
Žižak variety are shown in Table 5. Analyzing the two-year average values, it can
be noted that in vines loaded with 24 buds the bunch weight was the lowest and
accounted 162 g, while the highest bunch weight was in vines with 14 buds - 185
g. In variant V1 (14 buds), the average bunch weight was significantly very
higher in relation to other loads. Variants V2 -178 g and V3-171 g had also a
significantly higher bunch weight compared to variant V4. All tested load
variants had a higher bunch weight in the first year of the study. The higher
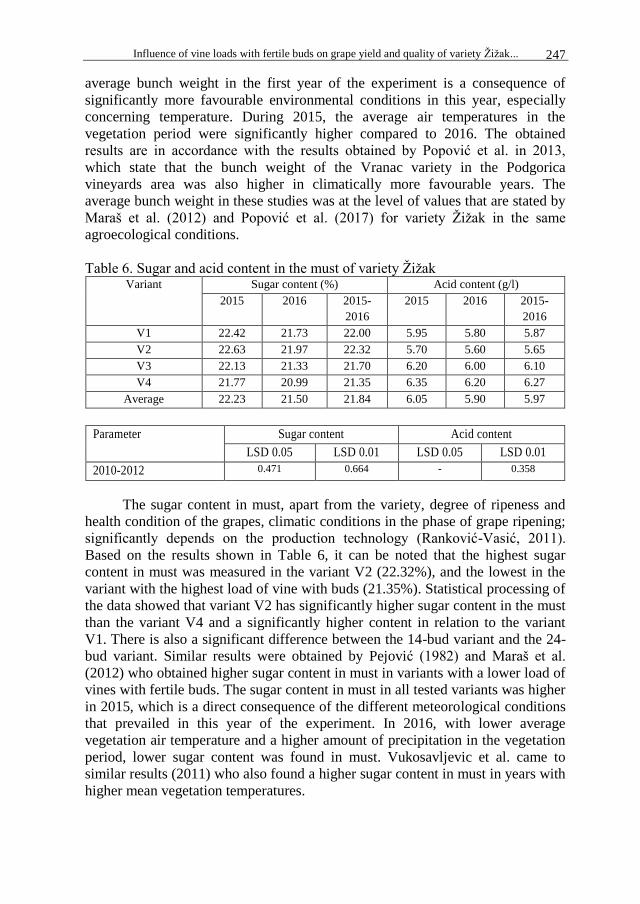
Influence of vine loads with fertile buds on grape yield and quality of variety Žižak... 247
average bunch weight in the first year of the experiment is a consequence of
significantly more favourable environmental conditions in this year, especially
concerning temperature. During 2015, the average air temperatures in the
vegetation period were significantly higher compared to 2016. The obtained
results are in accordance with the results obtained by Popović et al. in 2013,
which state that the bunch weight of the Vranac variety in the Podgorica
vineyards area was also higher in climatically more favourable years. The
average bunch weight in these studies was at the level of values that are stated by
Maraš et al. (2012) and Popović et al. (2017) for variety Žižak in the same
agroecological conditions.
Table 6. Sugar and acid content in the must of variety Žižak Variant Sugar content (%) Acid content (g/l)
2015 2016 2015-
2016
2015 2016 2015-
2016
V1 22.42 21.73 22.00 5.95 5.80 5.87
V2 22.63 21.97 22.32 5.70 5.60 5.65
V3 22.13 21.33 21.70 6.20 6.00 6.10
V4 21.77 20.99 21.35 6.35 6.20 6.27
Average 22.23 21.50 21.84 6.05 5.90 5.97
Parameter Sugar content Acid content
LSD 0.05 LSD 0.01 LSD 0.05 LSD 0.01
2010-2012 0.471 0.664 - 0.358
The sugar content in must, apart from the variety, degree of ripeness and
health condition of the grapes, climatic conditions in the phase of grape ripening;
significantly depends on the production technology (Ranković-Vasić, 2011).
Based on the results shown in Table 6, it can be noted that the highest sugar
content in must was measured in the variant V2 (22.32%), and the lowest in the
variant with the highest load of vine with buds (21.35%). Statistical processing of
the data showed that variant V2 has significantly higher sugar content in the must
than the variant V4 and a significantly higher content in relation to the variant
V1. There is also a significant difference between the 14-bud variant and the 24-
bud variant. Similar results were obtained by Pejović (1982) and Maraš et al.
(2012) who obtained higher sugar content in must in variants with a lower load of
vines with fertile buds. The sugar content in must in all tested variants was higher
in 2015, which is a direct consequence of the different meteorological conditions
that prevailed in this year of the experiment. In 2016, with lower average
vegetation air temperature and a higher amount of precipitation in the vegetation
period, lower sugar content was found in must. Vukosavljevic et al. came to
similar results (2011) who also found a higher sugar content in must in years with
higher mean vegetation temperatures.
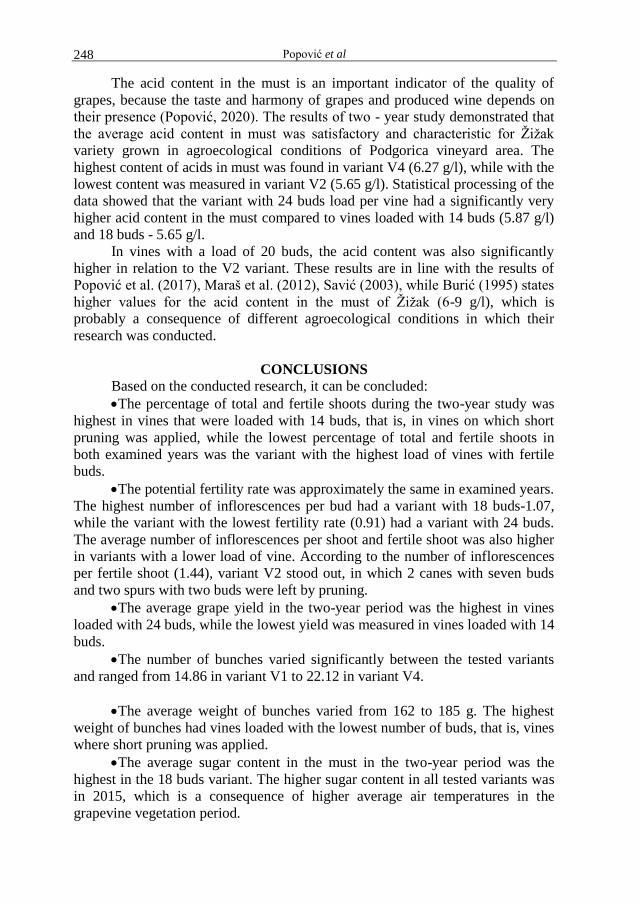
Popović et al 248
The acid content in the must is an important indicator of the quality of
grapes, because the taste and harmony of grapes and produced wine depends on
their presence (Popović, 2020). The results of two - year study demonstrated that
the average acid content in must was satisfactory and characteristic for Žižak
variety grown in agroecological conditions of Podgorica vineyard area. The
highest content of acids in must was found in variant V4 (6.27 g/l), while with the
lowest content was measured in variant V2 (5.65 g/l). Statistical processing of the
data showed that the variant with 24 buds load per vine had a significantly very
higher acid content in the must compared to vines loaded with 14 buds (5.87 g/l)
and 18 buds - 5.65 g/l.
In vines with a load of 20 buds, the acid content was also significantly
higher in relation to the V2 variant. These results are in line with the results of
Popović et al. (2017), Maraš et al. (2012), Savić (2003), while Burić (1995) states
higher values for the acid content in the must of Žižak (6-9 g/l), which is
probably a consequence of different agroecological conditions in which their
research was conducted.
CONCLUSIONS
Based on the conducted research, it can be concluded:
The percentage of total and fertile shoots during the two-year study was
highest in vines that were loaded with 14 buds, that is, in vines on which short
pruning was applied, while the lowest percentage of total and fertile shoots in
both examined years was the variant with the highest load of vines with fertile
buds.
The potential fertility rate was approximately the same in examined years.
The highest number of inflorescences per bud had a variant with 18 buds-1.07,
while the variant with the lowest fertility rate (0.91) had a variant with 24 buds.
The average number of inflorescences per shoot and fertile shoot was also higher
in variants with a lower load of vine. According to the number of inflorescences
per fertile shoot (1.44), variant V2 stood out, in which 2 canes with seven buds
and two spurs with two buds were left by pruning.
The average grape yield in the two-year period was the highest in vines
loaded with 24 buds, while the lowest yield was measured in vines loaded with 14
buds.
The number of bunches varied significantly between the tested variants
and ranged from 14.86 in variant V1 to 22.12 in variant V4.
The average weight of bunches varied from 162 to 185 g. The highest
weight of bunches had vines loaded with the lowest number of buds, that is, vines
where short pruning was applied.
The average sugar content in the must in the two-year period was the
highest in the 18 buds variant. The higher sugar content in all tested variants was
in 2015, which is a consequence of higher average air temperatures in the
grapevine vegetation period.
Influence of vine loads with fertile buds on grape yield and quality of variety Žižak... 249
The acid content in must was characteristic of tested variety in Podgorica
vineyard area. The highest acid content (6.27 g/l) was found in the variant with
the highest load of vines.
REFERENCES
Burić, D. (1995): Savremeno vinogradarstvo, Nolit, Beograd.
Cindrić, P., Korać, N., Kovač, V. (2000): Sorte vinove loze, Poljoprivredni
fakultet Novi Sad.
Mijatović, D., Jovanović-Cvetković, T. (2018): Zimska rezidba vinove loze,
Banja Luka
Maraš, V, Košmerl, T.,Kodžulović, V., Šućur, S., Savović, A., Perišić, M. (2012):
Yield and oenological potential of Montenegrin autochthonous grape
varieties ‘Kratošija’ and ‘Žižak’, Journal of Hygienic Engineering and
Design, 158-162
Maraš, V, Popović, T., Gazivoda, A., Raičević, J., Kodžulović, V., Mugoša, M.,
Šućur, S. (2015): Origin and characterization of Montenegrin grapevine
varieties, Vitis 54, 135-137
Miroševic, N, Karoglan-Kontić, J. (2008): Vinogradarstvo, Agronomski fakultet,
Zagreb.
Pejović Lj. (1982): Uticaj opterećenosti čokota rodnim okcima i načina
održavanja zemljišta u vinogradu na neke biološke i tehnološke
karakteristike sorte vranac u uslovima navodnjavanja, Doktorska
disertacija, Novi Sad.
Pejović, Lj., Ulićević, M. (1992): Rezultati proučavanja nekih bijelih vinskih
sorata vinove loze u okolini Titograda, Poljoprivreda i šumarstvo, Titograd.
Popović, T. (2007): Uticaj đubrenja i navodnjavanja na biološke i tehnološke
osobine vinove loze sorte vranac. Doktorska disertacija. Univerzitet u
Novom Sadu. Poljoprivredni fakultet.
Popović, T., Mijović, S., Pajović, R. (2013): The influence of climatic factors on
the level and quality of yield of Vranac variety in Podgorica vineyards.
Agriculture and forestry, Vol. 59. Issue 2: 137-145, 2013, Podgorica.
Popović, T., Kalač, A., Raičević, D., Pajović, R. (2017): Rodnost i kvalitet grožđa
sorte Žižak u podgoričkom vinogorju. XXII Savetovanje o biotehnologiji,
Zbornik radova 1: 231-237, Čačak, Srbija.
Popović, T., Mijović, S., Pajović-Šćepanović, R., Raičević, D. (2020): Analysis
of possibilities of reducing the quantity of mineral fertilizer application
using different types of organic fertilizers in Cardinal grape variety,
Agriculture and forestry, Vol. 66 Issue 1: 261-268, Podgorica
Ranković–Vasić, Z., Atanacković, Z., Vujadinović, M., Vuković, A., Sivčev, B.
(2011): Uticaj klimatskih faktora na kvalitet grožđa sorte Burgundac crni u
vršačkom vinogorju, International Scientific Symposium of Agriculture
"Agrosym Jahorina 2011", Zbornik radova, str. 177-183, Jahorina.
Vujović, D. (2013): Vinogradarstvo, Poljoprivredni fakultet Univerziteta u
Beogradu, Beograd - Zemun

Popović et al 250
Vukosavljević, V., Boškov, K., Pajović, R., Stojanov, M., Đurić, M., Murtić, S.,
Kojović, R. (2011): Rodni potencijal i kvalitet sorte Merlo u trsteničkom
vinogorju. XVI Savetovanje o Biotehnologiji sa međunarodnim učešćem,
Zbornik radova, Vol. 16 (18): 385-390. Mart 2011, Čačak, Srbija.
Savić, S. (2003): Ekološki uslovi i autohtone sorte vinove loze u Crnoj Gori,
Podgorica
Sefo, S., Hadžić, S., Kraljević, M., Delić, M. (2020): Uticaj različitog opterećenja
čokota rodnim pupoljcima na rodnost sorte Trnjak. XXV savetovanje o
biotehnologiji, Zbornik radova 1: 179-184, Čačak, Srbija.

Agriculture and Forestry, Vol 66, Issue 3: 251-252, Podgorica, 2020 251
INSTRUCTIONS TO AUTHORS The "Agriculture and Forestry" journal publishes original scientific papers, review
papers, short communications on agriculture, veterinary medicine, forestry, biology and
other natural sciences. It is the endeavour of the journal to give place to papers of high
scientific quality and international interest, authored by all the scientists from the South
Eastern European Region, as well as other international scientist in order to stimulate
contacts and exchange of knowledge fostering scientific productivity.
Manuscripts, submitted via electronic journal web system should be prepared in
Microsoft Word (Times New Roman font, 11 pt) and submitted in format 17 x 24
cm (File / Page setup / Paper / Width = 17 cm; Height = 24 cm), with single line
spacing (Format / Paragraph / Line spacing = Single), 2 cm margins all around (File /
Page setup / Margins / Top = 2 cm; Bottom = 2 cm; Left = 2 cm; Right = 2 cm), that is
approximately 44 lines per page in this format. All technical details are available in
section AUTHORS / Check-list for Authors.
Manuscripts are published in English. Papers that have been published elsewhere,
in whole or extracts (excerpts) of their important findings, will not be accepted. A
manuscript should not exceed 10 pages. Exceptions can be made if content and quality of
the paper justify it (at the discretion of the Editor).
Full research papers should include the following sections: - Author/s name/s, Title with DOI number
The author's name should be placed above the title and with the author's appellation and
affiliation in a footnote at the bottom of the front page. Author(s) affiliation should
indicate name and address of institution, including the e-mail address of the
corresponding author. Title should provide a concise but also an informative synthesis of
the study (recommended not more than 100 characters including spaces). Short title (not
more than 70 characters) should also be provided in order to be included in the header of
the Manuscript. Ensure that the title contains the most important words that relate to the
topic.
- Abstract The summary, in English language, should provide basic data on the problem that was
treated and the results obtained. It should be brief, preferably one paragraph only, up to
250 words, but sufficient to inform the reader of the character of the work, its results and
its conclusions. Include the keywords and phrases you repeated in your abstract.
- Key words
Keywords should provide 4-6 words or compound words, suitable for an information
retrieval system. Choose the appropriate keywords and phrases for your article. Think of
a phrase of 2-4 words that a researcher might search on to find your article. Repeat your
keywords and phrases 3-4 times throughout the abstract in a natural, contextual way.
Main text of the manuscript includes the following sections:
- INTRODUCTION
The introduction should answer the questions what was studied, why was it an
important question, what was known about it before and how the study will
advance our knowledge.
- MATERIAL AND METHODS
Material and methods explain how the study was carried: the organism(s) studied;
description of the study site, including the significant physical and biological
features, and the precise location (latitude and longitude, map, etc); the
Instructions to authors 252
experimental or sampling design; the protocol for collecting data; how the data
were analyzed. In this section also should be provided a clear description of
instruments and equipment, machines, devices, chemicals, diagnostic kits,
plants/animals studied, technology of growing/housing, sampling sites, software
used etc.
- RESULTS followed by DISCUSSION
Results and Discussion may be combined into a single section (if appropriate) or
it can be a separate section.
The results objectively present key results, without interpretation, in an orderly
and logical sequence using both text and illustrative materials (tables and
figures).
The discussion interpret results in light of what was already known about the
subject of the investigation, and explain new understanding of the problem after
taking results into consideration.
The International System of Units (SI) should be used.
- CONCLUSIONS
The conclusion should present a clear and concise review of experiments and
results obtained, with possible reference to the enclosures.
- ACKNOWLEDGMENTS
If received significant help in designing, or carrying out the work, or received
materials from someone who did a favour by supplying them, their assistance
must be acknowledged. Acknowledgments are always brief and never flowery.
- REFERENCES (LITERATURE)
References should cover all papers cited in the text. The in-text citation format
should be as follows: for one author (Karaman, 2011), for two authors (Erjavec
and Volk, 2011) and for more than two authors (Rednak et al., 2007). Use
semicolon (Rednak et al., 2012; Erjavec and Volk, 2011) to separate multiple
citations. Multiple citations should be ordered chronologically. The literature
section gives an alphabetical listing (by first author's last name) of the references.
More details you can find in the Annex to the INSTRUCTIONS TO AUTHORS /
Bibliographic style on the web page of the Journal: www.agricultforest.ac.me.
Short communication should include the following sections: Title, Abstract, Key
words, Main text, Acknowledgments, References, Tables and Figures with captions.
SUPPLY OF ARTWORK, PHOTOS: Diagrams and graphs should be provided
as finished black and white line artwork or colour images. Electronic graphics included in
your manuscript should be either inserted in the word document or as .gif or .jpg formats.
Please check with the editor if you wish to submit any other type of graphic for
conversion suitability. Photos should be supplied un-screened in original form or in
electronic form. All illustration (diagrams, graphs, tables, photos) must be fully
captioned. When there are a number of illustrations, the author should endeavour to
reduce the amount of text to accommodate the illustrations in the limited space available
for any article.
THE REVIEW PROCESS: Submitted manuscripts are reviewed anonymously
by 2 referees (duble blind review): one from the journal Editorial board, one must be an
international reviewer, working out of the University of Montenegro. All tracking of
manuscripts and reviewers is done by the Editor. All attempts will be made to ensure
submissions will be reviewed within three months after the submission. Manuscripts will
be returned to the coresponding authors when each review is completed.
Examples available on www.agricultforest.ac.me.