CRITERIA AND INDICATORS - Forests and forestry
145
CRITERIA AND INDICATORS OF SUSTAINABLE FOREST MANAGEMENT IN CANADA Conseil canadien des ministres des forêts Canadian Council of Forest Ministers TECHNICAL REPORT 1997
-
Upload
khangminh22 -
Category
Documents
-
view
1 -
download
0
Transcript of CRITERIA AND INDICATORS - Forests and forestry

C &
IO
FS
US
TA
IN
AB
LE
FO
RE
ST
MA
NA
GE
ME
NT
IN
CA
NA
DA
19
97
CRITERIA AND INDICATORS
OF SUSTAINABLE FOREST
MANAGEMENT
IN CANADA
Conseil canadien
des ministres
des forêts
Canadian Council
of Forest
Ministers
T E C H N I C A L
R E P O R T
1 9 9 7

New BrunswickThe Honourable Alan GrahamMinister of Natural Resources
and EnergyGovernment of New BrunswickHugh John Fleming Forestry ComplexRegent Street ExtensionP.O. Box 6000Fredericton NB E3B 5H1
QuebecThe Honourable Guy ChevretteMinister of State,
Ressources naturellesGouvernement du Québec5700, 4e avenue ouest, bureau A–308Charlesbourg QC G1H 6R1
OntarioThe Honourable Chris HodgsonMinister of Natural ResourcesGovernment of OntarioRoom 6301, Whitney Block 99 Wellesley Street WestToronto ON M7A 1W3
British ColumbiaThe Honourable David ZirnheltMinister of ForestsGovernment of British ColumbiaRoom 128, Legislative Building501 Belleville StreetVictoria BC V8V 1X4
Northwest TerritoriesThe Honourable Stephen KakfwiMinister of Resources, Wildlife
and Economic DevelopmentGovernment of the
Northwest Territories2nd floor, Legislative AssemblyP.O. Box 1320Yellowknife NT X1A 2L9
Yukon TerritoryThe Honourable Eric FaircloughMinister of Renewable ResourcesGovernment of the Yukon Territory2071 2nd AvenueP.O. Box 2703Whitehorse YK Y1A 2C6
Canadian Council of Forest Ministers (CCFM)
Newfoundland and LabradorThe Honourable Beaton Tulk (Chair)Minister of Forest Resources
and AgrifoodsGovernment of Newfoundland
and LabradorP.O. Box 8700St. John’s NF A1B 4J6
Prince Edward IslandThe Honourable J. Eric HammillMinister of Agriculture and ForestryGovernment of Prince Edward Island3rd floor, Shaw Building105 Rochford Street P.O. Box 2000Charlottetown PE C1A 7N8
Nova ScotiaThe Honourable Eleanor NorrieMinister of Natural ResourcesGovernment of Nova Scotia7th floor, Founder’s Square 1701 Hollis StreetP.O. Box 698Halifax NS B3J 2T9
ManitobaThe Honourable J. Glen CummingsMinister of Natural ResourcesGovernment of Manitoba333–450 Legislative Building Winnipeg MB R3C 0V8
SaskatchewanThe Honourable Lorne ScottMinister of Environment and
Resource ManagementGovernment of SaskatchewanRoom 43, Legislative BuildingRegina SK S4S 0B3
AlbertaThe Honourable Ty LundMinister of Environmental ProtectionGovernment of AlbertaRoom 323, Legislature BuildingEdmonton AB T5K 2B6
CanadaThe Honourable A. Anne McLellanMinister of Natural Resources Canada Government of CanadaRoom 322, West BlockHouse of CommonsOttawa ON K1A 0A6

© Canadian Council of Forest Ministers 1996
Cat. Fo75-3/6-1997E
ISBN 0-662-25623-9
Copies of this publication may be obtained free of charge from:
Natural Resources Canada–
Canadian Forest Service
8th floor, 580 Booth Street
Ottawa ON K1A 0E4
Fax: (613) 947-7396
For your convenience, this document will soon be made available on the Internet
A microfiche edition of this publication may be purchased from:
Micromedia Ltd.
305–240 Catherine Street
Ottawa ON K2P 2G8
Également disponible en français sous le titre
Critères et indicateurs de l’aménagement durable des forêts au Canada :
Rapport technique 1997
Printed on recycled paper

Action 3.5: “Canada…will develop a system of national indicators to measure and report regularly on progress in achieving
sustainable forest management.”
– Sustainable Forests: A Canadian CommitmentCanada’s National Forest Strategy
Forests are a major consideration in global
discussions on sustainable development. Because
Canada accounts for 10% of the world’s forest
land and almost 20% of global trade in forest
products, our decisions and actions with regard to
sustainability can have a major impact on global
economic, social and environmental systems.
In 1993, the Canadian Council of Forest
Ministers (CCFM) embarked on an initiative
to define, measure and report on the forest values
Canadians want to sustain and enhance. With
the support of technical and scientific advisors,
the CCFM consulted extensively with officials
and scientists from the federal, provincial and
territorial governments, as well as with experts
from the academic community, industry, non-
governmental organizations, the Aboriginal
community and various other interest groups.
Frameworki
CRITERIA AND INDICATORS FRAMEWORK
Criteria(6)
Elements(22)Ecosystem
diversity
Speciesdiversity
Geneticdiversity
Ecosystemcondition andproductivity
Disturbanceand stress
Ecosystemresilience
Extantbiomass
Soil andwater
conservation
Physicalenvironmental
factors
Policy andprotection forest
factors
Globalecological
cycles
Globalcarbonbudget
Forest landconversion
Carbondioxide
conservation
Policyfactors
Hydrologicalcycles
Multiplebenefits
Productivecapacity
Competitive-ness
Contributionto economy
Non-timbervalues
Informeddecisionmaking
Fair andeffective
decision making
Sustainabilityof forest
communities
Aboriginal andtreaty rights
Society’sresponsibility
Participation byAboriginal
communities
4 indicators 8 indicators 5 indicators 9 indicators 5 indicators 1 indicator
3 indicators 2 indicators 3 indicators 2 indicators 3 indicators 5 indicators
1 indicator 2 indicators 3 indicators 4 indicators 4 indicators
5 indicators 4 indicators 3 indicators
Conservation of biological
diversity
1 indicator 6 indicators
Indicators(83)

The results were reflected in Defining Sustainable
Forest Management: A Canadian Approach to
Criteria and Indicators, which was published in
March 1995. The development of these criteria
and indicators (C & I) is an important step
in meeting Canada’s domestic commitments on
sustainable forest management.
Our domestic commitment to sustainability
was enshrined in the National Forest Strategy,
entitled Sustainable Forests: A Canadian
Commitment, which was endorsed in March
1992 by federal, provincial and territorial
governments and by other interested groups
(e.g., industry, Aboriginal peoples and
environmental associations). Later that year, at
the United Nations Conference in Environment
and Development (UNCED), Canada successfully
argued for recognition of the importance of
sustainable forest management through the
adoption of a statement of forest principles.
Over the years, governments across Canada
have been rethinking their forest policies to better
reflect the principles of sustainable management.
Activities range from revising forest legislation
to take into account a wide array of forest
values, to developing programs that involve
the public in ecosystem management plans
and resource strategies.
The C & I are intended to provide a
common understanding and scientific definition
of sustainable forest management in Canada.
Together they serve as a framework for describing
and measuring the state of our forests, forest
management practices, values and progress toward
sustainability. This information and data are needed
to shape forest management policies and to focus
research on areas where we need to improve
our technology and knowledge. The C & I
framework reflects an approach to forest
management which is based on the recognition
that forests are ecosystems that provide a wide
range of environmental, economic and social
benefits to Canadians and that sustainable
forest management demands an informed and
participatory public, as well as the best available
information and knowledge.
The six sustainable forest management
criteria that have been identified include
traditional concepts, such as timber values,
but go beyond economics to encompass—among
others—environmental, social and Aboriginal
values. Each criteria is subdivided into elements,
and from those elements, 83 indicators have been
established to help track the nation’s progress in
achieving sustainable development and balancing
Frameworkii
In addition to measuring our progress on
sustainable forest management within
our national borders, Canada is playing
a leadership role in international efforts
to measure forest sustainability. Of particular
importance is the Montreal C & I Process,
so named because the first meeting sponsored
by the Conference on Security and Cooperation
in Europe took place in Montreal in 1993.
This initiative involves 12 countries that
together represent 90% of the world’s boreal
and temperate forests. Argentina, Australia,
Canada, Chile, China, Japan, Korea, Mexico,
New Zealand, Russia, Uruguay and the
United States are collaborating to develop
national C & I for the conservation and
sustainable management of all boreal and
temperate forests.
Montreal Criteria and Indicators Process

environmental, economic and social objectives.
No single criterion or indicator is a measure
of sustainability on its own, but together they
can highlight trends or changes in the status
of forests and forest management over time.
Soon after the release of the C & I
framework, the CCFM created a task force to
report on Canada’s ability to measure the various
indicators. The CCFM C & I Task Force included
representatives from the federal government and
each provincial and territorial forest jurisdiction.
Teams of experts (supported by a technical
committee representing many forest interests)
drafted Canada’s first report on the C & I using
data collected from a wide range of sources. The
report was then reviewed by all jurisdictions and
approved by the Task Force.
This first C & I report describes our
present ability to measure the forest values
that Canadians want to sustain and enhance.
Generally speaking, the most current data
available describe traditional timber management.
This is because values such as forest type and
age, and the incidence of natural and human
disturbances have been measured and monitored
for many years. Economic factors, such as
employment trends in the forest sector and the
value of timber exports, can be reported at a
national level. Some indicators, such as the carbon
budget, which is measured through computer
models, also can be reported on nationally.
In other areas, national and quantitative
data do not exist. Currently, efforts are underway
to determine means of addressing the lack of
information on such topics as biodiversity at
the genetic level and measures of soil and water
quality. There are also gaps in data for some
socioeconomic indicators. Canada is presently
unable to provide national economic analyses
of non-timber values, such as the recreational,
subsistence and Aboriginal use of forests, nor can
we fully report on the in-depth public involvement
at various levels in planning and monitoring forest
practices. Qualitative descriptions or case studies
are used to provide some level of understanding
of the status of indicators that lack data.
There has been a great deal of progress in
developing measures of Canada’s achievements
in sustainable forest management, but more work
remains to be done. Future CCFM efforts will
focus on maintaining and expanding current
databases, developing methodologies to collect
data for such areas as the social elements of
sustainability, and improving our understanding
of forest ecosystems. The framework will be
updated to include only those indicators that
provide a comprehensive picture of the
sustainability of our forests and can be
reported on nationally.
Frameworkiii
Canada views the C & I as an important policy tool
that will help guide and assess our progress toward sustainable
forest management. Moreover, likemany other countries, Canada
recognizes that development andimplementation of the C & I willrequire continuous refinement as
public values change and as we acquire new knowledge
of forest ecosystems.

Criteria and IndicatorsOF SUSTAINABLE FOREST MANAGEMENT
IN CANADA
Technical Report 1997
TABLE OF CONTENTS
FRAMEWORK i
CRITERION 1.0 CONSERVATION OF BIOLOGICAL DIVERSITY 1
Element 1.1 Ecosystem diversity 2
Element 1.2 Species diversity 10
Element 1.3 Genetic diversity 18
CRITERION 2.0 MAINTENANCE AND ENHANCEMENT 25
OF FOREST ECOSYSTEM CONDITION
AND PRODUCTIVITY
Element 2.1 Incidence of disturbance 25
and stress
Element 2.2 Ecosystem resilience 37
Element 2.3 Extant biomass 39
CRITERION 3.0 CONSERVATION OF SOIL AND 47
WATER RESOURCES
Element 3.1 Physical environmental factors 48
Element 3.2 Policy and protection 52
forest factors

CRITERION 4.0 FOREST ECOSYSTEM CONTRIBUTIONS 57
TO GLOBAL ECOLOGICAL CYCLES
Element 4.1 Contributions to the global 58
carbon budget
Element 4.2 Forest land conversion 64
Element 4.3 Forest sector carbon 66
dioxide conservation
Element 4.4 Forest sector policy factors 69
Element 4.5 Contributions to 74
hydrological cycles
CRITERION 5.0 MULTIPLE BENEFITS OF FORESTS 81
TO SOCIETY
Element 5.1 Productive capacity 82
Element 5.2 Competitiveness of 88
resource industries
Element 5.3 Contribution to the 92
national economy
Element 5.4 Non-timber values 97
CRITERION 6.0 ACCEPTING SOCIETY’S RESPONSIBILITY 105
FOR SUSTAINABLE DEVELOPMENT
Element 6.1 Aboriginal and treaty rights 106
Element 6.2 Participation by Aboriginal 107
communities in sustainableforest management
Element 6.3 Sustainability of 110
forest communities
Element 6.4 Fair and effective 112
decision making
Element 6.5 Informed decision making 113
GLOSSARY 120
SUBJECT INDEX 128
READER FEEDBACK CARD tear-out
ECOZONES TERRESTRIAL MAP tear-out

CR ITER ION 1 .0
Introduction 1
Element 1.1 Ecosystem diversity 2
Indicator 1.1.1 Percentage and extent, in area, of forest types relative to the historical 3condition and total forest area
Indicator 1.1.2 Percentage and extent of area by forest type and age class 6
Indicator 1.1.3 Area, percentage and representativeness of forest types in protected areas 6
Indicator 1.1.4 Level of fragmentation and connectedness of forest ecosystem components 8
Element 1.2 Species diversity 10
Indicator 1.2.1 Number of known forest-dependent species classified as extinct, threatened, 11endangered, rare or vulnerable relative to the total number of known forest-dependent species
Indicator 1.2.2 Population levels and changes over time for selected species and species guilds 12
Indicator 1.2.3 Number of known forest-dependent species that occupy only a small portion 16of their former range
Element 1.3 Genetic diversity 18
Indicator 1.3.1 Implementation of an in situ/ex situ genetic conservation strategy for 19commercial and endangered forest vegetation species
Literature cited 21
Contacts 21

Introduction
Conservation of biological diversity1
INTRODUCTION
Biodiversity is the variability among living
organisms and the ecological complexes of which
they are a part. It can be viewed in the context of
three elements: ecosystems, species and genes.
Many different types of forest
ecosystems are found throughout the world,
and they contain the majority of the Earth’s
plants, animals and microorganisms. The
conservation of biodiversity makes forests
productive and resilient, while enabling them
to cycle nutrients and to provide clean water,
oxygen and other life-support services.
Biodiversity and natural systems are
dynamic. The populations, species, forest
types and age classes that comprise Canada’s
forests are determined by the processes
of disturbance and renewal. Maintaining
biodiversity entails examining ecosystems
at many levels of organization and at different
time and space scales. It also involves making
land-use and resource management decisions that
incorporate biodiversity needs, such as limiting
the conversion of forests to agricultural and urban
lands, creating protected areas, managing the
harvest of forest plants and animals, preventing
the invasion of foreign insects and diseases,
and protecting wildlife habitat through careful
timber harvesting.
Viewed at the national level, Canada has
highly diverse forest ecosystems. They span
wide temperature and precipitation ranges—
from the Carolinian forest in southwestern
Ontario to the narrow strings of trees growing
along Arctic rivers, and from the West Coast
rainforests to the dry ponderosa pine forests.
Even boreal ecosystems are diverse, with their
complex mixtures of bogs, lakes and sparsely
vegetated rocks, and their coniferous stands
at varying stages of development following
fires and insect infestations. Element 1.1
(Ecosystem diversity) measures and reports on
this diversity and its importance for sustainable
forest management.
Estimates suggest that Canada is home
to approximately 140 000 species of plants,
animals and microorganisms, only half of which
are classified by science. (If viruses are included,
the total number could rise to nearly 300 000.)
Approximately two-thirds of these species are
found in forests or dependent on a forest habitat.
Roughly 180 species of trees grow in Canada’s
forest. Element 1.2 (Species diversity) focuses
on the status of better known groups of plants
and animals.
Genetic diversity is the ultimate basis
for the variety of species and ecosystems. It
enables organisms to respond to environmental
change and shape the ecosystems in which they
live. Distributions of genes are ever changing
as individuals and populations respond to such
factors as weather, food availability and
predators. Despite this complexity, practical
CR ITER ION 1 .0
CONSERVATION OF BIOLOGICAL DIVERSITY
Ecosystemcondition andproductivity
Soil and waterconservation
Globalecological
cycles
Multiplebenefits
Society’sresponsibility
Conservation of biological
diversity

Ecosystem diversity
Conservation of biological diversity2
measures to conserve forest ecosystem types and
tree species populations also help conserve the
genetic diversity of other organisms. Element 1.3
(Genetic diversity) describes genetic conservation
strategies for commercial and endangered forest
vegetation species.
More knowledge is required of all
three forest biodiversity elements; however,
Canada still has almost its entire original
complement of forest species and ecosystems.
With appropriate management, monitoring
and research strategies, it should be possible
to conserve this forest biodiversity for
future generations.
ELEMENT 1.1ECOSYSTEM DIVERSITY
What are we measuring?An ecosystem consists
of plants, animals and
microorganisms interacting
with their physical and climatic
environment in a given area.
Each forest ecosystem in Canada
has its own set of species adapted
to regional climate, habitat type and disturbance
patterns. Because species populations change in
response to such biotic factors as food availability
and predators, ecosystems also are constantly
changing. For example, the boreal ecosystems
that comprise roughly three-quarters of Canada’s
timber producing forests regularly experience
major fires and insect outbreaks, and the species
that grow in these ecosystems have adapted to
these natural disturbances.
Added to natural disturbances are human
pressures. Comparing the current status of
Canada’s forest ecosystems with their status
prior to large-scale human disturbances is one
way to assess the impact of these disturbances
on ecosystem diversity. The area of protected
forests can be used to measure how a natural
range of ecosystems is being maintained. The
density of roads in forested areas is used as a
substitute for data regarding the fragmentation
of forest ecosystems.
How does ecosystem diversity relate to the sustainability of Canada’s forests?When forests are converted to agricultural or
urban areas, biodiversity is clearly altered. More
subtle changes occur when forests are affected
by human impacts, such as air pollution, timber
harvesting and the introduction of exotic species
(e.g., Dutch elm disease).
Age-class information is important for
the conservation of biodiversity because it
enables timber harvests to be planned so as to
maintain a full range of successional habitats for
wildlife and ecosystem types over the long term.
Protected areas are useful too because they act as
ecological benchmarks for assessing the impacts
of forest management on biodiversity. They also
maintain habitat for rare and endangered species,
and ideally allow evolutionary and adaptive
processes to continue unimpeded.
Fragmentation is another indicator of
changes to forest biodiversity. For example,
when forests are fragmented into isolated units,
the associated increase in “edge habitat” can lead
to greater changes in biodiversity than would be
predicted based solely on the total area harvested.
By designing harvesting and other silvicultural
activities to minimize edge habitat or to emulate
natural disturbances, forest managers may help
minimize the impacts of these activities on
biodiversity. This requires information on the
Conservationof biological
diversity
Ecosystemdiversity
Speciesdiversity
Geneticdiversity

Ecosystem diversity
Conservation of biological diversity3
frequency, intensity, pattern and predisposing
factors of natural disturbances.
What data are available?
Percentage and extent, in area, of foresttypes relative to the historical conditionand total forest area (1.1.1)
Various sources can be used to reconstruct the
historical condition of Canada’s forests, including
early forest inventory data, land survey records,
and analyses of tree pollen in lakes and peat bogs.
To complete the portrait, research is required to
determine the former range of the species, based
on their known climate and soil preferences.
The 1996 National Ecological Framework
divides Canada into 15 terrestrial ecozones, 194
ecoregions and more than a thousand ecodistricts.
Figure 1.1a shows the location of the ecozones.
The ecozones are also shown in the tear-out
map at the end of the report.
Figure 1.1b provides an overview of the
ecozones based on data from the 1991 national
St. John’s
10
9
6 6
5
15
5
3 2412
14
11
332
7
8
6
2
2
13
1
2
11- Arctic Cordillera12- Northern Arctic13- Southern Arctic14- Taiga Plains15- Taiga Shield16- Boreal Shield17- Atlantic Maritime18- Mixedwood Plains19- Boreal Plains10- Prairies11- Taiga Cordillera12- Boreal Cordillera13- Pacific Maritime14- Montane Cordillera15- Hudson Plains
Terrestrial ecozones 1.1a
Source: Ecological Stratification Working Group, 1995

Ecosystem diversity
Conservation of biological diversity4
forest inventory. Of the 15 ecozones in Canada,
11 have 15% or more forest cover, and 8 have at
least 15% “productive” forest cover (i.e., forest
capable of producing a harvestable volume of
timber within a reasonable length of time).
Ecozones and ecoregions are valuable for
reporting and analysis, but have limited use in
decision making at the level of forest management
units. More detailed classifications identify forest
ecosystems wherever they occur in the landscape,
based on similarities in topographic position, soil,
geological properties and vegetation. Such forest
ecosystem classifications have been completed
for most of Canada’s commercial forests, and
they are a valuable resource for the practising
forester, especially when accompanied by field
guides that provide identification keys and
silvicultural interpretations.
Data on dominant tree species are obtained
from aerial photographs and are available from
provincial and territorial timber inventories.
A national overview of the state of Canada’s
forest ecosystems is compiled every five years
from these provincial and territorial databases.
From a biodiversity perspective, however, this
national inventory has significant limitations.
For example, it cannot be used to assess trends
in species composition. Also, younger forests
are underrepresented, and species are sometimes
grouped under general headings, such as
“spruces” or “unspecified broadleaves.” More
detail is needed to assess the conservation
status of various forest types and species.
Despite these shortcomings, the national
inventory provides the best available overview
of forest types in Canada. Figure 1.1c shows
the most common types in each ecozone. Pacific
Maritime forests are dominated by western and
mountain hemlock, western red cedar, various true
fir species and Douglas-fir. Montane Cordillera
ECOZONE TOTAL AREA TOTAL FOREST “PRODUCTIVE” FORESTmillion hectares million hectares % million hectares %
Arctic Cordillera 25.06 0.01 0.0 0.00 0.0Northern Arctic 151.09 0.00 0.0 0.00 0.0Southern Arctic 83.24 3.24 3.9 0.00 0.0Taiga Plains 64.70 50.02 77.3 17.08 26.4Taiga Shield 136.64 52.68 38.6 10.21 7.5Boreal Shield 194.64 151.08 77.6 106.10 54.5Atlantic Maritime 20.38 16.03 78.7 15.57 76.4Mixedwood Plains 19.44 3.66 18.8 3.30 17.0Boreal Plains 73.78 49.82 67.5 33.80 45.8Prairies 47.81 2.08 4.4 1.78 3.7Taiga Cordillera 26.48 8.49 32.0 0.58 2.2Boreal Cordillera 46.46 28.82 62.0 13.91 29.9Pacific Maritime 21.90 10.06 45.9 8.56 39.1Montane Cordillera 49.21 34.86 70.8 32.13 65.3Hudson Plains 36.24 6.71 18.5 1.54 4.2
CANADA 997.06 417.58 41.9 244.57 24.5
Source: Natural Resources Canada–Canadian Forest Service
1.1b Overview of Canada’s forests by terrestrial ecozone

Ecosystem diversity
Conservation of biological diversity5
forests have lodgepole pine, Engelmann and
white spruce, subalpine fir and Douglas-fir.
Forests of the Boreal Cordillera are dominated
by white and black spruce, lodgepole pine and
subalpine fir, occasionally mixed with poplars.
White and black spruce and poplars dominate
the Boreal Plains and Taiga Plains, in either
pure or mixed stands; lodgepole and jack pine
also are common.
Dominant Atlantic Maritime species
include black, white and red spruce; balsam fir;
sugar and red maple; white birch; and trembling
aspen. The abundance of some species, such as
white cedar, white pine and red spruce, may have
declined considerably during the past 200 years
of harvesting, but better data on historical forest
composition are needed to assess these changes.
The Boreal Shield is Canada’s largest
ecozone (195 million hectares). Approximately
40% of the forest is dominated by black and
white spruce. Jack pine occupies roughly 15%
of the forest area, while balsam fir, poplar and
birch make up most of the remainder.
The Mixedwood Plains ecozone has the
greatest diversity of tree species in Canada—
more than 100 in total. Sugar maple is the most
common species, with white cedar, trembling
aspen and white birch as major secondary
species. Roughly 10 million hectares of forests
have been cleared in this ecozone, largely for
agricultural and urban development. Of particular
concern is the disappearance of the Carolinian
forest in southwestern Ontario: less than 10%
forest cover remains, and roughly 60% of
Canada’s endangered forest-dwelling species
are found there. (Healthy populations of many
of these endangered species are still found in
the United States.)
Source: Natural Resources Canada–Canadian Forest Service
Dominant forest types by ecozone 1.1c
0 10 20 30 40 50
%
��yy
��yy��yy
��yy
0 10 20 30 40 50
PacificMaritime
MontaneCordillera
BorealShield
AtlanticMaritime
BorealPlains
TaigaPlains
MixedwoodPlains
BorealCordillera
Hemlock
Cedar and other conifers
Fir
Pine
Other broadleaves
Birch
Unspecified broadleaves
Unspecified conifers
Poplar
Maple
Douglas-fir
Spruce
�y

Percentage and extent of area by forest type and age class (1.1.2)
Most of Canada’s forests are composed of even-
aged stands that were established following major
disturbances, such as fires, insect outbreaks
and harvesting. These stands are dominated by
species that grow best in full sunlight: jack pine,
lodgepole pine, black spruce, trembling aspen
and white birch. The age of the stands is
generally estimated from aerial photographs.
A small, but economically significant
portion of Canada’s forests is composed of
species that commonly reproduce in the shade
and grow in uneven-aged stands. These forests
include the mixed conifer forests in the Pacific
Maritime ecozone and the northern hardwood
forests in the Atlantic Maritime and Mixedwood
Plains ecozones.
Age class data in the national inventory
need to be improved to more accurately reflect
the composition of Canada’s forests. Not all
provincial inventories are updated regularly
to reflect fires, insect outbreaks and timber
harvesting. For example, areas surveyed
to obtain timber volume data for harvesting
may not be resurveyed for decades. Hence,
the inventory data reflect a strong bias toward
semi-mature and mature stands. This picture is
complicated by the differing upper limits for age
data. Accurate dating of older stands has not been
a priority, and old-growth features, such as snags,
coarse woody debris and multiple canopy layers,
have not been identified.
Some differences in age class structure
among ecozones are nonetheless evident
(Figure 1.1d). Forests whose age exceeds
160 years are common only in the Pacific
Maritime ecozone, where major fires and
insect outbreaks are rare. Tree species in those
forests commonly live for several hundred years.
In the Boreal Cordillera and Montane Cordillera
ecozones, a large proportion of the forests (39%
and 47%, respectively) is more than 120 years
old. The proportion of forests in that age class
is much smaller in the Boreal Shield (10%)
and Boreal Plains (10%), and is even lower
in the Atlantic Maritime (3%) and Mixedwood
Plains (2%) ecozones.
The lower age of eastern forests only
partly reflects harvesting activity. Some tree
species, such as trembling aspen and balsam
fir, are short lived—rarely reaching 100 years
of age. Furthermore, the probability of major
natural disturbances, such as fires and severe
insect outbreaks, is high in eastern Canada.
Figure 1.1d also shows a decline in the
proportion of hardwoods in older age classes of
the Boreal Plains and Taiga Plains ecozones. The
composition and age class structure of Canada’s
forests are continually changing, owing to the
varying frequency of fires, insect outbreaks
and harvesting. The National Forestry Database
indicates that the average area affected annually
by harvesting and fire has increased since 1970.
This should in turn increase the proportion of
younger age classes in Canada’s forests.
Area, percentage and representativeness of forest types in protected areas (1.1.3)
Representative protected forest areas provide
ecological benchmarks, which enable the
biodiversity in undisturbed ecosystems to be
compared with that in areas managed for forest
products. Protected areas also provide wilderness
experiences and other recreational benefits.
Ecosystem diversity
Conservation of biological diversity6

Ecosystem diversity
Conservation of biological diversity7
Source: Natural Resources Canada–Canadian Forest Service
Age class distribution by ecozone and forest cover type 1.1d
MixedwoodHardwood Softwood
%
0 5 10 15 20 25 30 35 40
>160
120–160
80–120
40–80
0–40
>160
120–160
80–120
40–80
0–40
>160
120–160
80–120
40–80
0–40
>160
120–160
80–120
40–80
0–40
0 5 10 15 20 25 30 35 40
>160
120–160
80–120
40–80
0–40
>160
120–160
80–120
40–80
0–40
>160
120–160
80–120
40–80
0–40
>160
120–160
80–120
40–80
0–40
%0 5 10 15 20 25 30 35 40 0 5 10 15 20 25 30 35 40
BorealPlains
TaigaPlains
MixedwoodPlains
BorealCordillera
PacificMaritime
MontaneCordillera
BorealShield
AtlanticMaritime
years years

Ecosystem diversity
Conservation of biological diversity8
Different categories of protected areas have
been identified by the World Conservation Union
(IUCN). Logging may occur in some protected
areas, provided that it does not conflict with the
overall objective of conserving natural systems.
In November 1992, representatives of the
Councils of Environment, Parks and Wildlife
Ministers signed a statement of commitment to
complete Canada’s networks of protected areas
by 2000. These networks are representative of
Canada’s land-based natural regions.
According to Environment Canada’s
Canadian Conservation Areas Database, in 1995,
approximately 7.6% of Canada’s forest land was
located in protected areas—an increase of 11%
since 1985; roughly half of these protected
forests are considered “strictly protected,”
excluding them from such industrial activities
as logging and mining. However, because of
the discrepancies regarding data and definitions,
more analysis is needed to accurately determine
the exact number, location and size of protected
forest areas in Canada.
Increases in the amount of protected
forests have been even greater in some ecozones
(Figure 1.1e). In the Pacific Maritime, for
example, the protected forest area more than
doubled between 1985 and 1995—to 6.6% of the
total forest area. Virtually all of this area is
strictly protected (no logging is permitted).
In other ecozones, such as the Boreal Shield or
Atlantic Maritime, less than half the protected
area has the same degree of protection.
Policies and programs to conserve
biodiversity in forests outside protected areas
also are being put in place. In addition to
influencing the management of publicly owned
forest lands under timber tenures, these programs
can provide important benefits in ecozones, such
as the Mixedwood Plains or Atlantic Maritime,
where a large percentage of forest land is
privately owned.
Level of fragmentation and connectednessof forest ecosystem components (1.1.4)
When ecosystem components become separated
in time and space, the integrity of the ecosystem
is challenged. This fragmentation can affect
critical connections within an ecosystem. For
example, the association between mature pine
forests and recent fires influences natural
regeneration, landscape diversity and wildlife
habitats. Fragmentation of this association will
have consequences for ecosystem functioning.
From ecological modeling and baseline studies
in natural forested landscapes, it may be
possible to derive critical thresholds for levels
of fragmentation below which there is no
known adverse effect on the sustainability
of an ecosystem.
The first requirement for obtaining
data on fragmentation is mapping the spatial
location of ecosystem components. This has
been done for individual study sites, but not
on the wider scale suitable for national reporting.
As a proxy indicator, we can look at human
intrusion into landscapes by reporting on the
densities of roads in New Brunswick and
British Columbia. Although road density is
also a function of terrain, it is one type of
distribution with significant consequences
for landscape fragmentation.
In most parts of Canada, roads are a
precursor to human activity. The density of
roads clearly illustrates the intensity of human
activities, ranging from urban areas with very
high densities, to remote areas with sparse or
nonexistent road networks. Density is expressed

Ecosystem diversity
Conservation of biological diversity9
as the length of all existing roads divided by
the surface area of the ecoregion in question.
Some wildlife species are highly sensitive
to roads. Wolves, for example, are almost never
found where there is more than 0.45 km of roads
per km2. While the Atlantic Maritime ecozone
has a moderate road density throughout
(>0.25 km/km2), in the Taiga Plains and Boreal
Cordillera ecozones of British Columbia, there
are vast stretches with sparse road densities
(<0.25 km/km2). Comparative figures
are available for Alaska (0.08 km/km2),
Source: Environment Canada–Canadian Conservation Areas Database
Protected forest areas by ecozone 1.1e
Strictly protected areas Other protected areas Total protected areas
1995
1995
1995
1995
0 1 2 3 4 5 6 7 8 9 10
0 1 2 3 4 5 6 7 8 9 10%
PacificMaritime
MontaneCordillera
BorealShield
AtlanticMaritime
BorealPlains
TaigaPlains
MixedwoodPlains
BorealCordillera
%
1995
1985 1985
1995
1985 1985
1995
1985 1985
1995
1985 1985
0 1 2 3 4 5 6 7 8 9 10
0 1 2 3 4 5 6 7 8 9 10

Species diversity
Conservation of biological diversity10
Maine (0.53 km/km2), the United Kingdom
(2.29 km/km2), and Connecticut (8.76 km/km2).
The only areas that can claim status as
undisturbed (non-fragmented) are those located
at a certain distance from any road. Because
most human influences occur close to roads
and decline rapidly with distance, 1 km can
be assumed to be the critical distance. In
British Columbia, roughly 22% of the landscape
is within this distance; the remaining 78% has
less human disturbance.
SummaryConifers are abundant in Canada, notably in the
vast spruce and pine forests of the Boreal Shield,
and in the hemlock, cedar, fir and Douglas-fir
forests of the western mountains. Poplars are
commonly found mixed with spruces in the
Boreal Plains and Taiga Plains, and mixed
with a variety of other conifers and hardwoods
(mostly birch and maple) in eastern forests.
The average age of Canada’s forests
decreases from west to east, reflecting natural
variations in species longevity and differences
in the frequency of disturbances (e.g., fires,
insect outbreaks and timber harvesting). Forests
exceeding 160 years of age are common only in
the Pacific Maritime ecozone.
Approximately 7.6% of Canada’s
forests are in protected areas, and logging is
prohibited in more than half of these areas—in
forests classified as “strictly protected.” Between
1985 and 1995, there was an overall gain of 11%
in the amount of protected forests in Canada,
including a doubling of the protected forest area
in the Pacific Maritime ecozone.
Densities of road networks can be used
as a proxy for forest fragmentation. However,
more work is needed to establish the relationship
between road densities and the fragmentation
of forest ecosystems.
ELEMENT 1.2SPECIES DIVERSITY
What are we measuring?Each of Canada’s major forest
regions is inhabited by a
distinct group of species whose
diversity is primarily affected
by ecosystem productivity and
is influenced by geography,
history, soil nutrients, mean
temperature, growing season and moisture
levels. (“Species diversity” refers to the variety
of plants and animals in a particular area.) To
date, few provinces have selected species to
monitor as indicators of functional forests,
although many are in the process of doing so.
In many parts of the country, the Model Forest
Program has provided the incentive to examine
the role and validity of these indicators in
forest management.
Limited sources and studies provide
information on the changes over time in the
population levels of various species, and
some data exist that enable a comparison to be
made between the current ranges of particular
species and their known historical ranges. The
provincial, territorial and federal governments
maintain lists of species that are classified as
extinct, endangered, threatened and vulnerable.
How does species diversity relate to thesustainability of Canada’s forests?Conservationists worldwide agree that humans
have a responsibility to maintain all life-forms.
How populations of species are affected by
Conservationof biological
diversity
Ecosystemdiversity
Speciesdiversity
Geneticdiversity

environmental change is key to assessing
the impact of human activities. Therefore,
an important objective of sustainable forest
management is ensuring that populations of
species are not put at risk as a result of forest
harvesting and regeneration.
A component of biodiversity monitoring is
to follow species or groups to determine whether
they face long-term changes in population size or
distribution. Species extinction is the ultimate
sign of environmental degradation and
unsustainable resource use.
What data are available?
Number of known forest-dependent species classified as extinct, threatened,endangered, rare or vulnerable relative to the total number of known forest-dependent species (1.2.1)
“Extinct” refers to species that no longer exist.
Two forest-dependent species in Canada have
become extinct due to overhunting: the passenger
pigeon (1914) and the Queen Charlotte Islands
caribou (1935). Endangered species are those
facing imminent extinction or extirpation (extinction
in Canada); threatened species could become
endangered if limiting factors are not reversed;
and vulnerable species are those that are especially
sensitive to human activities or natural disturbances.
Some provinces and territories and the
federal government—through the Committee
on the Status of Endangered Wildlife in Canada
(COSEWIC)—maintain lists of animals and
plants falling into the above categories.
Provincial, territorial and national lists do
not always correspond because species may
be endangered in one province but not another,
or because national assessments are as yet
incomplete for some species. Figure 1.2a (see
page 13) lists forest dependent species that fall
into these categories at the national level.
The national list now includes nine
endangered animal species and ten endangered
plant species that need forest conditions for all
or part of their feeding, breeding or shelter
requirements. The two forest types that contain
the most species at risk are those with the most
restricted distribution in Canada: the temperate
rainforests of British Columbia (Pacific Maritime
ecozone) and the Carolinian forests within the
Mixedwood Plains. Both forest types are heavily
used and in the latter, clearing for agriculture
began more than 300 years ago. Some of the most
endangered species are highly dependent on old-
growth forests. They include the pine marten in
Newfoundland, the prothonotary warbler and
Acadian flycatcher in Ontario, the woodland
caribou in the Gaspé region of Quebec, and the
spotted owl in British Columbia. (Recent research
in Newfoundland, however, indicates that it is the
forest structure that is important to the pine
marten, not the age of the forest stand. Thus,
consideration is being given to modifying
harvesting and silvicultural practices to
manipulate young stands to create the forest
structure preferred by the marten.)
The two most widespread forest species
at risk are the woodland caribou and wolverine.
Woodland caribou require mature or old-growth
coniferous forests, which are disappearing in
many areas of their range. Indeed, there is
considerable concern over caribou habitat loss
in Quebec, Ontario, Saskatchewan, Alberta and
British Columbia. Wolverines, on the other hand,
use a variety of forest habitats. However, like
grizzly bears, they are negatively affected by
low levels of disturbance, occur naturally in
Species diversity
Conservation of biological diversity11

Species diversity
Conservation of biological diversity12
low abundance, and have been heavily trapped
throughout the past century. Wolverines are
listed as endangered in Ontario, Quebec and
Labrador. In Alberta, where approximately
1 000 individuals are estimated to exist, they
are listed as vulnerable.
Population levels and changes over time for selected species and species guilds (1.2.2)
Species populations fluctuate in response to
many factors, often in combination. Therefore,
it is not always possible to attribute simple
cause and effect between such factors as habitat
and population.
The decline of woodland caribou in the
interior montane region of British Columbia
provides an example of the interactions among
species, habitat and functional relationships. In
that region, harvesting increased the amount of
food available in young regenerating forests
and resulted in an expanded moose population.
In turn, the larger moose population supported
an increase in wolves, which meant higher
predation rates and lower populations of caribou
than would have been expected based solely on
the remaining suitable habitat. An understanding
of this situation was made possible only by the
constant monitoring of all of the species in the
study area, and this amount of data is rare.
An important consideration is that all
forests are modified regularly by disturbances,
and species have adapted to those disturbances
(see Criterion 2 [Maintenance and enhancement
of forest ecosystem condition and productivity]).
For example, much of the boreal forest is
naturally composed of younger age classes,
so many boreal plants and animals inhabit
early successional forests.
While some species prefer mature stands,
a significant number of species benefit from
forest harvesting, including some of the large
ungulates (e.g., moose and elk) and many species
of passerine birds (e.g., yellow warbler and most
forest sparrows). Therefore, sustainable forest
use requires the monitoring of species and
communities in all forest age classes.
At specific study areas throughout the
country, individual species or groups of species
have been monitored for a number of years, or
there are indirect indices of their populations.
Examples include breeding songbirds, certain
furbearers (e.g., marten in Newfoundland),
and moose and deer in most provinces.
Ideally, a pool of species for each forest age
class would be chosen and monitored to report
on the functioning of an ecosystem. Criteria for
species selection would include: functional links
between species (e.g., predator and prey), body
size (to reflect various spatial scales), breeding
and feeding requirements, use of specialized
habitat features, trophic levels and possible
keystone roles (i.e., whether loss of the species
would have an impact on several other species).
Figure 1.2b (see page 14) lists the species
that could be monitored for the various forest
ages and ecozones. A more definitive list will
be developed following consultations with
wildlife biologists across Canada. Data exist
for the trees and most of the large-bodied
animals, and provincial agencies are beginning
to accumulate data for other species. However,
not all Canadian species have been identified
(especially invertebrates), and historical data
for most species are not available.
Forest harvesting operations concentrate on
coniferous species. As a result primarily of early

Species diversity
Conservation of biological diversity13
ECO
ZON
EA
NIM
ALS
PLA
NTS
Paci
fic
Mar
itim
e gr
izzl
y be
ar, w
olve
rine
,m
arbl
ed m
urre
let
Van
couv
er I
slan
dph
anto
m o
rchi
d,ye
llow
mon
tane
vio
let,
seas
ide
cent
iped
eer
min
e (Q
ueen
Cha
rlot
tem
arm
ot, s
pott
ed
cryp
tic
paw
lic
hen,
whi
te-t
op a
ster
lich
en, d
elto
idIs
land
’s p
opul
atio
n), K
een’
s ow
lol
dgro
wth
bals
amro
ot,
long
-ear
ed b
at, P
acif
ic
spec
kleb
elly
lic
hen,
prai
rie
lupi
negi
ant
sala
man
der,
Que
ense
asid
e bo
ne l
iche
nC
harl
otte
gos
haw
k
Mon
tane
gr
izzl
y be
ar, w
olve
rine
,ye
llow
-bre
aste
dsp
otte
d ow
l—
——
Cor
dill
era
Nut
tall
’s c
otto
ntai
l, fr
inge
d ch
at, w
hite
-hea
ded
myo
tis
bat,
pall
id b
at,
woo
dpec
ker
spot
ted
bat,
flam
mul
ated
ow
l
Gre
at L
akes
–so
uthe
rn f
lyin
g sq
uirr
el,
east
ern
Mas
sasa
uga
Kir
tlan
d’s
war
bler
broa
d be
ech
fern
,bl
unt-
lobe
d w
oods
ia,
spot
ted
St.
Law
renc
ea
woo
d tu
rtle
, red
-sho
ulde
red
ratt
lesn
ake
gree
n dr
agon
deer
berr
y, g
inse
ng,
win
terg
reen
haw
k, c
erul
ean
war
bler
,w
hite
woo
d as
ter
red-
head
ed w
oodp
ecke
r
Car
olin
ianb
sout
hern
fly
ing
squi
rrel
,ho
oded
war
bler
blue
rac
er s
nake
,S
hum
ard
oak,
A
mer
ican
che
stnu
t,cu
cum
ber
tree
,w
ood
turt
le, c
erul
ean
prot
hono
tary
co
mm
on h
op t
ree,
blue
ash
, Ken
tuck
yhe
art-
leav
edw
arbl
er, y
ello
w-b
reas
ted
war
bler
, Aca
dian
dwar
f ha
ckbe
rry,
coff
ee t
ree,
red
pl
anta
in, l
arge
chat
, pra
irie
war
bler
,fl
ycat
cher
Am
eric
an c
olum
bo,
mul
berr
y, g
inse
ng,
who
rled
pog
onia
,L
ouis
iana
wat
erth
rush
,br
oad
beec
h fe
rn,
bird
’s-f
oot
viol
et,
smal
l w
horl
edre
d-he
aded
woo
dpec
ker,
fals
e ru
e-an
emon
e,de
erbe
rry,
gol
den
pogo
nia,
spo
tted
grey
fox
, eas
tern
mol
efe
w-f
low
ered
clu
bse
al, n
oddi
ng p
ogon
ia,
win
terg
reen
, woo
dru
sh, g
reen
dra
gon,
purp
le t
way
blad
e,po
ppy,
dro
opin
gw
ild
hyac
inth
roun
d-le
aved
tril
lium
gree
nbri
ar, w
hite
woo
d as
ter
Bor
eal
Shi
eld
woo
dlan
d ca
ribo
u,w
oodl
and
cari
bou
coug
ar, w
olve
rine
——
—w
olve
rine
(w
este
rn(G
aspé
pop
ulat
ion)
(eas
tern
pop
ulat
ion)
,po
pula
tion
), G
aspé
shr
ewN
ewfo
undl
and
pine
mar
ten
1.2
aFo
rest
-dep
ende
nt s
peci
es b
y ec
ozon
e th
at a
re li
sted
by
COSE
WIC
as
vuln
erab
le,t
hrea
tene
d or
end
ange
red
(Con
tinu
ed o
n pa
ge 1
4)
Vuln
erab
leTh
reat
ened
Enda
nger
edVu
lner
able
Thre
aten
edEn
dang
ered

Species diversity
Conservation of biological diversity14
ECO
ZON
EA
NIM
ALS
PLA
NTS
Vuln
erab
leTh
reat
ened
Enda
nger
edVu
lner
able
Thre
aten
edEn
dang
ered
Bor
eal
Pla
ins
woo
dlan
d ca
ribo
u,w
ood
biso
n—
——
—w
olve
rine
Atl
anti
c so
uthe
rn f
lyin
g sq
uirr
el,
Bla
ndin
g’s
turt
leco
ugar
——
—M
arit
ime
Gas
pé s
hrew
, woo
d tu
rtle
(Nov
a Sc
otia
po
pula
tion
)
1.2
aFo
rest
-dep
ende
nt s
peci
es b
y ec
ozon
e th
at a
re li
sted
by
COSE
WIC
as
vuln
erab
le,t
hrea
tene
d or
end
ange
red
(con
tinue
d fro
m p
age
13)
ath
e G
reat
Lak
es–S
t. L
awre
nce
fore
st,
whi
ch i
nclu
des
the
nort
hern
port
ion
of t
he M
ixed
woo
d P
lain
s ec
ozon
e an
d th
e so
uthe
rn p
orti
on o
f th
e B
orea
l S
hiel
d ec
ozo
ne i
n ex
trem
e so
uthe
aste
rn M
anit
oba,
Ont
ario
and
Que
bec,
has
its
ow
n ch
arac
teri
stic
gro
up o
f sp
ecie
sb
the
Car
olin
ian
fore
st,
whi
ch i
s pa
rt o
f th
e M
ixed
woo
d P
lain
s ec
ozon
e in
ext
rem
e so
uthw
este
rn O
ntar
io,
has
a un
ique
and
cha
ract
eris
tic
gro
up o
f sp
ecie
s
ECO
ZON
EFO
REST
STA
GE
Paci
fic
Mar
itim
ebl
ack-
tail
ed d
eer,
Van
couv
er I
slan
d bl
ack-
tail
ed d
eer,
Que
en C
harl
otte
mar
bled
mur
rele
t, ta
iled
fro
g, P
acif
ic g
iant
mar
mot
, bla
ck b
ear,
Roo
seve
lt e
lk,
gosh
awk,
Pea
le’s
per
egri
ne f
alco
n, r
edsa
lam
ande
r, cl
oude
d sa
lam
ande
r, K
een’
sL
ewis
’woo
dpec
ker,
hair
y w
oodp
ecke
rcr
ossb
ill,
Yum
a m
yoti
s, P
acif
ic j
umpi
nglo
ng-e
ared
myo
tis,
spo
tted
ow
l, R
oose
velt
mou
seel
k, T
row
brid
ge’s
shr
ew, s
ilve
r-ha
ired
bat
Mon
tane
moo
se, m
ule
deer
, lyn
x, R
ocky
m
ule
deer
, gri
zzly
bea
r, re
d cr
ossb
ill,
Wil
liam
son’
s sa
psuc
ker,
Roc
ky M
ount
ain
Cor
dill
era
Mou
ntai
n el
k, b
lack
bea
r, no
rthe
rnfl
amm
ulat
ed o
wl,
Ham
mon
d’s
flyc
atch
er,
elk,
car
ibou
, mou
ntai
n ch
icka
dee,
sil
ver-
long
-ear
ed m
yoti
s, L
ewis
’woo
dpec
ker,
frin
ged
myo
tis,
wes
tern
sm
all-
foot
edha
ired
bat
, tai
led
frog
, whi
te-h
eade
dha
iry
woo
dpec
ker
myo
tis,
Coe
ur d
’Ale
ne s
alam
ande
rw
oodp
ecke
r
1.2
bAn
imal
indi
cato
r spe
cies
in fo
rest
eco
zone
s by
age
of s
tand
(Con
tinu
ed o
n pa
ge 1
5)
Youn
gM
atur
eO
ld g
row
tha

Species diversity
Conservation of biological diversity15
ECO
ZON
EFO
REST
STA
GE
Mon
tane
moo
se, l
ynx,
mul
e de
er, b
lack
bea
r,ca
ribo
u, g
rizz
ly b
ear,
mou
ntai
n ch
icka
dee,
cari
bou,
mar
ten,
bla
ck-b
acke
d w
oodp
ecke
r,C
ordi
ller
ago
lden
-cro
wne
d sp
arro
wre
d cr
ossb
ill
thre
e-to
ed w
oodp
ecke
r, sp
otte
d ow
l, (s
ubal
pine
)H
amm
ond’
s fl
ycat
cher
Bor
eal
Pla
ins
moo
se, w
apit
i, ly
nx, r
uffe
d gr
ouse
,ca
ribo
u, e
lk, g
rizz
ly b
ear,
flyi
ng s
quir
rel,
mar
ten,
woo
d bi
son,
bla
ck-b
acke
d(i
nclu
des
Alb
erta
hair
y w
oodp
ecke
r, sn
owsh
oe h
are
vari
ed t
hrus
h, b
arre
d ow
l, bo
real
chi
ckad
ee,
woo
dpec
ker,
bore
al o
wl,
thre
e-to
ed
Mon
tane
and
asp
enre
d cr
ossb
ill,
Coo
per’s
haw
k, w
olve
rine
,w
oodp
ecke
r, si
lver
-hai
red
bat
park
land
)lo
ng-e
ared
bat
Bor
eal
Shi
eld
moo
se, l
ynx,
sno
wsh
oe h
are,
ruf
fed
cari
bou,
nor
ther
n fl
ying
squ
irre
l, ba
rred
ow
l,m
arte
n, b
lack
-bac
ked
woo
dpec
ker,
(nor
th)
grou
se, h
airy
woo
dpec
ker
bore
al c
hick
adee
, red
cro
ssbi
ll, w
olve
rine
,th
ree-
toed
woo
dpec
ker,
bore
al o
wl,
long
-ear
ed b
at, r
ock
vole
silv
er-h
aire
d ba
t
Bor
eal
Shi
eld
moo
se, l
ynx,
sno
wsh
oe h
are,
ruf
fed
cari
bou,
red
cro
ssbi
ll, b
orea
l ch
icka
dee,
mar
ten,
bla
ck-b
acke
d w
oodp
ecke
r, (N
ewfo
undl
and)
grou
se, h
airy
woo
dpec
ker
oven
bird
grey
-che
eked
thr
ush,
mea
dow
vol
e
Gre
at L
akes
–m
oose
, whi
te-t
aile
d de
er, l
ynx,
fish
er, r
ed-s
houl
dere
d ha
wk,
red
cro
ssbi
ll,
mar
ten,
pil
eate
d w
oodp
ecke
r, si
lver
-S
t. L
awre
nce
bsn
owsh
oe h
are,
ruf
fed
grou
se, h
airy
C
oope
r’s h
awk,
bar
red
owl,
pile
ated
ha
ired
bat
, sou
ther
n fl
ying
squ
irre
l, w
oodp
ecke
rw
oodp
ecke
r, lo
ng-e
ared
bat
smal
l-fo
oted
bat
Car
olin
ian
cw
hite
-tai
led
deer
, gre
y fo
x, h
oode
dw
hite
-tai
led
deer
, woo
dlan
d vo
le, r
ed-
sout
hern
fly
ing
squi
rrel
, pro
thon
otar
yw
arbl
erbe
llie
d w
oodp
ecke
r, ce
rule
an w
arbl
er,
war
bler
, scr
eech
ow
lA
cadi
an f
lyca
tche
r
Atl
anti
c M
arit
ime
whi
te-t
aile
d de
er, l
ynx,
sno
wsh
oe h
are,
whi
te-t
aile
d de
er, B
ickn
ell’s
thr
ush,
red
m
arte
n, b
lack
-bac
ked
woo
dpec
ker,
hair
y w
oodp
ecke
rcr
ossb
ill
barr
ed o
wl
1.2
bAn
imal
indi
cato
r spe
cies
in fo
rest
eco
zone
s by
age
of s
tand
(con
tinue
d fro
m p
age
14)
a“o
ld g
row
th”
is d
efin
ed a
s st
ands
in
whi
ch t
here
is
a ne
t an
nual
los
s of
the
sta
ndin
g bi
omas
s of
mat
ure
tree
s; m
any
old-
gro
wth
spe
cies
are
als
o fo
und
in o
lder
mat
ure
fore
sts
bth
e G
reat
Lak
es–S
t. L
awre
nce
fore
st,
whi
ch i
nclu
des
the
nort
hern
port
ion
of t
he M
ixed
woo
d P
lain
s ec
ozon
e an
d th
e so
uthe
rn p
orti
on o
f th
e B
orea
l S
hiel
d ec
ozo
ne i
n ex
trem
e so
uthe
aste
rn M
anit
oba,
Ont
ario
and
Que
bec,
has
its
ow
n ch
arac
teri
stic
gro
up o
f sp
ecie
sc
the
Car
olin
ian
fore
st,
whi
ch i
s pa
rt o
f th
e M
ixed
woo
d P
lain
s ec
ozon
e in
ext
rem
e so
uthw
este
rn O
ntar
io,
has
a un
ique
and
cha
ract
eris
tic
gro
up o
f sp
ecie
s
Youn
gM
atur
eO
ld g
row
tha

Species diversity
Conservation of biological diversity16
logging practices, the distribution of some tree
species has been reduced, notably that of white
pine throughout eastern Canada (especially
Quebec), and hemlock and black spruce in
Ontario. Garry oak ecosystems have been
reduced substantially on Vancouver Island
and in the Georgia Depression.
Number of known forest-dependent species that occupy only a small portion of their former range (1.2.3)
“Small portion” can be defined as a reduction
of at least 50% in the range of a given species,
compared with its known historical range within
Canada (Figure 1.2c). Many species currently
occupy a small portion of their former range,
and most of the reductions result from habitat
loss. Other factors, such as hunting and trapping,
may also contribute to reduced distributions
of species.
Over the past 150 years, another important
factor has been temperature fluctuations. During
the warming trend that occurred from 1900 to
1940, an expansion was recorded in the ranges
of white-tailed deer, bobcat and grey fox in
Ontario; during the subsequent cooling period,
their ranges were reduced. The species named
in Figure 1.2c, however, are known to have
been affected primarily by habitat loss—through
clearing of forest lands for agriculture and
settlement—and by reductions in the amount
of forests in the older age classes.
Although all species at risk are discussed
in this indicator, some more common species also
are included. For example, in the eastern boreal
forests, the amount of black and white spruce
in older age classes has declined considerably.
In Newfoundland, white pine was heavily
harvested during the late 1800s and early 1900s
to meet the demands of the shipbuilding trade in
England. The species, which was never abundant
in Newfoundland, has not regenerated to its
former levels because of the blister rust—a pest
that continues to limit regeneration efforts even
today. Two years ago, the Government of
Newfoundland and Labrador established the
White Pine Advisory Group to protect and
increase the white pine on the Island. In Ontario,
white pine forests now support a harvest that is
75% smaller than the harvest in 1900. Currently,
the Government of Ontario is moving to maintain
some of the remaining old-growth red and white
pine forests in the province.
SummaryWith the exception of the Carolinian forest, the
vast majority of species in Canada’s forests are
not in danger of extinction. Most species use
young forests, and with proper planning to
maintain sufficient old-growth forests and the
habitat features needed by imperiled species,
Canada should be able to maintain all of its
forest species. Several approaches are being
taken to protect species that are becoming more
rare, including: developing management plans
to maintain and develop habitats; incorporating
ecosystem and species concerns into forest
planning; monitoring populations to ensure
that further declines do not occur; and protecting
species and their habitats from further destruction
due to poaching and development.

Species diversity
Conservation of biological diversity17
ECOZONE ANIMALS PLANTS
Pacific Maritime black-tailed deer, Roosevelt elk, Townsend’s Garry oak, yellow-chipmunk, Trowbridge’s shrew, Sitka mouse, cedarPacific jumping mouse, shrew-mole, Townsend’s big-eared bat, Yuma myotis bat, silver-haired bat,sharp-tailed snake, clouded salamander, varied thrush, ancient murrelet, Vaux’s swift,Peale’s peregrine falcon, Lewis’ woodpecker
Montane Cordillera Rocky Mountain elk, fisher, silver-haired bat, ponderosa pineYuma myotis bat, Townsend’s big-eared bat, gopher snake, tailed frog, Coeur d’Alene salamander, varied thrush, three-toed woodpecker, Williamson’s sapsucker, Lewis’ woodpecker, Vaux’s swift, mountain chickadee
Great Lakes– Canada lynx, wapiti, river otter, silver-haired bat, white pine, red pine,St. Lawrenceaa small-footed bat, brown snake, spring salamander, eastern hemlock,
pickerel frog, bald eagle, golden eagle, peregrine white spruce, wild falcon, Cooper’s hawk, great gray owl, barred owl, leek, autumn spruce grouse, black-backed woodpecker coral-root
Carolinianb bobcat, fisher, marten, river otter, woodland vole, all forest-dependentwild turkey, screech owl species
Boreal Shield silver-haired bat, barred owl, boreal owl, black- white pine, black backed woodpecker, three-toed woodpecker, spruce, white sprucegrey-cheeked thrush, red crossbill
Boreal Plains silver-haired bat, barred owl, boreal owl, black- green ash, white backed woodpecker, three-toed woodpecker, varied sprucethrush
Atlantic Maritime fisher, lynx, marten, barred owl, black-backed white pine, red pine,woodpecker, three-toed woodpecker red spruce, eastern
hemlock
1.2c Forest-dependent species by ecozone that occupy only a small portion of their formerrange (excluding species listed by COSEWIC)
a the Great Lakes–St. Lawrence forest, which includes the northern portion of the Mixedwood Plains ecozone and the southern portion of the BorealShield ecozone in extreme southeastern Manitoba, Ontario and Quebec, has its own characteristic group of species
b the Carolinian forest, which is part of the Mixedwood Plains ecozone in extreme southwestern Ontario, has a unique and characteristic group of species

Genetic diversity
Conservation of biological diversity18
ELEMENT 1.3GENETIC DIVERSITY
What are we measuring?Genetic diversity is the
assortment of genes that have
arisen in Canada’s native species
through generations of migration
and selection, and have enabled
those species to adapt to their
native environment.
This element describes the genetic diversity
of forest plants (mostly trees) in Canada and the
activities conserving that diversity. In situ (on-
site) conservation of genetic diversity is provided
by parks and other protected areas, genetic and
ecological conservation areas, reserved stands
and planned natural regeneration. Ex situ (off-
site) conservation measures include seed banks,
seed orchards, clonal archives (produced by
grafting or other means of asexual propagation),
provenance tests and arboretums.
How does genetic diversity relate tosustainable forest management in Canada?Genetic diversity is one of three levels
identified in most definitions of biodiversity.
The genetic diversity of Canada’s forests is truly
an inheritance from previous generations, and we
are responsible for passing it on unimpaired to
future generations.
Conserving genetic diversity is key
to ensuring that species retain their capacity
to evolve and adapt to change. It sustains the
productive capacity and resilience of
forest ecosystems, and it can be viewed as the
fundamental basis of the diversity of all species
and the ecosystems of which they are a part.
Sustainable forest management requires
a commitment by forest agencies to conserve
locally or regionally adapted populations of
Canada’s major commercial tree species using
a combination of in situ and ex situ approaches.
It also requires special conservation measures
for rare and endangered vegetation species. A
third key requirement is genetics research—an
understanding of gene–environment interactions
provides a basis for both commercial tree
improvement and endangered species conservation.
Conserving and managing genetic
diversity is a key element in operational forest
management planning. One task of foresters is to
ensure that seedlings thrive when planted in
harvested areas. They must track seed sources for
greenhouse- and nursery-grown seedlings, and
not plant them in areas where they will be
exposed to climatic conditions vastly different
from those experienced by their parents. Most
provinces have designated seed-transfer zones
for this purpose.
Foresters must also consider genetic
diversity in planning for natural regeneration.
In white pine stands, for example, it has been
found that “seed tree” cuts (i.e., where only
a few widely spaced mature trees remain in
harvested areas) do not allow sufficient cross-
pollination to avoid inbreeding and serious
growth loss in seedlings. Other silvicultural
systems, such as shelterwood cuts, are now
preferred for this species.
Ecosystemdiversity
Speciesdiversity
Geneticdiversity
Conservationof biological
diversity

Genetic diversity
Conservation of biological diversity19
What data are available?
Implementation of an in situ/ex situgenetic conservation strategy forcommercial and endangered forestvegetation species (1.3.1)
Canada’s major commercial softwood
species—white spruce, black spruce, jack pine,
balsam fir and lodgepole pine—all have high
levels of genetic diversity. Unlike tropical forest
trees, these species are pollinated by the wind
and do not require insects, birds or bats for cross-
pollination. However, many Canadian tree species
benefit when animals, such as squirrels, blue jays
and crossbills, spread their seeds.
It is thought that Canada’s most widespread
broadleaved tree species—trembling aspen—is
one the world’s most diverse plants. Aspen is
capable of both sexual and asexual reproduction.
Its habit of sprouting from its roots after major
disturbances (e.g., fires and harvesting) means
that numerous locally adapted and genetically
distinct clones are found throughout its range.
Certain aspen clones are likely the world’s largest
living organisms—a single root system extending
over tens of hectares may support thousands of
mature stems, all genetically identical.
Not all of Canada’s tree species have high
levels of genetic diversity. Red pine, for example,
is thought to have gone through a “genetic
bottleneck” during its evolutionary history.
That may be why this species is confined to a
relatively narrow ecological niche (i.e., sandy,
drought-prone soils with frequent ground fires).
Red spruce and western red cedar are
two examples of tree species that have been
successful in Canada’s forests despite lower
overall levels of genetic diversity. However,
they may be less able to adapt to harvesting
activities, and special silvicultural treatments
may be needed to retain viable populations
of these species in managed forests.
Although tree species in Canada’s Boreal
and Taiga ecozones are genetically diverse
and adapted to a wide range of environmental
conditions, other ecozones have tree species
with relatively narrow ecological ranges. For
example, several tree species, such as Sitka
spruce, Pacific silver fir, yellow-cedar and
red alder, are restricted to the Pacific Maritime
ecozone. Many of Canada’s threatened and
endangered forest vegetation species are found
in the Mixedwood Plains ecozone. These include
some tree species (e.g., blue ash, Shumard oak,
cucumber tree and Kentucky coffee tree) whose
ranges barely extend into the Carolinian forest
of extreme southern Ontario, and are found only
in restricted habitats throughout their ranges.
Several dozen more common tree species of
eastern North America have their northern limits
in the Mixedwood Plains and Atlantic Maritime
ecozones. Many of these species are pollinated
by animals, and may have complex and poorly
understood patterns of genetic diversity.
A framework for a national strategy
on forest genetic resource conservation and
management was developed at a November 1993
workshop that was attended by representatives of
industry and provincial and federal governments.
Certain elements of this strategy are in place, but
much work remains to be done.
Most provinces and territories do not have
a genetic conservation strategy in place, although
they have all established some elements of a
strategy (e.g., parks and other protected areas,
genetic conservation areas, reserved stands, seed

Genetic diversity
Conservation of biological diversity20
orchards, tree seed banks or provenance tests).
For example, British Columbia has surveyed
the species composition of its protected areas
to assess their ability to conserve the genetic
resources of the province’s conifers and to
identify conservation gaps.
The best examples of genetic conservation
areas in Canada are those for remnant red pine
populations in Newfoundland. Ideally, genetic
conservation areas would be designated across
the range of a particular tree species. Certain
management activities (e.g., prescribed fires
and selection harvesting) would be permitted
with a view to maintaining naturally regenerating
populations of species of interest.
The Mixedwood Plains ecozone is a special
genetic conservation priority. Less than 20% of
the native forest cover remains, largely owing to
forest land conversion for agricultural and urban
development, and less than 1% of the ecozone
is in highly protected areas. Conservation
stewardship programs on private lands are an
alternative to protected areas and are helping
protect many Carolinian plant species.
All provinces have ex situ facilities
(e.g., seed orchards and tree seed banks) that
are used primarily for breeding genetically
superior trees and providing seeds for faster-
growing or disease-resistant plantation stock
(Figure 1.3a). The trees found in seed orchards
can themselves be derived from either seed
or asexually propagated materials (e.g., clonal
seed orchards produced by grafting).
Provenance tests play a special role in
genetic conservation programs. Much of what
geneticists know about the relationship between
a tree’s genetic diversity and its ability to adapt
to environmental variation comes from these
long-term experiments. Ideally, carefully designed
plantations would be established across the range
PROVINCE/ PROVENANCE SEED ORCHARDS CLONAL SEED ARBORETATERRITORY TESTS SEEDLING CLONAL ARCHIVES BANKS
No of No of No of No of No of No ofprov. Area families Area clones Area archives Area seedlots species
Y.T. 40 – – – – – – – 108 –N.W.T. – – – – – – – – – –B.C. 511 297 156 11 1 729 200 12 302 85 7 520 25Alta. 226 35 450 14 298 9 736 4 3 722 –Sask. 399 29 104 9 162 10 678 2 130 –Man. 101 4 1 147 22 – – 1 147 2 1 989 –Ont. 2 757 305 7 354 778 1 772 515 5 831 – 4 852 38Que. 3 876 337 13 204 877 7 101 193 18 088 185 15 474 110N.B. 798 67 2 678 145 694 104 3 177 5 698 –N.S. 151 4 2 400 24 2 846 40 1 078 3 1 907 –P.E.I. 210 7 230 7 140 11 250 2 497 –Nfld. 547 45 400 25 400 14 650 14 65 –
CANADA 9 616 1 131 28 123 1 912 15 142 1 096 43 937 302 36 962 173
Source: Natural Resources Canada–Canadian Forest Service
1.3a Summary of ex situ conservation activities

Literature cited
Conservation of biological diversity
of a species, and seed would be collected from
a similar range. Knowledge of gene–environment
interactions derived from provenance tests can
guide in situ conservation efforts, as well as
tree breeding programs.
Provenance tests often reveal unique
genetic properties of populations at the margin
of a species’ range, including hybrids that may
form where ranges of closely related species
overlap. Valuable genetic properties may also
be found in populations growing on unusual
soil types (e.g., limestone ecotypes of white
spruce). Range-wide provenance tests often
cross provincial and even international borders.
All of the provinces are involved in provenance
tests, with as many as 12 native species under
study in a single province (e.g., Quebec).
SummaryGenetic diversity is fundamental for
populations of forest dwelling organisms
to be able to adapt to changing environmental
conditions, and as such, it underlies species
as well as ecosystem diversity.
Simple, practical measures can conserve
genetic diversity where it occurs naturally and
in ex situ settings, such as seed banks and seed
orchards. Governments and industry are applying
some of these measures, but coordinated forest
genetic conservation strategies are not yet in
place, either nationally or provincially.
A general description has been provided of
the nature of genetic diversity in Canada’s major
commercial tree species, and some conservation
priorities for threatened and endangered species
have been identified. Genetics research would
enable cost-effective conservation strategies
to be designed.
LITERATURE CITED
Canadian biodiversity strategy. 1994. Report
of the biodiversity working group. 52p.
Ecological Stratification Working Group. 1995.
A national ecological framework for Canada.
Agriculture and Agri-Food Canada, Research
Branch, Centre for Land and Biological
Resources Research; Environment Canada,
State of the Environment Directorate, Ecozone
Analysis Branch, Ottawa–Hull. (Report and
national map at 1:7 500 000 scale)
Lowe, J.J.; Power, K.; Marson, M. 1996. Canada’s
forest inventory 1991: Summary by terrestrial
ecozones and ecoregions. Natural Resources
Canada, Canadian Forest Service, Pacific
Forestry Centre, Victoria, B.C. Inf. Rep.
BC-X-364E.
Sturtevant, B.R.; Bissonette, J.A.; Long, J.N.
1996. Temporal and spatial dynamics of boreal
forest structure in western Newfoundland:
silvicultural implications for marten habitat
management. Forest Ecology and Management
87 (1996) 13-25.
CONTACTS
Biological diversity
Dr. Ole Hendrickson (Criterion coordinator)
Science Branch
Natural Resources Canada–
Canadian Forest Service
7th floor, 580 Booth Street
Ottawa ON K1A 0E4
Tel.: (613) 947-9026
Fax: (613) 947-9090
21

Contacts
Conservation of biological diversity22
Forest health
Dr. Wade Bowers
IUFRO Secretariat
Seckendorff-Gudent Weg 8
A–1131 Vienna
Austria
Botany and endangered wildlife
Dr. Erich Haber
National Botanical Services
604 Wavell Avenue
Ottawa ON K2A 3A8
Tel.: (613) 722-5523
Fax: (613) 722-6291
Ecosystem diversity
Mr. Harry Hirvonen
Science Branch
Natural Resources Canada–
Canadian Forest Service
7th floor, 580 Booth Street
Ottawa ON K1A 0E4
Tel.: (613) 947-9015
Fax: (613) 947-9035
Forest inventory
Dr. Steen Magnussen
Pacific Forestry Centre
Natural Resources Canada–
Canadian Forest Service
506 West Burnside Road
Victoria BC V8Z 1M5
Tel.: (250) 363-0712
Fax: (250) 363-0775
Wildlife
Dr. Ian Thompson
Great Lakes Forestry Centre
Natural Resources Canada–
Canadian Forest Service
1219 Queen Street East
P.O. Box 490
Sault Ste. Marie ON P6A 5M7
Tel.: (705) 949-9461
Fax: (705) 759-5700

CR ITER ION 2 .0
Introduction 25
Element 2.1 Incidence of disturbance and stress 25
Indicator 2.1.1 Area and severity of insect attack 26
Indicator 2.1.2 Area and severity of disease infestation 27
Indicator 2.1.3 Area and severity of fire damage 28
Indicator 2.1.4 Rates of pollutant deposition 31
Indicator 2.1.5 Ozone concentrations in forested regions 32
Indicator 2.1.6 Crown transparency in percentage by class 34
Indicator 2.1.7 Area and severity of occurrence of exotic species 35detrimental to forest condition
Indicator 2.1.8 Climate change as measured by temperature sums 35
Element 2.2 Ecosystem resilience 37
Indicator 2.2.1 Percentage and extent of area by forest type and age class 38See also Indicator 1.1.2
Indicator 2.2.2 Percentage of area successfully naturally regenerated and 38artificially regenerated
Element 2.3 Extant biomass 39
Indicator 2.3.1 Mean annual increment by forest type and age class 40
Indicator 2.3.2 Frequency of occurrence within selected indicator species 40(vegetation, birds, mammals and fish) See also Indicator 1.2.2
Additional reading 41
Contacts 43

Introduction
Ecosystem condition and productivity25
INTRODUCTION
Forests dominate the world’s terrestrial biosphere.
They cover 21% of the continental area, and
account for 76% of terrestrial biomass and 37%
of bioproductivity. Canada’s forests encompass
approximately half (417.6 million hectares) of
the country’s land area and represent 10% of the
world’s forests. Thus, the health and management
of Canada’s forests will contribute to maintaining
a viable global environment.
Biological elements that strongly influence
forest sustainability and conservation include
levels of disturbance and stress, ecosystem
resilience and extant biomass (biota). Biological
elements are regulated by a myriad of biological
processes operating through time and space
to govern how forest ecosystems function.
Appropriate measures of these elements indicate
whether ecosystems are functioning normally—
whether there is sufficient energy transfer,
nutrient cycling, recovery potential and
species productivity to ensure sustainability.
Element 2.1 (Incidence of disturbance
and stress) measures such influences as pollutant
deposition, insect and disease infestation, and
fire to determine their impact on Canada’s forest
ecosystems. Element 2.2 (Ecosystem resilience)
is a measure of the ability of forests to recover
from those disturbances, both naturally and
through such activities as planting and seeding.
Element 2.3 (Extant biomass) explores the
condition of the forest in terms of the biomass
production of all species and types, including
rarer species.
ELEMENT 2.1INC IDENCE OF DISTURBANCEAND STRESS
What are we measuring?Sources of disturbance and stress
include insects, diseases, fires,
pollutants, ozone and exotic
pests. These sources may act
alone or in concert to influence
the development, structure and
functioning of forest ecosystems. Climate
change interacts with these disturbances to
further impact on the condition and productivity
of forests. Human activities also influence the
condition and productivity of forests. Element 3.1
(Physical environmental factors) and Element 4.2
(Forest land conversion) provide information on
some of these activities.
Historically, provincial disturbance and
stress data were reported nationally through
the cooperative efforts of the Forest Insect and
Disease Survey of Natural Resources Canada–
Canadian Forest Service (CFS), the provinces
and other agencies. In the future, national
assessments of forest health will be achieved
CR ITER ION 2 .0
MAINTENANCE AND ENHANCEMENT OF FORESTECOSYSTEM CONDITION AND PRODUCTIVITY
Ecosystemcondition andproductivity
Soil and waterconservation
Globalecological
cycles
Multiplebenefits
Society’sresponsibility
Conservation of biological
diversity
Ecosystemcondition andproductivity
Disturbanceand stress
Ecosystemresilience
Extantbiomass

Disturbance and stress
Ecosystem condition and productivity26
through negotiated partnerships and alliances
with the provinces and other agencies. In
particular, the CFS will work with the provinces
to compile disturbance information from across
the country, to improve mapping capabilities,
and to enhance national databases.
How does the incidence of disturbanceand stress relate to the sustainability of Canada’s forests?Disturbances and stress strongly influence the
health, vitality and productivity of forests, and
they are fundamental to the maintenance and
enhancement of forest ecosystems. Maintaining
ecosystem integrity and forest health is essential
for the sustainable management and conservation
of our forests.
The nature, extent and impact of
disturbances on forested ecosystems are all
highly variable. Natural and human-induced
disturbances both occur as a continuum, and
they may range in size, severity, duration and
frequency. While most disturbance and stress
events are fundamental to the recovery and
maintenance of forested ecosystems, others
may impede resilience, impact on extant biomass,
or alter patterns and processes, leading to new
successional trends. Forest ecosystems are never
static; rather, they are constantly changing
through the cycle of death and renewal.
Measuring the disturbance and stress
caused by biotic (e.g., insects and disease) and
abiotic (e.g., wind and ice) factors provides a
basis for sustainable forest management. For
example, improved decision making and sound
policy decisions require knowledge of the effects
of disturbance and stress on forest condition and
productivity, the ability to forecast disturbances,
and greater predictive powers.
What data are available?
Area and severity of insect attack (2.1.1)
Insects and diseases remain the dominant
causes of natural disturbances in most of
Canada’s forests, and their distribution is
largely influenced by the nature of those forests.
The provinces collect disturbance data primarily
by forest districts, and historical databases for
major insects date back to 1936.
Figure 2.1a shows the areas infested with
two important defoliators—spruce budworm
(Choristoneura fumiferana) and forest tent
caterpillar (Malacosoma disstria)—from 1976
to 1994. These areas are quantified as having
moderate to severe defoliation.
The population dynamics of these insect
species varies considerably, as does the extent
and nature of their impacts on forests. Spruce
budworm occurs predominantly in the boreal
forest region, from the Northwest Territories
Source: Natural Resources Canada–Canadian Forest Service
Areas infested with sprucebudworm and forest tent caterpillar
million hectares
2.1a
0
10
20
30
40
50
Spruce budworm Forest tent caterpillar
1994199119881985198219791976

Disturbance and stress
Ecosystem condition and productivity
to Newfoundland, but most tree mortality
occurs east of the Manitoba–Ontario border.
The budworm has been particularly significant
in the Atlantic Maritime ecozone; currently,
however, populations are low and few areas
are affected.
The forest tent caterpillar also is widely
distributed from coast to coast and is a serious
pest of trembling aspen. In 1994, moderate to
severe defoliation encompassed 785 000 hectares
of forests in Ontario.
One of the most destructive forest insects
in western Canada is the mountain pine beetle
(Dendroctonus ponderosae), which principally
attacks lodgepole pine in the montane forests
of Alberta and British Columbia. Unlike the
spruce budworm, which kills trees only after
consecutive years of severe defoliation, the
mountain pine beetle can kill trees in just one
year. In 1984, moderate to severe defoliation in
British Columbia occurred over 483 000 hectares;
however, since 1985, defoliation has been limited
to less than 50 000 hectares (Figure 2.1b).
Two other insects—hemlock looper
(Lambdina fiscellaria) and jack pine budworm
(Choristoneura pinus pinus)—are both highly
destructive and also are capable of causing
severe and extensive mortality in less than
a year. In 1994, the hemlock looper caused
moderate to severe defoliation on approximately
20 000 hectares, and the jack pine budworm, on
420 000 hectares.
Area and severity of disease infestation (2.1.2)
Native diseases often are chronic, and with
the exception of some foliage diseases, they
are slow in manifesting their effects on trees
and ecosystems. However, the average annual
tree mortality and growth loss from diseases
in Canada amounts to 51.2 million m3, which
is equivalent to 29% of the total annual harvest.
Two non-native diseases of concern—in
addition to the diseases listed in Figure 2.1c—
are scleroderris canker (Gremmeniella abietina)
and Dutch elm disease (Ophiostoma ulmi and
Ophiostoma novo-ulmi). Figure 2.1d illustrates
the location of the canker, which is found most
commonly east of Manitoba. Dutch elm disease
is transmitted by elm bark beetles and is reported
throughout Canada, with the exception of
British Columbia, Alberta and Newfoundland.
There is a need to gather and report on
disease infestations by ecozone and to maintain
adequate data coverage.
27
Source: Natural Resources Canada–Canadian Forest Service
Area infested with mountain pine beetle
thousand hectares
2.1b
0
100
200
300
400
500
19941985198219791976 1988 1991

Disturbance and stress
Ecosystem condition and productivity28
Area and severity of fire damage (2.1.3)
Wildland fire consumes nearly as much wood
in Canada as is harvested, and it constitutes a
dominant ecological and environmental
disturbance. Fire management accounts for
16% of the annual cost of forest management
($386 million of the $2.4 billion spent per year),
yet it is neither physically possible, ecologically
desirable, nor economically feasible to prevent
fires in forest ecosystems. In assessing the effects
of wildland fires, the following indirect measures
are used: fire occurrence, fire environment (i.e.,
weather, fuels and topography), area burned, fire
management expenditures and fire severity (i.e.,
the magnitude of significant negative impacts on
other systems).
North American strain
European/North American strain
Source: Natural Resources Canada–Canadian Forest Service
Quebec
Ontario
Nova Scotia
New Brunswick
Newfoundland and Labrador
Prince Edward Island
Distribution of scleroderris canker in eastern Canada, 1977–1993 2.1d
DISEASE TREE GROWTHMORTALITY LOSS—— thousand m3 ——
Hypoxylon canker 3 107 –(Hypoxylon mammatum)
Dwarf mistletoe – 1 819Maple decline 1 689 1 596White pine blister rust – 84
(Cronartium ribicola)Root rot 8 020 669Stem and root decays – 30 924Dieback 3 168 –Abiotic losses 102 –
TOTAL 16 086 35 092
Source: Natural Resources Canada—Canadian Forest Service
2.1c Average annual depletions causedby major forest diseases andabiotic factors, 1982–1987

Disturbance and stress
Ecosystem condition and productivity29
The fire environment controls the fire
behaviour (i.e., rate of spread and intensity),
which in turn affects the difficulty of control.
During the fire season, national maps of fire
danger and behaviour indices are produced daily;
however, no systems have been put in place to
integrate the spatial and temporal distribution of
this environmental information, nor to evaluate
the severity of the fire season.
The following systems are affected by
wildland fires: ecosystems (i.e., area burned
and fire severity), geosystems (i.e., area subject
to erosion), atmosphere (i.e., smoke emissions),
fire management (i.e., interagency resource
sharing and costs), forest management (i.e.,
wood loss and value) and society (i.e., evacuations,
deaths and injuries, and economic losses).
Over the past 10 years, an average of
9 600 fires per year have burned 2.9 million
hectares in Canada (0.6% of the total forested
land). On average, one-quarter of the area
burned has been commercial forests (0.4%
of the commercial forest land).
Figure 2.1e shows the annual variability
in forest fires. Since 1960, the number of forest
fires and the area burned have both increased
dramatically. For example, the number of fires
recorded between 1960 and 1995 was 60% higher
than the total for 1920–1960. This increase may
reflect the mounting pressures on our forests
that are associated with population growth.
Although the area burned appears to have
jumped substantially since 1980, statistics prior
to that date only included full-suppression fires.
(The response to forest fires ranges from full
suppression, in which adequate resources
are allocated to suppress the fire quickly, to
modified suppression, in which fewer resources
are allocated.) Currently, modified-suppression
fires, which represent 6.5% of all fires, account
for 60% of the total area burned.
Source: Natural Resources Canada–Canadian Forest Service
Annual variability of forest fires in Canada
million hectares
2.1e
1920
Number (thousand fires) Area burned (million hectares)
thousand fires
1940 1950 1960 1970 1980 1990 199619300
1
2
3
4
5
6
7
8
0
2
4
6
8
10
12
14

Disturbance and stress
Ecosystem condition and productivity30
Figure 2.1f indicates that 91.5% of fires
burn less than 10 hectares each. Although just
1.5% of fires exceed 1 000 hectares, they account
for 93.1% of the total area burned in Canada.
Large fires occur in all ecozones, but
not in agricultural or arctic regions. Figure 2.1g
shows the distribution of large fires across
Canada during the 1980s.
People start 58% of all fires in Canada,
but those fires consume only 15% of the total
area burned, whereas lightning starts 42% of
fires and accounts for 85% of the area burned
(Figure 2.1h).
11- Arctic Cordillera12- Northern Arctic13- Southern Arctic14- Taiga Plains15- Taiga Shield16- Boreal Shield17- Atlantic Maritime18- Mixedwood Plains19- Boreal Plains10- Prairies11- Taiga Cordillera12- Boreal Cordillera13- Pacific Maritime14- Montane Cordillera15- Hudson Plains
Distribution in Canada of fires exceeding 200 hectares by ecozone, 1980–1989 2.1g
Source: Natural Resources Canada–Canadian Forest Service
10
9
6 6
5
15
5
3 24
12
14
11
332
7
8
6
2
2
13
1
2
Source: Natural Resources Canada–Canadian Forest Service
Fires and area burned by size classand percent
2.1f
Fires Area burned
>10 000
100–1 000
10–100
1–10
<1
hectares
0 10 20 30 40 50 60 70 80
1 000–10 000
percent

États-Unis
Nouvelle-Écosse
Nouveau-Brunswick
Île-du-Prince-Édouar
Terre-NeuveetLabrador
QuébecManitoba
ritoires durd-Ouest
10
5
5
Ontario
20
20
2.1i Amount of nitrate deposition (kg/hectare/year), 1990–1993
Disturbance and stress
Ecosystem condition and productivity31
Rates of pollutant deposition (2.1.4)
Pollution, acting alone or in combination with
other stressors, affects ecological systems in
general and forests in particular. Two of the
most common types of air pollutants in Canada’s
forest ecosystems are sulphur dioxide (SO2) and
nitrogen oxides (NOx), along with their oxidation
products: sulphuric acids and nitric acids. The
Canadian Air and Precipitation Monitoring
Network (CAPMON) and the provinces have
been providing data on these pollutants from
11 sites for more than 13 years.
Pollutants impact on forest ecosystems via
dry and wet deposition pathways. Dry deposition
is very costly to measure and is usually calculated
from available air concentrations of sulphur
dioxide (SO2), particulate sulphate (SO4),
nitric acid (HNO3), particulate nitrate (NO3)
and ammonia (NH4). Air concentrations of
Source: Canadian Interagency Forest Fire Centre
Comparative fire statistics
%
2.1h
Total fires Total area burned
0
20
40
60
80
100
Lightning-caused
fires
People-caused
fires
Full-suppression
fires
Modified-suppression
fires
Note: The contour lines indicate the average wet nitrate depositions that occur within the areas delineated. A dotted line is used to indicate estimated amounts.
Source: Environment Canada

Disturbance and stress
Ecosystem condition and productivity32
these pollutants are generally greatest in the
Mixedwood Plains ecozone (located in southern
Ontario) and decrease with distance east, west
and north. Figure 2.1i depicts the distribution
of NO3 for the period 1990–1993.
Wet deposition includes precipitation in
the form of rain, snow and fog; it is commonly
referred to as “acid rain.” Despite substantial
progress in reducing SO2 emissions, both
unilaterally and in cooperation with the United
States (USA), acid rain remains a threat to forest
ecosystem condition and productivity in the
Boreal Plains, Mixedwood Plains and Atlantic
Maritime terrestrial ecozones. For example, the
condition of maples and birches is deteriorating
in portions of the two latter ecozones, where wet
deposition is the highest. Figure 2.1j depicts the
distribution of wet SO4 for the period 1990–1993.
Forest ecosystem sensitivity to acid
deposition is dependent on a number of
factors, including physical and chemical
soil characteristics. Research to determine
the critical loads of acid deposition for forest
soils is nearing completion.
The need to understand pollution–
forest interactions is paramount in view of
the increasing evidence linking the long-term
effects of acid deposition to the disruption of
biogeochemical processes and the decline of
annual forest biomass and accumulation.
Ozone concentrations in forested regions (2.1.5)
Tropospheric or ground-level ozone may
adversely affect the metabolic systems of
plants, and when present in the atmosphere
at or above critical levels, it is known to be
phytotoxic to trees. Plant exposure to ozone
that exceeds 2–3 times background levels
over a number of growing seasons may result
Manitoba
United States
Nova Scotia
NewBrunswick
Prince Edward Island
10
10
20
Quebec
30
30
NewfoundlandandLabrador
Ontario
2.1j Amount of wet sulphate deposition (kg/hectare/year), 1990–1993
Note: The contour lines indicate the average wet sulphate depositions that occur within the areas delineated. A dotted line is used to indicate estimated amounts.
Source: Environment Canada

10
50
Nova Scotia
NewBrunswick
Quebec
Manitoba
rthwestrritories
10
50
Prince Edward Island
Ontario
7575
100 150
20 10
NewfoundlandandLabrador
United States
2.1k Distribution of average hours with ozone exceeding 82 parts per billion, 1986–1993
Disturbance and stress
Ecosystem condition and productivity33
in changing patterns of carbon allocation,
premature defoliation, and loss of plant
productivity. Ecosystem structure and
function also may be altered, depending
on the sensitivities of different species.
Federal and provincial ozone-
monitoring agencies have been collecting
hourly ozone concentration data since 1980. This
information is reported by Environment Canada’s
Environmental Protection Service. Data are
currently available from 153 sites, 112 of which
are considered “urban” and 41, “rural.” (Ozone
is a regional-scale pollutant subject to long-range
transport. For this reason, data from 120 rural
U.S. sites also are used in the mapping of ozone
concentrations in Canada.) Figure 2.1k shows
the ozone concentration levels in eastern
Canada from 1986 to 1993.
The current National Ambient Air Quality
Objective for Ozone and Vegetation is set at 82
parts per billion ozone per hour, above which
plants are predicted to suffer injury. Forests
in four terrestrial ecozones (Atlantic Maritime,
Mixedwood Plains, Pacific Maritime and Boreal
Shield) have been exposed to concentrations of
ozone above this critical level. And at some
health-monitoring plots in eastern and western
Canada, ozone-like symptoms have been detected
in white pine. Declines are also occurring in areas
with sugar maple and white birch where critical
levels have been exceeded.
There are too few monitoring stations
in forested ecozones west of Ontario to permit
regional-scale mapping of ozone concentrations.
However, in 1996, passive ozone monitors were
introduced to allow for an initial assessment
of ozone concentrations throughout selected
forested areas.
Note: The contour lines indicate the average hourly concentrations of ozone that occur within the areas delineated.
Source: Environment Canada

Disturbance and stress
Ecosystem condition and productivity34
Crown transparency in percentage by class (2.1.6)
A number of factors can be used to assess
the health of trees. Crown transparency, in
combination with dieback, is one of the most
commonly used indicators for assessments of
the condition of hardwood crowns. Defoliation
is the more frequently used indicator for
assessments of conifer crowns.
“Transparency” is defined as the amount
of skylight visible through the foliated portion
of the crowns of dominant and co-dominant
trees. A crown transparency of less than 25%
is considered normal for a healthy sugar maple,
for example, while a higher transparency may
indicate significant stress. Incidence of crown
deterioration in sugar maple and other broad-
leaved trees is known to signal a trend toward
decreasing growth and productivity. Transparency
data acquired from the North American Maple
Project, which involves more than 200 sites
in eastern North America, indicate that high
transparency values occurred in 1988 and
1989 (Figure 2.1l); Quebec levels were
particularly high in 1988.
“Dieback” is defined as branch mortality
that begins at the terminal portion of a branch
and progresses downward. Figure 2.1m illustrates
the frequency of dieback for sugar maples in
Canada from 1988 to 1993. Dieback and
transparency data indicate that the health of
maple trees in Ontario, Quebec, New Brunswick
and Nova Scotia has generally improved since
1989; however, isolated areas of decline persist.
Future reporting on forest health will
employ a range of variables, including crown
transparency, dieback and defoliation. In 1996,
the CFS Forest Health Network began a pilot
study to develop more extensive monitoring
and improve crown rating schemes.
Source: Natural Resources Canada–Canadian Forest Service
Moderate and high levels of dieback for sugar maple in Canada
% trees
2.1m
16–35% dieback >35% dieback
1993199219911990198919880
1
2
3
4
5
6
Source: Natural Resources Canada–Canadian Forest Service
Moderate and high levels oftransparency for sugar maplein Canada
% trees
2.1l
16–35% transparency
>35% transparency
1993199219911990198919880
10
20
30
40
50
60
70
80

Disturbance and stress
Ecosystem condition and productivity35
Area and severity of occurrence of exotic species detrimental to forest condition (2.1.7)
For the past 50 years, the Forest Insect and Disease
Survey has been collecting detailed information
on various pests in Canada. Approximately 400
exotics (non-native species) are known to attack
woody plants in this country and the continental
USA, including balsam woolly adelgid (Adelges
piceae), pine shoot beetle (Tomicus piniperda),
beech scale (Cryptococcus fagisuga) and gypsy
moth (Lymantria dispar).
The vast majority of these pests are insects
and diseases that arrived accidentally in North
America over the past 100 years, primarily via
the shipping containers and packaging used for
forest and agricultural products. Largely in
response to the introduction of these pests in the
early 1900s, the CFS has developed biological
control programs and survey systems for
detecting and monitoring exotics in forested
ecosystems. Moreover, Agriculture and Agri-food
Canada has established strict regulations to control
the entry and movement of plant and animal
materials into and within this country.
The scarcity of taxonomic expertise is
a major impediment to addressing the threats
from exotics. Effective partnerships between
federal and provincial departments also will
be required to provide early detection and
response to exotics and to maintain the long-
term sustainability of our forested ecosystems.
The current efforts to monitor import sites are
one example of such partnerships.
Climate change as measured bytemperature sums (2.1.8)
Climate change as indicated by temperature
is a major factor determining the sustainability
of Canada’s forests. It influences the range
of tree species and affects the growth and
productivity of forests. Climate also plays a
role in disturbances (e.g., fires and drought)
that affect forest ecosystems, and thus it could
have major implications for the long-term
sustainability of our forests.
Figure 2.1n outlines changes in the mean
annual temperatures of three regions of the boreal
forest between 1895 and 1994, as well as changes
in the 10-year mean annual temperatures of those
regions. The Northeastern Forest includes much
of the Canadian Shield, as well as the Hudson
Bay Lowlands. The Northwestern Forest stretches
from the northern boundary of the Prairies to the
Mackenzie District, and from the foothills of
the Rocky Mountains to the Manitoba–Ontario
border. And the Mackenzie District takes in a
major portion of the Mackenzie River drainage
basin, including the Great Bear and Great Slave
lakes. Over the past century, the general trend
has been toward increasing temperatures: the
Northeastern Forest has recorded an overall
warming trend of approximately 0.5ºC; the
Northwestern Forest, 1.4ºC; and the Mackenzie
District, 1.7ºC.
Moisture is another key climate element
influencing growth, productivity, species range
and disturbances (e.g., fires, insects and diseases).
As such, it too impacts on the sustainability of
our forests.
In future assessments of forest health,
a combination of temperature and moisture
indices will be used to more fully describe
climate change and trends in the forest
regions of Canada.

Disturbance and stress
Ecosystem condition and productivity36
Source: Carbon Dioxide Information Analysis Center
Temperature deviations in three regions of the boreal forest
° C
2.1n
Mean annual temperature 10-year mean annual temperature
-2.5
-2.0
-1.5
-1.0
-0.5
0
0.5
1.0
1.5
2.01955194519351925191519051895 19751965 19941985
-3.0-2.5-2.0-1.5-1.0-0.5
00.51.01.52.02.53.03.5
Northeastern Forest
Northwestern Forest
-3.5-3.0-2.5-2.0-1.5-1.0-0.5
00.51.01.52.02.53.0 Mackenzie District
1955194519351925191519051895 19751965 19941985

Ecosystem resilience
Ecosystem condition and productivity37
SummaryHealthy forest ecosystems are essential to
the sustainability of forests. In a living system,
normal functioning implies appropriate levels
of health, vitality and productivity of the
various components.
Pollutants, fires, unfavourable climatic
conditions, and infestations by insects and diseases
often interact to stress forests. Measuring and
reporting on the severity and extent of disturbances
and stress provide an important ecological measure
of the condition, productivity and overall health
of forest ecosystems.
Canada’s forests are generally healthy,
and few large-scale declines have been observed.
Tree mortality (caused primarily by competition
and natural thinning) ranges from 1–3% annually;
although the effects of insects, diseases and
windstorms occasionally cause higher rates
of mortality. Recent findings in eastern North
America, however, suggest that the long-term
impact of acid deposition, and possibly ozone
concentrations, may lead to the degradation
of forest ecosystems.
Data gathered through a national
monitoring system and a directed research
program will provide information on major
forest stressors and on the changes occurring
—or anticipated—in the health of our forests.
The resulting knowledge will enable Canada to
contribute to the stewardship of forest ecosystems,
most notably by enhancing forest management
regimes, assessing the impacts of pollutants on
forests, and integrating non-timber values into
forestry decision making.
ELEMENT 2.2ECOSYSTEM RESIL IENCE
What are we measuring?Evolution has provided forest
ecosystems with elaborate
mechanisms for recovery from
disturbances. This capacity for
recovery may be described in
terms of resilience (return time)
and is a measure of the ability
of ecosystems to maintain their
integrity despite perturbations.
To date, no common method exists for
determining resilience. Return time following
disturbances can be measured experimentally
in two ways. First, it can be assessed by the
time it takes for populations to return to some
pre-disturbance condition. However, a serious
gap in this approach is the difficulty in
determining when a population has recovered.
A second measure of resilience is to estimate
variability in population densities. (Greater
resilience implies a greater tendency for
populations to move toward mean densities.)
A variation on the second method is to estimate
resilience using energy and nutrient flows through
different functional groups in the community.
In this report, the resilience of Canada’s
forest ecosystems will be determined, in part,
using the first method—measuring the successful
regeneration of areas harvested since 1975.
How does ecosystem resilience relate to the sustainability of Canada’s forests?Resilience reflects the persistence of ecosystems
and their capacity to absorb changes and
Ecosystemcondition andproductivity
Disturbanceand stress
Ecosystemresilience
Extantbiomass

Ecosystem resilience
Ecosystem condition and productivity
disturbances while maintaining productivity
levels and relationships among populations.
Ecosystems with greater regenerative capacity
and a balanced distribution of forest types and
age classes are considered to be more resilient
and therefore more sustainable.
What data are available?
Percentage and extent of area by forest type and age class (2.2.1)
This indicator is discussed under Indicator 1.1.2
(Percentage and extent of area by forest type and
age class).
Percentage of area successfully naturally regenerated and artificiallyregenerated (2.2.2)
The most widely used silvicultural system in
Canada is clearcut harvesting, which creates
open environments that favour seedling growth.
Most of our forests are even-aged and comprise
species that regenerate following major
disturbances, such as fire and clearcut harvesting.
Since 1975, other harvesting techniques
have been used increasingly in some regions
of Canada. For example, in 1992, selection
harvesting accounted for approximately 8% of
the total area harvested. This technique creates
relatively small openings in the forest canopy,
which allow for continuous regeneration, and it
is commonly used in uneven-aged forest stands.
In Canada, 60% of harvested areas are
left to regenerate naturally. Although harvesting
systems encourage this process, on the remaining
40% of harvested areas, planting and direct
seeding are carried out to hasten regeneration.
Regeneration efforts increased substantially in
the 1980s, peaking in 1991 at approximately
460 000 hectares of Crown land. (Planting
accounted for roughly 90% of that area;
the remaining land was regenerated by other
methods, such as aerial seeding.) In the early
1990s, when planting and seeding programs
had largely eliminated the backlog of treatable
understocked sites across the country, several
provincial forest management agencies began
scaling back their planting programs.
A significant proportion of recently
harvested areas will always be reported
as understocked because a time lag occurs
between harvesting and the observable results
of silvicultural treatments (e.g., planting and
seeding) or natural forest stand development.
This lag is evident in Figure 2.2a, which
illustrates the regeneration status in 1992 of
the areas harvested since 1975. However, the
figure also shows that silvicultural programs
ensured the successful regeneration of
90% of sites within 10 years of harvesting.
38
Source: National Forestry Database, REGEN
Regeneration status
% of sites
2.2a
0
20
40
60
80
100
2 4 6 8 10 1412 16 18
Successful regeneration
years since harvest

Extant biomass
Ecosystem condition and productivity39
The data for this element are derived
from the National Forestry Database Program
(NFDP) REGEN project. The NFDP, which
collects and reports on regeneration following
harvesting on provincial Crown lands, is currently
working to extend REGEN to report on private
lands. Information on the regeneration status
of those forest lands will be reported in the future.
SummaryMaintaining the health and productivity of forest
ecosystems is one important prerequisite to sound
stewardship and the sustainable development of
forest land. Evidence that forests are resilient
and therefore persistent implies that the integrity
of the forests is being maintained.
Regeneration of forest lands following
human activity, such as harvesting, is a good
indication of the sustained productivity of forest
ecosystems. In Canada, the vast majority of
harvested areas regenerate successfully.
ELEMENT 2.3EXTANT BIOMASS
What are we measuring?Forest condition is a measure
of relative freedom from stress
(health) and relative level of
physical/biological energy
(vitality) within a forest ecosystem.
Biomass represents the mass of
living organisms inherent in an
ecosystem and is considered a measure of
forest ecosystem condition. “Forest ecosystem
condition” refers to the condition of the forest
in terms of all species and types, and it includes
the ability of ecosystems to support rarer species.
As such, extant biomass is an integrating
measure of forest ecosystem condition and
is a reliable indicator of net performance
(biomass accumulation), as well as trophic
status. Increased trophic web complexity is
associated with increased ecological stability.
Thus, there are reciprocal relationships between
ecosystem resilience (Element 2.2 [Ecosystem
resilience]) and rates of accumulation of biomass,
disturbance and stress (Element 2.1 [Incidence of
disturbance and stress]).
The mean annual increment (MAI) is
the average net annual increase in the yield
(expressed in terms of volume per unit area)
of living trees to a given age, and is calculated
by dividing the yield of a stand of trees by its
mean age. The MAI is dependent on a number
of factors, including climate and elevation,
soil conditions and forest management practices.
MAI is a measure of the net biomass production
of the forest and can be used to indicate its
productivity. However, production loss due to
mortality, insects and diseases is not included;
therefore, total growth before losses generally
is considerably larger than net growth.
How does extant biomass relate to thesustainability of Canada’s forests?A measure of the frequency of biota occurrence
within selected indicator species, in combination
with a measure of MAI by forest type and age
class, provides a reliable measure of forest
ecosystem condition. A forested ecosystem
that is healthy, vital and self perpetuating is
considered to be functioning normally. The
sustainable development of an ecosystem
implies normal functioning over the long term.
Ecosystemcondition andproductivity
Disturbanceand stress
Ecosystemresilience
Extantbiomass

Extant biomass
Ecosystem condition and productivity40
What data are available?
Mean annual increment by forest type and age class (2.3.1)
The ideal source of information for this
indicator would be tree measurements taken
every 5–10 years on permanent sample plots
located in a variety of forest conditions.
This would reveal changes over time in forest
ecosystem productivity, health and vitality. Such
information exists regionally, but is not available
in a format suitable for national reporting.
Measures of forest ecosystem productivity may
be enhanced for future editions of this report.
The MAI from the national forest inventory
database is being used for the purposes of this
report. This MAI was calculated for stands
at the time of maturity, and thus is a long-term
average that may differ from the current growth
rate of our forests. For now, the inventory data
serve as a general overview of growth rates in
Canada’s ecozones, based on the most current
inventory area and the calculated MAI
at maturity.
Analysis of MAI by ecozone (Figure 2.3a)
indicates that the northernmost ecozone with
forests (Southern Arctic) has the lowest MAI
(0.2 m3/ha/yr), and the second lowest MAI
(0.8 m3/ha/yr) is in the mountainous area at the
Yukon Territory–Northwest Territories border
(Taiga Cordillera). That is expected, given the
climate and short growing season in those areas.
The Pacific Maritime ecozone on the west coast
of British Columbia—an area known for its
long growing season and favourable climatic
conditions—has the highest MAI (2.45 m3/ha/yr).
The forest type information has been
expanded to include predominant genus because
MAI varies more by species than by forest type.
This will give a better measure of the variety
of species and their rate of growth. Figure 2.3b
shows that poplar has the fastest growth rate
in four ecozones; spruce in three; pine in two;
and fir, birch and larch in one each.
Frequency of occurrence within selectedindicator species (vegetation, birds,mammals and fish) (2.3.2)
This indicator is discussed under Indicator 1.2.2
(Population levels and changes over time for
selected species and species guilds).
SummaryMAI is a measure of the net biomass production
of a forest. Canada’s forests can be broken down
into three broad types. The MAI of our softwood
forests, which are composed of such species
as fir, spruce and pine, indicate that they are
Source: Canada’s Forest Inventory*
Net mean annual increment by ecozone
m3/hectare/year
2.3a
0 0.5 1.0 1.5 2.0 2.5
Southern ArcticTaiga PlainsTaiga Shield
Boreal ShieldAtlantic Maritime
Mixedwood PlainsBoreal Plains
PrairiesTaiga Cordillera
Boreal CordilleraPacific Maritime
Montane CordilleraHudson Plains
*relational database of provincial and territorial forest inventories

Additional reading
Ecosystem condition and productivity41
generally long lived and slow growing (MAI =
1.69 m3/ha/yr). In contrast, our hardwood forests
comprise species, such as poplar, aspen and white
birch, that are short lived and faster growing
(MAI = 1.92 m3/ha/yr). Our mixedwood forests
consist of a combination of coniferous and
broadleaved species with growth rates (MAI =
1.78 m3/ha/yr) between those of the other two
forest types.
The biomass production of tree species
is one indicator of the ability of ecosystems
to support and maintain life forms. In future,
as forest inventories are enhanced and common
measurement standards are adopted across
Canada, actual growth may be derived using
growth models based on such inputs as climate,
site characteristics and forest type.
ADDITIONAL READING
Armstrong, J.A.; Ives, W.G.H. Editors. 1995.
Forest insect pests in Canada. Natural Resources
Canada, Canadian Forest Service, Headquarters,
Ottawa, Ont. 732 p.
Bowers, W.W.; Hudak, J.; Raske, A.G.
Editors. 1992. Host and vector surveys for
the pinewood nematode, Bursaphelenchus
xylopilus (Steiner and Buhrer) Nickle (Nematoda:
Aphelenchoididae) in Canada. Forestry Canada,
Newfoundland and Labrador Region, St. John’s,
Nfld. Inf. Rep. N-X-285. 55 p.
Canadian Council of Forest Ministers. 1995.
Defining sustainable forest management: A
Canadian approach to criteria and indicators. 22 p.
ECOZONE SPRUCE PINE FIR HEMLOCK DOUGLAS-FIR LARCH POPLAR BIRCH MAPLEm3/hectare/year
Taiga Plains 1.55 1.19 2.35 – – 0.85 1.98 0.91 –Taiga Shield 1.07 0.95 0.99 – – – 0.79 1.51 –Boreal Shield 1.21 1.84 1.56 1.52 – 1.31 2.94 1.46 1.57Atlantic 1.76 1.76 1.94 1.60 – 1.87 2.00 1.83 1.59
MaritimeMixedwood 1.40 2.87 1.68 1.75 – 1.89 2.93 1.87 1.77
PlainsBoreal Plains 1.63 2.26 2.04 – – 0.87 2.22 1.38 1.82Prairies 2.14 1.70 2.03 – 1.72 1.23 1.89 1.71 1.76Taiga 0.73 1.95 – – – – 0.64 – –
CordilleraBoreal 1.30 1.11 1.46 1.20 – 1.57 0.69 1.17 –
CordilleraPacific 3.80 1.62 3.04 2.45 2.81 – 1.72 1.71 2.87
MaritimeMontane 2.69 1.73 1.98 2.47 1.41 1.87 1.36 1.71 2.11
CordilleraHudson Plains 1.25 1.47 1.34 – – 0.94 2.58 1.00 –
Source: Canada’s Forest Inventory*
*relational database of provincial and territorial forest inventories
2.3b Mean annual increment by ecozone and species

Additional reading
Ecosystem condition and productivity42
Compendium of Canadian forestry statistics
1994. 1995. Canadian Council of Forest
Ministers, Natural Resources Canada, Canadian
Forest Service, Headquarters, Ottawa, Ont. 217 p.
Cox, R.M.; Lemieux, G.; Lodin. M. 1996. The
assessment and condition of Fundy white birches
in relation to ambient exposure to acid marine
fogs. Can. J. For. Res. 26: 682–688.
D’Eon, S.P.; Magasi, L.P.; Lachance, D.;
DesRochers, P. 1994. ARNEWS–Canada’s
national forest health monitoring plot network:
Manual on plot establishment and monitoring.
Rev. ed. Natural Resources Canada, Canadian
Forest Service, Petawawa National Forestry
Institute, Chalk River, Ont. Inf. Rep. PI-X-117.
Eager, C.; Adams, M.B. 1992. Ecology and
decline of red spruce in the eastern United States.
Ecol. Studies 96. 417 p.
Ecological Stratification Working Group. 1995.
A national ecological framework for Canada.
Agriculture and Agri-Food Canada, Research
Branch, Centre for Land and Biological
Resources Research; Environment Canada,
State of the Environment Directorate, Ecozone
Analysis Branch, Ottawa–Hull. (Report and
national map at 1:7 500 000 scale)
Farrar, J.L. 1995. Trees in Canada. Fitzhenry
& Whiteside Ltd., Markham, Ont.; Natural
Resources Canada, Canadian Forest Service,
Ottawa, Ont. 502 p.
Foster, N.W.; Hazlett, P.W. 1991. The influence
of reductions in atmospheric deposition on ion
leaching from podzolic soils under hardwood
forest. Pages 179–191 in Longhurst, J.W. Editor.
Acid deposition. Origins, impacts and abatement
strategies. Springer-Verlag, New York.
Gray, S.L. 1995. A descriptive forest inventory
of Canada’s forest regions. Natural Resources
Canada, Canadian Forest Service, Petawawa
National Forestry Institute, Chalk River, Ont.
Inf. Rep. PI-X-122. 192 p.
Hall, J.P. 1995. ARNEWS assesses the health of
Canada’s forests. For. Chron. 71: (5) 607–613.
Hall, J.P. 1995. Forest health monitoring in
Canada: how healthy is the boreal forest?
Water, Air and Soil Pollution 82: 77–85.
Hall, J.P. 1996. ARNEWS annual report 1994.
Natural Resources Canada, Canadian Forest
Service, Ottawa, Ont. Inf. Rep. ST-X-11. 26 p.
Hall, J.P.; Magasi, L.; Carlson, L.; Stolte, K.;
Niebla, E.; Bauer, L.I., de; Gonzalez-V., C.E.;
Hernandez-T., T. Health of North American
forests. 1996. Natural Resources Canada,
Canadian Forest Service, Headquarters,
Ottawa, Ont. 66 p.
Hanisch, B.; Kilz, E. 1990. Monitoring of forest
damage. Verlag Eugen Ulmer, Stuttgart. 334 p.
Lachance, D.A.; Hopkin, A.; Pendrel, B.; Hall,
J.P. 1995. Health of sugar maple in Canada:
Results from the North American Maple Project
1988–1993. Natural Resources Canada, Canadian
Forest Service, Headquarters, Ottawa, Ont. Inf.
Rep. ST-X-10. 27 p.
Likens, G.E.; Driscoll, C.T.; Buso, D.C. 1996.
Long-term effects of acid rain: response and
recovery of a forest ecosystem. Science 272:
244–245.
Magasi, L.P. 1989. White birch deterioration
in the Bay of Fundy region, New Brunswick
1979–1988. Forestry Canada, Maritimes region,
Fredericton, N.B. Inf. Rep. MX-177.

Contacts
Ecosystem condition and productivity
Manion, P.D.; Lachance, D. Editors. 1992.
Forest decline concepts. APS Press, St. Paul,
Minn. 249 p.
Millers, I.; Lachance, D.; Burkman, W.G.;
Allen, D.C. 1991. NE-154; Forestry Canada.
Editors. North American sugar maple decline
project: Organization and field methods. USDA
Forest Service, NE For. Exp. Sta. Gen. Tech.
Rep. 28 p.
Morrison, I.K. 1984. Acid rain. A review of
literature on acid deposition effects in forest
ecosystems. For. Abstr. 45: 483–506.
Morrison, I.K.; Foster, N.W.; Nicolson, J.A. 1992.
Influence of acid deposition on element cycling
in mature sugar maple forest, Algoma, Canada.
Water, Air and Soil Pollution 61: 243–252.
Morrison, I.K.; Fournier, R.E.; Hopkin, A. 1995.
Response of forest soil to acidic deposition:
Results of a five-year resampling study in
Canada. In Proceedings of the IUFRO mtg.
air pollut. and mult. stress, Sept. 7-9, 1994,
Fredericton, N.B.
Percy, K.E.; Jensen, K.F.; McQuattie, C.J. 1992.
Effects of ozone and acid fog on red spruce
needle epicuticular wax production, chemical
composition, cuticular membrane ultrastructure
and needle wettability. New Phytol. 122: 71–80.
Percy, K.E.; Krause, C.R.; Jensen, K.F.
1990. Effects of ozone and acid fog on red
spruce needle wax ultrastructure. Can. J. For.
Res. 20: 117–120.
Percy, K.E.; McQuattie, C.J.; Rebbeck, J.A.
1994. Percy, K.E.; Cape, J.N.; Jagels, R.;
Simpson, C.M. Editors. Effects of air pollutants
on epicuticular wax chemical composition.
Pages 67–79 in Air pollutants and the leaf
cuticle. NATO ASI Series G, Vol. 36. Springer-
Verlag, Heidelberg.
Raynal, D.J.; Foster, N.W.; Mitchell,
M.J.; Johnson, D.W. 1992. Johnson, D.W.;
Lindberg, S.E. Editors. Regional evaluations
of acid deposition effects on forests: eastern
hardwoods. Pages 526–534 in Atmospheric
deposition and forest nutrient cycling. Ecol.
Studies 91. Springer-Verlag, New York. 707 p.
de Vried, W. 1991. Methodologies for the
assessment and mapping of critical loads and
of the impact of abatement strategies on forest
soils. DLO Winand Staring Centre, Wageningen,
The Netherlands. Report 46.
CONTACTS
Forest health
Dr. Wade Bowers (Criterion coordinator)
IUFRO Secretariat
Seckendorff-Gudent Weg 8
A–1131 Vienna
Austria
National forest statistics
Mr. Brian Haddon
Industry, Economics and Programs Branch
Natural Resources Canada–
Canadian Forest Service
7th floor, 580 Booth Street
Ottawa ON K1A 0E4
Tel.: (613) 947-9065
Fax: (613) 947-7399
43

Contacts
Ecosystem condition and productivity
Forest science research
Dr. Peter Hall
Science Branch
Natural Resources Canada–
Canadian Forest Service
7th floor, 580 Booth Street
Ottawa ON K1A 0E4
Tel.: (613) 947-8987
Fax: (613) 947-9090
Biological diversity
Dr. Ole Hendrickson
Science Branch
Natural Resources Canada–
Canadian Forest Service
7th floor, 580 Booth Street
Ottawa ON K1A 0E4
Tel.: (613) 947-9026
Fax: (613) 947-9090
Forest ecology / ecozones
Mr. Harry Hirvonen
Science Branch
Natural Resources Canada–
Canadian Forest Service
7th floor, 580 Booth Street
Ottawa ON K1A 0E4
Tel.: (613) 947-9015
Fax: (613) 947-9035
Forest inventory
Dr. Steen Magnussen
Pacific Forestry Centre
Natural Resources Canada–
Canadian Forest Service
506 West Burnside Road
Victoria BC V8Z 1M5
Tel.: (250) 363-0712
Fax: (250) 363-0775
Air pollution
Dr. Kevin Percy
Atlantic Forestry Centre
Natural Resources Canada–
Canadian Forest Service
P.O. Box 4000
Fredericton NB E3B 5P7
Tel.: (506) 452-3524
Fax: (506) 452-3525
Fire
Dr. Albert Simard
Science Branch
Natural Resources Canada–
Canadian Forest Service
7th floor, 580 Booth Street
Ottawa ON K1A 0E4
Tel.: (613) 947-9023
Fax: (613) 947-9090
Forest science research
Dr. Tom Sterner
Atlantic Forestry Centre
Natural Resources Canada–
Canadian Forest Service
P.O. Box 4000
Fredericton NB E3B 5P7
Tel.: (506) 452-3504
Fax: (506) 452-3525
Climate change
Dr. Robert Stewart
Science Branch
Natural Resources Canada–
Canadian Forest Service
7th floor, 580 Booth Street
Ottawa ON K1A 0E4
Tel.: (613) 947-9014
Fax: (613) 947-9090
44

CR ITER ION 3 .0
Introduction 47
Element 3.1 Physical environmental factors 48
Indicator 3.1.1 Percentage of harvested area having significant soil compaction, 49displacement, erosion, puddling, loss of organic matter, etc.
Indicator 3.1.2 Area of forest converted to non-forest land use, e.g., urbanization 50See also Indicator 4.2.1
Indicator 3.1.3 Water quality as measured by water chemistry, turbidity, etc. 50
Indicator 3.1.4 Trends and timing of events in stream flows from forest catchments 51
Indicator 3.1.5 Changes in the distribution and abundance of aquatic fauna 51
Element 3.2 Policy and protection forest factors 52
Indicator 3.2.1 Percentage of forest managed primarily for soil and water protection 53
Indicator 3.2.2 Percentage of forested area having road construction and stream crossing 53 guidelines in place
Indicator 3.2.3 Area, percentage and representativeness of forest types in protected areas 53 See also Indicator 1.1.3
Literature cited 54
Contacts 54

Introduction
Soil and water conservation47
INTRODUCTION
This criterion includes physical environmental
indicators and policy indicators that are related
to soil and water characteristics. Physical
environmental indicators are essential in
tracking sustainable forest management because
the maintenance of appropriate levels of soil
oxygen, nutrients, moisture and organic matter
is key to the long-term productivity and resilience
of forest ecosystems.
Natural fluctuations in the quantity and
quality of water occur as a result of annual
and seasonal variations in precipitation and
temperature. Also, forest mortality caused
by fires, insects and diseases can naturally
impact the chemical composition and flow
rates within watersheds.
Man has influenced soil and water by
logging and by clearing land for settlements,
agriculture and other uses, such as recreational
activities. In addition, water flow rates are
controlled for hydro power generation, irrigation,
habitat “improvement,” flood control and human
consumption. The direct discharge of sewage,
industrial effluents, and fertilizers and pesticides
from agricultural activities also can have a
pronounced impact on water quality.
Other, indirect effects occur as a result of
the atmospheric pollution associated with fossil
fuel combustion. Acidification of water bodies
causes decreased biological activity, and
overfertilization or eutrophication may result
from increased nutrient inputs in the runoff
from forest ecosystems and agricultural lands.
Thus, while water quality provides a good
measure of the condition of forest watersheds,
care must be exercised in separating the impacts
of forest practices from those of other industrial,
recreational, agricultural and urban activities.
It is also imperative that the approach and
methodology applied to monitoring the sustainable
management of soil and water be sensitive to the
host of influences described above.
Forest practices, including the construction
of access roads, may impact on the quantity and
quality of soil and water in a number of ways.
The following are a few examples of potential
impacts: soil erosion and compaction, siltation
of aquatic habitats, flooding and increased water
temperatures. In addition, the rapid regeneration
of forests following harvesting is essential to
maintain the normal flow rates and nutrient
levels that prevent eutrophication.
In recent decades, researchers have
gained a better understanding of the important
interrelationships between the soil and water in
forest ecosystems. This knowledge has enabled
the provinces and territories to improve
their forest practices codes and guidelines to
promote the conservation of these two components.
Element 3.2 (Policy and protection forest factors)
CR ITER ION 3 .O
CONSERVATION OF SOIL AND WATER RESOURCES
Ecosystemcondition andproductivity
Soil and waterconservation
Globalecological
cycles
Multiplebenefits
Society’sresponsibility
Conservation of biological
diversity

Physical environmental factors
Soil and water conservation
discusses the guidelines that are currently
in place.
Criterion 3 cannot be fully reported
on nationally, because not all provinces and
territories have specific processes in place for
monitoring soil and water indicators. For this
reason, progress is measured using case studies
and proxy data. The application of national
measures for the indicators is made even more
difficult by the variations in climate, geology
and forest practices across Canada. Currently,
data from the provinces, territories and industry
are being collected and analyzed to identify
common policy directions and to demonstrate
trends related to improved codes of practice.
ELEMENT 3.1PHYSICAL ENVIRONMENTALFACTORS
What are we measuring?This element deals with
the characteristics of soil,
water and biota that serve
as indicators of long-term
ecosystem sustainability. Topics include
soil disturbances (e.g., compaction, erosion
and loss of organic matter) related to forest
activities, effects of forest activities on aquatic
fauna, changes in the quality and quantity of
water in forested watersheds, and conversion
of forest lands to other uses.
Reporting on these indicators presents a
unique challenge to environmental monitoring—
a limited number of sites are currently monitored,
and the impacts of traditional harvesting methods,
such as clearcutting, are measured on an even
smaller number of sites. Furthermore, there is
a lack of data regarding the impacts of alternative
harvesting practices, such as variable-retention
silvicultural systems. Also, in aquatic ecosystems,
it is essential to screen the monitoring data to
differentiate forestry impacts from those
associated with other land uses, such as
agriculture, hydro, mining, urban development
and industrial activities.
How do physical environmental factors relate to the sustainability of Canada’s forests?Physical soil disturbances affect forest
sustainability by decreasing the land area
suitable for forest growth, and by reducing the
potential productivity of forest soils and adjacent
aquatic systems. The most dramatic examples
of these impacts occur when forests are removed
for agricultural use, settlement, transportation
corridors, pipelines, mining or hydro reservoirs.
In addition, forest cover may be lost as
a result of certain forest management activities,
including the construction of roads and landings
essential for harvesting. During harvesting
activities, off-road machinery—if used
improperly—can reduce forest productivity
through soil compaction and the displacement
or removal of organic matter. (Wide, flexible
tires are now being used on some harvesting
machinery to prevent this type of disturbance.)
However, monitoring can ensure that appropriate
planning and construction techniques are
employed to minimize such losses.
In recent years, the public’s perception of
sustainability and its concern regarding the
appearance of cutovers have led to further
reductions in the amount of land available for
harvesting, as well as greater constraints on
where and how that harvesting can take place.
48
Soil and waterconservation
Physicalenvironmental
factors
Policy andprotection forest
factors

Physical environmental factors
Soil and water conservation49
Aquatic ecosystems within forests
reflect the overall condition of watersheds
and thus provide another important measure
of sustainability. Nutrient levels and flow rates
that are elevated over long periods of time in
forest streams are a clear indication of a major
forest ecosystem malfunction, because the water
and nutrients that should be utilized in forest
growth are instead moving rapidly into drainage
systems. This threatens the sustainability of not
only the forests, but also the aquatic systems
themselves (through eutrophication), as well
as downstream agricultural and urban areas
(through flooding).
What data are available?
Percentage of harvested area havingsignificant soil compaction, displacement,erosion, puddling, loss of organic matter,etc. (3.1.1)
The Forest Engineering Research Institute
of Canada (FERIC) has studied the impact
of various harvesting methods on ground
disturbance in eastern Canada. According
to FERIC, manual felling with skidding to
the roadside causes severe ground disturbance
on 7.4% of moderate slopes (an incline of
10–20%) and on 14% of steep slopes (an
incline of 20–30%). Mechanical harvesting
with transportation (rather than skidding) to
the roadside causes severe ground disturbance
on 0.1–2.4% of areas with a broad range of
terrain conditions.
A study in the interior of British Columbia
found that the extent of severe ground disturbance
increases with the degree of slope and is partially
determined by the season in which harvesting
occurs. On slopes with an incline of less than
45%, the level of disturbance is less severe in
winter (6.7–10.8%) than in summer (10.6–13.7%).
Ground disturbance is markedly reduced
by the implementation of guidelines and codes
of practice. For example, with the introduction
of provincial guidelines in Alberta, the level
of disturbance associated with aspen harvesting
decreased from 25% of harvested areas in the
mid-1980s, to 10% in 1990, and 3.5% in 1993.
In Quebec and British Columbia, ground
disturbance is systematically monitored for
compliance with forest practices codes. Some
of the information gathered by these provinces
include the time of harvesting, the percent
of area compacted, and the percent of humus
removed. In most other provinces and territories,
measurements usually are taken in the context
of ad hoc surveys related to equipment trials
or special research projects.
Certain kinds and amounts of soil
disturbance are essential for the restoration
of forest ecosystems and favour more adequate
levels of regeneration on sites that would
otherwise revert to non-commercial tree species.
For example, in the absence of fire, ground
disturbance is essential for the regeneration
of some black spruce ecosystems.
Existing data point to the range
of disturbances that occur under different
conditions; however, in most instances, these
data reflect past, rather than current, practices.
Thus, while there are a few sites that can serve
as case studies, in most jurisdictions, data are
not available to help determine whether forest
practices are sustainable with respect to the
level of soil disturbance.

Physical environmental factors
Soil and water conservation50
Area of forest converted to non-forest land use, e.g., urbanization (3.1.2)
The data and information relating to this
indicator are found under Indicator 4.2.1
(Area of forest permanently converted to
non-forest land use, e.g., urbanization).
Water quality as measured by waterchemistry, turbidity, etc. (3.1.3)
Studies indicate that when roads are
constructed through areas with acidic soil,
or when these areas are clearcut, the quality
of water decreases in terms of both chemistry
and turbidity. This decline is reflected in higher
concentrations of dissolved nutrients and organic
chemicals, and decreased pH levels. These
changes are usually small and short-lived.
Results of catchment studies in Canada,
the United States and overseas show that harvesting
of forests leads to an increase in nutrients and
organic chemicals in stream water for a period
of three to five years. (See Experimental Lakes
Watershed case study below.) This change reflects
the higher levels of these substances in the forest
floor that result from the removal of the
biological demand of trees and other vegetation,
and to a lesser extent, the disturbance of the ground.
Ground disturbance on the cutover and
construction of roads on adjacent areas can lead
to increased turbidity due to soil erosion and
Case study: Experimental Lakes Watershed, northwestern Ontario
Changes in the quantity of nutrients and suspended
sediments were monitored in the Experimental Lakes
Watershed near Dryden, Ontario, between 1973
and 1976. The site is dominated by jack pine and
black spruce on coarse-textured shallow soils.
These conditions are considered among the most
sensitive for nutrient loss following forest ecosystem
disturbance. (At the time of the study, no stream
crossing or road construction guidelines were in
place for forestry operations.)
Results for dissolved nitrogen and suspended
sediments clearly demonstrate that changes after
clearcutting are not excessive and that concentrations
return to near background levels within five years
(Figure 3.1a). Even the maximum concentrations for
dissolved nitrogen do not exceed Ontario’s drinking
water standards and are well below the nitrogen
loadings associated with other land uses (e.g., pastures,
3–14 kg/ha/yr; croplands, 7–21 kg/ha/yr; industries,
8 kg/ha/yr; and residences, 6 kg/ha/yr). Source: Natural Resources Canada–Canadian Forest Service
Dissolved nitrogen andsuspended sediments in the Experimental Lakes Watershed
kg/hectare/year
3.1a
years since harvestDissolved nitrogen Suspended sediments
0
1
2
3
4
5
543210
6

Physical environmental factors
Soil and water conservation51
siltation. Secondary succession after harvesting
restores the biological demand for nutrients,
resulting in near background levels of nutrients
in the water within three to five years. Increased
streamflow after harvesting can be attributed
to less biological demand and reduced
evapotranspiration, due to a smaller foliage
surface area. Return of the streamflow to near
background levels usually takes at least 20 years,
depending on the height and complexity of the
forest canopy.
Trends and timing of events in streamflows from forest catchments (3.1.4)
Methodologies for collecting national data on
the trends and timing of events in stream flows
from forest catchments are at the early stages
of development. For the purposes of this report,
some key factors are identified that will likely be
considered in future assessments of this indicator.
As mentioned in the introduction to this
criterion, stream flows can be impacted
dramatically by control structures for hydro
power generators, flood control measures,
agricultural irrigation and human consumption
levels. Natural catastrophes (e.g., an unusually
high rainfall or spring melt) also can cause
extreme fluctuations. Increased stream flows can
lead to erosion and stream sedimentation, which
can in turn lead to reduced water quality and
aquatic habitat for fish and other organisms.
(Soil disturbance, particularly erosion, also leads
to sedimentation and a reduction in water quality
and aquatic habitat.)
The extent and severity of impacts that
may result from road construction near streams
and other forestry activities depend on the site,
the conditions at the time of harvest, and the
logging methods employed. Typically, there is
a pronounced change immediately after harvesting,
followed by a period of recovery that may take
anywhere from a few years to decades, depending
on the site conditions and the indicator being
measured. Site conditions vary considerably
within and between forest ecosystems and across
ecoregions. Key variables include slope, soil
texture and amount of organic matter.
Each logging method has been developed
for use in a particular set of conditions and is
best suited to those conditions. Regional climatic
differences and seasonal weather conditions at the
time of harvest can, however, result in radically
different impacts from the same harvesting
system. The most important factors are the
amount of rain, frost and snow cover.
Examples of degradation that can arise from
poor harvesting practices include landslides on
unstable slopes, the removal of organic material
from unfertile sites, and the rutting and puddling
that disrupt surface hydrology.
Changes in the distribution andabundance of aquatic fauna (3.1.5)
Most aquatic organisms are sensitive to changes
in the temperature, chemical composition and
particulate matter in water bodies. These factors
can be affected by the discharge of municipal
wastes, atmospheric pollutants, industrial
effluents, and pesticides and fertilizers from
agricultural activities.
Specific impacts from forest harvesting
activities include increased water temperatures,
eutrophication, siltation of river gravels, and
reduced oxygen levels. A few species of aquatic
fauna benefit from these changes, but most are
negatively impacted. For fish populations, the
recovery of riparian vegetation is important in

Policy and protection forest factors
Soil and water conservation
mitigating water temperature and sedimentation
factors. Invertebrate species that form the basis
of aquatic food chains also are sensitive to the
physical and chemical alterations in streams
caused by sedimentation and changes in
riparian vegetation.
The situation regarding to aquatic
habitat has improved over the past decade
with the development and implementation of
riparian buffer zones and other forest practices.
Data on current practices are being collected
and will be reported on in the next few years.
SummarySoil and water conservation are critical to
sustainable forestry. The physical environmental
indicators included in this element are intended
to monitor the implementation of guidelines and
planning aimed at maintaining the productivity
of forest soils and water.
There is no formal process or protocol in
place across Canada for monitoring water quality,
flow rates and aquatic biota in relation to forest
practices. However, Environment Canada and
numerous provincial agencies maintain extensive
databases on streamflow, water chemistry and
fish populations.
Nevertheless, care must be exercised in
separating the impacts of forest practices from
those of other industrial, recreational, agricultural
and urban activities. This may be achieved by
stratifying the data to include only those streams
in which changes can be attributed directly to
such forestry activities as harvesting or road
building. Traditionally, studies of this type
have focused on remote headwater streams
in areas not affected by other forms of
human intervention.
Few provinces or territories have
aquatic monitoring systems in place that
cover extensive areas, as well as variations in
approaches and methods. Therefore, national
data on these indicators are not readily available.
Furthermore, while most provinces have collected
data on fish populations, the relative impacts of
recreational use versus forest practices are
difficult to separate, as is the impact of pollution.
(Moreover, many fish species have a high
tolerance for disturbances and are not always the
most sensitive indicators of habitat deterioration.
Thus, the damage may be well advanced before
symptoms are detected.)
The sustainability of our forest practices
is now determined on the basis of qualitative
data obtained from case studies, as well as
data recorded at a limited number of long-
term research sites. However, most of the
available data reflect past practices or, in
the case of water quality, a mixture of impacts.
Currently, water quality is monitored
at a few fixed stations within a watershed,
and comparisons between watersheds cannot
be made because of the lack of data. Biological
and chemical monitoring protocols need to be
developed that would rely on key indicator
organisms and elements, based on the findings
obtained at existing research sites.
ELEMENT 3.2POLICY AND PROTECTIONFOREST FACTORS
What are we measuring?This element monitors three
policy indicators related to
sustaining soil and water
productivity: the amount of land
52
Soil and waterconservation
Physicalenvironmental
factors
Policy andprotection forest
factors

Policy and protection forest factors
Soil and water conservation53
managed primarily for soil and water
protection; the percentage of forested areas
with guidelines in place for road construction
and stream crossings; and the area, percentage
and representativeness of forest types in
protected areas.
How do policy and protection forest factors relate to the sustainability of Canada’s forests?Soil and water are essential components of
the forest ecosystem. To ensure that terrestrial
systems are maintained, it is important to
implement policies that provide for specific
management practices to protect sensitive sites.
Sensitive site conditions include riparian zones,
steep slopes, wet and poor soils, and shallow
soils over bedrock. With respect to aquatic
systems, policies that address stream crossings,
watershed management and riparian areas will
assist in maintaining natural water-flow patterns
and water levels and quality.
What data are available?
Percentage of forest managed primarily for soil and water protection (3.2.1)
Municipal watersheds, riparian buffer zones,
and areas managed by water conservation
authorities are all aimed at promoting soil and
water conservation. Municipal watersheds and
managed areas represent a very small proportion
of the productive landbase in Canada. The creation
of riparian buffer zones is now standard practice
throughout most of the country, but their small
scale makes them difficult to quantify. It is
known, however, that the 30–50-metre riparian
zones currently utilized in most regions of
Canada amount to 60–100 hectares of reserve
per kilometre of stream.
Percentage of forested area having road construction and stream crossingguidelines in place (3.2.2)
Guidelines for general-purpose roads have
existed in Canada since the mid-1970s, and
in recent years, many jurisdictions have begun
to apply them to forest operations. There is a
need to identify the guidelines in every province
and territory to calculate the percentage of forest
lands where such guidelines are in place. There
is also a need to determine similar reporting
mechanisms across jurisdictions to determine
what information could be reported at the
national level.
Area, percentage and representativeness of forest types in protected areas (3.2.3)
Data and information relating to this indicator
are reported under Indicator 1.1.3 (Area,
percentage and representativeness of forest
types in protected areas).
SummaryCollectively, these indicators reflect the
value of forest soil and water conservation in
Canada. Policies aimed at conserving soil and
water within forested ecosystems are being
developed and implemented across the country
for many forest-related activities. Currently, all
public forest land is covered by guidelines for
road construction, stream crossings and riparian
buffer zones. Soil and water values are further
safeguarded by municipal watershed conservation
authorities and in protected areas.
In most provinces, the existing network
of water monitoring stations was not designed
to monitor trends in water quality and flow rates
attributable to forest practices. Nevertheless,
stations located in headwater streams that are

Literature cited
Soil and water conservation54
isolated from other impacts (e.g., fires, control
structures and settlements) may provide good
historical trend data. This information needs
to be screened and analyzed to determine its
value. In addition, to track trends arising from
improved forest practices and policies, chemical
and biological monitoring protocols need to be
developed based on experience obtained from
existing, long-term watershed research.
LITERATURE CITED
Jewett, K.; Daughty, D.; Krause, H; Arp, P.A.
1995. Watershed responses to clearcutting:
effects on soil solutions and stream water
discharge in central New Brunswick. Can.
J. Soil Sci. 75: 475–490.
Meek, P. 1996. Methods and results of ground
disturbance surveys in eastern Canada. Forest
Engineering Research Institute of Canada,
Eastern Division. (Internal report)
Nicolson, J.A.; Foster, N.W.; Morrison, I.K. 1982.
Forest harvesting effects on water quality and
nutrient status in the boreal forest. Pages 71–89
in Proceedings of the Canadian Hydrological
Symposium: Hydrological processes in forested
areas. Fredericton, N.B. (NRCC No 20548)
Thompson, S.R.; Osberg, P.M. 1992. Soil
disturbance after logging in British Columbia:
1001 results. B.C. Ministry of Forests, Research
Branch, Victoria, B.C. (Internal report)
CONTACTS
Ecosystem processes
Dr. Bill Meades (Criterion coordinator)
Great Lakes Forestry Centre
Natural Resources Canada–
Canadian Forest Service
1219 Queen Street East
P.O. Box 490
Sault Ste. Marie ON P6A 5M7
Tel.: (705) 949-9461
Fax: (705) 759-5719
Forest practices
Dr. Paul Addison
Pacific Forestry Centre
Natural Resources Canada–
Canadian Forest Service
506 West Burnside Road
Victoria BC V8Z 1M5
Tel.: (250) 363-0627
Fax: (250) 363-6004
Biogeochemistry
Dr. Neil Foster
Great Lakes Forestry Centre
Natural Resources Canada–
Canadian Forest Service
1219 Queen Street East
P.O. Box 490
Sault Ste. Marie ON P6A 5M7
Tel.: (705) 949-9461
Fax: (705) 759-5700

Contacts
Soil and water conservation
Aquatic organisms / riparian buffers
Mr. Dave Kreutzweiser
Great Lakes Forestry Centre
Natural Resources Canada–
Canadian Forest Service
1219 Queen Street East
P.O. Box 490
Sault Ste. Marie ON P6A 5M7
Tel.: (705) 949-9461
Fax: (705) 759-5700
Soils
Dr. David McNabb
Alberta Research Council
Bag 4000
Vegreville AB T9C 1T4
Tel.: (403) 632-8264
Fax: (403) 632-8379
Wood harvesting systems / soil disturbances
Mr. Phillipe Meek
Forest Engineering Research Institute
of Canada (FERIC)
580, boul. Saint-Jean
Pointe-Claire QC H9R 3J9
Tel.: (514) 694-1140
Fax: (514) 694-4351
Soil processes / road construction
Dr. Marty Osberg
B.C. Ministry of Forests
P.O. Box 9519
Stn.Prov.Govt.
Victoria BC V8W 9C2
Tel.: (250) 387-7795
Fax: (250) 387-0046
Soil processes / soil classification
Mr. John Senyk
Pacific Forestry Centre
Natural Resources Canada–
Canadian Forest Service
506 West Burnside Road
Victoria BC V8Z 1M5
Tel.: (250) 363-0688
Fax: (250) 363-0775
Wood harvesting systems / soil disturbances
Mr. Rod Smith
Great Lakes Forestry Centre
Natural Resources Canada–
Canadian Forest Service
1219 Queen Street East
P.O. Box 490
Sault Ste. Marie ON P6A 5M7
Tel.: (705) 949-9461
Fax: (705) 759-5700
Ecological land classification
Mr. Peter Uhlig
Ontario Forest Research Institute
Ontario Ministry of Natural Resources
1235 Queen Street East
P.O. Box 969
Sault Ste. Marie ON P6A 5N5
Tel.: (705) 946-2981
Fax: (705) 946-2030
55

C R I T E R I O N 4 . 0
Introduction 57
Element 4.1 Contributions to the global carbon budget 58
Indicator 4.1.1 Forest sector carbon budget 59- Indicator 4.1.9
Indicator 4.3.2 Fossil carbon products emissions 59
Indicator 4.4.1 Recycling rate of forest wood products manufactured and used 62in Canada
Element 4.2 Forest land conversion 64
Indicator 4.2.1 Area of forest permanently converted to non-forest land use, 65e.g., urbanization
Indicator 4.2.2 Semi-permanent or temporary loss or gain of forest ecosystems, 65e.g., grasslands and agriculture
Element 4.3 Forest sector carbon dioxide conservation 66
Indicator 4.3.1 Fossil fuel emissions 67
Indicator 4.3.3 Percentage of forest sector energy usage from renewable sources 67relative to the total energy requirement
Element 4.4 Forest sector policy factors 69
Indicator 4.4.5 Existence of laws and regulations on forest land management 69
Indicator 4.4.4 Existence of forest inventories 71
Indicator 4.4.2 Participation in the climate change conventions 71
Indicator 4.4.3 Economic incentives for bioenergy use 73
Element 4.5 Contributions to hydrological cycles 74
Indicator 4.5.1 Surface area of water within forested areas 75
Literature cited 76
Contacts 77

Introduction
Global ecological cycles57
INTRODUCTION
Forests occupy 4 billion hectares, or roughly
one-third of the Earth’s land surface. (Canada’s
forests cover 417.6 million hectares—almost
half the country’s land mass.) Because of their
size, forests play a major role in the functioning
of the Earth’s biosphere, and they contribute
to and regulate global biological cycles related
to carbon (the carbon cycle) and water (the
hydrological cycle). Understanding the role of
forests in these cycles is vital to develop forest
management practices that are sustainable in
the long term. The purpose of Criterion 4 is to
describe and measure the effects of forests and
their use on these important cycles.
Element 4.1 (Contributions to the global
carbon budget) outlines the overall contribution
of the boreal forest to atmospheric carbon dioxide
levels. In a process referred to as the “carbon
cycle,” forests exchange large amounts of
carbon dioxide with the atmosphere as they
grow (through photosynthesis and respiration)
and die (through decomposition).
Natural disturbances, such as fires, insects
and diseases, affect the movement of carbon from
the forests to the soil and atmosphere. Harvesting
and other forestry activities (e.g., planting and
slash burning) represent yet another disturbance
influencing the movement of carbon within and
from forest ecosystems.
In the case of harvesting, carbon moves
from the trees to wood and paper products.
Disposal of these products in landfill sites
results in the carbon being returned to the
atmosphere through decomposition. Recycling
of wood and paper products plays an important
role in the forest carbon budget by reducing the
requirement for harvesting and ultimately, the
amount of material ending up in landfill sites.
Thus, recycling helps lower the amount of
carbon returning to the atmosphere.
Given that forests and their soils represent
large reservoirs of carbon accumulated over
decades, centuries or even millennia, the
conversion of land to or from forests also
has an important effect on the global carbon
balance. This issue is discussed in Element 4.2
(Forest land conversion).
In managing and utilizing our forest
resources, we consume considerable quantities
of energy in the form of fossil and non-fossil
fuels. Element 4.3 (Forest sector carbon
dioxide conservation) discusses the forest
sector’s energy use in the context of its
impact on the carbon budget.
Understanding the impact of forests and
their soils on the global carbon balance is vital
in determining how we can best manage Canada’s
forests to reduce or mitigate climate change. It
is important to know whether our management
C R I T E R I O N 4 . 0
FOREST ECOSYSTEM CONTRIBUTIONS TO GLOBAL ECOLOGICAL CYCLES
Ecosystemcondition andproductivity
Soil and waterconservation
Globalecological
cycles
Multiplebenefits
Society’sresponsibility
Conservation of biological
diversity

and use of forests are contributing to increased
atmospheric carbon dioxide concentrations or
are helping to reduce them. Element 4.4 (Forest
sector policy factors) reviews the forest legislation,
policies and inventories that are currently in place
across Canada.
Another major global cycle in which
forests play an important role is the hydrological
cycle. As with carbon, forests exchange large
amounts of water with the atmosphere through
evapotranspiration. Forests also recycle water,
and by acting as storage areas, they regulate
the flow in most major streams and rivers.
These activities are measured and discussed in
Element 4.5 (Contributions to hydrological cycles).
To ensure that our forests and the demands
we place on them are sustainable, we must
learn as much as possible about the role of
forests in the carbon and hydrological cycles.
Criterion 4 measures our current knowledge
on this subject and highlights areas where more
research is required.
ELEMENT 4 .1C O N T R I B U T I O N S TO T H EG L O B A L CA R B O N B U D G E T
What are we measuring?The global carbon cycle is the
most important set of processes
linking forests with climate change.
The main factor driving climate
change is society’s influence on
the natural greenhouse effect
through changes in atmospheric
concentrations of greenhouse
gases, such as carbon dioxide,
methane and nitrous oxide.
Forests in Canada cover 45% of the nation’s
land and account for 10% of the world’s forested
area. Hence, the carbon budget of Canada’s
forests plays an important role in the global
carbon cycle.
In the context of sustainable forestry,
the carbon budget also represents a balance
sheet in terms of our forest assets. Carbon in
the form of standing biomass (e.g., tree trunks,
branches, leaves and roots) is a measure of the
timber volume available and is reported on in
this element.
In the context of climate change,
our forests both absorb and release carbon,
thus contributing to changes in the overall
atmospheric concentrations of carbon dioxide.
This element focuses on the role of forests in
the carbon budget.
A carbon budget model for Canada’s
forests is being developed under the leadership
of Natural Resources Canada–Canadian Forest
Service. Results are not yet complete, but
estimates are available for the carbon currently
stored in Canada’s forests and for the changes
in the carbon budget in the boreal and subarctic
forest regions over the period 1920–1990. As
these regions constitute three-quarters of our
forests, they provide a good indication of the
status of the carbon budget of Canada’s forests
as a whole.
Forest products also contribute to the
carbon cycle (Indicator 4.3.2 [Fossil carbon
products emissions]). Conversion of trees to
wood and paper shifts carbon from the standing
biomass pool to the forest products pool. Recycling
plays an important role in the products pool
(Indicator 4.4.1 [Recycling rate of forest wood
products manufactured and used in Canada]).
Global carbon budget
Global ecological cycles58
Globalecological
cycles
Global carbonbudget
Forest landconversion
Carbon dioxideconservation
Policyfactors
Hydrologicalcycles

Because Indicators 4.3.2 and 4.4.1 contribute
to the carbon cycle, data for these indicators
are reported as part of the carbon budget model.
For solid wood products, recycling is only in its
infancy and no national statistics are yet available.
However, we can describe the developments,
infrastructure and practices that are shaping
the efficient use, reuse and recycling of wood.
The nine indicators (4.1.1–4.1.9) for this
element represent key factors in the carbon budget.
This report does not describe the condition of
each one individually; rather, it provides
information regarding the combined effects
of these factors on the net exchange of carbon
between the forest ecosystem and the atmosphere.
How does the global carbon budget relateto the sustainability of Canada’s forests?In the context of sustainable forests, the carbon
budget represents a balance sheet for our forest
assets. Carbon in the form of standing biomass
is a measure of the timber volume available.
Assuming no change in forest structure, a
constant or increasing volume of standing
biomass shows that the forest can sustain the
wood supply indefinitely at current levels of
use. On the other hand, a declining volume of
biomass would indicate that our forest is losing
trees faster than it can replace them. These losses
cannot be sustained indefinitely without affecting
the economic, social, cultural, recreational and
environmental benefits the forest provides.
In Canada, we dispose of nearly
5 million tonnes of used paper products every
year—approximately 35% (by weight) of solid
wastes in municipal landfill sites. Recycling can
reduce our demands on the forest, improve wood
fibre utilization, reduce waste, and lengthen the
time carbon is stored in forest products.
What data are available?
Forest sector carbon budget (4.1.1–4.1.9)
Forests are vast, ever changing pools of
carbon. As trees grow, they absorb carbon
dioxide (CO2) from the atmosphere, convert it
into carbohydrates, and store it in roots, leaves,
branches and trunks (i.e., the standing biomass).
During the life cycle of a tree, the carbon it
contains is distributed as it grows, and as it
becomes diseased, dies or is killed by fire,
windthrow or other natural causes (Figure 4.1a).
When a tree is disturbed, some of the carbon it
contains is released back into the atmosphere;
however, even in the case of fire, only a small
portion is released immediately. The rest of the
carbon ends up on the forest floor or in the soil,
where it decomposes slowly.
Trees that are converted into forest products
represent another form of carbon storage. When
the products are disposed of in landfill sites,
where they decompose over time, the carbon
they contain is released back into the atmosphere.
Global carbon budget
Global ecological cycles59
Source: Natural Resources Canada–Canadian Forest Service
Products
Litter
Tops
StemsDebris
Soil
Roots
Atmosphere
Decaying trees
4.1a Forest carbon cycle

CO2 is one of the principal greenhouse
gases in the atmosphere, and roughly half the
annual exchange (100 000 million tonnes/year)
of this gas is attributed to global forest ecosystems.
These ecosystems also represent vast carbon pools,
containing large amounts of carbon in their soils
and standing biomass—some 1 500 000 million
and 650 000 million tonnes, respectively.
In Canada, approximately 221 000 million
tonnes of carbon are stored in our forest ecosystems.
Figure 4.1b outlines the principal carbon pools:
standing biomass, forest products (e.g., building
materials, and wood and paper products), forest
soils (e.g., litter and coarse woody debris) and
peatlands.
The carbon budget model for Canada
indicates that the products carbon pool (i.e.,
the amount of carbon stored in forest products
after 40 years of harvesting, minus the carbon
released during decomposition and burning) is
small (0.3% of the total carbon stored) compared
to other carbon pools (e.g., forest soils, standing
biomass and peatlands). It is important, however,
in terms of the annual movement (flux) of carbon
between pools.
On a daily, seasonal and annual basis, carbon
moves among these pools and the atmosphere in a
variety of ways. The difference between the amount
of carbon entering and leaving a pool determines
whether it is considered to be gaining carbon
(i.e., a “sink”) or losing carbon (i.e., a “source”).
Currently, models are the only method
available to estimate the exchange of carbon in
forest ecosystems. Figures 4.1c, d and e were
generated by the forest carbon budget model.
Global carbon budget
Global ecological cycles60
Source: Kurz & Apps
Changes in the carbon storage inthe boreal and subarctic forests
million tonnes/year
4.1c
-100
-50
0
50
100
150
200
Soil and detritus pool
Total ecosystem poolBiomass pool
1980 1989197019601950194019301920
4.1b Overview of the major carbonpools and net fluxes in Canada’sforests, 1985–1989
14 500Biomass pool
∆ = -79ATMOSPHERE
70 600Soils pool
∆ = +19
600Products pool
∆ = +23
135 000Peatlands pool
∆ = +26
Fossil fuel use@@@@@@@@e?@@@@@@@@e?@@h?@@h?@@h?@@h?@@h?@@h?
@@@@@@@@e?@@@@@@@@?e@@@@@@@@e?@@@@@@@@?e@@@@@@@@e?@@@@@@@@?e@@@@@@@@e?@@@@@@@@?e@@@@@@@@e?@@@@@@@@?e@@@@@@@@e?@@@@@@@@?e@@@@@@@@e?@@@@@@@@?e@@@@@@@@e?@@@@@@@@?e@@@@@@@@e?@@@@@@@@?e@@@@@@@@e?@@@@@@@@?e@@@@@@@@e?@@@@@@@@?e@@@@@@@@e?@@@@@@@@?e@@@@@@@@e?@@@@@@@@e?@@@@@@@@?e@@@@@@@@e?@@@@@@@@?e@@@@@@@@e?@@@@@@@@?e@@@@@@@@e?@@@@@@@@?e@@@@@@@@e?@@@@@@@@?e@@@@@@@@e?@@@@@@@@?e@@@@@@@@e?@@@@@@@@?e@@@@@@@@e?@@@@@@@@?e@@@@@@@@e?@@@@@@@@?e@@@@@@@@e?@@@@@@@@?e@@@@@@@@e?@@@@@@@@?e@@@@@@@@e?@@@@@@@@?e@@@@@@@@e?
@@@@@@@@@@@@@@@@@@@@@@@@@@@@
@@@@@@@@@@@@@@@@
@@@@@@@@@@@@@@@@
@@@@@@@@@@@@@@@@
@@@@@@@@@@@@@@@@
@@@@@@@@@@@@@@@@
?@@?@@?@@?@@?@@?@@
?@@@@@@@@?@@@@@@@@
?@@@@@@@@?e@@@@@@@@e?@@@@@@@@?e@@@@@@@@e?@@@@@@@@?e@@@@@@@@e?@@@@@@@@?e@@@@@@@@e?@@@@@@@@?e@@@@@@@@e?@@@@@@@@?e@@@@@@@@e?@@@@@@@@?e@@@@@@@@e?@@@@@@@@?e@@@@@@@@e?@@@@@@@@?e@@@@@@@@e?@@@@@@@@?e@@@@@@@@e?@@@@@@@@?e@@@@@@@@e?@@@@@@@@?e@@@@@@@@e?@@@@@@@@?@@@@@@@@?e@@@@@@@@e?@@@@@@@@?e@@@@@@@@e?@@@@@@@@?e@@@@@@@@e?@@@@@@@@?e@@@@@@@@e?@@@@@@@@?e@@@@@@@@e?@@@@@@@@?e@@@@@@@@e?@@@@@@@@?e@@@@@@@@e?@@@@@@@@?e@@@@@@@@e?@@@@@@@@?e@@@@@@@@e?@@@@@@@@?e@@@@@@@@e?@@@@@@@@?e@@@@@@@@e?@@@@@@@@?e@@@@@@@@e?@@@@@@@@
@@g@@g@@g@@g@@g@@g@@@@@@@@@@@@@@@@
@@@@@@@@@@@@@@@@
@@@@@@@@@@@@@@@@
@@@@@@@@@@@@@@@@
@@@@@@@@@@@@@@@@
@@@@@@@@@@@@@@@@
26
4.8
17
2736
3350
26
million tonnes/year
Note: the ∆ is used to indicate the net flux in the carbon pool;the dotted line indicates the carbon flux that results when fossilfuels are burned by the forest sector.
Source: Natural Resources Canada–Canadian Forest Service

They describe the area disturbed, as well as
the total carbon stored in Canada’s boreal and
subarctic forests over the period 1920–1989.
The results of the model are outlined below.
● Averaged over the 70-year period, the boreal
and subarctic forests were a net sink for carbon,
although the strength of the sink changed
markedly over time (Figure 4.1c).
● These forests became a source for atmospheric
carbon during the 1980s, apparently due to a
large increase in fire and insect disturbances
(Figure 4.1d). Harvesting appears to have
played a minor role in the change from
carbon sink to source, as it increased only
slightly during that decade.
● The amount of carbon stored in the biomass
pool increased by 55% from 1920 to 1970;
however, the pool subsequently declined by
18% from 1970 to 1989 (Figure 4.1e). Much
of this loss, however, was not to the atmosphere,
but rather to the soil pool, which also increased
over the period 1920–1970 and continued
to increase until 1985. Since 1985, the soil
pool and the standing biomass pool have
both lost carbon.
● Of the total carbon transferred from the biomass
pool to the forest products pool (Figure 4.1e),
an estimated 36% was retained in forest products
and landfills. The remainder was released into
the atmosphere through decomposition.
In response to the changes in disturbance
regimes, the age class structure of the boreal
forest has changed markedly since 1920. Over
the period 1920–1969, the average age of the
forest increased from 60.9 to 82.5 years, which
suggests that the rate of disturbance was lower
during this period than it had been previously.
An apparent increase in natural disturbances
since 1970 lowered the average age to 76.4
years by 1989.
Global carbon budget
Global ecological cycles61
Source: Kurz & Apps
Area disturbed in the boreal and subarctic forests
million hectares
4.1d
0
1
2
3
4
5
Area infested
Area harvestedArea burnedTotal area
19891980197019601950194019301920
Source: Kurz & Apps
Total carbon stored in the borealand subarctic forests
000 million tonnes
4.1e
Forest products poolBiomass poolSoil pool
19891980197019601950194019301920
55
50
45
40
35
30
25
20
15
10
5
0
-5

The age of the forest has a significant
influence on carbon sequestering. Although
young, fast growing trees absorb more carbon,
the older the forest ecosystem, the more carbon
it contains in its standing biomass and soil. This
is illustrated in Figure 4.1e for 1920, 1970 and
1980, at which times the forest biomass pool
contained an estimated 5 600 million, 8 700
million and 7 100 million tonnes of carbon,
respectively.
Another important factor in the carbon
cycle is the rate at which wood and paper products
are recycled. Carbon is stored in these products,
and by expanding the level of recycling, less
carbon is released into the atmosphere than
would occur if the products were disposed
of in landfill sites.
Recycling rate of forest wood productsmanufactured and used in Canada (4.4.1)
Data for this indicator are also included in the
forest sector carbon model discussed in
Indicators 4.1.1–4.1.9.
Recycling efficiency for paper products is
measured by comparing the quantity recovered
with the quantity used or consumed—the
“recovery rate.” Another way of measuring
this efficiency is the “utilization rate,” which
is obtained by comparing the quantity of
paper recovered with the quantity of pulp and
paper produced.
In 1995, 18.6 million tonnes of paper
and paperboard were produced in Canada.
The pulp utilized to manufacture these products
incorporated 4.1 million tonnes of recycled
wood fibre (2.2 million tonnes recovered in
Canada and 1.9 million tonnes imported from
the United States [USA]). The proportion derived
from post-consumer waste is not known.
Canada has made great strides in recycling.
Currently, 42% of all paper consumed is recovered,
and our paper products now contain 22% recycled
content, up from 10% in 1990. Recycled-material
content in paper is not regulated in Canada, but
voluntary national goals have been established.
From 1990 to 1995, Canada’s forest
industries invested $1.2 billion to increase their
recycling capacity, mostly in recycled newsprint
production. Some 60 of the country’s 110 paper
and paperboard mills now use recovered paper
for all or part of their supply. Of these, 23 mills
produce newsprint with old newspapers and
magazines as an important component of the
total fibre supply.
Some recent data and trends on recycled
products are shown in Figure 4.1f. Total mill
receipts of old newspapers and corrugated
containers, which each exceeded 1.5 million
tonnes, increased in 1995 compared with the
previous year. Imports of U.S. newspapers
represented more than 55% of consumption
and containers, 30%. Among other products,
receipts of high-grade de-inked papers fell in
1995; imports accounted for 57%. Total receipts
of old magazines also declined overall, but
domestic receipts increased, whereas imports—
which represented 75% of the total supply used
by mills—decreased.
Wood products, which are relatively
inexpensive in Canada, have long been
the residential building material of choice.
Construction generally produces 4–7 tonnes of
waste materials, of which wood products account
for 35–45%. Recently, competition has brought
down the cost allowance for off-cuts and waste
from 15%, to 5% or less. Also, on-site separation
of wood wastes has made it possible to reuse
and sell construction debris. In one instance,
Global carbon budget
Global ecological cycles62

framers and carpenters were able to reuse
approximately 500 kilograms of dimensional
lumber that might otherwise have gone to a
landfill site—a 20% reduction in wood waste.
This saving, added to an already reduced
allowance for construction wastes, generated an
on-site reduction of at least 30% in wood waste.
Today, a market is emerging for recycled
wood materials. The effects of recycling—although
small in terms of the overall carbon budget of the
forest sector—help lower emissions to the
atmosphere. In the context of climate change,
they also enable Canada to reduce its total carbon
emissions as part of its international obligations.
For every six homes built in Canada,
one is demolished. Recycling of demolition
waste is a growing market. With 10-fold or
higher increases in landfill tipping fees, 50
material recycling facilities have opened since
1988 in major urban markets. Approximately a
third operate retail outlets. Not only have they
created a market in Canada for value-added
wood products (e.g., large timbers, doors,
windows, architectural millwork, cabinetry
and hardwood flooring) at prices 30–50% below
those of new materials, they have also spawned
technologies to manufacture new products
(e.g., mulches, animal bedding, fibre-based
boards and mats for further manufacture by
the automotive industry) from demolition waste.
Wooden pallets, which account for 90% of
container production, are no longer accepted at
many urban landfill sites. However, they may be
reused up to 50 times, and each year, the Canadian
Pallet Council repairs almost a million pallets for
reuse by industry members. (The Council has
grown from 200 members in 1983, to more than
800 in 1996.) Pallets that are beyond repair are
now recycled as mulch, wood fibre for new-age
building products, and chips for composting
municipal sewage sludge.
SummaryCurrent estimates suggest that since the second
half of the 1980s, Canada’s boreal and subarctic
forests have been a net source for atmospheric
carbon. The precise magnitude of the carbon
release is uncertain, but it seems fairly clear that
after acting as a sink for atmospheric carbon for
much of this century, these forests have reversed
their role in the global carbon cycle.
Recent investigations into the carbon budget
suggest a number of important relationships. First,
the budget is not constant, but changes over time
in response to a number of factors that affect
Global carbon budget
Global ecological cycles63
PRODUCT TOTAL CHANGE DOMESTIC CHANGE IMPORTEDRECEIPTS 1994–1995 RECEIPTS 1994–1995 FROM USA
thousand tonnes % thousand tonnes % %
Old newspapers 1 518 +5 675 +2 55Old corrugated containers 1 512 +5 1 040 +5 30Hi-grade de-inked papers 527 -1 224 – 57
(e.g., computer print outsand sorted office waste)
Old magazines 195 -5 50 +9 75
Source: Canadian Pulp & Paper Association
4.1f Total and domestic mill receipts of recycled products, 1995

forest productivity, including forest management
practices, and fires, insects and diseases. Secondly,
the amount of carbon in a forest is strongly
influenced by the age distribution of its trees.
Hence, the timing and rate of disturbances are
important in determining whether our forests are
a sink or source for atmospheric carbon. Lastly,
changes in a forest’s uptake or release of carbon
are primarily the result of fluctuations in natural
disturbance regimes. For example, the recent
20-year period of high disturbances in the boreal
forest will likely affect the dynamics of the forest
carbon budget for decades. Consequently, over
the long-term, it is unclear whether Canada’s
forests can be considered significant sinks for
the atmospheric carbon released by society’s
use of fossil fuel energy sources.
Economics and a growing environmental
awareness are shaping the use, reuse and recycling
of wood and paper products. The infrastructure
for reusing and recycling wood products is
swiftly emerging, but data availability will
remain a problem until this new market segment
establishes reporting standards and protocols.
Development of the carbon budget model
of Canada’s forests is not complete—research to
improve various components is continuing.
Changes in the carbon estimates can be expected
as new data are obtained, improvements to the
model are made, and our understanding of the
carbon cycle increases.
ELEMENT 4 .2F O R E S T L A N D C O N V E R S I O N
What are we measuring?In Canada, forest lands are
being permanently converted to
purposes that serve our growing
population—to residential areas,
agricultural lands, roadways,
pipeline corridors, hydroelectric
right-of-ways, reservoirs, mining
areas, airports, etc. There is
concern that the magnitude
of the conversion is affecting the
global carbon and hydrological
cycles, which are linked to climate
change and global warming.
Comprehensive, current information
on land use changes in Canada is not available.
However, to give a general idea of the magnitude
of the conversion of forest lands to other uses,
rough estimates can be made from related
statistics and proxies in selected areas, and
they can then be extrapolated to the country
as a whole.
How does forest land conversion relate to the sustainability of Canada’s forests? The issue of land conversion is important
to the sustainability of our forests, because
if forest lands are being permanently lost, the
decline in forested area will ultimately affect
the amount of wood that can be extracted for
societal uses. It will also affect the ability of
the forest to provide environmental, social,
cultural and recreational benefits to society.
Forest land conversion
Global ecological cycles64
Globalecological
cycles
Global carbonbudget
Forest landconversion
Carbon dioxideconservation
Policyfactors
Hydrologicalcycles

When forests are converted to other uses,
there is usually a net loss of carbon from the
trees, vegetation and soils. The carbon moves
to the atmosphere, increasing concentrations of
CO2. When other lands (e.g., agricultural lands)
are converted to forests, however, the lands
incur a net carbon gain, which helps reduce
atmospheric concentrations. (Forest lands
contain more carbon than agricultural lands.)
Knowing whether our forested area is
contributing to or reducing atmospheric
carbon is an important element of Canada’s
reporting commitments under the Framework
Convention on Climate Change.
What data are available?The data currently available on forest land
conversions in Canada do not distinguish
between permanent and semi-permanent
or temporary conversions. For this reason,
Indicators 4.2.1 and 4.2.2 are being
addressed together in this report.
Area of forest permanently converted to non-forest land use, e.g., urbanization(4.2.1) and Semi-permanent or temporaryloss or gain of forest ecosystems, e.g.,grasslands and agriculture (4.2.2)
In Canada, since European settlement began in
the 17th century, the largest conversion of forest
lands to other uses has been to agricultural
lands—some 23 million hectares. Another
million hectares have been converted to urban
settlements, roadways, hydro right-of-ways,
pipeline corridors, and so on.
Today, Canada’s forest lands continue to be
converted to other uses; however, of the forested
area at settlement, 94.6% is still under forest cover.
Figure 4.2a illustrates the estimated annual
change in forest, agricultural and other land
uses from 1986 to 1991. The annual increase in
agricultural lands from forests is approximately
83 000 hectares, while 18 000 hectares of
agricultural lands are converted to other
societal uses.
Not all conversion of forest lands to
agricultural lands is permanent. Some lands
cannot sustain economically viable agricultural
use, and so are abandoned and intentionally or
naturally changed back to forests at a rate of
approximately 15 000 hectares per year.
In total, each year, some 88 000–103 000
hectares of forests are converted permanently
to non-forest land uses. However, with Canada’s
current forested area of 417.6 million hectares,
the significance of this conversion is diminished
by the size of our forests—the annual rate of
Forest land conversion
Global ecological cycles65
Source: Natural Resources Canada–Canadian Forest Service
Estimated conversion of forest landsin Canada to agricultural and other societal uses, 1986–1991
thousand hectares/year
4.2a
9815
18
5–20
Othersocietal
uses
Agriculturaluse
FORESTLANDS

conversion is roughly equal to 0.02% of
the resource.
SummaryComprehensive, current information on land
use changes in Canada is not available. Estimates
suggest that some 24 million hectares of forest
lands have been converted to agricultural or
other land uses since European settlement
began. Forest lands continue to be permanently
and semi-permanently converted to other land
uses; however, given the vastness of the forest
resource in Canada, the overall impact of these
conversions is negligible. Nevertheless, the
implications of this change for the global carbon
and hydrological cycles are not well understood.
ELEMENT 4 .3F O R E S T S E C TO R CA R B O N D I OX I D E C O N S E RVAT I O N
What are we measuring?Energy use by the forest
sector for the conversion of
raw materials to manufactured
products, and the storage and
disposal of these products, all
contribute to the global carbon
cycle. For example, the forest
sector uses energy in the
production of lumber, paper
and other wood products, which
release CO2 into the atmosphere.
At the same time, forest
products (e.g., buildings, furniture and paper)
store carbon and contribute to reduced emissions.
However, these products become a source of
carbon emissions over time—after disposal.
Because of the relationship between the forest
products carbon pool, the standing biomass
pool and the forest soils pool, this topic is
discussed in Element 4.1 (Contributions to
the global carbon budget).
Statistics Canada collects data quarterly
and annually on the energy used by the forest
sector and the quantities of fuel it consumes.
Statistics are available on the pulp and paper
industries and wood industries for the period
1980–1993. This element outlines the energy
(including non-fossil fuels) used by the forest
industries, the CO2 emissions to the atmosphere
that are associated with fossil fuel use, and the
changes that occurred between 1980 and 1993.
For the purposes of this report, Indicator 4.3.1
(Fossil fuel emissions) and Indicator 4.3.3
(Percentage of forest sector energy usage from
renewable sources relative to the total energy
requirement) are discussed together. Indicator
4.3.2 (Fossil carbon products emissions) is
covered in the discussion on the forest sector
carbon budget in Element 4.1 (Contributions to
the global carbon budget).
How does carbon dioxide conservationrelate to the sustainability of Canada’s forests? Rising concentrations of greenhouse gases in the
atmosphere have been linked to global warming.
The burning of fossil fuels is regarded as the
major source of the most significant of these
gases—CO2.
As a signatory to the Framework
Convention on Climate Change, Canada is
committed to stabilizing its greenhouse gas
emissions at 1990 levels by 2000. Increasing
the use of renewable or non-fossil fuel energy
sources (e.g., biofuels, and hydro and nuclear
power) is one way to reduce these emissions.
Carbon dioxide conservation
Global ecological cycles66
Globalecological
cycles
Global carbonbudget
Forest landconversion
Carbon dioxideconservation
Policyfactors
Hydrologicalcycles

What data are available?
Fossil fuel emissions (4.3.1) and Percentage of forest sector energy usage from renewable sources relative to the total energy requirement (4.3.3)
Fossil fuels utilized to produce energy include
coal and coke, natural gas and refined petroleum
products, as well as the portion of electricity that
is derived from coal and coke and natural gas.
Non-fossil fuels include hydro and nuclear power,
as well as the energy derived from biomass and
spent pulping liquor.
Figure 4.3a outlines changes in the specific
energy sources used by the forest sector between
1980 and 1993. Non-fossil energy derived from
biofuels rose by 32%, and hydro and nuclear
energy increased by 38.2%. Energy from fossil
fuels, on the other hand, decreased by 12.5%.
Overall, from 1980 to 1993, the use of fossil
fuel energy declined to 34% of total energy use,
whereas the use of non-fossil energy sources
increased to 66%, bioenergy rose to 51.8%,
and hydro and nuclear power grew to 14.2%.
Although total energy use by the forest
sector increased by approximately 13.5%, total
CO2 emissions decreased by 15.1% (Figure 4.3b).
These effects resulted from replacing fossil fuels
with biomass-derived fuels, using more hydro
and nuclear power, and switching from coal,
coke and heavy fuel oil to less carbon-intensive
fuels, such as natural gas.
The decline in CO2 emissions from
fossil fuels is broken down by major fuel
type in Figure 4.3c. In 1993, coal and coke
accounted for 2% of these emissions; natural
gas, 34%; refined petroleum products, 32%;
and fossil fuel electricity, 32%. Between 1980
and 1993, emissions from the use of refined
petroleum products declined by almost half,
and from the use of coal and coke, by roughly
Carbon dioxide conservation
Global ecological cycles67
Source: Statistics Canada
Source of energy used by theforest sector
petajoules
4.3a
0
100
200
300
400
500
Fossil fuelsBioenergy Hydro and nuclear
power
199319851980 1990
Source: Statistics Canada
Total energy use and total CO2 emissions in the forest sector
4.3b
Total energy use (petajoules)
CO2 emissions (million tonnes)
million tonnespetajoules
19931990198519800
5
10
15
20
25
0
100
200
300
400
500
600
700
800
900

three-quarters. However, emissions from the use
of natural gas and fossil fuel electricity increased
by 11% and 86%, respectively.
Between 1980 and 1993, CO2 emissions
from fossil fuels utilized by Canada’s forest sector
represented less than 5% of the emissions
attributed to the nation as a whole (Figure 4.3d).
Moreover, the proportion declined throughout
the 1980s and early 1990s—from 4.8% to 3.8%.
During this period, forest sector emissions were
reduced by 15.1% (from 21.2 million tonnes to
18 million tonnes), while those of Canada as
a whole increased by 6.6% (from 441 million
tonnes to 470 million tonnes).
SummaryTotal energy use by the forest sector has
increased by roughly 13.5% since 1980, but
the portion derived from fossil fuel sources has
declined by 12.5%. This improvement was made
possible by increasing the use of biofuels by 32%
and hydro and nuclear energy sources by 38.2%.
Associated with the decline in fossil fuel
use, total forest sector CO2 emissions decreased
by 15.1%. This decrease in emissions is linked
to the replacement of fossil fuels by biofuels,
the switching from more carbon-intensive
fuels (e.g., coal, coke and heavy fuel oil) to
less carbon-intensive fuels (e.g., natural gas),
and the implementation of more energy efficient
processes. Overall, the forest sector contributes
less than 5% of the total CO2 emissions from
fossil fuel use in Canada, and this proportion
is declining.
Carbon dioxide conservation
Global ecological cycles68
Source: Statistics Canada
CO2 emissions by fuel type
million tonnes
4.3c
Refined petroleum products
Coal and cokeNatural gas
Fossil fuel electricity
0
2
4
6
8
10
12
199319851980 1990
Source: Statistics Canada
CO2 emissions from fossil fuel used by Canada as a whole andby the forest sector
million tonnes
4.3d
Canada as a whole
Forest sector
19931990198519800
100
200
300
400
500

Policy factors
Global ecological cycles69
ELEMENT 4 .4F O R E S T S E C T O R P O L I C Y FA C TO R S
What are we measuring?The appropriateness of Canada’s
policies can be gauged by how
well its legal and regulatory
framework influences the
conservation and sustainable
development of its forests,
by the extent and quality of
its forest inventories, and by its
participation in the international
climate change convention.
How do policy factors relate to thesustainability of Canada’s forests?Canada’s legal and regulatory framework
promotes the sound stewardship of its forest
resources, provides for forest inventories to
monitor the extent and condition of its forests,
supports its participation in international climate
change initiatives, and encourages its use of
bioenergy. Canadians are custodians of 10%
of the planet’s forest area, and it is important
that Canada conserve and manage its forests so
that they continue to contribute to the orderly
working of global ecological cycles.
What data are available?
Existence of laws and regulations on forest land management (4.4.5)
In addition to statutes and regulations, the
legal framework for forest management in
Canada comprises guidelines, standards, rules
and manuals that provide direction to forest
managers in their daily operations. The
framework applies primarily to commercial
Crown forests.
Most of Canada’s public forest land is under
provincial jurisdiction, and tenure arrangements,
through which rights to public forest land are
allocated to private companies, are a key forest
management policy vehicle. The bulk of rights
to forest land are held in the form of long-term
tenure agreements. These agreements require
forest companies to prepare detailed management
plans (usually every five years) for approval by
provincial governments. Most of the agreements
contain provisions to ensure that areas are
reforested soon after being harvested, as well as
provisions aimed at achieving forest management
objectives—to maintain a vigorous forest cover.
For a discussion on tenures, please see page 70.
More recently, an increasing number of
forest policies have been based on environmental
and social, as well as economic considerations.
Legislation to achieve sustainable development
goals is beginning to reflect this change. New
forest laws and stricter enforcement of previously
informal policies and guidelines indicate the steps
being taken by an increasing number of provinces
in response to new imperatives.
The need to sustainably manage forest
resources is acknowledged by all levels of
government in Canada and is entrenched in
the 1992 National Forest Strategy. New acts
based on the principles of sustainability have
already been passed by three provinces: British
Columbia’s 1994 Forest Practices Code Act,
Ontario’s 1994 Crown Forest Sustainability
Act and Saskatchewan’s 1996 Forest Resources
Management Act. (In 1996, the Province of
Quebec amended its Forest Act to reflect the
same commitment.)
Globalecological
cycles
Global carbonbudget
Forest landconversion
Carbon dioxideconservation
Policyfactors
Hydrologicalcycles

Policy factors
Global ecological cycles70
Tenure arrangements
In Canada, all timber cut on Crown lands is harvested under some form of tenure, which is defined as a right or interest granted by the Crown, subject to governing legislation and the terms andconditions of the document containing the grant. The rights conveyed under tenure vary greatly incomprehensiveness, duration and exclusiveness; and the obligations of the holders increase with the security and length of tenure.
Under tenure arrangements, the government and a forest company negotiate an agreement thatallows the province to retain full ownership of the land, while conveying to the company exclusiverights to harvest the timber in a sustainable manner. (To obtain these rights, the company must submitdetailed short- and long-term management plans for review and approval by the province on a regularbasis.) The tenure also assigns responsibility for management costs. Long-term tenures (20–25 years)account for the majority of timber cutting rights (Figure 4.4a) and can be renewed, provided the companysatisfies the terms of the agreement. Tenure arrangements for timber harvesting may overlap, withseveral tenure holders operating in the same area. Coordination and joint planning of forest activitiesby tenure holders are encouraged and sometimes mandated (e.g., in Quebec and New Brunswick).
Although timber production is the predominant use of forest land under tenure, in recentdecades, tenure arrangements have also provided for access by other users in areas designated for integrated or multiple-use management. In cases of overlapping or conflicting uses ofresources, integrated planning processes exist to establish priorities and provide a mechanism fordepartmental consultation.
Access to and use of non-timber forest resources (e.g., wildlife, water and minerals) are oftengranted by different government departments operating under various statutes. For instance, agriculturalactivities in forested areas may require leases, licences or permits for grazing and haying. Mineralexploration and development also are subject to a variety of permits and licences. Hunting, fishing,trapping, guide outfitting and water uses also are regulated and subject to a licence or permit system.
PROVINCE FORM OF TENURE TIMBER ALLOCATED%
British Columbia Tree Farm Licences 25Forest Licences 56
Alberta Forest Management Agreements 47Saskatchewan Forest Management Licence Agreements 93Manitoba Forest Management Licences 60Ontario Forest Management Agreements 70Quebec Timber Supply and Forest Management Agreements 100New Brunswick Crown Timber Licences 73Nova Scotia Licences and Management Agreements 86Newfoundland Leased and licenced land 65
Sources: Canadian Institute of Resources Law, Department of Alberta Environmental Protection
4.4a Proportion of timber allocated by province and form of long-term tenure, 1990

Policy factors
Global ecological cycles71
Forest lands are also subject to environmental
protection legislation that applies regardless of
ownership. For instance, water pollution and
activities that may be harmful or destructive
to fish habitat are prohibited under federal
legislation (e.g., the Fisheries Act), as well as
provincial statutes, and are subject to prosecution.
Existence of forest inventories (4.4.4)
Because forest resource management is largely
a provincial and territorial responsibility, forest
inventories in Canada have been developed in
response to local or regional needs. Until fairly
recently, a “forest inventory” was carried out to
acquire information regarding area, condition,
timber volume and tree species composition. Forest
management agencies have since begun to broaden
the scope of their inventories to encompass non-
timber values, such as wildlife habitat and outdoor
recreation. Inventory information is used for such
purposes as planning, purchasing, evaluating,
managing and harvesting.
Over the years, resource inventories have
become more complete in their coverage, and
most jurisdictions have programs for renewing
inventories in areas under active forest
management. The oldest resource inventories
and the ones with the most data gaps tend to
be those pertaining to remote areas. The extent
of forest inventory coverage by data source class
is shown in Figure 4.4b on page 72.
The national inventory compiles existing
data from the inventory organizations of the
provincial and territorial forest services, and
aggregates it to the national level. Canada’s Forest
Inventory provides information on the distribution
and structure of all of the major forested areas.
Because it is a spatially referenced database, the
national inventory can have other information
overlaid on it for further analysis and to present
forest characteristics in thematic maps. (The
national inventory does not yield meaningful
information on changes over time because much
of the apparent change from previous inventories
is due to improved coverage and procedures.
Canada’s forest inventories generally are not
designed for monitoring forest conditions, but
are usually one-time surveys.)
Statistics Canada collects time-series data
on most economic indicators related to timber-
based industrial activity. However, new data
sets and monitoring systems will be required for
most of the indicators related to cultural, social
and spiritual needs and values, in terms of both
resources and benefits. The Canadian Council
of Forest Ministers (CCFM) has identified
the information gaps and is developing an
implementation plan to acquire the data
needed to report on the full range of indicators
of sustainable forest management. Progress
toward the establishment of multi-attribute
forest inventories is described in Element 6.2
(Participation by Aboriginal communities in
sustainable forest management) and Element 6.5
(Informed decision making).
Participation in the climate changeconventions (4.4.2)
Climate change is a key item on the
international policy agenda. The important
question for Canadians is how Canada, as a
signatory to the United Nations (UN) Framework
Convention on Climate Change, is responding to
its commitments and obligations regarding
greenhouse gas emissions.
As signatories to the Convention, Canada
and other developed nations aim to stabilize the
emissions of greenhouse gases (e.g., CO2) at
1990 levels by 2000, thereby preventing the
buildup of these gases from having a negative

Policy factors
Global ecological cycles72
impact on climate. The intent of the Convention
is to allow forests and other ecosystems to adapt
naturally to climate change, while allowing
economic development to proceed in a
sustainable manner.
The Convention also encourages scientific
research on climate change issues, through the
UN Intergovernmental Panel on Climate Change.
Forest scientists from Canada have participated
in deliberations on biomass burning, the global
carbon cycle, and the socioeconomic impacts
of climate change on forestry. The Panel’s 1995
assessment notes that the climate has changed
in the past and will likely change in the future;
it also points out, however, that a “discernable
human influence” on global climate is evident.
The next report is due in 2000.
In Canada, the federal, provincial and
territorial governments have prepared the
National Action Program on Climate Change
(NAPCC). A key component of the NAPCC
is to encourage voluntary action to offset and
reduce greenhouse gas emissions through the
national Voluntary Challenge and Registry
Program. The Program, which was endorsed
by energy and environment ministers at both
Reconnaissance
Regional
Management
Other
Not included*Ecozone boundaries
Data source Ecozones11- Arctic Cordillera12- Northern Arctic13- Southern Arctic14- Taiga Plains15- Taiga Shield16- Boreal Shield17- Atlantic Maritime18- Mixedwood Plains19- Boreal Plains10- Prairies11- Taiga Cordillera12- Boreal Cordillera13- Pacific Maritime14- Montane Cordillera15- Hudson Plains
11
124
3
22
2
2
3
5
5
6 7
6
8
3
1
1
1
14
15
9
10
6
6
13
Forest inventory coverage by data source 4.4b
Source: Natural Resources Canada–Canadian Forest Service
Note: Inventories fall into three major categories: reconnaissance (wide area, general information), regional (wide area, detailed information) and management (small area, very detailed information).
* area not included in Canada’s Forest Inventory

levels of government in late 1994, encourages
all sectors to explore cost-effective actions
that may be taken to reduce greenhouse gas
emissions. Major industry associations,
individual corporations (including a number
of forest companies) and municipalities are
now participating in the Program.
As part of the NAPCC, the federal
government is working with the provinces,
territories and forest sector to assess the capacity
of our forests to absorb and store carbon, the
effects that climate change will have on this
capacity, and the measures that the sector may
take to mitigate and adapt to climate change.
In addition, ways are being sought to preserve
and enhance our forests’ capacity to absorb and
store carbon through recycling wood and paper
waste, preventing the spread of wildfires, and
planting trees in urban and rural communities and
on marginal agricultural lands. Also, governments
are working with the forest sector to reduce CO2
emissions by improving energy-use efficiency
within the sector and by developing the use of
biomass as an alternative fuel.
Economic incentives for bioenergy use (4.4.3)
As mentioned above, the NAPCC includes
measures to reduce greenhouse gas emissions
by substituting bioenergy sources for fossil fuels.
Currently, biomass provides approximately 7%
of Canada’s total energy use; almost all of
that biomass originates from the forest. The
forest sector itself uses the largest share of
the bioenergy for space heating, steam and
electricity, primarily in pulp and paper mills.
Most of the provincial and territorial
governments offer programs that promote
alternative energy sources, including forest
biomass. The majority of these programs
focus on information and public awareness,
technology transfer, and the promotion of R & D.
Approximately half the governments also offer
financial incentives for the use of forest biomass.
The federal government allows
companies to reduce their corporate income
tax by claiming an accelerated capital cost
allowance for investments in energy-producing
equipment, providing that equipment is used in
industrial processes fueled by renewable energy
sources, including forest biomass. Also, the
federal ENFOR (ENergy from the FORest)
Program provides funding for R & D aimed at
increasing the use of forest biomass as a source
of bioenergy. Current work under the Program is
focused on examining how to increase the supply
of biomass for energy purposes, and determining
how the increased production and removal of
biomass will affect the environment. Other
federal activities include technology transfer
to increase biomass use, and the study of
socioeconomic constraints to biomass use.
SummaryAlthough each level of government has its
own responsibilities, there is a long tradition of
cooperation between the federal and provincial/
territorial governments in forestry matters. All
provinces and territories have forest legislation
governing the allocation of timber harvesting
rights on all Crown lands and the requirements
for forest planning and operations; private forests,
too, are increasingly being regulated to ensure
their sound management.
The CCFM has recognized that Canada’s
existing forest database systems should be
broadened to include the additional information
needed to manage forests for a full range of
Policy factors
Global ecological cycles73

values. Most provinces and territories are
examining the possibility of developing the
new data sets and monitoring systems required
for indicators related to non-timber values.
Over the past few years, Canada has
strengthened its R & D on the impacts of
climate change on forests; the role of forests
in absorbing, releasing and storing atmospheric
CO2; and the technologies required to improve
the use of forest biomass fuels as alternatives
to fossil fuels. The federal government also
funds R & D on forest bioenergy and provides
tax incentives for greater industrial bioenergy
use. In addition, most provincial and territorial
governments have programs to encourage the use
of forest biomass, although few of the programs
provide economic incentives for bioenergy use.
ELEMENT 4 .5C O N T R I B U T I O N S TO H Y D R O L O G I CA L C Y C L E S
What are we measuring?Global ecological cycles are a
series of processes that recycle
the Earth’s limited supply of
water, carbon, nitrogen and
other life-sustaining elements.
The world’s forests are
critically dependent on these
global processes, including
the hydrological cycle, and
make substantial contributions
to them.
An estimate of the surface water in
Canada is available from the Canada Year
Book. Canada’s Forest Inventory 1991 also
indicates the area covered by water, but only
for forest lands—it does not include the prairie
agricultural zone nor the areas north of the tree
line, which both contain a considerable amount
of surface water.
The numbers available from these two
sources differ. Figures in the yearbook for the
total area of surface water (60 million hectares)
are lower than those in the inventory database
(76 million hectares), despite the fact that the
latter do not cover the entire country. The
explanation for this discrepancy lies in the
different methods that were used in compiling
data for the yearbook and the inventory. The
yearbook figures are derived from 1:250 000-
scale maps; thus, they exclude rivers depicted
as single lines and bodies of water measuring
less than 6.25 hectares. Forest inventory data,
however, are collected at scales of approximately
1:10 000 or 1:20 000, which allows the inclusion
of a greater number of rivers, as well as bodies
of water as small as 100–200 m2.
This report outlines the estimated area of
surface water in the various ecozones of Canada,
based on Canada’s Forest Inventory 1991.
How do hydrological cycles relate to the sustainability of Canada’s forests? Hydrological cycles are a vital component
of ecological cycles. Forests require water
to grow and remain healthy and vigorous, and
in turn, they recycle some of the water to the
atmosphere. Lakes and wetlands represent large
reservoirs of fresh water within forested areas.
In many cases, forests regulate the flow of
water into these reservoirs, either directly
or by influencing stream and river flows.
Hydrological cycles
Global ecological cycles74
Globalecological
cycles
Global carbonbudget
Forest landconversion
Carbon dioxideconservation
Policyfactors
Hydrologicalcycles

What data are available?
Surface area of water within forested areas (4.5.1)
Nearly 25% of the world’s fresh water is found in
Canada. Indeed, surface fresh water covers almost
8% of our total land area (Figure 4.5a).
Of the surface fresh water in Canada’s
forested area, approximately 83% is found in the
Boreal and Taiga ecozones, combined. (Slightly
more than half of Canada’s forested area is located
in these ecozones.) The least amount of surface
water (1–3.5%) is in the Cordillera and Pacific
Maritime ecozones.
Within the Boreal and Taiga ecozones,
water covers 12.4% and 11.5%, respectively. This
is not unexpected if one looks at the geology of
these ecozones. The underlying bedrock is granite
that has been heavily glaciated, causing many
gouges in the hard rock and creating excellent
places for water to collect.
Most of the ecozones—the majority of
Canada, in fact—receive more precipitation
annually than is lost by vegetation through
evapotranspiration; and most of the forested
area, especially in the Boreal Shield and Taiga
Shield, registers at least twice as much annual
precipitation as evapotranspiration. This indicates
that the water supply is adequate to maintain
the hydrological cycle of the forest.
SummaryForests play an important role in the global
hydrological cycle. One key component of this
cycle is the storage of water in the form of lakes
and other bodies of open water.
Hydrological cycles
Global ecological cycles75
4.5a Surface area of fresh water by ecozone
ECOZONE TOTAL AREA FRESH WATER FRESH WATERmillion hectares million hectares %
Arctic Cordillera 25.06 0.07 0.28Northern Arctic 151.09 – –Southern Arctic 83.24 1.23 1.48Taiga Plains 64.70 5.46 8.44Taiga Shield 136.64 20.62 15.09Boreal Shield 194.64 29.38 15.10Atlantic Maritime 20.38 2.53 12.44Mixedwood Plains 19.44 6.27 32.26Boreal Plains 73.78 8.65 11.73Prairies 47.81 0.84 1.75Taiga Cordillera 26.48 0.23 0.88Boreal Cordillera 46.46 0.97 2.09Pacific Maritime 21.90 0.40 1.84Montane Cordillera 49.21 1.49 3.03Hudson Plains 36.24 0.68 1.86
CANADA 997.06 78.83* 7.91
* table may not add due to rounding
Source: Canada’s Forest Inventory

Canada is custodian of nearly a quarter
of the world’s fresh water. Lakes and other
bodies of open water occupy some 79 million
hectares—approximately 8% of of the nation’s
land area. Roughly 83% of the surface water area
is contained within the Boreal Shield and Taiga
Shield—the ecozones where more than half
of Canada’s forested area is located.
Canada’s forest water balance is positive,
with more precipitation falling annually in all of
the ecozones than is lost through evapotranspiration.
LITERATURE CITED
Apps, M.J.; Kurz, W.A. 1991. Assessing the role
of Canadian forests and forest sector activities in
the global carbon balance. World Resource
Review. 3(4): 333–343.
Canadian Wood Pallet and Container Association.
1993. The Canadian wood pallet industry and the
national packaging protocol. Prepared by G.W.R.
Burrill. 44 p.
Corson, J. 1995. The problems facing public
acceptance of building reuse facilities. Pages
43–47 in Compendium of the conf. on cost
effective management of construction and
demolition waste and green procurement, Nov.
1995, Toronto, Ont. Sponsored by Environment
Canada and the Univ. of Western Ontario.
Forintek Canada Corp. 1993. The state of
demolition waste recycling in Canada. Prepared
by Zev Kalin and Assoc. and the Centre for
Studies in Construction, Univ. of Western
Ontario, Building Materials in the Context
of Sustainable Development Project. 88 p.
Forintek Canada Corp. 1994. Demolition and
disposal environmental implications. Prepared
by the Centre for Studies in Construction,
Univ. of Western Ontario, Building Materials
in the Context of Sustainable Development
Project. 18 p.
Gray, S.L. 1995. A descriptive forest inventory
of Canada’s forest regions. Natural Resources
Canada, Canadian Forest Service, Petawawa
National Forestry Institute, Chalk River, Ont.
Inf. Rep. PI-X-122. 192 p.
Kokko, J.; Fisken, A. 1995. Waste management
at the Green on the Grand. Pages 63–67 in
Compendium of the conf. on cost effective
management of construction and demolition
waste and green procurement, Nov. 1995,
Toronto, Ont. Sponsored by Environment
Canada and the Univ. of Western Ontario.
Kurz, W.A.; Apps, M.J. 1995. Retrospective
assessment of carbon flows in Canadian boreal
forests. In Apps, M.J.; Price, D.T. Editors. Forest
ecosystems, forest management and the global
carbon cycle. NATO ASI Series 1: Global
environmental change. Springer-Verlag,
Heidelberg. 40: 173–182.
Kurz, W.A.; Apps, M.J.; Beukema, S.J.;
Lekstrum, T. 1995. 20th century carbon budget
of Canadian forests. Tellus 47B: 170–177.
Kurz, W.A.; Apps, M.J.; Webb, T.M.; McNamee,
P.J. 1992. The carbon budget of the Canadian
forest sector: phase 1. Forestry Canada,
Northwest Region, Edmonton, Alta. Inf.
Rep. NOR-X-326. 93 p.
Literature cited
Global ecological cycles76

Lowe, J.J. 1991. Canada’s forest inventory:
the sustainable commercial timber base and
its growth rate. Pages 33–36 in Brand, D.
Editor. Canada’s timber resources. Forestry
Canada, Petawawa National Forestry Institute,
Chalk River, Ont. Inf. Rep. PI-X-101.
Lowe, J.J.; Power, K.; Gray, S.L. 1996. Canada’s
forest inventory 1991: The 1994 version. Natural
Resources Canada, Canadian Forest Service,
Pacific Forestry Centre, Victoria, B.C. Inf.
Rep. BC-X-362E.
McCuaig, J.E.; Manning, E.W. 1982. Agricultural
land-use change in Canada: process and
consequences. Land use in Canada. Series
Nº 21. Environment Canada, Lands Directory,
Ottawa, Ont.
Sawatsky, B. 1995. The impact of used building
material facilities in Canada: impressions to date.
Pages 37–42 in Compendium of the conf. on cost
effective management of construction and
demolition waste and green procurement, Nov.
1995, Toronto, Ont. Sponsored by Environment
Canada and the Univ. of Western Ontario.
Statistics Canada. 1980–1991. Consumption
of purchased fuels and electricity.
Statistics Canada. 1980–1993. Electric power
statistics. Pub. 57–292.
Statistics Canada. 1985. Consumption of
purchased fuels and electricity. (Special
tabulation for manufacturing industries)
Industry Division.
Statistics Canada. 1987–1993. Quarterly report
on energy supply and demand. Pub. 57–003.
Statistics Canada. 1991. Canada year book 1992.
125th anniversary issue. Ministry of Industry,
Science and Technology Canada, Ottawa, Ont.
Statistics Canada. 1992. 1991 census of
agriculture. Agricultural profile. (Various
provinces) Ministry of Industry, Science and
Technology Canada, Ottawa, Ont.
Toronto Home Builders Association.
1990. Making a molehill out of a mountain.
Toronto, Ont.
Urkhart, M.C.; Buckley, K.A.H. Editors. 1965.
Historical statistics of Canada. MacMillan Co.
of Canada, Toronto, Ont.
Warren, C.L.; Rump, P.C. 1981. The urbanization
of rural land in Canada: 1966–1971 and
1971–1976. Land use in Canada. Series
Nº 20. Environment Canada, Lands Directory,
Ottawa, Ont.
CONTACTS
Carbon cycle / forest energy
Dr. Robert Stewart (Criterion coordinator)
Science Branch
Natural Resources Canada–
Canadian Forest Service
7th floor, 580 Booth Street
Ottawa ON K1A 0E4
Tel.: (613) 947-9014
Fax: (613) 947-9090
Carbon cycle
Dr. Mike Apps
Northern Forestry Centre
Natural Resources Canada–
Canadian Forest Service
5320–122nd Street
Edmonton AB T6H 3S5
Tel.: (403) 435-7305
Fax: (403) 435-7359
Contacts
Global ecological cycles77

Paper recycling
Mr. Jacques Cloutier
Technology Transfer Canada
10th floor, 300 Slater Street
Ottawa ON K1A 0C8
Tel.: (613) 946-1075
Fax: (613) 954-9117
Land-use changes
Mr. Steve Gray
Pacific Forestry Centre
Natural Resources Canada–
Canadian Forest Service
506 West Burnside Road
Victoria BC V8Z 1M5
Tel.: (250) 363-0709
Fax: (250) 363-0797
National forest statistics
Mr. Brian Haddon
Industry, Economics and Programs Branch
Natural Resources Canada–
Canadian Forest Service
7th floor, 580 Booth Street
Ottawa ON K1A 0E4
Tel.: (613) 947-9065
Fax: (613) 947-7399
Carbon cycle
Dr. Werner Kurz
ESSA Technologies Ltd.
3rd floor, 1765 West 8th Avenue
Vancouver BC V6J 5C6
Tel.: (604) 733-2996
Fax: (604) 733-4657
Recycling of wood products
Mr. Jamie Meil
Forintek Canada Corp.
8 Granville Avenue
Ottawa ON K1Y 0M4
Tel.: (613) 722-8075
Fax: (613) 722-9628
Forest policy and legislation
Mr. Hans Ottens
Science Branch
Natural Resources Canada–
Canadian Forest Service
7th floor, 580 Booth Street
Ottawa ON K1A 0E4
Tel.: (613) 947-9028
Fax: (613) 947-9090
Forest inventory
Ms. Katja Powers
Pacific Forestry Centre
Natural Resources Canada–
Canadian Forest Service
506 West Burnside Road
Victoria BC V8Z 1M5
Tel.: (250) 363-0615
Fax: (250) 363-0797
Carbon cycle
Dr. David Spittlehouse
Research Branch
B.C. Ministry of Forests
P.O. Box 9519
Stn.Prov.Govt.
Victoria BC V8W 9C2
Tel.: (250) 387-3453
Fax: (250) 387-0046
Contacts
Global ecological cycles78

CR ITER ION 5 .0
Introduction 81
Element 5.1 Productive capacity 82
Indicator 5.1.2 Distribution of, and changes in, the landbase available for timber production 82
Indicator 5.1.1 Annual removal of forest products relative to the volume of removals 83determined to be sustainable
Indicator 5.1.3 Animal population trends for selected species of economic importance 85
Indicator 5.1.5 Availability of habitat for selected wildlife species of economic importance 86
Indicator 5.1.4 Management and development expenditures 87
Element 5.2 Competitiveness of resource industries 88
Indicator 5.2.1 Net profitability 89
Indicator 5.2.2 Trends in global market share 89
Indicator 5.2.3 Trends in R & D expenditures in forest products and processing technologies 90
Element 5.3 Contribution to the national economy 92
Indicator 5.3.1 Contribution of timber and non-timber sectors to the gross domestic 92product (GDP)
Indicator 5.3.2 Total employment in all forest-related sectors 93
Indicator 5.3.3 Utilization of forests for non-market goods and services, including 95forest land use for subsistence purposes
Indicator 5.3.4 Economic value of non-market goods and services 96
Element 5.4 Non-timber values 97
Indicator 5.4.1 Availability and use of recreational opportunities 98
Indicator 5.4.2 Total expenditures by individuals on activities related to non-timber use 98
Indicator 5.4.3 Memberships and expenditures in forest recreation-oriented organizations 99and clubs
Indicator 5.4.4 Area and percentage of protected forest by degree of protection 100See also Indicator 1.1.3
Literature cited 100
Additional reading 101
Contacts 102

Introduction
Multiple benefits81
CR ITER ION 5 .0
MULTIPLE BENEFITS OF FORESTS TO SOCIETY
INTRODUCTION
The first four criteria within the Criteria and
Indicators (C & I) Framework are devoted to
monitoring environmental processes and the
impacts that human activities and natural
disturbances have on those processes.
Maintaining a flow of economic and other
benefits also is an important dimension of
sustainable development. The purpose of
this criterion is to describe and, where
possible, measure the economic and social
benefits derived from Canada’s forests.
Criterion 5 also considers the capacity
of the natural resource base and industrial
base to continue to supply those benefits.
Forests provide us with a multitude of
benefits. The production processes involved
in the delivery of forest products contribute
to the economy through the payment of wages,
taxes, profits and other costs, such as stumpage
fees. Non-timber and non-market benefits also
are important.
Forests are a finite resource. Therefore,
choices must be made regarding how forests will
be managed and utilized, how future consumption
demands will be met, and which benefits (and in
what proportion) will best satisfy the needs and
desires of Canadians.
The mix of benefits provided by forests
is determined by markets and governments.
Canada has a high percentage of forest land
under public ownership, and the flow of benefits
from our forests reflects the commitment by
governments to provide a broad range of public
goods and services to current and future
generations of Canadians.
Criterion 5 comprises four elements.
The first element (Productive capacity) focuses
on the capacity of the landbase to support a flow
of both timber and non-timber benefits for current
and future generations. The second element
(Competitiveness of resource industries)
considers the ability of the forest industries
to maintain or expand the flow of economic
benefits to the nation’s economy. The next
element (Contribution to the national economy)
identifies the array of goods and services that
forests provide and measures their contribution
to our economy. Lastly, the fourth element
(Non-timber values) considers goods, such
as outdoor recreation, and the importance that
Canadians place on some of the environmental
values of forests, such as biodiversity, wilderness
preservation and species preservation.
Ecosystemcondition andproductivity
Soil and waterconservation
Globalecological
cycles
Multiplebenefits
Society’sresponsibility
Conservation of biological
diversity

Productive capacity
Multiple benefits82
ELEMENT 5.1PRODUCTIVE CAPACITY
What are we measuring?Productive capacity is a measure
of the ability of the forest landbase
to provide a flow of benefits to
society. It applies to both timber
and non-timber resources and is a
key factor in assessing our progress
toward sustainable development.
Productive capacity can
be measured by evaluating the
magnitude and impact of harvesting, land-
use changes and natural disturbances on the
resource, versus the ability of the resource to
sustain itself through a combination of natural
processes (e.g., regeneration and growth) and
management activities (e.g., silviculture and
protection). Some information is available on
changes in the commercial forest landbase,
harvest rates for timber and wildlife, wildlife
population levels and habitat availability, and
forest management and development expenditures.
All of this information provides some perspective
regarding the productive capacity of the forest.
How does productive capacity relate to the sustainability of Canada’s forests? Forests and wildlife are renewable resources
and generally are managed on a sustainable
basis to maximize the productive capacity
of the resource, protect conservation values,
and maintain a perpetual flow of benefits.
By measuring the productive capacity of
the landbase, we can monitor the state of
the forest and trace the effects of human
intervention, while evaluating the forest’s
ability to provide society with a continuous
stream of benefits.
What data are available?
Distribution of, and changes in,the landbase available for timberproduction (5.1.2)
Most of Canada’s forest land is under public
ownership (provincial, 71%; federal and territorial,
23%). Of the 417.6 million hectares of forests,
57% are considered “commercial”—capable of
producing a range of both timber and non-timber
benefits. However, only half of those forests
are currently accessible and managed for
timber production.
The provincial and territorial governments,
which manage most (88%) of the commercial
forest land, have enacted a range of policies
and regulations to restrict the sale of forest
land and its conversion to other uses. For
example, Manitoba does not permit the sale
of its designated public forest land—public lands
with forest cover can only be sold if they are
designated for agricultural purposes. In British
Columbia, the 1994 Forest Land Reserve Act
restricts the removal of designated land from
forest production. In Alberta, the Green Area
policy (established in 1948) states that public
forest land will be managed primarily for
forest production, watershed protection,
recreation and other multiple uses.
In other provinces, privatization of
public forest land is strictly controlled. For
example, in Saskatchewan, disposal of public
land requires an amendment to the Forest Act.
In Ontario, the Public Lands Act enables the
Ministry of Natural Resources to prohibit,
regulate and control the sale of public land.
Multiplebenefits
Productivecapacity
Competitiveness
Contributionto nationaleconomy
Non-timbervalues

Productive capacity
Multiple benefits
The amount of public forest land that is sold
to private owners and subsequently converted to
alternate uses (e.g., farmland) is minimal. The level
of deforestation on public land from flooding,
mining or the establishment of pipelines or right-
of-ways also appears to be limited.
One factor affecting the availability of forest
land for commercial harvesting is the steady and
continuing increase in the amount of public forest
land protected for other uses, such as parks,
wilderness areas and reserves. Within areas that
have not been protected as parks, governments
have established policies and guidelines to regulate
and control commercial timber harvests, thereby
reducing the amount of public forest land available
for that purpose. For example, logging is prohibited
or restricted on buffer strips along waterways and
on steep slopes. In many regions across Canada,
forest cover must also be maintained for scenic
values and wildlife habitat. In some areas, this
has increased the flow of non-timber products
and enhanced wilderness benefits. The combined
effect of these policies has been, and will continue
to be, some local reductions in the amount of
public forest land available for timber production.
Annual removal of forest products relative to the volume of removalsdetermined to be sustainable (5.1.1)
A wide variety of products are extracted
from the forest annually, including timber,
firewood and fuelwood, pelts, game, food
(e.g., mushrooms and berries), and a range
of botanical medicines and craft materials.
At the national level, limited information
is available on the harvest of these products.
The harvest rate for timber on provincial
and territorial Crown lands is determined by
annual allowable cuts (AACs), which dictate
the maximum volume of timber that can be
harvested annually from an area over a period
of time. AACs do not include timber in parks,
wilderness areas or other types of reserves.
The national AAC is arrived at by adding
the total provincial and territorial AACs to the
estimated harvest potential of federal and private
lands. Over the past 20 years, Canada’s AAC
has remained relatively stable; however, it may
decline in the coming years, due to such factors
as fewer clearcuts and wider buffer strips.
Furthermore, provinces regularly review their
AACs, and since 1994, some have reduced
them in certain regions to accommodate other
land-use requirements, such as protected areas,
wildlife habitat and Aboriginal land claims. In
other regions, improved inventory information
(e.g., growth and yield data) has enabled the
provinces to increase local AACs.
Figure 5.1a shows that between 1970
and 1994, the national harvest of softwoods
83
Source: Natural Resources Canada–Canadian Forest Service
AACs and harvests
million m3
5.1a
Hardwood harvestHardwood AACSoftwood AAC
Total AAC
19941990198619821978197419700
50
100
150
200
250
300
Total harvest
Softwood harvest

Productive capacity
Multiple benefits84
5.1
bNu
mbe
r and
val
ue o
f pel
ts b
y sp
ecie
s
SPEC
IES
1990
–199
119
91–1
992
1992
–199
319
93–1
994
1994
–199
5
Num
ber
$ va
lue
Num
ber
$ va
lue
Num
ber
$ va
lue
Num
ber
$ va
lue
Num
ber
$ va
lue
Bad
ger
574
1043
793
311
599
686
1166
775
818
710
863
2152
3
Bea
r–
––
–2
827
300
646
––
––
Bla
ck/b
row
n b
ear
137
010
334
22
544
712
843
––
250
718
077
12
991
199
342
Gri
zzly
bea
r30
621
420
0–
––
––
–6
600
8W
hit
e b
ear
267
426
026
––
––
117
100
016
115
9803
5
Bea
ver
167
519
220
714
321
973
73
651
009
8596
52
776
341
244
561
733
543
932
655
08
908
501
Coy
ote/
pra
irie
wol
f24
324
443
445
4368
21
507
453
4869
61
890
970
4875
21
937
164
5105
91
328
219
Erm
ine
(wea
sel)
1867
565
344
3038
810
486
223
442
106
904
28 4
6014
995
551
804
201
981
Fis
her
879
143
329
515
381
783
000
1337
741
2 57
713
105
513
041
1467
558
440
6
Blu
e fo
x76
551
––
4942
789
544
2–
––
–C
ross
/red
fox
2850
237
295
1–
––
–13
63
395
905
223
308
6S
ilve
r/b
lack
fox
491
562
2–
––
–41
577
956
085
4425
51
176
058
Wh
ite
fox
102
311
455
––
––
988
420
354
52
380
6394
7
Lyn
x7
579
572
325
1154
299
917
07
180
511
333
4 71
348
785
54
875
419
235
Mar
ten
157
733
797
994
618
422
210
371
796
117
879
446
308
810
935
66
067
000
139
552
645
057
2M
ink
4103
71
052
597
4651
21
634
104
3361
880
262
934
450
926
048
3931
876
054
8M
usk
rat
195
659
321
496
204
112
444
297
218
890
436
133
326
353
875
134
401
372
101
093
3O
tter
848
924
564
712
026
601
486
1257
572
734
815
383
150
021
621
132
166
374
9R
acco
on12
499
7551
623
493
246
055
26 9
2729
109
356
390
957
690
122
660
188
438
6
Sk
un
k10
130
6–
––
–27
31
215
574
199
8S
qu
irre
l40
530
3395
695
974
129
709
68 5
5511
358
611
710
715
750
810
306
013
265
5W
ild
cat
582
2789
444
820
873
628
2575
672
750
402
122
174
355
Wol
f2
566
502
267
315
555
981
63
770
593
329
372
157
302
43
372
387
106
Wol
veri
ne
414
7804
068
614
769
663
710
648
548
585
500
559
105
667
Oth
er21
2623
156
11
395
2044
688
232
––
TO
TA
L71
912
815
183
827
951
876
2291
993
7 81
647
414
485
773
1 06
066
223
115
771
134
426
325
781
387
Sou
rce:
S
tati
stic
s C
anad
a

Productive capacity
Multiple benefits85
and hardwoods (176.0 million m3 in 1994)
was consistently below the national AAC
(229.8 million m3 in 1994). The annual
harvest of softwoods has increased since
1970, and by 1994, the harvest was close
to—but still below—the national AAC. Some
local shortages have been reported, however.
The hardwood harvest, on the other hand,
could be expanded in most areas.
The productive capacity of important
game and fur-bearing species is more difficult
to measure at the national level. Statistics Canada
collects data on the number of animal pelts sold
by species (Figure 5.1b); however, information
on annual quotas and harvest rates has never
been sought from the provinces and territories.
The current harvest of species that favour young
forests (e.g., moose and deer) is sustainable, but
there is concern regarding species that require
large tracts of mature and overmature forests
(e.g., grizzly bear and woodland caribou).
Animal population trends for selectedspecies of economic importance (5.1.3)
The forest provides habitat for many species of
birds, mammals, reptiles, amphibians and insects.
Currently, there is no systematic method in place
to track populations of commercially important
wildlife species across Canada. However, some
species are monitored by the provinces because
of their importance for recreational hunting,
trapping or subsistence use.
Since the 1970s, the Ontario Ministry of
Natural Resources (OMNR) has been conducting
aerial surveys in the winter to gauge moose
populations throughout the north-central
moose/km 2
< 0.1
0.1–0.3
> 0.3
Source: McKenney, Rempell & Wong
5.1c Moose density estimates in the southern half of Ontario, 1990 –1995

Productive capacity
Multiple benefits86
portion of the province. In a collaborative
effort between the OMNR and Natural Resources
Canada–Canadian Forest Service, researchers in
Sault Ste. Marie are using historical data to conduct
spatial analysis to determine trends in moose
population densities. The results are mapped
using a Geographic Information System.
Figure 5.1c shows the moose population
density (number of animals per km2) for
1990–1995. Moose densities have increased
substantially in parts of the province, particularly
in the Algonquin Park area of southern Ontario
and in northwestern Ontario.
Figure 5.1d shows the changes over time
in moose population densities. Between 1975 and
1995, the portion of Ontario that was characterized
by high-density populations increased from 3%
to 21%.
This research provides valuable baseline
information on population levels that is “spatially
explicit,” and is helping to identify and quantify
the key factors that affect moose population levels.
Because fiscal constraints are making it difficult
to undertake the same number of population
surveys as in the past, results of the research
are also being used to examine the implications
of reducing the number of aerial surveys.
Figure 5.1e estimates the population levels
of large forest-dwelling mammals. Populations
of most ungulates, such as deer and elk, are stable
or increasing. Barren ground caribou populations
are not at risk; however, the Committee on the
Status of Endangered Wildlife in Canada has
listed the western population of the woodland
caribou as “vulnerable” and the Gaspé population
as “threatened.” Black bear populations are stable
or increasing, while grizzly bear numbers appear
to be stable or declining.
Availability of habitat for selected wildlife species of economic importance (5.1.5)
Human activity and natural factors can both
significantly impact wildlife populations and
habitat availability, and often it is difficult to
separate their effects. For example, the mix
of habitats in an area can be modified by such
activities as high-impact, intensive logging
or clearing forest land for agriculture or hydro
right-of-ways. This may result in changes in
the mix of species or in the population levels of
individual species.
Wildlife populations are also sensitive to
many natural stress factors, such as contagious
diseases, predators, long and severe winters,
Moose populations by density class, 1975 –1995 5.1d
Source: Natural Resources Canada–Canadian Forest Service
49%
1975–1979 1980–1984
Density classes:
1985–1989 1990–1995
49%
3%8%
41%
51%
30%
56%
< 0.1 moose/km2 0.1– 0.3 moose/km2 >0.3 moose/km2
14% 25%
54%
21%

Productive capacity
Multiple benefits87
drought, and competition for food and cover.
A national scientific assessment of habitat status
for major forest-dwelling game and fur-bearing
species would complement research and
information on population status.
Management and developmentexpenditures (5.1.4)
Management and development expenditures have
the potential to increase the productive capacity
of the landbase. Data for silviculture, resource
access (e.g., road construction), protection and
general stewardship (e.g., inventory
development, research, timber management,
integrated resource management and public
information) are available at the national level
through the National Forestry Database Program
(NFDP). Trend data for wildlife management,
recreation management, parks programs and
costs of protected areas either are not available
or are aggregated with general stewardship
data. The NFDP could be expanded to include
this information.
Figure 5.1f shows the trends in forest
management spending by governments and
industry over the period 1990–1994. Expenditures
on silviculture, protection and resource access
decreased, while those for other management
activities (e.g., research and timber management)
increased slightly. These trends may reflect
the shift toward ecosystem-based management
regimes, which are information intensive and
emphasize natural regeneration of harvested
lands, rather than costly planting and seeding.
SummaryMeasuring productive capacity and comparing
those measures to levels of utilization is one way
to determine if our forest and wildlife management
practices are biologically sustainable.
At the national level, timber harvesting
remains within the limits of sustainability.
The annual harvest of softwoods and hardwoods
has consistently been below the national AAC.
LIFE ZONE MAMMAL SPECIES POPULATION ESTIMATE POPULATION TREND
Pacific/mountain grizzly bear 16 000 stable/decreasingblack bear 73 000–122 000 stable/increasingmule deer 135 000 increasingelk 35 000 increasingsheepa 17 000 stable/increasingwoodland caribou b 13 500 stablebarren ground caribou 178 000 increasing
(porcupine herd)
Boreal grizzly bear 4 000 stable/decreasingblack bear 207 000–217 000 stable/increasing
a includes Rocky Mountain bighorn sheep, California bighorn sheep, Dall’s sheep and Stone’s sheepb a regional population of 2 500 mountain caribou (a subspecies of woodland caribou) in the Pacific/Mountain life zone is being threatened by
economic development
Source: State of the Environment Report, 1991
5.1e Population estimates and trends for large forest-dwelling mammals by life zone, 1991

Competitiveness
Multiple benefits88
Similarly, hunting and trapping are closely
regulated to ensure that local wildlife populations
do not decline to unsustainable levels. However,
to improve our ability to monitor the status of
wildlife species, more information is required
regarding the types of wildlife, their population
levels, location and habitat needs.
ELEMENT 5.2COMPETIT IVENESS OF RESOURCE INDUSTRIES
What are we measuring?Competitiveness is a measure
of the ability of an industry to
efficiently combine inputs (e.g.,
labour, capital and raw material)
in producing and selling goods
and services. Competitiveness is
also influenced by institutional,
social, cultural and regulatory
regimes. For example, tax laws,
trade policies, social policies
(e.g., manpower training, education
and health) and environmental regulations
all have an impact on the competitiveness
and performance of industries.
The competitiveness of Canada’s forest
sector can be assessed by providing information
on changes over time in profitability. The industries’
ability to compete with foreign suppliers in the
global marketplace will be measured by examining
trend data on Canada’s share of trade in various
forest commodities. Technological change and
investment in industry-oriented research and
development (R & D) also are important for
remaining competitive, and expenditures in
this area will be assessed as well.
How does competitiveness relate to the sustainability of Canada’s forests?Measures of competitiveness are an important
element of sustainability for two basic reasons.
First, the ability of forest industries to continue
to provide jobs and incomes and pay corporate
taxes to governments is dependent on their ability
to continue to access foreign markets, earn profits,
Multiplebenefits
Productivecapacity
Competitiveness
Contributionto national economy
Non-timbervalues
Sources: Canadian Pulp & Paper Association, Natural Resources Canada–Canadian Forest Service, National Forestry Database
Forest management expendituresby activity
$ million
5.1f
0 200 400 600 800 1 000
1990
1991
1992
1993
1994
Other forest managementa
Resource accessProtectionSilviculture
576.4
655.3
706.4
802.9
724.5
417.3
338.0
395.1
457.1
452.0
468.6
446.9
432.2
562.9
564.9
812.3
937.0
927.6
832.2
707.5
a includes research, timber management, administration and other activities

Competitiveness
Multiple benefits89
and attract new investment. Secondly, the relative
efficiency and competitiveness of firms determines
their ability to absorb the higher costs that may
be associated with more environmentally sensitive
resource development and industrial production.
What data are available?
Net profitability (5.2.1)
Monitoring the profitability of the forest
sector enables us to assess the structural
changes that may be taking place. Canadian
firms compete with foreign firms in export
markets. In some cases, new low-cost producers
may enter traditional markets and reduce prices.
However, declining profitability in a particular
sub-sector should not automatically be equated
with unsustainability. The decline may simply
be a symptom of structural changes occurring
in the marketplace.
Figure 5.2a shows the profit performance
of Canada’s forest sector from 1988 to 1995.
The graph demonstrates the high levels of
profit variability that may be experienced
over short periods of time. Canada’s forest
industries are traditionally cyclical. Reduced
profits and financial losses are normal in the
forest sector during the down portion of business
cycles, as experienced in the early 1990s. Profits
rose again in 1995.
Trends in global market share (5.2.2)
Canada is the world’s major forest products
exporter, accounting for almost 20% of the total
value of global forest products trade. Our export
success stems from the consistently high quality
of our products, delivered at competitive prices.
Figure 5.2b shows Canada’s share of world
exports for various forest products. Canada accounts
Source: Statistics Canada
Profits in Canada’s forest sector
$ billion
5.2a
Forestry services and operations
Wood producers
Integrated operations
Total
Paper and allied producers
-2
-1
0
1
2
3
4
5
6
7
19951994199219901988
Source: Food & Agriculture Organization
Canada’s share of global trade in forest products
%
5.2b
0
10
20
30
40
50
60
70
80
1994199019861982197819741970
Newsprint Pulp
PanelsSoftwood lumber

Competitiveness
Multiple benefits90
for almost 50% of global trade in softwood lumber.
The majority of our exports are destined for the
U.S. market, although the Japanese market is
becoming increasingly important.
Our share of sales in panel products rose
from 6% in 1970, to 12% in 1994. This trend
can be attributed to the increasing acceptance
of new products manufactured from chips and
other wood residues.
Canada’s share of the global pulp
market remained at roughly 33% between
1970 and 1994. Traditionally, our advantage
in this market was attributed to the high
quality of our bleached kraft softwood pulp.
However, recent technological advances have
increased the quality of hardwood pulp and have
enabled countries without coniferous species to
enter the global pulp market. Nevertheless, the
introduction of other new technologies, such
as chemi-thermo-mechanical pulp, has enabled
Canada to keep its global market share relatively
constant over the past 25 years.
Canada’s share of newsprint trade declined
from 69% in 1970, to 54% in 1994. The majority
of our newsprint exports are destined for the USA;
however, our share of that market has declined
steadily since 1966, mostly because our mills
are older and smaller than those of our competitors.
Recently, a few state-of-the-art mills have been
built, particularly in western Canada, and some
older mills have upgraded their paper machines
to increase their production levels and expand their
product line to include more value-added papers.
Trends in R & D expenditures in forest products and processingtechnologies (5.2.3)
The ability of forest products producers to
compete in domestic and international markets
is determined by their ability to minimize
production costs and develop value-added
products for specialty markets. Technological
progress is important for achieving both of
these objectives.
Trends in R & D expenditures
provide a useful preliminary indication
of the ability of firms to innovate and thus
maintain their competitiveness. Several studies
on the expected net social benefits of R & D
in the forest sector indicate that increased
investment is desirable and that private
returns are high enough for firms to increase
their R & D investments, even in the absence
of government incentives.
Historically, research efforts in the forest
sector focused on developing the knowledge and
technology required to produce a quality product
while minimizing production costs. Recently, the
emphasis has changed. The sector is continuing
its research into efficient processing, but is now
focusing its efforts on new and value-added
products and on environmental protection
activities. It is also responding to changing
consumer preferences and placing a higher
emphasis on research into more environmentally
benign products, as well as products made from
recycled materials.
Figures 5.2c and 5.2d provide
information on industry-oriented R & D
expenditures by performers and funders,
respectively. Data from Canada’s three
principal industrial forest research institutes
are included in the figures. FERIC, Forintek
and PAPRICAN conduct R & D in forest
engineering, forest product development,
and pulp and paper technology, respectively.
Resource-oriented R & D expenditures will
be discussed in Indicator 6.5.2 (Investments
in forest-based R & D and information).

Competitiveness
Multiple benefits91
The definition of what constitutes
R & D spending varies from country to country.
Furthermore, spending levels may not fully reflect
the technological advancement of a country, as
firms may choose to purchase new technology
through licencing arrangements or obtain it
from parent firms in other countries, rather
than develop it on their own through R & D.
SummaryCanada has a proven track record in producing
and delivering high-quality products at a
competitive price. However, our overall dominant
position in the global marketplace has diminished
somewhat in recent years. The profit performance
of Canada’s forest products sector has been affected
by low product prices and increasing production
costs. To maintain our export position and compete
in the growing Pacific Rim market, Canadian
producers may be required to develop niche
markets in higher value-added commodity grades.
Canada’s forest industries must continue
to innovate to remain competitive. Examination
of trends in R & D investment suggests that
expenditures are not keeping pace with growth
in the sector and that more technological
innovation is required.
FUNDER FERIC FORINTEK PAPRICAN TOTAL1993 1994 1993 1994 1993 1994 1993 1994
$ million
Industry 2.6 2.7 3.9 4.0 26.5 27.0 33.0 33.7Federal govt. 2.2 2.1 6.6 6.3 3.4 2.5 12.2 10.9Provincial govt. 0.7 0.7 4.1 4.2 – – 4.8 4.9Others a 2.2 1.9 – – 2.6 2.8 4.8 4.7
TOTAL 7.7 7.4 14.6 14.5 32.5 32.3 54.8 54.2
a includes resources that could not be allocated by funders
Sources: Statistics Canada, Natural Resources Canada–Canadian Forest Service
5.2d Funders of three industrial forest research institutes
PERFORMER 1988 1989 1990 1991 1992 1993 1994 a 1995 b
Logging industry 7 8 8 11 8 9 9 9and forestry services
Wood industries 20 18 42 19 20 23 24 24Paper and allied industries 145 151 115 98 94 102 102 110
TOTAL 172 177 165 128 122 134 135 143a preliminaryb projections
Note: Also includes the following research institutes: FERIC, Forintek and PAPRICAN.
Sources: Statistics Canada, Natural Resources Canada–Canadian Forest Service
5.2c Performers of industrial intramural forestry R & D
$ million

Contribution to national economy
Multiple benefits
ELEMENT 5.3CONTRIBUTION TO THENATIONAL ECONOMY
What are we measuring?A wide range of goods
are manufactured from forest
resources, creating opportunities
for the establishment of industrial
enterprises. In addition to the
traditional forest products
industries, the forest landbase
supports a number of smaller
industries, including outfitters,
maple products producers and Christmas tree
growers, as well as the increasing number of
industries that cater to tourists.
The combination of all salaries,
wages, profits, taxes and royalties for
the sale of natural resources represents
the contribution of the forest sector to the
national Gross Domestic Product (GDP).
A complete picture of the contribution of
the forest landbase to Canada’s economy
also includes the many products, such as
firewood and subsistence food and craft
materials, that are obtained directly from
the forest without money being exchanged.
How does the forest sector’s contributionto the national economy relate to thesustainability of Canada’s forests?An important dimension of sustainable
development is the performance of various
industry sectors in creating jobs, generating
personal incomes and corporate profits, and
contributing to the national income through
the GDP. The forest sector also provides a
stable economic base for rural communities,
which is consistent with the principles
of sustainable development.
In rural areas, the production and sale of
goods and services derived from forests creates
jobs and incomes for many residents for whom
alternative economic activities may be limited.
In small, resource-dependent economies where
other employment opportunities are rare, mill
closures can lead to high and sustained levels
of unemployment, with significant potential
for social disruptions to workers, their families
and other members of the community.
What data are available?
Contribution of timber and non-timbersectors to the gross domestic product(GDP) (5.3.1)
Canada’s forest sector makes a significant
contribution ($20.38 billion in 1995) to the
national GDP ($776 billion in 1995). In 1995,
the pulp and allied industries made the largest
contribution to the national income—$9.86
billion. Wood industries contributed $6.37
billion; the logging industry, $3.65 billion;
and forestry services, $500 million.
Figure 5.3a shows the trends in the
forest sector GDP since 1961. The contribution
of the paper and allied industries increased by
approximately 66% between 1961 and 1994,
while the contribution of the wood industries
showed much more significant gains—a
233% increase.
Figure 5.3b shows that after peak sales
of almost $100 million in 1988, the wholesale
value of maple products declined overall until
92
Multiplebenefits
Productivecapacity
Competitiveness
Contributionto nationaleconomy
Non-timbervalues

Contribution to national economy
Multiple benefits93
1993, but improved dramatically in 1994—to
$106 million. The Christmas tree industry averaged
$52 million in sales between 1990 and 1994.
Figure 5.3c reveals that revenues of private
campgrounds, outfitting operations, and recreation
and vacation camps increased steadily between
1986 and 1993.
Total employment in all forest-relatedsectors (5.3.2)
Figure 5.3d shows that between 1975 and
1995, total direct employment in the forest
products industries was fairly constant overall,
at approximately 340 000. (Employment numbers
for non-timber industries are not available.)
Between 1992 and 1995, however, employment
Source: Statistics Canada
Changes in the forest sector’sreal GDP
%
5.3a
Wood industriesPaper and allied industries
Logging industry
0
50
100
150
200
250
300
19951991198619811976197119661961-50
Forestry services
Sources: National Forestry Database, Statistics Canada
Wholesale value of maple productsand Christmas trees
$ million
5.3b
Maple products Christmas trees a
a data not available before 1990
1994199219901988198619840
20
40
60
80
100
120
YEAR CAMPGROUNDS AND TRAVEL OUTFITTING OPERATIONS AND OTHER TRAILER PARKS RECREATION AND VACATION CAMPS
Number of Total revenue Number of Total revenueestablishments $ million establishments $ million
1986 2 003 229.9 1 439 232.01987 2 198 256.3 1 337 277.61988 2 387 279.1 1 618 299.91989 2 405 291.4 1 764 329.81990 2 454 310.1 1 826 347.11991 2 478 316.3 1 862 339.71992 2 514 325.3 1 847 331.31993 2 507 340.4 1 826 346.2
Source: Statistics Canada
5.3c Establishments and revenues for campgrounds, outfitting operations and camps

Contribution to national economy
Multiple benefits94
actually increased by more than 59 000. Logging
and wood industries (particularly sawmills,
oriented strand board [OSB] mills and particle-
board mills) accounted for most of this increase.
A wide range of labour-saving
technologies were adopted by the forest industries
between 1975 and 1995. The new technologies
have reduced the number of jobs required per unit
of production for certain products, particularly in
the pulp and paper sector (Figure 5.3e), and have
enabled the forest sector to increase its output and
remain competitive.
All of these factors have led to increased
wages in the forest sector, where salary increments
have now exceeded those in the manufacturing
sector (Figure 5.3f). In 1993, the average annual
income of workers in the paper and allied industries
was $45 327. Employees in the logging and wood
industries earned $40 645 and $33 694, respectively,
while the average income of employees in the
manufacturing industries was $35 800.
Sources: Canadian Pulp & Paper Association, Statistics Canada,Natural Resources Canada–Canadian Forest Service
Jobs per unit of production 5.3e
0
0.5
1.0
1.5
2.0
2.5
3.0
3.5
19931990198519801975
Jobs/1 000 tonnes of pulp and paper produced
Jobs/1 000 m3 of lumber produced
Jobs/1 000 m3 of wood harvested
Source: Statistics Canada
Direct employment in Canada’s forest sector
thousand employees
5.3d
0
50
100
150
200
250
300
350
400
19951990198519801975
Total
Paper and allied industries
Wood industries
Forestry services
Logging industry
Source: Statistics Canada
Changes in real wages
%
5.3f
1993199019861982197819741970
Logging industry
Manufacturing industriesWood industriesPaper and allied industries
0
10
20
30
40
50

Contribution to national economy
Multiple benefits95
Utilization of forests for non-market goods and services, including forest land use for subsistence purposes (5.3.3)
Non-market consumptive forest uses range
from subsistence hunting to berry picking.
One such use for which data are available
at the national level is the harvesting of trees
for firewood and fuelwood. (It should be noted,
however, that a significant volume of these goods
are in fact traded on the market.) Figure 5.3g
shows the long-term trend in this activity.
According to Statistics Canada, in 1995,
wood was the principal heating fuel in 3.8% of
Canada’s 11 million households, down from 4.5%
in 1990. The use of wood for this purpose tends
to be concentrated in small remote areas, Aboriginal
communities and isolated cottage areas. Also,
there are significant regional differences in the
percentage of households using wood as a fuel
source (Newfoundland, 16%; Prince Edward
Island, 10%; British Columbia, 3.4%; and
Alberta, 0.4%). On a global scale, the use
of wood for cooking and heating accounts
for approximately 55% of all wood harvested.
Data on other non-market consumptive
forest uses in Canada are not available at the
national level and are only sporadically available
at local levels. For this reason, a case study of
Source: Natural Resources Canada–Canadian Forest Service
million m3
Harvest of firewood and fuelwood 5.3g
0
3
4
5
6
7
1994199019861982197819741970
Case study: Subsistence use ofwildlife and fisheries resources by native bands in Manitoba
In 1985, a survey was conducted on the
subsistence use of wildlife resources by
26 of Manitoba’s 60 native bands. A total
of 17 100 individuals (20% of Manitoba’s
native population) were polled.
Figure 5.3h shows the number of species
harvested per capita and the amount of fish
and meat consumed. Based on these results,
the subsistence use of fish and wildlife by
Manitoba’s native population was estimated
to be in the order of 2.5 million kilograms
in 1985.
SPECIES NUMBER HARVESTED kg CONSUMEDPER CAPITA PER CAPITA
Moose 0.08 8.40Elk 0.00 0.27Deer 0.11 2.00Caribou 0.01 0.20Bear 0.01 0.30Lynx 0.01 0.03Fish – 12.62Waterfowl 2.93 1.61Grouse/ptarmigan 0.19 0.06Beaver 0.55 3.49Muskrat 4.48 1.04Hare 0.59 0.29
TOTAL – 30.06
Source: Wagner
5.3h Subsistence use of wildlife by 26 native bands in Manitoba, 1985

the subsistence benefits of forests for Manitoba’s
native community is provided above.
Economic value of non-market goods and services (5.3.4)
Products obtained by subsistence hunting and
gathering activities are not sold in the traditional
market economy, and national data are not readily
available on their economic value and contribution
to local economies. The products are, however,
of considerable value to the individuals who
collect them.
The purpose of this indicator is to
examine the inherent economic value of non-
market consumptive forest goods by determining
the replacement value of those goods—the cost
to an individual of purchasing similar goods from
a retail outlet. Because national information is not
available, a case study is presented below to
demonstrate the value of non-market consumptive
Contribution to national economy
Multiple benefits
Case study: Economic value of subsistence forest products for residents of the Lower Liard Valley
In 1993–1994, the Canadian Forest Service and the University of Alberta conducted a comprehensive
study of subsistence forest use in two communities in the Lower Liard Valley: Fort Liard and
Nahanni Butte. The study provided a detailed assessment of the relationship of residents with their
surrounding environment and included an analysis of the replacement value of subsistence products.
The study authors caution, however, that there are limitations to using replacement values that
assume consumers are indifferent regarding the choice of using their time to hunt and fish or to work
in the wage economy and purchase food. By ignoring the integral value of hunting and fishing to the
spiritual and cultural fabric of Aboriginal societies, this assumption may underestimate the inherent
value of subsistence products.
Figure 5.3i provides a summary of the study results. Meat products dominate the range of
subsistence forest products, and non-animal products (e.g., firewood, berries and birchbark crafts)
comprise the second most important category.
PRODUCT FORT LIARD NAHANNI BUTTE$ $
Meat 366 380 101 821Furs 106 133 14 858Non-animal products 252 096 69 670Moosehide crafts 40 000 5 000
Total for households sampled a 764 609 191 349Estimated total for all households 1 470 402 265 763Average per household 10 892 10 630
a of the 135 households in Fort Liard, 71 were surveyed; in Nahanni Butte, 18 of 25 households were surveyed
Source: Beckley & Hirsch
5.3i Total replacement value of selected subsistence forest products for residentsof the Lower Liard Valley, 1993–1994
96

Non-timber values
Multiple benefits97
goods to the residents of two communities in the
Lower Liard Valley.
SummaryThe contribution of Canada’s traditional forest
industries (e.g., paper and allied industries and
wood industries) to the GDP has increased since
1961. Between 1986 and 1993, the revenues of
campgrounds, outfitting operations, and recreation
and vacation camps also increased steadily. In
addition, the sale of maple products increased
dramatically in 1994 (after declining from 1988
to 1993), while that of Christmas trees has
remained stable in recent years.
Direct employment in the forest industries
has increased since 1992, reaching 369 000 in
1995, with an average of 340 000 since 1975.
Historically, the forest sector has provided well-
paying jobs. The number and type of positions,
however, has been affected by the adoption of
new labour-saving technologies, which have
enabled the forest sector to increase its
production levels.
No national data exist on the utilization
of forests for non-market goods and subsistence
purposes, although case studies may be used to
provide information on a particular community
or region.
ELEMENT 5.4NON-TIMBER VALUES
What are we measuring?Our forests provide a number
of non-timber values that are
difficult to measure because
of the absence of information
regarding their cost and use. This
general lack of information on
the social benefits of non-timber
values is a challenge for policy-
makers, planners and foresters,
who must make difficult choices
regarding the mix of benefits to provide.
Describing the range of non-timber
benefits provided by forests is a multi-
dimensional problem. Indicators must,
therefore, be selected that incorporate not
only the importance of the forest values
(worth per individual), but also the intensity
of utilization (total participation levels).
For non-timber values that involve forest
use, proxies such as visits to national parks and
trends in expenditures provide a partial indication
of preferences. One of the most comprehensive
databases on Canadians’ expenditure and activity
patterns for outdoor recreation is the National
Survey on the Importance of Wildlife to
Canadians, conducted by Environment
Canada and Statistics Canada.
People also place importance on forests even
though they may never actually visit or use them.
They just want to know that forests continue to
exist and will be available for future generations.
These values fall into a class termed “non-use” or
“passive-use” values. The proxies used to measure
these values are trends in the total area of natural
landscape protected from economic development,
Multiplebenefits
Productivecapacity
Competitiveness
Contributionto nationaleconomy
Non-timbervalues

Non-timber values
Multiple benefits98
as well as memberships in and donations to
conservation and outdoor organizations.
How do non-timber values relate to thesustainability of Canada’s forests? Canada’s forests provide a number of
non-timber benefits, including considerable
opportunities for outdoor recreation. As the
world population grows, demand for outdoor
experiences in natural settings is expected to
increase. This demand will be further affected
by increases in per capita income. Therefore,
indicators of the value of forest recreation and
the level of participation are important aspects
of reporting on sustainable development.
In addition, recreation and conservation
organizations can be significant players in the
development of forest and land-use policies.
The level of memberships in these groups could
be a barometer of preferences for such initiatives
as forest preservation, conservation and
sustainable use.
Lastly, protected areas serve as a vehicle
for preserving ecosystems, endangered species
and special landscape attributes that might
otherwise be at risk from economic development.
Trends in the amount of land set aside are an
indicator of the importance placed on ensuring
the continued existence of unique forest
ecosystems and habitats and maintaining
options for future generations.
What data are available?
Availability and use of recreationalopportunities (5.4.1)
Changes in public preferences and in the
availability of forests for outdoor recreation
are illustrated by the levels of participation in
a small set of forest-based recreation activities.
Trends in the number of days that Canadians
spent hunting and in the number of visitors
(Canadians and foreigners) to Canada’s national
parks are illustrated in Figure 5.4a and Figure 5.4b,
respectively. As wildlife populations are not
declining, the decrease in hunting over the period
1981–1991 would appear to reflect reduced interest
Source: National Survey on the Importance of Wildlifeto Canadians
Hunting by Canadians
million hunters
5.4a
0
0.5
1.0
1.5
2.0
199119871981
Source: Canadian Heritage
Visits to national parks in Canada’s forests
million day visits
5.4b
0
5
10
15
20
25
30
1994199319921991199019891988

Non-timber values
Multiple benefits99
on the part of Canadians. Visits to national parks,
on the other hand, rose over the period 1988–1994,
suggesting increased demand for the kinds of
forest-related goods and services offered by
parks (e.g., natural beauty, wildlife-viewing
opportunities and resorts).
Total expenditures by individuals onactivities related to non-timber use (5.4.2)
Expenditures incurred by people consuming non-
timber goods and services provide a partial proxy
for the value of outdoor recreation. It is important
to emphasize, however, that these are not direct
measures of the value of non-timber use, because
the true value of the experience may considerably
exceed the cost. A 1995 study in British Columbia,
for example, showed that the direct benefits of
big game hunting are valued at approximately
$45–105 per day over the expenditures incurred.
Figure 5.4c shows the trend in
wildlife-related expenditures in constant
1991 dollars. In 1981, Canadians spent a total
of $7 billion on wildlife-related activities, including
accommodation, transportation, food, equipment,
habitat improvements, donations, etc. In 1991,
the expenditures totalled $5.6 billion. A range of
factors may be used to explain this drop of more
than 20%, including the economic recession that
began in 1990, a declining interest in hunting,
and a shift to other outdoor recreation activities
that are not directly related to wildlife.
Memberships and expenditures in forestrecreation-oriented organizations andclubs (5.4.3)
Memberships in forestry-related organizations
may be a barometer of the interest in various
initiatives, such as the preservation, conservation
and sustainable use of forests, as well as in forest
recreation activities, such as hunting, fishing,
snowmobiling and skiing. Comprehensive national
summaries of membership levels and expenditures,
however, are not available.
In the spring of 1996, the Canadian
Institute of Forestry sent a survey to 145 national
and provincial organizations representing forest
recreation and conservation interests. Information
was requested on the number of members and the
level of contributions. (The organizations will be
surveyed annually to identify trends in rates of
participation by Canadians.) Seventy-three
organizations responded to the survey—a response
rate of 55%. More than 1.3 million individuals
and 1 451 corporations were members of at
least one of the outdoor and environmental
organizations that responded. Most membership
fees were under $100. The annual expenditures
of these organizations totalled approximately
$45 million.
Another important source of information
is the National Survey on the Importance ofSource: National Survey on the Importance of Wildlife to Canadians
Wildlife-related expenditures by Canadians
$ billion
5.4c
199119871981
Constant 1991 dollars
0
1
2
3
4
5
6
7
8

Literature cited
Multiple benefits100
Wildlife to Canadians. This survey was
conducted in 1981, 1987 and 1991, and
planning is now underway for another survey
in 1997. Between 1981 and 1991, there was a
73% increase in the number of Canadians who
were members of, or contributed to, a wildlife
organization. And between 1987 and 1991, fees
and donations to such groups more than doubled
(Figure 5.4d).
Area and percentage of protected forest by degree of protection (5.4.4)
The data and information relating to this
indicator are found under Indicator 1.1.3
(Area, percentage and representativeness
of forest types in protected areas).
SummaryThe study of non-market forest values
is not well developed in Canada. However,
the Canadian Forest Service has identified
non-market valuation methodologies as
a priority research area. The proxy values
used to measure Canadian participation rates
and expenditures on forest-related activities
suggest a general increase in the value of
nature to Canadians.
LITERATURE CITED
Beckley, T.; Hirsch, B.H. 1997. Subsistence
and non-industrial forest use in the Lower Liard
Valley. Natural Resources Canada, Canadian
Forest Service, Northern Forestry Centre,
Edmonton, Alta. Inf. Rep. NOR-X-353. 52 p.
Canadian Council of Forest Ministers; Natural
Resources Canada, Canadian Forest Service,
Headquarters, Ottawa, Ont. 1996. Compendium
of Canadian forestry statistics 1995. 216 p.
Canadian Pulp and Paper Association. 1996.
Reference tables 1996. 54 p.
Environment Canada, Canadian Wildlife Service;
Statistics Canada. 1993. The importance of
wildlife to Canadians: Highlights of the 1991
survey. Cat. Nº CW66-103/1993E. 60 p.
Environment Canada, State of the Environment
Reporting. 1991. State of Canada’s environment.
Ottawa, Ont.
Food and Agriculture Organization of the United
Nations, Forestry Department. 1996. Yearbook
of forest products 1994. 348 p.
Lowe, J.J.; Power, K.; Gray, S.L. 1994. Canada’s
forest inventory 1991. Prepared by Natural
Resources Canada, Canadian Forest Service in
cooperation with the Canadian Forest Inventory
Committee. Inf. Rep. PI-X-115. 67 p.
SURVEY YEAR MEMBERSHIPS PORTION OF POPULATION CONTRIBUTIONSmillion % $ million
1981 1.1 6.0 119.41987 1.4 6.9 73.51991 1.9 9.0 151.2
Source: National Survey on the Importance of Wildlife to Canadians
5.4d Memberships in and financial contributions to wildlife organizations

Additional reading
Multiple benefits101
McKenney, D.; Rempell, R.; Wang, Y. 1997.
Spatial analysis of moose population surveys
to rank Ontario’s wildlife management units.
Natural Resources Canada, Canadian Forest
Service–Ontario Ministry of Natural Resources
Collaborative Research Agreement Project
Report. (In review)
Natural Resources Canada, Canadian Forest
Service, Headquarters, Ottawa, Ont. 1994.
Timber supply in Canada: Challenges and
choices. Proceedings of a conference held in
Kananaskis, Alta., Nov. 16–18, 1994.
209 +173 p.
Price-Waterhouse. 1995. Forest products survey
1994: North America. 57 p.
Reid, R. 1997. The economic value of resident
hunting in British Columbia: 1995. B.C.
Ministry of the Environment, Wildlife Branch.
Runyon, K.L. 1991. Canada’s timber supply:
Current status and outlook. Forestry Canada.
Inf. Rep. E-X-45. 132 p.
Statistics Canada. 1986. Price indexes for
Canadian industrial research and development
expenditures. Cat. Nº 88 509. 37 p.
Statistics Canada. Various months. Gross
domestic product by industry. Cat. Nº 15 001.
Statistics Canada. Various months.
Labour force survey. Cat. Nº 71 001.
Statistics Canada. Various years. Fur production
in Canada. Cat. Nº 23 207.
Statistics Canada. Various years. Industrial research
and development statistics. Cat. Nº 88 202.
Statistics Canada. Various years. Paper
and allied products industries. Cat. Nº 36 250.
Wagner. 1985. Subsistence use of wildlife and
fisheries resources for native bands in Manitoba.
Study conducted for the Treaty of Aboriginal
Rights Research Centre of Manitoba.
ADDITIONAL READING
Adamowicz, W.L.; Boxall, P.C.; Luckert,
M.K.; Phillips, W.E.; White, W.A. Editors.
1996. Forestry, economics and the
environment. CAB International.
Bishop, R.C. 1993. Economic efficiency:
sustainability and biodiversity.
Ambio 22: 69–73.
Bouthillier, L.; Chua D.; Lapointe, B.;
Luckert, M.K. 1992. Réflexion économique
sur le rendement soutenu, le développement
durable et l’aménagement intégré des ressources
forestières. Université Laval, Département des
sciences forestières. Cahier 92–13. 54 p.
Bradley, D.P.; Bernard, J.L. 1992. Ecological
economics: integrating natural and social
dimensions. J. For. 90(2): 30–33.
Castle, E.N. 1993. A pluralistic, pragmatic
and evolutionary approach to natural resource
management. For. Ecol. Manage. 56: 279–295.
Common, M. 1995. Sustainability and
policy: Limits to economics. Cambridge
University Press.
Pearce, D.W. 1995. Ecological economics:
essays in the theory and practice of
environmental economics. In Sustainable
development. Edward Elgar Publishing,
Albershot, Hants, UK.

Contacts
Multiple benefits102
Solow, R.M. 1991. Sustainability: An economist’s
perspective. J. Seward Johnson Lecture, Woods
Hole Oceanographic Institution, Marine Policy
Center, Woods Hole, MA.
Ward, K.M.; Duffield, J.W. 1992. Natural
resource damages: Law and economics.
John Wiley and Sons Inc.
CONTACTS
Forest economics
Dr. Ilan Vertinsky (Criterion co-coordinator)
Forest Economics and Policy Analysis
Research Unit
University of British Columbia
Vancouver BC V6T 1W5
Tel.: (604) 822-3886
Fax: (604) 822-6970
Forest economics
Mr. Tim Williamson (Criterion co-coordinator)
Industry, Economics and Programs Branch
Natural Resources Canada–
Canadian Forest Service
7th floor, 580 Booth Street
Ottawa ON K1A 0E4
Tel.: (613) 947-9064
Fax: (613) 947-9020
Non-market values
Mr. Peter Boxall
Northern Forestry Centre
Natural Resources Canada–
Canadian Forest Service
5320–122nd Street
Edmonton AB T6H 3S5
Tel.: (403) 435-7272
Fax: (403) 435-7359
Forest-based non-governmental organizations
Ms. Roxanne Comeau
Executive Director
Canadian Institute of Forestry
Suite 606
151 Slater Street
Ottawa ON K1P 5H3
Tel.: (613) 234-2242
Fax: (613) 234-6181
National statistics
Mr. Gerry Gravel
National Accounts and Environment Division
Statistics Canada
21st floor, R.H. Coats Building
Tunney’s Pasture
Ottawa ON K1A 0T6
Tel.: (613) 951-1897
Fax: (613) 951-3618
Population / habitat analysis / forest economics
Dr. Dan McKenney
Great Lakes Forestry Centre
Natural Resources Canada–
Canadian Forest Service
1219 Queen Street East
P.O. Box 490
Sault Ste. Marie ON P6A 5M7
Tel.: (705) 949-9461
Fax: (705) 749-5700
Population / habitat analysis
Mr. Robert Rempel
Centre for Northern Forest Ecosystem Research
Ontario Ministry of Natural Resources
Lakehead University Campus
Thunder Bay ON P7B 5E1
Tel.: (807) 343-4018
Fax: (807) 343-4001

Contacts
Multiple benefits103
Economics
Mr. René Samson
Industry, Economics and Programs Branch
Natural Resources Canada–
Canadian Forest Service
7th floor, 580 Booth Street
Ottawa ON K1A 0E4
Tel.: (613) 947-9063
Fax: (613) 947-9020
Forest economics
Dr. Bill White
Northern Forestry Centre
Natural Resources Canada–
Canadian Forest Service
5320–122nd Street
Edmonton AB T6H 3S5
Tel.: (403) 435-7315
Fax: (403) 435-7359

Introduction
Multiple benefits104

Introduction 105
Element 6.1 Aboriginal and treaty rights 106
Indicator 6.1.1 Extent to which forest planning and management processes consider and meet 106legal obligations with respect to duly established Aboriginal and treaty rights
Element 6.2 Participation by Aboriginal communities in sustainable 107 forest management
Indicator 6.2.1 Extent of Aboriginal participation in forest-based economic opportunities 108
Indicator 6.2.2 Extent to which forest management planning takes into account the protection 108 of unique or significant Aboriginal social, cultural or spiritual sites
Indicator 6.2.3 Number of Aboriginal communities with a significant forestry component 108 in the economic base and diversity of forest use at the community level
Indicator 6.2.4 Area of forest land available for subsistence purposes 109
Indicator 6.2.5 Area of Indian reserve forest lands under integrated management plans 109
Element 6.3 Sustainability of forest communities 110
Indicator 6.3.1 Number of communities with a significant forestry component 110in the economic base
Indicator 6.3.2 Index of the diversity of the local industrial base 111
Indicator 6.3.3 Diversity of forest use at the community level 111
Indicator 6.3.4 Number of communities with stewardship or co-management responsibilities 111
Element 6.4 Fair and effective decision making 112
Indicator 6.4.1 Public participation in decision making 112- Indicator 6.4.3
Element 6.5 Informed decision making 113
Indicator 6.5.2 Investments in forest-based R & D and information 114
Indicator 6.5.3 Total effective expenditures on public forestry education 115
Indicator 6.5.6 Mutual learning mechanisms and processes 115
Indicator 6.5.5 Expenditures on international forestry 115
Literature cited 116
Additional reading 117
Contacts 118
Information related to 6.5.1 is found under 4.4.4; information for 6.5.4 is found under 6.4.1-6.4.3
CR ITER ION 6 .0

105Introduction
Society’s responsibility
INTRODUCTION
The sustainable development of forest
resources has as much to do with people
as it does with trees, soil, water and other
ecological components of forest ecosystems.
Criterion 6 comprises indicators that assess the
social dimensions of sustainable development.
Canadians are demanding more
direct involvement in forest management,
planning and policy making. Specific
stakeholders and interest groups that have
traditionally been outside these processes
are gaining legitimacy and are participating
more frequently and directly in forest issues.
However, the rights to use forest resources
and participate in forest policy making,
planning and management are accompanied
by certain responsibilities. That is why
Criterion 6 bears the title “Accepting Society’s
Responsibility for Sustainable Development.”
Creating a sustainable future is not solely the
responsibility of government or industry; rather,
it is a responsibility that must be shared by all
members of society.
The relationship between Canadians
and their forest resources is evolving, as are
the values placed on forests and the goals set
for forest management. The very notion of
sustainable development is quite new. As
society’s relationship with the natural world
changes, different priorities emerge, and
institutions are created to address these new
objectives. This criterion measures the degree
to which changing values and priorities are
being incorporated into forest practices,
programs and policies.
Criterion 6 encompasses such elements as
the respect for Aboriginal and treaty rights and
the role of Aboriginal communities in sustainable
forestry. It also deals with forest community
sustainability, fairness in decision making, and
the degree to which informed decisions are made.
Aboriginal and forest communities are both key
elements to consider because each has a vested
interest in maintaining the sustainability of our
forests. Informed public participation also is an
important aspect of sustainability, as it ensures
that the various demands placed on forests can
be mediated and accommodated.
Little information is available for many
of the indicators in Criterion 6, because the
social dimensions of sustainable forestry have
only recently become a priority for government
and university researchers. Further conceptual
work and definitional clarity will be required
for some of the indicators before reliable data
may be collected. Much of the existing data
and information are case-specific, and one
of the principal challenges facing forest
science researchers is aggregating this data
at the national level in a meaningful and
scientifically sound manner.
CR ITER ION 6 .0
ACCEPTING SOCIETY’S RESPONSIBIL ITY FORSUSTAINABLE DEVELOPMENT
Ecosystemcondition andproductivity
Soil and waterconservation
Globalecological
cycles
Multiplebenefits
Society’sresponsibility
Conservation of biological
diversity

Aboriginal and treaty rights
Society’s responsibility106
ELEMENT 6.1ABORIGINAL AND TREATY RIGHTS
What are we measuring?This element measures
the extent to which forest
planning and management
processes consider and meet
legal obligations with respect
to Aboriginal and treaty rights.
The Royal Proclamation
of 1763 required the consent
of Aboriginal peoples before
their land was occupied and
gave the Crown sole authority to negotiate such
land settlements. From the Proclamation flowed
treaties that outlined the Crown’s responsibility
to protect Aboriginal peoples’ way of life, including
hunting, trapping, fishing and gathering.
The Constitution Act of 1867 gave the
federal government jurisdiction over all matters
concerning “Indians” and “Indian lands.” In 1982,
the Act was updated to further affirm and protect
Aboriginal and treaty rights. Specifically, Section
35 states, in part, that the “existing Aboriginal and
treaty rights of the Aboriginal peoples of Canada
are hereby recognized and confirmed.” In 1992,
Strategic Direction Seven of the National Forest
Strategy recognized the importance of these
rights in forest management and reflected
the commitment made by Canada at the 1992
United Nations Conference on the Environment
and Development—to recognize the role of
Aboriginal peoples in forests, traditional use,
knowledge and ways of life.
How do Aboriginal and treaty rights relate to the sustainability of Canada’s forests?There is growing awareness of the need for
sustainable forest management to recognize
Aboriginal peoples’ rights and protect
their traditional way of life. Aboriginal
use of forest land—be it subsistence or
commercial fishing, hunting, trapping
or gathering—affects forest management
and thus, forest management planning.
What data are available?
Extent to which forest planning andmanagement processes consider and meet legal obligations with respect to duly established Aboriginal and treatyrights (6.1.1)
Aboriginal and treaty rights are in part defined
by law, and in some regions of Canada, they
are evolving as a result of land claims negotiations.
However, differences still exist between Aboriginal
peoples and the provinces regarding the intent
of the treaties. The National Aboriginal Forestry
Association (NAFA) addressed this issue in a
submission to the Royal Commission on Aboriginal
Peoples, entitled Forest Lands and Resources for
Aboriginal People, and in its position paper
Aboriginal Participation in Forest Management:
Not Just Another “Stakeholder.”
Some provinces have amended their forest
legislation, regulations and practices to address
Aboriginal rights. For example, as part of its
policies on Crown land, British Columbia has
instituted the Protection of Aboriginal Rights
Policy, which requires consultation with Aboriginal
communities impacted by resource activities. This
regularly affects logging plans and other Ministry
of Forests and licencee development plans. A
Fair andeffective
decision making
Sustainabilityof forest
communities
Participationby Aboriginalcommunities
Aboriginal and treaty rights
Society’sresponsibility
Informeddecision making

Participation by Aboriginal communities
Society’s responsibility
total of 614 000 hectares of operable commercial
forests (2.4% of the province’s operable landbase)
are currently in deferred (log-around) status due
to outstanding Aboriginal issues. Alberta,
Saskatchewan, Manitoba, Ontario, Quebec
and Nova Scotia all recognize the Aboriginal
right to fish, trap and hunt for food year-round.
The right to log commercial forests generally
is not recognized, although a New Brunswick
court recently ruled that Micmacs have a treaty
right to harvest timber on Crown land for
commercial purposes.
Recent land-claim settlements and modern
treaties have addressed Aboriginal rights to lands
and resources. For example, the Agreement in
Principle between the Nisga’a and the Province
of British Columbia includes rights to access
natural resources within the claim area. Land
claim agreements in the Northwest Territories
and the Yukon Territory also have incorporated
Aboriginal access to renewable resources.
SummaryMeasuring the extent to which forest planning
and management processes consider and meet
legal obligations with respect to Aboriginal and
treaty rights is difficult because of the changing
interpretations of those rights and the evolving
forms of co-management between Aboriginal
peoples and provincial governments. At this
point, measurement entails an overview of
provincial legislation and regulations and
a best-practices or case-study approach.
ELEMENT 6.2PARTIC IPATION BYABORIGINAL COMMUNITIESIN SUSTAINABLE FOREST MANAGEMENT
What are we measuring?This element measures
the extent of Aboriginal
participation in sustainable
forest management by
examining Aboriginal peoples’
share in forest-based economic
opportunities; the protection of
their social, cultural and spiritual
sites; the number of Aboriginal
communities with a significant
forestry component in their economic
base; the diversity of forest use at the
community level; the area of forest land available
for subsistence purposes; and the area of reserve
lands under integrated forest management plans.
Various federal, provincial and Aboriginal sources
provide some insight into these indicators, but
comprehensive national data are not yet available.
How does participation by Aboriginalcommunities relate to the sustainability of Canada’s forests?More than 80% of Aboriginal communities lie
in the productive forest zones of Canada. The
Aboriginal people living in some of these areas
have unique cultural and spiritual connections
with the land and an intimate knowledge of
forest ecosystems. This traditional knowledge
can enhance forest management, demonstrating
that Aboriginal participation is a valuable
component of sustainable forest management.
107
Fair andeffective
decision making
Sustainabilityof forest
communities
Participationby Aboriginalcommunities
Aboriginal andtreaty rights
Society’sresponsibility
Informeddecision making

Participation by Aboriginal communities
Society’s responsibility
What data are available?
Extent of Aboriginal participation inforest-based economic opportunities (6.2.1)
This indicator assesses Aboriginal participation
in forest industry-related activities. Some data on
industry-based economic opportunities are
available through Statistics Canada in the Standard
Industrial Classification Codes. Through the Indian
Lands Forestry Program, Natural Resources
Canada–Canadian Forest Service (CFS)
provides estimates of roundwood production,
as well as some information on the revenues
generated from forestry activities on reserve
lands between 1984 and 1992. Although no
comprehensive national data are available,
several studies have looked at Aboriginal
economic involvement in the forest industry.
These studies include the Aboriginal Forestry
Training and Employment Review, the Class
Environmental Assessment for Timber
Management on Crown Lands in Ontario and
the Lands, Revenues and Trusts Forestry Review.
In addition, some provinces record the forest
licences awarded to Aboriginal communities.
Extent to which forest managementplanning takes into account the protection of unique or significantAboriginal social, cultural or spiritual sites (6.2.2)
Several provinces have passed heritage
legislation to protect Aboriginal sites, while
others rely on forest management legislation.
In British Columbia, for example, provincial
forest legislation requires the cataloguing of
Aboriginal sites—work that is being done as
part of the Traditional-Use Study Program.
Archaeological sites in the province are
protected under the British Columbia
Heritage Conservation Act. Ontario has a
guidelines identification system in place
entitled Timber Management Guidelines
for the Protection of Cultural Heritage Resources,
while in the Yukon Territory and the Northwest
Territories, land claim agreements include
provisions for the protection of culturally
significant Aboriginal sites.
Many Aboriginal communities have
conducted land-use studies to map social,
cultural and spiritual sites. Monitoring
the integration of these sites into forest
management planning would provide an
indication of the extent to which such sites
are protected.
Number of Aboriginal communities with a significant forestry component in the economic base and diversity offorest use at the community level (6.2.3)
NAFA’s 1995 report, entitled An Assessment
of the Potential for Aboriginal Business
Development in the Ontario Forest Sector,
surveyed 17 communities and described
on- and off-reserve forestry activities; forest
sector impacts; human resources development;
and barriers and opportunities relative to the
population, reserve landbase and forest area.
NAFA has also begun to develop a
database on Aboriginal forest businesses. Other
business directories have already been compiled
for specific regions (e.g., the 1996 Quebec Native
Business Directory and the directory of Grand
Council Treaty No 3).
The information described in Indicator
6.2.1 (Extent of Aboriginal participation in forest-
based economic opportunities)—particularly the
data available through the former Indian Lands
Forestry Program—also can be used to establish
baseline information for this element.
108

Participation by Aboriginal communities
Society’s responsibility
Area of forest land available forsubsistence purposes (6.2.4)
For Aboriginal communities in forested areas,
subsistence use involves hunting, fishing, trapping
and gathering. The data currently available on
these activities are insufficient to determine
the amount of forest land required for
subsistence purposes.
One source of information on subsistence
use is Indian and Northern Affairs Canada,
which maintains a database on Aboriginal trappers.
In addition, many Aboriginal communities have
carried out traditional land-use studies to define
their areas of subsistence use. Among these
peoples are the Innu of Labrador, the Gitxsan and
Wet’suweten of northern British Columbia, and the
Dene of the Northwest Territories. In Alberta,
Alberta-Pacific Forest Industries (Al-Pac),
worked with Aboriginal communities to map their
traditional areas and incorporate this information
into the company’s forest management plans.
Historical reviews of land-use patterns
may give an indication of the area that is currently
available for subsistence use, as well as the changes
that have occurred over time. Also, an extensive
and growing body of academic literature on
traditional knowledge and practices can provide
case-study background. For example, in 1996,
NAFA completed a report entitled Aboriginal
Forest-Based Ecological Knowledge in Canada,
which described six cases involving Aboriginal
subsistence and traditional use of forests
in management planning processes.
Some provincial legislation recognizes the
Aboriginal use of forest resources. Saskatchewan’s
new Forest Resources Management Act, for
example, allows Aboriginal people to gather
such items as medicinal plants and fallen wood
for personal or family use without requiring
a licence.
Area of Indian reserve forest lands underintegrated management plans (6.2.5)
The federal government has responsibility for
land areas referred to as “Indian reserves.” The
forests on these reserves make up only a small
percentage of the total forest land in Canada
(roughly 0.3%). Some reserves, however, are
large enough to provide a base for sustainable
forest management and to enable Aboriginal
people to participate in sustainable management
off-reserve. The total area of reserve lands is
nearly 1.4 million hectares, with a total volume
of merchantable timber of almost 140 million m3
and an annual allowable cut estimated at just
under 3 million m3.
Of the total reserve land area, 807 845
hectares (58%) are currently under management.
Earlier management plans were for timber
harvesting rather than integrated management,
and existing records catalogue the total area,
total forested area, softwood and hardwood
volume, total volume, annual allowable cut,
and the year the management plan was prepared.
Further research is required to determine the
extent to which non-timber data have been
included in more recent management plans.
SummaryThe CFS has collected data regarding on-reserve
forestry activities for the past 10 years, but with
the exception of British Columbia, the provinces
have collected such information only sporadically.
Since the creation of NAFA in 1991, several studies
have highlighted Aboriginal participation in these
activities, while a number of other Aboriginal
organizations have surveyed their membership
for information on business and economic
109

Sustainability of forest communities
Society’s responsibility110
opportunities. Coordination among federal
and provincial governments and Aboriginal
organizations is needed for the collection
and assessment of this type of data.
ELEMENT 6.3SUSTAINABIL ITY OF FOREST COMMUNITIES
What are we measuring?Canada is highly dependent
on its forest resources for the
provision of domestic goods
and services, as well as exports.
That dependence, however, is
not distributed equally across
the country. Within or adjacent
to forested regions are hundreds
of communities that rely on
the forest sector. Ideally, to
determine how many such
communities exist in Canada, we would
create a yardstick that could be used to measure
all of the varied human uses of forests, including
psychological and cultural benefits, timber and
non-timber economic benefits, and subsistence
activities. Measurements for some of these values
are provided in Criterion 5 (Multiple benefits of
forests to society). Unfortunately, the national
data that are currently available can only be
used to determine timber dependence.
How do forest communities relate to the sustainability of Canada’s forests?Forest communities, by definition, depend
on local forests for their livelihood. Indicators
related to community sustainability contribute
to our overall understanding of the sustainable
management of our forests. For example, if
forest communities continue to be economically,
culturally and spiritually sustained by their local
forests, the forests are likely being managed on
a sustainable basis. However, if the health and
productivity of their forests decline due to natural
events (e.g., fires or insect damage) or human
actions (e.g., pollution or unsustainable harvest
rates), the viability of the communities may be
compromised. It is important to know how many
forest-dependent communities exist and determine,
to the extent possible, how vulnerable they are
to ecological, economic and political change.
Another important dimension pertaining to
the sustainability of forest communities is their
ability to control their own future. However, there
are too few community-based tenures to determine
the impact of local involvement on resource
management and community stability. Local
stakeholders have the most to gain from
responsible forest management and the most
to lose from unsustainable practices. Therefore,
their involvement in forest management and
stewardship also are considered indicators
of sustainability.
What data are available?There is no national research program that
examines the psychological and cultural
benefits of forests, nor are data available
to assign a monetary value to community
dependence on non-timber forest products
or subsistence activities.
Number of communities with a significant forestry component in the economic base (6.3.1)
In Canada, 337 communities are classified
as heavily forest dependent—forest industries
account for more than 50% of their economic
base employment (Figure 6.3a). An additional
1 294 communities are moderately forest
Fair andeffective
decision making
Sustainabilityof forest
communities
Participationby Aboriginalcommunities
Aboriginal andtreaty rights
Society’sresponsibility
Informeddecision making

Sustainability of forest communities
Society’s responsibility
dependent, relying on the forest sector for
10–50% of their economic base (Figure 6.3b).
Index of the diversity of the localindustrial base (6.3.2)
Forest-dependent communities often possess, or
are located in proximity to, resources that provide
other economic opportunities, such as mining,
agriculture or energy. Currently, data are available
on the diversity of the industrial base with respect
to natural resources for Prairie communities with
populations exceeding 250. Communities in which
one other sector accounts for more than 10%
of employment are classified as dual-sector
dependent; those with two or more additional
sectors are considered diversified (Figure 6.3c).
Diversity of forest use at the communitylevel (6.3.3)
Currently, there are no data available at the
national level to measure this indicator.
Number of communities with stewardshipor co-management responsibilities (6.3.4)
Public involvement in forest stewardship and
management is on the increase, particularly
with respect to Crown forest lands. However, it is
difficult to measure the number of communities
having stewardship or co-management
responsibilities, because definitions of these terms
vary considerably. Further research and more
111
Source: Natural Resources Canada–Canadian Forest Service
Moderately forest-dependentcommunities by province/territory
6.3b
200 300 400 500 600 7001000
Nfld.
N.S.N.B.Que.Ont.
Man.Sask.Alta.B.C.
P.E.I.
Y.T.N.W.T.
communities
Diversity of the economic base of moderately forest-dependentcommunities in the Prairies
6.3c
Source: Natural Resources Canada–Canadian Forest Service
Forest dependent(37%)
Dual-sector dependent(52%)
Diversified(8%)
Source: Natural Resources Canada–Canadian Forest Service
Heavily forest-dependentcommunities by province
6.3a
0 30 60 90 120 150
Nfld.
N.S.
N.B.
Que.
Ont.
Man.
Sask.
Alta.
B.C.
communities

Fair and effective decision making
Society’s responsibility
practical examples may enable us to better assess
this dimension of forest community sustainability.
SummaryThis element report has focused on measurable
dimensions of forest dependence, namely the
number, distribution and degree of dependence
of communities that rely on the forest sector for
their economic well-being. Further research is
required to develop measures of non-timber
dependence and to determine the number of
forest communities that still rely on subsistence
activities for a significant portion of their
livelihood. It is likely that some aspects of human
reliance on forests, such as psychological benefits
or ecological services, never will be measurable,
but they must be acknowledged as society considers
its responsibility for sustainable development.
ELEMENT 6.4FAIR AND EFFECTIVEDECIS ION MAKING
What are we measuring?Measuring public participation
for the purposes of reporting
on sustainable development
is difficult. Quantitative
assessments, such as person
days of participation, the number
of forest products companies
with citizen advisory boards,
and the number of government-
sponsored public meetings, fail
to reflect the real spirit behind
this element—the fairness and effectiveness
of decision-making processes. In this context,
“fairness” is defined in terms of inclusiveness,
while an “effective” decision is one that
incorporates and mediates the broad spectrum
of concerns on a given issue. Qualitative
assessments of decision-making processes
likely will prove more useful in determining
progress toward sustainable development.
These two types of assessments are difficult to
compare, however, and no one formula can work
in all situations.
Indicators of fair and effective decision
making include the degree of public participation
in designing decision-making processes, making
and implementing decisions, and monitoring
progress toward sustainable forest management.
How does fair and effective decisionmaking relate to the sustainability ofCanada’s forests?Public involvement is assumed to be linked to
sustainable development because of the breadth
of goods and services that Canadians demand
from their forests. Diversity of forest use was
discussed in Element 6.3 (Sustainability of
forest communities). If all of the stakeholders
advocating varying uses of forests are included
in the decision-making process, it is more likely
that forest management will be carried out on
a sustainable basis to maintain the flow of these
goods and services.
What data are available?
Public participation in decision making(6.4.1–6.4.3)
For the purposes of this report, Indicator 6.4.1
(Degree of public participation in the design
of decision-making processes), Indicator 6.4.2
(Degree of public participation in decision-
making processes) and Indicator 6.4.3 (Degree
of public participation in the implementation
of decisions and the monitoring of progress
toward sustainable forest management) are
discussed together.
112
Fair andeffective
decision making
Sustainabilityof forest
communities
Participationby Aboriginalcommunities
Aboriginal and treaty rights
Society’sresponsibility
Informeddecision making

Informed decision making
Society’s responsibility
Provincial governments are responsible for the
design of forest decision-making processes and
the development of forest-management policies
and strategies. Public participation in these areas
currently occurs through a variety of processes,
including round tables, public meetings, advisory
bodies, written submissions and the distribution
of discussion papers. It is rare for the public to be
invited to participate in creating decision-making
processes or monitoring the activities of public-
or private-sector forest managers. When that
occurs, it is done as a matter of tradition or
policy—not as a legislative requirement.
Although difficult to measure, public
participation appears to be on the increase,
with experiments and innovation beginning
to take place all across Canada. For example,
public involvement in land-use planning,
including forest planning, has increased
dramatically in British Columbia through
the province’s land- and resource-management
planning process. In northern Alberta and
Saskatchewan, the integration of Aboriginal
involvement in forest planning, decision making
and monitoring has been a focus in recent years.
Manitoba’s new Forest Plan explicitly states
that greater public involvement will be required
in future forestry activities. The Province of
Ontario has developed citizens committees under
its Crown Forest Sustainability Act. And
Quebec developed its “inhabited forest” policy
in response to a grassroots attempt to accept more
local responsibility for forest management. The
Nova Scotia Department of Natural Resources
has taken steps to involve the public in the
development of policies and in decision making.
And Newfoundland is experimenting with
consensus-based decision making by involving
planning teams in the management of
forest ecosystems.
SummaryIn the forest sector, there is more experimentation
in the areas of co-management, community
forestry, public advisory boards and consensus-
based processes than is reflected in the existing
literature. Qualitative assessments of decision-
making processes are difficult to compile and
compare. To advance our knowledge in this
area and make progress toward sustainable
development, it is critical that information be
shared and that we draw on existing professional
networks to do so. To date, very little analytical
work has been done to determine which models
have worked and why.
ELEMENT 6.5INFORMED DECIS ION MAKING
What are we measuring?Forest management
and planning are complex
tasks that require knowledge
of such diverse disciplines
as engineering, sociology,
hydrology, ecology and
economics. To make the right
choices, and to maximize the
societal benefits of forests
without compromising their
ability to continue to provide
these benefits, all of society must work in
partnership and employ the best and most
current information available. This element
relates to the quality of that information,
and to mechanisms for its incorporation
into forest policies and planning. Investments
in research and expenditures in public forest
education, international forestry and mutual
learning are all indicators of informed decision
113
Fair andeffective
decision making
Sustainabilityof forest
communities
Participationby Aboriginalcommunities
Aboriginal andtreaty rights
Society’sresponsibility
Informeddecision making

Informed decision making
Society’s responsibility114
making. There is a direct connection between
this element and Element 6.4 (Fair and effective
decision making), because for the public to
participate effectively in forest management,
it must be well-informed.
How does informed decision making relateto the sustainability of Canada’s forests?Continued excellence in forest-based
research is critical because it helps define
sustainable forestry and monitor and evaluate
sustainable forest practices. Ecosystems and
social systems are both in a constant state of
flux, and research is necessary so that the latest
findings on everything from society’s attitudes
and preferences to developments in environmentally
sound technologies may be integrated into forest
management planning and decision making.
People can make better decisions if
they know more about ecological processes,
and professional foresters and policy makers
can make better management decisions if they
know more about the public’s concerns.
Therefore, mutual learning—a rational and
reasonable exchange of information in the
spirit of partnership—is another indicator of
sustainable forestry.
Canadians’ responsibility for sustainable
forest management does not end in Canada,
however. Given our significant forest educational
and institutional infrastructures, and our political
will to practice sustainable forest management,
we have much leadership and direction
to offer the world. Expenditures in
international forestry are, therefore,
another indicator of informed decision
making and of society’s support for
sustainable development.
What data are available?
Investments in forest-based R & D and information (6.5.2)
Each year, significant resources are
allocated to forest research in Canada. In
1993–1994, the Model Forest Program spent
$1.8 million on forest research, and that figure
rose to $2.9 million in 1994–1995. The forest
research expenditures of the Sustainable Forest
Management–Network of Centres of Excellence
(SFM–NCE) Program totalled $2.4 million in
1995–1996 and $4.0 million in 1996–1997.
Figure 6.5a shows the amount of money
that was spent annually on other forest-based
research between 1990 and 1994. This includes
the budget of the CFS and provincial forest
agencies, as well as research supported by the
federal–provincial agreements in forestry, but
not research conducted in universities.
Most provincial funding goes to applied
forest research. Expenditures range from zero
in jurisdictions with low forest dependence
(e.g., Prince Edward Island and the Yukon
Territory), to tens of millions of dollars in
jurisdictions heavily dependent on forests
(e.g., British Columbia spent $18.7 million
in 1995–1996, and Quebec has averaged
$13.5 million per year over the past few years).
1990 1991 1992 1993 1994$ million
112.8 126.1 137.0 137.0 151.2
Source: National Forestry Database
6.5a Government expenditures on other forest-based research

Informed decision making
Society’s responsibility
In recent decades, federal–provincial
agreements provided millions of dollars for
forest research, but they have not been renewed.
Other forms of federal–provincial partnership are
now emerging, such as the $3 million that
Alberta contributed to the SFM–NCE. Some
new provincial initiatives, including the Forest
Renewal British Columbia Program, also may
provide research funds in the area of sustainable
forest management.
Total effective expenditures on publicforestry education (6.5.3)
Expenditures on public education are another
critical component of sustainable forestry. The
Model Forest Program places a high priority
on public awareness and technology transfer.
Its expenditures in those areas are outlined
in Figure 6.5b.
The Canadian Forestry Association has
documented more than 200 forest education
programs in local school systems. Public forest
education is difficult to measure, in part because
it is impossible to objectively distinguish between
programs and materials designed to educate and
those designed to affect public opinion. Interest
group and industry brochures and promotional
materials, as well as peer-reviewed science and
university extension efforts, are all considered
educational because they tell us how different
segments of society conceptualize
forest issues and processes. All such
expenditures on public information should,
therefore, be included in future reporting
on this indicator.
Mutual learning mechanisms andprocesses (6.5.6)
Some attempts have been made recently to
bring together a broad range of forest stakeholders
to discuss forest and environmental issues. The
WildFor and EnviroFor conferences, for example,
were structured so that interest groups, who often
conduct their dialogue indirectly (via letters,
protests or the media), could meet face to face
to discuss their perspectives and concerns.
The Model Forest Program also focuses
on partnership building. For example, the
management and partnership committees
of most model forests include representatives
from a broad range of interest groups.
Mutual learning has also occurred through
industry-sponsored initiatives, such as the public
involvement process and the co-management of
the NorSask forest in northwestern Saskatchewan.
Expenditures on international forestry (6.5.5)
Canadians’ acceptance of responsibility for
global sustainable development may be measured
by expenditures on international forestry. In 1995,
the Canadian International Development Agency
(CIDA) reported expenditures of nearly
$70 million on forest programs. This
compares with the previous level of
nearly $100 million per year. The CIDA
funds are spent on managing existing
forests, creating new forests, and
developing commercial forest ventures.
ACTIVITY 1993–1994 1994–1995$ thousand
Technology transfer 625.4 1 281.0Public awareness 1 102.5 1 514.0
Source: Canadian Model Forest Network
115
6.5b Model Forest Program expenditures on technologytransfer and public awareness activities

Literature cited
Society’s responsibility
More than 150 projects are ongoing in at
least 60 countries. In 1995, the International
Development Research Centre (IDRC) spent
approximately $1 million on the International
Model Forest Program. IDRC spent additional
millions on sustainable human development,
land rehabilitation and property rights, but is
unable to determine what percentage of those
projects had implications for forestry.
SummaryAs our society evolves and we learn more about
social, economic and ecological processes, the
values that we associate with “sustainable
development” will change. For this reason,
it is important to have up-to-date information.
“Informed” decision making refers to the quality
of information that goes into forest management
and planning. If sustainable forestry can be
considered a final product, accurate information
is the raw material. A strong commitment to
research, public education and mutual learning,
combined with an understanding of Canada’s role
and responsibilities in international forestry, will
move us closer to sustainable forest management.
More attention to these specific issues in a research
context will also allow us to better assess them
for future reports.
LITERATURE CITED
Canadian Council of Forest Ministers;
Natural Resources Canada, Canadian Forest
Service, Headquarters, Ottawa, Ont. 1992.
National Forest Strategy. Sustainable forests:
A Canadian commitment.
Government of Ontario. 1994. Class
environmental assessment for timber
management on Crown lands in Ontario.
Grand Council Treaty Nº 3. Business
directory 1995–1996.
Indiana Marketing. 1996. Quebec native
business directory.
Intertribal Forestry Association of British
Columbia. 1990. Lands, revenues and trusts
forestry review. Kelowna, B.C. 83 p.
Korber, D. 1997. Measuring forest dependence.
Implications for Aboriginal communities. University
of Alberta. (Unpublished M.Sc. thesis)
KPMG Management Consulting. 1995.
Manitoba’s forest plan...towards ecosystem-
based management: Report to Manitoba
Natural Resources 1995. Winnipeg, Manitoba.
National Aboriginal Forestry Association.
1993. Aboriginal forestry training and
employment review. Phase I final report.
National Aboriginal Forestry Association.
1993. Forest lands and resources for Aboriginal
people: An intervenor submission to the Royal
Commission on Aboriginal peoples.
National Aboriginal Forestry Association. 1995.
Aboriginal participation in forest management:
Not just another “stakeholder.”
National Aboriginal Forestry Association. 1995.
An assessment of the potential for Aboriginal
business development in the Ontario forest sector.
National Aboriginal Forestry Association.
1996. Aboriginal forest-based ecological
knowledge in Canada.
Ontario Ministry of Natural Resources.
1991. Timber management guidelines for
the protection of cultural heritage resources.
116

Additional reading
Society’s responsibility117
Ontario Ministry of the Environment. 1994.
Environmental Assessment Board’s reasons for
decision and decision of class environmental
assessment by the Ministry of Natural Resources
for timber management on Crown lands in Ontario.
Robinson, M.; Garvin, T.; Hodgson, G.
1994. Mapping how we use our land using
participatory action research. Arctic Institute
of North America, Calgary, Alta.
Ross, M.M. 1995. Forest management in
Canada. Canadian Institute of Resources
Law, Calgary, Alta.
Statistics Canada. Standard industrial
classification codes.
ADDITIONAL READING
British Columbia Round Table on the
Environment and the Economy. 1991.
Sustainable communities.
British Columbia Round Table on the Environment
and the Economy. 1993. Strategic directions for
community sustainability.
Burch, R.D. 1994. Municipal reporting on
sustainable development: a status review.
National Round Table on the Environment
and the Economy, Ont. Work. Pap. Nº 24.
Hart, M. 1995. Guide to sustainable
community indicators. QLF/Atlantic
Centre for the Environment, Ipsich.
Hodge, T. 1995. From theory to practice:
assessing progress toward sustainable
development in the Great Lakes Basin.
Pages 128–217 in Hodge, T. et al. Editors.
Pathways to sustainability: Assessing our
progress. National Round Table on the
Environment and the Economy, Ont.
Holtz, S. 1995. Approaches to reporting on
human well-being. Pages 104–112 in Hodge,
T. et al. Editors. Pathways to sustainability:
Assessing our progress. National Round Table on
the Environment and the Economy, Ont.
Kusel, J. 1996. Well-being in forest-dependent
communities. Part I: a new approach. Pages
361–373 in Sierra Nevada ecosystem project:
Final report to Congress. Vol. 2. Assessments
and scientific basis for management options.
University of California, Centers for Water
and Wildland Resources, Davis.
Minister of Supply and Services Canada. 1996.
Restructuring the relationship. Part II. Vol. 2
of the Report of the Royal Commission on
Aboriginal peoples.
Morse, B.W. 1991. Aboriginal peoples and the
law: Indian, Metis and Inuit rights in Canada.
Carleton University Press.
National Aboriginal Forestry Association. 1995.
Aboriginal forest land management guidelines:
A community approach.
Notzke, Claudia. 1994. Aboriginal peoples
and natural resources in Canada. Captus
University Publications.
Robson, Robert. 1995. Forest dependent
communities in Canada: An interpretive
overview and annotated bibliography. Natural
Resources Canada, Canadian Forest Service,
Headquarters, Ottawa, Ont. Work. Pap. series
of the Policy, Economics and International
Affairs Directorate.
University of Victoria. 1995. Sustainable
communities initiative. Victoria, B.C.
(Internet site prepared by G.R. Walter)
Walter, G.R. 1994. Defining sustainable
communities. Int. J. Ecoforestry 10(2): 68–70.

Contacts
Society’s responsibility118
Wollenberg, E.; Colfer, C.J.P. 1996. Social
sustainability in the forest. Tropical Forest
Update 6(2): 9–11.
CONTACTS
Social values
Dr. Tom Beckley (Criterion co-coordinator)
Northern Forestry Centre
Natural Resources Canada–
Canadian Forest Service
5320–122nd Street
Edmonton AB T6H 3S5
Tel.: (403) 435-7372
Fax: (403) 435-7359
Co-management
Ms. Dianne Korber
Northern Forestry Centre
Natural Resources Canada–
Canadian Forest Service
5320–122nd Street
Edmonton AB T6H 3S5
Tel.: (403) 435-7298
Fax: (403) 435-7359
Public participation
Ms. Monique Ross
Canadian Institute of Resources Law
Faculty of Law
University of Calgary
Calgary AB T2N 1N4
Tel.: (403) 220-3973
Fax: (403) 282-6128
Aboriginal forestry
Ms. Peggy Smith
National Aboriginal Forestry Association
875 Bank Street
Ottawa ON K1S 3W4
Tel.: (613) 233-5563
Fax: (613) 233-4329
Forest communities
Mr. Tim Williamson
Industry, Economics and Programs Branch
Natural Resources Canada–
Canadian Forest Service
7th floor, 580 Booth Street
Ottawa ON K1A 0E4
Tel.: (613) 947-9064
Fax: (613) 947-9020

120
Abiotic: Concerning the non-living component of
the environment (e.g. climate, ice, soil and water).
Aboriginal: As defined by the Constitution Act,
1982, Section 35(2), “Aboriginal peoples of
Canada” includes the “Indian, Inuit and Metis”
peoples of Canada.
Annual allowable cut (AAC): The amount of
timber that is permitted to be cut annually from
a particular area; AAC is used as the basis for
regulating harvest levels to ensure a sustainable
supply of timber.
Aquatic: Pertains to both marine and
freshwater ecosystems.
Bequest values: Values obtained by the
current members of society in knowing that
forests are being protected, conserved and
sustainably managed, and will be available
for future generations.
Biodiversity: The total variability of life on
Earth, including the diversity of genes, species
and ecosystems.
Bioenergy: The kinetic energy released
from biomass when it is eaten, burned or
converted into fuel; the potential energy
embodied in biomass.
Biological productivity: The capacity to
produce biomass; the production of biomass.
Biomass: The dry weight of all organic material
(i.e., animals, plants and microorganisms) living
or dead and above or below the soil surface.
Biosphere: Regions of the planet where
life is found, ranging from the oceans to the
lower atmosphere.
Biosystematics: The field of science dealing with
the diversity of life and the relationships of life’s
component organisms, including taxonomy
(recognition), phylogenetics (evolutionary
relationships), classification (patterns in evolution)
and taxagenetics (processes responsible for origin
and adaptation).
Biota: All of the living organisms in a given
ecosystem, including bacteria and other
microorganisms, plants and animals.
Bogs: Peatlands that are generally unaffected by
nutrient-rich groundwater. They are acidic and are
often dominated by shrubs and mosses; they may
also include open-growing, stunted trees.
Buffer: A strip of land where disturbances are
not allowed, or are closely monitored, to preserve
aesthetic and other qualities adjacent to roads,
trails, waterways and recreation sites.
Carbon cycle: The cycle of carbon in living
things in which carbon dioxide is fixed by
photosynthesis to form organic nutrients
and is ultimately restored to the inorganic
state by respiration and proto-plasmic decay.
Carbon sink: An area where the rate of carbon
uptake by living organisms exceeds the rate of
carbon release, so that carbon is actively
sequestered in organic or inorganic forms.
Abiotic — Carbon sink
Glossary
Glossary

121
Catchment area: The area tributary to or draining
to a lake, stream, reservoir or other body of water.
Chemi-thermomechanical pulp: Pulp that has
undergone the process by which wood chips
are separated into fibres using heat, pressure
and chemicals.
Climate change: An alteration to measured
quantities (e.g., precipitation, temperature, radiation,
wind and cloudiness) within the climate system
that departs significantly from previous average
conditions and is seen to endure, bringing about
corresponding changes to ecosystems and
socioeconomic activity.
Co-management: Forms of shared natural
resource management between local representatives
and provincial governments, with local participants
having a varying degree of decision-making
power—from advisory to shared jurisdiction.
Commercial forest: Forest land that is able to
grow commercial timber within an acceptable
time frame.
Commodity: A general term referring to primary-
level manufactured products (e.g., dimension
lumber, plywood and market pulp) that are sold
in bulk volumes. These products are often used
to produce higher value-added products
(e.g., structures, furniture and fine papers).
Compaction: A reduction in soil volume (usually
caused by repeated passes of heavy equipment)
leading to poor soil aeration, impeded drainage
and root deformation.
Connectedness: The ease with which individuals
of a given species move from one habitat patch
to another.
Crown transparency: The amount of skylight
visible through the foliated portion of a
tree crown.
Cutover: An area of forest from which some
or all of the timber has recently been cut.
Decomposition: The breakdown or decay of
organic materials by the action of bacteria,
fungi and other minute organisms.
Deferred area: An area in which a restriction-
of-activity order is put into effect for a specific
period of time.
Defoliator: An agent that causes plants to lose
their leaves.
Deforestation: Clearing an area of forest
for another long-term use.
Detritus: Loose material covering the soil
surface that consists of decomposing plant
matter that results directly from disintegration
Dieback: A condition in woody plants in which
peripheral parts are killed, usually beginning at
the terminal portion.
Displacement: The removal of soil, including the
forest floor, from one location to another, causing
a change in the natural microtopography.
Dual-sector dependent communities: Forest-
dependent communities in which one other
sector (e.g., mining, agriculture or hydro)
accounts for more than 10% of employment.
Ecosystem: A dynamic system of plants, animals
and other organisms, together with the non-living
components of the environment, functioning as an
interdependent unit.
Catchment area — Ecosystem
Glossary

122
Ecosystem resilience: The ability of an ecosystem
to recover from disturbances caused by natural
and human-induced means.
Ecosystem-based management: The development
of management systems that attempt to simulate
ecological processes with the goal of maintaining
a satisfactory level of diversity in natural landscapes
and their pattern of distribution in order to ensure
the sustainability of forest ecosystems and forest
ecosystem processes.
Ecozone: A broad-scale ecological unit that is
based on patterns that include climate, geography
and ecological diversity.
Edge habitat: A loosely defined type of habitat
that occurs at the boundary between two different
habitat types (e.g., where forests border on non-
forest land). Typically, edge habitats have
transitional characteristics that benefit certain
species, but exclude others.
Environmental service values: Values related
to the ability of forest ecosystems to assimilate
waste and respond to human disturbances while
continuing to provide environmental goods and
services, such as clean air, water, soil retention
and wildlife habitat. These functions include
ground water recharge, filtration, flood control,
erosion protection, migratory bird habitat, pest
control, nutrient recycling, climate regulation
and carbon fixing.
Erosion: To wear away by the action of water,
wind or glacial ice.
Eutrophication: The process by which a
body of water becomes—either naturally
or by pollution—rich in dissolved nutrients
(e.g., phosphates), often with a seasonal
deficiency in dissolved oxygen.
Evapotranspiration: Loss of water from soil
and vegetation, both by evaporation and by
transpiration from plants.
Ex situ approach: A method of conservation in
which components of biodiversity are conserved
outside their natural habitats.
Existence value: A value placed on the
knowledge that a particular forest ecosystem
exists and is being protected. It is not necessary
to actually experience the forest to obtain value
from it.
Exotic species: Any organism that enters an
ecosystem beyond its normal range through
deliberate or inadvertent introduction by humans.
Fire behaviour: Ignition, flame development,
spread and intensity of a forest or wildland fire.
Fire environment: Weather, fuels and topography
that affect forest or wildland fires.
Fire severity: Negative impacts of a forest or
wildland fire on other ecosystems.
Firewood: Trees that will yield logs suitable in
size and quantity for the production of firewood;
also the logs of such trees.
Forest-dependent community: A community
that is dependent on forests for its survival; due
to data availability, dependence is usually
measured with timber sector data.
Fossil fuel: Oil, gas, coal and other fuels that
were formed under the Earth’s surface from the
fossilized remains of plants and tiny animals that
lived millions of years ago.
Fragmentation: The division of a continuous
block of forest or other wildlife habitat into
disconnected units as a result of human or
natural disturbances.
Ecosystem resilience — Fragmentation
Glossary

Fuelwood: Trees that will yield logs suitable in
size and quality for the production of firewood
logs or other wood fuel; also the logs of such trees.
Full suppression fire: A forest or wildland
fire that is controlled as quickly as is
reasonably possible.
Geographic information system (GIS): An
information system that uses a spatial database
to provide answers to queries of a geographical
nature through a variety of manipulations, such
as sorting, selective retrieval, calculation, spatial
analysis and modeling.
Geosystem(s): Existing soil and water processes
affected by fire.
Greenhouse effect: The preservation of
warmth in the Earth-atmosphere system caused
by the presence in the atmosphere of certain trace
gases (e.g., water vapour and carbon dioxide) that
transmit shortwave energy (visible and ultraviolet
radiation) from the sun to the Earth’s surface,
and the absorption of long wave radiation
emitted from the Earth’s surface resulting in a
greater atmospheric temperature. Without the
“greenhouse” effect, the Earth’s temperature
would be 33ºC lower than present values, and
life on Earth as we know it would not exist.
Gross domestic product (GDP): A measure
of national income—the amount paid to
Canadians, including governments, in terms
of salaries, wages, profits, taxes and royalties.
Habitat (wildlife): The environment in which a
population or individual lives; includes not only
the place where a species is found, but also the
particular characteristics of the place (e.g.,
climate or availability of suitable food and
shelter) that make it especially well suited
to meet the life-cycle needs of that species.
Hardwood(s): Broad-leaved trees; also
refers to the wood produced by these trees.
Hardwoods belong to the botanical group
angiospermae and are the dominant type
of tree in the deciduous forest.
Heavily forest-dependent community: A forest-
dependent community that relies on the forest
sector for more than 50% of its economic base.
Heritage legislation: Legislation addressing the
protection of sites that have cultural, historical
or spiritual significance deemed important for
present and future generations.
Humus: A brown or black complex material
resulting from the partial decomposition of
plant or animal matter and forming the organic
portion of the soil.
Hydrological cycle: The global cycle that
describes the movement of water through
terrestrial and aquatic ecosystems and back
into the atmosphere.
Hydrology: A science dealing with the properties,
distribution and circulation of water on the surface
of the land, in the soil and underlying rocks, and
in the atmosphere.
In situ approach: The conservation of ecosystems
and natural habitats, and the maintenance and
recovery of viable populations of species in their
natural surroundings.
Integrated forest management: Forest
management that incorporates timber
and non-timber values.
Kraft pulp: Pulp made by boiling wood chips
in a sodium sulfate solution; typically used
for corrugated paper or grocery bags.
123Fuelwood — Kraft pulp
Glossary

124
Landfill site: Low-lying land that has been built
up by the disposal of waste buried between layers
of earth.
Life zone: Widely used in the study of birds and
mammals in North America: generally refers to
a series of temperature zones.
Litter: The uppermost slightly decayed layer
of organic matter on the forest floor.
Mean annual increment (MAI): Average net
annual increase in yield (expressed in terms of
volume per unit area) of living trees to a given
age; measure of the net biomass production of
the forest.
Moderately forest-dependent community: Aforest-dependent community that relies on the
forest sector for 10–50% of its economic base.
Modified fire response: Response to a forest
or wildland fire at less than full suppression;
normally employed in low-value areas.
Mulch: Any loose covering on the surface of the
soil, whether naturally occurring (e.g., litter) or
deliberately applied (e.g., gravel); used to reduce
competing vegetation, retain humidity, and
protect against frost and heavy rain.
Mutual learning: A rational and reasonable
exchange of information in the spirit
of partnership.
Non-commercial tree species: A tree species
for which there is currently no market.
Non-market consumptive goods: Products
(e.g., berries, mushrooms, craft products,
firewood, fiddleheads, Christmas trees and
ornamental trees) that individuals obtain
from forest lands free of charge.
Non-timber values: Includes all forest-related
values that are not derived from timber harvesting
and the subsequent production of forest products.
Non-use values/passive-use values: Values
where it is not necessary for the individual to
be in the forest or directly experience the forest
in any way. For example, many individuals in
Canada obtain psychological satisfaction and
place a value on knowing that a particular forest
ecosystem exists and is being protected.
Old-growth forest: A forest dominated by mature
trees that has not been significantly influenced by
human activity. The stand may contain trees of
different ages and various species of vegetation.
Oriented strand board (OSB): Panels made
from narrow strands of fibre oriented lengthwise
and crosswise in layers, with a resin binder.
Depending on the resin used, OSB can be
suitable for interior or exterior applications.
Outfitter(s): Small commercial operations where
the owner or operator provides the necessary
equipment and supplies to individuals or groups
so that they can obtain an outdoor experience in a
particular area. In some cases, the outfitter guides
or accompanies the individual or group to provide
his knowledge, of local sites, conditions, trails,
outdoor skills, and wildlife or fishing locations.
Overmature forests: Trees or stands past the
mature stage of development.
Ozone: A form of oxygen (O3) formed naturally
in the upper atmosphere by a photochemical
reaction with solar ultraviolet radiation and
a major agent in the formation of smogs.
Landfill site — Ozone
Glossary

Panel products: A class of forest products
sold in the form of sheets or panels of various
dimensions and thicknesses. Products include
softwood and hardwood plywood, particleboard,
oriented strand board, medium density fibreboard
and hardboard.
Particulate: Of or relating to minute
separate particles.
Passerine birds: The largest order of birds,
which includes more than half of all living
birds and consists chiefly of songbirds that
have perching habits.
Peatland: Terrain that is covered by an
accumulation of partially decomposed plant
matter due to excessive moisture.
Photosynthesis: Formation of carbohydrates
in the chlorophyll-containing tissues of plants
exposed to light.
Phytotoxic: Poisonous to plants.
Protected area: An area protected by legislation,
regulation or land-use policy to control the level
of human occupancy or activities. Categories
of protected areas include protected landscapes,
national parks, multiple-use management areas,
and nature or wildlife reserves.
Puddling: The development of very small
pools of water, usually as a result of compacting
heavy, textured soils.
Pulp: Wood chips that have been ground
mechanically into fibres and are used for
the production of inexpensive paper, such as
newsprint, or that have been chemically treated
to remove the lignin and are used to manufacture
higher quality papers.
Recycling: The set of processes for reclaiming–
as a material input to a product or service system–
material that would otherwise be disposed of
as waste.
Reforestation: The reestablishment of trees
on denuded forest land by natural means or
by planting or seeding.
Regeneration: The renewal of a forest stand
following disturbance. Natural regeneration
occurs from roots, stems or seeds that are
already present or are brought in by wind or
animals. Other forms of regeneration involve
direct seeding or planting.
Renewable resource: A natural resource that
is capable of regeneration. Renewable resources
can essentially never be exhausted, usually
because they are continuously produced
(e.g., tree biomass, fresh water and fish).
Reserve: A tract of land in which the Aboriginal
interest is permanently preserved for a particular
group of Aboriginal people. Defined under the
Indian Act as a “tract of land, the legal title to
which is vested in her Majesty, that has been set
apart by Her Majesty for the use and benefit of
a band.”
Resource industry: An industry based on the
primary resources obtained from agriculture,
fisheries, forestry or mining, including wheat,
cod, timber or iron ore.
Respiration: The physical and chemical
processes by which an organism supplies its
cells and tissues with the oxygen needed for
metabolism and relieves them of the carbon
dioxide formed in energy-producing reactions.
Any of various energy-yielding oxidative
reactions in living matter.
125Panel products — Respiration
Glossary

Riparian: Relating to, or living or located on,
the bank of a natural body of fresh water.
Rutting: The development of artificial drainage
channels in compacted, displaced soil.
Sedimentation: The action or process by which
matter settles to the bottom of a body of water.
Siltation: Loose sedimentary material with
rock particles.
Silviculture: The theory and practice of
controlling the establishment, composition,
growth and quality of forest stands; can include
basic silviculture (e.g., planting and seeding)
and intensive silviculture (e.g., site rehabilitation,
spacing and fertilization).
Slash burning: Burning the residue on the forest
floor that is left after stand tending or harvesting,
or after accumulating from natural causes.
Sludge: A soft, thick mixture, deposit or
sediment. Often a by-product of sewage
treatment processes.
Softwood(s): Cone-bearing trees with needles
or scale-like leaves; also refers to the wood
produced by these trees. Softwoods belong to
the botanical group gymnospermae and are the
predominant tree type in coniferous forests.
Species at risk: A wildlife species that is
facing extirpation or extinction if nothing is
done to reverse the factors causing its decline,
or that is of special concern because it is
particularly sensitive to human activities or
natural events.
Standing biomass: The amount of biomass that
occurs on a given site at a particular time without
reference to the rate of accumulation (i.e., kg/ha).
Stewardship: The science, art and skill of
responsible and accountable management
of resources.
Stocking: A qualitative expression of the
adequacy of tree cover on an area in terms of
crown closure, number of trees, basal area or
volume in relation to a pre-established norm.
Subsistence: The minimum food and shelter
necessary to support life.
Subsistence activities: Harvesting or growing
products directly for personal or family livelihood.
Succession (successional trends): Changes in
the species composition of an ecosystem over
time, often in a predictable order.
Sustainable forest development: The
development of forests to meet current needs
without prejudice to their future productivity,
ecological diversity or capacity for regeneration.
Trophic (web/status): Of or relating to
nutritional relationships.
Troposphere: The portion of the atmosphere
that extends outward approximately 11–16 km
from the Earth’s surface.
Turbidity: Reduced clarity or purity.
Ungulates: Any group of the hoofed mammals,
of which most are herbivorous and many
are horned.
Unspecified broadleaves: A group of hardwood
trees not identified to the genus or species level.
Use values: Activities (e.g., subsistence food
gathering, outdoor recreation, and hunting and
trapping) where the individual directly uses or
consumes a good or service from the forest.
126Riparian — Use values
Glossary

Value-added production: Manufacturing that
adds value to a primary product as it passes
through various processing stages.
Variable-retention silvicultural system(s):Harvesting method by which some forest
cover is retained.
Vitality: Capacity for ecosystems to maintain
energy flow and endurance.
Vulnerable species: A species that is particularly
at risk because of low or declining numbers, a
small range, or for some other reason, but is
not threatened.
Watershed: An area of land that is drained by
underground or surface streams into another
stream or waterway.
Wetland: Land that is seasonally or permanently
covered by shallow water, or land where the water
table is close to or at the surface. In either case,
the presence of abundant water has caused the
formation of hydrolic soils and has favoured
the dominance of either hydrophytic or water-
tolerant plants.
Wilderness: A part of our natural landscape
that is sufficiently large and varied to constitute
a more or less self-regulatory ecological unit,
where human interference with the land, plants
and animals is minimal, and where the beauty
and character of the landscape has aesthetic,
cultural or scientific significance.
127Value-added production — Wilderness
Glossary

128
S U B J E C T I N D E X
AAboriginal communities
· forest management participation107–109
· land claims 83, 106, 107· land use 95, 96f, 97f, 109· rights 106–107
access development 87, 88f
acid rain see pollution
age classes· by ecozone and forest
type 6, 7f, 10· and carbon cycling 61–62· and MAI 40· and resilience 38
agriculture· and carbon budget 65· impact on biodiversity 2, 11, 20· impact on soil and water 48, 51,
52· impact on wildlife 16, 86· Ontario 83· tenures 70
Agriculture and Agrifood Canada 35
Alaska 9
Alberta· Aboriginal rights 107· decision making 113· endangered species 11–12· forest-dependent communities
111f· fuelwood 95· genetic conservation 20· insect attack 27· legislation 82· R & D 115· soil disturbances 49· tenures 70f
animals· expenditures on wildlife-related
activities 99f
· extinct or at risk 11–12, 13–14f, 86
· game 83, 96f, 98-99· habitat 71, 83, 86–87· indicator species 12, 14,
13–15f, 17· National Survey on the
Importance of Wildlife to Canadians 97
· pelts 83, 84f, 85· population levels 12, 85–87· range reductions 9, 16· sustainability 87–88· wildlife organizations 100f
aquatic ecosystems see watershed
aquatic fauna 47, 51–52
Arctic Cordillera· defined 3f· forest area 4f· forest inventories 71· fresh water 75f
Atlantic Maritime· animals 14f, 15f, 17f· defined 3f· fire 30f· forest age class 6, 7f· forest area 4f· forest inventories 71· forest types 5, 5f, 19· fresh water 75f· insect attack 26–27· MAI 40f, 41f· ozone 33· pollution 32· protected areas 8, 9f· road density 9
Bbiodiversity
· defined 1–2· ecosystem 1, 2–10· genetic 1, 18–21· species 1, 10–17
bioenergy see non-fossil fuels
biological cycles· carbon 58–64, 66–68· forest land conversion 64–66· policy factors 69–74· role of forests 57–58· water 58, 64, 66, 74–76
biomass· alternative energy source 67,
73, 74· defined 39· MAI 40–41· measuring 39· and sustainability 39
birds see animals
Boreal Cordillera· defined 3f· fire 30f· forest age class 6, 7f· forest area 4f· forest inventories 71· forest types 5, 19· fresh water 75· MAI 40f, 41f· protected areas 9f· road density 9
Boreal Plains· animals 14f, 15f, 17f· defined 3f· fire 30f· forest age class 6, 7f· forest area 4f· forest inventories 71· forest types 5, 10, 19· fresh water 75f· MAI 40f, 41f· pollution 32· protected areas 9f
Boreal Shield· animals 13f, 15f, 17f· defined 3f· fire 30f· forest age class 6, 7f· forest area 4f
A–B
Subject index
An “f ” is used to indicate information that appears in a figure.

· forest inventories 71· forest types 5, 10, 19· fresh water 75–76· MAI 40f, 41f· ozone 33· protected areas 8, 9f
botanical medicines 83
British Columbia· Aboriginal communities
106–107, 108, 109· decision making 113· forest-dependent
communities 111f· fuelwood 96· genetic conservation 20· hunting 99· insect attack 27· legislation 69, 82· R & D 114, 115· road density 8, 9–10· soil disturbances 49· species at risk 11, 12· tenures 70f
British Columbia Ministry of Forests 106
Ccamping 94f, 97
Canada· carbon budget 58, 60–61, 63–64· carbon emissions 63· decision making 113, 114· ecozones 3· exotic species 35· forest area 4f, 57, 58, 69· forest fires 28–30· forest inventories 71f, 74· forest policy 69–74· forest profits 89–90· fresh water 75–76· genetic conservation 20f· global market share 90· greenhouse gases 66, 68, 72–73· international forestry
expenditures 115–116· land-use conversion 65–66
· protected areas 10· pulp and paper recycling 62, 63f· regeneration 38· watersheds 50
Canada Year Book 74
Canada's Forest Inventory 71, 72, 74
Canadian Air and PrecipitationMonitoring Network(CAPMON) 31
Canadian Council of ForestMinisters (CCFM) 72, 73
Canadian Forest Service (CFS)· Aboriginal land use 97f, 109· animal population monitoring 86· carbon budget model 58· exotic species monitoring 35· Forest Health Network 25–26,
34· Forest Insect and Disease Survey
25, 35· Indian Lands Forestry Program
108–109· R & D 114
Canadian Forestry Association115
Canadian Institute of Forestry 99
Canadian InternationalDevelopment Agency (CIDA)115–116
Canadian Pallet Council 63
CAPMON see Canadian Air andPrecipitation MonitoringNetwork
carbon 60, 63–64, 65
carbon biomass see also biomass58–62, 66
carbon budget· Canadian model 58, 60, 64· changing 63–64· as indicator 57, 58–59· and land-use conversion 64, 66· and sustainability 58, 59
carbon cycle· and age classes 61–62· defined 57, 59
· and energy use 66· and forest products 58–59,
61, 62· international cooperation 72· models 60–61· and recycling 58–59, 62–63, 73
carbon dioxide· atmospheric levels 57, 58, 61,
63, 66· conservation 66–68, 73· fossil fuel emissions 66, 67–68,
73· greenhouse gas 58, 60· non-fossil fuel emissions 68
carbon pools 60–62, 63–64
carbon sinks see carbon pools
carbon sources see carbon pools
Carolinian forest see MixedwoodPlains
catchment area see watershed
CCFM see Canadian Council of Forest Ministers
CFS see Canadian Forest Service
Christmas trees 92, 93f, 96
CIDA see Canadian InternationalDevelopment Agency
climate· impact on water 47, 51· impact on wildlife 16, 87· increased disturbances 25, 35
climate change· global carbon balance 57–58· greenhouse effect 66· greenhouse gases 58· measured by temperature 35,
36f· policies 72–73
clubs (conservation andrecreation) 98, 99
Committee on the Status ofEndangered Wildlife inCanada (COSEWIC) 11,13–14f, 17f, 86
129
S U B J E C T I N D E X
B–C
Subject index

competitiveness· global market share 90· as indicator 88· and profitability 89–90· and R & D 90–92· and sustainability 88–90, 92
Connecticut 10
conservation· biodiversity 1–2, 6, 8, 16,
18–21· carbon dioxide 66–68· clubs 98, 100· human responsibility 10, 18,
105· soil 47–48, 52, 53–54· water 47–48, 52, 53–54
Constitution Act (1867) 106
contributions to national economy92
Councils of Environment, Parksand Wildlife Ministers 8
craft materials 83, 92
Crown Forest Sustainability Act(Ontario, 1994) 69, 113
Crown lands· Aboriginal rights 106–107· forest-dependent communities
111· harvest rates 83, 85· legislation 69–70, 73· regeneration efforts 38
crown transparency 34
cultural sites 107, 108
Ddecision making
· indicators 112, 113–114· public participation 112–113· and sustainability 112, 114
disease infestation· area and severity 27, 28f, 37· and carbon cycle 57, 64· exotic species 35· impact on watershed 47
· impact on wildlife 87
disease infestation see alsodisturbances, natural
disturbances· defined 25· human
- continual 26- examples 2- and forest communities 110- impact on biodiversity 10,
20- impact on soil 47- impact on watershed 47- impact on wildlife 16, 86- road density 8–10
· human see also pollution· natural
- continual 26- data required 2–3- and forest communities 110- impact on biodiversity 11- impact on carbon cycle 57, 61- impact on watershed 47, 51- impact on wildlife 86, 87
· natural see also diseaseinfestation; fire; insect attack
· recovery from 37–39· in soil 47–49, 50–51· and sustainability 26, 37
Eeconomy
· Aboriginal participation 107,108–109
animal uses 83, 84f, 85–86· Canadian competitiveness
88–92· forest communities 110–112· forest sector contributions
92–97· international forestry
expenditures 115–116· management and development
expenditures 87, 88f· non-timber 93–94, 98–100· plant uses 83· timber 82–83, 85, 92
ecosystem diversity· defined 1· forest types
- age class distribution 6, 7f, 10- by ecozone 3–5, 10- in protected areas 6, 8, 9, 10
· as indicator 2· and sustainability 2–3
ecosystems· aquatic see watershed· defined 2· disturbance and stress 25–37· extant biomass 39–41· fragmentation 8–10· maintenance and enhancement
25, 26· resilience 37–39
ecozones· age class distribution 7f· forest cover 3–4· forest types 5f· forest-dependent species
- at risk 13–14f- by age of stand 14–15f- range reductions 17f
· locations 3f· protected areas 9f
ecozones see also specific zones
education see public education
employment 92–95, 97, 111
endangered species 11, 13–14f
ENergy from the FORestProgram 73
energy use (forest sector) 66,67–68, 73
ENFOR Program see ENergyfrom the FORest Program
EnviroFor conference 115
Environment Canada· Canadian Conservation Areas
Database 8· Environmental Protection
Service 33
130
S U B J E C T I N D E X
C–E
Subject index

E–F
Subject index
Environmental Protection Service33
erosion see soil, disturbances
eutrophication 49, 51
exotic species 35
extant biomass see biomass
extinct species 11
FFERIC see Forest Engineering
Research Institute
fire· area and severity 28–30, 31f· boreal forests 6· and carbon cycle 57, 59, 61,
64, 73· causes 30, 31f· eastern forests 6· impact on watershed 47
fire see also disturbances, natural
firewood 83, 92, 95
Fisheries Act (Canada) 71
fishing 70, 96f, 97f, 109
flooding 48–49, 51, 83
flow rates 49, 51
food products 92, 95, 109
Forest Act (Quebec, 1996amendment) 69
Forest Act (Saskatchewan) 82
forest activities see forestindustry; forest management;harvesting
forest communities· defined 110· economic diversity 111· numbers nationally 110–111· stewardship responsibilities 111· and sustainability 110, 112
Forest Engineering ResearchInstitute (FERIC) 49, 91f
Forest Health Network, CFS 34
forest industry· Aboriginal participation 108· competitiveness 88–92· contribution to national economy
92–97· energy use 66, 67–68, 73· impact on aquatic fauna 47,
51–52· profits 89–90
Forest Insect and Disease Survey,CFS 25, 35
forest land conversion 48, 57,64–65
Forest Land Reserve Act (BritishColumbia, 1994) 82
forest management· Aboriginal communities
106–110· biodiversity 2–3, 10–11, 18· carbon budget 63–64· climate change 72–73· decision making 112–116· expenditures 87, 88f· forest communities 110–112· international 115–116· laws and regulations 69–71· partnerships 115· soil 48· tenures 70
Forest Plan (Manitoba) 113
Forest Practices Code Act (BritishColumbia, 1994) 69
forest products· annual removal 83–85· Canadian competitiveness
90, 91· carbon cycling 57–60, 61,
62, 66· contribution to economy 91· employment 93· R & D 90–91· recycling 62–63· types 83
Forest Renewal British ColumbiaProgram 115
Forest Resources Management Act(Saskatchewan, 1996) 69, 109
forest types· age class 2, 6, 7f· ecozone 4–5· extent 6, 7f· MAI 40–41· protected areas 6, 8, 53· resilience 38
forests· carbon pools 60, 61–62, 63–64· cultural sites 107· ecozone classifications 4· fragmentation 2· genetic conservation 19–21· global 25· global biological cycles 57–58· inventories 4, 71–72, 74· multiple benefits 81· non-market use 95–97· non-timber values 98–100· productive capacity 82–88· protected areas 2, 6, 8, 9f,
53, 83· spiritual sites 107
forests see also forest types
Forintek Canada Corp. 91f
Fort Liard, Alberta 96f
fossil fuels· consumption 47· emissions 47, 66, 67–68· used by forest industry 66,
67f, 68
fossil fuels see also non-fossil fuels
fragmentation 8–10
Framework Convention onClimate Change see UnitedNations FrameworkConvention on Climate Change
fuels see fossil fuels; non-fossilfuels
fuelwood 83, 95
furs see pelts
131
S U B J E C T I N D E X

Ggame 83, 85
GDP see Gross Domestic Product
genetic diversity· conserving 19–21· defined 1–2, 18· as indicator 18· and sustainability 18· tree species 19
global biological cycles seebiological cycles
governments· federal
- Aboriginal communities 106,109–110
- policy factors 69–74- role in R & D 114–115
· federal see also Canada· provincial
- Aboriginal communities 106–107, 108, 109–110
- policy factors 69–74, 82- role in R & D 114–115
· provincial see also specificprovince or territory
Great Lakes–St. Lawrence forestsee Boreal Shield; MixedwoodPlains
Green Area policy (Alberta, 1948)82
greenhouse gases 58, 60, 66,72–73
Gross Domestic Product (GDP)92–94, 96–97
guide outfitting see outfitting
Hharvesting
· annual allowable cuts 83, 85· and carbon cycle 57, 61· employment and wages 93–94· expenditures 87· forest communities 110–112
· impact on biodiversity 10, 12, 16
· impact on soil and water 48, 49, 50–52, 53
· impact on wildlife 86· landbase distribution and
changes 82–83· in protected areas 8, 10· R & D 91f· and regeneration 38· sustainability 87· tenures 8, 69, 70, 73
Heritage Conservation Act(British Columbia) 108
Hudson Plains· defined 3f· fire 30f· forest area 4f· forest inventories 71· fresh water 75f· MAI 40f, 41f
humans· impact on animal ranges 16· impact on biodiversity 2, 10· impact on climate 72· impact on forests 25· impact on water 51, 52
humans see also disturbances,human
hunting· subsistence 95, 96f, 109· tenures 70· use patterns 99f
hydro use of land 48, 51, 86
hydrological cycle· area of water in forests 75–76· defined 57· as indicator 74· and land-use conversion 64, 66· and sustainability 74–75
IIndian Lands Forestry Program,
CFS 108–109
Indian and Northern AffairsCanada 109
industrial activities 48, 51
insect attack· area and severity 26–27, 37· boreal forests 6· and carbon cycle 57, 61, 64· eastern forests 6· exotic species 35· impact on watershed 47
insect attack see alsodisturbances, natural
International DevelopmentResearch Council (IDRC) 116
International Model ForestProgram 116
inventories· age class data 6, 74· forest areas 71, 74· forest condition 71, 74· forest recreation 71, 74· timber volume 71, 74· tree species 4, 74· wildlife habitat 71, 74
IUCN see World ConservationUnion
JJapan 90, 92
Kkraft pulp 90
LLabrador
· ozone 33f· pollution 31f, 32f· species at risk 12
land use· agricultural 2, 8, 11, 16, 20,
48, 51–52, 65, 70, 83, 86· conversion 48, 57, 64–66
132
S U B J E C T I N D E X
G–L
Subject index
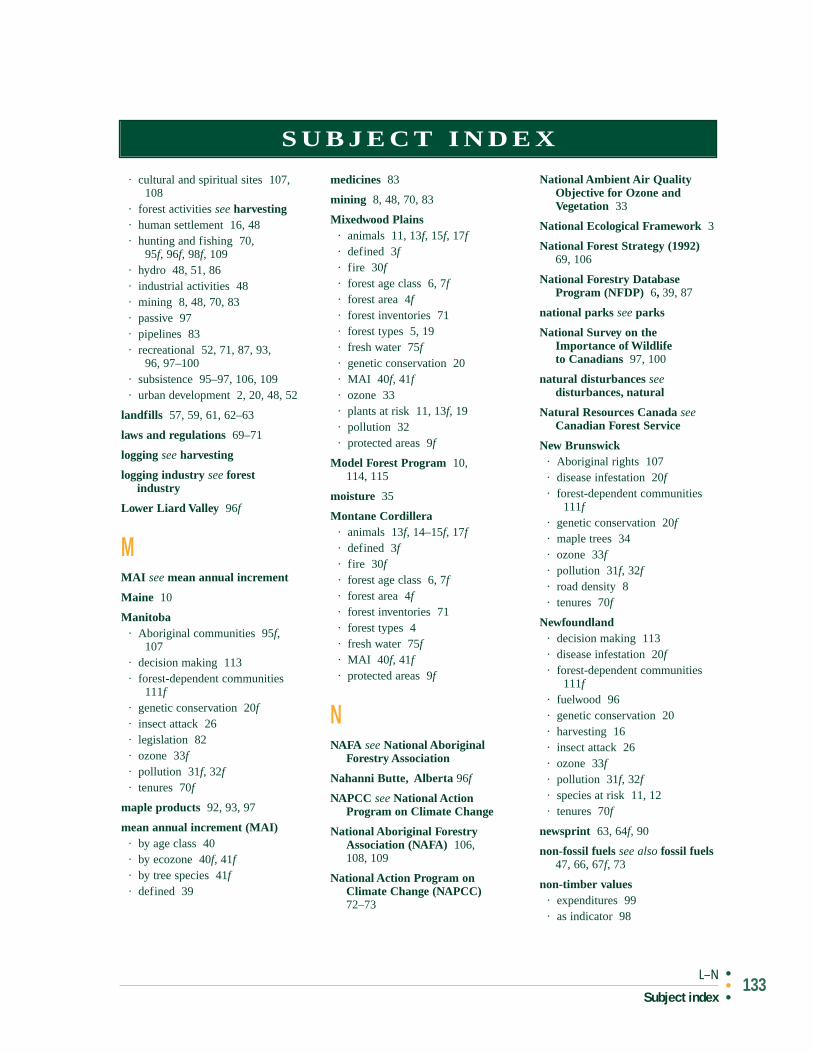
· cultural and spiritual sites 107,108
· forest activities see harvesting· human settlement 16, 48· hunting and fishing 70,
95f, 96f, 98f, 109· hydro 48, 51, 86· industrial activities 48· mining 8, 48, 70, 83· passive 97· pipelines 83· recreational 52, 71, 87, 93,
96, 97–100· subsistence 95–97, 106, 109· urban development 2, 20, 48, 52
landfills 57, 59, 61, 62–63
laws and regulations 69–71
logging see harvesting
logging industry see forestindustry
Lower Liard Valley 96f
MMAI see mean annual increment
Maine 10
Manitoba· Aboriginal communities 95f,
107· decision making 113· forest-dependent communities
111f· genetic conservation 20f· insect attack 26· legislation 82· ozone 33f· pollution 31f, 32f· tenures 70f
maple products 92, 93, 97
mean annual increment (MAI)· by age class 40· by ecozone 40f, 41f· by tree species 41f· defined 39
medicines 83
mining 8, 48, 70, 83
Mixedwood Plains· animals 11, 13f, 15f, 17f· defined 3f· fire 30f· forest age class 6, 7f· forest area 4f· forest inventories 71· forest types 5, 19· fresh water 75f· genetic conservation 20· MAI 40f, 41f· ozone 33· plants at risk 11, 13f, 19· pollution 32· protected areas 9f
Model Forest Program 10, 114, 115
moisture 35
Montane Cordillera· animals 13f, 14–15f, 17f· defined 3f· fire 30f· forest age class 6, 7f· forest area 4f· forest inventories 71· forest types 4· fresh water 75f· MAI 40f, 41f· protected areas 9f
NNAFA see National Aboriginal
Forestry Association
Nahanni Butte, Alberta 96f
NAPCC see National ActionProgram on Climate Change
National Aboriginal ForestryAssociation (NAFA) 106, 108, 109
National Action Program onClimate Change (NAPCC)72–73
National Ambient Air QualityObjective for Ozone andVegetation 33
National Ecological Framework 3
National Forest Strategy (1992)69, 106
National Forestry DatabaseProgram (NFDP) 6, 39, 87
national parks see parks
National Survey on theImportance of Wildlife to Canadians 97, 100
natural disturbances seedisturbances, natural
Natural Resources Canada seeCanadian Forest Service
New Brunswick· Aboriginal rights 107· disease infestation 20f· forest-dependent communities
111f· genetic conservation 20f· maple trees 34· ozone 33f· pollution 31f, 32f· road density 8· tenures 70f
Newfoundland· decision making 113· disease infestation 20f· forest-dependent communities
111f· fuelwood 96· genetic conservation 20· harvesting 16· insect attack 26· ozone 33f· pollution 31f, 32f· species at risk 11, 12· tenures 70f
newsprint 63, 64f, 90
non-fossil fuels see also fossil fuels47, 66, 67f, 73
non-timber values· expenditures 99· as indicator 98
133
S U B J E C T I N D E X
L–N
Subject index

· recreation clubs 99· recreation uses 99· and sustainability 98, 101
non-use values see passive-usevalues
North American Maple Project34
Northern Arctic· defined 3f· forest area 4f· forest inventories 71· fresh water 75f
Northwest Territories· Aboriginal communities 107,
108· forest-dependent communities
111f· genetic conservation 20f· insect attack 26
Nova Scotia· Aboriginal rights 107· decision making 113· disease infestation 20f· forest-dependent communities
111f· genetic conservation 20f· maple trees 34· ozone 33f· pollution 31f, 32f· tenures 70f
Nova Scotia Department ofNatural Resources 113
nutrient levels (watershed) 49, 50
OOntario
· Aboriginal communities 107,108
· animals 5, 11–12, 16, 85–86· decision making 113· disease infestation 28f· forest-dependent communities
111f· genetic conservation 20f· harvesting 16
· insect attack 26–27· legislation 69, 82· maple trees 34· ozone 33f· plants at risk 19· pollution 31f, 32· tenures 70f· watersheds 50
Ontario Ministry of NaturalResources 82, 85–86
outfitting 70, 92, 94f, 96
ozone concentrations 32–33, 37
PPacific Maritime
· animals 11, 13f, 14f, 17· defined 3f· fire 30f· forest age class 6, 7, 10· forest area 4f· forest inventories 71· forest types 4–5, 19· fresh water 75· MAI 40f, 41f· ozone 33· plants at risk 11, 13f· protected areas 8, 9f
paper· exports 90· R & D 91f· recycling 62, 63f, 64, 73
paper and allied industries,employment and wages 94f, 95f, 96
PAPRICAN 91f
parks 83, 87, 98, 99
partnerships 115
passive-use values 97
pelts 83, 84f, 85
pipelines 83
plants· dangers of ozone 32–33· diversity 18–21
· extinct or at risk 11–12, 13–14f· as food 83
policy· climate change 63, 64, 66,
72–74· forest stewardship 58, 69–72· role of recreation and
conservation groups 98· soil and water protection 49,
52–54
pollution· area and severity 31–32, 37· atmospheric 47· legislation 69, 71· water 47, 51
pollution see also disturbances,human
Prairies· defined 3f· fire 30f· forest area 4f· forest inventories 71· forest-dependent communities
111f· fresh water 75f· MAI 40f, 41f
precipitation 32, 47, 51
Prince Edward Island· forest-dependent communities
111f· fuelwood 95· genetic conservation 20f· ozone 33f· pollution 31f, 32f· R & D 114
productive capacity 82, 87–88
profits (forest industry) 89–90
protected areas· expenditures 87· recreational use 97
protection· forests 87, 88f· soil and water 49, 52–54· species 16
public education 73, 87, 115
134
S U B J E C T I N D E X
N–P
Subject index

Public Lands Act (Ontario) 82
pulp 62, 90
pulp and paper industry· Canadian market share 90· employment 94· energy use 66, 73· R & D 90
QQuebec
· Aboriginal communities 107,108
· decision making 113· disease infestation 20f· forest-dependent communities
111f· genetic conservation 20f· legislation 69· maple trees 34· ozone 33f· pollution 31f, 32f· R & D 114· soil disturbances 49· species at risk 11–12· tenures 70f
Rrecreational use of land 52, 71,
87, 93, 96, 98–100· availability 98–99· clubs 99· expenditures 99· trends 98–99
recycling 57–59, 62–64, 73, 90
reforestation see regeneration
REGEN project 39
regeneration 38–39, 47, 49, 73
research and development (R & D)
· climate change 72–73, 74· energy sources 73, 74· expenditures 87· forest biomass 58, 74
· forest products 90–91· sustainable development
114–115· technology 90–91, 115f
reserves· Aboriginal 109· protected areas 83
resilience· age classes 38· defined 37· forest types 38· measuring 37· natural and artificial
regeneration 38–39· and sustainability 37–38
resource access 87, 88f
right-of-ways see hydro
riparian zones 51–52, 53
roads· access development 87, 88f· density 8–10· impact on soil 48, 52· impact on water 50, 51, 52· policies 53
Royal Proclamation (1763) 106
SSaskatchewan
· Aboriginal rights 107, 109· decision making 113· forest-dependent communities
111f· genetic conservation 20f· legislation 69, 82· mutual learning mechanisms
115· species at risk 11· tenures 70f
sediment levels 50, 51–52
settlement 16, 48
silviculture 38, 87, 88f
societal responsibility· Aboriginal participation
107–110
· Aboriginal and treaty rights106–107
· decision making 112–116· forest communities 110–112· overview 105, 116
soil· as carbon pool 60· conservation 47–48, 52, 53–54· disturbances 47–49, 50–51· interrelationships with water 47,
50–51· sustainable management 47
Southern Arctic· defined 3f· fire 30f· forest area 4f· forest inventories 71· fresh water 75f· MAI 40f
species diversity· defined 1, 10· forest-dependent species
- by age of stand 14–15f- extinct or at risk 11–12,
13–14f, 16- population changes over time
12, 16- range reductions 16, 17f
· as indicator 10· protecting 16· and sustainability 10–11, 21
species diversity see also animals
spiritual sites 107, 108
Statistics Canada· animal pelts 85· non-market use of land 95· Standard Industrial
Classification Codes 108· timber-related data 72
stream crossing guidelines 53
stream flow 49, 51
stress see disturbances
subsistence land use 95–97, 106,109
135
S U B J E C T I N D E X
P–S
Subject index

sustainable development· Aboriginal rights and
participation 106–110· animals 87–88· biodiversity 10–11, 18, 21· biomass 39· carbon budget 58, 59· changing definition 116· competitiveness 88–90, 91· contributions to national
economy 92· decision making 112–116· disturbances 26, 37, 48· ecosystem diversity 2–3· forest communities 110–112· forest land conversion 64–65· harvesting 87–88· hydrological cycle 74–75· non-timber values 98, 100· policy factors 69· productive capacity 82, 87–88· resilience 37–38· societal responsibility 105, 116· soil 47· water 47, 49
Sustainable ForestManagement–Network ofCentres of Excellence Program114, 115
Sweden 92
TTaiga Cordillera
· defined 3f· fire 30f· forest area 4f· forest inventories 71· forest types 19· fresh water 75f· MAI 40f, 41f
Taiga Plains· defined 3f· fire 30f· forest age class 6, 7f· forest area 4f· forest inventories 71· forest types 5, 10, 19
· fresh water 75f· MAI 40f, 41f· protected areas 9f· road density 9
Taiga Shield· defined 3f· fire 30f· forest area 4f· forest inventories 71· forest types 19· fresh water 75–76· MAI 40f, 41f
taxes 73, 88, 92
technology· and Canadian market share 90· and employment 94· energy use 73· R & D 90–91, 115f
temperature· climate change 35, 36f· water quality 47, 51–52
tenures 8, 69, 70, 73
threatened species 11, 13–14f
timber harvesting see harvesting
tourism 92
traditional land use 95–97, 106,109
trapping 70, 109
tree species· conserving 18, 19–21· crown transparency 34· harvesting preferences 12, 16· MAI 41f· national inventory 4, 71· number in Canada 1
UUnited Kingdom 10
United Nations Conference on theEnvironment and Development106
United Nations FrameworkConvention on Climate Change66, 72
United Nations IntergovernmentalPanel on Climate Change 72
United States (USA)· exotic species 35· newsprint imports 90· ozone 33· pollution 32· pulp and paper recycling 62· watersheds 50
University of Alberta 96f
urban development 2, 20, 48, 52
Vvariable-retention silvicultural
systems 48
Voluntary Challenge and RegistryProgram 72–73
vulnerable species 11, 13–14f
Wwages 95
water· conservation 47–48, 52, 53–54· hydrological cycles 57, 64, 66,
74–76· interrelationships with soil 47,
50–51· pollution 69, 71· quality 47, 48, 50–52· quantity 48· and sustainability 47, 49· use legislation 70
water see also hydrological cycle
watershed· flow rates 49, 51· impact of natural disturbances
47· as indicator 48, 53–54· management 53· nutrient levels 49, 50· sediment levels 50
wilderness areas 83
136
S U B J E C T I N D E X
S–W
Subject index

WildFor conference 115
wildlife see animals; speciesdiversity
wood products· employment and wages 94f, 95f· energy use 66· exports 89–90· R & D 90f· recycling 62–63, 64, 73
wooden pallets 63
World Conservation Union(IUCN) 8
YYukon Territory
· Aboriginal communities 107,108
· forest-dependent communities111f
· genetic conservation 20f· R & D 114
137
S U B J E C T I N D E X
W–Y
Subject index

PacificOcean
ArcticOcean
AtlanticOcean
HudsonBay
NewBrunswick
NovaScotia
PrinceEdwardIsland
Labradorand
Newfoundland
Northwest Territories
YukonTerritory
BritishColumbia
Alberta
SaskatchewanManitoba
Ontario Quebec
Arctic CordilleraNorthern ArcticSouthern ArcticTaiga CordilleraTaiga PlainsTaiga Shield
Boreal CordilleraBoreal PlainsBoreal ShieldPacific MaritimeMontane Cordillera
PrairiesHudson PlainsMixedwood PlainsAtlantic Maritime
Terrestrial Ecozones of CanadaNatural ResourcesCanadaCanadian ForestService
Ressources naturellesCanadaService canadiendes forêts
Source: Ecological Stratification Working Group, 19950 255 510

New BrunswickMr. Robert Watson (Co-chair)Executive Director,
Policy and PlanningDepartment of Natural
Resources and EnergyP.O. Box 6000Fredericton NB E3B 5H1
QuebecMr. Jacques RobitailleAssociate Deputy Minister,
DevelopmentMinistère des Ressources naturelles10e étage880, chemin Sainte-FoyQuebec QC G1S 4X4
OntarioMs. Celia GrahamPolicy Advisor, Terrestrial
Ecosystems BranchPolicy Interpretation and
Coordination SectionMinistry of Natural Resources400–70 Foster DriveSault Ste. Marie ON P6A 6V5
British ColumbiaMr. Hartley LewisExecutive DirectorPolicy and Economic DivisionMinistry of Forests4th floor, 595 Pandora AvenueVictoria BC V8V 3E7
Northwest TerritoriesMr. Robert LarsonManager, Forest
Development ServicesDepartment of Resources,
Wildlife and Economic Development
P.O. Box 4354Hay River NT X0E 1G3
Yukon TerritoryMr. Jim ConnellDirector, Policy and PlanningDepartment of Renewable
ResourcesP.O. Box 2703Whitehorse YK Y1A 2C6
Criteria and Indicators Task Force
Newfoundland and LabradorDr. Muhammad NazirAssistant Deputy Minister,
Forestry and WildlifeDepartment of Forest
Resources and AgrifoodsP.O. Box 8700St. John’s NF A1B 4J6
Prince Edward IslandMr. Jerry GavinDirector, Forest ResourcesDepartment of Agriculture
and ForestryP.O. Box 2000Charlottetown PE C1A 7N8
Nova ScotiaMr. John D. SmithExecutive Director,
Renewable ResourcesDepartment of
Natural ResourcesP.O. Box 698Halifax NS B3J 2T9
ManitobaMr. Grant BakerDirector, Policy CoordinationDepartment of Natural Resources200 Saulteaux CrescentP.O. Box 38Winnipeg MB R3J 3W3
SaskatchewanMs. Lynda LangfordSenior Manager, Ecosystem
Management ProjectsSaskatchewan Environment
and Resource Management3211 Albert StreetRegina SK S4S 5W6
AlbertaMs. Evelynne WranglerManager of Resource Stewardship
Monitoring CenterEnvironmental Protection, Land
and Forest Service9th floor, Bramalea Building9920–108 StreetEdmonton AB T5K 2M4
CanadaMr. Jacques Carette (Co-chair)Director General, Policy, Planning
and International AffairsNatural Resources Canada–
Canadian Forest Service8th floor, 580 Booth StreetOttawa ON K1A 0E4