
The stratigraphy and fire history of the Kutai Peatlands, Kalimantan, Indonesia
Upload
khangminh22Category
view
1download
0
Page 1 of 125
Peatlands and forestry
Douglas Campbell & Peter Robson1
January 2019
This review was commissioned by the IUCN UK Peatland Programme’s Commission of Inquiry on
Peatlands. The IUCN UK Peatland Programme is not responsible for the content of this review and
does not necessarily endorse the views contained within.
1 With thanks to co-authors Roxane Andersen, Russell Anderson, Steve Chapman, Neil Cowie, Ruth
Gregg, Renée Hermans, Richard Payne, Mike Perks, Vicky West.

Page 2 of 125
1. Acknowledgements 4
2. Definitions 5
3. Summary 6
3.1. ‘Forest to Bog’ Restoration 6
3.2. Climatic implications 6
4. Introduction 8
5. Effects of Afforestation on Blanket Bog Habitat 11
5.1. Drainage and resulting micro-topography 11
5.2. Felling methods and residues 12
5.3. Tree species, age and size 14
5.4. Conifer regeneration 15
5.5. Site geography, altitude and topography 17
5.6. Hydrology and water chemistry 17
5.7. Effects on fauna 18
6. Projects reviewed 20
7. Forest to Bog Restoration methods 22
7.1. Habitat succession post-felling without intervention 22
7.2. Early trials 23
7.3. Surface smoothing methods 24
7.4. Furrow and drain blocking / disruption 27
7.5. Summary of methods 28
8. Implications for carbon and climate 32
8.1. Conceptual outline 32
8.2. Functioning Peatland Dynamics 33
8.3. Changes with afforestation 34
8.4. Role of harvested wood products and residual tree root systems 37
8.5. Changes with restoration 39
8.6. Modelling of Peat Soils and Forestry Function 40
8.7. Implications for the Peatland Code 41
8.8. Learning from the Woodland Carbon Code 42
9. Evidence gaps and further research 43
9.1. Forest to bog restoration 43
9.2. Carbon cycling 44
10. References 46

Page 3 of 125
Appendix A Afforested bog condition: a quantitative comparison 55
Appendix B Black Law Windfarm Habitat Succession Post-Felling 2004 – 2012 58
Appendix C Forsinard felling to waste and habitat succession post-felling (Talaheel) 66
Appendix D Trial of Multiple Surface Smoothing Methods at Whitelee windfarm, 2010 – 2012 72
Appendix E Large-scale ground smoothing (Whitelee windfarm, 2013 - 2016) 76
Appendix F Ground smoothing and cross-tracking at Black Law windfarm, 2014-2017 90
Appendix G RSPB Forsinard Flows Restoration Methods 105
Appendix H Forest Research Damming Trials 113
Appendix I Landscape Scale Forestry to Bog Restoration Planning: A Case Study of Whitelee
Windfarm 117

Page 4 of 125
1. Acknowledgements
Elements of the carbon synthesis section of the report were financially supported by the Valuing
Nature Programme of the Natural Environment Research Council (NE/C05173). Roxane Andersen and
Russell Anderson are supported by the Leverhulme Trust (RPG2015-162).
The authors are also grateful for review and comments made by Chris Evans and Mark Reed.

Page 5 of 125
2. Definitions
Bog specialist plant species: For the purposes of monitoring early restoration responses these
include species which only thrive when a bog has relatively unmodified hydrology e.g. Sphagnum
medium, Sphagnum papillosum, Vaccinium oxycoccos, Drosera sp., Narthecium ossifragum. The list
is not exhaustive and only includes specialist plant species that are relatively common and therefore
helpful to use as indicators of blanket bog conditions.
Cross tracking: Using the tracks of an excavator to pass over the bog surface and use the weight of
the machine to compress the surface.
Ditch (Drain) blocking: Construction of dams (peat or plywood/sheet plastic) within main forestry
collector drains.
Furrow blocking: Construction of dams (peat or plywood/sheet plastic) within plough furrows.
Ground smoothing: A technique which combines stump-flipping, drain in-filling and cross-tracking to
produce a flat, homogenous surface.
Organo-mineral soil: a soil with an upper organic (peaty) layer but where the peat is <50 cm deep
(Scotland) or <40 cm deep (England & Wales). In forestry literature these are often referred to as
shallow peats.
Peat soil: a soil with an upper organic (peaty) layer where the peat is >50 cm deep (Scotland) or >40
cm deep (England & Wales). In forestry literature these are often referred to as deep peats.
Re-profiling: The process of sliding ridge material into furrows, ensuring any vegetation remains on
top.
Stump-flipping: The process of carefully prying the rootplate of a stump off the bog surface and
turning it upside down in the adjacent furrow using a toothed excavator bucket.
Surface smoothing: Refers to a group of restoration methods which disrupt the ridge-furrow surface
pattern created by cultivation using mould-board ploughs for afforestation.
True grasses: includes all grasses, that is, members of the plant family, Poaceae. Excludes sedges
(Cyperaceae) and rushes (Juncaceae). Note that some sedges are commonly referred to as grasses,
e.g. cotton grasses (Eriophorum): these are not true grasses. . True grasses are typically rare on an
unmodified bog, high abundance of species like Molinia caerulea and Deschampsia flexuosa can
occur post-felling and indicates drier surface conditions and nutrient enrichment.

Page 6 of 125
3. Summary
3.1. ‘Forest to Bog’ Restoration
i. The challenge of restoring blanket bog from forestry requires different approaches to those
generally used for open peatland restoration.
ii. Restoration projects must reverse the impact of the ridge-furrow cultivation process which
continues to persist post-felling, as well as raising the bog water table within the underlying
peat mass which have been damaged by the afforestation process.
iii. Methods comprising various surface smoothing techniques, and furrow/drain blocking or a
combination of both have shown good potential in restoring active blanket bog habitat.
Mitigation measures to manage surface runoff (particularly water quality) from restored
sites may be required, in the short-term, depending on the method used, site conditions and
sensitivity of receptors.
iv. The timescale for specialist bog plants to fully recolonise following treatment - and for bare
peat to be re-colonised - is likely to be 3-10 years.
v. Conifer regeneration can be dealt with by surface smoothing methods, but otherwise must
be removed by additional treatment depending on size and density.
vi. Treatment costs for surface smoothing, once sites have been felled, can be as low as
£800/ha depending on the machine specification employed and ground conditions. Costs
for other restoration methods are in the order of £800 – £1500/ha.
3.2. Climatic implications
i. The afforestation of peatland, and the subsequent options for either continued forestry or
removal of forestry plantations and restoration of peatland vegetation, have significant
implications for carbon cycling and hence for addressing climate change.
ii. The main principles and processes involved have been studied in forestry and peatland
ecology research. However, while there is agreement over the main processes operating,
differences of opinion remain over the way these processes operate in afforested peatlands.
More empirical evidence from UK forestry on peatlands is needed to understand how the
carbon cycling of these systems responds to different types of restoration in different
contexts.
iii. One of the reasons for the paucity of empirical data is that land use change from open
peatland to forest and then back to open peatland is almost unique to the UK and Ireland. It
is difficult to apply findings from other European countries, in particular those of Scandinavia,
since the climate is different, peatlands are often naturally forested, land preparation and
drainage are less severe, and nutrient status is often higher.
iv. The evidence available indicates that following afforestation of peat soils, there is a loss of
peat carbon and a gain in tree carbon. Recent studies have suggested that for organo-mineral
soils (less than 50 cm of peat) this balance may be positive – the gain in the trees outweighs
any peat losses, even into a second rotation. The situation for a peat soil (more than 50 cm
peat) is unclear and opinion is divided as whether forest growth is likely to compensate for
losses of carbon from peat, and if so at what point tree carbon is likely to exceed peat carbon
losses.

Page 7 of 125
v. Part of the confusion stems from the role that methane emissions play in the carbon budget
of forested versus restored sites. Methane is a potent GHG (with a Global Warming Potential
24.5 times greater than carbon dioxide) and typically increases as water tables are raised post-
restoration. However, emissions are greater in the years after restoration, with emissions
from this source typically less important when considered over timescales greater than a
hundred years. While emissions may be halted or reversed after afforestation over the ground
surface, new emissions can occur from drainage ditches. These are included in the IPCC
reporting methodology and may be significant (in one Canadian study methane emissions
from drainage ditches exceeded methane emissions from the natural undrained system).
Recent evidence has demonstrated that for deep peat, forest-to-bog restoration can re-
instate a net GHG sink function after the first 15 years, in the case of the simplest felling to
waste, but further evidence is lacking for all other techniques.
vi. Another key consideration in determining the impact of forest to bog restoration on carbon
cycling is the fate of carbon in harvested wood, depending on its use in short (e.g. biofuel) or
long-lived products (e.g. building timber). Other aspects of the wider impact of forestry
practices – tracks, fences, fertilisation, harvesting and transport, also need to be considered
as part of a wider Life Cycle Analysis to determine the climatic implications of replanting versus
restoring from forest to bog.
vii. Given this uncertainty, it can be difficult to decide whether forest-to-bog restoration can bring
similar climate benefits (through avoided emissions) to other types of peatland restoration.
However, over longer time-horizons, afforestation and reforestation translocates carbon from
a reservoir that is secure over millennia under natural conditions (peat) to a more reactive
store (wood), which is more likely to be mineralised to carbon dioxide within years to decades.
Moreover, when other drivers for restoration (e.g. biodiversity, water quality) are also
considered, it is possible to build a case for restoring such sites.
viii. Modelling of forest to bog restoration processes is still at an early stage, with forest growth
and soil carbon turnover models presenting partial and often contradictory findings. However,
models are now being developed that will bring together an understanding of both forest
growth and soil carbon turnover. If successful it may be possible to use such models to target
locations where forest to bog restoration is most likely to lead to a net carbon benefit.
ix. The implications for the Peatland Code are that there is currently insufficient underlying data
to support a forest-to-bog category.

Page 8 of 125
4. Introduction
Around the world many areas of peatland are naturally forested. Across the boreal and sub-Arctic
zones large areas of peatland in North America and Eurasia are covered with taiga forest. In the
tropical peatland zone many peatlands are covered with broad-leaved trees and the true extent of
peat is only beginning to become evident (Dargie et al., 2017). This is not the case in the UK where
the majority of peatland is naturally treeless and trees on peatland largely exist where peatlands
have been converted to commercial plantations, mainly using non-native conifers.
As they cover an extensive land area in northern and western Britain, peatlands had long been
considered a potential location for forestry and attempts to plant trees on UK peatlands go back to
at least the 18th century (Sloan et al., 2018). In the second half of the twentieth century, technical
innovations such as more effective ploughs made large-scale afforestation a realistic prospect
(Stroud et al., 2015; Sloan et al., 2018). The desire for secure domestic timber supplies and the need
to promote economic activity and employment in remote regions of Britain made forestry expansion
for some a political imperative. Research by the Forestry Commission explored how timber crops
could be produced on peat soils, testing a range of species and ultimately settling on conifer species
from western North America (Lindsay et al., 2014a). Afforestation was further accelerated by a
favourable tax regime which made afforestation financially attractive for many investors, even in the
face of high uncertainty over ultimate forestry yield or wind throw risk. Between the late 1940s and
early 1990s (but particularly in the 1970s and 1980s) large areas of UK peatland were ploughed and
planted with conifers (Sloan et al., 2018). Into the 1980s there began to be increasing public concern
about peatland afforestation, particularly in the UK’s largest peatland area: the Flow Country
(Warren, 2000). Campaigns by conservation organisations highlighted the impact of forestry,
particularly on breeding birds, and the largely natural peatland vegetation communities and
landforms (Lindsay et al 1988). The Nature Conservancy Council became a strong advocate for
peatland conservation publishing two highly-influential reports (Stroud et al., 1988) and the debate
became increasingly heated (Warren, 2000; Stroud et al., 2015). In 1988 the tax incentives which
promoted afforestation were abolished by the government which led to new plantations slowing to
a trickle. New afforestation of peatland was then essentially halted with Forestry Commission
guidance advising against new plantations on deep peat (Patterson & Anderson, 2000). In essence
therefore, governments recognised in the early 1990s that the overall interests of society were best
served by preventing afforestation of deep peat soils of high nature conservation value. This
recognition took place before the climate impacts of such land use choices were widely discussed. By
the late 1990s, government agencies and NGOs were beginning the first trials of forestry removal on
deep peat (see below).
There is no universally-recognised figure for the proportion of UK peatland which is currently
planted with conifers as data sources are fragmented and obfuscated by definitional issues around
woodland, peat and peatland. In England the figure for afforested peatland appears to be around 9%
of blanket bogs, 92% of raised bogs and 32% of fens (Anderson et al., 2014). The JNCC quantify
peatland cover in England as 4.9% ‘afforested’, 2.9% ‘wooded’ and 0.7% ‘scrub’ (Joint Nature
Conservation Committee, 2011). In Wales, Vanguelova et al. (2012) suggested an overall figure of
around 15%, while Evans et al. (2014) suggested a lower figure of 10% based on a more detailed
base map. Habitat Survey of Wales data shows considerable conifer cover on peat and organo-
mineral soils, particularly in the uplands of mid- and South Wales (Joint Nature Conservation

Page 9 of 125
Committee, 2011). In Northern Ireland, data from the Northern Ireland Peatland Survey and
Landcover Map 2000 show scattered conifer plantations occurring widely on peat (Joint Nature
Conservation Committee, 2011). Scotland is the most extensively peat-covered nation of the UK and
also has the most widely afforested peat; it is estimated that 17% of peatlands >0.5m depth in
Scotland are afforested, and that 87% of these areas were blanket bog (Vanguelova et al., 2018). In a
JNCC analysis of ground cover and soil organic carbon data from the GB-wide Countryside Survey
dataset roughly 15% of highly organic soils (Soil Organic Matter >65% in top 15cm) have tree cover
(Joint Nature Conservation Committee, 2011). Tallis (1998) gives an approximate figure of 3500 km2
of afforested blanket bog (only) relative to a total cover of 22,500 km2 (16%), although the origin of
these figures is unclear. The IUCN peatland programme suggest that 10.7% of UK peatlands have
conifer cover and a further 1.6% have broadleaf cover (total 12.3%) but the source of these figures is
not clear (IUCN UK PP, 2018). Complex definitional issues around both ‘peatland’ and ‘forest’ mean
that a precise figure for the proportion of UK peatlands which are afforested may never be known
but a reasonable current estimate seems to be that around 15% of UK peatlands are currently tree-
covered, due either to direct planting or tree invasion of degraded peatland. Afforested peatland is
found in all UK peatland areas but is particularly abundant in the Flow Country, Dumfries and
Galloway, and Wales. By area, the most afforested peatland was upland blanket bog but as a
proportion of total area lowland raised bogs may be most affected.
With concern about the impacts of afforestation on peatland biodiversity and carbon stock,
attempts to restore afforested areas of peatland to open peatland habitat (‘forest-to-bog’
restoration) have been ongoing since the late 1990s. Restoration work on previously afforested
peatlands in the UK has so far2 been undertaken on ~ 5,000 hectares. Since 2000, forest-to-bog
restoration has been conducted at an average rate of 500 ha per year (Anderson et al., 2016).
Restoring afforested peatlands presents a different range of technical challenges compared to open
peatland sites, in part because the impacts on the peatlands tend to be more severe. In addition,
the restoration techniques employed are at present more experimental and hence are less well
understood than previously used techniques such as felling-to-waste, for which peer-reviewed
studies have now been published (e.g. Hancock et al., 2018, Gaffney et al., 2018). Only a few projects
employing these new techniques have been studied in enough depth or with proper experimental
designs to enable outcomes to be quantified and compared by monitoring, much less for robust
technical guidance to be produced. There are even fewer published rigorous experimental
comparisons of different treatments, Anderson & Peace 2017 being one of the very few, though
some such trials are in progress but not at a stage of being able to measure vegetation recovery yet
(e.g. at RSPB Forsinard). Since the evolution of techniques is occurring in response to monitoring
data, it is likely that further evidence will be available in future years to supplement what is covered
in this report.
The purpose of this report is to review the available evidence from several large forest-to-bog
restoration projects, some of which have been rigorously monitored over long time periods, in order
to evaluate the various methods which have been used and determine the extent to which each has
been successful. Since blanket bog is fundamentally different to raised and other types of lowland
2 Anderson (2010) estimated that ~ 3,000ha of restoration had been attempted between 1986 and 2005, at the time of his
report, but since then additional large projects have also been started.

Page 10 of 125
bog, and the majority of forestry-to-bog projects have been on blanket bog, only projects relating to
blanket bog are presented.

Page 11 of 125
5. Effects of Afforestation on Blanket Bog Habitat
The impacts of afforestation on blanket bog hydrology and ecology can be severe in comparison with
the nature of impacts which tend to arise on open peatlands after drainage. Therefore, a description
of the plantation forestry environment before restoration is useful to include at the outset to
emphasise how challenging forest-to-bog restoration projects can be.
5.1. Drainage and resulting micro-topography
At the time of afforestation, which occurred mainly in the 1970’s and 1980’s, blanket bog was first
prepared for planting. Traditionally this was done using tractors and towed ploughs. A furrow was
dug and the resulting ridge (Photo 1) was then used as the location on which to plant trees. The
ridge provided an elevated position, above the bog water table, which in most circumstances3
allowed an aerated rooting zone to develop over time within the drier ridge. There was significant
variation in the type of ploughs used in ground preparation, and the depth of deployment, with very
deep ploughing (up to 1m) undertaken on the wettest sites but with 0.5m deep furrows often
created on shallower or drier peatlands.
Photo 1: Forestry ploughing on peatland (courtesy of http://www.forestry-memories.org.uk/). This
image shows a double mould-board plough which throws a turf ridge up on either side of the furrow.
Other ploughs (single mould-board) throw only one turf ridge up per furrow.
Larger collecting drains were also dug at the afforestation stage to intercept runoff from the furrows
- actually acting as drains themselves in most cases - which would then typically link into existing
watercourses. The initial effect of this method of ground preparation was to rapidly remove runoff
from the site; over the longer-term, as the tree canopy developed and the drains continued to
operate, the bog water table level within the underlying peat mass lowered (Appendix A) causing the
3 Occasionally these afforestation schemes, or parts of them, failed due to the trees going into growth check. This arose for
a number of reasons, including lack of adequate fertilisation, but it was also sometimes because the attempts at land drainage failed.

Page 12 of 125
peat mass to dry and shrink (Anderson et al. 2000). A longer-term impact was that only a small
portion of the afforested site remained at all wet (generally the base of the plough furrow) along
with the unplanted rides.
Alongside drainage, forestry preparation works also had other impacts on the peatland. In most
cases tree planting was accompanied by fertilisation, typically with P but sometimes with N and K,
reducing nutritional constraints on peat decomposition. Drainage and shading by the tree canopy
and the accumulation of needle litter led to fundamental changes in the vegetation with the loss of
typical bog species: Sphagnum often became restricted to wetter furrows and drains, if present at
all.
Photo 2 shows a typical view of a harvested site with the ridge/furrow micro-topography of the
surface arising from ploughing still clearly visible. The effect of cultivation and subsequent forest
canopy development is to raise much of the actual surface of the forest, where plants grow, above
the level of the original bog water table.
Photo 2: Harvested trees on peatland, with a person standing in a furrow and ridges to either side.
5.2. Felling methods and residues
Depending on the commercial viability of the timber standing crop, including ease of extraction and
distance to markets, commercial forest is either harvested or felled to waste for forest-to-bog
restoration projects.
Conventional harvesting involves felling the trees mechanically, removing the timber in sections to
roadside for sale and using the non-merchantable branches (“lop and top”) to form brash mats used
by the harvesting and forwarding machinery for site access and egress4. The brash mats are typically
4 Ground conditions can often be very wet, and the ‘lop and top’ has to be used, sometimes along with actual tree stems, to
create a raft to float the machinery otherwise sites would be inaccessible.

Page 13 of 125
left in-situ and in some cases can be significant in width (Photo 3,) albeit they are sometimes
mulched to improve their visual appearance or improve prospects for restoration. On wetter
peatland sites it is common practice to use a proportion of the harvestable smaller tree stems within
the brash mats to give extra support to machines.
Photo 3: Brash mat at Black Law Windfarm 7 years after felling.
A variation of harvesting known as “Whole Tree Harvesting” is sometimes used on sites with difficult
access or which are too wet to use normal harvesting machinery. Typically, trees are felled by hand
at their base then dragged via a suspended cableway to a roadside location where they are stripped
of branches and sectioned into lengths. In this scenario only the stumps are left in the ground, with
very minimal branch material left on site. Whole tree harvesting is also achievable through
specialised tracked harvesters reducing the need for as many brash mats and leaving a much cleaner
surface.
For trees which are not commercially viable to harvest, but are more easily accessible, they are
typically cut into sections and left on the ground or mulched in-situ. The different types of mulching
machinery produce different results in terms of the size of material produced, but the principle is the
same: the entire tree is mulched into wood fragments which are left on the surface. The greater the
size of the tree in terms of volume, the greater the average depth of material5 which is deposited on
the surface (Photo 4).
5 Due to the way this machinery ‘sprays’ the chips the chipped material firstly fills up the plough furrows. Therefore, the
mulch tends to be deep in the furrows and shallow or absent on the plough ridges on most sites.

Page 14 of 125
Photo 4: Mulched trees, situated on peat >2m depth, 3 years after felling.
In addition to the varying depth of brash/mulch resulting from tree clearance, the surface following
felling also comprises stumps plus a thick layer of tree roots and the root plate along with needle
litter lying on top of the original peat mass. The stump/root/litter layer comprises a mat of material
that is all alien to a functioning blanket bog habitat. Dealing with this layer of material, either at
time of felling or later in the planned operation, requires careful consideration if restoration is
ultimately to be successful.
Another important consideration when planning forest-to-bog restoration projects is that the felling
method proposed by the contractor is often indicative of the underlying ground conditions present
before and during the afforestation phase. Conifer crops tend to grow better on somewhat drier
land and are thus harvested because of the larger diameter of timber produced; trees growing in
wetter conditions tend to grow poorly and are thus often felled/mulched to waste as they have little
or no commercial value. Therefore, the response of the site after restoration work is complete is
controlled by an interplay between the original ground conditions, the specification of the original
ground preparation carried out, the way the peatland has responded to the trees being present and
the way they are cleared from it.
5.3. Tree species, age and size
Modern forestry practices provide for greater diversity in age structure and species, but the
peatland restoration sites which have been the focus of restoration projects involve older
plantations with large tracts of even-aged crop comprising Sitka spruce (Picea sitchensis) and/or
lodgepole pine (Pinus contorta) in wetter areas.
The presence and proportions of each species can provide some clues as to the likely response to
restoration efforts. Lodgepole pine is well known to tolerate wetter conditions, and as such was
typically planted on wetter sites either alone or as a ‘nurse crop’ in combination with Sitka spruce to
try and deliberately dry it out to help the second rotation of the crop. In comparison with Sitka
spruce sites, Lodgepole pine sites can be harder to tackle as the trees have thicker side branches, the

Page 15 of 125
needle litter can be deeper and the underlying peat mass can have experienced stronger drying
impacts. Also, wind -throw can be very common on these sites and complicates clearance
operations.
The time since a site was first planted is also relevant when considering the potential effects of
afforestation on a peatland. As the crop grows, the moisture regime within the upper levels of the
peat changes at the same time as the bog water table within the peat mass lowers. These changes
occur partly as a result of the trees taking up water, but also arise due to the direct effects of the
land drainage installed. At its most extreme, drainage and tree growth acting in tandem can result in
peat cracking (Anderson, 2010) although how widely this occurs seems to vary between sites.
Similarly, the degree to which the tree canopy closes influences the residual surface vegetation. As
the trees grow they develop side branches each year. The trees eventually close canopy and shade
out the original bog vegetation as time goes on, meaning that many species will decline or disappear
over a typical crop rotation of 30-40 years. However if the crop is felled early, or otherwise is in
growth-check, remnant bog vegetation, or other plant species that have colonised as a result of the
ploughing and drainage, can be left in between the trees, although the remnant bog vegetation is
often found to survive best in the furrows. Original bog vegetation can also survive surprisingly well
in forest rides.
As the diameter of the tree crop increases, the potential weight bearing on the peat mass also
increases. The effect of the compressive force on the peat will vary according to how wet the site is,
with highly effective land drainage creating a negative interaction whereby the de-watered peat is
forced to carry progressively more of the weight of the larger and larger trees present; on wet sites
the trees do not grow so large but also the peat, commonly comprising 85-95% water if unaffected
by drainage, supports much more of their weight.
5.4. Conifer regeneration
The phenomenon of conifer trees regenerating from dormant seed on the deforested surface can be
a significant problem for forest-to-bog restoration projects. Artz et al. (2017), reviewing costs and
merits of different peatland restoration activities, concluded that restoration from a forested or
scrub-covered condition is likely to require ongoing maintenance work to control natural
regeneration in the longer term. However, if the water table is reinstated as per an unmodified
blanket bog it could be argued that long-term tree regeneration and ongoing maintenance will likely
be reduced. Where practical, deer fences should be removed, allowing natural herbivore grazing by
deer, which can be quite effective at controlling regeneration, especially if it is Sitka spruce.
At Whitelee windfarm, 3 years after felling, the mean height of regenerating Sitka spruce was
already 24 cm with maximum densities up to 79,000 stems/ha (Photo 5). After 10 years, it is not
uncommon to find trees of 2-3m height in areas not yet under restoration.
At Black Law windfarm, 7 years after felling, the mean height of regenerating Sitka spruce was
already 90cm and at the time of writing (2018, 14 years post-felling) trees can be over 5m tall in
places. Mean and maximum densities are similar to those found at Whitelee windfarm. Conversely,
at Beinn an Tuirc Extension Windfarm in Kintyre circa. 50% of the small seedlings which first
germinated after felling died within that year.

Page 16 of 125
Photo 5: Conifer regeneration at Whitelee Windfarm 3 years after conventional felling.
At Forsinard, deer densities have been managed to help control tree regeneration. Where possible,
red deer numbers were allowed to increase in the first 5 years following felling, when deer browsing
of seedlings is likely to be most effective (Appendix G). Significant conifer regeneration problems can
occur in plantations undergoing restoration back to bog that are within a larger deer fenced area
where deer are excluded. Conifer regeneration is also becoming an increasing problem on adjacent
open blanket bog sites next to standing forestry. Red deer browsing of Sitka spruce seedlings was
also recorded at Halsary and Braehour during FCS trials, although lodgepole pine seedlings were
recorded at an average density of 2700/ha and up to 8000/ha locally (Appendix H)
Without intervention, the new ground vegetation developing on most sites will start to be shaded
out again by the branches of regenerating trees. Eventually, dominant trees would start to out-
compete smaller trees and a degree of self-thinning would occur. However, the prognosis for forest-
to-bog restoration is poor if these regenerated trees are left untreated regardless of the ultimate
outcome.
The degree of conifer regeneration from seed is not uniform across all sites, and indeed varies
markedly within restoration sites. The mechanisms by which the level of seedling germination is
controlled are not fully understood, but evidence from study sites points to a range of key factors
including:
● Age of trees at felling (younger trees do not produce cones); ● Presence, or time since, a mast year of cone production; ● Timing of felling (felling in some seasons appears to lead to higher densities of seedlings) ● Method of felling (mulched sites tend to have fewer seedlings present than harvested sites) ● Tree species and provenance ● Persistence time of viable seed (seedlings germinate mainly in Year 1 but can germinate
later, up to circa. 4 years for Sitka spruce)

Page 17 of 125
● Survival rate, influenced by ground conditions (e.g. desiccation on mulched areas) and browsing rates.
5.5. Site geography, altitude and topography
The location of a forest-to-bog site will also play a role in determining its physical and ecological
characteristics in advance of deforestation.
At a coarse scale, the geographic location of the site will determine the prevailing climate and
weather which, in turn, will also be influenced by its altitude and aspect. The surface hydrology of
afforested blanket bog in eastern Scotland, for example, can be somewhat drier than on equivalent
western bogs. At a finer scale the topography, particularly the position of the forest on the hill slope,
will influence the nature of impacts present. For example, a forest located on a watershed bog will,
to an extent, intercept incoming precipitation which will reduce the available water for the peat
underneath so drying effects could be expected to be more severe. Conversely, afforested valley
bog sites may receive inputs via runoff from upslope hence the degree of damage caused to the peat
mass by drying may be less severe.
5.6. Hydrology and water chemistry
Most of the available research has focussed on changes in water quantity and quality following tree
removal and drain blocking. Hydrological changes due to the reduced evapotranspiration following
tree removal and drain blocking are likely to affect the water balance of a clear felled site whether in
the context of forest-to-bog restoration or not. For example, increased stream flows have been
observed following clear felling of conifers on naturally forested boreal peatland sites (complexes of
peatland and mineral soil) in Eastern Finland (Ahtiainen and Huttunen, 1999) and Sweden (Löfgren
et al., 2009), though these systems differ from treeless British bogs. In western Ireland, felling of
planted conifers on blanket peatland has been linked to elevated DOC concentrations in surface
waters as a result of decomposing conifer foliage, litter and brash (Cummins and Farrell, 2003b,
Muller et al., 2015). Increased stream DOC concentrations and fluxes were also observed in the two
years after felling in a site in the north of Scotland (Muller and Tankéré-Muller, 2012). However, a
longer term study by Menberu et al. (2017) showed a steady reduction back to baseline DOC levels
over a 6 year period post-restoration for a range of peat types in Finland. Despite changes in water
balance and DOC concentrations, a study comparison of catchments dominated by forested bog,
open bog or forest-to-bog management in the north of Scotland did not find any significant effects
of forest-to-bog management on aquatic carbon exports, which were more strongly associated with
catchment properties and climatic variables (Gaffney, 2017). Nevertheless, it is suggested that as the
proportion of a catchment felled increased, this could also increase C export and reduce any
“buffering” currently performed by non-afforested portions of studied catchments (Gaffney, 2017).
Peaks of C exports were associated with high discharge (storms) events, especially those in the late
summer which occurred after a build-up of DOC in the peat as a result of drier and warmer
conditions, with one study suggesting that between 57-95% of the export occurred during 5-10% of
the high flows (Vinjili, 2012).
A study set up using a chronosequence of felled-to-waste sites in Scotland by Gaffney et al. (2018)
suggested that deep and shallow pore water chemistry, as well as surface-water chemistry
indicators, all progressed towards values found in a reference bog, with three main categories of

Page 18 of 125
effects: elements scavenged by trees from the atmosphere (Mg, Na, S) completely recovered within
two decades post-restoration, with other elements (PO43-, K, Al, Ca) showing an initial impact of
restoration followed by a progressive recovery. However, in this study pH, dissolved organic carbon
(DOC), Zn and NH4+ didn’t recover particularly in shallow pore water, exhibiting a “legacy” from the
effects of drainage and afforestation, which have consequences for the recovery of vegetation. As
noted above, studies based on time-series data suggest that elevated DOC levels may be relatively
short lived, stabilising over longer time horizons (Cummins and Farrell, 2003b, Muller et al., 2015;
Muller and Tankéré-Muller, 2012; Menberu et al., 2017). In sites where felling-to-waste has been
used to remove trees which had originally been fertilised, the woody debris and brash remaining on
site leave a substantial source of nutrients on site (Anderson et al., 2016), which may be released to
watercourses (Neal and Reynolds, 1998; Cummins and Farrell, 2003a; Asam et al., 2014; O’Driscoll et
al., 2014). Several studies of peatland forestry felling have shown that there can be significant
stream water increases in nitrate, phosphate and potassium (> 4-fold), which have taken up to four
years to recover (Cummins and Farrell, 2003a, 2003b; Rodgers et al., 2010; Asam et al., 2014;
Finnegan et al., 2014b). This comes from a combination of decomposition of brash and needle litter
(Palviainen et al., 2004a,b; Asam et al., 2014), the cessation of nutrient uptake and the reduction of
precipitation interception once the trees are gone (Nisbet, 2005).
When looking at effects of novel management methods including whole tree harvesting and
enhanced drain blocking carried out over small areas in a catchment including forestry, open bog
and restoration areas, a separate study found significant increases in DOC, phosphate, K and NH4 (2-
99-fold) in pore- and surface- water in the first year post-restoration (Gaffney, 2017). In streams,
significant increases in Fe, Al (both 1.5-fold), and phosphate (4.4-fold) were found, but due to
dilution effects, no significant impacts on concentrations in rivers or pass rates for drinking water or
WFD standards. Similarly to C export though it was strongly advised that longer monitoring should
carry be carried out especially on sites where restoration is ongoing (i.e. ever larger portions of
catchments are to be felled) or where the felled area dominates the catchment.
5.7. Effects on fauna
The effects of forest-to-bog restoration on fauna has been less consistently and less frequently
studied, but the evidence to date suggests that changes brought about through afforestation led to
profound changes that may not be quickly reversed under past practices of restoration. However,
newer practices, with more dams and brash removal than in the past, and various ground smoothing
techniques should lead to faster recovery. Also, the oldest restorations (~20 years) even without
furrow-blocking, have reached a level of habitat quality meriting consideration for nature
conservation designation, indicating that ultimate recovery to high standard is possible with
appropriate intervention and sufficient time. Table 1 provides a summary of these effects. Note that
for vegetation communities, effects have been closely monitored in a number of trials, and are
described in greater details in the subsequent sections of this report.
Ultimately, it may be argued that losses of faunal species caused by afforestation may not be offset
by conservation of other peatland areas or by restoration, because of intrinsic variation among
peatland types relating to underlying geology, climate or geography. For taxa on which research has
been undertaken, a number of potential bio-indicators of recovery have been identified and could

Page 19 of 125
be targeted for future monitoring of forest-to-bog sites (Table 1), in particular where novel
management techniques are being applied and where data and knowledge are currently lacking.

Page 20 of 125

Page 21 of 125
Biodiversity component
Afforestation Forest-to-bog restoration Bio-indicator Reference
Bird ● ↓ of Dunlin (Calidris alpina),
Golden Plover (Pluvialis
apricaria) and Common
greenshank (Tringa nebularia) ● Negative edge effect on Red
Grouse (Lagopus lagopus),
Dunlin and Golden plover ● ↑ Hooded crows (Corvus
cornix)
No published studies Dunlin, Golden Plover, Common greenshank
Stroud et al., 1987 Lindsay et al., 1988 Lavers & Haines-Young, 1997 Hancock et al., 2009 Wilson et al., 2014
Mammals ● ↑ Red foxes (Vulpes vulpes) ● No published studies N/A Stroud et al., 1987 Lindsay et al., 1988
Terrestrial arthropods
● ↑ tick density ● Loss of specialist carabids ● Loss of specialist moths ● ↑ Diptera, Opiliones,
Oribatida, Staphylinidae; ↓
Araneae ● ↓ diversity of
Auchenorrhynca
● ↓tick density ● Auchenorrhynca
recovery ● Partial recovery of moth
communities
Coleoptera (Carabidae) Araneae
Artz & Chapman, 2016 Pravia, 2018
Testate amoeba
↓ taxon richness Smaller, bacterivorous with smaller aperture size Loss of mixotrophic taxa
Limited recovery of testate amoeba community No recovery of mixotrophic taxa
Mixotrophic taxa
Creevy et al., 2018
Fungi ↑ ectomycorrhizal fungi species from Atheliaceae family
Structure of fungal community converges towards open bog over time ↑ ericoid fungi from Helotiaceae family ↓ Atheliaceae
Helotiaceae Artz & Chapman, 2016
Table 1: Summary of general responses of fauna to afforestation and forest to bog restoration
projects.
6. Projects reviewed
An IUCN Commission of Enquiry (CoI) workshop, involving an invited group of researchers and
practitioners, was held in December 2017. The aims were to identify key projects where forest-to-
bog restoration had been carried out, and to identify the types of quantitative monitoring data
which were available from each to help underpin a robust empirically-based review.
The workshop identified that the most extensive trials of forest-to-bog restoration methods, where
companion monitoring data were also currently available, were held by ScottishPower Renewables
(SPR). RSPB and FCS also confirmed they held monitoring data for some of their study sites and RSPB
will have further data available in the future as part of ongoing studies.

Page 22 of 125
Forest Enterprise Scotland (FES) confirmed that they have been undertaking a large amount of
forest-to-bog restoration on the National Forest Estate but have not systematically monitored these
sites to date.
Peatland ACTION, coordinated through SNH, confirmed that RSPB and FES have been the main
recipients of funding to date and no other projects have restoration monitoring in place.
To date, Natural England’s experiences have been confined to scrub and tree management on
lowland raised bogs with no forest-to-bog restoration projects on blanket bog available.
The detailed SPR monitoring studies have not been published. Some RSPB and FCS study data have
been published, but most projects are either still in progress or the data sets remain unpublished.
The SPR, RSPB and FCS data sets – used to underpin this review – have been included in Appendices
for sake of brevity and ease of reference. The data sets referred to herein are:
● SPR Black Law Windfarm: habitat succession post-felling and a comparison of felling
techniques 2004 – 2012 (Appendix B)
● RSPB Forsinard: Talaheel habitat succession post-felling to waste 1998 - 2011 (Appendix C)
● SPR Whitelee Windfarm: trial of multiple surface smoothing methods 2010 – 2012
(Appendix D)
● SPR Whitelee Windfarm: large-scale trial of surface smoothing 2013 – 2016 (Appendix E)
● SPR Black Law Windfarm: comparison of two surface smoothing methods 2014 – 2017
(Appendix F)
● RSPB Forsinard: Furrow blocking trials 2011 – 2014, and reprofiling methods 2014 –
(Appendix G)
● FCS Braehour and Halsary: ditch and furrow damming trials 1996 – 2017 (Appendix H)

Page 23 of 125
7. Forest to Bog Restoration methods
7.1. Habitat succession post-felling without intervention
The long-term response of vegetation on blanket bog after felling, but without further intervention,
has been studied in detail at Black Law windfarm (Appendix B) and at Forsinard (Appendix C). It was
also studied at Whitelee and Cruach Mhor windfarms, but since the results were analogous to those
from Black Law windfarm they are not included in this report for brevity. All of these studies
identified that there was a significant difference in the composition of recolonizing species between
the ridges, furrows and original ground surface.
For the elevated ridges, the succession of vegetation communities in these areas is indicative of drier
conditions (e.g. higher abundance of True grasses, Calluna vulgaris and lichens), whereas specialist
bog species are typically absent (Appendix B and C). The depth to bog water table was directly
measured in advance of restoration trials at Whitelee windfarm and exhibited differences between
ridge, furrow and original surface locations all through the year (Figure 1).
Figure 1: Depth to the bog water table measured at n=20 dipwells located in ridge, original surface
and furrow locations along a transect at Whitelee windfarm. Dipwells were measured monthly over
a 6 month period July 2014 – January 2015 and the maximum (summer) and minimum (winter)
results are shown with 95% CI.
Furrow bases are typically close enough to the bog water table (or below it in some bases depending
on plough depth) for specialist bog species to occur, particularly on flatter ground (<3 degrees)
where flow rates are low enough to allow vegetation to occlude (Appendix C).
The original ground surface had an intermediate response, where some Sphagnum species were
able to recolonize on flatter sites but on sloping ground (>3 degrees), or where conditions remained
drier the overall recolonization remained mixed (Appendix C).
The method of felling, particularly the amount of resulting woody material left on the ground
surface, can influence the rate of vegetation growth immediately post-felling (Appendix B).
However, the felling method used is unlikely to control the climax vegetation community in the long-
term since the water table remains too far from the ground surface post-felling unless further
intervention to deal with ridges and furrows is undertaken (Appendices G & H). Therefore while the
chosen felling method is relatively important in minimising the amount of material left on site which

Page 24 of 125
affects the rate of vegetation colonization, it is unlikely to be a critical factor for the ultimate success
of forestry to bog restoration projects.
7.2. Early trials
Due to the poor prospects for establishing functional blanket bog habitat post-felling without further
intervention, a number of studies sought to test the practicability and efficacy of novel restoration
methods. Invariably these methods have been mechanical, with a context that they must be scalable
without excessive cost and safe to implement for both operators and the surrounding environment.
Early trials by Forestry Commission Scotland in Caithness setup in 1996 sought to determine whether
restoration could be achieved by blocking drains and furrows, with or without felling the trees. The
results showed that a combination of felling and furrow/drain blocking raised the water table
compared to the untreated control areas, but even after 10 years the water table had not reached
the same level as the reference unmodified blanket bog (Appendix H). Regeneration of conifers post-
felling remained an issue and further maintenance would be required in the long-term.
Attempts to restore the water table of a small 1ha area using plastic piling of main drains post-felling
were made at Black Law windfarm 2008 – 2012 as part of an early trial. The results from the
deforested site in the first year of the trial showed that the bog water table did rise slightly after
treatment, when compared to the reference site, but did not respond sufficiently to make a
difference to the surface hydrology of the site being studied (Appendix B).
Similar results were obtained during the early trials of drain blocking at Forsinard, where main drain
blocking allowed some bog vegetation to recover in drains and furrows in flatter areas (< 3 degrees
slope) but the ridges and original ground surface remained dry (Appendix G).
7.2.1. Lessons Learned
From the studies which considered the impacts of afforestation and re-colonisation, it is possible to
draw several key conclusions for forest-to-bog restoration projects on blanket bog:
● There is a clear differentiation between the ridge-furrow-original surface in terms of depth to water table and therefore rates of recolonisation of specialist bog species to post-felling sites.
● Leaving furrows untreated may allow bog vegetation to colonise them over time, but the
prospects for expanding cover of bog vegetation onto plough shoulders (the original surface level) and then to ridges seems very poor and the process would likely take a very long time (if it happens at all).
● Conifer regeneration levels after felling varies but can occur at very high densities locally and, moreover, the germinated trees grow very quickly - hand clearance measures are therefore likely to be ineffective except when densities are low, and the task is dealt with before it gets out of hand.
● Blocking main drains and plough furrows alone is unlikely to raise the bog water table sufficiently in most situations studied, especially as the plough ridges often occupy up to 50% of the plantation surface area. More intensive blocking and re-profiling are likely to re-wet better, but how this affects subsequent vegetation development is poorly known, due

Page 25 of 125
to results not yet being available from existing trials (none published to date, though studies underway) and the long-term nature of responses.
Therefore, projects seeking to undertake forestry-to-bog restoration must deal with the elevated
ridges, furrows, main drains and regenerating conifers (in the long-term) in order to be successful in
re-establishing a functional water table close to the surface providing conditions for specialist bog
species and “active” bog to develop.
7.3. Surface smoothing methods
The term “surface smoothing” refers to forest-to-bog restoration methods which aim to
mechanically homogenise the ridge/furrow pattern into a flat surface. It was first developed at
Whitelee windfarm, where a formal experiment was implemented in 2010 to trial different
approaches to dealing with residual surface ridge-furrow topography post-felling (Appendix D). Five
different techniques were devised to remove ridge/stump features and interrupt furrows. The most
successful method, termed “ground smoothing” at the time, involved inverting all remaining stumps
using a low ground pressure excavator and compressing them into the furrows, using machine
tracking, which simultaneously removed elevated ridges and filled in furrows as well as burying the
majority of regenerating conifers; concurrently, in-filling of the main drains was undertaken using
stumps and root plates plus drain spoil and excavated peat as required to create a seal (Photo 6).
Photo 6: Area of blanket bog immediately after ground smoothing at Black Law windfarm in October
2014
A further extended trial at Whitelee windfarm comprised a replicated, controlled study of “ground
smoothing” to assess its effectiveness and potential consequential environmental effects when
applied at a landscape scale (Appendix E). This trial confirmed the ability for specialist bog
vegetation to recolonize relatively quickly (within 2-3 growing seasons) and in parallel reduce the
density of regenerating conifers by 80-90% (Photo 7).

Page 26 of 125
Photo 7: The same area treated in Photo 6 above less than 3 years later (July 2017)
Whilst mean water table depth was comparable between treated and untreated blocks, the range of
fluctuation was lower in treated blocks with a notably slower discharge rate during dry periods and a
faster recharge rate following rainfall (Appendix E). This finding suggests that the duration the water
table is below some threshold limit is an important factor in bog vegetation recovery, not just the
overall mean depth.
A similar study was undertaken at Black Law windfarm to assess the “ground smoothing” technique
in slightly different conditions to Whitelee (eastern versus western blanket bog), and to contrast
with a less intensive method of surface smoothing which only used the weight of the excavator to
flatten the ground termed “cross-tracking” (Appendix F). “Cross-tracking” was used where stumps
were smaller (due to growth checking) or softer (due to longer time since felling, circa. 10 years), as
a less intensive alternative to “ground smoothing”. The response of vegetation and hydrology from
“ground smoothing” was similar to that recorded at Whitelee windfarm, with the “cross tracking”
results intermediate between those of “ground smoothing” and the untreated control areas.
An important consideration for surface smoothing projects is the potential for changes in water
quality resulting from exposed peat to cause changes in concentrations of DOC, suspended
sediment, N, P and K. Elevations in the concentration of DOC and suspended sediment were
detectable in the surface water flowing from treated areas for 2-3 years post-treatment, with data
after this period indicating a net reduction compared to control areas. An increase in the
concentrations of N, P and K was detectable for circa. 6 months post-treatment, after which they
were comparable to the control areas.

Page 27 of 125
These results demonstrate that surface smoothing can be highly effective at restoring blanket bog
habitat, but that care must be taken when planning projects to ensure surface water quality
mitigation measures are put in place (Appendix I).
7.4. Furrow and drain blocking / disruption
Further work blocking furrows, and on any remaining collector drains missed out first time round has
continued at Forsinard in an effort to improve restoration outcomes where stumps are
smaller/completely rotten which, combined with large double ploughed cultivation, do not
necessarily lend themselves to the ground smoothing approach described above. Following initial
trials at Lonielist and Leir, the best results were obtained when furrows were dammed using peat
dams, built 30cm higher than the original surface, at 20m intervals (the main drains were already
dammed during previous restoration attempts) (Appendix G). Both water table and bog vegetation
responses were improved in the treated areas compared to the control (unblocked), with a less
intensive small damming treatment yielding an intermediate response.
A similar approach has been implemented in parts of Cruach Mhor windfarm, where initial attempts
to implement “ground smoothing” were unlikely to be successful due to the minimal size of stump
material available to flip into the furrows, and the large depth of the furrows resulting from double
plough cultivation. Limited monitoring data exists from this project but the mean water table depth
is higher in the treated areas (furrow-blocked) compared with an adjacent control area during year 1
following treatment (Figure 2).
Figure 2: Mean water table depth and 95% CI’s measured in treatment (T) and control (C) areas at
Cruach Mhor windfarm from n=66 dipwells measured on 4 occasions June 2017 – June 2018.
A variation of this technique was implemented at Forsinard during 2016 whereby the excavator
crushed the felled trees and brash into the furrows, re-profiled the surface by pulling the ridge
material into the furrows prior to cross-tracking and furrow damming to provide a finished surface.
This approach is a blend of a surface smoothing approach to remove ridge/furrow patterns and
damming to ensure residual linear pathways for water flow are eliminated.
Limited data is currently available for these techniques, but a further round of monitoring is being
undertaken in 2018 and 2019.
7.5. Summary of methods
A summary of the status of each method, or combination of methods, as described above is
provided in Table 2 below.

Page 28 of 125

Page 29 of 125
Method Description Application Efficacy Cost Felling only Clear felling of forestry, either by
conventional harvesting, mulching of failed crops or whole tree removal. No further treatment.
Forestry on blanket bog. Evidence is consistent across several different projects. Vegetation recovery is typically indicative of dry surface conditions particularly on the elevated ridges and original ground surface, evidenced by a mean water table which remains further below the surface than an unmodified bog. Specialist bog vegetation remains restricted to the furrows, or on the original ground surface in particularly flat areas (even after 20 years+ at Talaheel). Conifer regeneration from seed can be extensive where seed sources remain nearby, and fences remain in place, excluding deer.
Felling costs highly variable depending on crop yield and access, could vary from providing a net income to >£4000/ha net cost for mulching.
Felling + stump-flipping + drain in-filling + cross-tracking (“Ground smoothing”)
Clear felling of forestry, either by conventional harvesting, mulching of failed crops or whole tree removal. Flipping of stumps and in-filling of main drains, followed by cross-tracking using a circa. 14 ton low ground pressure excavator.
Forestry on blanket bog where stumps are typically >15cm mean diameter and sufficiently large to block furrow spaces when flipped. Can be implemented independent of slope, conifer regeneration size or density.
Evidence is consistent across trials and landscape scale implementation in 2 different locations. Recolonisation by specialist bog species occurs rapidly following treatment (circa. 3-5 years) and water table is significantly closer to the ground surface. Conifer regeneration is reduced circa. 80-90% following treatment, with follow-up hand clearance of remaining trees potentially required depending on survival and growth rate of remaining trees. Careful planning and mitigation to manage treated surface water and avoid catchment scale water quality impacts are required.
Felling costs highly variable depending on crop yield and access, could vary from providing a net income to >£4000/ha net cost for mulching. Post-felling treatment costs are circa £1000/ha based on a rate of 0.45ha/day per excavator. Follow up hand clearance of surviving sparse conifer regeneration is estimated to be circa. £150/ha.
Felling + re-profiling + cross-tracking
Clear felling of forestry, either by conventional harvesting, mulching of failed crops, fell to waste or whole tree removal. Re-profiling the ridges by sliding them into the furrows using an excavator bucket, followed by cross-tracking using a circa. 14ton low ground pressure excavator. Fell to waste sites also have brash crushed into furrows prior to re-profiling.
Forestry on blanket bog where stumps are small (typically <15cm mean diameter) and/or considerably softened via rotting process, and where conifer regeneration is limited. Considered better option to furrow damming on steeper slopes (>3 degrees) and where peat is shallow (<1m). Considered better option when significant quantities of forestry brash remain on the surface.
Data not yet available. Visual assessment of the treated areas is positive.
Felling costs highly variable depending on crop yield and access, could vary from providing a net income to >£4000/ha net cost for mulching. Post-felling treatment costs are circa £900/ha. Follow up hand clearance of surviving sparse conifer.
Felling + furrow/drain damming
Clear felling of forestry, either by conventional harvesting, mulching of failed crops, fell to waste or whole tree removal. Construction of peat dams 30cm height in furrows and drains at 20m intervals using an excavator bucket using
Forestry on blanket bog where stumps are small (typically <15cm mean diameter) and/or considerably softened via rotting process, and where conifer
Evidence from two different sites shows a consistent improvement in water table compared to untreated areas. Vegetation data is restricted to one site but showed colonisation by specialist bog species.
Felling costs highly variable depending on crop yield and access, could vary from providing a net income to >£4000/ha net cost for mulching.

Page 30 of 125
a circa. 14ton low ground pressure excavator.
regeneration is limited. Considered better option to reprofiling on flatter slopes (<3 degrees) and where peat is > 1.5m deep, but in recent years carried out in combination with re-profiling.
Post-felling treatment costs are circa £800/ha based on a rate of 0.5ha/day per excavator. Follow up hand clearance of surviving sparse conifer regeneration is estimated to be circa. £150/ha.
Felling + furrow/drain damming + re-profiling + cross-tracking
Clear felling of forestry, either by conventional harvesting or felled to waste. Following brash crushing, ridges are re-profiled by sliding them into the furrows using an excavator bucket, followed by cross-tracking, then construction of peat dams 30cm height in furrows and drains at 20m intervals using an excavator bucket using a circa. 14ton low ground pressure excavator.
Forestry on blanket bog where stumps are small (typically <15cm mean diameter) and/or considerably softened via rotting process, and where conifer regeneration is limited. Considered better option regardless of quantities of forestry brash remain on the surface. Considered best option where peat is > 1.5m deep.
Monitoring in place, but data not yet available. Visual assessment of the treated areas is positive.
Post-felling treatment costs are circa £900/ha. Follow up hand clearance of surviving sparse conifer
Table 2: Summary of methods used for forestry to bog restoration

Page 31 of 125
8. Implications for carbon and climate
8.1. Conceptual outline
There is current uncertainty about the restocking of peatland forestry and the impacts of restoration
practices for carbon, net GHG benefit and climate mitigation. While most of the mechanisms are
broadly understood, their relative scale and importance is less clear (Morison, 2013). In this section
we focus on reviewing the likely mechanisms, identifying probable pathways and examining the data
currently available on the changes following afforestation and subsequent restoration. The major
carbon flows in natural, afforested and restored peat bogs are shown below (Figure 3).
Figure 3: Conceptual diagram of key carbon (C) cycle pathways and changes with peatland
afforestation and restoration. Note that the arrow widths are indicative only as there is much
uncertainty in their relative values. CO2 = carbon dioxide; CH4 = methane; DOC = dissolved organic
carbon; POC = particulate organic carbon.
In brief, undisturbed natural peatbogs (Fig. 3, left block) slowly accumulate carbon by the uptake of CO2 from the air, but they emit some methane (CH4) from the waterlogged (anaerobic) peat, often via the vegetation. Over a period of centuries, the long residence time of CO2 in the atmosphere compared to that of CH4 means that peat growth has a significant cooling impact on the climate.
Afforestation (Fig. 3, middle block) usually increases the depth of the water table, therefore reducing methane fluxes from the soil surface, but increasing peat losses (and therefore CO2 emissions) through the increased oxygenation and decomposition of the peat, and loss of dissolved and particulate carbon. Emissions of CH4 can continue from the newly created ditch network. In some cases these emissions are insignificant but in others they may be similar in magnitude to those from the undrained

Page 32 of 125
peatland. Forests also accumulate carbon as the trees grow, both in the trees, above and below ground, and in the litter accumulated on the soil surface. This accumulation of new carbon may partly, wholly or more than offset the loss of older carbon due to accelerated decomposition of the peat. When trees are harvested, the wood can be used as an energy source, or for wood products such as paper or construction timber, all with very different timescales of carbon loss. The roots, which contain a quarter to a third of the tree biomass, are usually not harvested but remain in the peat.
Successful restoration (Fig. 3, right block) of a previously drained and afforested bog will raise the water table, reducing oxidative losses of carbon but increasing methane fluxes. Bog vegetation will re-establish, leading to carbon accumulation and new peat formation. There will be continuing, but probably declining, losses of dissolved and particulate carbon.
8.2. Functioning Peatland Dynamics
In a natural or near-natural state, peatlands are likely to continue slowly accruing carbon and act as a
sink, both in terms of the net ecosystem carbon balance (NECB) and global warming potential (Clymo,
1984; Artz et al., 2013). Rates of accumulation vary with the type of peat bog, with recent reviews
suggesting uptake rates ranging between 0.1 – 1.0 t C ha-1 y-1 or approximately 0.4 – 4 tCO2 ha-1 y-1
(Morison, 2013). Even accounting for methane emissions, most natural peatlands are a net GHG sink.
However, in some individual cases, high and variable CH4 emissions from semi-natural peat bogs have
been measured such that the CO2-equivalent emission rates (mean values range from 0.5 – 7 t CO2e
ha-1 y-1, Morison et al., 2012, p. 48) can exceed the net rate of CO2 uptake (e.g. Byrne et al., 2004;
Couwenberg et al., 2011). However, this assessment is based on 100 year global warming potentials
and over longer (Holocene) periods there is little doubt that peatlands exert a sustained cooling impact
on climate, because CH4 has a much shorter atmospheric lifetime than CO2 (Frolking et al., 2006; Yu,
2011).
There is evidence that uptake rates can exhibit considerable interannual variation. Koehler et al.
(2011) studied the variability of greenhouse gas exchange and fluvial export in an Irish blanket peat
over six consecutive years and found ranges of -2.4 (net uptake) to +0.3 t CO2e ha-1 y-1 (net loss). Artz
et al. (2013) report that for near-natural peatlands in Scotland, the only currently available data relate
to balances for Auchencorth Moss, which are between -3.7 t CO2e ha-1 y-1 (net uptake, Dinsmore et
al., 2010) and +0.3 t CO2e ha-1 y-1 (net loss, Billett et al., 2004), in several climatically different years.
These figures include net exchange of greenhouse gases (CO2 and CH4) as well as fluvial export.
Expressed in global warming terms this site appears to be net cooling over all studied years (Artz et
al., 2013) and Helfter et al. (2015) have provided an updated (10 year) CO2 balance for Auchencorth
ranging from −0.05 to −1.36 t CO2-C ha-1 y-1 (mean of −0.64 ± 0.34 t CO2-C ha-1 y-1). Levy and Gray (2015)
reported a substantial net sink for Forsinard (net ecosystem carbon balance was −0.50 t CO2e-C ha-1 y-
1). Worrall et al. (2009) estimated the net carbon sink at the Moorhouse NNR (a heavily impacted
upland peatland in England) to vary between -0.2 to -0.71 t CO2e ha-1 y-1 (net uptake), based on multi-
annual studies of net GHG exchange and fluvial losses. Hence, C or GHG exchange values based on a
single year need to be viewed circumspectly. Billett et al. (2010) conclude that current figures are
more likely in the range of -1.3 to -2.6 t CO2e ha-1 y-1 (net uptake) based on long-term average
accumulation (i.e. net increment in peat accumulation). Similarly, a study of northern blanket bogs by
Strack (2008) provided estimates of the mean long term C accumulation rate as -0.7 to -1.1 t CO2e ha-
1 y-1 (net uptake), again based on long term average accumulation figures.

Page 33 of 125
8.3. Changes with afforestation
Considerable loss of carbon can be expected to have occurred during initial ground preparation and
planting (Reynolds, 2007), although as new afforestation on peat is no longer permitted (Forestry
Commission Scotland, 2015) and current planting methods are far less invasive, the extent of loss is
now difficult to quantify experimentally. Afforestation of peats routinely used ploughing and
concomitant drainage, which will have exposed deep, anoxic (catotelm) peat to oxygen in plough
ridges and large fluxes of dissolved and particulate carbon are likely to have occurred as plant material
and exposed peat were disaggregated and decomposed. Longer-term water table drawdown will have
exposed a greater depth of peat to oxygen, leading to carbon loss (Lindsay et al., 2014). There is a
well-understood positive correlation between peatland water table depth and CO2 efflux (Kritzler et
al., 2016) and it is certain that afforestation will have increased CO2 emission and DOC loss to some
degree in the initial stages (Reynolds, 2007). The scale of this change and its long-term trajectory will
partially depend on the wetness of the site, fertility and the extent to which drains are maintained.
While peat carbon losses are likely to have occurred, carbon accumulates in the trees and the litter as
the stand develops. For example, twenty seven sites (23 organo-mineral soils and 4 peats) afforested
during the last 40 years showed an increase in forest floor litter C stock (Lilly et al., 2016). However,
this may represent a shift from a stable carbon store (peat) formed over millennia to one that is less
stable (litter and root-derived material) with a relatively short turnover time. Conversely, the change
in soil C stock (i.e. that below the litter layer, but only measured in the organo-mineral soils) suggested
a loss not significantly different from zero, and this supports earlier reports by Reynolds (2007) and
Chapman et al. (2013). The net effect of afforestation on carbon fluxes from below ground (i.e. below
the forest litter layer) will depend on the balance between the input processes (root exudation, root
litter incorporation, root growth, needle litter incorporation) and the output processes (loss of
dissolved organic carbon to streams and CO2 emission to the atmosphere from respiration/peat
oxidation). The fate of carbon inputs from tree roots is poorly understood but gross inputs are
substantial, given that the roots are left in the peat when the trees are felled. Nevertheless, the
evidence points to a net below ground soil carbon loss (Vanguelova et al., 2018). However, it should
be noted that a lot of this evidence comes from organo-mineral soils, where nutrient availability is
generally higher, and that there are difficulties in estimating C stocks in peats.
There is conflicting evidence on the effect of afforestation on carbon accumulation or loss in peat soils.
Using a mass balance approach in Finland, Minkkinen and Laine (1998) and Ojanen et al. (2013)
showed that even after afforestation and drainage of nutrient poor, but naturally tree covered
peatlands, the soil can act as a small C sink. However, in more fertile peatlands, soils may turn into a
C source after drainage and afforestation, but because of the fast tree growth, the ecosystem stays a
C sink. Ojanen et al. (2013) suggested that the main factors controlling this balance were site fertility,
water table, and temperature. A longer-term study in which C stock changes were measured under
forestry in Finland (over 30 years) showed a strong tendency towards overall net C loss (Simola et al.,
2012). Even if the contradictory findings between these studies could be resolved, considerable
caution should be given in applying results from Finnish peatlands to British conditions (Lindsay, 2010).
In an unpublished study (Anderson, pers.comm.) comparing drained-only and drained afforested
blanket bog at Bad a’ Cheo, subsidence over 27 years starting from when the site was drained
amounted to 12 cm and 36 cm for the drained-only and afforested treatments respectively. Below-
ground carbon stock decreased by 3.4 t C ha-1 in the drained-only and increased by 30.0 t C ha-1 in the

Page 34 of 125
afforested treatment, representing 6 % and -18 % of the volume loss observed as subsidence for the
two treatments respectively.
A corollary of increased CO2 emission from peat drained for forestry is a likely reduction in CH4
emission. By increasing the depth of the oxic layer, water table drawdown increases the available
space for CH4 to be oxidised by methanotrophic bacteria. The decline of typical bog plant species
following drainage will often also reduce the abundance of plants with aerenchyma, e.g. sedges like
Eriophorum, which are disproportionately important in channelling CH4 to the atmosphere (Dinsmore
et al., 2009), although these species can sometimes be locally abundant in plough furrows before
forest canopy closure. Minkkinen et al. (2007) showed that in forested peatlands with effective
drainage the soil took up CH4 at a rate of up to 0.01 tC ha-1 y-1. Minkkinen at al. (1997) found that
although forestry drains emitted variable and in some cases substantial quantities of CH4, these
emissions were insignificant on a whole-site basis because the drains only occupied a small proportion
of the area. However, Minkkinen and Laine (2006) estimated that the waterlogged ditches in a Finnish
forest emitted as much or even more CH4 as is consumed by the rest of the forest. However, forestry
drainage of peatlands in Finland follows a fairly narrow range of drain spacing prescriptions, while in
the UK a much wider range of drainage intensities occur. A systematic review by Abdalla et al. (2016)
confirmed that drained peatlands generally emit less methane than undrained ones but that methane
emissions from drainage ditches could be significant. They cite the finding of Sundh et al. (2000), that
emissions from drains could be minimised by keeping the drains clear and free from vegetation.
In terms of GHG exchange, with afforestation there is likely to be some compensation in the net global
warming potential effect between reduced CH4 efflux from the peat surface and increased CO2 efflux
plus increased fluvial carbon loss (leading to further CO2 efflux downstream) and CH4 emission from
the ditch network. It is frequently suggested that in most afforested sites soil increased CO2 release
from the peat will exceed the reduction in soil CH4, though this requires further detailed study to
provide robust quantification. The loss of peatland plants means afforested peatlands will cease the
accumulation of new peat which may become important in the longer-term.
These losses in soil and peat carbon could be offset by carbon accumulation in the trees themselves
but this is very dependent upon tree productivity, which can be very variable contingent upon site
fertility and climatic conditions, and the ultimate fate of carbon in harvested wood and root systems
(see section 9.4). With current uncertainties in understanding, it is not possible to state definitively at
what point the balance would lie. While tree productivity can be measured (and modelled) with
reasonable accuracy, there have been few direct measures of peat carbon loss, particularly across a
complete forest rotation. Hargreaves et al. (2003) estimated the average loss, based on sites in
Scotland, to be no more than 1 – 2 tC ha-1 y-1. However, as the authors admit, this was the difference
between two large uncertain numbers and there were other weaknesses in their methodology (see
Lindsay, 2010). Reynolds (2007) presents data for SW Scotland that shows peat carbon to vary
between a loss of 0.9 tC ha-1 y-1 and a gain of 1.4 tC ha-1 y-1 though the data appears to include tree
litter inputs.
Hargreaves et al. (2003) (and following on from Cannell et al. (1993)) went on to consider multiple
forest rotations and showed that the ongoing peat carbon loss would eventually exceed the carbon
fixed in the tree biomass but that the time for this was very dependent upon the rate of peat C loss.
On a CO2 basis – for which Minunno et al. (2010) modelled NECB – they showed that there was a 150

Page 35 of 125
– 200 year (3 – 4 rotation) net benefit on peat if the tree yield class ≥10 m3 ha-1 y-1. Their modelled
peat C loss rate was 0.72 tC ha-1 y-1 during the first rotation. Their statement does not include net GHG
balance (due to paucity of data for CH4 and N2O). However, the model carbon module used in this
study may not have captured all the potential losses from a drained peat. A site of lower yield class
would reduce the number of rotations giving a net benefit. The carbon fixation potential of a conifer
crop is considerably greater than that of typical low-growing bog species (mostly bryophytes,
graminoids and dwarf shrubs) and a mature conifer crop contains more carbon than typical bog
vegetation (although the latter may be non-trivial (Lindsay, 2010)). So, afforestation will tend to
increase the carbon stock above ground while it decreases the carbon stock below ground. Based on
a global review of values from peer-reviewed literature, the Intergovernmental Panel on Climate
Change’s Wetland Supplement (IPCC, 2014) provides default Tier 2 CO2 emission factors for afforested
peat, which are positive (i.e. net C sources). With current uncertainties in understanding, it is not
possible to state precisely at what point and under what circumstances carbon accumulation via tree
biomass (ultimately embodied in wood products) is likely to exceed peat carbon losses. Taking all the
existing evidence, and the evidence is weak, it might be expected that a yield class of 6 would give a
carbon benefit for one forest rotation but for no longer.
It is difficult to quantify the extent to which tree planting on peat soils results in changes to GHG
balances, as opposed to just changes in carbon, as there are few measurements of simultaneous CO2,
methane (CH4) and nitrous oxide (N2O) fluxes from natural or afforested peat soils either outside or
within the UK (Morison et al. 2010), though simultaneous measurement of N2O is not required to
derive a reliable GHG balance of near-natural sites as it is consistently negligible in unfertilised
systems. Although there is evidence that moderate-high productivity forests on organo-mineral soils
can provide a substantial net carbon uptake over multiple forestry rotations (Vanguelova et al., 2018),
this evidence cannot be readily applied to peat soils. While Vanguelova et al. (2018) conclude that
“the majority of studies still show that afforested drained peats, dependent on the forest growth and
yield class, are likely to act as net carbon sinks despite large peat losses. and further studies are
required as it is unclear where the cut-off point in terms of yield class might be whereby tree growth
compensates for peat carbon losses”, Sloan et al. (2018) in another recent review maintain that “at
present it cannot be reliably determined whether afforestation of open UK peatlands exacerbates or
ameliorates climate change”.
For sites in Europe, Hommeltenberg et al. (2014) showed that over the two-year measurement
period, an afforested drained bog in southern Germany was a much stronger net CO2 sink (2.15 t C
ha-1 yr-1) than a nearby bog naturally wooded with bog pine (0.63 t C ha-1 yr-1). They did not measure
CH4 or DOC fluxes. They also estimated a net loss from the drained, afforested bog ecosystem of 134
t C ha-1 over the 44 years of forest growth but this was based on the doubtful assumption that 50%
of below-ground volume loss was due to peat oxidation. He et al. (2016) modelled the GHG balance
of a Norway Spruce forest on a fen in southwest Sweden. They concluded that overall, the forest
was a GHG source and if the biomass from the harvested trees is released back into the atmosphere
this source becomes even bigger. The spruce trees were modelled to take up 4.13 tC ha-1 y-1 (circa.
yield class 6) while the peat was decomposed at a rate of 3.99 tC ha-1 y-1, with N2O emissions
contributing a further 0.007 t N ha-1 y-1, which is equivalent to 0.76 t C ha1 y-1. These two examples
suggest that if the model’s assumptions are correct and the model is realistic, peat losses can be up
to 3 – 4 t C ha-1 y-1 but sit at the upper end of what is likely.

Page 36 of 125
Although most attention here has focussed on the fluxes of carbon, there are other changes with
afforestation, outwith the scope of this report, that may also have a lesser role in climate change.
While N2O fluxes from most bog and afforested bog sites are generally low, some forested peatlands
with greater nutrient supply, such as fen sites (He et al., 2016) or those with high atmospheric inputs
(see Morison et al., 2012), can be greater sources of N2O, though in all these examples comparison
with the original peatland is lacking. Also, forestry may sometimes reduce albedo (Betts, 2000), as well
as change the micro-climate, and these topics do require more attention.
8.4. Role of harvested wood products and residual tree root systems
Plantations on peat will ultimately be felled so the climate change mitigation potential of afforested
peatlands will depend partly on the fate of the felled trees and partly on what happens to the tree
roots, which remain in the peat after felling.
If felled trees are left above ground on-site (i.e. felled to waste), most of the carbon in the timber will
decompose, whilst a small proportion may be incorporated into the peat and, like the tree root
systems, remain relatively stable under anoxic conditions if the site hydrology is restored but
decompose further if conditions suitable for growing another timber crop are maintained. If the
timber is felled and burned as woodfuel, as is likely to occur with pre-commercial restoration felling,
then the carbon will be returned to the atmosphere rapidly but it will provide a benefit in replacing
some fossil fuel generated energy (depending on the grid-mix of energy counterfactual). If the timber
is used for longer life-time products such as construction, prolonging the carbon storage time, this will
provide additional emission mitigation benefit until the total stock of wood products reaches a steady
state. At that point, this carbon sink no longer offsets losses from peat (which do not reach a similar
steady state). Nationally, the most significant destination for felled timber is sawmills, implying a
reasonably slow return to the atmosphere. As such, any benefits are very dependent upon what the
wood substitutes for and the LCA (Life Cycle Analysis) is complex, especially when comparing different
land use management options (Morison et al., 2010; Suttie et al., 2009). Additionally, the use of timber
in longer lifetime products assumes a quality of wood that may not be achievable on many
(comparatively infertile) peat soils, as peat is a sub-optimal site type for commercial forestry (Worrell
and Malcolm, 1990).
As the full GHG balance of afforested peatbogs is not well-quantified, the Forestry Commission
advocates a conservative consideration of the likely whole-site carbon balance in supporting decisions
for restoration or continued forestry scenarios, based upon constrained carbon modelling studies
(Hargreaves et al., 2003; Minnuno et al., 2010). This suggests the retention of peatland forestry until
the end of the full economic rotation, avoiding premature felling, in order to maximise the net
emissions mitigation benefit, in all but the poorest growth stands, i.e. stands producing less than yield
class 8 (< 8 m3 ha-1 y-1) (cf. Forestry Commission, 2014). Upon clearfelling, Forestry Commission
guidance proposes that the site quality should be assessed and then given priority for restoration,
second rotation or peatland-edge woodland management, as currently underpins the Forestry
Commission Guidance for Scotland (Forestry Commission Scotland, 2015). A similar tool in Wales uses
soil type, peat depth, area and slope to determine if a site should be considered for restoration,
conversion to wet woodland, native woodland or other open wet habitat, or restocked as per the
forest management plan (Vanguelova et al., 2012).

Page 37 of 125
Windthrow is also an important factor affecting the sequestration of carbon in long-term timber
carbon stores (Anderson et al., 1989). Peat has a lower shear strength than mineral soils and
windthrow is more frequent and widespread in peatland plantations than mineral soils (Anderson et
al., 1989). Windthrow is a particular issue in wetter sites with water tables nearer the surface where
root plates may be very shallow (Ray and Nicoll, 1998). As windthrow probability increases with tree
maturity (Ruel, 1995) windthrow concerns may lead to plantations being harvested before they reach
the peak of maximum mean annual increment (MMAI), though in the windy UK this constraint to
rotation length is not only applied to peat soils. Peatland plantations disproportionately go to shorter-
lifespan uses due to shorter rotation lengths.
Roots typically contain 25% of the tree biomass and carbon in lodgepole pine and 29% in Sitka spruce,
although for individual trees the range is large, 15-40% for lodgepole pine and 14-55% for Sitka spruce
(Levy et al., 2004). It is not known whether the root biomass percentage of trees growing on peat
differ from these typical values, which are for a range of site and soil types on which the species grow
in Great Britain but Levy et al. found that soil type explained very little of the variance in root:shoot
ratios. They suggest that this ratio might be more dependent on the wind climate of sites. Given that
many peatlands are in windy places and that trees have to invest more in root growth to anchor
themselves on peat than on firmer soils, we could expect the root biomass percentages of trees on
peat to be larger than the typical values. After felling, the fate of the carbon in roots will depend on
soil conditions for decomposition, which in turn depend on the level of the water table. An initial rise
in the water table due to the cessation of transpiration and a major reduction in evaporation will be
followed by a fall in the water table if new drains are dug for restocking the forest or by a further rise
if the old drainage system is dammed to rewet the site for bog restoration. In the restocking case, the
old roots would decompose relatively quickly and completely, whereas under peat restoration, their
decomposition would be slower and incomplete, with preservation of roots in anoxic environments.
A particularly important factor in comparing the climate forcing of natural and afforested peatlands is
the time-scale under consideration. Afforested peat will probably continue losing carbon from peat
with every forestry rotation. It is likely that a point will be reached whereby the carbon being gradually
lost from the peat is not balanced by carbon accrual in tree biomass and timber products (cf.
Hargreaves et al. 2003; Minnuno et al. 2010). Over a suitably-long timescale it is very probable that
unafforested peatlands are ultimately ‘better’ for climate but on the time-scales most meaningful for
policy (1 – 100 years) this is much less clear and heavily dependent on the fate of timber and success
of restoration. In contrast to carbon locked up in harvested wood products, the carbon sequestered
in active peatland will be secure on a much longer timescale. A key question is at what point will a
restored peatland become a net sink.
8.5. Changes with restoration
There is currently a lack of robust data on the carbon budgets of forest-to-bog restoration sites, but
many of the likely changes can be identified. Harvesting of timber will remove a large pool of above-
ground carbon with the fate of this carbon dependent on subsequent timber products and usage as
discussed in section 9.4 above. The process of felling and restoration may lead to some short-term
increase in CO2 emission due to disturbance of surface peat and decomposition of brash, litter, stumps
and any trees felled to waste. An increased CH4 flux may result from raising water tables during
restoration, either through management or as a consequence of the removal of tree

Page 38 of 125
evapotranspiration, while damming of ditches and furrows during restoration may increase ‘ditch’ CH4
emissions (Baird et al. 2009). In the longer-term it can be expected that raising the water table will
substantially reduce CO2 emissions due to reduction in the oxic depth. This may be off-set by increased
emissions of CH4, particularly in the early stages of re-wetting and where species with aerenchyma,
such as Eriophorum angustifolium, become abundant (Morison, 2012). As peatland vegetation
becomes re-established this will begin to accumulate carbon and at some stage should begin to lead
to new peat formation, although this might take considerable time. These processes are reasonably
well-understood but currently poorly-quantified and there is particular uncertainty regarding the rate
of change (Morison, 2012).
There is a limited pool of data available to quantify the scale of these processes. One study in the Flow
Country investigated the effect of restoration on the greenhouse gas budget (CO2, CH4 and N2O) at a
small-scale using closed chambers across a forest-to-bog chronosequence, together with incubation
experiments in the laboratory. The study demonstrated that that CO2 respiration and CH4 fluxes are
progressively returning to values similar to nearby undamaged blanket bogs. This is in part related to
a slowing down of the peat decomposition rates over time after restoration, attributable to changes
in peat quality and nutrient availability. Restoration was also associated with an increase in CH4 fluxes
over time. However, when compared to the total NEE of these sites methane was only a small
proportion. N2O fluxes were also very small compared to NEE in all sites, irrespective of land use
(Hermans, 2018).
Similarly, a study looking at large-scale C fluxes using eddy-covariance measurements demonstrated
that the youngest restoration site (10 years post restoration) to be a net source of C to the atmosphere
of 0.80 t C ha-1 y-1, while the older restoration site (16 years post restoration) was a net C sink of -0.71
t C ha-1 y-1, with the differences mostly attributable to respiration (outputs) rather than photosynthesis
(inputs) (Hambley et al., 2019). Soil temperature and soil moisture were found to exert the greatest
control on respiration, with higher rates associated with drier, warmer conditions. These results
similarly suggest that peatland restoration is successful at returning sites to becoming net C sinks over
multi-decadal timescales (Hambley, 2016; Hambley et al., 2019). Despite the older restoration site
being a smaller sink than a close by near pristine bog, which was a C sink of -1.14 t C ha-1 y-1 (Levy and
Gray, 2015), it still fell within the range expected for northern peatlands more generally. Verification
across more sites and restoration ages is needed to assess the generality of the trends observed by
Hambley et al. (2019).
In western Ireland, felling of planted conifers on blanket peatland has been linked to elevated DOC
concentrations in surface waters as a result of decomposing conifer foliage, litter and brash (Cummins
and Farrell, 2003b; Muller et al., 2015). Additionally, increased stream DOC concentrations and fluxes
were observed in the two years after felling at a site in the north of Scotland (Muller and Tankéré-
Muller, 2012). Despite changes in water balance and DOC concentrations, a comparison of catchments
dominated by forested bog, open bog or forest-to-bog management in the north of Scotland did not
find any significant effects of forest-to-bog management on aquatic carbon exports, which were more
strongly associated with catchment properties and climatic variables (Gaffney, 2017). Nevertheless, it
is suggested that as the proportion of a catchment felled increases, this could also increase C export
and reduce any “buffering” currently performed by non-afforested portions of studied catchments
(Gaffney, 2017). Peaks of C exports were associated with high discharge (storms) events, especially
those in the late summer which occurred after a build-up of DOC in the peat as a result of drier and

Page 39 of 125
warmer conditions, with one study suggesting that between 57-95% of the export occurred during 5-
10% of the high flows (Vinjili, 2012). These studies indicate that monitoring of DOC export should
include a strategy combining high frequency sampling during storms as well as low frequency sampling
at low flow.
8.6. Modelling of Peat Soils and Forestry Function
While field studies are essential to understanding the GHG balance of individual sites, upscaling these
results in space and time may be done using either emission factors based upon empirical data (as
used in UNCFFF Tier 2 emissions accounting) or detailed process models. These need to be sufficiently
comprehensive to include CH4 and N2O fluxes, the effects of alterations to water tables and other
disturbances, and be appropriate for peatlands in UK conditions. Appropriate soil GHG process models
are only now becoming available, although their treatment of disturbance effects are presently
limited. The ECOSSE soil process model includes the major GHG’s (C and N gaseous and soluble losses)
(Smith et al., 2007, 2009) and the authors discuss the possible effects of climate change on peatland
erosion and peat loss in detail. They conclude from their scenario modelling that climate change,
between 1990 and 2060 will result in a decline in Scottish soil C stocks of less than 0.01% of present C
stocks, and less than 1/50th of the likely changes from land use (Smith et al., 2009). The experimental
collection of GHG flux data, and the deployment of flux measurement systems for CO2 and CH4 will
require around 3-5 years of ‘continuous’ measurements to provide adequately constrained data that
accounts for inter-annual variability. Measurements of C losses from first rotation cultivation are more
difficult to establish, since planting on peat is no longer sanctioned therefore balancing these initial
losses with subsequent gains in timber cannot be established in the field without specific new
experiments to do so. With methodologies based on chronosequence assessments it is possible to
cover a range of forest – bog restoration scenarios. The data from these can then be used to constrain
process-based models, to which should be added other elements of the climate footprint of forestry
compared to open blanket peatland: fossil fuel use in harvesting, transport to markets, track
construction and maintenance, fertiliser production, fencing, etc.
In the interim, it is feasible to provide additional general insight into the CO2e of CH4 dynamics of
afforested – restock – clearfell – restored – near pristine peatlands using simple CH4 emission
measurements from UK soils. For example, Levy et al. (2012) showed that UK upland peat sites had
positive and substantial mean CH4 emission rates (range from 0.69-3.46 tCO2e ha-1 y-1). They then
derived an empirical relationship between water table depth and soil CH4 emissions across their range
of sites. The authors noted that this CH4 emission rate change per cm water table depth implies that
an increase in CO2 sequestration (by restored bog vegetation) after restoration of 0.1 ± 0.04 tCO2 ha-1
y-1 per cm of water table height increase would be required to maintain the GHG balance. For
afforested and restocked sites data is required on the contribution of drainage features to CH4
production. In developing an understanding of the land use change for NECB the potential accrual of
bog vegetation carbon should also be accounted for. In Finland assessments of methane flux on
drained afforested peats have been used to constrain CH4 estimates based on broad peat type
classifications and tree standing volume as the scaler for methane flux (Minkkinen et al., 2007). This
approach would offer the potential for time-for-space assessments of CH4 in afforested and early
restocked peat forestry scenarios prior to flux constrained models being validated.
8.7. Implications for the Peatland Code

Page 40 of 125
“The Peatland Code is a voluntary standard for UK peatland projects wishing to market the climate
benefit of peatland restoration” (IUCN Peatland Programme). Currently forest-to-bog restoration is
not included under the Peatland Code. It would be too expensive to measure carbon values on a
project by project basis, and certainly could not account for the timeframe involved, hence the
peatland code relies on having broad average values to cover the various conversion options. These
are stated as the change in net ecosystem productivity from a degraded state to a less
degraded/improved one (Table 4).
Peatland Code
Condition Category
Descriptive Statistic
CO2 CH4 N2O DOC* POC Emission
Factor
Pristine - - - - - - Unknown
Near Natural
Mean (+-StE)
-3.0 (0.7) 3.2 (1.2) 0.00 (0.0) 0.88 0 1.08
Median -2.3 1.5 0.0
Modified
Mean (+-StE)
-0.1 (2.3) 1.0 (0.6) 0.5 (0.3) 1.14 0 2.54
Median 0.1 0.2 0.5
Drained
Mean (+-StE)
1.4 (1.8) 2.0 (0.8) 0.00 (0.0) 1.14 0 4.54
Median -0.9 1.0 0.0
Actively Eroding
Mean (+-StE)
2.6 (2.0) 0.8 (0.4) 0.0 (0.0) 1.14
19.3 (Average of 14.67
and 23.94)
23.84
Table 4: Emissions factors for each condition category after statistical analysis (tCO2e ha-1 y-1) using
IPCC default values for DOC. Insufficent data for Pristine sites (from Smyth et al., 2015).
At the present time equivalent values for forest-to-bog restoration cannot reasonably be estimated
from the available data for restoration of a forested or clear-felled site to an open bog of any
‘condition’ category. While the range of values from afforested bogs could be determined given
sufficient effort, determining the carbon balance of a set of restored bogs, previously under trees,
would require an extended period of time, covering the decades following restoration. With one or
two exceptions, these do not currently exist. To assume that a restored bog will achieve the carbon
balance of a ‘near-pristine’ bog is not something that is currently proven and, in absence of real
evidence, remains subject to debate.
There is only one study to date of CO2 emissions from a clear-fell site, with another ongoing, and there
are many uncertainties including the time since clear-fell, harvesting methods as well as the site
conditions, so it is not possible to determine emissions factors for clear-felled sites as a baseline from
which to restore under the Peatland Code.
8.8. Learning from the Woodland Carbon Code
The Woodland Carbon Code, managed by the Forestry Commission, is the UK’s standard for woodland
creation projects (on soils with less than 50 cm organic layer) where claims about the sequestration
benefits can be made. Whilst the UK Woodland Carbon Code accounts for stock changes over time
rather than change in flux moving from one state to another, there are some useful comparisons to
be made:

Page 41 of 125
Within the UK Woodland Carbon Code, projects need to account for any loss of GHG as a result of
their project going ahead. This could be:
● Loss of carbon from soil due to disturbance
● Loss of carbon from biomass already onsite if it is removed to create woodland
● GHG emissions due to onsite and offsite operations
Within the Woodland Carbon Code, only carbon or GHG onsite are accounted for (In practice a project
managed on a clearfell rotation can only claim the long-term average increase in carbon stock) and
effectively timber removed is accounted for as a loss for a number of reasons:
● It is conservative, and simpler
● As stated, there are large uncertainties in the ‘fate’ of the timber and to what use it will be
put
● There are difficulties in allocating ownership of carbon in harvested wood products.
If at some point in the future, there was sufficient data to account for forest to bog restoration within
the Peatland Code, these principles could be borne in mind. Also, it is unlikely that a single ‘forest’ or
‘clearfell’ flux could be established as there are many factors which would determine the flux at a
particular site (including the timescale, site conditions, age of trees or status through a first or second
rotation, amount of cultivation or drainage, harvesting techniques and time since harvest). Any flux
should represent the net ecosystem productivity (both the vegetation/biomass and the soil) in a
similar manner to the current flux estimates for each peatland condition category.
Tools developed for the Woodland Carbon Code could help determine the stock or flux of tree biomass
at a particular site prior to restoration, and both the change in net ecosystem productivity from forest
to bog as well as the stock changes in biomass should be considered in any calculation of change from
one status to another. This may require a range of fluxes or a site-specific calculation rather than a
single flux rate for a ‘forestry’ or a ‘clearfell’ site.
9. Evidence gaps and further research
9.1. Forest to bog restoration
There are several surface smoothing methods being used to restore blanket bog. Ground-smoothing
has been studied extensively and has demonstrated the ability to restore hydrology and initial
colonisation by specialist bog species. However, the long-term succession, tertiary vegetation
assemblages and implications for fauna are still unknown. Other surface smoothing approaches are
less well studied (though work is underway), and further empirical data is required to ratify
treatment efficacy.
The associated environmental effects of surface smoothing techniques are partially known, but
longer-term studies of sediment, nutrient and DOC parameters are needed to provide confidence to
the scale at which treatments can be implemented in the landscape and the effectiveness of
mitigation measures. There is also a need for further guidance on which water quality parameters
are important, and any thresholds which should be maintained.

Page 42 of 125
The costs of some treatments are currently only known from a small number of projects, or from
small treatment areas which are inherently less efficient. Additional focus on maximising technique
efficiencies and variability in different conditions would be useful for planning and budgeting for
forestry to bog restoration projects.
Almost all of the work on forestry to bog restoration with companion monitoring data has been
conducted on blanket bog, so the efficacy of the methods on lowland bogs is virtually unknown.
9.2. Carbon cycling
Current UK policy is to avoid afforestation on peat soils. Whether re-planting trees on existing UK peat
sites ameliorates or exacerbates climate change is uncertain, with active restoration considered for
many peat types, whilst certain peat site types can be considered for a further forestry rotation where
the inherent nutritional quality and underlying lithology will support commercial timber production.
There is additional uncertainty regarding restoration or “peatland edge woodland” development. The
situation is different with organo-mineral soils where there is greater acceptance that forestry
provides a considerable and multiple-rotation net climate benefit (Vanguelova et al. 2018).
A particularly important evidence gap is measurements of the whole system greenhouse gas budgets
for afforested peatlands. There is currently no complete, published ecosystem-scale flux monitoring
dataset for any UK afforested peatland, or for restored peatland sites, of any age. This data can only
be obtained from aquatic flux monitoring paired with eddy-covariance or intensive field campaign
assessments, which are both cost and labour-intensive. Additionally, such measurements need to be
multiannual as no single year can be taken as being typical. It is imperative that monitoring needs to
include CH4 assessment to be of real value in understanding the ecosystem net GHG balance, with
such data then being able to feed-in and constrain models of soil function, and ultimately inform land
use change decisions.
Monitoring is in progress, data is currently being analysed and prepared for publications, though
several sites do not have methane measurements. Furthermore, it will take several years to produce
a data series of suitable length to inform process-based models and inform policy decisions. This
monitoring is currently un-replicated, although studies are being conducted on organo-mineral soils.
Particular uncertainty surrounds carbon losses from peats in the initial planting phase when large
fluxes most likely occurred. Fluxes through this phase cannot be easily quantified as new planting on
unafforested peat is not taking place. As current policy removes new afforestation of peat, the key
questions are at the restock or restore phase, which should realistically be addressed prior to
commercial forest harvest, with appropriate models, constrained for full GHG balance and input to
LCA for ancilliary impacts of management. The construction of an LCA for peat management could
then be extended to include agricultural peats, grazed moorland and impacts such as muirburn and
peat erosion.
Carbon-stock comparison studies which integrate all losses or gains of carbon over time and avoid the
short-termism often encountered in flux studies, should also be considered. However, such studies
cannot disaggregate alternative carbon forms and pathways so there may even be a case for ploughing
and planting a small area of natural peat for measurements to be undertaken. In addition, the impacts
of restoration practices or restocking on DOC and POC fluxes are important components of site carbon
stock which need to be more thoroughly addressed.

Page 43 of 125
The development of full GHG constrained models of soil and forest function can then underpin and
allow robust intercomparison of site management options by LCA. LCA scenario analysis requires new
underpinning data, process understanding, and testing. Then the comparative impacts of different
land management options can be addressed robustly, both from the natural capital GHG point of view
and from the wider LCA point of view. It is recommended that both the site-level C balance (over a full
rotation and including biomass harvest as a loss term) ought to be considered alongside an LCA as part
of any management decision-making process. If underpinned by process modelling the potential
impacts of future regional climate change can be factored in to give nuance to the policy and best-
practice guidance. In terms of restoration and peatland edge woodland there is a basic need for flux
measurements from a range of sites and a range of time-periods. The chronosequence approach has
particular advantages to allow a pseudo-time-series to be produced rapidly.

Page 44 of 125
10. References
Abdalla, M., Hastings, A., Bell, M. J., Smith, J. U., Richards, M., Nilsson, M. B., Peichl, M., Lofvenius,
M. O., Lund, M., Helfter, C., Nemitz, E., Sutton, M. A., Aurela, M., Lohila, A., Laurila, T., Dolman, A. J.,
Belelli-Marchesini, L., Pogson, M., Jones, E., Drewer, J., Drosler, M. and Smith, P. 2014. Simulation of
CO2 and attribution analysis at six European peatland sites using the ECOSSE model. Water, Air and
Soil Pollution, 225, p.2182–2196.
Abdalla, M., Hastings, A., Truu, J., Espenberg, M., Mander, U & Smith, P. (2016) Emissions of
methane from northern peatlands: a review of management impacts and implications for future
management options. Ecology and Evolution 2016 6 7080-7102.
Ahtiainen, M., Huttunen, P., 1999. Long-term effects of forestry managements on water quality and
loading in brooks 101–114
Anderson, A. R., D. Ray, D.G. Pyatt. 2000; Physical and hydrological impacts of blanket bog
afforestation at Bad a′ Cheo, Caithness: the first 5 years, Forestry: An International Journal of Forest
Research, Volume 73, Issue 5, 1 January 2000, Pages 467–478,
https://doi.org/10.1093/forestry/73.5.467
Anderson, A. R. 2001. Deforesting and restoring peat bogs: A review. Forestry Commission,
Edinburgh.Anderson, A. R. 2010. Restoring afforested peat bogs: results of current research,
FCRN006. Forestry Commission, Edinburgh.
Anderson, A. R., K. Watts, N. Riddle, I. Crosher and I. Diack. 2014. An assessment of the afforested
peatland in England and opportunities for restoration. Forest Research, Edinburgh.
Anderson, C. J., D. J. Campbell, R. M. Ritchie and D. L. O. Smith. 1989. Soil shear strength
measurements and their relevance to windthrow in Sitka spruce. Soil Use and Management, 5:62-66.
Anderson, R., 2001. Forestry Commission Technical Paper 32: Deforesting and restoring peat bogs - a
review, Edinburgh.
Anderson, R., Vasander, H., Geddes, N., Laine, A., Tolvanen, A., O’sullivan, A., Aapala, K., 2016.
Afforested and forestry-drained peatland restoration. In: Bonn, A. (Ed.), Peatland Restoration and
Ecosystem Services: Science, Policy and Practice. Cambridge Univeristy Press, Cambridge, pp. 213–
233
Anderson, R. & Peace, A., 2017. Ten-year results of a comparison of methods for restoring afforested
blanket bog. Mires and Peat, 19(6), pp.1–23
Artz, R., Chapman, S., Donnelly, D., and Matthews, R., 2013. Potential Abatement from Peatland
Restoration. ClimateXChange enquiry number 1202-02. Edinburgh, ClimateXChange.
Artz, R. R. E. & Chapman, S. J., 2016. Peatlands. A summary of research outputs supported or
facilitated by the Environmental Change Programme of the Scottish Government’s Portfolio of
Strategic Research 2011-2016

Page 45 of 125
Artz, R. and A. McBride. 2017. Data from the Peatland Action Programme and their use for
evaluations of ecosystem benefits. ClimateXchange, Edinburgh.
Asam, Z. ul Z., Nieminen, M., O’Driscoll, C., O’Connor, M., Sarkkola, S., Kaila, A., Sana, A., Rodgers,
M., Zhan, X., Xiao, L., 2014. Export of phosphorus and nitrogen from lodgepole pine (Pinus contorta)
brash windrows on harvested blanket peat forests. Ecol. Eng. 64, 161–170.
Baird, A.J., Holden, J. and Chapman, P. (2009) A literature review of evidence on emissions of
methane in peatlands. Defra research project SP0574 final report. Defra.
Basiliko, N., Yavitt, J. B., Dees, P. M., and Merkel, S. M. (2003) Methane biogeochemistry and
methanogen communities in two northern peatland ecosystems, New York State. Geomicrobiology
Journal 20, 563-577.
Betts, R.A. (2000) Offset of the potential carbon sink from boreal forestation by decreases in surface
albedo. Nature 408, 187–190.
Beadle, J.M., Brown, L.E. & Holden, J., 2015. Biodiversity and ecosystem functioning in natural bog
pools and those created by rewetting schemes. Wiley Interdisciplinary Reviews: Water, 2(2), pp.65–
84.
Billett, M. F., Palmer, S. M., Hope, D., Deacon, C., Storeton-West, R., Hargreaves, K. J., Flechard, C.,
and Fowler, D. (2004) Linking land-atmosphere-stream carbon fluxes in a lowland peatland system.
Global Biogeochemical Cycles 18.
Billett, M. F., Charman, D. J., Clark, J. M., Evans, C. D., Evans, M. G., Ostle, N. J., Worrall, F., Burden,
A., Dinsmore, K. J., Jones, T., McNamara, N. P., Parry, L., Rowson, J. G., and Rose, R. (2010) Carbon
balance of UK peatlands: current state of knowledge and future research challenges. Climate
Research 45, 13-29.
Boggie, R. and H. G. Miller. 1976. Growth of Pinus contorta at Different Water-Table Levels in Deep
Blanket Peat. Forestry: An International Journal of Forest Research, 49:123-131.
Byrne, K. A., Chonjicki, B., Christensen, T. R., Drosler, M., Freibauer, A., Friborg, T., Frolking, S.,
Lindroth, A., Mailhammer, J., Malmer, N., Selin, P., Turunen, J., Valentini, R., and Zetterberg, L.
(2004) EU Peatlands: Current carbon stocks and trace gas fluxes. Christensen, T. R. and Friborg, T.
CarboEurope-GHG Report 7/2004 Specific Study 4.
Chapman, S. J., Bell, J. S., Campbell, C. D., Hudson, G., Lilly, A., Nolan, A. J., Robertson, A. H. J., Potts,
J. M., and Towers, W. (2013a) Comparison of soil carbon stocks in Scottish soils between 1978 and
2009. European Journal of Soil Science 64, 455-465.
Chapman, S., Thomson, K., and Matthews, R. (2013b) AFOLU accounting: implication for
implementing peatland restoration - costs and benefits. ClimateXChange enquiry number 1208-01.
2013. Edinburgh, ClimateXChange
Clymo, R. 1984. The limits to peat bog growth. Phil. Trans. R. Soc. Lond. B, 303:605-654.

Page 46 of 125
Couwenberg, J., Thiele, A., Tanneberger, F., Augustin, J., Baerisch, S., Dubovik, D., Liashchynskaya, N.,
Michaelis, D., Minke, M., Skuratovich, A., and Joosten, H. (2011) Assessing greenhouse gas emissions
from peatlands using vegetation as a proxy. Hydrobiologia 674, 67-89.
Creevy, A.L., Andersen, R., Rowson, J.G. and Payne, R.J., 2018. Testate amoebae as functionally
significant bioindicators in forest-to-bog restoration. Ecological Indicators, 84, pp.274-282.
Cummins, T., Farrell, E.P., 2003a. Biogeochemical impacts of clearfelling and reforestation on blanket
peatland streams I. phosphorus. For. Ecol. Manage. 180, 545–555.
Cummins, T., Farrell, E.P., 2003b. Biogeochemical impacts of clearfelling and reforestation on
blanket-peatland streams II. Major ions and dissolved organic carbon. For. Ecol. Manage. 180, 557–
570.Dargie, G. C., S. L. Lewis, I. T. Lawson, E. T. Mitchard, S. E. Page, Y. E. Bocko and S. A. Ifo. 2017.
Age, extent and carbon storage of the central Congo Basin peatland complex. Nature, 542:86.
Dinsmore, K. J., Skiba, U. M., Billett, M. F. , Rees, R. M., and Drewer, J. (2009) Spatial and temporal
variability in CH4 and N2O fluxes from a Scottish ombrotrophic peatland: Implications for modelling
and up-scaling. Soil Biology & Biochemistry 41, 1315-1323.
Dinsmore, K. J., Billett, M. F., Skiba, U. M., Rees, R. M., Drewer, J., and Helfter, C. (2010) Role of the
aquatic pathway in the carbon and greenhouse gas budgets of a peatland catchment. Global Change
Biology 16, 2750-2762.
Fernandez Pravia, A. 2018. The response of arthropod assemblages to peatland restoration in
formerly afforested blanket bog. PhD thesis, University of Aberdeen
Finnegan, J., Regan, J.T., O’Connor, M., Wilson, P., Healy, M.G., 2014b. Implications of applied best
management practice for peatland forest harvesting. Ecol. Eng. 63, 12–26.
Forestry Commission Scotland. 2015. Deciding future management options for afforested deep
peatland. Forestry Commission, Edinburgh.
Forestry Commission. 2016. Forestry Statistics 2016. HMSO.
Gaffney, P. 2017. The effects of bog restoration in formerly afforested peatlands on water quality
and aquatic carbon fluxes. PhD thesis, University of Aberdeen
Gaffney, P., Hancock, MH, Taggart, MA, Andersen, R. 2018. Measuring restoration progress using
pore- and surface-water chemistry across a chronosequence of formerly afforested blanket bogs.
Journal of Environmental Management, 219: 239-251
Gilbert, D., Amblard, C., Bourdier, G. and Francez, A.J., 1998. The microbial loop at the surface of a
peatland: structure, function, and impact of nutrient input. Microbial ecology, 35(1), pp.83-93.
Goodyer, E., 2014. Quantifying the desmid diversity of Scottish blanket mires. Aberdeen University
Hambley, G., (2016) The effect of forest-to-bog restoration on net ecosystem exchange in The Flow
Country peatlands. PhD thesis, University of St Andrews.

Page 47 of 125
Hambley, G., Andersen, R., Levy, P., Saunders, M., Cowie, N.R., Teh Y.A. & Hill, T.C. (2019): Net
ecosystem exchange from two formerly afforested peatlands undergoing restoration in the Flow
Country of northern Scotland. Mires and Peat, 23(05), 1-14.
Hancock, M., Grant, M. & Wilson, J., 2009. Associations between distance to forest and spatial and
temporal variation in abundance of key peatland breeding bird species. Bird Study, 56(1), pp.53–64.
Hancock, M.H., Klein, D,, Andersen, R., and Cowie, N.R., 2018. Vegetation response to restoration
management of a blanket bog damaged by drainage and afforestation. Applied Vegetation Science.
;21, 167–178.
Hargreaves, K. J., Milne, R., and Cannell, M. G. R. (2003) Carbon balance of afforested peatland in
Scotland. Forestry 76, 299-317.
He, H., Jansson, P. E., Svensson, M., Björklund, J., Tarvainen, L., Klemedtsson, L. and Kasimir, A.
(2016). Forests on drained agricultural peatland are potentially large sources of greenhouse gases -
Insights from a full rotation period simulation. Biogeosciences, 13 (8), p.2305–2318.
Hermans, R. (2018) Impact of forest-to-bog restoration on greenhouse gas fluxes. PhD thesis,
University of Stirling.
Hommeltenberg, J., Schmid, H., Droesler, M., and Werle, P. (2014) Can a bog drained for forestry be
a stronger carbon sink than a natural bog forest? Biogeosciences 11, 3477-3493.
Huttunen, J. T., Nykanen, H., Turunen, J., and Martikainen, P. J. (2003) Methane emissions from
natural peatlands in the northern boreal zone in Finland, Fennoscandia. Atmospheric Environment
37, 147-151.
Huttunen, J. T., H. Nykänen, P. J. Martikainen and M. Nieminen. 2003. Fluxes of nitrous oxide and
methane from drained peatlands following forest clear-felling in southern Finland. Plant and Soil,
255:457-462.
IUCN UK PP. 2018. A secure peatland future: A vision and strategy for the protection, restoration and
sustainable management of UK peatlands. IUCN UK peatland programme, Edinburgh.
Joint Nature Conservation Committee. 2011. Towards an assessment of the state of UK peatlands.
JNCC report no. 445. Joint Nature Conservation Committee, Peterborough.
Koehler, A-K, Sottokornola, M, and Kiely, G. (2011) How strong is the current carbon sequestration of
an Atlantic blanket bog? Global Change Biology 17, 309-319.
Konings, W., Boyd, K., Andersen, R., Comparison of plant traits from sedges, shrubs and Sphagnum
mosses between forest-to-bog and open blanket bog sites: a pilot study. (Under review for Mires
and Peat)
Kritzler, U,H., Artz, R.R.E. and Johnson, D. (2016) Soil CO2 efflux in a degraded raised bog is regulated
by water table depth rather than recent plant assimilate. Mires and Peat, Volume 17, Article 01, 1–
14.

Page 48 of 125
Lavers, C.P. and Haines-Young, R.H., 1997. Displacement of dunlin Calidris alpina schinzii by forestry
in the flow country and an estimate of the value of moorland adjacent to plantations. Biological
conservation, 79(1), pp.87-90.
Levy, P. E., Burden, A., Cooper, M. D. A., Dinsmore, K. J., Drewer, J., Evans, C., Fowler, D., Gaiawyn, J., Gray, A., Jones, S. K., Jones, T., McNamara, N. P., Mills, R., Ostle, N., Sheppard, L. J., Skiba, U., Sowerby, A., Ward, S. E., and Zielinski, P. (2012) Methane emissions from soils: synthesis and analysis of a large UK data set. Global Change Biology 18, 1657-1669.
Levy, P.E., Hale, S.E. and Nicoll, B.C. (2004) Biomass expansion factors and root:shoot ratios for
coniferous tree species in Great Britain. Forestry 77 (5) 421-430.
Levy, P. E. and Gray, A. (2015) Greenhouse gas balance of a semi-natural peatbog in northern
Scotland. Environmental Research Letters 10.
Lilly, A.; Chapman, S.J.; Perez-Fernandez, E.; Potts, J., (2016) Changes to C stocks in Scottish soils due
to afforestation., Contract Report to Forestry Commission, 33pp
Lindsay, R.A., Charman, D.J., Everingham, F, O'Reilly, R.M., Palmer, M.A., Rowell, T.A. and Stroud,
D.A. 1988. The Flow Country : The peatlands of Caithness and Sutherland. Peterborough,
Nature Conservancy Council.
Lindsay, R. 2010. Peatbogs and carbon: a critical synthesis to inform policy development in oceanic
peat bog conservation and restoration in the context of climate change. RSPB Scotland.
Lindsay, R., J. F. Birnie and J. Clough. 2014a. Briefing Note No 4: Ecological Impacts of Forestry on
Peatlands. IUCN Peatlands Programme, Edinburgh.
Lindsay, R., R. Birnie and J. Clough. 2014b. Impacts of Artificial Drainage on Peatlands. Briefing Note
3. IUCN Peatlands Programme, Edinburgh.
Löfgren, S., Ring, E., von Brömssen, C., Sørensen, R., Högbom, L., 2009. Short-term effects of clear-
cutting on the water chemistry of two boreal streams in northern Sweden: a paired catchment
study. Ambio 38, 347–56.
Menberu, M. W., et al. (2017). "Changes in Pore Water Quality After Peatland Restoration: Assessment of a Large-Scale, Replicated Before-After Control-Impact Study in Finland." Water Resources Research 53(10): 8327-8343.
Minkkinen, K., Laine, J., Nykänen, H. & Martikainen, P.J. (1997) Importance of drainage ditches in
emissions of methane from mires drained for forestry. Canadian Journal of Forest Research 27 949-
952.
Minkkinen, K. and Laine, J. (1998) Long-term effect of forest drainage on the peat carbon stores of
pine mires in Finland. Canadian Journal of Forest Research 28, 1267-1275.
Minkkinen, K. and Laine, J. (2006) Vegetation heterogeneity and ditches create spatial variability in methane fluxes from peatlands drained for forestry. Plant and Soil 285, 289-304.

Page 49 of 125
Minkkinen, K., Penttila, T., and Laine, J. (2007) Tree stand volume as a scalar for methane fluxes in forestry-drained peatlands in Finland. Boreal Environment Research 12, 127-132.
Minunno, F., Xenakis, G., Perks, M.P., and Mencuccini, M. (2010) Calibration and validation of a
simplified process-based model for the prediction of the carbon balance of Scottish Sitka spruce
(Picea sitchensis) plantations. Canadian Journal of Forest Research-Revue Canadienne de Recherche
Forestiere 40, 2411-2426.
Morison, J. 2012. Afforested peatland restoration. ClimateXchange, Edinburgh.
Morison, J. I. L. (2013) Afforested peatland restoration. Briefing to Scottish Government. Edinburgh,
ClimateXChange.
Morison, J., Vanguelova, E., Broadmeadow, S., Perks, M., Yamulki, S. and Randle, T. (2010).
Understanding the GHG implications of forestry on peat soils in Scotland. Report compiled by
Forestry Research staff for Forestry Commission Scotland, (October), p.55.
Muller, F.L.L., Tankéré-Muller, S.P.C., 2012. Seasonal variations in surface water chemistry at
disturbed and pristine peatland sites in the Flow Country of northern Scotland. Sci. Total Environ.
435–436, 351–62.
Muller, F.L.L., Chang, K.C., Lee, C.L., Chapman, S.J., 2015. Effects of temperature, rainfall and conifer
felling practices on the surface water chemistry of northern peatlands. Biogeochemistry 126, 343–
362.
Neal, C., Reynolds, B., 1998. The impact of conifer harvesting and replanting on upland water quality,
Environment Agency. Bristol.
Nisbet, T., 2005. Water Use by Trees. Edinburgh.
O’Driscoll, C., O’Connor, M., Asam, Z. ul Z., De Eyto, E., Rodgers, M., Xiao, L., 2014a. Creation and
functioning of a buffer zone in a blanket peat forested catchment. Ecol. Eng. 62, 83–92.
Ojanen, P., Minkkinen, K., and Penttila, T. (2013) The current greenhouse gas impact of forestry-
drained boreal peatlands. Forest Ecology and Management 289, 201-208.
Palviainen, M., Finer, L., Kurka, A. M., Mannerkoski, H., Piirainen, S., and Starr, M. (2004a) Release of potassium, calcium, iron and aluminium from Norway spruce, Scots pine and silver birch logging residues. Plant and Soil 259, 123-136.
Palviainen, M., Finer, L., Kurka, A. M., Mannerkoski, H., Piirainen, S., and Starr, M. (2004b) Decomposition and nutrient release from logging residues after clear-cutting of mixed boreal forest. Plant and Soil 263, 53-67.
Patterson, G. and R. Anderson. 2000. Forests and peatland habitats: guideline note. Guideline Note-
Forestry Commission.
Pravia Fernandez, A. 2018. The response of arthropod assemblages to peatland restoration in
formerly afforested blanket bog. PhD Thesis. University of Aberdeen. 299 pp.

Page 50 of 125
Ray, D. and B. C. Nicoll. 1998. The effect of soil water-table depth on root-plate development and
stability of Sitka spruce. Forestry: An International Journal of Forest Research, 71:169-182.
Reynolds, B. (2007) Implications of changing from grazed or semi-natural vegetation to forestry for
carbon stores and fluxes in upland organo-mineral soils in the UK. Hydrology and Earth System
Sciences 11, 61-76.
Rodgers, M., O’Connor, M., Healy, M.G., O’Driscoll, C., Asam, Z.U.Z., Nieminen, M., Poole, R.,
M??ller, M., Xiao, L., 2010. Phosphorus release from forest harvesting on an upland blanket peat
catchment. For. Ecol. Manage. 260, 2241–2248.
Ruel, J.-C. 1995. Understanding windthrow: Silvicultural implications. The Forestry Chronicle, 71:434-
445.
Samaritani, E., Siegenthaler, A., Yli-Petäys, M., Buttler, A., Christin, P.-A., and Mitchell, E. A. D.
Seasonal Net Ecosystem Carbon Exchange of a Regenerating Cutaway Bog: How Long Does it Take to
Restore the C-Sequestration Function? Restoration Ecology 19, 480-489. 2011.
Sloan, T., Payne, R.J., Anderson, A.R., Bain, C., Chapman, S., Cowie, N., Gilbert, P., Lindsay, R.,
Mauquoy, D., Newton, A. and Andersen, R., 2018. Peatland afforestation in the UK and
consequences for carbon storage. Mires and Peat. 23, 1-17.
Smith, J. U., Chapman, S. J., Bell, J. S., Bellarby, J., Gottschalk, P., Hudson, G., Lilly, A., Smith, P., and
Towers, W. (2009) Developing a methodology to improve soil C stock estimates for Scotland and use
of initial results from a resampling of the National Soil Inventory of Scotland to improve the ECOSSE
model: Final Report. Edinburgh, Rural and Environment Research and Analysis Directorate of the
Scottish Government, Science Policy and Co-ordination Division.
Smith, P., Smith, J., Flynn, H., Killham, K., Rangel-Castro, I., Foereid, B., Aitkenhead, M, Chapman, S.,
Towers, W., Bell, J., Lumsdon, D., Milne, R., Thomson, A., Simmons, I., Skiba, U., Reynolds, B., Evans,
C., Frogbrook, Z., Bradley, I., Whitmore, A, and Falloon, P. (2007) ECOSSE - Estimating carbon in
organic soils sequestration and emissions. Edinburgh, Scottish Executive Environment and Rural
Affairs Department.
Smyth, M.A., Taylor, E.S., Birnie, R.V., Artz, R.R.E., Dickie, I., Evans, C., Gray, A.,
Moxey, A., Prior, S., Littlewood, N. and Bonaventura, M. (2015) Developing Peatland Carbon Metrics
and Financial Modelling to Inform the Pilot Phase UK Peatland Code. Report to Defra for Project
NR0165, Crichton Carbon Centre, Dumfries
Strack, M. (2008) Peatlands and Climate Change. Jyväskylä, International Peat Society.
Stroud, D.A., Reed, T.M., Pienkowski, M.W. and Lindsay, R.A., 1987. Birds, bogs and forestry. British
Birds, 79, pp.110-185.
Stroud, D. A., T. M. Reed, W. Pienkowski and R. A. Lindsay. 1988. Birds, bogs and forestry- The
peatlands of Caithness and Sutherland. Nature Conservancy Council, Peterborough.

Page 51 of 125
Stroud, D. A., T. Reed, M. Pienkowski and R. Lindsay. 2015. The Flow Country: battles fought, war
won, organisation lost. p. 401-439. In D. B. A. Thompson, H. H. Birks and H. J. B. Birks (eds.), Nature's
conscience. The life and legacy of Derek Ratcliffe. Langford Press, Norfolk.
Sundh, I., Mikkela, È.-C., Nilsson, M. & Svensson, B.H. (1995) Potential aerobic methane oxidation in
a Sphagnum-dominated peatland: controlling factors and relation to methane emission. Soil Biology
and Biochemistry 27 829-837.
Suttie, G., Taylor, K., Livesey and F. Tickell (2009) Potential of forest products and substitution for
fossil fuels to contribute to mitigation Chapter 7 In: Read, D.J., Freer-Smith, P.H., Morison, J.I.L.,
Hanley, N., West, C.C. and Snowdon, P. (eds). Combating climate change – a role for UK forests. An
assessment of the potential of the UK’s trees and woodlands to mitigate and adapt to climate
change. The Stationery Office, Edinburgh.
Tallis, J. H. 1998. Growth and degradation of British and Irish blanket mires. Environmental Reviews,
6:81-122.
Vanguelova, E., Broadmeadow, S., Anderson, R., Yamulki, S., Randle, T., Nisbet, T., and Morison, J.
(2012) A Strategic Assessment of Afforested Peat Resources in Wales and the biodiversity, GHG flux
and hydrological implications of various management approaches for targeting peatland restoration.
Report by Forest Research staff for Forestry Commission Wales Project Reference No 480.CY.00075.
Vanguelova, E. I., S. Chapman, M. Perks, S. Yamulki, T. Randle, F. Ashwood and J. Morison. 2018.
Afforestation and restocking on peaty soils – new evidence assessment. Climate X Change, Scotland.
Vinjili, S., 2012. Landuse change and organic carbon exports from a peat catchment of the Halladale
River in the Flow Country of Sutherland and Caithness, Scotland. PhD Thesis. University of St
Andrews.
Warren, C. 2000. ‘Birds, bogs and forestry’ revisited: The significance of the flow country
controversy. The Scottish Geographical Magazine, 116:315-337.
Wilson, J.D., Anderson, R., Bailey, S., Chetcuti, J., Cowie, N.R., Hancock, M.H., Quine, C.P., Russell, N.,
Stephen, L. and Thompson, D., 2014. Modelling edge effects of mature forest plantations on
peatland waders informs landscape‐scale conservation. Journal of applied ecology, 51(1), pp.204-
213.
Worrell, R. and D. C. Malcolm. 1990. Productivity of Sitka Spruce in Northern Britain 2. Prediction
from Site Factors. Forestry: An International Journal of Forest Research, 63:119-128.
Worrall, F., Burt, T., Rowson, J., Warburton, J., and Adamson, J. (2009) The multi-annual carbon
budget of a peat-covered catchment. Science of the Total Environment 407, 4084-4094.
Worrall, F., Chapman, P., Holden, J., Evans, C., Artz, R., Smith, P. and Grayson, R. (2011). A review of
current evidence on carbon fluxes and greenhouse gas emissions from UK peatlands. JNCC Report
No. 442, (Report 442), p.91.
Yu, Z. (2011). Holocene carbon flux histories of the world’s peatlands: Global carbon-cycle
implications. The Holocene, 21(5), pp.761-774.

Page 52 of 125
Appendices: Peatlands and forestry
Douglas Campbell & Peter Robson6
January 2019
This review was commissioned by the IUCN UK Peatland Programme’s Commission of Inquiry on
Peatlands. The IUCN UK Peatland Programme is not responsible for the content of this review and
does not necessarily endorse the views contained within.
6 With thanks to co-authors Roxane Andersen, Russell Anderson, Steve Chapman, Neil Cowie, Ruth
Gregg, Renée Hermans, Richard Payne, Mike Perks, Vicky West.

Page 53 of 125

Page 54 of 125
Appendix A Afforested bog condition: a quantitative comparison
A study undertaken on SPR’s Black Law Windfarm Extension yielded a set of monitoring data which
neatly illustrates the variability of conditions likely to be experienced on a typical forest-to-bog
restoration site, in advance of it being deforested.
The original aim of the study was to quantify the impacts of turbine construction in forestry on a
parcel of high-quality adjacent open bog. A by-product of the study (refer to design diagram in
Figure A1) was that the conditions on site were quantified in great detail in advance of being cleared
of trees and the turbine constructed.
The site had 3 main habitat types present: high-quality blanket bog, afforested bog with growth-
checked Sitka spruce and afforested bog with well-developed Sitka spruce. A range of hydrological
monitoring was installed, including a systematic network of dipwells (to quantify differences in bog
water table at set intervals) and several pressure transducers (to quantify behaviour through time).
Various measurements were made of the tree crop and the vegetation present also.
Whilst all sites had broadly similar depths of peat present at 2-3m, and the topography of the sites
plus an analysis of historic air photos pre-afforestation showed that conditions in advance of
afforestation were very similar, the hydrology of the 3 habitats in advance of construction was very
different. The bog water table was highest in the high-quality bog, where it remained very close to
the surface almost all year round and varied very little indeed between rain events (Figure A2). The
well-developed woodland had a much lower bog water table, within the peat mass below the trees,
and a larger amplitude of fluctuation especially between summer and winter but also in between
rain events. The checked forest site showed an intermediate response. The well-developed forest
had lost most of its original bog vegetation whereas the checked forest retained a surprising amount
of it. The high-quality site contained well developed hummock and hollow topography and a wide
range of Sphagna, hence the most surprising aspect of this part of the study was that such different
habitats existed side-by-side within a relatively small area and yet all had been derived from the
same original peatland.

Page 55 of 125
Figure A1 Overview of the design for the ‘Turbine 77’ construction study. Part of this project
involved quantifying conditions prior to construction of the windfarm infrastructure (grey polygons).
A gradient design was employed, and a by-product was that undisturbed mire (dark green fill), dense
forest (green stripes) and checked forest (green hatching) were included. Dipwells (red crosses)
were monitored for almost 24 months in advance of construction – details of the bog water table
behaviour over time were also assessed through time using a pressure transducer in each habitat
type.
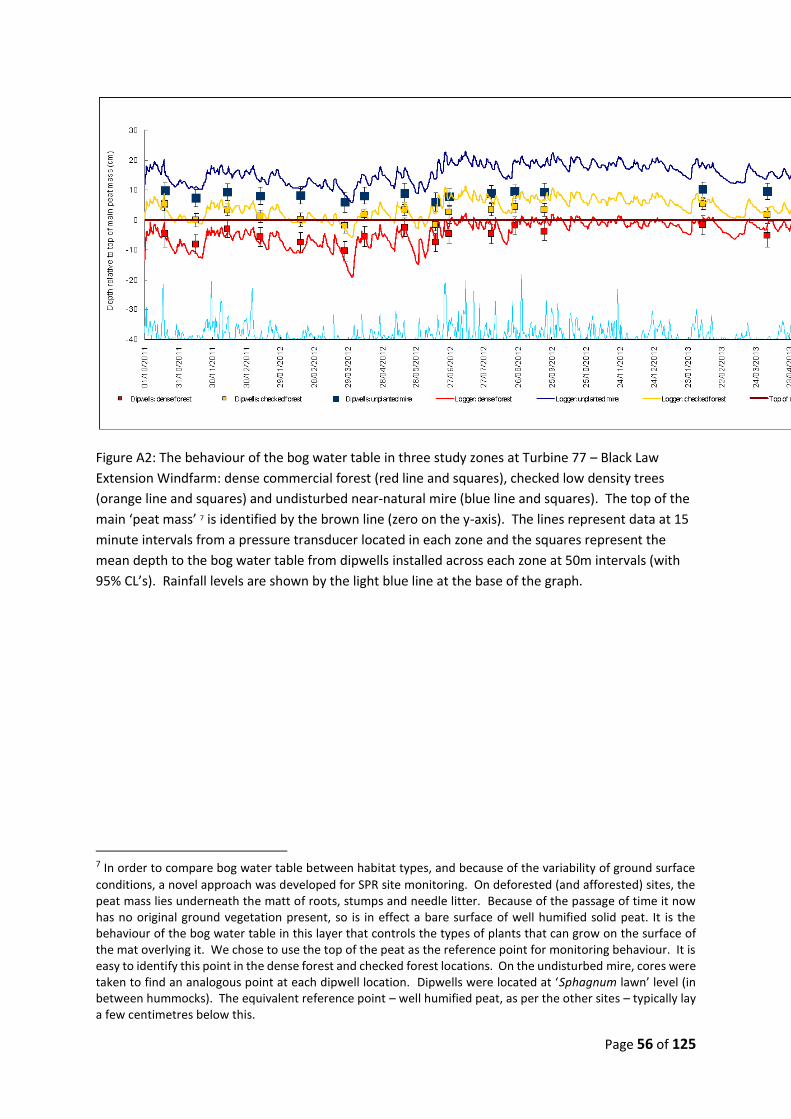
Page 56 of 125
Figure A2: The behaviour of the bog water table in three study zones at Turbine 77 – Black Law
Extension Windfarm: dense commercial forest (red line and squares), checked low density trees
(orange line and squares) and undisturbed near-natural mire (blue line and squares). The top of the
main ‘peat mass’ 7 is identified by the brown line (zero on the y-axis). The lines represent data at 15
minute intervals from a pressure transducer located in each zone and the squares represent the
mean depth to the bog water table from dipwells installed across each zone at 50m intervals (with
95% CL’s). Rainfall levels are shown by the light blue line at the base of the graph.
7 In order to compare bog water table between habitat types, and because of the variability of ground surface
conditions, a novel approach was developed for SPR site monitoring. On deforested (and afforested) sites, the peat mass lies underneath the matt of roots, stumps and needle litter. Because of the passage of time it now has no original ground vegetation present, so is in effect a bare surface of well humified solid peat. It is the behaviour of the bog water table in this layer that controls the types of plants that can grow on the surface of the mat overlying it. We chose to use the top of the peat as the reference point for monitoring behaviour. It is easy to identify this point in the dense forest and checked forest locations. On the undisturbed mire, cores were taken to find an analogous point at each dipwell location. Dipwells were located at ‘Sphagnum lawn’ level (in between hummocks). The equivalent reference point – well humified peat, as per the other sites – typically lay a few centimetres below this.

Page 57 of 125
Appendix B Black Law Windfarm Habitat Succession Post-Felling 2004 – 2012
The construction of Black Law windfarm in Lanarkshire, from 2004-05, involved the permanent
deforestation of 434ha of forest planted in the 1970’s. The site, which was dominated by peat
ranging in depth from 0.5m to over 6m, was monitored annually from 2004 (in advance of tree
clearance) to 2012 to ascertain the extent to which blanket bog re-colonised spontaneously (i.e.
without intervention).
Three main methods of tree clearance were used: Whole Tree Harvesting (WTH; sites dominated by
peat of 5-6m depth), Conventional Harvesting (also called “Fell and Brash” or FAB; variable peat
depth up to 3m but with considerable areas where peat was ~ 0.5m) and Mulch to Waste (MTW).
Mulching was in fact undertaken using two different approaches: Mulch to Waste “Flail” (using an
excavator mounted drum flail, MTW-F, on peat dominated sites where depths ranged from 0.5m –
6m, mainly in the range 2-4m) and Mulch to Waste “Gallotrax” (using a bulldozer style ground based
mulcher, MTW-G, but only on forest located on mineral soils which was localised).
Monitoring was set up using a network of permanent 1x1m quadrats, in advance of felling so that
the ‘background conditions’ could be quantified. A nested design was employed, whereby sampling
was undertaken in a range of different conditions to explain local variability in site restoration
response.
● Random quadrats were set up in each type of clearance site (n=50 FAB, n=50 WTH, n=50
MTW, mainly in F but with some G locations also). Quadrats lay where they fell, and were
not sub-stratified or otherwise deliberately located on particular micro-topographic
features8.
● Within each, quadrats were set up in two different situations: (i) where the forest floor
comprised exclusively of needle litter, and (ii) where the forest floor had remnant vegetation
present9.
● At each of the MTW locations, a nest of 3 quadrats was placed at the pre-felling stage. After
clearance all plots were re-located and manipulation of the surface was undertaken: (i) first
quadrat had mulch removed, (ii) second quadrat had the cleared chips piled on top and (iii)
the third quadrat was left untouched for reference purposes.
● On FAB sites additional quadrats were set up as required, after felling, so that all sampling
locations had monitoring on and off brash lanes.
8 This level of detail was not, at the time of design, felt worthwhile to include by the client based on cost-benefit.
At a later stage, once the site had been cleared and following several years of monitoring, stratified quadrats were sampled but by that stage it was very evident that intervention was needed on the sites hence tis monitoring stopped. 9 The selection process was as follows: (i) locate the first quadrat at random, and classify it as ‘needle dominated’
or ‘with remnant vegetation’, (ii) locate (using a systematic selection procedure) the opposite type nearby. Analysis was undertaken in two ways: (i) the first quadrat (‘primary’) comprised a true random sample and was employed when requiring site-wide inference (‘secondary quadrat’ omitted) and (ii) process-based analysis employed the two types as required.

Page 58 of 125
In addition, data were also collected from the Existing Blanket Bog (EBB), which is an area of
unplanted open blanket bog (albeit drained10) within the Windfarm site. The results from this area,
obtained in 2004, 2008 and 2012, were used as a reference to measure restoration success on the
deforested areas. An additional set of reference data were gathered in 2012 from the high-quality
open bog site at Turbine 77 (“HQ Mire”) on Black Law Extension (see section 3.6) for comparison
also11.
On each quadrat a range of environmental variables was gathered (e.g. peat depth) and the nature
of the vegetation cover quantified annually using pin frames, with the canopy being split into a lower
level (‘basal’; needles. mosses and soil) and a higher level (‘foliar’; vascular plants). This was
undertaken annually in summer or autumn12.
Trends in the abundance of key species groups13 over the monitoring period were as follows14:
a) Heather (Calluna vulgaris) recovered rapidly after deforestation but to the point where it
became more widely distributed and abundant on cleared sites than on the EBB and HQ
Mire reference sites despite felled areas being generally dominated by deep peat. This
result implied surface conditions remained generally dry across most of the site (Figure B1);
b) Bog mosses (Sphagnum spp.) were relatively common under the tree canopy prior to felling
(Figure B2; levels in WTH and MTW-F were close to levels in the EBB). A slow recovery was
seen after felling in WTH and MTW-F, following a dramatic decrease at the time of felling
due to dessication, but cover levels remained well below those in the EBB and far below
those on the HQ Mire. Cover levels present 7-8 years after felling tended to reflect the
levels present pre-felling (Figure B3).
c) ‘True grass’ species (e.g. Deschampsia, Holcus, Festuca etc) colonised rapidly after felling
and, by 2008, were already more widely distributed and abundant on the deforestation sites
than on the reference sites (Figure B4). However, abundance was somewhat variable with a
decline in 2009. It is thought that a large part of the variability in abundance recorded
related to variations in the monitoring date each year, and associated interactions between
10 It was judged, on balance, more important to employ an extensive local reference site than look for a reference site further
away in better condition. Given the nature of impacts present in this area of lowland Scotland, due to farming, the site we selected was in fact one of the better examples of extensive blanket mire available. In interpreting the evidence, it was then simply a case of accepting that the reference site was the ‘minimum standard’ we sought to reach in restoration work. That said, an undrained site was present at Black Law (very much smaller but in very good condition) so later in the project the data from this site was also used as an alternative reference (‘HQ Mire’ – see charts overleaf). 11 This site contained very high-quality open bog with no significant land management impacts present albeit the site was
adjacent to a forest plantation. However, the site is small and hence does not reflect the same degree of landscape variability as the EBB site which is, for this reason, a better analogue for the deforestation site as a whole. 12 MTW-G monitoring stopped quite early, as the sites very quickly re-colonised with grasses. Data have been left in the
charts within this section as a useful reference, as many forest-to-bog sites do have areas of shallow peat or mineral soil present. 13 Heather was considered a useful indicator – in abundance it is indicative of dry conditions but at low abundance on a
blanket mire is is expected to be seen and is a sign of acceptable condition. Bog mosses are expected to be seen, along with Hare’s Tail cottongrass (albeit not if over-dominant). True grasses are typically absent or otherwise exist at very low densities on good quality mire. 14 A far more extensive set of results was obtained but only a short summary is included here for brevity

Page 59 of 125
the weather pattern each year (quality of growing season; date of first frosts etc) and its
effect on the biomass of true grasses present at the exact time of assessment.
d) Cottongrasses (almost exclusively Eriophorum vaginatum) recovered rapidly, to the extent
that levels in WTH and MTW-F eventually became similar to the EBB albeit slightly below
that on the HQ Mire site (Figure B5). Cover is lower in FAB but this was to be expected due
to a lower proportion of quadrats located on peat > 0.5m.
Figure B1: The % of ‘pin hits’ in the upper vegetation canopy on Heather Calluna vulgaris, as
measured on randomly-located sets of monitoring plots in the FAB, MTW-F, MTW-G and WTH areas.
Plots were sampled in summer 2004 before felling then after felling in autumn 2005, 2006, 2007,
2008, 2009, 2010 , 2011 and finally 2012. Data for adjacent land (EBB) are also shown for reference
purposes. EBB plots were sampled in 2004, 2008 and 2012. Also shown are data gathered from the
high-quality open mire site at Turbine 77 on Black Law Extension (referred to earlier – see section
3.6).
Figure B2: The % of ‘pin hits’ in the lower vegetation canopy on Bog mosses Sphagnum spp., as
measured on randomly-located sets of monitoring plots in the FAB, MTW-F, MTW-G and WTH areas.
Refer to the caption for Figure B1 for more details.

Page 60 of 125
Figure B3: The mean % ‘pin hits’ in the lower vegetation canopy on Sphagnum moss spp. as
measured on monitoring plots located in three separate areas of WTH (Birniehall, Substation and
Climpy). Refer to the caption for Figure B1 for more details.
Figure B4: The mean % ‘pin hits’ in the upper vegetation canopy on ‘true grasses’ as measured on
randomly-located sets of monitoring plots in the FAB, MTW-F, MTW-G and WTH areas. Refer to the
caption for Figure B1 for more details.

Page 61 of 125
Figure B5: The % of ‘pin hits’ in the upper vegetation canopy on Hare’s Tail Cottongrass Eriophorum
vaginatum, as measured on randomly-located sets of monitoring plots in the FAB, MTW-F, MTW-G
and WTH areas. Refer to the caption for Figure B1 for more details.
The surface of the felled areas (FAB, WTH and to a lesser extent MTW-F sites) still had very visible
ridges present where the trees were planted on, and their associated plough furrows, clearly visible
amongst the vegetation. Upon testing, the ridges were found to have a much lower soil moisture
content than the furrows, with the original ground surface (termed the ‘shoulder’) intermediate
between the two in terms of soil moisture. It appeared likely that Sphagnum would fail to colonise
the majority of plough ridges and that it would take many decades for them to colonise the
shoulders (if at all) (Photo B1). The ridge and shoulder components of the cleared sites, when
measured ‘overhead’, accounted for c. 80% of the planar land area within the deforestation site.
Photo B1: Sphagnum restricted to the furrow bases after felling on Whitelee windfarm.

Page 62 of 125
The monitoring at Black Law carried out between 2004 and 2008 had indicated that restoration of
blanket bog could occur spontaneously, after removing the trees, but only in highly localised areas
where conditions were already inherently wet, trees had been small before clearance and the site
lay downslope and hence had runoff inbound. However, over the period 2008-2010 it became
apparent that conditions more widely were unable to support the re-development of a recognisable
blanket bog flora nor a surface which could ever realistically activate to the point of forming new
peat. In addition, the level of establishing conifer regeneration was by that stage becoming
apparent - if left unchecked, it was obvious it would have a significant impact on the level of
restoration success even if blanket bog vegetation did re-develop.
The Black Law re-colonisation study confirmed that the response on each part of the deforested site,
regardless of tree removal treatment where peat was dominant, was broadly similar from an eco-
hydrological perspective . Heather was over-represented along with true grasses – both indicators of
dry surface conditions – and Sphagnum was markedly under-represented, and restricted to the base
of plough furrows, which corroborates this view. Hare’s tails cotton grass (E. vaginatum) was
commonplace across the peat-dominated areas but its autecology is such (Wein, 1973) that it copes
with a wide range of moisture conditions because of its deep rooting system and tussock growth
form, hence are often present in abundance on degraded bogs.
As part of a wider research program, aiming to identify the most efficient and effective way to
restore bog on SPR’s deforested sites, a trial using plastic pile dams was undertaken at Black Law
windfarm from 2008-2012. The objective was to test whether a treatment prescription described in
the planning consent for the windfarm – namely use of pile damming along with hand clearance of
tree regeneration, after tree clearance – could conceivably restore blanket bog given the range of
observations made from the re-colonisation study. The concern was that a damming-only treatment
might not be intensive enough15, given the nature of the response observed, to produce their
desired outcome.
Two areas of deforested WTH land, previously planted with Lodgepole pine, at the Climpy end of the
windfarm (see Figure A3; the Climpy site was the worst site in terms of Sphagnum development, and
we assumed was potentially damaged by afforestation) were selected for the trial, each 100x100m
in size, along with two areas on the unplanted albeit drained EBB adjacent. All were part of the
same watershed bog and had similar underlying conditions (4m of peat on WTH site and 2.5m of
peat on EBB). Plastic pile dams were installed at intervals in one of each of the paired blocks, on all
drains, and the other was left untreated. Hydrological monitoring was installed in the form of a
dipwell network16 and regular measures made of the bog water table level on each of the 4 sites.
The results from the deforested WTH site in the first year of the trial showed that the bog water
table did rise slightly after treatment, when compared to the reference site, but did not respond
sufficiently to make a functional difference to the surface hydrology of the site being studied. There
15 SPR signed up to planning conditions on its site which meant success in restoration had to be achieved. The
poor response of the site post-deforestation, and some early investigations into water table behaviour, led us to worry that damming would not solve the problem. 16 Dipwells (n=25 per block) were set up on a grid system, located in between ridge and furrow at ‘shoulder’ or
‘original surface’ level (albeit it is worth noting that original surface is somewhat misleading on SPR sites where a thick layer of needles and roots typically lies on top of the original ground.

Page 63 of 125
was a suspicion some of the peat underlying the sites was cracked, but it was also apparent upon
inspection that the thickness of the stump/root/needle litter mat left from the afforestation phase
would cause problems for bog specialists even if water levels were raised markedly higher.
A parallel trial of hand cutting of tree regeneration undertaken in 2010/11 confirmed that it was
possible, in principle, to clear trees this way. However, many parts of the site had very high densities
of trees present (10,000 stems per ha; locally 20,000 or more). When clearance was attempted in
these areas it was obvious that there was nowhere to move the trees to – the forest workers simply
ended up being surrounded by swathes of cut trees. Moreover, once cut the trees presented a form
of forest waste that would have to be dealt with (at cost) because of the abundance of cut stems
present. Given Black Law was such a large site, and SPR had many thousands of hectares more to
restore, it was apparent that this form of clearance would be impractical.
The early trial work undertaken at Black Law confirmed that regenerating trees would have to be
cleared from the deforested sites somehow, as per the original request within the planning consent
for the site, but damming of main drains alone appeared unlikely to lead to the degree of change in
surface hydrology required to catalyse widespread development of new blanket bog vegetation on
the wider site. If site conditions remained dry, and it was likely they would, even if the first flush of
regeneration was cleared the sites would likely continue to regenerate from adjacent un-felled
stands thus rendering the initial clearance operation pointless.

Page 64 of 125
Appendix C Forsinard felling to waste and habitat succession post-felling
(Talaheel)
The RSPB Forsinard Flows National Nature Reserve in Caithness and Sutherland is the RSPB's largest
reserve, currently at c.21,000ha. Between 1994 and 1998, and then subsequently from 2001 to
2006, the site was supported by EU LIFE funding with the aim of restoring damaged peatlands
(Robinson, 2006). As well as restoring large areas of degraded open peatland mainly through
reversing the impacts of hill drainage, areas of commercial plantation were purchased for peatland
restoration totalling over 1500 ha. Through the Peatland Partnership, other smaller areas of forestry
mainly in state ownership in the Flows were also felled to waste as part of the first LIFE project. A
summary of the areas can be found here:
http://www.lifepeatlandsproject.com/htm/summary/progress.php . Between 2014 and 2019 a
major HLF funded project is delivering a further c.940ha of new forest to bog restoration at the Dyke
and Forsinain plantations within the Forsinard Flows reserve. This involves much older and larger
trees and greater challenges for restoration requiring the adaption of current techniques and the
development of new ones.
With restoration ongoing for 20 years over a range of sites, the Forsinard Flows NNR provides a
unique chronosequence where restoration progress has been studied in detail for a range of
peatland attributes, including vegetation, hydrology, water quality, carbon fluxes (aqueous and
gaseous) and biodiversity, including birds, arthropods and micro-organisms. As well as using the
long-term chronosequence of restoration (spanning 20 years) some more recent restoration projects
at Dyke and Forsinain have also focussed on the impacts of newer restoration techniques, including
whole tree-harvesting, enhanced drain/furrow blocking and various levels of brash removal.
The Talaheel plantation, partially restored by felling-to-waste in 1998, was used as a long-term
monitoring study area for measuring the progress of vegetation recovery post-restoration. At the
timing of felling , it comprised a mixture of 15 year old lodgepole pine and sitka spruce with a yield
class of 2 to 6 (Figure C1).
Figure C1: Talaheel plantation in 1997 prior to tree felling.

Page 65 of 125
The plantation was felled to waste by chainsaw in 1998, with trees being placed in the plough
furrows. The main collector drains were blocked only. Monitoring was undertaken in 1998 prior to
felling, and again in 2003 and 2011, respectively 0, 6 and 14 years after felling to assess the changes
in vegetation composition. The monitoring design considered the plough/furrow micro-topography
and stratified samples into ridge, furrow and original surface positions to determine differences
between these locations (Figure C2).
Figure C2: Monitoring design for Talaheel fell to waste management. Nine sets of three 0.5m x 2m
quadrats were set up in nine separate plantation compartments. It was important to look at the
responses of the ridge (R), furrow (F) and original surface (O) separately.
The results indicate that total Sphagnum spp. cover has increased in the furrows and original surface
positions, but not on the plough ridges. Non-Sphagnum mosses and lichens had increased
significantly on the plough ridges, indicating relatively dry conditions. Total cover of sedges,
particularly cottongrass species (Eriophorum sp.), had increased at all positions, and conversely
cover of Ling heather (Calluna vulgaris) had decreased at all positions helped by the odd outbreak of
heather beetle, which thrives in the boggier conditions. (Figure C3).

Page 66 of 125
Figure C3: Changes in total cover of Sphagnum, Eriophorum vaginatum and Calluna vulgaris after 14
years at Talaheel following felled to waste management.
Although Sphagnum continued to increase slightly on the original surface in 2011 there was a
decline in the furrows. On closer examination it seems that the decline in Sphagnum in the furrows,
is due in part to succession, as other species such as the two cotton-grass species Eriophorum
angustifolium and E. vaginatum have both increased within this microhabitat, and reduced the
dominance of Sphagnum.
A large amount of variability in response of bog vegetation was evident post-restoration. The data
suggests, and not surprisingly, that where the topography is flat or on gentle slopes, there is often a
rapid spread of Sphagnum and other open bog species, particularly in the furrow and original
surface. However, slopes greater than 3 degrees, the response is a lot slower (Figure C4a), which is
due to the impact of the furrows continuing to act as drains. Importantly, a very gradual recovery in
Sphagnum mosses on the original surface has occurred (Figure C4b). The monitoring has also shown
that for a proportion of the area where the ground is more sloping the bog vegetation is recovering
more slowly.

Page 67 of 125
Figure C4a/b: Variability in Sphagnum response according to slope and plantation microtopography
When all of the ridge, original surface and furrow quadrats are combined together, and compared
with the two sets of open bog controls, the restoration of bog vegetation at Talaheel is moving in the
right direction (Figure C5).
Figure C5: Vegetation composition of Talaheel felled to waste restoration site compared to open bog
and standing forestry controls and data collected in 1990/91 from a nearby reference site
representing the vegetation that was present before afforestation took place.
However, of concern is the lower % of Sphagnum and increased cover of grasses on the restoration
plots, driven mainly by an increase in Molinia caerulea but also Deschampsia flexuosa on the ridges
and on more sloping ground.
To look at plant community change, Principal Response curves were used (Figure C6). In this case,
the Y axis represents a gradient from open, acidic conditions dominated by plants typical of bogs and

Page 68 of 125
heaths, to forested conditions, with trees and forest mosses. It can be seen that the restoration area
proceeded in the desired direction initially, but later, progress has stalled.
Figure C6: Principal response curves for Talaheel vegetation monitoring data compared to forestry
and open bog controls.
Shown separately for ridges and furrows, it can be seen that the furrows were always closer to bog
conditions. The ridges however, were further from bog conditions, and diverged from them in the
later part of the study period, slowing down the overall recovery. It is worth remembering that the
ridge topography can sometimes take up as much as 50% of the felled plantation surface.
Ellenberg values were used to infer environmental conditions from the plant species present and
their abundance. The long-term environmental regime of a location can then be inferred, as the
weighted average of the Ellenberg values of the various plants that occur at that location. This
approach can be used not only for moisture, but for other environmental factors, like acidity and
nutrients. Looking at the moisture regime in our recording data using Ellenberg’s methods for all
quadrats combined suggests that moisture conditions have recovered well in the restoration area
(Figure C7). This is important, because a suitable moisture regime is probably a precursor to other
forms of recovery. Once the bog mosses are flourishing, then they can to some extent “engineer”
the bog environment to make it wetter, more acid, and more nutrient poor. This then favours the
wider recovery of the bog ecosystem.
Figure C7a/b: Ellenberg moisture index for Talaheel overall (left) and for furrow and ridges separated
out (right)

Page 69 of 125
The furrows are already very moist (Figure C7b). In fact more so than your average piece of open
blanket bog vegetation. The ridges are drier as expected. They initially wetted up but seem to have
stalled later in the study period.
Similar results were recorded for other measures like nutrients and pH: progress towards bog
conditions in the wetter areas like furrows, but not in the drier areas like ridges. Ellenberg N values
suggest that there has been some residual fertility from the forestry plantation either the use of
fertilisers or the breakdown of brash that has allowed the grasses to persist under more drained
conditions than surrounding open bog (Hancock et al., 2018).
Although no formal hydrological monitoring was undertaken up until 2011, using the vegetation
responses as a proxy for the prevailing conditions it appeared that conditions within the furrows are
suitable for the establishment of bog vegetation (large increase in abundance of Sphagnum mosses
and cottongrasses (Eriophorum spp.), the ridges remain too dry (increasing non-Sphagnum moss and
lichen cover), with the original surface intermediate in its response (small increase in Sphagnum
moss cover and cottongrasses). Further analysis of the slope data suggested there was significant
variation in response between different forestry blocks with flatter ground showing good
progression and succession towards bog vegetation similar to open bog control sites, but more
sloping ground effectively stalling in its restoration progress due to the presence of furrows which
were still acting as drains after 13 years. The monitoring work at Talaheel had clearly demonstrated
the need for subsequent restoration management in the form of furrow blocking to improve
hydrology, but also the need to deal with the plough ridges which sit well above the water table.

Page 70 of 125
Appendix D Trial of Multiple Surface Smoothing Methods at Whitelee
windfarm, 2010 – 2012
D1.1 Introduction
A formal experimental trial was set up at Whitelee windfarm in mid-2010 to develop new restoration
techniques capable of delivering the restoration objectives set out by SPR following completion of
initial forest-to-bog monitoring work at Black Law (Appendix B).
The Whitelee trial sought to compare different ways of treating main drains and ridge/furrow
complexes, to help the bog water table rise closer to the surface at the same time as homogenising
the surface level.
The trial was undertaken on an area that had been cleared by conventional felling 3 years previously
in 2007. The site selected had peat of depth 1.5-2.5m, lay on a gentle hillslope and had high levels of
conifer regeneration present albeit at the time it was small (~0.5m or less). Patches of land were
treated with different methods to compare their short and long term responses, with reference sites
left untreated for comparison. The main forms of treatment used were:
● Drain in-filling (this was shown to be faster and at least as effective as peat damming, and involved pushing forest waste and peat into the drain void).
● “Cross-graining” (flipping of stumps into furrows at intervals, at the same time as ripping the ridge through to allow free flow of surface water)
● “Wind rowing” (removal of stump and brash material to expose underlying peat surface, and piling up of the material removed)
● Brash manipulations (addition/removal of felling waste – mainly tree stems from brash rows – to ascertain whether it helped regulate the micro-environment at the peat surface)
● “Ground smoothing” (flipping of all the stumps upside down into furrows, infilling the main drains with brash and brash lane stems, then tracking over resultant surface several times to compress and smooth it; in doing so, virtually all tree regeneration was buried as it was attached by its roots to the wider layer of stumps, old roots and needle litter)
D1.2 Results
In the year after treatment, there was a strong seasonal pattern in the behaviour of the bog water
table in all blocks – it was lowest in spring 2011 and highest from late summer through to mid-winter
2011 (Figure D1).
The bog water table was consistently furthest from the ground surface in the felled control block
and was consistently closest to the surface in the ground-smoothed block (Figure D1); the other
treated blocks all had bog water table responses which were intermediate between the extremes,
albeit that the ‘wind-rowed’ blocks had bog water tables somewhat closer to the surface than the
other blocks assessed in this group. The bog water table in the ground-smoothed treatment block
remained very close to, or at the surface, for the duration of the monitoring period even in spring
2010, whereas it never rose above ~100mm from the surface in the felled control and was at almost
- 200mm in spring 2010.

Page 71 of 125
Figure D1: The mean depth (mm) to the bog water table in dipwells from the ground surface (ground
surface = 0mm on the y-axis) in each monitored block. The ground surface was defined as
Sphagnum lawn level in unplanted areas, ‘shoulder level’ on undisturbed felled surfaces, the top of
the main peat mass in wind-rowed areas and the general ground surface (ignoring defined hollows)
in the smoothed area. NOTE: The depth to the bog water table in the unplanted control was
measured from the vegetation surface rather than from the underlying peat surface which explains
to an extent why it was low relative to the smoothed block – if an adjustment were made to account
for the depth of the vegetation then the bog water table behaviour in the unplanted control would
appear more similar to that in the smoothed site. Note: this study was set up at short notice, as
results from it were considered to be an urgent operational priority (strict planning conditions meant
SPR had to ensure bog was restored, seedlings were fast encroaching and we had 1000’s of ha’s of
land to treat) hence there was not time to undertake pre-treatment monitoring. This is the reason
parallel controls were employed.
The effect of ‘ground smoothing’ was to make the mean difference in local land height between the
high and low points much smaller (c. 115mm) when compared to the felled control (c. 215mm)
(Figure D2); the other treatments varied in this parameter depending primarily on whether or not
brash was spread. The block which was wind-rowed but had no brash spreading had a similar type
of micro-topography to the smoothed block based on the data gathered, albeit that most of the
variation in height was associated with the ridge furrow pattern (the furrows were exposed by
stripping off the stumps, leaving flat bare peat in between) whereas on the smoothed site there was
no strong pattern to the variation in local height (i.e. the surface was fairly homogenous).
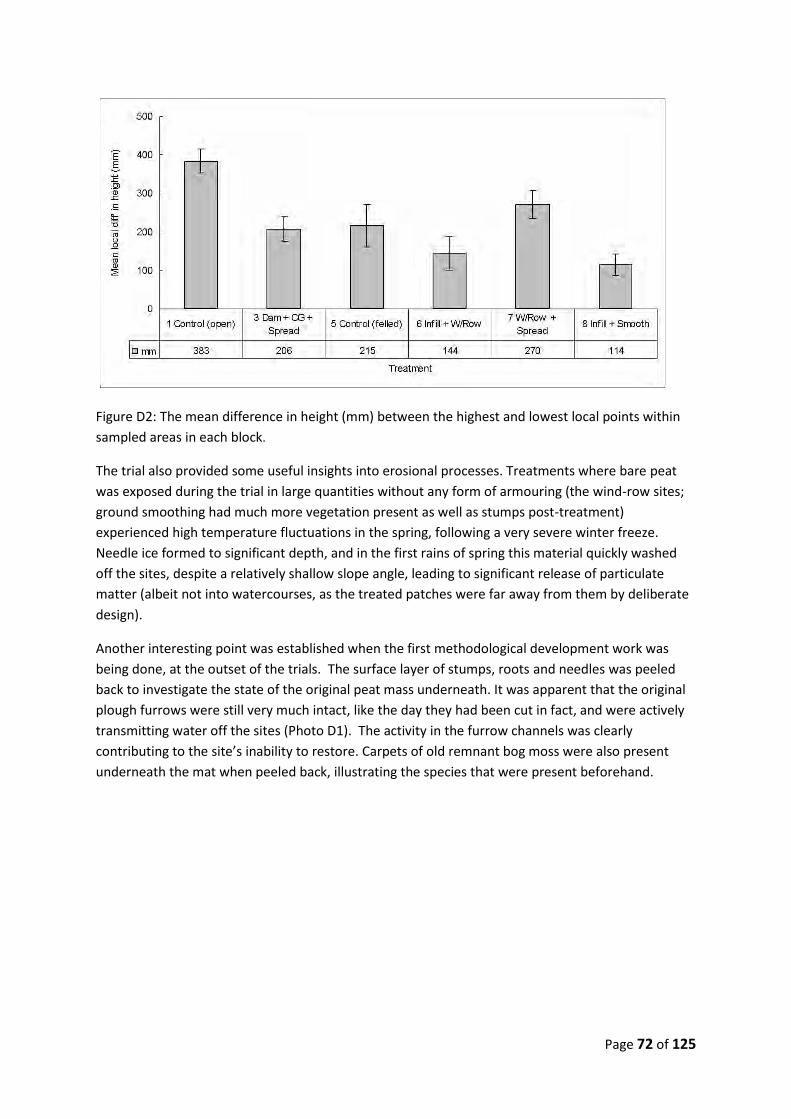
Page 72 of 125
Figure D2: The mean difference in height (mm) between the highest and lowest local points within
sampled areas in each block.
The trial also provided some useful insights into erosional processes. Treatments where bare peat
was exposed during the trial in large quantities without any form of armouring (the wind-row sites;
ground smoothing had much more vegetation present as well as stumps post-treatment)
experienced high temperature fluctuations in the spring, following a very severe winter freeze.
Needle ice formed to significant depth, and in the first rains of spring this material quickly washed
off the sites, despite a relatively shallow slope angle, leading to significant release of particulate
matter (albeit not into watercourses, as the treated patches were far away from them by deliberate
design).
Another interesting point was established when the first methodological development work was
being done, at the outset of the trials. The surface layer of stumps, roots and needles was peeled
back to investigate the state of the original peat mass underneath. It was apparent that the original
plough furrows were still very much intact, like the day they had been cut in fact, and were actively
transmitting water off the sites (Photo D1). The activity in the furrow channels was clearly
contributing to the site’s inability to restore. Carpets of old remnant bog moss were also present
underneath the mat when peeled back, illustrating the species that were present beforehand.

Page 73 of 125
Photo D1: an old plough furrow exposed during the trial, by peeling back the surface mat of roots
and needle litter.
D1.3 Conclusions
In summary, the effect of complete “Ground-Smoothing” was successful in raising the water table to
the ground surface, in part because of drain in-filling but also because it flattened the ridge/furrow
patterning. It also resulted in the virtual disappearance of the conifer seedlings from the surface due
to burial. Other treatments served to have an intermediate effect on bog water tables when
compared to the control site, left more of the micro-topography intact and typically left most of the
conifer regeneration on the surface. Moreover, undesirable impacts such as production of high
volumes of particulate matter and waste arose from wind-rowing rendering the treatment
impractical to use.

Page 74 of 125
Appendix E Large-scale ground smoothing (Whitelee windfarm, 2013 - 2016)
E1.1 Introduction
The aim of Trial 2, the second trial at Whitelee windfarm started in 2013, was to formally assess
ground-smoothing at a larger-scale to evaluate its effectiveness, environmental impacts, practicality
and costs when carried out in experimentally controlled conditions.
E1.2 Methods
Four formal trial blocks were set up, each with a control block and an adjacent ground-smoothing
block. Hydrological isolation was achieved through the creation of perimeter drains around each
treatment block17. In addition to the formal trial blocks, ground-smoothing was rolled out to treat a
wider area, some of which was used as a practise area for training the machine operators in the
ground-smoothing technique.
A monitoring grid was set up in each of the sub-blocks (four treatment and four control) comprising
the following: 20 dipwells to measure water table (some block also had pressure transducers
installed), 20 vegetation quadrats (2 x 0.5m) to record vegetation composition and 6 peat anchors
installed to monitor surface movements of the peat mass. Vegetation monitoring was carried out
before the start of the new growing season starting in 2013 (albeit the 2013 growing season was
only a 4 month period due to treatment work not finishing until June).
Water quality was monitored monthly through the installation of chambers in plough furrows at the
bottom of the sub-blocks which collected water run-off directly from the treatment or control areas,
without contamination from other sources18 (Photo E1). The grab samples were then tested for
dissolved organic carbon (DOC) levels, water colour and Suspended Solids (SS) as well as levels of
Nitrogen (N), Potassium (K) and Phosphorus (P). Water quality was also monitored for the wider
catchment through the use of an auto-sampler located in a water course near to the treated areas.
Rainfall data were gathered continuously by a water station and water level loggers, and was used to
aid quantification of the site water balance. Later, this was upgraded to a full weather station.
17 These led to some local draw-down in the bog water table around each treated block (control blocks did not have these)
but were necessary to ensure that all water flowing out of the treated sites came from them otherwise the runoff being gathered could have been diluted by upslope generation thus biasing, by a variable and unknown margin, the water quality data needed. 18 A buffer of 10m of untreated ground was left at the base of each block, as this was standard operational practice.
Chambers were located to the downhill side of these buffers.

Page 75 of 125
Photo E1: Furrow chamber located at the bottom of sub-block, downhill of the vegetated buffer left
in place as a deliberate part of the block design (this mimics the real operation, where buffers are
left in place). Chambers were installed by exposing the base of an old plough furrow, creating
drainage out to the downhill side and then creating a place (plastic gutter) where runoff samples
could be obtained for water quality testing (furrows were judged to be the main flow paths off the
trial sites, and obtaining samples in drought conditions would be difficult if not located in these
places).
E1.3 Results
The results in Figure E1 show the marked change in vegetation cover in the ground-smoothed blocks
over the three year period post-treatment. Although bare peat cover was initially high, cover
declined from approximately 60% to 20% after two growing seasons and by the following year had
declined to 12%. Eriopohorum vaginatum abundance rapidly increased, with cover on the treated
areas being similar to that of control sites by the end of the second growing season (25% on treated
vs 29% on control), and surpassing the control site by the end of the third growing season (45.5%
cover, Photo E2). Sphagnum cover on the control areas was low (2.7% for thin branched species and
0.05% for thick branched species), but was already well-developed on the treatment blocks after the
third growing season (24% and 1.5% for thin and thick branched species respectively). The
vegetation response confirmed that a viable propagule source remained on or near the treated sites,
given that key species were able to germinate and re-establish rapidly when the correct surface
conditions were re-established.

Page 76 of 125
Figures E1a-d: Vegetation response to treatment (T) at DrumClan 2013 – 2016 compared with
controls (C) for the 3 main paired blocks being monitored (Block 1, 2 & 5). Data shown for bare peat
(uppermost row), Eriophorum vaginatum, true grasses, thin-branched Sphagna (e.g. S. capillifolium,
fallax) and thick-branched Sphagna (lowest row; e.g. papillosum, magellanicum).

Page 77 of 125
Photo E2: Eripohorum vaginatum and Sphagnum cover on ground-smoothed areas in June 2016
(during fourth growing season post treatment)
As had been found from the original ground treatment trial at Whitelee, the ground-smoothing
technique reduced the density of regenerating conifers by approximately 80-90% at the time of
treatment (Figure E2) and density then continued to decline in subsequent years.
The rapid decline arose by not only burying trees (the vast majority) but also through the excavator
tracking the bark of any trees left on the surface – this tended to cause lethal damage. The operator
crushed and buried regenerating trees as part of the ground smoothing works incurring no extra
time or cost in doing so. Due to the extremely high density of trees present on treated sites it was
not possible to treat regenerating conifers through conventional measures such as hand clearance,
hence mechanical invervention was deemed necessary.
Figure E2: Mean conifer stem density on control and treatment blocks immediately after ground-
smoothing of the treatment blocks in 2013.
One of the key motivations for the second Whitelee trial was to fully investigate the response of the
water table to the treatments, as a suitable and stable hydrological regime is required to support

Page 78 of 125
functioning bog habitat. Figure E3 shows the continuous measurements from the pressure
transducers19 and the average dipwell readings for one of the paired blocks (Block 2, which had the
strongest reponse) as an example20.
19 Pressure transducer data is very useful in helping researchers to understand how the bog water table varies continuously
over time, but unless deployed at multiple locations they do not capture the extent of local spatial variation (hence we used dipwells also). The location selected for the transducer impacts upon the data obtained. If, by chance, it is placed in a location which reflects the average condition of the block then that is ideal but most of the time this does not happen unless a deliberate decision is made at some stage to move it. 20 A fourth block had quadrats and dipwells installed but not transducers.

Page 79 of 125
Figure E3: The position of the bog water table within one of the Whitelee trial site paired blocks over the period June 2013 – September 2016: Block 2C (upper) and Block 2T (lower). C= Control and T = Treatment. 2T has two loggers with the second logger represented by the dark orange line (the other block had one logger). See figure 3a for further details. The solid blue line represents the level of the bog water table (from logger data), compared to the top of the main peat mass (brown line). The red square represents the average level of the bog water table in the dipwells, with the red dots showing the individual dip well readings. The solid green line on the upper chart represents the level of the ground surface (standardised at ‘original ground level’ = shoulder of the plough furrow) (+/- 1 standard deviation). The orange line represents periods where SEPA rain data has been included during periods when our rain gauge was malfunctioning.

Page 80 of 125
The bog water table levels on all control and treatment blocks varied seasonally, with a general
reduction in level (discharge) in the spring or summer during warmer weather, when rain was more
limited and evaporation pressure highest, and a general rise (recharge) in the autumn.
Bog water tables also rose and fell in response to individual rainfall events; typically, sites recharged
very quickly in response to rainfall events but discharged more slowly in the periods afterwards. The
amplitude of fluctuation in levels was much greater in the spring and early summer months than in
the winter, when bog water table levels were typically higher and more stable.
In general, the mean level of the bog water table within the main peat mass was broadly similar in
control and treatment pairs based on the dipwell averages. However it is apparent that levels of
variation in the water table between dipwells were often markedly less in the treatment blocks
compared to their controls (i.e. the bog water table had a markedly lower amplitude of variation in
treatment blocks; water table level was more homogenous across each treatment site) particularly
where small differences in average level were also apparent.
Moreover, the treatment itself generated a major physical difference between each pair of blocks
that affects the relationship between plants and the bog water table. The control sites still have a
thick layer of vegetation, tree stumps, needles and roots overlying the main peat mass – this is
typically 10cm in depth (+/- 5cm; 1 standard deviation) at ‘plough shoulder’ level. In effect, the main
peat mass on these sites is 10cm or more below plough shoulder level (far more on plough ridges –
20 to 30cm) – the main peat mass is only ‘exposed’ to plants growing in the base of plough furrows.
The majority of plants (80-90% of overhead land surface) on the control blocks are therefore
growing 10-30cm above the level of the peat mass, and hence even further away from the bog water
table for most or all of the year. On the treated sites the main peat mass is exposed by treatment,
and now forms part of the land surface along with upturned stumps that were pressed into it. Thus,
plants growing on the treated sites are in much closer contact with the bog water table compared to
those growing across the majority of the control blocks, and the depth to the bog water table is also
more uniform in these areas.
In addition to investigating the effects of the technique from an eco-hydrological perspective, the
Whitelee trial was also designed to find out whether any significant environmental impacts arose as
a result of ground-smoothing. The action of flipping and tracking in the stumps leaves a variable
amount of exposed peat21 on the surface afterwards – this could conceivably erode, and wash off
into nearby watercouses, leading to an increase in particulate or dissolved carbon. It was also
expected that there might be an increase in nutrient levels arising from the act of burying trees and
disturbing brash mats part way through the process of them rotting.
21 The sources of bare peat and how they respond to treatment are important to recognise. Some comes from
the base of stumps and root plates, or from machine tracks, and is effectively in particulate form. This tends to wash off with the rain early on, and is deposited in the many holes created locally by the process. Some of the bare peat is exposed from the top of the main peat mass, and is available to erode by weathering but, again, is often locally contained by the holes created during the smoothing process. Sites quickly change in appearance post treatment also because the machine loosened particles wash off the residual ground vegetation. It then takes 2-4 seasons for the remaining exposed bare peat to re-colonise. However, undisturbed vegetated buffers within and on the edges of sites are used to contain as much as possible in the interim.

Page 81 of 125
Water quality data was taken from monthly samples gathered at the downslope end of each block
(control, treatment22) (Photo E3). Samples were sent for analysis to assess water colour, dissolved
organic carbon (DOC), particulate organic carbon (POC), total suspended solids (TSS) and nutrient
levels (nitrogen (N), phosphorus (P) and potassium (K) levels were measured). Water quality in the
wider area was also assessed by using an autosampler which collected samples from a nearby
watercourse discharging out of a comparable catchment (mainly deforested, so in theory analagous
with the reference blocks).
DOC levels were shown to be cyclical with spikes observed during summer months (40-80mg/L), and
lower levels observed during winter months (10-40mg/L). Figure 10a shows that in the first year
levels were higher (by 12% on average) on the treated areas than the control areas. After the first
year DOC levels reduced (-15%) so they were comparable on both treated and untreated areas,
before remaining low thereafter (-14%, -11%).
Photo E3: Weir used to collect water quality samples over a wider area
22 Multiple troughs were installed at the downhill edge of each control and treatment block, to ensure a robust
measure was obtained from across each blocks catchment, but samples were then merged for testing to reduce testing costs.

Page 82 of 125
A correlation was observed between DOC (Figure E4a) and water colour (Figure E4b) allowing
predictions to be made of early patterns (colour monitoring commenced in the winter following
treatment). Colour levels showed the same trend as DOC, with an elevation of 24% in the first year,
reducing to 6% (i.e. still slightly elevated) during the second year. In subsequent years colour levels
in treated areas were on average below controls (-5% then -9%) . It is worth noting that colour levels
on the main watercourse were similar to those on the control blocks, thereby acting as robust proxy
for the wider catchment.
Suspended solids did not appear to follow a seasonal pattern but were more likely to fluctuate in
response to periods of high rainfall (Figure E5). In the first year following treatment, concentrations
were on average 31% higher than in the control blocks. This peaked to an average of 86% higher in
the second year before reducing to 47% in the third year then 11% in the fourth. During the second
year the levels of suspended solids fluctuated, and on a few occassions some levels recorded on the
treatment area were hundreds of % higher than the control blocks. Nutrient levels initially showed a
spike post treatment but then reduced to negligible levels, after which monitoring was discontinued
(Figures E6 a – c).

Page 83 of 125
Figure E4a: DOC levels (mg/L) present in water discharged from furrows in sub-blocks during the period June 2013-June 2017 for all blocks combined. Samples were sometimes obtained on ‘back to back’ days (e.g. 6th May and 7th May) as flows had changed markedly over the 24 hour period and it was deemed worthy of testing for a difference in concentration. DIFF = difference between C and T levels, Red = Treatment level higher than Control level, Green = Control level higher than treatment level.
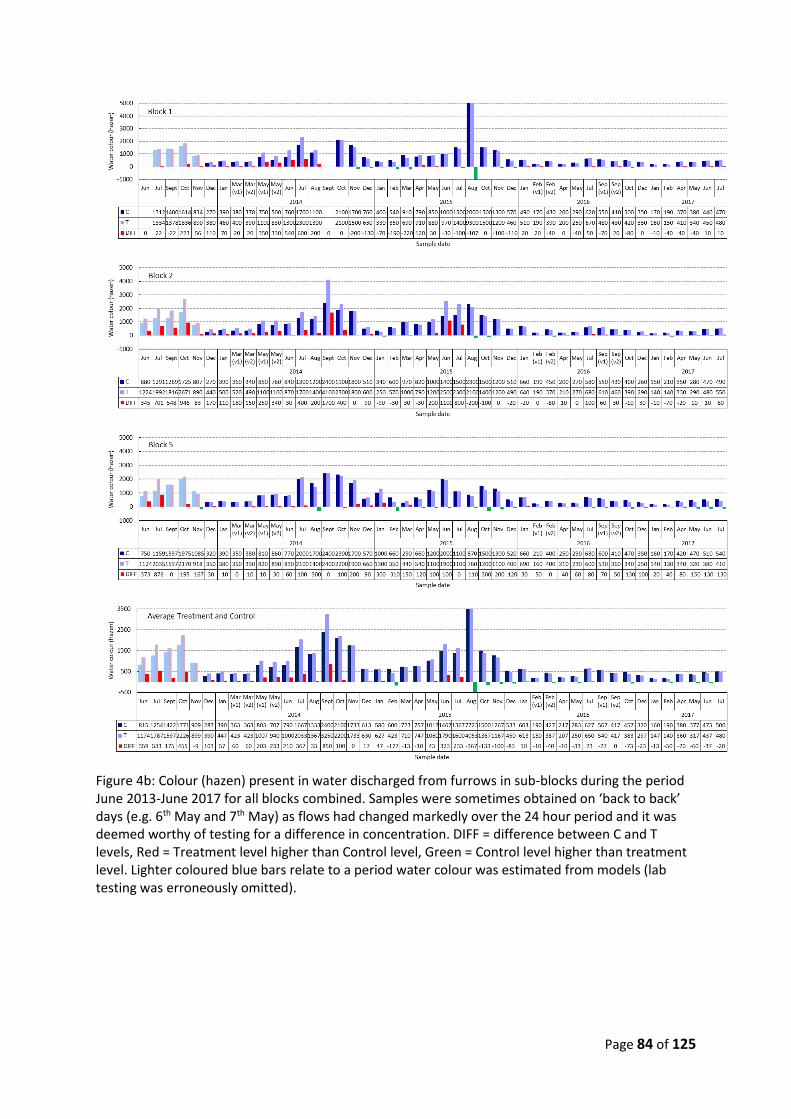
Page 84 of 125
Figure 4b: Colour (hazen) present in water discharged from furrows in sub-blocks during the period June 2013-June 2017 for all blocks combined. Samples were sometimes obtained on ‘back to back’ days (e.g. 6th May and 7th May) as flows had changed markedly over the 24 hour period and it was deemed worthy of testing for a difference in concentration. DIFF = difference between C and T levels, Red = Treatment level higher than Control level, Green = Control level higher than treatment level. Lighter coloured blue bars relate to a period water colour was estimated from models (lab testing was erroneously omitted).

Page 85 of 125
Figure 5: The level of suspended solids (mg/L) present in water discharged from furrows in sub-blocks during the period June 2013-June 2017 for all blocks combined. Samples were sometimes obtained on ‘back to back’ days (e.g. 6th May and 7th May) as flows had changed markedly over the 24 hour period and it was deemed worthy of testing for a difference in concentration. DIFF = difference between C and T levels, Red = Treatment level higher than Control level, Green = Control level higher than treatment level.

Page 86 of 125
Figures 6(a-c): Concentrations of Nitrogen (upper), Phosphorous (middle) and Potassium (lower) in the runoff from control(blue) and treatment(purple) blocks over the period June 2013-June 2015.
Water quality in the wider catchment was also measured during the surveys, and as with the sub-
blocks a seasonal pattern was observed with the majority of DOC and SS exported during the wetter
periods of the year (Figures 7a – c). Carbon and nutrient levels recorded in the adjacent watercourse
were low enough to suggest that the ground-smoothing was having a negative impact on water
quality in the wider area.

Page 87 of 125
Figure 7 a-c: The level of DOC (upper), water colour (middle) and suspended solids (lower) present in runoff from the watercourse adjacent to the DC-2 trial site over the period June 2013 – Sept 2017.
E1.4 Conclusions
In summary, the monitoring results from the detailed ground-smoothing trial at Whitelee supported
the use of ground-smoothing as an effective technique to restore deforested peatland habitat.
Although there were initial impacts on water quality at the treatment area interface following
treatment, after a period of 2-3 years these returned to levels comparable with the control blocks in
some cases even reducing below levels found on the control blocks. As such mitigation measures
should be taken to ensure works are planned to ensure any impacts at a catchment scale are
maintained at acceptable levels.

Page 88 of 125
Appendix F Ground smoothing and cross-tracking at Black Law windfarm,
2014-2017
F1.1 Introduction
Although the trials at Whitelee windfarm produced positive results, as described in the previous
section, a similar trial at Black Law windfarm was set up to establish whether a comparable outcome
could be obtained in different site conditions. Whitelee is a fairly homogenous site, being located on
a gently rolling plateau underlain by peat of 1-3m depth; at Black Law the peatland geomorphology
is markedly more complex with areas of deep peat (up to 6m), areas of thin organic soil on steeper
slopes and a variety of conditions intermediate between the two extremes.
F1.2 Methods
The design of the Black Law trial in 2014 was, in part, informed by a short duration trial previously
undertaken at Black Law in 2011. The ground smoothing technique, just developed at Whitelee the
year before in 2010, was trialled in small areas to assess practicality as the regenerated conifers at
Black Law were bigger. In doing the work, it became apparent that another technique – eventually
we termed it ‘cross-tracking’ – might also work in certain conditions. In essence, where very small
trees had been present at the time of deforestation the machine operator found it possible to drive
over the stumps and ‘pop’ them down into the peat surface thus saving time in comparison with
ground smoothing; plough ridges were also flattened by the process, resulting in a smooth finish but
with much less peat disturbance, and regenerated trees appeared to be broken or stripped of their
bark during the process also. It appeared possible to use the technique where the stumps were
smaller, but also where slightly larger stumps were older and thus more rotted – however, if the
excavator was tracked over bigger stumps the machine was badly damaged.
Three experimental blocks were set up at Black Law in 2014, each with three sub-blocks: ground-
smoothing, cross-tracking and control sub-blocks. The three blocks were spread across the site: two
were located near the substation (SS1 and SS2) and one was located near the former Climpy open
cast coal mine site (Climpy). Treatment works were completed in the experimental blocks by
December 2014 but the machinery remained on site to roll the treatment out across a larger area,
and in total c. 106ha at Black Law was ground-smoothed. During the works the decision was made to
include buffer strips (approximately every 60m x 60m) to mitigate against the overland flow of
sediment.
Monitoring points (n=20 per block, on a grid) were installed in the trial areas to record the response
of the vegetation, hydrology and water quality. A separate monitoring programme was also set up to
look at the response over the wider treated area. Water quality for the wider catchment was
monitored at suitable pour points (these are points on watercourses employed to monitor water
quality) having calculated the size of the basin upstream which contributes to the runoff being
gathered. Monitoring was carried out frequently throughout the year and to date has been carried
out over a two year period.
F1.3 Results

Page 89 of 125
As observed in previous trials at Whitelee, there was a lot of bare peat initially (approximately 90%)
on the ground-smoothed plots but this reduced by over half (to approximately 40% cover) after the
second growing season (Figure F1). There were low levels of bare peat on the cross-tracked plots (2
– 8%), just after treatment, while the control plot had virtually no bare peat present. After the
second growing season, percentage cover of Sphagnum mosses on the ground-smoothed sub-blocks
(~11%) was similar to that of the control site (~11%) as it was on cross-tracked sub-blocks (slightly
higher average cover ~13%) (Figure F1).
Calluna cover on the cross-tracked and ground-smoothed areas declined post-treatment, and
remained at lower levels thereafter (~ 18% and ~4% respectively) (Figure F1). Eriophorum cover on
the cross-tracked and ground-smoothed sub-blocks increased to levels higher than that of the
control site (Figure F1).
Figures F1 (a-d): Average percentage cover within control (C), ground-smoothing (GS) and cross-tracking (CT) sub-blocks in 2016 (after one growing season) and 2017 (after two growing seasons) following treatment. Left hand column = Sub-Station 1, middle column = Sub Statino 2 and right hand column = Climpy block. Bare peat (top row), all Sphagnum spp., Calluna vulgaris and Eriophorum vaginatum (lowest row). See other SPR appendices for reference levels on drained and undrained blanket mire.
Ground-smoothing again dealt well with regenerating conifers (Figure F2), with levels greatly
reduced after treatment. Although the decline was not as dramatic, cross-tracking also reduced the
levels of regenerating conifers immediately following treatment. Experience from the small-scale

Page 90 of 125
trial at Black Law in 2011 indicated that the extent of damage caused to trees by tracking was likely
to continue to kill them over subsequent years.
Figure F2: Density of regenerating conifers present within each treatment (ground smoothing “GS”;
cross-tracking “CT”) area after one growing season post treatment. Pre treatment levels are included
in the above figure (as controls – “C”) though it should be noted that the surveyed area was bigger
than the treated area.
As was seen in Trial 2 at Whitelee, the bog water table experienced a distinct seasonal fluctuation
across all monitoring sites. It declined in spring, then recharged in autumn/winter. That said, levels
of variation were lower in the treatment plots compared to the control plots.
In order to interpret the results and assess the true impact, the relative distance between the bog
water table level and the land surface was measured. After treatment the position of the land
surface and water table differed on all three sub-blocks (Figure F3a – c).
The unchanged nature of the control blocks meant that the ridge and furrow pattern was still
present with the layer of stumps, needles and roots isolating vegetation growing on the ground
surface from the water table by at least 10cm. This meant that the distance between vegetation and
bog water table was approximately 10 – 15cm, increasing to 30 – 40cm in drought periods. These
conditions are not conducive with supporting the plant species typical of bogs as these typically
prefer to be close to the water table; if far from the water table during a prolonged drought it can
stress them unduly and even prevent them from colonising in the first place.
On the other hand, the process of ground-smoothing buried the stumps (which also, in effect,
comprise most of the material in the plough ridges) into the ground (Photo F1), exposing the main
peat mass which is then tracked over to create a flattened surface (Photo F2).

Page 91 of 125
Photo F1: Stump being flipped over during the ground-smoothing process
Photo F2: Peat mass exposed as a result of ground-smoothing. The thick layer of needles, roots and
tree stumps has been buried along with profuse tree regeneration which had been on the ground
surface
This reduces the distance between vegetation and water table to approximately 0 – 5cm, increasing
to 15 – 20cm during times of drought (Figure F3).
Cross-tracking produced an intermediate response whereby treatment compressed the ground
somewhat and disrupted the ridge and furrow pattern leaving a more flattened surface (Photo F3).
The water table on cross-tracked sites was often at the surface of the peat mass, only dropping to 10
– 20cm below it during times of drought. It is worth noting that cross-tracking is only suitable for
areas where tree stumps are smaller and regenerating conifers are sparse and small; these areas

Page 92 of 125
already tend to have wetter ground conditions hence it is not the case that the treatment has, itself,
the ability to create much wetter conditions.
Photo F3: Excavator in the process of cross-tracking

Page 93 of 125
Figure F3a-c: The bog water table level on the three treatment sub-blocks within Climpy (upper), SS1
(middle) and SS2 (lower) blocks at Law over the period December 2014 – September 2016. The blue
(control), purple (CT) and lavender (GS) squares represent average dipwell readings (n=12, +/- 95%
CL). The solid and dashed green lines represent the mean ground level on the control and CT sub-
blocks respectively.

Page 94 of 125
The level of Dissolved Organic Carbon (DOC) in runoff from each of the sub-blocks showed a seasonal cycle, with levels being generally lower in the winter months compared to the rest of the year (Figure F4a). Levels of DOC in runoff sampled from the experimental blocks were higher, on average, in ground smoothed areas compared to reference blocks; levels in cross-tracked blocks generally lay in between (Figure F4a). On average across all samples, DOC levels in the first year of monitoring were ~ 40% higher on GS sub-blocks compared to reference areas; cross-tracked areas were ~ 25% higher than reference areas on average across all samples. In the second year of monitoring, albeit only a partial data set at the time of preparing this report, the differences appeared to have dropped again and were now markedly lower (<10% between GS and REF). Considerable variability in response to treatment was apparent between blocks as well as over time within blocks. Levels of DOC were markedly elevated at Climpy in the six months following treatment, but then appeared to decline back towards reference levels later in the autumn. Levels of DOC were also markedly elevated at Sub-Station 1 in the six months following treatment but then began to decline; at Sub-Station 2 some elevation was apparent but in general the differences between the treated and reference areas were notably smaller than in the other two blocks. Catchment scale monitoring of DOC levels in the predominantly ground smoothed area (captured at the “T17 weir”) were highly elevated in comparison with the reference catchment (“T28 weir”) (Figure 17a). However, this difference in DOC concentration between the reference and treated catchments was much larger than the difference in concentration between the adjacent, experimentally matched GS and REF blocks already stated (~ 40%). A notable feature of the DOC samples from the treated catchment was that several outlying values were recorded during periods of very dry weather, when stream flow was almost non-existent whereas the reference catchment did not ‘spike’ in the same way. Levels of water colour in runoff sampled from the experimental blocks were also higher, on average, in GS areas compared to reference blocks; CT blocks generally had an intermediate response (Figure F4b). On average across all samples in the first year, colour levels (in hazen) were ~ 70% higher on GS areas compared to reference areas; CT areas were ~ 20% higher than reference areas on average across all samples. In the second year of monitoring, albeit it is only a partial data set at the time of preparing this report, the differences appear to be markedly lower (~ 10% between GS and REF). Water colour concentrations between and within individual experimental blocks broadly followed a similar pattern to that observed for sampled DOC levels. However, there were some noteworthy differences in the patterns observed (Figure F4b):
a) In general water colour appeared to vary seasonally more than DOC levels on the same blocks, with colour levels tending to be proportionately lower in winter and higher in summer in comparison with DOC levels. b) The difference in water colour level between treated sub-blocks and reference sub-blocks tended to be proportionately larger than the difference in DOC when measured. c) Water colour levels at Climpy and SS1 remained elevated on the GS and CT sub-blocks for up to 18 months after treatment, when levels appeared to become more comparable to the reference sub-blocks. SS2 had a flatter response to treatment, with the elevated levels tailing off after only a few months following treatment.
Catchment scale monitoring of water colour revealed a similar pattern to DOC, in that the ratio of difference between treatment and reference catchments was much larger than the ratio of difference between treatment and reference experimental sub-blocks (Figure F4b). Extreme outlying values were again obtained in the treated catchment during drier periods, as with DOC.

Page 95 of 125
Levels of suspended solids in runoff from the experimental sub-blocks were higher, on average, when sampled in GS areas compared to reference sub-blocks; CT sub-blocks generally had an intermediate response (Figure F4c). On average across all samples, suspended solids concentrations were ~ 120% higher from GS areas compared to reference areas; CT areas were ~ 45% higher than reference areas on average across all samples. Differences remained large in the second year of monitoring on the GS compared to REF blocks (still > 100%). Concentrations of suspended solids were much higher in the experimental blocks than in the catchment-wide samples (Figure F4c). Interestingly, a considerable degree of variability was apparent between and within blocks, and over time, in the concentrations of suspended solids measured. In the early stages of sampling, marked spikes in concentration were detected but without a clear and consistent pattern between the block types as seen with DOC and colour. If anything, there was a trend towards suspended solids levels on GS sub-blocks being higher during the late spring and summer months following treatment. The processes by which suspended solids arise on the sites are worthy of consideration here. In essence, suspended solids being generated locally at block scale are transmitted down the sites towards the buffers, and in turn into the old plough furrows within them where they are likely to be trapped long before they reach watercourses. However, over a period of time these buffers are likely to fill up and then suspended solids may become more transmittable again. Extreme outlying values were again obtained in the treated catchment, as with DOC, but biases in the data arising through methodology are known to be present. The main one is that the catchments being compared are not very like each other. The treated catchment comprises a section of intermediate bog – with a raised dome in its centre – which was very dry and assumed to be very damaged before treatment23. Moreover, the catchment samples had to be obtained from a weir across a stream but in dry weather the flow was very limited meaning water gathered behind it and lay for weeks sometimes. We had to sample this water, and know concentrations will be markedly higher here than if the water had been flowing daily. The control catchment, on the other, hand, comprises a small flat section of peatland which appeared to recover spontaneously after deforestation and thus has a more bog-like appearance. In essence, the physical difference between the catchment sites is large whereas the difference between sub-blocks is very small – by design.
Average levels of N in runoff from the treated experimental sub-blocks and catchment scale weirs were generally very similar to those from their associated references (Figure F5). A very similar pattern was evident for P (Figure F5). However, levels of K were markedly elevated in the treated sub-blocks compared to the reference sub-blocks with the GS sites showing the largest difference. This difference remained in place until approximately one year following treatment when CT sub-block levels became comparable to that of reference areas and GS sub-blocks were only slightly elevated (Figure F5).
23 Drains were large on this site, trees were large before felling, stumps were large after felling, and tree regeneration was
very profuse and large. As a consequence, the treatment work was probably less effective thus meaning the site was drier and we would expect higher colour generation etc.

Page 96 of 125
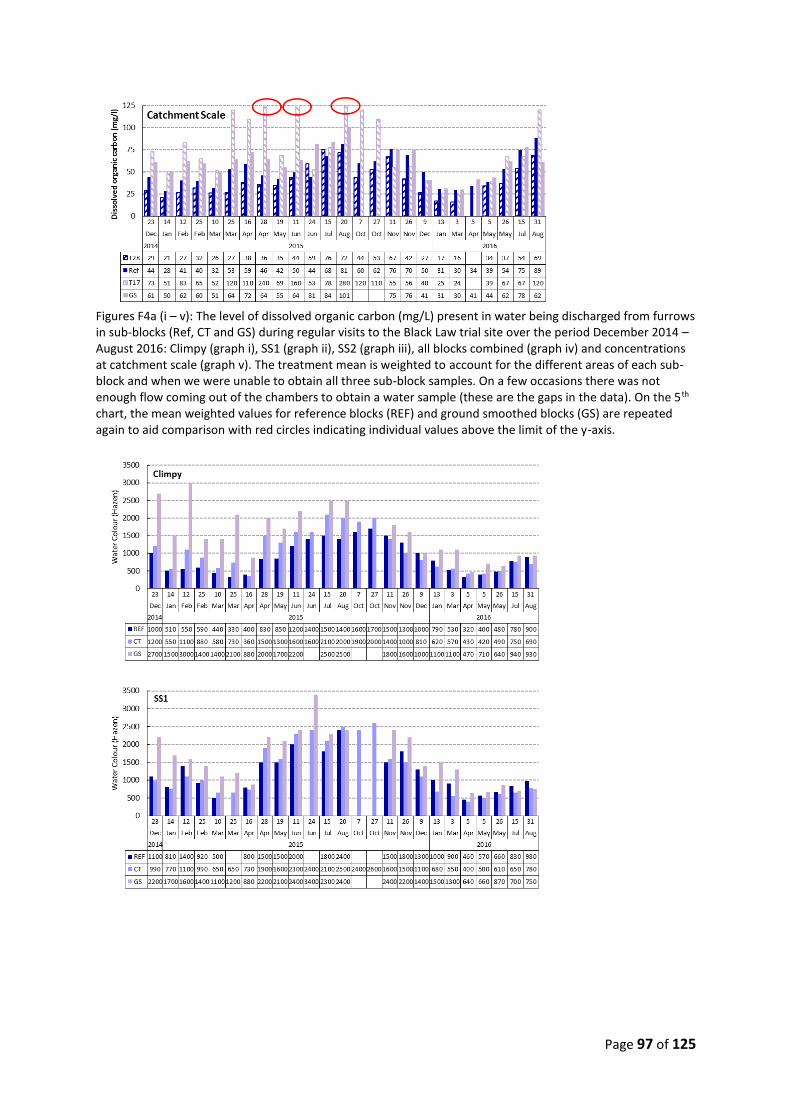
Page 97 of 125
Figures F4a (i – v): The level of dissolved organic carbon (mg/L) present in water being discharged from furrows in sub-blocks (Ref, CT and GS) during regular visits to the Black Law trial site over the period December 2014 – August 2016: Climpy (graph i), SS1 (graph ii), SS2 (graph iii), all blocks combined (graph iv) and concentrations at catchment scale (graph v). The treatment mean is weighted to account for the different areas of each sub-block and when we were unable to obtain all three sub-block samples. On a few occasions there was not enough flow coming out of the chambers to obtain a water sample (these are the gaps in the data). On the 5th chart, the mean weighted values for reference blocks (REF) and ground smoothed blocks (GS) are repeated again to aid comparison with red circles indicating individual values above the limit of the y-axis.

Page 98 of 125
Figure F4b (i – v): The level of colour (hazen) present in water being discharged from furrows in sub-blocks (Ref, CT and GS) during regular visits to the Black Law trial site over the period December 2014 – August 2016: Climpy (graph i), SS1 (graph ii), SS2 (graph iii), all blocks combined (graph iv) and concentrations at catchment scale (graph v). See Figure legend 18a for further details.

Page 99 of 125

Page 100 of 125
Figure F4c (i – v): The level of suspended solids (mg/L) present in water being discharged from furrows in sub-blocks (Ref, CT and GS) during regular visits to the Black Law trial site over the period December 2014 – August 2016: Climpy (graph i), SS1 (graph ii), SS2 (graph iii), all blocks combined (graph iv) and concentrations at catchment scale (graph v). Note that samples for the reference catchments are obtained from the weir outflows hence are likely to be biased downwards. See Figure legend 16a for further details.
Figure F5 (i – vi): Nitrogen, Phosphorous and Potassium concentrations in runoff captured from the experimental blocks (left hand column) and at the catchment weirs (right hand column) over the period December 2014 – July 2016. Gaps in the data after March reflect the change to a longer analysis regime after the first four months. The laboratory used for the testing work produces results to the nearest 1mg, with results lower than 1mg reported as ‘<1mg’ – these are shown in the charts above as 0.5mg/L.
F1.4 Conclusions

Page 101 of 125
The results from the second major trial supported SPR’s view that ground smoothing is a very
effective technique for restoring deforested peatland habitat on their sites, and that the short-term
impacts arising from it are justified given the quality of the end result. Ground-smoothing might best
be described as a technique which takes restoration sites “one step back, briefly, to go 3 or four
steps forward quickly and permanently”.
Cross-tracking was considered to provide a less intensive option suitable for use on areas where the
stumps are smaller and tree regeneration is less dense.

Page 102 of 125
Appendix G RSPB Forsinard Flows Restoration Methods
Talaheel and Lonielist furrow blocking
Across over 2000ha of felled to waste forestry at Forsinard Flows some areas were showing good
signs of recovery back to bog habitats, particular on flat ground. This was clearly helped by blocking
of feeder drains at the time of felling. Whereas other sites were responded more slowly, often due
to a combination of factors including levels of brash remaining, slope and peat depth (Photo G1).
Photo G1: Fell to waste sites at Forsinard. Left: parts of the flatter areas of Talaheel where feeder
drains were blocked at the time of felling which has kept water tables higher in the furrows and
developed good bog vegetation cover across most of the block except on the dry ridges. Right: a
more recently felled plantation site on slightly sloping ground with more brash and a poorer
response due to the continued drainage from the furrows.
Enhanced restoration management of previously felled to waste forestry blocks in the form of brash
crushing furrow blocking has been ongoing at Forsinard since 2011. Visual responses have been
encouraging on both flatter ground and on gently sloping ground (Photo G2).

Page 103 of 125
Photo G2: Aerial view of brash crushing and furrow blocking on flatter ground within old felled to
waste blocks at Dyke, Forsinard 4 years after management.
Monitoring of the earlier experimental furrow blocking work at Lonielist in Forsinard in 2011 tested
3 different methods:
● brash crushing only of the tree material into the furrows
● small dams flush with the remnant plough ridges (with brash crushing)
● full height dams where peat dams were built at least a 30cm higher than the original surface
(with brash crushing)
Baseline vegetation and dipwell data was collected in 2011 across a number of replicates of each
treatment prior to management and then repeat monitoring was carried out in 2012 and in 2014.
After 2 years post management, the vegetation response and water tables for brash crushing alone
was no better than the Control sites where no management took place (Figure G1). The smaller
dams treatment also showed little response, but it was the large dam treatment that showed an
increase in Sphagnum species in the furrows and original surface. Other open bog indicator species
also showed a positive response albeit slow. It was worth noting that at this particular site, because
of the combination of slopes and peat depths the Control site showed no recovery at all and even
showed a slight decline for so bog indicator species over the 4 year period.

Page 104 of 125
Figure G1: Summary of vegetation responses to brash crushing and furrow blocking treatments at
Lonielist between 2011 (prior to management) and in 2012 and 2014. Positive and negative bog
indicator species are listed in Bingham & Cowie, 2014, but are derived from various standards e.g.
NVC, Ellenberg value. OS= original surface.
In 2014 the percentage cover of Positive bog indicator species has decreased since 2012 for all
treatments except full height dams where it continued to increase. Negative bog indicators
decreased across all treatments except the Control, but the biggest declines were within the full
height dam treatment. By far the biggest difference in cover between Positive bog indicator and
Negative bog indicator species in 2014 was in full height dams (60% and 18% respectively). Only the
full height dam treatment is showing the desired combination of increase in Sphagnum and bog
sedges and a decrease in vegetation indicative of drier conditions.
Data from dipwells, averaged to monthly readings, confirm the responses we were measuring in the
vegetation for the different treatments Figure G2. The 4 treatments vary little prior to management.
After management the full height dam treatment typically has a water table that is about 100mm
higher than the Control, with the other treatments being intermediate. By 2014 the summer water
table was often at a critically higher level and closer to the surface of the bog in the full height dam
treatment compared to the other treatments.

Page 105 of 125
Figure G2: Monthly averaged dipwell data for brash crushing and furrow blocking monitoring
experiment.
The poor performance of the smaller dams is likely due to the different method in which they are
made. They did not use the same fully humified peat as full height dams which took the peat from
deeper down. They were also likely to incorporate some brash into the dams, and for these reasons
they were likely to be more porous. Deer trampling is another issue. This work will be repeated in
2018/2019, and with 4 additional growing seasons will provide more data on trends according to
treatments.
The promising results from the large dam treatment has resulted in a large-scale roll-out of this
management across the reserve and an adoption of this technique on other sites and by various
peatland restoration schemes. Because of the close proximity of furrows a management
compromise had to be made whereby dams were placed every 20m along the furrows regardless of
slope. Dams were also staggered between adjacent furrows. Our monitoring work has shown that on
flatter ground and gentle slopes typical of a good proportion of our felled plantations water tables
are more stable and much closer to the bog surface, and wet ground and pools are being rapidly
colonised by Sphagnum and Eriophorum angustifolium, other bog vegetation and aquatic inverts.
Recent innovations in low ground pressure equipment have also allowed us to use excavators with
tracks each in excess of 1.4m wide. An additional benefit of recent more wider tracked machines is
that during the brash crushing and furrow blocking management, they also run over both plough
ridges of drier peat and rotting stumps, helping flatten the peat surface topography, and further
infilling the Furrows (Photo G3).

Page 106 of 125
Photo G3: Brash crushing and furrow blocking within old felled to waste plantation at Dyke,
Forsinard using extra-wide tracked excavator.
Reprofiling and furrow blocking
Further development of techniques to deal with ridge/furrow patterns have extended to a re-
profiling technique whereby a 360 tracked excavator with a bucket would first crush any tree
material and brash deep into the furrow. Then working at 90 degrees to the furrow the machine
would pull and push adjacent ridge material into the furrow from where it had been ploughed
originally ensuring that the vegetation was kept uppermost. Once a block was completed the tracked
excavator would then cross-track the whole site further removing any brash that was sticking up and
smoothing out any topography. The resulting peatland surface retained at least 60% vegetation
cover and importantly the strip of vegetation that constituted the original surface was left intact,
which is important for re-colonisation and spread of bog plants. Photo G4 shows some reprofiling
work on sloping ground at Imriche at Forsinard.

Page 107 of 125
Photo G4: Brash crushing and re-profiling management at Imriche, Forsinard. This is example is on
sloping ground. What this management clearly shows is that the vast bulk of the brash from the
dead felled to waste trees is now buried in the peat, and the plough ridges have been carefully
pulled back into the furrows leaving the line of vegetation that makes up the original surface
between the plough ridges intact.
The straight lines of retained vegetation along the original surface in between where the plough
ridges have been removed into the furrows are clearly evident in this example taken shortly after
management. Re-profiling management is currently being monitored as part of a trial being
conducting at Cross Lochs at Forsinard. RSPB are testing the effects of this management on
vegetation and water tables at high and low levels of brash and on flatter (0-2 degrees) and more
sloping (2-4 degree slopes). This work started in 2015, and will be repeated in 2018 when empirical
data will be available.
In addition to doing the re-profiling work described above, RSPB are also furrow blocking these sites
to ensure the infilled furrows do not continue to act as drains due to the higher brash content
(Photo G5),

Page 108 of 125
Photo G5a/b: Imriche re-profiling, furrow blocking and cross-tracking. a. Dams and pools are evident
as is the original surface vegetation left untouched by the management. b. Aerial views one month
after management was completed.
Compared to standard furrow-blocking alone, only small pools are evident behind dams as the rest
of the furrow has been infilled. The benefit of this combination over re-profiling method alone is
that the dams prevent drainage lines along the furrows created by the brash. Damming and cross-
tracking also helps break down any cracks in the peat and peat piping. However, it is worth noting
that the type of furrow blocking depends on peat depth present. Full height dams are only used on
peat >1.5m, due to the risk of pulling up mineral material into the dams rendering them porous. For
peat depths between 1m and 1.5m we use a similar technique, but with pull-in dams taking wet
peat, but from a shallower depth. These are still good at preventing drainage. Less than 1m peat
depth and on steeper slopes usually greater than 3 degrees, we recommend re-profiling and cross
tracking only.

Page 109 of 125
From the early responses from the vegetation we have seen, this management is currently regarded
as the optimal for sites that have been previously felled to waste or harvested at Forsinard. To test
how effective this technique is compared to furrow blocking alone additional monitoring was set up
at Forsinard in 2017. 8 replicate felled plantation blocks across the reserve have had 2 matched
areas that have been furrow blocked and re-profiled, furrow blocked and cross-tracked. These pairs
also have a matched open bog control site nearby. Monitoring of vegetation and hydrology using
dipwells and autologgers was repeated in 2018 after which empirical data will be available for
analysis of efficacy.
Tree regeneration is very patchy in the Flows, and can be a big problem in some areas, particularly
within the first 5 years after felled from seed released from the felled crop. Interestingly, Lodgepole
pine in particular appears to germinate best where there is a bryophyte layer, even if it is Sphagnum.
Costs of regeneration control are extremely variable depending on height and density. Small
regeneration can be pulled by hand, but larger regeneration requires a clearing saw or even a
chainsaw. At Forsinard recent costs for regeneration control vary between £265/ha and £1,372/ha,
but costs to clear specific small dense and taller areas of regeneration could be more than this.
At Forsinard, red deer have been used to some extent to control tree regeneration on both felled
plantations and adjacent blanket bog habitats. Certainly within the first 5 years post-felling deer
numbers were allowed to increase within felled or harvested plantation areas and they
preferentially browse tree seedlings, especially in winter. Once this critical phase is passed deer
densities are reduced to allow the peatland vegetation to restore. It remains a delicate balancing act
between not wanting to impact recovering bog vegetation, and controlling regeneration. Despite
best efforts to manage red deer densities, a significant amount of regeneration control is also
required.

Page 110 of 125
Appendix H Forest Research Damming Trials
H1.1 Braehour and Halsary
The Forestry Commission has undertaken research into the potential and desirability of restoring
bogs after afforestation and has published reviews (Anderson, 2001; Anderson et al., 2016), results
(Anderson, 2010; Anderson & Peace, 2017) and policy guidance on this issue (Patterson & Anderson,
2000; Morison, 2012; Forestry Commission Scotland, 2016; Forestry Commission Scotland, 2015a;
Forestry Commission Scotland, 2015b).
The most recent of these publications provides monitoring data for a restoration trial undertaken in
Caithness (Anderson & Peace, 2017). This trial was set up in 1996 and the results of ten years’
monitoring are summarised
The blanket bog restoration study focussed on two factors: the method of dealing with the trees,
and the damming or leaving open of the plough furrows. The randomised block design allowed the
effect of the tree treatment, the furrow treatment and interactions between the two to be
quantified.
Two study sites were used: Halsary and Braehour Forests. Four replicates of each treatment were in
11-year-old Sitka spruce/lodgepole pine mixture forest at Halsaryand a further two replicates were
in 15-year-old lodgepole pine forest at Braehour.
The results were that damming plough furrows and felling trees (whether leaving them lying on the
ground or removing them from the site) raised the water table level in the first two years after
treatment and maintained this raised level up to Year 10, although the level did not return to that of
unplanted bog immediately adjacent, even after 10 years (Figure H1). Damming the furrows but
leaving the trees growing was less effective at raising the water table level, showing that uptake of
water by the trees lowered the water table. Damming the furrows did not kill the trees within ten
years, suggesting that for successful restoration, the trees must be felled.

Page 111 of 125
Figure H1: Water table levels at the Halsary/Braehour forest-to-bog restoration experiment over the
ten years following the application of restoration treatments in late 1996. Blue is the control (no
restoration, forest continues growing). Black is the ‘Dam furrows and fell trees to waste’ treatment.
Green is adjacent non-afforested bog used as a reference.
The results also indicate that there was little difference between felling to waste and felling with
removal of the trees from the site, both in terms of the effect on the water levels and the
subsequent abundance of Hare's-tail cottongrass (Eriophorum vaginatum).
Conifer regeneration was generally low, with Sitka spruce seedlings reported as being browsed by
deer resulting in very few becoming established. Lodgepole pine seedlings reached average densities
of 2,700 per hectare but could be as high as 8,000 per ha locally within the plots. There was a clear
decrease in density with increasing distance from the adjoining edge of the remaining forest and it
was speculated that average densities for much larger scale restoration areas should be lower
because a smaller proportion of the area would adjoin standing forest.
The report (Anderson & Peace, 2017) concludes the following in relation to blanket bog:
1. To restore afforested blanket bog, it is necessary to fell planted conifers. Ditch blocking
alone is unlikely to kill them.
2. It is not necessary to remove pre-commercially felled trees unless there are other reasons
for doing so. Bog vegetation can develop even if they are left on the ground.
3. Damming drains and plough furrows helps to raise the water table and may help to provide
aquatic microhabitats.
4. A combination of felling trees and damming drains and plough furrows looks likely to restore
the former wildlife habitat and carbon sink functions of blanket bog.
5. Natural regeneration of trees can occur. If this regeneration is from seed, control measures
are likely to be needed where self-seeding is densest, near remaining areas of forest. Further
research is needed to determine whether timing and method of felling can be optimised to
reduce conifer regeneration on restored afforested bogs.
H1.2 Flanders Moss NNR forest-to-bog restoration
This randomised block experiment combined three methods of dealing with the trees (25-year-old
lodgepole pine forest) with damming or not damming the plough furrows. All drains on the site were
dammed. Results up to Year 5 were summarised by Anderson (2010).
The water table rose quickly to near the ground surface in all treatments as a result of the drain
blocking. Damming the plough furrows made no further improvement. Raising the water table level
decreased the aeration depth in the peat from 63 cm in November before restoration to 16 cm in
October two years after restoration. Felling the trees and leaving them lying on site appeared to
reduce water table draw-down during prolonged dry summer conditions, compared with removing
the felled trees.

Page 112 of 125
Some of the main bog species made a comeback in response to the restoration treatments.
Sphagnum mosses recovered equally in all the treatments. Initial recovery of ling heather (Calluna
vulgaris) and hare’s-tail cottongrass (Eriophorum vaginatum) depended on how the trees were dealt
with – they recovered most rapidly where the trees were removed whole from the site and more
slowly where the trees were felled and left lying, with conventional harvesting (timber removed,
slash left on site) intermediate.
Lodgepole pine seedlings grew on the restoration treatment plots but disappeared by Year 5 without
the need for follow-up treatment. Silver birch and downy birch seedlings also appeared and did not
disappear by Year 5. They grew most quickly in the fell-to-waste treatment, where the felled trees
may have prevented deer from browsing them.
H1.3 Longbridgemuir and Dalchork cracked peat rewetting trials
Two trenching treatments were trialled at each of these two randomised-block rewetting trials, on a
lowland raised bog and a blanket bog respectively, both with severely cracked peat thought unlikely
to respond to conventional rewetting measures (i.e. damming drains and plough furrows). Both
treatments involved digging a trench to below the depth of the cracks and repacking it with intact
peat, some of which was taken from borrow pits to replace dried and porous peat from the near-
surface layer. In one treatment, the peat packed into the trench slowed water movement to raise
the water table level. In the other, the sealing quality of the repacked trench was enhanced by
installing a heavy-duty plastic membrane along one wall of the trench before repacking it. The
trenches were aligned along the contour with side fingers running at right angles up-slope from
them to prevent water from flowing around the ends of the short sections forming the trial plots. In
practice, the trenches would be continuous, rather than broken into short lengths but side fingers
would still be needed to limit seepage and overground flow of water to any one low point along the
trench.
High pre-treatment water table levels at the Dalchork trial showed the water table at the site to be
less severely affected by peat cracking than expected. A third, conventional furrow-damming
treatment (i.e. damming plough furrows at intervals calculated to give a 20 cm height difference
between one dam and the next one down-slope from it) confirmed that peat cracking was not so
severe as to preclude rewetting by this method.
In both trials, both treatments caused a rapid rise of the water table to much nearer the surface,
within 20 cm of it in the case of the lowland bog and within 10 cm on the blanket bog (Figure H2).
This improved the conditions for recovery of bog vegetation and functioning, and the raised water
level has endured for over 2 years except for some draw-down closer to previous levels during dry
spells in spring. Even when temporarily drawn down, the levels remained well above those of the
controls, where no rewetting measures had been implemented.

Page 113 of 125
Figure H2. Improvements in the suitability of the water table regime for bog restoration at the
cracked peat rewetting trials at (a) Longbridgemuir and (b) Dalchork.
An operational study at the Longbridgemuir trial showed that repacked trenching without a
membrane had been much cheaper to implement and since their results in terms of raising the
water table were similar, repacked trenching was more cost-effective than membrane trenching.
The study also identified potential safety issues with membrane installation that added to the cost of
this treatment.

Page 114 of 125
Appendix I Landscape Scale Forestry to Bog Restoration Planning: A Case
Study of Whitelee Windfarm
I1.1 Background
Water quality sampling at Whitelee in 2014 and Black Law in 2015, during the reported experimental
trials, indicated that ground smoothing can give rise to significantly elevated levels of water colour,
Dissolved Organic Carbon (DOC) and suspended solids (SS) for upwards of 12 months. The trials
confirmed that careful consideration would need to be given at a strategic scale to the planning of
large-scale forest-to-bog restoration work going forwards - if treatment work was to be scaled up at
Whitelee and Black Law, and especially when areas selected were sited closer to natural
watercourses24 which was inevitable, significant environmental impacts could conceivably arise on
water quality downstream. Key considerations included:
● How much deforested land actually needs to be treated at each SPR site? Some parts of the
sites comprise mineral soils or shallow peat and will not need treated, but large areas will.
● What proportion of land can be treated in any one year on an SPR site before adverse
impacts on the water environment become apparent? How should we define adverse
impacts?
● How long will it take to treat all the land on an SPR site, based on a conservative approach to
work planning? What implications does this have for other priorities (e.g. control of tree
regeneration, which will continue to grow each year it is left)?
A new program of research was commissioned by SPR in summer 2015 to help address these issues.
Two companion project scopes were developed.
A Strategic Review of SPR’s deforested sites nationally was undertaken using GIS - the aims of this
were to:
● Identify all the deforested land likely to need bog restoration treatment work undertaken at
a national scale on SPR sites.
● Identify the most appropriate point(s) downstream of each block of proposed treatment
land at which water quality should ideally be controlled by SPR (i.e. locations beyond which
adverse impacts would be apparent downstream if treatment work was not managed
properly).
● Identify the extent of the catchments lying upstream of these ‘pour points’ and also confirm
their character in respect of likely ‘background’ water quality: (i) how much land of each
type (unplanted land, forest, felled land) was present upstream and (ii) what soils were
present upstream within each land use type (mineral soil, shallow peat, deeper peat).
● Consider how much deforested land could be treated in each catchment, in any one year,
before adverse impacts would likely arise downstream of them. As part of this process,
undertake work to define thresholds for ‘adverse impact’. This involved creating and using a
predictive model to assess the likely maximum amount of treatable ground before
thresholds are crossed.
24 The experimental designs of these trials involved their deliberate siting away from natural watercourses to ensure no
downstream impacts arose, given the novel nature of the work being undertaken.

Page 115 of 125
● Propose a first landscape-scale cohort of deforested peatland to be treated at the Whitelee
site, one of the highest priorities at the time, so that SPR could move forward with plans as it
is becoming a high priority due to the ongoing growth of conifer regeneration. Provisional
areas for Cohort 1 would be identified on maps, and the maps could then be reviewed and
agreed with SPR.
A companion project on Downstream Water Chemistry was also commissioned in 2015 - the aims of
this project were to:
● Use a selection of catchments, sub catchments and treated areas to gather data on water
colour25 and how it varies in time and space, within peat dominated catchments and mineral
catchments under differing forms of land management (samples taken mainly from Whitelee
but also some from Black Law).
● Use the data to build a simple model of catchments on each windfarm, the aim being to try
and predict water colour level at a particular point downstream based on the likely
contributions of colour coming from each part of the catchment.
● Use the models to help identify likely maximum areas within each catchment of each
windfarm that could be treated before an agreed threshold in water colour is likely to be
passed, thus helping ensure areas of land to be treated are conservative in size and location
for the purposes of mitigating adverse effects.
Landscape-scale ground-smoothing operations needed to start at Whitelee as soon as possible after
the strategic and downstream research projects were completed, because of the rapid rate of tree
growth being observed. A further strand of work was commissioned, in tandem with the two
research trials, to consider other potential impacts of the planned work at Whitelee windfarm
because of the potentially huge scale of operations. This work involved undertaking ‘Pre-Treatment
Due Diligence’, with the key aims being to consider:
● Surface water flood risk to windfarm infrastructure owned by SPR, and downstream land not
owned by SPR
● Peat slide risk on the proposed treatment areas
● Other critical factors which might need to be considered when developing a technical
specification for contractors to quote on (e.g. were regenerated trees on the site larger than
had been treated previously, and if so what were the environmental and ecological
implications of ground-smoothing work being undertaken therein?).
The ‘strategic review’ process on GIS for Whitelee was completed in late 2015. The results were used
to identify the number and boundaries of all catchments associated with deforested ground on deep
peat that require some form of ground treatment in coming years.
Sensitive receptors were identified as part of this process to check if they would influence the
location of the outlet for each catchment, as these might have to be selected as the point (‘pour
point’) at which SPR would effectively control for water quality relating to flows coming from within
the site boundary. In reality, almost no such receptors (e.g. private water supplies) were present
25 Correlated strongly with DOC. Suspended solids were deemed to variable and hence difficult to model at this stage.

Page 116 of 125
within the site boundaries and so the site boundary itself, or a point downstream of it, tended to be
used as the location for basing water quality models and decisions.
The ‘downstream model’ for Whitelee was developed using water quality data from Whitelee
(untreated land) as well as from Black Law (values for large-scale treated sites). The model was used
to help determine how much land in each sub-catchment could be treated in any given year before
the agreed water quality thresholds were likely to be exceeded.
Based on other studies, and assuming appropriate environmental management measures are
adhered to, it was expected that effects on water quality will be limited mainly to elevations in
dissolved organic carbon (DOC) and water colour. There are no statutory limits on these and they are
not necessarily considered to be pollutants, however as they affect perceptions of drinking water
quality water is typically treated to meet threshold levels for water colour in drinking water supplies.
The water colour threshold levels are very low and are typically exceeded by any water flowing from
peaty catchments, therefore rather than use these the model for the wider Whitelee site was set up
to determine the maximum catchment area (in ha) that can be treated in one year before water
colour increases by more than 10% over the background level for that catchment, as predicted for
the catchment outlet. For the Drumtee-Clanfin section of Whitelee, where specific values were
available from the experimental trial started in 2014, the model was calibrated differently as site-
specific data on likely water colour levels after treatment were available (colour expected to be
lower than that from Black Law ground-smoothed trial sites, based on results to date, and hence a
larger area of land is considered treatable before problems arise at the pour points).
The maximum area (ha) in each catchment was calculated using the model, and then a mapping
exercise was undertaken to pinpoint the most appropriate part of the catchment to place the Cohort
1 treatment area. This was done by ensuring that the selected area (i) fell within land actually
requiring treatment (i.e. not on shallow peat) and (ii) was as far up catchment and away from
watercourses as possible, to allow the land in between to ‘scrub out’ sediment etc. In addition, and
where possible, parcels of treatment land from different catchments were located on a shared
boundary across a watershed to minimise the overall number of treatment zones (i.e. physical
locations an excavator would need to mobilise to).
I1.2 Key Findings
The downstream chemistry project confirmed that the intensity of water colour generated varied
markedly between land use types (Figure I1) at Whitelee. It also varied markedly within each land
use type across the year. Afforested catchments consistently generated the highest colour levels,
albeit even catchments dominated by shallow peat and mineral soil generated some colour. Map I1
shows the extent of peatland present within each catchment at Whitelee.

Page 117 of 125
Figure I1: The mean water colour level (hazens) obtained from a variety of sampling points spread
across the Whitelee site in areas where catchments upstream were dominated by one main soil
type/land use type (+/- 1 Standard Error).
The findings of the downstream chemistry study implied that water colour would vary seasonally,
but presumably also according to where in a catchment it was obtained from because, in turn, the
proportions of soils and land use types present upstream would be important. Sampling at Whitelee
confirmed this, with colour levels varying downstream in line with the proportion of ‘high colour
generation’ land uses present (combination of afforested and deforested peatland within the
catchment) (Figure I2).
Figure I2: The mean water colour level (hazens) from two locations at Whitelee, where various
points were sampled downstream of each other (left hand column: blue bars = ) alongside the % of
peat (afforested or deforested) present upstream of each point. The main sampling point at each
site is represented as 0m on the x-axis (i.e. furthest upstream of the length of watercourse sampled).
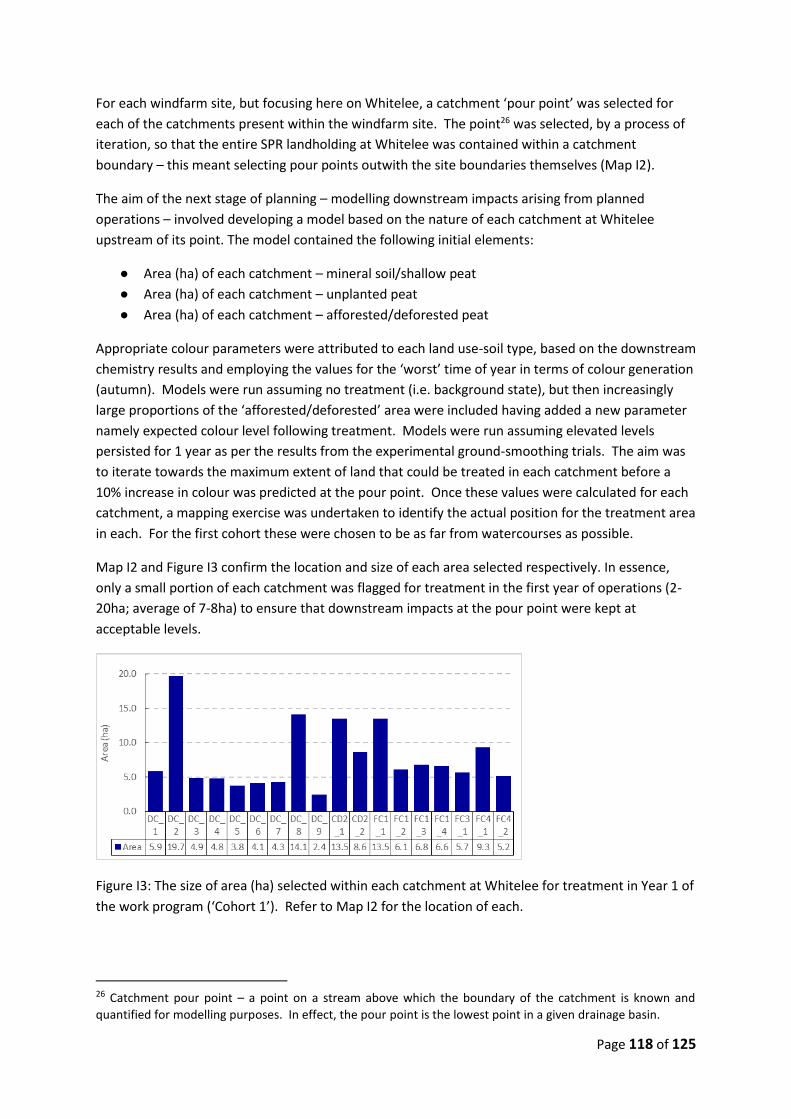
Page 118 of 125
For each windfarm site, but focusing here on Whitelee, a catchment ‘pour point’ was selected for
each of the catchments present within the windfarm site. The point26 was selected, by a process of
iteration, so that the entire SPR landholding at Whitelee was contained within a catchment
boundary – this meant selecting pour points outwith the site boundaries themselves (Map I2).
The aim of the next stage of planning – modelling downstream impacts arising from planned
operations – involved developing a model based on the nature of each catchment at Whitelee
upstream of its point. The model contained the following initial elements:
● Area (ha) of each catchment – mineral soil/shallow peat
● Area (ha) of each catchment – unplanted peat
● Area (ha) of each catchment – afforested/deforested peat
Appropriate colour parameters were attributed to each land use-soil type, based on the downstream
chemistry results and employing the values for the ‘worst’ time of year in terms of colour generation
(autumn). Models were run assuming no treatment (i.e. background state), but then increasingly
large proportions of the ‘afforested/deforested’ area were included having added a new parameter
namely expected colour level following treatment. Models were run assuming elevated levels
persisted for 1 year as per the results from the experimental ground-smoothing trials. The aim was
to iterate towards the maximum extent of land that could be treated in each catchment before a
10% increase in colour was predicted at the pour point. Once these values were calculated for each
catchment, a mapping exercise was undertaken to identify the actual position for the treatment area
in each. For the first cohort these were chosen to be as far from watercourses as possible.
Map I2 and Figure I3 confirm the location and size of each area selected respectively. In essence,
only a small portion of each catchment was flagged for treatment in the first year of operations (2-
20ha; average of 7-8ha) to ensure that downstream impacts at the pour point were kept at
acceptable levels.
Figure I3: The size of area (ha) selected within each catchment at Whitelee for treatment in Year 1 of
the work program (‘Cohort 1’). Refer to Map I2 for the location of each.
26 Catchment pour point – a point on a stream above which the boundary of the catchment is known and
quantified for modelling purposes. In effect, the pour point is the lowest point in a given drainage basin.

Page 119 of 125

Page 120 of 125
Map I1: The extent of peatland (brown; shallow peat is gold) at Whitelee windfarm (red) across the
landscape as a whole and specifically inside deforested areas (hatched). The boundary of each
catchment (black) is shown.

Page 121 of 125
Map I2: The location of each site selected for treatment as part of the landscape-scale ground-
smoothing operation at Whitelee windfarm in Cohort 1.

Page 122 of 125
Once the areas had been identified for Cohort 1 treatment works at Whitelee, due diligence studies
were undertaken to assess the other environmental risks associated with the work:
● Several locations were identified were there was a potential peat slide risk, as the peat mass
within the proposed treatment site was ‘unconstrained’. Figure I4 gives an example of an
unconstrained site compared with a constrained site where the topography downslope was
likely to (i) prevent peat from sliding in the first place but also (ii) would catch any released
material before it entered a watercourse.
● Several locations were identified where discontinuity was identified in the peat mass itself –
in Figure I5, transect 11_122 in the block FC1_4 appeared to have a layer of less humified
peat half-way down the profile (normally humification increases with depth).
● Surveys identified that a wide range of bog water table conditions was present, with some
sites unusually dry before treatment (see DC-7 in Figure I6).
● Certain sites were more dangerous than others for the contractors to work on due to the
presence of buried cables and other features such as steep banks (Figure I7).
Figure I4: Peat cross-sections for two slopes: the upper slope has an unconstrained peat mass,
potentially a risk if treatment work causes slope instabilities, and the lower slope is constrained at
the toe of the slope.

Page 123 of 125
Figure I5: Peat core results showing, typically, a progression of humification level with depth (von
Post score) but with one transect having a discontinuity present (11_122) half way down.
Figure I6: Assessment of depth to the bog water table, from the top of the main peat mass, before
treatment. A clear gradient if site wetness was apparent, with potential implications for how
machines may need to work as well as what outcomes might be obtained.

Page 124 of 125
Figure I7: Example of GIS constraints model built to guide contractors on site, and ensure they were
not exposed to undue levels of hazard.
The outcomes of the due diligence exercise for Cohort 1 at Whitelee produced a range of mitigation
measures including the following:
● Peat slide risk: (i) no machine to work within 300m of another and (ii) consider use of
containment cells 50x50m in size to reduce the risk of mass movements arising following
treatment.
● Flood risk: (i) avoid blocking peripheral drains around infrastructure, and cut-off drains
leading water away from crane pads, turbine bases etc, (ii) try to ensure that no new surface
water run-off features are inadvertently created, for example where machinery accesses the
site or where a machine becomes bogged and has to be extracted, (iii) avoid creating
hollows or low points where water could collect and subsequently wash out and (iv) give
particular consideration to avoiding blockages in functioning drains beside infrastructure
caused by treatment debris.
● Erosion / sedimentation: (i) leave appropriately sized vegetated buffer strips around
watercourses (10m, but consider 20m) and around infrastructure (25m) (Photo I1), (ii) create
containment cells to control sediment movement (see peat slide risk measures above), (iii)
monitor key watercourses/drains running off sites and consider installing silt screens if
required. On buffer strips and containment cells, remove regeneration where possible by
raking with the machine bucket.
● Tree regeneration size: where Lodgepole pine trees > 3m are present, these should be
broken down and left on the ground surface rather than being buried (to reduce prevalence
of large soil macropores being created). Consider the same for larger specimens of Spruce.

Page 125 of 125
Photo I1: A buffer in between treatment blocks, to help reduce the risk of sediment arriving in
watercourses over the 24-36 months it normally takes for bare peat cover levels to reduce to
normal.
Copyright © 2022 FDOKUMEN