Landbauforschung vTI Agriculture and Forestry Research
102
Landbauforschung vTI Agriculture and Forestry Research Vol.61 No. 4 12.2011
-
Upload
khangminh22 -
Category
Documents
-
view
3 -
download
0
Transcript of Landbauforschung vTI Agriculture and Forestry Research
4,41LBF_Vol. 61 4_U4 LBF_Vol. 61 4_U1
LandbauforschungvTI Agriculture andForestry Research
Vol.61 No. 4 12.2011
Preis /Price 8 €
ISSN 0458-6859
LandbauforschungvTI Agriculture andForestry Research
Vol.61 No. 4 12.2011

4,41LBF_Vol. 61 4_U2 LBF_Vol. 61 4_U3
Gutachtergremium Editorial Board
PD Dr. Martin Banse, Institut für Marktanalyse und Agrarhandelspolitik, vTIDr. Jürgen Bender, Institut für Biodiversität, vTIDr. Jutta Berk, Institut für Tierschutz und Tierhaltung, FLIDr. Herwart Böhm, Institut für Ökologischen Landbau, vTIProf. Dr. Andreas Bolte, Institut für Waldökologie und Waldinventuren, vTIDr. Ulrich Dämmgen, Institut für Agrarrelevante Klimaforschung, vTIPD Dr. Sven Dänicke, Institut für Tierernährung, FLIDr. habil. Bernd Degen, Institut für Forstgenetik, vTIPD Dr. Matthias Dieter, Institut für Ökonomie der Forst und Holzwirtschaft, vTIPD Dr. habil. Bettina EichlerLöbermann, Universität RostockDr. Peter Elsasser, Institut für Ökonomie der Forst und Holzwirtschaft, vTIProf. Dr. Andreas Fangmeier, Universität HohenheimPD Dr. Matthias Fladung, Institut für Forstgenetik, vTIProf. Dr. Heinz Flessa, Institut für Agrarrelevante Klimaforschung, vTIProf. Dr. Ulrike GrabskiKieron, Universität MünsterProf. Dr. JörgMichael Greef, Institut für Pflanzenbau und Bodenkunde, JKIProf. Dr. Konrad Hagedorn, HumboldtUniversität BerlinPD Dr. Ingrid Halle, Institut für Tierernährung, FLIDr. Silvia Haneklaus, Institut für Pflanzenbau und Bodenkunde, JKIProf. Dr. Eberhard Hartung, Universität KielProf. Dr. Roland Herrmann, Universität GießenProf. Dr. habil. Pierre Ibisch, Hochschule für nachhaltige Entwicklung, HNEEDipl. Ing.Agr. Robert Kaufmann, Forschungsanstalt Agroscope ReckenholzTänikon ART, SchweizDr. Jörg Kleinschmit, Nordwestdeutsche Forstliche VersuchsanstaltProf. Dr. Luit de Kok, Universität Groningen, NiederlandeProf. Dr. Uwe LataczLohmann, Universität KielDr. Oliver von Ledebur, Institut für Marktanalyse und Agrarhandelspolitik, vTIProf. Dr. Bernd Linke, Institut für Agrartechnik Bornim e.V.Dipl. Met. FranzJosef Löpmeier, Agrarmeteorologische Forschung des Deutschen WetterdienstesProf. Dr. Udo Mantau, Universität HamburgProf. Dr. Axel Munack, Institut für Agrartechnologie und Biosystemtechnik, vTIDr. Hiltrud Nieberg, Institut für Betriebswirtschaft, vTIDr. Rainer Oppermann, Institut für Ökologischen Landbau, vTIProf. Dr. Herbert Oberbeck, TU BraunschweigDr. Jürgen Puls, Institut für Holztechnologie und Holzbiologie, vTIProf. Dr. Gerold Rahmann, Institut für Ökologischen Landbau, vTIProf. Dr. Detlef Rath, Institut für Nutztiergenetik, FLIDr. Thomas Schneider, Institut für Weltforstwirtschaft, vTIProf. Dr. Dr. habil. Dr. h.c. Ewald Schnug, Institut für Pflanzenbau und Bodenkunde, JKIDr. Lars Schrader, Institut für Tierschutz und Tierhaltung, FLIProf. Dr. Andreas Susenbeth, Universität KielProf. Dr. Friedhelm Taube, Universität KielProf. Dr. KlausDieter Vorlop, Institut für Agrartechnologie und Biosystemtechnik, vTIProf. Dr. Dr. habil. Drs. h.c. Gerd Wegener, TU MünchenProf. Dr. HansJoachim Weigel, Institut für Biodiversität, vTIProf. Dr. Peter Weingarten, Institut für Ländliche Räume, vTIDr. Nicole Wellbrock, Institut für Waldökologie und Waldinventuren, vTI
Landbauforschung
Landbauforschung (vTI Agriculture and Forestry Research) ist ein wissenschaftliches Publikations organ des Johann Heinrich von ThünenInstituts (vTI), Bundesforschungsinstitut für Ländliche Räume, Wald und Fischerei. Die Zeitschrift wird vom vTI heraus gegeben und erscheint vierteljährlich. Die Sprache der Beiträge ist deutsch und englisch. Sonderhefte erscheinen nach Bedarf.
In der Zeitschrift werden Forschungsergebnisse aus der Ressortforschung des BMELV mit Bezug zur Land und Forstwirtschaft und den ländlichen Räumen veröffentlicht, einschließlich Forschungs ergebnissen aus Kooperationsprojekten, an denen das vTI beteiligt ist.
Die Landbauforschung ist eine multidisziplinär ausgerichtete Zeitschrift, die die verschiedenen Facetten der Agrar und Forstwissenschaften einschließt und besonderes Augenmerk auf deren interdisziplinäre Verknüpfung legt.
Englischsprachige Beiträge sind erwünscht, damit die Forschungsergebnisse einem möglichst breiten wissenschaftlichen Diskurs zugeführt werden können.
Für den Inhalt der Beiträge sind die Autoren ver antwortlich. Eine Haftungsübernahme durch die Redaktion erfolgt nicht.
Mit der Einsendung von Manuskripten geben die Verfasser ihre Einwilligung zur Veröffentlichung. Die von den Autoren zu beachtenden Richtlinien zur Einreichung der Beiträge sind unter www.vti.bund.de oder bei der Geschäftsführung erhältlich. Das exklusive Urheber und Verwertungsrecht für angenommene Manuskripte liegt beim vTI. Es darf kein Teil des Inhalts ohne schriftliche Genehmigung der Geschäftsführung in irgendeiner Form vervielfältigt oder verbreitet werden.
Indexiert in: CAB International, Science Citation Index Expanded, Current Contents Agriculture, Biology & Environmental Sciences
Herausgeber
Johann Heinrich von ThünenInstitut (vTI)
Gutachtergremium
Siehe 3. Umschlagseite
Schriftleitung
Prof. Dr. Folkhard Isermeyer
Geschäftsführung
Dr. Matthias Rütze Tel. 040 . 739 62 247 Leuschnerstraße 91 21031 Hamburg, Germany [email protected] www.vti.bund.de
ISSN 04586859
Alle Rechte vorbehalten.
vTI Agriculture and Forestry Research
Landbauforschung (vTI Agriculture and Forestry Research) is a scientific journal of the Johann Heinrich von Thünen Institute (vTI), Federal Research Institute for Rural Areas, Forestry and Fisheries. The journal is published quarterly by the vTI. The articles appear in either German or English. Special issues are published as required.
The journal publishes research results under the auspices of the German Ministry of Food, Agriculture and Consumer Protection (BMELV). Articles bear relevance to agriculture and forestry, as well as to rural areas, and include research results from cooperative projects involving the vTI.
vTI Agriculture and Forestry Research is a multidis ciplinary journal, encompassing the various facets of this field of research and placing a particular emphasis on interdisciplinary linkages.
English language contributions are desired so that the research results can achieve as broad a scientific discourse as possible.
The authors are responsible for the content of their papers. The publishers cannot assume responsibility for the accuracy of articles published.
With the submission of a manuscript, the author grants his or her permission for publication. Authors are requested to follow the guidelines for submission found at www.vti.bund.de or available from the management. The vTI retains exclusive copy and usage rights for accepted manuscripts. No portion of the content may be duplicated or distributed in any form without the written permission of the publisher.
Indexed in: CAB International, Science Citation Index Expanded, Current Contents Agriculture, Biology & Environmen
tal Sciences
Publisher Johann Heinrich von Thünen Institute (vTI)
Editorial Board Directors of vTIInstitutes
Editor in Chief Prof. Dr. Folkhard Isermeyer
Managing Editor Dr. Matthias Rütze Phone + 49 40 . 739 62 247 Leuschnerstraße 91 21031 Hamburg, Germany [email protected] www.vti.bund.de
ISSN 0458 – 6859
All rights reserved.

iLandbauforschungvTI Agriculture and Forestry ResearchVol. 61 No. 4 12.2011
JochenSchmitzandOlivervonLedebur
Volatility transmission on international futures markets during the 2007/08 price surgeVolatilitätsübertragungaufinternationalenTerminmärktenwährenddes2007/08Preisschubs
273
AnjaSchwalmundHeikoGeorg
Elektronische Tierkennzeichnung – ISO-Standards und aktuelle Situation in DeutschlandElectronicanimalidentification–ISO-standardsandcurrentsituationinGermany
283
GraciaUde,HeikoGeorg,SophiaBenderundAnjaSchwalm
Eignung von Thermo-Injektaten zur elektronischen Tierkennzeichnung und Körpertemperaturerfassung bei ZiegenResearchingoatswithbio-thermo-transpondersforelectronicidentificationandbodycoretemperaturelogging
289
IngridHalle,MartinaHenning,andPeterKöhler
Influence of vitamin B12 and Cobalt on growth of broiler chickens and Pekin ducksEinflussvonVitaminB12undKobaltaufdasWachstumvonBroilerundPekingente
299
KerstinBarth,KarenAulrich,HelgeChristianeHaufe,UteMüller,DagmarSchaub,andFranzSchulz
Metabolic status in early lactating dairy cows of two breeds kept under conditions of organic farming – a case study StoffwechselstatusvonzweiRasseninderFrühlaktationunterBedingungendesökologischenLandbaus–eineFallstudie
307
ChristineBrandt,ChristianeBalko,andBettinaEichler-Löbermann
Interactive effects of soil water content and phytin supply on phosphorus nutrition of different crops species WechselseitigerEinflussvonWassergehaltdesBodensundPhytin-ZufuhraufdiePhosphor-ErnährungverschiedenerFruchtarten
317
UlrichDämmgen,WilfriedBrade,JoachimSchulz,HeinrichKleineKlausing,NicholasJ.Hutchings,Hans-DieterHaenel,
andClausRösemann
The effect of feed composition and feeding strategies on excretion rates in German pig productionDerEinflussvonFutterzusammensetzungundFütterungsstrategienaufdieAusscheidungsrateninderdeutschenSchweineproduktion
327
JörgBurgstaler,DennyWiedow,FraukeGodlinskiundNorbertKanswohl
Einsatz von Natriumhydrogencarbonat in landwirtschaftlichen BiogasanlagenApplicationofsodiumbicarbonateinagriculturalbiogasplants
343
GeerdA.Smidt,AndreaKoschinsky,LeandroMacchadodeCarvalho,JoséMonserrat,andEwaldSchnug
Heavy metal concentrations in soils in the vicinity of a fertilizer factory in Southern BrazilSchwermetallgehalteinBödenimUmfeldeinerDüngerfabrikinSüdbrasilien
353
JoachimSpilke
Information zum „Leitfaden zur Einordnung, Planung, Durchführung und Auswertung von Versuchen unter Produktionsbedingungen (On-Farm-Experimente)“
365

J. Schmitz and O. v. Ledebur / Landbauforschung - vTI Agriculture and Forestry Research 4 2011 (61)273-282 273
Volatility transmission on international futures markets during the 2007/08 price surge
JochenSchmitz*andOlivervonLedebur*1
*1 JohannHeinrichvonThünen-Institut(vTI),InstituteforMarketAnalysisandAgriculturalTradePolicy,Bundesallee50,38116Braunschweig,GermanyE-mail:[email protected]
Abstract
Thestudyisacontributiontothedebateonthecom-moditypricespike in2007to2008andtherelationshipamong commodity futuresmarkets. The transmissionofprice volatilitybetween futuresmarkets is analysed. Thebackgroundquestioniswhether,andtowhatextent,thevolatilityofagriculturalfuturesatdifferentmarketplaceswastransferredduringthepricechangesof2008.Thevol-atilityofmaizefuturesatdifferentexchangesismodelledasamultivariateGARCH-process.Bydoingso,interactionsbetweenmarketsindifferentvenuesareincorporated.Es-timationresultsarediscussedagainstthebackgroundofthedevelopmentsinagriculturalandbiofuelpolicy.
Keywords: commodity futures, corn, time series, price volatility transmission, multivariate GARCH.
Zusammenfassung
Volatilitätsübertragung auf internationalen Termin-märkten während des 2007/08 Preisschubs
Diese Studie liefert ein Beitrag zur Debatte über denPreisanstieg auf den Rohstoffmärkten in 2007 bis 2008sowiedemVerständnisderBeziehungenzwischenWaren-terminmärkten.DieÜbertragungvonPreisschwankungenzwischenWarenterminmärktenwirdanalysiert.DieKern-frage ist,obund inwelchemUmfang,dieVolatilitätderAgrar-Futures auf verschiedenen Marktplätzen währendderPreisänderungendesJahres2008übertragenwurde.DieVolatilitätdesMais-FuturesanverschiedenenBörsenwirdalseinmultivariaterGARCH-Prozessmodelliert.Da-durch sind die Wechselwirkungen zwischen den Märk-ten an verschiedenen Börsenplätzen aufgenommen. DieErgebnisse der Schätzungwerden vor dem HintergrundderEntwicklungenderAgrarpolitikundderBiokraftstoff-Politikdiskutiert.
Keywords: Warenterminkontrakte, Mais, Zeitreihenana-lyse, Volatilitätsübertragung, multivariates GARCH
274
1 Introduction
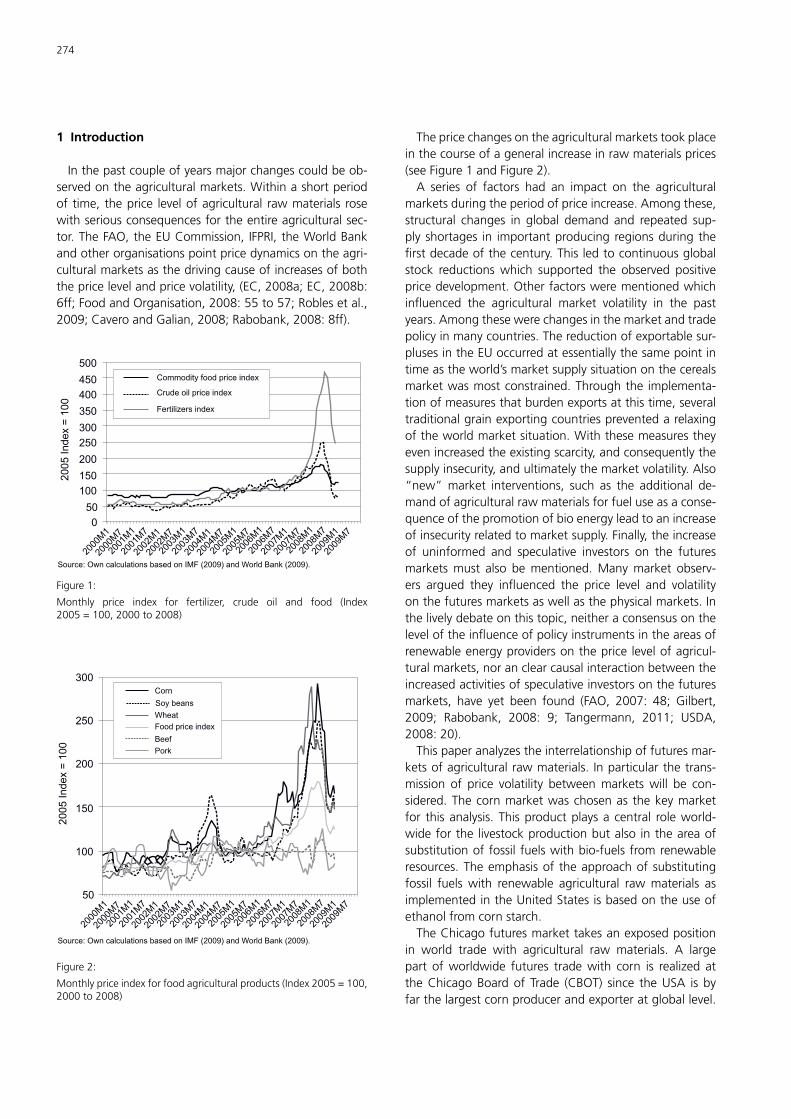
Inthepastcoupleofyearsmajorchangescouldbeob-servedontheagriculturalmarkets.Withinashortperiodof time, theprice levelofagricultural rawmaterials rosewithseriousconsequencesfortheentireagriculturalsec-tor.TheFAO,theEUCommission, IFPRI,theWorldBankandotherorganisationspointpricedynamicsontheagri-culturalmarketsasthedrivingcauseofincreasesofboththepricelevelandpricevolatility,(EC,2008a;EC,2008b:6ff;FoodandOrganisation,2008:55to57;Roblesetal.,2009;CaveroandGalian,2008;Rabobank,2008:8ff).
0
2000
M1
2005
M1
2001
M1
2006
M1
2002
M1
2007
M1
2003
M1
2008
M1
2004
M1
2009
M1
2000
M7
2005
M7
2001
M7
2006
M7
2002
M7
2007
M7
2003
M7
2008
M7
2004
M7
2009
M7
2005 Index
= 1
00
50
100
150
200
250
300
350
400
450
500
Commodity food price index
Crude oil price index
Fertilizers index
Source: Own calculations based on IMF (2009) and World Bank (2009).
Figure1:
Monthly price index for fertilizer, crude oil and food (Index2005=100,2000to2008)
50
100
150
200
250
300Corn
Soy beans
Wheat
Food price index
Beef
Pork
2005 Index
= 1
00
2000
M1
2005
M1
2001
M1
2006
M1
2002
M1
2007
M1
2003
M1
2008
M1
2004
M1
2009
M1
2000
M7
2005
M7
2001
M7
2006
M7
2002
M7
2007
M7
2003
M7
2008
M7
2004
M7
2009
M7
Source: Own calculations based on IMF (2009) and World Bank (2009).
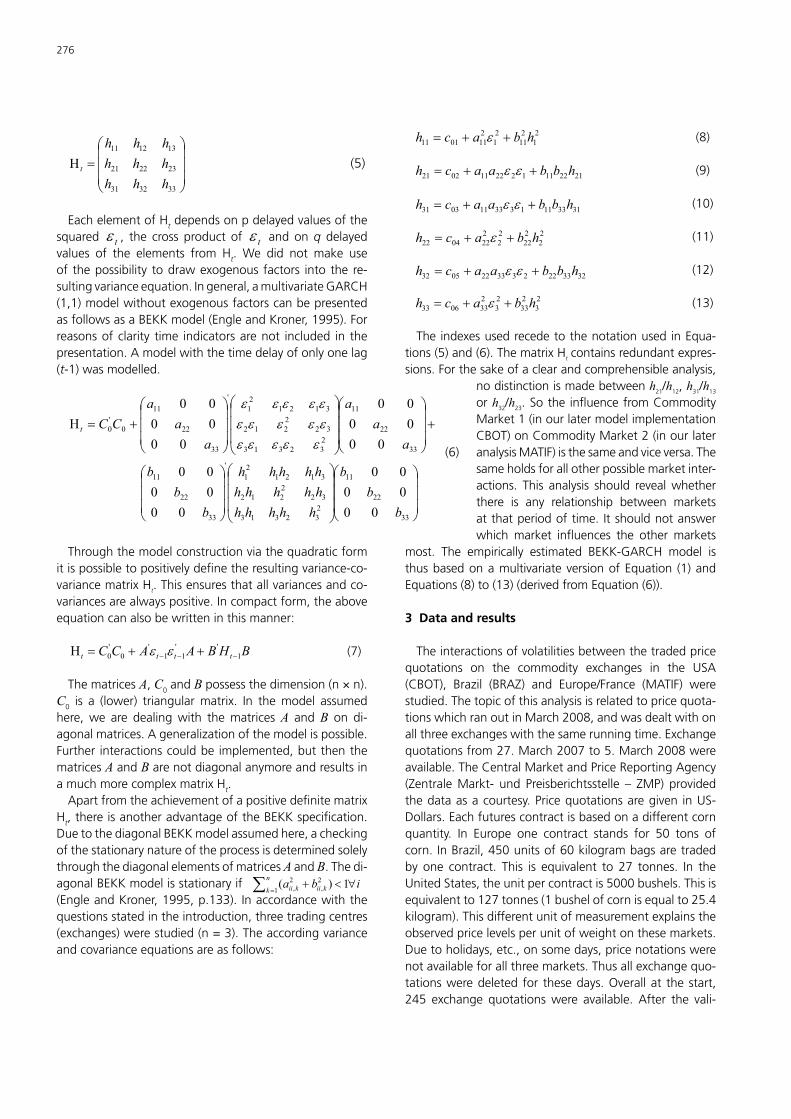
Figure2:
Monthlypriceindexforfoodagriculturalproducts(Index2005=100,2000to2008)
Thepricechangesontheagriculturalmarketstookplaceinthecourseofageneralincreaseinrawmaterialsprices(seeFigure1andFigure2).A series of factors had an impact on the agricultural
marketsduringtheperiodofpriceincrease.Amongthese,structural changes in global demand and repeated sup-plyshortages in importantproducingregionsduringthefirstdecadeofthecentury.Thisledtocontinuousglobalstock reductionswhich supported the observed positivepricedevelopment.Otherfactorswerementionedwhichinfluenced the agricultural market volatility in the pastyears.Amongthesewerechangesinthemarketandtradepolicyinmanycountries.Thereductionofexportablesur-plusesintheEUoccurredatessentiallythesamepointintimeastheworld’smarketsupplysituationonthecerealsmarketwasmostconstrained.Throughthe implementa-tionofmeasuresthatburdenexportsatthistime,severaltraditionalgrainexportingcountriespreventedarelaxingoftheworldmarketsituation.Withthesemeasurestheyevenincreasedtheexistingscarcity,andconsequentlythesupplyinsecurity,andultimatelythemarketvolatility.Also“new”market interventions, such as the additional de-mandofagriculturalrawmaterialsforfueluseasaconse-quenceofthepromotionofbioenergyleadtoanincreaseofinsecurityrelatedtomarketsupply.Finally,theincreaseof uninformed and speculative investors on the futuresmarketsmust also bementioned.Manymarket observ-ers argued they influenced the price level and volatilityonthefuturesmarketsaswellasthephysicalmarkets.Inthelivelydebateonthistopic,neitheraconsensusontheleveloftheinfluenceofpolicyinstrumentsintheareasofrenewableenergyprovidersontheprice levelofagricul-turalmarkets,noranclearcausalinteractionbetweentheincreasedactivitiesofspeculativeinvestorsonthefuturesmarkets, have yet been found (FAO, 2007: 48; Gilbert,2009; Rabobank, 2008: 9; Tangermann, 2011; USDA,2008:20).Thispaperanalyzestheinterrelationshipoffuturesmar-
ketsofagriculturalrawmaterials. Inparticularthetrans-mission of price volatility betweenmarketswill be con-sidered.Thecornmarketwaschosenas thekeymarketfor thisanalysis.Thisproductplaysacentral roleworld-wideforthe livestockproductionbutalso intheareaofsubstitutionoffossil fuelswithbio-fuelsfromrenewableresources.Theemphasisof theapproachof substitutingfossil fuelswith renewable agricultural rawmaterials asimplementedintheUnitedStatesisbasedontheuseofethanolfromcornstarch.TheChicagofuturesmarkettakesanexposedposition
in world trade with agricultural raw materials. A largepart ofworldwide futures tradewith corn is realized attheChicagoBoardof Trade (CBOT) since theUSA is byfarthelargestcornproducerandexporteratgloballevel.

J. Schmitz and O. v. Ledebur / Landbauforschung - vTI Agriculture and Forestry Research 4 2011 (61)273-282 275
ContractpricesachievedattheCBOTinthecourseofthefutures tradinghaveawide reachingsignal function forglobal cornmarkets. Inaddition to this exchange, therearetwootherexchangesofinterest.ThesearetheFuturesExchangeinSãoPaulo(BolsaMercantiledeFuturos,BMF,here denominated BRAZ) in Brazil and the Paris-basedExchange, theMarche a Terme d’Instruments Financiers(MATIF).TheBrazilianagriculturalmarketsarecharacter-izedbynotable largeexport surplusgrowth rates.SincetheBrazilianmacroeconomic stabilization succeeded the1990’s,tradeattheBMFhasincreased,andcurrentlytheexchangeassumes the roleof regional referencemarketfor some commodities. The French exchange takes therole of leading market with regard to cereals marketswithintheEuropeanUnion.Inthecontextofgloballyincreasinglyinterrelatedagri-
cultural and financial markets, the question emergeswhether and towhat extent futures price volatilitywascarriedoverbetweeninternationaltradingcentresduringthedrasticpricechangesof2008.Thisquestionhasonlybeendealtwithapproximately intheagriculturalecono-mic scientific literature (Baffes, 2007; EC, 2008a; EC,2008b;GarciaandLeuthold,2004).Untilnow,studiesonthevolatilityofagriculturalmar-
ket prices have mainly concentrated methodically on aunivariate approach.At theheartof thepast analysis isamodellingofvolatilityasaGARCH(GeneralizedAuto-regressiveConditionalHeteroscedasticity) Process,whichwas supplementedwith exogenous factors. Factors thathavebeenidentifiedaregovernmentprogramsfortheUSfuturesandcashwheatmarkets(CrainandLee,1996)orinventoriesandtradingvolumefortheUScornandwheatfuturesmarkets (Goodwin and Schnepf, 2000). Regard-ingthevariabilityinfuturesmarkets,abetterunderstand-ingofthefactorsthataffectpricechangesandvolatilityisneeded(GoodwinandSchnepf,2000;Boudoukhetal.,2003).Against this methodological background, interactions
betweenfuturesmarketsatdifferenttradingcentreswereexcluded. In lightof the jointprice increaseacrosscom-moditymarkets,thequestionemergesofhowadequateanisolatedconsiderationofasinglemarketis.Forthisrea-sonwetakeadifferentapproachinthisstudy.Itappearsto be necessary to illustrate the relevantmarkets simul-taneouslyandtodocumenttheirinterdependencies.Inor-dertoachievethisfortheglobalcornmarket,weillustratethe markets in a multivariate heteroscedasticity model.ThemodellingapproachofaBEKKModel1
1 BEKKmodelsarenamedafterBaba,Engle,KraftundKroner.
isusefulforthispurpose. A positive definite covariancematrix Ht (EngleandKroner,1995)duetothemodelset-upletthismodel
appeartobesuitedforthisanalysis.Thisarticleisdividedinto the following areas. The next section introduces indetailthemethodsoftheBEKKmodel.Section3presentsthedatausedandtheestimatedresults.Adiscussionontheresultsclosesthissection.Thefinalsectionconcludeswithadiscussionofpossiblefutureresearch.
2 Model
GARCHmodelsserveasthebackboneofvolatilitymo-delling.Throughtheapproachby(Engle,1982),itispos-sibletomodelthe(unobserved)secondmoment.There-sultingvarianceisdependentontheamountofcurrentlyavailable information. ThewholeGARCHmodel can becharacterizedby4equations.Thefirstpartdescribesthemean equation and illustrates the first moment of theprocess(Equation(1)).Inthisspecificationonlyalongtermtrend component μ is assumed. Daily percentage pricechanges(Pricereturns)areusedforestimation.Thosere-turnsarebestcharacterizedbyalongtermtrendcompo-nent.Thesecondpartdescribesthevarianceequation.Itserves
asthesecondmomentoftheprocess(Equation(4)).Theknowninformationset isgeneratedfromthereturnsuptothetimepointt-1.FurthermodelcharacterizationsareneededtofullydescribetheGARCHmodel.Equation(2)servesasalinkbetweenEquation(1)andEquation(4).Itstates that the secondmoment is driven by conditionalheteroscedasticity.Equation(3)declaresthedistributionoftheinnovationoftheprocessasanormaldistribution.Thereturnsarecalculatedasrt=log(Ft/Ft−1).Thefutures
priceatthatpointintimeiscalledFt,andrtdescribestheillustratedreturnsattimepointt:
rt P �H t (1)
ttt H (2) tt �H (3)
Theresultingvarianceofrtyieldsthegeneralizationofthemodel by (Bollerslev, 1986). It permits the inclusionofpastvariancesinadditiontotheconsiderationofpastinnovations.This leads to thegeneralunivariateGARCH(p,q)model:
ttttt ��� ������ EEHDHDD � (4)
Thepastinnovations D H t� � �D H�
t� arecalledtheARCH-termswhilethepastvariances E t� � � E t� � arecalledtheGARCH-terms.ThetransferintoamultivariateGARCHmodeltakesplace
withageneralizationoftheresultingvariancematrixHt.
� �
276
¸¸¸
¹
·
¨¨¨
©
§ t (5)
EachelementofHtdependsonpdelayedvaluesofthesquared H , the cross product oft H andonq delayedtvalues of the elements from Ht. We did not make useof thepossibility todrawexogenous factors into the re-sultingvarianceequation.Ingeneral,amultivariateGARCH(1,1)modelwithoutexogenousfactorscanbepresentedasfollowsasaBEKKmodel(EngleandKroner,1995).Forreasonsofclarity time indicatorsarenot included in thepresentation.Amodelwiththetimedelayofonlyonelag(t-1)wasmodelled.
¸¸¸
¹
·
¨¨¨
©
§
¸¸¸
¹
·
¨¨¨
©
§
¸¸¸
¹
·
¨¨¨
©
§
�¸¸¸
¹
·
¨¨¨
©
§
¸¸¸
¹
·
¨¨¨
©
§
¸¸¸
¹
·
¨¨¨
©
§�
t
HHHHHHHHHHHHHHH
(6)
Throughthemodelconstructionviathequadraticformitispossibletopositivelydefinetheresultingvariance-co-variancematrixHt.Thisensuresthatallvariancesandco-variancesarealwayspositive.Incompactform,theaboveequationcanalsobewritteninthismanner:
tttt ��� �� HH (7)
Thematrices , 0and possessthedimension(n×n).
0 is a (lower) triangularmatrix. In themodel assumedhere,we are dealingwith thematrices and on di-agonalmatrices.Ageneralizationofthemodelispossible.Further interactionscouldbeimplemented,butthenthematrices and arenotdiagonalanymoreandresultsinamuchmorecomplexmatrixHt.Apartfromtheachievementofapositivedefinitematrix
Ht,thereisanotheradvantageoftheBEKKspecification.DuetothediagonalBEKKmodelassumedhere,acheckingofthestationarynatureoftheprocessisdeterminedsolelythroughthediagonalelementsofmatrices and .Thedi-agonalBEKKmodelisstationaryif ¦
� � �(EngleandKroner,1995,p.133). Inaccordancewiththequestionsstatedintheintroduction,threetradingcentres(exchanges)werestudied(n=3).Theaccordingvarianceandcovarianceequationsareasfollows:
�� H (8)
�� HH (9)
�� HH
(10)
�� H
�� H
(11)
�� HH (12)
(13)
TheindexesusedrecedetothenotationusedinEqua-tions(5)and(6).ThematrixHtcontainsredundantexpres-sions.Forthesakeofaclearandcomprehensibleanalysis,
nodistinctionismadebetween 21/ 12, 31/ 13
or 32/ 23.Sothe influencefromCommodityMarket1(inourlatermodelimplementationCBOT)onCommodityMarket2(inourlateranalysisMATIF)isthesameandviceversa.Thesameholdsforallotherpossiblemarketinter-actions. This analysis should revealwhetherthere is any relationship between marketsatthatperiodoftime. Itshouldnotanswerwhichmarket influences the othermarkets
most. The empirically estimated BEKK-GARCH model isthusbasedonamultivariateversionofEquation (1)andEquations(8)to(13)(derivedfromEquation(6)).
3 Data and results
Theinteractionsofvolatilitiesbetweenthetradedpricequotations on the commodity exchanges in the USA(CBOT), Brazil (BRAZ) and Europe/France (MATIF) werestudied.Thetopicofthisanalysisisrelatedtopricequota-tionswhichranoutinMarch2008,andwasdealtwithonallthreeexchangeswiththesamerunningtime.Exchangequotationsfrom27.March2007to5.March2008wereavailable.TheCentralMarketandPriceReportingAgency(ZentraleMarkt- und Preisberichtsstelle – ZMP) providedthedataasacourtesy.Pricequotationsaregiven inUS-Dollars.Eachfuturescontractisbasedonadifferentcornquantity. In Europe one contract stands for 50 tons ofcorn.InBrazil,450unitsof60kilogrambagsaretradedby one contract. This is equivalent to 27 tonnes. In theUnitedStates,theunitpercontractis5000bushels.Thisisequivalentto127tonnes(1bushelofcornisequalto25.4kilogram).Thisdifferentunitofmeasurementexplainstheobservedpricelevelsperunitofweightonthesemarkets.Duetoholidays,etc.,onsomedays,pricenotationswerenotavailableforallthreemarkets.Thusallexchangequo-tationsweredeletedfor thesedays.Overallat thestart,245 exchange quotationswere available. After the vali-

J. Schmitz and O. v. Ledebur / Landbauforschung - vTI Agriculture and Forestry Research 4 2011 (61)273-282 277
dation, 226 observations remained for the estimates. IntheframeworkofaGARCHestimate,this is justasmallsample.AttheMATIFandBRAZtradingcentres,theap-propriatefutureswerenotplacedandtradedearlier.Thus,only thementioned 245 daily notations were available.This isduetothedifferentdefinitionofthecontractsatthefutureexchanges.Thetimedevelopmentofpricesperunitofweightfor
cornbetween27.March2007and5.March2008ispre-sentedinthefollowingFigure3.Thevalueofonefuturescontractconsistsofthepriceperunitofweightmultipliedwiththecorrespondingunitoftrading.OnecanrecognizeacontinualpriceincreaseontheChicagoexchange.ThisincreasebeganinOctober2007.Acomparablystrongandpermanentpriceincreasecannotbeobservedfortheother
exchanges. Consequently, this price development alsoaffectsthereturns,thelogarithmicdifferenceofthepricelevel,oftheprocess.AccordingtoFigure3,theprocessesshowaveryclear
non-stationarybehaviour.Stationarityoftimeseriesdatacan be tested by Unit-Root tests. The validation of sta-tionarity will be conducted by the Augmented-Dickey-Fuller-Test (ADF-test). For this test the null hypothesis isnon-stationarity.Resultsaregiven inTable1.Theresultsclearlyendorsethenon-stationarybehaviouroftheseries.Sincetheestimationofthemodelusingpricelevelsisnotindicated,stationaryvariablesaretobeused.The correspondent returns are significantly stationary at
the1percentlevelandaresuitedformodelling(seeFigure4).
200
250
300
350
400
MATIF
27.03
.07
27.04.0
7
27.05
.07
27.06.0
7
27.07
.07
27.08
.07
27.09.0
7
27.10
.07
27.11.0
7
27.12
.07
27.01.0
8
27.03
.07
27.04.0
7
27.05
.07
27.06.0
7
27.07
.07
27.08
.07
27.09.0
7
27.10
.07
27.11.0
7
27.12
.07
27.01.0
8
27.03
.07
27.04.0
7
27.05
.07
27.06.0
7
27.07
.07
27.08
.07
27.09.0
7
27.10
.07
27.11.0
7
27.12
.07
27.01.0
8
BRAZ CBOT
8
10
12
14
16
18
3
US
$ p
er
bush
el
4
5
6
Source: ZMP (2009).
US
$ p
er
60 k
g
US
$ p
er
ton
Figure3:
CornpricespertoninFrance(MATIF),per60kginBrazil(BolsaMercantiledeFuturos,BRAZ)andperbushelintheUSA(CBOT)
-0.08
-0.06
-0.04
-0.02
0
0.02
0.04
0.06
0.08
MATIF
27.03
.07
27.04.0
7
27.05
.07
27.06.0
7
27.07
.07
27.08
.07
27.09.0
7
27.10
.07
27.11.0
7
27.12
.07
27.01.0
8
27.03
.07
27.04.0
7
27.05
.07
27.06.0
7
27.07
.07
27.08
.07
27.09.0
7
27.10
.07
27.11.0
7
27.12
.07
27.01.0
8
27.03
.07
27.04.0
7
27.05
.07
27.06.0
7
27.07
.07
27.08
.07
27.09.0
7
27.10
.07
27.11.0
7
27.12
.07
27.01.0
8
BRAZ CBOT
-0.08
-0.10
-0.06
-0.04
-0.02
0
0.02
0.04
0.06
0.08
-0.06
-0.04
-0.02
0
0.02
0.04
0.06
Source: Own calculations based on ZMP (2009).
Figure4:
CornpricesreturnsinFrance(MATIF),inBrazil(BolsaMercantiledeFuturos,BRAZ)andintheUSA(CBOT)

278
Table1:
Unit-roottestsforpricelevelandreturns
MATIF BRAZ CBOT
Future Return Future Return Future Return
Observations 224 223 224 223 224 223
ADF-Test 1.200 -12.9035 1.2520 -13.0326 1.400 -14.3167
(0.9411) (0.0000) (0.9464) (0.0000) (0.9594) (0.0000)
Prob.Valueinparenthesis(Prob.value)
Source:Owncalculations.
Table2containsasummaryofthedataforthereturnsofthecornprices.MostclearlyevidentaretheresultsoftheJarque-BerastatisticsinTable2.Accordingtothesevaluestheassumptionofnormaldistributiononthebasisof5%levelcannotbe rejectedfor theCBOTdata.Thisfindingisincontrasttothestylizedfactsoffinancemarketdata.Thismarketdatareactioncanbeinterpretedasaninflu-enceofthepoliticalinstitutionalframeworkatthatperiodoftime. Inanormalmarketsituationoneshouldexpectonepriceforoneproductondifferentmarkets(inabsenceoftransportcost,etc.).Theclassiceconomic“Lawofoneprice”principlewasnotvalidinthistimeperiod.
Table2:
Summaryofreturnsfortheselectedexchanges(27.March2007to5.March2008)
MATIF BRAZ CBOT
Mean 0.0020 0.0020 0.0014
Median 0.0026 0.0022 0.0012
Max 0.0645 0.0701 0.0457
Min -0.0657 -0.0788 -0.0537
Std.deviation 0.0167 0.0182 0.0185
Skewness -0.2844 -0.0094 -0.2595
Kurtosis 5.0355 5.4022 3.2843
Jarque-Bera 41.6920 53.8667 3.2682
Prob.value 0.0000 0.0000 0.1952
Source:Owncalculations.
Thereasonsforsuchsurprisingresultscouldhavetheirorigininthepoliticalinstitutionalframeworkconditions.Herechangesinframeworkconditionsapplyforthecornmarket,particularlyintheUSA,wherethecornethanolindustryexpansionishighlysubsidized.Themassivelyextendedproductionofethanolonthebasisofcornstarch,inducedbytheUSethanolpolicy,re-quiresaccordingamountsofrawmaterials. IntheUSA,cornandsoyproductioncompeteforland.Alreadyinthepreviousperiod(October2006toMay2007),onecouldobserveasi-multaneous price increase for both products on the futuresexchangesandalsoonthephysicalmarkets,whichwasinter-
pretedasanexpressionofdemandpressureevidentthroughthecompetitionforlandduringthesowingperiod(Theis,2007:48to49).Thetimeperiodconsideredherecomeswithafurtherincreaseinthepriceofcrudeoil,whichdrovetheethanolboomfurther.Againstthebackgroundofthispricedevelopment,thepricecompetitivenessofthebiogenicfuelasasubstituteforfos-silfuelincreased(seeFigure5).Inlightoftheexpectedfurtherdemand,increasinglyhigherpriceswereofferedforcorncon-tractsontheChicagoexchangeinordertosecurethesupplyofcornforprocessingandfeeding.
22 140
12020
100
‘00
0 b
arr
els
18
8016
60
14 US
$ b
arr
el
40
12 20
10 0J F M A M J J A S O N D J F M A M J J A S O N D
07070707 0707070707070707 08080808080808080808 0808
US ethanol production
Crude oil price (US$/barrel)
Source: Renewable Fuel Association (2009) and IMF (2009).
Figure5:
US ethanol production and crude oil price development, January2007toDecember2008.
The increase of corn price at the CBOT during the timeperiodOctober2007toMarch2008coincidesalsowithade-valuationoftheUSDollaragainsttheBrazilianReal(Figure6).Thisexchangeratedevelopmentleadstoarelativepriceadvan-tageoftheUSpricedproduct,whichfinallymayhaveledtoanincreaseinforeigndemandforUScorn.Thisappliesparticularlyagainstthebackgroundofthetensesupplysituationoffeed-ingstuffin2007/08.IntheEuropeanUnionwheathasbeensubstitutedbycornandcornhasbeenincreasinglyimported.Due togeneticallymodifiedcorn,ArgentineancorndidnotobtainaccesstotheEuropeanmarketsatthistime.ThisledtoanincreaseddemandforBraziliancorn.Accordingtoextreme-lyhighworldmarketprices,Braziliancorncouldbetransported

J. Schmitz and O. v. Ledebur / Landbauforschung - vTI Agriculture and Forestry Research 4 2011 (61)273-282 279
totheEUmarketwithoutanytariffburden2
2 ThecalculationoftariffratesforcornbytheEUCommissionisbasedonFOBpricesoftheUSgoodsattheGulfofMexico,transportcoststoRotterdamandtheadministratedinterventionprice(CAPMonitor,2009).This linktotheUScornmarkethasbeenliftedundertheprevalentmarketconditions
.Thesefactorsto-getherleadtoasignificantpriceincrease,seeFigure3.
1
1.2
1.4
1.6
1.8
2
2.2
2.4
2.6
J
07
F
07
M
07
A
07
M
07
J
07
J
07
A
07
S
07
O
07
N
07
D
07
J
08
F
08
M
08
A
08
M
08
J
08
J
08
A
08
S
08
O
08
N
08
D
08
BRR per US$
Source: (MAPA – Ministério da Agricultura; Pecuaria e Abastecimento, 2009).
Figure6:
ExchangeratedevelopmentBrazilianRealtoUSDollar,January2007toDecember2008.
An impact of an increasing European demand on UScornprices canbe excludedbecause corn imports fromtheUSAhavenottakenplacesincetheendofthe1990s
due to consumer preferences and existing regulationsin the area of consumer protection. The EU Frameworkregulationsongeneticallymodifiedorganisms(GMOs)arecontinuallybeingexpandedandupdated.Aseriesoflegalregulation existwith the clear goal of protecting publichealthandtheenvironment.AnimportantbranchoftheEU laws on GMOs deal with the release of geneticallymodified organisms into the environment. In 2002, anauthorizationprocedurewasintroduceddealingwiththereleaseofGMOsoranytypeofproductmadefromGMOs.Theprohibition,orrather,thenon-authorizationofsomeso-calledBtCornvarietiesledtoanactualendoftheUSexportsintotheEU(Wirtschaftswoche,2005),ascanbeseeninFigure7.
0
Mio
. t
1000
2000
3000
4000
5000
6000
7000
8000
9000
198
1
198
2
1983
198
4
1985
198
6
198
7
1988
198
9
199
0
1991
199
2
199
3
1994
199
5
1996
199
7
199
8
1999
200
0
200
1
2002
200
3
2004
2005
200
6
Other extra-EU imports
USA
Canada
So. African Cust. Union
Serbia
Ukraine
Brazil
Argentina
EU -12
EU -10
EU -15
EU -25
Source: Own calculations based on COMTRADE (2009).
Figure7:
DevelopmentofCornImportsfromNonEC/EUMemberStatesintonnes,1981to2006
ThepoliticallyinducedmarketdevelopmentintheUSAledtoasolidifyingofexpectationsforincreasingcornpric-es,whichended,amongotherthings,infewerpricede-viations.ThismayhaveledtothefactthatforthefuturespriceattheChicagoExchange,theassumptionofnormaldistributionofreturnscouldnotberejected.Additionally, the prevailing corn price level in the ob-
servedperiodwassohighthatthevariabletariffsystem

280
oftheEUforcornwasdefactoinactive.ThissystembasesuponaseriesofpricesthatendwiththeentrypriceforimportedcornattheportofRotterdamandallowstheEu-ropeanCommissiontosetandpublishtheimporttariffintheOfficialJournaloftheEuropeanUnioninatwo-weekrhythm. Figure 8 illustrates how, due to a highmarketpricelevel,theresultingimporttariffresultsinzero.
0
€/t
50
100
150
200
250
300
01.1
0.05
01.12
.05
01.02
.06
01.0
4.06
01.0
6.06
01.08
.06
01.10
.06
01.1
2.06
01.0
2.07
01.04
.07
01.06
.07
01.0
8.07
01.10
.07
01.1
2.07
01.0
2.08
01.0
4.08
01.0
6.08
01.0
8.08
01.1
0.08
01.12
.08
01.02
.09
01.0
4.09
01.0
6.09
01.08
.09
01.10
.09
01.1
2.09
Corn Chicago
Corn - fob Gulf
Corn - cif Rotterdam
1,55*EU-intervention price
Tariff rate for corn
Source: Own calculations based on EU Commission Regulations (several issues).
Figure8:
Development of EUCorn Imports Tariff,October 2005 toOctober2009
Regarding the variance and covariance equations de-scribedinSection2,theinterdependenceofthemarketscannowbechecked.Particularlythecovarianceequationsprovideinsightintotheinteractionsofthemarkets.Fromtheestimatedparametersgiven inTable3 the followingcanbeseen:Inorder tobetter comprehend the resultsweaddress
theEquations(8), (11)and(13).Equation(8) isthevari-ance Equation for CBOT, Equation (11) for MATIF andEquation(13)forBRAZ.Parameters 11,andc01fortheCBOTMarketareallnot
statisticallysignificantatthefivepercentlevel.Thismeansthat the according variance equation is partially valid(Equation(8)).ThereturnsattheChicagoFuturesMarketwerenotmarkedbyconditionalheteroscedasticityinthetimeperiodconsidered.TheconditionalvarianceofCBOTpricesischaracterisedonlybyitsownlaggedvariance.Asparameter 11isinsignificant,informationshocksarenotaccountedfor.Thisfindingagainhighlightsthepeculiarityofthisexchangeatthistime.ThisisanimportantresultsinceEquations(9)and(10)
illustrate thespill-overeffectsof theChicagoMarketonMATIFandBrazil and theARCH-termsof this equations
describedbyparameters( 11 22)and( 11 33)arenull.Thusin the time period considered, no spill-over of price orinformation shocks fromChicago (e.g., updatedharvestforecast in theUSA) took place on the development ofprices at marketplaces MATIF and Brazil. NeverthelessCBOTisofsuchimportancethattheothermarketsconsid-eredareinfluencedviathecovarianceastheGARCH-termisdescribedbytheparameters(b11b22)and(b11b33)whicharedifferentfromzero.TheseresultsmeanthatonlythelaggedconditionalvarianceofCBOTinfluencesthecovari-ance.Thepolitically inducedmarketdevelopment in theUSAcausedapartialdecouplingof theUSmarket fromtheothermarketsanalysedhere.Duetothesignificanceof the Futuresexchange inChicago (it is theglobal keymarket),anoticeableinfluenceoftheothermarketplacescameonlyviathecovariance.
Table3:
EstimatedparametersoftheBEKKmodel
Coefficient Prob.value
µ1 0.0012 0.2850
µ2 0.0024 0.0475
µ3 0.0026 0.0210
c01 0.0026 0.6539
c02 0.0018 0.5760
c03 0.0037 0.5903
c04 0.0047 0.0093
c05 -0.0005 0.9102
c06 0.0000 1.0000
11 -0.0700 0.4179
22 0.2332 0.0002
33 0.4709 0.0000
b11 0.9855 0.0000
b22 0.9216 0.0000
b33 0.8745 0.0000
Source:owncalculations.
IncontrasttothecommodityexchangeinChicago,es-timationresultsshowthatclearinteractionsexistbetweenMATIFandBrazil.Thiscanbeseenduetothesignificantparameter values 22, 33, b22 and b33, which appear inEquation(12).Thusatleastanindirect(viathecovariance)influencecouldbeidentifiedforbothmarkets.Herebothcomponentsof thecovarianceequationare relevant. In-formation shocks that occur on one of the twomarketplaces impact the volatilityof theother. The laggedde-velopmentofthevarianceoftheothermarketalonedoesnotdetermineitsfuturedevelopment.Eachvarianceequationshowsalsothespecialsituation
during the time period studied.AGARCH (1,1) process
J. Schmitz and O. v. Ledebur / Landbauforschung - vTI Agriculture and Forestry Research 4 2011 (61)273-282 281
couldbeidentifiedforeachofthetradingcentresinEu-ropeandBrazil,.This isnot thecase for theUSmarket.Major cornmarkets prices arenot always tied together,northereforevolatility.Transmissionsofvolatilityimpulsesaredisruptedwith relation toCBOT.This revisionof thevolatilitymarketcharacteristicswasone intentionof thisstudy.ItwasshownthattheUScornmarketwasdecou-pledfromothercornmarkets. Internationalcorntradersthereforecannotrelyonapermanentlystablerelationshipbetweenthesemarkets.Sotheremightbetradingoppor-tunities.Also(international)hedgingofcornpositionsgetscomplicatedinsuchtimeperiods.This resultmust be seen in the context of the above-
described political framework conditions. The de factoimport ban on genetic corn into Europe, aswell as thesimultaneousethanolboom,ledtostronglychangedpricedevelopmentoffuturesattheChicagoFuturesExchange.ThisresultedinadecouplingofthepricedevelopmentandvolatilitytransmissionatthecommodityexchangesinEu-ropeandBrazil.Thisdecouplingwasultimatelymeasuredandconfirmedbythemodel.Thedrivingfactorsbehindthiscannotbeanalysedwiththismethodologyapproach.NoclearidentificationbetweentheGMObanandtheUSbiofuelpoliticscanbesetas themain factor.Themajorobstacleinresolvingthisliesinthedifferenttimefrequen-cyofavailabledata.Thisstudywascarriedoutwithdailydata.DecisionsregardingGMObanorbiofuelpoliticsaremadeonayearlyorlessfrequentbasis.Adding(daily)ex-planatorydata,basedonlowfrequentdecisions,inmod-elsfordailyvolatilityisanunresolvedtask.
4 Perspectives
Themultivariate analysis framework used here contrib-utestoabetterunderstandingofpricevolatilityonthefu-turesexchangesasaninteractionofmanymutuallyaffectedtradingcentres.Itcouldsuccessfullybeshownthatthevola-tilityoffuturespricesatdifferentmarketplacesdoimpacteachother.Inparticulartheanalysisresultsshowthatinter-actionsexistedamongfuturesmarketsfortheconsideredtimeperiod.Price formation (price levelandvolatility)areinterrelatedatdifferentcommodityexchanges.Thisspecificanalysisshowedthatthelinkageamongexchangesatdif-ferentmarketplacesmightbeaffectedbypoliciesasinthecaseofthesupportforcornethanolintheUSAduringtheobservedperiod.Henceanadditionalbuildingblockintheexplanationofthevolatilitycouldbeidentified.Theinter-marketrelationshipsshouldnotbedisregard-
ed.Thosevolatilityspill-overeffectsplayasignificantroleinexplainingvolatilitypatternsondifferentmarkets.ThisworkextendedtheexistingresearchofCrainand
Lee,1996;GoodwinandSchnepf,2000;Boudoukhetal.,2003,throughamultivariateanalysis.
Nevertheless, not all aspects of the determinants ofpricevolatilityareclearandfullyidentified.Futureresearchshouldalsoanalysewhetherornottheinteractionsidenti-fiedherearetimeindependent,andifnot,whichfactorsof influenceplay a role. Thisholds inparticular true fortheanalysisofthemarketsduringandaftertheturnsinthecrudeproductsmarketsasaconsequenceofglobalfi-nancemarketcrises.Anothertopicistheexpansionofthecurrent analytical framework to identify interactions be-tweenpriceformationofagriculturalandnon-agriculturalrawproducts.
References
BaffesJ(2007)Oilspillsonothercommodities.ResourPolicy32(3):91-148BollerslevT(1986)Generalizedautoregressiveconditionalheteroscedasticity.J
Econometrics31:307-327BoudoukhJ,RichardsonM,ShenY,WhitelawRF(2003)Doassetpricesreflect
fundamentals?FreshlysqueezedevidencefromtheOJmarket.NBERWor-kingPaper9515
CAPMonitor(2009)Cereals.TunbridgeWells:AgraInformaCaveroT,GalianC(2008)Double-edgedprices: lessonsfromthefoodprice
crisis;10actionsdevelopingcountriesshouldtake.Oxford:OxfamIntera-tional,46p,OxfamBriefingPaper
Crain SJ, Lee JH (1996) Volatility inwheat spot and futuresmarkets, 1950-1993: government farm programs, seasonality, and causality. J Finance51:325-343
EngleR(1982)AutoregressiveconditionalheteroscedasticitywithestimatesofthevarianceofUKinflation.Econometrica50:987-1008
EngleR,KronerK(1995)MultivariatesimultaneousgeneralizedARCH.EconomTheory11:122-150
EC (several issues)Commission regulationfixing the importduties in thece-reals sector [online]. To be found at <http://eur-lex.europa.eu/JOIndex.do?ihmlang=en>[quoted14.11.2011]
EC(2008a)Highpricesonagriculturalcommoditymarkets:situationandpro-spects;areviewofcausesofhighpricesandoutlookforworldagriculturalmarkets[online].Tobefoundat<http://ec.europa.eu/agriculture/analysis/tradepol/worldmarkets/high_prices_en.pdf>[quoted11.11.2011]
EC(2008b)NovemberupdateonrecentagriculturalcommodityandfoodpricedevelopmentsintheEU[online].Tobefoundat<http://ec.europa.eu/agri-culture/analysis/markets/food11_2008_en.pdf>[quoted23.11.2011]
FAO (2008) Food outlook : global market analysis ; may issue [online]. Tobe found at <http://www.fao.org/giews/english/fo/index.htm> [quoted10.11.2011]
FAO (2008b) Crop prospects and food situation ; july issue [online]. To befound at <http://www.fao.org/giews/english/cpfs/index.htm> [quoted10.11.2011]
FAO (2007) Foodoutlook :november issue [online]. Tobe foundat<http://www.fao.org/giews/english/fo/index.htm>[quoted10.11.2011]
GarciaP,LeutholdRM(2004)Aselectedreviewofagriculturalcommodityfu-turesandoptionsmarkets.EurRevAgricEcon31(3):235-272
GilbertCL (2010)Speculative influencesoncommodity futuresprices2006–2008.Geneva:UNCTAD,33p,UNCTADdiscusspap197
GoodwinBK,SchnepfR(2000)Determinantsofendogenouspriceriskincornandwheatfuturesmarkets.JFuturesMarkets20:753-774
IMF(2009)Primarycommodityprices[online].Tobefoundat<http://www.imf.org/external/np/res/commod/index.aspx>[quoted11.11.2011]
MinistériodaAgricultura,PecuariaeAbastecimento(2009)Estatisticas[online].Tobefoundat<http://www.agricultura.gov.br/portal/page/portal/Internet-MAPA/pagina-inicial/vegetal/estatisticas>[quoted23.11.2011]

282
RABOBANK (2008) Down to earth : finding new balances in agriculturalcommodity markets [online]. To be found at <http://overons.rabobank.com/content/images/Visieop2009-THEMA_tcm64-79411.pdf> [quoted11.11.2011]
RenewableFuelsAssociation(2009)MonthlyU.S.fuelethanolproduction/de-mand[online].Tobefoundat<http://www.ethanolrfa.org/pages/statistics>[quoted11.11.2011]
RoblesM,ToreroM,vonBraunJ(2009)Whenspeculationmatters.Washing-ton:IFPRI,IFPRIIssueBriefs57
TangermannS(2011)Policysolutionstoagriculturalmarketvolatility:asyn-thesis[online].Tobefoundat<http://ictsd.org/downloads/2011/06/tanger-mann-price-volatility-and-policy-options.pdf>[quoted14.11.2011]
TheisR(2007)StehteineneueKursrallyebevor?DLG-Mitteilungen11:48-49USDA (2008) Global agricultural supply and demand : factors contributing
totherecent increase in foodcommodityprices [online].Tobefoundat<http://www.ers.usda.gov/Publications/WRS0801/>[quoted14.11.2011]
WorldBank(2009)Commoditymarketsreview.Tobefoundat<http://econ.worldbank.org/WBSITE/EXTERNAL/EXTDEC/EXTDECPROSPECTS/0,,contentMDK:21574907~menuPK:7859231~pagePK:64165401~piPK:64165026~theSitePK:476883,00.htm>[quoted14.11.2011]
Wirtschaftswoche (2005) EU-Auflagen stoppen Import von US-Futtermitteln[online].Tobefoundat<http://www.wiwo.de/politik/eu-auflagen-stoppen-import-von-us-futtermitteln-97822/>[quoted14.11.2011]

A. Schwalm und H. Georg / Landbauforschung - vTI Agriculture and Forestry Research 4 2011 (61)283-288 283
Elektronische Tierkennzeichnung – ISO-Standards und aktuelle Situation in Deutschland
AnjaSchwalm*undHeikoGeorg*
* JohannHeinrichvonThünen-Institut(vTI), InstitutfürÖkologischenLand-bau,Trenthorst32,23847Westerau,E-mail:[email protected]
Zusammenfassung
DieelektronischeTierkennzeichnunghatindenletztenJahrenweiterdeutlichanBedeutunggewonnen.SiewirdinzwischenweltweitbeivielenverschiedenenTierartenso-wohlimNutztieralsauchimHeim-undHobbytierbereicheingesetzt.AuchwerdeninimmermehrLändernweltweitobligate
elektronische Tierkennzeichnungen bei einzelnen Tierar-teneingeführt,umdieVorteiledieserArtderKennzeich-nungnutzenzukönnen.BeiRindernsinddiesz.B.Kana-da,Australien,Uruguay,BotswanaundDänemark.Schafe,ZiegenundEquidenmüssenz.B. inderEUelektronischgekennzeichnetsein.AuchimHeimtiersektorsindteilwei-seelektronischeKennzeichnungenPflicht.Hundemüssenab2012z.B.beiGrenzübertritteninderEUelektronischgekennzeichnet sein. In Österreich, der Schweiz und ineinigendeutschenBundesländernbestehteinegenerelleChippflichtfürHunde.Um im Rahmen des globalen Handels eine optimale
NutzungdieserArtderKennzeichnunggewährleistenzukönnen,istesessentiell,internationaleStandardsdiesbe-züglichzuentwickeln.Die InternationalOrganizationforStandardization (ISO) ist die Internationale OrganisationfürNormung.Sieentwickeltundveröffentlichtinternatio-naleStandardsauchimZusammenhangmitelektronischerTierkennzeichnung.DieserArtikelgibteineÜbersichtüberISO-StandardsimZusammenhangmitderelektronischenKennzeichnung von Tieren, gegliedert in die AbschnitteNormung zur Tiererkennung, Standards zu AdvancedTranspondernundNormungimZusammenhangmitTest-verfahren für die elektronsiche Tierkennzeichnung. Zu-gleichwirdeinÜberblicküberdie aktuelle SituationderISO-konformenTierkennzeichnunginDeutschlanddarge-stellt.
Schlüsselwörter: Elektronische Tierkennzeichnung, ISO-Standards, Deutschland
Abstract
Electronic animal identification – ISO-standards and current situation in Germany
Theelectronicidentificationofanimals(eID)hasgainedinimportanceoverthelastyears.Itisusedworldwideinawiderangeofspeciesincludingproductivelifestock,pets,zooanimals,endangeredspeciesandwildlife.Itisbecom-ingincreasinglyimportantasanobligatoryofficialanimalidentificationinmoreandmorecountriesbecauseoftheassociatedbenefitsresultingofthisformofanimalidenti-fication.IncattleeIDisobligatoryforexampleinCanada,Australia,Uruguay,BotswanaandDenmark.Sheep,goatsandequinehavetobeelectronicallyidentifiedindieEU.There are obligatory eIDs also in the pet sector. For ex-amplepetshavetobechippedwhentheytravelintheEU(starting2012). InAustria,Switzerlandandinsomefed-eralstatesofGermanychippingisobligatoryforalldogs.In the light of global trade it is necessary to optimize
theuseofeIDworldwide;therefore,itisessentialtohaveinternationalstandardsconcerningeIDofanimals.ISO(In-ternational Organization for Standardization) is a globalnetwork thatdevelopsandpublishes International Stan-dards.Thisarticlegivesa summaryof the statusquo in ISO-
standards concerning electronic animal identification(standardsforanimalRFID,standardsforadvancedanimalRFID,testproceduresforanimalRFID).RFIDisanacronymforradiofrequencyidentification.AdditionallyanoverviewofthecurrentsituationofelectronicanimalidentificationinGermanyisprovided.
Keywords: electronic animal identification, ISO-standards, Germany

284
Einleitung
Nachdem im IDEA-Projekt (IDEA-Studie, 2001) dieDurchführbarkeit der elektronischenKennzeichnung vonWiederkäuernbestätigtwurde, istdieelektronischeTier-kennzeichnung(eTK)indenletztenJahrenzueineminte-gralenBestandteilderKennzeichnungvonTierengewor-den.SiefindetsowohlimNutztiersektor(insbesonderebeiPferd,Schaf,ZiegeundRind)alsauch imHeimtiersektor(Hund,Katze,Frettchen)Anwendung.Immermehr Länder weltweit führen obligate elektro-
nische Tierkennzeichnungen für einzelne Tierarten ein,um die Vorteile der elektronischen Form der Tierkenn-zeichnungnutzenzukönnen.InvielenweiterenLändernistzumindesteinefreiwilligeelektronischeTierkennzeich-nungmöglich.Eine obligate elektronische Kennzeichnung nach ISO
11784und ISO11785vonRinderngibteszurzeitunteranderem inKanada,Australien,Uruguay,BotswanaundDänemark.SehrvieleLänderunterstützenzumindesteinefreiwillige eTK bei Rindern u.a. Argentinien, EU, Japan,Südkorea, Brasilien, Mexiko, Neuseeland, USA (Greene,2010;CanadianCattleIdentificationAgency,2011;FCEC,2009,EuropäischenUnion,2011;Hansen,2010).DieEuropäischenKommissionprüftzurZeitdieEinfüh-
rung einer offiziellen elektronischenKennzeichnung vonRinderninEuropa(EuropäischenUnion,2011).InderEUistdieeTKvonSchaf,ZiegeundPferdPflicht
(VO(EG)21/2004;VO(EG)504/2008)undauchHunde,Katzen und Frettchenmüssen ab 2011 elektronisch ge-kennzeichnet sein, wenn sie innerhalb der EU verreisen(VO(EG)998/2003). InsbesonderefürHundefordernin-zwischenvieleLänderweltweiteineelektronischeKenn-zeichnungbeiderEinreise(z.B.Japan,Australien,Singa-pur,Neuseeland,etc.)(Agri-Food&VeterinaryAuthorityofSingapore,2011;AnimalQuarantineServiceJapan,2011;Australian Government – Australian Quarantine and In-spectionService,2011;ENZ,2011).
Normung
Der Welthandel mit Tieren und tierischen Produktenspielt eine immer größere Rolle in der Weltwirtschaft.AuchderHandelmitlebendenTierenisthierbeinichtzuvernachlässigen.ImJahr2010wurdenzumBeispielaus33Ländern lebende TierenachDeutschland importiert undin59Länderexportiert(StatistischesBundesamtDeutsch-land–Destatis,2011).EineNormungderelektronischenTierkennzeichnung ist somit international zwingend er-forderlich, um ein sicheres Auslesen der Daten an allenBedarfsstellenzugewährleisten,insbesondereimHinblickaufeineRückverfolgbarkeit imSinnederTierseuchenbe-kämpfungundderöffentlichenGesundheit.
EinefehlendeNormungkannauchbeiHeimtierenun-ter Umständen zu schwerwiegenden Folgen führen, dadieErkennungder tierindividuellenNummernicht sichergegeben ist. IndenUSAwurdez.B.einHund ineinemTierheim eingeschläfert, da der implantierte Mikrochip(ISOkonform)mitdenverwendetenLesegerätendesTier-heimesnichtablesbarwar(Nolen,2004).DieISO(InternationalOrganizationforStandardization)
istdieInternationaleOrganisationfürNormung.Sieent-wickeltundveröffentlichtinternationaleStandardsundisteinNetzwerknationalerStandardorganisationenaus161LändernmiteinerZentraleinGenf.JedesMitgliedvertrittein Land,wobeidasDeutsche Institut fürNormunge.V.(DIN)fürDeutschlandMitgliedderISOist.DieISOistkeineRegierungsorganisation. Eine ISO-Norm ist grundsätzlichfreiwilligundkeinGesetz,kannaber vonder jeweiligenRegierungzueinemerklärtwerden(ISO,2011).
ISO – Standards im Zusammenhang mit Tierkenn-zeichnung
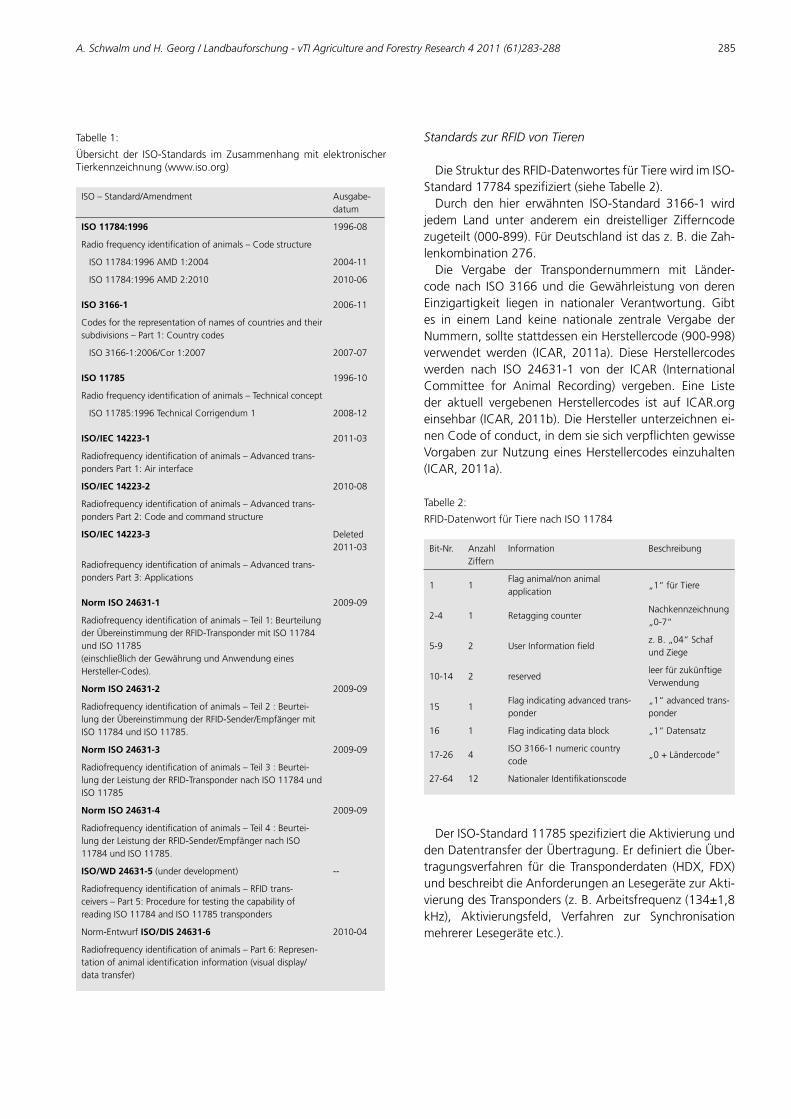
Es gibt mittlerweile einige ISO-Standards, die im Zu-sammenhangmit der elektronischen Tierkennzeichnungzu nennen sind. Ein Überblick der Standards ist in Ta-belle 1dargestellt. Bei einigender Standardswurden inden letzten JahrenÄnderungen eingefügt, bzw. kameszurEntwicklungneuerStandards. Einigewurdenwiederverworfenundanderewiederumbefinden sichnoch imEntwurf-Stadium (Tabelle 1). Daraus lässt sich ableiten,dass die elektronische Tierkennzeichnung auch auf ISO-Standard-EbeneeinensehraktuellenPlatzeinnimmtundauchhierdieaktuellenEntwicklungen/Veränderungen/Be-dürfnissemiteinbezogenwerden.DieISO-StandardszurTieridentifikation(ISO11784,ISO
11785, ISO14223-1..3)erlaubeneinenweltweitenHan-delmitTierenundermöglichendenAustauschvonInfor-mationenimSinnederTierkennzeichnung.Die Standards gelten für alle Tierarten, nicht nur für
Nutztiere sondern auch für Heimtiere, Zootiere, gefähr-deteSpezies,WildtiereundFische(FECE,2009).
A. Schwalm und H. Georg / Landbauforschung - vTI Agriculture and Forestry Research 4 2011 (61)283-288 285
Tabelle1:
Übersicht der ISO-Standards im Zusammenhangmit elektronischerTierkennzeichnung(www.iso.org)
ISO–Standard/Amendment Ausgabe-datum
ISO 11784:1996 1996-08
Radiofrequencyidentificationofanimals–Codestructure
ISO11784:1996AMD1:2004 2004-11
ISO11784:1996AMD2:2010 2010-06
ISO 3166-1 2006-11
Codesfortherepresentationofnamesofcountriesandtheirsubdivisions–Part1:Countrycodes
ISO3166-1:2006/Cor1:2007 2007-07
ISO 11785 1996-10
Radiofrequencyidentificationofanimals–Technicalconcept
ISO11785:1996TechnicalCorrigendum1 2008-12
ISO/IEC 14223-1 2011-03
Radiofrequencyidentificationofanimals–Advancedtrans-pondersPart1:Airinterface
ISO/IEC 14223-2 2010-08
Radiofrequencyidentificationofanimals–Advancedtrans-pondersPart2:Codeandcommandstructure
ISO/IEC 14223-3 Deleted2011-03
Radiofrequencyidentificationofanimals–Advancedtrans-pondersPart3:Applications
Norm ISO 24631-1 2009-09
Radiofrequencyidentificationofanimals–Teil1:BeurteilungderÜbereinstimmungderRFID-TranspondermitISO11784undISO11785(einschließlichderGewährungundAnwendungeinesHersteller-Codes).
Norm ISO 24631-2 2009-09
Radiofrequencyidentificationofanimals–Teil2:Beurtei-lungderÜbereinstimmungderRFID-Sender/EmpfängermitISO11784undISO11785.
Norm ISO 24631-3 2009-09
Radiofrequencyidentificationofanimals–Teil3:Beurtei-lungderLeistungderRFID-TranspondernachISO11784undISO11785
Norm ISO 24631-4 2009-09
Radiofrequencyidentificationofanimals–Teil4:Beurtei-lungderLeistungderRFID-Sender/EmpfängernachISO11784undISO11785.
ISO/WD 24631-5(underdevelopment) --
Radiofrequencyidentificationofanimals–RFIDtrans-ceivers–Part5:ProcedurefortestingthecapabilityofreadingISO11784andISO11785transponders
Norm-EntwurfISO/DIS 24631-6 2010-04
Radiofrequencyidentificationofanimals–Part6:Represen-tationofanimalidentificationinformation(visualdisplay/datatransfer)
Standards zur RFID von Tieren
DieStrukturdesRFID-DatenwortesfürTierewirdimISO-Standard17784spezifiziert(sieheTabelle2).Durch den hier erwähnten ISO-Standard 3166-1 wird
jedem Land unter anderem ein dreistelliger Zifferncodezugeteilt(000-899).FürDeutschlandistdasz.B.dieZah-lenkombination276.Die Vergabe der Transpondernummern mit Länder-
codenach ISO3166unddieGewährleistungvonderenEinzigartigkeit liegen in nationaler Verantwortung. Gibtes in einem Land keine nationale zentrale Vergabe derNummern,solltestattdesseneinHerstellercode(900-998)verwendet werden (ICAR, 2011a). Diese Herstellercodeswerden nach ISO 24631-1 von der ICAR (InternationalCommittee for Animal Recording) vergeben. Eine Listeder aktuell vergebenen Herstellercodes ist auf ICAR.orgeinsehbar(ICAR,2011b).DieHerstellerunterzeichnenei-nenCodeofconduct,indemsiesichverpflichtengewisseVorgabenzurNutzungeinesHerstellercodeseinzuhalten(ICAR,2011a).
Tabelle2:
RFID-DatenwortfürTierenachISO11784
Bit-Nr. AnzahlZiffern
Information Beschreibung
1 1Flaganimal/nonanimalapplication
„1“fürTiere
2-4 1 RetaggingcounterNachkennzeichnung„0-7“
5-9 2 UserInformationfieldz.B.„04“SchafundZiege
10-14 2 reservedleerfürzukünftigeVerwendung
15 1Flagindicatingadvancedtrans-ponder
„1“advancedtrans-ponder
16 1 Flagindicatingdatablock „1“Datensatz
17-26 4ISO3166-1numericcountrycode
„0+Ländercode“
27-64 12 NationalerIdentifikationscode
DerISO-Standard11785spezifiziertdieAktivierungunddenDatentransferderÜbertragung.ErdefiniertdieÜber-tragungsverfahren für die Transponderdaten (HDX, FDX)undbeschreibtdieAnforderungenanLesegerätezurAkti-vierungdesTransponders(z.B.Arbeitsfrequenz(134±1,8kHz), Aktivierungsfeld, Verfahren zur SynchronisationmehrererLesegeräteetc.).

286
Standards zu Advanced Transpondern
DerISO-Standard14223isteinedirekteErweiterungzudenISO-Standards11784und11785.WährendTranspon-dernach ISO11785 lediglicheinenfestprogrammiertenIdentifikationscodeausgeben,bestehtbeidenAdvancedTranspondern dieMöglichkeit, einen größeren Speicher-bereich zu verwalten.Dieser kanngelesen,geschrieben,gegen erneutes Überschreiben geschützt ((lockmemoryblock)oderdurcheinPasswortgeblocktwerden(Finken-zeller,2008;FCEC,2009)DerAdvancedTransponder istvollabwärtskompatibelzu ISO11784/85.Diesbedeutet,dass sowohl die Identifikationsnummer eines jeden Ad-vancedTranspondersvoneinemeinfachenISO11785Le-segerätausgelesenwerdenkann,alsauch,dassISO11785Transponder von jedem Advanced Lesegerät akzeptiertwerden(Finkenzeller,2008).BeimAdvancedTransponderistbit15des ISO11784Datenrahmensauf„1“gesetzt(sieheauchTab.2)umihnalsAdvancedTransponderzukennzeichnen. Bit 16 des Datenrahmens (ISO 1175) istebenso auf „1“ gesetzt und zeigt an, dass zusätzlicheDatenvorhandensind (sieheauchTab.2).BefindensichmehrereAdvancedTransponder imAnsprechbereichdesReaderswirdeineAntikollisionsprozedurgestartet.DieserAntikollisionsmechanismus benötigt Zeit, so dass dieseMethodebeidynamischenLeseprozessen(z.B.eineGrup-pesichschnellbewegenderkleinerTiere)eventuellnichtsoeinsatzfähigist(FCEC,2009).Zurzeit ist der Advanced Transponder kommerziell für
dieTierkennzeichnungnochnichterhältlich.EinemöglicheVerwendungdesDatenspeicherswärez.B.dieSpeiche-rungvonBehandlungsdaten.Dies ist insbesonderebeimPferd interessant, da hier z. B. eine Verwendung als le-bensmittellieferndesTierausgeschlossenwerdenkönnte.
Standards zu Testverfahren von RFID
EssindverschiedeneRFIDProdukteaufdemMarkt.FürdenNutzeristesschwierigherauszufindenwelchesRFIDseinen Bedürfnissen am Besten entspricht. Aus diesemGrundwurdenStandardsentwickelt,mitdenenRFIDge-testetwerdenkönnen(ISO24631-1…4,sieheTabelle1).Zwei verschiedene Gruppen von Testprozeduren sind
verfügbar:- TestszurÜbereinstimmungmitISO11784und11785vonTranspondernundLesegeräten,inklusivederVer-gabederHerstellercodes(sieheoben).
- Tests zur Leistungder zu ISO11784und ISO11785konformenProdukte
DieRFID-DatenkönneninverschiedenenFormatendar-gestelltwerden.Dies kannunterUmständen zu Fehlernbei der InterpretationderNummern führen.Daherwird
zurzeiteinISO-StandardfürdieDarstellungderTieridenti-fikationsinformationentwickelt(ISO24631-6,sieheTabel-le1)(FECE,2009).ISO entwickelt internationale Standards, führt jedoch
selbst keine Tests zur Übereinstimmung mit den ISO-Standards durch. Um eine effektive Nutzung der Stan-dardszugewährleistenbestimmtdieISOeinekompetenteStelle,diebeiBedarfdieseAufgabenübernimmt.ImFallder Standards, die die Tierkennzeichnung betreffen, istdies das International Committee on Animal Recording(ICAR).Die ICAR istunteranderemdafür verantwortlichTestergebnisseaufihrerWebsitezuveröffentlichen(ICAR,2011c;FECE,2009).
ISO-konforme Tierkennzeichnung in Deutschland
Für die „offizielle“ elektronische Kennzeichnung (VO(EG) Nr. 504/2008; VO (EG) Nr. 933/2008; VO (EG) Nr.21/2004)stehenjenachTierartalsTransponderartendieelektronische Ohrmarke mit integriertem Transponder,derBolus,derimVormagenvonWiederkäuernverbleibt,das Injektat, das subkutan oder intramuskulär injiziertwird, und ein elektronisches Fesselband zur Verfügung(Schwalmetal.,2009).
Schaf/Ziege
Die EG-Verordnungen (EG) Nr. 21/2004, VO (EG) Nr.759/2009undVO(EU)Nr.506/2010wurdenmitderVieh-verkehrsverordnung (ViehVerkV) vom 03. März 2010 innationalesRechtumgesetzt.DanachsindSchafeundZie-geninderEUundsomitauchinDeutschlandelektronischzukennzeichnen.EsbesteheneinigeAusnahmenvonderelektronischenKennzeichnungspflichtz.B.beidensoge-nanntenSchlachtlämmern.InDeutschlandliegtdieDurch-führungderVerordnungunddieVergabederNummernbeidenjeweiligenBundesländern.Darausergibtsichauchdie Situation, dass je nach Bundesland unterschiedlicheOhrmarkenvariantenzuerhaltensindund innureinigenBundesländern auch ein Bolus zur elektronischen Kenn-zeichnungvonSchafenundZiegen zurVerfügung steht(Schwalmetal.,2010a).
Rind
InDeutschland istnachderVVVOdieKennzeichnungmit zwei Sicht-Ohrmarken verpflichtend (Grundlage: VO(EG) Nr. 1760/2000). Nach der Viehverkehrsverordnungvom03.März2010kanneinedieserOhrmarkenelektro-nischausgeführtsein(mitGenehmigung),d.h.esbestehteinezunächstfreiwilligeEinführungdereTK.DieEinfüh-rungdereTKobliegtauchhierdeneinzelnenBundeslän-dern.

A. Schwalm und H. Georg / Landbauforschung - vTI Agriculture and Forestry Research 4 2011 (61)283-288 287
EineobligateelektronischeKennzeichnungvonRindernistineinigenLändernbereitsimEinsatz(z.B.Kanada,Aus-tralien,Uruguay,Dänemarks.o.).AuchinderEUwirddieEinführung einer elektronischenKennzeichnungbei Rin-derngeprüft(EuropäischenUnion,2011a–Tieridentifika-tion–bovine).
Hund/Katze
EinelektronischesKennzeichen(Transponder)istalsKenn-zeichnungbeiHeimtieren(Hund,Katze,Frettchen)zugelas-senundwirdab2012obligatorischbeiReiseninnerhalbderEUgefordert(VO(EG)Nr.998/2003).EsgibtinDeutschlandkeine generelle Pflicht zur elektronischen KennzeichnungvonHunden.Esgibt jedoch in jedemBundeslandgeson-derte„Hundeverordnungen“,dadieGefahrenabwehrbeiden Ländern liegt.Dabei ergeben sichmitunter sehr ver-schiedeneVorschriftenundRegelungenauchimBezugaufdie Kennzeichnungspflicht bei Hunden (Schwalm et al.,2010b).SosindineinigenBundesländernalleHundeelek-tronischzukennzeichnen(z.B.Sachsen-Anhalt),ineinigennurbestimmteHunde(z.B.Schleswig-Holstein)undineini-genisteineelektronischeKennzeichnungnurauffreiwilli-gerBasiseingeführt(z.B.Bayern)(Schwalmetal.,2010b).
Equiden
DieEG-VerordnungVO(EG)Nr.504/2008wurdemitderViehverkehrsverordnungvom03.März2010innationalesRechtüberführt.Danachsindab09.Juni2009geboreneEinhufermittelsMikrochipelektronischzukennzeichnen.
Schlussbetrachtung
Eineweltweite Normung der elektronischen Tierkenn-zeichnungistwichtigundsinnvoll,damitdieVorteilederelektronischenTierkennzeichnunganallenBedarfsstellengenutzt werden können. Auch können Synergieeffektez. B. bei der Verwendung der elektronischen Tierkenn-zeichnunginderVerfahrenstechnikoderdereinzeltierspe-zifischenÜberwachungnurgenutztwerden,wenndieseaucherkanntwerdenkönnen.An erster Stelle muss jedoch die Gewährleistung der
Einzigartigkeit der Tiernummer stehen. Dies kann nurüberDatenbankenerfolgen,indenendieausgegebenenNummerncodesgespeichertwerden.ImFalleeinerKenn-zeichnungmitLändercodenachISO3166obliegtdieVer-waltungdieserDatenbankunddieVergabederjeweiligenNummerndemjeweiligenLand. Istdiesnichtgewährlei-stetsollteeineKennzeichnungnurmitHerstellercodeer-folgen. IndiesemFalle liegtdieVerantwortungüberdieVergabeundAufzeichnungderNummernbeidemjewei-ligenHersteller(ICAR,2011a).
Mindestens ebensowichtigwie die einheitlicheKenn-zeichnung ist die Einrichtung zentralerDatenbanken fürTiere,indenenHalterinformationen,Tierbewegungenetcerfasstwerden.Nur so kann die Rückverfolgbarkeit vonTierenundFleisch,wievonderEUgefordert,gewährleis-tetwerden.
Literatur
Agri-Food&VeterinaryAuthorityofSingapore(2009)Veterinaryconditionsfortheimportationofdogs/cats[online].Zufindenin<http://www.ava.gov.sg/NR/rdonlyres/A6301E5F-8CE5-4ED4-A447-A2C3EF6216D6/12300/DOG-CAT311w_feeattd4.doc>[zitiertam10.10.2011]
AnimalQuarantineServiceJapan(2011)Guidetoimportingdogs,catandoth-eranimalssubjecttoanimalquarantinefromdesignatedregionsintoJapan[online].Zufinden in<http://www.maff.go.jp/aqs/english/animal/dog/pdf/guidefree-e20110430.pdf>[zitiertam10.10.2011]
AustralianGovernment/AustralianQuarantineandInspectionService(2011)Bringingcatsanddogs(andotherpets)toAustralia[online].Zufindenin<http://www.daff.gov.au/aqis/cat-dogs>[zitiertam10.10.2011]
CanadianCattle IdentificationAgency (2011)TheCanadiancattle Identifica-tionProgram[online].Zufinden in<http://www.canadaid.com/about_us/about_us.htm>[zitiertam10.10.2011]
ENZ(2011)MovingpetstoNewZealand[online].Zufindenin<http://www.emigratenz.org/moving-pets-to-new-zealand.html>[zitiertam10.10.2011]
EuropäischeUnion (2007)Verordnung (EG)Nr.1760/2000desEuropäischenParlamentsunddesRatesvom17.Juli2000zurEinführungeinesSystemszurKennzeichnungundRegistrierungvonRindernundüberdieEtikettie-rungvonRindfleischundRindfleischerzeugnissensowiezurAufhebungderVerordnung(EG)Nr.820/97desRates[online].Zufindenin<http://eur-lex.europa.eu/LexUriServ/LexUriServ.do?uri=CONSLEG:2000R1760:20070101:DE:PDF>[zitiertam10.10.2011]
Europäische Union (2008) Verordnung (EG) Nr. 504/2008 der Kommissionvom6.Juni2008zurUmsetzungderRichtlinien90/426/EWGund90/427/EWGdes Rates in Bezug aufMethoden zur Identifizierung von Equiden[online]. Zu finden in <http://eur-lex.europa.eu/LexUriServ/LexUriServ.do?uri=CELEX:32008R0504:EN:NOT>[zitiertam10.10.2011]
EuropäischeUnion(2008)Verordnung(EG)Nr.933/2008derKommissionvom23.September2008zurÄnderungdesAnhangsderVerordnung(EG)Nr.21/2004desRatesinBezugaufdieKennzeichnungderTiereunddenIn-haltderBegleitdokumente[online].Zufindenin<http://eur-lex.europa.eu/LexUriServ/LexUriServ.do?uri=OJ:L:2008:256:0005:0011:DE:PDF> [zitiertam10.10.2011]
EuropäischeUnion(2008)Verordung(EG)Nr.998/2003desEuropäischenPar-lamentsunddesRatesvom26.Mai2003überdieVeterinärbedingungenfürdieVerbringungvonHeimtierenzuanderenalsHandelszweckenundzurÄnderung der Richtlinie 92/65/EWGdes Rates [online]. Zu finden in<http://eur-lex.europa.eu/LexUriServ/LexUriServ.do?uri=CONSLEG:2003R0998:20081122:DE:PDF>[zitiertam10.10.2011]
Europäische Union (2009) Verordnung (EG) Nr. 759/2009 der Kommissionvom19.August2009zurÄnderungdesAnhangsderVerordnung(EG)Nr.21/2004desRateszurEinführungeinesSystemszurKennzeichnungundRegistrierungvonSchafenundZiegen[online].Zufindenin<http://eur-lex.europa.eu/LexUriServ/LexUriServ.do?uri=OJ:L:2009:215:0003:0004:DE:PDF>[zitiertam10.10.2011]
EuropäischeUnion(2009)Verordung(EG)Nr.21/2004desRatesvom17.De-zember2003zurEinführungeinesSystemszurKennzeichnungundRegis-trierungvonSchafenundZiegenundzurÄnderungderVerordnung(EG)Nr.1782/2003 sowiederRichtlinien92/102/EWGund64/432/EWG [on-line].Zufindenin<http://eur-lex.europa.eu/LexUriServ/LexUriServ.do?uri=CONSLEG:2004R0021:20090909:DE:PDF>[zitiertam10.10.2011]
EuropäischeUnion(2010)Verordnung(EU)Nr.506/2010derKommissionvom14.Juni2010zurÄnderungdesAnhangsderVerordnung(EG)Nr.21/2004desRateshinsichtlichinZoosgehaltenerSchafeundZiegen[online].Zufin-

288
denin<http://eur-lex.europa.eu/Notice.do?checktexts=checkbox&val=517642%3Acs&pos=1&page=1&lang=en&pgs=10&nbl=1&list=517642%3Acs&hwords=506%252F2010%257E&action=GO&visu=%23texte> [zitiertam10.10.2011]
EuropäischeUnion(2011)Electronicidentificationofbovineanimals.[online].Zu finden in <http://ec.europa.eu/food/animal/identification/bovine/elec_id_bovine_en.htm>[zitiertam10.10.2011]
FoodChainEvaluationConsortium(FCEC)(2009)Studyontheintroductionofelectronicidentification(EID)asofficialmethodtoidentifybovineanimalswithin the European Union. [online]. Zu finden in <http://ec.europa.eu/food/animal/identification/bovine/docs/EID_Bovine_Final_Report_en.pdf>[zitiertam10.10.2011]
Finkenzeller K (2008) RFID-Handbuch : Grundlagen und praktische Anwen-dungenvonTranspondern,kontaktlosenChipkartenundNFC.München:Hanser,528p
GreeneJL(2010)Animalidentificationandtraceability:overviewandissues.[online]. Zu finden in <www.nationalaglawcenter.org/assets/crs/R40832.pdf>[zitiertam10.10.2011]
HansenOK(2010) Introductionofmandatoryelectronic identificationofcat-tle in Denmark [online]. Zu finden in <http://www.icar.org/Documents/Riga_2010/index.htm>[zitiertam10.10.2011]
ICAR (2011a) Code of conduct [online]. Zu finden in <http://www.icar.org/pages/manifacturer_code_of_conduct.htm>[zitiertam10.10.2011]
ICAR(2011b)Manufacturercodes[online].Zufindenin<http://www.service-icar.com/manufacturer_codes/Manufacturers_DB/manufacturer_codes_main.asp>[zitiertam10.10.2011]
ICAR (2011c) Duties [online]. Zu finden in <http://www.icar.org/pages/Sub_Committees/sc_animal_identification.htm>[zitiertam10.10.2011]
IDEA-Project [online]. Zu finden in <http://idea.jrc.it/pages%20idea/final%20report.htm>[zitiertam10.10.2011]
ISO(2011)ISOaboutISO[online].Zufindenin<http://www.iso.org/iso/about.htm>[zitiertam10.10.2011]
ISO(2011)ISOinbrief.[online].Zufindenin<http://www.iso.org/iso/pressre-lease.htm?refid=Ref1425>[zitiertam10.10.2011]
NolenRS(2004)Pet`sdeathrekindleselectronicIDdebate[online].Zufindenin <http://www.avma.org/onlnews/javma/jul04/040701a.asp> [zitiert am10.10.2011]
SchwalmA,GeorgH,UdeG (2009)ElektronischeTierkennzeichnung.Land-bauforsch54(4):279-286
SchwalmA,GeorgH,UdeG(2010a)ElektronischeTierkennzeichnung:StatusquoinDeutschlandseitJanuar2010.Schafzucht10:1-3
SchwalmA,GeorgH,UdeG(2010b)GesetzlicheRegelungenzurKennzeich-nungvonHundeninDeutschland.Kleintiermed13(9/10):262-266
StatistischesBundesamtDeutschland–Destatis(2011)AltlasderAussenhan-delsstatistik[online].Zufindenin<http://ims.destatis.de/aussenhandel/Def-ault.aspx>[zitiertam10.10.2011]
ViehVerkV (2010) BekanntmachungderNeufassungderViehverkehrsverord-nungvom03.März2010[online].Zufindenin<http://www2.bgbl.de/Xa-ver/start.xav?startbk=Bundesanzeiger_BGB>[zitiertam10.10.2011]

G. Ude, H. Georg, S. Bender, A. Schwalm / Landbauforschung - vTI Agriculture and Forestry Research 4 2011 (61)289-298 289
Eignung von Thermo-Injektaten zur elektronischen Tierkennzeichnung und Körpertemperaturerfassung bei Ziegen
GraciaUde*,HeikoGeorg*,SophiaBender*undAnjaSchwalm*
* JohannHeinrichvonThünen-Institut(vTI), InstitutfürÖkologischenLand-bau,Trenthorst32,23847Westerau,E-mail:[email protected]
Zusammenfassung
Die Erfassung der Körpertemperatur eignet sich zurFrüherkennungvonKrankheiten,diemiteinerÄnderungderKörpertemperatureinhergehen.BislangwirddieKör-pertemperaturzumeistrektalerfasst,wobeiderBedarfanautomatischen und kontinuierlich messenden SystemenalsManagementhilfeimmergrößerwird.ZieldieserStudiewardieÜberprüfung,obsichbeiZiegenzweiunterschied-licheApplikationsorte(OhrgrundundSchwanzfalte)alsIn-jektionsortundfüreinesubkutaneKörpertemperaturmes-sungeignen.Die subkutanenTemperaturenwurdenmitzwei unterschiedlichen Systemen erfasst. Parallel wurdedie Körpertemperatur rektal gemessen. In AbhängigkeitvonderAußentemperaturwarendieDifferenzenzwischenrektaler und subkutaner Temperatur unterschiedlich.DieAblagetiefederTransponderwarzuniedrig.DasOhreig-netsichnichtalsApplikationsortbeiZiegen.
Schlüsselwörter: Ziegen, Rektaltemperatur, subkutane Körpertemperatur, Injektat, Ökologischer Landbau, Preci-sion organic dairy farming, elektronische Tierkennzeich-nung
Summary
Research in goats with bio-thermo-transponders for electronic identification and body core temperature logging
Themeasurementofbodycoretemperatureisahelpfultoolfortheearlyrecognitionofdiseases ingoats.Uptonow,temperaturemeasurementisalmostdonemanuallymeasuringrectaltemperature.Nevertheless,thereisanin-creasingdemandonautomaticandcontinuouslymeasur-ingdevices.Theobjectiveofourstudywastheevaluationofinject-
able transponders with temperature sensing option ingoats.Inthestudyinjectabletransponderswithtempera-turesensorweretestedintengoatsattheskinfoldoftailandatasecondapplicationpointatthebaseoftheleftear.Thetemperaturesofthetransponderswererecordedusingtwodifferentmeasurementsystems.Therectaltem-peraturewasmeasuredsimultaneously.Independenceofseasons thedifferencesbetween rectal temperatureandsubcutaneous temperaturewere different. The depth oftheinjectabletransponderwastoolow.Theearisnotsuit-ableastransponderlocationforgoats.
Keywords: goat, rectal temperature, subcutaneous tem-perature, injectable transponder organic farming, preci-sion organic dairy farming, electronic identification

290
1 Einleitung
Die elektronische Einzeltierkennzeichnung bestimmterTierarteninnerhalbderEUundauchinanderenLänderngewährleisteteineschnelleRückverfolgbarkeitundleistetdamiteinenBeitragzurLebensmittelsicherheit (Georgetal.,2008).InDeutschlandwurdedieelektronischeEinzeltierkenn-
zeichnunginderViehVerkV,dieseitdem9.März2010inKraftgetreten ist, fürSchafeundZiegenumgesetzt.AlselektronischeKennzeichen fürSchafeundZiegengeltenOhrmarkenmitintegriertemTransponder,Bolus-Transpon-derundFußfesseltransponder(nurbeiTieren,dienichtfürdeninnergemeinschaftlichenHandelbestimmtsind).Injektatewerdenseit2009nachEU-RechtbeiderPfer-
dekennzeichnung eingesetzt, ansonsten werden sie beilebensmittelliefernden Tieren aufgrund der ProblematikbeiderRückgewinnungaufdemSchlachthofsehrkritischbewertet(Schwalmetal.,2010;Klindtworth,2007).Die kritischeMeinung zurNutzung von Injektaten zur
elektronischenKennzeichnungkönntedurch verbesserteMaßnahmenbeiderRückgewinnungunddurchdieVer-wendungintegrierterSensoren(z.B.Temperaturmessung),dieeinenZusatznutzenbedeutenwürden,gesteigertwer-den(Klindtworth,2007).
2 Literatur
ErsteProjektezurelektronischenTierkennzeichnungmitInjektaten begannen 1993/94 im Mittelmeerraum (Spa-nien, Portugal und Italien)mit insgesamt5000Schafen,3000Rindernund2000Ziegen,denenanverschiedenenInjektionsorten 32mm x 3,8mmgroße Injektate appli-ziertwurden.DazugehörtedasFEOGAProjekt(Cajaetal.,1994).ImRahmendesFEOGAProjektsinjiziertenFonsecaetal.(1994a)bei90Ziegen32mmx3,8mmgroßeInjek-tateamOhrgrund,derAchselhöhle,derLeistenbeugeso-wiedemSchwanz.DieLesbarkeitlagnachdreiMonatenbei93%amOhrgrund,100%anderAchselhöhle,98%inderLeistenbeugeund89%amSchwanz.DieVerlusteunddiebeschädigtenInjektatewarenimOhrgrund(2In-jektatebzw.6%)undimSchwanz(4Injektatebzw.7%)amhöchsten.Bei1362ausgewachsenenZiegenmitdem-selben Injektat, das in dieAchselhöhle appliziertwurde,warennachca.einemJahrnoch98%derInjektatelesbar(Fonseca,1994b).EsgabnurgeringeDifferenzeninBe-zugaufeinengeübtenoderungeübtenApplikator(Cajaetal.,1997).In Deutschland wurden spezielle Untersuchungen zur
elektronischenTierkennzeichnungbeiSchafenundZiegenaußerhalbdesIDEA-Projektsu.a.andersächsischenLehr-undVersuchsanstalt inKöllitschdurchgeführt(Wehlitzetal.,2006).EswurdendabeiInjektatederGröße23mmx
4mmverwendet.50InjektatewurdenimAltervon2bis5MonatenindieAfter-Schwanzfalteappliziert.DieVerlustebetrugen2%.AusderselbenApplikationbeiSchafläm-mern,dieindenerstenLebenstagenerfolgte,resultiertenVerlustevon24,1%.IneinemTestvonSimon(2006)mit120Ziegenaufzwei
Betrieben wurden die laktierenden Ziegen in der After-Schwanzfalte mit Injektaten gekennzeichnet. Die After-schwanzfalteistaucheinegutePositionbeiderMilchleis-tungsprüfungimMelkstand.DieVerlustratewarmitdreivon120Injektatengering.Bisher sindnurwenigeProjektemitBio-Thermo-Injek-
taten,dienebendertierindividuellenelektronischenKenn-zeichnung auch die Körpertemperatur erfassen können,durchgeführtworden.Goodwin(1998)hatbei30Ziegen,18Pferdenund35
SchafendieKörpertemperaturmiteinemInfrarotthermo-meterimOhr,subkutanüberMikrochip,appliziert indieAchselhöhle, und rektal mit digitalem Thermometer er-fasst.BeidenZiegenwarendierektalenundsubkutanenTemperaturen signifikanthöher alsdie Infrarot-Tempera-turen,wobeidierektalenundsubkutanenTemperaturensichmit einerDifferenz von0,2 °Cnicht signifikantun-terschieden.Die subkutaneKörpertemperatur zeigte diehöherenWerte.BeidenPferdenundSchafenwarendierektalenTempe-
raturensignifikanthöheralsdiesubkutaneKörpertempe-ratur.BeidenPferdenbetrugdieDifferenzdurchschnittlich1,6°C,beidenSchafen3,5°C.EineUntersuchungvonKamannetal. (1999)beschäf-
tigtesichmit15Kälbern.DieInjektatewurdenunterdemSkutulum,d.h.subkutanunterdemDreiecksknorpelamOhransatz, injiziert. Die Korrelation zwischen rektal undSkutulumbetrugr=0,82.AbderzweitenbiszurzehntenVersuchswochewardiesubkutaneTemperaturumdurch-schnittlich1,0 °Cniedriger als die rektaleKörpertempe-ratur.IneinerUntersuchungvonUdeetal.(2010)mitzwölf
Bullenkälbern lagen97,0%dersubkutanenKörpertem-peraturendesHalses,79,3%desOhrgrundsund96,0%derOhrbasisunterhalbderRektaltemperatur.DiemittlerenDifferenzenzwischenrektalerundsubkutanerKörpertem-peraturdesDreiecksknorpelslagenmit0,49°CunterdenDifferenzenderanderenbeidenInjektionsortemitWertenvon0,96und1,27°C.
3 Ziel der Untersuchung
ZieldieserStudiewardieÜberprüfung,obsichbeiZie-genzweiunterschiedlicheApplikationsorte,derOhrgrundunddieSchwanzfalte,alsInjektionsortsowiefüreinesub-kutaneKörpertemperaturmessungeignen.DamitkönntedieelektronischeTierkennzeichnungzurTieridentifikation

G. Ude, H. Georg, S. Bender, A. Schwalm / Landbauforschung - vTI Agriculture and Forestry Research 4 2011 (61)289-298 291
undzurKrankheitsfrüherkennungundsomitfürdieTier-gesundheit genutzt werden. Hierzu wurden mehrereMessperiodenunterunterschiedlichenklimatischenBedin-gungendurchgeführt.
4 Material und Methode
DerVersuchwurdeamInstitutfürÖkologischenLand-bau in Trenthorst (vTI) von Februar 2009 bis Mai 2011durchgeführt.
Tiere
Am18.02.2009wurde10ZiegenderRasseBunteDeut-sche Edelziege, die zu diesem Zeitpunkt ca. ein Jahr altwaren,voneinerTierärztinjezweiInjektatemitTempera-tursensor („Bio-Thermo“)subkutanappliziert:AmlinkenOhr in denOhrgrund sowie in die Schwanzfalte.Da imMärz2009undimOktober2009jeeineZiegegeschlach-tetwurde,wurdeimSeptember2009zweiweiterenZie-genjeeinInjektatindieSchwanzfalteinjiziert,umweiter-hineineGruppevonzehnTierenbegutachtenzukönnen(Tabelle1).AllerdingswurdebeidenzweiTierenaufdieApplikationimOhrverzichtet,weilderOhrgrundzudie-semZeitpunktbereitsalsungeeigneteingestuftwurde.
Tabelle1:
Grunddaten
Datum VorgangAnzahlZiegen
Applikationsort
Schwanzfalte Ohrgrund
02/09 ApplikationInjektate 10 10 10
03/09 Schlachtung 1
09/09 ApplikationInjektate 2 2 0
10/09 Schlachtung 1
Injektate
DieInjektate„Bio-Thermo“,vonderFirmaDestronFea-ringfürVersuchszweckezurVerfügunggestellt,habeneineGrößevonca.14,5mmx2,1mmundkönnensubkutanoderintramuskulärinjiziertwerden;dieElektronikistvonei-nerGlashülleumschlossen.Der„Bio-Thermo“-Chipermög-licht eine individuelle Identifikation des Tieres über einen15-stelligenCodeundistmiteinemTemperatursensorzurMessungdersubkutanenKörpertemperaturausgestattet.
Lesegeräte
Ein Systembesteht aus einerKennungundeinemLe-ser.DieKennungenthälteinenpassivenTransponder(ein
MikrochipohneEnergiequelle),derdiegespeichertenIn-formationenüberträgt,wennder Leser (einSende-Emp-fänger)ihnaufeinerbestimmtenFrequenzaktiviert.DurchISO-NormenwerdensowohldieStrukturderTiernummer(ISO11784)alsauchdieFunktionsweisedesTransponders(ISO11785)geregelt,sodassdurchdieKombinationvonLändercode (ISO 3166) und der nationalen TiernummerjedemTiereineweltweiteinmaligeNummerzugeordnetwerdenkönnte.AlsDatenlesegerätezurErfassungdersubkutanenKör-
pertemperaturwurdenzweiunterschiedlicheReaderein-gesetzt:Bei dem Destron Universal Pocket-Reader EX®, der
ebenfalls zurVerfügunggestelltwurde,handeltees sichumeinenHandleser,derbeimAktivierendesGerätsdurchKnopfdruckdieChip-NummerunddieKörpertemperaturimDisplayangegebenhat.Als zweites Lesegerät kam ein vom Institut für Agrar-
technologie und Biosystemtechnik des vTI entwickeltesGerätzumEinsatz.DiesesSystembestandauseinerRing-antenne, die über ein ca. 1,5m langes Kabel an einenDatenloggerangeschlossenwar,derinfreiwählbarenIn-tervallendieKörpertemperaturabspeichernkann.DiesesSystemwurde für einen früherenVersuch zur ErfassungderKörpertemperaturvonMilchkühenamOhrgrundent-wickelt.
Fieberthermometer
FürdierektalenMessungenwurdeeindigitalesFieber-thermometer(VT1831derFirmamicrolife®)ausdemVe-terinärbereicheingesetzt,das füreineMessung lediglich10Sekundenbenötigt.
Datenerfassung
EineFunktionsüberprüfunginBezugaufdieLesbarkeitderInjektatewurdevonFebruar2009bisMai2011durch-geführt. ImJahr2009erfolgtediesesallezweiWochen,in2010und2011wurdejeeinmalproJahreinePrüfungdurchgeführt.DieErfassungderKörpertemperatur(subkutanundrek-
tal) erfolgte in vierMessperioden von Februar 2009 bisMai2010.WährenddererstenMessperiodeimFrühjahr2009wur-
dendie subkutanenKörpertemperaturendesOhrgrundsundderSchwanzfaltemitdemPocket-Readerder FirmaDestron Fearing und dem Datenlogger des vTI als Ver-gleichsmessung erfasst. In dieserMessperiodewurde zujedemMesszeitpunktjederWertinsiebenfacherWieder-holungaufgenommen.DaesderFirmaDestronFearingnichtmöglichwar,die
UmrechnungderDatendarzulegen,wurdendieDatenin

292
der zweiten und dritten Messperiode ausschließlich mitdemDatenloggerdesvTIerfasst.ImSommer(Juli)2009wurdenbeineunZiegendiesub-
kutane Körpertemperatur in der Schwanzfalte und dieRektaltemperatur inder Sonneund imSchatten erfasst.Die subkutanen Körpertemperaturen wurden in sechs-facher, die rektalen aufgrund niedriger Standardabwei-chungindreifacherWiederholungerfasst.DieZiegenwur-denzunächstfüreineStundeindieSonnegesperrtbevordieMessungdurchgeführtwurde.NacheinerStundeimSchattenwurdeerneutdieKörpertemperaturerfasst.AusTierschutzgründenwurdendieZiegennichtlängeralseineStundederSonneausgesetzt.ImWinter (Dezember2009undJanuar2010)wurden
beisechsZiegendiesubkutaneKörpertemperatur inderSchwanzfaltesowiedieRektaltemperaturerfasst.Diesub-kutanenDatenwurdeninsechsfacher,dierektalenWertein dreifacher Wiederholung aufgenommen. Die Körper-temperaturwurdezunächstimStallerfasst.Anschließendwurden die Ziegen in denAuslauf gesperrt und alle 10MinutenübereineDauervoneinerStundeinfestgelegterReihenfolgegemessen.15MonatenachApplikationwurdeimMai2010noch
einmal eine Vergleichsmessung zwischen dem Readerund dem Datenlogger durchgeführt. In dieser Messpe-riodewurde zu jedemMesszeitpunkt jederWertwiederin siebenfacherWiederholung aufgenommen. Für dieseweitereVergleichsmessungwurdederPocket-ReadereinweiteresMaleingesetzt.
Statistische Auswertung
DadieKörpertemperatur tierindividuell unddieAppli-kationder Injektatenicht standardisiert ist,erfolgteeineEinzeltierbetrachtung der Messwerte. So wurden derKorrelationskoeffizient und die Standardabweichungentierindividuell innerhalb jederVariante jeMessortund jeMesszeitpunkt ausgewertetunddieMittelwerte jeMes-sort berechnet.Die statistischeAuswertung erfolgtemitSAS9.1.
5 Ergebnisse
Verluste
Bereits zwei Wochen nach Applikation der Injektatekonnte ein Injektat des Ohrgrunds nicht mehr ausge-lesenwerden. Nachweiteren zweiWochenwaren zweivonneunInjektatendesOhrgrunds(eineZiegewurdege-schlachtet)defekt.DreiMonatenachApplikationfieleinweiteresInjektataus,wiedereines,dasamOhrgrundap-pliziertwurde.BisMai2010warenkeineweiterenVerlustezuverzeichnen.D.h.von8InjektatenimOhrgrundwaren
5lesbarundbiszudiesemZeitpunktwarenalleInjektateder Schwanzfalte intakt. Die Funktionsmessung im Mai2011zeigte,dasseinweiteresInjektatdesOhrgrundsundzweiInjektatederSchwanzfaltenichtmehrlesbarwaren(Tabelle2).
Tabelle2:
ErgebnissederFunktionsmessungen
Anzahl AnzahllesbarerInjektate
Datum Ziegen[n] Ohrgrund[n] Schwanzfalte[n]
18.02.09 10 10 10
02.03.09 10 9 10
14.03.09 9 7 9
14.05.09 9 6 9
12.10.09 9 6 9
02.12.09 10 5/8* 10
02.05.10 10 5/8* 10
06.05.11 10 4/8* 8
*:DenbeidennachgechipptenZiegenwurdekeinInjektatindenOhrgrundappliziert.
Messperiode im Frühjahr 2009
DieDatenerfassungimFrühjahrerfolgtebeieinerUm-gebungstemperaturvondurchschnittlich14°C.BeiachtvonneunZiegenwarderKorrelationskoeffizi-
ent zwischender Rektaltemperatur undder subkutanendesOhrgrundshöheralszwischenderRektaltemperaturunddersubkutanenderSchwanzfalte(Tabelle3),d.h.dieKorrelationzwischenderRektaltemperaturundder sub-kutanendesOhrgrundszeigteeinengrößerenZusammen-hangalszurSchwanzfalte.DerhöchsteKorrelationskoeffizientlagbeiderZiege268
amOhrgrundbeir=0,93undderniedrigstebeiderZie-ge337mitr=0,09.InsgesamtzeigtendieKorrelationenje Tier sehr unterschiedlicheWerte (Tabelle 3), es tratenauchnegativeKorrelationenauf,dieeinengegenläufigenZusammenhang zeigen. Dieses trat bei denMessungenim Frühjahr nur vereinzelt auf, bei den Kältemessungenhäufiger(Tabelle3undTabelle6).Dieniedrigenp-Werte(<0,05)verdeutlichendensignifikantenZusammenhangzwischen der rektalen und der jeweiligen subkutanenTemperatur.DieniedrigstenStandardabweichungenzeigtedieRek-
taltemperatur bei allen zehn Ziegen mit Abweichungen<0,1°C.DieStandardabweichungendesDatenloggerslagenzwi-
schen0,05°Cund0,40°C,derReaderhattemitWertenzwischen0,11°Cund0,53°CdiegrößtenAbweichungenzuverzeichnen.JeTierzeigtensichtierindividuelleUnter-schiede(Tabelle4).

G. Ude, H. Georg, S. Bender, A. Schwalm / Landbauforschung - vTI Agriculture and Forestry Research 4 2011 (61)289-298 293
Tabelle3:
Korrelationrektal-subkutantierindividuell,MessperiodeFrühjahr2009
Ohrmarke ReaderOhrgrund ReaderSchwanzfalte LoggerOhrgrund LoggerSchwanzfalte
r p r p r p r p
268 0,90 <0,0001 0,64 <0,0001 0,93 <0,0001 0,70 <0,0001
274 0,72 <0,0001 0,22 0,1323 0,81 <0,0001 0,43 0,0030
275 0,72 <0,0001 0,54 <0,0001 0,83 <0,0001 0,55 <0,0001
283 0,55 <0,0001 0,25 0,0831 0,63 <0,0001 0,39 0,0050
285 0,37 0,0093 0,71 <0,0001 0,64 0,0003 0,77 <0,0001
309 0,78 <0,0001 0,37 0,0093 0,71 <0,0001 0,50 0,0002
311 -0,08 0,6025 0,39 0,0061
314 0,27 0,0646 0,57 <0,0001 0,45 0,0014 0,32 0,0348
337 0,64 <0,0001 -0,29 0,0462 0,61 <0,0001 0,09 0,5610
801 0,72 <0,0001 0,59 <0,0001 0,72 <0,0001 0,38 0,0070
Tabelle4:
Standardabweichungentierindividuell,MessperiodeFrühjahr2009
Ohrmarke rektal Reader Logger
stdev[°C] Ohrgrundstdev[°C] Schwanzfaltestdev[°C] Ohrgrundstdev[°C] Schwanzfaltestdev[°C]
268 0,026 0,121 0,237 0,090 0,064
274 0,026 0,526 0,199 0,084 0,181
275 0,051 0,116 0,142 0,064 0,404
283 0,075 0,287 0,243 0,072 0,219
285 0,035 0,136 0,214 0,051 0,064
309 0,060 0,168 0,234 0,084 0,130
311 0,040 0,239 0,088
314 0,033 0,141 0,199 0,099 0,171
337 0,040 0,105 0,207 0,122 0,227
801 0,032 0,135 0,126 0,068 0,381
Messperiode im Sommer 2009
DieDatenerfassungimSommererfolgtebeieinerUm-gebungstemperaturinderSonnezwischen23und43°C.DieKorrelationenbeiderDatenerfassunginderSonne
und im Schatten zeigten einen hohen Zusammenhangmit r = 0,73 bis r = 0,94 und einemp-Wert < 0,0001.Die Standardabweichungen lagen im ähnlichen BereichwiebeidenMessungenimFrühjahrmitWertenzwischen0,068bis0,272(Tabelle5).
Tabelle5:
Korrelationenrektal-subkutanundStandardabweichungtierindividu-ellbeiderSommermessperiode
LoggerSchwanzfalte Logger
Ohrmarke r p SchwanzfalteSonnestdev
[°C]
SchwanzfalteSchattenstdev
[°C]
268 0,88 <0,0001 0,092 0,068
274 0,89 <0,0001 0,084 0,106
275 0,73 <0,0001 0,272 0,218
283 0,85 <0,0001 0,161 0,193
285 0,93 <0,0001 0,113 0,200
311 0,95 <0,0001 0,078 0,175
314 0,85 <0,0001 0,111 0,179
337 0,85 <0,0001 0,168 0,161
801 0,89 <0,0001 0,165 0,258
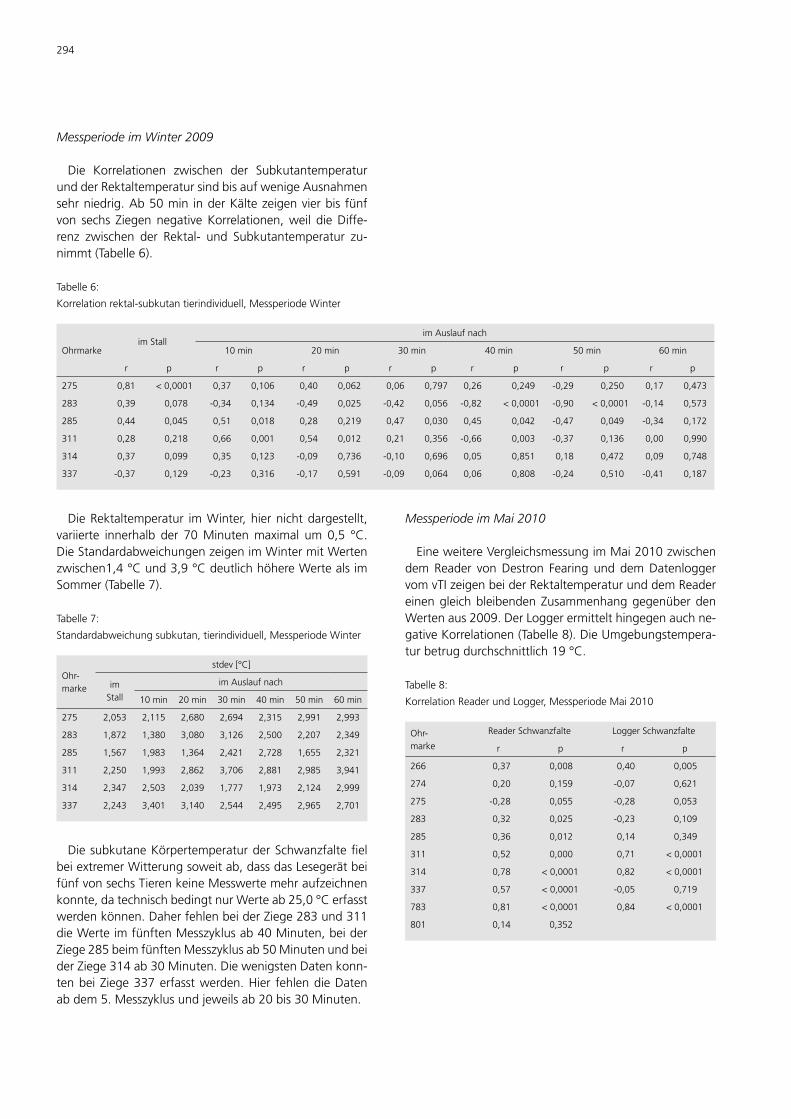
294
Messperiode im Winter 2009
Die Korrelationen zwischen der SubkutantemperaturundderRektaltemperatursindbisaufwenigeAusnahmensehrniedrig.Ab50min inderKältezeigenvierbisfünfvon sechs ZiegennegativeKorrelationen,weil dieDiffe-renz zwischen der Rektal- und Subkutantemperatur zu-nimmt(Tabelle6).
Tabelle6:
Korrelationrektal-subkutantierindividuell,MessperiodeWinter
OhrmarkeimStall
imAuslaufnach
10min 20min 30min 40min 50min 60min
r p r p r p r p r p r p r p
275 0,81 <0,0001 0,37 0,106 0,40 0,062 0,06 0,797 0,26 0,249 -0,29 0,250 0,17 0,473
283 0,39 0,078 -0,34 0,134 -0,49 0,025 -0,42 0,056 -0,82 <0,0001 -0,90 <0,0001 -0,14 0,573
285 0,44 0,045 0,51 0,018 0,28 0,219 0,47 0,030 0,45 0,042 -0,47 0,049 -0,34 0,172
311 0,28 0,218 0,66 0,001 0,54 0,012 0,21 0,356 -0,66 0,003 -0,37 0,136 0,00 0,990
314 0,37 0,099 0,35 0,123 -0,09 0,736 -0,10 0,696 0,05 0,851 0,18 0,472 0,09 0,748
337 -0,37 0,129 -0,23 0,316 -0,17 0,591 -0,09 0,064 0,06 0,808 -0,24 0,510 -0,41 0,187
DieRektaltemperatur imWinter,hiernichtdargestellt,variierte innerhalb der 70Minutenmaximal um0,5 °C.DieStandardabweichungenzeigenimWintermitWertenzwischen1,4°Cund3,9°CdeutlichhöhereWertealsimSommer(Tabelle7).
Tabelle7:
Standardabweichungsubkutan,tierindividuell,MessperiodeWinter
Ohr-marke
stdev[°C]
imStall
imAuslaufnach
10min 20min 30min 40min 50min 60min
275 2,053 2,115 2,680 2,694 2,315 2,991 2,993
283 1,872 1,380 3,080 3,126 2,500 2,207 2,349
285 1,567 1,983 1,364 2,421 2,728 1,655 2,321
311 2,250 1,993 2,862 3,706 2,881 2,985 3,941
314 2,347 2,503 2,039 1,777 1,973 2,124 2,999
337 2,243 3,401 3,140 2,544 2,495 2,965 2,701
DiesubkutaneKörpertemperaturderSchwanzfaltefielbeiextremerWitterungsoweitab,dassdasLesegerätbeifünfvonsechsTierenkeineMesswertemehraufzeichnenkonnte,datechnischbedingtnurWerteab25,0°Cerfasstwerdenkönnen.DaherfehlenbeiderZiege283und311dieWerteimfünftenMesszyklusab40Minuten,beiderZiege285beimfünftenMesszyklusab50MinutenundbeiderZiege314ab30Minuten.DiewenigstenDatenkonn-tenbeiZiege337erfasstwerden.Hier fehlendieDatenabdem5.Messzyklusundjeweilsab20bis30Minuten.
Messperiode im Mai 2010
EineweitereVergleichsmessungimMai2010zwischendemReader vonDestron Fearing und demDatenloggervomvTIzeigenbeiderRektaltemperaturunddemReadereinengleichbleibendenZusammenhanggegenüberdenWertenaus2009.DerLoggerermittelthingegenauchne-gativeKorrelationen(Tabelle8).DieUmgebungstempera-turbetrugdurchschnittlich19°C.
Tabelle8:
KorrelationReaderundLogger,MessperiodeMai2010
Ohr-marke
ReaderSchwanzfalte LoggerSchwanzfalte
r p r p
266 0,37 0,008 0,40 0,005
274 0,20 0,159 -0,07 0,621
275 -0,28 0,055 -0,28 0,053
283 0,32 0,025 -0,23 0,109
285 0,36 0,012 0,14 0,349
311 0,52 0,000 0,71 <0,0001
314 0,78 <0,0001 0,82 <0,0001
337 0,57 <0,0001 -0,05 0,719
783 0,81 <0,0001 0,84 <0,0001
801 0,14 0,352
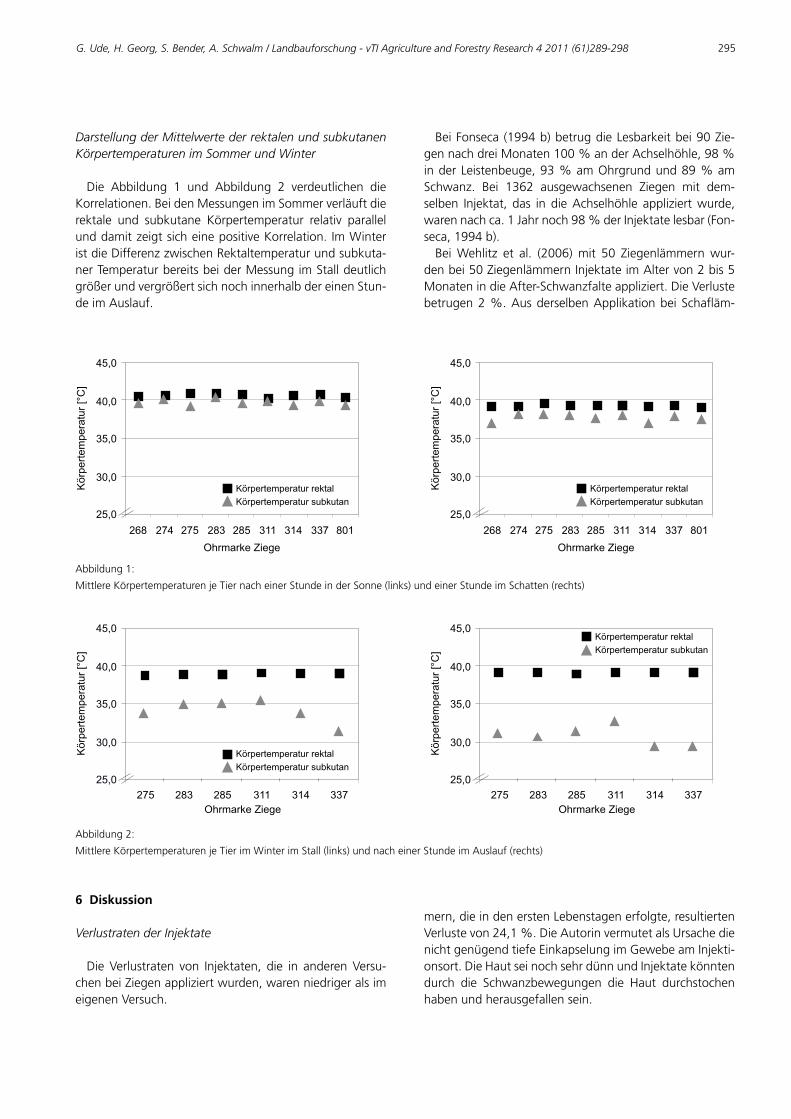
G. Ude, H. Georg, S. Bender, A. Schwalm / Landbauforschung - vTI Agriculture and Forestry Research 4 2011 (61)289-298 295
Darstellung der Mittelwerte der rektalen und subkutanen Körpertemperaturen im Sommer und Winter
Die Abbildung 1 und Abbildung 2 verdeutlichen dieKorrelationen.BeidenMessungenimSommerverläuftdierektale und subkutane Körpertemperatur relativ parallelunddamitzeigtsicheinepositiveKorrelation.ImWinteristdieDifferenzzwischenRektaltemperaturundsubkuta-nerTemperaturbereitsbeiderMessungimStalldeutlichgrößerundvergrößertsichnochinnerhalbdereinenStun-deimAuslauf.
25,0
30,0
35,0
40,0
45,0
268 274 275 283 285 311 314 337 801
Ohrmarke Ziege
Körp
ert
em
pera
tur
[°C
]
Körpertemperatur rektal
Körpertemperatur subkutan
25,0
30,0
35,0
40,0
45,0
268 274 275 283 285 311 314 337 801
Ohrmarke Ziege
Körp
ert
em
pera
tur
[°C
]
Körpertemperatur rektal
Körpertemperatur subkutan
Abbildung1:
MittlereKörpertemperaturenjeTiernacheinerStundeinderSonne(links)undeinerStundeimSchatten(rechts)
25,0
30,0
35,0
40,0
45,0
Körp
ert
em
pera
tur
[°C
]
Körpertemperatur rektal
Körpertemperatur subkutan
275 283 285 311 314 337
Ohrmarke Ziege
25,0
30,0
35,0
40,0
45,0
Körp
ert
em
pera
tur
[°C
]
Körpertemperatur rektal
Körpertemperatur subkutan
275 283 285 311 314 337
Ohrmarke Ziege
Abbildung2:
MittlereKörpertemperaturenjeTierimWinterimStall(links)undnacheinerStundeimAuslauf(rechts)
6 Diskussion
Verlustraten der Injektate
DieVerlustraten von Injektaten, die in anderenVersu-chenbeiZiegenappliziertwurden,warenniedrigeralsimeigenenVersuch.
BeiFonseca(1994b)betrugdieLesbarkeitbei90Zie-gennachdreiMonaten100%anderAchselhöhle,98%inderLeistenbeuge,93%amOhrgrundund89%amSchwanz. Bei 1362 ausgewachsenen Ziegen mit dem-selben Injektat, das in dieAchselhöhle appliziertwurde,warennachca.1Jahrnoch98%derInjektatelesbar(Fon-seca,1994b).BeiWehlitz et al. (2006)mit 50 Ziegenlämmernwur-
denbei50ZiegenlämmernInjektateimAltervon2bis5MonatenindieAfter-Schwanzfalteappliziert.DieVerlustebetrugen2%.AusderselbenApplikationbeiSchafläm-
mern,dieindenerstenLebenstagenerfolgte,resultiertenVerlustevon24,1%.DieAutorinvermutetalsUrsachedienichtgenügendtiefeEinkapselungimGewebeamInjekti-onsort.DieHautseinochsehrdünnundInjektatekönntendurch die Schwanzbewegungen die Haut durchstochenhabenundherausgefallensein.
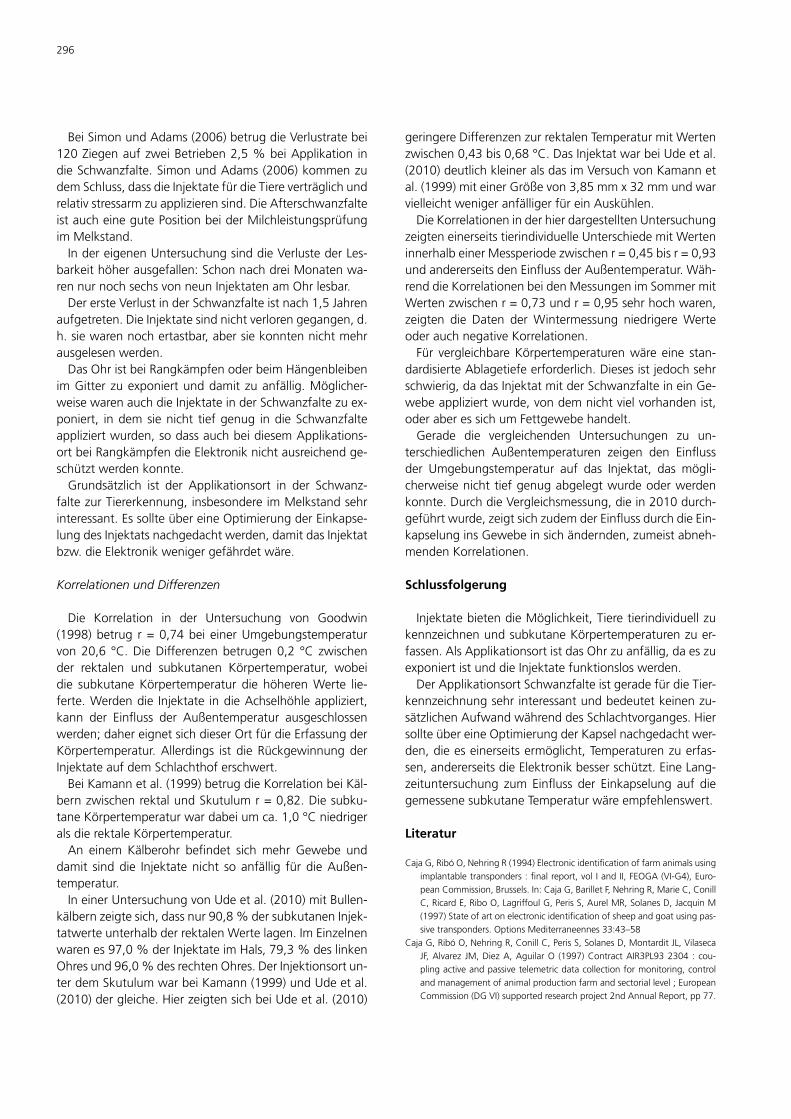
296
BeiSimonundAdams(2006)betrugdieVerlustratebei120ZiegenaufzweiBetrieben2,5%beiApplikation indieSchwanzfalte.SimonundAdams(2006)kommenzudemSchluss,dassdieInjektatefürdieTiereverträglichundrelativstressarmzuapplizierensind.DieAfterschwanzfalteistaucheinegutePositionbeiderMilchleistungsprüfungimMelkstand.IndereigenenUntersuchungsinddieVerlustederLes-
barkeithöherausgefallen:SchonnachdreiMonatenwa-rennurnochsechsvonneunInjektatenamOhrlesbar.DerersteVerlustinderSchwanzfalteistnach1,5Jahren
aufgetreten.DieInjektatesindnichtverlorengegangen,d.h.siewarennochertastbar,abersiekonntennichtmehrausgelesenwerden.DasOhristbeiRangkämpfenoderbeimHängenbleiben
imGitterzuexponiertunddamitzuanfällig.Möglicher-weisewarenauchdieInjektateinderSchwanzfaltezuex-poniert, indemsienicht tiefgenug indieSchwanzfalteappliziertwurden,sodassauchbeidiesemApplikations-ortbeiRangkämpfendieElektroniknichtausreichendge-schütztwerdenkonnte.Grundsätzlich ist der Applikationsort in der Schwanz-
faltezurTiererkennung,insbesondereimMelkstandsehrinteressant.EssollteübereineOptimierungderEinkapse-lungdesInjektatsnachgedachtwerden,damitdasInjektatbzw.dieElektronikwenigergefährdetwäre.
Korrelationen und Differenzen
Die Korrelation in der Untersuchung von Goodwin(1998)betrug r=0,74beieinerUmgebungstemperaturvon20,6 °C.DieDifferenzenbetrugen0,2 °C zwischender rektalen und subkutanen Körpertemperatur, wobeidie subkutaneKörpertemperatur die höherenWerte lie-ferte.Werdendie Injektate indieAchselhöhleappliziert,kann der Einfluss der Außentemperatur ausgeschlossenwerden;dahereignetsichdieserOrtfürdieErfassungderKörpertemperatur.Allerdings ist dieRückgewinnungderInjektateaufdemSchlachthoferschwert.BeiKamannetal.(1999)betrugdieKorrelationbeiKäl-
bernzwischenrektalundSkutulumr=0,82.Diesubku-taneKörpertemperaturwardabeiumca.1,0°CniedrigeralsdierektaleKörpertemperatur.An einem Kälberohr befindet sichmehr Gewebe und
damit sinddie Injektatenicht soanfällig fürdieAußen-temperatur.IneinerUntersuchungvonUdeetal.(2010)mitBullen-
kälbernzeigtesich,dassnur90,8%dersubkutanenInjek-tatwerteunterhalbderrektalenWertelagen.ImEinzelnenwarenes97,0%derInjektateimHals,79,3%deslinkenOhresund96,0%desrechtenOhres.DerInjektionsortun-terdemSkutulumwarbeiKamann(1999)undUdeetal.(2010)dergleiche.HierzeigtensichbeiUdeetal.(2010)
geringereDifferenzenzurrektalenTemperaturmitWertenzwischen0,43bis0,68°C.DasInjektatwarbeiUdeetal.(2010)deutlichkleineralsdasimVersuchvonKamannetal.(1999)miteinerGrößevon3,85mmx32mmundwarvielleichtwenigeranfälligerfüreinAuskühlen.DieKorrelationeninderhierdargestelltenUntersuchung
zeigteneinerseitstierindividuelleUnterschiedemitWerteninnerhalbeinerMessperiodezwischenr=0,45bisr=0,93undandererseitsdenEinflussderAußentemperatur.Wäh-renddieKorrelationenbeidenMessungenimSommermitWertenzwischenr=0,73undr=0,95sehrhochwaren,zeigten die Daten derWintermessung niedrigereWerteoderauchnegativeKorrelationen.Für vergleichbareKörpertemperaturenwäre eine stan-
dardisierteAblagetiefeerforderlich.Diesesistjedochsehrschwierig,dadasInjektatmitderSchwanzfalteineinGe-webeappliziertwurde,vondemnichtvielvorhandenist,oderaberessichumFettgewebehandelt.Gerade die vergleichenden Untersuchungen zu un-
terschiedlichen Außentemperaturen zeigen den Einflussder Umgebungstemperatur auf das Injektat, das mögli-cherweisenichttiefgenugabgelegtwurdeoderwerdenkonnte.DurchdieVergleichsmessung,diein2010durch-geführtwurde,zeigtsichzudemderEinflussdurchdieEin-kapselunginsGewebeinsichändernden,zumeistabneh-mendenKorrelationen.
Schlussfolgerung
InjektatebietendieMöglichkeit,TieretierindividuellzukennzeichnenundsubkutaneKörpertemperaturenzuer-fassen.AlsApplikationsortistdasOhrzuanfällig,daeszuexponiertistunddieInjektatefunktionsloswerden.DerApplikationsortSchwanzfalteistgeradefürdieTier-
kennzeichnungsehrinteressantundbedeutetkeinenzu-sätzlichenAufwandwährenddesSchlachtvorganges.HiersollteübereineOptimierungderKapselnachgedachtwer-den,dieeseinerseitsermöglicht,Temperaturenzuerfas-sen,andererseitsdieElektronikbesserschützt.EineLang-zeituntersuchung zum Einfluss der Einkapselung auf diegemessenesubkutaneTemperaturwäreempfehlenswert.
Literatur
CajaG,RibóO,NehringR(1994)Electronicidentificationoffarmanimalsusingimplantabletransponders:finalreport,volIandII,FEOGA(VI-G4),Euro-peanCommission,Brussels.In:CajaG,BarilletF,NehringR,MarieC,ConillC,RicardE,RiboO,LagriffoulG,PerisS,AurelMR,SolanesD,JacquinM(1997)Stateofartonelectronicidentificationofsheepandgoatusingpas-sivetransponders.OptionsMediterraneennes33:43–58
CajaG,RibóO,NehringR,ConillC,PerisS,SolanesD,MontarditJL,VilasecaJF,Alvarez JM,DiezA,AguilarO (1997)ContractAIR3PL932304 : cou-plingactiveandpassivetelemetricdatacollectionformonitoring,controlandmanagementofanimalproductionfarmandsectoriallevel;EuropeanCommission(DGVI)supportedresearchproject2ndAnnualReport,pp77.
G. Ude, H. Georg, S. Bender, A. Schwalm / Landbauforschung - vTI Agriculture and Forestry Research 4 2011 (61)289-298 297
Zitiertaus:CajaG,BarilletF,NehringR,MarieC,ConillC,RicardE,RiboO,LagriffoulG,PerisS,AurelMR,SolanesD,JacquinM(1997):Stateofartonelectronicidentificationofsheepandgoatusingpassivetransponders.OptionsMediterraneennes33:43–58
FonsecaPD,RoqueteCR,CastroJL,CondeçoAG,FernandesJV(1994a)Evalu-ationofbodyreactionofelectronicidentificationtranspondersimplantedinfourdifferentsitesinadultgoats.In:Electronicidentificationoffarmani-malsusingimplantabletransponders:finalreport,vol.II,FEOGA(VI-G4),EuropeanCommission,Brussels,ExperienceUE-03/2.1.Zitiertaus:CajaG,BarilletF,NehringR,MarieC,ConillC,RicardE,RiboO,LagriffoulG,PerisS,AurelMR,SolanesD,JacquinM(1997)Stateofartonelectroniciden-tificationofsheepandgoatusingpassivetransponders.OptionsMediter-raneennes33:43–58
FonsecaPD,RoqueteCR,CastroJL,PaisJM,FernandesJV(1994b)Efficiencyevaluationofautomaticelectronicidentificationinextensivegoatproduc-tionsystems.In:Electronicidentificationoffarmanimalsusingimplantabletransponders:finalreport,vol.II,FEOGA(VI-G4),EuropeanCommission,Brussels, ExperienceUE-03/4.1. Zitiert aus: CajaG, Barillet F, Nehring R,MarieC,ConillC,RicardE,RiboO,LagriffoulG,PerisS,AurelMR,SolanesD,JacquinM(1997):Stateofartonelectronicidentificationofsheepandgoatusingpassivetransponders.OptionsMediterraneennes33:43–58
GeorgH,UdeG,SchwalmA(2008)NeueAspektezurelektronischenTierkenn-zeichnung-Teil1.Landtechn63(3):174-175
Goodwin S (1998)Comparison of body temperatures of goats, horses, andsheepmeasured with a tympanic infrared thermometer, an implantablemicrochiptransponder,andarectalthermometer.ContempTopLabAnimSci37(3):51-55
KamannB,KlindtworthK,WendlG,KraetzlW-D,SchönH,HartungJ(1999)AutomatischeGesundheitsüberwachungmitHilfevoninjizierbarenTempe-raturtransponderninderKälberaufzucht.In:InstitutfürLandtechnik,Wei-henstephan(eds)TagungBau,TechnikundUmwelt1999inderlandwirt-schaftlichenNutztierhaltung.Freising:InstitutfürLandtechnik,pp249-254
Klindtworth K (2007) Elektronische Tierkennzeichnung: Anwendungen undPerspektiven.KTBL-Schrift457:89-98
SchwalmA,GeorgH,UdeG(2010)ElektronischeTierkennzeichnung:StatusQuoinDeutschlandseitJanuar2010.Schafzucht(10):1-3
SimonI(2006)KennzeichnungvonZiegenuntertierschutzrelevantenAspekten[online]. Zu finden in <http://www.landwirtschaftskammer.de/landwirt-schaft/tiergesundheit/pdf/2006-11-08-simon.pdf>[zitiertam08.09.2011]
SimonI,AdamsW(2006)Testmit injizierbarenTranspondernan120ZiegenaufzweiBetrieben inZusammenarbeitmitZiegengesundheitsdienstLWKNRW im Jahre 2003/2004 [online]. Zu finden in <http://www.landwirt-schaftskammer.de/landwirtschaft/tiergesundheit/pdf/2006-11-08-simon.pdf>[zitiertam08.09.2011]
UdeG,GeorgH,SchwalmA(2010)ElektronischeTierkennzeichnungbeiBul-lenkälbernmitInjektatenundTemperatursensoren.Landtechn65(1):31-33
ViehVerkV (2010) Verordnung zum Schutz gegen die Verschleppung vonTierseuchen im Viehverkehr (Viehverkehrsordnung – ViehVerkV) vomMärz2010 (BGBl. I S.230) zuletztgeändertdurchdieErsteVerordnungzurÄnderungderViehverkehrsverordnungvom3.März2010(BGBl. IS.198) [online]. Zu finden in <http://www.loerrach-landkreis.de/servlet/PB/show/1570557/ViehVerkV.pdf>[zitiertam12.09.2011]
WehlitzR,WaltherR,BergfeldU,GolzeM(2006)Schaf-undZiegenhaltung:MöglichkeitenderelektronischenKennzeichnung.DtTierärztebl5:560-562

298
I. Halle, M. Henning, P. Köhler / Landbauforschung - vTI Agriculture and Forestry Research 4 2011 (61)299-306 299
Influence of vitamin B12 and Cobalt on growth of broiler chickens and Pekin ducks
IngridHalle*,MartinaHenning**,andPeterKöhler**
* Friedrich-Loeffler-Institut,FederalResearchInstituteforAnimalHealth,In-stituteofAnimalNutrition,Bundesallee50,Braunschweig,Germany
** Friedrich-Loeffler-Institut,FederalResearchInstituteforAnimalHealth,In-stituteofFarmAnimalGenetics,Höltystr.10,Neustadt,Germany
Correspondingauthor:PDDr.IngridHalle,E.mail:[email protected]
Summary
TheeffectsofdietaryvitaminB12andcobaltsupplemen-tationonfeedintake,growthperformance,feed-to-gainratio,carcasscomposition,andnutrientcontentofbreastmeat of ducks were investigated in broilers and Pekinducks.768male chickensand384maleduckswereal-locatedto8dietarytreatmentgroups(0/10/20/40μgvi-taminB12,0.65mgCo,0.65mgCo+10μgB12,0.65mgCo+20μgB12,0.65mgCo+40μgB12)andfedfor35or49days.Thedailyfeedintakeincreasedsignificantlyfrom76.3to81.3g,thedailyweightgainfrom52.3to56.1g,thefinalbodyweightfrom1874to2007gperbroilerbyraising theB12concentration from0 to40μg/kg. In thesamewaythesupplementationof0.65mgCoimprovedthefeedintakeandthusthedevelopmentofbroilers.Thefeed-to-gainratiowasonlyaffectedinthefirsttwoweeksunderhigherB12andB12xCoconcentrationinthefeed.The statistical evaluationof the single effectsof vitaminB12andCoandthecombinedeffectofvitaminB12+Coonperformanceofduckscouldnotdemonstrateondailyfeedintake,bodyweightgain,andfinalbodyweight.Thefeedconversionwasnegativelyaffectedbysupplementa-tionofCo.An increasedsupply for theanimalswithvi-taminB12orCoinducedahigheryieldofbreastmeatbysupplementationof20μgB12andahigherpercentageofbreastmeatandlegswhenaddingon0.65mgCo.Inthefreshbreastmatterofduckswassignificantlyhigherwa-tercontentanddecreasedproteincontentofthe0.65mg
Co-Groupcomparedto0.65mgCo+40μgB12-Group.Theresultsallowtheconclusion,that20μgofvitaminB12perkg feedmeet the requirementsofgrowingchickensand ducks for fattening.An additional supplementationof Co to feed does not have additional advantages forthebirds.
Keywords: vitamin B12, Cobalt, growth performance, broil-er, Pekin duck
Zusammenfassung
Einfluss von Vitamin B12 und Kobalt auf das Wachs-tum von Broiler und Pekingente
Der Einfluss der Supplementierung von Vitamin B12und Kobalt auf Futteraufnahme, Wachstum, Futterauf-wand, Schlachtkörperzusammensetzung und Gehalt anNährstoffen im Entenbrustmuskel wurde untersucht. IndenzweiVersuchenüber35bzw.49Tagenwurden768männlicheBroilerkükenund384männlichePekingentenin 8 Versuchsgruppen (0/10/20/40 μg B12, 0.65mgCo,0.65mgCo+10μgB12,0.65mgCo+20μgB12,0.65mgCo+40μgB12)eingeteilt.DieErhöhungdesVitaminB12Gehaltes imBroilerfuttererhöhtestatistischgesichertdietäglicheFutteraufnahmevon76,3auf81,3g,dietäglicheLebendmassezunahmevon52,3auf56,1unddieMasten-dmassevon1874gauf2007.DieSupplementierungvon0,65mgCoverbessertedieFutteraufnahmeundEntwick-lungderBroiler.DiebessereEntwicklungderBroilermitVitaminB12 imFutter führtezueinemhöherenBrustflei-schertragundAbdominalfettgehaltimSchlachtkörper.DieSupplementierungvonB12oderCobzw.B12+CozumEn-tenmastfutterhattekeinenstatistischgesichertenEinflussaufFutteraufnahme,täglicheLebendmassezunahmeundMastendmasse.DerFutteraufwandwargesichertschlech-ternachCoSupplementierunginsFutter.DieSupplemen-tierungvon20μgB12oder0,65mgCoerhöhtegesichertdenBrustfleischertragbeidenEnten.DieAnalysedesfri-schenEntenbrustfleischesergabeinengesicherthöherenGehaltanWasserundniedrigerenProteingehaltimFleischderGruppemit 0,65mgCo im Futter imVergleich zurGruppemit40μgB12+0,65mgCo.DieErgebnisselassendie Schlussfolgerung zu, dass 20 μgVitamin B12 pro kgFutterdenBedarfvonBroilerundPekingentedeckenundeine zusätzliche Co Supplementierung keinen additivenEinflusshat.
Schlüsselworte: Vitamin B12, Kobalt, Wachstum, Broiler, Pekingente

300
VitaminB12isthemostrecentlydiscoveredvitamin(West,1948)withthe lowestconcentrationofvitaminsneededtomeettherequirementofanimals.Thisvitaminbelongsto a specific group of Cobalt (Co)-containing corrinoidswithbiologicalactivity inhumansandanimals.ThetermvitaminB12isrestrictedtotherecommendedbiochemicalnomenclaturefortheformofcobalamin.Cobalamindoesnotoccur inplants, it issynthesized innaturebycertainbacteria,fungiandalgae(Green,2005).Microbesintherumenofruminants incorporateCo intoacorrinringtoformvitaminB12.VitaminB12isanessentialcomponentofseveralenzymesystems thatcarryoutanumberofverybasicmetabolicfunctionsintheanimal’sbody(McDowell,1989).Thisvitaminplaysacentralroleinnormalfunctionsofthebrainandthenervoussystem,inthehomocysteinmetabolism, in the blood function, energy metabolism,celldivisionand functionsof the immunesystem (EFSA,2009a;2010).10μgperkgfeedareindicatedbytheNRC(1994),and9μgB12perkgbytheGfE(1999)asthere-quirementforbroilerchickensandPekinducks.Thereisnoevidencethatmonogastricanimals(pigsand
poultry) requireCobalt (Co) other than through vitaminB12. Consequently, there is no need for any Co supple-mentation to the feed for these animals (EFSA, 2009b).AlthoughCoisnotnecessaryfornutritionofbroilerchick-ens, it is often added into the vitamin-mineral premix.PoultryobtaintheirB12eitherpreformed in feedor indi-rectlybyingestingfaeces.Theobjectiveofthisstudywastodeterminetheeffect
ofaVitaminB12-freedietsupplementedwithVitaminB12or/andCobaltonbroilerandPekinduckperformance.
Material and methods
InTrial1atotalnumberof768one-dayoldmalechick-ensforfattening(Ross308)wasrandomlydistributedintreatmentswith12chickensperpenand8penspergroup(Table 1). The duration of the trial was 35 days. Bodyweightwasrecordedforeachbroiler individuallyatdays14,21and35ofage.Feedwasweighedbackonapen-basis weekly. One bird per pen, representing themeanbodyweightofbroilersofthispen,wasslaughteredattheendofthetrial(8broilerspergroup)todeterminecarcasscomposition.Weightsoftotalbreastmeat(withoutskin),completerightleg,liver,heart,gizzard,spleenandsumofabdominalandviscerafatwereindividuallyrecorded.Allpartswereexpressedaspercentageofbodyweight.InTrial2a totalnumberof384maleone-dayoldPe-
kinduckswasrandomlydistributedintreatmentswith6ducksperpenand8penspergroup(Table1).Thedura-tionofthetrialwas49days.Bodyweightwasrecordedforeachduckindividuallyatdays21and49ofage.Feedwasweighedbackon apen-basisweekly.Onebirdper
pen,representingthemeanbodyweightofducksofthispen,wasslaughteredattheendofthetrial(8duckspergroup)todeterminecarcasscomposition.Weightsoftotalbreastmeat(withoutskin),completerightleg,liver,heart,gizzard,spleenandsumofabdominalandviscerafatwereindividuallyrecorded.BreastmeatofslaughteredducksofGroups1,4,5and8wasanalyzedformoistureand in-tramuscular fat contentwith Near Infrared TransmissionSpectroscopy (NIT) according to percentages of proteinwerecalculated(Köhleretal.,1995).
Table1:
Trialdesign
Group B12,μg/kg Co,mg/kg
1 0 0
2 10 0
3 20 0
4 40 0
5 0 0.65
6 10 0.65
7 20 0.65
8 40 0.65
Pelletedfeed(Table2)wasprovidedforadlibitumcon-sumption as a one phase feed for broilers and second-phasefeed(starterfeed:day1to21,fatteningfeed:day22to49)forPekinducks.Thebasaldietwasnotsupple-mentedwithvitaminB12andcontainedCoonlyfromnat-uralsources(wheat,corn,soyabeanmeal).Themicrobio-logicalanalyses(LUFASpeyer,LUFASP22013)ofthedietyieldedavalueof4μgB12perkg.Thisvalueresultedfrommicrobiologicalcontaminationofthefeedstuffs.Thebasaldiet was supplementedwith 0/10/20/40 μg B12 per kg,0.65mgCo,0.65mgCo+10μgB12,0.65mgCo+20μgB12and0.65mgCo+40μgB12perkg(Table1).Data from the two trialswereanalyzedbya two-way
ANOVA:yijk=μ+Vi+Cj+VCij+eijk,withyijk=ob-servation,μ=generalmean,Vi=vitaminB12 (0,10,20and40μg),Cj=Cobalt(0and0.65mg),interactionVCijandeijk=error term(random).MultiplecomparisonsofmeanswerecarriedoutusingtheStudent-Newman-KeulsTest(P 0.05).ThestatisticalanalyseswereperformedbytheSASsoftwarepackage(Version9.1).

I. Halle, M. Henning, P. Köhler / Landbauforschung - vTI Agriculture and Forestry Research 4 2011 (61)299-306 301
Table2:
Ingredientcomposition,analysedandcalculatednutrientsofthediets(g/kg)
IngredientAgeofdays
Broiler
1-35 1-
Pekin
21
duck
22-49
Wheat
Corn
Soyabeanmeal
Soyaoil
Di-calcium-phosphate
Calciumcarbonate
Sodiumchloride
DL-Methionine
L-Lysine-HCl
L-Threonine
Premix1)
2)VitaminB ,μg/kg12
Co2),mg/kg
Drymatter3)
Crudeprotein3)
ME,MJ/kg4)
Lysine5)
Methionine+Cystine5)
Cobalt,μg/kg6)
7)VitaminB ,μg/kg12
150.0
378.7
386.4
49.8
10.0
10.5
3.2
2.8
1.7
-
10.0
0/10/20/40
0/0.65
887
202
13.16
12.5
9.6
51
4.0
150.0
480.7
299.8
24.9
19.6
7.8
3.4
2.0
1.6
0.2
10.0
0/10/20/40
0/0.65
878
199
12.37
11.5
8.5
48
4.0
400.0
316.3
212.8
29.4
17.6
6.7
3.5
2.1
1.6
-
10.0
0/10/20/40
0/0.65
882
172
12.62
9.5
8.0
39
4.01)Vitamin–mineralpremixprovidedperkgofdiet:vitaminA,12000IE;vitaminD3
3500IE;tocopherol,40mg;menadion,4.5mg;thiamine,2.5mg;riboflavin,8mg;
pyridoxine,6mg;nicotinicacid,45mg;pantothenicacid,15mg;folicacid,1.2mg;
biotin,50μg;cholinechloride,550mg;Fe,32mg;Cu,12mg;Zn,80mg;Mn,100
mg;Se,0.4mg;I,1.6mg2)Cyanocobalaminsupplements–0.1%vitaminB12;Cobaltcarbonat–5%Co3)Analyzedvalues4)Calculatedvalues(WPSA,1985)5)Calculatedvalues6)Calculatedvalues(Soucietal.,2008)
7)Analyzedvalues–LUFASP22013
Table3:
Performanceofbroilers–Feedintake,bodyweightgain(Mean,SD,P-value)
Treatments Feedintake,g/broiler/day,ageofdays Bodyweightgain,g/broiler/day,ageofdays
B ,μg/kg12 Co,mg/kg 1–14 15–21 22–35 1–35 1–14 15–21 22–35 1–35
0 0 24.7±1.4 58.7±3.1 122.0±7.7 70.3±4.2 18.1±0.8 42.0±3.9 80.5±5.4 47.8±2.5
10 0 26.1±2.0 67.5±4.6 131.9±7.6 76.7±4.3 20.6±1.2 46.9±2.9 88.0±4.3 52.8±2.5
20 0 28.0±1.5 70.2±5.7 138.4±8.7 80.4±4.8 21.6±1.4 49.8±4.0 92.0±5.2 55.4±3.1
40 0 28.0±1.0 71.5±2.8 138.8±4.3 81.0±2.3 21.4±0.7 50.9±1.8 93.4±3.0 56.0±1.5
0 0.65 29.0±1.3 73.1±4.6 140.5±6.0 82.2±3.7 21.9±1.3 52.0±4.4 94.0±5.0 56.8±3.1
10 0.65 27.6±0.9 69.3±3.3 134.8±7.9 78.8±4.0 20.8±0.9 47.3±2.8 89.6±4.4 53.6±2.4
20 0.65 27.1±1.5 69.6±3.6 136.4±5.1 79.2±3.2 20.7±1.1 48.1±1.9 91.2±3.4 54.4±1.9
40 0.65 27.6±1.3 71.7±4.3 140.4±7.0 81.5±3.9 21.2±1.1 51.2±3.5 93.6±4.3 56.2±2.3
ANOVA,P-value
B12 0.125 0.002 0.005 0.003 0.006 0.006 0.003 0.003
Co <0.004 0.001 0.004 0.001 0.009 0.009 0.008 0.008
B xCo12 <0.001 <0.001 <0.001 <0.001 <0.001 <0.001 <0.001 <0.001
Results
Trial 1 – Broiler chicken
ThestatisticalevaluationofthesingleeffectofvitaminB12andCoandthecombinedeffectofvitaminB12+Coonperformanceofbroilersdemonstratedahighdepend-ence (P<0.05)of thevitaminB12or/andCoconcentra-tioninthebroilerfeedonthedailyfeedintake,thebodyweightgain,andfinalbodyweight.Thedailyfeedintakeincreased significantly from 76.3 g to 81.3 g, the dailyweightgainfrom52.3gto56.1g,thefinalbodyweightfrom1874gto2007gperbroilerwithraisingtheB12con-centrationfrom0to40μgperkgfeed(Table3,4,5).Inthesamewaythesupplementationof0.65mgCoperkgdietimproved(P<0.05)thefeedintakeandthusthede-velopmentofbroilerchickens(Table6).Thefeed-to-gainratiowasonlyaffectedinthefirsttwoweeksoftheraisedB12andB12xCoconcentrations inthefeed(Table4).Animproved supply of vitamin B12 for the animals led to ahigheryieldofbreastmeat(P<0.05),butalsoahighermassofviscerafatinbroilers(Table7).
Trial 2 – Pekin ducks
ThestatisticalevaluationofthesingleeffectsofvitaminB12andCoandthecombinedeffectofvitaminB12+Coonperformanceofduckscouldnotdemonstratedependence(P>0.05)ofvitaminB12or/andCoconcentration inthefeedonthedailyfeedintake,thebodyweightgain,andfinalbodyweight(Table8,9,10).Thefeed-to-gainratiowasnegativelyaffected(P 0.05)bysupplementationofCointhefeed(Table9,11).Anincreasedsupplywithvi-taminB12orCoresultedinahigheryieldofbreastmeat

302
Table4:
Performanceofbroilers–Feed-to-gain-ratio,bodyweight(Mean,SD,P-value)
Treatments Feed-to-gainratio,kg/kg,ageofdays Bodyweight,g/broiler,ageofdays
B12,μg/kg Co,mg/kg 1–14 15–21 22–35 1–35 1 14 21 35
0 0 1.37±0.06 1.40±0.11 1.52±0.05 1.47±0.02 44±1 297±10 591±31 1718±88
10 0 1.27±0.06 1.44±0.04 1.50±0.03 1.45±0.02 44±1 332±17 661±35 1893±87
20 0 1.29±0.04 1.41±0.04 1.50±0.42 1.45±0.03 44±1 347±19 696±44 1983±109
40 0 1.31±0.03 1.41±0.04 1.49±0.04 1.44±0.02 44±1 343±11 699±21 2006±53
0 0.65 1.32±0.03 1.41±0.06 1.50±0.04 1.45±0.03 44±1 351±18 715±47 2031±108
10 0.65 1.33±0.04 1.46±0.04 1.50±0.03 1.47±0.02 44±1 335±12 666±30 1921±84
20 0.65 1.31±0.06 1.45±0.03 1.50±0.03 1.46±0.04 43±1 334±15 670±26 1947±68
40 0.65 1.30±0.02 1.40±0.05 1.50±0.03 1.45±0.02 43±1 340±17 698±35 2008±81
ANOVA,P-value
B12 0.018 0.088 0.845 0.508 - 0.007 0.002 <0.001
Co 0.822 0.261 0.768 0.731 - 0.100 <0.004 <0.001
B12xCo 0.018 0.718 0.595 0.205 - <0.001 <0.001 <0.001
(P 0.05)bysupplementationof20μgB12andahigheryieldofbreastmeatandpercentageofbreastmeatandlegsof0.65mgCoperkgdiet(Table11,12).Analysisofthenutrientsinthefreshbreastmatter(Ta-
ble 13) caused a significantly higherwater content anddecreasedproteincontentinbreastmeatofthe0.65mgCo-Groupcomparedto0.65mgCo+40μgB12-Group.
Table5:
InfluenceofvitaminB12onperformanceofbroilers(Mean,day1to35)
VitaminB12,μg/kg 0 10 20 40
Feedintake,g/broiler/day
76.3c 77.8bc 79.8ab 81.3a
Bodyweightgain,g/broiler/day
52.3c 53.2bc 54.9ab 56.1a
Finalbodyweight,g
1874.0c 1907.0bc 1965.0ab 2007.0a
a;b;c;–Meanswithdifferentlettersdiffersignificantlywithinrows
Table6:
InfluenceofCoonperformanceofbroilers(Mean,day1to35)
Co,mg/kg 0 0.65
Feedintake,g/broiler/day
77.1b 80.4a
Bodyweightgain,g/broiler/day
53.0b 55.2a
Finalbodyweight,g
1900.0b 1977.0a
a;b;–Meanswithdifferentlettersdiffersignificantlywithinrows
Discussion
The effect of Vitamin B12 and Cobalt on growth andbodycompositionwasstudiedinbroilerchickensandPe-kinducks.DataontherequirementofVitaminB12inchick-ensforfatteningandducksarelimited.Inthepresentstudiesthemainimpactofprolongedvita-
minB12deficiencyinchickensforfatteningwasareduceddailyfeedintake.Asaresultthefeedintakeofthesebroil-ers (supplementationof0μgB12perkg feed)was6%andfinal bodyweightwas 7% less compared to birdswith40μgB12perkgdiet.InthetrialwithPekinducksnodifferencesinthefeedintakeandbodyweightgainwereestablishedbetweenthevitaminB12-deficientgroupandthevitaminB12-supplementedgroups.ButthedepletionofvitaminB12decreasedthebreastmeatyieldinducks.Thebreastmeatyieldwas12%lessinthecontrolgroup(0μgB12perkgfeed)comparedtoduckswith20μgB12perkgdietattheageof49days.ThedietaryneedsforvitaminB12forpoultryspeciesare
lowand theNRC (1984) recommended todecrease thevitamin B12 supplementation from 9 to 3 μg B12per kgfeed (drymatter) as Leghornchicksprogressbetween0to6and6to12weeksofage.Butthereisnoevidencetojustifythisscalingtobodyweightorage.Pair-feedingbroiler studies of Looi andRenner (1974) demonstratedthatvitaminB12stimulatedgrowthofchickensfedeithercarbohydrate-containing or carbohydrate-free diets bystimulatingfeedintakeandnotbyincreasingutilizationofeitherproteinorenergy.Theseresultsshowedthatthead-ditionof20μgB12perkgdietcausedasignificantincreaseinthegrowthofchicks(Table5)andnofurthersignificantincreasewasobservedwiththeadditionofhigher levels

I. Halle, M. Henning, P. Köhler / Landbauforschung - vTI Agriculture and Forestry Research 4 2011 (61)299-306 303
Table7:
Carcass(%ofbodyweight),carcasscomposition(%ofcarcassweight)andmuscleandorganweight(g)ofbroilers(n=8)(Mean,SD,P-value)
B12,μg/kg
Co,mg/kg
Bodyweight,g
Carcase,%
Breastskin,%
Breastmeat,g
Breastmeat,%
Legs,g
Legs,%
Liver,g
Heart,g
Gizzard,g
Spleen,g
Fat,g
Fat,%
0 0 1831±71
64.5±1.0
1.3±0.3
214±18
11.6±0.5
362±17
19.8±1.0
40.6±2.7
12.4±1.6
39.9±3.5
1.8±0.4
20.1±3.4
1.1±0.2
10 0 1958±56
64.6±1.6
1.2±0.2
255±21
13.0±1.0
373±25
19.0±1.1
42.8±5.9
12.2±1.1
33.1±6.6
1.7±0.4
29.0±6.3
1.5±0.3
20 0 1958±20
64.0±1.5
1.2±0.2
221±28
11.3±1.4
380±22
19.4±1.0
43.2±3.2
12.8±1.2
33.6±1.9
2.1±0.5
28.0±6.3
1.4±0.3
40 0 1979±96
64.7±0.9
1.1±0.2
244±21
12.3±0.9
386±20
19.5±0.9
43.3±2.3
12.6±1.2
33.1±7.1
2.4±0.6
29.5±2.4
1.5±0.1
0 0.65 1981±36
64.7±3.6
1.1±0.1
259±31
13.1±1.5
384±26
19.4±1.3
41.4±3.4
11.8±2.0
28.8±4.6
2.0±0.6
20.2±5.9
1.0±0.3
10 0.65 1958±85
64.6±2.4
1.1±0.2
244±21
12.5±0.8
383±30
19.5±1.2
42.9±2.5
12.5±0.9
36.2±9.1
2.1±0.3
25.6±7.5
1.3±0.4
20 0.65 1944±51
63.9±1.9
1.3±0.2
229±34
11.8±1.6
384±16
19.8±0.9
43.8±4.8
12.9±2.0
33.1±5.6
2.0±0.5
23.7±4.8
1.2±0.2
40 0.65 1949±62
65.1±1.4
1.1±0.1
246±23
12.6±1.2
395±24
20.2±1.0
41.7±2.6
13.0±0.6
30.6±6.2
1.6±0.7
23.7±5.3
1.2±0.3
ANOVA,P-value
B12 0.055 0.574 0.199 0.043 0.004 0.177 0.495 0.270 0.380 0.391 0.734 0.002 0.004
Co 0.110 0.695 0.233 0.081 0.168 0.060 0.279 1.000 0.993 0.413 0.427 0.018 0.010
B12xCo <0.001 0.985 0.025 0.018 0.151 0.729 0.495 0.774 0.718 0.272 0.011 0.490 0.799
Table8:
Performanceofducks–Feedintake,dailyweightgain(Mean,SD,P-value)
Treatments Feedintake,g/duck/day,ageofdays Dailyweightgain,g/duck/day,ageofdays
B12μg/kg Co,mg/kg 1–21 22–49 1–49 1–21 22–49 1–49
0 0 116.0±4.1 256.1±8.0 193.0±4.1 69.2±1.7 92.0±2.4 81.8±1.3
10 0 116.4±5.6 248.8±12.9 189.2±9.3 69.7±3.3 89.9±5.3 80.9±4.0
20 0 116.2±8.8 246.1±23.8 187.7±17.2 69.7±3.6 90.8±4.9 81.4±3.8
40 0 113.7±5.4 250.4±12.1 188.6±8.9 69.5±2.0 90.1±6.0 80.9±3.6
0 65 115.4±5.3 257.4±12.5 194.0±8.2 69.3±2.6 89.6±4.4 80.5±3.0
10 65 117.5±4.3 251.5±19.2 191.6±11.3 70.5±2.8 87.7±7.0 80.1±4.6
20 65 114.7±5.5 253.6±14.2 191.0±9.2 70.3±2.4 88.8±3.2 80.5±2.3
40 65 117.0±3.8 250.6±12.9 190.7±8.3 71.1±2.3 87.1±5.3 80.0±3.6
ANOVA,P-value
B12 0.817 0.523 0.647 0.724 0.584 0.896
Co 0.708 0.446 0.396 0.265 0.062 0.252
B12xCo 0.602 0.906 0.990 0.880 0.994 0.998
ofvitaminB12.PatelandMcGinnis(1980)foundthatvita-minB12isimportantintheenergymetabolism.InastudywithWhiteLeghornchicks thegrowthandefficiencyoffeedutilizationweredepresseduponadditionof10and20%fatunlessthedietcontainedadequatevitaminB12.Isoenergeticsubstitutionofglucoseinsteadoffatalsode-
pressedgrowthunlessB12wasadded.Higherproteincon-tentinthedietincreasestheneedforvitaminB12.
Leeson and Summers (2001) summarized that a defi-ciencyofB12ingrowingchickensresultsinreducedweightgainandfeedintake,alongwithpoorfeatheringandner-vousdisorders.Whileadeficiencymayleadtoperosis,this
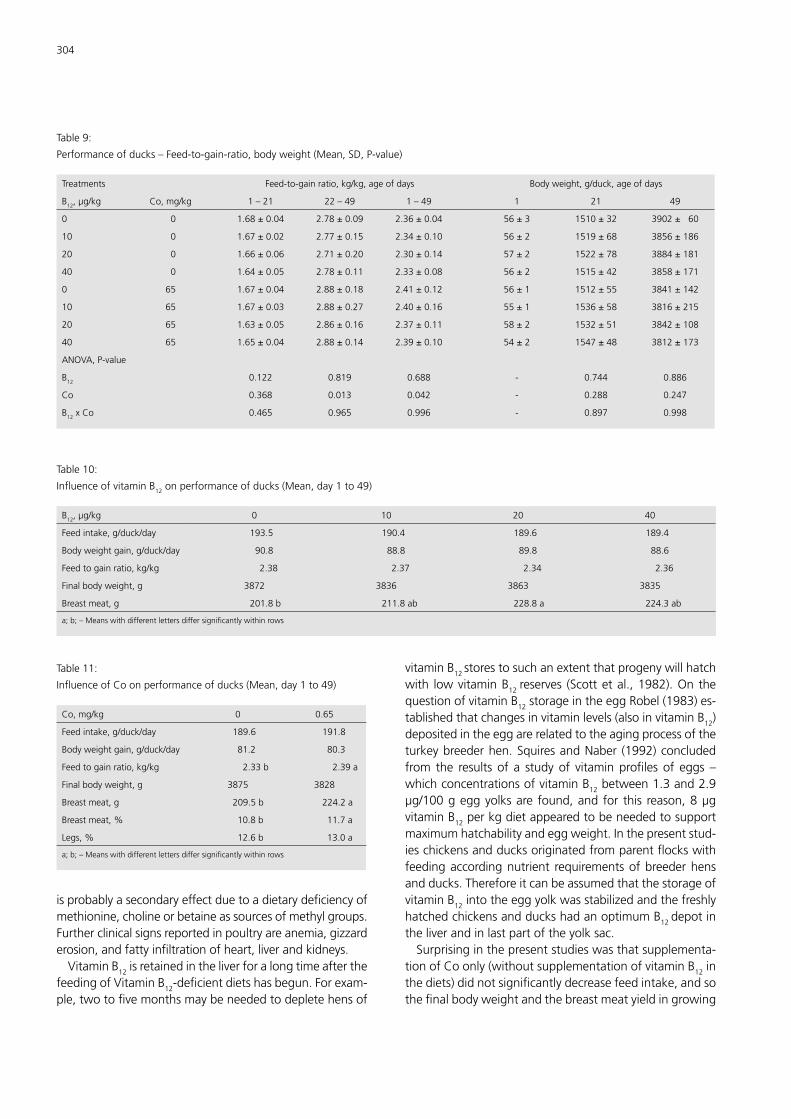
304
isprobablyasecondaryeffectduetoadietarydeficiencyofmethionine,cholineorbetaineassourcesofmethylgroups.Furtherclinicalsignsreportedinpoultryareanemia,gizzarderosion,andfattyinfiltrationofheart,liverandkidneys.VitaminB12isretainedintheliverforalongtimeafterthe
feedingofVitaminB12-deficientdietshasbegun.Forexam-ple,twotofivemonthsmaybeneededtodepletehensof
vitaminB12storestosuchanextentthatprogenywillhatchwith lowvitaminB12reserves (Scottetal.,1982).OnthequestionofvitaminB12storageintheeggRobel(1983)es-tablishedthatchangesinvitaminlevels(alsoinvitaminB12)depositedintheeggarerelatedtotheagingprocessoftheturkeybreederhen.SquiresandNaber (1992)concludedfrom the results of a studyof vitaminprofiles of eggs –whichconcentrationsofvitaminB12between1.3and2.9μg/100geggyolksare found,andfor this reason,8μgvitaminB12perkgdietappearedtobeneededtosupportmaximumhatchabilityandeggweight.Inthepresentstud-ieschickensandducksoriginatedfromparentflockswithfeedingaccordingnutrient requirementsofbreederhensandducks.ThereforeitcanbeassumedthatthestorageofvitaminB12intotheeggyolkwasstabilizedandthefreshlyhatchedchickensandduckshadanoptimumB12depotintheliverandinlastpartoftheyolksac.
Table9:
Performanceofducks–Feed-to-gain-ratio,bodyweight(Mean,SD,P-value)
Treatments Feed-to-gainratio,kg/kg,ageofdays Bodyweight,g/duck,ageofdays
B12,μg/kg Co,mg/kg 1–21 22–49 1–49 1 21 49
0 0 1.68±0.04 2.78±0.09 2.36±0.04 56±3 1510±32 3902±60
10 0 1.67±0.02 2.77±0.15 2.34±0.10 56±2 1519±68 3856±186
20 0 1.66±0.06 2.71±0.20 2.30±0.14 57±2 1522±78 3884±181
40 0 1.64±0.05 2.78±0.11 2.33±0.08 56±2 1515±42 3858±171
0 65 1.67±0.04 2.88±0.18 2.41±0.12 56±1 1512±55 3841±142
10 65 1.67±0.03 2.88±0.27 2.40±0.16 55±1 1536±58 3816±215
20 65 1.63±0.05 2.86±0.16 2.37±0.11 58±2 1532±51 3842±108
40 65 1.65±0.04 2.88±0.14 2.39±0.10 54±2 1547±48 3812±173
ANOVA,P-value
B12 0.122 0.819 0.688 - 0.744 0.886
Co 0.368 0.013 0.042 - 0.288 0.247
B12xCo 0.465 0.965 0.996 - 0.897 0.998
Table10:
InfluenceofvitaminB12onperformanceofducks(Mean,day1to49)
B12,μg/kg 0 10 20 40
Feedintake,g/duck/day 193.5 190.4 189.6 189.4
Bodyweightgain,g/duck/day 90.8 88.8 89.8 88.6
Feedtogainratio,kg/kg 2.38 2.37 2.34 2.36
Finalbodyweight,g 3872 3836 3863 3835
Breastmeat,g 201.8b 211.8ab 228.8a 224.3ab
a;b;–Meanswithdifferentlettersdiffersignificantlywithinrows
Table11:
InfluenceofCoonperformanceofducks(Mean,day1to49)
Co,mg/kg 0 0.65
Feedintake,g/duck/day 189.6 191.8
Bodyweightgain,g/duck/day 81.2 80.3
Feedtogainratio,kg/kg 2.33b 2.39a
Finalbodyweight,g 3875 3828
Breastmeat,g 209.5b 224.2a
Breastmeat,% 10.8b 11.7a
Legs,% 12.6b 13.0a
a;b;–Meanswithdifferentlettersdiffersignificantlywithinrows
Surprisinginthepresentstudieswasthatsupplementa-tionofCoonly(withoutsupplementationofvitaminB12inthediets)didnotsignificantlydecreasefeedintake,andsothefinalbodyweightandthebreastmeatyieldingrowing

I. Halle, M. Henning, P. Köhler / Landbauforschung - vTI Agriculture and Forestry Research 4 2011 (61)299-306 305
chickensandducksforfatteningwasidenticaltogroupssupplementedwithvitaminB12 (10/20/40μgvitaminB12perkgdiet).Instudieswithpigsitwasobservedthatvita-minB12–deficiencysymptoms,includinganaccumulationofserumhomocysteine,canbeattenuatedbyNickelandCo,althoughthemodeofactionseemstodiffer(Stangletal.,2000).PreviousstudiesfoundoutthatCoionsinduceaseriesofmetabolicchangesinexperimentalanimals.Cosupplementation only improved homocysteine accretioninserum,whereas thevitaminB12status remainedcom-pletely unchanged (Goncharevskaia et al., 1985;Rosen-
bergandKappas,1989; Zhangetal.,1998).InthisduckstudythebreastmeatyieldoftheCogroupwassimilartogroupssupplementedwithvitaminB12,howeverthepro-tein contentofbreastmeatwasdecreased.ThisfindingindicatedthatthereisnotanimprovementofthevitaminB12statusandproteinsynthesesofthemeataftersupple-mentationofCo.
Table12:
Carcass(%ofbodyweight),carcasscomposition(%ofcarcassweight)andmuscleandorganweight(g)ofducks(n=8)(Mean,SD,P-value)
B12,μg/kg
Co,mg/kg
Bodyweight,g
Carcase,%
Breastskin,%
Breastmeat,g
Breastmeat,%
Legs,g
Legs,%
Liver,g
Heart,g
Gizzard,g
Spleen,g
Fat,g
Fat%
0 0 3882±121
67.5±0.4
3.6±0.6
377±24
9.7±0.5
497±32
12.9±1.0
93.0±15.4
20.5±1.6
124.6±13.9
2.4±0.4
35.1±5.6
0.9±0.2
10 0 3801±262
66.9±0.8
3.9±1.2
402±45
10.6±1.0
482±56
12.6±0.9
84.2±12.8
19.3±2.3
116.4±14.1
2.3±0.4
37.0±14.9
1.0±0.3
20 0 3960±173
67.3±0.9
4.1±0.6
460±51
11.6±1.3
496±19
12.5±0.6
87.2±12.3
20.0±1.6
126.0±9.3
2.4±0.6
35.9±8.8
0.9±0.2
40 0 3934±150
68.0±1.3
4.2±1.0
432±19
11.0±0.5
484±27
12.3±0.9
85.7±12.0
20.3±1.8
122.2±17.2
1.8±0.6
34.5±8.0
0.9±0.2
0 0.65 3754±217
67.4±1.2
3.9±0.5
428±76
11.4±1.5
480±22
12.8±0.6
84.7±9.7
19.9±2.7
114.8±12.0
2.0±0.6
28.4±7.6
0.8±0.2
10 0.65 3815±311
68.2±1.4
4.4±0.9
445±62
11.7±1.3
516±49
13.5±0.9
75.2±12.0
19.7±1.4
125.6±19.5
1.7±0.6
37.8±14.9
1.0±0.4
20 0.65 3861±100
68.0±1.5
4.2±0.8
455±68
11.8±1.8
516±49
12.7±0.5
78.9±15.2
19.8±1.3
121.1±8.6
2.2±0.5
36.0±14.3
0.9±0.4
40 0.65 3845±155
68.5±1.3
4.2±0.9
465±48
12.1±1.0
497±32
12.9±0.6
87.0±11.8
20.9±2.1
119.6±12.3
2.0±0.6
35.6±11.6
0.9±0.3
ANOVA,P-value
B12 0.342 0.280 0.677 0.021 0.045 0.862 0.275 0.336 0.452 0.791 0.264 0.624 0.614
Co 0.162 0.052 0.385 0.025 0.002 0.484 0.052 0.104 0.903 0.675 0.051 0.636 0.825
B12xCo 0.805 0.370 0.782 0.450 0.406 0.208 0.320 0.626 0.849 0.349 0.153 0.693 0.659
Table13:
Contentofwater,proteinandfat inthefreshmatterofthebreastmeatofPekinducks(%)(n=8)(Mean,SD)
Group 1Control
440μgB12
50.65mgCo
80.65mgCo+40μgB12
Water 76.6ab±0.4
76.4ab±0.3
76.8a±0.5
75.9b±0.6
Crudefat 1.2±0.2
1.2±0.1
1.2±0.2
1.2±0.1
Crudeprotein 22.2ab±0.4
22.4ab±0.3
22.0b±0.8
22.8a±0.5
a;b;–Meanswithdifferentlettersdiffersignificantlywithinrows
Furthermore it cannot be excluded that broilers, andnotablyducks, in thepresent studiesobtainedapartoftheirvitaminB12requirementmoreindirectlybyingestingfaeces in the litterorwith litter in thepens. The faecesbacterialfloraisanimportantsourceofvitaminsforcopro-phagicanimals.ThesupplementationofCotothebroilerandduckdietssupportedthevitaminB12synthesisofbac-teriainthedigestivetract.Itcanbeconcludedfromtheseobservationsthatasup-
plementationof20μgvitaminB12perkgbroilerfeedwassufficient tocompensate thedeficiencieson feed intakeandgrowingperformance.AnexclusivesupplementationofCo to the broiler feed improved the growing perfor-mance inasmall scale.ThesupplementationofB12plusCodidnothaveanyadditiveeffectontheperformanceofbroilers.ThegradedsupplementationofvitaminB12tothediet
ofPekinduckshadnosignificanteffectongrowingper-formance,however, increasedthebreastmeatyieldpar-

306
ticularlyat20μgB12perkgoffeed.SupplementationofonlyCoorCo+B12 into the feeddidnot change feedintakeandgrowingperformanceamongtheduckseither.Althoughthesupplementationof0.65mgofCo/kg im-provedthebreastmeatyield,itleadstoanunfavourableriseofthefeed-to-gainratio,however.Insummarytheresultsallowtheconclusion,that20μg
vitaminB12perkgfeedmeettherequirementsofgrowingchickens and ducks for fattening. An additional supple-mentationofCotofeeddoesnothaveadditionaladvan-tagesforthebirds.
Acknowledgement
Theauthorsthankthemembersoftheexperimentalre-searchstationCelleoftheInstituteofAnimalWelfareandAnimalHusbandry(FLI)fortheexecutionofthetwotrialsaswellasthelaboratoryoftheInstituteofAnimalNutri-tion(FLI)forthedifferentchemicalfeedanalysesandtheLUFA-SpeyerforvitaminB12analyses inthedietsandDr.U.Baulain(InstituteofFarmAnimalGenetics,FLI)forthesupportwiththestatisticalevaluationoftheresults.
References
EFSA(2009a)ScientificopiniononthesubstantiationofhealthclaimsrelatedtovitaminB12and redbloodcell formation (ID92,101),celldivision (ID93),energy-yieldingmetabolism(ID99,190)andfunctionoftheimmunesystem(ID107)pursuanttoArticle13(1)ofRegulation(EC)No1924/2006.EFSAJ7(9):1223
EFSA(2009b)Scientificopinionontheuseofcobaltcompoundsasadditivesinanimalnutrition.EFSAJ7(12):1383
EFSA(2010)ScientificopiniononthesubstantiationofhealthclaimsrelatedtovitaminB12andcontributiontonormalneurologicalandpsychologicalfunc-tions(ID95,97,98,100,102,109),contributiontonormalhomocysteinemetabolism(ID96,103,106),maintenanceofnormalbone(ID104),main-tenanceofnormal teeth (ID104),maintenanceofnormalhair (ID104),maintenanceofnormalskin(ID104),maintenanceofnormalnails(ID104),reductionoftirednessandfatigue(ID108),andcelldivision(ID212)pursu-anttoArticle13(1)ofRegulation(EC)No1924/2006.EFSAJ8(10):1756
GfE(1999)EmpfehlungenzurEnergie-undNährstoffversorgungderLegehen-nenundMasthühner (Broiler).FrankfurtaM:DLG-Verl,185p,Energie-undNährstoffbedarflandwirtschaftlicherNutztiere7
GoncharevskalaOA,MoninI,NatochinI(1985)Regulationoftherateofproxi-malanddistalreabsorptionafterintratubularinjectionofcobaltions.FiziolZhSSSRimIMSechenova71:1287-1292
GreenR(2005)Cobalamins.In:In:CaballerCaballerooB,B,AllenAllenL,L,PrPrenticeenticeAA(eds)(eds)Encyclope-Encyclope-diaofhumannutrition.Amsterdam:Elsevier,pp401-407
KöhlerP,WiederholdS,KallweitE(1995)Nearinfraredtransmissionspectros-copy : a rapidmethod for evaluation of intramuscular fat andmoisturecontentinpekingducks.In:World‘sPoultryScienceAssociation(ed)Pro-ceedings:10thEuropeanSymposiumonWaterfowl;March26-31,1995,Halle(Saale),Germany.Halle/Saale:WPSA,pp368-372
LeesonS,SummersJD(2001)Nutritionofthechicken.Guelph:UnivBooks,pp298-303
LooiSH,RennerR(1974)Effectoffeeding“carbohydrate-free”dietsonthechick’srequirementforVitaminB12.JNutr104:394-399
McDowellLR(1989)Vitaminsinanimalnutrition:comparativeaspectstohu-mannutrition.SanDiego:AcademicPress,pp323-346
NRC(1984)Nutrientrequirementsofpoultry.WashingtonDC,71p
NRC(1994)Nutrientrequirementsofpoultry.WashingtonDC:NationalAcadPr,155p
PatelMB,McGinnisJ(1980)TheeffectofvitaminB12onthetoleranceofchicksforhighlevelsofdietaryfatandcarbohydrate.PoultSci59:2279-2286
RobelEJ(1983)Theeffectofageofbreederhenonthelevelsofvitaminsandmineralsinturkeyeggs.PoultSci62:1751-1756
RosenbergDW,KappasA (1989)Tracemetal interactions invivo : inorganiccobaltenhancesurinarycopperexcretionwithoutproducinganassociatedzincuresisinrats.JNutr119:1259-1268
SASInstitute,2002-2003,Cary,NC,USA,SAS9.1ScottML, NesheimMC, Young RJ (1982) Nutrition of the chicken. Ithaca :
CornellUniv,pp237-243SouciSW,FachmannW,KrautH(2008)DieZusammensetzungderLebensmit-
tel,Nährwert-Tabellen.Stuttgart:Medpharm,1364pSquiresMW,NaberEC(1992)Vitaminprofilesofeggsasindicatorsofnutri-
tionalstatusinthelayinghen:vitaminB12study.PoultSci71:2075-2082StanglGI,Roth-MaierDA,KirchgessnerM(2000)VitaminB12deficiencyand
hyperhomocysteinemiaarepartlyamelioratedbycobaltandnickelsupple-mentationinpigs.JNutr130:3038-3044
WestR(1948)ActivityofvitaminB12inAddisonianPerniciousAnaemia.Science107:397-398
ZhangYB,MagyarCE,Holstein-RathlouNN,McDonoughAA(1998)Thecyto-chromeP-450inhibitorcobaltchloridepreventsinhibitionofrenaleNa,K-ATPaseandredistributionofapicalNHE-3duringacutehypertension.JAmSocNephrol9:531-537
VogtH(1986)WPSA-Energieschätzungsgleichung.World’sPoultSciJ42:189-190

K. Barth, K. Aulrich, H. C. Haufe, U. Müller, D. Schaub, F. Schulz / Landbauforschung - vTI Agriculture and Forestry Research 4 2011 (61)307-316
307
Metabolic status in early lactating dairy cows of two breeds kept under conditions of organic farming – a case study
KerstinBarth*,KarenAulrich*,HelgeChristianeHaufe*,UteMüller**,DagmarSchaub*,andFranzSchulz***
* JohannHeinrich vonThünen-Institut (vTI), Federal Research Institute forRuralAreas,ForestryandFisheries,InstituteofOrganicFarming,Trenthorst32,23847Westerau,Germany
** University Bonn, Institute of Animal Science, Physiology and HygieneGroup,Katzenburgweg7–9,53115Bonn,Germany
***Justus Liebig University Giessen, Experimental Station Gladbacherhof,65606Villmar,Germany
Correspondingauthor:Dr.KerstinBarth,E-mail:[email protected]
Abstract
Thetransitionperiodisthekeyforthehealthandperfor-manceofthelactatingdairycow:Anincreasingdemandofenergyduetothefoetalgrowth,lactogenesisandthebeginning lactation is accompanied by a restricted feedintake and leads to a negative energy balance.Organicfarmingaimstoproduceforagebasedmilk–agoalwhichmightincreasetheriskofmetabolicdisordersduringthattime.Aimof this studywas to compare adual-purpose(GermanRedPied–GRP)andadairybreed(GermanHol-stein–GH)keptunderthesamemanagementconditionsand a comparison of two herds consisting of the samedairybreed(GH)butmanageddifferentlytotesttheeffectofthebreedorthemanagementonthemetabolicstatusofcowsduringthefirstfiveweeksof lactation.Recordsof179cows(84GHatFarm1,and46GHand49GRPatFarm2)were included in the study. Energy requirements(EB%)werebetterfulfilledatFarm1thanatFarm2.Weekof sampling and farmhad an effect on the ratio of fattoprotein(FPR)and -hydroxybutyricacid(BHBA)inmilk,nonesterified fatty acids (NEFA) andglutamatedehydro-genase(GLDH)inblood,respectively.BreedaffectedFPR,BHBAandGLDHsignificantlybutnotNEFA,andtheEB%showedasignificanteffectonFPR,BHBAandNEFA.Sea-sonaffectedFPRandGLDHwiththetendencyofhigherreadingsinwinter.Ourstudyconfirmedthatbreedswithahighergeneticmeritformilkyieldsufferahighermeta-bolicloadwhenthefeedingmanagementintheperipar-turientperiod is suboptimalbutunder conditionsbetter
fulfilling their demands, these differences could not beobserved.Thus, there isnoneed topreferdual-purposebreeds inorganicdairy farmingas longas themanage-mentisappropriateforhighyieldingcows.
Keywords: organic farming, metabolism, ketosis, German Red Pied, German Holstein
Zusammenfassung
Stoffwechselstatus von zwei Rassen in der Frühlak-tation unter Bedingungen des ökologischen Land-baus – eine Fallstudie
Die Transition Periode ist entscheidend für die laktier-ende Kuh: Eine reduzierte Futteraufnahme steht demsteigenden Energiebedarf für das Wachstum des Fö-tus sowieder LaktogenesegegenüberundbedingteinenegativeEnergiebilanz.DasZielderBio-Milchviehhaltung,Milchraufutterbasiertzuerzeugen,erhöhtdasRisikofürStoffwechselstörungenindieserZeitundesstelltsichdieFrage, obwenigermilchbetonte Rinderrassen besser fürdiese Haltungsform geeignet sind. Um den Effekt derRassebzw.desManagementsaufdenStoffwechselstatusder Kühewährend der ersten Laktationswochen zu tes-ten,wurdenzumeineneineDoppelnutzungs-(DeutscheRotbunte–DRB)undeinemilchbetonteRasse(DeutscheHolstein–DH)unterdengleichenBedingungenundzumanderenzweiunterschiedlichgemanagteHerdengleicherRasse(DH),verglichen.179Kühe(Herde1:84DH,Herde2:46DHund49DRB)konntenausgewertetwerden.DerEnergiebedarf (EB%) der Tierewurde inHerde 1 bessergedecktalsinHerde2.DieProbenwochesowiedieHerdehatteneinenEffektaufdenFett-Eiweiß-Quotienten(FEQ)und den -Hydroxy-Buttersäure-Gehalt (BHBA) in derMilch, die nichtveresterten freien Fettsäuren (NEFA) unddieGlutamadehydrogenase-Aktivität (GLDH) imBlut.DieRassebeeinflussteFEQ,BHBAundGLDHundEB%zeigteeinenEffektaufFEQ,sowieBHBAundNEFA.Esbestandein saisonaler Effekt bei FEQ sowie GLDH mit höherenMesswertenimWinter.Esbestätigtesichdiestärkereme-tabolischeBelastungvonTierendermilchbetontenRasseinderFrühlaktationaufgrundsuboptimalerBedingungenwährendderTransitionPeriode.BeieineradäquatenFüt-terungtratdieserUnterschiednichtmehrauf.
Schlüsselwörter: Ökologischer Landbau, Stoffwechsel, Ke-tose, Deutsche Rotbunte, Deutsche Holstein
308
Introduction
Organicdairyfarmingaimsto“feednofood”andthus,reducetheamountofconcentratesfedtocowsandpro-duceforage-basedmilk.ThereforetheEuropeanCommis-sionCouncilRegulationonOrganicProduction(EC,2007)requiresatleast60%roughageindairycowrations.Tofulfiltheenergyrequirementsoftheearly lactatingcow,thislimitmightbereducedto50%atthebeginningoflactation.Itiswellknownthatthetransitionperiod,start-ingwith the thirdweekprior to calvingand lastingun-til thethirdweekpost partum, is thekeyperiodfor thehealthandperformanceofthelactatingdairycow(Drack-ley,1999).Duringthattime,anincreasingdemandofen-ergyduetothefoetalgrowth,lactogenesisandthebegin-ninglactationisaccompaniedbyarestrictedfeedintakeandleadstoanegativeenergybalance(e.g.,Bell,1995;Grummer,1993;Goff&Horst,1997).Duetohomeorheticregulation thenutrientsarepartitioned tosupportpreg-nancyandlactation,andespeciallytheonsetoflactationisassociatedwithmetabolicchangesinbodytissues(Bau-man&Currie,1980).Toovercomethedeficitofenergy,bodyfatismobilizedresultinginanincreaseofnonesteri-fied fatty acids (NEFA) concentration inblood.NEFAareusedtoprovideenergybycompleteoxidisationtocarbondioxideandpartialoxidisationtoketonebodies;theyareincorporated into lipoproteins or stored as triglyceridesin the hepatic tissue. Increasing NEFA concentrations inbloodarefollowedbyanincreasingNEFAuptakerateoftheliverresultinginahigherproductionofketonebodiesandanaccumulationoftriglyceridesinthehepatictissue,whichmightcausefattyliversyndromeintheanimal(Goff&Horst,1997).Asaconsequenceoffattyliversyndrome,liver cellswill bedamaged and release the enzymeglu-tamatedehydrogenase (GLDH) (Wemheuer,1987;West,1990), primarily located in mitochondria of liver cellsand required for the urea synthesis. Of all ketone bod-ies, -hydroxybutyricacid(BHBA)isseenaspredominant(Duffield et al., 2009) and can be found in blood,milkandurine(Nielsen&Ingvartsen,2004).ElevatedNEFAandBHBAconcentrationsareconsideredtohaveadepressingeffectonthebovineimmunesystemandthus,toincreasetheriskofdiseases(Hoebenetal.,2000;Hachenbergetal.,2007).Althoughmastitisasoneofthemostimportantdiseasesofdairycowshastobeseenascausedbyvariousfactors,Leslieetal. (2000)foundthat increasedratesofmastitisalsowereassociatedwithsubclinicalketosis.Besides the sustainability of food production organic
farmingtargetsthemaintenanceofanimalhealthbyen-couragingthenaturalimmunologicaldefenceoftheani-mal, aswell as the selection of appropriate breeds andhusbandry practices. As a consequence, the EU regula-tionsbantheprophylacticuseof“chemicallysynthesised
allopathicveterinarymedicinalproducts includingantibi-otics”(EC,2008),andaccordingtothestandardsoftheAmericanNationalOrganic Program, the treated animalitselfaswellasitsproductsarenotallowedtobelabelledorganic.Amongotherthings,diseasepreventionshallbebasedonbreedselection,husbandrymanagementprac-ticesandmeetingtheanimal’snutritionalrequirementsatthevariousstagesofitsdevelopmentbyprovidingorganicfeedofhighquality(EC,2008).Althoughonemightexpectahigherketosis incidence
duetothe limitationsofconcentratefeed,HardengandEdge(2001),evaluatingtreatmentrecordsfoundamuchlowerriskofketosisincowskeptunderorganicfarmingconditionsinNorway,wherethemaximumlimitforcon-centratesis30%oftheration.ThisisincontrasttoHar-darson(2001)whoexpectedcowswithhighgeneticmeritformilk yield tobeatgreater risk todevelopmetabolicdisordersinorganicfarming.Hardeng& Edge (2001) explained their resultswith a
tastier while diversified diet and consequently a higherfeedintake.However,analysesofveterinarytreatmentre-cordsarealwaysbiasedbythefactthatonlytreatedcaseswerereported,whichmeansthattherecordsarelimitedtoclinicalcases.Nevertheless, organic cows produced 22% less milk
thantheconventionalcowsin305days(Hardeng&Edge,2001),andthiscannotbeexplainedbytheuseofloweryielding breeds, because high performance breeds likeHolsteins are dominant in organic aswell as in conven-tionaldairyfarming(Rahmann&Nieberg,2005).Accord-ingtothecalculationsmadebyKnausetal.(2001),cowskeptundertherulesoforganicfarmingwouldbeabletoproduceupto7,000kgmilkwithoutexceedingthetoler-ablerestrictionsforsuboptimalenergysupplyifthequal-ityoftheforagewerehighenoughandthemanagementwereoptimal.However, the currentgeneticpotential ofdairybreeds ismuchhigherand the lowerperformanceoforganiccowssuggeststhatthefarmsfacedifficultiesinfulfillingthenutrientrequirementsoftheircows.EUlegislationsoforganicfarmingdemandthechoiceof
breedsbebasedontheircapacitytoadapttolocalcondi-tions,theirvitalityandtheirresistancetohealthproblems(EC,2008).Crossbreeds are seen as advantageous under subop-
timalmanagement conditions (Freyer et al., 2008), andorganicdairyfarmingmightbenefitfromusingsuchani-malsinsteadofpurebredhighyieldingcows.Anotherap-proachwouldbetheuseofdual-purposebreeds.Distletal.(1989)foundlowerincidencesofmetabolicdisordersinthedual-purposeGermanSimmentalthanintheGermanBrownSwiss,butinthestudybyFalletal.(2008)compar-ingearly lactatingcowsunderorganicandconventionalfarmingconditions,thedualpurposeSwedishRedbreed
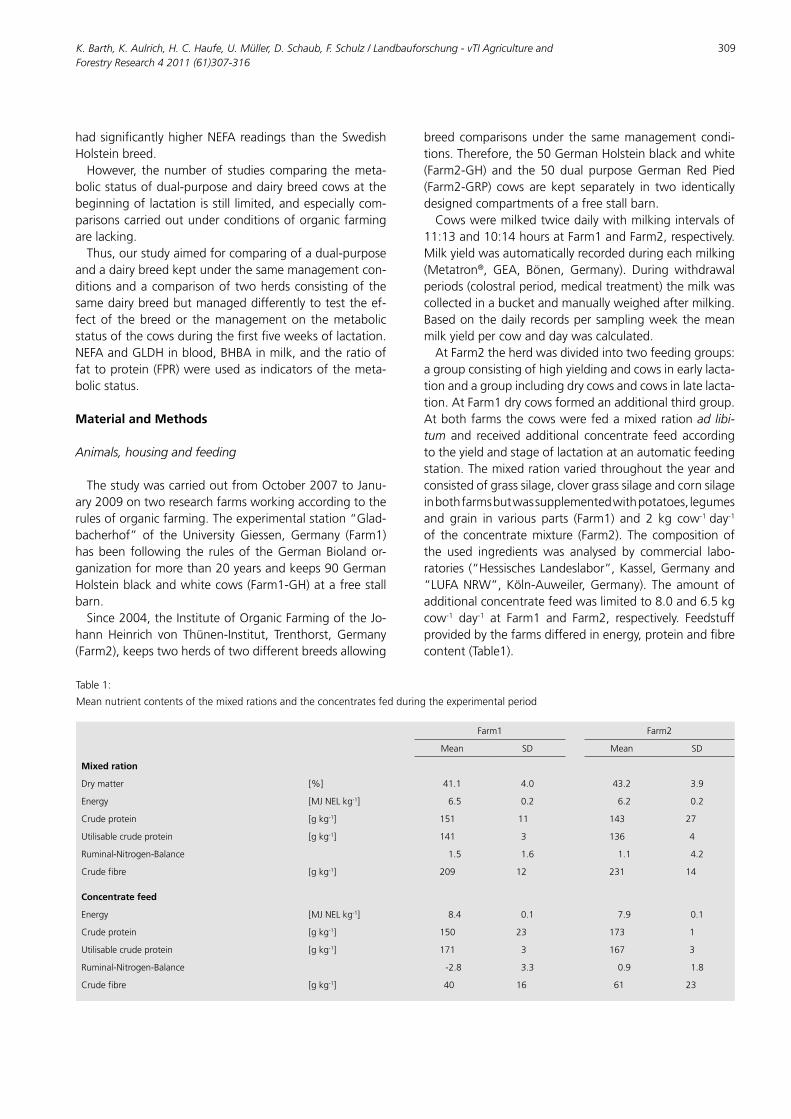
K. Barth, K. Aulrich, H. C. Haufe, U. Müller, D. Schaub, F. Schulz / Landbauforschung - vTI Agriculture and Forestry Research 4 2011 (61)307-316
309
hadsignificantlyhigherNEFAreadingsthantheSwedishHolsteinbreed.However, thenumberof studiescomparing themeta-
bolicstatusofdual-purposeanddairybreedcowsatthebeginningoflactationisstill limited,andespeciallycom-parisonscarriedoutunderconditionsoforganicfarmingarelacking.Thus,ourstudyaimedforcomparingofadual-purpose
andadairybreedkeptunderthesamemanagementcon-ditionsandacomparisonoftwoherdsconsistingofthesamedairybreedbutmanageddifferentlytotesttheef-fectof thebreedor themanagementon themetabolicstatusofthecowsduringthefirstfiveweeksoflactation.NEFAandGLDHinblood,BHBAinmilk,andtheratiooffattoprotein(FPR)wereusedasindicatorsofthemeta-bolicstatus.
Material and Methods
Animals, housing and feeding
ThestudywascarriedoutfromOctober2007toJanu-ary2009ontworesearchfarmsworkingaccordingtotherulesoforganicfarming.Theexperimentalstation“Glad-bacherhof” of the University Giessen, Germany (Farm1)hasbeen following the rulesof theGermanBiolandor-ganizationformorethan20yearsandkeeps90GermanHolsteinblackandwhitecows(Farm1-GH)atafreestallbarn.Since2004,theInstituteofOrganicFarmingoftheJo-
hannHeinrich von Thünen-Institut, Trenthorst, Germany(Farm2),keepstwoherdsoftwodifferentbreedsallowing
breedcomparisonsunder the samemanagement condi-tions.Therefore,the50GermanHolsteinblackandwhite(Farm2-GH) and the 50 dual purposeGerman Red Pied(Farm2-GRP) cows are kept separately in two identicallydesignedcompartmentsofafreestallbarn.Cowsweremilkedtwicedailywithmilkingintervalsof
11:13and10:14hoursatFarm1andFarm2,respectively.Milkyieldwasautomaticallyrecordedduringeachmilking(Metatron®, GEA, Bönen, Germany). During withdrawalperiods(colostralperiod,medicaltreatment)themilkwascollectedinabucketandmanuallyweighedaftermilking.Basedonthedailyrecordspersamplingweekthemeanmilkyieldpercowanddaywascalculated.AtFarm2theherdwasdividedintotwofeedinggroups:
agroupconsistingofhighyieldingandcowsinearlylacta-tionandagroupincludingdrycowsandcowsinlatelacta-tion.AtFarm1drycowsformedanadditionalthirdgroup.Atbothfarmsthecowswerefedamixedrationad libi-tum and received additional concentrate feed accordingtotheyieldandstageoflactationatanautomaticfeedingstation.Themixedrationvariedthroughouttheyearandconsistedofgrasssilage,clovergrasssilageandcornsilageinbothfarmsbutwassupplementedwithpotatoes,legumesand grain in various parts (Farm1) and 2 kg cow-1day-1of the concentratemixture (Farm2). The compositionofthe used ingredients was analysed by commercial labo-ratories(“HessischesLandeslabor”,Kassel,Germanyand“LUFANRW”,Köln-Auweiler,Germany). Theamountofadditionalconcentratefeedwaslimitedto8.0and6.5kgcow-1 day-1 at Farm1 and Farm2, respectively. Feedstuffprovidedbythefarmsdifferedinenergy,proteinandfibrecontent(Table1).
Table1:
Meannutrientcontentsofthemixedrationsandtheconcentratesfedduringtheexperimentalperiod
Farm1 Farm2
Mean SD Mean SD
Mixed ration
Drymatter [%] 41.1 4.0 43.2 3.9
Energy [MJNELkg-1] 6.5 0.2 6.2 0.2
Crudeprotein [gkg-1] 151 11 143 27
Utilisablecrudeprotein [gkg-1] 141 3 136 4
Ruminal-Nitrogen-Balance 1.5 1.6 1.1 4.2
Crudefibre [gkg-1] 209 12 231 14
Concentrate feed
Energy [MJNELkg-1] 8.4 0.1 7.9 0.1
Crudeprotein [gkg-1] 150 23 173 1
Utilisablecrudeprotein [gkg-1] 171 3 167 3
Ruminal-Nitrogen-Balance -2.8 3.3 0.9 1.8
Crudefibre [gkg-1] 40 16 61 23

310
Threeweeksbeforetheexpecteddateofcalving,cowsatFarm1receivedthedrycows’rationsupplementedby10kgmaizesilagepercowandday.Heiferswereintegrat-edatthesametime.Farm2didnotseparatethedrycowsfromthe late lactatingonesbutmovedthecows in latepregnancy into thegroupof early lactating cows. Thus,threeweeksantepartumthesecows,aswellasthenewintegratedheifershadaccesstotherationofearlylactat-ing and high yielding cows. BetweenMay andOctoberallcowsofFarm1werepasturedabout3hoursperday.AnimalsatFarm2didnothaveaccesstopasturebuthadoutdooraccessoverthewholetimeperiod.The daily consumption of concentrate feed per cow
was recordedonboth farms.Themean feed intakepergroupanddaywascalculatedasdifferencebetweentheamountsofmixedrationprovided(recordeddaily)andtheremains (recordedonceperweek).Daily feed intakepercowwasthenroughlyestimatedbydividingthefeedin-takepergroupbythenumberofcowsbelongingtothatgroupintheregardedweek.Togetanimpressionaboutthenutrientsupplydespite
lackingrecordsoftheindividualfeedintakepercow,thefulfilment of the energy needs was estimated by com-paring the individual demandof energy and the energyprovided by the ration. At Farm1 maintenance require-mentswere35.5MJNELand39.9MJNELforprimiparous(estimated body weight: 650 kg) and pluriparous (esti-matedbodyweight:750kg)cows,respectively.AtFarm2individualbodyweightofeachcowwas recorded twiceperdaybyanautomaticwalk-throughweightscale(GEA,Bönen,Germany).Basedon the readingsperweek, themeanbodyweightateachlactationweekwascalculated.Themedianforprimiparouscowswas582kg(from448to803kg)andforpluriparouscows684kg(from496to866kg).Iflessthanfivereadingsperweekwereavailable,datawererejectedduetounreliabilityandabodyweightof650kgand700kgwasassumedforprimiparousandpluriparous cows, respectively. The daily requirementformilkproductionwascalculated (Spiekers&Potthast,2004):
MJNEL=milkyield [kgday-1]x (0.38fatcontent [%]+0.21proteincontent[%]+1.05)
The total requirement of energy formaintenance andmilkproductionwasrelatedtotheenergyprovidedbytherationandtheconcentratefeed,andtheindividualcover-ageoftheenergyneeds(EB%)wascalculated.Bodyconditionofthestudiedanimalswasscoredweek-
ly by trained technicians according to Edmonson et al.(1989)using0.25incrementsona1to5scale.BCSloss(BCSDiff)duringtheexperimentalperiodwascalculatedasdifferencebetweenBCSonDay5andDay1.
Usuallycowsatbothfarmsweredriedoff6to8weeksbeforetheexpectedcalving.Basedoncyto-bacteriologicalanalyses, Farm1 used different antibiotics togetherwithaninternalteatsealer(Orbeseal®,Pfizer,NewYork,USA)whereasFarm2treatedwhennecessarytheanimalswithOrbenin®(Pfizer,NewYork,USA).Duetoanincreasedin-cidenceofparturientparesisallcowsatFarm2receivedaCa-andP-boluspostcalving(Bovikalc,Boehringer Ingel-heimVetmedicaGmbH,Ingelheim,Germany).Farm1ap-pliedsuchaprophylactictreatmentonlyonsixoldercows.
Sampling and analyses
Duringthefirstfiveweekspostcalvingcowsweresam-pledonceperweekonafixedday.Duetothevariouscalv-ingdates,cowsdifferedintheDIMatthesamplingday.Onaveragethefirstsamplewastakenatday5(range:1to8)andthelastatday35(range:27to37)ofthelacta-tion.Duplicatedcompositemilksampleswereautomatically
gained at morning milking. One sample was stored at-20°Cuntil analysisof the fatandproteincontentwascarriedoutatthe laboratoryofthe“HessischerVerbandfürLeistungs-undQualitätsprüfungeninderTierzuchte.V.”(Alsfeld,Germany,samplesofFarm1)andatthelabo-ratory of the “Landeskontrollverband Schleswig-Holsteine.V.”(Kiel,Germany,samplesofFarm2).TheFPRwascal-culatedbasedontheseanalyses.Trichloroaceticacid(TCA,50%)wasaddedtothesec-
ondcompositemilksample(ratio:1mlTCAto10mlmilk).Samples were cooled and centrifuged. The supernatantwasstoredat-20°Cuntil itsanalysisfortheBHBAcon-tentatthelaboratoryoftheUniversityofAppliedScienceandArtsHanover(Germany).BHBAwasmeasuredusingan AutoAnalyzer (Traacs 2000 System®, SEAL AnalyticalGmbH, Norderstedt, Germany). The analysis based ontheoxidationofBHBAtoacetoacetatewhiletheenzymeBHBA-dehydrogenaseandthecoenzymeNAD+arepres-ent.ThegeneratedNADHwasmeasuredphotometrically( =340nm).Followingthemorningmilking,trainedtechnicianstook
blood samples from the jugular vein (Farm1)andby tailvenipuncture (Farm2). Serum sampleswere prepared bycentrifugation(15min,3000xg,4°C)andaliquotedforanalysesofNEFAandGLDH.Serum aliquots for analyses of NEFA were stored at
-20°CuntilanalysedatthelaboratoryoftheInstituteofAnimalScience(UniversityofBonn,Germany).NEFAweremeasured using an enzymatic test kit (kit nr. 1383175,Roche Diagnostics, Mannheim, Germany), which wasadaptedforuseonmicrotitreplates(Oliveretal.,1995).Intraassay and interassay coefficients were 6.3 % and5.6%plus8.3%and8.2%,respectively.Thetestwas
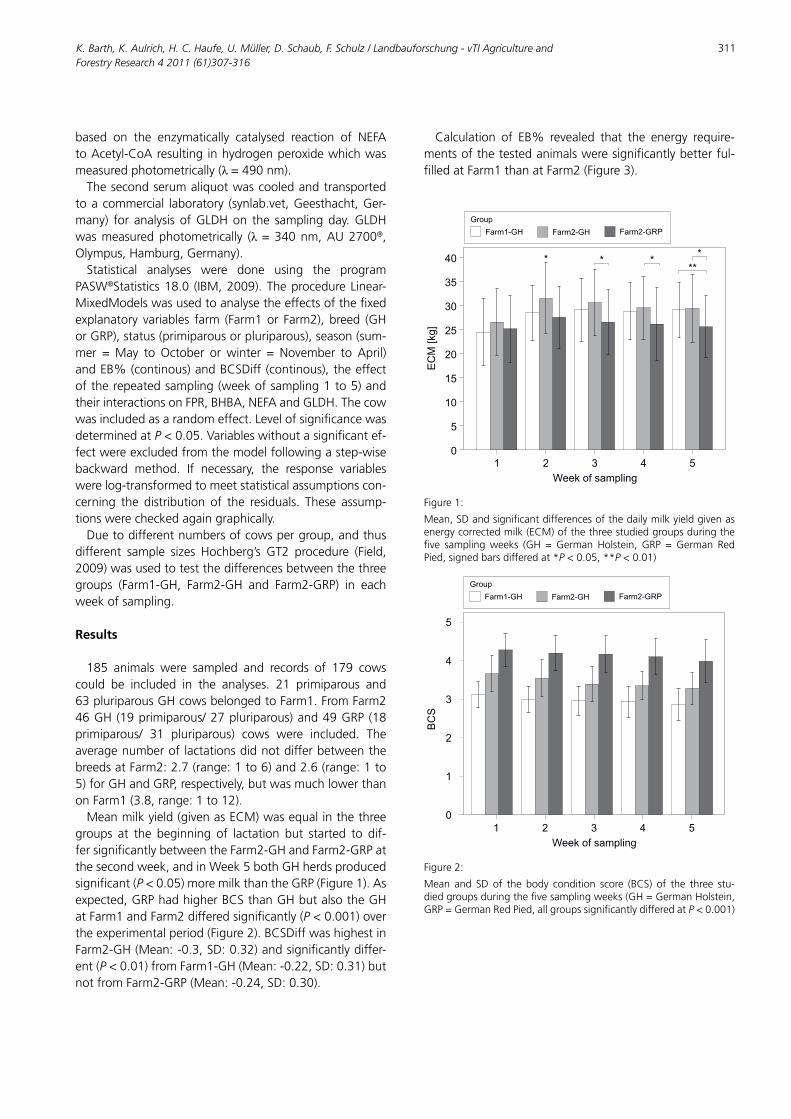
K. Barth, K. Aulrich, H. C. Haufe, U. Müller, D. Schaub, F. Schulz / Landbauforschung - vTI Agriculture and Forestry Research 4 2011 (61)307-316
311
based on the enzymatically catalysed reaction of NEFAtoAcetyl-CoAresultinginhydrogenperoxidewhichwasmeasuredphotometrically( =490nm).Thesecondserumaliquotwascooledandtransported
toacommercial laboratory (synlab.vet,Geesthacht,Ger-many) for analysisofGLDHon the samplingday.GLDHwasmeasuredphotometrically ( =340nm,AU2700®,Olympus,Hamburg,Germany).Statistical analyses were done using the program
PASW®Statistics18.0 (IBM,2009).TheprocedureLinear-MixedModelswasusedtoanalysetheeffectsofthefixedexplanatory variables farm (Farm1or Farm2),breed (GHorGRP),status(primiparousorpluriparous),season(sum-mer =May to October orwinter = November to April)andEB%(continous)andBCSDiff(continous),theeffectoftherepeatedsampling(weekofsampling1to5)andtheirinteractionsonFPR,BHBA,NEFAandGLDH.Thecowwasincludedasarandomeffect.LevelofsignificancewasdeterminedatP <0.05.Variableswithoutasignificantef-fectwereexcludedfromthemodelfollowingastep-wisebackward method. If necessary, the response variableswerelog-transformedtomeetstatisticalassumptionscon-cerning the distribution of the residuals. These assump-tionswerecheckedagaingraphically.Duetodifferentnumbersofcowspergroup,andthus
different sample sizes Hochberg’s GT2 procedure (Field,2009)wasusedtotestthedifferencesbetweenthethreegroups (Farm1-GH, Farm2-GH and Farm2-GRP) in eachweekofsampling.
Results
185 animals were sampled and records of 179 cowscould be included in the analyses. 21 primiparous and63pluriparousGHcowsbelongedtoFarm1.FromFarm246GH(19primiparous/27pluriparous)and49GRP(18primiparous/ 31 pluriparous) cows were included. TheaveragenumberoflactationsdidnotdifferbetweenthebreedsatFarm2:2.7(range:1to6)and2.6(range:1to5)forGHandGRP,respectively,butwasmuchlowerthanonFarm1(3.8,range:1to12).Meanmilkyield(givenasECM)wasequalinthethree
groups at the beginning of lactation but started to dif-fersignificantlybetweentheFarm2-GHandFarm2-GRPatthesecondweek,andinWeek5bothGHherdsproducedsignificant(P <0.05)moremilkthantheGRP(Figure1).Asexpected,GRPhadhigherBCSthanGHbutalsotheGHatFarm1andFarm2differedsignificantly(P <0.001)overtheexperimentalperiod(Figure2).BCSDiffwashighestinFarm2-GH(Mean:-0.3,SD:0.32)andsignificantlydiffer-ent(P <0.01)fromFarm1-GH(Mean:-0.22,SD:0.31)butnotfromFarm2-GRP(Mean:-0.24,SD:0.30).
Calculation of EB% revealed that the energy require-mentsofthetestedanimalsweresignificantlybetterful-filledatFarm1thanatFarm2(Figure3).
Week of sampling
54321
EC
M [kg
]
40
35
30
25
20
15
10
5
0
Farm2-GRPFarm2-GHFarm1-GH
Group
* * ***
*
Figure1:
Mean,SDandsignificantdifferencesofthedailymilkyieldgivenasenergycorrectedmilk(ECM)ofthethreestudiedgroupsduringthefive samplingweeks (GH =GermanHolstein, GRP =German RedPied,signedbarsdifferedat*P<0.05,**P<0.01)
Week of sampling
54321
BC
S
Farm2-GRPFarm2-GHFarm1-GH
Group
5
4
3
2
1
0
Figure2:
Mean and SDof the body condition score (BCS) of the three stu-diedgroupsduringthefivesamplingweeks(GH=GermanHolstein,GRP=GermanRedPied,allgroupssignificantlydifferedatP<0.001)

312
Week of sampling
54321
EB
[%
]
Farm2-GRPFarm2-GHFarm1-GH
Group
175
150
125
100
75
50
25
0
* * * ****
Figure3:
Mean and SD of the energy needs coverage (EB%) of the threestudiedgroupsduringthefivesamplingweeks(GH=GermanHol-stein,GRP=GermanRedPied, signedbarsdifferedat*P<0.05,***P <0.001)
EffectsofthetestedvariablesontheoutcomevariablesFPR,BHBA,NEFAandGLDHdifferedinthemodels.Farmand theweekof samplingaffectedall studiedvariables,whilebreedaffectedonlyFPR,BHBAandGLDH(Table2).An increasing EB% predicted lower readings for FPR(b= -0.012, t= -14.34,P <0.001),BHBA (b= -0.003,t = -3.33, P < 0.01) and NEFA (b = -0.004, t = -4.66,P <0.001)butnoeffectonGLDHwasfound.
Table2:
Effectsoftheexplanatoryfixedvariablesontheinvestigatedindicatorsofmetabolicdisordersgainedinmilk(Fat-Protein-Ratio-FPR), -hydroxybutyricacid-BHBA)andinblood(nonesterifiedfattyacids–NEFA,glutamatedehydrogenase–GLDH)
FPR lnBHBA lnNEFA lnGLDH
F P F P F P F P
Farm 18.28 <0.001 33.66 <0.001 7.27 <0.01 21.34 <0.001
Breed 7.57 <0.01 11.54 <0.01 n.s. 14.29 <0.001
Paritystatus 18.95 <0.001 n.s. n.s. n.s.
Season 15.48 <0.001 n.s. n.s. 4.73 <0.05
Weekofsampling 18.81 <0.001 7.23 <0.001 43.46 <0.001 20.49 <0.001
EB%a 205.57 <0.001 11.07 <0.01 21.69 <0.001 n.s.
BCSDiffb n.s. n.s. 11.76 <0.01 n.s.
aEB%=coverageoftheenergyneeds,bBCSDiff=bodyconditionscorelossfromsamplingweek1tosamplingweek5
Milk samples
ThefinalmodelshowedthatFPRwassignificantlyloweratFarm1(1.09±0.04)thanFarm2(1.27±0.02,t=-4.28,P <0.001),andGRP(1.11±0.04)hadsignificantlylowerreadingsthanGH(1.24±0.02,t=-2.75,P <0.01).Dur-ingthesummer(1.11±0.03)FPRwassignificantlylowerthaninwinter(1.25±0.03,t=-3.93,P <0.001)andfirstlactatingheifers(1.26±0.04)hadhigherFPRthanoldercows (1.09±0.02, t = 4.35,P <0.001). FPRwas low-estat thebeginningof lactation. Inallstatisticalmodelsthe farm effectwasmore dominant than the breed ef-fectwhichwasconfirmedbymultiplecomparisonsofthethreegroupsofcowscarriedoutondataofeachsamplingweek.FPRofmilkfromFarm1-GHwasalwayssignificantlylowerthanfromFarm2-GHandFarm2-GRP, respectively.Thelatterdifferedonlyatthelastsamplingday(Figure4).If an FPR threshold of 1.4was applied (Dirksen, 1994),22.6%(19outof84),76.1%(35outof46)and59.2%(29outof49)ofthesampledFarm1-GH,Farm2-GHandFarm2-GRP, respectively, overstepped this threshold atleastonceduringthesamplingperiod.BHBAincreasedfromweektoweek,too.Farm1(13.33±
1.06μmoll-1)hadsignificantlylowerBHBAcontentsthanFarm2(19.88±1.04μmoll-1,t=-5.80,P <0.001)andGH(18.54±1.03μmoll-1)significantlyhigherBHBAreadingsthanthedual-purposebreedGRP(14.30±1.06μmoll-1,t=-3.40,P <0.01).Primiparousandpluriparouscowsdidnotdiffer,andalsotheseasondidnotsignificantlyaffectBHBA.Farm2-GHshowedalwaysthehighestBHBAcon-tentsinmilkandalwaysdifferedsignificantlyfromtheGHkeptonFarm1(Figure5).GRPatFarm2hadalsohigherBHBAreadings thanFarm1-GHbut thedifferenceswerenotsignificantuntilthethirdweekofsampling.Inweek4and5alsotheBHBAofGHandGRPatFarm2differed

K. Barth, K. Aulrich, H. C. Haufe, U. Müller, D. Schaub, F. Schulz / Landbauforschung - vTI Agriculture and Forestry Research 4 2011 (61)307-316
313
significantly.NumberofcowswhichshowedBHBAread-ingshigherthan70μmoll-1(accordingtoEnjalbertetal.,2001)reflectedthesefindings:1,9and3cowssampledingroupFarm1-GH,Farm2-GHandFarm2-GRP indicatedasubclinicalketosisbyBHBAcontentsinmilk.
*****
***
*** ***
*
Week of sampling
54321
FP
R
Farm2-GRPFarm2-GHFarm1-GH
Group
2.0
1.5
1.0
0.5
0.0
Figure4:
Mean and SD of the Fat-Protein-Ratio (FPR) of the three studiedgroupsduringthefivesamplingweeks(GH=GermanHolstein,GRP=German Red Pied, signed bars differed at *P <0.05, **P <0.01,***P <0.001)
*
* *
*** *** ******
Week of sampling
54321
InB
HB
A
Farm2-GRPFarm2-GHFarm1-GH
Group
5
4
3
2
1
0
Figure5:
Mean and SD of the -hydroxybutyric acid concentration in milk(BHBA)ofthethreestudiedgroupsduringthefivesamplingweeks(GH=GermanHolstein,GRP=GermanRedPied,signedbarsdifferedat*P<0.05,**P<0.01,***P <0.001)
Blood samples
NEFAcontentsinbloodwerehighestatthebeginningoflactationanddecreasedovertheweeks.AnimalsofFarm1(185±1.05μmoll-1)hadsignificantlylowerNEFAreadingsthananimalsofFarm2(215±1.04μmoll-1,t=-2.70,P <0.01).AnegativeBCSDiffpredictedhigherNEFAconcentra-tions inblood(b=-0.35,t=-3.43,P <0.01).Farm1-GHhadalwayslowerNEFAcontentsinbloodbutonlyatWeek2and5werethedifferencestocowsatFarm2significant.NEFAdidnotdifferbetweenthebreedskeptatFarm2(Fig-ure6).Atotalof9,8and8animalsofFarm1-GH,Farm2-GHandFarm2-GRP,respectively,hadNEFAcontentshigherthan500μmol l-1according to the threshold recommendedbyHachenbergetal.(2007)forthefirstweekoflactation.GLDH activity increasedoverthesamplingperiodandwas
significantlyhigherincowsfromFarm2(11.12±1.06Ul-1)thanfromFarm1(7.09±1.08Ul-1,t=-4.62,P <0.001).TheGLDHofGRPcows(7.24±1.09Ul-1)wassignificantlylowerthanthatofGHcows(10.89±1.05Ul-1,t=-3.78,P <0.001). Therewasa slightbut significantdifferencebetweenGLDHactivityinsummer(8.11±1.07Ul-1)andwinter(9.73±1.06Ul-1,t=-2.18,P <0.05).InFarm2-GH,activityofGLDHwasalwayshighestandalwaysdifferedsignificantlyfromGHonFarm1(Figure7).Farm2-GRPandFarm1-GHnevershowedsignificantdifferencesofGLDHactivity. GLDH readings higher than 40 U l-1 indicatingdamagesofthehepatictissue(Fürll,2005)showedatleastonceduring the samplingperiod9, 9 and2 animals ofFarm1-GH,Farm2-GHandFarm2-GRP,respectively.
**
***
Week of sampling
54321
InN
EFA
Farm2-GRPFarm2-GHFarm1-GH
Group
7
6
5
4
3
2
1
0
Figure6:
MeanandSDofthebloodconcentrationofnonesterifiedfattyacids(NEFA)ofthethreestudiedgroupsduringthefivesamplingweeks(GH=GermanHolstein,GRP=GermanRedPied,signedbarsdifferedat*P<0.05,**P<0.01,***P<0.001)

314
**
****** ***
Week of sampling
54321
InG
LD
H
Farm2-GRPFarm2-GHFarm1-GH
Group
4
3
2
1
0
Figure7:
Mean and SD of the glutamate dehydrogenase activity (GLDH) inbloodof the three studiedgroupsduring thefive samplingweeks(GH=GermanHolstein,GRP=GermanRedPied,signedbarsdifferedat*P<0.05,**P<0.01,***P<0.001)
Discussion
Asexpected,milkyieldofGHwashigherthanofGRP,andthemilkyieldoftheGHatthetwofarmsdifferedonlyonce significantly in the secondweek of sampling. TheaveragemilkyieldofFarm2-GHwashighestinthisweekandindicatesthattheaccelerationinmilkyieldfromWeek1toWeek2wasgreaterthaninFarm1-GH.Milkyieldac-celerationreflectstrendsforhigherstressinhighyieldingcows(Hansenetal.,2006),andthedecreaseofECMinFarm2-GHafterthesecondweekmightbeexplainedbynon-fulfillmentoftheenergyrequirementsofthecowsatFarm2leadingtoadepressioninmilkyieldalthoughthepartitioningofnutrientsindairybreedsprefersthemam-marytissue(Veerkampetal.,2003).Besidesthelowerenergydensityofthefeedprovidedat
Farm2,thedrycowmanagementhasperhapsinfluencedtheperformanceofthecowsaftercalving,too.TheBCSsupportthisassumption.BCSrangingfrom2.6to3.0areseen as optimal for Holstein breeds (Bernabucci et al.,2005).Duetothedifferenttypeofnutrientaccretion,du-al-purposebreedsshowhigherscores,butalimitof3.5isrecommendedtoavoidketosis(Gillundetal.,2001).Com-paredtothesethresholdsthecowsatFarm2wereclearlyoverfedduringthedryperiod.ThoughBCS issubjecttoindividualeffectsoftheassessors(Edmonsonetal.,1989),inthiscasethisdoesnotexplainthesignificantdifferencesbetweentheGHatthefarms.AlltechnicianswhogainedBCSweretrainedatthebeginningofthestudyandagaininthemiddleofthewholesamplingperiod.Thus,theob-
serveddifferenceshavetobearesultofthedifferencesinthedrycowmanagementonthetwofarms.Adipose tissue of cows overfed during the dry period
shows lower basal lipolytic rates and the livers of thesecowsseemtobe lessadaptedfor themetabolizationoffattyacidsaroundparturition(Rukkwamsuketal.,1998).Thus,ahighermetabolicloadwastobeexpectedinani-malsat Farm2.NEFAconcentration inbloodwashigherfor Farm2 indicating a higher body fat mobilization ofcows kept there. This was confirmed by a significantlyhigherBCS lossof thesecows.However, theNEFAcon-centrationonlydifferedsignificantlyinsamplingWeeks2and5,andtherewasnodifferenceatallbetweenGHandGRPat Farm2.This is in contrast toKronschnabl (2010)who found higherNEFA readings (+ 100...200 μmol l-1)inGHcomparedtothedual-purposebreedGermanSim-mental. According to Hachenberg et al. (2007), NEFAreadingst500μmoll-1duringthefirstweekoflactationsignalalimitedadaptiveperformanceindairycows.Whenthisthresholdwasapplied,thefrequencyofcowsshowingthislimitationwastwiceasmuchatFarm2thanatFarm1–againwithoutadifferencebetweenGHandGRPatFarm2.ThefulfilmentoftheenergyrequirementsatFarm2aswellastheBCSlossdidnotsignificantlydifferbetweenthesetwo breeds. Thus, either of themhad tomobilize bodyfattocopewiththeacceleratingmilkproduction.There-vealedsignificanteffectofEB%onNEFAconcentrationssupportsthesefindingswhichareinaccordancewithReistetal.,(2002)whofoundahighlysignificantandrelevantcorrelationbetweenNEFAconcentrationinbloodandEB(r= -0.685,P <0.001).Energybalanceprofiles throughlactationaregeneticallydriven(Friggensetal.,2007)butdifferencesobservedbetweenbreedsdonotpointinthesamedirection:inthestudybyFriggensetal.(2007)Hol-steindairycowsmobilizedsignificantlymorebodyenergyatthebeginningoflactationthanthedual-purposeDanishRedandJerseybreedskeptunderthesamedietarytreat-ment.ThisisincontrasttoFalletal.(2008)whofoundop-positeresultsforSwedishRedandSwedishHolsteincowskeptunderorganicfarmingconditions.UnlikeNEFAinblood,BHBAconcentrationinmilkwas
clearly affectedby themanagement conditions onbothfarmsaswell asby thebreed. SourcesofBHBA inmilkare the hepaticmetabolism resulting from fatmobiliza-tion (Nielsen et al., 2003), feedstuff (Ingvartsen, 2006)and the rumen epithelial cells (Nielsen et al., 2003).Al-thoughNielsenetal.(2003)founditdifficulttodetermineanabsolutethresholdofBHBAinmilkasanindicatorofketosis,theyrecommendedusingthiscriterioninsteadoffatorcitrateduetothefactthatBHBArespondedwithahigherincreasetofeedrestrictionsinearlylactatingcows.Previously, Enjalbert et al. (2001) defined a threshold of70μmoll-1forBHBAasasignofanincreasedriskofketo-
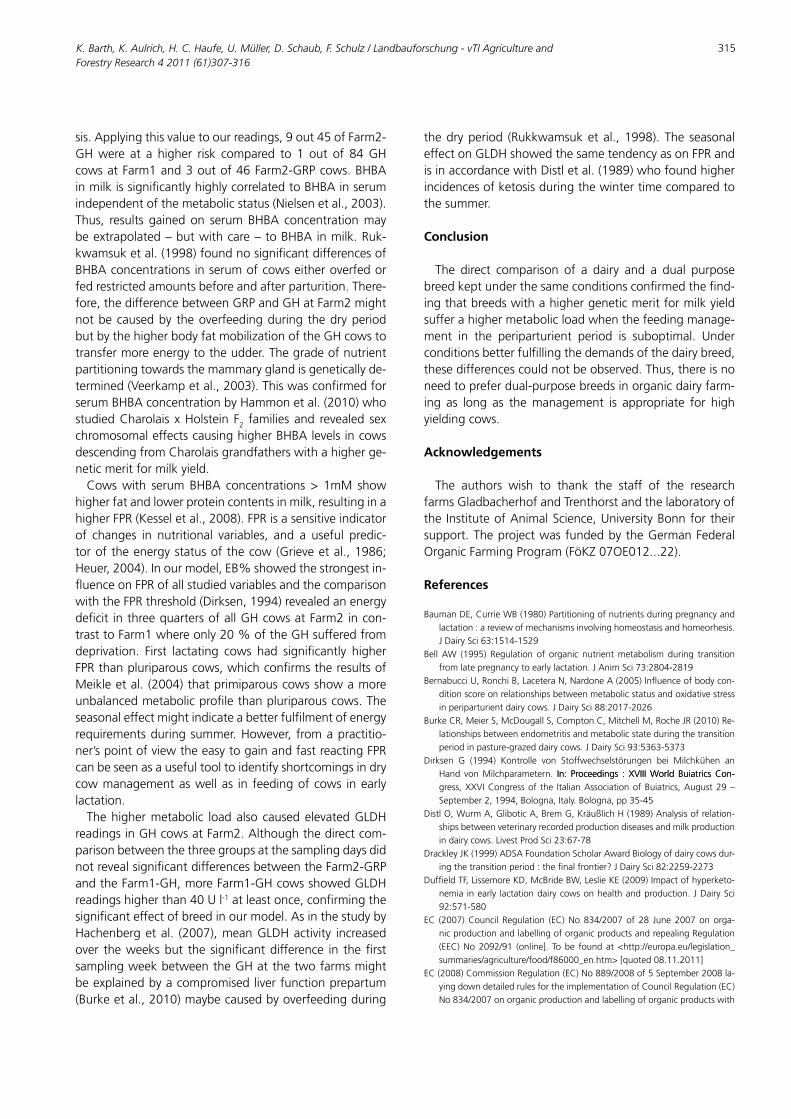
K. Barth, K. Aulrich, H. C. Haufe, U. Müller, D. Schaub, F. Schulz / Landbauforschung - vTI Agriculture and Forestry Research 4 2011 (61)307-316
315
sis.Applyingthisvaluetoourreadings,9out45ofFarm2-GHwere at a higher risk compared to 1 out of 84GHcowsatFarm1and3outof46Farm2-GRPcows.BHBAinmilkissignificantlyhighlycorrelatedtoBHBAinserumindependentofthemetabolicstatus(Nielsenetal.,2003).Thus, results gainedon serumBHBA concentrationmaybeextrapolated–butwithcare–toBHBAinmilk.Ruk-kwamsuketal.(1998)foundnosignificantdifferencesofBHBAconcentrationsinserumofcowseitheroverfedorfedrestrictedamountsbeforeandafterparturition.There-fore,thedifferencebetweenGRPandGHatFarm2mightnotbecausedby theoverfeedingduring thedryperiodbutbythehigherbodyfatmobilizationoftheGHcowstotransfermoreenergytotheudder.Thegradeofnutrientpartitioningtowardsthemammaryglandisgeneticallyde-termined(Veerkampetal.,2003).ThiswasconfirmedforserumBHBAconcentrationbyHammonetal.(2010)whostudiedCharolais xHolstein F2 familiesand revealed sexchromosomaleffectscausinghigherBHBAlevelsincowsdescendingfromCharolaisgrandfatherswithahigherge-neticmeritformilkyield.Cowswith serumBHBA concentrations> 1mM show
higherfatandlowerproteincontentsinmilk,resultinginahigherFPR(Kesseletal.,2008).FPRisasensitiveindicatorof changes in nutritional variables, and a useful predic-toroftheenergystatusofthecow(Grieveetal.,1986;Heuer,2004).Inourmodel,EB%showedthestrongestin-fluenceonFPRofallstudiedvariablesandthecomparisonwiththeFPRthreshold(Dirksen,1994)revealedanenergydeficit inthreequartersofallGHcowsatFarm2incon-trasttoFarm1whereonly20%oftheGHsufferedfromdeprivation. First lactating cows had significantly higherFPRthanpluriparouscows,whichconfirmstheresultsofMeikleetal.(2004)thatprimiparouscowsshowamoreunbalancedmetabolicprofilethanpluriparouscows.Theseasonaleffectmightindicateabetterfulfilmentofenergyrequirementsduringsummer.However, fromapractitio-ner’spointofviewtheeasytogainandfastreactingFPRcanbeseenasausefultooltoidentifyshortcomingsindrycowmanagementaswellas in feedingofcows inearlylactation.Thehighermetabolic loadalsocausedelevatedGLDH
readingsinGHcowsatFarm2.Althoughthedirectcom-parisonbetweenthethreegroupsatthesamplingdaysdidnotrevealsignificantdifferencesbetweentheFarm2-GRPandtheFarm1-GH,moreFarm1-GHcowsshowedGLDHreadingshigherthan40Ul-1atleastonce,confirmingthesignificanteffectofbreedinourmodel.AsinthestudybyHachenbergetal. (2007),meanGLDHactivity increasedover theweeksbut the significantdifference in thefirstsamplingweekbetweentheGHatthetwofarmsmightbeexplainedbyacompromisedliverfunctionprepartum(Burkeetal.,2010)maybecausedbyoverfeedingduring
thedryperiod (Rukkwamsuketal.,1998).The seasonaleffectonGLDHshowedthesametendencyasonFPRandisinaccordancewithDistletal.(1989)whofoundhigherincidencesofketosisduringthewintertimecomparedtothesummer.
Conclusion
The direct comparison of a dairy and a dual purposebreedkeptunderthesameconditionsconfirmedthefind-ingthatbreedswithahighergeneticmeritformilkyieldsufferahighermetabolicloadwhenthefeedingmanage-ment in the periparturient period is suboptimal. Underconditionsbetterfulfillingthedemandsofthedairybreed,thesedifferencescouldnotbeobserved.Thus,thereisnoneedtopreferdual-purposebreedsinorganicdairyfarm-ing as long as themanagement is appropriate for highyieldingcows.
Acknowledgements
The authors wish to thank the staff of the researchfarmsGladbacherhofandTrenthorstandthelaboratoryofthe InstituteofAnimalScience,UniversityBonnfortheirsupport.TheprojectwasfundedbytheGermanFederalOrganicFarmingProgram(FöKZ07OE012...22).
References
BaumanDE,CurrieWB(1980)Partitioningofnutrientsduringpregnancyandlactation:areviewofmechanismsinvolvinghomeostasisandhomeorhesis.JDairySci63:1514-1529
Bell AW (1995) Regulation of organic nutrientmetabolismduring transitionfromlatepregnancytoearlylactation.JAnimSci73:2804-2819
BernabucciU,RonchiB,LaceteraN,NardoneA(2005)Influenceofbodycon-ditionscoreonrelationshipsbetweenmetabolicstatusandoxidativestressinperiparturientdairycows.JDairySci88:2017-2026
BurkeCR,MeierS,McDougallS,ComptonC,MitchellM,RocheJR(2010)Re-lationshipsbetweenendometritisandmetabolicstateduringthetransitionperiodinpasture-grazeddairycows.JDairySci93:5363-5373
Dirksen G (1994) Kontrolle von Stoffwechselstörungen bei Milchkühen anHand vonMilchparametern. In: Proceedings : XVIIIWorld BuiatricsCon-In: Proceedings : XVIIIWorld BuiatricsCon-gress,XXVICongressof the ItalianAssociationofBuiatrics,August29–September2,1994,Bologna,Italy.Bologna,pp35-45
DistlO,WurmA,GliboticA,BremG,KräußlichH(1989)Analysisofrelation-shipsbetweenveterinaryrecordedproductiondiseasesandmilkproductionindairycows.LivestProdSci23:67-78
DrackleyJK(1999)ADSAFoundationScholarAwardBiologyofdairycowsdur-ingthetransitionperiod:thefinalfrontier?JDairySci82:2259-2273
DuffieldTF,LissemoreKD,McBrideBW,LeslieKE(2009)Impactofhyperketo-nemia inearly lactationdairycowsonhealthandproduction. JDairySci92:571-580
EC (2007)Council Regulation (EC)No834/2007of 28 June2007onorga-nicproductionandlabellingoforganicproductsandrepealingRegulation(EEC)No2092/91 (online]. Tobe foundat<http://europa.eu/legislation_summaries/agriculture/food/f86000_en.htm>[quoted08.11.2011]
EC(2008)CommissionRegulation(EC)No889/2008of5September2008la-yingdowndetailedrulesfortheimplementationofCouncilRegulation(EC)No834/2007onorganicproductionandlabellingoforganicproductswith

316
regardtoorganicproduction,labellingandcontrol[online].Tobefoundat<http://eur-lex.europa.eu/LexUriServ/LexUriServ.do?uri=OJ:L:2008:250:0001:0084:EN:PDF>[quoted08.11.2011]
EdmonsonAJ,LeanIJ,WeaverLD,FarverT,WebsterG(1989)AbodyconditionscoringchartforHolsteindairycows.JDairySci72:68-78
EnjalbertF,NicotMC,BayourtheC,MoncoulonR(2001)Ketonebodiesinmilkandbloodofdairycows:relationshipbetweenconcentrationsandutiliza-tionfordetectionofsubclinicalketosis.JDairySci84:583-589
Fall N, Gröhn YT, Forslund K, Essen-Gustafsson B, Niskanen R, EmanuelsonU (2008) An observational study on early-lactationmetabolic profiles inSwedish organically and conventionallymanaged dairy cows. J Dairy Sci91:3983-3992
FieldA(2009)DiscoveringstatisticsusingSPSS.LosAngeles:SagePubl,821pFreyerG, König S, Fischer B, BergfeldU,Cassell BG (2008) Invited review :
crossbreeding indairy cattle fromaGermanperspectiveof thepastandtoday.JDairySci91:3725-3743
FriggensNC, Berg P, Theilgaard P,Korsgaard IR, IngvartsenKL, Lovendahl P,JensenJ(2007)Breedandparityeffectsonenergybalanceprofilesthroughlactation:evidenceofgeneticallydrivenbodyenergychange.JDairySci90:5291-5305
FürllM(2005)SpezielleUntersuchungenbeimWiederkäuer.In:KraftW,DürrUM(eds)KlinischeLabordiagnostikinderTiermedizin.Stuttgart:Schattau-er,pp30
GillundP,ReksenO,GröhnYT,KarlbergK (2001)Bodycondition related toketosisandreproductiveperformanceinNorwegiandairycows.JDairySci84:1390-1396
GoffJP,HorstRL(1997)Physiologicalchangesatparturitionandtheirrelation-shiptometabolicdisorders.JDairySci80:1260-1268
GrieveDG,Korver S,RijpkemaYS,HofG (1986)Relationshipbetweenmilkcompositionandsomenutritionalparametersinearlylactation.LivestProdSci14:239-254
GrummerRR(1993)Etiologyoflipid-relatedmetabolicdisordersinperiparturi-entdairycows.JDairySci76:3882-3896
HachenbergS,WeinkaufC,HissS,SauerweinH(2007)Evaluationofclassifica-tionmodespotentiallysuitabletoidentifymetabolicstressinhealthydairycowsduringtheperipartalperiod.JAnimSci85:1923-1932
HammonHM,MetgesCC,SchulzA,JunghansP,SteinhoffJ,SchneiderF,PfuhlR,BruckmaierRM,WeikardR,KühnC(2010)Differencesinmilkproduc-tion,glucosemetabolism,andcarcasscompositionof2Charolais×Hol-steinF2 familiesderived fromreciprocalpaternalandmaternalgrandsirecrosses.JDairySci93:3007-3018
HansenJV,FriggensNC,HojsgaardS(2006)Theinfluenceofbreedandparityonmilkyield,andmilkyieldaccelerationcurves.LivestSci104:53-62
HardarsonGH(2001)Isthemodernhighpotentialdairycowsuitablefororga-nicfarmingconditions?ActaVetScanSuppl95:63-67
HardengF,EdgeVL(2001)Mastitis,ketosis,andmilkfeverin31organicand93conventionalNorwegiandairyherds.JDairySci84:2673-2679
HeuerC(2004)Theuseoftestdayinformationtopredictenergyintakeofdairycowsinearlylactation.JDairySci87:593-601
HoebenD,MonfardiniE,OpsomerG,BurvenichC,DosogneH,DeKruifA,BeckersJF(2000)Chemiluminescenceofbovinepolymorphonuclearleuco-cytesduringtheperiparturientperiodandrelationwithmetabolicmarkersandbovinepregnancy-associatedglycoprotein.JDairyRes67:249-259
IngvartsenKL(2006)Feeding-andmanagement-relateddiseasesinthetransi-tioncow :physiologicaladaptationsaroundcalvingandstrategies to re-ducefeeding-relateddiseases.AnimFeedSciTech126:175-213
KesselS,StroehlM,MeyerHHD,HissS,SauerweinH,SchwarzFJ,Bruckmai-erRM(2008)Individualvariabilityinphysiologicaladaptationtometabolicstressduringearly lactation indairycowskeptunderequalconditions. JAnimSci86:2903-2912
KnausWF,SteinwidderA,ZollitschW(2001)Energyandproteinbalanceinor-ganicdairycownutrition:modelcalculationsbasedonEUregulations.In:HoviM,BaarsT(eds)Breedingandfeedingforanimalhealthandwelfareinorganiclivestocksystems:proceedingsofthefourthNAHWOAWorkshop,Wageningen,24-27March2001.Reading:Univ,pp141-154
KronschnablC(2010)ErmittlungvonlaktationsspezifischenPrognosebereichenzurBeurteilungderKonzentrationvonBlutparameternbeprobterMilchkü-he.München:Ludwig-Maximilians-Univ,229p
LeslieKE,DuffieldTF,SchukkenYH,LeBlancSJ(2000)Theinfluenceofnega-tiveenergybalanceonudderhealth[online].Tobefoundat<http://www.nmconline.org/articles/ketosis.pdf>[quoted08.11.2011]
MeikleA,KulcsarM,ChilliardY,FebelH,DelavaudC,CavestanyD,ChilibrosteP(2004)Effectsofparityandbodyconditionatparturitiononendocrineandreproductiveparametersofthecow.Reprod127:727-737
NielsenNI,IngvartsenKL(2004)Propyleneglycolfordairycows:areviewofthemetabolismofpropyleneglycolanditseffectsonphysiologicalparam-eters,feedintake,milkproductionandriskofketosis.AnimFeedSciTech115:191-213
NielsenNI, IngvartsenKL,LarsenT(2003)DiurnalvariationandtheeffectoffeedrestrictiononplasmaandmilkmetabolitesinTMR-feddairycows.JVetMed50:88-97
OliverMH,HardingJE,BreierBH,EvansPC,GallagherBW,GluckmanPD(1995)Theeffectsofovineplacental-lactogeninfusiononmetabolites,insulin–likegrowth-factorsandbinding-proteinsinthefetalsheep.JEndocrin144:333-338
RahmannG,NiebergH (2005)New insights intoorganic farming inGerma-ny:empiricalresultsofasurveyin218farms.LandbauforschVölkenrode55(3):193-202
ReistM,ErdinD,vonEuwD,TschuemperlinK,LeuenbergerH,ChilliardY,Ham-monHM,MorelC,PhiliponaC,ZbindenY,KuenziN,BlumJW(2002)Esti-mationofenergybalanceattheindividualandherdlevelusingbloodandmilktraitsinhigh-yieldingdairycows.JDairySci85:3314-3327
RukkwamsukT,WensingT,GeelenMJH(1998)Effectofoverfeedingduringthedryperiodonregulationofadiposetissuemetabolismindairycowsduringtheperiparturientperiod.JDairySci81:2904-2911
SpiekersH,PotthastV(2004)ErfolgreicheMilchviehfütterung.FrankfurtaM:DLG-Verl,448p
VeerkampRF,BeerdaB,vanderLendeT(2003)Effectsofgeneticselectionformilkyieldonenergybalance,levelsofhormones,andmetabolitesinlacta-tingcattle,andpossiblelinkstoreducedfertility’s.LivestProdSci83:257-275
WemheuerW (1987) Evaluation of blood values in dairy herdswith fertilitydisorders.TierärztlPrax15:353-360
WestHJ(1990)Effectonliver-functionofacetonaemiaandthefatcowsyn-dromeincattle.ResVetSci48:221-227

C. Brandt, C. Balko, B. Eichler-Löbermann / Landbauforschung - vTI Agriculture and Forestry Research 4 2011 (61)317-326 317
Interactive effects of soil water content and phytin supply on phosphorus nutrition of different crops species
ChristineBrandt*,ChristianeBalko**,andBettinaEichler-Löbermann****
* UniversityofRostock,FacultyofAgricultureandEnvironmentalSciences,Agriculture by Tillage and Crop Husbandry, Justus-von-Liebig-Weg 6,18051Rostock,Germany,
** JuliusKühn-Institut,FederalResearchCentreforCultivatedPlants,InstituteforResistanceResearchandStressTolerance,Rudolf-Schick-Platz3,18190GroßLüsewitz,Germany
Correspondingauthor:PDDr.habil.BettinaEichler-Löbermann,E-mail:[email protected]
Abstract
An eight week pot experiment was conducted undersemicontrolledconditionstoinvestigatetheinteractiveef-fectsoforganicPnutritionanddroughtstressonPutilisa-tionoffourdifferentcropspecies.Two P treatments were established: organic P supply
withphytin(0.40gPperpot)andacontrolwithoutanyadditionalPsupply.Thetwowatertreatmentswereirrigat-edaccordingto60%(wellwatered)and30%(droughtstress)waterholdingcapacityofthesoil.ThePuptake,shootbiomassandprolinecontentofsor-
ghum(Sorghum bicolor x Sorghum sudanense),amaranth(Amaranthus cruentus),oilseedrape(Brassica napus)andrye(Secale cereale)werestudied.Furthermore,inthesoilwemeasuredthepHvalue,soilPpools(solubleinwater,double-lactateandoxalate)aswellasthePsorptionca-pacity,degreeofPsaturationandtheactivitiesofacidandalkalinephosphatases.Drought stress reduced the P uptakeof sorghumand
rye, while P uptake of amaranth and oilseed rape wasnotaffectedbywatersupply.TheapplicationoforganicPincreasedtheplantPuptakeandbiomassproductioninbothwatertreatmentsabout30%butdidnotmitigatetheeffectsofwaterstress.Droughtresultedinhigherpro-linecontents inplant tissue;significantlyelevatedvaluesweremeasuredinoilseedrapeandrye.TheactivityofacidphosphataseinsoilwasincreasedinthetreatmentswithdroughtstressaswellasafterorganicPsupply.SoilPpoolswereaffectedbythebalanceofPsupplyandplantPup-take,butobviouslynotbythewatertreatments.The results suggest crop specific reactions on water
shortage and P deficiency, which should be taken intoconsiderationforPfertilizationrecommendations.
Keywords: phosphorus, drought stress, organic fertilizer, phosphatase activity
Zusammenfassung
Wechselseitiger Einfluss von Wassergehalt des Bo-dens und Phytin-Zufuhr auf die Phosphor-Ernährung verschiedener Fruchtarten
IneinemachtwöchigenGefäßversuchwurdendiewech-selseitigenEffektevonorganischerP-ZufuhrundTrocken-stressaufdieP-VersorgungvierverschiedenerFruchtartenuntersucht. Dabei wurde Phytin als organische P-Quelle(0.40g PproGefäß) genutzt. ZurKontrollewurde eineVarianteohneP-Zufuhrangelegt.ZweiWasserstufenwur-denentsprechend60%(optimaleVersorgung)und30%(Trockenstressvariante)dermaximalenWasserhaltekapazi-tätdesBodenseingestellt.DieP-Aufnahme,derBiomasseertragsowiederProlin-
GehaltderFruchtartenSorghum(Sorghum bicolor x Sor-ghum sudanense),Amarant(Amaranthus cruentus),Raps(Brassica napus)andRoggen(Secale cereale)wurdenun-tersucht. Im Boden wurden der pH Wert, ausgewählteP-Fraktionen, sowiederGradder P-Sättigungermittelt.Zudem wurde die Aktivität der sauren und alkalischenPhosphatasebestimmt.TrockenstressreduziertedieP-AufnahmevonSorghum
und Roggen,währendAmarant und Raps keinen Rück-gang in der P-Aufnahme zeigten. Die Zufuhr von orga-nischem P erhöhte die P-Aufnahme sowie die BiomasseallerFruchtarteninbeidenWasserstufenumetwa30%.DieWirkungdesTrockenstressimVergleichzuroptimalenWasserversorgungwurde allerdings durch eine P-Zufuhrnichtabgeschwächt.UnterTrockenstresswurdenstarker-höhteProlin-GehaltebeiRapsundRoggengemessen.DieAktivitätder saurenPhosphatasen imBodenstiegeben-falls unter Trockenstress sowie durch die Zufuhr von or-ganischemPan.DieP-PoolsimBodenwurdendurchdieBilanzvonP-ZufuhrundP-AufnahmederPflanzenbeein-flusst, offensichtlich jedoch nicht durch die unterschied-licheWasserversorgung.
Schlüsselwörter: Phosphor, Trockenstress, organische Dün-gung, Phosphatase-Aktivität
318
Introduction
Droughtstress isoneof themajorabiotic factors thatconstrainscropproductivity.Climateperiodswithdroughtwilloccurmorefrequentlyinthenearfuture(Jacobetal.,2008).Thegrowthandthephysiologicalresponsesofcropplantsandtherewiththeplantyieldarehighlysensitivetoareductionofwateravailabilityinsoils(BartelsandSunk-ar,2005).Plantsdevelopdifferentmechanismtoadapttodrought
stress.Drought tolerancemay increase by stomatal reg-ulation (Sing andSing, 1995),maintainedwater uptakethrough changes in root characteristics like root length,thickness and rootingdepth (Aschet al., 2005) andac-cumulation of osmolytes like soluble sugars, alcohols orproline(Stoddardetal.,2006).Thepositiveeffectofpro-lineasamajorosmoregulatorysoluteunderdroughtstresswasshownindifferentstudies(Delauneyetal.,1993;So-maletal.,1998;KuznetsovandShevyakova,1999;Diazetal.,2005).Drought affects nutrient availability in soil. Generally,
adecrease insoilmoisturecontent limitsthecapacityofmassflowandnutrientdiffusion.Especiallythelessmobilenutrients insoil, suchasP,areaffectedbywaterdeficit.DroughtleadstoformationofstabilePcompoundsinsoil(HuandSchmidhalter,2005)andcanresultinadecreasedPabsorptionbyplants(Samarahetal.,2004).Ontheotherhand,severalstudiesreportedthattheap-
plicationofPcanimprovegrowthandPuptakeofplantsunderdroughtconditionsandthereforeamelioratenega-tiveeffectsofwaterstress.ForinstancePfertilizationcanincrease drought tolerance by advanced root growth.Therewithalargervolumeofsoilcanbeexploredleadingtoahigherwaterandnutrientuptakeandhigherbiomassproduction (Rodriguez and Oyarzabal, 1996; Gutièrrez-BoemandThomas,1999).Furthermore,Psupplycanen-hancechlorophyllcontentandtherewithrateofphotosyn-thesis(Gargetal.,2004).IncreasedPfertilizationhasalsoabeneficialinfluenceontheleafmetabolism,therelativewatercontent(Shubhraetal.,2004)aswellasthewateruseefficiency(Heetal.,2002).Ingeneral,Pefficiencyofcropsvarieswidely.Welladapt-
edplantspeciesdevelopstrategiestoenhancetheacquisi-tionofPfromsoil.E.g.theyexploreagreatervolumeofsoiltroughmodifiedrootmorphologylikeincreasedroothairdensityandrootslength(BatesandLynch,2001;Maetal.,2001;Abeletal.,2002,)andtheyincreasetheroottoshootratio(Ramaekersetal.,2010).Furthermore,theavailabilityofPcompoundscanbeimprovedbycropspe-ciesthroughrhizospheremodificationlikeshiftingpHandexcretionofprotons (WittenmayerandMerbach,2005),organicacids(Römer,2006;Carvalhais,2011)andphos-phatases(Wangetal.,2008).Therefore,thecultivationof
differentcropscanresultinverydifferentcontentsofhighsolubleP in soil (Schiemenz&Eichler-Löbermann,2010;Eichler-Löbermannetal.,2008).OrganicPcompoundsareimportantsourcesforplantP
supply.The largestfractionoforganicPappears informofphytinanditsderivates(Dalal,1978;Schilling,2000).Primarily the activity of phosphatases in soils plays an
importantroleinPcyclingtransformingorganicPinplantavailableforms(Nuruzzamanetal.,2006).Alkaline(AlP)andacidphosphatase(AcP)canbeexcretedbycropsandmicroorganisms,whereashighercropsavoidexcretionofAlP(Dicketal.,2000).Theactivityofphosphatasesisinfluencedbycropspe-
cies and even varieties. Investigations of Li et al. (2004)showed that chickpea rootswere able to secret greateramountsofAcPthanmaizeandtherewithincreasedhy-drolyseofphytates.Ciereszkoetal. (2011) founddiffer-encesintwowheatvarietiesrelatedtotheirabilitytoin-ducesoilphosphataseactivity.Theactivityofphosphatasesusuallyincreaseswhenthe
Pnutritionstatusinsoildecreases(TarafdarandClaassen,2005;Kreyetal.,2011).Therefore, theactivityofphos-phatasemayplayakeyroletoenhanceavailabilityofor-ganicPunderdryconditions.InthepastmainlytheeffectsofmineralPwereinvesti-
gatedinthecontextofdroughtstress.However,informa-tionabout theutilisationoforganicPunderwaterdefi-ciency is rarely available. Therefore, in apot experimentwecultivated4differentcropsonasoildifferinginwaterandphytinsupply.Theobjectiveofthisworkwasto(I)evaluatetheability
ofdifferentcropspeciestoutilizePunderdroughtcondi-tions, (II)exploretheeffectoforganicPsupplyonplantandsoilparametersinrelationtothewatersupply.
Material and methods
Soil
ThesoilusedforthepotexperimentwascollectedfromtheA-horizonofalong-termfieldexperimentoftheUni-versityofRostockinNorthernGermany.Thesoilwasclas-sifiedas loamysand. Initialplant-availablesoilPcontentof40.6mgkg -1(Pdl) indicatedasuboptimalPstatusoftheusedsoil(Table1).Thesoilreactionwasmediumacid(pH(H2O)=5.3,pH(CaCl2)=4.9).
Treatments and experimental design
An outdoor pot experiment was established in May,2009consistingof4plantspecies,2levelsofirrigation,2fertilizationtreatmentsand4replicates.

C. Brandt, C. Balko, B. Eichler-Löbermann / Landbauforschung - vTI Agriculture and Forestry Research 4 2011 (61)317-326 319
Table1:
Soilpropertiesatthebeginningofthepotexperiment
pH Pw Pdl Pox DPS PSC Kdl Mgdl
(CaCl2) (mgkg-1) (mgkg-1) (mmolkg-1) (%) (mmolkg-1) (mgkg-1) (mgkg-1)
4.91 6.15 40.6 16.9 49.3 26.2 64.9 140.0
Pw=watersolubleP;Pdl,Kdl,Mgdl=doublelactateP,K,Mg;Pox=oxalatesolubleP;DPS=degreeofPsaturation;PSC=Psorptioncapacity
Mitscherlich pots were filled with 6 kg air dried and2mmsievedsoil.Beforesowing,plantnutrientshadbeenmixed thoroughlywith the soil (per pot: 1.4 gNH4NO3,1.4 g MgSO4+7H2O, 1.9 g KCl). Organic P supply (P1)was establishedwith0.4g Pper pot by supply of phy-tin(C6H16CaO24P6).AtreatmentwithoutPsupply(P0)wasusedascontrol.The following crops (species and varieties) were culti-
vated:sorghum(Sorghum bicolor x Sorghum sudanense, Inka), amaranth (Amaranthus cruentus, Bärnkrafft), oil-seedrape(Brassica napus, Palma)andrye(Secale cereal, Arantes).UntilBBCH13irrigationwasdoneaccordingtocropde-
mandwithdistilledwaterforallpots.Afterwardstwolevelsofirrigationwereestablished.Thedroughttreatmentwasirrigatedaccordingto30%ofthewaterholdingcapacity(WHC)ofthesoil.Thewellwateredcontroltreatmentwasirrigatedaccordingto60%WHC.Thepotswereweighedeveryseconddayandtheconsumedamountofwaterwasreplacedaccordinglytothetreatments.Potswereplacedundernaturalweatherconditions;ashelterexcludedrain-falltoavoiduncontrolledirrigationofthepotexperiment.Allplantswereharvestedaftereightweeksofgrowth.
Leavesamplesweretaken,groundinliquidnitrogenandstoredat-21°Cuntilchemicalanalyseswereperformed.Theremainingplantmaterialwasoven-driedat60°Cuntilconstancyofweight.Sixsoilcores(3cmdiameter)weretakenperpot,mixed
anddivided into two sub-samples. Soil samples for bio-chemicalanalyseswerestoredfrozen.Theothersampleswereair-driedandpassed througha2mmsievebeforedeterminingchemicalsoilparameters.
Plant and soil analyses
TheshootPconcentrationwasmeasuredafterdryash-inganddigestion in20%HCl.ForPdeterminationthevanadate-molybdate method by Page et al. (1982) wasused.ThePuptakewascalculatedfromdrymatteryieldandPcontent.Prolineanalyseswereperformedfromtheplantsamples
asdescribedpreviouslybyBatesetal.(1973).Absorbancewasmeasuredat520nmusingaspectrophotometer.
Content of double lactate soluble P (Pdl) as well assoilpH (CaCl2)weremeasuredaccording toBlumeetal.(2000).Water-extractableP(Pw)insoilwasdeterminedasdescribedbyVanderPaauwetal.(1971).ThePconcen-tration was measured with the phosphomolybdate bluemethod via flow-injection analysis. The oxalate solublecontentofP,aluminium(Al),andiron(Fe)insoil(Pox,Alox,Feox)wereanalysedbyshaking2gofsoilinacidoxalatesolution(100ml)for1hinthedarkinaccordancetoSchw-ertmann (1964).With thesedata thePsorptioncapacity(PSC=[Alox+Feox)/2(mmolkg-1])andthedegreeofPsaturation(DPS[%]=Pox/PSCx100)werecalculatedac-cordingtoLookmanetal.(1995)andSchoumans(2000).Concentration in the filtrate of the elementswas deter-minedbyinductivelycoupledplasma(ICP)spectrometry.Acid and alkaline phosphatase (AcP andAlP) activities
weredeterminedusingthemethodofTabatabaiandBrem-ner (1969).Theenzymeactivitywasmeasuredinμmolp-nitrophenol released from p-nitrophenylphosphate solu-tionin1gsoilwithin1hour(μmolp-nitrophenolg-1h-1).
Statistics
Soilandplantdataof4replicatesweresubjectedtoananalysisofvariance(Generallinearmodel,GLM).To compare means of soil and plant parameters the
Duncanmultiple range test was used. Significance wasdeterminedatp<0.05,andsignificantlydifferentmeanswereindicatedusingdifferentletters.
Results
Effects of water and P supply on plant biomass, P uptake and proline accumulation in leaves
Onaverage,shoot biomassincreasedsignificantlywithorganicPandhigherwatersupply.TheeffectoforganicPsupplyonshootbiomassinthisstudywasfoundtobehigher than the effect of drought stress (Eta2 0.822 vs.0.587).Psupplyresultedin30%biomassincrease(aver-ageofallcrops),whereashigherwatersupplyresultedinabout10%higherbiomassweights.Shootbiomassofryeandoilseedrapewerehighest inbothwater levels.Lowshootbiomasswasfoundforsorghum.
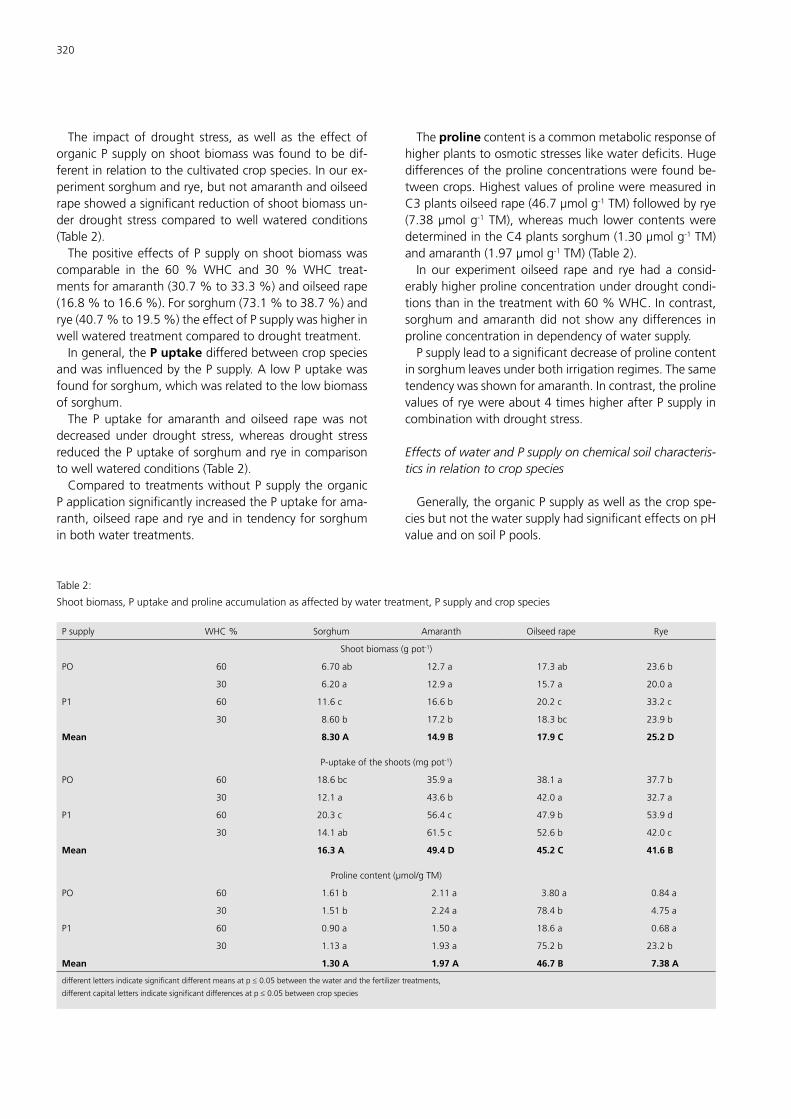
320
The impact of drought stress, aswell as the effect oforganicPsupplyonshootbiomasswasfoundtobedif-ferentinrelationtothecultivatedcropspecies.Inourex-perimentsorghumandrye,butnotamaranthandoilseedrapeshowedasignificantreductionofshootbiomassun-derdrought stresscompared towellwateredconditions(Table2).ThepositiveeffectsofPsupplyonshootbiomasswas
comparable in the 60%WHC and 30%WHC treat-mentsforamaranth(30.7%to33.3%)andoilseedrape(16.8%to16.6%).Forsorghum(73.1%to38.7%)andrye(40.7%to19.5%)theeffectofPsupplywashigherinwellwateredtreatmentcomparedtodroughttreatment.Ingeneral,theP uptakedifferedbetweencropspecies
andwasinfluencedbythePsupply.AlowPuptakewasfoundforsorghum,whichwasrelatedtothelowbiomassofsorghum.The P uptake for amaranth and oilseed rapewas not
decreased under drought stress,whereas drought stressreducedthePuptakeofsorghumandryeincomparisontowellwateredconditions(Table2).ComparedtotreatmentswithoutPsupplytheorganic
PapplicationsignificantlyincreasedthePuptakeforama-ranth,oilseedrapeandryeandintendencyforsorghuminbothwatertreatments.
Table2:
Shootbiomass,Puptakeandprolineaccumulationasaffectedbywatertreatment,Psupplyandcropspecies
Psupply WHC% Sorghum Amaranth Oilseedrape Rye
Shootbiomass(gpot-1)
PO 60 6.70ab 12.7a 17.3ab 23.6b
30 6.20a 12.9a 15.7a 20.0a
P1 60 11.6c 16.6b 20.2c 33.2c
30 8.60b 17.2b 18.3bc 23.9b
Mean 8.30 A 14.9 B 17.9 C 25.2 D
P-uptakeoftheshoots(mgpot-1)
PO 60 18.6bc 35.9a 38.1a 37.7b
30 12.1a 43.6b 42.0a 32.7a
P1 60 20.3c 56.4c 47.9b 53.9d
30 14.1ab 61.5c 52.6b 42.0c
Mean 16.3 A 49.4 D 45.2 C 41.6 B
Prolinecontent(μmol/gTM)
PO 60 1.61b 2.11a 3.80a 0.84a
30 1.51b 2.24a 78.4b 4.75a
P1 60 0.90a 1.50a 18.6a 0.68a
30 1.13a 1.93a 75.2b 23.2b
Mean 1.30 A 1.97 A 46.7 B 7.38 A
differentlettersindicatesignificantdifferentmeansatpd0.05betweenthewaterandthefertilizertreatments,
differentcapitallettersindicatesignificantdifferencesatpd0.05betweencropspecies
The proline contentisacommonmetabolicresponseofhigherplantstoosmoticstresseslikewaterdeficits.Hugedifferencesoftheprolineconcentrationswerefoundbe-tweencrops.HighestvaluesofprolineweremeasuredinC3plantsoilseedrape(46.7μmolg-1TM)followedbyrye(7.38μmolg-1TM),whereasmuch lowercontentsweredeterminedintheC4plantssorghum(1.30μmolg-1TM)andamaranth(1.97μmolg-1TM)(Table2).In our experiment oilseed rape and rye had a consid-
erablyhigherprolineconcentrationunderdroughtcondi-tionsthaninthetreatmentwith60%WHC.Incontrast,sorghumandamaranthdidnot showanydifferences inprolineconcentrationindependencyofwatersupply.Psupplyleadtoasignificantdecreaseofprolinecontent
insorghumleavesunderbothirrigationregimes.Thesametendencywasshownforamaranth.Incontrast,theprolinevaluesofryewereabout4timeshigherafterPsupplyincombinationwithdroughtstress.
Effects of water and P supply on chemical soil characteris-tics in relation to crop species
Generally,theorganicPsupplyaswellasthecropspe-ciesbutnotthewatersupplyhadsignificanteffectsonpHvalueandonsoilPpools.

C. Brandt, C. Balko, B. Eichler-Löbermann / Landbauforschung - vTI Agriculture and Forestry Research 4 2011 (61)317-326 321
Table3:
Chemicalpropertiesinsoil(pH,Pw,Pdl,Pox,DPSandPSC)asaffectedbywatertreatment,Psupplyandcropspecies
Psupply WHC% Sorghum Amaranth Oilseedrape Rye
pH(CaCl2)
PO 60 4.62a 4.35a 4.76a 4.73a
30 4.66a 4.43a 4.69a 4.79a
P1 60 4.69a 4.44a 4.76a 4.84a
30 4.68a 4.41a 4.81a 4.88a
Mean 4.66 B 4.41 A 4.75 C 4.80 D
Pw(mgkg-1)
PO 60 4.99a 5.37a 5.38a 4.72a
30 4.53a 5.68b 4.85a 5.23a
P1 60 6.50b 6.53bc 5.77a 6.24b
30 6.99b 6.88c 5.40a 6.30b
Mean 5.75 B 6.14 C 5.38 A 5.62 AB
Pdl(mgkg-1)
PO 60 35.8a 32.0a 31.5a 29.9ab
30 37.2a 30.4a 31.0a 29.1a
P1 60 39.9b 31.7a 32.9a 31.3bc
30 42.7c 31.5a 31.2a 32.9c
Mean 38.9 B 31.4 A 31.7 A 30.8 A
Pox(mmolkg-1)
PO 60 14.3a 11.0a 13.0a 12.5a
30 13.8a 9.78a 13.5a 12.1a
P1 60 16.5b 13.0b 16.3b 14.4a
30 16.7b 13.8b 16.8b 14.4a
Mean 15.3 C 11.9 A 14.9 C 13.3 B
DPS(%)
PO 60 46.4a 36.6a 45.7a 42.8a
30 46.0a 33.8a 44.9a 42.1a
P1 60 53.4b 43.8b 54.9b 48.8a
30 54.2b 44.2b 55.2b 50.3a
Mean 50.0 C 39.6 A 50.18 C 46.0 B
PSC(mmol/kg-1)
PO 60 30.8a 30.1a 28.6a 29.2a
30 30.1a 28.8a 30.0a 28.7a
P1 60 30.9a 29.7a 29.8a 29.4a
30 31.0a 31.3a 30.5a 28.6a
Mean 30.7 A 30.0 A 29.7 A 29.0 A
differentlettersindicatesignificantdifferentmeansatpd0.05betweenthewaterandthefertilizertreatments,
differentcapitallettersindicatesignificantdifferencesatpd0.05betweencropspecies
In our experiment, the pH values weremainly influ-encedbythecultivationofdifferentcropspecies,whichallresultedinafurtherdecreaseoftheinitiallylowvalues.MainlyafteramaranthcultivationextremelylowvaluesofpH4.41werefound(Table3),
TheorganicPsupplyhadapositiveeffectonplantavail-ablePpoolsinsoil,inbothwatertreatments.InparticularthePwvaluesincreasedwithorganicPapplication.DespitethehighPuptakeofamaranth,highestPwconcentrationinsoilwerefoundaftercultivationofthiscrop(Table3).

322
P supply also increased thePdl values in combinationwith sorghumand rye significantly compared to controlwithoutPaddition.PwandPdlvaluestendedtobehigherunderwaterdeficiency,whichcanbeexplainedbylowerplant P uptake rates (Table 3). Negative correlation be-tweenPuptakeandPw(r=-0.714**)andPuptakeandPdl(r=-0.711**)werefound.The supply of organic P increased Pox and DPS sig-
nificantlyforsorghum,amaranthandoilseedrapeandintendencyforryeinbothwatertreatments.Incontrasttothe Pw content lowest Pox valuesweremeasured afteramaranthcultivation(11.9mmolkg-1)(Table3).Neitherwater and P supply, nor crop species affected
thePSCinthisexperiment(Table3).
Effects of water and P supply on enzyme activity of diffe-rent crops
Theactivityofphosphataseswasstronglyinfluencedbywateravailability,Psupplyandcropspecies.ThehighestAcPvaluesweremeasuredforoilseedrapeandryewith210and223μgp-nitrophenol/g/h.WatershortageyieldedahigheractivityofAcPinsoilin
comparisontosufficientlywateredtreatments.Significant-lyhighervaluesduetodroughtstresswerefoundforoil-seedrape(42.9%),amaranth(25.1%)andrye(9.54%)intreatmentswithoutPsupply,andforsorghum(15.4%),amaranth(13.3%)andrye(10.6%) intreatmentswithPapplication.Generally,theactivityofAcPwasfoundtoincreaseafterorganicPsupply(Table4).
Table4:
Enzymeactivitiesinsoil(AcPandAlP)asaffectedbywatertreatment,Psupplyandcropspecies
Psupply WHC% Sorghum Amaranth Oilseedrape Rye
AcP(μgp-nitrophenol/gTS/h)
PO 60 178.0a 148.7a 160.8a 206.6a
30 180.7a 185.9b 229.9b 226.3b
P1 60 190.2a 195.6c 221.2b 218.8b
30 219.4b 221.6d 231.3b 242.0c
Mean 192.1 A 188.0 A 210.8 B 223.4 C
AlP(μgp-nitrophenol/gTS/h)
PO 60 12.4b 9.42b 11.6a 12.4a
30 8.12a 7.80a 11.5a 12.3a
P1 60 13.3b 10.8c 11.3a 12.6a
30 17.3c 14.7d 11.4a 13.5b
Mean 12.8 C 10.7 A 11.4 B 12.7 C
differentlettersindicatesignificantdifferentmeansatpd0.05betweenthewaterandthefertilizertreatments,
differentcapitallettersindicatesignificantdifferencesatpd0.05betweencropspecies
TheactivityofAlPwasabout10%oftheAcPactivity.HighestAlPvaluesweremeasuredaftersorghumandryecultivation.TheeffectsofdroughtstressonAlPdependedonthePsupply. IntreatmentswithoutPsupplydroughtstresssignificantlydecreasedAlPactivityforsorghumandamaranth. In contrast, in thephytin treatmentsdroughtstress increased the activity of AlP in combination withamaranth,sorghumandryecultivation(Table4).
Discussion
Effect of water supply on P uptake of different crop species
Shoot biomass and P uptake of crop species are usu-allyreducedunderdrysoilconditions(e.g.PinkertonandSimpson,1986).TheresultsofourexperimentshowedareducedbiomassandPuptakeonlyforsorghumandrye,whilethePuptakeofamaranthandoilseedrapewasnotaffectedbydroughtstress.
Oilseed rape is described tohaveahighPefficiencywhen cultivatedonPpoor soil,which canbeexplainedbyrootexudatesmodifyingthebiochemicalconditionsintherhizosphere(Zhangetal.,1997;Bertrandetal.,1999).This crop is also adapted to P starvation by developinganextensiverootsystemtoexploreahighersoilvolume(Hendriksetal.,1981;Wangetal.,2007).Advancedrootgrowthmayalsoenhancetheuptakeofwaterandothernutrientsunderdroughtconditionsandtherewithelevateplantgrowth.Inaddition,inourexperimentoilseedrapeshowedbyfarthehighestprolinecontentsinleaveswhich
C. Brandt, C. Balko, B. Eichler-Löbermann / Landbauforschung - vTI Agriculture and Forestry Research 4 2011 (61)317-326 323
were further increasedunderdrought stress. This seemsto indicate anadaptationmechanismofoilseed rape todroughtstress.Mülleretal.(2010)foundthatoilseedrapeplantsreacttodroughtstresswithosmoticadjustmenttokeep up tissue metabolic activity and enable re-growthuponre-wetting.Maintenanceofphysiologicalplantpa-rametersmayalsosustainthePuptakeoftherootsunderwaterdeficiency.Besidesoilseedrapeamaranthwasfoundtomaintain
Puptakealsounderdroughtconditions.Thefurtherde-creaseofpHvaluesinsoilafteramaranthcultivationmighthaveaffectedthePavailability,althoughanimprovedavail-abilityduetoafurtherdecreaseofsoilpHcanbehardlyexpectedwhenconsideringthelowinitialpHvaluesofthesoil.IncontrasttoitshighPuptakeamaranthcultivationalsoresultedinhighestvaluesofplantavailablePwinsoil.Ourresultsconfirmedfindingsinotherstudies,showing
theoverallhighnutrientuptakeofamaranth(Escuderoetal.,1999),thehighPuptakeefficiency(Ojoetal.,2010)aswellasa relativelygoodadaptationtodroughtstress(Huraetal.,2007).Theseauthorsdemonstratedthatam-aranthmaintained the leafwater potential underwaterdeficiencywhichresultedinlesswaterstressespeciallyatanearlystageofgrowth.LiuandStützel(2004)foundadecreasedleafareaperrootdrymassforamaranthunderdroughtaffectingthebalancebetweenwater-losingandwater-gainingorgans.In our experiment the shoot biomass and the water
use efficiency (data not shown) of rye were highest ofallcropsinbothwatertreatments.However,droughtre-sultedinadecreaseofshootbiomassandPuptake.Waterdeficiencywasalsofoundtoreducethesecharacteristicsforsorghum.Generally,ryeandsorghumareconsideredtobeadaptedtomarginallandandtobeefficientinwa-ter and nutrient uptake (Baon et al., 1994; Berenji andDahlberg,2004).Itmightbespeculatedthatthedroughteffectsonsorghumhadbeenlowerunderfieldconditionsduetothefastgrowingrootsystemofsorghumthatcanexplorelargesoilvolumes.Otherrelevantaspectsaretheintensityofdroughtandthegrowthstage(Al-Karakietal.,1995;Khalilietal.,2008).Schittenhelm(2010)foundthatsorghumachieved itsmaximumbiomassyieldalreadyatmediumwatersupplywith40to50%ofplantavailablesoilwater,butreducedbiomassconsiderablywhenwatersupplywaslower.Forrye,negativeeffectofdroughtstressonplantgrowthwasalsoshownbyHlavinkaetal.(2009).Thegeneral lowshootbiomass formationof sorghum
inourinvestigationwasmostprobablycausedbythelowtemperatures at the beginning of our outdoor pot ex-periment.Sorghumisknownforitscoldstresssensitivity(Andaetal.,1994).AcidsoilreactionwasalsoshowntoreducethegrowthofvarietiesofSorghum bicolor(Dun-can,1991).
Effect of P supply on P uptake of different crop species
In the present study the organic P supply was foundtohaveagreater impactonplantgrowth than thewa-ter supply. P addition increased the Puptake and shootbiomassofthecrops inbothwatertreatments.Though,theincreasingeffectofPsupplywasusuallyhigherinwellwatered treatments,which point to the growth limitingeffectofwater.Fromtheotherpointofview,thereductionofshootbio-
massforsorghumandryeduetodroughtwasmorepro-nouncedintreatmentswithPthanintreatmentswithoutPsupply.ThiscanbeexplainedbyincreasedplantgrowthafterP supply,which resulted inhigherwaterconsump-tionandthefollowingnegativeeffectthroughincreasingdroughtstress,asalsodescribedbyHuandSchmidthalter(2005).Ryereactedwithasignificantincreasedprolineac-cumulationinleaveswhenPwassupplied,whichwasalsoanindicatorforhigherwaterstressinthefertilizedtreat-ment.Ingeneral,theresultsshowedapositiveeffectoforgan-
icPsupplyonplantparameters.However,thefindingsdidnotindicateanincreaseddroughttoleranceofthetestedcropspeciesasaconsequenceoftheorganicPsupply.
Effect of water and P supply on chemical soil characteristics
ThesoilPpoolsinourstudywereaffectedbycropspe-ciesandPsupply.GenerallyplantavailablePpoolsinsoilincreasedwhenphytinwasapplied,even thewater sol-ublePcontent.Thus itmaybeassumedthatorganicallyboundPwasmineralizedrapidlyintohighlysolublemin-eralPforms,irrespectiveofthewatersupply.DroughtstressdidnotlowertheplantavailablePpools
in soil in the presented pot experiment. In contrast, in-creasedvalueswerefoundwhichwere inaccordancetolower rates of P uptake. Probably, permanent droughtstressunderfieldconditionscouldreduceplantavailableP by formingmore insoluble compounds in soil, aswasshowninotherstudies,e.g.byGarciaetal.(2008).Thecultivationofthedifferentcropspeciesstronglyin-
fluencedPdlcontentinsoil.Anegative,significantcorrela-tionbetweenPuptakeandPdlwasfound(r=0,711**).Therewith Pdl content decreased with increasing P de-mand.
Effect of water and P supply on enzyme activity
ThesupplyoforganicPasphytinincreasedtheactivitiesofAcPandAlPcomparedtotreatmentswithoutP.Usually,theactivityofphosphatasesinsoilincreaseswithorganicPapplication,catalyzingthetransformationoforganicPlikephytin into plant-available P forms (Yadav and Tarafdar,

324
2001).Incontrast,inorganicPsourcesdidnotcauseanin-creaseofphosphataseactivityinsoil(YadavandTarafdar,2001;Wangetal.,2008).The results of the present research also demonstrate
that AcP activity increased under water deficiency. ThismaycontributetoPsupplyofplantsfromorganicsourcesunderdroughtconditions.
Conclusions
TheresultsofthisstudyindicatethatanapplicationoforganicPasphytin can improve thePavailability in soilandincreaseshootbiomassandPuptakeunderdroughtconditions.Ontheotherhand,increasedplantgrowthbyPsupplycausesahigherwaterdemandandmayenforcenegativeeffectsofdroughtstress.Asaconsequence,wesuggestmoderatePfertilizerratesondeficientsoilsinre-lationtothewateravailabilityofthesite.FurtherstudiesunderfieldconditionsneedtobecarriedouttoquantifytheinteractiveroleofdroughtstressandorganicPformsinrelationtocropspeciesonplantproductivity.
References
AbelS,TicconiCA,DelatorreCA(2002)Phosphatesensing inhigherplants.PhysiolPlant115:1-8
Al-KarakiGN,ClarkRB,SullivanCY(1995)Effectsofphosphorusandwaterstresslevelsongrowthandphosphorusuptakeofbeanandsorghumculti-vars.JPlantNutr18:563-578
AndaA,PinterL(1994)Sorghumgerminationanddevelopmentasinfluencedbysoiltemperatureandwatercontent.AgronJ86(4):621-624
Asch F, DingkuhnM, SowA, Audebert A (2005) Drought-induced changesinrootingpatternsandassimilatepartitioningbetweenrootandshootinuplandrice.FieldCropsRes93:223-236
BaoJB,SmithSE,AlstonAM(1994)Growthresponseandphosphorusuptakeof ryewith longand shorthairs : interactionwithmycorrhizal infection.PlantSoil167:247-254
BartelsD,SunkarR(2005)Droughtandsalttoleranceinplants.CritRevPlantSci24:23-58
BatesLS,WaldrenRP,TeareJD(1973)Rapiddeterminationoffreeprolineforwaterstressstudies.PlantSoil39:205-207
BatesTR,LynchJP(2001)Roothairsconferacompetitiveadvantageunderlowphosphorusavailability.PlantSoil236:243-250
BlumeHP,DellerB,LeschberR,PaetzA,SchmidtS,WilkeBM(2000)HandbuchderBodenuntersuchung:Terminologie,VerfahrensvorschriftenundDaten-blätter ; physikalische, chemische, biologische Untersuchungsverfahren ;gesetzlicheRegelwerke.Berlin:Beuth
Berenji J,Dahlberg J (2004)Perspectivesof sorghum inEurope. JAgronomyCropSci190:332-338
BertrandI,HinsingerP,JaillardB,ArvieuJC(1999)Dynamicsofphosphorusintherhizosphereofmaizeandrapegrownonsynthetic,phosphatedcalciteandgoethite.PlantSoil211:111-119
CarvalhaisLC,DennisPG,FedoseyenkoD,HajirezaeiMR,BorrissR,WirènN(2011)Rootexudationofsugars,aminoacids,andorganicacidsbymaizeasaffectedbynitrogen,phosphorus,potassium,andirondeficiency.JPlantNutrSoilSci174:3-11
Ciereszko I, Szczygla A, Zebrowska E (2011) Phosphate deficiency affectsacidphosphataseactivityandgrowthoftwowheatvarieties.JPlantNutr34:815-829
DalalRC(1978)Organicphosphorus.AdvAgron29:83-117
Delauney AJ, Verma DPS (1993) Proline biosynthesis and osmoregulation inplants.PlantJ4(2):215-223
Diaz P, Borsani O,Màrquez A,Monza J (2005) Osmotically induced prolineaccumulationinLotus corniculatus leves isaffectedbylightandnitrogensource.PlantGrowthRegul46:223-232
DickWA,ChengL,WangP(2000)SoilacidandalkalinephosphatesactivityaspHadjustmentindicators.SoilBiolBiochem32:1915-1919
DuncanRR(1991)TheinfluenceofsoilpHonsorghumgrainyields.Commun.SoilSci.PlantAnal.22(15&16):1605-1611
Eichler-LöbermannB,SchiemenzK,MakadiM,VagoI,KöppenD(2008)Nutri-entcyclingbyusingresiduesofbioenergyproduction:II.Effectsofbiomassashesonplantandsoilparameters.CerealResComm36:1259-1262
EscuderoNL,AlbarracinG,FernàndezS,deArellanoLM,MucciarelliS(1999)Nutrient and antinutrient composition of Amaranthus muricatus. PlantFoodsHumanNutr54:327-336
GarciaI,MendozaR,PomarMC(2008)DeficitandexcessofsoilwaterimpactonplantgrowthofLotus tenuisbyaffectingnutrientuptakeandarbuscularmycorrhizalsymbiosis.PlantSoil304:117-131
GargBK,BurmanU,KathjuS(2004)Theinfluenceofphosphorusnutritiononthephysiologicalresponseofmothbeangenotypestodrought.JPlantNutrSoilSci167:503-508
Gutièrrez-BoemFH,ThomasGW(1999)Phosphorusnutritionandwaterdefi-citsinfield-grownsoybeans.PlantSoil207:87-96
HeYQ,ZhuYG,SmithSE,SmithFA(2002)Interactionbetweensoilmoisturecontentandphosphorussupply inspringwheatplantsgrowninpotcul-ture.JPlantNutr25(4):913-925
HendriksL,ClaassenN,JungkA(1981)PhosphatverarmungdeswurzelnahenBodensundPhosphataufnahmevonMaisundRaps.ZPflanzenernaehrBo-denkd144:486-499
HlavinkaP,TrnkaM,SemeràdovàD,DubrovskyM,ZaludZ,MoznyM(2009)EffectofdroughtonyieldvariabilityofkeycropsinCzechRepublic.AgricForMeteorol149:431-442
HuY,SchmidhalterU(2005)Droughtandsalinity:acomparisonoftheireffectsonmineralnutritionofplants.JPlantNutrSoilSci168:541-549
HuraT,HuraK,GrzesiakM,RzepkaA(2007)Effectoflong-termdroughtstressonleafgasexchangeandfluorescenceparametersinC3andC4plants.ActaPhysiolPlant29:103-113
JacobD,GöttelH,KotlarskS,LorenzP,SieckK(2008)KlimaauswirkungenundAnpassungeninDeutschland:Phase1:ErstellungregionalerKlimaszenari-enfürDeutschland[online].Tobefoundat<http://www.umweltdaten.de/publikationen/fpdf-l/3513.pdf>[quoted06.10.2011]
KhaliliA,AkbariN,ChaichiMR(2008)Limitedirrigationandphosphorusfer-tilizereffectsonyieldandyieldcomponentsofgrainsorghum(Sorghum bicolor L. var. Kima).Am-EurasianJAgricEnvironSci3(5):697-702
KreyT,CausM,BaumC,RuppelS,Eichler-LöbermannB(2011)Interactiveef-fectsofplantgrowth-promotingrhizobacteriaandorganicfertilizationonPnutritionofZea maysL.andBrassica napusL..JPlantNutrSoilSci174:1-12
KuznetsovVlV,ShevyakovaNI(1999)Prolineunderstress:biologicalrole,me-tabolism,andregulation.RussJPlantPhysiol46(2):305-320
LiSM,LiL,ZhangFS,TangC(2004)Acidphosphataseroleinchickpea/maizeintercropping.AnnBot94(2):297-303
LiuF,StützelH(2004)Biomasspartitioning,specificleafarea,andwateruseefficiencyofvegetableamaranth(Amaranthusspp.)inresponsetodroughtstress.SciHortic102:15-27
LookmannR,VanderweertN,MerckxR,VlassakK(1995)Geostatisticalassess-mentof the regionaldistributionofphosphate sorption capacityparam-eters(FeoxandAlox)innorthernBelgium.Geoderma66:285-296
MaZ,BielenbergDG,BrownKM,LynchJP(2001)Regulationofroothairden-sity by phosphorus availability inArabidopsis thaliana. PlantCell Environ24:459-467
MüllerT,LüttschwagerD,LentzschP(2010)Recoveryfromdroughtstressattheshootingstageinoilseedrape(Brassica napus).JAgronCropSci196:81-89
NuruzzamanM,LambersH,BollandMDA,VeneklaasEJ(2006)Distributionofcarboxylatesandacidphosphataseanddepletionofdifferentphosphorusfractionsintherhizosphereofacerealandthreegrainlegumes.PlantSoil281:109-120

C. Brandt, C. Balko, B. Eichler-Löbermann / Landbauforschung - vTI Agriculture and Forestry Research 4 2011 (61)317-326 325
OjoOD, Akinrinde EA, AkorodaMO (2010) Residual effects of phosphorussourcesingrainamaranthproduction.JPlantNutr33:770-783
PageAL,MillerRH,KeeneyDR(1982)Methodsofsoilanalysis:Part2:chemicalandmicrobiologicalproperties.MadisonWis:AmSocAgron,Agronomy9,2
PinkertonA,SimpsonJR(1986)Interactionsofsurfacedryingandsubsurfacenutrientsaffectingplant-growthonacidsoilprofilesfromanoldpasture.AustJExpAgric26:681-689
RamaekersL,RemansR,RaoIM,BlairMW,VanderleydenJ(2010)Strategiesforimprovingphosphorusacquisitionefficiencyofcropplants.FieldCropsRes117:169-176
RodriguezD,GoudriaanJ,OyarzabalM,PomarMC(1996)Phosphorusnutriti-onandwaterstresstoleranceinwheatplants.JPlantNutr19:29-39
RömerW(2006)NeuereErkenntnissezurPhosphataufnahmevonPflanzen–Literaturbefunde.ArchAgronSoilSci52(1):1-17
SamarahN,MullenR,CianzioS(2004)Sizedistributionandmineralnutrientsofsoybeanseedsinresponsetodroughtstress.JPlantNutr27:815-835
SchiemenzK,Eichler-LöbermannB(2010)Biomassashesandtheirphosphorusfertilizingeffectondifferentcrops.NutrCyclAgroecosyst87:471-482
SchillingG,KerschbergerM,KummerKF,PeschkeH(2000)PflanzenernährungundDüngung.Stuttgart:Ulmer,464p
SchittenhelmS(2010)Effectofdroughtstressonyieldandqualityofmaize/sunflowerandmaize/sorghumintercropsforbiogasproduction.JAgrono-JAgrono-myCropSci196:253-261
SchoumansOF(2000)Determinationofthedegreeofphosphatesaturationinnon-calcaroussoils.SouthernCooperativeSeriesBulletin396:31-34
SchwertmannU(1964)DifferenzierungderEisenoxidedesBodensdurchEx-durchEx-traktionmitAmmoniumoxalatlösung.ZPflanzenernährBodenkd105:194-202
Shubhra,DayalJ,GoswamiCL,MunjalR(2004)Influenceofphosphorusap-plicationonwaterrelations,biochemicalparametersandgumcontent inclusterbeanunderwaterdeficit.BiolPlant48(3):445-448
SingBR,SingDP (1995)Agronomicandphysiological responseof sorghum,maizeandpearlmillettoirrigation.FieldCropsRes42:57-67
SomalTLC,YapaPAJ(1998)Accumulationofprolineincowpeaundernutrient,drought,andsalinestresses.JPlantNutr21(11):2465-2473
StoddardFL,BalkoC,ErskineW,KhanHR,LinkW,SarkerA(2006)Screeningtechniquesandsourcesofresistancetoabioticstressesincool-seasonfoodlegumes.Euphytica147:167-184
TabatabaiMA,BremnerJM(1969)Useofp-nitrophenylphosphateforassayofsoilphosphataseactivity.SoilBiolBiochem1:301-307
TarafdarJC,ClaassenN(2005)Preferentialutilisationoforganicandinorganicsourcesofphosphorusbywheatplant.PlantSoil275:285-293
VanderPaauwF(1971)Aneffectivewaterextractionmethodforthedetermi-nationofplant-availablesoilphosphorus.PlantSoil34:467-481
WangL,deKroonH,SmitsAJM(2007)Combinedeffectsofpartialrootdryingandpatchyfertilizerplacementonnutrientacquisitionandgrowthofoil-seedrape.PlantSoil295:207-216
WangX, TangC,GuppyCN, Sale PWG (2008) Phosphorus acquisition cha-racteristics of cotton (Gossypium hirsutum L.), wheat (Triticum aestivum L.)andwhitelupin(Lupinus albusL.)underPdeficitconditions.PlantSoil312:117-128
WittenmayerL,MerbachW(2005)Plantresponsestodroughtandphospho-rusdeficiency:contributionofphytohormonesinroot-relatedprocesses.JPlantNutrSoilSci168:531-540
YadavRS,Tarafdar JC (2001) Influenceoforganicand inorganicphosphorussupplyonthemaximumsecretionofacidphosphatasebyplants.BiolFertilSoils34:140-143
ZhangFS,MaJ,CaoYP(1997)Phosphorusdeficiencyenhancesrootexudationoflow-molecularweightorganicacidandutilizationofsparinglysolublein-organicphosphatesbyradish(Raghanus satiuvsL.)andrape(Brassica napus L.)plants.PlantSoil196:261-264

326
U. Dämmgen, W. Brade, J. Schulz, H. Kleine Klausing, N. J. Hutchings, H.-D. Haenel, C. Rösemann / Landbauforschung - vTI Agriculture and Forestry Research 4 2011 (61)327-342
327
The effect of feed composition and feeding strategies on excretion rates in German pig production
UlrichDämmgen*,1WilfriedBrade**,2JoachimSchulz***,3HeinrichKleineKlausing****,4NicholasJ.Hutchings*****,5
Hans-DieterHaenel*,andClausRösemann*
*1 JohannHeinrichvonThünenInstitute,InstituteofAgriculturalClimate Research,Bundesallee50,38116Braunschweig,Germany
**2 University of Veterinary Medicine Hannover, Institute for Animal BreedingandGenetics,Buenteweg17p,30559Hannover,Germany
***3 Landwirtschaftskammer Niedersachsen, Außenstelle Lingen, Am Hundesand12,49809Lingen,Germany
****4 Deuka-DeutscheTiernahrungCremerGmbH&Co.KG,Weizenmüh- lenstraße20,40221Düsseldorf,Germany
*****5University of Aarhus, Dept. of Agroecology, Faculty of Agricultural Sciences,POBox50,ResearchCentreFoulum,8830Tjele,Denmark
Abstract
Inorderto improvethemethodsandupdatethedatafor theGermanagricultural emission inventory, a surveywasmadeamongpignutritionexpertstoobtainrepresen-tativedietcompositionsandfeedingstrategies.Theanaly-sis shows that the introductionof phase feeding resultsin reduced excretion rates of volatile solids.Contrary toexpectations,thedirecteffectonallotherexcretionratesis comparatively small. However, phase feedingwith itstypicalall-in-all-outmanagementresultsinextendedpro-duction cycles as fattening of new animal groups com-mencesaftercleansinganddisinfection,andthesedonotcommencebeforethelastanimallefttherespectivecom-partment.Thisleadstoareductionofemissionsperplace.Theeffectofdietsadjustedtocrudeproteindemands isobvious.Improvementofstandarddietisaclearoptiontoreduceemissions.As the emissions of methane from manure manage-
ment,aswellasthoseofallnitrogenspecies,aredirectlyrelated to the respective amounts excreted, the calcula-tionsusingdetailedinformationonfeedcompositionwillresultinreducedemissionratesfrompigproduction.
Keywords: pigs, feed, phase feeding, production cycles, excretion, methane, volatile solids, nitrogen, TAN
Zusammenfassung
Der Einfluss von Futterzusammensetzung und Fütte-rungsstrategien auf die Ausscheidungsraten in der deutschen Schweineproduktion
Zur methodischen Verbesserung und Aktualisierungder deutschen landwirtschaftlichen Emissionsinventarefür Schweine wurden repräsentative Futterzusammen-setzungenundDaten zu Fütterungsstrategienbei Fütte-rungsexpertenerfragt.DieAuswertungzeigt,dassmitderEinführungderPhasenfütterungdieAusscheidungenvonumsetzbaremKohlenstoff (volatile solids) verringertwer-den.DerdirekteEinflussaufalleanderenAusscheidungenist wider Erwarten gering. Bedingt durch das Mastma-nagement der Rein-Raus-Methode verlängern sich dieProduktionszyklen.EineneueTiergruppekannersteinge-stalltwerden,wenndasletzteTierdasStallabteilgeräumthatunddieReinigungundDesinfektionerfolgt ist.Diesverringert die Emissionenpro Platz erheblich.Der EffektvonN-angepassterFütterungistklarzuerkennen,ebensodasPotential,dasbeiverbesserterStandardfütterungnochausgeschöpftwerdenkann.Da die Mengen der Ausscheidungen linear die Men-
ge der Emissionen von Methan aus dem Lager sowiesämtlicher Stickstoff-Spezies beeinflusst, werden die Be-rechnungen unter Verwendung detaillierter Futterzu-sammensetzungen zu niedrigeren Emissionen aus derSchweine-Produktionführen.
Schlüsselwörter: Schweine, Futter, Phasenfütterung, Pro-duktionszyklen, Ausscheidung, Methan, „volatile solids“, Stickstoff, TAN
328
1 Introduction
Pigproduction isan important sector inGermanagri-culture.Itisalsoakeysourceofgreenhousegasandam-moniaemissions.Duringthepastdecades,methodsinpigproductionhavechanged.Thishasbeenduetochangesingenetics,feeding,housing,andmanuremanagement.AccordingtoGoodPracticeRules,emissionreportinghastoreflectthesechangesasfaraspossible.Changesingeneticshavebeenreflectedintheperfor-
mancedatausedtodescribeenergyintake(Haeneletal.,2011).Housingandmanuremanagementaswellastheroleofairscrubbershavebeendealtwithinrecentpub-lications (Dämmgenetal.,2010;2011a,b).Changes infeedingpracticeshavenotbeentakenintoaccountyet.Thepurposeofthisworkisthecompilationofregional
dataonfeedcompositionandfeedingregimes inawaythatallowstheirincorporationintoemissioninventories.In order to illustrate the effects of changing feeding
practices,thefeedintakeratesandexcretionratesarecal-culatedforstandardanimals(seebelow).
2 Modelling procedures and data requirements
Thefirststepinthecalculationofemissionsfromanimalhusbandryistheassessmentofenergyrequirementsandfeedintakerates.Bothguidancedocuments(IPCC,1996;2006;EEA,2009)presupposethatanimalsarefedaccord-ingtoenergyrequirements.Thesecondstepisthecalcula-tionofrelevantexcretionrates.Methane(CH4)isdirectlyreleasedasaconsequenceofentericfermentationinthedigestivetract.Excretionsofvolatilesolids(VS)leadtotheemissionsofCH4fromthestorageofanimalfaeces.Excre-tionoftotalnitrogen(N)andtotalammoniacalnitrogen(TAN)govern the releaseofammonia (NH3),nitrousandnitricoxides(N2O,NO),anddi-nitrogen(N2)intheanimalhouse,duringmanurestorageandduringandafteritsap-plication.Here,theguidancedocumentsoutlinethepro-cedure;theyalsosupposetheuseofnationalapproachesanddataasfaraspossible.
2.1 Energy intake rates
Energyrequirementsaretheentitiesgoverningfeedin-takerates.TheGermansystemmakesuseofthemetabo-lizable energy (ME) requirements that are calculated ac-cordingtoFlachowskyetal.(2006)asdescribedinHaeneletal.(2011).Themethodologydistinguishesbetweenthe following
subcategoriesoflivestock:Sows and suckling pigsaretreatedtogether.Energy
requirementsarecalculatedfortwogravidityphases,forthelactatingperiodandtheperiodbetweenweaningand
mating. Thenumberofpiglets raised, their finalweightandthemeanweightofthesowaretakenintoaccount.Thestandard sowusedinthisworkhasameanweight
of200kganimal-1.Noweightgainisconsidered.23pig-letsareraisedandweanedataweightof8.5kganimal-1.
Weaners, fattening pigs and boars(maturemalesforreproduction)aretreatedinasimilarmanner.Theirweightandweightgainsareconsideredasdriversforenergyre-quirements.FordetailsseeHaeneletal.(2011).Thestandard weanershaveameanweightgainof410
ganimal-1d-1andafinalweightof28.5kganimal-1.Thenumberofproductioncyclesperyeartakesaserviceanddisinfectionperiodof8dround-1intoaccount.
Standard fattenersareassumedtohaveameanweightgainof750ganimal-1d-1andafinalweightof110kganimal-1.Serviceanddisinfectionperiodsarevariable.
Standard boarshaveameanweightof180kganimal-1.Aweightgainisnottakenintoaccount.
2.2 Feed intake rates and feed properties
Inadditiontothedifferentiationofsubcategories,feed-ing-phases1,
1 A feeding-phase is defined as a period duringwhich the composition ofadietiskeptunchanged.Bothbeginningandendofafeeding-phasearedefinedbyanimalweights.
andadministrative region (e.g. federal stateor–withinNiedersachsen(LowerSaxony)–ruraldistricts)aretakenintoaccount.Unlessstatedotherwise,variablesshould be subscripted accordingly; a given variable would therefore relate to livestock subcategory i in thefeedingphasejandfortheregionk.Anyelementofanequationthatisconstantacrosslivestockcategory,feedingphaseandregionisindicatedasconstant.
Calculation of weighted means. The livestockdietscommonlyconsistofamixtureofconstituents.Thechar-acteristicsofthecompletediet(specificMEcontentetc.)are calculatedusingaweightedaverage, so for agivencharacteristic in a diet containing constituents, thevalueforthecompletedietis:
� �¦
� (1)
where weightedmeanofagivencharacteristicZ
valueofthecharacteristicforthenthconstituent
proportion that thenth constituent contributes tothemassofthecompletediet(inkgkg-1)
and
¦
¦
(1a)

U. Dämmgen, W. Brade, J. Schulz, H. Kleine Klausing, N. J. Hutchings, H.-D. Haenel, C. Rösemann / Landbauforschung - vTI Agriculture and Forestry Research 4 2011 (61)327-342
329
Feed intake rates(drymatter,DM)arededucedfromenergyintakeratesaccordingtoEquation(2):
K (2)
where
feedintakerate(DM)forananimalsub- categoryiinafeedingphasejandare- gionk(inkganimal-1d-1DM)
ME requirements of an animal sub- categoryiinafeedingphasejandare- gionk(inMJanimal-1d-1)
specificMEcontentoffeedforanani- mal subcategory i in a feedingphase j andaregionk(inMJkg-1)
Nitrogen intake ratesareobtainedbycombiningfeedintakerateswithNcontentsofthefeedconstituents:
K
K� (3)
where
rateofNintake(drymatter)foranani- mal subcategory i in a feedingphase j andaregionk(inkganimal-1d-1DM)
metabolizable energy requirements for an animal subcategory i in a feeding phasejandaregionk(inMJanimal-1d-1)
specificMEcontentoffeedforanani- mal subcategory i in a feedingphase j andaregionk(inMJkg-1)
mean N content of feed of an animal subcategoryiinafeedingphasejanda regionk(inkg-1kg-1)
ThemeanNcontentsareweightedmeansobtainedinanalogytoEquations(1)and(1a).
Mean feed properties(suchasmeangrossenergycon-tents ,meanashcontents arealsoweightedmeans calculated from the respective feed constituents’propertiesasinEquation(1).Withfewexceptions,standardspecificME,GE,N,and
ashcontentsanddigestibilitiesareobtainedfromJentschet al. (2004), crude protein (XP) contents from the listsprovidedbyLfL(2009)andDLG(2011).Therelevantpropertiesofthedietconstituentsconsid-
eredarelistedinTable1.Regional feed compositions were supplied by experts
(seeChapter3).
2.3 Methane excretion from enteric fermentation
IPCC (1996) relates the amount ofCH4 released fromentericfermentationtothegrossenergy(GE)intake.Withdata available for German pig production this relationreads:
DK
KK
��� (4)
where
rateofCH4excretion(emission)fromentericfer- mentation(inkgplace-1a-1CH4) intakerateofmetabolizableenergy(inMJplace-1d-1) MEcontentoffeed(inMJkg-1) GEcontentoffeed(inMJkg-1) methaneconversionrate( =0.006MJMJ-1) energycontentofmethane( =55.65MJ(kgCH4)
-1) timeunitsconversionfactor( =365da-1)
2.4 Volatile solids excretion rates
VSexcretionratesarederivedfromtheintakeratesofmetabolizableenergy,theenergy,andtheashcontentsoffeedandthedigestibilityoforganicmatter,asexpressedinEquation(5)2.
2 ThisapproachdiffersfromthemethodologypreviouslyusedinGermanin-ThisapproachdiffersfromthemethodologypreviouslyusedinGermanin-ventories(Rösemannetal.,2011).FordetailsseeDämmgenetal.(2011a).
� � � � ���� K
(5)
where volatile solids excretion rate with faeces (in kg
place-1a-1) intakerateofmetabolizableenergy(inMJplace-1a-1) MEcontentoffeed(inMJkg-1)
ashcontentoffeed(inkgkg-1) apparentdigestibilityoforganicmatter(inkgkg-1)
2.5 Nitrogen excretion rates
ThegeneralNbalanceisusedtoassesstheratesofover-allNexcreted:
���� K
K (6)
where rateofNexcreted(kgplace-1a-1N) MEintakeratewithfeed(kgplace-1a-1N)
-1 MEcontentoffeed(inMJkg ) Ncontentoffeed(inkgkg-1),derivedfromXP
content

330
rateofNexcretedwithmilk(kgplace-1 -1a N) rateofNretainedintheanimal(kgplace-1a-1N) rateofNinoffspringproduced(kgplace-1a-1N)
and
KK (6a)
where Ncontentoffeed(inkgkg-1) crudeproteincontentoffeed(inkgkg-1) Ncontentofcrudeproteininfeed( =1/6.25kgkg-1)
Forsowswithsuckling-pigsml is ignoredintheinven-toryas theNbalancecovers theunitofasowwithherlitter. Also, for sows,meanweight gains are not takenintoaccount.Hence, iszeroforsows.TheNcontentofgrowingpigsis0.0256kgkg-1.
2.6 Total ammoniacal nitrogen excretion rates
It is assumed that TAN is excreted with urine only,whereasallorganicNiscontainedinfaeces3.
3 ThemethodusedinRösemannetal.(2011)wasslightlymodifiedbyreplac-ThemethodusedinRösemannetal.(2011)wasslightlymodifiedbyreplac-ingthedigestibilityofenergybythatofN.
4 RAM:Rohprotein-angepassteMischung:mixtureadjustedtocrudeproteindemands
����� KK
(7)
where rateofNexcretedwithurine(kgplace-1a-1N) MEintakeratewithfeed(kgplace-1a-1N) MEcontentoffeed(inMJkg-1) Ncontentoffeed(inkgkg-1) apparentdigestibilityofN(inkgkg-1) rateofNexcretedwithmilk(kgplace-1a-1N) rateofNretainedintheanimal(kgplace-1a-1N) rateofNinoffspringproduced(kgplace-1a-1N)
3 Data base
Asurveywasmadein2010toprovideinformationonfeedsforsowswithpiglets,weaners,fatteners,andboars(forreproduction).Thissurveyprovidedinformationabouttypical animal feed compositions among regions aswellas on the frequency distribution of feeding phases, theshareofdietswithreducedNcontents(RAMfeed4),andthenumberofanimal roundsperyearforeachGermanfederalstateandeachyearfrom1990to2009.
3.1 Feed composition
3.1.1 Results of the survey
Asurveywasmadetoassesstypicalfeedcompositionsforallregionalfeedtypes.Asarule,thelocalagriculturaladvisorsprovidedvariousdietsforeachpigsubcategory.So,inall,288dietsweredescribed,ofwhich86werefedtosows,66toweanersand122tofatteningpigs.Boarswerenormallyfedonsowfeed.ThespatialresolutionwastoreflectthevariabilityinGermanpigproductionthatisobviouslygovernedbysoilpropertiesandmarketsaswellastradition.ForNiedersachsen,thefederalstatewiththehighestpigdensity,11regionswereidentifiedwherethefeedcompositionwaslikelytovary.Allotherfederalstateswereassumedtobehomogeneouswithrespecttotheirpigfeedcompositionandfeedingstrategy.Someadvisorsconsideredtheirinformationconfidential.
Hence,resultswillbeanonymized.
3.1.2 Gap filling
One federal state did not provide data. Here, thosedatafromtheneighbouringfederalstateswereusedthatwouldresultinthemostunfavourableexcretionrates.Thiswastoavoidunderestimationofemissions.For thecity statesofHamburg,Bremen (withBremer-
haven), and Berlin data for Schleswig-Holstein, Nieder-sachsen, and Brandenburgwere used, respectively. Saa-rlandwasdescribedinthesamewayasRheinland-Pfalz.
3.1.3 Temporal representativeness
Thecompositionoffeedsisassumedtohavechangedonlytoalesserextent.From1996onwards,theuseofgraininthefeedmanu-
facturingindustryhassteadilyincreasedfrom35percentinaverageoverallkindoffeedvarietiesto44percent(DVT,2011).Grainreplacedstarch-richby-productslikemanioc,importedfromthirdcountries,aswellasby-productsfromthe grain-milling industry likemaize gluten feed. InDe-cember2000 theuseofby-products fromanimaloriginwhichwasusedasproteinandenergysourceinsomefeedforpigsandpoultrywasbannedbecauseoftheBSEcrisis.Thesefeedstuffswerereplacedbyanincreaseduseof,forinstance,soyabeanmeal.Figure 1 illustrates that the main properties have
changedlittleoverthelasttwodecades.

U. Dämmgen, W. Brade, J. Schulz, H. Kleine Klausing, N. J. Hutchings, H.-D. Haenel, C. Rösemann / Landbauforschung - vTI Agriculture and Forestry Research 4 2011 (61)327-342
331
10
11
12
13
14
15
1990 1995 2000 2005 2010Year
ME
conte
nt [M
J kg
]-1
mean min max
1990 1995 2000 20102005Year
1990 1995 2000 20102005Year
1990 1995 2000 20102005Year
12
14
16
18
20
XP
conte
nt [g
kg
]-1
mean min max
mean min max mean min max
ME
conte
nt [M
J kg
]-1
XP
conte
nt [g
kg
]-1
8
9
10
11
12
13
14
10
12
14
16
18
Figure1
Temporal variationofMEandXP contentsof various feeds.Above: fatteningpig feeds;below: farrowing sow feeds.Data courtesyofK.-H.Grünewald,contentsbefore2000fromalimitednumberofsamples,dataafter2000fromabout300to250and140to200samplesperyearforfatteningpigsandsows,respectively.
3.2 Feed properties
3.2.1 Properties of feed constituents
BasedontheequationsprovidedinChapter2,thecal-culationofexcretionratesforCH4,VS,N,andTANpresup-posesknowledgeofthefollowingfeedproperties• metabolizableenergycontent, ,forallanimals(feedintakerates)
• gross energy content, (assessment of emissionsfromentericfermentation)
• digestibilityfororganicmatter, ,(assessmentofVSexcretionrates)
• crudeproteincontent, (Nintakerate)• digestibility of N, (assessment of TAN excretionrates)
InEurope,propertiesandcompositionofcommoditieshavetobedeclaredtosomeextent(EC,2002).Thiscov-ersthepercentagesofpigfeedconstituentsaswellasthemeanME,XP,andashcontentsofthemix.Propertiesoffeedconstituentscanbeobtainedfromvariousdatacol-lations:
• DLG(2005)isconsideredtobetheofficialexpertjud-gementforGermanyandnationalconsent (Spiekers,headofthegroupofauthors,pers.comm.).Table3ainDLG(2005)isconfinedtothemostimportantfeedandcontainsDM,ME,andcrudeprotein(XP)contents.
• LfL(2009)isanalmostcomprehensivedatabase.TheinformationusedforthisworkcomprisestheDM,ME,andXPcontents.
• KTBL(unpublished)usesacollationoffeedpropertiesthatcontainsthedigestibilities and inadditiontoDM,ME,andXPcontents.
• Jentschetal.(2004)isacomprehensiveandveryde-taileddatabase.ApartfromGE,DE,ME,andashcon-tentsitprovidesinformationonthedigestibilities ,
and .
3.2.2 Harmonization and data gap closing for feed con-stituents
Thebackboneof Table1 is thedataprovidedby Jen-tschetal.(2004).Inordertomeetthe“official”informa-tioninDLG(2005),weightedmeanshadtobeproducedfromJentschetal.(2004)data,suchasamixtureofvari-
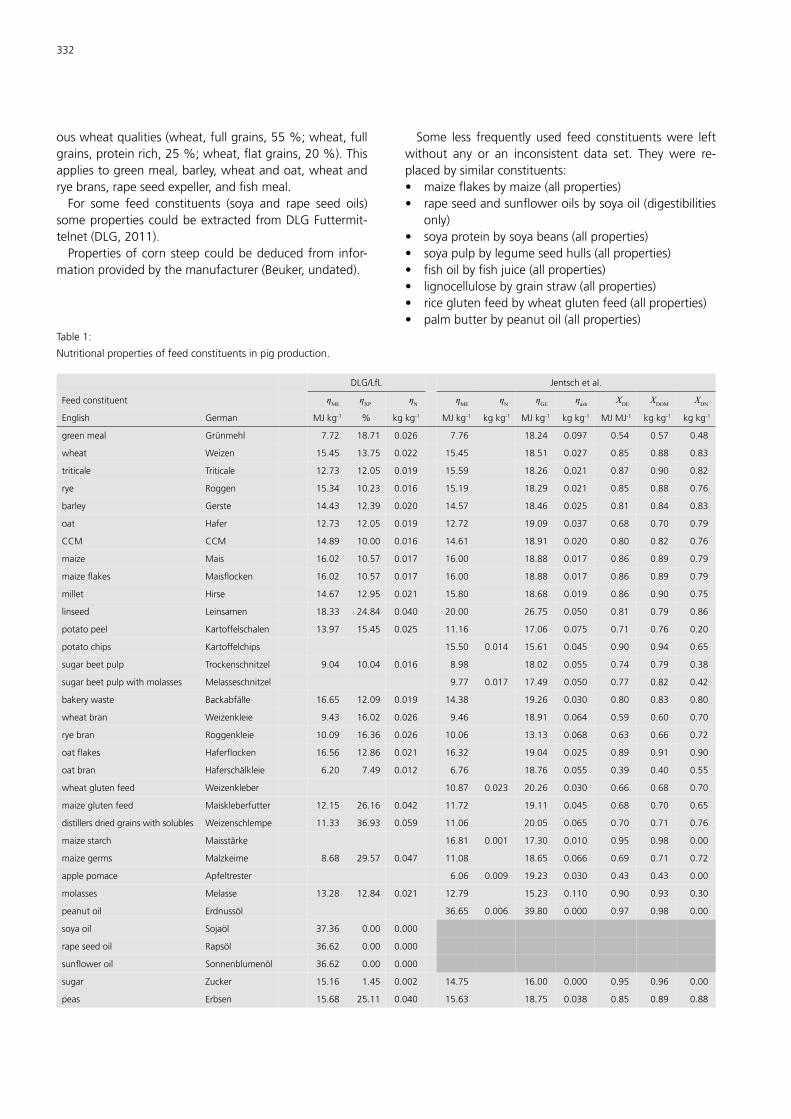
332
ouswheatqualities(wheat,fullgrains,55%;wheat,fullgrains,proteinrich,25%;wheat,flatgrains,20%).Thisappliestogreenmeal,barley,wheatandoat,wheatandryebrans,rapeseedexpeller,andfishmeal.For some feed constituents (soya and rape seed oils)
somepropertiescouldbeextractedfromDLGFuttermit-telnet(DLG,2011).Propertiesofcornsteepcouldbededucedfrom infor-
mationprovidedbythemanufacturer(Beuker,undated).
Table1:
Nutritionalpropertiesoffeedconstituentsinpigproduction.
DLG/LfL Jentschetal.
Feedconstituent
English German MJkg-1 % kgkg-1 MJkg-1 kgkg-1 MJkg-1 kgkg-1 MJMJ-1 kgkg-1 kgkg-1
greenmeal Grünmehl 7.72 18.71 0.026 7.76 18.24 0.097 0.54 0.57 0.48
wheat Weizen 15.45 13.75 0.022 15.45 18.51 0.027 0.85 0.88 0.83
triticale Triticale 12.73 12.05 0.019 15.59 18.26 0.021 0.87 0.90 0.82
rye Roggen 15.34 10.23 0.016 15.19 18.29 0.021 0.85 0.88 0.76
barley Gerste 14.43 12.39 0.020 14.57 18.46 0.025 0.81 0.84 0.83
oat Hafer 12.73 12.05 0.019 12.72 19.09 0.037 0.68 0.70 0.79
CCM CCM 14.89 10.00 0.016 14.61 18.91 0.020 0.80 0.82 0.76
maize Mais 16.02 10.57 0.017 16.00 18.88 0.017 0.86 0.89 0.79
maizeflakes Maisflocken 16.02 10.57 0.017 16.00 18.88 0.017 0.86 0.89 0.79
millet Hirse 14.67 12.95 0.021 15.80 18.68 0.019 0.86 0.90 0.75
linseed Leinsamen 18.33 24.84 0.040 20.00 26.75 0.050 0.81 0.79 0.86
potatopeel Kartoffelschalen 13.97 15.45 0.025 11.16 17.06 0.075 0.71 0.76 0.20
potatochips Kartoffelchips 15.50 0.014 15.61 0.045 0.90 0.94 0.65
sugarbeetpulp Trockenschnitzel 9.04 10.04 0.016 8.98 18.02 0.055 0.74 0.79 0.38
sugarbeetpulpwithmolasses Melasseschnitzel 9.77 0.017 17.49 0.050 0.77 0.82 0.42
bakerywaste Backabfälle 16.65 12.09 0.019 14.38 19.26 0.030 0.80 0.83 0.80
wheatbran Weizenkleie 9.43 16.02 0.026 9.46 18.91 0.064 0.59 0.60 0.70
ryebran Roggenkleie 10.09 16.36 0.026 10.06 13.13 0.068 0.63 0.66 0.72
oatflakes Haferflocken 16.56 12.86 0.021 16.32 19.04 0.025 0.89 0.91 0.90
oatbran Haferschälkleie 6.20 7.49 0.012 6.76 18.76 0.055 0.39 0.40 0.55
wheatglutenfeed Weizenkleber 10.87 0.023 20.26 0.030 0.66 0.68 0.70
maizeglutenfeed Maiskleberfutter 12.15 26.16 0.042 11.72 19.11 0.045 0.68 0.70 0.65
distillersdriedgrainswithsolubles Weizenschlempe 11.33 36.93 0.059 11.06 20.05 0.065 0.70 0.71 0.76
maizestarch Maisstärke 16.81 0.001 17.30 0.010 0.95 0.98 0.00
maizegerms Malzkeime 8.68 29.57 0.047 11.08 18.65 0.066 0.69 0.71 0.72
applepomace Apfeltrester 6.06 0.009 19.23 0.030 0.43 0.43 0.00
molasses Melasse 13.28 12.84 0.021 12.79 15.23 0.110 0.90 0.93 0.30
peanutoil Erdnussöl 36.65 0.006 39.80 0.000 0.97 0.98 0.00
soyaoil Sojaöl 37.36 0.00 0.000
rapeseedoil Rapsöl 36.62 0.00 0.000
sunfloweroil Sonnenblumenöl 36.62 0.00 0.000
sugar Zucker 15.16 1.45 0.002 14.75 16.00 0.000 0.95 0.96 0.00
peas Erbsen 15.68 25.11 0.040 15.63 18.75 0.038 0.85 0.89 0.88
Some less frequently used feed constituentswere leftwithout any or an inconsistent data set. They were re-placedbysimilarconstituents:• maizeflakesbymaize(allproperties)• rapeseedandsunfloweroilsbysoyaoil(digestibilitiesonly)
• soyaproteinbysoyabeans(allproperties)• soyapulpbylegumeseedhulls(allproperties)• fishoilbyfishjuice(allproperties)• lignocellulosebygrainstraw(allproperties)• riceglutenfeedbywheatglutenfeed(allproperties)• palmbutterbypeanutoil(allproperties)
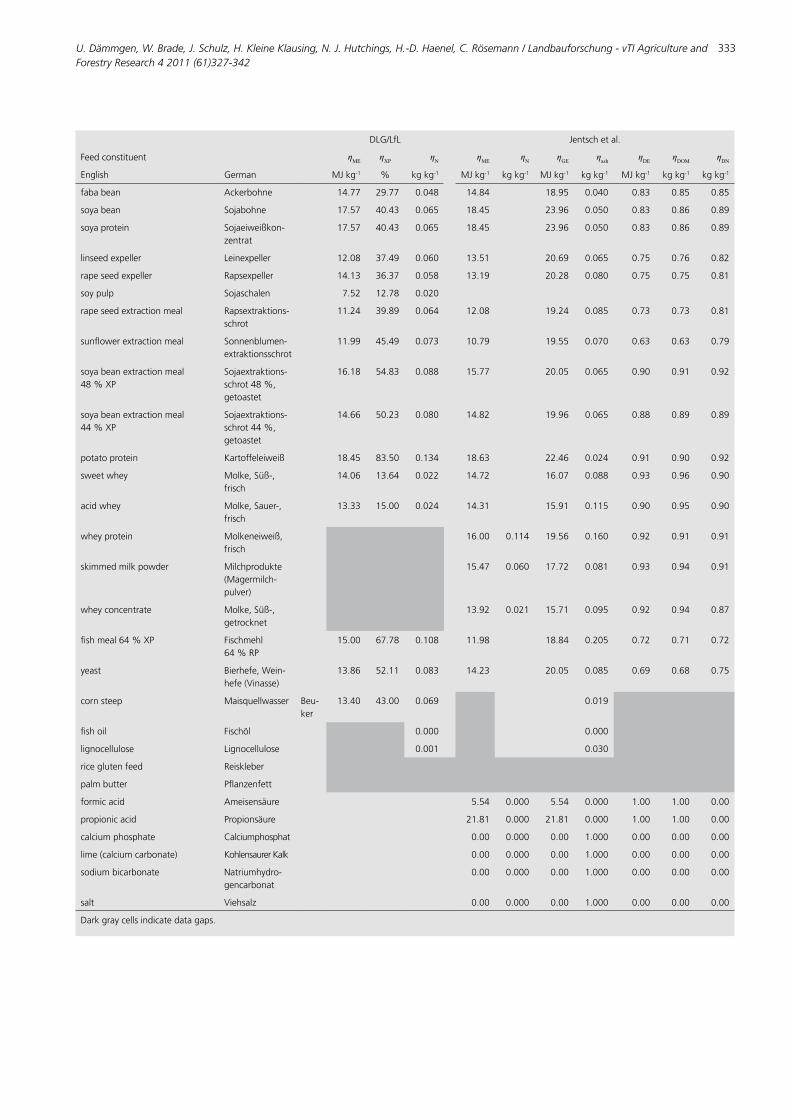
U. Dämmgen, W. Brade, J. Schulz, H. Kleine Klausing, N. J. Hutchings, H.-D. Haenel, C. Rösemann / Landbauforschung - vTI Agriculture and Forestry Research 4 2011 (61)327-342
333
DLG/LfL Jentschetal.
Feedconstituent
English German MJkg-1 % kgkg-1 MJkg-1 kgkg-1 MJkg-1 kgkg-1 MJkg-1 kgkg-1 kgkg-1
fababean Ackerbohne 14.77 29.77 0.048 14.84 18.95 0.040 0.83 0.85 0.85
soyabean Sojabohne 17.57 40.43 0.065 18.45 23.96 0.050 0.83 0.86 0.89
soyaprotein Sojaeiweißkon-zentrat
17.57 40.43 0.065 18.45 23.96 0.050 0.83 0.86 0.89
linseedexpeller Leinexpeller 12.08 37.49 0.060 13.51 20.69 0.065 0.75 0.76 0.82
rapeseedexpeller Rapsexpeller 14.13 36.37 0.058 13.19 20.28 0.080 0.75 0.75 0.81
soypulp Sojaschalen 7.52 12.78 0.020
rapeseedextractionmeal Rapsextraktions-schrot
11.24 39.89 0.064 12.08 19.24 0.085 0.73 0.73 0.81
sunflowerextractionmeal Sonnenblumen-extraktionsschrot
11.99 45.49 0.073 10.79 19.55 0.070 0.63 0.63 0.79
soyabeanextractionmeal48%XP
Sojaextraktions-schrot48%,getoastet
16.18 54.83 0.088 15.77 20.05 0.065 0.90 0.91 0.92
soyabeanextractionmeal44%XP
Sojaextraktions-schrot44%,getoastet
14.66 50.23 0.080 14.82 19.96 0.065 0.88 0.89 0.89
potatoprotein Kartoffeleiweiß 18.45 83.50 0.134 18.63 22.46 0.024 0.91 0.90 0.92
sweetwhey Molke,Süß-,frisch
14.06 13.64 0.022 14.72 16.07 0.088 0.93 0.96 0.90
acidwhey Molke,Sauer-,frisch
13.33 15.00 0.024 14.31 15.91 0.115 0.90 0.95 0.90
wheyprotein Molkeneiweiß,frisch
16.00 0.114 19.56 0.160 0.92 0.91 0.91
skimmedmilkpowder Milchprodukte(Magermilch-pulver)
15.47 0.060 17.72 0.081 0.93 0.94 0.91
wheyconcentrate Molke,Süß-,getrocknet
13.92 0.021 15.71 0.095 0.92 0.94 0.87
fishmeal64%XP Fischmehl64%RP
15.00 67.78 0.108 11.98 18.84 0.205 0.72 0.71 0.72
yeast Bierhefe,Wein-hefe(Vinasse)
13.86 52.11 0.083 14.23 20.05 0.085 0.69 0.68 0.75
cornsteep Maisquellwasser Beu-ker
13.40 43.00 0.069 0.019
fishoil Fischöl 0.000 0.000
lignocellulose Lignocellulose 0.001 0.030
riceglutenfeed Reiskleber
palmbutter Pflanzenfett
formicacid Ameisensäure 5.54 0.000 5.54 0.000 1.00 1.00 0.00
propionicacid Propionsäure 21.81 0.000 21.81 0.000 1.00 1.00 0.00
calciumphosphate Calciumphosphat 0.00 0.000 0.00 1.000 0.00 0.00 0.00
lime(calciumcarbonate) KohlensaurerKalk 0.00 0.000 0.00 1.000 0.00 0.00 0.00
sodiumbicarbonate Natriumhydro-gencarbonat
0.00 0.000 0.00 1.000 0.00 0.00 0.00
salt Viehsalz 0.00 0.000 0.00 1.000 0.00 0.00 0.00
Darkgraycellsindicatedatagaps.

334
3.2.3 Gap closure for a missing diet digestibility of organic matter
Onefederalstatedidnotreportfeedcompositiondatabutoverallfeedproperties.Thesedidnotcoverdigestibil-ityofOM.ThedietdigestibilityofOMcannotbederivedfrom the digestibility for energy by a simple regressionanalysis (seeFigure2).Hence,thereporteddigestibilitiesforenergywereusedasasubstitute.
0.75
0.80
0.85
0.90
0.95
0.75 0.80 0.85 0.90 0.95Digestibility [MJ MJ ]X
-1
Dig
est
ibili
ty[k
g k
g]
XD
om
-1
Figure2:DE
Comparisonbetweenthedietdigestibilitiesforenergy andorga-nicmatter .DatapairscalculatedforthevariousexemplarGer-mandistricts.
3.2.4 Exemplary feed composition and properties
Theexpertscommunicatedfeedcompositionsandprop-ertiesaslistedwiththeadvicenotes.Theweightedmeanwasformedifmorethanonefeedcompositionwasavail-able.Table2showsanexample.
Table2:
Compositionoffatteningpigfeedsinadistrict.FeedsforfatteningpigsinSchleswig-Holstein,weights45to85kganimal-1.Feedpropertiesrelatedtofreshmatter(FM)(DMcontentofFM0.88kgkg-1).
feedconstituent feed1 feed2 feed3 feed4 feed5 mean unit
barley 25 25.2 26.4 20 28 24.9 %
triticale 0 0 0 5 5 2.0 %
wheat 40 54.2 43.8 49 42 45.8 %
wheatbran 2.4 0 4.3 1 0 1.5 %
maize 3.5 0 0 0 0 0.7 %
millet 5.1 0 0 0 0 1.0 %
rapeseedextractionmeal 2 2 4.3 0 0 1.7 %
rapeseedexpeller 6 6 2.5 8 8 6.1 %
soyabeanextractionmeal48%XP 11 10 14 13.4 13.1 12.3 %
molasses 0.5 0.4 1.7 0 0 0.5 %
palmbutter 1.4 0.5 2.1 0.5 0.9 1.1 %
lime(calciumcarbonate) 1.17 1.1 1.1 1.13 1.12 1.1 %
calciumphosphate 0.12 0.3 0.1 0.13 0.16 0.2 %
salt 0.39 0.4 0.4 0.41 0.45 0.4 %
weightingfactor 0.2 0.2 0.2 0.2 0.2
MEcontent 13.4 13.4 13.4 13.4 13.4 13.4 MJkg-1
XPcontent 0.170 0.175 0.17 0.17 0.171 kgkg-1
ashcontent 0.047 0.047 0.047 0.047 0.047 0.047 kgkg-1

U. Dämmgen, W. Brade, J. Schulz, H. Kleine Klausing, N. J. Hutchings, H.-D. Haenel, C. Rösemann / Landbauforschung - vTI Agriculture and Forestry Research 4 2011 (61)327-342
335
3.3 Feeding strategies
Forsowsandweaners,singleandtwo-phasefeedingsareconsidered. Fatteningpigsareassumed tobe fed inone, twoor threephases; bigmodernenterprises feed-ingcontinuouslyvaryingfeedsareincludedinthree-phasefeeding. InNiedersachsen, special diets are fedwith re-duced N contents. An example result of the inquiry isshowninTable3.
Table3:
Fatteningpigs–feedingstrategies(%ofanimalplaces).ExampleresultsobtainedforEmslandruraldistrict.
1990 1991 1992 1993 1994 1995 1996 1997 1998 1999
1phase 30 25 20 15 10 5 5 5 5 5
2phases 65 66 67 68 69 70 70 70 70 70
ofwhichNreduced 0 0 5 7.5 10 12.5 15 20 25 25
3phases 5 9 13 17 21 25 25 25 25 25
ofwhichNreduced 0 0 5 7.5 10 12.5 15 20 25 25
2000 2001 2002 2003 2004 2005 2006 2007 2008 2009
1phase 3 3 3 3 3 3 3 3 3 3
2phases 70 65 60 55 50 45 45 45 45 45
ofwhichNreduced 30 40 50 60 70 70 75 80 85 85
3phases 27 32 37 42 47 52 52 52 52 52
ofwhichNreduced 30 40 50 60 70 70 75 80 85 85
3.4 Animal rounds
Adistinctionismadebetweentheassessmentsofani-mal rounds for single and multi-phase feeding. Expertsagreeonthefactthat,insinglephasefeeding,ithadbeenGermanpracticetoreplaceanimalswithoutthethoroughcleansingprocedurethathasbecomestandardfor“all-in-all-out”productionintwo-andthree-phasefeeding.Theyalsoagreethatinsinglephasefeedingthemeandurationoftheperiodduringwhichtheplaceisempty,isabout5dround-1(seealsoKTBL,2006,pg,503).Thisisassumedtobeconstantoverthewholeperiodconsidered.Incontrastmulti-phase feeding is typically related to“all-in-all-out”production.Here,service,cleansing,anddisinfectionvarywithtime.
3.4.1 Expert judgement
Germanexpertswereaskedtocontributethetimeseriesofanimalroundsfortheirrespectiveregion.ResultsfromalmostallGermanfederalstatescouldbeobtained.Somedatawasextractedfromreportsofbreeders’institutions,
otherwasderivedfromweightandweightgaindataandlocaltimesforservice,cleansing,anddisinfection.Assomeofthedatawerecommunicatedconfidentially,theresultsshowninTable4havetobepresentedanonymously.
3.4.2 Data gap closure
Numbersofanimalroundsarerequiredforeachsinglefederal stateascomplete timeseries.However, someofthetimeserieswereincomplete.Theanalysisofthedata
providedbytheexpertsrevealedthattheassumptionofalinearreductionofthetimespanduringwhichplaceswereemptyforanyreasonfrom22dround-1in1990and15dround-1resultedinthesmallestscatter.Hence,thesetimespans incombinationwith reportedweightsandweightgainswereusedtoassessthenumberofanimalrounds.Onefederalstatedidnotsupplydata.Thelowestnum-
ber of animal rounds obtained for its direct neighbourswasusedinstead.Informationaboutanimalperformance isnonexistent
or rare for the smaller states. Again, it is assumed thatHamburgcanbe treated in thesamewayasSchleswig-Holstein, Bremen as Niedersachsen, Berlin as Branden-burg,andSaarlandasRheinland-Pfalz.Theresultsforthevariousfederalstatesarecollatedin
Table4.
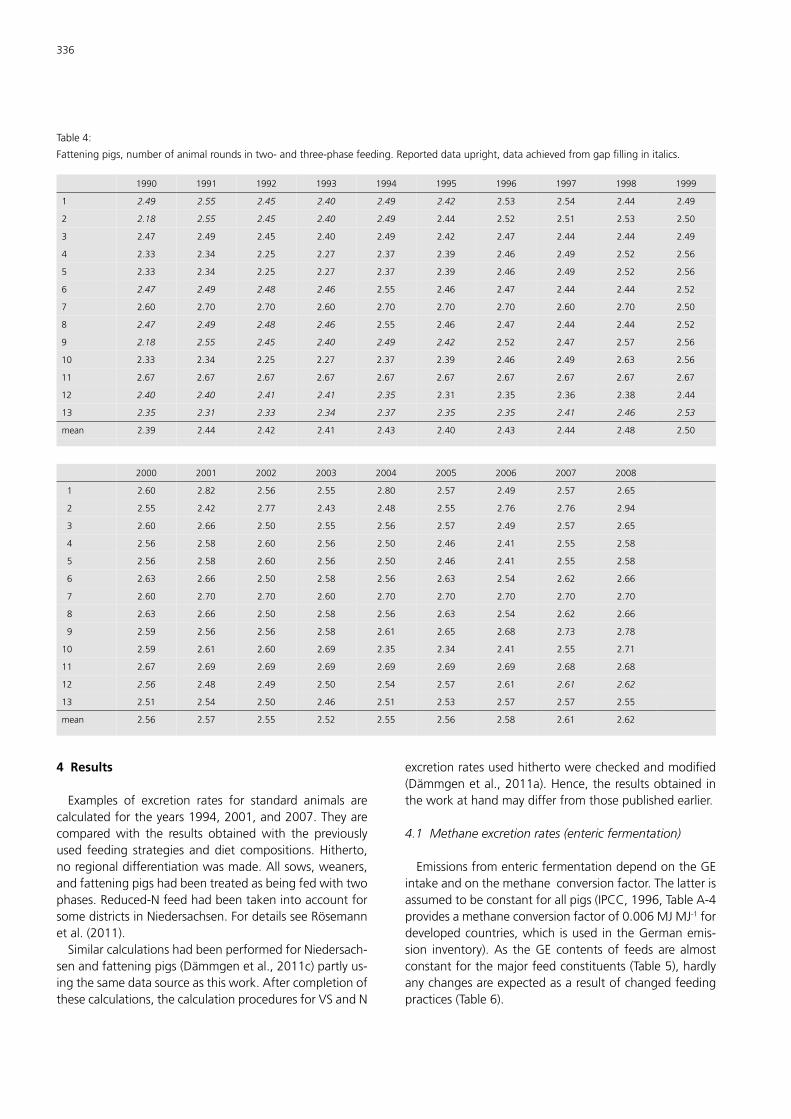
336
Table4:
Fatteningpigs,numberofanimalroundsintwo-andthree-phasefeeding.Reporteddataupright,dataachievedfromgapfillinginitalics.
1990 1991 1992 1993 1994 1995 1996 1997 1998 1999
1 2.49 2.55 2.45 2.40 2.49 2.42 2.53 2.54 2.44 2.49
2 2.18 2.55 2.45 2.40 2.49 2.44 2.52 2.51 2.53 2.50
3 2.47 2.49 2.45 2.40 2.49 2.42 2.47 2.44 2.44 2.49
4 2.33 2.34 2.25 2.27 2.37 2.39 2.46 2.49 2.52 2.56
5 2.33 2.34 2.25 2.27 2.37 2.39 2.46 2.49 2.52 2.56
6 2.47 2.49 2.48 2.46 2.55 2.46 2.47 2.44 2.44 2.52
7 2.60 2.70 2.70 2.60 2.70 2.70 2.70 2.60 2.70 2.50
8 2.47 2.49 2.48 2.46 2.55 2.46 2.47 2.44 2.44 2.52
9 2.18 2.55 2.45 2.40 2.49 2.42 2.52 2.47 2.57 2.56
10 2.33 2.34 2.25 2.27 2.37 2.39 2.46 2.49 2.63 2.56
11 2.67 2.67 2.67 2.67 2.67 2.67 2.67 2.67 2.67 2.67
12 2.40 2.40 2.41 2.41 2.35 2.31 2.35 2.36 2.38 2.44
13 2.35 2.31 2.33 2.34 2.37 2.35 2.35 2.41 2.46 2.53
mean 2.39 2.44 2.42 2.41 2.43 2.40 2.43 2.44 2.48 2.50
2000 2001 2002 2003 2004 2005 2006 2007 2008
1 2.60 2.82 2.56 2.55 2.80 2.57 2.49 2.57 2.65
2 2.55 2.42 2.77 2.43 2.48 2.55 2.76 2.76 2.94
3 2.60 2.66 2.50 2.55 2.56 2.57 2.49 2.57 2.65
4 2.56 2.58 2.60 2.56 2.50 2.46 2.41 2.55 2.58
5 2.56 2.58 2.60 2.56 2.50 2.46 2.41 2.55 2.58
6 2.63 2.66 2.50 2.58 2.56 2.63 2.54 2.62 2.66
7 2.60 2.70 2.70 2.60 2.70 2.70 2.70 2.70 2.70
8 2.63 2.66 2.50 2.58 2.56 2.63 2.54 2.62 2.66
9 2.59 2.56 2.56 2.58 2.61 2.65 2.68 2.73 2.78
10 2.59 2.61 2.60 2.69 2.35 2.34 2.41 2.55 2.71
11 2.67 2.69 2.69 2.69 2.69 2.69 2.69 2.68 2.68
12 2.56 2.48 2.49 2.50 2.54 2.57 2.61 2.61 2.62
13 2.51 2.54 2.50 2.46 2.51 2.53 2.57 2.57 2.55
mean 2.56 2.57 2.55 2.52 2.55 2.56 2.58 2.61 2.62
4 Results
Examples of excretion rates for standard animals arecalculatedfortheyears1994,2001,and2007.Theyarecomparedwith the results obtainedwith the previouslyused feeding strategies anddiet compositions.Hitherto,noregionaldifferentiationwasmade.Allsows,weaners,andfatteningpigshadbeentreatedasbeingfedwithtwophases.Reduced-NfeedhadbeentakenintoaccountforsomedistrictsinNiedersachsen.FordetailsseeRösemannetal.(2011).SimilarcalculationshadbeenperformedforNiedersach-
senandfatteningpigs(Dämmgenetal.,2011c)partlyus-ingthesamedatasourceasthiswork.Aftercompletionofthesecalculations,thecalculationproceduresforVSandN
excretionratesusedhithertowerecheckedandmodified(Dämmgenetal.,2011a).Hence,theresultsobtainedintheworkathandmaydifferfromthosepublishedearlier.
4.1 Methane excretion rates (enteric fermentation)
EmissionsfromentericfermentationdependontheGEintakeandonthemethaneconversionfactor.Thelatterisassumedtobeconstantforallpigs(IPCC,1996,TableA-4providesamethaneconversionfactorof0.006MJMJ-1fordevelopedcountries,which isused intheGermanemis-sion inventory).As theGE contents of feeds are almostconstantforthemajorfeedconstituents(Table5),hardlyanychangesareexpectedasaresultofchangedfeedingpractices(Table6).

U. Dämmgen, W. Brade, J. Schulz, H. Kleine Klausing, N. J. Hutchings, H.-D. Haenel, C. Rösemann / Landbauforschung - vTI Agriculture and Forestry Research 4 2011 (61)327-342
337
Table5:
GEcontentsoffeed,annualnationalmeans
1994 2001 2007 previouscalculations1) unit
sows(includingsucklingpiglets) 18.32 18.28 18.31 18.45 MJkg-1GE
weaners 18.76 18.77 18.78 18.45 MJkg-1GE
fatteningpigs 18.71 18.67 18.65 18.45 MJkg-1GE
boars 18.32 18.33 18.34 18.45 MJkg-1GE
1)usingthemethodologydescribedinRösemannetal.(2011)
Table6:
Methaneexcretionrates(entericfermentation),annualnationalmeans
1994 2001 2007 previouscalculations1) unit
sows(includingsucklingpiglets) 2.07 2.07 2.08 2.13 kgplace-1a-1CH4
weaners 0.42 0.42 0.42 0.43 kgplace-1a-1CH4
fatteningpigs 1.21 1.18 1.17 1.32 kgplace-1a-1CH4
boars 1.75 1.74 1.75 1.73 kgplace-1a-1CH41)usingthemethodologydescribedinRösemannetal.(2011)
Table7:
Digestibilitiesoforganicmatter,annualnationalmeans
1994 2001 2007 previouscalculations1) unit
sows(includingsucklingpiglets) 0.84 0.84 0.84 0.81 kgkg-1
weaners 0.86 0.85 0.87 0.85 kgkg-1
fatteningpigs 0,86 0.86 0.86 0.82 kgkg-1
boars 0.83 0.84 0.83 0.83 kgkg-1
1)digestibilitiesofenergyinMJMJ-1,usingthemethodologydescribedinRösemannetal.(2011)
Table8:
Ashcontentsoffeed,annualnationalmeans
1994 2001 2007 previouscalculations1) unit
sows(includingsucklingpiglets) 0.062 0.059 0.059 0.02 kgkg-1
weaners 0.058 0.058 0.058 0.02 kgkg-1
fatteningpigs 0.056 0.056 0.056 0.02 kgkg-1
boars 0.057 0.056 0.057 0.02 kgkg-1
1)usingthemethodologydescribedinRösemannetal.(2011)
Table9:
Volatilesolidsexcretionrates,annualnationalmeans
1994 2001 2007 previouscalculations1) unit
sows(includingsucklingpiglets) 155 161 163 205 kgplace-1a-1VS
weaners 26.0 26.2 26.5 31.6 kgplace-1a-1VS
fatteningpigs 80.5 79.3 79.4 117 kgplace-1a-1VS
boars 128 129 128 145 kgplace-1a-1VS
1)usingthemethodologydescribedinRösemannetal.(2011)

338
Table10:
Nitrogenexcretionrates,annualnationalmeans
1994 2001 2007 previouscalculations1) unit
sows(includingsucklingpiglets) 25.7 25.3 25.2 26.3 kgplace-1a-1N
weaners 3.5 3.4 3.4 3.0 kgplace-1a-1N
fatteningpigs 11.9 11.5 11.3 13.9 kgplace-1a-1N
boars 27.0 27.1 27.0 27.5 kgplace-1a-1N
1)usingthemethodologydescribedinRösemannetal.(2011)
Table11:
Totalammoniacalnitrogenexcretionrates,annualnationalmeans
1994 2001 2007 previouscalculations1) unit
sows(includingsucklingpiglets) 19.4 19.1 19.0 20.1 kgplace-1a-1TAN
weaners 2.3 2.3 2.3 2.1 kgplace-1a-1TAN
fatteningpigs 8.6 8.2 8.0 10.2 kgplace-1a-1TAN
boars 21.4 21.4 21.3 22.2 kgplace-1a-1TAN
1)usingthemethodologydescribedinRösemannetal.(2011)
4.2 Volatile solids excretion rates
Major changes can be observed for VS (Table 9). Thesmalldifferencesindigestibilities(Table7)havealargeef-fect onVS excretion rates,which is farmore importantthanthetreblingoftheashcontents(Table8).
4.3 Nitrogen and TAN excretion rates
TheeffectofreducedNinputandthereductionofpro-ductioncyclesleadtoasignificantreductioninNexcretionratesforfatteningpigs,comparedtothepreviousmeth-od.ThechangesinNexcretionratesfortheothersubcat-egoriesaresmaller.Asignificant increase isobservedforweaners(Table10).ThisappliesalsotoTANexcretionrates(Table11).Theuseofthedigestibilityofcrudeprotein(XP)NinsteadofthedigestibilityofenergyreducesTANexcre-tionrates.
5 Discussion
For sows,nutrition requirements (energy,protein) varysignificantlyamongthedifferentstagesofthepigletpro-duction cycle. For growing pigs (weaners and fatteners)theratioofcrudeproteintoenergydecreasescontinuallywithage.Hence,ithasbecomegeneralpracticetoreflectthisinthedietsbyphasefeedingasthisisalsoeconomi-callybeneficial.
InNiedersachsen,specialmeasureshavebeentakentoreducetheNandphosphorus loadsontheenvironmentby introducing special dietswith reduced XP and phos-phoruscontents.Anexampledetailedanalysisoftheinfluenceofthevari-
ousinputparametersismadeforNiedersachsen,asherefeeding practices are more differentiated than in otherfederalstates.Fivefeedingtypesweredistinguished:• 1 singlephasefeeding• 2S two-phasefeeding,standardXPcontents• 2Rtwo-phasefeeding,reducedXPcontents• 3S three-phasefeeding,standardXPcontents• 3Rthree-phasefeeding,reducedXPcontents
The comparison is performed for sowswith litter andfattening pigs, as the contribution to emissions fromweanersandboarsisofminorimportance.The2007datasetisused.Changesarenegativeforreductionsandpositiveforin-
creases.
5.1 Sows with litter
Duetothefactthatthefeedintakeisgovernedbyen-ergy requirements, the energy intake is not affected byphase feeding.AsCH4emissions fromenteric fermenta-tionarederivedfromenergyintake,theyarealsonotaf-fectedbyphasefeeding(Table12).

U. Dämmgen, W. Brade, J. Schulz, H. Kleine Klausing, N. J. Hutchings, H.-D. Haenel, C. Rösemann / Landbauforschung - vTI Agriculture and Forestry Research 4 2011 (61)327-342
339
Table12:
Sowspluslitter.CH4excretionrates(emissions)peranimalplaceasafunctionoffeedingstrategy.
Feedtype 1 2S 2R unit
CH4excretionrate 2.1 2.1 2.1 kgplace-1a-1CH4
changescomparedto“1”duetoadjustedXPcontent
+0.0 kgplace-1a-1CH4
introductionofphasefeeding +0.0 +0.0 kgplace-1a-1CH4
Theenergycontentoffeedsisadjustedtotherequire-mentsoflactatingandnon-lactatingsows.Thisresultsinaconsiderable reduction inVSexcretions.The reductionoftheXPcontenthasasmallnegativeeffect(Table13).
Table13:
Sowspluslitter.VSexcretionratesperanimalplaceasafunctionoffeedingstrategy.
Feedtype 1 2S 2R unit
VSexcretionrate 165 142 147 kgplace-1a-1VS
changescomparedto“1”duetoadjustedXPcontent
0 +5 kgplace-1a-1VS
introductionofphasefeeding -23 -23 kgplace-1a-1VS
AminoreffectonNexcretionratescanbeobservedasaresultofphasefeeding.However,thereductionoffeedXPcontentsisclearlyvisible(Table14).
Table14:
Sowspluslitter.Nexcretionratesperanimalplaceasafunctionoffeedingstrategy.
Feedtype 1 2S 2R unit
Nexcretionrate 26.5 26.2 24.3 kgplace-1a-1N
changescomparedto“1”duetoadjustedXPcontent
-1.9 kgplace-1a-1N
introductionofphasefeeding -0.3 -0.3 kgplace-1a-1N
IncontrasttoNexcretionrates,TANexcretionratesarere-ducedbyphasefeeding.Forthedietscompared,theeffectofthereducedXPcontentsisadverse,albeitsmall(Table15).
Table15:
Sowspluslitter.TANexcretionratesperanimalplaceasafunctionoffeedingstrategy.
Feedtype 1 2S 2R unit
TANexcretionrate 19.1 17.3 18.5 kgplace-1a-1N
changescomparedto“1”duetoadjustedXPcontent
+1.2 kgplace-1a-1N
introductionofphasefeeding -1.8 -1.8 kgplace-1a-1N
5.2 Fattening pigs
Phase feeding results in a reduced number of animalrounds.Thiscausesalinearreductioninallemissions.ForCH4emissionrates,theeffectsofbothadjusteden-
ergyandXPcontentsofthefeedareofminorimportance(Table16).
Table16:
Fatteningpigs.Methaneexcretionratesperanimalplaceasafunc-tionoffeedingstrategy.
Feedtype 1 2S 2R 3S 3R unit
CH4excretionrate 1.31 1.20 1.18 1.16 1.17 kgplace-1a-1CH4
changescompa-redto“1”duetoadjustedXPcontent
-0.01 +0.01 kgplace-1a-1CH4
introductionofphasefeeding
+0.04 +0.04 -0.00 -0.00 kgplace-1a-1CH4
reducednumberofrounds
-0.15 -0.15 -0.15 -0.15 kgplace-1a-1CH4
With VS excretion rates, changes in both energy andXPcontentshaveanadverseeffect.Thismayevenover-compensate the gains due to reduced animal rounds inthecaseof3Rfeeding(Table17).
Table17:
Fatteningpigs.VSexcretionratesperanimalplaceasafunctionoffeedingstrategy(2007dataset).
Feedtype 1 2S 2R 3S 3R unit
VSexcretionrate 84.8 79.2 80.7 84.0 86.7 kgplace-1a-1VS
reductionscom-paredto“1”duetoadjustedXPcontent
+1.5 +2.8 kgplace-1a-1VS
introductionofphasefeeding
+4.3 +4.3 +9.1 +9.1 kgplace-1a-1VS
reducednumberofrounds
-9.9 -9.9 -9.9 -9.9 kgplace-1a-1VS
N excretion rates benefit from all aspects of feedingchanges.TheintroductionofphasefeedingalonereducesNexcretionratesofabout7%,whichisinlinewithex-perimentalfindings(e.g.Lindermeyeretal.,2010;Anony-mus,2010).HerethereducedN inputs intotheanimalsaffect the excretions significantly. Adjusted feeding as awholehaspositiveeffects.Thereishardlyanydifferencebetween2Sand3Sfeedings.Thecombinedeffectsadduptomorethan5kgplace-1a-1N(Table18).

340
Table18:
Fatteningpigs.Nexcretion ratesperanimalplaceasa functionoffeedingstrategy
Feedtype 1 2S 2R 3S 3R unit
Nexcretionrate 13.2 10.8 9.9 11.1 7.7 kgplace-1a-1N
reductionscom-paredto“1”duetoadjustedXPcontent
-0.9 -3.5 kgplace-1a-1N
introductionofphasefeeding
-0.9 -0.9 -0.5 -0.5kgplace-1a-1N
reducednumberofrounds
-1.5 -1.5 -1.5 -1.5kgplace-1a-1N
Theintroductionofphasefeedingasameasuretoad-justfeedpropertiestoenergyrequirementshasonlyami-noreffectonTANexcretionsrates.However,XPreductionaddsaconsiderableamountofsavings(Table19).
Table19:
Fatteningpigs.TANexcretionratesperanimalplaceasafunctionoffeedingstrategy(2007dataset).
Feedtype 1 2S 2R 3S 3R unit
TANexcretionrate 9.1 7.8 6.6 7.8 5.4 kgplace-1a-1N
reductionscom-paredto“1”duetoadjustedXPcontent
-1.2 -2.4 kgplace-1a-1N
introductionofphasefeeding
-0.3 -0.3 -0.2 -0.2 kgplace-1a-1N
reducednumberofrounds
-1.1 -1.1 -1.1 -1.1 kgplace-1a-1N
BothNandTANexcretionratesvaryregionally.Figure3illustratestheresultsobtainedforthe22Germanregionsinvestigated.
0
3
6
9
12
15
Region
N e
xcre
tion r
ate
[kg
pla
cea
]-1
-1
0
3
6
9
12
15
Region
TA
N e
xcre
tion r
ate
[kg
pla
cea
]-1
-1
Figure3.
Variabilityoftotalnitrogen(N)andurinarynitrogen(TAN)excretionratescalculatedfor22Germanregions
6 Conclusions
TheGermandatasetscollatedforthisworkshowthatphasefeedingaloneresultsinreducedVSexcretionrates.Thereductionisachievedinthestepfromsingletotwo-phasefeeding.Theintroductionofathirdphaseisfarlesseffective.Changed feed compositions do not affect CH4 excre-
tionsfromentericfermentation,nordotheyshowagreateffect on N excretions. This contradicts the statementsfoundintheliteraturewithrespecttoNexcretionrates.In two- and three-phase feeding, the reductions in N
andTANexcretionsareasideeffectofthereducednum-berofanimal rounds thatgoeswith the introductionofphasefeeding.However,Nexcretionratesfortwo-phasefeedingoffat-
teningpigsrangefrom10.1to13.1kgplace-1a-1Nandfrom6.4to9.8kgplace-1a-1TAN,indicatingthatthereisconsiderableroomforreductions.AremarkablereductionintheexcretionratesofNand
TANcanbeachievedbyadjustingtheproteincontentsofthefeedtotherequirements.
Acknowledgements
Thedatausedinthisworkisbasedoncontributionsbyexpertsinpigproductionandpigfeedinginparticular:Dr.Hans-JoachimAlert,Köllitsch;Dr.UweBergfeld,Köllitsch;Hanke Bokelmann, Bremervörde; Johannes Bruns, Os-nabrück;Dr. UweClar, Uelzen;Hartwig Fehrendt,Olden-burg;BerndGrünhaupt,Fritzlar;LuiseHagemann,Teltow;Dr.ArndHeinze,Jena;GerdHermeling,Bersenbrück;KajoHollmichel, Kassel; Petra Klaus, Großenkneten; KlemensKuhlmann, Coesfeld; Dr. Jörg Küster, Northeim; Dr. Her-mannLindermayer,Poing;Dr.WernerLüpping,Blekendorf;DirkLüvolding,Vechta;Prof.Dr.WinfriedMatthes,Dummer-storf;AndreaMeyer,Hannover;HenningPieper,Hameln;Dr.ThomasPriesmann,Bitburg;Dr.ManfredWeber,Iden.
U. Dämmgen, W. Brade, J. Schulz, H. Kleine Klausing, N. J. Hutchings, H.-D. Haenel, C. Rösemann / Landbauforschung - vTI Agriculture and Forestry Research 4 2011 (61)327-342
341
Dr.Karl-HermannGrünewald,VFT-Geschäftsstelle,Bonn,suppliedthetimeseriesofdietproperties.Dr.Walter Staudacher, DLG, Frankfurt, supported the
inquirycritically.The authors express their gratitude, as the process of
datacompilationdemandedtimeandpatience.This work was supported by Landwirtschaftskammer
Niedersachsen,Oldenburg.
References
Anonymus(2010)MitPhasenfütterungFutterkostensenken.ÖsterrBauernzeit10.12.2010
Beuker (2010) Cornsteep [online]. To be found at <http://www.beuker.net/nl/rundveehouderij/producten/eiwitrijk/vloeibaar/cornsteep> [quoted14.10.2011]
DämmgenU,AmonB,GyldenkærneS,HutchingsNJ,KleineKlausingH,Ha-enelH-D,RösemannC(2011a)Reassessmentofthecalculationprocedureforthevolatilesolidsexcretionratesofcattle,pigsandpoultryintheAus-trian,DanishandGermanagriculturalemissioninventories.Landbauforsch61(2):115-126
DämmgenU,AmonB,HaenelH-D,HutchingsNJ,RösemannC(2011b)DatasetstoassessmethaneemissionsfromuntreatedcattleandpigslurryandsolidmanurestoragesystemsintheGermanandAustrianemissioninven-tories.Landbauforsch(62)1(submitted)
DämmgenU,BradeW,SchulzJ,HaenelH-D,RösemannC(2011c)EinflussvonFütterungsverfahrenaufdie EmissionenausderMastschweinehaltung inNiedersachsen.Züchtungskunde83(3):191-202
DämmgenU,HahneJ,HaenelH-D,RösemannC(2010)DieModellierungderEmissionenvonStickstoffspezies,NMVOCundStaubausAbluftreinigungs-anlageninderSchweinehaltungimdeutschenlandwirtschaftlichenEmissi-onsinventar.GefahrstoffeReinhaltungLuft70(10):437-443
DLG - Deutsche Landwirtschafts-Gesellschaft (2005) Bilanzierung der Nähr-stoffausscheidungen landwirtschaftlicherNutztiere. Frankfurt aM :DLG-Verl,69p,ArbeitenDLG199
DLG - Deutsche Landwirtschafts-Gesellschaft (2011) Futtermittelnet [on-line].Tobe foundat<http://www.dlg.org/futtermittel_net.html> [quoted14.10.2011]
DTV -DeutscherVerbandTiernahrung (2010)Mischfutter Tabellarium2010.Bonn:DVT
EC-EuropeanCommunity(2002)Directive2002/32/ECoftheEuropeanPar-liamentandof theCouncilof7May2002onundesirablesubstances inanimal feed[online].Tobefoundat<http://eur-lex.europa.eu/LexUriServ/LexUriServ.do?uri=CONSLEG:2002L0032:20060224:EN:PDF>[quoted14.10.2011]
EEA-EuropeanEnvironmentAgency(2009)EMEP/EEAairpollutantemissioninventoryguidebook.TechnicalreportNo6/2009.EuropeanEnvironmentAgency (EEA),Copenhagen.Tobe foundat<http://www.eea.europa.eu/publications/emep-eea-emission-inventory-guidebook-2009>[quoted14.10.2011
FlachowskyG,PallaufJ,PfefferE,RodehutscordM,SchenkelH,StaudacherW,SusenbethA(2006)EmpfehlungenzurEnergie-undNährstoffversorgungvonSchweinen2006.FrankfurtaM:DLG-Verl,247p,Energie-undNähr-stoffbedarflandwirtschaftlicherNutztiere10
Lindermeyer H, Preißinger W, Propstmeier G (2010) „Einfache“ Multipha-senfütterung in der Ferkelaufzucht: „Verschneiden“ : VersuchsberichtS 17 (S13/2) [online]. To be found at <http://www.lfl.bayern.de/ite/sch-To be found at <http://www.lfl.bayern.de/ite/sch-wein/40343/linkurl_0_9.pdf>[quoted14.10.2011]
LfL-BayerischeLandesanstaltfürLandwirtschaft(2009)FutterberechnungfürSchweine.Freising-Weihenstephan:LfL,88p
HaenelH-D,DämmgenU,LaubachP,RösemannC(2011)Updateofthecalcu-lationofmetabolizableenergyrequirementsforpigsintheGermanagricu-lturalemissioninventory.Landbauforsch61(3):217-228
IPCC – Intergovernmental Panel on Climate Change (1996) Revised 1996IPCCguidelinesfornationalgreenhousegasinventories:vol3:Referencemanual [online].Tobe foundat<http://www.ipcc-nggip.iges.or.jp/public/gl/invs6.html>[quoted14.10.2011]
IPCC–IntergovernmentalPanelonClimateChange(2006)2006IPCCguide-linesfornationalgreenhousegas inventories:vol4:Agriculture,forestryandother landuse[online].Tobefoundat<http://www.ipcc-nggip.iges.or.jp/public/2006gl/vol4.html>[quoted14.10.2011]
JentschW,ChudyA,BeyerM(eds)(2004)RostockerFutterbewertungssystem:KennzahlendesFutterwertesundFutterbedarfsaufderBasisvonNettoe-nergie.Dummerstorf:FBN,392p
RösemannC,HaenelH-D,PoddeyE,DämmgenU,DöhlerH,Eurich-MendenB,LaubachP,DieterleM,OsterburgB(2011)CalculationsofgaseousandparticulateemissionsfromGermanagriculture1990-2009.Braunschweig:vTI,402p,LandbauforschSH342

342

J. Burgstaler, D. Wiedow, F. Godlinski, N. Kanswohl / Landbauforschung - vTI Agriculture and Forestry Research 4 2011 (61)343-352 343
Einsatz von Natriumhydrogencarbonat in landwirtschaftlichen Biogasanlagen
JörgBurgstaler*,DennyWiedow*,FraukeGodlinski**undNorbertKanswohl*
* UniversitätRostock,Agrar-undUmweltwissenschaftlicheFakultät,Profes-surfürAgrartechnologieundVerfahrenstechnik,Justus-von-Liebig-Weg8,18059 Rostock, [email protected]; [email protected];[email protected]
** JuliusKühn-Institut (JKI), Institut für PflanzenbauundBodenkunde,Bun-desallee50,38116Braunschweig,[email protected]
Zusammenfassung
Das Betreiben von Biogasanlagen erfordert die Bereit-stellung von Futtersubstrat in ausreichenderMengeundgleichmäßiger Qualität. Durch häufige Substratwechselund eine stark schwankende Futterqualität kann es zueinersinkendenProzessstabilitätmiteinerzunehmendenVersäuerungdesFermenterskommen.ImkontinuierlichenLabormaßstabkonnteerfolgreichderpräventiveundakuteEinsatzvonNatriumhydrogencarbonatzurBehebungvonVersäuerungen nachgewiesenwerden. Die ÜberführungundAnwendungderErkenntnisseausdenLaborversuchenin eine landwirtschaftliche Praxisanlage ist Gegenstanddieser Arbeit. Grundlage sind zwei baugleiche landwirt-schaftlicheBiogasanlagen,wobeieinenachweislichdurchÜberfütterung,d.h.zuhoheMengenanInputsubstraten,inihrerProzessstabilitätbeeinträchtigtwarunddaraufhinmitNatriumhydrogencarbonatbehandeltwurde,währenddiezweiteAnlagestabilliefundalsKontrollediente.BeideAnlagengehörtenzueinemAnlagenkomplexundwurdenvordemVersuchunterschiedlichinArt/Mengeundwäh-rend des Versuchesmitmit identischenidentischen InputsubstratenInputsubstraten verver--sorgt. InInderderüberfüttertenüberfüttertenPraxisanlagePraxisanlagekonntekonnteNatrium-Natrium-hydrogencarbonat sowohl zurAkutapplikationwie auchals Präventionsmittel erfolgreich eingesetzt werden undbestätigtdamitbisherigeErgebnisseausLaborversuchen.ZudemzeigtesichdieleistungsförderndeWirkunginFormeinerhöherenBiogasausbeutebeigleichzeitighohenMe-thanqualitäten. Weiterhin wurde durch den effektivenEinsatzvonNatriumhydrogencarbonateineVerminderungdesnochvorhandenenRestgaspotentialsundsomiteineReduzierung des Ausstoßes klimarelevanter SpurengaseimGärrestbewirkt.NatriumhydrogencarbonatkannsomitalsProzesshilfsstoffinlandwirtschaftlichenBiogasanlagenfüreinkontrolliertesAnhebendespH-WertesundzurSta-bilisierung der Prozessbiologie bei Versäuerungserschei-nungenuneingeschränktangewendetwerden.
Schlüsselworte: Biogas, Prozesshilfsstoff, Versäuerung
Abstract
Application of sodium bicarbonate in agricultural biogas plants
Biogasplants requireconsistentvolumeandqualityoffeedstockinput.Frequentchangesintypeandqualityoffeedstockreducetheprocessstabilitybycausingincreasedacidification in the biogas digester. In laboratory experi-mentstheadditionofsodiumbicarbonatetopreventandreverseacidification inbiogasdigestershasbeenproventobesuccessful.Thispaperfocusesontheapplicationinagriculturalbiogasplants.Twoidenticallydesignedbiogasdigesterswereused. Inoneof thedigesters theprocesshaddestabilizedasaresultofoverfeedingandthereforewastreatedwithsodiumbicarbonate,whiletheotheroneranunderstableconditionsandwasusedasthecontrol.Bothbiogasdigesterswerepartofthesamebiogasplantandweresuppliedwith identical feedstockmaterial.So-diumbicarbonatehasbeenaddedtothebiogasdigestertosuccessfullyreverseacuteacidificationaswellastopre-ventacidification, confirmingearlier results from labora-toryexperiments.Atthesametimetheadditionofsodiumbicarbonatealsoenhancedtheperformanceofthebiogasdigester by increasing the yield ofmethane thereby im-proving thequalityof thebiogas. Inaddition, theeffec-tive input reduces the residual biogas potential and theunwantedemissionofgreenhousegasesfromthedigestresidues.Therefore,sodiumbicarbonatecanunequivocallybeusedinagriculturalbiogasplantsasaprocessadditiveforacontrolledincreaseinpHandtostabilizethebiologi-calprocessintheeventofacidification.
Keywords: biogas, process additive, acidification

344
1 Einleitung
Die Biogasbranche erlebt gegenwärtig ein rasantesWachstum. Die Zahl der Biogasanlagen in Deutschlandwirdheuteaufüber5000AnlagenmiteinerelektrischenLeistungvonca.2000MWelgeschätzt(Schüsseler,2011).Biogas stellt derzeit diewichtigsteundauch vielseitigsteFormder Bioenergie aus der Landwirtschaft dar. Für dieeffizienteBiogaserzeugung ist jedochdieGestaltungop-timaler Prozessbedingungen unabdingbar. Aufgrund vonFütterungs- undManagementfehlern beim Betreiben ei-nerBiogasanlagekanneszuSchwankungeninnerhalbderProzessbiologiedurcheineVersäuerungunddamitzueinerBeeinträchtigungderEffizienzdergesamtenAnlagekom-men.DieVersäuerungführtzueinerVerringerungderBio-gasbeuteundderMethanqualitätbeieinergleichzeitigenAnreicherung von unerwünschten Spurengasen. Ammo-niak (NH3), Lachgas (N2O)undSchwefelwasserstoff (H2S)führenzueinerqualitativenVerschlechterungdesBiogasessowiezuumweltrelevantenGeruchs-undEmissionsproble-menimGärrestlager.NachPestaundMeyer-Pittroff(2002)sowiePestaetal.(2004)führenunerwünschteSpurengasebeiderVerwertungvonRohgasgemischenzuerheblichentechnischenProblemenimVerbrennungsraumundAbgas-systemder Blockheizkraftwerke.Der Brennwert unddasZündverhaltenreduzierensichunddiegesetzlichenAbgas-normenwerdenüberschritten.UmimPraxisbetriebeinerVersäuerungdesFermenter-
inhaltes entgegenzuwirken wäre eine Möglichkeit einabrupterFütterungsstopp,derdannwiederumzuerheb-lichenwirtschaftlichenEinbußen führenkann,oderaberder Einsatz von vermeintlich puffernden Additiven wieBranntkalk und Löschkalk. Diese besitzen jedoch eineVielzahl von negativen Eigenschaften,wie Ablagerungs-und Verhärtungserscheinungen, schlechteWasserlöslich-keit, Spurenelementfixierungen oder Hemmungen desbiologischen Systems durch Calcium (Hoffmann, 2008).DennochwerdenBranntkalkundLöschkalk„unverständ-licherweise“ indergängigenPraxiseingesetzt.AlsFolgewird die Effizienz der gesamten Anlage beeinflusst, esentstehtwenigerBiogas,wodurchsichderErlösdesEner-giewirtesreduziert.EineAlternative,umeineVersäuerungzu vermeidenoder sie beimAuftreten kostengünstig zubehebenunddendamitverbundenProblemenentgegen-zuwirken,stelltdasausderTierernährungbekannteNatri-umhydrogencarbonatdar.DabislangnurkontinuierlichelabortechnischeVersuchezumEinsatzvonNatriumhydro-gencarbonatimBiogasprozessexistieren(Burgstaleretal.,2010;2011), sowiediskontinuierlicheBatchversuchezurVerbesserungderPufferkapazitätundSteigerungderEffi-zienzdurchgeführtwurden(Scherer,2008;Raposoetal.,2006;Kasalietal.,1989;BrovkoundChen,1977;Barber,1978)solldievorliegendeUntersuchungdieinLaborver-
suchen gewonnenenwissenschaftlichen Erkenntnisse aneinerlandwirtschaftlichenBiogasanlageüberprüfen.Dabeisollnachgewiesenwerden,obNatriumhydrogencarbonatim Praxisbetrieb eine akute Versäuerung beheben kann,eineSteigerungderEffizienzundMethanqualitätbewirkt,welchenEinflussverschiedeneApplikationsformenhabenundwie sich der Einsatz von NatriumhydrogencarbonataufdasRestgaspotentialunddamitdiepraktischeWeiter-nutzungdesGärrestesauswirkt.
2 Anlagenbeschreibung und Versuchsplan
VersuchsobjektfürdenPraxisversuchwareinAnlagen-komplex bestehend aus fünf einzelnenModulen die zueinerlandwirtschaftlichenBiogasanlagezusammengefasstsind.ImRahmendesPraxistestswurdendavonzweibau-gleicheBiogasanlagenausgewählt,wobeieinModul(Mo-dul5)durchÜberfütterunginderProzessstabilitätbeein-trächtigtwar,währenddaszweiteModul(Modul1)stabillief und als Kontrolle diente. Beide Anlagenwurden abVersuchsbeginn(15.bis139.Versuchstag)mitidentischemInputsubstrat,bestehendausdurdurchschnittlichchschnittlich5656%%Mais-Mais-silage und 44 % Schweinegülle, versorgt. Zusätzlichwurden sie über den Versuchszeitraum mit annäherndgleichen Raumbelastungen gefahren. Die tägliche Sub-stratzufuhr imMittel beiderAnlagenbetrug:25,23 t·d-1
Maissilage (25,21 bis 25,25 t·d-1) mit durchschnittlich35,35%Trockensubstanz(TS)und20,06t·d-1Schweine-gülle(19,18bis20,94t·d-1)mitimMittel1,81%TS.Natriumhydrogencarbonat wurde als Bicar® Z 0/50
zur Stabilisierung desGärprozesses eingesetzt. Die bau-gleichen Biogasanlagenmodule 1 und 5 weisen eineelektrische Leistungvon je526kWelundein Fermenter-volumenvon2.560m3auf.BeideModule sind ineinenBiogasanlagenkomplex mit insgesamt 2,63 MWel inte-griert.WeiterewichtigeParameterdievondenBetreibernzu denModulen 1 und 5 angegebenwurden sind eineFaulraumbelastungvonca.3,8bis4,5kgoTS·m-3·d-1undeine durchschnittliche jährliche Verweilzeit von ca. 40 dohneRezirkulatbzw.ca.20dmitRezirkulat.
Tabelle1:
Versuchsphasen beim diskontinuierlichen und kontinuierlichen Ein-satzvonNatriumhydrogencarbonatineinerPraxisanlage(Modul5)
Phase Versuchstage
Vorbereitungsphase 0.-15.
1.Versuchsphase:Akutapplikation(einmaligeGabea5,00t) 15.-38.
2.Versuchsphase:Teilapplikation(dreiGabenzuje2,33t) 38.-77.
3.Versuchsphase:kontinuierlicheApplikation(konstanteGabena125kg·d-1)
77.-125.
Rekonvaleszenzphase:ErholungsphaseohnePuffersub-stanz
125.-139.

J. Burgstaler, D. Wiedow, F. Godlinski, N. Kanswohl / Landbauforschung - vTI Agriculture and Forestry Research 4 2011 (61)343-352 345
DerVersucherstrecktesichüber139Tage,unterteiltinzweiPhasenmitdiskontinuierlichemundeinePhasemitkontinuierlichem Einsatz von NatriumhydrogencarbonatimModul5(Tabelle1).Zur Beurteilung der Prozessstabilität der Biogasanlagen
wurdendieProzessparameterzuBeginnsowie indenfol-genden Versuchsphasen am 15., 36., 49., 70., 105. und131.Versuchstagerfasst.DieAuswahlderVersuchstageba-ba-sierteaufErgebnissenvonLaborversuchensowieausprak-tischenGegebenheiten.DieUntersuchungenzurProzesspa-rametererfassungwurden vonder LUFANord-West, LUFARostock,derUniversitätRostockunddemBetreibervorOrtbegleitet.DieUniversitätRostockundderBetreibervorOrtführten an den Versuchstagen eine unabhängige Proben-nahmedurch,wobeidienotwendigenParametermitmin-destensdreifacherWiederholunganalysiertwurden.DieausdenWiederholungendesBetreibersundderUniversitätRos-tockgebildetenMittelwertewurdenaufgrunddergeringenStreuungvond2%zueinemMittelwertzusammengefasst.In den verschiedenen Versuchsphasen wurden jeweils
dieinTabelle2untersuchtenProzessparameterundche-mischeAnalysengrößenbestimmt(Burgstaleretal.,2010,2011).
Tabelle2:
Untersuchte Prozessparameter und chemische Analysengrößen derPraxisanlagen
Parameter Einheit Vorschrift
Biogasausbeute lN·kg-1 VDI-4630
Biogasqualität Vol.%,ppm VDI-4630
Analysegrößen Einheit Vorschrift
pH-Wert(Mittelwert) - DIN38404-C5
Trockensubstanzgehalt(TS) % DIN12880
organischerTrockensub-stanzgehalt(oTS)
g·kg-1FM DIN12879
organischeSäuren(Sr) g·l-1 DIN38414-S19
organischeSubstanz(oS=oTS+Sr)
g·kg-1FM DIN12880/DIN12879/DIN38414-S19
Alkalinität mmol·l-1 DIN38409-7
FOS/TAC-Wert - VTI-Arbeitsanweisung(2007):Nordmann-Methode
FOS/TAC=flüchtigeorganischeSäuren/totalenanorganischenCarbonat
Vorbereitungsphase
In der Vorbereitungsphase, also vor dem eigentlichenVersuchsbeginn,wurdendiezuuntersuchendenProzess-parameterunddiechemischeAnalysengrößenindenMo-dulen1und5erfasst.Die ProzessdatenpH-Wert, orga-nischeSäuregehalt (Sr),AlkalinitätundFOS/TACwurdenzudiesemZeitpunktvomBetreibererhoben.DieBestim-
mungder Parameter erfolgte auchhierwie in Tabelle2beschriebennachDINVorschriften.ZusätzlichwurdendieGehaltederSpurenelementeCo,Mo,Ni,Se,Cr,Mn,FeundZnnachDINEN ISO11885-E22 imGärsubstratvonModul5vonderLUFARostockbestimmt,umeineSpu-renelementunterversorgungalsUrsachederVersäuerunginderweiterenAnwendungauszuschließen.UmdieÜberfütterungdesModuls5vordemVersuchs-
zeitraumgegenüberdemModul1nachzuweisen,erfolgteeineAuswertungdesBetriebstagebuchszudenverfütter-tenInputmaterialienMaissilageundSchweinegülle.Dabeiwurdeersichtlich,dassModul5eineerheblicheVariabilitätin der täglichen Substratzufuhr von 7 bis 32 t·d-1Mais-silage (Mittelwert 22,2 t·d-1)mit schwankender Qualität24bis45%TSund7bis69t·d-1 (Mittelwert32,3t·d-1)Schweingülle mit unterschiedlichen hohen Trockensub-stanzgehaltenvon1bis6%undeineunregelmäßigeZu-von1bis6%undeineunregelmäßigeZu-gabevonGetreideundWasseraufwies.
Versuchsphasen: Akutapplikation, Teilapplikation und kontinuierliche Applikation
Im Vorfeld der Anwendung zur Akutapplikation vonNatriumhydrogencarbonat wurden Gärrestproben derModule1und5hinsichtlichderbenötigtenMengenanNatriumhydrogencarbonat untersucht. Dabei wurde einTAC-Wert von>9.000mgCaCO3·l
-1 und eine Säureka-und eine Säureka-pazität (Alkalinität) von>200mmol·l-1 alsZielgrößede-alsZielgrößede-finiert. In Titrationsversuchenmit Gärresten desModuls5wurden die definierten Zielgrößenmittels ApplikationvonNatriumhydrogencarbonateingestelltunddieMengeanPuffersubstanzbestimmt.AufdieserBasiskonntedieGesamtmengeinTeilmengeninFormvonPulver(Bicar®Z0/50)verabreichtwerden.
Akutapplikation: Zur Akutapplikation wurden demModul5am15.VersuchstagineinerStoßgabe5,00tNa-triumhydrogencarbonat(Bicar®Z0/50)zugegeben.
Teilapplikation: Die zweite Versuchsphase war ge-kennzeichnet durch eine Dosierung von Natriumhydro-gencarbonatindreiTeilgabenzuje2,33tam38.,40.und42.Versuchstag.WeiterhinerfolgteimModul5vom5.biszum20.VersuchstageinekonstanteSubstratzufuhrundvom20.biszum51.VersuchtageinegesteigerteSubstrat-zufuhrmit Silagewechseln. ImModul 1 (Kontrolle)wur-deüberdiegesamteVersuchsphasevom5.biszum51.VersuchtagdagegenkonstantInputsubstratzugeführtmitebenfallswechselndenSilagen.DieSilagewechselwarencharakterisiertdurchschwankendeTS-Gehaltevon33bis37%TS, die eineVeränderungder Fütterungbzw.derRaumbelastungundVerweilzeitennachsichzogen.
kontinuierliche Applikation: InderdrittenVersuchs-phase wurde Natriumhydrogencarbonat in kleinen kon-stantenGabenzuje125kg·d-1vom77.biszum125.Ver-
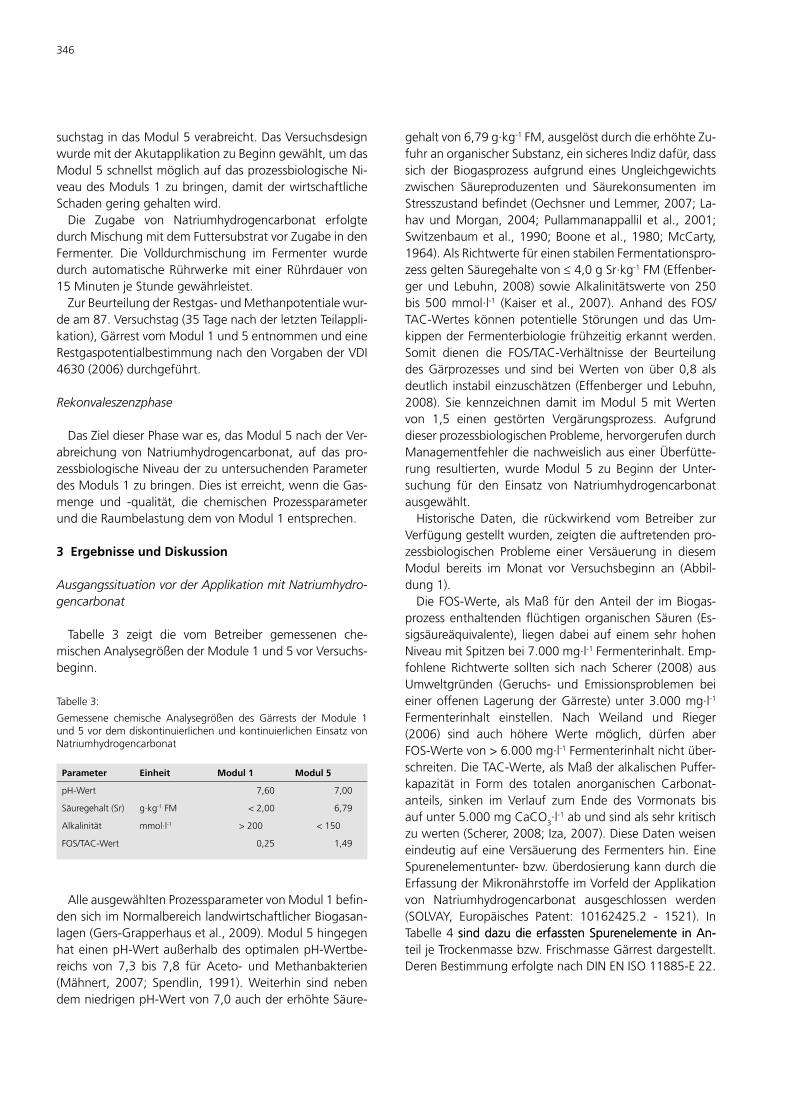
346
suchstagindasModul5verabreicht.DasVersuchsdesignwurdemitderAkutapplikationzuBeginngewählt,umdasModul5schnellstmöglichaufdasprozessbiologischeNi-veaudesModuls1zubringen,damitderwirtschaftlicheSchadengeringgehaltenwird.Die Zugabe von Natriumhydrogencarbonat erfolgte
durchMischungmitdemFuttersubstratvorZugabeindenFermenter. Die Volldurchmischung im Fermenter wurdedurchautomatischeRührwerkemiteinerRührdauervon15MinutenjeStundegewährleistet.ZurBeurteilungderRestgas-undMethanpotentialewur-
deam87.Versuchstag(35TagenachderletztenTeilappli-kation),GärrestvomModul1und5entnommenundeineRestgaspotentialbestimmungnachdenVorgabenderVDI4630(2006)durchgeführt.
Rekonvaleszenzphase
DasZieldieserPhasewares,dasModul5nachderVer-abreichung vonNatriumhydrogencarbonat, auf das pro-zessbiologischeNiveauderzuuntersuchendenParameterdesModuls1zubringen.Diesisterreicht,wenndieGas-menge und -qualität, die chemischen ProzessparameterunddieRaumbelastungdemvonModul1entsprechen.
3 Ergebnisse und Diskussion
Ausgangssituation vor der Applikation mit Natriumhydro-gencarbonat
Tabelle 3 zeigt die vom Betreiber gemessenen che-mischenAnalysegrößenderModule1und5vorVersuchs-beginn.
Tabelle3:
Gemessene chemische Analysegrößen des Gärrests der Module 1und5vordemdiskontinuierlichenundkontinuierlichenEinsatzvonNatriumhydrogencarbonat
Parameter Einheit Modul 1 Modul 5
pH-Wert 7,60 7,00
Säuregehalt(Sr) g·kg-1FM <2,00 6,79
Alkalinität mmol·l-1 >200 <150
FOS/TAC-Wert 0,25 1,49
AlleausgewähltenProzessparametervonModul1befin-densichimNormalbereichlandwirtschaftlicherBiogasan-lagen(Gers-Grapperhausetal.,2009).Modul5hingegenhateinenpH-WertaußerhalbdesoptimalenpH-Wertbe-reichs von 7,3 bis 7,8 für Aceto- undMethanbakterien(Mähnert, 2007; Spendlin, 1991).Weiterhin sind nebendemniedrigenpH-Wertvon7,0auchdererhöhteSäure-
gehaltvon6,79g·kg-1FM,ausgelöstdurchdieerhöhteZu-fuhranorganischerSubstanz,einsicheresIndizdafür,dasssichder Biogasprozess aufgrund einesUngleichgewichtszwischen Säureproduzenten und Säurekonsumenten imStresszustandbefindet(OechsnerundLemmer,2007;La-hav undMorgan, 2004; Pullammanappallil et al., 2001;Switzenbaumetal.,1990;Booneetal.,1980;McCarty,1964).AlsRichtwertefüreinenstabilenFermentationspro-zessgeltenSäuregehaltevond4,0gSr·kg-1FM(Effenber-gerundLebuhn,2008) sowieAlkalinitätswerte von250bis 500mmol·l-1 (Kaiser et al., 2007).Anhand des FOS/TAC-Werteskönnenpotentielle Störungen unddasUm-kippenderFermenterbiologiefrühzeitigerkanntwerden.Somit dienen die FOS/TAC-Verhältnisse der BeurteilungdesGärprozesses und sindbeiWerten vonüber 0,8 alsdeutlich instabileinzuschätzen(EffenbergerundLebuhn,2008). Sie kennzeichnendamit imModul 5mitWertenvon 1,5 einen gestörten Vergärungsprozess. AufgrunddieserprozessbiologischenProbleme,hervorgerufendurchManagementfehlerdienachweislichauseinerÜberfütte-rung resultierten,wurdeModul 5 zu Beginn der Unter-suchung für den Einsatz von Natriumhydrogencarbonatausgewählt.Historische Daten, die rückwirkend vom Betreiber zur
Verfügunggestelltwurden,zeigtendieauftretendenpro-zessbiologischen Probleme einer Versäuerung in diesemModul bereits imMonat vor Versuchsbeginn an (Abbil-dung1).DieFOS-Werte,alsMaß fürdenAnteilder imBiogas-
prozessenthaltendenflüchtigenorganischenSäuren (Es-sigsäureäquivalente), liegendabeiaufeinemsehrhohenNiveaumitSpitzenbei7.000mg·l-1Fermenterinhalt.Emp-fohlene Richtwerte sollten sich nach Scherer (2008) ausUmweltgründen (Geruchs- und Emissionsproblemen beieineroffenenLagerungderGärreste)unter3.000mg·l-1
Fermenterinhalt einstellen. Nach Weiland und Rieger(2006) sind auch höhere Werte möglich, dürfen aberFOS-Wertevon>6.000mg·l-1Fermenterinhaltnichtüber-schreiten.DieTAC-Werte,alsMaßderalkalischenPuffer-kapazität in Form des totalen anorganischen Carbonat-anteils, sinken im Verlauf zum Ende des Vormonats bisaufunter5.000mgCaCO3·l
-1abundsindalssehrkritischzuwerten(Scherer,2008;Iza,2007).DieseDatenweiseneindeutigaufeineVersäuerungdesFermentershin.EineSpurenelementunter-bzw.überdosierungkanndurchdieErfassungderMikronährstoffeimVorfeldderApplikationvon Natriumhydrogencarbonat ausgeschlossen werden(SOLVAY, Europäisches Patent: 10162425.2 - 1521). InTabelle4sinddazudieerfasstenSpurenelemente inAn-sinddazudieerfasstenSpurenelemente inAn-teiljeTrockenmassebzw.FrischmasseGärrestdargestellt.DerenBestimmungerfolgtenachDINENISO11885-E22.
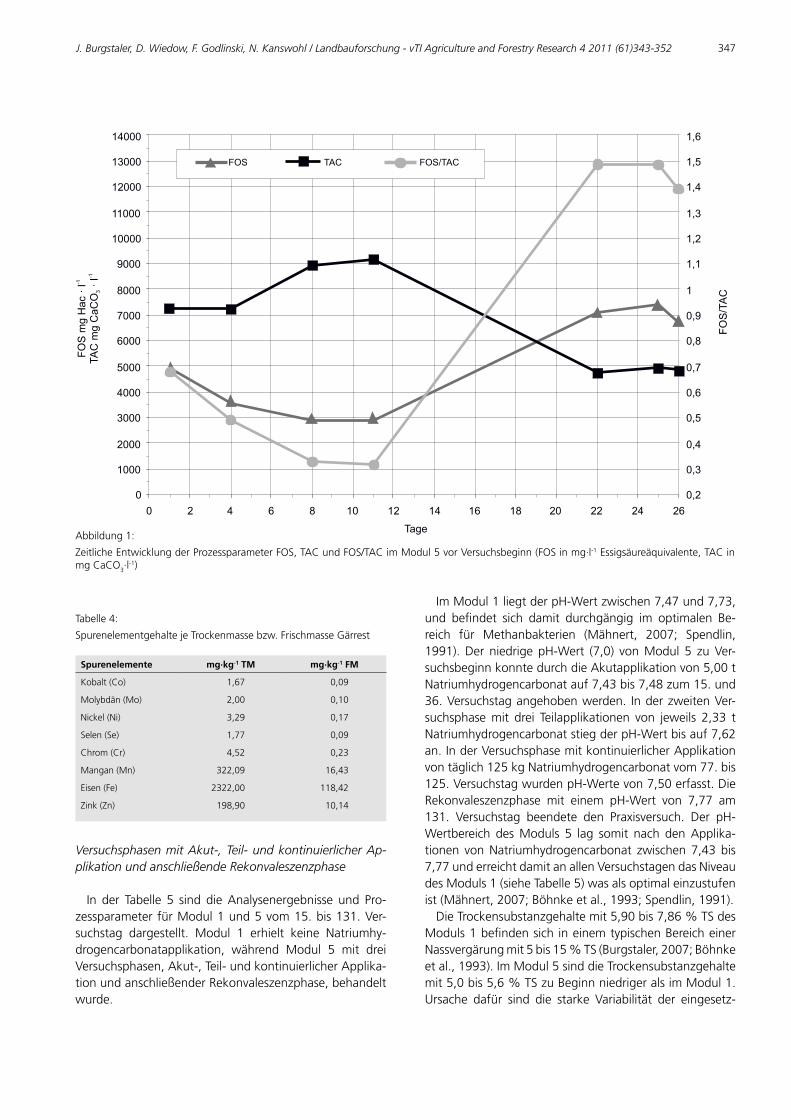
J. Burgstaler, D. Wiedow, F. Godlinski, N. Kanswohl / Landbauforschung - vTI Agriculture and Forestry Research 4 2011 (61)343-352 347
FO
S m
g H
ac
· l
TA
C m
g C
aC
O·
l
-1
-1
3
0
FO
S/T
AC
1000
2000
3000
4000
5000
6000
7000
8000
9000
10000
11000
12000
13000
14000
0 2 4 6 8 10 12 14 16 18 20 22 24 26
0,2
0,3
0,4
0,5
0,6
0,7
0,8
0,9
1
1,1
1,2
1,3
1,4
1,5
1,6
FOS TAC FOS/TAC
TageAbbildung1:
ZeitlicheEntwicklungderProzessparameterFOS,TACundFOS/TACimModul5vorVersuchsbeginn(FOSinmg·l-1Essigsäureäquivalente,TACinmgCaCO3·l
-1)
Tabelle4:
SpurenelementgehaltejeTrockenmassebzw.FrischmasseGärrest
Spurenelemente mg·kg-1 TM mg·kg-1 FM
Kobalt(Co) 1,67 0,09
Molybdän(Mo) 2,00 0,10
Nickel(Ni) 3,29 0,17
Selen(Se) 1,77 0,09
Chrom(Cr) 4,52 0,23
Mangan(Mn) 322,09 16,43
Eisen(Fe) 2322,00 118,42
Zink(Zn) 198,90 10,14
Versuchsphasen mit Akut-, Teil- und kontinuierlicher Ap-plikation und anschließende Rekonvaleszenzphase
In der Tabelle 5 sind dieAnalysenergebnisse und Pro-zessparameterfürModul1und5vom15.bis131.Ver-suchstag dargestellt. Modul 1 erhielt keine Natriumhy-drogencarbonatapplikation, während Modul 5 mit dreiVersuchsphasen,Akut-,Teil-undkontinuierlicherApplika-tionundanschließenderRekonvaleszenzphase,behandeltwurde.
ImModul1liegtderpH-Wertzwischen7,47und7,73,und befindet sich damit durchgängig im optimalen Be-reich für Methanbakterien (Mähnert, 2007; Spendlin,1991).Der niedrigepH-Wert (7,0) vonModul 5 zuVer-suchsbeginnkonntedurchdieAkutapplikationvon5,00tNatriumhydrogencarbonatauf7,43bis7,48zum15.und36.Versuchstagangehobenwerden. InderzweitenVer-suchsphasemit drei Teilapplikationen von jeweils 2,33 tNatriumhydrogencarbonatstiegderpH-Wertbisauf7,62an.InderVersuchsphasemitkontinuierlicherApplikationvontäglich125kgNatriumhydrogencarbonatvom77.bis125.VersuchstagwurdenpH-Wertevon7,50erfasst.DieRekonvaleszenzphase mit einem pH-Wert von 7,77 am131. Versuchstag beendete den Praxisversuch. Der pH-Wertbereich desModuls 5 lag somit nach denApplika-tionen vonNatriumhydrogencarbonat zwischen7,43bis7,77underreichtdamitanallenVersuchstagendasNiveaudesModuls1(sieheTabelle5)wasalsoptimaleinzustufenist(Mähnert,2007;Böhnkeetal.,1993; Spendlin,1991).DieTrockensubstanzgehaltemit5,90bis7,86%TSdes
Moduls1befindensichineinemtypischenBereicheinerNassvergärungmit5bis15%TS(Burgstaler,2007;Böhnkeetal.,1993).ImModul5sinddieTrockensubstanzgehaltemit5,0bis5,6%TSzuBeginnniedrigeralsimModul1.Ursache dafür sind die starke Variabilität der eingesetz-
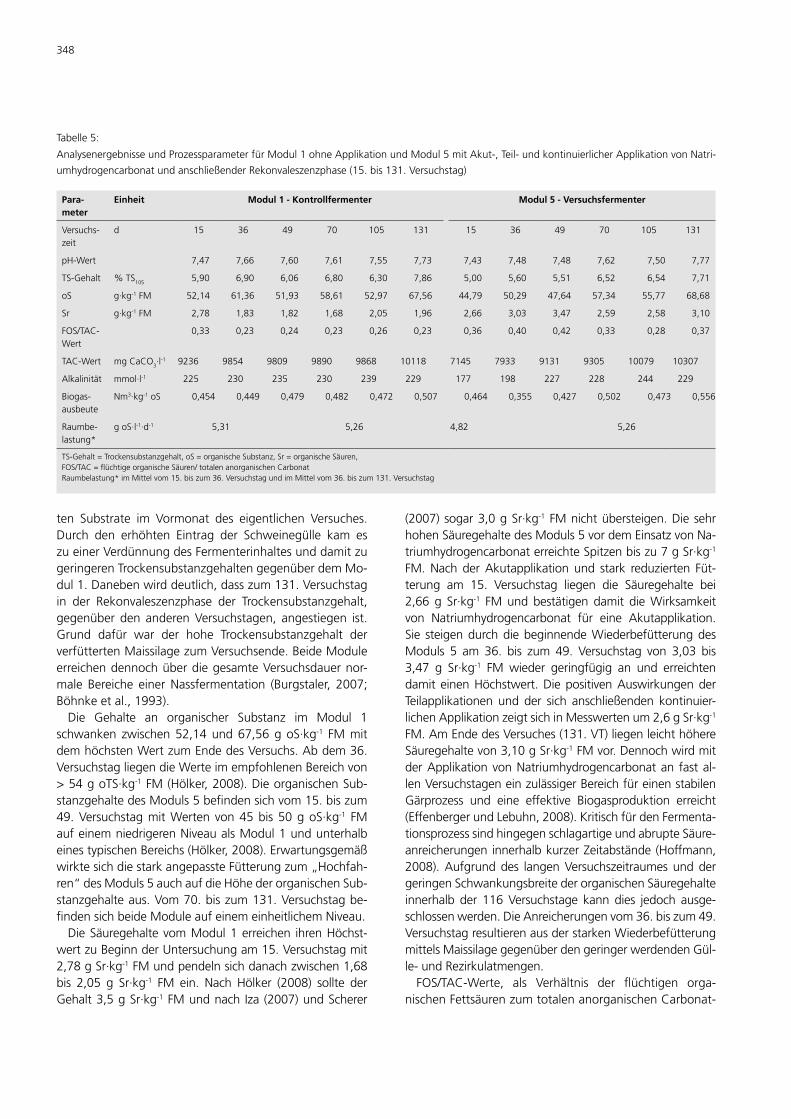
348
ten Substrate im Vormonat des eigentlichen Versuches.Durch den erhöhten Eintrag der Schweinegülle kam eszueinerVerdünnungdesFermenterinhaltesunddamitzugeringerenTrockensubstanzgehaltengegenüberdemMo-dul1.Danebenwirddeutlich,dasszum131.Versuchstagin der Rekonvaleszenzphase der Trockensubstanzgehalt,gegenüber den anderenVersuchstagen, angestiegen ist.Grund dafür war der hohe Trockensubstanzgehalt derverfüttertenMaissilagezumVersuchsende.BeideModuleerreichendennochüberdiegesamteVersuchsdauernor-male Bereiche einerNassfermentation (Burgstaler, 2007;Böhnkeetal.,1993).
Tabelle5:
AnalysenergebnisseundProzessparameterfürModul1ohneApplikationundModul5mitAkut-,Teil-undkontinuierlicherApplikationvonNatri-
umhydrogencarbonatundanschließenderRekonvaleszenzphase(15.bis131.Versuchstag)
Para-meter
Einheit Modul 1 - Kontrollfermenter Modul 5 - Versuchsfermenter
Versuchs-zeit
d 15 36 49 70 105 131 15 36 49 70 105 131
pH-Wert 7,47 7,66 7,60 7,61 7,55 7,73 7,43 7,48 7,48 7,62 7,50 7,77
TS-Gehalt %TS105 5,90 6,90 6,06 6,80 6,30 7,86 5,00 5,60 5,51 6,52 6,54 7,71
oS g·kg-1FM 52,14 61,36 51,93 58,61 52,97 67,56 44,79 50,29 47,64 57,34 55,77 68,68
Sr g·kg-1FM 2,78 1,83 1,82 1,68 2,05 1,96 2,66 3,03 3,47 2,59 2,58 3,10
FOS/TAC-Wert
0,33 0,23 0,24 0,23 0,26 0,23 0,36 0,40 0,42 0,33 0,28 0,37
TAC-Wert mgCaCO3·l-1 9236 9854 9809 9890 9868 10118 7145 7933 9131 9305 10079 10307
Alkalinität mmol·l-1 225 230 235 230 239 229 177 198 227 228 244 229
Biogas-ausbeute
Nm3·kg-1oS 0,454 0,449 0,479 0,482 0,472 0,507 0,464 0,355 0,427 0,502 0,473 0,556
Raumbe-lastung*
goS·l-1·d-1 5,31 5,26 4,82 5,26
TS-Gehalt=Trockensubstanzgehalt,oS=organischeSubstanz,Sr=organischeSäuren,FOS/TAC=flüchtigeorganischeSäuren/totalenanorganischenCarbonatRaumbelastung*imMittelvom15.biszum36.VersuchstagundimMittelvom36.biszum131.Versuchstag
Die Gehalte an organischer Substanz im Modul 1schwanken zwischen52,14und67,56goS·kg-1 FMmitdemhöchstenWertzumEndedesVersuchs.Abdem36.VersuchstagliegendieWerteimempfohlenenBereichvon>54goTS·kg-1FM(Hölker,2008).DieorganischenSub-stanzgehaltedesModuls5befindensichvom15.biszum49.VersuchstagmitWerten von45bis50goS·kg-1 FMaufeinemniedrigerenNiveaualsModul1undunterhalbeinestypischenBereichs(Hölker,2008).ErwartungsgemäßwirktesichdiestarkangepassteFütterungzum„Hochfah-ren“desModuls5auchaufdieHöhederorganischenSub-stanzgehalteaus.Vom70.biszum131.Versuchstagbe-findensichbeideModuleaufeinemeinheitlichemNiveau.DieSäuregehaltevomModul1erreichen ihrenHöchst-
wertzuBeginnderUntersuchungam15.Versuchstagmit2,78gSr·kg-1FMundpendelnsichdanachzwischen1,68bis 2,05 g Sr·kg-1 FM ein. Nach Hölker (2008) sollte derGehalt3,5gSr·kg-1FMundnach Iza (2007)undScherer
(2007)sogar3,0gSr·kg-1FMnichtübersteigen.DiesehrhohenSäuregehaltedesModuls5vordemEinsatzvonNa-triumhydrogencarbonaterreichteSpitzenbiszu7gSr·kg-1FM.NachderAkutapplikation und stark reduzierten Füt-terung am 15. Versuchstag liegen die Säuregehalte bei2,66 g Sr·kg-1 FMund bestätigen damit dieWirksamkeitvon Natriumhydrogencarbonat für eine Akutapplikation.Sie steigendurchdiebeginnendeWiederbefütterungdesModuls 5 am 36. bis zum 49. Versuchstag von 3,03 bis3,47 g Sr·kg-1 FM wieder geringfügig an und erreichtendamit einenHöchstwert.DiepositivenAuswirkungenderTeilapplikationen und der sich anschließenden kontinuier-lichenApplikationzeigtsichinMesswertenum2,6gSr·kg-1FM.AmEndedesVersuches(131.VT)liegenleichthöhereSäuregehaltevon3,10gSr·kg-1FMvor.DennochwirdmitderApplikationvonNatriumhydrogencarbonatan fastal-lenVersuchstageneinzulässigerBereichfüreinenstabilenGärprozess und eine effektive Biogasproduktion erreicht(EffenbergerundLebuhn,2008).KritischfürdenFermenta-tionsprozesssindhingegenschlagartigeundabrupteSäure-anreicherungeninnerhalbkurzerZeitabstände(Hoffmann,2008).Aufgrunddes langenVersuchszeitraumesunddergeringenSchwankungsbreitederorganischenSäuregehalteinnerhalb der 116Versuchstage kann dies jedoch ausge-schlossenwerden.DieAnreicherungenvom36.biszum49.VersuchstagresultierenausderstarkenWiederbefütterungmittelsMaissilagegegenüberdengeringerwerdendenGül-le-undRezirkulatmengen.FOS/TAC-Werte, als Verhältnis der flüchtigen orga-
nischenFettsäurenzumtotalenanorganischenCarbonat-

J. Burgstaler, D. Wiedow, F. Godlinski, N. Kanswohl / Landbauforschung - vTI Agriculture and Forestry Research 4 2011 (61)343-352 349
gehalt,dienenhauptsächlichderBeurteilungderLangzeit-entwicklunginFermentern.ImModul1deutendieFOS/TAC-Wertemit0,33bis0,23aufein intaktesVerhältnis,wie vonVoßet al. (2009),Kaiser et al. (2007),WeilandundRieger(2006)undWieseundKönig(2006)beschrie-(2006)beschrie-benmit0,15bis0,45,hin.ImModul5sankdurchdieAp-0,15bis0,45,hin.ImModul5sankdurchdieAp-,hin.ImModul5sankdurchdieAp-plikation vonNatriumhydrogencarbonatmit angepassterFütterungder FOS/TAC-Wert von1,00auf0,36ab.DerleichteAnstiegderFOS/TAC-Wertevom36.biszum49.Versuchstag auf 0,40 resultiert aus der schon beschrie-benen Wiederbefütterung mit steigenden MaismengenimModul5.DanachwurdendurchgängigFOS/TAC-Wertevon0,28und0,37 imoptimalenBereicherfasst (Voßetal.,2009).Die definierte Zielgröße, innerhalb der Versuchspha-
se mit einem angestrebten TAC-Wert von > 9.000 mgCaCO3·l
-1, wurde am 131. Versuchstag mit 10.307 mgCaCO3·l
-1erreichtundistalsgünstigfürdieMilieubedin-erreichtundistalsgünstigfürdieMilieubedin-gungeneinzustufen(Hölker,2008).DieAlkalinitätswertedesModuls1schwankenwährend
der 116-tägigen Versuchsdauer zwischen 225 bis 239mmol·l-1. ImModul 5 hingegen konnten die wesentlichniedrigeren Alkalinitätswerte von 177 bis 198 mmol·l-1zu Beginn durch die Applikation von Natriumhydrogen-carbonat auf die Zielgröße von > 200mmol·l-1mit 227bis244mmol·l-1angehobenwerden.Damitbefindensichbeide Fermenter nachMeinung vonKaiser et al. (2007)aufeinemetwaszuniedrigenNiveau,währendKottmair(2010)diesenBereichalsunproblematischundstabil fürdenBiogasprozesseinstuft.Die mittlere Raumbelastung desModuls 1 betrug für
den15.bis36.Versuchstag5,31goS·l-1·d-1,danachwurdeeinemittlereRaumbelastungvon5,26goS·l-1·d-1biszumVersuchsendeimFermentereingestellt.Modul5zeigteeinähnlichesVerhalten,geringereWertemit4,82goS·l-1·d-1
zuBeginnaufgrundderAnfahrphasemitansteigenderBe-fütterungundanschließendeinemittlereRaumbelastungvon5,26goS·l-1·d-1.AufgrundderhohenRaumbelastungzuBeginnundder
damitstärkerenBelastungdesbiologischenMilieus,fallenzunächstauchdieBiogasausbeutendesModuls1vom15.biszum36.Versuchstagmit0,454bis0,449Nm3·kg-1oSniedrigeraus.EinenähnlichenAbfallzeigtauchModul5,derjedochbedingtistdurchdieschnelleVerstoffwechse-lung der vorliegenden angereicherten Säuren, ausgelöstdurch die Überfütterung vor dem 15. Versuchstag. Abdem49.VersuchstagnehmendieBiogasausbeutenjedochin beiden Modulen wieder zu und erreichen Endwertevon0,507bzw.0,556Nm3·kg-1oSderModule1bzw.5.ÄhnlicheWertewerdenauchvonvergleichbarenAnlagendes BiogasMessprogramms (Gemmeke et al., 2009) er-reicht.DieBiogasausbeutendesModuls5liegenabdem70.VersuchstagüberdenendesModuls1undbeweisen
nochmals die schon in den vorangegangenen kontinu-ierlichen Laborversuchen (Burgstaler et al., 2010, 2011)nachgewiesenenpositivenEffektebeioptimalangepassterDosierungvonNatriumhydrogencarbonat(Scherer,2008;Raposoetal.,2006;Kasalietal.,1989;BrovkoundChen,1977;Barber,1978).Die durchschnittliche Verweilzeit im Versuchszeitraum
desModuls1liegtbei58TagenohneRezirkulat,währendsierund55TageohneRezirkulatfürModul5beträgt.DieniedrigeregemittelteVerweilzeitdesModuls5gegenüberdemModul1resultiertausdemvermehrtenEinsatzvonSchweinegülleimAnfahrprozess.In dem Modul 5 wurden insgesamt 18 t Natriumhy-
drogencarbonatwährendderVersuchsphasenmitAkut-,Teil- und kontinuierlicher Applikation verabreicht. Dabeiwurden die in den kontinuierlichen Laborversuchen vonBurgstaleretal.,(2010,2011)gewonnenErkenntnissezurAkutwirksamkeit von Natriumhydrogencarbonat (Akut-applikation)beieinerbestehendenVersäuerungsowiezurLeistungsförderungundEffizienzverbesserungdesBiogas-prozessesbeieinerTeil-undkontinuierlichenApplikationauf einer Praxisanlage nachgewiesen. Erkenntnisse ausanderen Arbeitenwie z. B. von Scherer (2008), Raposoetal.(2006)undKasalietal.(1989)konntennichtheran-gezogenwerden,dasichdiesenuraufdiskontinuierlicheVersuchebezogenundkeineRückschlüsseaufdiezuver-wendenenMengenvonNatriumhydrogencarbonatabge-leitetwerdenkonnten.DieBiogasmengenund-qualitätendesModuls1wäh-
rend der Versuchsphasen vom 15. bis 139. VersuchstagsindinAbbildung2dargestellt.DerVerlaufdernormiertenBiogasausbeute schwankt innerhalb dieses Zeitraumeszwischen5.500bis6.500Nm3jeTag.DieMethangehaltebewegensichvon45bis53Vol.%unddieKohlendioxid-gehalteliegenineinemBereichvon47bis54Vol.%.Abbildung3zeigtebenfallsdieerfasstenBiogasmengen
und-qualitätendesModuls5währendderVersuchspha-senvom15.bis139.Versuchstag.InbeidenModulensinddieMethan- undKohlendioxidgehalte relativ einheitlich.DermittlereMethangehaltwährendderVersuchsphasenlagbei49,8Vol.%fürModul1undbei49,2Vol.%fürModul5,miteinemSchwankungsbereichvon45bis53Vol.% bei beidenModulen. Diemittleren Kohlendioxid-gehalte befanden sich zwischen 49,9 bzw. 50,3 Vol.%fürModul1bzw.5,auchhiermitnurgeringenSchwan-kungenvon47bis54Vol.%.ImGegensatzzubisherigenLaboruntersuchungen (Burgstaler et al., 2010; Kasali etal.,1989;BrovkoundChen,1977)konntenkeinedurch-schnittlichhöherenMethanqualitätenimModul5erfasstwerden.Die normierten Biogasausbeuten der beiden Module
zubeginnderVersuchsphasenweisenUnterschiedeauf.DerVerlaufdernormiertenBiogasausbeutevonModul1
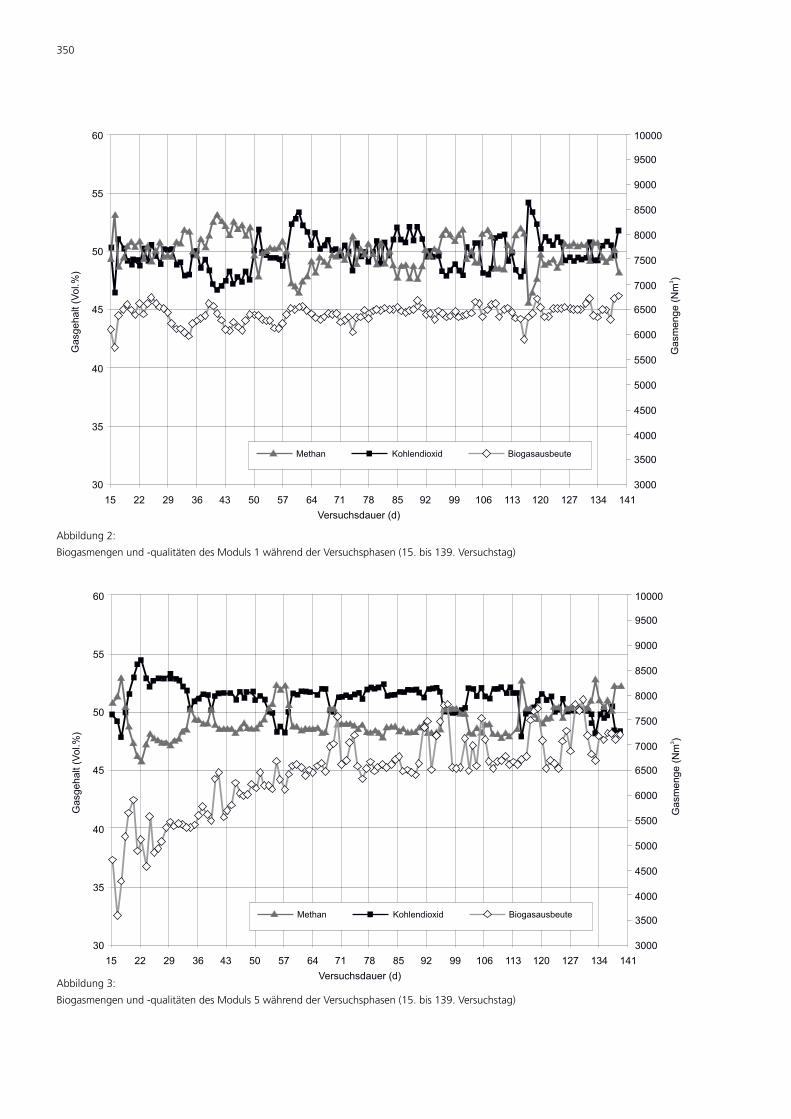
350
30
35
40
45
50
55
60
15
Gasg
ehalt
(Vol.%
)
Gasm
enge (
Nm
)3
22 29 36 43 50 57 64 71 78 85 92 99 106 113 120 127 134 141
Versuchsdauer (d)
3000
3500
4000
4500
5000
5500
6000
6500
7000
7500
8000
8500
9000
9500
10000
Methan Kohlendioxid Biogasausbeute
Abbildung2:
Biogasmengenund-qualitätendesModuls1währendderVersuchsphasen(15.bis139.Versuchstag)
30
35
40
45
50
55
60
15
Gasg
ehalt
(Vol.%
)
Gasm
enge (
Nm
)3
22 29 36 43 50 57 64 71 78 85 92 99 106 113 120 127 134 141
Versuchsdauer (d)
3000
3500
4000
4500
5000
5500
6000
6500
7000
7500
8000
8500
9000
9500
10000
Methan Kohlendioxid Biogasausbeute
Abbildung3:
Biogasmengenund-qualitätendesModuls5währendderVersuchsphasen(15.bis139.Versuchstag)

J. Burgstaler, D. Wiedow, F. Godlinski, N. Kanswohl / Landbauforschung - vTI Agriculture and Forestry Research 4 2011 (61)343-352 351
variierte innerhalb des gesamten Versuchszeitraumszwischen5.500bis 6.500Nm3·d-1mit einemMittel von6.404Nm3·d-1.HingegenbefindetsichdienormierteBio-gasausbeutevonModul5vom15.biszum50.Versuchs-tagaufeinemniedrigerenNiveau,erreichtaberausgehendvom51.VersuchstaghöhereBiogasausbeutenalsdasMo-dul 1mit einemdurchschnittlichenMehrertrag von115m3·d-1.DiegeringerennormiertenGasausbeutenbiszum50.VersuchstaglassensichdurchdiegeringereRaumbe-lastunginderAnfahrphasedesModuls5gegenüberdemModul1erklären. ImMittelerreichtModul5sogareinehöhere Biogasausbeutemit 6.519Nm3·d-1. Die erzieltenBiogasausbeutendesModuls5befinden sichauf einemhohen Niveau und im Bereich vergleichbarer Anlagen(Gemmekeetal.,2009).SieerlaubendamiteinepositiveKosten-undNutzenbilanzfürdenlandwirtschaftlichenBe-treiberderBiogasanlage.InderTabelle6sinddiegebildetenRestgas-unddieMe-
thanpotentiale der Fermenter vom 87. Versuchstag dar-gestellt.
Tabelle6:
Restgas-undMethanpotentialevomModul1und5am87.Versuchs-tag
Proben Restgas-potential
Methan-potential
Methan-potential
Methan-anteil
(lN·kg-1·FM) (lN·kg
-1·FM) (lN·kg-1·oS) (Vol.%)
Modul1 10,24 5,87 104,65 57,4
Modul5 5,90 3,49 80,76 59,1
ErwartungsgemäßunterscheidensichdieRestgaspoten-tiale (lN·kg
-1 FM bzw. lN·kg-1 oS) bezogen auf die Frisch-
massebzw.organischeSubstanzdereinzelnenFermenter-inhaltevoneinander.DashöchsteRestgaspotentialbesitztdasModul 1 und das geringsteModul 5. EntsprechenddemRestgaspotentialwurdedashöchsteMethanpotential(5,9lN·kg
-1FM)beidemModul1unddasniedrigstebeimModul5(3,5lN·kg
-1FM)ermittelt.AlleWertebefindensichweit unter denen des BiogasMessprogramms (Gemme-keetal.,2009),dieeindurchschnittlichesMethanpoten-tial von9,5 lN·kg
-1 FMausweisen.DieMethanpotentialedesModuls 1mit 105 lN·kg
-1 oS und desModuls 5mit81 lN·kg
-1oS,sinddamitdeutlichniedrigeralsdieAnga-bendesBiogasMessprogramms(Gemmekeetal.,2009)mitimMittel130lN·kg
-1oTS.DasgeringereRestgas-undMethanpotentialdesModuls5gegenüberdemModul1ist einweiteres Indiz für einenbedarfsgerechten EinsatzvonNatriumhydrogencarbonatundsprichtfüreineneffi-zienterenBiogasprozess.Dennochkannvondenbeschrie-Dennochkannvondenbeschrie-benen praktischen Bedingungen eine Beeinflussung derchemischen Analyse- und Prozessparameter durch den
erhöhten Einsatz von Schweinegülle im Modul 5 nichtausgeschlossen werden. Trotzdem lassen die ErgebnisseeindeutigdiepositivenWirkungenvonNatriumhydrogen-carbonaterkennen.Der Methananteil in Volumenprozent ergibt sich aus
demQuotientenderBiogas-undMethanmenge.DerVer-gleichderbeidenFermenterzeigt,dassdasModul1mit57,4Vol.%diegeringereunddasModul5mit59,1Vol.%diehöhereMethanqualitätbesitzt.BeideMethangehalteliegenengbeieinanderundsindinBezugauftypischeBe-reichefürBiogasanlagenalsnormaleinzustufen(LeschberundLoll,1996;Ederetal.,2007;Weiland,2003).InderabschließendenRekonvaleszenzphasevom125.
bis zum139.Versuchstagwurde imModul 5 ein annä-herndgleichesprozessbiologischesNiveaueingestelltwieim Modul 1. Die gebildeten Gasqualitäten, chemischenProzessparameter und Raumbelastungen des Moduls 5entsprachen dem Modul 1, übertrafen aber die Erwar-tungen desModul 5 im Bezug auf die generierten Bio-gasmengenum1,8%proTaggegenüberdemModul1.Damit konnten in dem mit Natriumhydrogencarbonat
versetztenFermenterhöhereBiogasausbeutennachgewie-senwerden.InnerhalbvonknappeinemMonatwurdederBiogasprozessdesversäuertenFermentersaufdasNiveauder Kontrolle angehoben. Jedoch konnten dabei keinedurchschnittlichhöherenMethanqualitätenerfasstwerden.
4 Schlussfolgerung
EineVersäuerungvonBiogasfermenternausgelöstdurcheineÜberfütterungführtzurerheblichenwirtschaftlichenSchäden. Natriumhydrogencarbonat kann nachweislichdenpH-WertanhebenunddamiteinenversäuertenFer-menterinhalt effizient abpuffern und führt zu einer Sta-bilisierung der Prozessbiologie. Aufgrund der basischenWirkungvonNatriumhydrogencarbonaterfolgteineMili-euverbesserungfürdiemethanogenenBakterien.DieUntersuchungenbeiderAnwendunganeinerPra-
xisanlagehabengezeigt,dassNatriumhydrogencarbonatalsProzesshilfsstoffbeieinerstarkenVersäuerunginFormeiner bedarfsgerechten einmaligen Gabe (Akutappli-kation) eingesetzt werden kann. Daneben konnte beischwankendenSubstratqualitätendeseingesetztenInput-substratessowiebeizeitweisenhohenRaumbelastungen(Stoßbelastungen), bei Substratwechsel, im Anfahr- undHochfahrmodus die positive Wirkung von Natriumhy-drogencarbonat in Form von größeren Teilapplikationennachgewiesenwerden.WeiterhineignetsichNatriumhy-drogencarbonatalsPräventionsmittelundLeistungsförde-rer bei kontinuierlicherApplikation zurOptimierungdesBiogasprozesses.UmeinebedarfsgerechteDosierungvonNatriumhydrogencarbonat zu ermöglichen, muss einesorgfältigeAnalysedesProzessesimHinblickaufdievaria-

352
blenProzessparameterundAnalysedaten(Substratartund-menge,Verweilzeiten,Raumbelastungen,GasmengeundGasqualität) durchgeführtwerden. Parallel dazumüssenimLaborbestimmtemikrobiologisch,chemischrelevanteProzesswerteerfasstundabgeglichenwerden.AufGrund-lage dieser Analysedaten kann eine exakte ApplikationvonNatriumhydrogencarbonaterfolgen.GenerellistdamitderEinsatzvonNatriumhydrogencar-
bonateinepraktikableVarianteumProzessstörungdurchVersäuerungenzuvermeiden.DaNatriumhydrogencarbo-nat relativgünstigverfügbar ist, stellteseinepreiswerteAlternative zum komplettenHerunterfahren von versäu-ertenBiogasanlagendar.Zu berücksichtigen ist zudem, dass der Praxisversuch
beim Einsatz von Natriumhydrogencarbonat im Gärrestzu einem verringerten Restgaspotential und somit zureiner Reduzierung von klimarelevanten Treibhausgasenführt.Dies ist besonders für dieweitereVerwendung inderLandwirtschaftvonVorteil,aufgrundvonreduziertenEmissionenundeinerErhöhungdespH-WertesimBoden.
Literatur
BarberNR (1978) Limeand sodabicarbonate treatment increases sludgedi-gesterefficiency.JEnvironSci21:28-30
BooneDR,ChynowethDP,MahRA,SmithPH,WilkieAC(1980)Terminalreactionsintheanaerobicdigestionofanimalwaste.ApplEnvironMicrobiol43:57-64
BöhnkeB,BischofsbergerW,SeyfriedC-F(eds)(1993)Anaerobtechnik:Hand-buch der anaeroben Behandlung von Abwasser und Schlamm. Berlin :Springer,837p
BrovkoN,ChenKY(1977)Optimizinggasproduction,methanecontent,andbuffercapacityindigesteroperation.WaterSewageWorks124(7):54–57
BurgstalerJ(2007)BeschreibungderVersuchsbiogasanlageundwichtigerPro-zessparameter : Bericht zum agrarökologischen Komplexseminar an derUniversitätRostock2007,25p(unpubl)
BurgstalerJ,BlumenthalJ,WiedowD,GodlinskiF,KanswohlN(2010)Möglich-keit zur pH-Wertregulation versäuerter Biogasfermenter und die Auswir-kungenaufdieBiogasausbeute.Landbauforsch60(4):213-220
Burgstaler J,WiedowD,Godlinski F, Kanswohl N (2011) Verminderung desRestgaspotentialsundgasförmigerEmissionenausGärrestenderBiogas-produktion.Landbauforsch61(2)127-140
EderB,SchulzH,KriegA(2007)Biogas-Praxis:Grundlagen,Planung,Anlagen-bau,Beispiele,Wirtschaftlichkeit,Staufen/Freiburg:ÖkobuchVerl,236p
EffenbergerM,LebhunM(2008)BiologiederMethangärung:dieBelastungs-grenzenerkennen.Maisspecial(2):2-7
GemmekeB,RiegerC,WeilandP,SchröderJ(2009)Biogas-MessprogrammII:61BiogasanlagenimVergleich.Gülzow:FNR,168p
Gers-GrapperhausC,HoffstedeU,MaciejczykM,MitterleitnerH,OechsnerH,Rein-holdG,SchüsselerP,WeilandP,WelschW(2009)SchwachstellenanBiogasan-lagenverstehenundvermeiden.Darmstadt:KTBL,56p,KTBL-Heft84
HoffmannJ(2008)StabilisierungderPufferkapazitätvonlandwirtschaftlichenBiogasanlagendurchKalkzugabe.Bonn:Univ,81p,Diplomarbeit
HölkerU(2008)Gerüchtekücheschließen:Datenauswertungvonüber1000BiogasanlagendurchdieBioreactGmbH.BiogasJournal(4):22-29
IzaJ(2007)Simplelowcostcontroltechniqueforanaerobicreactors.In:Molet-taH(ed)Workshop“Anaerobicdigestioninmountainarea(andinisolatedruralzones)”:June5-72007,Chambery(France)
KaiserF,MetznerT,EffenbergerM,GronauerA(2007)SicherungderProzess-stabilität in landwirtschaftlichenBiogasanlagen.Freising-Weihenstephan :LfL,14p,LfL-Information
KasaliGB,SeniorE,Watson-CraikIA(1989)Sodiumbicarbonateeffectsontheanaerobicdigestionofrefuse.JChemTechnolBiotechnol45(4):279-289
KottmairA(2010)Inline-AnalysederBicarbonatkonzentrationinFaulschlamm:eineinnovativeMethodezurÜberwachungderProzessbiologieinBiogas-anlagen. In:Biogas3. Innovationskongress:17.und18.Juni2010,Zen-trum für Umweltkommunikation der Deutschen Bundesstiftung Umwelt(DBU)Osnabrück;Tagungsband.Hildesheim:ProfairConsult,pp67-72
KTBL(2009)FaustzahlenBiogas.Darmstadt:KTBL,240pLahavO,MorganBE(2004)Titrationmethodologiesformonitoringofanaero-
bicdigestionindevelopingcountries:areview.JChemTechnolBiotechnol79(12):1331-1341
LeschberR,LollU(1996)Klärschlamm.Berlin:Ernst,729pMähnert P (2007) Kinetik der Biogasproduktion aus nachwachsenden Roh-
stoffenundGülle.Berlin:Humboldt-Univ,168pMcCartyPL(1964)Anaerobicwastetreatmentfundamentals:part1-4,chemis-
tryandmicrobiology,environmentalrequirements,toxicmaterialsandtheircontrol,processdesign.Publicworks95(9-12):91-126
OechsnerH, LemmerA (2007)Biogas :VorlesungsunterlagenM41252,SS2007, Agrartechnik / Landesanstalt für Landwirtschaftliches Maschinen-undBauwesen,UniversitätHohenheim
PestaG,Meyer-PittroffR(2002)Kofermentate:sovermeidenSieFütterungs-fehler.In:AmonT(ed)Biogas:StromausGülleundBiomasse.Münster:Landwirtschaftsverl,pp78-80
PestaG,GrepmeierM,Meyer-PittroffR(2004)DieInline/OnlineGasanalyse:einzu-verlässigesInstrumentzurOptimierungdermikrobiologischenEntschwefelungundderProzessführungbeiBiogasanlagen.In:RutschmannC(ed)13.Sym-posium„EnergieausBiomasse :Biogas,Flüssigkraftstoffe,Festbrennstoffe“,25.und26.November2004,KlosterBanz.Regensburg:OTTI,pp183–188
PullammanappallilPC,ChynowethDP,LyberatosG,SvoronosS(2001)Stableperformanceofanaerobicdigestioninthepresenceofahighconcentrationofpropionicacid.BioresTechnol78:165-169
RaposoF,BanksCJ,SiegertI,HeavenS,BorjaR(2006)Influenceofinoculumtosubstrateratioonthebiochemicalmethanepotentialofmaizeinbatchtests.ProcessBiochem41(6):1444-1450
SanderHH(2009)DieBedeutungder„ErneuerbareEnergieninNorddeutschland“[on-line].Zufindenin<http://www.umwelt.niedersachsen.de/live/live.php?navigation_id=2180&article_id=9051&_psmand=10>[zitiertam09.11.2011]
SchererP(2007)Operatinganalyticsofbiogasplantstoimproveefficiencyandtoensureprocessstability.In:FNBB(ed)Progressinbiogas:biogasproductionfromagriculturalbiomassandorganicresidues.Kirchberg/Jagst:FNBB,pp77-84
Scherer P (2008) Bestimmung der Abbauraten von Biogasanlagen [online].Zu finden in <http://eti-brandenburg.de/fileadmin/eti_upload/down-loads2008/06_Scherer.pdf>[zitiertam21.10.2010]
SchüsselerP (2011)Standder Förderarbeitder FNRzumThemaHilfsmittel :offeneFragen.GülzowerFachgespr35:7-15
SpendlinHH(1991)UntersuchungzurfrühzeitigenInitiierungderMethanbildungbeifestenAbfallstoffen.Bonn:Economica,192p,HamburgerBer:Abfallwirtschaft4
SOLVAYSA,UnivRostock(2010)Useofsodiumbicarbonateinbiogas:processforproducingbiogas ;EP10162425.2-1521.München:EuropPatentor-ganisation
SwitzenbaumMS,GomezEG,HickeyRF(1990)Monitoringoftheanaerobicmethanefermentationprocess.EnzymeMicrobTechnol12(10):722-730
VoßE,WeichgrebeD,RosenwinkelHH(2009)FOS/TACHerleitung,Methodik,AnwendungundAussagekraft.In:InternationaleWissenschaftstagungBio-gasScience2009,02.-04.2009inErding.Freising,pp675-682
WeilandP(2003)NotwendigkeitderBiogasaufbereitung,AnsprücheeinzelnerNutzungsroutenundStandderTechnik.GülzowerFachgespr21:7-23
WeilandP,RiegerC(2006)Prozessstörungenfrühzeitigerkennen.Biogas-Jour-nal(4):18-20
Wiese J,KönigR (2006)ProzessbegleitendeFermenterüberwachungaufBiogas-anlagen [online]. Zu finden in <http://www.hach-lange.de/shop/action_q/download%3Bdocument/DOK_ID/14782554/type/pdf/lkz/DE/spkz/de/TOKEN/NmRAQU5PagkuR3DXpNx5YJs9WJ0/M/oN4QtQ>[zitiertam09.11.2011]

G. A. Smidt, A. Koschinsky, L. M. de Carvalho, J. Monserrat, E. Schnug / Landbauforschung - vTI Agriculture and Forestry Research 4 2011 (61)353-364
353
Heavy metal concentrations in soils in the vicinity of a fertilizer factory in Southern Brazil1)
1) Contributionontheworkshops„BetterSoilsforBetterLife“during theGerman-BrazilianYearofScience2010/2011,jointlyorganizedby theGeochemistryWorkgroup-SchoolofEngineeringandScienceat
JacobsUniversityinBremenandtheInstituteforCropandSoilScience at JKI in Braunschweig, Germany. Part one “Protecting our future
through soil conservation” held from December 6-10, 2010 on the campusoftheJacobsUniversityinBremen.
GeerdA.Smidt*,AndreaKoschinsky*,LeandroMacchadodeCarvalho**,JoséMonserrat***,andEwaldSchnug****
* Jacobs University Bremen, Integrated Environmental Studies Program, CampusRing1,D-28759Bremen,Germany,E-mail:g.smidt@jacobs-uni- versity.de
** Federal University of Santa Maria (UFSM), Institute for Analytical Chemistry,CampusUniversitário,CP5051,SantaMaria(RS),Brazil
*** FederalUniversityofRioGrande(FURG),InstituteforBiologicalScience (ICB),Av.Itáliakm8s/n,Centro,RioGrande(RS),Brazil
**** TechnicalUniversityBraunschweig,DepartmentofLifeSciences,Pockels- straße14,38106Braunschweig,Germany,E-mail:[email protected]
Abstract
ApeninsulainRioGrandedoSul(SouthernBrazil)hasbeenknowntobeinfluencedbytheimmissionsofaphosphorusfertilizerfactorysincefourdecades.Asother industriesareassumedtoaffectthespatialdistributionofmetalsatthissiteaswell,thisstudywasconductedtoidentifyanddifferentiatebetweenpotentialcontaminationsourcesandtheir impacton accumulation of environmentally relevant elements insoilsandgroundwater.Theconcentrationsofmajorelements(Al,Ca,Fe,K,Mg,Na,andP)andheavyandtracemetals(Cu,Co,Ni,Nb,Pb,Sr,Th,U,V,Zn,andrareearthelementsincludingY(REY))weredeterminedintopandsubsoilsandgroundwateralongatransect.Highenrichmentfactorsforalltracemetalsinthetopsoilshowedastrongcontaminationatthesiteofthefactory.ApetroleumrefineryandawoodpreservationfactorywereidentifiedaspotentialsourcesforNi,V,Cu,andAsaccumulationinsoils.PhosphorusfertilizersamplesusedinSouthernBrazilwereanalyzedtoexploreco-herenceswithmetalemissionpatternspotentiallyreleasedbyprocessingoftherockphosphate.Highvariationcoefficientsofallmetalconcentrationsinfertilizersindicatedifferentori-ginsandshowthepotentialcontaminationhazardforsoilsthrough agricultural fertilization. The REY patterns of thefertilizers allowed for the identificationof the sedimentaryor igneousoriginof thephosphate rockused for fertilizerproduction.TheREYpatternsoftopsoilinthevicinityofthefactoryconfirmthatthefertilizerfactoryisamajorsourceofcontaminationinthesurroundingenvironment.
Keywords: Southern Brazil, soil contamination, fertilizer factory, phosphorus fertilizer, heavy metals, rare earth ele-ments, trace elements
Zusammenfassung
Schwermetallgehalte in Böden im Umfeld einer Dün-gerfabrik in Südbrasilien
EineHalbinsel in RioGrandedo Sul (Südbrasilien)wirdseitvierJahrzehntendurchdieImmissioneneinerFabrikzurHerstellung von Phosphordüngemitteln beeinflusst. DieseStudiehatte zumZiel,dieseundandere industrielleKon-taminationsquellen inOber-undUnterbödenundGrund-wasserzuidentifizierenundihrenEinflussaufdieräumlicheVerteilungvonHauptelementen(Al,Ca,Fe,K,Mg,NaundP)undSchwermetallenbzw.Spurenelementen(Cu,Co,Ni,Nb,Pb,Sr,Th,U,V,ZnundSelteneErd-ElementeinklusiveY (REY)) zuuntersuchen.HoheAnreichungsfaktorenallerSpurenelementeinderNähederFabrikbelegeneinestarkeKontamination durch dieDüngemittelproduktion.Weiter-hinwurden eineHolzimprägnierungsfabrik und eine Erd-ölraffineriealsmöglicheEmissionsquellenvonCuundAsbzw.VundNi identifiziert.HoheVariationskoeffizientender Spurenmetall-Konzentrationen in Düngemitteln ausSüdbrasilien kennzeichnen deren unterschiedliche Her-kunft.DurchUntersuchungderREY-MusterderDüngemit-telundBödenkonntediesedimentäreodermagmatischeHerkunft identifiziertwerden. Die Dünger zeigen Zusam-menhängemitEmissionsmusternderElemente,diebeiderRohphosphat-VerarbeitungfreigesetztwurdenundweisendieDüngemittelfabrikalsHauptverursacherderKontamina-tiondernäherenUmgebungaus.EntsprechendkannauchlandwirtschaftlicheDüngungzumEintragvonSchwerme-talleninBödenführen.
Schlüsselworte: Südbrasilien, Bodenkontamination, Dün-gemittelfabrik, Phosphor-Düngemittel, Schwermetalle, Seltene Erden, Spurenelemente

354
1 Introduction
Chemicalproductionsitesareknownaspotentialemit-ters of organic and inorganic contaminants,whichmaypollute the environment. The understanding of the dis-persionandspatialdistributionoftheemittedsubstancesfrom any kind of factory is important to assess the riskofenvironmentalpollution.Fertilizerproductionisamongthesepotentialsourcesofenvironmentalpollution,whichhastobecontrolledandregulatedbytheindustry(FAO,2004). For example, the release of silicon tetrafluoride(SiF4),hydrogenfluoride(HF),andparticulatescomposedoffluorideandphosphatematerialhas tobeminimizedin phosphate processing factories (USEPA, 1995). Stan-dardqualityofemissionforthereleaseoffluorineatthereactionunitof a factory shouldnotbehigher than30mgm-3(FAO,2004).Besidesfluorine,sulfurdioxide,nitro-gendioxide,andthetotalparticlereleasefromphospho-rus(P)fertilizerfactories,aregulationofotherhazardoustrace elements (heavy metals, radionuclides, rare earthelements, andother traceelements)doesnotexist. TheproductionofPfertilizersrequiresrockphosphatesasrawmaterial,which can be found as amixture of fluorapa-titeCa5(PO4)3F,hydroxylapatiteCa5(PO4)3(OH),chlorapatiteCa5(PO4)3Cl,andfrancoliteCa10(PO4)6–x(CO3)x(F,OH)2+x.Therockphosphatehastobegroundandtreatedwithcon-centratedsulfuricorphosphoricacidforthedestructionofthecalciumphosphatemineraltoextractthefinalproductPfertilizerandtheby-productphosphogypsum(PG).Rockphosphates contain traceelements in a rangeof
1to100mgkg-1Cd,70to110mgkg-1Cr,1to1000mgkg-1Cu,<LLD(lowerlimitofdetection)-117mgkg-1Ni,<LLD-45mgkg-1Pb,4to1000mgkg-1Zn,710mgkg-1F,and8to220mgkg-1U(Malavolta,1994;DaConceicaoandBonotto,2006;Kratzetal.,2008).Dependingontheoriginoftherockphosphatesmineralfertilizersshowtraceele-mentconcentrationsinarangeof<LLD-58.8mgkg-1Cd,10.4to72.7mgkg-1Cr,1to183mgkg-1Cu,5to26.9mgkg-1Ni,0.6to30.7mgkg-1Pb,8.8to181mgkg-1Zn,and39.7to206mgkg-1U(Hamamoetal.,1995;Cameloetal.,1997;Abdel-Haleemetal.,2001;McBrideandSpiers,2001,Smidtetal.,2011b).Phosphogypsum (PG) is usually deposited, but is also
usedforlimingoftropicalarablesoilsinBrazil.PGcontainshighconcentrationsofCd(15mgkg-1),Cu(32mgkg-1),Ni(43mgkg-1),Sr(963mgkg-1),Zn(263mgkg-1),U(135mgkg-1),andoftheradionuclides226Ra,40K,andU(Perez-Lopezetal.,2007;Abriletal.,2009).Itsuseforagricul-turalpracticesasasoilamendment isbanned in theUSsince1992unlesstheRaactivityislowerthan370Bqkg-1(USEPA,1999).Theminimization of the total loads of trace elements
byagriculturalfertilizerapplicationtoarablefieldsaredis-
cussed worldwide and many countries developed limitsforcertainheavymetalsinfertilizers(USEPA1999,DÜMV2008).Phosphorusfertilizer-derivedpollutantsmayreachthefoodchainbycroppingandcarry-overintodairyprod-ucts,orleachingintogroundwaterresources.Thediffusepollutionpathwayoftraceelementco-applicationbyfer-tilizersisintensivelydiscussedinthescientificcommunity(Rogasik et al., 2008; Kratz et al. 2008; Tunney et al.,2009;Smidtetal.,2011aand2011b).The cumulative load of gaseous and particulate pollut-
ants fromaP fertilizer factory into theneighboringenvi-ronmentcanbeconsiderablyhigh.Elevatedconcentrationsof toxicelements (Hg,F,Cd,andAs)were found in soilsandwatersaroundaPfertilizerfactoryonapeninsulaclosetothecityofRioGrande(SouthernBrazil) (Mirleanetal.,2003a;2003b;2006,and2007).Thisstudysitehasbeenknowntobestrongly influencedbytheemissionsfromaPfertilizerfactorysince40years.However,sofarnothingisknownabouttheinputofotherrockphosphate-derivedtraceelementsintotheenvironmentatthissite.Inthisstudytheconcentrationsofnumeroustraceelementsinsoilsandgroundwater,potentiallyreleasedfromthePfertilizerfacto-ryinRioGrandehavebeeninvestigated.Additionallyacol-lectionoffertilizerstradedinsouthernBrazilwasanalyzedto identify possible contaminants in the products and tosourcethesedimentaryorigneousoriginoftherawmate-rial.Itwastestedifcoherencesbetweenemissionpatternsreleasedbythefactorythroughparticulateemissionenabletoidentifytheoriginoftheprocessedphosphaterocktype.
2 Materials and methods
2.1 Study area
Thestudysiteislocatedonapeninsula“Superporto”inthePatosLagoonestuaryinthevicinityofthecityofRioGrandeinthefederalstateofRioGrandedoSul(RS)–Bra-zil(Figure1).ThispeninsulaispartofaHolocenebarrier-lagoon system having very fine-grained quartoze beachsands,derivedprobablyfromtheinnercontinentalshelf.TheoverallgeologicalsettingofthestudyareaconsistsofPaleozoic andMezozoic sedimentary and volcanic rocksof the Paraná Basin in the northern part of RS and theigneousandmetamorphicrocksofthePrecambrianshieldin the southern part of RS (Tomazelli et al., 2000). Thesubtropicaloceanic climatewithanaverageannualpre-cipitationof1300mmandprevailingwinddirectionsfromnorth-northeastinsummerandsouth-southwestinwinterformedadunesandvegetationwithdifferentgrassspeciesinthenorthofthepeninsula.Onlysmallareasareusedaspastureforcattlegrazingandeucalyptusplantationscanbefoundrandomly.Thesouthernendofthepeninsulaisdirectlyinfluencedbytheoceanicseasprayandbrackish

G. A. Smidt, A. Koschinsky, L. M. de Carvalho, J. Monserrat, E. Schnug / Landbauforschung - vTI Agriculture and Forestry Research 4 2011 (61)353-364
355
groundwater,whichisshownbythehalophyteplantcom-munityatthissite(MirleanandRoisenberg,2006).The soil is a sandy soil with low organic carbon con-
tent,which is influenced by the groundwater level at 1to2mdepthforminganoxicgleyicsoilconditions,identi-fied through the typical Fe(III)-richoxidizedhorizon (Go)andtheanoxicreducedhorizon(Gr).Atthesouthernpartofthepeninsulathegroundwaterisinfluencedbydiurnaltidalchanges, resulting in temporalwater loggedcondi-tions.Acontainerfreightterminal,ashipyard,awoodfac-toryandaruralsettlementarelocatedatthesouthernpartandoneruralsettlementatthenorthernpartofthe11.5kmlongpeninsula.
2.2 Sampling
In2008soilsamples(N=21)weretakenatsevensitesalongatransectfromnorthtosouthacrosstheproductionsitefromdifferentdepths(0to10,10to40,and40to100cm;Figure1).CorrespondingtothelocationofthePfer-tilizerfactory(km0)onesoilsamplingpointislocatedinnortherndirection(km-1.1)ofandfivesoilsamplesweretakensouthwards(km1,km1.9,km5.1,km6.3,km9.3).Thenorth-southtransectacrossthefertilizerfactorywaschosentodeterminethedistributionofpollutantspoten-tiallyreleasedbythefactoryeffectedbyseasonalchangesintheprevailingwinddirection.ThespatialdistributionofthesamplingsitesfollowsthetransectstudiedbyMirleanandRoisenberg(2006and2007).Inthisstudytheselec-tionofthesevensamplingsiteswasbasedontheresultsofthenamedauthors,whoshowedincreasedCdandAsconcentrationintopsoils(N=19)atthefactorysitewithdecreasingconcentrationstowardskm5.1andincreasingconcentrationofAsatthesouthernendofthepeninsula.Inourstudythesoilhorizonswereopenedwithashoveltoasamplingdepthof100cmtostudytheverticaldistribu-tionoftraceelementsinsoils.Thetimeconsumingsam-plingproceduredidnotallowopeningmore thansevenhorizonsatoneday.Samplesweretakenwithastainlesssteelknifeoutofthedifferenthorizonsandstoredinpoly-ethylene (PE)bags.Thegroundwater leveldepthsvariedalongthetransectandsamplescouldonlybecollectedatthesamplingpointskm-1.1,km0.9,km6.1,andkm9.3.AftertheopeningofthesoilhorizonthepitwascleanedandthegroundwaterwassampledwithPEbottlesaftersedimentationofdispersedsoilparticles.Phosphorusfertilizersamples(N=39)tradedinSouth-
ernBrazilin2007and2008werecollectedtodeterminetypicaltraceelementconcentrationsoflocalproducts.Outofthe39samples29aremulticomponentfertilizers(13NPK,11NP,and5PK)and10straightPfertilizers(4singlesuperphosphate and6 triple superphosphate). Phospho-ruscontentsvarybetween14to52%.
Figure1:
SamplingsiteonthepeninsulasouthofRioGrande(SouthernBrazil)showing the spatial distribution of seven sampling points and thelocationofaPfertilizerfactory(1),awoodfactory(2),acontainerfreightterminal(3),ashipyard(4),andapetroleumrefinery(5)(mapmodifiedafterMirleanandRoisenberg,2006).
2.3 Sample preparation and chemical analysis
Thecollectedsoilsampleswereair-driedandstored inplasticbags.Thesamplesweresieved(2mm)andgroundinanagateballmilltoaparticlesizeof<20μmanddriedovernight at 105 °C before further chemical treatment.ForthedeterminationofthetotalelementalcontenttheprocedurefortraceelementanalysesdescribedbyDulski(1994and2001)andAlexander(2008)wasused.100mgofeachsamplewasdigestedwith3mlofHCl,1mlHNO3

356
and1mlHF(allacidsusedareconcentratedandsupra-puregrade)for16hoursat>180°Cinaclosedacidpres-suredigestionsystem(Picotrace).Priortotheanalysestheacidswereevaporatedintheopenteflonvesselatatem-peratureof 120 °C. The evaporation stepwas repeatedtwotimeswith5mlHClforthecompleteevaporationoffluoride complexes,which affect the rare earth elementanalysis.Thefinalsamplesolutionwastakenupin50mlof0.5MHCl.Thegroundwatersampleswerefilteredwith0.2μmcelluloseacetatefiltersimmediatelyafterthesam-pling.Thegroundwatersampleswereacidifiedwithcon-centratedsuprapureHNO3topH2.Thefertilizersamples(N=39)werehand-groundwitha
mortarandpestleandtogetherwithtwocertifiedProckstandard reference material (NIST 120b and NIST 694)driedovernight at105 °C, and thendigestedbymicro-wave(MLSStart1500).Thesamples(0.05g)wereextract-edwithaquaregia(3.6mlconcentratedHCland1.2mlconcentratedHNO3) at constant temperature of 210 °Cfor 60minutes. Filtered sampleswere diluted to 100 gwithde-ionizedwater.
2.4 Analytical procedures
Traceelementconcentrationsinsoilandfertilizersam-plesweredeterminedina0.5MHNO3matrixwithaPer-kin-Elmer/SciexElanModel5000inductivelycoupledplas-mamassspectrometer(ICP-MS)followingtheproceduresofDulski(2001).BesidethetraceelementsCd,Co,Ni,Nb,Pb,Sr,Th,U,andZr,therareearthelementsLa,Ce,Pr,Nd,Pm,Sm,Eu,Gd,Tb,Dy,Ho,Er,Tm,Yb,Lu,andY(REY)wereanalysedviaICP-MS.ThemajorelementsAl,K,Fe,Ca,Na,Mg,andPandthetraceelementsZnandVcon-tentsweredeterminedusinganinductivelycoupleplasmaopticalemissionspectrometer(SpectroCirosVision–ICP-OES).TheCuconcentrationsinthesoilsampleswerede-terminedusingcathodicstrippingvoltammetry(Metrohm757VAComputrace).Theaccuracyofthemeasurementswas tested using certified reference material (BHVO-2,NIST120b,andNIST694).ThepHvalueofthesoilswasmeasuredin0.01MCaCl2witha1:5soiltosolutionratioaccordingtoISO10390.Majorandtraceelementconcen-trationsingroundwatersampleswereanalyzedviaICP-MSandICP-OES.AdditionallythepHwasmeasuredandtheanionconcentrations(F-,Cl-,NO3
-,andSO42-)weredeter-
minedusingionchromatography(MetrohmIC462).
2.5 Statistical analysis and calculation of enrichment fac-tors for trace elements (EFTE)
The statistical description of the dataset, includingmean,minimum,maximum values, and standard devia-tionwascarriedoutwithSPSS12.
The evaluation of the enrichment of the investigatedtraceelementsinthetopsoilsalongthetransectcannotbe donewith simple calculation of the top soil/sub soilquotients. The different geochemical behavior and themultiple sources of the trace elements require differentcalculationofthetraceelementenrichmentfactors(EFTE).ThereforeamodifiedcalculationmodelbasedonmethodsbyZolleretal.(1974)andReimannandCaritat(2000)wasused.TheconcentrationofthetraceelementatthesiteXisdevidedbytheconcentrationofthetraceelementatthecontrolsite(ctrl).Inaddition,thesevaluesarenormalizedtoa“conservative”element(Zr),whichisnotanthropo-genicallyenrichedintopsoilsalongthetransect.
EFTE=(conc(TE)X/conc(Zr)X)/(conc(TE)ctrl/conc(Zr)ctrl)
withEFTE =enrichmentfactorforacertaintrace elementconc(TE)x =concentrationoftraceelementintopsoil atsamplingpointxconc(TE)ctrl =concentrationoftraceelementintopsoil atsamplingpointkm5.1conc(Zr)X =concentrationofzirkoniumintopsoilat samplingpointxconc(Zr)ctrl =concentrationofzirkoniumintopsoilat samplingpointkm5.1
3 Results and discussion
3.1 Major and trace elements in P fertilizers traded in Brazil
AllBrazilianPfertilizersanalyzedinthisstudyshowtypi-calrangesofmajorandtraceelementconcentrations.Themean,median,minimum,andmaximumconcentrationofP2O5,K2O,Ca,Fe,Al,Mg,andNaaregiveninTable1.Highvariationcoefficients(RSD)between41to210%indicatethebroadconcentrationrange inthestudiedPfertilizers.TheresultsinTable1and2areseparatedintotwoclasses,whichrepresentasedimentary(s)(N=34)andigneous(i)(N=5)originoftherawphosphatematerial.Theidentifica-tionofdifferentgeologicaloriginoftherawphosphatesisbasedonthedifferentgeochemicalcompositionoftherareearthelementsinthetwosources(seesection3.5).Themean,median,minimum, andmaximumconcen-
trationsoftraceelements(Sr,Zn,V,Ce,U,La,Ni,Zr,Cd,Pb, Nb, and Th) are listed in Table 2.While highmeanconcentrations of the potentially environmental harmfulheavymetalsZn(306mgkg-1),U(78mgkg-1),Ni(33mgkg-1),Cd(16mgkg-1),andPb(6.9mgkg-1)werefoundinfertilizersofsedimentaryorigin,themeanconcentrationsof theseelementsare low in fertilizersof igneousorigin(12mgZnkg-1,2mgUkg-1,7.7mgNikg-1,<LLDmgCdkg-1,and2.9mgPbkg-1).Incontrastothertraceele-

G. A. Smidt, A. Koschinsky, L. M. de Carvalho, J. Monserrat, E. Schnug / Landbauforschung - vTI Agriculture and Forestry Research 4 2011 (61)353-364
357
mentsweredeterminedinhighermeanconcentrationsinPfertilizersofigneousorigin(1588mgSrkg-1,566mgCekg-1,317mgLakg-1,and18mgNbkg-1)incomparisontofertilizersofsedimentaryorigin(309mgSrkg-1,35mgCekg-1,28mgLakg-1,and1.3mgNbkg-1).Suchvariationin traceelement contentsof fertilizers in relation to thegeogenic origin of thematerial is confirmed by a studyfrom Niedergesäss et al. (1992), who analyzed mineralfertilizersprocessedfromeitherigneousorsedimentaryProcksources.AcomparisonofthevaluesofthisstudywithconcentrationsinPfertilizerproductstradedinGermany(Smidtetal.,2011b)showsthatBrazilianfertilizerscontaindistinctlyhighermeanconcentrationsofP2O5,Cd,andU.Thehighconcentrationsofheavymetals (Zn,U,Ni,Cd,and Pb) in the analyzed fertilizers indicate the potentialcontaminationhazardforarablesoilswhichreceiveregu-larlyapplications.
Table1:
Concentrationsofmajorcomponents(P2O5,K2O,Ca,Fe,Al,Mg,andNa)in%infertilizersampleswithsedimentary(s)(N=34)andigneous(i)(N=5)originwithaP2O5-contentof>5%tradedinsouthernBrazilin2007and2008
P2O5 K2O Ca Fe Al Mg Na
s i s i s i s i s i s i s i
Mean 29 35 9.9 3.0 8.9 1.0 0.63 0.26 0.56 0.31 0.51 0.06 0.36 0.26
Median 22 34 2.2 0.14 8.9 0.6 0.54 0.33 0.42 0.35 0.28 0.07 0.32 0.21
RSD(%) 48 45 131 210 83 114 79 60 72 41 99 61 55 64
Minimum 14 18 0.05 0.13 0.16 0.17 0.06 0.03 0.13 0.15 0.09 0.03 0.12 0.06
Maximum 53 51 58 14 22 2.9 1.9 0.40 1.6 0.42 2.58 0.12 1.13 0.51
Table2:
Concentrationsofselectedtraceelements(Sr,Zn,V,Ce,U,La,Ni,Zr,Cd,Pb,Nb,andTh)inmgkg-1infertilizersampleswithsedimentary(s)(N=34)andigneous(i)(N=5)originwithaP2O5-contentof>5%tradedinsouthernBrazilin2007and2008
Sr Zn V Ce U La
s i s i s i s i s i s i
Mean 309 1588 306 12 118 105 35 566 78 2 28 317
Median 237 241 235 12 102 116 15 385 61 2.9 20 165
RSD(%) 93 196 79 34 43 17 119 102 74 64 83 131
Minimum 0.16 72 44 8.0 63 85 0.05 54 0.01 0.25 0.06 24
Maximum 1072 7148 1005 16 229 116 171 1558 200 3.5 93 1048
Ni Zr Cd Pb Nb Th
s i s i s i s i s i s i
Mean 33 7.7 20 22 16 <LLD 6.9 2.9 1.3 18 5.5 11
Median 25 8.4 18 16 9.7 <LLD 4.0 1.3 0.6 19 3.7 16
RSD(%) 58 24 52 63 98 107 114 119 67 98 76
Minimum 0.35 5.1 0.21 7.7 1.3 <LLD 0.32 0.59 0.01 0.25 0.01 0.13
Maximum 82 9.7 57 44 56 <LLD 31 8.5 6.8 30 20 19
LLD=lowerlimitofdetection
3.2 Major and trace elements in top and sub soils
Themean,minimum,maximum, and variation coeffi-cient(RSD)ofmajorelementsinthetopsoilsofthesevensampling sites along the transect are given in Table 3.Thebroadrangesofallmajorelementconcentrationsre-flectthevariationoftopsoilelementcontentsalongthesampledtransect.EspeciallyPandCa,whicharethemaincomponents of apatite rock phosphates, show extrememaximumconcentrationsof5225and15035mgkg-1 incomparisontothemeanconcentrations(1095mgPkg-1and4318mgCakg-1).Themean,minimum,maximum,andvariationcoefficient(RSD)oftraceelements(Sr,Zn,V,Ce,U,La,Ni,Zr,Cu,Pb,Nb,Th,andCo)(Table4)showahighvariationinthetopsoilsalongtheinvestigatedtran-sect,whichisespeciallypronouncedforSr,La,Ce,Zn,Nb,Th,andU.

358
Table3:
Concentrationsofmajorcomponents(P,K,Ca,Fe,Al,Mg,andNa)inseventopsoilsfromSouthernBrazil(mgkg-1)
P K Ca Fe Al Mg Na
Mean 1095 5498 4318 4532 13097 510 3199
Median 398 4977 3180 4072 15658 540 2660
RSD(%) 170 36 112 68 43 72 49
Minimum 80 3245 1200 1726 6109 113 1683
Maximum 5225 8675 15035 10267 19438 1121 5912
Table4:
Concentrationsofselectedtraceelements(Sr,Zn,V,Ce,U,La,Ni,Zr,Cu,Pb,Nb,Th,andCo)inseventopsoilsfromSouthernBrazil(mgkg-1)
Sr Zn V Ce U La Ni Zr Cu Pb Nb Th Co
Mean 62 38 12 15 1.1 7.8 2.3 33 8.6 7.3 4.5 1.7 1.4
Median 41 19 11 10 0.5 5.3 1.6 37 5.9 6.7 2.1 1.1 1.2
RSD(%) 83 132 53 120 131 115 74 18 76 58 136 92 74
Minimum 27 9 5.0 2.9 0.32 2.2 0.79 25 2.0 3.5 1.2 0.47 0.51
Maximum 168 151 23 57 4.3 28 5.0 39 18 15 18 5.0 3.3
ThespatialdistributionofP(Figure2a)alongthesam-pledtransectonthepeninsulashowsthehighestconcen-trationof5225mgkg-1inthetopsoilclosetotheproduc-tionsite(km0).FromheredecreasingconcentrationswithincreasingdistancetothePfertilizerfactorywerefound.Inthedistanceof-1.1and1kmtheconcentrationofPisstillstronglyelevated(1188and496mgkg-1,respectively)whencomparedtothetopsoilinthedistanceof9.3kmat the end of the peninsulawith 148mg kg-1. A slightincreaseintopsoilconcentrationatthesamplingpointatkm6.3isapossibleeffectofPfertilizationofpasturelandusedforcattlegrazing.Calcium concentrations (Figure 2b) along the transect
havealsotheirmaximum(15035mgkg-1)atthefactorysite,whereapatite rocks (CaPO4)areextractedbyH2SO4forPfertilizerproduction.Thelowestconcentration(1200mgkg-1)wasfoundinadistanceof1.9km.TheincreasinginfluenceofbrackishgroundwatercausesanincreasingCaconcentrationintopandsubsoilswithincreasingdistancefromthesamplingpointkm5.1towardsthesouthernendofthepeninsula(km9.3).TheMgconcentration (Figure2c) in the top soil is el-
evatedatthefactorysite(774mgkg-1),butthemaximumconcentration(1121mgkg-1)canbefoundatthenorth-ernmostsamplingpoint (km-1.1).Theelevatedconcen-trationsofMgandFe(Figure2f)atthesamplingkm-1.1areprobablyaneffectofurbandustimmission.Temporalwaterloggedconditionscauseahighergroundwaterlevelat the southern end of the peninsula (km 6.3 and 9.3)whichyieldsanoxicconditionsandFeoxidationalongO2
gradientsatplantrootsandothermacroporesuptothetop soil. The spatial distributionofK andNa (Figure2dand2e)alongthesampledtransectonthepeninsulaalsoshowsenrichmentatthefactorysite(7532mgKkg-1and4095mgNa kg-1, respectively), but has thehighest topsoilconcentrations(8675mgKkg-1and5911mgNakg-1,respectively) at the outermost sampling point (km 9.3)atthesouthernendofthepeninsula,duetothebrakishgroundwaterinfluence.ThehighconcentrationsofPandCa(Figure2aand2b)
inthetopsoil(0to10cm)incomparisontothedeepersoillayersat10to40cmand40to100cmatthefactorysite (km0)demonstrate thehighPandCa input to thesoilsbythePfertilizerproductioncomparedtothenaturalbackgroundconcentration.ThehighloadofPtothetopsoilandtheacidicpHvaluesof4.7enabledslightPleach-ingtodeepersoilhorizonsasindicatedbythesmallPpeakatthefactorysiteinthe10to40cmsoillayer.PotassiumandNa(Figure2cand2d)showadifferentdistributionintopandsubsoilsat the factory sitecompared toP.Thehighermobility of themonovalent cations K and Na incomparisontothebivalentCaandMginthesoilcolumnisreflectedinthemostlyequaldistributionoftheelementsintop(0to10cm)andsubsoil(10to40cmand40to100cm)horizons.However,thesubsoilconcentrationsofallmajorelementsandPareelevatedinthesoillayerbe-tween10to40cmatthefactorysiteiscomparisontothesurroundingsubsoils.Thedislocatedelementsaresorbedtotheiron-richGohorizon,whichisinfluencedbychang-inggroundwaterlevels.

G. A. Smidt, A. Koschinsky, L. M. de Carvalho, J. Monserrat, E. Schnug / Landbauforschung - vTI Agriculture and Forestry Research 4 2011 (61)353-364
359
0
1000
2000
3000
4000
5000
6000
km
mg
/kg
0-10
10-40
40-100
-1.1 0.0 1.0 1.9 5.1 6.3 9.3
a)
P
km
0-10
10-40
40-100
-1.1 0.0 1.0 1.9 5.1 6.3 9.3
b)
Ca
0
2000
4000
6000
8000
10000
12000
14000
16000
mg
/kg
0
km
mg
/kg
0-10
10-40
40-100
-1.1 0.0 1.0 1.9 5.1 6.3 9.3
c)
Mg
km
0-10
10-40
40-100
-1.1 0.0 1.0 1.9 5.1 6.3 9.3
d)
K
0
mg
/kg
0
km
mg
/kg
0-10
10-40
40-100
-1.1 0.0 1.0 1.9 5.1 6.3 9.3
e)
Na
km
0-10
10-40
40-100
-1.1 0.0 1.0 1.9 5.1 6.3 9.3
f)
Fe
0
mg
/kg
1000
1200
800
600
400
2001000
2000
3000
4000
5000
6000
7000
8000
9000
10000
1000
2000
3000
4000
5000
6000
7000
2000
4000
6000
8000
10000
12000
Figure2:
SpatialdistributionofP(a),Ca(b),Mg(c),K(d),Na(e),andFe(f)intop(0to10cm)–andsub(10to40cmand40to100cm)–soils(mgkg-1)inrelationtothedistancefromafertilizerfactory(0kmcorrespondstothefactoryposition).
ThespatialdistributionofU(Figure3a)alongthesampledtransectonthepeninsulashowsthehighestconcentrationof4.3mgkg-1inthetopsoilclosetotheproductionsite(km0).WithincreasingdistancetothePfertilizerfactorydecreasingconcentrationswerefound.Inthedistanceof1kmtheconcentrationofUisstillelevated(0.9mgkg-1)incomparisontothetopsoilinthedistanceof9.3kmattheendofthepeninsula(0.5mgkg-1).ThelowestUcon-centrationisfoundin5.1kmdistance(0.3mgkg-1).ThespatialdistributionsofNb,La,Zn,andPb(Figure3b,3c,3d,and3e)resemblethatofU.Thecomparisonoftopsoil
andsubsoilconcentrationsoftraceelementsdemonstratetheenrichmentintheuppermosthorizonatthefertilizerfactory.Niobiumasarefractoryelement,whichisconsid-eredextremelyimmobileinsoils(Kurtzetal.,2000),showsthestrongestenrichmentofthetopsoilincomparisontothesubsoilatkm0(Figure3b)ofallanalysedtraceele-ments. In comparison toNb, elevated concentrationsofU,Ni,Zn,Pb,andVarefoundintheiron-richGohorizon(10to40cm)atthefertilizerfactory(km0),whichpointstotheverticaldislocationofthesetraceelementsatthissite.Leadcanbefoundinslightlyhigherconcentrationin

360
0.0
0.5
1.0
1.5
2.0
2.5
3.0
3.5
4.0
4.5
5.0
mg
/kg
0-10
10-40
40-100
-1.1 0.0 1.0 1.9 5.1 6.3 9.3
a)
U 0-10
10-40
40-100
-1.1 0.0 1.0 1.9 5.1 6.3 9.3
b)
Nb
mg
/kg
km
mg
/kg
-1.1 0.0 1.0 1.9 5.1 6.3 9.3
e)
Pb
km
0-10
10-40
40-100
-1.1 0.0 1.0 1.9 5.1 6.3 9.3
f)
Ni
0.0
mg
/kg
km km
km
mg
/kg
0-10
10-40
40-100
-1.1 0.0 1.0 1.9 5.1 6.3 9.3
c)
La
km-1.1 0.0 1.0 1.9 5.1 6.3 9.3
d)
Zn
mg
/kg
1.0
2.0
3.0
4.0
5.0
6.0
km
mg
/kg
-1.1 0.0 1.0 1.9 5.1 6.3 9.3
g)
V
km
0-10
10-40
40-100
-1.1 0.0 1.0 1.9 5.1 6.3 9.3
h)
Zr
mg
/kg
0.0
2.0
4.0
6.0
8.0
10.0
12.0
14.0
16.0
18.0
20.0
0.0
5.0
10.0
15.0
20.0
25.0
30.0
0.0
20.0
40.0
60.0
80.0
100,0
120.0
140.0
160.00-10
10-40
40-100
0.0
2.0
4.0
6.0
8.0
10.0
12.0
14.0
16.0
0-10
10-40
40-100
0.0
5.0
10.0
15.0
20.0
25.0
0-10
10-40
40-100
0.0
10.0
20.0
30.0
40.0
50.0
60.0
70.0
80.0
Figure3:
SpatialdistributionofU(a),Nb(b),La(c),Zn(d),Pb(e),Ni(f),V(g),andZr(h)intop(0to10cm)-andsub(10to40cmand40to100cm)–soils(mgkg-1)inrelationtothedistancefromafertilizerfactory(0kmcorrespondstothefactoryposition).

G. A. Smidt, A. Koschinsky, L. M. de Carvalho, J. Monserrat, E. Schnug / Landbauforschung - vTI Agriculture and Forestry Research 4 2011 (61)353-364
361
the top soils along thewhole transect in comparison tothesubsoils,whichpossiblyoriginatesfromtheemissionofleadedgasolineexhaustfromcarsuntilthe1990s.Thispollutionsourcemayalsohaveaffectedtheincreasedtopsoil concentrationofPb (Figure3e)at thenorthernend(km-1.1)ofthepeninsulaintheclosevicinitytothecityofRioGrande.Copperwasfoundtobeincreasedintopsoilsattwosamplingpointsalongthetransect.Thepoten-tialsourcesarediscussedinthefollowingsection.DuetoanalyticaluncertaintiesthespatialdistributionofCdisnotshown,butMirleanandRoisenberg(2006)foundelevatedCdconcentrationsintopsoils(9.3mgkg-1)inthevicinityofthePfertilizerfactoryincomparisontothelocalback-ground(0.03mgkg-1).
3.3 Variations of element enrichment factors
Zirkonium(Zr)waschosenastheconservativeelementfornormalizationofthetraceelementenrichmentfactors(EFTE),sincetheconcentrationinthesoiltransectispracti-callyexclusivelyinfluencedbygeogenicsources.ThemeanconcentrationofZris33.1±6.1mgkg-1intopsoilsand27.7 ± 5.5mg kg-1 in sub soils and its spatial distribu-tiondoesnot showany trend (Figure3h).Thesamplingpointat5.1kmdistancefromthePfactoryischosenasthecontrolsite.Thislocationintheintermediatelocationbetweenfactoryandoceanshowedthelowestconcentra-tionformostoftheobservedtraceelements.OnlyCuisnormalizedagainstanothercontrolsite(km1.9),becauseCu isassumed tohaveanotherpollution sourcebesidesthePfertilizerfactory.Awoodpreservativefactory is lo-catedatthesouthernendofthepeninsula.WhileanEFTEvaluearound1indicatesnotraceelement
enrichmentinthetopsoil,valueshigherthan1.5showaclearenrichmentoftraceelementsbyeitheranthropogen-icactivitiesorgeologicalsources.Uranium(9.3),Nb(8.3),Zn(7.3),Ce(5.6),La(5.1),andTh(3.4)showhighEFTEonlyatthefactorysite(Table5),which indicatesthefertilizer
factorytobeaonepointpollutionsourcefor theseele-ments.TheEFTEofPb(2.9),Ni(3.7),Co(1.7),andV(2.0)also reflect an emission by the fertilizer factory, but theEFTEatthesamplingpointkm-1.1(1.9,4.0,3.8,and2.2,respectively) give indications for other emission sourcesfrom thecityofRioGrande.Apetrochemical refinery islocatedin2kmlineardistanceofthesamplingpointkm-1.1(Figure1).NickelandVareknowntobeemittedbyoilrefineriesandarecentstudyconductedinthevicinityofthelocalproductionsiteshowedfourtimeshigherNiandVconcentrationsinthetopsoilsclosetotheemissionsource incomparisontothe localbackground(Garciaetal.,2010).AnothersourceofpollutionofNiandVcouldbethecombustionofheavyresidualfueloilswhichtypi-callycontain1to1000mgkg-1Vand3to345mgkg-1Ni(Russelletal.,2010).HeavyresidualfueloilsalsocontainCo,buttheconcentrationlevelislower(7to3300μgkg-1)incomparisontoNiandV(Russelletal.,2010).Theele-vatedEFTEofCo,Zn,andPbatthenorthernendofthetransectarepossiblyderivedfromotherindustrialsourcesinthecityofRioGrande.ThespatialdistributionofEFTEforCushowstwopointsofenrichmentinthetopsoilonthepeninsula.Oneislocatedatthefertilizerfactory(8.9),thesecondoneislocatedatthesamplingpointkm5.1(11.6)andkm6.3(6.4).Atthissamplingpointawoodfactoryislocatedinapproximately500mdistance(Figure1),pos-sibly using chromated-copper-arsenates (CCA) forwoodpreservation.TheelevatedconcentrationsofAsintopsoilsreportedbyMirleanandRoisenberg(2006)aremostlikelyrelatedtothiscontaminationsource,too.
Table5:
Elementenrichmentfactors(EFTE)oftraceelementsintopsoilsfromSouthernBrazilinrelationtothedistancefromafertilizerfactory(TEconcen-trationnormalizedtobackgroundandZrconcentrationintopsoilsatkm5.3(backgroundforCuatkm1.9))
Distance(km) Sr Zn V Ce U Nb La Ni Cu Pb Th Co
-1.1 0.9 1.9 2.2 1.2 1.9 1.6 1.0 4.0 2.8 1.9 1.2 3.8
0.0 3.9 7.3 2.0 5.6 9.3 8.3 5.1 3.7 8.9 2.9 3.4 1.7
1.0 1.0 1.3 1.4 1.5 3.2 1.4 1.4 1.8 3.5 1.1 0.9 0.9
1.9 0.7 0.5 0.5 0.3 0.8 0.6 0.4 0.7 1.0 0.8 0.3 0.7
5.1 1.0 1.0 1.0 1.0 1.0 1.0 1.0 1.0 11.6 1.0 1.0 1.0
6.3 1.7 1.3 1.5 1.1 1.0 1.7 1.0 2.1 6.4 1.6 1.0 1.7
9.3 1.9 0.7 1.1 1.0 1.0 0.9 0.9 1.3 1.2 1.4 0.9 2.0
3.4 Elemental composition of groundwater
Theanalysesofgroundwaterdidnotshowanysignifi-cantlyelevatedtraceelementconcentrationsatthesam-pling points close to the fertilizer factory (km -1.1 andkm1).However,theresultsofanionanalyzesshowhighnitrate, phosphate, fluoride, and sulfate concentrations

362
(Table6)atthesamplingpointatkm+1.ThehighestNO3-
concentrationwasfoundatthenorthernsamplingpointatkm-1.1,whichisinfluencedbyaruralsettlementnotconnected to the urbanwastewater treatment system.The highNa, Sr, andCl concentrations at the samplingpointsatkm-1.1,6.3,and9.3indicatetheinfluenceofbrackishgroundwateratthesesites.Apreviousstudycon-ductedbyMirleanandRoisenberg(2006)ongroundwa-terofthepeninsulashowedhighconcentrationsoftheseanionsinthevicinityofthefertilizerproductionsite,too.Here,Cdwasfoundincorrelationwithortho-phosphateandnitratewithmaximumconcentrationof 3.06μg L-1(background0.06μgL-1)ingroundwaterinthevicinitytothefactory.
Table6:
Concentrationsofselectedcompounds(F-,NO -3 ,PO
3-4 ;SO
2-4 ,Cl
-,Na,andSr)andpHvaluesinfourgroundwatersamplesalongatransectacrossthePfertilizerfactory(km0)inSouthernBrazil(mgL-1),(Groundwatercouldnotbesampledatsiteskm0,km1.9,km5.1sincethegroundwatertablewaslowerthan100cm).
Distance(km) F- NO3- PO4
3- SO42- Cl- Na Sr pH
-1.1 1.7 32.7 0.69 36 48 22 0.15 6.6
1.0 7.6 11.5 15.8 143 8.1 6.5 0.16 5.0
6.3 0.26 1.5 <LLD 0.36 38 21 0.16 5.9
9.3 0.39 0.06 <LLD 0.61 112 57 0.43 6.5
LLD=lowerlimitofdetection
0.10
1.00
10.00
La Ce Pr Nd PmSmEu Gd Tb Dy Y Ho Er Tm Yb Lu
log
RE
Y/P
AA
S
0-5 cm 5-10 cm 10-20 cm
20-40 cm 40-100 cm
0.01
0.10
1.00
10.00
La Ce Pr Nd PmSm Eu Gd Tb Dy Y Ho Er Tm Yb Lu
log
RE
Y/P
AA
S
km 0 km 1
km 5.1 km 9.3
NP 20_20 NPK 7_15_13
NP 15_52
a) b)
Figure4a:
REYSNpatternsinfourtopsoilsamples(0to5cm)fromtheRioGrandepeninsula(km0,km1,km5.1,andkm9.3)andthreefertilizersamplestradedinSouthernBrazil(NP20_20,NPK7_15_13andNP15_52)
Figure4b:
REYSNpatternsinfivedifferentsoilhorizonsamples(0to5,5to10,10to20,20to40,and40to100cm)fromtheRioGrandepeninsulatakenatthePfertilizerfactory(km0)
3.5 Rare earth elements in soils and fertilizers
Thedeterminationof rare earth elements and yttrium(REY)andthenormalizationof theREYSNconcentrationsagainstPostAchaeanAustralianShale(sub-script‘SN’re-fers toshale (PAAS)normalizedREEconcentrations,Tay-lorandMcLennan,1989)enabledtoidentifythemarinesedimentaryorthe igneousdepositsourceoftheProckusedfortheproductionofthePfertilizersusedinBrazil.Ofour39fertilizersamples,5couldbeidentifiedasigne-ousProckderived,whiletheremaining34wereofma-rinesedimentaryorigin.Thisdistributionratioisconsistentwith the valueof 87%given in literature for amarinesedimentaryoriginofPfertilizers(Kratzetal.,2006).Fig-

G. A. Smidt, A. Koschinsky, L. M. de Carvalho, J. Monserrat, E. Schnug / Landbauforschung - vTI Agriculture and Forestry Research 4 2011 (61)353-364
363
ure2showsshalenormalizedREYpatternsofthreeselect-edfertilizersamplesfromtheanalysedsetof39samples.ThesedimentaryoriginoffertilizersampleNPK7_15_32is indicated through thenegativeCeand thepositiveYanomaly,whicharetypicalseawaterfeatures.ThesamplesNP15_52andNP20_20bothshowthetypicaldistribu-tionpatternsfor igneousProckdeposits, indicatedbyapositiveEuandaslightpositiveYanomaly.TheREYSNpatternofthetopsoilsampleatkm0(Fig-
ure4aand4b)showsenrichmentinREYelements,whichconfirms the resultsof theenrichment factor that thePfertilizerfactory(km0)isobviouslythesourceofhighREYemission.Thisalsoindicatesthatthefactoryhaspredomi-nantly been processing rock phosphates of sedimentaryorigin.Nevertheless,highNbconcentrationfoundatkm0alsogivesindicationforprocessingofrockphosphatesofigneousorigin.IgneousphosphaterockdepositsareusedinBrazilforNbminingproviding85%oftheworldwideNbsupply(Oliveiraetal.,2011).IgneousPfertilizersshowalso significantly higher Nb contents than fertilizers ofsedimentary origin (Table 2). Since the factory has beenprocessingfertilizersfor40years(MirleanandRoisenberg,2006),itcanbeassumedthattherockphosphatesourcesfluctuate.Figure4bshowstheverticalREYSNpatternsofthedifferentsoilhorizonsatthesamplingpointkm0.Thepositiveeuropium(Eu)anomalyfoundinallanalyzedtopandsubsoil samplesalongthetransectoriginatesprob-ablyfromfeldsparmineralcontentinthedunesandwitharkosiccomposition(Tomazellietal.,2000;Martins,2003).
4 Conclusion
Thestudyprovidesevidenceforthereleaseofnumeroustrace elements from a P fertilizer factory in Rio Grande(Southern Brazil) by analyzing soil samples at differentdepthandatdifferentdistancestothefactoryandasetoftypicalfertilizersamplesfromtheregion.AsPfertiliz-erscontainhighconcentrationsofelementswithpotentialtoxicity(U,Cd,Zn,Pb,Ni,Co,andF-)theriskofenviron-mentalcontaminationduetotheuncontrolledparticulatereleaseoftheseelementsishighatsuchproductionsites.Themultitraceelementanalyzesofsoilsconductedinthisstudy identifiedvarious industrialpollutionsourcesemit-tingdifferenttraceelementswhicharespatiallydistributedalonganorth-southtransectofthepeninsula.BesidethePfertilizerfactory,arefinerycouldbeidentifiedtoemitNiandVatthenorthernendofthepeninsula.Furthermore,awoodfactorypossiblyusingchromate-copper-arsenatesisassumedtobethesourceofelevatedCu(andAs)con-centrationintopsoilsatthesouthernendofthepenin-sula.REYSNpatternsoffertilizersincomparisontotopsoilsallowedtodistinguishbetweenmarinesedimentaryorig-neousrocksourcesusedasrawmaterialforthefertilizer
productionandareyetanothermanifestationoffertilizerfactory-derived pollution of top soils at the investigatedsite.
Acknowledgement
WewouldliketothanktheDAAD/CAPESprogramPRO-BRALforthefinancialsupportofthisstudyinRioGrandedoSul(Brazil).Furthermore,weacknowledgethesupportof LauraGeracitano at the sampling sites,Michael Bau,Autun Purser, and the Geochemistry lab team for theirsupportatdifferentstagesofthelabworkandthemanu-script.
References
Abdel-HaleemAS,SroorA,El-BahiSM,ZohnyE(2001)Heavymetalsandrareearthelementsinphosphatefertilizercomponentsusinginstrumentalneu-tronactivationanalysis.ApplRadiatIsot55:569-573
AbrilJM,García-TenorioR,ManjónG(2009)Extensiveradioactivecharacteriza-tionofaphosphogypsumstackinSWSpain:226Ra,238U,210Poconcen-trationsand222Rnexhalationrate.JHazardMater164:790–797
AlexanderBW(2008)Traceelementanalysesingeologicalmaterialsusinglowresolutioninductivelycoupledplasmamassspectrometry(ICPMS).Bremen:JacobsUniv,73p,TechnRep18
CameloLGD,deMiguezSR,MarbanL(1997)Heavymetalsinputwithphos-phatefertilizersusedinArgentina.SciTotalEnviron204:245-250
daConceicaoFT,BonottoDM(2006)Radionuclides,heavymetalsandfluorineincidence at Tapira phosphate rocks, Brazil, and their industrial (by) pro-ducts.EnvironPollut139:232-243
DulskiP(1994)Interferencesofoxide,hydroxideandchlorideanalytespeciesinthedeterminationofrareearthelementsingeologicalsamplesbyinduc-tivelycoupledplasma-massspectrometry.FreseniusJAnalChem350:194-203
DulskiP (2001)Referencematerials forgeochemical studies :newanalyticaldataby ICP-MSandcriticaldiscussionof referencevalues.GeostandardsNewsl25(1):87-125
DüMV–Düngemittelverordnung(2008)VerordnungüberdasInverkehrbringenvonDüngemitteln,Bodenhilfsstoffen,KultursubstratenundPflanzenhilfs-mitteln(Düngemittelverordnung–DüMV)[online].Tobefoundat<http://www.gesetze-im-internet.de/bundesrecht/d_mv_2008/gesamt.pdf> [quot-ed18.10.2011
FAO(2004)Thestandardqualityofemissionforactivitiesoffertilizerindustry(Decree of the StateMinister for Environment No. 133/2004 dated Au-gust12,2004)[online].Tobefoundat<http://faolex.fao.org/docs/pdf/ins52107.pdf>[quoted18.10.2011]
GarciaFAP,MirleanN,BaischPR(2010)Marcadorresmetalicoscomoavaliacaodoimpactocronicodeemissoespetroquimicasemzonaurbana.QuimicaNova33(3):716-720
HamamoH, Landsberger S, Harbottle G, Panno S (1995). Studies of radio-activity andheavymetals in phosphate fertilizer. J RadioanalNuclChem194:331-336
Kratz S, Schnug E (2006) Rock phosphates and P fertilizers as sources ofUcontamination in agricultural soils. In:Merkel BJ, Hasche-Berger A (eds)Uranium in theenvironment :mining impactandconsequences.Berlin :Springer,pp57-67
KratzS,KnappeF,RogasikJ,SchnugE(2008)Uraniumbalancesinagroeco-systems.In:deKokLJ,SchnugE(eds)Loadsandfateoffertilizer-deriveduranium.Leiden:Backhuys,pp179-190
KurtzAC,DerryLA,ChadwickOA,AlfanoMJ(2000)Refractoryelementmobil-ityinvolcanicsoils.Geology28(8):683-686
364
MalavoltaE(1994)Fertilizanteseseuimpactoambientalmicronutrienteseme-taispesados:mitos,mistificaçaoefatos.SãoPaulo:ProduQuímica,153p
MartinsLR(2003)Recentsedimentsandgrain-sizeanalysis.Gravel1:90-105McBrideMB, SpearsG (2001) Trace element contentof selected fertilizers and
dairymanuresasdeterminedbyICP-MS.CommSoilSciPlantAnal32:139-156MirleanN,AndrusVE,BaischP(2003a)Mercurypollutionsourcesinsediments
ofPatosLagoonEstuary,SouthernBrazil.MarPollutBull46:331-334MirleanN,AndrusVE,BaischP,GriepG,CasartelliMR(2003b)Arsenicpollution
inPatosLagoonestuarinesediments.BrazilMarPollutBull46:1480-1484MirleanN,RoisenbergA(2006)Theeffectofemissionsoffertilizerproduction
on theenvironment contaminationby cadmiumandarsenic in southernBrazil.EnvironPollut143:335-340
MirleanN,RoisenbergA(2007)Fluoridedistributionintheenvironmentalongthegradientofaphosphate-fertilizerproductionemission(southernBrazil),EnvironGeochemHealth29:179-187
NiedergesässR,SchnierC,PepelnikR(1992)Analysisoffertilizerphosphatesusing reactor neutrons and 14MeV neutrons. J Radioanal Nucl Chem168(2):317-328
OliveiraCordeiroPFde,BrodJA,PalmieriM,GouveiadeOliveiraC,BarbosaESR,SantosRV,GasparJC,AssisLC(2011)TheCatalãoIniobiumdeposit,centralBrazil:resources,geologyandpyrochlorechemistry.OreGeolRev41:112-121
Perez-LopezR,Alvarez-ValeroAM,NietoJM(2007)Changesinmobilityofto-xicelementsduringtheproductionofphosphoricacidinthefertilizer in-dustryofHuelva(SWSpain)andenvironmentalimpactofphosphogypsumwastes.JHazardMater148:745-750
ReimannC,DeCariatP (2000) Intrinsicflawsofelementenrichmentfactors(EFs)inenvironmentalgeochemistry.EnvironSciTechnol34:5084-5091
RogasikJ,KratzS,FunderU,PantenK,BarkuskyD,BaumeckerM,GutserR,LausenP,SchererHW,SchmidtL,SchnugE(2008)UraniuminsoilsofGer-manlong-termfertilizerexperiments.In:deKokLJ,SchnugE(eds)Loadsandfateoffertilizerderiveduranium.Leiden:BackhuysPubl,pp135-146
RussellNA,GrahamJ,ShieldsL,MillerP,MarinA(2010)DeterminationofsulfurandtoxicmetalscontentofdistillatesandresidualoilinthestateofNewYork :final report10/31 [online]. Tobe foundat<http://www.nescaum.org/documents/nyserda-determination_sulfur_toxic_metals-201012-final.pdf/view>[quoted18.10.2011]
SmidtGA,HassounR,BirkeM,ErdingerL,SchäfM,KnolleF,SchnugE(2011a)UraniuminGermantapandgroundwater:occurrenceandorigins.In:Mer-kelB,SchipekM(eds)Thenewuraniumminingboom:challengeandles-sonslearned.Berlin:Springer,pp807-820
SmidtGA,LandesFC,CarvalhoLMde,KoschniskyA,SchnugE(2011b)Cadmi-umanduraniuminGermanandBrazilianphosphorousfertilisers.In:MerkelB,SchipekM(eds)Thenewuraniumminingboom:challengeandlessonslearned.Berlin:Springer,pp167-175
TaylorSR,McLennan SM (1985) The continental crust : its composition andevolution.Oxford:Blackwell,312p
TomazelliLJ,DillenburgSR,VillwockJA(2000)Latequaternarygeologicalhis-toryofRioGrandedoSulCoastalPlain,SouthernBrazil.RevBrasGeociênc30(3):474-476
TunneyH,StojanovicM,PopicJM,McGrathD,ZhangCS(2009)RelationshipofsoilphosphoruswithuraniumingrasslandmineralsoilsinIrelandusingsoilsfromalong-termphosphorusexperimentandanationalsoildatabase.JSoilSciPlantNutr172(2):346-352
USEPA(1995)Compilationofairpollutantemissionfactors:volI:backgroundreportAP-42SECTION8.5:introductiontophosphatefertilizers[online].Tobe found at <http://www.epa.gov/ttn/chief/ap42/toc_kwrd.pdf> [quoted18.10.2011]
USEPA(1999)Backgroundreportonfertilizeruse,contaminantsandregulati-ons[online].Tobefoundat<http://www.epa.gov/oppt/pubs/fertilizer.pdf>[quoted18.10.2011]
ZollerWH,GladneyES,DuceRA(1974)Atmosphericconcentrationsandsour-cesoftracemetalsatthesouthpole.Science183(4121):198-200

J. Spilke / Landbauforschung - vTI Agriculture and Forestry Research 4 2011 (61)365-366 365
Information zum „Leitfaden zur Einordnung, Planung, Durchführung und Auswertung von Versuchen unter Produktionsbedingungen (On-Farm-Experimente)“
JoachimSpilke*
* Martin-Luther-UniversitätHalle-Wittenberg, InstitutfürAgrar-undErnäh-rungswissenschaften,ArbeitsgruppeBiometrieundAgrarinformatik,Karl-Freiherr-von-Fritsch-Str. 4, 06120 Halle (Saale), E-mail: [email protected]
Versuche spielen als Erkenntnismittel in der Agrarfor-schungundderUmsetzungvonForschungsergebnissenindielandwirtschaftlichePraxisseitjehereinezentraleRolle.Soistesnichtverwunderlich,dasseinigefürbiologischeAnwendungenhäufiggenutztenMethodenderBiometrieihren Ursprung im landwirtschaftlichen Versuchswesenhaben.EinmarkantesBeispielistdieVarianzanalyse.Heute verfügt die Kulturpflanzenforschung über ein
System aufeinander abgestimmter Versuchstypen – vomTastversuch,Labor-undKlimakammerversuch,Gewächs-hausversuch, Parzellenversuch bis zum Versuch unterProduktionsbedingungen. Jeder dieser Versuchstypenhat eine spezifische Bedeutung und Rechtfertigung imErkenntnisprozess. Allgemein nimmt in der genanntenFolgederVersuchstypendieMöglichkeitderKontrollederUmweltbedingungenabunddieNähezulandwirtschaft-lichenProduktionsbedingungenzu.UmalsVersuchimbi-ometrischen Sinne zu gelten, gilt aber für alle VersuchegrundsätzlichdieEinhaltungderbiometrischenPrinzipienRandomisation, Wiederholung und Blockbildung. DiesePrinzipiensindsomitdieverbindendeKlammer,gültigfüralleVersuchstypen.Bei der Auswahl des jeweils geeigneten Versuchstyps
geht es stets darum, die Einhaltung der biometrischenPrinzipien zur Durchführung von Versuchen mit einergrößtmöglichenNähezurlandwirtschaftlichenProduktionzuverbinden.GeradeunterdemGesichtspunkteinerkon-trolliertenPräzisionundKonstanthaltungvonStörgrößenhaben Parzellenversuche auf Versuchsstationen eine he-rausragendeBedeutung.DaswirdauchinZukunftsoblei-ben. Daneben sind aber Untersuchungen unter Produk-tionsbedingungen, sog. „On-Farm-Experimente“ (OFE),wegenihrerNähezudenlandwirtschaftlichenProduktions-bedingungenseitjehervonbesonderemInteresse.Wennderzeit dieses Interessenoch zunimmt, ist das vor allemauchtechnischenEntwicklungengeschuldet.SobietetdieMöglichkeitderräumlichenOrtungvonArbeitsmaschinen
mitGPS (Global Positioning System), verbundenmit lei-stungsfähigerProzesstechnikzurflächenspezifischenAus-bringungvonBetriebsmittelnwieDüngemittelnoderSaat-gutsowiederErtragserfassung,technischeMöglichkeiten,die zu einer Anwendung im Versuchswesen geradezuherausfordernundeineabschließendeBewertungvonFor-schungsergebnissenimProduktionsfeldermöglichen.DasisteingroßerVorteilvonOFE.DiedamitverbundenenEr-wartungenwerdensichabernurerfüllen,wennmanOFEalseinenVersuchstypbegreift,fürdendiebiometrischenPrinzipien der Planung undAuswertung vomGrundsatzebenso geltenwie für jeden anderenVersuchstyp auch.DieserSachverhaltwirdoftnichtausreichendbeachtet.DavonabgeleitethatdieArbeitsgruppeLandwirtschaft-
liches Versuchswesen der Deutschen Region der Biome-trischen Gesellschaft federführend in ZusammenarbeitmitderArbeitsgruppeVersuchswesenderGesellschaftfürPflanzenbauwissenschaften, dem Arbeitskreis BiometrieundVersuchsmethodikderDeutschenPhytomedizinischenGesellschaftundderArbeitsgruppeBiometrieundBioin-formatikderGesellschaftfürPflanzenzüchtungeinenLeit-fadenmitdenbiometrischenGrundsätzenfürdiePlanungundAuswertungvonOFEerarbeitet.DieErarbeitunger-folgteinengerAbstimmungmitdemFachausschuss„Ver-suchswesen in der Pflanzenproduktion“ der DeutschenLandwirtschaftsgesellschaft.Der Leitfaden behandelt neben den Prinzipien zur
Durchführung von Versuchen weitere Themenschwer-punktewie Versuchsanlagen fürOFE, biometrischeMo-dellbildung, Auswertung von Versuchen ohne und mitGeoreferenzierung,Datenaufbereitung,AggregationundZusammenführungvonMerkmalsdaten.Der Leitfaden richtet sich vorrangig an den Personen-
kreis, der diese Versuche plant, durchführt und auswer-tet.DiewichtigstenAussagenwurdenin10ThesenzumLeitfaden zusammengefasst. Entsprechend diesesAdres-satenkreiseswurdederSchwerpunktbewusstaufdiebio-
366
metrischeMethodikgelegt.DamitlässtsicheineSpezifikundDarstellungvonDetailsnichtvermeiden,ummitdemLeitfaden diesem Nutzerkreis tatsächlich eine wirksameUnterstützungzuliefern.Natürlich sind die allgemeinen Grundsätze auch für
andereZielgruppenvonInteresse.HiersindzunächstdieFührungskräfte in Bundes- und Länderbehörden, Land-wirtschaftskammernundLandesanstaltenzunennen,dieselbst keine Versuche durchführen, deren Durchführungaber anweisen und kontrollieren. Für diese Zielgruppewurde ebenfalls ein Thesenpapier erarbeitet (Thesen fürEntscheider).AlsweiteresehrbedeutsameZielgruppeer-geben sichdie Landwirte, die anderDurchführung vonOFEinihremBetrieboderanderNutzungvonOFE-Ergeb-nissenfürdieeigeneEntscheidungsunterstützunginteres-siertsind.AuchfürdieseZielgruppesinddieAussageninThesen(ThesenfürLandwirte)zusammengefasst.EinweitererAbschnittumfasstBeispielefürdieAuswer-
tung von OFE. Hiermit wird die Zielstellung verbunden,an praktischen Beispielen die im Leitfaden dargestelltenmethodischenGrundsätzezuuntermauern.Weitersollendie Beispiele die große Breite der fürOFE bedeutsamenFragestellungensowiedamitverbundenenModifikationender Versuchsdurchführung und Auswertung zeigen, dieimLeitfadennichtvollständigabgebildetwerdenkönnen.DerBereichderpraktischenVersuchesollschrittweisezueiner Beispielsbibliothek ausgebaut werden. Der Leitfa-denistaufdenSeitenderArbeitsgruppeLandwirtschaft-liches Versuchswesen der Biometrischen Gesellschaft(www.biometrische-gesellschaft.de) bzw. direkt unterhttp://130.75.68.3/ibs/arbeitsgruppen/ag-lwv/on-farm-experimente/Leitfaden_OFE.pdfverfügbar.

LandbauforschungvTI Agriculture and Forestry Research
Lieferbare Sonderhefte / Special issues available
322 Wilfried Brade, Gerhard Flachowsky, Lars Schrader (Hrsg) (2008)Legehuhnzucht und Eiererzeugung - Empfehlungen für die Praxis
12,00 €
323 Christian Dominik Ebmeyer (2008)Crop portfolio composition under shifting output price relations – Analyzed for selected locations in Canada and Germany –
14,00 €
324 Ulrich Dämmgen (Hrsg.) (2009)Calculations of Emissions from German Agriculture – National Emission Inventory Report (NIR) 2009 for 2007
8,00 €
324A
Berechnungen der Emissionen aus der deutschen Landwirtschaft – Nationaler Emissionsbericht (NIR) 2009 für 2007Tables 8,00 €Tabellen
325 Frank Offermann, Martina Brockmeier, Horst Gömann, Werner Kleinhanß, Peter Kreins, Oliver von Ledebur, 8,00 €Bernhard Osterburg, Janine Pelikan, Petra Salamon (2009)vTI-Baseline 2008
326 Gerold Rahmann (Hrsg.) (2009)Ressortforschung für den Ökologischen Landbau 2008
8,00 €
327 Björn Seintsch, Matthias Dieter (Hrsg.) (2009)Waldstrategie 2020Tagungsband zum Symposium des BMELV, 10.-11. Dez. 2008, Berlin
18,00 €
328 Walter Dirksmeyer, Heinz Sourell (Hrsg.) (2009)Wasser im Gartenbau – Tagungsband zum Statusseminar am 9. und 10. Februar 2009 im Forum des vTI in Braunschweig. Organisiert im Auftrag des BMELV
8,00 €
329 Janine Pelikan, Martina Brockmeier, Werner Kleinhanß, Andreas Tietz, Peter Weingarten (2009) Auswirkungen eines EU-Beitritts der Türkei
8,00 €
330 Walter Dirksmeyer (Hrsg.) (2009)Status quo und Perspektiven des deutschen Produktionsgartenbaus
14,00 €
331 Frieder Jörg Schwarz, Ulrich Meyer (2009)Optimierung des Futterwertes von Mais und Maisprodukten
12,00 €
332 Gerold Rahmann und Ulrich Schumacher (Hrsg.) (2009)Praxis trifft Forschung — Neues aus der Ökologischen Tierhaltung 2009
8,00 €
333 Frank Offermann, Horst Gömann, Werner Kleinhanß, Peter Kreins, Oliver von Ledebur, Bernhard Osterburg, Janine Pelikan, Petra Salamon, Jürn Sanders (2010)vTI-Baseline 2009 – 2019: Agrarökonomische Projektionen für Deutschland
10,00 €
334 Hans-Dieter Haenel (Hrsg.) (2010) 12,00 €Calculations of Emissions from German Agriculture - National Emission Inventory Report (NIR) 2010 for 2008Berechnung der Emissionen aus der deutschen Landwirtschaft - Nationaler Emissionsbericht (NIR) 2010 für 2008
335 Gerold Rahmann (Hrsg.) (2010)Ressortforschung für den Ökologischen Landbau 2009
8,00 €
336 Peter Kreins, Horst Behrendt, Horst Gömann, Claudia Heidecke, Ulrike Hirt, Ralf Kunkel, 22,00 €Kirsten Seidel, Björn Tetzlaff, Frank Wendland (2010)Analyse von Agrar- und Umweltmaßnahmen im Bereich des landwirtschaftlichen Gewässerschutzes vor dem Hintergrund der EG-Wasserrahmenrichtlinie in der Flussgebietseinheit Weser

337 Ulrich Dämmgen, Lotti Thöni, Ralf Lumpp, Kerstin Gilke, Eva Seitler und Marion Bullinger (2010)Feldexperiment zum Methodenvergleich von Ammoniak- und Ammonium-Konzentrationsmes-sungen in der Umgebungsluft, 2005 bis 2008 in Braunschweig
8,00 €
338 Janine Pelikan, Folkhard Isermeyer, Frank Offermann, Jürn Sanders und Yelto Zimmer (2010)Auswirkungen einer Handelsliberalisierung auf die deutsche und europäische Landwirtschaft
10,00 €
339 Gerald Schwarz, Hiltrud Nieberg und Jürn Sanders (2010)Organic Farming Support Payments in the EU
14,00 €
340 Shrini K. Upadhyaya, D. K. Giles, Silvia Haneklaus, and Ewald Schnug (Editors) (2010)Advanced Engineering Systems for Specialty Crops: A Review of Precision Agriculture for Water, Chemical, and Nutrient - Application, and Yield Monitoring
8,00 €
341 Gerold Rahmann und Ulrich Schumacher (Hrsg.) (2010)Praxis trifft Forschung — Neues aus der Ökologischen Tierhaltung 2010
8,00 €
342 Claus Rösemann, Hans-Dieter Haenel, Eike Poddey, Ulrich Dämmgen, Helmut Döhler, Brigitte Eurich-Menden, Petra Laubach, Maria Dieterle, Bernhard Osterburg (2011)Calculation of gaseous and particulate emissions from German agriculture 1990 - 2009Berechnung von gas- und partikelförmigen Emissionen aus der deutschen Landwirtschaft 1990 - 2009
12,00 €
343 Katja Oehmichen, Burkhard Demant, Karsten Dunger, Erik Grüneberg, Petra Hennig, Franz Kroiher, Mirko Neubauer, Heino Polley, Thomas Riedel, Joachim Rock, Frank Schwitzgebel, Wolfgang Stümer, Nicole Wellbrock, Daniel Ziche, Andreas Bolte (2011)Inventurstudie 2008 und Treibhausgasinventar Wald
16,00 €
344 Dierk Kownatzki, Wolf-Ulrich Kriebitzsch, Andreas Bolte, Heike Liesebach, Uwe Schmitt, Peter Elsasser (2011)Zum Douglasienanbau in Deutschland – Ökologische, waldbauliche, genetische und holzbiologischeGesichtspunkte des Douglasienanbaus in Deutschland und den angrenzenden Staaten aus naturwissen-schaftlicher und gesellschaftspolitischer Sicht
10,00 €
345 Daniel Heinrich Brüggemann (2011)Anpassungsmöglichkeiten der deutschen Rindermast an die Liberalisierung der Agrarmärkte
14,00 €
346 Gerold Rahmann (Hrsg.) (2011)Ressortforschung für den Ökologischen Landbau 2010
8,00 €
347 Hiltrud Nieberg, Heike Kuhnert und Jürn Sanders (2011)Förderung des ökologischen Landbaus in Deutschland – Stand, Entwicklung und internationale Perspektive – 2., überarbeitete und aktualisierte Auflage
12,00 €
348 Herwart Böhm (Hrsg.) (2011)Optimierung der ökologischen Kartoffelproduktion
12,00 €
349 Klaus Nehring (2011)Farm level implications of high commodity prices – An assessment of adaptation strategies and potentials in selected regions in Australia and Germany –
18,00 €
350 Josef Frýdl, Petr Novotný, John Fennessy and Georg von Wühlisch (eds.) (2011)COST Action E 52 Genetic resources of beech in Europe – current state
18,00 €
351 Stefan Neumeier, Kim Pollermann, Ruth Jäger (2011)Überprüfung der Nachhaltigkeit des Modellprojektes Einkommenssicherung durch Dorftourismus
12,00 €
352 Bernhard Forstner , Andreas Tietz , Klaus Klare, Werner Kleinhanss, Peter Weingarten (2011)Aktivitäten von nichtlandwirtschaftlichen und überregional ausgerichteten Investoren auf dem landwirtschaftlichen Bodenmarkt in Deutschland
8,00 €
353 Wilfried Brade, Ottmar Distl, Harald Sieme und Annette Zeyner (Hrsg.) (2011)Pferdezucht, -haltung und -fütterung – Empfehlungen für die Praxis
10,00 €
354 Gerold Rahmann und Ulrich Schumacher (Hrsg.) (2011)Praxis trifft Forschung — Neues aus dem Ökologischen Landbau und der Ökologischen Tierhaltung 2011
8,00 €

4,41LBF_Vol. 61 4_U2 LBF_Vol. 61 4_U3
Landbauforschung (vTI Agriculture and Forestry Research) ist ein wissenschaftliches Publikations organ des Johann Heinrich von ThünenInstituts (vTI), Bundesforschungsinstitut für Ländliche Räume, Wald und Fischerei. Die Zeitschrift wird vom vTI heraus gegeben und erscheint vierteljährlich. Die Sprache der Beiträge ist deutsch und englisch. Sonderhefte erscheinen nach Bedarf.
In der Zeitschrift werden Forschungsergebnisse aus der Ressortforschung des BMELV mit Bezug zur Land und Forstwirtschaft und den ländlichen Räumen veröffentlicht, einschließlich Forschungs ergebnissen aus Kooperationsprojekten, an denen das vTI beteiligt ist.
Die Landbauforschung ist eine multidisziplinär ausgerichtete Zeitschrift, die die verschiedenen Facetten der Agrar und Forstwissenschaften einschließt und besonderes Augenmerk auf deren interdisziplinäre Verknüpfung legt.
Englischsprachige Beiträge sind erwünscht, damit die Forschungsergebnisse einem möglichst breiten wissenschaftlichen Diskurs zugeführt werden können.
Für den Inhalt der Beiträge sind die Autoren ver antwortlich. Eine Haftungsübernahme durch die Redaktion erfolgt nicht.
Mit der Einsendung von Manuskripten geben die Verfasser ihre Einwilligung zur Veröffentlichung. Die von den Autoren zu beachtenden Richtlinien zur Einreichung der Beiträge sind unter www.vti.bund.deoder bei der Geschäftsführung erhältlich. Das exklusive Urheber und Verwertungsrecht für angenommene Manuskripte liegt beim vTI. Es darf kein Teil des Inhalts ohne schriftliche Genehmigung der Geschäftsführung in irgendeiner Form vervielfältigt oder verbreitet werden.
Indexiert in:CAB International, Science Citation Index Expanded, Current Contents Agriculture, Biology & Environmental Sciences
Herausgeber
Johann Heinrich von ThünenInstitut (vTI)
Gutachtergremium
Siehe 3.Umschlagseite
Schriftleitung
Prof. Dr. Folkhard Isermeyer
Geschäftsführung
Dr. Matthias RützeTel. 040 . 739 62 247Leuschnerstraße 9121031 Hamburg, [email protected]
ISSN 04586859
Alle Rechte vorbehalten.
Landbauforschung vTI Agriculture and Forestry Research
Landbauforschung (vTI Agriculture and Forestry
Research) is a scientific journal of the Johann Heinrich
von Thünen Institute (vTI), Federal Research Institute
for Rural Areas, Forestry and Fisheries. The journal is
published quarterly by the vTI. The articles appear in
either German or English. Special issues are published as
required.
The journal publishes research results under the
auspices of the German Ministry of Food, Agriculture
and Consumer Protection (BMELV). Articles bear
relevance to agriculture and forestry, as well as to
rural areas, and include research results from cooperative
projects involving the vTI.
vTI Agriculture and Forestry Research is a multidis
ciplinary journal, encompassing the various facets
of this field of research and placing a particular
emphasis on interdisciplinary linkages.
English language contributions are desired so that
the research results can achieve as broad a scientific
discourse as possible.
The authors are responsible for the content of their
papers. The publishers cannot assume responsibility
for the accuracy of articles published.
With the submission of a manuscript, the author
grants his or her permission for publication. Authors
are requested to follow the guidelines for submission
found at www.vti.bund.de or available from the
management.
The vTI retains exclusive copy and usage rights for
accepted manuscripts. No portion of the content may
be duplicated or distributed in any form without the
written permission of the publisher.
Indexed in:
CAB International, Science Citation Index Expanded,
Current Contents Agriculture, Biology & Environmen
tal Sciences
Publisher
Johann Heinrich von Thünen Institute (vTI)
Editorial Board
Directors of vTIInstitutes
Editor in Chief
Prof. Dr. Folkhard Isermeyer
Managing Editor
Dr. Matthias Rütze
Phone + 49 40 .739 62 247
Leuschnerstraße 91
21031 Hamburg, Germany
www.vti.bund.de
ISSN 0458 – 6859
All rights reserved.
Gutachtergremium Editorial Board
PD Dr. Martin Banse, Institut für Marktanalyse und Agrarhandelspolitik, vTI Dr. Jürgen Bender, Institut für Biodiversität, vTI Dr. Jutta Berk, Institut für Tierschutz und Tierhaltung, FLI Dr. Herwart Böhm, Institut für Ökologischen Landbau, vTI Prof. Dr. Andreas Bolte, Institut für Waldökologie und Waldinventuren, vTI Dr. Ulrich Dämmgen, Institut für Agrarrelevante Klimaforschung, vTI PD Dr. Sven Dänicke, Institut für Tierernährung, FLI Dr. habil. Bernd Degen, Institut für Forstgenetik, vTI PD Dr. Matthias Dieter, Institut für Ökonomie der Forst und Holzwirtschaft, vTI PD Dr. habil. Bettina EichlerLöbermann, Universität Rostock Dr. Peter Elsasser, Institut für Ökonomie der Forst und Holzwirtschaft, vTI Prof. Dr. Andreas Fangmeier, Universität Hohenheim PD Dr. Matthias Fladung, Institut für Forstgenetik, vTI Prof. Dr. Heinz Flessa, Institut für Agrarrelevante Klimaforschung, vTI Prof. Dr. Ulrike GrabskiKieron, Universität Münster Prof. Dr. JörgMichael Greef, Institut für Pflanzenbau und Bodenkunde, JKI Prof. Dr. Konrad Hagedorn, HumboldtUniversität Berlin PD Dr. Ingrid Halle, Institut für Tierernährung, FLI Dr. Silvia Haneklaus, Institut für Pflanzenbau und Bodenkunde, JKI Prof. Dr. Eberhard Hartung, Universität Kiel Prof. Dr. Roland Herrmann, Universität Gießen Prof. Dr. habil. Pierre Ibisch, Hochschule für nachhaltige Entwicklung, HNEE Dipl. Ing.Agr. Robert Kaufmann, Forschungsanstalt Agroscope ReckenholzTänikon ART, Schweiz Dr. Jörg Kleinschmit, Nordwestdeutsche Forstliche Versuchsanstalt Prof. Dr. Luit de Kok, Universität Groningen, Niederlande Prof. Dr. Uwe LataczLohmann, Universität Kiel Dr. Oliver von Ledebur, Institut für Marktanalyse und Agrarhandelspolitik, vTI Prof. Dr. Bernd Linke, Institut für Agrartechnik Bornim e.V. Dipl. Met. FranzJosef Löpmeier, Agrarmeteorologische Forschung des Deutschen Wetterdienstes Prof. Dr. Udo Mantau, Universität Hamburg Prof. Dr. Axel Munack, Institut für Agrartechnologie und Biosystemtechnik, vTI Dr. Hiltrud Nieberg, Institut für Betriebswirtschaft, vTI Dr. Rainer Oppermann, Institut für Ökologischen Landbau, vTI Prof. Dr. Herbert Oberbeck, TU Braunschweig Dr. Jürgen Puls, Institut für Holztechnologie und Holzbiologie, vTI Prof. Dr. Gerold Rahmann, Institut für Ökologischen Landbau, vTI Prof. Dr. Detlef Rath, Institut für Nutztiergenetik, FLI Dr. Thomas Schneider, Institut für Weltforstwirtschaft, vTI Prof. Dr. Dr. habil. Dr. h.c. Ewald Schnug, Institut für Pflanzenbau und Bodenkunde, JKI Dr. Lars Schrader, Institut für Tierschutz und Tierhaltung, FLI Prof. Dr. Andreas Susenbeth, Universität Kiel Prof. Dr. Friedhelm Taube, Universität Kiel Prof. Dr. KlausDieter Vorlop, Institut für Agrartechnologie und Biosystemtechnik, vTI Prof. Dr. Dr. habil. Drs. h.c. Gerd Wegener, TU München Prof. Dr. HansJoachim Weigel, Institut für Biodiversität, vTI Prof. Dr. Peter Weingarten, Institut für Ländliche Räume, vTI Dr. Nicole Wellbrock, Institut für Waldökologie und Waldinventuren, vTI

4,41LBF_Vol. 61 4_U4 LBF_Vol. 61 4_U1
Vol.61 No. 4 12.2011
LandbauforschungvTI Agriculture andForestry Research
Landbauforschung vTI Agriculture andForestry Research
Vol.61 No. 4 12.2011
Preis / Price 8 €
ISSN 0458-6859