ICICI Prudential - NASDAQ 100 Index Fund
18
1 ICICI Prudential NASDAQ 100 Index Fund NFO Opens on: 27th September, 2021 NFO Closes on: 11th October, 2021
-
Upload
khangminh22 -
Category
Documents
-
view
1 -
download
0
Transcript of ICICI Prudential - NASDAQ 100 Index Fund

1
ICICI Prudential
NASDAQ 100
Index Fund
NFO Opens on: 27th September, 2021
NFO Closes on: 11th October, 2021

Why Should Your Investments Go Global?
CLOUD
COMPUTING
DIGITAL
PLATFORMS
E-COMMERCE
CASHLESS
ECONOMY
ARTIFICIAL
INTELLIGENCE
DRIVERLESS
CARS
Tapping into some
themes/opportunities
of future that are
rarely available in
Domestic Markets
2

Date : 31st
Aug 2021 Data Source: BSE, global indices. Returns are of calendar year in absolute terms in the local currency of respective economies. Past performance may or may not sustain in the
future. YTD – Year to date
Diversification: Markets of Different Countries
India
US
France
Germany
UK
China
Japan
-5.0%
5.7%
8.5%
9.6%
-4.9%
9.4%
9.1%
1.9%
7.5%
4.9%
6.9%
14.4%
-12.3%
0.4%
27.9%
28.2%
9.3%
12.5%
7.6%
6.6%
19.1%
5.9%
-3.9%
-11.0%
-18.3%
-12.5%
-24.6%
-12.1%
14.4%
35.2%
26.4%
25.5%
12.1%
22.3%
18.2%
15.8%
43.6%
-7.1%
3.5%
-14.3%
13.9%
16.0%
20.5%
18.4%
20.3%
15.4%
10.2%
2.0%
2.4%
Markets around the Globe perform differently each year, thus diversification to International Markets may enable
investors to earn stable returns
Table Showing Calendar Year Returns of Stock Market Indices of each Country
COUNTRY 2015 2016 2017 2018 2019 2020 YTD 2021
3

Data as on August 18, 2021 Source: RBI. Past Performance may or may not sustain in future. The above data is for understanding purposes only
On August 15, 1947 1$ was equivalent to 1 INR
Potential Appreciation of Dollar
Currently 1$~ 74.3 INR
If you had invested in
$100,000 in 1947, value
of your wealth would be
INR 74,30,000.
4
0
10
20
30
40
50
60
70
80
1947 1956 1964 1973 1981 1989 1997 2005 2013 2021
Valu
e o
f $ p
er IN
R
Years
Appreciation of Dollar

The above listed are some of the factors for investing US Markets. The above list is inclusive but not exhaustive.
COMMON ADVANTAGES OF INVESTING IN US MARKETS
Why Specifically Invest In US Markets?
5
Investment in Top
Brands from
Various Sectors
Highest Share in
Global Equity Markets
Developed Country
with Mature Markets Diversification
Combination of
Growth and GDP

Significance of US in Global Markets
6Data Source :Market Cap as on August 31, 2021 is considered. Past Volumes may or may not sustain in future. Data Source: BofA Global research Report of July 29,2021 :Exhibit 12:
US holds the largest share of equity global market.
Index Name
Market Cap as on
August 31, 2021 (USD Billion)
NASDAQ-100 ® 18,554
Nifty 50 TRI 1,852
Nifty 100 TRI 2,353
US has Highest Share in Global Equity Markets
The US Equity Market accounts for 59% of the Global Market Capitalization

Presenting
ICICI Prudential
NASDAQ 100 Index Fund
The scheme invests in NASDAQ-100 INDEX® giving exposure to
100 largest globally leading non financial companies
Time to expand the boundaries
of growth

Data Source: Nasdaq https://www.nasdaq.com/market-activity/stocks/fds Date: 31st August 2021. Past performance may or may not be sustained in the future.
Key Features of NASDAQ-100 INDEX®
8
Access to globally leading companies that maintain dominant positions in the market
NASDAQ-100 INDEX® Price to Equity Ratio: 28.01 & Price to Book Ratio: 4.91
Nifty 50 Price to Equity Ratio: 26.45 & Price to Book Ratio: 4.33
With a market cap of $18T, this index has outperformed broad market in US
NASDAQ-100 INDEX® has grown ~ 4x times in last two decades
The constituents of NASDAQ-100 INDEX® have grown the value of their patents by 900% since May 2007
44% weightage in technology stocks
NASDAQ-100 INDEX® has relatively lower correlation with Indian equity indices
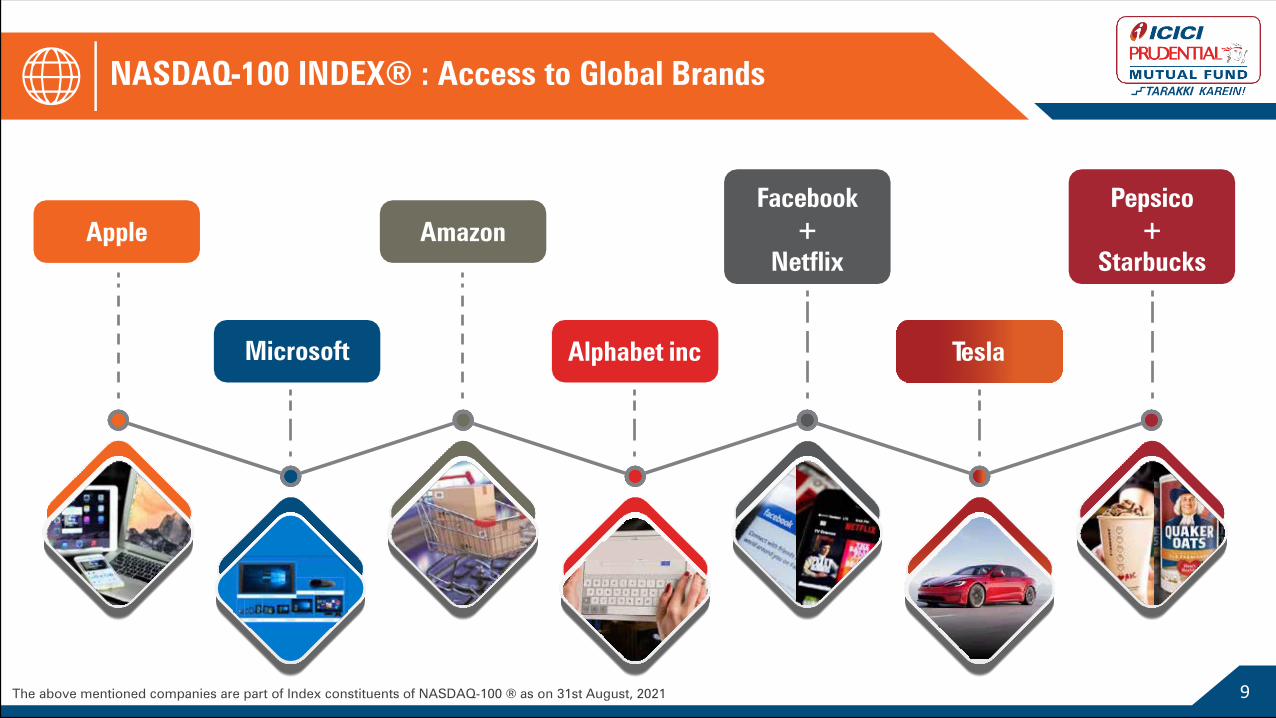
NASDAQ-100 INDEX® : Access to Global Brands
9The above mentioned companies are part of Index constituents of NASDAQ-100 ® as on 31st August, 2021
+
Netflix
Pepsico
+
Starbucks
Apple
Microsoft
Amazon
Alphabet inc Tesla
Stock
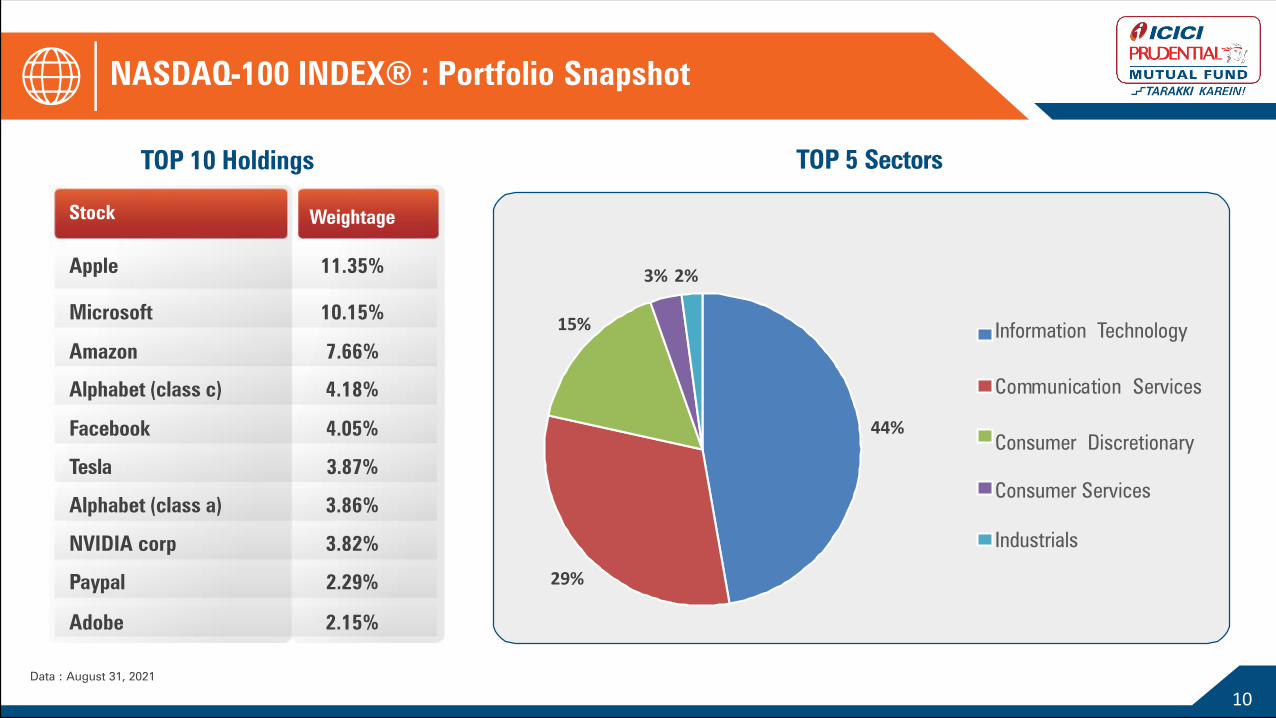
TOP 10 Holdings
Weightage
NASDAQ-100 INDEX® : Portfolio Snapshot
Data : August 31, 2021
44%
29%
15%
3% 2%
Information Technology
Communication Services
Consumer Discretionary
Consumer Services
Industrials
Apple
Microsoft
Amazon
Alphabet (class c)
Tesla
Alphabet (class a)
NVIDIA corp
Paypal
Adobe
11.35%
10.15%
7.66%
4.18%
4.05%
3.87%
3.86%
3.82%
2.29%
2.15%
TOP 5 Sectors
10
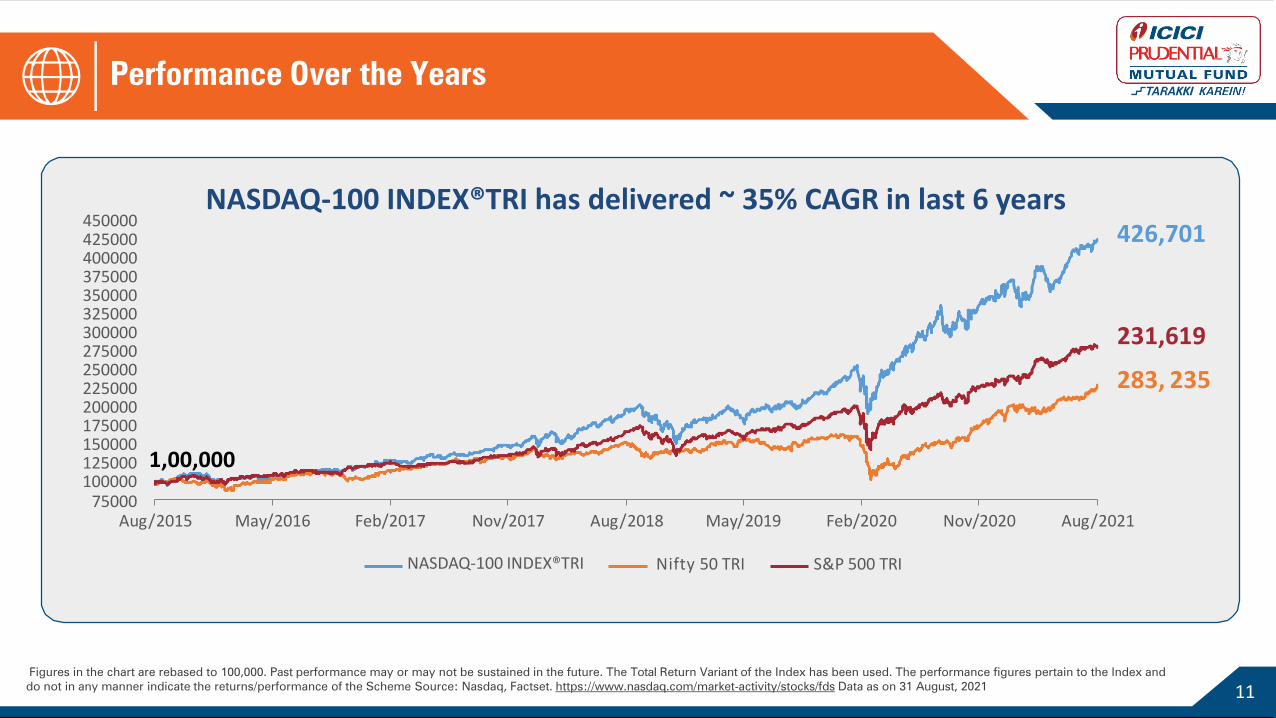
Figures in the chart are rebased to 100,000. Past performance may or may not be sustained in the future. The Total Return Variant of the Index has been used. The performance figures pertain to the Index and
do not in any manner indicate the returns/performance of the Scheme Source: Nasdaq, Factset. https://www.nasdaq.com/market-activity/stocks/fds Data as on 31 August, 2021
Performance Over the Years
11
450000425000400000375000350000325000300000275000250000225000200000175000150000125000100000
75000Aug/2015 May/2016 Aug/2018 May/2019 Feb/2020 Nov/2020 Aug/2021Feb/2017 Nov/2017
NASDAQ-100 INDEX®TRI Nifty 50 TRI S&P 500 TRI
426,701
231,619
283, 235
1,00,000
NASDAQ-100 INDEX®TRI has delivered ~ 35% CAGR in last 6 years

Performance: Calendar Year
12
Years NASDAQ-100 INDEX®TRI Nifty 50 TRI S&P 500 TRI
2010 16.2% 18.6% 10.91%
2011 22.3% -23.4% 20.91%
2012 22.1% 29.4% 19.68%
2013 54.6% 8.1% 49.46%
2014 22.1% 32.9% 16.21%
2015 15.0% -3.0% 6.21%
2016 10.1% 4.4% 14.91%
2017 24.9% 30.3% 14.44%
2018 9.2% 4.6% 4.36%
2019 42.5% 13.5% 34.38%
2020 52.7% 16.1% 21.44%
2021(YTD) 21.5% 23.3% 21.44%
The NASDAQ-100 INDEX®TRI has outperformed the Nifty 50 Index 6 times over the last decade
Source: Nasdaq, Factset. https://www.nasdaq.com/market-activity/stocks/fds and MFDI Explorer Data as on 1st September, 2021 . Past performance may or may not be sustained in the future.
The Total Return Variant of the Index has been used. The performance figures pertain to the Index and do not in any manner indicate the returns/performance of the Scheme

Source: Nasdaq, Factset. https://www.nasdaq.com/market-activity/stocks/fds and MFI Explorer. Data as on 1st September, 2021 . Past performance may or may not be sustained in the future.
The Total Return Variant of the Index has been used. The performance figures pertain to the Index and do not in any manner indicate the returns/performance of the Scheme
Performance: CAGR
13
27.7%29.1%
34.6%
31.2%
50.7%
15.2%
18.8%
13.6%
30.0%
19.0%
23.9% 23.3%
0%
10%
20%
30%
40%
50%
60%
1 year 3 Years 5 Years 10 Years
CA
GR
Retu
rn
s (
%)
Years
NASDAQ-100 TRI® Nifty 50 TRI S&P 500 TRI

Reasons to invest in ICICI Prudential NASDAQ 100 Index Fund
Diversification
NASDAQ-100
INDEX®has
performed well
over the last 2
decades
Exposure to
Big Tech Stocks
Transparent
and Index
Based Investing
Access to Global
Companies listed on
NASDAQ-100
INDEX®
Potential hedge
against Rupee
Depreciation vs
Dollar
Direct Investment in
Index Constituents
Global Products &
Services catering to
all age groups
14The factors mentioned above are not exhaustive. Past performance may or may not be sustained in the future. The performance figures pertain to the Index and do not in any manner indicate the
returns/performance of the Scheme
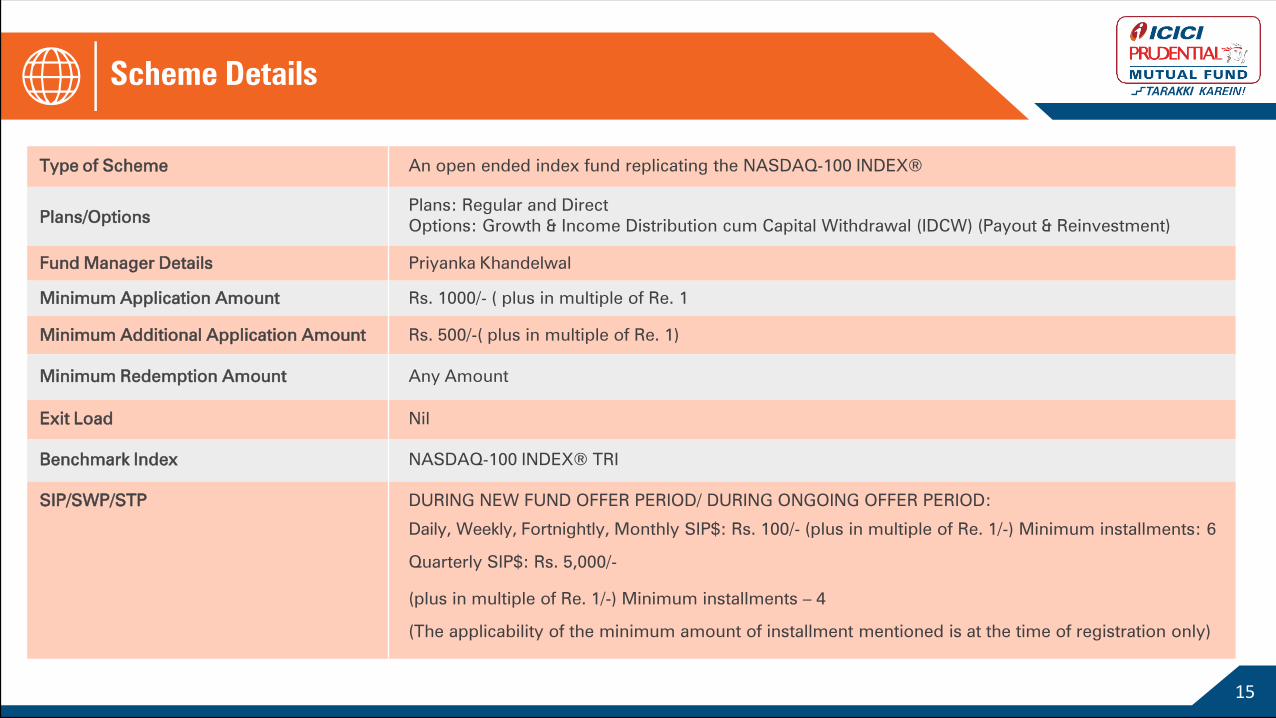
Scheme Details
15
Type of Scheme An open ended index fund replicating the NASDAQ-100 INDEX®
Plans/Options
Plans: Regular and Direct
Options: Growth & Income Distribution cum Capital Withdrawal (IDCW) (Payout & Reinvestment)
Fund Manager Details Priyanka Khandelwal
Minimum Application Amount Rs. 1000/- ( plus in multiple of Re. 1
Minimum Additional Application Amount Rs. 500/-( plus in multiple of Re. 1)
Minimum Redemption Amount Any Amount
Exit Load Nil
Benchmark Index NASDAQ-100 INDEX® TRI
SIP/SWP/STP DURING NEW FUND OFFER PERIOD/ DURING ONGOING OFFER PERIOD:
Daily, Weekly, Fortnightly, Monthly SIP$: Rs. 100/- (plus in multiple of Re. 1/-) Minimum installments: 6
Quarterly SIP$: Rs. 5,000/-
(plus in multiple of Re. 1/-) Minimum installments – 4
(The applicability of the minimum amount of installment mentioned is at the time of registration only)

Riskometer and Disclaimer
This scheme is suitable for investors who are seeking*:
•Long term wealth creation
•An index fund that seeks to track returns by investing in a basket of NASDAQ-100
INDEX® stocks and aims to achieve returns of the stated index, subject to
tracking error
*Investors should consult their financial advisers if in doubt about whether the product is
suitable for them
Investors understand that their principal
will be at Very High risk
Benchmark of
the scheme
Benchmark
Riskometer
-
The Benchmark Riskometer is at very
high risk
NASDAQ-100 INDEX®
Mutual Fund investments are subject to market risks, read all scheme related documents
carefully.
Disclaimer: All figures and data given in the document are dated unless stated otherwise. In the preparation of the material contained in this document, the AMC has used information that is publicly available, including information
developed in-house. Some of the material used in the document may have been obtained from members/persons other than the AMC and/or its affiliates and which may have been made available to the AMC and/or to its affiliates.
Information gathered and material used in this document is believed to be from reliable sources. The AMC however does not warrant the accuracy, reasonableness and / or completeness of any information. We have included
statements / opinions / recommendations in this document, which contain words, or phrases such as “will”, “expect”, “should”, “believe” and similar expressions or variations of such expressions, that are “forward looking
statements”. Actual results may differ materially from those suggested by the forward looking statements due to risk or uncertainties associated with our expectations with respect to, but not limited to, exposure to market
risks, general economic and political conditions in India and other countries globally, which have an impact on our services and / or investments, the monetary and interest policies of India, inflation, deflation,
unanticipated turbulence in interest rates, foreign exchange rates, equity prices or other rates or prices etc.
The AMC (including its affiliates), the Mutual Fund, the trust and any of its officers, directors, personnel and employees, shall not liable for any loss, damage of any nature, including but not limited to direct, indirect, punitive, special,
exemplary, consequential, as also any loss of profit in any way arising from the use of this material in any manner. The recipient alone shall be fully responsible/are liable for any decision taken on this material.
Investors are advised to consult their own legal, tax and financial advisors to determine possible tax, legal and other financial implication or consequence of subscribing to the units of ICICI Prudential Mutual Fund.
16

Riskometer and Disclaimer
NASDAQ-100 INDEX®Disclaimer:
The Product(s) is not sponsored, endorsed, sold or promoted by Nasdaq, Inc. or its affiliates (Nasdaq, with its affiliates, are referred to as the
“Corporations”). The Corporations have not passed on the legality or suitability of, or the accuracy or adequacy of descriptions and disclosures relating
to, the Product(s). The Corporations make no representation or warranty, express or implied to the owners of the Product(s) or any member of the public
regarding the advisability of investing in securities generally or in the Product(s) particularly, or the ability of the NASDAQ-100 INDEX® to track general
stock market performance. The Corporations' only relationship to ICICI Prudential Asset Management Company Limited (“Licensee”) is in the licensing of
the Nasdaq®, NASDAQ-100 ®, NASDAQ-100 INDEX®, and certain trade names of the Corporations and the use of the NASDAQ-100 INDEX® which is
determined, composed and calculated by Nasdaq without regard to Licensee or the Product(s). Nasdaq has no obligation to take the needs of the
Licensee or the owners of the Product(s) into consideration in determining, composing or calculating the NASDAQ-100 INDEX®. The Corporations are
not responsible for and have not participated in the determination of the timing of, prices at, or quantities of the Product(s) to be issued or in the
determination or calculation of the equation by which the Product(s) is to be converted into cash. The Corporations have no liability in connection with
the administration, marketing or trading of the Product(s).
The Corporations do not guarantee the accuracy and/or uninterrupted calculation of NASDAQ-100 INDEX® or any data included therein. The
Corporations make no warranty, express or implied, as to results to be obtained by Licensee, owners of the product(s), or any other person or entity
from the use of the NASDAQ-100 INDEX® or any data included therein. The Corporations make no express or implied warranties, and expressly
disclaim all warranties of merchantability or fitness for a particular purpose or use with respect to the NASDAQ-100 INDEX® or any data included
therein. Without limit- ing any of the foregoing, in no event shall the Corporations have any liability for any lost profits or special, incidental, punitive,
indirect, or consequential damages, even if notified of the possibility of such damages.
17

18