ICICI Prudential Life Insurance - Moneycontrol
18
Investors are advised to refer through important disclosures made at the last page of the Research Report. Motilal Oswal research is available on www.motilaloswal.com/Institutional-Equities, Bloomberg, Thomson Reuters, Factset and S&P Capital. Nitin Aggarwal - Research Analyst ([email protected]) Research Analyst: Yash Agarwal ([email protected]) | Vinayak Agarwal ([email protected] BSE SENSEX S&P CNX CMP: INR497 TP: INR630 (+27%) Buy 52,266 15,557 Bloomberg IPRU IN Equity Shares (m) 1,435 M.Cap.(INRb)/(USDb) 714 / 9.1 52-Week Range (INR) 725 / 430 1, 6, 12 Rel. Per (%) 1/-3/-18 12M Avg Val (INR M) 958 Free float (%) 26.6 Financials & Valuations (INR b) Y/E MARCH FY22 FY23E FY24E Net Premiums 363.2 408.9 472.0 Surplus / Deficit 21.9 24.1 26.7 Sh. holder's PAT 7.5 8.4 10.8 NBP growth unwtd (%) 17.2 20.0 20.0 APE growth - (%) 19.7 20.8 22.1 Tot. Premium growth (%) 4.8 11.8 15.5 VNB margin (%) 28.0 28.5 28.7 RoE (%) 8.2 8.9 10.7 RoEV (%) 8.7 14.3 16.7 Total AUMs (INRt) 2.4 2.7 3.2 VNB (INRb) 21.7 26.6 32.8 EV per share 220.3 251.9 294.1 Valuations P/EV (x) 2.2 1.9 1.7 P/EVOP (x) 22.0 13.5 11.5 Shareholding pattern (%) As On Mar-22 Dec-21 Mar-21 Promoter 73.4 73.4 73.5 DII 4.7 4.3 4.3 FII 16.4 16.9 16.5 Others 5.5 5.4 5.7 FII Includes depository receipts Successful transformation to a more balanced player Protection & non-par savings remain focus segments; reiterates VNB doubling guidance ICICI Prudential Life’s (IPRU) Annual Report reaffirms the company’s focus on steadily diversifying its product mix, especially, the non-par savings & protection segment. The addition of new-age partners and a wider presence across traditional channels will boost its business growth. The share of banca channel (excluding ICICI Bank) has increased to 14% in FY22 from 5% in FY18. These initiatives will provide the company with diversification benefits and drive an optimal business mix, thereby supporting margins. IPRU reiterated its guidance to double FY19 Value of New Business (VNB) by FY23 led by its 4P strategy. IPRU has reported 34% YoY growth in individual WRP in FY23 YTD and we estimate ~21% CAGR in new business APE and 23% CAGR in VNB over FY22-24E. We reiterate our Buy rating with a revised PT of INR630 (2.1x FY24E EV). On track to achieve guidance of doubling FY19 VNB by FY23E IPRU remains on-course to double FY19 VNB by FY23. It continues to execute its 4P strategy of Protection focus, Premium growth, Persistency improvement, and Productivity enhancement. Wider product offerings, newer channels of distribution and superior customer service are key enablers of this strategy. VNB margins have improved sharply over the years and are likely to remain resilient, aided by further improvement in the company’s product mix. We estimate VNB growth to be mainly driven by premium growth rather than margin enhancement, going forward. Premium mix more balanced; ULIP share declines to 48% from 80% in FY19 IPRU has successfully transformed and diversified its product mix over the last few years. Having shed its singular focus on ULIPs, its balanced product mix is now evident from the decline in the share of ULIPs to 48% in FY22 from 80% of APE in FY19. The share of traditional savings and protection has increased from 9% each in FY19 to 27% and 17% in FY22, respectively. With improving life expectancy and increasing awareness about retirement products, the management is trying to explore the highly underpenetrated annuity segment, which is fast gaining traction. Protection and Annuity remain key growth opportunities Protection and Annuity segments remain the key focus areas and offer a long growth runway. Demand for retail protection is holding well despite reinsurers- led price hike. As supply side challenges abate, we expect retail protection growth to improve. During FY22, IPRU opportunistically focussed on group-term segment and overall the segment contributed 43% of VNB in FY22. IPRU is now focussed on expanding the contribution from its annuity business. At present, annuity contributes 4% of APE, while its share in NBP has improved to 19% in FY22 from 7% in FY19. 23 June 2022 Update | Sector: Insurance ICICI Prudential Life Insurance Motilal Oswal values your support in the Asiamoney Brokers Poll 2022 for India Research, Sales, Corporate Access and Trading team. We request your ballot.
-
Upload
khangminh22 -
Category
Documents
-
view
0 -
download
0
Transcript of ICICI Prudential Life Insurance - Moneycontrol

Investors are advised to refer through important disclosures made at the last page of the Research Report.
Motilal Oswal research is available on www.motilaloswal.com/Institutional-Equities, Bloomberg, Thomson Reuters, Factset and S&P Capital.
Nitin Aggarwal - Research Analyst ([email protected])
Research Analyst: Yash Agarwal ([email protected]) | Vinayak Agarwal ([email protected]
BSE SENSEX S&P CNX CMP: INR497 TP: INR630 (+27%) Buy 52,266 15,557
Bloomberg IPRU IN
Equity Shares (m) 1,435
M.Cap.(INRb)/(USDb) 714 / 9.1
52-Week Range (INR) 725 / 430
1, 6, 12 Rel. Per (%) 1/-3/-18
12M Avg Val (INR M) 958
Free float (%) 26.6
Financials & Valuations (INR b)
Y/E MARCH FY22 FY23E FY24E
Net Premiums 363.2 408.9 472.0
Surplus / Deficit 21.9 24.1 26.7
Sh. holder's PAT 7.5 8.4 10.8
NBP growth unwtd (%) 17.2 20.0 20.0
APE growth - (%) 19.7 20.8 22.1
Tot. Premium growth (%) 4.8 11.8 15.5
VNB margin (%) 28.0 28.5 28.7
RoE (%) 8.2 8.9 10.7
RoEV (%) 8.7 14.3 16.7
Total AUMs (INRt) 2.4 2.7 3.2
VNB (INRb) 21.7 26.6 32.8
EV per share 220.3 251.9 294.1
Valuations
P/EV (x) 2.2 1.9 1.7
P/EVOP (x) 22.0 13.5 11.5
Shareholding pattern (%)
As On Mar-22 Dec-21 Mar-21
Promoter 73.4 73.4 73.5
DII 4.7 4.3 4.3
FII 16.4 16.9 16.5
Others 5.5 5.4 5.7
FII Includes depository receipts
Successful transformation to a more balanced player
Protection & non-par savings remain focus segments; reiterates VNB doubling guidance ICICI Prudential Life’s (IPRU) Annual Report reaffirms the company’s focus on
steadily diversifying its product mix, especially, the non-par savings & protection
segment.
The addition of new-age partners and a wider presence across traditional
channels will boost its business growth. The share of banca channel (excluding
ICICI Bank) has increased to 14% in FY22 from 5% in FY18. These initiatives will
provide the company with diversification benefits and drive an optimal business
mix, thereby supporting margins.
IPRU reiterated its guidance to double FY19 Value of New Business (VNB) by FY23
led by its 4P strategy.
IPRU has reported 34% YoY growth in individual WRP in FY23 YTD and we
estimate ~21% CAGR in new business APE and 23% CAGR in VNB over FY22-24E.
We reiterate our Buy rating with a revised PT of INR630 (2.1x FY24E EV).
On track to achieve guidance of doubling FY19 VNB by FY23E
IPRU remains on-course to double FY19 VNB by FY23. It continues to execute its
4P strategy of Protection focus, Premium growth, Persistency improvement,
and Productivity enhancement. Wider product offerings, newer channels of
distribution and superior customer service are key enablers of this strategy.
VNB margins have improved sharply over the years and are likely to remain
resilient, aided by further improvement in the company’s product mix. We
estimate VNB growth to be mainly driven by premium growth rather than
margin enhancement, going forward.
Premium mix more balanced; ULIP share declines to 48% from 80% in FY19
IPRU has successfully transformed and diversified its product mix over the last
few years. Having shed its singular focus on ULIPs, its balanced product mix is
now evident from the decline in the share of ULIPs to 48% in FY22 from 80% of
APE in FY19. The share of traditional savings and protection has increased from
9% each in FY19 to 27% and 17% in FY22, respectively. With improving life
expectancy and increasing awareness about retirement products, the
management is trying to explore the highly underpenetrated annuity segment,
which is fast gaining traction.
Protection and Annuity remain key growth opportunities
Protection and Annuity segments remain the key focus areas and offer a long
growth runway. Demand for retail protection is holding well despite reinsurers-
led price hike. As supply side challenges abate, we expect retail protection
growth to improve. During FY22, IPRU opportunistically focussed on group-term
segment and overall the segment contributed 43% of VNB in FY22. IPRU is now
focussed on expanding the contribution from its annuity business. At present,
annuity contributes 4% of APE, while its share in NBP has improved to 19% in
FY22 from 7% in FY19.
23 June 2022 Update | Sector: Insurance
ICICI Prudential Life Insurance
Motilal Oswal values your support in the Asiamoney Brokers Poll 2022 for India Research, Sales, Corporate Access and Trading team. We request your ballot.

ICICI Prudential Life Insurance
23 June 2022 2
Mix of non-ICICI Bank banca partners has increased to 14% from 4% in FY19
With the intention to reduce focus on ICICI Bank as a distribution partner, IPRU
formed a slew of partnerships over the last few years. It is gradually moving toward
a digitally-enabled, omni-channel distribution model with presence across all
platforms and customer touchpoints. Recent banca partnerships with IDFC First
Bank, IndusInd Bank, RBL Bank, and AU Small Finance Bank have started to yield
results. The share of non-ICICI Bank has increased from 4% of APE in FY19 to 14% in
FY22. During the year, it added ~24K individual agents and formed 112 new
partnerships. Overall, it is expanding its distribution network across all channels and
strengthening its reach by closely mapping its distribution segments with customer
segments and products.
Persistency trends steady; cost-ratios rise on increased business investments IPRU’s persistency ratios improved across most cohorts during FY22. While 13M
persistency ratio dipped marginally by 30bps to 84.6%, 25M and 61M persistency
ratio improved 440bps and 580bps to 77.3% and 54.7%, respectively. IPRU
continues to expand its innovative capabilities by leveraging new age technologies
across the customer lifecycle. In FY22, IPRU increased spends on enhancing
distribution channels and building a stronger brand. As a result, Cost/TWRP
increased to 18.6% in FY22 from 14.8% in FY21.
Worst of COVID impact absorbed in FY22 Owing to the impact of COVID-19, the last few years have been extremely
challenging for life insurers with increased distributions, resulting from spikes in
mortality. A surge in the number of claims during the second wave of the pandemic
had a significant impact on the statutory profits in FY22. The frequency of claims has
tapered down in Q3 and Q4, consistent with global trends. During FY22, the
company received COVID claim intimation of INR10.2b (net of reinsurance) and now
it carries INR0.24b as reserves for delayed claims. Heightened mortality charges
dragged Operating RoEV to 11% in F22, which otherwise would have been 15% for
FY22.
Valuation and view IPRU has maintained a steady traction in VNB growth, led by a healthy product mix
and APE growth, aided by a more balanced distribution mix. The share of higher
margin products such as protection and annuity/non-par savings has increased in
recent years, thus reducing dependence on ULIPs. On the distribution side, the share
of banks (excluding ICICI Bank) has increased over the years (off a low base),
supporting the diversification in its distribution mix. The increase in agent
recruitment and the forming of new partnerships will continue to support premium
growth. We expect VNB margins to improve slightly and project IPRU to deliver 21%
and 23% CAGR in new business APE and VNB over FY22-24E, respectively, thus
enabling an operating RoEV of 16.9% in FY24E. We reiterate our Buy rating with a
revised TP of INR630 (premised on 2.1x FY24E EV).
Stock Performance (1-year)

ICICI Prudential Life Insurance
23 June 2022 3
Successful execution to a well-balanced product/distribution mix IPRU aspires for deeper penetration in under-served customer segments, larger
distribution network with the help of new partners and improved productivity from the existing ones. Among savings products, the company has increased its focus on under-penetrated retirement products such as pension and annuity.
Despite the impact of the pandemic in FY22, IPRU posted an overall growth of
20% in APE, with all the product segments contributing adequately. On the
distribution side, growth in banca at 10% YoY was soft, compared to other
channels
Based on RWRP, IPRU maintained its market share at 7.2% of the total industry
in FY22
Exhibit 1: Net premium income grew at 4% YoY; slower than NBP/APE growth due to
pressure on renewal premiums
Sources: MOFSL, Company
Exhibit 2: NBP grew 15% YoY in FY22 as growth was higher
in regular premium products compared to single premium
Sources: MOFSL, Company
Exhibit 3: Total APE saw a bounce of 20% YoY after a dull
FY20/21
Sources: MOFSL, Company
Exhibit 4: Successfully diversified from singular focus on ULIPs
to a balanced product mix with increasing share of annuity
and protection (%) Product Mix – On the basis of APE FY18 FY19 FY20 FY21 FY22
Savings 94.3 90.7 84.9 83.8 83.0
-Linked 81.9 79.6 64.7 47.8 48.3
-Non-Linked 10.9 9.0 15.5 27.5 27.4
-Annuity 0.4 0.9 1.4 3.5 3.9
-Group 1.1 1.3 3.3 4.9 3.4
Protection 5.7 9.3 15.1 16.2 17.0
Sources: MOFSL, Company
Exhibit 5: Distribution mix getting broad based with the
addition of banca partners and new age tie-ups; ICICI Bank
contributes only 25% now Product Mix (%) FY18 FY19 FY20 FY21 FY22
Bancassurrance 52.3 55.8 50.8 42.3 38.9
-ICICI Bank n.a. n.a. 45.6 31.3 24.9
-Non-ICICI Bank n.a. n.a. 5.1 11.0 14.0
Agency 25.4 21.7 21.2 23.8 23.6
Direct 13.5 12.0 12.6 12.5 12.9
Partnership Distribution 6.0 5.9 7.4 9.1 9.3
Group 2.7 4.7 8.0 12.3 15.3
Sources: MOFSL, Company
268.1 305.8
328.8 349.7 363.2
21%
14%
8% 6% 4%
FY18 FY19 FY20 FY21 FY22
Net Premium income (INRb) Growth (YoY, %)
91
.2
10
2.5
12
3.5
13
0.3
15
0.4
17%
12%
20%
6%
15%
FY18 FY19 FY20 FY21 FY22
Total NBP (INRb) Growth (YoY, %)
77
.9
78
.0
73
.8
64
.6
77
.3
18%
0%
-5% -12%
20%
FY18 FY19 FY20 FY21 FY22
Total APE (INRb) Growth (YoY, %)

ICICI Prudential Life Insurance
23 June 2022 4
Exhibit 6: IPRU Product plan description Business segments Products Details
Non-Linked
ICICI Pru Guaranteed Income for tomorrow
This is a guaranteed savings plan and provides customers benefits of guarantee, life insurance cover and tax-saving
ICICI Pru Guaranteed Income for tomorrow (Long-Term)
This is a savings and protection oriented life insurance plan which helps customers to provide a financial safety-net to the family, along with guaranteed benefits
ICICI Pru Future Perfect This is a participating insurance plan which provides attractive returns
through equity participation with the comfort of a guarantee
ICICI Pru Lakshya This is a specially designed participating product to cater to diverse financial needs of the customer
ICICI Pru Cash Advantage This is a participating insurance plan which offers a guaranteed amount
every month or year for ten years
ICICI Pru Anmol Bachat This is a micro-insurance plan that offers dual benefits of savings and
protection at affordable premiums starting as low as INR200/month.
ICICI Pru Savings Suraksha This is a participating savings insurance plan and offers the benefits of
guaranteed additions and regular bonuses
Protection
ICICI Pru iProtect Smart This is an innovative term insurance plan which provides customers and
their families a complete financial safety
ICICI Pru Heart Cancer Protect This health plan provides coverage against minor and major conditions
related to heart and cancer at affordable premiums
ICICI Pru Precious Life This is a unique term plan specifically designed to provide a life cover for
individuals with existing health concerns
ICICI Pru iProtect Return of Premium This is a comprehensive term plan with return of premium. It provides
protection at every life stage and ensures return of premium as lump-sum or income on survival
ICICI Pru Saral Jeevan Bima This is a simple term plan designed to meet protection needs of
customers by providing a life cover at affordable rates
ULIP
ICICI Pru Signature This one-of-its-kind unit-linked plan returns all premium allocation
charges to the customers not just once, but multiple times. It offers flexibility to design a financial plan to meet specific needs
ICICI Pru Life Time Classic This product offers four portfolio strategies to its customers: Target
Asset Allocation, Trigger Portfolio, Lifecycle-based Portfolio, and Fixed Portfolio
ICICI Pru Smart Life This savings plan fulfils the customers’ goals even in their absence as all
future premiums are paid by the Company.
ICICI Pru Guaranteed Wealth Protector This is a unique plan that offers the potential for high returns by
investing a portion of the customer’s money into equity. It also provides the dual assurance of capital guarantee and life cover.
ICICI Pru1 Wealth This is a single premium, cost-efficient plan which enables customers to
achieve financial goals with a one-time premium payment.
Group Term
ICICI Pru Group Term Plus This is a one-year renewable term plan which offers protection to
members of employer-employee and non-employer-employee groups at affordable premiums
ICICI Pru Super Protect Credit This is a product offering comprehensive financial protection to
customers availing loans from financial institutions
ICICI Pru Super Protect Life This plan offers life cover to members belonging to a specific group in a
cost effective manner. It also offers flexibility to customise payout options, as per convenience of customer.
ICICI Pru Shubh Raksha Credit This credit-linked group micro-insurance plan offers financial protection
to individuals availing small-ticket loans from financial institutions.
Pension ICICI Pru Easy Retirement This unit-linked pension product helps customers plan to receive a
regular income after retirement
Annuity Plans
ICICI Pru Guaranteed Pension Plan
This is designed as a one-stop solution to meet customers’ income needs during retirement. It not only provides a guaranteed lifelong income, but also provides the flexibility to receive income either immediately or defer it to a later date
ICICI Pru Saral Pension Plan This is designed as a single premium annuity plan to offer a simple
solution in the form of lifelong guaranteed income. In addition, it provides liquidity on diagnosis of specified critical illness.
ICICI Pru Guaranteed Pension Plan Flexi This is designed as a regular pay, deferred annuity plan. The objective is
to systematically contribute and build retirement savings and receive guaranteed lifelong income.
Source: MOFSL, Company
ICICI Prudential Life Insurance
23 June 2022 5
Continues to focus on protection and annuity
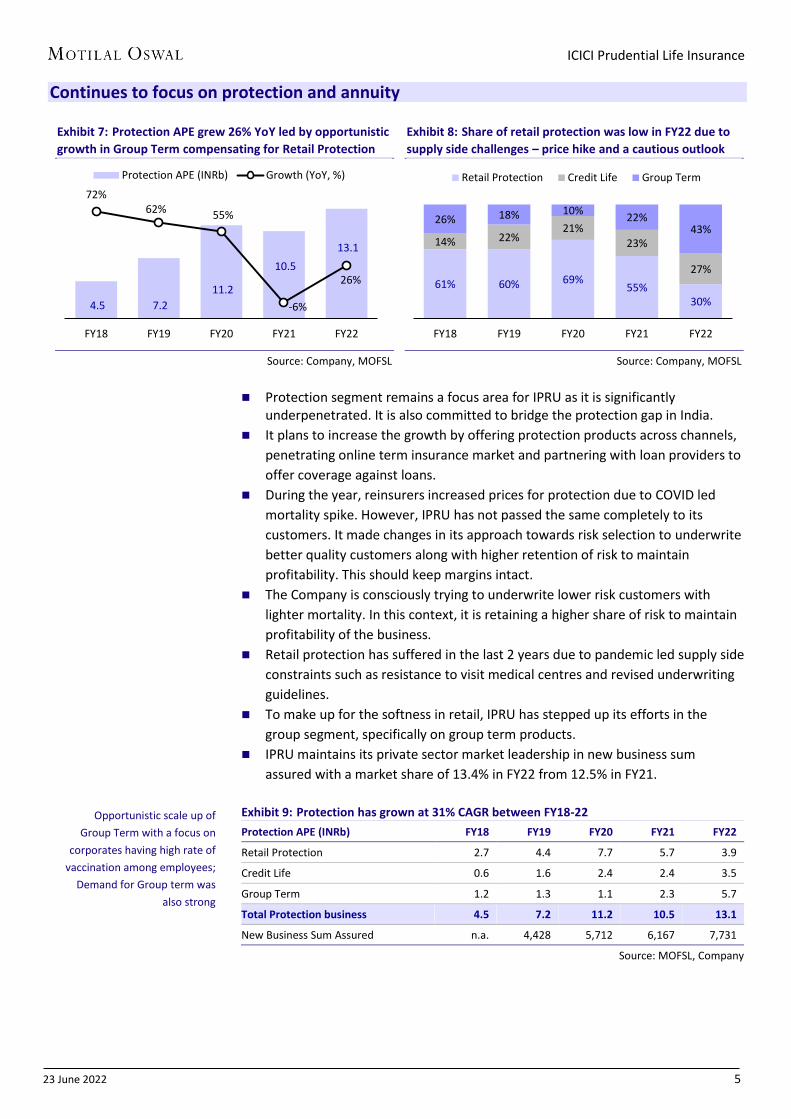
Exhibit 7: Protection APE grew 26% YoY led by opportunistic
growth in Group Term compensating for Retail Protection
Source: Company, MOFSL
Exhibit 8: Share of retail protection was low in FY22 due to
supply side challenges – price hike and a cautious outlook
Source: Company, MOFSL
Protection segment remains a focus area for IPRU as it is significantly
underpenetrated. It is also committed to bridge the protection gap in India.
It plans to increase the growth by offering protection products across channels,
penetrating online term insurance market and partnering with loan providers to
offer coverage against loans.
During the year, reinsurers increased prices for protection due to COVID led
mortality spike. However, IPRU has not passed the same completely to its
customers. It made changes in its approach towards risk selection to underwrite
better quality customers along with higher retention of risk to maintain
profitability. This should keep margins intact.
The Company is consciously trying to underwrite lower risk customers with
lighter mortality. In this context, it is retaining a higher share of risk to maintain
profitability of the business.
Retail protection has suffered in the last 2 years due to pandemic led supply side
constraints such as resistance to visit medical centres and revised underwriting
guidelines.
To make up for the softness in retail, IPRU has stepped up its efforts in the
group segment, specifically on group term products.
IPRU maintains its private sector market leadership in new business sum
assured with a market share of 13.4% in FY22 from 12.5% in FY21.
Exhibit 9: Protection has grown at 31% CAGR between FY18-22
Protection APE (INRb) FY18 FY19 FY20 FY21 FY22
Retail Protection 2.7 4.4 7.7 5.7 3.9
Credit Life 0.6 1.6 2.4 2.4 3.5
Group Term 1.2 1.3 1.1 2.3 5.7
Total Protection business 4.5 7.2 11.2 10.5 13.1
New Business Sum Assured n.a. 4,428 5,712 6,167 7,731
Source: MOFSL, Company
4.5 7.2
11.2
10.5
13.1
72% 62% 55%
-6%
26%
FY18 FY19 FY20 FY21 FY22
Protection APE (INRb) Growth (YoY, %)
61% 60% 69% 55%
30%
14% 22% 21%
23%
27%
26% 18% 10% 22%
43%
FY18 FY19 FY20 FY21 FY22
Retail Protection Credit Life Group Term
Opportunistic scale up of
Group Term with a focus on
corporates having high rate of
vaccination among employees;
Demand for Group term was
also strong

ICICI Prudential Life Insurance
23 June 2022 6
Exhibit 10: Total Sum Assured grew at 30% CAGR between FY18-22, in line with protection
premium
Source: MOFSL, Company
Exhibit 11: Percentage of risk retained in Individual business remains steady at 38% in
FY22; risk retained in Group business inches up marginally to 70%
Particulars FY18 FY19 FY20 FY21 FY22
Individual business
Risk retained 43% 41% 38% 38% 38%
Risk reinsured 57% 59% 62% 62% 62%
Group business
Risk retained 70% 76% 73% 69% 70%
Risk reinsured 30% 24% 27% 31% 30%
Source: Company
India has one of the lowest pension assets to GDP ratio, estimated at 5.8% in
2021, as compared to various other countries. Also, India has one of the largest
working population in the world, but only about 10% of the work force is
covered under various pension schemes.
With increase in life expectancy for males and females, the post retirement
period (after 60 years) has increased. Thus, there is more reception for
retirement products like annuities.
Annuities provide for a series of guaranteed payout to the annuitant at regular
intervals in return for a certain sum paid upfront or an option to pay premium
for certain period. Therefore, they are well suited and are becoming increasingly
popular as an effective tool for post-retirement life.
Like peers, IPRU is focussed on expanding the contribution of annuity business
and scaling it up further as it is significantly underpenetrated in the country.
It is also cognisant of the interest risk invoved in the contract and therefore
monitors and manages the investment risk appropriately.
Exhibit 12: Annuity NBP grew at a robust CAGR of 76% YoY
between FY18-FY22; Focus remains on scaling it further
Source: MOFSL, Company
Exhibit 13: As a result, share of annuity in NBP mix has risen
from 3% in FY18 to 19% in FY22
Source: MOFSL, Company
8.2 11.3 14.8 20.3 23.5
41% 37%
32% 37%
16%
FY18 FY19 FY20 FY21 FY22
Total Sum Assured (INRt) Growth (YoY, %)
3.1 6.9 10.4 22.9
29.6 51%
120%
52%
120%
29%
FY18 FY19 FY20 FY21 FY22
Annuity NBP (INRb) Growth (YoY, %)
3.4
6.6 8.4
17.3 19.1
FY18 FY19 FY20 FY21 FY22
Share of annuity in business mix (%)

ICICI Prudential Life Insurance
23 June 2022 7
Improving operating metrics to help achieve VNB guidance IPRU attaches a high importance to persistency ratio as one of the most
effective indicators of quality of sale and barometer of customer experience Therefore, it endeavors to maintain a high level of persistency ratio as it drives
value for insurers as well as customers. Exhibit 14: Persistency ratio in a narrow range over the last few years
Source: MOFSL, Company
Exhibit 15: Persistency ratio for key product categories
Source: MOFSL, Company
IPRU is making continuous investments in digital technologies with an aim to
become future-ready, achieve higher productivity and drive cost efficiencies.
It is combining in-depth customer understanding and data analytics to position
itself for growth and productivity gains. Productivity gains are targeted at
improving cost ratios.
Due to improved economic momentum in FY22, IPRU has increased its focus on
expanding distribution presence and strengthening the brand. Therefore,
discretionary spends were back in FY22 after some curtailment in FY21, led by
the pandemic.
85
.0
75
.9
67
.8
66
.2
55
.3
84
.9
72
.9
65
.8
63
.5
48
.9
84
.6
77
.3
66
.9
63
.4
54
.7
13 Month 25 Month 37 Month 49 Month 61 Month
FY20 FY21 FY22
84
.4 88
.5
78
.8 8
5.1
94
.4
89
.2
84
.4
93
.9
86
.9
82
.9 8
8.0
82
.9
Linked Non-linked Protection
FY19 FY20 FY21 FY22

ICICI Prudential Life Insurance
23 June 2022 8
Exhibit 16: Pressure on opex ratio in FY22 due to high
discretionary spends to augment distribution capacity
Source: MOFSL, Company
Exhibit 17: Cost to Average AUM also saw a minor uptick
due to increased investments in brand building
Source: MOFSL, Company
Exhibit 18: Overall Commission ratio increased to 4.2% in FY22 led by higher commissions on single premium products like annuity
Commission (INR b) FY20 FY21 FY22
First Single Renewal Total First Single Renewal Total First Single Renewal Total
Premium 65.1 59.8 209.4 334.3 51.9 80.4 225.1 357.3 59.7 95.4 219.6 374.6
Commission 10.8 0.6 3.8 15.2 9.3 1.0 4.0 14.3 10.3 1.4 4.1 15.9
Commission (%) 16.5% 1.1% 1.8% 4.6% 17.9% 1.3% 1.8% 4.0% 17.3% 1.5% 1.9% 4.2%
Source: Company, MOFSL
Exhibit 19: Banca continues to garner maximum commission
share while agency stable at 30%
Source: Company, MOFSL
Exhibit 20: As mix of non-par savings rises, proportion of
commission paid follows similar trajectory
Source: Company, MOFSL
Exhibit 21: AUM grew at 15% CAGR between FY18-22
Source: MOFSL, Company
Exhibit 22: Share of Debt in AUM marginally up in FY22
Source: MOFSL, Company
13.7 15.0 15.9
14.8
18.6
FY18 FY19 FY20 FY21 FY22
Cost/TWRP (%)
2.6 2.8 2.9
2.3 2.4
FY18 FY19 FY20 FY21 FY22
Cost/Average AUM (%)
23% 22% 25% 30% 30%
73% 72% 68% 62% 61%
4% 5% 6% 7% 8%
1% 2% 1% 1%
FY18 FY19 FY20 FY21 FY22
Individual agents Banca
Brokers Others (new-age partners)
19% 16% 20% 22% 18%
13% 15% 25%
35% 42%
68% 69% 55%
43% 40%
FY18 FY19 FY20 FY21 FY22
Par Non-par Linked
1.4 1.6 1.5 2.1 2.4
14% 15%
-4%
40%
12%
FY18 FY19 FY20 FY21 FY22
AUM (INRt) Growth (YoY, %)
53% 52% 60% 55% 53%
47% 48% 40% 45% 48%
FY18 FY19 FY20 FY21 FY22
Debt Equity

ICICI Prudential Life Insurance
23 June 2022 9
IPRU has a stated aspiration of doubling the absolute level of FY19 VNB by FY23
through 4P strategy - Protection focus, Premium growth, Persistency
improvement and Productivity enhancement
Despite challenges, management is confident of meeting the same with
innovative products, distribution reach and superior customer service.
Further, diversification in sources of VNB from a high focus on ULIPs a couple of
years back to a more equitable mix is encouraging and prepares the company to
withstand different economic cycles.
Protection contributes 43% of total VNB for FY22 (v/s 60% in FY20) while the
share of non-linked business in total VNB has increased to 41% v/s 14% in FY20.
Exhibit 23: VNB has grown at a CAGR of 14% between FY18-22; Significant improvement in
VNB margin led by a more optimal product mix
Source: MOFSL, Company
Exhibit 24: Protection has the highest margin among
different product categories
Source: Company, MOFSL
Exhibit 25: With rising focus on annuity/non-par savings,
contribution of same in VNB has risen significantly
Source: Company, MOFSL
Exhibit 26: Improvement in VNB margin led primarily by a better business mix, partially offset by stronger operating
assumptions
Source: MOFSL, Company
12.9 13.3 16.0 16.2 21.6
16.5 17.0
21.7
25.1 28.0
FY18 FY19 FY20 FY21 FY22
VNB (INRb) VNB margin (%)
12 22
83
9
42
70
Savings - Linked Savings - Non-Linked Protection
FY21 FY22
26% 22% 16%
14% 24% 41%
60% 53% 43%
FY20 FY21 FY22
Savings - Linked Savings - Non-Linked Protection
25.1%
28.0%
4.3% 2.0%
0.6%
VNB margin (FY2021) Business mix Operating Assumptionchange
Economic Assumptionchange
VNB margin (FY2022)

ICICI Prudential Life Insurance
23 June 2022 10
IPRU has grown its embedded value at 14% CAGR between FY18-22 to reach
INR316b. During FY22, accretion to EV was lower than usual, primarily due to
mortality variance.
Mortality variance included an impact of INR10.1b from COVID-19 claims on the
non-micro insurance portfolio. Further, a spike in non-COVID-19 claims was
observed during second wave of COVID-19 in 1QFY22. This spike was a
meaningful proportion of the aggregate non-COVID-19 claims, especially in the
Group Protection portfolio.
The true underlying mortality patterns are expected to emerge over FY23,
provided there is no further spike in COVID-19 cases. In the absence of any
COVID waves, we do expect a normalization to mean.
Excluding mortality variance, the Return on Embedded Value (ROEV) was 15.0%
for FY2022.
Exhibit 27: EV has grown at 14% CAGR between FY18-22; Operating RoEV took a hit in
FY22 due to COVID led mortality spike
Source: MOFSL, Company
Exhibit 28: EV walkthrough; Ex. Of mortality variance, RoEV stood at 15% in FY22
Source: MOFSL, Company
18
7.8
21
6.1
23
0.2
29
1.1
31
6.4
22.7 20.2
15.2 15.2
11.0
FY18 FY19 FY20 FY21 FY22
EV (INRb) Operating RoEV (%)
95.2 83.6
195.8
20.9 21.6
0.9
1.5
11.9 0.7
4.4 2.4 232.7
EV (
Mar
'21
)
Un
win
d
VN
B
Op
erat
ing
Ass
um
pti
on
Ch
ange
s
Pe
rsis
ten
cy v
ar
Mo
rtal
ity
var
Exp
en
ses
& o
ther
vari
ance
Eco
no
mic
Ass
um
pti
on
&In
vst.
Var
ian
ce
Net
Cap
ital
inje
ctio
ns
EV (
Mar
'22
)
Adj NW VIF

ICICI Prudential Life Insurance
23 June 2022 11
Walks the talk on customer service metrics
Exhibit 29: Claim settlement ratio remains steady
Source: Company, MOFSL
Exhibit 30: Avg. Claim Settlement time stable
Source: Company, MOFSL
Exhibit 31: Grievance Ratio has inched up to 58
Source: Company, MOFSL
Exhibit 32: Surrenders as % of total claims declined further
Source: Company, MOFSL
During FY22, IPRU received death claims due to COVID to the extent of INR21.0b
(gross) and INR10.2b (net of reinsurance). However, this has been tapering off
since October, 2022. With declining severity and frequency of cases, we expect
the trend to normalize in FY23.
As a conservative practice, it carries a provision of INR0.2b for delayed claims on
account of COVID.
IPRU is constantly adopting new digital tools and technology to innovate and
enhance all possible customer needs during a policy life cycle – from onboarding
to servicing to claims processing
Exhibit 33: Claims paid by IPRU over the years…
Benefits Paid (net) (INRb) FY19 FY20 FY21 FY22
Surrender claims 106 150 162 204
Maturity & Annuity claims 25 28 40 46
Mortality (death) claims 11 16 27 56
Survival benefits and other claims 5 5 6 9
Amount recovered from re-insurer (4) (6) (10) (21)
Total 143 194 226 294
Source: MOFSL, Company
97.8
98.5
97.8 97.9
97.8
FY18 FY19 FY20 FY21 FY22
Claim settlement ratio (%) 3.0
2.3
1.6 1.4 1.5
FY18 FY19 FY20 FY21 FY22
Claim settlement time (days)
92.0
72.0
48.0 46.0
58.0
FY18 FY19 FY20 FY21 FY22
Grievance ratio (%), per 10K new retail policies
128 106 150 162 204
73% 73% 75%
69%
65%
FY18 FY19 FY20 FY21 FY22
Surrender Surrender (as % of total claims)

ICICI Prudential Life Insurance
23 June 2022 12
Analyzing the COVID impact
Exhibit 34: COVID claims, net of reinsurance impacted
financial performance in FY22
Source: Company, MOFSL
Exhibit 35: Higher mortality claims knocked EV by low single
digit during FY22
Source: Company, MOFSL
Exhibit 36: SBI Life carries the highest COVID reserves, going into FY23
Source: MOFSL, Company
As per Life Insurance Council figures, the industry settled approximately 250,000
COVID-19 claims during FY22. A large part of these claims were settled by the
larger players, function of a higher market share in protection.
As a result, COVID claims were heightened and impacted financial performance
and Embedded Value in FY22. EV took a knock in the range of 2-4% due to
excess mortality claims and reserves built by individual insurers.
However, claims intimation started to drop since 3QFY22 and continues to show
a declining trend. Given the uncertainty with respect to delayed reporting, most
life insurers continue to carry provisions in books of accounts as at March 31,
2022 for such delayed claims.
The true underlying mortality patterns are expected to emerge over FY23
provided there is no further spike in COVID-19 cases.
10.2
8.2
ICICI Pru Life HDFC Life
Covid claims (net, INRb)
11.9
6.5 2.8
4.1%
2.4% 2.3%
ICICI Pru Life HDFC Life Max Life
Adverse Mortality variance in EV (INRb)
Adverse Mortality variance as a % of Opening EV
0.24 0.55
2.9
ICICI Pru Life HDFC Life SBI Life
Covid reserves (INRb) as of Mar 31, 2022
ICICI Prudential Life Insurance
23 June 2022 13
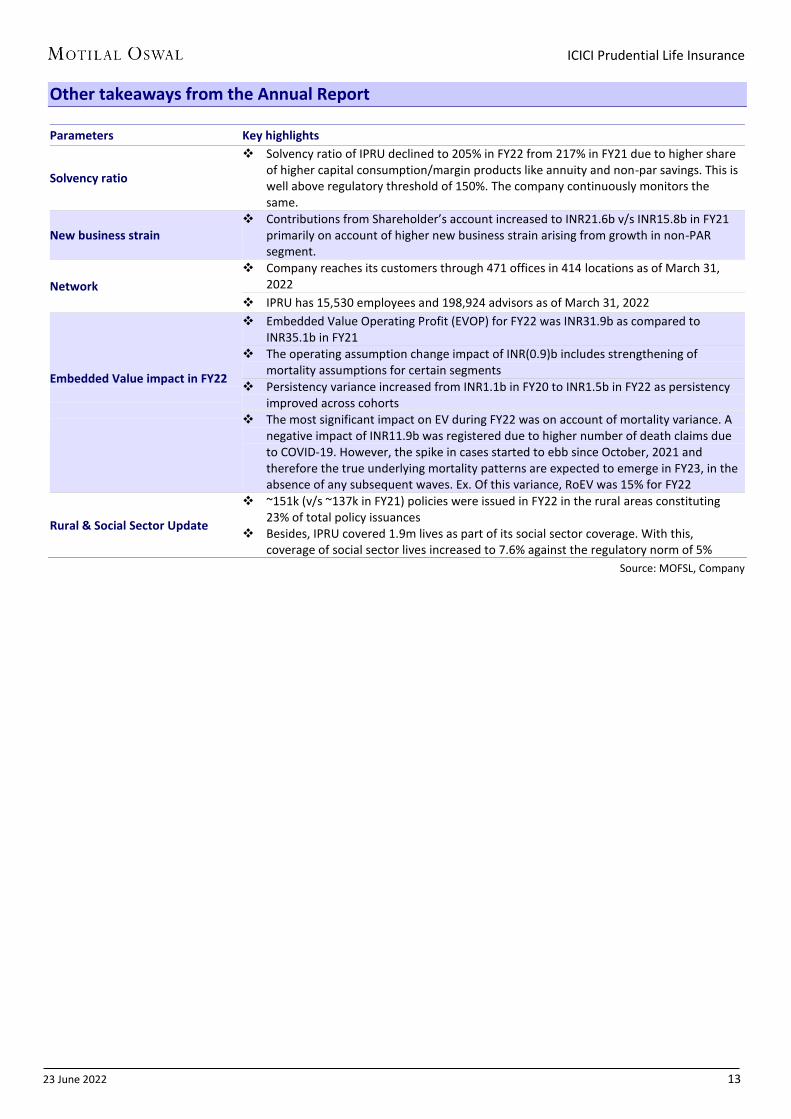
Other takeaways from the Annual Report
Parameters Key highlights
Solvency ratio
Solvency ratio of IPRU declined to 205% in FY22 from 217% in FY21 due to higher share of higher capital consumption/margin products like annuity and non-par savings. This is well above regulatory threshold of 150%. The company continuously monitors the same.
New business strain Contributions from Shareholder’s account increased to INR21.6b v/s INR15.8b in FY21
primarily on account of higher new business strain arising from growth in non-PAR segment.
Network
Company reaches its customers through 471 offices in 414 locations as of March 31, 2022
IPRU has 15,530 employees and 198,924 advisors as of March 31, 2022
Embedded Value impact in FY22
Embedded Value Operating Profit (EVOP) for FY22 was INR31.9b as compared to INR35.1b in FY21
The operating assumption change impact of INR(0.9)b includes strengthening of mortality assumptions for certain segments
Persistency variance increased from INR1.1b in FY20 to INR1.5b in FY22 as persistency improved across cohorts
The most significant impact on EV during FY22 was on account of mortality variance. A negative impact of INR11.9b was registered due to higher number of death claims due to COVID-19. However, the spike in cases started to ebb since October, 2021 and therefore the true underlying mortality patterns are expected to emerge in FY23, in the absence of any subsequent waves. Ex. Of this variance, RoEV was 15% for FY22
Rural & Social Sector Update
~151k (v/s ~137k in FY21) policies were issued in FY22 in the rural areas constituting 23% of total policy issuances
Besides, IPRU covered 1.9m lives as part of its social sector coverage. With this, coverage of social sector lives increased to 7.6% against the regulatory norm of 5%
Source: MOFSL, Company
ICICI Prudential Life Insurance
23 June 2022 14
Valuations and view
Despite the pandemic, the life insurance industry in India is slated to enjoy a
multi-decadal growth in the coming years. Continuous product innovations,
based on evolving customer needs will be a key driver. With increased
awareness led by COVID, transformation of life insurance from a ‘push’ to a
‘pull’ product has begun.
A rising share of financial savings led by higher disposable incomes along with
favourable demographics will enable healthy business growth for the insurers.
Thus, we expect Indian insurers to trade at a premium to global insurers.
Over the last few years, IPRU has been consciously trying to reduce its high
product and distribution dependence on ULIPs and ICICI Bank. The share of
ULIPs has reduced from 82% in FY18 to 48% in FY22. Similarly, the share of ICICI
Bank in APE has gone down to 25% in FY22 from 46% in FY20.
Protection, Annuity and Non-PAR savings will be the key growth drivers over the
next decade as these remain highly underpenetrated and we note an increasing
awareness with favorable demographics. These are higher margin products and
we expect VNB margins to reach ~29% by FY24E.
IPRU has forged a bunch of partnerships in the recent years to further enhance
its distribution capability. New banca tie-ups has started to yield results and will
be a key growth driver going forward. The company is also realizing the
importance of being available on new-age platforms and touch points as
preferred by the varied customer base.
The management reiterated its guidance to double the FY19 VNB by FY23E,
underpinned by: a) the opportunities in the long-term Savings/Protection
businesses and b) improving persistency and cost ratios.
Buy, with Target Price of INR630: With IPRU’s healthy product mix with
increased focus on non-linked segments, backed by strengthened distribution
network is driving healthy premium growth. The share of banca (excluding ICICI
Bank) has increased to 14% in FY22 from 4% in FY19, supporting the growth and
diversification in its distribution mix. The increase in agent recruitment and
forging of new partnerships will also support premium growth. We expect VNB
margin to improve slightly and project IPRU to deliver 21% and 23% CAGR in
new business APE and VNB over FY22-24E, respectively, thus enabling an
operating RoEV of 16.9% in FY24. We reiterate our BUY rating with a TP of
INR630 (premised on 2.1x FY24E EV).

ICICI Prudential Life Insurance
23 June 2022 15
Financials and valuations
Technical account (INR b) FY19 FY20 FY21 FY22 FY23E FY24E
Gross Premiums 309.3 334.3 357.3 374.6 418.9 483.8
Reinsurance Ceded (3.5) (5.5) (7.6) (11.4) (10.0) (11.7)
Net Premiums 305.8 328.8 349.7 363.2 408.9 472.0
Income from Investments 102.1 (125.2) 474.4 249.7 133.1 301.1
Other Income 5.5 15.3 16.2 21.8 25.1 28.8
Total income (A) 414.0 219.4 840.8 635.6 567.1 802.0
Commission 15.5 15.9 15.0 16.7 24.4 28.0
Operating expenses 26.1 28.5 26.9 36.7 55.8 63.0
Total commission and opex 41.6 44.3 41.9 53.5 80.2 91.0
Benefits Paid (Net) 142.6 193.8 226.4 291.5 194.9 220.1
Chg in reserves 210.0 (50.6) 543.2 260.0 258.9 454.3
Provisions for doubtful debts 6.4 8.7 6.8 7.2 5.8 6.7
Total expenses (B) 400.5 196.2 818.3 612.1 539.9 772.0
(A) - (B) 13.4 23.2 22.5 23.6 27.2 29.9
Prov for Tax 1.1 1.3 1.4 1.7 3.1 3.2
Surplus / Deficit 12.3 21.9 21.1 21.9 24.1 26.7
Shareholder's a/c (INR b) FY19 FY20 FY21 FY22 FY23E FY24E
Transfer from technical a/c 10.8 19.9 19.8 21.6 21.7 23.5
Income From Investments 6.4 6.6 7.7 10.1 8.9 9.2
Total Income 17.3 26.5 27.5 31.7 30.6 32.7
Other expenses 0.4 0.4 0.6 1.0 1.1 1.2
Contribution to technical a/c 5.3 15.0 15.7 21.6 20.5 19.9
Total Expenses 5.6 15.8 16.7 23.8 21.6 21.0
PBT 11.6 10.7 10.8 7.9 9.0 11.7
Prov for Tax 0.2 - 1.2 0.4 0.6 0.8
PAT 11.4 10.7 9.6 7.5 8.4 10.8
Growth -30% -6% -10% -21% 11% 29%
Premium (INR b) & growth (%) FY19 FY20 FY21 FY22 FY23E FY24E
NBP - unweighted 103.6 124.9 132.3 155.0 186 223
NBP - wrp 78.0 73.8 64.6 77.3 93 114
Renewal premium 205.7 209.4 225.1 219.6 233 261
Total premium - unweighted 309.3 334.3 357.3 374.6 419 484
NBP growth - unweighted 12.5% 20.5% 5.9% 17.2% 20.0% 20.0%
NBP growth - wrp 0.1% -5.4% -12.5% 19.7% 20.8% 22.1%
Renewal premium growth 15.2% 1.8% 7.5% -2.4% 6.1% 11.9%
Tot. premium growth - unweighted 14.3% 8.1% 6.9% 4.8% 11.8% 15.5%
Premium mix (%) FY19 FY20 FY21 FY22 FY23E FY24E
New business - un-wtd
- Individual mix 78.5% 63.1% 61.1% 60.0% 64.0% 67.0%
- Group mix 21.5% 36.9% 40.7% 40.0% 36.0% 33.0%
New business mix - APE
- Participating 9.0% 12.5% 14.9% 9.6% 17.0% 16.9%
- Non-participating 9.1% 18.6% 32.6% 36.8% 37.4% 37.1%
- ULIPs 82.0% 69.0% 52.5% 53.6% 45.6% 46.0%
Total premium mix - un-wtd
- Participating 11.3% 12.0% 12.9% 12.7% 12.8% 12.3%
- Non-participating 15.3% 18.1% 23.7% 33.3% 34.6% 35.1%
- ULIPs 73.5% 69.8% 63.4% 54.0% 52.6% 52.5%
Indi. Premium sourcing mix (%) FY19 FY20 FY21 FY22 FY23E FY24E
Individual agents 21.8% 21.9% 24.0% 27.6% 28.6% 29.6%
Corporate agents-Banks 55.2% 49.7% 45.5% 45.2% 45.0% 44.8%
Direct business 16.7% 20.1% 19.5% 16.3% 18.7% 18.5%
Others 6.3% 8.3% 11.0% 10.9% 7.7% 7.1%

ICICI Prudential Life Insurance
23 June 2022 16
Financials and valuations
Balance sheet (INR b) FY19 FY20 FY21 FY22 FY23E FY24E
Sources of Fund
Share Capital 14.4 14.4 14.4 14.4 14.4 14.4
Reserves And Surplus 54.4 61.1 70.7 75.9 81.2 88.6
Shareholders' Fund 70.4 72.2 91.2 91.6 97.0 104.6
Policy Liabilities 385.5 473.6 602.2 736.8 876.8 1,188.0
Prov. for Linked Liab. 1,037.0 880.4 1,277.7 1,405.4 1,644.4 1,792.4
Funds For Future App. 10.3 12.3 13.5 13.8 15.9 18.3
Current liabilities & prov. 36.6 33.3 37.3 52.5 63.0 75.6
Total 1,630.9 1,560.4 2,172.3 2,444.4 2,727.5 3,210.8
Application of Funds
105.4 112.8
Shareholders’ inv 79.9 74.2 100.9 98.5
Policyholders’ inv 400.7 467.5 635.7 773.9 909.5 1,232.1
Assets to cover linked liab. 1,109.5 970.8 1,385.5 1,508.7 1,644.4 1,792.4
Loans 2.7 4.6 6.6 9.4 10.6 12.0
Fixed Assets 4.8 4.8 4.6 4.9 5.6 6.3
Current assets 33.4 38.4 39.0 49.1 52.0 55.1
Total 1,630.9 1,560.4 2,172.3 2,444.4 2,727.5 3,210.8
Operating ratios (%) FY19 FY20 FY21 FY22 FY23E FY24E
Investment yield (%) 6.8% -8.7% 23.5% 10.9% 5.2% 10.0%
Commissions / GWP 5.0% 4.7% 4.2% 4.5% 5.8% 5.8%
- first year premiums 16.0% 16.5% 17.9% 17.3% 25.7% 24.1%
- renewal premiums 1.9% 1.8% 1.8% 1.9% 1.8% 1.8%
- single premiums 1.4% 1.1% 1.3% 1.5% 1.1% 1.1%
Operating expenses / GWP 8.4% 8.5% 7.5% 9.8% 13.3% 13.0%
Total expense ratio 13.4% 13.3% 11.7% 14.3% 19.1% 18.8%
Claims / NWP 46.6% 58.9% 64.7% 80.2% 47.7% 46.6%
Solvency margin 215% 194% 217% 205% 468% 448%
Persistency ratios (%) FY19 FY20 FY21 FY22 FY23E FY24E
13th Month 86.2% 83.2% 84.9% 85.7% 86.2% 86.5%
25th Month 77.4% 75.1% 72.9% 77.2% 79.4% 80.4%
37th Month 71.0% 66.7% 65.8% 67.1% 68.9% 70.9%
49th Month 65.0% 64.6% 63.5% 63.7% 64.1% 64.7%
61st Month 58.1% 56.0% 48.9% 54.4% 56.1% 56.5%
Profitability ratios FY19 FY20 FY21 FY22 FY23E FY24E
VNB margin (%) 17.0% 21.7% 25.1% 28.0% 28.5% 28.7%
RoE (%) 16.4% 15.0% 11.8% 8.2% 8.9% 10.7%
RoIC (%) 23.5% 22.0% 19.8% 15.5% 17.2% 22.3%
Operating ROEV (%) 20.2% 15.2% 15.2% 11.0% 16.4% 16.9%
RoEV (%) 15.1% 6.5% 26.5% 8.7% 14.3% 16.7%
Valuation ratios FY19 FY20 FY21 FY22 FY23E FY24E
Total AUMs (INRb) 1,604.1 1,529.7 2,142.2 2,404.9 2,659.4 3,200.1
Dividend (%) 49% 24% 0% 20% 22% 24%
Dividend payout ratio (%) 74% 38% 0% 38% 37% 31%
EPS (INR) 8.0 7.4 6.7 5.3 5.8 7.5
VNB (INRb) 13.3 16.0 16.2 21.7 26.6 32.8
EV (INRb) 216.1 230.2 291.1 316.2 361.6 422.1
EV/Per share 150.6 160.4 202.8 220.3 251.9 294.1
VIF as % of EV 66% 66% 67% 74% 75% 77%
P/VIF 4.9 4.6 3.6 3.0 2.6 2.2
P/AUM (%) 44% 46% 33% 29% 26% 22%
P/EV (x) 3.3 3.1 2.4 2.2 1.9 1.7
P/EPS (x) 61.6 65.9 73.2 93.3 84.1 65.0
P/EVOP (x) 18.5 21.4 20.1 22.0 13.5 11.5

ICICI Prudential Life Insurance
23 June 2022 17
Explanation of Investment Rating
Investment Rating Expected return (over 12-month)
BUY >=15%
SELL < - 10%
NEUTRAL < - 10 % to 15%
UNDER REVIEW Rating may undergo a change
NOT RATED We have forward looking estimates for the stock but we refrain from assigning recommendation
*In case the recommendation given by the Research Analyst is inconsistent with the investment rating legend for a continuous period of 30 days, the Research Analyst shall within following 30 days take appropriate measures to make the recommendation consistent with the investment rating legend. Disclosures The following Disclosures are being made in compliance with the SEBI Research Analyst Regulations 2014 (herein after referred to as the Regulations). Motilal Oswal Financial Services Ltd. (MOFSL) is a SEBI Registered Research Analyst having registration no. INH000000412. MOFSL, the Research Entity (RE) as defined in the Regulations, is engaged in the business of providing Stock broking services, Investment Advisory Services, Depository participant services & distribution of various financial products. MOFSL is a subsidiary company of Passionate Investment Management Pvt. Ltd.. (PIMPL). MOFSL is a listed public company, the details in respect of which are available on www.motilaloswal.com. MOFSL (erstwhile Motilal Oswal Securities Limited - MOSL) is registered with the Securities & Exchange Board of India (SEBI) and is a registered Trading Member with National Stock Exchange of India Ltd. (NSE) and Bombay Stock Exchange Limited (BSE), Multi Commodity Exchange of India Limited (MCX) and National Commodity & Derivatives Exchange Limited (NCDEX) for its stock broking activities & is Depository participant with Central Depository Services Limited (CDSL) National Securities Depository Limited (NSDL),NERL, COMRIS and CCRL and is member of Association of Mutual Funds of India (AMFI) for distribution of financial products and Insurance Regulatory & Development Authority of India (IRDA) as Corporate Agent for insurance products. Details of associate entities of Motilal Oswal Financial Services Limited are available on the website at http://onlinereports.motilaloswal.com/Dormant/documents/List%20of%20Associate%20companies.pdf MOFSL and its associate company(ies), their directors and Research Analyst and their relatives may; (a) from time to time, have a long or short position in, act as principal in, and buy or sell the securities or derivatives thereof of companies mentioned herein. (b) be engaged in any other transaction involving such securities and earn brokerage or other compensation or act as a market maker in the financial instruments of the company(ies) discussed herein or act as an advisor or lender/borrower to such company(ies) or may have any other potential conflict of interests with respect to any recommendation and other related information and opinions.; however the same shall have no bearing whatsoever on the specific recommendations made by the analyst(s), as the recommendations made by the analyst(s) are completely independent of the views of the associates of MOFSL even though there might exist an inherent conflict of interest in some of the stocks mentioned in the research report MOFSL and / or its affiliates do and seek to do business including investment banking with companies covered in its research reports. As a result, the recipients of this report should be aware that MOFSL may have a potential conflict of interest that may affect the objectivity of this report. Compensation of Research Analysts is not based on any specific merchant banking, investment banking or brokerage service transactions. Details of pending Enquiry Proceedings of Motilal Oswal Financial Services Limited are available on the website at https://galaxy.motilaloswal.com/ResearchAnalyst/PublishViewLitigation.aspx A graph of daily closing prices of securities is available at www.nseindia.com, www.bseindia.com. Research Analyst views on Subject Company may vary based on Fundamental research and Technical Research. Proprietary trading desk of MOFSL or its associates maintains arm’s length distance with Research Team as all the activities are segregated from MOFSL research activity and therefore it can have an independent view with regards to Subject Company for which Research Team have expressed their views. Regional Disclosures (outside India) This report is not directed or intended for distribution to or use by any person or entity resident in a state, country or any jurisdiction, where such distribution, publication, availability or use would be contrary to law, regulation or which would subject MOFSL & its group companies to registration or licensing requirements within such jurisdictions. For Hong Kong: This report is distributed in Hong Kong by Motilal Oswal capital Markets (Hong Kong) Private Limited, a licensed corporation (CE AYY-301) licensed and regulated by the Hong Kong Securities and Futures Commission (SFC) pursuant to the Securities and Futures Ordinance (Chapter 571 of the Laws of Hong Kong) “SFO”. As per SEBI (Research Analyst Regulations) 2014 Motilal Oswal Securities (SEBI Reg No. INH000000412) has an agreement with Motilal Oswal capital Markets (Hong Kong) Private Limited for distribution of research report in Hong Kong. This report is intended for distribution only to “Professional Investors” as defined in Part I of Schedule 1 to SFO. Any investment or investment activity to which this document relates is only available to professional investor and will be engaged only with professional investors.” Nothing here is an offer or solicitation of these securities, products and services in any jurisdiction where their offer or sale is not qualified or exempt from registration. The Indian Analyst(s) who compile this report is/are not located in Hong Kong & are not conducting Research Analysis in Hong Kong. For U.S. Motilal Oswal Financial Services Limited (MOFSL) is not a registered broker - dealer under the U.S. Securities Exchange Act of 1934, as amended (the"1934 act") and under applicable state laws in the United States. In addition MOFSL is not a registered investment adviser under the U.S. Investment Advisers Act of 1940, as amended (the "Advisers Act" and together with the 1934 Act, the "Acts), and under applicable state laws in the United States. Accordingly, in the absence of specific exemption under the Acts, any brokerage and investment services provided by MOFSL , including the products and services described herein are not available to or intended for U.S. persons. This report is intended for distribution only to "Major Institutional Investors" as defined by Rule 15a-6(b)(4) of the Exchange Act and interpretations thereof by SEC (henceforth referred to as "major institutional investors"). This document must not be acted on or relied on by persons who are not major institutional investors. Any investment or investment activity to which this document relates is only available to major institutional investors and will be engaged in only with major institutional investors. In reliance on the exemption from registration provided by Rule 15a-6 of the U.S. Securities Exchange Act of 1934, as amended (the "Exchange Act") and interpretations thereof by the U.S. Securities and Exchange Commission ("SEC") in order to conduct business with Institutional Investors based in the U.S., MOFSL has entered into a chaperoning agreement with a U.S. registered broker-dealer, Motilal Oswal Securities International Private Limited. ("MOSIPL"). Any business interaction pursuant to this report will have to be executed within the provisions of this chaperoning agreement. The Research Analysts contributing to the report may not be registered /qualified as research analyst with FINRA. Such research analyst may not be associated persons of the U.S. registered broker-dealer, MOSIPL, and therefore, may not be subject to NASD rule 2711 and NYSE Rule 472 restrictions on communication with a subject company, public appearances and trading securities held by a research analyst account. For Singapore In Singapore, this report is being distributed by Motilal Oswal Capital Markets Singapore Pte Ltd (“MOCMSPL”) (Co.Reg. NO. 201129401Z) which is a holder of a capital markets services license and an exempt financial adviser in Singapore.As per the approved agreement under Paragraph 9 of Third Schedule of Securities and Futures Act (CAP 289) and Paragraph 11 of First Schedule of Financial Advisors Act (CAP 110) provided to MOCMSPL by Monetary Authority of Singapore. Persons in Singapore should contact MOCMSPL in respect of any matter arising from, or in connection with this report/publication/communication. This report is distributed solely to persons who qualify as “Institutional Investors”, of which some of whom may consist of "accredited" institutional investors as defined in section 4A(1) of the Securities and Futures Act, Chapter 289 of Singapore (“the SFA”). Accordingly, if a Singapore person is not or ceases to be such an institutional investor, such Singapore Person must immediately discontinue any use of this Report and inform MOCMSPL. Specific Disclosures 1 MOFSL, Research Analyst and/or his relatives does not have financial interest in the subject company, as they do not have equity holdings in the subject company. 2 MOFSL, Research Analyst and/or his relatives do not have actual/beneficial ownership of 1% or more securities in the subject company 3 MOFSL, Research Analyst and/or his relatives have not received compensation/other benefits from the subject company in the past 12 months 4 MOFSL, Research Analyst and/or his relatives do not have material conflict of interest in the subject company at the time of publication of research report 5 Research Analyst has not served as director/officer/employee in the subject company 6 MOFSL has not acted as a manager or co-manager of public offering of securities of the subject company in past 12 months 7 MOFSL has not received compensation for investment banking/ merchant banking/brokerage services from the subject company in the past 12 months 8 MOFSL has not received compensation for other than investment banking/merchant banking/brokerage services from the subject company in the past 12 months 9 MOFSL has not received any compensation or other benefits from third party in connection with the research report 10 MOFSL has not engaged in market making activity for the subject company
********************************************************************************************************************************

ICICI Prudential Life Insurance
23 June 2022 18
The associates of MOFSL may have: - financial interest in the subject company - actual/beneficial ownership of 1% or more securities in the subject company - received compensation/other benefits from the subject company in the past 12 months - other potential conflict of interests with respect to any recommendation and other related information and opinions.; however the same shall have no bearing whatsoever on the
specific recommendations made by the analyst(s), as the recommendations made by the analyst(s) are completely independent of the views of the associates of MOFSL even though there might exist an inherent conflict of interest in some of the stocks mentioned in the research report.
- acted as a manager or co-manager of public offering of securities of the subject company in past 12 months
- be engaged in any other transaction involving such securities and earn brokerage or other compensation or act as a market maker in the financial instruments of the company(ies) discussed herein or act as an advisor or lender/borrower to such company(ies)
- received compensation from the subject company in the past 12 months for investment banking / merchant banking / brokerage services or from other than said services.
The associates of MOFSL has not received any compensation or other benefits from third party in connection with the research report Above disclosures include beneficial holdings lying in demat account of MOFSL which are opened for proprietary investments only. While calculating beneficial holdings, It does not consider demat accounts which are opened in name of MOFSL for other purposes (i.e holding client securities, collaterals, error trades etc.). MOFSL also earns DP income from clients which are not considered in above disclosures. Analyst Certification The views expressed in this research report accurately reflect the personal views of the analyst(s) about the subject securities or issues, and no part of the compensation of the research analyst(s) was, is, or will be directly or indirectly related to the specific recommendations and views expressed by research analyst(s) in this report. Terms & Conditions: This report has been prepared by MOFSL and is meant for sole use by the recipient and not for circulation. The report and information contained herein is strictly confidential and may not be altered in any way, transmitted to, copied or distributed, in part or in whole, to any other person or to the media or reproduced in any form, without prior written consent of MOFSL. The report is based on the facts, figures and information that are considered true, correct, reliable and accurate. The intent of this report is not recommendatory in nature. The information is obtained from publicly available media or other sources believed to be reliable. Such information has not been independently verified and no guaranty, representation of warranty, express or implied, is made as to its accuracy, completeness or correctness. All such information and opinions are subject to change without notice. The report is prepared solely for informational purpose and does not constitute an offer document or solicitation of offer to buy or sell or subscribe for securities or other financial instruments for the clients. Though disseminated to all the customers simultaneously, not all customers may receive this report at the same time. MOFSL will not treat recipients as customers by virtue of their receiving this report. Disclaimer: The report and information contained herein is strictly confidential and meant solely for the selected recipient and may not be altered in any way, transmitted to, copied or distributed, in part or in whole, to any other person or to the media or reproduced in any form, without prior written consent. This report and information herein is solely for informational purpose and may not be used or considered as an offer document or solicitation of offer to buy or sell or subscribe for securities or other financial instruments. Nothing in this report constitutes investment, legal, accounting and tax advice or a representation that any investment or strategy is suitable or appropriate to your specific circumstances. The securities discussed and opinions expressed in this report may not be suitable for all investors, who must make their own investment decisions, based on their own investment objectives, financial positions and needs of specific recipient. This may not be taken in substitution for the exercise of independent judgment by any recipient. Each recipient of this document should make such investigations as it deems necessary to arrive at an independent evaluation of an investment in the securities of companies referred to in this document (including the merits and risks involved), and should consult its own advisors to determine the merits and risks of such an investment. The investment discussed or views expressed may not be suitable for all investors. Certain transactions -including those involving futures, options, another derivative products as well as non-investment grade securities - involve substantial risk and are not suitable for all investors. No representation or warranty, express or implied, is made as to the accuracy, completeness or fairness of the information and opinions contained in this document. The Disclosures of Interest Statement incorporated in this document is provided solely to enhance the transparency and should not be treated as endorsement of the views expressed in the report. This information is subject to change without any prior notice. The Company reserves the right to make modifications and alternations to this statement as may be required from time to time without any prior approval. MOFSL, its associates, their directors and the employees may from time to time, effect or have effected an own account transaction in, or deal as principal or agent in or for the securities mentioned in this document. They may perform or seek to perform investment banking or other services for, or solicit investment banking or other business from, any company referred to in this report. Each of these entities functions as a separate, distinct and independent of each other. The recipient should take this into account before interpreting the document. This report has been prepared on the basis of information that is already available in publicly accessible media or developed through analysis of MOFSL. The views expressed are those of the analyst, and the Company may or may not subscribe to all the views expressed therein. This document is being supplied to you solely for your information and may not be reproduced, redistributed or passed on, directly or indirectly, to any other person or published, copied, in whole or in part, for any purpose. This report is not directed or intended for distribution to, or use by, any person or entity who is a citizen or resident of or located in any locality, state, country or other jurisdiction, where such distribution, publication, availability or use would be contrary to law, regulation or which would subject MOFSL to any registration or licensing requirement within such jurisdiction. The securities described herein may or may not be eligible for sale in all jurisdictions or to certain category of investors. Persons in whose possession this document may come are required to inform themselves of and to observe such restriction. Neither the Firm, not its directors, employees, agents or representatives shall be liable for any damages whether direct or indirect, incidental, special or consequential including lost revenue or lost profits that may arise from or in connection with the use of the information. The person accessing this information specifically agrees to exempt MOFSL or any of its affiliates or employees from, any and all responsibility/liability arising from such misuse and agrees not to hold MOFSL or any of its affiliates or employees responsible for any such misuse and further agrees to hold MOFSL or any of its affiliates or employees free and harmless from all losses, costs, damages, expenses that may be suffered by the person accessing this information due to any errors and delays. Registered Office Address: Motilal Oswal Tower, Rahimtullah Sayani Road, Opposite Parel ST Depot, Prabhadevi, Mumbai-400025; Tel No.: 022 71934200/ 022-71934263;
Website www.motilaloswal.com.CIN no.: L67190MH2005PLC153397.Correspondence Office Address: Palm Spring Centre, 2nd Floor, Palm Court Complex, New Link Road,
Malad(West), Mumbai- 400 064. Tel No: 022 7188 1000. Registration Nos.: Motilal Oswal Financial Services Limited (MOFSL)*: INZ000158836(BSE/NSE/MCX/NCDEX); CDSL and NSDL: IN-DP-16-2015; Research Analyst: INH000000412. AMFI: ARN - 146822; Investment Adviser: INA000007100; Insurance Corporate Agent: CA0579;PMS:INP000006712. Motilal Oswal Asset Management Company Ltd. (MOAMC): PMS (Registration No.: INP000000670); PMS and Mutual Funds are offered through MOAMC which is group company of MOFSL. Motilal Oswal Wealth Management Ltd. (MOWML): PMS (Registration No.: INP000004409) is offered through MOWML, which is a group company of MOFSL. Motilal Oswal Financial Services Limited is a distributor of Mutual Funds, PMS, Fixed Deposit, Bond, NCDs,Insurance Products and IPOs.Real Estate is offered through Motilal Oswal Real Estate Investment Advisors II Pvt. Ltd. which is a group company of MOFSL. Private Equity is offered through Motilal Oswal Private Equity Investment Advisors Pvt. Ltd which is a group company of MOFSL. Research & Advisory services is backed by proper research. Please read the Risk Disclosure Document prescribed by the Stock Exchanges carefully before investing. There is no assurance or guarantee of the returns. Investment in securities market is subject to market risk, read all the related documents carefully before investing. Details of Compliance Officer: Name: Neeraj Agarwal, Email ID: [email protected], Contact No.:022-71881085. * MOSL has been amalgamated with Motilal Oswal Financial Services Limited (MOFSL) w.e.f August 21, 2018 pursuant to order dated July 30, 2018 issued by Hon'ble National Company Law Tribunal, Mumbai Bench.