
Stock Idea - Moneycontrol
28
Stock Idea March 19, 2021 Sector: NBFC Turning the wheels of fortune Powered by Sharekhan’s 3R Research Philosophy Mahindra & Mahindra Financial Services Limited
-
Upload
khangminh22 -
Category
Documents
-
view
5 -
download
0
Transcript of Stock Idea - Moneycontrol

Stock IdeaMarch 19, 2021Sector: NBFC
Turning the wheels of fortune
Powered by Sharekhan’s 3R Research Philosophy
Mahindra & Mahindra Financial Services Limited

March 19, 2021 2
Company details
Market cap: Rs. 25,501 cr
52-week high/low: Rs. 224 / 77
NSE volume: (No of shares)
97.8 lakh
BSE code: 532720
NSE code: M&MFIN
Free float: (No of shares)
59.1 cr
Shareholding (%)
Promoters 52.2
Public 47.5
Others 0.3
Sto
ck Id
ea
Price performance
(%) 1m 3m 6m 12m
Absolute -0.8 15.5 64.1 46.4
Relative to Sensex
-1.1 12.4 34.8 -20.6
Sharekhan Research, Bloomberg
Reco/View
Reco: Buy
CMP: Rs. 202
Price Target: Rs. 260
Valuation Rs cr
Particulars FY19 FY20 FY21E FY22E FY23E
NII 4,756.9 5,210.0 5,825.5 6,068.2 6,444.5
PPOP 3,017.7 3,398.2 4,191.6 4,363.6 4,630.1
PAT 1,557.1 906.4 839.1 1,263.3 1,802.5
EPS 25.3 14.7 6.8 10.2 14.6
ABVPS 124.1 120.2 104.5 113.9 121.8
P/E 8.0 13.7 29.7 19.8 13.8
P/ABVPS 1.6 1.7 1.9 1.8 1.7
ROE 14.3% 8.0% 5.5% 7.8% 10.3%
ROA 2.3% 1.2% 1.1% 1.5% 1.8%
Source: Company; Sharekhan estimates
Price chart
NBFC Sharekhan code: M&MFIN Initiating Coverage
+ Positive = Neutral - Negative
Mahindra & Mahindra Financial Services (MMFS) has grown and transformed from being primarily a financing entity for vehicle purchases (from parent M&M) to a leading multi-product auto finance non-banking financing company (NBFC) with a pan-India presence, deep penetration and a strong, rural-focused network. Going ahead, we believe that normalisation of credit costs (MMFS has taken significant upfront provision till Q3FY2021; credit costs would normalise in FY22E), pick-up in AUMs in FY22E and FY23E (aided by rise in auto sales), GDP growth and an improved capex cycle leading to disbursement growth) will drive up MMFS’ earnings and RoE. Hence, while the past few quarters have been challenging (due to COVID-19 and the economic slowdown) for growth and asset quality, we expect MMFS to bounce back in FY2022E and FY2023E, which we believe would be key re-rating triggers. The rural segment has been resilient and rising government spends, increased sowing and ample reservoir levels augur well for rural-focused players such as MMFS. Growth is expected to be higher in Q4FY21 led by better cash flows from rural and semi-urban areas. Segments such as tractors should see better volumes in Q4FY21, while cars and other auto segment may take another six months to see complete revival. Asset-quality wise, the improvement in Collections is positive, and we expect the trend to continue, as Q4 is seasonally the best quarter in terms of collections on strong farm cash flows. Going forward, the management has guided to keep net NPAs at sub-4% levels and maintain provisioning coverage ratio (PCR) at 35-36%. The company has restructured only 1% of AUMs, which is also a positive cushion. We believe that as the company brings down its liquidity in next couple of months, margins should improve as the drag on profitability goes down. Backed by the Mahindra Group’s strength, a strong and stable credit rating profile (which allows best-in-class borrowing rates) and augmented capital base (capital raise done in mid-FY21; Tier 1 at 21.9%) the business is attractive over the long term and set to stage a comeback as the economic scenario normalises. We initiate with a Buy rating with a Price Target (PT) of Rs. 260.
Our Call
At CMP, the stock is available at 1.8x / 1.7x FY2022E / FY2023E on the standalone ABVPS, which we find attractive, given the improving growth outlook (resumption of economic activity, support from a resilient rural segment etc). We expect disbursements to grow in H2 FY22E and expect an AUM growth of ~10% / 15% for FY2022E & FY2023E. The asset quality outlook is improving, with collection efficiency surging to 96% in December (from 82% in October); the November number too saw the m-o-m improvement continuing. The management has indicated that <1% of portfolio can be potentially restructured, which is manageable; and improving cost of funds will be positive for NIMs. We expect operating expenses to AUM ratio to be 2.5-2.7% range and RoE improving to 8% and 10%, respectively for FY2022E and FY2023E. We believe that the buoyancy in rural markets augurs well for commercial vehicle (CV) financiers, and coupled with business benefits from a strong parentage, a well-capitalised balance sheet and rigorous risk management practices (provides long-term visibility) offer scope for improving operating leverage and Return ratios, which provides additional comfort. We initiate with a Buy rating on the stock with price target of Rs. 260.
Key risk
Delayed recovery in economic activity will affect growth and profitability, further, it has exposure to the SME segments which may be vulnerable if economic recovery is delayed.
3R MATRIX + = -
Right Sector (RS) ü
Right Quality (RQ) ü
Right Valuation (RV) ü
Summary
� M&M Financial Services (MMFS) has evolved into a multi-product auto finance NBFC operating pan-India, having deep penetration and rural-centric strong network from being a vehicle financing arm for M&M earlier.
� Normalisation of credit costs and pick-up in AUMs in FY22E and FY23E would drive earnings and RoE.
� Stock trades at 1.8x / 1.7x FY2022E / FY2023E on standalone ABVPS; strong parent backing, strong and stable credit rating profile and high capital levels make business attractive.
� We initiate coverage with a Buy and Price Target (PT) of Rs. 260.
Powered by the Sharekhan 3R Research Philosophy
Mahindra & Mahindra Financial Services LimitedTurning the wheels of fortune
-
75.0
150.0
225.0
300.0
Mar
-20
Jul-2
0
Nov
-20
Mar
-21
March 19, 2021 3
Sto
ck Id
ea
Powered by the Sharekhan3R Research Philosophy
Executive Summary
3R Research Positioning Summary
n Right Sector: Encouraging demand recovery, lower funding costs, and improving asset qual-ity trends (rising collection efficiency and low restructuring pipeline).
n Right Quality: MMFS has progressed well as a pan-India, rural-focused, diversified vehicle financier (M&M Group’s contribution is ~45%); with high and stable credit ratings and strong operating metrics, which underline its high pedigree.
n Right Valuation: Stock is available at rea-sonable valuations of 1.8x / 1.7x FY2022E / FY2023E on standalone ABVPS; supported by improving growth outlook and resumption of economic activity.
Valuation and return potential
� We expect the operating expenses to AUM ratio to be at 2.7-2.5% and see RoE improving to 7.8% and 10.3%, respectively for FY2022E and FY2023E.
� We initiate coverage with a Buy rating and a price target of Rs 260.
Earnings and Balance sheet highlights
� Backed by the Mahindra Group’s strength, with a strong and stable credit rating profile (which allows best in class borrowing rates) MMFS has structural strengths
� Has augmented capital base (Rights issue done; takes Tier-1 ratio to 21.9%); well placed to capture growth opportunity
� Asset quality outlook is improving, with December collection efficiency at 96% (from 82% in October); m-o-m improvement is likely to continue.
Catalysts
Medium Term Triggers� Q4 is seasonally a strong quarter (due to bet-
ter cash flows from rural and semi urban ar-eas) and hence MMFS may see improved dis-bursement growth
� Segments like tractors may see better volumes in Q4FY21, while the cars and auto segment may take couple of quarters to normalise.
� NBFCs’ one-year spreads have dropped significantly over the last few months, which helps reduce marginal Cost of Funds.
Medium Term Triggers� Fall in credit costs to normal run-rate levels is
to drive RoE recovery� Drop in Cost of Funds and leverage to help
support margins � Strong rural recovery to support pick-up in
AUMs in FY2022E and FY2023E
March 19, 2021 4
Sto
ck Id
ea
Powered by the Sharekhan3R Research Philosophy
Table of Contents PagesExecutive Summary 3
Right Sector - why we like NBFC Sector
� India’s Economic Outlook for FY22 Is Favourable 5
� Liquidity and Interest Rate Environment Is Likely to Stay; augurs well for margins 7
� Rural economy is well positioned to see a strong growth pickup 8
� Better days ahead for auto financiers 9
� Housing Finance Growth 10
� Tractor Industry – improving prospects 11
Right Quality - why we like Mahindra & Mahindra Financial Services Limited
� MMFS should benefit from improvement in ROE and earnings growth 12
� Aided by low credit costs going forward, scope for multi-year re-rating 13
� Rights issue augments Capital base, well placed to capture growth 15
� Strong Distribution network, to capture uptick with diversification 15
� Control on Opex can add to ROE 16
� Auto sales growth to trigger AUM growth for MMFS 17
� Falling Cost of funds – provides cushion for NIMs 18
Company Background
� Evolution and development 19
� Credit Rating 20
� Broad Based Liability Mix 21
Financials in charts 22
Outlook and Valuation
� Sector View 23
� Company Outlook 23
� Valuation 23
� One-year forward P/BV (x) band 23
� Peer Comparison 23
Key financials
� Statement of Profit and Loss 24
� Others Parameters 24
� Balance Sheet 25
MMFS snapshot
� About the Company 26
� Investment Theme 26
� Key management personnel 26
� Top shareholders 26
3R Philosophy definitions 27

March 19, 2021 5
Sto
ck Id
ea
Powered by the Sharekhan3R Research Philosophy
Why we like the NBFC sector
India’s GDP growth expected to pick up in FY2022E, and as a result the automobile sector and thereby vehicle financiers expected to see better growth. An encouraging demand recovery, lower funding costs and improving asset quality (rising collection efficiency and low restructuring pipeline) augur well for NBFCs.
India – A Favourable Economic Outlook for FY22
There has been a sharp improvement in economic activity in the past six months (as the effect of COVID-19
recedes) and many sectors were now reaching near normalcy in terms of activity levels. Macro-economic
indicators are showing strong signs of improvement.
Indian GDP FY2022 - healthy growth expected
Source: Media report, Sharekhan Research
PMI Manufacturing stays steady above 50 mark
Source: IHS Markit, Sharekhan Research
-7.7%
10.0%
-7.0%
13.7%
-7.5%
10.5%
-10.0%
-5.0%
0.0%
5.0%
10.0%
15.0%
FY2021E FY2022E
S&P Moody's RBI
5355 55
52
2731
47 4652
57 5956 56 58 58
0
10
20
30
40
50
60
70
Dec-19 Jan-20 Feb-20 Mar-20 Apr-20 May-20 Jun-20 Jul-20 Aug-20 Sep-20 Oct-20 Nov-20 Dec-20 Jan-21 Feb-21
PMI Manufacturing

March 19, 2021 6
Sto
ck Id
ea
Powered by the Sharekhan3R Research Philosophy
IIP recovering gradually
Source: MOSPI
E-way bill growth points to improving picture
Source: CEIC
Source: JHU CSSE COVID-19 Data
The revival has also been reflected in the monthly collections for lenders (Banks and NBFCs) who have seen
off the moratorium and are seeing increasingly normalizing trends in collections.
While the battle with COVID 19 is still on
(and the picture is still evolving), the decline
in the new cases (seen in India) over last few
months, the development and deployment
of vaccine are healthy trends which indicate
the probability of sustained business
activity levels and economic recovery are
increased and likely to sustain.
The revival in private-sector capex along
with a V-shaped recovery, will be positive
and with expectations of GDP growth crossing 10%+ in FY22 (as estimated by several agencies), we believe
that it will augur well for a pick-up in the automobile sector as well.
-70
-60
-50
-40
-30
-20
-10
0
10
0
20
40
60
80
100
120
140
160
Jan-
19
Feb-
19
Mar
-19
Apr-
19
May
-19
Jun-
19
Jul-1
9
Aug-
19
Sep-
19
Oct
-19
Nov
-19
Dec-
19
Jan-
20
Feb-
20
Mar
-20
Apr-
20
May
-20
Jun-
20
Jul-2
0
Aug-
20
Sep-
20
Oct
-20
Nov
-20
Dec-
20
Jan-
21
IIP Index (LHS) IIP YoY Growth (%)

March 19, 2021 7
Sto
ck Id
ea
Powered by the Sharekhan3R Research Philosophy
Revival of Private Capex
Source: RBI, Media report, Sharekhan Research
-20,000
0
20,000
40,000
60,000
80,000
1,00,000
FY17 FY20 FY21E FY23E
FMCG Agri Auto Capital Goods Cement Infra Pharma Speciality Chem Metal Consumer Durables
Due to the fact that Vehicle financing NBFCs cater to informal borrower segments which are vulnerable and
impacted by a weaker economic profile of the economy. Hence, an improving economic outlook, will be
positive for their collection efficiency and disbursements.
Liquidity and interest rate environment to stay steady; augurs well for NBFC margins
The RBI, for the near foreseeable future, has stated that its stance of liquidity management remains
accommodative and completely in consonance with its monetary policy stance. The RBI stands committed
to ensure the availability of ample liquidity in the system and thereby foster easy financial conditions for
the recovery to gain traction. Hence, supportive government and RBI policies in terms of keeping liquidity
conditions benign and other measures (such as the TLTRO scheme) have significantly helped NBFCs segment
in tiding over through the challenging past year. The accommodative monetary policy stance, with the real
call rate in negative territory, tracking near eight-year lows has been beneficial for wholesale funded entities,
such as NBFCs.
Corporate Bond yeild and spread
Products Yeilds Spreads
Rating Dec-20 Jan-21 Variation Dec-20 Jan-21 Variation
Percent (BPS) (BPS)
PSU Banks & Fis
AAA 4.89 4.96 7 43 26 -17
AA 5.56 5.62 6 114 92 -22
BBB- 8.76 8.75 -1 430 405 -25
Corporate
AAA 4.76 4.85 9 30 16 -14
AA 5.62 5.74 12 116 105 -11
BBB- 9.57 9.69 12 512 500 -12
NBFCs
AAA 4.94 4.96 2 48 27 -21
AA 6.28 6.34 6 182 164 -22
BBB- 10.56 10.62 6 611 592 -19
Source: FIMMDA

March 19, 2021 8
Sto
ck Id
ea
Powered by the Sharekhan3R Research Philosophy
Steady rise in Rural expenses (MGNREGA)
Source: Ministry of Rural Development
2,36
7
2,41
6
2,36
7
2,88
3
2,42
0
2,93
0
3,22
5
3,14
7
9,69
3
9,42
1
9,69
3
14,4
28
18,1
00
19,4
65
16,1
92
24,3
07
26,4
91
24,1
87
30,8
90 40,7
50
43,1
28
47,1
72
48,8
48
73,4
52
38,5
52
36,0
25
44,0
02 58,0
62
63,6
49
69,6
18
68,2
65
1,00
,907
0
20,000
40,000
60,000
80,000
1,00,000
1,20,000
FY14 FY15 FY16 FY17 FY18 FY19 FY20 FY21
Wages Material & Skilled wages Admin Total Expenditures
Corporate bond yields remained stable and spreads narrowed across the rating spectrum and issuer
categories, reflecting that easing of risk premia and a congenial policy environment. Average spread of
3-year AAA rated corporate bonds over the G-sec yields of corresponding maturity issued by (i) public sector
undertakings (PSUs), banks and financial institutions (FIs), (ii) corporates and (iii) NBFCs declined by 17 bps,
14 bps and 21 bps, respectively, in January. Even spreads on three-year BBB- rated bonds - the lowest rated
investment grade bonds - issued by these entities narrowed by 25 bps, 12 bps and 19 bps, respectively,
reflecting reduced risk aversion and benefitting from a system flush with liquidity.
We believe that while interest rates are likely to hold for the medium term, but on the incremental basis, they
still remain below portfolio funding costs, and hence, as liabilities come up for re-pricing, the overall cost of
borrowing for NBFCs should continue to decline.
Further, due to the nature of the industry, loan yields at a portfolio level are unlikely to move much lower,
given that the back book is usually fixed rate (lesser proportion will re-price), and also lesser competitive
intensity and not much pricing pressure (especially given the absence / or minimal presence of banks) in new
loans in the segments.
Further, as economic and funding scenario improves and sustains, we believe that NBFCs would also be
winding down excess liquidity they are carrying, which should support their net interest margins.
Rural economy well–placed to see strong growth pick-up
The Rural economy and the agriculture sector are likely to see strong a growth pick-up, helped by factors
such as a good monsoon, high reservoir levels, increase in crop sowing, etc. Moreover, the non-farm sector
is expected to be helped by increased government spending, road construction, etc. which are likely to aid
growth.
Even on a long-term basis, there is a structural case for the share of rural sales in overall auto sales to go up,
given the under penetration, lack of requisite last-mile connectivity, rural road network expansion, etc. We
believe that the above factors can help further accelerate, and provide a cyclical fillip for Vehicle financing
NBFCs, which have a relatively higher share of their own business linked to the rural economy, and therefore
stand to benefit.
March 19, 2021 9
Sto
ck Id
ea
Powered by the Sharekhan3R Research Philosophy
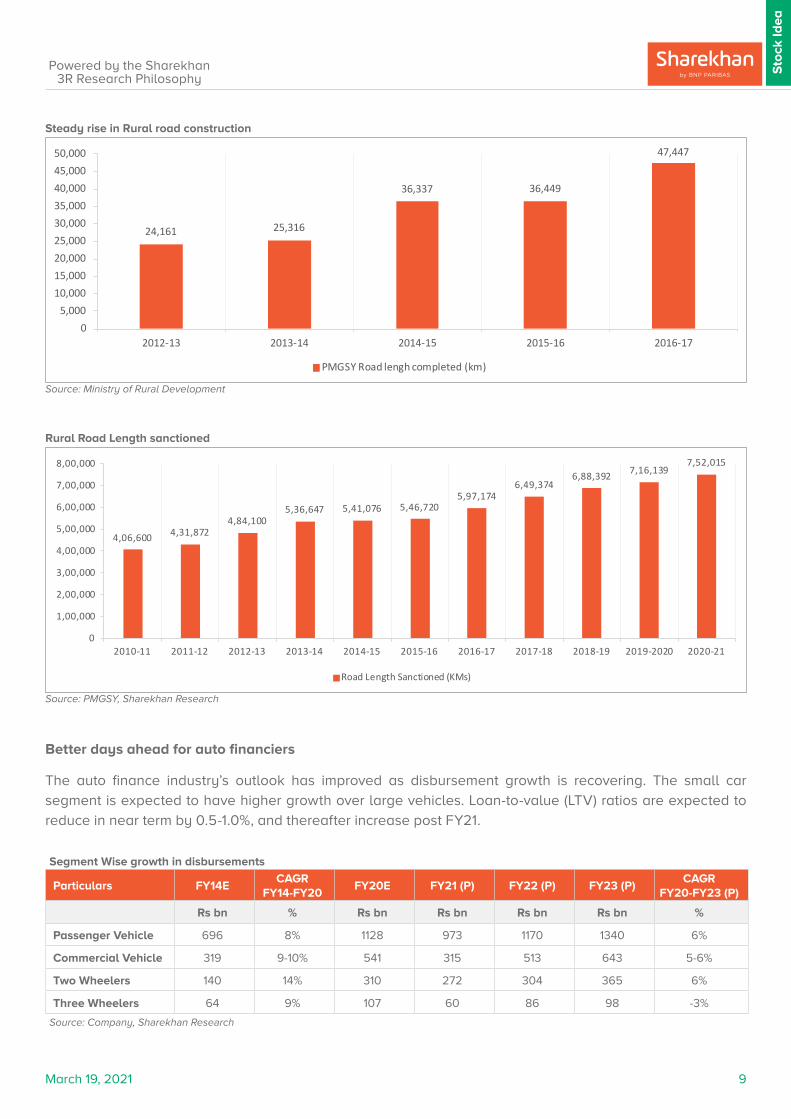
Better days ahead for auto financiers
The auto finance industry’s outlook has improved as disbursement growth is recovering. The small car
segment is expected to have higher growth over large vehicles. Loan-to-value (LTV) ratios are expected to
reduce in near term by 0.5-1.0%, and thereafter increase post FY21.
Steady rise in Rural road construction
Source: Ministry of Rural Development
24,161 25,316
36,337 36,449
47,447
05,000
10,00015,00020,00025,00030,00035,00040,00045,00050,000
2012-13 2013-14 2014-15 2015-16 2016-17
PMGSY Road lengh completed (km)
Rural Road Length sanctioned
Source: PMGSY, Sharekhan Research
4,06,600 4,31,8724,84,100
5,36,647 5,41,076 5,46,7205,97,174
6,49,3746,88,392 7,16,139
7,52,015
0
1,00,000
2,00,000
3,00,000
4,00,000
5,00,000
6,00,000
7,00,000
8,00,000
2010-11 2011-12 2012-13 2013-14 2014-15 2015-16 2016-17 2017-18 2018-19 2019-2020 2020-21
Road Length Sanctioned (KMs)
Segment Wise growth in disbursements
Particulars FY14ECAGR
FY14-FY20FY20E FY21 (P) FY22 (P) FY23 (P)
CAGR FY20-FY23 (P)
Rs bn % Rs bn Rs bn Rs bn Rs bn %
Passenger Vehicle 696 8% 1128 973 1170 1340 6%
Commercial Vehicle 319 9-10% 541 315 513 643 5-6%
Two Wheelers 140 14% 310 272 304 365 6%
Three Wheelers 64 9% 107 60 86 98 -3%
Source: Company, Sharekhan Research

March 19, 2021 10
Sto
ck Id
ea
Powered by the Sharekhan3R Research Philosophy
Passenger vehicle penetration in India is still a long way to go as compared to other developed economies.
Car & UV Loan Portfolio Top 20 Cities Other Cities
Finance Penetration Ratio 80% 65%
Banks 17% 9%
Source: Company, Sharekhan Research
80%65%
Top 20 Cities Other Cities
Finance Penetration Ratio
We believe a NBFC with a strong connect with dealerships and captive customer base is likely to maintain market share.
Housing Finance Growth
While growth in home financing has expectedly slowed down, it is likely to recover post COVID-19. Housing Credit outstanding is estimated to grow by 3-5% in FY21 and by 7-9% in FY22. The growth rate of banks is likely to be double that of HFCs in FY2021 due to lower interest rates and also a lower demand for bank credit.
However, average home loan rates have reduced by 100 bps in the last one year. Even though delinquencies have risen in FY21 with growth slow growth and seasoning of portfolio, profitability has reduced. Positive actions taken by government like liquidity support and regulatory forbearance on asset quality have helped
the sector.
Housing Portfolio size and market share
Source: Company, Sharekhan Research
Loan Book Outstanding Growth Rate
Source: Company, Sharekhan Research
22%
4%
19%21%
9%
3%
3%5%
17% 18%
15%13%
19%
15%
5%
9%
0%
5%
10%
15%
20%
25%
FY15 FY16 FY17 FY18 FY19 FY20 FY21 (P) FY22 (P)
HFC Banks
March 19, 2021 11
Sto
ck Id
ea
Powered by the Sharekhan3R Research Philosophy
The rise in penetration of financing in Tier II/ smaller towns would fuel loan growth. Mortgage penetration in
India is 9-11 years behind other regional emerging markets such as China and Thailand. Yet, higher disposable
incomes, urbanisation and increased mortgage and finance penetration remain long-term growth drivers.
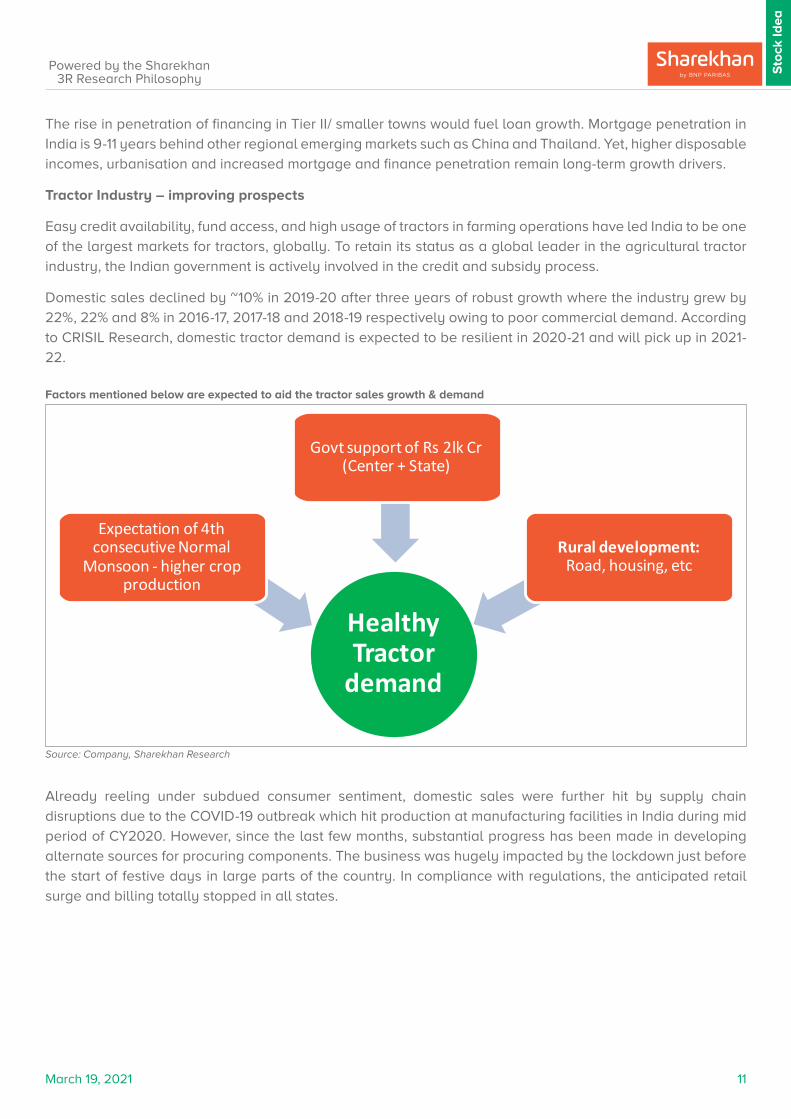
Tractor Industry – improving prospects
Easy credit availability, fund access, and high usage of tractors in farming operations have led India to be one
of the largest markets for tractors, globally. To retain its status as a global leader in the agricultural tractor
industry, the Indian government is actively involved in the credit and subsidy process.
Domestic sales declined by ~10% in 2019-20 after three years of robust growth where the industry grew by
22%, 22% and 8% in 2016-17, 2017-18 and 2018-19 respectively owing to poor commercial demand. According
to CRISIL Research, domestic tractor demand is expected to be resilient in 2020-21 and will pick up in 2021-
22.
Factors mentioned below are expected to aid the tractor sales growth & demand
Source: Company, Sharekhan Research
Healthy Tractor
demand
Govt support of Rs 2lk Cr (Center + State)
Expectation of 4th consecutive Normal
Monsoon - higher crop production
Rural development: Road, housing, etc
Already reeling under subdued consumer sentiment, domestic sales were further hit by supply chain
disruptions due to the COVID-19 outbreak which hit production at manufacturing facilities in India during mid
period of CY2020. However, since the last few months, substantial progress has been made in developing
alternate sources for procuring components. The business was hugely impacted by the lockdown just before
the start of festive days in large parts of the country. In compliance with regulations, the anticipated retail
surge and billing totally stopped in all states.

March 19, 2021 12
Sto
ck Id
ea
Powered by the Sharekhan3R Research Philosophy
Why we like Mahindra Finance
Mahindra & Mahindra Financial Services (MMFS) has progressed well as a pan-India, rural-focused multi-segment diversified Auto financier (M&M group contribution ~45%); with high and stable credit ratings and strong operating metrics, which underline its high pedigree.
MMFS should benefit from improvement in RoE and earnings growth
We expect RoE and earnings growth to improve for FY2022E and FY2023E, as credit costs normalise and
growth outlook improves.
Credit cost (in BPS) on the path to normalcy
Expected revival in ROE going forward
Source: Company, Sharekhan Research
Source: Company, Sharekhan Research
MMFS has taken significant upfront provisioning and going forward, we expect its credit costs to move largely
toward normalcy in F2022E and improve further in FY2023E, provided the economic strength is sustained. We
expect economic recovery to also reflect positively on its credit costs, albeit with a lag.
114
323
470
400
300
050
100150200250300350400450500
FY2019 FY2020 FY2021E FY2022E FY2023E
Credit Cost (in bps)
14.3%
8.0%
5.7%
8.1%
10.7%
0.0%
2.0%
4.0%
6.0%
8.0%
10.0%
12.0%
14.0%
16.0%
FY2019 FY2020 FY2021E FY2022E FY2023E
ROE
March 19, 2021 13
Sto
ck Id
ea
Powered by the Sharekhan3R Research Philosophy
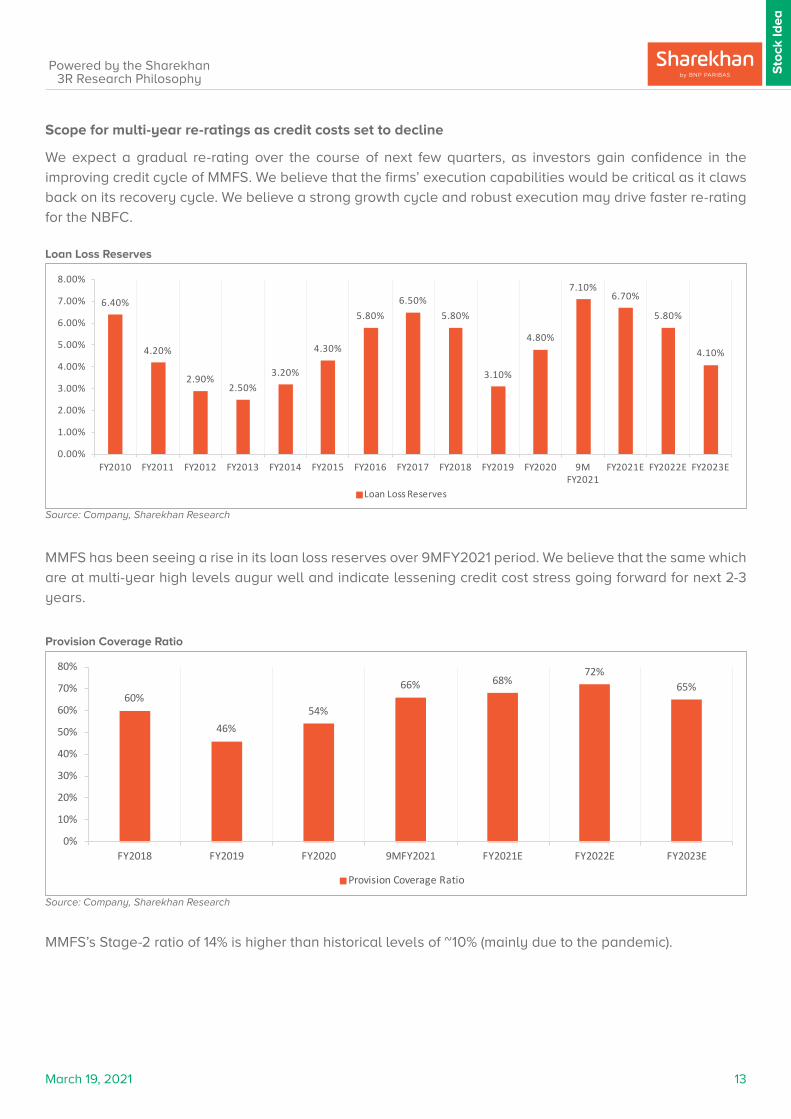
Loan Loss Reserves
Provision Coverage Ratio
Source: Company, Sharekhan Research
Source: Company, Sharekhan Research
Scope for multi-year re-ratings as credit costs set to decline
We expect a gradual re-rating over the course of next few quarters, as investors gain confidence in the
improving credit cycle of MMFS. We believe that the firms’ execution capabilities would be critical as it claws
back on its recovery cycle. We believe a strong growth cycle and robust execution may drive faster re-rating
for the NBFC.
MMFS has been seeing a rise in its loan loss reserves over 9MFY2021 period. We believe that the same which
are at multi-year high levels augur well and indicate lessening credit cost stress going forward for next 2-3
years.
MMFS’s Stage-2 ratio of 14% is higher than historical levels of ~10% (mainly due to the pandemic).
6.40%
4.20%
2.90%2.50%
3.20%
4.30%
5.80%6.50%
5.80%
3.10%
4.80%
7.10%6.70%
5.80%
4.10%
0.00%
1.00%
2.00%
3.00%
4.00%
5.00%
6.00%
7.00%
8.00%
FY2010 FY2011 FY2012 FY2013 FY2014 FY2015 FY2016 FY2017 FY2018 FY2019 FY2020 9M FY2021
FY2021E FY2022E FY2023E
Loan Loss Reserves
60%
46%54%
66% 68%72%
65%
0%
10%
20%
30%
40%
50%
60%
70%
80%
FY2018 FY2019 FY2020 9MFY2021 FY2021E FY2022E FY2023E
Provision Coverage Ratio

March 19, 2021 14
Sto
ck Id
ea
Powered by the Sharekhan3R Research Philosophy
Helped by a high provision cover and improving economic scenario, we believe that credit costs forecasts for
FY21-23 to be much lower than recent past for MMFS. This can help RoE recover, which would be a trigger for
further re-rating of the stock.
Collection Efficiency, Moratorium and Restructuring
Source: Company, Sharekhan Research
Collection Efficiency October November Decemeber Q3
FY2021 82% 84% 96% 88%
FY2020 88% 95% 95% 93%
Computed as (Current month demand collected + overdue collected) / (Curr Month demand due for the month)
Moratorium Availed contracts Total No of Contracts Nil collection in Q3 FY2021 - % of Nos
With amount due in Q3 FY2021 14,97,184 6%
Which had not made any payment till end Sep'20 2,74,061 16%
GS3 assets trending down
Source: Company, Sharekhan Research
14.7%13.2%
12.2%
9.8% 10.1% 9.6%8.3%
6.4%
8.2% 7.9% 8.5% 8.4%9.2%
7.5%6.0%
0.0%
2.0%
4.0%
6.0%
8.0%
10.0%
12.0%
14.0%
16.0%
Q1 FY2018
Q2 FY2018
Q3 FY2018
Q4 FY2018
Q1 FY2019
Q2 FY2019
Q3 FY2019
Q4 FY2019
Q1 FY2020
Q2 FY2020
Q3 FY2020
Q4 FY2020
Q1 FY2021
Q2 FY2021
Q3 FY2021
GS3
NS3 assets expected to decline
Source: Company, Sharekhan Research
1.50%
4%3.60%
3.00% 3.00%
0.00%
0.50%
1.00%
1.50%
2.00%
2.50%
3.00%
3.50%
4.00%
4.50%
FY2019 FY2020 FY2021E FY2022E FY2023E
NS3

March 19, 2021 15
Sto
ck Id
ea
Powered by the Sharekhan3R Research Philosophy
Rights issue / Capital raise bolsters CRAR by 680 BPS
Source: Company, Sharekhan Research
Hence, while FY2022E will be the recovery year, the same is also likely to flow into FY2023E as well. We
believe that the company is likely to see twin benefits of lower new bad loan formation, as well as also see
improved loan recoveries and hence write-backs of provisions made in F2021E.
Rights issue augments Capital base, well placed to capture growth
MMFS augmented its capital base via a rights issue which not only saw its Tier-1 ratio rise, but also added
to its net worth. The fund-raising has taken the Tier 1 ratio to 21.9% (added 680 bps to CRAR) and makes the
company well-placed to capture growth opportunities.
15.3%
19.6%21.9%
26.4%
Tier 1 CRAR
PRE Capital Raise Dec-21
Strong Distribution network, to capture uptick with diversification
Essentially, MMFS has a strong and large network with on-ground presence. This not only enables wide
reach and geographic diversification but is also a growth trigger, which the company can take advantage of
as the cycle turns.
Extensive Branch Network
Source: Company, Sharekhan Research
256
436
547
893
1,182
1,284 1,321 1,322 1,246
Mar '06 Mar '08 Mar '11 Mar '14 Mar '17 Mar '18 Mar '19 Mar '20 Dec '20
Coverage Branch Network as of

March 19, 2021 16
Sto
ck Id
ea
Powered by the Sharekhan3R Research Philosophy
Controlling operating expenses can boost ROE
MMFS has been hinting at operational and structural tweaks which along with structural technology-led cost
control initiatives can result in lower core operating expenses, which can add to its RoE. While for 9M FY2021,
the company saw a fall in opex and an opex ratio of 2%, we believe that for the medium term as business
and costs normalize, there is likely to be a rise in opex. However, with a pick-up in disbursements and a rise
in AUM and therefore better branch utilisation, we expect the Opex to AUM ratio to decline.
ROAA COMPONENTS
ROAA breakup FY19 FY20 FY21E FY22E FY23E
NII as % of AVG. ASS 7.9% 7.4% 7.6% 7.3% 7.0%
NON INT. as % AVG. ASS 0.1% 0.2% 0.2% 0.2% 0.2%
Less: Op COST as % of AVG ASS 3.0% 2.8% 2.4% 2.3% 2.2%
Less: Impairments as % of AVG ASS 1.1% 2.9% 4.0% 3.2% 2.4%
Less: TAX as % of AVG ASS 1.4% 0.6% 0.4% 0.5% 0.7%
ROAA 2.6% 1.3% 1.1% 1.5% 1.9%
Source: Company, Sharekhan Research
Intuitively, if MMFS is able to cut opex by 50 bps, it can potentially result in structurally adding at ~280 bps
to its RoE at normalized leverage, which will be significant. We believe that this is an additional positive for its
valuation and would depend on successful execution.
Even as the opex to AUM ratio has fallen in FY21E, we expect normalisation and some pickup in FY22E and
FY23E as MMFS steps up growth efforts.
Opex as proportion of Average Assets expected to trend down
Source: Company, Sharekhan Research
3.4%3.8%
3.3%3.1%
2.9% 2.8%3.0%
3.3% 3.3%3.1%
2.9% 2.8% 2.7%2.5%
0.0%
0.5%
1.0%
1.5%
2.0%
2.5%
3.0%
3.5%
4.0%
FY2010 FY2011 FY2012 FY2013 FY2014 FY2015 FY2016 FY2017 FY2018 FY2019 FY2020 FY2021E FY2022E FY2023E
Opex / Average Assets

March 19, 2021 17
Sto
ck Id
ea
Powered by the Sharekhan3R Research Philosophy
Opex growth to rationalise going forward
Source: Company, Sharekhan Research
22.0%
47.0%
24.0% 25.0% 23.0%
10.0%
17.0%23.0%
15.0%11.0% 9.0%
-2.2%
11.8% 13.6%
-10.0%
0.0%
10.0%
20.0%
30.0%
40.0%
50.0%
FY2010 FY2011 FY2012 FY2013 FY2014 FY2015 FY2016 FY2017 FY2018 FY2019 FY2020 FY2021E FY2022E FY2023E
Opex Growth
AUM growth expected to pickup in FY2022E and FY2023E
Source: Company, Sharekhan Research
Auto sales growth to drive up AUMs
India’s GDP is expected to make a strong comeback in FY22E after a pandemic-hit FY21. Auto sector being
closely linked with the fortunes of the economic activity is also expected to benefit. Hence, as vehicle sales
pick up in FY22E, we expect a logical conclusion to be vehicle financier’s disbursements to also rise as well.
Further while we have not factored in ticket size increase, the same will also be a factor in to aid growth for
players like MMFS.
MMFS’ management too has indicated that while they expect Q4FY21 volumes to be closer to pre-COVID19
levels, they expect growth to revert to normal from H2FY22 onwards. Segments driving the same are
expected to be CVs (aided by infrastructure push, pick-up in mining activities and overall economic pickup),
used tractors (MMFS has a strong leadership position in the tractor market, and can aggressively target the
used tractors segment both within existing customer and new customers base) and revival/normalisation in
demand from pandemic-hit segments (e.g. taxi operators, tour operators, etc).
0.0%
10.0%
20.0%
30.0%
40.0%
50.0%
FY2010 FY2011 FY2012 FY2013 FY2014 FY2015 FY2016 FY2017 FY2018 FY2019 FY2020 FY2021E FY2022E FY2023E
AUM Growth Avg growth

March 19, 2021 18
Sto
ck Id
ea
Powered by the Sharekhan3R Research Philosophy
Falling Cost of funds – provides cushion for NIMs
MMFS has been able to maintain its NIMs well, helped by its consistent high credit ratings and improving
yields. We expect NIMs to be on a positive trajectory due to lower cost of funds.
However, higher liquidity on the balance sheet, which the company has been maintaining on a prudent basis,
has been a drag on the margins, due to lower yields on liquid assets.
Falling cost of Funds, to continue benefiting MMFS as re-pricing happens
Source: Company, Sharekhan Research
0.0%
2.0%
4.0%
6.0%
8.0%
10.0%
12.0%
FY2010 FY2011 FY2012 FY2013 FY2014 FY2015 FY2016 FY2017 FY2018 FY2019 FY2020 FY2021E FY2022E FY2023E
Cost of Funds

March 19, 2021 19
Sto
ck Id
ea
Powered by the Sharekhan3R Research Philosophy
Company Background
Mahindra & Mahindra Financial Services has decades of rich experience in the financial sector and the expertise of the management provide the company a deep insight into customer requirements.
The company provides a wide range of financial products and services through a nationwide distribution network. It has presence in multiple businesses and with its ‘AAA’ credit rating is well placed in the rural India.
MMFS is the Preferred partner of prominent original equipment manufacturers (OEMs) and associated with nearly 9,000 dealers providing assured business and cross-sell opportunities.
MMFSL Group structure
Source: Company, Sharekhan Research
Mahindra & Mahindra Limited
52.16%
80%(1)
98.43%(2)
49%
51%(3)
51%(3)
38.2%(5)
Mahindra & MahindraFinancial Services Limited
Mahindra Insurance Brokers Limited (“MIBL”)
Mahindra Rural Housing Finance Limited(“MRHFL”)
Mahindra Finance USA LLC(Joint venture with Rabobank group subsidiary)
Mahindra Manulife Investment ManagementPvt. Ltd (“MMIMPL”)
Mahindra Manulife Trustee Pvt. Ltd(“MMTPL”)
Ideal Finance Ltd (“IFL”), Sri LankaNote:1. Balance 20% with Inclusion Resources Pvt. Ltd. (IRPL), subsidiary of AXA XL Group2. Balance 1.57% held by MRHFL Employee Welfare Trust and employees3. Manulife Investment Management (Singapore) Pte. Ltd. holds 49% of the shareholding of MMIMPL and MMTPL.4. Mahindra Finance CSR Foundation is a wholly owned subsidiary to undertake all CSR initiatives under one umbrella5. The Company has entered into a subscription agreement to acquire 58.26% of IFL and has remitted an amount of Rs.440 million towards acquiring 38.2% of its equity share capital
Evolution and development
Source: Company, Sharekhan Research
FY08FY06 FY13 FY 18FY10 FY16 FY20FY09 FY15 FY19FY11 FY17 FY21
Commenced housing finance business through MRHFL
Raised Rs. 4.14 Bn through Private Equity
Completed Rights Issue of Rs. 3089 crores
Maiden Retail NCD Issue of Rs. 1000 crores. Oversubscribed over 7 times over base issue size of Rs. 250 crores
Partnered withManulife for MutualFund business
Invested in Ideal Finance for providing financial services in Sri Lanka
Sale of 5% of MIBL at a valuation of Rs. 1300 crores
QIP Issuance :Rs. 10.56 bn and Preferential Issue to M&M : Rs. 10.55 bn
Certificate of Registration received from SEBI by Mahindra Mutual Fund
Long term debt ratingupgraded to AAA by India Ratings and Brickwork.
CARE Ratings assigned AAA rating to long term debt
Maiden QIP Issue of Rs. 4.26 Bn
JV with Rabobank subsidiary for tractor financing in USA
Crossed 1 million cumulative customer contracts
Completed IPO, Subscribed ~27 times
Stake sale in MIBL to Inclusion Resources Pvt. Ltd.
QIP Issue of Rs. 8.67 Bn
Equity participation of12.5%by NHB in MRHFL
RecommencedFixed Deposit Program
Maiden issue of ECBundertaken. Raisedover $200 mn.
Crossed 6 million cumulative customer contracts
Our Journey
March 19, 2021 20
Sto
ck Id
ea
Powered by the Sharekhan3R Research Philosophy
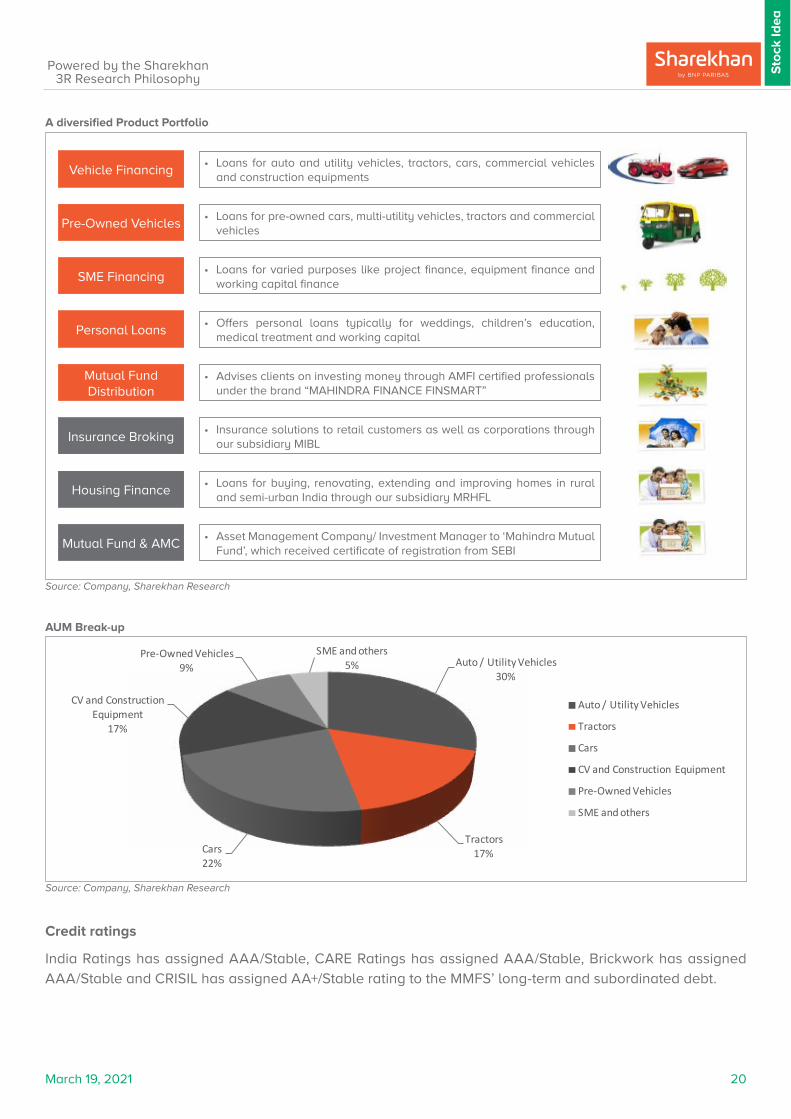
A diversified Product Portfolio
Source: Company, Sharekhan Research
Vehicle Financing• Loans for auto and utility vehicles, tractors, cars, commercial vehicles
and construction equipments
Personal Loans• Offers personal loans typically for weddings, children’s education,
medical treatment and working capital
Pre-Owned Vehicles• Loans for pre-owned cars, multi-utility vehicles, tractors and commercial
vehicles
Mutual Fund Distribution
• Advises clients on investing money through AMFI certified professionals under the brand “MAHINDRA FINANCE FINSMART”
Housing Finance• Loans for buying, renovating, extending and improving homes in rural
and semi-urban India through our subsidiary MRHFL
SME Financing• Loans for varied purposes like project finance, equipment finance and
working capital finance
Insurance Broking• Insurance solutions to retail customers as well as corporations through
our subsidiary MIBL
Mutual Fund & AMC• Asset Management Company/ Investment Manager to ‘Mahindra Mutual
Fund’, which received certificate of registration from SEBI
Credit ratings
India Ratings has assigned AAA/Stable, CARE Ratings has assigned AAA/Stable, Brickwork has assigned
AAA/Stable and CRISIL has assigned AA+/Stable rating to the MMFS’ long-term and subordinated debt.
AUM Break-up
Source: Company, Sharekhan Research
Auto / Utility Vehicles30%
Tractors17%Cars
22%
CV and Construction Equipment
17%
Pre-Owned Vehicles9%
SME and others5%
Auto / Utility Vehicles
Tractors
Cars
CV and Construction Equipment
Pre-Owned Vehicles
SME and others
March 19, 2021 21
Sto
ck Id
ea
Powered by the Sharekhan3R Research Philosophy
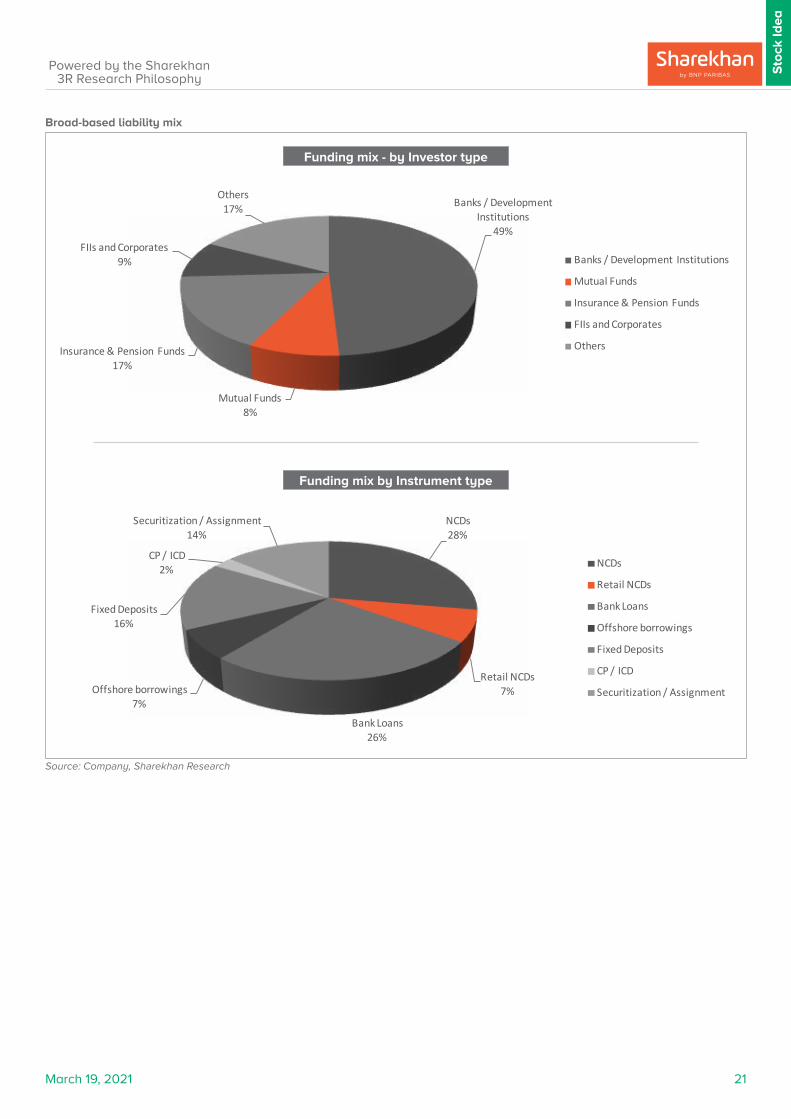
Broad-based liability mix
Source: Company, Sharekhan Research
Funding mix - by Investor type
Funding mix by Instrument type
Banks / Development Institutions
49%
Mutual Funds8%
Insurance & Pension Funds17%
FIIs and Corporates9%
Others17%
Banks / Development Institutions
Mutual Funds
Insurance & Pension Funds
FIIs and Corporates
Others
NCDs28%
Retail NCDs7%
Bank Loans26%
Offshore borrowings7%
Fixed Deposits16%
CP / ICD2%
Securitization / Assignment14%
NCDs
Retail NCDs
Bank Loans
Offshore borrowings
Fixed Deposits
CP / ICD
Securitization / Assignment
March 19, 2021 22
Sto
ck Id
ea
Powered by the Sharekhan3R Research Philosophy
Source: Company, Sharekhan Research
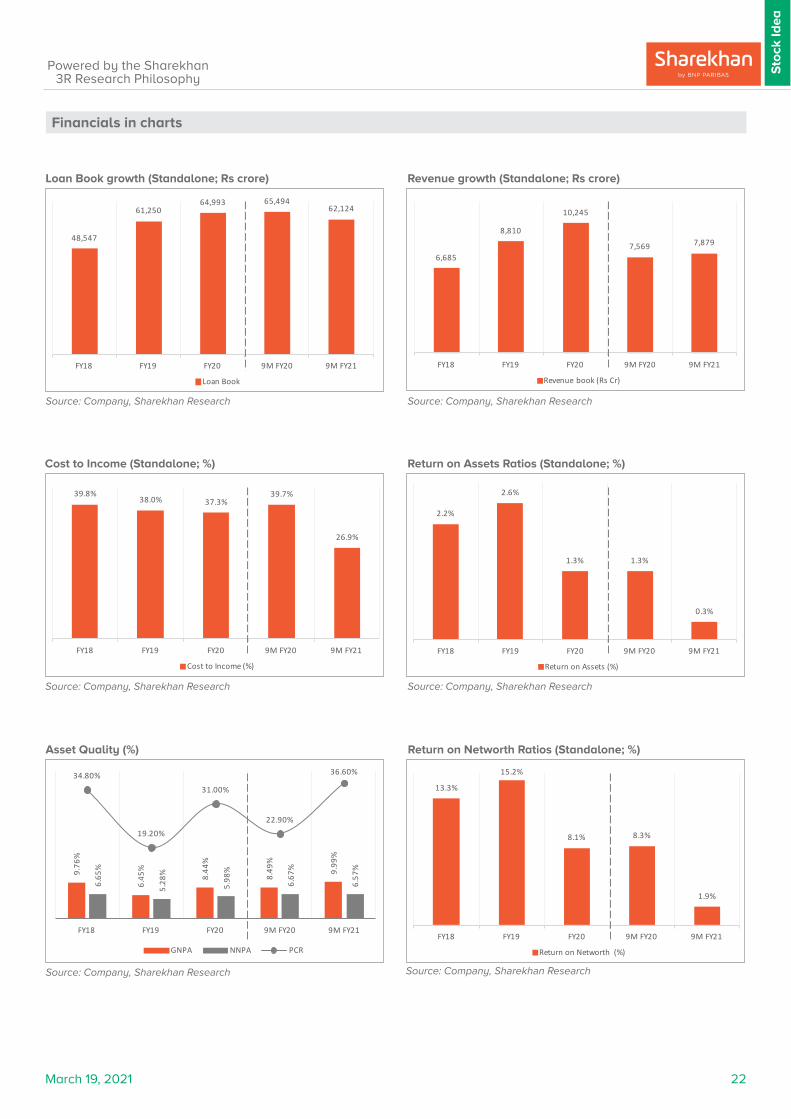
Cost to Income (Standalone; %)
Source: Company, Sharekhan Research
Revenue growth (Standalone; Rs crore)
Return on Assets Ratios (Standalone; %)
Source: Company, Sharekhan Research
Financials in charts
Loan Book growth (Standalone; Rs crore)
Source: Company, Sharekhan Research
Asset Quality (%)
Source: Company, Sharekhan Research
Return on Networth Ratios (Standalone; %)
Source: Company, Sharekhan Research
48,547
61,25064,993 65,494
62,124
FY18 FY19 FY20 9M FY20 9M FY21
Loan Book
6,685
8,810
10,245
7,569 7,879
FY18 FY19 FY20 9M FY20 9M FY21
Revenue book (Rs Cr)
39.8%38.0% 37.3%
39.7%
26.9%
FY18 FY19 FY20 9M FY20 9M FY21
Cost to Income (%)
2.2%
2.6%
1.3% 1.3%
0.3%
FY18 FY19 FY20 9M FY20 9M FY21
Return on Assets (%)
9.76
%
6.45
%
8.44
%
8.49
%
9.99
%
6.65
%
5.28
%
5.98
%
6.67
%
6.57
%
34.80%
19.20%
31.00%
22.90%
36.60%
FY18 FY19 FY20 9M FY20 9M FY21
GNPA NNPA PCR
13.3%
15.2%
8.1% 8.3%
1.9%
FY18 FY19 FY20 9M FY20 9M FY21
Return on Networth (%)

March 19, 2021 23
Sto
ck Id
ea
Powered by the Sharekhan3R Research Philosophy
Outlook and Valuation
n Sector View – Green shoots in the economy encouraging; Rural segment a bright spot
Post the unlocking of the economy, financial services companies are reporting an incremental pick-up in credit demand. Leading indicators specify recovery in economic activity, which will be positive. Higher MSPs, increased Kharif sowing, good monsoons, and adequate water storage position are leading to increased tractor demand and overall resilience of the rural economy; therefore, the rural economy continues to be a bright spot at these times as well. A recovery in the vehicle finance (VF) sector over the past six months has been encouraging, with lower funding costs and improving traction (including sub-segments), among other factors. Asset-quality trends have also improved, driven by managements’ assessment of a low restructuring pipeline. While the sector is not completely out of the woods, we expect a normalisation in H2CY2021. In this backdrop, aided by a strong parentage, highly rated and well-capitalised nimble NBFCs have ample growth opportunities as the market expands.
n Company Outlook – Strong fundamentals make it attractive
Mahindra & Mahindra Financial Services (MMFS) has transformed in the past decade from primarily a financing entity for vehicle purchases (from parent M&M) to a leading multi-product NBFC in India with a pan India presence, deep penetration and strong network with a rural focus. Going ahead, we believe factors like normalization in credit costs (MMFS has took significant upfront provision till Q3 FY2021; FY2022E to see normalized credit costs) and pickup in AUMs in FY22E and FY23E (aided by Auto sales pickup, GDP growth and improved capex cycle leading to disbursement growth) will aid earnings growth and ROE expansion. Hence, while the past few quarters have been a challenge (due to pandemic, economic slowdown etc) for growth and asset quality, we expect a rebound in earnings and ROE for MMFS in FY2022E and FY2023E which we believe would be triggers for re-rating of the stock. Asset quality wise, the improvement in Collections is positive, and we expect the trend to continue, as Q4 is seasonally best quarter in terms of collections on strong farm cash flows. Going forward, management guides to keep Net NPAs at sub 4% levels and maintain PCR at 35-36%. Company has restructured only 1% of AUM which is also a positive cushion. Its subsidiaries, namely Mahindra Rural Housing Finance (MRHF) is expected to be strong franchise in the long term. Its Insurance broking business, Mahindra Insurance Brokers (MIBL) is an asset light broking business and has strong fee income engine in its favour. We believe that strong subsidiaries also add to the company’s overall value.
n Valuation – Initiate with a Buy, with a Price Target (PT) of Rs. 260
At CMP, the stock is available at 1.9x / 1.8x FY2022E / FY2023E on the standalone ABVPS, which we find attractive, given the improving growth outlook (resumption of economic activity, support from a resilient rural segment etc). We expect disbursements to grow in H2 FY22E and expect an AUM growth of ~10% / 15% for FY2022E & FY2023E. The asset quality outlook is improving, with collection efficiency surging to 96% in December (from 82% in October); the November number too saw the m-o-m improvement continuing. The management has indicated that <1% of portfolio can be potentially restructured, which is manageable; and improving cost of funds will be positive for NIMs. We expect operating expenses to AUM ratio to be 2.8-2.5% range and RoE improving to 8% and 10%, respectively for FY2022E and FY2023E. We believe that the buoyancy in rural markets augurs well for commercial vehicle (CV) financiers, and coupled with business benefits from a strong parentage, a well-capitalised balance sheet and rigorous risk management practices (provides long-term visibility) offer scope for improving operating leverage and Return ratios, which provides additional comfort. We initiate with a Buy rating on the stock with price target of Rs. 260.
Source: Sharekhan Research
One-year forward P/BV (x) band
0.50
0.75
1.00
1.25
1.50
1.75
2.00
Mar
-16
Jun-
16
Sep-
16
Dec
-16
Mar
-17
Jun-
17
Sep-
17
Dec
-17
Mar
-18
Jun-
18
Sep-
18
Dec
-18
Mar
-19
Jun-
19
Sep-
19
Dec
-19
Mar
-20
Jun-
20
Sep-
20
Dec
-20
Mar
-21
PBV +1sd -1 Sd 3-yr Avg
Peer Comparison
ParticularsCMP P/BVPS (x) P/EPS (x) RoE (%) RoA (%)
Rs/Share FY22E FY23E FY22E FY23E FY22E FY23E FY22E FY23E
M&M Financial 202 1.5 1.4 19.8 13.8 7.8 10.3 1.5 1.8
Cholamandalam Investment 527 3.6 3.0 18.8 16.0 21.2 20.9 3.0 3.0
Shriram Transport Finance 1,327 1.4 1.2 10.9 9.1 13.2 14.1 2.4 2.6
Sundaram Finance 2,499 4.0 3.5 29.4 23.3 14.5 16.2 2.7 3.1
Source: Company, Sharekhan research

March 19, 2021 24
Sto
ck Id
ea
Powered by the Sharekhan3R Research Philosophy
Financials
Statement of Profit and Loss Rs cr
Particulars FY2019 FY2020 FY2021E FY2022E FY2023E
Total revenue from operations 8,723 10,098 10,474 10,973 11,965
Other income 87 147 155 162 171
Total income 8,810 10,245 10,628 11,135 12,136
Finance costs 3,945 4,829 4,579 4,830 5,439
Net Interest income 4,757 5,210 5,825 6,068 6,445
Expenses - - - - -
Fees and commission expense 30 41 42 46 53
Employee benefits expenses 1,090 1,148 1,120 1,141 1,162
Depreciation, amortization and impairment 60 118 121 123 125
Others expenses 667 710 575 632 727
Pre-Provisions Operating Profit 3,018 3,398 4,192 4,364 4,630
Impairment on financial instruments 635 2,054 3,055 2,652 2,188
Exceptional items - - - - -
Profit before tax 2,382 1,344 1,137 1,712 2,442
Source: Company; Sharekhan estimates
Key Ratios
Others Parameters FY2019 FY2020 FY2021E FY2022E FY2023E
Tax / PBT 34.6% 32.5% 26.2% 26.2% 26.2%
Cost / Income 38.0% 37.3% 30.7% 30.8% 30.9%
Opex / AUM 3.0% 3.1% 2.8% 2.7% 2.5%
Total Income / Avg. Assets 14.7% 14.5% 13.9% 13.5% 13.1%
Intest Exp. / Avg. Assets 6.6% 6.8% 6.0% 5.8% 5.9%
Gross Spread 8.1% 7.7% 7.9% 7.6% 7.2%
Overheads / Avg. Assets 3.1% 2.9% 2.4% 2.3% 2.2%
W/o & NPA / Avg. Assets 1.1% 2.9% 4.0% 3.2% 2.4%
Net Spread 4.0% 1.9% 1.5% 2.1% 2.6%
NIMs 7.9% 7.4% 7.6% 7.3% 7.0%
RoE 14.3% 8.0% 5.5% 7.8% 10.3%
RoA 2.3% 1.2% 1.1% 1.5% 1.8%
Per Share Nos
EPS 25.3 14.7 6.8 10.2 14.6
Adj. BVPS 124.1 120.2 104.5 113.9 121.8
Asset Quality
GS-3% 5.9% 8.4% 9.2% 7.5% 6.0%
NS-3% 4.8% 6.0% 3.6% 3.0% 3.0%
Source: Company; Sharekhan estimates
March 19, 2021 25
Sto
ck Id
ea
Powered by the Sharekhan3R Research Philosophy
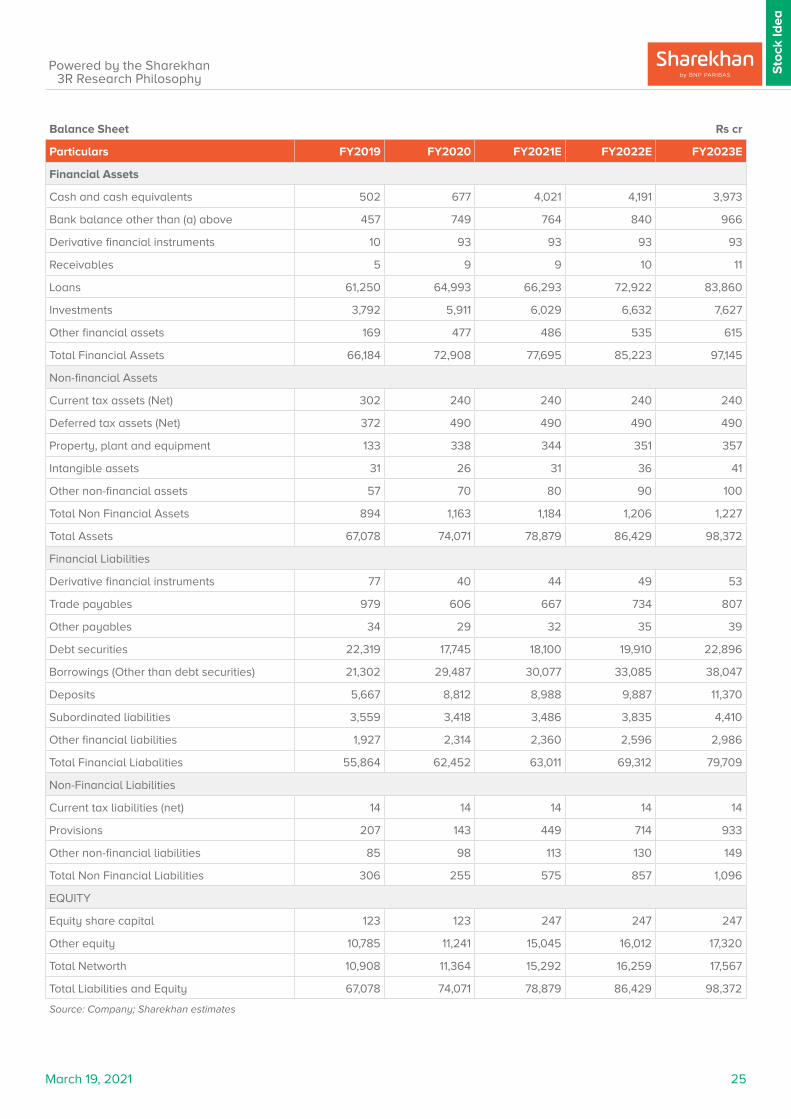
Balance Sheet Rs cr
Particulars FY2019 FY2020 FY2021E FY2022E FY2023E
Financial Assets
Cash and cash equivalents 502 677 4,021 4,191 3,973
Bank balance other than (a) above 457 749 764 840 966
Derivative financial instruments 10 93 93 93 93
Receivables 5 9 9 10 11
Loans 61,250 64,993 66,293 72,922 83,860
Investments 3,792 5,911 6,029 6,632 7,627
Other financial assets 169 477 486 535 615
Total Financial Assets 66,184 72,908 77,695 85,223 97,145
Non-financial Assets
Current tax assets (Net) 302 240 240 240 240
Deferred tax assets (Net) 372 490 490 490 490
Property, plant and equipment 133 338 344 351 357
Intangible assets 31 26 31 36 41
Other non-financial assets 57 70 80 90 100
Total Non Financial Assets 894 1,163 1,184 1,206 1,227
Total Assets 67,078 74,071 78,879 86,429 98,372
Financial Liabilities
Derivative financial instruments 77 40 44 49 53
Trade payables 979 606 667 734 807
Other payables 34 29 32 35 39
Debt securities 22,319 17,745 18,100 19,910 22,896
Borrowings (Other than debt securities) 21,302 29,487 30,077 33,085 38,047
Deposits 5,667 8,812 8,988 9,887 11,370
Subordinated liabilities 3,559 3,418 3,486 3,835 4,410
Other financial liabilities 1,927 2,314 2,360 2,596 2,986
Total Financial Liabalities 55,864 62,452 63,011 69,312 79,709
Non-Financial Liabilities
Current tax liabilities (net) 14 14 14 14 14
Provisions 207 143 449 714 933
Other non-financial liabilities 85 98 113 130 149
Total Non Financial Liabilities 306 255 575 857 1,096
EQUITY
Equity share capital 123 123 247 247 247
Other equity 10,785 11,241 15,045 16,012 17,320
Total Networth 10,908 11,364 15,292 16,259 17,567
Total Liabilities and Equity 67,078 74,071 78,879 86,429 98,372
Source: Company; Sharekhan estimates
March 19, 2021 26
Sto
ck Id
ea
Powered by the Sharekhan3R Research Philosophy
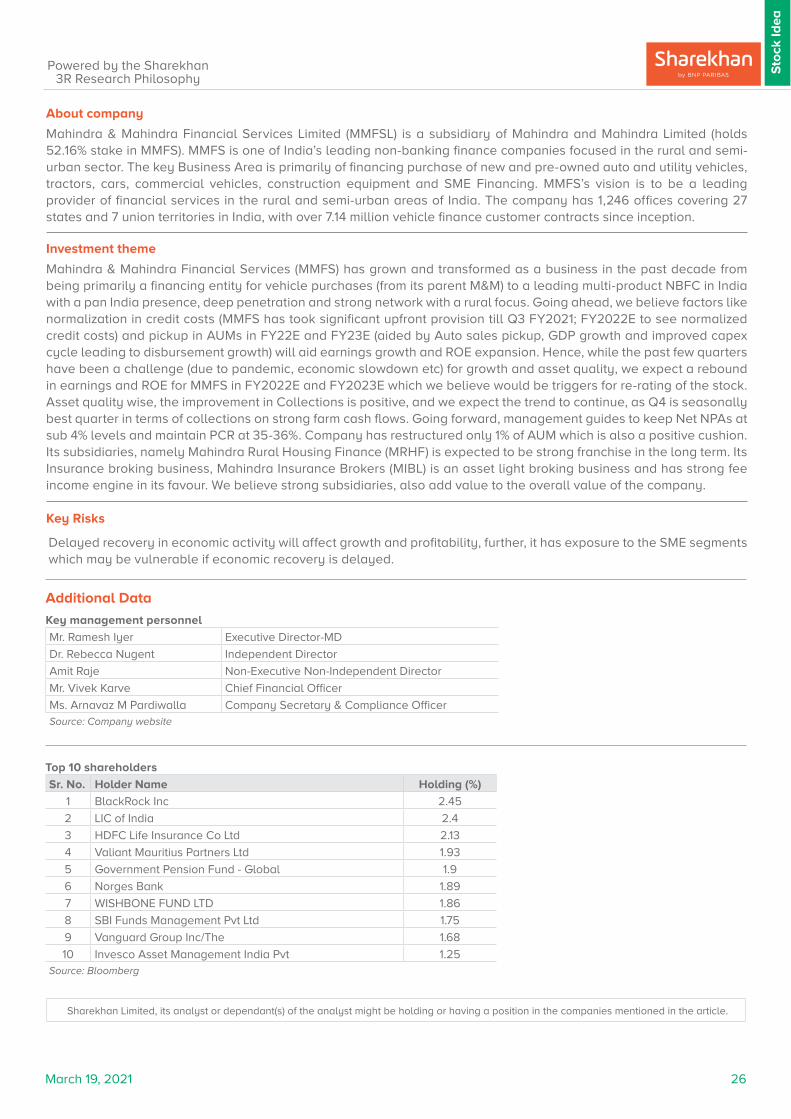
About company
Mahindra & Mahindra Financial Services Limited (MMFSL) is a subsidiary of Mahindra and Mahindra Limited (holds 52.16% stake in MMFS). MMFS is one of India’s leading non-banking finance companies focused in the rural and semi-urban sector. The key Business Area is primarily of financing purchase of new and pre-owned auto and utility vehicles, tractors, cars, commercial vehicles, construction equipment and SME Financing. MMFS’s vision is to be a leading provider of financial services in the rural and semi-urban areas of India. The company has 1,246 offices covering 27 states and 7 union territories in India, with over 7.14 million vehicle finance customer contracts since inception.
Investment theme
Mahindra & Mahindra Financial Services (MMFS) has grown and transformed as a business in the past decade from being primarily a financing entity for vehicle purchases (from its parent M&M) to a leading multi-product NBFC in India with a pan India presence, deep penetration and strong network with a rural focus. Going ahead, we believe factors like normalization in credit costs (MMFS has took significant upfront provision till Q3 FY2021; FY2022E to see normalized credit costs) and pickup in AUMs in FY22E and FY23E (aided by Auto sales pickup, GDP growth and improved capex cycle leading to disbursement growth) will aid earnings growth and ROE expansion. Hence, while the past few quarters have been a challenge (due to pandemic, economic slowdown etc) for growth and asset quality, we expect a rebound in earnings and ROE for MMFS in FY2022E and FY2023E which we believe would be triggers for re-rating of the stock. Asset quality wise, the improvement in Collections is positive, and we expect the trend to continue, as Q4 is seasonally best quarter in terms of collections on strong farm cash flows. Going forward, management guides to keep Net NPAs at sub 4% levels and maintain PCR at 35-36%. Company has restructured only 1% of AUM which is also a positive cushion. Its subsidiaries, namely Mahindra Rural Housing Finance (MRHF) is expected to be strong franchise in the long term. Its Insurance broking business, Mahindra Insurance Brokers (MIBL) is an asset light broking business and has strong fee income engine in its favour. We believe strong subsidiaries, also add value to the overall value of the company. Key Risks
Delayed recovery in economic activity will affect growth and profitability, further, it has exposure to the SME segments which may be vulnerable if economic recovery is delayed.
Additional Data
Key management personnel
Mr. Ramesh Iyer Executive Director-MD
Dr. Rebecca Nugent Independent Director
Amit Raje Non-Executive Non-Independent Director
Mr. Vivek Karve Chief Financial Officer
Ms. Arnavaz M Pardiwalla Company Secretary & Compliance OfficerSource: Company website
Top 10 shareholders
Sr. No. Holder Name Holding (%)
1 BlackRock Inc 2.45
2 LIC of India 2.4
3 HDFC Life Insurance Co Ltd 2.13
4 Valiant Mauritius Partners Ltd 1.93
5 Government Pension Fund - Global 1.9
6 Norges Bank 1.89
7 WISHBONE FUND LTD 1.86
8 SBI Funds Management Pvt Ltd 1.75
9 Vanguard Group Inc/The 1.68
10 Invesco Asset Management India Pvt 1.25Source: Bloomberg
Sharekhan Limited, its analyst or dependant(s) of the analyst might be holding or having a position in the companies mentioned in the article.
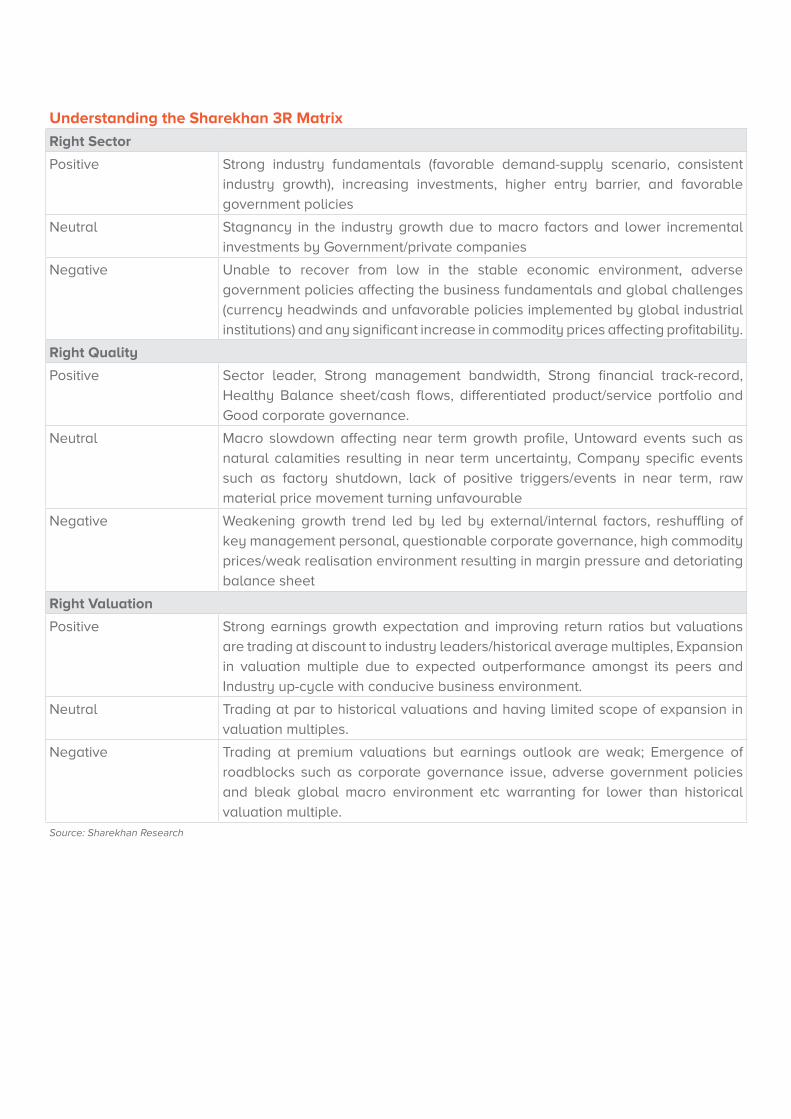
Understanding the Sharekhan 3R Matrix
Right Sector
Positive Strong industry fundamentals (favorable demand-supply scenario, consistent
industry growth), increasing investments, higher entry barrier, and favorable
government policies
Neutral Stagnancy in the industry growth due to macro factors and lower incremental
investments by Government/private companies
Negative Unable to recover from low in the stable economic environment, adverse
government policies affecting the business fundamentals and global challenges
(currency headwinds and unfavorable policies implemented by global industrial
institutions) and any significant increase in commodity prices affecting profitability.
Right Quality
Positive Sector leader, Strong management bandwidth, Strong financial track-record,
Healthy Balance sheet/cash flows, differentiated product/service portfolio and
Good corporate governance.
Neutral Macro slowdown affecting near term growth profile, Untoward events such as
natural calamities resulting in near term uncertainty, Company specific events
such as factory shutdown, lack of positive triggers/events in near term, raw
material price movement turning unfavourable
Negative Weakening growth trend led by led by external/internal factors, reshuffling of
key management personal, questionable corporate governance, high commodity
prices/weak realisation environment resulting in margin pressure and detoriating
balance sheet
Right Valuation
Positive Strong earnings growth expectation and improving return ratios but valuations
are trading at discount to industry leaders/historical average multiples, Expansion
in valuation multiple due to expected outperformance amongst its peers and
Industry up-cycle with conducive business environment.
Neutral Trading at par to historical valuations and having limited scope of expansion in
valuation multiples.
Negative Trading at premium valuations but earnings outlook are weak; Emergence of
roadblocks such as corporate governance issue, adverse government policies
and bleak global macro environment etc warranting for lower than historical
valuation multiple.Source: Sharekhan Research

Disclaimer: This document has been prepared by Sharekhan Ltd. (SHAREKHAN) and is intended for use only by the person or entity to which it is addressed to. This Document may contain confidential and/or privileged material and is not for any type of circulation and any review, retransmission, or any other use is strictly prohibited. This Document is subject to changes without prior notice. This document does not constitute an offer to sell or solicitation for the purchase or sale of any financial instrument or as an official confirmation of any transaction. Though disseminated to all customers who are due to receive the same, not all customers may receive this report at the same time. SHAREKHAN will not treat recipients as customers by virtue of their receiving this report.
The information contained herein is obtained from publicly available data or other sources believed to be reliable and SHAREKHAN has not independently verified the accuracy and completeness of the said data and hence it should not be relied upon as such. While we would endeavour to update the information herein on reasonable basis, SHAREKHAN, its subsidiaries and associated companies, their directors and employees (“SHAREKHAN and affiliates”) are under no obligation to update or keep the information current. Also, there may be regulatory, compliance, or other reasons that may prevent SHAREKHAN and affiliates from doing so. This document is prepared for assistance only and is not intended to be and must not alone be taken as the basis for an investment decision. Recipients of this report should also be aware that past performance is not necessarily a guide to future performance and value of investments can go down as well. The user assumes the entire risk of any use made of this information. Each recipient of this document should make such investigations as it deems necessary to arrive at an independent evaluation of an investment in the securities of companies referred to in this document (including the merits and risks involved), and should consult its own advisors to determine the merits and risks of such an investment. The investment discussed or views expressed may not be suitable for all investors. We do not undertake to advise you as to any change of our views. Affiliates of Sharekhan may have issued other reports that are inconsistent with and reach different conclusions from the information presented in this report.
This report is not directed or intended for distribution to, or use by, any person or entity who is a citizen or resident of or located in any locality, state, country or other jurisdiction, where such distribution, publication, availability or use would be contrary to law, regulation or which would subject SHAREKHAN and affiliates to any registration or licensing requirement within such jurisdiction. The securities described herein may or may not be eligible for sale in all jurisdictions or to certain category of investors. Persons in whose possession this document may come are required to inform themselves of and to observe such restriction.
The analyst certifies that the analyst has not dealt or traded directly or indirectly in securities of the company and that all of the views expressed in this document accurately reflect his or her personal views about the subject company or companies and its or their securities and do not necessarily reflect those of SHAREKHAN. The analyst further certifies that neither he or its associates or his relatives has any direct or indirect financial interest nor have actual or beneficial ownership of 1% or more in the securities of the company at the end of the month immediately preceding the date of publication of the research report nor have any material conflict of interest nor has served as officer, director or employee or engaged in market making activity of the company. Further, the analyst has also not been a part of the team which has managed or co-managed the public offerings of the company and no part of the analyst’s compensation was, is or will be, directly or indirectly related to specific recommendations or views expressed in this document. Sharekhan Limited or its associates or analysts have not received any compensation for investment banking, merchant banking, brokerage services or any compensation or other benefits from the subject company or from third party in the past twelve months in connection with the research report.
Either SHAREKHAN or its affiliates or its directors or employees / representatives / clients or their relatives may have position(s), make market, act as principal or engage in transactions of purchase or sell of securities, from time to time or may be materially interested in any of the securities or related securities referred to in this report and they may have used the information set forth herein before publication. SHAREKHAN may from time to time solicit from, or perform investment banking, or other services for, any company mentioned herein. Without limiting any of the foregoing, in no event shall SHAREKHAN, any of its affiliates or any third party involved in, or related to, computing or compiling the information have any liability for any damages of any kind.
Compliance Officer: Mr. Joby John Meledan; Tel: 022-61150000; email id: [email protected];
For any queries or grievances kindly email [email protected] or contact: [email protected]
Registered Office: Sharekhan Limited, 10th Floor, Beta Building, Lodha iThink Techno Campus, Off. JVLR, Opp. Kanjurmarg Railway Station, Kanjurmarg (East), Mumbai – 400042, Maharashtra. Tel: 022 - 61150000. Sharekhan Ltd.: SEBI Regn. Nos.: BSE / NSE / MSEI (CASH / F&O / CD) / MCX - Commodity: INZ000171337; DP: NSDL/CDSL-IN-DP-365-2018; PMS: INP000005786; Mutual Fund: ARN 20669; Research Analyst: INH000006183;
Disclaimer: Client should read the Risk Disclosure Document issued by SEBI & relevant exchanges and the T&C on www.sharekhan.com; Investment in securities market are subject to market risks, read all the related documents carefully before investing.
Know more about our products and services
For Private Circulation only