Ambuja Cements - Moneycontrol
10
18 February 2022 4QCY21 Results Update | Sector: Cement Ambuja Cements Sanjeev Kumar Singh - Research analyst ([email protected]) Investors are advised to refer through important disclosures made at the last page of the Research Report. Motilal Oswal research is available on www.motilaloswal.com/Institutional-Equities, Bloomberg, Thomson Reuters, Factset and S&P Capital. Estimate change TP change Rating change Bloomberg ACEM IN Equity Shares (m) 1,986 M.Cap.(INRb)/(USDb) 671.7 / 9 52-Week Range (INR) 443 / 261 1, 6, 12 Rel. Per (%) -6/-21/7 12M Avg Val (INR M) 1672 Free float (%) 36.9 Financial Snapshot (INR b) Y/E Dec 2021 2022E 2023E Sales 139.6 158.0 162.8 EBITDA 32.1 29.6 36.9 Adj. PAT 21.3 21.7 24.8 EBITDA Margin (%) 23.0 18.8 22.7 Adj. EPS (INR) 10.7 10.9 12.5 EPS Gr. (%) 18.9 1.9 14.4 BV/Sh. (INR) 111.8 116.3 121.8 Ratios Net D:E -0.2 -0.2 -0.2 RoE (%) 22.3 19.8 20.8 RoCE (%) 22.9 20.4 21.3 Payout (%) 60.1 59.5 56.0 Valuations P/E (x) 23.9 23.5 20.5 P/BV (x) 2.3 2.2 2.1 EV/EBITDA(x) 14.2 15.3 12.0 EV/ton (USD) 198.8 197.3 185.1 Div. Yield (%) 1.9 1.9 2.1 FCF Yield (%) 2.0 3.4 2.7 Shareholding pattern (%) As On Dec-21 Sep-21 Dec-20 Promoter 63.1 63.1 63.1 DII 15.3 13.6 11.8 FII 14.8 16.7 18.3 Others 6.7 6.6 6.8 FII Includes depository receipts CMP: INR338 TP: INR370 (+9%) Neutral Rising cost a challenge; new capex plans announced Higher energy costs impacted performance in 4QCY21 ACEM’s 4QCY21 result was significantly below our estimates due to higher variable costs (up 28% YoY and 25% QoQ). EBITDA stood at INR5.7b (est. INR6.7b). EBITDA/t came in at INR793 (est. INR1,043). Adjusted profit stood at INR3b (est. INR4.1b). As expected, increased opex (up 14% YoY) dented profitability. EBITDA fell 26% YoY, while adjusted profit (adjusted for an additional charge on restructuring cost) fell 40% YoY. We reduce our CY22E/CY23E EBITDA estimate by 15%/5%, considering a steep increase in energy costs. Our profit estimate for CY22E is being cut by a mere 6% (despite higher reduction in EBITDA), considering the higher dividend income from ACC. We reduce our CY23E profit estimate by 5%. The company has announced plans for increasing grinding capacities by 7mtpa in East India. Valuations at 15.3x/12x CY22/23E EV/EBITDA will restrict upside in the near term. We maintain our Neutral rating on ACEM. EBITDA/t at a 11-quarter low, OPM down 6.6pp YoY Standalone revenue/EBITDA/adjusted PAT stood at INR37.4b/INR5.7b/ INR3b (+6%/-26%/-40% YoY and +8%/-15%/-27% v/s our estimate). Sales volume rose 2% YoY to 7.2mt (est. 6.44mt). Realization grew 5% YoY (flat QoQ) to INR5,217/t (3% below our estimate). Opex/t rose 14% YoY and 8% QoQ led by increase in variable costs and other expense (up 17% YoY on higher branding, maintenance, and packaging costs). Employee cost declined by 4% YoY, leading to a 5% YoY drop in employee expense/t. EBITDA/t stood at INR793 (a 11 quarter low) v/s INR1,089/INR1,134 in 4QCY20/3QCY21. OPM fell 6.6pp YoY to 15.2%. Depreciation expense grew 35% YoY on commissioning of new capacity. Other income fell 16% YoY. In CY21, sales volume/realization increased by 19%/3% YoY, leading to a 23% YoY growth in revenue to INR139.6b. Opex/t rose 3% YoY. EBITDA increased by 21% YoY to INR32.1b. OPM stood at 23% v/s 23.3% in CY20; while EBITDA/t stood at INR1,187 v/s INR1,167. Adjusted PAT grew 19% YoY. The company announced a dividend of INR6.3/share. CFO/FCF stood at INR24.7b/INR13.2b v/s INR26.1b/INR16.3b in CY20. Capex in CY21 stood at INR11.6b v/s INR9.9b in CY20. Inventory days rose to 38 days v/s 24 days in CY20, primarily due to coal inventory.
-
Upload
khangminh22 -
Category
Documents
-
view
0 -
download
0
Transcript of Ambuja Cements - Moneycontrol

18 February 2022 4QCY21 Results Update | Sector: Cement
Ambuja Cements
Sanjeev Kumar Singh - Research analyst ([email protected])
Investors are advised to refer through important disclosures made at the last page of the Research Report. Motilal Oswal research is available on www.motilaloswal.com/Institutional-Equities, Bloomberg, Thomson Reuters, Factset and S&P Capital.
Estimate change TP change Rating change
Bloomberg ACEM IN Equity Shares (m) 1,986 M.Cap.(INRb)/(USDb) 671.7 / 9 52-Week Range (INR) 443 / 261 1, 6, 12 Rel. Per (%) -6/-21/7 12M Avg Val (INR M) 1672 Free float (%) 36.9
Financial Snapshot (INR b) Y/E Dec 2021 2022E 2023E Sales 139.6 158.0 162.8 EBITDA 32.1 29.6 36.9 Adj. PAT 21.3 21.7 24.8 EBITDA Margin (%) 23.0 18.8 22.7 Adj. EPS (INR) 10.7 10.9 12.5 EPS Gr. (%) 18.9 1.9 14.4 BV/Sh. (INR) 111.8 116.3 121.8 Ratios Net D:E -0.2 -0.2 -0.2RoE (%) 22.3 19.8 20.8 RoCE (%) 22.9 20.4 21.3 Payout (%) 60.1 59.5 56.0 Valuations P/E (x) 23.9 23.5 20.5 P/BV (x) 2.3 2.2 2.1 EV/EBITDA(x) 14.2 15.3 12.0 EV/ton (USD) 198.8 197.3 185.1 Div. Yield (%) 1.9 1.9 2.1 FCF Yield (%) 2.0 3.4 2.7
Shareholding pattern (%) As On Dec-21 Sep-21 Dec-20 Promoter 63.1 63.1 63.1 DII 15.3 13.6 11.8 FII 14.8 16.7 18.3 Others 6.7 6.6 6.8
FII Includes depository receipts
CMP: INR338 TP: INR370 (+9%) Neutral Rising cost a challenge; new capex plans announced Higher energy costs impacted performance in 4QCY21 ACEM’s 4QCY21 result was significantly below our estimates due to higher
variable costs (up 28% YoY and 25% QoQ). EBITDA stood at INR5.7b (est.INR6.7b). EBITDA/t came in at INR793 (est. INR1,043). Adjusted profit stoodat INR3b (est. INR4.1b).
As expected, increased opex (up 14% YoY) dented profitability. EBITDA fell26% YoY, while adjusted profit (adjusted for an additional charge onrestructuring cost) fell 40% YoY.
We reduce our CY22E/CY23E EBITDA estimate by 15%/5%, considering asteep increase in energy costs. Our profit estimate for CY22E is being cut bya mere 6% (despite higher reduction in EBITDA), considering the higherdividend income from ACC. We reduce our CY23E profit estimate by 5%.
The company has announced plans for increasing grinding capacities by7mtpa in East India. Valuations at 15.3x/12x CY22/23E EV/EBITDA willrestrict upside in the near term. We maintain our Neutral rating on ACEM.
EBITDA/t at a 11-quarter low, OPM down 6.6pp YoY Standalone revenue/EBITDA/adjusted PAT stood at INR37.4b/INR5.7b/
INR3b (+6%/-26%/-40% YoY and +8%/-15%/-27% v/s our estimate). Sales volume rose 2% YoY to 7.2mt (est. 6.44mt). Realization grew 5% YoY
(flat QoQ) to INR5,217/t (3% below our estimate). Opex/t rose 14% YoY and 8% QoQ led by increase in variable costs and other
expense (up 17% YoY on higher branding, maintenance, and packaging costs). Employee cost declined by 4% YoY, leading to a 5% YoY drop in employee expense/t.
EBITDA/t stood at INR793 (a 11 quarter low) v/s INR1,089/INR1,134 in 4QCY20/3QCY21. OPM fell 6.6pp YoY to 15.2%. Depreciation expense grew 35% YoY on commissioning of new capacity. Other income fell 16% YoY.
In CY21, sales volume/realization increased by 19%/3% YoY, leading to a 23%YoY growth in revenue to INR139.6b. Opex/t rose 3% YoY. EBITDA increased by 21% YoY to INR32.1b. OPM stood at 23% v/s 23.3% in CY20; while EBITDA/t stood at INR1,187 v/s INR1,167. Adjusted PAT grew 19% YoY. The company announced a dividend of INR6.3/share.
CFO/FCF stood at INR24.7b/INR13.2b v/s INR26.1b/INR16.3b in CY20. Capexin CY21 stood at INR11.6b v/s INR9.9b in CY20. Inventory days rose to 38days v/s 24 days in CY20, primarily due to coal inventory.

Ambuja Cements
18 February 2022 2
Highlights from the management commentary Grinding capacity expansion of 7mtpa has been planned in East India
considering the long-term growth potential of the region. Capacity utilization inthe eastern region is expected to touch 85% by CY25, with an increase in thecapacity share of top players (90% by CY25 v/s 82% now).
There was a 40km reduction in the direct lead distance, decrease in secondarylead, and higher direct dispatches in 4QCY21. Sales volume under the mastersupply agreement (MSA) with ACC rose 73% YoY in 4QCY21.
Cost savings of INR300/t have been achieved under the ‘I Can’ project in the lasttwo years. Green power fulfills 4% of its Power requirements at present and willrise to 25-28%. Alternate fuel usage (AFR) stands at 5% and will increase to15%/25% in the near/medium term.
Earnings under pressure on rising costs; maintain Neutral Change in the management’s strategy is visible as ACEM announced further
expansion plans in the eastern region. Clinker capacity will be raised by 3.2mtpaat Bhatapara (Chhattisgarh) and grinding capacity will be increased by 7mtpa(Sankrail and Farakka in West Bengal and Barh in Bihar). Capex for theseexpansions stand at INR35b.
The stock trades at 15.3x/12x CY22/CY23E EV/EBITDA (v/s its 10-year averageone-year forward EV/EBITDA of 12.3x). There remain near-term uncertainties inits earnings outlook as the industry has not been able to raise prices foroffsetting higher energy costs. We maintain our Neutral rating and value thestock at 13x CY23E EV/EBITDA to arrive at our TP of INR370.
Standalone quarterly performance (INR m) Y/E December CY20 CY21 CY20 CY21 CY21E Var.
1Q 2Q 3Q 4Q 1Q 2Q 3Q 4Q 4QE (%) Sales Volume (mt) 5.77 4.19 5.67 7.05 7.24 6.42 6.20 7.16 22.67 27.02 6.44 11
YoY Change (%) (10) (29) 8 8 25 53 9 2 (6) 19 (9) Cement Realization (INR/t) 4,783 5,119 4,942 4,919 4,943 5,206 5,150 5,138 4,929 5,105 5,284 (3)
YoY Change (%) 7 3 2 6 3 2 4 4 4 4 7 QoQ Change (%) 3 7 (3) (0) 0 5 (1) (0) 3
Net Sales 28,275 21,768 28,525 35,151 36,214 33,712 32,373 37,351 1,13,719 1,39,650 34,445 8 YoY Change (%) (3) (27) 9 12 28 55 13 6 (3) 23 (2)
EBITDA 6,033 5,952 6,803 7,678 9,768 9,597 7,032 5,679 26,466 32,075 6,715 (15) Margin (%) 21.3 27.3 23.9 21.8 27.0 28.5 21.7 15.2 23.3 23.0 19.5 (429)
Depreciation 1,379 1,289 1,287 1,257 1,254 1,304 1,257 1,698 5,212 5,512 1,514 12 Interest 231 183 185 233 204 239 215 252 831 909 192 32 Other Income 881 1,922 523 394 552 1,610 362 332 3,720 2,856 640 (48) PBT before EO Item 5,304 6,402 5,855 6,583 8,861 9,665 5,922 4,061 24,144 28,509 5,649 (28) Extraordinary Inc./(Exp.) 0 0 0 0 0 0 0 -657 0 -657 0 PBT after EO Exp./(Inc.) 5,304 6,402 5,855 6,583 8,861 9,665 5,922 3,404 24,144 27,853 5,649 (40) Tax 1,313 1,868 1,450 1,612 2,215 2,434 1,510 888 6,243 7,047 1,546
Rate (%) 24.8 29.2 24.8 24.5 25.0 25.2 25.5 26.1 25.9 25.3 27.4 Reported Profit 3,991 4,534 4,405 4,971 6,646 7,231 4,412 2,517 17,901 20,805 4,104 (39) Adj. PAT 3,991 4,534 4,405 4,971 6,646 7,231 4,412 2,990 17,901 21,278 4,104 (27)
YoY Change (%) (3) 1 71 52 67 59 0 (40) 24 19 (17)

Ambuja Cements
18 February 2022 3
CY20 CY21 CY21E Var. Per tonne analysis (INR/t) 1Q 2Q 3Q 4Q 1Q 2Q 3Q 4Q CY20 CY21 4QE (%) Volume (mt) 5.77 4.19 5.67 7.05 7.24 6.42 6.20 7.16 22.67 27.02 6.44 11
YoY Change (%) (10) (29) 8 8 25 53 9 2 (6) 19 (9) Blended Realization 4,900 5,195 5,031 4,986 5,002 5,251 5,221 5,217 5,016 5,168 5,351 (3)
YoY Change (%) 7.0 2.4 0.8 4.0 2.1 1.1 3.8 4.6 3.4 3.0 7.3 Raw Material 436 553 449 636 475 274 435 518 523 429 634 (18) Staff Cost 298 357 286 262 234 252 273 248 295 251 273 (9) Power & fuel 974 988 1,014 994 1,015 1,228 1,244 1,573 993 1,266 1,224 29 Freight 1,286 1,201 1,306 1,233 1,216 1,228 1,283 1,179 1,259 1,224 1,304 (10) Other expenditure 860 676 776 771 713 775 853 905 787 811 874 4 Total cost 3,855 3,775 3,831 3,897 3,653 3,756 4,087 4,424 3,858 3,981 4,308 3 EBITDA 1,046 1,421 1,200 1,089 1,349 1,495 1,134 793 1,158 1,187 1,043 (24)
YoY Change (%) 44 19 43 30 29 5 (5) (27) 30 2 (4)
Source: Company, MOFSL
Highlights from the management commentary View on demand and expansion in East India The management is optimistic on a demand recovery, led by the need for
housing and better infrastructure as India’s population is expected to increase(1.5b by CY30 from 1.37b at present). The rising number of people in urbanareas will also help drive demand for Cement.
The management believes that Cement demand in East India (market size:90mtpa, 26% of domestic consumption) will grow at 8-9% CAGR as the regionhas very low per capita consumption. Capacity utilization in the region isexpected to be 85% by CY25. This region is well consolidated and top playersaccount for 82% of installed capacities, which should increase to 90% by CY25.Capacity expansion in this region will arrest the market share decline for ACCand ACEM in the medium term.
Operational highlights The management’s focus is on blended Cement production and not on OPC.
Production of blended Cement is currently at 89% and is expected to remain atsimilar levels going forward.
Sales volume break-up in CY21 | North West: 20%, South West: 24%, North:35%, and East: 21%.
The sale of high margin premium products stood at 15% of volumes in CY21 v/s8% two years back.
Other expense was higher due to increase in brand promotion expenses and risein packaging and maintenance costs.
There has been a significant improvement in Logistics cost, a 40km reduction indirect lead distance, decrease in secondary lead, and higher direct dispatches in4QCY21.
Capex Bhatapara’s clinker capacity will be 10,000tpd, along with a Waste Heat
Recovery System (WHRS) of 17MW, apart from the one being commissioned forits existing plant. Barh (Bihar) grinding unit will have a capacity of 3mtpa and willproduce 100% fly ash-based Cement (NTPC mega Power plant is near this plant).

Ambuja Cements
18 February 2022 4
Capacity of Sankarail and Farakka grinding units will be raised by 1.6mtpa each(but equipment guarantee will be much higher). Clinker will be supplied fromBhatapara to all these grinding units. Capex for these expansions will be INR35b.
The delivered cost of Bhatapara to markets in East India is lower than that of theJamul plant. The company requires long term mining deposits that are availableat Bhatapara. In terms of cost structure, Bhatapara is superior compared tomost other plants of ACEM.
Clinker capacity expansion of 1.5mtpa, at its existing grinding unit at Ropar(Punjab), will be completed in CY23. The management is also consideringdebottlenecking initiatives across various plants.
Cost savings and ESG initiatives Sales volume under the MSA with ACC rose 73% YoY in 4QCY21. The
management is exploring other areas where cost savings can be achieved (e.g.standard equipment for future expansions).
Cost savings of INR300/t have been achieved under its ‘I Can’ project in the lasttwo years.
A WHRS of 54MW is under implementation at Darlaghat, Bhatapara, andMarwar plants. The management is considering setting up WHRS units atAmbujanagar and Maratha plants.
Green power fulfills 4% of its power requirements at present, but will rise to 25-28%. AFR is currently at 5% and will rise to 15%/25% in the near/medium term.Bhatapara will consume 25% of AFR and has the potential to rise to 50% of AFR.
ACEM has one of the lowest clinker factors in the industry. It is also 8x waterpositive, which is the highest in the industry. It aims to become 10x waterpositive over the next few years.
The management targets to reduce its carbon footprint over the next seven-to-eight years (CO2 emission target of 453kg/t of cement v/s 529kg in CY21).
Exhibit 1: Revisions in our estimates Revised Earlier Change (%)
CY22E CY23E CY22E CY23E CY22E CY23E Assumptions – standalone Sales volume (mt) 29.2 30.6 27.6 29.0 6 6 Realization (INR/t) 5,355 5,255 5,369 5,369 (0) (2) Energy cost (INR/t) 1,583 1,187 1,336 1,176 18 1 EBITDA/t (INR) 1,016 1,205 1,262 1,344 (20) (10) Standalone (INR m) Net Sales 1,56,259 1,61,008 1,48,260 1,55,673 5 3 EBITDA 29,644 36,914 34,847 38,953 (15) (5) PAT 21,692 24,824 23,116 26,155 (6) (5) EPS (INR) 10.9 12.5 11.6 13.2 (6) (5)

Ambuja Cements
18 February 2022 5
Story in charts
Exhibit 2: Sales volume (including clinker) up 2% YoY
Source: Company, MOFSL
Exhibit 3: Blended realization up 5% YoY, flat QoQ
Source: Company, MOFSL
Exhibit 4: Opex/t up 14% YoY on 28% higher variable cost
Source: Company, MOFSL
Exhibit 5: EBITDA/t falls 27% YoY and 30% QoQ
Source: Company, MOFSL
Exhibit 6: Key performance indicators – per ton analysis INR/t 4QCY21 4QCY20 YoY (%) 3QCY21 QoQ (%) Blended Realization 5,217 4,986 5 5,221 (0) Raw Material 518 636 (19) 435 19 Staff Cost 248 262 (5) 273 (9) Power and Fuel 1,573 994 58 1,244 26 Freight 1,179 1,233 (4) 1,283 (8) Other exp. 905 916 (1) 853 6 Total Cost 4,424 3,897 14 4,087 8 EBITDA 793 1,089 (27) 1,134 (30)
Source: Company, MOFSL
Exhibit 7: One-year forward EV/EBITDA chart
Source: Company, MOFSL
Exhibit 8: One-year forward EV/t chart
Source: Company, MOFSL
6.4 5.9 5.3 6.5 5.8 4.2 5.7 7.1 7.2 6.4 6.2 7.2
2 (8) (4)
7 (10)
(29)
8 8 25
53
9 2
1QCY
19
2QCY
19
3QCY
19
4QCY
19
1QCY
20
2QCY
20
3QCY
20
4QCY
20
1QCY
21
2QCY
21
3QCY
21
4QCY
21
Sales Volume (mt) YoY change (%)
4,58
2
5,07
4
4,99
3
4,79
5
4,90
0
5,19
5
5,03
1
4,98
6
5,00
2
5,25
1
5,22
1
5,21
7
0
7
5 3
7
2 1
4 2
1
4 5
1QCY
19
2QCY
19
3QCY
19
4QCY
19
1QCY
20
2QCY
20
3QCY
20
4QCY
20
1QCY
21
2QCY
21
3QCY
21
4QCY
21
Realization (INR/t) YoY change (%)
3,85
7
3,88
4
4,15
6
3,95
8
3,85
5
3,77
5
3,83
1
3,89
7
3,65
3
3,75
6
4,08
7
4,42
4
1QCY
19
2QCY
19
3QCY
19
4QCY
19
1QCY
20
2QCY
20
3QCY
20
4QCY
20
1QCY
21
2QCY
21
3QCY
21
4QCY
21
Opex/t (INR)72
5
1,19
0
836
837
1,04
6
1,42
1
1,20
0
1,08
9
1,34
9
1,49
5
1,13
4
793
1QCY
19
2QCY
19
3QCY
19
4QCY
19
1QCY
20
2QCY
20
3QCY
20
4QCY
20
1QCY
21
2QCY
21
3QCY
21
4QCY
21
EBITDA (INR/t)
15.0
20.1
12.3
5.7
0
6
12
18
24
Feb-
11
Feb-
12
Feb-
13
Feb-
14
Feb-
15
Feb-
16
Feb-
17
Feb-
18
Feb-
19
Feb-
20
Feb-
21
Feb-
22
EV/EBITDA(x) Peak(x) Avg(x) Min(x)
197
267
142
78 40
100
160
220
280
Feb-
11
Feb-
12
Feb-
13
Feb-
14
Feb-
15
Feb-
16
Feb-
17
Feb-
18
Feb-
19
Feb-
20
Feb-
21
Feb-
22
EV/ton (USD) Max Avg Min
Ambuja Cements
18 February 2022 6
Standalone financials and valuations
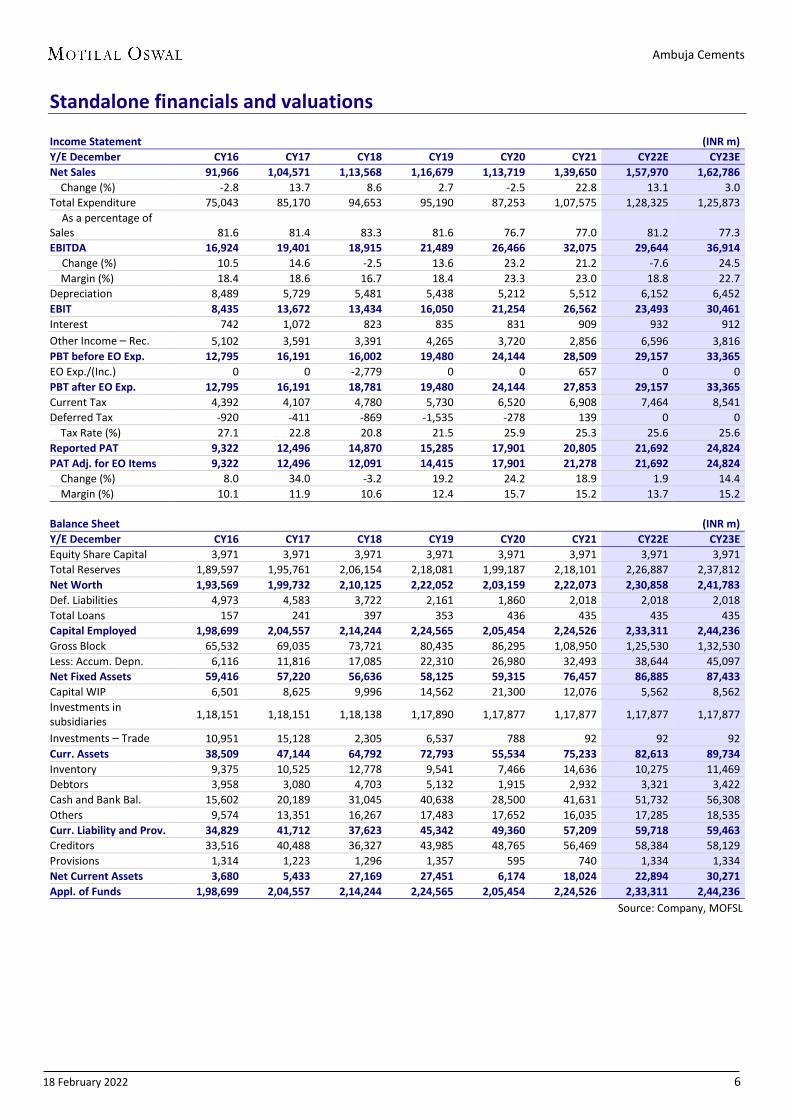
Income Statement (INR m) Y/E December CY16 CY17 CY18 CY19 CY20 CY21 CY22E CY23E Net Sales 91,966 1,04,571 1,13,568 1,16,679 1,13,719 1,39,650 1,57,970 1,62,786 Change (%) -2.8 13.7 8.6 2.7 -2.5 22.8 13.1 3.0 Total Expenditure 75,043 85,170 94,653 95,190 87,253 1,07,575 1,28,325 1,25,873
As a percentage of Sales 81.6 81.4 83.3 81.6 76.7 77.0 81.2 77.3 EBITDA 16,924 19,401 18,915 21,489 26,466 32,075 29,644 36,914
Change (%) 10.5 14.6 -2.5 13.6 23.2 21.2 -7.6 24.5 Margin (%) 18.4 18.6 16.7 18.4 23.3 23.0 18.8 22.7 Depreciation 8,489 5,729 5,481 5,438 5,212 5,512 6,152 6,452 EBIT 8,435 13,672 13,434 16,050 21,254 26,562 23,493 30,461 Interest 742 1,072 823 835 831 909 932 912 Other Income – Rec. 5,102 3,591 3,391 4,265 3,720 2,856 6,596 3,816 PBT before EO Exp. 12,795 16,191 16,002 19,480 24,144 28,509 29,157 33,365 EO Exp./(Inc.) 0 0 -2,779 0 0 657 0 0 PBT after EO Exp. 12,795 16,191 18,781 19,480 24,144 27,853 29,157 33,365 Current Tax 4,392 4,107 4,780 5,730 6,520 6,908 7,464 8,541 Deferred Tax -920 -411 -869 -1,535 -278 139 0 0 Tax Rate (%) 27.1 22.8 20.8 21.5 25.9 25.3 25.6 25.6 Reported PAT 9,322 12,496 14,870 15,285 17,901 20,805 21,692 24,824 PAT Adj. for EO Items 9,322 12,496 12,091 14,415 17,901 21,278 21,692 24,824 Change (%) 8.0 34.0 -3.2 19.2 24.2 18.9 1.9 14.4 Margin (%) 10.1 11.9 10.6 12.4 15.7 15.2 13.7 15.2
Balance Sheet (INR m) Y/E December CY16 CY17 CY18 CY19 CY20 CY21 CY22E CY23E Equity Share Capital 3,971 3,971 3,971 3,971 3,971 3,971 3,971 3,971 Total Reserves 1,89,597 1,95,761 2,06,154 2,18,081 1,99,187 2,18,101 2,26,887 2,37,812 Net Worth 1,93,569 1,99,732 2,10,125 2,22,052 2,03,159 2,22,073 2,30,858 2,41,783 Def. Liabilities 4,973 4,583 3,722 2,161 1,860 2,018 2,018 2,018 Total Loans 157 241 397 353 436 435 435 435 Capital Employed 1,98,699 2,04,557 2,14,244 2,24,565 2,05,454 2,24,526 2,33,311 2,44,236 Gross Block 65,532 69,035 73,721 80,435 86,295 1,08,950 1,25,530 1,32,530 Less: Accum. Depn. 6,116 11,816 17,085 22,310 26,980 32,493 38,644 45,097 Net Fixed Assets 59,416 57,220 56,636 58,125 59,315 76,457 86,885 87,433 Capital WIP 6,501 8,625 9,996 14,562 21,300 12,076 5,562 8,562 Investments in subsidiaries 1,18,151 1,18,151 1,18,138 1,17,890 1,17,877 1,17,877 1,17,877 1,17,877
Investments – Trade 10,951 15,128 2,305 6,537 788 92 92 92 Curr. Assets 38,509 47,144 64,792 72,793 55,534 75,233 82,613 89,734 Inventory 9,375 10,525 12,778 9,541 7,466 14,636 10,275 11,469 Debtors 3,958 3,080 4,703 5,132 1,915 2,932 3,321 3,422 Cash and Bank Bal. 15,602 20,189 31,045 40,638 28,500 41,631 51,732 56,308 Others 9,574 13,351 16,267 17,483 17,652 16,035 17,285 18,535 Curr. Liability and Prov. 34,829 41,712 37,623 45,342 49,360 57,209 59,718 59,463 Creditors 33,516 40,488 36,327 43,985 48,765 56,469 58,384 58,129 Provisions 1,314 1,223 1,296 1,357 595 740 1,334 1,334 Net Current Assets 3,680 5,433 27,169 27,451 6,174 18,024 22,894 30,271 Appl. of Funds 1,98,699 2,04,557 2,14,244 2,24,565 2,05,454 2,24,526 2,33,311 2,44,236 Source: Company, MOFSL

Ambuja Cements
18 February 2022 7
Standalone financials and valuations
Ratios Y/E December CY16 CY17 CY18 CY19 CY20 CY21 CY22E CY23E Basic (INR) EPS 4.7 6.3 6.1 7.3 9.0 10.7 10.9 12.5 Cash EPS 9.0 9.2 8.8 10.0 11.6 13.5 14.0 15.8 BV/Share 97.5 100.6 105.8 111.8 102.3 111.8 116.3 121.8 DPS 2.8 3.6 1.5 1.5 18.5 6.3 6.5 7.0 Payout (%) 68.5 64.9 22.3 19.5 205.2 60.1 59.5 56.0 Valuation (x) P/E 42.1 35.3 28.4 23.9 23.5 20.5 Cash P/E 29.0 25.6 22.0 19.0 18.3 16.3 P/BV 2.4 2.3 2.5 2.3 2.2 2.1 EV/Sales 4.1 3.8 4.0 3.3 2.9 2.7 EV/EBITDA 24.6 20.8 17.3 14.2 15.3 12.0 EV/t (Cap) - USD 216 207 212 199 197 185 Dividend Yield (%) 0 0 5 2 1.9 2.1 Return Ratios (%) RoE 30.9 15.9 13.9 14.7 18.7 22.3 19.8 20.8 RoCE 11.0 16.8 15.2 16.1 19.3 22.9 20.4 21.3 RoIC 9.4 18.2 18.9 23.6 35.3 43.7 31.5 37.9 Working Capital Ratios Asset Turnover (x) 0.5 0.5 0.5 0.5 0.6 0.6 0.7 0.7 Debtor (Days) 15.7 10.7 15.1 16.1 6.1 7.7 7.7 7.7 Inventory (Days) 37 37 41 30 24 38 24 26 Work Cap (Days) 14.6 19.0 87.3 85.9 19.8 47.1 52.9 67.9 Leverage Ratio (x) Current Ratio 1.1 1.1 1.7 1.6 1.1 1.3 1.4 1.5 Debt/Equity ratio 0.0 0.0 0.0 0.0 0.0 0.0 0.0 0.0
Cash Flow Statement (INR m) Y/E December CY16 CY17 CY18 CY19 CY20 CY21 CY22E CY23E OP/(Loss) before Tax 12,795 16,191 15,061 19,480 24,144 27,853 29,157 33,365 Depreciation 8,489 5,729 5,481 5,438 5,212 5,512 6,152 6,452 Interest and Finance Charges -1,247 -58 -709 -1,515 0 0 0 Direct Taxes Paid -3,187 -3,101 -6,251 -808 -4,648 -3,629 -7,464 -8,541(Inc.)/Dec. in WC 325 2,136 -6,166 3,877 3,676 -4,615 5,231 -2,801CF from Operations 17,173 20,898 7,416 26,472 28,383 25,121 33,075 28,475 Others -3,015 -2,356 -2,406 -3,147 -2,321 -459 0 0 CF from Operations incl. EO 14,158 18,541 5,009 23,325 26,062 24,663 33,075 28,475 (Inc.)/Dec. in FA -3,832 -5,427 -5,936 -11,114 -9,756 -11,425 -10,067 -10,000Free Cash Flow 10,327 13,115 -927 12,211 16,307 13,238 23,008 18,475 (Pur.)/Sale of Investments -30,859 3,468 3,393 3,734 3,342 2,607 0 0 Others 14,253 -4,509 13,174 -2,484CF from Investments -20,438 -6,468 10,631 -9,864 -6,414 -8,818 -10,067 -10,000Issue of Shares 868 0 0 0 0 0 0 0 Inc./(Dec.) in Debt -957 -793 216 0 -237 -275 0 0 Interest Paid -360 -1,143 -513 -558 -633 -908 0 0 Dividend Paid -5,516 -5,550 -4,498 -3,320 -36,646 -2,021 -12,907 -13,900Others -868 0 12 11 -88 35 0 0 CF from Fin. Activity -6,833 -7,487 -4,784 -3,868 -37,604 -3,168 -12,907 -13,900Inc./Dec. in Cash -13,112 4,587 10,856 9,593 -17,956 12,677 10,102 4,576 Opening Balance 28,714 15,602 20,189 31,045 40,638 28,500 41,631 51,732 Closing Balance 15,603 20,189 31,045 40,638 22,681 41,177 51,732 56,308
Source: Company, MOFSL

Ambuja Cements
18 February 2022 8
N O T E S

Ambuja Cements
18 February 2022 9
Explanation of Investment Rating Investment Rating Expected return (over 12-month) BUY >=15% SELL < - 10% NEUTRAL < - 10 % to 15% UNDER REVIEW Rating may undergo a change NOT RATED We have forward looking estimates for the stock but we refrain from assigning recommendation *In case the recommendation given by the Research Analyst is inconsistent with the investment rating legend for a continuous period of 30 days, the Research Analyst shall within following 30 days take appropriate measures to make the recommendation consistent with the investment rating legend. Disclosures The following Disclosures are being made in compliance with the SEBI Research Analyst Regulations 2014 (herein after referred to as the Regulations). Motilal Oswal Financial Services Ltd. (MOFSL) is a SEBI Registered Research Analyst having registration no. INH000000412. MOFSL, the Research Entity (RE) as defined in the Regulations, is engaged in the business of providing Stock broking services, Investment Advisory Services, Depository participant services & distribution of various financial products. MOFSL is a subsidiary company of Passionate Investment Management Pvt. Ltd.. (PIMPL). MOFSL is a listed public company, the details in respect of which are available on www.motilaloswal.com. MOFSL (erstwhile Motilal Oswal Securities Limited - MOSL) is registered with the Securities & Exchange Board of India (SEBI) and is a registered Trading Member with National Stock Exchange of India Ltd. (NSE) and Bombay Stock Exchange Limited (BSE), Multi Commodity Exchange of India Limited (MCX) and National Commodity & Derivatives Exchange Limited (NCDEX) for its stock broking activities & is Depository participant with Central Depository Services Limited (CDSL) National Securities Depository Limited (NSDL),NERL, COMRIS and CCRL and is member of Association of Mutual Funds of India (AMFI) for distribution of financial products and Insurance Regulatory & Development Authority of India (IRDA) as Corporate Agent for insurance products. Details of associate entities of Motilal Oswal Financial Services Limited are available on the website at http://onlinereports.motilaloswal.com/Dormant/documents/List%20of%20Associate%20companies.pdf MOFSL and its associate company(ies), their directors and Research Analyst and their relatives may; (a) from time to time, have a long or short position in, act as principal in, and buy or sell the securities or derivatives thereof of companies mentioned herein. (b) be engaged in any other transaction involving such securities and earn brokerage or other compensation or act as a market maker in the financial instruments of the company(ies) discussed herein or act as an advisor or lender/borrower to such company(ies) or may have any other potential conflict of interests with respect to any recommendation and other related information and opinions.; however the same shall have no bearing whatsoever on the specific recommendations made by the analyst(s), as the recommendations made by the analyst(s) are completely independent of the views of the associates of MOFSL even though there might exist an inherent conflict of interest in some of the stocks mentioned in the research report MOFSL and / or its affiliates do and seek to do business including investment banking with companies covered in its research reports. As a result, the recipients of this report should be aware that MOFSL may have a potential conflict of interest that may affect the objectivity of this report. Compensation of Research Analysts is not based on any specific merchant banking, investment banking or brokerage service transactions. Details of pending Enquiry Proceedings of Motilal Oswal Financial Services Limited are available on the website at https://galaxy.motilaloswal.com/ResearchAnalyst/PublishViewLitigation.aspx A graph of daily closing prices of securities is available at www.nseindia.com, www.bseindia.com. Research Analyst views on Subject Company may vary based on Fundamental research and Technical Research. Proprietary trading desk of MOFSL or its associates maintains arm’s length distance with Research Team as all the activities are segregated from MOFSL research activity and therefore it can have an independent view with regards to Subject Company for which Research Team have expressed their views. Regional Disclosures (outside India) This report is not directed or intended for distribution to or use by any person or entity resident in a state, country or any jurisdiction, where such distribution, publication, availability or use would be contrary to law, regulation or which would subject MOFSL & its group companies to registration or licensing requirements within such jurisdictions. For Hong Kong: This report is distributed in Hong Kong by Motilal Oswal capital Markets (Hong Kong) Private Limited, a licensed corporation (CE AYY-301) licensed and regulated by the Hong Kong Securities and Futures Commission (SFC) pursuant to the Securities and Futures Ordinance (Chapter 571 of the Laws of Hong Kong) “SFO”. As per SEBI (Research Analyst Regulations) 2014 Motilal Oswal Securities (SEBI Reg No. INH000000412) has an agreement with Motilal Oswal capital Markets (Hong Kong) Private Limited for distribution of research report in Hong Kong. This report is intended for distribution only to “Professional Investors” as defined in Part I of Schedule 1 to SFO. Any investment or investment activity to which this document relates is only available to professional investor and will be engaged only with professional investors.” Nothing here is an offer or solicitation of these securities, products and services in any jurisdiction where their offer or sale is not qualified or exempt from registration. The Indian Analyst(s) who compile this report is/are not located in Hong Kong & are not conducting Research Analysis in Hong Kong. For U.S. Motilal Oswal Financial Services Limited (MOFSL) is not a registered broker - dealer under the U.S. Securities Exchange Act of 1934, as amended (the"1934 act") and under applicable state laws in the United States. In addition MOFSL is not a registered investment adviser under the U.S. Investment Advisers Act of 1940, as amended (the "Advisers Act" and together with the 1934 Act, the "Acts), and under applicable state laws in the United States. Accordingly, in the absence of specific exemption under the Acts, any brokerage and investment services provided by MOFSL , including the products and services described herein are not available to or intended for U.S. persons. This report is intended for distribution only to "Major Institutional Investors" as defined by Rule 15a-6(b)(4) of the Exchange Act and interpretations thereof by SEC (henceforth referred to as "major institutional investors"). This document must not be acted on or relied on by persons who are not major institutional investors. Any investment or investment activity to which this document relates is only available to major institutional investors and will be engaged in only with major institutional investors. In reliance on the exemption from registration provided by Rule 15a-6 of the U.S. Securities Exchange Act of 1934, as amended (the "Exchange Act") and interpretations thereof by the U.S. Securities and Exchange Commission ("SEC") in order to conduct business with Institutional Investors based in the U.S., MOFSL has entered into a chaperoning agreement with a U.S. registered broker-dealer, Motilal Oswal Securities International Private Limited. ("MOSIPL"). Any business interaction pursuant to this report will have to be executed within the provisions of this chaperoning agreement. The Research Analysts contributing to the report may not be registered /qualified as research analyst with FINRA. Such research analyst may not be associated persons of the U.S. registered broker-dealer, MOSIPL, and therefore, may not be subject to NASD rule 2711 and NYSE Rule 472 restrictions on communication with a subject company, public appearances and trading securities held by a research analyst account. For Singapore In Singapore, this report is being distributed by Motilal Oswal Capital Markets Singapore Pte Ltd (“MOCMSPL”) (Co.Reg. NO. 201129401Z) which is a holder of a capital markets services license and an exempt financial adviser in Singapore.As per the approved agreement under Paragraph 9 of Third Schedule of Securities and Futures Act (CAP 289) and Paragraph 11 of First Schedule of Financial Advisors Act (CAP 110) provided to MOCMSPL by Monetary Authority of Singapore. Persons in Singapore should contact MOCMSPL in respect of any matter arising from, or in connection with this report/publication/communication. This report is distributed solely to persons who qualify as “Institutional Investors”, of which some of whom may consist of "accredited" institutional investors as defined in section 4A(1) of the Securities and Futures Act, Chapter 289 of Singapore (“the SFA”). Accordingly, if a Singapore person is not or ceases to be such an institutional investor, such Singapore Person must immediately discontinue any use of this Report and inform MOCMSPL. Specific Disclosures 1 MOFSL, Research Analyst and/or his relatives does not have financial interest in the subject company, as they do not have equity holdings in the subject company. 2 MOFSL, Research Analyst and/or his relatives do not have actual/beneficial ownership of 1% or more securities in the subject company 3 MOFSL, Research Analyst and/or his relatives have not received compensation/other benefits from the subject company in the past 12 months 4 MOFSL, Research Analyst and/or his relatives do not have material conflict of interest in the subject company at the time of publication of research report 5 Research Analyst has not served as director/officer/employee in the subject company 6 MOFSL has not acted as a manager or co-manager of public offering of securities of the subject company in past 12 months 7 MOFSL has not received compensation for investment banking/ merchant banking/brokerage services from the subject company in the past 12 months 8 MOFSL has not received compensation for other than investment banking/merchant banking/brokerage services from the subject company in the past 12 months 9 MOFSL has not received any compensation or other benefits from third party in connection with the research report 10 MOFSL has not engaged in market making activity for the subject company ******************************************************************************************************************************** The associates of MOFSL may have: - financial interest in the subject company - actual/beneficial ownership of 1% or more securities in the subject company - received compensation/other benefits from the subject company in the past 12 months - other potential conflict of interests with respect to any recommendation and other related information and opinions.; however the same shall have no bearing whatsoever on the specific
recommendations made by the analyst(s), as the recommendations made by the analyst(s) are completely independent of the views of the associates of MOFSL even though there might exist an inherent conflict of interest in some of the stocks mentioned in the research report.
- acted as a manager or co-manager of public offering of securities of the subject company in past 12 months - be engaged in any other transaction involving such securities and earn brokerage or other compensation or act as a market maker in the financial instruments of the company(ies) discussed herein or
act as an advisor or lender/borrower to such company(ies) - received compensation from the subject company in the past 12 months for investment banking / merchant banking / brokerage services or from other than said services.
The associates of MOFSL has not received any compensation or other benefits from third party in connection with the research report

Ambuja Cements
18 February 2022 10
Above disclosures include beneficial holdings lying in demat account of MOFSL which are opened for proprietary investments only. While calculating beneficial holdings, It does not consider demat accounts which are opened in name of MOFSL for other purposes (i.e holding client securities, collaterals, error trades etc.). MOFSL also earns DP income from clients which are not considered in above disclosures. Analyst Certification The views expressed in this research report accurately reflect the personal views of the analyst(s) about the subject securities or issues, and no part of the compensation of the research analyst(s) was, is, or will be directly or indirectly related to the specific recommendations and views expressed by research analyst(s) in this report. Terms & Conditions: This report has been prepared by MOFSL and is meant for sole use by the recipient and not for circulation. The report and information contained herein is strictly confidential and may not be altered in any way, transmitted to, copied or distributed, in part or in whole, to any other person or to the media or reproduced in any form, without prior written consent of MOFSL. The report is based on the facts, figures and information that are considered true, correct, reliable and accurate. The intent of this report is not recommendatory in nature. The information is obtained from publicly available media or other sources believed to be reliable. Such information has not been independently verified and no guaranty, representation of warranty, express or implied, is made as to its accuracy, completeness or correctness. All such information and opinions are subject to change without notice. The report is prepared solely for informational purpose and does not constitute an offer document or solicitation of offer to buy or sell or subscribe for securities or other financial instruments for the clients. Though disseminated to all the customers simultaneously, not all customers may receive this report at the same time. MOFSL will not treat recipients as customers by virtue of their receiving this report. Disclaimer: The report and information contained herein is strictly confidential and meant solely for the selected recipient and may not be altered in any way, transmitted to, copied or distributed, in part or in whole, to any other person or to the media or reproduced in any form, without prior written consent. This report and information herein is solely for informational purpose and may not be used or considered as an offer document or solicitation of offer to buy or sell or subscribe for securities or other financial instruments. Nothing in this report constitutes investment, legal, accounting and tax advice or a representation that any investment or strategy is suitable or appropriate to your specific circumstances. The securities discussed and opinions expressed in this report may not be suitable for all investors, who must make their own investment decisions, based on their own investment objectives, financial positions and needs of specific recipient. This may not be taken in substitution for the exercise of independent judgment by any recipient. Each recipient of this document should make such investigations as it deems necessary to arrive at an independent evaluation of an investment in the securities of companies referred to in this document (including the merits and risks involved), and should consult its own advisors to determine the merits and risks of such an investment. The investment discussed or views expressed may not be suitable for all investors. Certain transactions -including those involving futures, options, another derivative products as well as non-investment grade securities - involve substantial risk and are not suitable for all investors. No representation or warranty, express or implied, is made as to the accuracy, completeness or fairness of the information and opinions contained in this document. The Disclosures of Interest Statement incorporated in this document is provided solely to enhance the transparency and should not be treated as endorsement of the views expressed in the report. This information is subject to change without any prior notice. The Company reserves the right to make modifications and alternations to this statement as may be required from time to time without any prior approval. MOFSL, its associates, their directors and the employees may from time to time, effect or have effected an own account transaction in, or deal as principal or agent in or for the securities mentioned in this document. They may perform or seek to perform investment banking or other services for, or solicit investment banking or other business from, any company referred to in this report. Each of these entities functions as a separate, distinct and independent of each other. The recipient should take this into account before interpreting the document. This report has been prepared on the basis of information that is already available in publicly accessible media or developed through analysis of MOFSL. The views expressed are those of the analyst, and the Company may or may not subscribe to all the views expressed therein. This document is being supplied to you solely for your information and may not be reproduced, redistributed or passed on, directly or indirectly, to any other person or published, copied, in whole or in part, for any purpose. This report is not directed or intended for distribution to, or use by, any person or entity who is a citizen or resident of or located in any locality, state, country or other jurisdiction, where such distribution, publication, availability or use would be contrary to law, regulation or which would subject MOFSL to any registration or licensing requirement within such jurisdiction. The securities described herein may or may not be eligible for sale in all jurisdictions or to certain category of investors. Persons in whose possession this document may come are required to inform themselves of and to observe such restriction. Neither the Firm, not its directors, employees, agents or representatives shall be liable for any damages whether direct or indirect, incidental, special or consequential including lost revenue or lost profits that may arise from or in connection with the use of the information. The person accessing this information specifically agrees to exempt MOFSL or any of its affiliates or employees from, any and all responsibility/liability arising from such misuse and agrees not to hold MOFSL or any of its affiliates or employees responsible for any such misuse and further agrees to hold MOFSL or any of its affiliates or employees free and harmless from all losses, costs, damages, expenses that may be suffered by the person accessing this information due to any errors and delays. Registered Office Address: Motilal Oswal Tower, Rahimtullah Sayani Road, Opposite Parel ST Depot, Prabhadevi, Mumbai-400025; Tel No.: 022 71934200/ 022-71934263; Website www.motilaloswal.com.CIN no.: L67190MH2005PLC153397.Correspondence Office Address: Palm Spring Centre, 2nd Floor, Palm Court Complex, New Link Road, Malad(West), Mumbai- 400 064. Tel No: 022 7188 1000. Registration Nos.: Motilal Oswal Financial Services Limited (MOFSL)*: INZ000158836(BSE/NSE/MCX/NCDEX); CDSL and NSDL: IN-DP-16-2015; Research Analyst: INH000000412. AMFI: ARN - 146822; Investment Adviser: INA000007100; Insurance Corporate Agent: CA0579;PMS:INP000006712. Motilal Oswal Asset Management Company Ltd. (MOAMC): PMS (Registration No.: INP000000670); PMS and Mutual Funds are offered through MOAMC which is group company of MOFSL. Motilal Oswal Wealth Management Ltd. (MOWML): PMS (Registration No.: INP000004409) is offered through MOWML, which is a group company of MOFSL. Motilal Oswal Financial Services Limited is a distributor of Mutual Funds, PMS, Fixed Deposit, Bond, NCDs,Insurance Products and IPOs.Real Estate is offered through Motilal Oswal Real Estate Investment Advisors II Pvt. Ltd. which is a group company of MOFSL. Private Equity is offered through Motilal Oswal Private Equity Investment Advisors Pvt. Ltd which is a group company of MOFSL. Research & Advisory services is backed by proper research. Please read the Risk Disclosure Document prescribed by the Stock Exchanges carefully before investing. There is no assurance or guarantee of the returns. Investment in securities market is subject to market risk, read all the related documents carefully before investing. Details of Compliance Officer: Name: Neeraj Agarwal, Email ID: [email protected], Contact No.:022-71881085. * MOSL has been amalgamated with Motilal Oswal Financial Services Limited (MOFSL) w.e.f August 21, 2018 pursuant to order dated July 30, 2018 issued by Hon'ble National Company Law Tribunal, Mumbai Bench.