Indian Hotels - Moneycontrol
20
Sumant Kumar - Research Analyst ([email protected]) 19 January 2022 Update | Sector: Hotels Indian Hotels Investors are advised to refer through important disclosures made at the last page of the Research Report. Motilal Oswal research is available on www.motilaloswal.com/Institutional-Equities, Bloomberg, Thomson Reuters, Factset and S&P Capital. BSE SENSEX S&P CNX CMP: INR208 TP: INR258 (+24%) Buy 60,099 17,938 Stock Info Bloomberg IH IN Equity Shares (m) 1,321 M.Cap.(INRb)/(USDb) 274.2 / 3.7 52-Week Range (INR) 230 / 91 1, 6, 12 Rel. Per (%) 3/28/51 12M Avg Val (INR M) 1089 Free float (%) 59.3 ~78% of pipeline rooms are under management contract Portfolio figures are as of March 2021, includes hotels in various stages of development | Source: Company, MOFSL Entity wise room mix as of FY21 (19,533 rooms) Source: Company, MOFSL When strategy meets execution! Management contracts to ‘light up’ the business Investment rationale: We reiterate Indian Hotels (IHIN) as our top pick in the hospitality industry driven by its continuous focus on: a) leveraging its brands, b) expanding its operations through management contracts, c) unlocking value by launching new/ reimagined brands, d) creating a hospitality eco-system across the country, e) reducing costs sustainably, and f) deploying capital judiciously to improve return ratios. A focused and scalable asset-light operating model to underpin growth There has been a major transition in IHIN’s business strategy from an asset- heavy model (adding owned rooms that entail higher capex and debt) to an asset-light operating strategy (adding rooms under management contracts by leveraging its brand). We believe this shift will foster business expansion for IHIN. Notably, it reported industry-leading hotel signings and openings in CY20. Moreover, we anticipate unbranded and distressed hotel owners to approach branded players (such as IHIN) for partnerships in the post-COVID era, to leverage the latter’s established distribution network. The share of IHIN’s management contract rooms has improved to 46% of its overall room portfolio at present (including pipeline) from 32% in FY18. Management aims to expand the ratio to 50% going forward. During FY18-21, IHIN added 2,079 management contract rooms that are yet to generate revenue due to the pandemic. Further, IHIN signed 68 hotels/8,986 rooms over FY19-21 (refer to Exhibit 3). All these additions are likely to drive management contract revenue in the long run. The company generated INR2.2b of revenue in FY20 from management contracts, which is expected to rise to INR3.5b in future. Notably, the EBITDA generated from management contract income stands at 70–80% without deploying capital/with minimum capital and is, thus, highly RoCE accretive. We expect the contribution of contract income EBITDA to the consolidated EBITDA of IHIN to be at 20% in FY24. Unlocking value by launching reimagined and new brands IHIN reimagined Ginger, and repositioned the brand to yield higher ARRs. Ginger reported positive EBITDA in FY21. Currently, Ginger has 80 hotels (with 36% of Lean Luxe Hotels) under its umbrella and the management aims to increase the tally to 100 in the long run. The Chambers – Taj’s exclusive business club – was relaunched with enhanced features. It has over 2,200 members currently, and IHIN intends to increase the count to over 4,000. Management expects this margin-accretive business to generate revenue of INR1.5b. IHIN launched Qmin – a food delivery app – in mid-2020 that has witnessed over 0.3m/0.1m app downloads / orders since its launch. The app is now 23% 6% 18% 44% 16% 36% 33% 78% 46% Operational Pipeline Total Mgmt Contract Group Companies Holdco 23% 29% 7% JVs, 9% 33% Managed Properties, IHIN - Standalone, Associate, Subsidiaries,
-
Upload
khangminh22 -
Category
Documents
-
view
1 -
download
0
Transcript of Indian Hotels - Moneycontrol
Sumant Kumar - Research Analyst ([email protected])
19 January 2022
Update | Sector: Hotels
Indian Hotels
Investors are advised to refer through important disclosures made at the last page of the Research Report. Motilal Oswal research is available on www.motilaloswal.com/Institutional-Equities, Bloomberg, Thomson Reuters, Factset and S&P Capital.
BSE SENSEX S&P CNX CMP: INR208 TP: INR258 (+24%) Buy 60,099 17,938
Stock Info
Bloomberg IH IN
Equity Shares (m) 1,321
M.Cap.(INRb)/(USDb) 274.2 / 3.7
52-Week Range (INR) 230 / 91
1, 6, 12 Rel. Per (%) 3/28/51
12M Avg Val (INR M) 1089
Free float (%) 59.3
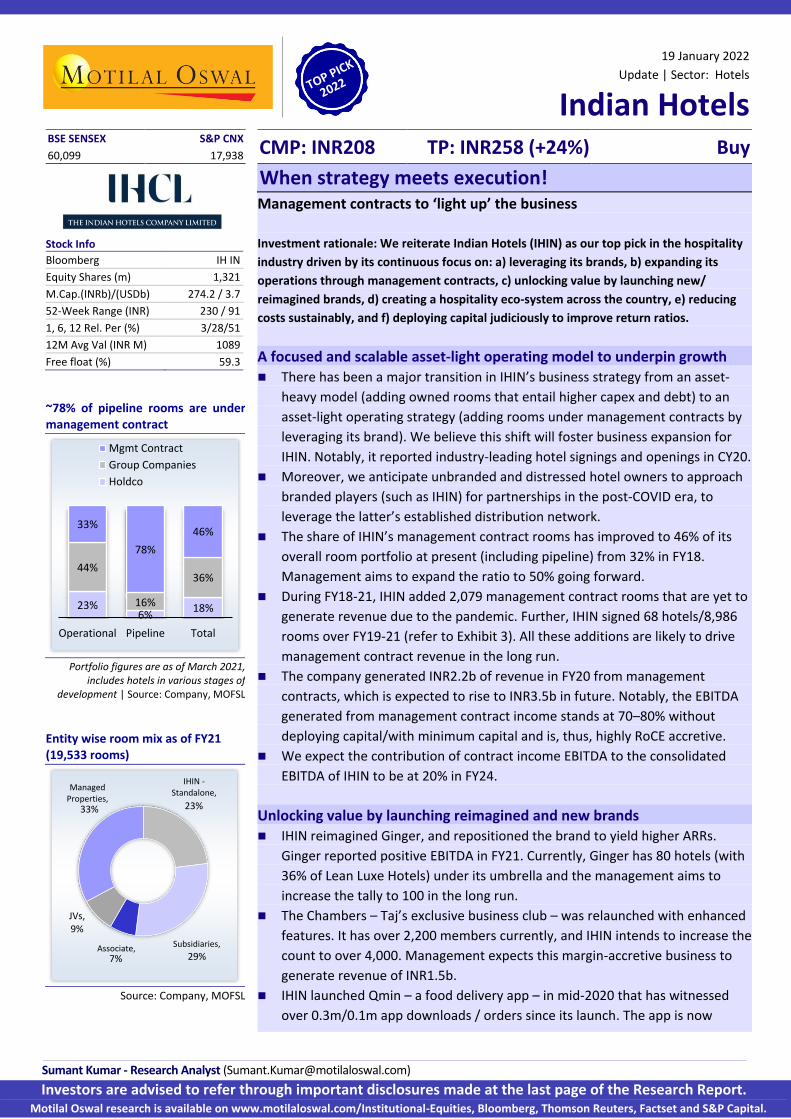
~78% of pipeline rooms are under management contract
Portfolio figures are as of March 2021, includes hotels in various stages of
development | Source: Company, MOFSL
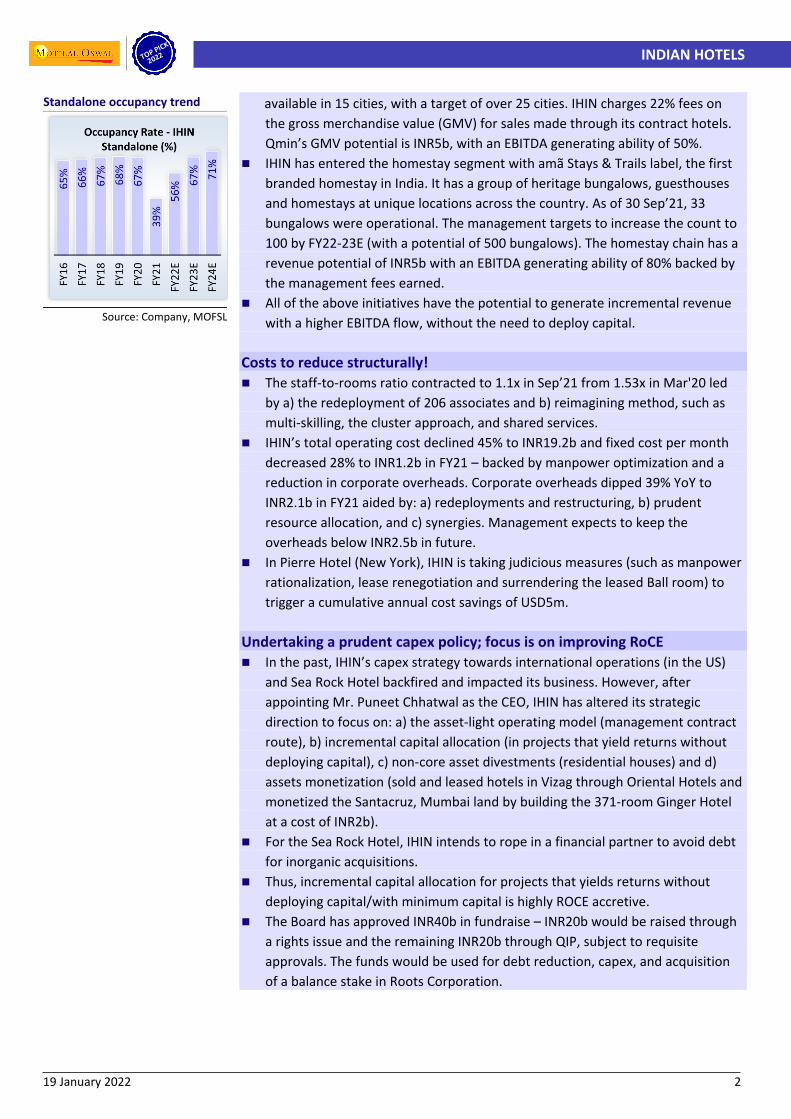
Entity wise room mix as of FY21 (19,533 rooms)
Source: Company, MOFSL
When strategy meets execution!Management contracts to ‘light up’ the business
Investment rationale: We reiterate Indian Hotels (IHIN) as our top pick in the hospitality
industry driven by its continuous focus on: a) leveraging its brands, b) expanding its
operations through management contracts, c) unlocking value by launching new/
reimagined brands, d) creating a hospitality eco-system across the country, e) reducing
costs sustainably, and f) deploying capital judiciously to improve return ratios.
A focused and scalable asset-light operating model to underpin growth There has been a major transition in IHIN’s business strategy from an asset-
heavy model (adding owned rooms that entail higher capex and debt) to an
asset-light operating strategy (adding rooms under management contracts by
leveraging its brand). We believe this shift will foster business expansion for
IHIN. Notably, it reported industry-leading hotel signings and openings in CY20.
Moreover, we anticipate unbranded and distressed hotel owners to approach
branded players (such as IHIN) for partnerships in the post-COVID era, to
leverage the latter’s established distribution network.
The share of IHIN’s management contract rooms has improved to 46% of its
overall room portfolio at present (including pipeline) from 32% in FY18.
Management aims to expand the ratio to 50% going forward.
During FY18-21, IHIN added 2,079 management contract rooms that are yet to
generate revenue due to the pandemic. Further, IHIN signed 68 hotels/8,986
rooms over FY19-21 (refer to Exhibit 3). All these additions are likely to drive
management contract revenue in the long run.
The company generated INR2.2b of revenue in FY20 from management
contracts, which is expected to rise to INR3.5b in future. Notably, the EBITDA
generated from management contract income stands at 70–80% without
deploying capital/with minimum capital and is, thus, highly RoCE accretive.
We expect the contribution of contract income EBITDA to the consolidated
EBITDA of IHIN to be at 20% in FY24.
Unlocking value by launching reimagined and new brands IHIN reimagined Ginger, and repositioned the brand to yield higher ARRs.
Ginger reported positive EBITDA in FY21. Currently, Ginger has 80 hotels (with
36% of Lean Luxe Hotels) under its umbrella and the management aims to
increase the tally to 100 in the long run.
The Chambers – Taj’s exclusive business club – was relaunched with enhanced
features. It has over 2,200 members currently, and IHIN intends to increase the
count to over 4,000. Management expects this margin-accretive business to
generate revenue of INR1.5b.
IHIN launched Qmin – a food delivery app – in mid-2020 that has witnessed
over 0.3m/0.1m app downloads / orders since its launch. The app is now
23% 6%
18%
44%
16%
36%
33%
78%
46%
Operational Pipeline Total
Mgmt Contract
Group Companies
Holdco
23%
29% 7%
JVs, 9%
33%
Managed Properties,
IHIN - Standalone,
Associate, Subsidiaries,
INDIAN HOTELS
19 January 2022 2
available in 15 cities, with a target of over 25 cities. IHIN charges 22% fees on
the gross merchandise value (GMV) for sales made through its contract hotels.
Qmin’s GMV potential is INR5b, with an EBITDA generating ability of 50%.
IHIN has entered the homestay segment with amã Stays & Trails label, the first
branded homestay in India. It has a group of heritage bungalows, guesthouses
and homestays at unique locations across the country. As of 30 Sep’21, 33
bungalows were operational. The management targets to increase the count to
100 by FY22-23E (with a potential of 500 bungalows). The homestay chain has a
revenue potential of INR5b with an EBITDA generating ability of 80% backed by
the management fees earned.
All of the above initiatives have the potential to generate incremental revenue
with a higher EBITDA flow, without the need to deploy capital.
Costs to reduce structurally! The staff-to-rooms ratio contracted to 1.1x in Sep’21 from 1.53x in Mar'20 led
by a) the redeployment of 206 associates and b) reimagining method, such as
multi-skilling, the cluster approach, and shared services.
IHIN’s total operating cost declined 45% to INR19.2b and fixed cost per month
decreased 28% to INR1.2b in FY21 – backed by manpower optimization and a
reduction in corporate overheads. Corporate overheads dipped 39% YoY to
INR2.1b in FY21 aided by: a) redeployments and restructuring, b) prudent
resource allocation, and c) synergies. Management expects to keep the
overheads below INR2.5b in future.
In Pierre Hotel (New York), IHIN is taking judicious measures (such as manpower
rationalization, lease renegotiation and surrendering the leased Ball room) to
trigger a cumulative annual cost savings of USD5m.
Undertaking a prudent capex policy; focus is on improving RoCE In the past, IHIN’s capex strategy towards international operations (in the US)
and Sea Rock Hotel backfired and impacted its business. However, after
appointing Mr. Puneet Chhatwal as the CEO, IHIN has altered its strategic
direction to focus on: a) the asset-light operating model (management contract
route), b) incremental capital allocation (in projects that yield returns without
deploying capital), c) non-core asset divestments (residential houses) and d)
assets monetization (sold and leased hotels in Vizag through Oriental Hotels and
monetized the Santacruz, Mumbai land by building the 371-room Ginger Hotel
at a cost of INR2b).
For the Sea Rock Hotel, IHIN intends to rope in a financial partner to avoid debt
for inorganic acquisitions.
Thus, incremental capital allocation for projects that yields returns without
deploying capital/with minimum capital is highly ROCE accretive.
The Board has approved INR40b in fundraise – INR20b would be raised through
a rights issue and the remaining INR20b through QIP, subject to requisite
approvals. The funds would be used for debt reduction, capex, and acquisition
of a balance stake in Roots Corporation.
Standalone occupancy trend
Source: Company, MOFSL

INDIAN HOTELS
19 January 2022 3
Valuation and view: Maintain BUY with an SoTP-based TP of INR258 Though the ongoing third COVID wave poses a threat to near-term earnings of
the hospitality sector, higher vaccination and lower hospitalization rates will
lead to a much stronger rebound than the second wave. Thus, we view this
weakness as a buying opportunity.
We believe IHIN’s asset-light model as well as the new/reimagined revenue
generating avenues with higher EBITDA margins bodes well for RoCE expansion.
Like in FY22, we anticipate a strong recovery in FY23E/FY24E as well on: a) ARR
improvement, once the economic activities normalize, b) improved occupancies
driven by business travel as well as leisure segment, c) cost rationalization
efforts, d) an increase in F&B income as banqueting/conferences resume, and e)
higher income from management contracts.
We value the stock at 21x FY24E EV/EBITDA to arrive at our SoTP-based TP of
INR258, implying a 24% potential upside. We maintain our BUY rating on IHIN.
Key risks to our call: a) prolonged delay in demand revival due to the pandemic,
b) intensified competition in acquisition of rooms under management contracts
and c) failure in scaling up new businesses.
Exhibit 1: Valuation methodology
Particulars Methodology Metrics FY24 Multiple (x) Value
(INRm) Value/
share (INR)
IHCL- ex JV/ Associate
EV EV/EBITDA (x) EBITDA 16,586 21 3,52,698 267
Less: Net Debt
-10,263 (8)
Less: Minority Interest
-5,767 (4)
Sub Total
3,36,667 255
JV/Associate
Taj GVK (IHCL's Share - 25.5%) - JV 20% discount to
MCAP Attributable
Mcap 2,170 0.8 1,736 1.3
Oriental Hotel (IHCL's Share - 35.7%) - Associate 20% discount to
MCAP Attributable
Mcap 3,124 0.8 2,499 1.9
Sub Total
4,235 3.2
Target Price
3,40,902 258
Source: MOFSL
Management contracts – a preferred asset-light strategy During the last cycle, i.e., before the global financial crisis (GFC), IHIN focused on
adding owned rooms or through inorganic acquisitions that led to a mounting
debt – net debt stood at INR14.5b in FY04, which rose to INR32.3b in FY08.
Post-GFC, there has been a major transition in IHIN’s business strategy from the
asset-heavy model mentioned above to an asset-light operating strategy (adding
rooms under management contracts by leveraging its brand). Under the hotel
management contract, the operator (brand owners like IHIN) runs the hotel on
behalf of the owner for a fee ranging between 5% and 8% of revenue.
Notably, IHIN reported industry-leading hotel signings and openings in CY20.
Aided by the growing traction in management contract room signings, IHIN
signed 68 hotels over FY19-21 v/s 27 during FY16-18 (refer to Exhibit 3). IHIN’s
average market share of management contract rooms in incremental rooms
added by the hospitality industry stood at 15% during FY19-21 v/s 6% over FY14-
18. Further, management contract rooms form 78% of the current pipeline and
post-operational, they will constitute 46% of the portfolio (refer to Exhibit 4).

INDIAN HOTELS
19 January 2022 4
During FY18-21, IHIN added 2,079 management contract rooms that are yet to
generate revenue due to the pandemic. Further, IHIN signed 68 hotels/8,986
rooms over FY19-21 (refer to Exhibit 3). All these additions are likely to drive
management contract revenue in the long run.
The company generated INR2.2b of revenue in FY20 from management
contracts, which is expected to rise to INR3.5b in future. Notably, the EBITDA
generated from management contract income stands at 70–80% without
deploying capital and is, thus, RoCE-accretive.
We expect the contribution of contract income EBITDA to the consolidated
EBITDA of IHIN to be at 20% in FY24. Higher income from management contracts
will lead to improving margins and capital efficiency.
Exhibit 2: Industry leader with the highest signings and openings in CY20
Source: Company, MOFSL
Exhibit 3: IHIN signed 68 hotels under management contracts
over FY19–21
Source: Company, MOFSL
Exhibit 4: ~78% of pipeline rooms are under management
contract
Portfolio figures are as of March 2021, includes hotels in various
stages of development | Source: Company, MOFSL
632 1,174 468 3,258 3,582 2,146
8
14
5
22
29
17
FY16 FY17 FY18 FY19 FY20 FY21
New rooms signed New hotels signed
Pace of management contract room addtions has
accelerated
23% 6%
18%
44%
16%
36%
33%
78%
46%
Operational Pipeline Total
Holdco Group Companies Mgmt Contract

INDIAN HOTELS
19 January 2022 5
Exhibit 5: Targets for IHIN’s management contract portfolio
Source: Company, MOFSL
Exhibit 6: Expected growth in management contract income (INR Cr)
Source: Company, MOFSL
Exhibit 7: IHIN’s standalone management contract room addition trend
Source: Company, MOFSL
1,397 1,567 1,655 1,655 1,905 2,266 3,163 3,098 3,501 3,741 3,735 4,494 5,042 5,408 6,408 7,408 8,408
27
12
6 0
15 19
40
-2
13
7
0
20
12 7
18 16 13
FY08 FY09 FY10 FY11 FY12 FY13 FY14 FY15 FY16 FY17 FY18 FY19 FY20 FY21 FY22E FY23E FY24E
Standalone management contract rooms (nos.) Growth (%)

INDIAN HOTELS
19 January 2022 6
Exhibit 8: Management contract revenue to record a 50% CAGR during FY22-24E
Source: Company, MOFSL
Exhibit 9: Market share of IHIN in incremental rooms added has increased since FY19
Source: HVS, Company, MOFSL
Unlocking value from reimagined and new brands IHIN implemented several tactical initiatives to maximize both current and
future revenue streams.
During COVID-19, the company capitalized on demand opportunities by focusing
on: (i) domestic tourism, especially at leisure resorts, shorter vacation getaways,
staycations, bizcations, holidays within drivable distances, and smaller social
gatherings within norms; (ii) promotions such as 4D – Dream, Drive, Discover,
Delight and Urban Getaways targeted at driving-distance holidays and younger
travelers among other campaigns; (iii) earning revenue from room occupancy
due to quarantine of medical professionals and customers who conducted
business continuity operations from hotels; and (iv) the “amã Stays & Trails”
homestay brand to gain from the demand for exclusive and extended stays.
Some of IHIN’s reimagined/new brand initiatives are discussed below:
IHIN reimagined Ginger, and repositioned the brand to yield higher ARRs.
Ginger reported positive EBITDA in FY21. Currently, Ginger has 80 hotels
(with 36% of Lean Luxe Hotels) under its umbrella and the management
aims to increase the tally to 100 in the long run.
752 1,065 1,227 1,364 1,606 1,774 2,043 2,132 2,127 1,365 2,011 3,466 4,523
-20
42
15 11 18
10 15 4 0
-36
47
72
30
FY12 FY13 FY14 FY15 FY16 FY17 FY18 FY19 FY20 FY21 FY22E FY23E FY24E
Management contract income (INRm) Growth (%)
294
268
88 100 250 361
999
41
522
295
(2)
759 754 566
4%
18%
1% 1% 2% 4%
14%
1%
13%
4%
0%
27%
8%
12%
FY08 FY09 FY10 FY11 FY12 FY13 FY14 FY15 FY16 FY17 FY18 FY19 FY20 FY21
IHIN's incremental managed rooms Market share of IHIN in incremental rooms added in industry (%)

INDIAN HOTELS
19 January 2022 7
The Chambers – Taj’s exclusive business club – was relaunched with
enhanced features. It has over 2,200 members currently, and IHIN intends
to increase the count to over 4,000. Management expects this margin-
accretive business to generate revenue of INR1.5b.
It launched Qmin – a food delivery app – in mid-2020 that has witnessed
over 0.3m/0.1m app downloads / orders since its launch. The app is now
available in 15 cities, with a target of over 25 cities. IHIN charges 22% fees
on the gross merchandise value (GMV) for sales made through its contract
hotels. Qmin’s GMV potential is INR5b, with an EBITDA generating ability of
50%. Going forward, the company plans to launch Qmin food truck in areas
where Taj is not present. The company is also looking for the subscription-
based meal opportunity under the sub-brand “Anuka” from TajSats. IHIN
will receive management fee from this JV with TajSats.
IHIN has entered the homestay segment with amã Stays & Trails label, the
first branded homestay in India. It has a group of heritage bungalows,
guesthouses and homestays at unique locations across the country. As of 30
Sep’21, 33 bungalows were operational. The management targets to
increase the count to 100 by FY22-23E (with a potential of 500 bungalows).
The homestay chain has a revenue potential of INR5b with an EBITDA
generating ability of 80% backed by the management fees earned.
All of the above initiatives have the potential to generate incremental revenue
with a higher EBITDA flow, without the need to deploy capital.
Exhibit 10: IHIN’s new/reimagined brands
Source: Company, MOFSL

INDIAN HOTELS
19 January 2022 8
Exhibit 11: Re-imagined Ginger
Source: Company, MOFSL
Exhibit 12: Target of the Ginger portfolio
Source: Company, MOFSL
Exhibit 13: TAJSATS reimagined
Source: Company, MOFSL

INDIAN HOTELS
19 January 2022 9
Exhibit 14: The Chambers – New avatar
Source: Company, MOFSL
Exhibit 15: Qmin – food delivery, food trucks and shops
Source: Company, MOFSL
Exhibit 16: amã STAYS & TRAILS
Source: Company, MOFSL

INDIAN HOTELS
19 January 2022 10
Cost savings are here to stay! During the first two waves of the pandemic, the hospitality sector was the worst
hit. Hence, several cost rationalization measures were introduced by hotel
chains. The cost efficiencies achieved by these companies through key
rationalization approaches are likely to sustain and provide value.
IHIN initiated a spend optimization program to reduce fixed costs and optimize
resources:
Manpower rationalization programs were conducted with redeployments
and developing new ways of working including, multi-skilling, cluster- and
shared-service approaches.
Contracts for supplies of food ingredients, consumables, etc. were
renegotiated and food & beverages offerings were pruned to essentials.
Contracts for services and discretionary spends on repairs, selling,
distribution, marketing and administration costs at hotels were reduced.
The staff-to-rooms ratio contracted to 1.1x in Sep’21 from 1.53x in Mar'20 led
by: a) the redeployment of 206 associates and b) reimagining method, such as
multi-skilling, the cluster approach, and shared services mentioned above.
IHIN’s total operating cost declined 45% to INR19.2b and fixed cost per month
decreased 28% to INR1.2b in FY21 – backed by manpower optimization and a
reduction in corporate overheads. Corporate overheads dipped 39% YoY to
INR2.1b in FY21 aided by: a) redeployments and restructuring, b) prudent
resource allocation, and c) synergies. Management expects to keep the
overheads below INR2.5b in future.
In Pierre Hotel (New York), IHIN is taking judicious measures (such as manpower
rationalization, lease renegotiation and surrendering the leased Ball room) to
trigger a cumulative annual cost savings of USD5m.
Exhibit 17: The staff-to-rooms ratio has contracted v/s pre-COVID levels
Source: Company, MOFSL
Exhibit 18: Corporate overheads dipped 39% YoY in FY21
Source: Company, MOFSL
2.17 1.95
1.48
0.48
1.53 1.62 1.33
0.92
0.39
1.14
1.60 1.30
0.91
0.36
1.10
Taj SeleQtions Vivanta Ginger IHIN
FY20 FY21 Sept'21
3,490 3,450 3,470 2,130
34.2 33.2 32.1
19.2
FY18 FY19 FY20 FY21
Corporate overheads (INRm) Corporate overheads per hotel (INRm)
INDIAN HOTELS
19 January 2022 11
Undertaking a prudent capex policy; focus is on improving RoCE In the past, IHIN’s capex strategy towards international operations (in the US)
and Sea Rock Hotel backfired and impacted its business. However, after
appointing Mr. Puneet Chhatwal as the CEO, IHIN has altered its strategic
direction to focus on: a) the asset-light operating model (management contract
route), b) incremental capital allocation (in projects that yield returns without
deploying capital), c) non-core asset divestments (residential houses) and d)
assets monetization (sold and leased hotels in Vizag through Oriental Hotels and
monetized the Santacruz, Mumbai land by building the 371-room Ginger Hotel
at a cost of INR2b).
For the Sea Rock Hotel, IHIN intends to rope in a financial partner to avoid debt
for inorganic acquisitions. IHIN acquired ~14% stake in ELEL Hotels &
Investments Limited for INR2,500m (of which INR250m is to be paid), thereby
converting it as its wholly owned subsidiary.
Thus, incremental capital allocation for projects that yields returns without
deploying capital/with minimum capital is highly ROCE accretive.
The Board has approved INR40b in fundraise – INR20b would be raised through
a rights issue and the remaining INR20b through QIP, subject to requisite
approvals. The funds would be used for debt reduction, capex, and acquisition
of a balance stake in Roots Corporation.
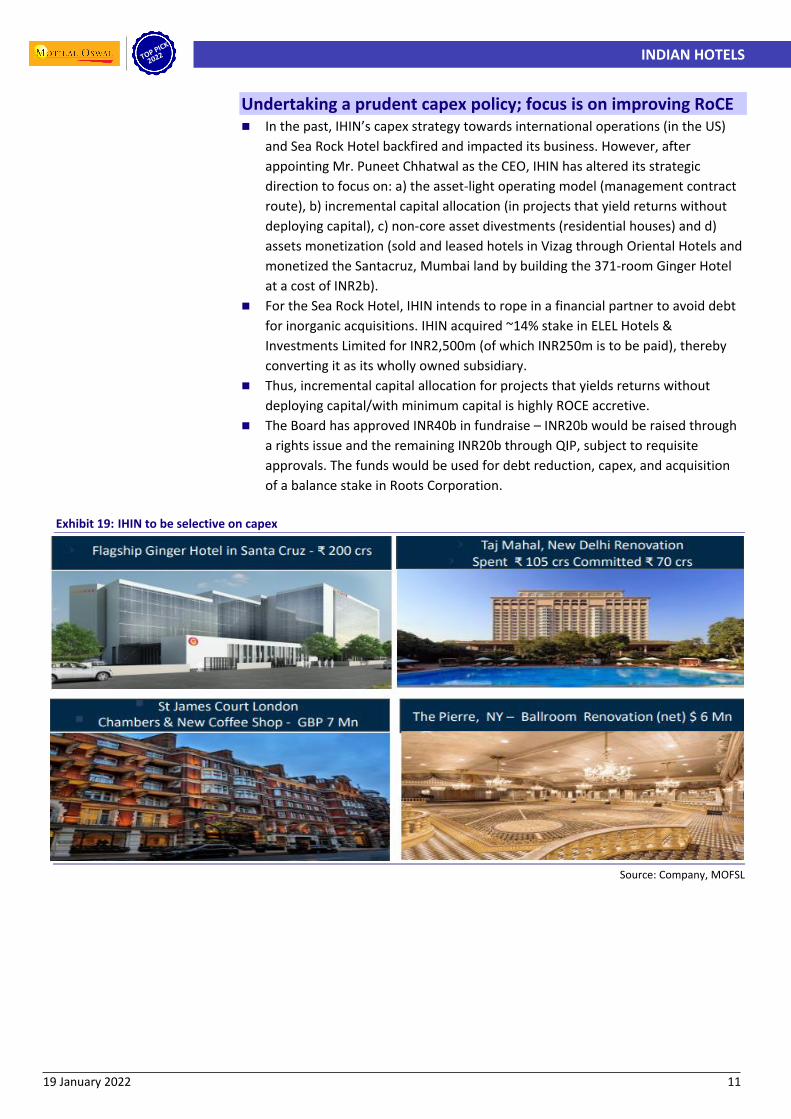
Exhibit 19: IHIN to be selective on capex
Source: Company, MOFSL
Company name Company name

INDIAN HOTELS
19 January 2022 12
Exhibit 20: Initiatives taken by IHIN to restructure/simplify/divest its non-core assets
Particulars Nature of
transaction Amount
Acquisition of 100% stake in Sea Rock (ELEL Hotels and Investments Ltd)
Simplification and full control
INR2,500m (of which INR1,750m was paid in Dec’21, INR250m was paid in Dec’20 and Feb’21 each and balance
INR250m will be paid in Dec’24)
Gateway Vizag & Vivanta Trivandrum Sale and
manage back INR1,700m
Ginger Santacruz Unlocking value of latent assets
Pune Land Monetization of non-core assets
Residential flats Monetization of non-core assets
INR210m (FY21)
Taj Madras Flight Kitchen Simplify controls and holding structures
Restructured the holding of Taj Cape Town and it became a wholly owned subsidiary of IHIN, by acquiring 50% of the holding in Tata Africa Holding (TAH)
Restructured holding of
African subsidiary
USD1m
Acquiring balance stake in Roots Corporation (Ginger)
Simplify controls and
holding structures
Not more than INR5,000m
Source: Company, MOFSL
ABOUT INDIAN HOTELS & GROUP STRUCTURE Established by the founder of the Tata Group, Mr. Jamsedji N. Tata, the company opened its first property, The
Taj Mahal Palace Hotel, Bombay in 1903. IHIN is one of the oldest hotel chains in India with its flagship brand
“Taj” being ranked as the #1 hospitality brand in India (Source: Brand Finance ‘India 100 2021’ Report). In 2021,
“Taj” has been rated as the World’s Strongest Hotel Brand by Brand Finance, the world's leading brand valuation
consultancy, in its annual 'Hotels 50 2021' report.
IHIN is the largest hotel chain operator in India, with presence across the pricing spectrum through its four
brands – Taj, Vivanta, SeleQtions and Ginger. It manages >19,500 rooms across India and international locations.
Around >85% of IHIN’s room inventory is in the domestic market, while the rest is in outside India. Domestic
business remains the key driver, contributing around >80% of its consolidated revenue.
Key brands under which IHIN operates its hotels and stays include:
“Taj” – it is the flagship brand used for palace hotels, landmark hotels, resorts and safaris and leisure
destinations across the globe. As of Sep’21, the company had a portfolio of 89 hotels under the “Taj” brand, of
which 73 are in operation and 16 are in the pipeline.
“SeleQtions” is the brand under which IHIN includes a collection of marquee hotels in, and around, key metro
cities across India. As of Sep’21, the company had a portfolio of 22 hotels under the “SeleQtions” brand, of
which 17 are in operation and five are in the pipeline.
“Vivanta” is the brand under which IHIN includes hotels in business and leisure centers across India and South
East Asia. As of Sep’21, IHIN had a portfolio of 34 hotels, of which 25 are in operation and nine are in the
pipeline.
“Ginger” is the brand for budget travelers with hotels in approximately 50 cities in India, which is operated
through its subsidiary, Roots Corporation Ltd. As of Sep’21, IHIN had a portfolio of 80 hotels under the “Ginger”
brand, of which 55 are in operation and 25 are in the pipeline.
“amã Stays & Trails” is a homestay brand for exclusive and longer duration stays in unexplored destinations. As
of Sep’21, IHIN had a portfolio of 51 bungalows under the “amã Stays & Trails” brand, of which 33 are in
operation and 18 are in the pipeline.

INDIAN HOTELS
19 January 2022 13
Exhibit 21: IHIN’s brandscape
Source: Company, MOFSL
Exhibit 22: Key financial data points
Particulars FY18 FY19 FY20 FY21 FY22E FY23E FY24E
Domestic Rooms (including JV, Mgmt contract, subs) 14,549 15,565 16,645 17,218 18,566 20,166 21,766
International Rooms (including JV, Mgmt contract, subs) 2,596 2,323 2,315 2,315 2,315 2,315 2,315
International Revenue (own subs); INRm 8,614 9,705 10,056 1,413 5,544 10,231 10,938
International EBITDA (own subs); INRm (297) 111 (9) (2,190) (569) 595 823
Consolidated Revenue; INRm 41,036 45,120 44,631 15,752 30,871 48,958 55,100
Consolidated EBITDA; INRm 6,704 8,297 9,675 -3,618 3,761 13,163 16,586
Balance Domestic Revenue; INRm 32,421 35,415 34,575 14,338 25,327 38,727 44,162
Balance Domestic EBITDA; INRm 7,000 8,187 9,684 -1,428 4,331 12,568 15,763
Management Contract Revenue; INRm 2,043 2,132 2,127 1,365 2,011 3,466 4,523
Management Contract Revenue as a % of consolidated Revenue 5% 5% 5% 9% 7% 7% 8%
Source: Company, MOFSL
Exhibit 23: Entity wise room mix as of FY21 (19,533 rooms)
Source: Company, MOFSL
IHIN - Standalone, 23%
Subsidiaries, 29% Associates, 7%
JVs, 9%
Managed Properties, 33%

INDIAN HOTELS
19 January 2022 14
Exhibit 24: IHIN’s group structure
Source: Company, MOFSL
Reference of the colors as given in the table: IHIN’s holding in the company | Hotels: Rooms (as of FY21) |Revenue/EBIDTA: As % of the consolidated revenue/ EBIDTA (FY20)| Revenue and EBITDA of FY20 are considered as FY21 numbers were impacted by the pandemic
Valuation and view: Our top pick in the hospitality sector; maintain BUY with an SoTP-based TP of INR258 Though the ongoing third COVID wave poses a threat to near-term earnings of
the hospitality sector, higher vaccination and lower hospitalization rates will
lead to a much stronger rebound than the second wave. Thus, we view this
weakness as a buying opportunity.
We believe IHIN’s asset-light model as well as the new/reimagined revenue
generating avenues with higher EBITDA margins bodes well for RoCE expansion.
Like in FY22, we anticipate a strong recovery in FY23E/FY24E as well on: a) ARR
improvement, once the economic activities normalize, b) improved occupancies
driven by business travel as well as leisure segment, c) cost rationalization
efforts, d) an increase in F&B income as banqueting/conferences resume, and e)
higher income from management contracts.
We believe IHIN is well placed to capitalize on the impending opportunity in the
domestic hospitality industry and expected upcycle due to its: a) ability to cater
to luxury, upscale, midscale and economy hotels through its diverse brands, b)
strong brand recall and (iii) increased room inventory ex-JV & associate hotels
(up ~1.6x to 16,698 over FY12-21, majorly through management contracts).
We forecast a consolidated revenue/EBITDA CAGR of 34%/110% over FY22-24.
IHIN’s balance sheet is likely to strengthen further due to the fundraise through
THE TAJ GROUP (19,533 ROOMS)
IHIN (Standalone)
Revenue - INR27.4b (61%)
EBIDTA - INR7.6b (79%)
Managed
41; 5,408
Owned
26 Hotels; 4,545 rooms
Subsidiaries
Revenue - INR17.2b (39%)
EBITDA - INR2.1b (21%)
Domestic
Roots (Ginger)
(63%)
40; 3,544
5%; 5%
Managed
14; 990
Piem Hotels (52%)
7; 1,072
9%; 6%
United Hotels (55%)
1; 88
1%; 1%
Benares Hotels (54%)
3; 178
1%; 2%
International
United Overseas Holding (100%)
2; 299
15%; -7%
St. James (72%) 2; 415 8%; 7%
Taj International (UK, Bombay
Brasseree Restaurant,
Quilon Restaurant)
JV
Domestic
Taj GVK (26%)
6; 1,083
Taj Kerala (28%)
3; 166
Kaveri Retreats
(50%)
2; 92
Taj Safaris Ltd
(29%) 5; 83
International
Taj Lanka
3; 292
Lanka Island
Resorts
(25%)
1; 160
Associate
Domestic
Oriental (36%)
7; 825
International (Sri Lanka)
(25%)
2; 460
Taj Lanka Hotels PLC (Sri Lanka)
(25%)
1; 300
International

INDIAN HOTELS
19 January 2022 15
rights issue and higher FCF generation (FCF of INR16b over FY23-24E). Its RoCE is
likely to improve to 11.2% in FY24E from 6.8% in FY20.
On a one-year forward EV/EBITDA, IHIN has historically traded at a 10-year
average of 22.3x.
We value the stock at 21x FY24E EV/EBITDA to arrive at our SoTP-based TP of
INR258, implying a 24% potential upside. We maintain our BUY rating on IHIN.
Risks to our call Key risks to our call include: a) prolonged delay in demand revival due to the
pandemic, b) intensified competition in acquisition of rooms under
management contracts and c) failure in scaling up new businesses.
Some of IHIN’s hotels, including a few key hotels, are maintained under license
or lease arrangements entered with third parties. While the company typically
has long-term lease arrangements, there is no assurance that the license or
leasehold arrangements will be renewed upon expiry of the period. Further,
there is no guarantee that renewals will be on the same terms & conditions or
the revised conditions would not be unfavorable for IHIN.
Exhibit 25: Valuation methodology
Particulars Methodology Metrics FY24 Multiple
(x) Value
(INRm) Value/
share (INR)
IHCL- ex JV/ Associate
EV EV/EBITDA (x) EBITDA 16,586 21 3,52,698 267
Less: Net Debt
-10,263 (8)
Less: Minority Interest
-5,767 (4)
Sub Total
3,36,667 255
JV/Associate
Taj GVK (IHCL's Share - 25.5%) - JV 20% discount to MCAP Attributable Mcap 2,170 0.8 1,736 1.3
Oriental Hotel (IHCL's Share - 35.7%) - Associate 20% discount to MCAP Attributable Mcap 3,124 0.8 2,499 1.9
Sub Total
4,235 3.2
Target Price
3,40,902 258
Source: MOFSL
Exhibit 26: One-year forward EV/EBITDA (x)
Source: Bloomberg, MOFSL
Exhibit 27: Peer comparison
Company Name M Cap EV/ EBITDA (x) PE (x) RoE (%) Revenue CAGR EBITDA CAGR
(INR b) FY23E FY24E FY23E FY24E FY23E FY24E % FY22-24E % FY22-24E
Indian Hotels Co Ltd 276 26.7 21.1 61.8 37.8 11 15 28 81
EIH Ltd 94 21.2 16.5 32.7 25.5 8 10 44 203
Chalet Hotels Ltd 50 20.2 12.5 117.6 27.0 3 12 52 97
Lemon Tree Hotels Ltd 40 20.1 16.0 71.1 48.0 3 9 47 59
Mahindra Holidays & Resorts In 42 13.5 11.8 26.3 20.8 125 86 9 20
37.9
22.3
70.8
14.1
31.2
13.4 5.0
25.0
45.0
65.0
85.0
Oct
-11
Jan
-13
Ap
r-1
4
Jul-
15
Oct
-16
Jan
-18
Ap
r-1
9
Jul-
20
Oct
-21
EV/EBITDA (x) Avg (x) Max (x) Min (x) +1SD -1SD

INDIAN HOTELS
19 January 2022 16
Story In Charts
Exhibit 28: Revenue likely to cross FY20 levels in FY23E
Source: Company, MOFSL
Exhibit 29: Cost savings to underpin EBITDA margin
Source: Company, MOFSL
Exhibit 30: Standalone ARR to reach near-FY20 levels by FY23E
Source: Company, MOFSL
Exhibit 31: Standalone occupancy trend
Source: Company, MOFSL
Exhibit 32: Adj. PAT trend
Source: Company, MOFSL
Exhibit 33: Net debt-to-equity trend
Source: Company, MOFSL
Exhibit 34: RoE and RoCE trends
Source: Company, MOFSL
40.2 40.2 41.0 45.1 44.6 15.8 30.9 49.0 55.1
-4% 0% 2% 10% -1%
-65%
96% 59%
13%
FY16 FY17 FY18 FY19 FY20 FY21 FY22E FY23E FY24E
Consol Revenue (INRb) Growth (%)
5.5 6.1 6.7 8.3 9.7
(3.6)
3.8 13.2 16.6
13.7% 15.2% 16.3% 18.4% 21.7%
-23.0%
12.2% 26.9% 30.1%
FY16 FY17 FY18 FY19 FY20 FY21 FY22E FY23E FY24E
Consol EBITDA (INRb) EBITDA Margin (%)
9,3
08
10
,21
3
10
,24
9
11
,00
3
10
,73
4
7,3
51
8,6
45
10
,54
7
11
,28
5
-3% 10%
0% 7%
-2%
-32%
18% 22% 7%
FY16 FY17 FY18 FY19 FY20 FY21 FY22E FY23E FY24E
ARR - IHIN Standalone (INR/day) Growth (%)
65
%
66
%
67
%
68
%
67
%
39
%
56
% 67
%
71
%
FY16 FY17 FY18 FY19 FY20 FY21 FY22E FY23E FY24E
Occupancy Rate - IHIN Standalone (%)
-1,692 -551
840 2,819 3,237
-8,401
-3,613
4,239
6,664
FY16 FY17 FY18 FY19 FY20 FY21 FY22E FY23E FY24E
Adj. PAT (INRm)
41.7 30.5 18.3 18.7 18.5 30.3 20.5 17.3 10.3
1.6
1.2
0.4 0.4 0.4
0.8
0.4 0.3 0.2
FY16 FY17 FY18 FY19 FY20 FY21 FY22E FY23E FY24E
Net Debt to Equity (INRb) Net Debt to Equity Ratio (x)
-5% -7% -2%
3% 7% 7%
-21%
-8%
8% 11%
3% 3% 4% 5% 6% 7%
-6% 1%
9% 11%
FY15 FY16 FY17 FY18 FY19 FY20 FY21 FY22E FY23E FY24E
RoE (%) RoCE (%)

INDIAN HOTELS
19 January 2022 17
Financials and valuations
Consolidated - Income Statement (INR M)
Y/E March FY17 FY18 FY19 FY20 FY21 FY22E FY23E FY24E
Total Income from Operations 40,206 41,036 45,120 44,631 15,752 30,871 48,958 55,100
Change (%) -0.1 2.1 10.0 -1.1 -64.7 96.0 58.6 12.5
Total Expenditure 34,110 34,332 36,823 34,956 19,369 27,109 35,795 38,514
% of Sales 84.8 83.7 81.6 78.3 123.0 87.8 73.1 69.9
EBITDA 6,096 6,704 8,297 9,675 -3,618 3,761 13,163 16,586
Margin (%) 15.2 16.3 18.4 21.7 -23.0 12.2 26.9 30.1
Depreciation 2,994 3,012 3,279 4,042 4,096 4,143 4,450 4,696
EBIT 3,102 3,692 5,019 5,633 -7,714 -382 8,713 11,890
Int. and Finance Charges 3,238 2,690 1,901 3,411 4,028 4,486 3,782 3,518
Other Income 549 617 834 1,324 1,647 1,000 1,567 1,763
PBT bef. EO Exp. 413 1,618 3,951 3,546 -10,095 -3,868 6,498 10,135
EO Items -108 225 66 410 1,600 95 0 0
PBT after EO Exp. 306 1,843 4,017 3,955 -8,495 -3,773 6,498 10,135
Total Tax 1,137 1,211 1,571 448 -1,553 -341 2,144 3,344
Tax Rate (%) 372.2 65.7 39.1 11.3 18.3 9.0 33.0 33.0
Minority Interest -200 -376 -422 -37 259 109 115 126
Reported PAT -632 1,009 2,868 3,544 -7,201 -3,541 4,239 6,664
Adjusted PAT -551 840 2,819 3,237 -8,401 -3,613 4,239 6,664
Change (%) NA NA 235.4 14.8 -359.5 -57.0 -217.3 57.2
Margin (%) -1.4 2.0 6.2 7.3 -53.3 -11.7 8.7 12.1
Consolidated - Balance Sheet (INR M)
Y/E March FY17 FY18 FY19 FY20 FY21 FY22E FY23E FY24E
Equity Share Capital 989 1,189 1,189 1,189 1,189 1,321 1,321 1,321
Total Reserves 24,188 40,622 42,291 42,379 35,295 50,782 54,228 60,099
Net Worth 25,177 41,811 43,480 43,568 36,484 52,103 55,549 61,421
Minority Interest 7,378 7,774 7,999 7,649 6,346 5,767 5,767 5,767
Total Loans 33,830 24,270 23,260 26,020 36,330 26,630 25,430 20,430
Lease Liability 0 0 0 18,987 18,464 18,464 18,464 18,464
Deferred Tax Liabilities 2,820 3,563 3,768 1,869 781 781 781 781
Capital Employed 69,206 77,418 78,506 98,093 98,404 1,03,745 1,05,991 1,06,862
Gross Block 57,923 63,356 69,051 73,316 81,772 84,342 87,356 90,759
Less: Accum. Deprn. 5,506 7,385 10,663 14,706 18,802 22,945 27,395 32,091
Net Fixed Assets 52,417 55,971 58,388 58,610 62,970 61,397 59,960 58,667
Goodwill on Consolidation 5,737 5,655 5,835 6,146 6,110 6,110 6,110 6,110
Right-of-Use assets 15,833 15,297 15,297 15,297 15,297
Capital WIP 2,227 1,970 1,162 2,441 1,650 1,580 2,066 2,163
Total Investments 12,437 15,965 13,351 14,266 14,832 21,582 21,582 21,582
Curr. Assets, Loans & Adv. 13,173 14,184 17,102 17,887 14,269 15,322 18,655 21,379
Inventory 804 857 804 936 929 966 981 1,055
Account Receivables 2,721 3,286 3,214 2,900 2,198 2,537 3,219 3,623
Cash and Bank Balance 2,471 2,703 2,409 3,156 1,536 1,632 3,685 5,681
Loans and Advances 7,177 7,338 10,675 10,895 9,605 10,187 10,771 11,020
Curr. Liability & Prov. 16,785 16,328 17,331 17,090 16,723 17,543 17,680 18,336
Account Payables 3,370 3,513 3,253 3,893 3,178 3,342 3,727 4,010
Other Current Liabilities 11,305 10,349 11,579 10,441 10,920 11,422 11,260 11,571
Provisions 2,110 2,465 2,500 2,756 2,625 2,778 2,693 2,755
Net Current Assets -3,612 -2,143 -229 798 -2,454 -2,221 976 3,043
Appl. of Funds 69,206 77,418 78,506 98,093 98,404 1,03,745 1,05,991 1,06,862

INDIAN HOTELS
19 January 2022 18
Financials and valuations
Ratios
Y/E March FY17 FY18 FY19 FY20 FY21 FY22E FY23E FY24E
Basic (INR)
EPS -0.4 0.6 2.1 2.4 -6.4 -2.7 3.2 5.0
Cash EPS 1.8 2.9 4.6 5.5 -3.3 0.4 6.6 8.6
BV/Share 19.1 31.6 32.9 33.0 27.6 39.4 42.0 46.5
DPS 0.2 0.3 0.5 0.5 0.4 0.5 0.6 0.6
Payout (%) -53.9 41.9 25.3 20.5 -7.3 -18.7 18.7 11.9
Valuation (x)
P/E NA 326.3 97.3 84.7 -32.6 -75.9 64.7 41.1
Cash P/E 112.3 71.2 45.0 37.7 -63.7 517.0 31.6 24.1
P/BV 10.9 6.6 6.3 6.3 7.5 5.3 4.9 4.5
EV/Sales 7.8 7.3 6.7 6.7 19.7 9.7 6.1 5.3
EV/EBITDA 51.2 44.8 36.3 31.0 -85.9 79.9 22.6 17.5
Dividend Yield (%) 0.1 0.1 0.2 0.2 0.2 0.2 0.3 0.3
FCF per share 7.2 -0.1 1.5 1.8 -8.2 0.7 4.8 7.3
EV/ Adj Rooms (INRm) 32.7 30.4 29.8 28.9 29.8 28.3 27.5 26.3
EBITDA/ Room (INR) 4,107 4,313 5,157 5,869 -6,404 3,320 7,710 8,820
Return Ratios (%)
RoE -2.2 2.5 6.6 7.4 -21.0 -8.2 7.9 11.4
RoCE 3.8 4.6 5.9 6.8 -5.7 0.5 8.6 11.2
RoIC -14.9 2.3 5.2 7.1 -7.9 -0.4 7.4 10.2
Working Capital Ratios
Fixed Asset Turnover (x) 0.7 0.6 0.7 0.6 0.2 0.4 0.6 0.6
Asset Turnover (x) 0.6 0.5 0.6 0.5 0.2 0.3 0.5 0.5
Inventory (Days) 7 8 7 8 22 11 7 7
Debtor (Days) 25 29 26 24 51 30 24 24
Creditor (Days) 31 31 26 32 74 40 28 27
Leverage Ratio (x)
Current Ratio 0.8 0.9 1.0 1.0 0.9 0.9 1.1 1.2
Interest Cover Ratio 1.0 1.4 2.6 1.7 -1.9 -0.1 2.3 3.4
Net Debt/Equity 1.2 0.4 0.4 0.4 0.8 0.4 0.3 0.2
Consolidated - Cash Flow Statement (INR M)
Y/E March FY17 FY18 FY19 FY20 FY21 FY22E FY23E FY24E
OP/(Loss) before Tax 306 1,618 4,017 3,955 -10,095 -3,868 6,498 10,135
Depreciation 2,994 3,012 3,279 4,042 4,096 4,143 4,450 4,696
Interest & Finance Charges 3,015 2,073 1,068 2,087 2,381 3,486 2,215 1,755
Direct Taxes Paid -868 -1,425 -1,571 -448 1,553 341 -2,144 -3,344
(Inc)/Dec in WC -599 -1,033 323 -1,402 -2,722 -138 -1,144 -72
CF from Operations 4,848 4,246 7,115 8,235 -4,786 3,964 9,876 13,170
Others 498 675 0 0 1,600 -484 0 0
CF from Operating incl EO 5,345 4,920 7,114 8,235 -3,187 3,481 9,876 13,170
(Inc)/Dec in FA 4,193 -5,094 -5,067 -5,855 -7,629 -2,500 -3,500 -3,500
Free Cash Flow 9,538 -174 2,048 2,380 -10,816 981 6,376 9,670
(Pur)/Sale of Investments 4,425 -1,462 2,614 -915 -566 -6,750 0 0
Others 496 912 -1,428 1,750 6,998 1,000 1,567 1,763
CF from Investments 9,114 -5,644 -3,882 -5,019 -1,197 -8,250 -1,933 -1,737
Issue of Shares 0 14,999 0 0 0 19,821 0 0
Inc/(Dec) in Debt -11,719 -9,498 -1,010 2,760 10,310 -9,700 -1,200 -5,000
Interest Paid -1,637 -4,089 -1,901 -3,411 -4,028 -4,486 -3,782 -3,518
Dividend Paid -458 -447 -725 -725 -529 -661 -793 -793
Others 0 -7 110 -1,093 -2,989 -109 -115 -126
CF from Fin. Activity -13,814 957 -3,527 -2,470 2,764 4,865 -5,889 -9,437
Inc/Dec of Cash 645 233 -294 746 -1,619 95 2,053 1,996
Opening Balance 1,826 2,471 2,704 2,409 3,156 1,536 1,632 3,685
Closing Balance 2,471 2,704 2,409 3,156 1,536 1,632 3,685 5,681

INDIAN HOTELS
19 January 2022 19
Explanation of Investment Rating
Investment Rating Expected return (over 12-month)
BUY >=15%
SELL < - 10%
NEUTRAL < - 10 % to 15%
UNDER REVIEW Rating may undergo a change
NOT RATED We have forward looking estimates for the stock but we refrain from assigning recommendation
*In case the recommendation given by the Research Analyst is inconsistent with the investment rating legend for a continuous period of 30 days, the Research Analyst shall within following 30 days take appropriate measures to make the recommendation consistent with the investment rating legend. Disclosures The following Disclosures are being made in compliance with the SEBI Research Analyst Regulations 2014 (herein after referred to as the Regulations). Motilal Oswal Financial Services Ltd. (MOFSL) is a SEBI Registered Research Analyst having registration no. INH000000412. MOFSL, the Research Entity (RE) as defined in the Regulations, is engaged in the business of providing Stock broking services, Investment Advisory Services, Depository participant services & distribution of various financial products. MOFSL is a subsidiary company of Passionate Investment Management Pvt. Ltd.. (PIMPL). MOFSL is a listed public company, the details in respect of which are available on www.motilaloswal.com. MOFSL (erstwhile Motilal Oswal Securities Limited - MOSL) is registered with the Securities & Exchange Board of India (SEBI) and is a registered Trading Member with National Stock Exchange of India Ltd. (NSE) and Bombay Stock Exchange Limited (BSE), Multi Commodity Exchange of India Limited (MCX) and National Commodity & Derivatives Exchange Limited (NCDEX) for its stock broking activities & is Depository participant with Central Depository Services Limited (CDSL) National Securities Depository Limited (NSDL),NERL, COMRIS and CCRL and is member of Association of Mutual Funds of India (AMFI) for distribution of financial products and Insurance Regulatory & Development Authority of India (IRDA) as Corporate Agent for insurance products. Details of associate entities of Motilal Oswal Financial Services Limited are available on the website at http://onlinereports.motilaloswal.com/Dormant/documents/List%20of%20Associate%20companies.pdf MOFSL and its associate company(ies), their directors and Research Analyst and their relatives may; (a) from time to time, have a long or short position in, act as principal in, and buy or sell the securities or derivatives thereof of companies mentioned herein. (b) be engaged in any other transaction involving such securities and earn brokerage or other compensation or act as a market maker in the financial instruments of the company(ies) discussed herein or act as an advisor or lender/borrower to such company(ies) or may have any other potential conflict of interests with respect to any recommendation and other related information and opinions.; however the same shall have no bearing whatsoever on the specific recommendations made by the analyst(s), as the recommendations made by the analyst(s) are completely independent of the views of the associates of MOFSL even though there might exist an inherent conflict of interest in some of the stocks mentioned in the research report MOFSL and / or its affiliates do and seek to do business including investment banking with companies covered in its research reports. As a result, the recipients of this report should be aware that MOFSL may have a potential conflict of interest that may affect the objectivity of this report. Compensation of Research Analysts is not based on any specific merchant banking, investment banking or brokerage service transactions. Details of pending Enquiry Proceedings of Motilal Oswal Financial Services Limited are available on the website at https://galaxy.motilaloswal.com/ResearchAnalyst/PublishViewLitigation.aspx A graph of daily closing prices of securities is available at www.nseindia.com, www.bseindia.com. Research Analyst views on Subject Company may vary based on Fundamental research and Technical Research. Proprietary trading desk of MOFSL or its associates maintains arm’s length distance with Research Team as all the activities are segregated from MOFSL research activity and therefore it can have an independent view with regards to Subject Company for which Research Team have expressed their views. Regional Disclosures (outside India) This report is not directed or intended for distribution to or use by any person or entity resident in a state, country or any jurisdiction, where such distribution, publication, availability or use would be contrary to law, regulation or which would subject MOFSL & its group companies to registration or licensing requirements within such jurisdictions. For Hong Kong: This report is distributed in Hong Kong by Motilal Oswal capital Markets (Hong Kong) Private Limited, a licensed corporation (CE AYY-301) licensed and regulated by the Hong Kong Securities and Futures Commission (SFC) pursuant to the Securities and Futures Ordinance (Chapter 571 of the Laws of Hong Kong) “SFO”. As per SEBI (Research Analyst Regulations) 2014 Motilal Oswal Securities (SEBI Reg No. INH000000412) has an agreement with Motilal Oswal capital Markets (Hong Kong) Private Limited for distribution of research report in Hong Kong. This report is intended for distribution only to “Professional Investors” as defined in Part I of Schedule 1 to SFO. Any investment or investment activity to which this document relates is only available to professional investor and will be engaged only with professional investors.” Nothing here is an offer or solicitation of these securities, products and services in any jurisdiction where their offer or sale is not qualified or exempt from registration. The Indian Analyst(s) who compile this report is/are not located in Hong Kong & are not conducting Research Analysis in Hong Kong. For U.S. Motilal Oswal Financial Services Limited (MOFSL) is not a registered broker - dealer under the U.S. Securities Exchange Act of 1934, as amended (the"1934 act") and under applicable state laws in the United States. In addition MOFSL is not a registered investment adviser under the U.S. Investment Advisers Act of 1940, as amended (the "Advisers Act" and together with the 1934 Act, the "Acts), and under applicable state laws in the United States. Accordingly, in the absence of specific exemption under the Acts, any brokerage and investment services provided by MOFSL , including the products and services described herein are not available to or intended for U.S. persons. This report is intended for distribution only to "Major Institutional Investors" as defined by Rule 15a-6(b)(4) of the Exchange Act and interpretations thereof by SEC (henceforth referred to as "major institutional investors"). This document must not be acted on or relied on by persons who are not major institutional investors. Any investment or investment activity to which this document relates is only available to major institutional investors and will be engaged in only with major institutional investors. In reliance on the exemption from registration provided by Rule 15a-6 of the U.S. Securities Exchange Act of 1934, as amended (the "Exchange Act") and interpretations thereof by the U.S. Securities and Exchange Commission ("SEC") in order to conduct business with Institutional Investors based in the U.S., MOFSL has entered into a chaperoning agreement with a U.S. registered broker-dealer, Motilal Oswal Securities International Private Limited. ("MOSIPL"). Any business interaction pursuant to this report will have to be executed within the provisions of this chaperoning agreement. The Research Analysts contributing to the report may not be registered /qualified as research analyst with FINRA. Such research analyst may not be associated persons of the U.S. registered broker-dealer, MOSIPL, and therefore, may not be subject to NASD rule 2711 and NYSE Rule 472 restrictions on communication with a subject company, public appearances and trading securities held by a research analyst account. For Singapore In Singapore, this report is being distributed by Motilal Oswal Capital Markets Singapore Pte Ltd (“MOCMSPL”) (Co.Reg. NO. 201129401Z) which is a holder of a capital markets services license and an exempt financial adviser in Singapore.As per the approved agreement under Paragraph 9 of Third Schedule of Securities and Futures Act (CAP 289) and Paragraph 11 of First Schedule of Financial Advisors Act (CAP 110) provided to MOCMSPL by Monetary Authority of Singapore. Persons in Singapore should contact MOCMSPL in respect of any matter arising from, or in connection with this report/publication/communication. This report is distributed solely to persons who qualify as “Institutional Investors”, of which some of whom may consist of "accredited" institutional investors as defined in section 4A(1) of the Securities and Futures Act, Chapter 289 of Singapore (“the SFA”). Accordingly, if a Singapore person is not or ceases to be such an institutional investor, such Singapore Person must immediately discontinue any use of this Report and inform MOCMSPL. Specific Disclosures 1 MOFSL, Research Analyst and/or his relatives does not have financial interest in the subject company, as they do not have equity holdings in the subject company. 2 MOFSL, Research Analyst and/or his relatives do not have actual/beneficial ownership of 1% or more securities in the subject company 3 MOFSL, Research Analyst and/or his relatives have not received compensation/other benefits from the subject company in the past 12 months 4 MOFSL, Research Analyst and/or his relatives do not have material conflict of interest in the subject company at the time of publication of research report 5 Research Analyst has not served as director/officer/employee in the subject company 6 MOFSL has not acted as a manager or co-manager of public offering of securities of the subject company in past 12 months 7 MOFSL has not received compensation for investment banking/ merchant banking/brokerage services from the subject company in the past 12 months 8 MOFSL has not received compensation for other than investment banking/merchant banking/brokerage services from the subject company in the past 12 months 9 MOFSL has not received any compensation or other benefits from third party in connection with the research report 10 MOFSL has not engaged in market making activity for the subject company

INDIAN HOTELS
19 January 2022 20
******************************************************************************************************************************** The associates of MOFSL may have: - financial interest in the subject company - actual/beneficial ownership of 1% or more securities in the subject company - received compensation/other benefits from the subject company in the past 12 months - other potential conflict of interests with respect to any recommendation and other related information and opinions.; however the same shall have no bearing whatsoever on the
specific recommendations made by the analyst(s), as the recommendations made by the analyst(s) are completely independent of the views of the associates of MOFSL even though there might exist an inherent conflict of interest in some of the stocks mentioned in the research report.
- acted as a manager or co-manager of public offering of securities of the subject company in past 12 months
- be engaged in any other transaction involving such securities and earn brokerage or other compensation or act as a market maker in the financial instruments of the company(ies) discussed herein or act as an advisor or lender/borrower to such company(ies)
- received compensation from the subject company in the past 12 months for investment banking / merchant banking / brokerage services or from other than said services.
The associates of MOFSL has not received any compensation or other benefits from third party in connection with the research report Above disclosures include beneficial holdings lying in demat account of MOFSL which are opened for proprietary investments only. While calculating beneficial holdings, It does not consider demat accounts which are opened in name of MOFSL for other purposes (i.e holding client securities, collaterals, error trades etc.). MOFSL also earns DP income from clients which are not considered in above disclosures. Analyst Certification The views expressed in this research report accurately reflect the personal views of the analyst(s) about the subject securities or issues, and no part of the compensation of the research analyst(s) was, is, or will be directly or indirectly related to the specific recommendations and views expressed by research analyst(s) in this report. Terms & Conditions: This report has been prepared by MOFSL and is meant for sole use by the recipient and not for circulation. The report and information contained herein is strictly confidential and may not be altered in any way, transmitted to, copied or distributed, in part or in whole, to any other person or to the media or reproduced in any form, without prior written consent of MOFSL. The report is based on the facts, figures and information that are considered true, correct, reliable and accurate. The intent of this report is not recommendatory in nature. The information is obtained from publicly available media or other sources believed to be reliable. Such information has not been independently verified and no guaranty, representation of warranty, express or implied, is made as to its accuracy, completeness or correctness. All such information and opinions are subject to change without notice. The report is prepared solely for informational purpose and does not constitute an offer document or solicitation of offer to buy or sell or subscribe for securities or other financial instruments for the clients. Though disseminated to all the customers simultaneously, not all customers may receive this report at the same time. MOFSL will not treat recipients as customers by virtue of their receiving this report. Disclaimer: The report and information contained herein is strictly confidential and meant solely for the selected recipient and may not be altered in any way, transmitted to, copied or distributed, in part or in whole, to any other person or to the media or reproduced in any form, without prior written consent. This report and information herein is solely for informational purpose and may not be used or considered as an offer document or solicitation of offer to buy or sell or subscribe for securities or other financial instruments. Nothing in this report constitutes investment, legal, accounting and tax advice or a representation that any investment or strategy is suitable or appropriate to your specific circumstances. The securities discussed and opinions expressed in this report may not be suitable for all investors, who must make their own investment decisions, based on their own investment objectives, financial positions and needs of specific recipient. This may not be taken in substitution for the exercise of independent judgment by any recipient. Each recipient of this document should make such investigations as it deems necessary to arrive at an independent evaluation of an investment in the securities of companies referred to in this document (including the merits and risks involved), and should consult its own advisors to determine the merits and risks of such an investment. The investment discussed or views expressed may not be suitable for all investors. Certain transactions -including those involving futures, options, another derivative products as well as non-investment grade securities - involve substantial risk and are not suitable for all investors. No representation or warranty, express or implied, is made as to the accuracy, completeness or fairness of the information and opinions contained in this document. The Disclosures of Interest Statement incorporated in this document is provided solely to enhance the transparency and should not be treated as endorsement of the views expressed in the report. This information is subject to change without any prior notice. The Company reserves the right to make modifications and alternations to this statement as may be required from time to time without any prior approval. MOFSL, its associates, their directors and the employees may from time to time, effect or have effected an own account transaction in, or deal as principal or agent in or for the securities mentioned in this document. They may perform or seek to perform investment banking or other services for, or solicit investment banking or other business from, any company referred to in this report. Each of these entities functions as a separate, distinct and independent of each other. The recipient should take this into account before interpreting the document. This report has been prepared on the basis of information that is already available in publicly accessible media or developed through analysis of MOFSL. The views expressed are those of the analyst, and the Company may or may not subscribe to all the views expressed therein. This document is being supplied to you solely for your information and may not be reproduced, redistributed or passed on, directly or indirectly, to any other person or published, copied, in whole or in part, for any purpose. This report is not directed or intended for distribution to, or use by, any person or entity who is a citizen or resident of or located in any locality, state, country or other jurisdiction, where such distribution, publication, availability or use would be contrary to law, regulation or which would subject MOFSL to any registration or licensing requirement within such jurisdiction. The securities described herein may or may not be eligible for sale in all jurisdictions or to certain category of investors. Persons in whose possession this document may come are required to inform themselves of and to observe such restriction. Neither the Firm, not its directors, employees, agents or representatives shall be liable for any damages whether direct or indirect, incidental, special or consequential including lost revenue or lost profits that may arise from or in connection with the use of the information. The person accessing this information specifically agrees to exempt MOFSL or any of its affiliates or employees from, any and all responsibility/liability arising from such misuse and agrees not to hold MOFSL or any of its affiliates or employees responsible for any such misuse and further agrees to hold MOFSL or any of its affiliates or employees free and harmless from all losses, costs, damages, expenses that may be suffered by the person accessing this information due to any errors and delays. Registered Office Address: Motilal Oswal Tower, Rahimtullah Sayani Road, Opposite Parel ST Depot, Prabhadevi, Mumbai-400025; Tel No.: 022 71934200/ 022-71934263;
Website www.motilaloswal.com.CIN no.: L67190MH2005PLC153397.Correspondence Office Address: Palm Spring Centre, 2nd Floor, Palm Court Complex, New Link Road,
Malad(West), Mumbai- 400 064. Tel No: 022 7188 1000. Registration Nos.: Motilal Oswal Financial Services Limited (MOFSL)*: INZ000158836(BSE/NSE/MCX/NCDEX); CDSL and NSDL: IN-DP-16-2015; Research Analyst: INH000000412. AMFI: ARN - 146822; Investment Adviser: INA000007100; Insurance Corporate Agent: CA0579;PMS:INP000006712. Motilal Oswal Asset Management Company Ltd. (MOAMC): PMS (Registration No.: INP000000670); PMS and Mutual Funds are offered through MOAMC which is group company of MOFSL. Motilal Oswal Wealth Management Ltd. (MOWML): PMS (Registration No.: INP000004409) is offered through MOWML, which is a group company of MOFSL. Motilal Oswal Financial Services Limited is a distributor of Mutual Funds, PMS, Fixed Deposit, Bond, NCDs,Insurance Products and IPOs.Real Estate is offered through Motilal Oswal Real Estate Investment Advisors II Pvt. Ltd. which is a group company of MOFSL. Private Equity is offered through Motilal Oswal Private Equity Investment Advisors Pvt. Ltd which is a group company of MOFSL. Research & Advisory services is backed by proper research. Please read the Risk Disclosure Document prescribed by the Stock Exchanges carefully before investing. There is no assurance or guarantee of the returns. Investment in securities market is subject to market risk, read all the related documents carefully before investing. Details of Compliance Officer: Name: Neeraj Agarwal, Email ID: [email protected], Contact No.:022-71881085. * MOSL has been amalgamated with Motilal Oswal Financial Services Limited (MOFSL) w.e.f August 21, 2018 pursuant to order dated July 30, 2018 issued by Hon'ble National Company Law Tribunal, Mumbai Bench.