Shasun Pharmaceuticals Limited - Moneycontrol
100
Annual Report 2012–13 Shasun Pharmaceuticals Limited
-
Upload
khangminh22 -
Category
Documents
-
view
0 -
download
0
Transcript of Shasun Pharmaceuticals Limited - Moneycontrol

Annual Report
2012–13
Shasun Pharmaceuticals Limited

Forward Looking Statements
In this Annual Report we have disclosed forward-looking information to enable investors to comprehend our prospects and
take informed investment decisions. This report and other statements-written and oral-that we periodically make contain
forward-looking statements that set out anticipated results based on the management’s plans and assumptions. We have
tried wherever possible to identify such statements using words such as ‘anticipate’, ‘estimate’, ‘expects’, ‘projects’,
‘intends’, ‘plans’, ‘believes’ and words of similar substance in connection with any discussion of future performance.
We cannot guarantee that these forward-looking statements will be realized, although we believe we have been prudent
in our assumptions. The achievement of results is subject to risks, uncertainties and even inaccurate assumptions. Should
known or unknown risks or uncertainties materialize, or should underlying assumptions prove inaccurate, actual results
could vary materially from those anticipated, estimated or projected. Readers should bear this in mind.
We undertake no obligation to publicly update any forward looking-statements, whether as a result of new information,
future events or otherwise.
Board of Directors
Mr R Kannan Chairman
Mr R Sundara Rajan Independent Director
Mr N Subramanian Independent Director
Dr Sunny Sharma Independent Director
Prof Indira J Parikh Independent Director
Mr S Abhaya Kumar Managing Director
Dr S Devendra Wholetime Director
Mr S Vimal Kumar Wholetime Director
Mr M Mohan Wholetime Director
Contents
Financial Highlights 1
Letter from Managing Mirector 2
Doing Our Bit in the Community 4
Over the Years 6
Directors’ report 8
Management Discussion and Analysis 14
Report on Corporate Governance 20
General Shareholder’s Information 26
Independent Auditors’ Report 34
Standalone Financial Statements 38
Consolidated Auditors’ Report 65
Consolidated Financial Statements 66
Research and Development Financials 91
Summary of Financial Information of
Subsidiary Companies 92
Notice of Annual General Meeting 93

| S
HA
SU
N P
HA
RM
AC
EU
TIC
ALS
LIM
ITE
D |
AN
NU
AL
RE
PO
RT
201
2–13
1
Who are we?
An award-winning pharma solutions provider that aims to be a preferred partner for drug substance and drug product development and supply.
A truly global company from India with a global asset base that melds the best of the East and the West.
A pharmaceutical contract organization with demonstrated capabilities of manufacturing and development at every scale across the whole drug cycle.
A research and technology driven innovator in biotechnology, nanotechnology, bulk substance and generic drug development and manufacturing.
A fully integrated drug lifecycle manager that meshes research, engineering solutions, process development, project management, and logistics to efficiently deliver products.
A brand presence in the area of health solutions and initiative.
We are Shasun.
An aw
research and techn
A fully integrated drudevelopment
A truly
A pharmaceut
five years consolidated financial highlights
Rs in Mn
Financials 2008-09 2009-10 2010-11 2011-12 2012-13
Sales 7,382.62 7,654.42 8,344.51 10,664.03 10,847.71
Profit Before Depreciation, Interest and Tax (822.77) 699.66 934.33 1,639.02 1,352.31
Interest 209.84 301.06 322.59 436.99 321.88
Depreciation 381.26 378.47 375.79 405.70 526.47
Profit Before Tax (1,413.87) 20.13 235.95 796.33 503.96
Profit After Tax (1,370.86) 37.67 266.24 1,005.67 530.36
Dividend Distributed on equity shares - 48.31 14.56 119.14 84.94
Dividend % (including proposed) - 50.00 15.00 120.00 75.00
Earnings per share before prior period items (Rs.) (28.37) 0.42 5.48 20.69 9.61
Share Capital 96.63 96.63 97.09 110.25 113.25
Reserves 967.08 1,076.46 742.07 2,084.68 2,607.59
Money received against share warrants - - - 28.13 -
Net worth 1,063.71 1,173.09 839.16 2,213.11 2,700.28
Gross Block 4,772.00 4,811.19 5,218.99 5,863.77 6,985.60

| S
HA
SU
N P
HA
RM
AC
EU
TIC
ALS
LIM
ITE
D |
AN
NU
AL
RE
PO
RT
201
2–13
2
Dear Shareholders,
At the very outset, I would thank you for being with us and
reposing your confidence on the management. We make
all possible efforts to meet the highest standards for our
products. Our focus is quality and we believe in delivering
nothing but the best.
Herein, I am pleased to write to you about your Company’s
performance for the financial year 2012–13. During Fiscal
13, your Company posted revenue of Rs.11030.52 Mn.
and Profit after Tax of Rs.530.36 Mn. We have started
the new fiscal with confidence and positivity. I do believe
that the decisions by management over the last year will
yield positive results in the coming year. We have made
impressive strides towards the branded generic space
and at the same time maintaining our momentum towards
manufacturing operations and technology development.
The idea behind the above strategy is to make your
Company’s presence felt across the pharmaceutical value
Letter from Managing Director

| S
HA
SU
N P
HA
RM
AC
EU
TIC
ALS
LIM
ITE
D |
AN
NU
AL
RE
PO
RT
201
2–13
3
chain and at the same time provide impetus to its growth. You will be glad to hear that we have made appreciable
headway in nano- and biotechnology areas. FY 13 has been a very challenging year for all of us. The economic
scenario is not cheerful and power cuts have posed problems. But please be assured that capital expenditure
plan is on track and your Company’s infrastructure development is well on target. You will be delighted to know
that your Company’s facilities in Vizag and Cuddalore will soon be ready to support the expansion of next growth
phase.
I am very happy to share with you that Shasun has the highest number of phase-3 molecules in the pipeline.
All this has the potential of being translated into far greater supplier opportunities for us in the near future. On the
regulatory side, we have received approvals from key regulatory agencies for our API and Formulations divisions
and have acquired accreditation from all majority agencies post their inspections.
The performance of the CRAMS division has been encouraging. We have signed agreement for about 5 products
with one of the top 3 generic players in the world. This augurs well for the business unit in FY14.
EHS (Environment, Health and Safety) play an integral role in your Company’s functioning. We are committed
to promoting the best EHS practices for wholesome and holistic development of your Company and its people.
Your Company has invested in reverse osmosis plants, multiple-effect evaporators, agitated thin film driers and
an activated carbon bed facility for fugitive emissions. Apart from this, the environment around your Company’s
factory is regularly monitored by MOEF-approved labs. The above expounds our commitment towards exemplary
EHS practices. Various audits by customers and consultants have also established Shasun’s EHS practice as
amongst the best in the industry in the whole of our country.
We take our corporate social responsibility seriously and have taken humble efforts to contribute to the
community we live in. We have partnered with Sankar Foundation Eye Hospital in Vizag, Andhra Pradesh, to roll
out awareness programmes, health camps, and have funded surgeries for the poor. SPSL in the UK has been
supporting apprenticeships through a new initiative and has partnered with the Northumberland County Council
to make this a success. The waste water management programmes have also been refurbished and the initiative
has succeeded in involving people from the community on an on-going basis.
The future looks exciting and your Company is all geared for value creation. I am confident and enthused as we
head towards our goal. I would like to place on record my sincere appreciation and thanks for the assistance and
cooperation received from the Banks during the year under review. My deepest thanks to each of you for your
continual support and confidence. Without you and the support of our customers, and suppliers, your Company
would not have been where it is today. Finally I would like to end by thanking our staffs for their commitment and
contribution towards achieving our business objectives.
As I conclude a quote of Frank Lloyd Wright comes to my head, “I know the price of success; dedication, hard work, and an unremitting devotion to the things you want to see happen.”
With warm regards,
S. Abhaya Kumar Managing Director
Chennai

| S
HA
SU
N P
HA
RM
AC
EU
TIC
ALS
LIM
ITE
D |
AN
NU
AL
RE
PO
RT
201
2–13
4
Doing Our Bit in the Community
Health
SPSL, Dudley, UK
witnessed participation of a cross-section of its
employees and wholehearted involvement of
the local community including political leaders
and dignitaries. As in the past, a fund-raiser
was organized by Shasun employees this year
too, where £6,700 was raised. The company
made matching contribution and the total amount
was set aside to help local families with differently-
abled children.
with funds during the event. These include the
Newcastle Freeman Hospital, Newcastle Infirmary
Kidney Funds, The Julie Kent Trust Fund, the
Macmillan Cancer Research, and Children Today.
SPL, INDIA
Shasun Dispensary
eye camp, cardiology camp, etc., for patients from
around 10 villages around Kalapet, Puducherry.
Sankar Foundation Eye Hospital, Vizag, AP
partnership with SHASUN conducted eye camps
in Pinnintipeta on the occasion of the 10th death
anniversary of Late Smt. Sundarbai. In these
camps, 350 patients were examined and 132
among them underwent surgeries. Also utilised this
camp to create awareness regarding eye diseases,
and focused on its prevention and management.
We also received local support from the Sri Satya
Sai Bhajan Mandali.
partnership with SHASUN also conducted five
Cataract Eye Screening Camps at Dibbapalem,
Menthipeta, Pinnintipeta, Pundi, and Thanam.
Manavaseva Dharma Samvardhani
Shasun also supported the Manavaseva Dharma
Samvardhani, a charitable trust, to promote social
consciousness in its initiatives.
Shasun Pharmaceuticals is in continuous lookout for new
ways to actively and fruitfully contribute resources towards
corporate social responsibility activities; its primary focus areas
being—Health, Education & Social Infrastructure, to enhance
the social and economic development of the community in
which it operates.
| S
HA
SU
N P
HA
RM
AC
EU
TIC
ALS
LIM
ITE
D |
AN
NU
AL
RE
PO
RT
201
2–13
5
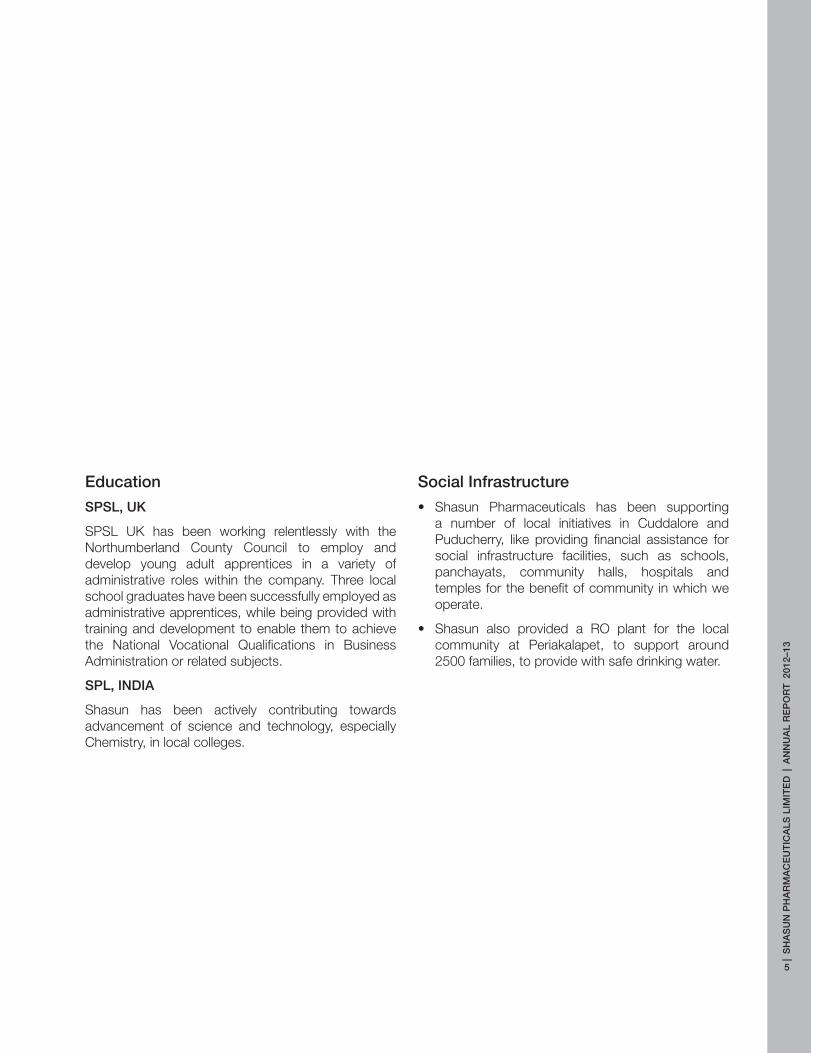
Education
SPSL, UK
SPSL UK has been working relentlessly with the
Northumberland County Council to employ and
develop young adult apprentices in a variety of
administrative roles within the company. Three local
school graduates have been successfully employed as
administrative apprentices, while being provided with
training and development to enable them to achieve
the National Vocational Qualifications in Business
Administration or related subjects.
SPL, INDIA
Shasun has been actively contributing towards
advancement of science and technology, especially
Chemistry, in local colleges.
Social Infrastructure
a number of local initiatives in Cuddalore and
Puducherry, like providing financial assistance for
social infrastructure facilities, such as schools,
panchayats, community halls, hospitals and
temples for the benefit of community in which we
operate.
community at Periakalapet, to support around
2500 families, to provide with safe drinking water.

| S
HA
SU
N P
HA
RM
AC
EU
TIC
ALS
LIM
ITE
D |
AN
NU
AL
RE
PO
RT
201
2–13
6
Over the Years
1976 19921977 1986 1988 1990 1991
2000 20062001 2002 2003 2004 2005

| S
HA
SU
N P
HA
RM
AC
EU
TIC
ALS
LIM
ITE
D |
AN
NU
AL
RE
PO
RT
201
2–13
7
1993 19991994 1995 1996 1997 1998
2007 20132008 2009 2010 2011 2012

| S
HA
SU
N P
HA
RM
AC
EU
TIC
ALS
LIM
ITE
D |
AN
NU
AL
RE
PO
RT
201
2–13
8
Directors’ Report
Dear Shareowners,
The Directors take pleasure in presenting the Thirty Eighth Annual Report of your Company together with the
audited statement of accounts for the year ended March 31, 2013.
FINANCIAL RESULTS Rs. in Mn
Financial Results for the year ending Standalone Consolidated
31.03.2013 31.03.2012 31.03.2013 31.03.2012
Gross Revenue 7964.11 7768.73 11030.52 11073.23
Profit before interest, Depreciation and Tax 817.83 924.82 1352.31 1639.02
Profit before tax 236.34 372.73 503.96 796.33
Profit after tax 262.78 530.58 530.36 1005.67
Appropriated as follows
Dividend on Equity Shares 84.94 119.14 84.94 119.14
Tax on Dividend 14.43 19.33 14.43 19.33
Transfer to General Reserve 26.28 53.06 26.28 53.06
EPS (diluted) on the basis of Rs 2/- share 4.76 10.76 9.61 20.39
A detailed analysis of the operations of the Company has been provided in the management discussion and
analysis report, which forms a part of this annual report
1. Dividend
The Board of Directors of the Company are pleased to recommend a dividend of Rs. 1.50 per equity
share of Rs. 2.00 each for the financial year of 2012–13. This dividend, if approved at the ensuing AGM,
will be paid to those shareholders whose names appear on the register of members of the Company as on
August 2, 2013. The total outflow on account of dividend, including the tax on distributed profits, is Rs.
99.37 Mn (Rs. 138.47 Mn for the previous year)
2. Directors
In accordance with the Articles of Association of the Company, Mr. R. Kannan and Mr. N. Subramanian retire
by rotation and are eligible for reappointment.
The Board appointed Prof. Indira J Parikh as Additional Director on the Board of Directors of the Company
on August 2, 2012. She will hold this office till the next Annual General Meeting of the Company. Due notice
has been received from a member proposing her appointment. It is proposed to appoint her as Director of
the Company liable to retire by rotation. The resolution for the same has been included in the notice of the
Annual General Meeting.
3. Allotment of Equity Shares upon conversion of Warrants
During the year under review, based on your approval, the Company allotted 15,00,000 equity shares at a
price of Rs. 75 per share upon conversion of warrants on a preferential basis to promoter group and directors.

| S
HA
SU
N P
HA
RM
AC
EU
TIC
ALS
LIM
ITE
D |
AN
NU
AL
RE
PO
RT
201
2–13
9
4. Auditors
The Statutory auditors of the Company, M/s B.S.R. & Co., Chartered Accountants retire at the ensuing
Annual General Meeting and are eligible for re-appointment.
5. Cost Audit
Pursuant to Section 233B of the Companies Act, 1956, the Central Government has prescribed Cost Audit
of the Company. Subject to approval from the Central Government, the Board has appointed M/s. Geeyes
& Co., Cost Accountants as cost auditor of the Company for the financial year 2013–14. The Cost Audit
is under process and the Company will submit the cost audit report to the Central Government within the
prescribed time.
6. Listing arrangements
The company’s shares are listed in the BSE Ltd. and National Stock Exchange of India Ltd., and the annual
listing fee has been paid to these stock exchanges.
7. Subsidiaries
The company has five subsidiary companies as on March 31, 2013. The members may refer to the statement
under Section 212 of the Companies Act, 1956, and the information on the financials of the subsidiaries
appended to the above statement under Section 212 of the Companies Act, 1956, in the Annual Report for
further information on these subsidiaries.
In accordance with the general circular issued by the Ministry of Corporate Affairs, Government of India, the
Balance Sheet, Profit and Loss Account, and other documents of the subsidiary companies are not being
attached with the Balance Sheet of the Company. The Company will make available the Annual Accounts of
the subsidiary companies and the related detailed information to any member of the Company who may be
interested in obtaining the same. The annual accounts of the subsidiary companies will also be kept open
for inspection at the Registered Office of the Company. The consolidated financial statements presented by
the Company include the financial results of its subsidiary companies in prescribed formats.
8. Environment, Health & Safety
Shasun has a team of experienced and competent resources in the management of Environment, Health
and Safety. EHS plays an integral part of the business. The EHS resource team is well structured catering
to Process safety, General & Occupational Health and Safety, Fire Safety, Compliance management and
ETP operations at the site level, managed by the Corporate EHS under the guidance of the Director - EHS.
The team invests proactively in process safety studies like Hazardous Area classification, Consequence
Analysis / Quantitative Risk Analysis PHA, What-if analysis, HAZOP and Work place Chemical Risk
Assessments.
Towards better EHS management and operational control, the Environmental Management System (EMS
ISO 14001:2004) and the BS OHSAS 18001:2007 are well integrated as Integrated Management system,
which is periodically audited for the adequacy and continual improvement. The recent award given by CII for
the EHS excellence & NSC award given for best Safety Practices stand testimony.
From the Environmental protection front, Shasun has taken many water recycling and reuse initiatives
through Advanced treatment technologies like Electrochemical oxidation and coagulation. Towards better
treatment efficiency and Wastes reduction, increased focus is given by implementing comprehensive
Source Segregation Scheme. The Hazardous waste disposed in time through TSDF. Solid waste
management has been improved through environment friendly recycling/reuse of wastes in collaboration
with reputed organizations for paper recycling, plastic waste recycling and E-waste recycling. As part
of Corporate Social Responsibility, the company has undertaken various activities in the field of health
care, education and social infrastructure development which is elaborated in the Corporate Social
Responsibility section.

| S
HA
SU
N P
HA
RM
AC
EU
TIC
ALS
LIM
ITE
D |
AN
NU
AL
RE
PO
RT
201
2–13
10
9. Corporate Governance and Management Discussion and Analysis
The Corporate Governance and Management Discussion and Analysis reports as set out in annexure hereto
form an integral part of this report. A certificate from the auditors of the Company certifying compliance
of the conditions of corporate governance as stipulated in Clause 49 of the listing agreement with stock
exchanges is also annexed to the report on Corporate Governance.
10. Personnel
The Directors wish to place on record their appreciation to the employees for their notable contributions to
the Company and for the co–operation extended to the management in maintaining harmonious industrial
relations at all the units.
11. Particulars of Employees
The Statement of Particulars of Employees, providing information as per Section 217(2A) of the Companies
Act, 1956 read with Companies (Particulars of Employees) Rules, 1975, form a part of this report. However,
as per the provisions of Section 219(1)(b)(iv) of the Companies Act, 1956, the Annual Report excluding this
statement is being sent to all the members. Any member interested in obtaining a copy of this statement
may write to the Company Secretary at the Registered Office.
12. Conservation of Energy, Technology Absorption, Foreign Exchange Earnings and Outgo
Particulars in respect of conservation of energy, technology absorption and foreign exchange earnings and
outgo as required under section 217(1)(e) of the Companies Act, 1956, read with the Companies (Particulars
of Employees) Rules, 1975, as amended up to date is annexed hereto and the same forms part of the report.
13. Directors’ Responsibility Statement
In terms of the provisions of section 217(2AA) of the Companies Act, 1956, your Directors confirm as under:
a) That in preparation of the annual accounts, the applicable accounting standards have been followed and
that no material departure has been made from the same.
b) That they have selected such accounting policies and applied them consistently and made judgements
and estimates that are reasonable and prudent so as to give a true and fair view of the state of affairs of
the company at the end of financial year and of the profit or loss of the company for that period.
c) That they have taken proper and sufficient care for the maintenance of adequate accounting records
in accordance with the provisions of the Companies Act, 1956, for safeguarding the assets of the
company and for preventing and detecting fraud and other irregularities.
d) That they have prepared the annual accounts on a going concern basis.
14. Public Deposits
The company has not accepted any public deposits.
15. Acknowledgement
Your Directors would like to express their grateful appreciation for the assistance and co-operation received
from the Banks during the year under review. Your Directors also place on record their deep sense of
appreciation for the continued support of customers, suppliers and investors of the Company.
For and on behalf of Board of Directors
Place : Chennai S. Abhaya Kumar Dr. S. Devendra S. Vimal KumarDate : May 29, 2013 Managing Director Wholetime Director Wholetime Director

| S
HA
SU
N P
HA
RM
AC
EU
TIC
ALS
LIM
ITE
D |
AN
NU
AL
RE
PO
RT
201
2–13
11
ANNEXURE 1
Statement as per Section 217(1) (e) of the Companies Act 1956
Year ended 31.03.2013
Year ended 31.03.2012
A. Power & Fuel Consumption
Electricity
a. Purchased units in 000's 41,065 41,964
Total amount paid Rs in 000's 236,974 187,930
Rate per unit Rupees 5.77 4.48
b. Own generation by
Diesel Generator (Units) in 000's 11,327 7,159
Unit per Ltr. of Diesel Oil 3.42 3.63
Rate per unit Rupees 13.28 11.54
c. Windmills units purchased in 000's 8,275 3,999
Amount Adjusted Rs in 000's 46,985 14,772
Rate per unit Rupees 5.68 3.69
Others
Furnace Oil Kgs in 000's 574 4,706
Total Amount paid Rs in 000's 25,622 170,467
Rate per Kg Rupees 44.63 36.22
Fuel Briquettes Kgs in 000's 20,668 9,032
Total Amount Paid Rs in 000's 116,389 47,207
Rate Per Kg Rupees 5.63 5.23
B. Consumption per unit of Production
Electricity purchased KWH/ton 4.80 6.47
Diesel Generator KWH/ton 1.32 1.10
Furnace Oil Kg/ton 0.07 0.73
Fuel Briquettes Kg/ton 2.41 1.39
ANNEXURE 2
Information under Section 217 (1) (E) of the Companies Act, 1956, read with Companies (Disclosure of Particulars in the report of Board of Directors) Rules, 1988.
Research and Development:
Active Pharma Ingredients
The research and development function at Shasun is involved in research and product development
activities and last year, both these activities saw a big thrust in terms of the number of projects, research
scientists & customers.
The research activity at Shasun Research Center (SRC) is focused towards chemistry process research for
preclinical & clinical molecules for customers, including some of the top pharmaceutical companies across
US, Europe & Japan. The center witnessed a healthy trend with a high rate of repeat orders and successfully
completed projects as well as bagging clinical supply projects integrated across the chemistry & formulation
value chain.

| S
HA
SU
N P
HA
RM
AC
EU
TIC
ALS
LIM
ITE
D |
AN
NU
AL
RE
PO
RT
201
2–13
12
The infrastructure at SRC including its aesthetic design and high-end instrumentation continues to impress
potential customers and is a key asset for the company for attracting future contract manufacturing
opportunities. Also the investments in recent years in cGMP & safety training & installations of related
infrastructure have helped the center to build a robust system of compliance and have a productive work
culture. This was also reflected in the successful inspection of its analytical facilities by the US FDA in an
audit conducted in December 2012.
The product development efforts at Shasun was also augmented last year with the allocation of additional
labs to this effort and a resulting increase in the number of products taken up for development. Some of the
key products completed lab-scale development during the year and are in the process of being scaled-up or
being validated at our plants. Key aspects of the product development such as cost effectiveness, patent
non-infringement, scaleability and time-to-market have been targeted during the R&D efforts to ensure
successful commercialization of the products.
As a result of the focused work on generic products, the company has also filed 9 process patents for
various products and this is expected to give the company a major edge in production & marketing of these
products.
Formulations
A state-of-art Research and Development centre, it is spread over 7500 square feet area with modern
corporate quality construction and located along with commercial manufacturing unit at Puducherry, India.
The R&D centre of excellence comprises, Formulation Research & Development, Analytical Research &
Development, Technology Transfer, IPR Division, Clinical Division and Project Management departments.
The core business model of Shasun R&D is to design and develop new formulation & Innovative formulations
(NDA) for Shasun and also for third party’s based on development contracts. Our service includes Advanced
manufacturing technologies for highly complex products, Platform technologies, Cost effective formulation
development and commercial manufacturing, Analytical Method Development & Validation, Patent protection
& IP clearance, Safety & Efficacy studies (Clinical, BA, BE studies), Dossier registration and Regulatory
support for post-approval changes.
Shasun customer base includes several top pharmaceutical multi-national companies as well as a large
number of emerging pharmaceutical companies. Our development teams are fully dedicated to their projects
and follow strict project management schedules to deliver products on time, and within budget.
Our state of the art laboratories have all the required equipment to develop formulations as well as analytical
methods for drug products. Equipment design from development laboratories to pilot plant and commercial
manufacturing areas is similar in make and design to facilitate seamless technology transfer of our processes.
Analytical Development Lab have the instruments like HPLC, UPLC, TOC Analyzer, UV, Atomic absorption
spectrometer, FTIR, Polarimeter, Dissolution tester with auto samplers, Stability Chambers (1000L) and
Walk-In stability chambers (18000L), etc.,
The Company is endowed with sufficient knowledge in formulation capabilities especially in the areas of
Sustained Release and Controlled Release Technologies, Erosion Controlled Oral drug delivery systems,
Enteric coating for Site Specific Delivery & Conventional release.
The R&D facility is well supported by an in-house Quality Management System to monitor processes and
documentation as per regulatory guidelines of various stringent countries like US, Canada, Brazil, Japan,
UK and other European countries.
EXPENDITURE ON RESEARCH AND DEVELOPMENT (Rs. Mn)
Year Ended March 31, 2013
Year Ended March 31, 2012
Capital 79.84 14.76
Recurring 243.83 101.46
Total 323.67 116.22
| S
HA
SU
N P
HA
RM
AC
EU
TIC
ALS
LIM
ITE
D |
AN
NU
AL
RE
PO
RT
201
2–13
13
ANNEXURE 3
INFORMATION ON FOREIGN EXCHANGE EARNINGS AND OUTGO IS GIVEN IN ITEM NOS. 31, 32 & 33 IN NOTES TO FINANCIAL STATEMENTS.
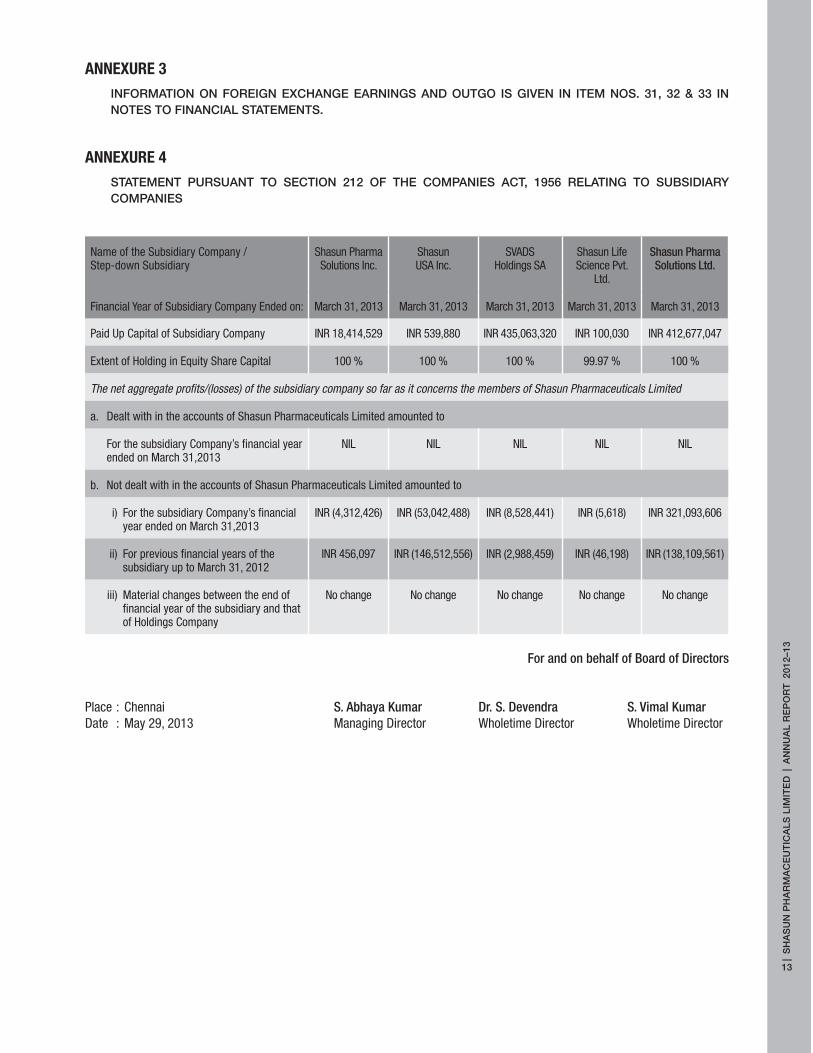
ANNEXURE 4
STATEMENT PURSUANT TO SECTION 212 OF THE COMPANIES ACT, 1956 RELATING TO SUBSIDIARY COMPANIES
Name of the Subsidiary Company / Step-down Subsidiary
Shasun Pharma Solutions Inc.
Shasun USA Inc.
SVADS Holdings SA
Shasun Life Science Pvt.
Ltd.
Shasun Pharma Solutions Ltd.
Financial Year of Subsidiary Company Ended on: March 31, 2013 March 31, 2013 March 31, 2013 March 31, 2013 March 31, 2013
Paid Up Capital of Subsidiary Company INR 18,414,529 INR 539,880 INR 435,063,320 INR 100,030 INR 412,677,047
Extent of Holding in Equity Share Capital 100 % 100 % 100 % 99.97 % 100 %
The net aggregate profits/(losses) of the subsidiary company so far as it concerns the members of Shasun Pharmaceuticals Limited
a. Dealt with in the accounts of Shasun Pharmaceuticals Limited amounted to
For the subsidiary Company’s financial year ended on March 31,2013
NIL NIL NIL NIL NIL
b. Not dealt with in the accounts of Shasun Pharmaceuticals Limited amounted to
i) For the subsidiary Company’s financial year ended on March 31,2013
INR (4,312,426) INR (53,042,488) INR (8,528,441) INR (5,618) INR 321,093,606
ii) For previous financial years of the subsidiary up to March 31, 2012
INR 456,097 INR (146,512,556) INR (2,988,459) INR (46,198) INR (138,109,561)
iii) Material changes between the end of financial year of the subsidiary and that of Holdings Company
No change No change No change No change No change
For and on behalf of Board of Directors
Place : Chennai S. Abhaya Kumar Dr. S. Devendra S. Vimal KumarDate : May 29, 2013 Managing Director Wholetime Director Wholetime Director

| S
HA
SU
N P
HA
RM
AC
EU
TIC
ALS
LIM
ITE
D |
AN
NU
AL
RE
PO
RT
201
2–13
14
Management Discussion and Analysis
Company Performance
Your company is cognizant of the various emerging trends in the global pharmaceutical landscape and has
taken a lot of initiatives to ensure that it is well positioned to leverage the opportunities that arise out of such
trends.
The following section discusses such initiatives on a divisional basis
API Business
On a consolidated basis, API and its intermediate business contributed close to 52% of the turnover of the
company. On a standalone basis, they contributed close to 73% of the total sales.
Your Company’s strategy with respect to this SBU is to enhance sales and profitability. This can be achieved
through the following measures:
Capacity enhancement of the existing products to meet the growing demand
Commercializing new products which are under development
New products development to improve pipeline of products
Process Improvement initiatives
Shasun’s current API portfolio consists of Ibuprofen, Ranitidine, Nizatidine, Gabapentin, Levetiracetan and
Cycloserine, amongst others.
The Company has filed 5 new DMFs and 2 ANDAs in the current financial year.
In this current financial year, the API SBU has achieved a sales revenue of Rs.5316.22 Mn.
Outlook for API Business
The company continues to enjoy significant traction in its core APIs.
New products introduction is major initiative in FY 14 to enhance the sales and profitability.
Currently, your Company is investing in new facilities to manufacture three new APIs, which are to be
launched in FY15. This will bring significant volume and value to your Company. The USDMFs filed by your
company has been triggered by various customers
This year your Company is investing in Vizag SEZ to create manufacturing capacities for API business
segment
While North America and Europe continue to be key markets for your Company, other markets such as Korea,
Japan, and Brazil have presented new opportunities thereby opening more avenues for your Company.
Contract Research and Manufacturing Services Business
Your Company has an active presence in CRAMS in both APIs and Formulations
API CRAMS includes
1. Shasun Pharma Solutions Limited, UK
2. CRAMS SBU in India

| S
HA
SU
N P
HA
RM
AC
EU
TIC
ALS
LIM
ITE
D |
AN
NU
AL
RE
PO
RT
201
2–13
15
Formulations CRAMS includes
Finished Dosages facility in Pondicherry caters to contract manufacturing and contract development of
finished dosages for Innovator, Emerging and Generic pharma companies.
Formulation research centre in Pondicherry provides support for development of new formulation products.
During FY13, CRAMS consolidated business registered the revenue of Rs 4,899 Mn, comprising 48% of the
total consolidated revenue of Shasun and registering a growth of 3% over previous year.
Shasun Pharma Solutions Limited, UK( SPSL)
Operations-SPSL
During FY13, SPSL has continued to focus on its core strengths of safety and quality compliance, continuous
improvement, and innovation.
Safety performance and compliance were maintained at an industry leading level. The year under review
saw the successful completion of several scheduled major hazard regulatory inspections on key risk control
systems with no major observations. In addition, our safety performance and commitment to ensuring
the safety of our employees has been reinforced through a number of initiatives. Working with the Health
and Safety Executive on a competency project engaging all employees and a waste minimization project
working closely with the UK Environmental Agency. REACH compliance was maintained and expert support
and advise continues to be provided to our customer base as part of our service offering.
Compliance with cGMP standards was acknowledged through customer visits and eighteen quality audits at
our facility. The Company continued its excellent performance with respect to quality performance indicators
with a Process right first time of 98%. The company has invested around GBP 3 Million at Dudley facility to
capacity and capability enhancement and to infrastructure upgrades.
Sales-SPSL
Market interest continues to be driven by our key strengths – technical expertise and capability, speed of
response, good facilities, our people and our reliability.
SPSL has a unique ability to handle both highly complex and hazardous projects. A world class hazard
evaluation capability which is fully integrated into our process development group and project management
process allows early understanding and appropriate measures to ensure safe execution. This approach is
seen as an advantage over our competitors by several of our customers.
SPSL UK has achieved sales GBP 35.23 Million and posted PAT of GBP 3.69 million. Focus on high
value added, technically challenging projects has enabled SPSL to return a good PAT performance, despite
pressure on sales.
In 2012, SPSL hosted ninety customer visits to the Dudley site, of which 50% were new and prospective
clients. We have also seen improvements in other key performance metrics including number of inquiries,
number of proposals and proposal closure rate, generating a number of good prospects for our future
pipeline.
Science & technology - SPSL
Over the past year we have continued to focus on science & technology as a key initiative to differentiate
our offering. We continue to develop our HKR (Hydrolytic Kinetic Resolution) technology and broaden its
application, In 2012 a key milestone was achieved with the commercialisation of our 4th generation Salen
catalyst and novel synthesis for Hyperzine A(natural product).

| S
HA
SU
N P
HA
RM
AC
EU
TIC
ALS
LIM
ITE
D |
AN
NU
AL
RE
PO
RT
201
2–13
16
Outlook for SPSL
In 2012 SPSL had a pipeline of 24 launched products and grew its pre-launch pipeline to 27 projects
spanning all clinical phases. The pipeline remains strong with 9 exciting projects in Phase III, 2 of which
have been filed and are pending regulatory approval. The company, through its excellent level of service
coupled with it’s proprietary technology and innovation, is well placed to take advantage of the increased
outsourcing opportunities presented by both established and emerging pharma customers. The company
remains confident that based upon current orders and new business opportunities identified for 2013-14
it can sustain sales and coupled with planned plant efficiency improvements ensure the company remains
profitable.
CRAMS SBU in India
On the Contract Manufacturing front in India, your Company has posted a growth of 26% by successfully
capitalising on the global growth in the contract manufacturing business
Finished Dosages Business – Formulations CRAMS
Your company offers the services of development and manufacture of finished dosages to both Innovator
and generic companies worldwide. The division achieved sales of Rs.1472 Mn during FY13, a substantial
growth of 75% over the previous year.
The Finished Dosages facility has undergone successful inspections by various regulatory bodies such as
WHO Geneva, NDA Uganda, PMPB Malawi, TFDA Tanzania, MCAZ Zimbabwe and ROA Ivory Coast during
FY13.
During this period, it has also five products for registration with various regulatory agencies and has received
one approval for a product previously filed for registration.
Outlook for Formulation CRAMS
Finished Dosages Business remains a major opportunity for Shasun to increase and diversify its
revenue base. With the increased expansion capacity and expected approvals on newer Products, the
Formulation Division is planning to increase its revenues from FY13.The development work on ANDAs
have commenced with a goal of filing atleast 10 ANDAs and 2 CTDs for the European market in FY 14.
The outlook for the Formulations division is robust and your Company is preparing plans to initiate work
on Phase-III expansion later part of this year so as to increase the capacity to meet the growing needs
of its existing customers, and it is also preparing for new product approvals.
The service levels to our existing customers have improved with the changing needs, taking our partnership
with customers to newer heights. Customers have started adding new products from our formulation facility.
Biotechnology
The division achieved Sales growth of 58% for its flagship recombinant streptokinase product and continued
to strengthen its position as a leading manufacturer for streptokinase in India.
The product is also under export registration in some of the key developing countries.
While its other pipeline biosimilar molecules are progressing in development, the division is also drawing up
strategic plans for future growth on a sustainable & differentiated basis.

| S
HA
SU
N P
HA
RM
AC
EU
TIC
ALS
LIM
ITE
D |
AN
NU
AL
RE
PO
RT
201
2–13
17
Nanotechnology
Your company is one of the first few pharmaceutical companies in India to have embarked on nanotechnology-
based research & drug development. As the application & potential of nanotechnology keeps validating
through numerous research papers and partnering deals worldwide, your company is well-positioned to
leverage its knowledge and skills in this sunrise area.
The company is involved in a lead development compound based on the nanotechnology platform with
its joint venture partner – Nanoparticle Biochem Inc., USA & support from the University of Missouri, USA.
The compound is a radioactive gold nanoparticle and is being investigated for treatment of solid tumours.
Extensive preclinical testing is underway in animals and these include studies in both rodent & non-rodents
like dogs & pigs.
A clinical study has also been undertaken for treating prostate-cancer bearing patient dogs and the
compound has shown promising evidence of increase in survival time, tumour regression and retention
within the tumour.
The plan is for completing the rest of the identified preclinical studies and take the product for Investigational
New Drug (IND) filing in both India & USA. A Scientific Advisory team comprising of well-known experts has
also been formed in India and they are guiding the team in the development of this molecule.
With its nanotechnology foray, the company has also undertaken another area of research into polymeric
nanoparticles with the objective of developing a drug delivery platform that can be applied across various
molecules. This research is currently underway with the target of establishing the preliminary proof-of-
concept of the proposed technology platform.
Consolidated Financial Review
The Company has registered a consolidated Gross revenue of Rs.11030.52 Mn as compared to the previous
year figure of Rs.11073.23 Mn.
Raw material cost as a proportion of total net income decreased to 50.33% in FY13 from 52.64% in FY12.
This is mainly due to product sales mix and process improvement in various products.
Other operating expenses increase in line with increase in sales growth.
The Company has achieved PAT of Rs.530.36 Mn. in FY13 as compared to the previous year figure of
Rs.1005.67 Mn.
Forex forward contracts
Your Company has completed all forex forward contracts during October, 2012 and there is no pending
contracts.
Internal control and systems
The company deploys internal control procedures commensurate with the size and nature of its business.
The aim of these procedures is to ensure efficient use and protection of the Company’s resources, accuracy in
financial reporting, and due compliance with statutes and company procedures. Well-defined individual roles
and responsibilities, as well as an effective feedback flow, facilitate effective monitoring and a responsible
internal audit. Regular Audit Committee Meetings are held where the statutory auditors as well as the internal
auditors participate and the internal audit reports are thoroughly discussed and reviewed.

| S
HA
SU
N P
HA
RM
AC
EU
TIC
ALS
LIM
ITE
D |
AN
NU
AL
RE
PO
RT
201
2–13
18
Risk Management
Shasun is exposed to varied business risks while competing in global environment. The major risks and mitigations are as follows:
Environment risk
Manufacturing of APIs involves handling and processing of chemicals with water and thus results in the
generation of effluents. Effluents if not treated properly can adversely affect the environment. Any emission
or discharge beyond the norms laid down by the relevant regulatory bodies could cause legal censure and
affect the Company’s brand equity.
Risk mitigation
EHS plays an integral role in the running and success of the Company. An EHS policy outlines this approach,
promoting best EHS practices towards continual improvement. The Company’s investments in reverse
osmosis plants, multiple-effect evaporators, agitated thin flim driers, and an activated carbon bed facility
for fugitive emissions, apart from ensuring the monitoring of the environment by MOEF-approved labs, are
proof of its commitment to exemplary EHS practices. Various audits by customers and consultants have
also established. Shasun’s EHS practices are among the best in its industry in the country. The ISO 14001
and OSHAS 18001 certification of its Cuddalore and Pondy API facilities by BVQI are testimony to their
commitment and compliance. The recent award given by CII for the EHS excellence & NSC award given for
Best Safety Practices are further proof.
Regulatory risk
The Pharma industry is strictly regulated in most developed countries. Therefore, any failure to meet
regulatory requirements could potentially pose a risk that may be detrimental, for companies like Shasun,
to the expansion in existing markets and foray into new markets. This, in turn, may limit the prospects for
growth of these companies.
Risk mitigation
Regulatory capability is a key strength of Shasun’s reflected in the following achievements:
different markets and coordinating with its manufacturing team to make products that conform to them
for the Company’s products to be placed in markets in the shortest time
Japanese authorities TGA, and others.
and TPD (Canada).
Client concentration risk
Your Company depends on a few large companies for a majority of its revenues, any attrition in which could
impact its fortunes.

| S
HA
SU
N P
HA
RM
AC
EU
TIC
ALS
LIM
ITE
D |
AN
NU
AL
RE
PO
RT
201
2–13
19
Risk mitigation
The Company has built its foundation on long-term relationships with many important customers. Shasun is
focused on consolidating and expanding these relationships, as these partners increasingly sought Shasun’s
participation across a wider range of products and services. However, from a de-risking point of view, the
Company is broadening its customer base by training its focus on a few high -potential markets (such as
Japan, Brazil, Chile, South Africa, apart from its existing market base in Europe and US) and approaching
new customers with newer products. This would reduce risk associated with dealings with only a few large
customers.
Exchange rate risk
Shasun derives nearly 3/4th of its revenues from exports, exposing the company to an exchange fluctuation
risk.
Risk mitigation
Your Company is addressing this risk at multiple levels: providing for escalation clauses in key contracts,
borrowing in appropriate currency, diversifying its sales into various currencies, viz., US Dollar, Euro, Pound
Sterling, Japanese Yen and Indian Rupee.
Information Technology (IT) risk
Inappropriate IT framework may hamper uninterrupted operations
Risk mitigation
The company has initiated several IT automation measures to continue to strengthen the information risk
management process. The entire network is secured through the implementation of solutions like firewall,
intrusion prevention system, network segregation and End-Point Data Leak Prevention Solutions to ensure
that there is no unauthorized access to the company’s network or data. However, access to internet
is controlled through web security applications. Moreover, validation process has been strengthened to
ensure validation activity is carried in parallel with the application development or deployment. All business
application and infrastructure are continuously validated as a part of the Good Manufacturing Process (GMP)
guideline.
Human Resources
The Company’s induction training for new recruits includes familiarization visits and orientation on various
functions, tailor made to each unit. The company initiates comprise of training and motivate people to
achieve greater efficiencies.
The focus area for human resource function for the coming year is to build team and continue team efforts
for organization excellence.
| S
HA
SU
N P
HA
RM
AC
EU
TIC
ALS
LIM
ITE
D |
AN
NU
AL
RE
PO
RT
201
2–13
20
Report on Corporate Governance
1. Philosophy on Corporate Governance
The company is committed to good corporate governance. The company provides detailed information on
various issues concerning its business and financial performance. The company respects its shareholders’
right to information regarding the performance of the company and considers itself to be the trustee of its
shareholders.
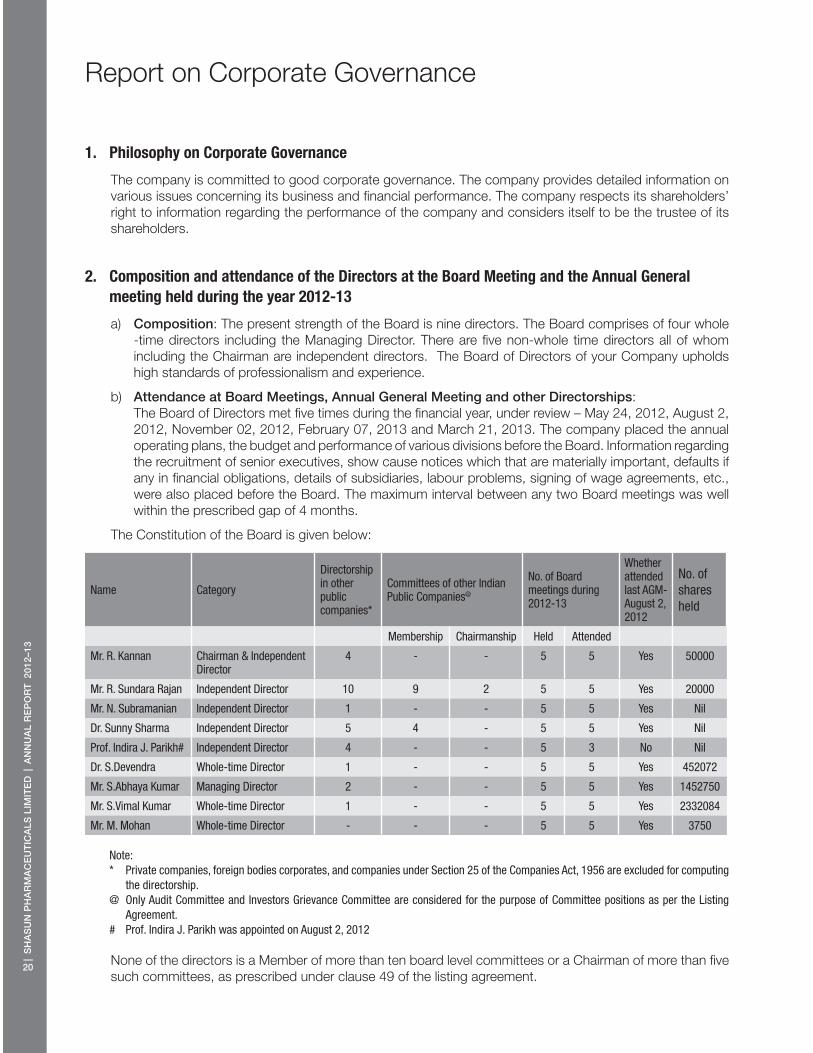
2. Composition and attendance of the Directors at the Board Meeting and the Annual General
meeting held during the year 2012-13
a) Composition: The present strength of the Board is nine directors. The Board comprises of four whole
-time directors including the Managing Director. There are five non-whole time directors all of whom
including the Chairman are independent directors. The Board of Directors of your Company upholds
high standards of professionalism and experience.
b) Attendance at Board Meetings, Annual General Meeting and other Directorships:
The Board of Directors met five times during the financial year, under review – May 24, 2012, August 2,
2012, November 02, 2012, February 07, 2013 and March 21, 2013. The company placed the annual
operating plans, the budget and performance of various divisions before the Board. Information regarding
the recruitment of senior executives, show cause notices which that are materially important, defaults if
any in financial obligations, details of subsidiaries, labour problems, signing of wage agreements, etc.,
were also placed before the Board. The maximum interval between any two Board meetings was well
within the prescribed gap of 4 months.
The Constitution of the Board is given below:
Name Category
Directorship in other public companies*
Committees of other Indian Public Companies@
No. of Board meetings during 2012-13
Whether attended last AGM-August 2, 2012
No. of shares held
Membership Chairmanship Held Attended
Mr. R. Kannan Chairman & Independent Director
4 - - 5 5 Yes 50000
Mr. R. Sundara Rajan Independent Director 10 9 2 5 5 Yes 20000
Mr. N. Subramanian Independent Director 1 - - 5 5 Yes Nil
Dr. Sunny Sharma Independent Director 5 4 - 5 5 Yes Nil
Prof. Indira J. Parikh# Independent Director 4 - - 5 3 No Nil
Dr. S.Devendra Whole-time Director 1 - - 5 5 Yes 452072
Mr. S.Abhaya Kumar Managing Director 2 - - 5 5 Yes 1452750
Mr. S.Vimal Kumar Whole-time Director 1 - - 5 5 Yes 2332084
Mr. M. Mohan Whole-time Director - - - 5 5 Yes 3750
Note:* Private companies, foreign bodies corporates, and companies under Section 25 of the Companies Act, 1956 are excluded for computing
the directorship.@ Only Audit Committee and Investors Grievance Committee are considered for the purpose of Committee positions as per the Listing
Agreement.# Prof. Indira J. Parikh was appointed on August 2, 2012
None of the directors is a Member of more than ten board level committees or a Chairman of more than five
such committees, as prescribed under clause 49 of the listing agreement.

| S
HA
SU
N P
HA
RM
AC
EU
TIC
ALS
LIM
ITE
D |
AN
NU
AL
RE
PO
RT
201
2–13
21
3. Audit Committee
The audit committee was constituted in the year 2000. It was last reconstituted on February 7, 2013. During
the year under review, the committee met four times - May 24, 2012, August 2, 2012, November 02, 2012
and February 07, 2013.
The constitution of the Committee and the attendance of each member of the Committee are given below:
Name of the Director Position CategoryNo. of Committee
Meetings heldNo. of Committee Meetings attended
Mr. N. Subramanian Chairman Independent Director 4 4
Mr. R. Kannan Member Independent Director 4 4
Dr. Sunny Sharma Member Independent Director 4 4
Mr. S.Vimal Kumar Member Wholetime Director 4 4
Mr. S. Murali Krishna, Company Secretary is the Secretary of Audit Committee.
Terms of reference of the Audit Committee include a review of
Financial reporting process
Recommending to the Board, the appointment, re-appointment and if required the removal of the
Statutory Auditor, Cost Auditor and Internal Auditors and the determination of their fees.
Draft financial statements (Quarterly & Annual) and auditors’ report before submission to the board
Accounting policies and practices
Internal controls and internal audit systems
Risk management policies and practices
Related party transactions
Internal audit reports and adequacy of internal audit function
Compliance with Stock Exchange and legal requirements concerning Financial Statements.
4. Investors Grievance Committee
The Investor Grievance Committee of the Board was re-constituted on August, 19, 2011 and now comprises
of
1. Mr. R. Kannan - Chairman
2. Mr. N. Subramanian - Member
3. Mr. S. Abhaya Kumar - Member
The Investor Grievances Committee specifically looks into the redressal of shareholders’ complaints such as
transfer of shares, non-receipt of annual reports, non-receipt of declared dividends and an expeditious share
transfer process. During the year under review, the Committee met on November 01, 2012.

| S
HA
SU
N P
HA
RM
AC
EU
TIC
ALS
LIM
ITE
D |
AN
NU
AL
RE
PO
RT
201
2–13
22
A statement of the various complaints received and cleared by the Company during the financial year 2012-
13 is given below:-
Nature of Complaints 2012-13
Received Cleared
Non-receipt of shares certificates duly transferred Nil Nil
Non-receipt of dividend warrant 18 18
Non-receipt of Annual Report 6 6
Letters from SEBI Nil Nil
Letters from Stock Exchange Nil Nil
Letters from Ministry of Corporate Affairs Nil Nil
Mr. S. Murali Krishna, Company Secretary is designated as Compliance Officer of the Company for overseeing
and addressing investor complaints.
5. Compensation Committee / Selection Committee:
The Compensation Committee / Selection Committee was constituted on October 29, 2001 comprising
of non-executive Directors. It was last reconstituted on February 7, 2013. The Committee devises suitable
remuneration packages for Wholetime directors & their relatives and recommends the same to the Board.
The Board thereafter may approve the package, subject to the approval of the Shareholders at the ensuing
General Meeting wherever applicable. The committee also approves issue of stock options to employees.
The Compensation Committee / Selection Committee held two meetings during the year - May 24, 2012
and August 2, 2012. The attendance of committee members at the meetings is given below:
Name Position Category No. of meetings held Attended
Prof. Indira J. Parikh* Chairman Independent Director 2 Nil
Mr. R. Sundara Rajan Member Independent Director 2 2
Mr. R. Kannan Member Independent Director 2 2
Dr. Sunny Sharma Member Independent Director 2 2
Mr. N. Subramanian ** Member Independent Director 2 2
* Prof. Indira J. Parikh became a Chairperson on February 7, 2013.** Mr. N Subramanian was relieved from the Committee on February 7, 2013.
6. Remuneration to Directors
Details of remuneration paid to Directors are given below:
Director
Relationship with Directors
Business relationship with Shasun if any
Remuneration paid during 2012-13 (Rs. In Million)
Sitting fees
Salary/ Perquisites/Other
benefits
Commission Total
Executive Directors
Dr. S. Devendra Brothers Promoter 5.65 - 5.65
Mr. S. Abhaya Kumar Brothers Promoter 8.44 - 8.44
Mr. S. Vimal Kumar Brothers Promoter 5.65 - 5.65
Mr. M. Mohan Wholetime Director 5.14 - 5.14

| S
HA
SU
N P
HA
RM
AC
EU
TIC
ALS
LIM
ITE
D |
AN
NU
AL
RE
PO
RT
201
2–13
23
Director
Relationship with Directors
Business relationship with Shasun if any
Remuneration paid during 2012-13 (Rs. In Million)
Sitting fees
Salary/ Perquisites/Other
benefits
Commission Total
Non-Executive Directors
Mr. R. Kannan None 0.14 0.90 1.04
Mr. N. Subramanian None 0.13 0.50 0.63
Mr. R. Sundara Rajan None 0.10 0.90 1.00
Dr. Sunny Sharma None 0.12 - 0.12
Prof. Indira J. Parikh None 0.05 - 0.05
Note: 1. Salary paid to Executive Directors includes contribution made to provident fund and other funds. 2. Company has not given any loans and advances to its directors 3. Company has not granted any options under ESOP to its directors.
7. Code of Conduct:
The Company has laid down a code of conduct pursuant to Clause 49 (D) of the Listing Agreement for all
Board Members and Senior Management of the Company with the aim of ensuring the most effective and
best business practices and strict adherence to legal requirements. The code of conduct has been posted
on the Company’s Website www.shasun.com.
The Board Members and the Senior Management personnel affirmed compliance with the code on an
annual basis and a declaration to this effect has been given by the Managing Director as below:
I hereby confirm that the Company has obtained affirmation from all the members of the Board and the
Senior Management that they have complied with the code of conduct for Board Members and Senior
Management in respect to the financial year 2012-13.
S. Abhaya Kumar,
Managing Director
8. Name and Designation of Compliance Officer
Mr. S. Murali Krishna – Company Secretary
9. Disclosures
A. Related Party Disclosure
Information on related party disclosure is given in Item No. 39 of Notes to the Financial Statement.
Compliance:
No transactions of material nature are entered into by the company with promoters, directors or management,
or their relatives, etc. that may have a potential conflict of interest with the company. There are no material
pecuniary transactions with the independent/non-executive directors other than the payment of remuneration
as disclosed above.
B. The Company follows the Accounting Standards as specified in the Companies (Accounting Standard)
Rules, 2006 and the relevant provisions of the Companies Act, 1956. The Company has not adopted a
treatment different from that prescribed in any Accounting Standard, in the preparation of financial statements
C. The Company has laid down procedures to inform Board members about risk assessment and
minimization procedures. The Company has identified major and minor risks and these risks are analyzed
by the Management Team.

| S
HA
SU
N P
HA
RM
AC
EU
TIC
ALS
LIM
ITE
D |
AN
NU
AL
RE
PO
RT
201
2–13
24
D. There were no instances of non-compliances by the Company, no penalties and strictures imposed on
the Company by the Stock Exchanges or SEBI or any other statutory authorities on any matter related to the
capital markets during the last three years.
E. During the year, allotment of 15,00,000 equity shares of Rs. 2 each at a premium of Rs. 73 per share
were allotted to the Promoters and Director upon conversion of warrants on preferential basis. There were
no public & rights issues.
F. The Managing Director and the Chief Financial Officer of the Company certify to the Board every quarter
on matters related to the financial statements and other matters in accordance with Clause 49 of the Listing
Agreement.
10. Means of Communication
The Company’s quarterly unaudited financial results / annual audited results are being published in atleast
one of the leading English news papers viz Business Standard, Economic Times, Business Line, and also
in one vernacular news paper in compliance with Stock Exchange listing requirements. The Annual Report
is circulated to Shareholders. The financial results, periodical business updates and Annual Report are also
posted on the company’s website – www.shasun.com. The Company is also sending financial results on a
quarterly basis to all its Shareholders.
11. SEBI prescription of Insider Trading
As per SEBI guidelines, the Board has designed a code of conduct strictly in accordance with the model
code of conduct prescribed. The Code aside from other relevant matters prohibits an insider from dealing
with the shares of the company while in possession of the unpublished price sensitive information in relation
to the company. During the declaration of the results, dividend and other material events the trading
window is closed as per the code.
12. Reconciliation of Share Capital Audit
As stipulated by the SEBI, a qualified Practising Company Secretary carries out the reconciliation of Share
Capital Audit. This is done to reconcile the total admitted capital with National Securities Depository Limited
and Central Depository Services (India) Limited and the total issued and listed capital. The Audit confirms
that the total listed and paid up capital is in agreement with the aggregate of the total number of shares in
dematerialized form (held by NSDL and CDSL) and total number of shares in physical form
Quarterly Secretarial Audit Reports on the reconciliation of the total admitted capital with NSDL/CDSL and
the total issued and listed capital were carried out and furnished to the Stock Exchanges.

| S
HA
SU
N P
HA
RM
AC
EU
TIC
ALS
LIM
ITE
D |
AN
NU
AL
RE
PO
RT
201
2–13
25
Auditors’ Certification on Corporate Governance
To the Members of Shasun Pharmaceuticals Limited
We have examined the compliance of conditions of Corporate Governance by Shasun Pharmaceuticals
Limited (“the Company”) for the year ended on March 31, 2013 as stipulated in Clause 49 of the Listing
Agreement of the said Company with stock exchanges.
The compliance of conditions of Corporate Governance is the responsibility of the management. Our
examination was limited to procedures and implementation thereof, adopted by the Company for ensuring
the compliance of the conditions of corporate governance. It is neither an audit nor an expression of opinion
on the financial statements of the Company.
In our opinion and to the best of our information and according to the explanations given to us, we certify
that the Company has complied with the conditions of Corporate Governance as stipulated in the above
mentioned Listing Agreement.
We further state that such compliance is neither an assurance as to the future viability of the Company nor
the efficiency or effectiveness with which the management has conducted the affairs of the Company.
for B S R & Co.Chartered AccountantsFirm Registration No. 101248W
S. SethuramanPartnerMembership No. 203491
Place : Chennai
Date : May 29, 2013

| S
HA
SU
N P
HA
RM
AC
EU
TIC
ALS
LIM
ITE
D |
AN
NU
AL
RE
PO
RT
201
2–13
26
General Shareholder’s Information
1. Annual General Meeting
The Thirty-Eighth Annual General Meeting of the Shareholders of the company will be held on Friday,
August 02, 2013 at Red Cross Building, No. 32/50, Montieth Road, Egmore, Chennai – 600 008 at 2.30 P.M.
for the financial year ended March 31, 2013.
2. Details of Annual / Extra-Ordinary General Meetings held in last three years and
Special Resolutions passed.
Financial Year ended
AGM / EGM
Date Time Venue Special resolutions
2009-10 AGM 30.07.2010 03.00 P.M Russian Cultural CentreNo. 74, Kasturi Ranga RoadTeynampet, Chennai – 600 018
1. Amendment to Memorandum and Articles of Association consequent to change of name of the company.
2. Payment of remuneration to non-Whole-time Directors.
2010-11 EGM 24.03.2011 11.30 A.M. Narada Gana Sabha (Mini Hall), 1st Floor, No. 314, TTK Road Alwarpet, Chennai 600 018
Nil
2010-11 AGM 29.07.2011 03.00 P.M. P. Obul Reddy Hall, Vani Mahal, 103, G.N. Road T. Nagar, Chennai - 600 017
1. Increase in remuneration payable to Mr. Jitesh Devendra under Section 314 of the Companies Act, 1956
2. Increase in remuneration payable to Mr. Jatin Vimal Kumar under Section 314 of the Companies Act, 1956
3. Increase in remuneration payable to Mr. Chaitanya Devendra under Section 314 of the Companies Act, 1956
4. Increase in remuneration payable to Mr. Nitin Vimal Kumar under Section 314 of the Companies Act, 1956
2011-12 EGM 22.03.2012 11.00 A.M. Narada Gana Sabha (Mini Hall), 1st Floor, No.314, TTK Road, Alwarpet, Chennai 600 018
Issue of 65,78,947 equity shares to M/s. Caduceus Asia Mauritius Limited on preferential basis under Section 81(1A) of the Companies Act, 1956
2011-12 AGM 02.08.2012 02.30 P.M. P. Obul Reddy Hall, Vani Mahal, 103, G.N. Road, T. Nagar, Chennai - 600 017
Nil
3. Postal Ballot
During the year under review, Special Resolutions were passed through Postal Ballot for the Issue of
Employee Stock Option under SPL-ESOP Plan 2012 to the employees of the Company, Issue of Employee
Stock Option under SPL-ESOP Plan 2012 to the employees of Subsidiary Companies and step down
Subsidiary Companies and an increase in the remuneration payable to Mr. Nitin Vimal Kumar under Section
314 of the Companies Act, 1956.

| S
HA
SU
N P
HA
RM
AC
EU
TIC
ALS
LIM
ITE
D |
AN
NU
AL
RE
PO
RT
201
2–13
27
Mrs. Lakshmmi Subramanian, Senior Partner, M/s. Lakshmmi Subramanian & Associates, Practising
Company Secretaries, Chennai was appointed as the Scrutinizer for the Postal Ballot. The procedure
as given in the Companies (Passing of the resolution by Postal Ballot) Rules 2011 was followed by the
Company.
The result of the Postal Ballot is as follows:
1. Issue of Employee Stock Option under Shasun Pharmaceuticals Limited Scheme to the employees of
the Company – Special Resolution
Particulars Number of Members
Representative Number of Shares
Total number of Postal Ballots received 389 24066144
Total number of Postal Ballot considered valid 359 24050034
Total number of Postal Ballots considered invalid 30 16110
Out of the above valid Ballots:
i) Number of votes cast in favour of the resolution 334 23721334
ii) Number of votes cast in against the resolution 25 328700
iii) Percentage to the total votes received in favour of the resolution 93.04% 98.63%
2. Issue of Employee Stock Option under Shasun Pharmaceuticals Limited Scheme to the eligible
employees of Subsidiary Companies and step down Subsidiary Companies – Special Resolution
Particulars Number of Members
Representative Number of Shares
Total number of Postal Ballots received 389 24066144
Total number of Postal Ballot considered valid 350 24044453
Total number of Postal Ballots considered invalid 39 21691
Out of the above valid Ballots:
i) Number of votes cast in favour of the resolution 328 23716530
ii) Number of votes cast in against the resolution 22 327923
iii) Percentage to the total votes received in favour of the resolution 93.71% 98.64%
3. Approval for increase in remuneration payable to Mr. Nitin Vimal Kumar – Special Resolution
Particulars Number of Members
Representative Number of Shares
Total number of Postal Ballots received 389 24066144
Total number of Postal Ballot considered valid 352 24044963
Total number of Postal Ballots considered invalid 37 21181
Out of the above valid Ballots:
i) Number of votes cast in favour of the resolution 315 24033433
ii) Number of votes cast in against the resolution 37 11530
iii) Percentage to the total votes received in favour of the resolution 89.49% 99.95%
The results of the Postal Ballot was published in Trinity Mirror (English) and Makkal Kural (Tamil) newspapers
and the same has been posted in the Company’s website www.shasun.com.
4. Book Closure
The company’s Register of Members and Share Transfer Books will remain closed from July 25, 2013 to
August 2, 2013 (both days inclusive) for payment of dividend.

| S
HA
SU
N P
HA
RM
AC
EU
TIC
ALS
LIM
ITE
D |
AN
NU
AL
RE
PO
RT
201
2–13
28
5. Dividend payment
The dividend payment will be made between August 9, 2013 and August 14, 2013.
6. Financial Calendar
Financial reporting for Month / Year
Quarter ending June 30, 2013 July / August 2013
Quarter ending September 30, 2013 October / November 2013
Quarter ending December 31, 2013 January / February 2014
Quarter ending, March 31, 2014 May 2014
7. Registered Office/Corporate Office:
‘Batra Centre’, 3rd & 4th Floor
28, Sardar Patel Road,
Guindy, Chennai 600032,
Tamil Nadu, India.
Tel : 91-44-43446700
Fax : 91-44-22350278
E- mail : [email protected]
Website : www.shasun.com
Details on Location of Factories:
A) Active Pharmaceutical Ingredient
Puducherry : Mathur Road, Periakalapet, Puducherry – 605 014.
Cuddalore : A 1/B SIPCOT Industrial Complex, Kudikadu, Cuddalore – 607 005.
B) Finished Dosage facility
Puducherry : Unit – II, R.S. No. 32, 33 & 34, PIMS Road, Periakalapet, Puducherry – 605 014.
C) Research & Development Centre
Chennai : No. 27, Vandalur-Kelambakkam Road, Keezhakottaiyur, Chennai – 600 048.
Puducherry : Unit II, R.J, No. 32, 33 & 34, PIMJ Road, Periakalapet, Puducherry – 605 014.
Bio-tech : Mathur Road, Periakalapet, Puducherry – 605 014.
D) Bio-tech : Mathur Road, Periakalapet, Puducherry – 605 014.
8. Listing on Stock Exchanges
The Company’s shares are listed at BSE Limited and National Stock Exchange of India Limited. The listing
fees have been paid to both the Stock Exchanges for the financial year 2013-14. The Company applied for
the delisting of equity shares with the Madras Stock Exchange and is awaiting approval.

| S
HA
SU
N P
HA
RM
AC
EU
TIC
ALS
LIM
ITE
D |
AN
NU
AL
RE
PO
RT
201
2–13
29
9. Stock Market Data:
a. Stock Code: The Stock Code for the company’s shares is as follows
BSE Limited : 524552 / SHASUNPHA
National Stock Exchange of India Limited : SHASUNPHAR
b. The ISIN Nos. for the company’s shares in demat mode : INE317A01028
c. Stock price data on a month-to-month basis during financial year 2012-13
NSE BSE
Month High LowNo. of shares traded
(Qty)High Low
No. of shares traded (Qty)
Apr-12 118.00 85.00 17,44,028 116.90 85.40 17,34,614
May-12 135.00 101.00 20,12,138 136.80 100.20 14,45,782
Jun-12 121.70 107.30 12,57,367 121.90 106.50 7,56,514
Jul-12 141.40 115.70 64,05,659 141.30 116.45 39,65,243
Aug-12 165.00 120.50 1,38,62,752 165.25 120.50 73,74,163
Sep-12 185.60 154.00 1,17,54,956 185.90 154.10 59,00,227
Oct-12 171.60 140.55 48,72,409 171.20 140.10 25,22,824
Nov-12 177.40 139.00 74,11,588 177.40 139.15 31,79,259
Dec-12 184.00 130.90 70,17,002 184.20 131.15 29,50,255
Jan-13 145.25 90.25 1,03,77,551 145.25 90.50 41,50,688
Feb-13 112.00 65.15 72,96,088 111.70 75.00 35,14,262
Mar-13 83.00 60.40 34,33,231 83.00 60.40 17,06,989
Shasun’s Share Price at NSE versus the Nifty
10. Registrar and Share Transfer Agent
Transfer agent for physical transfers and Demat shares
Integrated Enterprises (India) Limited, 2nd Floor, Kences Towers,
No.1 Ramakrishna Street, North Usman Road,
T. Nagar - Chennai - 600 017.
Tel.: 044 - 28140801-03. Fax – 91-44-28142479
email id:[email protected]
0
1,000
2,000
3,000
4,000
5,000
6,000
Apr-12 May-12 Jun-12 Jul-12 Aug-12 Sep-12 Oct-12 Nov-12 Dec-12 Jan-13 Feb-13 Mar-13-
20
40
60
80
100
120
140
160
180
200
NSE Shasun

| S
HA
SU
N P
HA
RM
AC
EU
TIC
ALS
LIM
ITE
D |
AN
NU
AL
RE
PO
RT
201
2–13
30
11. Share Transfer System
The transfers of shares are processed by “Integrated Enterprises (India) Limited” and approved by the Share
Transfer Committee which meets once in 20 days. The transfers of shares are effected and share certificates
dispatched within 25-30 days from the date of receipt, if the relevant documents are complete in all respects.
12. Shareholding Pattern as on March 31, 2013
Category Shares Rs. Crs %
Foreign Venture Capital Investor 6,578,947 1.32 11.62%
Foreign Institutional Investor 192,297 0.04 0.34%
Foreign National 191,666 0.04 0.34%
Banks 177,355 0.04 0.31%
Financial Institutions 351,950 0.07 0.62%
Mutual Funds 3,957,609 0.79 6.99%
Non-resident Indian 279,941 0.06 0.49%
Corporate Bodies 4,184,342 0.84 7.39%
Promoters 24,062,699 4.81 42.50%
Independent Directors 70,000 0.01 0.12%
General Public 16,567,546 3.31 29.26%
Trust 9,000 0.00 0.02%
Limited Liability Partnership 500 0.00 0.00%
Total 56,623,852 11.32 100.00%
13. Distribution of shareholding as on March 31, 2013
No. of shares No. of Shareholders %
No. of Shares % to Capital
From To
1 500 19,197 81.63 29,30,840 5.18
501 1,000 2,211 9.40 1,785,225 3.15
1,001 2,000 912 3.88 1,413,112 2.50
2,001 3,000 344 1.46 892,842 1.58
3,001 4,000 172 0.73 626,475 1.11
4,001 5,000 164 0.70 769,355 1.36
5,001 10,000 220 0.94 1,573,024 2.78
Above 10,000 296 1.26 46,632,979 82.36
Total 23,516 100.00 56,623,852 100.00
14. Dematerialisation of Shares
Trading in Shares of the company is permitted in dematerialized form for all investors w.e.f. July 24, 2000.
As on March 31, 2013 - 54,189,117 equity shares constituting 95.70% of the total paid-up capital of the
company have been dematerialized.
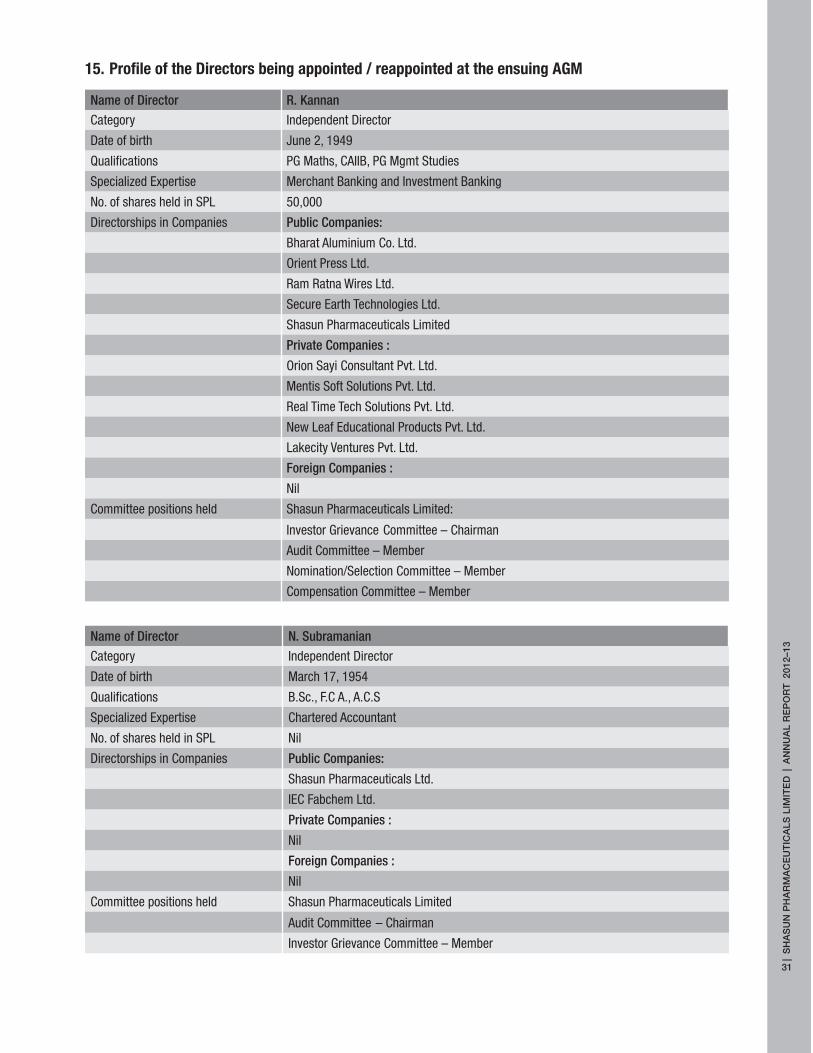
| S
HA
SU
N P
HA
RM
AC
EU
TIC
ALS
LIM
ITE
D |
AN
NU
AL
RE
PO
RT
201
2–13
31
15. Profile of the Directors being appointed / reappointed at the ensuing AGM
Name of Director R. Kannan
Category Independent Director
Date of birth June 2, 1949
Qualifications PG Maths, CAIIB, PG Mgmt Studies
Specialized Expertise Merchant Banking and Investment Banking
No. of shares held in SPL 50,000
Directorships in Companies Public Companies:
Bharat Aluminium Co. Ltd.
Orient Press Ltd.
Ram Ratna Wires Ltd.
Secure Earth Technologies Ltd.
Shasun Pharmaceuticals Limited
Private Companies :
Orion Sayi Consultant Pvt. Ltd.
Mentis Soft Solutions Pvt. Ltd.
Real Time Tech Solutions Pvt. Ltd.
New Leaf Educational Products Pvt. Ltd.
Lakecity Ventures Pvt. Ltd.
Foreign Companies :
Nil
Committee positions held Shasun Pharmaceuticals Limited:
Investor Grievance Committee – Chairman
Audit Committee – Member
Nomination/Selection Committee – Member
Compensation Committee – Member
Name of Director N. Subramanian
Category Independent Director
Date of birth March 17, 1954
Qualifications B.Sc., F.C A., A.C.S
Specialized Expertise Chartered Accountant
No. of shares held in SPL Nil
Directorships in Companies Public Companies:
Shasun Pharmaceuticals Ltd.
IEC Fabchem Ltd.
Private Companies :
Nil
Foreign Companies :
Nil
Committee positions held Shasun Pharmaceuticals Limited
Audit Committee – Chairman
Investor Grievance Committee – Member

| S
HA
SU
N P
HA
RM
AC
EU
TIC
ALS
LIM
ITE
D |
AN
NU
AL
RE
PO
RT
201
2–13
32
Name of Director Prof. Indira J. Parikh
Category Independent Director
Date of birth August 29, 1943
Qualifications M.A., Ph.D.
Specialized Expertise Management Education
No. of shares held in SPL Nil
Directorships in Companies Public Companies:
Shasun Pharmaceuticals Limited
Anil Ltd.
Marck Biosciences Ltd.
Sintex Industries Ltd.
Zydus Wellness Ltd.
Private Companies :
Flame-Tao Knoware Pvt. Ltd.
Foreign Companies :
Nil
Committee positions held Shasun Pharmaceuticals Limited
Compensation Committee – Chairperson
Nomination Committee – Member
16. Outstanding ADR’s / GDR’s
The company has not issued any Global Depository Receipt / American Depository Receipt / which are
likely to have an impact on Company’s equity.
17. Investors Correspondence
For the convenience of our investors, transfer requests, and other connected matters are also accepted at
the Registered Office:
Contact person: Mr. S. Murali Krishna, Company Secretary
Time: 09.00 a.m. to 01.30 p.m. and 02.00 p.m. to 06.15 p.m. on all working days (Monday to Friday)
Phone: 044 - 43446700. E-Mail: [email protected]
18. Non-mandatory requirements
The non mandatory requirements have been adopted to the extent and in the manner as stated under the
appropriate sections detailed below:
1. The Chairman’s officeThe need for implementing this non mandatory requirement has not arisen.
2. Compensation committeeThe Company has set up a Compensation Committee. The terms of reference of this committee is given in
para 5 of report on Corporate Governance.
3. Shareholders’ rightsThe quarterly un-audited results of the Company after being subjected to a Limited Review by the Statutory
Auditors, are published in newspapers and on the Company’s website www.shasun.com. These results are
sent to shareholders individually on quarterly / half yearly basis.
4. Audit QualificationsThe auditors have issued an unqualified opinion on the statutory financial statements of the Company.
5. Training of Board Members / Mechanism for evaluating non-executive DirectorsAll the Non-Executive Directors have adequate experience and expertise in functional areas and attend in
their personal capacities various programmes that keep them abreast of relevant developments. There is

| S
HA
SU
N P
HA
RM
AC
EU
TIC
ALS
LIM
ITE
D |
AN
NU
AL
RE
PO
RT
201
2–13
33
no formal system of evaluating individual Directors but the Audit Committee evaluates their performance
annually and takes corrective action.
6. Whistle blower policyThe Company has a whistle blower mechanism in place.
19. Auditors
B S R & Co.
Firm Registration Number: 101248W
Chartered Accountants
KPMG House,
10, Mahatma Gandhi Road
Nungambakkam, Chennai – 600 034.
21. Bankers
State Bank of Travancore
State Bank of India
ICICI Bank Limited
State Bank of Mysore
State Bank of Hyderabad
Axis Bank Ltd
DBS Bank
Canara Bank
IDBI Bank
Managing Director (MD) and Chief Financial Officer (CFO) Certification
We, S. Abhaya Kumar, Managing Director and S. Hariharan, Chief Financial Officer of Shasun Pharmaceuticals
Limited,
1. To the best of our knowledge and belief, certify that we have reviewed the balance sheet and profit and loss
account (Consolidated and Unconsolidated) along with all its schedules and notes on Accounts, Cash Flow
statements and the Director’s report;
2. To the best of our knowledge and belief, certify that these statements do not contain any untrue statement
of a material fact or any omission to state a material fact on the statements made;
3. To the best of our knowledge and belief, certify that the financial statements and other financial information
contained thereon in this report, present a true and fair view of, the Company’s affairs, its financial condition,
the results of operations and cash flows of the company as of, and for, the period ending March 31, 2013.
These statements and other information presented in the report are in compliance with the existing accounting
standards and applicable laws and regulations as on the closing date;
4. To the best of our knowledge and belief, certify that no transactions entered into by the company during the
year are in contravention with the applicable laws and regulations, fraudulent, or in breach of the company’s
code of conduct;
5. To the best of our knowledge and belief, certify that we are responsible for establishing and maintaining
controls and procedures on disclosure as well as internal control over financial reporting for the company,
and we have:
a) designed such controls and procedures so as to ensure the material information relating to the company
and the consolidated position along with its subsidiaries are made available to us by others within those
entities, during the period in which this report is being prepared;
b) designed such internal control over financial reporting with a view to provide reasonable assurance
regarding the reliability of financial reporting and the preparation of financial statements for external
purpose in accordance with generally accepted accounting principles;
c) evaluated the effectiveness of the company’s disclosure, controls and procedures;
6. We further declare that all board members and senior managerial personnel have affirmed compliance with
the code of conduct for the current year.
Chennai S. Abhaya Kumar S. HariharanMay 29, 2013 Managing Director Chief Financial Officer
20. Details of the Cost Auditor
Mr. Manivannan R Rajan
Membership No. 9532
M/s. Geeyes & Co.,
Cost Accountants
A-3, III Floor, 56, Seventh Avenue
Ashok Nagar, Chennai 600 083.

| S
HA
SU
N P
HA
RM
AC
EU
TIC
ALS
LIM
ITE
D |
AN
NU
AL
RE
PO
RT
201
2–13
34
Independent Auditors’ Report
Independent Auditors’ Report to the Members of Shasun Pharmaceuticals Limited
Report on the financial statements
We have audited the accompanying financial statements of Shasun Pharmaceuticals Limited (‘the Company’), which comprise the balance sheet as at March 31, 2013, the statement of profit and loss and the cash flow statement for the year then ended, and a summary of significant accounting policies and other explanatory information.
Management’s responsibility for the financial statements
Management is responsible for the preparation of these financial statements that give a true and fair view of the financial position, financial performance and cash flows of the Company in accordance with the Accounting Standards referred to in sub-section (3C) of section 211 of the Companies Act, 1956 (‘the Act’). This responsibility includes the design, implementation and maintenance of internal control relevant to the preparation and presentation of the financial statements that give a true and fair view and are free from material misstatement, whether due to fraud or error.
Auditors’ responsibility
Our responsibility is to express an opinion on these financial statements based on our audit. We conducted our audit in accordance with the Standards on Auditing issued by the Institute of Chartered Accountants of India. Those Standards require that we comply with ethical requirements and plan and perform the audit to obtain reasonable assurance about whether the financial statements are free from material misstatement.
An audit involves performing procedures to obtain audit evidence, about the amounts and disclosures in the financial statements. The procedures selected depend on the auditors’ judgment, including the assessment of the risks of material misstatement of the financial statements, whether due to fraud or error. In making those risk assessments, the auditor consider the internal control relevant to the Company’s preparation and fair presentation of the financial statements in order to design audit procedures that are appropriate in the circumstances. An audit also includes evaluating the appropriateness of accounting policies used and the reasonableness of the accounting estimates made by the management, as well as evaluating the overall presentation of the financial statements.
We believe that the audit evidence we have obtained is sufficient and appropriate to provide a basis for our audit opinion.
Opinion
In our opinion, and to the best of our information and according to the explanations given to us, the said financial statements give the information required by the Act in the manner so required and give a true and fair view in conformity with the accounting principles generally accepted in India:
(a) in the case of the balance sheet, of the state of affairs of the Company as at March 31, 2013;
(b) in the case of the statement of profit and loss, of the profit for the year ended on that date; and
(c) in the case of the cash flow statement, of the cash flows for the year ended on that date.
Report on other legal and regulatory requirements
1. As required by the Companies (Auditor’s Report) Order, 2003 (“the Order”), as amended, issued by the Central Government of India in terms of sub-section (4A) of section 227 of the Act, we enclose in the Annexure a statement on the matters specified in paragraphs 4 and 5 of the said Order.
2. As required by Section 227(3) of the Act, we report that:
(a) We have obtained all the information and explanations which, to the best of our knowledge and belief, were necessary for the purpose of our audit;
(b) In our opinion, proper books of account as required by law have been kept by the Company so far as appears from our examination of the books of account;
(c) The balance sheet, statement of profit and loss, and cash flow statement dealt with by this report are in agreement with the books of account;

| S
HA
SU
N P
HA
RM
AC
EU
TIC
ALS
LIM
ITE
D |
AN
NU
AL
RE
PO
RT
201
2–13
35
(d) In our opinion, the balance sheet, statement of profit and loss, and cash flow statement dealt with by this report comply with the accounting standards referred to in sub-section (3C) of section 211 of the Companies Act, 1956; and
(e) On the basis of written representations received from the directors as at March 31, 2013, and taken on record by the board of directors, we report that none of the directors is disqualified as at March 31, 2013, from being appointed as a director in terms of clause (g) of sub-section (1) of section 274 of the Companies Act, 1956.
for B S R & Co. Chartered Accountants Firm registration no. 101248W
S SethuramanPartnerMembership No: 203491
Place: Chennai Date: May 29, 2013
Annexure to the Independent Auditors’ report(Referred to in our report of even date)
1. (a) The Company has maintained proper records showing full particulars, including quantitative details and situation of fixed assets.
(b) The Company has a regular programme of physical verification of its fixed assets, by which all fixed assets are verified in a phased manner over a period of three years. In our opinion, this periodicity of physical verification is reasonable having regard to the size of the Company and the nature of its assets. In accordance with this program certain fixed assets were verified during the year and no material discrepancies were noticed on such verification.
(c) Fixed assets disposed off during the year were not substantial, and therefore, do not affect the going concern assumption.
2. (a) The inventory, except the goods in transit, has been physically verified by the management during the year. In our opinion, the frequency of such verification is reasonable. For stocks lying with the third parties at the year-end, written confirmations have been obtained.
(b) The procedures of physical verification of inventories followed by the management are reasonable and adequate in relation to the size of the Company and the nature of its business.
(c) The Company is maintaining proper records of inventory. The discrepancies noticed on verification between the physical stocks and book records were not material.
3. (a) The Company has granted loans to one party covered in the register maintained under section 301 of the Companies Act, 1956. The maximum amount outstanding during the year was Rs.283.35 million and the year-end balance of such loan was Rs. 187.96 million.
(b) In our opinion, the rate of interest and other terms and conditions on which the aforesaid loan has been granted are not prima facie, prejudicial to the interest of the Company.
(c) The terms of agreement do not stipulate any repayment schedule in respect of principal amount or interest. Accordingly paragraph 4(iii)(c) of the order is not applicable to the Company in respect of repayment of principal amount and interest.
Independent Auditors’ report (Contd.)

| S
HA
SU
N P
HA
RM
AC
EU
TIC
ALS
LIM
ITE
D |
AN
NU
AL
RE
PO
RT
201
2–13
36
(d) There is no overdue amount of more than Rupees One lakh in respect of loans granted to any of the Companies, firms or other parties listed in the register maintained under Section 301.
(e) The Company has not taken any loans, secured or unsecured, from Companies, firms or other parties covered in the register maintained under section 301 of the Companies Act, 1956.
4. In our opinion and according to the information and explanations given to us, and having regard to the explanation that certain goods sold and services rendered are for the specialised requirements of the buyers and suitable alternative sources are not available to obtain comparable quotations, there is an adequate internal control system commensurate with the size of the Company and the nature of its business with regard to purchase of inventories and fixed assets, and with regard to the sale of goods and services. In our opinion and according to the information and explanations given to us, we have not observed any major weakness in the internal control system during the course of audit.
5. (a) In our opinion, and according to the information and explanations given to us, the particulars of contracts and arrangements referred to in section 301 of the Act have been entered in the register required to be maintained under that section.
(b) In our opinion, and according to the information and explanations given to us, the transactions made in pursuance of contracts and arrangements referred to in (a) above and exceeding the value of Rs.5 lakhs with any party during the year have been made at prices which are reasonable having regard to the prevailing market prices at the relevant time.
6. The Company has not accepted any deposits from the public.
7. In our opinion, the Company has an internal audit system commensurate with the size and nature of its business.
8. We have broadly reviewed the books of account maintained by the Company pursuant to the rules prescribed by the Central Government for maintenance of cost records under Section 209(1)(d) of the Companies Act, 1956 in respect of manufacture of Bulk Drugs, and are of the opinion that, prima facie, the prescribed accounts and records have been made and maintained. However, we have not made a detailed examination of the records.
9. (a) According to the information and explanations given to us and on the basis of our examination of the records of the Company, amounts deducted/ accrued in the books of account in respect of undisputed statutory dues including Provident fund, Employees’ state insurance, Income-tax, Sales tax, Service tax, Customs duty, Wealth tax, Excise duty and other material statutory dues have been generally regularly deposited during the year by the Company with the appropriate authorities. As explained to us, the Company did not have any dues on account of investor education and protection fund.
According to the information and explanations given to us, no undisputed amounts payable in respect of Provident fund, Employees’ state insurance, Income tax, Sales tax, Service tax, Customs duty, Wealth tax, Excise duty and other material statutory dues were in arrears as at March 31, 2013 for a period of more than six months from the date they became payable.
(b) According to the information and explanations given to us, the dues set out in Appendix I in respect of income tax, sales tax, service tax, customs duty and excise duty have not been deposited with the appropriate authorities on account of disputes.
10. The Company does not have any accumulated losses at the end of the financial year and has not incurred any cash losses in the financial year and in the immediately preceding financial year.
11. In our opinion and according to the information and explanations given to us, the Company has not defaulted in repayment of dues to its bankers or to any financial institutions. The Company did not have any outstanding debentures during the year.
12. The Company has not granted any loans and advances on the basis of security by way of pledge of shares, debentures and other securities.
13. In our opinion and according to the information and explanations given to us, the Company is not a chit fund or a nidhi/ mutual benefit fund/ society.
14. According to the information and explanations given to us, the Company is not dealing or trading in shares, securities, debentures and other investments.
15. In our opinion and according to the information and explanations given to us, the terms and conditions on which the Company has given guarantees for loans taken by others from banks or financial institutions are not prejudicial to the interest of the Company.
Annexure to the Independent Auditors’ report (Contd.)(Referred to in our report of even date)

| S
HA
SU
N P
HA
RM
AC
EU
TIC
ALS
LIM
ITE
D |
AN
NU
AL
RE
PO
RT
201
2–13
37
16. In our opinion and according to the information and explanations given to us, the term loans taken by the Company have been applied for the purpose for which they were raised.
17. According to the information and explanations given to us, and on an overall examination of the balance sheet of the Company, we are of the opinion that the funds raised on short-term basis have not been used for long-term investment.
18. The Company has not made any preferential allotment of shares to companies/ firms/ parties covered in the register maintained under section 301 of the Companies Act, 1956.
19. The Company did not have any outstanding debentures during the year.
20. During the current year, the Company has not raised any money by public issues.
21. According to the information and explanations given to us, no fraud on or by the Company has been noticed or reported during the course of our audit.
for B S R & Co. Chartered Accountants Firm Registration No. 101248W
S SethuramanPartnerMembership No: 203491
Place: Chennai Date: May 29, 2013
Appendix I as referred to in Para ix (b) of Annexure to the Independent Auditors’ report:
(Amount in Rs. Millions)
Name of Statute Forum pending
Income Tax Act,1961 Commissioner of Income Tax (Appeals)
Income tax Appellate Tribunal
High Court Total
3 years to 7 years - 44.21 - 44.21
Above 7 years - 5.13 35.51 40.64
Finance Act, 1994 Commissioner of central Excise
Customs, Excise and Service Tax Appellate Tribunal
High Court Total
Below 3 years 14.96 - - 14.96
3 years to 7 years 14.45 - - 14.45
Above 7 years 11.00 - - 11.00
Central Excise Act, 1944
Commissioner of central Excise
Customs, Excise and Service Tax Appellate Tribunal
High Court Total
Below 3 years 87.06 - - 87.06
3 years to 7 years 0.33 48.25 - 48.58
Above 7 years 8.03 1.30 - 9.33
Customs Act, 1962 Commissioner of central Customs
Customs, Excise and Service Tax Appellate Tribunal
High Court Total
Above 7 years 22.66 16.74 - 39.40
Grand total 309.63
Annexure to the Independent Auditors’ report (Contd.)(Referred to in our report of even date)

| S
HA
SU
N P
HA
RM
AC
EU
TIC
ALS
LIM
ITE
D |
AN
NU
AL
RE
PO
RT
201
2–13
38
Balance Sheet as at March 31, 2013(All amounts are in million Indian Rupees except share data and if otherwise stated)
Notes As at March 31, 2013
As at March 31, 2012
EQUITY AND LIABILITIESSHAREHOLDERS’ FUNDS
Share capital 3 113.25 110.25 Reserves and surplus 4 2,759.40 2,486.49 Money received against share warrants 46 - 28.13 Foreign currency monetary item translation difference account (20.56) (9.95)
2,852.09 2,614.92 NON-CURRENT LIABILITIES
Long-term borrowings 5 985.30 490.53 Deferred tax liability (net) 6 - 15.03 Other non-current liabilities 7 10.40 0.80 Long-term provisions 8 59.68 51.37
1,055.38 557.73 CURRENT LIABILITIES
Short-term borrowings 9 2,720.04 1,652.51 Trade payables 10 1,763.65 1,552.66 Other current liabilities 11 637.07 516.78 Short-term provisions 12 123.30 225.04
5,244.06 3,946.99 9,151.53 7,119.64
ASSETSNON-CURRENT ASSETS
Fixed assetsTangible assets 13 2,663.89 1,938.50 Intangible assets 14 9.96 4.79 Capital work-in-progress 773.36 308.09 Intangible assets under development 35.21 -
Deferred tax asset (net) 6 11.41 - Non-current investments 15 509.00 50.40 Long-term loans and advances 16 701.08 1,000.15 Other non-current assets 17 11.31 5.29
4,715.22 3,307.22 CURRENT ASSETS
Inventories 18 1,453.33 1,106.88 Trade receivables 19 2,206.76 1,970.55 Cash and bank balances 20 39.74 66.27 Short-term loans and advances 21 680.10 593.71 Other current assets 22 56.38 75.01
4,436.31 3,812.42 9,151.53 7,119.64
Significant accounting policies 2
The accompanying notes form an integral part of the financial statements.
As per our report of even date attached.
for B S R & Co. For and on behalf of Board of Directors ofChartered Accountants Shasun Pharmaceuticals LimitedFirm registration No. 101248W
S Sethuraman S Abhaya Kumar Dr. S Devendra S Vimal KumarPartner Managing Director Wholetime Director Wholetime DirectorMembership No: 203491
Place: Chennai S Murali Krishna S HariharanDate: May 29, 2013 Company Secretary Chief Financial Officer

| S
HA
SU
N P
HA
RM
AC
EU
TIC
ALS
LIM
ITE
D |
AN
NU
AL
RE
PO
RT
201
2–13
39
Statement of Profit and Loss for the year ended March 31, 2013(All amounts are in million Indian Rupees except share data and if otherwise stated)
Notes Year ended March 31, 2013
Year ended March 31, 2012
INCOME
Revenue from operations 23 7,827.56 7,359.09
Other income 24 136.55 409.64
7,964.11 7,768.73
EXPENDITURE
Cost of materials consumed 25 5,009.68 4,655.13
Purchases of traded goods 17.74 42.92
Changes in inventories 26 (177.84) (11.40)
Employee benefits expenses 27 767.43 595.24
Finance costs 28 264.87 304.81
Depreciation and amortization 12 and 13 316.62 247.28
Other expenses 29 1,529.27 1,562.02
7,727.77 7,396.00
PROFIT BEFORE TAXATION 236.34 372.73
PROVISION FOR TAXATION
- Current tax 14.91 62.10
- Minimum alternate tax credit entitlement (14.91) (105.15)
- Deferred tax (benefit) / charge (26.44) (114.80)
NET PROFIT FOR THE YEAR 262.78 530.58
Earnings per share 38
Basic 4.76 10.92
Diluted 4.76 10.76
Significant accounting policies 2
The accompanying notes form an integral part of the financial statements.
As per our report of even date attached.
for B S R & Co. For and on behalf of Board of Directors ofChartered Accountants Shasun Pharmaceuticals LimitedFirm registration No. 101248W
S Sethuraman S Abhaya Kumar Dr. S Devendra S Vimal KumarPartner Managing Director Wholetime Director Wholetime DirectorMembership No: 203491
Place: Chennai S Murali Krishna S HariharanDate: May 29, 2013 Company Secretary Chief Financial Officer
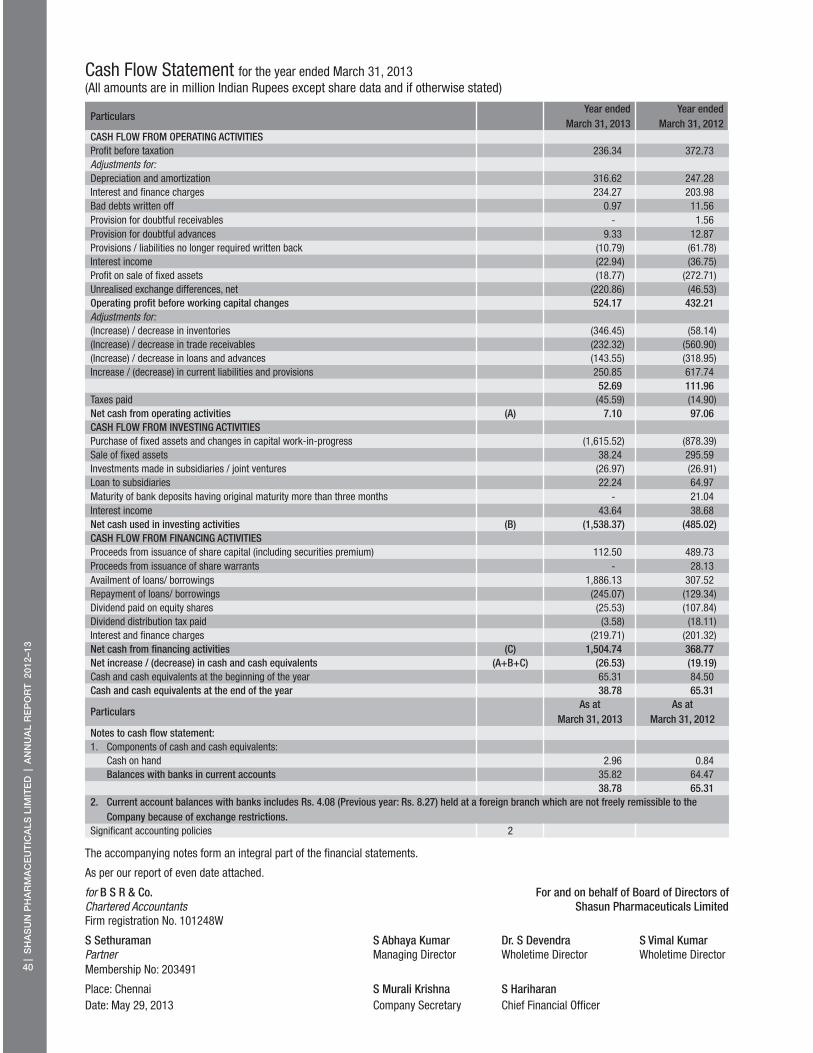
| S
HA
SU
N P
HA
RM
AC
EU
TIC
ALS
LIM
ITE
D |
AN
NU
AL
RE
PO
RT
201
2–13
40
Cash Flow Statement for the year ended March 31, 2013(All amounts are in million Indian Rupees except share data and if otherwise stated)
ParticularsYear ended
March 31, 2013Year ended
March 31, 2012CASH FLOW FROM OPERATING ACTIVITIESProfit before taxation 236.34 372.73 Adjustments for:Depreciation and amortization 316.62 247.28 Interest and finance charges 234.27 203.98 Bad debts written off 0.97 11.56 Provision for doubtful receivables - 1.56 Provision for doubtful advances 9.33 12.87 Provisions / liabilities no longer required written back (10.79) (61.78)Interest income (22.94) (36.75)Profit on sale of fixed assets (18.77) (272.71)Unrealised exchange differences, net (220.86) (46.53)Operating profit before working capital changes 524.17 432.21 Adjustments for:(Increase) / decrease in inventories (346.45) (58.14)(Increase) / decrease in trade receivables (232.32) (560.90)(Increase) / decrease in loans and advances (143.55) (318.95)Increase / (decrease) in current liabilities and provisions 250.85 617.74
52.69 111.96Taxes paid (45.59) (14.90)Net cash from operating activities (A) 7.10 97.06 CASH FLOW FROM INVESTING ACTIVITIESPurchase of fixed assets and changes in capital work-in-progress (1,615.52) (878.39)Sale of fixed assets 38.24 295.59 Investments made in subsidiaries / joint ventures (26.97) (26.91)Loan to subsidiaries 22.24 64.97 Maturity of bank deposits having original maturity more than three months - 21.04 Interest income 43.64 38.68 Net cash used in investing activities (B) (1,538.37) (485.02)CASH FLOW FROM FINANCING ACTIVITIESProceeds from issuance of share capital (including securities premium) 112.50 489.73 Proceeds from issuance of share warrants - 28.13 Availment of loans/ borrowings 1,886.13 307.52 Repayment of loans/ borrowings (245.07) (129.34)Dividend paid on equity shares (25.53) (107.84)Dividend distribution tax paid (3.58) (18.11)Interest and finance charges (219.71) (201.32)Net cash from financing activities (C) 1,504.74 368.77 Net increase / (decrease) in cash and cash equivalents (A+B+C) (26.53) (19.19)Cash and cash equivalents at the beginning of the year 65.31 84.50 Cash and cash equivalents at the end of the year 38.78 65.31
ParticularsAs at
March 31, 2013As at
March 31, 2012Notes to cash flow statement:1. Components of cash and cash equivalents: Cash on hand 2.96 0.84 Balances with banks in current accounts 35.82 64.47
38.78 65.31 2. Current account balances with banks includes Rs. 4.08 (Previous year: Rs. 8.27) held at a foreign branch which are not freely remissible to the
Company because of exchange restrictions.Significant accounting policies 2
The accompanying notes form an integral part of the financial statements.
As per our report of even date attached.
for B S R & Co. For and on behalf of Board of Directors ofChartered Accountants Shasun Pharmaceuticals LimitedFirm registration No. 101248W
S Sethuraman S Abhaya Kumar Dr. S Devendra S Vimal KumarPartner Managing Director Wholetime Director Wholetime DirectorMembership No: 203491
Place: Chennai S Murali Krishna S HariharanDate: May 29, 2013 Company Secretary Chief Financial Officer

| S
HA
SU
N P
HA
RM
AC
EU
TIC
ALS
LIM
ITE
D |
AN
NU
AL
RE
PO
RT
201
2–13
41
Notes to financial statements for the year ended March 31, 2013(All amounts are in million Indian Rupees except share data and if otherwise stated)
1. Company overview
Shasun Pharmaceuticals Limited (‘SPL’ / ‘the Company’) was incorporated in 1976 having its registered office in Chennai, India. The Company is primarily engaged in manufacturing of Active Pharmaceutical Ingredients (APIs), their intermediates and finished dosage. The Company is also into product development and provides contract research and manufacturing services.
2. Significant accounting policies
2.1 Basis of preparation of financial statements
The financial statements have been prepared and presented in accordance with Indian Generally Accepted Accounting Principles (GAAP) under the historical cost convention using the accrual basis. GAAP comprises accounting standards notified by the Central Government of India under Section 211(3C) of the Companies Act, 1956 other pronouncements of Institute of Chartered Accountants of India, the provisions of Companies Act, 1956 and guidelines issued by Securities and Exchange Board of India (SEBI).
2.2 Use of estimates
The preparation of the financial statements in conformity with generally accepted accounting principles in India requires management to make estimates and assumptions that affect the reported amount of assets and liabilities and disclosure of contingent liabilities on the date of the financial statements. Management believes that the estimates made in the preparation of financial statements are prudent and reasonable. Actual results could differ from those estimates. Any revision to accounting estimates is recognized prospectively in current and future periods.
2.3 Tangible assets, intangible assets, depreciation and amortization
Tangible assets are stated at cost of acquisition or construction, less accumulated depreciation. Cost includes inward freight, duties, taxes and incidental expenses related to acquisition and installation of the asset. Borrowing costs directly attributable to acquisition or construction of tangible assets, which necessarily take a substantial period of time to be ready for their intended use, are capitalized.
Depreciation on tangible assets is provided using the straight-line method at the rates specified in schedule XIV to the Companies Act, 1956 or based on the useful lives of the assets as estimated by the management, whichever is higher. The management’s estimates of the useful lives for various categories of tangible assets are given below:
Asset category Estimated useful lives (in years)Factory buildings 30.00Non factory buildings 60.00Plant and machinery 10.00Electrical installations 10.00Office equipments 10.00Computers and accessories 2.50Furniture, fixtures and fittings 16.00Vehicles 5.00
Depreciation is charged on pro-rata basis for assets purchased / sold during the year. Individual assets costing less than Rs. 5,000/- are depreciated at 100%.
Intangible assets are recorded at the consideration paid for acquisition and are amortized over their estimated useful lives ranging from 3 to 5 years on a straight-line basis, commencing from the date the asset is available to the Company for its use.
The cost of assets not ready to be put to use before the yearend is disclosed under capital work in progress.
2.4 Impairment of assets
The Company assesses at each balance sheet date whether there is any indication that an asset may be impaired. If any such indication exists, the Company estimates the recoverable amount (higher of net realizable value and value in use) of the asset. If such recoverable amount of the asset or the recoverable amount of the cash generating unit to which the asset belongs is less than the carrying amount, the carrying amount is reduced to its recoverable amount.

| S
HA
SU
N P
HA
RM
AC
EU
TIC
ALS
LIM
ITE
D |
AN
NU
AL
RE
PO
RT
201
2–13
42
The reduction is treated as an impairment loss and is recognized in the Statement of profit and loss. If at the balance sheet date there is an indication that a previously assessed impairment loss no longer exists, the recoverable amount is reassessed and the asset is reflected at the recoverable amount subject to a maximum of depreciable historical cost.
2.5 Revenue recognition
Revenue from sale of goods is recognised when significant risks and rewards in respect of ownership of products are transferred to customers. Revenue from sale of goods is recognised in case of exports on the date of the bill of lading or airway bill which coincides with transfer of significant risks and rewards to customer and is net of trade discounts, sales returns and sales tax, where applicable. Revenue from domestic sales is primarily recognized on dispatch basis.
Service income is recognised as per the terms of contracts with customers when the related services are performed, or when the agreed milestones are achieved. Upfront non-refundable payments received under these arrangements are deferred and recognized as revenue over the expected period over which the related services are expected to be performed.
Dividend income is recognised when the unconditional right to receive the income is established.
Income from interest on deposits and loans is recognised on the time proportionate basis.
Export entitlements are recognised as income when the right to receive credit as per the terms of the scheme is established in respect of the exports made and where there is no significant uncertainty regarding the ultimate collection of the relevant export proceeds.
2.6 Leases
Leases under which the Company assumes substantially all the risks and rewards of ownership are classified as finance leases. Such assets are capitalized at fair value of the assets or present value of the minimum lease payments at the inception of the lease, whichever is lower.
Lease payments are apportioned between finance charges and reduction of the lease liability at the implicit rate of return. Finance charges are charged to the Statement of profit and loss.
Leases where the lessor effectively retains substantially all the risks and benefits of ownership of the leased items are classified as operating leases. Operating lease payments are recognised as an expense in the Statement of profit and loss on a straight line basis over the period of the lease or as and when the payments are made over the lease term.
2.7 Investments
Investments that are readily realizable and intended to be held for not more than a year are classified as current investments. All other investments are classified as long-term investments.
Current investments are carried at the lower of cost and fair value. Long-term investments are carried at cost and provisions are recorded to recognize any decline, other than temporary, in the carrying value of each investment.
2.8 Inventories
Raw and packaging materials, stores and spare parts and lab chemicals are carried at cost. Cost includes purchase price (excluding those subsequently recoverable by the enterprise from the concerned revenue authorities), freight inwards and other expenditure incurred in bringing such inventories to their present location and condition. In determining the cost, weighted average cost method is used.
The carrying cost of raw and packing materials, stores and spare parts and lab chemicals are appropriately written down when there is a decline in replacement cost of such materials and finished products in which they will be incorporated are expected to be sold below cost.
Work in progress, manufactured finished goods and traded goods are valued at the lower of cost and net realizable value. The comparison of cost and net realizable value is made on an item by item basis. Cost of work in progress and manufactured finished goods is determined on a weighted average basis and comprises direct material, cost of conversion and other costs incurred in bringing these inventories to their present location and condition. Cost of traded goods is determined on weighted average basis.
The excise duty in respect of closing inventory of finished goods is included as part of inventory.
Notes to financial statements for the year ended March 31, 2013 (Contd.)(All amounts are in million Indian Rupees except share data and if otherwise stated)

| S
HA
SU
N P
HA
RM
AC
EU
TIC
ALS
LIM
ITE
D |
AN
NU
AL
RE
PO
RT
201
2–13
43
2.9 Employee benefits
The Company’s contribution in respect to Provident fund, Employees’ state insurance scheme, Pension fund and other defined contribution plans are charged to the Statement of profit and loss when incurred. The Company has no further obligation other than the monthly contributions to these funds.
Gratuity costs with respect to defined benefit schemes are accrued based on actuarial valuation, carried out by an independent actuary as at the balance sheet date. The contributions are made to approved ‘Shasun Chemicals Employees Gratuity Trust Fund’. Liabilities are determined by actuarial valuation using projected unit credit method carried out by an independent actuary as at the balance sheet date.
Provision for compensated absences is made on the basis of actuarial valuation as at the balance sheet date by an independent actuary using projected unit credit method.
Under the superannuation scheme, a defined contribution plan, the Company pays fixed contributions to approved superannuation trust and has no obligation to pay further amounts. Such fixed contributions are charged to the Statement of profit and loss on accrual basis.
All actuarial gains and losses arising during the year are recognized immediately in the Statement of profit and loss.
2.10 Foreign currency transactions and derivative instruments
Foreign currency transactions are recorded using the exchange rates prevailing on the dates of the respective transactions. Exchange differences arising on foreign currency transactions settled during the year are recognised in the Statement of profit and loss.
Monetary assets and liabilities denominated in foreign currencies as at the balance sheet date, not covered by forward exchange contracts, are translated at year-end rates. The resultant exchange differences are recognised in the Statement of profit and loss. Non-monetary assets are recorded at the rates prevailing on the date of the transaction.
Income and expenditure items at representative offices are translated at the respective monthly average rates. Monetary assets at representative offices at the balance sheet date are translated using the year-end rates. Non-monetary assets are recorded at the rates prevailing on the date of the transaction.
Forward contracts are entered into to hedge the foreign currency risk of the underlying outstanding at the balance sheet date. The premium or discount on all such contracts is amortized as income or expense over the life of the contract. Any profit or loss arising on the cancellation or renewal of forward contracts is recognised as income or expense for the period.
In relation to the forward contracts entered into to hedge the foreign currency risk of the underlying outstanding at the balance sheet date, the exchange difference is calculated and recorded in accordance with AS-11 (revised). The exchange difference on such a forward exchange contract is calculated as the difference of the foreign currency amount of the contract translated at the exchange rate at the reporting date, or the settlement date where the transaction is settled during the reporting period and the corresponding foreign currency amount translated at the later of the date of inception of the forward exchange contract and the last reporting date. Such exchange differences are recognized in the Statement of profit and loss in the reporting period in which the exchange rates change.
Pursuant to the notification of the Ministry of Corporate Affairs issued on December 29, 2011, the Company has decided to exercise the irrevocable option granted under the said notification. Accordingly, the exchange fluctuations on all long term monetary items so far as they relate to the acquisition of a depreciable capital asset, are added to or deducted from the cost of the asset and are depreciated over the balance life of such assets. In cases other than those falling under above are accumulated in ‘Foreign Currency Monetary Item Translation Difference Account’ (FCMITDA), grouped under Reserves and Surplus, and amortized over the balance period of long-term monetary asset/liability but not beyond March 31, 2020.
In accordance with the announcement of “Accounting for Derivatives” made by the Institute of Chartered Accountants of India (‘ICAI’) on March 29, 2008, derivatives are marked to market and the changes in the value of such derivatives, to the extent they reflect a loss, are recognized in Statement of profit or loss.
2.11 Research and development
Research costs are expensed as and when incurred. Development expenditure is capitalized based on technical feasibility for each project and where future recoverability can reasonably be assured through probable future economic benefits.
Notes to financial statements for the year ended March 31, 2013 (Contd.)(All amounts are in million Indian Rupees except share data and if otherwise stated)

| S
HA
SU
N P
HA
RM
AC
EU
TIC
ALS
LIM
ITE
D |
AN
NU
AL
RE
PO
RT
201
2–13
44
The carrying value of development costs is reviewed for impairment annually when the asset is not yet in use, and otherwise when events or changes in circumstances indicate that the carrying value may not be recoverable.
Materials identified for use in research and development process are carried as inventories and charged to Statement of profit and loss on issuance of such materials for research activities.
2.12 Taxation
Income tax expense comprises current tax (i.e. amount of tax for the year determined in accordance with the income tax law) and deferred tax charge or credit (reflecting the tax effects of the timing differences between accounting income and taxable income for the year). The deferred tax charge or credit and the corresponding deferred tax liabilities or assets are recognized using the tax rates that have been enacted or substantially enacted by the balance sheet date. Deferred tax assets are recognized only to the extent there is reasonable certainty that the assets can be realized in future; however, where there is unabsorbed depreciation or carry forward of losses under taxation laws, deferred tax assets are recognized only if there is virtual certainty of realization of such assets. Deferred tax assets are reviewed at each balance sheet date and written down or written up to reflect the amount that is reasonably and virtually certain respectively to be realized.
Minimum Alternate Tax (“MAT”) paid in accordance with tax laws, which gives rise to future economic benefits in the form of adjustment of future income tax liability, is considered as an asset if there is convincing evidence that the company would pay normal income tax after tax holiday period and accordingly, MAT is recognized as an asset in the balance sheet when it is probable that the future economic benefit associated with it will flow to the company and the asset can be measured reliably. MAT credit entitlement is reviewed at each balance sheet date and written down to the extent there is no convincing evidence to the effect that the Company will pay normal income tax during the specified period.
2.13 Earnings per share
Basic earnings per share is computed by dividing net profit or loss for the period attributable to equity shareholders by the weighted average number of shares outstanding during the year. Diluted earnings per share amounts are computed after adjusting the effects of all dilutive potential equity shares. The number of shares used in computing diluted earnings per share comprises the weighted average number of shares considered for deriving basic earnings per share, and also the weighted average number of equity shares, which could have been issued on the conversion of all dilutive potential shares. In computing dilutive earnings per share, only potential equity shares that are dilutive and that decrease profit per share are included.
2.14 Employee stock option based compensation
The Company calculates the compensation cost based on the intrinsic value method wherein the excess of value of underlying equity shares as of the date of the grant of options over the exercise price of the options given to employees under the employee stock option schemes of the Company is amortised over the vesting period on a straight line basis. The Company follows the SEBI guidelines for accounting of employee stock options.
2.15 Cash flows
Cash flows are reported using the indirect method, whereby profit before tax is adjusted for the effects of transactions of a non–cash nature and any deferrals or accruals of past or future cash receipts or payments. The cash flows operating, financing and investing activities of the Company are segregated.
2.16 Provisions, Contingent liabilities and Contingent assets
The Company creates a provision when there is present obligation as a result of past events that probably requires an outflow of resources and a reliable estimate can be made of the amount of the obligation. A disclosure for a contingent liability is made when there is a possible obligation or a present obligation that may, but probably will not, require an outflow of resources. Where there is a possible obligation or a present obligation in respect of which the likelihood of outflow of resources is remote, no provision or disclosure is made. Contingent assets are neither recognised nor disclosed in the financial statements.
Notes to financial statements for the year ended March 31, 2013 (Contd.)(All amounts are in million Indian Rupees except share data and if otherwise stated)

| S
HA
SU
N P
HA
RM
AC
EU
TIC
ALS
LIM
ITE
D |
AN
NU
AL
RE
PO
RT
201
2–13
45
As at March 31, 2013
As at March 31, 2012
3 SHARE CAPITAL
Authorised
75,000,000 (Previous year: 75,000,000) equity shares of Rs. 2/- each 150.00 150.00
1,000,000 (Previous year: 1,000,000) redeemable preference shares of Rs. 100/- each 100.00 100.00
250.00 250.00
Issued, subscribed and paid-up
56,623,852 (Previous year: 55,123,852) equity shares of Rs. 2/- each fully paid up 113.25 110.25
113.25 110.25
a. Reconciliation of equity shares outstanding at the beginning and at the end of the reporting period
As at March 31, 2013 As at March 31, 2012
No. of shares Amount No. of shares Amount
At the beginning of the year 55,123,852 110.25 48,544,905 97.09
Issued during the year (Refer note 46) 1,500,000 3.00 6,578,947 13.16
Outstanding at the end of the year 56,623,852 113.25 55,123,852 110.25
b. Terms / rights attached to equity shares
The Company has a single class of equity shares. Accordingly, all equity shares rank equally with regard to dividends and share in the Company’s residual assets. The equity shares are entitled to receive dividend as declared from time to time. The voting rights of an equity shareholder on a poll (not on show of hands) are in proportion to its share of the paid-up equity capital of the Company.
On winding up of the Company, the holders of equity shares will be entitled to receive the residual assets of the Company, remaining after distribution of all preferential amounts in proportion to the number of equity shares held.
During the year ended March 31, 2013, the amount of dividend recognized as distribution to equity shareholders was Rs. Nil per share (Previous year: Rs 2.00/- per share) on interim basis and Rs. 1.50/- per share (Previous year Rs. 0.40/- per share) as proposed final dividend.
c. Details of shareholders holding more than 5% of equity shares of Rs. 2/- each fully paid in the Company
As at March 31, 2013 As at March 31, 2012
No. of shares % held No. of shares % held
Caduceus Asia Mauritius Limited 6,578,947 11.62 6,578,947 11.93
Shasun Leasing and Finance Private Limited 4,627,494 8.17 4,327,494 7.85
Devendra Estates Private Limited 2,956,652 5.22 2,831,406 5.14
As per records of the Company, including its register of shareholders/members and other declarations received from shareholders regarding beneficial interest, the above shareholding represents both legal and beneficial ownership of shares.During the previous year, the Company has made a preferential allotment of 6,578,947 equity shares of Rs. 2/- each at a premium of Rs.74/- per share aggregating to Rs. 499.99 to Caduceus Asia Mauritius Limited, Mauritius, a SEBI registered foreign venture capital investor after obtaining the approval of the shareholders and stock exchanges. In response to the Company’s intimation through the authorized dealer, the Reserve Bank of India has advised the Company to obtain the approval of the Foreign Investment Promotion Board (‘FIPB’) in respect of such investment. The Company has obtained the required approval from FIPB vide F.No.11(1)/2012-FIPB on July 24, 2012.
Notes to financial statements for the year ended March 31, 2013 (Contd.)(All amounts are in million Indian Rupees except share data and if otherwise stated)

| S
HA
SU
N P
HA
RM
AC
EU
TIC
ALS
LIM
ITE
D |
AN
NU
AL
RE
PO
RT
201
2–13
46
As at March 31, 2013
As at March 31, 2012
4 RESERVES AND SURPLUS
Capital reserve
As at the beginning and end of the year 3.00 3.00
Capital redemption reserve
As at the beginning and end of the year 50.00 50.00
Securities premium account
Balance at the beginning of the year 894.28 417.71
Add: additions made during the year (Refer note 46) 109.50 486.84
Less: share issue expenses incurred during the year - 10.27
Balance at the end of the year 1,003.78 894.28
General reserve
Balance at the beginning of the year 409.94 356.88
Add: amount transferred from surplus in the Statement of profit and loss 26.28 53.06
Balance at the end of the year 436.22 409.94
Surplus in the Statement of profit and loss
Balance at the beginning of the year 1,129.27 790.22
Add: Net profit for the year 262.78 530.58
Less: appropriations
Proposed dividend 84.94 22.05
Interim dividend - 97.09
Dividend distribution tax 14.43 19.33
Transfer to general reserve 26.28 53.06
Balance at the end of the year 1,266.40 1,129.27
2,759.40 2,486.49
5 LONG-TERM BORROWINGS
Secured:
External commercial borrowings from banks 1,000.10 566.83
Foreign currency term loans from banks 298.29 158.16
Unsecured:
Loan from others 10.74 -
1309.13 724.99
Less: disclosed under "Other current liabilities" (Refer note 11) (323.83) (234.46)
985.30 490.53
Security details and terms of re-payment for loans:
i. Foreign currency loan (INR loan with swing option of converting into foreign currency loan) from State Bank of India amounting to Rs. 68.50 (Previous year Rs. 158.16) is secured by way of first charge on:
(a) Moveable and immoveable fixed assets at Shasun Research Centre (SRC) located at Vandalur(b) Unencumbered immoveable assets at plot No. A1/A, measuring 5.01 acres located in Sipcot Complex, Cuddalore
Notes to financial statements for the year ended March 31, 2013 (Contd.)(All amounts are in million Indian Rupees except share data and if otherwise stated)
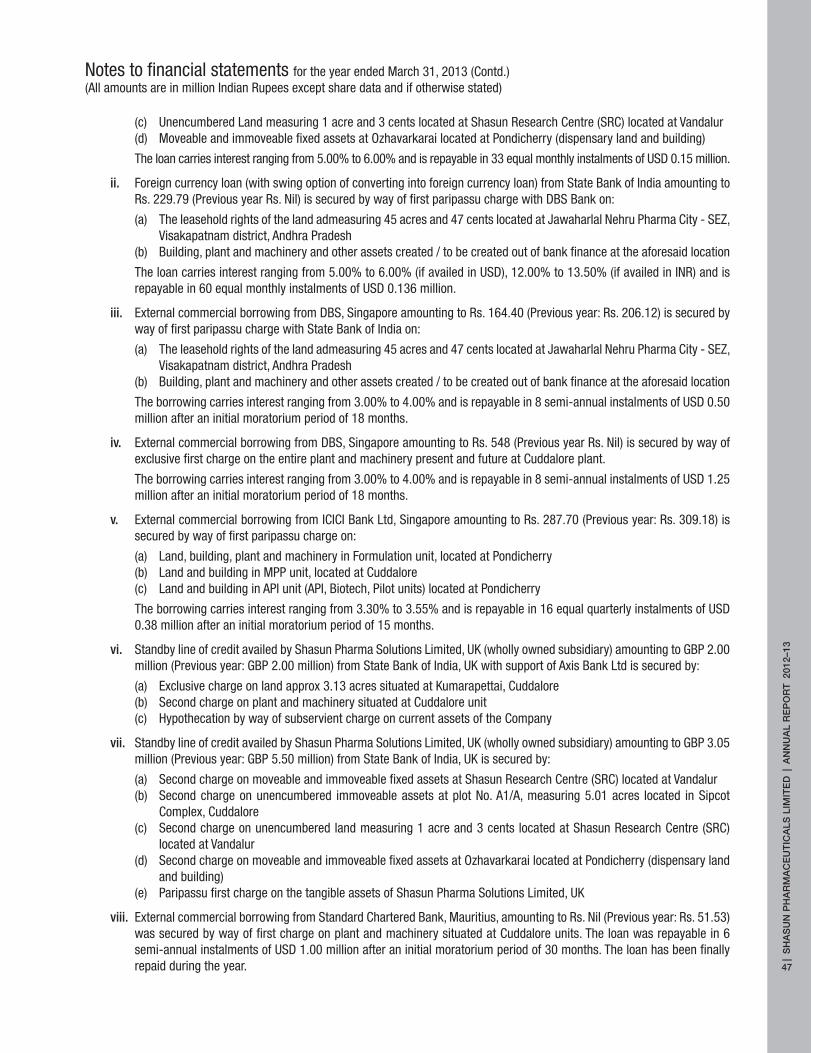
| S
HA
SU
N P
HA
RM
AC
EU
TIC
ALS
LIM
ITE
D |
AN
NU
AL
RE
PO
RT
201
2–13
47
(c) Unencumbered Land measuring 1 acre and 3 cents located at Shasun Research Centre (SRC) located at Vandalur(d) Moveable and immoveable fixed assets at Ozhavarkarai located at Pondicherry (dispensary land and building)
The loan carries interest ranging from 5.00% to 6.00% and is repayable in 33 equal monthly instalments of USD 0.15 million.
ii. Foreign currency loan (with swing option of converting into foreign currency loan) from State Bank of India amounting to Rs. 229.79 (Previous year Rs. Nil) is secured by way of first paripassu charge with DBS Bank on:
(a) The leasehold rights of the land admeasuring 45 acres and 47 cents located at Jawaharlal Nehru Pharma City - SEZ, Visakapatnam district, Andhra Pradesh
(b) Building, plant and machinery and other assets created / to be created out of bank finance at the aforesaid location
The loan carries interest ranging from 5.00% to 6.00% (if availed in USD), 12.00% to 13.50% (if availed in INR) and is repayable in 60 equal monthly instalments of USD 0.136 million.
iii. External commercial borrowing from DBS, Singapore amounting to Rs. 164.40 (Previous year: Rs. 206.12) is secured by way of first paripassu charge with State Bank of India on:
(a) The leasehold rights of the land admeasuring 45 acres and 47 cents located at Jawaharlal Nehru Pharma City - SEZ, Visakapatnam district, Andhra Pradesh
(b) Building, plant and machinery and other assets created / to be created out of bank finance at the aforesaid location
The borrowing carries interest ranging from 3.00% to 4.00% and is repayable in 8 semi-annual instalments of USD 0.50 million after an initial moratorium period of 18 months.
iv. External commercial borrowing from DBS, Singapore amounting to Rs. 548 (Previous year Rs. Nil) is secured by way of exclusive first charge on the entire plant and machinery present and future at Cuddalore plant.
The borrowing carries interest ranging from 3.00% to 4.00% and is repayable in 8 semi-annual instalments of USD 1.25 million after an initial moratorium period of 18 months.
v. External commercial borrowing from ICICI Bank Ltd, Singapore amounting to Rs. 287.70 (Previous year: Rs. 309.18) is secured by way of first paripassu charge on:
(a) Land, building, plant and machinery in Formulation unit, located at Pondicherry(b) Land and building in MPP unit, located at Cuddalore(c) Land and building in API unit (API, Biotech, Pilot units) located at Pondicherry
The borrowing carries interest ranging from 3.30% to 3.55% and is repayable in 16 equal quarterly instalments of USD 0.38 million after an initial moratorium period of 15 months.
vi. Standby line of credit availed by Shasun Pharma Solutions Limited, UK (wholly owned subsidiary) amounting to GBP 2.00 million (Previous year: GBP 2.00 million) from State Bank of India, UK with support of Axis Bank Ltd is secured by:
(a) Exclusive charge on land approx 3.13 acres situated at Kumarapettai, Cuddalore(b) Second charge on plant and machinery situated at Cuddalore unit(c) Hypothecation by way of subservient charge on current assets of the Company
vii. Standby line of credit availed by Shasun Pharma Solutions Limited, UK (wholly owned subsidiary) amounting to GBP 3.05 million (Previous year: GBP 5.50 million) from State Bank of India, UK is secured by:
(a) Second charge on moveable and immoveable fixed assets at Shasun Research Centre (SRC) located at Vandalur(b) Second charge on unencumbered immoveable assets at plot No. A1/A, measuring 5.01 acres located in Sipcot
Complex, Cuddalore(c) Second charge on unencumbered land measuring 1 acre and 3 cents located at Shasun Research Centre (SRC)
located at Vandalur(d) Second charge on moveable and immoveable fixed assets at Ozhavarkarai located at Pondicherry (dispensary land
and building)(e) Paripassu first charge on the tangible assets of Shasun Pharma Solutions Limited, UK
viii. External commercial borrowing from Standard Chartered Bank, Mauritius, amounting to Rs. Nil (Previous year: Rs. 51.53) was secured by way of first charge on plant and machinery situated at Cuddalore units. The loan was repayable in 6 semi-annual instalments of USD 1.00 million after an initial moratorium period of 30 months. The loan has been finally repaid during the year.
Notes to financial statements for the year ended March 31, 2013 (Contd.)(All amounts are in million Indian Rupees except share data and if otherwise stated)

| S
HA
SU
N P
HA
RM
AC
EU
TIC
ALS
LIM
ITE
D |
AN
NU
AL
RE
PO
RT
201
2–13
48
As at March 31, 2013
As at March 31, 2012
6 DEFERRED TAX (ASSET) / LIABILITY, net
Deferred tax liability on account of:
Depreciation and amortization 205.72 142.65
205.72 142.65
Deferred tax asset on account of:
Provision for mark-to-market losses on derivatives 3.35 58.53
Carry forward business loss and unabsorbed depreciation 183.69 53.35
Retirement benefits 9.88 5.64
Others 20.21 10.10
217.13 127.62
(11.41) 15.03
7 OTHER NON-CURRENT LIABILITIES
Security deposits from dealers 10.40 0.80
10.40 0.80
8 LONG TERM PROVISIONS
Provision for employee benefits:
- Compensated absence 22.00 17.78
Provision for taxation (net of advance taxes and tax deducted at source) 29.81 24.83
Provision for mark-to-market losses on derivatives 7.87 8.76
59.68 51.37
9 SHORT TERM BORROWINGS
Secured:
Overdrafts from banks 580.13 39.19
Packing credit facilities from banks 1,592.37 1,300.48
Unsecured:
Other loans from banks 547.54 312.84
2,720.04 1,652.51
Security details and terms of re-payment for loans:
i. Working Capital facility sharing under consortium arrangement from bankers aggregating to Rs. 3,800 (Fund based Rs. 2,200, Non-fund based Rs. 1,500 and standby line of credit amounting to Rs. 100) is secured by way of exclusive first charge on:
(a) Hypothecation of entire current assets on a paripassu basis with other members of the consortium(b) Paripassu first charge on land and building in API unit (API, Biotech and Pilot Units) located at Pondicherry(c) Paripassu first charge on land and building in MPP unit, located at Cuddalore(d) Land, buildings, plant and machinery in Formulation unit located at Pondicherry(e) Second charge on all other fixed assets of the Company.
Notes to financial statements for the year ended March 31, 2013 (Contd.)(All amounts are in million Indian Rupees except share data and if otherwise stated)
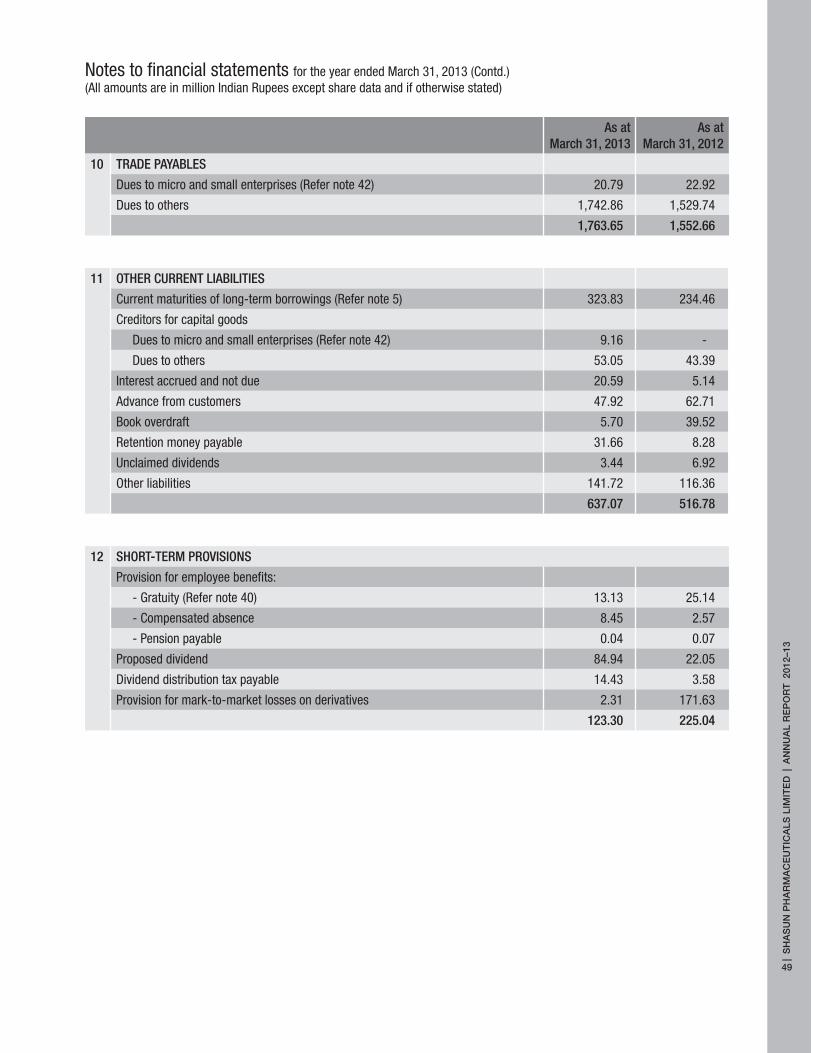
| S
HA
SU
N P
HA
RM
AC
EU
TIC
ALS
LIM
ITE
D |
AN
NU
AL
RE
PO
RT
201
2–13
49
As at March 31, 2013
As at March 31, 2012
10 TRADE PAYABLES
Dues to micro and small enterprises (Refer note 42) 20.79 22.92
Dues to others 1,742.86 1,529.74
1,763.65 1,552.66
11 OTHER CURRENT LIABILITIES
Current maturities of long-term borrowings (Refer note 5) 323.83 234.46
Creditors for capital goods
Dues to micro and small enterprises (Refer note 42) 9.16 -
Dues to others 53.05 43.39
Interest accrued and not due 20.59 5.14
Advance from customers 47.92 62.71
Book overdraft 5.70 39.52
Retention money payable 31.66 8.28
Unclaimed dividends 3.44 6.92
Other liabilities 141.72 116.36
637.07 516.78
12 SHORT-TERM PROVISIONS
Provision for employee benefits:
- Gratuity (Refer note 40) 13.13 25.14
- Compensated absence 8.45 2.57
- Pension payable 0.04 0.07
Proposed dividend 84.94 22.05
Dividend distribution tax payable 14.43 3.58
Provision for mark-to-market losses on derivatives 2.31 171.63
123.30 225.04
Notes to financial statements for the year ended March 31, 2013 (Contd.)(All amounts are in million Indian Rupees except share data and if otherwise stated)

| S
HA
SU
N P
HA
RM
AC
EU
TIC
ALS
LIM
ITE
D |
AN
NU
AL
RE
PO
RT
201
2–13
50
13 TANGIBLE ASSETS
ParticularsFreehold
landLeasehold
land #Factory
buildings
Non factory
buildings
Plant and machinery *
Electrical installations
Office equipments
Computers and
accessories
Furniture, fixtures
and fittingsVehicles Total
GROSS BLOCK
As at April 1, 2011 34.94 286.90 626.36 3.64 2,532.53 285.36 49.12 84.32 45.10 36.65 3,984.92
Additions / adjustments - - 121.03 11.47 357.43 28.00 13.05 3.72 4.43 11.54 550.67
Deletions 1.40 - 23.86 - 63.71 9.45 3.13 1.30 5.22 18.88 126.95
As at March 31, 2012 34.87 286.90 723.53 15.11 2,826.25 303.91 59.04 86.74 44.31 29.31 4,409.97
Additions / adjustments 13.13 6.97 153.59 57.39 689.10 52.12 28.96 23.85 6.39 25.67 1,057.17
Deletions 0.44 - 14.39 1.27 249.33 0.52 3.35 3.56 0.83 11.59 285.28
As at March 31, 2013 47.56 293.87 862.73 71.23 3,266.02 355.51 84.65 107.03 49.87 43.39 5,181.86
ACCUMULATED DEPRECIATION
As at April 1, 2011 - 9.93 181.33 0.44 1,781.65 188.29 33.37 80.39 24.39 26.03 2,325.82
Depreciation for the year - 2.90 22.96 0.14 183.22 24.46 4.28 3.04 2.62 4.42 248.04
Deletions - - 9.20 - 62.21 7.45 2.94 1.29 3.93 15.37 102.39
As at March 31, 2012 - 12.83 195.09 0.58 1,902.66 205.30 34.71 82.14 23.08 15.08 2,471.47
Depreciation for the year - 3.03 26.67 0.68 227.91 29.26 6.14 9.43 2.99 6.20 312.31
Deletions - - 3.95 0.10 245.26 0.50 3.21 3.56 0.80 8.43 265.81
As at March 31, 2013 - 15.86 217.81 1.16 1,885.31 234.06 37.64 88.01 25.27 12.85 2,517.97
NET BLOCK
As at March 31, 2013 47.56 278.01 644.92 70.07 1,380.71 121.45 47.01 19.02 24.60 30.54 2,663.89
As at March 31, 2012 34.87 274.07 528.44 14.53 923.59 98.61 24.33 4.60 21.23 14.23 1,938.50
# Amortization of Rs. 2.78 (Previous year: Rs. 2.76) is allocated to projects under capital work-in-progress.
* Depreciation for the year includes depreciation amounting to Rs. 42.11 (Previous year: Rs. 38.59) on assets used for research and development. During the year, the Company incurred Rs. 79.84 (Previous year: Rs. 14.76) towards capital expenditure for research and development.
14 INTANGIBLE ASSETS
Particulars SoftwareOther
intangible assets
Total
GROSS BLOCKAs at April 1, 2011 31.47 3.00 34.47 Additions / adjustments 4.15 - 4.15 Deletions - - - As at March 31, 2012 35.62 3.00 38.62 Additions / adjustments 9.77 2.49 12.26 Deletions - - - As at March 31, 2013 45.39 5.49 50.88 ACCUMULATED AMORTIZATIONAs at April 1, 2011 30.73 1.10 31.83 Amortization for the year 1.35 0.65 2.00 Deletions - - - As at March 31, 2012 32.08 1.75 33.83 Amortization for the year 5.14 1.95 7.09 Deletions - - - As at March 31, 2013 37.22 3.70 40.92 NET BLOCKAs at March 31, 2013 8.17 1.79 9.96 As at March 31, 2012 3.54 1.25 4.79
Notes to financial statements for the year ended March 31, 2013 (Contd.)(All amounts are in million Indian Rupees except share data and if otherwise stated)

| S
HA
SU
N P
HA
RM
AC
EU
TIC
ALS
LIM
ITE
D |
AN
NU
AL
RE
PO
RT
201
2–13
51
As at March 31, 2013
As at March 31, 2012
15 NON-CURRENT INVESTMENTS
Trade investments valued at cost unless stated otherwise
Unquoted equity instruments
Investments in wholly owned subsidiaries
Shasun USA Inc., USA
15,000 (Previous year: 15,000) common stock of USD 1 each, fully paid up 0.54 0.54
SVADS Holdings SA, Switzerland (Also, refer note 16)
12,324,759 (Previous year: 100,000) shares of CHF 1 each, fully paid up 435.06 3.43
Shasun Life Sciences Private Limited, India
10,000 (Previous year: 10,000) equity shares of Rs. 10/- each, fully paid up 0.10 0.10
Investment in a joint venture
Shasun NBI LLC, USA
(A Limited Liability Company registered in the State of Missouri, USA, wherein the Company is a member in the ratio of 50:50 along with Nanoparticle BioChem Inc., USA)
63.88 43.91
Investment in others
Clarion Wind Farm Private Limited, India
900,000 (Previous year: 200,000) equity shares of Rs. 10/- each, fully paid up 9.00 2.00
SIPCOT Industrial Common Utilities Limited, India
4,242 (Previous year: 4,242) equity shares of Rs. 100/- each, fully paid up 0.42 0.42
509.00 50.40
Aggregate book value and unquoted non-current investments 509.00 50.40
16 LONG-TERM LOANS AND ADVANCES
Unsecured and considered good:
Capital advances 147.52 111.61
Security deposits 44.46 34.03
Minimum alternate tax credit entitlement 120.06 105.15
Share application money pending allotment with related parties - 431.63
Loans and advances to related parties (Refer note (i) and (ii) below) 187.96 210.20
Loans and advances to other than related parties (Refer note (iii) below) 55.13 -
Advance income tax and tax deducted at source (net of provision for taxation) 141.44 105.78
Loans and advances to employees 4.51 1.75
701.08 1,000.15
i) Loans and advances to related parties (including interest receivable): In view of certain customer arrangements and working capital facilities arranged, the management believes that the loans granted to SVADS and the receivables due from SPSL would be recovered and that there is no diminution other than temporary in the value of the investment in SVADS. Accordingly, the investment in and dues from SVADS / SPSL have been carried at cost.
ii) Share application money pending allotment with related parties: In view of certain provisions of Swiss Code of Obligations, SVADS had not allotted shares against advances until previous year. During the current year, SVADS has allotted the shares based on necessary approvals being obtained from appropriate authorities.
iii) Loans and advances to other than related parties: Loans and advances to other than related parties include advances given to a Company towards capital expenditure for developing manufacturing facilities and loans granted to the shareholders of such Company towards acquiring equity shares. As at the year end, the Company is in the process of obtaining necessary approvals from the relevant authorities for transfer of aforesaid equity shares. Pending such approval, the loan balances have been grouped under long-term loans and advances.
Notes to financial statements for the year ended March 31, 2013 (Contd.)(All amounts are in million Indian Rupees except share data and if otherwise stated)

| S
HA
SU
N P
HA
RM
AC
EU
TIC
ALS
LIM
ITE
D |
AN
NU
AL
RE
PO
RT
201
2–13
52
As at March 31, 2013
As at March 31, 2012
17 OTHER NON-CURRENT ASSETS
Unamortised expenses - ancillary borrowing costs 11.31 5.29
11.31 5.29
18 INVENTORIES
Raw and packing materials (includes goods-in-transit of Rs. 40.00 (Previous year: Rs. 28.22))
671.72 520.99
Work-in-progress 573.10 404.14
Finished goods 149.24 142.75
Traded goods 2.39 -
Stores, spares and lab chemicals 56.88 39.00
1,453.33 1,106.88
19 TRADE RECEIVABLES
Unsecured:
Outstanding for a period exceeding six months from the date they are due for payment
- Considered good 42.86 64.21
- Considered doubtful 11.79 13.24
Other receivables
- Considered good 2,163.90 1,906.34
Less: Provision for doubtful receivables (11.79) (13.24)
2,206.76 1,970.55
20 CASH AND BANK BALANCES
Cash and cash equivalents:
Cash on hand 2.96 0.84
Balances with banks
- In current accounts 35.82 64.47
38.78 65.31
Other bank balances:
Margin money deposit 0.96 0.96
0.96 0.96
39.74 66.27
Notes to financial statements for the year ended March 31, 2013 (Contd.)(All amounts are in million Indian Rupees except share data and if otherwise stated)
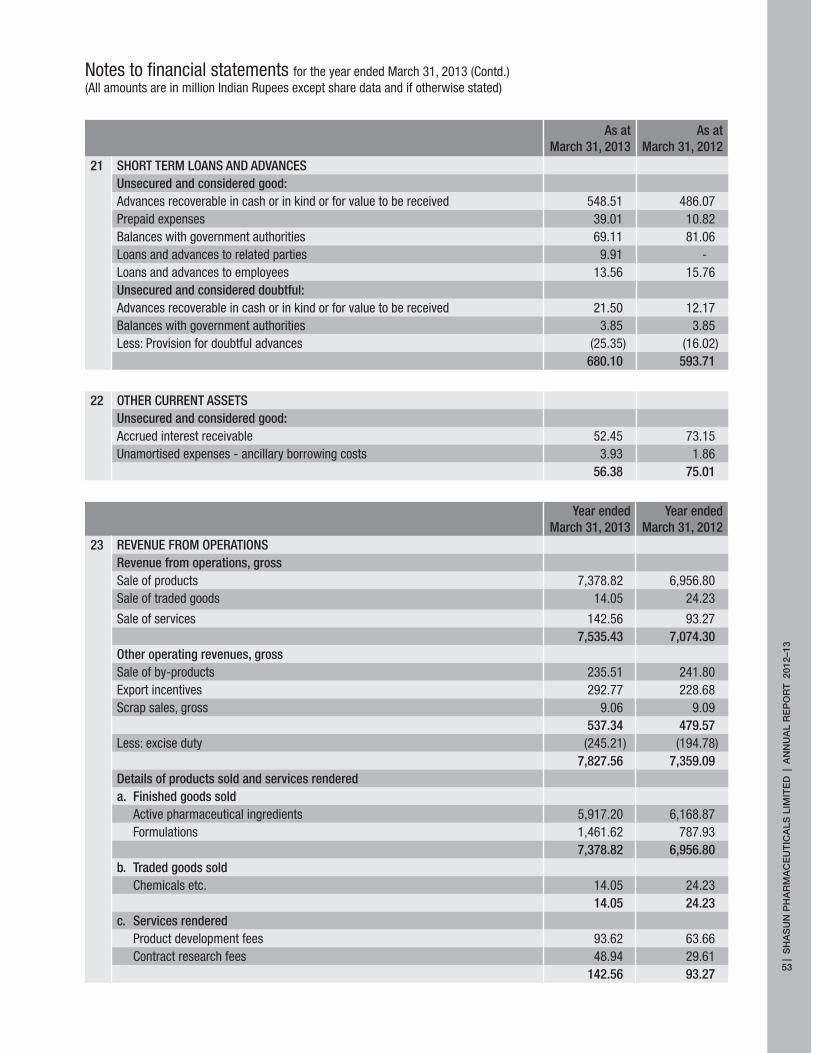
| S
HA
SU
N P
HA
RM
AC
EU
TIC
ALS
LIM
ITE
D |
AN
NU
AL
RE
PO
RT
201
2–13
53
As at March 31, 2013
As at March 31, 2012
21 SHORT TERM LOANS AND ADVANCESUnsecured and considered good:Advances recoverable in cash or in kind or for value to be received 548.51 486.07 Prepaid expenses 39.01 10.82 Balances with government authorities 69.11 81.06 Loans and advances to related parties 9.91 - Loans and advances to employees 13.56 15.76 Unsecured and considered doubtful:Advances recoverable in cash or in kind or for value to be received 21.50 12.17 Balances with government authorities 3.85 3.85 Less: Provision for doubtful advances (25.35) (16.02)
680.10 593.71
22 OTHER CURRENT ASSETSUnsecured and considered good:Accrued interest receivable 52.45 73.15 Unamortised expenses - ancillary borrowing costs 3.93 1.86
56.38 75.01
Year ended March 31, 2013
Year ended March 31, 2012
23 REVENUE FROM OPERATIONSRevenue from operations, grossSale of products 7,378.82 6,956.80 Sale of traded goods 14.05 24.23
Sale of services 142.56 93.27 7,535.43 7,074.30
Other operating revenues, grossSale of by-products 235.51 241.80 Export incentives 292.77 228.68 Scrap sales, gross 9.06 9.09
537.34 479.57 Less: excise duty (245.21) (194.78)
7,827.56 7,359.09 Details of products sold and services rendereda. Finished goods sold Active pharmaceutical ingredients 5,917.20 6,168.87 Formulations 1,461.62 787.93
7,378.82 6,956.80 b. Traded goods sold Chemicals etc. 14.05 24.23
14.05 24.23 c. Services rendered Product development fees 93.62 63.66 Contract research fees 48.94 29.61
142.56 93.27
Notes to financial statements for the year ended March 31, 2013 (Contd.)(All amounts are in million Indian Rupees except share data and if otherwise stated)

| S
HA
SU
N P
HA
RM
AC
EU
TIC
ALS
LIM
ITE
D |
AN
NU
AL
RE
PO
RT
201
2–13
54
Year ended March 31, 2013
Year ended March 31, 2012
24 OTHER INCOME
Interest income 22.94 36.75
Net gain on foreign currency transactions and translation 4.08 -
Profit on sale of fixed assets (net) 18.77 272.71
Bad debts written off now recovered - 4.73
Provisions / liabilities no longer required written back 10.79 61.78
Insurance claims 53.72 33.50
Miscellaneous income 26.25 0.17
136.55 409.64
25 COST OF RAW AND PACKING MATERIALS CONSUMED
Opening stock 520.99 490.15
Add: Purchased during the year 5,160.41 4,685.97
Less: Closing stock (671.72) (520.99)
5,009.68 4,655.13
i. Details of raw and packing materials consumed
Chemicals etc. for active pharmaceutical ingredients 4,128.28 4,159.87
Chemicals etc. for formulations 881.40 495.26
5,009.68 4,655.13
ii. Details of inventories raw and packing materials
Chemicals etc. for active pharmaceutical ingredients 498.12 411.67
Chemicals etc. for formulations 173.60 109.32
671.72 520.99
26 CHANGE IN INVENTORIES
Opening stock
- Finished goods 142.75 217.47
- Traded goods - -
- Work-in-progress 404.14 318.02
546.89 535.49
Closing stock
- Finished goods 149.24 142.75
- Traded goods 2.39 -
- Work-in-progress 573.10 404.14
724.73 546.89
(177.84) (11.40)
Notes to financial statements for the year ended March 31, 2013 (Contd.)(All amounts are in million Indian Rupees except share data and if otherwise stated)

| S
HA
SU
N P
HA
RM
AC
EU
TIC
ALS
LIM
ITE
D |
AN
NU
AL
RE
PO
RT
201
2–13
55
Year ended March 31, 2013
Year ended March 31, 2012
26 i. Details of work-in-progress
Active pharmaceutical ingredients 526.55 386.81
Formulations 46.55 17.33
573.10 404.14
ii. Details of finished goods
Active pharmaceutical ingredients 140.83 108.39
Formulations 8.41 34.36
149.24 142.75
iii. Details of traded goods
Formulations 2.39 -
2.39 -
27 EMPLOYEE BENEFIT EXPENSES
Salaries, wages and bonus 641.98 504.51
Contribution to provident and other funds 48.32 43.17
Staff welfare expenses 77.13 47.56
767.43 595.24
28 FINANCE COSTS
Interest expenses
- On bank loans 216.52 177.46
- On others 17.29 16.81
- On interest rate swap 0.46 9.71
Bank charges 53.46 46.20
Net loss on foreign currency transactions and translation - 54.63
Less: Capitalised during the year (Refer note 47) (22.86) -
264.87 304.81
29 OTHER EXPENSESConsumption of stores and spare parts 137.21 82.05 Power and fuel 535.42 495.03 Rent 11.87 14.66 Repairs and maintenance *
- Buildings 32.50 9.20 - Plant and machinery 175.21 140.90 - Others 127.19 91.85
Insurance 41.40 24.04 Rates and taxes 3.27 22.24 Net loss on foreign currency transactions and translation - 152.13 Communication expenses 9.43 9.29
Notes to financial statements for the year ended March 31, 2013 (Contd.)(All amounts are in million Indian Rupees except share data and if otherwise stated)

| S
HA
SU
N P
HA
RM
AC
EU
TIC
ALS
LIM
ITE
D |
AN
NU
AL
RE
PO
RT
201
2–13
56
Year ended March 31, 2013
Year ended March 31, 2012
29 Travelling and conveyance 60.28 37.49 Legal and professional charges (Refer note 34) 58.35 35.10 Printing and stationery 11.41 9.88 Commission and discounts 37.95 115.06 Commission to non-wholetime directors 2.30 1.20 Freight outwards 201.47 255.30 Sales promotion expenses 25.24 14.61 Bad debts written off 0.97 11.56 Provision for doubtful receivables - 1.56 Provision for doubtful advances 9.33 12.87 Miscellaneous expenses 48.47 26.00
1,529.27 1,562.02
* Includes stores and spares consumed Rs. 156.52 (Previous year Rs. 103.40)
30 Commitments and Contingent liabilities
Particulars As at March 31, 2013
As at March 31, 2012
CommitmentsEstimated amount of contracts remaining to be executed on capital amount and not provided for (net of advances)
26.74 591.23
Commitments relating to further investment in joint venture 37.68 58.40Contingent liabilities
Income tax - 318.14 Sales tax 15.37 13.27 Excise / customs 101.08 83.53 Counter guarantees given by the company to the bankers for bank guarantee 51.50 58.15 Obligations in respect of letter of credit outstanding 459.79 348.97 Corporate guarantee given to the bankers in respect of loan taken by Shasun Pharma Solutions Limited, UK (wholly owned subsidiary)
Out of the above corporate guarantee utilized in connection with loans availed by SPSL, UK
540.54
457.02
949.67
454.14Other claims against the Company not acknowledged as debts 41.22 38.76
31 Earnings in foreign currency
Particulars Year ended March 31, 2013
Year ended March 31, 2012
Exports of goods calculated on FOB basis 5,101.32 4,981.45
Product development fee 68.92 54.94
Contract research fee 48.94 29.61
Interest income 18.72 16.63
Miscellaneous income 20.47 -
Total 5,258.36 5,082.63
Notes to financial statements for the year ended March 31, 2013 (Contd.)(All amounts are in million Indian Rupees except share data and if otherwise stated)

| S
HA
SU
N P
HA
RM
AC
EU
TIC
ALS
LIM
ITE
D |
AN
NU
AL
RE
PO
RT
201
2–13
57
32 Expenditure in foreign currency
Particulars Year ended March 31, 2013
Year ended March 31, 2012
Carriage outwards 65.47 84.81
Commission 21.49 65.99
Interest on loans 53.13 38.03
Discounts 1.21 29.91
Salaries and wages 20.03 13.47
Travelling and conveyance 8.85 8.34
Legal and professional expenses 29.18 6.26
Sales promotion expenses 9.00 3.48
Licence and Listing fees 3.56 -
Others 10.44 5.18
Total 222.36 255.47
33 CIF value of imports
Particulars Year ended March 31, 2013
Year ended March 31, 2012
Raw and packing materials 1,304.29 1,362.26
Capital goods and spare parts 179.91 172.85
Total 1,484.20 1,535.11
34 Payments to Auditors, excluding service tax (included in legal and professional charges under note 29)
Particulars Year ended March 31, 2013
Year ended March 31, 2012
a) Statutory audit fees 2.40 2.40
b) Other charges
- Taxation matters 0.15 -
- Other matters 0.33 0.23
c) Out of pocket expenses 0.52 0.18
Total 3.40 2.81
35 Purchase of traded goods
Particulars Year ended March 31, 2013
Year ended March 31, 2012
Chemicals etc. 17.74 42.92
Total 17.74 42.92
Notes to financial statements for the year ended March 31, 2013 (Contd.)(All amounts are in million Indian Rupees except share data and if otherwise stated)

| S
HA
SU
N P
HA
RM
AC
EU
TIC
ALS
LIM
ITE
D |
AN
NU
AL
RE
PO
RT
201
2–13
58
36 Value of imported and indigenous raw and packing materials and stores and spares consumed
Particulars Year ended March 31, 2013 Year ended March 31, 2012
Amount % Amount %
Raw and packing materials
- Imported 1,587.45 31.69% 1,397.48 30.02%
- Domestic 3,422.23 68.31% 3,257.65 69.98%
Total 5,009.68 4,655.13
Stores, spares and lab chemicals
- Imported 1.82 0.62% 1.42 0.77%
- Domestic 291.91 99.38% 184.03 99.23%
Total 293.73 185.45
37 Operating Leases
The Company had entered into an operating lease arrangement in respect of office space during the previous year with a lease term of 3 years, which are subject to renewal at mutual consent thereafter. The cancellable arrangements can be terminated by either party after giving due notice. The lease rent expense recognized during the year amounts to Rs. 8.37 (Previous year: Rs. 7.59). The schedule for future minimum lease payments in respect of non-cancellable operating leases is set out below:
Particulars As at March 31, 2013
As at March 31, 2012
Not later than one year 8.37 8.37
Later than one year but not later than five years - -
Later than five years - -
38 Earnings per share
Earnings per share are calculated by dividing the Profit / (loss) attributable to the equity shareholders by the weighted average number of equity shares outstanding during the year.
Particulars Year ended March 31, 2013
Year ended March 31, 2012
Earnings
Net profit after tax as per statement of profit and loss 262.78 530.58
Number of shares
Number of shares at the beginning of the year 55,123,852 48,544,905
Add: Equity shares issued on conversion of warrants issued on preferential basis 1,500,000 -
Add: Equity shares issued on preferential allotment basis - 6,578,947
Total number of equity shares outstanding at the end of the year 56,623,852 55,123,852
Weighted average number of equity shares outstanding during the year - basic 55,164,948 48,598,831
Weighted average number of equity shares outstanding during the year - diluted 55,164,948 49,324,241
Earnings per share
- of par value Rs. 2 – Basic (Rs.) 4.76 10.92
- of par value Rs. 2 – Diluted (Rs.) 4.76 10.76
Notes to financial statements for the year ended March 31, 2013 (Contd.)(All amounts are in million Indian Rupees except share data and if otherwise stated)

| S
HA
SU
N P
HA
RM
AC
EU
TIC
ALS
LIM
ITE
D |
AN
NU
AL
RE
PO
RT
201
2–13
59
39 Related party disclosures
Details of related parties including summary of transactions entered into by the Company during the year ended March 31, 2013 are summarized below:
Name of related parties and description of relationship:
Wholly owned subsidiaries:Shasun USA Inc., USAShasun Life Sciences Private Limited, IndiaSVADS Holding SA, Switzerland
Wholly owned step down subsidiaries: Shasun Pharma Solutions Limited, UK (100% subsidiary of SVADS Holding SA) Shasun Pharma Solutions Inc., USA (100% subsidiary of SVADS Holding SA)
Joint venture: Shasun NBI LLC, USAShasun NBI Nanotech India Private Limited (subsidiary of Shasun NBI LLC, USA)
Key management personnel and their relatives: Dr. S Devendra Wholetime Director S Abhaya Kumar Managing DirectorS Vimal Kumar Wholetime DirectorM Mohan Wholetime Director (from August 19, 2011)D Jitesh S/o of Dr. S Devendra D Chaitanya S/o of Dr. S Devendra V Jatin S/o of S Vimal Kumar V Nitin S/o of S Vimal Kumar
Entities where Directors have control or significant influence:Shasun Finance LimitedShasun Leasing and Finance Private LimitedDevendra Estate Private Limited Shasun Foundation Trust
Transactions during the year
Description Related party Year ended March 31, 2013
Year ended March 31, 2012
Loan repaid SVADS Holding SA 36.62 86.98
Advance Paid Shasun USA Inc 6.36 -
Interest income SVADS Holding SA 8.96 16.63
Shasun Pharma Solutions Limited 9.74 15.50
Sales of goods, net of sales returns Shasun USA Inc 0.41 (1.81)
Shasun Pharma Solutions Limited - (0.31)
Sale of asset Devendra Estates Private Limited 30.00 -
Donation Shasun Foundation Trust 4.15 0.60
Purchase of goods Shasun Pharma Solutions Limited - 6.63
Shasun USA Inc - 0.56
Notes to financial statements for the year ended March 31, 2013 (Contd.)(All amounts are in million Indian Rupees except share data and if otherwise stated)

| S
HA
SU
N P
HA
RM
AC
EU
TIC
ALS
LIM
ITE
D |
AN
NU
AL
RE
PO
RT
201
2–13
60
Description Related party Year ended March 31, 2013
Year ended March 31, 2012
Selling commission Shasun USA Inc - 44.92
Income from services Shasun USA Inc 0.11 0.21
Shasun Pharma Solutions Limited 12.98 -
Reimbursement of expenses to Shasun USA Inc 2.12 -
Shasun Pharma Solutions Limited 1.87 0.76
Payment made on behalf and reimbursed by Shasun Pharma Solutions Limited 18.47 46.41
Shasun USA Inc 0.10 -
Remuneration S Abhaya Kumar 8.44 2.67
S Vimal Kumar 5.65 2.74
Dr. S Devendra 5.65 2.66
D Jitesh 7.68 4.45
V Jatin 5.91 2.94
M Mohan 5.14 3.00
V Nitin 2.34 0.56
Rent for leased property Devendra Estate Private Limited 0.78 -
Investments Shasun NBI LLC 19.97 26.91
Balances
Description Related party Receivable / (Payable) as at March 31, 2013
Receivable / (Payable) as at March 31, 2012
Payable Shasun USA Inc (0.79) (58.53)
Shasun Pharma Solutions Limited (8.33) (10.55)
Receivable Shasun USA Inc 6.36 -
Shasun NBI Nanotech India Private Limited 0.10 -
Shasun Pharma Solutions Limited 30.20 129.63
SVADS Holdings SA 240.41 714.98
Investments Shasun USA Inc 0.54 0.54
SVADS Holdings SA 435.06 3.43
Shasun Life Sciences Private Limited 0.10 0.10
Shasun NBI LLC 63.88 43.91
Share application money pending allotment
SVADS Holdings SA - 431.63
Remuneration payable D Jitesh (0.37) (1.09)
V Jatin (0.26) (0.89)
M Mohan (0.54) -
Notes to financial statements for the year ended March 31, 2013 (Contd.)(All amounts are in million Indian Rupees except share data and if otherwise stated)

| S
HA
SU
N P
HA
RM
AC
EU
TIC
ALS
LIM
ITE
D |
AN
NU
AL
RE
PO
RT
201
2–13
61
40 Employee benefits
Gratuity
The details in respect of gratuity are set out below:
Change in present value defined benefit obligation
Particulars As at March 31, 2013
As at March 31, 2012
Obligations at the beginning of the year 83.47 68.94
Current service costs 7.76 5.96
Past Service cost - -
Interest costs 6.42 5.67
Actuarial (gain) / loss 2.42 8.49
Benefits paid (6.48) (5.59)
Obligations at the end of the year 93.59 83.47
Change in fair value of plan assets
Particulars As at March 31, 2013
As at March 31, 2012
Fair value of plan assets at beginning of the year 58.33 55.46
Expected return on plan assets 5.48 4.51
Actuarial gain / (loss) 0.36 (0.91)
Contributions 26.77 4.86
Benefits paid (6.48) (5.59)
Fair value of plans assets at end of the year 84.46 58.33
Actual return on plan assets 5.84 3.59
Reconciliation of present value of defined benefit obligation and the fair value of plan assets
Particulars As at March 31, 2013
As at March 31, 2012
Present value of defined benefit obligation at the end of the year 93.58 83.47
Fair value of plan assets at the end of the year 84.46 58.33
Funded status amount of liability recognized in balance sheet 9.12 25.14
Classified as long term provision - -
Classified as short term provision 9.12 25.14
Note: The provision for gratuity payable under note 12 includes provision relating to certain employees amounting to Rs. 4.01 (Previous
year: Rs. Nil) who have completed 30 years of service with the Company. The provision is being made based on maximum ceiling under
the Gratuity Act, 1972.
Notes to financial statements for the year ended March 31, 2013 (Contd.)(All amounts are in million Indian Rupees except share data and if otherwise stated)

| S
HA
SU
N P
HA
RM
AC
EU
TIC
ALS
LIM
ITE
D |
AN
NU
AL
RE
PO
RT
201
2–13
62
Gratuity cost for the year
Particulars Year ended March 31, 2013
Year ended March 31, 2012
Current Service cost 7.75 5.96
Past Service cost - -
Interest cost 6.42 5.67
Expected return on plan assets (5.48) (4.51)
Actuarial (gain) / loss 2.06 9.41
Net gratuity cost 10.75 16.53
The gratuity cost has been recognized in ‘Employee benefits expenses’ under note 27 to the Statement of profit and loss.
Experience adjustment for the current and previous four years
Particulars As at March 31, 2013
As at March 31, 2012
As at March 31, 2011
As at March 31, 2010
As at March 31, 2009
Defined benefit obligation 93.58 83.47 68.94 64.56 58.73
Plan asset 84.46 58.34 55.46 46.21 29.16
Surplus/(defecit) (9.12) (25.14) (13.48) (18.35) (29.57)
Experience adjustments in plan liabilities - (loss) / gain
2.42 8.49 (2.03) 1.54 1.15
Experience adjustments in plan assets - (loss) / gain
(0.36) 0.91 - 0.62 (0.41)
Assumptions
Particulars As at March 31, 2013
As at March 31, 2012
Discount rate 8.00% 8.57%
Estimated rate of return on plan assets 8.00% 8.00%
Attrition rate 9.00% 11.00%
Rate of growth in salary levels 9.00% 9.00%
The estimates of rate of escalation in salary considered in actuarial valuation take into account inflation, seniority, promotion and other relevant factors including supply and demand in the employment market.
Investment details of plan assets
Particulars As at March 31, 2013
As at March 31, 2012
Insurer managed funds 100.00% 100.00%
Fixed deposits 0.00% 0.00%
Total 100.00% 100.00%
Notes to financial statements for the year ended March 31, 2013 (Contd.)(All amounts are in million Indian Rupees except share data and if otherwise stated)

| S
HA
SU
N P
HA
RM
AC
EU
TIC
ALS
LIM
ITE
D |
AN
NU
AL
RE
PO
RT
201
2–13
63
41 Segment reporting
In accordance with AS-17 “Segment Reporting”, segment information has been given in the consolidated financial statements of the Company and therefore no separate disclosure on segment information is given in these standalone financial statements.
42 Micro, small and medium enterprises
Under the Micro, Small and Medium Enterprises Development Act, 2006, (MSMED) which came into force from October 2, 2006, certain disclosures are required to be made relating to Micro, Small and Medium enterprises. The following is the list of Micro, Small and Medium Enterprises to whom the Company owes any sum together with interest outstanding for more than thirty days as at March 31, 2013. This list of undertakings covered under MSMED was determined by the Company on the basis of information available with the Company and have been relied upon by the auditors.
Particulars As at March 31, 2013
As at March 31, 2012
Principal amount due 18.15 4.20
Interest due on the above 0.65 1.05
Amount of interest due and payable where principal has already been paid but the interest has not been paid
0.40 1.05
Amount of interest accrued and remaining unpaid at the end of the period 1.05 2.10
Amount of further interest remaining due and payable even in the succeeding years, until such date when the interest dues as above are actually paid to the small enterprise for the purpose of disallowance as a deductible expenditure under Section 23 of the Act
1.05 2.10
Name of the enterprise Name of the enterprise Name of the enterpriseA Muthukrisnan Axiva Sichem Biotech Vensil Glass Works LimitedB.K. Equipments P Ltd Digital Instruments & Control Systems Newtech Industrial ValvesEnopeck Seals (India) Endee Engineers Pvt Ltd Labindia Analytical InstrumentsVaibhav Industries Kaypee Cargo Movers Pvt Ltd Electrolab (India) Pvt LtdBharat Rubber Works Pvt Ltd Novex Poly Films Pvt Ltd Sakthi Instruments & ServicesSidharth Chemicals Polycoat Flowchem Pvt Ltd Gandhi Automations Private LimitedAllchem Laboratories Chennai Metex Lab Private Limited Surya Pipes & EquipmentsTalli Godavari Fine Chemicals Pvt Ltd Sri Ragavendra Weighing Systems BenlabPrecia Molen India Ltd Adheswara Alum Pvt Ltd Chemcrux Enterprises LtdBhavika Chemicals Corpoartion Sri Chementor Private Limited Kalanjiam IndustriesJPN Pharma Pvt Limited Rolon Seals Enanti Labs Pvt LtdR.R.Industries Vignesh Engineering Works Innofab (India) Pvt LtdPremsen Engineering Corporation Best Labels Enterprises Pvt Ltd Polmon Vesnfer Private LimitedGenius Engineering Spak Orgochem (India) Pvt Ltd Avra Synthesis Private LimitedAscent Finechem Private Limited
43 Transfer pricing
The Company has international transactions with related parties. For the financial year ended March 31, 2012, the Company has obtained the Accountant’s Report from a Chartered Accountant as required by the relevant provisions of the Income-tax Act, 1961 and has filed the same with the tax authorities. For the financial year ended March 31, 2013, management confirms that it maintains documents as prescribed by the Income-tax Act, 1961 to prove that these international transactions are at arm’s length and the aforesaid legislation will not have any impact on the financial statements, particularly on the amount of tax expense and that of provision for taxation.
Notes to financial statements for the year ended March 31, 2013 (Contd.)(All amounts are in million Indian Rupees except share data and if otherwise stated)

| S
HA
SU
N P
HA
RM
AC
EU
TIC
ALS
LIM
ITE
D |
AN
NU
AL
RE
PO
RT
201
2–13
64
44 Un-hedged foreign currency
The yearend foreign currency exposures that have not been hedged by a derivative instrument or otherwise are as follows:
Particulars Amount receivable in foreign currency
Amount payable in foreign currency
March 31, 2013 March 31, 2012 March 31, 2013 March 31, 2012EUR equivalent 2.38 1.61 0.39 0.61 GBP equivalent 2.05 4.11 0.54 0.28 CHF equivalent - 0.01 0.04 0.05 USD equivalent 25.34 22.74 68.68 37.94 JPY equivalent 34.60 5.46 4.70 48.31 CAD equivalent - - 0.01 - INR equivalent 1,719.69 1,597.93 2,717.56 2,052.29
45 Outstanding forward contracts
March 31, 2013 March 31, 2012
Currency No. of contracts Buy / sell Currency No. of contracts Buy / sell
USD 14 Sell USD 20 Sell
46 During the previous year, the Company has made preferential allotment of 1,500,000 convertible warrants of Rs. 75/- each aggregating to Rs. 112.50 to its Promoter, Promoter group and an independent director after obtaining the approval of the shareholders and stock exchanges. During the current year, consequent to the option exercised by the allotees towards conversion of the warrants, the Company had issued 1,500,000 equity shares to the allotees.
47 Borrowing costs in connection with the borrowing and funds utilized towards qualifying assets amounting to Rs. 22.86 (Previous year: Rs. Nil) have been capitalized and included in capital work-in-progress.
48 Comparative figures
Prior year figures have been reclassified/regrouped wherever necessary to conform to the current year’s classification.
for B S R & Co. For and on behalf of Board of Directors ofChartered Accountants Shasun Pharmaceuticals LimitedFirm registration No. 101248W
S Sethuraman S Abhaya Kumar Dr. S Devendra S Vimal KumarPartner Managing Director Wholetime Director Wholetime DirectorMembership No: 203491
Place: Chennai S Murali Krishna S HariharanDate: May 29, 2013 Company Secretary Chief Financial Officer
Notes to financial statements for the year ended March 31, 2013 (Contd.)(All amounts are in million Indian Rupees except share data and if otherwise stated)

| S
HA
SU
N P
HA
RM
AC
EU
TIC
ALS
LIM
ITE
D |
AN
NU
AL
RE
PO
RT
201
2–13
65
Consolidated Auditors’ Report
Independent Auditors’ Report to the Board of Directors of Shasun Pharmaceuticals Limited on the
Consolidated Financial Statements of Shasun Pharmaceuticals Limited and its subsidiaries and a
joint venture
Report on the financial statementsWe have audited the accompanying consolidated balance sheet of Shasun Pharmaceuticals Limited (“the Company”) and its subsidiaries and a joint venture (collectively referred to as “the Group”) as at March 31, 2013, and also the consolidated statement of profit and loss and consolidated cash flow statement for the year then ended, and a summary of significant accounting policies and other explanatory information.
Management’s responsibility for the consolidated financial statementsManagement is responsible for the preparation of these consolidated financial statements that give a true and fair view of the consolidated financial position, consolidated financial performance and consolidated cash flows of the Group in accordance with the requirements of Accounting Standard 21, Consolidated Financial Statements and Accounting Standard 27, Financial Reporting of interest in Joint Ventures prescribed by the Companies (Accounting Standards) Rules, 2006. This responsibility includes the design, implementation and maintenance of internal control relevant to the preparation and presentation of the consolidated financial statements that give a true and fair view and are free from material misstatement, whether due to fraud or error.
Auditors’ responsibilityOur responsibility is to express an opinion on these consolidated financial statements based on our audit. We conducted our audit in accordance with the Standards on Auditing issued by the Institute of Chartered Accountants of India. Those Standards require that we comply with ethical requirements and plan and perform the audit to obtain reasonable assurance about whether the consolidated financial statements are free from material misstatement.An audit involves performing procedures to obtain audit evidence, about the amounts and disclosures in the financial statements. The procedures selected depend on the auditors’ judgment, including the assessment of the risks of material misstatement of the consolidated financial statements, whether due to fraud or error. In making those risk assessments, the auditor considers the internal control relevant to the Company’s preparation and fair presentation of the consolidated financial statements in order to design audit procedures that are appropriate in the circumstances. An audit also includes evaluating the appropriateness of accounting policies used and the reasonableness of the accounting estimates made by the management, as well as evaluating the overall presentation of the financial statements.
We believe that the audit evidence we have obtained is sufficient and appropriate to provide a basis for our audit opinion.
OpinionIn our opinion, and to the best of our information and according to the explanations given to us, the consolidated financial statements give a true and fair view in conformity with the accounting principles generally accepted in India:
(a) in the case of the consolidated balance sheet, of the state of affairs of the Group as at March 31, 2013;(b) in the case of the consolidated statement of profit and loss, of the profit of the Group for the year ended on that date; and(c) in the case of the consolidated cash flow statement, of the cash flows of the Group for the year ended on that date.
Other mattersWe did not audit the financial statements and other financial information of certain subsidiaries and joint venture, which have been audited by other auditors whose reports have been furnished to us and our opinion is based on the report of other auditors. The attached consolidated financial statements include assets of Rs. 1,936.33 million as at March 31, 2013, revenues of Rs. 3,020.60 million and net cash outflows amounting to Rs. 59.11 million in respect of the aforesaid subsidiaries and joint venture for the year then ended. Our opinion is not qualified in respect of this matter.
for B S R & Co. Chartered Accountants Firm Registration No. 101248W
S SethuramanPartnerMembership No: 203491
Place: Chennai Date: May 29, 2013

| S
HA
SU
N P
HA
RM
AC
EU
TIC
ALS
LIM
ITE
D |
AN
NU
AL
RE
PO
RT
201
2–13
66
Consolidated Balance Sheet as at March 31, 2013(All amounts are in million Indian Rupees except share data and if otherwise stated)
Notes As at March 31, 2013
As at March 31, 2012
EQUITY AND LIABILITIESSHAREHOLDERS’ FUNDS
Share capital 3 113.25 110.25 Reserves and surplus 4 2,607.59 2,084.68 Money received against share warrants - 28.13 Foreign currency monetary item translation difference account (20.56) (9.95)
2,700.28 2,213.11 NON-CURRENT LIABILITIES
Long-term borrowings 5 1,182.81 778.73 Deferred tax liability (net) 6 - 15.28 Other non-current liabilities 7 10.40 0.80 Long-term provisions 8 60.68 52.15
1,253.89 846.96 CURRENT LIABILITIES
Short-term borrowings 9 3,177.24 2,286.01 Trade payables 10 2,093.62 2,116.78 Other current liabilities 11 1,091.45 911.84 Short-term provisions 12 128.43 230.01
6,490.74 5,544.64 10,444.91 8,604.71
ASSETSNON-CURRENT ASSETS
Fixed assetsTangible assets 13 3,636.70 2,768.21 Intangible assets 14 10.45 16.30 Capital work-in-progress 773.77 523.91 Intangible assets under development 35.21 -
Non-current investments 15 9.52 2.52 Deferred tax asset (net) 6 142.71 129.41 Long-term loans and advances 16 513.68 365.86 Other non-current assets 17 11.32 6.70
5,133.36 3,812.91 CURRENT ASSETS
Inventories 18 1,691.70 1,378.74 Trade receivables 19 2,637.47 2,317.59 Cash and bank balances 20 65.68 150.01 Short-term loans and advances 21 716.58 677.62 Other current assets 22 200.12 267.84
5,311.55 4,791.80 10,444.91 8,604.71
Significant accounting policies 2
The accompanying notes form an integral part of the financial statements.
As per our report of even date attached.
for B S R & Co. For and on behalf of Board of DirectorsChartered Accountants Shasun Pharmaceuticals LimitedFirm registration No. 101248W
S Sethuraman S Abhaya Kumar Dr. S Devendra S Vimal KumarPartner Managing Director Wholetime Director Wholetime DirectorMembership No: 203491
Place: Chennai S Murali Krishna S Hariharan Date: May 29, 2013 Company Secretary Chief Financial Officer

| S
HA
SU
N P
HA
RM
AC
EU
TIC
ALS
LIM
ITE
D |
AN
NU
AL
RE
PO
RT
201
2–13
67
Consolidated Statement of Profit and Loss for the year ended March 31, 2013(All amounts are in million Indian Rupees except share data and if otherwise stated)
Notes Year ended March 31, 2013
Year ended March 31, 2012
INCOME
Revenue from operations 23 10,847.71 10,664.03
Other income 24 182.81 409.20
11,030.52 11,073.23
EXPENDITURE
Cost of raw and packing materials consumed 25 5,646.92 5,585.66
Purchases of traded goods 17.74 52.26
Changes in inventories 26 (205.50) (24.01)
Employee benefits expenses 27 1,866.41 1,594.05
Finance costs 28 321.88 436.99
Depreciation and amortization 12 and 13 526.47 405.70
Other expenses 29 2,352.64 2,226.25
10,526.56 10,276.90
PROFIT BEFORE TAXATION 503.96 796.33
PROVISION FOR TAXATION
- Current tax 14.60 61.72
- Minimum alternate tax credit entitlement (14.91) (105.15)
- Deferred tax (benefit) (26.09) (165.91)
NET PROFIT FOR THE YEAR 530.36 1,005.67
Earnings per share 33
Basic 9.61 20.69
Diluted 9.61 20.39
Significant accounting policies 2
The accompanying notes form an integral part of the financial statements.
As per our report of even date attached.
for B S R & Co. For and on behalf of Board of DirectorsChartered Accountants Shasun Pharmaceuticals LimitedFirm registration No. 101248W
S Sethuraman S Abhaya Kumar Dr. S Devendra S Vimal KumarPartner Managing Director Wholetime Director Wholetime DirectorMembership No: 203491 Place: Chennai S Murali Krishna S HariharanDate: May 29, 2013 Company Secretary Chief Financial Officer

| S
HA
SU
N P
HA
RM
AC
EU
TIC
ALS
LIM
ITE
D |
AN
NU
AL
RE
PO
RT
201
2–13
68
Consolidated Cash Flow Statement for the year ended March 31, 2013(All amounts are in million Indian Rupees except share data and if otherwise stated)
Particulars Year ended March 31, 2013
Year ended March 31, 2012
CASH FLOW FROM OPERATING ACTIVITIESProfit before taxation 503.96 796.33 Adjustments for:Depreciation and amortization 526.47 405.70 Interest and finance charges 277.44 300.35 Bad debts written off 0.97 6.65 Provision for doubtful receivables - 1.88 Provision for doubtful advances 9.33 12.87 Provisions / liabilities no longer required written back (10.79) (60.94)Interest income (5.77) (7.20)Profit on sale of fixed assets (18.92) (279.47)Unrealised exchange differences, net (269.16) (166.22)Operating Profit before working capital changes 1,013.53 1,009.95 Adjustments for:(Increase) / decrease in inventories (312.96) (96.81)(Increase) / decrease in trade receivables (315.99) (738.13)(Increase) / decrease in loans and advances (19.46) (288.86)Increase / (decrease) in current liabilities and provisions (70.98) 731.58
294.14 617.73 Taxes paid (45.05) (109.44)Net cash from operating activities (A) 249.09 508.29 CASH FLOW FROM INVESTING ACTIVITIESPurchase of fixed assets and changes in capital work-in-progress (1,714.89) (1,108.57)Sale of fixed assets 38.36 302.87 Investments made (7.00) -Maturity of bank deposits having original maturity more than three months 1.30 26.26 Interest income 5.77 6.55 Net cash used in investing activities (B) (1,676.46) (772.89)CASH FLOW FROM FINANCING ACTIVITIESProceeds from issuance of share capital including securities premium 112.50 489.73 Proceeds from issuance of share warrants - 28.13 Availment of loans / borrowings 1,997.53 363.48 Repayment of loans / borrowings (476.30) (132.85)Dividend paid (25.53) (107.84)Dividend distribution tax paid (3.58) (18.11)Interest and finance charges (262.88) (306.45)Net cash from / (used in) financing activities (C) 1,341.74 316.09 Net increase / (decrease) in cash and cash equivalents (A+B+C) (85.63) 51.49 Cash and cash equivalents at the beginning of the year 139.92 88.43 Cash and cash equivalents at the end of the year 54.29 139.92 Particulars As at
March 31, 2013 As at
March 31, 2012Notes to cash flow statement:1. Components of cash and cash equivalents:
Cash on hand 2.97 0.85 Cheques on hand 2.03 - Balances with banks in current accounts 49.29 139.07
54.29 139.92 2. Current account balances with banks includes Rs. 4.08 (Previous year: Rs. 8.27) held at a foreign branch which are not freely remissible to the Company because of
exchange restrictions.Significant accounting policies 2
The accompanying notes form an integral part of the financial statements.
As per our report of even date attached.
for B S R & Co. For and on behalf of Board of DirectorsChartered Accountants Shasun Pharmaceuticals LimitedFirm registration No. 101248W
S Sethuraman S Abhaya Kumar Dr. S Devendra S Vimal KumarPartner Managing Director Wholetime Director Wholetime DirectorMembership No: 203491
Place: Chennai S Murali Krishna S HariharanDate: May 29, 2013 Company Secretary Chief Financial Officer

| S
HA
SU
N P
HA
RM
AC
EU
TIC
ALS
LIM
ITE
D |
AN
NU
AL
RE
PO
RT
201
2–13
69
1. Description of Group
The Shasun group is an India-based pharmaceutical group headquartered in Chennai, India. The group’s principal areas of operation are manufacturing of Active Pharmaceutical Ingredients (APIs), their intermediates and finished dosage. The group is also into product development and provides contract research and manufacturing services.
Entity Country of incorporation
Nature of interest % share holding
Functional currency
Shasun Pharmaceuticals Limited India Holding Company Indian Rupees (INR)
Shasun USA Inc., USA USA Subsidiary of Shasun Pharmaceuticals Limited 100% US Dollars (USD)
SVADS Holdings SA, Switzerland (‘SVADS’)
Switzerland Subsidiary of Shasun Pharmaceuticals Limited 100% Swiss Francs (CHF)
Shasun Life Sciences Private Limited India Subsidiary of Shasun Pharmaceuticals Limited 100% Indian Rupees (INR)
Shasun Pharma Solutions Limited, UK (‘SPSL’)
United Kingdom Subsidiary of SVADS 100% Pounds (GBP)
Shasun Pharma Solutions Inc., USA USA Subsidiary of SVADS 100% US Dollar (USD)
Shasun NBI LLC, USA USA Joint venture entity of Shasun Pharmaceuti-cals Limited.
50% US Dollar (USD)
Shasun NBI Nanotech India Pvt. Ltd. India Subsidiary of Shasun NBI LLC, USA. 99% Indian Rupees (INR)
Shasun Life Sciences Private Limited (‘SLSPL’) is an immaterial subsidiary of the Company and does not have any operation during the year. Consequently, it has not been considered for the purpose of consolidation and the investment in SLSPL has been considered in the consolidated financial statements in accordance with AS 13 (Accounting for Investments).
2. Significant accounting policies
2.1 Basis of preparation of consolidated financial statements
The financial statements have been prepared and presented in accordance with Indian Generally Accepted Accounting Principles (GAAP) under the historical cost convention using the accrual basis. GAAP comprises accounting standards notified by the Central Government of India under Section 211(3C) of the Companies Act, other pronouncements of Institute of Chartered Accountants of India, the provisions of Companies Act, 1956 and guidelines issued by Securities and Exchange Board of India.
2.2 Principles of consolidation
The consolidated financial statements include the financial statements of Shasun Pharmaceuticals Limited (“SPL or the Company”), the parent company and all of its subsidiaries (collectively referred to as “the group” or “Shasun Group”), in which the Company has more than one half of the voting power of an enterprise or where the Company controls the composition of the Board of Directors. In accordance with AS 27, - “Financial Reporting of Interests in Joint Ventures”, issued under the Companies (Accounting Standards) Rules, 2006, the group has accounted for its proportionate share of interest in a joint venture by the proportionate consolidation method.
The consolidated financial statements have been prepared on the following basis:
adding together the book values of like items of assets, liabilities, income and expenses after eliminating intra-group balances / transactions and resulting unrealised profits in full. Unrealised losses resulting from intra-group transactions have also been eliminated except to the extent that recoverable value of related assets is lower than their cost to the group. The amounts shown in respect of reserves comprise the amount of the relevant reserves as per the balance sheet of the parent company and its share in the post-acquisition increase in the relevant reserves of the subsidiaries.
the company’s proportionate share in the joint venture is combined on a line-by-line basis by adding the book values of like items of assets, liabilities, income and expenses after eliminating intra-group transactions and resulting unrealized profits, to the extent it pertains to the company.
equity at the respective dates on which investment in such entities were made is recognised in the financial statements as goodwill / capital reserve. The parent company’s portion of equity in such entities is determined on the basis of the
Notes to consolidated financial statements for the year ended March 31, 2013(All amounts are in million Indian Rupees except share data and if otherwise stated)

| S
HA
SU
N P
HA
RM
AC
EU
TIC
ALS
LIM
ITE
D |
AN
NU
AL
RE
PO
RT
201
2–13
70
book values of assets and liabilities as per the financial statements of such entities as on the date of investment and if not available, the financial statements for the immediately preceding period adjusted for the effects of significant transactions, up to the date of investment.
parent company for its separate financial statements.
events in similar circumstances.
2.3 Use of estimates
The preparation of the financial statements in conformity with generally accepted accounting principles in India requires management to make estimates and assumptions that affect the reported amount of assets and liabilities and disclosure of contingent liabilities on the date of the financial statements. Management believes that the estimates made in the preparation of financial statements are prudent and reasonable. Actual results could differ from those estimates. Any revision to accounting estimates is recognized prospectively in current and future periods.
2.4 Tangible assets, intangible assets, depreciation and amortization
Tangible assets are stated at cost of acquisition or construction, less accumulated depreciation. Cost includes inward freight, duties, taxes and incidental expenses related to acquisition and installation of the asset. Borrowing costs directly attributable to acquisition or construction of tangible assets, which necessarily take a substantial period of time to be ready for their intended use, are capitalized.
Depreciation on tangible assets is provided using the straight-line method at the rates specified in schedule XIV to the Companies Act, 1956 or based on the useful lives of the assets as estimated by the management, whichever is higher. The management’s estimates of the useful lives for various categories of tangible assets are given below:
Asset category Estimated useful lives (in years)Factory buildings 30.00Non factory buildings 60.00Plant and machinery 10.00Electrical installations 10.00Office equipments 10.00Computers and accessories 2.50Furniture, fixtures and fittings 16.00Vehicles 5.00
Depreciation is charged on pro-rata basis for assets purchased / sold during the year. Individual assets costing less than Rs. 5,000/- are depreciated at 100%.
Intangible assets are recorded at the consideration paid for acquisition and are amortized over their estimated useful lives ranging from 3 to 5 years on a straight-line basis, commencing from the date the asset is available to the Company for its use.
The cost of assets not ready to be put to use before the yearend is disclosed under capital work in progress.
2.5 Impairment of assets
The Company assesses at each balance sheet date whether there is any indication that an asset may be impaired. If any such indication exists, the Company estimates the recoverable amount (higher of net realizable value and value in use) of the asset. If such recoverable amount of the asset or the recoverable amount of the cash generating unit to which the asset belongs is less than the carrying amount, the carrying amount is reduced to its recoverable amount. The reduction is treated as an impairment loss and is recognized in the Statement of profit and loss. If at the balance sheet date there is an indication that a previously assessed impairment loss no longer exists, the recoverable amount is reassessed and the asset is reflected at the recoverable amount subject to a maximum of depreciable historical cost.
2.6 Revenue recognition
Revenue from sale of goods is recognised when significant risks and rewards in respect of ownership of products are transferred to customers. Revenue from sale of goods is recognised in case of exports on the date of the bill of lading or
Notes to consolidated financial statements for the year ended March 31, 2013 (Contd.)(All amounts are in million Indian Rupees except share data and if otherwise stated)

| S
HA
SU
N P
HA
RM
AC
EU
TIC
ALS
LIM
ITE
D |
AN
NU
AL
RE
PO
RT
201
2–13
71
Notes to consolidated financial statements for the year ended March 31, 2013 (Contd.)(All amounts are in million Indian Rupees except share data and if otherwise stated)
airway bill which coincides with transfer of significant risks and rewards to customer and is net of trade discounts, sales returns and sales tax, where applicable. Revenue from domestic sales is primarily recognized on dispatch basis.
Service income is recognised as per the terms of contracts with customers when the related services are performed, or when the agreed milestones are achieved. Upfront non-refundable payments received under these arrangements are deferred and recognized as revenue over the expected period over which the related services are expected to be performed.
Dividend income is recognised when the unconditional right to receive the income is established.
Income from interest on deposits and loans is recognised on the time proportionate basis.
Export entitlements are recognised as income when the right to receive credit as per the terms of the scheme is established in respect of the exports made and where there is no significant uncertainty regarding the ultimate collection of the relevant export proceeds.
2.7 Leases
Leases under which the Company assumes substantially all the risks and rewards of ownership are classified as finance leases. Such assets are capitalized at fair value of the assets or present value of the minimum lease payments at the inception of the lease, whichever is lower.
Lease payments are apportioned between finance charges and reduction of the lease liability at the implicit rate of return. Finance charges are charged to the Statement of profit and loss.
Leases where the lessor effectively retains substantially all the risks and benefits of ownership of the leased items are classified as operating leases. Operating lease payments are recognised as an expense in the Statement of profit and loss on a straight line basis over the period of the lease or as and when the payments are made over the lease term.
2.8 Investments
Investments that are readily realizable and intended to be held for not more than a year are classified as current investments. All other investments are classified as long-term investments.
Current investments are carried at the lower of cost and fair value. Long-term investments are carried at cost and provisions are recorded to recognize any decline, other than temporary, in the carrying value of each investment.
2.9 Inventories
Raw and packing materials, stores and spare parts and lab chemicals are carried at cost. Cost includes purchase price (excluding those subsequently recoverable by the enterprise from the concerned revenue authorities), freight inwards and other expenditure incurred in bringing such inventories to their present location and condition. In determining the cost, weighted average cost method is used.
The carrying cost of raw and packing materials, stores and spare parts and lab chemicals are appropriately written down when there is a decline in replacement cost of such materials and finished products in which they will be incorporated are expected to be sold below cost.
Work in progress, manufactured finished goods and traded goods are valued at the lower of cost and net realizable value. The comparison of cost and net realizable value is made on an item by item basis. Cost of work in progress and manufactured finished goods is determined on a weighted average basis and comprises direct material, cost of conversion and other costs incurred in bringing these inventories to their present location and condition. Cost of traded goods is determined on weighted average basis.
The excise duty in respect of closing inventory of finished goods is included as part of inventory.
10 Employee benefits
The Company’s contribution in respect to Provident fund, Employees’ state insurance scheme, Pension fund and defined contribution plans are charged to the Statement of profit and loss when incurred.
Gratuity costs with respect to defined benefit schemes are accrued based on actuarial valuation, carried out by an independent actuary as at the balance sheet date. The contributions are made to approved ‘Shasun Chemicals Employees Gratuity Trust Fund’. Liabilities are determined by actuarial valuation using projected unit credit method carried out by an independent actuary as at the balance sheet date.
2.

| S
HA
SU
N P
HA
RM
AC
EU
TIC
ALS
LIM
ITE
D |
AN
NU
AL
RE
PO
RT
201
2–13
72
Provision for compensated absences is made on the basis of actuarial valuation as at the balance sheet date by an independent actuary using projected unit credit method.
Under the superannuation scheme, a defined contribution plan, the Company pays fixed contributions to approved superannuation trust and has no obligation to pay further amounts. Such fixed contributions are charged to the Statement of profit and loss on accrual basis.
All actuarial gains and losses arising during the year are recognized in the Statement of profit and loss of the year.
2.11 Foreign currency transactions and derivative instruments
Foreign currency transactions are recorded using the exchange rates prevailing on the dates of the respective transactions. Exchange differences arising on foreign currency transactions settled during the year are recognised in the Statement of profit and loss.
Monetary assets and liabilities denominated in foreign currencies as at the balance sheet date, not covered by forward exchange contracts, are translated at yearend rates. The resultant exchange differences are recognised in the Statement of profit and loss. Non-monetary assets are recorded at the rates prevailing on the date of the transaction.
Income and expenditure items at representative offices are translated at the respective monthly average rates. Monetary assets at representative offices at the balance sheet date are translated using the year-end rates. Non-monetary assets are recorded at the rates prevailing on the date of the transaction.
Forward contracts are entered into to hedge the foreign currency risk of the underlying outstanding at the balance sheet date. The premium or discount on all such contracts is amortized as income or expense over the life of the contract. Any profit or loss arising on the cancellation or renewal of forward contracts is recognised as income or expense for the period.
In relation to the forward contracts entered into to hedge the foreign currency risk of the underlying outstanding at the balance sheet date, the exchange difference is calculated and recorded in accordance with AS-11 (revised). The exchange difference on such a forward exchange contract is calculated as the difference of the foreign currency amount of the contract translated at the exchange rate at the reporting date, or the settlement date where the transaction is settled during the reporting period and the corresponding foreign currency amount translated at the later of the date of inception of the forward exchange contract and the last reporting date. Such exchange differences are recognized in the Statement of profit and loss in the reporting period in which the exchange rates change.
Pursuant to the notification of the Ministry of Corporate Affairs issued on December 29, 2011, the Company has decided to exercise the irrevocable option granted under the said notification. Accordingly, the exchange fluctuations on all long term monetary items so far as they relate to the acquisition of a depreciable capital asset, are added to or deducted from the cost of the asset and are depreciated over the balance life of such assets. In cases other than those falling under above are accumulated in ‘Foreign Currency Monetary Item Translation Difference Account’ (FCMITDA) and amortized over the balance period of long-term monetary asset/liability but not beyond March 31, 2020.
In accordance with the announcement of “Accounting for Derivatives” made by the Institute of Chartered Accountants of India (‘ICAI’) on 29 March 2008, derivatives are marked to market and the changes in the value of such derivatives, to the extent they reflect a loss, are recognized in Statement of profit or loss.
In accordance with the accounting principles as prescribed under AS 11 (revised) and based on the analysis of relevant criteria, the group has designated the operations of the following overseas consolidated entities viz. Shasun USA Inc., USA and SVADS Holdings SA, Switzerland as ‘Integral foreign operations’.
In translating the financial statements of an integral foreign operation for incorporation in consolidated financial statements, revenue items are translated at average rates; monetary items are translated using the closing rate; non-monetary items are translated using the exchange rate at the date of transaction i.e., the date when they were acquired. The net exchange difference resulting from the translation of items in the financial statements of foreign integral operations is recognised as income or as expense for the year; contingent liabilities are translated at the closing rate.
In translating the financial statements of a non-integral foreign operation for incorporation in consolidated financial statements, the assets and liabilities, both monetary and non-monetary, of the non-integral foreign operation are translated at the closing rate; income and expense items of the non-integral foreign operation are translated using average exchange rates prevailing during the reporting period. All resulting exchange differences are accumulated in a foreign currency translation reserve until the disposal of the net investment.
Notes to consolidated financial statements for the year ended March 31, 2013 (Contd.)(All amounts are in million Indian Rupees except share data and if otherwise stated)
| S
HA
SU
N P
HA
RM
AC
EU
TIC
ALS
LIM
ITE
D |
AN
NU
AL
RE
PO
RT
201
2–13
73
Notes to consolidated financial statements for the year ended March 31, 2013 (Contd.)(All amounts are in million Indian Rupees except share data and if otherwise stated)
2.12 Research and development
Research costs are expensed as and when incurred. Development expenditure is capitalized based on technical feasibility for each project and where future recoverability can reasonably be assured through probable future economic benefits.
The carrying value of development costs is reviewed for impairment annually when the asset is not yet in use, and otherwise when events or changes in circumstances indicate that the carrying value may not be recoverable.
Materials identified for use in research and development process are carried as inventories and charged to Statement of profit and loss on issuance of such materials for research activities.
2.13 Taxation
Income tax expense comprises current tax (i.e. amount of tax for the year determined in accordance with the income tax law) and deferred tax charge or credit (reflecting the tax effects of the timing differences between accounting income and taxable income for the year). The deferred tax charge or credit and the corresponding deferred tax liabilities or assets are recognized using the tax rates that have been enacted or substantially enacted by the balance sheet date. Deferred tax assets are recognized only to the extent there is reasonable certainty that the assets can be realized in future; however, where there is unabsorbed depreciation or carry forward of losses under taxation laws, deferred tax assets are recognized only if there is virtual certainty of realization of such assets. Deferred tax assets are reviewed at each balance sheet date and written down or written up to reflect the amount that is reasonably and virtually certain respectively to be realized.
Minimum Alternate Tax (“MAT”) paid in accordance with tax laws, which gives rise to future economic benefits in the form of adjustment of future income tax liability, is considered as an asset if there is convincing evidence that the company would pay normal income tax after tax holiday period and accordingly, MAT is recognized as an asset in the balance sheet when it is probable that the future economic benefit associated with it will flow to the company and the asset can be measured reliably. MAT credit entitlement is reviewed at each balance sheet date and written down to the extent there is no convincing evidence to the effect that the Company will pay normal income tax during the specified period.
2.14 Earnings per share
Basic earnings per share is computed by dividing net profit or loss for the period attributable to equity shareholders by the weighted average number of shares outstanding during the year. Diluted earnings per share amounts are computed after adjusting the effects of all dilutive potential equity shares. The number of shares used in computing diluted earnings per share comprises the weighted average number of shares considered for deriving basic earnings per share, and also the weighted average number of equity shares, which could have been issued on the conversion of all dilutive potential shares. In computing dilutive earnings per share, only potential equity shares that are dilutive and that decrease profit per share are included.
2.15 Employee stock option based compensation
The Company calculates the compensation cost based on the intrinsic value method wherein the excess of value of underlying equity shares as of the date of the grant of options over the exercise price of the options given to employees under the employee stock option schemes of the Company is amortised over the vesting period on a straight line basis. The Company follows the SEBI guidelines for accounting of employee stock options.
2.16 Cash flows
Cash flows are reported using the indirect method, whereby profit before tax is adjusted for the effects of transactions of a non–cash nature and any deferrals or accruals of past or future cash receipts or payments. The cash flows operating, financing and investing activities of the Company are segregated.
2.17 Provisions, Contingent liabilities and Contingent assets
The Company creates a provision when there is present obligation as a result of past events that probably requires an outflow of resources and a reliable estimate can be made of the amount of the obligation. A disclosure for a contingent liability is made when there is a possible obligation or a present obligation that may, but probably will not, require an outflow of resources. Where there is a possible obligation or a present obligation in respect of which the likelihood of outflow of resources is remote, no provision or disclosure is made. Contingent assets are neither recognised nor disclosed in the financial statements.

| S
HA
SU
N P
HA
RM
AC
EU
TIC
ALS
LIM
ITE
D |
AN
NU
AL
RE
PO
RT
201
2–13
74
Notes to consolidated financial statements for the year ended March 31, 2013 (Contd.)(All amounts are in million Indian Rupees except share data and if otherwise stated)
As at March 31, 2013
As at March 31, 2012
3 SHARE CAPITALAuthorised75,000,000 (Previous year: 75,000,000) equity shares of Rs. 2/- each 150.00 150.00 1,000,000 (Previous year: 1,000,000) redeemable preference shares of Rs. 100/- each 100.00 100.00
250.00 250.00 Issued, subscribed and paid-up56,623,852 (Previous year: 55,123,852) equity shares of Rs. 2/- each fully paid up 113.25 110.25
113.25 110.25
a. Reconciliation of equity shares outstanding at the beginning and at the end of the reporting period
As at March 31, 2013 As at March 31, 2012
No. of shares Amount No. of shares AmountAt the beginning of the year 55,123,852 110.25 48,544,905 97.09 Issued during the year (Refer note 38) 1,500,000 3.00 6,578,947 13.16 Outstanding at the end of the year 56,623,852 113.25 55,123,852 110.25
b. Terms / rights attached to equity shares
The Company has a single class of equity shares. Accordingly, all equity shares rank equally with regard to dividends and share in the Company’s residual assets. The equity shares are entitled to receive dividend as declared from time to time. The voting rights of an equity shareholder on a poll (not on show of hands) are in proportion to its share of the paid-up equity capital of the Company.
On winding up of the Company, the holders of equity shares will be entitled to receive the residual assets of the Company, remaining after distribution of all preferential amounts in proportion to the number of equity shares held.
During the year ended March 31, 2013, the amount of dividend recognized as distribution to equity shareholders was Rs. Nil per share (Previous year: Rs 2.00/- per share) on interim basis and Rs. 1.50/- per share (Previous year Rs. 0.40/- per share) as proposed final dividend.
c. Details of shareholders holding more than 5% of equity shares of Rs. 2/- each fully paid in the company
As at March 31, 2013 As at March 31, 2012
No. of shares % held No. of shares % heldCaduceus Asia Mauritius Limited 6,578,947 11.62% 6,578,947 11.93%Shasun Leasing and Finance Private Ltd 4,627,494 8.17% 4,327,494 7.85%Devendra Estates Private Limited 2,956,652 5.22% 2,831,406 5.14%
As per records of the Company, including its register of shareholders/members and other declarations received from shareholders regarding beneficial interest, the above shareholding represents both legal and beneficial ownership of shares.
During the previous year, the Company has made a preferential allotment of 6,578,947 equity shares of Rs. 2/- each at a premium of Rs.74/- per share aggregating to Rs. 499.99 to Caduceus Asia Mauritius Limited, Mauritius, a SEBI registered foreign venture capital investor after obtaining the approval of the shareholders and stock exchanges. In response to the Company’s intimation through the authorized dealer, the Reserve Bank of India has advised the Company to obtain the approval of the Foreign Investment Promotion Board (‘FIPB’) in respect of such investment. The Company has obtained the required approval from FIPB vide F.No.11(1)/2012-FIPB on July 24, 2012.

| S
HA
SU
N P
HA
RM
AC
EU
TIC
ALS
LIM
ITE
D |
AN
NU
AL
RE
PO
RT
201
2–13
75
As at March 31, 2013
As at March 31, 2012
4 RESERVES AND SURPLUS
Capital reserve
As at the beginning and end of the year 3.00 3.00
Capital redemption reserve
As at the beginning and end of the year 50.00 50.00
Securities premium account
Balance at the beginning of the year 894.28 417.71
Add: additions made during the years (Refer note 38) 109.50 486.84
Less: share issue expenses incurred during the year - 10.27
Balance at the end of the year 1,003.78 894.28
General reserve
Balance at the beginning of the year 409.94 356.88
Add: amount transferred from surplus in the Statement of profit and loss 26.28 53.06
Balance at the end of the year 436.22 409.94
Foreign currency translation reserve
Balance at the beginning of the year (16.83) (15.67)
Less: deductions during the year 17.58 1.16
(34.41) (16.83)
Surplus in the Statement of profit and loss
Balance at the beginning of the year 744.29 (69.85)
Add: net profit for the year 530.36 1,005.67
Less: appropriations
Proposed dividend 84.94 22.05
Interim dividend - 97.09
Dividend distribution tax 14.43 19.33
Transfer to general reserve 26.28 53.06
Balance at the end of the year 1,149.00 744.29
2,607.59 2,084.68
5 LONG-TERM BORROWINGS
Secured:
External commercial borrowings from banks 1,000.10 566.84
Foreign currency term loans from banks 874.19 677.58
Unsecured:
Loan from others 10.74 -
1,885.03 1,244.42
Less: disclosed under the head Other current liabilities (Refer note 11) (702.22) (465.69)
1,182.81 778.73
Notes to consolidated financial statements for the year ended March 31, 2013 (Contd.)(All amounts are in million Indian Rupees except share data and if otherwise stated)

| S
HA
SU
N P
HA
RM
AC
EU
TIC
ALS
LIM
ITE
D |
AN
NU
AL
RE
PO
RT
201
2–13
76
Notes to consolidated financial statements for the year ended March 31, 2013 (Contd.)(All amounts are in million Indian Rupees except share data and if otherwise stated)
Security details and terms of re-payment for loans:
i. Foreign currency loan (INR loan with swing option of converting into foreign currency loan) from State Bank of India amounting to Rs. 68.50 (Previous year: Rs. 158.16) is secured by way of first charge on:
(a) Moveable and immoveable fixed assets at Shasun Research Centre (SRC) located at Vandalur(b) Unencumbered immoveable assets at plot No. A1/A, measuring 5.01 acres located in Sipcot Complex, Cuddalore(c) Unencumbered Land measuring 1 acre and 3 cents located at Shasun Research Centre (SRC) located at Vandalur(d) Moveable and immoveable fixed assets at Ozhavarkarai located at Pondicherry (dispensary land and building)
The loan carries interest ranging from 5.00% to 6.00% and is repayable in 33 equal monthly instalments of USD 0.15 million.
ii. Foreign currency loan (with swing option of converting into foreign currency loan) from State Bank of India amounting to Rs. 229.79 (Previous year: Rs. Nil) is secured by way of first paripassu charge with DBS Bank on:
(a) The leasehold rights of the land admeasuring 45 acres and 47 cents located at Jawaharlal Nehru Pharma City - SEZ, Visakapatnam district, Andhra Pradesh
(b) Building, plant and machinery and other assets created / to be created out of bank finance at the aforesaid location
The loan carries interest ranging from 5.00% to 6.00% (if availed in USD), 12.00% to 13.50% (if availed in INR) and is repayable in 60 equal monthly instalments of USD 0.136 million.
iii. External commercial borrowing from DBS, Singapore amounting to Rs. 164.40 (Previous year: Rs. 206.12) is secured by way of first paripassu charge with State Bank of India on:
(a) The leasehold rights of the land admeasuring 45 acres and 47 cents located at Jawaharlal Nehru Pharma City - SEZ, Visakapatnam district, Andhra Pradesh
(b) Building, plant and machinery and other assets created / to be created out of bank finance at the aforesaid location
The borrowing carries interest ranging from 3.00% to 4.00% and is repayable in 8 semi-annual instalments of USD 0.50 million after an initial moratorium period of 18 months.
iv. External commercial borrowing from DBS, Singapore amounting to Rs. 548 (Previous year: Rs. Nil) is secured by way of exclusive first charge on the entire plant and machinery present and future at cuddalore plant.
The borrowing carries interest ranging from 3.00% to 4.00% and is repayable in 8 semi-annual instalments of USD 1.25 million after an initial moratorium period of 18 months.
v. External commercial borrowing from ICICI Bank Ltd, Singapore amounting to Rs. 287.70 (Previous year: Rs. 309.18) is secured by way of first paripassu charge on:
(a) Land, building, plant and machinery in formulation unit, located at Pondicherry(b) Land and building in MPP unit, located at Cuddalore(c) Land and building in API unit (API, Biotech, Pilot units) located at Pondicherry
The borrowing carries interest ranging from 3.30% to 3.55% and is repayable in 16 equal quarterly instalments of USD 0.38 million after an initial moratorium period of 15 months.
vi. Standby line of credit availed by Shasun Pharma Solutions Limited, UK (wholly owned subsidiary) amounting to GBP 2.00 million (Previous year: GBP 2.00 million) from State Bank of India, UK with support of Axis Bank Ltd is secured by:
(a) Exclusive charge on land approx 3.13 acres situated at Kumarapettai, Cuddalore(b) Second charge on plant and machinery situated at Cuddalore unit(c) Hypothecation by way of subservient charge on current assets of the Company
vii. Standby line of credit availed by Shasun Pharma Solutions Limited, UK (wholly owned subsidiary) amounting to GBP 3.05 million (Previous year: GBP 5.50 million) from State Bank of India, UK is secured by:
(a) Second charge on moveable and immoveable fixed assets at Shasun Research Centre (SRC) located at Vandalur(b) Second charge on unencumbered immoveable assets at plot no. A1/A, measuring 5.01 acres located in Sipcot
Complex, Cuddalore(c) Second charge on unencumbered land measuring 1 acre and 3 cents located at Shasun Research Centre (SRC)
located at Vandalur

| S
HA
SU
N P
HA
RM
AC
EU
TIC
ALS
LIM
ITE
D |
AN
NU
AL
RE
PO
RT
201
2–13
77
(d) Second charge on moveable and immoveable fixed assets at Ozhavarkarai located at Pondicherry (dispensary land and building)
(e) Paripassu first charge on the tangible assets of Shasun Pharma Solutions Limited, UK
viii. External commercial borrowing from Standard Chartered Bank, Mauritius, amounting to Rs. Nil (Previous year: Rs. 51.53) is secured by way of first charge on plant and machinery situated at Cuddalore units. The loan was repayable in 6 semi-annual installments of USD 1.00 million after an initial moratorium period of 30 months. The loan has been finally repaid during the year.
ix. Term loan from ICICI Bank amounting to Nil (Previous year: Rs. 81.80) is secured by Standby Line of Credit from Axis Bank Ltd which is covered as part of the Consortium arrangement from bankers referred under short term borrowings.
x. Term loan from Royal Bank of Scotland availed by Shasun Pharma Solutions Limited, UK (Wholly owned subsidiary) amounting to Rs. 280.67 (Previous year: Nil) is secured by Standby Line of Credit from Axis Bank Ltd which is covered as part of the Consortium arrangement from bankers referred under short term borrowings.
As at March 31, 2013
As at March 31, 2012
6 DEFERRED TAX LIABILITY / (ASSET)
Deferred tax liability on account of:
Depreciation and amortization 205.72 245.14
205.72 245.14
Deferred tax asset on account of:
Provision for mark-to-market losses on derivatives 3.35 58.53
Carry forward business loss and unabsorbed depreciation 315.25 266.68
Retirement benefits 9.88 5.64
Others 19.95 28.42
348.43 359.27
Net deferred tax liability / (asset) (142.71) (114.13)
The net deferred tax asset of Rs. 142.71 (Previous year: Rs. 114.13) has the following breakdown:
Deferred tax liability - 15.28
Deferred tax asset (142.71) (129.41)
(142.71) (114.13)
7 OTHER NON-CURRENT LIABILITIES
Security deposits from dealers 10.40 0.80
10.40 0.80
8 LONG-TERM PROVISIONS
Provision for employee benefits:
- Compensated absence 22.00 17.78
Provision for taxation net of advance taxes and tax deducted at source 30.81 25.61
Provision for mark-to-market losses on derivatives 7.87 8.76
60.68 52.15
Notes to consolidated financial statements for the year ended March 31, 2013 (Contd.)(All amounts are in million Indian Rupees except share data and if otherwise stated)

| S
HA
SU
N P
HA
RM
AC
EU
TIC
ALS
LIM
ITE
D |
AN
NU
AL
RE
PO
RT
201
2–13
78
Notes to consolidated financial statements for the year ended March 31, 2013 (Contd.)(All amounts are in million Indian Rupees except share data and if otherwise stated)
As at March 31, 2013
As at March 31, 2012
9 SHORT-TERM BORROWINGS
Secured:
Overdraft from banks 1,037.33 672.69
Packing credit facilities from banks 1,592.37 1,300.48
Unsecured:
Other loans from banks 547.54 312.84
3,177.24 2,286.01
Security details and terms of re-payment for loans:
i. Working Capital facility sharing under consortium arrangement from bankers aggregating to Rs. 3,800 (Fund based Rs. 2,200, Non-fund based Rs. 1,500, standby line of credit amounting to Rs. 100) is secured by way of exclusive first Charge on:
(a) Hypothecation of entire current assets on a pari passu basis with other members of the Consortium(b) Paripassu first charge on Land and Building in API Unit (API, Biotech, Pilot Units), located at Pondicherry(c) Paripassu first charge on Land and Building in MPP Unit, located at Cuddalore(d) Land, Building, Plant and Machinery in Formulation Unit, located at Pondicherry(e) Second charge on all other fixed assets of the Company
ii. Working capital facilities of Shasun Pharma Solutions Limited, UK are subject to corporate guarantee by the ulimate parent company, Shasun Pharmaceuticals Limited and are secured by Paripassu first charge on tangible assets of Shasun Pharma Solutions Limited, UK.
10 TRADE PAYABLES
Dues to micro and small enterprises 20.79 22.92
Dues to others 2,072.83 2,093.86
2,093.62 2,116.78
11 OTHER CURRENT LIABILITIES
Current maturities of long-term borrowings (Refer note 5) 702.22 465.69
Creditors for capital goods
Dues to micro and small enterprises 9.16 -
Dues to others 53.05 43.39
Interest accrued and not due 20.59 5.14
Advance from customers 95.95 175.64
Book overdraft 5.70 39.52
Retention money payable 31.66 8.28
Unclaimed dividends 3.44 6.92
Other liabilities 169.68 167.26
1,091.45 911.84

| S
HA
SU
N P
HA
RM
AC
EU
TIC
ALS
LIM
ITE
D |
AN
NU
AL
RE
PO
RT
201
2–13
79
As at March 31, 2013
As at March 31, 2012
12 SHORT-TERM PROVISIONS
Provision for employee benefits:
- Gratuity (Refer note 36) 13.13 25.14
- Compensated absence 8.45 2.57
- Pension payable 5.17 5.04
Proposed dividend 84.94 22.05
Dividend distribution tax payable 14.43 3.58
Provision for mark-to-market losses on derivatives 2.31 171.63
128.43 230.01
13 TANGIBLE ASSETS
Particulars Freehold land
Leasehold land #
Leasehold improve-
ments
Factory buildings
Non factory
buildings
Plant and machin-
ery *
Electrical installa-
tions
Office equip-ments
Computers and
acces-sories
Furniture, fixtures
and fittings
Vehicles Total
GROSS BLOCK
As at April 1, 2011 37.81 286.90 18.57 633.62 5.31 3,622.69 285.36 50.22 113.05 46.24 38.08 5,137.85
Foreign exchange adjustments 0.40 - 0.64 1.03 - 146.79 - 0.03 3.76 - 0.19 152.84
Additions / adjustments - - - 121.03 11.47 401.90 28.00 13.05 28.96 4.43 11.54 620.38
Deletions 0.07 - 13.68 23.86 - 63.71 9.45 3.13 1.30 5.22 18.88 139.30
As at March 31, 2012 38.14 286.90 5.53 731.82 16.78 4,107.67 303.91 60.17 144.47 45.45 30.93 5,771.77
Foreign exchange adjustments 0.06 - 0.83 0.21 (1.67) 76.68 - 0.01 0.90 (0.01) 0.04 77.05
Additions / adjustments 13.13 6.97 - 166.47 57.39 936.41 52.12 29.00 24.00 6.39 26.78 1,318.66
Deletions 0.44 - 4.75 14.39 1.27 249.32 0.52 3.35 3.56 0.83 11.59 290.02
As at March, 31 2013 50.89 293.87 1.61 884.11 71.23 4,871.44 355.51 85.83 165.81 51.00 46.16 6,877.45
ACCUMULATED DEPRECIATION
As at April 1, 2011 - 9.93 13.92 183.17 2.12 2,101.98 188.29 34.29 105.22 25.25 26.94 2,691.11
Foreign exchange adjustments - - - 0.26 - 44.97 - - 3.20 - 0.13 48.56
Depreciation for the year - 2.90 0.87 23.58 0.14 310.26 24.46 4.37 5.73 2.75 4.73 379.79
Deletions - - 13.51 9.20 - 62.21 7.45 2.94 1.29 3.93 15.37 115.90
As at March 31, 2012 - 12.83 1.28 197.81 2.26 2,395.00 205.30 35.72 112.86 24.07 16.43 3,003.56
Foreign exchange adjustments - - 0.33 0.01 (1.68) (1.12) - (0.17) 2.93 (0.01) 0.02 0.31
Depreciation for the year - 3.03 4.75 28.37 0.68 408.95 29.26 6.24 16.42 3.15 6.62 507.47
Deletions - - 4.75 3.95 0.10 245.26 0.50 3.21 3.56 0.80 8.45 270.58
As at March, 31 2013 - 15.86 1.61 222.24 1.16 2,557.57 234.06 38.58 128.65 26.41 14.62 3,240.75
NET BLOCK
As at March 31, 2013 50.89 278.01 - 661.87 70.07 2,313.87 121.45 47.25 37.16 24.59 31.54 3,636.70
As at March 31, 2012 38.14 274.07 4.25 534.01 14.52 1,712.67 98.61 24.45 31.61 21.38 14.50 2,768.21
# Amortization of Rs. 2.78 (Previous year: Rs. 2.76) is allocated to projects under capital work-in-progress.
* Depreciation for the year includes depreciation amounting to Rs. 42.11 (Previous year: Rs. 38.59) on assets used for research and development. During the year, the Company incurred Rs. 79.84 (Previous year: Rs. 14.76) towards capital expenditure for research and development.
Notes to consolidated financial statements for the year ended March 31, 2013 (Contd.)(All amounts are in million Indian Rupees except share data and if otherwise stated)

| S
HA
SU
N P
HA
RM
AC
EU
TIC
ALS
LIM
ITE
D |
AN
NU
AL
RE
PO
RT
201
2–13
80
Notes to consolidated financial statements for the year ended March 31, 2013 (Contd.)(All amounts are in million Indian Rupees except share data and if otherwise stated)
14 INTANGIBLE ASSETS
Particulars SoftwarePatent,
licences and trademark
Total
GROSS BLOCKAs at April 1, 2011 31.47 49.67 81.14 Foreign exchange adjustments - 6.71 6.71 Additions / adjustments 4.15 - 4.15 Deletions - - - As at March 31, 2012 35.62 56.38 92.00 Foreign exchange adjustments - 3.89 3.89 Additions / adjustments 9.76 2.50 12.26 Deletions - - - As at March, 31 2013 45.38 62.77 108.15 ACCUMULATED AMORTIZATIONAs at April 1, 2011 30.73 12.96 43.69 Foreign exchange adjustments - 3.34 3.34 Amortization for the year 1.35 27.32 28.67 Deletions - - - As at March 31, 2012 32.08 43.62 75.70 Foreign exchange adjustments - 0.21 0.21 Amortization for the year 5.14 16.65 21.79 Deletions - - - As at March, 31 2013 37.22 60.48 97.70 NET BLOCKAs at March 31, 2013 8.16 2.29 10.45 As at March 31, 2012 3.54 12.76 16.30
As at March 31, 2013
As at March 31, 2012
15 NON-CURRENT INVESTMENTS
Trade investments valued at cost unless stated otherwise
Unquoted equity instruments
Investments in wholly owned subsidiaries
Shasun Life Sciences Private Limited, India (Refer note 1)
10,000 (Previous year: 10,000) equity shares of Rs. 10/- each, fully paid up 0.10 0.10
Investment in others
Clarion Wind Farm Private Limited, India
900,000 (Previous year: 200,000) equity shares of Rs. 10/- each, fully paid up 9.00 2.00
SIPCOT Industrial Common Utilities Limited, India
4,242 (Previous year: 4,242) equity shares of Rs. 100/- each, fully paid up 0.42 0.42
9.52 2.52
Aggregate book value of unquoted non current investments 9.52 2.52

| S
HA
SU
N P
HA
RM
AC
EU
TIC
ALS
LIM
ITE
D |
AN
NU
AL
RE
PO
RT
201
2–13
81
As at March 31, 2013
As at March 31, 2012
16 LONG-TERM LOANS AND ADVANCES
Unsecured and considered good:
Capital advances 147.52 113.11
Security deposits 45.02 40.07
Minimum alternate tax credit entitlement 120.06 105.15
Loans and advances to other than related parties (Refer note (i) below) 55.13 -
Advance income tax and tax deducted at source (net of provision for taxation) 141.44 105.78
Others 4.51 1.75
513.68 365.86
(i) Loans and advances to other than related parties: Loans and advances to other than related parties include advances given to a Company towards capital expenditure for developing manufacturing facilities and loans granted to the shareholders of such Company towards acquiring equity shares. As at the year end, the Company is in the process of obtaining necessary approvals from the relevant authorities for transfer of aforesaid equity shares. Pending such approval, the loan balances have been been grouped under long-term loans and advances.
17 OTHER NON-CURRENT ASSETS
Unamortised expenses - ancillary borrowing costs 11.32 6.70
11.32 6.70
18 INVENTORIES
Raw and Packing materials (includes goods-in-transit of Rs. 40.00 (Previous year: Rs. 28.22))
728.77 628.19
Work-in-progress 628.88 457.24
Finished goods 228.94 197.47
Traded Goods 2.39 -
Stores, spares and lab chemicals 102.72 95.84
1,691.70 1,378.74
19 TRADE RECEIVABLES
Unsecured:
Outstanding for a period exceeding six months from the date they are due for payment
- Considered good 42.86 16.77
- Considered doubtful 14.80 16.05
Other receivables
- Considered good 2,594.61 2,300.82
Less: Provision for doubtful receivables (14.80) (16.05)
2,637.47 2,317.59
Notes to consolidated financial statements for the year ended March 31, 2013 (Contd.)(All amounts are in million Indian Rupees except share data and if otherwise stated)

| S
HA
SU
N P
HA
RM
AC
EU
TIC
ALS
LIM
ITE
D |
AN
NU
AL
RE
PO
RT
201
2–13
82
Notes to consolidated financial statements for the year ended March 31, 2013 (Contd.)(All amounts are in million Indian Rupees except share data and if otherwise stated)
As at March 31, 2013
As at March 31, 2012
20 CASH AND BANK BALANCES
Cash and cash equivalents:
Cash on hand 2.97 0.85
Cheques on hand 2.03 -
Balances with banks
- In current accounts 49.29 139.07
54.29 139.92
Other bank balances:
Margin money deposit 0.96 0.96
Deposits with original maturity for more than 3 months but less than 12 months 10.43 6.22
Deposits with original maturity for more than 12 months - 2.91
11.39 10.09
65.68 150.01
21 SHORT-TERM LOANS AND ADVANCES
Unsecured and considered good:
Advances recoverable in cash or in kind or for value to be received 548.51 512.11
Prepaid expenses 70.05 34.35
Loans to employees - 15.76
Balances with government authorities 84.46 115.40
Others 13.56 -
Unsecured and considered doubtful:
Advances recoverable in cash or in kind or for value to be received 21.50 12.17
Balances with government authorities 3.85 3.85
Less: Provision for doubtful advances (25.35) (16.02)
716.58 677.62
22 OTHER CURRENT ASSETS
Unbilled revenue 196.19 265.98
Unamortised expenses - ancillary borrowing costs 3.93 1.86
200.12 267.84

| S
HA
SU
N P
HA
RM
AC
EU
TIC
ALS
LIM
ITE
D |
AN
NU
AL
RE
PO
RT
201
2–13
83
Year ended March 31, 2013
Year ended March 31, 2012
23 REVENUE FROM OPERATIONS
Revenue from operations, grossSale of products 10,357.50 10,183.08
Sale of traded goods 14.12 67.77
Sale of services 142.56 93.13
10,514.18 10,343.98 Other operating revenues, grossSale of by-products 235.51 241.80
Export incentives 292.77 228.68
Scrap sales, gross 50.46 44.35
578.74 514.83 Less: Excise duty (245.21) (194.78)
10,847.71 10,664.03
24 OTHER INCOME
Interest income 5.77 7.20
Profit on sale of fixed assets (net) 18.92 279.47
Bad debts written off now recovered - 4.73
Provisions / liabilities no longer required written back 10.79 60.94
Insurance claims 53.72 33.50
Miscellaneous income 93.61 23.36
182.81 409.20
25 COST OF RAW AND PACKING MATERIALS CONSUMED
Opening stock 628.19 566.86
Add : Purchases during the year 5,747.50 5,646.99
Less : Closing stock (728.77) (628.19)
5,646.92 5,585.66
26 CHANGES IN INVENTORIES
Opening stock
- Manufactured goods 197.47 281.05
- Work-in-progress 457.24 349.65
654.71 630.70 Closing stock
- Manufactured goods 228.94 197.47
- Traded Goods 2.39 -
- Work-in-progress 628.88 457.24
860.21 654.71
(205.50) (24.01)
Notes to consolidated financial statements for the year ended March 31, 2013 (Contd.)(All amounts are in million Indian Rupees except share data and if otherwise stated)

| S
HA
SU
N P
HA
RM
AC
EU
TIC
ALS
LIM
ITE
D |
AN
NU
AL
RE
PO
RT
201
2–13
84
Notes to consolidated financial statements for the year ended March 31, 2013 (Contd.)(All amounts are in million Indian Rupees except share data and if otherwise stated)
Year ended March 31, 2013
Year ended March 31, 2012
27 EMPLOYEE BENEFITS EXPENSESSalaries, wages and bonus 1,672.27 1,452.35 Contribution to provident and other funds 90.95 75.79 Staff welfare expenses 103.19 65.91
1,866.41 1,594.05
28 FINANCE COSTSInterest expenses
- On bank loans 216.52 177.46 - On others 60.46 113.18 - On interest rate swap 0.46 9.71
Bank charges 67.30 82.01 Net loss on foreign currency transactions and translation - 54.63 Less: Capitalised during the year (Refer note 39) (22.86) -
321.88 436.99
29 OTHER EXPENSESConsumption of stores and spare parts 234.73 162.72 Power and fuel 788.59 718.25 Rent 37.29 39.30 Repairs and maintenance *
- Buildings 42.72 21.52 - Plant and equipment 350.09 319.14 - Others 161.10 137.61
Research and development expenses 16.88 15.10 Insurance 88.51 67.13 Rates and taxes 28.57 62.59 Net loss on foreign currency transactions and translation 2.07 142.13 Communication expenses 25.10 16.53 Travelling and conveyance 82.00 54.55 Legal and professional charges 134.72 61.75 Printing and stationery 14.60 13.74 Commission and discounts 37.95 54.99 Commission to non-wholetime directors 2.83 1.69 Freight outwards 205.44 263.85 Sales promotion expenses 34.75 21.28 Bad debts written off 0.97 11.38 Provision for doubtful receivables - 1.88 Provision for doubtful advances 9.33 12.87 Miscellaneous expenses 54.40 26.25
2,352.64 2,226.25
* Includes stores and spares consumed Rs. 156.52 (Previous year Rs.103.40)

| S
HA
SU
N P
HA
RM
AC
EU
TIC
ALS
LIM
ITE
D |
AN
NU
AL
RE
PO
RT
201
2–13
85
30 Commitments and Contingent liabilities
Particulars As at March 31, 2013
As at March 31, 2012
CommitmentsEstimated amount of contracts remaining to be executed on capital account and not provided for (net of advances)
46.86 598.67
Contingent liabilitiesIncome tax - 318.14
Sales tax 15.37 13.27
Excise / customs 101.08 83.53
Counter guarantees given by the company to the bankers for bank guarantee 51.50 126.52
Obligations in respect of letter of credit outstanding 466.44 416.46
Corporate guarantee given by the Company to bankers of Shasun Pharma Solutions Limited, UK (wholly owned subsidiary)
540.54 949.67
Out of the above corporate guarantee utilized in connection with loans availed by SPSL, UK
457.02 454.14
Other claims against the Company not acknowledged as debts 41.22 38.76
31 Accounting for interest in Joint Venture (JV)
During 2011, the Company had entered into an agreement with Nanoparticle Biochem Inc. for establishing a joint venture company in USA called Shasun NBI LLC. The Company has a 50% interest in Shasun NBI LLC. The contractual arrangement between Nanoparticle Biochem Inc and the Company indicates that it jointly controls the financial and operating policies of Shasun NBI LLC in the ordinary course of business.
The Company has, in accordance with AS 27 “Financial Reporting of Interests in Joint Ventures” issued under the Companies (Accounting Standards) Rules 2006, accounted for its 50% interest in the JV by the proportionate consolidation method. Thus the Group’s income statement, balance sheet and cash flow statement incorporate the Company’s share of income, expenses, assets, liabilities and cash flows of the JV on a line-by-line basis.
The aggregate amount of assets, liabilities, income and expenses related to the company’s share in the joint venture included in these financial statements as of and for the year ended March 31, 2013 are given below:
Particulars As at March 31, 2013
As at March 31, 2012
EQUITY AND LIABILITIES
Shareholders’ funds
Reserves and surplus (89.26) (57.30)
Current liabilities
Other current liabilities 28.49 34.00
(60.77) (23.30)
ASSETS
Non-current assets
Tangible assets 0.03 -
Intangible assets - 12.79
Current assets
Cash and cash equivalents 3.08 7.82
3.11 20.61
Notes to consolidated financial statements for the year ended March 31, 2013 (Contd.)(All amounts are in million Indian Rupees except share data and if otherwise stated)

| S
HA
SU
N P
HA
RM
AC
EU
TIC
ALS
LIM
ITE
D |
AN
NU
AL
RE
PO
RT
201
2–13
86
Notes to consolidated financial statements for the year ended March 31, 2013 (Contd.)(All amounts are in million Indian Rupees except share data and if otherwise stated)
Particulars Year ended March 31, 2013
Year ended March 31, 2012
ExpenditureOperating and other expenses 1.09 0.53 Research and development expenses 16.88 15.10 Depreciation and amortization expense 13.76 23.96 Loss before taxation 31.73 39.59 Provision for tax - - Loss after taxation 31.73 39.59
32 Operating Leases
The Company had entered into operating lease arrangements in respect of office and storage space, which are subject to renewal at mutual consent thereafter. The cancellable arrangements can be terminated by either party after giving due notice. The lease rent expense recognized during the year amounts to Rs. 37.29 (Previous year: Rs. 18.85). The schedule for future minimum lease payments in respect of non-cancellable operating leases is set out below:
Particulars As at March 31, 2013
As at March 31, 2012
Not later than one year 17.35 17.57
Later than one year but not later than five years 16.55 19.63
Later than five years - 0.49
33 Earnings per share
Earnings per share are calculated by dividing the Profit/ (loss) attributable to the equity shareholders by the weighted average number of equity shares outstanding during the year.
Particulars Year ended March 31, 2013
Year ended March 31, 2012
EarningsNet profit after tax as per statement of profit and loss 530.36 1,005.67 Number of sharesNumber of shares at the beginning of the year 55,123,852 48,544,905 Add: Equity shares issued on conversion of warrants issued on preferential basis 1,500,000 - Add: Equity shares issued on preferential allotment basis - 6,578,947 Total number of equity shares outstanding at the end of the year 56,623,852 55,123,852 Weighted average number of equity shares outstanding during the year - basic 55,164,948 48,598,831 Weighted average number of equity shares outstanding during the year - diluted 55,164,948 49,324,241 Earnings per share
- of par value Rs. 2 – Basic (Rs.) 9.61 20.69 - of par value Rs. 2 – Diluted (Rs.) 9.61 20.39
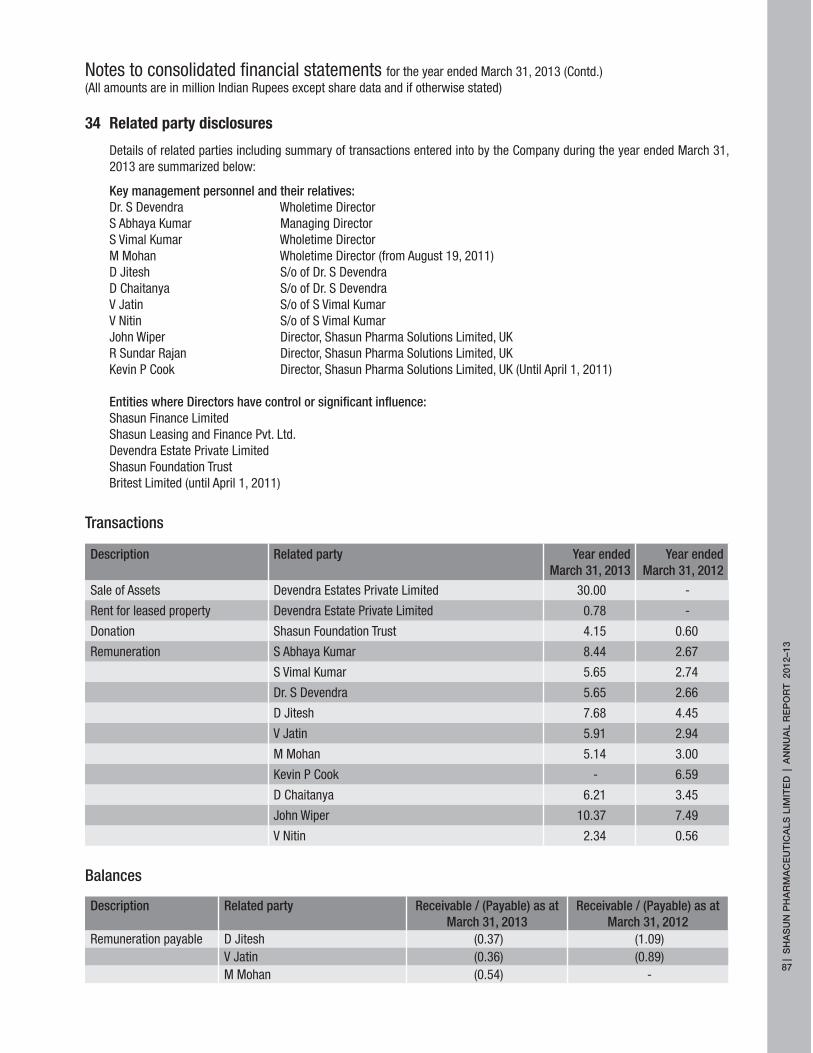
| S
HA
SU
N P
HA
RM
AC
EU
TIC
ALS
LIM
ITE
D |
AN
NU
AL
RE
PO
RT
201
2–13
87
34 Related party disclosures
Details of related parties including summary of transactions entered into by the Company during the year ended March 31, 2013 are summarized below:
Key management personnel and their relatives:Dr. S Devendra Wholetime Director S Abhaya Kumar Managing Director S Vimal Kumar Wholetime Director M Mohan Wholetime Director (from August 19, 2011) D Jitesh S/o of Dr. S Devendra D Chaitanya S/o of Dr. S Devendra V Jatin S/o of S Vimal Kumar V Nitin S/o of S Vimal Kumar John Wiper Director, Shasun Pharma Solutions Limited, UK R Sundar Rajan Director, Shasun Pharma Solutions Limited, UK Kevin P Cook Director, Shasun Pharma Solutions Limited, UK (Until April 1, 2011)
Entities where Directors have control or significant influence:Shasun Finance LimitedShasun Leasing and Finance Pvt. Ltd.Devendra Estate Private LimitedShasun Foundation TrustBritest Limited (until April 1, 2011)
Transactions
Description Related party Year ended March 31, 2013
Year ended March 31, 2012
Sale of Assets Devendra Estates Private Limited 30.00 -
Rent for leased property Devendra Estate Private Limited 0.78 -
Donation Shasun Foundation Trust 4.15 0.60
Remuneration S Abhaya Kumar 8.44 2.67
S Vimal Kumar 5.65 2.74
Dr. S Devendra 5.65 2.66
D Jitesh 7.68 4.45
V Jatin 5.91 2.94
M Mohan 5.14 3.00
Kevin P Cook - 6.59
D Chaitanya 6.21 3.45
John Wiper 10.37 7.49
V Nitin 2.34 0.56
Balances
Description Related party Receivable / (Payable) as at March 31, 2013
Receivable / (Payable) as at March 31, 2012
Remuneration payable D Jitesh (0.37) (1.09)V Jatin (0.36) (0.89)M Mohan (0.54) -
Notes to consolidated financial statements for the year ended March 31, 2013 (Contd.)(All amounts are in million Indian Rupees except share data and if otherwise stated)

| S
HA
SU
N P
HA
RM
AC
EU
TIC
ALS
LIM
ITE
D |
AN
NU
AL
RE
PO
RT
201
2–13
88
Notes to consolidated financial statements for the year ended March 31, 2013 (Contd.)(All amounts are in million Indian Rupees except share data and if otherwise stated)
35 Segment reporting
Primary segment
The Company has identifed “Pharmaceuticals” as its single reportable business segment. Pharmaceuticals segment comprises manufacture of Active Pharmaceuticals Ingredients (API), Intermediates and Formulations.
Geographic segment
The business is organized into five key geographic segments.
Segment Revenues: Revenues are attributable to individual geographic segments based upon the location of the customers.
Segment Assets and liabilities: The assets and liabilities of the entity are not fully identifiable with/ allocable to individual reportable segments. Consequently, the management believes that it is not practicable to provide segmental disclosures relating to total assets and liabilities of the enterprise.
Secondary segment information - geographical segments:
Particulars Year ended March 31, 2013
Year ended March 31, 2012
Revenue from operationsAsia Pacific 863.10 650.62 Europe 2,665.47 2,416.41 India 2,421.61 2,076.90 Africa 30.39 30.72 Americas (North and South) 4,681.53 5,462.51 Rest of the world 185.61 26.87 Total 10,847.71 10,664.03
36 Employee benefits
Gratuity
The details in respect of gratuity are set out below:
Change in present value defined benefit obligation
Particulars As at March 31, 2013
As at March 31, 2012
Obligations at the beginning of the year 83.47 68.94 Current service costs 7.76 5.96 Past Service cost - - Interest costs 6.42 5.67 Actuarial (gain) / loss 2.42 8.49 Benefits paid (6.48) (5.59)Obligations at the end of the year 93.59 83.47

| S
HA
SU
N P
HA
RM
AC
EU
TIC
ALS
LIM
ITE
D |
AN
NU
AL
RE
PO
RT
201
2–13
89
Change in fair value of plan assets
Particulars As at March 31, 2013
As at March 31, 2012
Fair value of plan assets at beginning of the year 58.33 55.46
Expected return on plan assets 5.48 4.51
Actuarial gain / (loss) 0.36 (0.91)
Contributions 26.77 4.86
Benefits paid (6.48) (5.59)
Fair value of plans assets at end of the year 84.46 58.33
Actual return on plan assets 5.84 3.59
Reconciliation of present value of defined benefit obligation and the fair value of plan assets
Particulars As at March 31, 2013
As at March 31, 2012
Present value of defined benefit obligation at the end of the year 93.58 83.47
Fair value of plan assets at the end of the year 84.46 58.33
Funded status amount of liability recognized in balance sheet 9.12 25.14
Classified as long term provision - -
Classified as short term provision 9.12 25.14
Note: The provision for gratuity payable under note 12 includes provision relating to certain employees amounting to Rs. 4.01 (Previous year: Rs. Nil) who have completed 30 years of service with the Company. The provision is being made based on maximum ceiling under the Gratuity Act, 1972. Gratuity cost for the year
Particulars Year ended March 31, 2013
Year ended March 31, 2012
Current Service cost 7.75 5.96
Past Service cost - -
Interest cost 6.42 5.67
Expected return on plan assets (5.48) (4.51)
Actuarial (gain) / loss 2.06 9.41
Net gratuity cost 10.75 16.53
The gratuity cost has been recognized in ‘Employee benefits expenses’ under note 27 to the Statement of profit and loss.
Experience adjustment for the current and previous four years
Particulars As at March 31, 2013
As at March 31, 2012
As at March 31, 2011
As at March 31, 2010
As at March 31, 2009
Defined benefit obligation 93.58 83.47 68.94 64.56 58.73
Plan asset 84.46 58.34 55.46 46.21 29.16
Surplus/(defecit) (9.12) (25.14) (13.48) (18.35) (29.57)
Experience adjustments in plan liabilities - (loss) / gain
2.42 8.49 (2.03) 1.54 1.15
Experience adjustments in plan assets - (loss) / gain
(0.36) 0.91 - 0.62 (0.41)
Notes to consolidated financial statements for the year ended March 31, 2013 (Contd.)(All amounts are in million Indian Rupees except share data and if otherwise stated)

| S
HA
SU
N P
HA
RM
AC
EU
TIC
ALS
LIM
ITE
D |
AN
NU
AL
RE
PO
RT
201
2–13
90
Notes to consolidated financial statements for the year ended March 31, 2013 (Contd.)(All amounts are in million Indian Rupees except share data and if otherwise stated)
Assumptions
Particulars As at March 31, 2013
As at March 31, 2012
Discount rate 8.00% 8.57%Estimated rate of return on plan assets 8.00% 8.00%Attrition rate 9.00% 11.00%Rate of growth in salary levels 9.00% 9.00%
The estimates of rate of escalation in salary considered in actuarial valuation take into account inflation, seniority, promotion and other relevant factors including supply and demand in the employment market.
Investment details of plan assets
Particulars As at March 31, 2013
As at March 31, 2012
Insurer managed funds 100.00% 100.00%Fixed deposits 0.00% 0.00%Total 100.00% 100.00%
37 Outstanding forward contracts
March 31, 2013 March 31, 2012
Currency No. of contracts Buy / sell Currency No. of contracts Buy / sell
USD 14 Sell USD 20 Sell
38 During the previous year, the Company had made preferential allotment of 1,500,000 convertible warrants of Rs. 75/- each aggregating to Rs. 112.50 to its Promoter, Promoter group and an independent director after obtaining the approval of the shareholders and stock exchanges. During the current year, consequent to the option exercised by the allotees towards con-version of the warrants, the Company had issued 1,500,000 equity shares to the allotees.
39 Borrowing costs in connection with the borrowing of funds utilized towards qualifying assets amounting to Rs. 22.86 (Previous year: Rs. Nil) have been capitalized and included in capital work-in-progress.
40 Comparative figures
Prior year figures have been reclassified/regrouped wherever necessary to conform to the current year’s classification.
for B S R & Co. For and on behalf of Board of DirectorsChartered Accountants Shasun Pharmaceuticals LimitedFirm registration No. 101248W S Sethuraman S Abhaya Kumar Dr. S Devendra S Vimal KumarPartner Managing Director Wholetime Director Wholetime DirectorMembership No: 203491
Place: Chennai S Murali Krishna S HariharanDate: May 29, 2013 Company Secretary Chief Financial Officer

| S
HA
SU
N P
HA
RM
AC
EU
TIC
ALS
LIM
ITE
D |
AN
NU
AL
RE
PO
RT
201
2–13
91
Research and Development Financials(All amounts are in million Indian Rupees except share data and if otherwise stated)
Balance Sheet as at March 31, 2013Rs in Mn
R&D Unit I As at
March 31, 2013
R&D Unit II As at
March 31, 2013
R&D Unit III As at
March 31, 2013
Total As at
March 31, 2013
Total As at
March 31, 2012*Sources of fundsHead Office Control a/c 28.91 192.59 - 221.50 265.90Add: Transfers 21.49 172.16 65.69 259.34 38.83Less: Excess of Expenditure over Income 14.38 36.02 132.84 231.91 (13.25) 78.94 133.97 346.87 83.23 221.50Total 36.02 231.91 78.94 346.87 221.50Application of FundsFixed AssetsR&D EquipmentsGross BlockOpening as at April 1, 2012 80.94 248.61 47.24 376.79 367.47Additions - 54.44 9.26 63.70 14.71Deletions - 0.06 - 0.06 52.63Closing as at March 31, 2013 80.94 302.99 56.49 440.43 329.55Less: Accumulated Depreciation (52.70) (195.36) (33.27) (281.33) (229.68)Net Block as at March 31, 2013 28.24 107.63 23.23 159.10 99.87OthersGross BlockOpening as at April 1, 2012 16.28 165.33 5.56 187.17 222.53Additions - 15.37 0.77 16.14 0.05Deletions - 4.69 - 4.69 40.97Closing as at March 31, 2013 16.28 176.01 6.33 198.62 181.61Less: Accumulated Depreciation (8.50) (56.99) (2.31) (67.80) (63.15)Net Block as at March 31, 2013 7.78 119.02 4.03 130.83 118.46Current AssetsInventory - Lab Chemicals - 5.26 51.69 56.95 3.17Total 36.02 231.91 78.94 346.87 221.50
Statement of Income and Expenditure for the year ended March 31, 2013 Rs in Mn
R&D Unit I Year ended
March 31, 2013
R&D Unit II Year ended
March 31, 2013
R&D Unit III Year ended
March 31, 2013
Total Year ended
March 31, 2013
Total Year ended
March 31, 2012*ExpenditureEmployee Cost 4.52 85.62 21.27 111.41 48.86Materials / Consumables / Spares 1.35 36.48 25.72 63.55 14.85Utilities - 12.49 - 12.49 5.11Other Expenditure - R&D 1.40 53.73 0.22 55.35 32.39Interest - 1.03 - 1.03 0.25Total Revenue Expenditure excluding Depreciation
7.27 189.35 47.21 243.83 101.46
Depreciation 7.11 29.56 5.44 42.11 38.59Total Expenditure 14.38 218.91 52.65 285.94 140.05
IncomeCommercial Sale of Prototype & Others - 86.07 65.90 151.97 56.82Total Income - 86.07 65.90 151.97 56.82
Excess of Expenditure over Income 14.38 132.84 (13.25) 133.97 83.23
* Comparative information does not include R&D Unit III

| S
HA
SU
N P
HA
RM
AC
EU
TIC
ALS
LIM
ITE
D |
AN
NU
AL
RE
PO
RT
201
2–13
92
Summary of Financial Information of Subsidiary Companies(All amounts are in million Indian Rupees except share data and if otherwise stated)
Rs in Mn
Name of the Subsidiary Shasun Pharma
Solutions Inc
Shasun USA Inc
SVADS Holdings
SA
Shasun Life Science Pvt
Ltd
Shasun Pharma
Solutions Ltd.
Company/Step-down Subsidiary
Paid up Capital of Subsidiary Company as on March 31, 2013 18.41 0.54 435 0.10 412.68
Reserves & Surplus as on March 31, 2013 5.93 (199.59) (11.52) (0.05) 157.61
Total Assets as on March 31, 2013 25.29 6.80 676.15 0.15 2,071.54
Total Liabilities as on March 31, 2013 0.95 205.85 252.61 0.11 1,501.25
Details of Investment (Excluding Investment in Subsidiaries) as on March 31, 2013
Nil Nil Nil Nil Nil
Turnover for financial year ended on March 31, 2013 Nil 0.41 Nil Nil 3,020.19
Profit/(Loss) Before Taxation for financial yearended on March 31, 2013
(4.27) (53.01) (8.90) (0.01) 321.45
Provision for Taxation for financial year ended on March 31, 2013 0.03 0.03 (0.37) Nil 0.35
Profit/ (Loss) After Tax for financial year ended on March 31, 2013 (4.30) (53.04) (8.53) Nil 321.10
Proposed Dividend for financial year ended on March 31, 2013 Nil Nil Nil Nil Nil
Year end Exchange Rates
GBP/INR 83.16
USD/INR 54.80 54.80
CHF/INR 57.68

| S
HA
SU
N P
HA
RM
AC
EU
TIC
ALS
LIM
ITE
D |
AN
NU
AL
RE
PO
RT
201
2–13
93
Notice of Annual General Meeting
Notice is hereby given that 38th Annual General Meeting of the Company will be held on Friday, August 2, 2013 at Red Cross Building, No. 32/50 Montieth Road, Egmore, Chennai – 600 008 at 2.30 p.m. to transact the following business:
ORDINARY BUSINESS
1. To receive, consider and adopt the Audited Profit & Loss Account for the year ended March 31, 2013, the Balance sheet as on that date and the reports of the Auditors and Directors thereon.
2. To declare a dividend on equity shares for the financial year ended March 31, 2013.
3. To appoint a Director in place of Mr. R. Kannan who retires by rotation and who, being eligible, offers himself for re-appointment.
4. To appoint a Director in place of Mr. N. Subramanian who retires by rotation and who, being eligible, offers himself for re-appointment.
5. To consider and, if thought fit, to pass, with or without modification, the following resolution as an Ordinary Resolution:
“RESOLVED THAT M/s. B S R & Co., Chartered Accountants be and are hereby appointed as Auditors of the Company to hold office from the conclusion of this Meeting till the conclusion of the next Annual General Meeting”
“RESOLVED FURTHER THAT the Board of Directors be and is hereby authorized to fix the remuneration payable and the reimbursement of out-of-pocket expenses, if any to the said Auditors”
SPECIAL BUSINESS
6. To consider and if thought fit, to pass, with or without modification(s) the following resolution as an Ordinary Resolution:
RESOLVED THAT pursuant to the provisions of Section 260 of the Companies Act,1956, and Articles of Association of the Company, Prof. Indira J Parikh who was appointed as an Additional Director at the meeting of the Board of Directors of the Company held on August 2, 2012 and who holds office up to the date of ensuing Annual General Meeting of the Company and in respect of whom the Company has received a notice from a member under Section 257 of the Companies Act,1956, proposing her candidature, be and is hereby appointed as Director of the Company, liable to retire by rotation.
Registered Office: By order of the Board Batra Centre, 3rd & 4th Floor S. Murali Krishna No. 28, Sardar Patel Road, Company Secretary Guindy, Chennai – 600 032
Place : Chennai Date : May 29, 2013
Notes:1. A member entitled to attend and vote is entitled to appoint a proxy to attend and vote instead of himself. A proxy need not
be a member of the company. Proxies, in order to be effective, must be received at the registered office of the company not less than 48 hours before the commencement of the meeting.
2. An Explanatory statement pursuant to Section 173(2) of the Companies Act, 1956, relating to the Special business to be transacted at the meeting is annexed hereto.
3. Shareholders are requested to bring their copy of the Annual Report to the Meeting.

| S
HA
SU
N P
HA
RM
AC
EU
TIC
ALS
LIM
ITE
D |
AN
NU
AL
RE
PO
RT
201
2–13
94
4. Members/Proxies should fill the Attendance Slip for attending the Meeting.
5. The information on the Directors appointment/reappointment is provided as per Clause 49 of the Listing Agreement and is given in the Corporate Governance Section of this Annual Report.
6. Members who hold shares in dematerialized form are requested to write their client ID and DPID numbers and those who hold shares in physical form are requested to write their Folio number in the attendance slip for attending the meeting.
7. The register of members will be closed from July 25, 2013 to August 2, 2013 (both days inclusive).
8. All documents referred to in the accompanying notice and explanatory statement are open for inspection at the registered office of the company during office hours on working days up to the date of the Annual General Meeting.
9. The company has already transferred all unclaimed dividends declared up to the financial year 2004-05 to the Investor Education and Protection Fund pursuant to Section 205C of the Companies Act, 1956. Members who have still not encashed their dividend for subsequent years are requested to encash the same at the earliest.
10. The Company provides the facility of National Electronic Clearing Services (NECS) to all shareholders, holding shares in electronic and physical forms, subject to availability of such facility at the respective location of such shareholders.
All members holding shares in Electronic form are requested to furnish the new bank account number allotted to them by their bank after implementation of (CBS), along with a photocopy of a cheque pertaining to the concerned account, to their Depository Participant (DP) at their earliest convenience.
If they do not provide their new account number allotted after implementation of CBS by the bank, to the DP, please note that ECS to their old account may either be rejected or returned.
11. The equity shares of the Company are listed at BSE Limited & National Stock Exchange of India Limited.
Annexure to the Notice:
Explanatory Statement pursuant to Section 173 (2) of the Companies Act, 1956:
Statement in respect of Item No. 6
Prof. Indira J. Parikh is the Founder President of FLAME. She was a faculty at IIM-Ahmedabad for over 30 years and Dean from 2002-05. She has taught at INSEAD, Fontainebleau (France) and Texas A&M University. She has specialized in organization development and design and institution building. She has designed and offered management and leadership development programs in public sector, private sector and multinational organizations. She has been a consultant to various national and international organizations and a coach for many leading and upcoming organiations. Her current work focuses on facilitating learning and development of Management and employees across levels in the context of organisation growth. Prof. Indira J. Parikh is also on the board of several companies. Prof. Parikh has been honored with several life time achievement awards both nationally and internationally. She has written numerous articles, published in National & International Journals and is the co-author/author of several books.
Prof. Indira J Parikh was appointed as Additional Director by the Board at its meeting held on August 2, 2012.
She holds directorship in Zydus Wellness Ltd., Anil Ltd., Sintex Industries Ltd., Marck Biosciences Ltd. and Flame-Tao Knoware Pvt. Ltd.
No other directors, other than Prof. Indira J Parikh is concerned or interested in this resolution.
Registered Office: By order of the Board Batra Centre, 3rd & 4th Floor S. Murali Krishna No.28, Sardar Patel Road, Company Secretary Guindy, Chennai – 600 032
Place: Chennai Date: May 29, 2013

:
:
Regd. Office: “Batra Centre”, 28 Sardar Patel Road, Guindy, Chennai 600 032
ATTENDANCE SLIP I hereby record my presence at the 38th Annual General Mee g of the Company held onFriday, August 02, 2013 at 2.30. P.M. at Red Cross Building, No. 32/50, Chennai-600008. ___________________ ___________________________________ Client ID/Folio Number Signature of the a ending member/proxy Notes: 1. Please fill in this attendance slip and hand it over duly signed at the ENTRANCE OF THE MEETING HALL. 2. As a token of hospitality your Company is arranging lunch for the shareholders at the AGM venue between 1 p.m. and 2.30 p.m. Cut here
Regd. Office: “Batra Centre”, 28 Sardar Patel Road, Guindy, Chennai 600 032
PROXY FORM I/We __________________________________of ____________________________________________ being a Member of Shasun Pharma cals Limited hereby appoint _______________ of____________ _____________________________________________________________________________________ failing him ___________________ at ____________________________________________________ as my/our proxy to a end and vote for me/us/and on my/our behalf at the 38th Annual General Mee of the Company to be held on Friday, August 02, 2013 at 2.30 P.M. and at any adjournment (s) thereof. Signed this____________________ day of __________________ 2013 Signature Client ID/Folio Number Notes: This Proxy form must be returned so as to reach the Registered Office of the Company, not less than 48 hours before the time for holding the aforesaid meeting.
AffixRevenue
Stamp forRe. 1


Corporate Information
Corporate Office Multi Product Facility - Cuddalore“Batra Centre”, 3rd & 4th Floor, A1/B SIPCOT Industrial Complex28, Sardar Patel Road, Kudikadu, Cuddalore – 607 005Guindy, Chennai 600 032 Tamil Nadu, IndiaTamil Nadu, India Tel : 91-4142-285400Tel : 91-44-43446700, 22207500 Fax : 91-4142-239709Fax : 91-44-22350278 Email : [email protected] : [email protected]
Bio-tech Centre Branch Office UKMathur Road, Periyakalapet 165 A Thornbury RoadPuducherry 605 014 Isleworth, London–TW7 4QG, United KingdomIndia Tel : + 44 20 8560 9711Tel : 91-413-2654181, 2654190, 2654100 Fax : + 44 20 8560 9455 Fax : 91-413-2655154 Email : [email protected] : [email protected]
Research Centre Shasun USA Inc. & Shasun PharmaNo.27, Vandalur-Kelambakkam Road Solutions Inc.Keezhakottaiyur Village 197, Rt 18 South, Suite 102Chennai – 600 048. East Brunswick, Tamil Nadu, India NJ 08816, USATel : 91-44-47406100 Tel : +1-732-465-0700 * 106Fax : 91-44-47406190 Fax : +1-732-465-0710 Email : [email protected] Email : [email protected]
API Facility – Puducherry SVADS Holding SAMathur Road, Periyakalapet Rue Fritz-Courvoisier 40Puducherry – 605 014, India. 2300 La Chaux-De-FondsTel : 91-413-2655157, 2654100 Suisse, SwitzerlandFax : 91-413-2655154 Tel : +41 32 967 95 95Email : [email protected]
Finished Dosage Facility Shasun Pharma Solutions LtdUnit – II, R.S.No. 32, 33 & 34, PIMS Road Dudley Lane, DudleyPeriyakalapet, Puducherry – 605 014, India Cramlington, NorthumberlandPhone: 91-413-2655946 / 2655952 / 2655697 / 2655698 England NE23 7QGFax : 91-413-2655154 Tel : +44 191 250 0471Email : [email protected] Email : [email protected]

co
ncep
t and
desig
n b
y S
TA
MP
A,
the b
rand
co
mm
unic
atio
ns c
om
pany,
chennai (in
fo@
sta
mp
a.c
o.in)
Shasun Pharmaceuticals Limitedwww.shasun.com