India Pharmaceuticals
84
Disclaimer & Disclosures This report must be read with the disclosures and the analyst certifications in the Disclosure appendix, and with the Disclaimer, which forms part of it. Issuer of report: HSBC Securities and Capital Markets (India) Private Limited View HSBC Global Research at: https://www.research.hsbc.com Secular growth in domestic India pharma market to continue, despite short-term regulatory issues Companies with emerging focus on chronic therapies likely to sustain India growth; lower US exposure limits US FDA risk Initiate on Alkem Lab with a Buy (TP INR1,945) and Alembic Pharma with a Hold (TP INR645) Tough times: The past 15-18 months have been difficult for Indian pharma players. The numerous regulatory red flags raised by the US FDA have hurt sentiment and growth. Domestic price controls haven’t helped either, so little wonder that the sector has underperformed in the last year. Despite this, we think long-term growth opportunities remain intact in India, while a US recovery will depend on resolving FDA issues. Better India prospects: Strong growth – the Indian pharma market has tripled in the last 10 years – is being driven by a higher incidence of lifestyle diseases, growing healthcare awareness and increasing affordability. Chronic therapies for lifestyle-related disorders (e.g. diabetes) are likely to contribute to higher sales for emerging players like Alkem Lab (current share c15%) and Alembic Pharma, the focus of this report. Home advantage: The two companies have a much lower share of sales from the US (c25%) than larger peers like Sun Pharma, Lupin and Dr Reddy’s (c45%). We believe this makes them less exposed to regulatory risk (to date they have a good US FDA record). We think better compliance, quality control and increased spending on R&D make a case for the US being a long-term driver for these companies. We forecast Alkem’s earnings will rise at a CAGR of 22.5% over FY16-19e and Alembic’s c11%. Initiate coverage: We initiate on Alkem Lab with a Buy (TP INR1,945) and Alembic Pharma with a Hold (TP INR645). We prefer Alkem for its sustained growth outlook in India due to its strong brand positioning and expected market share gains in chronic therapies, as well as product launches in the US. We like Alembic’s long-term story but see limited upside from current levels. We value Alkem at 22x Sep-18 EPS of INR95.2 and Alembic at 22x Sep-18 EPS of INR31.6 and discount back the values to derive our TPs. Key risks: higher-than-expected price cuts in India and regulatory issues in the US. 21 September 2016 Damayanti Kerai* Analyst, Healthcare & Hospitals HSBC Securities and Capital Markets (India) Private Limited [email protected] +9122 3396 0692 Girish Bakhru*, CFA Analyst, South East Asia Healthcare HSBC Securities and Capital Markets (India) Private Limited [email protected] +9122 2268 1638 *Employed by a non-US affiliate of HSBC Securities (USA) Inc, and is not registered/ qualified pursuant to FINRA regulations India Pharmaceuticals EQUITIES PHARMACEUTICALS India Summary: Alkem Lab and Alembic Pharma Ticker Company Mcap (USDb) 3m ADTV (USDm) TP (INR) Rating Upside/ Downside EPS FY16 EPS FY17e EPS FY18e PE FY16 PE FY17e PE FY18e ALKEM IN Alkem Lab 3.0 1 1,945 Buy 14.6% 56.3 70.9 86.8 30.2 23.9 19.6 ALPM IN Alembic Pharma 1.8 1 645 Hold -1.3% 26.4 21.6 27.9 24.7 30.2 23.4 Source: HSBC estimates, Thomson Reuters DataStream. Based on closing prices as of 20 Sep 2016. Look for home advantage: initiate on Alkem, Alembic
-
Upload
khangminh22 -
Category
Documents
-
view
1 -
download
0
Transcript of India Pharmaceuticals

Disclaimer & Disclosures
This report must be read with the disclosures and the analyst certifications in
the Disclosure appendix, and with the Disclaimer, which forms part of it.
Issuer of report: HSBC Securities and Capital Markets (India) Private Limited
View HSBC Global Research at:
https://www.research.hsbc.com
Secular growth in domestic India pharma market to continue,
despite short-term regulatory issues
Companies with emerging focus on chronic therapies likely to
sustain India growth; lower US exposure limits US FDA risk
Initiate on Alkem Lab with a Buy (TP INR1,945) and Alembic
Pharma with a Hold (TP INR645)
Tough times: The past 15-18 months have been difficult for Indian pharma players.
The numerous regulatory red flags raised by the US FDA have hurt sentiment and
growth. Domestic price controls haven’t helped either, so little wonder that the sector
has underperformed in the last year. Despite this, we think long-term growth
opportunities remain intact in India, while a US recovery will depend on resolving
FDA issues.
Better India prospects: Strong growth – the Indian pharma market has tripled in the
last 10 years – is being driven by a higher incidence of lifestyle diseases, growing
healthcare awareness and increasing affordability. Chronic therapies for lifestyle-related
disorders (e.g. diabetes) are likely to contribute to higher sales for emerging players like
Alkem Lab (current share c15%) and Alembic Pharma, the focus of this report.
Home advantage: The two companies have a much lower share of sales from the US
(c25%) than larger peers like Sun Pharma, Lupin and Dr Reddy’s (c45%). We believe
this makes them less exposed to regulatory risk (to date they have a good US FDA
record). We think better compliance, quality control and increased spending on R&D
make a case for the US being a long-term driver for these companies. We forecast
Alkem’s earnings will rise at a CAGR of 22.5% over FY16-19e and Alembic’s c11%.
Initiate coverage: We initiate on Alkem Lab with a Buy (TP INR1,945) and Alembic
Pharma with a Hold (TP INR645). We prefer Alkem for its sustained growth outlook in
India due to its strong brand positioning and expected market share gains in chronic
therapies, as well as product launches in the US. We like Alembic’s long-term story
but see limited upside from current levels. We value Alkem at 22x Sep-18 EPS of
INR95.2 and Alembic at 22x Sep-18 EPS of INR31.6 and discount back the values to
derive our TPs. Key risks: higher-than-expected price cuts in India and regulatory
issues in the US.
21 September 2016
Damayanti Kerai*
Analyst, Healthcare & Hospitals
HSBC Securities and Capital Markets (India) Private Limited
+9122 3396 0692
Girish Bakhru*, CFA Analyst, South East Asia Healthcare
HSBC Securities and Capital Markets (India) Private Limited
+9122 2268 1638
*Employed by a non-US affiliate of HSBC Securities (USA) Inc, and is not registered/ qualified pursuant to FINRA regulations
India Pharmaceuticals EQUITIES PHARMACEUTICALS
India
Summary: Alkem Lab and Alembic Pharma
Ticker
Company
Mcap (USDb)
3m ADTV (USDm)
TP (INR)
Rating Upside/ Downside
EPS FY16
EPS FY17e
EPS FY18e
PE FY16
PE FY17e
PE FY18e
ALKEM IN Alkem Lab 3.0 1 1,945 Buy 14.6% 56.3 70.9 86.8 30.2 23.9 19.6 ALPM IN Alembic Pharma 1.8 1 645 Hold -1.3% 26.4 21.6 27.9 24.7 30.2 23.4
Source: HSBC estimates, Thomson Reuters DataStream. Based on closing prices as of 20 Sep 2016.
Look for home advantage: initiate on Alkem, Alembic

2
EQ
UIT
IES
P
HA
RM
AC
EU
TIC
AL
S
21
Se
pte
mb
er 2
01
6
Exhibit 1: India Healthcare coverage
Companies BBG Mcap (USDb) Rating CMP (INR) TP (INR) _____________ EPS (INR) ______________ ______________ PE (x) ________________ ___________ EV/EBITDA (x) ____________ FY16 FY17e FY18e FY16 FY17e FY18e FY16 FY17e FY18e
Generics Alkem Lab ALKEM IN 3.0 Initiate at Buy 1,698 1,945 56.3 70.9 86.8 30.2 23.9 19.6 23.3 18.3 14.1 Alembic Pharma ALPM IN 1.8 Initiate at Hold 653 645 26.4 21.6 27.9 24.7 30.2 23.4 11.9 19.9 15.5 Cipla CIPLA IN 7.2 Buy 603 586 20.6 21.3 26.9 29.2 28.3 22.4 20.9 18.8 15.0 Dr Reddy's DRRD IN 7.8 Reduce 3,158 2,700 138.9 110.6 147.9 22.7 28.6 21.4 15.8 20.4 16.0 Lupin LPC IN 10.4 Buy 1,548 1,846 47.4 61.9 79.5 32.7 25.0 19.5 21.1 16.7 13.1 Sun Pharma SUNP IN 28.0 Hold 779 815 21.3 27.8 35.8 36.6 28.0 21.7 22.1 16.4 13.5 Aurobindo ARBP IN 7.0 Buy 806 880 33.9 42.1 50.4 23.7 19.2 16.0 17.1 19.2 14.5 Cadila Healthcare CDH IN 6.0 Hold 393 369 15.0 14.7 18.9 26.2 26.6 20.8 18.6 11.7 8.8 Glenmark Pharma GNP IN 3.8 Hold 905 900 27.1 46.8 53.2 33.3 19.3 17.0 10.2 16.3 13.5 Ipca Lab IPCA IN 1.1 Buy 591 761 15.2 32.2 41.7 38.9 18.3 14.2 25.0 20.6 16.4 Torrent Pharma TRP IN 4.1 Buy 1,606 1,571 100.8 69.1 84.7 15.9 23.2 18.9 25.5 20.1 15.0 Biocon BIOS IN 2.9 Hold 960 780 19.6 26.5 31.1 48.9 36.2 30.9 24.2 19.1 15.9 Divi's Lab DIVI IN 5.3 Hold 1,336 1,077 41.7 47.7 58.1 32.0 28.0 23.0 25.0 20.6 16.4 Hospitals Apollo Hospitals APHS IN 2.7 Buy 1,297 1,565 23.8 24.7 37.2 54.5 52.5 34.9 26.9 24.4 19.3 Fortis Healthcare FORH IN 1.2 Buy 172 224 -0.5 0.9 1.7 NM 195.0 100.8 42.5 25.0 19.4
Source: HSBC estimates, Thomson Reuters DataStream (as of 20 Sep 2016 closing price)

3
EQUITIES PHARMACEUTICALS
21 September 2016
Investment summary 5
India secular growth to continue
despite challenges 5
Chronic therapies lead growth 6
Low US exposure reduces FDA-
related risks 7
Initiating coverage 8
Valuation and performance 12
Growth drivers are intact 15
Revisiting the sector 15
Industry trends 18
Domestic regulatory challenges 29
Company Section 37
Alkem Laboratories 38
Alembic Pharma 59
Disclosure appendix 80
Disclaimer 83
Contents

EQUITIES PHARMACEUTICALS
21 September 2016
4
Exhibit 2: Alkem Lab and Alembic Pharma snapshot
Parameters Alkem Lab Alembic Pharma
Bloomberg ticker ALKEM IN ALPM IN Year of establishment 1973 1907 Public listing on: Dec 2015 Sep 2011* Shareholding pattern** Major shareholders (66.88%), Institutional (6.91%),
non-institutional (26.21%) Major shareholders (74.13%), Institutional (13.54%), non-institutional (12.33%)
Market cap (USDbn) 3.1 1.8 3m ADTV (USDm) 1 1 Initiate with Buy Hold Target price (INR) 1,945 645 CMP (INR) 1,698 653 FY16 sales split (%) India:73, US:20, RoW: 7 India:38, US:38, RoW:7, API:17 India (acute: chronic/specialty mix)
86:14 40:60
FY16-19 adj. core EPS CAGR
22.5% 11%
Strength Sixth largest player in highly fragmented
India pharma market with leadership positions in key acute therapies of anti-infectives, gastrointestinal and pan/analgesics
Rapidly changing product mix towards specialty products in India
Strong brand recognition in industry with multiple power brands like Clavam, Pan, Pan D, Taxim, Taxim O
Demonstrated execution in the US on gAbilify success
Robust sales & distribution network with wide reach in small towns and rural markets
One of best asset turnover ratios in the industry
Weakness Yet to be proven capabilities in developing niche/complex generics in the US & execution record in regulated markets
Below industry average sales force productivity in India
Heavy inclination of its India portfolio towards low margin acute products
Yet to be proven capabilities in developing niche/complex generics in the US
Opportunities New launches and consistent market share gain in key chronic segments (anti-diabetic, neuro, cardiac, derma etc), OTC and new areas of growth in India
New launches and consistent market share gain in key chronic segments (anti-diabetic, neuro, cardiac, derma etc), OTC and new areas of growth in India
US sales ramp-up on consistent new launches
US sales ramp-up on consistent new launches and ongoing R&D for niche/complex opportunities coming to fruition faster
Threats Product & concentration risks in India (top 10 products contribute c46% of sales in India, top four therapies account for c80%)
Facility concentration risk-It has single formulation facility (Panelav) for the US market
Heavy tilt of its India portfolio towards acute therapies (c85% of total India sales) hence more prone to government-mandated price cuts which generally cover acute therapies
Exposure to foreign currency fluctuations given exports contribute for c55% of total sales
Adverse observations from regulatory bodies like the USFDA, EMA at key facilities
Adverse observations from regulatory bodies like the USFDA, EMA at key facilities
Key catalysts 1) Strong growth in India formulations sales; 2) Successful FDA inspection of Daman and Ankaleshwar facilities
Recovery in India formulations sales
Source: Company data, HSBC estimates (*Alembic Pharma was separately listed from parent Alembic Ltd in Sep 2011, **Major shareholders are mainly company promoters)
5
EQUITIES PHARMACEUTICALS
21 September 2016
India secular growth to continue despite challenges
The India pharma market (IPM) is one of the fastest growing drug markets in the world,
increasing from cUSD5bn in 2005 to current sales of cUSD15bn. This growth has been driven
by a higher incidence of lifestyle diseases, better healthcare awareness and increasing
affordability. Despite this, healthcare spending in India remains low – expenditure per capita is
just cUSD74 p.a. vs the global average of USD1,061.
Similarly, India’s pharma expenditure per capita at cUSD20 p.a. is far lower than in the US
(cUSD1,100), other developed nations like Japan, Canada, Germany and France (USD500-800),
and emerging markets such as Brazil, Russia and Mexico (USD150-200). This implies continued
significant growth opportunities in India and CRISIL Research forecasts that India’s pharma market
will grow at a CAGR of c13-15% to reach cUSD20bn by 2019-20.
While the secular growth story remains intact due to favourable demographics and healthcare
demand, recent regulatory events have slowed down overall market growth. In India, the
government has issued a series of regulatory updates in the last 8-10 months. These include
putting additional drugs under price controls as well as reducing prices for certain drugs in line
with the negative wholesale price inflation (WPI) for 2015. The government has also proposed
banning several hundred fixed dose combination (FDC) medicines on health grounds.
These regulatory changes have created uncertainty among manufacturers and trade channel
participants who have reduced/delayed product uptake from manufacturers, impacting sales
growth. As a result, sector growth has fallen from the historical trend of 12-15% to single digits
in recent quarters. See page 29 for the full list of recent regulatory changes.
The overall Indian pharma sector has also been faced with a series of regulatory issues raised
by the US Food and Drug Administration (US FDA) and other global regulatory agencies with
regard to the some of the larger companies’ facilities. These regulatory issues, as well as a
challenging pricing environment due to channel consolidation and increasing competition, have
slowed sales growth in the US, an important market for most of the Indian pharma companies.
While investor sentiment has remained cautious due to these concerns, we believe growth
prospects in the domestic Indian market continue to be bright, while a recovery in US sales is
largely dependent on the resolution of FDA-related issues.
Investment summary
We expect sustained growth for emerging chronic players in India,
driven by a chronic therapies sales ramp-up and a stable base in the
acute segment
Lower exposure to US limits near-term FDA related risks
Initiate with a Buy on Alkem Lab and a Hold on Alembic Pharma
Recent regulatory events
have slowed down overall
market growth

EQUITIES PHARMACEUTICALS
21 September 2016
6
We believe government-mandated price revisions are scheduled every two to three years and
therefore the next round of revisions will likely take place in India in 2018-19. Additionally, companies
are consciously launching brands in discretionary areas where pricing may be flexible.
We now take a more detailed look at what pharma categories are driving India pharma and
introduce the two companies highlighted in this report, Alkem Lab and Alembic Pharma.
Exhibit 3: India pharma growth trend
Source: AIOCD, HSBC
Chronic therapies lead growth
The India pharma market is dominated by acute therapies used for short-term treatments. They
account for 66% of total sales versus 34% for chronic treatments, which need to be taken for a
longer period (e.g. cardiac, anti-diabetic, oncology and neurology). However it is the chronic
category that is growing fastest – recording a CAGR of 15% over the last 10 years compared to
10% for the overall market.
There are several reasons for this, ranging from an increasing incidence of lifestyle related
diseases and better awareness about healthcare, to greater penetration in small towns and rural
areas and general affordability. We expect the chronic category to represent 40-45% of sales by
2020, up from 34%. Growth in sales of acute therapies will continue, but the pace of increase
will be slower than for chronic therapies.
Given the significant growth potential and better margin profile, it is little surprise that most
companies have enhanced their focus on the chronic segment. We believe this trend will
continue to be the key driver for India sales growth.
Presence across categories
We have mapped the domestic sales of leading companies across acute, sub-chronic and
chronic therapies to assess areas of strength and growth opportunities. This is what we found:
Chronic: Sun Pharma, Lupin, Torrent and Cadila Healthcare have an established presence
in cardiac therapies. In diabetes treatments, Sun Pharma, Lupin and Glenmark are the
leading names. Neuro/central nervous system (CNS) is an important segment for
Sun Pharma and Torrent Pharma, while oncology treatments are among the top therapies
for Dr Reddy’s and Cadila (mainly biosimilars). Respiratory remains the biggest segment
for Cipla, where it has maintained leadership status in inhalers.
10.8%
14.6%
12.8%
17.0%
11.3%13.0%
11.5%
13.8%12.1%
14.9%
11.9%
6.2%
10.8%
13.7%
11.1%
16.8%
14.8%
11.9%
14.9%
9.5%6.4%
0.0%
2.0%
4.0%
6.0%
8.0%
10.0%
12.0%
14.0%
16.0%
18.0%
2003
2004
2005
2006
2007
2008
2009
2010
2011
2012
2013
2014
1QF
Y15
2QF
Y15
3QF
Y15
4QF
Y15
1QF
Y16
2QF
Y16
3QF
Y16
4QF
Y16
1QF
Y17
IPM growth
Impact of new DPCO 2013
Combined impact ofNLEM expansion, WPI-related price revisions,propsoed FDC ban

7
EQUITIES PHARMACEUTICALS
21 September 2016
Sub-chronic: Derma, pain management and gynaecology therapies offer opportunities to
increase market share. Derma is a focus therapy for Glenmark, and pain for Sun Pharma,
Alkem Lab, Torrent and Ipca Lab.
Acute: Anti-infectives remain key revenue contributors for Alkem, Cipla, Lupin, GSK and
Mankind, while gastro remains a major therapy for Sun Pharma, Abbott, Alkem, Cadila and
Dr Reddy’s.
Growth areas for Alkem Lab and Alembic Pharma
As shown in the table below, Alkem Lab trails its bigger rivals in terms of sales of cardiac,
anti-diabetes and neuro therapies. Alkem, which makes most of its sales from acute therapies
(anti-infectives, gastrointestinal, pain/analgesics) is deploying more resources to try to close the
gap in the chronic segment. Alembic Pharma is also ramping up major chronic segment sales
(cardiac and anti-diabetic) through launches in high-growth molecules.
We believe Alkem Lab and Alembic Pharma will see strong growth in their chronic sales from
the current low base, supported by their established presence in acute therapies. They also
have less exposure to the US market than their larger peers, which in the current environment
we see as a definite advantage, as discussed in the next section.
Exhibit 4: Therapy sales split for key companies
Company ________________________________ Therapy share in India sales _________________________________ Anti-
infective Cardiac Gastro VNM Anti-
diabetic Respiratory pain Neuro Derma Gynae Oncology Others
Sun + Ranbaxy
11.8% 18.2% 12.0% 4.0% 9.0% 3.7% 7.3% 17.2% 4.7% 4.0% 0.5% 7.6%
Abbott 11.1% 10.4% 18.7% 12.6% 4.9% 7.7% 5.6% 11.8% 6.0% 4.0% 0.0% 7.1%
Cipla 26.8% 11.8% 7.9% 1.8% 1.0% 30.2% 3.1% 3.5% 2.5% 1.5% 0.7% 9.1%
Zydus Cadila 7.4% 16.8% 13.6% 4.2% 1.3% 10.5% 9.6% 1.3% 8.0% 10.7% 5.3% 11.1%
Mankind 23.3% 8.8% 11.2% 14.5% 5.4% 6.3% 5.0% 3.0% 4.6% 6.2% 0.0% 11.6%
Alkem 42.8% 2.7% 17.8% 12.0% 2.5% 2.8% 6.9% 5.1% 3.7% 2.2% 0.7% 0.8%
Lupin 21.1% 25.0% 7.9% 5.5% 11.3% 12.3% 4.4% 5.0% 0.5% 3.5% 0.3% 3.2%
Glaxo Pharma
23.0% 1.9% 5.6% 7.6% 0.0% 8.1% 9.2% 0.3% 18.8% 1.1% 0.4% 23.9%
Glenmark 13.1% 22.7% 2.4% 2.8% 8.4% 15.3% 2.1% 0.4% 29.2% 1.8% 0.1% 1.8%
Dr. Reddy’s 8.0% 14.5% 22.0% 2.7% 6.7% 8.6% 7.8% 3.2% 6.8% 0.2% 6.7% 12.9%
Torrent 4.2% 29.2% 14.6% 15.7% 6.0% 0.3% 7.8% 16.3% 2.6% 1.6% 0.0% 1.6%
Alembic 23.5% 13.9% 13.9% 7.7% 6.1% 12.7% 3.8% 1.0% 2.0% 10.8% 0.0% 4.6%
Ipca Lab 5.9% 17.2% 8.2% 2.2% 5.3% 4.1% 26.1% 3.4% 2.9% 0.0% 4.1% 20.6%
Source: AIOCD, HSBC analysis (red cell indicates chronic therapies, grey cell indicates acute therapies while pale red cells indicate sub-chronic therapies; focus areas shown in bordered cells for Alkem and Alembic)
Low US exposure reduces FDA-related risks
The US remains the largest market for the majority of Indian pharma companies. In the past 15-18
months multiple US FDA regulatory issues have slowed/delayed new product approvals and
impacted product supplies from the key facilities of several large companies in the sector.
Alkem and Alembic generate about 20-25% of their sales in the US, much lower than the c45-50%
for larger companies like Sun, Lupin and Dr Reddy’s. This makes them less exposed to the US
FDA risk that is currently troubling the sector. Alkem and Alembic have a good record with the US
FDA so far, hence their long-term focus on maintaining high quality standards and increasing front-
end investments make the case for the US market becoming a long-term driver for these
companies.

EQUITIES PHARMACEUTICALS
21 September 2016
8
Exhibit 5: Alkem and Alembic have less exposure to US than peers (FY16 sales)
Company India formulations US Russia Japan EU Others
Alkem Lab 72.5% 20.3% 7.2% Alembic Pharma 37.6% 38.3%* 24.2% Aurobindo Pharma 21.0% 43.7% 22.3% 13.0% Cadila Healthcare 30.8% 41.5% 3.1% 24.6% Cipla 38.2% 15.3% 4.4% 42.0% Dr Reddy's 13.8% 48.8% 9.2% 11.0% 17.3% Glenmark 27.6% 31.6% 9.4% 31.4% Lupin 24.8% 43.3% 10.0% 3.1% 18.8% Sun Pharma 25.9% 48.3% 25.8% Torrent Pharma 27.3% 40.0% 9.5% 23.2%
Source: Company data, HSBC analysis (*Higher due to gAbilify in FY16, otherwise 20-25% on a normalized basis)
Despite being late entrants in the US both companies have ambitious plans to expand in that
market. Alembic has demonstrated its execution capabilities by securing FDA approval and
launching the generic Abilify (aripiprazole) in FY15-16 ahead of many front-line generics. Alkem,
through strategic acquisitions and product launches (including in-licensed products), has a
leading market share in areas like mycophenolate, benzonatate, silver sulfadiazine. Both
companies are investing in R&D and we expect them to reap the benefits in the next two to
three years.
Initiating coverage
Alkem Lab (ALKEM IN, Initiate at Buy, TP INR1,945). See full company write-up
commencing on page 38.
Alkem Lab is the sixth largest player by sales in the highly fragmented India pharma market,
with leadership positions in key acute therapies like anti-infectives (consistently No 1 for the last
10 years), gastrointestinal and pain/analgesics. Alkem has established industry recognition for
creating strong brands like Clavam, Pan, Pan D and Taxim in a crowded market and is one of
the fastest growing pharma companies among the top 10 players in India. India formulations
accounted for c72% of overall sales in FY16. After establishing a leadership position in acute
therapies, Alkem is aiming to repeat this success in better margin, high-growth chronic therapies
(e.g. cardiac, anti-diabetes, derma), leveraging on its strong sales and distribution network and
strong reach to the medical fraternity.
India growth to sustain: Despite the challenging regulatory environment, we believe Alkem
can sustain above market growth for its India formulations business, driven by volume growth in
power brands, increasing marketing share in the chronic segment and new product launches.
An increasingly competitive pricing environment in segments like anti-infectives and gastro may
continue to impact the prices of its key brands. However, this will also provide opportunities for
higher volume growth in price-sensitive segments. The company has been able to hold/increase
market share in several of its biggest brands, which should sustain the growth of its domestic
formulations business, along with increasing share in chronic therapies products. We expect
India formulations sales to grow at a CAGR of c18% over FY16-19e (acute therapies c16% and
chronic therapies c29%).
US to grow from a small base: Alkem’s US sales have increased from USD14m in FY11 (from
less than 10 products) to cUSD150m in FY16 (19 products, of which five are in-licensed). We
believe several factors will drive further growth in the US growth – its Abbreviated New Drug
Application (ANDA) pipeline, strong market share in key products, the company’s own front-end
commercial and manufacturing infrastructure and strong channel reach.
We forecast that US sales will increase at a CAGR of c23% over FY16-19e which will be driven
by continued traction in existing products, new product launches and a gradual shift towards

9
EQUITIES PHARMACEUTICALS
21 September 2016
Paragraph-IV (P-IV) ANDA and specialty launches. (Under a P-IV filing, a company can seek
FDA approval to market a generic drug in the US before the expiration of a patent protecting the
reference brand drug. P-IV certifies that the patent in question is either invalid or is not infringed
by the generic product. If the generic filer successfully invalidates the patent in the subsequent
legal battle which follows after P-IV filing, it can launch the generic before the expiry of the
patent.)
Margin improvements: Alkem has historically lagged behind peers in terms of gross margins
and subsequent operating margins due to a heavy dependence on acute therapies. In the long
term it aims to bridge this gap in EBITDA margins – Alkem’s c17% vs 23-25% for key peers – by
increasing the sales share of chronic therapies in India and growing sales in the US. We
estimate that gross margin improvement, coupled with increasing operating efficiency, should
drive the EBITDA margin up at least 260bps over FY16-19e. Overall, we expect earnings CAGR
of 22.5% between FY16-19e. Moreover a healthy balance sheet, with cash and equivalents of
cINR8bn in FY16 and net debt/equity of -0.06, should enable the company to make strategic
acquisitions to support its growth plans.
Valuation: We value the stock at a PE of 22x (Gordon Growth based PE) September 2018e
EPS of INR95.2, and we discount this value to arrive at our TP of INR1,945. Our TP implies
FY17, FY18, FY19 PE of 27.4x, 22.4x and 18.8x, compared to peer averages of 26.4x, 20.8x
and 17.8x. Our TP offers 14.6% upside; at this level, according to HSBC’s rating system, the
stock could be rated either as a Hold or a Buy. We rate Alkem a Buy, however, based on its
sustained growth outlook in India on strong brand positioning and expected market share gain
in chronic therapies products, as well as increasing sales in the US which should lead to margin
expansion.
Our Gordon Growth Model assumes 22% ROE, 7.7% cost of equity and a 4% long-term growth
rate. ROE is based on our explicit forecast average of FY17-19e period, while the cost of equity
of 7.7% is based on our in-house view of a global risk free rate of 3% and a 6.5% equity risk
premium for India.
Key catalysts: 1) Strong recovery in India formulations sales; 2) successful US FDA inspection
of its Daman and Ankaleshwar facilities.
Key downside risks: 1) Concentration risk from dependence on top brands; 2) price cuts and
other regulatory challenges in India; 3) delay/failure to receive drug approvals in the US;
4) regulatory risks (US FDA and other regulatory agencies like EMA, UK MHRA); 5) lack of
vertical integration in the US market.
For more detailed risks, see page 52 in the company section.
HSBC vs Consensus: We are in-line with Bloomberg consensus on FY17 EPS estimates while
we are 5-6% ahead of consensus on FY18 and FY19 estimates (see Exhibit 6 below).
Alembic Pharma (ALPM IN, Initiate at Hold, TP INR645). See full company write-up
commencing on page 59.
Alembic Pharma, a mid-sized pharma company, has successfully transitioned from being
predominantly an acute player to becoming a specialty therapy focused player after the current
management team re-aligned their strategies towards the high-growth specialty segment in
2007-08. These specialty products will be key drivers for its India formulations business, which
contributed c60% of total India sales in FY16. We forecast c21% FY16-19e CAGR for its India
specialty formulations sales (vs 14% CAGR for total India sales). Overall, we forecast c11%
adjusted core PAT CAGR for FY16-19e.

EQUITIES PHARMACEUTICALS
21 September 2016
10
US investment ongoing: After the success of exclusive gAbilify (an anti-psychotic treatment)
sales during FY16, Alembic expects core US sales (excluding any one-off benefits) momentum
to continue with y-o-y sales growth of c30-35%, driven by new launches. Its pipeline of c35
pending ANDAs (of which 40% are P-IV opportunities) has an attractive maturity profile based
on their filing dates as they all could be approved in the next three to four years. The company
has ramped-up its R&D efforts to increase the width and quality of its pipeline. It is targeting
niche areas like injectables (including oncology injectables) and derma and we believe these
R&D investments will start to bear fruit in two to three years. With a front-end marketing
infrastructure now in place we expect margins to improve (it previously had to share revenues
with marketing partners). On the back of seven to eight expected new launches a year, we
expect core US sales to grow at a FY16-19e CAGR of c29%.
Strong management team: We believe the management team deserves credit for making
structural changes to the company. These include shifting the focus to specialty therapies in
India, de-merging Alembic Pharma from its parent to unlock the value of the India business,
putting a greater focus on the US and ramping up its R&D investment. We think this will take the
company to the next level of growth and profitability.
Valuation: We value the stock at 22x (Gordon Growth based PE) September 2018e EPS of
INR31.6 and discount this value to arrive at our TP of INR645. Our TP implies FY17, FY18 and
FY19 PE of 29.8x, 23.1x and 18.0x compared to peer averages of 26.4x, 20.8x and 17.8x.
Our model assumes c25% sustainable ROE, 7.9% cost of equity and 4% long-term growth rate.
ROE is based on our explicit forecast average of the FY17-19e period, while the cost of equity
is based on a global risk-free rate of 3% and a 6.5% equity risk premium for India.
We are positive about Alembic’s long-term growth prospects, which will be driven by increasing
specialty market share in India, the ramp-up of US sales and R&D investment. However, we
believe the current stock price, which implies forward multiples of 28.4x FY17 and 21.3x FY18
consensus earnings estimates, reflects the long-term positives from ongoing R&D initiatives and
we don’t have much upside in our numbers. Hence, we initiate with a Hold rating.
Key downside risks: 1) Higher margin pressure due to higher R&D expense; 2) regulatory risks,
especially the US FDA); 3) delay/failure to receive US FDA approvals in the US; 4) price cuts
and other regulatory challenges in India; c18% of its domestic branded formulations portfolio
comes under the National List of Essential Medicines, which are subject to price caps by
regulatory bodies; 5) foreign currency fluctuations: export sales contribute c55% of company
revenues.
Key upside risks: 1) Strong recovery in India formulations sales after a muted 1Q FY17; 2)
faster than expected pick-up of US sales from new launches.
For more detailed risks, see pages 70-71 in the company section.
HSBC vs Consensus: We are 6.5-7.5% below Bloomberg consensus on FY17-19 earnings
(see Exhibit 6 below) due to our assumption of a more gradual improvement in margins.

11
EQUITIES PHARMACEUTICALS
21 September 2016
Exhibit 6: HSBC vs Consensus estimates
Company Estimates (INRm except EPS) FY17e FY18e FY19e
Alkem Lab HSBC Sales 60,202 72,738 83,308 EBITDA 10,717 13,709 16,319 PAT 8,477 10,382 12,386 EPS 70.9 86.8 103.6 Bloomberg Sales 57,544 67,898 78,634 EBITDA 10,132 12,514 15,647 PAT 8,448 9,783 11,759 EPS 70.7 81.8 98.4 % difference HSBC vs BBG Sales 4.6% 7.1% 5.9% EBITDA 5.8% 9.5% 4.3% PAT 0.4% 6.1% 5.3% EPS 0.3% 6.1% 5.3% Alembic Pharma FY17e FY18e FY19e HSBC Sales 30,365 36,479 43,667 EBITDA 6,105 7,865 9,990 PAT 4,080 5,266 6,747 EPS 21.64 27.94 35.79 Bloomberg Sales 31,667 36,507 41,341 EBITDA 6,411 8,159 10,376 PAT 4,379 5,695 7,221 EPS 23.23 30.20 38.28 % difference-HSBC vs BBG Sales -4.1% -0.1% 5.6% EBITDA -4.8% -3.6% -3.7% PAT -6.8% -7.5% -6.6% EPS -6.8% -7.5% -6.5%
Source: HSBC estimates, Bloomberg
Exhibit 7: Valuation comparison
Alkem Lab Alembic Pharma Remarks
Target price (INR) 1,945 645 Implied PE FY17e 27.4 29.8 FY18e 22.4 23.1 FY19e 18.8 18.0 Average 12-m forward PE 3-yr average na 18.3 Alembic has significantly rerated in FY16 on gAbilify
success in the US. Alkem went public in Dec 2015 5-yr average na 14.8 Current 22.1 24.2 Comps average FY17e 26.4 Range 17-34x FY18e 20.8 Range 16-30x FY19e 17.8 Range 14-25x
Source: HSBC estimates, Thomson Reuters DataStream

EQUITIES PHARMACEUTICALS
21 September 2016
12
The Indian pharma sector has gone through a difficult time in the last 15-18 months as a result
of US FDA regulatory issues. This has resulted in slower approvals, launches and sales in the
US for many of the larger companies in the sector. After years of outperformance, it is not a
surprise that India healthcare has underperformed other sectors in the past 12 months
(see Exhibit 8).
Additionally, increasing competition and channel consolidation in the US have led to price
erosion, which has had a material impact (see our report Cherry picking amidst consolidation,
16 September 2015). In India, domestic sales have been hurt by pricing controls, while
emerging market sales have been impacted by currency volatility.
Exhibit 8: India healthcare has underperformed other sectors in the past 12 months
Source: Thomson Reuters DataStream
70.0
80.0
90.0
100.0
110.0
120.0
130.0
140.0
Aug-15 Sep-15 Oct-15 Nov-15 Dec-15 Jan-16 Feb-16 Mar-16 Apr-16 May-16 Jun-16 Jul-16 Aug-16
Basic Mat. Energy FMCG Finance Healthcare
Industrials IT Telecom Utilities Sensex
Valuation and performance
Regulatory issues are the major overhang for the sector
Resolving problems raised by the US FDA will be a key trigger for
sector rerating
A strong recovery in India sales for domestic focused players like
Alkem and Alembic will be key to strong performance

13
EQUITIES PHARMACEUTICALS
21 September 2016
Exhibit 9: US sales growth has slowed for major Indian generics
US Sales (USDm) FY11 FY12 FY13 FY14 FY15 FY16 1QFY17
Aurobindo Pharma 261 247 322 567 773 940 255 Dr Reddy's Lab 417 670 738 921 1,055 1,168 237 Lupin 441 507 693 803 891 887 322 Sun Pharma 481 725 1,132 1,620 2,244 2,064 609 Sun Pharma ex Taro 266 291 524 922 1,450 1,208 399 Cadila Healthcare 212 260 277 366 551 609 129 Glenmark Pharma 182 250 310 336 333 371 104 Torrent Pharma 24 44 64 128 133 403 65 % y-o-y Aurobindo Pharma 35.8% -5.2% 30.4% 75.9% 36.3% 21.6% 20.3% Dr Reddy's Lab 17.5% 60.7% 10.1% 24.8% 14.5% 10.7% -19.7% Lupin 26.7% 15.0% 36.7% 15.9% 11.0% -0.4% 56.7*% Sun Pharma 108.2% 50.7% 56.1% 43.1% 38.5% -8.0% 5.3**% Sun Pharma ex Taro 15.2% 9.4% 80.1% 76.0% 57.3% -16.7% 0.3**% Cadila Healthcare 49.3% 22.6% 6.5% 32.1% 50.5% 10.5% -18.4% Glenmark Pharma 19.6% 37.4% 24.0% 8.4% -0.9% 11.4% 17.4% Torrent Pharma 25.5% 83.6% 45.5% 100.7% 3.5% 203.0% -53.2%
Source: Company data, HSBC analysis (*Appear high on very low base, **Showing base sales growth excluding one-offs)
Exhibit 10: 2016 ytd Stock performance
Source: Thomson Reuters DataStream (as of 20 Sep 2016 closing price)
Biocon
Cadila Healthcare
Alkem Lab
Sensex
Torrent Pharma
Dr Reddy's
Glenmark
Sun Pharma
Alembic Pharma
Cipla
Aurobindo Pharma
Lupin
Ipca Lab
-40.0% -20.0% 0.0% 20.0% 40.0% 60.0% 80.0% 100.0%
EQUITIES PHARMACEUTICALS
21 September 2016
14
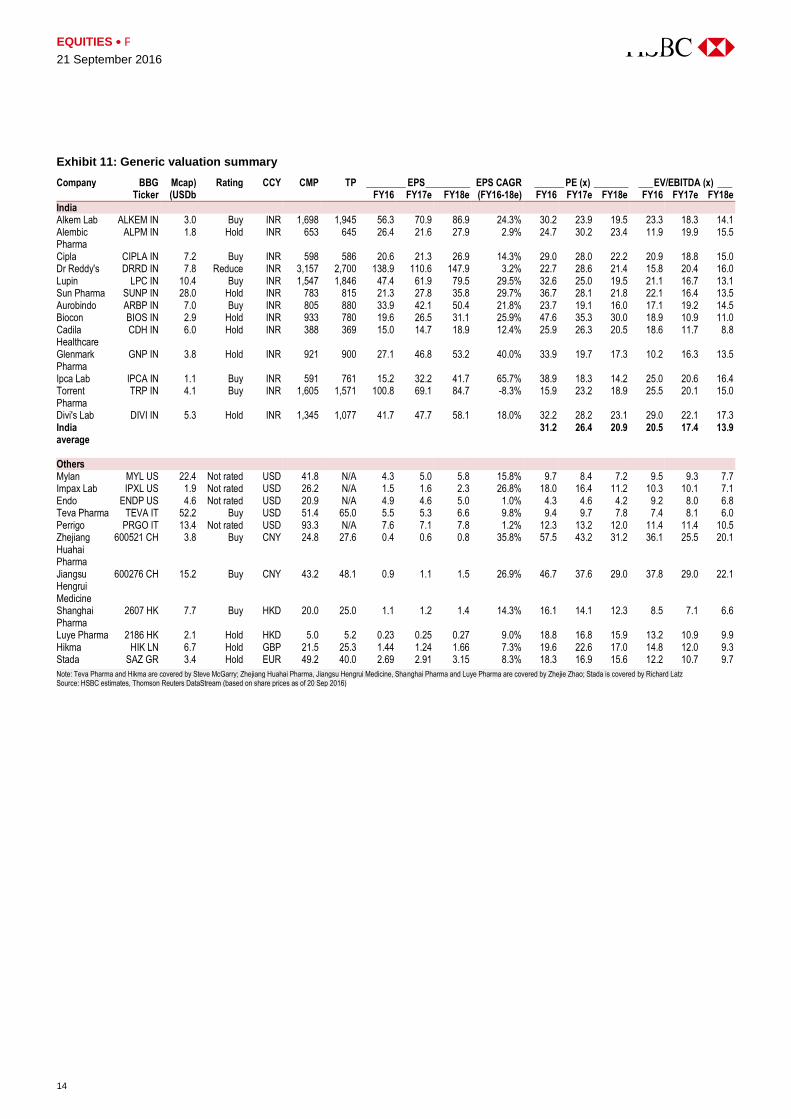
Exhibit 11: Generic valuation summary
Company BBG Mcap) Rating CCY CMP TP ________ EPS _________ EPS CAGR ______ PE (x) _______ ___ EV/EBITDA (x) ___ Ticker (USDb FY16 FY17e FY18e (FY16-18e) FY16 FY17e FY18e FY16 FY17e FY18e
India Alkem Lab ALKEM IN 3.0 Buy INR 1,698 1,945 56.3 70.9 86.9 24.3% 30.2 23.9 19.5 23.3 18.3 14.1 Alembic Pharma
ALPM IN 1.8 Hold INR 653 645 26.4 21.6 27.9 2.9% 24.7 30.2 23.4 11.9 19.9 15.5
Cipla CIPLA IN 7.2 Buy INR 598 586 20.6 21.3 26.9 14.3% 29.0 28.0 22.2 20.9 18.8 15.0 Dr Reddy's DRRD IN 7.8 Reduce INR 3,157 2,700 138.9 110.6 147.9 3.2% 22.7 28.6 21.4 15.8 20.4 16.0 Lupin LPC IN 10.4 Buy INR 1,547 1,846 47.4 61.9 79.5 29.5% 32.6 25.0 19.5 21.1 16.7 13.1 Sun Pharma SUNP IN 28.0 Hold INR 783 815 21.3 27.8 35.8 29.7% 36.7 28.1 21.8 22.1 16.4 13.5 Aurobindo ARBP IN 7.0 Buy INR 805 880 33.9 42.1 50.4 21.8% 23.7 19.1 16.0 17.1 19.2 14.5 Biocon BIOS IN 2.9 Hold INR 933 780 19.6 26.5 31.1 25.9% 47.6 35.3 30.0 18.9 10.9 11.0 Cadila Healthcare
CDH IN 6.0 Hold INR 388 369 15.0 14.7 18.9 12.4% 25.9 26.3 20.5 18.6 11.7 8.8
Glenmark Pharma
GNP IN 3.8 Hold INR 921 900 27.1 46.8 53.2 40.0% 33.9 19.7 17.3 10.2 16.3 13.5
Ipca Lab IPCA IN 1.1 Buy INR 591 761 15.2 32.2 41.7 65.7% 38.9 18.3 14.2 25.0 20.6 16.4 Torrent Pharma
TRP IN 4.1 Buy INR 1,605 1,571 100.8 69.1 84.7 -8.3% 15.9 23.2 18.9 25.5 20.1 15.0
Divi's Lab DIVI IN 5.3 Hold INR 1,345 1,077 41.7 47.7 58.1 18.0% 32.2 28.2 23.1 29.0 22.1 17.3 India average
31.2 26.4 20.9 20.5 17.4 13.9
Others Mylan MYL US 22.4 Not rated USD 41.8 N/A 4.3 5.0 5.8 15.8% 9.7 8.4 7.2 9.5 9.3 7.7 Impax Lab IPXL US 1.9 Not rated USD 26.2 N/A 1.5 1.6 2.3 26.8% 18.0 16.4 11.2 10.3 10.1 7.1 Endo ENDP US 4.6 Not rated USD 20.9 N/A 4.9 4.6 5.0 1.0% 4.3 4.6 4.2 9.2 8.0 6.8 Teva Pharma TEVA IT 52.2 Buy USD 51.4 65.0 5.5 5.3 6.6 9.8% 9.4 9.7 7.8 7.4 8.1 6.0 Perrigo PRGO IT 13.4 Not rated USD 93.3 N/A 7.6 7.1 7.8 1.2% 12.3 13.2 12.0 11.4 11.4 10.5 Zhejiang Huahai Pharma
600521 CH 3.8 Buy CNY 24.8 27.6 0.4 0.6 0.8 35.8% 57.5 43.2 31.2 36.1 25.5 20.1
Jiangsu Hengrui Medicine
600276 CH 15.2 Buy CNY 43.2 48.1 0.9 1.1 1.5 26.9% 46.7 37.6 29.0 37.8 29.0 22.1
Shanghai Pharma
2607 HK 7.7 Buy HKD 20.0 25.0 1.1 1.2 1.4 14.3% 16.1 14.1 12.3 8.5 7.1 6.6
Luye Pharma 2186 HK 2.1 Hold HKD 5.0 5.2 0.23 0.25 0.27 9.0% 18.8 16.8 15.9 13.2 10.9 9.9 Hikma HIK LN 6.7 Hold GBP 21.5 25.3 1.44 1.24 1.66 7.3% 19.6 22.6 17.0 14.8 12.0 9.3 Stada SAZ GR 3.4 Hold EUR 49.2 40.0 2.69 2.91 3.15 8.3% 18.3 16.9 15.6 12.2 10.7 9.7
Note: Teva Pharma and Hikma are covered by Steve McGarry; Zhejiang Huahai Pharma, Jiangsu Hengrui Medicine, Shanghai Pharma and Luye Pharma are covered by Zhejie Zhao; Stada is covered by Richard Latz Source: HSBC estimates, Thomson Reuters DataStream (based on share prices as of 20 Sep 2016)

15
EQUITIES PHARMACEUTICALS
21 September 2016
Revisiting the sector
India’s pharmaceutical market (IPM) has tripled in size from cUSD5bn in 2005 to around
USD15bn currently. It’s highly fragmented, with the top 10 companies accounting for c44% of
the market (source: AIOCD MAT July 2016). Acute therapies dominate the market and
contribute for 66% of total sales while chronic therapies account for 34% sales. We expect this
to change due to changes in lifestyle, demographics and healthcare demand. Chronic therapies,
which need to be taken for a longer period, continue to be the key growth drivers for India’s
pharma market.
India formulations account for an average of 30-35% of total company sales for major
companies. The figure is generally lower for US-focused generic companies like Lupin, Sun
Pharma, Glenmark and Dr Reddy’s.
See Exhibits 12-14 for more details on market and growth trends.
Growth drivers are intact
We look at the categories and segments which are driving growth in
a difficult, fragmented market
We also take a detailed look at the regulatory problems facing the
industry in India
Despite these challenges, double-digit annual growth is still possible
due to favourable demographics and strong healthcare demand

EQUITIES PHARMACEUTICALS
21 September 2016
16
Exhibit 12: Top players in the fragmented market (INRbn)
Rank INRbn Type of company MAT July 2016 (AIOCD basis)
Jul13-16 CAGR Market share
IPM 1009.0 11.7% 100.0% 1 Sun + Ranbaxy Public/Indian 87.9 9.6% 8.7% 2 Abbott + Novo Public/MNC 63.2 8.6% 6.3% 3 Cipla Public/Indian 50.0 11.0% 5.0% 4 Zydus + Biochem Public/Indian 42.5 9.4% 4.2% 5 Mankind Private/Indian 38.9 13.7% 3.9% 6 Alkem + Cachet + Indchemie Public/Indian 34.7 11.2% 3.4% 7 Lupin Public/Indian 33.8 15.6% 3.3% 8 Glaxo Public/MNC 32.5 0.8% 3.2% 9 Macleods Private/Indian 29.5 16.3% 2.9% 10 Pfizer+Wyeth Public/Indian 29.1 9.8% 2.9% 11 Intas Private/Indian 28.9 17.1% 2.9% 12 Emcure Private/India 26.8 16.1% 2.7% 13 Aristo Private/Indian 25.0 13.6% 2.5% 14 Glenmark Public/Indian 24.3 18.7% 2.4% 15 Sanofi India Public/Indian 24.3 16.2% 2.4% 16 Dr. Reddys Public/MNC 24.1 14.6% 2.4% 17 Torrent Public/Indian 22.8 21.9% 2.3% 18 USV Private/Indian 20.3 15.7% 2.0% 19 Micro + Bal Private/India 19.6 14.4% 1.9% 20 Alembic Public/Indian 14.2 13.5% 1.4% Top 10 share in IPM 43.8% Top 20 share in IPM 66.6%
Source: AIOCD, HSBC analysis
Exhibit 13: India formulations growth trend for key companies
Company FY16 reported
sales India as % of
sales FY12 FY13 FY14 FY15 FY16 ___________________________ % y-o-y ____________________________
Sun+Ranbaxy 72.5 25.9% 10.6% 13.1% 11.0% 14.4% 8.0% Cipla 51.1 38.2% 14.0% 14.6% 12.0% 17.0% 5.9% Zydus Cadila 29.7 30.8% 10.6% 22.6% 6.1% 8.6% 11.1% Alkem 35.4 72.5% 18.6% 16.8% 14.6% 20.3% 30.4% Lupin 33.9 24.8% 22.8% 21.4% 4.9% 19.7% 14.3% Glaxo 27.3 100.0% 8.6% 11.2% -3.1% 4.8% -16.1% Glenmark 21.1 27.6% 18.6% 30.7% 15.3% 15.8% 20.6% Dr. Reddys 21.3 13.8% 10.6% 12.6% 7.9% 13.7% 19.2% Torrent 18.3 27.3% 9.0% 13.2% 12.6% 38.6% 13.4% Alembic 11.9 40.6% 12.9% 13.2% 10.7% 12.5% 8.3% Ipca Lab 12.1 42.5% 8.2% 16.6% 10.4% 16.4% 6.9%
Source: Company data, HSBC analysis

17
EQ
UIT
IES
P
HA
RM
AC
EU
TIC
AL
S
21
Se
pte
mb
er 2
01
6
Exhibit 14: Snapshot of top companies (INRm)
Source: AIOCD, HSBC analysis (*Abbott doesn’t include anti-diabetic brands which it distributes in India under agreement with Novo Nordisk)
Company Sun Pharma Sales Abbott* Sales Cipla Sales Zydus Cadila Sales Mankind Sales Alkem Sales
Rank (previous year) 1 (1) 2 (2) 3 (3) 4 (4) 5 (5) 6 (6)
Top 5 brands Volini 2,303 Phensedyl Cough Linctus 2,473 Foracort 2,007 Skinlite 1,822 Manforce 1,767 Clavam 2,453
Rosuvas 1,760 Thyronorm 1,824 Budecort 1,646 Atorva 1,304 Moxikind CV 1,674 Pan 2,005
Istamet 1,624 Duphaston 1,745 Asthalin 1,391 Mifegest Kit 1,234 Unwanted Kit 1,224 Taxim O 1,948
Gemer 1,605 Vertin 1,270 Seroflo 1,328 Deriphyllin 1,034 Glimestar M 739 Pan D 1,634
Levipil 1,539 Udiliv 1,259 Duolin 1,267 Pantodac 1,022 Amlokind-AT 722 Taxim 1,425Total no of brands 1,323 919 1,027 1,247 703 954% Sales contribution
Top 15 brands 22.7% 31.4% 30.6% 29.9% 29.1% 48.9%
Top 16-50 brands 20.5% 26.2% 26.7% 22.9% 25.9% 18.5%
Top 51-100 brands 15.1% 18.2% 17.2% 14.2% 17.3% 10.3%
Remaining brands 41.6% 24.2% 25.5% 33.0% 27.7% 22.3%
Total India sales 87,380 52,531 49,668 42,470 38,281 34,720
Acute: Chronic mix 40:60 39:61 59:41 67:33 57:43 86:14
Company Lupin Sales Glaxo Sales Glenmark Sales Dr Reddy's Sales Torrent Sales Alembic Sales
Rank (previous year) 7 (7) 8 (8) 14 (16) 16 (17) 17 (15) 20 (20)
Top 5 brands Gluconorm-G 1,464 Augmentin 3,025 Telma 1,772 Omez 1,312 Shelcal 1,856 Azithral 1,371
Tonact 965 Synflorix 1,985 Telma H 1,437 Omez D 987 Chymoral Forte 1,111 Althrocin 818
Budamate 855 Calpol 1,785 Ascoril Plus 1,059 Econorm 730 Nikoran 856 Roxid 579
Rablet-D 547 Zinetac 1,575 Candid 1,004 Nise 720 Dilzem 634 Gestofit 557
Esiflo 517 Betnovate C 1,539 Candid-B 928 Stamlo 665 Nebicard 616 Wikoryl 465Total no of brands 829 225 350 379 490 441% Sales contribution
Top 15 brands 25.8% 60.7% 42.9% 38.9% 40.5% 45.0%
Top 16-50 brands 26.9% 25.4% 29.3% 28.2% 27.4% 28.9%
Top 51-100 brands 18.6% 10.7% 15.8% 16.8% 16.8% 16.7%
Remaining brands 28.7% 3.1% 12.1% 16.0% 15.4% 9.3%
Total India sales 33,524 1,014 2,913 3,822 3,491 1,308
Acute: Chronic mix 42:58 87:13 40:60 52:48 38:62 40:60

EQUITIES PHARMACEUTICALS
21 September 2016
18
Industry trends
We now look at therapies, molecules and brands to assess recent industry trends.
A. Therapeutic overview
Anti-infectives remains the leading therapeutic segment, with a market share of c15%. Its share
has though gradually come down due to the increased growth in chronic therapies.
Exhibit 15: Anti-infectives continue its dominance in IPM
Therapy Sales (INRb) CAGR ___________________ Market share ____________________ MAT Jul 16 MAT Jul 13-16 MAT Jul 13 MAT Jul 14 MAT Jul 15 MAT Jul 16
IPM 1,009 11.7% 100.0% 100.0% 100.0% 100.0% Anti-Infectives 152 5.9% 17.7% 16.1% 15.5% 15.1% Cardiac 125 12.7% 12.1% 12.3% 12.5% 12.4% Gastro Intestinal 119 13.1% 11.4% 11.4% 11.6% 11.8% Vitamins/Minerals/Nutrients 89 11.7% 8.8% 9.0% 9.0% 8.8% Anti-Diabetic 85 20.0% 6.7% 7.2% 7.9% 8.4% Respiratory 78 11.9% 7.7% 7.8% 7.8% 7.8% Pain / Analgesics 70 9.5% 7.3% 7.2% 6.9% 6.9% Neuro/CNS 62 11.9% 6.1% 6.2% 6.1% 6.2% Derma 60 16.3% 5.3% 5.8% 5.9% 5.9% Gynaecological 51 2.9% 6.4% 5.2% 4.9% 5.0% Ophthal / Otologicals 19 13.2% 1.8% 1.8% 1.8% 1.9% Hormones 17 10.7% 1.7% 1.7% 1.7% 1.7% Anti-Neoplastics 15 18.0% 1.3% 1.6% 1.7% 1.5% Vaccines 17 24.4% 1.2% 1.5% 1.7% 1.7% Others 50 15.9% 4.4% 5.2% 4.9% 4.9%
Source: AIOCD, HSBC analysis
Chronic/specialty therapies including areas such as anti-diabetic, respiratory (inhalers), cardiac
and the CNS (central nervous system) have grown significantly in recent years, driven by
increasing incidence of lifestyle related diseases. For example, anti-diabetic treatments have
gained c160bps in market share in the last four years.
Given the strong growth and better margin profile, most companies have increased their focus
on chronic therapies. This will continue to be the key driver for India sales growth and we expect
the share of chronic therapies sales to reach 40-45% by 2020 from the current level of c34%.
We expect sales of acute therapies to grow in high single-digits on the back of poor healthcare
facilities, including poor hygiene/sanitation for the majority of the population.
19
EQUITIES PHARMACEUTICALS
21 September 2016
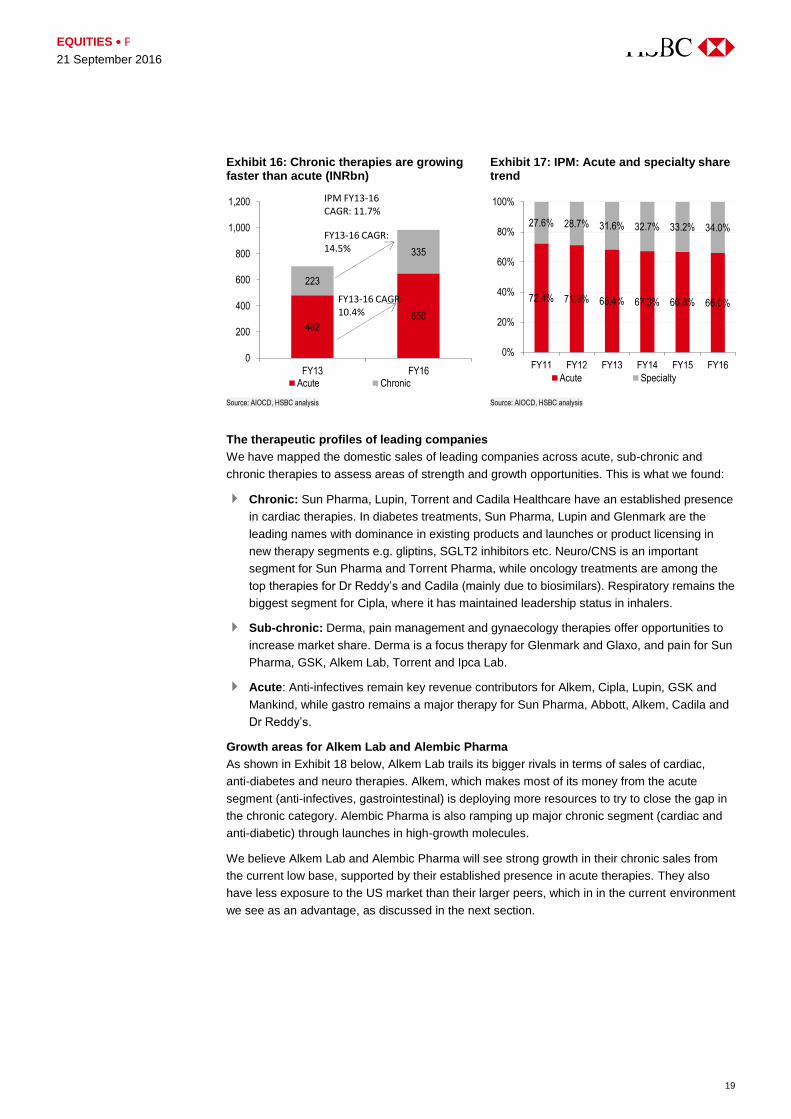
Exhibit 16: Chronic therapies are growing faster than acute (INRbn)
Exhibit 17: IPM: Acute and specialty share trend
Source: AIOCD, HSBC analysis Source: AIOCD, HSBC analysis
The therapeutic profiles of leading companies
We have mapped the domestic sales of leading companies across acute, sub-chronic and
chronic therapies to assess areas of strength and growth opportunities. This is what we found:
Chronic: Sun Pharma, Lupin, Torrent and Cadila Healthcare have an established presence
in cardiac therapies. In diabetes treatments, Sun Pharma, Lupin and Glenmark are the
leading names with dominance in existing products and launches or product licensing in
new therapy segments e.g. gliptins, SGLT2 inhibitors etc. Neuro/CNS is an important
segment for Sun Pharma and Torrent Pharma, while oncology treatments are among the
top therapies for Dr Reddy’s and Cadila (mainly due to biosimilars). Respiratory remains the
biggest segment for Cipla, where it has maintained leadership status in inhalers.
Sub-chronic: Derma, pain management and gynaecology therapies offer opportunities to
increase market share. Derma is a focus therapy for Glenmark and Glaxo, and pain for Sun
Pharma, GSK, Alkem Lab, Torrent and Ipca Lab.
Acute: Anti-infectives remain key revenue contributors for Alkem, Cipla, Lupin, GSK and
Mankind, while gastro remains a major therapy for Sun Pharma, Abbott, Alkem, Cadila and
Dr Reddy’s.
Growth areas for Alkem Lab and Alembic Pharma
As shown in Exhibit 18 below, Alkem Lab trails its bigger rivals in terms of sales of cardiac,
anti-diabetes and neuro therapies. Alkem, which makes most of its money from the acute
segment (anti-infectives, gastrointestinal) is deploying more resources to try to close the gap in
the chronic category. Alembic Pharma is also ramping up major chronic segment (cardiac and
anti-diabetic) through launches in high-growth molecules.
We believe Alkem Lab and Alembic Pharma will see strong growth in their chronic sales from
the current low base, supported by their established presence in acute therapies. They also
have less exposure to the US market than their larger peers, which in in the current environment
we see as an advantage, as discussed in the next section.
482650
223
335
0
200
400
600
800
1,000
1,200
FY13 FY16Acute Chronic
FY13-16 CAGR:14.5%
FY13-16 CAGR:10.4%
IPM FY13-16 CAGR: 11.7%
72.4% 71.3% 68.4% 67.3% 66.8% 66.0%
27.6% 28.7% 31.6% 32.7% 33.2% 34.0%
0%
20%
40%
60%
80%
100%
FY11 FY12 FY13 FY14 FY15 FY16
Acute Specialty

EQUITIES PHARMACEUTICALS
21 September 2016
20
Exhibit 18: Therapy sales split for key companies
Company ________________________________ Therapy share in India sales _________________________________ Anti-
Infective Cardiac Gastro VNM Anti-
diabetic Respiratory Pain Neuro Derma Gynae Onco. Others
Sun + Ranbaxy
11.8% 18.2% 12.0% 4.0% 9.0% 3.7% 7.3% 17.2% 4.7% 4.0% 0.5% 7.6%
Abbott 11.1% 10.4% 18.7% 12.6% 4.9% 7.7% 5.6% 11.8% 6.0% 4.0% 0.0% 7.1%
Cipla 26.8% 11.8% 7.9% 1.8% 1.0% 30.2% 3.1% 3.5% 2.5% 1.5% 0.7% 9.1%
Zydus Cadila 7.4% 16.8% 13.6% 4.2% 1.3% 10.5% 9.6% 1.3% 8.0% 10.7% 5.3% 11.1%
Mankind 23.3% 8.8% 11.2% 14.5% 5.4% 6.3% 5.0% 3.0% 4.6% 6.2% 0.0% 11.6%
Alkem 42.8% 2.7% 17.8% 12.0% 2.5% 2.8% 6.9% 5.1% 3.7% 2.2% 0.7% 0.8%
Lupin 21.1% 25.0% 7.9% 5.5% 11.3% 12.3% 4.4% 5.0% 0.5% 3.5% 0.3% 3.2%
Glaxo 23.0% 1.9% 5.6% 7.6% 0.0% 8.1% 9.2% 0.3% 18.8% 1.1% 0.4% 23.9%
Glenmark 13.1% 22.7% 2.4% 2.8% 8.4% 15.3% 2.1% 0.4% 29.2% 1.8% 0.1% 1.8%
Dr. Reddy’s 8.0% 14.5% 22.0% 2.7% 6.7% 8.6% 7.8% 3.2% 6.8% 0.2% 6.7% 12.9%
Torrent 4.2% 29.2% 14.6% 15.7% 6.0% 0.3% 7.8% 16.3% 2.6% 1.6% 0.0% 1.6%
Alembic 23.5% 13.9% 13.9% 7.7% 6.1% 12.7% 3.8% 1.0% 2.0% 10.8% 0.0% 4.6%
Ipca Lab 5.9% 17.2% 8.2% 2.2% 5.3% 4.1% 26.1% 3.4% 2.9% 0.0% 4.1% 20.6%
Source: AIOCD, HSBC analysis (red cell indicates chronic therapies, grey cell indicates acute therapies while pale red cells indicate sub-chronic therapies; focus areas shown in bordered cells for Alkem and Alembic)
B. Molecules overview
In India, the top 10 molecules account for 9.9% of the total market, down from c10.2% in 2012,
indicating increasing competition. Of the top 10 molecules, four are in the anti-infectives
category of the acute segment. However in terms of growth, chronic therapies have
outperformed acute therapies.
Exhibit 19: Dominance of anti-infective molecules continues in IPM
Top ranked molecules Therapy MAT Jul'16 sales (INRb)
MAT Jul 12-16 CAGR
MAT Jul 14-16 CAGR
% share of IPM
1.Amoxycillin + Clavulanic acid Anti-infectives 17 9.0% 10.5% 1.7% 2. Glimepiride + Metformin Anti-diabetes 16 22.8% 15.6% 1.6% 3.Multivitamins + Minerals Vitamins/minerals
/nutrients 12 11.8% 15.6% 1.2%
4.Atorvastatin Cardiac 8 4.4% 8.0% 0.8% 5.Cefixime Anti-infectives 8 0.6% 5.5% 0.8% 6.Human Premix Anti-diabetes 8 3.9% 9.0% 0.8% 7.Ceftriaxone Anti-infectives 8 7.8% 12.1% 0.8% 8.Paracetamol Pain/analgesics 8 13.1% 17.3% 0.8% 9.Pantoprazole Gastro-intestinal 8 10.5% 14.9% 0.8% 10.Cefpodoxime Anti-infectives 7 9.2% 12.2% 0.7% Top 10 100 9.6% 12.1% 9.9% Top 11-25 88 12.5% 14.2% 8.8% Top 26-50 107 11.7% 13.7% 10.6% Top 51-100 136 11.0% 11.3% 13.5% 100+ 577 9.5% 11.8% 57.2% IPM 1,009 10.2% 12.2% 100.0%
Source: AIOCD, HSBC analysis

21
EQUITIES PHARMACEUTICALS
21 September 2016
Exhibit 20: Positioning of top 20 molecules over the last five years
Rank MAT July 2012 MAT July 2013 MAT July 2014 MAT July 2015 MAT July 2016
1 Amoxycillin + Clavulanic Acid
Amoxycillin + Clavulanic Acid
Amoxycillin + Clavulanic Acid
Amoxycillin + Clavulanic Acid
Amoxycillin + Clavulanic Acid
2 Cefixime Glimepiride + Metformin Glimepiride + Metformin Glimepiride + Metformin Glimepiride + Metformin
3 Multivitamins + Minerals
Multivitamins + Minerals
Multivitamins + Minerals
Multivitamins + Minerals
Multivitamins + Minerals
4 Glimepiride + Metformin Cefixime Cefixime Human Premix Atorvastatin
5 Atorvastatin Atorvastatin Atorvastatin Atorvastatin Cefixime
6 Human Premix Human Premix Human Premix Cefixime Human Premix
7 Ceftriaxone Ceftriaxone Chlorpheniramine + Codeine
Ceftriaxone Ceftriaxone
8 Pantoprazole Chlorpheniramine + Codeine
Ceftriaxone Pantoprazole Paracetamol
9 Cefpodoxime Paracetamol Methylcobalamin Combinations
Chlorpheniramine + Codeine
Pantoprazole
10 Chlorpheniramine + Codeine
Cefpodoxime Pantoprazole Methylcobalamin Combinations
Cefpodoxime
11 Methylcobalamin Combinations
Pantoprazole Cefpodoxime Cefpodoxime Chlorpheniramine + Codeine
12 Azithromycin Methylcobalamin Combinations
Paracetamol Paracetamol Methylcobalamin Combinations
13 Paracetamol Azithromycin Cefuroxime Domperidone + Pantoprazole
Domperidone + Pantoprazole
14 Cefuroxime Ranitidine Ranitidine Protein Supplements Rosuvastatin
15 Ranitidine Cefuroxime Protein Supplements Azithromycin Protein Supplements
16 Protein Supplements Glimepiride + Metformin + Pioglitazone
Azithromycin Rosuvastatin Ranitidine
17 Ferrous Combination Protein Supplements Domperidone + Pantoprazole
Ranitidine Meropenem
18 Glimepiride + Metformin + Pioglitazone
Ferrous Combination Ferrous Combination Domperidone + Rabeprazole
Telmisartan
19 Piperacillin + Tazobactam
Domperidone + Pantoprazole
Rosuvastatin Cefuroxime Domperidone + Rabeprazole
20 Diclofenac Diclofenac Domperidone + Rabeprazole
Calcium Carbonate + Vit D3 (Cholecalciferol)
Azithromycin
Source: AIOCD, HSBC analysis (Red cells are chronic therapy molecules; grey cells are acute/sub-chronic therapies products)
B1. Chronic therapy molecules are growing fastest
We have looked at fastest growing molecules among the top 100 (selection criteria of CAGR of
more than 20% in last two and four years). As expected, majority of these molecules were in
anti-diabetics, followed by cardiac, derma and anti-infectives. See Exhibit 21 below.
Exhibit 21: Fastest growing molecules within the top 100
Molecules Therapy MAT July
16 sales (INRbn) MAT July
12-16 CAGR MAT July
14-16 CAGR
Rosuvastatin Cardiac 6.4 23.5% 20.6% Meropenem Anti-infectives 6.0 23.1% 29.2%
Vildagliptin + Metformin Anti-diabetes 5.3 40.4% 37.6% Sitagliptin + Metformin Anti-diabetes 4.6 40.3% 46.8% Levetiracetam Neuro/CNS 4.5 30.6% 27.4% Vitamin D3 (Cholecalciferol) Vitamins/minerals/
nutrients 4.5 41.7% 25.0%
Voglibose + Metformin + Glimepiride Anti-diabetes 3.8 141.4% 46.9% Telmisartan + Amlodipine Cardiac 3.3 24.0% 23.3% Dicyclomine + Paracetamol + Tramadol Gastro-intestinal 3.1 259.0% 49.3% Terbinafine + Clobetasol + Ofloxacin + Ornidazole
Derma 2.7 65.0% 51.1%
Clotrimazole Derma 2.6 18.4% 24.3% Paracetamol + Tramadol Pain/analgesics 2.6 21.8% 20.0% Itraconazole Anti-infectives 2.2 72.9% 111.3%
Source: AIOCD, HSBC analysis (shaded cells represent chronic/sub-chronic therapy molecules)
The fastest growing
molecules within the top 100
EQUITIES PHARMACEUTICALS
21 September 2016
22
Alkem and Alembic’s standing: In Vitamin D3 (cholecalciferol), Alkem’s Uprise D3 brand
maintains a leading position with c13% market share. In Voglibose+metformin+glimperide
combination and the meropenem market, Alkem is gradually stepping up its presence with a
market share of 6.3% and 4.5% respectively. Alembic is expanding in telmisartan+amlodipine
through brand Tellzy MT.
B2. New molecules that have grown most
We have analysed new molecules launched in the last three years that have achieved
significant sales growth. Sofosbuvir and combinations indicated for hepatitis C (Hep C) and a
new glitpin class of teneligliptin and combinations for diabetes treatment stand out in terms of
new launches and sales growth.
Sofosbuvir & combinations: Gilead Sciences (GILD US, Not Rated) in September 2014
entered a licensing agreement with multiple generic players for the launch of its new Hep C
drug in India (sofosbuvir mono or in combination with ledipasvir or in combination with each
other). Since March 2015, 14 companies have launched brands in the sofosbuvir mono
segment. In sofosbuvir+ledipasvir combination, nine new brands have been launched.
Gliptin class: This now represents c25% of overall anti-diabetic sales (INR84.5bn) in India.
In October 2015, the Delhi high court ruled in favour of MSD for patents covering its gliptin
drug, Sitagliptin (brand Januvia/Januvia) and restrained the litigating counterpart, Glenmark
Pharma, from marketing its brands (Zita/Zita-Met) in India. While sitaglitpin is under patent
protection, most companies have focused on another glitpin class, teneligliptin, which is not
protected by any patent in India. To date, there have been 33 teneliglitpin molecule brands
launches and 21 for teneligliptin+metformin combination.
Which new molecules have
grown most?

23
EQUITIES PHARMACEUTICALS
21 September 2016
Exhibit 22: Teneligliptin and combination brand launches
Molecule Brand Company Launch date MAT Jul'16 sales (INRm)
Teneligliptin Zita Plus Glenmark 6/1/2015 331 Ziten Glenmark 6/1/2015 213 Tenglyn Zydus Cadila 11/1/2015 154 Tenepride Micro Labs 11/1/2015 107 Teniva Intas 10/1/2015 88 Tendia Eris Life Sciences 10/1/2015 79 Dynaglipt Mankind 11/1/2015 73 Inogla Wockhardt 10/1/2015 71 Eternex T Alembic 10/1/2015 52 Tiban Ajanta Pharma 8/1/2015 48 Tenlimac Macleods 12/1/2015 46 Teneza Unichem 12/1/2015 38 Tglip Intas 10/1/2015 31 Tenepure Unichem 10/1/2015 27 Tenebite Corona 10/1/2015 16 Olymprix Alkem Lab 3/1/2016 10 Tenali Cadila Pharma 1/1/2016 9 Afoglip Torrent Pharma 3/1/2016 9 Glytrin Medley Pharma 2/1/2016 7 Megagliptin Aristo 5/1/2016 6 Tenuvia Precia Pharma 11/1/2015 5 Ten (Centaur) Centaur Pharma 11/1/2015 4 Teneliglip Akumentis 4/1/2016 3 Glipijub Jubilant Life Sciences 5/1/2016 2 Zilenta Indoco Remedies 4/1/2016 2 Jring Indoco Remedies 4/1/2016 1 Janisha UTH Healthcare 4/1/2016 1 Eliptin HBC Lifesciences 4/1/2016 1 Tenepan Panacea Biotec 6/1/2016 1 Tenlin Lincoln Pharma 6/1/2016 0 Ecoglip T Ozone Pharma 6/1/2016 0 Telnimac Macleods 3/1/2016 0 Ten DC FDC 7/1/2016 0 Teneligliptin + Metformin Zitamet Plus Glenmark 10/1/2015 231 Ziten M Glenmark 10/1/2015 126 Tendia M Eris Life Sciences 3/1/2016 28 Totaglipt M Mankind 3/1/2016 14 Teniva M Intas 4/1/2016 10 Tglip M Intas 4/1/2016 9 Eternex M Alembic 4/1/2016 9 Tenepride M Micro Labs 5/1/2016 8 Tenglyn M Zydus Cadila 6/1/2016 6 Afoglip M Torrent Pharma 5/1/2016 4 Tiban M Ajanta Pharma 4/1/2016 3 Tenebite M Corona 4/1/2016 2 Zilenta M Indoco Remedies 5/1/2016 1 Jring M Indoco Remedies 5/1/2016 1 Glytrin Met Medley Pharma 5/1/2016 1 Tolnim Delcure Life Sciences 12/1/2015 1 Tenepure M Unichem 7/1/2016 1 Teneza M Unichem 7/1/2016 1 Inogla M Wockhardt 7/1/2016 1 Ten M Centaur 5/1/2016 0 Olymprix M Alkem Lab 7/1/2016 0
Source: AIOCD, HSBC analysis
First-in market molecules: Patented launches by multinationals have focused on diabetes
treatments like SGLT2 inhibitors (Boehringer’s Jardiance, Janssen’s Invokana and
AstraZeneca’s Forxiga) and Novo’s insulin degludec (Tresiba and Ryzodeg). These are the
fastest growing molecules, indicating increased demand for new and improved treatments
in anti-diabetes segment. Sales of Saroglitazar, Zydus Cadilla’s indigenously developed
novel drug for treatment of type 2 diabetes and dyslipidemia, have grown to cINR400m
(145% y-o-y).

EQUITIES PHARMACEUTICALS
21 September 2016
24
Exhibit 23: First-in class launches focus on anti-diabetes and cardiac
Company Brand Molecule Therapy Launched Patented? Remark
GSK Priorix Tetra Quadravalent MMRV vaccine
Vaccine Jul'16 Combined vaccine for measles, mumps, rubella and varicella
Merck Rebif Interferon beta 1-a Multiple sclerosis Jun'16 Sanofi India Lyxumia Lixisenatide Anti-diabetes May'16 Yes GLP-1 inhibitor Novartis Jakavi Ruxolitinib Oncology May'16 Yes Sanofi India Zemiglo Gemigliptin Anti-diabetes Apr'16 DPP-4 inhibitor (gliptin) AstraZeneca Forxiga Dapagliflozin SGLT2 inhibitors
for anti-diabetes May'15 Yes Agreement in Mar'16 with
Sun Pharma marketing its product under brand name Oxra/Oxramet
Boehringer Ingelheim
Jardiance Empagliflozin SGLT2 inhibitors for anti-diabetes
Oct'15 Yes
Janssen Invokana Canagliflozin SGLT2 inhibitors for anti-diabetes
June'15 Yes
Pfizer Inlyta Axitinib Oncology May'15 MSD Variped Varicella vaccine Vaccine May'15 Novo Nordisk Ryzodeg Insulin
degludec+insulin Anti-diabetes Jan'15
Cadila Healthcare Lipaglyn Saroglitazar Diabetes combined with high cholesterol
Sep’13 Yes World’s first drug for treatment of diabetes and high cholesterol
Source: AIOCD, Company data, HSBC analysis
Biosimilars: Only a few companies have technical expertise in monoclonal antibodies
biosimilars. Sales of adalimumab (a biosimilar version of AbbVir’s auto-immune biologic
drug, Humira) have grown to cINR330m. There are four brands, one from Zydus Cadila and
three from Torrent Pharma, which it has licensed from Reliance LifeSciences.
Exhibit 24: Key recent monoclonal antibodies biosimilar launches
Brand Molecule Company MAT Jul'16 sales (INRm)
Launch date
Cizumab Bevacizumab Hetero Pharma 1 Jul-16 Adfrar P Adalimumab Torrent Pharma 1 Jul-16 Vivitra Trastuzumab Zydus Cadila 194 Apr-16 Mabtas N Rituximab Intas Pharma 1 Mar-16 Adfrar IB Adalimumab Torrent Pharma 1 Mar-16 Adfrar Adalimumab Torrent Pharma 5 Feb-16 Toritz Rituximab Torrent Pharma 13 Dec-15 Lupiximab Rituximab Lupin 2 Dec-15 Toritz RA Rituximab Torrent Pharma 1 Dec-15 Toritz MS Rituximab Torrent Pharma 0 Dec-15 Infimab Infliximab Sun Pharma 82 Jun-15 Maball Rituximab Hetero Pharma Feb-15 Mabtas T Rituximab Intas Pharma 9 Jan-15 Exemptia Adalimumab Zydus Cadila 326 Dec-14 Mabtas RA Rituximab Intas Pharma 12 Dec-14 Reditux RA Rituximab Dr. Reddys Lab 30 Sep-14
Source: Company data, AIOCD, HSBC analysis
Combination molecules: Other molecules which have grown rapidly in the last three years
include triple combination drugs for cardiac ailments like aspirin+rosuvastatin+clopidogrel
and olmesartan+clinidipine+chlorthalidone and neurological disorders (e.g.
pregabalin+nortriptyline).
Alkem and Alembic’s standing in fastest growing new molecules:
In sofosbuvir and combinations, Alkem has launched its own brands during FY16.
In teneligliptin and combination molecules, both Alkem and Alembic have introduced their
brands, emphasising their focus on entering new segments.
During FY16, Alkem launched its first biosimilar (rituximab).

25
EQUITIES PHARMACEUTICALS
21 September 2016
Alkem and Alembic are increasing their focus on combinations molecules. Alkem is now the
second largest player in telmisartan+clinidipine+chlorthalidone and olmesratn+
clinidipine+chlorthalidone molecules. Both companies have recently entered the
aspirin+rosuvastatin+clopidogrel combination market.
B3. Overview of launches by top 25 companies
The launch of new products (including line extensions) is one of the key growth drivers. On
average there are more than 3,000 brand launches a year in the India pharma market.
Exhibit 25: Number of brand launches Exhibit 26: New product growth: the contribution is consistent
Source: AIOCD, HSBC analysis Source: AIOCD, HSBC analysis
Launch quality: In view of ever increasing competition, most companies are focusing on quality
rather than quantity. They tend to compete of their areas of strength and segments where they
can gain a viable share of the market.
Exhibit 27: New launches by key players in IPM
Company FY11 FY12 FY13 FY14 FY15 FY16 FY17 ytd
Abbott 68 70 40 30 41 48 11
Alembic 30 23 25 22 29 44 11
Alkem 62 45 51 32 41 53 15
Aristo 11 10 18 19 5 7 2
Cadila 60 90 90 75 55 40 18
Cipla 72 46 39 47 30 57 21
Dr Reddy's 35 24 19 22 20 31 3
FDC 17 12 10 10 9 18 6
Glenmark 28 28 29 31 25 29 17
GSK 25 8 14 6 8 4 2
Intas 76 43 53 48 34 43 39
Ipca 32 19 19 31 26 11 2
Lupin 67 47 58 46 36 48 18
Macleods 30 42 32 31 26 44 14
Mankind 58 44 42 27 39 42 24
MSD 2 6 1 5 0 0 0
Pfizer 30 46 15 11 8 2
Ranbaxy 77 45 18 32 22 23 20
Sanofi 29 11 32 6 7 6 4
Sun Pharma 47 35 25 24 21 19 7
Torrent Pharma 34 26 19 11 17 30 5
USV 15 17 9 12 6 4 2
Source: AIOCD, Company data, HSBC analysis
0
100
200
300
400
500
600
700
800
Jul'15 Sep'15 Nov'15 Jan'16 Mar'16 May'16 Jul'16
No. of brands launches No. of SKUS launches
8.36.7
4.16.7
1.5
-1.0
3.2
5.24.8
4.6
5.0
5.04.4
3.3
3.3
3.4
3.1
3.1
3.0
3.1
3.1
-2
0
2
4
6
8
10
12
14
16
18
4QF
Y15
1QF
Y16
2QF
Y16
3QF
Y16
4QF
Y16
1QF
Y17
Jul'1
6
Vol growth Price growth NP growth

EQUITIES PHARMACEUTICALS
21 September 2016
26
Launches by the top 25: We have looked at launches by the top 25 companies over the last
two years. Excluding the “Others” category, which includes unspecified molecules such as anti-
allergies, laxatives, non-medicated skin-care products, parasitic worm treatments, and smoking
cessation chewing gum; anti-infectives led with 11%, closely followed by
vitamins/minerals/nutrients supplements, cardiac and derma.
Exhibit 28: Top 25 companies’ new launches by therapy in last two years (n=1,174)
Source: AIOCD, HSBC analysis (“All others” include urology, hormones, sex stimulants, vaccines, anti-malarials, etc.)
Exhibit 29: Top companies’ launches* in the last two years
Company No of launches
Anti-Infectives
Anti-diabetic
Cardiac GI VNM Neuro Derma Gynae Resp. Onco. Pain Others
Cipla 104 14 8 7 5 7 7 2 14 4 4 32
Intas Pharma 102 12 4 7 2 9 16 2 4 6 10 5 25
Sun Pharma 94 11 1 10 13 11 8 7 2 10 3 7 11
Mankind 90 5 2 2 9 19 4 7 5 5 5 27
Alkem 90 11 2 6 13 5 9 9 2 12 2 3 16
Lupin 86 8 6 16 3 5 4 6 6 6 2 6 18
Abbott 79 11 1 2 5 1 12 2 3 4 12
Macleods 75 6 3 12 7 15 5 8 3 5 3 8
Zydus Cadila 73 7 2 8 6 9 1 5 4 8 8 4 11
Glenmark 58 5 6 6 2 3 1 15 10 1 2 7
Dr Reddy's 45 6 3 4 2 3 2 6 2 4 2 11
Torrent 42 4 3 6 2 3 8 2 1 3 3 5 2
Alembic 40 2 4 9 3 4 3 2 6 3 4
Ipca Lab 29 3 3 5 2 12 1 3
GSK 11 1 1 1 1 2 2 3
Source: AIOCD, HSBC analysis (*Last 24 months launches as of MAT Jul’16 data.)
Differentiated, better margin products: In view of aggressive launches by new entrants, more
stringent rules for new product approvals and a proposed ban on certain combinations, leading
companies have shifted their focus to new/differentiated launches, including biosimilars and
in-licensed products. Higher-margin over the counter (OTC) and consumer healthcare products,
including derma, pain, hair loss and nutritional products, are also popular.
12%11%
10% 10% 10%
8% 8%
7%6%
5%3% 3%
2%
5%
0%
2%
4%
6%
8%
10%
12%
14%
27
EQUITIES PHARMACEUTICALS
21 September 2016
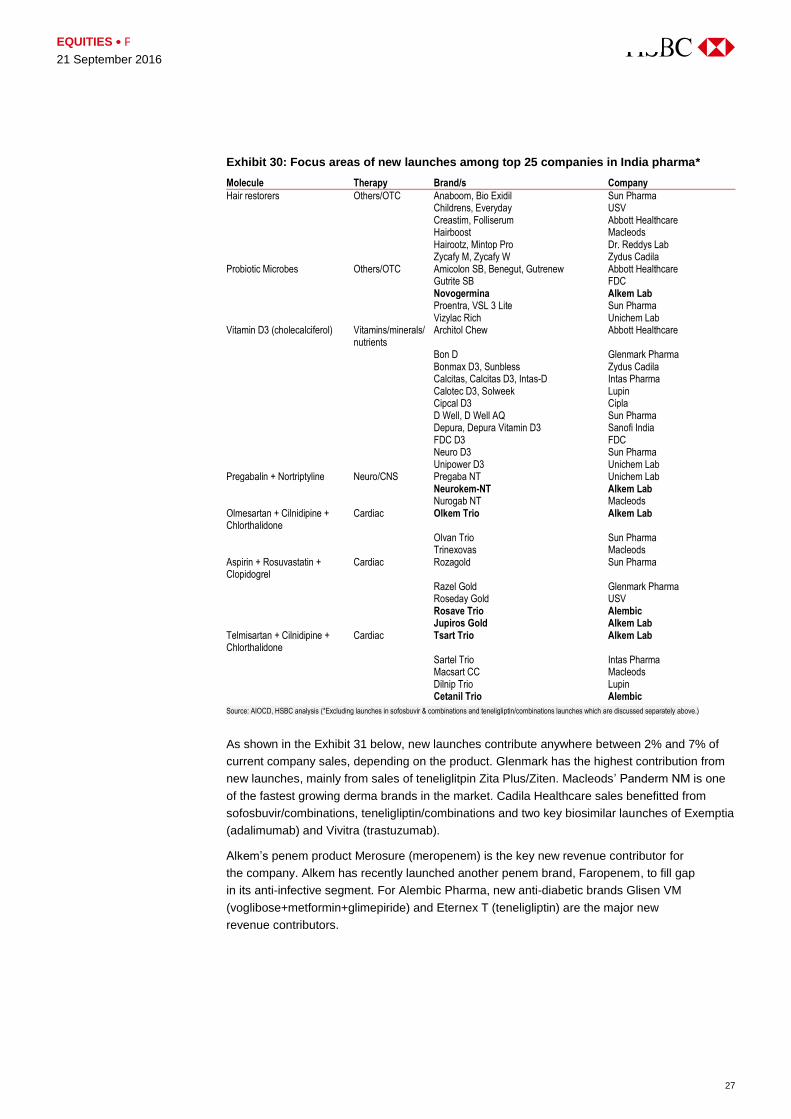
Exhibit 30: Focus areas of new launches among top 25 companies in India pharma*
Molecule Therapy Brand/s Company
Hair restorers Others/OTC Anaboom, Bio Exidil Sun Pharma Childrens, Everyday USV Creastim, Folliserum Abbott Healthcare Hairboost Macleods Hairootz, Mintop Pro Dr. Reddys Lab Zycafy M, Zycafy W Zydus Cadila Probiotic Microbes Others/OTC Amicolon SB, Benegut, Gutrenew Abbott Healthcare Gutrite SB FDC Novogermina Alkem Lab Proentra, VSL 3 Lite Sun Pharma Vizylac Rich Unichem Lab Vitamin D3 (cholecalciferol) Vitamins/minerals/
nutrients Architol Chew Abbott Healthcare
Bon D Glenmark Pharma Bonmax D3, Sunbless Zydus Cadila Calcitas, Calcitas D3, Intas-D Intas Pharma Calotec D3, Solweek Lupin Cipcal D3 Cipla D Well, D Well AQ Sun Pharma Depura, Depura Vitamin D3 Sanofi India FDC D3 FDC Neuro D3 Sun Pharma Unipower D3 Unichem Lab Pregabalin + Nortriptyline Neuro/CNS Pregaba NT Unichem Lab Neurokem-NT Alkem Lab Nurogab NT Macleods Olmesartan + Cilnidipine + Chlorthalidone
Cardiac Olkem Trio Alkem Lab
Olvan Trio Sun Pharma Trinexovas Macleods Aspirin + Rosuvastatin + Clopidogrel
Cardiac Rozagold Sun Pharma
Razel Gold Glenmark Pharma Roseday Gold USV Rosave Trio Alembic Jupiros Gold Alkem Lab Telmisartan + Cilnidipine + Chlorthalidone
Cardiac Tsart Trio Alkem Lab
Sartel Trio Intas Pharma Macsart CC Macleods Dilnip Trio Lupin Cetanil Trio Alembic
Source: AIOCD, HSBC analysis (*Excluding launches in sofosbuvir & combinations and teneligliptin/combinations launches which are discussed separately above.)
As shown in the Exhibit 31 below, new launches contribute anywhere between 2% and 7% of
current company sales, depending on the product. Glenmark has the highest contribution from
new launches, mainly from sales of teneliglitpin Zita Plus/Ziten. Macleods’ Panderm NM is one
of the fastest growing derma brands in the market. Cadila Healthcare sales benefitted from
sofosbuvir/combinations, teneligliptin/combinations and two key biosimilar launches of Exemptia
(adalimumab) and Vivitra (trastuzumab).
Alkem’s penem product Merosure (meropenem) is the key new revenue contributor for
the company. Alkem has recently launched another penem brand, Faropenem, to fill gap
in its anti-infective segment. For Alembic Pharma, new anti-diabetic brands Glisen VM
(voglibose+metformin+glimepiride) and Eternex T (teneligliptin) are the major new
revenue contributors.

EQUITIES PHARMACEUTICALS
21 September 2016
28
Exhibit 31: Contribution from new launches* to sales of leading companies
Source: AIOCD, HSBC analysis (*New launches for last 24 months as of MAT Jul’16 data.)
C. Brand positioning
The key to success is to create strong brands which have strong recall value among doctors
and patients. Alkem is strong in this area. It has five brands in the top 50, more than bigger
companies like Cipla and Sun Pharma.
Exhibit 32: Brand positioning in India
Company Total brands ________________________ Brands in: _________________________ Top 50 Top 100 Top 300
Sun + Ranbaxy 1,323 3 11 29 Abbott + Novo 919 5 11 28 Cipla 1,027 3 6 23 Zydus Cadila 1,247 0 4 11 Mankind 703 2 2 11 Alkem 954 5 5 15 Lupin 829 0 1 4 Glaxo 225 7 10 14 Macleods 507 1 1 6 Pfizer+Wyeth 209 3 7 13 Intas 967 0 1 11 Emcure 752 0 1 5 Aristo 305 1 5 11 Glenmark 350 1 2 8 Dr. Reddys 379 0 1 9 Sanofi India 195 2 4 10 Torrent 490 1 1 7 USV 196 2 4 8 Micro + Bal 775 0 1 1 Alembic 441 1 1 5
Source: IMS Health, HSBC analysis
7.3%
5.2%
4.4% 4.3% 4.3% 4.1% 4.0% 3.8%3.5% 3.3% 3.1%
2.4% 2.3% 2.3% 2.0%
0.0%
1.0%
2.0%
3.0%
4.0%
5.0%
6.0%
7.0%
8.0%
Gle
nmar
k
Mac
leod
s
Cad
ilaH
thca
re
Ale
mbi
c
MS
D
Man
kind
Sun
Pha
rma
Uni
chem
Lupi
n
Inta
s
Dr
Red
dy's
Cip
la
Alk
em
Aris
to
Tor
rent
Strong brand positioning
leads to better brand recall
by doctors & patients. Hence,
companies strive to create
strong brands in the market

29
EQUITIES PHARMACEUTICALS
21 September 2016
Domestic regulatory challenges
Volume growth accounts for c60% of total growth in the Indian pharma market. The market is
very price sensitive and the government has established the National Pharmaceutical Pricing
Authority (NPPA) to control drug prices.
Under the government drug policy, certain drugs on the National List of Essential Medicines
(NLEM) are subject to price controls. In May 2013, the Department of Pharmaceuticals released
the Drugs Price Control Order (DPCO), 2013 governing the price control mechanism for 348
drugs listed in the NLEM.
DPCO 2013 replaced DPCO 1995 which earlier controlled the price of 74 drugs. With DPCO
2013, the government has moved from a cost to market-based pricing mechanism. Under
DPCO 1995, companies were allowed to make a nominal profit over manufacturing costs.
Under DPCO 2013, the price of a brand can’t exceed the average price of various brands of the
same underlying formulation with a market share of 1% or more.
In March this year, three separate regulatory announcements either capped drug prices or
banned certain drugs. As Exhibits 33 and 36 show, these changes have increased the volatility
of sector growth.
Summary of key regulatory changes in India:
May 2013: The government implemented DPCO 2013, which governs the price control
mechanism for 348 drugs listed on the NLEM.
December 2015: The government issued a proposal to list certain additional drugs on
the NLEM.
March 2016: The maximum prices of various drugs were subject to reduction as a result of
negative inflation measured by India’s Wholesale Price Index (WPI) which declined
2.7105% y-o-y during 2015.
March 2016: The Department of Pharmaceuticals issued Drugs Price Control Amendment
Order (DPCAO), 2016. A total of 106 drugs were added and 70 drugs were deleted from
the NLEM, which now contains 376 drugs.
March 2016: The Department of Health and Family Welfare proposed a ban on 344 fixed
dose combination (FDC) drugs. Drug manufacturers have received an interim stay on the
ban from the high court in Delhi. A final decision is awaited.
Looking ahead, government-mandated price revisions are scheduled every 2-3 years, so the
next round of revisions will likely take place in 2018-19 in our understanding.
Impact
Drugs on the NLEM constitute c12% of total sales and FDC products c3% (source: AIOCD July
2016) in IPM. The frequent regulatory changes with regard to drug prices have created
concerns along the supply chain, hurting sales growth. Major companies have indicated an
impact of between 1% and 5% on their India sales on account of NLEM and FDC. While the
actual impact is dependent on a company’s product profile, most are reducing risk by moving to
formulations not under regulatory control.
The exhibits on the following pages assess the impact in more detail.
Multiple regulatory changes
have been announced in
recent times, impacting
overall market growth

EQUITIES PHARMACEUTICALS
21 September 2016
30
Exhibit 33: Growth has been impacted by recent regulatory challenges (% y-o-y)
Source: AIOCD, HSBC analysis
Exhibit 34: Drugs under price control accounted for c12% of total sales (as of MAT Jul’16)
Exhibit 35: FDC drugs accounted only for c3% of sales (as of MAT Jul’16)
Source: AIOCD, HSBC analysis Source: AIOCD, HSBC analysis
Exhibit 36: NLEM drug sales growth have slipped into negative territory
Source: AIOCD, HSBC analysis
6.5 5.0 5.2
2.3
13.2
1.0
4.0
1.2
3.7
-5.3-4.4
0.0 -0.6
3.2
14.812.9
13.0
9.9
21.8
8.6 11.99.1
12.0
6.43.5
7.7 6.49.5
-10.0
-5.0
0.0
5.0
10.0
15.0
20.0
25.0
Jun'15 Jul'15 Aug'15 Sep'15 Oct'15 Nov'15 Dec'15 Jan'16 Feb'16 Mar'16 Apr'16 May'16 Jun'16 Jul'16
Vol growth Price growth NP growth Total IPM growth
NLEM drugs12.2%
Non-NLEM drugs83.2%
Non-sch. Para-19
4.6%
FDC3.0%
Non-FDC97.0%
5.6 5.13.3 2.8
15.4
4.87.5
5.3
6.9
-0.1
-2.7
2.6
-1.5
1.6
16.214.2 14.5
10.9
22.9
9.3
12.79.8 12.9
7.24.3
8.68.0
11.2
-5.0
0.0
5.0
10.0
15.0
20.0
25.0
Jun'15 Jul'15 Aug'15 Sep'15 Oct'15 Nov'15 Dec'15 Jan'16 Feb'16 Mar'16 Apr'16 May'16 Jun'16 Jul'16
IPM NLEM drugs Non-NLEM drugs Non-sch. Para-19

31
EQUITIES PHARMACEUTICALS
21 September 2016
Exhibit 37: Sales impact of various regulatory updates (%)
Company New NLEM impact WPI mandated impact FDC impact
Sun Pharma 1.1 0.5 1.0 Abbott 0.4 0.5 9.3 Cipla 1.6 0.7 0.5 Zydus Cadila 1.6 0.7 0.5 Mankind 0.1 0.4 4.6 Lupin 0.9 0.5 1.9 GSK 0.4 0.9 1.7 Alkem 1.5 0.7 2.5 Pfizer 1.8 0.8 12.7 Macleods 0.4 0.5 12.0 Intas 1.0 0.5 1.7 Aristo 0.1 0.7 2.6 Dr Reddy's 1.5 0.6 0.5 Sanofi India 1.9 0.7 0.4 Glenmark 1.8 0.4 6.0 Torrent 0.6 0.7 0.5 USV 0.4 0.4 2.4 Micro 1.0 0.5 3.8
Source: AIOCD, HSBC analysis
NLEM impact on Alkem and Alembic: The top brands for Alkem in major molecules are either
below or near the ceiling price, indicating no further potential price cuts. For Alembic, Azithral is
the key brand adversely impacted by NLEM related price cuts, however its price has been
adjusted to the ceiling price, hence no further price cuts risk for it too. See Exhibit 38 below.

32
EQ
UIT
IES
P
HA
RM
AC
EU
TIC
AL
S
21
Se
pte
mb
er 2
01
6
Exhibit 38: NLEM impact on key molecules
Molecules Brand Company MAT Jul'16 sales (S)
% share Key SKUs impacted
MRP* (INR)
% differential to CP
SKU contribution to
to (S)
Key SKUs impacted
MRP* (INR) % differential to CP
SKU contribution to
(S)
Remarks (for Alkem & Alembic brands)
Amoxycillin (A) +Clavulanic Acid (C)
Augmentin Glaxo 2,970 17.4% 500mg(A)+ 125mg (C) tab
169.5 0.0% 64.3% Oral liquid 200mg (A) +
28.5mg (C)/5 ml
52.9 0.0% 12.6%
Clavam Alkem 2,507 14.7% 169.5 0.0% 46.2% 52.9 0.0% 11.9% MRP is at ceiling price, hence no further price risk here
Moxikind CV Mankind 1,680 9.9% 80.5 -20.8% 63.8% 49.4 -6.7% 7.4% Moxclav Ranbaxy 819 4.8% 169.5 0.0% 54.1% Advent Cipla 728 4.3% 169.5 0.0% 17.6% 52.9 0.0% 21.4% Total sales 17,027 Ceiling Price-CP 161.4+
taxes 50.4+taxes
Pantoprazole Pan Alkem 2,034 26.0% 40mg injection 43.4 0.0% 12.1% 40 mg tablet which constitutes more than 80% of Pan sales not under NLEM
Pantocid Sun Pharma 1,400 17.9% 43.4 0.0% 8.2% Pantop Aristo 1,312 16.7% 43.4 0.0% 30.4% Pantodac Zydus Cadila 1,043 13.3% 43.4 0.0% 42.8% Total sales 7,832 100.0% CP 41.32+
taxes
Cefixime Taxim O Alkem 1,949 24.0% 200mg tab 89.0 0.0% 47.7% 100mg tab 86.64 -0.1% 8.5% MRP for Alkem is at CP, hence no price cut risks Zifi FDC 1,699 21.0% 89.0 0.0% 59.9% 53.0 -38.9% 15.0% Mahacef Mankind 468 5.8% 72.7 -18.3% 73.6% 53.5 -38.3% 8.8% Cefolac Macleods 399 4.9% 89.0 -0.0% 56.3% 51.9 -40.1% 15.5% Total 8,106 CP 84.8+tax 84.9+taxes
Cefotaxime 1gm inj. 500mg inj. 250 mg inj SKU impacted
% diff. vs CP
sales contribution
Taxim Alkem 1,426 76.4% 33.4 0.0% 27.6% 21.6 0.0% 27.6% 16.5 0.0% 14.7% Biotax Biochem 295 15.8% 33.0 -1.3% 23.4% 20.6 -4.6% 23.4% 16.3 -1.6% 17.3% Cefantral Lupin 49 2.6% 32.5 -2.8% 13.7% 20.5 -5.0% 13.7% 15.5 -6.3% 13.7% C Tax Zuventus 46 2.5% 32.8 -1.9% 13.9% 20.4 -5.5% 13.9% 15.7 -5.4% 13.9% Omnicef Aristo 29 1.6% 32.8 -1.9% 25.1% 20.7 -4.3% 25.1% 15.9 -3.8% 13.6% Total sales 1,867 CP 31.9+taxes 20.6+taxes 15.8+taxes
Azithromycin Azithral Alembic 1,365 24.5% 500mg tab 18.7 0.0% 56.0% 250mg tab 9.5 0.0% 16.9% Azithral MRP is now set at CP, hence no further price cut risks
Azee Cipla 944 17.0% 18.8 0.0% 54.8% 9.5 0.0% 21.8% ATM Indoco 300 5.4% 18.8 0.5% 34.0% 9.6 0.5% 23.2% Azibact Ipca Lab 229 4.1% 18.8 0.5% 46.9% 9.6 0.5% 17.2% Total sales 5,565 CP 17.8+taxes 9.1+taxes
Source: AIOCD, HSBC analysis (Please note MRP are based on AIOCD data and may not show latest price revision taken by individual companies.)

33
EQUITIES PHARMACEUTICALS
21 September 2016
FDC ban decision awaited: The proposed ban on certain products has hit FDC drug sales
hard. Major therapies impacted are respiratory (primarily cough and cold preparations), anti-
diabetic, anti-infectives and derma. According to the latest data, the situation started to improve
in July 2016. This indicates a gradual shift towards alternative products not covered by the
proposed ban. The final court ruling on the FDC ban is awaited by the industry.
Exhibit 39: FDC drugs growth (% y-o-y)
Source: AIOCD, HSBC analysis
Key therapies facing potential FDC ban
Respiratory: Most at risk from the proposed FDC ban – 19-20% of market is vulnerable.
Chlorpheniramine+codeine preparations for coughs and colds represent more than 50% of
therapies under threat.
Anti-infectives: c4% of anti-infectives sales are at risk. Cefixime+azithromycin is the largest
product (40% of total FDC anti-infectives), followed by cefixime+linezolid,
azithromycin+cefpodoxime, and cefuroxime+linezolid.
Derma: c5% of derma market is vulnerable to the proposed FDC ban.
Clobetasol+ofloxacin+ornidazole+terbinafine is the largest combination
Anti-diabetes: c5-6% of anti-diabetes sales are at risk from the proposed ban.
Glimepiride+metformin+pioglitazone, gliclazide+pioglitazone+metformin, gliclazide+metformin
are the leading combinations under threat.
18.313.5
9.7 11.7
28.4
13.3
20.1
15.6
6.6
-9.1
-16.4-14.5 -14.0
-3.9
-20.0
-10.0
0.0
10.0
20.0
30.0
40.0
Jun'15 Jul'15 Aug'15 Sep'15 Oct'15 Nov'15 Dec'15 Jan'16 Feb'16 Mar'16 Apr'16 May'16 Jun'16 Jul'16
IPM FDC Non-FDC

EQUITIES PHARMACEUTICALS
21 September 2016
34
Exhibit 40: Respiratory segment has highest exposure to proposed FDC ban
Exhibit 41: Respiratory FDC market growth settling
Source: AIOCD, HSBC analysis Source: AIOCD, HSBC analysis
Exhibit 42: Growth (% y-o-y) trend in anti-infectives
Exhibit 43: Growth (% y-o-y) trend in derma
Source: AIOCD, HSBC analysis Source: AIOCD, HSBC analysis
0%
4%
8%
12%
16%
20%
% under proposed ban
15.6
0.1
-14.4
-11.9
-2.8
2.1
17.2
-20.0
-15.0
-10.0
-5.0
0.0
5.0
10.0
15.0
20.0
25.0
30.0
Jan
'16
Feb
'16
Mar
'16
Apr
'16
May
'16
Jun
'16
Jul'1
6
Respiratory FDC Non-FDC
26.1
2.5
-21.0
-35.7-31.8
-29.4
-13.8
-40.0
-30.0
-20.0
-10.0
0.0
10.0
20.0
30.0
Jan
'16
Feb
'16
Mar
'16
Apr
'16
May
'16
Jun
'16
Jul'1
6
Anti-infectives FDC Non-FDC
27.0
25.429.4
12.4
-19.6 -24.0
-12.9
-30.0
-20.0
-10.0
0.0
10.0
20.0
30.0
40.0
Jan
'16
Feb
'16
Mar
'16
Apr
'16
May
'16
Jun
'16
Jul'1
6
Derma FDC Non-FDC

35
EQUITIES PHARMACEUTICALS
21 September 2016
Exhibit 44: Key molecules under proposed FDC ban
Molecule MAT Jun'16 sales Brand Company % of sales at risk
Cefixime + Azithromycin (Anti-infectives)
1,370 Zifi AZ FDC 2.9%
Taxim AZ Alkem Lab 0.7% Zimnic AZ Abbott Healthcare 0.4% Zithrox Plus Macleods Pharma 0.4% Omnicef-AZ Aristo Pharma 0.4% Glimepiride + Metformin + Pioglitazone (Anti-diabetes)
3,480 Tribet Abbott Healthcare 0.7%
Glimestar PM Mankind Pharma 1.1% Gluconorm-PG Lupin 1.1% Gemer P Sun Pharma 0.4% Triglynase USV 1.3% Gliclazide + Metformin (anti-diabetes)
1,446 Reclimet Dr. Reddys Lab 1.7%
Glycinorm M Ipca Lab 2.8% Glykind-M Mankind Pharma 0.6% Glychek M Indoco Remedies 1.6% Glycigon M Aristo Pharma 0.4% Terbinafine + Clobetasol + Ofloxacin + Ornidazole (derma)
2,596 Panderm Plus Macleods Pharma 7.2%
Terbinaforce Plus Mankind Pharma 0.7% Candid Total Glenmark Pharma 0.5%
Source: AIOCD, HSBC analysis
Exhibit 45: Key cough and cold (respiratory) products at risk from FDC ban
Molecule Total market (INRm) Key brands under impact Company % sales of at risk
Chlorpheniramine + Codeine
6,850 Corex Pfizer 11.1%
Phensedyl Cough Linctus Abbott 4.7% Tossex Abbott 0.8% Codistar Mankind 0.8% Paracetamol + Phenylephrine + Chlorpheniramine
1,000 Sinarest Centaur Pharma
Wikoryl Alembic 3.3% Ammonium + CPM + Dextromethorphan + Guaifenesin
655 Grilinctus Franco Indian 9.2%
Phenylephrine + Dextromethorphan + Triprolidine
449 Ascoril D Glenmark 1.4%
Deletus D Abbott <0.2% New Deletus D Abbott <0.2% New Deletus Abbott <0.2% Bromhexine + Dextromethorphan + Ammonium Chloride
418 Zedex Wockhardt 2.4%
Zedex SF Wockhardt 0.4% Zedex PET Wockhardt 0.3% Guaifenesin + Bromhexine + Diphenhydramine
207 Zeet Alembic Pharma 1.8%
Source: AIOCD, HSBC analysis

EQUITIES PHARMACEUTICALS
21 September 2016
36
There are longstanding concerns about irrational combinations which are available in the Indian
market but have not been approved by most health regulators around the world. We believe that
the Indian health regulator will continue to evaluate drug combinations marketed in India and we
expect increased scrutiny on new combination launches. Companies need to focus on
launching approved combinations.
Exhibit 46: Few irrational drug combinations
Combinations Key brands Company Sales (INRm) % of company sales impacted
Health threat
Eberconazole + Mometasone Furate cream
Ebernet M Dr Reddy's 25.0 nm Combination of antibacterial with corticosteriods decreases immunity and leads to higher susceptibility to infections. People don't have bacterial, fungal and viral infection together, hence this combination not required
Nimesulide + Paracetamol
Nobel Plus Mankind 57.3 nm As per WHO, this combination increases liver toxicity. Moreover numesulide has more anti-pyretic and analgesics property and there is no rationale for combining it with paracetamol
Dolamide Sun Pharma 49.6 nm Lornoxicam + Paracetamol + Serratiopepetidase
Flexilor SP Glenmark 0.2 nm No scientific literature to support claim that serratiopeptidase could promote rapid resolution of inflammation
Nimesulide + Serratiopeptidase
Flozen-NS Mankind 18.4 nm No scientific literature to support claim that serratiopeptidase could promote rapid resolution of inflammation
Nimtech SP Macleods 5.2 nm Roxithromycin + Serratiopeptidase
Roxid Alembic 0.0 nm
Source: WHO, EMA, AIOCD, HSBC analysis
Conclusion
While the challenges continue, we believe the sector growth drivers remain intact.
Demographics, lifestyle changes and the improvement in healthcare infrastructure in India all
point to strong growth. We think the regulatory speedbump is a temporary setback. NLEM
revisions are a fact of life – they take place every two to three years and we can expect the next
round of revisions in 2018-19. Additionally, companies are launching brands in discretionary
areas where pricing may be flexible such as OTC (hair) and supplements. As far as the FDC
ban is concerned, we will have to wait for the final ruling. In a worst case scenario we believe
the ban will result in a shift of sales to individual/or alternative molecules (this process is already
underway at most companies). We believe there is higher risk to irrational combinations.
However, most companies are already moving towards better alternatives.
Industry focus ahead will be
on rational drug
combinations

37
EQUITIES PHARMACEUTICALS
21 September 2016
Company Section
EQUITIES PHARMACEUTICALS
21 September 2016
38
Alkem Lab, established in 1973, was listed in December 2015. The founders, Mr. Samprada
Singh and Mr. Basudeo N. Singh, have been associated with pharmaceutical business for over
four decades. India formulations business is the largest segment, contributing 72.5% of revenue
in FY16. Alkem has been among the top 10 companies in India in terms of sales for 12 years
and its domestic formulations have grown at a CAGR of c22% over FY13-16.
Sustained India growth: We expect India formulations growth to continue despite the
challenging environment. The growth will be sustained by continued growth in power brands
and market share gain in chronic therapies, leveraging on robust sales and distribution network
and strong reach to the medical fraternity. We expect India formulations sales to grow at CAGR
of c18% over FY16-19e (acute therapies c16% and chronic therapies c29%).
US to grow on a small base: US sales, currently cUSD150m, appear set to increase, driven by
new product launches (43 ANDAs pending) and continued strong market share in key products.
Alkem’s own front-end commercial & manufacturing infrastructures and strong channel reach will
provide required support for its US sales ramp-up. We forecast US sales will grow at a CAGR of
c23% over FY16-19e from the current small base. The gradual shift towards P-IV and specialty
launches will help this growth. Importantly, the limited exposure to the US market reduces FDA
related risks compared to peers in the near term.
Margin improvement outlook: Alkem has historically lagged behind peers in terms of margins
due to a heavy dependence on acute therapies. The long-term aim is to bridge this gap in
EBITDA margin – Alkem’s c17% vs 23-25% for key peers – by increasing the sales share of
chronic therapies in India and increasing sales in the US. Gross margin improvement, coupled
with increasing operating efficiency, should drive EBITDA margin improvement of c260bps over
FY16-19e. Overall, we expect an earnings CAGR of 22.5% over FY16-19e.
Valuation: We initiate with a Buy rating and a TP of INR1,945. We value the stock at 22x
September 2018e EPS of INR95.2, and we discount this value to arrive at our TP of INR1,945.
Our Gordon growth model assumes 22% ROE, 7.7% cost of equity and 4% long-term growth
rate. Key downside risks include further exposure to price cuts in India, deterioration of sales
of leading brands and slower pick-up of US sales. Catalysts include a strong recovery in India
formulations sales and successful US FDA inspection of its Daman and Ankaleshwar facilities.
Alkem Laboratories
Strong India formulations base with leadership in acute therapies;
growing chronic therapies sales to improve margins & market share
India growth to continue despite regulatory challenges, driven by
volume growth in leading brands and market share gains in the
chronic segment
Room for margin growth on higher India chronic and US sales.
Initiate with a Buy rating and a TP of INR1,945

39
EQUITIES PHARMACEUTICALS
21 September 2016
Financial statements
Year to 03/2016a 03/2017e 03/2018e 03/2019e
Profit & loss summary (INRm)
Revenue 49,916 60,202 72,738 83,308
EBITDA 8,483 10,717 13,709 16,319
Depreciation & amortisation -1,006 -1,189 -1,539 -1,875
Operating profit/EBIT 7,477 9,528 12,170 14,444
Net interest 328 328 328 299
PBT 8,452 10,107 12,799 15,244
HSBC PBT 8,452 10,107 12,799 15,244
Taxation -1,606 -1,516 -2,304 -2,744
Net profit 6,732 8,477 10,382 12,386
HSBC net profit 6,732 8,477 10,382 12,386
Cash flow summary (INRm)
Cash flow from operations 7,342 7,457 9,502 12,000
Capex -2,572 -5,000 -4,800 -4,600
Cash flow from investment 1,864 -5,000 -4,800 -4,600
Dividends -1,845 -1,187 -1,453 -1,734
Change in net debt -5,823 -1,521 -3,550 -6,167
FCF equity 4,770 2,457 4,702 7,400
Balance sheet summary (INRm)
Intangible fixed assets 4,096 4,096 4,096 4,096
Tangible fixed assets 12,044 15,854 19,115 21,840
Current assets 25,105 29,124 36,104 45,146
Cash & others 7,964 9,486 13,035 19,202
Total assets 54,387 62,216 72,457 84,223
Operating liabilities 9,487 9,912 11,111 12,111
Gross debt 5,854 5,854 5,854 5,854
Net debt -2,110 -3,632 -7,181 -13,348
Shareholders' funds 35,058 42,348 51,276 61,928
Invested capital 23,794 29,677 35,169 39,768
Ratio, growth and per share analysis
Year to 03/2016a 03/2017e 03/2018e 03/2019e
Y-o-y % change
Revenue 33.3 20.6 20.8 14.5
EBITDA 101.1 26.3 27.9 19.0
Operating profit 113.1 27.4 27.7 18.7
PBT 87.5 19.6 26.6 19.1
HSBC EPS 71.9 25.9 22.5 19.3
Ratios (%)
Revenue/IC (x) 2.2 2.3 2.2 2.2
ROIC 27.6 31.1 31.5 32.2
ROE 20.7 21.9 22.2 21.9
ROA 13.8 15.7 16.4 16.7
EBITDA margin 17.0 17.8 18.8 19.6
Operating profit margin 15.0 15.8 16.7 17.3
EBITDA/net interest (x)
Net debt/equity -5.9 -8.4 -13.7 -21.1
Net debt/EBITDA (x) -0.2 -0.3 -0.5 -0.8
CF from operations/net debt
Per share data (INR)
EPS Rep (diluted) 56.30 70.90 86.83 103.59
HSBC EPS (diluted) 56.30 70.90 86.83 103.59
DPS 15.30 9.93 12.16 14.50
Book value 293.21 354.18 428.86 517.95
Valuation data
Year to 03/2016a 03/2017e 03/2018e 03/2019e
EV/sales 4.0 3.3 2.7 2.2
EV/EBITDA 23.3 18.3 14.1 11.4
EV/IC 8.3 6.6 5.5 4.7
PE* 30.2 23.9 19.6 16.4
PB 5.8 4.8 4.0 3.3
FCF yield (%) 2.4 1.2 2.4 3.7
Dividend yield (%) 0.9 0.6 0.7 0.9
* Based on HSBC EPS (diluted)
Issuer information
Share price (INR) 1697.70 Free float 33%
Target price (INR) 1945.00 Sector Pharmaceuticals
Reuters (Equity) ALKE.NS Country India
Bloomberg (Equity) ALKEM IN Analyst Damayanti Kerai
Market cap (USDm) 3,029 Contact +9122 3396 0692
Price relative
Source: HSBC Note: Priced at close of 20 Sep 2016
1100.00
1200.00
1300.00
1400.00
1500.00
1600.00
1700.00
1800.00
1100.00
1200.00
1300.00
1400.00
1500.00
1600.00
1700.00
1800.00
2014 2015 2016
Alkem Laboratories Ltd Rel to BOMBAY SE SENSITIVE INDEX
Financials & valuation: Alkem Laboratories Ltd Buy

EQUITIES PHARMACEUTICALS
21 September 2016
40
India growth to sustain despite challenges
Exhibit 47: Alkem is currently ranked sixth in terms of sales in India
Rank Company MAT Jul'16
sales (INRbn) Jul13-16
CAGR Market
share
FY16 reported
sales
India as % of total
company sales FY13-16
CAGR
IPM 1009.0 11.7% 100.0% 1 Sun + Ranbaxy 87.9 9.6% 8.7% 72.5 25.9% 11.9% 2 Abbott + Novo 63.2 8.6% 6.3% 3 Cipla 50.0 11.0% 5.0% 51.1 38.2% 11.6% 4 Zydus + Biochem 42.5 9.4% 4.2% 29.7 30.8% 8.6% 5 Mankind 38.9 13.7% 3.9% 40.0 18.4% 6 Alkem + Cachet +
Indchemie 34.7 11.2% 3.4% 35.4 72.5% 21.6%
7 Lupin 33.8 15.6% 3.3% 33.9 24.8% 12.8% 8 Glaxo 32.5 0.8% 3.2% 27.3 100.0% 1.6% 9 Macleods 29.5 16.3% 2.9% 10 Pfizer+Wyeth 29.1 9.8% 2.9% 19.9 100.0% 6.0% 11 Intas 28.9 17.1% 2.9% 12 Emcure 26.8 16.1% 2.7% 13 Aristo 25.0 13.6% 2.5% 14 Glenmark 24.3 18.7% 2.4% 21.1 27.6% 17.2% 15 Sanofi India 24.3 16.2% 2.4% 20.5 9.2% 16 Dr. Reddys 24.1 14.6% 2.4% 21.3 13.8% 13.5% 17 Torrent 22.8 21.9% 2.3% 18.3 21.0% 18 USV 20.3 15.7% 2.0% 19 Micro + Bal 19.6 14.4% 1.9% 20 Alembic 14.2 13.5% 1.4% 11.9 10.5% Top 10 as % of IPM sales 43.8% Top 20 as % of IPM sales 66.6%
Source: AIOCD, HSBC analysis
Acute therapies accounted for c86% of the company’s India formulations sales in FY16. Alkem has
leadership status in key acute therapies like anti-infectives (No 1 for the last 10 years), gastro-
intestinal (No. 3), pain/analgesics (No 3) and nutrient supplements (vitamins/minerals/nutrients).
These therapies accounted for c80% of India sales in FY16.
The company has achieved consistent, above-market growth in these established therapies
through market share gains in key brands and new products launches. Alkem is now making
significant investments in emerging therapies like diabetes, cardiac, derma and neuro/CNS to
benefit from the strong underlying growth in these therapies.
Exhibit 48: Alkem has been growing higher than market in established acute therapies*
Therapy Rank in Type of therapy __________ % y-o-y ___________ Alkem’s share IPM Alkem Market in therapy
Anti-infectives 1 Acute 9.4% 3.3% 12.5% Gastro-Intestinal 3 Acute 14.6% 7.0% 5.9% Pain/Analgesics 3 Acute 8.0% 5.8% 5.1% Vitamins/Minerals/Nutrients 5 Acute 10.4% 9.0% 3.8% Neuro / CNS 12 Specialty 22.7% 11.2% 2.0% Derma 18 Specialty 10.9% 12.5% 1.5% Cardiac 30 Specialty 13.8% 9.7% 0.6% Anti-Diabetic 26 Specialty 22.9% 15.8% 0.8% Total 10.6% 8.6%
Source: Company data, IMS Health (*As of 1QFY17)
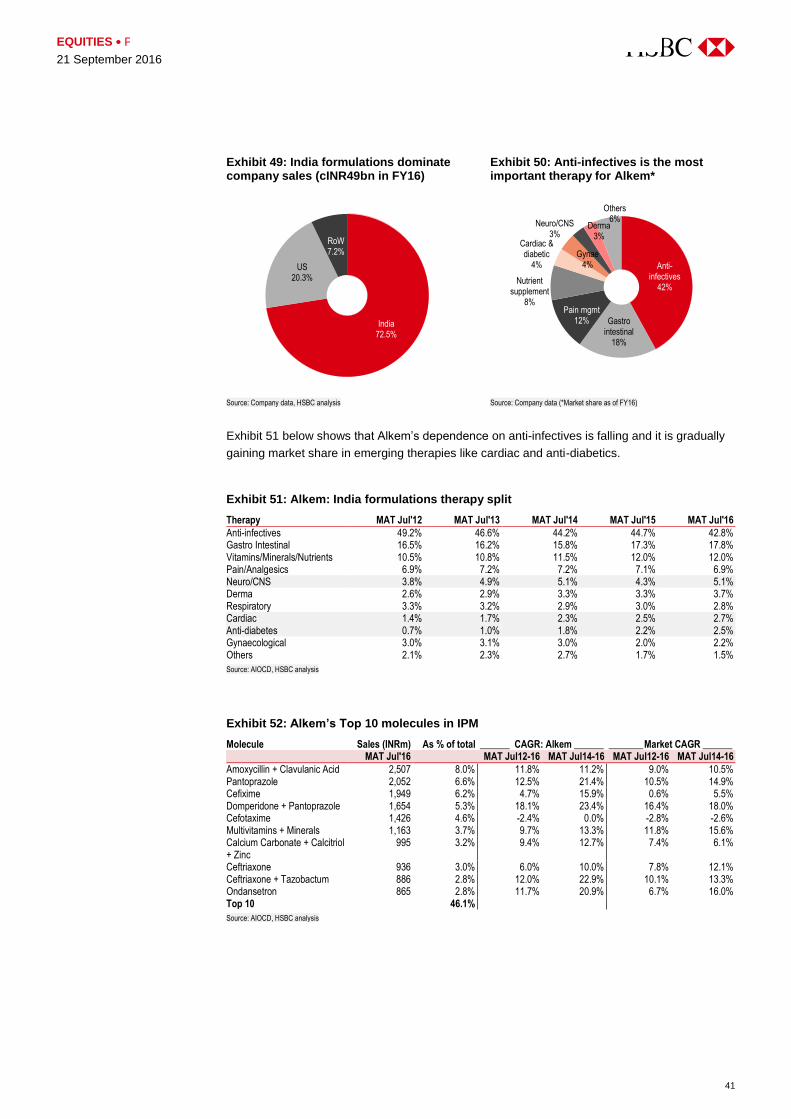
41
EQUITIES PHARMACEUTICALS
21 September 2016
Exhibit 49: India formulations dominate company sales (cINR49bn in FY16)
Exhibit 50: Anti-infectives is the most important therapy for Alkem*
Source: Company data, HSBC analysis Source: Company data (*Market share as of FY16)
Exhibit 51 below shows that Alkem’s dependence on anti-infectives is falling and it is gradually
gaining market share in emerging therapies like cardiac and anti-diabetics.
Exhibit 51: Alkem: India formulations therapy split
Therapy MAT Jul'12 MAT Jul'13 MAT Jul'14 MAT Jul'15 MAT Jul'16
Anti-infectives 49.2% 46.6% 44.2% 44.7% 42.8% Gastro Intestinal 16.5% 16.2% 15.8% 17.3% 17.8% Vitamins/Minerals/Nutrients 10.5% 10.8% 11.5% 12.0% 12.0% Pain/Analgesics 6.9% 7.2% 7.2% 7.1% 6.9% Neuro/CNS 3.8% 4.9% 5.1% 4.3% 5.1% Derma 2.6% 2.9% 3.3% 3.3% 3.7% Respiratory 3.3% 3.2% 2.9% 3.0% 2.8% Cardiac 1.4% 1.7% 2.3% 2.5% 2.7% Anti-diabetes 0.7% 1.0% 1.8% 2.2% 2.5% Gynaecological 3.0% 3.1% 3.0% 2.0% 2.2% Others 2.1% 2.3% 2.7% 1.7% 1.5%
Source: AIOCD, HSBC analysis
Exhibit 52: Alkem’s Top 10 molecules in IPM
Molecule Sales (INRm) As % of total ______ CAGR: Alkem ______ _______ Market CAGR ______ MAT Jul'16 MAT Jul12-16 MAT Jul14-16 MAT Jul12-16 MAT Jul14-16
Amoxycillin + Clavulanic Acid 2,507 8.0% 11.8% 11.2% 9.0% 10.5% Pantoprazole 2,052 6.6% 12.5% 21.4% 10.5% 14.9% Cefixime 1,949 6.2% 4.7% 15.9% 0.6% 5.5% Domperidone + Pantoprazole 1,654 5.3% 18.1% 23.4% 16.4% 18.0% Cefotaxime 1,426 4.6% -2.4% 0.0% -2.8% -2.6% Multivitamins + Minerals 1,163 3.7% 9.7% 13.3% 11.8% 15.6% Calcium Carbonate + Calcitriol + Zinc
995 3.2% 9.4% 12.7% 7.4% 6.1%
Ceftriaxone 936 3.0% 6.0% 10.0% 7.8% 12.1% Ceftriaxone + Tazobactum 886 2.8% 12.0% 22.9% 10.1% 13.3% Ondansetron 865 2.8% 11.7% 20.9% 6.7% 16.0% Top 10 46.1%
Source: AIOCD, HSBC analysis
India72.5%
US20.3%
RoW7.2%
Anti-infectives
42%
Gastro intestinal
18%
Pain mgmt12%
Nutrient supplement
8%
Cardiac & diabetic
4%Gynae
4%
Neuro/CNS3%
Derma3%
Others6%

EQUITIES PHARMACEUTICALS
21 September 2016
42
Impact from domestic regulatory updates
As mentioned earlier, overall India formulations market growth has slowed down recently due to
a number of regulatory issues, including expansion of products under price controls, price cuts
in-line with negative WPI and a proposed ban on certain fixed dose combination (FDC)
products. This has disrupted supply chains as wholesalers and retailers have refused to take
products from manufacturers, or reduced orders.
Alkem’s growth has been impacted in line with the decline in the market. During 1Q FY17,
Alkem indicated there would be an annualized impact of 4-5% on its India formulations sales
from the combined effect of: 1) the downward price revision due to negative WPI as of the end
of 2015; 2) the inclusion of new products under the new DPCO amendment order 2016; 3)
further price revision for molecules under DPCO order 2013. The company further indicated that
3-4% of its India sales were from FDC products.
Alkem managed to reduce the impact of regulatory challenges on margins in 1QFY17 by its
on-going cost optimization programme, which was initiated 18 months ago. The company is
already in the process of shifting to brands which do not come under the proposed FDC ban
and is developing formulations approved by the DPCO to replace certain FDC products.
Our analysis indicates that Alkem has been able to hold/increase market share in several of its
biggest molecules, primarily through volume led growth. The company said that while the
expansion of the number of drugs on the National List of Essential Medicines (NLEM) has
impacted prices of some key brands, it has also made its products more competitive in terms of
pricing. This provides opportunities from higher volume growth in price-sensitive segments.
Exhibit 53: Alkem’s Top 10 brands
Brand Molecule Therapy MAT Jul'16
sales (INRm) % sales
share MAT Jul 12-16
CAGR MAT Jul
14-16 CAGR
Clavam Amoxycillin + Clavulanic Acid
Anti-Infectives 2,507 8.0% 11.8% 11.2%
Pan Pantoprazole Gastro Intestinal 2,034 6.5% 12.4% 21.4% Taxim O Cefixime Anti-Infectives 1,949 6.2% 4.7% 15.9% Pan D Domperidone +
Pantoprazole Gastro Intestinal 1,654 5.3% 18.1% 23.4%
Taxim Cefotaxime Anti-Infectives 1,426 4.6% -2.4% 0.0% Gemcal Calcium Carbonate +
Calcitriol + Zinc VNM* 965 3.1% 8.5% 11.0%
Xone Ceftriaxone Anti-Infectives 936 3.0% 7.2% 11.3% Ondem Ondansetron Gastro Intestinal 865 2.8% 11.7% 21.4% A to Z NS Multivitamins + Minerals VNM* 861 2.8% 23.7% 14.9% Sumo Nimesulide + Paracetamol Pain / Analgesics 852 2.7% 7.6% 9.0% Top-10 44.9% 8.8% 13.7% Total India sales 31,282 100.0% 11.8% 13.9%
Source: AIOCD, HSBC analysis (*VNM=vitamins/ nutrient supplements/minerals)
We have analysed the company’s leading brands (sales of more than INR1bn) to assess the
impact of the NLEM additions. Most of its top brands are already priced at or below the
mandated ceiling price, so we don’t expect further price cuts. Key stock keeping unit (SKU) of
40mg tablets for Pan, one of its top brands, is not on the NLEM list. We expect growth in key
brands to continue on back of volume growth and the shift towards formulations which are not
affected by the threat of price cuts.

43
EQUITIES PHARMACEUTICALS
21 September 2016
Exhibit 54: NLEM impact on Alkem’s top brands
Brand Molecule Brand sales
(INRm) Key SKUs impacted
SKU contribution
to sales
% price differential
to CP* Remark
Clavam Amoxycillin (A) + Clavulanic Acid (C)
2,507 Tablet 500mg (A)+ 125 mg ('C)
64.3% 0.0% No further risk of price cuts here as MRP is equal to ceiling price
Oral liquid 200 mg (A) + 28.5 mg (B)/5 ml
12.6% 0.0%
Dry Syrup 125 mg (A) + 31.25 (C)/5 ml
1.3%
Pan Pantoprazole 2,034 40 mg injection 12.1% -20.8% Key 40 mg tablet which constitutes more than 80% of sales not under NLEM
Taxim O Cefixime 1,949 200mg tab 47.7% 0.0% No further price cut risk in 200mg/100mg tab. 50 mg syrup which contributes for c25% of brand sales is not under NLEM
100mg tab 8.5% 0.0%
Taxim Cefotaxime 1,426 1gm injection 53.2% 0.0% No further risk of price cuts here as MRP is equal to ceiling price
500 mg injection 27.6% 0.0% 250 mg injection 14.7% 0.0%
Source: AIOCD, HSBC analysis (*CP including local taxes)
Exhibits 55-57 show that Alkem’s top three brands – Clavam, Pan and Taxim O – continue to
gain market share.
Exhibit 55: Top 5 brands in Amoxycillin+clavulanic acid: Clavam has gained market share in the last two years
Source: AIOCD, HSBC analysis
27.55% 26.00%18.29% 20.61% 17.44%
13.32% 13.31%
15.41% 13.91%14.72%
10.17% 10.99%
10.86% 10.35%9.87%
2.86% 2.86%
3.30% 3.94%4.81%
3.08% 3.58%
4.09% 3.76% 4.28%
0%
10%
20%
30%
40%
50%
60%
MAT Jul'12 MAT Jul'13 MAT Jul'14 MAT Jul'15 MAT Jul'16Augmentin-GSK Clavam-Alkem Moxikind CV-Mankind Moxclav-Ranbaxy Advent-Cipla

EQUITIES PHARMACEUTICALS
21 September 2016
44
Exhibit 56: Pan brand maintains its leadership position in the pantoprazole market
Source: AIOCD, HSBC analysis
Exhibit 57: Taxim O continues to gain market share
Source: AIOCD, HSBC analysis
Exhibit 58 shows Alkem’s key brands that are potentially exposed to the proposed FDC ban, in
our assessment. However, the company is developing alternative formulations to minimise the
impact of any FDC ban.
Exhibit 58: Alkem’s key combinations potentially exposed to FDC ban
Brand Molecule Therapy
% sales to Alkem India
sales Remarks
Enzoflam Diclofenac + Paracetamol + Serratiopeptidase
Pain / Analgesics 1.1% Irrational combination as no scientific literature to support claim that enzyme serratiopeptidase could rapidly reduce inflammation
Taxim AZ Cefixime + Azithromycin Anti-Infectives 0.8% Sumoflam Nimesulide + Paracetamol +
Serratiopeptidase Pain / Analgesics 0.5% Nimesulide banned internationally on its role
in increasing liver toxicity Lincef Cefixime + Linezolid Anti-Infectives 0.4%
Source: AIOCD, HSBC analysis
24.3% 22.9% 24.7% 25.9% 26.0%
18.2% 19.0% 18.7% 19.8% 17.9%
15.1% 16.3% 16.9% 16.6% 16.7%
17.4% 16.8% 15.3% 12.9% 13.3%
1.4% 2.7% 3.6% 3.9% 5.0%
0%
10%
20%
30%
40%
50%
60%
70%
80%
90%
MAT Jul'12 MAT Jul'13 MAT Jul'14 MAT Jul'15 MAT Jul'16Pan-Alkem Pantocid-Sun Pharma Pantop-Aristo Pantodac-Zydus Cadilla Pansec-Cipla
20.5% 21.6% 21.1% 23.0% 24.0%
17.0% 17.9% 19.4% 19.7% 21.0%
5.5% 5.8% 5.6% 5.5%5.8%
5.1% 4.9% 5.0% 5.1%4.9%
5.1% 4.7% 4.9% 4.7%4.6%
0%
10%
20%
30%
40%
50%
60%
70%
MAT Jul'12 MAT Jul'13 MAT Jul'14 MAT Jul'15 MAT Jul'16Taxim O-Alkem Zifi-FDC Mahacef-Mankind Cefolac-Macleods Hifen-Hetero
We expect minimal impact
from potential FDC ban on
Alkem
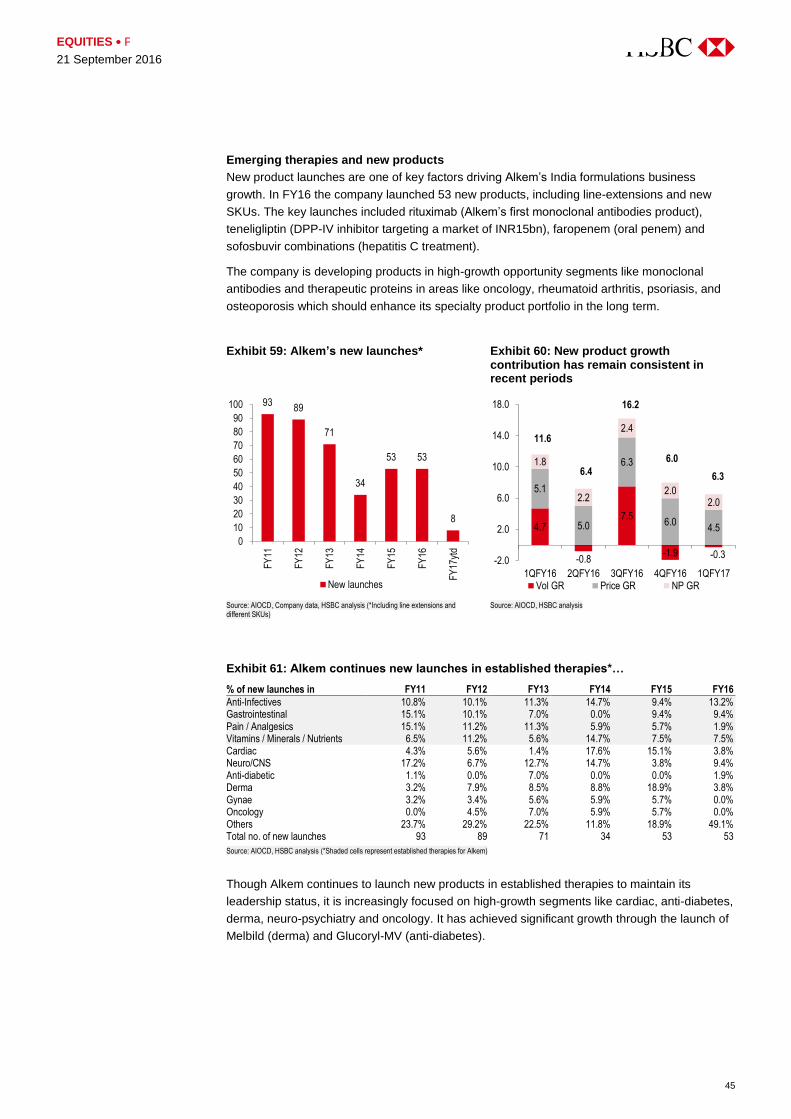
45
EQUITIES PHARMACEUTICALS
21 September 2016
Emerging therapies and new products
New product launches are one of key factors driving Alkem’s India formulations business
growth. In FY16 the company launched 53 new products, including line-extensions and new
SKUs. The key launches included rituximab (Alkem’s first monoclonal antibodies product),
teneligliptin (DPP-IV inhibitor targeting a market of INR15bn), faropenem (oral penem) and
sofosbuvir combinations (hepatitis C treatment).
The company is developing products in high-growth opportunity segments like monoclonal
antibodies and therapeutic proteins in areas like oncology, rheumatoid arthritis, psoriasis, and
osteoporosis which should enhance its specialty product portfolio in the long term.
Exhibit 59: Alkem’s new launches* Exhibit 60: New product growth contribution has remain consistent in recent periods
Source: AIOCD, Company data, HSBC analysis (*Including line extensions and different SKUs)
Source: AIOCD, HSBC analysis
Exhibit 61: Alkem continues new launches in established therapies*…
% of new launches in FY11 FY12 FY13 FY14 FY15 FY16
Anti-Infectives 10.8% 10.1% 11.3% 14.7% 9.4% 13.2% Gastrointestinal 15.1% 10.1% 7.0% 0.0% 9.4% 9.4% Pain / Analgesics 15.1% 11.2% 11.3% 5.9% 5.7% 1.9% Vitamins / Minerals / Nutrients 6.5% 11.2% 5.6% 14.7% 7.5% 7.5% Cardiac 4.3% 5.6% 1.4% 17.6% 15.1% 3.8% Neuro/CNS 17.2% 6.7% 12.7% 14.7% 3.8% 9.4% Anti-diabetic 1.1% 0.0% 7.0% 0.0% 0.0% 1.9% Derma 3.2% 7.9% 8.5% 8.8% 18.9% 3.8% Gynae 3.2% 3.4% 5.6% 5.9% 5.7% 0.0% Oncology 0.0% 4.5% 7.0% 5.9% 5.7% 0.0% Others 23.7% 29.2% 22.5% 11.8% 18.9% 49.1% Total no. of new launches 93 89 71 34 53 53
Source: AIOCD, HSBC analysis (*Shaded cells represent established therapies for Alkem)
Though Alkem continues to launch new products in established therapies to maintain its
leadership status, it is increasingly focused on high-growth segments like cardiac, anti-diabetes,
derma, neuro-psychiatry and oncology. It has achieved significant growth through the launch of
Melbild (derma) and Glucoryl-MV (anti-diabetes).
9389
71
34
53 53
8
0
10
20
30
40
50
60
70
80
90
100
FY
11
FY
12
FY
13
FY
14
FY
15
FY
16
FY
17yt
d
New launches
4.7
-0.8
7.5
-1.9 -0.3
5.1
5.0
6.3
6.04.5
1.8
2.2
2.4
2.02.0
-2.0
2.0
6.0
10.0
14.0
18.0
1QFY16 2QFY16 3QFY16 4QFY16 1QFY17Vol GR Price GR NP GR
11.6
6.4 6.3
6.0
16.2

EQUITIES PHARMACEUTICALS
21 September 2016
46
Exhibit 62: Key recent launches by Alkem
Brand Molecule Therapy Launch date MAT Jun'15 MAT Jun'16 % y-o-y As % of total MAT Jun'16
Merosure O Faropenem Anti-Infectives 3/1/2016 Olymprix Teneligliptin Anti-Diabetic 3/1/2016 Gemcal Plus Calcium+ Calcitriol Vitamins /
Minerals / Nutrients
6/1/2015 14 18 28.9% 0.6%
Melbild Deca Peptide+Isopropyl Alcohol+Myristate+Glycol
Derma 4/1/2014 14 19 30.6% 0.6%
PAN MPS Aluminium + Dimethicone + Magnesium
Gastro Intestinal
4/1/2014
Glucoryl-MV Voglibose + Metformin + Glimepiride
Anti-Diabetic 7/1/2012 17 24 37.7% 0.8%
Source: AIOCD, Company data, HSBC analysis
Investments in place to sustain India growth
Alkem has created power brands in acute therapies like Clavam, Pan, Pan D, and Taxim
through well-structured marketing comprising of therapy-specific marketing divisions. The
company has a strong product management team which aims to fill gaps in product offerings in
a particular therapy. This approach helps to target specific doctors/medical practitioners by
offering them a wide range of products in various therapeutic segments which, in turn, helps to
create highly recognisable brands.
Apart from GlaxoSmithKline Pharmaceuticals (GLXO IN, Not Rated), which has seven brands in
the Top 50, Alkem and Abbott Lab are the only other companies with five brands in the Top 50,
ahead of many bigger names like Cipla, Sun Pharma and Lupin. Alkem also has 14 brands in
the Top 300, as of FY16.
The company has a strong sales and distribution network consisting of 5,800 medical
representatives, 40 sales depots, 49 clearing and forwarding agents, 19 consignees, and eight
central warehouses covering more than 7,000 stockists. Its domestic business is divided into 19
marketing divisions which formulate promotional strategies for their portfolio of products.
Alkem’s information technology systems are well integrated with its sales and distribution
infrastructure, enabling it to standardize processes and improve productivity.
The company is expecting to create similarly recognised brands in chronic therapies, by using a
marketing and distribution network that has extensive reach, even in semi-urban and rural markets.
Alkem has ramped up the number of its sales representatives that focus on specialty therapies
in recent years. More than half of the 800-1,000 sales staff hired recently focus on specialty
segments, taking the total to 1,400 out of the 5,800 strong sales team. With the hiring phase
largely over, the company now wants to improve the productivity of medical representatives
(MR), which we are measuring as annual sales achieved by a MR. Current productivity is
INR6.5m compared to the industry average of INR7-8m, which is impressive given that acute
therapies contribute c85% of sales. We think there is huge scope for improvement in specialty
MR productivity, which currently stands at less than INR2.5m/year versus INR6.7-6.8m/year for
acute therapies.
Outlook for India formulations business: Despite the challenging pricing environment in
India, we believe Alkem will maintain an above market growth rate on the back of volume
growth and market share gains in established therapies and new launches in both established
and emerging segments. Increasingly competitive pricing in certain key therapy segments like
anti-infectives and gastro could continue to impact prices of its key brands. However, this will
also provide opportunities from higher volume growth in price-sensitive segments. The company
has been able to hold its ground in several of its biggest molecules, which should support the
growth of its India formulations business.
Alkem has ramped up the
number of its sales
representatives that focus on
specialty therapies

47
EQUITIES PHARMACEUTICALS
21 September 2016
The company comfortably expects c25% growth in specialty therapy sales and looks for 2-3%
higher than market growth in the acute therapy segment. We expect India formulations sales to
grow at a CAGR of c18% over FY16-19e, with acute therapies rising c16% and chronic
therapies c29% over this period.
US investments to bear fruit
Strategic investments to tap US opportunities: Compared to peers, Alkem is a relatively late
entrant to the US. It started operations there in 2009, unlike major peers which entered the US
market in the late 1990s and early-to-mid 2000s.
In order to establish a front-end marketing presence, it acquired The Pharmanetwork (TPN) LLC
(the holding company of Ascend Lab, a generic marketing company) in the US in July 2010. This
acquisition provided the company with the commercial platform through which it market its product
in the US. After gaining marketing infrastructure there, Alkem made two US acquisitions of
manufacturing assets: 1) from NORAC, in December 2012; 2) from Long Pharmaceuticals LLC in
June 2015. The NORAC acquisition provided manufacturing capabilities of specialty APIs as well as
contract research and manufacturing services. The Long Pharmaceutical assets provide
semi-solids, liquid, nasal formulations and controlled substances manufacturing capabilities.
Alkem’s US sales have increased from USD14m in FY11 (from less than 10 products) to
cUSD150m in FY16 (from 19 products, of which five are in-licensed). This growth is driven by
own launches as well as in-licensed products. It has maintained significant market shares in
established products like benzonatate, silver sulfadiazine and Ibuprofen while ramping up its
presence in relatively new launches like mycophenolate mofetil, gabapentin & triamcinolone
acetonide. In mycophenolate suspension Alkem is generating cUSD30m sales as per the latest
IMS data. Alkem doesn’t expect much competition in products like benzonatate and silver
sulfadiazine as they involve high levels of investment and high-competition led price erosion
doesn’t justify such investments.
Exhibit 63: Ascend maintains significant TRx share in established molecules
Exhibit 64: Relatively recent products showing ramp up in TRx share
Source: IMS Health, HSBC analysis Source: IMS Health, HSBC analysis
19.2%
65.2%
36.5%
72.1%
0%
20%
40%
60%
80%
FY11 FY12 FY13 FY14 FY15 FY16
Benzonatate Silver Sulfadiazine
12.5%
9.5%
14.4%
4.0%
0%
5%
10%
15%
20%
FY11 FY12 FY13 FY14 FY15 FY16
Ibuprofen (RX) Gabapentin
Triamcinolone Actn Mycophenolate Mof
Alkem’s US sales rose to
cUSD150m in FY16 from
cUSD14m in FY11

EQUITIES PHARMACEUTICALS
21 September 2016
48
Alkem is currently spending c90% of its total R&D budget (c5% of total sales) on building a
strong product pipeline in the US. Alkem targets 12-15 ANDA filings per year in the US to ramp-
up its pipeline. It currently has 43 pending ANDAs (including seven tentative approvals) and it
expects to launch 8-10 products per year. The company aims to increase the number of owned
product launches in order to improve margins (for in-licensed products, it needs to share
margins with the owner of the product).
Exhibit 65: Alkem Lab: ANDA filings and approvals ramping up gradually
Source: Company data
Exhibit 66: ANDA filings comparison across key generics
ANDA filings FY12 FY13 FY14 FY15 FY16 Pending ANDAs
Alkem Lab 8 8 10 14 14 43 Alembic Pharma 7 13 4 7 8 35 Aurobindo Pharma 30 30 67 40 22 147 Cadila Healthcare 33 50 38 30 166 Dr Reddy's Lab 17 18 12 13 14 78 Glenmark Pharma 12 18 20 18 12 62 Lupin 25 21 19 18 36 149 Sun Pharma 22 22 29 19 22 159 Torrent Pharma 6 3 0 2 14 Wockhardt 13 20 10 14 17 84
Source: Company data
While most of the 31 P-IV ANDA opportunities, including several first-to-file (FTF) ANDAs which
can potentially entitle it to exclusive generic sales during first six months of a generic launch, will
start in FY18-19, the company says it has some meaningful opportunities in the near-to-medium
term. After P-IV opportunities, the next leg of US growth should come from its two acquisitions,
NORAC and Long Pharmaceuticals, where relatively niche generics like semi solids, nasal
formulations and controlled substances are being developed. The company also expects to
transfer several commercialized products, currently manufactured under contract, to these
facilities.
8 8
10
14 14
12 2
4
12
0
2
4
6
8
10
12
14
16
FY12 FY13 FY14 FY15 FY16
ANDA filings ANDA approvals
Major R&D focus on ramping
up the US pipeline

49
EQUITIES PHARMACEUTICALS
21 September 2016
Exhibit 67: Alkem: US P-IV pipeline
Product Brand Indication Annual sales
(USDm)
Launch timeline
Remarks
Rosuvastatin Crestor Anti-cholesterol 6,248 FY17 Allergan, Glenmark, Mylan, Sun Pharma, Apotex, Sandoz, Citron and Par Pharma in market; Alkem, Torrent and Biocon have tentative FDA approvals
Lanthanum carbonate
Fosrenol Hyperphosphatemia
115 FY17 Natco partnered with Lupin. Alkem, Mylan, Teva and Invagen have filed too. Three composition patents covering the drug; earliest expires in Oct 2018, last in Aug 2024. Settled opportunity for Natco/Lupin for which terms are undisclosed
Dronedarone Multaq Cardiac 400 FY17 Alkem, Glenmark and Actavis have tentative approval. Sandoz, Alembic, Lupin, Sun, Amneal, Unimark other known filers. Alkem has settled for a certain-date launch
Rasagiline mesylate
Azilect Early Parkinson's disease
300 FY17 Expected generic entry in Feb 2017; Alkem, Apotex, Mylan, Orchid, Sandoz and Teva are ANDA filers. Apotex and Orchid have final ANDA approval
Olmesartan medoxomil
Benicar Hypertension 841 FY18 12 generics have tentative approvals (Alkem, Alembic, Mylan, Sandoz, Teva, Torrent, Glenmark, Aurobindo, Macleods, Jubilant, Amneal and Scigen). Most likely a FY18 opportunity assuming Mylan's FTF starts in Oct 2016 and other players enter after Mylan's FTF period
Olmesartan medoxomil HCTZ
Benicar HCT
Hypertension 562 FY18 Mylan, Teva, Macleods, Aurobindo and Prinston Pharma have tentative approvals. Apotex other filer
Esomeprazole Nexium GERD 4,965 FY18 Currently (as of Jul-16), Teva, Torrent, Mylan, Dr Reddy's, Hetero and Aurobindo generics in market. Alkem is under litigation, most likely going to be a 2H FY18 opportunity
Aripiprazole Abilify Schizophrenia, bipolar disorder, depression
7,068 FY18 Teva, Hetero, Apotex, Trigen (Alembic's partner), Torrent Pharma, Aurobindo Pharma, Amneal, Silrax in market
Minocycline Solodyn Acne 240 FY18 Aurobindo, Lupin, Mylan, Teva other known filers. 45mg, 90mg, 135mg generics in market. 65mg and 115mg to some in Feb 2018 and 55mg, 80mg and 150mg to come in Feb 2019
Dalfampridine Ampyra Multiple sclerosis 235 Settled for 2027 launch unless some generic launch the product first. Par Pharma, Aurobindo, Sun Pharma, Actavis, Accord also settled, Teva, Mylan, Apotex, Roxane are other filers
Tapentadol Nucynta ER
Pain management
168 Late opportunity as the DC of NJ ruled in favour of Depomed upholding patent validity
Tapentadol Nucynta Pain management
216 Actavis, Sandoz, Roxane are other known ANDA filers
Fesoterodine fumarate
Toviaz Overactive bladder
220 5/11/2019 Multiple ANDA filers - Alkem, Sandoz, Lupin, Zydus, Accord, Amerigen, Amneal, Impax, Wockhardt, Mylan and Hetero. Alkem case is voluntary dismissed by Pfizer which indicates settlement
Sodium oxybate
Xyrem Narcolepsy 2020 Alkem has DMF. Amneal, Par, Actavis are other filers. Weak patents post 2022. Par and Amneal challenged claims 1-11 of '730 patent in IPR
Nebivolol Bystolic Hypertension 910 9/1/2021 Alkem has received final FDA approval. Watson, Glenmark, Hetero, Alkem, Indchemie, Amerigen are known ANDA filers. Hetero + Glenmark settled for 3 mth prior launch to '040 patent expiring in Dec-2021 or the date a generic company receives final FDA approval. No active litigation. US FTC is conducting a non-public investigation on Bystolic ANDA settlement.
Dabigatran Pradaxa Anti-coagulant 850 Assume launch upon expiry of '380 patent on Feb 18, 2018
Source: Company data, HSBC analysis
Outlook for US sales: We believe multiple factors can drive the company’s US growth, including
a front-end commercial and manufacturing infrastructure, strong channel reach, a decent ANDA
pipeline and continued strong market share in key products. We forecast a 23% CAGR sales
growth in the US over FY16-19e from a small base, driven by continued traction in existing
products, the launch of new products and a gradual shift towards P-IV and specialty launches.

EQUITIES PHARMACEUTICALS
21 September 2016
50
Exhibit 68: Alkem: US sales growth trend
Source: Company data, HSBC estimates
Regulatory track record
Alkem has six US FDA approved facilities (two in the US) and four R&D centres to support its
US sales growth plans. The company has maintained a relatively clean track record with the
FDA, with no FDA import alert ban or FDA warning letter so far.
In 2015 it passed an FDA inspection of the formulation facilities at Baddi (India) and St. Louis
(Missouri, US) and the API facility in California. In March 2016, its API facility at Mandva in
Gujarat passed an FDA inspection.
Exhibit 69: FDA audit status of US-dedicated facilities
Facility Manufacturing capabilities Remark
Baddi, India Capsules, tablets, injectables, dry syrups Last FDA inspection in July 2015 and it was cleared with no major observations. 30%-40% of ANDA filed from Baddi
Daman, India Capsules, tablets, injectables, dry syrups 60-70% ANDA filed from this facility. FDA inspection due in near term
St. Louis, Missouri, US Controlled substances, liquid, nasal spray, semi-solids and solids
Last FDA inspection in 2015
Mandva, India APIs Mandva received FDA EIR in March 2016 Ankaleshwar, India APIs FDA inspection due in near term California, US APIs Last FDA inspection in 2015
Source: Company data
In August 2016 its R&D centre at Taloja passed an FDA audit, with no Form 483 observations.
(An FDA Form 483 is issued to a company at the conclusion of a facility inspection. It contains
observations which may indicate that a product is prepared, packed or stored under conditions
whereby it many become adulterated. The issuance of a Form 483 doesn’t always indicate that
there are serious deviations from required regulatory requirements. It depends on the nature of
the observations made by the FDA on a case to case basis.) In June 2016, it completed
remediation of issues raised by the UK MHRA at the Taloja facility.
Other regulatory inspection status of Taloja facility: In a notice sent to the European
Medical Agency (EMA) on 24 March 2016, the German regulator accused Alkem of engaging in
“intentional misrepresentation” of data and duplication of electrocardiogram (ECG) readings of
patients in clinical trials. This observation was based on an inspection of Alkem’s Taloja facility
during March 2015.
As per Alkem, it submitted its response to the EMA and provided an update regarding this on
25 June 2016. As per the update: 1) EMA has allowed continuation of marketing of Cefuroxime-
(sold as Cefuroxime Alkem & Cefuroxime KrKa) as Alkem has provided alternative studies that
support a positive benefit-risk balance. 2) EMA stated that Cefuroxime Ingen Pharma (currently
1125
36 79
117151
282
0
50
100
150
200
250
300
FY11 FY12 FY13 FY14 FY15 FY16 FY19e
US sales (USDm)

51
EQUITIES PHARMACEUTICALS
21 September 2016
under evaluation by national authorities) can be still considered for marketing approval as
Alkem has provided study results from other sources as recommended by the agency.
3) Ibuprofen Orion (currently under evaluation by national authorities) cannot be authorised for
marketing on the basis of studies carried out at the company. So far no alternative studies from
other sources have been provided by the company. Alkem is considering to provide alternate
studies from other sources to support authorization. 4) Riluzole Alkem (which is yet to be
marketed in the EU) should be suspended as per EMA. Alkem is considering to provide
alternate studies from other sources to support authorization.
Currently sales from the EU account for less than 1% of total company revenues, hence even in
the event of an adverse EMA decision for pending concerned products there will be a negligible
impact on revenues/profit.
RoW markets: small presence
Alkem has a small presence in international markets, which contribute c8% of total sales. It has
identified focus markets like Australia, Chile, Europe, Kazakhstan and the Philippines where it
intends to create a strong local presence. Alkem acquired Pharmacor Pty Ltd in Australia in
2009, gaining access to c100 products.
Valuation and risks
Since listing on the National Stock Exchange of India and Bombay Stock Exchange on 23
December 2015 Alkem has outperformed the market by c14%.
Exhibit 70: Alkem stock performance since listing
Source: Thomson Reuters DataStream
We initiate coverage on Alkem with a target price of INR1,945. We value the stock at 22x
(Gordon Growth based PE) Sep-18e EPS of INR95.2, and we discount this value to arrive at
our TP of INR1,945. Our TP implies FY17, FY18 and FY19 PEs of 27.4x, 22.4x and 18.8x
compared to comp averages of 26.4x, 20.8x and 17.8x respectively.
Our Gordon growth model assumes 22% ROE, 7.7% cost of equity and a 4% long-term growth
rate.
Our TP offers 14.6% upside; at this level, according to HSBC’s rating system, the stock could be
rated either as a Hold or a Buy. We rate Alkem a Buy, however, based on its sustained growth
outlook in India on strong brand positioning and expected market share gain in chronic therapies
products, as well as increasing sales in the US which should lead to margin expansion.
1,100
1,200
1,300
1,400
1,500
1,600
1,700
1,800
Jan-16 Jan-16 Mar-16 Mar-16 Apr-16 May-16 Jun-16 Jul-16 Aug-16
1 Apr : Taloja R&D facilityreceived UK MHRAobservations
7 Jun: Taloja facilityreceived UK MHRAclearance

EQUITIES PHARMACEUTICALS
21 September 2016
52
Key catalysts: A strong recovery in India formulations sales and successful FDA inspections of
its Daman and Ankaleshwar facilities.
Key downside risks
1. Heavy dependence on top brands: Alkem is exposed to product/therapy concentration risk
given four top therapies (anti-infectives, gastro-intestinal, pain/analgesics and nutrient
supplements) account for c80% of total India sales. Its top 10 brands account for c46% of
total India sales.
2. Price cuts and other regulatory challenges in India: Given the heavy tilt towards acute
therapies (contributing to more than 80% of India sales), Alkem’s portfolio is exposed to
near-term sector headwinds like price controls funder NLEM (the National List of Essential
Medicines) and the proposed ban on certain fixed dose combination (FDC) drugs.
Currently, c31% of the company’s domestic portfolio is under the NLEM.
3. Delay/failure to receive FDA approvals in the US: Any delay or failure to receive approvals
will impact our earnings estimates adversely as we think US sales growth is one of the
company’s main growth drivers.
4. Regulatory risks (especially to US FDA): The Company has six US FDA approved facility
which cater to the US market. Any adverse development, such as the issuance of an FDA
warning letter or an import ban if the company fails to maintain FDA specified quality and
manufacturing, will disrupt US sales growth. Similar regulatory risks from other agencies
such as EMA, UK MHRA can impact export sales in that region.
5. Lack of vertical integration: Of the 19 products in the US market, none is vertically
integrated. This is a risk, particularly in a market with falling prices. The company says that
c50% of future products will be vertically integrated.
Exhibit 71: ROE vs PB Exhibit 72: PE vs EPS CAGR
Source: HSBC estimates Source: HSBC estimates
0.0
1.0
2.0
3.0
4.0
5.0
6.0
7.0
10.0% 15.0% 20.0% 25.0% 30.0% 35.0%
FY
17 P
B (
x)
FY17 ROE
Biocon
Cadila
Dr Reddy's
CiplaIpca
AurobindoGlenmark
Torrent Sun Pharma
Lupin
Alkem
Alembic
0%
5%
10%
15%
20%
25%
30%
35%
15.0 20.0 25.0 30.0 35.0
FY
17-1
9 E
PS
CA
GR
FY17 PE
Glenmark
Alkem
Aurobindo
Lupin
Sun Pharma
Torrent
Cadila
Dr Reddy's
Cipla
Alembic

53
EQUITIES PHARMACEUTICALS
21 September 2016
1Q FY17 quarterly review
1. Alkem reported India sales of INR10.8bn, up 22.4% y-o-y. However, after accounting
adjustments for the reversal of sales recognised before dispatches at the cut-off date in 1Q
FY16, the company reported India formulations growth of 15-16% for 1Q FY17.
2. The company indicated an annualized impact of 4-5% on its India formulations sales from
the combined effect of downward price revision due to negative WPI as of the end of 2015,
inclusion of new products under the new DPCO order 2015 and further price revision for
molecules under the DPCO order 2013. The company further indicated that 3-4% of its
India sales are from FDC products.
3. US sales grew c12% y-o-y on holding market share in key products despite no major
contribution from three new launches which were launched towards the end of the quarter.
As per company these launch contributions will be reflected from 2Q FY17.
4. Alkem held gross margin at 60.3% despite the impact of price controls and WPI mandated
downward price revisions. This was the result of cost optimization measures and price
increases on other brands.
5. Alkem indicated an effective tax rate of 12-15% for FY17.
Exhibit 73: Alkem quarterly results review
INRm 1Q FY16 2Q FY16 3Q FY16 4Q FY16 1Q FY17 q-o-q y-o-y
Total revenues 12,075 13,560 12,747 11,426 14,579 27.6% 20.7% Material expenses 4,745 5,488 5,089 4,279 5,789 35.3% 22.0% As % of sales 39.3% 40.5% 39.9% 37.4% 39.7% Staff expense 2,282 2,420 2,337 2,066 2,541 23.0% 11.3% As % of sales 18.9% 17.8% 18.3% 18.1% 17.4% R&D 430 411 438 870 788 -9.4% 83.3% As % of sales 3.6% 3.0% 3.4% 7.6% 5.4% Other expenses 2,556 2,692 2,529 2,631 2,750 4.5% 7.6% As % of sales 21.2% 19.9% 19.8% 23.0% 18.9% Total expense 10,013 11,012 10,394 9,845 11,868 20.5% 18.5% EBITDA 2,062 2,548 2,354 1,580 2,711 71.5% 31.5% EBITDA margin 17.1% 18.8% 18.5% 13.8% 18.6% Other income 475 518 330 426 281 -34.1% -41.0% Interest 225 184 170 107 100 -7.2% -55.7% Depreciation 206 277 244 260 230 -11.7% 11.4% PBT 2,107 2,605 2,270 1,639 2,663 62.5% 26.4% Tax 68 91 345 1,066 230 -78.5% 237.2% Tax rate 3.2% 3.5% 15.2% 65.0% 8.6% Minority -28 -45 -35 -6 -45 Net profit 2,011 2,469 1,889 567 2,388 321.0% 18.7%
Source: Company data, HSBC analysis
Exhibit 74: Alkem: Quarterly sales split
INRm 1Q FY16 2Q FY16 3Q FY16 4Q FY16 1Q FY17 q-o-q y-o-y
India formulations 8,827 9,971 8,816 7,748 10,803 39.4% 22.4% US 2,432 2,439 2,602 2,434 2,719 11.7% 11.8% RoW 702 830 1,041 927 871 -6.0% 24.1% Total 11,961 13,240 12,459 11,109 14,393 29.6% 20.3%
Source: Company data, HSBC analysis

EQUITIES PHARMACEUTICALS
21 September 2016
54
Financial forecasts
We forecast overall FY16-19e revenue CAGR of c19%, driven by strong growth in chronic
therapies product sales in India and the ramp-up of US sales.
We expect India formulations sales to grow at a CAGR of c18% over FY16-19e, with acute
therapies growing c16% chronic therapies c29% over the period.
For US sales, we expect a FY16-19 CAGR of 23% (in USD terms) on the back of holding
market share in key products and new launches, including P-IV opportunities.
Exhibit 75: Alkem sales split
INRm FY15 FY16 FY17e FY18e FY19e FY16-19e CAGR
India formulations 27,127 35,362 41,409 48,807 57,604 17.7% Acute 23,872 30,411 34,973 40,569 47,060 15.7% Chronic 3,255 4,951 6,436 8,238 10,545 28.7% US formulation 7,111 9,907 13,530 17,925 18,886 24.0% RoW 2,378 3,500 4,025 4,669 5,439 15.8% Total sales 36,616 48,769 58,964 71,400 81,930 18.9% As % of total sales India formulations 74.1% 72.5% 70.2% 68.4% 70.3% Acute 65.2% 62.4% 59.3% 56.8% 57.4% Chronic 8.9% 10.2% 10.9% 11.5% 12.9% US formulation 19.4% 20.3% 22.9% 25.1% 23.1% RoW 6.5% 7.2% 6.8% 6.5% 6.6%
Source: Company data, HSBC estimates
EBITDA margins to maintain uptick: We estimate EBITDA margins will grow c260bps over
FY16-19e, driven by increasing sales share of chronic therapy products in India, higher sales
contribution from the US and increasing operating efficiency. Alkem has a long-term plan to
bridge the c700bp gap in EBITDA margins (Alkem’s c17% vs 23-25% for key peers).
Core EPS to grow at CAGR of 22.5% in FY16-19e: We expect strong growth of core earnings
for Alkem, driven by operating margin improvement on the back of higher US sales and India
specialty formulations sales. For FY16-19e, we build in an EPS CAGR of 22.5%.

55
EQUITIES PHARMACEUTICALS
21 September 2016
Exhibit 76: Alkem: Income statement
INRm FY15 FY16 FY17e FY18e FY19e
Net revenues 37,434 49,916 60,202 72,738 83,308 Material expenses 16,906 19,612 23,051 26,906 29,316 Staff expense 6,459 9,171 10,822 12,987 15,324 R&D 1,696 2,149 3,010 3,637 3,749 Other expense 8,155 10,501 12,601 15,500 18,600 EBITDA 4,219 8,483 10,717 13,709 16,319 % EBITDA margin 11.3% 17.0% 17.8% 18.8% 19.6% Other income 895 647 251 301 501 Depreciation 709 1,006 1,189 1,539 1,875 EBIT 4,405 8,124 9,779 12,471 14,946 Net interest expense -104 -328 -328 -328 -299 PBT 4,509 8,452 10,107 12,799 15,244 Tax 592 1,606 1,516 2,304 2,744 Minorities 0 114 114 114 114 Net profit 3,916 6,732 8,477 10,382 12,386 As % of revenues Material expenses 45.2% 39.3% 38.3% 37.0% 35.2% Staff expense 17.3% 18.4% 18.0% 17.9% 18.4% R&D 4.5% 4.3% 5.0% 5.0% 4.5% Other expense 21.8% 21.0% 20.9% 21.3% 22.3% EBITDA 11.3% 17.0% 17.8% 18.8% 19.6% EBIT 11.8% 16.3% 16.2% 17.1% 17.9% PBT 12.0% 16.9% 16.8% 17.6% 18.3% Tax rate 13.1% 19.0% 15.0% 18.0% 18.0% Net profit 10.5% 13.5% 14.1% 14.3% 14.9% % y-o-y Net revenues 19.7% 33.3% 20.6% 20.8% 14.5% Material expenses 22.0% 16.0% 17.5% 16.7% 9.0% Staff expense 21.5% 42.0% 18.0% 20.0% 18.0% R&D 8.0% 26.7% 40.1% 20.8% 3.1% Other expense 27.1% 28.8% 20.0% 23.0% 20.0% EBITDA 2.9% 101.1% 26.3% 27.9% 19.0% EBIT 5.9% 84.4% 20.4% 27.5% 19.8% PBT 4.9% 87.5% 19.6% 26.6% 19.1% Net profit -10.0% 71.9% 25.9% 22.5% 19.3%
Source: Company data, HSBC estimates
Income statement, key points:
1. Revenue: During FY11-16 revenues grew at a CAGR of c24% thanks to sustained growth
momentum in India formulations. In the near term, Alkem can expect to see pressure on its
acute portfolio for India formulations but we expect momentum to continue in the specialty
portfolio. Moreover, US sales can continue to grow from a small base due to consistent new
launches and stable market share in key products. We build in annual revenue growth in
the high teens to early 20% for FY17-19.
2. Gross margin: Historically, Alkem has had gross margins which were c500-600bps below
most peers because its India portfolio is heavily focused on acute therapies. Alkem
achieved gross margin improvement of c590bps y-o-y (from 54.8% to 60.7%) in FY16 due
to improved product mix and cost optimization measures. We forecast a further
improvement of 100-180bps a year over FY17-19 for the same reasons.
3. R&D: In view of on-going investments in the product pipeline, especially in the US, we
assume R&D to continue at c5% of net sales (compared to a historical average of 4-4.5%).
4. EBITDA margins: We estimate EBITDA margins will grow by c260bps between FY16-19e,
driven by increasing sales share of chronic therapy products in India, a higher sales
contribution from the US and increasing operating efficiency.
5. Taxes: In view of tax breaks associated with its manufacturing facilities at Baddi and
Sikkim, we expect the tax rate to remain low (15-18%).

EQUITIES PHARMACEUTICALS
21 September 2016
56
Exhibit 77: Alkem: Balance sheet
INRm FY15 FY16 FY17e FY18e FY19e
Net Fixed Assets 9,727 10,319 14,130 17,390 20,115 Net intangible 596 566 566 566 566 Goodwill 3,421 3,531 3,531 3,531 3,531 CWIP 1,107 1,725 1,725 1,725 1,725 Total Long-Term Assets 14,850 16,140 19,951 23,211 25,936 LT Investments 4,197 2,263 2,263 2,263 2,263 Deferred taxation 45 82 82 82 82 Long-term loans and advances 5,422 6,440 6,440 6,440 6,440 Other non-current assets 5,063 2,399 2,399 2,399 2,399 Current investments 611 1,957 1,957 1,957 1,957 Inventories 7,842 9,094 10,309 12,298 13,956 Cash & Bank Balance 7,908 7,964 9,486 13,035 19,202 Debtors 5,271 5,645 6,927 8,370 9,586 Short-term loans and advances 1,296 1,564 1,564 1,564 1,564 Other current assets 453 837 837 837 837 Total Current Assets 23,381 27,062 31,080 38,061 47,102 Total assets 52,958 54,387 62,216 72,457 84,223 Short-term debt 11,286 4,643 4,643 4,643 4,643 Creditors 4,619 5,793 6,218 7,417 8,417 Others CL 3,311 3,671 3,671 3,671 3,671 Short-term provisions 844 1,217 1,217 1,217 1,217 Total Current Liabilities 20,060 15,324 15,748 16,948 17,948 Long-Term Debts 334 1,212 1,212 1,212 1,212 Deferred Taxation 964 1,027 1,027 1,027 1,027 Other long-term liabilities 51 23 23 23 23 Long-term provisions 666 778 778 778 778 Total Liabilities 2,015 3,040 3,040 3,040 3,040 Share Capital 239 239 239 239 239 Reserves 29,787 34,818 42,109 51,037 61,689 Shareholders' Funds 30,026 35,058 42,348 51,276 61,928 Minorities/ESOPs/Preference 857 965 1,079 1,193 1,307 Total shareholders’ equity and liabilities
52,958 54,387 62,216 72,457 84,223
Source: Company data, HSBC analysis
Balance sheet highlights
1. Debt: During FY16 Alkem repaid INR6.8bn in short-term debt, bringing down overall debt to
INR5.8bn from INR11.6bn the previous year. It remains a net cash company with a net
debt/equity of -0.06.
2. Current investments: As of FY16, Alkem has INR1,934m of its non-current investments in
the Avenue Venture Real Estate Fund, down from INR2,221.4m in FY15. The company
plans to liquidate this real estate investment in the next one to two years.

57
EQUITIES PHARMACEUTICALS
21 September 2016
Exhibit 78: Alkem: Cash flow statement
INRm FY15 FY16 FY17e FY18e FY19e
Cash Flow from operating activity Profit before Tax 4,508 8,451 10,107 12,799 15,244 Adjustment for: Depreciation and amortisation expense 709 1,006 1,189 1,539 1,875 Other adjustments -788 -353 671 671 700 Operating profit before working capital changes
4,430 9,104 11,967 15,009 17,819
Changes in working capital: -119 137 -2,072 -2,232 -1,874 Less: Direct taxes paid ( net of refund) -1,056 -1,982 -1,516 -2,304 -2,744 Net Cash from operating activities 3,255 7,259 8,379 10,474 13,201 Cash Flow From Investing Activities Purchases of fixed assets -1,382 -2,572 -5,000 -4,800 -4,600 Others -988 4,436 0 0 0 Net cash generated from / (used in) investing activities
-2,370 1,864 -5,000 -4,800 -4,600
Cash Flow From Financing Activities Proceeds / (Repayment) of loans 871 -6,710 0 0 0 Dividends and corporate dividend tax paid -567 -1,845 -1,187 -1,453 -1,734 Others -823 -718 -671 -671 -700 Net cash (used) in financing activities -518 -9,273 -1,857 -2,124 -2,434 Net Increase/ (Decrease) In cash and cash equivalents
367 -150 1,521 3,550 6,167
Beginning cash & cash equivalents 1,008 1,396 1,271 2,792 6,342 Other Bank balance 6,512 6,694 6,694 6,694 6,694 Cash and bank balance at the beginning 7,520 8,090 7,964 9,486 13,035 Add/Less: Exchange difference on cash and cash equivalents
21 25 0 0 0
Cash and bank balance at the end of the year
7,908 7,964 9,486 13,035 19,202
Source: Company data, HSBC analysis
Cash flow highlights
1. Capex: Alkem expects capex of INR5bn for FY17 as it is expanding capacities in the north
eastern states of India in order to continue to receive tax benefits (the current benefits
under the sunset clause expire on 31 March 2017). It is also expanding capacities for the
developed markets for new launches.
2. CFO: In FY16 the company generated INR7.3bn of cash flow from operating activities,
mainly on better profitability and improved working capital management (the cash
conversion cycle fell to 66 days from 83 days in FY15).
Exhibit 79: Alkem: DuPont analysis
FY15 FY16 FY17e FY18e FY19e
Net income/PBT (tax burden) 0.87 0.80 0.84 0.81 0.81 PBT/EBIT (Interest burden) 1.02 1.04 1.03 1.03 1.02 EBIT/Revenue (EBIT margin) 0.12 0.16 0.16 0.17 0.18 Revenue/Total assets (Asset turnover) 0.78 0.93 1.03 1.08 1.06 Average total assets/Average shareholders equity (Leverage)
1.72 1.65 1.51 1.44 1.38
RoE 14.0% 20.7% 21.9% 22.2% 21.9%
Source: Company data, HSBC analysis
Alkem’s ROE will be primarily be driven by improving operating margins and asset turnover.

EQUITIES PHARMACEUTICALS
21 September 2016
58
Exhibit 80: Alkem: Shareholding structure (as of 1Q FY17)
Source: Company data, HSBC estimates
Exhibit 81: Key management personnel
Name Designation Joined Remarks
Prabhat Agrawal CEO 2014 He is a chartered accountant & chartered financial analyst and has a Master's Degree in Business Administration from the Indian School of Business, Hyderabad. He has over 15 years of experience in corporate strategy, operational and financial management
Rajesh Dubey CFO 2010 He is a chartered accountant and has over 23 years of experience in audit, taxation and finance
Amit Ghare President, International Business 2008 He has a Master's Degree in Business Administration from the University of Pune and has over 20 years of experience in international sales, corporate planning and strategic management
Satyen Manikani Vice President, Business Development and Strategy
2010
Manish Narang Senior Vice President, Legal and Company Secretary
2006 He is a lawyer and also holds a company secretary qualification and Master's Degree in Management Sciences from the University of Pune. He has over 23 years of experience in legal and secretarial compliance
Nitin Agarwal AVP, Finance
Source: HSBC, Company data
Management strategy: The focus is on consolidating leadership positions in the acute
therapies segment in India and gaining market share in chronic segment products. Expanding
margins through higher chronic sales in India, improved sales force productivity and a ramp-up
of US sales remain the priorities.
Key company milestones
Year Milestones
1973 Alkem Laboratories Limited was incorporated 1978 Established first plant at Taloja, Mumbai 1992 Established its manufacturing facility in Mandwa, Maharashtra. This facility was converted into an API facility in 2005. 2003 Set up research and development facility for ANDA development at Taloja. 2006 Anti-infective drug Taxim became the first anti-infective drug in the Indian pharma industry to cross INR1,000 million in
terms of domestic sales in India. (Source: IMS Health) 2007 Filed first ANDA in the United States for the drug Amlodipine. 2009 Received first ANDA approval in the United States for Amlodipine. 2009 Acquired Pharmacor Pty Ltd., a generic pharma company in Australia. 2010 Acquired Ascend Laboratories, a generic marketing company in the US. 2011 Acquired Enzene, a company engaged in the development of biosimilars in India. 2012 Acquired NORAC API manufacturing facility in the United States. 2014 Clavam crossed INR2,000 million in terms of domestic sales in India (Source: IMS SSA MAT March 2015). 2015 Acquired Long Pharma formulation manufacturing facility in the United States. Acquired 51% controlling stake in Indchemie Health and Cachet Pharma Completion of Initial Public Offering
Source: Company data
Promoters66.88%
Non-institution26.21%
Institution6.91%

59
EQUITIES PHARMACEUTICALS
21 September 2016
Alembic Pharma is one of the oldest pharmaceuticals companies in India, starting in 1907 as a
manufacturer of tinctures and alcohol in Baroda. It is now the 20th largest player in India’s
formulations market, with legacy brands in anti-infectives (Azithral and Althrocin) and cough syrups
(Glycodin, Zeet and Brozeet). Alembic acquired the non-oncology product portfolio from Dabur in
2007 to increase its focus in specialty therapies. In 2010-11, the company was de-merged from
parent Alembic Ltd in order to hive off the most profitable and sustainable segments, like the India
and export formulations and select APIs. India formulations contribute c50% of overall sales.
Specialty focus to drive India growth: Alembic has successfully switched the focus of its Indian
business from acute to specialty therapies. We expect c21% FY16-19e CAGR for its India
specialty sales (vs 14% CAGR for total India sales). Strong specialty segment growth and an
improvement in sales force productivity should be key drivers for India formulations growth.
Growth drivers in place for US sales: After the success of the exclusive gAbilify opportunity in
FY16, Alembic expects US sales to rise 30-35% y-o-y, driven by new launches. Its pipeline of 35
pending ANDAs including four tentative approvals (40% are P-IV opportunities) should receive
approval in the next three to four years based on the maturity profile of the filings. Alembic has
ramped up its R&D efforts to increase the width and quality of its pipeline, targeting areas like
injectables (including oncology injectables) and derma that will sustain long-term growth. With a front-
end marketing infrastructure now in place, we expect better margins. With seven to eight expected
new launches a year, we estimate core US sales should grow at a CAGR of 29% over FY16-19.
Proven execution record: We believe the management team deserves credit for making
structural changes to the company. These include shifting the focus to specialty therapies in India,
de-merging Alembic Pharma from its parent to unlock the value of the India business, putting a
greater focus on the US and ramping up R&D investments. We think this will take the company to
the next level of growth and profitability.
Initiate with a Hold: We remain positive about Alembic’s long-term growth outlook, driven by an
increasing specialty share in India, and the ramp-up of US sales and R&D investment. However, we
believe the current stock price, which implies forward multiples of 28.4x FY17 and 21.3x FY18
consensus earnings estimates, already reflects long-term positives and we don’t have much upside
in our numbers. Hence, we initiate with a Hold. We value the stock at 22x (Gordon Growth based
PE) Sep-18e EPS of INR31.6, and we discount this value to arrive at our TP of INR645. Our Gordon
growth model assumes c25% sustainable ROE, 7.9% cost of equity and a 4% long-term growth rate.
Key downside risks: A delay in the recovery of India sales, further impact from price cuts in India
and delay in new approvals in the US. Key upside risk: A strong recovery in its India sales.
Alembic Pharma
After successfully transforming its Indian business, the company is
investing in sustainable R&D growth drivers in the US
Increasing specialty share in India, growing US sales and R&D-
driven niche launches to drive long-term profitability
Limited short-term upside. Initiate with a Hold rating, TP of INR645

EQUITIES PHARMACEUTICALS
21 September 2016
60
Financial statements
Year to 03/2016a 03/2017e 03/2018e 03/2019e
Profit & loss summary (INRm)
Revenue 31,487 30,365 36,479 43,667
EBITDA 10,060 6,105 7,865 9,990
Depreciation & amortisation -722 -913 -1,213 -1,463
Operating profit/EBIT 9,338 5,193 6,653 8,527
Net interest -37 -46 -46 -46
PBT 9,356 5,165 6,666 8,541
HSBC PBT 9,356 5,165 6,666 8,541
Taxation -2,160 -1,085 -1,400 -1,794
Net profit 6,287 2,856 3,686 4,723
HSBC net profit 4,977 4,080 5,266 6,747
Cash flow summary (INRm)
Cash flow from operations 9,208 4,354 5,576 7,159
Capex -3,036 -5,000 -4,000 -3,500
Cash flow from investment -3,105 -5,000 -4,000 -3,500
Dividends -653 -1,224 -1,580 -2,024
Change in net debt -5,300 1,851 -56 -1,695
FCF equity 6,172 -646 1,576 3,659
Balance sheet summary (INRm)
Intangible fixed assets 436 436 436 436
Tangible fixed assets 8,237 12,325 15,112 17,149
Current assets 15,066 12,582 14,272 17,879
Cash & others 4,508 2,657 2,713 4,408
Total assets 24,594 26,197 30,675 36,319
Operating liabilities 6,320 5,066 5,858 6,779
Gross debt 1,325 1,325 1,325 1,325
Net debt -3,183 -1,332 -1,388 -3,083
Shareholders' funds 16,005 18,862 22,548 27,271
Invested capital 12,911 17,618 21,249 24,277
Ratio, growth and per share analysis
Year to 03/2016a 03/2017e 03/2018e 03/2019e
Y-o-y % change
Revenue 53.1 -3.6 20.1 19.7
EBITDA 149.6 -39.3 28.8 27.0
Operating profit 160.4 -44.4 28.1 28.2
PBT 160.6 -44.8 29.1 28.1
HSBC EPS 76.0 -18.0 29.1 28.1
Ratios (%)
Revenue/IC (x) 2.6 2.0 1.9 1.9
ROIC 59.9 27.0 27.1 29.7
ROE 40.1 23.4 25.4 27.1
ROA 35.3 16.2 18.6 20.3
EBITDA margin 31.9 20.1 21.6 22.9
Operating profit margin 29.7 17.1 18.2 19.5
EBITDA/net interest (x) 273.3 131.6 169.6 215.4
Net debt/equity -19.9 -7.1 -6.2 -11.3
Net debt/EBITDA (x) -0.3 -0.2 -0.2 -0.3
CF from operations/net debt
Per share data (INR)
EPS Rep (diluted) 33.35 15.15 19.55 25.05
HSBC EPS (diluted) 26.40 21.64 27.94 35.79
DPS 4.81 6.49 8.38 10.74
Book value 84.90 100.05 119.61 144.66
Valuation data
Year to 03/2016a 03/2017e 03/2018e 03/2019e
EV/sales 3.8 4.0 3.3 2.7
EV/EBITDA 11.9 19.9 15.5 12.0
EV/IC 9.3 6.9 5.7 4.9
PE* 24.7 30.2 23.4 18.3
PB 7.7 6.5 5.5 4.5
FCF yield (%) 5.0 -0.5 1.3 3.0
Dividend yield (%) 0.7 1.0 1.3 1.6
* Based on HSBC EPS (diluted)
Issuer information
Share price (INR) 653.25 Free float 26%
Target price (INR) 645.00 Sector Pharmaceuticals
Reuters (Equity) ALEM.NS Country India
Bloomberg (Equity) ALPM IN Analyst Damayanti Kerai
Market cap (USDm) 1,838 Contact +9122 3396 0692
Price relative
Source: HSBC Note: Priced at close of 20 Sep 2016
120.00
220.00
320.00
420.00
520.00
620.00
720.00
820.00
120.00
220.00
320.00
420.00
520.00
620.00
720.00
820.00
2014 2015 2016
Alembic Pharmaceuticals Rel to BOMBAY SE SENSITIVE INDEX
Financials & valuation: Alembic Pharmaceuticals Hold

61
EQUITIES PHARMACEUTICALS
21 September 2016
Successful transition to specialty player in India
Exhibit 82: Alembic Pharma business segment sales split*
Source: Company data, HSBC analysis (*FY16 export formulations share look higher due to exclusive gAbilify sales in the US; on a normalized basis we believe export formulations would have contributed 30-32% of total FY16 sales)
For years, Alembic Pharma’s India formulations business had lagged the market in terms of
sales growth due to a heavy dependence on acute therapies. The current management team,
which took over in 2007-08, realigned the India formulations strategy towards high growth
specialty therapies (e.g. cardiac, anti-diabetes). In six to seven years, ALPM has made the
successful transition from being an acute player to a specialty focused player.
Through a strategic re-alignment of its product portfolio, helped by the acquisition of 24 chronic
therapy brands from Dabur Pharma for INR1.7bn and the goals of its medical representatives
(MRs), the company has increased the sales contribution from chronic therapies to c60% in
FY16 from c40% 5-6 years ago. Alembic’s domestic branded formulations sales have grown at
a CAGR of 14% over FY12-16, with specialty therapies outgrowing sales of acute products.
Exhibit 83: Branded formulations the majority of India sales
Exhibit 84: Within branded formulations specialty share has increased
Source: Company data Source: Company data
53.8% 58.4% 53.0% 53.8%
37.6%
20.5%18.5% 28.6% 28.4%
45.9%
25.7% 23.1% 18.4% 17.9% 16.5%
0%
20%
40%
60%
80%
100%
FY12 FY13 FY14 FY15 FY16India formulations Export formulations API
86.3% 86.4%88.3% 88.9%
92.4%
13.7% 13.6%11.7% 11.1%
7.6%
75%
80%
85%
90%
95%
100%
FY12 FY13 FY14 FY15 FY16
Branded Generic
54% 51% 46% 43% 40%
46% 49% 54% 57% 60%
0%
20%
40%
60%
80%
100%
FY12 FY13 FY14 FY15 FY16Acute Specialty

EQUITIES PHARMACEUTICALS
21 September 2016
62
Exhibit 85: Alembic has outperformed in key specialty therapies*, while lagging behind in India pharma market (IPM) therapies like anti-infectives
Therapy Growth (%) FY12 FY13 FY14 FY15 FY16
Cardiology Alembic 22 42 27 32 32 IPM 16 12 12 13 14 Anti-diabetic Alembic 26 40 24 29 38 IPM 25 23 23 20 20 Gynae Alembic 6 30 23 27 32 IPM 11 5 9 13 14 Gastro Alembic 28 25 10 12 2 IPM 11 11 10 15 15 Derma Alembic 200 42 30 IPM 20 20 17 Orthopaedic Alembic 10 6 9 4 2 IPM 11 7 9 14 11 Ophthal Alembic 13 48 41 0 -6 IPM 15 7 11 22 14 Nephro/Uro Alembic 25 63 17 13 IPM 17 15 17 18 Anti-infective Alembic 8 2 -6 4 -1 IPM 11 3 1 10 6 Cough & Cold Alembic 6 8 9 22 4 IPM 9 8 13 11 8 Overall Alembic 13 15 8 15 11 IPM 13 8 10 14 14
Source: Company data, IMS ORG (*e.g. cardiology, anti-diabetic, gynae, derma)
Exhibit 86: FY16 sales split by therapy Exhibit 87: Anti-infectives sales contribution has declined gradually
Source: Company data Source: Company data
28%
15%
15%4%
15%
6%
12%
1%2% 2%
Anti-infectives
Cough & cold
GI
Orthopaedics
Cadiac
Anti-diabetic
Gynae
Ophtha
Nepho/urology
0%
20%
40%
60%
80%
100%
FY12 FY13 FY14 FY15 FY16
Anti-infectives Cough & cold GI
Orthopaedics Cadiac Anti-diabetic

63
EQUITIES PHARMACEUTICALS
21 September 2016
Exhibit 88: Alembic’s Top 10 brands in India
Brand Molecule Therapy MAT Jul'16 sales (INRm)
% sales share MAT Jul 12-16 MAT Jul 14-16
Azithral Azithromycin Anti-Infectives 1,376 9.7% 2.1% 11.5% Althrocin Erythromycin Anti-Infectives 834 5.9% -1.0% -2.0% Roxid Roxithromycin Anti-Infectives 581 4.1% 1.0% 7.1% Gestofit Natural Micronised
Progesterone Gynaecological 564 4.0% 34.8% 23.7%
Wikoryl Paracetamol + Phenylephrine + Chlorpheniramine + Sodium Citrate
Respiratory 485 3.4% 2.4% 2.8%
Ulgel Magaldrate + Simethicone
Gastro Intestinal 354 2.5% 9.8% 17.9%
Rekool D Domperidone + Rabeprazole
Gastro Intestinal 333 2.3% 19.2% 18.0%
Zeet Chlorpheniramine Respiratory 254 1.8% 7.0% 8.2% Glisen MF Glimepiride + Metformin Anti-diabetic 252 1.8% 35.0% 22.1% Rekool Rabeprazole Gastro Intestinal 251 1.8% 16.2% 21.1% Top 10 37.1% 6.4% 10.1% Total 14,240 100.0% 12.1% 15.6%
Source: AIOCD, HSBC analysis
Focus on launches in chronic therapies and increasing sales force productivity
Looking ahead, Alembic plans to launch 25-30 new products a year in India’s formulations
market, mainly in chronic therapies like women’s healthcare, gastrointestinal and cardiac.
Alembic believes it can sustain the sales growth of its India formulation business in the mid to
high teens range. The company also thinks it will benefit from the expiry of a large number of
patents in FY19 and beyond. Growth will be primarily driven by increasing market share in
identified (mainly chronic) therapy-important molecules and better productivity of its sales force.
Alembic has doubled the number of its medical representatives (MR) to 5,000 in the last five
years in order to widen its chronic therapy coverage and deepen penetration within existing
therapies. The majority of the sales staff focuses on specialty therapies. To improve the
productivity of MRs, the company has shifted from cumulative monthly targets to sales targets
based on brands. We estimate that current MR productivity, which we define as sales per MR
per year, is INR2.4m, considerably below the peer average of cINR5.1m. We believe there is
sufficient room for Alembic’s MR productivity to grow, given its increasing share of sales from
specialty formulations.
We forecast FY16-19e sales CAGR of c15% for India branded formulations, driven by a c21%
CAGR for specialty therapies and 5% CAGR for acute therapies sales. For same period, we
expect overall India sales to grow 14%.

EQUITIES PHARMACEUTICALS
21 September 2016
64
Exhibit 89: Specialty therapies will continue to grow faster than acute therapies
Exhibit 90: Specialty therapies: share to increase
Source: Company data, HSBC estimates Source: Company data, HSBC estimates
Exhibit 91: Alembic has room to improve its MR productivity
Source: Company data, HSBC analysis
Minimal impact for from revised price controls
Overall growth for India formulations has been recently hampered by various regulatory
headwinds such as expanded price controls and a proposed ban on certain combination drugs.
Price control India remains a challenge, although the company believes the impact will be
minimal. Currently 18% of its India product portfolio by sales is under price controls, based on
the National List of Essential Medicine (NLEM) list. One of its key brands, Althrocin, recently
came out of price control and the company has raised the price by 9-10%.
For its largest brand, Azithral (azithromycin), the 500mg and 250mg tablets which constitute
more than 72% of brand sales, the price has already been adjusted to the mandated ceiling
price, so we don’t see a further risk of price cuts.
0.0
2.0
4.0
6.0
8.0
10.0
12.0
14.0
FY13 FY14 FY15 FY16 FY17e FY18e FY19e
Acute Specialty
FY16-19e CAGR:Specialty: 20.6%Acute: 5.2%
51.0% 46.0% 43.0% 40.0% 37.3% 33.9% 30.6%
49.0%54.0% 57.0%
60.0% 62.7%66.1%
69.4%
0%
20%
40%
60%
80%
100%
FY13 FY14 FY15 FY16 FY17e FY18e FY19e
Acute Specialty
0.0
2.0
4.0
6.0
8.0
10.0
12.0
0.0
1.0
2.0
3.0
4.0
5.0
6.0
7.0
8.0
9.0
Alembic Sun Pharma Cipla Dr Reddy's Lupin Cadila Ipca TorrentPharma
Alkem
Sales per MR per year (INRm) Sales force ('000)-RHS
Price impact due to revised
NLEM list will be minimal

65
EQUITIES PHARMACEUTICALS
21 September 2016
Exhibit 92: Azithral is further exposed to price cuts
Brand Molecule Brand sales (INRm)
Key SKUs impacted
SKU contribution to sales
% price differential to CP*
Remarks
Azithral Azithromycin 1,365 500 mg tab 56.0% 0.0% MRP is above ceiling price, so price cut risks remain
250 mg tab 16.9% 0.0%
Source: AIOCD, HSBC analysis ( *CP of INR18.7 per tablet for 500mg and INR9.5 for 250mg including all local taxes)
Impact from proposed FDC ban: In 1Q FY17, Alembic mentioned the adverse impact on the
market uptake of its three key cold and cough brands, Wikoryl, Zeet and Brozeet (c6.5% of
company sales) due to uncertainties caused by a proposed ban on certain fixed dose
combination drugs. The company said it was refocusing its efforts towards the aggressive
promotion of the SKUs of these brands which are not part of the proposed FDC ban. Alembic
said the results of these efforts should be seen from the next quarter onwards. It expected the
impact to be minimal impact, even if the FDC ban is confirmed.
US sales to see significant upside from a small base
Alembic was a relatively late entrant to the US market. It started operations there in 2008-09,
while major peers entered the US in the late 1990s and early-to-mid 2000s.
Despite being a late entrant and having a small product portfolio in the US, Alembic has
demonstrated its execution capabilities in that market by securing FDA approval for the launch
of generic Abilify (aripiprazole) in FY15-16 ahead of many front-line generics.
The company has built a US product portfolio with 23 products launched so far under its own
label (either new launches or re-launches after acquiring back rights from partners) in the
market and c35 pending ANDAs (including four tentative approvals). Its FY16 US sales grew
c150% y-o-y, driven by the launch of generic Abilify under shared exclusivity. Given limited
initial competition in the generic Abilify market, we estimate this opportunity could have added
cUSD85-95m of sales to the US business. Even on a normalised basis, its base US business
(excluding aripiprazole) has grown significantly during FY16 (in excess of 50% y-o-y, in our
assessment).
Alembic Pharma expects momentum to continue in the base business with y-o-y growth of
c30-35%, driven by new launches in the US. The age profile of the pending ANDAs (of which
40% are P-IV opportunities) remains attractive as the company expects approvals for these
ANDAs in the next 3-4 years (see Exhibit 94). On a sustainable basis, Alembic expects 7-8 new
approvals a year in the US, which should drive growth for US base business.
Alembic can improve the margins of its US business through its front-end presence in the US,
where it initially had to share margins with marketing partners. With a full-fledged front end
marketing infrastructure in place; we believe Alembic is better positioned to directly negotiate
with channel players and can control product launches under its own label, which will translate
into better margins.

EQUITIES PHARMACEUTICALS
21 September 2016
66
Exhibit 93: Alembic’s US sales can grow at a CAGR of 29% over FY16-19e
Source: HSBC analysis (* base sales after excluding one-off sales of generic Abilify)
Exhibit 94: Maturity of pending ANDAs (total 31*) as per filing dates
Exhibit 95: ANDA filings and approvals trends
Source: Company data, HSBC analysis (*not including 4 tentative approvals) Source: Company data, HSBC analysis
0
50
100
150
200
250
FY12 FY13 FY14 FY15 FY16 FY17e FY18e FY19e
US sales (USDm)
FY16-19e CAGR*: 29%
Over 3 years38.7%
2-3 years19.4%
1-2 years12.9%
0-1 years29.0% 7 7
12
7
13
4
78
43
6
3
6
3
5
10
0
2
4
6
8
10
12
14
FY09 FY10 FY11 FY12 FY13 FY14 FY15 FY16
ANDA filings ANDA approvals

67
EQUITIES PHARMACEUTICALS
21 September 2016
Exhibit 96: Known ANDA pipeline is largely competitive
Molecule Brand Brand sales (USDm)
Potential Launch
Remarks
Dronedarone Multaq 400 FY17 Multiple ANDA filers-Alkem, Amneal, FTUG, Glenmark, Lupin, Sandoz, Sun Pharma, Unimark, Actavis
O-Desmethyl Venlafaxine Succinate
Pristiq 742 FY17 Settled generic opportunity for Alembic. Final FDA approval yet to come. Alembic's partner Breckenridge is the FTF. More than 10 known ANDA filers
Olmesartan Medoxomil/HCTZ
Benicar/Benicar HCT
958 FY18 Alembic to come after Mylan’s exclusivity period. Other generic players are Amneal, Aurobindo, Jubilant, Mylan, Sandoz, Scigen, Teva and Torrent Pharma.
Pregabalin Lyrica 3,630 FY19 may not a significant opportunity owing to intense competition, compound patent expires on 30 Dec 2018
Vardenafil ODT Staxyn 11 FY20 We assume launch upon expiry earlier patent in Oct 2018. Par Pharma (FTF), Macleods and Actavis other known ANDA filers. Alembic can come post FTF period in April 2019 in best case
Fesoterodine Fumarate Toviaz 220 FY20 Earliest generic entry after May 11, 2019. Competitive opportunity as multiple generics (>10) have filed their ANDAs
Febuxostat Uloric 430 FY20 Settled but launch date unknown. More than 10 ANDA filers known for Uloric and likely to be competitive opportunity
Lacosamide Vimpat 782 Launch dependent on litigation outcome, Alembic has final approval. Likely to be a competitive opportunity
Asenapine Saphris 220 Hikma, Sigmapharm, Breckenridge are other ANDA filers. Earliest generic entry after Jun 9, 2020
Vilazodone Viibryd 268 First patent to expire on Sep 29, 2019 and hence generics can enter post unless litigation turns in favour of generics
Ticagrelor Brilinta 270 late opportunity; Multiple ANDA filers including InvaGen, Mylan, Sandoz, Actavis
Pentosan Polysulfate Sodium
Elmiron 278 Uncertain
Metoprolol Succinate Toprol XL 1,589 Uncertain Nisoldipine Sular 62 Uncertain
Source: Company data, HSBC analysis
Front-end marketing set-up to help margins:
Alembic initially participated in the US market through various partnerships. It can look ahead
for product launches under its own label after establishing a full-pledged front-end marketing
infrastructure in Bridgewater, New Jersey. The company has entered agreements with large
customer groups in the US and has partnered with established third party logistics players to
ensure efficient supply chain management.
We believe this will help the company better control product launches and give it a negotiating
advantage with channel participants in the US (distributors and retailers). This, in turn, should
help it command better margins (it previously had to share them with marketing partners).
Relatively clean record with the FDA:
ALPM has four FDA-approved manufacturing facilities – one formulations manufacturing facility at
Panelav in Gujarat and three API manufacturing facilities at Panelav and Vadorada. Its key
Panelav facility was recently audited by the US FDA in March 2016 and issued a Form 483. As
mentioned earlier, the issuance of Form 483 doesn’t always indicate that there are serious
deviations from required regulatory requirements. Some might be easily correctable, while others
can lead to further FDA action. According to the company, the four observations noted in the Form
483 are minor in nature. This facility has a capacity to manufacture 7bn tablets and capsules a
year and is the only formulation facility that manufactures products for the US market.

EQUITIES PHARMACEUTICALS
21 September 2016
68
R&D investment to create long-term sustainable drivers
The company’s US product portfolio consists of oral solid dosages (OSDs), where competition is
high. However Alembic is making major R&D leap to increase the width and quality of its
pipeline, especially for the US market. R&D expense as a percentage of sales has gradually
increased to 6% of revenues in FY15 (from c4% in FY11) but jumped significantly in FY16 to
c10%. This follows a management decision to develop strategically identified products in areas
like injectables (including oncology injectables) and derma. The R&D expense is expected to
reach cINR4.5bn (a c45% y-o-y increase) in FY17 as R&D spend continues in priority
segments. The management is deploying windfall gains from generic Abilify sales in the US to
fund its R&D expense, which will help maintain a healthy balance sheet without the need for any
external borrowings to fund projects.
The company expects ANDA filings for 12-15 products in FY17, rising to 25 and above starting
in FY18.
Alembic is expanding its pipeline quality and quantity internally and externally. It has established
a new R&D centre in Hyderabad to handle OSD and injectable development projects and is
building a new manufacturing facility in Baroda for derma products. The company is also
evaluating various agreements with external parties and contract manufacturers to help ramp-
up its product filings in the US.
In a major step towards scaling up its R&D initiatives, Alembic has entered an agreement with
Orbicular Pharmaceuticals Technologies for developing derma products for the global markets.
Orbicular is headed by renowned scientist Dr. M.S. Mohan who has previously demonstrated
his niche/complex product development skills at Dr Reddy’s and Strides Arcolab.
This JV has c40 projects under development of which 10-15 are in an advanced stage of
development, targeting a market size of cUSD5bn. While the derma projects under development
are currently undisclosed we believe that derma remains an attractive segment in the US, where
the current market size is around USD12bn p.a. The company expects ANDA filings will start
once the derma facility at Baroda is completed.
Alembic Pharma indicated ANDA filings to start from 2HFY18 and beyond for other non-oral
opportunities (injectables, oncology injectables) for which manufacturing facilities are currently
under construction.
Exhibit 97: R&D expense ramped up on investment in complex therapies*
Exhibit 98: Alembic’s R&D spend is catching up with larger peers
Source: Company data ( * FY17 as per management expectations) Source: Company data
0.0%
2.0%
4.0%
6.0%
8.0%
10.0%
12.0%
14.0%
16.0%
0
1,000
2,000
3,000
4,000
5,000
FY11 FY13 FY15 FY17e
R&D spend (INRm)R&D spend as % of sales (RHS)
0.0%
5.0%
10.0%
15.0%
FY 12 FY 13 FY 14 FY 15 FY 16
Alembic Pharma Sun PharmaDr Reddy's LupinGlenmark CiplaAurobindo CadilaIpca Lab Torrent Pharma
Alembic has entered a JV to
develop derma products for
the global market

69
EQUITIES PHARMACEUTICALS
21 September 2016
Warfarin 505(b)(2) filing: Alembic entered an in-licensing agreement with Accu Break Pharma
in August 2012 for the development of warfarin tablets. Accu Break filed the product with the
FDA in September 2015 via the 505(b)(2) route and the companies are awaiting the FDA’s
response. (A drug filed through 505 (b)(2) is not entirely new, but differs in several meaningful
aspects from previous versions. The FDA allows some of the clinical data required for approval,
to come from studies not conducted by or for the applicant, and can quote results from other
entities’ studies.) We are not building in any sales from this opportunity given that it was filed
through a partner and approval and launch timings remain uncertain. Moreover, 505(b)(2)
products involves significantly higher marketing and promoting costs than plain generics.
Other markets: focus remains selective
Outside India, Alembic Pharma has concentrated on deepening its reach in the US. Elsewhere
its focus is on Algeria. In 2015 the company acquired a 49% stake in a new solid oral dosage
manufacturing facility in Algeria, which will provide it strong base in the county’s USD3bn
market. In other existing markets such as Europe, Australia, Canada and South Africa, it will
continue with its current businesses and no further investment is expected.
Strong management execution record
We believe the current management team, which has run the company’s operations since 2007-
08, has proved its strategic and execution capabilities by making structural changes to the
company. These include shifting the focus to specialty therapies in India, de-merging Alembic
Pharma from its parent to unlock the value of the India business, and putting greater focus on
the US and ramping up R&D investment. We think this will take the company to the next level of
growth and profitability.
Valuation and risks
Alembic Pharma rerated significantly last year after the launch of Abilify in April 2015 (see chart
below). The stock has historically traded at a discount to front line generics due to its lower
exposure to the lucrative US market. However, the valuation gap has been reduced significantly
thanks to the success of Abilify.
The stock is trading at a c5% premium to the sector’s one-year forward PE. We believe this
premium factors in potential stock triggers such as a strong recovery in the India formulations
business and positive developments from ongoing R&D investment.

EQUITIES PHARMACEUTICALS
21 September 2016
70
Exhibit 99: Alembic’s valuation premium/discount (12-mth forward PE) against sector average
Source: Thomson Reuters DataStream, HSBC analysis
We value the stock at 22x (Gordon Growth based PE) Sep-18e EPS of INR31.6, and we
discount this value to arrive at our TP of INR645. Our TP implies FY17, FY18, FY19 PEs of
29.8x, 23.1x and 18.0x compared to peer averages of 26.4x, 20.8x and 17.8x.
Our Gordon growth model assumes c25% sustainable ROE, 7.9% cost of equity and a 4% long-
term growth rate. ROE is based on our explicit forecast average for FY17-19e while the cost of
equity is based on in-house view of global RfR of 3% and 6.5% of ERP for India.
We remain positive about Alembic’s long-term growth outlook, driven by increasing specialty share
in India, a ramp-up of US sales and R&D investments towards long-term growth drivers. However,
we don’t have much upside in our numbers from the current stock price. Hence, we initiate with a
Hold rating.
Key downside risks
1. Margin pressure from higher R&D expense: Alembic Pharma has guided for a significant
increase its R&D expense in the near term as invests in long-term growth drivers for the US
market. Any overshoot of R&D expense beyond what we have factored in will adversely
impact margins.
2. Price cuts and other regulatory challenges in India: Current c20% of Alembic’s Pharma India
branded formulations portfolio comes under the NLEM (National List of Essential Medicines)
and are subject to price caps by the regulatory bodies. If more products come under price
control, our estimates for India formulations will be adversely impacted. There are additional
regulatory threats like a proposed ban of certain fixed dose combinations drugs.
3. Delay/failure to receive FDA approvals in the US: Any delay or failure to receive approvals
will impact our earnings estimates adversely as we have factored in US sales growth as a
key driver.
4. Regulatory risks: The company has only one FDA approved facility which caters to the US
market. Any adverse development such as an issuance of an FDA warning letter or an
import ban if the company fails to maintain FDA specified quality and manufacturing
standards will lead to the disruption of US sales.
5. Foreign currency fluctuations: Export sales contribute c55% of overall revenues and the
company doesn’t actively hedge outstanding positions. Any adverse movement of foreign
currency, especially USD against INR, could negatively impact earnings.
-80.0%
-60.0%
-40.0%
-20.0%
0.0%
20.0%
40.0%
Sep-12 Jan-13 May-13 Sep-13 Jan-14 May-14 Sep-14 Jan-15 May-15 Sep-15 Jan-16 May-16 Sep-16
Discount to sector average

71
EQUITIES PHARMACEUTICALS
21 September 2016
Key upside risks
1. Strong recovery in India formulations sales after a muted 1Q FY17 performance.
2. Faster-than-expected pick-up of US sales on new launches.
3. Faster than expected realization of current R&D investments.
Exhibit 100: Alembic Pharma-12m forward PE band
Exhibit 101: Alembic Pharma-12m forward PE range
Source: HSBC estimates, Thomson Reuters DataStream Source: HSBC estimates, Thomson Reuters DataStream
1Q FY17 review
1. India branded formulations were muted, with 5.7% y-o-y growth on a 10% y-o-y decline in
acute segment sales on NLEM related price cuts and the proposed FDC ban, impacting
four of the company’s major brands. Specialty segment sales grew 16% y-o-y. The
company expects India growth to be back on track from 2Q FY17.
2. Staff cost grew c32% y-o-y due to new recruitments for projects under construction and
performance incentive pay-outs.
3. Despite lower R&D expense in 1Q, Alembic maintained its expected R&D guidance of
cINR4.5bn for FY17
4. Other expenses grew c39% y-o-y due to some product buy backs from partners in order to
launch these under its own label (23 products to date).
5. Capex guidance of INR15bn in the next 2.5-3 years (cINR5bn for FY17). Multiple
facilities are under construction for opportunities in general injectables, oncology
injectables and derma.
0
200
400
600
800
1,000
1,200
Aug-12 Aug-13 Aug-14 Aug-15 Aug-16
Price (INR)
25x
20x
15x
10x
0
5
10
15
20
25
30
Aug
-12
Aug
-13
Aug
-14
Aug
-15
Aug
-16
PE Mean Minimum Maximum

EQUITIES PHARMACEUTICALS
21 September 2016
72
Exhibit 102: Alembic Pharma: quarterly review
(INRm) 1Q16 2Q16 3Q16 4Q16 1Q17 % y-o-y % q-o-q
Net revenues 5,833 10,088 9,217 6,266 7,280 24.8% 16.2% Material expense 2,132 2,263 2,060 1,239 1,909 -10.4% 54.1% As % of revenues 36.5 22.4 22.4 19.8 26.2 Staff Cost 878 1,196 1,170 969 1,163 32.4% 20.0% % of revenues 15.1 11.9 12.7 15.5 16.0 R&D 480 780 701 1,110 795 65.7% -28.4% % of revenues 8.2 7.7 7.6 17.7 10.9 Other Expenses 1,323 2,089 1,440 1,514 1,844 39.4% 21.8% % of revenues 22.7 20.7 15.6 24.2 25.4 EBITDA 1,021 3,760 3,846 1,433 1,570 53.8% 9.5% EBITDA margin 17.5 37.3 41.8 22.9 21.6 Other Income 0 1 28 26 4 Operating Profit 1,021 3,761 3,874 1,459 1,573 54.1% 7.8% Interest 6 7 10 13 11 72.6% -17.7% Depreciation 129 133 217 244 194 50.3% -20.6% PBT 886 3,621 3,647 1,202 1,369 54.6% 13.9% Tax 188 735 951 286 333 77.4% 16.4% Tax Rate 21.2 20.3 26.1 23.8 24.3 PAT (Adj.) 699 1,041 847 912 1,037 48.4% 13.8% PAT (Reported) 699 2,889 2,695 912 1,037 48.4% 13.8%
Source: Company data, HSBC analysis
Exhibit 103: Alembic Pharma: quarterly sales split
(INRm) 1Q16 2Q16 3Q16 4Q16 1Q17 1Q17 % y-o-y 1Q17 % q-o-q
India formulations 2,913 3,097 3,083 2,771 2,991 2.6% 7.9% Branded 2,628 2,846 2,883 2,596 2,777 5.7% 7.0% Generic 286 251 201 174 213 -25.4% 22.2% US generics 1,174 5,033 4,638 1,331 2,310 96.8% 73.5% RoW 587 675 573 571 775 32.1% 35.9% APIs & others 1,229 1,372 1,012 1,669 1,282 4.3% -23.2% Total sales 5,903 10,177 9,307 6,342 7,358 24.6% 16.0%
Source: Company data, HSBC analysis
Financial forecasts
Revenue forecast: We forecast FY16-19e core revenue CAGR of c17% (excluding US sales of
gAbilify in FY16), driven by US base sales growth and sustained momentum of India branded
formulations sales. US sales will be driven by 7-8 new launches per year and our estimate
doesn’t include any one-off opportunities like generic Abilify. Alembic may potentially launch
products like generic Toprol XL, and generic Pentosan but the launch timeline is unclear so we
haven’t built this into our forecast and any such launch will be upside to our sales estimates. We
expect US base sales to grow at a CAGR of c29% during FY16-19e.
We forecast c14% FY16-19e CAGR for India formulations sales, with c21% sales CAGR for
specialty sales and c5% CAGR for acute therapy sales.
Exhibit 104: ALPM: Sales split
Sales split FY13 FY14 FY15 FY16 FY17e FY18e FY19e FY16-19e
CAGR
India branded formulations
7,654 8,659 9,809 11,036 12,360 14,419 16,759 14.9%
Specialty formulations 3,750 4,676 5,591 6,621 7,747 9,529 11,625 20.6% Acute formulations 3,904 3,983 4,218 4,414 4,613 4,890 5,134 5.2% India generics 1,209 1,152 1,227 912 866 892 919 0.3% India formulations total
8,863 9,811 11,036 11,948 13,226 15,311 17,678 14.0%
US generics 3,122 3,465 12,176 8,710 11,323 14,493 6.0% Others 441 2,171 2,354 2,439 3,049 3,720 4,538 23.0% Total formulations 11,662 15,104 16,855 26,563 24,985 30,354 36,710 11.4% Total API 3,506 3,417 3,665 5,249 5,669 6,463 7,368 12.0% Total revenues 15,167 18,521 20,520 31,812 30,655 36,817 44,078 11.5%
Source: Company data, HSBC estimates

73
EQUITIES PHARMACEUTICALS
21 September 2016
EBITDA margins to maintain uptick: In view of expected higher R&D investment in product
development for derma and injectables (including oncology injectables), the management
guided for a slow improvement in margins and profitability in the near term. However, we
believe a gradual uptrend for base EBITDA margins will continue, driven by a better product mix
in terms of specialty therapies in the India formulations business, improvement in sales force
productivity and incremental new launches in the US. We expect EBITDA margins to improve by
c130-140bps a year between F17 and FY19.
Core EPS: For FY16-19 we build in a core EPS CAGR of c11%, driven by base margin
improvement on the back of higher India specialty formulations sales and a US sales ramp up. Exhibit 105: Alembic Pharma: Income statement
INRm FY13 FY14 FY15 FY16 FY17e FY18e FY19e FY16-19e
CAGR
Net revenues 15,203 18,632 20,561 31,487 30,365 36,479 43,667 11.5% Material expense 6,807 7,133 7,145 7,694 8,806 10,287 11,965 15.9% Staff Cost 1,938 2,470 3,068 4,214 4,593 5,420 6,395 14.9% R&D 743 1,164 1,216 3,071 4,251 5,107 6,113 25.8% Others 3,196 4,287 5,103 6,449 6,610 7,800 9,204 12.6% EBITDA 2,520 3,577 4,030 10,060 6,105 7,865 9,990 -0.2% Other income 39 32 23 55 19 60 60 2.9% Depreciation 350 405 444 722 913 1,213 1,463 26.5% EBIT 2,209 3,204 3,609 9,393 5,211 6,713 8,587 -2.9% Net interest expense 146 98 18 37 46 46 46 8.0% Pre-tax profits 2,064 3,106 3,591 9,356 5,165 6,666 8,541 -3.0% Taxation 411 751 763 2,160 1,085 1,400 1,794 -6.0% Net profit 1,652 2,355 2,827 7,194 4,080 5,266 6,747 -2.1% Adjusted net profit 1,652 2,355 2,827 4,977 4,080 5,266 6,747 10.7% EPS adjusted 8.76 12.49 15.00 26.40 21.64 27.94 35.79 % y-o-y growth Net revenues 3.7% 22.6% 10.4% 53.1% -3.6% 20.1% 19.7% Material expense -3.8% 4.8% 0.2% 7.7% 14.4% 16.8% 16.3% Staff cost 15.0% 27.5% 24.2% 37.4% 9.0% 18.0% 18.0% R&D cost 26.8% 56.7% 4.5% 152.5% 38.4% 20.1% 19.7% Other expenses 2.8% 34.1% 19.0% 26.4% 2.5% 18.0% 18.0% EBITDA 14.8% 42.0% 12.6% 149.6% -39.3% 28.8% 27.0% EBIT 18.0% 45.0% 12.6% 160.3% -44.5% 28.8% 27.9% Pre-tax profits 28.2% 50.5% 15.6% 160.6% -44.8% 29.1% 28.1% Net profit 27.0% 42.5% 20.0% 154.5% -43.3% 29.1% 28.1% Margins EBITDA 16.6% 19.2% 19.6% 31.9% 20.1% 21.6% 22.9% EBIT 14.5% 17.2% 17.6% 29.8% 17.2% 18.4% 19.7% PBT 13.6% 16.7% 17.5% 29.7% 17.0% 18.3% 19.6% Cost component Material expenses 44.8% 38.3% 34.8% 24.4% 29.0% 28.2% 27.4% Staff cost 12.7% 13.3% 14.9% 13.4% 15.1% 14.9% 14.6% R&D 4.9% 6.2% 5.9% 9.8% 14.0% 14.0% 14.0% Others 21.0% 23.0% 24.8% 20.5% 21.8% 21.4% 21.1% Interest expense 1.6% 0.6% 0.2% 0.1% 0.2% 0.1% 0.1% Tax Rate 19.9% 24.2% 21.3% 23.1% 21.0% 21.0% 21.0%
Source: Company data, HSBC estimates
Income statement highlights:
Higher R&D cost: Alembic expects higher R&D expense (cINR4.5bn in FY17) as a result of
investment in product development for derma and injectables (including oncology injectables)
targeting the US market.
Pre R&D margin to improve: The management guided for improvement of pre-R&D EBITDA
margins from the FY15 level of c25%. Higher R&D can put pressure in post-R&D EBITDA.
Depreciation: We expect depreciation to go up due to higher planned capex.

EQUITIES PHARMACEUTICALS
21 September 2016
74
Exhibit 106: Alembic Pharma: Balance sheet statement
INRm FY13 FY14 FY15 FY16 FY17e FY18e FY19e
Net fixed assets 3,442 3,970 5,116 7,312 11,400 14,187 16,224 Goodwill 0 0 353 436 436 436 436 CWIP 323 207 831 925 925 925 925 Total long-term assets 3,765 4,176 6,300 8,673 12,760 15,548 17,585 Investments 33 34 23 21 21 21 21 Deferred taxation 0 0 0 0 0 0 0 Long-term loans and advances 1,163 948 1,182 834 834 834 834 Inventories 2,668 3,108 3,828 5,776 4,852 5,723 6,735 Cash & bank balance 161 240 268 4,508 2,657 2,713 4,408 Debtors 2,329 2,734 3,612 3,505 3,796 4,560 5,458 Short-term loans and advances 359 933 1,200 1,277 1,277 1,277 1,277 Total current assets 5,517 7,014 8,907 15,066 12,582 14,272 17,879 Total assets 10,478 12,173 16,412 24,594 26,197 30,675 36,319 Short-term debt 701 254 188 0 0 0 0 Creditors 2,400 2,884 3,109 5,664 4,411 5,202 6,123 Short-term provisions 623 729 949 160 160 160 160 Other current liabilities 693 606 586 525 525 525 525 Total current liabilities 4,416 4,474 4,832 6,349 5,096 5,888 6,808 Long-term debt 705 522 2,197 1,325 1,325 1,325 1,325 Deferred taxation 139 227 314 501 501 501 501 Other long-term liabilities 128 127 128 131 131 131 131 Long-term provisions 61 67 94 282 282 282 282 Total long-term liabilities 1,033 943 2,733 2,239 2,239 2,239 2,239 Share capital 377 377 377 377 377 377 377 Reserves 4,652 6,379 8,469 15,628 18,485 22,171 26,894 Shareholders' funds 5,029 6,756 8,846 16,005 18,862 22,548 27,271 Minorities 0 0 0 0 0 0 0 Total shareholders’ equity and liabilities
10,478 12,173 16,412 24,594 26,197 30,675 36,319
Source: Company data, HSBC estimates
Balance sheet highlights
Remaining healthy: Despite capex guidance of INR15bn over the next 2.5-3 years to construct
facilities to address US opportunities, the company doesn’t expect any significant increase in
debt. Most of its planned capex will be funded through windfall gains from generic Abilify in the
US, ruling out any large borrowing which could impact the health of the balance sheet. FY16 net
debt/equity stood at 0.08.
Good return ratios: Alembic has one of the best RoCE in the industry, driven by strong asset
turnover. In view of planned capex, return ratios could be depressed in the near term but we
expect the healthy long-term trend to continue.

75
EQUITIES PHARMACEUTICALS
21 September 2016
Exhibit 107: Alembic Pharma: best asset turnover ratio (GB to Op revenue)
Exhibit 108: Alembic’s RoCE is best among peers
Source: Company data, HSBC analysis Source: Company data, HSBC analysis
Exhibit 109: Alembic Pharma: cash flow statement
INRm FY13 FY14 FY15 FY16 FY17e FY18e FY19e
Cash flow from operating activities Net profit before tax 2,064 3,106 3,591 9,356 5,165 6,666 8,541 Adjustment for non-cash charges Depreciation 350 405 444 722 913 1,213 1,463 Interest charged 240 104 38 43 46 46 46 Others 136 201 -132 -82 0 0 0 Operating profit before change in working capital
2,597 3,804 4,037 9,928 6,124 7,925 10,050
Change in working capital 439 -715 -1,625 1,346 -620 -843 -991 Cash generated from operations 3,035 3,088 2,412 11,274 5,504 7,082 9,059 Direct taxes paid -387 -689 -694 -1,970 -1,085 -1,400 -1,794 Net cash inflow from operating activities
2,648 2,400 1,718 9,304 4,419 5,682 7,266
Cash flow from investing activities Purchase of tangible assets / Increase in capital work-in-progress
-860 -820 -2,236 -3,036 -5,000 -4,000 -3,500
Others 190 9 -320 -69 0 0 0 Net cash inflow from investing activities
-670 -811 -2,556 -3,105 -5,000 -4,000 -3,500
Cash flow from financial activities Repayment of long-term borrowings
-1,018 -407 -372 -392 0 0 0
Repayment of short-term borrowings
-683 -447 1,943 -872 0 0 0
Dividends paid -304 -546 -655 -653 -1,224 -1,580 -2,024 Interest and other finance costs -288 -110 -50 -44 -46 -46 -46 Others 5 -1 1 2 0 0 0 Net cash inflow from financing activities
-2,288 -1,511 867 -1,959 -1,271 -1,626 -2,071
Net (decrease)/increase in cash and cash equivalents
-310 79 29 4,240 -1,851 56 1,695
Cash and bank balance at the end of the period
161 240 268 4,508 2,657 2,713 4,408
Source: Company data, HSBC estimates
1.0
1.5
2.0
2.5
3.0
3.5
FY 12 FY 13 FY 14 FY 15 FY 16
Alembic Pharma Sun PharmaDr Reddy's LupinGlenmark CiplaAurobindo Cadila healthcareIpca Lab Torrent Pharma
0%
10%
20%
30%
40%
50%
60%
FY12 FY13 FY14 FY15 FY16
Alembic Pharma Cipla
Dr Reddy's Lupin
Sun Pharma Aurobindo Pharma
Cadila Healthcare Glenmark Pharma
Torrent Pharma

EQUITIES PHARMACEUTICALS
21 September 2016
76
Cash flow highlights
Capex: Alembic guided for capex of INR15bn in next 2.5-3 years (INR5bn for FY17). The company
has generated free cash flow on a consistent basis, but this could be impacted by planned capex in
the short term. However, we think the positive free cash flow trend will continue.
Exhibit 110: Alembic Pharma: DuPont analysis
FY13 FY14 FY15 FY16 FY17e FY18e FY19e
Net income/PBT (tax burden) 0.80 0.76 0.79 0.77 0.79 0.79 0.79 PBT/EBIT (interest burden) 0.93 0.97 1.00 1.00 0.99 0.99 0.99 EBIT/Revenue (EBIT margin) 0.15 0.17 0.18 0.30 0.17 0.18 0.20 Revenue/Total assets 1.45 1.65 1.44 1.54 1.20 1.28 1.30 Leverage 2.34 1.92 1.83 1.65 1.46 1.37 1.34 RoE 36.8% 40.0% 36.2% 57.9% 23.4% 25.4% 27.1%
Source: Company data, HSBC estimates
Exhibit 111: Shareholding pattern as of 1Q FY17
Exhibit 112: Institutions holding has consistently increased since listing
Source: BSE Source: BSE
Exhibit 113: ALPM: Key management personnel
Name Age Designation Description
Chirayu R. Amin
69 Chairman & Managing Director
Mr Amin holds a B.Sc and an MBA degree and has more than 33 years of industry experience. He had served as the President of FICCI and represented the industry in various associations and federations such as international chambers of commerce, and the Federation of Gujarat Industries. He is former Vice President of the Board of Control of Cricket in India (BCCI) and Baroda Cricket Association
Pranav Amin 41 Director & President-International Business
He graduated from Carnegie Mellon University and he had worked as a financial analysts at Dendrite Inc. in New Jersey, US. He has 16 year of industry experience.
Shaunak Amin
38 Director & President-Branded Formulations Business
He graduated from the University of Massachusetts in economics and has worked for multinationals such as Merrill Lynch and HSBC. He has headed the branded formulations division of the company since 2009 and has 13 years of industry experience
R.K Baheti 57 Finance & CFO Mr Baheti is a commerce graduate and a fellow member of Institute of Chartered Accountants in India. He is also a fellow member of Institute of Company Secretaries of India, with wide experience in finance, accounts, taxation and management function
Ajay Desai Vice President-Finance & Company Secretary
Source: Company data
Promoter74.13%
Institutions13.54%
Others12.33%
6.00
7.00
8.00
9.00
10.00
11.00
12.00
13.00
14.00
Listing 1QFY13 1QFY14 1QFY15 1QFY16 1QFY17
Institutions holding (%)

77
EQUITIES PHARMACEUTICALS
21 September 2016
Management strategy: After a successful transformation, Alembic’s management is investing
heavily in R&D and capex to capture niche opportunities in the US.
Key company milestones
Year Milestones
1907 Alembic established by Amin family 2006 FDA approved API facilities 2007 Acquired Dabur's cardiac, GI and gynaecology brands to augment specialty presence 2008 FDA approved Panelav formulation facility 2010/11 Pharma business demerged from Alembic-Alembic Pharma listed separately 2013 Launched first NDA Desvenlafaxine Base ER tablets with partner Ranbaxy in the US 2015 Launched generic Abilify (aripiprazole) on Day 1 2016 Formed a JV with Orbicular Inc.
Source: Company data

EQUITIES PHARMACEUTICALS
21 September 2016
78
Notes

79
EQUITIES PHARMACEUTICALS
21 September 2016
Notes

EQUITIES PHARMACEUTICALS
21 September 2016
80
Disclosure appendix
Analyst Certification
The following analyst(s), economist(s), and/or strategist(s) who is(are) primarily responsible for this report, certifies(y) that the
opinion(s) on the subject security(ies) or issuer(s) and/or any other views or forecasts expressed herein accurately reflect their
personal view(s) and that no part of their compensation was, is or will be directly or indirectly related to the specific
recommendation(s) or views contained in this research report: Damayanti Kerai and Girish Bakhru
Important disclosures
Equities: Stock ratings and basis for financial analysis
HSBC believes an investor's decision to buy or sell a stock should depend on individual circumstances such as the investor's
existing holdings, risk tolerance and other considerations and that investors utilise various disciplines and investment horizons
when making investment decisions. Ratings should not be used or relied on in isolation as investment advice. Different
securities firms use a variety of ratings terms as well as different rating systems to describe their recommendations and
therefore investors should carefully read the definitions of the ratings used in each research report. Further, investors should
carefully read the entire research report and not infer its contents from the rating because research reports contain more
complete information concerning the analysts' views and the basis for the rating.
From 23rd March 2015 HSBC has assigned ratings on the following basis:
The target price is based on the analyst’s assessment of the stock’s actual current value, although we expect it to take six to 12
months for the market price to reflect this. When the target price is more than 20% above the current share price, the stock will
be classified as a Buy; when it is between 5% and 20% above the current share price, the stock may be classified as a Buy or a
Hold; when it is between 5% below and 5% above the current share price, the stock will be classified as a Hold; when it is
between 5% and 20% below the current share price, the stock may be classified as a Hold or a Reduce; and when it is more
than 20% below the current share price, the stock will be classified as a Reduce.
Our ratings are re-calibrated against these bands at the time of any 'material change' (initiation or resumption of coverage,
change in target price or estimates).
Upside/Downside is the percentage difference between the target price and the share price.
Prior to this date, HSBC’s rating structure was applied on the following basis:
For each stock we set a required rate of return calculated from the cost of equity for that stock’s domestic or, as appropriate,
regional market established by our strategy team. The target price for a stock represented the value the analyst expected the
stock to reach over our performance horizon. The performance horizon was 12 months. For a stock to be classified as
Overweight, the potential return, which equals the percentage difference between the current share price and the target price,
including the forecast dividend yield when indicated, had to exceed the required return by at least 5 percentage points over the
succeeding 12 months (or 10 percentage points for a stock classified as Volatile*). For a stock to be classified as Underweight,
the stock was expected to underperform its required return by at least 5 percentage points over the succeeding 12 months (or
10 percentage points for a stock classified as Volatile*). Stocks between these bands were classified as Neutral.
*A stock was classified as volatile if its historical volatility had exceeded 40%, if the stock had been listed for less than 12
months (unless it was in an industry or sector where volatility is low) or if the analyst expected significant volatility. However,
stocks which we did not consider volatile may in fact also have behaved in such a way. Historical volatility was defined as the
past month's average of the daily 365-day moving average volatilities. In order to avoid misleadingly frequent changes in rating,
however, volatility had to move 2.5 percentage points past the 40% benchmark in either direction for a stock's status to change.

81
EQUITIES PHARMACEUTICALS
21 September 2016
Rating distribution for long-term investment opportunities
As of 21 September 2016, the distribution of all independent ratings published by HSBC is as follows:
For the purposes of the distribution above the following mapping structure is used during the transition from the previous to
current rating models: under our previous model, Overweight = Buy, Neutral = Hold and Underweight = Sell; under our current
model Buy = Buy, Hold = Hold and Reduce = Sell. For rating definitions under both models, please see “Stock ratings and basis
for financial analysis” above.
For the distribution of non-independent ratings published by HSBC, please see the disclosure page available at
http://www.hsbcnet.com/gbm/financial-regulation/investment-recommendations-disclosures.
To view a list of all the independent fundamental ratings disseminated by HSBC during the preceding 12-month period, please
see the disclosure page available at www.research.hsbc.com/A/Disclosures.
HSBC & Analyst disclosures
Disclosure checklist
Company Ticker Recent price Price date Disclosure
ALEMBIC PHARMACEUTICALS LTD ALEM.NS 653.25 20 Sep 2016 7 ALKEM LABORATORIES LTD ALKE.NS 1697.70 20 Sep 2016 7
Source: HSBC
1 HSBC has managed or co-managed a public offering of securities for this company within the past 12 months.
2 HSBC expects to receive or intends to seek compensation for investment banking services from this company in the next 3
months.
3 At the time of publication of this report, HSBC Securities (USA) Inc. is a Market Maker in securities issued by this
company.
4 As of 31 August 2016 HSBC beneficially owned 1% or more of a class of common equity securities of this company.
5 As of 31 July 2016, this company was a client of HSBC or had during the preceding 12 month period been a client of
and/or paid compensation to HSBC in respect of investment banking services.
6 As of 31 July 2016, this company was a client of HSBC or had during the preceding 12 month period been a client of
and/or paid compensation to HSBC in respect of non-investment banking securities-related services.
7 As of 31 July 2016, this company was a client of HSBC or had during the preceding 12 month period been a client of
and/or paid compensation to HSBC in respect of non-securities services.
8 A covering analyst/s has received compensation from this company in the past 12 months.
9 A covering analyst/s or a member of his/her household has a financial interest in the securities of this company, as
detailed below.
10 A covering analyst/s or a member of his/her household is an officer, director or supervisory board member of this
company, as detailed below.
11 At the time of publication of this report, HSBC is a non-US Market Maker in securities issued by this company and/or in
securities in respect of this company
12 As of 15 September 2016, HSBC beneficially held a net long position of more than 0.5% of this company’s total issued
share capital, calculated according to the SSR methodology.
13 As of 15 September 2016, HSBC beneficially held a net short position of more than 0.5% of this company’s total issued
share capital, calculated according to the SSR methodology. HSBC and its affiliates will from time to time sell to and buy from customers the securities/instruments, both equity and debt
(including derivatives) of companies covered in HSBC Research on a principal or agency basis.
Analysts, economists, and strategists are paid in part by reference to the profitability of HSBC which includes investment
banking, sales & trading, and principal trading revenues.
Buy 43% ( 24% of these provided with Investment Banking Services )
Hold 41% ( 25% of these provided with Investment Banking Services )
Sell 16% ( 19% of these provided with Investment Banking Services )

EQUITIES PHARMACEUTICALS
21 September 2016
82
Whether, or in what time frame, an update of this analysis will be published is not determined in advance.
Economic sanctions imposed by the EU and OFAC prohibit transacting or dealing in new debt or equity of Russian SSI entities.
This report does not constitute advice in relation to any securities issued by Russian SSI entities on or after July 16 2014 and as
such, this report should not be construed as an inducement to transact in any sanctioned securities.
For disclosures in respect of any company mentioned in this report, please see the most recently published report on that
company available at www.hsbcnet.com/research. In order to find out more about the proprietary models used to produce this
report, please contact the authoring analyst.
Additional disclosures
1. This report is dated as at 21 September 2016.
2. All market data included in this report are dated as at close 20 September 2016, unless a different date and/or a specific
time of day is indicated in the report.
3. HSBC has procedures in place to identify and manage any potential conflicts of interest that arise in connection with its
Research business. HSBC's analysts and its other staff who are involved in the preparation and dissemination of Research
operate and have a management reporting line independent of HSBC's Investment Banking business. Information Barrier
procedures are in place between the Investment Banking, Principal Trading, and Research businesses to ensure that any
confidential and/or price sensitive information is handled in an appropriate manner.
4. You are not permitted to use, for reference, any data in this document for the purpose of (i) determining the interest
payable, or other sums due, under loan agreements or under other financial contracts or instruments, (ii) determining the
price at which a financial instrument may be bought or sold or traded or redeemed, or the value of a financial instrument,
and/or (iii) measuring the performance of a financial instrument.
Production & distribution disclosures
1. This report was produced and signed off by the author on 21 Sep 2016 05:56 GMT.
2. In order to see when this report was first disseminated please see the disclosure page available at
https://www.research.hsbc.com/R/34/FPKJ7dT

83
EQUITIES PHARMACEUTICALS
21 September 2016
Disclaimer
Legal entities as at 1 July 2016
‘UAE’ HSBC Bank Middle East Limited, Dubai; ‘HK’ The Hongkong and Shanghai Banking Corporation Limited, Hong
Kong; ‘TW’ HSBC Securities (Taiwan) Corporation Limited; 'CA' HSBC Bank Canada, Toronto; HSBC Bank, Paris Branch;
HSBC France; ‘DE’ HSBC Trinkaus & Burkhardt AG, Düsseldorf; 000 HSBC Bank (RR), Moscow; ‘IN’ HSBC Securities and
Capital Markets (India) Private Limited, Mumbai; ‘JP’ HSBC Securities (Japan) Limited, Tokyo; ‘EG’ HSBC Securities Egypt
SAE, Cairo; ‘CN’ HSBC Investment Bank Asia Limited, Beijing Representative Office; The Hongkong and Shanghai
Banking Corporation Limited, Singapore Branch; The Hongkong and Shanghai Banking Corporation Limited, Seoul
Securities Branch; The Hongkong and Shanghai Banking Corporation Limited, Seoul Branch; HSBC Securities (South
Africa) (Pty) Ltd, Johannesburg; HSBC Bank plc, London, Madrid, Milan, Stockholm, Tel Aviv; ‘US’ HSBC Securities (USA)
Inc, New York; HSBC Yatirim Menkul Degerler AS, Istanbul; HSBC México, SA, Institución de Banca Múltiple, Grupo
Financiero HSBC; HSBC Bank Australia Limited; HSBC Bank Argentina SA; HSBC Saudi Arabia Limited; The Hongkong
and Shanghai Banking Corporation Limited, New Zealand Branch incorporated in Hong Kong SAR; The Hongkong and
Shanghai Banking Corporation Limited, Bangkok Branch
Issuer of report
HSBC Securities and Capital Markets (India) Private
Limited
Registered Office
52/60 Mahatma Gandhi Road
Fort, Mumbai 400 001, India
Telephone: +91 22 2267 4921
Fax: +91 22 2263 1983
Website: www.research.hsbc.com
SEBI Reg No. INH000001287
CIN: U67120MH1994PTC081575
This document has been issued by HSBC Securities and Capital Markets (India) Private Limited ("HSBC") for the information of its customers only. HSBC Securities and Capital Markets (India)
Private Limited is registered as "Research Analyst" (Reg No. INH000001287), Merchant Banker (Reg No. INM000010353) and Stock Broker (Reg. No. NSE Cash -INB230791734, NSE F & O-
INF230791734, BSE Cash- INB010791730, BSE F & O- INF010791730) and regulated by the Securities and Exchange Board of India. If it is received by a customer of an affiliate of HSBC, its
provision to the recipient is subject to the terms of business in place between the recipient and such affiliate. This document is not and should not be construed as an offer to sell or the
solicitation of an offer to purchase or subscribe for any investment. HSBC has based this document on information obtained from sources it believes to be reliable but which it has not
independently verified; HSBC makes no guarantee, representation or warranty and accepts no responsibility or liability as to its accuracy or completeness. Expressions of opinion are those of
the Research Division of HSBC only and are subject to change without notice. From time to time research analysts conduct site visits of covered issuers. HSBC policies prohibit research
analysts from accepting payment or reimbursement for travel expenses from the issuer for such visits. HSBC and its affiliates and/or their officers, directors and employees may have positions in
any securities mentioned in this document (or in any related investment) and may from time to time add to or dispose of any such securities (or investment). HSBC and its affiliates may act as
market maker or have assumed an underwriting commitment in the securities of companies discussed in this document (or in related investments), may sell them to or buy them from customers
on a principal basis and may also perform or seek to perform investment banking or underwriting services for or relating to those companies and may also be represented in the supervisory
board or any other committee of those companies. Details of Associates of HSBC Securities and Capital Markets (India) Private Limited can be obtained from Compliance Officer: Mudit Tayal,
Email: [email protected] The information and opinions contained within the research reports are based upon publicly available information and rates of taxation applicable at the time of
publication which are subject to change from time to time. Past performance is not necessarily a guide to future performance. The value of any investment or income may go down as well as up
and you may not get back the full amount invested. Where an investment is denominated in a currency other than the local currency of the recipient of the research report, changes in the
exchange rates may have an adverse effect on the value, price or income of that investment. In case of investments for which there is no recognised market it may be difficult for investors to sell
their investments or to obtain reliable information about its value or the extent of the risk to which it is exposed.
HSBC Securities (USA) Inc. accepts responsibility for the content of this research report prepared by its non-US foreign affiliate. All U.S. persons receiving and/or accessing this report and
wishing to effect transactions in any security discussed herein should do so with HSBC Securities (USA) Inc. in the United States and not with its non-US foreign affiliate, the issuer of this report.
In the UK this report may only be distributed to persons of a kind described in Article 19(5) of the Financial Services and Markets Act 2000 (Financial Promotion) Order 2005. The protections
afforded by the UK regulatory regime are available only to those dealing with a representative of HSBC Bank plc in the UK. In Singapore, this publication is distributed by The Hongkong and
Shanghai Banking Corporation Limited, Singapore Branch for the general information of institutional investors or other persons specified in Sections 274 and 304 of the Securities and Futures
Act (Chapter 289) (“SFA”) and accredited investors and other persons in accordance with the conditions specified in Sections 275 and 305 of the SFA. This publication is not a prospectus as
defined in the SFA. It may not be further distributed in whole or in part for any purpose. The Hongkong and Shanghai Banking Corporation Limited Singapore Branch is regulated by the
Monetary Authority of Singapore. Recipients in Singapore should contact a "Hongkong and Shanghai Banking Corporation Limited, Singapore Branch" representative in respect of any matters
arising from, or in connection with this report. In Australia, this publication has been distributed by The Hongkong and Shanghai Banking Corporation Limited (ABN 65 117 925 970, AFSL
301737) for the general information of its “wholesale” customers (as defined in the Corporations Act 2001). Where distributed to retail customers, this research is distributed by HSBC Bank
Australia Limited (AFSL No. 232595). These respective entities make no representations that the products or services mentioned in this document are available to persons in Australia or are
necessarily suitable for any particular person or appropriate in accordance with local law. No consideration has been given to the particular investment ob jectives, financial situation or particular
needs of any recipient. This publication is distributed in New Zealand by The Hongkong and Shanghai Banking Corporation Limited, New Zealand Branch incorporated in Hong Kong SAR.
In Japan, this publication has been distributed by HSBC Securities (Japan) Limited. In Hong Kong, this document has been distributed by The Hongkong and Shanghai Banking Corporation
Limited in the conduct of its Hong Kong regulated business for the information of its institutional and professional customers; it is not intended for and should not be distributed to retail customers
in Hong Kong. The Hongkong and Shanghai Banking Corporation Limited makes no representations that the products or services mentioned in this document are available to persons in Hong
Kong or are necessarily suitable for any particular person or appropriate in accordance with local law. All inquiries by such recipients must be directed to The Hongkong and Shanghai Banking
Corporation Limited. In Korea, this publication is distributed by The Hongkong and Shanghai Banking Corporation Limited, Seoul Securities Branch ("HBAP SLS") for the general information of
professional investors specified in Article 9 of the Financial Investment Services and Capital Markets Act (“FSCMA”). This publication is not a prospectus as defined in the FSCMA. It may not be
further distributed in whole or in part for any purpose. HBAP SLS is regulated by the Financial Services Commission and the Financial Supervisory Service of Korea.
In Canada, this document has been distributed by HSBC Bank Canada and/or its affiliates. Where this document contains market updates/overviews, or similar materials (collectively deemed
“Commentary” in Canada although other affiliate jurisdictions may term “Commentary” as either “macro-research” or “research”), the Commentary is not an offer to sell, or a solicitation of an offer
to sell or subscribe for, any financial product or instrument (including, without limitation, any currencies, securities, commodities or other financial instruments).
© Copyright 2016, HSBC Securities and Capital Markets (India) Private Limited, ALL RIGHTS RESERVED. No part of this publication may be reproduced, stored in a retrieval system, or
transmitted, on any form or by any means, electronic, mechanical, photocopying, recording, or otherwise, without the prior written permission of HSBC Securities and Capital Markets (India)
Private Limited. MCI (P) 094/06/2016, MCI (P) 085/06/2016 and MICA (P) 021/01/2016
[526201]

Head of Research, India Yogesh Aggarwal +91 22 2268 1246 [email protected]
Equity Strategy
Strategist Devendra Joshi +852 2996 6592 [email protected]
Banks
Analyst Sachin Sheth +91 22 2268 1224 [email protected]
Analyst Tejas Mehta +91 22 2268 1243 [email protected]
Analyst Aseem Pant +91 22 3396 0688 [email protected]
Consumer & Retail
Analyst Amit Sachdeva +91 22 2268 1240 [email protected]
Analyst Kuldeep Gangwar +91 22 3396 0686 [email protected]
Healthcare
Analyst Girish Bakhru +91 22 2268 1638 [email protected]
Analyst Damayanti Kerai +91 22 3396 0692 [email protected]
Infrastructure, Real Estate
Analyst Ashutosh Narkar +91 22 2268 1474 [email protected]
Analyst Shrinidhi Karlekar +91 22 6164 0689 [email protected]
IT Services and Autos
Analyst Yogesh Aggarwal +91 22 2268 1246 [email protected]
Analyst Vivek Gedda +91 22 6164 0693 [email protected]
Analyst Vikas Ahuja +91 22 3396 0690 [email protected]
Metals & Mining
Analyst Jigar Mistry +91 22 2268 1079 [email protected]
Analyst Kirtan Mehta, CFA +91 80 4555 2752 [email protected]
Analyst Rajesh V Lachhani +91 22 6164 0687 [email protected]
Oil & Gas
Analyst Kumar Manish +91 22 2268 1238 [email protected]
Analyst Alok Deshpande +91 22 2268 1245 [email protected]
Real Estate, Auto Components
Analyst Puneet Gulati +91 22 2268 1235 [email protected]
Analyst Saurabh Jain +91 22 6164 0691 [email protected]
Telecom, Media
Analyst Rajiv Sharma +91 22 2268 1239 [email protected]
Analyst Darpan Thakkar +91 22 6164 0695 [email protected]
Utilities
Analyst Jigar Mistry +91 22 2268 1079 [email protected]
India Research Team